PWC Eindrapport prijsvergelijk gasprijzen Ministerie van Economische Zaken
24
Ministerie van Economische Zaken Gasprijzen in de mineralogische en metallurgische industrie: een internationale vergelijking April 2015 Strikt persoonlijk en vertrouwelijk Finaal
-
Upload
frank-buijs -
Category
Business
-
view
367 -
download
0
Transcript of PWC Eindrapport prijsvergelijk gasprijzen Ministerie van Economische Zaken
Ministerie van Economische Zaken Gasprijzen in de mineralogische en metallurgische industrie: een internationale vergelijking
April 2015
Strikt persoonlijk en
vertrouwelijk
Finaal
PwC
April 2015
Use the divider control box below to
make the slide title appear in your
primary TOC and section TOCs.
Please follow these steps:
Type ‘Divider’ in the control box
provided below.
Click the Divider command on the
Smart ribbon.
Enter the text that you’d like to
appear in the TOCs and select a
divider level.
Click Update. The slide title should
now appear on all TOCs.
To remove the slide title from your
TOCs, delete the ‘Divider’ text from
the divider control box and hit
Update.
Finaal 2
Ministerie van Economische Zaken
Use the divider control box below to
make the slide title appear in your
primary TOC and section TOCs.
Please follow these steps:
Type ‘Divider’ in the control box
provided below.
Click the Divider command on the
Smart ribbon.
Enter the text that you’d like to
appear in the TOCs and select a
divider level.
Click Update. The slide title should
now appear on all TOCs.
To remove the slide title from your
TOCs, delete the ‘Divider’ text from
the divider control box and hit
Update.
PricewaterhouseCoopers Advisory N.V. Thomas R. Malthusstraat 5 1006 GC Amsterdam
Ministerie van Economische Zaken T.a.v. heer M. Janson Postbus 20401 2500 EK Den Haag
Betreft - Rapportage “Gasprijzen in de mineralogische en metallurgische industrie: een internationale vergelijking”
Geachte heer Janson, beste Michiel,
Voor u ligt een vergelijking van de gasprijzen voor bedrijven actief in de mineralogische en metallurgische industrie in Nederland, Duitsland en België. Het Ministerie van Economische Zaken ontvangt regelmatig signalen van bedrijven in de mineralogische en metallurgische industrie dat de Nederlandse gasprijzen relatief hoog zijn. In dit kader heeft het Ministerie van Economische Zaken PwC gevraagd om een vergelijking te maken tussen de integrale gasrekening van Nederlandse grootgebruikers en die van omliggende landen, specifiek België en Duitsland.
In onze analyses hebben wij aannames en vereenvoudigingen moeten maken, aangezien niet alle informatie publiek beschikbaar is, of tussen regio’s verschilt, zoals bijvoorbeeld netwerktarieven. Daarnaast is er sprake van specifieke uitzonderingen op de heffingen en belastingen. Om hier rekening mee te houden laten wij de geschatte rekening met en zonder de ontheffingen zien. Individuele energierekeningen kunnen uiteraard op onderdelen afwijken van de hier gepresenteerde uitkomsten.
Wij hebben geen activiteiten uitgevoerd die het karakter dragen van een accountantscontrole of due diligence. Dit rapport is strikt vertrouwelijk en alleen voor u bedoeld. Het mag alleen aan derden worden verstrekt voor zover overeengekomen in ons contract of nadat wij vooraf schriftelijke toestemming hebben gegeven. Wij accepteren geen aansprakelijkheid (ook niet voor nalatigheid) richting enige andere partij dan u of voor enig ander gebruik van dit rapport dan waarvoor het bedoeld is.
Ik wens u veel leesplezier.
Met vriendelijke groet,
Dr. Paul Nillesen, Partner PwC Advisory
Dr. Paul Nillesen Partner [email protected] Robert Hensgens Senior Manager [email protected]
Appendix Gedetailleerde bevindingen Aannames Overzicht van bevindingen
PwC
April 2015
Finaal
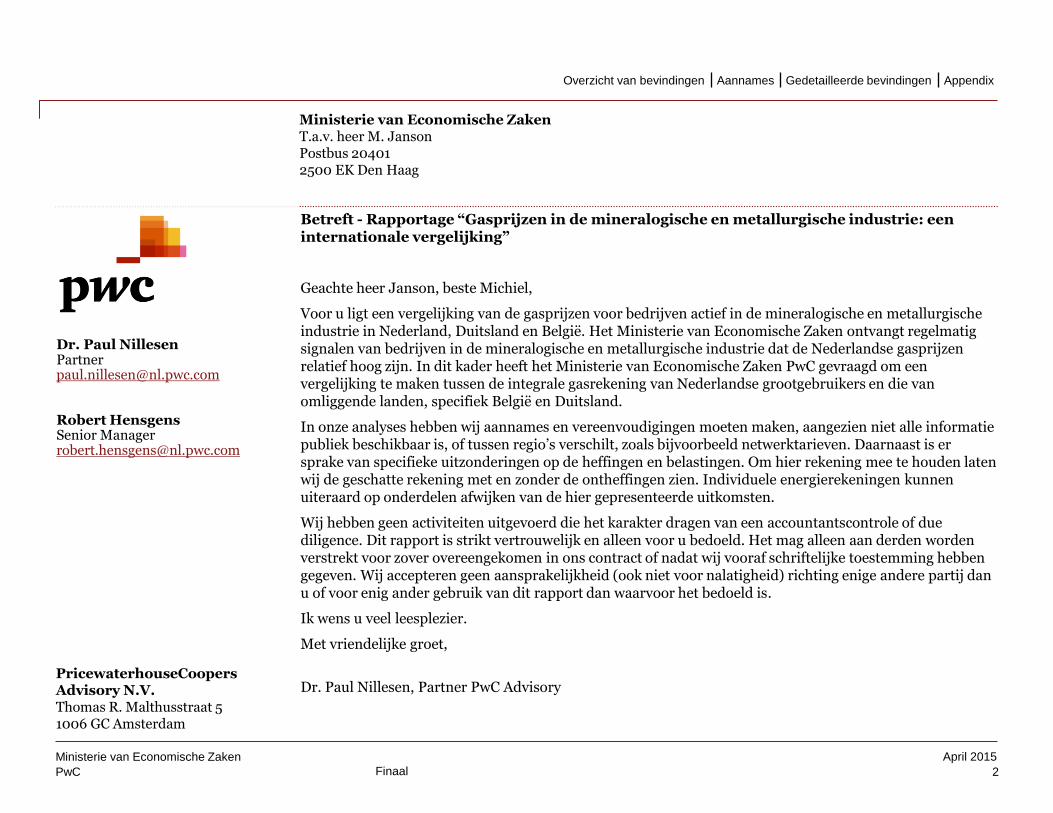
Overzicht van beschikbaarheid kwaliteit en reikwijdte van de gebruikte informatie
3
Ministerie van Economische Zaken
Beschikbaarheid informatie
De daadwerkelijke gasrekeningen verschillen per gebruiker: deze zijn niet publiekelijk toegankelijk. Met name de component “verkoopmarge” zal verschillen per gasleverancier, en is derhalve generiek geschat op basis van literatuur.
Beperkt Uitgebreid
Kwaliteit van informatie
Wij hebben openbare bronnen gebruikt, afkomstig van officiële kanalen zoals toezichthouders en ministeries. Onze bevindingen zijn aldus reproduceerbaar.
Zwak Goed
Reikwijdte van informatie
Wij hebben 4 gebruikersprofielen vastgesteld, en waar nodig de relevante ontheffingen voor specifieke groepen gebruikers toegepast. De 4 gebruikersprofielen omvatten het MKB en de industriële gebruikers, en zijn indicatief voor de variëteit aan afnemers die wij in de praktijk zien. Individuele gasrekeningen kunnen verschillen, afhankelijk van factoren zoals geografische verschillen in de netwerkkosten en gecontracteerde capaciteit: dit hebben wij ondervangen door aannames te maken en deze zo representatief mogelijk weer te geven over alle gebruikers en landen heen. Alle analyses in deze rapportage zijn momentopnames, met eind 2014 als peildatum.
Beperkt Uitgebreid
Appendix Gedetailleerde bevindingen Aannames Overzicht van bevindingen
PwC
April 2015
Finaal
Overzicht van bevindingen
4
Ministerie van Economische Zaken
Appendix Gedetailleerde bevindingen Aannames Overzicht van bevindingen
PwC
April 2015
Use the divider control box below to
make the slide title appear in your
primary TOC and section TOCs.
Please follow these steps:
Type ‘Divider’ in the control box
provided below.
Click the Divider command on the
Smart ribbon.
Enter the text that you’d like to
appear in the TOCs and select a
divider level.
Click Update. The slide title should
now appear on all TOCs.
To remove the slide title from your
TOCs, delete the ‘Divider’ text from
the divider control box and hit
Update.
Finaal
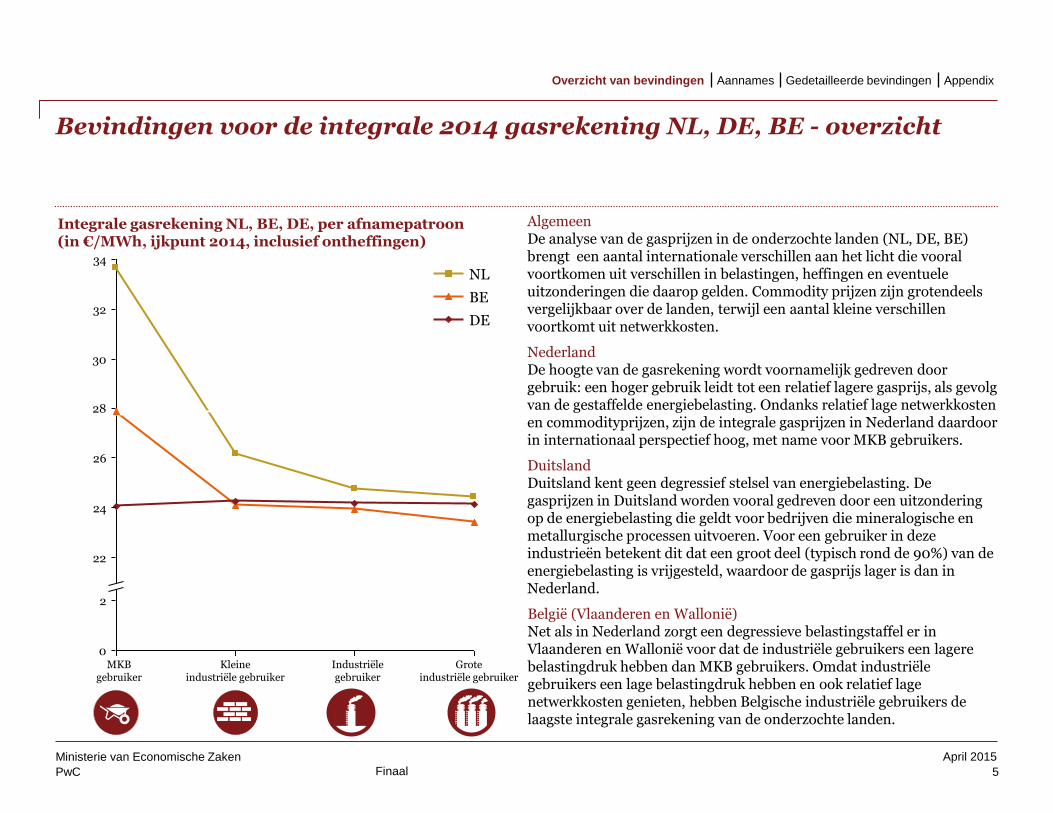
Algemeen De analyse van de gasprijzen in de onderzochte landen (NL, DE, BE) brengt een aantal internationale verschillen aan het licht die vooral voortkomen uit verschillen in belastingen, heffingen en eventuele uitzonderingen die daarop gelden. Commodity prijzen zijn grotendeels vergelijkbaar over de landen, terwijl een aantal kleine verschillen voortkomt uit netwerkkosten.
Nederland De hoogte van de gasrekening wordt voornamelijk gedreven door gebruik: een hoger gebruik leidt tot een relatief lagere gasprijs, als gevolg van de gestaffelde energiebelasting. Ondanks relatief lage netwerkkosten en commodityprijzen, zijn de integrale gasprijzen in Nederland daardoor in internationaal perspectief hoog, met name voor MKB gebruikers.
Duitsland Duitsland kent geen degressief stelsel van energiebelasting. De gasprijzen in Duitsland worden vooral gedreven door een uitzondering op de energiebelasting die geldt voor bedrijven die mineralogische en metallurgische processen uitvoeren. Voor een gebruiker in deze industrieën betekent dit dat een groot deel (typisch rond de 90%) van de energiebelasting is vrijgesteld, waardoor de gasprijs lager is dan in Nederland.
België (Vlaanderen en Wallonië) Net als in Nederland zorgt een degressieve belastingstaffel er in Vlaanderen en Wallonië voor dat de industriële gebruikers een lagere belastingdruk hebben dan MKB gebruikers. Omdat industriële gebruikers een lage belastingdruk hebben en ook relatief lage netwerkkosten genieten, hebben Belgische industriële gebruikers de laagste integrale gasrekening van de onderzochte landen.
Bevindingen voor de integrale 2014 gasrekening NL, DE, BE - overzicht
5
Ministerie van Economische Zaken
34
32
30
28
26
24
22
2
0
DE
BE
NL
MKB gebruiker
Kleine industriële gebruiker
Industriële gebruiker
Grote industriële gebruiker
Integrale gasrekening NL, BE, DE, per afnamepatroon (in €/MWh, ijkpunt 2014, inclusief ontheffingen)
Appendix Gedetailleerde bevindingen Aannames Overzicht van bevindingen
PwC
April 2015
Finaal
Bevindingen voor de integrale 2014 gasrekening NL, BE, DE – per gebruikersprofiel (1/2)
6
Ministerie van Economische Zaken
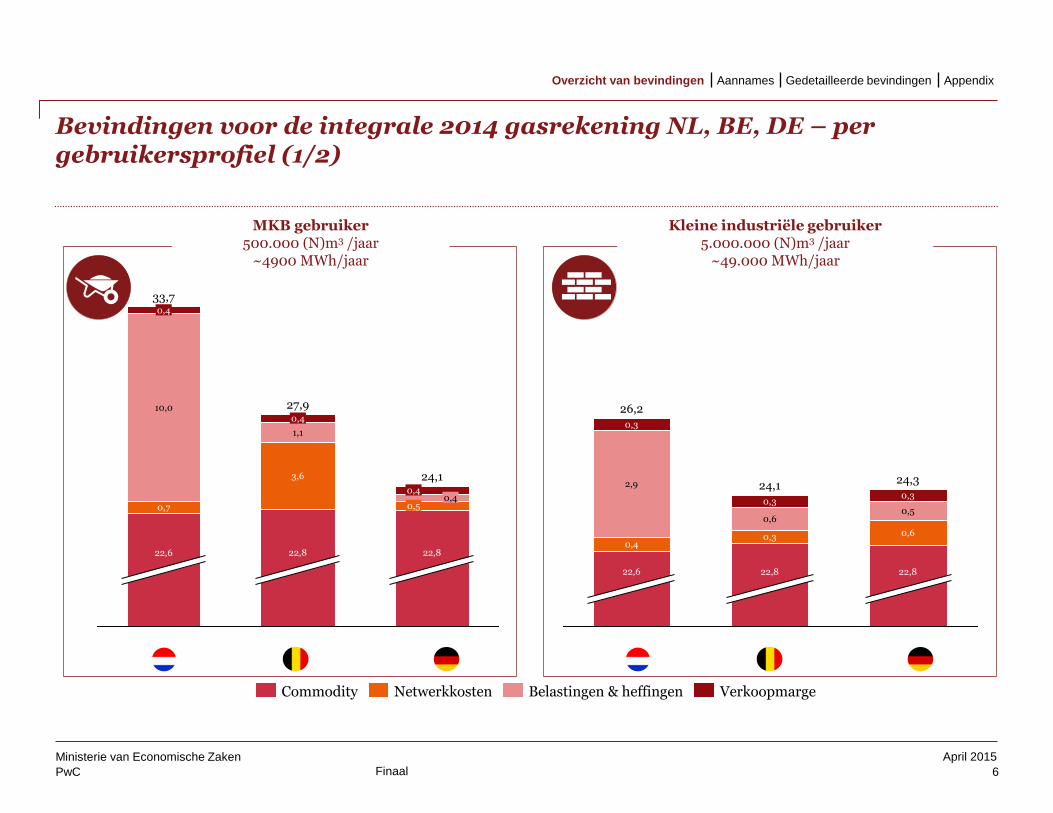
MKB gebruiker 500.000 (N)m3 /jaar
~4900 MWh/jaar
Kleine industriële gebruiker 5.000.000 (N)m3 /jaar
~49.000 MWh/jaar
24,3
0,3
0,5
0,6
22,8
24,1
0,3
0,6
0,3
22,8
26,2
0,3
2,9
0,4
22,6
Verkoopmarge Belastingen & heffingen Netwerkkosten Commodity
0,4
27,9 0,4
1,1
3,6
22,8
33,7 0,4
10,0
0,7
22,6
24,1
0,4 0,5
22,8
Appendix Gedetailleerde bevindingen Aannames Overzicht van bevindingen
PwC
April 2015
Finaal
Bevindingen voor de integrale 2014 gasrekening NL, BE, DE – per gebruikersprofiel (2/2)
7
Ministerie van Economische Zaken
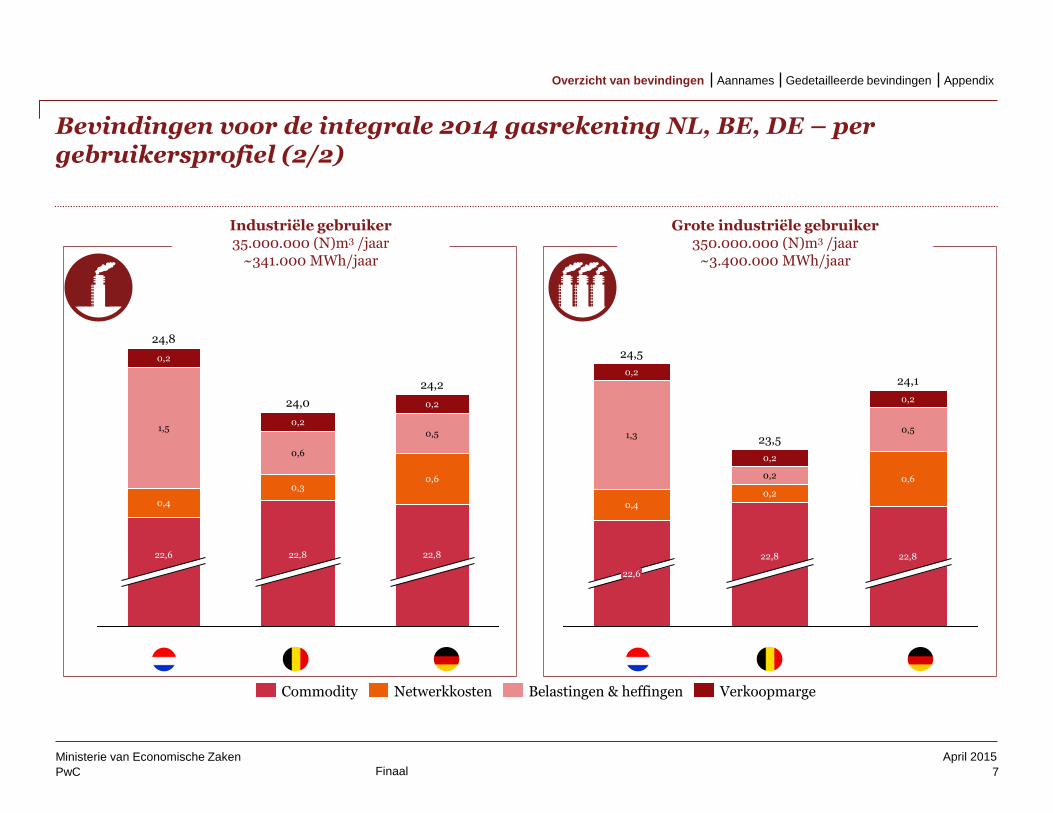
24,2
0,2
0,5
0,6
22,8
24,0
0,2
0,6
0,3
22,8
24,8
0,2
1,5
0,4
22,6
24,1
0,2
0,5
0,6
22,8
23,5
0,2
0,2
0,2
22,8
24,5
0,2
1,3
0,4
22,6
Verkoopmarge Belastingen & heffingen Netwerkkosten Commodity
Industriële gebruiker 35.000.000 (N)m3 /jaar
~341.000 MWh/jaar
Grote industriële gebruiker 350.000.000 (N)m3 /jaar
~3.400.000 MWh/jaar
Appendix Gedetailleerde bevindingen Aannames Overzicht van bevindingen
PwC
April 2015
Finaal
Aannames
8
Ministerie van Economische Zaken
Appendix Gedetailleerde bevindingen Aannames Overzicht van bevindingen
PwC
April 2015
Use the divider control box below to
make the slide title appear in your
primary TOC and section TOCs.
Please follow these steps:
Type ‘Divider’ in the control box
provided below.
Click the Divider command on the
Smart ribbon.
Enter the text that you’d like to
appear in the TOCs and select a
divider level.
Click Update. The slide title should
now appear on all TOCs.
To remove the slide title from your
TOCs, delete the ‘Divider’ text from
the divider control box and hit
Update.
Finaal
Profielen
MKB gebruiker
Kleine industriële gebruiker
Industriële gebruiker
Grote industriële gebruiker
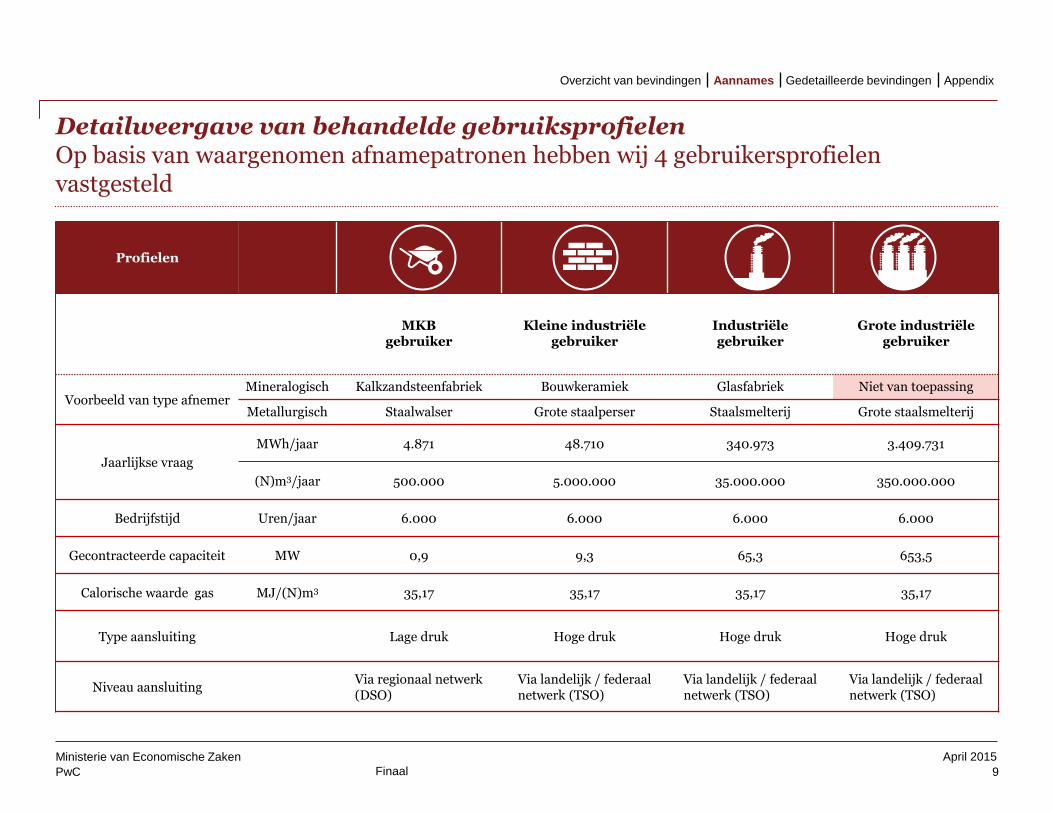
Voorbeeld van type afnemer Mineralogisch Kalkzandsteenfabriek Bouwkeramiek Glasfabriek Niet van toepassing
Metallurgisch Staalwalser Grote staalperser Staalsmelterij Grote staalsmelterij
Jaarlijkse vraag
MWh/jaar 4.871 48.710 340.973 3.409.731
(N)m3/jaar 500.000 5.000.000 35.000.000 350.000.000
Bedrijfstijd Uren/jaar 6.000 6.000 6.000 6.000
Gecontracteerde capaciteit MW 0,9 9,3 65,3 653,5
Calorische waarde gas MJ/(N)m3 35,17 35,17 35,17 35,17
Type aansluiting Lage druk Hoge druk Hoge druk Hoge druk
Niveau aansluiting Via regionaal netwerk (DSO)
Via landelijk / federaal netwerk (TSO)
Via landelijk / federaal netwerk (TSO)
Via landelijk / federaal netwerk (TSO)
Detailweergave van behandelde gebruiksprofielen Op basis van waargenomen afnamepatronen hebben wij 4 gebruikersprofielen vastgesteld
9
Ministerie van Economische Zaken
Use the divider control box below to
make the slide title appear in your
primary TOC and section TOCs.
Please follow these steps:
Type ‘Divider’ in the control box
provided below.
Click the Divider command on the
Smart ribbon.
Enter the text that you’d like to
appear in the TOCs and select a
divider level.
Click Update. The slide title should
now appear on all TOCs.
To remove the slide title from your
TOCs, delete the ‘Divider’ text from
the divider control box and hit
Update.
Appendix Gedetailleerde bevindingen Aannames Overzicht van bevindingen
PwC
April 2015
Use the divider control box below to
make the slide title appear in your
primary TOC and section TOCs.
Please follow these steps:
Type ‘Divider’ in the control box
provided below.
Click the Divider command on the
Smart ribbon.
Enter the text that you’d like to
appear in the TOCs and select a
divider level.
Click Update. The slide title should
now appear on all TOCs.
To remove the slide title from your
TOCs, delete the ‘Divider’ text from
the divider control box and hit
Update.
Finaal
Algemene aannames
10
Ministerie van Economische Zaken
Use the divider control box below to
make the slide title appear in your
primary TOC and section TOCs.
Please follow these steps:
Type ‘Divider’ in the control box
provided below.
Click the Divider command on the
Smart ribbon.
Enter the text that you’d like to
appear in the TOCs and select a
divider level.
Click Update. The slide title should
now appear on all TOCs.
To remove the slide title from your
TOCs, delete the ‘Divider’ text from
the divider control box and hit
Update.
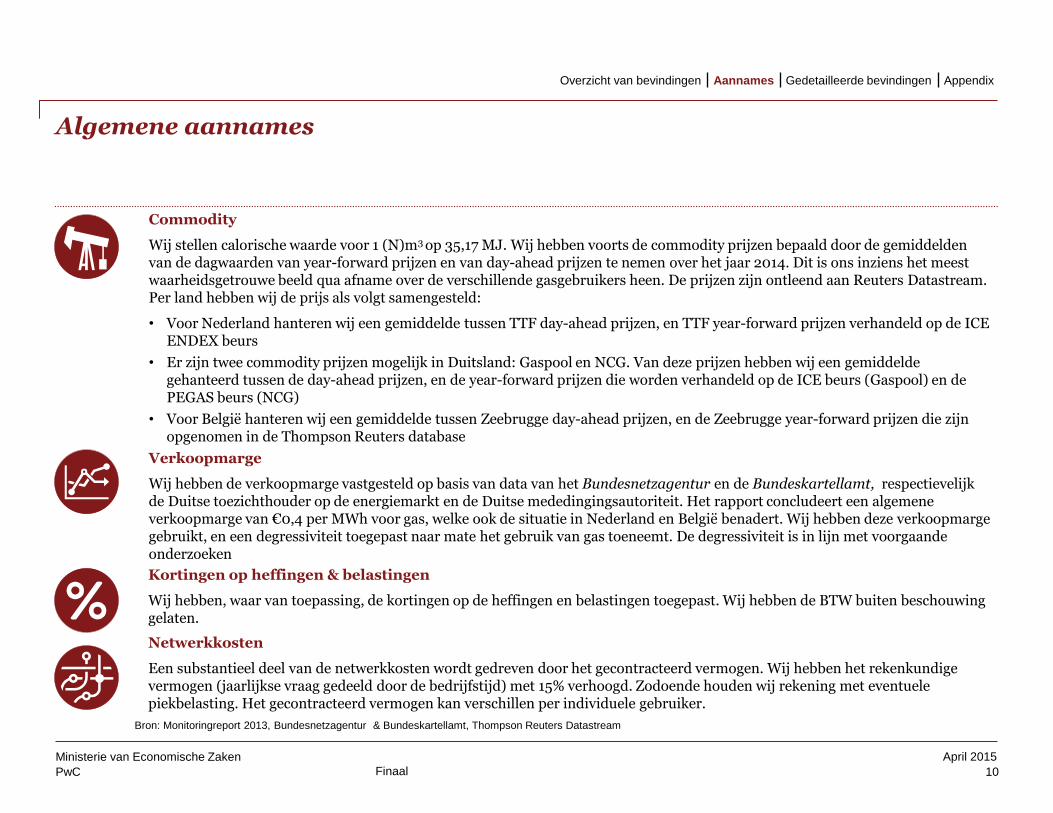
Bron: Monitoringreport 2013, Bundesnetzagentur & Bundeskartellamt, Thompson Reuters Datastream
Commodity
Wij stellen calorische waarde voor 1 (N)m3 op 35,17 MJ. Wij hebben voorts de commodity prijzen bepaald door de gemiddelden van de dagwaarden van year-forward prijzen en van day-ahead prijzen te nemen over het jaar 2014. Dit is ons inziens het meest waarheidsgetrouwe beeld qua afname over de verschillende gasgebruikers heen. De prijzen zijn ontleend aan Reuters Datastream. Per land hebben wij de prijs als volgt samengesteld:
• Voor Nederland hanteren wij een gemiddelde tussen TTF day-ahead prijzen, en TTF year-forward prijzen verhandeld op de ICE ENDEX beurs
• Er zijn twee commodity prijzen mogelijk in Duitsland: Gaspool en NCG. Van deze prijzen hebben wij een gemiddelde gehanteerd tussen de day-ahead prijzen, en de year-forward prijzen die worden verhandeld op de ICE beurs (Gaspool) en de PEGAS beurs (NCG)
• Voor België hanteren wij een gemiddelde tussen Zeebrugge day-ahead prijzen, en de Zeebrugge year-forward prijzen die zijn opgenomen in de Thompson Reuters database
Verkoopmarge
Wij hebben de verkoopmarge vastgesteld op basis van data van het Bundesnetzagentur en de Bundeskartellamt, respectievelijk de Duitse toezichthouder op de energiemarkt en de Duitse mededingingsautoriteit. Het rapport concludeert een algemene verkoopmarge van €0,4 per MWh voor gas, welke ook de situatie in Nederland en België benadert. Wij hebben deze verkoopmarge gebruikt, en een degressiviteit toegepast naar mate het gebruik van gas toeneemt. De degressiviteit is in lijn met voorgaande onderzoeken
Kortingen op heffingen & belastingen
Wij hebben, waar van toepassing, de kortingen op de heffingen en belastingen toegepast. Wij hebben de BTW buiten beschouwing gelaten.
Netwerkkosten
Een substantieel deel van de netwerkkosten wordt gedreven door het gecontracteerd vermogen. Wij hebben het rekenkundige vermogen (jaarlijkse vraag gedeeld door de bedrijfstijd) met 15% verhoogd. Zodoende houden wij rekening met eventuele piekbelasting. Het gecontracteerd vermogen kan verschillen per individuele gebruiker.
Appendix Gedetailleerde bevindingen Aannames Overzicht van bevindingen
PwC
April 2015
Use the divider control box below to
make the slide title appear in your
primary TOC and section TOCs.
Please follow these steps:
Type ‘Divider’ in the control box
provided below.
Click the Divider command on the
Smart ribbon.
Enter the text that you’d like to
appear in the TOCs and select a
divider level.
Click Update. The slide title should
now appear on all TOCs.
To remove the slide title from your
TOCs, delete the ‘Divider’ text from
the divider control box and hit
Update.
Finaal
Aannames Nederland
11
Ministerie van Economische Zaken
Use the divider control box below to
make the slide title appear in your
primary TOC and section TOCs.
Please follow these steps:
Type ‘Divider’ in the control box
provided below.
Click the Divider command on the
Smart ribbon.
Enter the text that you’d like to
appear in the TOCs and select a
divider level.
Click Update. The slide title should
now appear on all TOCs.
To remove the slide title from your
TOCs, delete the ‘Divider’ text from
the divider control box and hit
Update.
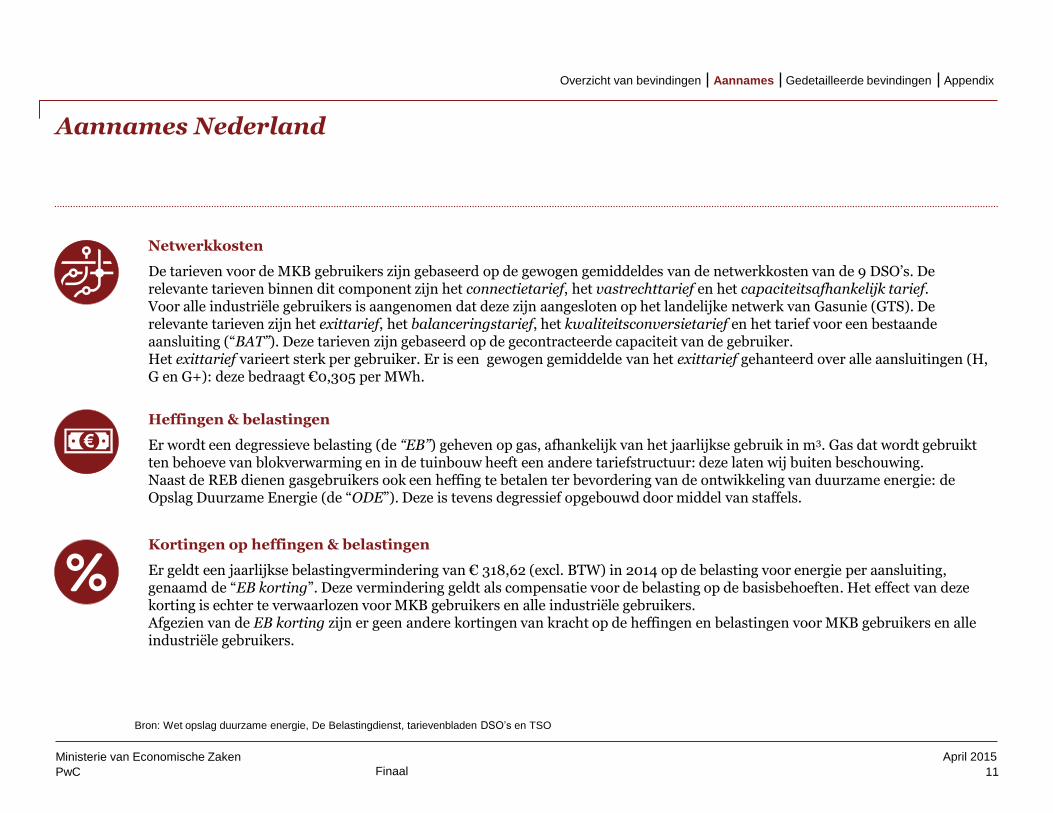
Bron: Wet opslag duurzame energie, De Belastingdienst, tarievenbladen DSO’s en TSO
Netwerkkosten
De tarieven voor de MKB gebruikers zijn gebaseerd op de gewogen gemiddeldes van de netwerkkosten van de 9 DSO’s. De relevante tarieven binnen dit component zijn het connectietarief, het vastrechttarief en het capaciteitsafhankelijk tarief. Voor alle industriële gebruikers is aangenomen dat deze zijn aangesloten op het landelijke netwerk van Gasunie (GTS). De relevante tarieven zijn het exittarief, het balanceringstarief, het kwaliteitsconversietarief en het tarief voor een bestaande aansluiting (“BAT”). Deze tarieven zijn gebaseerd op de gecontracteerde capaciteit van de gebruiker. Het exittarief varieert sterk per gebruiker. Er is een gewogen gemiddelde van het exittarief gehanteerd over alle aansluitingen (H, G en G+): deze bedraagt €0,305 per MWh.
Heffingen & belastingen
Er wordt een degressieve belasting (de “EB”) geheven op gas, afhankelijk van het jaarlijkse gebruik in m3. Gas dat wordt gebruikt ten behoeve van blokverwarming en in de tuinbouw heeft een andere tariefstructuur: deze laten wij buiten beschouwing. Naast de REB dienen gasgebruikers ook een heffing te betalen ter bevordering van de ontwikkeling van duurzame energie: de Opslag Duurzame Energie (de “ODE”). Deze is tevens degressief opgebouwd door middel van staffels.
Kortingen op heffingen & belastingen
Er geldt een jaarlijkse belastingvermindering van € 318,62 (excl. BTW) in 2014 op de belasting voor energie per aansluiting, genaamd de “EB korting”. Deze vermindering geldt als compensatie voor de belasting op de basisbehoeften. Het effect van deze korting is echter te verwaarlozen voor MKB gebruikers en alle industriële gebruikers. Afgezien van de EB korting zijn er geen andere kortingen van kracht op de heffingen en belastingen voor MKB gebruikers en alle industriële gebruikers.
Appendix Gedetailleerde bevindingen Aannames Overzicht van bevindingen
€
PwC
April 2015
Use the divider control box below to
make the slide title appear in your
primary TOC and section TOCs.
Please follow these steps:
Type ‘Divider’ in the control box
provided below.
Click the Divider command on the
Smart ribbon.
Enter the text that you’d like to
appear in the TOCs and select a
divider level.
Click Update. The slide title should
now appear on all TOCs.
To remove the slide title from your
TOCs, delete the ‘Divider’ text from
the divider control box and hit
Update.
Finaal
Aannames België
12
Ministerie van Economische Zaken
Use the divider control box below to
make the slide title appear in your
primary TOC and section TOCs.
Please follow these steps:
Type ‘Divider’ in the control box
provided below.
Click the Divider command on the
Smart ribbon.
Enter the text that you’d like to
appear in the TOCs and select a
divider level.
Click Update. The slide title should
now appear on all TOCs.
To remove the slide title from your
TOCs, delete the ‘Divider’ text from
the divider control box and hit
Update.
Bron: CREG, ejustice.just.fgov, tarievenbladen DSO’s en TSO’s
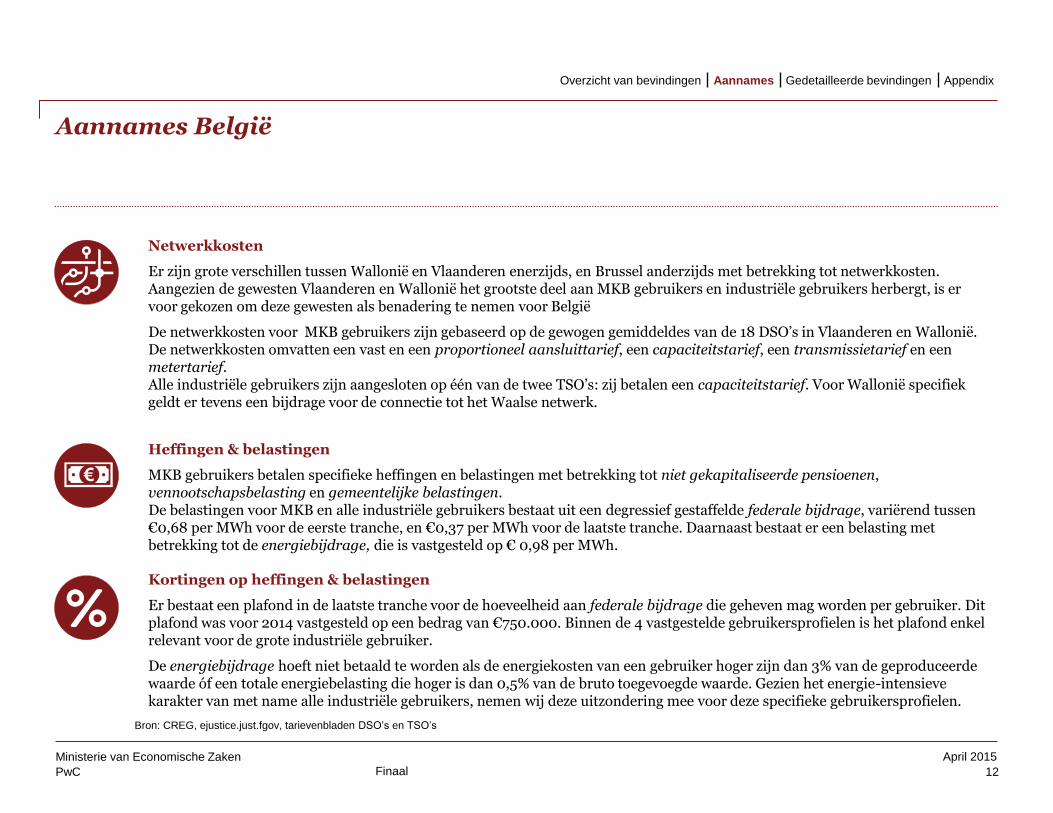
Heffingen & belastingen
MKB gebruikers betalen specifieke heffingen en belastingen met betrekking tot niet gekapitaliseerde pensioenen, vennootschapsbelasting en gemeentelijke belastingen. De belastingen voor MKB en alle industriële gebruikers bestaat uit een degressief gestaffelde federale bijdrage, variërend tussen €0,68 per MWh voor de eerste tranche, en €0,37 per MWh voor de laatste tranche. Daarnaast bestaat er een belasting met betrekking tot de energiebijdrage, die is vastgesteld op € 0,98 per MWh.
Kortingen op heffingen & belastingen
Er bestaat een plafond in de laatste tranche voor de hoeveelheid aan federale bijdrage die geheven mag worden per gebruiker. Dit plafond was voor 2014 vastgesteld op een bedrag van €750.000. Binnen de 4 vastgestelde gebruikersprofielen is het plafond enkel relevant voor de grote industriële gebruiker.
De energiebijdrage hoeft niet betaald te worden als de energiekosten van een gebruiker hoger zijn dan 3% van de geproduceerde waarde óf een totale energiebelasting die hoger is dan 0,5% van de bruto toegevoegde waarde. Gezien het energie-intensieve karakter van met name alle industriële gebruikers, nemen wij deze uitzondering mee voor deze specifieke gebruikersprofielen.
Netwerkkosten
Er zijn grote verschillen tussen Wallonië en Vlaanderen enerzijds, en Brussel anderzijds met betrekking tot netwerkkosten. Aangezien de gewesten Vlaanderen en Wallonië het grootste deel aan MKB gebruikers en industriële gebruikers herbergt, is er voor gekozen om deze gewesten als benadering te nemen voor België
De netwerkkosten voor MKB gebruikers zijn gebaseerd op de gewogen gemiddeldes van de 18 DSO’s in Vlaanderen en Wallonië. De netwerkkosten omvatten een vast en een proportioneel aansluittarief, een capaciteitstarief, een transmissietarief en een metertarief. Alle industriële gebruikers zijn aangesloten op één van de twee TSO’s: zij betalen een capaciteitstarief. Voor Wallonië specifiek geldt er tevens een bijdrage voor de connectie tot het Waalse netwerk.
Appendix Gedetailleerde bevindingen Aannames Overzicht van bevindingen
€
PwC
April 2015
Use the divider control box below to
make the slide title appear in your
primary TOC and section TOCs.
Please follow these steps:
Type ‘Divider’ in the control box
provided below.
Click the Divider command on the
Smart ribbon.
Enter the text that you’d like to
appear in the TOCs and select a
divider level.
Click Update. The slide title should
now appear on all TOCs.
To remove the slide title from your
TOCs, delete the ‘Divider’ text from
the divider control box and hit
Update.
Finaal
Aannames Duitsland
13
Ministerie van Economische Zaken
Use the divider control box below to
make the slide title appear in your
primary TOC and section TOCs.
Please follow these steps:
Type ‘Divider’ in the control box
provided below.
Click the Divider command on the
Smart ribbon.
Enter the text that you’d like to
appear in the TOCs and select a
divider level.
Click Update. The slide title should
now appear on all TOCs.
To remove the slide title from your
TOCs, delete the ‘Divider’ text from
the divider control box and hit
Update.
Bron: § 2 Energiesteuergesetz („EnergieStG“), § 51 EnergieStG, tarievenbladen DSO’s en TSO’s
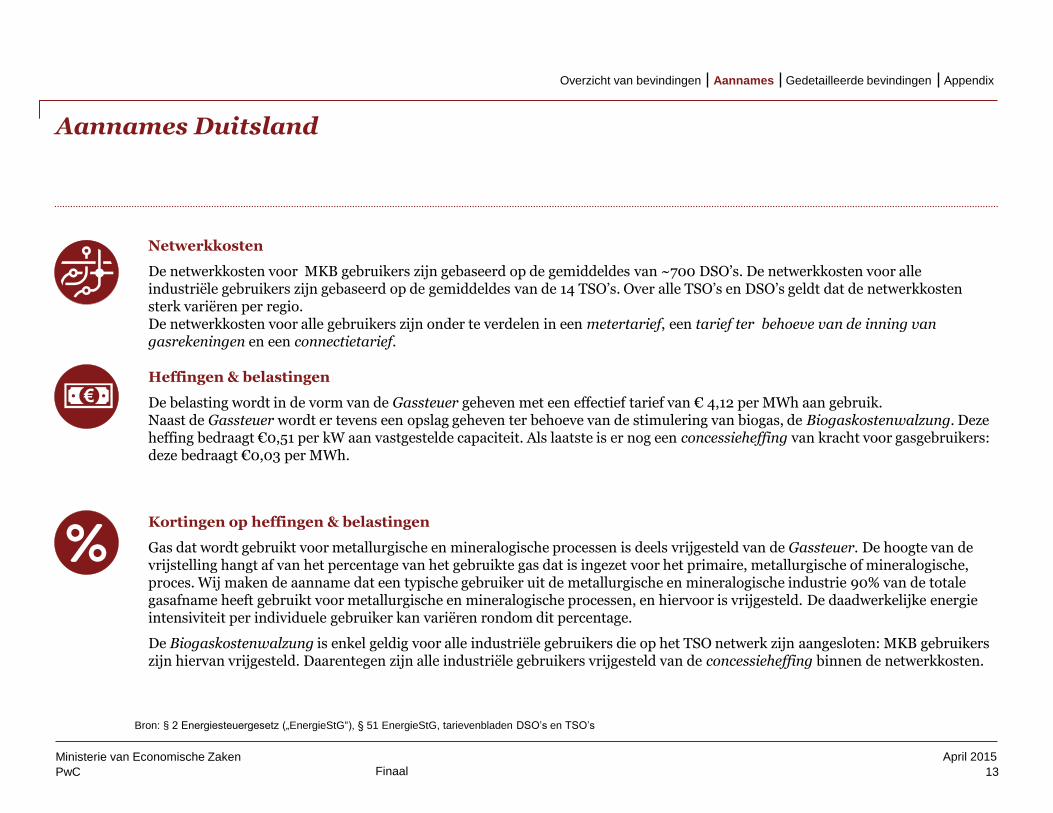
Heffingen & belastingen
De belasting wordt in de vorm van de Gassteuer geheven met een effectief tarief van € 4,12 per MWh aan gebruik. Naast de Gassteuer wordt er tevens een opslag geheven ter behoeve van de stimulering van biogas, de Biogaskostenwalzung. Deze heffing bedraagt €0,51 per kW aan vastgestelde capaciteit. Als laatste is er nog een concessieheffing van kracht voor gasgebruikers: deze bedraagt €0,03 per MWh.
Kortingen op heffingen & belastingen
Gas dat wordt gebruikt voor metallurgische en mineralogische processen is deels vrijgesteld van de Gassteuer. De hoogte van de vrijstelling hangt af van het percentage van het gebruikte gas dat is ingezet voor het primaire, metallurgische of mineralogische, proces. Wij maken de aanname dat een typische gebruiker uit de metallurgische en mineralogische industrie 90% van de totale gasafname heeft gebruikt voor metallurgische en mineralogische processen, en hiervoor is vrijgesteld. De daadwerkelijke energie intensiviteit per individuele gebruiker kan variëren rondom dit percentage.
De Biogaskostenwalzung is enkel geldig voor alle industriële gebruikers die op het TSO netwerk zijn aangesloten: MKB gebruikers zijn hiervan vrijgesteld. Daarentegen zijn alle industriële gebruikers vrijgesteld van de concessieheffing binnen de netwerkkosten.
Netwerkkosten
De netwerkkosten voor MKB gebruikers zijn gebaseerd op de gemiddeldes van ~700 DSO’s. De netwerkkosten voor alle industriële gebruikers zijn gebaseerd op de gemiddeldes van de 14 TSO’s. Over alle TSO’s en DSO’s geldt dat de netwerkkosten sterk variëren per regio. De netwerkkosten voor alle gebruikers zijn onder te verdelen in een metertarief, een tarief ter behoeve van de inning van gasrekeningen en een connectietarief.
Appendix Gedetailleerde bevindingen Aannames Overzicht van bevindingen
€
PwC
April 2015
Finaal 14
Ministerie van Economische Zaken
Gedetailleerde bevindingen
Appendix Gedetailleerde bevindingen Aannames Overzicht van bevindingen
PwC
April 2015
Use the divider control box below to
make the slide title appear in your
primary TOC and section TOCs.
Please follow these steps:
Type ‘Divider’ in the control box
provided below.
Click the Divider command on the
Smart ribbon.
Enter the text that you’d like to
appear in the TOCs and select a
divider level.
Click Update. The slide title should
now appear on all TOCs.
To remove the slide title from your
TOCs, delete the ‘Divider’ text from
the divider control box and hit
Update.
Finaal
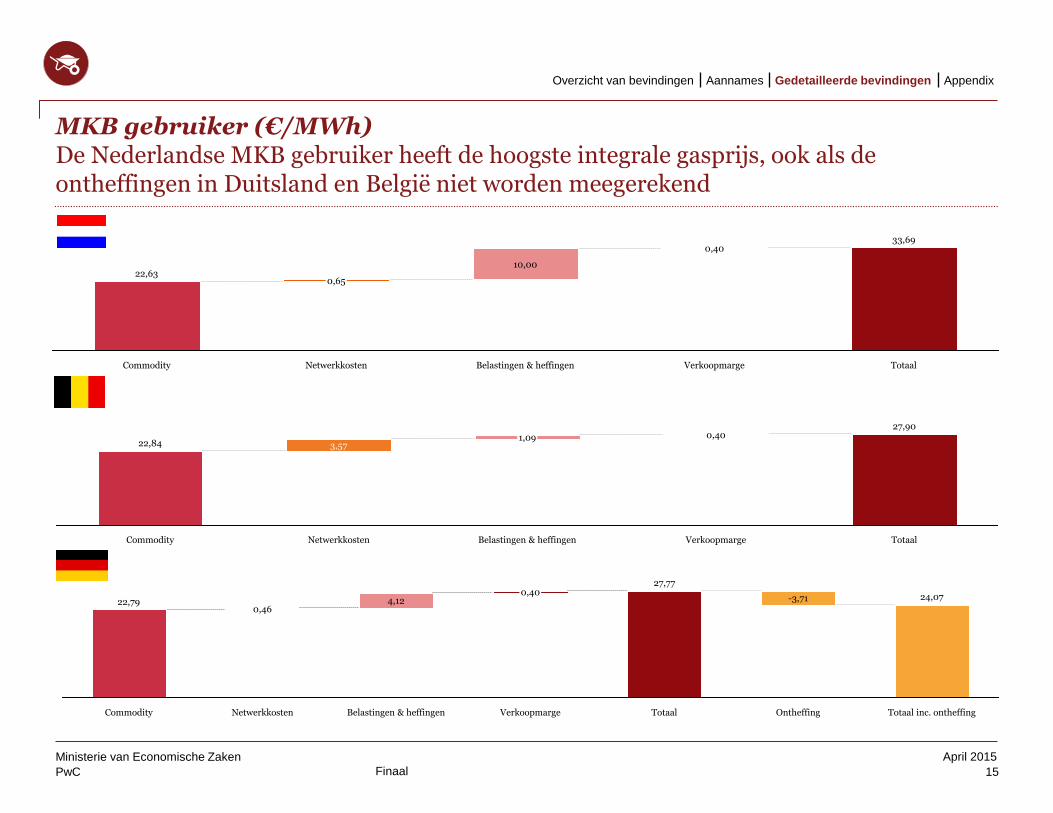
MKB gebruiker (€/MWh) De Nederlandse MKB gebruiker heeft de hoogste integrale gasprijs, ook als de ontheffingen in Duitsland en België niet worden meegerekend
15
Ministerie van Economische Zaken
Use the divider control box below to
make the slide title appear in your
primary TOC and section TOCs.
Please follow these steps:
Type ‘Divider’ in the control box
provided below.
Click the Divider command on the
Smart ribbon.
Enter the text that you’d like to
appear in the TOCs and select a
divider level.
Click Update. The slide title should
now appear on all TOCs.
To remove the slide title from your
TOCs, delete the ‘Divider’ text from
the divider control box and hit
Update.
Totaal
27,90
Verkoopmarge
0,40
Belastingen & heffingen
1,09
Netwerkkosten
3,57
Commodity
22,84
Totaal inc. ontheffing
24,07
Ontheffing
-3,71
Totaal
27,77
Verkoopmarge
0,40
Belastingen & heffingen
4,12
Netwerkkosten
0,46
Commodity
22,79
Totaal
33,69
Verkoopmarge
0,40
Belastingen & heffingen
10,00
Netwerkkosten
0,65
Commodity
22,63
Appendix Gedetailleerde bevindingen Aannames Overzicht van bevindingen
PwC
April 2015
Use the divider control box below to
make the slide title appear in your
primary TOC and section TOCs.
Please follow these steps:
Type ‘Divider’ in the control box
provided below.
Click the Divider command on the
Smart ribbon.
Enter the text that you’d like to
appear in the TOCs and select a
divider level.
Click Update. The slide title should
now appear on all TOCs.
To remove the slide title from your
TOCs, delete the ‘Divider’ text from
the divider control box and hit
Update.
Finaal
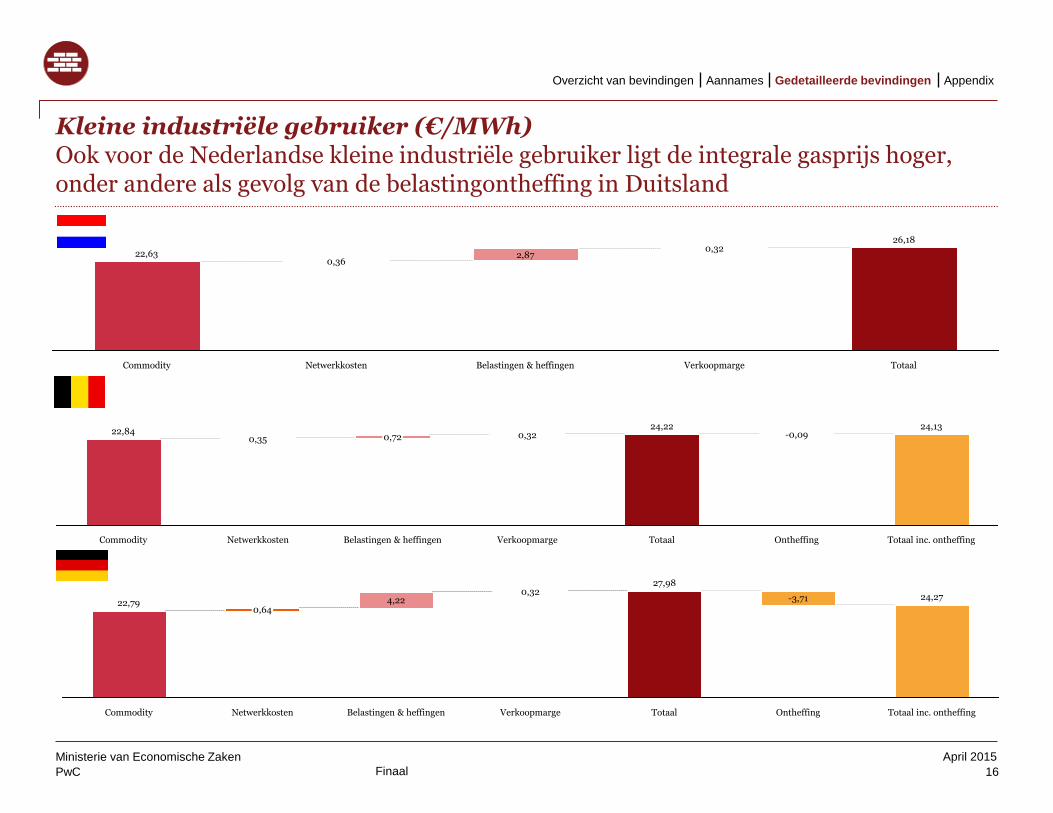
Kleine industriële gebruiker (€/MWh) Ook voor de Nederlandse kleine industriële gebruiker ligt de integrale gasprijs hoger, onder andere als gevolg van de belastingontheffing in Duitsland
16
Ministerie van Economische Zaken
Use the divider control box below to
make the slide title appear in your
primary TOC and section TOCs.
Please follow these steps:
Type ‘Divider’ in the control box
provided below.
Click the Divider command on the
Smart ribbon.
Enter the text that you’d like to
appear in the TOCs and select a
divider level.
Click Update. The slide title should
now appear on all TOCs.
To remove the slide title from your
TOCs, delete the ‘Divider’ text from
the divider control box and hit
Update.
Commodity
22,84
Totaal inc. ontheffing
24,13 0,32 0,72
Netwerkkosten Belastingen & heffingen Verkoopmarge
-0,09
Ontheffing
24,22
Totaal
0,35
Totaal inc. ontheffing
24,27
Ontheffing
-3,71
Totaal
27,98
Verkoopmarge
0,32
Belastingen & heffingen
4,22
Netwerkkosten
0,64
Commodity
22,79
Totaal
26,18
Verkoopmarge
0,32
Belastingen & heffingen
2,87
Netwerkkosten
0,36
Commodity
22,63
Appendix Gedetailleerde bevindingen Aannames Overzicht van bevindingen

PwC
April 2015
Use the divider control box below to
make the slide title appear in your
primary TOC and section TOCs.
Please follow these steps:
Type ‘Divider’ in the control box
provided below.
Click the Divider command on the
Smart ribbon.
Enter the text that you’d like to
appear in the TOCs and select a
divider level.
Click Update. The slide title should
now appear on all TOCs.
To remove the slide title from your
TOCs, delete the ‘Divider’ text from
the divider control box and hit
Update.
Finaal
Industriële gebruiker (€/MWh) Voor industriële gebruikers worden de verschillen per gebruikte MWh kleiner. Het prijspeil in Nederland is het hoogst, gevolgd door Duitsland en daarna België
17
Use the divider control box below to
make the slide title appear in your
primary TOC and section TOCs.
Please follow these steps:
Type ‘Divider’ in the control box
provided below.
Click the Divider command on the
Smart ribbon.
Enter the text that you’d like to
appear in the TOCs and select a
divider level.
Click Update. The slide title should
now appear on all TOCs.
To remove the slide title from your
TOCs, delete the ‘Divider’ text from
the divider control box and hit
Update.
Ministerie van Economische Zaken
Totaal inc. ontheffing
23,96
Ontheffing
-0,09
Totaal
24,06
Verkoopmarge
0,24
Belastingen & heffingen
0,65
Netwerkkosten
0,33
Commodity
22,84
Totaal inc. ontheffing
24,19
Ontheffing
-3,71
Totaal
27,90
Verkoopmarge
0,24
Belastingen & heffingen
4,22
Netwerkkosten
0,64
Commodity
22,79
24,77
Verkoopmarge
0,24
Belastingen & heffingen
1,54
Netwerkkosten
0,36
Commodity
22,63
Totaal
Appendix Gedetailleerde bevindingen Aannames Overzicht van bevindingen
PwC
April 2015
Use the divider control box below to
make the slide title appear in your
primary TOC and section TOCs.
Please follow these steps:
Type ‘Divider’ in the control box
provided below.
Click the Divider command on the
Smart ribbon.
Enter the text that you’d like to
appear in the TOCs and select a
divider level.
Click Update. The slide title should
now appear on all TOCs.
To remove the slide title from your
TOCs, delete the ‘Divider’ text from
the divider control box and hit
Update.
Finaal
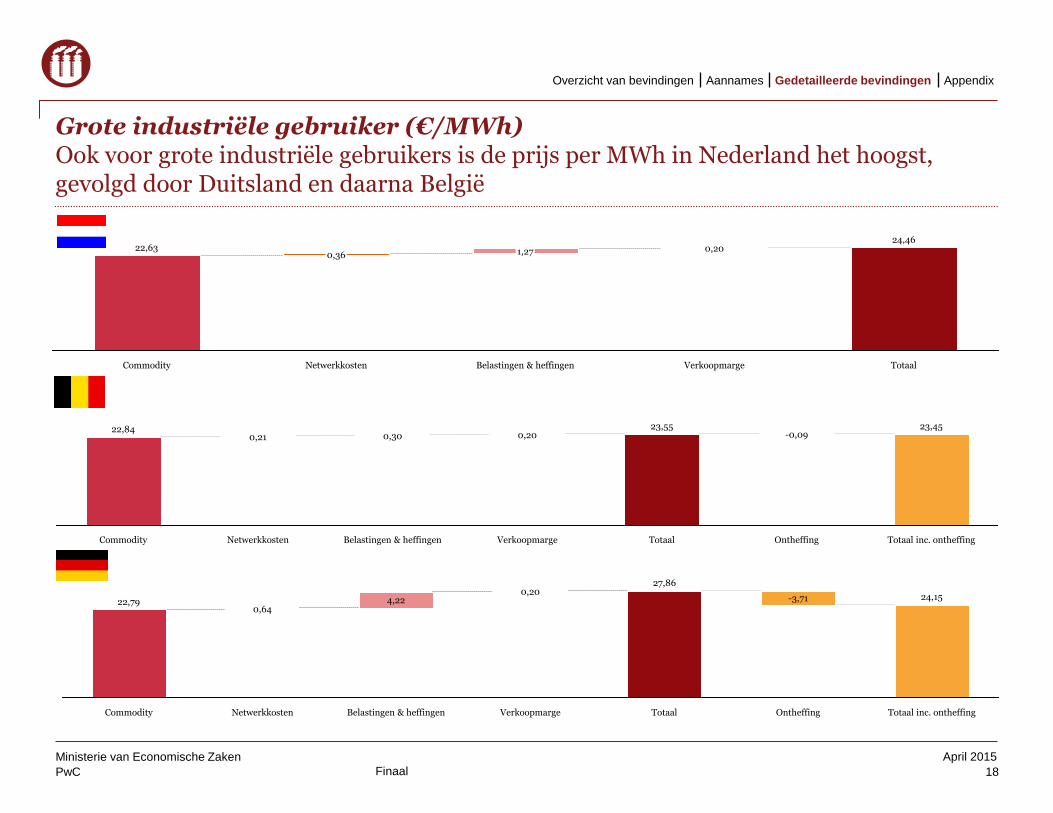
Grote industriële gebruiker (€/MWh) Ook voor grote industriële gebruikers is de prijs per MWh in Nederland het hoogst, gevolgd door Duitsland en daarna België
18
Use the divider control box below to
make the slide title appear in your
primary TOC and section TOCs.
Please follow these steps:
Type ‘Divider’ in the control box
provided below.
Click the Divider command on the
Smart ribbon.
Enter the text that you’d like to
appear in the TOCs and select a
divider level.
Click Update. The slide title should
now appear on all TOCs.
To remove the slide title from your
TOCs, delete the ‘Divider’ text from
the divider control box and hit
Update.
Ministerie van Economische Zaken
Totaal inc. ontheffing
23,45
Ontheffing
-0,09
Totaal
23,55
Verkoopmarge
0,20
Belastingen & heffingen
0,30
Netwerkkosten
0,21
Commodity
22,84
Totaal inc. ontheffing
24,15
Ontheffing
-3,71
Totaal
27,86
Verkoopmarge
0,20
Belastingen & heffingen
4,22
Netwerkkosten
0,64
Commodity
22,79
Totaal
24,46
Verkoopmarge
0,20
Belastingen & heffingen
1,27
Netwerkkosten
0,36
Commodity
22,63
Appendix Gedetailleerde bevindingen Aannames Overzicht van bevindingen
PwC
April 2015
Finaal
Appendix
19
Ministerie van Economische Zaken
Appendix Gedetailleerde bevindingen Aannames Overzicht van bevindingen
PwC
April 2015
Use the divider control box below to
make the slide title appear in your
primary TOC and section TOCs.
Please follow these steps:
Type ‘Divider’ in the control box
provided below.
Click the Divider command on the
Smart ribbon.
Enter the text that you’d like to
appear in the TOCs and select a
divider level.
Click Update. The slide title should
now appear on all TOCs.
To remove the slide title from your
TOCs, delete the ‘Divider’ text from
the divider control box and hit
Update.
Finaal
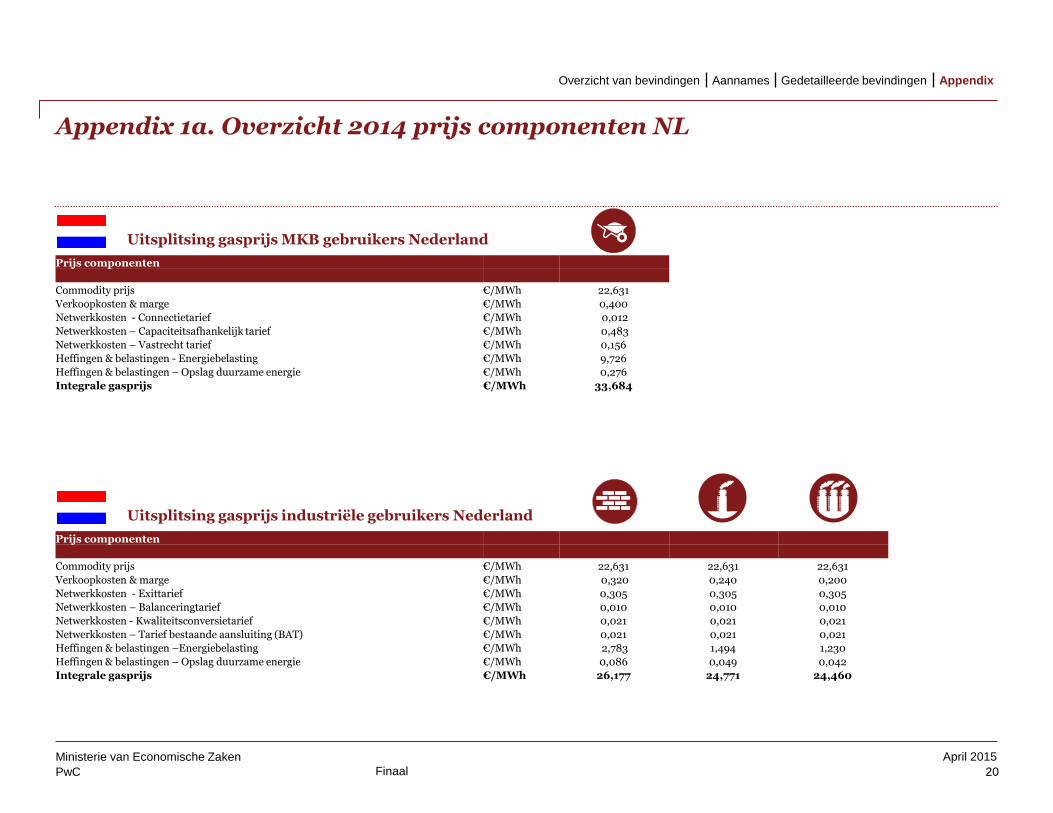
Appendix 1a. Overzicht 2014 prijs componenten NL
20
Ministerie van Economische Zaken
Use the divider control box below to
make the slide title appear in your
primary TOC and section TOCs.
Please follow these steps:
Type ‘Divider’ in the control box
provided below.
Click the Divider command on the
Smart ribbon.
Enter the text that you’d like to
appear in the TOCs and select a
divider level.
Click Update. The slide title should
now appear on all TOCs.
To remove the slide title from your
TOCs, delete the ‘Divider’ text from
the divider control box and hit
Update.
Prijs componenten
Commodity prijs €/MWh 22,631
Verkoopkosten & marge €/MWh 0,400
Netwerkkosten - Connectietarief €/MWh 0,012
Netwerkkosten – Capaciteitsafhankelijk tarief €/MWh 0,483
Netwerkkosten – Vastrecht tarief €/MWh 0,156
Heffingen & belastingen - Energiebelasting €/MWh 9,726
Heffingen & belastingen – Opslag duurzame energie €/MWh 0,276
Integrale gasprijs €/MWh 33,684
Uitsplitsing gasprijs MKB gebruikers Nederland
Prijs componenten
Commodity prijs €/MWh 22,631 22,631 22,631
Verkoopkosten & marge €/MWh 0,320 0,240 0,200
Netwerkkosten - Exittarief €/MWh 0,305 0,305 0,305
Netwerkkosten – Balanceringtarief €/MWh 0,010 0,010 0,010
Netwerkkosten - Kwaliteitsconversietarief €/MWh 0,021 0,021 0,021
Netwerkkosten – Tarief bestaande aansluiting (BAT) €/MWh 0,021 0,021 0,021
Heffingen & belastingen –Energiebelasting €/MWh 2,783 1,494 1,230
Heffingen & belastingen – Opslag duurzame energie €/MWh 0,086 0,049 0,042
Integrale gasprijs €/MWh 26,177 24,771 24,460
Uitsplitsing gasprijs industriële gebruikers Nederland
Appendix Gedetailleerde bevindingen Aannames Overzicht van bevindingen
PwC
April 2015
Use the divider control box below to
make the slide title appear in your
primary TOC and section TOCs.
Please follow these steps:
Type ‘Divider’ in the control box
provided below.
Click the Divider command on the
Smart ribbon.
Enter the text that you’d like to
appear in the TOCs and select a
divider level.
Click Update. The slide title should
now appear on all TOCs.
To remove the slide title from your
TOCs, delete the ‘Divider’ text from
the divider control box and hit
Update.
Finaal
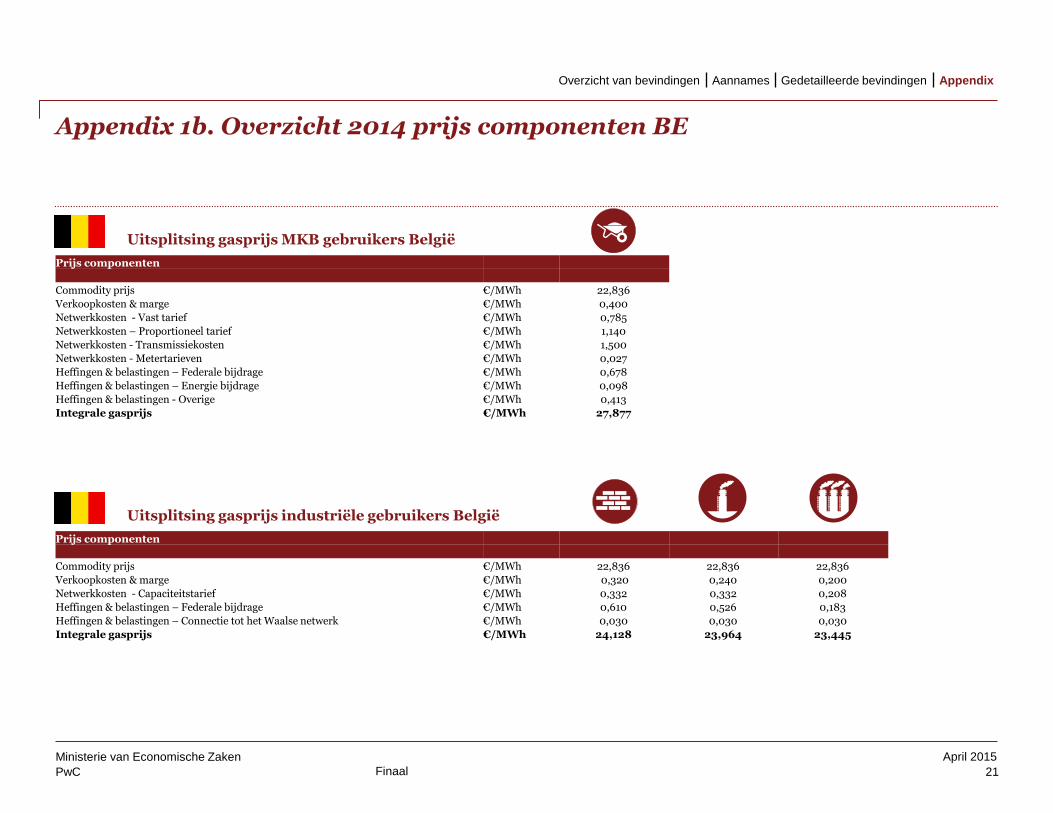
Appendix 1b. Overzicht 2014 prijs componenten BE
21
Ministerie van Economische Zaken
Use the divider control box below to
make the slide title appear in your
primary TOC and section TOCs.
Please follow these steps:
Type ‘Divider’ in the control box
provided below.
Click the Divider command on the
Smart ribbon.
Enter the text that you’d like to
appear in the TOCs and select a
divider level.
Click Update. The slide title should
now appear on all TOCs.
To remove the slide title from your
TOCs, delete the ‘Divider’ text from
the divider control box and hit
Update.
Prijs componenten
Commodity prijs €/MWh 22,836
Verkoopkosten & marge €/MWh 0,400
Netwerkkosten - Vast tarief €/MWh 0,785
Netwerkkosten – Proportioneel tarief €/MWh 1,140
Netwerkkosten - Transmissiekosten €/MWh 1,500
Netwerkkosten - Metertarieven €/MWh 0,027
Heffingen & belastingen – Federale bijdrage €/MWh 0,678
Heffingen & belastingen – Energie bijdrage €/MWh 0,098
Heffingen & belastingen - Overige €/MWh 0,413
Integrale gasprijs €/MWh 27,877
Uitsplitsing gasprijs MKB gebruikers België
Prijs componenten
Commodity prijs €/MWh 22,836 22,836 22,836
Verkoopkosten & marge €/MWh 0,320 0,240 0,200
Netwerkkosten - Capaciteitstarief €/MWh 0,332 0,332 0,208
Heffingen & belastingen – Federale bijdrage €/MWh 0,610 0,526 0,183
Heffingen & belastingen – Connectie tot het Waalse netwerk €/MWh 0,030 0,030 0,030
Integrale gasprijs €/MWh 24,128 23,964 23,445
Uitsplitsing gasprijs industriële gebruikers België
Appendix Gedetailleerde bevindingen Aannames Overzicht van bevindingen
PwC
April 2015
Use the divider control box below to
make the slide title appear in your
primary TOC and section TOCs.
Please follow these steps:
Type ‘Divider’ in the control box
provided below.
Click the Divider command on the
Smart ribbon.
Enter the text that you’d like to
appear in the TOCs and select a
divider level.
Click Update. The slide title should
now appear on all TOCs.
To remove the slide title from your
TOCs, delete the ‘Divider’ text from
the divider control box and hit
Update.
Finaal
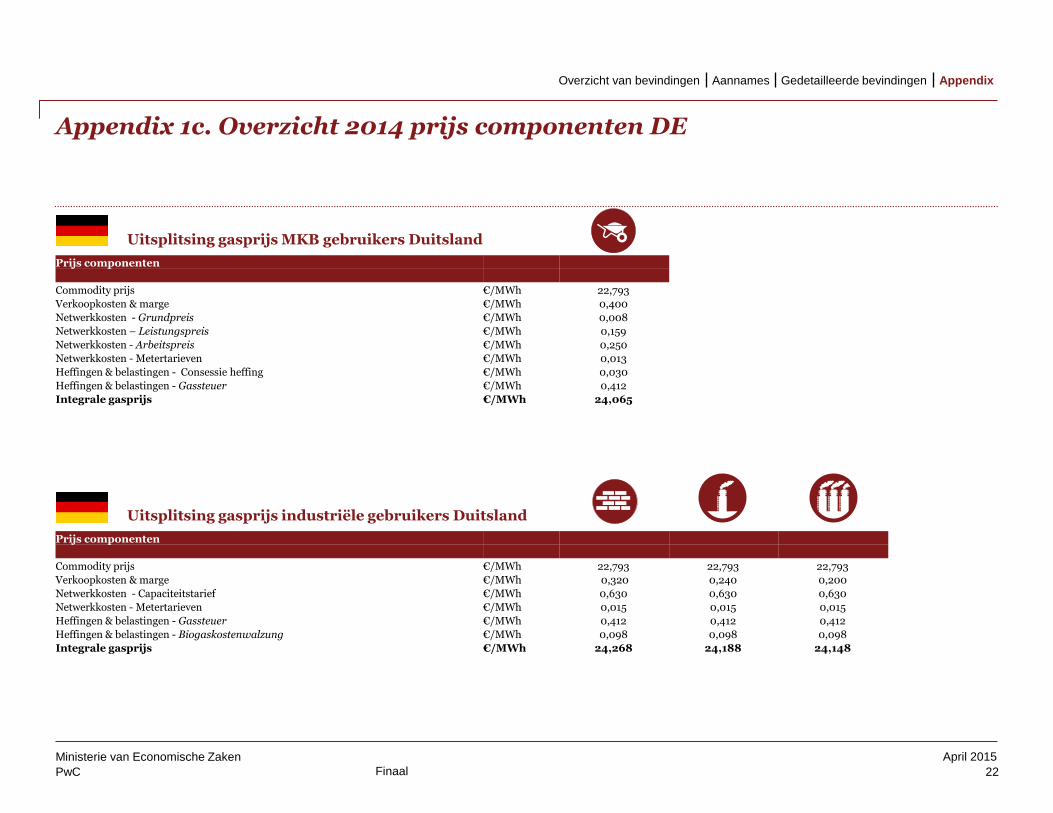
Appendix 1c. Overzicht 2014 prijs componenten DE
22
Ministerie van Economische Zaken
Use the divider control box below to
make the slide title appear in your
primary TOC and section TOCs.
Please follow these steps:
Type ‘Divider’ in the control box
provided below.
Click the Divider command on the
Smart ribbon.
Enter the text that you’d like to
appear in the TOCs and select a
divider level.
Click Update. The slide title should
now appear on all TOCs.
To remove the slide title from your
TOCs, delete the ‘Divider’ text from
the divider control box and hit
Update.
Prijs componenten
Commodity prijs €/MWh 22,793
Verkoopkosten & marge €/MWh 0,400
Netwerkkosten - Grundpreis €/MWh 0,008
Netwerkkosten – Leistungspreis €/MWh 0,159
Netwerkkosten - Arbeitspreis €/MWh 0,250
Netwerkkosten - Metertarieven €/MWh 0,013
Heffingen & belastingen - Consessie heffing €/MWh 0,030
Heffingen & belastingen - Gassteuer €/MWh 0,412
Integrale gasprijs €/MWh 24,065
Uitsplitsing gasprijs MKB gebruikers Duitsland
Prijs componenten
Commodity prijs €/MWh 22,793 22,793 22,793
Verkoopkosten & marge €/MWh 0,320 0,240 0,200
Netwerkkosten - Capaciteitstarief €/MWh 0,630 0,630 0,630
Netwerkkosten - Metertarieven €/MWh 0,015 0,015 0,015
Heffingen & belastingen - Gassteuer €/MWh 0,412 0,412 0,412
Heffingen & belastingen - Biogaskostenwalzung €/MWh 0,098 0,098 0,098
Integrale gasprijs €/MWh 24,268 24,188 24,148
Uitsplitsing gasprijs industriële gebruikers Duitsland
Appendix Gedetailleerde bevindingen Aannames Overzicht van bevindingen
PwC
April 2015
Use the divider control box below to
make the slide title appear in your
primary TOC and section TOCs.
Please follow these steps:
Type ‘Divider’ in the control box
provided below.
Click the Divider command on the
Smart ribbon.
Enter the text that you’d like to
appear in the TOCs and select a
divider level.
Click Update. The slide title should
now appear on all TOCs.
To remove the slide title from your
TOCs, delete the ‘Divider’ text from
the divider control box and hit
Update.
Finaal
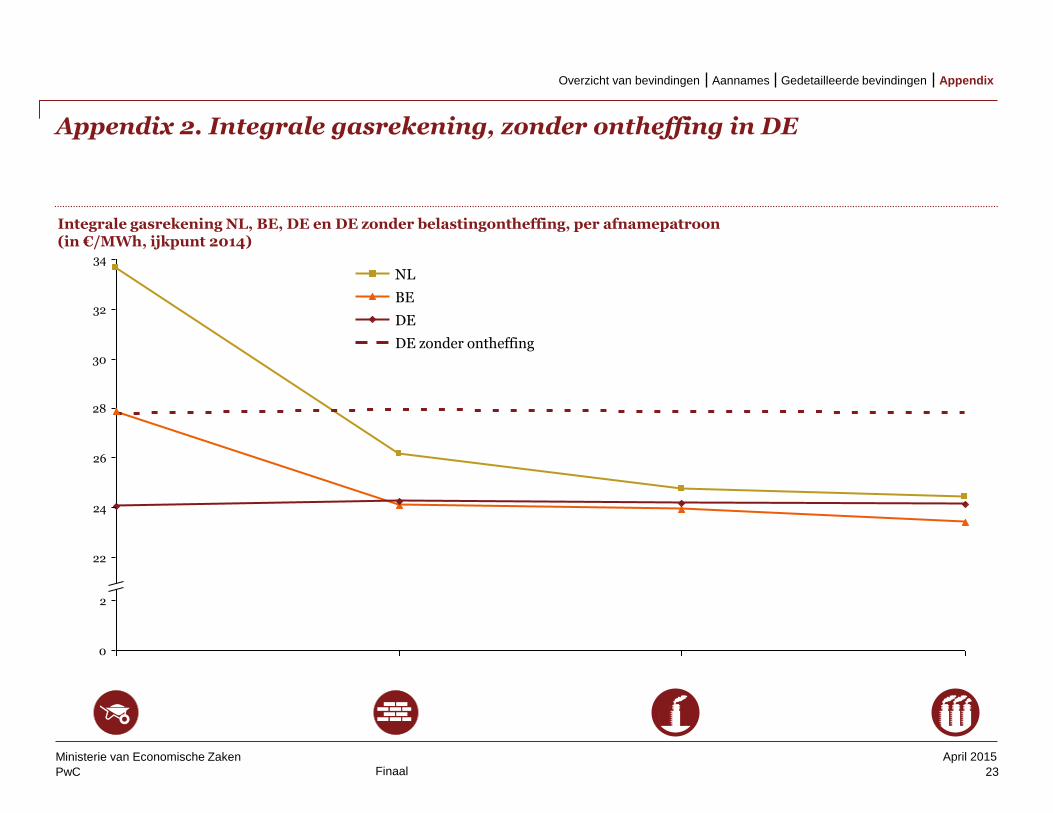
Appendix 2. Integrale gasrekening, zonder ontheffing in DE
23
Ministerie van Economische Zaken
Use the divider control box below to
make the slide title appear in your
primary TOC and section TOCs.
Please follow these steps:
Type ‘Divider’ in the control box
provided below.
Click the Divider command on the
Smart ribbon.
Enter the text that you’d like to
appear in the TOCs and select a
divider level.
Click Update. The slide title should
now appear on all TOCs.
To remove the slide title from your
TOCs, delete the ‘Divider’ text from
the divider control box and hit
Update.
Integrale gasrekening NL, BE, DE en DE zonder belastingontheffing, per afnamepatroon (in €/MWh, ijkpunt 2014)
0
22
28
30
34
2
26
32
24
DE zonder ontheffing
BE
NL
DE
Appendix Gedetailleerde bevindingen Aannames Overzicht van bevindingen
PwC
April 2015
Use the divider control box below to
make the slide title appear in your
primary TOC and section TOCs.
Please follow these steps:
Type ‘Divider’ in the control box
provided below.
Click the Divider command on the
Smart ribbon.
Enter the text that you’d like to
appear in the TOCs and select a
divider level.
Click Update. The slide title should
now appear on all TOCs.
To remove the slide title from your
TOCs, delete the ‘Divider’ text from
the divider control box and hit
Update.
Finaal
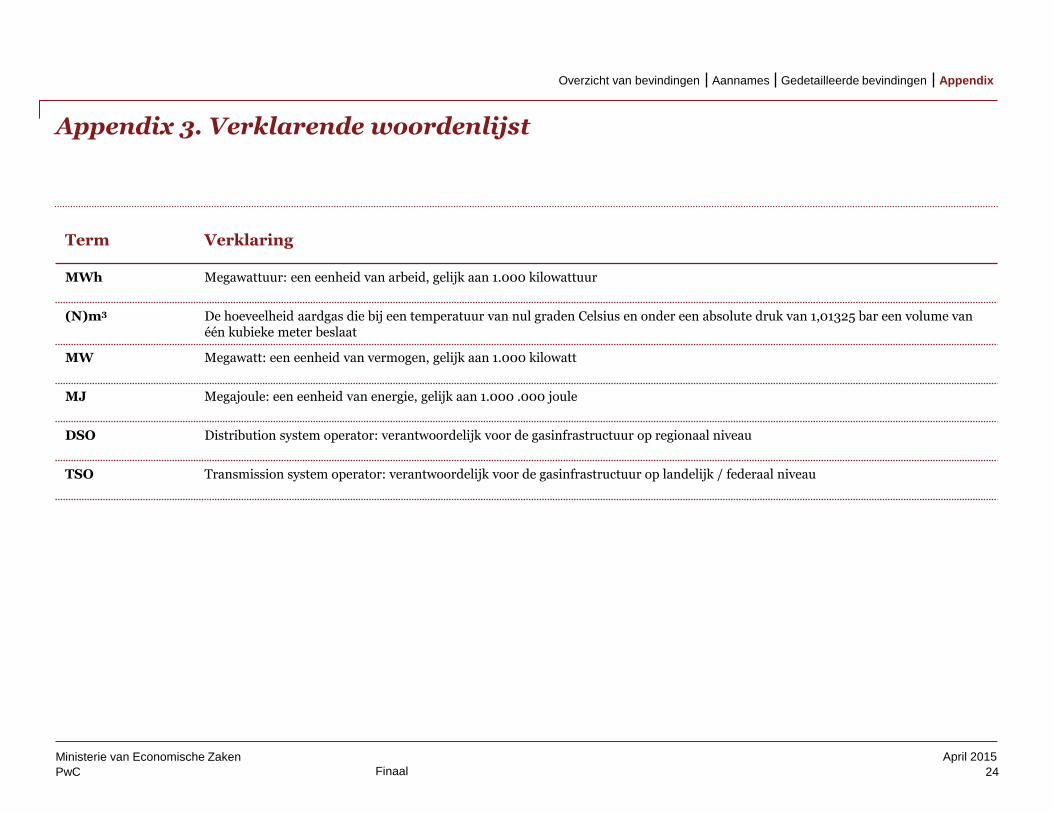
Appendix 3. Verklarende woordenlijst
24
Ministerie van Economische Zaken
Use the divider control box below to
make the slide title appear in your
primary TOC and section TOCs.
Please follow these steps:
Type ‘Divider’ in the control box
provided below.
Click the Divider command on the
Smart ribbon.
Enter the text that you’d like to
appear in the TOCs and select a
divider level.
Click Update. The slide title should
now appear on all TOCs.
To remove the slide title from your
TOCs, delete the ‘Divider’ text from
the divider control box and hit
Update.
Appendix Gedetailleerde bevindingen Aannames Overzicht van bevindingen
Term Verklaring
MWh Megawattuur: een eenheid van arbeid, gelijk aan 1.000 kilowattuur
(N)m3 De hoeveelheid aardgas die bij een temperatuur van nul graden Celsius en onder een absolute druk van 1,01325 bar een volume van één kubieke meter beslaat
MW Megawatt: een eenheid van vermogen, gelijk aan 1.000 kilowatt
MJ Megajoule: een eenheid van energie, gelijk aan 1.000 .000 joule
DSO Distribution system operator: verantwoordelijk voor de gasinfrastructuur op regionaal niveau
TSO Transmission system operator: verantwoordelijk voor de gasinfrastructuur op landelijk / federaal niveau