Technical Efficiency and Returns to Scale on Banking ...
18
Pertanika J. Soc. Sci. & Hum. 23 (S): 219 – 236 (2015) ISSN: 0128-7702 © Universiti Putra Malaysia Press SOCIAL SCIENCES & HUMANITIES Journal homepage: http://www.pertanika.upm.edu.my/ ARTICLE INFO Article history: Received: 30 March 2015 Accepted: 10 September 2015 E-mail addresses: [email protected] / [email protected] (Fakarudin Kamarudin), fadzlan.sufi[email protected] (Fadzlan Sufian), [email protected] (Annuar Md. Nassir), [email protected] (Nazratul Aina Mohamad Anwar) * Corresponding author Technical Efficiency and Returns to Scale on Banking Sector: Empirical Evidence from GCC Countries Fakarudin Kamarudin 1 *, Fadzlan Sufian 2 , Annuar Md. Nassir 1,3 and Nazratul Aina Mohamad Anwar 1 1 Department of Accounting and Finance, Faculty of Economics and Management, Universiti Putra Malaysia, 43400 Serdang, Selangor Darul Ehsan, Malaysia 2 Taylor’s University, Lakeside Campus, 1 Jalan Taylor’s, 50088, Subang Jaya, Selangor Darul Ehsan, Malaysia 3 Financial Economics Research Center, Faculty of Economics and Management, Universiti Putra Malaysia, 43400 UPM Serdang, Selangor, Malaysia ABSTRACT This paper investigates the efficiency level of Gulf Cooperation Council (GCC) banks on technical efficiency (TE), pure technical efficiency (PTE) and scale efficiency (SE). Both PTE and SE represent potential factors that influence the efficiency of GCC banks. This study investigates a total of 43 GCC banks over the time period of 2007 to 2011. Data Envelopment Analysis (DEA), a non-parametric method using variable returns to scale (VRTS) under the Banker, Charnes, and Cooper (BCC) model, was applied, with assets and deposit as input, and loan and income as output. On average, results revealed that GCC Banks operate with an optimal scale. Nevertheless, the results were contaminated by the managerial inefficiency in utilising the recourses, although TE, or managerial efficiency, increased to 83.6% in 2011. Furthermore, the results also indicated that, while larger banks (the 22 largest) tend to operate at constant returns to scale (CRS) or decreasing returns to scale (DRS), smaller banks (the 21 smallest) were susceptible to operate at either CRS or increasing returns to scale (IRS). Keywords: Technical efficiency, pure technical efficiency, scale efficiency, returns to scale, bank, Gulf Cooperation Council INTRODUCTION The Gulf Cooperation Council (GCC) was established in an agreement that took place on May 25 th , 1981, in Riyadh, Saudi Arabia. The GCC bloc comprises of Bahrain, Kuwait, Oman, Qatar, Saudi Arabia and the United Arab Emirates
Transcript of Technical Efficiency and Returns to Scale on Banking ...
Pertanika J. Soc. Sci. & Hum. 23 (S): 219 – 236 (2015)
ISSN: 0128-7702 © Universiti Putra Malaysia Press
SOCIAL SCIENCES & HUMANITIESJournal homepage: http://www.pertanika.upm.edu.my/
ARTICLE INFOArticle history:Received: 30 March 2015Accepted: 10 September 2015
E-mail addresses:[email protected] / [email protected] (Fakarudin Kamarudin),[email protected] (Fadzlan Sufian),[email protected] (Annuar Md. Nassir),[email protected] (Nazratul Aina Mohamad Anwar)* Corresponding author
Technical Efficiency and Returns to Scale on Banking Sector: Empirical Evidence from GCC Countries
Fakarudin Kamarudin1*, Fadzlan Sufian2, Annuar Md. Nassir1,3 and Nazratul Aina Mohamad Anwar 1
1Department of Accounting and Finance, Faculty of Economics and Management, Universiti Putra Malaysia, 43400 Serdang, Selangor Darul Ehsan, Malaysia2Taylor’s University, Lakeside Campus, 1 Jalan Taylor’s, 50088, Subang Jaya, Selangor Darul Ehsan, Malaysia3Financial Economics Research Center, Faculty of Economics and Management, Universiti Putra Malaysia, 43400 UPM Serdang, Selangor, Malaysia
ABSTRACT
This paper investigates the efficiency level of Gulf Cooperation Council (GCC) banks on technical efficiency (TE), pure technical efficiency (PTE) and scale efficiency (SE). Both PTE and SE represent potential factors that influence the efficiency of GCC banks. This study investigates a total of 43 GCC banks over the time period of 2007 to 2011. Data Envelopment Analysis (DEA), a non-parametric method using variable returns to scale (VRTS) under the Banker, Charnes, and Cooper (BCC) model, was applied, with assets and deposit as input, and loan and income as output. On average, results revealed that GCC Banks operate with an optimal scale. Nevertheless, the results were contaminated by the managerial inefficiency in utilising the recourses, although TE, or managerial efficiency, increased to 83.6% in 2011. Furthermore, the results also indicated that, while larger banks (the 22 largest) tend to operate at constant returns to scale (CRS) or decreasing returns to scale (DRS), smaller banks (the 21 smallest) were susceptible to operate at either CRS or increasing returns to scale (IRS).
Keywords: Technical efficiency, pure technical efficiency, scale efficiency, returns to scale, bank, Gulf Cooperation Council
INTRODUCTION
The Gulf Cooperation Council (GCC) was established in an agreement that took place on May 25th, 1981, in Riyadh, Saudi Arabia. The GCC bloc comprises of Bahrain, Kuwait, Oman, Qatar, Saudi Arabia and the United Arab Emirates

Pertanika J. Soc. Sci. & Hum. 23 (S): 219 – 236 (2015)
Fakarudin Kamarudin, Fadzlan Sufian, Annuar Md. Nassir and Nazratul Aina Mohamad Anwar
220
(UAE). The six member countries declared that the aim of the GCC is to establish, in view of the special relations between them, joint destiny, common objectives and also similarity of political systems based on the Islamic belief.
The GCC has acquired remarkable financial wealth through their oil markets since the 1970’s, a period during which these markets have prospered. To enhance the economics of the GCC, the well-functioning financial system is an important one for economic growth. The links between financial intermediation and economic growth focus on the key functions of financial systems in the saving-investment-growth nexus. Nissanke and Stein (2003) asserted that these include effective channelling funds from surplus to deficit units, ensuring an efficient transformation of funds into real productive capital. According to Levine (1998), the efficiency of financial intermediation affects a country’s economic growth, and, at the same time, the bank (financial intermediation) insolvencies could result in systemic crises which have negative consequences on the economy as a whole. The financial intermediation also changes the maturity of the portfolios of savers and investors, while providing sufficient liquidity to the system as the need arises. In addition, the diversification and techniques of risk sharing and pooling affect the reduction of risks. The banking sector in GCC countries is one of the most important mechanisms of their financial system. In maintaining
the stability of the banking system, a sustainable and healthy profitability is significantly important.
Nevertheless, there are many challenges that may have a significant impact on their ability to grow and operate within a more competitive environment. First, the sector is heavily dependent on oil sector activities. Oil still represents a very large portion of their export earnings and budget revenues. As a result of the over-dependence on oil, and the dominance of the public sector, growth in the region remains vulnerable to the vagaries of world oil markets and fluctuation in oil prices. The investors uncover limited profitable investment opportunities offered by the scope, from a few sectors such as real estate, trade and stock market activities. Therefore, banks restricted to focus on bank lending mainly in consumer loans, real estate, construction and trade finance. Second, the GCC has reduced competitive pressure on domestic banks through over-protection from foreign competition. However, GCC banks are expected to face massive competitive pressure from foreign banks since their eventual commitment to liberalise many financial services including banking through their membership in the World Trade Organisation (WTO). Finally, GCC banks are experiencing pressure to fulfil the increasing demand of international standards in terms of risk management, capital adequacy and accounting practise.
The capability of the GCC banks to face all these challenges depends on how efficiently they are performing. However,
Pertanika J. Soc. Sci. & Hum. 23 (S): 219 – 236 (2015)
Technical Efficiency and Returns to Scale on Banking Sector: Empirical Evidence from GCC Countries
221
very few research works have been carried out on the efficiency of the GCC banking sector. This study aims to investigate the technical efficiency (TE), pure technical efficiency (PTE) and scale efficiency (SE) of GCC banks. Furthermore, the technical inefficiency (TIE) of the GCC banks could be discovered through pure technical inefficiency (PTIE) or scale inefficiency (SIE). PTE represents managerial efficiency, while SE refers to the scale or size of operational efficiency. TE measures the proportional reduction in input usage that can be attained if the bank operates on the efficient frontier, or if the effectiveness of the limited set of inputs is used to produce maximum outputs. TE is related to managerial factors (Isik & Hassan, 2002). Meanwhile, PTE is the measurement of TE devoid of the scale efficiency or firm’s SE effects (Coelli, 1998).
All this information is of value and benefit to investors, managers and consumers. This study also employed the non-parametric data envelopment analysis (DEA) method. Rickards (2003) discovered that, although widely employed to evaluate bank efficiency in the West, DEA is less known within the banking sector in developing countries, including the GCC countries. This study attempted to fill in this gap via several investigations on the efficiency of GCC banks using recent data (2007-2011). Additionally, this study also contributes in the methodology part by applying the DEA methods.
The study is set out as follows: the next section provides the related literature in
terms of the efficiency of banks throughout the world, and the use of the DEA method in evaluating a bank’s efficiency. Most of the works in the body of literature focus more on Islamic banking since most of the banks in GCC countries are also based on the Islamic banking system. Section 3 outlines the approach to the measurement of banks’ TE, PTE and SE, and data used to construct the efficiency frontiers. Section 4 discusses the results, and finally, the paper concludes in section 5.
LITERATURE REVIEW
Ramanthan (2007) examined the performance of banks operating in the six countries of the Gulf Cooperation Council (GCC). This study employed the DEA method on data recorded during the time period of 2000 to 2004. Only 15 of the 55 banks are rated as efficient under constant returns to scale (CRS), or TE. The number of efficient banks has nearly doubled to 27 under variable returns to scale (VRS), or PTE, and the additional 12 banks could not register unit CRS efficiencies due to size limitations (also known as scale inefficiency). Further analysis has shown that the selected banks in all six countries have registered the same efficiencies for a five-year period (2000 to 2004). There was a significant increase in the TE of selected banks in Bahrain, Kuwait, Oman, Qatar, Saudi Arabia and UAE during the time period of 2000 to 2004.
Srairi (2010) found that Islamic banks in GCC countries, on average, are less cost and profit efficient compared
Pertanika J. Soc. Sci. & Hum. 23 (S): 219 – 236 (2015)
Fakarudin Kamarudin, Fadzlan Sufian, Annuar Md. Nassir and Nazratul Aina Mohamad Anwar
222
to conventional banks. There are several reasons that may explain the lower cost and profit efficiencies of these Islamic banks. The main factor that leads to the lower efficiency in the Islamic banks is their size. They discover that the size of the average Islamic bank is smaller than that of a conventional bank. Olson and Zoubi (2008) examined the performance of Islamic and conventional banks in the GCC country banking sectors by using five different accounting ratios categories, namely, profitability, efficiency, credit risk, liquidity, and risk ratios. They concluded that Islamic banks are more profitable than their conventional counterparts.
Yudistira (2004) conducted an analysis of the efficiency levels of Islamic Banking in an empirical analysis of 18 Islamic banks during the period of 1997-2000, which were made available by the London-based International Bank Credit Analysis LTD’s BankScope database. The samples were grouped by total assets in which banks with assets worth over $600 million were categorised as large sized banks, and banks below this level were categorised as small-to-medium sized banks. Concentrating on SE, it is clear that the largest degrees of SIE come from large size Islamic banks (i.e., DRS). It is worthy to note that all but one of the large size Islamic banks in 1997 to 1998 exhibited DRS, whilst in 1999 to 2000, most large size banks showed CRS. The level of TIE in 1998 is more attributable to PTIE than SIE.
Size (SE) and technology are also important considerations. Research by
Ferrier and Lovell (1990) on a sample of 575 US commercial banks found that 88% exhibited IRS (a result which supports our choice of the VRTS variant of the DEA model). Somewhat surprisingly, the most efficient banks in the sample belonged to the smallest sized class. This was attributed to the successful application of technology, which allowed smaller banks to overcome capital cost disadvantages and distribute products more effectively. The results proved that the banks were higher in PTE compared to SE.
The earliest attempt to use DEA for banking was reported by Sherman and Gold (1985) in the context of evaluating different branches of a bank. Subsequently, there are several studies that have also applied the DEA method in measuring the banking sector’s efficiency. Due to the heavy concentration on the US, DEA has quickly become a popular method in evaluating the financial institutions’ efficiency among researchers in other nations. The DEA method was widely used to evaluate banking institutions during the late 1980s, and particularly in the 1990s. Berger and Humphrey (1997) discovered 130 studies on the efficiency of the banking sector in 21 countries; among them, 116 were published between 1992 and 1997.
The DEA method was used by Alirezaee et al. (1998) to examine a number of bank branches in Canada comprising data on 1,282 banks. They suggested that the average branch efficiency score varied inversely with the number of branches in the sample, and directly with the total number
Pertanika J. Soc. Sci. & Hum. 23 (S): 219 – 236 (2015)
Technical Efficiency and Returns to Scale on Banking Sector: Empirical Evidence from GCC Countries
223
of inputs and outputs. In fact, there are many studies that applied the DEA method to identify the efficiency of the banks (e.g., Vassiloglou & Giokas, 1990; Sherman & Ladino, 1995; Golany & Storbeck, 1999; Kantor & Maital, 1999) in the context of evaluating branches of a bank. Meanwhile, other studies compared the performance of different banks in various countries using the DEA method [e.g., Darrat et al. (2002) in Kuwait; Wheelock & Wilson (1999) in the USA; Saha & Ravisankar (2000) in India; Stanton (2002) in Canada; Brown (2001) in Australia; Mercana et al. (2003) in Turkey].
As a conclusion, based on the works mentioned above, most International Islamic banks face a similar problem, where their PTIE outweighs their SIE. In other words, although Islamic banks have been operating on a relatively optimal scale of operations, they were managerially inefficient to exploit their resources. On the other hand, the opposite is true for international conventional banks. Most of these studies have presented inefficiency from the scale side (wrong scale of operations). This indicates that large and small sized banks normally operated under IRS and DRS. However, the number of research works on the TE, PTE and SE in GCC banks is limited, since most of the literature covered focuses on developed countries. There is therefore a gap in the literature created by the majority of these studies, which have mainly concentrated on the TE, PTE, SE, cost efficiency and profit efficiency of the banking sectors
in developed countries. Meanwhile, few works have been devoted to investigate the technical efficiency concepts of the GCC banking sector, which presents the most important efficiency concept, since it may influence the profitability of the banks. In light of this gap in the related literature, this study seeks to provide the empirical evidence, particularly on TE, PTE and SE in the GCC banking sector.
METHODOLOGY
Sources of Data
The present study gathered data from a list of top 43 commercial GCC banks from 2007 to 2011. The primary source for financial data was obtained from the BankScope database produced by the Bureau van Dijk which provided the banks’ balance sheets and income statements. Bankscope database contains specific data on 25,800 banks world-wide, including commercial banks in GCC countries. Furthermore, BankScope database presents the original currencies’ data of the specific countries and provides the option to convert the data to any other currencies. The data are updated monthly. United States Dollar (USD) is used in this study since the study involved six countries in GCC bloc in order to maintain the homogeneity.
Data Envelopment Analysis (DEA)
This non-parametric efficiency measurement approach developed by Farrell (1957) defines a simple measure of firm efficiency which is capable to measure
Pertanika J. Soc. Sci. & Hum. 23 (S): 219 – 236 (2015)
Fakarudin Kamarudin, Fadzlan Sufian, Annuar Md. Nassir and Nazratul Aina Mohamad Anwar
224
for multiple inputs. Technical efficiency and allocative efficiency are two components proposed by Farell (1957) that consist in the firm’s efficiency components. The combination of both efficiency components produces the overall efficiency. Farrell’s (1957) concept can best be illustrated by a single output and two input case, in the unit isoquant diagram.
In this study, the GCC banks are modelled as multi-product firms producing two outputs and two outputs (Ariff & Can, 2008; Kamarudin et al., 2014a; 2014b; 2013; Sufian et al., 2014; 2013a; 2013b;
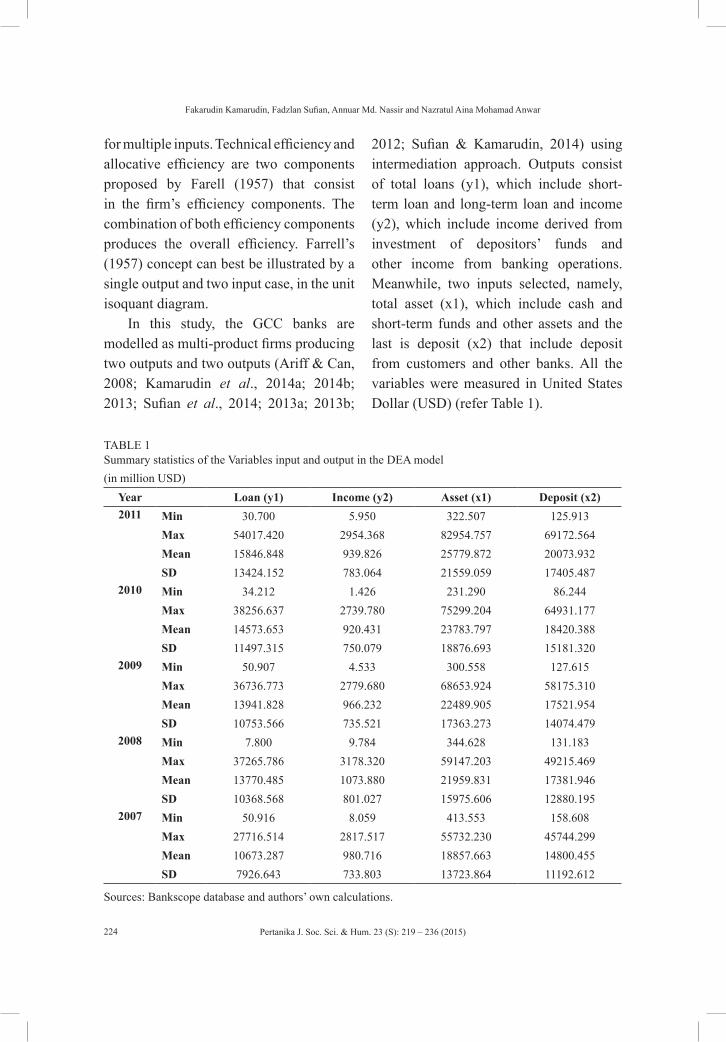
2012; Sufian & Kamarudin, 2014) using intermediation approach. Outputs consist of total loans (y1), which include short-term loan and long-term loan and income (y2), which include income derived from investment of depositors’ funds and other income from banking operations. Meanwhile, two inputs selected, namely, total asset (x1), which include cash and short-term funds and other assets and the last is deposit (x2) that include deposit from customers and other banks. All the variables were measured in United States Dollar (USD) (refer Table 1).
TABLE 1Summary statistics of the Variables input and output in the DEA model(in million USD)
Year Loan (y1) Income (y2) Asset (x1) Deposit (x2)2011 Min 30.700 5.950 322.507 125.913
Max 54017.420 2954.368 82954.757 69172.564Mean 15846.848 939.826 25779.872 20073.932SD 13424.152 783.064 21559.059 17405.487
2010 Min 34.212 1.426 231.290 86.244Max 38256.637 2739.780 75299.204 64931.177Mean 14573.653 920.431 23783.797 18420.388SD 11497.315 750.079 18876.693 15181.320
2009 Min 50.907 4.533 300.558 127.615Max 36736.773 2779.680 68653.924 58175.310Mean 13941.828 966.232 22489.905 17521.954SD 10753.566 735.521 17363.273 14074.479
2008 Min 7.800 9.784 344.628 131.183Max 37265.786 3178.320 59147.203 49215.469Mean 13770.485 1073.880 21959.831 17381.946SD 10368.568 801.027 15975.606 12880.195
2007 Min 50.916 8.059 413.553 158.608Max 27716.514 2817.517 55732.230 45744.299Mean 10673.287 980.716 18857.663 14800.455SD 7926.643 733.803 13723.864 11192.612
Sources: Bankscope database and authors’ own calculations.
Pertanika J. Soc. Sci. & Hum. 23 (S): 219 – 236 (2015)
Technical Efficiency and Returns to Scale on Banking Sector: Empirical Evidence from GCC Countries
225
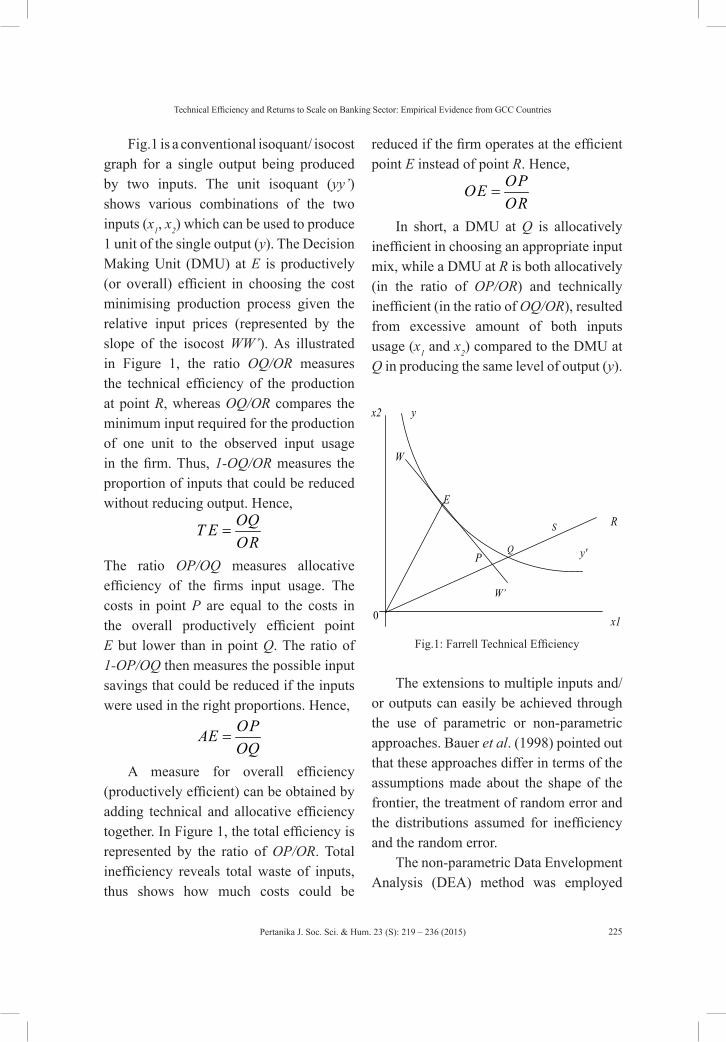
Fig.1 is a conventional isoquant/ isocost graph for a single output being produced by two inputs. The unit isoquant (yy’) shows various combinations of the two inputs (x1, x2) which can be used to produce 1 unit of the single output (y). The Decision Making Unit (DMU) at E is productively (or overall) efficient in choosing the cost minimising production process given the relative input prices (represented by the slope of the isocost WW’). As illustrated in Figure 1, the ratio OQ/OR measures the technical efficiency of the production at point R, whereas OQ/OR compares the minimum input required for the production of one unit to the observed input usage in the firm. Thus, 1-OQ/OR measures the proportion of inputs that could be reduced without reducing output. Hence,
ROQOET =
The ratio OP/OQ measures allocative efficiency of the firms input usage. The costs in point P are equal to the costs in the overall productively efficient point E but lower than in point Q. The ratio of 1-OP/OQ then measures the possible input savings that could be reduced if the inputs were used in the right proportions. Hence,
QOPOEA =
A measure for overall efficiency (productively efficient) can be obtained by adding technical and allocative efficiency together. In Figure 1, the total efficiency is represented by the ratio of OP/OR. Total inefficiency reveals total waste of inputs, thus shows how much costs could be
reduced if the firm operates at the efficient point E instead of point R. Hence,
ROPOEO =
In short, a DMU at Q is allocatively inefficient in choosing an appropriate input mix, while a DMU at R is both allocatively (in the ratio of OP/OR) and technically inefficient (in the ratio of OQ/OR), resulted from excessive amount of both inputs usage (x1 and x2) compared to the DMU at Q in producing the same level of output (y).
W’
W
P
R
0
E
y'
x2
Q
S
y
x1
Fig.1: Farrell Technical Efficiency
The extensions to multiple inputs and/or outputs can easily be achieved through the use of parametric or non-parametric approaches. Bauer et al. (1998) pointed out that these approaches differ in terms of the assumptions made about the shape of the frontier, the treatment of random error and the distributions assumed for inefficiency and the random error.
The non-parametric Data Envelopment Analysis (DEA) method was employed
Pertanika J. Soc. Sci. & Hum. 23 (S): 219 – 236 (2015)
Fakarudin Kamarudin, Fadzlan Sufian, Annuar Md. Nassir and Nazratul Aina Mohamad Anwar
226
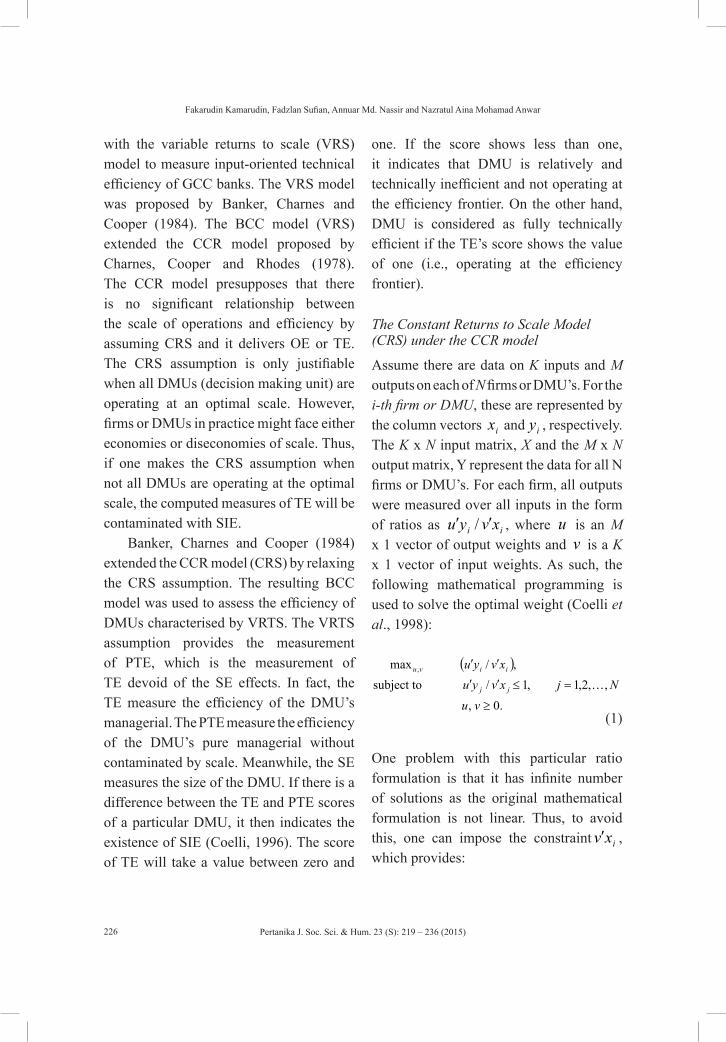
with the variable returns to scale (VRS) model to measure input-oriented technical efficiency of GCC banks. The VRS model was proposed by Banker, Charnes and Cooper (1984). The BCC model (VRS) extended the CCR model proposed by Charnes, Cooper and Rhodes (1978). The CCR model presupposes that there is no significant relationship between the scale of operations and efficiency by assuming CRS and it delivers OE or TE. The CRS assumption is only justifiable when all DMUs (decision making unit) are operating at an optimal scale. However, firms or DMUs in practice might face either economies or diseconomies of scale. Thus, if one makes the CRS assumption when not all DMUs are operating at the optimal scale, the computed measures of TE will be contaminated with SIE.
Banker, Charnes and Cooper (1984) extended the CCR model (CRS) by relaxing the CRS assumption. The resulting BCC model was used to assess the efficiency of DMUs characterised by VRTS. The VRTS assumption provides the measurement of PTE, which is the measurement of TE devoid of the SE effects. In fact, the TE measure the efficiency of the DMU’s managerial. The PTE measure the efficiency of the DMU’s pure managerial without contaminated by scale. Meanwhile, the SE measures the size of the DMU. If there is a difference between the TE and PTE scores of a particular DMU, it then indicates the existence of SIE (Coelli, 1996). The score of TE will take a value between zero and
one. If the score shows less than one, it indicates that DMU is relatively and technically inefficient and not operating at the efficiency frontier. On the other hand, DMU is considered as fully technically efficient if the TE’s score shows the value of one (i.e., operating at the efficiency frontier).
The Constant Returns to Scale Model (CRS) under the CCR model
Assume there are data on K inputs and M outputs on each of N firms or DMU’s. For the i-th firm or DMU, these are represented by the column vectors ix and iy , respectively. The K x N input matrix, X and the M x N output matrix, Y represent the data for all N firms or DMU’s. For each firm, all outputs were measured over all inputs in the form of ratios as ii xvyu ′′ / , where u is an M x 1 vector of output weights and v is a K x 1 vector of input weights. As such, the following mathematical programming is used to solve the optimal weight (Coelli et al., 1998):
( )
.0,
,,2,1,1/subject to,/max ,
≥
=≤′′
′′
vuNjxvyu
xvyu
jj
iivu
(1)
One problem with this particular ratio formulation is that it has infinite number of solutions as the original mathematical formulation is not linear. Thus, to avoid this, one can impose the constraint ixv′ , which provides:
Pertanika J. Soc. Sci. & Hum. 23 (S): 219 – 236 (2015)
Technical Efficiency and Returns to Scale on Banking Sector: Empirical Evidence from GCC Countries
227
( )
,0,
,,,2,1,0subject to
,1,max ,
≥
=≤′−′
=′′
vNjxvy
xvty
jj
iiv
µ
µ
µµ
(2)
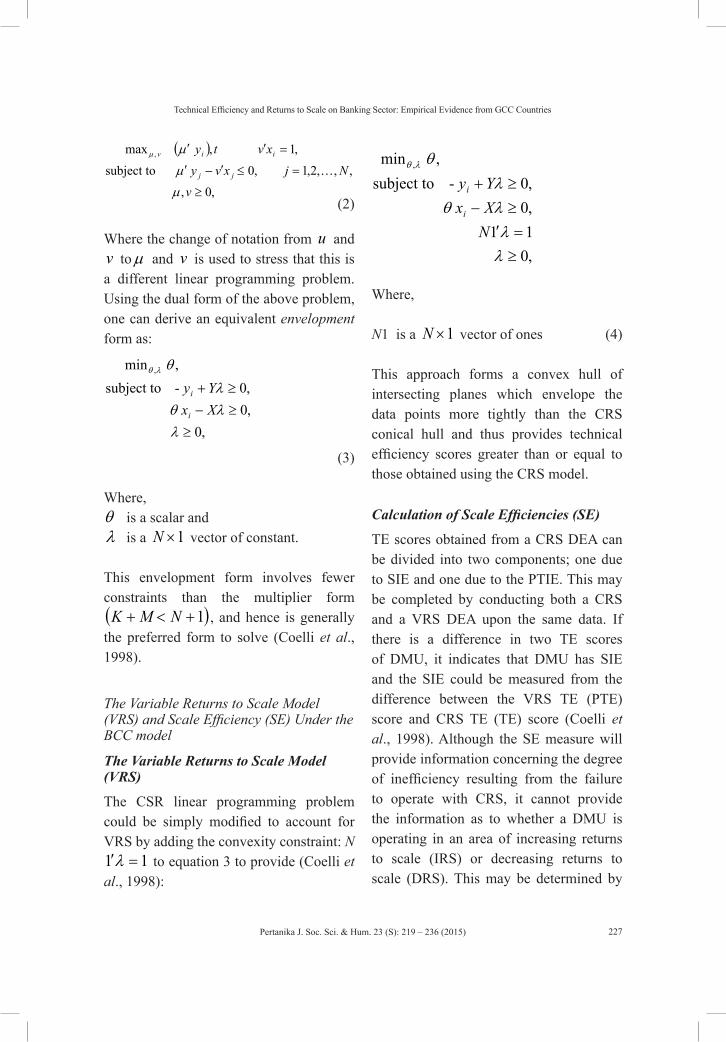
Where the change of notation from u and v toµ and v is used to stress that this is a different linear programming problem. Using the dual form of the above problem, one can derive an equivalent envelopment form as:
,0,0,0- subject to
,min ,
≥≥−≥+
λλθλ
θλθ
XxYy
i
i
(3)
Where,θ is a scalar andλ is a 1×N vector of constant.
This envelopment form involves fewer constraints than the multiplier form( )1+<+ NMK , and hence is generally the preferred form to solve (Coelli et al., 1998).
The Variable Returns to Scale Model (VRS) and Scale Efficiency (SE) Under the BCC model
The Variable Returns to Scale Model (VRS)
The CSR linear programming problem could be simply modified to account for VRS by adding the convexity constraint: N
11 =′λ to equation 3 to provide (Coelli et al., 1998):
,min , θλθ
,011,0,0- subject to
≥=′≥−≥+
λλλθλ
NXxYy
i
i
Where,
N1 is a 1×N vector of ones (4)
This approach forms a convex hull of intersecting planes which envelope the data points more tightly than the CRS conical hull and thus provides technical efficiency scores greater than or equal to those obtained using the CRS model.
Calculation of Scale Efficiencies (SE)
TE scores obtained from a CRS DEA can be divided into two components; one due to SIE and one due to the PTIE. This may be completed by conducting both a CRS and a VRS DEA upon the same data. If there is a difference in two TE scores of DMU, it indicates that DMU has SIE and the SIE could be measured from the difference between the VRS TE (PTE) score and CRS TE (TE) score (Coelli et al., 1998). Although the SE measure will provide information concerning the degree of inefficiency resulting from the failure to operate with CRS, it cannot provide the information as to whether a DMU is operating in an area of increasing returns to scale (IRS) or decreasing returns to scale (DRS). This may be determined by
Pertanika J. Soc. Sci. & Hum. 23 (S): 219 – 236 (2015)
Fakarudin Kamarudin, Fadzlan Sufian, Annuar Md. Nassir and Nazratul Aina Mohamad Anwar
228
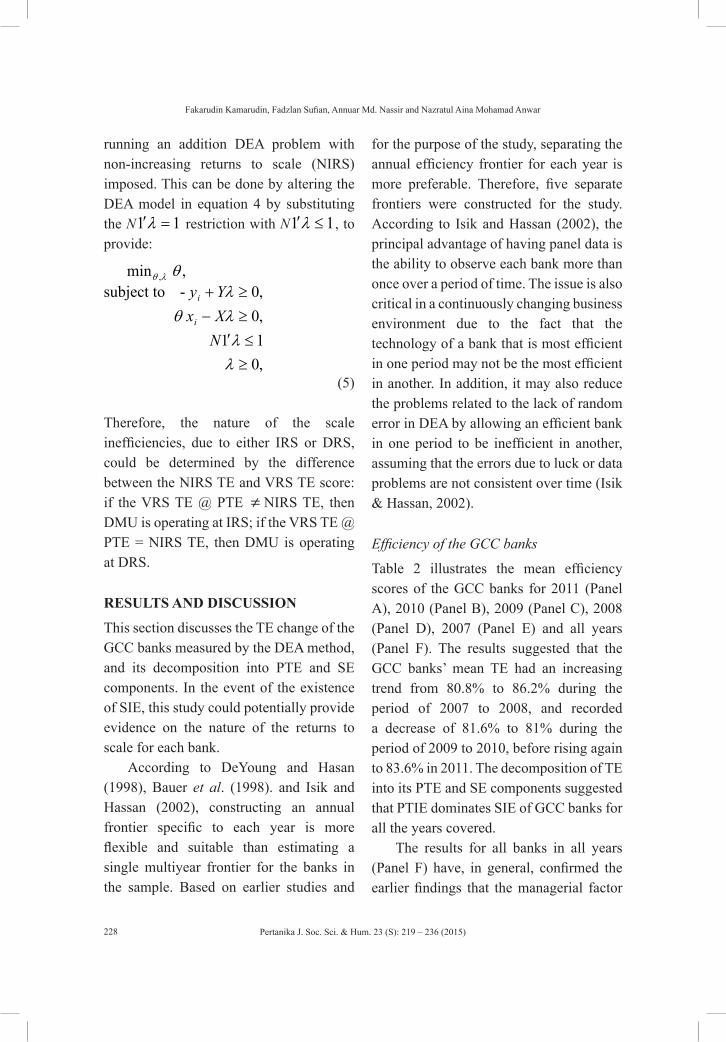
running an addition DEA problem with non-increasing returns to scale (NIRS) imposed. This can be done by altering the DEA model in equation 4 by substituting the N 11 =′λ restriction with N 11 ≤′λ , to provide:
,min , θλθ
,011,0,0- subject to
≥≤′≥−≥+
λλλθλ
NXxYy
i
i
(5)
Therefore, the nature of the scale inefficiencies, due to either IRS or DRS, could be determined by the difference between the NIRS TE and VRS TE score: if the VRS TE @ PTE ≠ NIRS TE, then DMU is operating at IRS; if the VRS TE @ PTE = NIRS TE, then DMU is operating at DRS.
RESULTS AND DISCUSSION
This section discusses the TE change of the GCC banks measured by the DEA method, and its decomposition into PTE and SE components. In the event of the existence of SIE, this study could potentially provide evidence on the nature of the returns to scale for each bank.
According to DeYoung and Hasan (1998), Bauer et al. (1998). and Isik and Hassan (2002), constructing an annual frontier specific to each year is more flexible and suitable than estimating a single multiyear frontier for the banks in the sample. Based on earlier studies and
for the purpose of the study, separating the annual efficiency frontier for each year is more preferable. Therefore, five separate frontiers were constructed for the study. According to Isik and Hassan (2002), the principal advantage of having panel data is the ability to observe each bank more than once over a period of time. The issue is also critical in a continuously changing business environment due to the fact that the technology of a bank that is most efficient in one period may not be the most efficient in another. In addition, it may also reduce the problems related to the lack of random error in DEA by allowing an efficient bank in one period to be inefficient in another, assuming that the errors due to luck or data problems are not consistent over time (Isik & Hassan, 2002).
Efficiency of the GCC banks
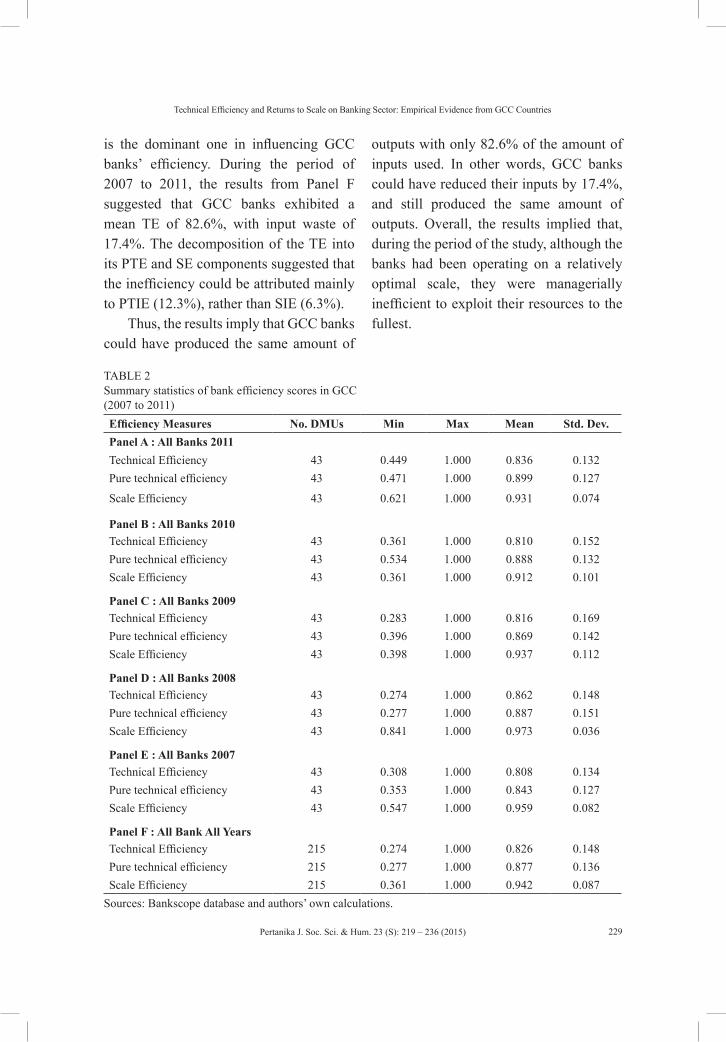
Table 2 illustrates the mean efficiency scores of the GCC banks for 2011 (Panel A), 2010 (Panel B), 2009 (Panel C), 2008 (Panel D), 2007 (Panel E) and all years (Panel F). The results suggested that the GCC banks’ mean TE had an increasing trend from 80.8% to 86.2% during the period of 2007 to 2008, and recorded a decrease of 81.6% to 81% during the period of 2009 to 2010, before rising again to 83.6% in 2011. The decomposition of TE into its PTE and SE components suggested that PTIE dominates SIE of GCC banks for all the years covered.
The results for all banks in all years (Panel F) have, in general, confirmed the earlier findings that the managerial factor
Pertanika J. Soc. Sci. & Hum. 23 (S): 219 – 236 (2015)
Technical Efficiency and Returns to Scale on Banking Sector: Empirical Evidence from GCC Countries
229
is the dominant one in influencing GCC banks’ efficiency. During the period of 2007 to 2011, the results from Panel F suggested that GCC banks exhibited a mean TE of 82.6%, with input waste of 17.4%. The decomposition of the TE into its PTE and SE components suggested that the inefficiency could be attributed mainly to PTIE (12.3%), rather than SIE (6.3%).
Thus, the results imply that GCC banks could have produced the same amount of
outputs with only 82.6% of the amount of inputs used. In other words, GCC banks could have reduced their inputs by 17.4%, and still produced the same amount of outputs. Overall, the results implied that, during the period of the study, although the banks had been operating on a relatively optimal scale, they were managerially inefficient to exploit their resources to the fullest.
TABLE 2Summary statistics of bank efficiency scores in GCC(2007 to 2011)Efficiency Measures No. DMUs Min Max Mean Std. Dev.Panel A : All Banks 2011Technical Efficiency 43 0.449 1.000 0.836 0.132Pure technical efficiency 43 0.471 1.000 0.899 0.127
Scale Efficiency 43 0.621 1.000 0.931 0.074
Panel B : All Banks 2010Technical Efficiency 43 0.361 1.000 0.810 0.152Pure technical efficiency 43 0.534 1.000 0.888 0.132Scale Efficiency 43 0.361 1.000 0.912 0.101
Panel C : All Banks 2009Technical Efficiency 43 0.283 1.000 0.816 0.169Pure technical efficiency 43 0.396 1.000 0.869 0.142Scale Efficiency 43 0.398 1.000 0.937 0.112
Panel D : All Banks 2008Technical Efficiency 43 0.274 1.000 0.862 0.148Pure technical efficiency 43 0.277 1.000 0.887 0.151Scale Efficiency 43 0.841 1.000 0.973 0.036
Panel E : All Banks 2007Technical Efficiency 43 0.308 1.000 0.808 0.134Pure technical efficiency 43 0.353 1.000 0.843 0.127Scale Efficiency 43 0.547 1.000 0.959 0.082
Panel F : All Bank All YearsTechnical Efficiency 215 0.274 1.000 0.826 0.148Pure technical efficiency 215 0.277 1.000 0.877 0.136Scale Efficiency 215 0.361 1.000 0.942 0.087
Sources: Bankscope database and authors’ own calculations.
Pertanika J. Soc. Sci. & Hum. 23 (S): 219 – 236 (2015)
Fakarudin Kamarudin, Fadzlan Sufian, Annuar Md. Nassir and Nazratul Aina Mohamad Anwar
230
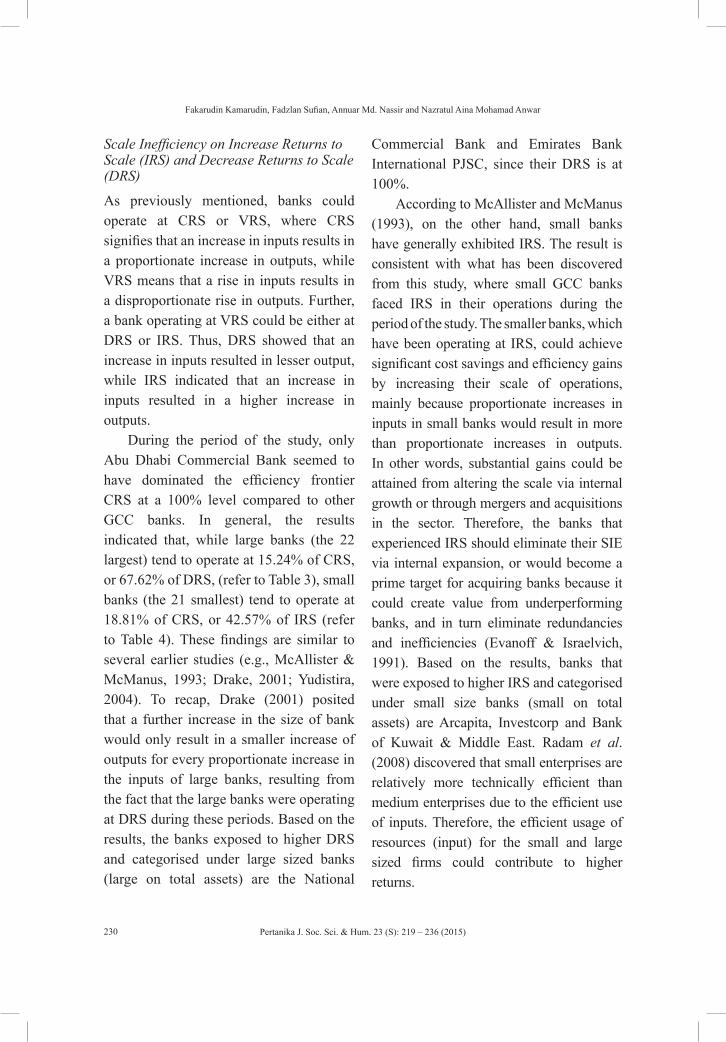
Scale Inefficiency on Increase Returns to Scale (IRS) and Decrease Returns to Scale (DRS)
As previously mentioned, banks could operate at CRS or VRS, where CRS signifies that an increase in inputs results in a proportionate increase in outputs, while VRS means that a rise in inputs results in a disproportionate rise in outputs. Further, a bank operating at VRS could be either at DRS or IRS. Thus, DRS showed that an increase in inputs resulted in lesser output, while IRS indicated that an increase in inputs resulted in a higher increase in outputs.
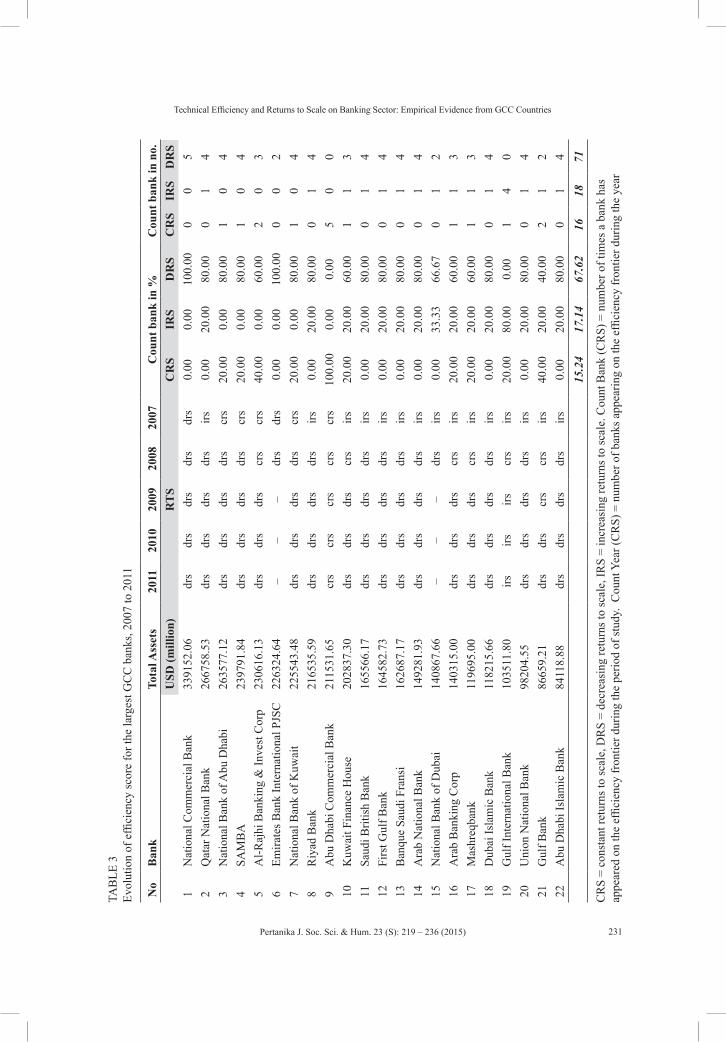
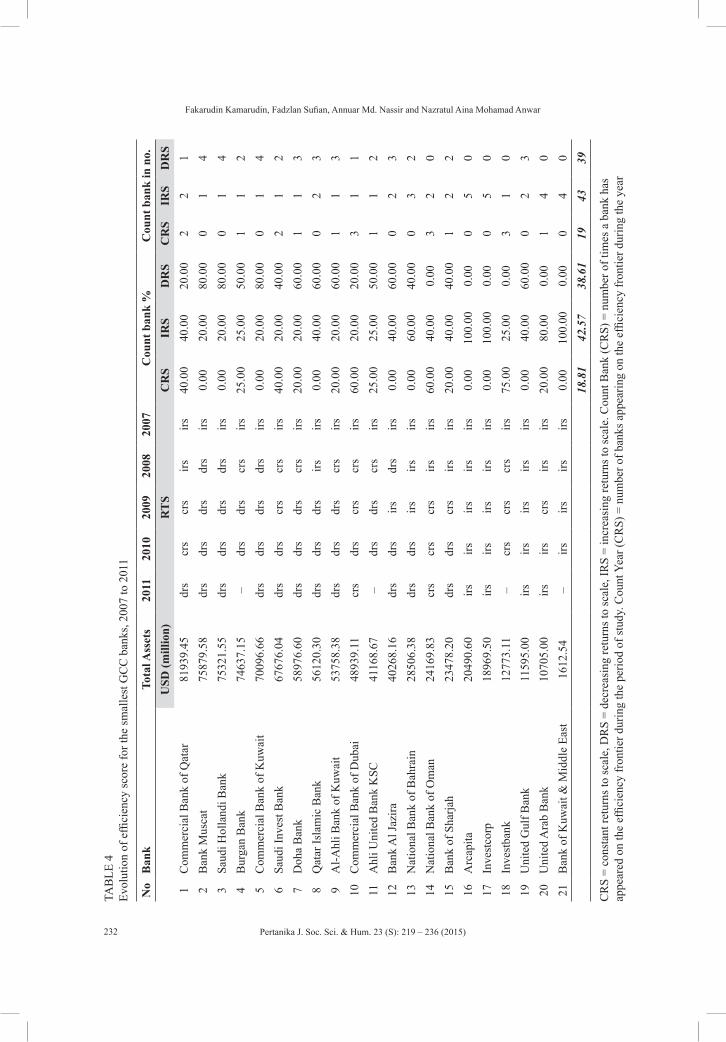
During the period of the study, only Abu Dhabi Commercial Bank seemed to have dominated the efficiency frontier CRS at a 100% level compared to other GCC banks. In general, the results indicated that, while large banks (the 22 largest) tend to operate at 15.24% of CRS, or 67.62% of DRS, (refer to Table 3), small banks (the 21 smallest) tend to operate at 18.81% of CRS, or 42.57% of IRS (refer to Table 4). These findings are similar to several earlier studies (e.g., McAllister & McManus, 1993; Drake, 2001; Yudistira, 2004). To recap, Drake (2001) posited that a further increase in the size of bank would only result in a smaller increase of outputs for every proportionate increase in the inputs of large banks, resulting from the fact that the large banks were operating at DRS during these periods. Based on the results, the banks exposed to higher DRS and categorised under large sized banks (large on total assets) are the National
Commercial Bank and Emirates Bank International PJSC, since their DRS is at 100%.
According to McAllister and McManus (1993), on the other hand, small banks have generally exhibited IRS. The result is consistent with what has been discovered from this study, where small GCC banks faced IRS in their operations during the period of the study. The smaller banks, which have been operating at IRS, could achieve significant cost savings and efficiency gains by increasing their scale of operations, mainly because proportionate increases in inputs in small banks would result in more than proportionate increases in outputs. In other words, substantial gains could be attained from altering the scale via internal growth or through mergers and acquisitions in the sector. Therefore, the banks that experienced IRS should eliminate their SIE via internal expansion, or would become a prime target for acquiring banks because it could create value from underperforming banks, and in turn eliminate redundancies and inefficiencies (Evanoff & Israelvich, 1991). Based on the results, banks that were exposed to higher IRS and categorised under small size banks (small on total assets) are Arcapita, Investcorp and Bank of Kuwait & Middle East. Radam et al. (2008) discovered that small enterprises are relatively more technically efficient than medium enterprises due to the efficient use of inputs. Therefore, the efficient usage of resources (input) for the small and large sized firms could contribute to higher returns.
Pertanika J. Soc. Sci. & Hum. 23 (S): 219 – 236 (2015)
Technical Efficiency and Returns to Scale on Banking Sector: Empirical Evidence from GCC Countries
231
TAB
LE 3
Evol
utio
n of
effi
cien
cy sc
ore
for t
he la
rges
t GC
C b
anks
, 200
7 to
201
1
No
Ban
kTo
tal A
sset
s20
1120
1020
0920
0820
07C
ount
ban
k in
%C
ount
ban
k in
no.
USD
(mill
ion)
RT
SC
RS
IRS
DR
SC
RS
IRS
DR
S1
Nat
iona
l Com
mer
cial
Ban
k33
9152
.06
drs
drs
drs
drs
drs
0.00
0.00
100.
000
05
2Q
atar
Nat
iona
l Ban
k 26
6758
.53
drs
drs
drs
drs
irs0.
0020
.00
80.0
00
14
3N
atio
nal B
ank
of A
bu D
habi
26
3577
.12
drs
drs
drs
drs
crs
20.0
00.
0080
.00
10
44
SAM
BA
23
9791
.84
drs
drs
drs
drs
crs
20.0
00.
0080
.00
10
45
Al-R
ajhi
Ban
king
& In
vest
Cor
p 23
0616
.13
drs
drs
drs
crs
crs
40.0
00.
0060
.00
20
36
Emira
tes B
ank
Inte
rnat
iona
l PJS
C22
6324
.64
––
–dr
sdr
s0.
000.
0010
0.00
00
27
Nat
iona
l Ban
k of
Kuw
ait
2255
43.4
8dr
sdr
sdr
sdr
scr
s20
.00
0.00
80.0
01
04
8R
iyad
Ban
k 21
6535
.59
drs
drs
drs
drs
irs0.
0020
.00
80.0
00
14
9A
bu D
habi
Com
mer
cial
Ban
k 21
1531
.65
crs
crs
crs
crs
crs
100.
000.
000.
005
00
10K
uwai
t Fin
ance
Hou
se20
2837
.30
drs
drs
drs
crs
irs20
.00
20.0
060
.00
11
311
Saud
i Brit
ish
Ban
k 16
5566
.17
drs
drs
drs
drs
irs0.
0020
.00
80.0
00
14
12Fi
rst G
ulf B
ank
1645
82.7
3dr
sdr
sdr
sdr
sirs
0.00
20.0
080
.00
01
413
Ban
que
Saud
i Fra
nsi
1626
87.1
7dr
sdr
sdr
sdr
sirs
0.00
20.0
080
.00
01
414
Ara
b N
atio
nal B
ank
1492
81.9
3dr
sdr
sdr
sdr
sirs
0.00
20.0
080
.00
01
415
Nat
iona
l Ban
k of
Dub
ai
1408
67.6
6–
––
drs
irs0.
0033
.33
66.6
70
12
16A
rab
Ban
king
Cor
p14
0315
.00
drs
drs
drs
crs
irs20
.00
20.0
060
.00
11
317
Mas
hreq
bank
11
9695
.00
drs
drs
drs
crs
irs20
.00
20.0
060
.00
11
318
Dub
ai Is
lam
ic B
ank
1182
15.6
6dr
sdr
sdr
sdr
sirs
0.00
20.0
080
.00
01
419
Gul
f Int
erna
tiona
l Ban
k 10
3511
.80
irsirs
irscr
sirs
20.0
080
.00
0.00
14
020
Uni
on N
atio
nal B
ank
9820
4.55
drs
drs
drs
drs
irs0.
0020
.00
80.0
00
14
21G
ulf B
ank
8665
9.21
drs
drs
crs
crs
irs40
.00
20.0
040
.00
21
222
Abu
Dha
bi Is
lam
ic B
ank
8411
8.88
drs
drs
drs
drs
irs0.
0020
.00
80.0
00
14
15.2
417
.14
67.6
216
1871
CR
S =
cons
tant
retu
rns t
o sc
ale,
DR
S =
decr
easi
ng re
turn
s to
scal
e, IR
S =
incr
easi
ng re
turn
s to
scal
e. C
ount
Ban
k (C
RS)
= n
umbe
r of t
imes
a b
ank
has
appe
ared
on
the
effic
ienc
y fr
ontie
r dur
ing
the
perio
d of
stud
y. C
ount
Yea
r (C
RS)
= n
umbe
r of b
anks
app
earin
g on
the
effic
ienc
y fr
ontie
r dur
ing
the
year
Pertanika J. Soc. Sci. & Hum. 23 (S): 219 – 236 (2015)
Fakarudin Kamarudin, Fadzlan Sufian, Annuar Md. Nassir and Nazratul Aina Mohamad Anwar
232
TAB
LE 4
Ev
olut
ion
of e
ffici
ency
scor
e fo
r the
smal
lest
GC
C b
anks
, 200
7 to
201
1
No
Ban
kTo
tal A
sset
s20
1120
1020
0920
0820
07C
ount
ban
k %
Cou
nt b
ank
in n
o.
U
SD (m
illio
n)R
TS
CR
SIR
SD
RS
CR
SIR
SD
RS
1C
omm
erci
al B
ank
of Q
atar
8193
9.45
drs
crs
crs
irsirs
40.0
040
.00
20.0
02
21
2B
ank
Mus
cat
7587
9.58
drs
drs
drs
drs
irs0.
0020
.00
80.0
00
14
3Sa
udi H
olla
ndi B
ank
7532
1.55
drs
drs
drs
drs
irs0.
0020
.00
80.0
00
14
4B
urga
n B
ank
7463
7.15
–dr
sdr
scr
sirs
25.0
025
.00
50.0
01
12
5C
omm
erci
al B
ank
of K
uwai
t 70
096.
66dr
sdr
sdr
sdr
sirs
0.00
20.0
080
.00
01
46
Saud
i Inv
est B
ank
6767
6.04
drs
drs
crs
crs
irs40
.00
20.0
040
.00
21
27
Doh
a B
ank
5897
6.60
drs
drs
drs
crs
irs20
.00
20.0
060
.00
11
38
Qat
ar Is
lam
ic B
ank
5612
0.30
drs
drs
drs
irsirs
0.00
40.0
060
.00
02
39
Al-A
hli B
ank
of K
uwai
t 53
758.
38dr
sdr
sdr
scr
sirs
20.0
020
.00
60.0
01
13
10C
omm
erci
al B
ank
of D
ubai
48
939.
11cr
sdr
scr
scr
sirs
60.0
020
.00
20.0
03
11
11A
hli U
nite
d B
ank
KSC
4116
8.67
–dr
sdr
scr
sirs
25.0
025
.00
50.0
01
12
12B
ank
Al J
azira
40
268.
16dr
sdr
sirs
drs
irs0.
0040
.00
60.0
00
23
13N
atio
nal B
ank
of B
ahra
in
2850
6.38
drs
drs
irsirs
irs0.
0060
.00
40.0
00
32
14N
atio
nal B
ank
of O
man
24
169.
83cr
scr
scr
sirs
irs60
.00
40.0
00.
003
20
15B
ank
of S
harja
h23
478.
20dr
sdr
scr
sirs
irs20
.00
40.0
040
.00
12
216
Arc
apita
20
490.
60irs
irsirs
irsirs
0.00
100.
000.
000
50
17In
vest
corp
1896
9.50
irsirs
irsirs
irs0.
0010
0.00
0.00
05
018
Inve
stba
nk
1277
3.11
–cr
scr
scr
sirs
75.0
025
.00
0.00
31
019
Uni
ted
Gul
f Ban
k 11
595.
00irs
irsirs
irsirs
0.00
40.0
060
.00
02
320
Uni
ted
Ara
b B
ank
1070
5.00
irsirs
crs
irsirs
20.0
080
.00
0.00
14
021
Ban
k of
Kuw
ait &
Mid
dle
East
16
12.5
4–
irsirs
irsirs
0.00
100.
000.
000
40
18.8
142
.57
38.6
119
4339
CR
S =
cons
tant
retu
rns t
o sc
ale,
DR
S =
decr
easi
ng re
turn
s to
scal
e, IR
S =
incr
easi
ng re
turn
s to
scal
e. C
ount
Ban
k (C
RS)
= n
umbe
r of t
imes
a b
ank
has
appe
ared
on
the
effic
ienc
y fr
ontie
r dur
ing
the
perio
d of
stud
y. C
ount
Yea
r (C
RS)
= n
umbe
r of b
anks
app
earin
g on
the
effic
ienc
y fr
ontie
r dur
ing
the
year
Pertanika J. Soc. Sci. & Hum. 23 (S): 219 – 236 (2015)
Technical Efficiency and Returns to Scale on Banking Sector: Empirical Evidence from GCC Countries
233
CONCLUSION
This paper examined the relative efficiency of the banks in GCC countries by analysing the technical efficiency, pure technical efficiency and scale efficiency of GCC banks over the period of 2007-2011. The non-parametric Data Envelopment Analysis (DEA) approach was used to examine the efficiency of these banks. The empirical findings suggest that PTIE outweighs SIE in these GCC banks. During the period of 2007 to 2011, the results suggested that GCC banks exhibited a mean TE of 82.6%, with an input waste of 17.4%. The decomposition of TE into its PTE and SE components suggested that the inefficiency could mainly be attributed to PTIE (12.3%) rather than SIE (6.3%).
This may indicate that the overall results of the GCC banks imply that, during the period of study, although the banks had been operating on a relatively optimal scale, they were managerially inefficient to exploit their resources to the fullest. In addition, the empirical findings suggest that only Abu Dhabi Commercial Bank has dominated the efficiency frontier (CRS) compared with the other GCC banks. In general, the results indicate that, while large banks (the 22 largest) tend to operate at CRS or DRS, small banks (21 smallest banks) tend to operate at CRS or IRS. Therefore, the banks experiencing IRS (Arcapita, Investcorp and Bank of Kuwait & Middle East) should eliminate their SIE via internal expansion, or they would become a prime target for acquiring
banks because it could create value from underperforming banks and eliminate redundancies and inefficiencies (Evanoff & Israelvich, 1991). On the other hand, GCC banks operating at DRS (National Commercial Bank and Emirates Bank International PJSC) are advised not to increase their size or be involved with mergers and acquisitions events, mainly because a further increase in the size of the bank will only result in a smaller increase of outputs for every proportionate increase in inputs of the large banks.
These empirical findings are expected to contribute significantly to the existing knowledge on the operating performance of the GCC banking sector. Nevertheless, the study has also provided further insights into bank’s specific management, as well as to the policymakers, with regard to attaining optimal utilisation of capacities, improvement in managerial expertise, efficient allocation of scarce resources, and the most productive scale of operation of banks operating in GCC countries. Moreover, this study may also facilitate directions for sustainable competitiveness of the GCC banking sector operations in the future.
ACKNOWLEDGEMENTS
The authors would like to thank the editors and the anonymous referees of the journal for their constructive comments and suggestions, which have significantly helped to improve the contents of the paper. The usual caveats apply.
Pertanika J. Soc. Sci. & Hum. 23 (S): 219 – 236 (2015)
Fakarudin Kamarudin, Fadzlan Sufian, Annuar Md. Nassir and Nazratul Aina Mohamad Anwar
234
REFERENCESAlirezaee, M., Howland, M., & van de Panne, C.
(1998). Sampling size and efficiency bias in data envelopment analysis. Journal of Applied Mathematics and Decision Sciences, 2(1), 51-64.
Ariff, M., & Can, L. (2008). Cost and profit efficiency of Chinese banks: A non-parametric analysis. China Economic Review, 19(2), 260-273.
Banker, R. D., Charnes, A., & Cooper, W. W. (1984). Some models for estimating technical and scale inefficiencies in data envelopment analysis. Management Science, 30(10), 78-92.
Bauer, P. W., Berger, A. N., Ferrier, G. D., & Humphrey, D. B. (1998). Consistency conditions for regulatory analysis of financial institutions: A comparison of frontier efficiency methods. Journal of Economics and Business, 50(2), 85-114.
Berger, A., & Humphrey, D. (1997). Efficiency of financial institutions: international survey and directions for future research. European Journal of Operational Research, 98(2), 175-212.
Brown, R. (2001). Data envelopment analysis: application issues in the financial services sector (pp. 01-05). University of Melbourne, Melbourne.
Charnes, A., Cooper, W. W., & Rhodes, E. (1978). Measuring the efficiency of decision making units. European Journal of Operations Research, 2(6), 429-44.
Coelli, T. (1996). A guide to DEAP: Version 2.1: A data development analysis (computer program). Working Paper 96/08, CEPA, University of New England, Armidale (pp. 1-49).
Coelli, T., Prasada, R., & Battese, G. (1998). An introduction to efficiency and productivity analysis. Boston, MA: Kluwer Academic Publishers.
Darrat, A.F., Topuz, C., & Youzef, T. (2002). Assessing cost and technical efficiency of banks in Kuwait. Paper presented at the ERF’s 8th Annual Conference in Cairo, ERF, Cairo. Retrieved 9 August, 2005, from www.erf.org.eg
DeYoung, R. & Hasan, I. (1998). The performance of De Novo commercial banks: A profit efficiency approach. Journal of Banking and Finance, 22(5), 565-587.
Drake, L. (2001). Efficiency and Productivity Change in UK Banking. Applied Financial Economics, 11(5), 557–71.
Evanoff, D. D., & Israelvich, P. R. (1991). Productive efficiency in banking. Economic Perspectives, Federal Reserve Bank of Chicago, 15(4), 11-32.
Farrell, M. J. (1957). The measurement of productive efficiency. Journal of Royal Statistical Society Association, 120(3), 253-281.
Ferrier, G., & Lovell, C. A. K. (1990). Measuring cost efficiency in banking: econometric and linear programming evidence. Journal of Econometrics, 46(1), 229-45.
Golany, B. & Storbeck, J. (1999). A data envelopment analysis of the operational efficiency and bank branches. Interfaces, 29(3), 14-26.
Isik, I., & Hassan, M. K. (2002). Technical, scale and allocative efficiencies of Turkish banking industry. Journal of Banking and Finance, 26(4), 719-766.
Kamarudin, F., Nordin, B. A. A., & Nasir, A. M. (2013). Price efficiency and returns to scale of banking sector in gulf cooperative council countries: Empirical evidence from Islamic and conventional banks. Economic Computation and Economic Cybernetics Studies and Research, 47(3), 215-236.
Pertanika J. Soc. Sci. & Hum. 23 (S): 219 – 236 (2015)
Technical Efficiency and Returns to Scale on Banking Sector: Empirical Evidence from GCC Countries
235
Kamarudin, F., Nordin, B. A. A., Muhammad, J., & Hamid, M. A. A. (2014a). Cost, revenue and profit efficiency of Islamic and conventional banking sector: Empirical evidence from Gulf Cooperative Council countries. Global Business Review, 15(1), 1-24.
Kamarudin. F., Nasir, A. M., Yahya, M. H., Said, R. M., & Nordin, B. A. A. (2014b). Islamic banking sectors in Gulf Cooperative Council countries. Analysis on revenue, cost and profit efficiency concepts. Journal of Economic Cooperation and Development, 35(2), 1-42.
Kantor, J., & Maital, S. (1999). Measuring efficiency by product group: integrating DEA with activity-based accounting in a large Mideast Bank. Interfaces, 29(3), 27-36.
Levine, R., (1998). The legal environment, banks, and long-run economic growth, Journal of Money, Credit and Banking, 30(3), 596-613.
McAllister, P. H. & McManus, D. A. (1993). Resolving the scale efficiencies puzzle in banking. Journal of Banking and Finance, 17(2), 389-405.
Mercana, M., Reismanb, A., Yolaland, R., & Emel, A. B. (2003). The effect of scale and mode of ownership on the financial performance of the Turkish banking sector: results of a DEA-based analysis. Socio-Economic Planning Sciences, 37(3), 185-202.
Murillo-Zamorano, L. R. (2004). Economic efficiency and frontier techniques. Journal of Economic Surveys, 18(1), 33−77.
Nissanke, M., & Stein, H. (2003). Financial globalization and economic development: toward an institutional foundation. Eastern Economic Journal, 29(2), 287-308.
Olson, D. & Zoubi, T. A. (2008). Using accounting ratios to distinguish between Islamic and conventional banks in the GCC region. International Journal of Accounting, 43(1), 45-65.
Radam, A., Abu, M. L., & Abdullah, A. M. (2008). Technical efficiency of small and medium enterprise in Malaysia: a stochastic frontier production model. International Journal of Economics and Management, 2(2), 395-408.
Rickards, R. (2003). Setting benchmarks and evaluating balanced scorecards with data envelopment analysis. Benchmarking: An International Journal, 10(3), 226-45.
Saha, A., & Ravisankar, T. S. (2000). Rating of Indian commercial banks: a DEA approach. European Journal of Operational Research, 124(1), 187-203.
Sherman, H. D. & Gold, F. (1985). Bank branch operating efficiency: evaluation with data envelopment analysis. Journal of Banking and Finance, 9(2), 297-315.
Sherman, H. D., & Ladino, G. (1995). Managing bank productivity using data envelopment analysis (DEA). Interfaces, 25(2), 60-73.
Srairi, S.A. (2010). Cost and profit efficiency of conventional and Islamic banks in GCC countries. Journal of Productivity Analysis, 34(1), 45-62.
Stanton, K. R. (2002). Trends in relationship lending and factors affecting relationship lending efficiency. Journal of Banking & Finance, 26(1), 127-52.
Sufian, F., & Kamarudin, F. (2014). Efficiency and Returns to Scale in the Bangladesh Banking Sector: Empirical Evidence from the Slack-Based DEA Method. Inzinerine Ekonomika - Engineering Economics, 25(5), 549-557.
Sufian, F., Kamarudin, F., & Noor, N. H. H. M. (2012). Determinants of Revenue Efficiency in the Malaysian Islamic Banking Sector. Journal of King Abdulaziz: Islamic Economics, 25(2), 195-224.
Pertanika J. Soc. Sci. & Hum. 23 (S): 219 – 236 (2015)
Fakarudin Kamarudin, Fadzlan Sufian, Annuar Md. Nassir and Nazratul Aina Mohamad Anwar
236
Sufian, F., Kamarudin, F., & Noor, N. H. H. M. (2013a). Assessing the revenue efficiency of domestic and foreign Islamic banks: empirical evidence from. Jurnal Pengurusan, 37(1), 77-90.
Sufian, F., Kamarudin, F., & Noor, N. H. H. M. (2014). Revenue Efficiency and Returns to Scale in Islamic Banks: Empirical Evidence from Malaysia. Journal of Economic Cooperation and Development, 35(1), 47-80.
Sufian, F., Muhammad, J., Nordin, B. A. A., Yahya, M. H., & Kamarudin, F. (2013b). Assessing the Effect of Mergers and Acquisition on Revenue Efficiency: Evidence from Malaysian Banking Sector. International Journal of Economic Research, 10(2), 309-325.
Vassiloglou, M., & Giokas, D. (1990). A study of the relative efficiency of bank branches: an application of data envelopment analysis. Journal of Operational Research Society, 41(7), 591-7.
Wheelock, D. C., & Wilson, P. W. (1999). Technical progress, inefficiency, and productivity change in US banking 1984-1993. Journal of Money, Credit and Banking, 31(2), 212-34.
Yudistira, D. (2004). Efficiency in Islamic Banking: an Empirical Analysis of 18 Banks. Islamic Economic Studies, 12(1), 1-18.