DESIGN OF A MATURITY MODEL FOR PAYMENT...
132
UNIVERSITEIT GENT FACULTEIT ECONOMIE EN BEDRIJFSKUNDE ACADEMIE JAAR 2013– 2014 DESIGN OF A MATURITY MODEL FOR PAYMENT PROCESSES Masterproef voorgedragen tot het bekomen van de graad van Master of Science in de Toegepaste Economische Wetenschappen: Handelsingenieur Arben Dervisholii onder leiding van Prof. Dr. Geert Poels en Prof. Dr. Amy van Looy
Transcript of DESIGN OF A MATURITY MODEL FOR PAYMENT...
UNIVERSITEIT GENT
FACULTEIT ECONOMIE EN BEDRIJFSKUNDE
ACADEMIE JAAR 2013– 2014
DESIGN OF A MATURITY MODEL FOR
PAYMENT PROCESSES
Masterproef voorgedragen tot het bekomen van de graad van
Master of Science in de Toegepaste Economische Wetenschappen: Handelsingenieur
Arben Dervisholii
onder leiding van
Prof. Dr. Geert Poels en Prof. Dr. Amy van Looy

I
Permission
I, the undersigned, declare that the content of this master thesis may be consulted and/or
reproduced, provided that the source is acknowledged.
Ondergetekende verklaart dat de inhoud van deze masterproef mag geraadpleegd en/of
gereproduceerd worden, mits bronvermelding.
Arben Dervisholii
II
Nederlandstalige samenvatting
Er zijn vier belangrijke marktcondities die een uitdaging vormen voor de betalingsindustrie. Ten
eerste is er de steeds groter wordende concurrentie. Verder is er een stijgende regulering en de
groeiende en meer gecompliceerd wordende behoeften van klanten. Tenslotte is er een grote
variatie in ontwikkeling van de verschillende markten waar aanbieders van betalingsdiensten
actief in zijn. Deze marktcondities verhogen de kost voor het aanbieden van betalingsdiensten
en zetten de marges onder druk. Bovendien vergen ze een grotere flexibiliteit van de
betalingsprocessen en systemen om meer op maat gemaakte betalingsproducten aan te
kunnen bieden en zich op tijd te kunnen aanpassen aan de behoeftes van de markt.
Daarom ontwerpen we in dit onderzoek een maturiteitsmodel voor betalingsprocessen. Dit
model helpt de huidige staat van de betalingsprocessen van een welbepaalde aanbieder van
betalingsdiensten vast te stellen en te beoordelen. Voorts biedt het een stappenplan naar meer
geoptimaliseerde en flexibele betalingsprocessen.
Naast ons maturiteitsmodel voor betalingsprocessen bestaan er nog twee andere. In
tegenstelling tot deze twee modellen, is ons model ontworpen op een wetenschappelijk
onderbouwde manier en is het publiekelijk en gratis toegankelijk. Daarnaast, houdt ons model
rekening met het belang van de Informatie Technologie (IT) bij het uitvoeren van de
betalingsprocessen en de onderlinge afstemming tussen de betalingsprocessen en IT. Om dit te
realiseren hebben we rekening gehouden met Becker`s et al. (2009) criteria voor het
ontwerpen van een maturiteitsmodel. Voorts hebben we een uitgebreide literatuurstudie rond
maturiteitsmodellen uitgevoerd in verband met bedrijfsprocessen, service oriëntatie en het
afstemmen van bedrijfsprocessen en IT. Ons model is dan ook gebaseerd op drie modellen die
elk deel uitmaken van een van deze soorten maturiteitsmodellen. Concreet resulteert het
model uit een combinatie van verschillende aspecten van het Process & Enterprise Maturity
Model(PEMM) (Hammer, 2007), het Open Group Service Integration Model(OSIMM) (Open
Group, 2009) en het Strategic Alignment Model (SAM) (Luftman J. , 2003). Tenslotte is het
model empirisch gevalideerd door vier diepte interviews met drie verschillende experts uit de
betalingsindustrie. In totaal resulteerden deze interviews in 18 concrete aanbevelingen, welke
ook opgenomen zijn in het model.
III
Foreword
It would not have been possible to successfully complete the writing of my master dissertation
without the help of many people. First, I would like to thank my promoter Prof. Dr. Geert Poels
and co-promoter Prof. Dr. Amy Van Looy for their passionate support throughout the year and
a half. Next, I would like to thank Francis Chlarie who proposed the subject of this master
dissertation to my promoter, for introducing me to the existing world of payments, for finding
the other experts to empirically validate my model and for all the other support.
To conclude, I would also like to thank the two other experts who cooperated in this research
and my family and friends for their unconditional support.
IV
Table of Contents
Permission ......................................................................................................................................... I
Nederlandstalige samenvatting ......................................................................................................... II
Foreword ......................................................................................................................................... III
Table of Contents ............................................................................................................................. IV
List of Abbreviations ........................................................................................................................ VII
List of Figures ................................................................................................................................... IX
List of Tables ..................................................................................................................................... X
Introduction ...................................................................................................................................... 1
Methodology .................................................................................................................................... 3
0.1 Introduction .................................................................................................................................. 3
0.2 Problem formulation .................................................................................................................... 3
0.3 Research question: How can we gradually improve the payments processes towards agility?
...................................................................................................................................................... 4
0.4 Social and academic relevance ..................................................................................................... 4
0.5 Research Design and Methodology .............................................................................................. 5
Part I: Predesign phase ...................................................................................................................... 8
Chapter 1: Introduction to national and international payments ..................................................... 9
1.1 Introduction .............................................................................................................................. 9
1.2 Basics of a bank ...................................................................................................................... 10
1.3 Introduction to payment service providers ............................................................................ 11
1.4 Current payments landscape and its implications ................................................................. 15
1.4.1 Presence of nonbank payment service providers .......................................................... 16
1.4.2 Changing customer needs .............................................................................................. 17
1.4.3 Impact of regulation ....................................................................................................... 18
1.4.4 Development of the region ............................................................................................ 20
1.5 Possible solutions ................................................................................................................... 20
1.6 Conclusion .............................................................................................................................. 24
Chapter 2: Maturity Models ............................................................................................................. 25
2.1 Introduction ............................................................................................................................ 25
2.2 Business Process Maturity Models ......................................................................................... 26
V
2.2.1 BPMM definition and terminology ................................................................................. 26
2.2.2 Existing research on BPMM ............................................................................................ 28
2.2.3 Existing Payment Maturity Models ................................................................................ 30
2.3 Service Oriented Architecture Maturity Models .................................................................... 32
2.3.1 Service Orientation Architecture definition and terminology ....................................... 32
2.3.2 Existing research on SOA Maturity Models .................................................................... 33
2.4 Business-IT Alignment ............................................................................................................ 35
2.4.1 Business-IT alignment definition and terminology ........................................................ 35
2.4.2 Existing research on business-IT alignment ................................................................... 38
2.5 Conclusion .............................................................................................................................. 40
Part II: Design Phase ........................................................................................................................ 41
Chapter 3: Design of the initial Payment Maturity Model ............................................................... 42
3.1 Introduction ............................................................................................................................ 42
3.2 Scope of the payment maturity model .................................................................................. 42
3.3 Design methodology............................................................................................................... 44
3.4 Set up Hammer`s Process Maturity Model as basic framework ............................................ 45
3.5 Integration of OSIMM to the framework ............................................................................... 50
3.6 Covering Luftman`s business-IT alignment criteria ................................................................ 56
3.7 Finalizing the model: Initial Payment Maturity Model ........................................................... 66
Chapter 4: Empirical Validation ........................................................................................................ 71
4.1 Introduction ............................................................................................................................ 71
4.2 Methodology .......................................................................................................................... 71
4.3 First empirical validation ........................................................................................................ 73
4.3.1 Results ............................................................................................................................ 73
4.3.2 Model update ................................................................................................................. 74
4.4 Second empirical validation ................................................................................................... 80
4.4.1 Results second interview ................................................................................................ 81
4.4.2 Results third interview ................................................................................................... 82
4.4.3 Model Update................................................................................................................. 84
4.5 Third Empirical Validation ...................................................................................................... 91
4.5.1 Results ............................................................................................................................ 91
VI
4.5.2 Model Update................................................................................................................. 92
Part III: General Conclusion.............................................................................................................. 97
Chapter 5: General Conclusion......................................................................................................... 97
5.1 Overview of the research ....................................................................................................... 97
5.2 Limitations and recommendations for further research ........................................................ 99
Bibliography .................................................................................................................................... VII
Appendices .................................................................................................................................... XIV
Appendix 1 Screenshots of use of BPMM Smart-Selector ............................................................... XIV
Appendix 1.1 Overview of the BPMM Smart-Selector ................................................................... XIV
Appendix 1.2 No BPMMs specified on payment processes included ............................................. XV
Appendix 1.3 Specifying that we are looking for a generic model................................................. XVI
Appendix 1.4 Specifying that the model has to be at least validated for the application ............ XVII
Appendix 1.5 Specifying that the assessment questions and level calculations have to be fully
known XVIII
Appendix 1.6: Specifying that the model has to be free to access and use ................................... XIX
Appendix 1.7: Overview of the models that comply with our core criteria .................................... XX
Appendix 2 Interview Guide ............................................................................................................. XXI
Appendix 2.1 Introduction ............................................................................................................. XXI
Appendix 2.2 Questions ................................................................................................................ XXII
Appendix 2.3 Conclusion ............................................................................................................... XXII
Appendix 3: Content Analysis of the first interview ........................................................................ XXIII
Appendix 4: Content Analysis of the second interview ................................................................... XXIII
Appendix 5: Content Analysis of the third interview ...................................................................... XXIV
Appendix 6: Content Analysis of the fourth interview .................................................................... XXIV
VII
List of Abbreviations
ACH: Automated Clearinghouse
BOJ: Bank of Japan
BP: Business Process
BPM: Business Process Management
BPMM: Business Process Maturity Model
BPO: Business Process Orientation
CMM: Capability Maturity Model
EBPP: Electronic Bill Presentment and Payment
ECB: European Central Bank
EIPP: Electronic Invoice Presentment and Payment
ESB: Enterprise Service Bus
FED: Federal Reserves
HR: Human Resource
IS: Information system
iSOAMM: Independent SOA Maturity Model
IT: Information Technology
LCR: Liquidity Coverage Ratio
LOB: Line of Business
NSFR: Net Stable Funding Ratio
NSOAMM: New Service Oriented Maturity Model
OSIMM: Open Group Service Integration Maturity Model
OSOAMM: Oracle Service-Orientation Maturity Model
PEMM: Process and Enterprise Maturity Model
PMM: Payments maturity model
VIII
PSD: Payment Services Directive
PSP: Payment Service Provider
ROI: Return on Investment
SAM: Strategic Alignment Model
SEPA: Single European Payment Area
SIMM: Service Integration Maturity Model
SLA: Service Level Agreement
SOA: Service-orientated Architecture
SOAMM: Service-Oriented Architecture Maturity Model
UML: Unified Modeling Language
IX
List of Figures
Figure 1: Research design and methodology, based on (Becker, Knackstedt, & Pöppelbuß, 2009). .......... 6
Figure 2: Payment processes, based on (Weiner, Bradford, Hayashi, Sullivan, Whang, & Rosati, 2007) .. 14
Figure 3: Balancing standardization and customization (Grealish, Mohr, Rutstein, Schwarz, Storz, &
Urban, 2011, p. 8) ....................................................................................................................................... 23
Figure 4: The funnel structure, based on (Van Looy A. , 2012, p. 44). ....................................................... 27
Figure 5: CMMI maturity levels, based on (Paulk, 2011, p. 7) ................................................................... 28
Figure 6: The Strategic Alignment Model (Henderson & Venkatraman, 1993, p. 8) ................................. 36
Figure 7: Scope of the Payment Maturity Model, based on Van Looy (2012) and Henderson &
Venkatraman`s (1993) ................................................................................................................................ 43
Figure 8: Process Maturity Levels (Hammer, 2007, pp. 114-115) .............................................................. 46
Figure 9: OSIMM Maturity Levels (Open Group, 2009) . ............................................................................ 51
Figure 10: Maturity Levels of Luftman`s Business-IT alignment maturity model (Luftman J. , 2003) ....... 60
Figure 11: Updated names and definitions, based on Hammer (2007, pp. 114-115) and AITE Group
(2010, p. 1) ................................................................................................................................................. 76
Figure 12: Conceptual representation of the payment maturity model. ................................................... 80
Figure 13: Conceptual representation of the payment maturity model after the second empirical
validation. ................................................................................................................................................... 90
X
List of Tables
Table 1: Balance sheet of a bank (Chlarie & Goldmann, 2013, p. 86) ........................................................ 10
Table 2: Payment types, based on (Bradford, Davies, & Weiner, 2003) .................................................... 13
Table 3: An overview of the influencing factors on the payments landscape ........................................... 16
Table 4: Criteria to be met, based on Van Looy A. , De Backer, Poels, & Snoeck (2013) ........................... 29
Table 5: Criteria to be met applied on the existing PMM, based on Van Looy A. , De Backer, Poels, &
Snoeck (2013) ............................................................................................................................................. 30
Table 6: Criteria to be met applied on SOA Maturity Models, based on Van Looy A. , De Backer, Poels, &
Snoeck (2013) ............................................................................................................................................. 34
Table 7: Degree of coverage of Luftman`s underlying dimensions, based on Belfo & Sousa`s (2012, p. 3)
.................................................................................................................................................................... 39
Table 8: Overview of the design steps of the initial model ........................................................................ 44
Table 9: Hammer`s Process Enablers and Enterprise Capabilities (Hammer, 2007, p. 113). ..................... 45
Table 10: Original Process Maturity Model (Hammer, 2007, pp. 116-117) ............................................... 48
Table 11: OSIMM dimensions (Open Group, 2009) ................................................................................... 52
Table 12: Integration of OSIMM dimensions into our basic Framework based on Hammer (2007) ......... 53
Table 13: Model after integration of the OSIMM into our basic framework, based on Hammer (2007, pp.
116-117) ..................................................................................................................................................... 54
Table 14: Coverage of Luftman`s (2000, p. 12) criteria in our current model .......................................... 57
Table 15: Model after integration of the OSIMM and after coverage of Luftman’s (2000) alignment
criteria, based on Hammer (2007, pp. 116-117) ........................................................................................ 62
Table 16: Overview of the initial payment maturity model`s enablers ..................................................... 66
Table 17: Initial Payment Maturity Model based on Hammer (2007), Open Group (2009) and Luftman
(2003) ......................................................................................................................................................... 67
Table 18: Recommendations resulted from the first interview ................................................................. 73
Table 19: Comparison of the maturity levels of Hammer`s PEMM and the two existing payment maturity
models ........................................................................................................................................................ 75
Table 20: The adapted statements of sub-enabler `Human Resource efforts`, after they have been
moved from the enabler `Infrastructure` to `Performers`. ........................................................................ 78
Table 21: The new definitions for the enablers `Performer` and `Infrastructure`. .................................... 79
Table 22: Recommendations resulted from the second interview ............................................................ 81
Table 23: Recommendations resulted from the third interview ............................................................... 82
XI
Table 24: Grouping of the recommendations resulted from the second empirical validation. ................ 84
Table 25: Updated `Design` enabler which meets the recommendations of the second empirical
validation .................................................................................................................................................... 86
Table 26: Updated `Performers` enabler which meets the recommendations of the second empirical
validation .................................................................................................................................................... 87
Table 27: Updated `Information Technology` enabler which meets the recommendations of the second
empirical validation .................................................................................................................................... 88
Table 28: Updated `Metrics` enabler which meets the recommendations of the second empirical
validation .................................................................................................................................................... 89
Table 29: The new definitions for the enablers `Design` and `Information Technology`. ......................... 91
Table 30: Recommendations resulted from the fourth interview ............................................................. 91
Table 31: Final version of the payment maturity model ............................................................................ 93
Table 32: Overview of the final payment maturity model`s enablers. ...................................................... 96
1
Introduction
In this thesis we design a maturity model for the payment processes, which can be used across
the world. The model is built on behalf of Belpay; a Belgian consulting company specialized in
the payment industry. This model is needed, since the payment industry is situated in a state in
which it is struggling to profitably handle the challenges imposed by its environment. Our
maturity model focuses on how to improve the payment processes, in order to achieve a state
in which the imposed challenges can be faced. Contrary to the existing payment maturity
models, our model does not only focus on business process maturity but also on IT and
business-IT alignment. This is important, given the fact that IT is essential in executing payment
processes. Therefore, having a high business process maturity with the IT lacking behind or vice
versa does not add any value. Furthermore, the design process of our model is scientifically
well-founded since we apply Becker`s et al. (2009) eight guidelines for building a maturity
model. The limitations of our model rely in its validation. Our model is namely only empirically
validated by interviews with professionals and is not applied on any case. The validation of the
model through application in real life cases is determined by Belpay. Therefore, in order to have
a fully validated and scientifically well-founded model, further research is recommended.
Most of the scholars concerning the creation of a maturity model propose to divide the
research process in a pre-design, a design, and a post-design phase (Van Looy A. , 2012). Since
the validation of the model will be carried out by Belpay, the post-design phase falls out of the
scope of this research. As a result, this thesis is structured in four parts, namely a part on the
methodology of this thesis, the two parts of the research itself and a concluding part.
So first, we start with a detailed description of the followed methodology in the process of
designing our maturity model. The description includes the problem definition, the social and
academic relevance and gives more insight into the followed methodology for designing our
maturity model.
Secondly, the pre-design phase introduces the reader to the world of payments, its implications
and the need for a solution. Moreover, it gives an overview of the research that already has

2
been done in the field of maturity models by academics in general and by the payment industry
in specific. To conclude, the business-IT alignment research is also covered.
Furthermore, the design phase deals with the design of the model itself. This part includes the
design of the initial model based on the research in part one, and extra payment specific
expertise provided by Belpay. As well as the design of the definitive model which results out of
empirical validation through in-depth interviews with three different experts. Finally, the
general conclusion part provides a summary of the research, an overview of the model and
suggestions concerning further research.
3
Methodology
0.1 Introduction
First, we provide a concrete definition of the problem followed by the research question that is
being researched. Furthermore, we retrieve the social and academic relevance of this thesis out
of our research. To conclude, we outline the exact research methodology followed to design
our maturity model.
0.2 Problem formulation
The baseline problem is that the payment industry in general, in its current conditions and with
its current payment systems, is struggling to profitably handle the challenges imposed by its
dynamic environment. Two challenges that the payment industry currently face are for instance
the payment needs of customers that are getting more demanding and sophisticated and the
increased regulation which typically has a great impact on payment revenues and margins. As
we will discuss in section 1.5, payment service providers (PSPs) need to move to new operating
and business models that can successfully meet the different and dynamically changing
customer needs, while still being profitable. In practice, this implies that PSPs are in need of
payment processes which enable to be flexible enough to satisfy the customer, while still being
enough cost-efficient. Therefore, authors like Chandra (2011), Tyagi et al. (2008) and Hayden et
al. (2010) advocate that PSPs need to move towards agility, with agility being defined as
follows: ` The agile organization experiences a decreased time-to-market, consolidated costs
and improved operating income. Rules and predictive models allow the business to respond
dynamically to market changes and to create new offerings ‘on the fly’ for specific customer
segments. Services and capacity are shared up and down the enterprise and across units, further
reducing resource requirements and improving the ability to anticipate change, thereby bringing
true agility to the organization` (Chandra, 2011, p. 13).
The concrete problem relies exactly in the difficulty of the assessment of the current stage of
the payment processes of a specific PSP and the assessment of the needed changes to move
4
from this stage to a stage that fits best to their business. This translates into the research
question discussed in section 1.3.
0.3 Research question: How can we gradually improve the payments
processes towards agility?
In order to address the problem stated in section 0.2, we research how we can gradually move
from the current stage of a specific payment service provider`s (PSP) payment processes to a
stage that fits best their business, where the highest stage of maturity enables the payment
processes to be fully agile. This translates itself into the following research question: How can
we gradually improve the payments processes towards agility?
We resolve this question by means of a maturity model. This maturity model focuses on how to
improve the payment processes while recognizing the importance of the maturity of service-
orientation and business-IT alignment. The recognition of the maturity of service-orientation is
important since the execution of payment processes highly relies on IT and having a service-
oriented IT is seen as essential to deliver agility (Sprott & Wilkes, 2004). Furthermore, the
relevance of including the business-IT alignment maturity is illustrated by the fact that having a
high business process maturity with the IT lacking behind or vice versa does not add any value.
The model resolves the question in two ways. The first way is by enabling payment service
providers (PSPs) across the world to assess the current stage of their payment processes. The
second is by guiding them to a desired stage through clear descriptions of the suggested steps
to take in order to move from one stage to another. Another aspect of the model is that it does
not specify what the desired stage is for a PSP, as this depends from organization to
organization. Therefore, a PSP should evaluate for itself which level fits best to their strategy.
0.4 Social and academic relevance
This thesis is socially as well as academically relevant. Firstly, the social relevance of this thesis
can be revealed out of the problem definition. In current circumstances the payment industry
cannot fully fulfill the customers` needs, as will be discussed in chapter two. This is because
given its current stage of processes and organizations it is not possible to do so. Furthermore, it
5
is confronted with challenges that decrease its profitability. Our designed tool, offers the
participants of the industry the opportunity to assess their current stage and to define a
roadmap to a stage where they can face these challenges and where they can fully fulfill the
customers` needs. Notice that not all the payment service provider (PSPs) have to reach the
highest possible maturity, but the most appropriate in terms of costs and benefits for their
specific situation and their chosen strategy. Therefore, this thesis is socially relevant because it
intends to help increase the profitability of the payment industry and the capability of the
payment service provider (PSPs) to fulfill the customers` needs.
Secondly, the academic relevance can be found in the way the tool is designed. Out of our
literature study in chapter two appeared that there does not exist any academic maturity
model that is domain-specific to payment processes. We did, however, find two payment
maturity models designed by companies from the industry. Our model, contrary to these two
models, is built following a scientific research methodology. For the detailed description of our
methodology we refer to section 0.5. This is the first way in which it contributes to the
academic literature on maturity models. Furthermore, our model also differentiates itself from
these existing models because it does not only recognize the importance of IT but also the
alignment of the IT with the payment processes. The second way of contribution relies in this
characteristic.
0.5 Research Design and Methodology
To situate the research of this thesis we use Hevner`s et al. (2004) research-cycle, as our
research is situated in the Information Systems (IS) discipline. They describe this research-cycle
as a complementarity between the behavioral-science and the design science paradigm. Since
we focus on the process of building, in Hevner`s et al. (2004, p. 75) terms, a new and innovative
artifact (e.g. maturity model) in order to extend the boundaries of the human and
organizational capabilities (e.g. make it possible to increase the maturity of the payment
processes where necessary). Our research is situated in the design science paradigm.
We follow the proposition of most of the scholars concerning the creation of a maturity model
to divide the research process is in a pre-design, design, and post-design phase (Van Looy A. ,
2012). However, only the pre-design and design phase are included in the scope of this thesis.
6
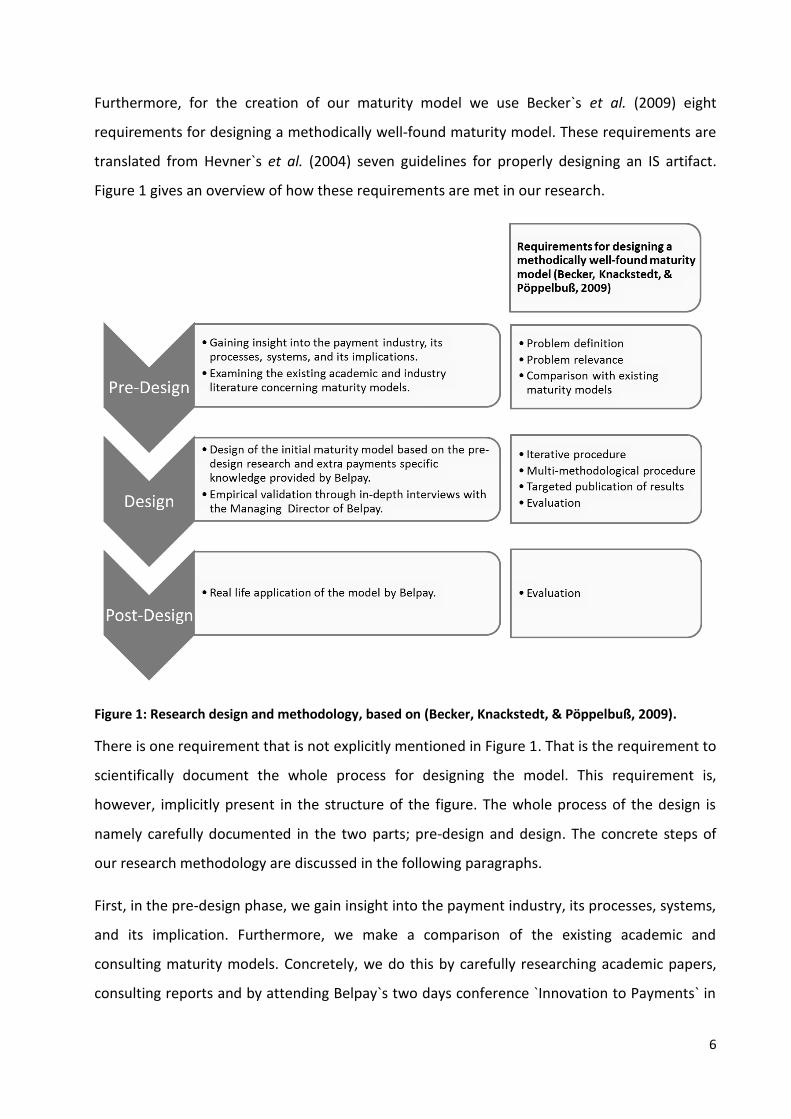
Furthermore, for the creation of our maturity model we use Becker`s et al. (2009) eight
requirements for designing a methodically well-found maturity model. These requirements are
translated from Hevner`s et al. (2004) seven guidelines for properly designing an IS artifact.
Figure 1 gives an overview of how these requirements are met in our research.
Figure 1: Research design and methodology, based on (Becker, Knackstedt, & Pöppelbuß, 2009).
There is one requirement that is not explicitly mentioned in Figure 1. That is the requirement to
scientifically document the whole process for designing the model. This requirement is,
however, implicitly present in the structure of the figure. The whole process of the design is
namely carefully documented in the two parts; pre-design and design. The concrete steps of
our research methodology are discussed in the following paragraphs.
First, in the pre-design phase, we gain insight into the payment industry, its processes, systems,
and its implication. Furthermore, we make a comparison of the existing academic and
consulting maturity models. Concretely, we do this by carefully researching academic papers,
consulting reports and by attending Belpay`s two days conference `Innovation to Payments` in
7
Brussels. Three of Becker`s et al. (2009) requirements are met in this part. The first two are the
definition of the problem and the relevance of the problem. They result from our research and
are well documented in this part. The third requirement results from our comparison of the
existing maturity models.
Furthermore, in the design phase, we build our model. We first design an initial maturity model
based on our pre-design research. After having built our initial model we empirically validate
our model through an in-depth interview with Francis Chlarie, Managing Director of Belpay the
company on whose behalf this model is being designed. This results in a new payment maturity
model, which then further is validated through new in-depth interviews with two other experts
from the industry. After these two interviews, the model is further modified and refined. To
conclude, we go back to Belpay with our definitive model and have one more in-depth
interview with Francis Chlarie. During this interview the model is evaluated and some last
modifications are made where necessary. Moreover, the differences between the initial model
and the last model which resulted out of this last interview are well documented.
By using these multiple methods to design our model we fulfill Becker`s et al. (2009) multi-
methodological procedure requirement. The iteration procedure is fulfilled by building up to a
definitive model step by step, using in-depth interviews. Finally, the thesis results in an
evaluated model to be publicized for usage by practitioners under its specified conditions of
application. This covers the evaluation and target publication requirement of Becker et al.
(2009).
The post-design phase falls out of the scope of this thesis, as previously mentioned. This phase
could have been filled with further evaluation and validation of the model through case studies.
However, given the high confidentiality concerning payment processes and systems it was
impossible to find appropriate companies to apply the model on. Therefore, we decided in
consultation with Belpay, that they will independently carry out the further validation of the
model by applying it to their clients.
8
Part I: Predesign phase
This part consists of two chapters. It introduces the payments landscape and examines the
existing research on maturity models.
First, in chapter one, the basics of payments are explained. Moreover, an explanation is given
for the current payment landscape, its implications and the need for a solution.
Finally, the second chapter gives more insight into the maturity model as a solution for the
difficulties with which payment service providers (PSPs) are faced. This gives an overview of the
definitions and existing research concerning business process maturity models, service
orientation maturity models, business-IT alignment and the link of these subjects to payments.
9
Chapter 1: Introduction to national and international payments
1.1 Introduction
It is important to have a clear definition of a payment service provider. Most of the definitions
consist out of a long list of what kinds of payment services exist, followed by another long list of
which institutions can provide these services. The latter depends on the legislation of a specific
region or country. Giving a list of the different legible providers by region falls out of the scope
of this course, that is why we generalize our definition as followed: A payment service provider
(PSP) is every institution that is legible of providing one or more of the following payment
services: ‘services enabling cash to be placed or withdrawn from a payment account as well as
all the operations required for operating a payment account, execution of payment
transactions, issuing and/or acquiring of payment instruments, and money remittance'
(European Parliament, Council of the European Union, 2007, p. 36).
Even though we generalized the providers of these payment services, we do follow the existing
literature in splitting them up in bank and nonbank payment service providers (PSPs). In the
following paragraph, we present an explanation of the way a bank works, as banks are the
traditional payment service providers before discussing the nonbank payment service providers
and PSPs in general.
10
1.2 Basics of a bank
As mentioned in the previous paragraph, we first explain the basics of a bank. Besides the fact
that banks are the traditional PSP, they form also the basis of our financial system. Given their
crucial role in our financial system, banks are carefully regulated and monitored by
governments. A bank is a credit institution, and categorized as a financial institution. Other
financial institutions, however, exist, for example, insurance companies and investment funds.
In this thesis, a credit institution is defined as: `an undertaking the business of which is to
receive deposits or other repayable funds from the public and to grant credit for its own account
(European Central Bank, 2012, p. 220).` Therefore, banks are often referred to as deposit taking
institutions.
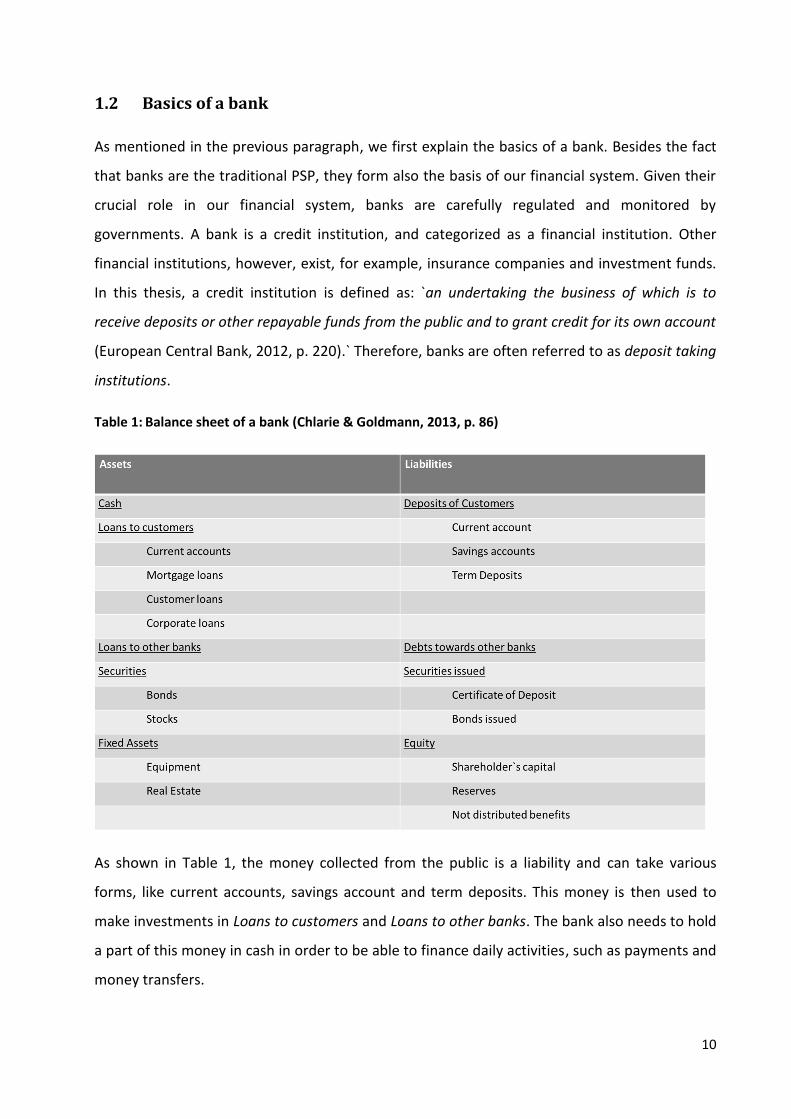
Table 1: Balance sheet of a bank (Chlarie & Goldmann, 2013, p. 86)
As shown in Table 1, the money collected from the public is a liability and can take various
forms, like current accounts, savings account and term deposits. This money is then used to
make investments in Loans to customers and Loans to other banks. The bank also needs to hold
a part of this money in cash in order to be able to finance daily activities, such as payments and
money transfers.
11
The activities of a bank are carefully monitored and regulated by a central bank. Every currency
has its own central bank that regulates the banks active in its jurisdiction. For instance, in the
European Union, the European Central Bank (ECB) regulates the banks that participate in the
euro. In the United States it is the Federal Reserves (FED), in Japan the Bank of Japan (BOJ) etc.
There is, however, one committee which tries to harmonize the regulation. This committee is
the Basel Committee. In the Basel Committee 27 countries are represented from around the
world (Bank for International Settlements, 2013). This committee sets up recommendations for
regulations, mostly regarding capital and liquidity requirements. This means that such
recommendations are not mandatory. However, most of the countries with international active
banks implement them, even if they are not a member of the committee.
Due to the recent financial crisis, the Basel Committee decided to strengthen its Basel II
framework by introducing Basel III in 2008. Several people in the industry like R. Wandhofer
(2011) and D. Turing (2011) believe that the Basel III framework will make it more expensive for
banks to provide some payment services. For instance, the introduction of the “liquidity
coverage ratio” (LCR), the “net stable funding ratio” (NSFR) and some changes in the way of the
risk-weighted calculations discourages banks especially of offering clearing and settlement
activities. First, in the calculations of the LCR it is assumed that a bank in stress -meaning in a
difficult situation- will lose 25 percent of the deposits associated with clearing, custody or cash
management activities. Furthermore, due to the NSFR banks providing clearing and settlement
services to non-retail customers may need to commit valuable retail funding to fund these
services (Turing, 2011). Finally, the influence of the changes of risk-weighted calculations on
providing payment services will be explained in detail in section 1.4.2 explained.
1.3 Introduction to payment service providers
After having introduced the meaning of a bank, we now turn to PSPs in general. As mentioned
in the previous section a PSP can be a bank or a nonbank. A bank has already been defined in
section 1.2 as a deposit taking institution. Consequently we can define a nonbank PSP as a non-
deposit taking PSP. Or in other words, a nonbank PSP is every PSP that does not collect money
from the public to finance its assets. An example of a nonbank PSP is Ogone. This is market
leader in processing online payments in Belgium (Fockedey, 2013).
12
To get more insight into payments, we introduce two concepts which are closely related to
each other, namely: payment types and payment processes (Bradford, Davies, & Weiner, 2003).
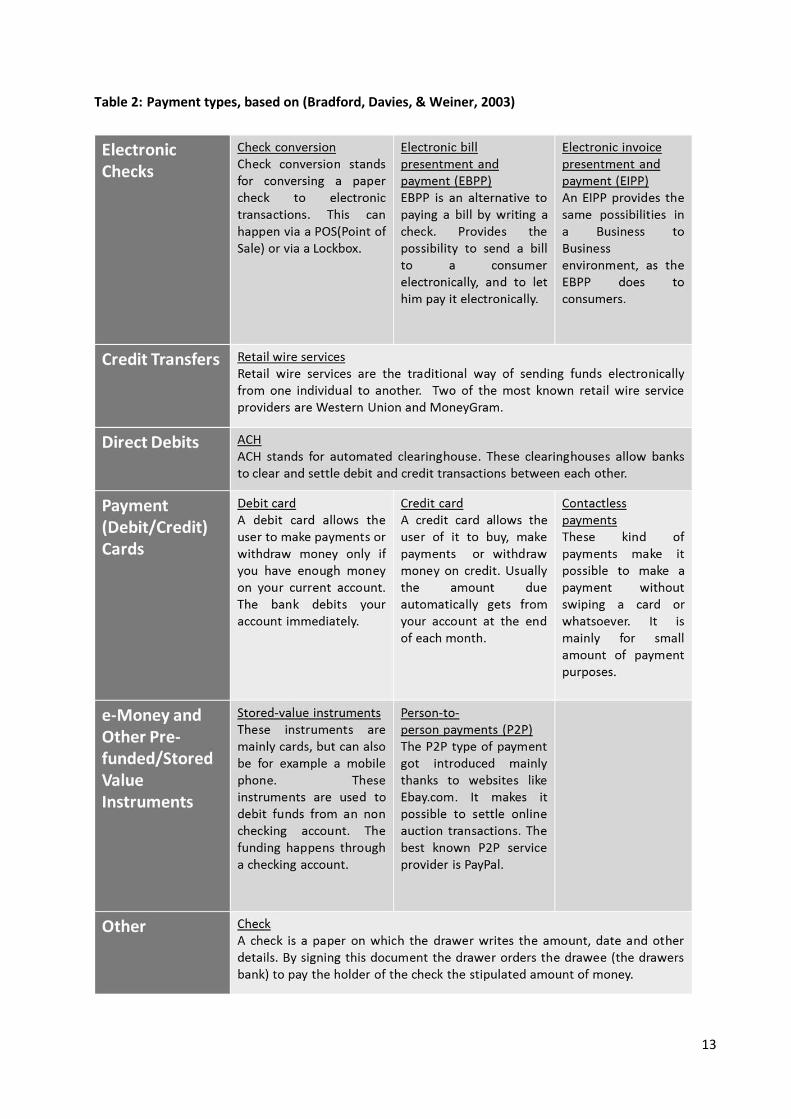
Payments types are different ways of making a payment. One way of describing the payment
types is by dividing them into five broad categories: Electronic Checks, Credit Transfers, Direct
Debits, Payment (Credit/Debit) Cards, e-Money and Other Pre-funded/Stored Value
Instruments (including Internet Person-to-Person) (Weiner, Bradford, Hayashi, Sullivan, Whang,
& Rosati, 2007). Another way is to define 11 more narrow payments types and divide them in
two groups: traditional payments types and emerging payment types (Bradford, Davies, &
Weiner, 2003). Traditional payment types are for example credit card transactions or checks.
While emerging payment types are payments such as internet bill payment or online person-to-
person transactions. Ten of the 11 of these payment types form the basis for the five broader
categories of Weiner et al. (2007). Table 2 gives an overview of these 11 payment types in the
framework of the five broader categories of Weiner et al. (2007). The payment type ‘Check’ is
defined according to its traditional definition and could thus not be added to the broad
category of ‘Electronic Checks’. That is why we added an extra broad category named ‘Other’.
13
Table 2: Payment types, based on (Bradford, Davies, & Weiner, 2003)
14
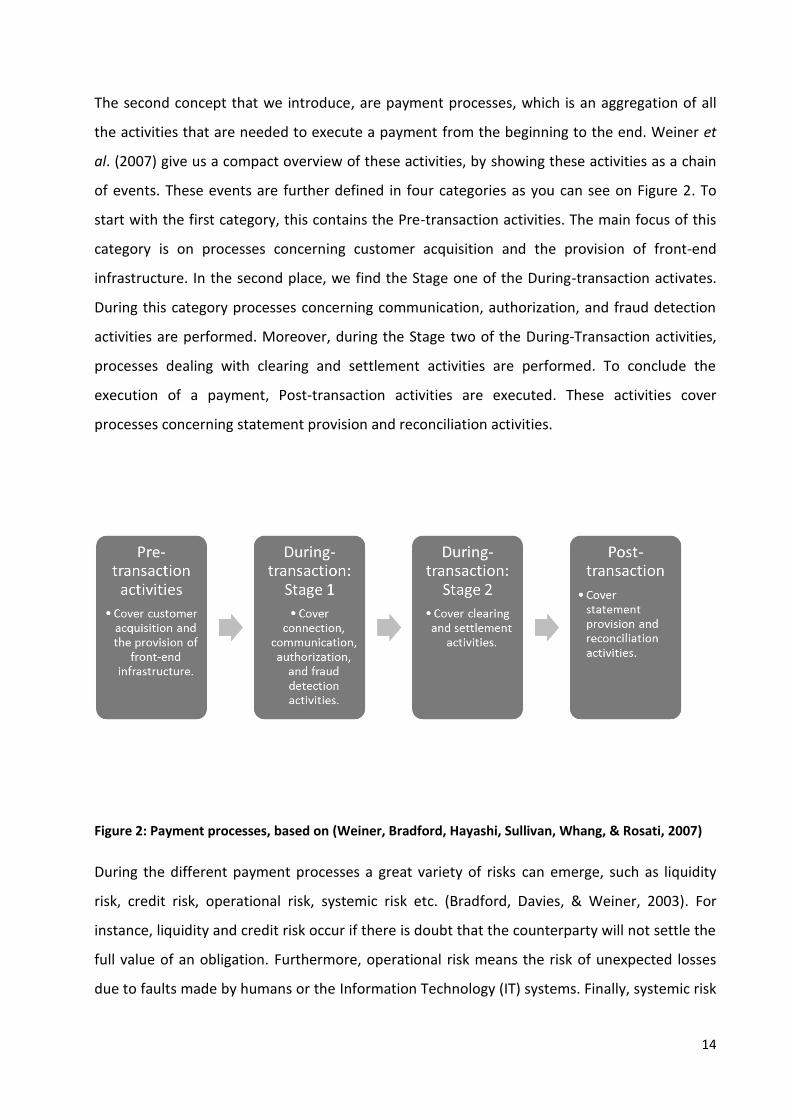
The second concept that we introduce, are payment processes, which is an aggregation of all
the activities that are needed to execute a payment from the beginning to the end. Weiner et
al. (2007) give us a compact overview of these activities, by showing these activities as a chain
of events. These events are further defined in four categories as you can see on Figure 2. To
start with the first category, this contains the Pre-transaction activities. The main focus of this
category is on processes concerning customer acquisition and the provision of front-end
infrastructure. In the second place, we find the Stage one of the During-transaction activates.
During this category processes concerning communication, authorization, and fraud detection
activities are performed. Moreover, during the Stage two of the During-Transaction activities,
processes dealing with clearing and settlement activities are performed. To conclude the
execution of a payment, Post-transaction activities are executed. These activities cover
processes concerning statement provision and reconciliation activities.
Figure 2: Payment processes, based on (Weiner, Bradford, Hayashi, Sullivan, Whang, & Rosati, 2007)
During the different payment processes a great variety of risks can emerge, such as liquidity
risk, credit risk, operational risk, systemic risk etc. (Bradford, Davies, & Weiner, 2003). For
instance, liquidity and credit risk occur if there is doubt that the counterparty will not settle the
full value of an obligation. Furthermore, operational risk means the risk of unexpected losses
due to faults made by humans or the Information Technology (IT) systems. Finally, systemic risk
15
is the risk that a participant in the payment system fails to meet its obligations due to the
failure of another participant. To reduce these risks and other risks in the payment system,
regulators are regulating PSPs more and more. There is, however, a difference in regulation for
nonbank and bank PSPs. The banks are subject to much more regulation, which are not
necessarily payment related but which do have an impact on payments. For instance the
introduction of LCR and NSFR by Basel III as explained in section 1.2
As a result, we would like to stress the importance of IT in executing the payment processes
and delivering the various payment types. PSPs can spend up to 10% of their revenue on
technology in order to process and store the large volumes of transaction data needed to
perform their processes (Chubak, Kaplan, & Catharine, 2011). Thus, even a small reduction in
costs of IT would have a big influence on the profitability of the company. Furthermore, in most
PSPs technology costs are driven by business demand. Namely, mostly there has to be taken a
business decision (e.g. offer the possibility to pay over the internet) which then creates demand
for the technology that satisfies it (e.g. adapting card based payments for use over the internet)
(Chubak, Kaplan, & Catharine, 2011). We summarize this paragraph in two points. One, given
the high importance of IT in executing payment processes it is important to have a good
management of the relation between payment processes and IT. And two, given the fact that
business demand drives technology costs it is important to have a good management and
matching of the business demand and the technology supply. Or in other words, the business
and IT have to be aligned.
1.4 Current payments landscape and its implications
In pursuit of the description of what a PSP is, we now discuss the PSP environment and its
landscape. There are different factors which influence the landscape in which the PSPs are
active in. For instance, the prominence of nonbank PSPs, which can differ from region to region,
is one of these factors. The more nonbanks enter the market of payments, the more
competition there will be for the banks. This implies that there will be more pressure on the
margins in payment revenues. Thus, in regions with more nonbanks presence in the payment
industry, there will be more pressure on those margins. Other factors like customer needs,
regulation and the development of the region also influence the payment landscape. In the
16
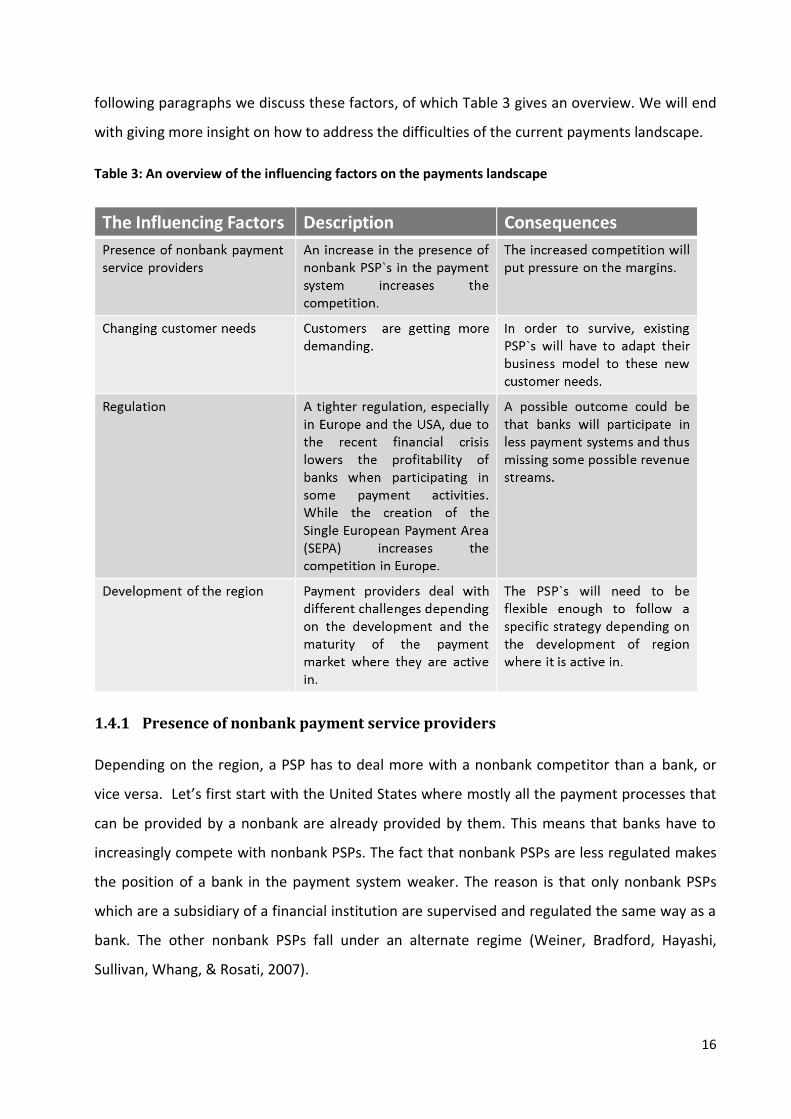
following paragraphs we discuss these factors, of which Table 3 gives an overview. We will end
with giving more insight on how to address the difficulties of the current payments landscape.
Table 3: An overview of the influencing factors on the payments landscape
1.4.1 Presence of nonbank payment service providers
Depending on the region, a PSP has to deal more with a nonbank competitor than a bank, or
vice versa. Let’s first start with the United States where mostly all the payment processes that
can be provided by a nonbank are already provided by them. This means that banks have to
increasingly compete with nonbank PSPs. The fact that nonbank PSPs are less regulated makes
the position of a bank in the payment system weaker. The reason is that only nonbank PSPs
which are a subsidiary of a financial institution are supervised and regulated the same way as a
bank. The other nonbank PSPs fall under an alternate regime (Weiner, Bradford, Hayashi,
Sullivan, Whang, & Rosati, 2007).
17
Furthermore, the presence of nonbank PSPs in Europe is lower than in the United States, but
still significantly differs from country to country. However, the overall nonbank presence is
expected to grow in the future. One of the reasons for growth is the regulation supporting the
SEPA project, and the recently introduced Payment Services Directive (PSD). SEPA, stands for
Single European Payment Area, and inherently aims to achieve one European payment market.
This will increase competition and nonbank presence, as there will be no obstacles anymore for
payment providers to be active in different European countries. The PSD increases nonbank
presence because it allows the creation of “payment institutions”. These institutions can differ
from banks and e-money institutions and will have the right to provide payment services
(Weiner, Bradford, Hayashi, Sullivan, Whang, & Rosati, 2007). An e-money institution is an
undertaking that is authorized to issue electronic money (digital equivalent of cash, which can
be stored on a chip card or a computer memory) within the Euro Area (European Central Bank,
2013). Unlike these e-money institutions, payment institutions are also allowed to run other
business activities. For example, they can be merchants or telecom companies.
Finally, in other parts of the world, like Asia, the nonbank presence is also increasing. For
instance, China has recently licensed almost 200 nonbank domestic PSPs the Chinese
government also indicated in its Twelfth Five Year Plan that they will give high priority to the
payments industry (Chong, 2012). This will probably have implications on PSPs around the
globe, as it also increases the global competition.
1.4.2 Changing customer needs
The payment needs of customers are getting more demanding and sophisticated. These needs
differ depending on the development of the customers’ society and on the customer segments.
The influence of the development of the society is explained in detail in section 1.4.4. Here we
discuss only the differences within the customer segments.
There can be made a difference in retail and corporate customers. The most important
demands of retail customers are convenience, price, rewards, security in transaction processing
and accessibility of funds. While corporate customers are more demanding in flexibility and
customized services in cash management, as transaction-processing services are already
commodities. Examples of these customized services are real-time monitoring of funds and
information about account balances. (Creyghton, Storz, Rutstein, Mohr, & Grealish, 2009).This
18
means that the PSPs and banks in special will need to be able to satisfy this diversity of
customer needs. In order to do that they need a proper business and operational model that
can satisfy these needs while generating profit.
Customers commonly do not know that it is not that easy to deliver what they are asking for,
even if it looks very easy at first sight. Take for example, opening an international account for a
wholesale client. An international account is needed when a client wants to manage its finance
from other countries than its own and to process transactions in multiple currencies. In the
current globalized world, this seems a legit customer need. According to Creyghton et al. (2009)
more than 70% of the clients expect that their bank can open them an international bank
account within two weeks, while this can take up to 90 days for banks to deliver. The reason is
because there are up to 10 parties within the banks, which are involved in delivering this
product, while none of them has a real overview of the process.
1.4.3 Impact of regulation
Regulation typically has a great impact on payment revenues and margins in different regions.
For instance, in Europe it is especially the creation of the Single European Payment Area which
is creating this impact (Creyghton, Storz, Rutstein, Mohr, & Grealish, 2009) while in the United
States it is the Durbin Amendment of the Dodd-Franc Act of 2010. The Dodd-Frank Act brings
the United States regulation in line with Basel III (Brouillard, Burgess, Castillo, Grant, Pollek, &
Stewart, 2012). We can expect that other regulations around the world will also follow the
Basel III requirements. Therefore, we discuss in the following paragraphs the influence of the
two regulations in Europe and the United States discussed here above. Together with an
example of how the Basel III requirements can influence the payment revenues independently
from the Dodd-Frank Act in the United States. More specifically, we discuss the following three
regulations: (1) The Durbin Amendment to the Dodd-Franc Act of 2010 in the United States, (2)
the regulation concerning the SEPA project in Europe and (3) the regulatory focus on intra-day
liquidity introduced by Basel III.
First, the Dodd-Franc Act was introduced as a reaction to the financial crisis of 2008-2009.
Section 1075 of this act (Congress, 2010), which is known as the Durbin Amendment includes
regulation concerning the debit interchange transaction fees and card payment transactions.
This amendment gave the government a price-fixing role, which resulted in fee rates far below
19
the market-set rates. This rule directly puts pressure on the payment revenues of a bank.
Another compliancy rule of the Durbin Amendment is the non-exclusivity rule of 2012. Non-
exclusivity means that each card must have the possibility to be processed on at least two
unaffiliated networks (Strayer & Bowlin, 2011). To satisfy this rule an issuer could, enable an
unaffiliated PIN-based network on a debit card together with a signature-based network. The
former two networks can also be affiliated, but then the issuer would need to enable at least
one more unaffiliated signature or PIN network on the card ( Board of Governors of the Federal
Reserve System, 2013). Due to this rule, banks cannot negotiate the same favorable terms as
before.
Also the SEPA project in Europe puts pressure on payment revenues of banks in two ways. The
first way is by increasing competition, as SEPA targets a Single European Payment Area. One
European payment market would make it easier for payment providers to start an activity in
other European countries and thus increases competition (European Payments Council, 2013).
An increased pressure on margins could be seen as a logical consequence. The second way of
pressure can be found in the infrastructure investments needed to switch to SEPA. Such
investments cost money and do not necessary lead to higher revenues (Creyghton, Storz,
Rutstein, Mohr, & Grealish, 2009). Given the fact that banks in the SEPA environment will have
to deal with loss in revenue and increased cost, they will need a different business model which
is more responsive (Kuber, Padhiyar, & Bhagwatkar, 2008).
There are different proposals in Basel III, which will also have an impact on payment revenues.
These proposals will impact payment revenues in multiple regions around the globe, as the
Basel Committee has an international influence. For the purpose of this thesis, we only discuss
the introduction of intra-day liquidity by Basel III (Bank for International Settlements, 2010) to
give an example. In order to have a smoothly running financial system, a bank may provide an
uncommitted credit facility to a client. This would give the client the necessary short term
liquidity to participate in the payment system. Basel III proposes to identify and manage this
liquidity exposure, which will drive banks to take liquidity efficiency into consideration. A direct
consequence is that banks will have to be more selective in which and in how many payment
systems they want to participate. A possible outcome could be that banks will participate in less
payment systems and thus missing some possible revenue streams (Wandhofer, 2011).
20
1.4.4 Development of the region
The usage of the payment types varies a lot, depending on the region. For instance, even inside
Europe there are differences. North Europe has a mature payment market with a high affinity
towards cash payment. Central Europe is similar, but the ratio of debit-credit cards usage is
lower than in the north. Meanwhile, Southern Europe market is the least mature one, with a
much higher usage of cash (Grealish, Mohr, Rutstein, Schwarz, Storz, & Urban, 2011). Payment
providers deal with different challenges, depending on the development and the maturity of
the payment market in which they are active. Consistent with Grealish et al. (2011) we define a
mature payment market as a market with a maximum percentage of unbanked consumers of
40 in combination with a maximum average real-income growth of 2.5%. Consequently, all the
markets with an average real-income growth higher than 2.5% and a percentage of unbanked
consumers higher than 40 are defined as emerging markets. An unbanked consumer is defined
as a consumer with now formal banking relationship.
In mature markets, like in West Europe, North America, and Australia, banks have to focus on
increasing the share of wallet ratio in order to increase revenues. This comes down to
encouraging existing customers to use the provided payment services and other services as
much as possible. This can be achieved by offering more convenient payment solutions and
further innovation. For example, in Australia, an increasing usage of contactless cards already
exists for small purchases (Grealish, Mohr, Rutstein, Schwarz, Storz, & Urban, 2011).
In less mature markets or emerging markets, such as India and China, payment providers will
need to focus on including the unbanked consumers in the financial system. The combination of
a high number of unbanked consumers and a rise of smartphone usage gives telecom providers
an important role in achieving this inclusion (Grealish, Mohr, Rutstein, Schwarz, Storz, & Urban,
2011). Banks will have to take this fact into consideration and find a way to control it. One
possible solution could be to choose to cooperate with the telecom providers instead of
competing against them.
1.5 Possible solutions
The market conditions discussed in the previous paragraphs pose a real challenge to banks. The
current systems are not flexible enough to be integrated in order to decrease costs and at the
21
same time to offer customized products in order to increase revenue (Hayden, Lal, Ledford, &
Nunn, 2010). The reason is because they are defined by the organization`s history and
environment, such as the regulation they were/are subjected to, the consumers they serve, the
region they are active in etc. (Chandra, 2011).
Therefore, Chandra (2011) states that there is a need for new flexible and agile payment
systems which do permit to offer and customized and common products to respectively a
specific and a large public. A sample of new payment systems that do have the required
flexibility are those using payment hubs (Hayden, Lal, Ledford, & Nunn, 2010). A payment hub
can be described as followed: ` A hub is a central platform that breaks down internal, vertical
barriers to integration. Rather than having one system for each channel, payment type or
business unit, mature payment hubs will provide a central processing service to feed all channels
and all payment types` (Chandra, 2011, p. 11). A payment hub is brought forward as a solution
for meeting the challenges of the previous paragraphs by various authors like Hayden et al.
(2010), Chandra (2011) and Tyagi et al. (2008). This solution, however, has a downside that it
gives just on specific solution for all the PSPs. It does not give them the opportunity to choose
what fits best to their specific situation. Maybe for a specific PSP the payment systems do not
need to be as flexible as in a payment hub, or maybe they need to be even more flexible than a
payment hub.
Another possible solution that deals with the described challenges is given by Gordon & Van
der Ouderaa (2012). They present four business models for banks to overcome the current
conditions set by the payment industry. Even though these models are set up for banks in
general, they are still worth to mention, since offering payments is one of the main activities of
a bank. According to the above scholars a bank has to choose between offering a full service, a
simplified service or to be product specialists. A full service bank is one that offers almost all the
services that a normal commercial bank offers. A bank with a simplified service would have to
focus on a specific customer segment. They can choose for instance to offer only retail savings
or only wholesale banking. A product specialist bank is a bank that specializes in some specific
products that have a high value. They can for instance focus on mortgage products or asset
management (Gordon & Van der Ouderaa, 2012). After having chosen one of the four business
models a bank should align its operational model to the chosen business model. They state that
banks with aligned business and operating models outperform the banks with no such
22
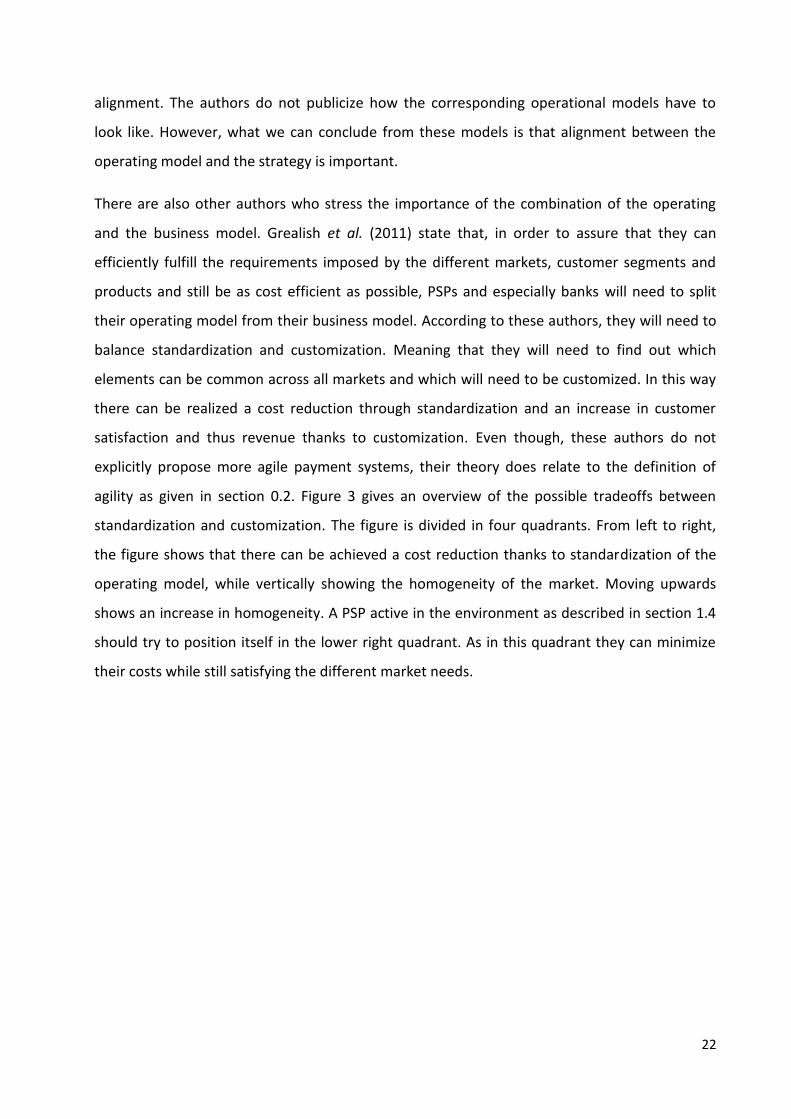
alignment. The authors do not publicize how the corresponding operational models have to
look like. However, what we can conclude from these models is that alignment between the
operating model and the strategy is important.
There are also other authors who stress the importance of the combination of the operating
and the business model. Grealish et al. (2011) state that, in order to assure that they can
efficiently fulfill the requirements imposed by the different markets, customer segments and
products and still be as cost efficient as possible, PSPs and especially banks will need to split
their operating model from their business model. According to these authors, they will need to
balance standardization and customization. Meaning that they will need to find out which
elements can be common across all markets and which will need to be customized. In this way
there can be realized a cost reduction through standardization and an increase in customer
satisfaction and thus revenue thanks to customization. Even though, these authors do not
explicitly propose more agile payment systems, their theory does relate to the definition of
agility as given in section 0.2. Figure 3 gives an overview of the possible tradeoffs between
standardization and customization. The figure is divided in four quadrants. From left to right,
the figure shows that there can be achieved a cost reduction thanks to standardization of the
operating model, while vertically showing the homogeneity of the market. Moving upwards
shows an increase in homogeneity. A PSP active in the environment as described in section 1.4
should try to position itself in the lower right quadrant. As in this quadrant they can minimize
their costs while still satisfying the different market needs.
23
Figure 3: Balancing standardization and customization (Grealish, Mohr, Rutstein, Schwarz, Storz, &
Urban, 2011, p. 8)
Other authors stress the importance of the management of a bank`s payment businesses in
overcoming the current challenges. Bruno & Ewing (2011) give four organizational models
which can be used by banks, namely a business unit-driven model, a leadership model, formal
coordination mechanisms or fully integrated payments businesses. First, in the business unit-
driven model payment groups are divided in business units that are not much formally
coordinated. Secondly, in the leadership model the bank`s payment businesses are ran by a
small group of highly experienced executives or by a single senior executive. Whereas, the
bank`s payment businesses managed by formal coordination mechanism keep an enterprise-
wide oversight using tools such as structured committees. To conclude, in the fully integrated
payments business model, a bank decides to gather all of its payment businesses in one
business unit which drives the corporate agenda (Bruno & Ewing, 2011). The authors stress that
the right model to use depends on the various factors, such as the ones described in section
1.4.
24
1.6 Conclusion
In this chapter, we examined the role of PSPs and how they work. Moreover, we gave an
overview of the challenges they face. We concluded by summing up some solutions to meet
these challenges that are proposed by the industry.
To conclude, we notice that the payment industry is situated in a state that cannot offer the
possibilities described in the previous paragraphs, so it should move to one where it can offer
them. Given the importance of the operating model, we derive that this is possible by
improving its payment processes. Therefore, there is a need for a tool, a maturity model for
payment processes, which assesses this progression (Chandra, 2011). A maturity model is such
a tool as it is `a tool to systematically assess and improve capabilities or critical success factors
to reach a goal` (Van Looy A. , 2012, p. 6). Using this tool, a PSP can determine the current
stage of their payment processes. Furthermore, the tool can serve as a roadmap to another
stage, without making any assumption about which stage that specific PSP should reach. That is
namely for the management of the PSP to decide, based on their strategy, business model or
their specific environment. This is different than the solutions that argue for a payment hub, as
they propose one specific form of a payment system. We gain more insight in maturity models
and how they can help the PSPs to deal with the current payment landscape in chapter 2.
25
Chapter 2: Maturity Models
2.1 Introduction
In chapter one, we outlined the current payments landscape and the need for a maturity model
with which the PSPs can assess and benchmark their processes. In this chapter we go deeper in
understanding what a maturity model is and how it can be used.
Concretely, we limit ourselves to business process maturity models (BPMM), service-
orientation architecture (SOA) maturity models and business-IT alignment models. This
limitation makes sense since it exactly covers what we have researched in chapter one.
First, our case deals with payment processes, which are de facto business processes. This
justifies the research of BPMMs. Second, we found in section 1.3 that the execution of these
payment processes highly relies on IT and in section 1.5 we recognized the importance of
agility. The fact that a service-oriented architecture is seen as essential to deliver business
agility and IT flexibility (Sprott & Wilkes, 2004) justifies our research for SOA maturity models.
Third, in section 1.3 we recognized the importance of managing the relationship between the
business and IT. This justifies our choice to conduct further research concerning business-IT
alignment. Having made this choice, we gain an understanding in how we can assess and
improve the payment processes towards process excellence and agility, while also recognizing
the importance of the IT and the alignment between the payment processes and IT.
In the following sections of this chapter we discuss maturity models for business processes in
general, for SOA and for business-IT alignment. First, we define a business process maturity
model (BPMM) and discuss the existing research and its relevance to our case. Furthermore, we
do the same concerning SOA and business-IT alignment maturity models. To conclude, we
reflect how the combination of a BPMM with a SOA maturity model and business-IT alignment
can add value to the PSPs.
26
2.2 Business Process Maturity Models
2.2.1 BPMM definition and terminology
We use the definition of Van Looy (2012) as this definition is formed by comparing and studying
different definitions found in the BPMM literature. Furthermore, this definition introduces a
terminology that can be used to indicate the scope that is measured by the BPMM. The
definition is the following: `A model to assess and/or to guide best practice improvements in
organizational maturity and process capability, expressed in lifecycle levels, by taking into
account an evolutionary road map regarding (1) process modeling, (2) process deployment, (3)
process optimization, (4) process management, (5) the organizational culture, and/or (6) the
organizational structure` (Van Looy A. , 2012, p. 54). It is not necessary for a BPMM to address
all of the six theoretical components mentioned in the definition.
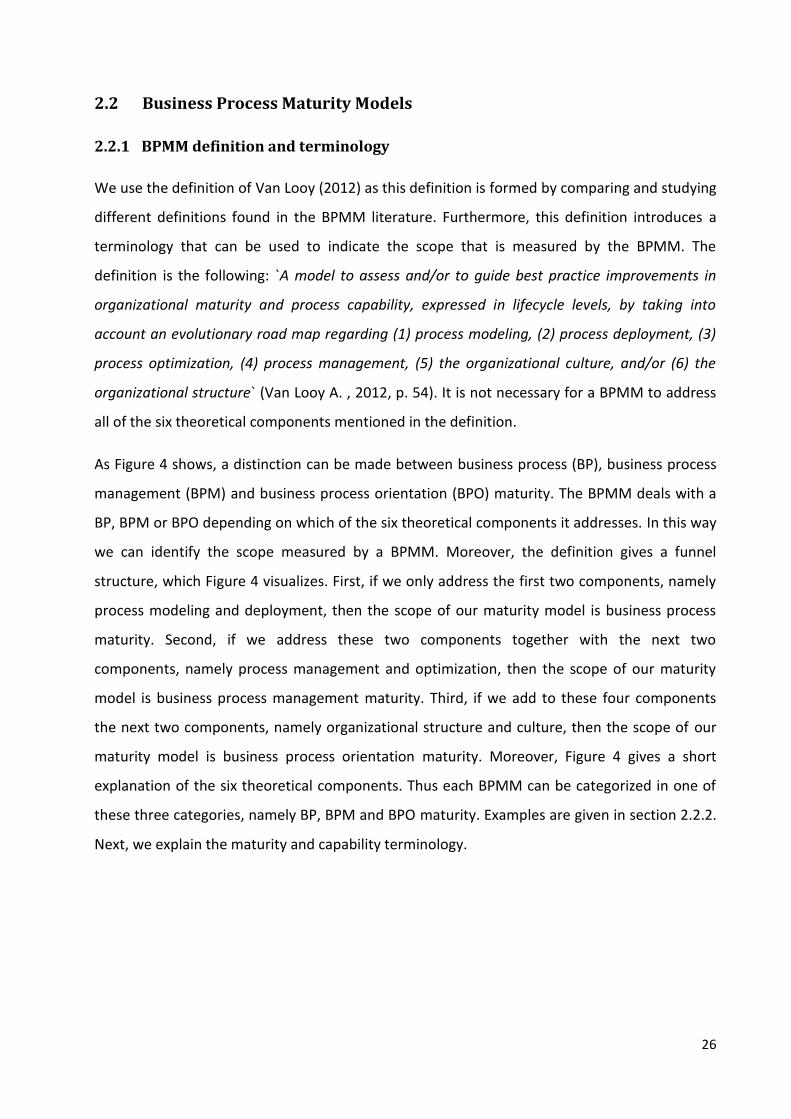
As Figure 4 shows, a distinction can be made between business process (BP), business process
management (BPM) and business process orientation (BPO) maturity. The BPMM deals with a
BP, BPM or BPO depending on which of the six theoretical components it addresses. In this way
we can identify the scope measured by a BPMM. Moreover, the definition gives a funnel
structure, which Figure 4 visualizes. First, if we only address the first two components, namely
process modeling and deployment, then the scope of our maturity model is business process
maturity. Second, if we address these two components together with the next two
components, namely process management and optimization, then the scope of our maturity
model is business process management maturity. Third, if we add to these four components
the next two components, namely organizational structure and culture, then the scope of our
maturity model is business process orientation maturity. Moreover, Figure 4 gives a short
explanation of the six theoretical components. Thus each BPMM can be categorized in one of
these three categories, namely BP, BPM and BPO maturity. Examples are given in section 2.2.2.
Next, we explain the maturity and capability terminology.
27
Figure 4: The funnel structure, based on (Van Looy A. , 2012, p. 44).
A maturity model or in our case a BPMM uses two kinds of measurements, namely capability
levels and maturity levels. A capability level measures the growth or the maturity of a capability
area. While a maturity level measures the growth through all the capability areas together.
Figure 4 shows the four capability areas that can be measured. A capability area is an
aggregation of related capabilities. Examples for capabilities of business processes are for
instance the capability to model a process as it is currently performed and the capability to
monitor this business process.
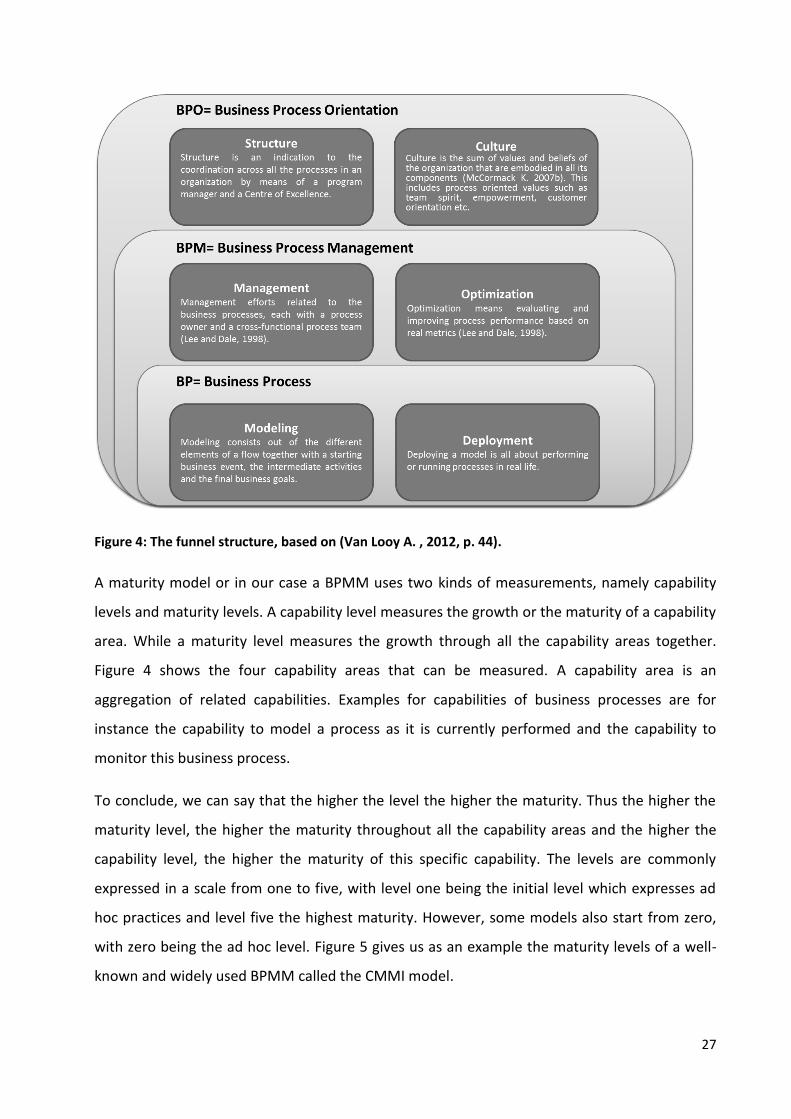
To conclude, we can say that the higher the level the higher the maturity. Thus the higher the
maturity level, the higher the maturity throughout all the capability areas and the higher the
capability level, the higher the maturity of this specific capability. The levels are commonly
expressed in a scale from one to five, with level one being the initial level which expresses ad
hoc practices and level five the highest maturity. However, some models also start from zero,
with zero being the ad hoc level. Figure 5 gives us as an example the maturity levels of a well-
known and widely used BPMM called the CMMI model.
28
Figure 5: CMMI maturity levels, based on (Paulk, 2011, p. 7)
2.2.2 Existing research on BPMM
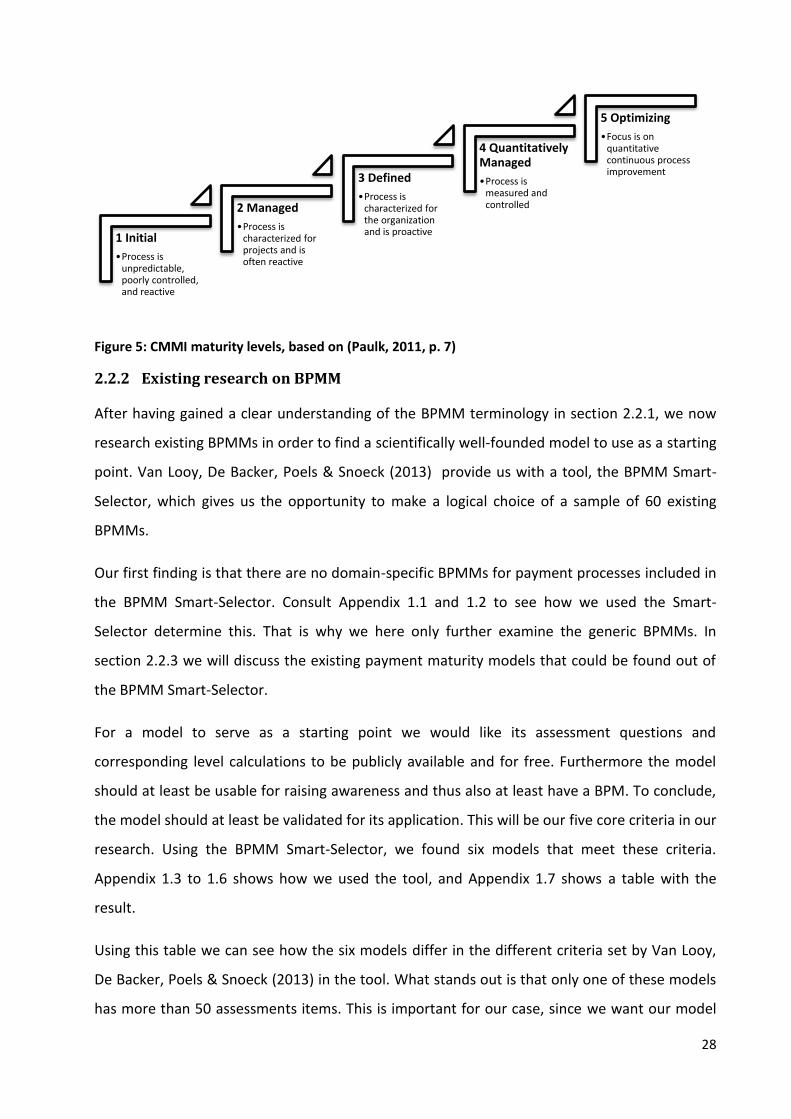
After having gained a clear understanding of the BPMM terminology in section 2.2.1, we now
research existing BPMMs in order to find a scientifically well-founded model to use as a starting
point. Van Looy, De Backer, Poels & Snoeck (2013) provide us with a tool, the BPMM Smart-
Selector, which gives us the opportunity to make a logical choice of a sample of 60 existing
BPMMs.
Our first finding is that there are no domain-specific BPMMs for payment processes included in
the BPMM Smart-Selector. Consult Appendix 1.1 and 1.2 to see how we used the Smart-
Selector determine this. That is why we here only further examine the generic BPMMs. In
section 2.2.3 we will discuss the existing payment maturity models that could be found out of
the BPMM Smart-Selector.
For a model to serve as a starting point we would like its assessment questions and
corresponding level calculations to be publicly available and for free. Furthermore the model
should at least be usable for raising awareness and thus also at least have a BPM. To conclude,
the model should at least be validated for its application. This will be our five core criteria in our
research. Using the BPMM Smart-Selector, we found six models that meet these criteria.
Appendix 1.3 to 1.6 shows how we used the tool, and Appendix 1.7 shows a table with the
result.
Using this table we can see how the six models differ in the different criteria set by Van Looy,
De Backer, Poels & Snoeck (2013) in the tool. What stands out is that only one of these models
has more than 50 assessments items. This is important for our case, since we want our model
1 Initial
•Process is unpredictable, poorly controlled, and reactive
2 Managed
•Process is characterized for projects and is often reactive
3 Defined
•Process is characterized for the organization and is proactive
4 Quantitatively Managed
•Process is measured and controlled
5 Optimizing
•Focus is on quantitative continuous process improvement
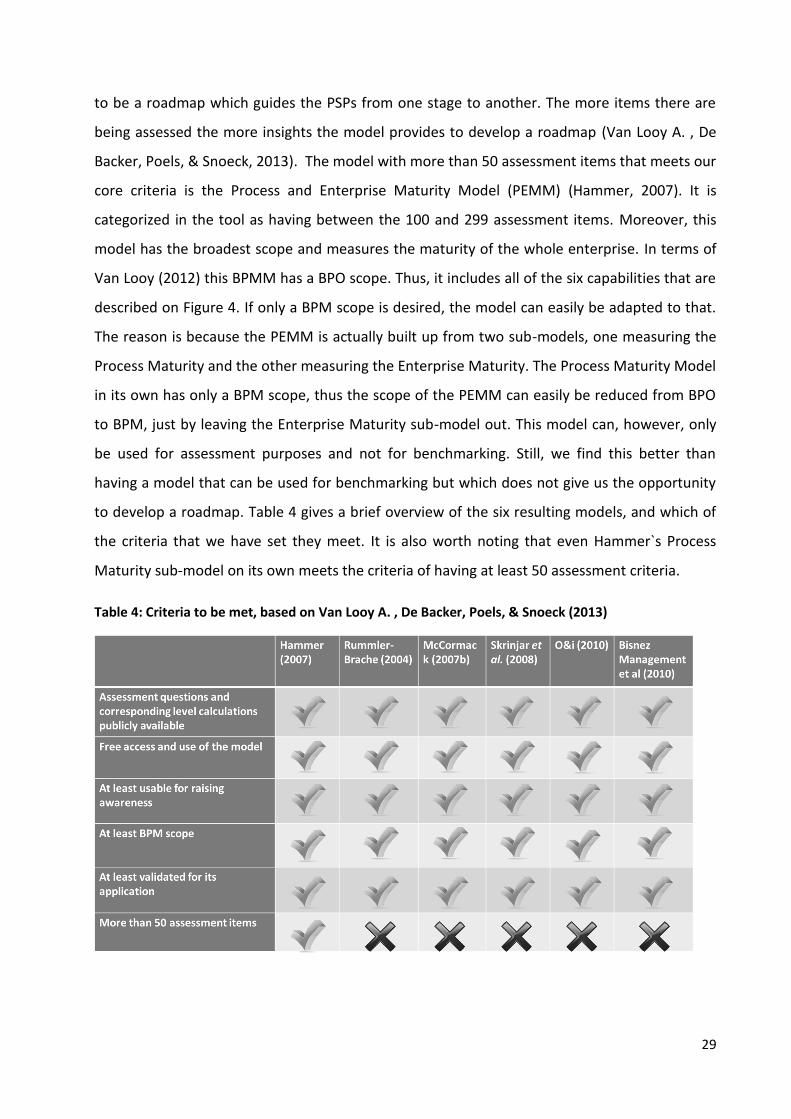
29
to be a roadmap which guides the PSPs from one stage to another. The more items there are
being assessed the more insights the model provides to develop a roadmap (Van Looy A. , De
Backer, Poels, & Snoeck, 2013). The model with more than 50 assessment items that meets our
core criteria is the Process and Enterprise Maturity Model (PEMM) (Hammer, 2007). It is
categorized in the tool as having between the 100 and 299 assessment items. Moreover, this
model has the broadest scope and measures the maturity of the whole enterprise. In terms of
Van Looy (2012) this BPMM has a BPO scope. Thus, it includes all of the six capabilities that are
described on Figure 4. If only a BPM scope is desired, the model can easily be adapted to that.
The reason is because the PEMM is actually built up from two sub-models, one measuring the
Process Maturity and the other measuring the Enterprise Maturity. The Process Maturity Model
in its own has only a BPM scope, thus the scope of the PEMM can easily be reduced from BPO
to BPM, just by leaving the Enterprise Maturity sub-model out. This model can, however, only
be used for assessment purposes and not for benchmarking. Still, we find this better than
having a model that can be used for benchmarking but which does not give us the opportunity
to develop a roadmap. Table 4 gives a brief overview of the six resulting models, and which of
the criteria that we have set they meet. It is also worth noting that even Hammer`s Process
Maturity sub-model on its own meets the criteria of having at least 50 assessment criteria.
Table 4: Criteria to be met, based on Van Looy A. , De Backer, Poels, & Snoeck (2013)
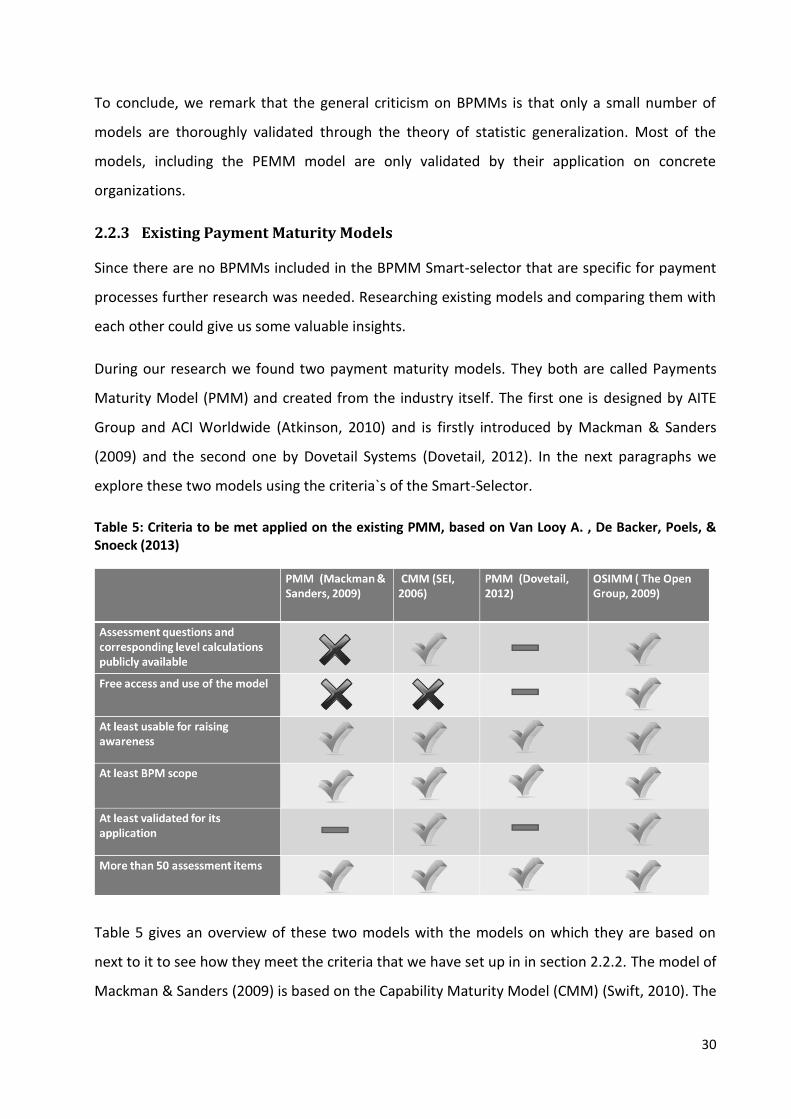
30
To conclude, we remark that the general criticism on BPMMs is that only a small number of
models are thoroughly validated through the theory of statistic generalization. Most of the
models, including the PEMM model are only validated by their application on concrete
organizations.
2.2.3 Existing Payment Maturity Models
Since there are no BPMMs included in the BPMM Smart-selector that are specific for payment
processes further research was needed. Researching existing models and comparing them with
each other could give us some valuable insights.
During our research we found two payment maturity models. They both are called Payments
Maturity Model (PMM) and created from the industry itself. The first one is designed by AITE
Group and ACI Worldwide (Atkinson, 2010) and is firstly introduced by Mackman & Sanders
(2009) and the second one by Dovetail Systems (Dovetail, 2012). In the next paragraphs we
explore these two models using the criteria`s of the Smart-Selector.
Table 5: Criteria to be met applied on the existing PMM, based on Van Looy A. , De Backer, Poels, & Snoeck (2013)
Table 5 gives an overview of these two models with the models on which they are based on
next to it to see how they meet the criteria that we have set up in in section 2.2.2. The model of
Mackman & Sanders (2009) is based on the Capability Maturity Model (CMM) (Swift, 2010). The
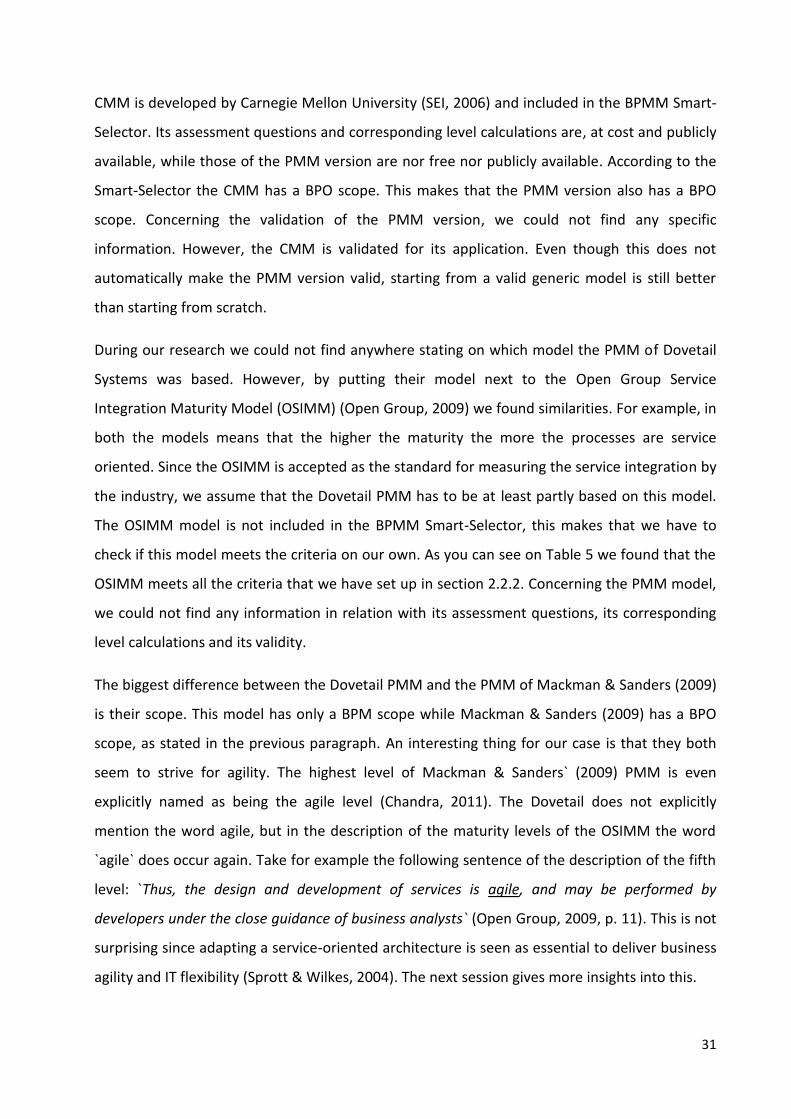
31
CMM is developed by Carnegie Mellon University (SEI, 2006) and included in the BPMM Smart-
Selector. Its assessment questions and corresponding level calculations are, at cost and publicly
available, while those of the PMM version are nor free nor publicly available. According to the
Smart-Selector the CMM has a BPO scope. This makes that the PMM version also has a BPO
scope. Concerning the validation of the PMM version, we could not find any specific
information. However, the CMM is validated for its application. Even though this does not
automatically make the PMM version valid, starting from a valid generic model is still better
than starting from scratch.
During our research we could not find anywhere stating on which model the PMM of Dovetail
Systems was based. However, by putting their model next to the Open Group Service
Integration Maturity Model (OSIMM) (Open Group, 2009) we found similarities. For example, in
both the models means that the higher the maturity the more the processes are service
oriented. Since the OSIMM is accepted as the standard for measuring the service integration by
the industry, we assume that the Dovetail PMM has to be at least partly based on this model.
The OSIMM model is not included in the BPMM Smart-Selector, this makes that we have to
check if this model meets the criteria on our own. As you can see on Table 5 we found that the
OSIMM meets all the criteria that we have set up in section 2.2.2. Concerning the PMM model,
we could not find any information in relation with its assessment questions, its corresponding
level calculations and its validity.
The biggest difference between the Dovetail PMM and the PMM of Mackman & Sanders (2009)
is their scope. This model has only a BPM scope while Mackman & Sanders (2009) has a BPO
scope, as stated in the previous paragraph. An interesting thing for our case is that they both
seem to strive for agility. The highest level of Mackman & Sanders` (2009) PMM is even
explicitly named as being the agile level (Chandra, 2011). The Dovetail does not explicitly
mention the word agile, but in the description of the maturity levels of the OSIMM the word
`agile` does occur again. Take for example the following sentence of the description of the fifth
level: `Thus, the design and development of services is agile, and may be performed by
developers under the close guidance of business analysts` (Open Group, 2009, p. 11). This is not
surprising since adapting a service-oriented architecture is seen as essential to deliver business
agility and IT flexibility (Sprott & Wilkes, 2004). The next session gives more insights into this.
32
2.3 Service Oriented Architecture Maturity Models
2.3.1 Service Orientation Architecture definition and terminology
During our research we found that there exist a variety of definitions for SOA. This finding is
confirmed by other researches on their journey to provide a synthesized definition such as
Abuosba & El-Sheikh (2008) and Ren & Lyytinen (2008). The former defines the SOA in a formal
way by using Unified Modeling Langua (UML) and setting up SOA building blocks in Z notation.
(a formal specification language). The later gives a more practical definition on attempting to
syntesise the existing definitions. In this thesis we use this defintion, since we want it to be
understandble regardless of the reader`s background.
The definition goes as follows: `Service-Oriented Architecture is primarily regarded as a
technical architecture consisting of tools and service specification to build loosely coupled
applications. At another level it is also a means to leverage flexibility and agility to system
services as it offers a hierarchical framework to coordinate simultaneous business process
design and implementations using loosely coupled service infrastructures` (Ren & Lyytinen,
2008, p. 75). This definition reassures us that SOA indeed has a high focus on IT and that it is
used to achieve flexibility and agility. Given Van Looy`s (2012, p. 6) definition of a maturity
model, we define a SOA maturity model as a tool to systematically assess and improve
capabilities or critical success factors to reach a service-oriented architecture.
To better understand this definition and how a SOA achieves flexibility and agility, we should
have a clear view on what `a service` and `loosely coupled` mean. A service can be explained in
a nutshell as anything that can perform a task (Sprott & Wilkes, 2004). Or more specifically, a
service can be seen as `a software component that can be accessed via the Internet and
provides clearly specified functions` (Hirschheim, Welke, & Schwarz, 2010, p. 42). Examples of
such services are for instance adding or modifying a name or address or purchasing an item.
A service or an application in a SOA environment can be consumed by different customers in
different ways, regardless of the way that it is produced by the underlying systems and
regardless of the architecture of these systems (Ren & Lyytinen, 2008). That is what we mean
with `loosely coupled`. The consumer is only concerned with what functionality the service
offers e.g. its behavior. The way a service is implemented is not relevant for the consumer and
33
therefore is treated as a `black box`. The production of a service and the consumption of it are
thus loosely coupled from each other.
We conclude by summarizing our findings in two points. One, since we don`t have to care about
the implementation, we can directly define a business requirement as a service instead of
having to translate business requirements into lower-level IT artifacts (Hirschheim, Welke, &
Schwarz, 2011). This automatically brings IT and business closer to each other and thus
increases the speed with which IT can respond to business needs. And two, since a service can
be used by different consumers internally as externally regardless of its implementation, there
can be achieved a flexible delivery of functionality. Both these conclusions lead to a more agile
organization (Hirschheim, Welke, & Schwarz, 2011).
2.3.2 Existing research on SOA Maturity Models
Throughout our research we found six different maturity models relating to SOA. Table 6 gives
an overview of these models and how they meet the criteria that we have set up in section
2.2.2. Remark that we did not include the criteria of having at least a BPM scope, since the BP,
BPM or BPO scope only relates to BPMMs. Regarding to the scope of a SOA maturity model, we
could examine if a model covers the technical as well as the organizational aspects, or only the
technical aspects. Since we are only interested in the technical aspects, and since this aspect
forms the basis of a SOA, it is obsolete to include this criterion in our research.
The first two models in the table are originated from the academic world. About the first one,
namely the Service-Oriented Architecture Maturity Model (SOAMM) (Hirschheim, Welke, &
Schwarz, 2011) we could not find much information. What we could find is that it fits at least
the purpose of raising awareness and that it is a modification of the CMM model to fit SOA
purposes. Thus we have only certainty of the fulfillment of the criterion of at least being usable
for raising awareness purposes. Concerning the second academic model, the Independent SOA
Maturity Model (iSOAMM) (Rathfelder & Groenda, 2008), we found that it also meets this
criterion. Moreover, we found that it is at least validated for its application through three case
studies (Rathfelder & Groenda, 2008). Regarding the fulfillment of the other criteria we again
could not find any reliable information.
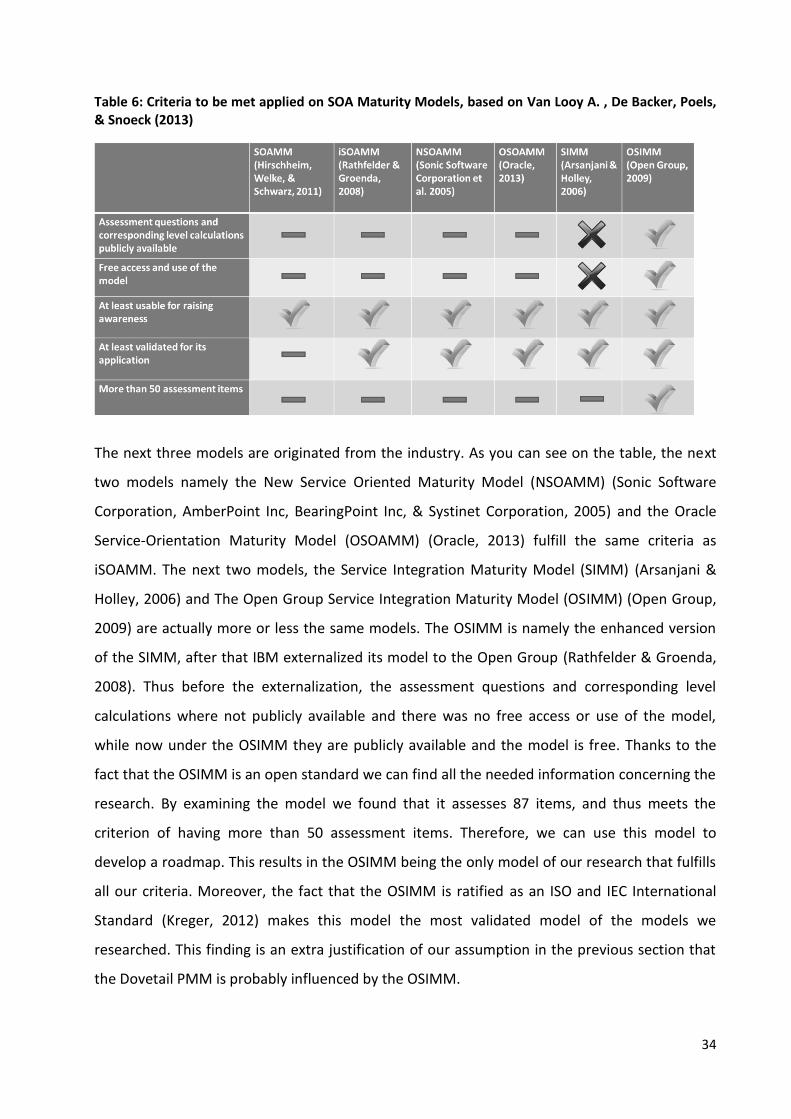
34
Table 6: Criteria to be met applied on SOA Maturity Models, based on Van Looy A. , De Backer, Poels, & Snoeck (2013)
The next three models are originated from the industry. As you can see on the table, the next
two models namely the New Service Oriented Maturity Model (NSOAMM) (Sonic Software
Corporation, AmberPoint Inc, BearingPoint Inc, & Systinet Corporation, 2005) and the Oracle
Service-Orientation Maturity Model (OSOAMM) (Oracle, 2013) fulfill the same criteria as
iSOAMM. The next two models, the Service Integration Maturity Model (SIMM) (Arsanjani &
Holley, 2006) and The Open Group Service Integration Maturity Model (OSIMM) (Open Group,
2009) are actually more or less the same models. The OSIMM is namely the enhanced version
of the SIMM, after that IBM externalized its model to the Open Group (Rathfelder & Groenda,
2008). Thus before the externalization, the assessment questions and corresponding level
calculations where not publicly available and there was no free access or use of the model,
while now under the OSIMM they are publicly available and the model is free. Thanks to the
fact that the OSIMM is an open standard we can find all the needed information concerning the
research. By examining the model we found that it assesses 87 items, and thus meets the
criterion of having more than 50 assessment items. Therefore, we can use this model to
develop a roadmap. This results in the OSIMM being the only model of our research that fulfills
all our criteria. Moreover, the fact that the OSIMM is ratified as an ISO and IEC International
Standard (Kreger, 2012) makes this model the most validated model of the models we
researched. This finding is an extra justification of our assumption in the previous section that
the Dovetail PMM is probably influenced by the OSIMM.
35
To conclude, we remind that the high IT focus of the SOA models is relevant to our case, since
we found in section 1.3 that IT is essential for executing the payment processes. Moreover, we
found that the OSIMM is the only founded SOA model that meets all our criteria. Therefore,
assuming that we use Hammer`s model as a starting point, we could integrate the OSIMM in
Hammer`s framework. In this way we could capture the importance of IT and the processes in
one model. Even though we recognized that SOA automatically brings IT and business closer to
each other we still further research how we can capture and measure the business and IT
alignment in the next section. In this way we`ll have a strong foundation for the design of our
maturity model for payment processes.
2.4 Business-IT Alignment
2.4.1 Business-IT alignment definition and terminology
In consonance with section 2.2.1 and 2.3.1 we start by first giving a clear definition of Business-
IT alignment. Here we use the definition of Maes et al. (2000) as their definition is formed as a
result of a study of definitions that are used in different Business-IT alignment frameworks.
They define business-IT alignment as `the continuous process, involving management and
design sub-processes, of consciously and coherently interrelating all components of the
business-IT relationship in order to contribute to the organization`s performance over time`
(Maes, Rijsenbrij, Truijens, & Goedvolk, 2000, p. 19).
Even though this definition implies managerial and design processes, most of the literature on
business-IT alignment deals with strategic alignment and thus with the managerial processes
(Maes, Rijsenbrij, Truijens, & Goedvolk, 2000). Henderson & Venkatraman`s (1993) framework
for strategic alignment can be seen as the theoretical foundation for the further research on
business-IT alignment. Their work is one of the most cited on Google Scholars, with in total
2765 times cited. In the next paragraph we outline this framework in order to get more insight
into the business-IT alignment terminology.
Henderson & Venkatraman (1993) argued that the lack of business-IT alignment is at least
partly the reason why the increased role of IT in organizations did not bring much evidence of
increased productivity at an aggregate level of the economy. Their concept of strategic
alignment is based on the two building blocks: strategic fit and functional integration. The first
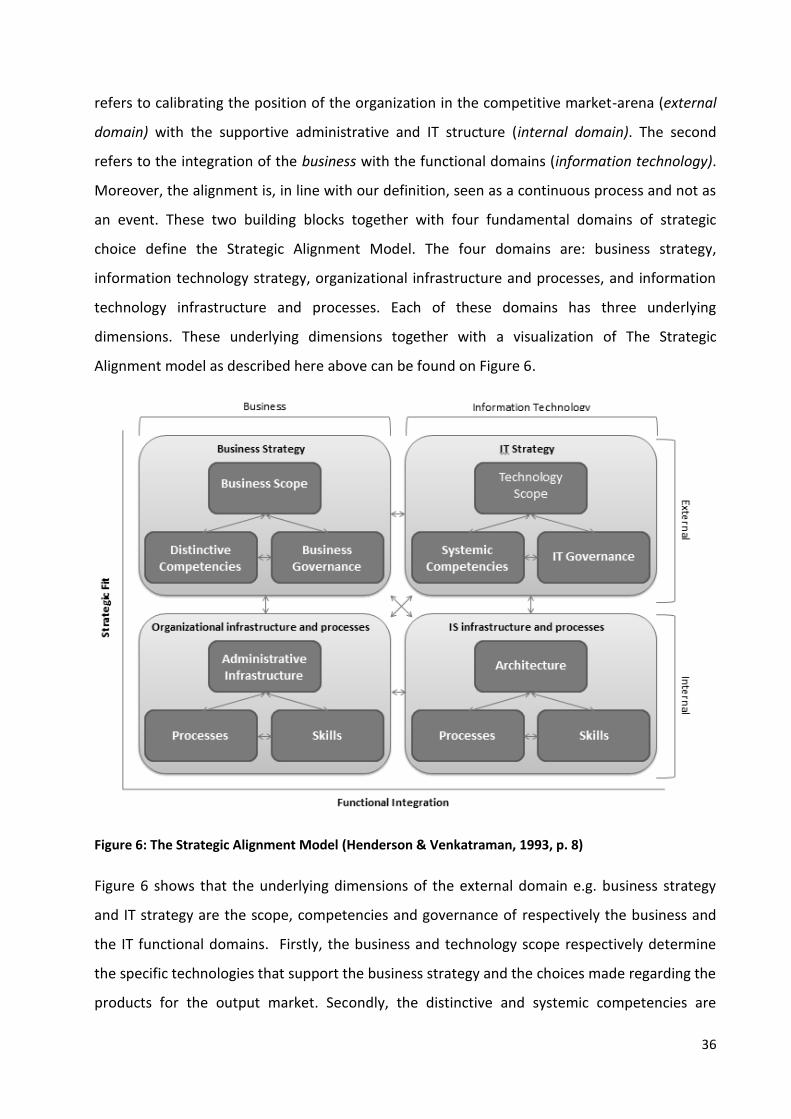
36
refers to calibrating the position of the organization in the competitive market-arena (external
domain) with the supportive administrative and IT structure (internal domain). The second
refers to the integration of the business with the functional domains (information technology).
Moreover, the alignment is, in line with our definition, seen as a continuous process and not as
an event. These two building blocks together with four fundamental domains of strategic
choice define the Strategic Alignment Model. The four domains are: business strategy,
information technology strategy, organizational infrastructure and processes, and information
technology infrastructure and processes. Each of these domains has three underlying
dimensions. These underlying dimensions together with a visualization of The Strategic
Alignment model as described here above can be found on Figure 6.
Figure 6: The Strategic Alignment Model (Henderson & Venkatraman, 1993, p. 8)
Figure 6 shows that the underlying dimensions of the external domain e.g. business strategy
and IT strategy are the scope, competencies and governance of respectively the business and
the IT functional domains. Firstly, the business and technology scope respectively determine
the specific technologies that support the business strategy and the choices made regarding the
products for the output market. Secondly, the distinctive and systemic competencies are
37
respectively those attributes of strategy that contribute to a comparative advantage and those
attributes of IT strategy that support the business strategy. Lastly, the business and IT
governance respectively involve respectively make-versus-buy choices and the selection and
use of mechanisms for obtaining the required IT competencies.
Similarly, the underlying dimensions of the internal domain e.g. the infrastructure and
processes of the organization and information system (IS) are the infrastructure of architecture,
the processes and the skills of respectively the business and IT functional domains. Firstly, the
administrative infrastructure deals with the structures concerning roles, responsibilities and
authority. The IT architecture stands for the portfolio of all the applications, software, hardware
etc. that define the IT infrastructure. Secondly, the business processes make it possible to
perform the business strategy. Analogously, the IS processes make it possible to perform the
activities such as systems development, maintenance, monitoring and control. Lastly, skills
stand for the acquisition of the knowledge, and training and development needed for the
individuals, in order to achieve a good performance of the organizational and IS processes.
To conclude we describe how the BPMM capability areas from section 2.2.1 relate to the
framework of Henderson & Venkatraman (1993). During our examination of the funnel
structure as described in Figure 4 and the framework on Figure 6, we noticed three things. First
is that that the BPMM capability areas relate only to the left side of the framework on Figure 6.
This makes sense since the BPMMs relate only to business processes. Second is that the
capability areas modelling, deployment, management and optimizing fit best in `Organizational
Infrastructure and Processes` domain of the framework on Figure 6. It is namely the underlying
dimensions of this domain that deal with modelling, deploying, managing and optimizing the
processes. Furthermore, the capability areas structure and culture fit best in the domain of
`Business Strategy` since they are both what the outside world sees and also have a big
influence on the internal domain. Third is that in the framework of Henderson & Venkatraman
(1993) cannot be find a funnel structure like with the capability areas on Figure 4. This means
that the external domain does not imply anything about the internal domain. This makes sense,
since one of the objectives of this framework is to show that there should be a strategic fit, thus
that these two domains fit to each other.
38
2.4.2 Existing research on business-IT alignment
After having introduced the main concepts and terminology of business-IT alignment using
Henderson & Venkatraman (1993) framework, we now research existing business-IT alignment
maturity models that we could use for our payment maturity model. Contrary to section 2.2.2,
here could not be found any tool which guides us through all the existing business-IT alignment
models. Therefore, we started our research looking for models that have as basic the
framework described in 2.3.1.
During our research we found Luftman`s (2000) Strategic Alignment Model (SAM). This model is
directly related with the framework of Henderson & Venkatraman (1993), as they both use the
same 12 underlying dimension as building blocks. Furthermore, we found that this model is
relatively good validated (Belfo & Sousa, 2012). Even though we also found authors arguing
that there does not exist any real validated instrument for measuring alignment (Sledgianowski,
Luftman, & Reilly, 2006). Moreover, we found that this model has conceptual and practical
value in the financial services industry (Avison, Jones, Powell, & Wilson, 2004). This is relevant
to our research as most of the PSP`s are part of this industry.
In our attempt to find a way through all the existing business-IT literature, we found Belfo &
Sousa`s (2012) study. They made a comparison of the six most cited business-IT alignment
models on google scholars with Luftman`s SAM. More specific, they compared which of the six
dimensions of the SAM have also been measured by the other models. These six dimensions or
six maturity criteria are the following: communications, competency/value measurements,
governance, partnership, scope and architecture and skills (Luftman J. , 2000).
Even though it may seem subjective to compare other models to the SAM, we still find it useful.
The reason is that we would like our model to measure all the facets of business-IT alignment,
or in other words to have content validity. This view is shared by Straub et al. (2004), who
highly recommended every measurement tool in IS research to possess content validity. It is in
this aspect that Luftman et al. (1999) have done important research. Namely, the SAM is
preceded by a multi-year study of five years (1992-1997) of 500 companies US Fortune 1000
companies, representing 15 different industries. This study aimed to identify the enablers and
inhibitors that support or hinder the alignment using statistical generalization. As a result, we
can say the SAM, using the six dimensions as building blocks, represents good content validity.
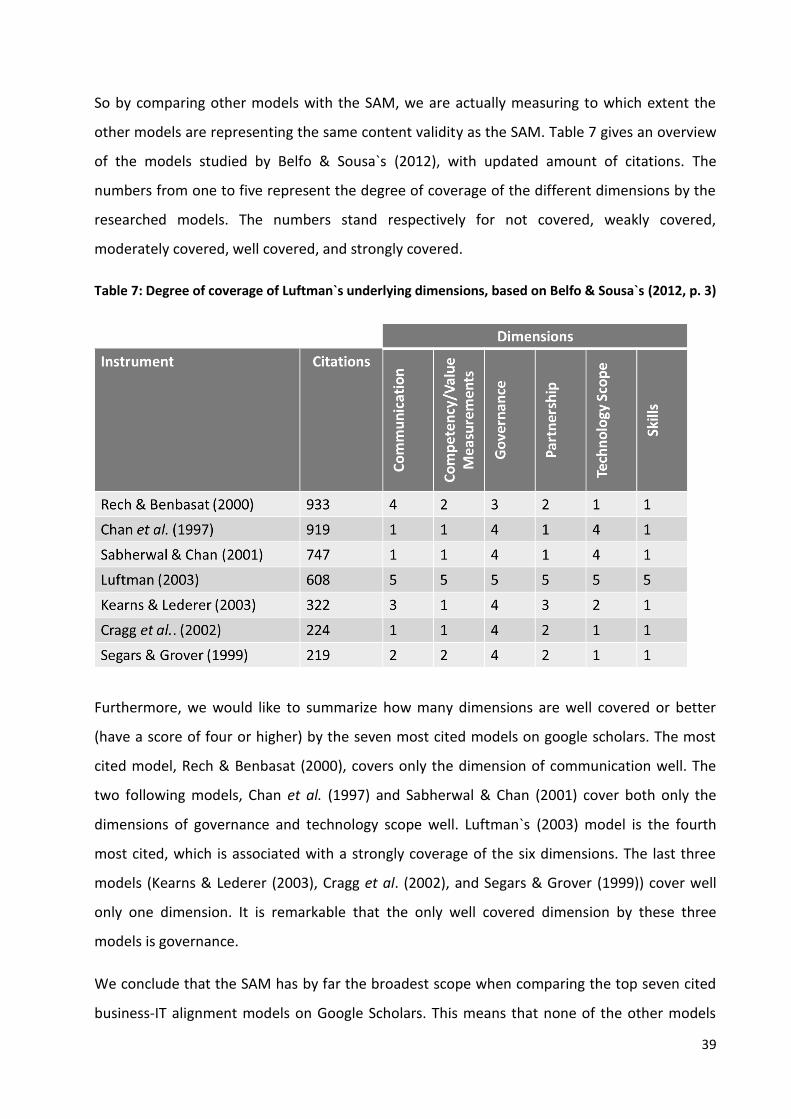
39
So by comparing other models with the SAM, we are actually measuring to which extent the
other models are representing the same content validity as the SAM. Table 7 gives an overview
of the models studied by Belfo & Sousa`s (2012), with updated amount of citations. The
numbers from one to five represent the degree of coverage of the different dimensions by the
researched models. The numbers stand respectively for not covered, weakly covered,
moderately covered, well covered, and strongly covered.
Table 7: Degree of coverage of Luftman`s underlying dimensions, based on Belfo & Sousa`s (2012, p. 3)
Furthermore, we would like to summarize how many dimensions are well covered or better
(have a score of four or higher) by the seven most cited models on google scholars. The most
cited model, Rech & Benbasat (2000), covers only the dimension of communication well. The
two following models, Chan et al. (1997) and Sabherwal & Chan (2001) cover both only the
dimensions of governance and technology scope well. Luftman`s (2003) model is the fourth
most cited, which is associated with a strongly coverage of the six dimensions. The last three
models (Kearns & Lederer (2003), Cragg et al. (2002), and Segars & Grover (1999)) cover well
only one dimension. It is remarkable that the only well covered dimension by these three
models is governance.
We conclude that the SAM has by far the broadest scope when comparing the top seven cited
business-IT alignment models on Google Scholars. This means that none of the other models
40
reaches the same content validity as the SAM. Therefore, to have a strong foundation for the
design of our payment maturity model we could use Luftman`s model to investigate how much
the business-IT alignment maturity is covered by our model.
2.5 Conclusion
In this chapter, we examined the possible maturity models that could serve as a tool to assess
the progression of a PSP to move to a stage in which it can deal with the implications of the
payment landscape. More specifically, we discussed BPMMs, SOA and business-IT alignment
models. The justification of using such models to move to the desired stage (by improving the
payment processes) is outlined in the next paragraphs.
First, the payment processes can only be improved if they are fully known. Only then the PSP
can move on to improving and optimizing them. Moreover, this improvement can be
encouraged or discouraged depending on the organization`s culture and structure. As discussed
in section 2.2.1 a BPMM measures exactly these components. Namely Van Looy`s (2012)
definition states that a BPMM measures the ability to model, deploy, manage and optimize
processes, including the influence of the culture and structure of the organization.
Secondly, since the payment processes highly rely on IT as we noticed in section 1.3, they can
only be improved if the supporting IT is also being improved. Furthermore, the improvement of
the processes should make the payment processes more flexible as we found in section 1.5.
That is in line with bringing a more SOA to the organization. SOA, has namely a strong focus on
IT and leads to agility by ensuring a flexible delivery of functionality (e.g. services)
To conclude, the organization`s IT and business have to be aligned otherwise this action is
doomed to fail. This argumentation is in line with Henderson & Venkatraman`s (1993)
framework, which states that there has to be a functional integration in the internal domain of
the business-IT alignment. Henderson & Venkatraman`s (1993) also advocated that an
organization should aim a strategic fit between the internal and external domain. Indeed,
having improved payment processes that are fully supported by the organization`s IT is
worthless if it does not permit to realize the organization`s strategy.
41
Part II: Design Phase
After having thoroughly examined the payment industry, its challenges and possible solutions
we concluded that a maturity model could help this industry meet its challenges. Then we
researched the theory behind these models and discussed some existing models. Based on this
research done in the pre-design phase, we now start designing a maturity model for the
payment processes.
The design phase part consists out of three chapters. First, in chapter 3 we build the initial
model, based on our pre-design research. Then, in chapter 4 we empirically validate our model
through an in-depth interview with Francis Chlarie and modify the model where necessary. In
addition, we further empirically validate our model through two in-depth interviews with two
other payment experts who are independent from Belpay. Since there are bank and nonbank
PSPs, we have chosen to interview one expert which is part of a bank PSP and one being part of
a nonbank PSP. To conclude, we validate our model one last time by another in-depth interview
with Francis Chlarie.
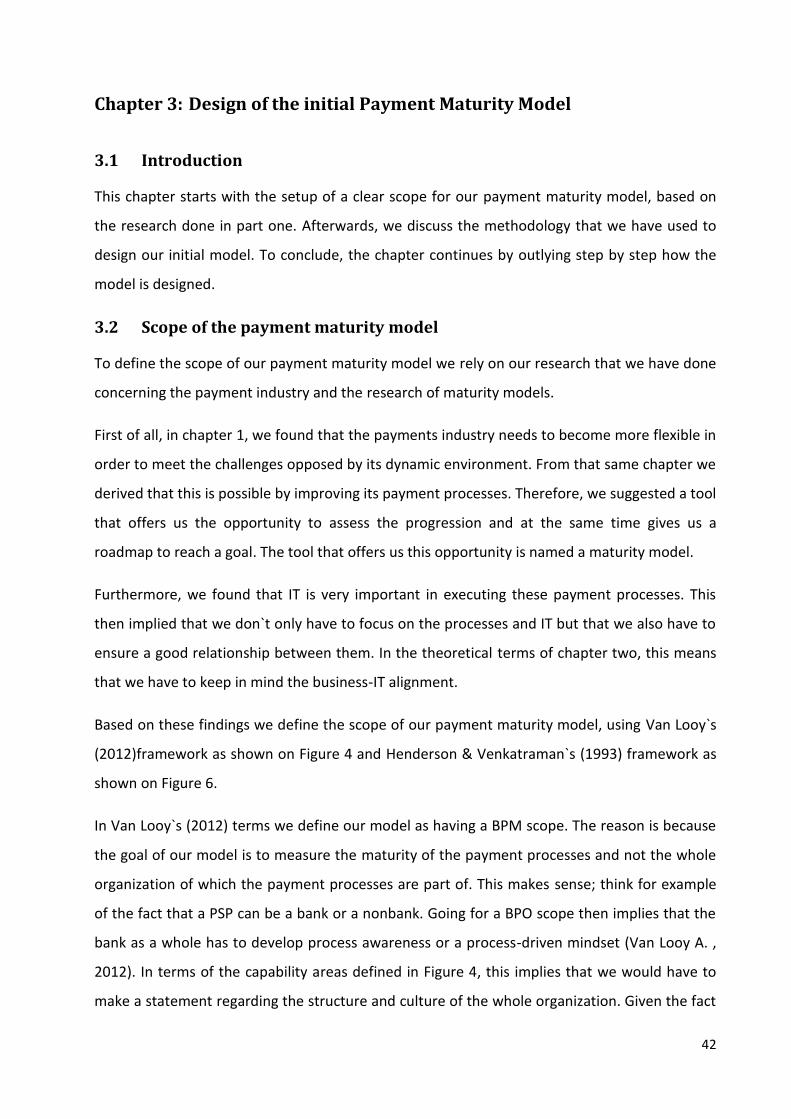
42
Chapter 3: Design of the initial Payment Maturity Model
3.1 Introduction
This chapter starts with the setup of a clear scope for our payment maturity model, based on
the research done in part one. Afterwards, we discuss the methodology that we have used to
design our initial model. To conclude, the chapter continues by outlying step by step how the
model is designed.
3.2 Scope of the payment maturity model
To define the scope of our payment maturity model we rely on our research that we have done
concerning the payment industry and the research of maturity models.
First of all, in chapter 1, we found that the payments industry needs to become more flexible in
order to meet the challenges opposed by its dynamic environment. From that same chapter we
derived that this is possible by improving its payment processes. Therefore, we suggested a tool
that offers us the opportunity to assess the progression and at the same time gives us a
roadmap to reach a goal. The tool that offers us this opportunity is named a maturity model.
Furthermore, we found that IT is very important in executing these payment processes. This
then implied that we don`t only have to focus on the processes and IT but that we also have to
ensure a good relationship between them. In the theoretical terms of chapter two, this means
that we have to keep in mind the business-IT alignment.
Based on these findings we define the scope of our payment maturity model, using Van Looy`s
(2012)framework as shown on Figure 4 and Henderson & Venkatraman`s (1993) framework as
shown on Figure 6.
In Van Looy`s (2012) terms we define our model as having a BPM scope. The reason is because
the goal of our model is to measure the maturity of the payment processes and not the whole
organization of which the payment processes are part of. This makes sense; think for example
of the fact that a PSP can be a bank or a nonbank. Going for a BPO scope then implies that the
bank as a whole has to develop process awareness or a process-driven mindset (Van Looy A. ,
2012). In terms of the capability areas defined in Figure 4, this implies that we would have to
make a statement regarding the structure and culture of the whole organization. Given the fact
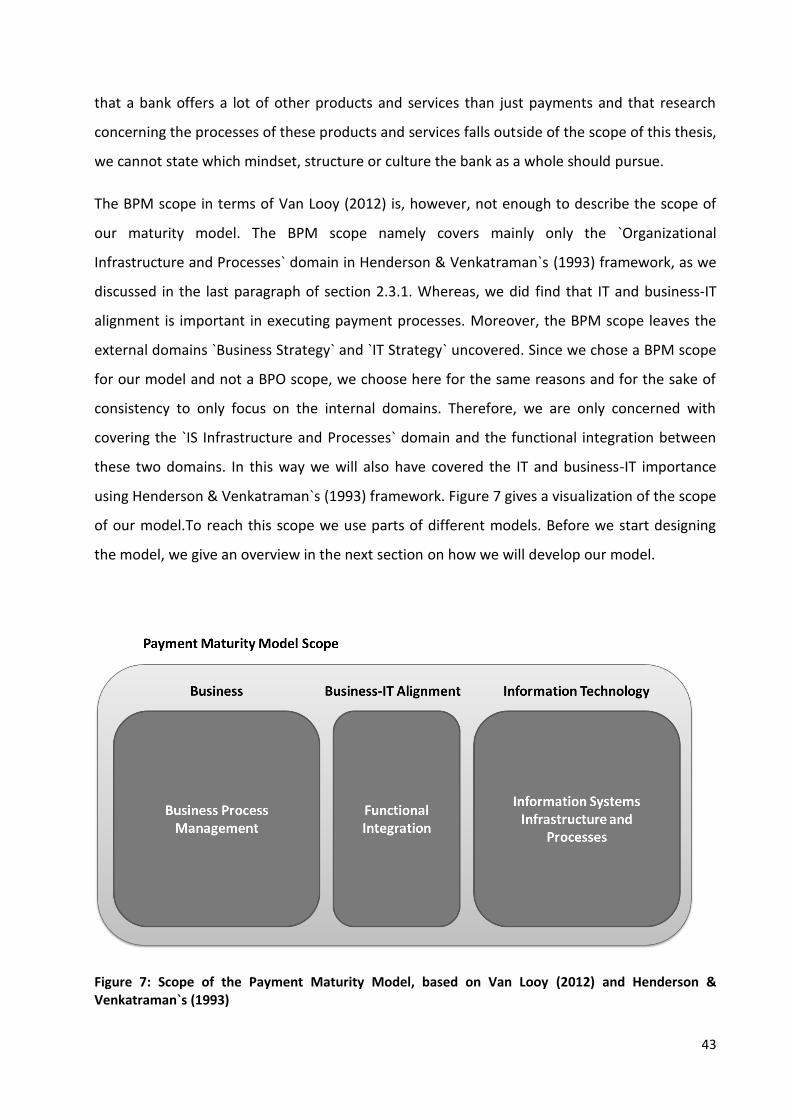
43
that a bank offers a lot of other products and services than just payments and that research
concerning the processes of these products and services falls outside of the scope of this thesis,
we cannot state which mindset, structure or culture the bank as a whole should pursue.
The BPM scope in terms of Van Looy (2012) is, however, not enough to describe the scope of
our maturity model. The BPM scope namely covers mainly only the `Organizational
Infrastructure and Processes` domain in Henderson & Venkatraman`s (1993) framework, as we
discussed in the last paragraph of section 2.3.1. Whereas, we did find that IT and business-IT
alignment is important in executing payment processes. Moreover, the BPM scope leaves the
external domains `Business Strategy` and `IT Strategy` uncovered. Since we chose a BPM scope
for our model and not a BPO scope, we choose here for the same reasons and for the sake of
consistency to only focus on the internal domains. Therefore, we are only concerned with
covering the `IS Infrastructure and Processes` domain and the functional integration between
these two domains. In this way we will also have covered the IT and business-IT importance
using Henderson & Venkatraman`s (1993) framework. Figure 7 gives a visualization of the scope
of our model.To reach this scope we use parts of different models. Before we start designing
the model, we give an overview in the next section on how we will develop our model.
Figure 7: Scope of the Payment Maturity Model, based on Van Looy (2012) and Henderson & Venkatraman`s (1993)
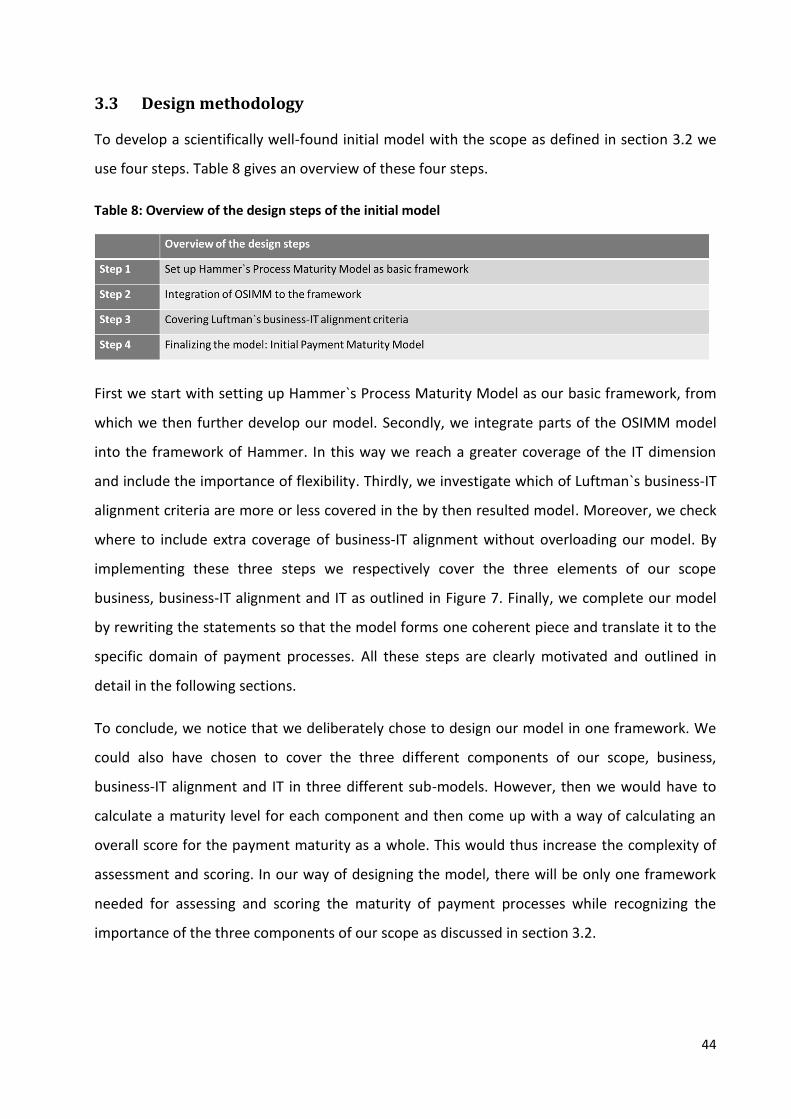
44
3.3 Design methodology
To develop a scientifically well-found initial model with the scope as defined in section 3.2 we
use four steps. Table 8 gives an overview of these four steps.
Table 8: Overview of the design steps of the initial model
First we start with setting up Hammer`s Process Maturity Model as our basic framework, from
which we then further develop our model. Secondly, we integrate parts of the OSIMM model
into the framework of Hammer. In this way we reach a greater coverage of the IT dimension
and include the importance of flexibility. Thirdly, we investigate which of Luftman`s business-IT
alignment criteria are more or less covered in the by then resulted model. Moreover, we check
where to include extra coverage of business-IT alignment without overloading our model. By
implementing these three steps we respectively cover the three elements of our scope
business, business-IT alignment and IT as outlined in Figure 7. Finally, we complete our model
by rewriting the statements so that the model forms one coherent piece and translate it to the
specific domain of payment processes. All these steps are clearly motivated and outlined in
detail in the following sections.
To conclude, we notice that we deliberately chose to design our model in one framework. We
could also have chosen to cover the three different components of our scope, business,
business-IT alignment and IT in three different sub-models. However, then we would have to
calculate a maturity level for each component and then come up with a way of calculating an
overall score for the payment maturity as a whole. This would thus increase the complexity of
assessment and scoring. In our way of designing the model, there will be only one framework
needed for assessing and scoring the maturity of payment processes while recognizing the
importance of the three components of our scope as discussed in section 3.2.
45
3.4 Set up Hammer`s Process Maturity Model as basic framework
In section 2.2.2 we set up some criteria to find ourselves a way out through the existing generic
BPMMs. This resulted in the Hammer`s PEMM (2007). We noticed that this model has a BPO
scope and that it can be easily reduced to a BPM scope by leaving out the Enterprise Maturity
Model and thus only using the Process Maturity Model. We further found, that even the
Process Maturity Model on its own meets all the criteria that we have set up in section 2.2.2.
Therefore, we choose this model as a starting point to develop our payment maturity model.
Table 9 gives an overview of the Hammer`s PEMM split up in the two sub-models.
Table 9: Hammer`s Process Enablers and Enterprise Capabilities (Hammer, 2007, p. 113).
Hammer`s PEMM has five maturity levels starting from zero to four, with zero being the ad hoc
level. In the model it is assumed that if a process enabler or enterprise capability does not fulfill
the conditions of level one, it is automatically situated in level zero (Hammer, 2007). That is
why level zero is not explicitly included in the model. Since we are only interested in the
Process Maturity sub-model, we further discuss only the Process Maturity Levels. Figure 8 gives
an overview of these five levels together with their definitions.
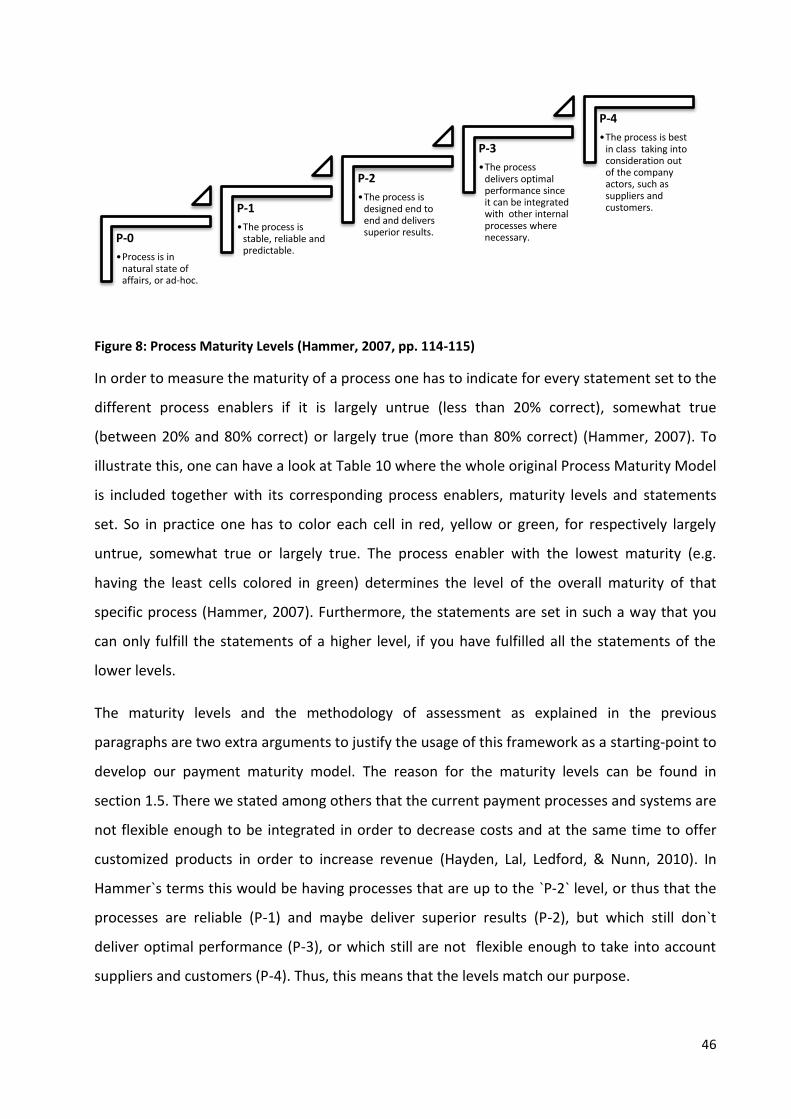
46
Figure 8: Process Maturity Levels (Hammer, 2007, pp. 114-115)
In order to measure the maturity of a process one has to indicate for every statement set to the
different process enablers if it is largely untrue (less than 20% correct), somewhat true
(between 20% and 80% correct) or largely true (more than 80% correct) (Hammer, 2007). To
illustrate this, one can have a look at Table 10 where the whole original Process Maturity Model
is included together with its corresponding process enablers, maturity levels and statements
set. So in practice one has to color each cell in red, yellow or green, for respectively largely
untrue, somewhat true or largely true. The process enabler with the lowest maturity (e.g.
having the least cells colored in green) determines the level of the overall maturity of that
specific process (Hammer, 2007). Furthermore, the statements are set in such a way that you
can only fulfill the statements of a higher level, if you have fulfilled all the statements of the
lower levels.
The maturity levels and the methodology of assessment as explained in the previous
paragraphs are two extra arguments to justify the usage of this framework as a starting-point to
develop our payment maturity model. The reason for the maturity levels can be found in
section 1.5. There we stated among others that the current payment processes and systems are
not flexible enough to be integrated in order to decrease costs and at the same time to offer
customized products in order to increase revenue (Hayden, Lal, Ledford, & Nunn, 2010). In
Hammer`s terms this would be having processes that are up to the `P-2` level, or thus that the
processes are reliable (P-1) and maybe deliver superior results (P-2), but which still don`t
deliver optimal performance (P-3), or which still are not flexible enough to take into account
suppliers and customers (P-4). Thus, this means that the levels match our purpose.
P-0
•Process is in natural state of affairs, or ad-hoc.
P-1
•The process is stable, reliable and predictable.
P-2
•The process is designed end to end and delivers superior results.
P-3
•The process delivers optimal performance since it can be integrated with other internal processes where necessary.
P-4
•The process is best in class taking into consideration out of the company actors, such as suppliers and customers.

47
The reason for the assessment methodology can be found in that fact that this methodology
can also be used for assessing multiple processes at once. This is interesting for our case, since
we would like to know the maturity of the payment processes as a whole. The assessment of a
set of processes can be performed in a similar way as when assessing one specific process.
Only, when assessing a set of processes, the statements largely untrue, somewhat true, and
largely true get one dimension more. Namely, a specific statement is then for instance largely
true because the statement is at least for 80% correct for at least 80% of the payment
processes.
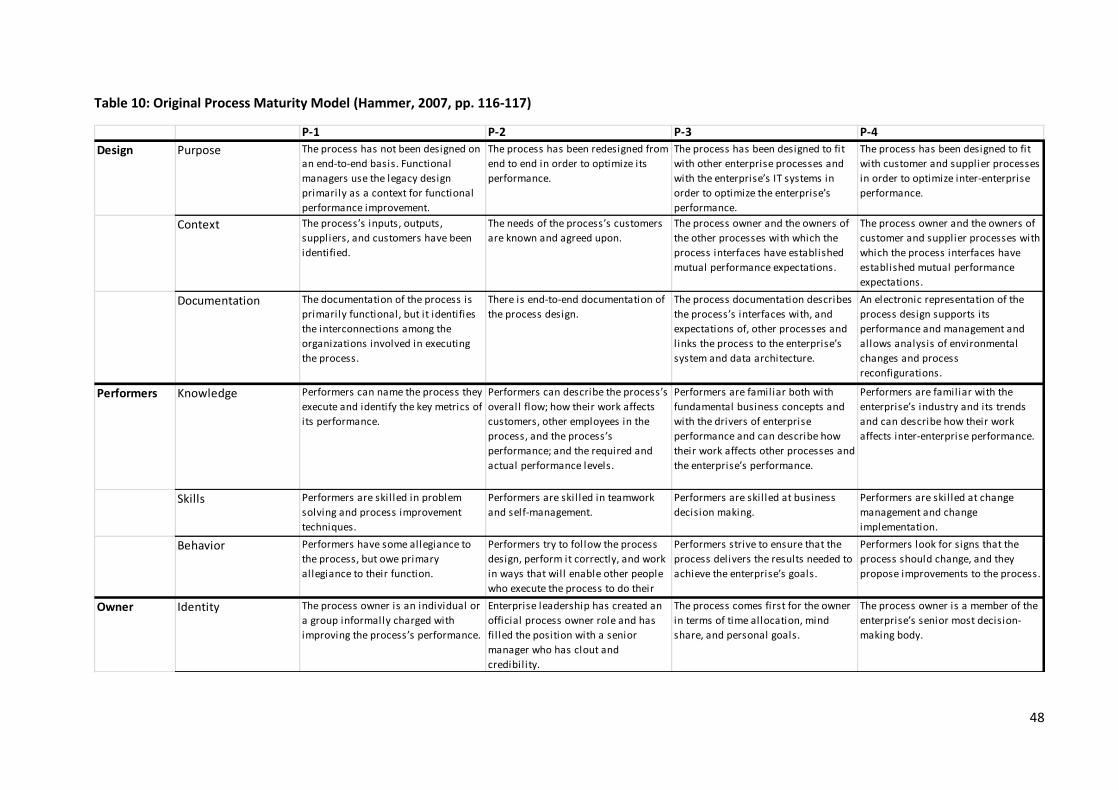
48
Table 10: Original Process Maturity Model (Hammer, 2007, pp. 116-117)
P-1 P-2 P-3 P-4
Design Purpose The process has not been designed on
an end-to-end basis. Functional
managers use the legacy design
primarily as a context for functional
performance improvement.
The process has been redesigned from
end to end in order to optimize its
performance.
The process has been designed to fit
with other enterprise processes and
with the enterprise’s IT systems in
order to optimize the enterprise’s
performance.
The process has been designed to fit
with customer and supplier processes
in order to optimize inter-enterprise
performance.
Context The process’s inputs, outputs,
suppliers, and customers have been
identified.
The needs of the process’s customers
are known and agreed upon.
The process owner and the owners of
the other processes with which the
process interfaces have established
mutual performance expectations.
The process owner and the owners of
customer and supplier processes with
which the process interfaces have
established mutual performance
expectations.
Documentation The documentation of the process is
primarily functional, but it identifies
the interconnections among the
organizations involved in executing
the process.
There is end-to-end documentation of
the process design.
The process documentation describes
the process’s interfaces with, and
expectations of, other processes and
l inks the process to the enterprise’s
system and data architecture.
An electronic representation of the
process design supports its
performance and management and
allows analysis of environmental
changes and process
reconfigurations.
Performers Knowledge Performers can name the process they
execute and identify the key metrics of
its performance.
Performers can describe the process’s
overall flow; how their work affects
customers, other employees in the
process, and the process’s
performance; and the required and
actual performance levels.
Performers are familiar both with
fundamental business concepts and
with the drivers of enterprise
performance and can describe how
their work affects other processes and
the enterprise’s performance.
Performers are familiar with the
enterprise’s industry and its trends
and can describe how their work
affects inter-enterprise performance.
Skills Performers are skil led in problem
solving and process improvement
techniques.
Performers are skil led in teamwork
and self-management.
Performers are skil led at business
decision making.
Performers are skil led at change
management and change
implementation.
Behavior Performers have some allegiance to
the process, but owe primary
allegiance to their function.
Performers try to follow the process
design, perform it correctly, and work
in ways that will enable other people
who execute the process to do their
work effectively.
Performers strive to ensure that the
process delivers the results needed to
achieve the enterprise’s goals.
Performers look for signs that the
process should change, and they
propose improvements to the process.
Owner Identity The process owner is an individual or
a group informally charged with
improving the process’s performance.
Enterprise leadership has created an
official process owner role and has
fi l led the position with a senior
manager who has clout and
credibility.
The process comes first for the owner
in terms of time allocation, mind
share, and personal goals.
The process owner is a member of the
enterprise’s senior most decision-
making body.
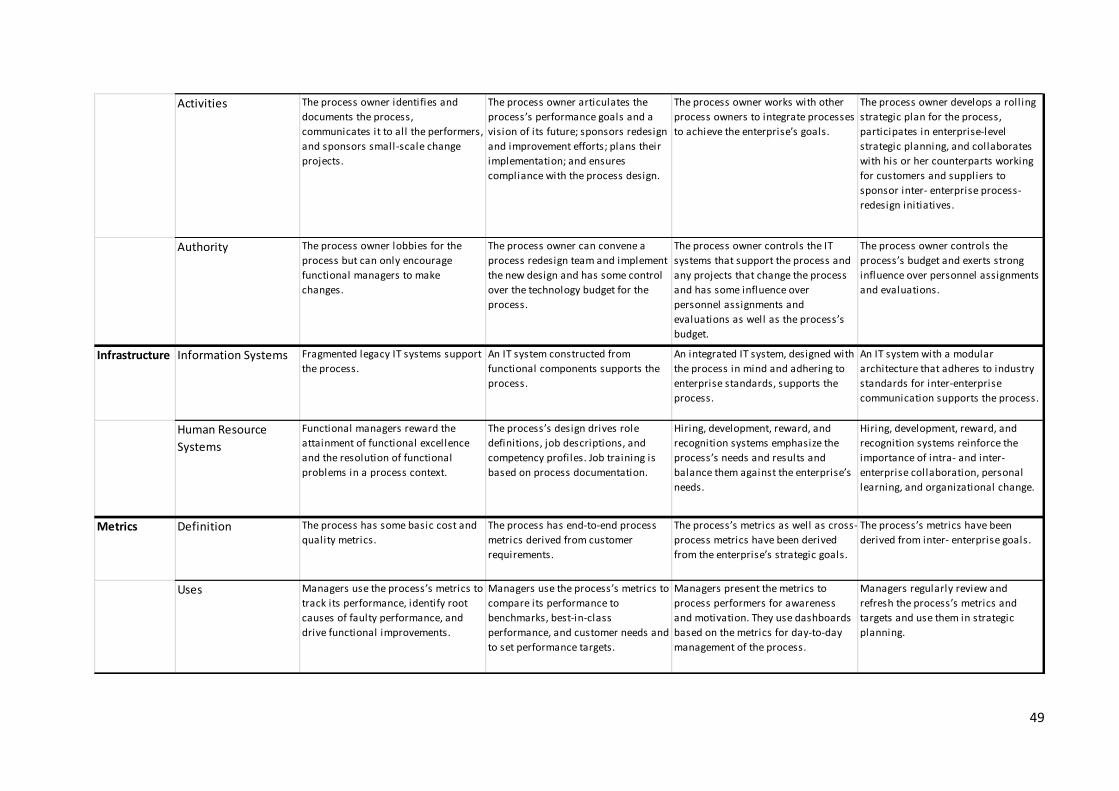
49
Activities The process owner identifies and
documents the process,
communicates it to all the performers,
and sponsors small-scale change
projects.
The process owner articulates the
process’s performance goals and a
vision of its future; sponsors redesign
and improvement efforts; plans their
implementation; and ensures
compliance with the process design.
The process owner works with other
process owners to integrate processes
to achieve the enterprise’s goals.
The process owner develops a rolling
strategic plan for the process,
participates in enterprise-level
strategic planning, and collaborates
with his or her counterparts working
for customers and suppliers to
sponsor inter- enterprise process-
redesign initiatives.
Authority The process owner lobbies for the
process but can only encourage
functional managers to make
changes.
The process owner can convene a
process redesign team and implement
the new design and has some control
over the technology budget for the
process.
The process owner controls the IT
systems that support the process and
any projects that change the process
and has some influence over
personnel assignments and
evaluations as well as the process’s
budget.
The process owner controls the
process’s budget and exerts strong
influence over personnel assignments
and evaluations.
Infrastructure Information Systems Fragmented legacy IT systems support
the process.
An IT system constructed from
functional components supports the
process.
An integrated IT system, designed with
the process in mind and adhering to
enterprise standards, supports the
process.
An IT system with a modular
architecture that adheres to industry
standards for inter-enterprise
communication supports the process.
Human Resource
Systems
Functional managers reward the
attainment of functional excellence
and the resolution of functional
problems in a process context.
The process’s design drives role
definitions, job descriptions, and
competency profiles. Job training is
based on process documentation.
Hiring, development, reward, and
recognition systems emphasize the
process’s needs and results and
balance them against the enterprise’s
needs.
Hiring, development, reward, and
recognition systems reinforce the
importance of intra- and inter-
enterprise collaboration, personal
learning, and organizational change.
Metrics Definition The process has some basic cost and
quality metrics.
The process has end-to-end process
metrics derived from customer
requirements.
The process’s metrics as well as cross-
process metrics have been derived
from the enterprise’s strategic goals.
The process’s metrics have been
derived from inter- enterprise goals.
Uses Managers use the process’s metrics to
track its performance, identify root
causes of faulty performance, and
drive functional improvements.
Managers use the process’s metrics to
compare its performance to
benchmarks, best-in-class
performance, and customer needs and
to set performance targets.
Managers present the metrics to
process performers for awareness
and motivation. They use dashboards
based on the metrics for day-to-day
management of the process.
Managers regularly review and
refresh the process’s metrics and
targets and use them in strategic
planning.
50
As mentioned before, this framework has a BPM scope, and thus covers the business aspect of
our scope. Even though the model does include a small coverage of IT, since it includes the sub-
enabler `Information Systems`, the model still remains primarily a business process maturity
model. Therefore, the business-IT alignment and the IT aspect remain mainly uncovered. Hence
we`ll need to make some modifications to our basic framework. In the following section, we
make the necessary modifications in order to increase the coverage of the IT aspect.
3.5 Integration of OSIMM to the framework
To include a higher coverage of the IT dimension and to add a more explicit measurement for
agility we integrate parts of the OSIMM model into the basic framework that we have chosen in
section 3.2. Our research in section 2.3 justifies this choice, as we found that a SOA maturity
model does include the measurement of agility while covering the IT dimension. Our choice to
specifically use the OSIMM is also based on our research in section 2.3. The OSIMM is namely
recognized as the standard for the measurement of SOA maturity. Furthermore, it fulfills all the
criteria that we have set up in that same section.
To set out the execution of this integration we start with an overview of the OSIMM maturity
levels. Moreover, we motivate which levels we integrate in our model and how we do this.
Furthermore, we give an overview of which dimensions the OSIMM covers, which parts we
integrate to our model and why we choose those specific dimensions.
Figure 9 gives an overview of the seven maturity levels of the OSIMM. The first three levels are
referred to as the `Service Foundation Levels` by the Open Group (2009), hence only the
remaining four levels really consider services. According to the OSIMM, an organization already
reaches agility on the fifth level `Composite Services`. The agility of the preceding level is
limited. The reason is that the definition of services and flow of control within a composite
application are written using a customized code instead of a declarative flow language. The
sixth level is more agile thanks to the façade (the service consumer namely calls on a service
through a `virtual service` and not directly), which makes the services even more loosely
coupled form the infrastructure. The difference between the seventh and sixth level is that the
business process assembly in the sixth level is performed at design time while in the seventh
level it can be performed at runtime.
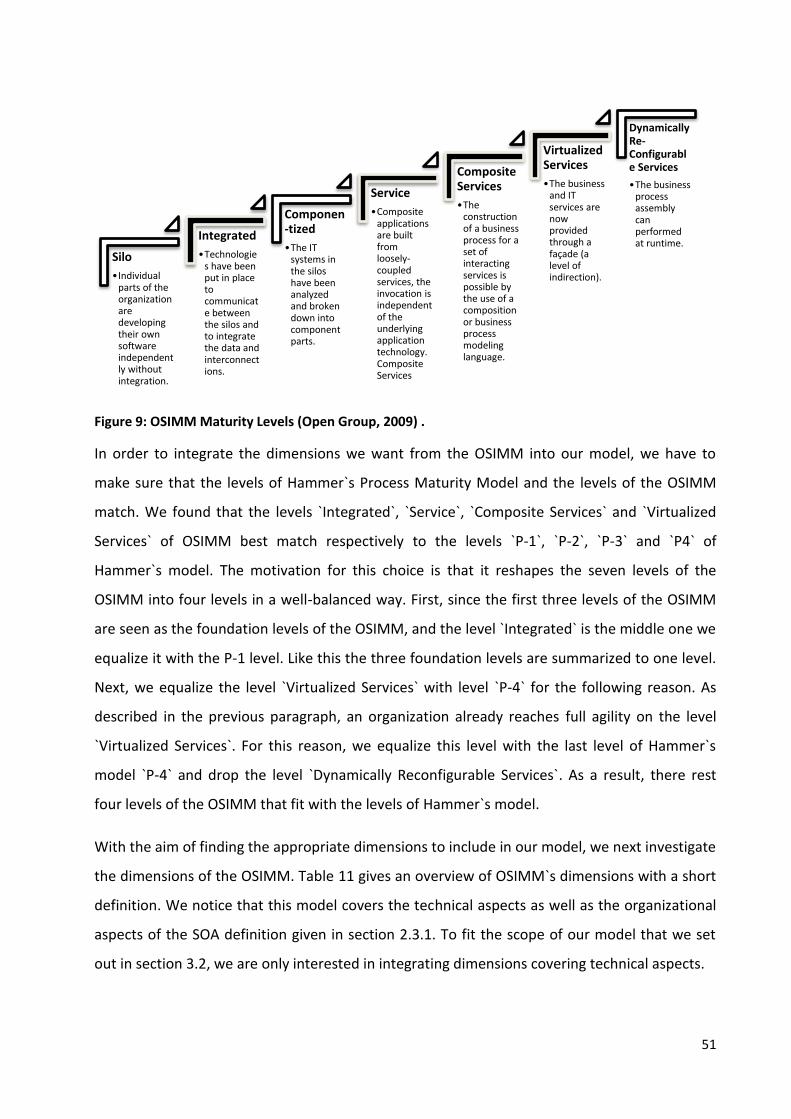
51
Figure 9: OSIMM Maturity Levels (Open Group, 2009) .
In order to integrate the dimensions we want from the OSIMM into our model, we have to
make sure that the levels of Hammer`s Process Maturity Model and the levels of the OSIMM
match. We found that the levels `Integrated`, `Service`, `Composite Services` and `Virtualized
Services` of OSIMM best match respectively to the levels `P-1`, `P-2`, `P-3` and `P4` of
Hammer`s model. The motivation for this choice is that it reshapes the seven levels of the
OSIMM into four levels in a well-balanced way. First, since the first three levels of the OSIMM
are seen as the foundation levels of the OSIMM, and the level `Integrated` is the middle one we
equalize it with the P-1 level. Like this the three foundation levels are summarized to one level.
Next, we equalize the level `Virtualized Services` with level `P-4` for the following reason. As
described in the previous paragraph, an organization already reaches full agility on the level
`Virtualized Services`. For this reason, we equalize this level with the last level of Hammer`s
model `P-4` and drop the level `Dynamically Reconfigurable Services`. As a result, there rest
four levels of the OSIMM that fit with the levels of Hammer`s model.
With the aim of finding the appropriate dimensions to include in our model, we next investigate
the dimensions of the OSIMM. Table 11 gives an overview of OSIMM`s dimensions with a short
definition. We notice that this model covers the technical aspects as well as the organizational
aspects of the SOA definition given in section 2.3.1. To fit the scope of our model that we set
out in section 3.2, we are only interested in integrating dimensions covering technical aspects.
Silo
•Individual parts of the organization are developing their own software independently without integration.
Integrated
•Technologies have been put in place to communicate between the silos and to integrate the data and interconnections.
Componen-tized
•The IT systems in the silos have been analyzed and broken down into component parts.
Service
•Composite applications are built from loosely-coupled services, the invocation is independent of the underlying application technology. Composite Services
Composite Services
•The construction of a business process for a set of interacting services is possible by the use of a composition or business process modeling language.
Virtualized Services
•The business and IT services are now provided through a façade (a level of indirection).
Dynamically Re-Configurable Services
•The business process assembly can performed at runtime.
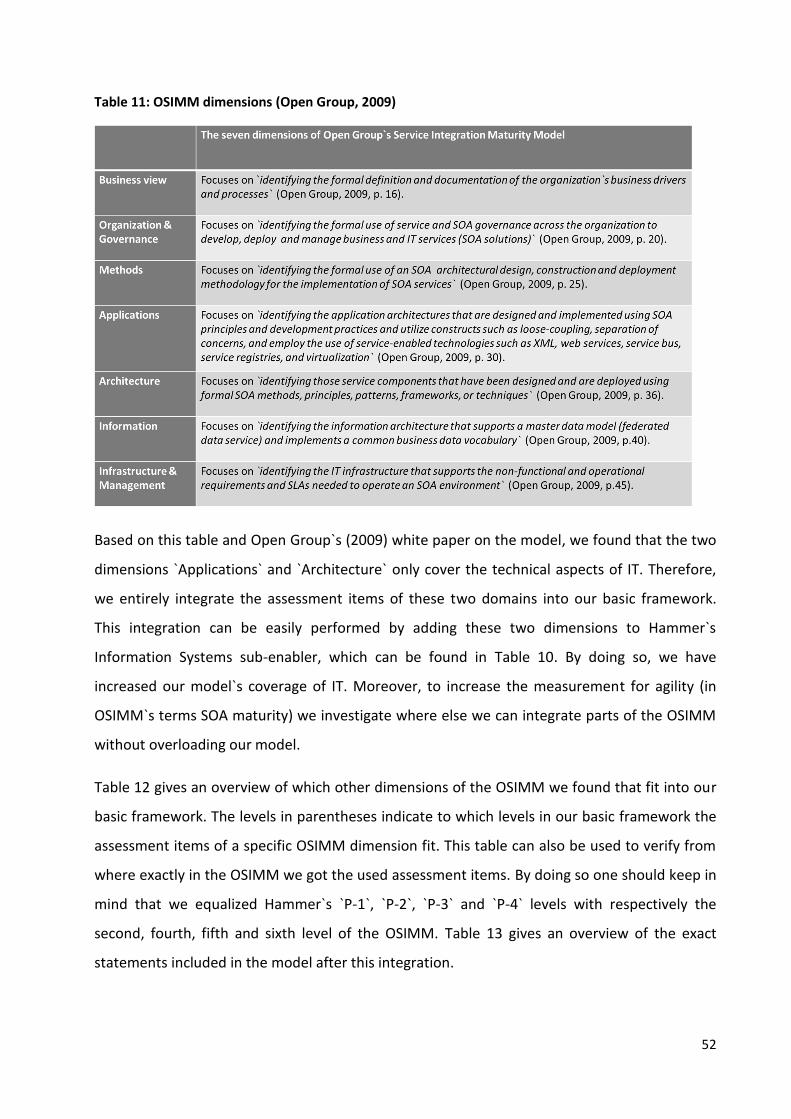
52
Table 11: OSIMM dimensions (Open Group, 2009)
Based on this table and Open Group`s (2009) white paper on the model, we found that the two
dimensions `Applications` and `Architecture` only cover the technical aspects of IT. Therefore,
we entirely integrate the assessment items of these two domains into our basic framework.
This integration can be easily performed by adding these two dimensions to Hammer`s
Information Systems sub-enabler, which can be found in Table 10. By doing so, we have
increased our model`s coverage of IT. Moreover, to increase the measurement for agility (in
OSIMM`s terms SOA maturity) we investigate where else we can integrate parts of the OSIMM
without overloading our model.
Table 12 gives an overview of which other dimensions of the OSIMM we found that fit into our
basic framework. The levels in parentheses indicate to which levels in our basic framework the
assessment items of a specific OSIMM dimension fit. This table can also be used to verify from
where exactly in the OSIMM we got the used assessment items. By doing so one should keep in
mind that we equalized Hammer`s `P-1`, `P-2`, `P-3` and `P-4` levels with respectively the
second, fourth, fifth and sixth level of the OSIMM. Table 13 gives an overview of the exact
statements included in the model after this integration.
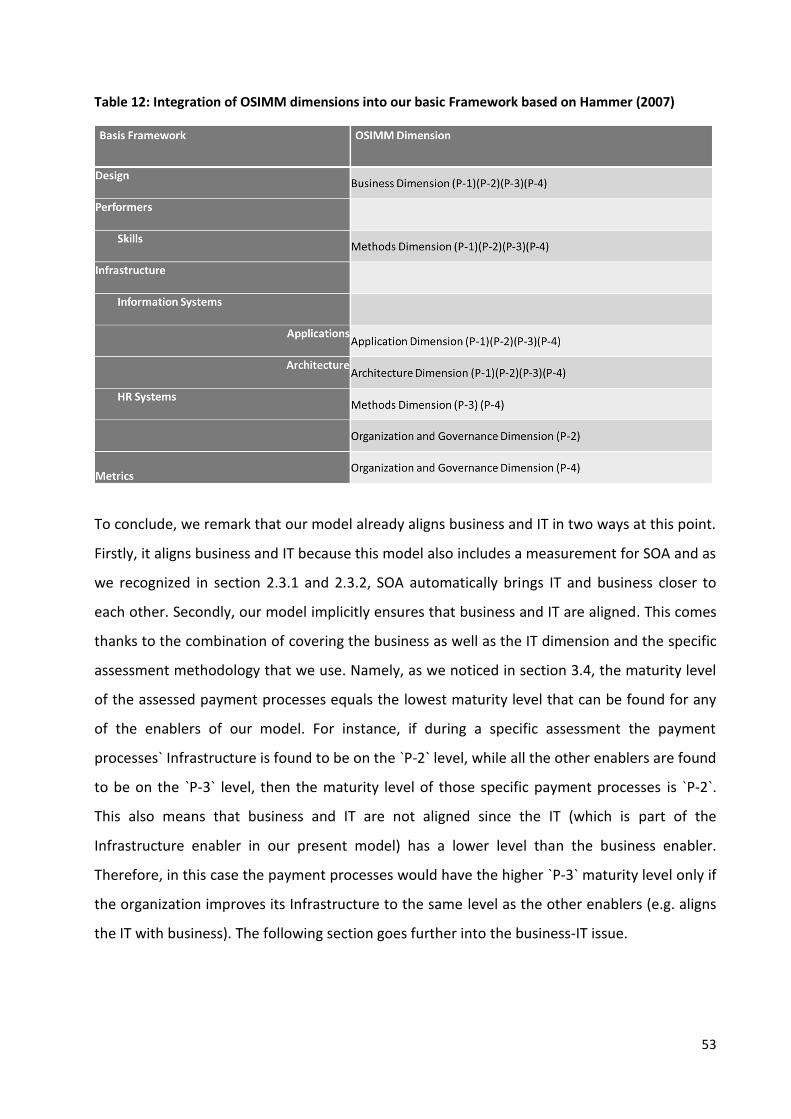
53
Table 12: Integration of OSIMM dimensions into our basic Framework based on Hammer (2007)
To conclude, we remark that our model already aligns business and IT in two ways at this point.
Firstly, it aligns business and IT because this model also includes a measurement for SOA and as
we recognized in section 2.3.1 and 2.3.2, SOA automatically brings IT and business closer to
each other. Secondly, our model implicitly ensures that business and IT are aligned. This comes
thanks to the combination of covering the business as well as the IT dimension and the specific
assessment methodology that we use. Namely, as we noticed in section 3.4, the maturity level
of the assessed payment processes equals the lowest maturity level that can be found for any
of the enablers of our model. For instance, if during a specific assessment the payment
processes` Infrastructure is found to be on the `P-2` level, while all the other enablers are found
to be on the `P-3` level, then the maturity level of those specific payment processes is `P-2`.
This also means that business and IT are not aligned since the IT (which is part of the
Infrastructure enabler in our present model) has a lower level than the business enabler.
Therefore, in this case the payment processes would have the higher `P-3` maturity level only if
the organization improves its Infrastructure to the same level as the other enablers (e.g. aligns
the IT with business). The following section goes further into the business-IT issue.
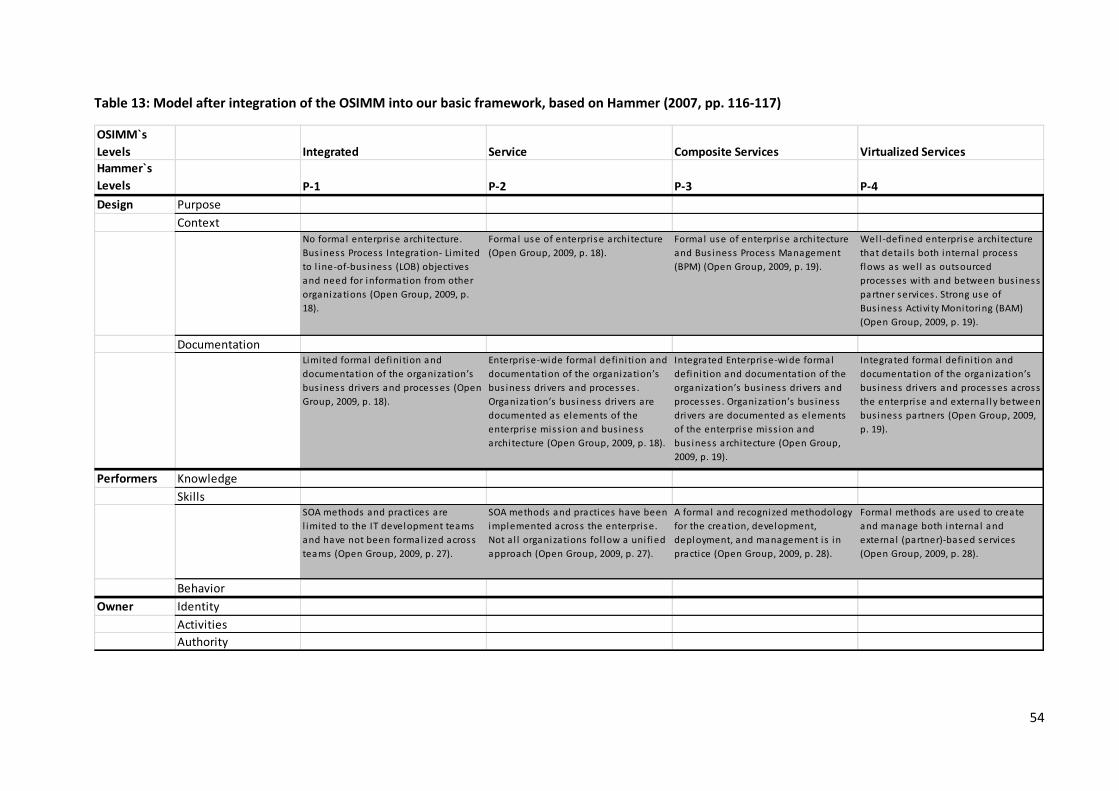
54
Table 13: Model after integration of the OSIMM into our basic framework, based on Hammer (2007, pp. 116-117)
OSIMM`s
Levels Integrated Service Composite Services Virtualized Services
Hammer`s
Levels P-1 P-2 P-3 P-4
Design Purpose
ContextNo formal enterprise architecture.
Bus iness Process Integration- Limited
to l ine-of-bus iness (LOB) objectives
and need for information from other
organizations (Open Group, 2009, p.
18).
Formal use of enterprise architecture
(Open Group, 2009, p. 18).
Formal use of enterprise architecture
and Bus iness Process Management
(BPM) (Open Group, 2009, p. 19).
Wel l -defined enterprise architecture
that detai l s both internal process
flows as wel l as outsourced
processes with and between bus iness
partner services . Strong use of
Bus iness Activi ty Monitoring (BAM)
(Open Group, 2009, p. 19).
DocumentationLimited formal defini tion and
documentation of the organization’s
bus iness drivers and processes (Open
Group, 2009, p. 18).
Enterprise-wide formal defini tion and
documentation of the organization’s
bus iness drivers and processes .
Organization’s bus iness drivers are
documented as elements of the
enterprise miss ion and bus iness
architecture (Open Group, 2009, p. 18).
Integrated Enterprise-wide formal
defini tion and documentation of the
organization’s bus iness drivers and
processes . Organization’s bus iness
drivers are documented as elements
of the enterprise miss ion and
bus iness architecture (Open Group,
2009, p. 19).
Integrated formal defini tion and
documentation of the organization’s
bus iness drivers and processes across
the enterprise and external ly between
bus iness partners (Open Group, 2009,
p. 19).
Performers Knowledge
SkillsSOA methods and practices are
l imited to the IT development teams
and have not been formal ized across
teams (Open Group, 2009, p. 27).
SOA methods and practices have been
implemented across the enterprise.
Not a l l organizations fol low a uni fied
approach (Open Group, 2009, p. 27).
A formal and recognized methodology
for the creation, development,
deployment, and management i s in
practice (Open Group, 2009, p. 28).
Formal methods are used to create
and manage both internal and
external (partner)-based services
(Open Group, 2009, p. 28).
Behavior
Owner Identity
Activities
Authority
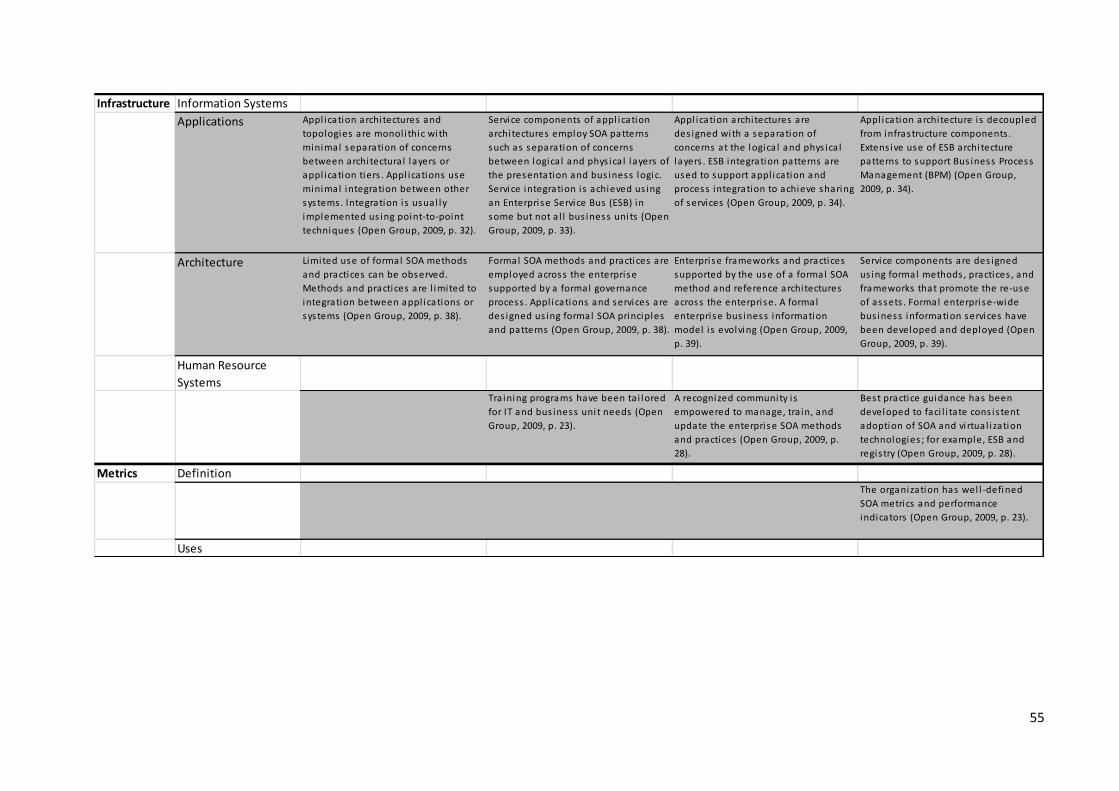
55
Infrastructure Information Systems
Applications Appl ication architectures and
topologies are monol i thic with
minimal separation of concerns
between architectura l layers or
appl ication tiers . Appl ications use
minimal integration between other
systems. Integration is usual ly
implemented us ing point-to-point
techniques (Open Group, 2009, p. 32).
Service components of appl ication
architectures employ SOA patterns
such as separation of concerns
between logica l and phys ica l layers of
the presentation and bus iness logic.
Service integration is achieved us ing
an Enterprise Service Bus (ESB) in
some but not a l l bus iness units (Open
Group, 2009, p. 33).
Appl ication architectures are
des igned with a separation of
concerns at the logica l and phys ica l
layers . ESB integration patterns are
used to support appl ication and
process integration to achieve sharing
of services (Open Group, 2009, p. 34).
Appl ication architecture is decoupled
from infrastructure components .
Extens ive use of ESB architecture
patterns to support Bus iness Process
Management (BPM) (Open Group,
2009, p. 34).
Architecture Limited use of formal SOA methods
and practices can be observed.
Methods and practices are l imited to
integration between appl ications or
systems (Open Group, 2009, p. 38).
Formal SOA methods and practices are
employed across the enterprise
supported by a formal governance
process . Appl ications and services are
des igned us ing formal SOA principles
and patterns (Open Group, 2009, p. 38).
Enterprise frameworks and practices
supported by the use of a formal SOA
method and reference architectures
across the enterprise. A formal
enterprise bus iness information
model i s evolving (Open Group, 2009,
p. 39).
Service components are des igned
us ing formal methods , practices , and
frameworks that promote the re-use
of assets . Formal enterprise-wide
bus iness information services have
been developed and deployed (Open
Group, 2009, p. 39).
Human Resource
SystemsTra ining programs have been ta i lored
for IT and bus iness unit needs (Open
Group, 2009, p. 23).
A recognized community i s
empowered to manage, tra in, and
update the enterprise SOA methods
and practices (Open Group, 2009, p.
28).
Best practice guidance has been
developed to faci l i tate cons is tent
adoption of SOA and vi rtual ization
technologies ; for example, ESB and
regis try (Open Group, 2009, p. 28).
Metrics DefinitionThe organization has wel l -defined
SOA metrics and performance
indicators (Open Group, 2009, p. 23).
Uses
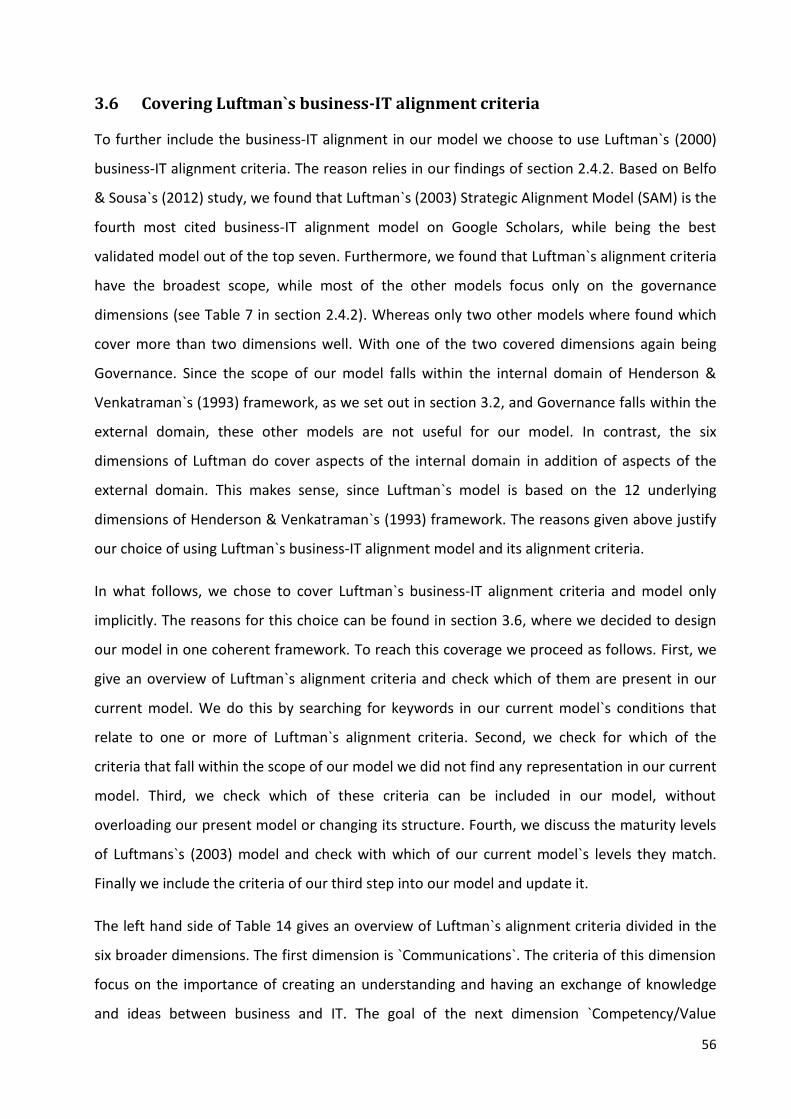
56
3.6 Covering Luftman`s business-IT alignment criteria
To further include the business-IT alignment in our model we choose to use Luftman`s (2000)
business-IT alignment criteria. The reason relies in our findings of section 2.4.2. Based on Belfo
& Sousa`s (2012) study, we found that Luftman`s (2003) Strategic Alignment Model (SAM) is the
fourth most cited business-IT alignment model on Google Scholars, while being the best
validated model out of the top seven. Furthermore, we found that Luftman`s alignment criteria
have the broadest scope, while most of the other models focus only on the governance
dimensions (see Table 7 in section 2.4.2). Whereas only two other models where found which
cover more than two dimensions well. With one of the two covered dimensions again being
Governance. Since the scope of our model falls within the internal domain of Henderson &
Venkatraman`s (1993) framework, as we set out in section 3.2, and Governance falls within the
external domain, these other models are not useful for our model. In contrast, the six
dimensions of Luftman do cover aspects of the internal domain in addition of aspects of the
external domain. This makes sense, since Luftman`s model is based on the 12 underlying
dimensions of Henderson & Venkatraman`s (1993) framework. The reasons given above justify
our choice of using Luftman`s business-IT alignment model and its alignment criteria.
In what follows, we chose to cover Luftman`s business-IT alignment criteria and model only
implicitly. The reasons for this choice can be found in section 3.6, where we decided to design
our model in one coherent framework. To reach this coverage we proceed as follows. First, we
give an overview of Luftman`s alignment criteria and check which of them are present in our
current model. We do this by searching for keywords in our current model`s conditions that
relate to one or more of Luftman`s alignment criteria. Second, we check for which of the
criteria that fall within the scope of our model we did not find any representation in our current
model. Third, we check which of these criteria can be included in our model, without
overloading our present model or changing its structure. Fourth, we discuss the maturity levels
of Luftmans`s (2003) model and check with which of our current model`s levels they match.
Finally we include the criteria of our third step into our model and update it.
The left hand side of Table 14 gives an overview of Luftman`s alignment criteria divided in the
six broader dimensions. The first dimension is `Communications`. The criteria of this dimension
focus on the importance of creating an understanding and having an exchange of knowledge
and ideas between business and IT. The goal of the next dimension `Competency/Value
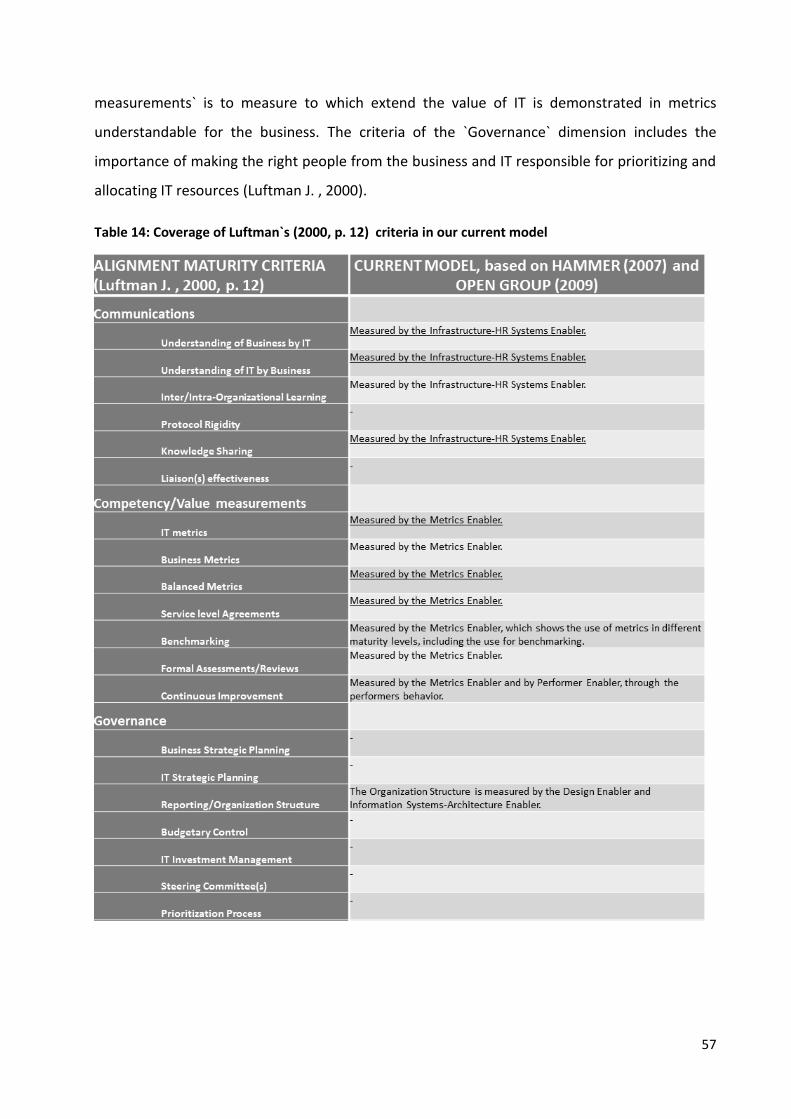
57
measurements` is to measure to which extend the value of IT is demonstrated in metrics
understandable for the business. The criteria of the `Governance` dimension includes the
importance of making the right people from the business and IT responsible for prioritizing and
allocating IT resources (Luftman J. , 2000).
Table 14: Coverage of Luftman`s (2000, p. 12) criteria in our current model
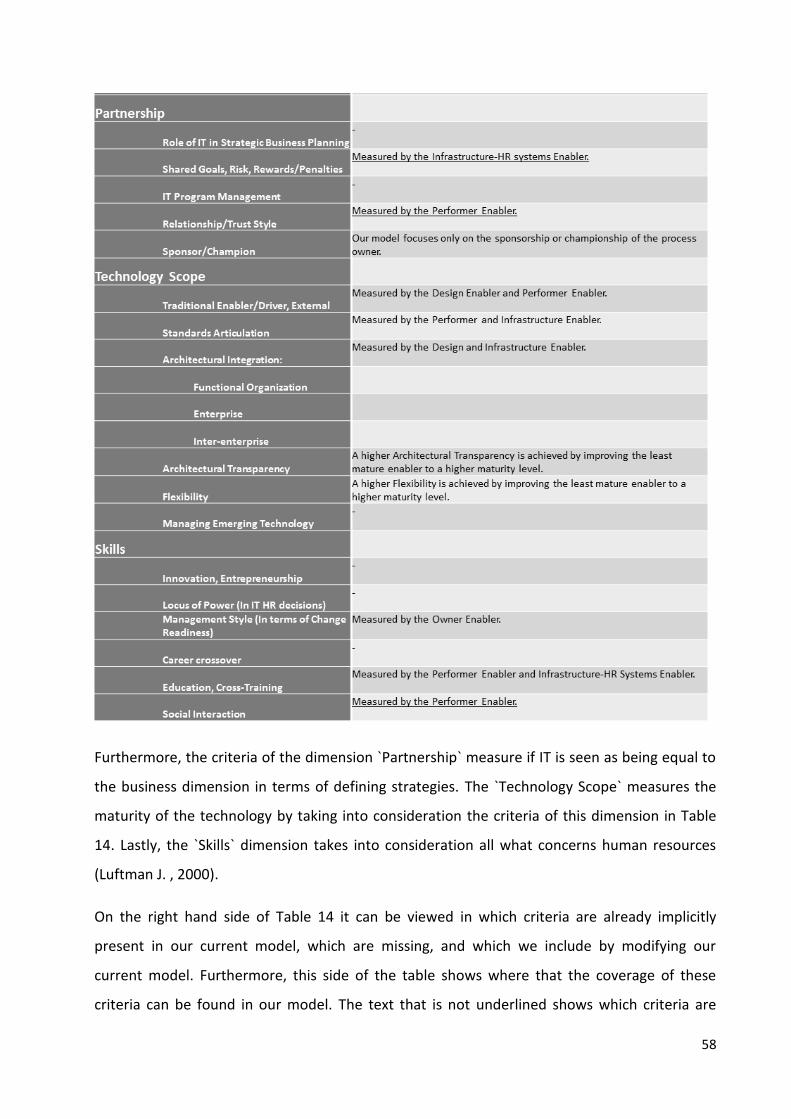
58
Furthermore, the criteria of the dimension `Partnership` measure if IT is seen as being equal to
the business dimension in terms of defining strategies. The `Technology Scope` measures the
maturity of the technology by taking into consideration the criteria of this dimension in Table
14. Lastly, the `Skills` dimension takes into consideration all what concerns human resources
(Luftman J. , 2000).
On the right hand side of Table 14 it can be viewed in which criteria are already implicitly
present in our current model, which are missing, and which we include by modifying our
current model. Furthermore, this side of the table shows where that the coverage of these
criteria can be found in our model. The text that is not underlined shows which criteria are
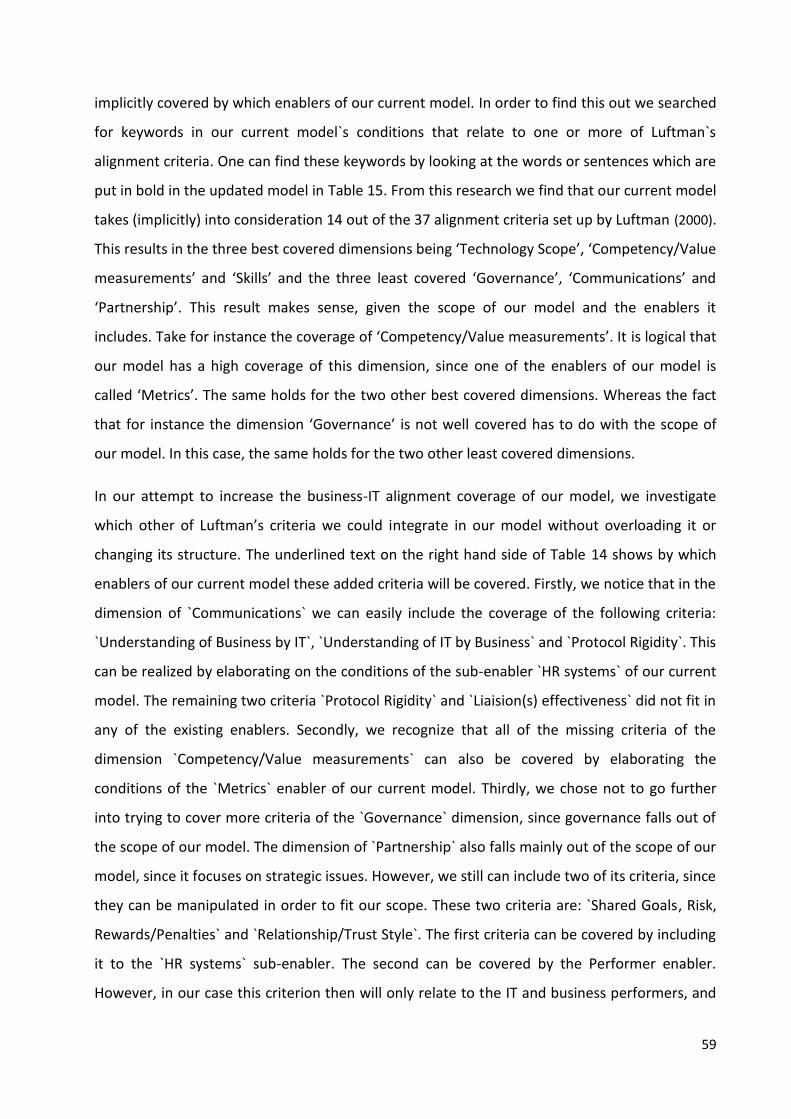
59
implicitly covered by which enablers of our current model. In order to find this out we searched
for keywords in our current model`s conditions that relate to one or more of Luftman`s
alignment criteria. One can find these keywords by looking at the words or sentences which are
put in bold in the updated model in Table 15. From this research we find that our current model
takes (implicitly) into consideration 14 out of the 37 alignment criteria set up by Luftman (2000).
This results in the three best covered dimensions being ‘Technology Scope’, ‘Competency/Value
measurements’ and ‘Skills’ and the three least covered ‘Governance’, ‘Communications’ and
‘Partnership’. This result makes sense, given the scope of our model and the enablers it
includes. Take for instance the coverage of ‘Competency/Value measurements’. It is logical that
our model has a high coverage of this dimension, since one of the enablers of our model is
called ‘Metrics’. The same holds for the two other best covered dimensions. Whereas the fact
that for instance the dimension ‘Governance’ is not well covered has to do with the scope of
our model. In this case, the same holds for the two other least covered dimensions.
In our attempt to increase the business-IT alignment coverage of our model, we investigate
which other of Luftman’s criteria we could integrate in our model without overloading it or
changing its structure. The underlined text on the right hand side of Table 14 shows by which
enablers of our current model these added criteria will be covered. Firstly, we notice that in the
dimension of `Communications` we can easily include the coverage of the following criteria:
`Understanding of Business by IT`, `Understanding of IT by Business` and `Protocol Rigidity`. This
can be realized by elaborating on the conditions of the sub-enabler `HR systems` of our current
model. The remaining two criteria `Protocol Rigidity` and `Liaision(s) effectiveness` did not fit in
any of the existing enablers. Secondly, we recognize that all of the missing criteria of the
dimension `Competency/Value measurements` can also be covered by elaborating the
conditions of the `Metrics` enabler of our current model. Thirdly, we chose not to go further
into trying to cover more criteria of the `Governance` dimension, since governance falls out of
the scope of our model. The dimension of `Partnership` also falls mainly out of the scope of our
model, since it focuses on strategic issues. However, we still can include two of its criteria, since
they can be manipulated in order to fit our scope. These two criteria are: `Shared Goals, Risk,
Rewards/Penalties` and `Relationship/Trust Style`. The first criteria can be covered by including
it to the `HR systems` sub-enabler. The second can be covered by the Performer enabler.
However, in our case this criterion then will only relate to the IT and business performers, and
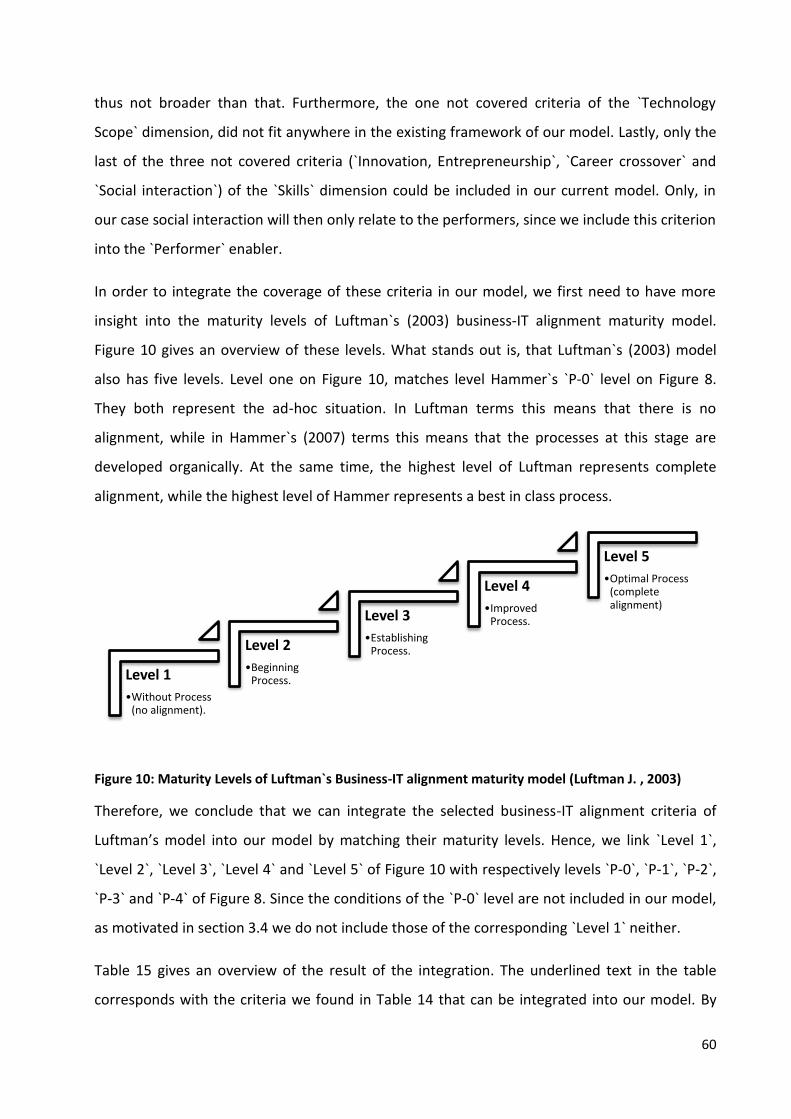
60
thus not broader than that. Furthermore, the one not covered criteria of the `Technology
Scope` dimension, did not fit anywhere in the existing framework of our model. Lastly, only the
last of the three not covered criteria (`Innovation, Entrepreneurship`, `Career crossover` and
`Social interaction`) of the `Skills` dimension could be included in our current model. Only, in
our case social interaction will then only relate to the performers, since we include this criterion
into the `Performer` enabler.
In order to integrate the coverage of these criteria in our model, we first need to have more
insight into the maturity levels of Luftman`s (2003) business-IT alignment maturity model.
Figure 10 gives an overview of these levels. What stands out is, that Luftman`s (2003) model
also has five levels. Level one on Figure 10, matches level Hammer`s `P-0` level on Figure 8.
They both represent the ad-hoc situation. In Luftman terms this means that there is no
alignment, while in Hammer`s (2007) terms this means that the processes at this stage are
developed organically. At the same time, the highest level of Luftman represents complete
alignment, while the highest level of Hammer represents a best in class process.
Figure 10: Maturity Levels of Luftman`s Business-IT alignment maturity model (Luftman J. , 2003)
Therefore, we conclude that we can integrate the selected business-IT alignment criteria of
Luftman’s model into our model by matching their maturity levels. Hence, we link `Level 1`,
`Level 2`, `Level 3`, `Level 4` and `Level 5` of Figure 10 with respectively levels `P-0`, `P-1`, `P-2`,
`P-3` and `P-4` of Figure 8. Since the conditions of the `P-0` level are not included in our model,
as motivated in section 3.4 we do not include those of the corresponding `Level 1` neither.
Table 15 gives an overview of the result of the integration. The underlined text in the table
corresponds with the criteria we found in Table 14 that can be integrated into our model. By
Level 1
•Without Process (no alignment).
Level 2
•Beginning Process.
Level 3
•Establishing Process.
Level 4
•Improved Process.
Level 5
•Optimal Process (complete alignment)

61
using Table 15 together with Table 14 anyone can verify where exactly we got each condition
from. After this step, we have covered the three parts of the scope of our Payment Maturity
Model, namely: Business, Business-IT alignment and IT (see Figure 7). Specifically for the
Business-IT alignment part, we increased the coverage of Luftman`s (2000) criteria from
originally 14 out of the 37 to 21 out of the 37. However, our model still looks more like a
working sheet than a finished model. This brings us to the next section, where we finalize our
model.
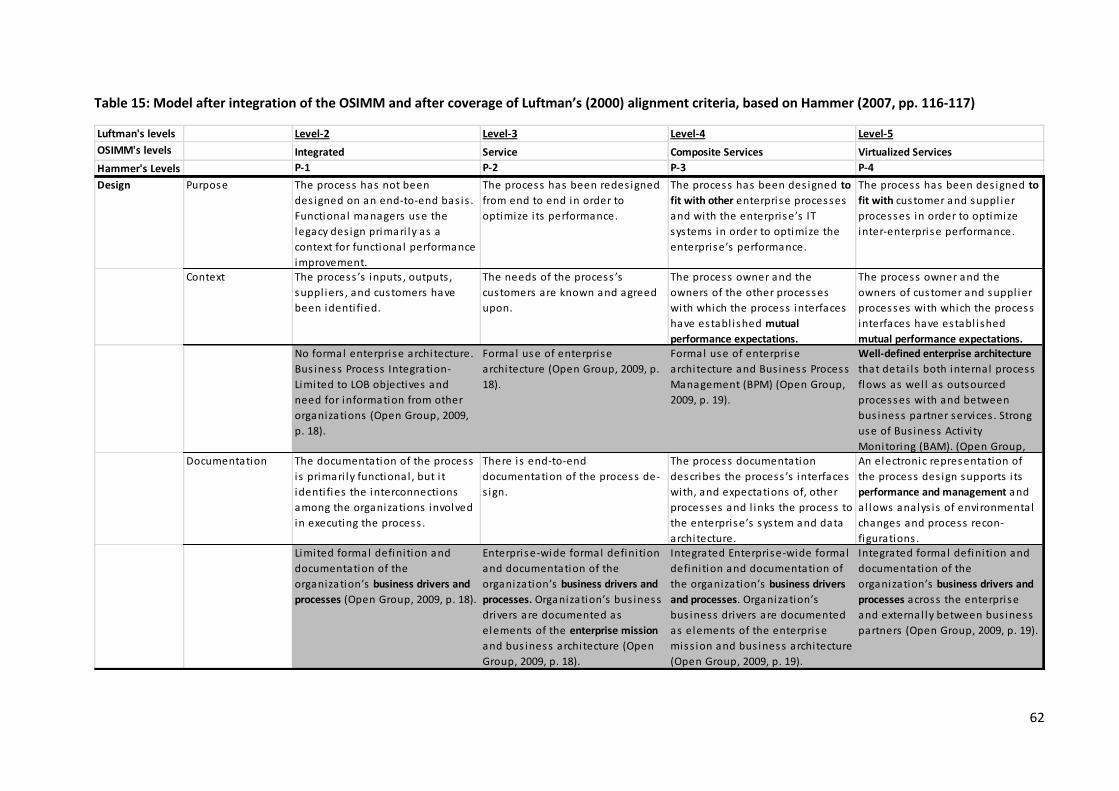
62
Table 15: Model after integration of the OSIMM and after coverage of Luftman’s (2000) alignment criteria, based on Hammer (2007, pp. 116-117)
Luftman's levels Level-2 Level-3 Level-4 Level-5
OSIMM's levels Integrated Service Composite Services Virtualized Services
Hammer's Levels P-1 P-2 P-3 P-4
Design Purpose The process has not been
des igned on an end-to-end bas is .
Functional managers use the
legacy des ign primari ly as a
context for functional performance
improvement.
The process has been redes igned
from end to end in order to
optimize i ts performance.
The process has been des igned to
fit with other enterprise processes
and with the enterprise’s IT
systems in order to optimize the
enterprise’s performance.
The process has been des igned to
fit with customer and suppl ier
processes in order to optimize
inter-enterprise performance.
Context The process ’s inputs , outputs ,
suppl iers , and customers have
been identi fied.
The needs of the process ’s
customers are known and agreed
upon.
The process owner and the
owners of the other processes
with which the process interfaces
have establ ished mutual
performance expectations.
The process owner and the
owners of customer and suppl ier
processes with which the process
interfaces have establ ished
mutual performance expectations.No formal enterprise architecture.
Bus iness Process Integration-
Limited to LOB objectives and
need for information from other
organizations (Open Group, 2009,
p. 18).
Formal use of enterprise
architecture (Open Group, 2009, p.
18).
Formal use of enterprise
architecture and Bus iness Process
Management (BPM) (Open Group,
2009, p. 19).
Well-defined enterprise architecture
that detai l s both internal process
flows as wel l as outsourced
processes with and between
bus iness partner services . Strong
use of Bus iness Activi ty
Monitoring (BAM). (Open Group, Documentation The documentation of the process
i s primari ly functional , but i t
identi fies the interconnections
among the organizations involved
in executing the process .
There is end-to-end
documentation of the process de-
s ign.
The process documentation
describes the process ’s interfaces
with, and expectations of, other
processes and l inks the process to
the enterprise’s system and data
architecture.
An electronic representation of
the process des ign supports i ts
performance and management and
a l lows analys is of environmental
changes and process recon-
figurations .Limited formal defini tion and
documentation of the
organization’s business drivers and
processes (Open Group, 2009, p. 18).
Enterprise-wide formal defini tion
and documentation of the
organization’s business drivers and
processes. Organization’s bus iness
drivers are documented as
elements of the enterprise mission
and bus iness architecture (Open
Group, 2009, p. 18).
Integrated Enterprise-wide formal
defini tion and documentation of
the organization’s business drivers
and processes. Organization’s
bus iness drivers are documented
as elements of the enterprise
miss ion and bus iness architecture
(Open Group, 2009, p. 19).
Integrated formal defini tion and
documentation of the
organization’s business drivers and
processes across the enterprise
and external ly between bus iness
partners (Open Group, 2009, p. 19).
63
Performers Knowledge Performers can name the process
they execute and identi fy the key
metrics of i ts performance.
Performers can describe the
process ’s overa l l flow; how their
work affects customers , other
employees in the process , and the
process ’s performance; and the
required and actual performance
levels .
Performers are fami l iar both with
fundamental business concepts and
with the drivers of enterprise
performance and can describe how
their work affects other processes
and the enterprise’s performance.
Performers are fami l iar with the
enterprise’s industry and its trends
and can describe how their work
affects inter-enterprise performance.
Ski l l s Performers are ski l led in problem
solving and process improvement
techniques .
Performers are ski l led in teamwork
and self-management.
Performers are ski l led at business
decision making.
Performers are ski l led at change
management and change
implementation.SOA methods and practices are
limited to the IT development teams
and have not been formal ized
across teams (Open Group, 2009,
p. 27). Bus iness and IT performers
are only able to socia l ly interact
in a s trictly bus iness-only
relationship (Luftman J. , 2003, p.
10).
SOA methods and practices have
been implemented across the
enterprise. Not a l l organizations
fol low a uni fied approach (Open
Group, 2009, p. 27). Bus iness and
IT performers are able to s tart
bui lding confidence and trust
(Luftman J. , 2003, p. 10).
A formal and recognized methodology
for the creation, development,
deployment, and management i s
in practice (Open Group, 2009, p.
28). Bus iness and IT performers
are able to achieve trust and
confidence (Luftman J. , 2003, p.
10).
Formal methods are used to
create and manage both internal
and external (partner)-based services
(Open Group, 2009, p. 28).
Bus iness and IT performers are
able to atta in socia l interaction
witch customers and partners
(Luftman J. , 2003, p. 10).
Behavior Performers have some a l legiance
to the process , but owe primary
allegiance to their function.
Performers try to follow the process
design, perform i t correctly, and
work in ways that wi l l enable
other people who execute the
process to do their work
effectively.
Performers s trive to ensure that
the process del ivers the results
needed to achieve the enterprise’s
goals.
Performers look for s igns that the
process should change, and they
propose improvements to the process.
Owner Identi ty The process owner i s an
individual or a group informal ly
charged with improving the
process ’s performance.
Enterprise leadership has created
an officia l process owner role and
has fi l led the pos i tion with a
senior manager who has clout and
credibi l i ty.
The process comes fi rs t for the
owner in terms of time a l location,
mind share, and personal goals .
The process owner i s a member of
the enterprise’s senior most
decis ion-making body.
Activi ties The process owner identi fies and
documents the process ,
communicates i t to a l l the
performers , and sponsors small-
scale change projects.
The process owner articulates the
process ’s performance goals and
a vis ion of i ts future; sponsors
redesign and improvement efforts;
plans their implementation; and
ensures compl iance with the
process des ign.
The process owner works with
other process owners and IT
people to integrate processes to
achieve the enterprise’s goals.
The process owner develops a
rolling strategic plan for the process,
participates in enterprise-level
strategic planning, and col laborates
with his or her counterparts
working for customers and
suppl iers to sponsor inter-
enterprise process-redes ign
ini tiatives .
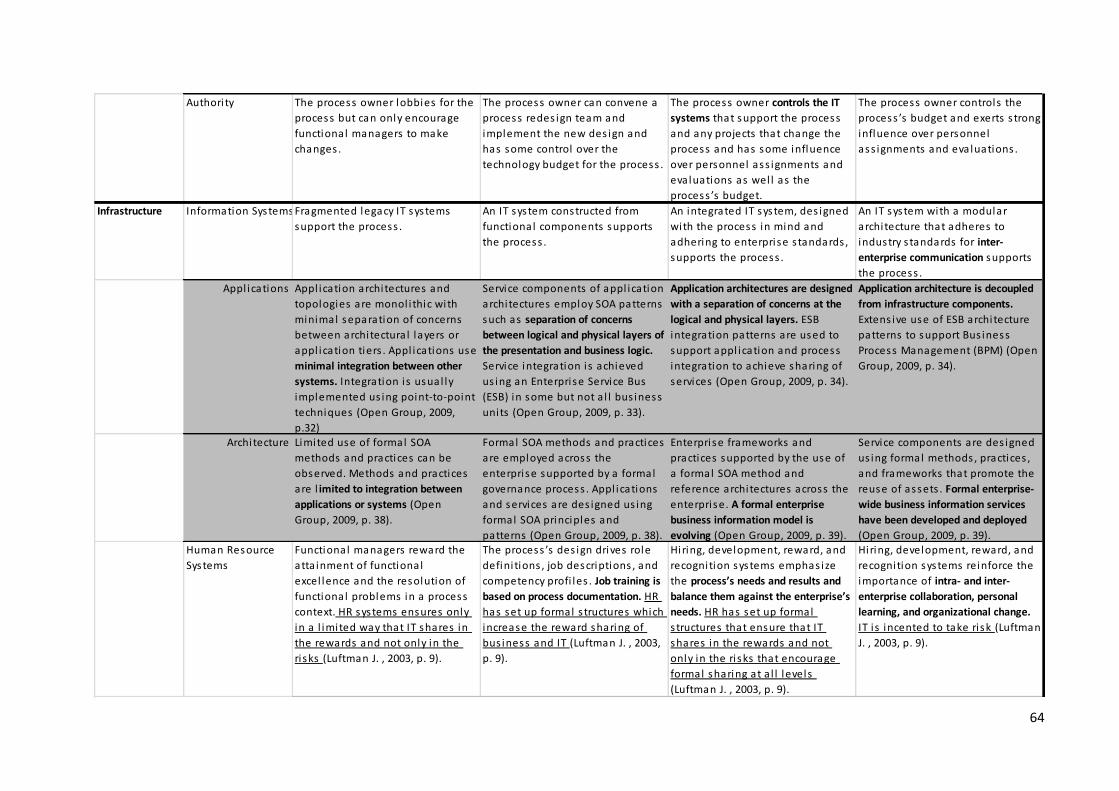
64
Authori ty The process owner lobbies for the
process but can only encourage
functional managers to make
changes .
The process owner can convene a
process redes ign team and
implement the new des ign and
has some control over the
technology budget for the process .
The process owner controls the IT
systems that support the process
and any projects that change the
process and has some influence
over personnel ass ignments and
evaluations as wel l as the
process ’s budget.
The process owner controls the
process ’s budget and exerts s trong
influence over personnel
ass ignments and evaluations .
Infrastructure Information Systems Fragmented legacy IT systems
support the process .
An IT system constructed from
functional components supports
the process .
An integrated IT system, des igned
with the process in mind and
adhering to enterprise s tandards ,
supports the process .
An IT system with a modular
architecture that adheres to
industry s tandards for inter-
enterprise communication supports
the process .
Appl ications Appl ication architectures and
topologies are monol i thic with
minimal separation of concerns
between architectura l layers or
appl ication tiers . Appl ications use
minimal integration between other
systems. Integration is usual ly
implemented us ing point-to-point
techniques (Open Group, 2009,
p.32)
Service components of appl ication
architectures employ SOA patterns
such as separation of concerns
between logical and physical layers of
the presentation and business logic.
Service integration is achieved
us ing an Enterprise Service Bus
(ESB) in some but not a l l bus iness
units (Open Group, 2009, p. 33).
Application architectures are designed
with a separation of concerns at the
logical and physical layers. ESB
integration patterns are used to
support appl ication and process
integration to achieve sharing of
services (Open Group, 2009, p. 34).
Application architecture is decoupled
from infrastructure components.
Extens ive use of ESB architecture
patterns to support Bus iness
Process Management (BPM) (Open
Group, 2009, p. 34).
Architecture Limited use of formal SOA
methods and practices can be
observed. Methods and practices
are l imited to integration between
applications or systems (Open
Group, 2009, p. 38).
Formal SOA methods and practices
are employed across the
enterprise supported by a formal
governance process . Appl ications
and services are des igned us ing
formal SOA principles and
patterns (Open Group, 2009, p. 38).
Enterprise frameworks and
practices supported by the use of
a formal SOA method and
reference architectures across the
enterprise. A formal enterprise
business information model is
evolving (Open Group, 2009, p. 39).
Service components are des igned
us ing formal methods , practices ,
and frameworks that promote the
reuse of assets . Formal enterprise-
wide business information services
have been developed and deployed
(Open Group, 2009, p. 39).Human Resource
Systems
Functional managers reward the
atta inment of functional
excel lence and the resolution of
functional problems in a process
context. HR systems ensures only
in a l imited way that IT shares in
the rewards and not only in the
risks (Luftman J. , 2003, p. 9).
The process ’s des ign drives role
defini tions , job descriptions , and
competency profi les . Job training is
based on process documentation. HR
has set up formal s tructures which
increase the reward sharing of
bus iness and IT (Luftman J. , 2003,
p. 9).
Hiring, development, reward, and
recognition systems emphas ize
the process’s needs and results and
balance them against the enterprise’s
needs. HR has set up formal
s tructures that ensure that IT
shares in the rewards and not
only in the risks that encourage
formal sharing at a l l levels
(Luftman J. , 2003, p. 9).
Hiring, development, reward, and
recognition systems reinforce the
importance of intra- and inter-
enterprise collaboration, personal
learning, and organizational change.
IT i s incented to take risk (Luftman
J. , 2003, p. 9).
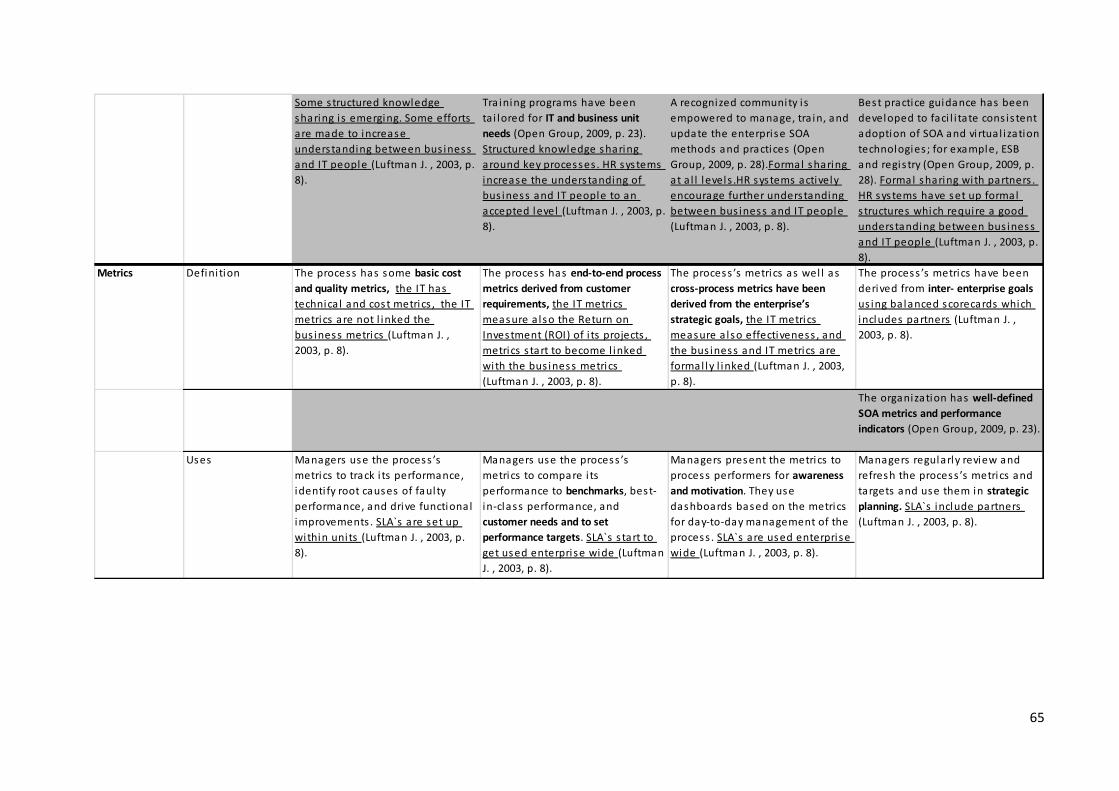
65
Some structured knowledge
sharing is emerging. Some efforts
are made to increase
understanding between bus iness
and IT people (Luftman J. , 2003, p.
8).
Tra ining programs have been
ta i lored for IT and business unit
needs (Open Group, 2009, p. 23).
Structured knowledge sharing
around key processes . HR systems
increase the understanding of
bus iness and IT people to an
accepted level (Luftman J. , 2003, p.
8).
A recognized community i s
empowered to manage, tra in, and
update the enterprise SOA
methods and practices (Open
Group, 2009, p. 28).Formal sharing
at a l l levels .HR systems actively
encourage further understanding
between bus iness and IT people
(Luftman J. , 2003, p. 8).
Best practice guidance has been
developed to faci l i tate cons is tent
adoption of SOA and vi rtual ization
technologies ; for example, ESB
and regis try (Open Group, 2009, p.
28). Formal sharing with partners .
HR systems have set up formal
s tructures which require a good
understanding between bus iness
and IT people (Luftman J. , 2003, p.
8).
Metrics Defini tion The process has some basic cost
and quality metrics, the IT has
technica l and cost metrics , the IT
metrics are not l inked the
bus iness metrics (Luftman J. ,
2003, p. 8).
The process has end-to-end process
metrics derived from customer
requirements, the IT metrics
measure a lso the Return on
Investment (ROI) of i ts projects ,
metrics s tart to become l inked
with the bus iness metrics
(Luftman J. , 2003, p. 8).
The process ’s metrics as wel l as
cross-process metrics have been
derived from the enterprise’s
strategic goals, the IT metrics
measure a lso effectiveness , and
the bus iness and IT metrics are
formal ly l inked (Luftman J. , 2003,
p. 8).
The process ’s metrics have been
derived from inter- enterprise goals
us ing balanced scorecards which
includes partners (Luftman J. ,
2003, p. 8).
The organization has well-defined
SOA metrics and performance
indicators (Open Group, 2009, p. 23).
Uses Managers use the process ’s
metrics to track i ts performance,
identi fy root causes of faulty
performance, and drive functional
improvements . SLA`s are set up
within units (Luftman J. , 2003, p.
8).
Managers use the process ’s
metrics to compare i ts
performance to benchmarks, best-
in-class performance, and
customer needs and to set
performance targets. SLA`s s tart to
get used enterprise wide (Luftman
J. , 2003, p. 8).
Managers present the metrics to
process performers for awareness
and motivation. They use
dashboards based on the metrics
for day-to-day management of the
process . SLA`s are used enterprise
wide (Luftman J. , 2003, p. 8).
Managers regularly review and
refresh the process ’s metrics and
targets and use them in strategic
planning. SLA`s include partners
(Luftman J. , 2003, p. 8).
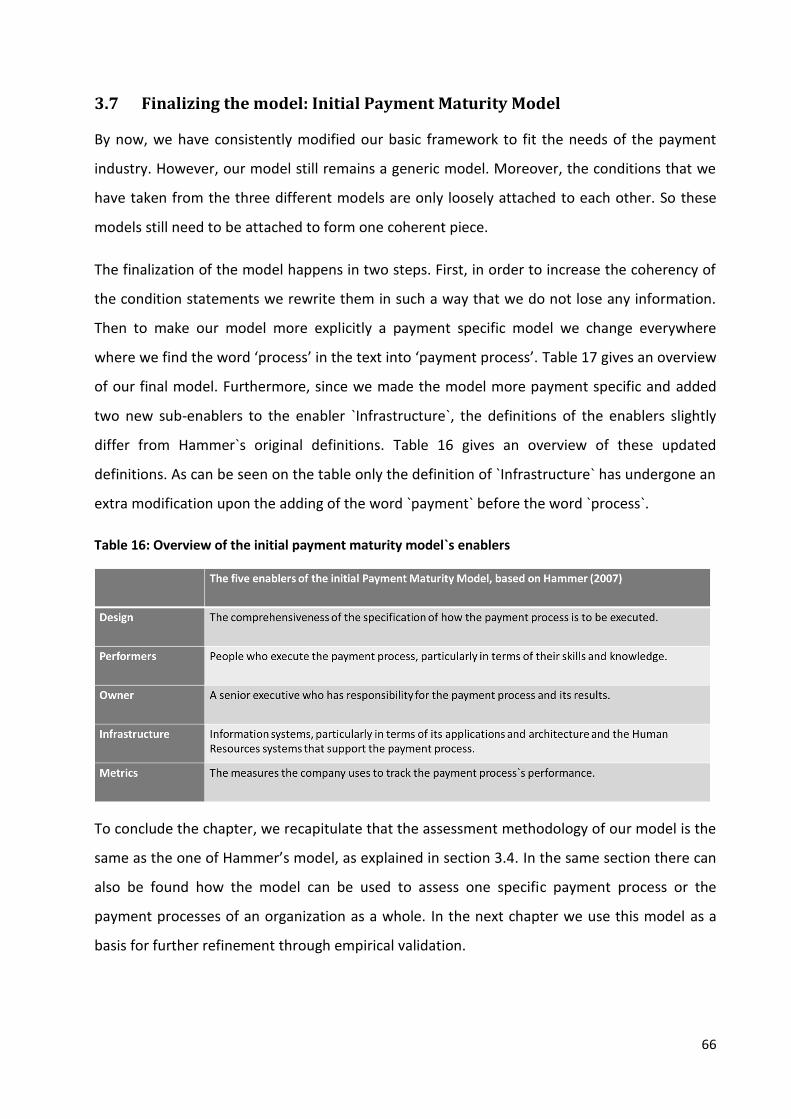
66
3.7 Finalizing the model: Initial Payment Maturity Model
By now, we have consistently modified our basic framework to fit the needs of the payment
industry. However, our model still remains a generic model. Moreover, the conditions that we
have taken from the three different models are only loosely attached to each other. So these
models still need to be attached to form one coherent piece.
The finalization of the model happens in two steps. First, in order to increase the coherency of
the condition statements we rewrite them in such a way that we do not lose any information.
Then to make our model more explicitly a payment specific model we change everywhere
where we find the word ‘process’ in the text into ‘payment process’. Table 17 gives an overview
of our final model. Furthermore, since we made the model more payment specific and added
two new sub-enablers to the enabler `Infrastructure`, the definitions of the enablers slightly
differ from Hammer`s original definitions. Table 16 gives an overview of these updated
definitions. As can be seen on the table only the definition of `Infrastructure` has undergone an
extra modification upon the adding of the word `payment` before the word `process`.
Table 16: Overview of the initial payment maturity model`s enablers
To conclude the chapter, we recapitulate that the assessment methodology of our model is the
same as the one of Hammer’s model, as explained in section 3.4. In the same section there can
also be found how the model can be used to assess one specific payment process or the
payment processes of an organization as a whole. In the next chapter we use this model as a
basis for further refinement through empirical validation.
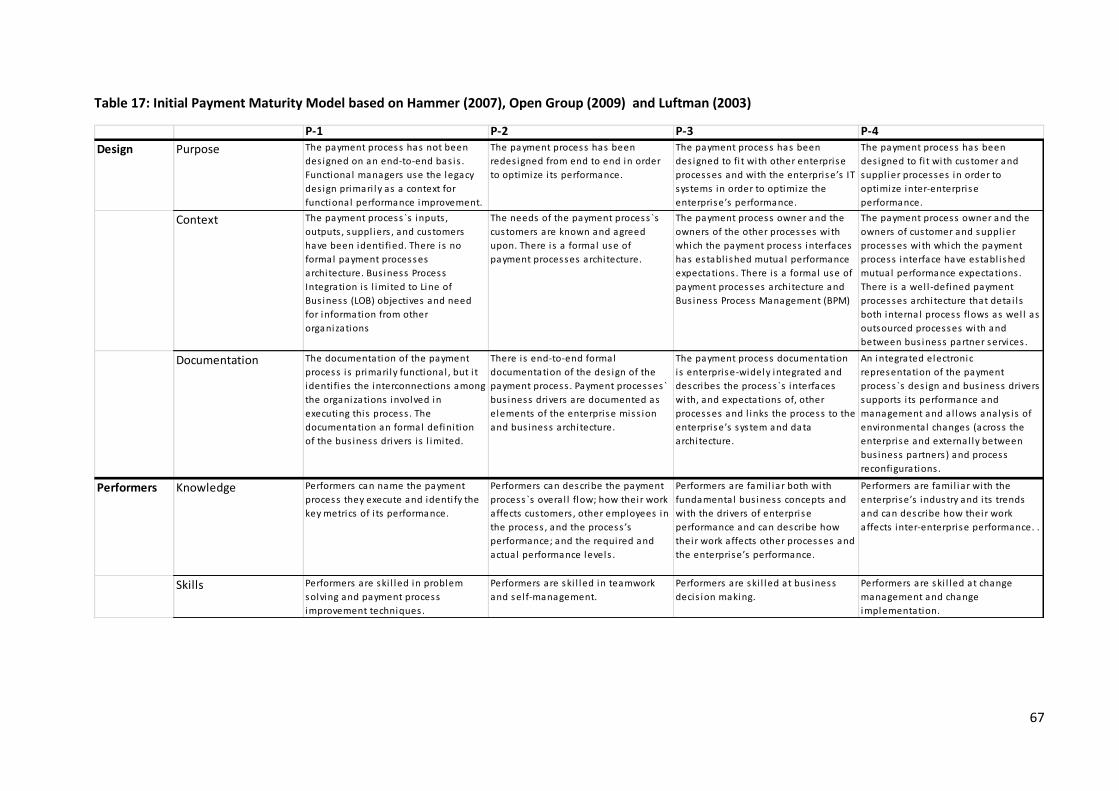
67
Table 17: Initial Payment Maturity Model based on Hammer (2007), Open Group (2009) and Luftman (2003)
P-1 P-2 P-3 P-4
Design Purpose The payment process has not been
des igned on an end-to-end bas is .
Functional managers use the legacy
des ign primari ly as a context for
functional performance improvement.
The payment process has been
redes igned from end to end in order
to optimize i ts performance.
The payment process has been
des igned to fi t with other enterprise
processes and with the enterprise’s IT
systems in order to optimize the
enterprise’s performance.
The payment process has been
des igned to fi t with customer and
suppl ier processes in order to
optimize inter-enterprise
performance.
Context The payment process `s inputs ,
outputs , suppl iers , and customers
have been identi fied. There is no
formal payment processes
architecture. Bus iness Process
Integration is l imited to Line of
Bus iness (LOB) objectives and need
for information from other
organizations
The needs of the payment process `s
customers are known and agreed
upon. There is a formal use of
payment processes architecture.
The payment process owner and the
owners of the other processes with
which the payment process interfaces
has establ ished mutual performance
expectations . There is a formal use of
payment processes architecture and
Bus iness Process Management (BPM)
The payment process owner and the
owners of customer and suppl ier
processes with which the payment
process interface have establ ished
mutual performance expectations .
There is a wel l -defined payment
processes architecture that detai l s
both internal process flows as wel l as
outsourced processes with and
between bus iness partner services .
Strong use of Bus iness Activi ty Documentation The documentation of the payment
process i s primari ly functional , but i t
identi fies the interconnections among
the organizations involved in
executing this process . The
documentation an formal defini tion
of the bus iness drivers i s l imited.
There is end-to-end formal
documentation of the des ign of the
payment process . Payment processes`
bus iness drivers are documented as
elements of the enterprise miss ion
and bus iness architecture.
The payment process documentation
is enterprise-widely integrated and
describes the process `s interfaces
with, and expectations of, other
processes and l inks the process to the
enterprise’s system and data
architecture.
An integrated electronic
representation of the payment
process `s des ign and bus iness drivers
supports i ts performance and
management and a l lows analys is of
environmental changes (across the
enterprise and external ly between
bus iness partners ) and process
reconfigurations .
Performers Knowledge Performers can name the payment
process they execute and identi fy the
key metrics of i ts performance.
Performers can describe the payment
process `s overa l l flow; how their work
affects customers , other employees in
the process , and the process ’s
performance; and the required and
actual performance levels .
Performers are fami l iar both with
fundamental bus iness concepts and
with the drivers of enterprise
performance and can describe how
their work affects other processes and
the enterprise’s performance.
Performers are fami l iar with the
enterprise’s industry and i ts trends
and can describe how their work
affects inter-enterprise performance. .
Skills Performers are ski l led in problem
solving and payment process
improvement techniques .
Performers are ski l led in teamwork
and sel f-management.
Performers are ski l led at bus iness
decis ion making.
Performers are ski l led at change
management and change
implementation.
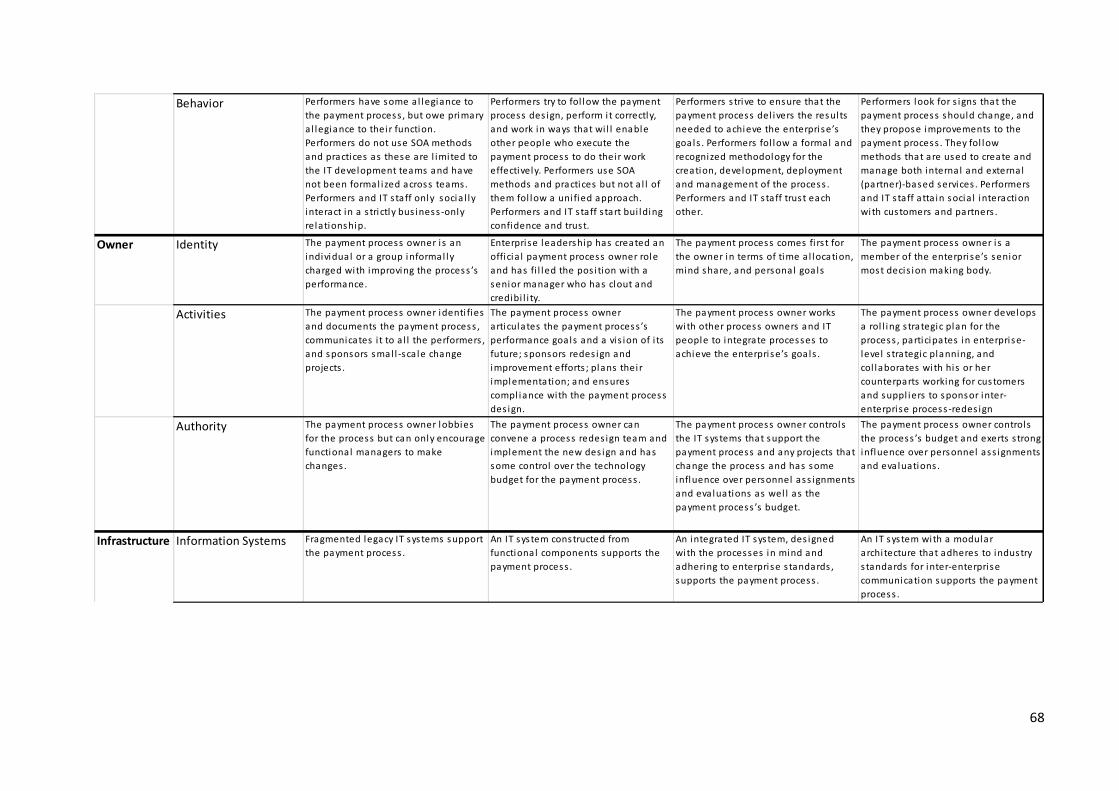
68
Behavior Performers have some a l legiance to
the payment process , but owe primary
a l legiance to their function.
Performers do not use SOA methods
and practices as these are l imited to
the IT development teams and have
not been formal ized across teams.
Performers and IT s taff only socia l ly
interact in a s trictly bus iness-only
relationship.
Performers try to fol low the payment
process des ign, perform i t correctly,
and work in ways that wi l l enable
other people who execute the
payment process to do their work
effectively. Performers use SOA
methods and practices but not a l l of
them fol low a uni fied approach.
Performers and IT s taff s tart bui lding
confidence and trust.
Performers s trive to ensure that the
payment process del ivers the results
needed to achieve the enterprise’s
goals . Performers fol low a formal and
recognized methodology for the
creation, development, deployment
and management of the process .
Performers and IT s taff trust each
other.
Performers look for s igns that the
payment process should change, and
they propose improvements to the
payment process . They fol low
methods that are used to create and
manage both internal and external
(partner)-based services . Performers
and IT s taff atta in socia l interaction
with customers and partners .
Owner Identity The payment process owner i s an
individual or a group informal ly
charged with improving the process ’s
performance.
Enterprise leadership has created an
officia l payment process owner role
and has fi l led the pos i tion with a
senior manager who has clout and
credibi l i ty.
The payment process comes fi rs t for
the owner in terms of time a l location,
mind share, and personal goals
The payment process owner i s a
member of the enterprise’s senior
most decis ion making body.
Activities The payment process owner identi fies
and documents the payment process ,
communicates i t to a l l the performers ,
and sponsors smal l -sca le change
projects .
The payment process owner
articulates the payment process ’s
performance goals and a vis ion of i ts
future; sponsors redes ign and
improvement efforts ; plans their
implementation; and ensures
compl iance with the payment process
des ign.
The payment process owner works
with other process owners and IT
people to integrate processes to
achieve the enterprise’s goals .
The payment process owner develops
a rol l ing s trategic plan for the
process , participates in enterprise-
level s trategic planning, and
col laborates with his or her
counterparts working for customers
and suppl iers to sponsor inter-
enterprise process-redes ign
ini tiatives . Authority The payment process owner lobbies
for the process but can only encourage
functional managers to make
changes .
The payment process owner can
convene a process redes ign team and
implement the new des ign and has
some control over the technology
budget for the payment process .
The payment process owner controls
the IT systems that support the
payment process and any projects that
change the process and has some
influence over personnel ass ignments
and evaluations as wel l as the
payment process ’s budget.
The payment process owner controls
the process ’s budget and exerts s trong
influence over personnel ass ignments
and evaluations .
Infrastructure Information Systems Fragmented legacy IT systems support
the payment process .
An IT system constructed from
functional components supports the
payment process .
An integrated IT system, des igned
with the processes in mind and
adhering to enterprise s tandards ,
supports the payment process .
An IT system with a modular
architecture that adheres to industry
s tandards for inter-enterprise
communication supports the payment
process .
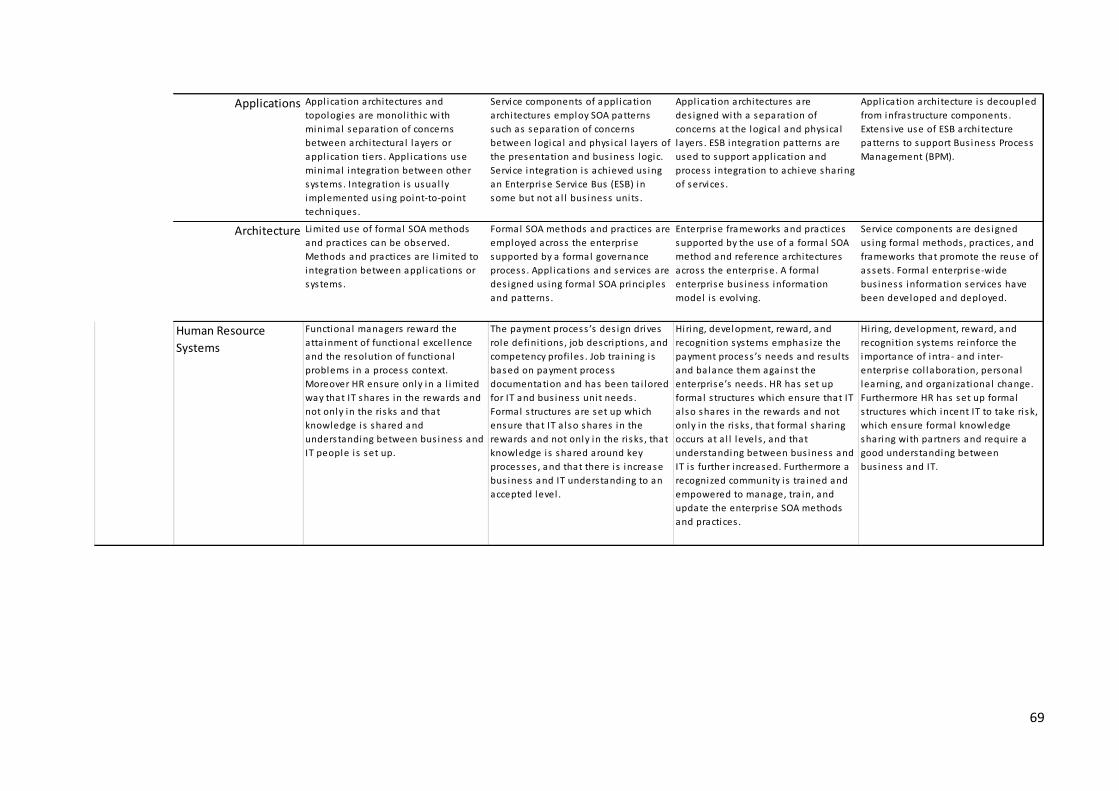
69
Applications Appl ication architectures and
topologies are monol i thic with
minimal separation of concerns
between architectura l layers or
appl ication tiers . Appl ications use
minimal integration between other
systems. Integration is usual ly
implemented us ing point-to-point
techniques .
Service components of appl ication
architectures employ SOA patterns
such as separation of concerns
between logica l and phys ica l layers of
the presentation and bus iness logic.
Service integration is achieved us ing
an Enterprise Service Bus (ESB) in
some but not a l l bus iness units .
Appl ication architectures are
des igned with a separation of
concerns at the logica l and phys ica l
layers . ESB integration patterns are
used to support appl ication and
process integration to achieve sharing
of services .
Appl ication architecture is decoupled
from infrastructure components .
Extens ive use of ESB architecture
patterns to support Bus iness Process
Management (BPM).
Architecture Limited use of formal SOA methods
and practices can be observed.
Methods and practices are l imited to
integration between appl ications or
systems.
Formal SOA methods and practices are
employed across the enterprise
supported by a formal governance
process . Appl ications and services are
des igned us ing formal SOA principles
and patterns .
Enterprise frameworks and practices
supported by the use of a formal SOA
method and reference architectures
across the enterprise. A formal
enterprise bus iness information
model i s evolving.
Service components are des igned
us ing formal methods , practices , and
frameworks that promote the reuse of
assets . Formal enterprise-wide
bus iness information services have
been developed and deployed.
Human Resource
Systems
Functional managers reward the
atta inment of functional excel lence
and the resolution of functional
problems in a process context.
Moreover HR ensure only in a l imited
way that IT shares in the rewards and
not only in the risks and that
knowledge is shared and
understanding between bus iness and
IT people i s set up.
The payment process ’s des ign drives
role defini tions , job descriptions , and
competency profi les . Job tra ining is
based on payment process
documentation and has been ta i lored
for IT and bus iness unit needs .
Formal s tructures are set up which
ensure that IT a lso shares in the
rewards and not only in the risks , that
knowledge is shared around key
processes , and that there is increase
bus iness and IT understanding to an
accepted level .
Hiring, development, reward, and
recognition systems emphas ize the
payment process ’s needs and results
and balance them against the
enterprise’s needs . HR has set up
formal s tructures which ensure that IT
a lso shares in the rewards and not
only in the risks , that formal sharing
occurs at a l l levels , and that
understanding between bus iness and
IT i s further increased. Furthermore a
recognized community i s tra ined and
empowered to manage, tra in, and
update the enterprise SOA methods
and practices .
Hiring, development, reward, and
recognition systems reinforce the
importance of intra- and inter-
enterprise col laboration, personal
learning, and organizational change.
Furthermore HR has set up formal
s tructures which incent IT to take risk,
which ensure formal knowledge
sharing with partners and require a
good understanding between
bus iness and IT.
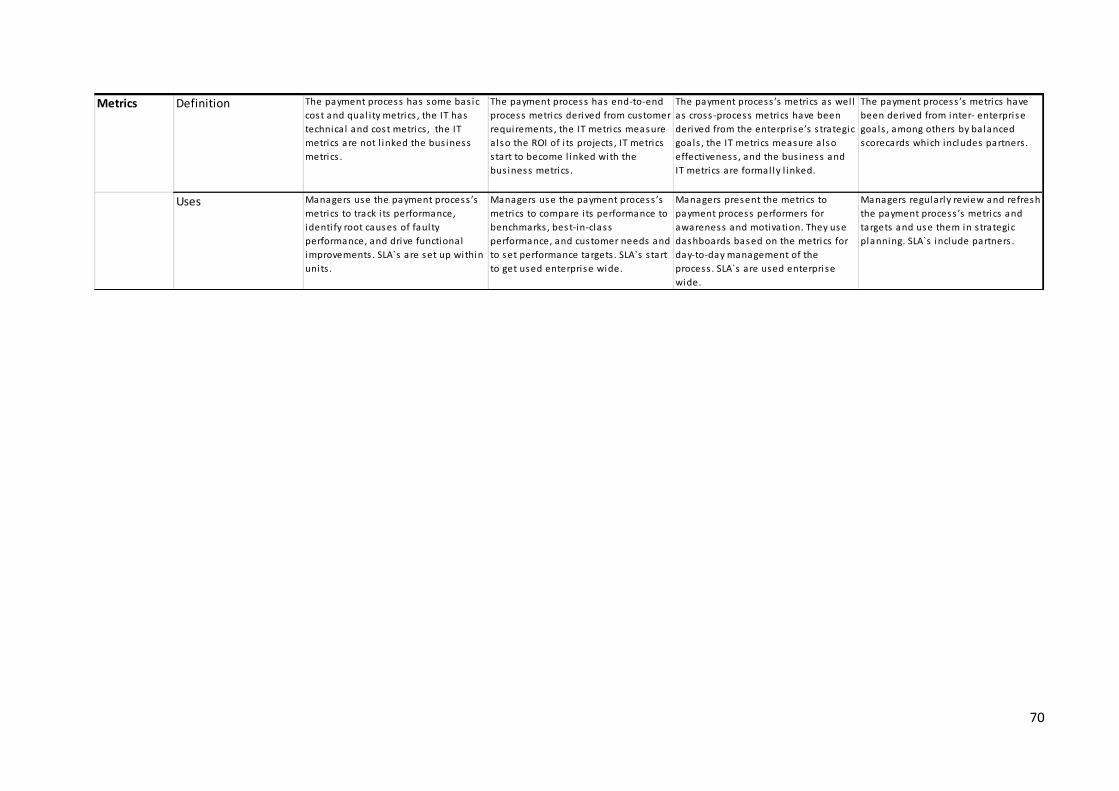
70
Metrics Definition The payment process has some bas ic
cost and qual i ty metrics , the IT has
technica l and cost metrics , the IT
metrics are not l inked the bus iness
metrics .
The payment process has end-to-end
process metrics derived from customer
requirements , the IT metrics measure
a lso the ROI of i ts projects , IT metrics
s tart to become l inked with the
bus iness metrics .
The payment process ’s metrics as wel l
as cross-process metrics have been
derived from the enterprise’s s trategic
goals , the IT metrics measure a lso
effectiveness , and the bus iness and
IT metrics are formal ly l inked.
The payment process ’s metrics have
been derived from inter- enterprise
goals , among others by balanced
scorecards which includes partners .
Uses Managers use the payment process ’s
metrics to track i ts performance,
identi fy root causes of faulty
performance, and drive functional
improvements . SLA`s are set up within
units .
Managers use the payment process ’s
metrics to compare i ts performance to
benchmarks , best-in-class
performance, and customer needs and
to set performance targets . SLA`s s tart
to get used enterprise wide.
Managers present the metrics to
payment process performers for
awareness and motivation. They use
dashboards based on the metrics for
day-to-day management of the
process . SLA`s are used enterprise
wide.
Managers regularly review and refresh
the payment process ’s metrics and
targets and use them in s trategic
planning. SLA`s include partners .
71
Chapter 4: Empirical Validation
4.1 Introduction
In this chapter we further refine our Payment maturity model through in-depth interviews with
experts. By the end of this chapter we will have updated our model three times. Hence, we
fulfill Becker`s et al. (2009) multi-methodological procedure requirement.
The chapter is organized as follows. First, we give more insight into the followed methodology
regarding the empirical validation. Furthermore, we proceed with the first, second and third
empirical validations and model modifications. Throughout the three empirical validations, we
consistently give an overview of the model modifications the differences with the previous
model.
4.2 Methodology
In order to empirically validate our model and further refine it we choose the qualitative
research design. More specifically, we use in-depth interviews with experts. The reason why we
choose this specific form is because we want to have an in-depth understanding of how we can
improve our model. There exists also the possibility to empirically validate our model through
quantitative research. The positive point of quantitative research is that it can be generalized
while qualitative research is often case-specific and interview depended. However, quantitative
research is much more structured and there is not much flexibility allowed (De Pelsmacker &
Van Kenhove, 2010).
In our case, we need this flexibility since the expert has a much better and deeper knowledge of
the payment processes than the interviewer has. During the in-depth interviews we only use an
interview guide as suggested by De Pelsmacker & Van Kenhove (2010). This interview guide can
be found in Appendix 2. The questions in the interview guide only ensure us that we cover all
the aspects of the model, such as the maturity levels, the enablers and the content. Other than
that, the interview and the expert can give the interview any direction based on their discussion
about the topics on this guide. If we would use a structured questioning methodology we
would risk missing important information of which we were not aware of.
72
With the purpose of increasing the validity of our research we use a purposive sample or more
specifically a judgment sample consisting out of three experts. This kind of sample sets
conditions which the respondents have to meet in order to be selected and is often used when
interviewing experts (De Pelsmacker & Van Kenhove, 2010). In our case, the first condition is
that the respondents should have held multiple senior positions in payments during their
career. The second condition is that the representation of both the nonbank and bank payment
service providers should be ensured. In this way we make our empirical validation less case-
specific. We concretize this by requiring that at least one of the respondents is currently
employed by a nonbank PSP and one by a bank PSP. Hence we choose to interview Francis
Chlarie, Expert X and Expert Y. Francis Chlarie is the Managing Director of Belpay, a consulting
company specialized in payments and also the person on whose behalf we are designing the
model. Expert X holds a management position in a nonbank PSP while Expert Y holds a
management position in a bank PSP.
The empirical validation of our model proceeds as follows. Firstly, we interview Francis Chlarie,
report the results of the interview and update our model. Secondly we sequentially interview
Expert X and Expert Y, report the results of each interview separately and update our model
after the last interview. This second validation permits us to further refine our model using
information from a bank PSP as well as a nonbank PSP. Lastly, we interview Francis Chlarie
again, report the results and modify our model where necessary one last time.
This set up improves the validity of our research in two ways. One by contributing to the
fulfillment of Becker`s et al. (2009) multi-methodological procedure requirement, as stated in
section 0.5. And two by decreasing the interviewer dependency, which is one of the main
disadvantages of in-depth interviews (De Pelsmacker & Van Kenhove, 2010). This set up
decreases the interviewer influence, since the model is checked by another expert (who gets
informed through which modifications the model has been gone) after every update of it
except after the last one.
To conclude, we notice that the analysis of data retrieved from qualitative research is not
obvious, that is why this analysis often happens through content analysis (De Pelsmacker & Van
Kenhove, 2010). This comes down to trying to bring a structure in what you could derive from
the interview. In our case we`ll make summary tables based on our questions of the interview
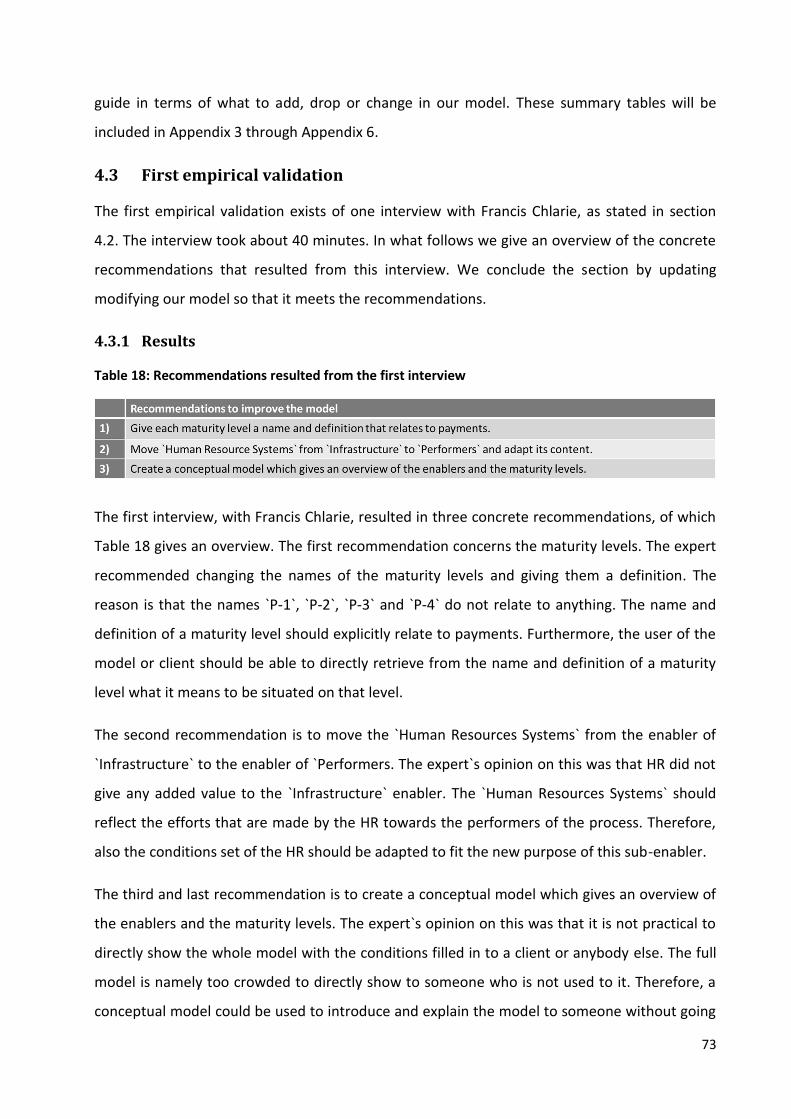
73
guide in terms of what to add, drop or change in our model. These summary tables will be
included in Appendix 3 through Appendix 6.
4.3 First empirical validation
The first empirical validation exists of one interview with Francis Chlarie, as stated in section
4.2. The interview took about 40 minutes. In what follows we give an overview of the concrete
recommendations that resulted from this interview. We conclude the section by updating
modifying our model so that it meets the recommendations.
4.3.1 Results
Table 18: Recommendations resulted from the first interview
The first interview, with Francis Chlarie, resulted in three concrete recommendations, of which
Table 18 gives an overview. The first recommendation concerns the maturity levels. The expert
recommended changing the names of the maturity levels and giving them a definition. The
reason is that the names `P-1`, `P-2`, `P-3` and `P-4` do not relate to anything. The name and
definition of a maturity level should explicitly relate to payments. Furthermore, the user of the
model or client should be able to directly retrieve from the name and definition of a maturity
level what it means to be situated on that level.
The second recommendation is to move the `Human Resources Systems` from the enabler of
`Infrastructure` to the enabler of `Performers. The expert`s opinion on this was that HR did not
give any added value to the `Infrastructure` enabler. The `Human Resources Systems` should
reflect the efforts that are made by the HR towards the performers of the process. Therefore,
also the conditions set of the HR should be adapted to fit the new purpose of this sub-enabler.
The third and last recommendation is to create a conceptual model which gives an overview of
the enablers and the maturity levels. The expert`s opinion on this was that it is not practical to
directly show the whole model with the conditions filled in to a client or anybody else. The full
model is namely too crowded to directly show to someone who is not used to it. Therefore, a
conceptual model could be used to introduce and explain the model to someone without going
74
directly into the details of the conditions. According to the expert, this conceptual model
should include the enablers and the name and definitions of the maturity levels.
4.3.2 Model update
In this part we implement the recommendations of the first empirical validation. We start with
renaming the maturity levels and giving them a payment specific definition. Second, we adapt
the model by moving the `Human Resource Systems` to `Performers` and give an overview of
the updated model. We conclude by giving a conceptual model and updating the definitions of
the enablers.
4.3.2.1 Renaming the maturity levels
In order to find an appropriate name and definition of the maturity levels that relate to
payments we investigate the names and definitions of the maturity levels of the existing
payment maturity models that we described in section 2.2.2. Table 19 gives a comparison of
the levels of these different models. Overall, we find that the levels of the model of Mackman &
Sanders (2009) better fit to our levels. We motivate our choice in detail in the next paragraphs.
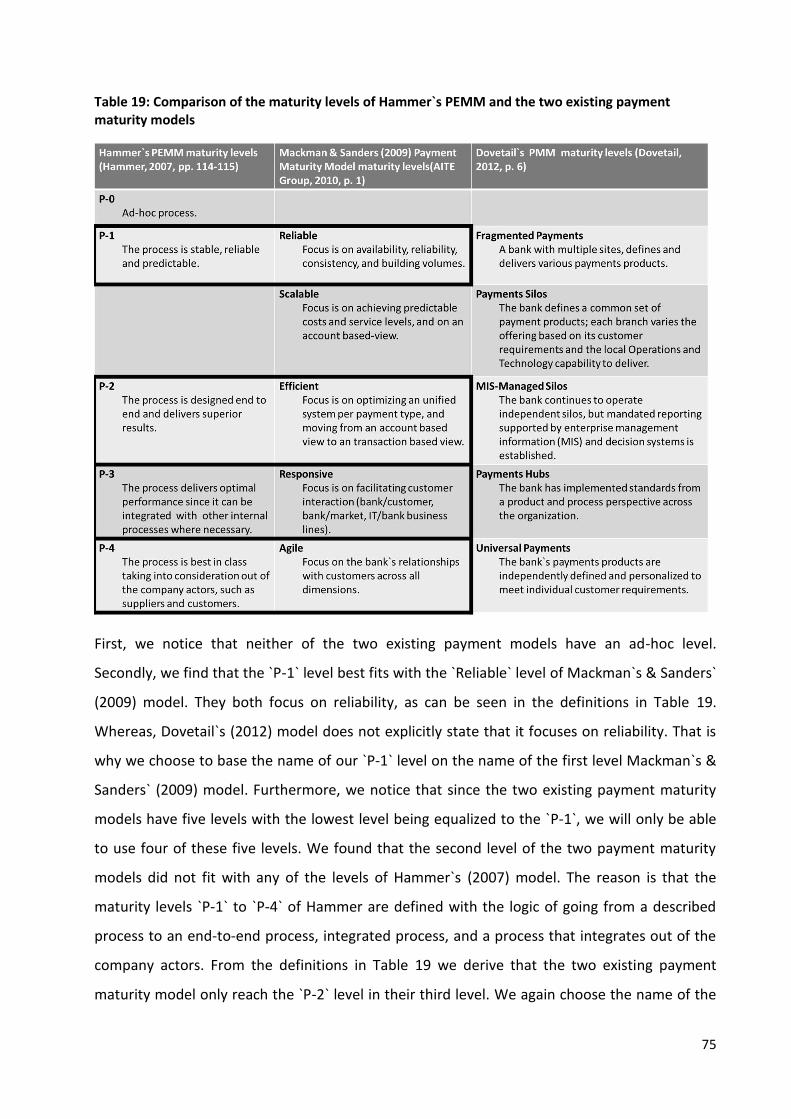
75
Table 19: Comparison of the maturity levels of Hammer`s PEMM and the two existing payment maturity models
First, we notice that neither of the two existing payment models have an ad-hoc level.
Secondly, we find that the `P-1` level best fits with the `Reliable` level of Mackman`s & Sanders`
(2009) model. They both focus on reliability, as can be seen in the definitions in Table 19.
Whereas, Dovetail`s (2012) model does not explicitly state that it focuses on reliability. That is
why we choose to base the name of our `P-1` level on the name of the first level Mackman`s &
Sanders` (2009) model. Furthermore, we notice that since the two existing payment maturity
models have five levels with the lowest level being equalized to the `P-1`, we will only be able
to use four of these five levels. We found that the second level of the two payment maturity
models did not fit with any of the levels of Hammer`s (2007) model. The reason is that the
maturity levels `P-1` to `P-4` of Hammer are defined with the logic of going from a described
process to an end-to-end process, integrated process, and a process that integrates out of the
company actors. From the definitions in Table 19 we derive that the two existing payment
maturity model only reach the `P-2` level in their third level. We again choose the name of the
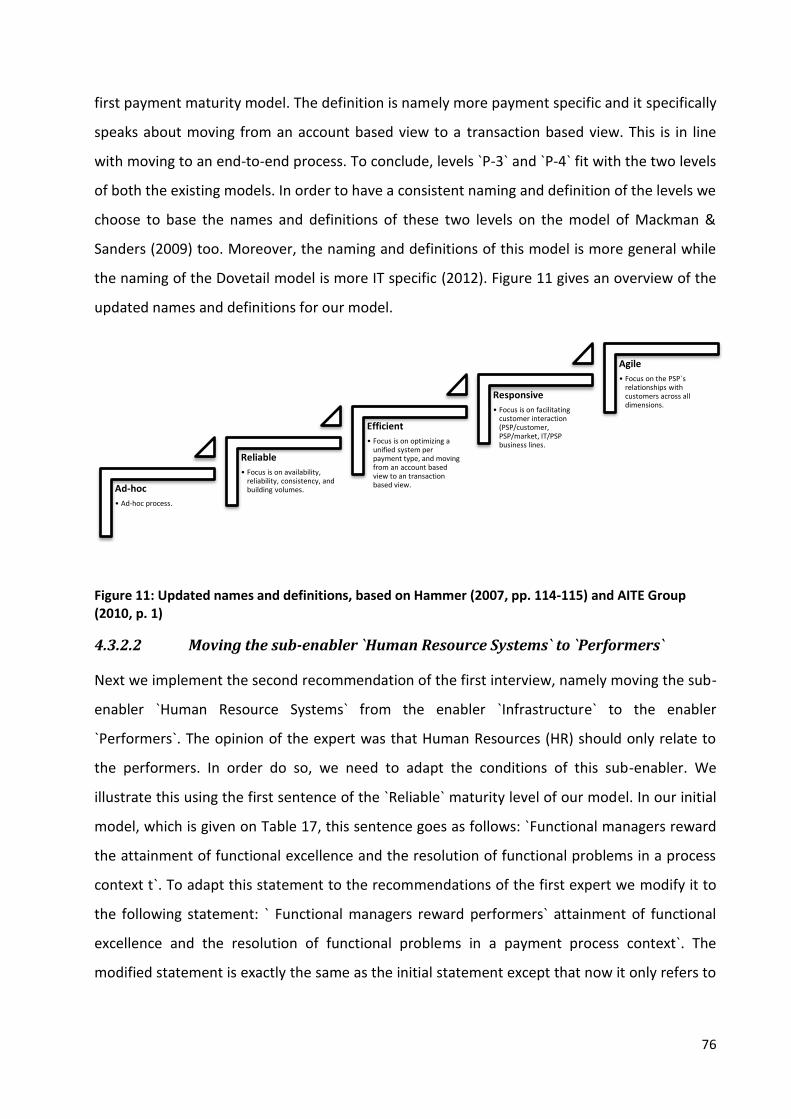
76
first payment maturity model. The definition is namely more payment specific and it specifically
speaks about moving from an account based view to a transaction based view. This is in line
with moving to an end-to-end process. To conclude, levels `P-3` and `P-4` fit with the two levels
of both the existing models. In order to have a consistent naming and definition of the levels we
choose to base the names and definitions of these two levels on the model of Mackman &
Sanders (2009) too. Moreover, the naming and definitions of this model is more general while
the naming of the Dovetail model is more IT specific (2012). Figure 11 gives an overview of the
updated names and definitions for our model.
Figure 11: Updated names and definitions, based on Hammer (2007, pp. 114-115) and AITE Group (2010, p. 1)
4.3.2.2 Moving the sub-enabler `Human Resource Systems` to `Performers`
Next we implement the second recommendation of the first interview, namely moving the sub-
enabler `Human Resource Systems` from the enabler `Infrastructure` to the enabler
`Performers`. The opinion of the expert was that Human Resources (HR) should only relate to
the performers. In order do so, we need to adapt the conditions of this sub-enabler. We
illustrate this using the first sentence of the `Reliable` maturity level of our model. In our initial
model, which is given on Table 17, this sentence goes as follows: `Functional managers reward
the attainment of functional excellence and the resolution of functional problems in a process
context t`. To adapt this statement to the recommendations of the first expert we modify it to
the following statement: ` Functional managers reward performers` attainment of functional
excellence and the resolution of functional problems in a payment process context`. The
modified statement is exactly the same as the initial statement except that now it only refers to
Ad-hoc
• Ad-hoc process.
Reliable
• Focus is on availability, reliability, consistency, and building volumes.
Efficient
• Focus is on optimizing a unified system per payment type, and moving from an account based view to an transaction based view.
Responsive
• Focus is on facilitating customer interaction (PSP/customer, PSP/market, IT/PSP business lines.
Agile
• Focus on the PSP`s relationships with customers across all dimensions.

77
the performers. We do this for all the statements of the `Human Resource Systems`. The result
of this modification can be found on Table 20.
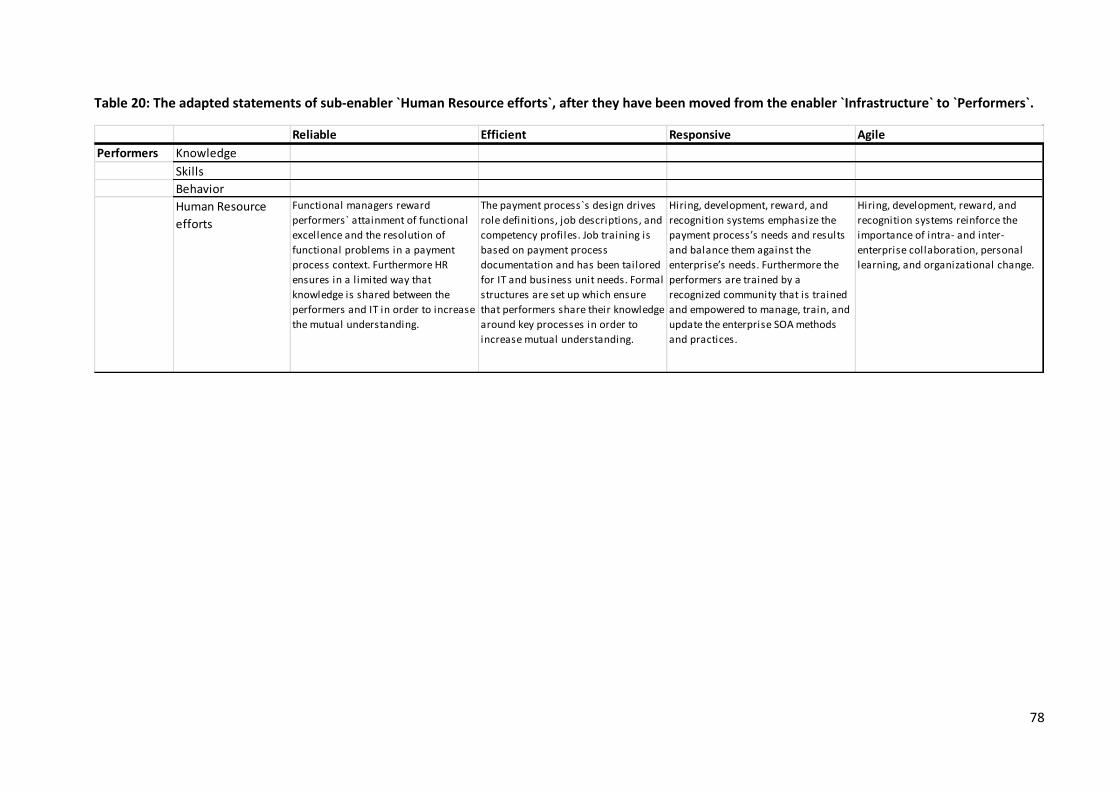
78
Table 20: The adapted statements of sub-enabler `Human Resource efforts`, after they have been moved from the enabler `Infrastructure` to `Performers`.
Reliable Efficient Responsive Agile
Performers Knowledge
Skills
Behavior
Human Resource
efforts
Functional managers reward
performers` attainment of functional
excellence and the resolution of
functional problems in a payment
process context. Furthermore HR
ensures in a l imited way that
knowledge is shared between the
performers and IT in order to increase
the mutual understanding.
The payment process`s design drives
role definitions, job descriptions, and
competency profiles. Job training is
based on payment process
documentation and has been tailored
for IT and business unit needs. Formal
structures are set up which ensure
that performers share their knowledge
around key processes in order to
increase mutual understanding.
Hiring, development, reward, and
recognition systems emphasize the
payment process’s needs and results
and balance them against the
enterprise’s needs. Furthermore the
performers are trained by a
recognized community that is trained
and empowered to manage, train, and
update the enterprise SOA methods
and practices.
Hiring, development, reward, and
recognition systems reinforce the
importance of intra- and inter-
enterprise collaboration, personal
learning, and organizational change.
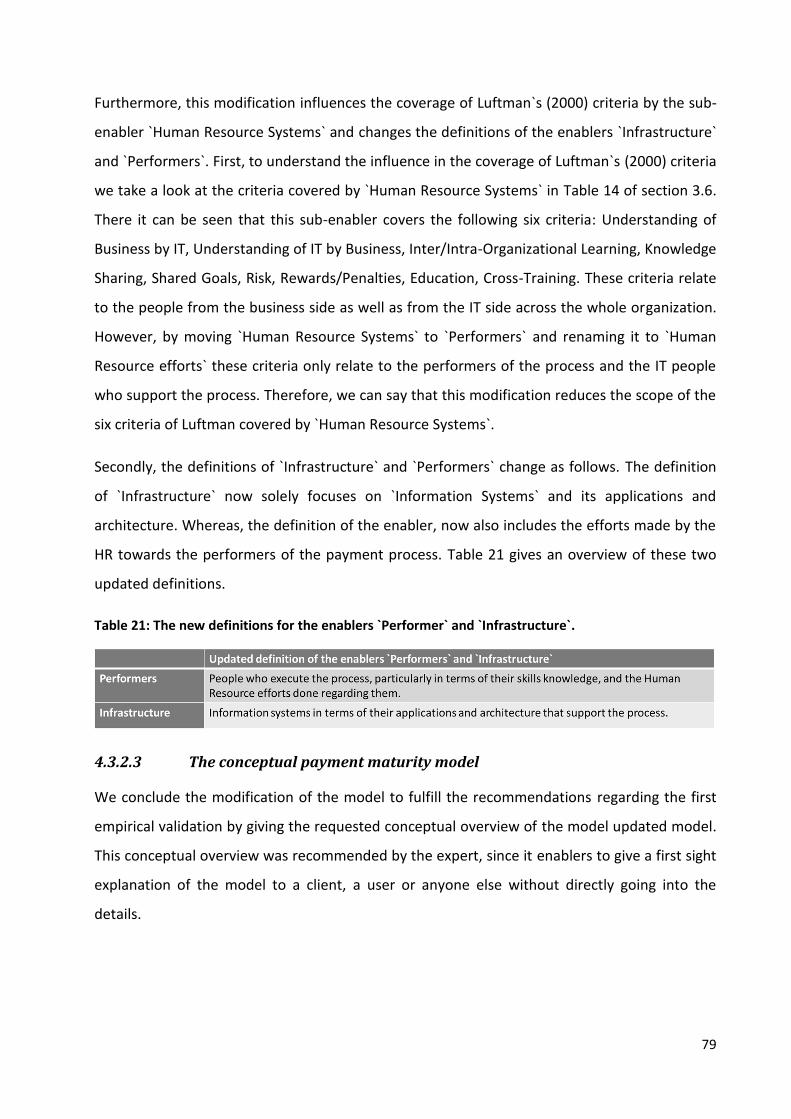
79
Furthermore, this modification influences the coverage of Luftman`s (2000) criteria by the sub-
enabler `Human Resource Systems` and changes the definitions of the enablers `Infrastructure`
and `Performers`. First, to understand the influence in the coverage of Luftman`s (2000) criteria
we take a look at the criteria covered by `Human Resource Systems` in Table 14 of section 3.6.
There it can be seen that this sub-enabler covers the following six criteria: Understanding of
Business by IT, Understanding of IT by Business, Inter/Intra-Organizational Learning, Knowledge
Sharing, Shared Goals, Risk, Rewards/Penalties, Education, Cross-Training. These criteria relate
to the people from the business side as well as from the IT side across the whole organization.
However, by moving `Human Resource Systems` to `Performers` and renaming it to `Human
Resource efforts` these criteria only relate to the performers of the process and the IT people
who support the process. Therefore, we can say that this modification reduces the scope of the
six criteria of Luftman covered by `Human Resource Systems`.
Secondly, the definitions of `Infrastructure` and `Performers` change as follows. The definition
of `Infrastructure` now solely focuses on `Information Systems` and its applications and
architecture. Whereas, the definition of the enabler, now also includes the efforts made by the
HR towards the performers of the payment process. Table 21 gives an overview of these two
updated definitions.
Table 21: The new definitions for the enablers `Performer` and `Infrastructure`.
4.3.2.3 The conceptual payment maturity model
We conclude the modification of the model to fulfill the recommendations regarding the first
empirical validation by giving the requested conceptual overview of the model updated model.
This conceptual overview was recommended by the expert, since it enablers to give a first sight
explanation of the model to a client, a user or anyone else without directly going into the
details.
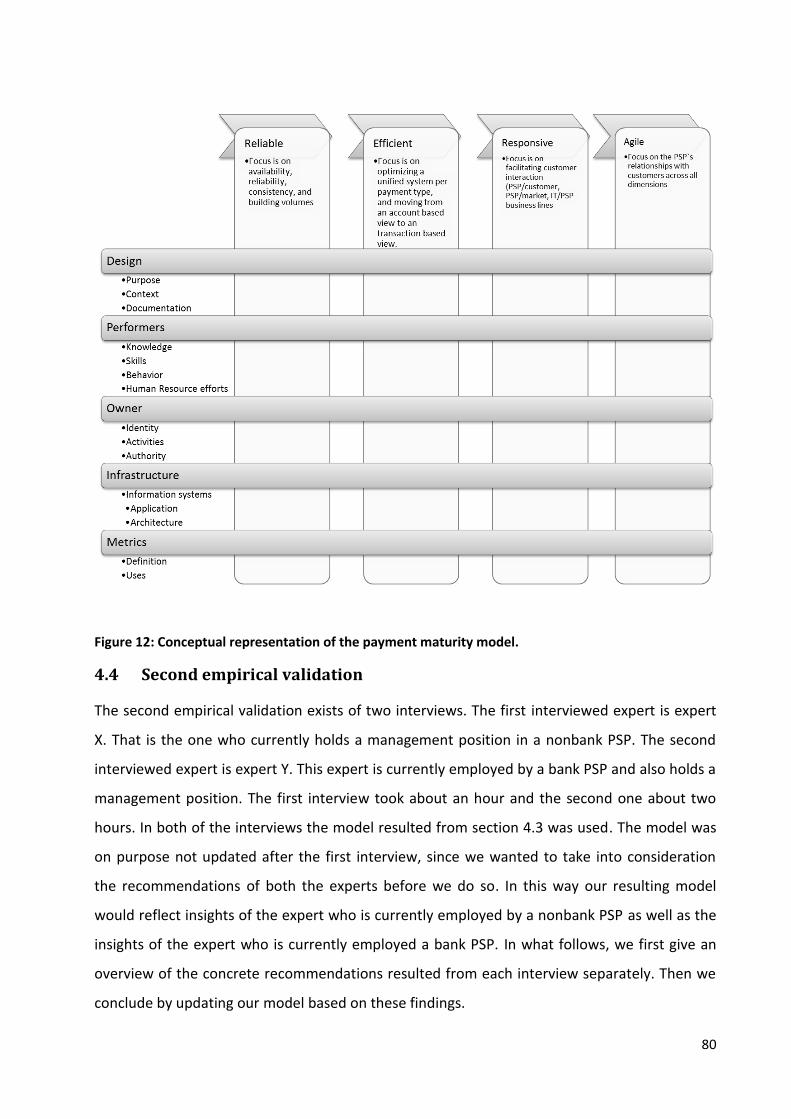
80
Figure 12: Conceptual representation of the payment maturity model.
4.4 Second empirical validation
The second empirical validation exists of two interviews. The first interviewed expert is expert
X. That is the one who currently holds a management position in a nonbank PSP. The second
interviewed expert is expert Y. This expert is currently employed by a bank PSP and also holds a
management position. The first interview took about an hour and the second one about two
hours. In both of the interviews the model resulted from section 4.3 was used. The model was
on purpose not updated after the first interview, since we wanted to take into consideration
the recommendations of both the experts before we do so. In this way our resulting model
would reflect insights of the expert who is currently employed by a nonbank PSP as well as the
insights of the expert who is currently employed a bank PSP. In what follows, we first give an
overview of the concrete recommendations resulted from each interview separately. Then we
conclude by updating our model based on these findings.
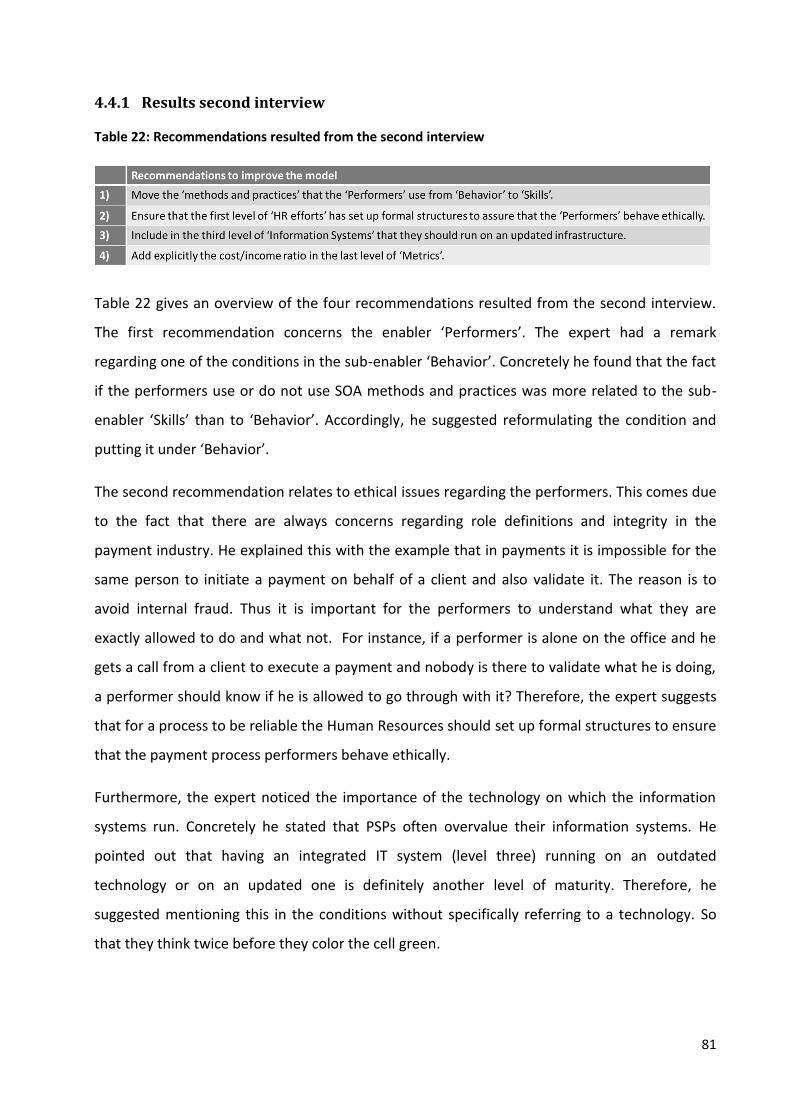
81
4.4.1 Results second interview
Table 22: Recommendations resulted from the second interview
Table 22 gives an overview of the four recommendations resulted from the second interview.
The first recommendation concerns the enabler ‘Performers’. The expert had a remark
regarding one of the conditions in the sub-enabler ‘Behavior’. Concretely he found that the fact
if the performers use or do not use SOA methods and practices was more related to the sub-
enabler ‘Skills’ than to ‘Behavior’. Accordingly, he suggested reformulating the condition and
putting it under ‘Behavior’.
The second recommendation relates to ethical issues regarding the performers. This comes due
to the fact that there are always concerns regarding role definitions and integrity in the
payment industry. He explained this with the example that in payments it is impossible for the
same person to initiate a payment on behalf of a client and also validate it. The reason is to
avoid internal fraud. Thus it is important for the performers to understand what they are
exactly allowed to do and what not. For instance, if a performer is alone on the office and he
gets a call from a client to execute a payment and nobody is there to validate what he is doing,
a performer should know if he is allowed to go through with it? Therefore, the expert suggests
that for a process to be reliable the Human Resources should set up formal structures to ensure
that the payment process performers behave ethically.
Furthermore, the expert noticed the importance of the technology on which the information
systems run. Concretely he stated that PSPs often overvalue their information systems. He
pointed out that having an integrated IT system (level three) running on an outdated
technology or on an updated one is definitely another level of maturity. Therefore, he
suggested mentioning this in the conditions without specifically referring to a technology. So
that they think twice before they color the cell green.
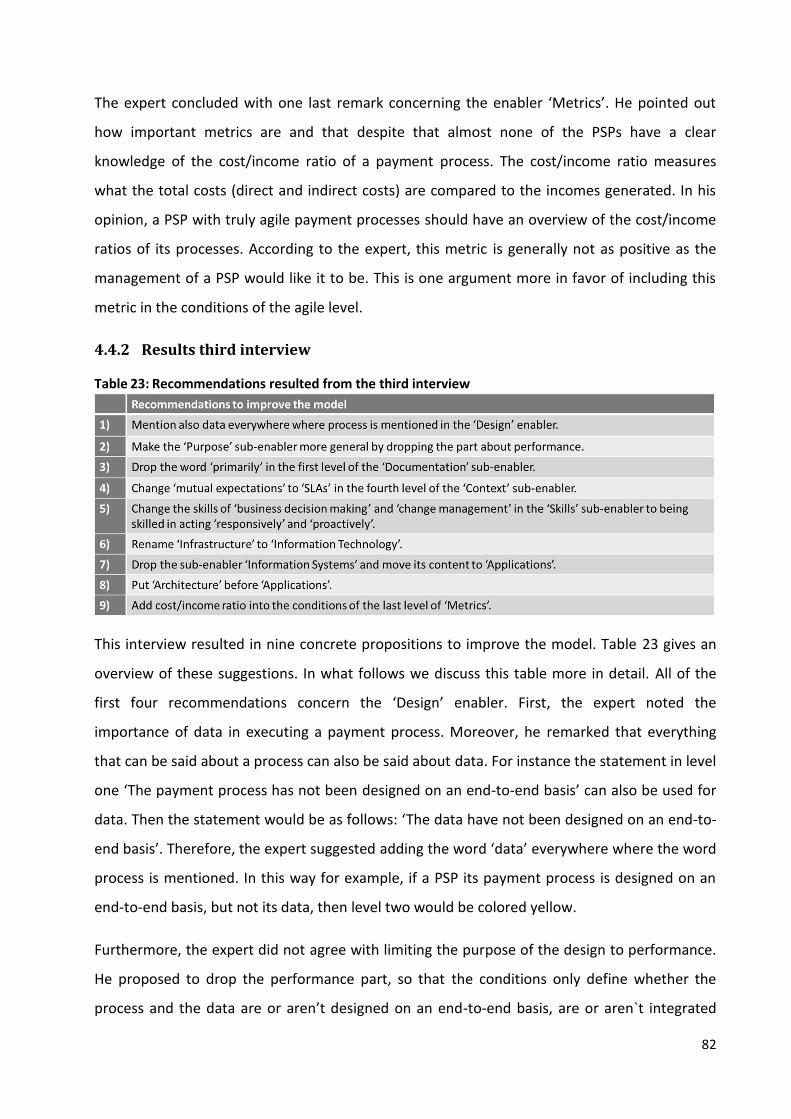
82
The expert concluded with one last remark concerning the enabler ‘Metrics’. He pointed out
how important metrics are and that despite that almost none of the PSPs have a clear
knowledge of the cost/income ratio of a payment process. The cost/income ratio measures
what the total costs (direct and indirect costs) are compared to the incomes generated. In his
opinion, a PSP with truly agile payment processes should have an overview of the cost/income
ratios of its processes. According to the expert, this metric is generally not as positive as the
management of a PSP would like it to be. This is one argument more in favor of including this
metric in the conditions of the agile level.
4.4.2 Results third interview
Table 23: Recommendations resulted from the third interview
This interview resulted in nine concrete propositions to improve the model. Table 23 gives an
overview of these suggestions. In what follows we discuss this table more in detail. All of the
first four recommendations concern the ‘Design’ enabler. First, the expert noted the
importance of data in executing a payment process. Moreover, he remarked that everything
that can be said about a process can also be said about data. For instance the statement in level
one ‘The payment process has not been designed on an end-to-end basis’ can also be used for
data. Then the statement would be as follows: ‘The data have not been designed on an end-to-
end basis’. Therefore, the expert suggested adding the word ‘data’ everywhere where the word
process is mentioned. In this way for example, if a PSP its payment process is designed on an
end-to-end basis, but not its data, then level two would be colored yellow.
Furthermore, the expert did not agree with limiting the purpose of the design to performance.
He proposed to drop the performance part, so that the conditions only define whether the
process and the data are or aren’t designed on an end-to-end basis, are or aren`t integrated
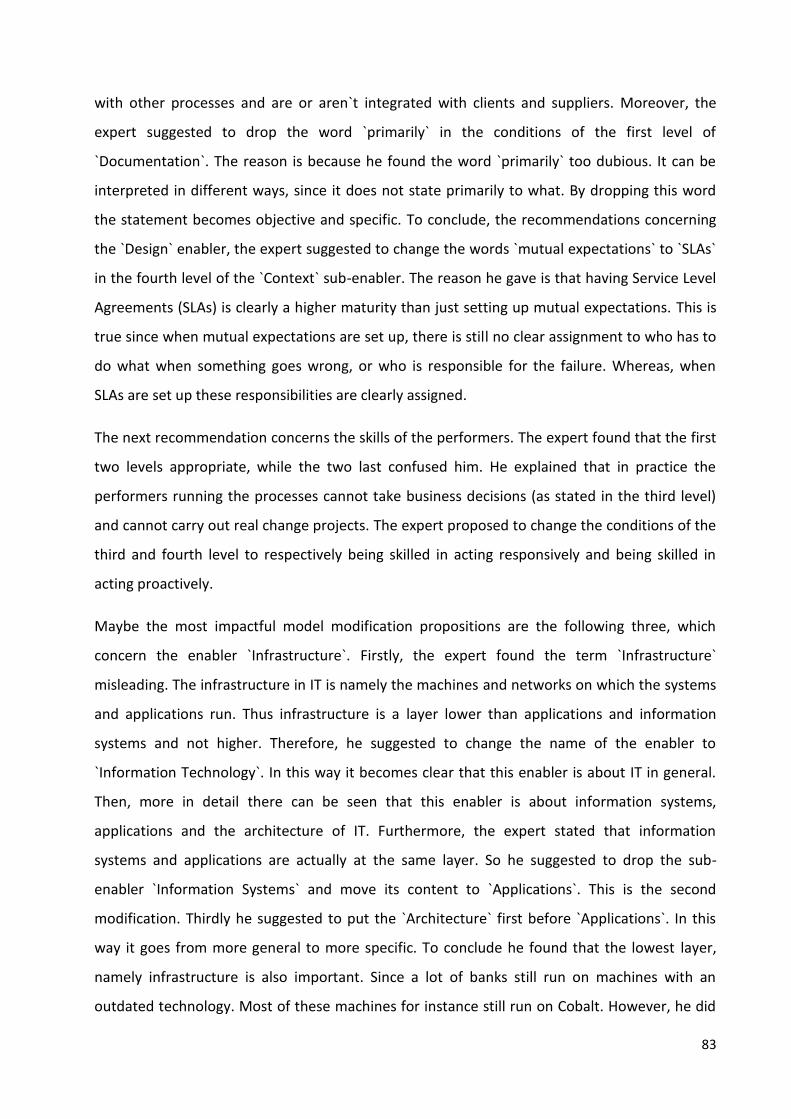
83
with other processes and are or aren`t integrated with clients and suppliers. Moreover, the
expert suggested to drop the word `primarily` in the conditions of the first level of
`Documentation`. The reason is because he found the word `primarily` too dubious. It can be
interpreted in different ways, since it does not state primarily to what. By dropping this word
the statement becomes objective and specific. To conclude, the recommendations concerning
the `Design` enabler, the expert suggested to change the words `mutual expectations` to `SLAs`
in the fourth level of the `Context` sub-enabler. The reason he gave is that having Service Level
Agreements (SLAs) is clearly a higher maturity than just setting up mutual expectations. This is
true since when mutual expectations are set up, there is still no clear assignment to who has to
do what when something goes wrong, or who is responsible for the failure. Whereas, when
SLAs are set up these responsibilities are clearly assigned.
The next recommendation concerns the skills of the performers. The expert found that the first
two levels appropriate, while the two last confused him. He explained that in practice the
performers running the processes cannot take business decisions (as stated in the third level)
and cannot carry out real change projects. The expert proposed to change the conditions of the
third and fourth level to respectively being skilled in acting responsively and being skilled in
acting proactively.
Maybe the most impactful model modification propositions are the following three, which
concern the enabler `Infrastructure`. Firstly, the expert found the term `Infrastructure`
misleading. The infrastructure in IT is namely the machines and networks on which the systems
and applications run. Thus infrastructure is a layer lower than applications and information
systems and not higher. Therefore, he suggested to change the name of the enabler to
`Information Technology`. In this way it becomes clear that this enabler is about IT in general.
Then, more in detail there can be seen that this enabler is about information systems,
applications and the architecture of IT. Furthermore, the expert stated that information
systems and applications are actually at the same layer. So he suggested to drop the sub-
enabler `Information Systems` and move its content to `Applications`. This is the second
modification. Thirdly he suggested to put the `Architecture` first before `Applications`. In this
way it goes from more general to more specific. To conclude he found that the lowest layer,
namely infrastructure is also important. Since a lot of banks still run on machines with an
outdated technology. Most of these machines for instance still run on Cobalt. However, he did
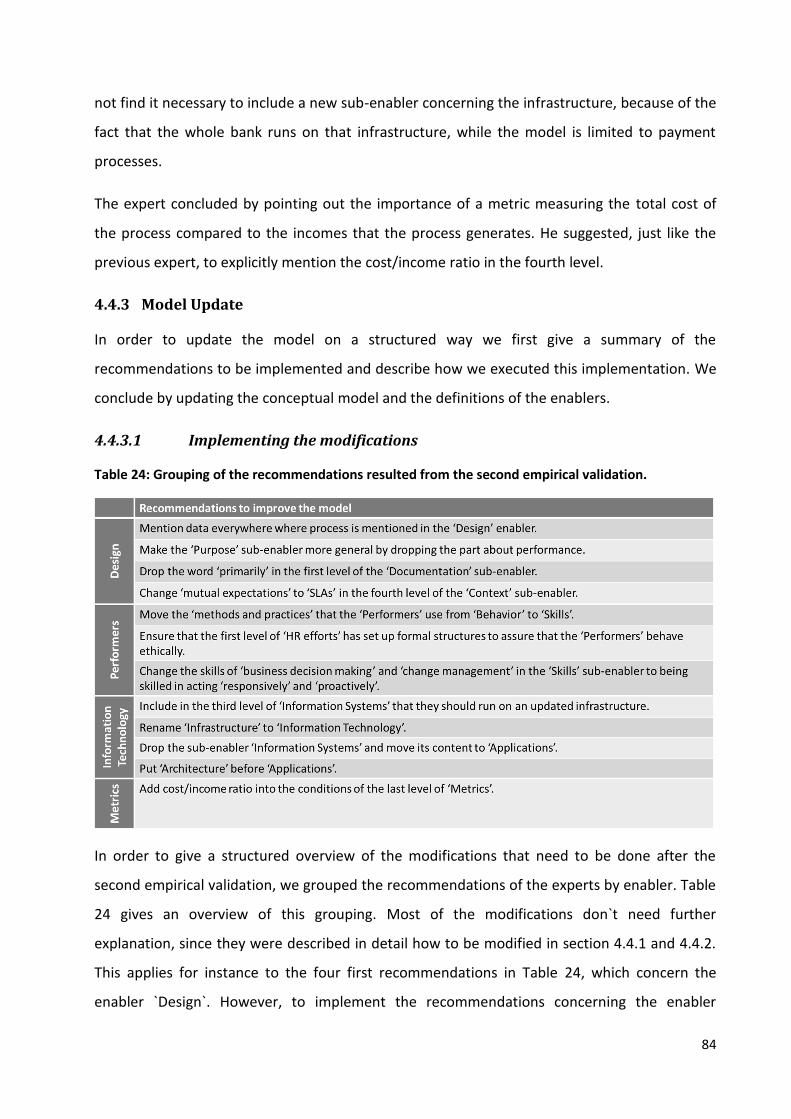
84
not find it necessary to include a new sub-enabler concerning the infrastructure, because of the
fact that the whole bank runs on that infrastructure, while the model is limited to payment
processes.
The expert concluded by pointing out the importance of a metric measuring the total cost of
the process compared to the incomes that the process generates. He suggested, just like the
previous expert, to explicitly mention the cost/income ratio in the fourth level.
4.4.3 Model Update
In order to update the model on a structured way we first give a summary of the
recommendations to be implemented and describe how we executed this implementation. We
conclude by updating the conceptual model and the definitions of the enablers.
4.4.3.1 Implementing the modifications
Table 24: Grouping of the recommendations resulted from the second empirical validation.
In order to give a structured overview of the modifications that need to be done after the
second empirical validation, we grouped the recommendations of the experts by enabler. Table
24 gives an overview of this grouping. Most of the modifications don`t need further
explanation, since they were described in detail how to be modified in section 4.4.1 and 4.4.2.
This applies for instance to the four first recommendations in Table 24, which concern the
enabler `Design`. However, to implement the recommendations concerning the enabler
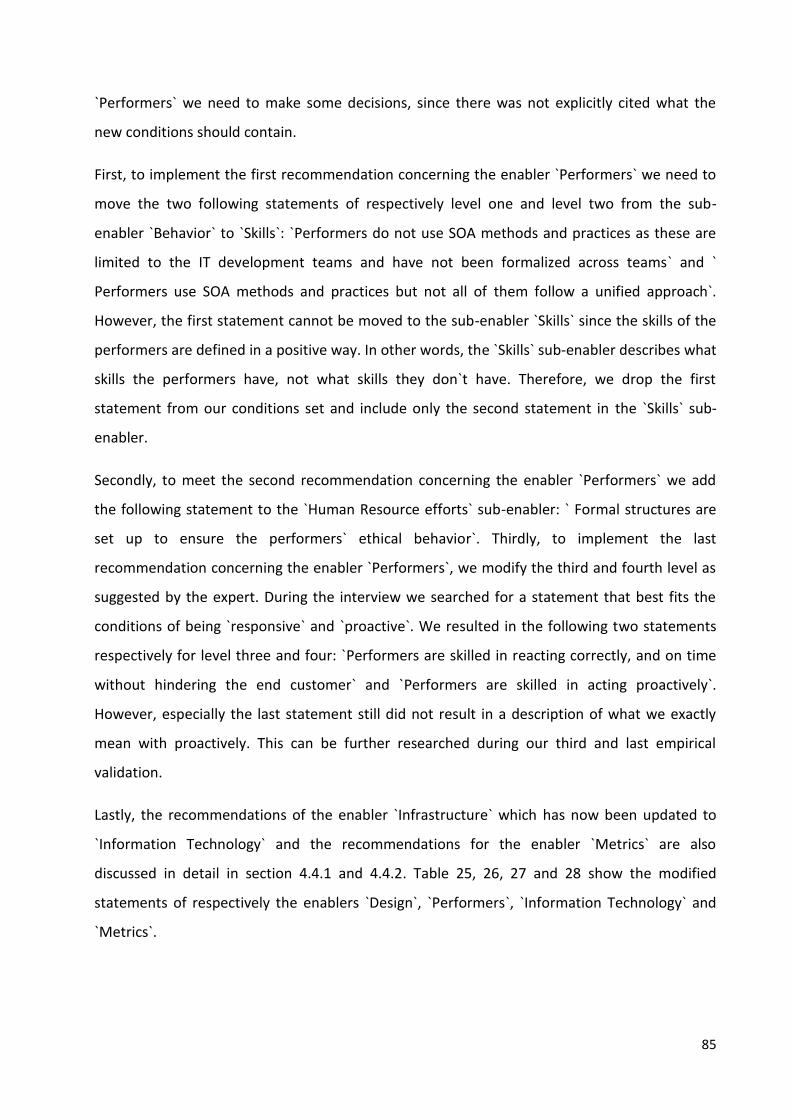
85
`Performers` we need to make some decisions, since there was not explicitly cited what the
new conditions should contain.
First, to implement the first recommendation concerning the enabler `Performers` we need to
move the two following statements of respectively level one and level two from the sub-
enabler `Behavior` to `Skills`: `Performers do not use SOA methods and practices as these are
limited to the IT development teams and have not been formalized across teams` and `
Performers use SOA methods and practices but not all of them follow a unified approach`.
However, the first statement cannot be moved to the sub-enabler `Skills` since the skills of the
performers are defined in a positive way. In other words, the `Skills` sub-enabler describes what
skills the performers have, not what skills they don`t have. Therefore, we drop the first
statement from our conditions set and include only the second statement in the `Skills` sub-
enabler.
Secondly, to meet the second recommendation concerning the enabler `Performers` we add
the following statement to the `Human Resource efforts` sub-enabler: ` Formal structures are
set up to ensure the performers` ethical behavior`. Thirdly, to implement the last
recommendation concerning the enabler `Performers`, we modify the third and fourth level as
suggested by the expert. During the interview we searched for a statement that best fits the
conditions of being `responsive` and `proactive`. We resulted in the following two statements
respectively for level three and four: `Performers are skilled in reacting correctly, and on time
without hindering the end customer` and `Performers are skilled in acting proactively`.
However, especially the last statement still did not result in a description of what we exactly
mean with proactively. This can be further researched during our third and last empirical
validation.
Lastly, the recommendations of the enabler `Infrastructure` which has now been updated to
`Information Technology` and the recommendations for the enabler `Metrics` are also
discussed in detail in section 4.4.1 and 4.4.2. Table 25, 26, 27 and 28 show the modified
statements of respectively the enablers `Design`, `Performers`, `Information Technology` and
`Metrics`.
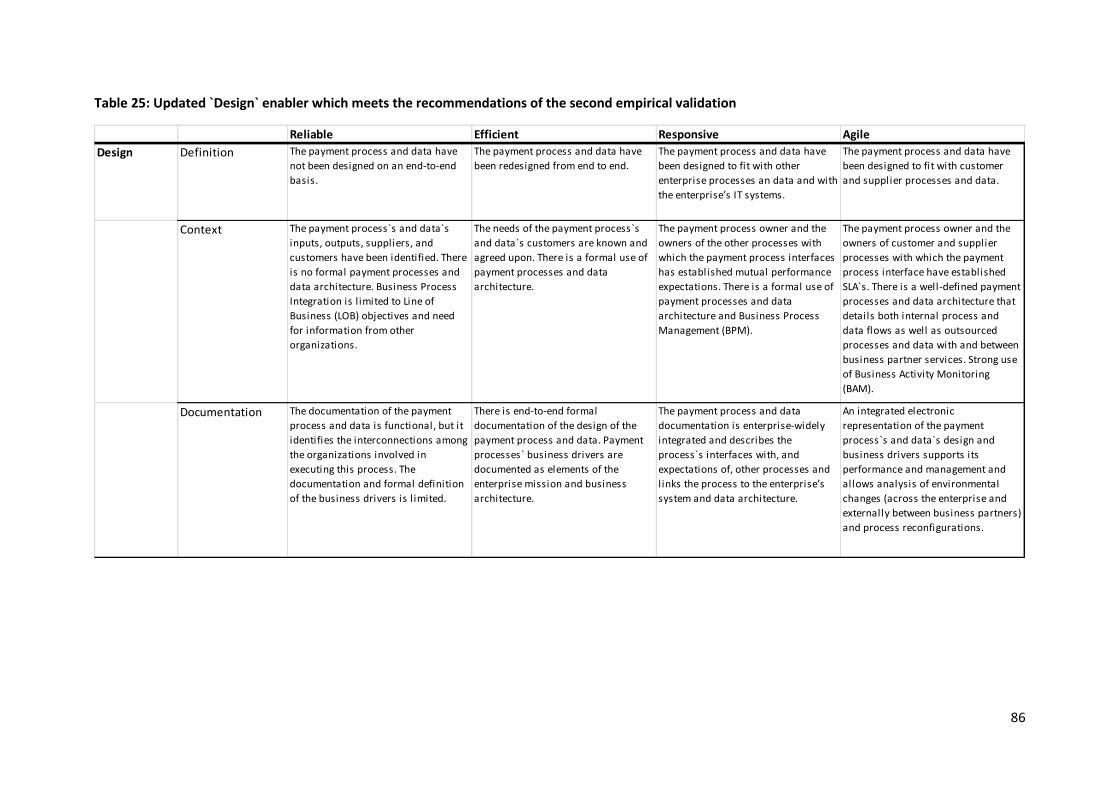
86
Table 25: Updated `Design` enabler which meets the recommendations of the second empirical validation
Reliable Efficient Responsive Agile
Design Definition The payment process and data have
not been designed on an end-to-end
basis.
The payment process and data have
been redesigned from end to end.
The payment process and data have
been designed to fit with other
enterprise processes an data and with
the enterprise’s IT systems.
The payment process and data have
been designed to fit with customer
and supplier processes and data.
Context The payment process`s and data`s
inputs, outputs, suppliers, and
customers have been identified. There
is no formal payment processes and
data architecture. Business Process
Integration is l imited to Line of
Business (LOB) objectives and need
for information from other
organizations.
The needs of the payment process`s
and data`s customers are known and
agreed upon. There is a formal use of
payment processes and data
architecture.
The payment process owner and the
owners of the other processes with
which the payment process interfaces
has established mutual performance
expectations. There is a formal use of
payment processes and data
architecture and Business Process
Management (BPM).
The payment process owner and the
owners of customer and supplier
processes with which the payment
process interface have established
SLA`s. There is a well-defined payment
processes and data architecture that
details both internal process and
data flows as well as outsourced
processes and data with and between
business partner services. Strong use
of Business Activity Monitoring
(BAM).
Documentation The documentation of the payment
process and data is functional, but it
identifies the interconnections among
the organizations involved in
executing this process. The
documentation and formal definition
of the business drivers is l imited.
There is end-to-end formal
documentation of the design of the
payment process and data. Payment
processes` business drivers are
documented as elements of the
enterprise mission and business
architecture.
The payment process and data
documentation is enterprise-widely
integrated and describes the
process`s interfaces with, and
expectations of, other processes and
l inks the process to the enterprise’s
system and data architecture.
An integrated electronic
representation of the payment
process`s and data`s design and
business drivers supports its
performance and management and
allows analysis of environmental
changes (across the enterprise and
externally between business partners)
and process reconfigurations.
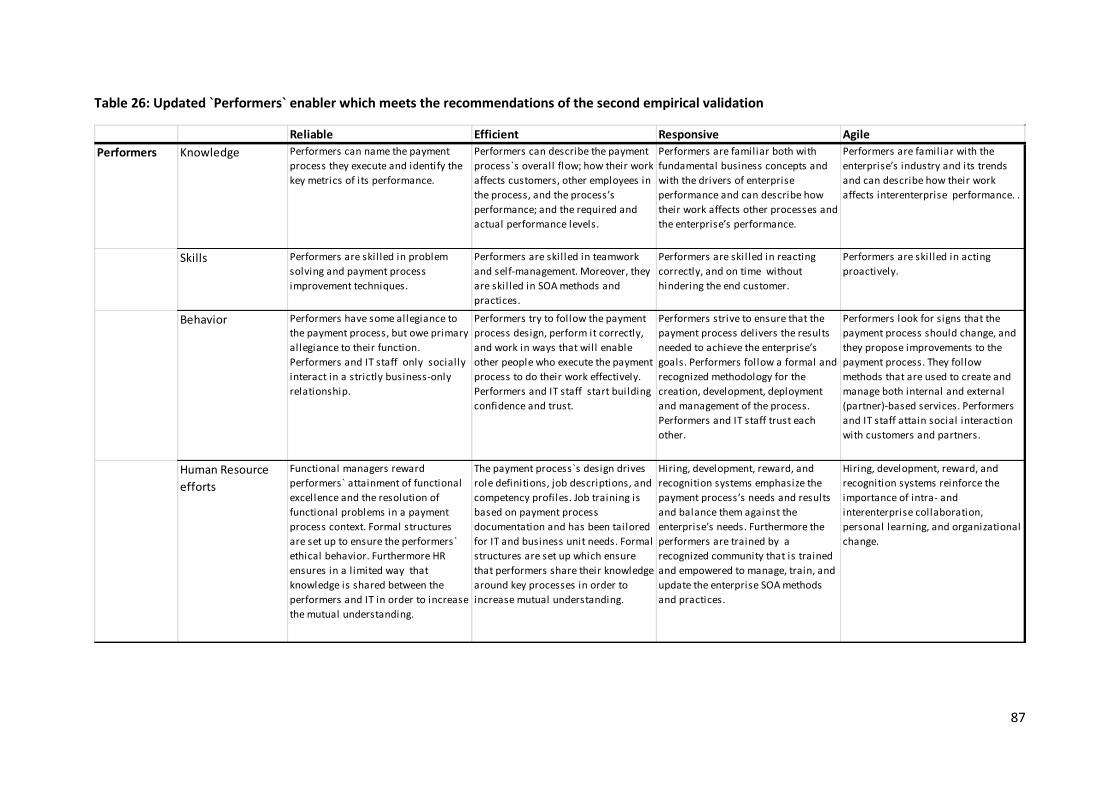
87
Table 26: Updated `Performers` enabler which meets the recommendations of the second empirical validation
Reliable Efficient Responsive Agile
Performers Knowledge Performers can name the payment
process they execute and identify the
key metrics of its performance.
Performers can describe the payment
process`s overall flow; how their work
affects customers, other employees in
the process, and the process’s
performance; and the required and
actual performance levels.
Performers are familiar both with
fundamental business concepts and
with the drivers of enterprise
performance and can describe how
their work affects other processes and
the enterprise’s performance.
Performers are familiar with the
enterprise’s industry and its trends
and can describe how their work
affects interenterprise performance. .
Skills Performers are skil led in problem
solving and payment process
improvement techniques.
Performers are skil led in teamwork
and self-management. Moreover, they
are skil led in SOA methods and
practices.
Performers are skil led in reacting
correctly, and on time without
hindering the end customer.
Performers are skil led in acting
proactively.
Behavior Performers have some allegiance to
the payment process, but owe primary
allegiance to their function.
Performers and IT staff only socially
interact in a strictly business-only
relationship.
Performers try to follow the payment
process design, perform it correctly,
and work in ways that will enable
other people who execute the payment
process to do their work effectively.
Performers and IT staff start building
confidence and trust.
Performers strive to ensure that the
payment process delivers the results
needed to achieve the enterprise’s
goals. Performers follow a formal and
recognized methodology for the
creation, development, deployment
and management of the process.
Performers and IT staff trust each
other.
Performers look for signs that the
payment process should change, and
they propose improvements to the
payment process. They follow
methods that are used to create and
manage both internal and external
(partner)-based services. Performers
and IT staff attain social interaction
with customers and partners.
Human Resource
efforts
Functional managers reward
performers` attainment of functional
excellence and the resolution of
functional problems in a payment
process context. Formal structures
are set up to ensure the performers`
ethical behavior. Furthermore HR
ensures in a l imited way that
knowledge is shared between the
performers and IT in order to increase
the mutual understanding.
The payment process`s design drives
role definitions, job descriptions, and
competency profiles. Job training is
based on payment process
documentation and has been tailored
for IT and business unit needs. Formal
structures are set up which ensure
that performers share their knowledge
around key processes in order to
increase mutual understanding.
Hiring, development, reward, and
recognition systems emphasize the
payment process’s needs and results
and balance them against the
enterprise’s needs. Furthermore the
performers are trained by a
recognized community that is trained
and empowered to manage, train, and
update the enterprise SOA methods
and practices.
Hiring, development, reward, and
recognition systems reinforce the
importance of intra- and
interenterprise collaboration,
personal learning, and organizational
change.
88
Table 27: Updated `Information Technology` enabler which meets the recommendations of the second empirical validation
Reliable Efficient Responsive Agile
Information
Technology
Architecture Limited use of formal SOA methods
and practices can be
observed.Methods and practices are
limited to integration between
applications or systems.
Formal SOA methods and practices
are employed across the enterprise
supported by a formal governance
process. Applications and services
are designed using formal SOA
principles and patterns.
Enterprise frameworks and practices
supported by the use of a formal SOA
method and reference architectures
across the enterprise. A formal
enterprise business information
model is evolving.
Service components are designed
using formal methods, practices, and
frameworks that promote the reuse of
assets. Formal enterprise-wide
business information services have
been developed and deployed.
Applications Fragmented legacy IT systems support
the payment process. Application
architectures and topologies are
monolithic with minimal separation
of concerns between architectural
layers or application tiers.
Applications use minimal integration
between other systems. Integration is
usually implemented using point-to-
point techniques.
An IT system constructed from
functional components supports the
payment process. Service components
of application architectures employ
SOA patterns such as separation of
concerns between logical and
physical layers of the presentation
and business logic. Service
integration is achieved using an
Enterprise Service Bus (ESB) in some
but not all business units.
An integrated IT system which runs on
an updated infrastructure, designed
with the processes in mind and
adhering to enterprise standards,
supports the payment process.
Application architectures are
designed with a separation of
concerns at the logical and physical
layers. ESB integration patterns are
used to support application and
process integration to achieve
sharing of services.
An IT system with a modular
architecture that adheres to industry
standards for inter-enterprise
communication supports the payment
process. Application architecture is
decoupled from infrastructure
components. Extensive use of ESB
architecture patterns to support
Business Process Management (BPM).
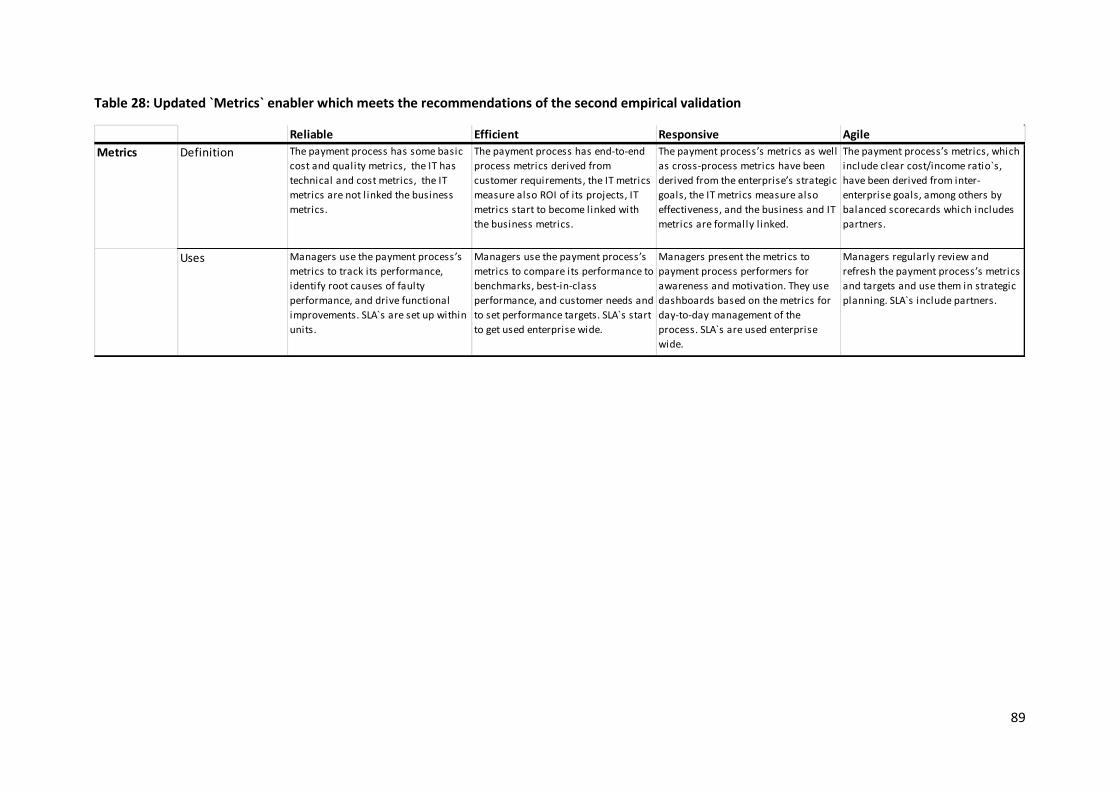
89
Table 28: Updated `Metrics` enabler which meets the recommendations of the second empirical validation
Reliable Efficient Responsive Agile
Metrics Definition The payment process has some basic
cost and quality metrics, the IT has
technical and cost metrics, the IT
metrics are not l inked the business
metrics.
The payment process has end-to-end
process metrics derived from
customer requirements, the IT metrics
measure also ROI of its projects, IT
metrics start to become linked with
the business metrics.
The payment process’s metrics as well
as cross-process metrics have been
derived from the enterprise’s strategic
goals, the IT metrics measure also
effectiveness, and the business and IT
metrics are formally l inked.
The payment process’s metrics, which
include clear cost/income ratio`s,
have been derived from inter-
enterprise goals, among others by
balanced scorecards which includes
partners.
Uses Managers use the payment process’s
metrics to track its performance,
identify root causes of faulty
performance, and drive functional
improvements. SLA`s are set up within
units.
Managers use the payment process’s
metrics to compare its performance to
benchmarks, best-in-class
performance, and customer needs and
to set performance targets. SLA`s start
to get used enterprise wide.
Managers present the metrics to
payment process performers for
awareness and motivation. They use
dashboards based on the metrics for
day-to-day management of the
process. SLA`s are used enterprise
wide.
Managers regularly review and
refresh the payment process’s metrics
and targets and use them in strategic
planning. SLA`s include partners.
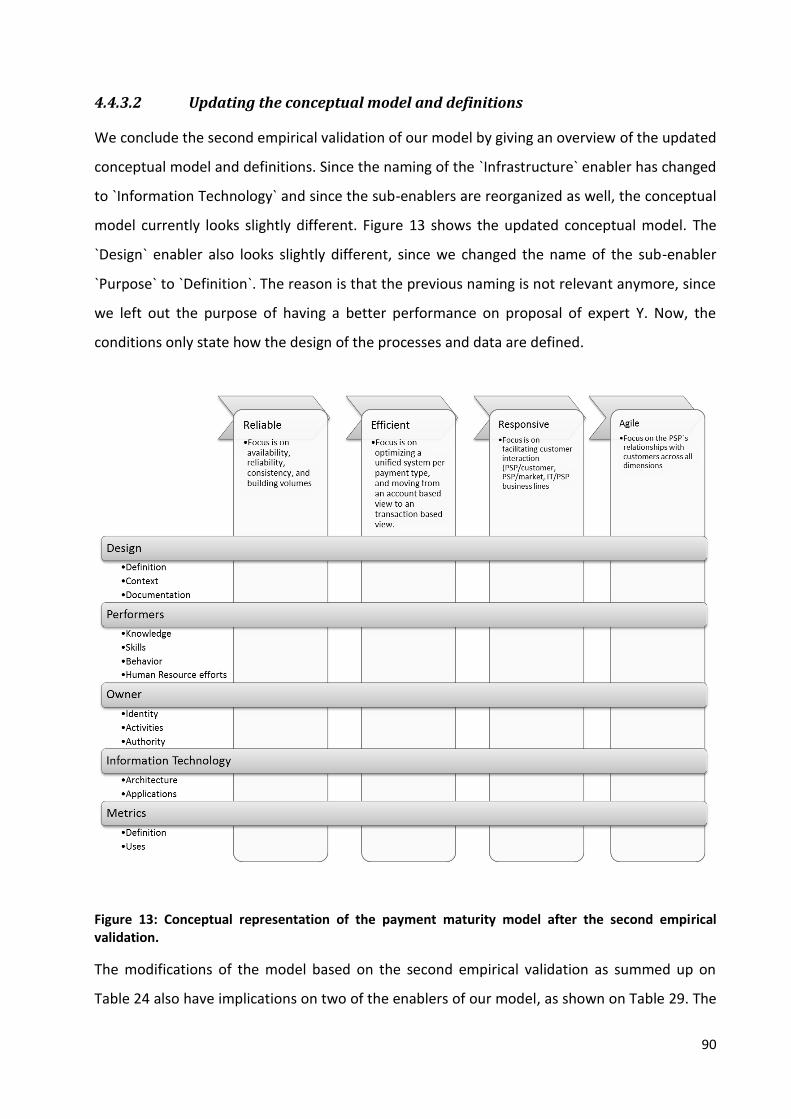
90
4.4.3.2 Updating the conceptual model and definitions
We conclude the second empirical validation of our model by giving an overview of the updated
conceptual model and definitions. Since the naming of the `Infrastructure` enabler has changed
to `Information Technology` and since the sub-enablers are reorganized as well, the conceptual
model currently looks slightly different. Figure 13 shows the updated conceptual model. The
`Design` enabler also looks slightly different, since we changed the name of the sub-enabler
`Purpose` to `Definition`. The reason is that the previous naming is not relevant anymore, since
we left out the purpose of having a better performance on proposal of expert Y. Now, the
conditions only state how the design of the processes and data are defined.
Figure 13: Conceptual representation of the payment maturity model after the second empirical validation.
The modifications of the model based on the second empirical validation as summed up on
Table 24 also have implications on two of the enablers of our model, as shown on Table 29. The
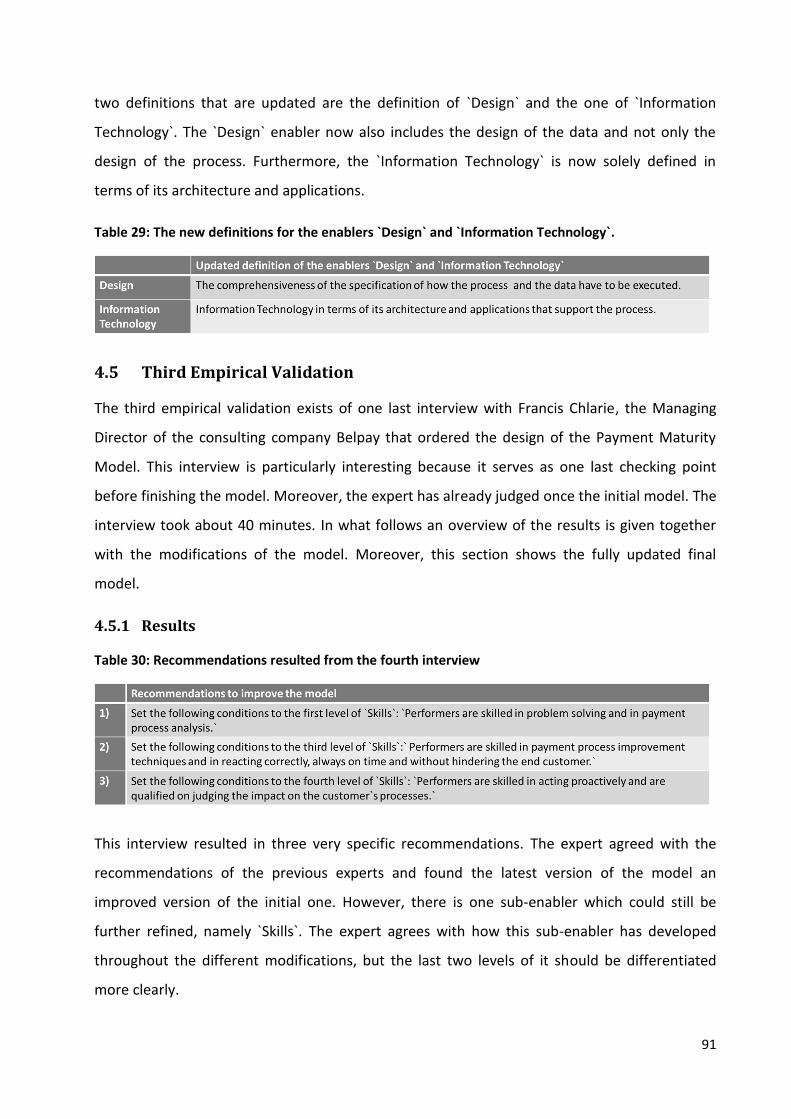
91
two definitions that are updated are the definition of `Design` and the one of `Information
Technology`. The `Design` enabler now also includes the design of the data and not only the
design of the process. Furthermore, the `Information Technology` is now solely defined in
terms of its architecture and applications.
Table 29: The new definitions for the enablers `Design` and `Information Technology`.
4.5 Third Empirical Validation
The third empirical validation exists of one last interview with Francis Chlarie, the Managing
Director of the consulting company Belpay that ordered the design of the Payment Maturity
Model. This interview is particularly interesting because it serves as one last checking point
before finishing the model. Moreover, the expert has already judged once the initial model. The
interview took about 40 minutes. In what follows an overview of the results is given together
with the modifications of the model. Moreover, this section shows the fully updated final
model.
4.5.1 Results
Table 30: Recommendations resulted from the fourth interview
This interview resulted in three very specific recommendations. The expert agreed with the
recommendations of the previous experts and found the latest version of the model an
improved version of the initial one. However, there is one sub-enabler which could still be
further refined, namely `Skills`. The expert agrees with how this sub-enabler has developed
throughout the different modifications, but the last two levels of it should be differentiated
more clearly.
92
Moreover, he found that the description of the first level does not fit in the row anymore. The
conditions of the first level should be rewritten as shown on the first line of Table 30. Thus to
meet the first level, the performers should only be skilled in payment process analysis and not
in payment process improvement techniques. The performers should only be required to be
skilled in payment process improvement techniques to meet the third level. Thus the third level
should be expanded with this extra condition. Therefore, the conditions set of this level for
`Skills` should be as shown on the second line of Table 30.
To clearly differentiate the agile level with the responsive level, the performers of the agile
level should also be able to judge the impact on the customer processes. This is in line with the
rest of the model and the definition of this level which underlines the importance of the
relationship with the customer. The expert gave the example that it often happens that the PSP
resolves an issue without taking into account the impact of it on the payment process on the
customer`s side. For instance, performing a process in another way could change the sequence
of the steps that the customer has to take in order to execute a payment, which could be
experienced as disturbing.
4.5.2 Model Update
The modifications needed to fulfill the recommendations of the third empirical validation are
very straight forward, since the needed modifications are practically cited in Table 30. That is
why there is no overview of the modifications given in this section. Instead, the final model that
resulted from the three empirical validations together is outlined. A full overview of the final
enablers` definitions and of the conceptual model is also given. Table 31 shows the final model.
All the modifications that were done throughout this chapter on the initial payment maturity
model of chapter 3 are implemented in this version.
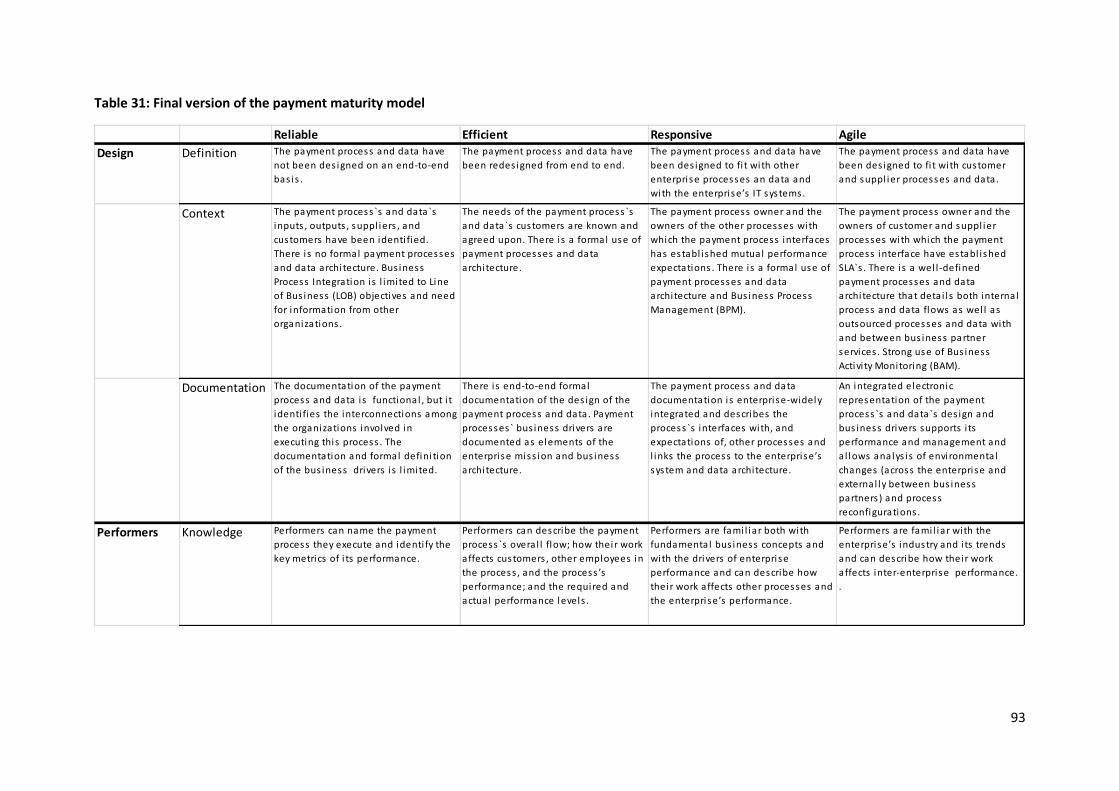
93
Table 31: Final version of the payment maturity model
Reliable Efficient Responsive Agile
Design Definition The payment process and data have
not been des igned on an end-to-end
bas is .
The payment process and data have
been redes igned from end to end.
The payment process and data have
been des igned to fi t with other
enterprise processes an data and
with the enterprise’s IT systems.
The payment process and data have
been des igned to fi t with customer
and suppl ier processes and data.
Context The payment process `s and data`s
inputs , outputs , suppl iers , and
customers have been identi fied.
There is no formal payment processes
and data architecture. Bus iness
Process Integration is l imited to Line
of Bus iness (LOB) objectives and need
for information from other
organizations .
The needs of the payment process `s
and data`s customers are known and
agreed upon. There is a formal use of
payment processes and data
architecture.
The payment process owner and the
owners of the other processes with
which the payment process interfaces
has establ ished mutual performance
expectations . There is a formal use of
payment processes and data
architecture and Bus iness Process
Management (BPM).
The payment process owner and the
owners of customer and suppl ier
processes with which the payment
process interface have establ ished
SLA`s . There is a wel l -defined
payment processes and data
architecture that detai l s both internal
process and data flows as wel l as
outsourced processes and data with
and between bus iness partner
services . Strong use of Bus iness
Activi ty Monitoring (BAM).
Documentation The documentation of the payment
process and data i s functional , but i t
identi fies the interconnections among
the organizations involved in
executing this process . The
documentation and formal defini tion
of the bus iness drivers i s l imited.
There is end-to-end formal
documentation of the des ign of the
payment process and data. Payment
processes` bus iness drivers are
documented as elements of the
enterprise miss ion and bus iness
architecture.
The payment process and data
documentation is enterprise-widely
integrated and describes the
process `s interfaces with, and
expectations of, other processes and
l inks the process to the enterprise’s
system and data architecture.
An integrated electronic
representation of the payment
process `s and data`s des ign and
bus iness drivers supports i ts
performance and management and
a l lows analys is of environmental
changes (across the enterprise and
external ly between bus iness
partners ) and process
reconfigurations .
Performers Knowledge Performers can name the payment
process they execute and identi fy the
key metrics of i ts performance.
Performers can describe the payment
process `s overa l l flow; how their work
affects customers , other employees in
the process , and the process ’s
performance; and the required and
actual performance levels .
Performers are fami l iar both with
fundamental bus iness concepts and
with the drivers of enterprise
performance and can describe how
their work affects other processes and
the enterprise’s performance.
Performers are fami l iar with the
enterprise’s industry and i ts trends
and can describe how their work
affects inter-enterprise performance.
.
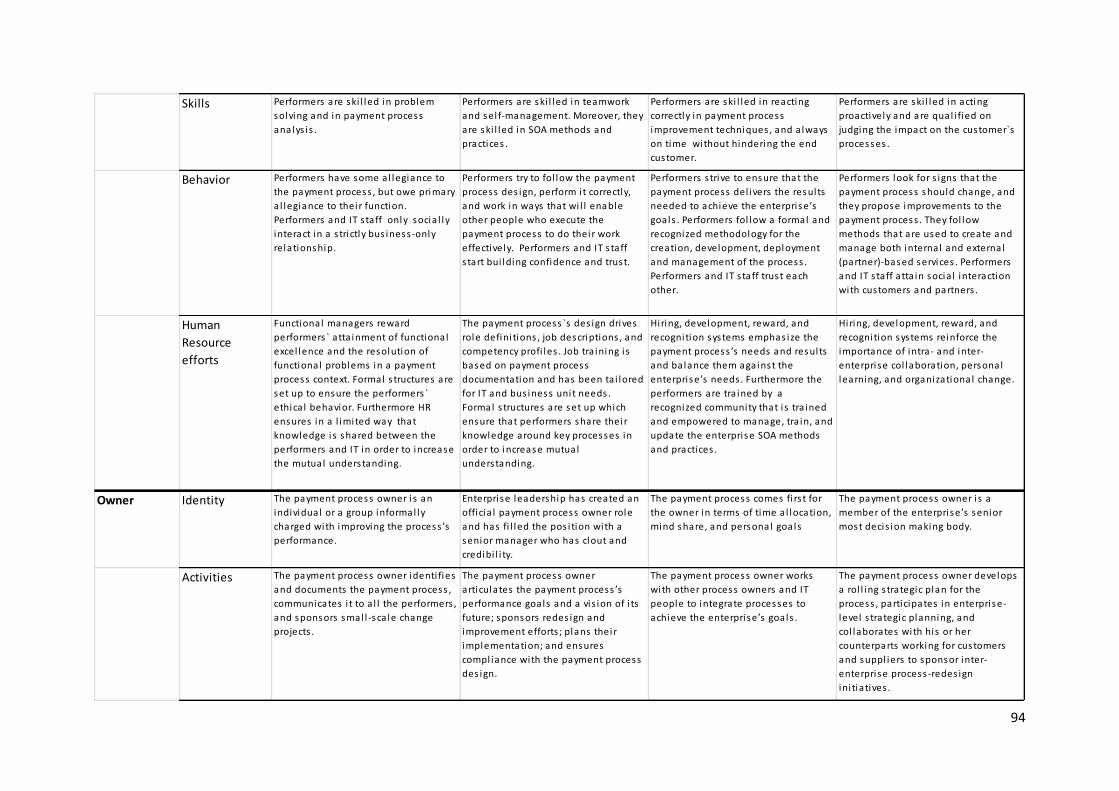
94
Skills Performers are ski l led in problem
solving and in payment process
analys is .
Performers are ski l led in teamwork
and sel f-management. Moreover, they
are ski l led in SOA methods and
practices .
Performers are ski l led in reacting
correctly in payment process
improvement techniques , and a lways
on time without hindering the end
customer.
Performers are ski l led in acting
proactively and are qual i fied on
judging the impact on the customer`s
processes .
Behavior Performers have some a l legiance to
the payment process , but owe primary
a l legiance to their function.
Performers and IT s taff only socia l ly
interact in a s trictly bus iness-only
relationship.
Performers try to fol low the payment
process des ign, perform i t correctly,
and work in ways that wi l l enable
other people who execute the
payment process to do their work
effectively. Performers and IT s taff
s tart bui lding confidence and trust.
Performers s trive to ensure that the
payment process del ivers the results
needed to achieve the enterprise’s
goals . Performers fol low a formal and
recognized methodology for the
creation, development, deployment
and management of the process .
Performers and IT s taff trust each
other.
Performers look for s igns that the
payment process should change, and
they propose improvements to the
payment process . They fol low
methods that are used to create and
manage both internal and external
(partner)-based services . Performers
and IT s taff atta in socia l interaction
with customers and partners .
Human
Resource
efforts
Functional managers reward
performers ` atta inment of functional
excel lence and the resolution of
functional problems in a payment
process context. Formal s tructures are
set up to ensure the performers `
ethica l behavior. Furthermore HR
ensures in a l imited way that
knowledge is shared between the
performers and IT in order to increase
the mutual understanding.
The payment process `s des ign drives
role defini tions , job descriptions , and
competency profi les . Job tra ining is
based on payment process
documentation and has been ta i lored
for IT and bus iness unit needs .
Formal s tructures are set up which
ensure that performers share their
knowledge around key processes in
order to increase mutual
understanding.
Hiring, development, reward, and
recognition systems emphas ize the
payment process ’s needs and results
and balance them against the
enterprise’s needs . Furthermore the
performers are tra ined by a
recognized community that i s tra ined
and empowered to manage, tra in, and
update the enterprise SOA methods
and practices .
Hiring, development, reward, and
recognition systems reinforce the
importance of intra- and inter-
enterprise col laboration, personal
learning, and organizational change.
Owner Identity The payment process owner i s an
individual or a group informal ly
charged with improving the process ’s
performance.
Enterprise leadership has created an
officia l payment process owner role
and has fi l led the pos i tion with a
senior manager who has clout and
credibi l i ty.
The payment process comes fi rs t for
the owner in terms of time a l location,
mind share, and personal goals
The payment process owner i s a
member of the enterprise’s senior
most decis ion making body.
Activities The payment process owner identi fies
and documents the payment process ,
communicates i t to a l l the performers ,
and sponsors smal l -sca le change
projects .
The payment process owner
articulates the payment process ’s
performance goals and a vis ion of i ts
future; sponsors redes ign and
improvement efforts ; plans their
implementation; and ensures
compl iance with the payment process
des ign.
The payment process owner works
with other process owners and IT
people to integrate processes to
achieve the enterprise’s goals .
The payment process owner develops
a rol l ing s trategic plan for the
process , participates in enterprise-
level s trategic planning, and
col laborates with his or her
counterparts working for customers
and suppl iers to sponsor inter-
enterprise process-redes ign
ini tiatives .
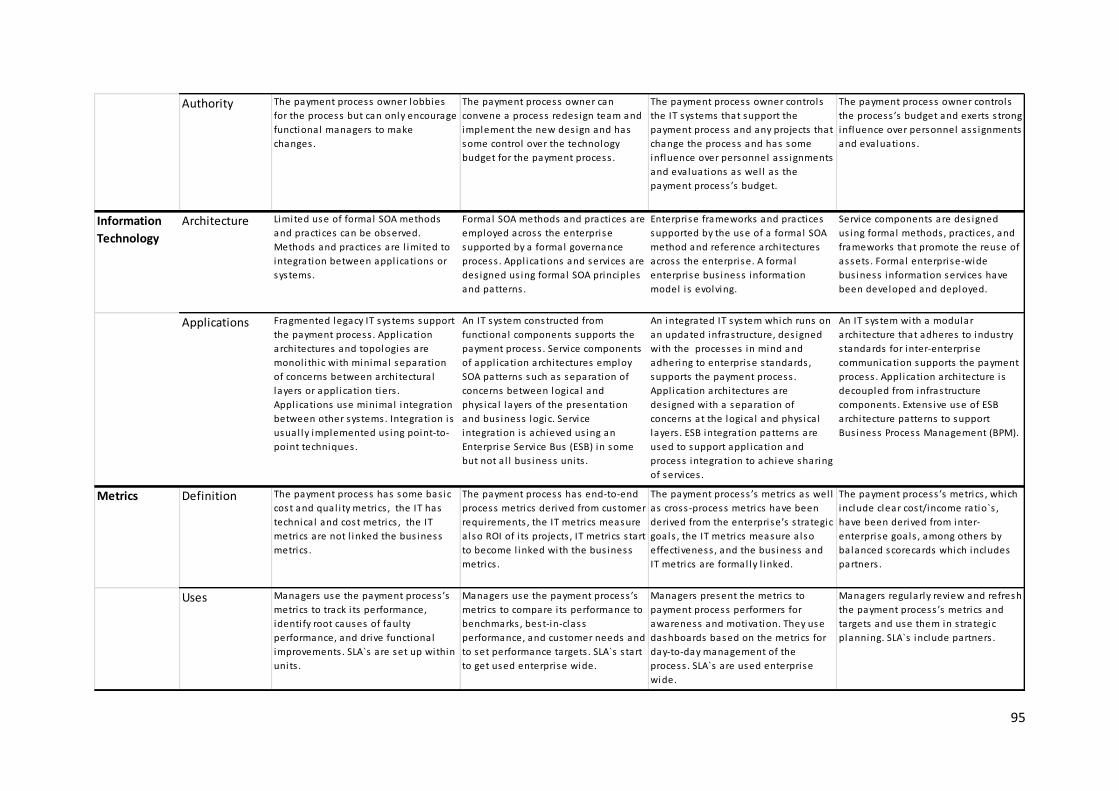
95
Authority The payment process owner lobbies
for the process but can only encourage
functional managers to make
changes .
The payment process owner can
convene a process redes ign team and
implement the new des ign and has
some control over the technology
budget for the payment process .
The payment process owner controls
the IT systems that support the
payment process and any projects that
change the process and has some
influence over personnel ass ignments
and evaluations as wel l as the
payment process ’s budget.
The payment process owner controls
the process ’s budget and exerts s trong
influence over personnel ass ignments
and evaluations .
Information
Technology
Architecture Limited use of formal SOA methods
and practices can be observed.
Methods and practices are l imited to
integration between appl ications or
systems.
Formal SOA methods and practices are
employed across the enterprise
supported by a formal governance
process . Appl ications and services are
des igned us ing formal SOA principles
and patterns .
Enterprise frameworks and practices
supported by the use of a formal SOA
method and reference architectures
across the enterprise. A formal
enterprise bus iness information
model i s evolving.
Service components are des igned
us ing formal methods , practices , and
frameworks that promote the reuse of
assets . Formal enterprise-wide
bus iness information services have
been developed and deployed.
Applications Fragmented legacy IT systems support
the payment process . Appl ication
architectures and topologies are
monol i thic with minimal separation
of concerns between architectura l
layers or appl ication tiers .
Appl ications use minimal integration
between other systems. Integration is
usual ly implemented us ing point-to-
point techniques .
An IT system constructed from
functional components supports the
payment process . Service components
of appl ication architectures employ
SOA patterns such as separation of
concerns between logica l and
phys ica l layers of the presentation
and bus iness logic. Service
integration is achieved us ing an
Enterprise Service Bus (ESB) in some
but not a l l bus iness units .
An integrated IT system which runs on
an updated infrastructure, des igned
with the processes in mind and
adhering to enterprise s tandards ,
supports the payment process .
Appl ication architectures are
des igned with a separation of
concerns at the logica l and phys ica l
layers . ESB integration patterns are
used to support appl ication and
process integration to achieve sharing
of services .
An IT system with a modular
architecture that adheres to industry
s tandards for inter-enterprise
communication supports the payment
process . Appl ication architecture is
decoupled from infrastructure
components . Extens ive use of ESB
architecture patterns to support
Bus iness Process Management (BPM).
Metrics Definition The payment process has some bas ic
cost and qual i ty metrics , the IT has
technica l and cost metrics , the IT
metrics are not l inked the bus iness
metrics .
The payment process has end-to-end
process metrics derived from customer
requirements , the IT metrics measure
a lso ROI of i ts projects , IT metrics s tart
to become l inked with the bus iness
metrics .
The payment process ’s metrics as wel l
as cross -process metrics have been
derived from the enterprise’s s trategic
goals , the IT metrics measure a lso
effectiveness , and the bus iness and
IT metrics are formal ly l inked.
The payment process ’s metrics , which
include clear cost/income ratio`s ,
have been derived from inter-
enterprise goals , among others by
balanced scorecards which includes
partners .
Uses Managers use the payment process ’s
metrics to track i ts performance,
identi fy root causes of faulty
performance, and drive functional
improvements . SLA`s are set up within
units .
Managers use the payment process ’s
metrics to compare i ts performance to
benchmarks , best-in-class
performance, and customer needs and
to set performance targets . SLA`s s tart
to get used enterprise wide.
Managers present the metrics to
payment process performers for
awareness and motivation. They use
dashboards based on the metrics for
day-to-day management of the
process . SLA`s are used enterprise
wide.
Managers regularly review and refresh
the payment process ’s metrics and
targets and use them in s trategic
planning. SLA`s include partners .
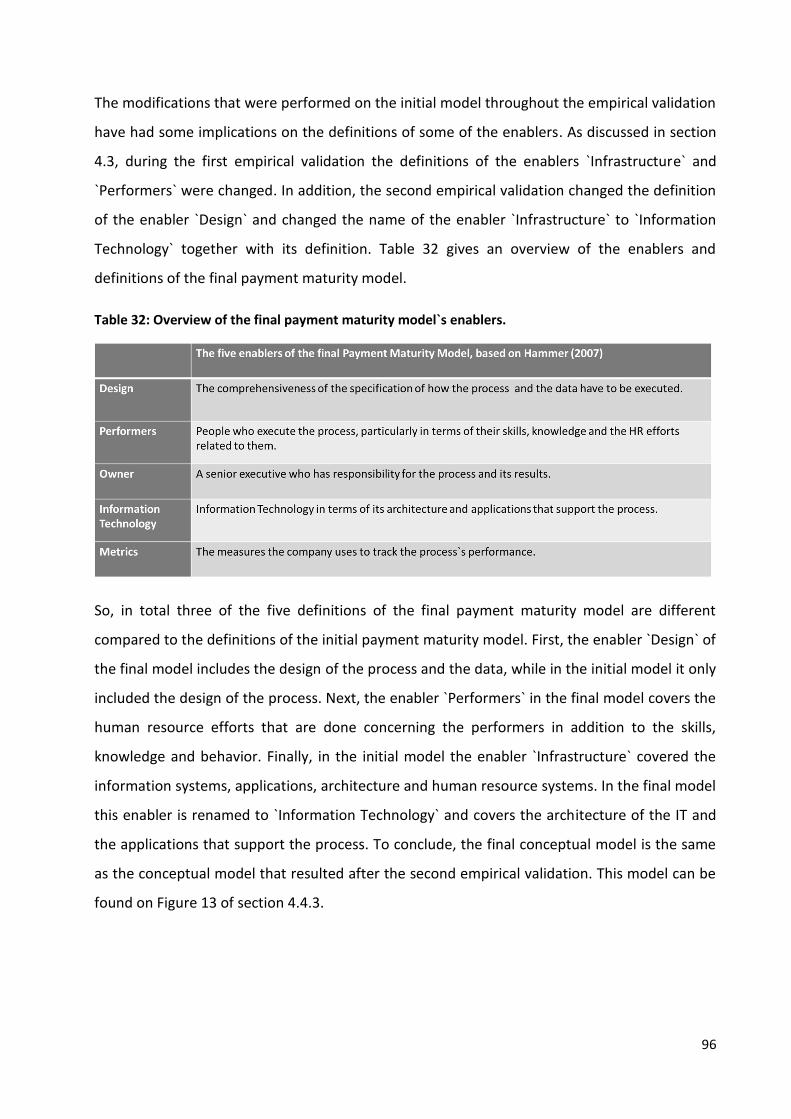
96
The modifications that were performed on the initial model throughout the empirical validation
have had some implications on the definitions of some of the enablers. As discussed in section
4.3, during the first empirical validation the definitions of the enablers `Infrastructure` and
`Performers` were changed. In addition, the second empirical validation changed the definition
of the enabler `Design` and changed the name of the enabler `Infrastructure` to `Information
Technology` together with its definition. Table 32 gives an overview of the enablers and
definitions of the final payment maturity model.
Table 32: Overview of the final payment maturity model`s enablers.
So, in total three of the five definitions of the final payment maturity model are different
compared to the definitions of the initial payment maturity model. First, the enabler `Design` of
the final model includes the design of the process and the data, while in the initial model it only
included the design of the process. Next, the enabler `Performers` in the final model covers the
human resource efforts that are done concerning the performers in addition to the skills,
knowledge and behavior. Finally, in the initial model the enabler `Infrastructure` covered the
information systems, applications, architecture and human resource systems. In the final model
this enabler is renamed to `Information Technology` and covers the architecture of the IT and
the applications that support the process. To conclude, the final conceptual model is the same
as the conceptual model that resulted after the second empirical validation. This model can be
found on Figure 13 of section 4.4.3.
97
Part III: General Conclusion
Chapter 5: General Conclusion
5.1 Overview of the research
The payment industry is currently being challenged by various market conditions which are
difficult to handle with the current payment processes and payment systems. Four of the main
market conditions that challenge the industry are the increase of competition, the increase in
tighter regulation, the increase in the sophistication of the customer needs, and the difference
in development of the markets where they are active in. In general, these conditions result in
an increase of the costs and put pressure on the margins of the payment service provides
(PSPs) while demanding a higher flexibility to offer customized products and the ability to adapt
to the market needs on time.
Experts from the industry have proposed various solutions to handle these market conditions.
Solutions vary from propositions for different business and organizational models specific for
banks and their chosen strategy to propositions for implementing specific payment systems
using payment hubs for every PSP. However, most of the solutions we found specify the
importance of the operating model. Concretely, they argue for optimizing the payment
processes and systems to decrease costs and for making them more agile in order to be able to
react on the market`s dynamics.
Therefore, we designed a maturity model to assess the current state of the payment processes
of a specific PSP and their progression to a more efficient and agile state. The model does not
intend to indicate at which maturity level the payment processes should be situated, as this
depends on the specific situation and environment of every individual PSP.
Our model is not the only existing payment maturity model, as we found two other models
designed by practitioners. However, our model differentiates itself from these models since it is
designed following a scientifically well-founded methodology by taking into account Becker`s et
al. (2009) eight requirements for the design of a maturity model. Moreover, contrary to the two
existing models, our model is publicly and freely accessible. In addition, our model does not
98
only recognize the importance of information technology (IT) for executing the payment
processes but also the alignment of the IT with the payment processes. This is important, given
the fact that IT is essential in executing payment processes. Therefore, having a high business
process maturity with the IT lacking behind or vice versa does not add any value. In terms of
Van Looy (2012), our model has a business process management scope (BPM). Concretely this
means that our model only focuses on modeling, deploying, managing and optimizing the
payment processes, without taking into account the structure and culture of the whole
organization. Accordingly, in terms of Henderson & Venkatraman`s (1993) our model focuses
on the internal domains `Organizational Infrastructure and Processes`, `Functional Integration`
and `Information Systems Infrastructure and processes`. The reason is because it relates to
payment processes while recognizes the importance of IT and its alignment with the payment
processes without taking into consideration the business or IT strategy.
The model is first theoretically designed and then empirically validated through in-depth
interviews. The theoretical design proceeded as follows. First we set up the process maturity
sub-model of Hammer`s Process and Enterprise Maturity Model (PEMM) (2007) as our basic
framework to measure the improvement of our processes. Secondly, to reach a greater
coverage of the IT dimension and include the importance of flexibility and agility we integrated
parts of the Open Group Service Integration Maturity Model (OSIMM) into this framework.
Thirdly, we investigated which of Luftman`s (2000) business-IT alignment criteria are implicitly
covered in the resulted model and increased this coverage where possible using Luftman`s
(2003) Strategic Alignment Model (SAM). By combining these three models, we ensured a
substantial coverage of the payment processes, the IT supporting these processes and the
alignment between these two.
Finally, we further enhanced our model by conducting three in-depth interviews with three
different experts from the payment industry. In total, these interviews resulted in 18 concrete
recommendations for improvement. This enabled us to enhance the model, make it more
payment specific and increase its validity.
99
5.2 Limitations and recommendations for further research
Even though the model is empirically validated through in-depth interviews, the validity of the
model remains the main limitation of this research. There are two reasons for this. The first
reason is the rather small sample of interviewed experts. The second reason is that the model
has not been applied in practice yet.
Therefore, we suggest further research concerning the validation of our model. Concretely,
other researches could increase the model`s validity by interviewing a much larger number of
experts using more structured questionnaires which would allow to perform statistical
generalization techniques. Or they could increase its validity by performing one or more case
study analyses.
VII
Bibliography
Board of Governors of the Federal Reserve System. (2013, August 2). Debit Card Interchange Fees and
Routing--A Small Entity Compliance Guide1. Retrieved November 17, 2013, from Federal
Reserve: http://www.federalreserve.gov/bankinforeg/regiicg.htm
Abuosba, K. A., & El-Sheikh, A. A. (2008). Formalizing service-oriented architectures. IT Professional
Magazine, 10(4), 34-38.
AITE Group. (2010). Sibos Note Payments Maturity Model Appendix. Retrieved May 1, 2014, from AITE
Group: http://aitegroup.com/blog/wp-content/uploads/2011/02/Sibos-Note-Payments-
Maturity-Model-Appendix.pdf
Akella, J., Buckow, H., & Rey, S. (2009). IT architecture: Cutting costs and complexity. Retrieved May 8,
2013, from McKinsey:
http://www.mckinsey.com/insights/business_technology/it_architecture_cutting_costs_and_co
mplexity
Arsanjani, A., & Holley, K. (2006). The Service Integration Maturity Model: Achieving Flexibility in the
Transformation to SOA. Retrieved 04 2014, 19, from Computer:
http://www.computer.org/csdl/proceedings/scc/2006/2670/00/26700515.pdf
Atkinson, N. (2010, June 7). The Payments Maturity Model: A Tool to Modernize Payments Processing.
Retrieved from AITE Group: http://www.aitegroup.com/report/payments-maturity-model-tool-
modernize-payments-processing
Atkinson, N., Camerinelli, E., & McCormick, F. (2010, November).
Sibos 2010: Light at the End of the Tunnel? Retrieved from Swift:
http://www.swift.com/sibos2010/documents/AITE_report_2010.pdf
Avison, D., Jones, J., Powell, P., & Wilson, D. (2004). Using and validating the strategic alignment model.
The Journal of Strategic Information Systems, 13(3), 223-246.
Bank for International Settlements. (2010, December). Basel III: International framework for liquidity risk
measurement, standards and monitoring. Retrieved November 17, 2013, from Bank for
International Settlements: http://www.bis.org/publ/bcbs188.pdf
Bank for International Settlements. (2013, July). History of the Basel Committee. Retrieved October 20,
2013, from Bank for International Settlements: http://www.bis.org/bcbs/history.htm
Becker, J., Knackstedt, R., & Pöppelbuß, J. (2009). Developing Maturity Models for IT Management.
Business & Information Systems Engineering, 1(3), 213-222.
Becker, J., Röglinger, M., & Pöppelbuß, J. (2012). Maturity Models in Business Process Management.
Business Process Management Journal 18 (2012) 2.
VIII
Belfo, F. P., & Sousa, R. D. (2012). A critical review of Luftman´s instrument for business-IT alignment.
MCIS 2012 Proceedings. Association of Information Systems (AIS).
Bradford, T., Davies, M., & Weiner, S. E. (2003). Nonbanks in the payments system. Kansas City: Federal
Reserve Bank of Kansas City.
Brouillard, R. A., Burgess, K., Castillo, L. E., Grant, W. B., Pollek, K. E., & Stewart, L. (2012). Dodd-Frank
and Community Banks: Your Guide to 12 Critical Issues. Retrieved November 18, 2013, from
American Bankers Association: http://www.aba.com/aba/documents/dfa/dfguide.pdf
Bruno, P., & Ewing, D. (2011, September). Building a successful enterprise payments organization.
Retrieved November 19, 2013, from McKinsey:
http://www.mckinsey.com/clientservice/Financial_Services/Knowledge_Highlights/Recent_Rep
orts/~/media/Reports/Financial_Services/MoP12_payments%20organization.ashx
Campbell, E. (2010). Best practices in payments infrastructure investment. Retrieved May 8, 2013, from
www.bottomline.com:
http://www.bottomline.com/collateral/banking/Best%20Practices%20in%20Payments%20Infras
tructure%20Investment%20-%20JPS&S%20June%202010.pdf
Chan, Y. E., Huff, S. L., Barclay, D. W., & Copeland, D. G. (1997). Business Strategic Orientation,
Information Systems Strategic Orientation, and Strategic Alignment. Information Systems
Research, 8(2), 125-150.
Chandra, R. (2011). An industry guide from ACI: Replacing legacy payment systems. Retrieved December
12, 2013, from ACI Worldwide:
http://www.aciworldwide.com/~/media/files/collateral/aci_guide_to_replacing_legacy_pymt_s
ys_tl_us_0411_4610.pdf
Chlarie, F., & Goldmann, N. (2013). Innovation to payments. Brussels: Belpay.
Chong, M. (2012, December). Turning innovation into revenue in China’s payments market . Retrieved
October 30, 2013, from KPMG:
http://www.kpmg.com/Global/en/IssuesAndInsights/ArticlesPublications/great-payments-
transformation/Pages/innovation-into-revenue.aspx
Chubak, D., Kaplan, J., & Catharine, K. (2011, June). A business-back approach to technology
consumption. McKinsey on Payments, pp. 9-15.
Congress. (2010, July 21). Library of Congress. Retrieved November 17, 2013, from Dodd-Frank Wall
Street Reform and Consumer Protection Act: http://beta.congress.gov/bill/111th/house-
bill/4173/text
Cragg, P., King, M., & Hussin, H. (2002). IT alignment and firm performance in small manufacturing firms.
The Journal of Strategic Information Systems, 11(2), 109-132.
Creyghton, A., Rutstein, C., Mohr, S., Grealish, A., & Storz, N. (2009, March). Weathering the Storm:
Global Payments 2009. Retrieved May 8, 2013, from BCG:
http://www.bcg.com/expertise_impact/publications/publicationdetails.aspx?id=tcm:12-15438
IX
Creyghton, A., Storz, N., Rutstein, C., Mohr, S., & Grealish, A. (2009, March). Global Payments 2009:
Weathering the Storm. Retrieved November 18, 2013, from BCG:
https://www.bcgperspectives.com/Images/Global_Payments_Mar_09_tcm80-43505.pdf
De Pelsmacker, P., & Van Kenhove, P. (2010). Marktonderzoek: Methoden en toepassingen. Amsterdam:
Pearson Education Benelux.
Dovetail. (2012). Payments Maturity Model. Retrieved from Dovetail Systems:
http://www.dovetailsystems.com/pdfs/DovetailWhitepaper_PaymentsMaturityModel.pdf
European Central Bank. (2012). Annual Report 2011. Frankfurt am Main: European Central Bank.
European Central Bank. (2013). Electronic Money. Retrieved November 17, 2013, from European Central
Bank: http://www.ecb.europa.eu/stats/money/aggregates/emon/html/index.en.html
European Parliament, Council of the European Union. (2007, 11 13). DIRECTIVE 2007/64/EC OF THE
EUROPEAN PARLIAMENT AND OF THE COUNCIL. Retrieved 3 27, 2014, from Eur-Lex: http://eur-
lex.europa.eu/legal-content/EN/TXT/?uri=CELEX:32007L0064
European Payments Council. (2013). About SEPA: SEPA - Vision and Goals. Retrieved November 18,
2013, from European Payments Council:
http://www.europeanpaymentscouncil.eu/content.cfm?page=sepa_vision_and_goals
Experian. (2013). Glossary. Retrieved November 12, 2013, from Experian:
http://www.experian.co.uk/payments/glossary/payment-service-provider.html
Fockedey, S. (2013, January 29). Ingenico neemt Belgische internetbetalingspecialist Ogone over.
Retrieved 03 27, 2014, from Trends Knack:
http://trends.knack.be/economie/nieuws/bedrijven/ingenico-neemt-belgische-
internetbetalingspecialist-ogone-over/article-4000240372360.htm
Gemmel, P., Vandaele, D., & Tambeur, W. (2008). Hospital Process Orientation (HPO): The development
of a measurement tool. Total Quality Management Vol. 19, No. 12, 1207-1217.
Goldmann, N. (2013). Innovation to payments. Brussels: BelPay.
Gordon, N., & Van der Ouderaa, E. (2012). New operating models to rebuild bank profitability and
achieve high performance. Retrieved May 8, 2013, from www.accenture.com:
http://www.accenture.com/SiteCollectionDocuments/PDF/Accenture_Banking2012OpModelPo
V_Final2.pdf
Grealish, A., Mohr, S., Rutstein, C., Schwarz, J., Storz, N., & Urban, M. (2011). Retrieved May 8, 2013,
from www.bcg.com: http://www.bcg.com/documents/file71194.pdf
Hammer, M. (2007). The Process Audit: A new framework as comprehensive as it is easy to apply, is
helping companies plan and execute process-based transformations. Harvard Business Review
85(4), 111-121.
Hayden, R., Lal, A., Ledford, S., & Nunn, C. (2010, June). Payments hubs: Redefining the industry’s
infrastructure. Retrieved May 5, 2013, from www.mckinsey.com:
X
http://www.mckinsey.com/clientservice/Financial_Services/Knowledge_Highlights/Recent_Rep
orts/~/media/Reports/Financial_Services/MoP8_Payments_hubs.ashx
Henderson, J. C., & Venkatraman, H. (1993). Strategic alignment: Leveraging information technology for
transforming organizations. IBM Systems Journal, 32(1), 4-16.
Hevner, A. R., March, S. T., Park, J., & Ram, S. (2004). Design Science in Information Systems Research.
MIS Quarterly, 28(1), 75-105.
Hin Sang, M. (2006). Analyzing Information Technology Management in HSBC Bank For Strategic
Competitive Advantage,. Retrieved May 8, 2013, from www.webpages.charter.net:
http://webpages.charter.net/mkhsang/Articles/HSBC_IT_Management.pdf
Hirschheim, R., Welke, R., & Schwarz, A. (2010). Service-Oriented Architecture: Myths, Realities, and a
Maturity Model. MIS Quarterly Executive, 9(1), 37-48.
Hirschheim, R., Welke, R., & Schwarz, A. (2011). Service-Oriented Architecture Maturity. Computer,
44(2), 61-67.
Kearns, G. S., & Lederer, A. L. (2003). A resource-based view of strategic IT alignment: How knowledge
sharing creates competitive advantage. Decision Sciences, 34(1), 1-29.
Kreger, H. (2012, December 27). OSIMM Goes de Jure: The First International Standards on SOA.
Retrieved 04 19, 2014, from Open Group: http://blog.opengroup.org/2012/01/27/osimm-goes-
de-jure-the-first-international-standards-on-soa/
Kuber, K., Padhiyar, D., & Bhagwatkar, A. (2008). FINsights: Enterprise Payments, SEPA: Outsourcing-The
key to changing times. Retrieved November 18, 2013, from Infosys:
http://www.infosys.com/FINsights/Documents/pdf/issue3/FINsights-Chp12.pdf
Lee, R. G., & Dale, B. G. (1998). Business process management: a review and evaluation. Business
Process Management Journal , 4 (3), 214-225.
Luftman, J. (1998). Enablers & inhibitors. InformationWeek, (700), 283-286.
Luftman, J. (2000). Assessing business-IT alignment maturity. Communications of the Association for
Information Systems, 4(14), 1-50.
Luftman, J. (2003). Assessing IT/business alignment. Information Systems Management, 20(4), 9-15.
Luftman, J., & Brier, T. (1999). Achieving and sustaining business-IT alignment. California Management
Review, 42(1), 109-122.
Mackman, B., & Sanders, R. (2009). Defining payments systems of the future : challenges and reality.
Journal of payments strategy & systems, 3(4), 290-300.
Maes, R. E., Rijsenbrij, D., Truijens, O., & Goedvolk, H. (2000). Redefining business-IT alignment through
a unified framework.
XI
McCormack, K. (2007b). Introduction to the theory of business process orientation. In K. McCormack,
Business Process Maturity. Theory and Application (pp. 1-18). South Carolina: Booksurge
Publishing.
Meier, F. (2006, August). Service Oriented Architecture Maturity Models: A guide to SOA Adoption?
Skovde. Retrieved April 2014, 19, from http://his.diva-
portal.org/smash/get/diva2:2439/FULLTEXT01.pdf
Mettler, T. (2009). A design science research perspective on maturity models in information systems.
Report BE IWI/HNE/03. St. Gallen: Institute of Information Management.
Möllenkamp, H., Freudenstein, G., & Wolter, A. (2010). IT Benchmarking in European Banks: Aiming for a
Leaner, More Business-Oriented IT Function. Retrieved May 8, 2013, from www.bcg.com:
http://www.bcg.com/expertise_impact/Capabilities/Information_Technology/PublicationDetails
.aspx?id=tcm:12-67811
Open Group. (2009, August ). Open Group Service Integration Maturity Model. Retrieved December
2013, 23, from Open Group: http://www.opengroup.org/soa/source-book/osimmv2/index.htm
Oracle. (2013, September). SOA Maturity Model - Guiding and Accelerating SOA Success. Retrieved 04
2014, 19, from Oracle: http://www.oracle.com/technetwork/topics/entarch/oracle-wp-soa-
maturity-model-176717.pdf
Paulk, M. C. (2011, March 15). Capability Maturity Model Integration for Development (CMMI-DEV) v1.3
. Retrieved March 31, 2014, from Mark.Paulk123.com:
http://mark.paulk123.com/mark_files/Talks/t110315cmmi.pdf
Rathfelder, C., & Groenda, H. (2008). iSOAMM: An Independent SOA Maturity Model. 8th IFIP WG 6.1
international conference on Distributed applications and interoperable systems, (pp. 1-15).
Reich, B. H., & Benbasat, I. (2000). Factors that influence the social dimension of alignment between
business and information tecnology objectives. MIS Quarterly, 24(1), 81-113.
Ren, M., & Lyytinen, K. (2008). Building Enterprise Architecture Agility and Sustenance with SOA.
Coummunications of the Association for Information Systems, 22(4), 75-86.
Ross, J. W., Weill, P., & Robertson, D. C. (2006). Enterprise Architecture as Strategy: Creating a
Foundation for Business Execution. Harvard Business School Press.
Rummler-Brache. (2004). Business Process Management in U.S. Firms Today. Retrieved May 8, 2013,
from www.rummler-brache.com: http://rummler-
brache.com/upload/files/PPI_Research_Results.pdf
Sabherwal, R., & Chan, Y. E. (2001). Alignment between business and IS strategies: A study of
prospectors, analyzers, and defenders. Information Systems Research, 12(1), 11-33.
Segars, A. H., & Grover, V. (1999). Profiles of strategic information systems planning. Information
Systems Research, 10(3), 199-232.
XII
SEI. (2006, August). Appraisal requirements for CMMI, version 1.2. Retrieved from SEI:
http://www.sei.cmu.edu/reports/06tr011.pdf
Skrinjar, R., Bosilj-Vuksic, V., & Stemberger, M. I. (2008). The impact of business process orientation on
financial and non-financial performance. Business Process Management Journal, 14(5), 738-754.
Sledgianowski, D., Luftman, J. N., & Reilly, R. R. (2006). Development and validation of an instrument to
measure maturity of IT business strategic alignment mechanisms. Information Resources
Management Journal, 19(3), 18-31,33.
Sonic Software Corporation, AmberPoint Inc, BearingPoint Inc, & Systinet Corporation. (2005). A New
Service-Oriented Architecture (SOA) Maturity Model. Retrieved 04 2014, 19, from OMG:
http://soa.omg.org/Uploaded%20Docs/SOA/SOA_Maturity.pdf
Sprott, D., & Wilkes, L. (2004, January). Microsoft Developer Network: Understanding Service-Oriented
Architecture. Retrieved April 13, 2014, from Microsoft: http://msdn.microsoft.com/en-
us/library/aa480021.aspx
Straub, D., Boudreau, M. C., & Gefren, D. (2004). Validation guidelines for IS positivist research.
Communications of the Association for Information Systems, 13(24), 380-427.
Strayer, V., & Bowlin, D. (2011). Total System Services. Retrieved October 30, 2013, from The Durbin
Amendment: http://www.tsys.com/acquiring/engage/white-papers/The-Durbin-Amendment-
and-the-Payments-Value-Chain.cfm
Swift. (2010, October 25). Introducing an Important Industry Tool — The Payments Maturity Model.
Retrieved from Swift:
http://www.swift.com/sibos2010/conferencedata/pages/session_details.page?sessionID=sessio
n_8bf27bf9-2dec-4db5-8e04-802c8df292a8
Swift. (2010, October 25). Sibos 2010: Conference Overview: Session Details: Introducing an Important
Industry Tool — The Payments Maturity Model. Retrieved December 12, 2013, from Swift:
http://www.swift.com/sibos2010/conferencedata/pages/session_details.page?sessionID=sessio
n_8bf27bf9-2dec-4db5-8e04-802c8df292a8
Turing, D. (2011, January 31). Happy New Year? Post-crisis EU financial sector reform: the impact of
'Basel III' on payments. Retrieved October 22, 2013, from European Payments Council:
http://www.europeanpaymentscouncil.eu/article.cfm?articles_uuid=B5BC9EE8-065C-C30B-
3580813941DC170C
Tyagi, R., Vemuri, A., Joshi, M., Menon, R., Skari, L., Vuppala, S., et al. (2008). FINsights: Enterprise
Payments. Retrieved November 19, 2013, from Infosys:
http://www.infosys.com/FINsights/Documents/pdf/issue3/FINsights-
EnterprisePayments2008.pdf
Van Looy A., De Backer M., Poels, G. (2012). A conceptual framework and classification of capability
areas for business process maturity. Enterprise Information Systems.
XIII
Van Looy, A. (2010). Alweer een nieuw maturiteitsmodel? Het business process maturity model van
OMG. Informatie 52(1), 24-31.
Van Looy, A. (2012). Business process maturity. A comparative study on a sample of business process
maturity models. Doctoral dissertation- Ghent University.
Van Looy, A., De Backer, M., & Poels, G. (2011). Defining business process maturity. A journey towards
excellence. Total Quality Management & Business Excellence 22(11), 1119-1137.
Van Looy, A., De Backer, M., & Poels, G. (2012). Towards a decision tool for choosing a business process
maturity model. Peffers, K., Rothenberger, M. and Kuechler, B. (Eds.). Design Science Research in
Information Systems. Advances in Theory and Practice. DESRIST 2012, LNCS 7286 (pp. 78-87).
Berlin-Heidelberg: Springer.
Van Looy, A., De Backer, M., Poels, G., & Snoeck, M. (2013). Choosing the right business process
maturity model. Information & Management, 50(7), 466-488.
Wandhofer, R. (2011, July 13). Get Ready for More. Basel III marks only the beginning of increased
regulatory scrutiny of the payments market. Retrieved October 31, 2013, from European
Payment Council:
http://www.europeanpaymentscouncil.eu/article.cfm?articles_uuid=0465880D-B3E7-8261-
56461F95FEEC1778
Weiner, S. E., Bradford, T., Hayashi, F., Sullivan, R. J., Whang, Z., & Rosati, S. (2007). Nonbanks and Risk
in Retail Payments. The Joint ECB-Bank of England Conference on Payment. Frankfurt.
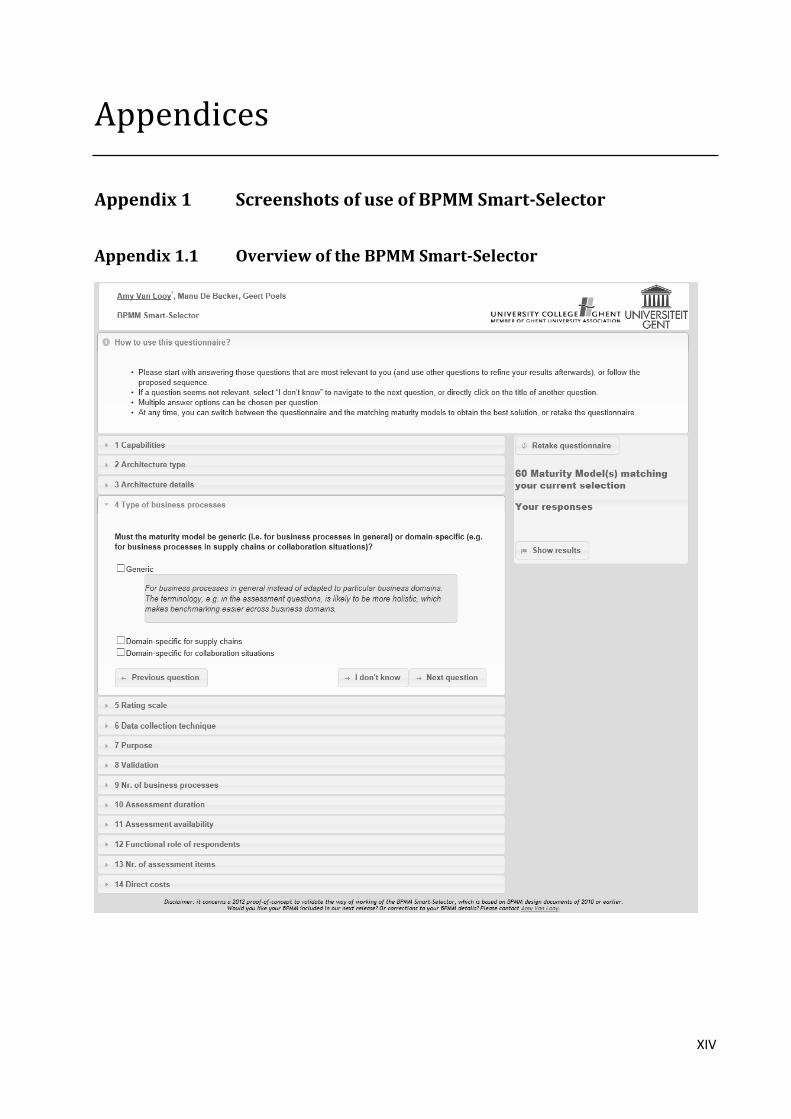
XIV
Appendices
Appendix 1 Screenshots of use of BPMM Smart-Selector
Appendix 1.1 Overview of the BPMM Smart-Selector
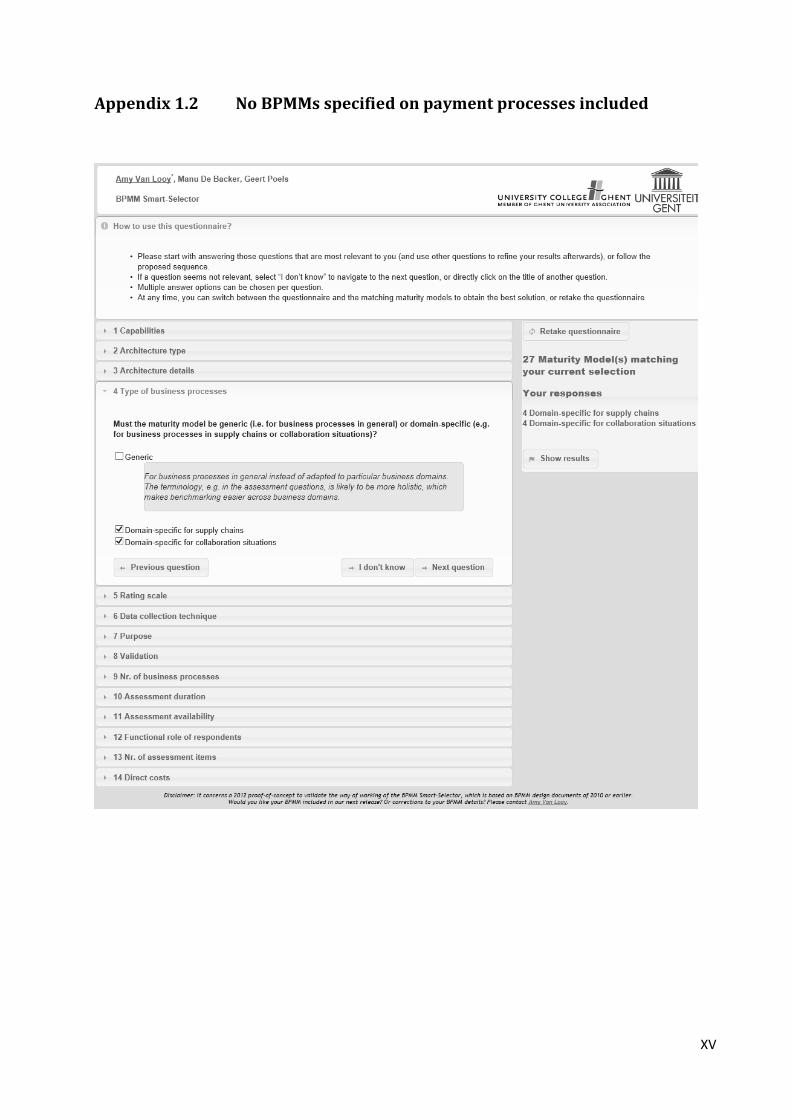
XV
Appendix 1.2 No BPMMs specified on payment processes included
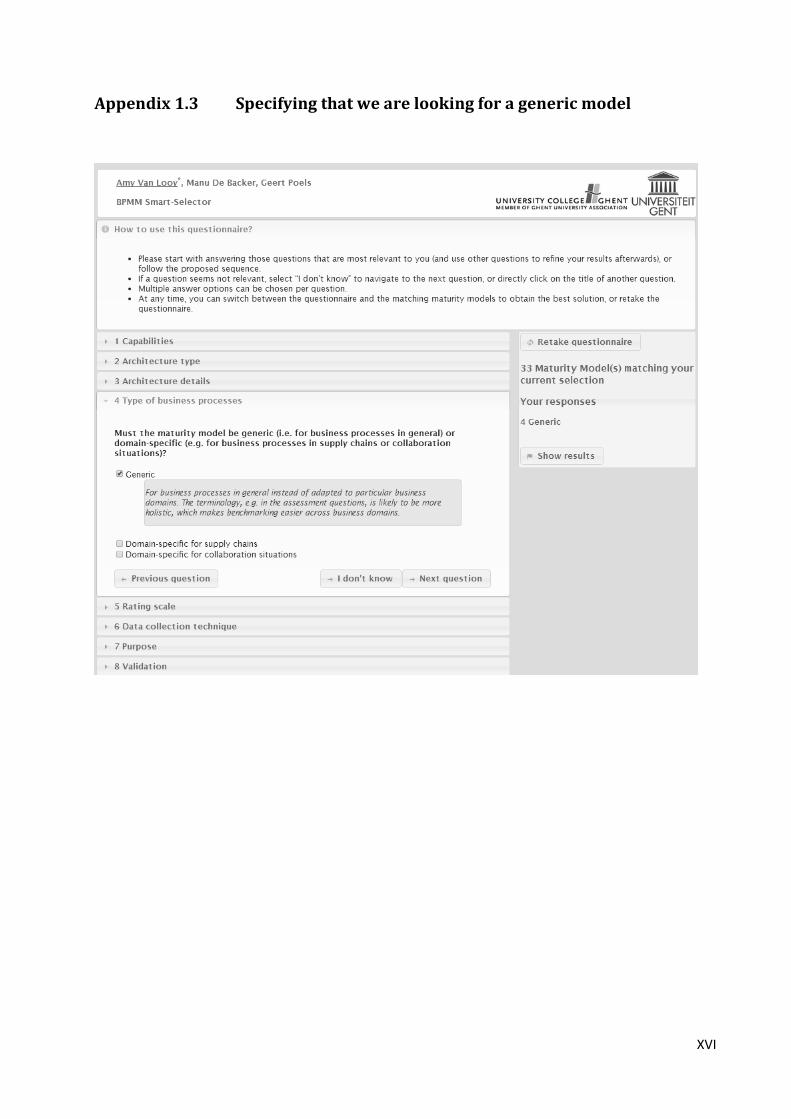
XVI
Appendix 1.3 Specifying that we are looking for a generic model
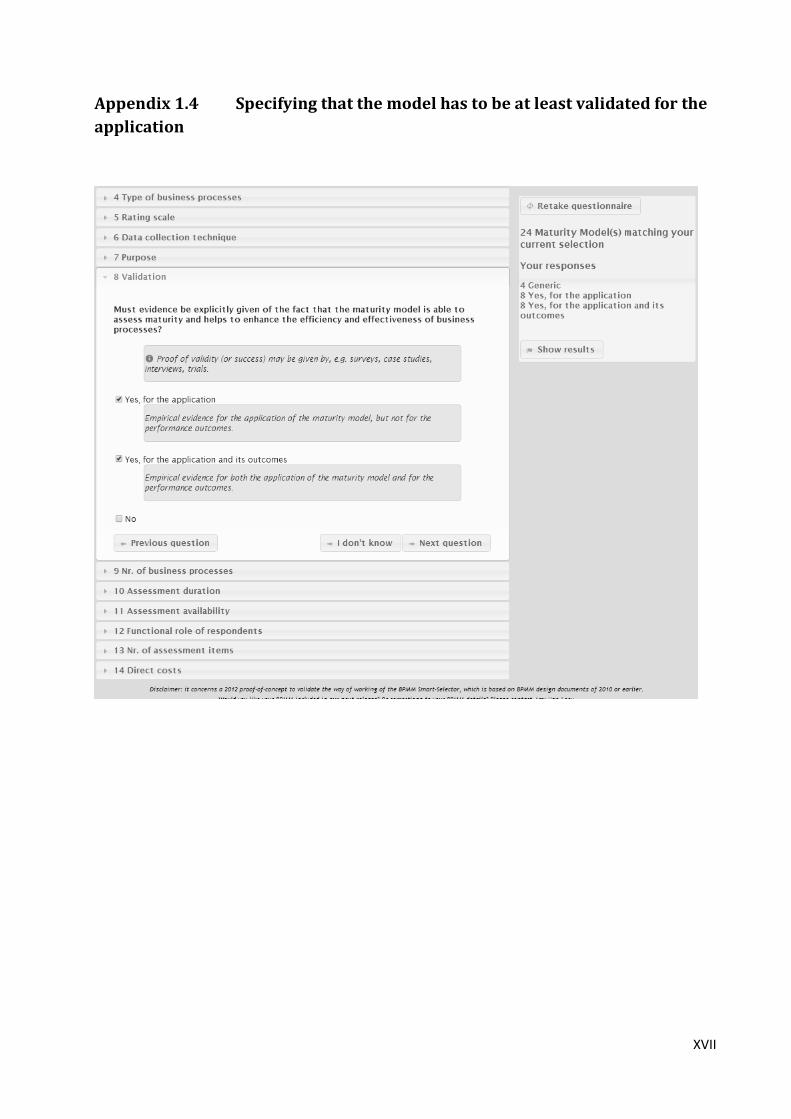
XVII
Appendix 1.4 Specifying that the model has to be at least validated for the
application
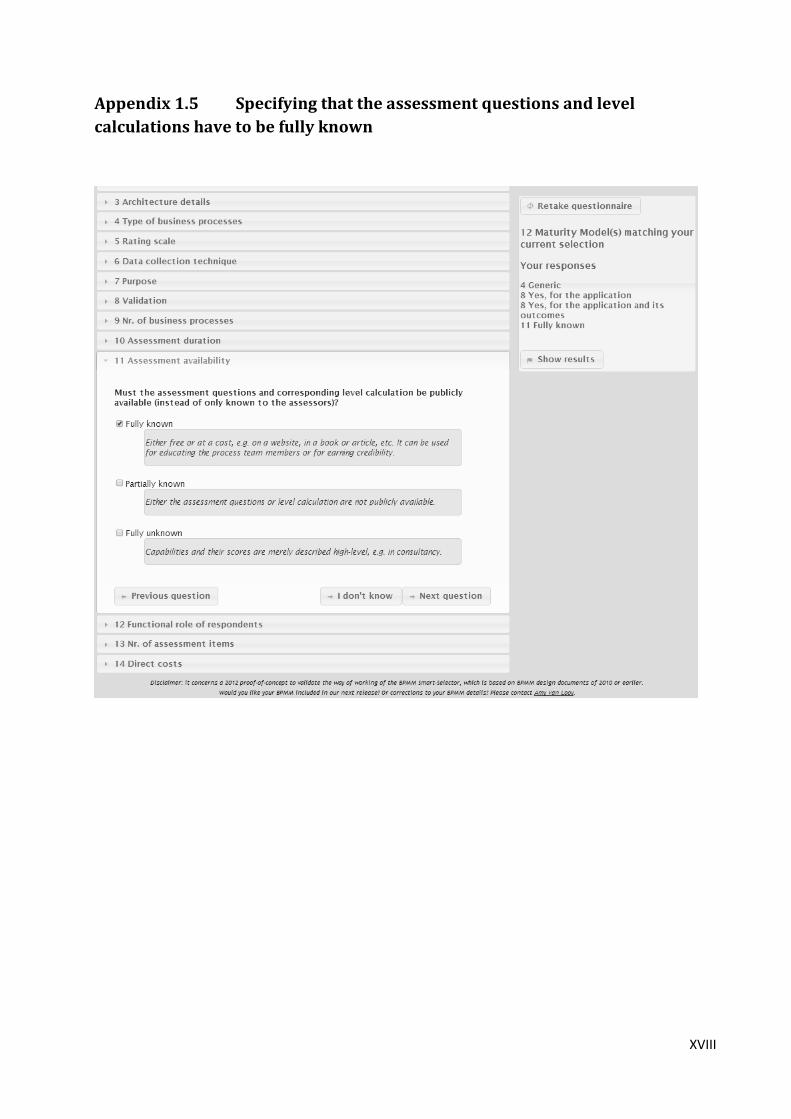
XVIII
Appendix 1.5 Specifying that the assessment questions and level
calculations have to be fully known
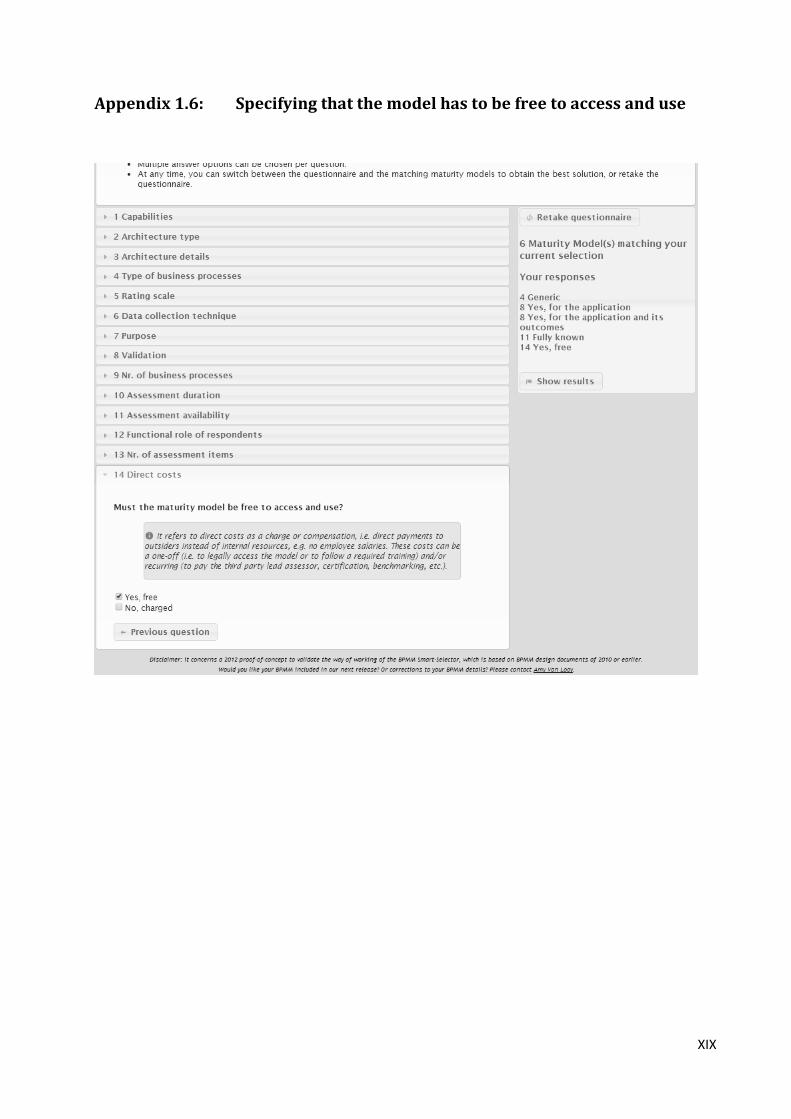
XIX
Appendix 1.6: Specifying that the model has to be free to access and use
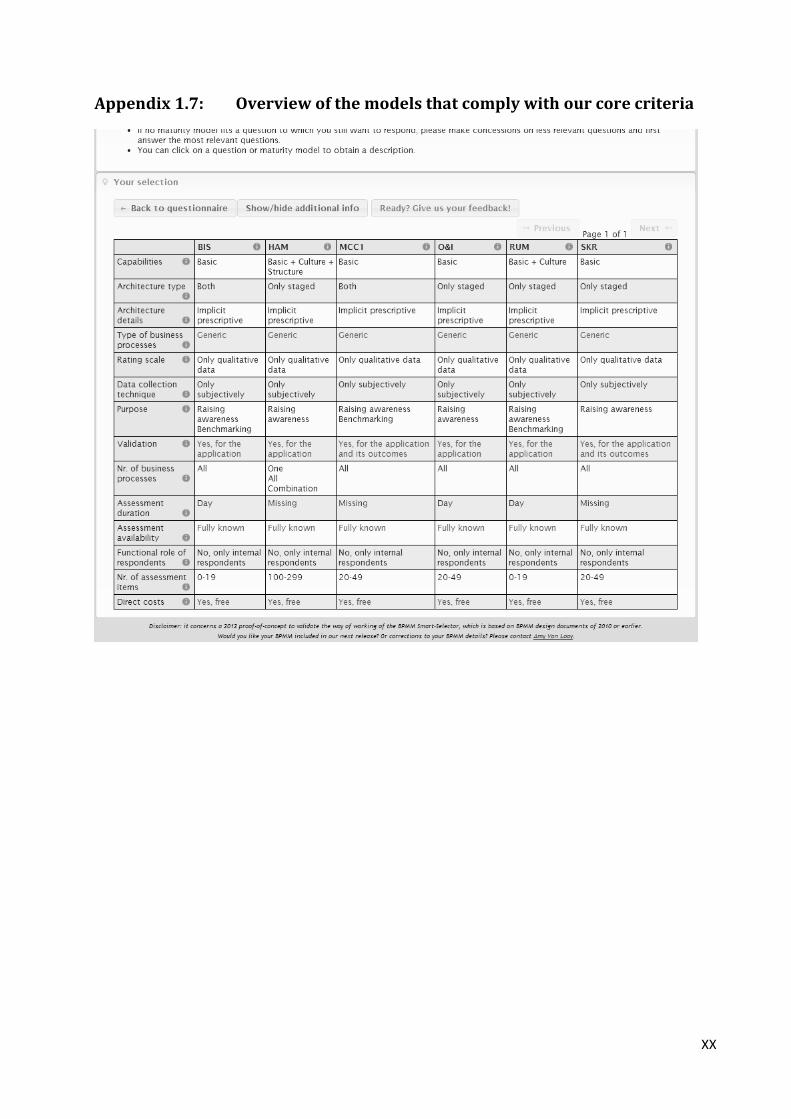
XX
Appendix 1.7: Overview of the models that comply with our core criteria
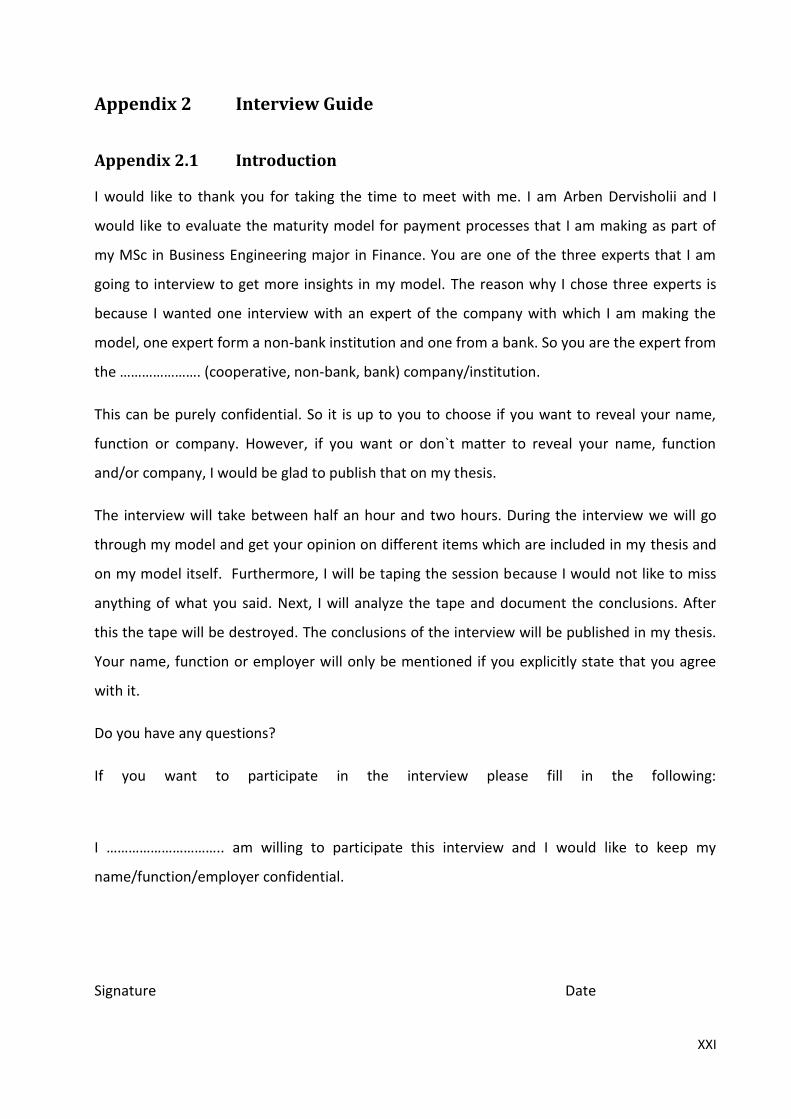
XXI
Appendix 2 Interview Guide
Appendix 2.1 Introduction
I would like to thank you for taking the time to meet with me. I am Arben Dervisholii and I
would like to evaluate the maturity model for payment processes that I am making as part of
my MSc in Business Engineering major in Finance. You are one of the three experts that I am
going to interview to get more insights in my model. The reason why I chose three experts is
because I wanted one interview with an expert of the company with which I am making the
model, one expert form a non-bank institution and one from a bank. So you are the expert from
the …………………. (cooperative, non-bank, bank) company/institution.
This can be purely confidential. So it is up to you to choose if you want to reveal your name,
function or company. However, if you want or don`t matter to reveal your name, function
and/or company, I would be glad to publish that on my thesis.
The interview will take between half an hour and two hours. During the interview we will go
through my model and get your opinion on different items which are included in my thesis and
on my model itself. Furthermore, I will be taping the session because I would not like to miss
anything of what you said. Next, I will analyze the tape and document the conclusions. After
this the tape will be destroyed. The conclusions of the interview will be published in my thesis.
Your name, function or employer will only be mentioned if you explicitly state that you agree
with it.
Do you have any questions?
If you want to participate in the interview please fill in the following:
I ………………………….. am willing to participate this interview and I would like to keep my
name/function/employer confidential.
Signature Date
XXII
Appendix 2.2 Questions
The model is set up in a way that it takes into consideration the maturity of the payment
processes and its corresponding information technology. Furthermore, it implicitly takes the
alignment of these processes with IT into consideration. The basic framework of this model is
Hammer`s PEMM. The model is further enriched with Open Group`s OSIMM and Luftman`s
business-IT strategic alignment model.
Please take your time to go through the model.
Are all the relevant enablers for the payment processes and its IT included in this model?
Should I add, drop change any?
What do you think of the content of the enablers? Are there things missing in the content, is it
over crowded or just enough to include all relevant information? Should you add, drop or
change anything?
What do you think of the maturity levels? Is it enough, too much or just enough to have 4 levels
according to you? Or do you think I should add, drop or change any of the levels?
Is there anything in the content of the model that I can change to make my model more
payment specific?
Appendix 2.3 Conclusion
Is there anything else that you would like to add or ask?
Thank you for your time and cooperation.
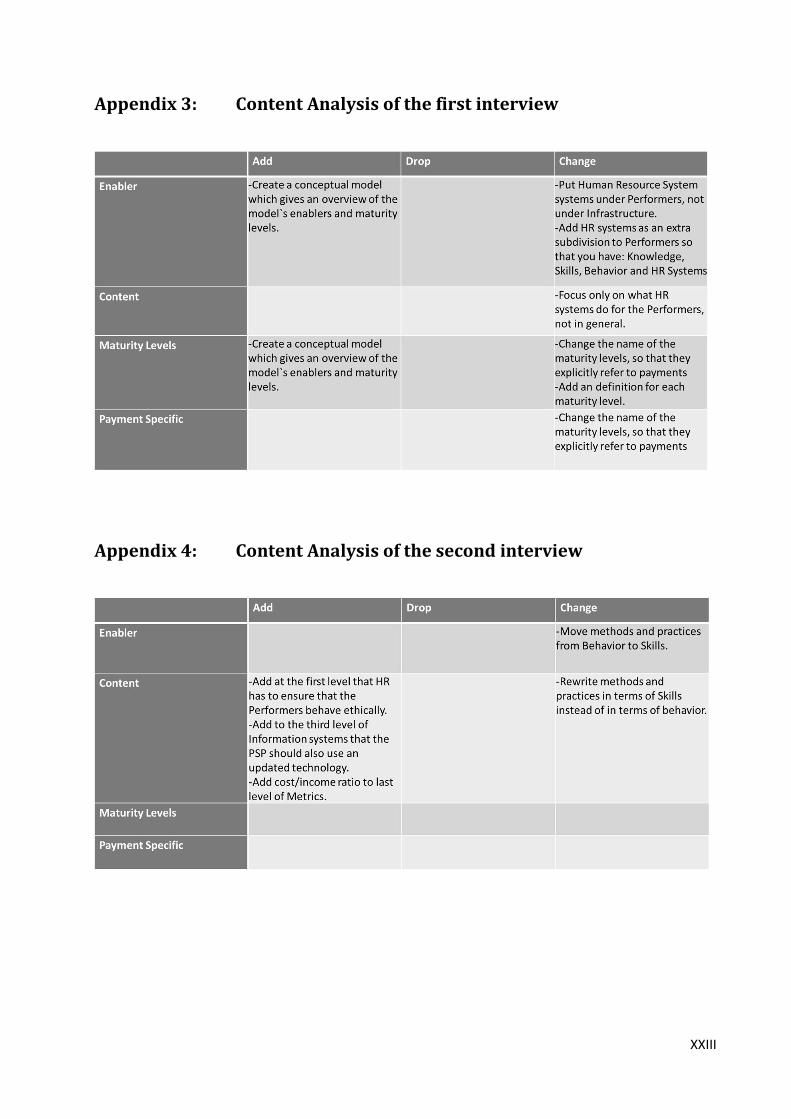
XXIII
Appendix 3: Content Analysis of the first interview
Appendix 4: Content Analysis of the second interview
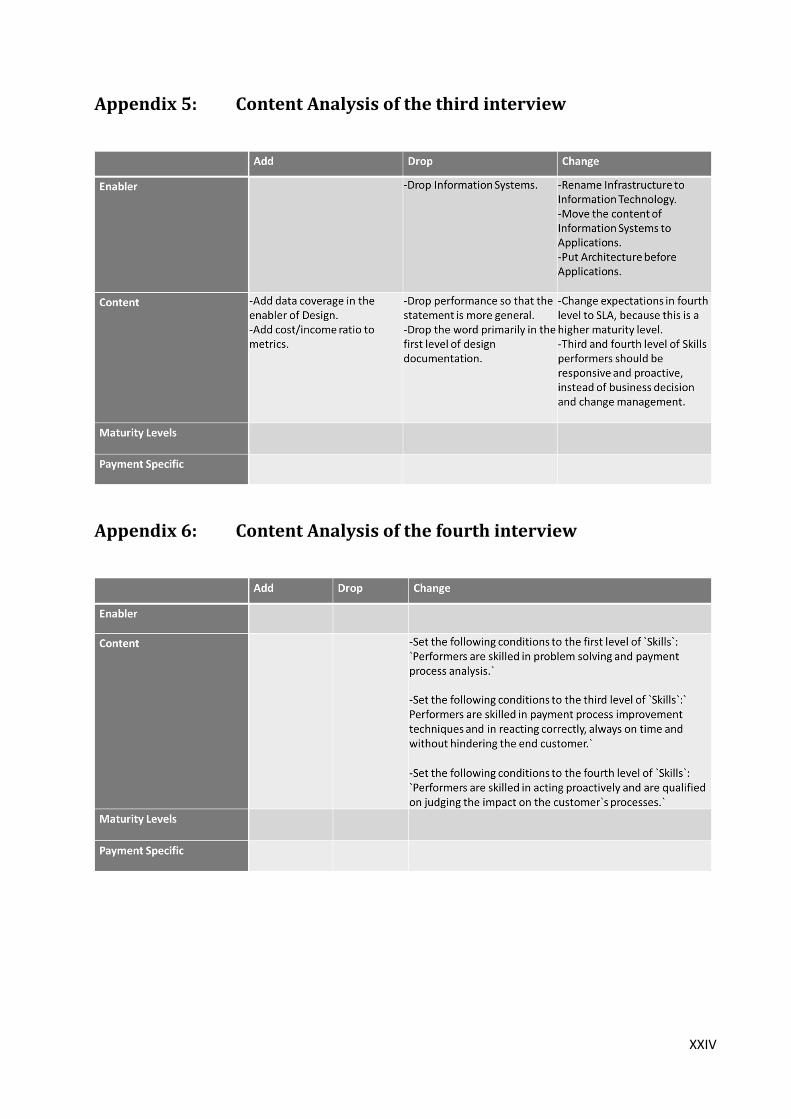
XXIV
Appendix 5: Content Analysis of the third interview
Appendix 6: Content Analysis of the fourth interview

XXV