1960 Annual Report and Accounts - Unilever Global
42
REPORT & ACCOUNTS 1960
Transcript of 1960 Annual Report and Accounts - Unilever Global
R E P O R T & A C C O U N T S
1 9 6 0
U N I L E V E R
R E P O R T & A C C O U N T S
1 0
U N I L E V E R N. V.
EC
F. J. TEMPEL - CHAIRMAN
SIDNEY J.VAN DEN BERGH -VICE-CHAIRMAN GEORGE COLE -VICE-CHAIRMAN
COLIN BAXTER J. P. VAN DEN BERGH
A. F. H. BLAAUW A. D. BONHAM CARTER
A. W. J. CARON J. A. CONNEL
HAROLD HARTOG F. J. PEDLER M. M. VAN HENGEL
G. D. A. KLIJNSTRA J. F. K N I G H T ANDREW M. KNOX D. J. MANN J. F. VAN MOORSEL F. D. MORRELL
R. H. SIDDONS A. J. C. HOSKYNS-ABRAHALL A. H. SMITH
RUDOLF G. JURGENS J. P. STUBBS E. G. WOODROOFE
H. M. HIRSCHFELD J. M. HONIG
K. P. VAN DER MANDELE PAUL RIJKENS
JHR. J. A. G. SANDBERG
E. A. HOFMAN
PRICE WATERHOUSE & Co. COOPER BROTHERS & Co.

This is a translation of the original Dutch report.
1959
F1. 19,016,000,000
14,140,000,000
1,207,000,000
594,000,000
43,000,000
640,000,000
146,000,000
20 "0
4s. 6.5d.
454,000,000
6,140,000,000
439,000,000
27 1,000,000
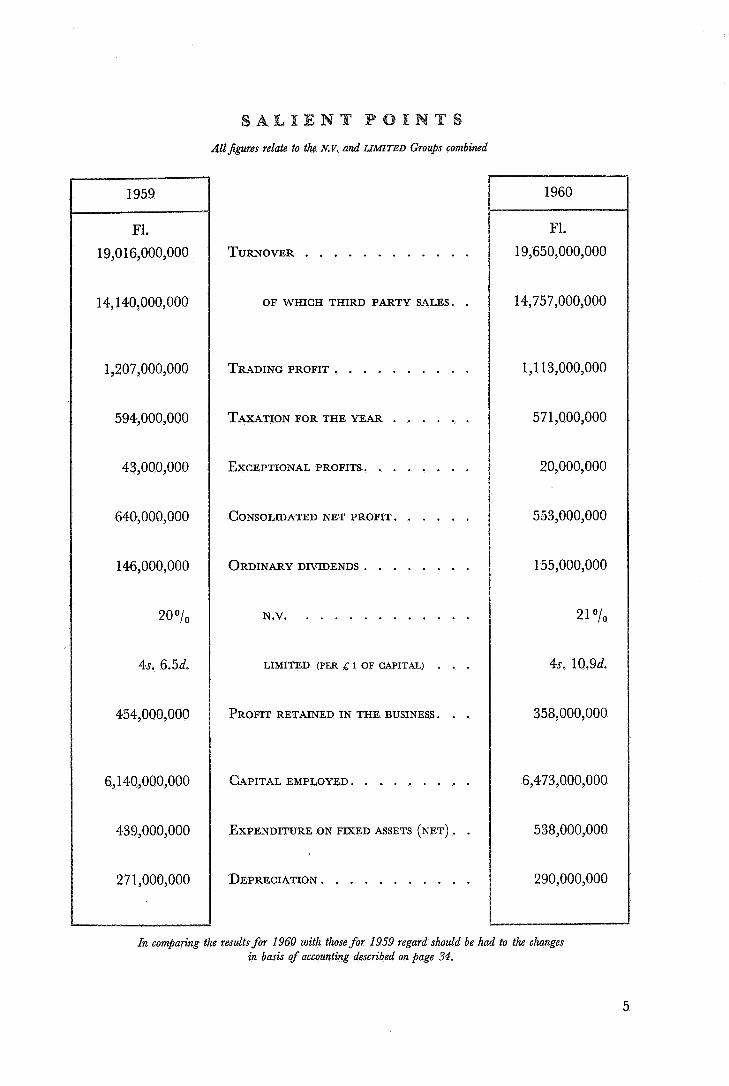
Allfigures relate to the N.V. and LIMITED Groups combined
1960
TURNOVER . . . . . . . . . . . .
OF WHICH THIRD PARTY SALES. .
TRADING PROFIT . . . . . . . . . .
TAXATIONFORTHEYEAR . . . . . .
EXCEPTIONAL PROFITS. . . . . . . .
CONSOLIDATED NET PROFIT. . . . . .
ORDINARY DIVIDENDS . . . . . . . .
N.V. . . . . . . . . . . . .
LIMITED (PER & 1 OF CAPITAL) . . .
PROFIT RETAINED IN THE BUSINESS. . .
CAPITAL EMPLOYED. . . . . . . . .
EXPENDITURE ON FIXED ASSETS (NET) . .
DEPRECIATION . . . . . . . . . . .
F1. 19,650,000,000
14,757,000,000
1,113,000,000
571,000,000
20,000,000
553,000,000
155,000,000
21 "0
4J. 10.9d.
358,000,000
6,473,000,000
538,000,000
290,000,000
I n comparing the results for 1960 with those for 1959 regard should be had to the changes in basis of accounting described on page 34.
5
UNILEVER N.V. and UNILEVER LIMITED are linked by a series of agreements of which the principal is the Equalisation Agreement. This, inter alia, in effect equalises the rights of the ordinary capitals of the two companies as to dividends and, on liquidation, as to capital value, on the basis of F1. 12 nominal of N.V.’S ordinary capital being equivalent to E I nominal of LIMITED’S ordinary capital.
6
R E P O R T O F T H E D I R E C T O R S
F O R T H E Y E A R 1 9 6 0
to be submitted at the General Meeting of Shareholders to be held at Rotterdam on 27th April, 1961
The Directors submit their Report and Accounts for the year 1960. As usual, these combine the results and operations of the two Groups, UNILEVER N.V.
( c c ~ . ~ . ” ) and UNILEVER LIMITED (“LIMITED”), with the guilder equivalents of all LIMITED figures calculated at the official parity at 31st December last, i.e. L 1 = F1. 10.64.
R E S U L T S
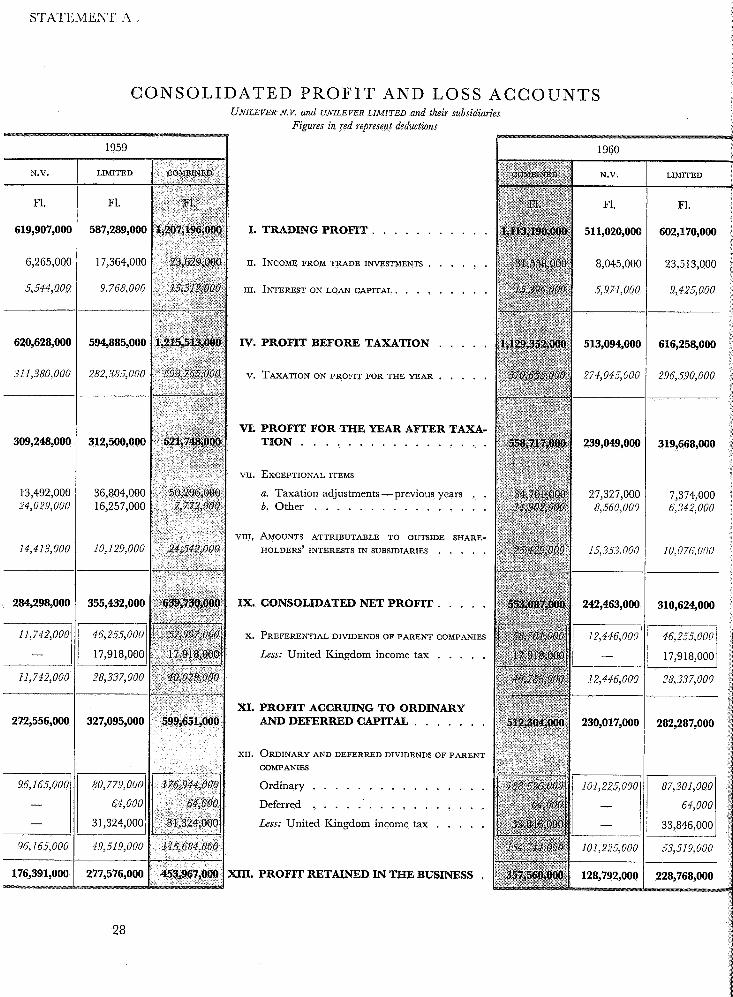
Turnover, particulars of which are shown on pages 12 and 13, was up (Fl. 19,650,367,000 in 1960 against F1. 19,015,776,000 in 1959), but tradingprofits fell by F1.94,006,000, from F1. 1,207,196,000 in 1959 to F1. 1,113,190,000 in 1960. After charging taxation of F1. 570,635,000 (1959, F1. 593,765,000) the con- solidated net profit in 1960 was F1. 553,087,000 compared with F1. 639,730,000 in 1959. The 1960 profit, without the changes in accounting practice described on page 34, would have been F1. 543,681,000.
To see these figures in their proper perspective, three features of the year must be remembered. First, the rapid economic expansion throughout the world which had characterised 1959 was checked in 1960. Secondly, 1960 was a year which saw ever-increasing competition in nearly all our spheres of operation, and particularly Western Europe and the United States. And finally, Europe experienced the very reverse of the exceptionally hot summer which, in 1959, had helped some of our product groups, particularly ice cream.
I
7
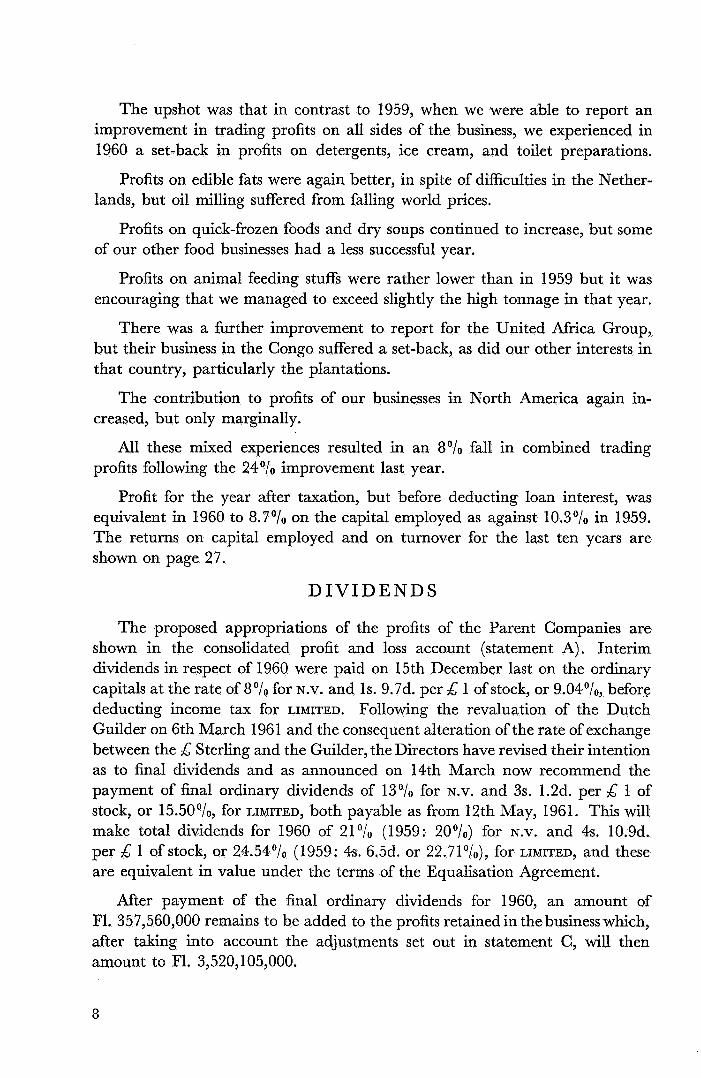
The upshot was that in contrast to 1959, when we were able to report an improvement in trading profits on all sides of the business, we experienced in 1960 a set-back in profits on detergents, ice cream, and toilet preparations.
Profits on edible fats were again better, in spite of difficulties in the Nether- lands, but oil milling suffered from falling world prices.
Profits on quick-frozen foods and dry soups continued to increase, but some of our other food businesses had a less successful year.
Profits on animal feeding stuffs were rather lower than in 1959 but it was encouraging that we managed to exceed slightly the high tonnage in that year.
There was a further improvement to report for the United Africa Group, but their business in the Congo suffered a set-back, as did our other interests in that country, particularly the plantations.
The contribution to profits of our businesses in North America again in- creased, but only marginally.
All these mixed experiences resulted in an 8'/0 fall in combined trading profits following the 24'10 improvement last year.
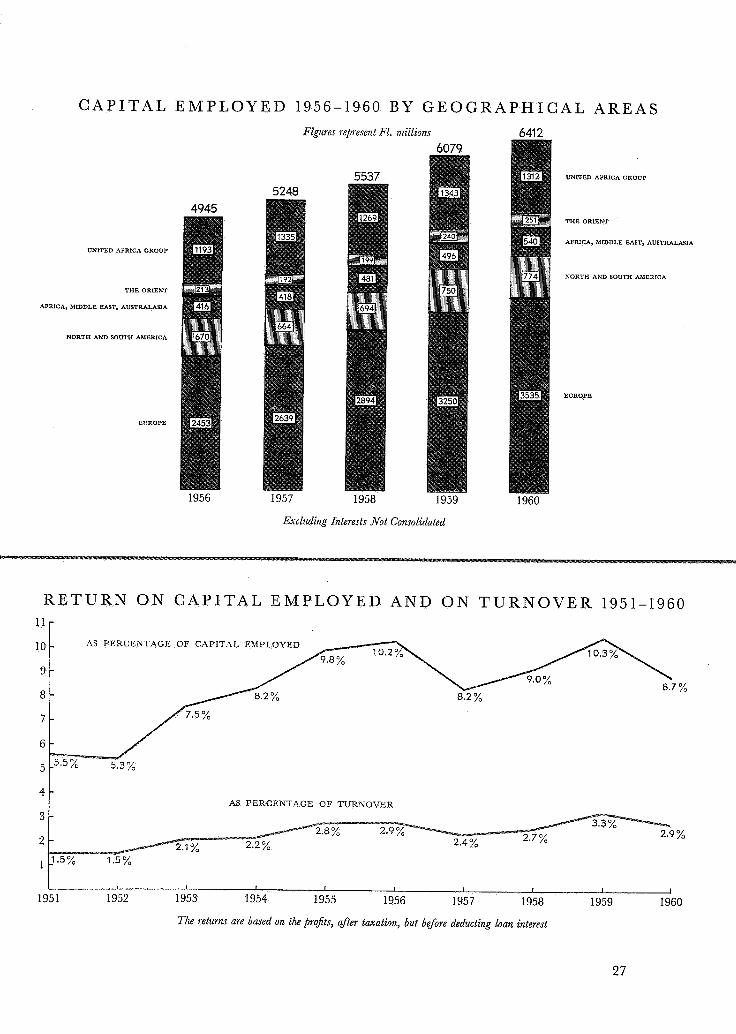
Profit for the year after taxation, but before deducting loan interest, was equivalent in 1960 to 8.7'10 on the capital employed as against 10.3'/0 in 1959. The returns on capital employed and on turnover for the last ten years are shown on page 27.
D I V I D E N D S
The proposed appropriations of the profits of the Parent Companies are shown in the consolidated profit and loss account (statement A). Interim dividends in respect of 1960 were paid on 15th December last on the ordinary capitals at the rate of 8' /0 for N.V. and 1s. 9.7d. per iC; 1 of stock, or 9.04'/0, before deducting income tax for LIMITED. Following the revaluation of the Dutch Guilder on 6th March 1961 and the consequent alteration of the rate of exchange between the E Sterling and the Guilder, the Directors have revised their intention as to final dividends and as announced on 14th March now recommend the payment of final ordinary dividends of 13'/0 for N.V. and 3s. 1.2d. per iC; 1 of stock, or 15.50'/0, for LIMITED, both payable as from 12th May, 1961. This will make total dividends for 1960 of 21°/' (1959: 20°/') for N.V. and 4s. 10.9d. per E 1 of stock, or 24.54'/0 (1959: 4s. 6.5d. or 22.71'/0), for LIMITED, and these are equivalent in value under the terms of the Equalisation Agreement.
After payment of the final ordinary dividends for 1960, an amount of F1. 357,560,000 remains to be added to the profits retained in the business which, after taking into account the adjustments set out in statement C, will then amount to F1. 3,520,105,000.
8

T H E C O N G O
Last year we reported that in the former Belgian Congo business had been hampered by riots, tribal disturbances and strikes in 1959, but these turned out
e the merest foretaste of what was to come in 1960. The troubles that have beset that unhappy country since it achieved independence on July 1st last year are only too well known.
Unilever’s interests in the Congo comprise merchandise trading, through the United Africa Group, plantations, ranches and the manufacture of soap, edible oils and fats. These assets now represent less than 4OlO of Unilever’s total resources and in a normal year contribute a rather smaller proportion of its total profits. But the second half of 1960 was far from normal, and the whole internal trade of the territory was disrupted. We suffered some damage to property in the early days of independence, mostly caused by the looting of stocks in one or two places, and our trading operations quickly met with difficulties created by the interruption of imports, a scarcity of import licences, depletion of stores and default by debtors. By the end of the year the general picture was one of a steady disintegration of the economy, with complete economic breakdown just round the corner.
Nevertheless, if order can be restored, our businesses in the Congo can yet have a satisfactory future. Even in the period since 1st July, whenever conditions were anything like normal our trading and manufacturing operations were able to continue on a reasonably satisfactory basis and production from the plantations was maintained. There is no doubt that the effort that has been made to keep the businesses going has been appreciated in the Congo itself.
Most encouraging of all has been the behaviour of our staff, both European and African, which has been worthy of the highest praise. They have had to face discomfort, danger and on occasion the threat of death itself and they have responded magnificently to the ordeal.
Unfortunately, the opening weeks of 1961 have brought no improvement in the general situation. Indeed, in many areas it has deteriorated, but with the many efforts now being made it is hoped that more normal conditions will prevail.
Full provision has been made in the Accounts for all known losses with the result that we take up a net loss for the Congo in 1960 of F1. 1.4 million com- pared with a net profit in 1959 of F1. 19.5 million.
P L A N T A I N T H E N E T H E R L A N D S
When in August, 1960, thousands of people in the Netherlands suddenly showed symptoms of a hitherto unknown skin disorder, this was imputed to an ingredient which our Dutch subsidiary Van den Bergh en Jurgens N.V. had
9
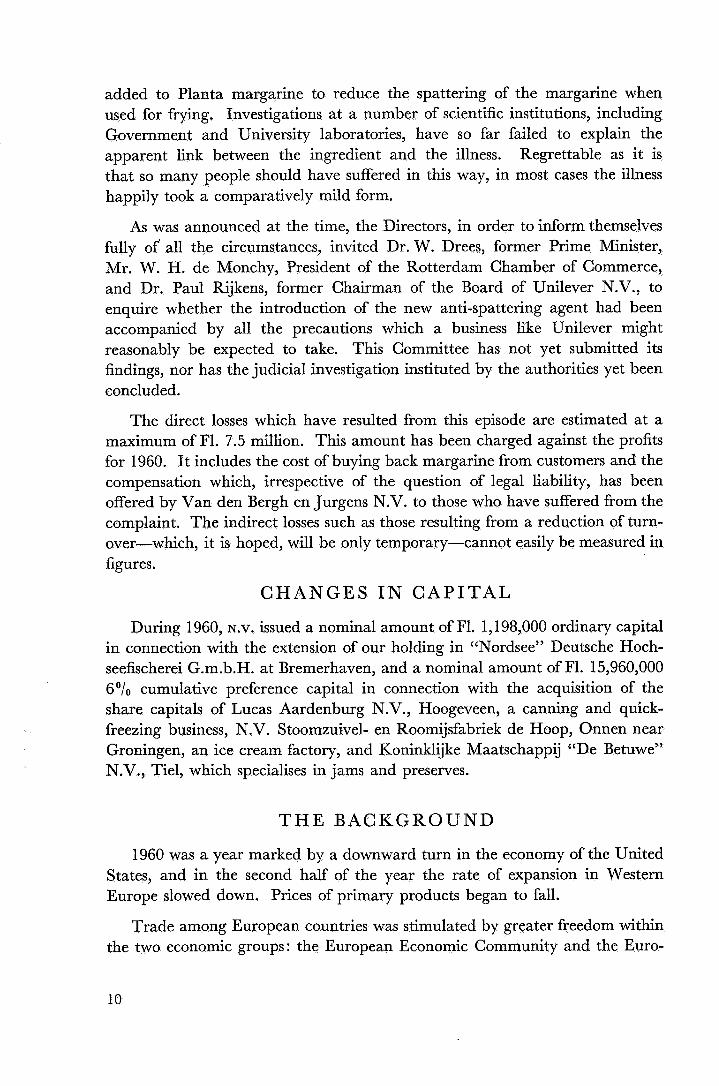
added to Planta margarine to reduce the spattering of the margarine when used for frying. Investigations at a number of scientific institutions, including Government and University laboratories, have so far failed to explain the apparent link between the ingredient and the illness. Regrettable as it is that so many people should have suffered in this way, in most cases the illness happily took a comparatively mild form.
As was announced at the time, the Directors, in order to inform themselves fully of all the circumstances, invited Dr. W. Drees, former Prime Minister, Mr. W. H. de Monchy, President of the Rotterdam Chamber of Commerce, and Dr. Paul Rijkens, former Chairman of the Board of Unilever N.V., to enquire whether the introduction of the new anti-spattering agent had been accompanied by all the precautions which a business like Unilever might reasonably be expected to take. This Committee has not yet submitted its findings, nor has the judicial investigation instituted by the authorities yet been concluded.
The direct losses which have resulted from this episode are estimated at a maximum of F1. 7.5 million. This amount has been charged against the profits for 1960. I t includes the cost of buying back margarine from customers and the compensation which, irrespective of the question of legal liability, has been offered by Van den Bergh en Jurgens N.V. to those who have suffered from the complaint. The indirect losses such as those resulting from a reduction of turn- over-which, it is hoped, will be only temporary-cannot easily be measured in figures.
C H A N G E S I N C A P I T A L
During 1960, N.V. issued a nominal amount of F1. 1,198,000 ordinary capital in connection with the extension of our holding in “Nordsee” Deutsche Hoch- seefischerei G.m.b.H. at Bremerhaven, and a nominal amount of F1. 15,960,000 6O/o cumulative preference capital in connection with the acquisition of the share capitals of Lucas Aardenburg N.V., Hoogeveen, a canning and quick- freezing business, N.V. Stoomzuivel- en Roomijsfabriek de Hoop, Onnen near Groningen, an ice cream factory, and Koninklijke Maatschappij ((De Betuwe” N.V., Tiel, which specialises in jams and preserves.
T H E B A C K G R O U N D
1960 was a year marked by a downward turn in the economy of the United States, and in the second half of the year the rate of expansion in Western Europe slowed down. Prices of primary products began to fall.
Trade among European countries was stimulated by greater freedom within the two economic groups: the European Economic Community and the Euro-
10

pean Free Trade Association. Unfortunately there has been no real progress integration of the two blocs, and uncertainty about the ultimate shape
bership of the economic areas is making it difficult for European to plan the future deployment of its resources.
e significant changes in taxation during the year included an increase he rate of United Kingdom profits tax from lo'/' to 12l/2'/0: Belgium, key, Australia and Argentina also increased their taxes on profits. Ceylon osed a surcharge of 15'10 on all taxes. In Pakistan there were substantial
in the taxes on profits and dividends. Taxes were also reduced in Finland and Sweden.
M A T E R I A L S
So far as materials for Unilever products were concerned, the main features of the year were as follows:-
OILS AND FATS
Prices generally were lower than in 1959. Coconut oil, United States soya bean oil and cottonseed oil were on the average cheaper than in 1959, but groundnut oil, although it fell gradually from its peak at the beginning of the year, was dearer. Palm oil was a fairly steady market. The net effect of the price changes towards the end of the year was to narrow the differentials between alternative materials. Since then the prices, particularly of liquid oils, have risen sharply.
The prices (per ton) of the principal raw materials are shown in the following table:-
January March June September December February 1960 1960 1960 1960 1960 1961 E E E ic: E E
Philippine Copra 93 87 70 62 62 64 Palm Kernels . . . . . . . . . . . . . 7 1 65 57 51 51 51 Groundnut Oil 12 1 124 119 116 109 127 Palm Oil (Congo) 85 81 80 78 79 83 Cottonseed Oil (U.S. crude) 85 81 88 82 88 110 Lard (U.S.). 68 75 83 80 89 112 Soya Oil (U.S. crude) . . . . . . . . . 75 72 81 82 91 110
World exports of edible and soap-making oils and fats were 9l/Z0/0 up on 1959, increased shipments of liquid oils, lard and tallows from the United States more than making up for reduced supplies of West African groundnuts. The Philippines also exported more copra. Supplies in 1961 are expected to be adequate.
GRAINS, ETC.
Prices of raw materials used in compound feeding stuffs were on average slightly below those of 1959, the decline being mainly in oilcake and meal,
. . . . . . . . . . . . . . . . . . . . . . .
. . . . . . . . . . . . . . . . .
. . . . . . . . . . . . .
11
with grains showing little change. Contrary to the usual seasonal pattern, prices fell sharply in the last quarter after rising in the middle of the year.
OTHER MATERIALS
Supplies of detergent alkylate were adequate and there was no significant change in price. Tripolyphosphate was cheaper but prices of other chemicals showed little change.
Prices of materials used in our food products tended to be a little above those of 1959.
The demand for carton board continued to be strong and prices rose slightly, but prices of paper and fibre board did not change much in the course of the year.
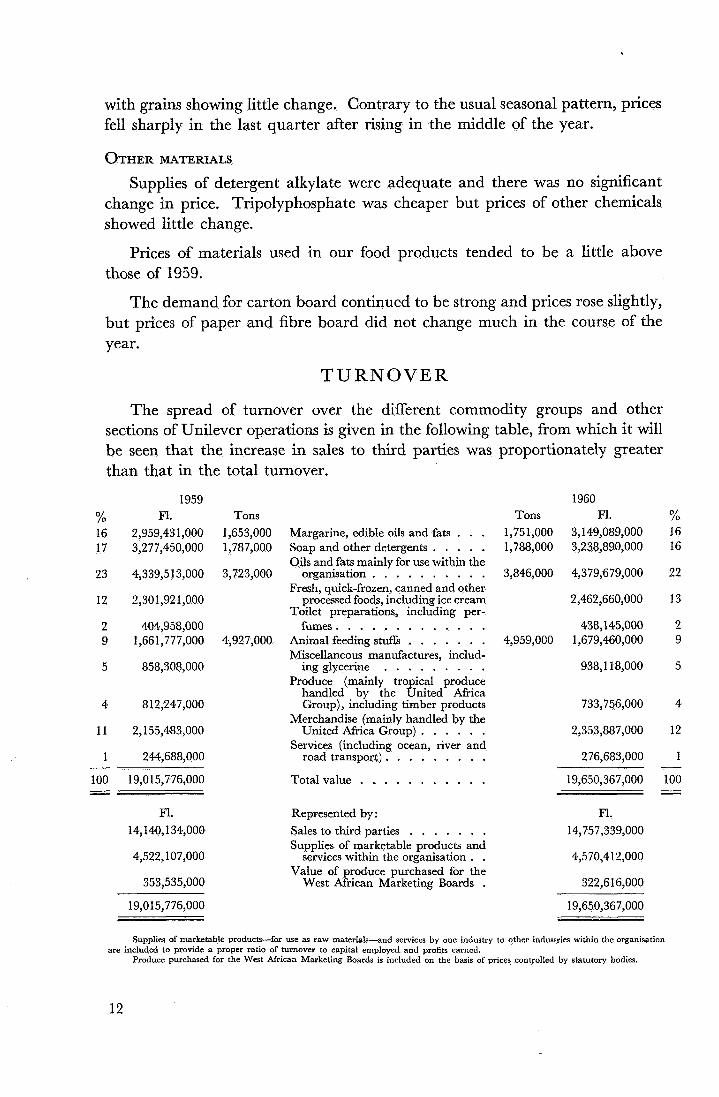
T U R N O V E R
The spread of turnover over the different commodity groups and other sections of Unilever operations is given in the following table, from which it will be seen that the increase in sales to third parties was proportionately greater than that in the total turnover.
% 16 17
23
12
2 9
5
4
11
1
1959 F1.
2,959,431,000 3,277,450,000
4,339,5 13,000
2,301,921,000
404,958,000 1,661,777,000
858,308,000
812,247,000
2,155,483,000
244,688,000 - 100 19,015,776,000 - -
Tons 1,653,000 Margarine, edible oils and fats . . . 1,787,000 Soap and other detergents . . . . .
Oils and fats mainly for use within the 3,723,000 organisation . . . . . . . . . .
Fresh, quick-frozen, canned and other processed foods, including ice cream
Toilet preparations, including per- fumes . . . . , . . . . . . . .
4,927,000 Animal feeding stuffs . . . . . . . Miscellaneous manufactures, includ-
ing glycerine . . . . . . . . . Produce (mainly tropical produce
handled by the United Africa Group), including timber products
Merchandise (mainly handled by the United Africa Group) . . . . . .
Services (including ocean, river and road transport) . . . . . . . . .
1960 Tons F1.
1,751,000 3,149,089,000 1,788,000 3,238,890,000
3,846,000 4,379,679,000
2,462,660,000
438,145,000 4,959,000 1,679,460,000
938,118,000
733,756,000
2,353,887,000
276,683,000
% 16 16
22
13
2 9
5
4
12
1 - Total value . . . . . . . . . . . 19,650,367,000 100 -
_I
F1. Represented by : F1. 14,140,134,000 Sales to third parties . . . . . . . 14,757,339,000
Supplies of marketable products and 4,570,412,000 4,522,107,000 services within the organisation . .
Value of produce purchased for the 353,535,000 West African Marketing Boards . 322,616,000
19,015,776,000 19,650,367,000
Supplies of marketable products-for use as raw materials-and services by one industry to other industries within the organisa tion
Produce purchased for the West African Marketing Boards is included on the basis of prices controlled by statutory bodies. are included to provide a proper ratio of turnover to capital employed and profits earned.
12
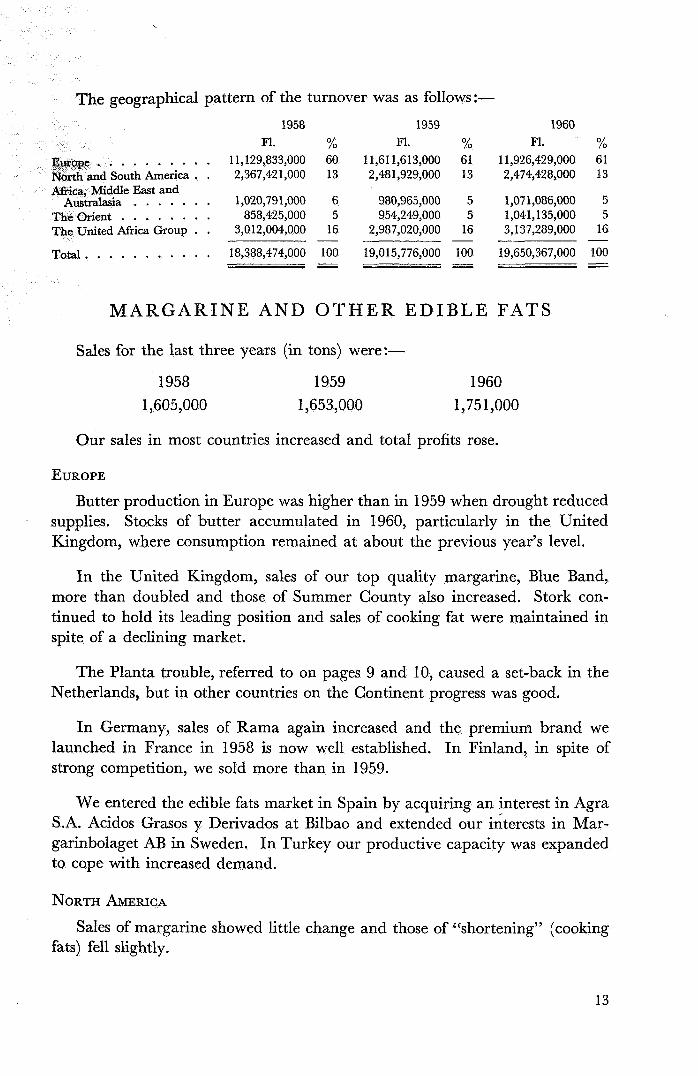
The geographical pattern of the turnover was as follows :- 1958 1959 1960
F1. % F1. % F1. . . . . . . . 11,129,833,000 60 11,611,613,000 61 11,926,429,000
th America . . 2,367,421,000 13 2,481,929,000 13 2,474,428,000
asla . . . . . . . 1,020,791,000 6 980,965,000 5 1,071,086,000 ent . . . . . . . . 858,425,000 5 954,249,000 5 1,041,135,000
nited Africa Group . . 3,012,004,000 16 2,987,020,000 16 3,137,289,000
tal . . . . . . . . . . . 18,388,474,000 100 19,015,776,000 100 19,650,367,000 - - -
- - - -
M A R G A R I N E AND O T H E R E D I B L E FATS
Sales for the last three years (in tons) were:-
1958 1959 1960 1,605,000 1,653,000 1,75 1,000
Our sales in most countries increased and total profits rose.
% 61 13
5 5
16
100 - L_
EUROPE Butter production in Europe was higher than in 1959 when drought reduced
supplies. Stocks of butter accumulated in 1960, particularly in the United Kingdom, where consumption remained at about the previous year’s level.
In the United Kingdom, sales of our top quality margarine, Blue Band, more than doubled and those of Summer County also increased. Stork con- tinued to hold its leading position and sales of cooking fat were maintained in spite of a declining market.
The Planta trouble, referred to on pages 9 and 10, caused a set-back in the Netherlands, but in other countries on the Continent progress was good.
In Germany, sales of Rama again increased and the premium brand we launched in France in 1958 is now well established. In Finland, in spite of strong competition, we sold more than in 1959.
We entered the edible fats market in Spain by acquiring an interest in Agra S.A. Acidos Grasos y Derivados at Bilbao and extended our interests in Mar- garinbolaget AB in Sweden. In Turkey our productive capacity was expanded to cope with increased demand.
NORTH AMERICA
fats) fell slightly. Sales of margarine showed little change and those of c‘shortening’’ (cooking
13
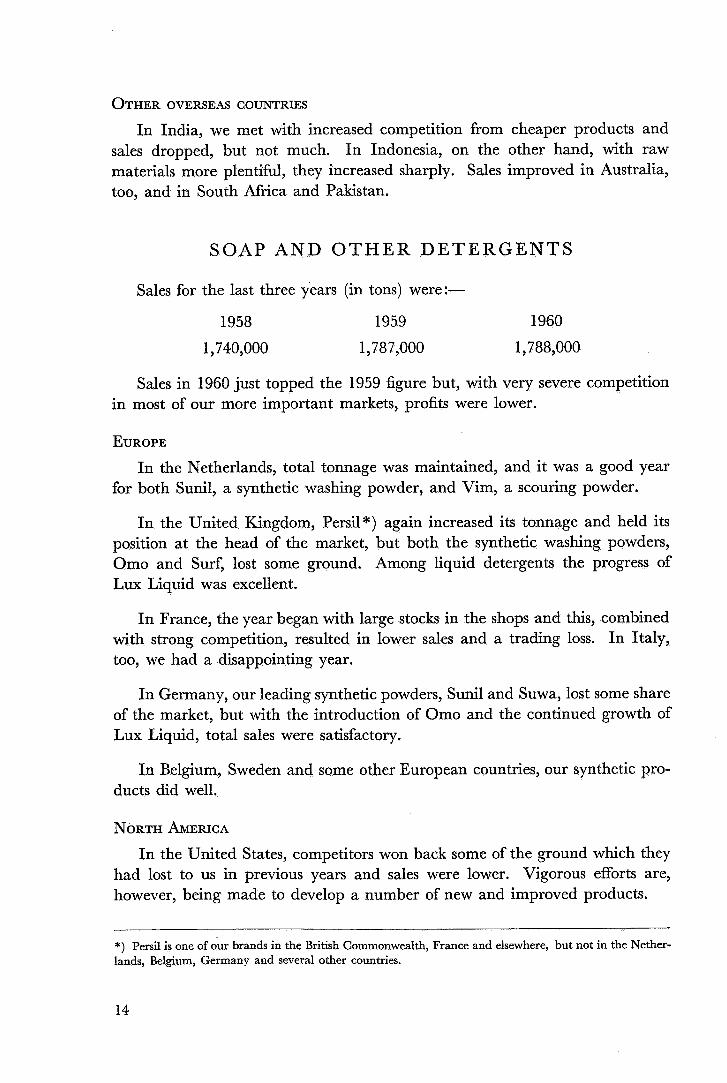
OTHER OVERSEAS COUNTRIES
In India, we met with increased competition from cheaper products and sales dropped, but not much. In Indonesia, on the other hand, with raw materials more plentiful, they increased sharply. Sales improved in Australia, too, and in South Africa and Pakistan.
SOAP A N D O T H E R D E T E R G E N T S
Sales for the last three years (in tons) were:-
1958 1959 1960
1,740,000 1,787,000 1,788,000
Sales in 1960 just topped the 1959 figure but, with very severe competition in most of our more important markets, profits were lower.
EUROPE
for both Sunil, a synthetic washing powder, and Vim, a scouring powder. In the Netherlands, total tonnage was maintained, and it was a good year
In the United Kingdom, Persil") again increased its tonnage and held its position at the head of the market, but both the synthetic washing powders, Omo and Surf, lost some ground. Among liquid detergents the progress of Lux Liquid was excellent.
In France, the year began with large stocks in the shops and this, combined with strong competition, resulted in lower sales and a trading loss. In Italy, too, we had a disappointing year.
In Germany, our leading synthetic powders, Sunil and Suwa, lost some share of the market, but with the introduction of Orno and the continued growth of Lux Liquid, total sales were satisfactory.
In Belgium, Sweden and some other European countries, our synthetic pro- ducts did well.
NORTH AMERICA In the United States, competitors won back some of the ground which they
had lost to us in previous years and sales were lower. Vigorous efforts are, however, being made to develop a number of new and improved products.
*) Persil is one of our brands in the British Commonwealth, France and elsewhere, but not in the Nether- lands, Belgium, Germany and several other countries.
14
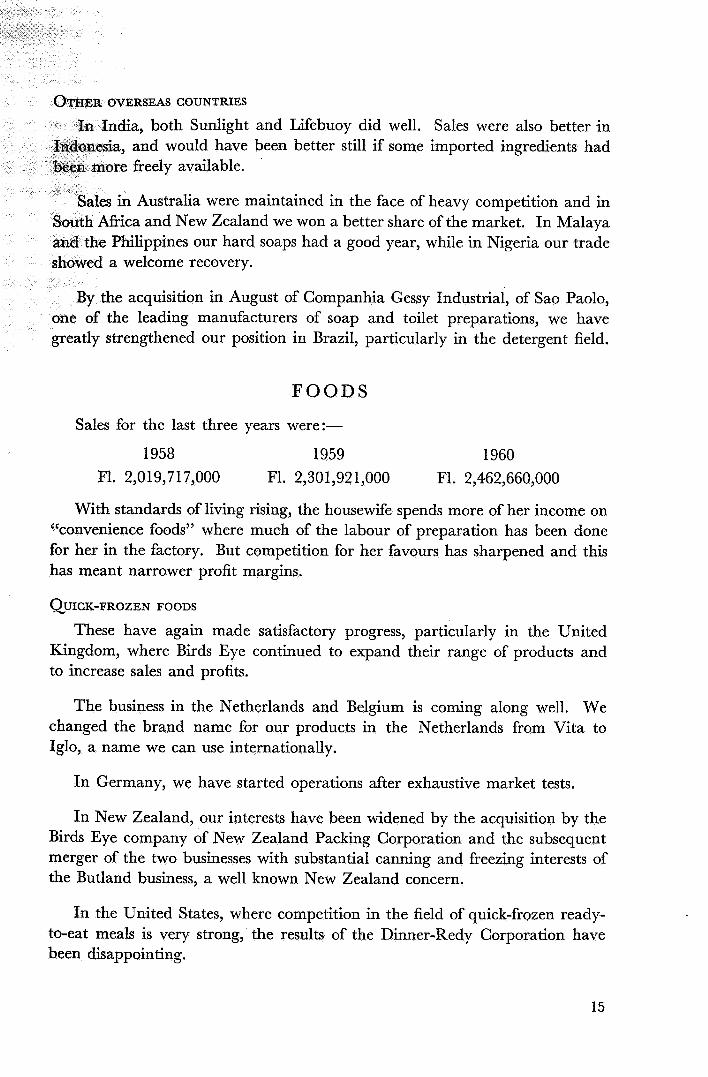
VERSEAS COUNTRIES
ia, both Sunlight and Lifebuoy did well. Sales were also better in and would have been better still if some imported ingredients had freely available.
in Australia were maintained in the face of heavy competition and in ca and New Zealand we won a better share of the market. In Malaya
e Philippines our hard soaps had a good year, while in Nigeria our trade d a welcome recovery.
the acquisition in August of Companhia Gessy Industrial, of Sao Paolo, of the leading manufacturers of soap and toilet preparations, we have
greatly strengthened our position in Brazil, particularly in the detergent field.
FOODS
Sales for the last three years were:-
1958 1959 1960 F1. 2,019,717,000 F1. 2,301,921,000 F1. 2,462,660,000
With standards of living rising, the housewife spends more of her income on “convenience foods” where much of the labour of preparation has been done for her in the factory. But competition for her favours has sharpened and this has meant narrower profit margins.
QUICK-FROZEN FOODS
These have again made satisfactory progress, particularly in the United Kingdom, where Birds Eye continued to expand their range of products and to increase sales and profits.
The business in the Netherlands and Belgium is coming along well. We changed the brand name for our products in the Netherlands from Vita to Iglo, a name we can use internationally.
In Germany, we have started operations after exhaustive market tests.
In New Zealand, our interests have been widened by the acquisition by the Birds Eye company of New Zealand Packing Corporation and the subsequent merger of the two businesses with substantial canning and freezing interests of the Butland business, a well known New Zealand concern.
In the United States, where competition in the field of quick-frozen ready- to-eat meals is very strong, the results of the Dinner-Redy Corporation have been disappointing.
15
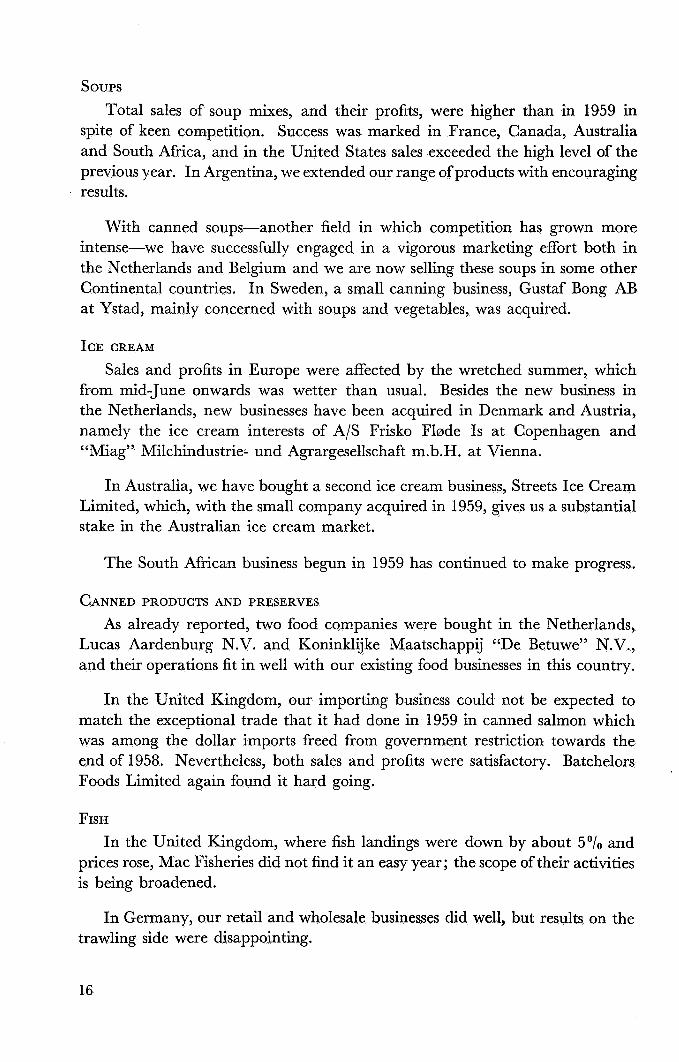
SOUPS Total sales of soup mixes, and their profits, were higher than in 1959 in
spite of keen competition. Success was marked in France, Canada, Australia and South Africa, and in the United States sales exceeded the high level of the previous year. In Argentina, we extended our range of products with encouraging results.
With canned soups-another field in which competition has grown more intense-we have successfully engaged in a vigorous marketing effort both in the Netherlands and Belgium and we are now selling these soups in some other Continental countries. In Sweden, a small canning business, Gustaf Bong AB at Ystad, mainly concerned with soups and vegetables, was acquired.
ICE CREAM
Sales and profits in Europe were affected by the wretched summer, which from mid-June onwards was wetter than usual. Besides the new business in the Netherlands, new businesses have been acquired in Denmark and Austria, namely the ice cream interests of A/S Frisko Flade Is at Copenhagen and “Miag” Milchindustrie- und Agrargesellschaft m.b.H. at Vienna.
In Australia, we have bought a second ice cream business, Streets Ice Cream Limited, which, with the small company acquired in 1959, gives us a substantial stake in the Australian ice cream market.
The South African business begun in 1959 has continued to make progress.
CANNED PRODUCTS AND PRESERVES
As already reported, two food companies were bought in the Netherlands, Lucas Aardenburg N.V. and Koninklijke Maatschappij ((De Betuwe” N.V., and their operations fit in well with our existing food businesses in this country.
In the United Kingdom, our importing business could not be expected to match the exceptional trade that it had done in 1959 in canned salmon which was among the dollar imports freed from government restriction towards the end of 1958. Nevertheless, both sales and profits were satisfactory. Batchelors Foods Limited again found it hard going.
FISH In the United Kingdom, where fish landings were down by about 5°/0 and
prices rose, Mac Fisheries did not find it an easy year; the scope of their activities is being broadened.
In Germany, our retail and wholesale businesses did well, but results on the trawling side were disappointing.
16
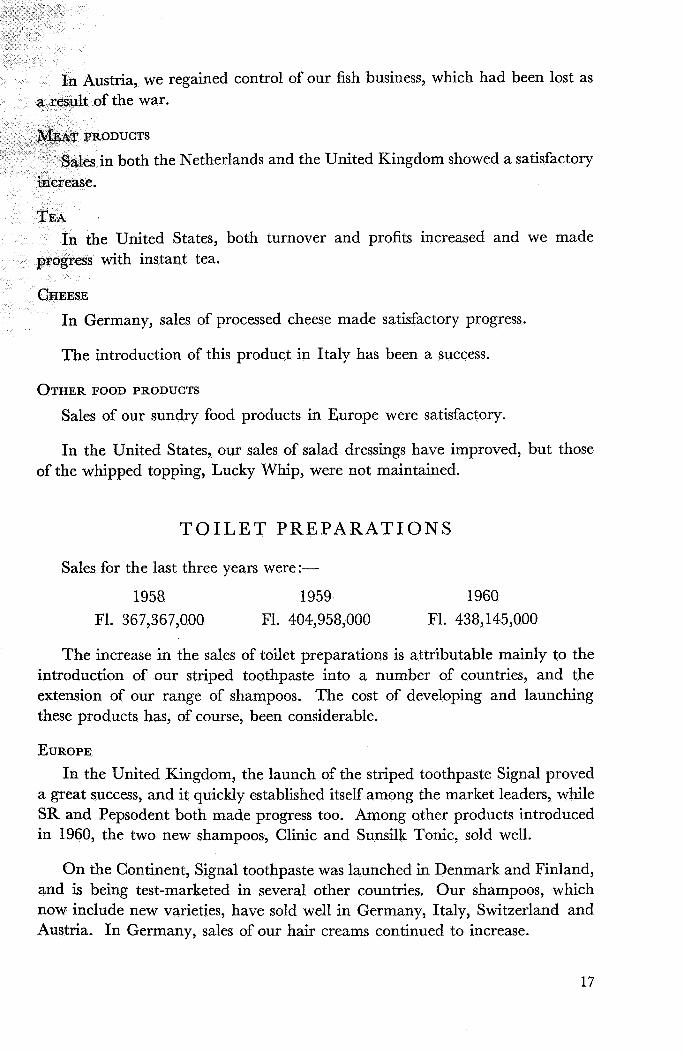
ustria, we regained control of our fish business, which had been lost as
n both the Netherlands and the United Kingdom showed a satisfactory
the United States, both turnover and profits increased and we made s with instant tea.
In Germany, sales of processed cheese made satisfactory progress.
The introduction of this product in Italy has been a success.
OTHER FOOD PRODUCTS
Sales of our sundry food products in Europe were satisfactory.
In the United States, our sales of salad dressings have improved, but those of the whipped topping, Lucky Whip, were not maintained.
TOILET PREPARATIONS
Sales for the last three years were :-
1958 1959 1960 F1. 367,367,000 F1. 404,958,000 F1. 438,145,000
The increase in the sales of toilet preparations is attributable mainly to the introduction of our striped toothpaste into a number of countries, and the extension of our range of shampoos. The cost of developing and launching these products has, of course, been considerable.
EUROPE In the United Kingdom, the launch of the striped toothpaste Signal proved
a great success, and it quickly established itself among the market leaders, while SR and Pepsodent both made progress too. Among other products introduced in 1960, the two new shampoos, Clinic and Sunsilk Tonic, sold well.
On the Continent, Signal toothpaste was launched in Denmark and Finland, and is being test-marketed in several other countries. Our shampoos, which now include new varieties, have sold well in Germany, Italy, Switzerland and Austria. In Germany, sales of our hair creams continued to increase.
17
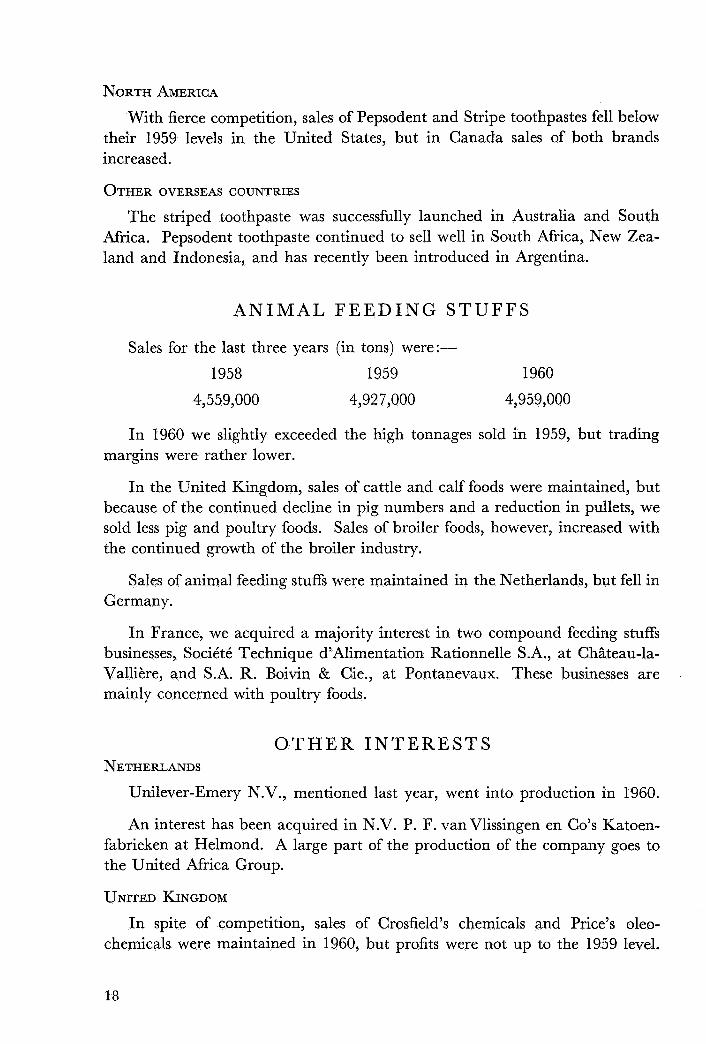
NORTH AMERICA
With fierce competition, sales of Pepsodent and Stripe toothpastes fell below their 1959 levels in the United States, but in Canada sales of both brands increased.
OTHER OVERSEAS COUNTRIES
The striped toothpaste was successfully launched in Australia and South Africa. Pepsodent toothpaste continued to sell well in South Africa, New Zea- land and Indonesia, and has recently been introduced in Argentina.
A N I M A L F E E D I N G S T U F F S
Sales for the last three years (in tons) were:-
1958 1959 1960
4,559,000 4,927,000 4,959,000
In 1960 we slightly exceeded the high tonnages sold in 1959, but trading margins were rather lower.
In the United Kingdom, sales of cattle and calf foods were maintained, but because of the continued decline in pig numbers and a reduction in pullets, we sold less pig and poultry foods. Sales of broiler foods, however, increased with the continued growth of the broiler industry.
Sales of animal feeding stuffs were maintained in the Netherlands, but fell in Germany.
In France, we acquired a majority interest in two compound feeding stuffs businesses, SociCtC Technique d’Alimentation Rationnelle S.A., at Chhteau-la- Vallikre, and S.A. R. Boivin & Cie., at Pontanevaux. These businesses are mainly concerned with poultry foods.
O T H E R I N T E R E S T S NETHERLANDS
Unilever-Emery N.V., mentioned last year, went into production in 1960.
An interest has been acquired in N.V. P. F. vanvlissingen en Co’s Katoen- fabrieken at Helmond. A large part of the production of the company goes to the United Africa Group.
UNITED KINGDOM
In spite of competition, sales of Crosfield’s chemicals and Price’s oleo- chemicals were maintained in 1960, but profits were not up to the 1959 level.
18
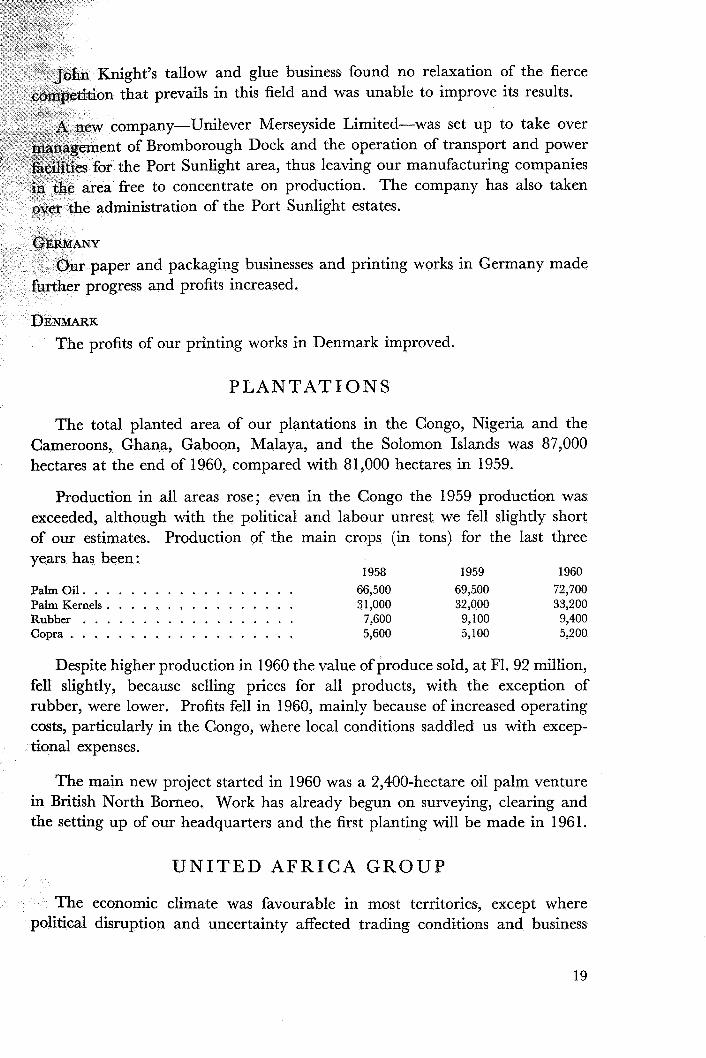
Knight’s tallow and glue business found no relaxation of the fierce on that prevails in this field and was unable to improve its results.
ompany-Unilever Merseyside Limited-was set up to take over t of Bromborough Dock and the operation of transport and power the Port Sunlight area, thus leaving our manufacturing companies
ea free to concentrate on production. The company has also taken administration of the Port Sunlight estates.
aper and packaging businesses and printing works in Germany made er progress and profits increased.
The profits of our printing works in Denmark improved.
P L A N T A T I O N S
The total planted area of our plantations in the Congo, Nigeria and the Cameroons, Ghana, Gaboon, Malaya, and the Solomon Islands was 87,000 hectares at the end of 1960, compared with 81,000 hectares in 1959.
Production in all areas rose; even in the Congo the 1959 production was exceeded, although with the political and labour unrest we fell slightly short of our estimates. Production of the main crops (in tons) for the last three years has been:
1958 1959 1960 Palm Oil. . . . . . . . . . . . . . . . . . 66,500 69,500 72,700 Palm Kernels . . . . . . . . . . . . . . . . 3 1,000 32,000 33,200 Rubber . . . . . . . . . . . . . . . . . . 7,600 9,100 9,400 Copra . . . . . . . . . . . . . . . . . . . 5,600 5,100 5,200
Despite higher production in 1960 the value of produce sold, at F1. 92 million, fell slightly, because selling prices for all products, with the exception of rubber, were lower. Profits fell in 1960, mainly because of increased operating costs, particularly in the Congo, where local conditions saddled us with excep- tional expenses.
The main new project started in 1960 was a 2,400-hectare oil palm venture in British North Borneo, Work has already begun on surveying, clearing and the setting up of our headquarters and the first planting will be made in 196 1.
U N I T E D A F R I C A G R O U P
The economic climate was favourable in most territories, except where political disruption and uncertainty affected trading conditions and business
19
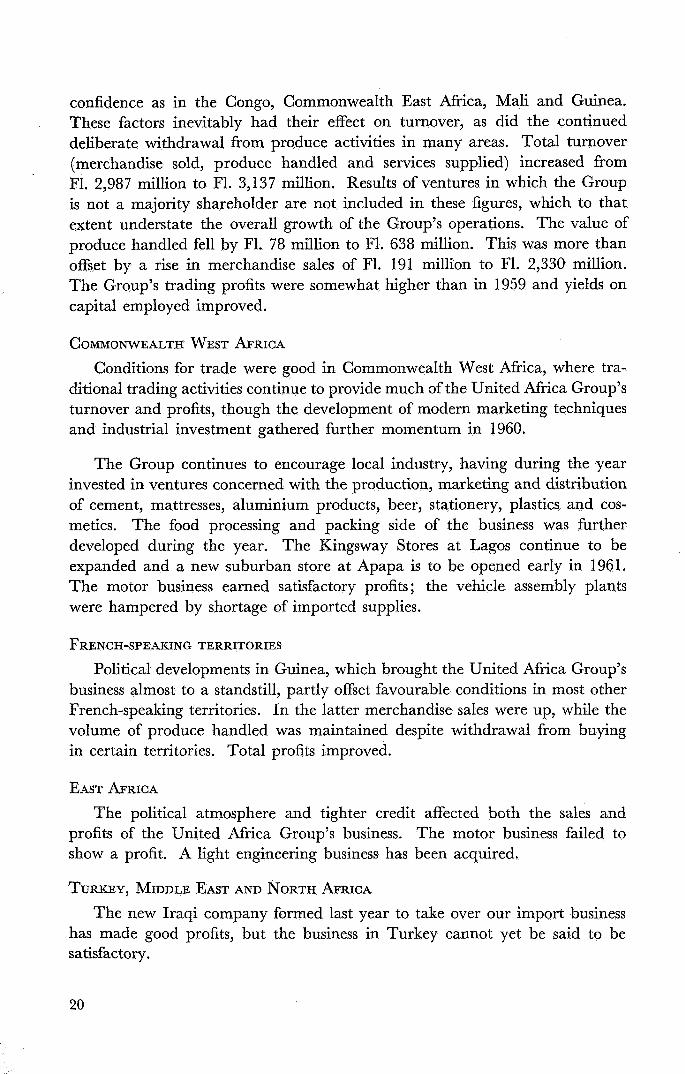
confidence as in the Congo, Commonwealth East Africa, Mali and Guinea. These factors inevitably had their effect on turnover, as did the continued deliberate withdrawal from produce activities in many areas. Total turnover (merchandise sold, produce handled and services supplied) increased from F1. 2,987 million to F1. 3,137 million. Results of ventures in which the Group is not a majority shareholder are not included in these figures, which to that extent understate the overall growth of the Group’s operations. The value of produce handled fell by F1. 78 million to F1. 638 million. This was more than offset by a rise in merchandise sales of F1. 191 million to F1. 2,330 million. The Group’s trading profits were somewhat higher than in 1959 and yields on capital employed improved.
COMMONWEALTH WEST AFRICA Conditions for trade were good in Commonwealth West Africa, where tra-
ditional trading activities continue to provide much of the United Africa Group’s turnover and profits, though the development of modern marketing techniques and industrial investment gathered further momentum in 1960.
The Group continues to encourage local industry, having during the year invested in ventures concerned with the production, marketing and distribution of cement, mattresses, aluminium products, beer, stationery, plastics and cos- metics. The food processing and packing side of the business was further developed during the year. The Kingsway Stores at Lagos continue to be expanded and a new suburban store at Apapa is to be opened early in 1961. The motor business earned satisfactory profits ; the vehicle assembly plants were hampered by shortage of imported supplies.
FRENCH-SPEAKING TERRITORIES
Political developments in Guinea, which brought the United Africa Group’s business almost to a standstill, partly offset favourable conditions in most other French-speaking territories. In the latter merchandise sales were up, while the volume of produce handled was maintained despite withdrawal from buying in certain territories. Total profits improved.
EAST AFRICA The political atmosphere and tighter credit affected both the sales and
profits of the United Africa Group’s business. The motor business failed to show a profit. A light engineering business has been acquired.
TURKEY, MIDDLE EAST AND NORTH AFRICA The new Iraqi company formed last year to take over our import business
has made good profits, but the business in Turkey cannot yet be said to be satisfactory.
20
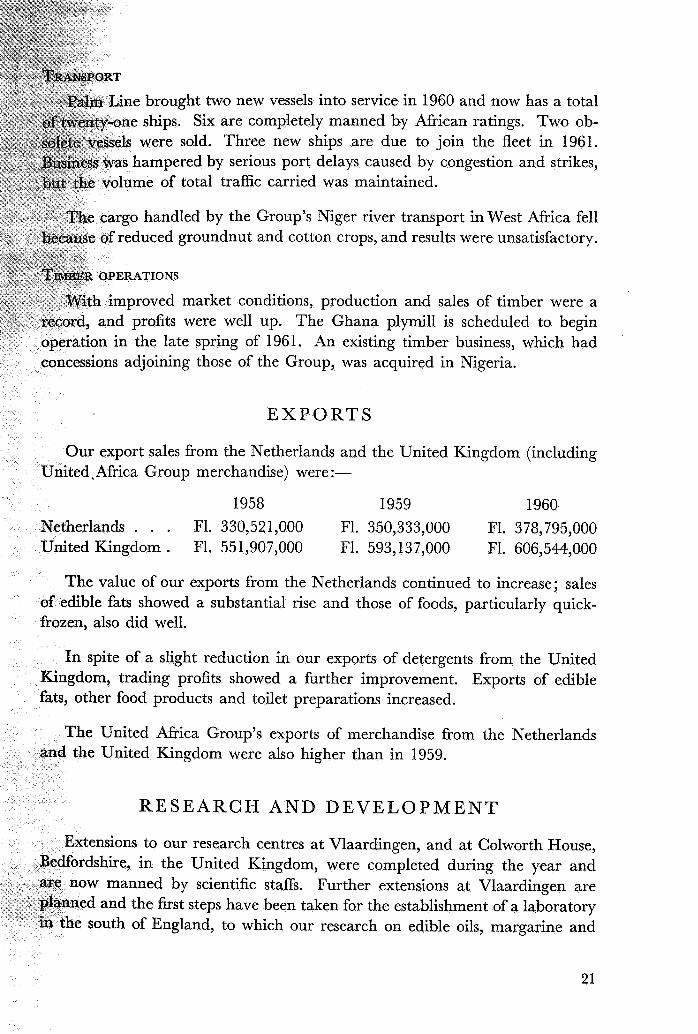
brought two new vessels into service in 1960 and now has a total ships. Six are completely manned by African ratings. Two ob-
ere sold. Three new ships are due to join the fleet in 1961. pered by serious port delays caused by congestion and strikes,
e of total traffic carried was maintained.
go handled by the Group’s Niger river transport in West Africa fell educed groundnut and cotton crops, and results were unsatisfactory.
improved market conditions, production and sales of timber were a , and profits were well up. The Ghana plymill is scheduled to begin on in the late spring of 1961. An existing timber business, which had
ncessions adjoining those of the Group, was acquired in Nigeria.
E X P O R T S
Our export sales from the Netherlands and the United Kingdom (including ited ,Africa Group merchandise) were :-
1958 1959 1960 erlands . . . F1. 330,521,000 F1. 350,333,000 F1. 378,795,000 d Kingdom . F1. 551,907,000 F1. 593,137,000 F1. 606,544,000
The value of our exports from the Netherlands continued to increase; sales dible fats showed a substantial rise and those of foods, particularly quick-
ozen, also did well.
In spite of a slight reduction in our exports of detergents from the United Kingdom, trading profits showed a further improvement. Exports of edible fats, other food products and toilet preparations increased.
United Africa Group’s exports of merchandise from the Netherlands e United Kingdom were also higher than in 1959.
R E S E A R C H AND D E V E L O P M E N T
tensions to our research centres at Vlaardingen, and at Colworth House, rdshire, in the United Kingdom, were completed during the year and
manned by scientific staffs. Further extensions at Vlaardingen are d and the first steps have been taken for the establishment of a laboratory south of England, to which our research on edible oils, margarine and
21
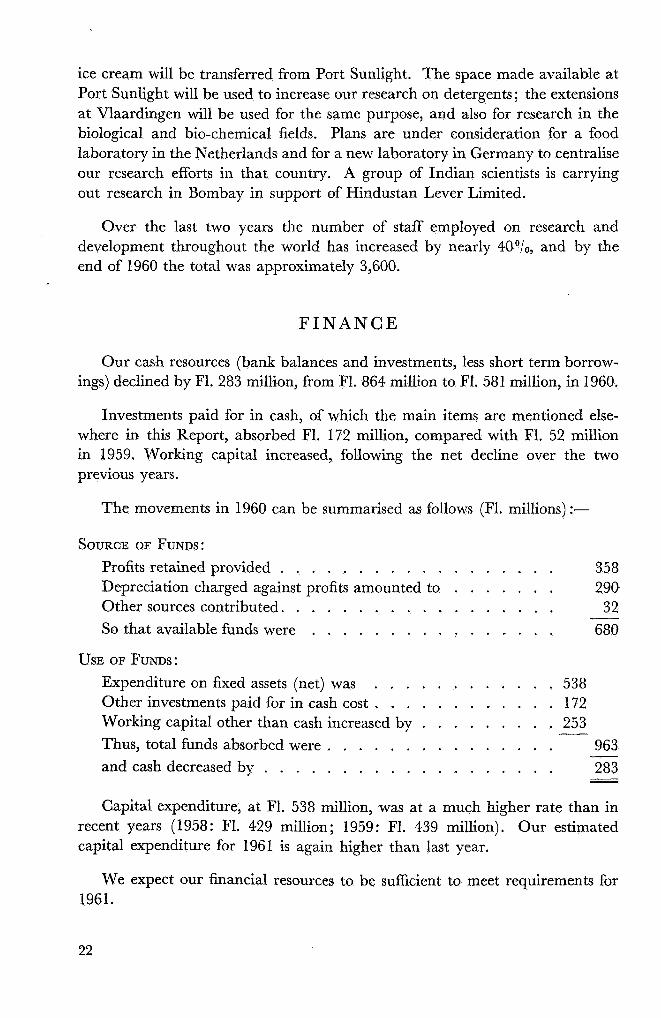
ice cream will be transferred from Port Sunlight. The space made available at Port Sunlight will be used to increase our research on detergents; the extensions at Vlaardingen will be used for the same purpose, and also for research in the biological and bio-chemical fields. Plans are under consideration for a food laboratory in the Netherlands and for a new laboratory in Germany to centralise our research efforts in that country. A group of Indian scientists is carrying out research in Bombay in support of Hindustan Lever Limited.
Over the last two years the number of staff employed on research and development throughout the world has increased by nearly 40°/0, and by the end of 1960 the total was approximately 3,600.
Our cash resources (bank balances and investments, less short term borrow- ings) declined by F1. 283 million, from F1. 864 million to F1. 581 million, in 1960.
Investments paid for in cash, of which the main items are mentioned else- where in this Report, absorbed F1. 172 million, compared with F1. 52 million in 1959. Working capital increased, following the net decline over the two previous years.
The movements in 1960 can be summarised as follows (Fl. millions) :-
SOURCE OF FUNDS: . . . . . . . . . . . . . . . . . . Profits retained provided 358
Depreciation charged against profits amounted to 290 Other sources contributed. - 32 So that available funds were . . . . . . . . . . . . . . . . 680
. . . . . . . . . . . . . . . . . . . . . . . .
USE OF FUNDS: Expenditure on fixed assets (net) was . . . . . . . . . . . . 538 Other investments paid for in cash cost . . . . . . . . . . . . 172 Working capital other than cash increased by . . . . . . . . . 253
. . . . . . . . . . . . . . . 963 Thus, total funds absorbed were and cash decreased by - 283
- -
. . . . . . . . . . . . . . . . . . . - Capital expenditure, at F1. 538 million, was at a much higher rate than in
recent years (1958: F1. 429 million; 1959: F1. 439 million). Our estimated capital expenditure for 1961 is again higher than last year.
We expect our financial resources to be sufficient to meet requirements for 1961.
22
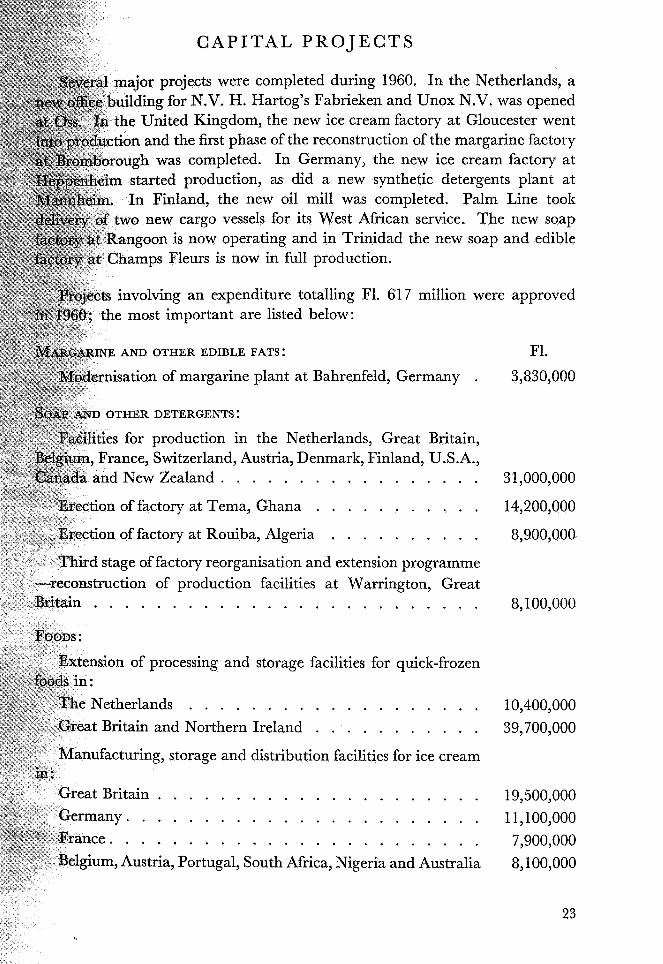
C A P I T A L P R O J E C T S
or projects were completed during 1960. In the Netherlands, a ing for N.V. H. Hartog’s Fabrieken and Unox N.V. was opened United Kingdom, the new ice cream factory at Gloucester went
tion and the first phase of the reconstruction of the margarine factory gh was completed. In Germany, the new ice cream factory at started production, as did a new synthetic detergents plant at In Finland, the new oil mill was completed. Palm Line took
new cargo vessels for its West African service. The new soap oon is now operating and in Trinidad the new soap and edible
amps Fleurs is now in full production.
nvolving an expenditure totalling F1. 61 7 million were approved e most important are listed below:
E AND OTHER EDIBLE FATS:
nisation of margarine plant at Bahrenfeld, Germany . 3,830,000 F1.
THER DETERGENTS :
for production in the Netherlands, Great Britain, ance, Switzerland, Austria, Denmark, Finland, U.S.A.,
New Zealand . . . . . . . . . . . . . . . . . 3 1,000,000
tion of factory at Tema, Ghana . . . . . . . . . . . 14,200,000
on of factory at Rouiba, Algeria . . . . . . . . . . 8,900,000
rd stage of factory reorganisation and extension programme construction of production facilities at Warrington, Great
tain . . . . . . . . . . . . . . . . . . . . . . . . . 8,100,000
sion of processing and storage facilities for quick-frozen
etherlands . . . . . . . . . . . . . . . . . . . 10,400,000 t Britain and Northern Ireland . . . . . . . . . . . 39,700,000
nufacturing, storage and distribution facilities for ice cream
reat Britain . . . . . . . . . . . . . . . . . . . . . 19,500,000 any. . . . . . . . . . . . . . . . . . . . . . . 11,100,000
ce. . . . . . . . . . . . . . . . . . . . . . . . 7,900,000 8,100,000 glum, Austria, Portugal, South Africa, Nigeria and Australia
23
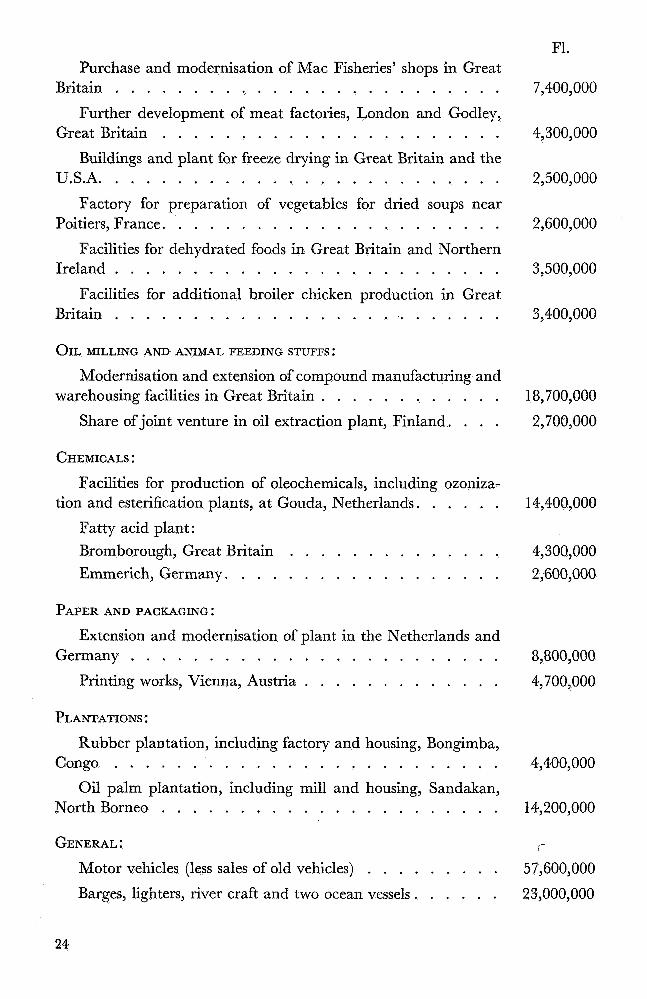
F1. Purchase and modernisation of Mac Fisheries’ shops in Great
Further development of meat factories, London and Godley,
Buildings and plant for freeze drying in Great Britain and the
Britain . . . . . . . . . . . . . . . . . . . . . . . . . 7,400,000
Great Britain . . . . . . . . . . . . . . . . . . . . . . 4,300,000
U.S.A. . . . . . . . . . . . . . . . . . . . . . . . . . 2,500,000
Factory for preparation of vegetables for dried soups near Poitiers, France. . . . . . . . . . . . . . . . . . . . . .
Facilities for dehydrated foods in Great Britain and Northern Ireland . . . . . . . . . . . . . . . . . . . . . . . . .
Facilities for additional broiler chicken production in Great Britain . . . . . . . . . . . . . . . . . . . . . . . . .
OIL MILLING AND ANIMAL FEEDING STUFFS:
Modernisation and extension of compound manufacturing and
Share of joint venture in oil extraction plant, Finland. . . . warehousing facilities in Great Britain . . . . . . . . . . . .
CHEMICALS :
Facilities for production of oleochemicals, including ozoniza- tion and esterification plants, at Gouda, Netherlands. . . . . .
Fatty acid plant:
Emmerich, Germany. . . . . . . . . . . . . . . . . . Bromborough, Great Britain . . . . . . . . . . . . . .
PAPER AND PACKAGING :
Extension and modernisation of plant in the Netherlands and Germany . . . . . . . . . . . . . . . . . . . . . . . .
Printing works, Vienna, Austria . . . . . . . . . . . . .
2,600,000
3,500,000
3,400,000
18,700,000 2,700,000
14,400,000
4,300,000 2,600,000
8,800,000 4,700,000
PLANTATIONS :
Rubber plantation, including factory and housing, Bongimba,
Oil palm plantation, including mill and housing, Sandakan,
Congo . . . . . . . . . . . . . . . . . . . . . . . . . 4,400,000
North Borneo . . . . . . . . . . . . . . . . . . . . . . 14,200,000
GENERAL : , - Motor vehicles (less sales of old vehicles) . . . . . . . . . 57,600,000
Barges, lighters, river craft and two ocean vessels. . . . . . 23,000,000
F1. Storage and distribution depots in Great Britain . . . . . . 8,000,000 Housing and welfare facilities for employees . . . . . . . . 11,200,000 Offices for Birds Eye, Walton-on-Thames, Great Britain, . . 16,000,000 Extension of research laboratory, Vlaardingen, Netherlands . 3,200,000 Site for office building, New Jersey, U.S.A. . . . . . . . . 3,400,000
P E N S I O N S
The Companies’ pension contributions and other payments for employees’ retirement and death benefits amounted in 1960 to F1. 150 million.
The assets of the Unilever Pension and Provident Funds increased during 1960 from F1. 1,287 million to F1. 1,436 million. These Funds cover 114,000 employees,
In accordance with the changes in accounting practice described on page 34, a provision of F1. 103,284,000 has been entered in the Balance Sheet under the heading of “Deferred Liabilities” to cover the Companies’ commitments for unfunded retirement benefits.
M E M B E R S H I P
At 31st December, 1960, the number of stockholders in LIMITED was 188,005. Nearly all the share capital Of N.V. is represented by bearer scrip and the number of members cannot be ascertained.
D I R E C T O R S
In August, 1960, the death occurred of Mr. H. L. Woltersom, who had been an Advisory Director of N.V. since 1941. We record our appreciation of his services to the Company.
Mr. F. D. Morrell has stated that for reasons of health he has decided not to seek re-election. Mr. Morrell, who started in the business with Lever Brothers Limited at Port Sunlight in 1927, has been a member of the Boards of N.V. and LIMITED for more than 12 years, and his colleagues, in recording their appreciation of his services, greatly regret their premature termination.
Since the last Annual General Meeting Mr. A. J. C. Hoskyns-Abrahall has been elected a Director of N.V. and LIMITED.
25
92
C A P I T A L E M P L O Y E D 1956-1960 BY G E O G R A P H I C A L A R E A S
4945
UNITED AFRICA GROUP
THE ORIENT
AFRICA, MIDDLE EAST, AUSTRALASIA
NORTH AND SOUTH AUERlCA
EliROPE
Figures repeesent FL.
1957 1958
inillions 6079
1959
Excluding 4iterests Not Consolidated
UNITED AFRICA OROUP
THE ORIENT
AFRICA, MIDDLE EAST, AUSTRALASIA I
NORTH AND SOUTH AMERICA
EUROPE
R E T U R N O N C A P I T A L E M P L O Y E D A N D O N T U R N O V E R 1951-1960 11
10
9
.ZS PERCENTAGE OF CLZPIT.\L. EhfPLOYED
% a 7
6
5
4 AS PERCENTAGE OF TURNOVER
3
2
1
%
I I , I I I I I I
1951 1952 1953 1954 1955 1956 1957 1958 1959 1960 The returns are based on Lhe proJts, after taxation, but before deducting loan interest
27
C O N S O L I D A T E D P R O F I T AND LOSS A C C O U N T S URILEVER bf.V. and U b r ~ L ~ V ~ ~ LIMITED and their subsidiaries
Figures in red represent deductions
N.V.
F1.
619,907,000
6,265,000
5,544,000
620,628,000
31 1,380,000
309,248,000
13,492,000 24,029,000
14,413.000
. 284,298,000
11,742.000! -
11,742,OOO
272,556,000
96,l65,000 - -
96,165,000
176,391,000
TRADING PROFIT. . . . . . . . . . .
INCOME FROM TRADE INVESTMENTS . . . . . .
INTEREST ON LOAN CAPITAL. . . . . . . . .
PROFITBEFOPPETAXATION . . . . .
TAXATION ON PROFITFORTHEYEAR . . . . .
PROFIT FOR THE YEAR AFTER TAXA- TION . . . . . . . . . . . . . . . . .
EXCEPTIONAL ITEMS
a. Taxation adjustments -previous years . 6. Other . . . . . . . . . . . . . . .
AMOUNTS ATTRIBUTABLE TO OUTSIDE SHARE-
HOLDERS’ INTERESTS IN SUBSIDIARIES . . . . .
CONSOLIDATED NET PROFIT. . . .
PREFERENTIAL DIVIDENDS OF PARENT COMPANIES
Less: United Kingdom income tax . . . . .
PROFIT ACCRUING TO ORDINARY AND DEFERRED CAPITAL . . . . . . .
ORDINARY AND DEFERRED DIVIDENDS OF PARENT
COMPANIES
Ordinary . . . . . . . . . . . . . . . . Deferred . . . . . . . . . . . . . . . . Less: United Kingdom income tax . . . . .
PROFIT RETAINED IN THE BUSINESS .
LIMITED
F1.
602,170,000
23,5 13,000
9,425,000
616,258,000
296,5.90,000
319,668,000
7,374,000 6,342,000
10.076,OOO
310,624,000
46.255,OOO i -___ 17,918,0001
2‘8,737,000
282,287,000
-~ 87,301,000
64,000
33,846,000
.i3,519.000 ~. _I
228,768,000
28
N O T E S
i
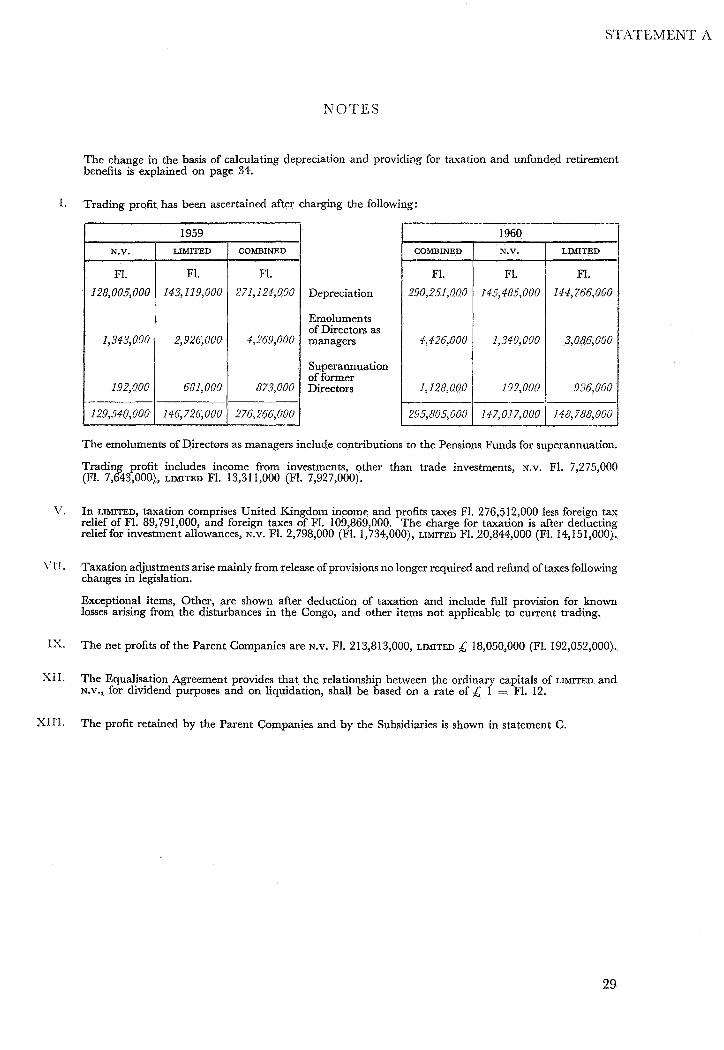
The change in the basis of calculating depreciation and providing for taxation and unfunded retirement benefits is explained on page 34.
Trading profit has been ascertained after charging the following: I.
F1. 128,005,000
1,343,000
192,000
1959 LIMITED I COMBINED
Depreciation
Emoluments of Directors as managers
Superannuation of former Directors
I960 COMBINED I N.V.
F1. F1. 290,251,000 145,485,000
4,426,000 1,340,000
I , 128,000 192,000
295,805,000 147,017.000
LIMITED
The emoluments of Directors as managers include contributions to the Pensions Funds for superannuation.
Trading profit includes income from investments, other than trade investments, N.V. F1. 7,275,000 (FI. 7,643,000), LIMITED F1. 13,311,000 (Fl. 7,927,000).
V. In LIMITED, taxation comprises United Kingdom income and profits taxes F1. 276,512,000 less foreign tax relief of F1. 89,791,000, and foreign taxes of F1. 109,869,000. The charge for taxation is after deducting relief for investment allowances, N.V. F1. 2,798,000 (FI. 1,734,000), LIMITED F1. 20,844,000 (Fl. 14,15 1,000).
\'II. Taxation adjustments arise mainly from release of provisions no longer required and refund of taxes following changes in legislation.
Exceptional items, Other, are shown after deduction of taxation and include full provision for known losses arising from the disturbances in the Congo, and other items not applicable to current trading.
IX. The net profits of the Parent Companies are N.V. F1. 213,813,000, LIMITED E 18,050,000 (FI. 192,052,000).
XII. The Equalisation Agreement provides that the relationship between the ordinary capitals of LIMITED and N.v., for dividend purposes and on liquidation, shall be based on a rate of E 1 = F1. 12.
XIII. The profit retained by the Parent Companies and by the Subsidiaries is shown in statement C.
29
STATEMENT I3
CON 1
31st December 1959 I
XI.
I.
11.
111.
IV.
V.
VI *
VII.
vn1.
IX.
X.
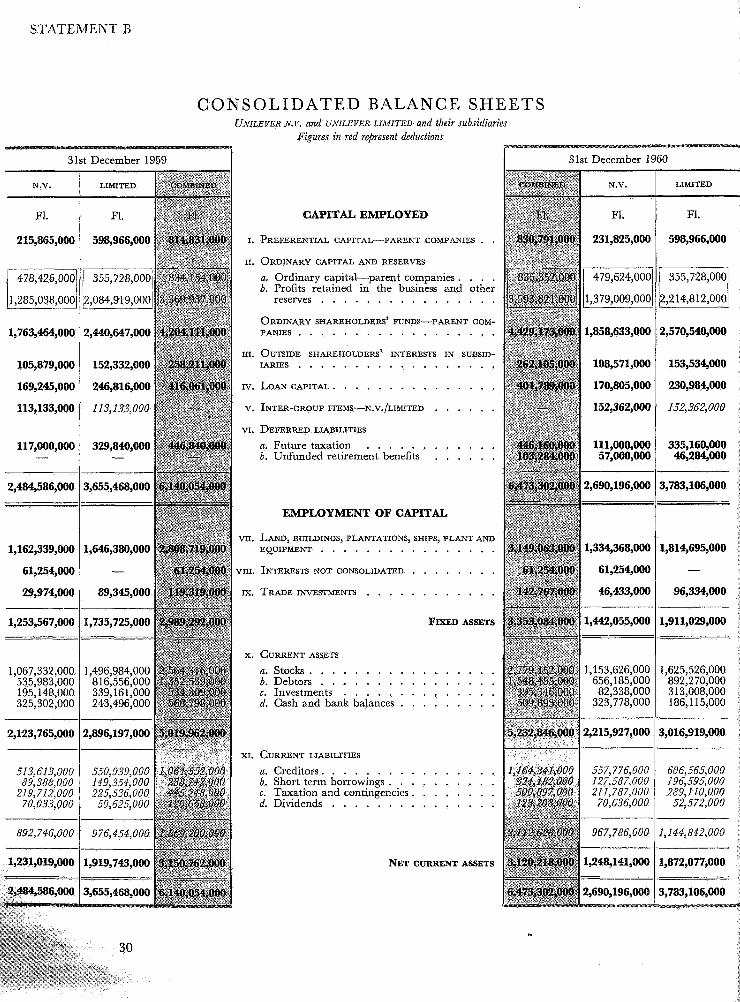
I L I D A T E D BALANCE S H E E T S EVER N.v. and UNILEVER LIMITED and their subsidiaries
Figures in red represent deductions
CAPITAL EMPLOYED
PREFERENTIAL CAPITAL-PARENT COMPANIES . . ORDINARY CAPITAL AND RESERVES
a. Ordinary capital-parent companies. b. Profits retained in the business and other
. . . . . . . . . . . . . . . . . . . reserves
ORDINARY SHAREHOLDERS’ FUNDS-PARENT COM- PANIES . . . . . . . . . . . . . . . . . . OUTSIDE SHAREHOLDERS’ INTERESTS IN SUBSID- IARIES . . . . . . . . . . . . . . . . . . LOAN CAPITAL. . . . . . . . . . . . . . . INTER-GROUP ITEMS-N.V./LIMITED . . . . . . DEFERRED LIABILITIES
a. Future taxation . . . . . . . . . . b. Unfunded retirement benefits . . . .
. .
EMPLOYMENT OF CAPITAL
LAND, BUILDINGS, PLANTATIONS, SHIPS, PLANT AND
INTERESTS NOT CONSOLIDATED . . . . . . . . TRADE INVESTMENTS . . . . . . . . . .
EQUIPMENT . . . . . . . . . . . . . . . .
. .
1,858,633,000 2,570,540,000
108,571,000 153,534,000
170,805,000 230,984,000
152,362,000 152,362,000
2,690,196,000 3,783,106,000
1,334,368,000 1,814,695,000
- 46,433,000 96,334,000
1,442,055,000 1,911,029,000 FIXED ASSETS
I 1x1,000,000 57,000,000
- 335,160,000 46 ,2~000
CURRENT ASSETS
a. Stocks. 1,153,626,000 1,625,526,000
c. Investments . . . . . . . . . . . . . . 82,338,000 313,008,000 d . Cash and bank balances . . . . . . . . . 323,778,000 186,115,000
. . . . . . . . . . . . . . . . b. Debtors . . . . . . . . . . . . . . . . 656,185,000 892,270,000
CURRENT LIABILITIES
a. Creditors. . . . . . . . b. Short term borrowings . . c. Taxation and contingencies d. Dividends . . . . . . .
NET
2,215,927,000 3,016,919,000
. . . . . . . .
. . . . . . . . . . . . . . . .
. . . . . . . .
’ CURRENT ASSETS
- 357,776,000 127,$87,000 21 1,787,000 70,636,000
STATEMENT I3
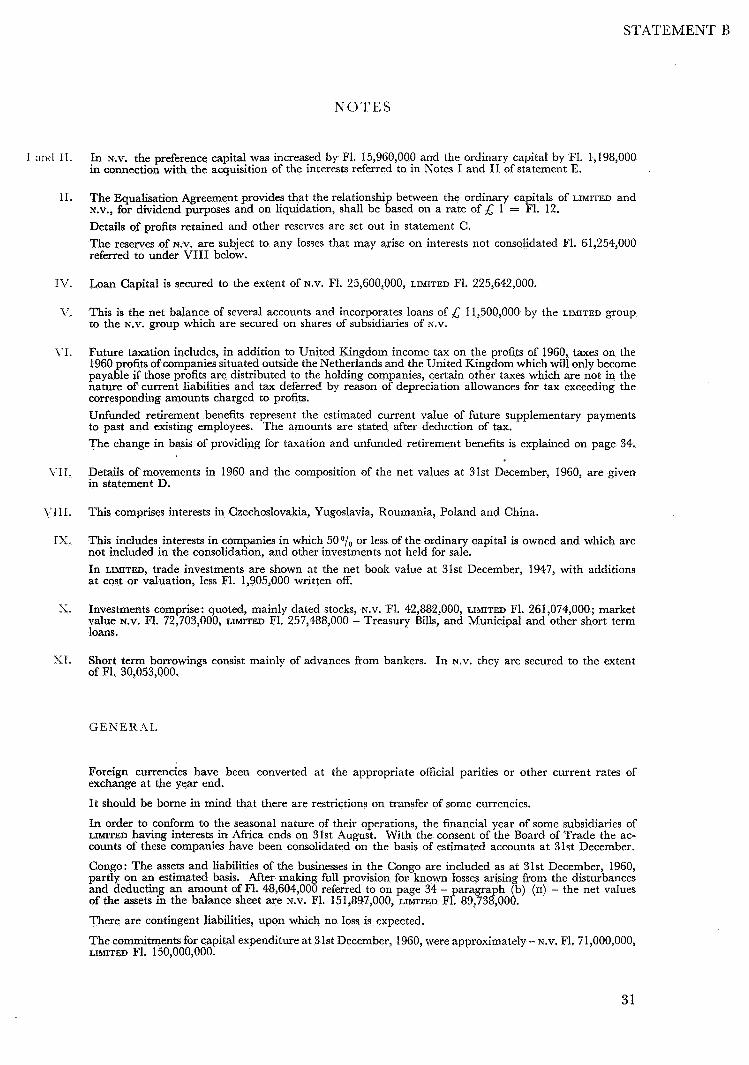
NOTES
I . i r i t l 11. In N.V. the preference capital was increased by F1. 15,960,000 and the ordinary capital by F1. 1,198,000 in connection with the acquisition of the interests referred to in Notes I and I1 of statement E.
The Equalisation Agreement provides that the relationship between the ordinary capitals of LIMITED and N.v., for dividend purposes and on liquidation, shall be based on a rate of E 1 = F1. 12. Details of profits retained and other reserves are set out in statement C. The reserves of N.V. are subject to any losses that may arise on interests not consolidated F1. 61,254,000 referred to under VI11 below.
11.
11’. Loan Capital is secured to the extent of N.V. F1. 25,600,000, LIMITED F1. 225,642,000.
1’. This is the net balance of several accounts and incorporates loans of E 11,500,000 by the LIMITED group to the N.V. group which are secured on shares of subsidiaries of N.V.
1’1. Future taxation includes, in addition to United Kingdom income tax on the profits of 1960, taxes on the 1960 profits of companies situated outside the Netherlands and the United Kingdom which will only become payable if those profits are distributed to the holding companies, certain other taxes which are not in the nature of current liabilities and tax deferred by reason of depreciation allowances for tax exceeding the corresponding amounts charged to profits. Unfunded retirement benefits represent the estimated current value of future supplementary payments to past and existing employees. The amounts are stated after deduction of tax. The change in basis of providing for taxation and unfunded retirement benefits is explained on page 34.
1-11. Details of movements in 1960 and the composition of the net values at 31st December, 1960, are given in statement D.
1’1 I I. This comprises interests in Czechoslovakia, Yugoslavia, Roumania, Poland and China.
IS. This includes interests in companies in which 50 or less of the ordinary capital is owned and which are not included in the consolidation, and other investments not held for sale. In LIMITED, trade investments are shown at the net book value at 31st December, 1947, with additions at cost or valuation, less F1. 1,905,000 written off.
S. Investments comprise: quoted, mainly dated stocks, N.V. F1. 42,882,000, LIMITED F1. 261,074,000; market value N.V. F1. 72,703,000, LIMITED F1. 257,488,000 - Treasury Bills, and Municipal and other short term loans.
SI. Short term borrowings consist mainly of advances from bankers. In N.V. they are secured to the extent of F1. 30,053,000.
G E N E R -1 1,
Foreign currencies have been converted at the appropriate official parities or other current rates of exchange at the year end.
I t should be borne in mind that there are restrictions on transfer of some currencies.
In order to conform to the seasonal nature of their operations, the financial year of some subsidiaries of LIMITED having interests in Africa ends on 31st August. With the consent of the Board of Trade the ac- counts of these companies have been consolidated on the basis of estimated accounts at 31st December.
Congo: The assets and liabilities of the businesses in the Congo are included as at 31st December, 1960, partly on an estimated basis. After making full provision for known losses arising from the disturbances and deducting an amount of F1. 48,604,000 referred to on page 34 - paragraph (b) (11) - the net values of the assets in the balance sheet are N.V. F1. 151,897,000, LIMITED F1. 89,738,000.
There are contingent liabilities, upon which no loss is expected.
The commitments for capital expenditure at 31st December, 1960, were approximately - N.V. F1. 71,000,000, LIMITED F1. 150,000,000.
31
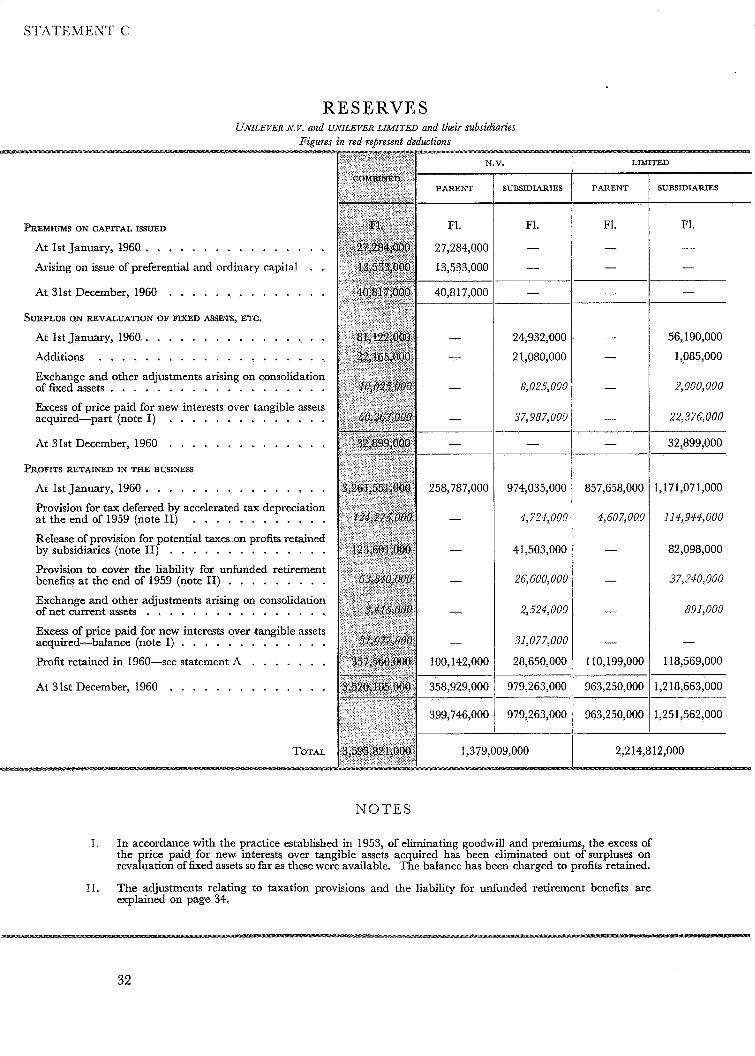
RE SERVES UNILEVER N.V. and U ~ I L E V E R LIMITED and their subsidiaries
Figures in red rebresent deductions
SUBSIDIARIES
F1.
- -
PARENT
PREMIUMS ON CAPITAL ISSUED
At 1st January, 1960 . . . . . . . . . . . . . . . . Arising on issue of preferential and ordinary capital . . At 31st December, 1960 . . . . . . . . . . . . . .
SURPLUS ON REVALUATION OF FIXED ASSETS, ETC.
At 1st January, 1960 . . . . . . . . . . . . . . . . Additions . . . . . . . . . . . . . . . . . . . . Exchange and other adjustments arising on consolidation of fixed assets . . . . . . . . . . . . . . . . . . . Excess of price paid for new interests over tangible assets acquired-part (note I) . . . . . . . . . . . . . . At 31st December, 1960 . . . . . . . . . . . . . .
PROFITS RETAINED IN THE BUSINESS
At 1st January, 1960 . . . . . . . . . . . . . . . .
at the end of 1959 (note 11) Provision for tax deferred by accelerated tax depreciation
Release of provision for potential taxes on profits retained by subsidiaries (note 11) . . . . . . . . . . . . . . Provision to cover the liability for unfunded retirement benefits at the end of 1959 (note 11) . . . . . . . . . Exchange and other adjustments arising on consolidation of net current assets . . . . . . . . . . . . . . . . Excess of price paid for new interests over tangible assets acquired-balance (note I) . . . . . . . . . . . . . Profit retained in 1960-see statement A
At 31st December, 1960 . . . . . . . . . . . . . .
. . . . . . . . . . . .
. . . . . . .
1,379,009,000
24,932,000
2 1,080,000
8,O 25,006
37,987,006
-
974,035,000
4,724,006
41,503,000
26,600,006
2,524,OOG
31,077,OOG
28,650,000
979,263,000
979,263,000
LIMITED
PARENT
F1.
- -
857,658,000
4,607,000
- 1 10,199,000
963,250,000
963,250,000
SUBSIDIARIES
F1.
-
-
56,190,000
1,085,000
2,000,000
22,376,000
32,899,000
1,17 1,07 1,000
114,944,000
82,098,000
37,240,000
891,000
-
118,569,000
1,2 18,663,000
1,251,562,000
2,2 14,812,000
N O T E S
I. In accordance with the practice established in 1953, of eliminating goodwill and premiums, the excess of the price paid for new interests over tangible assets acquired has been eliminated out of surpluses on revaluation of fixed assets so far as these were available. The balance has been charged to profits retained.
The adjustments relating to taxation provisions and the liability for unfunded retirement benefits are explained on page 34.
11.
32
STATEMENT D
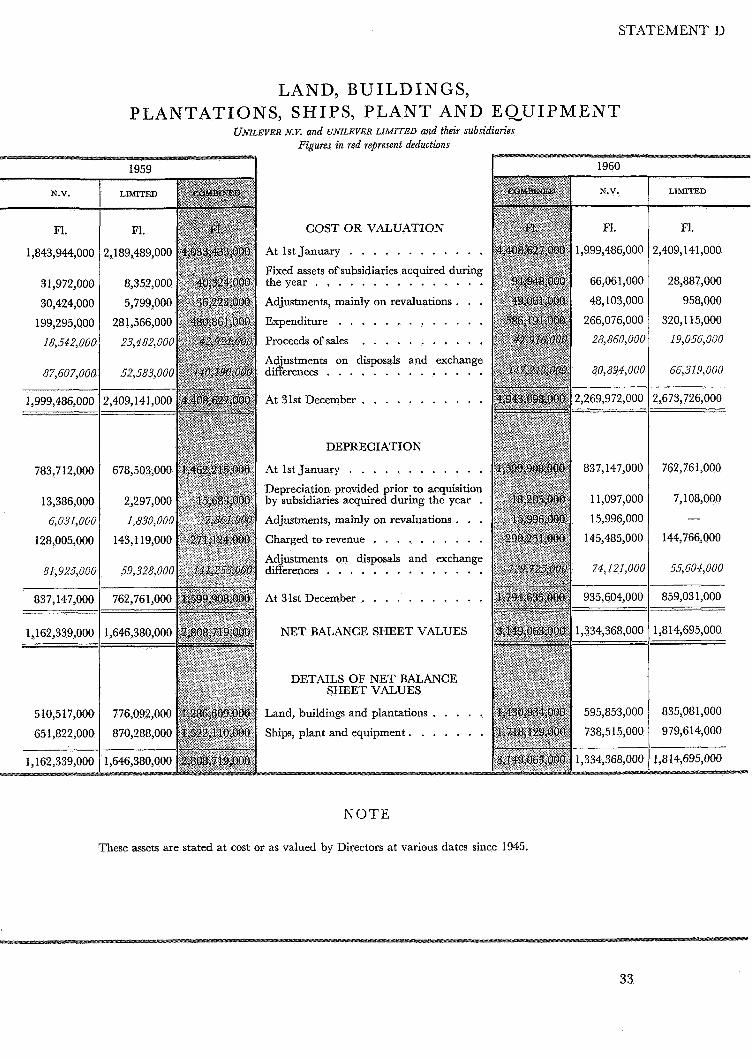
LAND, BUILDINGS, PLANTATIONS, SHIPS, P L A N T AND E Q U I P M E N T
UNILEVER N.V. and UNILEVER LIMITED and their subsidiaries Figures in red represent deductions
t i
I
1959 I
COST OR VALUATION
At 1st January . . . . . . . . . . . . Fixed assets of subsidiaries acquired during the year . . . . . . . . . . . . . . . Adjustments, mainly on revaluations . . . Expenditure . . . . . . . . . . . . . Proceeds of sales . . . . . . . . . . . Adjustments on disposals and exchange differences . . . . . . . . . . . . . . At 31st December . . . . . . . . . . .
DEPRECIATION
At 1st January . . . . . . . . . . . . Depreciation provided prior to acquisition by subsidiaries acquired during the year . Adjustments, mainly on revaluations . . . Charged to revenue . . . . . . . . . . Adjustments on disposals and exchange differences . . . . . . . . . . . . . . At 31st December . . . . . . . . . . .
NETBALANCESHEETVALUES
DETAILS OF NET BALANCE SHEET VALUES
Land, buildings and plantations . . . . . Ships, plant and equipment. . . . . . .
NOTE
These assets are stated at cost or as valued by Directors at various dates since 1945. #
LIMITED
F1.
!,409,141,000
28,887,000
958,000
320,115,000
19,056,000
66,319,000
!,673,726,000
762,761,000
7,108,000 -
144,766,000
55,604,OUO
859,03 1,000
L,814,695,000
835,081,000
979,614,000
1,8 14,695,000
33
CHANGES IN ACCOUNTING PRACTICE
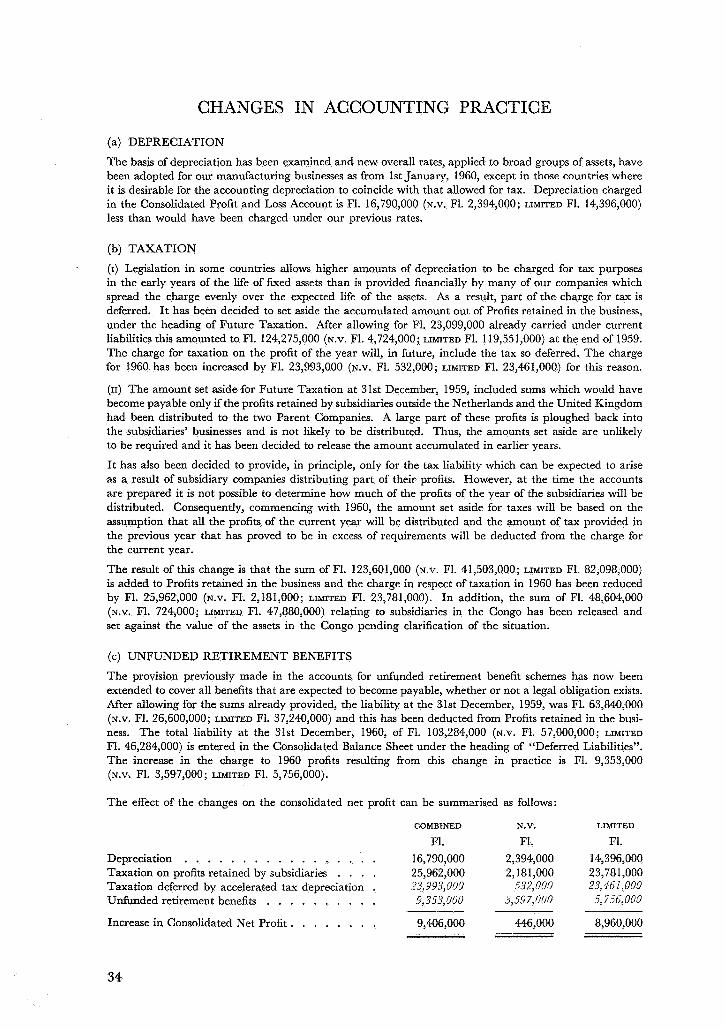
(a) DEPRECIATION
The basis of depreciation has been examined and new overall rates, applied to broad groups of assets, have been adopted for our manufacturing businesses as from 1st January, 1960, except in those countries where it is desirable for the accounting depreciation to coincide with that allowed for tax. Depreciation charged in the Consolidated Profit and Loss Account is F1. 16,790,000 (N.v. F1. 2,394,000; LIMITED F1. 14,396,000) less than would have been charged under our previous rates.
(b) TAXATION
(I) Legislation in some countries allows higher amounts of depreciation to be charged for tax purposes in the early years of the life of fixed assets than is provided financially by many of our companies which spread the charge evenly over the expected life of the assets. As a result, part of the charge for tax is deferred. I t has been decided to set aside the accumulated amount out of Profits retained in the business, under the heading of Future Taxation. After allowing for F1. 23,099,000 already carried under current liabilities this amounted to F1. 124,275,000 (N.v. F1. 4,724,000; LIMITED F1. 119,551,000) at the end of 1959. The charge for taxation on the profit of the year will, in future, include the tax so deferred. The charge for 1960 has been increased by F1. 23,993,000 (N.v. F1. 532,000; LIMITED F1. 23,461,000) for this reason.
(11) The amount set aside for Future Taxation at 31st December, 1959, included sums which would have become payable only if the profits retained by subsidiaries outside the Netherlands and the United Kingdom had been distributed to the two Parent Companies. A large part of these profits is ploughed back into the subsidiaries’ businesses and is not likely to be distributed. Thus, the amounts set aside are unlikely to be required and it has been decided to release the amount accumulated in earlier years.
It has also been decided to provide, in principle, only for the tax liability which can be expected to arise as a result of subsidiary companies distributing part of their profits. However, at the time the accounts are prepared it is not possible to determine how much of the profits of the year of the subsidiaries will be distributed. Consequently, commencing with 1960, the amount set aside for taxes will be based on the assumption that all the profits of the current year will be distributed and the amount of tax provided in the previous year that has proved to be in excess of requirements will be deducted from the charge for the current year.
The result of this change is that the sum of F1. 123,601,000 (N.v. F1. 41,503,000; LIMITED F1. 82,098,000) is added to Profits retained in the business and the charge in respect of taxation in 1960 has been reduced by F1. 25,962,000 (N.v. F1. 2,181,000; LIMITED F1. 23,781,000). In addition, the sum of F1. 48,604,000 (N.v. F1. 724,000; LIMITED F1. 47,880,000) relating to subsidiaries in the Congo has been released and set against the value of the assets in the Congo pending clarification of the situation.
(c) UNFUNDED RETIREMENT BENEFITS
The provision previously made in the accounts for unfunded retirement benefit schemes has now been extended to cover all benefits that are expected to become payable, whether or not a legal obligation exists. After allowing for the sums already provided, the liability at the 31st December, 1959, was F1. 63,840,000 (N.v. F1. 26,600,000; LIMITED Fl. 37,240,000) and this has been deducted from Profits retained in the busi- ness. The total liability at the 31st December, 1960, of F1. 103,284,000 (N.v. F1. 57,000,000; LIMITED
F1. 46,284,000) is entered in the Consolidated Balance Sheet under the heading of “Deferred Liabilities”. The increase in the charge to 1960 profits resulting from this change in practice is F1. 9,353,000 (N.v. F1. 3,597,000; LIMITED F1. 5,756,000).
The effect of the changes on the consolidated net profit can be summarised as follows:
COMBINED
F1. Depreciation . . . . , . . . . . . . . . . . . 16,790,000 Taxation on profits retained by subsidiaries . . . . 25,962,000 Taxation deferred by accelerated tax depreciation . 23,993,000 Unfunded retirement benefits . . . . . . . . . . 9,353,000
Increase in Consolidated Net Profit . . . . . . . . 9,406,000
N.V. LIMITED
F1. F1. 2,394,000 14,396,000 2,181,000 23,78 1,000
3,59 7,000 5,756,000
446,000 8,960,000
532,000 23. -!Fi,000
34
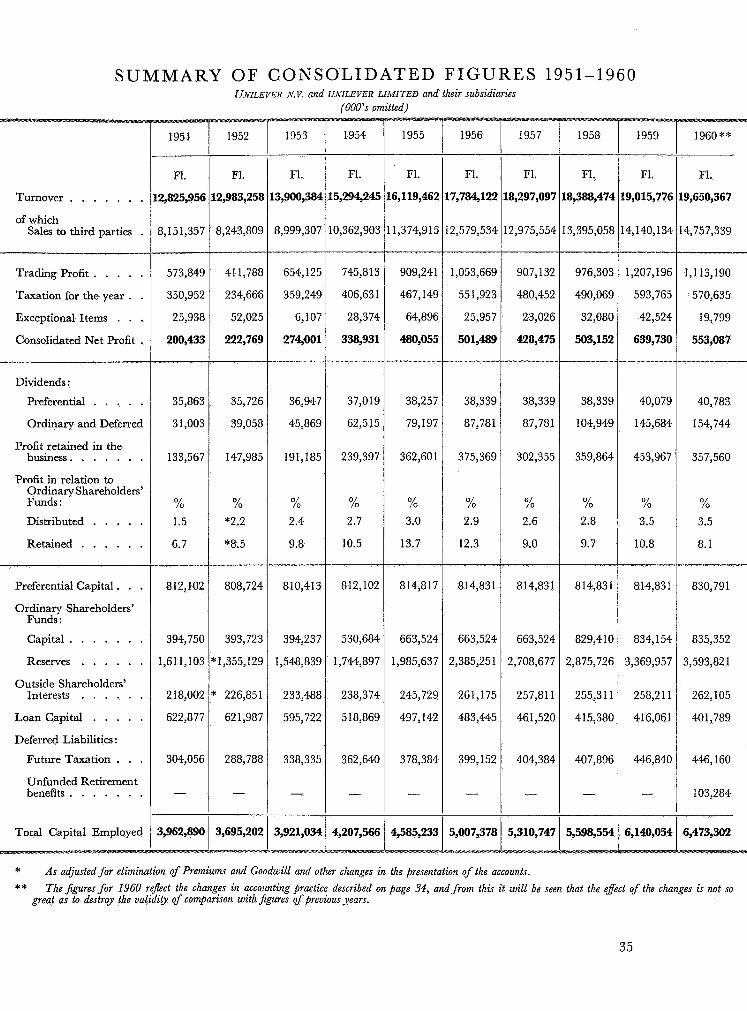
SUMMARY OF CONSOLIDATED FIGURES 1951-1960 UNILEVER hr.K and UhrILEVER LIMITED and their subsidiaries
(000's omitted)
1960"" 1955
F1.
6,119,462
1,374,9 15
909,241
467,149
64,896
480,055
38,257
79,197
362,601
% 3.0
13.7
814,817
663,524
1,985,637
245,729
497,142
378,384
-
1956
F1.
7,784,122
2,579,534
1,053,669
55 1,923
25,957
501,489
38,339
87,781
375,369
% 2.9
12.3
1954
F1.
5,294,245
0,362,903
745,813
406,63 1
28,374
338,931
37,019
62,515
239,397
% 2.7
10.5
812,102
530,684
1,744,897
238,374
5 18,869
362,640
-
1957
F1.
8,297,095
2,975,554
907,132
480,452
23,026
428,475 -.
38,339
87,781
302,355
% 2.6
9.0
81433 1
663,524
2,708,677
257,811
46 1,520
404,384
-
5,310,747
1953
F1.
3,900,384
8,999,307 --
654,125
359,249
6,107
274,001 -~
36,947
45,869
191,185
% 2.4
9.8
810,413
394,237
1,548,839
2 3 3,488
595,722
338,335
-
3,921,034 P
1952 1951
F1.
2,825,956
8,15 1,357
F1.
.9,650,367
4,757,339
F1.
.2,983,25a
8,243,809
41 1,788
234,666
.52,02 5
222,769
35,726
39,058
147,985
% *2.2
"8.5
Turnover . . . . , . . of which
Sales to third parties .
1,113,190
570,635
19,799
553,087
573,849
350,952
25,938
200,433
35,863
3 1,003
133,567
% 1.5
6.7
8 12,102
394,750
1,611,103
2 18,002
622,877
304,056
-
Trading Profit. . . . . Taxation for the year . . Exceptional Items . . . Consolidated Net Profit .
I
Dividends :
Preferential . . . . , Ordinary and Deferred
business . . . . . . . Profit retained in the
Profit in relation to Ordinary Shareholders' Funds :
Distributed . . . . . Retained . . . . .
Preferential Capital. . . Ordinary Shareholders'
Funds :
Capital . . . . . . . Reserves . . . . .
Outside Shareholders' Interests . . . . .
Loan Capital . . . .
40,783
1 54,744
357,560
% 3.5
8.1
38,339 40,079
104,949 145,684
359,864 453,967
% % 2.8 3.5
9.7 10.8
814,831 814,831
829,410 834,154
2,875,726 3,369,957
808,724
393,723
'1,355,129
' 226,851
62 1,987
288,788
-
814,831
663,524
2,385,25 1
261,175
483,445
399,152
-
830,791
835,352
3,593,82 1
262,105
40 1,789
446,160
103,284
255,3 1 1
415,380
258,2 11
41 6,06 1
Deferred Liabilities :
Future Taxation . . . Unfunded Retirement benefits . . . . . . .
407,896 446,840
- - I 3,962,890 3,695,202 4,207,566
P
5,007,378 6,473,302 Total Capital Employed 4,585,233
* **
As adjusted for elimination of Premiums and Goodwill and other changes in the presentation of the accounts. The jigures fo r 1960 reflect the changes in accounting practice described on page 34, and from this it will be seen that the effect of the changes is not so
great as to destroy the validity of comparison with figures of previous years.
35
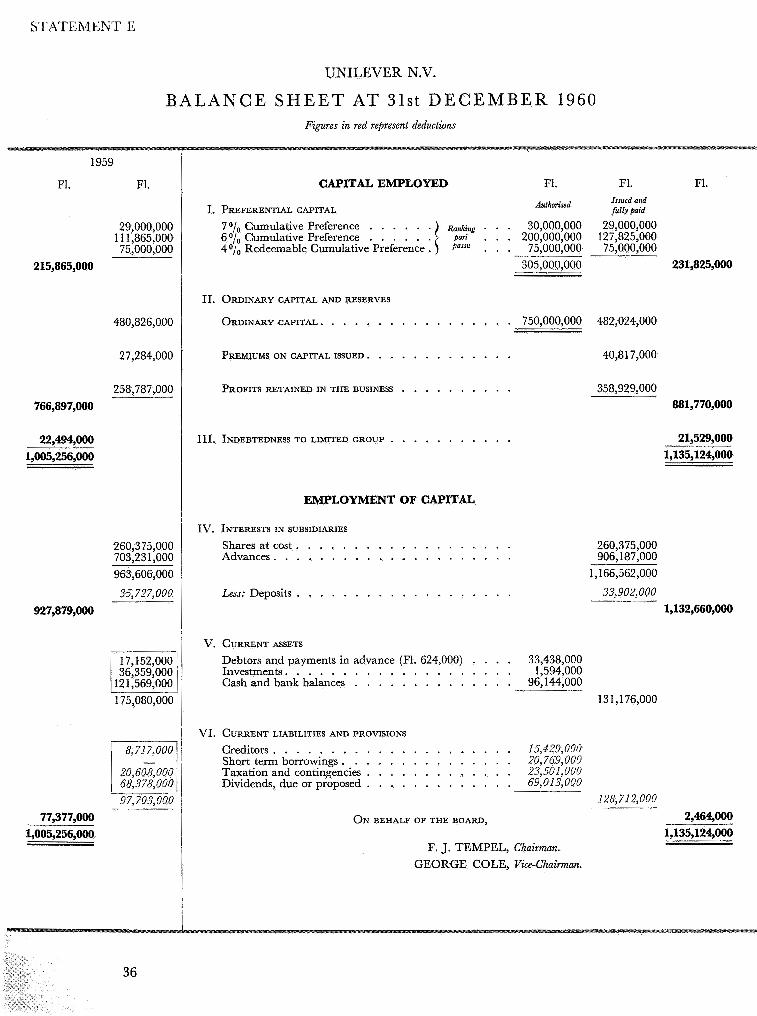
STATEMENT E
UNILEVER N.V.
B A L A N C E S H E E T AT 31st D E C E M B E R 1960 Figures in red rebresent deductiolls
CAPITAL EMPLOYED
I. PREFERENTIAL CAPITAL
29,000,000 1 1 1,865,000 75,000,000
215,865,000
7 O/o Cumulative Preference . . . . . . . . . 30,000,000 29,000,000 60//, Cumulative Preference . . . . . . pan . . . 200,000,000 127,825,000 40/,, Redeemable Cumulative Preference. . . . 75,000,000 75,000,000
11. ORDINARY CAPITAL AND RESERVES
ORDINARY CAPITAL. . . . . . . . . . . . . . . 480,826,000 I
305,000,000 231,825,000
. . 750,000,000 482,024,000
27,284,000 PREMIUMS ON CAPITAL ISSUED. . . . . . . . . . . . . 40,817,000 I 258,787,000
766,897,000
22,494,000 1,005,256,000
260,375,000 703,23 1,000 963,606,000 35,727,000
927,879,000
17,152,000 I 36,359,000
12 1,569,000 I 175,080,000
' 8,717.000
20,608,000 68,378,000 97,703,000
- 1 77,377,000
1,005,256,000
PROFITS RETAINED IN THE BUSINESS . . . . . . . . .
111. INDEBTEDNESS TO LIMITED GROUP . . . . . . . . . . .
358,929,000 881,770,000
21,529,000 1,135,124,000
EMPLOYMENT OF CAPITAL
IV. INTERESTS IN SUBSIDIARIES
Shares at cost. . . . . . . . . . . . . . . . . . . Advances . . . . . . . . . . . . . . . . . . . . .
Less: Deposits . . . . . . . . . . . . . . . . . . .
260,375,000 906,187,000
1,166,562,000 33,902,000
1,132,660,000
V. CURRENT ASSETS
Debtors and payments in advance (Fl. 624,000) . . . . 33,438,000 Investments . . . . . . . . . . . . . . . . . . . . 1,594,000 Cash and bank balances . . . . . . . . . . . . . . 96,144,000
131,176,000
VI. CURRENT LIABILITIES AND PROVISIONS
Creditors . . . . . . . . . . . . . . . . . . . . . 15..429,000 Short term borrowings . . . . . . . . . . . . . . . 20,769,000 Taxation and contingencies . . . . . . . . . . . . . 23,501.000 Dividends, due or proposed . . . . . . . . . . . . . 6$013,000
128,712,000
ON BEHALF OF THE BOARD, 2,464,000 1.135.124.000 I _ -
F. J. TEMPEL, Chairman. GEORGE COLE, Vice-Chairman.
36
I
STATEMENT E
X O T E S
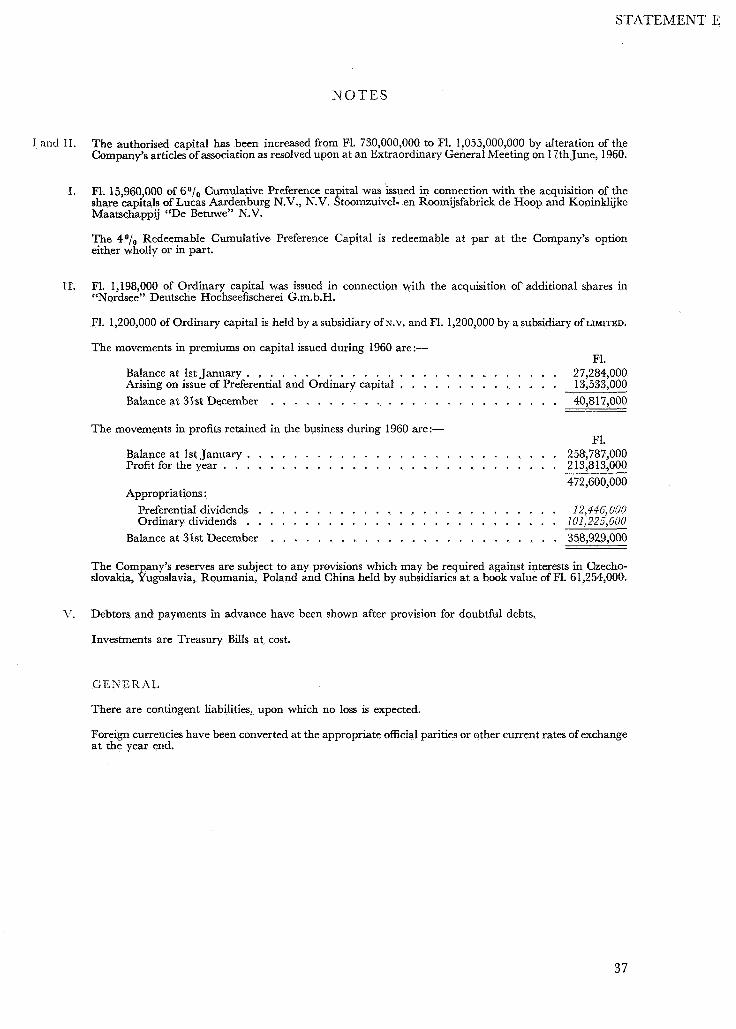
I and TI. The authorised capital has been increased from F1. 730,000,000 to F1. 1,055,000,000 by alteration of the Company’s articles of association as resolved upon at an Extraordinary General Meeting on 17th June, 1960.
I. F1. 15,960,000 of 60/ , Cumulative Preference capital was issued in connection with the acquisition of the share capitals of Lucas Aardenburg N.V., N.V. Stoomzuivel- en Roomijsfabriek de Hoop and Koninklijke Maatschappij (‘De Betuwe” N.V.
The 40/, Redeemable Cumulative Preference Capital is redeemable at par at the Company’s option either wholly or in part.
11. F1. 1,198,000 of Ordinary capital was issued in connection with the acquisition of additional shares in ‘(Nordsee” Deutsche Hochseefischerei G.m.b.H.
F1. 1,200,000 of Ordinary capital is held by a subsidiary Of N.V. and F1. 1,200,000 by a subsidiary Of LIMITED.
The movements in premiums on capital issued during 1960 are:- F1.
Balance at 1st January . . . . . . . . . . . . . . . . . . . . . . . . . . . 27,284,000 Arising on issue of Preferential and Ordinary capital . . . . . . . . . . . . . . 13,533,000 Balance a t 31st December . . . . . . . . . . . . . . . . . . . . . . . . . 40,817,000
The movements in profits retained in the business during 1960 are:- F1.
258,787,000 213,813,000 472,600,000
Balance at 1st January . . . . . . . . . . . . . . . . . . . . . . . . . . . Profit for the year . . . . . . . . . . . . . . . . . . . . . . . . . . . . . Appropriations :
Preferential dividends . . . . . . . . . . . . . . . . . . . . . . . . . . 12,446,000 Ordinary dividends . . . . . . . . . . . . . . . . . . . . . . . . . . . 101,225,000
Balance at 31st December . . . . . . . . . . . . . . . . . . . . . . . . . 358,929,000
The Company’s reserves are subject to any provisions which may be required against interests in Czecho- slovakia, Yugoslavia, Roumania, Poland and China held by subsidiaries at a book value of F1. 61,254,000.
V, Debtors and payments in advance have been shown after provision for doubtful debts.
Investments are Treasury Bills at cost.
GE S E R A L
There are contingent liabilities, upon which no loss is expected.
Foreign currencies have been converted at the appropriate official parities or other current rates of exchange a t the year end.
37
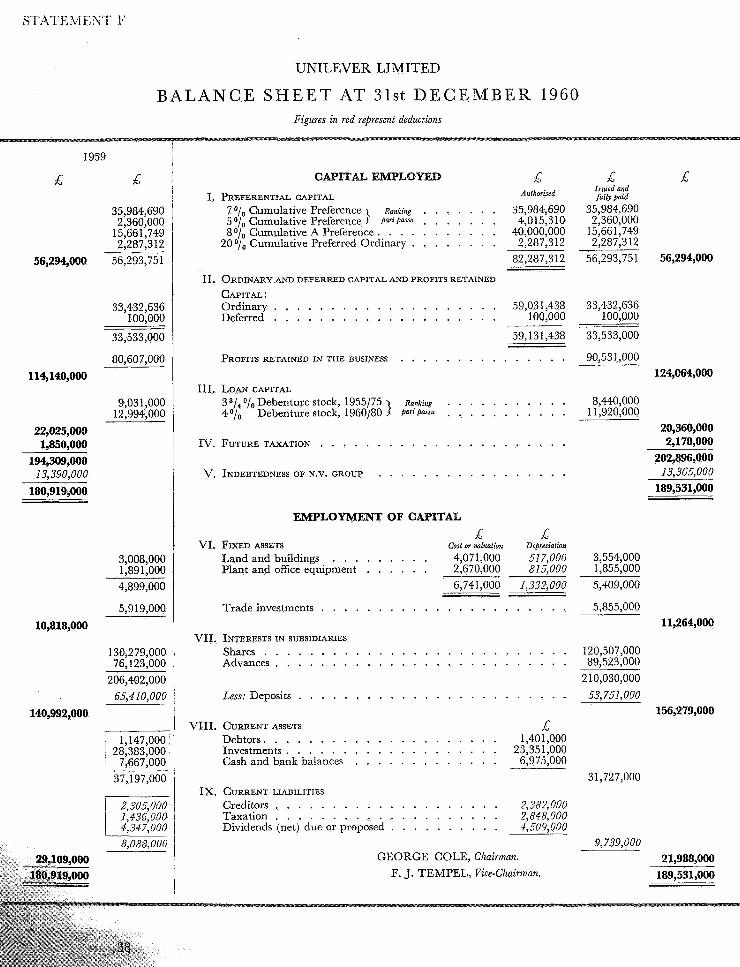
UNILEVER LIMITED
BALANCE S H E E T AT 31st D E C E M B E R 1960 Figures in red represent deductions
1959
E E
35,984,690 2,360,000
15,66 1,749 2,287,312
56,294,000 56,293,751
33,432,636 100,000
33,533,000
80,607,000 114,140,000
9,03 1,000 12,994,000
22,025,000 1,850,000
194,309,000 13.390.000
180,919,000
3,008,000 1,891,000 4,899,000
CAPITAL EWLOYED E Aulhorised I. PREFERENTIAL CAPITAL
7 o/o Cumulative Preference 1 ~ ~ ~ i i ~ ~ . . . . . . . 35,984,690 5O//, Cumulative Preference 1 fiartpass" . . . . . . . 4,015,310 8 O/,, Cumulative A Preference . . . . . . . . . . . 40,000,000
20 o/o Cumulative Preferred Ordinary . . . . . . . . 2,287,312 82,287,312
11. ORDINARY AND DEFERRED CAPITAL AND PROFITS RETAINED
CAPITAL: Ordinary . . . . . . . . . . . . . . . . . . . . 59,031,438 Deferred 100,000 . . . . . . . . . . . . . . . . . . . .
59,131,438
PROFITS RETAINED IN THE BUSINESS . . . . . . . . . . . . . .
111. LOAN CAPITAL 33/, O/,, Debenture stock, 1955/75 Rankmns . . . . . . . . . . . 40/, Debenture stock, 1960/80 1 f i a r i k i s u . . . . . . . . . . .
IV. FUTURE TAXATION . . . . . . . . . . . . . . . . . . . . . .
V. INDEBTEDNESS OF N.V. GROUP . . . . . . . . . . . . . . . . .
E E Issued and f . 1 1 ~ paid
35,984,690 2,360,000
15,66 1,749 2,287,312
56,293,75 1 56,294,000
33,432,636 100.000 -~
33,533,000
90,531,000 124,064,000
8,440,000 1 1,920,000
20,360,000 2,178,000
202,896,000 13.365.000
189,531,000 -
EMPLOYMENT OF CAPITAL E E
VI. FIXED ASSETS Cost or ualuation Depreciation Land and buildings . . . . . . . . . 4,07 1,000 51 7,000 3,554,000 Plant and ofice equipment . . . . . . 2,670,000 815,000 1,855,000
6,74 1,000 1,332,000 5,409,000
5,9 19,000 Trade investments . . . . . . . . . . . . . . . . . . . . . . 5,855,000
Shares . . . . . . . . . . . . . . . . . . . . . . . . . . . 120,507,000 Advances . . . . . . . . . . . . . . . . . . . . . . . . . . 89,523,000
Less: Deposits . . . . . . . . . . . . . . . . . . . . . . . . 53,751,000
10,818,000 VII. INTERESTS IN SUBSIDIARIES
206,402,000
VIII. CURRENT ASSETS
Debtors. . . . . . . . . . . . . . . . . . . . . 1,401,000 Investments . . . . . . . . . . . . . . . . . . . 23,351,000 Cash and bank balances . . . . . . . . . . . . . 6,975,000 ____
IX. CURRENT LIABILITIES
Creditors . . . . . . . . . . . . . . . . . . . . ?, .?82,000 Taxation . . . . . . . . . . . . . . . . . . . . 2,848,000 Dividends (net) due or proposed . . . . . . . . . . 4,509,000
GEORGE COLE, Chairman. F. J. TEMPEL, Vice-Chairman,
I
I
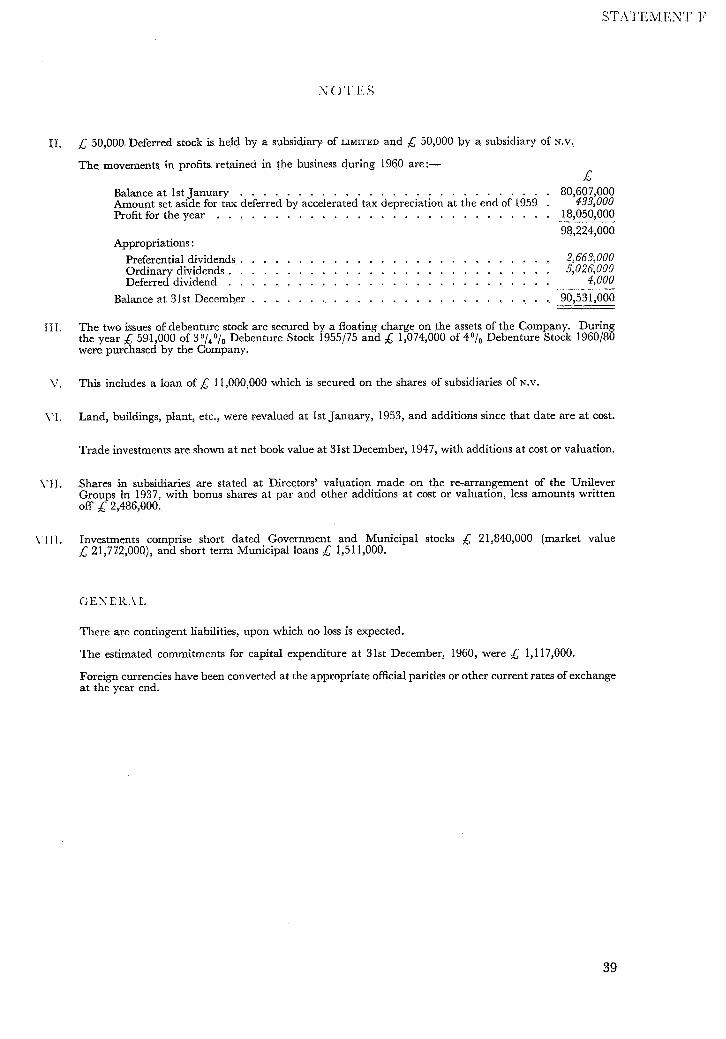
IT. 50,000 Deferred stock is held by a subsidiary of LIMITED and E 50,000 by a subsidiary of N.V.
The movements in profits retained in the business during 1960 are:- E
Balance at 1st January . . . . . . . . . . . . . . . . . . . . . . . . . . . 80,607 000
Profit for the year . . . . . . . . . . . . . . . . . . . . . . . . . . . . . 18,050,000 Amount set aside for tax deferred by accelerated tax depreciation at the end of 1959 . 4333000
98,224,000 Appropriations :
Preferential dividends . . . . . . . . . . . . . . . . . . . . . . . . . . . 2,663,000 Ordinary dividends . . . . . . . . . . . . . . . . . . . . . . . . . . . . 5,026,000
90,53 1,000
Deferred dividend . . . . . . . . . . . . . . . . . . . . . . . . . . . . 4,000
Balance at 3 1st December . . . . . . . . . . . . . . . . . . . . . . . . . .
111. The two issues of debenture stock are secured by a floating charge on the assets of the Company. During the year A 591,000 of 33/40/0 Debenture Stock 1955/75 and 1,074,000 of 4O/, Debenture Stock 1960/80 were purchased by the Company.
1.. This includes a loan of 6 11,000,000 which is secured on the shares of subsidiaries of N.V.
\.I, Land, buildings, plant, etc., were revalued at 1st January, 1953, and additions since that date are at cost.
Trade investments are shown a t net book value at 31st December, 1947, with additions at cost or valuation.
1'11. Shares in subsidiaries are stated at Directors' valuation made on the re-arrangement of the Unilever Groups in 1937, with bonus shares at par and other additions at cost or valuation, less amounts written off E 2,486,000.
\TII. Investments comprise short dated Government and Municipal stocks .& 2 1,840,000 (market value 21,772,000), and short term Municipal loans 1,511,000.
There are contingent liabilities, upon which no loss is expected.
The estimated commitments for capital expenditure at 31st December, 1960, were E 1,117,000.
Foreign currencies have been converted at the appropriate official parities or other current rates of exchange at the year end.
39
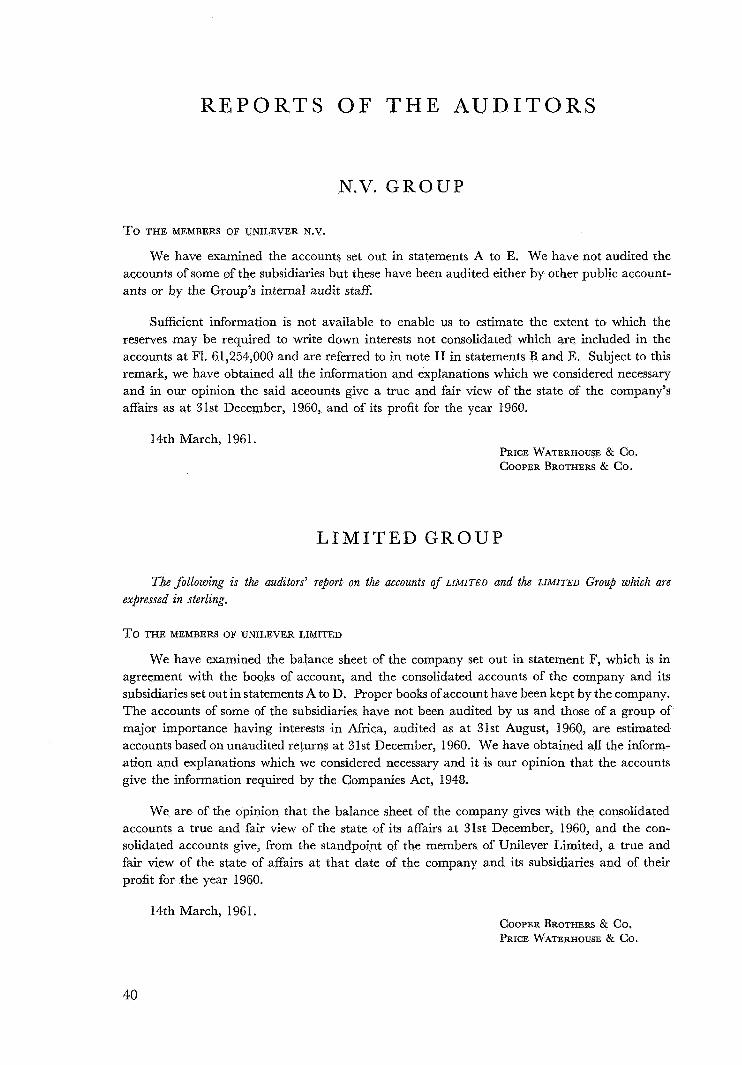
R E P O R T S O F T H E A U D I T O R S
N.V. G R O U P
T O THE MEMBERS OF UNILEVER N.V.
We have examined the accounts set out in statements A to E. We have not audited the accounts of some of the subsidiaries but these have been audited either by other public account- ants or by the Group’s internal audit staff.
Sufficient information is not available to enable us to estimate the extent to which the reserves may be required to write down interests not consolidated which are included in the accounts at F1. 61,254,000 and are referred to in note I1 in statements B and E. Subject to this remark, we have obtained all the information and explanations which we considered necessary and in our opinion the said accounts give a true and fair view of the state of the company’s affairs as at 3Ist December, 1960, and of its profit for the year 1960.
14th March, 1961. PRICE WATERHOUSE & Co. COOPER BROTHERS & Co.
L I M I T E D G R O U P
The following is the auditors’ report on the accounts of LIMITED and the LIM1T.m Group which are expressed in sterling.
T O THE MEMBERS OF UNILEVER LIMITED
We have examined the balance sheet of the company set out in statement F, which is in agreement with the books of account, and the consolidated accounts of the company and its subsidiaries set out in statements A to D. Proper books of account have been kept by the company. The accounts of some of the subsidiaries have not been audited by us and those of a group of major importance having interests in Africa, audited as at 31st August, 1960, are estimated accounts based on unaudited returns at 31st December, 1960. We have obtained all the inform- ation and explanations which we considered necessary and it is our opinion that the accounts give the information required by the Companies Act, 1948.
We are of the opinion that the balance sheet of the company gives with the consolidated accounts a true and fair view of the state of its affairs at 31st December, 1960, and the con- solidated accounts give, from the standpoint of the members of Unilever Limited, a true and fair view of the state of affairs at that date of the company and its subsidiaries and of their profit for the year 1960.
14th March, 1961
40
COOPER BROTHERS & Co. PRICE WATERHOUSE & Co.