ISSN 0079-0419 PEDOLOGIE - Ghent...
90
ISSN 0079-0419 PEDOLOGIE Edité avec l'aide financière de la Fondation Universitaire et du Ministère de l'Education nationale et de la Culture française et du Ministère de l'Education nationale et de la Culture néerlandaise Uitgegeven met de financiële steun van de Universitaire Stichting en van het Ministerie van Nationale Opvoeding en Nederlandse Cultuur en van het Ministerie van Nationale Opvoeding en Franse Cultuur Bulletin de la Société BeIge de Pédologie Bulletin van de Belgische Bodemkundige Vereniging 1981 XXXI, 3 Comité de rédaction Redactiecomité A. Cottenie, J. D'Hoore, G. Hanotiaux, A. Herbillon, T. Jacobs, A. Noirfalise, G. Scheys, C. Sys, R. Tavernier, M. Van Ruymbeke, W. Verheye. D/1982/0346/1
Transcript of ISSN 0079-0419 PEDOLOGIE - Ghent...
ISSN 0079-0419
PEDOLOGIE Edité avec l'aide financière de la Fondation Universitaire
et du Ministère de l'Education nationale et de la Culture française et du Ministère de l'Education nationale et de la Culture néerlandaise
Uitgegeven met de financiële steun van de Universitaire Stichting en van het Ministerie van Nationale Opvoeding en Nederlandse Cultuur
en van het Ministerie van Nationale Opvoeding en Franse Cultuur
Bulletin de la Société BeIge de Pédologie
Bulletin van de Belgische Bodemkundige Vereniging
1981
XXXI, 3
Comité de rédaction Redactiecomité
A. Cottenie, J. D'Hoore, G. Hanotiaux, A. Herbillon, T. Jacobs, A. Noirfalise, G. Scheys, C. Sys,
R. Tavernier, M. Van Ruymbeke, W. Verheye.
D/1982/0346/1
PRESIDENT D'HONNEUR ERE-VOORZITTER
J. Baeyens
SECRETAIRES GENERAL HONORAIRES ERE-SECRETARISSEN -G ENERAAL
R. Tavernier J. Ameryckx C. Sys
ANClENS PRESIDENTS OUD-VOORZITTERS
V. Van Straelen t F. Jurion t L. De Leenheer G. Manil t A. Van den Hende G. Scheys L. Sine t A. Cottenie G. Hanotiaux M. De Boodt A. Herbillon P. Avril J. D'Hoore M. Van Ruymbeke
(1950-1953) (1954-1955) (1956-1957) (1958-1959) (1960-1961 ) (1962-1963 ) (1964-1965) (1966-1967) (1968-1969) ( 1 970-1971 ) (1972-1973 ) (1974-1975) (1976-1977) ( 1978-1 979 )
PEDOLOGIE, XXXI, 3, p. 309-327,9 fig. 7 tab. Ghent, 1981
SOME FACTORS INDUCING THE LOSS OF NUTRIENTS OUT OF THE SOIL PROFILE
1.INTRODUCTION
L. VERDEGEM O. VAN CLEEMPUT
J. VANDERDEELEN
Research project supported by LW.O.N.L. (Institute for encouraging Scientific Research in Industry and Agriculture, Brussels)
In modern agricultural practice, farmers are faced with continuously increasing fertilizer rates in order to obtain higher yields, whereas on the other hand the Greenpeace movement is worrying more and more about the influence of an excess of chemicals on the environmental quality.
In order to compromise the arguments of both groups, a research project was started investigating the mobility, migration and losses of some nutrients in different textured soils.
Nutrient losses from the profile can be due to leaching, to which all mobile nutrients are susceptible. Incidentally it can be the result of a reduction process, inducing an enhanced mobility of insoluble elements (e.g. Fe, Mn) or leading to the formation of gaseous products (e.g. N, S).
In this paper the susceptibility for losses of the three major nutrients N, Pand K will be discussed.
The approach is based on the analysis of soU and soU water samples in order to evaluate the Ieaching process, whereas denitrification Iosses are studied by means of redox-potential measurements, soil-gas-analysis, calculation of Cl-/N03 -N ratios and finally hy a N-15 experiment on winterbarley.
2. MATERlALS AND METHODS
The experiments are carried out in situ, under normal field conditions on different soil types: a wet sandy soil in St.-Laureins, a shallow and a deep polder day soil in Watervliet, all of them with a common character-
L. Verdegem, o. Van Cleemput & J. Vanderdeelen - Faculty of Agriculture, University of Ghent, Coupure 653, 9000 Ghent, Belgium.
309
L Vol ~
o
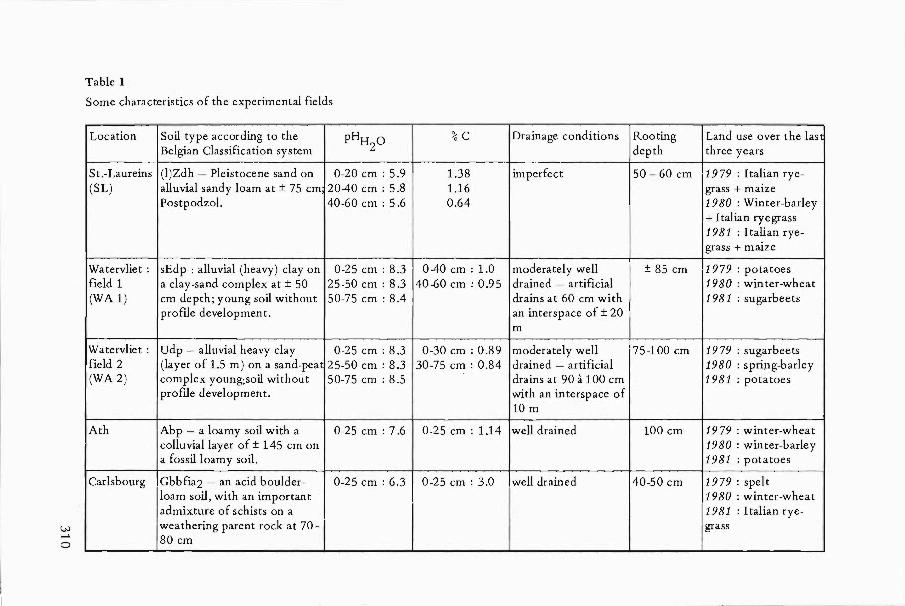
Table 1
Some characteristics of the experimental fields
Location Soil type according to the pHH 0 Belgian Classification system 2
St.-Laureins (I)Zdh - pleistocene sand on 0-20 cm : 5.9 (SL) alluvial sandy loam at ± 75 cm 2040 cm : 5.8
Postpodzol. 40-60 cm : 5.6
Watervliet : sEdp : alluvial (heavy) dayon 0-25 cm : 8.3 field 1 a day-sand complex at ± 50 25-50 cm : 8.3 (WA 1) cm depth; young soil without 50-75 cm : 8.4
prome development.
Watervliet : Udp - alluvial heavy day 0-25 cm : 8.3 field 2 (layer of 1.5 m) on a sand-peat 25-50 cm : 8.3 (WA 2) complex young;soil without 50-75 cm : 8.5
prome development.
Ath Abp - a loamy soil with a 0-25 cm : 7.6 coUuviallayer of ± 145 cm on a fossilloamy soil.
Carlsbourg Gbbfia2 - an acid boulder- 0-25 cm : 6.3 loam soU, with an important admixture of schists on a weathering parent rock at 70-80 cm
%C Drainage conditions Rooting Land use over the last depth three years
1.38 imperfect 50 -60 cm 1979 : Italian rye-1.16 grass + maize 0.64 1980 : Winter-barley
+ Italian ryegrass 1981 : Italian rye-grass + maize
040 cm : 1.0 moderately weU ± 85 cm 1979 : potatoes 40-60 cm : 0.95 drained - artificial 1980 : winter-wheat
drains at 60 cm with 1981 : sugarbeets an interspace of ± 20 m
0-30 cm : 0.89 moderately weU 75-100 cm 1979 : sugarbeets 30-75 cm : 0.84 drained - artificial 1980 : spring-barley
drains at 90 à 100 cm 1981 : potatoes with an interspace of 10 m
0-25 cm : 1.14 weIl drained 100 cm 1979 : winter-wheat 1980 : winter-barley 1981 : potatoes
0-25 cm : 3.0 weU drained 40-50 cm 1979 : spelt 1980 : winter-wheat 1981 : Italian rye-grass
istic, namely the occurence of a shallow groundwatertable (GWT) during . winter- and springtime.
Furthermore there is a deep loamy soil in Ath and an acid stony soil in Carlsbourg. Some important characteristics and data of these fields are given in table 1.
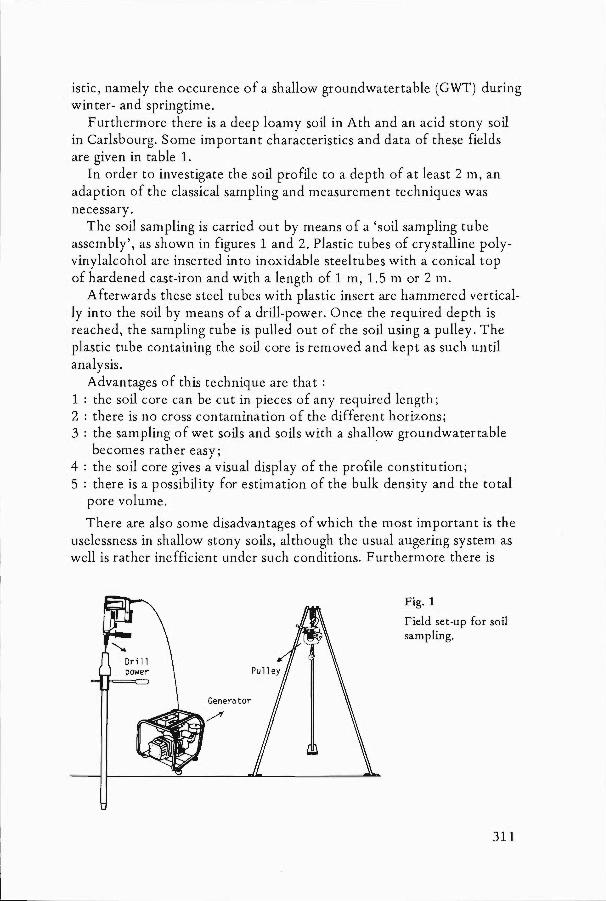
In order to investigate the soil profile to a depth of at least 2 m, an adaption of the classic al sampling and measurement techniques was necessary.
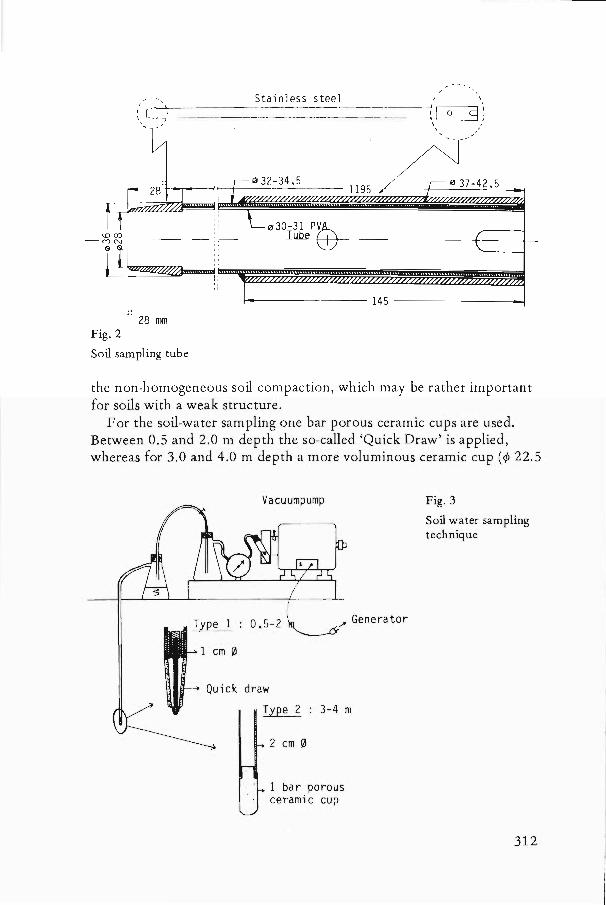
The soil sampling is carried out by means of a 'soil sampling tube assembly', as shown in figures 1 and 2. Plastic tubes of crystalline polyvinylalcohol are inserted into inoxidable steeltubes with a conical top of hardened cast-iron and with a length of 1 m, 1.5 m or 2 m.
Afterwards these steel tubes with plastic insert are hammered vertically into the soil by means of a drill-power. Once the required depth is reached, the sampling tube is pulled out of the soil using a pulley. The plastic tube containing the soil core is removed and kept as such until analysis.
Advantages of this technique are that : 1 : the soil core can be cut in pieces of any required length; 2 : there is no cross contamination of the different horizons; 3 : the sampling of wet soils and soils with a shall~w groundwatertable
becomes rather easy; 4 : the soil core gives a visual display of the profile constitution; 5 : there is a possibility for estimation of the bulk. density and the total
pore volume.
There are also some disadvantages of which the most important is the uselessness in shallow stony soils, although the usual augering system as weIl is rather inefficient under such conditions. Furthermore there is
Fig. 1
Field set-up for soil sampling.
311
Stainless steel __ -___ -_-__ ~-___ -_ -------- ---Lj( I-o-~--'-
\ , "
+-4-~~~_4--------------- 1195~----~---~~3~7--4~2:~.~5~~
",30-31 P"Á - JJilie C!:I --
~------------- 145--------------~~
.. 28 JTl11
Fig. 2
Soil sampling tube
the non-homogeneous soil compaction, which may be rather important for soils with a weak structure.
For the soil-water sampling one bar porous ceramic cups are used. Between 0.5 and 2.0 m depth the so-called 'Quick Draw' is applied, whereas [or 3.0 and 4.0 m depth a more voluminous ceramic cup (~ 22.5
Vacuumpump
0.5-2 ~~ Generator
Quick draw
~ 3-4m
2 cm 0
1 bar porous ceramic cup
Fig. 3
Soil water sampling technique
312
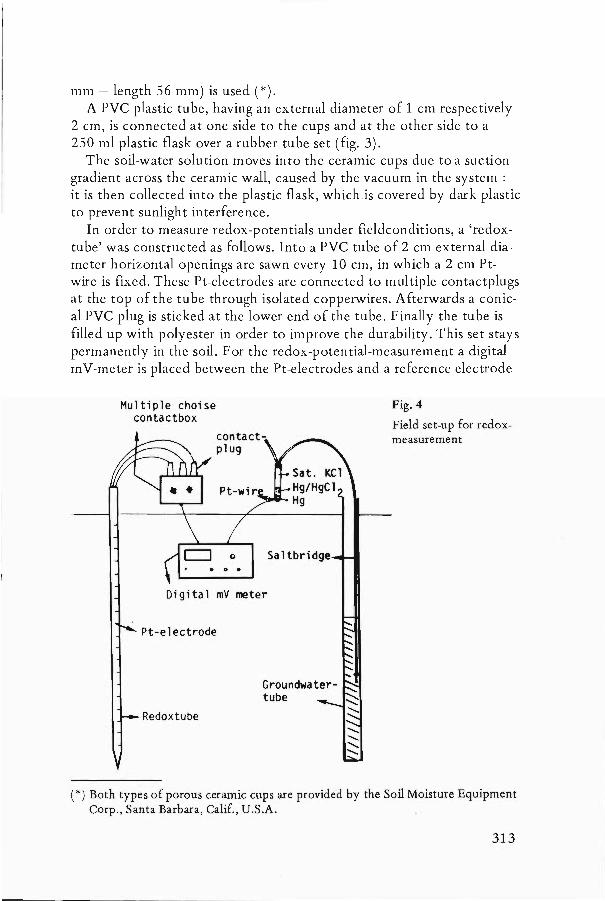
mm - length 56 mm) is used (*). A PVC plastic tube, having an external diameter of 1 cm respectively
2 cm, is connected at one side to the cups and at the other side to a 250 mI plastic flask over a rubber tube set (fig. 3).
The soil-water solution moves into the ceramic cups due to a suction gradient across the ceramic wall, caused by the vacuum in the system : it is then collected into the plastic flask, whichjs covered by dark plastic to prevent sunlight interference.
In order to measure redox-potentials under fieldconditions, a 'redoxtube' was constructed as follows. Into a PVC tube of 2 cm external diameter horizontal openings are sawn every 10 cm, in which a 2 cm Ptwire is fixed. These Pt-electrodes are connected to multiple contactplugs at the top of the tube through isolated copperwires. Afterwards a conical PVC plug is sticked at the lower end of the tube. Finally the tube is filled up with polyester in order to improve the durability. This set stays permanently in the soil. For the redox-potential-measurement a digital m V-meter is placed between the Pt-electrodes and a reference electrode
Multiple choise contactbox
Digital mV meter
Pt-electrode
Redoxtube
Fig. 4
Field set-up for redoxmeasurement
(*) Both types of porous ceramic cups are provided by the Soil Moisture Equipment Corp., Santa Barbara, Calif., U.S.A.
313
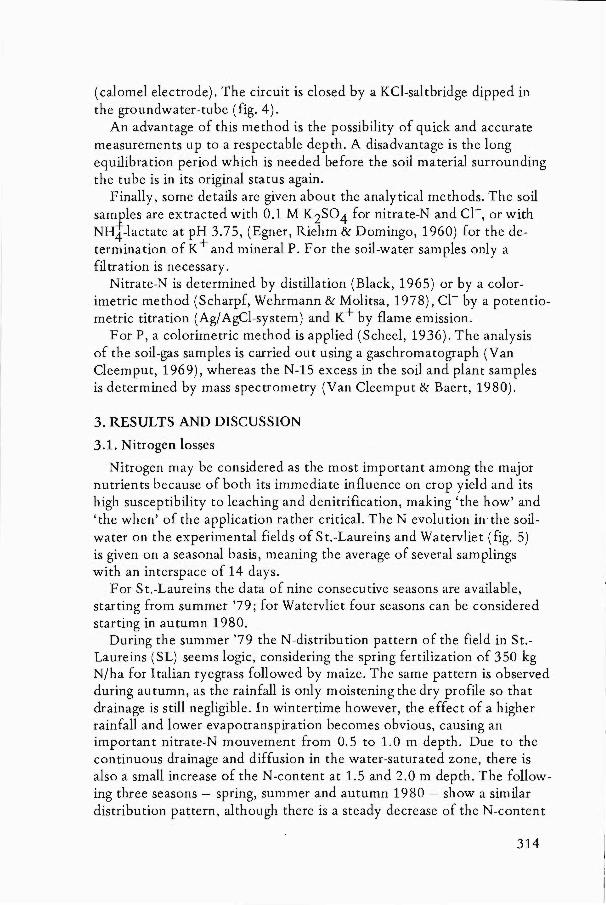
(calomel electrode). The circuit is closed by a KCl-saltbridge dipped in the groundwater-tube (fig. 4).
An advantage of this method is the possibility of quick and accurate measurements up to a respectable depth. A disadvantage is the long equilibration period which is needed before the soil material surrounding the tube is in its original status again.
Finally, some details are given about the analytical methods. The soil sam-fles are extracted with 0.1 M K2S04 for nitrate-N and Cl-, or with NH4-lactate at pH 3.75, (Egner, Riehm & Domingo, 1960) for the determination ofK+ and mineral P. For the soil-water samples only a fil tration is necessary.
Nitrate-N is determined by distillation (Black, 1965) or by a colorimetric method (Scharpf, Wehrmann & Molitsa, 1978), cl- by a potentiometric titration (Ag/AgCl-system) and K+ by flame emission.
For P, a colorimetric method is applied (Scheel, 1936). The analysis of the soil-gas samples is carried out using a gaschromatograph (Van Cleemput, 1969), whereas the N-15 excess in the soil and plant samples is determined by mass spectrometry (Van Cleemput & Baert, 1980).
3. RESULTS AND DISCUSSION
3.1. N itrogen losses
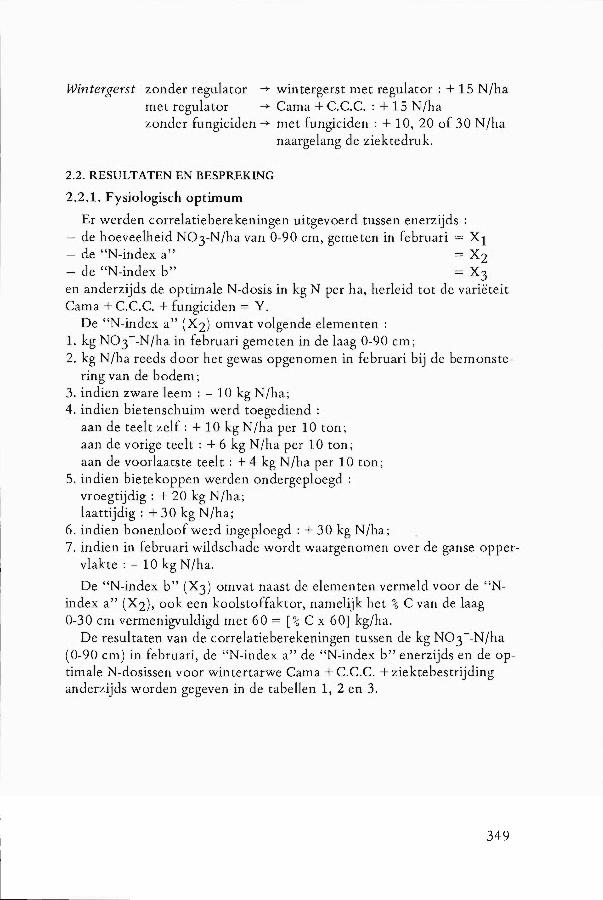
Nitrogen may be considered as the most important among the major nutrients because of both its immediate influence on crop yield and its high susceptibility to leaching and denitrification, making 'the how' and 'the when' of the application rather critical. The N evolution in-the soilwater on the experimental fields of S t.-Laureins and Watervliet (fig. 5) is given on a seasonal basis, meaning the average of several samplings with an interspace of 14 days.
For St.-Laureins the data of nine consecutive seasons are available, starting from summer '79; for Watervliet four seasons can be considered starting in autumn 1980.
During the summer '79 the N-distribution pattern of the field in St.Laureins (SL) seems logic, considering the spring fertilization of 350 kg N/ha for Italian ryegrass followed by maize. The same pattern is observed during autumn, as the rainfall is only moistening the dry profile so that drainage is still negligible. In wintertime however, the effect of a higher rainfall and lower evapotranspiration becomes obvious, causing an important nitrate-N mouvement from 0.5 to 1.0 m depth. Due to the continuous drainage and diffusion in the water-saturated zone, there is also a small increase of the N-content at 1.5 and 2.0 m depth. The following three seasons - spring, summer and autumn 1980 - show a similar distribution paçtern, although there is a steady decrease of the N-content
314
o
0.5
1.0
1.5 E
~ 2.0 Cl. Q) o
E
.s:::. ...., Cl. Q)
0
3.0
4.0
0
0.5
1.0
1.5
2.0
3.0
4.0
Fig. 5
St.-Laureins (SL) 10 20 30 40 o 10 20 30 40
ppm NO;-N ppm NO;-N
--- Sunvner '79
- - - - Autumn '79
SL 10 2 0
ppm NO;-N 0.5
1.0
1.5
2.0
- 0.5
1.0
1.5
2.0
3.0 -- Wi nter '79- '80
- - -- Spring '80
_. - ' - ' - Summer '80
4.0
WA 2 o 1
ppm NO;-N ppm NO;-N /
Autumn '80
Winter '80-'81
Spring '81
SUfTlTler '81
0.5
1.0
1.5
2.0
/' , //.,'
. /,' .'!01
Nitrate evolution in water samples on the different experimental fields (seasonal interpretation) .
at all depths. In the succeeding period, including winter '80-'81 and spring and summer '81, the 1 m-peak disappears completely without comparable increase of the N-content in the deeper layers. An interesting phenomenon is the difference in N-distribution pattern between summer '79, '80 and '81. In the spring of '79 there was a N-application of 350
315
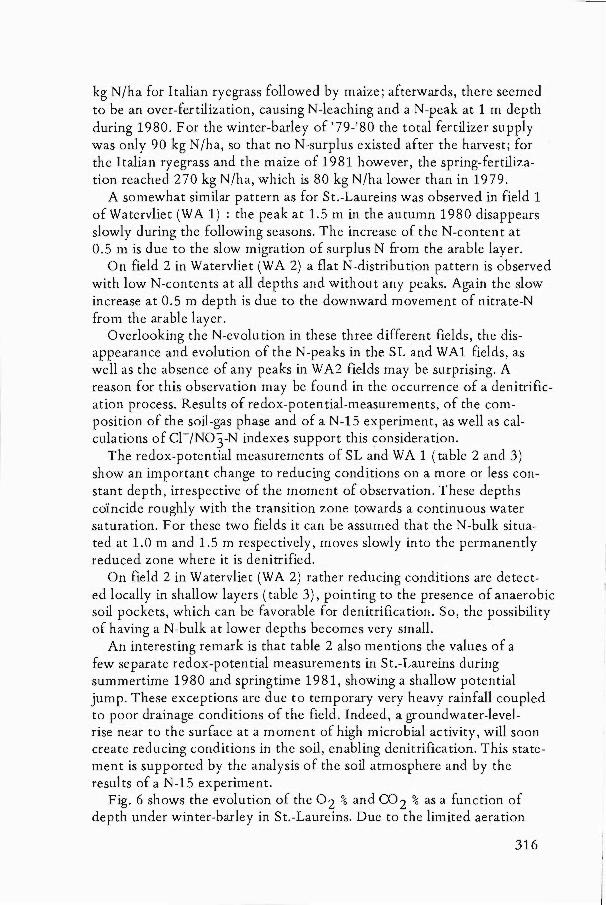
kg N /ha for I talian ryegrass followed by maize; afterwards, there seemed to be an over-fertilization, causing N-Ieaching and a N-peak at 1 m depth during 1980. For the winter-barley of '79-'80 the total fertilizer supply was only 90 kg N/ha, so that no N-surplus existed af ter the harvest; for the Italian ryegrass and the maize of 1981 however, the spring-fertilization reached 270 kg N /ha, w hich is 80 kg N /ha lower than in 1979.
A somewhat similar pattern as for St.-Laureins was observed in field 1 ofWatervliet (WA 1) : the peak at 1.5 m in the autumn 1980 disappears slowly during the following seasons. The increase of the N -conten t at 0.5 m is due to the slow migration of surplus N from the arabie layer.
On field 2 in Watervliet (WA 2) a flat N-distribution pattern is observed with low N-contents at all depths and without any peaks. Again the slow increase at 0.5 m depth is due to the downward movement of nitrate-N from the arabie layer.
Overlooking the N -evolu tion in these three different fields, the disappearance and evolution of the N-peaks in the SL and WAl fields, as well as the absence of any peaks in WA2 fields may be surprising. A reason for this observation may be found in the occurrence of a denitrification process. Results of redox-potential-measurements, of the composition of the soil-gas phase and of a N-15 experiment, as well as calculations of CI-/N03-N indexes support this ~onsideration.
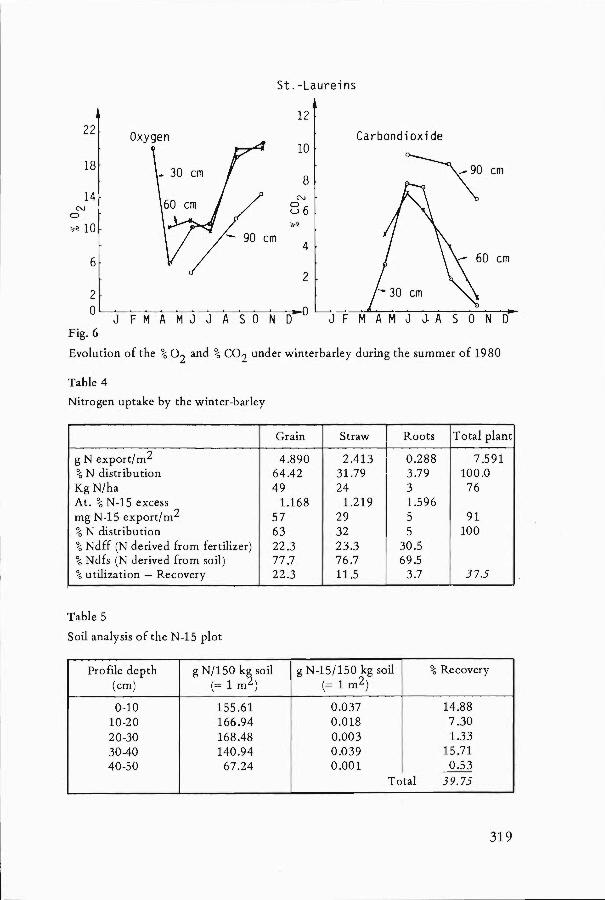
The redox-potential measurements of SL and WA 1 (tabie 2 and 3) show an important change to reducing conditions on a more or less constant depth, irrespective of the moment of observation. These depths coïncide roughly with the transition zone towards a continuous water saturation. For these two fields it can be assumed that the N-bulk situated at 1.0 mand 1.5 m respectively, moves slowly into the permanently reduced zone where it is denitrified.
On field 2 in W atervliet (WA 2) rather reducing conditions are detected locally in shallow layers (tabie 3), pointing to the presence of anaerobic soil pockets, which can be favorable for denitrification. So, the possibUity of having a N-bulk at lower depths becomes very small.
An interesting remark is that table 2 also mentions thé values of a few separate redox-potential measurements in St.-Laureins during summertime 1980 and springtime 1981, showing a shallow potential jump. These exceptions are due to temporary very heavy rainfall coupled to poor drainage conditions of the field. Indeed, a groundwater-Ievel-rise near to the surface at a moment of high microbial activity, wUI soon create reducing conditions in the soil, enabling denitrification. This statement is supported by the analysis of the soil atmosphere and by the results of a N-15 experiment.
Fig. 6 shows the evolution of the 02 % and CO 2 % as a function of depth under winter-barley in St.-Laureins. Due to the limited aeration
I
316 I
~
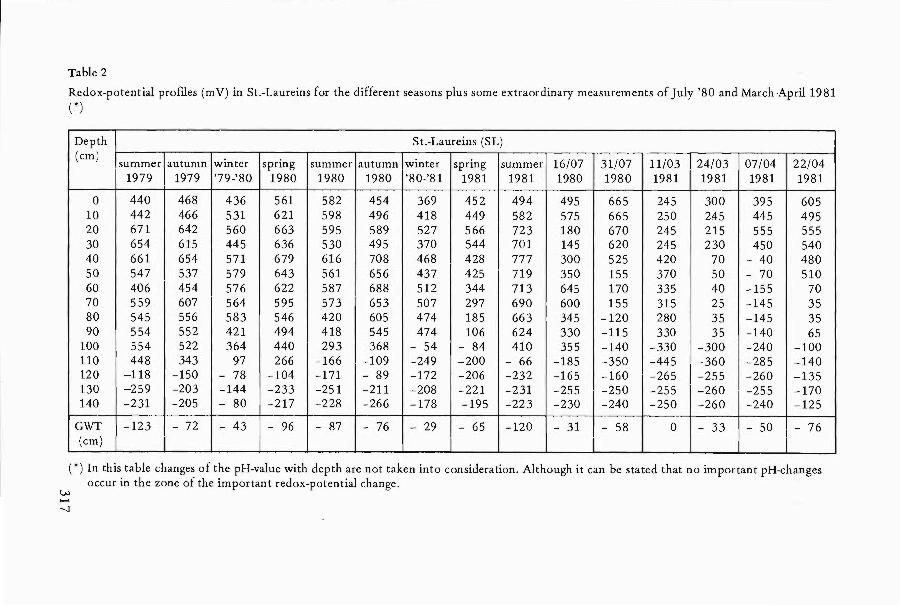
Table 2
Redox-potential promes (mV) in St.-Laureins for the different seasons plus some extraordinary measurements of July '80 and March-April1981 (*)
Depth St.-Laureins (SL) (cm) summer autumn winter spring summer autumn winter spring summer 16/07 31/07 11/03 24/03 07/04 22/04
1979 1979 '79-'80 1980 1980 1980 '80-'81 1981 1981 1980 1980 1981 1981 1981 1981
0 440 468 436 561 582 454 369 452 494 495 665 245 300 395 605 10 442 466 531 621 598 496 418 449 582 575 665 250 245 445 495 20 671 642 560 663 595 589 527 566 723 180 670 245 215 555 555 30 654 615 445 636 530 495 370 544 701 145 620 245 230 450 540 40 661 654 571 679 616 708 468 428 777 300 525 420 70 - 40 480 50 547 537 579 643 561 656 437 425 719 350 155 370 50 - 70 510 60 406 454 576 622 587 688 512 344 713 645 170 335 40 -155 70 70 559 607 564 595 573 653 507 297 690 600 155 315 25 -145 35 80 545 556 583 546 420 605 474 185 663 345 -120 280 35 -145 35 90 554 552 421 494 418 545 474 106 624 330 -115 330 35 -140 65
100 554 522 364 440 293 368 - 54 - 84 410 355 -140 -330 -300 -240 -100 110 448 343 97 266 -166 -109 -249 -200 - 66 -185 -350 -445 -360 -285 -140 120 -118 -150 - 78 -104 -171 - 89 -172 -206 -232 -165 -160 -265 -255 -260 -135 130 -259 -203 -144 -233 -251 -211 -208 -221 -231 -255 -250 -255 -260 -255 -170 140 -231 -205 - 80 -217 -228 -266 -178 -195 -223 -230 -240 -250 -260 -240 -125
CWT -123 - 72 - 43 - 96 - 87 - 76 - 29 - 65 -120 - 31 - 58 0 - 33 - 50 1- 76 (cm) L _ _ . _-
(*) In this table changes of the pH-value with depth are not taken into consideration. Although it can be stated that no important pH-changes
Vol
""""" -....]
occur in the zone of the important redox-potential change.
I
I
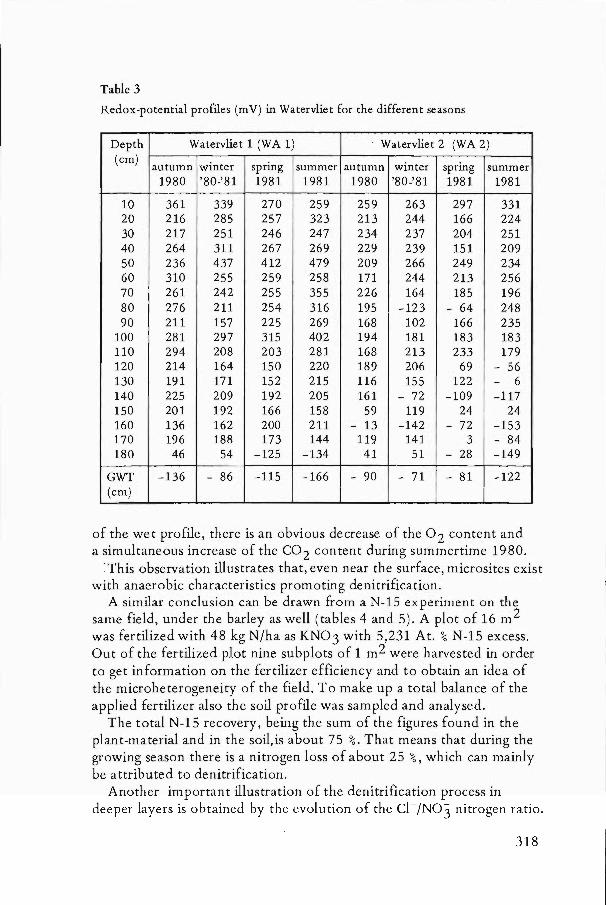
Table 3
Redox-potential profües (mV) in Watervliet for the different seasons
Depth Watervliet 1 (WA 1) Watervliet 2 (WA 2) (cm) autumn winter spring summer autumn winter spring summer
1980 '80-'81 1981 1981 1980 '80-'81 1981 1981
10 361 339 270 259 259 263 297 331 20 216 285 257 323 213 244 166 224 30 217 251 246 247 234 237 204 251 40 264 311 267 269 229 239 151 209 50 236 437 412 479 209 266 249 234 60 310 255 259 258 171 244 213 256 70 261 242 255 355 226 164 185 196 80 276 211 254 316 195 -123 - 64 248 90 211 157 225 269 168 102 166 235
100 281 297 315 402 194 181 183 183 110 294 208 203 281 168 213 233 179 120 214 164 150 220 189 206 69 - 56 130 191 171 152 215 116 155 122 - 6 140 225 209 192 205 161 - 72 -109 -117 150 201 192 166 158 59 119 24 24 160 136 162 200 211 - 13 -142 - 72 -153 170 196 188 173 144 119 141 3 - 84 180 46 54 -125 -134 41 51 - 28 -149
GWT -136 - 86 -115 -166 - 90 - 71 - 81 -122 (cm)
of the wet profile, there is an obvious decrease of the 02 content and a simultaneous increase of the CO 2 content during summertime 1980.
: This observation illustrates that, even near the surface, microsites exist with anaerobic characteristics promoting denitrification.
A similar conclusion can be drawn fr om a N-15 experiment on the same field, under the barley as well (tables 4 and 5). A plot of 16 m 2
was fertilized with 48 kg N/ha as KN03 with 5,231 At. % N-15 excess. Out of the fertilized plot nine subplots of 1 m2 were harvested in order to get information on the fertilizer efficiency and to ohtain an idea of the microheterogeneity of the field. To make up a total balance of the applied fertilizer also the soil profile was sampled and analysed.
The total N-15 recovery, being the sum of the figures found in the plant-material and in the soil,is about 75 %. That means that during the growing season there is a nitrogen loss of about 25 %, which can mainly be attributed to denitrification.
Another important illustration of the denitrification pro ce ss in deeper layers is obtained by the evolution of the Cl-/N0:3 nitrogen ratio.
318
St.-Laureins
22
18
14 N
0
~1O
6
2 o
Fig. 6
12
Carbondioxide 10
cm 8
N
86 ~
4
2
J F MAM J JAS 0 N D~ 0 D~
Evolution of the % 92 and % CO2 under winterbarley during the summer of 1980
Table 4
Nitrogen uptake by the winter-barley
Grain Straw Roots Total plant
g N export/ m 2 4.890 2.413 0.288 7.591 % N distribution 64.42 31.79 3.79 100.0 Kg N/ha 49 24 3 76 At. % N-15 excess 1.168 1.219 1.596 mg N-15 export/m2 57 29 5 91 % N distribution 63 32 5 100 % Ndff (N derived from fertilizer) 22.3 23.3 30.5 % Ndfs (N derived from soil) 77.7 76.7 69.5 % utilization - Recovery 22.3 11.5 3.7 37.5
Table 5
Soil analysis of the N-15 plot
prome depth g N/150 k~ soil g N-15/150 kg soil % Recovery (cm) (= 1 m ) (= 1 m2)
0-10 155.61 0.037 14.88 10-20 166.94 0.018 7.30 20-30 168.48 0.003 1.33 30-40 140.94 0.039 15.71 40-50 67.24 0.001 0.53
Total 39.75
319
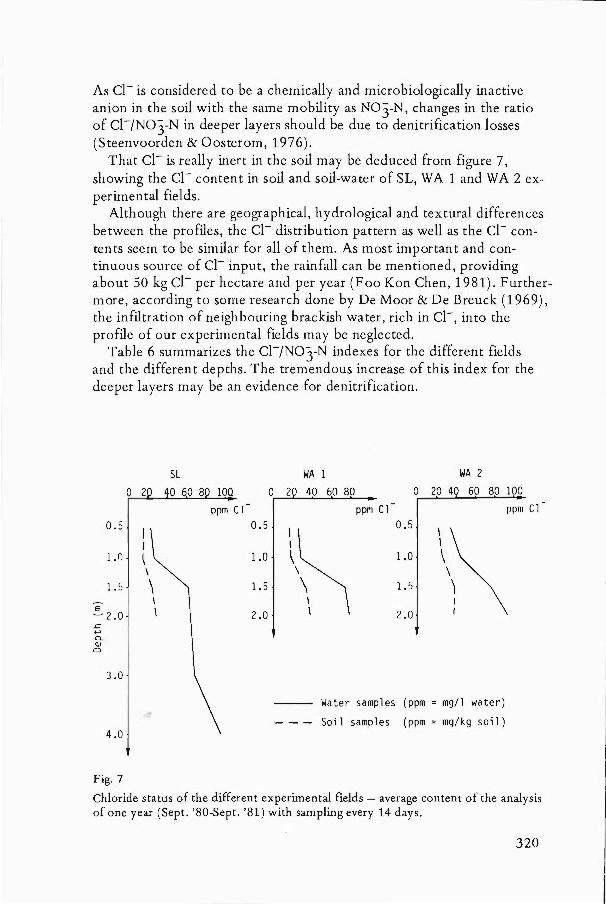
As Cl- is considered to be a chemically and microbiologically inactive anion in the soil with the same mobility as N03-N, changes in the ratio of Cl-/N03-N in deeper layers should be due to denitrification losses (Steenvoorden & Oosterom, 1976).
That Cl- is really inert in the soil may be deduced from figure 7, showing the cl- content in soil and soil-water of SL, WA 1 and WA 2 experimental fields.
Although there are geographical, hydrologïcal and textural differences between the profiles, the cl- distribution pattern as wen as the cl- contents seem to be simûar for all of them. As most important and continuous source of cl- input, the rainfall can be mentioned, providing about 50 kg cl- per hectare and per year (Foo Kon Chen, 1981). Furthermore, according to some research done by De Moor & De Breuck (1969), the infiltration of neighbouring brackish water, rich in Cl-, into the profile of our experimental fields may be neglected.
Table 6 summarizes the Cl-/N03-N indexes for the different fields and the different depths. The tremendous increase of this index for the deeper layers may be an evidence for denitrification.
SL WA 1 WA 2
0 2 100 0 2 40 60 80 0 20 4 60 80 100
ppm Cl ppm Cl ppm Cl 0.5
I 0.5 0.5
I 1.0 \ 1.0 1.0
\
1.5 \ 1.5 1.5
E ~2.0 2.0 2.0 ~
+-' 0.. Q)
0
3.0
Water samples (ppm = mg/l water)
Soil samples (ppm = mg/kg soil) 4.0
Fig. 7
Chloride status of the different experimental fields - average content of the analysis of one year (Sept. '80-Sept. '81) with sampling every 14 days.
320
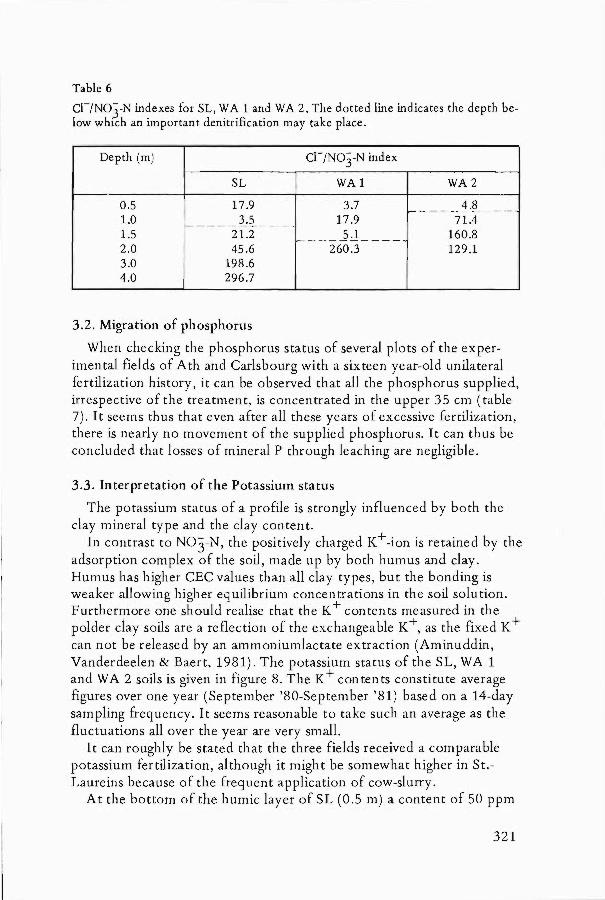
Table 6
CI-/N0.:3-N indexes for SL, WA 1 and WA 2. The dotted line indicates the depth below WhlCh an important denitrification may take place.
Depth (m) CI-/N03-N index
SL WAl WA2
0.5 17.9 3.7 4.8 ~ ---------
1.0 __ _ __ _ l·~ ___ _ 17.9 71..4 1.5 21.2 ~ __ _ ~J __ __ 160.8 2.0 45.6 260.3 129.1 3.0 198.6 4.0 296.7
3.2. Migration of phosphorus
when checking the phosphorus status of several plots of the experimental fields of Ath and Carlsbourg with a sixteen year-old unilateral fertilization history, it can be observed that all the phosphorus supplied, irrespective of the treatment, is concentrated in the upper 35 cm (tabie 7). It seems thus that even af ter all these years of excessive fertilization, there is nearly no movement of the supplied phosphorus. I t can thus be conduded that losses of mineral P through leaching are negligible.
3.3. Interpretation of the Potassium status
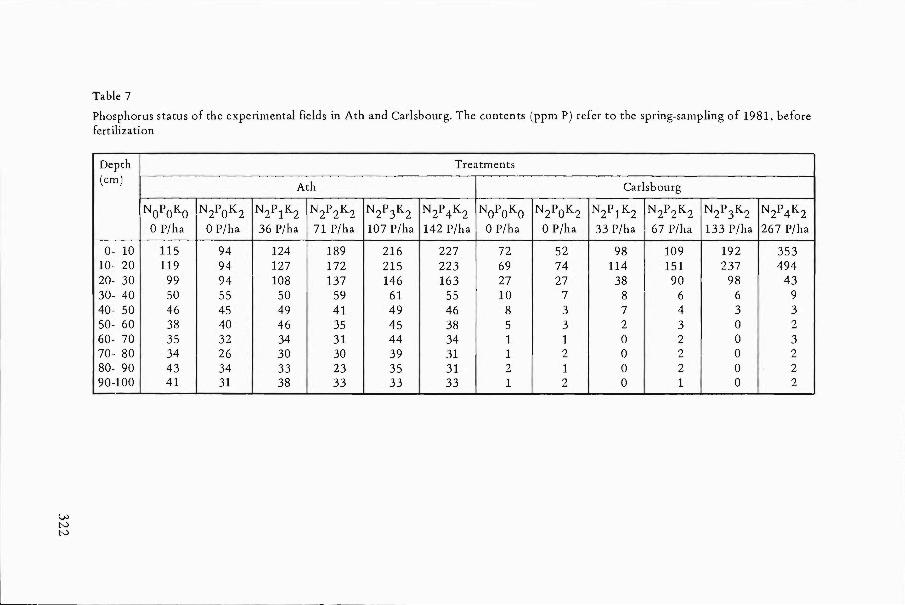
The potassium status of a profile is strongly influenced by both the day mineral type and the day conten t.
In contrast to N03-N, the positively charged K+-ion is retained by the adsorption complex of the soil, made up by both humus and day. Humus has higher CEC values than all day types, but the bonding is we aker allowing higher equilibrium concentrations in the soil solution. Furthermore one should realise th at the K+ contents measured in the polder day soils are a reflection of the exchangeable K+, as the fixed K+ can not be released by an ammoniumlactate extraction (Aminuddin, Vanderdeelen & Baert, 1981). The potassium status of the SL, WA 1 and WA 2 soils is given in figure 8. The K+ contents constitute average figures over one year (September '80-September '81) based on a 14-day sam pling freq uency. I t seems reasonable to take such an average as the fluctuations all over the year are very sm all.
It can roughly be stated that the three fields received a comparable potassium fertilization, although it might be somewhat higher in St.Laureins because of the frequent application of cow-slurry.
At the bottom of the humic layer of SL (0.5 m) a content of 50 ppm
321
Vl tv tv
Table 7
phosphorus status of the experimental fields in Ath and Carlsbourg. The contents (ppm P) refer to the spring-sampling of 1981, before fertilization
Depth Treatments (cm)
Ath Carlsbourg
NOPOKO N2POK2 N2P1K2 N2P2K2 N2P3K2 N2P4K2 NOPOKO N2POK2 N2P1K2 N2P2K2 N2P3K2 N2P4 K2 OP/ha OP/ha 36 P/ha 71 P/ha 107 P/ha 142 P/ha OP/ha OP/ha 33 P/ha 67 P/ha 133 P/ha 267 P/ha
0- 10 115 94 124 189 216 227 72 52 98 109 192 353 10- 20 119 94 127 172 215 223 69 74 114 151 237 494 20- 30 99 94 108 137 146 163 27 27 38 90 98 43 30- 40 50 55 50 59 61 55 10 7 8 6 6 9 40- 50 46 45 49 41 49 46 8 3 7 4 3 3 50- 60 38 40 46 35 45 38 5 3 2 3 0 2 60- 70 35 32 34 31 44 34 1 1 0 2 0 3 70- 80 34 26 30 30 39 31 1 2 0 2 0 2 80- 90 43 34 33 23 35 31. 2 1 0 2 0 2 90-100 41 31 38 33 33 33 1 2 0 1 0 2
SL WA 1 WA 2
0 50 100 0 50 100 150 200
ppm K+ ppm K+ ppm K+
0. 5 / 0.5 /
/
1.0 ( 1.0
...... 0.5 " " "-
1.0 " r " ..... ..... I I
..... '"
1. 5 ( l. I
~ 1.5 ::> "-
I "- '" ~ 2.0 I 2.
, '" , 2.0 '" .t::: +-' 0-Q) Cl
3.0
--Water samples I ppm = mg/kg so; 1 (K+ contents in the
---50;1 samples \ water samples are transformed to
mg/kg soil) '
4.0
Fig. 8
Potassium status of the different experimental fields. Average content of the analysis of one year (Sept. '80-Sept. '81) on a 14-day sampling frequency.
in the soil material is determined, against 2 ppm in the soil solution. The latter figure of 2 ppm corresponds to 2 mg/kg soil, as,the contents measured in the soU-water samples are transformed from mg/l water into mg/kg soil, taking into account the moisture content of the soU.
Deeper in the profUe there is a weak increase of the day content, causing a decrease of the potassium exchange with the soU-water, although a small K+ leaching can be considered, as it has been pointed out that the exchangeable K+ content can only amount to 5 % of the CEC, which is stililow in the deeper horizons (Van Ruymbeke, personal communication) . The shaIlow polder day soU (WA 1) contains twice as much potassium as the SL field up to a depth of 1.5 mand even four times as much at 2 m depth, whereas the contents in the soU-water are always negHgible. The influence of the higher day percentage and of the potassium-containing parent material becomes obvious.
On the deep polderday-soU (WA 2), this effect is stUI more pronounced. Besides, it should be mentioned that some peat material is presen t from a depth of 1.5 m onward. This peat material is partly represen ted by low-molecular-weight organic compounds, which are dispersed in the water phase and which can neither be retained by the porous cups, nor by a mUlipore filtration. The origin of this material combined with its high CEC-value explains the important potassium bulk, as weIl as the respectable K+ content in the water at 1.5 and 2.0 m depth.
It may seem peculiar that this bulk is not susceptible for any displacement, but due to the artificial drainage there is only a respectable water
323
Ath
0 100 200
2P2KO '\ ppm K+
20 )
./ Ál2K3
/ 5 40 (
.L: +J ~ ~ 60 0 \ -1
K3 250 kg K ha yr I 80 I I
10
Fig. 9
o
20
E u '-'40 .L: +J 0. <IJ
0
60 -1
80 I
/ 100
Carlsbourg
100 200
I
./ r
300 400
I
/
500 +
ppm K
>
/ -1 -1 K - 250 kg K ha yr / 2-/
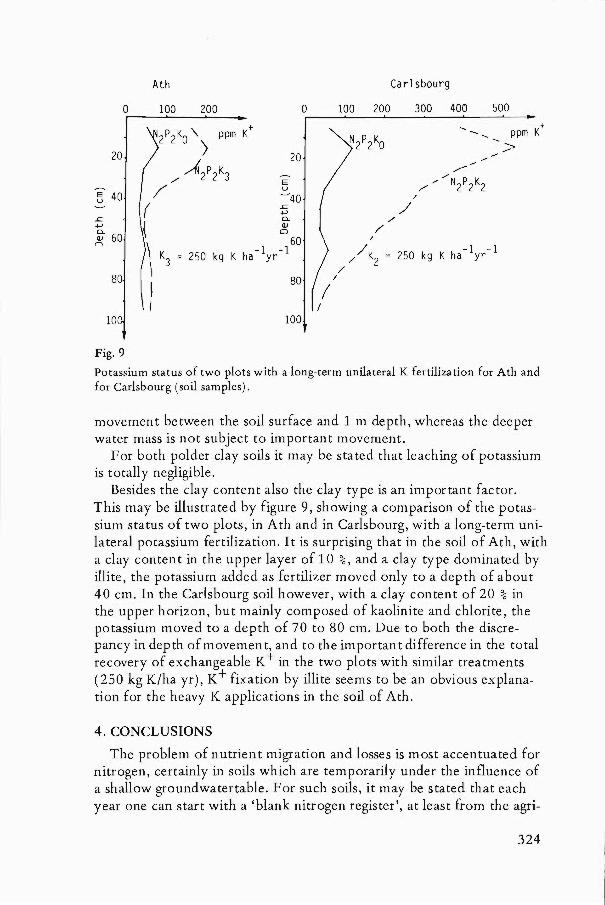
Potassium status of two plots with a long-term unüateral K fertilization for Ath and for Carlsbourg (soü samples).
movement between the soil surface and 1 m depth, whereas the deeper water mass is not subject to important movement.
F or both polder day soUs it may be stated that leaching of potassium is totally negligible.
Besides the day content also the day type is an important factor. This may be illustrated by figure 9, showing a comparison of the potassium status of two plots, in Ath and in Carlsbourg, with a long-term unilateral potassium fertilization. I t is surprising that in the soil of Ath, with a day content in the upper layer of 10 %, and a day type dominated by illite, the potassium added as fertUizer moved only to a depth of about 40 cm. In the Carlsbourg soU however, with a day content of 20 % in the upper horizon, but mainly composed of kaolinite and chlorite, the potassium moved to a depth of 70 to 80 cm. Due to both the discrepancy in depth of movement, and to the important difference in the total recovery of exchangeable K+ in the two plots with similar treatments (250 kg K/ha yr), K+ fixation by illite seems to be an obvious explanation for the heavy K applications in the soU of Ath.
4. CONCLUSIONS
The problem of nutrient migration and losses is most accentuated for nitrogen, certainly in soils which are temporarUy under the influence of a shallow groundwatertable. F or su eh soUs, it may be stated that each year one can start with a 'blank nitrogen register', at least from the agri-
324
cultural point of view. Indeed, the N03-N left in the rooting zone af ter the harvest leaches into the permanently saturated zone - in which no roots can penetrate - where it is lost by denitrification. Consequently a good groundwater quality may be maintained. But on the other hand the reduction process of N0:3-N may lead to the formation of NO and N 20, which are important pollutants of the atmosphere.
Denitrification losses can also occur above the permanen tly reduced zone and in the upper layers, especially as a result of wet conditions during a period of high microbial oxygen demand, so that microsites with anaerobic conditions are created. Migration and losses of P are negligible even over long periods or af ter heavy dressings.
Concerning potassium, it can be stated that on the polder day soils of Watervliet, losses seem to be negligible again. Consequently, from the high K-contents in the soil, one may condude that the frequency of a potassium fertilization on these soils might be reduced to e.g. once in four or five years. This statement is confirmed by the potassium status of the humic, wet sandy soil of St.-Laureins. This soil has a much lower K content, it is more or less susceptible for K+-Ieaching, it only gets a sustenance fertilization, and still there are no problems with the potassium supply.
REFERENCES
Aminuddin H., VanderdeelenJ. & Baert L. (1981). Chemical and isotopic exchangeability of potassium in two Malaysian soils. Phospotrops Confer. Malaysia 1981, in press.
Black C. A. (1965). Methods of soil analysis - Part 2 : chemical and microbiological properties. Amer. Soc. Agron. Publ. Madison, Wisconsin, USA: 1191-1206.
De Moor G. & De Breuck W. (1969). De freatische waters in het Oostelijk Kustgebied en in de Vlaamse vallei. Natuurwet. Ts.) 51 : 3-68.
Egner H., Riehm H. & Domingo W. R. (1960). Untersuchungen über die chemische Bodenanalyse als Grundlage für die Beurteilung des Nährstoffzustandes der Böden. 2. Chemische Extraktionsmethoden zur Phosphorund Kalibestimmung. Kgl. LantbruckshÖgsk. Ann. 26 : 199-215.
Foo Kon Chen (1981). The mobility of nitrate and chloride in a light sandy loam prome. M. Sci. thesis, ITC Post Graduate SoU Scientists, State University of Ghent.
Scharpf H. c., Wehrmann J. & Molitsa H. D. I. (1978). N-min-methode. Stand und weiterentwicklung. DLG Mitteilungen, Frankfurt/M, 93 (2) : 66-68.
325
Scheel K. C. (1936). Colorimetric determination of phosphoric acid in fertilizers with the Pulfrich photometer. Zeitschr. Analyt. Chemie, 105 : 256-269.
Steenvoorden J. H. A. M. & Oosterom H. P. (1976). Leaching of nitrate and denitrification in a sandy soil as influenced by manure application. EEC Seminar on "Utilization of manures by landspreading", Modena, Italy, September 1976 : 249-256.
Van Cleemput O. (1969). Gas chromatography of gases emanating from the soil atmosphere. J. Chromatog., 45 : 315-316.
Van Cleemput O. & Baert L. (1980). Recovery and balance of field-applied nitrate. Pedologie, XXX (3) : 309-321.
Summary
By means of adapted or new sampling- and measurement techniques, it was possible to get a rather defmite idea about the behaviour of the major nutrients, N, Pand K, in some differently textured soils.
In soils, which are periodically influenced by a shallow groundwatertable, residual nitrate-nitrogen moves gradually into the permanently saturated zone, where it will be denitrified. Consequently, the quality of the groundwater may be preserved; however, there is still the possibility of atmospheric pollution by reduction products as NO and N20.
During wet periods in the growing season an (important) part of the N03-N present in the rooting zone can also be lost by denitrification.
Phosphorus migrations are limited and losses are negligible even for longer periods and after heavy dressings. For potassium both the day content and the day type seem to be the most important influencing factors.
Quelques facteurs induisant la perte d'éléments nutritifs hors du profil de sol
Résumé
En faisant usage de techniques modifiées ou nouvelles d'échantillonnage et de mesure, il fut possible de se faire une image assez daire de la conduite des éléments majeurs nutritifs N, P et K, dans quelques profils de sols de texture différente.
Dans des sols sous I'influence périodique d'une nappe phréatique superficielIe, l'azote nitrique résiduel est sujet à une migration graduelle jusque dans la zone de saturation permanente, afin d'être dénitrifié. Ainsi la qualité de l'eau souterraine est conservée, bien qu'une pollution de l'atmosphère reste possible à cause des produits de réduction comme Ie NO et Ie N20.
En temps humide durant la saison de croissance, il est aussi possible qu'une partie (importante) du N03-N soit sujette à une dénitrification au niveau des racines.
En ce qui concerne Ie phosphore, les migrations sont limitées et les pertes négli-
326
geables, même pour des périodes longues et après une application de doses importantes.
Les facteurs dominants influençant Ie mouvement du potassium semblent être la texture du sol et Ie type d'argile.
Inducerende factoren voor het verlies aan voedingselementen uit het profiel
Samenvatting
Via aangepaste of nieuwe monstername- en meettechnieken was het mogelijk een vrij duidelijk beeld op te hangen van het gedrag van de hoofdvoedingselementen N, P en K, in enkele verschillend getextureerde bodemprofielen.
In gronden die periodisch onder invloed staan van een ondiepe grondwatertafel, migreert residuele nitraat-stikstof tijdens het na- en voorjaar geleidelijk tot in de permanent gesatureerde zone, waar denitrifikatie plaatsheeft. Aldus wordt de kwaliteit van het grondwater vrij gaaf gehouden, alhoewel de mogelijkheid van atmosferische pollutie bestaat door reduktieprodukten als NO en N20.
Tijdens natte perioden in het groeiseizoen kan oOk in de wortelzone een (belangrijk ) deel van de aanwezige N03-N denitrificeren.
Voor fosfor blijven de migraties beperkt en zijn de verliezen onbestaande, zelfs over langere periodes en voor hoge dosissen; voor kalium daarentegen lijken het bodemtype en het kleitype dominante invloedfaktoren te zijn.
327

PEDOLOGIE, XXXI, 3, p. 329-346, 2 fig., 14 tab. Ghent, 1981
RESIDUAL NITRATE NITROGEN IN SANDY LOAM SOILS IN A MODERATE MARINE CLIMATE
1.INTRODUCTION
G. HOFMAN M. VAN RUYMBEKE
C. OSSEMERCT G.IDE
Research subsidized by I.W.O.N.L. (Institute for encouraging Scientific Research in Industry and Agriculture, Brussels).
Efficient use of fertilizers is more than ever a must. The main reasons are: - increasing costs of mineral fertilizers caused by the rising prices of
energy; - protection of the environment.
In spite of extended research, a justified economical fertilization is especially difficult for nitrogen as : - contradictory to a P20 5- and K20-manure, only a nitrogen fertiliza
tion between strict limits leads to maxima! yields and (or) qualities; - soil nitrogen is influenced by several physical, chemical and biochemic
al processes such as mineralization, leaching, run-off, fixation, volatilization, denitrification, etc ...
In classical fertilization studies, the optimum N-application for a crop is deduced by using different nitrogen rates. Repeating this system during several years results in variations of the optimum nitrogen doses, caused by the above-mentioned processes.
Making abstraction of the N-supply by rainfall and the N-fixation by micro-organisms, an efficient nitrogen balance can be represented by the following equation (tabie 1).
A scientific, justified nitrogen fertilization advice can be derived if all
G. Hofman, M. Van Ruymbeke & G. Ide - Laboratory of Agricultural Pedology. C. Ossemerct - Committee of Applied pedology. Faculty of Agricultural Sciences, State University of Ghent, Coupure 653, 9000 Ghent, Belgium.
329
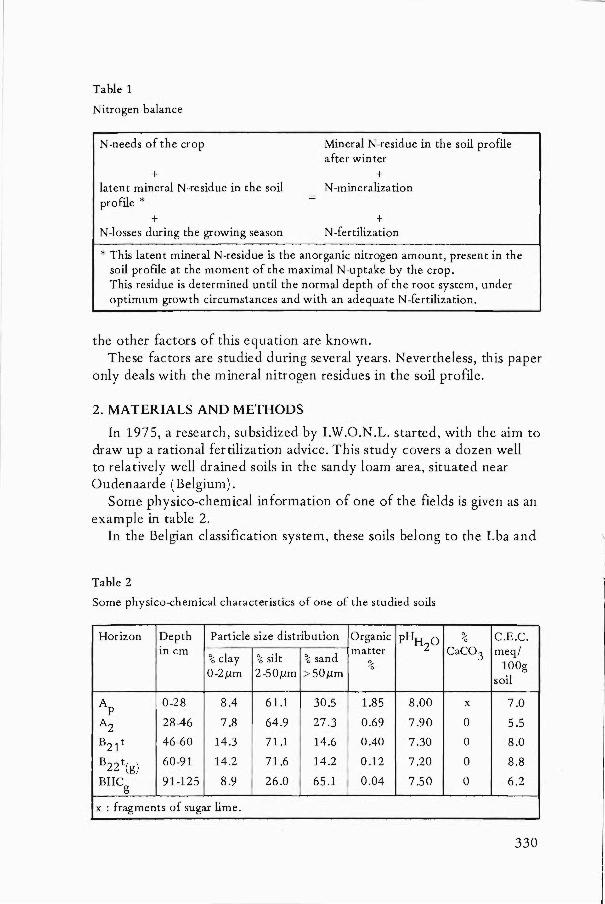
Table 1
Nitrogen balanee
N-needs of the erop
+ latent mineral N-residue in the soil prome *
+ N-losses during the growing season
Mineral N-residue in the soil profile af ter winter
+ N -mineraliza tion
+ N -fertilization
* This latent mineral N-residue is the anorganic nitrogen amount, present in the soil profile at the moment of the maximal N-uptake by the erop. This residue is determined until the normal depth of the root system, under optimum growth eireumstanees and with an adequate N -fertilization.
the other factors of this equation are known. These factors are studied during several years. Nevertheless, this paper
only deals with the mineral nitrogen residues in the soil profile.
2. MATERlALS AND METHODS
In 1975, a research, subsidized by I.W .O.N .L. started, with the aim to draw up a rational fertilization advice. This study covers a dozen weU to relatively weU drained soils in the sandy loam area, situated near Oudenaarde (Belgium).
Some physico-chemical information of one of the fields is given as an example in table 2.
In the Belgian classification system, these soils belong to the Lba and
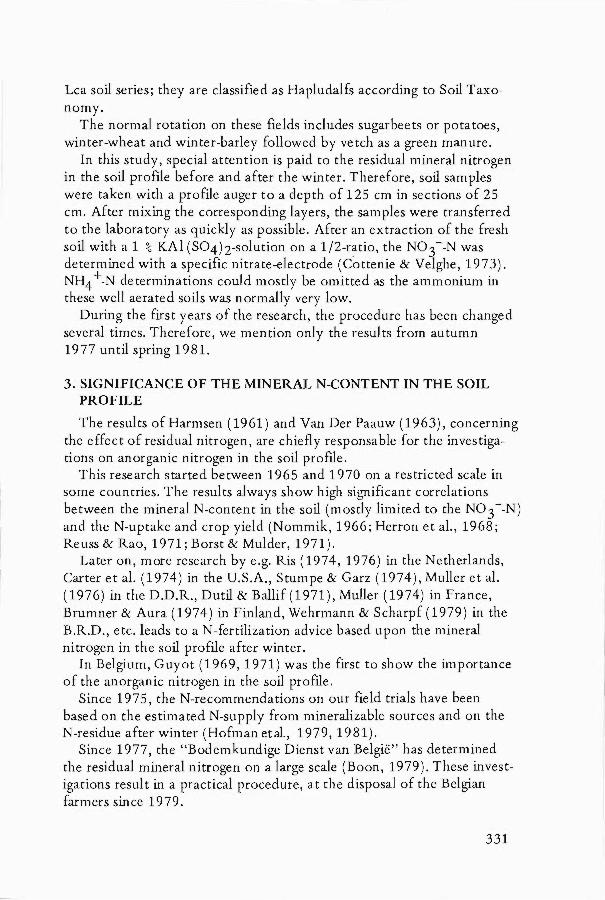
Table 2
Some physieo-chemieal eharaeteristies of one of the studied soils
Horizon Depth Particle size distribution Organic pHH ° % C.E.C.
in em matter 2 CaC03 meq/ % day % silt % sand % lOOg 0-2Jlm 2-50Jlm >50Jlm soil
Ap 0-28 8.4 61.1 30.5 1.85 8.00 x 7.0
A2 28-46 7.8 64.9 27.3 0.69 7.90 0 5.5
B21 t 46-60 14.3 71.1 14.6 0.40 7.30 0 8.0
B22 t(g) 60-91 14.2 71.6 14.2 0.12 7.20 0 8.8
BIICg 91-125 8.9 26.0 65.1 0.04 7.50 0 6.2
x : fr.agments of sugar lime.
330
I
I
1
Lca soil series; they are classified as Hapludalfs according to Soil Taxonomy.
The normal rotation on these fields includes sugarbeets or potatoes, winter-wheat and winter-barley followed by vetch as a green man ure.
In th is study, special attention is paid to the residual mineral nitrogen in the soil profile before and af ter the winter. Therefore, soil samples were taken with a profile auger to a depth of 125 cm in sections of 25 cm. After mixing the corresponding layers, the samples were transferred to the laboratory as quickly as possible. After an extraction of the fresh soil with a 1 % KAl (S04)2-Solution on a 1/2-r~tio, the N03 --N was determined with a specific nitrate-electrode (Cottenie & Velghe, 1973). NH4 +-N determinations could mostly be omitted as the ammonium in these well aerated soils was normally very low.
During the first years of the research, the procedure has been changed several times. Therefore, we mention only the results from autumn 1977 until spring 1981.
3. SIGNIFICANCE OF THE MINERAL N-CONTENT IN THE SOIL PROFILE
The results of Harmsen (1961) and Van Der Paauw (1963), concerning the effect of residual nitrogen, are chiefly responsabie for theinvestigations on anorganic nitrogen in the soil profile.
This research started between 1965 and 1970 on a restricted sc ale in some countries. The results always show high significant correlations between the mineral N-content in the soil (mostly limited to the N03 --N) and the N-uptake and erop yield (Nommik, 1966; Herron et aL, 1968; Reuss & Rao, 1971; Borst & Mulder, 1971).
Later on, more research by e.g. Ris (1974, 1976) in the Netherlands, Carter et al. (1974) in the U.S.A., Stumpe & Garz (1974), Muller et al. (1976) in the D.D.R., Dutil & Ballif(1971), Muller (1974) in France, Brumner & Aura (1974) in Finland, Wehrmann & Scharpf (1979) in the B.R.D., etc. leads to a N-fertilization advice based upon the mineral nitrogen in the soil profile af ter winter.
In Belgium, Guyot (1969,1971) was the first to show the importance of the anorganic nitrogen in the soil profile.
Since 1975, the N-recommendations on our field trials have been based on the estimated N-supply from mineralizable sourees and on the N-residue af ter winter (Hofman et al., 1979, 1981).
Since 1977, the "Bodemkundige Dienst van België" has determined the residual mineral nitrogen on a large scale (Boon, 1979). These investigations result in a practical procedure, at the disposal of the Belgian farmers since 1979.
331
300
200
100
N03
--N
kg/ha
Mr
Fig. 1
A M Jn Jl
sugarbeets winter-}Vh~at win ter -barley
•• 1977 o 0 1978 4 4 1979
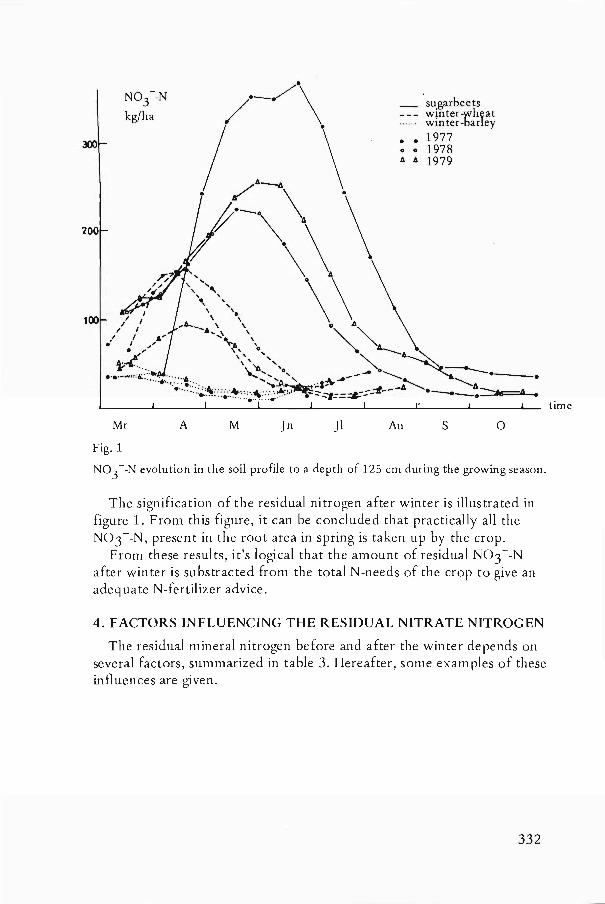
Au s ° N03 --N evolution in the soil profile to a depth of 125 cm during the growing season.
The signifieation of the residual nitrogen after winter is illustrated in figure 1. From this figure, it ean be eoncluded that praetieally all the N03--N, present in the root area in spring is taken up by the erop.
From these results, it's logical that the amount of residual N03 --N af ter winter is substraeted from the total N-needs of the erop to give an adequate N-fertilizer adviee.
4. FACTORS INFLUENCING THE RESIDUAL NITRATE NITROGEN
The residual mineral nitrogen befare and after the winter depends on several faetors, summarized in table 3. Hereafter, same examples of these influenees are given.
332
time
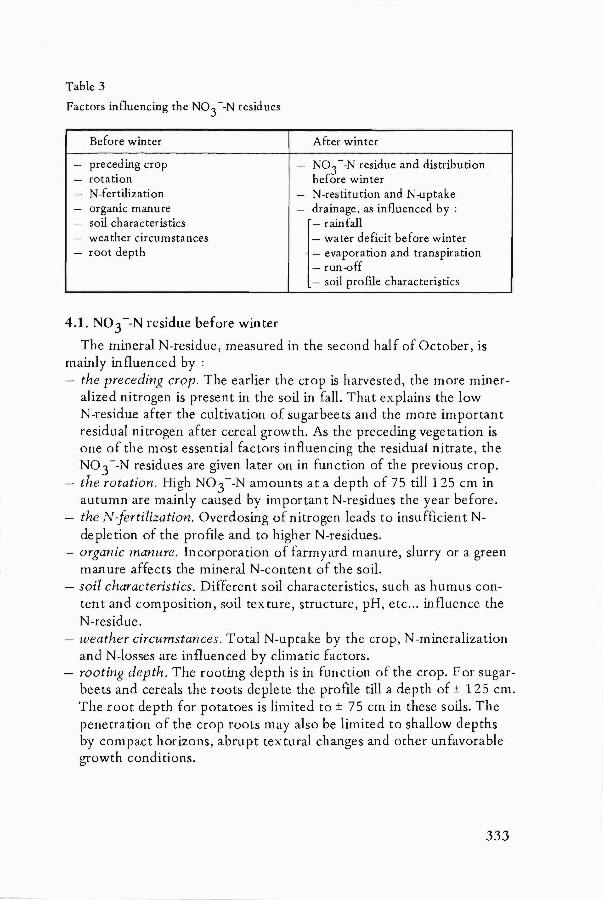
Table 3
Factors influencing the N03 --N residues
Before winter Af ter winter
- preceding crop - N03 --N residue and distribution - rotation before winter - N-fertilization - N-restitution and N-uptake - organic manure - drainage, as influenced by : - soil characteristics r ramfall - weather circumstances - water deficit before winter - root depth - evaporation and transpiration
- run-off - soil profile characteristics
4.1. N03 --N residue before winter
The mineral N-residue, measured in the second half of Octoher, is mainly influenced hy : - the preeeding erop. The earlier the crop is harvested, the more miner
alized nitrogen is present in the soU in fall. That explains the low N-residue af ter the cultivation of sugarheets and the more important residual nitrogen af ter cereal growth. As the preceding vegetation is one of the most essential factors influencing the residual nitrate, the NO 3 --N residues are given later on in function of the previous crop.
- the rotation. High N03 --N amounts at a depth of 75 till125 cm in autumn are mainly caused hy important N-residues the year hefore.
- the N-fertilization. Overdosing of nitrogen leads to insufficient Ndepletion of the profile and to higher N-residues.
- organie manure. Incorporation of farmyard manure, slurry or a green manure affects the mineral N-conten t of the soU.
- soil eharaeteristies. Different soU characteristics, such as humus content and composition, soil texture, structure, pH, etc ... influence the N-residue.
- weather cireumstanees. Total N-uptake hy the crop, N-mineralization and N-losses are influenced hy climatic factors.
- rooting depth. The rooting depth is in function of the crop. F or sugarheets and cereals the roots deplete the profile till a depth of ± 125 cm. The root depth for potatoes is limited to ± 75 cm in these soils. The penetration of the crop roots mayalso he limited to shallow depths hy compact horizons, abrupt textural changes and other unfavorable growth conditions.
333
4.2. N03 --N residue af ter winter
The residual nitrate-nitrogen af ter the winter, measured between the end of February and the first decade of March, depends mainly on : - the NO 3 --N residue and the distributian befare winter. Large losses
of nitrogen could be expected by high NO 3 --N concentrations in the subsoil before winter.
- the N-restitution and the N-uptake. Variations of residual nitrogen are found by nitrogen mineralization of crop residues or N-uptake by e.g. winter-barley in the late fall.
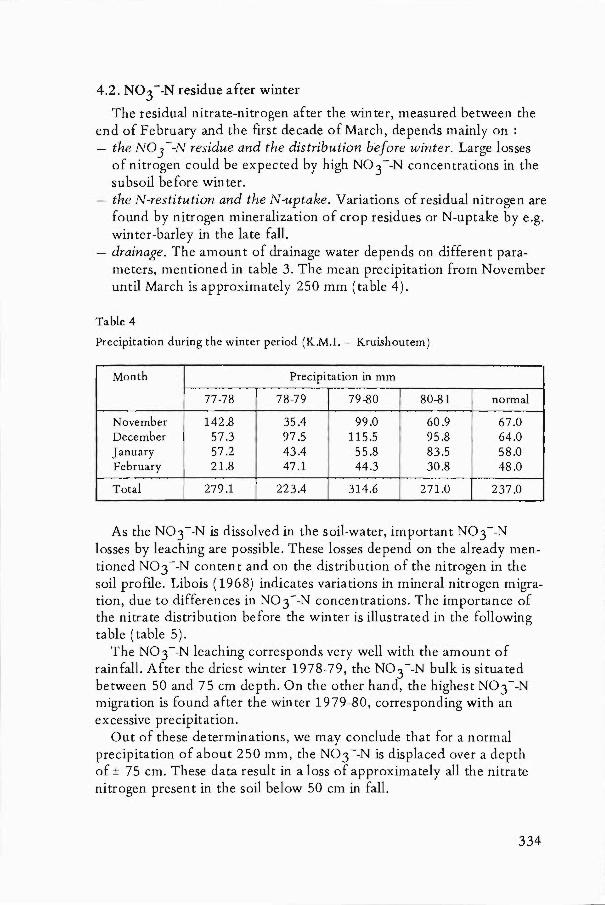
- drainage. The amount of drainage water depends on different parameters, mentioned in table 3. The mean precipitation from November until March is approximately 250 mm (table 4).
Table 4
Precipitation during the winter period (K.M.I. - Kruishoutem)
Month Precipitation in mm
77-78 78-79 79-80 80-81 normal
November 142.8 35.4 99.0 60.9 67.0 December 57.3 97.5 115.5 95.8 64.0 January 57.2 43.4 55.8 83.5 58.0 February 21.8 47.1 44.3 30.8 48.0
Total 279.1 223.4 314.6 271.0 237.0
As the N03--N is dissolved in the soil-water, important N03--N losses by leaching are possible. These losses depend on the already mentioned N03--N content and on the distribution of the nitrogen in the soil profile. Libois (1968) indicates variations in mineral nitrogen migration, due to differences in N03--N concentrations. The importance of the nitrate distribution before the winter is illustrated in the following table (table 5).
The N03--N leaching corresponds very wen with the amount of rainfall. Af ter the driest winter 1978-79, the N03 --N bulk is situated between 50 and 75 cm depth. On the other hand, the highest N03--N migration is found af ter the winter 1979-80, corresponding with an excessive precipitation.
Out of these determinations, we may conclude that for a normal precipitation of about 250 mm, the N03--N is displaced over a depth of ± 75 cm. These data result in a loss of approximately all the nitrate nitrogen present in the soil below 50 cm in fall.
334
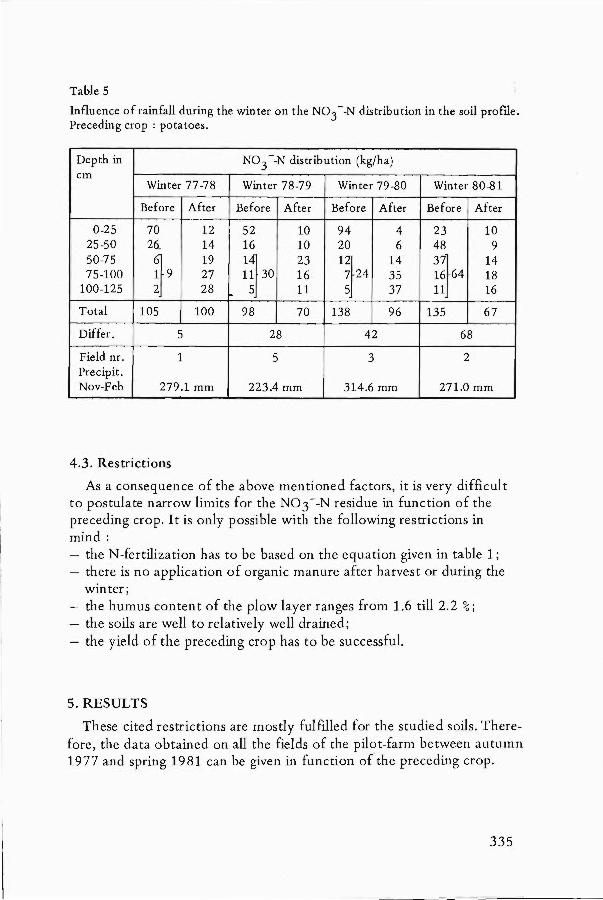
Table 5
Influenee of rainfall during the winter on the N03 --N distribution in the soil prome. Preeeding erop: potatoes.
Depth in N03 --N distribution (kg/ha) em
Winter 77 -78' Winter 78-79 Winter 79-80 Winter 80-81
Before Af ter Before Af ter Before Af ter Before Af ter
0-25 70 12 52 10 94 4 23 10 25-50 26. 14 16 10 20 6 48 9 50-75
~9 19
~~30 23 1~24
14" 37} 14 75-100 27 16 35 16 64 18
100-125 28 I-
11 37 11 16
Total 105 100 98 70 138 96 135 67
Differ. 5 28 42 68
Field nr. 1 5 3 2 Precipit. Nov-Feb 279.1 mm 223.4 mm 314.6 mm 271.0 mm
4.3. Restrictions
As a eonsequenee of the above mentioned factors, it is very diffi.cult to postulate narrow limits for the N03--N residue in funetion of the preeeding erop. It is only possible with the following restrictions in mind: - the N-fertilization has to be based on the equation given in table 1; - there is no applieation of organie manure af ter harvest or during the
winter; - the humus content of the plow layer ranges from 1.6 till 2.2 %; - the soils are well to relatively well drained; - the yield of the preeeding erop has to be sueeessful.
5. RESULTS
These eited restrictions are mostly fulfilled for the studied soils. Therefore, the data obtained on all the fields of the pilot-farm between autumn 1977 and spring 1981 can be given in funetion o(the preceding erop.
335
5.1. N03 --N residues af ter sugarbeets
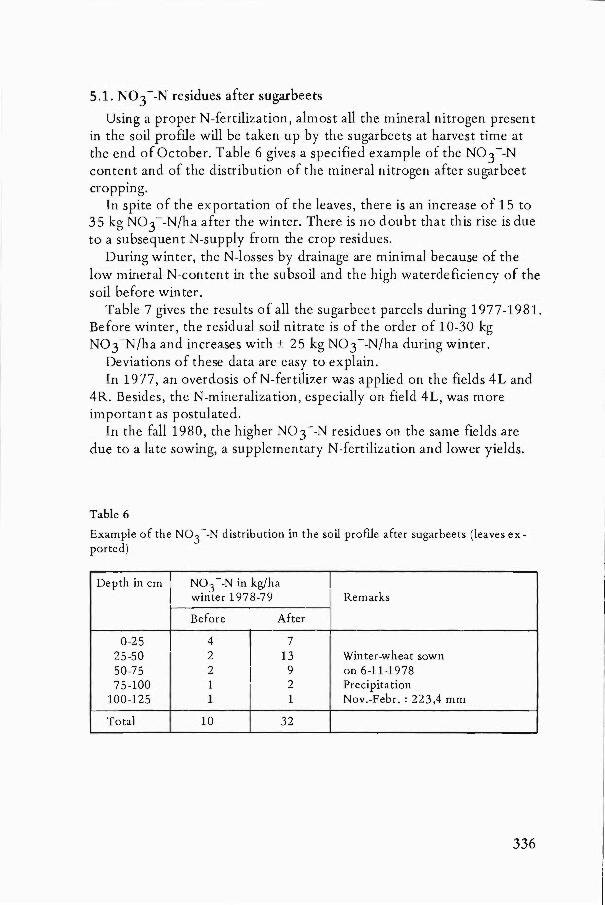
Using a proper N -fertilization, almost all the mineral nitrogen presen t in the soil profile will be taken up by the sugarbeets at harvest time at the end of October. Table 6 gives a specified example of the NO 3 --N content and of the distribution of the mineral nitrogen af ter sugarbeet eropping.
In spite of the exportation of the leaves, there is an increase of 15 to 35 kg N03 --N/ha af ter the winter. There is no doubt that this rise is due to a subsequent N-supply from the erop residues.
During winter, the N-losses by drainage are minimal because of the low mineral N-content in the subsoil and the high waterdeficiency of the soil before winter.
Table 7 gives the results of all the sugarbeet parcels during 1977-1981. Before winter, the residual soil nitrate is of the order of 10-30 kg N03-N/ha and increases with ± 25 kg N03--N/ha during winter.
Deviations of these data are easy to explain. In 1977, an overdosis of N-fertilizer was applied on the fields 4L and
4R. Besides, the N-mineralization, especially on field 4L, was more important as postulated.
In the fa1119 80, the higher NO 3 - -N residues on the same fields are due to a late sowing, a supplementary N-fertilization and lower yields.
Table 6
Example of the N03 __ N distribution in the soil prome af ter sugarbeets (leaves exported)
Depth in cm N03
__ N in kg/ha winter 1978-79 Remarks
Before Af ter
0-25 4
I
7 25-50 2 13 Winter-wheat sown 50-75 2 9 on 6-11-1978 75-100 1 2 Precipita tion
100-125 1 1 Nov.-Febr. : 223,4 mm
Total 10 32
336
Table 7
N03 --N residues in the soil profile till125 cm depth af ter sugarbe"ets (leaves exported)
Winter Field N03--N in kg/ha number
Before Af ter Difference winter winter
77-78 4L* 55 89 +34 4R 35 48 +13
78-79 3 6 21 +15 9c 10 32 +22 10 13 I 41 +28
79-80 2 9 I 43 +34 80-81 1 16 38 +22
4L* 31 I 59 +28 4R 43 64 +21 7 27 65 +38
Average 24 50 +26
4 L * : old pasture
5.2. N03 --N residues af ter winter-wheat, followed by winter-badey
Table 8 shows two detailed examples of the nitrogen distributionjn the soil profile af ter winter-wheat
Table 8
Example of the N03 --N distribution in the soil profile af ter winter-wheat, followed by winter-barley
Depth in cm N03 --N in kg/ha
24-10-78 1-3-79 24-10-78 1-3-79
0-25 48 9 67 13 25-50 25 10 42 17 50-75 4 10 9 21 75-100 3 13 5 22
100-125 5 12 5 20
Total 85 54 128 93
Remarks : field 4R : winter-barley sown Field 4 L : pasture un til 1971; on 2-10-78 winter-barley sown on 2-10-78
A higher humus content on field 4L results in a more important Nmineralization and explains the higher residual nitrate-nitrogen amount
337
compared to field 4R. The low N03 --N quantities in the subsoil at the end of October con
firm the total depletion of the soil profile until a depth of 125 cm by the winter-wheat. Af ter harvest, only the tWQ upper layers are enriched by a N-mineralization.
All the results for the period 1977-1981 are put together in table 9.
Table 9
N03 --N residues in the soU profile till125 cm depth af ter winter-wheat, followed by winter-barley
Winter Field N03 --N in kg/ha number
Before Af ter Difference winter winter
77-78 2 122 42 - 80 9a* 113 40 - 73 9b 182 21 -161
78-89 1 57 26 - 31 4L* 128 93 - 35 4R 85 I 54 - 31 7 68 39 - 29
79-80 5 43 12 - 31 6 52 20 - 32 9c 53 15 - 38 10 41 15 - 26
80-81 3 56 40 - 16 9a* 155 81 - 34 9b 82 70 - 12
Average 86 41 - 45
4L * & 9a * : old pasture
In fall, the amount of residues fluctuates between 45 and 85 kg N03--N/ha. Residues higher than 100 kg N03--N/ha before winter are only observed af ter an excessive N-supply (as in 1977) or af ter an important N-mineralization (as on the fields 4L and 9a).
Excluding the results of the winter 77-78, the average N03--N decrease is about 30 kg N/ha. This amount is not arealloss because the main part of this N03--N, namely about 25 kg N/ha, is taken up by winter-badey in November. Important N -losses by drainage are only possible if large N-residues are present in the subsoil (such as in 1977) corresponding with losses from 80 to 160 kg NO 3 --N /ha.
In table 10, the detailed results of field 2 during the winter 1977-78 are given.
338
Table 10
Example of important N03 --N losses by drainage
Depth in cm N03 --N in kg/ha Remarks
24-10-77 28-2-78
0-25 4~}66 3 Field 2 25-50 24 5 Preceding erop : winter-wheat 50-75 7 4 followed by winter-badey, 75-100 23 12 sown on 27-9-77.
100-125 26 18 Precipitation : 279,1 mmo
Total 122 42
An excessive N-fertilization is responsible for the high residual nitrogen amount in the subsoil. The optimum N-fertilization for winterwheat in that year was 56 kg N/ha (Boon, 1979) instead of the applied 83 kg N/ha. During winter, we lost by drainage about all the nitratenitrogen present in the soil profile below 50 cm" namely ± 55 kg N03--N/ha. Combining this amount with the ± 25 kg N-uptake by winter-barley results in a N03--N decrease after winter of about 80 kg N03--N/ha.
5.3. N03--N residues af ter winter-badey, followed by vetch
In the used rotation, vetch was sown immediately af ter winter-barley and then incorporated af ter winter as a green manure.
In table 11, two examples are given of the N03--N distribution under vetch. The data show the important enrichment of mineral nitrogen during winter, due to a N-restitution from the vetch.
Table 11
Example of the N03 --N distribution in the soil profile under vetch
Depth in cm N03 - -N in kg/ha
17 -10-79 26-2-80 17-10-79 26-2-80
0-25 9 32 15 33 25-50 5 25 5 23 50-75 4 24 4 19 75-100 5 18 4 16
100-125 7 12 7 13
Total 30 111 35 104
Remarks : field 4R-vetch sown on 28-7- Field 4L-vetch sown on 28-7-79; vetch incorporation : 78; vetch incorporation : 18-4-80 18-4-80
A combination of a continuous N-restitution and a simultaneous N03 --N migration results in an almost homogeneous distribution of the mineral nitrogen in the soil profile af ter winter.
Normally, the N-release out of the vetch starts at the end of October and continues during the winter with an intensity depending on weather circumstances. If there is not yet any N-restitution from veteh, we Eind at fall-sampling low N03--N residu es of the order of 30 to 40 kg N03--N/ha. If the N-release has already started before sampling time, mainly due to frost influences, we obtain nitrate-nitrogen residues of about 60 to 70 kg N03--N/ha (table 12).
Af ter winter, the total residu al N03--N amounts from 100 to 130 kg N03--N/ha, corresponding with an average enrichment of about 70 kg N/ha.
The practical consequences of these high N03--N residues vary from erop to erop. If the vetch is followed by sugarbeets or cereals, the total N-residue can be substracted from the erop need. On the other hand, if vetch is followed by a less deeper rooting erop, such as potatoes, only the N-residue present in the upper 75 cm of the soil profile is effective.
At the same time is to be noticed that, depending on weather circumstances, a N-release out of the veteh, going from 0 to 30 kg N/ha, can appear af ter spring sampling time.
Table 12
N03 --N residues in the soil profile till125 cm depth under vetch
Winter Field N03 --N in kg/ha number
Before Af ter Difference winter winter
77-78 3 40 93 + 53 9c 68 119 + 51
78-79 2 54 107 + 53 9b 37 117 + 80
79-80 1 36 112 + 76 4L 35 104 + 69 4R 30 111 + 81
80-81 5 66 130 + 64 6 63 144 + 81 9c 31 118 + 87
Average 46 116 + 70
5.4. N03 --N residues aft er potatoes
In the studied rotation, the highest N03 --N residues before winter are
340
found af ter potatoes. This is due to a restricted rooting depth" an incomplete depletion of the soil by the plants and a N-release out of the crop after the decay of the leaves.
In the followed rotation, important losses by leaching can best be measured after potatoes, followed by winter-wheat. These are reallosses because between the two sampling times, there is normally no N-restitution out of the crop residues and the N-uptake by winter-wheat during this period is negHgible.
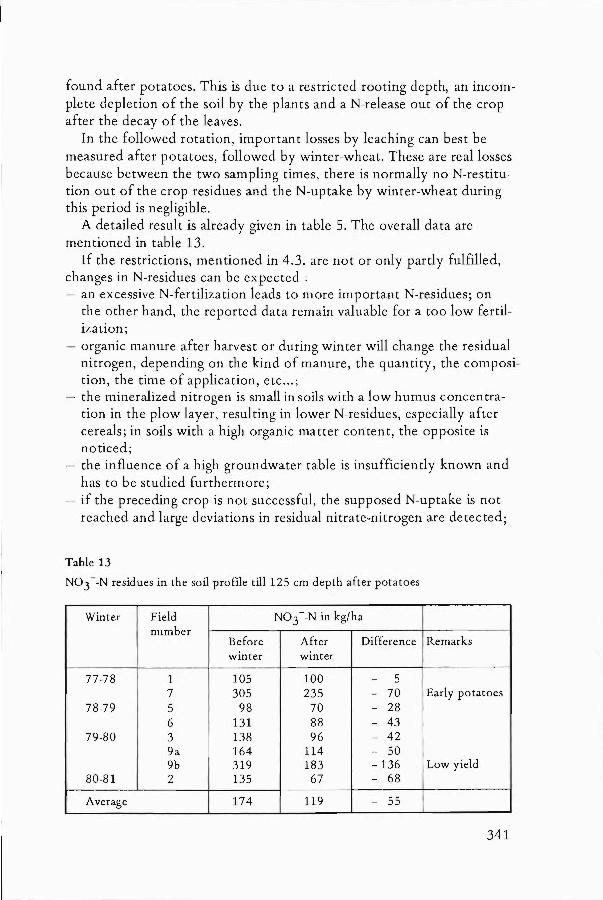
A detailed result is already given in table 5. The overall data are mentioned in table 13.
If the restrictions, mentioned in 4.3. are not or only partly fulfilled, changes in N-residues can be expected : - an excessive N-fertilization leads to more important N-residues; on
the other hand, the reported data remain valuable for a too low fertilization;
- organic man ure af ter harvest or during win ter will change the residual nitrogen, depending on the kind of manure, the quantity, the composition, the time of application, etc ... ;
- the mineralized nitrogen is small in soils with a low humus concentration in the plow layer, resulting in lower N-residues, especially af ter cereals; in soils with a high organic matter content, the opposite is noticed;
- the influence of a high groundwater table is insufficiently known and has to be studied furthermore;
- if the preceding crop is not successful, the supposed N-uptake is not reached and large deviations in residual nitrate-nitrogen are detected;
Table 13
N03 --N residues in the soil prome till125 cm dep th af ter potatoes
Winter Field NO 3 - -N in kg/ha number
Before Af ter Difference Remarks winter winter
77-78 1 105 100 - 5 7 305 235 - 70 Early potatoes
78-79 5 98 70 - 28 6 131 88 - 43
79-80 3 138 96 - 42 9a 164 114 - 50 9b 319 183 -136 Low yield
80-81 2 135 67 - 68
Average 174 119 - 55
341
in this situation, the determination of the residual mineral nitrogen in spring is indispensable to give a correct N-fertilizer advice.
6. CONCLUSIONS
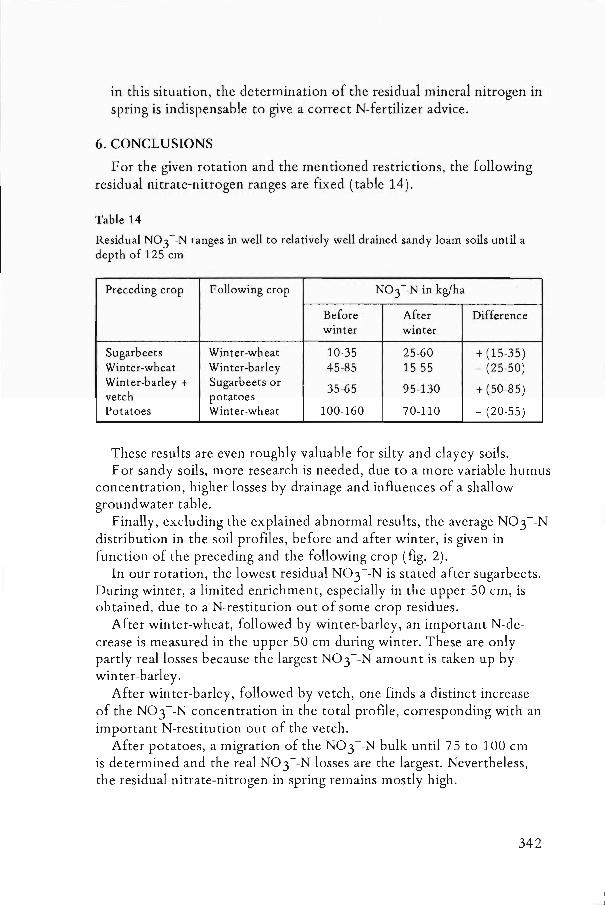
For the given rotation and the mentioned restrictions, the following residual nitrate-nitrogen ranges are fixed (tabie 14).
Table 14
Residual N03 --N ranges in weil to relatively weU drained sandy loam soils until a depth of 125 cm
Preeeding erop F oilowing erop N03 --N in kg/ha
Before Af ter Differenee winter winter
Sugarbeets Winter-wheat 10-35 25-60 +(15-35) Winter-wheat Winter-barley 45-85 15-55 - (25-50) Winter-badey + Sugarbeets or
35-65 95-130 + (50-85) vet eh potatoes Potatoes Winter-wheat 100-160 70-110 - (20-55)
These results are even roughly valuable for silty and clayey soils. For sandy soils, more research is needed, due to a more variabie humus
concentration, higher losses by drainage and influences of a shallow groundwater tabie.
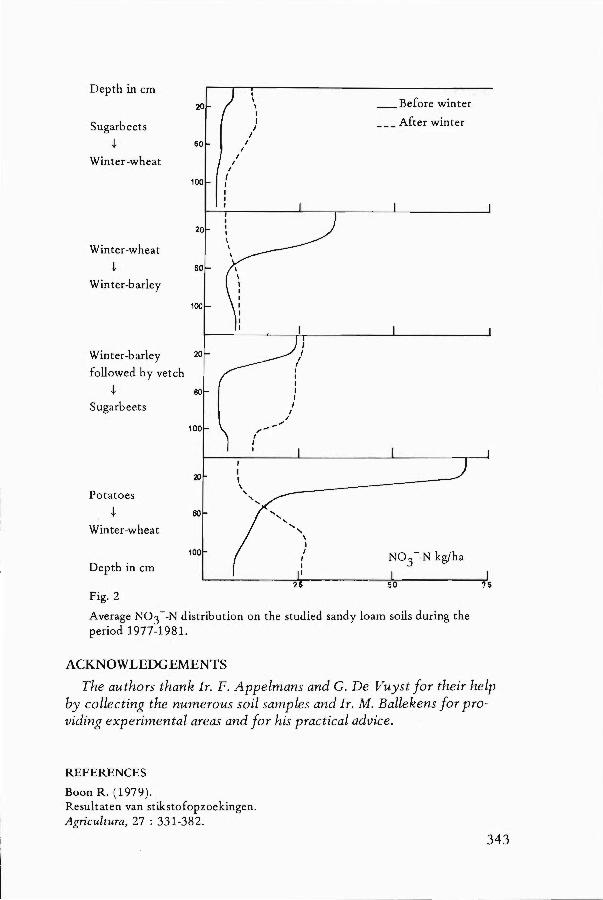
Finally, excluding the explained abnormal results, the average N03--N distribution in the soil profiles, before and af ter winter, is given in function of the preceding and the following crop (fig. 2).
In our rotation, the lowest residual NO 3 - -N is stated af ter sugarbeets. During winter, a limited enrichment, especially in the upper 50 cm, is obtained, due to a N-restitution out of some crop residues.
Af ter winter-wheat, followed by winter-barley; an important N-decrease is measured in the upper 50 cm during winter. These are only partly reallosses because the largest N03--N amount is taken up by winter-barley.
Af ter winter-badey, followed by vetch, one finds a distinct increase of the N03--N concentration in the total profile, corresponding with an important N-restitution out of the vetch.
Af ter potatoes, a migration of the N03--N bulk until 75 to 100 cm is determined and the real NO 3 - -N losses are the largest. Nevertheless, the residual nitrate-nitrogen in spring remains mostly high.
342
Depth in cm I \ _ Before winter 20 \ ,
Sugarbeets I ___ Af ter winter I
I .l- 60 I
I
Winter--wheat I I
I
100 , I I I I
20
Winter-wheat
.l- 60
Winter-badey
100
, Winter-barley 20 I
I , followed by vetch I
I
.l-I
80 I , Sugarbeets I
I I
100 ,'" ... / I , I
~
Potatoes
.l- 60
Winter-wheat
100 N03
--N kg/ha Depth in cm
50 7S Fig. 2
Average N03 --N distribution on the studied sandy loam soils during the period 1977-198l.
ACKNOWLEDGEMENTS The authors thank Ir. F. Appelmans and G. De Vuyst for their help
by collecting the numerous soil samples and Ir. M. Ballekens for providing experimental areas and for his practical advice.
REFERENCES
Boon R. (1979). Resultaten van stikstofopzoekingen. Agricultura, 27 : 331-382.
343
Borst N. P. & Mulder C. (1971). Stikstofgehalte, stikstofbemesting en opbrengst van wintertarwe op zeezand-, kleien zavelgronden in Noord-Nederland. Bedrijfsontwikkeling, 2 : 31-36.
Brummer V. & Aura E. (1974). Effect of residual nitrogen and fertilizer nitrogen on sugar beet production in Finland. Journal Sci. Agric. Soc. Finland, 46 : 143-155.
Carter J. N., Jensen M. E. & Bosma S. M. (1974). Determining nitrogen fertilizer needs for sugarbeets from residual soil nitrate and mineralizabie nitrogen. Agronomy Journal, 66 : 319-323.
CottenÎe A. & Velghe G. (1973). Het gebruik van de specifieke nitraat elektrode voor de bepaling van nitraat in gronden en planten. Meded. Fak. Landbouwwet., Rijksuniversiteit Gent, 38 : 560-568.
Dutil P. & Ballif J. L. (1971). Prévision de la fumure azotée du blé d'hiver en Champagne crayeuse. C. R. Hebdo Séances.Acad. Agric. France, 57 : 88-95.
GuyotJ. (1969). Etude préliminaire du dynamisme de l'azote minéral dans un sollimoneux profond. Bull. Rech. Agron. Gembloux, 4 : 260-271.
Guyot J. (1971). Evolution de l'azote minéral dans un sol et fumure azotée du blé d'hiver. Bull. Rech. Agron. Gembloux, 6 : 280-326.
Harmsen G. W. (1961). Einfluss von Witterung, Düngung und Vegetation auf den Stickstoffgehalt des Bodens. Landwirtschaftliche Forschung, 15 : 61-74.
Herron G. M., Terman G. L., Dreier A. F. & Olson R. A. (1968). Residual nitrate nitrogen in fertilized deep loess-derived soils. Agronomy Journal, 60 : 477-482.
Hofman G., Ossemerct c., Van Cleemput 0., Ide G. & Van Ruymbeke M. (1979). Het stikstof bemestingsadvies voor suikerbiet berekend op het stikstof relikwaat in het profiel op het einde van de winter is veelbelovend. L'avis de fumure azotée pour betterave sucrière basé sur Ie reliquat azoté du profil à la fin de l'hiver est prometteur. Belgisch Instituut tot Verbetering van de Biet, Tienen. Institut Beige pour l'Amélioration de la Betterave, Tirlemont, 195-210.
Hofman G., Van Ruymbeke M., Ossemerct C. & Ide G. (1981). Nieuwe tendenzen in het formuleren van bemestingsadviezen op basis van profielonderzoek. Tendances nouvelles dans la formulation des avis de fumure basés sur l'examen du profil. Landbouwtijdschrift. Revue de l'Agriculture, 34 : 905-937.
Koninklijk Meteorologisch Instituut. Weergegevens Kruishoutem. Brussel.
Libois A. (1968). Dynamique de l'azote minéral en sol nu. Annales Agron., 19 : 103-128.
344
Muller J. (1974). Arrière effet du précédent cultural sur Ie reliquat d'azote minéral à la sortie d'hiver : cas du maïs-grain. C. R. Hebdo. Séances Acad. d'Agric. France, 60 : 850-856.
Muller S., Ansorge H., Hagemann 0., Goerlitz H., GarzJ. & Stumpe H. (1976). Untersuchungen über die Möglichkeiten einer Bemessung der ersten N-Gabe zu Getreide durch Berücksichtigung des Gehaltes an anorganischem Stickstoff im Boden. Archiv für Acker- und PJZanzenbau und Bodenkunde, 20 : 713-722.
Nommik H. (1966). The residual effects of nitrogen fertilizers in relation to the quantities of mineral nitrogen recovered in the soil profile. Acta Agriculturae Scandinavica, 16 : 163-178.
Reussj. O. & Rao P. S. C. (1971). Soil nitrate nitrogen levels as an index of nitrogen fertilizer needs of sugarbeets. Journal Amer. Soc. Sugar Beet Technologists, 16 : 461-470.
Ris J. (1974). Stikstofbemestingsadviezen voor bouwland. Stikstof, 7 : 168-173.
Ris J. (1976). Mogelijkheden voor grondonderzoek voor het geven van stikstofbemestingsadviezen voor konsumptieaardappelen en suikerbieten. Bedrijfsontwikkeling, 7 : 766-770.
Soper R. J., Racz G. J. & Fehr P. I. (1970). Nitrate nitrogen in the soil as a means of predicting the fertilizer nitrogen requirements ofbarley. Can. Journal Soil Sci., 51 : 45-49.
Stumpe H. & GarzJ. (1974). Vorfruchtbedingte Unterschiede in der Stickstoffversorgung des Getreides und die Möglichkeit ihres Nachweis durch Bestimmung des anorganischen Bodenstickstoffs. Archiv für Acker- und Pflanzenbau und Bodenkunde, 18 : 736-746.
Van Der Paauw F. (1963). Residual effect of nitrogen fertilizer on succeeding crops in a moderate climate. Plant and Soil, 19 : 324-331.
Wehrmann J. & Scharpf H. C. (1979). Der Mineralstickstoffgehalt des Bodens als Massstab für den Stickstoffdüngerbedarf (N min-Methode). Plant and Soil, 52 : 109-126.
Summary
A more efficient nitrogen fertilizer advice can be formulated if the nitrogen recommendations are based on the residual mineral nitrogen in the soil profile in spring.
Nitrate-nitrogen determinations are indispensable as a consequence of the influences of a lot of factors on this residual nitrogen.
On condition that some restrietions are made, it is possible to postulate narrow ranges of this nitrogen residue before and af ter winter, in function of the preceding
345
erop. During the period 1977-1981, the N03 --N residu es were studied on 12 fields of
a pilot-farm in the sandy loam region, for a rotation sugarbeets or potatoes - winterwheat - winter-badey foIlowed by veteh.
From determinations before and af ter winter, it is possible to deduce the available nitrate-nitrogen amount as weIl as the changes of this mine ral nitrogen during winter.
Finally, an idea of the distribution and the variations of this residual nitrogen is found by soil sampling in layers of 25 cm.
Reliquats d'azote nitrique dans des sols de limon sableux sous climat tempéré humide
Résumé
Un meilleur avis de fumure azotée peut être donné en tenant compte de la réserve d' N-minéral dans Ie profil du sol à la fin de l'hiver.
Ce reliquat azoté dépend d'un grand nombre de facteurs, de telle sorte qu'il est indispensable de déterminer I'N-N03-.
Si cependan.! certaines conditions sont remplies, il est possible de prévoir des reliquats d'N-N03 dans des limites assez restreintes, aussi bien avant qu'après l'hiver, en fonction du précédant cultural.
Au cours des années 1977-1981, nous avons déterminé ces reliquats sur une douzaine de parcelles d 'une exploitation située en région sablo-limoneuse pour une rotation betteraves sucrières ou pommes de terre - froment - escourgeon suivi de vesces.
De ces déterminations, aussi bien avant qu'après l'hiver, nous avons pu déduire les réserves ainsi que l'évolution d'N-N03 - dans Ie profil au cours de l'hiver.
Par un échantillonage en couche de 25 cm, on obtient également une idée de la répartition de l'azote résiduel.
Nitraatstikstofrelikwaten in zandleemgronden onder gematigd vochtig klimaat
Samenvatting
Nauwkeuriger N-bemestingsadviezen kunnen opgesteld worden indien rekening gehouden wordt met de minerale N-reserve in het bodemprofiel in het voorjaar.
Deze stikstofnavette wordt door een groot aantal factoren beïnvloed zodat N03 - -N bepalingen onontbeerlijk zijn.
Wordt nochtans aan een aantal voorwaarden voldaan, dan kunnen relatief nauwe grenzen opgesteld worden voor deze N03 --N relikwaten, zowel vóór als nà de winter, in functie van de voorvrucht.
Gedurende de periode 1977-1981 werden voor de rotatie suikerbieten of aardappelen - wintertarwe - wintergerst gevolgd door wikke, deze minerale N-hoeveelheden in het bodemprofiel, op een 12-tal velden van een proefbedrijf in de zandleemstreek gevolgd.
Uit bepalingen, zowel vóór als nà de winter, konden naast de beschikbare N03 --N hoeveelheden tevens de wijzigingen in minerale stikstof in het bodemprofiel gedurende de winter afgeleid worden.
Door een laagsgewijze monstername om de 25 cm kon tevens een idee verkregen worden van de verdeling van deze residuele stikstof.
346
PEDOLOGIE, XXXI, 3, p. 347-363,3 fig.,. 6 tab. Gent, 1981
STIKSTOFADVIES OP BASIS VAN PROFIELANALYSE VOOR WINTERGRAAN EN SUIKERBIETEN OP DIEPE LEEM-ENZANDLEEMGRONDEN
1. INLEIDING
R. BOON
Onderzoek gesubsidieerd door LW.O.N.L. (Instituut voor Wetenschappelijk Onderzoek in Nijverheid en Landbouw, Brussel).
Sinds enkele jaren wordt in verschillende landen voor belangrijke teelten een stikstofbemestingsadvies geformuleerd, gebaseerd op een analyse van de bouwlaag en van de ondergrond tot op min of meer grote diepte (Ris, 1974;Soper, Raez& Fehr, 1971;Wehrman& Scharpf, 1977). Dergelijke analyse wordt uitgevoerd in het voorjaar, bij de aanvang van de groeiperiode van de win tergranen of vóór de zaai van de suikerbieten.
Onderzoek naar de peilers voor zulk advies werd in 1977 in België aangevat op diepe zandleem- en leemgronden, d.w.z. op gronden waarin retentie van nitraatanionen mogelijk is over het winterseizoen.
Indien in vergelijkende plantengroeistudies slechts één onder de vele vruchtbaarheidsbepalende faktoren geanalyseerd wordt, is het een noodzaak alle overige faktoren konstant te houden of te neutraliseren. Gezien het groot aantal faktoren die bij de plantaardige produktie een rol spelen is deze opdracht niet onaanzienlijk.
Zeer belangrijke parameters bij de ondernomen studie bleken te zijn : - voor de bodem: vochtregime, doorwortelbare zone, koolstofgehalte ; - voor de teelt: bewortelingsdiepte, stikstofbehoefte, variëteit, groei-
fase, ziektegevoeligheid; - voor de teelt-technische maatregelen: ziektebestrijding, onkruidbe
strijding, groeiregulatoren, zaaiomstandigheden ; - voor de (N)-bemesting : soort, hoeveelheid, tijdstip, toedieningswijze; - voor het klimaat: neerslag, zonneuren, temperatuur, wind.
In deze publikatie zullen alleen de bodemkundig belangrijkste variabelen beschouwd worden, zoals het procent koolstof van de bouwlaag
R. Boon - Bodemkundige Dienst van België, de Croylaan 48, 3030 Heverlee - Leuven, België.
347
en het kleigehalte, alsook het al dan niet toedienen van organische bemesting- en of bietenschuim. Andere belangrijke invloedsfaktoren zoals de variëteit, de stikstofbehoeften, de teelt-technische maatregelen worden gestandardiseerd bij het opstellen van de bemestingsformule.
2. STIKSTOF-ADVIES VOOR WINTERGRAANGEWASSEN OP DIEPE LEE~~ENZANDLEEMGRONDEN
2.1. METHODIEK
De studie naar de modaliteiten om via een bepaling van de minerale N in de bodem tot een verbeterd en meer aangepast stikstofadvies te komen werd in de periode 1977-1981 uitgevoerd op 96 proefpercelen.
Al deze percelen waren leem- of zandleemgronden van lössoorsprong; 76 waren bezaaid met wintertarwe en 20 met wintergerst van verschillende variëteiten. In februari werd de bodem in drie lagen bemonsterd: van 0-30 cm, van 30-60 cm en van 60-90 cm diepte. Op de bodemmonsters werdde minerale N (hoofdzakelijk N03--N) bepaald, evenals de humustoestand ( % C). Op elk van de 96 proefpercelen werd via een proef met stijgende hoeveelheden stikstof, nagegaan welke de optimale N-dosis was. Daarenboven werd op alle velden een reeks waarnemingen verricht omtrent variëteit en teeltzorgen alsmede omtrent de groei en de gezondheid van het gewas.
Aldus beschikt men enerzijds over een reeks mogelijke causale faktoren i.v.m. de stikstofbehoefte en anderzijds over een reeks optimale Ndosissen.
Deze optimale N-dosissen werden alle omgerekend naar éénzelfde zgn. "standaardgewas" zijnde tarwe, variëteit Cama met toepassing van CCC (groeiregulator) en een efficiënte fungicidetoepassing tegen blad- een aarziekten. Deze berekende optima zijn zogenaamde "fysiologische optima", d.w.z. de N-dosissen waarmede de hoogste graanopbrengst wordt bekomen zonder rekening te houden met de uitgaven aan stikstof.
De herrekening van de optimale N-dosissen naar Cama + C.C.C. + fungiciden geschiedde als volgt : Wintertarwe zonder C.C.C. ~ wintertarwe + C.C.C. : + 25 N/ha
Zemon + C.C.C. ) Albatros + C.C.C. ~ H d ' C C C Cama + C.C.C. : + 0 N/ha ar 1 + ... Nautica + C.C.C. Wattines + C.C.C. ~ Cama + C.C.C. : - 20 N/ha Talent + c.c.c.} Gamin + C.C.C. ~ Cama + C.C.C. : - 30 N/ha Fidel + C.C.C.
348
Wintergerst zonder regulator ""* wintergerst met regulator: + 15 N/ha met regulator ""* Cama + C.C.C. : + 15 N/ha zonder fungiciden""* met fungiciden: + 10, 20 of 30 N/ha
naargelang de ziektedruk.
2.2. RESULTATEN EN BESPREKING
2.2.1. Fysiologisch optimum
Er werden correlatieberekeningen uitgevoerd tussen enerzijds: - de hoeveelheid N03-N/ha van 0-90 cm, gemeten in februari = Xl - de "N-index a" = X2 - de "N-index b" = X3 en anderzijds de optimale N-dosis in kg N per ha, herleid tot de variëteit Cama + C.C.C. + fungiciden = Y.
De "N-index a" (X2) omvat volgende elementen: 1. kg N03--N/ha in februari gemeten in de laag 0-90 cm; 2. kg N/ha reeds door het gewas opgenomen in februari bij de bemonste
ring van de bodem; 3. indien zware leem: - 10 kg N/ha; 4. indien bietenschuim werd toegediend:
aan de teelt zelf: + 10 kg N/ha per 10 ton; aan de vorige teelt : + 6 kg N /ha per 10 ton; aan de voorlaatste teelt: + 4 kg N/ha per 10 ton;
5. indien bietekoppen werden ondergeploegd: vroegtijdig: + 20 kg N/ha; laattijdig: + 30 kg N/ha;
6. indien bonenloof werd ingeploegd: + 30 kg N/ha; 7. indien in februari wildschade wordt waargenomen over de ganse opper
vlakte : - 10 kg N /ha.
De "N-index b" (X3) omvat naast de elementen vermeld voor de "Nindex a" (X2), ook een koolstoffaktor, namelijk het % C van de laag 0-30 cm vermenigvuldigd met 60 = [% C x 60] kg/ha.
De resultaten van de correlatieberekeningen tussen de kg N03<N/ha (0-90 cm) in februari, de "N-index a" de "N-index b" enerzijds en de optimale N-dosissen voor wintertarwe Cama + C.C.C. + ziektebestrijding anderzijds worden gegeven in de tabellen 1, 2 en 3.
349
Tabell
Correlaties (r) tussen de kg N03 --N/ha (0-90 cm) in februari in de bodem (Xl) en de optimale N-dosis in kg N/ha voor wintertarwe Cama + C.C.C. + ziektebestrijding (Y)
Jaar Aantal Lineair verb and r2-waarden r-waarden velden
1977 14 Y = 202,3 - 0,923 Xl 0,556 - 0,745 ** 1978 18 = 206,7 - 0,955 Xl 0,635 - 0,797 ** 1979 22 = 203,1 - 0,805 Xl 0,850 - 0,922** 1980 13 = 213,6 - 1,091 Xl 0,799 - 0,894** 1981 29 = 198,2 - 0,922 Xl 0,844 - 0,919**
Gemidd. 96 = 199,9 - 0,883 Xl 0,751 - 0,867** n= 91 (1) = 200,1 - 0,864 Xl 0,769 - 0,877**
(1) Koolstofrijke percelen ( % C > 1,6) niet in aanmerking genomen: voor 1977 vallen vier en voor 1978 één perceel weg.
Tabel 2
Correlaties (r) tussen de "N-index a" (X2) en de optimale N-dosis in kg N/ha voor wintertarwe Cama + C.C.c. + ziektebestrijding (Y)
Jaar Aantal Lineaire relatie r2-waarden r-waarden velden n
1977 14 Y = 199,5 - 0,761 X2 0,552 - 0,743** 1978 18 = 209,6 - 0,812 X2 0,796 - 0,892** 1979 22 = 219,8 - 0,785 X2 0,901 - 0,949** 1980 13 = 220,3 - 0,811 X2 0,906 - 0,952** 1981 29 = 209,2 - 0,828 X2 0,879 - 0,937 **
Gemidd. 96 = 212,0 - 0,804 X2 0,809 - 0,899 ** n 91 (1) = 213,3 - 0,794 X2 0,853 - 0,924**
(1) zie opmerking tabel 1
Tabel 3
Correlaties (r) tussen de "N-index b" (X3) en de optimale N-dosis in kg N/ha voor wintertarwe Cama + C.C.C. + ziektebestrijding (Y)
Jaar Aantal Lineaire relatie r2-waarden r-waarden velden n
1977 14 Y = 262,8 - 0,754 X3 0,908 - 0,953** 1978 18 = 251,2 - 0,697 X3 0,824 - 0,908** 1979 22 = 273,2 - 0,810 X3 0,915 - 0,956 ** 1980 13 = 268,5 - 0,782 X3 0,885 - 0,941 ** 1981 29 = 267 ,0 - 0,822 X3 0,862 - 0,928 **
Gemidd. 96 = 264,7 - 0,777 X3 0,876 - 0,936 ** n 91 (1) = 268,3 - 0,795 X3 0,872 - 0,934**
(1) zie opmerking tabel 1.
J
Bij deze resultaten kunnen volgende besluiten geformuleerd worden. 1. De stikstofbehoefte van wintertarwe op leemgrond wordt in sterke
mate beïnvloed door de hoeveelheid N03--N in februari in de bodem aanwezig van ° tot 90 cm. Dit blijkt uit de individuele correlaties voor de vijf jaren van onderzoek alsook uit de globale correlatie over vijf jaar.
2. In 1977 was de correlatie tussen kg N03--N/ha (0-90 cm) en de optimale N-dosis het laagst, alhoewel nog hoog signifikant daar vier van de 14 percelen een hoog koolstofgehalte vertoonden. Op deze humusrijke percelen geschiedde naast de N-Ievering uit de N03--N voorraad, een extra N-Ievering uit de humus. Trouwens, voor 1977 was de correlatie tussen de N03--N:.voorraad en de optimale N-dosis veel hoger indien alleen de percelen met een normaal C-gehalte in rekening worden gebracht:
n = 10 Y = 216,0 - 0,902 X r2 = 0,723 r = -0,851 **
3. Voor de 96 gevolgde proefvelden vindt men gemiddeld volgende vergelijking tussen de hoeveelheid N03--N van ° tot 90 cm in februari (Xl) en de optimale N-dosis Y = 199,9 - 0,883 Xl; r2 = 0,751 r = - 0,867**. Beschouwt men alleen de percelen met een normaal koolstofgehalte, d.w.z. % C < 1,7, dan bekomt men ongeveer dezelfde bemestingsformule, doch met een iets hogere correlatie: r2 = 0,769 en r = -0,877**.
4. Er kan gesteld worden dat op leemgronden met een normaal koolstofgehalte de N-behoefte voor ca 77 % verklaard wordt door de hoeveelheid N03--N die na de winter nog in het profiel 0-90 cm aanwezig is.
5. Wordt de hoeveelheid N03--N in de laag 0-90 cm aanwezig in februari aangevuld me t bijkomende waarden, zoals de reeds opgenomen N door het jonge graangewas, korrektiefaktoren voor zware gronden (- 10), voor bietenschuimbehandelingen (per 10 ton respektievelijk + 10, + 6 en + 4 voor toedieningen aan de teelt zelf, aan de voorteelt of aan de voorlaatste teelt), voor toegediende bietekoppen (+ 20 à + 30), voor ingeploegd bonenloof (+ 30) en voor eventuele wildschade (-10), dan komt men tot de zgn. "N-index a".
De correlatie tussen deze index en de optimale N-dosis bedraagt voor de onderzochte percelen:
Y = 212, ° -0,804 X 2 , n = 96 r2 = ° 809 en r = - ° 899* * , ,
De correlatie met de optimale N-gift is derhalve nog duidelijk beter voor de "N-index a" dan voor de N03--N in de laag 0-90 C1TI alleen.
351
Worden enkel de percelen met een normaal humusgehalte in aanmerking genomen (n = 91), vindt men volgende correlatievergelijking : Y = 213,3 - 0,794 X2, r2 = 0,853 en r = - 0,924** , wat een hogere graad van overeenstemming betekent.
6. De "N-index b" (X3) heeft dezelfde inhoud als de "N-index a", doch is aangevuld met een koolstoffaktor : % C (0-30 cm) x 60. Voor de "N-index b" vindt men voor elk van de 5 afzonderlijke jaren zeer hoog signifikante overeenkomsten met de N-behoefte, evenals voor de 96 proefvelden globaal, wat blijkt uit volgende vergelijking:
Y = 264,7 - 0,777 X3 n = 96 r2 = ° 876 en r = - ° 936* * , ,
De correlatie met de N-behoefte is voor de "N-index b" derhalve nog beter dan voor de "N-index a". Uitschakelen van de vijf percelen met hoog % C brengt geen verdere verbetering mee voor de signifikantie, gezien nu de N-Ievering door de humus expliciet ingecalculeerd werd.
De gemiddelde waarde van de "N-index b" voor de 96 percelen bedraagt 197,8, voor de "N-index a" 128,3 en voor de kg N03--N per ha in de laag 0-90 cm 103,8.
In figuur 1 zijn de experimenteel bekomen optimale N-dosissen weergegeven t.O.V. de advieslijn volgens de bemestingsformule voor de "Nindex b" : Y = 264,7- 0,777 ** .
280
240
200
~ 160
lil
lil 120 o ';' z: Q)
'" E ....., 0-o
80
40
o o
Fig. 1
Y = 264,7 - 0,777 X3 r = -O,936U n = 96
40 80 120 160 200 240 280 • -320 360· 400' 440
Correlatie tussen de "N-index b" (X3) en de optimale N~osis voor wintergraan voor de periode 1977-1981.
352
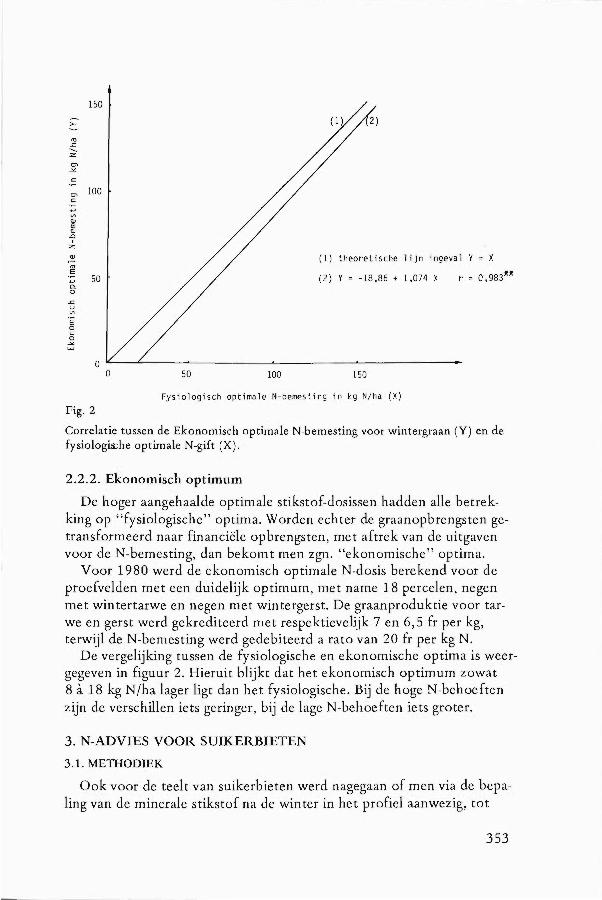
L
150
0) 100 c::
(1) theoretische lijn ingeval Y = X
50 (2) Y = -18,86 + 1,074 X
o ~--~----~----------~--------~--------------o 50 100 150
Fysiologisch optimale N-bemesting in kg N/ha (X)
Fig. 2
Correlatie tussen de Ekonomisch optimale N-bemesting voor wintergraan (Y) en de fysiologis:he optimale N-gift (X).
2.2.2. Ekonomisch optimum
De hoger aangehaalde optimale stikstof-dosissen hadden alle betrekking op "fysiologische" optima. Worden echter de graanopbrengsten getransformeerd naar financiële opbrengsten, met aftrek van de uitgaven voor de N-bemesting, dan bekomt men zgn. "ekonomische" optima.
Voor 1980 werd de ekonomisch optimale N-dosis berekend voor de proefvelden met een duidelijk optimum, met name 18 percelen, negen met wintertarwe en negen met wintergerst. De graanproduktie voor tarwe en gerst werd gekrediteerd met respektievelijk 7 en 6,5 fr per kg, terwijl de N-bemesting werd gedebiteerd a rato van 20 fr per kg N.
De vergelijking tussen de fysiologische en ekonomische optima is weergegeven in figuur 2. Hieruit blijkt dat het ekonomisch optimum zowat 8 à 18 kg NJha lager ligt dan het fysiologische. Bij de hoge N-behoeften zijn de verschillen iets geringer, bij de lage N-behoeften iets groter.
3. N-ADVIES VOOR SUIKERBIETEN
3.1. METHODIEK
Ook voor de teelt van suikerbieten werd nagegaan of men via de bepaling van de minerale stikstof na de winter in het profiel aanwezig, tot
353
een verbeterd stikstofadvies kon komen. Hiervoor werden in de periode 1977-1980 37 stikstofbemestingsproefvelden aangelegd op diepe zandleem- en leemgronden, in samenwerking met het Nationaal Instituut tot Verbetering van de Biet te Tienen.
Op alle velden werd in februari, zoals voor wintergraan, de bodem in drie lagen bemonsterd nl. van 0 tot 30 cm, van 30 tot 60 cm en van 60 tot 90 cm diepte. Voor elke proef werden de bodemkundige en landbouwkundige karakteristieken vastgelegd. De invloed van stijgende dosissen stikstof op de wortel- en loofopbrengst, op het suikergehalte en de suikerproduktie werd nagegaan. De industriële waarde van de bieten werd bepaald door het Bieteninstituut.
Aan de hand van de wortelop brengsten en de suikergehalten werd op elk veld en voor elke stikstofgift het financieel rendement per ha berekend.
Voor deze berekeningen werden de suikerbietprijzen van 1979 aangehouden, terwijl alle stikstofbemestingen werden gedebiteerd met 14 fr per kg toegediende stikstof.
De totale kostprijs van stikstof ligt weliswaar hoger, maar aangezien een gedeelte van de toegediende stikstof via de bladeren wordt gevaloriseerd, werd een verminderde aftrek voor de stikstofmeststof ingecalculeerd.
3.2. RESULTATEN EN BESPREKING
De correlatie berekeningen uitgevoerd tussen enerzijds de voorjaarshoeveelheid N03 --N/ha in de verschillende grondlagen aanwezig en anderzijds de optimale N-dosis in kg N/ha voor de wortelproduktie, suikeropbrengst of financieel rendement zijn samengevat in tabel 4.
Tabel 4
Correlatiecoëfficienten tussen de N03-N-voorraad per ha per grondlaag en de optimale N-dosis per ha i.v.m. de wortelproduktie, de suikeropbrengst en het financieel rendement (n = 37)
Diepte Co rrela tiecoë fficiën ten grondlaag
Wortelproduktie Suikeropbrengst Financieel rendement
0-30 cm - 0,575 ** - 0,574 ** -0,668** 30-60 cm - 0,389 * - 0,504 ** - 0,712 ** 60-90 cm - 0,306 - 0,444 ** -0,593 **
0-60 cm -0,605** -0,676 ** - 0,865 ** 0-90 cm - 0,525 ** -0,632 ** - 0,819 **
r-waarde p 0,05 = 0,325 P 0,01 = 0,418
354
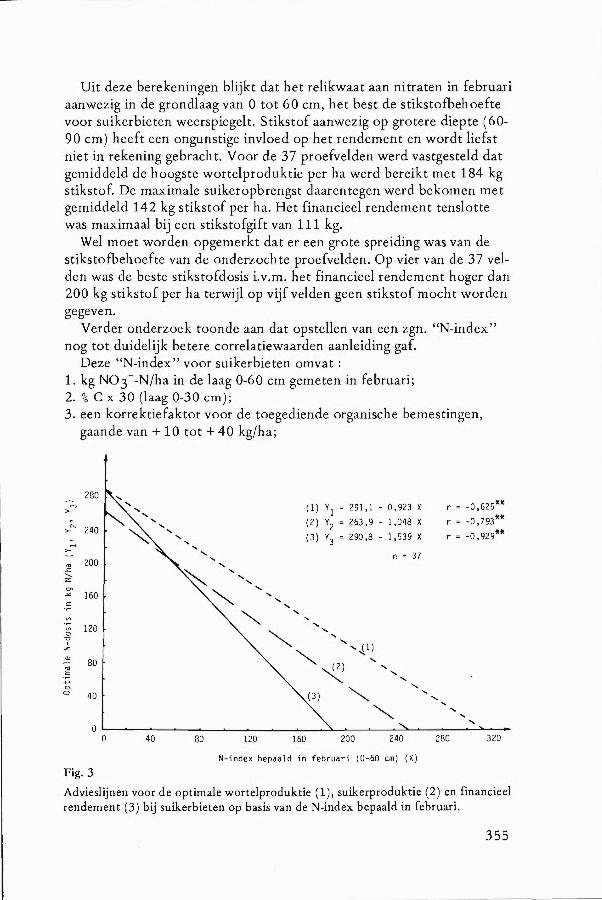
Uit deze berekeningen blijkt dat het relikwaat aan nitraten in februari aanwezig in de grondlaag van 0 tot 60 cm, het best de stikstofbehoefte voor suikerbieten weerspiegelt. Stikstof aanwezig op grotere diepte (60-90 cm) heeft een ongunstige invloed op het rendement en wordt liefst niet in rekening gebracht. Voor de 37 proefvelden werd vastgesteld dat gemiddeld de hoogste wortelproduktie per ha werd bereikt met 184 kg stikstof. De maximale suikeropbrengst daarentegen werd bekomen met gemiddeld 142 kg stikstof per ha. Het financieel rendement tenslotte was maximaal bij een stikstofgift van 111 kg.
Wel moet worden opgemerkt dat er een grote spreiding was van de stikstofbehoefte van de onderzochte proefvelden. Op vier van de 37 velden was de beste stikstofdosis i.v.m. het financieel rendement hoger dan 200 kg stikstof per ha terwijl op vijf velden geen stikstof mocht worden gegeven.
Verder onderzoek toonde aan dat opstellen van een zgn. "N-index" nog tot duidelijk betere correlatiewaarden aanleiding gaf.
Deze "N-index" voor suikerbieten omvat: 1. kg N03--N/ha in de laag 0-60 cm gemeten in februari; 2. % ex 30 (laag 0-30 cm); 3. een korrektiefaktor voor de toegediende organische bemestingen,
gaande van + 10 tot + 40 kg/ha;
280 C""l
>-
~ 240 >-A .....
>-
~ 200
-...... :z
~ 160 c:
Vl
Vl 120 0
"? :z (1)
80 '" E
~ c-o 40
0
Fig. 3
0
" , , , ,
40
, , , , , , ,
80
, , , " ,
120
, , , ,
(1) Yl = 291,1 - 0,923 X (2) Y2 = 263,9 - 1,048 X (3) Y3 = 290.8 - 1.539 X
n = 37
, , "" ",(1)
~ (2) ....... " '" "
r = -0.625**
r = -0.793U
r = -0.929u
~ ",
"" 160 200 240
,
280
, , 320
N-index bepaald in februari (0-60 cm) (X)
Advieslijnen voor de optimale wortelproduktie (1), suikerproduktie (2) en fmancieel rendement (3) bij suikerbieten op basis van de N-index bepaald in februari.
355
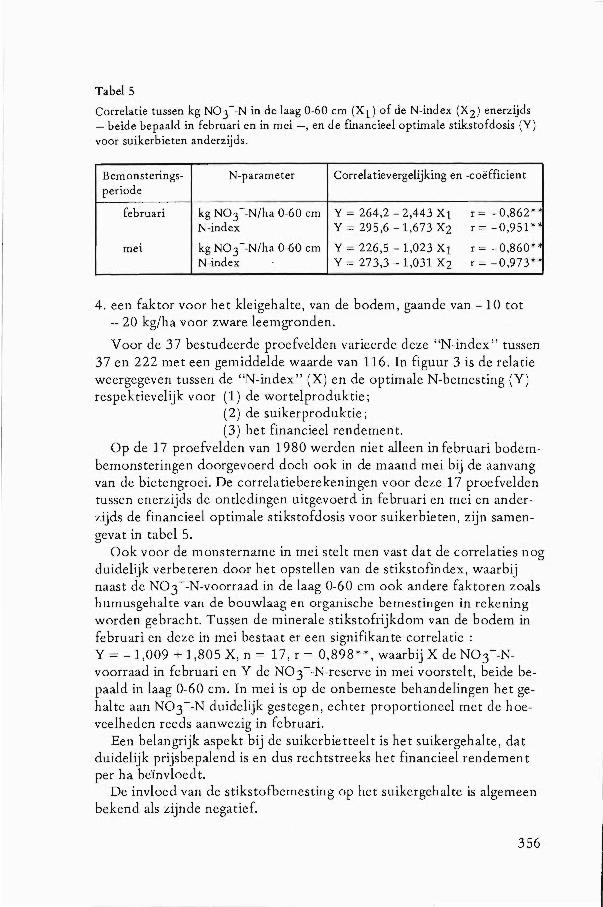
Tabel 5
Correlatie tussen kg N03 --N in de laag 0-60 cm (Xl) of de N-index (X2) enerzijds - beide bepaald in februari en in mei -, en de fmancieel optimale stikstofdosis (Y) voor suikerbieten anderzijds.
Bemonsterings- N-parameter Correlatievergelijking en -coëfficient periode
februari kg N03 --N/ha 0-60 cm Y = 264,2 - 2,443 Xl r = -0,862** N-index Y = 295,6 - 1,673 X2 r = -0,951 **
mei kg N03 --N/ha 0-60 cm Y = 226,5 - 1,023 Xl r = -0,860** N-index Y = 273,3 - 1,031 X2 r = -0,973**
4. een faktor voor het kleigehalte, van de bodem, gaande van - 10 tot -- 20 kg/ha voor zware leemgronden.
Voor de 37 bestudeerde proefvelden varieerde deze "N-index" tussen 37 en 222 met een gemiddelde waarde van 116. In figuur 3 is de relatie weergegeven tussen de "N-index" (X) en de optimale N-bemesting (Y) respektievelijk voor (1) de wortelproduktie ;
( 2) de suikerproduktie ; (3) het financieel rendement.
Op de 17 proefvelden van 1980 werden niet alleen in februari bodembemonsteringen doorgevoerd doch ook in de maand mei bij de aanvang van de bietengroei. De correlatieberekeningen voor deze 17 proefvelden tussen enerzijds de ontledingen uitgevoerd in februari en mei en anderzijds de financieel optimale stikstofdosis voor suikerbieten, zijn samengevat in tabelS.
Ook voor de monstername in mei stelt men vast dat de correlaties nog duidelijk verbeteren door het opstellen van de stikstofindex, waarbij naast de N03--N-voorraad in de laag 0-60 cm ook andere faktoren zoals humusgehalte van de bouwlaag en organische bemestingen in rekening worden gebracht. Tussen de minerale stikstofrijkdom van de bodem in februari en deze in mei bestaat er een signifikante correlatie: Y = -1,009 + 1,805 X, n = 17, r = 0,898** , waarbij X de N03--Nvoorraad in februari en Y de N03--N-reserve in mei voorstelt, beide bepaald in laag 0-60 cm. In mei is op de onbemeste behandelingen het gehalte aan N03--N duidelijk gestegen, echter proportioneel met de hoeveelheden reeds aanwezig in februari.
Een belangrijk aspekt bij de suikerbietteelt is het suikergehalte, dat duidelijk prijsbepalend is en dus rechtstreeks het financieel rendement per ha beïnvloedt.
De invloed van de stikstofbemesting op het suikergehalte is algemeen bekend als zijnde negatief.
356
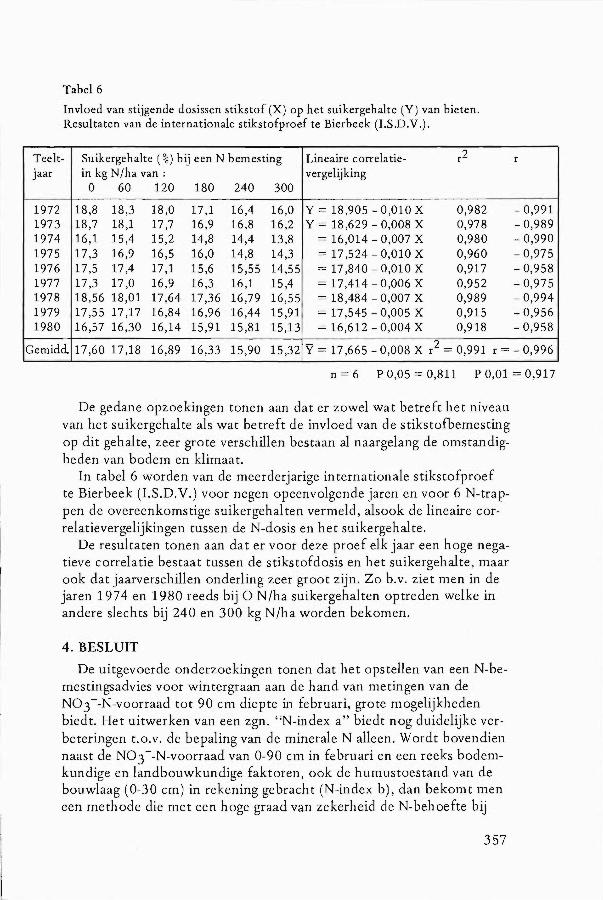
Tabel 6
Invloed van stijgende dosissen stikstof (X) op het suikergehalte (Y) van bieten. Resultaten van de internationale stikstofproef te Bierbeek (I.S.D.V.).
Teelt- Suikergehalte (%) bij een N bemesting Lineaire correlatie- r2 r jaar in kg N/ha van: vergelijking
° 60 120 180 240 300
1972 18,8 18,3 18,0 17,1 16,4 16,0 Y = 18,905 - 0,010 X 0,982 - 0,991 1973 18,7 18,1 17,7 16,9 16,8 16,2 Y = 18,629 - 0,008 X 0,978 - 0,989 1974 16,1 15,4 15,2 14,8 14,4 13,8 = 16,014 - 0,007 X 0,980 - 0,990 1975 17,3 16,9 16,5 16,0 14,8 14,3 = 17,524 - 0,010 X 0,960 - 0,975 1976 17,5 17,4 17,1 15,6 15,55 14,55 = 17,840 - 0,010 X 0,917 - 0,958 1977 17,3 17,0 16,9 16,3 16,1 15,4 = 17,414 - 0,006 X 0,952 - 0,975 1978 18,56 18,01 17 ,64 17,36 16,79 16,55 = 18,484 - 0,007 X 0,989 - 0,994 1979 17,55 17,17 16,84 16,96 16,44 15,91 = 17,545 - 0,005 X 0,915 - 0,956 1980 16,57 16,30 16,14 15,91 15,81 15,13 = 16,612 - 0,004 X 0,918 - 0,958
Gemidd. 17,60 17,18 16,89 16,33 15,90 15,32 Y = 17,665 - 0,008 X r2 = 0,991 r = - 0,996
n = 6 P 0,05 = 0,811 P 0,01 = 0,917
De gedane opzoekingen tonen aan dat er zowel wat betreft het niveau van het suikergehalte als wat betreft de invloed van de stikstofbemesting op dit gehalte, zeer grote verschillen bestaan al naargelang de omstandigheden van bodem en klimaat.
In tabel 6 worden van de meerderjarige internationale stikstofproef te Bierbeek (I.S.D.V.) voor negen opeenvolgende jaren en voor 6 N-trappen de overeenkomstige suikergehalten vermeld, alsook de lineaire correlatievergelijkingen tussen de N-dosis en het suikergehalte.
De resultaten tonen aan dat er voor deze proef elk jaar een hoge negatieve correlatie bestaat tussen de stikstofdosis en het suikergehalte, maar ook dat jaarverschillen onderling zeer groot zijn. Zo b.v. ziet men in de jaren 1974 en 1980 reeds bij ON/ha suikergehalten optreden welke in andere slechts bij 240 en 300 kg N/ha worden bekomen.
4. BESLUIT
De uitgevoerde onderzoekingen tonen dat het opstellen van een N-bemestingsadvies voor wintergraan aan de hand van metingen van de N03--N-voorraad tot 90 cm diepte in februari, grote mogelijkheden biedt. Het uitwerken van een zgn. "N-index a" biedt nog duidelijke verbeteringen t.O.V. de bepaling van de minerale N alleen. Wordt bovendien naast de N03--N-voorraad van 0-90 cm in februari en een reeks bodemkundige en landbouwkundige faktoren, ook de humustoestand van de bouwlaag (0-30 cm) in rekening gebracht (N-index b), dan bekomt men een methode die met een hoge graad van zekerheid de N-behoefte bij
357
wintergraan kan voorspellen. Bij analoge proeven uitgevoerd op suikerbieten werd vastgesteld dat
een bepaling van het N03---N-relikwaat in de bodem tot 60 cm diepte in februari een goede maatstaf bleek voor het vaststellen van de optimale stikstofdosis. De N03--N in februari aanwezig tussen 60 en 90 cm kan als schadelijke stikstof voor de afrij ping en suikervorming bestempeld worden.
Ook hier kon het N-advies aanzienlijk verbeterd worden door het opstellen van een N-index.
Ontleding van de bodem voor suikerbieten is eveneens mogelijk in de maand mei. Correlaties tussen de N-index vastgesteld in mei met de optimale N-dosissen waren zeer hoog signifikant.
REFERENTIES
Ris J. (1974). Stikstofbemestingsadviezen voor bouwland. Stikstof: 7 : 169-173.
Soper R. J., Raez G. J. & Fehr P. J. (1971). Nitrate nitrogen in the soil as a mean of predicting the fertilizer nitrogen requirements of badey. Can J. Soil. Sci., 51 : 45-49.
Wehrmann J. & ScharpfH. C. (1977). Stickstoffdüngung : Nmin - Methode hat sich bewährt. DLG Mitteilungen, Frankfurt/M, 92 : 1058 .
Samenvatting
Opzoekingen door de Bodemkundige Dienst van België te Heverlee uitgevoerd op diepe leem- en zandleemgronden, hebben geleid tot het operationeel maken van een nieuw N-bemestingsadvies voor wintergranen en suikerbieten.
Aan de hand van 96 stikstofproefvelden op wintergraan, aangelegd in de periode 1977 -1981, werd vastgesteld dat een zogenaamde "stikstofindex" de beste basis voor het opstellen van een stikstofadvies betekende. Op de onderzochte proefvelden werd de bodem in februari in drie lagen bemonsterd en ontleed, nl. van 0 tot 30, van 30 tot 60 en van 60 tot 90 cm diepte.
De "stikstofindex" omvat volgende elementen: de hoeveelheid nitraatstikstof van 0 tot 90 cm diepte, bepaald in februari (som van 3 lagen); een faktor gebaseerd op het koolstofgehalte van de 0-30 cm grondlaag, namelijk % C x 60; een faktor welke de eventuele organische bemesting evalueert, b.v. voor wintertarwe de bietenbladeren op het perceel achtergelaten; de stikstof door het jonge gewas in februari reeds opgenomen.
Eventueel worden nog kleine correcties toegepast voor het kleigehalte van de bo-
358
dem, het toedienen van bietenschuim en het optreden van ernstige wildschade. Tussen de stikstofindex aldus samengesteld en de optimale stikstofdosis bestaat
volgende lineaire correlatievergelijking : Y = 265 - 0,777 X n = 96 proefvelden Y = optimale totale N dosis/ha r = -0,936 * * X = "stikstofindex" r2 = 0,876
Deze formule is geldig voor bepaalde variëteiten (Cama, Zemon) met toepassing van de normale dosis groeiregulator (C.C.C.) en een efficiënte ziektebestrijding. In de praktijk wordt het stikstofadvies aangepast aan de verbouwde variëteit, de zaaidichtheid, het zaaitijdstip en aan de toegepaste kultuurmaatregelen wat betreft het aanwenden van groeiregulator en fungiciden tegen ziekten.
De stikstoffraktionering bij deze nieuwe methode is in hoofdzaak gebaseerd op de verdeling van de nitraatstikstof doorheen het profiel. Bij hoge voorraad in de bovenste grondlaag (0-60 cm) mag de eerste N-gift begin maart laag blijven. Naast de N-verdeling doorheen het profiel spelen de reeds opgenomen stikstof door het jonge gewas in februari, evenals de dichtheid van het gewas en het uitstoelingsvermogen van de verbouwde variëteit nog een rol bij de stikstoffraktionering.
Proeven in dezelfde periode doorgevoerd op suikerbieten, in samenwerking met het Nationaal Instituut tot Verbetering van de Biet te Tienen, geven eveneens aanleiding tot een nieuwe methode van grondonderzoek voor stikstof voor de teelt van suikerbieten. Bij deze opzoekingen werd vastgesteld dat een ontleding van de bodem tot 60 cm diepte in februari de beste maatstaf bleek voor het vaststellen van de optimale stikstofdosis. Er bestaat immers een vrij belangrijk verschil tussen suikerbieten en wintergranen inzake de werking van de minerale stikstof in februari aanwezig in de grondlaag 60-90 cm. Waar voor wintergranen die stikstof nog duidelijk gevaloriseerd wordt, lijkt ze voor suikerbieten eerder als schadelijke stikstof te funktioneren omwille van de afremming van de suikervorming.
Ook voor de suikerbieten wordt een stikstofindex opgesteld als basis voor het stikstofadvies. De stikstofindex voor suikerbieten omvat:
kg N03-N in februari aanwezig in de bodemlaag 0-60 cm; een humusfaktor van de laag 0-30 cm : %.C x 30; een faktor welke de organische bemesting evalueert (stalmest, groenbemesting); een faktor voor het bodemtyepe (-10, of - 20 voor zware leem).
Tussen de aldus samengestelde stikstofindex en de optimale N-dosis (financieel optimum) bestaat volgende vergelijking:
Y = 291 - 1,539 X r = -0,929 ** n = 37 proefvelden Y = optimale N-dosis/ha X = stikstofindex
Ontleding van de bodem voor suikerbieten is eveneens mogelijk in de maand mei. Correlaties tussen de N-index vastgesteld in mei met de optimale N-dosissen voor suikerbieten waren zeer hoog signiflkant.
De uitgevoerde proeven toonden verder aan dat het suikergehalte naast de invloed van de stikstofbemesting ook sterk de invloed van de klimatologische jaaromstandigheden ondergaat.
359
Nitrogen fertilization advice for winter cereals and sugarbeets on deep loam and sandy loam soils based on a profile analysis
Summary
Investigations by the "Bodemkundige Dienst van België, Heverlee" , carried out on deep loam and sandy loam soils, resulted in a new method of nitrogen fertilization advice for winter cereals and sugarbeets.
Out of 96 experimental fields with winter cereals during the period of 1977-1981, it has been found th at aso called "nitrigen-index" offers the best base for nitrogen fertilization advice. On the experimental fields, the soil samplings and analysis were carried out on three layers, resp. situated at 0-30, 30-60 and 60-90 cm depth. This "nitrogen-index" contains the folIowing factors:
the amount of nitrate-nitrogen till 90 cm depth (sum of the three layers), analysed in February; a factor based on the carbon content of the 0-30 cm soillayer : % C x 60; a factor for evaluation of eventual organic fertilization, e.g. sugarbeet leafs; the nitrogen already taken up by the young crop in February.
Eventually, small corrections can be introduced for the day content of the soil, for the addition of sugarbeet foam, or for game.
The following linear equation between the "nitrogen-index" and the optimum nitrogen dose was found :
Y = 265 - 0.777 X n = 96 experimental fields Y = optimum total N dose/Ha r = -0.936 ** X = "nitrogenindex" r2 = 0.876
This equation is valid for some varieties (Cama, Zemon), considering also the application of a normal dose of a growing regulator, and an efficient plant disease control. In practice, the nitrogen fertilization advice is adjusted to the used variety, the sowing-density, the sowing-time and the used cultivation circumstances with regard to the application of growing regulators and fungicides against diseases.
The nitrogen fractionation with this new method is mostly based on the distribution of the nitrate-nitrogen throughout the profile. A high amount in the top layer (0-60 cm) reduces the first N-application at the beginning of March. Besides the Ndistribution in the profile, the N-fractionation is also influenced by the nitrogen already taken up by the young crop in February, as weIl as by the density of the crop and the tillering possibility of the used variety.
Investigation with sugarbeets, in collaboration with the "Nationaal Instituut tot Verbetering van de Biet, Tienen" have also lead to a new method for soil analysis with regard to nitrogen for sugarbeets. It has been found th at soil analysis to a depth of 60 cm in February gives the best results for establishing the optimum nitrogen dose. Indeed, the mineral nitrogen in the 60-90 cm soillayer present in February, differently influences winter-cereals and sugarbeets. For winter-cereals, this nitrogen has a positive effect, while for sugarbeets, it inhibits sugar formation.
Also for sugarbeet fertilization advice, a "nitrogen-index" has been established. It contains the following factors:
the amount of nitrate nitrogen till 60 cm depth, analysed in February; a humus factor for the soillayer 0-30 cm : % C x 30; a factor for evaluation of organic fertilization (e.g. farmyardmanure, green manure ); a factor related to the soil type (- 10 or - 20 for fine silt.
The following equation between the " nitrogen-index" and the optimum N-dose (financial optimum) was found :
360
Y = 291 - 1.539 X r = -0.929** Y = optimum total N-dose/Ha X = "nitrogenindex"
n = 37 experimental fields
Analysis of the soil for sugarbeets is also possible in May. Correlations between the "nitrogen-index" of May and the optimum N-dose were very highly significant.
The investigations also showed that the sugar content of the sugarbeets is, besides the influence of a N-fertilization, also influenced by climatological differences from year to year.
Avis de fumure azotée basé sur l'analyse de prom pour céréales d'hiver et betteraves sucrières sur sols limoneux et sablo-limoneux profonds
Résumé
Des recherches effectuées par Ie Service Pédologique de Belgique à Heverlee, sur sols limoneux et sablo-limoneux profonds, ont abouti à rendre opérationel un nouvel avis de fumure azotée pour les cultures de céréales d'hiver et de betteraves suáières.
Sur 96 champs d'essai de froment d'hiver établis entre 1977 et 1981, il est apparu qu'un "index-azote" constituait une excellente base pour la rédaction d'un avis de fumure azotée. Un échantillonnage de trois couches de sol, suivi d'analyses fut effectué en février et portait sur les couches de 0 à 30, 30 à 60 et 60 à 90 cm de profondeur.
L'index-azote contenait les éléments suivants : . l'azote nitrique présent dans les couches successives de 0 à 90 cm au mois de février; un facteur basé sur la teneur en carbone de la couche de 0 à 30 cm, a savoir % C x 60; un facteur évaluant l'engrais organique éventuel (par exemple pour Ie froment d'hiver il s'agit des feuilles de betteraves abandonnées sur la parcelle); l'azote déjà absorbé par la jeune plante en février.
Eventuellement de légères corrections sont encore apportées sur base de la fraction argileuse du. sol ou d'apports d'écumes de sucrerie ou de dégats de gibier, etc.
La relation entre l'index-azote (X) et la dose optimale d'azote à appliquer (Y) est la suivante :
Y = 265 - 0,777 X n = 96 r 2 = 0,876 r = -0,936 **
Cette formule vaut pour certaines variétés (Carna, Zémon) traitées aux doses normales de régulateurs de croissance (C.C.C.) et de fongicides. En pratique, les avis de fumure azotée sont toujours adaptés à la variété, à la densité et à la date du semis, aux opérations culturales appliquées concernant les fongicides et les régulateurs de croissance. Le fractionnement de l'azote conseillé dans cette nouvelle méthode est essentiellement basé sur la répartition de l'azote nitrique dans l'entièreté du profil. Par exemple, en présence d'une quantité élevée d'azote dans les couches supérieures (0 à 60 cm), la première dose d'azote, appliquée en mars, peut être ramenée au minimum. Jouent également un rale lors du fractionnement : l'azote déjà absorbé par la jeune plante en février, la densité de la végétation et Ie tallage propre à la variété.
Des essais durant la même période sur betteraves sucrières et effectués en collaboration avec l'Institut Belge pour l'Amélioration de la Betterave ont permis d'adapter la nouvelle methode d'analyse des sols en ce qui concerne l'azote à la culture des
361
betteraves sucrières. De ces recherches il ressort que l'analyse du sol jusqu'à 60 cm de profondeur en février permet d'établir Ie meilleur indice de dose optimale d'azote. 11 existe en effet une différence fondamentale entre les betteraves sucrières et les céréales d'hiver en ce qui concerne Ie fonctionnement de l'azote minéral présent en février dans la couche de 60-90 cm. Pour les céréales d'hiver cet azote est nettement valorisé alors que pour les betteraves sucrières il a un effet nodf du fait d'un ral entissement de la formation de sucre.
Pour les betteraves sucrières Pon a également établi un index-azote servant de base pour l'avis de.fumure en azote, il est calculé à partir des paramètres suivants :
la teneur en azote nitrique des couches 0 à 60 cm en février; un facteur basé sur la teneur en carbone de la couche 0 à 30 cm : % C x 30; un facteur se rapportan t à la fumure organique (fumier, engrais verts) ; un facteur qui tient compte du type de sol (sollourd).
Entre l'index-azote et la fumure azotée optimale (optimum financier), il existe la relation suivante :
Y = 291 - 1,539 X n = 37 r 2 = 0,863 r = -0,929 **
La détermination de l'azote nitrique du sol peut encore être effectuée au mois de mai quand il s'agit d'une culture de betterave. Dans ce cas, la corrélation entre l'indexazote et la dOse N-optimale est également très significative.
Les essais ont également démontré que la teneur en sucre subissait l'influence non seulement de la fumure azotée mais également des circonstances climatologiques annuelles.
Die Profilanalyse als Basis für die Stickstoffberatung für Wintergetreide und Zuckerrüben auf tiefen Lehm- und Sandlehmböden
Zusammen fassung
Untersuchungen von dem Bodemkundige Dienst van België-Heverlee auf tiefen Lehm- und Sandlehmböden ausgeführt, haben zu einer neuen Methode der Stickstoffberatung für Wintergetreide und Zuckerrüben geführt.
Anhand 96 Stickstoffversuchsfeldern für Wintergetreide die in der Periode : zwischen 1977 und 1981 angelegt wurden, wurde festgestellt dass ein sogenannter Stickstoffindex die weitaus beste Basis für die Stickstoffberatung ist.
Auf den untersuchten Feldern wurde der Boden im Februar auf drei verschiedenen Schich ten bemunstert und analysiert : von 0 bis 30 cm, von 30 bis 60 cm und von 60 bis 90 cm.
In diesem Stickstoffindex spielen die folgenden Elemente eine Rolle : der Gehalt an Nitratstickstoff bis auf eine Tiefe von 90 cm (dieser Gehalt wird im Februar aufgemessen); der KDhlenstoffaktor der den C-Gehalt der Bodenschicht bis auf eine Tiefe von 30 cm andeutet (% C x 60); ein Faktor der die eventuelle organische Düngung (Z.B. Rübenblätter) andeutet; der von den jungen Pflanzen schon aufgenommene Stickstoffmenge.
Es werden eventuell noch kleine Korrekturen für den Kleigehalt des Bodens, für die Düngung mit Rübenschlamm und ernsthaften Wildschaden angebracht.
Zwischen dem Stickstoffindex und der optimalen Stickstoffdosis besteht folgende lineare Gleichung :
362
Y = 265 - 0,777 X n = 96 Y = optimale gesamte Stickstoff
dosis pro Hectar X = N-index
r = -0,936 ** r2 = 0,876
Diese Formel ist gültig für bestimmte Getreiden varietäten (Z.B. Cama und Zemon) wenn die normale Dosis Wachtumregulatoren und eine zielmässige Krankheitsbekämpfung angewendet werden.
In der Praxis wird der Stickstoffberatung an der gebrauchten Varietät, der Säabstand, der Säezeit und den spezifischen Anbaumassnahmen wie dem Gebrauch von Wachstumregulatoren und Krankheitsbekämpfungmitteln angepasst.
Die Stickstoffaufteilung bei der neuen Methode basiert sich vor allem auf die Verteilung des Nitratstickstoffes über das BodenproHl. Bei hohem Gehalt in der oberen Bodenschicht (0 bis 60 cm) darf die erste N-Düngung niedrig bleiben. Neben der N-Verteilung über das Profil spielen bei der Stickstoffaufteilung noch einige Elemente eine Rolle : der von der jungen Pflanze schon im Februar aufgenommene Stickstoffmenge, die Getreidedichte, der gebrauchten Varietät.
Versuchungen die in derselben Periode in Zusammenarbeit mit das " Nationaal Instituut tot Verbetering van de Biet te Tienen" auf Zuckerrüben durchgeführt wurden, haben gleichfalls zu einer neuen Methode der Bodenanalyse für Stickstoff auf Zuckerrübenfeldern geführt. Bei diesen untersuchungen wurde festgestellt dass eine Bodenanalyse bis auf 60 cm im Februar sich als die beste Basis für die Bestimmung der optimalen Stickstoffdosis erwiesen hat. Es gibt je doch ein wichtiges Unterschied zwischen Zuckerrüben und Wintergetreide inbetreff der Wirkung von dem in Februar auf 60 bis 90 cm befindliche Stickstoff. Dieser Stickstoff darf als schädlich bestimmt werden, infolge eines negativen Einfluss auf die Zuckerbildung.
Auch für die Zuckerrüben wird ein StickstofHndex zum Basis der Stickstoffbera-tung entwickelt. Der, Stickstoffindex ist aus folgenden Elementen zusammengestellt :
das im Februari bis auf 60 cm aufgemesse N03 --N-Gewicht; ein Humusfaktor für die Bodenschicht bis auf 30 cm (% C x 30); ein Faktor der die organische Düngung andeutet; ein Bodentypfaktor (-10 oder - 20 für sc:hwere Lehmboden).
Zwischen dem Berechneten Stickstoffindex (X) und der optimalen N-Dosis (Y) (finanziellen Optimum) besteht folgende Gleichung :
Y = 291 - 1,539 X r = -0,929** n = 37 Y = optimale N-Dosis X = Stickstoffindex
Bodenanalysen sind gleichfalls möglich im Mai. Der Zusammenhang zwischen dem N-Index im Mai und den optimalen N-Dosen für Zuckerrüben, waren auch sehr hoch signifikant.
Die ausgeführten Versuche erwiesen dass der Zuckergehalt nicht nur von der Stickstoffdüngung sondern auch von den Wetterverhältnissen über das Jahr beeinflusst wird.
363

PEDOLOGIE, XXXI, 3, p. 365-377,3 fig., 3 tab. Ghent, 1981
INVESTIGATION IN THE NETHERLANDS OF OPTIMUM NITROGEN FERTILIZATION ON THE BASIS OF THE AMOUNT OF Nmin IN THE SOIL PROFILE
G. J. KOLENBRANDER J. J. NEETESON
G. WIJNEN
1. DEVELOPMENT OF THE NITROGEN-RECOMMENDATION
In the period 1950-1960, Van der Paauw (1972) found that a good relationship existed between the amount of precipitation in the period 1 November-1 March and crop response to nitrogen in the following growing season. The result was that farmers were advised, af ter a wet autumn and winter, to increase their "average" application by 20-30 kg Njha. Af ter a dry winter the "average" application could be decreased by 20-30 kg N/ha. It is clear that the farmer had to know what amount constituted the "average" optimum N-dose for the various crops.
Horticultural practice had already progressed further. The optimum rate of nitrogen fertilization for glasshouse tomatoes was determined on the basis of the level of mineral nitrogen in the soil.
The developments in horticulture prompted two staff members of the Agricultural Extension Service, Borst and Mulder, to start an investigation, in collaboration with the Institute for Soil Fertility (IB), on the relation between the amount of mineral nitrogen in the soil profile (0-100 cm) at the end of winter (about 1 March) and the optimum dose of nitrogen for winter-wheat. The advantage would be that the farmer, besides his experience, would have an additional aid in determining an optimum N-dose in which, besides the weather conditions in the preceding months, also differences in soil type, crop rotation, and organic-matter supply would be taken into account.
Under the direction of Ris, the investigation was soon expanded to include also other crops. This led to close cooperation with the Research Station for Arabie Farming and Field Production of Vegetables (PAGV) in Lelystad, and, for sugar beet, with the Sugar Research Institute (IRS) in Bergen op Zoom, as wen as with the Agricultural Extension
G. J. Kolenbrander, J. J. Neeteson & G. Wijnen - Instituut voor Bodemvruchtbaarheid, Haren (Gr.), The Netherlands.
365
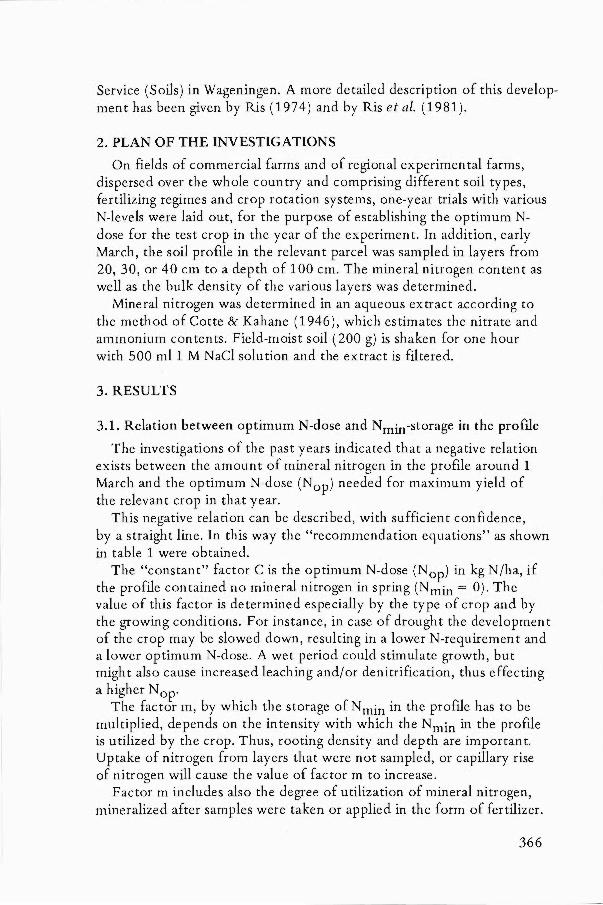
Service (Soils) in Wageningen. A more detailed description of this development has been given by Ris (1974) and by Ris et al. (1981).
2. PLAN OF THE INVESTIGATIONS
On fields of commercial farms and of regional experimental farms, dispersed over the whole country and comprising different soil types, fertilizing regimes and erop rotation systems, one-year trials with various N-Ievels were laid out, for the purpose of establishing the optimum Ndose for the test erop in the year of the experiment. In addition, early Mareh, the soil profile in the relevant parcel was sampled in layers from 20, 30, or 40 cm to a depth of 100 cm. The mineral nitrogen content as weIl as the bulk density of the various layers was determined.
Mineral nitrogen was determined in an aqueous extract according to the method of Cotte & Kahane (1946), which estimates the nitrate and ammonium contents. Field-moist soil (200 g) is shaken for one hour with 500 mIl M NaCI solution and the extract is filtered.
3. RESULTS
3.1. Relation between optimum N-dose and Nmin-storage in the profile
The investigations of the past years indicated that a negative relation exists between the amount of mineral nitrogen in the profile around 1 March and the optimum N-dose (Nop) needed for maximum yield of the relevan t erop in that year.
This negative relation can be described, with sufficient confidence, by a straight line. In this way the "recommendation equations" as shown in table 1 were obtained.
The "constant" factor C is the optimum N-dose (Nop) in kg N/ha, if the profile contained no mineral nitrogen in spring (Nmin = 0). The value of this factor is determined especially by the type of erop and hy the growing conditions. For instanee, in case of drought the development of the erop may be slowed down, resulting in a lower N-requirement and a lower optimum. N-dose. A wet period could stimulate growth, hut might also cause increased leaching and/or denitrification, thus effecting a higher Nop'
The factor m, by which the storage of N min in the profile has to be multiplied, depends on the intensity with which the Nmin in the profile is utilized hy the erop. Thus, rooting density and depth are important. Uptake of nitrogen from layers that were not sampled, or capillary rise of nitrogen will cause the value of factor m to increase.
Factor m includes also the degree of utilization of mineral nitrogen, mineralized after samples were taken or applied in the form of fertilizer.
366
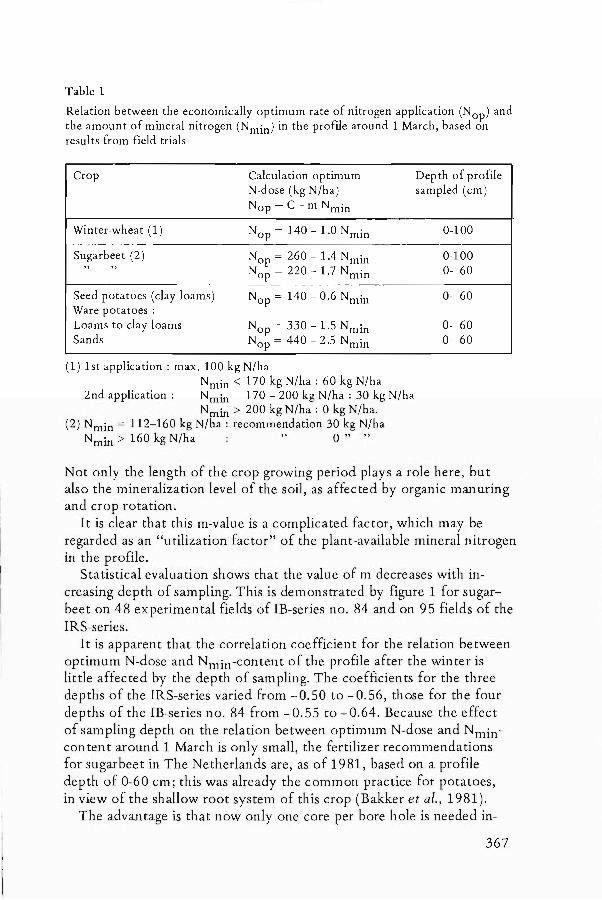
Table 1
Relation between the economically optimum rate of nitrogen application (Nop) and the amount of mineral nitrogen (Nmin) in the profUe around 1 March, based on results from field trials
Crop Calculation optimum N-dose (kg N/ha) Nop = C - m Nmin
Winter-wheat (1) Nop = 140 - 1.0 Nmin
Sugarbeet (2) Nop = 260 - 1.4 Nmin " " Nop = 220 - 1.7 Nmin
Seed potatoes (day loams) Nop = 140 - 0.6 Nmin Ware potatoes : Loams to day loams Nop = 330 - 1.5 Nmin Sands Nop = 440 - 2.5 Nmin
(1) lst application : max. 100 kg N/ha Nmin < 170 kg N/ha : 60 kg N/ha
2nd application : Nmin 170 - 200 kg N/ha : 30 kg N/ha Nmin> 200 kg N/ha : 0 kg N/ha.
(2) Nmin = 112-160 kg N/ha: recommendation 30 kg N/ha Nmin> 160 kg N/ha "0" "
Depth of profUe sampled (cm)
0-100
0-100 0- 60
0- 60
0- 60 0- 60
Not only the length of the erop growing period plays a role here, but also the mineralization level of the soil, as affected by organic manuring and erop rotation.
It is clear that this m-value is a complicated factor, which may be regarded as an "utilization factor" of the plant-available mineral nitrogen in the profile.
Statistical evaluation shows that the value of m decreases with increasing depth of sampling. This is demonstrated by figure 1 for sugarbeet on 48 experimental fields of IB-series no. 84 and on 95 fields of the IRS-series.
It is apparent that the correlation coefficient for the relation between optimum N-dose and Nmin-content of the profile af ter the winter is little affected by the depth of sampling. The coefficients for the three depths of the IRS-series varied from -0.50 to -0.56, those for the four depths of the IB-series no. 84 from - O. 55 to - 0.64. Because the effect of sampling depth on the relation between optimum N-dose and Nmincontent around 1 March is only small, the fertilizer recommendations for sugarbeet in The Netherlands are, as of 1981, based on a profile depth of 0-60 cm; this was already the common practice for potatoes, in view of the shallow root system of this erop (Bakker et al., 1981).
The advantage is that now only one core per bore hole is needed in-
367
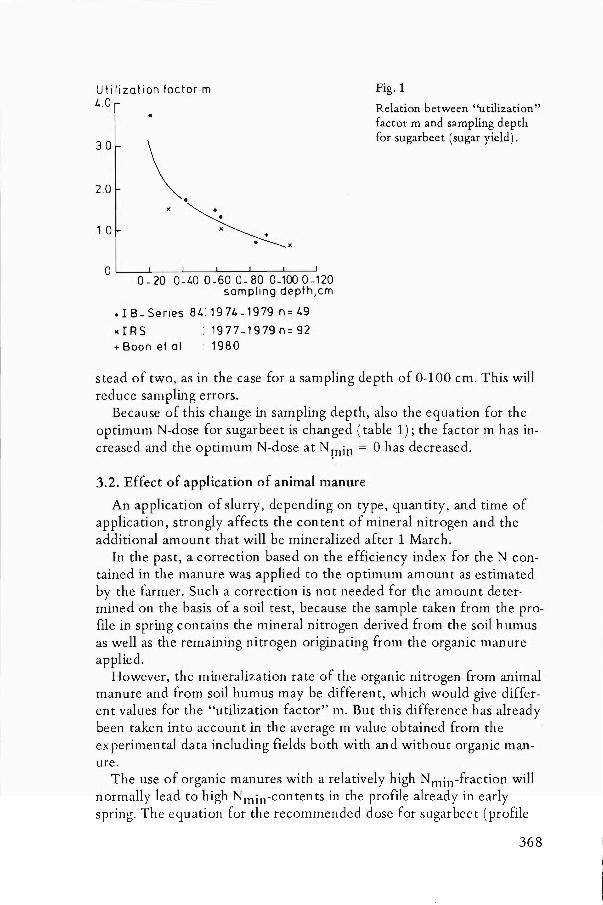
Utilization factor m 1. .0
3.0
2.0
1.0
\. x~,
OL---~--~--~--~--~~~ 0-20 0-1.0 0 -60 0- 80 0-100 0-120
sampling depth,cm
.IB-Series 81.:1971.-1979 n=1.9
)( r R S : 1 9 7 7 - 1 9 79 n = 92 + Boon et al : 1980
Fig. 1
Relation between "utilization" factor mand sampling depth for sugarbeet (sugar yield).
stead of two, as in the case for a sampling depth of 0-100 cm. This will reduce sampling errors.
Because of this change in sampling depth, also the equation for the optimum N-dose for sugarbeet is changed (tabie 1); the factor m has increased and the optimum N-dose at N ~in = 0 has decreased.
3.2. Effect of application of animal manure
An application of slurry, depending on type, quan tity, and time of application, strongly affects the content of mineral nitrogen and the additional amount that will be mineralized af ter 1 Mareh.
In the past, a correction based on the efficiency index for the N contained in the manure was applied to the optimum amount as estimated by the farmer. Such a correction is not needed for the amount determined on the basis of a soi! test, because the sample taken from the profile in spring contains the mineral nitrogen derived from the soil humus as wen as the remaining nitrogen originating from the organic manure applied.
However, the mineralization rate of the organic nitrogen from anima! manure and from soil humus may be different, which would give different values for the "utilization factor" m. But this difference has already been taken into account in the average m value obtained from the experimental data including fields both with and without organic manure.
The use of organic manures with a relatively high Nmin-fraction will normally lead to high Nmin-contents in the profile already in early spring. The equation for the recommended dose for sugarbeet (profile
368
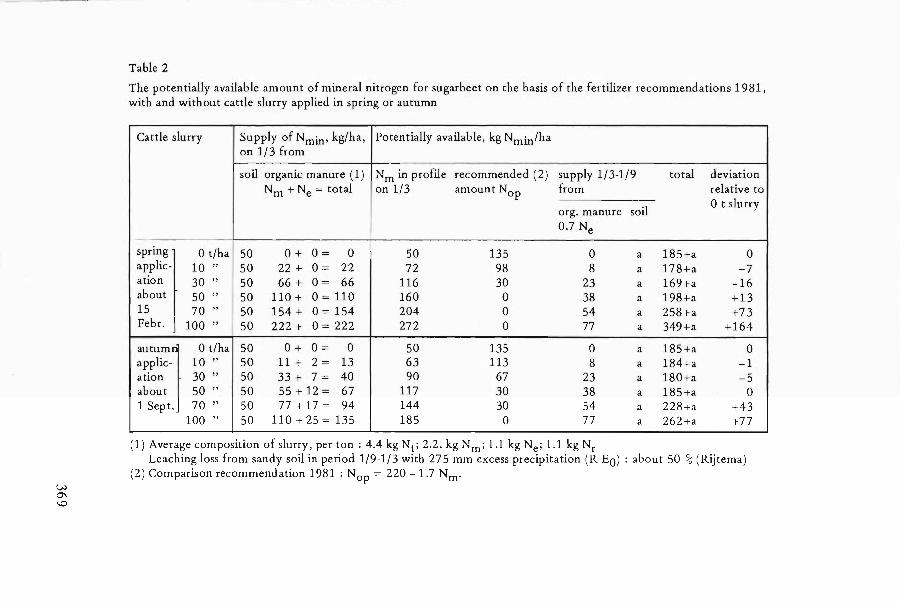
Vl 0'\
'"
Table 2
The potentially available amount of mineral nitrogen for sugarbeet on the basis of the fertilizer recommendations 1981, with and without cattle slurryapplied in spring or autumn
Cattle slurry Supply of Nmin' kg/ha, Potentially available, kg Nmin/ha on 1/3 from
soil organic manure (1) Nm in profile recommended (2) supply 1/3-1/9 total deviation Nm + Ne = total on 1/3 amount Nop from relative to
org. manure soil o t slurry
0.7 Ne
sprmg 1 Ot/ha 50 0+ 0 = 0 50 135 0 a 185+a 0 a~plic- 10 " 50 22 + 0 = 22 72 98 8 a 178+a -7 atlon 30 " 50 66 + 0 = 66 116 30 23 a 169+a -16 about 50 " 50 110 + 0 = 110 160 0 38 a 198+a +13 15 70 " 50 154+ 0=154 204 0 54 a 258+a +73 Febr. J 100 " 50 222 + 0 = 222 272 0 77 a 349+a +164
autum} 0 t/ha 50 0+ 0 = 0 50 135 0 a 185+a 0 applic- 10" 50 11 + 2 = 13 63 113 8 a 184+a -1 ation 30 " 50 33 + 7 = 40 90 67 23 a 180+a -5 about 50" 50 55 + 12 = 67 117 30 38 a 185+a 0 1 Sept. 70" 50 77 + 17 = 94 144 30 54 a 228+a +43
100 " 50 110 + 25 = 135 185 0 77 a 262+a +77
(1) Average composition of slurry, per ton: 4.4 kg Nt; 2.2. kg Nm; 1.1 kg Ne; 1.1 kg Nr Leaching loss from sandy soil in period 1/9-1/3 with 275 mm excess precipitation (R-EO) : about 50 % (Rijtema)
(2) Comparison recommendation 1981 : Nop = 220 -1.7 Nm.
of 0-60 cm) indicates that no supplemental mineraLfertilizer is needed when the storage on 1 March exceeds 130 kg Nmin/ha. However, because it is difficult to apply doses of less than 30 kg N/ha, it is recommended to apply a supplemental dose of 30 kg N/ha when the amount found in the profile sampled to 60 cm ranges from 112-160 kg Nmin/ha (Bakker et al., 1 981 ) .
On the basis of average values, table 2 shows how much cattle slurry may be applied to sugarbeet shortly before sampling (spring application) or around 1 September of the preceding year (autumn application).
The composition of the cattle slurry is based on the division into three N-fractions as given by Sluijsmans & Kolenbrander (1977), viz., amineral fraction (N-min) that comprises about 50 % of the total nitrogen content, a fraction organic nitrogen (Ne) that is completely mineralized in the first year af ter application, and a more resistant fraction (Nr) that only begins to contribute significantly in subsequent years. The fractions Ne and Nr in this case each amount to about 25 % of the total quantity of nitrogen.
In the case of the spring application in table 2 it is assumed that no losses due to volatilization and leaching occur so shortly before sampling and that no mineralization of fraction Ne has occurred on 1 March.
For the autumn application, the leaching model of Rijterna (1980) was used. It assumes that on sandy soils, given an excess of precipitation over evapotranspiration of 275 mm in the period 1 September-1 March, about 50 % of the mineral nitrogen present on 1 September will be lost, so that on 1 March 0.5 Nmin win remain. In the same period about 30 % of the Ne-fraction may be mineralized, 25 % of which win be lost due to leaching, so that on 1 March 0.75 x 30 = 22.5 % of the Ne-fraction will be left in mineral form.
It is further assumed that, without slurry, the profile (0-60 cm) will contain 50 kg Nmin/ha on 1 March, while the soil in the period between 1 March and 1 September will release an additional quantity of mineral nitrogen amounting to a kg N/ha.
Table 2 now permits calculation of the amount of potentially available mineral nitrogen for sugarbeet during the period 1 March-1 September by adding the amount in the profile on 1 March, the recommended optimum N-dose, and the expected contribution from mineralization of the Ne-fraction of the slurry on the basis of the average temperature (Sluijsmans & Kolenbrander, 1977) and soil humus in the period 1 March-1 September.
Table 2 shows that, without slurry, this supply amounts to (185 + a) kg Nmin/ha and that only small deviations from this value occur up to 50 t slurry per ha. Larger amounts, however, produce an excess that increases with increasing application of slurry.
370
This calculation shows why in the original experiments, in which the maximum slurry application was 60 t/ha, no significant difference could be found between treatments with and without slurry.
I t may be concluded that the fertilizer recommendations need no correction as long as the catde slurry applications do not exceed 50 t/ha. This maximum will probably be somewhat lower for pig slurry and poultry slurry in view of their higher Nt-contents. However, applications in excess of 50 t slurry per ha are risky, because too much nitrogen may become available to the beet, also in the case of autumn application, which may reduce sugar yield and lower sap quality through formation of a-amino compounds in the beet. Moreover, the excess nitrogen poses a potential threat to the quality of our ground- and surface-waters.
3.3. The efficiency of the N-recommendation
Another point that deserves attention is the fact that the farmer gets an average N-recommendation. That considerable deviations occur from the mean optimum N-dose for the same amount of Nmin in the profile is indicated by the correlation coefficients for this relation. Ris et al. (1981) reported the Eollowing values :
winter-wheat r = - 0.53 potatoes r = - 0.65 sugarbeet r = - 0.68
Figure 2 shows the frequency distribution for the difference between the optimum N-dose as determined Erom the yields Erom the experimental fields and the N-recommendation for the same fields on the basis of the Nmin-supply in a 0-100 cm profile:in spring. The results concern sugarbeet in the years 1977, 1978 and 1979 on IRS experimen tal fields.
A positive deviation indicates that the real optimum N-dose, determined on the experimental field, was higher than the recommended dose. A negative deviation denotes the. inverse.
frequency 50 %
10
.1977 )(1978
+ 1979
+
L-+.)( ~_-'--_-'--_-'--_-'--_-'-------=::"L...-----' -160 -120 -80 -40 0 +40 .80 +120 .160
cia ss of difference ,kg .ha -1
Fig. 2
Frequency distribution of the differences between recommended N-dose and optimum N -close in the 1. R.S. experimental fields in the years 1977, 1978, 1979 (sugarbeet).
371
It is apparent from figure 2 that the results fit reasonably weU a normal distribution in which 3S = about 120 kg N/ha, so that the standard deviation S amounts to about 40 kg N/ha.
This standard deviation is made up of errors arising from profile sampling, insufficient care in the preservation of the sample, analytical errors, and differences among trial fields, which are a consequence of other factors such as differencesin weather, organic matter supply, moisture level, diseases, etc.
Ris & Wolf (1979) found that the sampling error in a profile of 0-60 cm and 0-100 cm with 10 cores per sample was about 12 1/2 % of the Nmin-content in ppm. They observed that the error is only little affected when also bulk density and layer thickness are induded in the determination, so that this value can also be used for the amount of mineral nitrogen (kgN/ha) in the profile.
At an Nmin-Ievel of 25 kg N/ha, this error gives a standard deviation of about 3 kg N/ha. In the recommendation, this deviation is multiplied by 1. 7, so that it becomes about 5 kg Nmin/ha. At a level of 100 kg Nmin/ha (for instance af ter an application of organic manure) the standard deviation may increase to about 21 kg Nmin/ha.
In addition, these values have to be increased by the error that is made in establishing the optimum N-dose, which may be the source of relatively large deviations, especially in the case of level yield curves. I f we assume that such a standard deviation is about 20 kg N/ha, then the "total" standard deviation on the basis of these two factors for a profile of 0-60 cm and an average Nmin-content of 50 kg/ha (when S = 10 kg Nmin/ha) becomes :
)102 + 202 = 22 kg N/ha.
This value constitutes about 50 % of the total standard deviation of 40 kg Nmin/ha. The remaining 50 % will have to be accounted for by other factors that are responsible for the differences among experimental fields, such as weather conditions. These may act indirectly via the nitrogen cycle, but mayalso affect crop growth directly. For instance, an attack by disease in winter-wheat is clearly demonstrated by figure 3. The strongly different data for the year 1971/1972, resulting from a mildew attack (Erysiphe graminis) , are dear.
The results for three years of sugarbeet (IRS-fields) are shown in table 3. Averaged over 33-35 experimental fields, the mean difference between the optimum N-dose and the recommended dose over the years 1977, 1978 and 1979 increases from -7 kg via + 7 kg to + 22 kg N/ha. It is also apparent that in this period the number of fields with a positive difference increases and that with a negative difference decreases.
These effects suggest the presence of a systematic factor. An excess
372
Winter wheat
Optimum N application kg. ha-1
200
100
o
. -_ .. -.. ..
........ - ........ 0· ........
... ........
........ -._. -
r =-0.53
........... ................... -........... ........
0000
Fig. 3
Relationship between soil mineral N in the 0-100 cm layer around 1 March and oP" timum N application for winterwheat in field experiments . from 1967 to 1972 exclusive.
o 100 200
Table 3
.1967-1970 01971-1972
Soli mmeral N,kg .ha -1
0- 100cm
Average difference per year between recommended N-dase and optimum N-dose in about 35 IRS field experiments with sugarbeet, and the excess precipitation (R-EO) at De Bilt in the period March-June in the years 1977, 1978,1979
1977 1978 1979
No. of field experiments positive 12 15 24 Difference relative to recommendation none 2 3 1
negative 20 15 10 total 34 33 35
Average deviation, kg N/ha -7 +7 +22
Precipitation R, mm March 42 81 98 April 62 38 81 M!ly 60 ~ 120 R tatal 164 144 299
Evaporation according to Penman (ave.) EO 229 229 229
R-EO -65 -85 +70
Precipitation R, mm June 39 68 93
of rainfall in the period 1 March-1 June could be considered; in 1979, it was the highest of the preceding 40 years.
Uptake ofN by sugarbeet is only small in this period, but the Nmin-
373
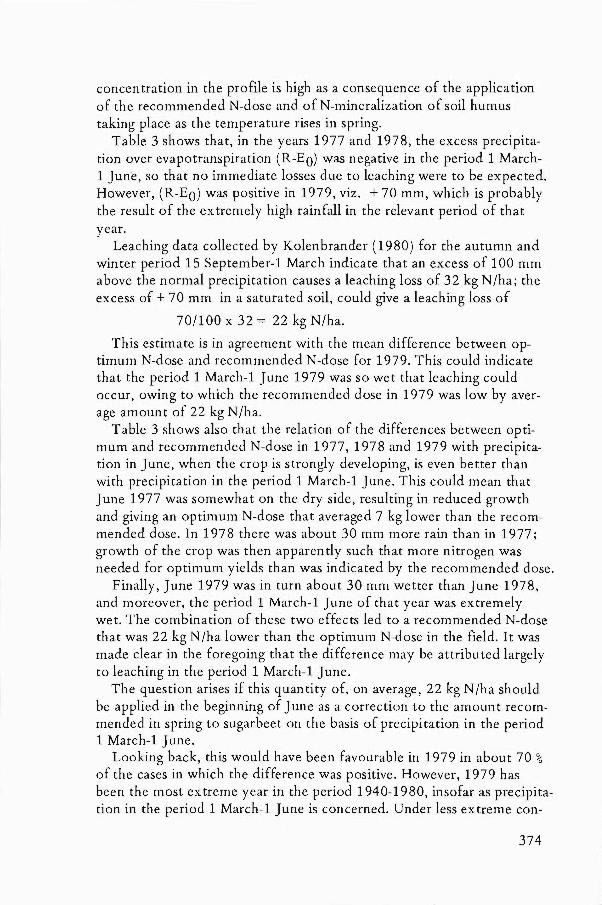
concentration in the profile is high as a consequence of the application of the recommended N-dose and of N-mineralization of soil humus taking place as the temperature rises in spring.
Table 3 shows that, in the years 1977 and 1978, the excess precipitation over evapotranspiration (R-EO) was negative in the period 1 March-1 J un'e, so that no immediate losses due to leaching were to be expected. However, (R-EO) was positive in 1979, viz. + 70 mm, which is probably the result of the extremely high rainfall in the relevant period of that year.
Leaching data collected by Kolenbrander (1980) for the autumn and winter period 15 September-l March indicate that an excess of 100 mm above the normal precipitation causes a leaching loss of 32 kg N/ha; the excess of + 70 mm in a saturated soil, could give a leaching loss of
70/100 x 32 = 22 kg N/ha.
This estimate is in agreement with the mean difference between optimum N-dose and recommended N-dose for 1979. This could indicate that the period 1 March-l June 1979 was so wet that leaching could occur, owing to which the recommended dose in 1979 was low by average amount of 22 kg N/ha.
Table 3 shows also that the relation of the differences between optimum and recommended N-dose in 1977, 1978 and 1979 with precipitation in J une, when the erop is strongly developing, is even better than with precipitation in the period 1 March-l June. This could mean that June 1977 was somewhat on the dry side, resulting in reduced growth and giving an optimum N-dose that averaged 7 kg lower than the recommended dose. In 1978 there was about 30 mm more rain than in 1977; growth of the crop was th en apparen dy such that more nitrogen was needed for optimum yields than was indicated by the recommended dose.
Finally, June 1979 was in turn about 30 mm wetter than June 1978, and moreover, the period 1 March-l June of that year was extremely wet. The combination of these two effects led to a recommended N-dose that was 22 kg N/ha lower than the optimum N-dose in the field. It was made clear in the foregoing that the difference may be attributed largely to leaching in the period 1 March-l June.
The question arises if this quantity of, on average, 22 kg N/ha should be applied in the beginning of June as a correction to the amount recommended in spring to sugarbeet on the basis of precipitation in the period 1 March-l June.
Looking back, this would have been favourable in 1979 in about 70 % of the cases in which the difference was positive. However, 1979 has been the most extreme year in the period 1940-1980, insofar as precipitation in the period 1 March-l June is concerned. Under less extreme con-
374
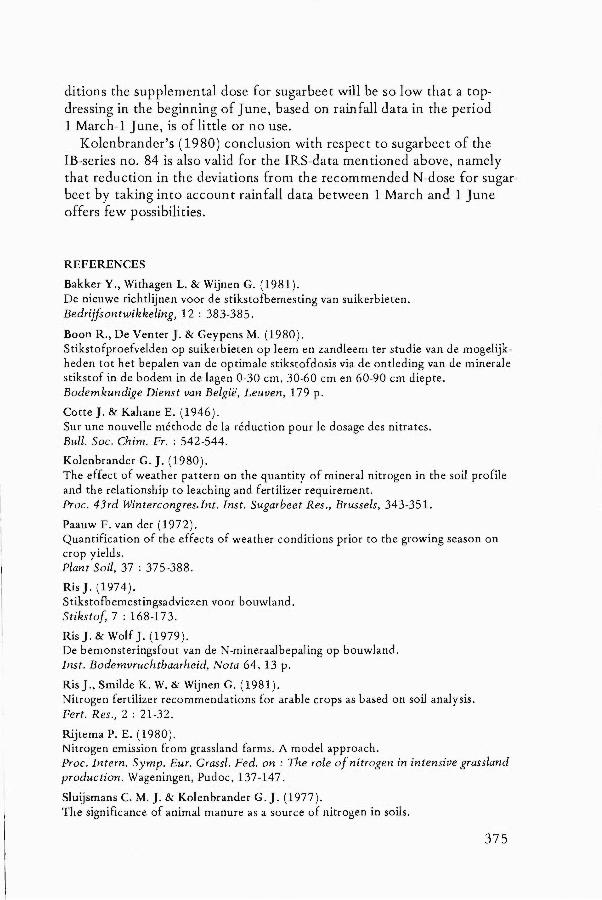
ditions the supplemental dose for sugarheet will he so low that a topdressing in the beginning of J une, based on rainfall data in the period 1 March-1 June, is oflittle or no use.
Kolenbrander's (1980) conclusion with respect to sugarbeet of the IB-series no. 84 is also valid for the IRS-data mentioned above, namely that reduction in the deviations from the recommended N-dose for sugarbeet by taking into account rainfall data between 1 March and 1 June offers few possibilities.
REFERENCES
Bakker V., Withagen L. & Wijnen G. (1981). De nieuwe richtlijnen voor de stikstofbemesting van suikerbieten. Bedrijfsontwikkeling, 12 : 383-385.
Boon R., De Venter J. & Geypens M. (1980). Stikstofproefvelden op suikerbieten op leem en zandleem ter studie van de mogelijkheden tot het bepalen van de optimale stikstofdosis via de ontleding van de minerale stikstof in de bodem in de lagen 0-30 cm, 30-60 cm en 60-90 cm diepte. Bodemkundige Dienst van België, Leuven, 179 p.
Cotte J. & Kahane E. (1946). Sur une nouvelle méthode de la réduction pour Ie dosage des nitrates. Bull. Soc. Chim. Fr. : 542-544.
Kolenbrander G. J. (1980). The effect of weather pattern on the quantity of mineral nitrogen in the soil profile and the relationship to leaching and fertilizer requirement. Proc. 43rd Wintercongres.lnt. Inst. Sugarbeet Res., Brussels, 343-351.
Paauw F. van der (1972). Quantification of the effects of weather conditions prior to the growing season on crop yields. Plant Soil, 37 : 375-388.
Ris J. (1974). Stikstofbemestingsadviezen voor bouwland. Stikstof, 7 : 168-173.
RisJ. & Wolf J. (1979). De bemonsteringsfout van de N-mineraalbepaling op bouwland. Inst. Bodemvruchtbaarheid, Nota 64, 13 p.
RisJ., Smilde K. W. & Wijnen G. (1981). Nitrogen fertilizer recommendations for arabie crops as based on soil analysis. Pert. Res., 2 : 21-32.
Rijtema P. E. (1980). Nitrogen emission from grassland farms. A model approach. Proc. Intern. Symp. Eur. Grassl. Fed. on : The role of nitrogen in intensive grassland production. Wageningen, Pudoc, 137 -147.
SIuijsmans C. M. J. & Kolenbrander G.J. (1977). The significance of animal manure as a source of nitrogen in soils.
375
Proc. Int. Semin. on Soil environment and fertility management in intensive agriculture. Tokyo, Japan, 403-411.
Summary
The negative relation between the amount of mineral nitrogen in the soil prome at the end of the winter and the optimum N-dose can be described satisfactorily by a straight line. The slope of this line increases as sampling depth is decreased.
It has been calculated that the recommended dose needs no correction when amounts of cattle slurry of up to about 50 t/ha are applied before sampling.
The standard deviation for the scat ter about the mean recommendation line is about 40 kg N/ha. About 50 % of it is caused by errors in sampling, analysis, preservation of the samples during transport to the laboratory , and by inaccuracies in determining the optimum N-dose.
On average, rainfall in the period March-June gives no cause to adjust the recommended do se for sugarbeet by applying a top dressing in J une.
La recherche aux Pays Bas au sujet du dosage optimal de la fumure azotée à base de la quantité de Nmin disponible du sol
Résumé
La corrélation négative qui existe entre la réserve d'azote minéral du sol après l'hiver et l'apport optimal d'azote pour différentes cultures est très bien décrite par une ligne droite. L'angle d'inclinaison de cette ligne est fonction de la profondeur d'échantillonage et diminuera avec celle-ci.
D'après les calculs il n'y aura pas lieu d'adapter les recommendations de fumure lorsque les amendements de lisier bovin faits avant Ie prélèvement d'échantillons de sol ne dépassent pas 50 t/ha.
La variation autour de la ligne d'avis médiane a une déviation standard de ± 40 kg N/ha. De celle-ci 50 % peut être expliquée par les fautes d'échantillonage, de laboratoire, de conservation pendant Ie transport des échantillons au laboratoire, ainsi que par les inexactitudes dans la détermination de la dose d'azote optimale.
Les précipitations aux mois de mars à juin ne donnent pas lieu à une adaptation des conseils de fumure dans Ie sens d'une fumure supplémentaire éventuelle au mois de juin.
Het onderzoek in Nederland naar de optimale stikstQfbemesting op basis van Nmin in het profiel
Samenvatting
De negatieve samenhang tussen de voorraad minerale stikstof aan het eind van de winter en de optimale N-gift wordt voor verschillende gewassen goed beschreven door een rechte lijn. De richtingscoëfficiënt van deze lijn is groter naarmate minder diep bemonsterd wordt.
Berekend is dat op het bemestingsadvies geen correctie behoeft te worden toegepast wanneer runderdrijfmestgiften tot ca. 50 ton/ha worden toegediend voor de be-
376
monstering. De spreiding rond de gemiddelde advieslijn vertoont een standaardafwijking van
ca. 40 kg Nlha. Hiervan wordt ca. 50 % veroorzaakt door fouten bij de bemonstering, analyse en de conservering van de stalen tijdens het transport naar het laboratorium, alsmede door onnauwkeurigheden in de vaststelling van de optimale N-gift.
De regenval in de periode maart tot juni geeft gemiddeld geen aanleiding om het bemestingsadvies voor suikerbieten bij te stellen, door in juni (eventueel) een overbemesting te geven.
377

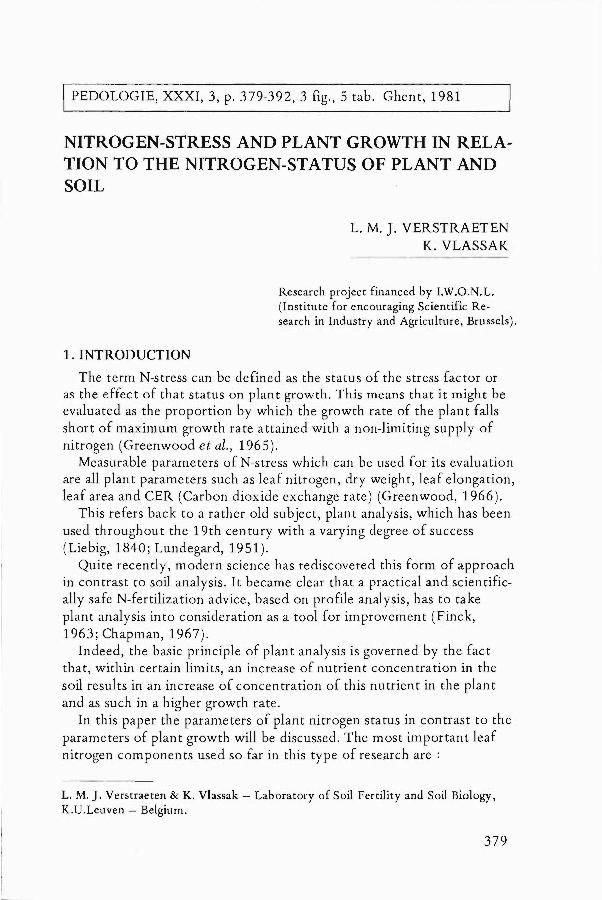
PEDOLOGIE, XXXI, 3, p. 379-392,3 fig., 5 tab. Ghent, 1981
NITROGEN-STRESS AND PLANT GROWTH IN RELATION TO THE NITROGEN-STATUS OF PLANT AND SOIL
1.INTRODUCTION
L. M. J. VERSTRAETEN K. VLASSAK
Research project financed by LW.O.N.L. (Institute for encouraging Scientific Research in Industry and Agriculture, Brussels).
The term N-stress can be defined as the status of the stress factor or as the effect of th at status on plant growth. This means that it might he evaluated as the proportion by which the growth rate of the plant faUs short of maximum growth ra te attained with a non-limiting supply of nitrogen (Greenwood et al., 1965).
Measurable parameters of N-stress which can be used for its evaluation are all plant parameters such as leaf nitrogen, dry weight, leaf elongation, leaf area and CER (Carbon dioxide exchange rate) (Greenwood, 1966).
This refers back to a rather old subject, plant analysis, which has been used throughout the 19th century with a varying degree of success (Liebig, 1840; Lundegard, 1951).
Quite recently, modern science has rediscovered this form of approach in contrast to soil analysis. It became clear that a practical and scientifically safe N-fertilization advice, based on profile analysis, has to take plant analysis into consideration as a tooI for improvement (Finck, 1963; Chapman, 1967).
Indeed, the basic principle of plant analysis is governed hy the fact that, within certain limits, an increase of nutrient concentration in the soil results in an increase of concentration of this nutrient in the plant and as such in a higher growth rate.
In this paper the parameters of plant nitrogen status in contrast to the parameters of plant growth wiU be discussed. The most important leaf nitrogen components used so far in this type of research are:
L. M. J. Verstraeten & K. Vlassak - Laboratory of Soil Fertility and Soil Biology, K.U.Leuven - Belgium.
379
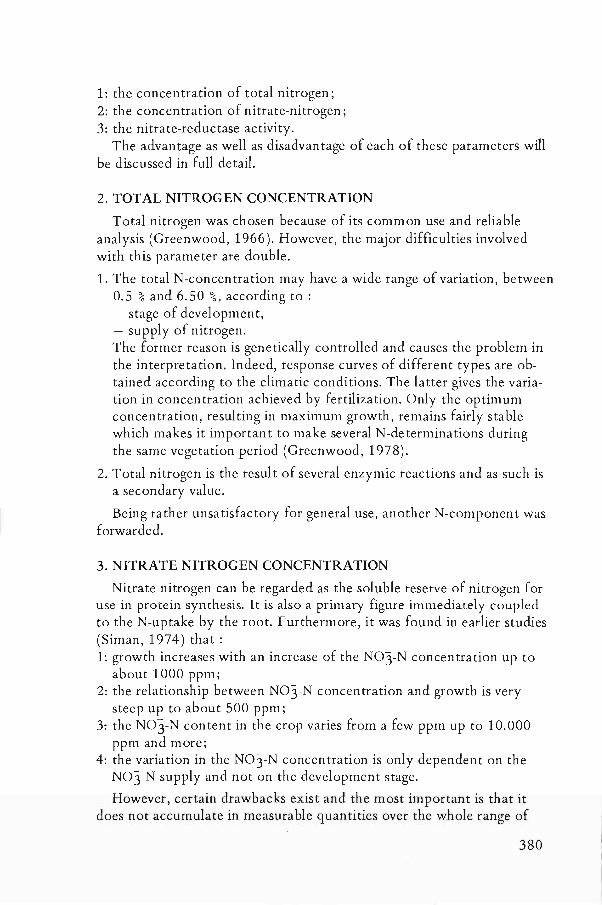
1: the concentration of total nitrogen; 2: the concentration of nitrate-nitrogen; 3: the nitrate-reductase activity.
The advantage as well as disadvantage of each of these parameters will be discussed in full detail.
2. TOTAL NITROGEN CONCENTRATION
Total nitrogen was chosen because of its common use and reliable analysis (Greenwood, 1966). However, the major difficulties involved with this parameter are double.
1. The total N-concentration may have a wide range of variation, between 0.5 % and 6.50 %, according to : - stage of development, - supply of nitrogen. The former reason is genetically controlled and causes the problem in the interpretation. Indeed, response curves of different types are obtained according to the climatic conditions. The latter gives the variation in concentration achieved by fertilization. Only the optimum concentration, resulting in maximum growth, remains fairly stabie which makes it important to make several N-determinations during the same vegetation period (Greenwood, 1978).
2. Total nitrogen is the result of several enzymic reactions and as such is a secondary value.
Being rather unsatisfactory for general use, another N-component was forwarded.
3. NITRATE NITROGEN CONCENTRATION
Nitrate nitrogen can be regarded as the soluble reserve of nitrogen for use in protein synthesis. It is also a primary figure immediately coupled to the N-uptake by the root. Furthermore, it was found in earlier studies (Siman, 1974) that: 1: growth increases with an increase of the N03-N concentration up to
about 1000 ppm; 2: the relationship between N03-N concentration and growth is very
steep up to about 500 ppm; 3: the N03-N content in the cr op varies from a few ppm up to 10.000
ppm and more; 4: the variation in the N03-N concentration is only dependent on the
N03-N supply and not on the development stage.
However, certain drawbacks exist and the most important is that it does not accumulate in measurable quantities over the whole range of
380
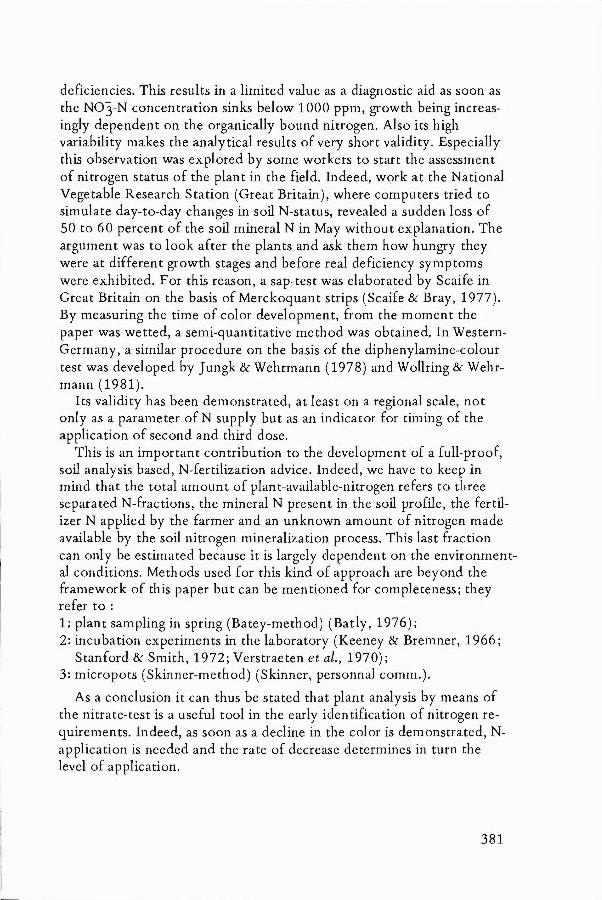
deficiencies. This results in a limited value as a diagnostic aid as soon as the N03-N concentration sinks below 1000 ppm, growth being increasingly dependent on the organically bound nitrogen. Also its high variability makes the analytical results of very short validity. Especially this observation was explored by some workers to start the assessment of nitrogen status of the plant in the field. Indeed, work at the National Vegetable Research Station (Great Britain), where computers tried to simulate day-to-day changes in soil N-status, revealed a sudden loss of 50 to 60 percent of the soil mineral N in May without explanation. The argument was to look af ter the plants and ask them how hungry they were at different growth stages and before real deficiency symptoms were exhibited. F or this reason, a sap-test was elaborated by Scaife in Great Britain on the basis of Merckoquant strips (Scaife & Bray, 1977). By measuring the time of color development, from the moment the paper was wetted, a semi-quantitative method was obtained. In WesternGermany, a similar procedure on the basis of the diphenylamine-colour test was developed by ] ungk & Wehrmann (1978) and W ollring & Wehrmann (1981).
lts validity has been demonstrated, at least on a regional scale, not only as a parameter of N supply but as an indicator for timing of the application of second and third dose.
This is an important contribution to the development of a full-proof, soil analysis based, N-fertilization advice. Indeed, we have to keep in mind that the total amount of plant-available-nitrogen refers to three separated N-fractions, the mineral N present in the soil profile, the fertilizer N applied by the farmer and an unknown amount of nitrogen made available by the soil nitrogen mineralization process. This last fraction can only be estimated because it is largely dependent on the environmental conditions. Methods used for this kind of approach are beyond the framework of this paper but can be mentioned for completeness; they refer to : 1; plant sampling in spring (Batey-method) (Batly, 1976); 2: incubation experiments in the laboratory (Keeney & Bremner, 1966;
Stanford & Smith, 1972; Verstraeten et al., 1970); 3: micropots (Skinner-method) (Skinner, personnal comm.).
As a conclusion it can thus be stated that plant analysis by means of the nitrate-test is a useful tooI in the early iclentification of nitrogen requirements. Indeed, as soon as a decline in the color is demonstrated, Napplication is needed and the rate of decrease determines in turn the level of application. .
381
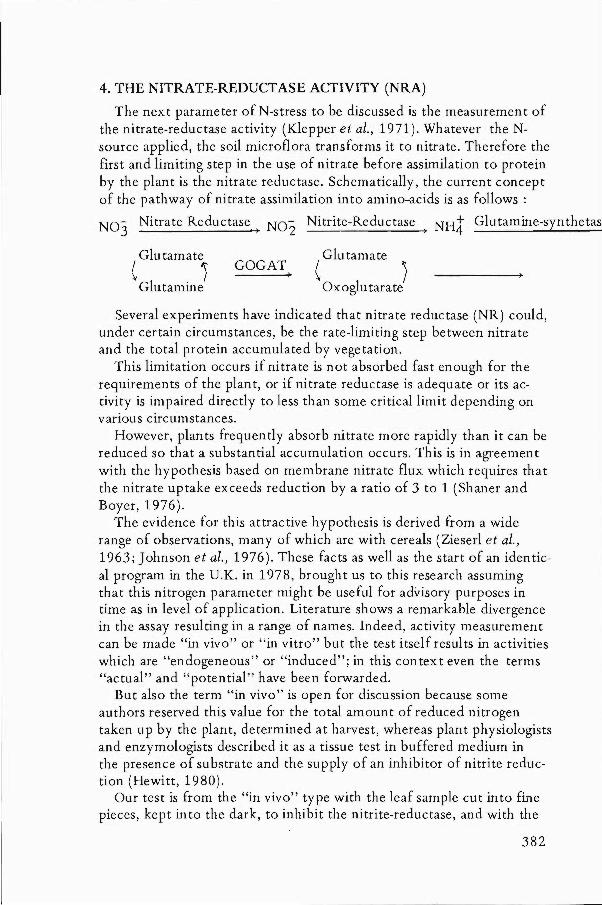
4. THE NITRATE-REDUCTASE ACTIVITY (NRA)
The next parameter of N-stress to be discussed is the measurement of the nitrate-reductase activity (Klepper et al., 1971). Whatever the Nsource applied, the soil microflora transforms it to nitrate. Therefore the first and limiting step in the use of nitrate before assimilation to protein by the plant is the nitrate reductase. Schematically, the current concept of the pathway of nitrate assimilation into amino-acids is as follows :
NO) Nitrate Reductase. ) N02 Nitrite-Reductase ) NHt Glutamine-synthetas~
Glutamate ( )
Glutamine
GOGAT Glutamate
( ! Oxoglutarate
Several experiments have indicated that nitrate reductase (NR) could, under certain circumstances, be the rate-limiting step between nitrate and the total protein accumulated by vegetation.
This limitation occurs if nitrate is not absorbed fast enough for the requirements of the plant, or if nitrate reductase is adequate or its activity is impaired directly to less than some criticallimit depending on various circumstances.
However, plants frequently abs orb nitrate more rapidly than it can be reduced so that a substantial accumulation occurs. This is in agreement with the hypothesis based on membrane nitrate flux which requires that the nitrate uptake exceeds reduction by a ratio of 3 to 1 (Shaner and Boyer, 1976).
The evidence for this attractive hypothesis is derived from a wide range of observations, manY of which are with cereals (Zieserl et al., 1963; J ohnson et al., 1976). These facts as well as the start of an iden tical program in the O.K. in 1978, brought us to th is research assuming that this nitrogen parameter might be useful for advisory purposes in time as in level of application. Literature shows a remarkable divergence in the assay resulting in a range of names. Indeed, activity measuremen t can be made "in vivo" or "in vitro" but the test itself results in activities which are "endogeneous" or "induced"; in this context even the terms "actual" and "potential" have been forwarded.
But also the term "in vivo" is open for discussion because some authors reserved this value for the total amount of reduced nitrogen taken up by the plant, determined at harvest, whereas plant physiologists and enzymologists described it as a tissue test in buffered medium in the presence of substrate and the supply of an inhibitor of nitrite reduction (Hewitt, 1980).
Our test is from the "in vivo" type with the leaf sample cut into fine pieces, kept into the dark, to inhibit the nitrite-reductase, and with the
382
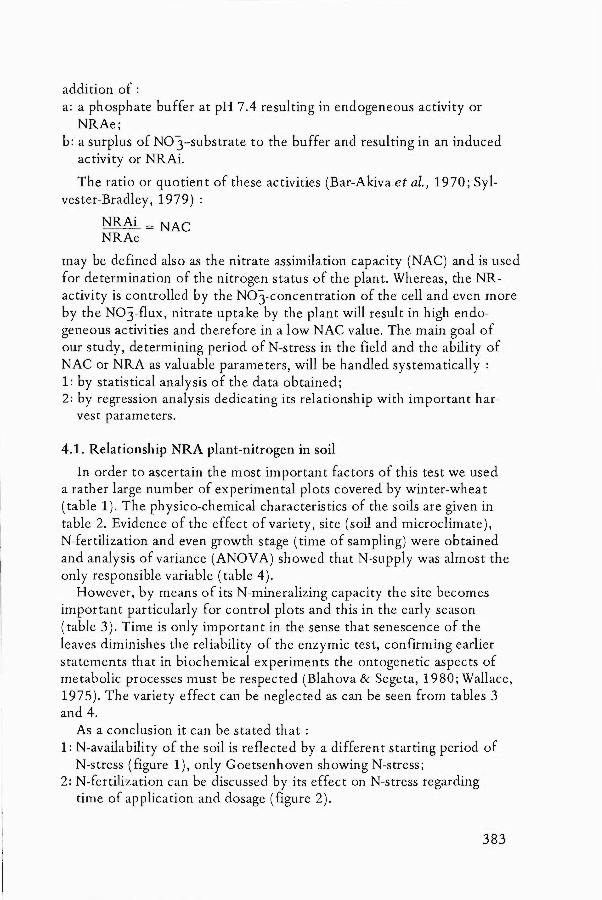
addition of: a: a phosphate buffer at pH 7.4 resulting in endogeneous activity or
NRAe; b: a surplus of N03-substrate to the buffer and resulting in an induced
activity or NRAi.
The ratio or quotient of these activities (Bar-Akiva.et al., 1970; Sylvester-Bradley, 1979) :
NRAi = NAC NRAe
may be defined also as the nitrate assimilation capacity (NAC) and is used for determination of the nitrogen status of the plant. Whereas, the NRactivity is controlled by the NO)-concentration of the cell and even more by the N03-flux, nitrate up take by the plant will result in high endogeneous activities and therefore in a low NAC value. The main goal of our study, determining period of N-stress in the field and the ability of NAC or NRA as valuable parameters, will be handled systematically : 1: by statistical analysis of the data obtained; 2: by regression analysis dedicating its relationship with important har
vest parameters.
4.1. Relationship NRA plant-nitrogen in soil
In order to ascertain the most important factors of th is test we used a rather large number of experimental plots covered by winter-wheat (tabie 1). The physico-chemical characteristics of the soils are given in table 2. Evidence of the effect of variety, site (soil and microclimate), N-fertilization and even growth stage (time of sampling) were obtained and analysis of variance (ANOV A) showed th at N-supply was almost the only responsible variabie (tabie 4).
However, by means of its N-mineralizing capacity the site becomes important particularly for control plots and this in the early season (table 3). Time is only important in the sense that senescence of the leaves diminishes the reliability of the enzymic test, confirming earlier statements that in biochemical experiments the ontogenetic aspects of metabolic processes must be respected (Blahova & Segeta, 1980; Wallace, 1975). The variety effect can be neglected as can be seen from tables 3 and 4.
As a conclusion it can be stated that : 1: N-availability of the soil is reflected by a different starting period of
N-stress (figure 1), only Goetsenhoven showing N-stress; 2: N-fertilization can be discussed by its effect on N-stress regarding
time of application and dosage (figure 2).
383
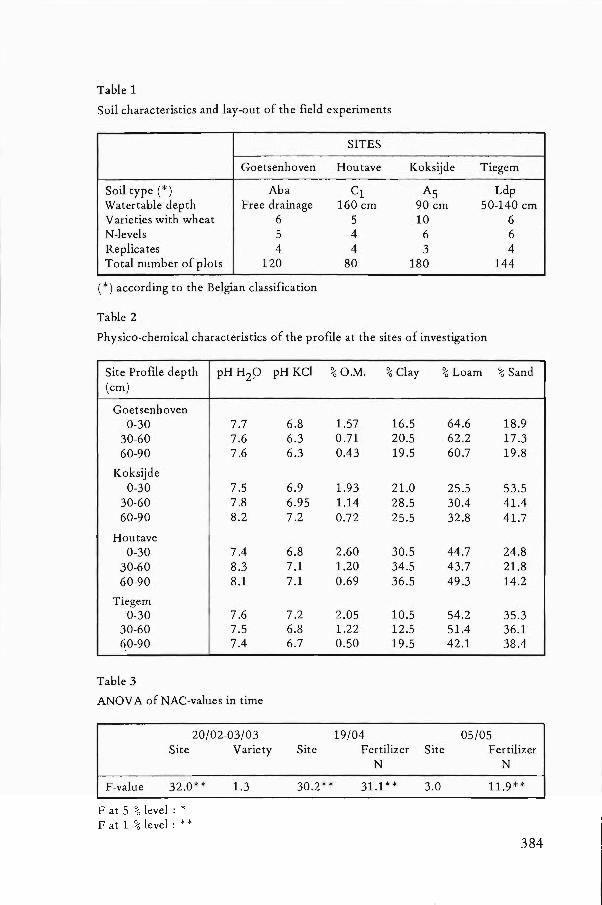
Tahle 1
Soil characteristics and lay-out of the field experiments
SITES
Goetsenhoven Houtave Koksijde Tiegem
Soil type (*) Aha Cl A5 Ldp Watertable dep th Free drainage 160 cm 90 cm 50-140 cm Varieties with wheat 6 5 10 6 N-Ievels 5 4 6 6 Replicates 4 4 3 4 Total number of plots 120 80 180 144
(*) according to the Belgian classification
Tahle 2
Physico-chemical characteristics of the profile at the sites of investigation
Site Profile depth pHH29 (cm)
Goetsenhoven 0-30 7.7
30-60 7.6 60-90 7.6
Koksijde 0-30 7.5
30-60 7.8 60-90 8.2
Houtave 0-30 7.4
30-60 8.3 60-90 8.1
Tiegem 0-30 7.6
30-60 7.5 60-90 7.4
Table 3
ANOV A of NAC-values in time
20;02-03/03 Site Variety
F-value 32.0** 1.3
F at 5 % level : * F at 1 % level: * *
pH KCI % O.M. % Clay % Loam % Sand
6.8 6.3 6.3
6.9 6.95 7.2
6.8 7.1 7.1
7.2 6.8 6.7
Site
30.2 **
1.57 16.5 0.71 20.5 0.43 19.5
1.93 21.0 1.14 28.5 0.72 25.5
2.60 30.5 1.20 34.5 0.69 36.5
2.05 10.5 1.22 12.5 0.50 19.5
19/04 Fertilizer Site
N
31.1 ** 3.0
64.6 18.9 62.2 17.3 60.7 19.8
25.5 53.5 30.4 41.4 32.8 41.7
44.7 24.8 43.7 21.8 49.3 14.2
54.2 35.3 51.4 36.1 42.1 38.4
05/05 Fertilizer
N
11.9 **
384
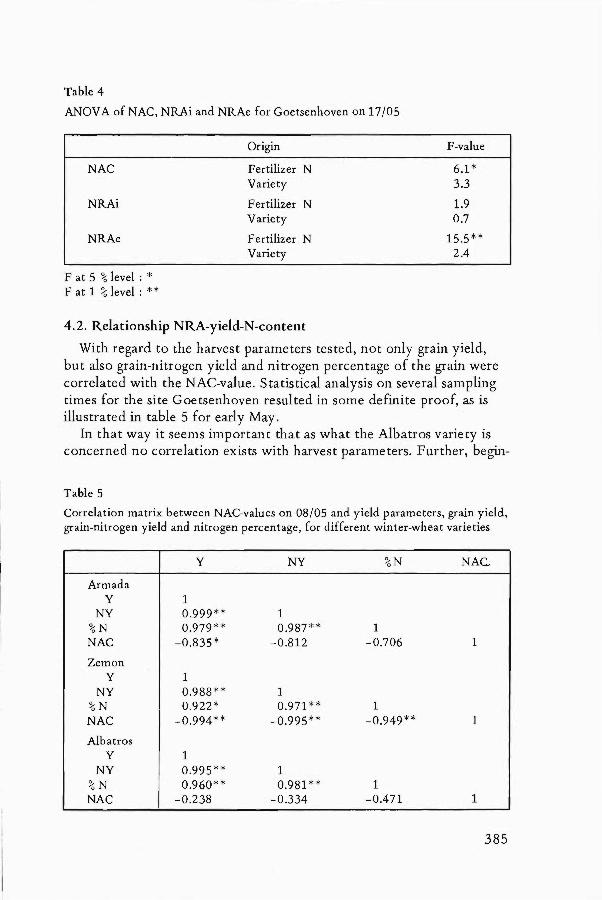
Table 4
ANOV A of NAC, NRAi and NRAe for Goetsenhoven on 17/05
NAC
NRAi
NRAe
F at 5 % level : * F at 1 % level: **
Origin
Fertilizer N Variety
F ertilizer N Variety
Fertilizer N Variety
4.2. Relationship NRA-yield-N-content
F-value
6.1 * 3.3
1.9 0.7
15.5** 2.4
With regard to the harvest parameters tested, not only grain yield, but also grain-nitrogen yield and nitrogen percentage of the grain were correlated with the NAC-value. Statistical analysis on several sampling times for the site Goetsenhoven resulted in some definite proof, as is illustrated in table 5 for early May.
In that way it seems importan t that as what the Albatros variety is concerned no correlation exists with harvest parameters. Further, begin-
Table 5
Correlation matrix between NAC-values on 08/05 and yield parameters, grain yield, grain-nitrogen yield and nitrogen percentage, for different winter-wheat varieties
Y NY %N NAC
Armada Y 1
NY 0.999 ** 1 %N 0.979 ** 0.987 ** 1 NAC -0.835 * -0.812 -0.706 1
Zemon Y 1
NY 0.988 ** 1 %N 0.922 * 0.971 ** 1 NAC -0.994** -0.995 ** -0.949 ** 1
Albatros Y 1
NY 0.995 * * 1 %N 0.960** 0.981 ** 1 NAC -0.238 -0.334 - 0.471 1
385
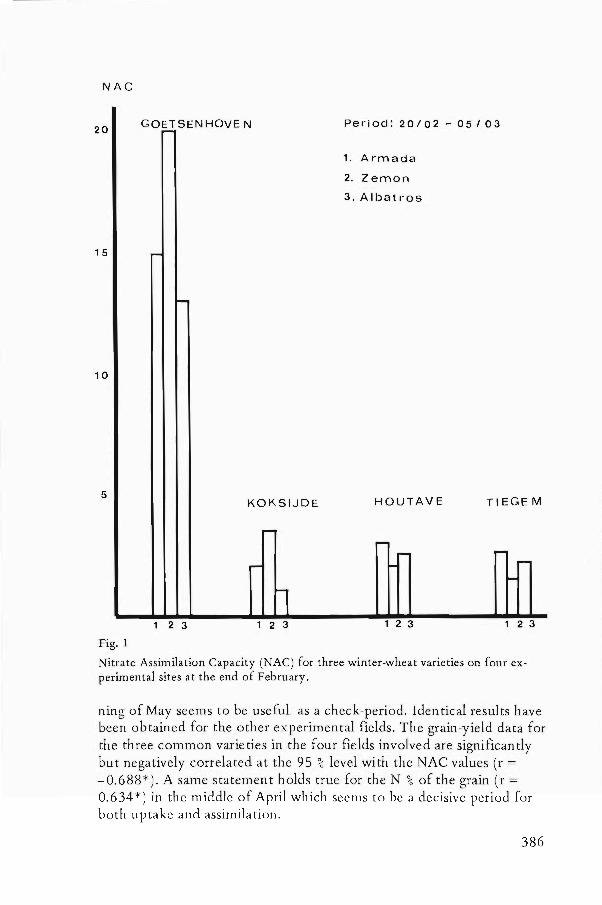
NAC
20 GOpSENHOVE N Period: 20/02 - 05/03
1. Armada
2. Zemon
3. Albatros
15 r-
10
5 KOKSIJDE HOUTAVE TI EGE M
..... r-
.....
n 1 2 3 123 123 1 2 3
Fig. 1
Nitrate Assimilation Capacity (NAC) for three winter-wheat varieties on four experimental sites at the end of February.
ning of May seems to be useful as a eheek-period. Iden tic al results have been obtained for the other experimental fields. The grain-yield data for the three eommon varieties in the four ficlds involved are significantly but negatively eorrelated at the 95 % level with the NAC values (r = -0.688*). A same statement holds true for the N % of the grain (r = 0.634 *) in the middle of April whieh seems to be a decisive period for both uptake and assimilation.
386
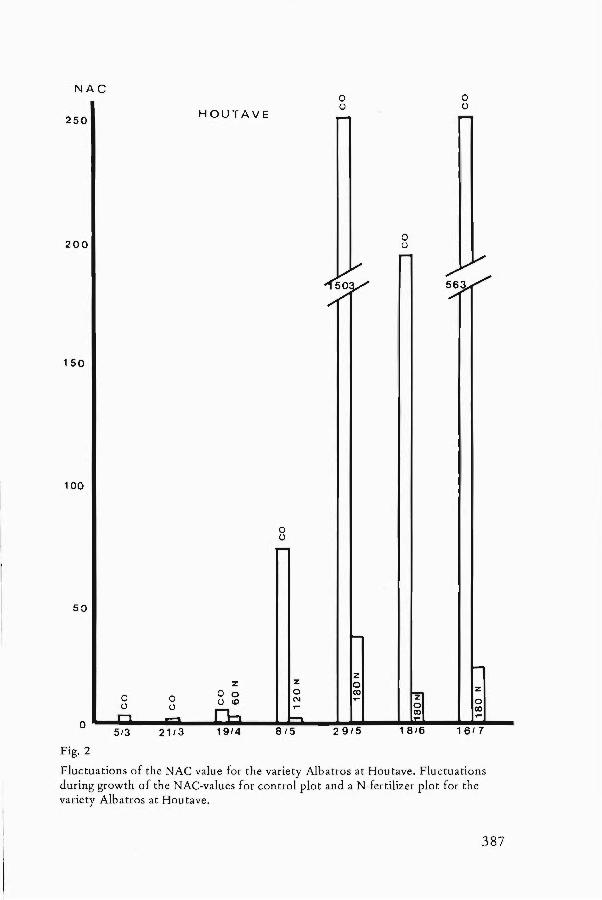
NAC o o () ()
HOUTAVE ~ -250
200 0 () ,....
~V ~ ....... 50V
" ....... 56~
'"
150
100
0 ()
,....
50
~
-z z z 0
0 0 co
m z
0 0 0 () <0 ('Ij ~ 0 ü () n..., - co ~ - ~ -o
5/3 21/3 19/4 815 29/5 16/7
Fig. 2
Fluctuations of the NAC-value for the variety Albatros at Houtave. Fluctuations during growth of the NAC-values for control plot and a N-fertilizer plot for the variety Albatros at Houtave.
387
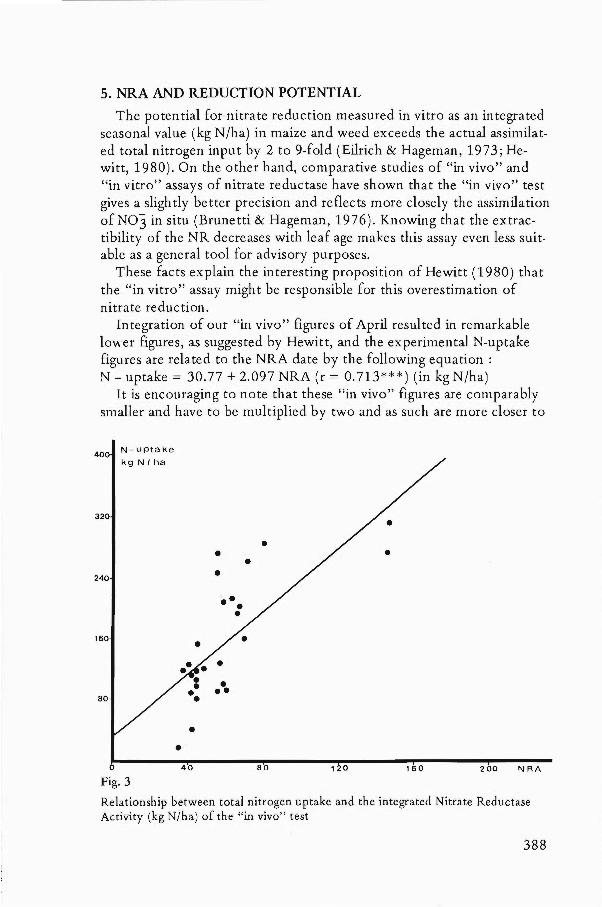
5. NRA AND REDUCTION POTENT lAL
The potential for nitrate reduction measured in vitro as an integrated seasonal value (kg N/ha) in maize and weed exceeds the actual assimilated total nitrogen input by 2 to 9-fold (Eilrich & Hageman, 1973; Hewitt, 1980). On the other hand, comparative studies of "in vivo" and "in vitro" assays of nitrate reductase have shown that the "in vivo" test gives a slightly better precision and reflects more closely the assimilation of NO) in situ (Brunetti & Hageman, 1976). Knowing that the extractibility of the NR decreases with leaf age makes this assay even less suitable as a general tooI for advisory purposes.
These facts explain the interesting proposition of Hewitt (1980) that the "in vitro" assay migh t be responsible for this overestimation of nitrate reduction.
Integration of our "in vivo" figures of April resulted in remarkable lower figures, as suggested by Hewitt, and the experimental N-uptake figures are related to the NRA date by the following equation : N - uptake = 30.77 + 2.097 NRA (r = 0.713***) (in kg N/ha)
It is encouraging to note that these "in vivo" figures are comparably smaller and have to be multiplied by two and as such are more closer to
40
320
240
160
80
N-uptake
kg N I ha
Fig. 3
• •
40
• •
• ••
• •
80
•
1 0 160 200 N RA
Relationship between total nitrogen uptake and the integrated Nitrate Reductase Activity (kg N/ha) of the "in vivo" test
388
reality. These findings are in agreement with the theoretical expectations (figure 3). Furthermore, the use of several "in vitro" factors throughout the integration procedure may have affected the final data which in turn migh t he responsihle for another kind of error. The adaptation of these factors to "in vivo" figures will only he possihle af ter some additional years of experience with the technique in general.
6. CONCLUSION
The conclusion can he reached that the NR assay migh t he an important parameter for the assessment of N-stress during growth. lts use will certainly contrihute to the optimalization of N-fertilization advice, hased on the N-status of the soil profile.
ACKNOWLEDGEMENTS
The authors express their grati tu de to the I. W.O.N.L. (Instituut tot aanmoediging van het Wetenschappelijk Onderzoek in Nijverheid en Landbouw) for financial support. They also wish to thank Dr. R. Sylvester-Bradley for useful discussions and help in the final evaluation of the "in ViljO" NR -assay.
REFERENCES
Batey T. (1976). Some effects of nitrogen f~rtilizer on winter-wheat. J. Sci. Food Agric., 27 : 287 -297.
Bar-Akiva A., Sagiv S. & Leshem J. (1970). Nitrate Reduction Activity as an indicator for assessing the nitrogen requirement of grass crops. J. Sci. Food Agric., 21 : 405-407.
Blahova M. & Segeta V. (1980). Nitrate Reductase Activity in the course of Cucumber Leaf. Ontogenesis Biol.Plantarum, 22 : 176-182.
Brunetti N. & Hageman R. H. (1976). Comparison of in vivo and in vitro Assays of Nitrate Reductase in \Vheat (Triticum aestivum L.) seedlings. Plant Physiol., 58 : 583-587.
Chapman H. D. (1967). plant analysis values suggestive of nutrient status of selected crops. In : Soil Testing and Plant Analysis. Madison, Wisc., USA, pp. 77-92.
Dalling M. J., Halloran G. M. & WilsonJ. H. (1975). The relation between Nitrate Reductase Activity and grain nitrogen productivity in wheat. Austr. j. Agric. Res., 26 : 1-10.
389
Eilrich G. L. & Hageman R. H. (1973). Nitrate Reductase Activity and its relationship to accumulation of vegetative and grain nitrogen in wheat. Grop Sci., 13 : 59-66.
Finck A. (1963). Bedeutung und Anwendung der Blottanalyse in den Tropen. Landw. Forschung., 16 : 145-152.
Greenwood E. A. N., Goodall D. W. & Titmanis Z. V. (1965). The measurement of Nitrogen deficiency in grass swards. Plant and Soil, 23 : 97-116.
Greenwood E. A. N. (1966). Nitrogen stress in wheat - lts measurement and relation to leaf nitrogen. Plant and Soil, 24 : 279-288.
Greenwood D. J. (1978). Measurement and prediction of the changes in protein contents of field crops during growth. J. Agric. Sci., 91 : 467-477.
Hewitt E.J. (1980). Primary nitrogen assimilation from nitrate with special reference to cereals. In : "Crop Physiology", Wageningen, pp. 139-155.
Johnson C. B., Whittington W.J. & Blackwood G. C. (1976). Nitrate Reductase as a possible predictive test of erop yield. Nature, 262 : 133-134.
Jungk A. & Wehrmann J. (1978). Determination of Nitrogen Fertilizer Requirements by plant and soil analysis. Proc. 8th Intern. Collo Plant Analysis and Fert. Problems, Auckland, New Zealand, pp. 209-224.
Keeney D. R. & Bremner J. M. (1966). Comparison and evaluation of laboratory methods of obtaining an index of soil nitrogen availability. Agron. J., 58 : 498-503.
Klepper L., Flesher D. & Hageman R. H. (1971). Generation of redueed nicotinamide adenine dinucleotide for nitrate reduction in green leaves. Plant physiol., 48 : 580-590.
LiebigJ. (1840). Die organische Chemie in ihrer Anwendung auf Agrikultur und Physiologie. Friedrich Bieweg Und Soku Editors, Braunsehweig, 353 p.
Lundegard H. (1951). Leaf Analysis. Hilges and Watts Editors, London, 176 p.
Scaife M. A. & Bray B. G. (1977). Quick sap tests for improved control of erop nutrient status. ADAS, Quaterly Rev., 27 : 137-145.
390
Shaner D. L. & Boyer J. S. (1976). Nitrate Reductase Activity in Maize (Zea Mays L.) leaves. Plant Physiol., 58 : 499-504.
Siman G. (1974). Nitrogen Status in Growing Cereals. The Royal Agricultural College of Sweden, 93 p.
Stanford F. & Smith S. J. (1972). Nitrogen mineralisation potentials of soils. Soil Sci. Soc. Am. Proc., 36 : 465-472.
Sylvester-Bradley R. (1979). Measurement of Nitrate Reductase Activîty in crops. MAFF-Plant Physiology Unit (Wolverhampton), Intern. Report.
Verstraeten L. M. J., Vlassak K. & Livens J. (1970). Factors affecting the determination of available soil nitrogen by chemical methods. Soil Sci., 110 : 365-370.
Wallace W. (1975). A re-evaluation of the Nitrate Reductase Content of the Maize root. Plant. Physiol., 55 : 774-777.
WollringJ. & WehrmannJ. (1981). Der Nitrat - Schalltest - Entscheidungshilfe für die N-Spätdüngung. DLG-Mitteilungen, 8 : 448-450.
ZieserlJ. F., Rivenbark W. L. & Hageman R. H. (1963). Nitrate Reductase Activity, protein content and yield of four maize hybrids at varying plant population. Grop Science, 3 : 27-32.
Summary
This review discusses the use of plant analysis as a potential assay of N-stress during plant growth. The most important parameters involved in this evaluation are total nitrogen concentration, nitrate-nitrogen concentration and the nitrate reductase activity.
Especially this last parameter has been intensively investigated during the last years in order to obtain a better knowledge of the phenomenon of N-hunger.
The most important results are briefly discussed and this regarding the relationship between the NRActivity and plant and soil characteristics, as weIl as with yield data. lts reliability and theoretical potential as an evaluation test is described in connection with the experimental data. Combination of the data of plant analysis together with soil analysis of the profIle must result in a substantial improvement of the N-fertilization advice.
391
N-stress en plantengroei met betrekking tot de N-toestand van plant en bodem
Samenvatting
Deze bijdrage geeft een overzicht van het gebruik van plantenanalyses voor het aantonen van N-stress tijdens de groei. De belangrijkste parameters hierbij betrokken zijn de totale stikstofconcentratie, de nitraat-stikstofconcentratie en de nitraat-reduktase aktiviteit.
Vooral deze laatste parameter werd tijdens de laatste jaren door het laboratorium aangewend om een inzicht te krijgen in dit fenomeen van N-honger.
In het kort worden dan de voornaamste resultaten geschetst, wat betreft de verhouding van de enzymatische aktiviteit met bodem- en plantkarakteristieken, alsmede met de oogstgegevens. Tenslotte wordt de betrouwbaarheid van deze test onderzocht door het vergelijken van zijn geïntegreerde waarde met de experimenteel bekomen gegevens.
Het koppelen van deze gegevens van plantenanalyses met de eigenlijke bodemanalyse van het profiel moet tot een uiteindelijke verbetering van het N-bemestingsadvies leiden.
Stress d 'azote et croissance végétale à l'égard du niveau d'azote dans la plante et Ie sol
Résumé
Cetteétude donne un aperçu de I'utilisation de l'analyse végétale afin d'indiquer Ie stress d'azote durant la croissance. Les principaux paramètres sont la concentration totale en azote, la concentration en azote nitrique et l'activité de la réductase nitrique. Cette dernière fût, principalement durant ces dernières années, utilisée par Ie laboratoire en vue d'éclaircir Ie phénomène de la déficience en azote.
Les principaux résultats reliant cette activité enzymatique aux caractéristiques du sol et des plantes ainsi qu'aux données de récolte furent schématisés. Enfin, ce test fût évalué en comparant sa valeur intégrée avec les données expérimentales.
Les données d'analyse végétale mises en relation avec l'analyse du prom du sol doivent finalement aboutir à une amélioration de l'avis de fumure azotée.
392
BOEKBESPREKINGEN COMPTES RENDUS
Suhmicroscopy of soils and weathered rocks/Suhmicroscopie du sol et des altérites. lst Workshop of the International Working Group on Submicroscopy of Undisturbed Soil Materials (IWGSUSM) 1980, Wageningen, the Netherlands. Edited by E.B.A. Bisdom. Pudoc (Wageningen) 1981,320 p., doth, ISBN 90-220-07774; 80.00 Dfl.
This book is a collection of papers presented during the first Workshop of the IWGSUSM. Most of them are in English, some in Frenchj all have as weIl an English as a French summary, followed by a set of key words. As explained in the fint chapter, the aim of the International Working Group on Submicroscopy of Undisturbed Soil Materials is to promote the exchange of individual experience in this field of research, and to co me to a doser international cooperation, necessary in view of the sophisticated and expensive equipments involved. As weIl submicroscopic studies on undisturbed fragments as on thin sections are considered.
Chapters 2, 3 and 4 deal with the different equipments and techniques in use, such as electron microscopes, microprobes and accessoriesj the next chapters review systematically the already published submicroscopic research in soil micromorphology. New techniques for submicroscopic analysis on soil thin sections (e.g. the destruction of the impregnating resin by low temperature asking, previous to S.E.M. investigations j the use of backscattered electron scanning images for the study of microporosity patternsj the preparation of ultra thin sections with ion thinning) are presented in the next papers. The last series of papers is devoted to some examples of new applications of submicroscopic research in micropedology (e.g. in rock weathering, salt deposits, marine sediments). One of the important aspects of this book is the fact that a dear (and practically complete) review is given on instruments, techniques and applications of soil subrnicroscopy. Such a state of arts is particularly valuable for a joung science as it serves as an introduction and guide to this new field, not only for those that want to start working in this domain, but also for all research workers which have to deal with its results. In this aspect the book HUs a real gap in litterature. The book is therefore a must for each laboratory of micromorphology, and strongly recommended for all soil science departments.
The presentation of the book is excellent, and the pictures are of good quality. A short subject index (e.g. comprising minerals, rocks, soil types and horizons) would have been helpfull when using the book as a reference work.
G. Stoops
393
SOMMAIRE INHOUD
L. Verdegem, O. Van Cleemput & J. Vanderdeelen Some factors inducing the loss of nutrients out of the soil profile 309
G. Hofman, M. Van Ruymbeke, C. Ossemerct & G. Ide Residual nitrate-nitrogen in sandy loam soils in a moderate marine climate 329
R. Boon Stikstofadvies op basis van profielanalyse voor wintergraan en suikerbieten op diepe leem- en zandleemgronden 347
G. J. Kolenbrander, J. J. Neeteson, G. Wijnen Investigation in the Netherlands into optimun nitrogen fertilization on the basis of the amount of Nmin in the soil profile 365
L. M. J . Verstraeten & K. Vlassak N-stress and plant growth in relation to the N-status of plant and soil 379
Boekbesprekingen - Comptes rendus 393
394
SOMMAIRE
1
In Memoriam L. Sine
PEDOLOGIE XXXI
In Memoriam F. Geelhand de Merxem
c. Sys
INHOUD
5
7
Influence of the factors of the physical environment on agricultural development 9
I. G. Scheys Les recherches effectuées en Belgique sur l'aptitude des sols 27
L. Bock, J. Calembert & L. Mathieu Réflexions sur les aptitudes des terres en milieu méditerranéen 47
J. Degand Aspects économiques de l'évaluation de la potentialité des terres 65
T. O'Dubháin & J. F. Collins Morphology and genesis of Podzols developed in contrasting parent materials in Ireland 81
D. Lamberts Hydroponics in horticulture
J. Embrechts & C. Sys Quantitative evaluation of climate in humid tropical areas. Application to coca
Note - Nota W. G. Sombroek The use of palygorskite as diagnostic criterion in soil classification
2
G. M. Higgins & A. H. Kassam
99
107
121
The FAO agro-ecological zone approch to determination ofland potential 147
C. Sys Evaluation of soil and landscape criteria with respect to land-use potentials in Europe 169
N. Gerbier L'agrométéorologie, domaine, objectifs et moyens 191
J. Lee State of knowledge and problems related to the definition and delimination of farming systems and land utilization types in Europe 207
J. Vandamme, K. Van Nerum, A. de la Kethulle & D. Lambrechts The suitability of soils for bush beans (Phaseolus vulgaris L.) 243
T. Deckers & D. Lamberts Production of white Asperagus in containers
Boekbesprekingen - Comptes rendus
267
273
395
3
L. Verdegem, O. Van Cleemput & J. Vanderdeelen Some factors inducing the loss of nutrients out of the soil prome 309
G. Hofman, M. Van Ruymbeke, C. Ossemerct & G. Ide Residual nitrate nitrogen in sandy loam soils in a moderate marine climate 329
R. Boon Stikstofadvies op basis van profielanalyse voor wintergraan en suikerbieten op diepe leem- en zandleemgronden 347
G. J. Kolenbrander, J. J. Neeteson, G. Wijnen Investigation in the Netherlands into optimum nitrogen fertilization on the basis of the amount of Nmin in the soil pro me 365
L. M. J. Verstraeten & K. Vlassak N-stress and plant growth in relation to the N-status of plant and soil 379
Boekbesprekingen - Comptes rendus 393
Offsetdruk VITA, 9750 Zingem
396