IMARES Wageningen UR - WUR E-depot home
117
Combining offshore wind energy and large-scale mussel farming: background & technical, ecological and economic considerations Editors: Sander Lagerveld, Christine Röckmann, Michaela Scholl Contributing authors: Heleen Bartelings, Sander van den Burg, Robbert Jak, Henrice Jansen, Job Klijnstra, Sander Lagerveld, Mardik Leopold, Marnix Poelman, Christine Röckmann, Michaela Scholl, Sarah Smith, John Stavenuiter, Frans Veenstra, Chris Veltman, Chris Westra Report C056/14 IMARES Wageningen UR Institute for Marine Resources & Ecosystem Studies Client: Maritime Campus Netherlands P.O. Box 505 1780 AM Den Helder Publication date: 28 August 2014
Transcript of IMARES Wageningen UR - WUR E-depot home
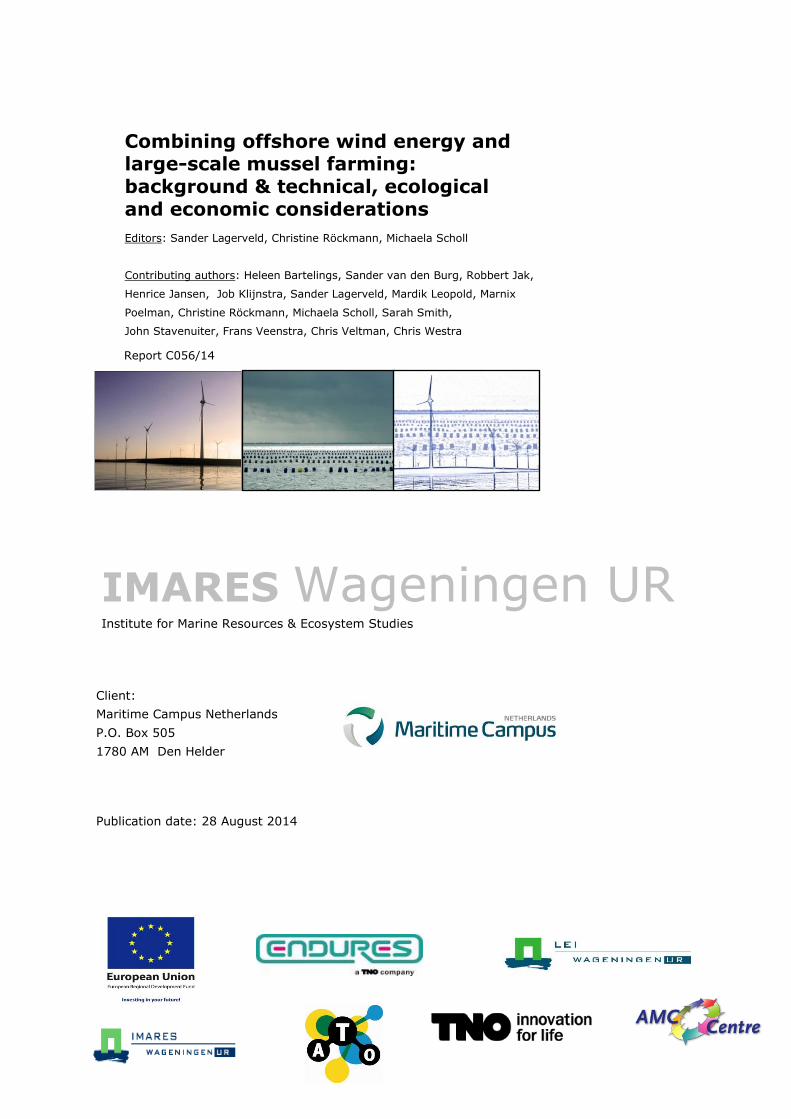
Combining offshore wind energy and large-scale mussel farming: background & technical, ecological and economic considerations
Editors: Sander Lagerveld, Christine Röckmann, Michaela Scholl
Contributing authors: Heleen Bartelings, Sander van den Burg, Robbert Jak,
Henrice Jansen, Job Klijnstra, Sander Lagerveld, Mardik Leopold, Marnix
Poelman, Christine Röckmann, Michaela Scholl, Sarah Smith,
John Stavenuiter, Frans Veenstra, Chris Veltman, Chris Westra
Report C056/14
IMARES Wageningen UR Institute for Marine Resources & Ecosystem Studies
Client:
Maritime Campus Netherlands
P.O. Box 505
1780 AM Den Helder
Publication date: 28 August 2014
2 of 117 Report number C056/14
IMARES is:
an independent, objective and authoritative institute that provides knowledge necessary for an
integrated sustainable protection, exploitation and spatial use of the sea and coastal zones;
an institute that provides knowledge necessary for an integrated sustainable protection, exploitation
and spatial use of the sea and coastal zones;
a key, proactive player in national and international marine networks (including ICES and EFARO).
P.O. Box 68 P.O. Box 77 P.O. Box 57 P.O. Box 167
1970 AB IJmuiden 4400 AB Yerseke 1780 AB Den Helder 1790 AD Den Burg Texel
Phone: +31 (0)317 48 09 00 Phone: +31 (0)317 48 09 00 Phone: +31 (0)317 48 09 00 Phone: +31 (0)317 48 09 00
Fax: +31 (0)317 48 73 26 Fax: +31 (0)317 48 73 59 Fax: +31 (0)223 63 06 87 Fax: +31 (0)317 48 73 62
E-Mail: [email protected] E-Mail: [email protected] E-Mail: [email protected] E-Mail: [email protected]
www.imares.wur.nl www.imares.wur.nl www.imares.wur.nl www.imares.wur.nl
© 2014 IMARES Wageningen UR
IMARES, institute of Stichting DLO
is registered in the Dutch trade
record nr. 09098104,
BTW nr. NL 806511618
The Management of IMARES is not responsible for resulting
damage, as well as for damage resulting from the application of
results or research obtained by IMARES, its clients or any claims
related to the application of information found within its research.
This report has been made on the request of the client and is
wholly the client's property. This report may not be reproduced
and/or published partially or in its entirety without the express
written consent of the client.
A_4_3_2-V13.2
Report number C056/14 3 of 117
Preface
Offshore wind energy production and offshore aquaculture – an unusual combination? Whether you judge
it an unrealistic idea or an innovative concept within reach, the first thing to do is: find out what the
points of departure are of the different actors in the field and whether it makes sense to further explore
such an uncertain path. That's exactly what the Blauwdruk study does. It looks into the technical,
ecological and economic challenges and risks, and simulates the feasibility of combining an offshore wind
farm with offshore aquaculture, namely an offshore mussel farm. The starting point of our study was the
assumption that there is a potential for synergy. Although there are still more uncertainties than
certainties, looking at this final report, we believe that our considerations touch the key issues and fill in
a knowledge gap. We consider this report a useful source of inspiration to continue the exploration of
combining offshore activities and to start up (small-scale) pilot studies. In the end: the proof of the
pudding is in the eating, isn’t it?

4 of 117 Report number C056/14

Report number C056/14 5 of 117
Contents
Glossary and abbreviations .......................................................................................... 7
Summary ................................................................................................................. 9
1 Introduction ................................................................................................... 11
1.1 MCN-Efro and the Blauwdruk project ........................................................ 11
1.2 Aim and scope of the project ................................................................... 11
1.3 Reading guide ....................................................................................... 12
2 Single and multi-use activities in the North Sea ................................................... 13
2.1 The Dutch government perspective .......................................................... 13
2.2 The offshore industry’s perspective ........................................................... 14
2.3 References ............................................................................................ 15
3 Offshore wind energy production ....................................................................... 17
3.1 Dutch energy policy ............................................................................... 17
3.2 Government and sectoral initiatives in the Netherlands ................................ 21 Green deal ................................................................................. 21 3.2.1 Far Large Offshore Wind (FLOW) program ...................................... 21 3.2.2 Dutch national energy agreement .................................................. 22 3.2.3
3.3 Operation and maintenance of offshore wind farms ..................................... 22 Accessibility of offshore wind farms ............................................... 22 3.3.1 Infrastructure for cabling and cable repair ...................................... 24 3.3.2 Trained staff .............................................................................. 24 3.3.3 Dutch Offshore Wind Energy Services (DOWES) .............................. 25 3.3.4
3.4 References ............................................................................................ 25
4 Offshore aquaculture ....................................................................................... 27
4.1 Potential for offshore aquaculture ............................................................. 27
4.2 Species selection for offshore aquaculture in the Dutch part of the North Sea . 27 Fish culture ................................................................................ 27 4.2.1 Bivalve culture ........................................................................... 28 4.2.2 Seaweed culture ......................................................................... 28 4.2.3
Bioremediation and integrated culture ............................................ 29 4.2.4 Prospective ................................................................................ 30 4.2.5
4.3 Mussel farming and mussel seed collection ................................................ 30 Site suitability ............................................................................ 30 4.3.1 Seed mussel collectors (SMCs) ...................................................... 31 4.3.2 System requirements/prerequisites ............................................... 33 4.3.3 Physical potential ........................................................................ 34 4.3.4 Ecological potential and challenges ................................................ 35 4.3.5 Economic feasibility ..................................................................... 35 4.3.6
4.4 References ............................................................................................ 36
5 Technical aspects of offshore structures ............................................................. 39
5.1 Introduction .......................................................................................... 39
5.2 Corrosion aspects and biofouling .............................................................. 39
6 of 117 Report number C056/14
Basic aspects of seawater chemistry .............................................. 39 5.2.1 Corrosion mechanisms and corrosivity zones for offshore structures ... 39 5.2.2 Corrosion risks in currently used offshore wind turbines .................... 40 5.2.3 Biofouling on offshore structures ................................................... 41 5.2.4 Potential influence of offshore aquaculture on the corrosion of 5.2.5
unprotected steel structures......................................................... 42
5.3 Mechanical risks of wind farms due to the presence of offshore aquaculture constructions ........................................................................................ 43
Scenario analyses ....................................................................... 44 5.3.1
5.4 References ............................................................................................ 47
6 Ecological risks and opportunities ...................................................................... 49
6.1 Introduction .......................................................................................... 49
6.2 Impacts of offshore wind farms ................................................................ 49 Construction phase ..................................................................... 49 6.2.1 Operational phase ....................................................................... 51 6.2.2
6.3 Impacts of offshore mussel farming .......................................................... 53
6.4 Impacts of a Wind & Mussel Farm............................................................. 55 Construction phase ..................................................................... 55 6.4.1 Operational phase ....................................................................... 56 6.4.2
6.5 References ............................................................................................ 57
7 Towards a business case – one scenario ............................................................. 61
7.1 Analysis of operation and maintenance costs ............................................. 61
7.2 Potential for synergy .............................................................................. 64
7.3 Practical implementation of the virtual wind and mussel farm ....................... 65
7.4 Asset Management Control (AMC) model ................................................... 71
7.5 Results of the scenario analyses ............................................................... 74
7.6 References ............................................................................................ 77
8 Conclusions, recommendations, perspectives and outlook ..................................... 81
8.1 Conclusions .......................................................................................... 81
8.2 Perspectives and outlook ........................................................................ 83 Roadmap for implementation of offshore mussel culture ................... 83 8.2.1 The potential for seaweed ............................................................ 83 8.2.2 Alternative small scale aquaculture production approaches ................ 84 8.2.3
8.3 Recommendations ................................................................................. 84
8.4 References ............................................................................................ 85
9 Quality Assurance ........................................................................................... 87
Justification ............................................................................................................. 89
Blauwdruk final report – List of Annexes ...................................................................... 91
Report number C056/14 7 of 117
Glossary and abbreviations
AMC Asset Management Control: a management approach to manage and control,
over the life cycle, all processes (specify, design, produce, maintain and
dispose) needed to achieve a capital asset capable to meet the operational
need in the most effective way for the customer/user.
Blauwdruk Dutch for blueprint, in general: an operational plan
Business case Captures the reasoning for initiating a project, the quantifiable and
unquantifiable characteristics of a proposed project.
Business scenario One or more options considered in a business case.
Business case model Computer model; tool for the financial analyses of a business case
CAPEX Capital expenditures; expenditures creating future benefits. A capital
expenditure is incurred when a business spends money either to buy fixed
assets or to add to the value of an existing fixed asset with a useful life
extending beyond the taxable year.
DM Dry matter
DOWES Dutch offshore wind energy services
EBIT Earnings before interest and tax
EFRO European Fund for Regional Development
FLOW Far and large offshore wind farm
FTE Full time equivalent
HAB Harmful Algal Bloom
IMTA Integrated Multi Trophic Aquaculture
LCA Life-cycle analysis
NM Nautical mile
MCN Maritime Campus Netherlands
MIC Microbial corrosion
MSP Marine spatial planning
MUP Multi-use platform
MWH Megawatt hours
MYM Multiyear maintenance
MYC Multiyear confidence
O&M Operation and maintenance
OPEX Operational Expenditures
OWF Offshore wind farm
OWEZ Offshore Windfarm Egmond aan Zee
PAWP Prinses Amalia Windfarm
ROI Return on Investment
SMC Seed Mussel Collector (in Dutch: MZI; Mosselzaadinvanginstallatie)
SWH Significant wave height: usually defined as four times the standard deviation
of the surface elevation (wikipedia)
WPSP Wind power sales price
W&MF Wind and mussel farm

8 of 117 Report number C056/14
Report number C056/14 9 of 117
Summary
This Blauwdruk project report presents background and technical, ecological and economic
considerations of the potential combination of offshore wind energy production and large-scale mussel
farming in offshore areas in the North Sea. The main objective of the Blauwdruk project was to study the
feasibility of such a combination on the Dutch Continental Shelf.
The Blauwdruk project focused on a virtual offshore wind farm of 1000 MW, arranged in five clusters of
200 MW each, combined with an offshore mussel farming system that consists of four clusters of 1,800
mussel long line systems. The four mussel long line clusters are integrated in the empty corridors
between the five wind farm clusters of the virtual wind farm and are supposed to produce 50,000 tons of
mussels per year.
After a brief introduction to the project, this report describes the current perspectives of the Dutch
government and the offshore industry on the concept of marine multi-use. This facilitates a broader
understanding of the different stakes.
An overview is presented of the development of offshore wind energy in the Netherlands, the related
Dutch policies, and the technological gaps and logistical problems that the offshore wind energy sector
faces. This report zooms in particularly on operation and maintenance issues of offshore wind farms.
Offshore mussel farming is still a novelty in the North Sea; practical experiences from the field are still
lacking. Hence, this report builds on literature to describe the state of the art of offshore aquaculture in
general and mussel farming in particular.
The proposed combination of offshore wind energy and aquaculture production is promising, but it also
involves risks. There are the technical risks of corrosion and biofouling, as well as ecological risks, such
as underwater-noise disturbance of marine mammals, disturbance of the seabed sediments and seabed
communities underwater, collision risks to birds and bats above water, and attraction of invasive species.
Apart from risks, the combination of an offshore wind farm with and offshore mussel farming can provide
ecological benefits, such as offering increased food availability and shelter, thereby attracting flora and
fauna. This, in turn, enhances biological diversity and production.
This report also investigates a concrete business case, using an expanded version of the Asset
Management Control (AMC) model to simulate the return on investment (ROI) of a virtual wind and
mussel farm. It seems likely that a combined offshore wind and mussel farm can achieve synergy effects
through savings on operation and maintenance costs of at least 10%. The scenario simulations
demonstrate the potential financial benefits. Assuming unfavourable economic conditions and no synergy
effects, an ROI of 4.9% should be possible. Applying a 10% synergy factor in the model raises the
simulated ROI to 5.5%. When economic conditions are favourable, without assumed synergy effects , the
simulated ROI is significantly higher: 8.3%,. Applying the 10% synergy factor, an ROI of 9.6% can be
yielded.
Finally, the report summarizes the main findings for each of the relevant topics of this study. It
concludes with recommendations for practitioners and policy makers on how to proceed in the future
with combining offshore wind energy production and offshore aquaculture.
The four most important conclusions of the Blauwdruk study are:
With regard to the Dutch part of the North Sea, currently mussel culture and seed mussel
culture are considered the most promising options for offshore aquaculture.
Concerning the technical aspects of an offshore wind farm in a combined wind/aquaculture
setting, the preferred foundation type should be monopile or gravity based in order to minimize
the risk of a high drag force incident.
10 of 117 Report number C056/14
Type and size of the integrated aquaculture activity determine the extent of effects on water and
sediment quality, which in turn effects the corrosion resistance of the materials used. This aspect
should be dealt with in a dedicated risk assessment for the specific location. Appropriate
measures are the application of corrosion resistant materials and/or suitable protective coatings.
The combination of offshore wind and mussel farming poses ecological risks, but also offers
potential benefits to the marine ecosystem. Since individual marine ecosystem components may
be affected differently by different pressures, it is difficult to generalize conclusions concerning
ecosystem impacts.
The Blauwdruk approach focused on large-scale, (semi-)intensive offshore aquaculture production and
providesan overview of the potential developments. The authors realize that there are still many
uncertainties concerning possibilities, risks, and benefits. We therefore recommend a stepwise learning-
by-doing approach, starting with small-scale pilot projects, instead of directly jumping into large-scale
implementation. It seems likely that the development from pilot studies to full-scale commercial cultures
will take approximately 8-10 years. During this process other aquaculture options (fisheries, seaweed,
lobsters, and/or oysters) might be considered in order to optimize spatial use within (or in the vicinity of)
wind farms.
Report number C056/14 11 of 117
1 Introduction
1.1 MCN-Efro and the Blauwdruk project
This report is the result of Work Packages 1 and 2 of the MCN1-Efro2 program 2009-2014, called the
‘Blauwdruk’3 project. The MCN-Efro program addresses three major strategic topics, namely shipping,
offshore energy and offshore aquaculture. The Blauwdruk project focuses on the latter two subjects and
in particular on the combination of both activities, which is a subject in itself: multi-use of marine space.
The Blauwdruk report represents a feasibility study, covering technical, ecological, and economic aspects.
1.2 Aim and scope of the project
The Blauwdruk study deals with offshore wind energy production in combination with offshore
aquaculture in general and mussel farming in particular, and the potential economic viability, ecological
sustainability, and technical soundness thereof. If there are advantages via synergy, this could make
offshore aquaculture feasible and attractive to financiers; at the same time, synergies with aquaculture
could contribute to the wind industry’s efforts to reduce costs, particularly operation and maintenance
(O&M) costs.
The Blauwdruk investigations focus on one specific scenario4, i.e. an exemplary case description. This
scenario can be worked out in more detail and result in a real business case, which can be brought into
practice in the coming five to ten years. The scenario chosen acts as a means to identify pre-conditions
and constraints that are relevant for future implementations of combined marine activities (generally
indicated with multi-use platforms (MUPs)) and to give recommendations for the improvement of
operational processes in such offshore multi-use settings.
The Blauwdruk project team decided to focus on the 1000 MW wind farm concessions on the Dutch
Continental Shelf (see chapter 3). Since several public-private partnerships have already been launched
in the Province of Zeeland (e.g. Zeeuwse Offshore Wind Project (ZOWP)5) to discuss and develop plans
for combined activities, the offshore wind farm concession Borssele was taken in mind as a possible
location. Some characteristics and pre-set parameters for the combination of offshore aquaculture and
offshore wind energy production are given in Table 1-1.
1 Maritime Campus Netherlands (MCN); Its goal is to expand and strengthen the economic infrastructure in the
north of the Province of Noord-Holland (‘Noord Holland Noord’) by establishing, developing, expanding and maintaining an authoritative international Marine, Maritime and Environmental Technological cluster based in the city of Den Helder which promotes the sustainable use of the sea and the marine environment.
www.maritimecampus.nl 2 Efro; European Fund for Regional Development
3 ‘Blauwdruk’ is the Dutch word for blueprint or template 4 We prefer to speak of a scenario to underline that the particular local circumstances always play an important
part. Although the project-title is ‘Blauwdruk’ (in English: blueprint) we did not intend to create a blueprint meaning a guide or design that can simply be followed by ‘copy & paste’.
5 www.zowp.nl/content/meervoudig-ruimtegebruik
12 of 117 Report number C056/14
Table 1-1. Characteristics and pre-set parameters of a possible combination of offshore wind energy production and offshore aquaculture, as used in the Blauwdruk study.
Wind farm turbines and
foundations
Wind farm with 5 MW turbines and new type of foundations, suitable for
deeper water *)
Aquaculture zone The offshore aquaculture installations will only be installed in the freely
accessible zones between the clusters of turbines/within the wind farm
(e.g. with poles or lines and anchors). They will not be attached to the
foundations of the wind turbines.
Synergy: scenarios to be
evaluated with the Asset
Management Control
(AMC) model
0% and 10% reduction of costs through combination of offshore wind and
offshore aquaculture operation and maintenance (O&M) activities
* for example jackets and gravity based constructions
The quantitative analyses in chapter 7 of this report are limited to mussel farming; all simulations focus
on the operational phase.
The decommissioning of offshore constructions, which is regulated in several treaties and Dutch national
law based on IMO Resolution A.672 (16)6, can be a compulsory requirement, but is not specifically taken
into account in this report. Another aspect that has not been dealt with in this study, is how insurance
companies assess the risks arising from the operational processes when modified for combined use.
Although this is of major importance, especially for financial calculations and results, this can only be
examined once it is known how the operational processes in an offshore mussel farm exactly look like,
and whether typical risks of combined use can be mitigated.
1.3 Reading guide
As an introduction and to facilitate a broader understanding of the different stakes and perspectives, we
first describe the current perspectives of the Dutch government and the offshore industry on the concept
of multi-use (chapter 2). In chapter 3, we outline the development of offshore wind energy in the
Netherlands and the related Dutch policies up to the time of writing of this report (August 2014). We also
point out technological gaps and logistical problems that the offshore wind energy sector faces, in order
to identify potential synergy fields that advocate combined use. In chapter 4, the state of the art of
offshore aquaculture is presented. Chapter 5 and 6 elaborate on the technical aspects of corrosion and
biofouling, and on ecological risks and opportunities respectively, paying special attention to the
combination of offshore wind energy and aquaculture. In chapter 7, a concrete business case is depicted
and four scenario simulations, run with an expanded version of the Asset Management Control (AMC)
model, are presented and compared. Chapter 8 concludes with recommendations for practitioners and
policy makers how to proceed in the future with combining offshore wind energy production and offshore
aquaculture.
6 www.imo.org/blast/mainframe.asp?topic_id=1026
Report number C056/14 13 of 117
2 Single and multi-use activities in the North Sea
2.1 The Dutch government perspective
The Dutch government recognizes the need for new marine activities, their particular needs and the
potential competition for space. The Dutch marine spatial policy therefore does not only focus on
sustainable and safe use of the North Sea, but also stresses the need for space-efficient use. The Policy
Note North Sea 2009-20157 elaborates on the Dutch North Sea policy and explicitly mentions that co-
use of offshore wind farms with other functions, for example with recreation, fisheries or aquaculture,
should be stimulated, thus leading towards multi-use platforms (MUPs) in the North Sea. The Integral
Management Plan for the North Sea 20158 (IBN 2015) expresses objectives of similar meaning, stating
that the Dutch policy should be based on three pillars: a healthy, safe, and profitable sea. The two
important principles of Dutch marine spatial planning policy are: multiple use and ecosystem approach.
Triggered by the European renewable energy objectives, the Dutch policy goal is to achieve 14% of
sustainable energy production by 20209. The switch to renewable energy should be completed in 2050.
Wind energy – generated on land as well as at sea – plays an important contribution to achieve this goal.
The Dutch national government’s website also states that the Dutch part of the North Sea should provide
space for a total installed volume of wind turbines of 4450 MW after 2020. This is roughly 20 times more
than the currently (2014) installed 220 MW. Moreover, it also implies that at least 1000 km2 of suitable
marine space on the Dutch continental shelf have to be reserved for wind farm development. Originally,
the Dutch government had decided to exclude the 12 NM zone for offshore wind farm concessions.
Meanwhile, the government considers opening this coastal zone to offshore wind farm construction as
well. Developments after 2020 might require even more marine space.
In the Integral Management Plan for the North Sea 2015 (IBN 2015), the Dutch water management
authority10 explicitly points out that aquaculture inside offshore wind farms is a possibility for smart use
of space, which leads to opportunities for innovative entrepreneurship. No space has yet been indicated
for offshore aquaculture in the Dutch part of the North Sea though. This means that aquaculture
activities in or around offshore wind farms need to apply for permits to obtain exemption. Obtaining
permits does not seem to be a preliminary off-set, as the government does not principally oppose to
offshore aquaculture and the development of MUPs. Nevertheless, a regulatory framework for MUPs is
yet missing, and existing guidelines are not supportive of MUPs. Anyhow, apart from the problem of
space, growing world population and food consumption, and diminishing fish stocks will lead to a growing
demand for marine protein from aquaculture. Therefore, it is plausible that the multi-use concept will
gain ground among policymakers.
7 Dutch: “Beleidsnota Noordzee 2009-2015”: www.rijksoverheid.nl/documenten-en-
publicaties/brochures/2010/08/12/beleidsnota-noordzee-2009-2015-engels.html 8 Dutch: “Integraal Beheerplan Noordzee 2015”: zoek.officielebekendmakingen.nl/stcrt-2011-20771.html 9 http://www.rijksoverheid.nl/onderwerpen/duurzame-energie/windenergie (last accessed: 23 January 2014) 10 Dutch: “Rijkswaterstaat”: http://www.rijkswaterstaat.nl/
14 of 117 Report number C056/14
2.2 The offshore industry’s perspective
Up till now, when it comes to multi-use, only a few individual (offshore) companies have started to
develop innovative concepts, mostly through isolated activities or studies. Time seems ready now for
progressing with combined offshore activities, for a number of reasons. As mentioned in section 2.1,
more offshore wind farms have to be built to comply with renewable energy goals. Traditional marine
sectors now have to compete for space with other new users, and they start feeling threatened in their
operations. This leads to a public debate on the fair and sustainable use of marine space.
Multi-use is apparent when the potential of use conflicts is low, i.e., when overlap of activities in time
and space is limited but still allows for synergies and - perhaps the most important criterion – when risks
arising from combined activities are minimal in relation to the benefits. Combining activities at the same
place and time can lead to increased or new risks, though. To date the offshore wind energy sector has
been reluctant to allow other activities within the boundaries of their wind farms. Moreover, the offshore
wind energy sector, being subsidized, has not felt the urgency to look for potential synergies and
collaboration with other users in order to share, and thus reduce, costs. This situation is changing now;
pressure is increasing on the offshore wind sector to become a mature industry that can stand on its own
feet, i.e., survive without, or at least with less, subsidies. Due to these developments, the wind energy
sector is now more inclined to seek synergies with other sectors. Surveys (MERMAID 2013, COEXIST
2011) reveal that stakeholders consider the combination of offshore wind energy and offshore
aquaculture as worthy to be explored. For offshore-wind energy companies, faster licensing procedures,
financial benefits, and/or the improvement of the company’s corporate social responsibility would be
strong incentives. Knockdown arguments are: higher insurance costs and an increase of ecological risks.
Anyway, given the current uncertainties, stakeholders advocate a level playing-field and a facilitative role
of government (MERMAID 2013).
Development of offshore aquaculture is a relatively new activity in the North Sea, in contrast to the more
than 40 years of experience of the offshore oil and gas industries. Culture of fish in (offshore) sea cages
is commercially applied in many areas around the world; the potential for fish culture, in particular in the
rather shallow Dutch part of the North sea, is low, though (Reijs et al. 2008). The Dutch aquaculture
industry is therefore looking for opportunities for offshore production of shellfish and seaweed in the
North Sea. There are indications that the traditional areas for shellfish culture (Eastern Scheldt, Wadden
Sea) are reaching their carrying capacity, setting limits to further growth of production in those areas
(Smaal et al. 2013, Schellekens et al. 2013, Brinkman 2013). Furthermore, induced by recent changes in
collection of mussel seed (transition from seed fishery to collection of seed with so-called Seed Mussel
Collectors; SMC), suspended spat collection measures have recently proven their technical and economic
feasibility for use in inshore and near shore areas (Van Stralen 2012, 2013). The shellfish industry now
wants to expand and is looking for areas outside the traditional production locations to collect mussel
spat and to grow consumption mussels to a marketable size. This has led to commercial interest for
development of offshore shellfish culture.
The production and sale of seaweed is less mature compared to shellfish, but increasing demand for
marine natural resources, healthy food and increasing food prices have spiked interest in alternative
marine production methods. Seaweed production is promising as it can provide material required for the
production of (animal) feed, feed additives (alginates, protein, carbohydrates), trace minerals, source for
biofuels, or novel feedstock and antibiotics in a green chemical sector.
Report number C056/14 15 of 117
Various small-scale research projects have investigated the viability of seaweed production onshore or
near shore in the Netherlands over the past years, and demonstrated the technical potential to grow
seaweeds in estuarine areas (such as experiments in the Oosterschelde, as well as nearby Texel). Using
offshore oil, gas, and wind energy platforms to facilitate shellfish and seaweed production, has so far
mostly remained theoretical (Reith et al. 2005), and been tested only at pilot scales on a few occasions
(Buck 2004, Brandenburg 2012).The technical implementation and practicalities of production and
harvesting of aquaculture products pose many questions and challenges. As newcomers, the pioneers
from the Dutch offshore aquaculture sector need to collaborate with offshore wind energy companies and
will have to convince other stakeholders – government and nature organizations – that good
neighborhood and, even more, synergy through collaboration are possible (Stuiver et al. 2012).
Despite the still existing strong doubts about integrating offshore wind energy generation with
aquaculture, especially held by wind farm operators (MERMAID 2013), there is potential for cost
reduction and thus financial benefit through economies of scale (e.g. transport, shared (electrical power)
installations, co-use of maintenance vessels and platforms) and economies of knowledge and experience
(e.g. personnel, environmental studies, risk analyses). Clearly, both offshore wind farm operators and
offshore aquaculture operators will only adopt a multi-use concept once the technical and economic
feasibility has been demonstrated with a certain degree of reliability. The likelihood of collaboration in a
multi-use setting not only depends on how well risks and uncertainties are addressed in feasibility
studies but also on the economic and social environment (market conditions, demand for corporate social
responsibility) and regulatory frameworks, which can stimulate or counteract the adoption of the multi-
use concept.
2.3 References
Brandenburg, W 2012. Test location de Wierderij – an overview of one year of experiments, Neeltje Jans
16, September 2012. www.presentations-dlgbenelux.com/Congres/.../741 (last accessed: February
2014)
Brinkman AG 2013 Modelling the effects of mussel seed collectors on the Wadden Sea ecosystem.
IMARES Report C061/13.
Buck, BH 2004. The offshore ring: a new system design for the open ocean aquaculture of macroalgae.
Journal of Applied Phycology 16, 355-368.
Burg, S van den, M Stuiver, F Veenstra, P Bikker, A López Contreras, A Palstra, J Broeze, H Jansen, R
Jak, A Gerritsen, P Harmsen, J Kals, A Blanco, W Brandenburg, M van Krimpen, A-P van Duijn, W
Mulder, L van Raamsdonk 2013. A Triple P review of the feasibility of sustainable offshore seaweed
production in the North Sea. Wageningen, Wageningen UR (University & Research centre). LEI report
13-077.
COEXIST 2011. Stakeholder map and database for each case study area: identification of stakeholder
issues and interactions. (COEXIST project). Deliverable D2.1. October 2011.
Efro-MCN program http://www.maritimecampus.nl/en/projects.
IBN 2015. Integral Management plan for the North Sea 2015. (Dutch: Integraal Beheerplan Noordzee
2015). Ministry of Infrastructure and Environment.
Krause G, RM Griffin & BH Buck 2011. Perceived Concerns and Advocated Organisational Structures of
Ownership Supporting ‘Offshore Wind Farm – Mariculture Integration’. From: Turbine to Wind Farms
- Technical Requirements and Spin-Off Products, Dr. Gesche Krause (Ed.), ISBN: 978-953-307-237-
1. InTech; available from: http://www.intechopen.com/books/from-turbine-to-wind-farms-technical-
requirements-and-spin-off-products/perceived-concerns-and-advocated-organisational-structures-of-
ownership-supporting-offshore wind-far
16 of 117 Report number C056/14
MERMAID 2013. Stakeholder views. Innovative Multi-purpose off-shore platforms: planning, design and
operation” (MERMAID project) Deliverable D2.2, April 2013. www.mermaidproject.eu
Policy Note North Sea (Beleidsnota Noordzee) 2009-2015. 22 December 2009.
http://www.rijksoverheid.nl/documenten-en-publicaties/kamerstukken/2009/12/22/d-beleidsnota-
noordzee-pdf.html (last accessed: 26 August 2013)
Reith JH, EP Deurwaarder, K Hemmes, APWM Curvers, P. Kamermans, W Brandenburg & G Zeeman
2005. BIO-OFFSHORE; grootschalige teelt van zeewieren in combinatie met offshore windparken in
de Noordzee. ECN report ECN-C--05-008.
Schellekens T, M van Stralen, J Kesteloo-Hendrikse, A Smaal 2013. Analyse historische data
Oosterschelde en Waddenzee. IMARES Rapport C189/13 (in Dutch).
Smaal AC, Schellenkes T, Van Stralen MR and Kromkamp JC, 2013. Decrease of the carrying capacity of
the Oosterschelde estuary (SW Delta, NL) for bivalve filter feeders due to overgrazing. Aquaculture
404-405: 28-34
Stuiver, M., Agricola, H., Fontein, R.J., Gerritsen, A.L., Kersten, P,H., en Kselik, R.A.L. 2012.
Multifunctionele Platforms op Zee. Het concept, de wet en regelgeving en de lessen voor de
toekomst. Wageningen, Alterra-rapport 2364.
Verhaeghe D, D Delbare, H Polet 2011. Haalbaarheidsstudie van geselecteerde passieve visserij –
methodes en maricultuur in de omgeving van windmolenparken in de Noordzee (Maripas).
Rapportnummer D/2011/10.970/99, ILVO; mededeling nr. 99; ISSN 1784-3197.
Report number C056/14 17 of 117
3 Offshore wind energy production
3.1 Dutch energy policy
The development of wind farms in the Netherlands is inseparable from the Dutch energy policy, which
aims at stimulating sustainable energy to meet the targets under the Kyoto Protocol. In the early years
of the energy discussion (2001-2004)11, offshore wind was considered to contribute largely to achieving
these policy objectives. In 2008, the Dutch government set itself the goal to realize, by 2020, an overall
production capacity of 6,000 MW of wind energy on land (Rijksoverheid 200812). A clear commitment for
offshore wind energy, however, was not there: a target for offshore wind was lacking in that plan. In
2010, the Dutch government appointed the taskforce ‘Wind Energy at Sea’ in support of meeting this
goal. The taskforce identified a number of bottlenecks, especially related to the supply and investment
chain capacity (Taskforce Windenergie op Zee 2010; Price Waterhouse Coopers 2011)
The development of offshore wind farm technology faces enormous challenges, implying huge costs, and
thus initially calling for public subsidies. In the Netherlands, the SDE+ program13 provides subsidies for
sustainable energy projects, but in 2012, offshore wind projects were expelled from this program. It was
argued that offshore wind was too expensive compared to other methods of energy production and that
the offshore wind energy sector should first focus on technical innovation and cost reduction. Nowadays
offshore wind energy still costs about 13.5-15 Euro cent/kWh14, which can be twice as much as onshore
wind energy. A newspaper article from December 2013 on wind energy even reported 17 Euro cent/kWh,
being 10 cent above the costs for energy from coal.15 In 2013, the SDE+ program has reopened again
for offshore wind energy projects; this triggered critical evaluations of the Central Bureau of Statistics
(CBS) and another Dutch research institute (Planbureau voor de Leefomgeving, PBL16), as they doubt
the efficiency of wind energy in general (onshore and offshore). According to the CBS, the recent wind
energy calculations are based on assumptions that are too favorable17. A study of the Dutch Ministry of
Economic Affairs on the costs and benefits of energy and climate policy is critical of the costs and the
effect on CO2 reduction by renewable energy such as wind power (CPB 2013). Despite all calculations, it
is clear that there are conflicting messages and large uncertainties about the cost-effectiveness of wind
energy.
11 In 2001, a management agreement on wind energy development was signed in the Netherlands (in Dutch:
“Bestuursovereenkomst Landelijke Ontwikkeling Windenergie (BLOW akkoord)”): www.infomil.nl/publish/pages/86443/blow_akkoord_2001.pdf; last accessed March 2014.
12 Rijksoverheid 2008: Nationaal Plan van Aanpak Windenergie: http://www.rijksoverheid.nl/documenten-en-publicaties/brochures/2011/03/01/nationaal-plan-van-aanpak-windenergie.html, last accessed March 2014.
13 SDE = Stimulering Duurzame Energie (in English: Stimulation of sustainable energy); successor to the MEP-programme (MEP = Milieukwaliteit Electriciteitsproductie).
14 ECN calculations for the purpose of SDE+ 2014; http://www.energiebusiness.nl/2013/05/17/ecn-wind-op-land-veel-goedkoper-dan-zonne-energie/, last accessed March 2014.
15 “Zeewind vergt nog heel wat”, Volkskrant 21 December 2013. 16 The PBL Netherlands Environmental Assessment Agency is the national institute for strategic policy analysis
in the fields of environment, nature and spatial planning.
17 CBS Statline: http://www.cbs.nl/enGB/menu/themas/industrieenergie/publicaties/artikelen/archief/2011/ 2011-3321-wm.htm?Languageswitch=on, last accessed March 2014.
18 of 117 Report number C056/14
The Dutch government is currently funding studies that investigate additional renewable energy
possibilities and measures. One study examines whether offshore wind farms could be given permits
closer to the coast, i.e. in the 12 NM zone (Quickscan Haalbaarheidsstudie 201318; Leopold et al. 2013a,
b). Up to now, territorial waters have been excluded from wind farm development because of too many
objections (for example visual pollution) raised by coastal inhabitants, environmental NGOs, etc. The
stimulatory effect of a policy that allows wind farms in the 12 NM zone, arises from the fact that near
shore constructions are more economical due to shorter cable routes and lower transportation costs. On
the other hand, there are many use functions near the coast, and there is a risk that wind farms
negatively impact the natural environment.
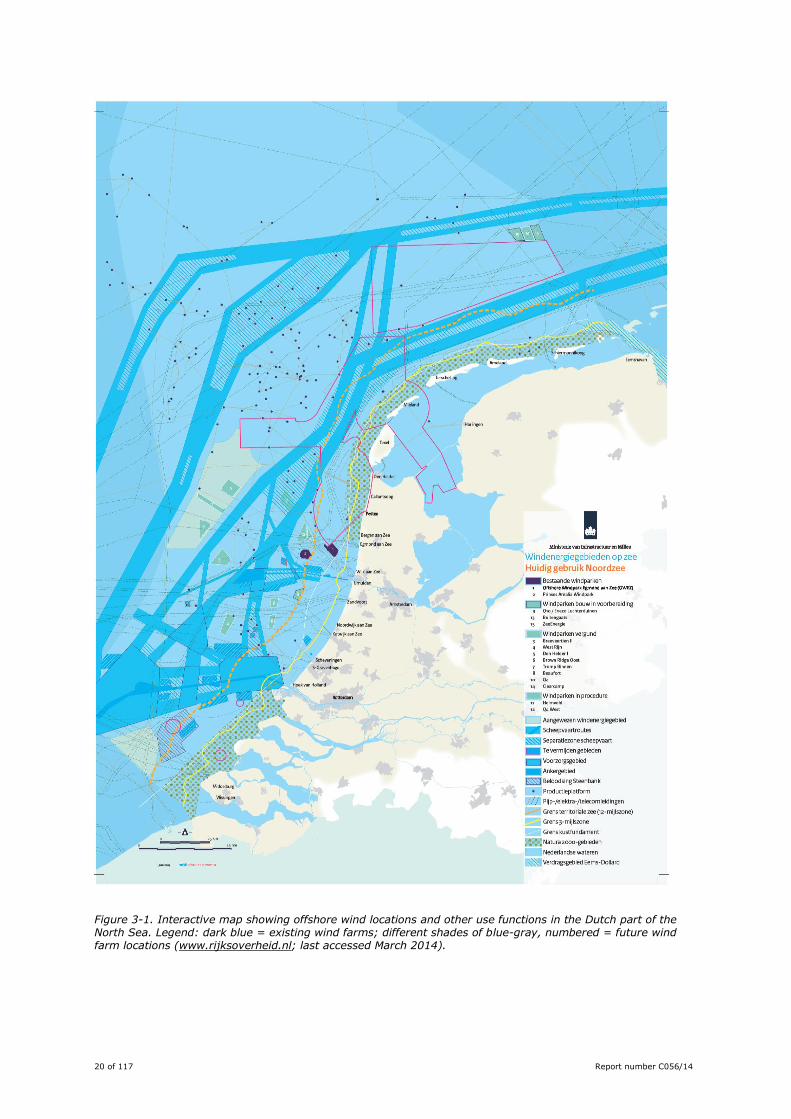
The development of offshore wind farms in the Dutch part of the North Sea can best be described when
looking at the different ‘permit rounds’ in which the wind farms were and are to be realized (see Box).
The interactive map (Figure 3-1), managed by the government, presents an overview of the existing and
future Dutch wind farms in various stages of planning and development19.
18 www.rijksoverheid.nl/documenten-en-publicaties/rapporten/2013/06/27/quickscan- haalbaarheidsstudie-
windparken-binnen-12-mijlszone.html; last accessed March 2014. 19 Since the status of marine areas designated for wind farm development can change rapidly, we also like to
refer to http://www.4coffshore.com/windfarms/windfarms.aspx?windfarmid=NL18 for the most up-to-date maps on and descriptions of offshore wind energy development in the North Sea.
Report number C056/14 19 of 117
20 www.noordzeewind.nl 21 www.prinsesamaliawindpark.eu/nl/index.asp 22 www.typhoonoffshore.eu/projects/gemini 23 http://projecten.eneco.nl/eneco-luchterduinen/Pages/default.aspx 24 http://cdn.vanoord.com 25 http://www.typhoonoffshore.eu/projects/gemini/ 26 https://data.overheid.nl/data/search?f[0]=tags%3Awindgebied 27 https://zoek.officielebekendmakingen.nl/kst-33561-1.html 28 In Dutch: NWP = Nationaal Waterplan. http://www.rijksoverheid.nl/onderwerpen/water-en-
veiligheid/documenten-en-publicaties/rapporten/2009/12/01/nationaal-waterplan-2002015%5B2%5D.htmllast accessed March 2014
29 See http://www.4coffshore.com/windfarms/support-structures-for-offshore-wind-turbines- aid268.html for
more information on the different types of wind farm foundations, e.g. jacket or lattice structures: http://www.4coffshore.com/windfarms/jacket-or-lattice-structures-aid271.html
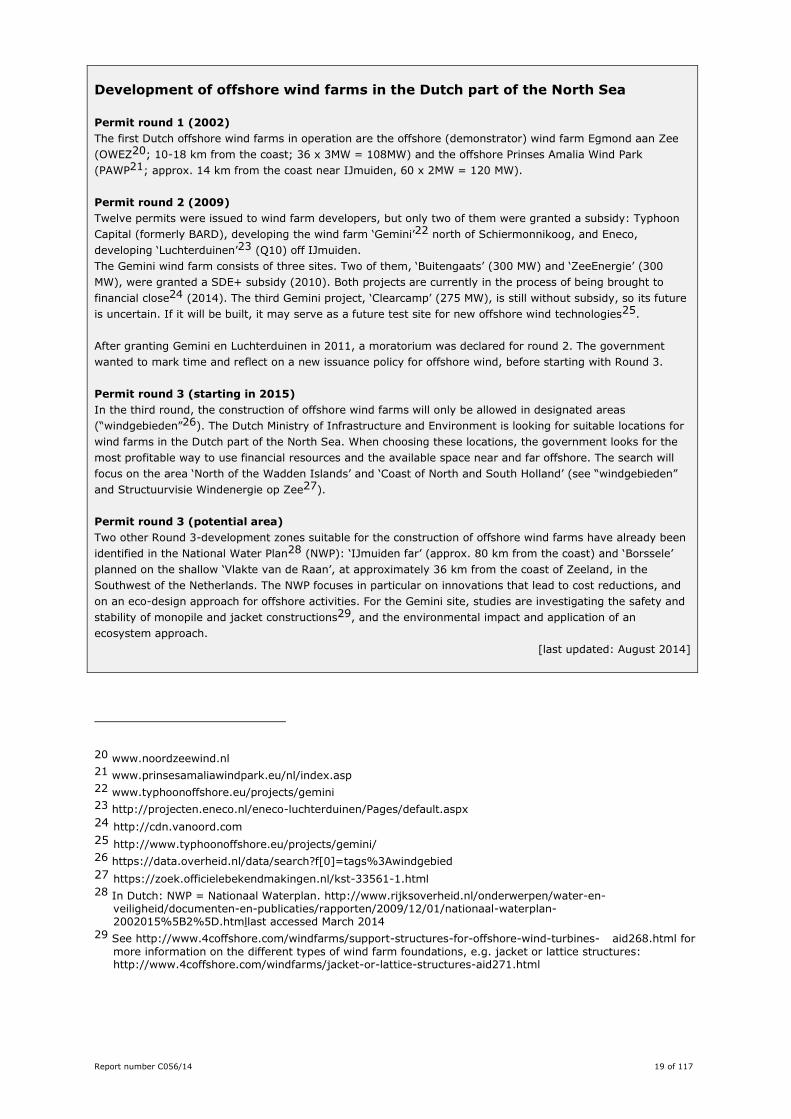
Development of offshore wind farms in the Dutch part of the North Sea
Permit round 1 (2002)
The first Dutch offshore wind farms in operation are the offshore (demonstrator) wind farm Egmond aan Zee
(OWEZ20; 10-18 km from the coast; 36 x 3MW = 108MW) and the offshore Prinses Amalia Wind Park
(PAWP21; approx. 14 km from the coast near IJmuiden, 60 x 2MW = 120 MW).
Permit round 2 (2009)
Twelve permits were issued to wind farm developers, but only two of them were granted a subsidy: Typhoon
Capital (formerly BARD), developing the wind farm ‘Gemini’22 north of Schiermonnikoog, and Eneco,
developing ‘Luchterduinen’23 (Q10) off IJmuiden.
The Gemini wind farm consists of three sites. Two of them, ‘Buitengaats’ (300 MW) and ‘ZeeEnergie’ (300
MW), were granted a SDE+ subsidy (2010). Both projects are currently in the process of being brought to
financial close24 (2014). The third Gemini project, ‘Clearcamp’ (275 MW), is still without subsidy, so its future
is uncertain. If it will be built, it may serve as a future test site for new offshore wind technologies25.
After granting Gemini en Luchterduinen in 2011, a moratorium was declared for round 2. The government
wanted to mark time and reflect on a new issuance policy for offshore wind, before starting with Round 3.
Permit round 3 (starting in 2015)
In the third round, the construction of offshore wind farms will only be allowed in designated areas
(“windgebieden”26). The Dutch Ministry of Infrastructure and Environment is looking for suitable locations for
wind farms in the Dutch part of the North Sea. When choosing these locations, the government looks for the
most profitable way to use financial resources and the available space near and far offshore. The search will
focus on the area ‘North of the Wadden Islands’ and ‘Coast of North and South Holland’ (see “windgebieden”
and Structuurvisie Windenergie op Zee27).
Permit round 3 (potential area)
Two other Round 3-development zones suitable for the construction of offshore wind farms have already been
identified in the National Water Plan28 (NWP): ‘IJmuiden far’ (approx. 80 km from the coast) and ‘Borssele’
planned on the shallow ‘Vlakte van de Raan’, at approximately 36 km from the coast of Zeeland, in the
Southwest of the Netherlands. The NWP focuses in particular on innovations that lead to cost reductions, and
on an eco-design approach for offshore activities. For the Gemini site, studies are investigating the safety and
stability of monopile and jacket constructions29, and the environmental impact and application of an
ecosystem approach.
[last updated: August 2014]
20 of 117 Report number C056/14
Figure 3-1. Interactive map showing offshore wind locations and other use functions in the Dutch part of the North Sea. Legend: dark blue = existing wind farms; different shades of blue-gray, numbered = future wind farm locations (www.rijksoverheid.nl; last accessed March 2014).
Report number C056/14 21 of 117
3.2 Government and sectoral initiatives in the Netherlands
Green deal 3.2.1
In 2011, the government and the Netherland Wind Energy Association (NWEA) signed a Green
Deal. They strive for a 40% cost reduction of offshore wind energy in 2020 (meant are the total costs per
MWh). The Green Deal describes the agreed input and actions to be taken by the government and NWEA
to meet this goal. Proposed actions are: improving the licensing process, stimulation of innovation,
promotion of offshore wind energy, drawing up of legislation to create electrical grids and the possible
construction of an experimental and demonstrator wind farm30. Up to now, the turnaround time from
first initiative to an operational wind farm is about ten years. The new policy intends to shorten the
turnaround time. The government is ready to fund innovative research on cost reduction but will only
grant SDE+ subsidies on the condition that the agreed cost reduction of 40% is achieved.31
Far Large Offshore Wind (FLOW) program 3.2.2
Due to limitations such as shipping routes, oil and gas platforms, visual impact and ecological effects,
only 2,000-3,000 MW of the 6,000 MW, projected to be achieved in Dutch waters by 2020, can be
installed within 50-60 km from the coast. The remaining capacity will have to be installed far offshore, in
water depths of more than 30 m. These are challenging conditions. Worldwide, there is little knowledge
and experience on how to build and operate a wind farm far offshore and at great depths. A fully
commissioned initiative to examine the feasibility and benefits of a deepwater wind farm is the
demonstrator project ‘Beatrice’32 near the Beatrice oil field 22 km offshore in the Moray Firth, which is a
Special Area of Conservation. By 2017, two 5 MW turbines with a total turbine height of 170 m will be
operational. The turbines are fixed to the ground at a notable depth of 45 m.
In a similar way, in 2009, nine Dutch companies and knowledge institutes took up the challenge and
established the FLOW group (Far Large Offshore Wind33). The main objective of FLOW is to speed up the
deployment of (far) offshore wind energy production. Future wind farms will be built up to 75 km
offshore, mostly in more than 30 m water depth. Currently, most turbines are founded on monopiles
which are less/not suitable for locations farther offshore. Therefore, in the future, more resistant
foundation types, such as gravity based or floating, will have to be built there.
To achieve these challenges, a significant reduction of costs and risks of far-offshore wind energy is
necessary; FLOW aims at a reduction of more than 20% to improve commercial viability of offshore wind
energy. Cost and risk reduction requires the development of specific far-offshore competences.
30 The wind energy sector has already drawn up a project proposal called ‘Leeghwater-project’, which is
partially a demonstrator wind farm for those innovations that can already bring down the costs, and partially testing ground for the effective market launch of promising innovations which are still under development.
31 Letter of Minister Kamps to the parliament: ‘Energieakkoord voor Duurzame Groei’; 6 september 2013; overheidsidentificatienr. 00000001003214369000; en ‘Beantwoording vragen over het bericht dat overheidssubsidie voor duurzame energie moet worden beperkt tot bedrijven die nieuwe productiemethodes introduceren’; 9 december 2013; overheidsidentificatienr. 00000001003214369000
32 http://www.beatricewind.co.uk/home/default.asp; last accessed March 2014 33 http://flow-offshore.nl; last accessed March 2014
22 of 117 Report number C056/14
The FLOW group has drawn up a Research and Development (R&D) plan that promotes the development
of new technologies onshore and near-shore as well as a far-offshore demonstrator wind farm.
Meanwhile, the ideas of the FLOW program have been incorporated into the project document of the
public/private-partnership ‘TKI Wind at sea’34, which has been submitted for government subsidy.
Dutch national energy agreement 3.2.3
In July 2013, the responsible Dutch ministers and several union representatives, employers and
environmental groups have reached an agreement on clean technology, saving energy and climate
policy. They expect the agreement to lead to billions of euros of investment and a fully sustainable Dutch
energy market by 2050. It involves the setting up of a special fund to pay for energy efficiency measures
and a major focus on offshore wind energy production. However, the agreement implies a 3-year delay
of the deadline to achieve at least 16% of energy from sustainable sources (i.e., from 2020 to 2023).
Despite the clear vote for renewable energy sources, (offshore) wind energy will have to compete with
other ways of generating renewable energy. Therefore the toughest challenge for the wind energy sector
remains cost reduction.
3.3 Operation and maintenance of offshore wind farms
In this paragraph we elaborate on some technological and logistical problems the Dutch offshore wind
industry will have to solve - alone or jointly with other (potential) users – in order to achieve substantial
cost reduction. Large offshore wind farms farther off the cost pose high expectations because of higher
average wind speeds and hence greater wind energy yield (in terms of megawatts per capital). These
conditions entail additional challenges in logistics, though. It is precisely these logistical problems where
most likely synergy benefits can be achieved.
Accessibility of offshore wind farms 3.3.1
The offshore marine environment is characterized by harsh conditions. Project developers of offshore
wind farms have to cope with many logistical and safety issues that developers of wind energy projects
on land do not have to contend with, or at least not to the same extent. Operation and maintenance
costs make up 25-30% of the total costs of an offshore wind farm (Miedema 2012, cf. chapter 7.1). This
is almost as much as the cost of the wind turbines only, or about as much as the costs of construction
and installation. Offshore wind turbines currently require about five site visits per year35. With
technological progress, this can potentially be reduced to three visits per year. Nonetheless, a future
offshore wind farm comprising 200 turbines of 5 MW each will need some 3,000 offshore visits per year.
Operation and maintenance (O&M) visits are carried out by boat or helicopter, which means that the
personnel performing the repair, has to climb onto the turbines. Especially in rough conditions –
helicopters for example are used at wind speeds of up to 20 m/s – this is a risky undertaking. Systems
need to be developed to ensure the safety of staff and to expand workability. In the future, certain
maintenance tasks may also be carried out remotely (see DOWES, section 3.3.4).
34 Innovatiecontract Wind op Zee, 2012: http://www.agentschapnl.nl/programmas-regelingen/tender-tki-wind-
op-zee, last accessed March 2014. 35 http://www.noordzeewind.nl/elektriciteit/onderhoud/; last accessed March 2014
Report number C056/14 23 of 117
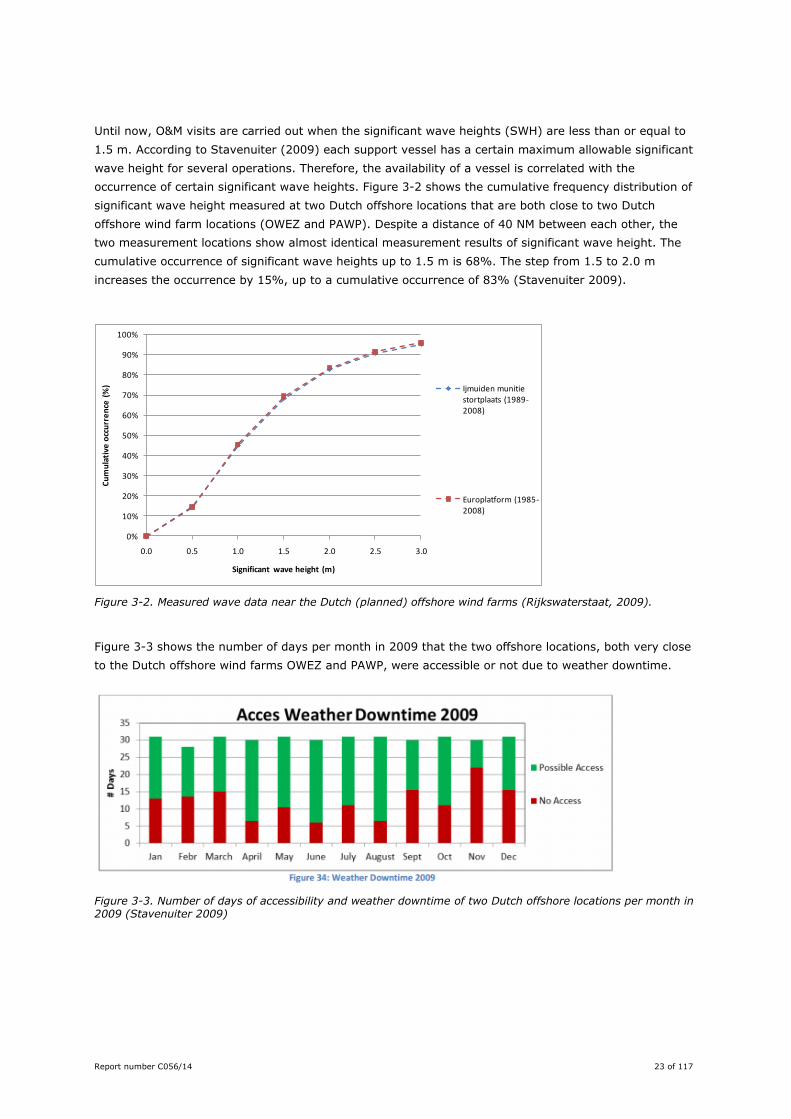
Until now, O&M visits are carried out when the significant wave heights (SWH) are less than or equal to
1.5 m. According to Stavenuiter (2009) each support vessel has a certain maximum allowable significant
wave height for several operations. Therefore, the availability of a vessel is correlated with the
occurrence of certain significant wave heights. Figure 3-2 shows the cumulative frequency distribution of
significant wave height measured at two Dutch offshore locations that are both close to two Dutch
offshore wind farm locations (OWEZ and PAWP). Despite a distance of 40 NM between each other, the
two measurement locations show almost identical measurement results of significant wave height. The
cumulative occurrence of significant wave heights up to 1.5 m is 68%. The step from 1.5 to 2.0 m
increases the occurrence by 15%, up to a cumulative occurrence of 83% (Stavenuiter 2009).
Figure 3-2. Measured wave data near the Dutch (planned) offshore wind farms (Rijkswaterstaat, 2009).
Figure 3-3 shows the number of days per month in 2009 that the two offshore locations, both very close
to the Dutch offshore wind farms OWEZ and PAWP, were accessible or not due to weather downtime.
Figure 3-3. Number of days of accessibility and weather downtime of two Dutch offshore locations per month in 2009 (Stavenuiter 2009)
0%
10%
20%
30%
40%
50%
60%
70%
80%
90%
100%
0.0 0.5 1.0 1.5 2.0 2.5 3.0
Cu
mu
lati
ve o
ccu
rre
nce
(%
)
Significant wave height (m)
Ijmuiden munitie stortplaats (1989-2008)
Europlatform (1985-2008)
24 of 117 Report number C056/14
The chance for larger wave heights will require new systems for safe O&M personnel transfer. If transfers
are to be restricted to wave heights of 1.5 m, this will limit offshore work to about 200 days a year
(Noordzeewind 2010, Miedema 2012). Noordzeewind (2010) estimated a total of approximately 218
possible access days in 2009, and the remaining time of the year was considered non-productive time
(‘weather downtime’) in 2009. Increasing the workable significant wave height from 1.5 to 2 m, could
increase the accessibility of wind farms by 15% (Stavenuiter 2009). An increase of the safe working
wave height to 3 m and above could increase the number of days available for transfers up to 310 days
per year. Hence, increasing overall accessibility can lead to cost reduction of wind energy production. To
achieve this, new ships with motion stabilizers are required to guaranty safe transfers of personnel and
material. Current solutions are offshore access systems such as ‘Ampelmann’, a motion compensated
access system, which enable safe operations, when applicable related to wave height and ship capability.
But even if these new systems for operating in far-offshore conditions are developed, a constant
shuttling of workboats to and from the coast is impractical and costly. Therefore, developers and offshore
service providers are looking for new methods, one of which is the 'mother ship' approach. A single large
vessel would then service one or more offshore wind farms staying in the neighbourhood of these farms
for long periods of time and deploying multiple smaller craft for daily servicing.
Infrastructure for cabling and cable repair 3.3.2
Up to now, there are neither standardized practices nor procedures to procure cables as well as sharing
cabling equipment, ships, and all other elements necessary for a safe and speedy repair. If developers
were more willing to collaborate with each other, to share facilities, vessels, and their particular
knowledge, this could lead to far more efficient procedures through economies of knowledge. So far, the
desire to keep cable choices and technologies confidential, prevailed over the opportunity to develop a
more efficient infrastructure for joint installation and maintenance or repair of cables. But these facilities
will be necessary as bases for long-range offshore vessels and to service the offshore wind farms closer
to the shore. Especially with future FLOW farms, it could be a unique asset to have manufacture and
dedicated repair and storage facilities for spare parts closer to the FLOW sites. Despite the benefits to be
expected, it is far from certain whether developers and offshore operators are willing to pay for collective
facilities that they may not need to use.
Trained staff 3.3.3
To keep up with developments, companies will need to permanently invest in capacity building and
training to ensure that sufficiently skilled O&M personnel are available. This holds even more for FLOW
farms. A rough calculation suggests that one O&M job will be created for every two turbines installed.
With 200 turbines of 5 MW each, this equates to a need of about 100 FTE of trained staff. Even if this
calculation is conservative, and the number of staff can be reduced through greater efficiency, there will
still be a huge need for skilled personnel. To meet that demand, operators and developers will have to
set up offshore training centers and training programs. It would not be wise, if they do this just for their
own purposes. As with the cabling sector, it is obvious that collaboration and joint financing have great
advantages.
Report number C056/14 25 of 117
Dutch Offshore Wind Energy Services (DOWES) 3.3.4
There are three lines of intervention in a wind farm: first, scanner control with remote management;
second, helicopter intervention; and third, heavy lift operations. Reactive maintenance, e.g. arranging a
site visit if a turbine stops working, is always expensive and can sometimes be impossible; for instance,
in bad weather conditions or if boats and crew are unavailable. This dependence on weather, crew, and
boat availability increases the risk of an expensive wind generation asset being unable to produce
electricity for weeks or even months. Predictive maintenance, i.e. remote surveillance, can help in
constant monitoring and real time information about what is happening at a site. Key to such planned
predictive maintenance is the increased deployment of sensors in offshore wind turbines. Modern
offshore wind turbines, particularly those that are custom built for offshore, will contain a huge number
(>1000) of sensors in key components. The ongoing Dutch Offshore Wind Energy Services (DOWES36)
project focuses on developing an innovative ICT system to manage offshore wind parks in the Den
Helder region (2008-2014). The DOWES management plan aims to lead to high wind farm availability at
minimum cost. The ICT system will be capable of reading the sensors on the wind turbines using remote
control, making use of the most up-to-date science.
It is possible to manage and maintain offshore wind parks in various ways. DOWES aims to safeguard
offshore wind parks from a distance/at land. Constant monitoring of the state of the wind turbines can
facilitate timely information of the right people. This can aid in making cost-effective choices and carrying
out maintenance optimally. In the long run such systems are expected to increase the manageability of
offshore wind parks and reduce maintenance costs.
3.4 References
Note: see ANNEX A for more electronic references.
Burg, S. van den, M. Stuiver, F. Veenstra, P. Bikker, A. López Contreras, A. Palstra, J. Broeze, H. Jansen,
R. Jak, A. Gerritsen, P. Harmsen, J. Kals, A. Blanco, W. Brandenburg, M. van Krimpen, A.-P. van
Duijn, W. Mulder, L. van Raamsdonk 2013. A Triple P review of the feasibility of sustainable offshore
seaweed production in the North Sea. Wageningen, Wageningen UR (University & Research centre).
LEI report 13-077.
CPB 2013. Windenergie op de Noordzee; een maatschappelijke kosten-batenanalyse.
www.cpb.nl/publicatie/windenergie-op-de-noordzee-een-maatschappelijke-kosten-batenanalyse
Innovatiecontract Wind op Zee 2012. http://www.agentschapnl.nl/programmas-regelingen/tender-tki-
wind-op-zee
Leopold M.F., Dijkman E.M., Winter E., Lensink R. & Scholl M.M. 2013a. "Windenergie binnen 12 mijl" in
relatie tot ecologie. IMARES Rapport C034b/13.
Leopold M.F., 2013b, M.M. Scholl, R.S.A. van Bemmelen, S.M.J.M. Brasseur, J.S.M. Cremer, S.C.V.
Geelhoed, Lucke, K, S. Lagerveld & H.V. Winter. Haalbaarheidsstudie wind op zee: vijf potentiële
zoekgebieden binnen de 12-mijlszone vergeleken in relatie tot beschermde natuurwaarden. Rapport
C132/13
36 DOWES = Dutch offshore wind energy services: www.dowes.nl; last accessed March 2014.
26 of 117 Report number C056/14
Lindeboom H.J., Kouwenhoven H.J., Bergman M.J.N., Bouma S., Brasseur S., Daan R., Fijn R.C., de Haan
D., Dirksen S., van Hal R., Hille Ris Lambers R. ter Hofstede R., Krijgsveld K.L., Leopold M. &
Scheidat M. 2013. Short-term ecological effects of an offshore wind farm in the Dutch coastal zone;
a compilation. Environ. Res. Lett. 6 (2011) 035101 (13pp). doi:10.1088/1748-9326/6/3/035101.
Mann, J. & J. Teilmann 2013. Environmental impact of wind energy. Environmental Research Letters
8(3): 035001.
Miedema, R. 2012. Research: Offshore Wind Energy Operations & Maintenance Analysis, MSc Thesis,
Hogeschool van Amsterdam. 82 p.
Ministerie van Economische Zaken 2010. Taskforce Windenergie op Zee. Ministerie van Economische
Zaken. Eindrapportage 2010.
Ministerie I&M 2013. Quickscan haalbaarheidsstudie windparken binnen 12-mijlszone.
Nationaal Plan van Aanpak windenergie 2008; www.rijksoverheid.nl/.../nationaal-plan-van-aanpak-
windenergie/11br20..
Noordzeewind 2010. Operations Report 2009. OWEZ-R_000_20101112. 32 p. www.noordzeewind.nl
PriceWaterhouseCoopers 2009. Crisis or not, renewable energy is hot - to reap the rewards,
governments and compagnies should act now, PriceWaterhouseCoopers, Maart 2009.
PriceWaterhouseCoopers 2011. Windenergie op zee. Een vergelijking van verschillende PPS constructies
voor windenergie op zee. Definitief rapport, 2011-0731/FK/hyo/ns, 6 april 2011, 128 p.
Taskforce Windenergie op Zee 2010 (Ministerie van Economische Zaken). Eindrapport Taskforce
Windenergie op Zee mei 2010. 56 p.
TKI wind op zee 2013. How Dutch innovations support 40% cost price reduction. 13 June 2013:
http://www.tki-windopzee.nl/files/2013-
07/General%20Presentation%20TKI%20Wind%20op%20Zee%20%283%29.pdf
Stavenuiter W. 2009. The missink link in the offshore wind industry: offshore wind support ship. Report
SDPO.09.020.m Master Thesis TUD. 114 p.
Report number C056/14 27 of 117
4 Offshore aquaculture
4.1 Potential for offshore aquaculture
Aquaculture within offshore wind farms has been identified as one of the many possibilities of smart use
of marine space, leading to opportunities for innovative entrepreneurship. Although the combination of
offshore wind energy and offshore aquaculture is increasingly seen as worthy to be explored (chapter 2),
the aquaculture sector – in order to be recognized as a potential partner – still has to demonstrate that
aquaculture in Dutch offshore areas is feasible in the first place. This is not an easy task since offshore
areas for aquaculture are exposed to a wide range of oceanographic conditions, such as high currents
and high wave action (Ryan 2004). Aquaculture in offshore areas therefore faces major challenges
compared to coastal (and land based) aquaculture. Ships are required to transport all inputs to and from
the farm, resulting in higher operational costs than for coastal aquaculture sites. Besides these costs
there is an increased risk of natural influences, such as rough seas and storms. Nevertheless, there are
positive assets to offshore aquaculture as well. The main reasons to develop offshore aquaculture are the
often favorable conditions for growth due to water depth and hydrodynamics (e.g. quick nutrient input
and waste dispersal), and less potential for disease spread, pollution and agricultural interactions.
Offshore areas potentially pose less conflict with co-users than onshore. With increasing marine activities
and uses, however, this situation is currently changing. Open water aquaculture interacts with the
surrounding ecosystem and the aim for offshore aquaculture is therefore not only to develop technically
and economically feasible systems but also to develop ecologically sustainable production systems.
Aquaculture is a broad term and includes the culture of fin fish, crustaceans, bivalves, and aquatic
plants, as well as other emerging culture species. Generally we distinguish between culture types based
on the feed requirements of the species. Fish culture typically relies on external feed supply (fed species)
while bivalves and seaweeds (extractive species) rely on naturally available resources. At this moment,
mainly because of technical reasons, offshore aquaculture in the North Sea is absent.
In the next section we outline a selection of species with potential for offshore production in the Dutch
part of the North Sea.
4.2 Species selection for offshore aquaculture in the Dutch part of the North Sea37
Fish culture 4.2.1
Offshore fish culture started approximately 40 years ago in Asia, and soon after that a number of marine
species have been taken into production in fish cages. Many of these species are raised in specially
designed cages, of which the configuration depends on the fish species and the geographical location. In
2012, offshore fish culture was commercially performed in Australia, Canada, Chile, China, Croatia,
Greece, Ireland, Italy, Japan, Malta, New Zealand, Norway, Russia, the Shetland Islands, Spain and
Turkey. As to date, no fish culture activities take place in the open North Sea. The conditions in the North
Sea differ from the conditions in locations where typically most of the European aquaculture production is
realized nowadays (e.g. Norway, Mediterranean Sea).
37 This section is mainly based on Burg et al. (2013).
28 of 117 Report number C056/14
Therefore it is not possible to directly apply common culture techniques to the North Sea situation. A
study by Reijs et al. (2008) concluded that commercial fish culture appears to be challenging in the
Dutch North Sea as there are technical and biological constrains for most areas. The study took into
account the economic potential of finfish culture based on the biological growth performance. For
commercially interesting species temperature was found either too high in summer (e.g. for species like
cod) or too low in winter (e.g. for species like Bluefin Tuna), and the relative shallowness of the North
Sea does not allow culture cages to be submerged (minimum depth 40m) at most locations. Hence, just
a few sites are potentially suitable for fish culture, with a high estimated risk in terms of economic
feasibility38. At this moment the economic and technological advancements are not considered far
enough to overcome the biological boundaries for growth and production.
Bivalve culture39 4.2.2
Four shellfish species have been identified as ‘promising for culture in the Dutch North Sea’: the blue
mussel (Mytilus edulis), flat oyster (Ostrea edulis), Pacific oyster (Crassostrea gigas), and scallop (Pecten
maximus) (Reijs et al. 2008). In the current study we focus on mussel culture because this is an
important and well established industry in the Netherlands. The Dutch mussel culture sector has an
average yearly production of 50,000-60,000 tons40, but the total production ambition is 100,000 tons;
the difference is currently partially supplied by import of mussels from other EU member states (BluePort
Oosterschelde innovation program 2012). There is commercial interest to expand mussel culture from
the Wadden Sea and Delta towards offshore areas, as carrying capacity and environmental pressure
hinder further direct production growth in the former mentioned areas (Sas 2011). Theoretically it is
possible to culture mussels at any location in the Dutch North Sea. There are pilot scale examples in
other countries providing some data and reference material for mussels (UK, Canada, New Zealand),
while information on e.g. suspended offshore oyster and scallop culture are currently not available. Note
that the research on offshore mussel culture is dominated by reviews and desk studies. Only few
resources have been invested in field-scale trials to identify the best offshore production concepts,
thereby improving the quality of the knowledge to the current topic. Commercially viable culture systems
for offshore production of mussels are in operation for green lipped mussels in New Zealand (Cheney et
al. 2012). There are initiatives for pilot scale offshore mussel culture in Belgium, Germany, UK, Ireland,
Denmark, France, Italy (for details see Kamermans et al. 2011), but technical feasibility at commercial
scale still needs to be proven.
Seaweed culture 4.2.3
Reith et al. (2005) concluded that Ulva sp., Laminaria sp. and Palmaria sp. have highest potential for
successful culture in the North Sea. This was confirmed by Burg et al. (2013) who performed a feasibility
study to further investigate the potential for offshore seaweed culture in the North Sea.
38 The German Thünen Institue currently carries out a study to develop criteria for the site selection for
offshore aquaculture systems in combination with offshore windfarms: http://www.ti.bund.de/index.php?id=4833&detail_id=238496&L=2&llang=en&stichw_suche=selection&zeilenzahl_zaehler=4
39 This section is based on/partially adopted from Burg et al. (2013). 40 Metric tons; not to be confused with “mosseltonnen” (Dutch for mussel tons) which is 100 kg.
Report number C056/14 29 of 117
Their study concluded that there is a significant potential for seaweed culture, however there are still
many unknowns, for example regarding technical solutions to large-scale commercial production,
variable chemical composition of seaweed, and therefore uncertainties concerning ways of processing.
These uncertainties and the large spread in production and processing estimates make it difficult to
project the economic feasibility of seaweed culture at this moment. A preliminary simulation exercise,
comparing scenarios of offshore mussel and offshore seaweed culture, is depicted in Annex C. This
exercise triggered us to focus our Blauwdruk business scenario on mussel aquaculture only. The
progressing research on seaweed culture should clarify the exact potential for future commercial sea
weed farming in the North Sea.
Bioremediation and integrated culture41 4.2.4
Marine protein production in open water systems per definition interacts with the surrounding aquatic
ecosystem. Whether and to what degree this affects ecological sustainability depends on the type of
culture and the extent of integration between different culture types and other activities. Extractive
species such as seaweeds and bivalves remove (in)organic nutrients from the water column; in coastal
eutrophic waters (rather coastal) they can therefore be applied as bioremediation measure. Lindal et al.
(2005) suggested nutrients can be removed from the water column by harvest of bivalves and they
proposed that bivalves therefore can be incorporated into a nutrient trading system as an alternative to
nutrient (nitrogen) reduction for improving coastal water quality. Similar concepts apply to seaweeds.
A special approach that exploits the extractive properties of bivalves and seaweed is Integrated Multi
Trophic Aquaculture (IMTA). In IMTA systems the extractive species are introduced to remove the excess
nutrients discharged from fish cage aquaculture (Figure 4-1) in order to create a more sustainable
production system and simultaneously increase the economic profitability. In open seas, IMTA fits with
the concept of ‘ecosystem based management’ as each activity is placed in a wider ecosystem context
and managed so that it contributes to the sustainable development (Ryther et al. 1975). However, as
concluded above, commercial fish culture in the North Sea seems unviable at this moment, which takes
away the principle basis for the IMTA approach in this area (that is, having a fed component). Figure 4-1
also shows that limited (bio-chemical) interaction between bivalves (shellfish) and seaweeds exists, as
they rely on different types of nutrients (organic versus inorganic, respectively) as food source.
Integrated production systems where two or more species are cultured at the same location without any
apparent positive or negative biological influence are often referred to as co-culture. Advantages for co-
culture are related to finding synergies in work-activities and expenses for the co-cultured cultivation
which may lead to increased economic benefits compared to single-species cultivation sites. Challenges
associated with IMTA and/or co-culture relate to 1) marketing and processing of two or more completely
different types of products, 2) variable nutrient removal by the extractive species, 3) mismatch in
seasonality and production rates of different trophic levels, 4) logistical problems associated with shared
space and equipment.
41 This section is based on Burg et al. (2013).
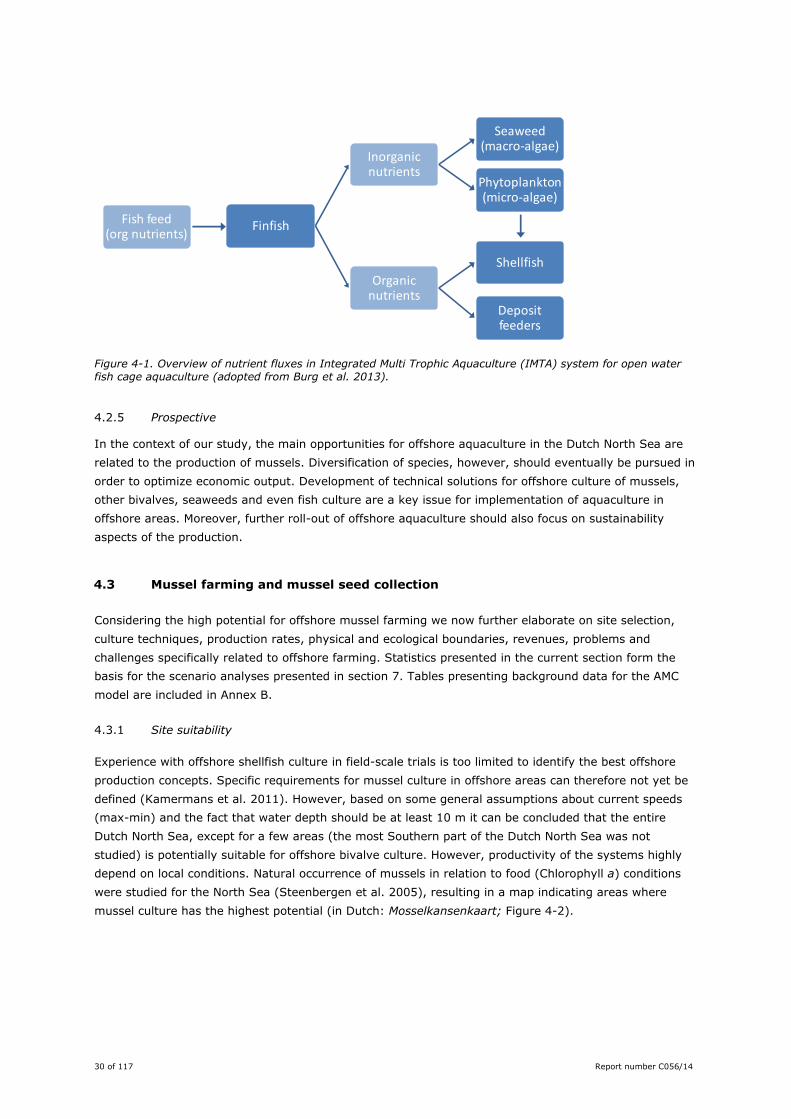
30 of 117 Report number C056/14
Figure 4-1. Overview of nutrient fluxes in Integrated Multi Trophic Aquaculture (IMTA) system for open water fish cage aquaculture (adopted from Burg et al. 2013).
Prospective 4.2.5
In the context of our study, the main opportunities for offshore aquaculture in the Dutch North Sea are
related to the production of mussels. Diversification of species, however, should eventually be pursued in
order to optimize economic output. Development of technical solutions for offshore culture of mussels,
other bivalves, seaweeds and even fish culture are a key issue for implementation of aquaculture in
offshore areas. Moreover, further roll-out of offshore aquaculture should also focus on sustainability
aspects of the production.
4.3 Mussel farming and mussel seed collection
Considering the high potential for offshore mussel farming we now further elaborate on site selection,
culture techniques, production rates, physical and ecological boundaries, revenues, problems and
challenges specifically related to offshore farming. Statistics presented in the current section form the
basis for the scenario analyses presented in section 7. Tables presenting background data for the AMC
model are included in Annex B.
Site suitability 4.3.1
Experience with offshore shellfish culture in field-scale trials is too limited to identify the best offshore
production concepts. Specific requirements for mussel culture in offshore areas can therefore not yet be
defined (Kamermans et al. 2011). However, based on some general assumptions about current speeds
(max-min) and the fact that water depth should be at least 10 m it can be concluded that the entire
Dutch North Sea, except for a few areas (the most Southern part of the Dutch North Sea was not
studied) is potentially suitable for offshore bivalve culture. However, productivity of the systems highly
depend on local conditions. Natural occurrence of mussels in relation to food (Chlorophyll a) conditions
were studied for the North Sea (Steenbergen et al. 2005), resulting in a map indicating areas where
mussel culture has the highest potential (in Dutch: Mosselkansenkaart; Figure 4-2).
Finfish
Inorganic nutrients
Seaweed (macro-algae)
Phytoplankton (micro-algae)
Organic nutrients
Shellfish
Deposit feeders
Fish feed (org nutrients)
Report number C056/14 31 of 117
Seed mussel collectors (SMCs) 4.3.2
Traditionally the Dutch shellfish sector has been based on culture and fishery on bottom plots. However,
since the last decade suspended culture systems (Seed Mussel Collectors – SMCs) have been taken into
use to relieve fishing pressure on natural seed beds. SMCs are mainly floating buoys and tubes on which
a collector substrate is deployed. This substrate may vary from a net (mesh size 10-15 cm) to different
types of collector ropes, e.g. (continuous) long lines. All systems are anchored using offshore anchors or,
more recently, using poles. The systems are deployed in the water from February till May. The SMCs are
inspected throughout the following months for growth and predation. SMCs applying nets as collector
substrate may be harvested (thinned out) once or twice during the process. All SMCs are harvested (end
product) between July and September/October; subsequently, the mussel seed is (most often)
transferred to the bottom plots in the Wadden Sea or Eastern Scheldt. In 2014, the first trials of SMC are
expected to be deployed in the North Sea “Voordelta”(cf. Figure 4-2).
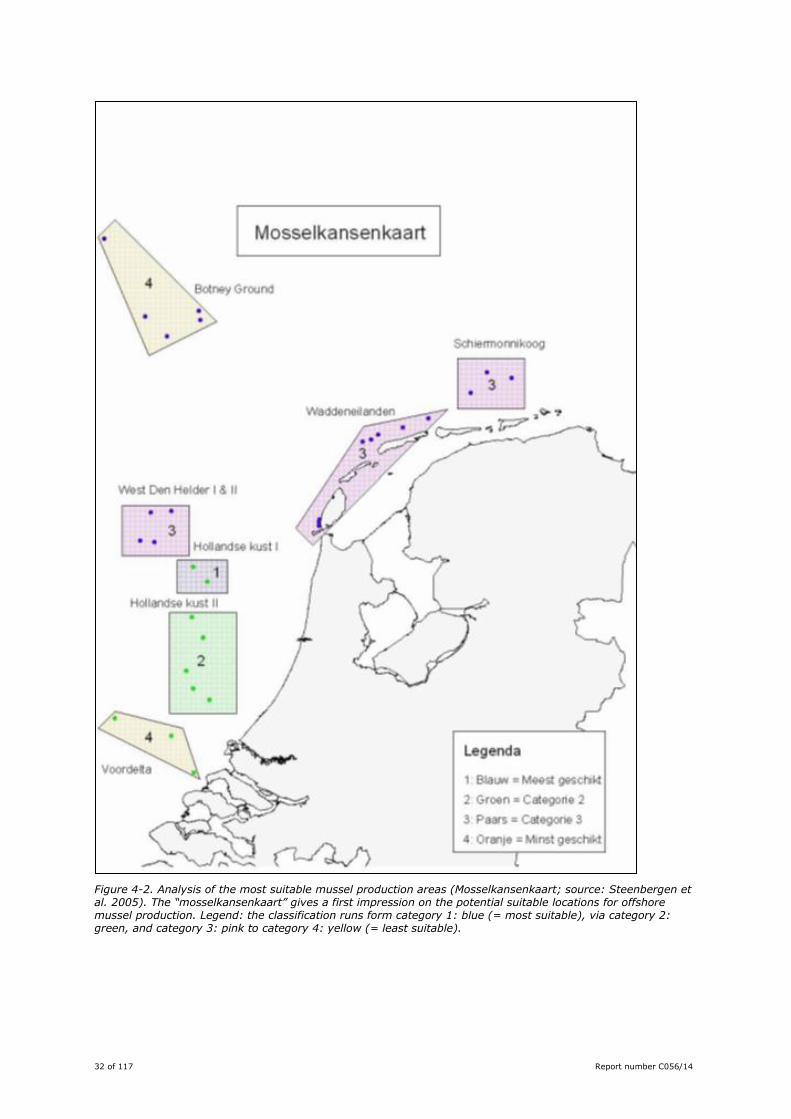
32 of 117 Report number C056/14
Figure 4-2. Analysis of the most suitable mussel production areas (Mosselkansenkaart; source: Steenbergen et al. 2005). The “mosselkansenkaart” gives a first impression on the potential suitable locations for offshore mussel production. Legend: the classification runs form category 1: blue (= most suitable), via category 2: green, and category 3: pink to category 4: yellow (= least suitable).
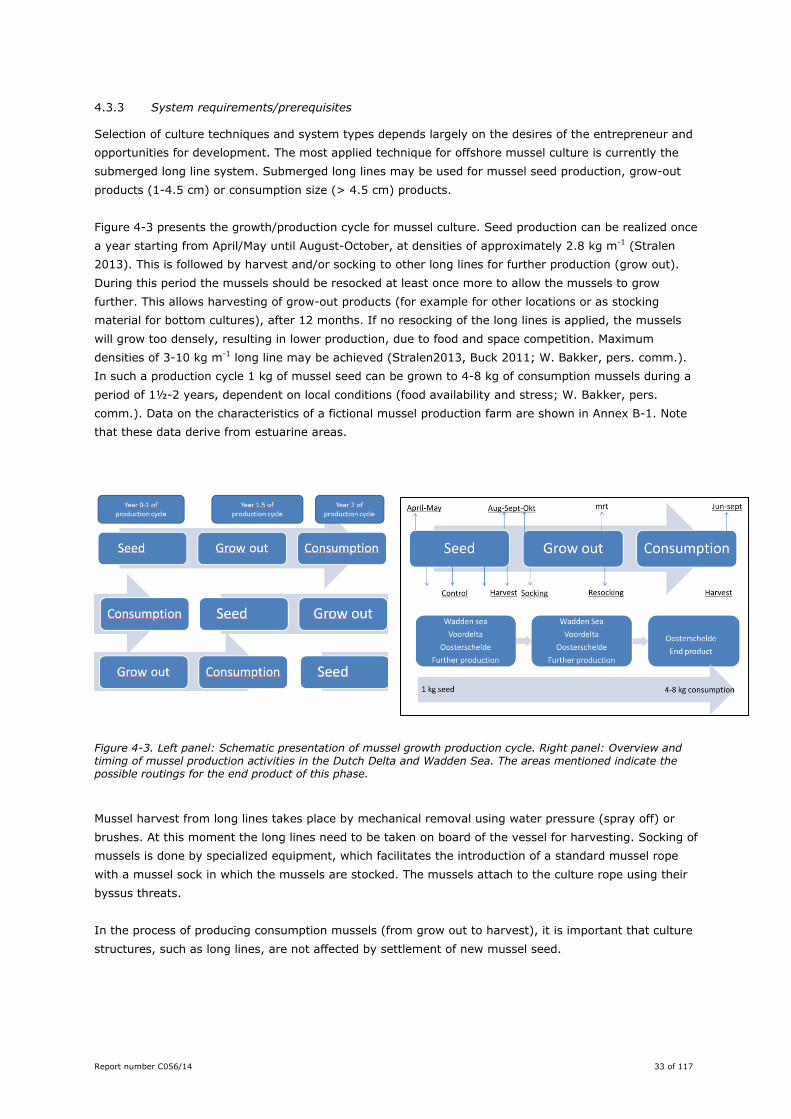
Report number C056/14 33 of 117
System requirements/prerequisites 4.3.3
Selection of culture techniques and system types depends largely on the desires of the entrepreneur and
opportunities for development. The most applied technique for offshore mussel culture is currently the
submerged long line system. Submerged long lines may be used for mussel seed production, grow-out
products (1-4.5 cm) or consumption size (> 4.5 cm) products.
Figure 4-3 presents the growth/production cycle for mussel culture. Seed production can be realized once
a year starting from April/May until August-October, at densities of approximately 2.8 kg m-1 (Stralen
2013). This is followed by harvest and/or socking to other long lines for further production (grow out).
During this period the mussels should be resocked at least once more to allow the mussels to grow
further. This allows harvesting of grow-out products (for example for other locations or as stocking
material for bottom cultures), after 12 months. If no resocking of the long lines is applied, the mussels
will grow too densely, resulting in lower production, due to food and space competition. Maximum
densities of 3-10 kg m-1 long line may be achieved (Stralen2013, Buck 2011; W. Bakker, pers. comm.).
In such a production cycle 1 kg of mussel seed can be grown to 4-8 kg of consumption mussels during a
period of 1½-2 years, dependent on local conditions (food availability and stress; W. Bakker, pers.
comm.). Data on the characteristics of a fictional mussel production farm are shown in Annex B-1. Note
that these data derive from estuarine areas.
Figure 4-3. Left panel: Schematic presentation of mussel growth production cycle. Right panel: Overview and timing of mussel production activities in the Dutch Delta and Wadden Sea. The areas mentioned indicate the possible routings for the end product of this phase.
Mussel harvest from long lines takes place by mechanical removal using water pressure (spray off) or
brushes. At this moment the long lines need to be taken on board of the vessel for harvesting. Socking of
mussels is done by specialized equipment, which facilitates the introduction of a standard mussel rope
with a mussel sock in which the mussels are stocked. The mussels attach to the culture rope using their
byssus threats.
In the process of producing consumption mussels (from grow out to harvest), it is important that culture
structures, such as long lines, are not affected by settlement of new mussel seed.
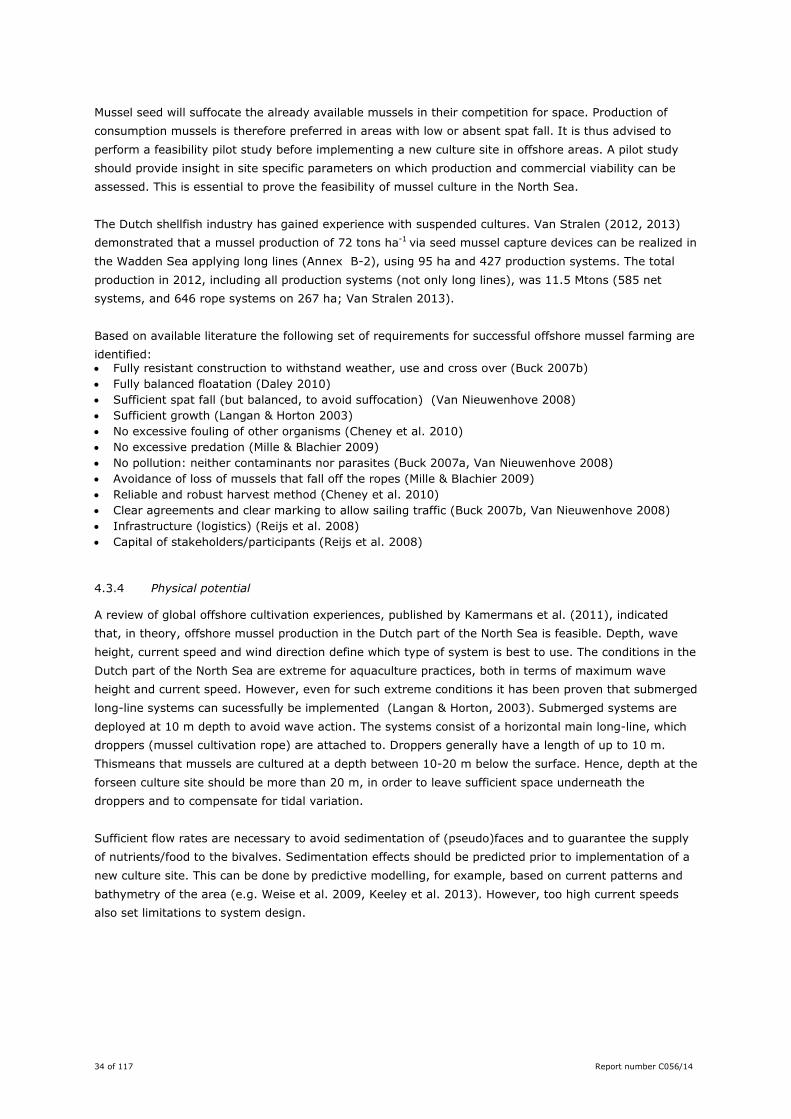
34 of 117 Report number C056/14
Mussel seed will suffocate the already available mussels in their competition for space. Production of
consumption mussels is therefore preferred in areas with low or absent spat fall. It is thus advised to
perform a feasibility pilot study before implementing a new culture site in offshore areas. A pilot study
should provide insight in site specific parameters on which production and commercial viability can be
assessed. This is essential to prove the feasibility of mussel culture in the North Sea.
The Dutch shellfish industry has gained experience with suspended cultures. Van Stralen (2012, 2013)
demonstrated that a mussel production of 72 tons ha-1 via seed mussel capture devices can be realized in
the Wadden Sea applying long lines (Annex B-2), using 95 ha and 427 production systems. The total
production in 2012, including all production systems (not only long lines), was 11.5 Mtons (585 net
systems, and 646 rope systems on 267 ha; Van Stralen 2013).
Based on available literature the following set of requirements for successful offshore mussel farming are
identified: Fully resistant construction to withstand weather, use and cross over (Buck 2007b)
Fully balanced floatation (Daley 2010)
Sufficient spat fall (but balanced, to avoid suffocation) (Van Nieuwenhove 2008)
Sufficient growth (Langan & Horton 2003)
No excessive fouling of other organisms (Cheney et al. 2010)
No excessive predation (Mille & Blachier 2009)
No pollution: neither contaminants nor parasites (Buck 2007a, Van Nieuwenhove 2008)
Avoidance of loss of mussels that fall off the ropes (Mille & Blachier 2009)
Reliable and robust harvest method (Cheney et al. 2010)
Clear agreements and clear marking to allow sailing traffic (Buck 2007b, Van Nieuwenhove 2008)
Infrastructure (logistics) (Reijs et al. 2008)
Capital of stakeholders/participants (Reijs et al. 2008)
Physical potential 4.3.4
A review of global offshore cultivation experiences, published by Kamermans et al. (2011), indicated
that, in theory, offshore mussel production in the Dutch part of the North Sea is feasible. Depth, wave
height, current speed and wind direction define which type of system is best to use. The conditions in the
Dutch part of the North Sea are extreme for aquaculture practices, both in terms of maximum wave
height and current speed. However, even for such extreme conditions it has been proven that submerged
long-line systems can sucessfully be implemented (Langan & Horton, 2003). Submerged systems are
deployed at 10 m depth to avoid wave action. The systems consist of a horizontal main long-line, which
droppers (mussel cultivation rope) are attached to. Droppers generally have a length of up to 10 m.
Thismeans that mussels are cultured at a depth between 10-20 m below the surface. Hence, depth at the
forseen culture site should be more than 20 m, in order to leave sufficient space underneath the
droppers and to compensate for tidal variation.
Sufficient flow rates are necessary to avoid sedimentation of (pseudo)faces and to guarantee the supply
of nutrients/food to the bivalves. Sedimentation effects should be predicted prior to implementation of a
new culture site. This can be done by predictive modelling, for example, based on current patterns and
bathymetry of the area (e.g. Weise et al. 2009, Keeley et al. 2013). However, too high current speeds
also set limitations to system design.
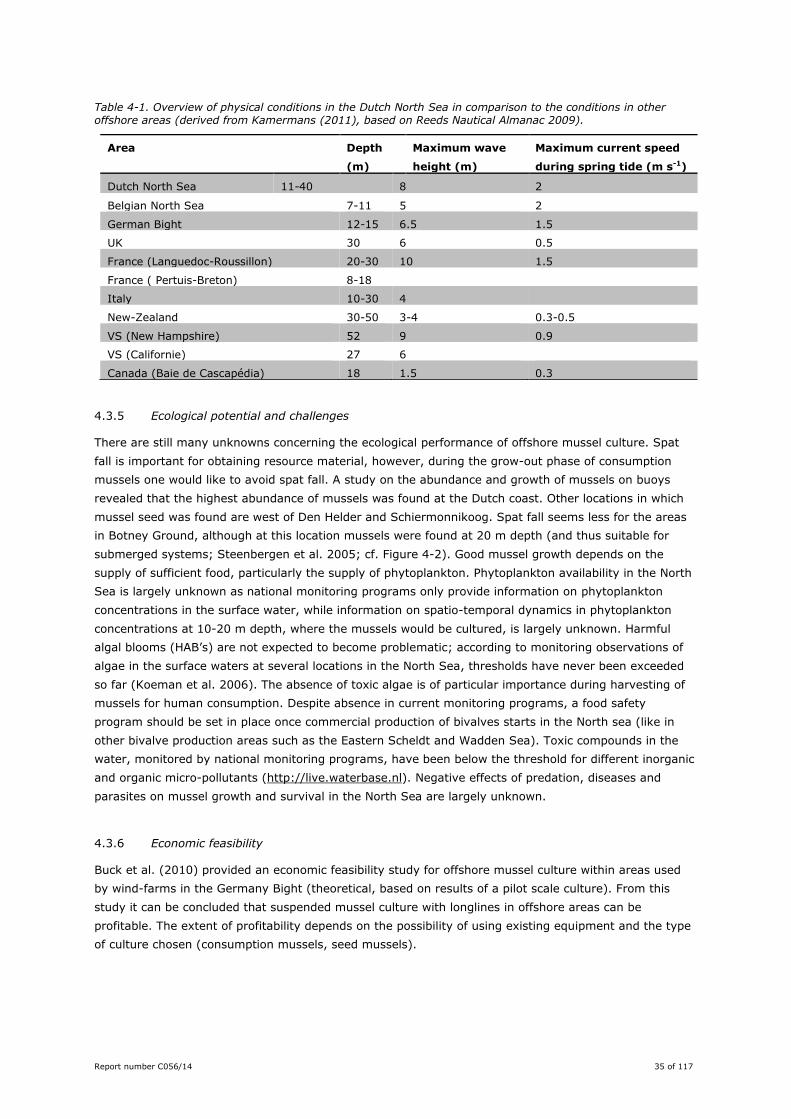
Report number C056/14 35 of 117
Table 4-1. Overview of physical conditions in the Dutch North Sea in comparison to the conditions in other offshore areas (derived from Kamermans (2011), based on Reeds Nautical Almanac 2009).
Ecological potential and challenges 4.3.5
There are still many unknowns concerning the ecological performance of offshore mussel culture. Spat
fall is important for obtaining resource material, however, during the grow-out phase of consumption
mussels one would like to avoid spat fall. A study on the abundance and growth of mussels on buoys
revealed that the highest abundance of mussels was found at the Dutch coast. Other locations in which
mussel seed was found are west of Den Helder and Schiermonnikoog. Spat fall seems less for the areas
in Botney Ground, although at this location mussels were found at 20 m depth (and thus suitable for
submerged systems; Steenbergen et al. 2005; cf. Figure 4-2). Good mussel growth depends on the
supply of sufficient food, particularly the supply of phytoplankton. Phytoplankton availability in the North
Sea is largely unknown as national monitoring programs only provide information on phytoplankton
concentrations in the surface water, while information on spatio-temporal dynamics in phytoplankton
concentrations at 10-20 m depth, where the mussels would be cultured, is largely unknown. Harmful
algal blooms (HAB’s) are not expected to become problematic; according to monitoring observations of
algae in the surface waters at several locations in the North Sea, thresholds have never been exceeded
so far (Koeman et al. 2006). The absence of toxic algae is of particular importance during harvesting of
mussels for human consumption. Despite absence in current monitoring programs, a food safety
program should be set in place once commercial production of bivalves starts in the North sea (like in
other bivalve production areas such as the Eastern Scheldt and Wadden Sea). Toxic compounds in the
water, monitored by national monitoring programs, have been below the threshold for different inorganic
and organic micro-pollutants (http://live.waterbase.nl). Negative effects of predation, diseases and
parasites on mussel growth and survival in the North Sea are largely unknown.
Economic feasibility 4.3.6
Buck et al. (2010) provided an economic feasibility study for offshore mussel culture within areas used
by wind-farms in the Germany Bight (theoretical, based on results of a pilot scale culture). From this
study it can be concluded that suspended mussel culture with longlines in offshore areas can be
profitable. The extent of profitability depends on the possibility of using existing equipment and the type
of culture chosen (consumption mussels, seed mussels).
Area Depth
(m)
Maximum wave
height (m)
Maximum current speed
during spring tide (m s-1)
Dutch North Sea 11-40 8 2
Belgian North Sea 7-11 5 2
German Bight 12-15 6.5 1.5
UK 30 6 0.5
France (Languedoc-Roussillon) 20-30 10 1.5
France ( Pertuis-Breton) 8-18
Italy 10-30 4
New-Zealand 30-50 3-4 0.3-0.5
VS (New Hampshire) 52 9 0.9
VS (Californie) 27 6
Canada (Baie de Cascapédia) 18 1.5 0.3
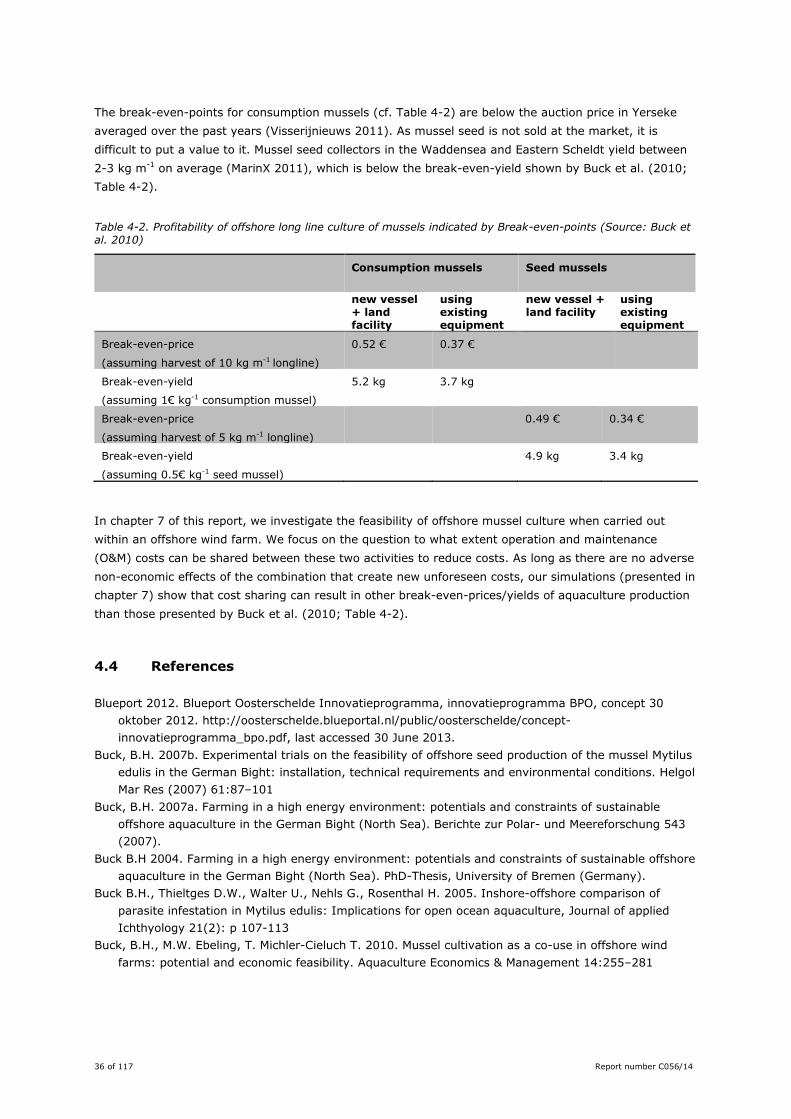
36 of 117 Report number C056/14
The break-even-points for consumption mussels (cf. Table 4-2) are below the auction price in Yerseke
averaged over the past years (Visserijnieuws 2011). As mussel seed is not sold at the market, it is
difficult to put a value to it. Mussel seed collectors in the Waddensea and Eastern Scheldt yield between
2-3 kg m-1 on average (MarinX 2011), which is below the break-even-yield shown by Buck et al. (2010;
Table 4-2).
Table 4-2. Profitability of offshore long line culture of mussels indicated by Break-even-points (Source: Buck et al. 2010)
Consumption mussels Seed mussels
new vessel
+ land facility
using existing equipment
new vessel + land facility
using existing equipment
Break-even-price
(assuming harvest of 10 kg m-1 longline)
0.52 € 0.37 €
Break-even-yield
(assuming 1€ kg-1 consumption mussel)
5.2 kg 3.7 kg
Break-even-price
(assuming harvest of 5 kg m-1 longline)
0.49 € 0.34 €
Break-even-yield
(assuming 0.5€ kg-1 seed mussel)
4.9 kg 3.4 kg
In chapter 7 of this report, we investigate the feasibility of offshore mussel culture when carried out
within an offshore wind farm. We focus on the question to what extent operation and maintenance
(O&M) costs can be shared between these two activities to reduce costs. As long as there are no adverse
non-economic effects of the combination that create new unforeseen costs, our simulations (presented in
chapter 7) show that cost sharing can result in other break-even-prices/yields of aquaculture production
than those presented by Buck et al. (2010; Table 4-2).
4.4 References
Blueport 2012. Blueport Oosterschelde Innovatieprogramma, innovatieprogramma BPO, concept 30
oktober 2012. http://oosterschelde.blueportal.nl/public/oosterschelde/concept-
innovatieprogramma_bpo.pdf, last accessed 30 June 2013.
Buck, B.H. 2007b. Experimental trials on the feasibility of offshore seed production of the mussel Mytilus
edulis in the German Bight: installation, technical requirements and environmental conditions. Helgol
Mar Res (2007) 61:87–101
Buck, B.H. 2007a. Farming in a high energy environment: potentials and constraints of sustainable
offshore aquaculture in the German Bight (North Sea). Berichte zur Polar- und Meereforschung 543
(2007).
Buck B.H 2004. Farming in a high energy environment: potentials and constraints of sustainable offshore
aquaculture in the German Bight (North Sea). PhD-Thesis, University of Bremen (Germany).
Buck B.H., Thieltges D.W., Walter U., Nehls G., Rosenthal H. 2005. Inshore-offshore comparison of
parasite infestation in Mytilus edulis: Implications for open ocean aquaculture, Journal of applied
Ichthyology 21(2): p 107-113
Buck, B.H., M.W. Ebeling, T. Michler-Cieluch T. 2010. Mussel cultivation as a co-use in offshore wind
farms: potential and economic feasibility. Aquaculture Economics & Management 14:255–281
Report number C056/14 37 of 117
Burg, S. van den, M. Stuiver, F. Veenstra, P. Bikker, A. López Contreras, A. Palstra, J. Broeze, H. Jansen,
R. Jak, A. Gerritsen, P. Harmsen, J. Kals, A. Blanco, W. Brandenburg, M. van Krimpen, A-P. van
Duijn, W. Mulder, L. van Raamsdonk 2013. A Triple P review of the feasibility of sustainable offshore
seaweed production in the North Sea. Wageningen, Wageningen UR (University & Research centre),
LEI report 13-077.
Holmyard J. 2008. Potential for Offshore Mussel Culture. Shellfish News, Issue No.25 Spring Summer
2008
Kamermans P., Schellekens, T. R. Beukers 2011. Verkenning van mogelijkheden voor mosselteelt op
Noordzee. IMARES Rapport C021/11.
Kamermans P., Smit C., Wijsman J., Smaal A. (in prep.). Meerjarige effect- en productiemetingen aan
MZI's in de Westelijke Waddenzee, Oosterschelde en Voordelta. Deel 1: Inschatting ecologische
effecten van opschaling. IMARES Rapport (in Dutch)
Keeley et al. 2013. Predictive depositional modelling (DEPOMOD) of the interactive effect of current flow
and resuspension on ecological impacts beneath salmon farms. Aquaculture environment interactions
3(3): 275-291
Koeman, R.P.T., C.J.E. Brochard, K. Fockens, A.L. de Keijzer-de Haan, G.L. Verweij, R. van Wezel, G.J.
Berg & P. Esselink 2006. Biomonitoring van fytoplankton in de Nederlandse zoute wateren 2005.
Rapport 2006-046.
Langan, R. & C.F. Horton 2003. Design, Operation and Economics of Submerged Longline Mussel Culture
in the Open Ocean. Bulletin of the Aquaculture Association of Canada. Vol. 103-3, December 2003,
p. 11-20.
MarinX 2011. Invang van mosselzaad in MZI’s - Resultaten 2011. Rapport 2012.117.
Reijs Th.A.M., R.W.A. Oorschot, M. Poelman, J. Kals, I. Immink 2008. Aquacultuur op open zee. TNO
rapport 2008-D-R1048/A.
Reith, J. H., Deurwaarder, E. P., Hemmes, K., Curvers, A. P. W. M., Kamermans, P., Brandenburg, W. &
Zeeman, G. 2005. Bio-offshore : grootschalige teelt van zeewieren in combinatie met offshore
windparken in de Noordzee. Petten, Energieonderzoek Centrum Nederland
Ryther, J.H, Goldman, J.C., Gifford, C.E., Huguenin, J.E., Wing, A.S., Clarner, J.P., Williams, L.D.,
Lapointe, B.E. 1975. Physical models of integrated waste recycling–marine polyculture systems.
Aquaculture 5, 163–177
Ryan J. 2004. Farming the Deep Blue. Report of an offshore aquaculture conference. 6-7 October 2004,
Limmerik (Ireland)
Sas H. 2011. Mosselkweek/-invang op de Noordzee? Verslag Workshop date 19 april 2011.
http://visserijnieuws.punt.nl/content/2011/05/mosselkweek--invang-op-de-
noordzee#sthash.Z47gSs83.dpuf (accessed 30 June 2013).
Steenbergen J., M.C.J. Verdegem, J.J. Jol, J. Perdon, P. Kamermans, V.G. Blankendaal, A.C. Sneekes,
A.G. Bakker, H. van ’t Groenewoud, G. Hoornsman 2005. Verkenning van mogelijkheden voor
mosselteelt op open zee & een mosselkansenkaart voor de Noordzee. RIVO-rapport nr. C088/05
Stralen, M.R. van 2012. Invang van mosselzaad in MZI’s, resultaten 2011. Marinx-rapport 2012.117.
Scharendijke.
Stralen, M.R. van 2013. Invang van mosselzaad in MZI’s, resultaten 2012. Marinx-rapport 2013.126.
Scharendijke.
Van Nieuwenhove K. 2008. Studie naar de commercialisering van de Belgische off-shore
hangmosselcultuur. WP3. Uitbreiding van schelpdierproductiegebieden. ILVO-rapport Mei 2008.
Visserijnieuws, 2011. http://www.visserijnieuws.nl/component/content/article/70-archief-2011/7474-
meer-mosselen-over-zeeuwse-klokomzet-mosselveiling-yerseke-stijgt-met-137-miljoen-naar-70-
miljoen-euro.html
Weise, A.M., C.J. Cromey, M.D. Calliera, Ph. Archambaulta, J. Chamberlaind & C.W. McKindseya. 2009.
Shellfish-DEPOMOD: Modelling the biodeposition from suspended shellfish aquaculture and assessing
benthic effects. Aquaculture, Vol.288 (1-3), p. 239-253.

38 of 117 Report number C056/14
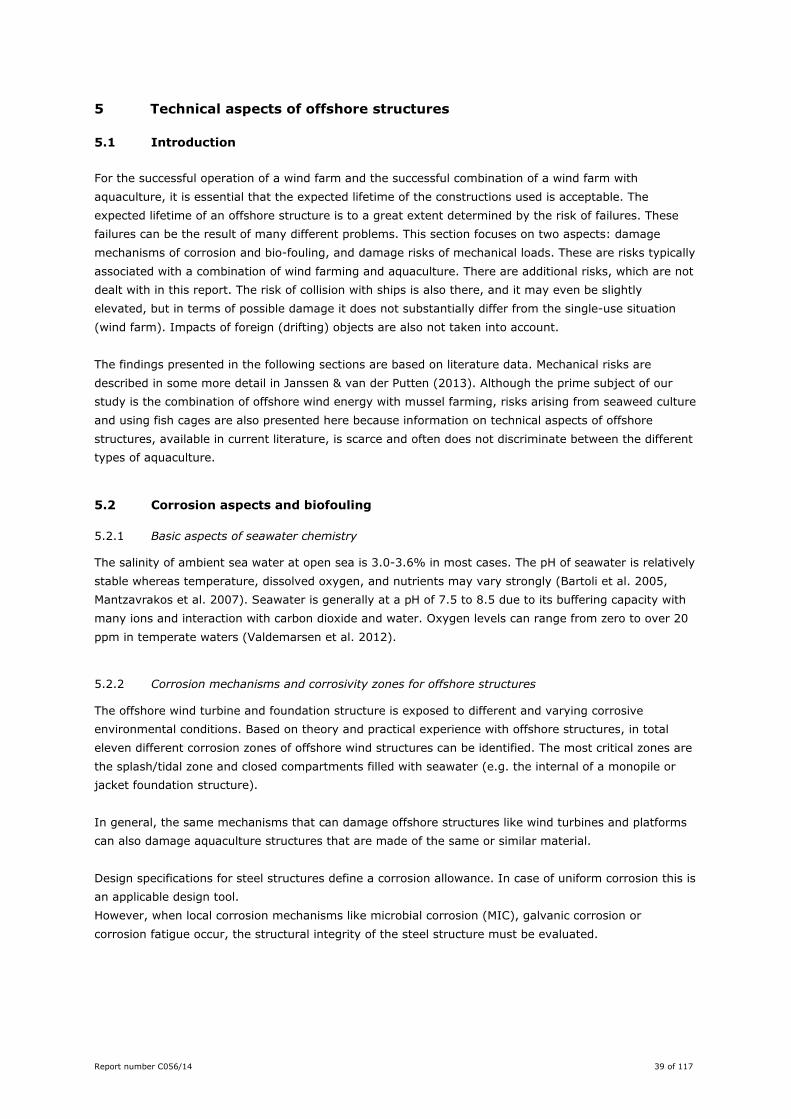
Report number C056/14 39 of 117
5 Technical aspects of offshore structures
5.1 Introduction
For the successful operation of a wind farm and the successful combination of a wind farm with
aquaculture, it is essential that the expected lifetime of the constructions used is acceptable. The
expected lifetime of an offshore structure is to a great extent determined by the risk of failures. These
failures can be the result of many different problems. This section focuses on two aspects: damage
mechanisms of corrosion and bio-fouling, and damage risks of mechanical loads. These are risks typically
associated with a combination of wind farming and aquaculture. There are additional risks, which are not
dealt with in this report. The risk of collision with ships is also there, and it may even be slightly
elevated, but in terms of possible damage it does not substantially differ from the single-use situation
(wind farm). Impacts of foreign (drifting) objects are also not taken into account.
The findings presented in the following sections are based on literature data. Mechanical risks are
described in some more detail in Janssen & van der Putten (2013). Although the prime subject of our
study is the combination of offshore wind energy with mussel farming, risks arising from seaweed culture
and using fish cages are also presented here because information on technical aspects of offshore
structures, available in current literature, is scarce and often does not discriminate between the different
types of aquaculture.
5.2 Corrosion aspects and biofouling
Basic aspects of seawater chemistry 5.2.1
The salinity of ambient sea water at open sea is 3.0-3.6% in most cases. The pH of seawater is relatively
stable whereas temperature, dissolved oxygen, and nutrients may vary strongly (Bartoli et al. 2005,
Mantzavrakos et al. 2007). Seawater is generally at a pH of 7.5 to 8.5 due to its buffering capacity with
many ions and interaction with carbon dioxide and water. Oxygen levels can range from zero to over 20
ppm in temperate waters (Valdemarsen et al. 2012).
Corrosion mechanisms and corrosivity zones for offshore structures 5.2.2
The offshore wind turbine and foundation structure is exposed to different and varying corrosive
environmental conditions. Based on theory and practical experience with offshore structures, in total
eleven different corrosion zones of offshore wind structures can be identified. The most critical zones are
the splash/tidal zone and closed compartments filled with seawater (e.g. the internal of a monopile or
jacket foundation structure).
In general, the same mechanisms that can damage offshore structures like wind turbines and platforms
can also damage aquaculture structures that are made of the same or similar material.
Design specifications for steel structures define a corrosion allowance. In case of uniform corrosion this is
an applicable design tool.
However, when local corrosion mechanisms like microbial corrosion (MIC), galvanic corrosion or
corrosion fatigue occur, the structural integrity of the steel structure must be evaluated.
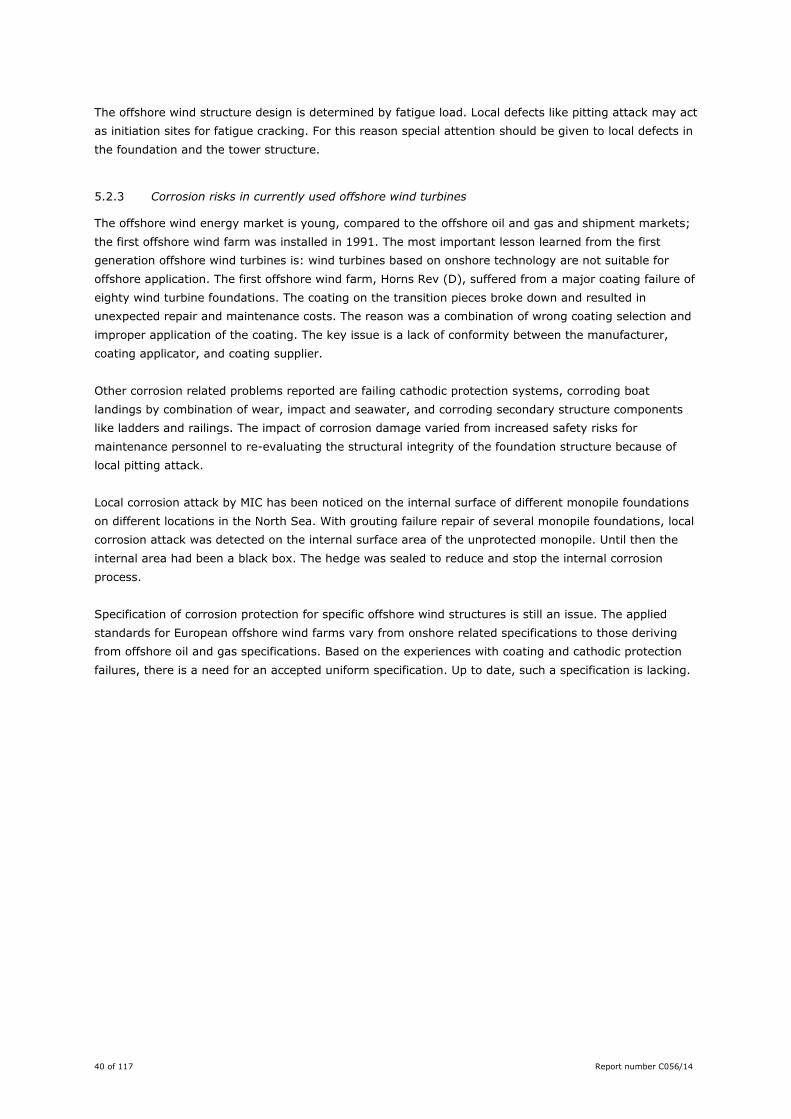
40 of 117 Report number C056/14
The offshore wind structure design is determined by fatigue load. Local defects like pitting attack may act
as initiation sites for fatigue cracking. For this reason special attention should be given to local defects in
the foundation and the tower structure.
Corrosion risks in currently used offshore wind turbines 5.2.3
The offshore wind energy market is young, compared to the offshore oil and gas and shipment markets;
the first offshore wind farm was installed in 1991. The most important lesson learned from the first
generation offshore wind turbines is: wind turbines based on onshore technology are not suitable for
offshore application. The first offshore wind farm, Horns Rev (D), suffered from a major coating failure of
eighty wind turbine foundations. The coating on the transition pieces broke down and resulted in
unexpected repair and maintenance costs. The reason was a combination of wrong coating selection and
improper application of the coating. The key issue is a lack of conformity between the manufacturer,
coating applicator, and coating supplier.
Other corrosion related problems reported are failing cathodic protection systems, corroding boat
landings by combination of wear, impact and seawater, and corroding secondary structure components
like ladders and railings. The impact of corrosion damage varied from increased safety risks for
maintenance personnel to re-evaluating the structural integrity of the foundation structure because of
local pitting attack.
Local corrosion attack by MIC has been noticed on the internal surface of different monopile foundations
on different locations in the North Sea. With grouting failure repair of several monopile foundations, local
corrosion attack was detected on the internal surface area of the unprotected monopile. Until then the
internal area had been a black box. The hedge was sealed to reduce and stop the internal corrosion
process.
Specification of corrosion protection for specific offshore wind structures is still an issue. The applied
standards for European offshore wind farms vary from onshore related specifications to those deriving
from offshore oil and gas specifications. Based on the experiences with coating and cathodic protection
failures, there is a need for an accepted uniform specification. Up to date, such a specification is lacking.
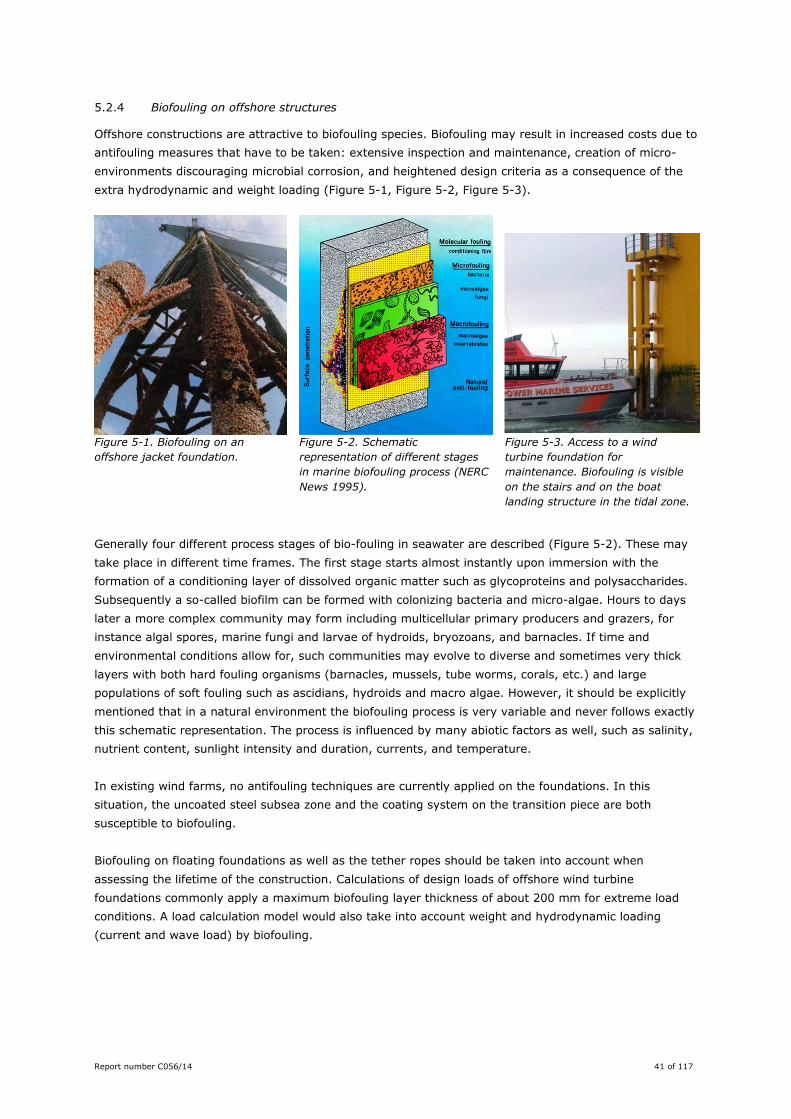
Report number C056/14 41 of 117
Biofouling on offshore structures 5.2.4
Offshore constructions are attractive to biofouling species. Biofouling may result in increased costs due to
antifouling measures that have to be taken: extensive inspection and maintenance, creation of micro-
environments discouraging microbial corrosion, and heightened design criteria as a consequence of the
extra hydrodynamic and weight loading (Figure 5-1, Figure 5-2, Figure 5-3).
Figure 5-1. Biofouling on an
offshore jacket foundation.
Figure 5-2. Schematic
representation of different stages
in marine biofouling process (NERC
News 1995).
Figure 5-3. Access to a wind
turbine foundation for
maintenance. Biofouling is visible
on the stairs and on the boat
landing structure in the tidal zone.
Generally four different process stages of bio-fouling in seawater are described (Figure 5-2). These may
take place in different time frames. The first stage starts almost instantly upon immersion with the
formation of a conditioning layer of dissolved organic matter such as glycoproteins and polysaccharides.
Subsequently a so-called biofilm can be formed with colonizing bacteria and micro-algae. Hours to days
later a more complex community may form including multicellular primary producers and grazers, for
instance algal spores, marine fungi and larvae of hydroids, bryozoans, and barnacles. If time and
environmental conditions allow for, such communities may evolve to diverse and sometimes very thick
layers with both hard fouling organisms (barnacles, mussels, tube worms, corals, etc.) and large
populations of soft fouling such as ascidians, hydroids and macro algae. However, it should be explicitly
mentioned that in a natural environment the biofouling process is very variable and never follows exactly
this schematic representation. The process is influenced by many abiotic factors as well, such as salinity,
nutrient content, sunlight intensity and duration, currents, and temperature.
In existing wind farms, no antifouling techniques are currently applied on the foundations. In this
situation, the uncoated steel subsea zone and the coating system on the transition piece are both
susceptible to biofouling.
Biofouling on floating foundations as well as the tether ropes should be taken into account when
assessing the lifetime of the construction. Calculations of design loads of offshore wind turbine
foundations commonly apply a maximum biofouling layer thickness of about 200 mm for extreme load
conditions. A load calculation model would also take into account weight and hydrodynamic loading
(current and wave load) by biofouling.
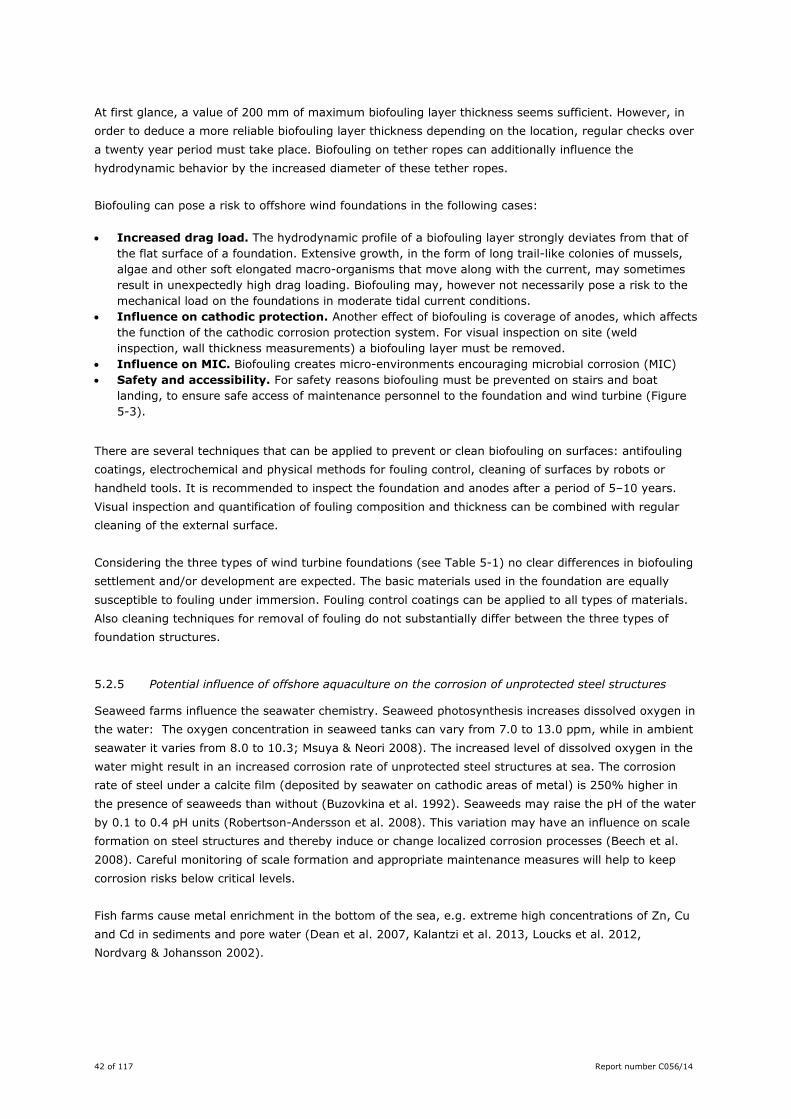
42 of 117 Report number C056/14
At first glance, a value of 200 mm of maximum biofouling layer thickness seems sufficient. However, in
order to deduce a more reliable biofouling layer thickness depending on the location, regular checks over
a twenty year period must take place. Biofouling on tether ropes can additionally influence the
hydrodynamic behavior by the increased diameter of these tether ropes.
Biofouling can pose a risk to offshore wind foundations in the following cases:
Increased drag load. The hydrodynamic profile of a biofouling layer strongly deviates from that of
the flat surface of a foundation. Extensive growth, in the form of long trail-like colonies of mussels,
algae and other soft elongated macro-organisms that move along with the current, may sometimes
result in unexpectedly high drag loading. Biofouling may, however not necessarily pose a risk to the
mechanical load on the foundations in moderate tidal current conditions.
Influence on cathodic protection. Another effect of biofouling is coverage of anodes, which affects
the function of the cathodic corrosion protection system. For visual inspection on site (weld
inspection, wall thickness measurements) a biofouling layer must be removed.
Influence on MIC. Biofouling creates micro-environments encouraging microbial corrosion (MIC)
Safety and accessibility. For safety reasons biofouling must be prevented on stairs and boat
landing, to ensure safe access of maintenance personnel to the foundation and wind turbine (Figure
5-3).
There are several techniques that can be applied to prevent or clean biofouling on surfaces: antifouling
coatings, electrochemical and physical methods for fouling control, cleaning of surfaces by robots or
handheld tools. It is recommended to inspect the foundation and anodes after a period of 5–10 years.
Visual inspection and quantification of fouling composition and thickness can be combined with regular
cleaning of the external surface.
Considering the three types of wind turbine foundations (see Table 5-1) no clear differences in biofouling
settlement and/or development are expected. The basic materials used in the foundation are equally
susceptible to fouling under immersion. Fouling control coatings can be applied to all types of materials.
Also cleaning techniques for removal of fouling do not substantially differ between the three types of
foundation structures.
Potential influence of offshore aquaculture on the corrosion of unprotected steel structures 5.2.5
Seaweed farms influence the seawater chemistry. Seaweed photosynthesis increases dissolved oxygen in
the water: The oxygen concentration in seaweed tanks can vary from 7.0 to 13.0 ppm, while in ambient
seawater it varies from 8.0 to 10.3; Msuya & Neori 2008). The increased level of dissolved oxygen in the
water might result in an increased corrosion rate of unprotected steel structures at sea. The corrosion
rate of steel under a calcite film (deposited by seawater on cathodic areas of metal) is 250% higher in
the presence of seaweeds than without (Buzovkina et al. 1992). Seaweeds may raise the pH of the water
by 0.1 to 0.4 pH units (Robertson-Andersson et al. 2008). This variation may have an influence on scale
formation on steel structures and thereby induce or change localized corrosion processes (Beech et al.
2008). Careful monitoring of scale formation and appropriate maintenance measures will help to keep
corrosion risks below critical levels.
Fish farms cause metal enrichment in the bottom of the sea, e.g. extreme high concentrations of Zn, Cu
and Cd in sediments and pore water (Dean et al. 2007, Kalantzi et al. 2013, Loucks et al. 2012,
Nordvarg & Johansson 2002).
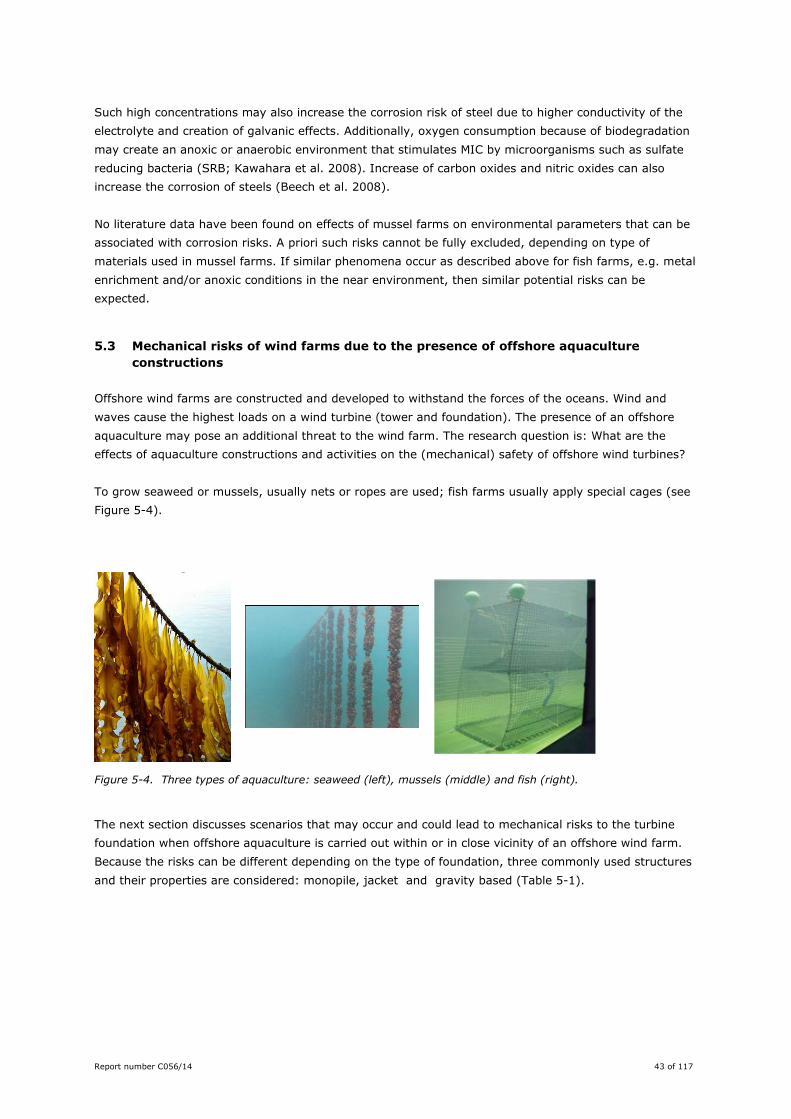
Report number C056/14 43 of 117
Such high concentrations may also increase the corrosion risk of steel due to higher conductivity of the
electrolyte and creation of galvanic effects. Additionally, oxygen consumption because of biodegradation
may create an anoxic or anaerobic environment that stimulates MIC by microorganisms such as sulfate
reducing bacteria (SRB; Kawahara et al. 2008). Increase of carbon oxides and nitric oxides can also
increase the corrosion of steels (Beech et al. 2008).
No literature data have been found on effects of mussel farms on environmental parameters that can be
associated with corrosion risks. A priori such risks cannot be fully excluded, depending on type of
materials used in mussel farms. If similar phenomena occur as described above for fish farms, e.g. metal
enrichment and/or anoxic conditions in the near environment, then similar potential risks can be
expected.
5.3 Mechanical risks of wind farms due to the presence of offshore aquaculture
constructions
Offshore wind farms are constructed and developed to withstand the forces of the oceans. Wind and
waves cause the highest loads on a wind turbine (tower and foundation). The presence of an offshore
aquaculture may pose an additional threat to the wind farm. The research question is: What are the
effects of aquaculture constructions and activities on the (mechanical) safety of offshore wind turbines?
To grow seaweed or mussels, usually nets or ropes are used; fish farms usually apply special cages (see
Figure 5-4).
Figure 5-4. Three types of aquaculture: seaweed (left), mussels (middle) and fish (right).
The next section discusses scenarios that may occur and could lead to mechanical risks to the turbine
foundation when offshore aquaculture is carried out within or in close vicinity of an offshore wind farm.
Because the risks can be different depending on the type of foundation, three commonly used structures
and their properties are considered: monopile, jacket and gravity based (Table 5-1).
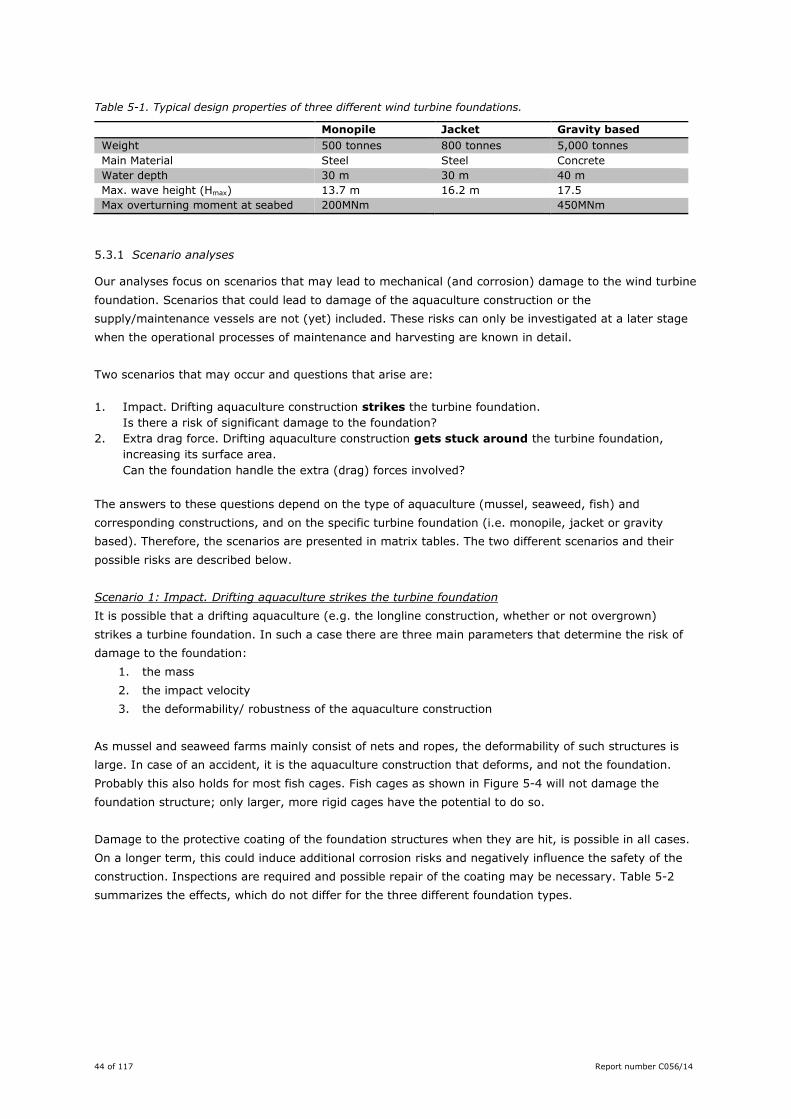
44 of 117 Report number C056/14
Table 5-1. Typical design properties of three different wind turbine foundations.
Monopile Jacket Gravity based
Weight 500 tonnes 800 tonnes 5,000 tonnes
Main Material Steel Steel Concrete
Water depth 30 m 30 m 40 m
Max. wave height (Hmax) 13.7 m 16.2 m 17.5
Max overturning moment at seabed 200MNm 450MNm
Scenario analyses 5.3.1
Our analyses focus on scenarios that may lead to mechanical (and corrosion) damage to the wind turbine
foundation. Scenarios that could lead to damage of the aquaculture construction or the
supply/maintenance vessels are not (yet) included. These risks can only be investigated at a later stage
when the operational processes of maintenance and harvesting are known in detail.
Two scenarios that may occur and questions that arise are:
1. Impact. Drifting aquaculture construction strikes the turbine foundation.
Is there a risk of significant damage to the foundation?
2. Extra drag force. Drifting aquaculture construction gets stuck around the turbine foundation,
increasing its surface area.
Can the foundation handle the extra (drag) forces involved?
The answers to these questions depend on the type of aquaculture (mussel, seaweed, fish) and
corresponding constructions, and on the specific turbine foundation (i.e. monopile, jacket or gravity
based). Therefore, the scenarios are presented in matrix tables. The two different scenarios and their
possible risks are described below.
Scenario 1: Impact. Drifting aquaculture strikes the turbine foundation
It is possible that a drifting aquaculture (e.g. the longline construction, whether or not overgrown)
strikes a turbine foundation. In such a case there are three main parameters that determine the risk of
damage to the foundation:
1. the mass
2. the impact velocity
3. the deformability/ robustness of the aquaculture construction
As mussel and seaweed farms mainly consist of nets and ropes, the deformability of such structures is
large. In case of an accident, it is the aquaculture construction that deforms, and not the foundation.
Probably this also holds for most fish cages. Fish cages as shown in Figure 5-4 will not damage the
foundation structure; only larger, more rigid cages have the potential to do so.
Damage to the protective coating of the foundation structures when they are hit, is possible in all cases.
On a longer term, this could induce additional corrosion risks and negatively influence the safety of the
construction. Inspections are required and possible repair of the coating may be necessary. Table 5-2
summarizes the effects, which do not differ for the three different foundation types.
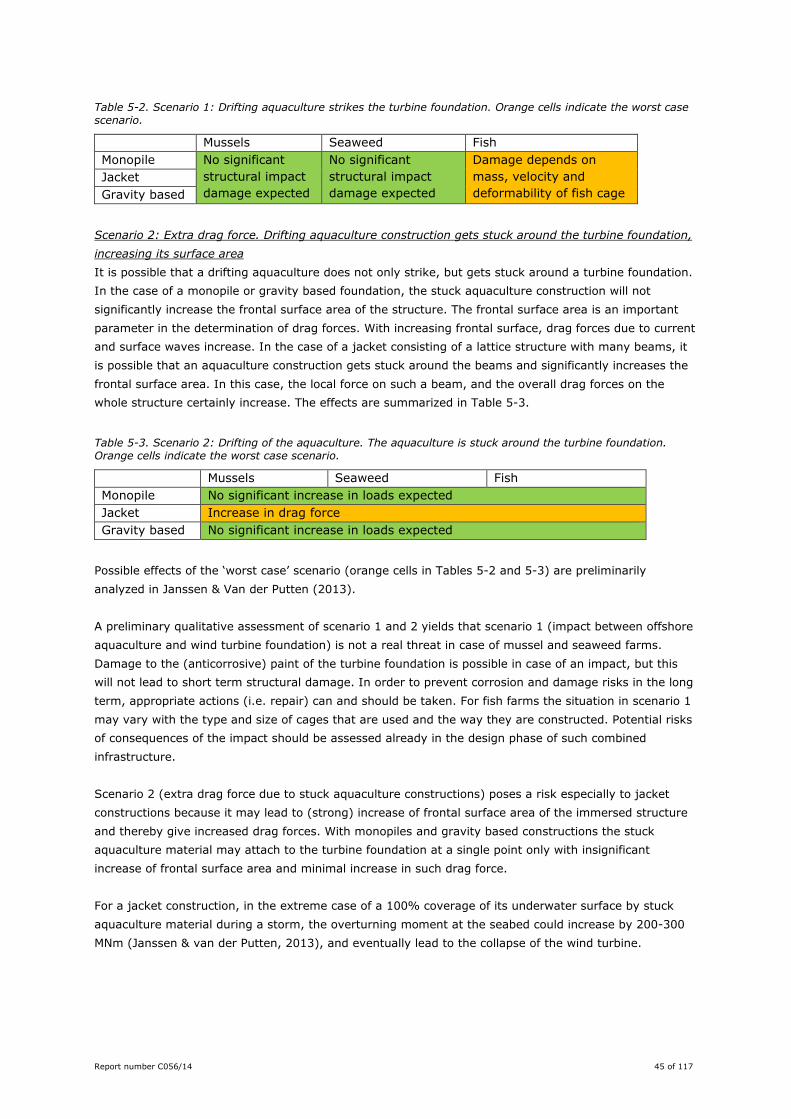
Report number C056/14 45 of 117
Table 5-2. Scenario 1: Drifting aquaculture strikes the turbine foundation. Orange cells indicate the worst case scenario.
Mussels Seaweed Fish
Monopile No significant
structural impact
damage expected
No significant
structural impact
damage expected
Damage depends on
mass, velocity and
deformability of fish cage
Jacket
Gravity based
Scenario 2: Extra drag force. Drifting aquaculture construction gets stuck around the turbine foundation,
increasing its surface area
It is possible that a drifting aquaculture does not only strike, but gets stuck around a turbine foundation.
In the case of a monopile or gravity based foundation, the stuck aquaculture construction will not
significantly increase the frontal surface area of the structure. The frontal surface area is an important
parameter in the determination of drag forces. With increasing frontal surface, drag forces due to current
and surface waves increase. In the case of a jacket consisting of a lattice structure with many beams, it
is possible that an aquaculture construction gets stuck around the beams and significantly increases the
frontal surface area. In this case, the local force on such a beam, and the overall drag forces on the
whole structure certainly increase. The effects are summarized in Table 5-3.
Table 5-3. Scenario 2: Drifting of the aquaculture. The aquaculture is stuck around the turbine foundation. Orange cells indicate the worst case scenario.
Mussels Seaweed Fish
Monopile No significant increase in loads expected
Jacket Increase in drag force
Gravity based No significant increase in loads expected
Possible effects of the ‘worst case’ scenario (orange cells in Tables 5-2 and 5-3) are preliminarily
analyzed in Janssen & Van der Putten (2013).
A preliminary qualitative assessment of scenario 1 and 2 yields that scenario 1 (impact between offshore
aquaculture and wind turbine foundation) is not a real threat in case of mussel and seaweed farms.
Damage to the (anticorrosive) paint of the turbine foundation is possible in case of an impact, but this
will not lead to short term structural damage. In order to prevent corrosion and damage risks in the long
term, appropriate actions (i.e. repair) can and should be taken. For fish farms the situation in scenario 1
may vary with the type and size of cages that are used and the way they are constructed. Potential risks
of consequences of the impact should be assessed already in the design phase of such combined
infrastructure.
Scenario 2 (extra drag force due to stuck aquaculture constructions) poses a risk especially to jacket
constructions because it may lead to (strong) increase of frontal surface area of the immersed structure
and thereby give increased drag forces. With monopiles and gravity based constructions the stuck
aquaculture material may attach to the turbine foundation at a single point only with insignificant
increase of frontal surface area and minimal increase in such drag force.
For a jacket construction, in the extreme case of a 100% coverage of its underwater surface by stuck
aquaculture material during a storm, the overturning moment at the seabed could increase by 200-300
MNm (Janssen & van der Putten, 2013), and eventually lead to the collapse of the wind turbine.
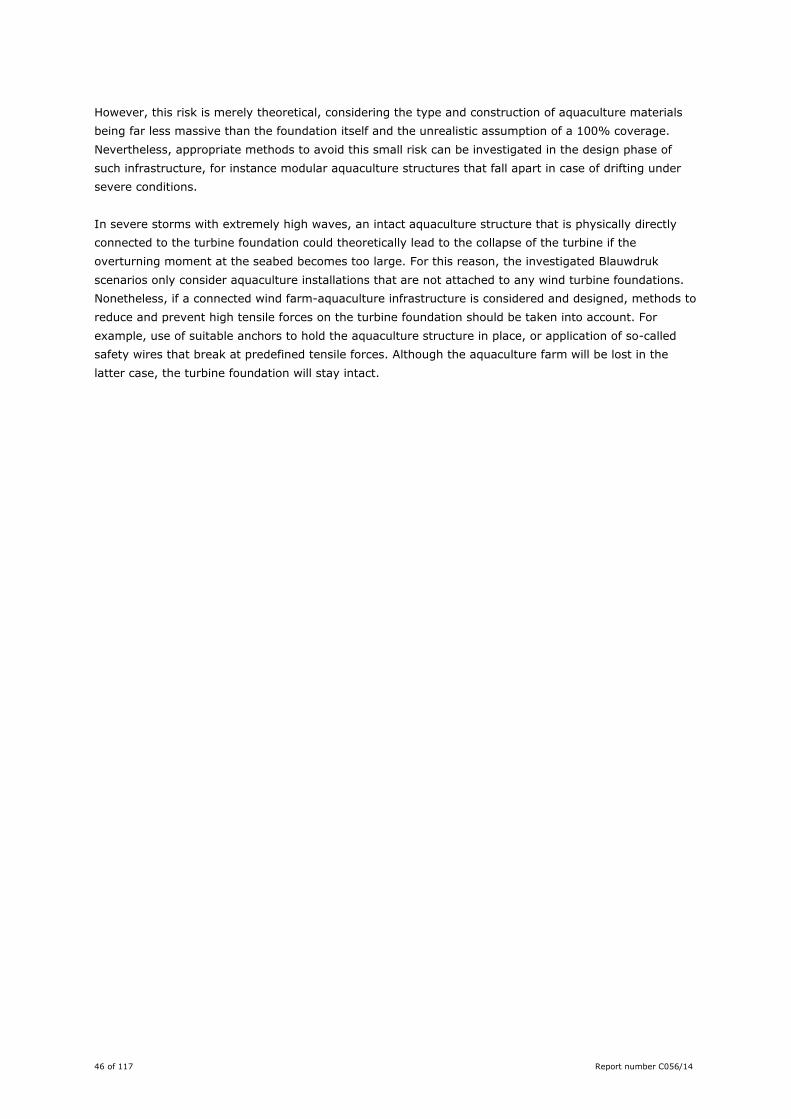
46 of 117 Report number C056/14
However, this risk is merely theoretical, considering the type and construction of aquaculture materials
being far less massive than the foundation itself and the unrealistic assumption of a 100% coverage.
Nevertheless, appropriate methods to avoid this small risk can be investigated in the design phase of
such infrastructure, for instance modular aquaculture structures that fall apart in case of drifting under
severe conditions.
In severe storms with extremely high waves, an intact aquaculture structure that is physically directly
connected to the turbine foundation could theoretically lead to the collapse of the turbine if the
overturning moment at the seabed becomes too large. For this reason, the investigated Blauwdruk
scenarios only consider aquaculture installations that are not attached to any wind turbine foundations.
Nonetheless, if a connected wind farm-aquaculture infrastructure is considered and designed, methods to
reduce and prevent high tensile forces on the turbine foundation should be taken into account. For
example, use of suitable anchors to hold the aquaculture structure in place, or application of so-called
safety wires that break at predefined tensile forces. Although the aquaculture farm will be lost in the
latter case, the turbine foundation will stay intact.
Report number C056/14 47 of 117
5.4 References
Bartoli, Marco, Daniele Nizzoli, Mariachiara Naldi, Luigi Vezzulli, Salvatore Porrello, Mauro Lenzi, and
Pierluigi Viaroli. 2005. Inorganic Nitrogen Control in Wastewater Treatment Ponds from a Fish Farm
(Orbetello, Italy): Denitrification Versus Ulva Uptake. Marine Pollution Bulletin 50 (11) (November):
1386–1397.
Beech, Iwona B., and Sheelagh A. Campbell. 2008. Accelerated Low Water Corrosion of Carbon Steel in
the Presence of a Biofilm Harbouring Sulphate-reducing and Sulphur-oxidising Bacteria Recovered
from a Marine Sediment. Electrochimica Acta 54 (1) (December): 14–21.
Buzovkina, T.B., V.A. Aleksandrov, and L.I. Shlyaga. 1992. Influence of the Initial Fouling on the Marine
Corrosion of Steel 3: 501–503.
Dean, Rebecca J., Tracy M. Shimmield, and Kenneth D. Black. 2007. Copper, Zinc and Cadmium in
Marine Cage Fish Farm Sediments: An Extensive Survey. Environmental Pollution 145 (1) (January):
84–95.
Janssen M.M.H.H. & S. van der Putten 2013. Mechanical risks involved with aqua farming on offshore
wind farm sites. TNO-MEM-2013-0100000996.
Kalantzi, I., T.M. Shimmield, S.A. Pergantis, N. Papageorgiou, K.D. Black, and I. Karakassis. 2013. Heavy
Metals, Trace Elements and Sediment Geochemistry at Four Mediterranean Fish Farms. Science of
the Total Environment 444 (February): 128–137.
Kawahara, Naoki, Kotaro Shigematsu, Satoko Miura, Toshiaki Miyadai, and Ryuji Kondo. 2008.
Distribution of Sulfate-reducing Bacteria in Fish Farm Sediments on the Coast of Southern Fukui
Prefecture, Japan. Plankton and Benthos Research 3 (1): 42–45.
Loucks, Ronald H., Ruth E. Smith, Clyde V. Fisher, and E. Brian Fisher. 2012. Copper in the Sediment
and Sea Surface Microlayer near a Fallowed, Open-net Fish Farm. Marine Pollution Bulletin 64 (9)
(September): 1970–1973.
Mantzavrakos, E., M. Kornaros, G. Lyberatos, and P. Kaspiris. 2007. Impacts of a Marine Fish Farm in
Argolikos Gulf (Greece) on the Water Column and the Sediment. Desalination 210 (1-3) (June): 110–
124.
Msuya, Flower E., and Amir Neori. 2008. Effect of Water Aeration and Nutrient Load Level on Biomass
Yield, N Uptake and Protein Content of the Seaweed Ulva Lactuca Cultured in Seawater Tanks.
Journal of Applied Phycology 20 (6) (February 1): 1021–1031.
Nordvarg, Lennart, and Torbjörn Johansson. 2002. The Effects of Fish Farm Effluents on the Water
Quality in the \AAland Archipelago, Baltic Sea. Aquacultural Engineering 25 (4): 253–279.
Porrello, Salvatore, Giuseppe Ferrari, Mauro Lenzi, and Emma Persia. 2003. Ammonia Variations in
Phytotreatment Ponds of Land-based Fish Farm Wastewater. Aquaculture 219 (1-4) (April): 485–
494.
Robertson-Andersson, Deborah V., Michelle Potgieter, Joakim Hansen, John J. Bolton, Max Troell, Robert
J. Anderson, Christina Halling, and Trevor Probyn. 2008. Integrated Seaweed Cultivation on an
Abalone Farm in South Africa. Journal of Applied Phycology 20 (5) (May 27): 579–595.
Valdemarsen, Thomas, Raymond J. Bannister, Pia K. Hansen, Marianne Holmer, and Arne Ervik. 2012.
Biogeochemical Malfunctioning in Sediments beneath a Deep-water Fish Farm. Environmental
Pollution 170 (November): 15–25.

48 of 117 Report number C056/14
Report number C056/14 49 of 117
6 Ecological risks and opportunities
6.1 Introduction
This section describes the potential effects of wind farms and of mussel farming on the marine
ecosystem. First we consider both activities separately, based on recent literature, then we try to assess
the potential effects when both activities are combined. An assessment of the ecological impact(s) of a
combination that does not yet exist remains highly speculative. Therefore we can only discuss some
areas of concern in a more general way.
Note that the financial analyses (chapter 7) focus on the operational phase. In this ecological chapter, it
is relevant to also look at the construction phase, because potential negative ecological effects can
prevent a Wind & Mussel Farm (W&MF) from being built, simply because the necessary permits will not
be issued.
6.2 Impacts of offshore wind farms
Potential key effects of offshore wind farms are: noise disturbance to marine mammals, collision risks to
birds and bats, displacement of mammals and seabirds, attraction of fish and epibenthos42, damage to
seabed communities (Lindeboom et al. 2011, Degraer et al. 2012), and potential effects on fish, fish
eggs or larvae caused by underwater noise or electromagnetic fields (experimental studies have shown
that some fish species are sensitive to electricity).
Construction phase 6.2.1
Potential effects during the construction phase relate to the sound produced by preparatory subsea
works, and construction activities, including vessel traffic. Piling of wind turbine foundations, for
example, introduces very high levels of underwater sound into the environment and has the most
marked impacts. Although many accompanying research programmes have been carried out in the North
Sea, there is still a great knowledge gap about the impacts of offshore wind farms on the ecosystem, in
particular with regard to the impact of noise in the construction phase. Only limited evidence is available.
Measurable impacts arising in the construction phase (e.g. displacement of animals) are usually
temporary and reversible, and more or less confined to the period in which the construction activities
take place. However, permanent effects on individual animals cannot be excluded. Depending on how
many individuals are affected and how resilient the population is, there may be an impact on the
population level, too. Based on a recent review of scientific literature and reports (Lindeboom et al.
2011; Leopold et al. 2013a), some general conclusions can be drawn for the species groups fish, marine
mammals and birds. Note that these studies concern wind farms in the shallow coastal zone of the North
Sea and not in the offshore area considered in this report. Since no large far-offshore wind farms have
been completed yet, there is almost no scientific knowledge available on potential ecological impacts of
wind farms in deeper North Sea waters.
42 Community of organisms living on the top of the marine sediment.
50 of 117 Report number C056/14
The (initial) environmental impact assessments43 that were carried out for the demonstrator project
‘Beatrice’ (see section 3.2), only briefly address the aspects that typically play a role in deep-water
areas, but they do provide some insight in specific concerns.
Fish
Fish are at risk of physical damage in the vicinity of piling operations, and of possible behavioural
changes in a wider spatial range (references in Leopold et al. 2013a). Significant physical impacts mainly
occur to fish with swim bladders at high sound exposure levels. Whereas adult fish may be able to avoid
exposure by leaving the area, larval and young fish – passively drifting – cannot escape from (possible)
harmful sound levels and are likely to be adversely affected. Since small fish are prey for other species,
including larger fish and birds (e.g. terns), food availability for these species may be affected during the
construction phase in a limited area but also at larger distances, if fish larvae drift past the piling site to
a nursery area downstream (Arends et al. 2008).
Marine mammals
The construction phase is considered to be the most disturbing period for sea mammals. Within several
hundreds of meters from the piling site, depending on the noise level, underwater sound may result in
avoidance behaviour or even (permanent or temporary) hearing loss (Seamarco 201144).
Harbour porpoises. In Belgian waters Haelters et al. (2012) measured “that immediately upon the start
of piling activities, harbour porpoise detections at a few km from the piling site fell to virtually zero. After
the cessation of piling it took hours to days before new detections were made at this location.”
Researchers who investigated the spatial distribution pattern of harbour porpoises in a German wind
farm by carrying out two aerial surveys three weeks before and exactly during pile-driving operations
demonstrated a strong avoidance response of the animals within 20 km distance of the noise source
(Dähne et al. 2013). Negative long-term effects (avoidance) and slow recovery were found by Teilmann
& Carstensen (2012) for a large-scale offshore wind farm in the Baltic.
Harbour seals. Based on a short period of overlap between piling operations and seal tagging data,
Brasseur et al. (2012) observed that the tagged harbour seals stayed away several tens of kilometres
from the construction area. This telemetry study concerns the coastal zone, and it is not clear how these
results can be extrapolated to (far)offshore areas. Seals can also be disturbed by the physical presence
of installation vessels. During the construction of an offshore wind farm in the United Kingdom (Scroby
Sands) harbour seals on a haul-out location nearby were adversely affected by shipping activities
(Skeate et al. 2012). It is unknown yet whether severe peak sound noise pollution has long-term effects.
A study on the effects of a commercial two-dimensional seismic survey in the central Moray Firth
(Scotland, the Beatrice area) did not find any such effects (Thompson et al. 2013).
43 http://www.beatricewind.co.uk/environmental_statement.pdf; last accessed March 2014
44http://www.informatiehuismarien.nl/Images/Final%20%28short%29%20report%20on%20TTS%20in%20seals%20%26%20a%20porpoise_2025.pdf; last accessed March 2014
Report number C056/14 51 of 117
Seabirds
Underwater sound due to pile driving operations or seismic surveys may disturb seabirds as they dive
down to forage. Although not much is known about the effects (Turnpenny & Nedwell 1994), it is
generally assumed that there are no effects on population level. Local seabirds are likely displaced from
the building site during construction.
Seabed organisms
Construction activities like pile driving, and trenching and burying of cables destroy and modify the
present benthic habitat on the construction site and along the cable routes. Due to the disruption of the
seabed sediments, existing benthos will be affected but only in the immediate area, which is relatively
small. Lindeboom et al. (2011) carried out a monitoring study in the OWEZ wind farm, and drew the
following preliminary conclusion (based on two years: there were “no short-term effects on the benthos
in the sandy area between the generators, while the new hard substratum of the monopiles and the
scouring protection led to the establishment of new species and new fauna communities”.
Operational phase 6.2.2
During the operational phase impacts can arise from the physical presence of the wind farm, including
disturbance of the seabed sediments. Furthermore, when in operation, turbines generate noise and
introduce energy in the seafloor by the tower and via the subsea cables.
Fish
On a larger scale, the construction of a wind farm will most probably not lead to detectable changes in
the abundance of fish (Van Hal et al. 2012). However, on the scale of the wind farm (OWEZ: 24 km2;
PAWP: 17 km2) clear differences were observed between the new, artificial hard-substrate habitat and
the sandy seabed. Van Hal et al. (2012) found higher densities of a.o. horse mackerel and cod, on the
scour protection of the monopiles, while lower abundances were observed of flatfish and whiting. Note
that fisheries was prohibited inside these two wind farms. Possible negative impacts on migrating fish
species (e.g. salmonids) and elasmobranchs (lampreys, sharks and rays) may occur due to the
electromagnetic fields around cables, but evidence for this is scarce (Gill 2010, and references in Leopold
et al. 2013a).
Marine mammals
Harbour porpoises. Concluding from an acoustic activity monitoring carried out in wind farms in Dutch
nearshore waters, harbour porpoises did not seem to avoid these farms. Inside the farms higher acoustic
activity was recorded than outside, which may be linked to increased food availability due to the reef
effect of the turbine foundations and the exclusion of fishery from the wind farm (Scheidat et al. 2012).
However, the opposite (avoidance of the wind farm) was found in a Danish study (Teilmann &
Carstensen 2012).
Seals. Seals mainly live and forage in the coastal zone but also make long foraging excursions across the
North Sea. They may be attracted by increased levels of food (fish, benthos) that may occur within wind
farms when fisheries are excluded inside the farm (Van Hal et al. 2012). Noise levels of operational wind
farms are not considered detrimental to seals (Madsen et al. 2006).
On the other hand, there are concerns that high densities of wind farms in the coastal zone may create
barriers for the migration of seals from one habitat to another, which may (partly) be due to the
underwater sound created by turning turbines (Leopold et al. 2013a).
52 of 117 Report number C056/14
Bats
Bats have been found on oil platforms in the North Sea (Boshamer & Bekker, 2008) and have been
observed during surveys at sea (S. Lagerveld; pers. comm.). A recent study has shown that bats occur
regularly in the Dutch offshore wind farms, up to 23 km off the coast (Jonge Poerink et al. 2013). The
first firm evidence that bats actually migrate over sea came from a ‘Nathusius pipistrelle’, which was
banded in the United Kingdom and was found 600 km to the east in the Netherlands45.
Several studies in Europe, South Africa and the United States have shown that wind turbines can cause
high fatality rates amongst bats (Osborne et al. 1996, Bach et al. 1999, Rahmel et al. 1999, Rodrigues et
al. 2008, Brinkmann et al. 2006, Arnet 2005, Johnson 2005, Fiedler et al. 2007, Dürr & Bach 2004, Doty
& Martin 2012). The causes of death are collisions with rotating blades (Kunz et al. 2007) and
barotrauma: internal injuries due to sudden pressure fluctuations near moving turbine blades (Baerwald
2008). It is not known whether offshore wind turbines cause fatalities as well, but the risks might be
comparable to onshore wind turbines (Ahlen et al. 2007).
Seabirds
Some bird species appear to be indifferent to the presence of wind farms (especially gulls), or are even
attracted by them. Other birds, particularly divers, seaducks and auks avoid wind farms (Petersen et al.
2011, Dierschke et al. 2012, Leopold et al. 2013b). The species composition at sea is mainly determined
by the distance from shore. Nearshore species include divers, grebes and seaducks; offshore species
include northern fulmar, northern gannet, black-legged kittiwake and auks. Several species with a wider
distribution, including the northern gannet and gulls, are attracted by fishing vessels and will be
displaced from wind farm sites, if fisheries are banned from wind farms (Hartman et al. 2012). In
general, seabirds may be impacted directly by collisions, and indirectly by behavioural responses, i.e.
avoidance/ attraction. Collisions are most likely where fluxes of (flying) birds are high, and when species
do not show avoidance behaviour. However, if collision rates are at such a low level that impacts on
population level are unlikely for most species. On the other hand, when vulnerable species are involved,
also small death rates can have a great impact on the population. Pelagic seabirds46 show strongest
avoidance behaviour. However, if collisions occur, the population may be impacted because of the
longevity of these offshore/ pelagic seabirds.
In general, where wind farms increase in number and area, the risks of barrier effects and disturbance
increase. Avoidance may further lead to a reduction of suitable feeding grounds. Seaducks, for example,
forage in shallow areas where shellfish densities are very high and a wind farm in such habitats may
displace large numbers of birds (Petersen et al. 2011); however, the combination of shallow grounds and
high shellfish densities do not occur in the offshore areas considered in this report.
45 http://www.bats.org.uk/pages/amazing_journey_for_a_tiny_bat.html; last accessed May 2014.
46 These are birds that live in the pelagic zone. The word pelagic is derived from Ancient Greek pélagos, meaning "open sea". The pelagic zone can be thought of in terms of an imaginary cylinder or water column
that goes from the surface of the sea almost to the bottom. Conditions change deeper down the water column; the pressure increases, the temperature drops and there is less light (Wikipedia).
Report number C056/14 53 of 117
Migrating birds are at risk of collisions, particularly near shore, because they use the coastal zone as
navigation guidance and they occur in high densities and fly lower than further offshore (Krijgsveld et al.
2011).
Seabed organisms
Wind turbine foundations, if fixed to the seafloor, occupy a certain area of the seabed and also may have
an impact on seabed currents and patterns of scouring, e.g. re-suspension of sediment in the water
column or coverage of nearby benthos. These effects are considered to be small, because they are very
localised (Lindeboom et al. 2011).
Changes on ecosystem level
Offshore wind farm constructions can create a new (type of) habitat under water (Lindeboom et al.
2011). In an area of sandy sediment, turbine foundations form a new type of hard substrate. Sessile
flora and fauna colonize these substrates, thereby enhancing biological diversity and production and
creating (micro-)habitats where organisms may find shelter in addition to food. This new community also
attracts mobile species, including fish and at a final stage, possibly larger piscivores such as large fish,
seabirds, and marine mammals. However, there is also the risk of introducing unwanted invasive
species, since constructions in general provide a good habitat or substrate for invasive epibenthic
species.
6.3 Impacts of offshore mussel farming
Since no offshore aquaculture takes place in the Dutch part of the North Sea, only general information
about ecological impacts of mussel farming is reported here. For the same reason we do not distinguish
between the construction and operational phase. Even if longline constructions need heavy foundations,
it is still unlikely that the impact of placing them is greater than that of wind farm construction activities
(see section 6.2). Offshore mussel farming (on suspended longlines) results in several impacts on the
environment (McKindsey et al. 2011). The physical environment is altered by the mechanical farming
construction and the presence of mussels, leading to altered hydro-sedimentary processes, e.g. locally
modified currents and increased sedimentation. In addition, the longline-construction provides a habitat
for other invertebrates by providing refuge from predation and adverse environmental conditions, and by
increasing food availability (in the form of other invertebrates or algae). The deposition of (pseudo)faecal
material from the mussels, and settlement of particles from the water column as a result of reduced
water mixing, increases the organic load of the sediment. This in turn changes biochemical processes in
the seabed, leading to changes in oxygen levels, pH, redox potential, dissolved sulphides and other
sediment parameters. Depending on the local current speeds, the organic load can also be transported to
other areas. The effect of this process is considered to be very small (H. Lindeboom; pers. comm.)
Seabed organisms
Changed sediment conditions alter the benthic community. As the level of organic input increases, typical
soft sediment communities dominated by large filter-feeders are replaced by smaller, more deposit-
feeding organisms, mainly polychaetes and nematodes (McKindsey et al. 2011). At high organic loading
rates, the sediment may become anoxic and only bacteria may be present. However, since the Southern
Bight of the North Sea is a very dynamic environment, anoxic sediment conditions are unlikely to occur.
54 of 117 Report number C056/14
Constructions in general may provide an additional habitat or substrate for exotic species. It has been
shown that suspended bivalve culture sites are hotspots for invasive species, including tunicate
ascidians47, algae and molluscs (McKindsey et al. 2011). Since mussels and associated fauna may drop
off from the constructions, the natural benthic soft-sediment habitat may adapt features of a biogenic
reef. This may enhance the amount of food available to benthic predators and scavengers.
Fish
Suspended mussel culture may also provide benefits for fish, including the availability of food by the
enriched hard-substrate fauna, and shelter from predators. It appears that mainly demersal fish48 are
associated with mussel lines (McKindsey et al. 2011). Some of these species are predators of the
cultured mussels. In general, it is unknown whether the fish are attracted by the vertical structures, the
farmed product, or the associated organisms. Fish and other species attracted to aquaculture may also
remove fouling organisms, thereby improving the mussel farming performance.
Seals and seabirds
Roycoft et al. (2004) studied the occurrence of bird species and seals in a mussel culture area in
comparison to a reference area. The study was performed in a large bay in Southwest Ireland, where
mussels were cultured using suspended longlines at less than 20 m above the sediment. It appeared that
cormorants, gulls and auks were present in higher numbers at the mussel sites than outside. The
abundance of divers (Gaviidae) and harbour seals did not show spatial variation related to aquaculture
sites. No adverse effects from suspended mussel culture on the numbers of seabirds and harbour seal
were observed. Particularly gulls made use of the floating devices to rest. Similar observations were
made around mussel culture plots in the Wadden Sea, where eiders flock together in large numbers and
where mussels are abundantly available on the seafloor (Cervencl et al. in prep.). Sea ducks are only
rarely observed offshore, probably because the water is too deep for feeding and stocks of suitable
bivalves are generally low. Still, sea ducks do migrate across the North Sea (Offringa 1993, Wernham et
al. 2002) and if suitable feeding conditions are present they may in time learn to exploit these.
Bats
Aquaculture structures, which do not have rotating parts, are not likely to affect bats.
Plankton
In addition to the impacts on benthos, fish, birds, and marine mammals, described above, mussel
farming may reduce the availability of food in the water column by filtering phytoplankton and
zooplankton. While the biomass of plankton may be reduced due to mussel grazing, the production of
phytoplankton may be enhanced by the recycling of nutrients. This could result in a shift in the plankton
species composition towards fast growing species, which are/might be less favoured as food by
predators.
47 In Dutch: zakvormige manteldieren. 48 Fish that live and feed on or near the bottom of seas.
Report number C056/14 55 of 117
Changes on ecosystem level
Carrying capacity refers to the maximum amount of mussels that might be farmed without causing any
negative impact to the surrounding ecosystem. For bivalve farms carrying capacity is often related to
primary production and phytoplankton concentration. If carrying capacity is exceeded, changes in
phytoplankton availability may lead to cascading effects on other trophic levels such as fish, birds and
even sea mammals. Lower phytoplankton levels limit bivalve growth itself and should therefore be
avoided for commercial purposes. The open nature of offshore mussel farming, and thus the availability
of currents supplying new fluxes of nutrients and phytoplankton to the culture site, indicate that negative
impacts are not likely to occur rapidly. However, for planning and up-scaling of mussel farming, potential
carrying capacity models should provide insight in the maximum level that can be sustained in a given
area. Such ecosystem models should also take bio-deposition and potential benthic effects into account.
Shipping
The physical presence of operation and maintenance vessels on the culture sites (anchoring or passing
through) may cause disturbance. Disturbance of birds and sea mammals may give rise to concerns, if
boat activity greatly increases. Seed mussel culture (SMC) requires more boat operations than bottom
cultures. However, in the Wadden Sea there are no indications that shelducks or eider ducks are
adversely affected by the presence of SMC (Kamermans et al. 2014). Other studies also demonstrated
that effects of boat activities are minor/absent (Cheney et al. 2010). This may, however, vary per
farming system, and the type and condition of the vessels used.
6.4 Impacts of a Wind & Mussel Farm
This section deals with the question whether a Wind & Mussel Farm (as described in chapter 7) can lead
to impacts that have not been described in the previous sections of this chapter. In other words: Does
the combined use of an offshore area for generating wind energy and farming mussels cause other
potential synergistic effects (including the individual effects but to another extent), as compared to the
situation in which the two activities are carried out singly.
Construction phase 6.4.1
It is likely to assume that the construction of a Wind & Mussel Farm does not take more time than would
be required when building the wind farm and the mussel farm separately (at two comparable locations).
Unless there are synergy effects allowing the construction period to be shortened, negative cumulative
effects may however occur because when building a Wind & Mussel Farm, the period of continuous
construction activity in one and the same area is longer. It is speculative whether an extended
construction phase leads to the accumulation and aggravation of adverse effects. Short-term, reversible
effects could become permanent, because the disturbances persist over a too long period of time. On the
other hand, habituation may also occur. If synergy in the construction phase is possible and installation
activities can be carried out simultaneously, negative cumulative effects can still occur because of
increased intensity of disturbance. Although a typical property of (underwater) noise is that it does not
simply add up, critical noise levels could be reached. An obvious advantage of multi-use is that the
disturbed area where the most marked adverse effects occur, the construction site itself, is likely smaller
because of the combined use.
56 of 117 Report number C056/14
Operational phase 6.4.2
The physical structures of the Wind & Mussel Farm may act as shelter for several species, including fish
and mobile invertebrates. They add a different type of substrate, a hard one, to sandy seabed, thereby
enabling fouling organisms to settle. This leads to a different type of (sessile) community. The fouling
community attracts other invertebrate species and (mainly) demersal fish. These fish may attract
predatory fish, sea birds and marine mammals. In addition, the hard substrate from the Wind & Mussel
Farm structures may form an attractive habitat for non-indigenous species, thus increasing the risk of
establishment of invasive species.
The presence of mussel farming constructions within a wind farm might hypothetically result in a barrier
effect, since the ’open’ wind farm is now ‘filled’ with longlines which is more of a closed construction.
Some species of seabirds may be attracted by the mussel farm, but this is unlikely to result in
significantly more bird strikes as these birds will quickly become “locals” with good knowledge of their
surroundings. In a similar way, marine mammals could be attracted by increased food availability, in
particular fish, ignoring temporary disturbance, which eventually can have negative long-term effects for
their well-being depending on the levels and duration of noise exposure (but see Madsen et al. 2006:
operational noise levels may be too low to present real danger).
Regardless whether the operation of a wind farm or of a mussel farm is concerned, both farms require
maintenance, involving transport by vessel and/or helicopter. These activities cause various disturbances
like underwater noise, marine litter, introduction of contaminants, and visual disturbance. Underwater
noise and visual disturbance may lead to avoidance of the area by seabirds and sea mammals during the
period of time in which these operations take place. If synergy advantages can be achieved through
sharing of transport and access facilities (see section 3.3 and chapter 7), e.g. when maintenance
activities in the wind farm and the mussel farm can be carried out in a same window of opportunity, it
may be assumed that compared to single-use less potential disturbances occur, since a vessel then
needs to make the trip from the coast to the farm only once.
Table 6-1 summarizes the potential effects in the operational phase described above.
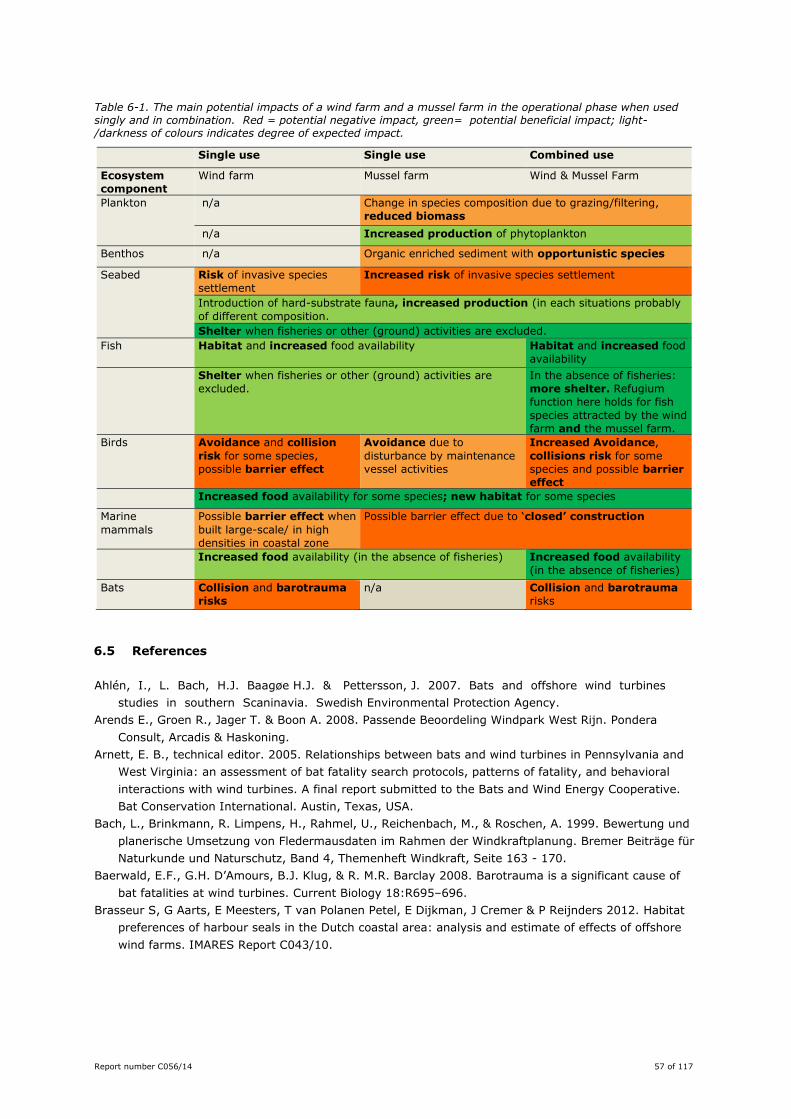
Report number C056/14 57 of 117
Table 6-1. The main potential impacts of a wind farm and a mussel farm in the operational phase when used singly and in combination. Red = potential negative impact, green= potential beneficial impact; light-/darkness of colours indicates degree of expected impact.
Single use Single use Combined use
Ecosystem
component
Wind farm Mussel farm Wind & Mussel Farm
Plankton
n/a Change in species composition due to grazing/filtering,
reduced biomass
n/a Increased production of phytoplankton
Benthos n/a Organic enriched sediment with opportunistic species
Seabed Risk of invasive species
settlement
Increased risk of invasive species settlement
Introduction of hard-substrate fauna, increased production (in each situations probably
of different composition.
Shelter when fisheries or other (ground) activities are excluded.
Fish Habitat and increased food availability Habitat and increased food
availability
Shelter when fisheries or other (ground) activities are
excluded.
In the absence of fisheries:
more shelter. Refugium
function here holds for fish
species attracted by the wind
farm and the mussel farm.
Birds Avoidance and collision
risk for some species,
possible barrier effect
Avoidance due to
disturbance by maintenance
vessel activities
Increased Avoidance,
collisions risk for some
species and possible barrier
effect
Increased food availability for some species; new habitat for some species
Marine
mammals
Possible barrier effect when
built large-scale/ in high
densities in coastal zone
Possible barrier effect due to ‘closed’ construction
Increased food availability (in the absence of fisheries) Increased food availability
(in the absence of fisheries)
Bats Collision and barotrauma
risks
n/a Collision and barotrauma
risks
6.5 References
Ahlén, I., L. Bach, H.J. Baagøe H.J. & Pettersson, J. 2007. Bats and offshore wind turbines
studies in southern Scaninavia. Swedish Environmental Protection Agency.
Arends E., Groen R., Jager T. & Boon A. 2008. Passende Beoordeling Windpark West Rijn. Pondera
Consult, Arcadis & Haskoning.
Arnett, E. B., technical editor. 2005. Relationships between bats and wind turbines in Pennsylvania and
West Virginia: an assessment of bat fatality search protocols, patterns of fatality, and behavioral
interactions with wind turbines. A final report submitted to the Bats and Wind Energy Cooperative.
Bat Conservation International. Austin, Texas, USA.
Bach, L., Brinkmann, R. Limpens, H., Rahmel, U., Reichenbach, M., & Roschen, A. 1999. Bewertung und
planerische Umsetzung von Fledermausdaten im Rahmen der Windkraftplanung. Bremer Beiträge für
Naturkunde und Naturschutz, Band 4, Themenheft Windkraft, Seite 163 - 170.
Baerwald, E.F., G.H. D’Amours, B.J. Klug, & R. M.R. Barclay 2008. Barotrauma is a significant cause of
bat fatalities at wind turbines. Current Biology 18:R695–696.
Brasseur S, G Aarts, E Meesters, T van Polanen Petel, E Dijkman, J Cremer & P Reijnders 2012. Habitat
preferences of harbour seals in the Dutch coastal area: analysis and estimate of effects of offshore
wind farms. IMARES Report C043/10.
58 of 117 Report number C056/14
Brinkmann R, Schauer-Weisshahn H, and Bontadina F. 2006. Survey of possible operational impacts on
bats by wind facilities in Southern Germany.Conservation and Landscape Management & Foundation
Naturschutzfonds. Baden-Württemberg
Cheney, D., Langan, R., Heasman, K., Friedman, B., Davis, J. 2010. Shellfish culture in the open ocean:
Lessons learned for offshore expansion. Marine Technology Society Journal 44 (3), pp. 55-67.
Dähne M., Gilles A., Lucke K., Peschko V., Adler S., Krügel K., Sundermeyer J. & Siebert U. 2013. Effects
of pile-driving on harbour porpoises (Phocoena phocoena) at the first offshore wind farm in
Germany. Environ. Res. Lett. 8 (2012) 025002, 16p. doi:10.1088/1748-9326/8/2/025002.
Degraer, S, R. Brabant & B. Rumes (eds). 2012. Offshore wind farms in the Belgian part of the North
Sea: Heading for an understanding of environmental impacts. Royal Belgian Institute of Natural
sciences, Management Unit of the North Sea Mathematical Models, Marine ecosystem management
unit.
Dierschke, V., Exo K.-M., Mendel B. & Garthe S. 2012. Gefährdung von Sterntaucher Gavia stellata und
Prachttaucher G. arctica in Brut-, Zug- und Überwinterungsgebieten - eine Übersicht mit
Schwerpunkt auf den deutschen Meeresgebieten. Vogelwelt 133: 163-194.
Doty, AC & AP Martin 2012. Assessment of bat and avian mortality at a pilot wind turbine at Coega, Port
Elizabeth, Eastern Cape, South Africa. New Zealand Journal of Zoology 40(1): 75 - 80.
Dürr, T & L Bach 2004. Fledermäuse als Schlagopfer von Windenergieanlagen – Stand der Erfahrungen
mit Einblick in die bundesweite Fundkartei. Bremer Beiträge für Naturkunde und Naturschutz Band 7:
253-264.
Fiedler, JK, TH Henry, CP Nicholson 2007. Results of bat and bird mortality at the expanded Buffalo
Mountain windfarm, 2005. Knoxville, TN, Tennessee Valley Authority.
Gill, A.B. & M Bartlett 2010. Literature review on the potential effects of electromagnetic fields and
subsea noise from marine renewable energy developments on Atlantic salmon, sea trout and
European eel. Scottish Natural Heritage Commissioned Report No.401
Haelters, J, W van Roy, L Vigin, S Degraer 2012. The effect of pile driving on harbour porpoises in
Belgian waters, in: Degraer, S. et al. (Ed.) (2012). Offshore wind farms in the Belgian part of the
North Sea: Heading for an understanding of environmental impacts. pp. 127-144
Hartman JC, KL Krijgsveld, MJM Poot, RC Fijn, MF Leopold & S Dirksen 2012. Effects on birds of Offshore
Wind farm Egmond aan Zee (OWEZ). An overview and integration of insights obtained.
NoordzeeWind Report nr OWEZ_R_233_T1_20121002, Bureau Waardenburg report nr 12-005.
James, V 2013. Marine Renewable Energy: A Global Review of the Extent of Marine Renewable Energy
Developments, the Developing Technologies and Possible Conservation Implications for Cetaceans.
124 p.
Johnson GD. 2005. A review of bat mortality at wind-energy developments in the United States. Bat Res
News 46: 45–49
Jonge Poerink, B, S Lagerveld, H Verdaat 2013. IMARES report number C026/13 / tFC report number
20120402, 2013.
Krijgsveld K.L., Fijn R.C., Japink M., van Horssen P.W., Heunks C. Collier M.P., Poot M.J.M., Beuker D. &
Dirksen S. 2011. Effect studies Offshore Wind Farm Egmond aan Zee. Final report on fluxes, flight
altitudes and behaviour of flying birds. NoordzeeWind report nr
OWEZ_R_231_T1_20111114_flux&flight. Bureau Waardenburg report nr 10-219
Kunz, TH, EB Arnett, WP Erickson, AR Hoar, GD Johnson, RP Larkin, MD Strickland, RW Thresher, & MD
Tuttle 2007. Ecological impacts of wind energy development on bats: questions, research needs, and
hypotheses Front Ecol Environ 2007; 5(6): 315–324
Leopold MF, EM Dijkman, E Winter, R Lensink & MM Scholl 2013a. Windenergie binnen 12 mijl in relatie
tot ecologie. IMARES Rapport C043b/13.
Leopold M.F., van Bemmelen R.S.A. & Zuur A.F. 2013b. Responses of local birds to the offshore wind
farms PAWP and OWEZ off the Dutch mainland coast. IMARES Report C151/12.
Lindeboom HJ, HJ Kouwenhoven, MJN Bergman, S Bouma, S Brasseur, R Daan, RC Fijn, D de Haan, S
Dirksen, R van Hal, R Hille Ris Lambers, R ter Hofstede, KL Krijgsveld, M Leopold & M Scheidat 2011.
Report number C056/14 59 of 117
Short-term ecological effects of an offshore wind farm in the Dutch coastal zone; a compilation.
Environmental Research Letters 6, 035101.
Madsen P.T., Whalberg M., Tougaard J. & Tyack P. 2006. Wind turbine underwater noise and marine
mammals: implications of current knowledge and data needs. Mar. Ecol. Prog. Ser. 309: 279-295.
McKindsey CW, P Archambault, MD Callier & F Olivier 2011. Influence of suspended and off-bottom
mussel culture on the sea bottom and benthic habitats: a review. Canadian Journal of Zoology,
89:622-646.
Offringa H. 1993. Zwarte Zeeëenden Melanitta nigra offshore. Sula 7(4): 142-144.
Petersen I.K., MacKenzie M.L., Rexstad E., Wisz M.S. & Fox A.D. 2011. Comparing pre- and post-
construction distributions of long-tailed ducks Clangula hyemalis in and around the Nysted offshore
wind farm, Denmark: a quasi-designed experiment accounting for imperfect detection, local surface
features and autocorrelation. CREEM Technical Report 2011-1, University of St Andrews.
Rahmel, U., L Bach, R Brinkmann, C Dense, H Limpens, G Mäscher, M Reichenbach & A Roschen 1999.
Windkraftplanung und Fledermäuse - Konfliktfelder und Hinweise zur Erfassungsmethodik. Bremer
Beiträge für Naturkunde und Naturschutz, 4,
Rodrigues, L., L. Bach, M.-J. Dubourg-Savage, J. Goodwin & C. Harbusch 2008. Guidelines for
consideration of bats in wind farm projects. EUROBATS Publication Series No. 3 (English version).
UNEP/EUROBATS Secretariat, Bonn, Germany, 51 pp.
Roycroft D, TC Kelly & LJ Lewis, 2004. Birds, seals and the suspension culture of mussles in Bantry Bay,
a non-seaduck area in Southwest Ireland. Estuarine, Coastal and Shelf Science 61:703-712.
Scheidat M., Tougaard J., Brasseur S., Carstensen J., van Polanen Petel T., Teilmann J. & Reijnders P.
2011. Harbour porpoises (Phocoena phocoena) and wind farms: a case study in the Dutch North Sea.
Environ. Res. Lett. 6 (2011) 025102 (10p).
Seamarco 2011. Temporary hearing threshold shifts and recovery in a harbor porpoise and two harbor
seals after exposure to continuous noise and playbacks of pile driving sounds; Part of the Shortlist
Masterplan Wind ‘Monitoring the Ecological Impact of Offshore Wind Farms on the Dutch Continental
Shelf’. Report ref. 2011/01. August 2011.
Skeate ER, Perrow MR en Gilroy JJ 2012. Likely effects of construction of Scroby Sands offshore wind
farm on a mixed population of harbour Phoca vitulina and grey Halichoerus grypus seals. Mar. Poll.
Bull. 64: 872-881.
Teilmann J. & Carstensen J. 2012. Negative long term effects on harbour porpoises from a large scale
offshore wind farm in the Baltic - evidence of slow recovery. Environ. Res. Lett. 7 (2012) 045101
(10pp). http://iopscience.iop.org/1748-9326/7/4/045101.
Thompson P.M., Brookes K.L., Graham I.M., Barton T.R., Needham K., Bradbury G. & Merchant N.D.
2013. Short-term disturbance by a commercial two-dimensional seismic survey does not lead to
long-term displace-ment of harbour porpoises. Proc. R. Soc. B 280: 20132001.
http://dx.doi.org/10.1098/rspb.2013.2001.
Turnpenny A W H, Nedwell J R 1994. The effects on marine fish, diving mammals and birds of
underwater sound generated by seismic surveys. FARL Report Reference: FCR 089/94, October 1994
Van Hal R , OG Bos & RG Jak 2011. Noordzee: systeemdynamiek, klimaatverandering, natuurtypen en
benthos : achtergronddocument bij Natuurverkenning 2011. Wageningen : Wettelijke
Onderzoekstaken Natuur & Milieu, (WOt-werkdocument 255)
Wernham C., Toms M., Marchant J., Clark J., Siriwardena G. & Baillie S. (eds) 2002. The migration atlas:
movements of the birds of Britain and Ireland. T. & A.D. Poyser, London, 884 p.

60 of 117 Report number C056/14
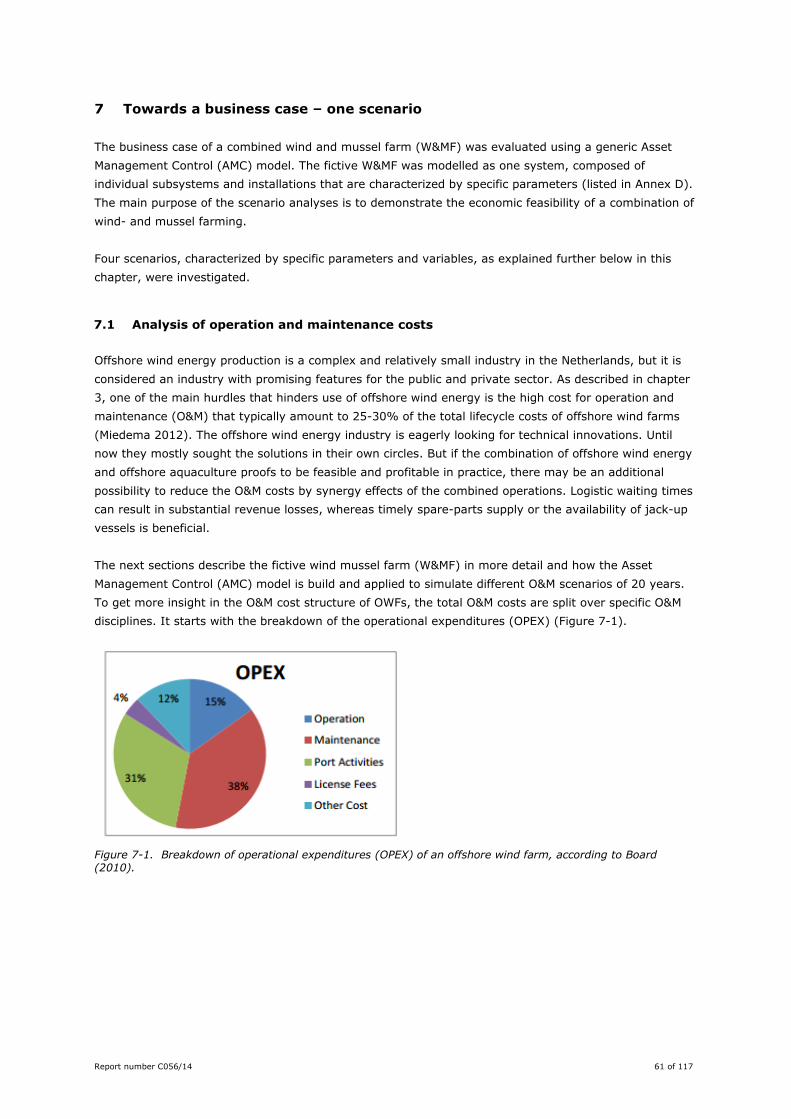
Report number C056/14 61 of 117
7 Towards a business case – one scenario
The business case of a combined wind and mussel farm (W&MF) was evaluated using a generic Asset
Management Control (AMC) model. The fictive W&MF was modelled as one system, composed of
individual subsystems and installations that are characterized by specific parameters (listed in Annex D).
The main purpose of the scenario analyses is to demonstrate the economic feasibility of a combination of
wind- and mussel farming.
Four scenarios, characterized by specific parameters and variables, as explained further below in this
chapter, were investigated.
7.1 Analysis of operation and maintenance costs
Offshore wind energy production is a complex and relatively small industry in the Netherlands, but it is
considered an industry with promising features for the public and private sector. As described in chapter
3, one of the main hurdles that hinders use of offshore wind energy is the high cost for operation and
maintenance (O&M) that typically amount to 25-30% of the total lifecycle costs of offshore wind farms
(Miedema 2012). The offshore wind energy industry is eagerly looking for technical innovations. Until
now they mostly sought the solutions in their own circles. But if the combination of offshore wind energy
and offshore aquaculture proofs to be feasible and profitable in practice, there may be an additional
possibility to reduce the O&M costs by synergy effects of the combined operations. Logistic waiting times
can result in substantial revenue losses, whereas timely spare-parts supply or the availability of jack-up
vessels is beneficial.
The next sections describe the fictive wind mussel farm (W&MF) in more detail and how the Asset
Management Control (AMC) model is build and applied to simulate different O&M scenarios of 20 years.
To get more insight in the O&M cost structure of OWFs, the total O&M costs are split over specific O&M
disciplines. It starts with the breakdown of the operational expenditures (OPEX) (Figure 7-1).
Figure 7-1. Breakdown of operational expenditures (OPEX) of an offshore wind farm, according to Board (2010).
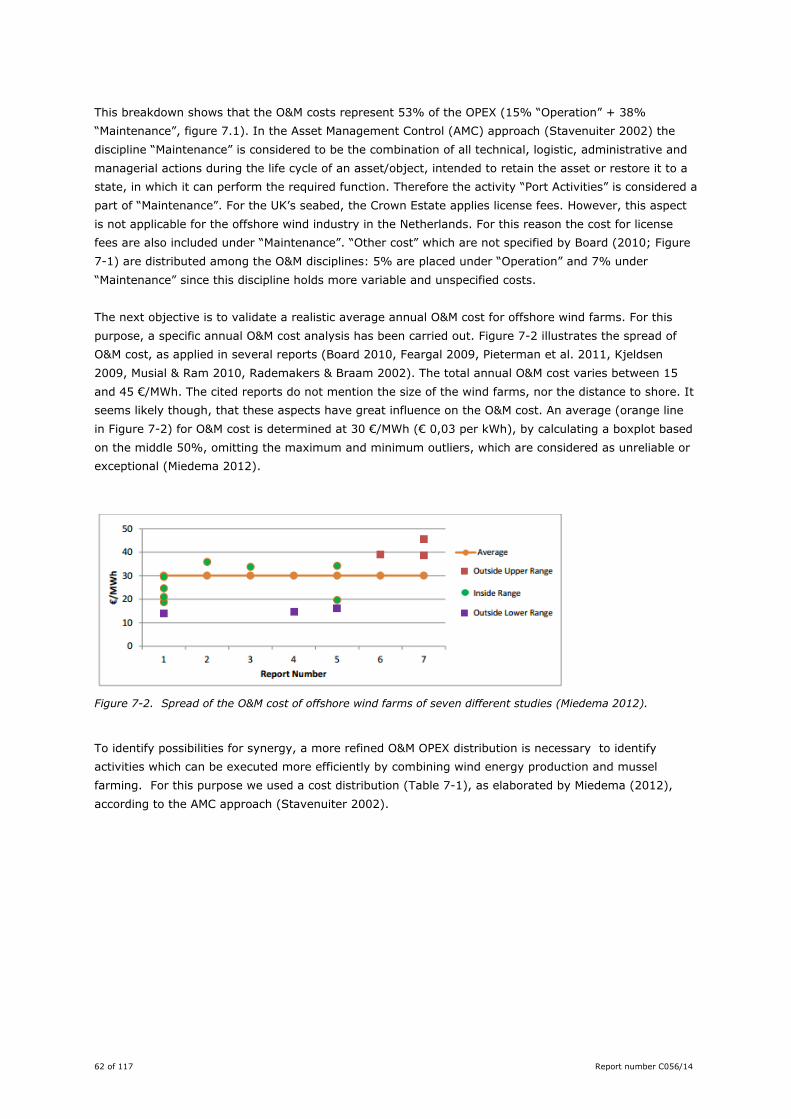
62 of 117 Report number C056/14
This breakdown shows that the O&M costs represent 53% of the OPEX (15% “Operation” + 38%
“Maintenance”, figure 7.1). In the Asset Management Control (AMC) approach (Stavenuiter 2002) the
discipline “Maintenance” is considered to be the combination of all technical, logistic, administrative and
managerial actions during the life cycle of an asset/object, intended to retain the asset or restore it to a
state, in which it can perform the required function. Therefore the activity “Port Activities” is considered a
part of “Maintenance”. For the UK’s seabed, the Crown Estate applies license fees. However, this aspect
is not applicable for the offshore wind industry in the Netherlands. For this reason the cost for license
fees are also included under “Maintenance”. “Other cost” which are not specified by Board (2010; Figure
7-1) are distributed among the O&M disciplines: 5% are placed under “Operation” and 7% under
“Maintenance” since this discipline holds more variable and unspecified costs.
The next objective is to validate a realistic average annual O&M cost for offshore wind farms. For this
purpose, a specific annual O&M cost analysis has been carried out. Figure 7-2 illustrates the spread of
O&M cost, as applied in several reports (Board 2010, Feargal 2009, Pieterman et al. 2011, Kjeldsen
2009, Musial & Ram 2010, Rademakers & Braam 2002). The total annual O&M cost varies between 15
and 45 €/MWh. The cited reports do not mention the size of the wind farms, nor the distance to shore. It
seems likely though, that these aspects have great influence on the O&M cost. An average (orange line
in Figure 7-2) for O&M cost is determined at 30 €/MWh (€ 0,03 per kWh), by calculating a boxplot based
on the middle 50%, omitting the maximum and minimum outliers, which are considered as unreliable or
exceptional (Miedema 2012).
Figure 7-2. Spread of the O&M cost of offshore wind farms of seven different studies (Miedema 2012).
To identify possibilities for synergy, a more refined O&M OPEX distribution is necessary to identify
activities which can be executed more efficiently by combining wind energy production and mussel
farming. For this purpose we used a cost distribution (Table 7-1), as elaborated by Miedema (2012),
according to the AMC approach (Stavenuiter 2002).
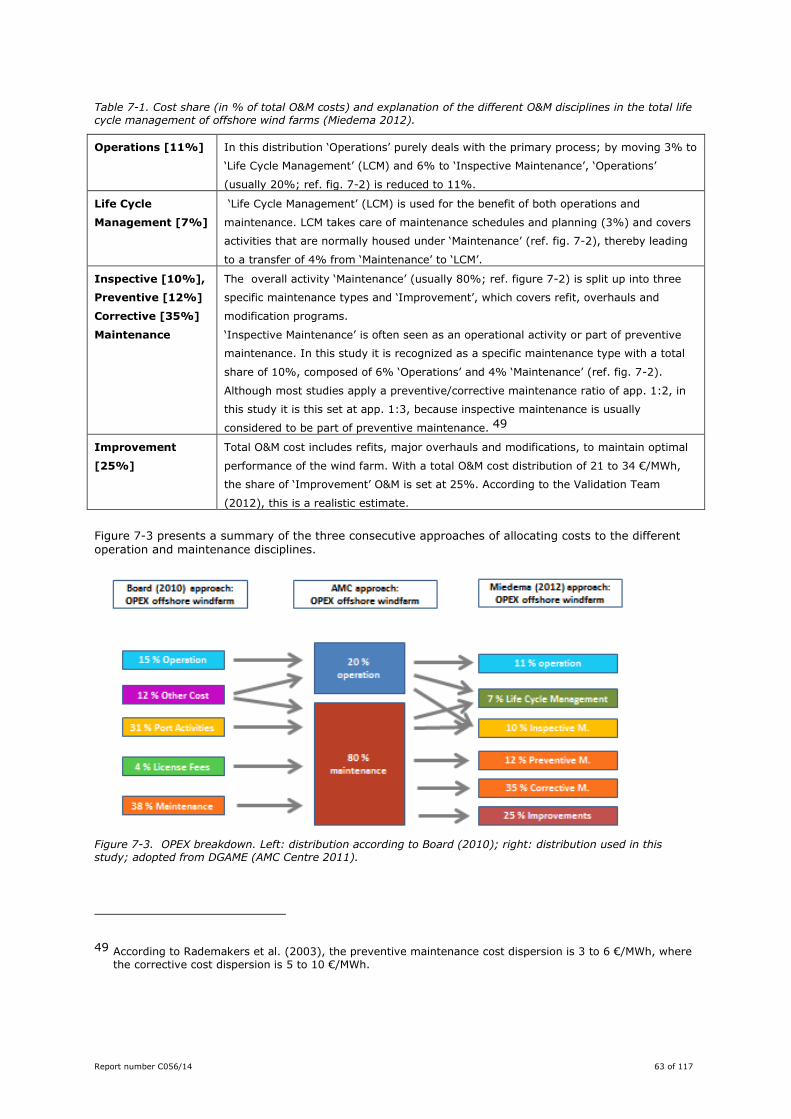
Report number C056/14 63 of 117
Table 7-1. Cost share (in % of total O&M costs) and explanation of the different O&M disciplines in the total life cycle management of offshore wind farms (Miedema 2012).
Operations [11%]
In this distribution ‘Operations’ purely deals with the primary process; by moving 3% to
‘Life Cycle Management’ (LCM) and 6% to ‘Inspective Maintenance’, ‘Operations’
(usually 20%; ref. fig. 7-2) is reduced to 11%.
Life Cycle
Management [7%]
‘Life Cycle Management’ (LCM) is used for the benefit of both operations and
maintenance. LCM takes care of maintenance schedules and planning (3%) and covers
activities that are normally housed under ‘Maintenance’ (ref. fig. 7-2), thereby leading
to a transfer of 4% from ‘Maintenance’ to ‘LCM’.
Inspective [10%],
Preventive [12%]
Corrective [35%]
Maintenance
The overall activity ‘Maintenance’ (usually 80%; ref. figure 7-2) is split up into three
specific maintenance types and ‘Improvement’, which covers refit, overhauls and
modification programs.
‘Inspective Maintenance’ is often seen as an operational activity or part of preventive
maintenance. In this study it is recognized as a specific maintenance type with a total
share of 10%, composed of 6% ‘Operations’ and 4% ‘Maintenance’ (ref. fig. 7-2).
Although most studies apply a preventive/corrective maintenance ratio of app. 1:2, in
this study it is this set at app. 1:3, because inspective maintenance is usually
considered to be part of preventive maintenance. 49
Improvement
[25%]
Total O&M cost includes refits, major overhauls and modifications, to maintain optimal
performance of the wind farm. With a total O&M cost distribution of 21 to 34 €/MWh,
the share of ‘Improvement’ O&M is set at 25%. According to the Validation Team
(2012), this is a realistic estimate.
Figure 7-3 presents a summary of the three consecutive approaches of allocating costs to the different operation and maintenance disciplines.
Figure 7-3. OPEX breakdown. Left: distribution according to Board (2010); right: distribution used in this study; adopted from DGAME (AMC Centre 2011).
49 According to Rademakers et al. (2003), the preventive maintenance cost dispersion is 3 to 6 €/MWh, where
the corrective cost dispersion is 5 to 10 €/MWh.
64 of 117 Report number C056/14
7.2 Potential for synergy
To estimate the potential synergy through combining wind and mussel farming, the following
assumptions apply50:
Operations & Life Cycle Management
For OWFs larger than 200MW, it is common to have a control room ashore, 24 hours and 7 days a week
staffed by two to four people. In this study, the assumption is made that with little extra effort this team
can also manage the mussel farm, if it is integrated in the wind farm environment.
Inspective, Preventive, Corrective Maintenance and Improvement Maintenance
Previous studies and practical experiences (Thomsen 2012) have shown that in general 50% of the
charged maintenance labour are non-productive time because of waiting for e.g. specific certified
personnel, transport opportunities, acceptable weather windows, adequate spares, tools and equipment.
It is assumed that by combining wind energy and mussel production these ‘lost hours’ can be reduced to
at least 25% of the charged maintenance labour. This means that, when the labour cost is 60% of the
total O&M cost of a wind farm, a cost reduction of 15% is attainable.
To reduce the waiting time related to O&M of wind farms, and thus reduce O&M costs, , the project team
has discussed several logistical opportunities for synergy. For example, when a multi-purpose ship sails
out for a week to transport a maintenance crew to and from the wind turbines, it can inspect the
longline-installations and/or harvest the mussels, while the crew is busy carrying out the maintenance
work. When tasks are finished, the ship takes the crew on board again and brings the harvest ashore.
To achieve the pursued cost reductions, the following aspects of synergy are seen as prerequisites:
Clusters of aquaculture integrated with, or between, clusters of wind turbines
Combined Operations and Life Cycle Management
Use of multi-purpose support vessels, capable to operate under significant wave-height conditions of
up to 3 m
Well-trained staff, capable to operate and maintain all installations
No additional staff needed for the control room
The previously mentioned assumptions are expected to lead to an overall reduction of O&M costs by at
least 10%. The following cost breakdown (in % of the total O&M cost of wind energy; see Table 7-1) is
considered to be an adequate estimation for offshore mussel farming and the combination of offshore
wind and mussel farming. The figures derived serve as set targets and baselines or references for a first
analysis in the LCA model (Table 7-2).
50 These assumptions were formulated and agreed on in an expert workshop consisting of Ramses Alma (AMC
T&T), Nico Bolleman (Blue-H), Henk Braam (ECN), Wim de Goede (HVA), Ko Hartog (HVA), Bertrand van
Leersum (ATO NH), Tom Obdam (ECN), Luc Rademakers (ECN), Hein Sabelis (Peterson), John Stavenuiter (AMC Centre) & Frans Veenstra (IMARES).
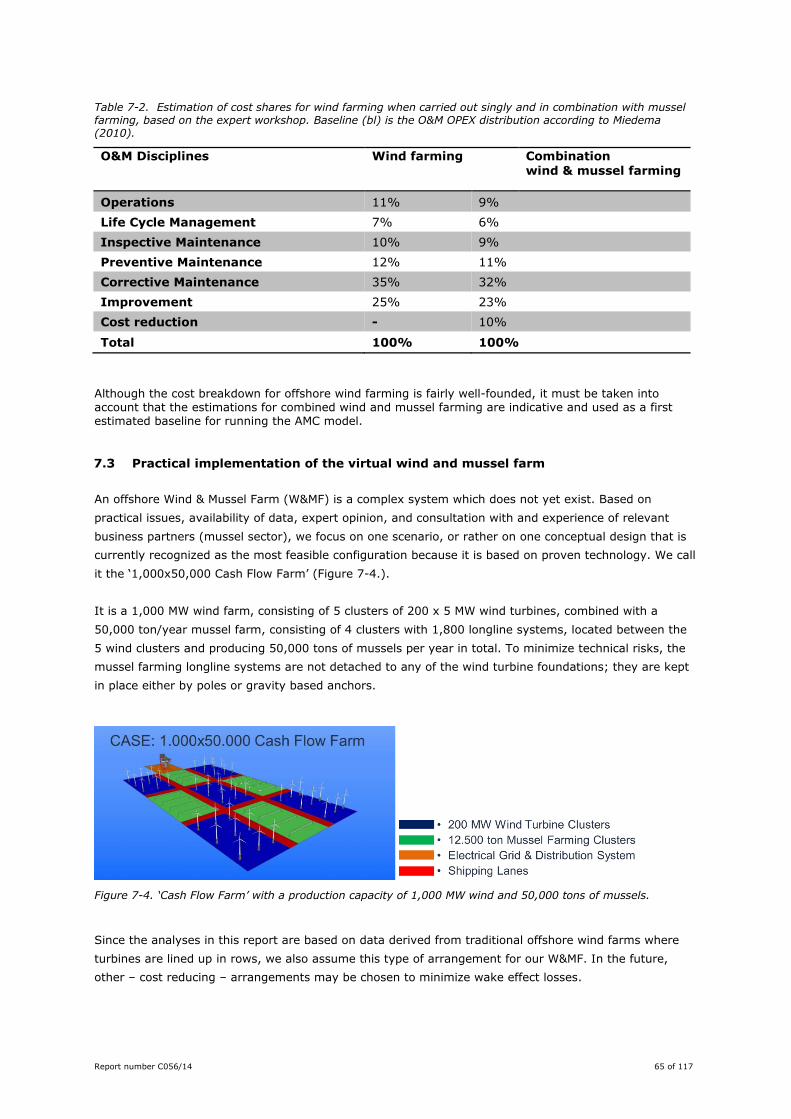
Report number C056/14 65 of 117
Table 7-2. Estimation of cost shares for wind farming when carried out singly and in combination with mussel farming, based on the expert workshop. Baseline (bl) is the O&M OPEX distribution according to Miedema (2010).
O&M Disciplines Wind farming Combination wind & mussel farming
Operations 11% 9%
Life Cycle Management 7% 6%
Inspective Maintenance 10% 9%
Preventive Maintenance 12% 11%
Corrective Maintenance 35% 32%
Improvement 25% 23%
Cost reduction - 10%
Total 100% 100%
Although the cost breakdown for offshore wind farming is fairly well-founded, it must be taken into account that the estimations for combined wind and mussel farming are indicative and used as a first estimated baseline for running the AMC model.
7.3 Practical implementation of the virtual wind and mussel farm
An offshore Wind & Mussel Farm (W&MF) is a complex system which does not yet exist. Based on
practical issues, availability of data, expert opinion, and consultation with and experience of relevant
business partners (mussel sector), we focus on one scenario, or rather on one conceptual design that is
currently recognized as the most feasible configuration because it is based on proven technology. We call
it the ‘1,000x50,000 Cash Flow Farm’ (Figure 7-4.).
It is a 1,000 MW wind farm, consisting of 5 clusters of 200 x 5 MW wind turbines, combined with a
50,000 ton/year mussel farm, consisting of 4 clusters with 1,800 longline systems, located between the
5 wind clusters and producing 50,000 tons of mussels per year in total. To minimize technical risks, the
mussel farming longline systems are not detached to any of the wind turbine foundations; they are kept
in place either by poles or gravity based anchors.
Figure 7-4. ‘Cash Flow Farm’ with a production capacity of 1,000 MW wind and 50,000 tons of mussels.
Since the analyses in this report are based on data derived from traditional offshore wind farms where
turbines are lined up in rows, we also assume this type of arrangement for our W&MF. In the future,
other – cost reducing – arrangements may be chosen to minimize wake effect losses.
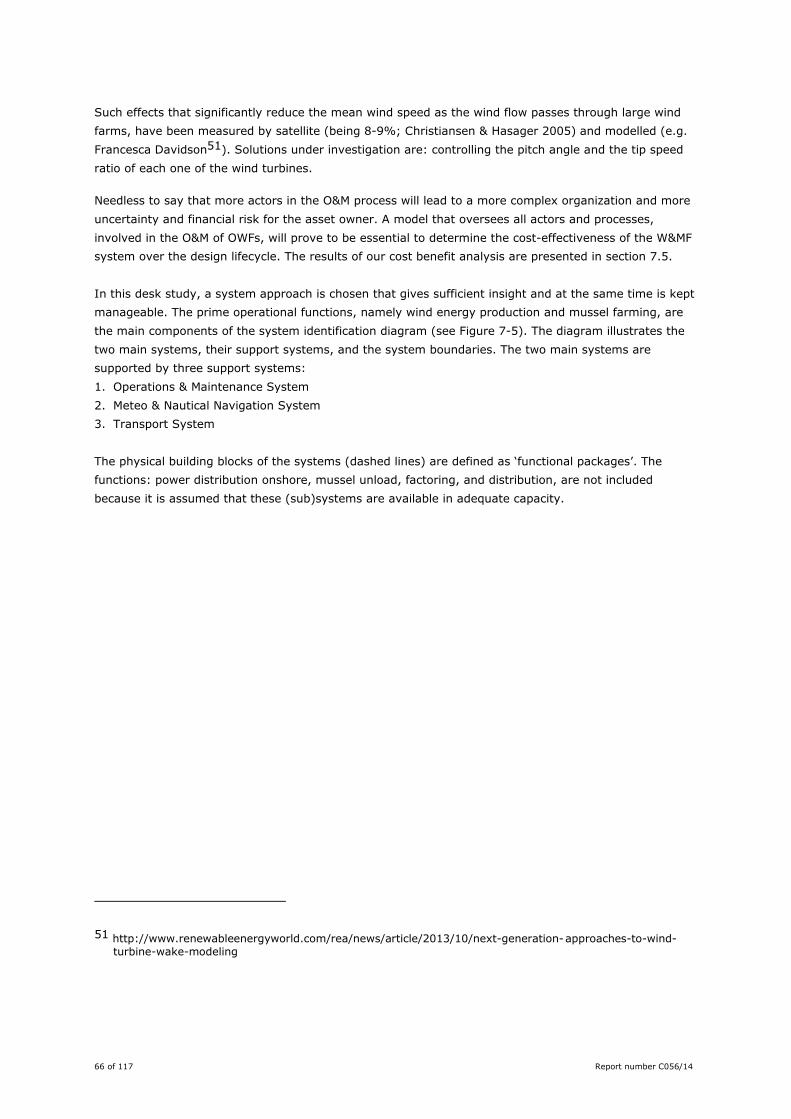
66 of 117 Report number C056/14
Such effects that significantly reduce the mean wind speed as the wind flow passes through large wind
farms, have been measured by satellite (being 8-9%; Christiansen & Hasager 2005) and modelled (e.g.
Francesca Davidson51). Solutions under investigation are: controlling the pitch angle and the tip speed
ratio of each one of the wind turbines.
Needless to say that more actors in the O&M process will lead to a more complex organization and more
uncertainty and financial risk for the asset owner. A model that oversees all actors and processes,
involved in the O&M of OWFs, will prove to be essential to determine the cost-effectiveness of the W&MF
system over the design lifecycle. The results of our cost benefit analysis are presented in section 7.5.
In this desk study, a system approach is chosen that gives sufficient insight and at the same time is kept
manageable. The prime operational functions, namely wind energy production and mussel farming, are
the main components of the system identification diagram (see Figure 7-5). The diagram illustrates the
two main systems, their support systems, and the system boundaries. The two main systems are
supported by three support systems:
1. Operations & Maintenance System
2. Meteo & Nautical Navigation System
3. Transport System
The physical building blocks of the systems (dashed lines) are defined as ‘functional packages’. The
functions: power distribution onshore, mussel unload, factoring, and distribution, are not included
because it is assumed that these (sub)systems are available in adequate capacity.
51 http://www.renewableenergyworld.com/rea/news/article/2013/10/next-generation- approaches-to-wind-
turbine-wake-modeling
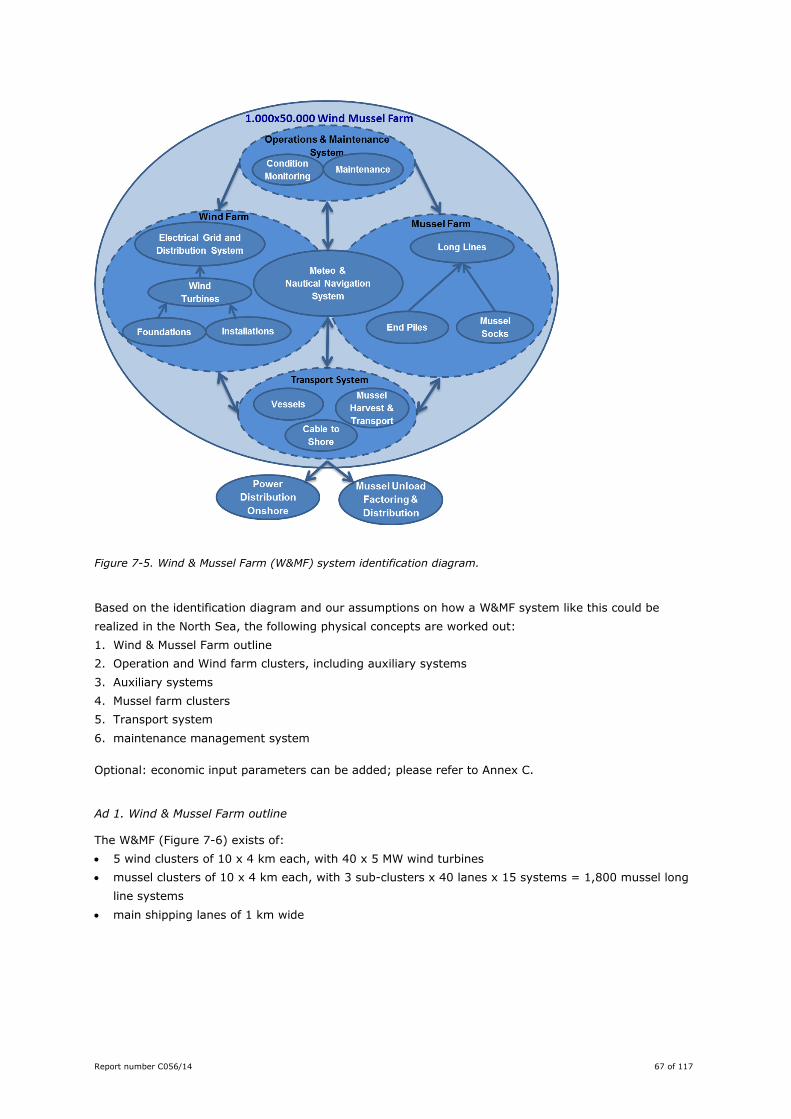
Report number C056/14 67 of 117
Figure 7-5. Wind & Mussel Farm (W&MF) system identification diagram.
Based on the identification diagram and our assumptions on how a W&MF system like this could be
realized in the North Sea, the following physical concepts are worked out:
1. Wind & Mussel Farm outline
2. Operation and Wind farm clusters, including auxiliary systems
3. Auxiliary systems
4. Mussel farm clusters
5. Transport system
6. maintenance management system
Optional: economic input parameters can be added; please refer to Annex C.
Ad 1. Wind & Mussel Farm outline
The W&MF (Figure 7-6) exists of:
5 wind clusters of 10 x 4 km each, with 40 x 5 MW wind turbines
mussel clusters of 10 x 4 km each, with 3 sub-clusters x 40 lanes x 15 systems = 1,800 mussel long
line systems
main shipping lanes of 1 km wide
68 of 117 Report number C056/14
Figure 7-6. Wind & Mussel Farm (W&MF) outline.
The dimensions are determined by the design distance between the wind turbines of 3 km. The spacing
should ensure that the wind turbines are minimally disturbed by one another (wake effects). For mussel
farming on this scale, this size of farm area seems to be realistic to guaranty sufficient nutrients for
feeding the mussels. The shipping lanes are considered necessary to provide an acceptable ‘freedom to
shipping’.
Ad 2. Wind farm clusters including auxiliary systems
The five wind farm clusters contain 40 wind turbines of 5 MW per cluster (Figure 7-7). Based on this
configuration the most important auxiliary systems are defined (BVG Associates 2011):
5 x 50 km wind farm grid subsea cable
1 x wind farm sub-station;
4 x wind farm meteorological and navigation mast
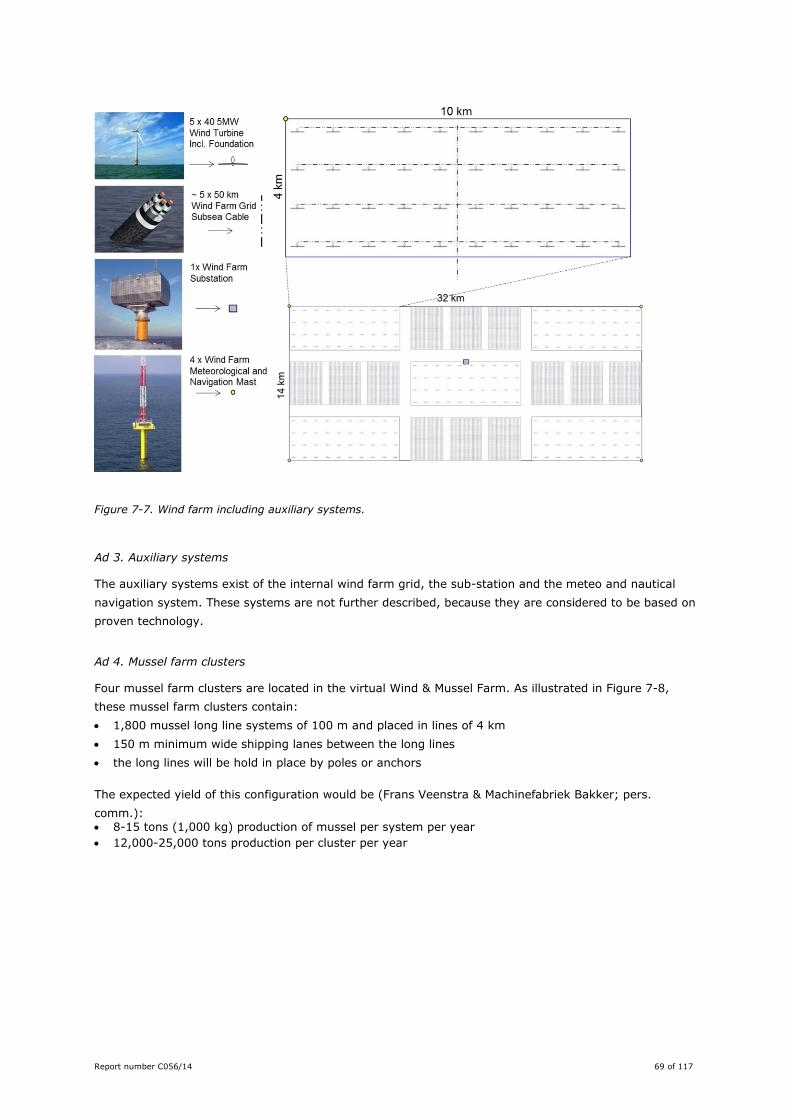
Report number C056/14 69 of 117
Figure 7-7. Wind farm including auxiliary systems.
Ad 3. Auxiliary systems
The auxiliary systems exist of the internal wind farm grid, the sub-station and the meteo and nautical
navigation system. These systems are not further described, because they are considered to be based on
proven technology.
Ad 4. Mussel farm clusters
Four mussel farm clusters are located in the virtual Wind & Mussel Farm. As illustrated in Figure 7-8,
these mussel farm clusters contain:
1,800 mussel long line systems of 100 m and placed in lines of 4 km
150 m minimum wide shipping lanes between the long lines
the long lines will be hold in place by poles or anchors
The expected yield of this configuration would be (Frans Veenstra & Machinefabriek Bakker; pers.
comm.): 8-15 tons (1,000 kg) production of mussel per system per year
12,000-25,000 tons production per cluster per year
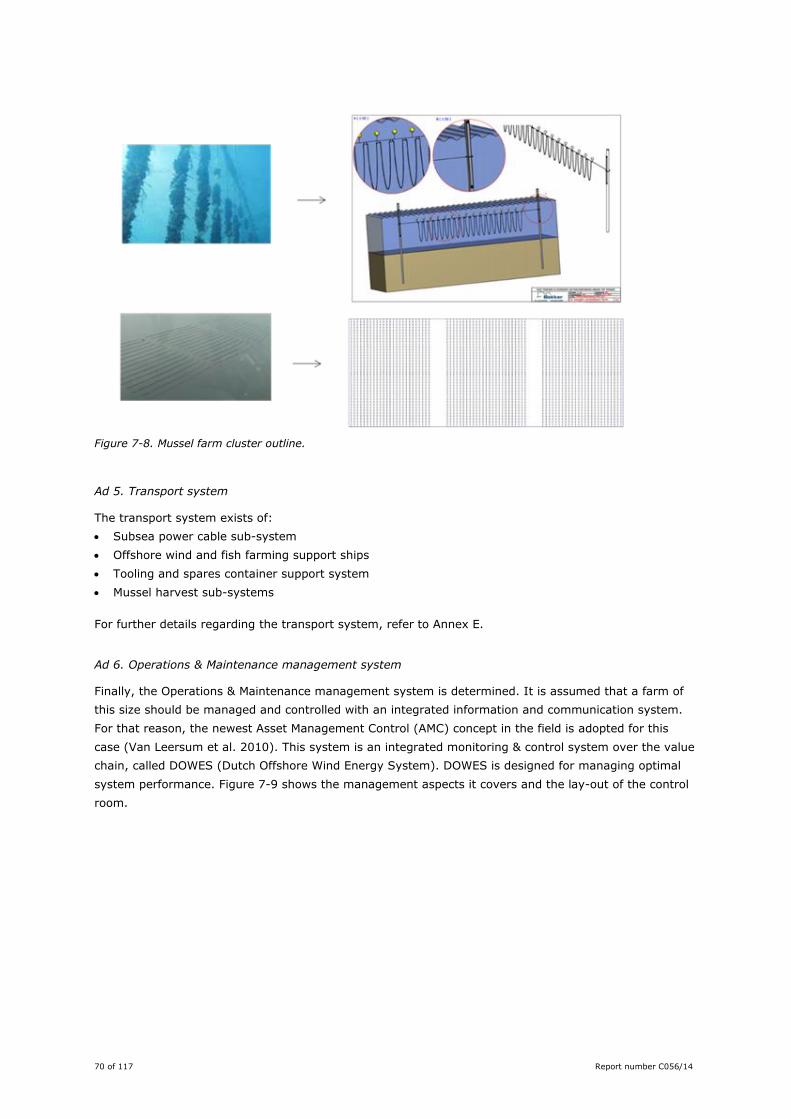
70 of 117 Report number C056/14
Figure 7-8. Mussel farm cluster outline.
Ad 5. Transport system
The transport system exists of:
Subsea power cable sub-system
Offshore wind and fish farming support ships
Tooling and spares container support system
Mussel harvest sub-systems
For further details regarding the transport system, refer to Annex E.
Ad 6. Operations & Maintenance management system
Finally, the Operations & Maintenance management system is determined. It is assumed that a farm of
this size should be managed and controlled with an integrated information and communication system.
For that reason, the newest Asset Management Control (AMC) concept in the field is adopted for this
case (Van Leersum et al. 2010). This system is an integrated monitoring & control system over the value
chain, called DOWES (Dutch Offshore Wind Energy System). DOWES is designed for managing optimal
system performance. Figure 7-9 shows the management aspects it covers and the lay-out of the control
room.
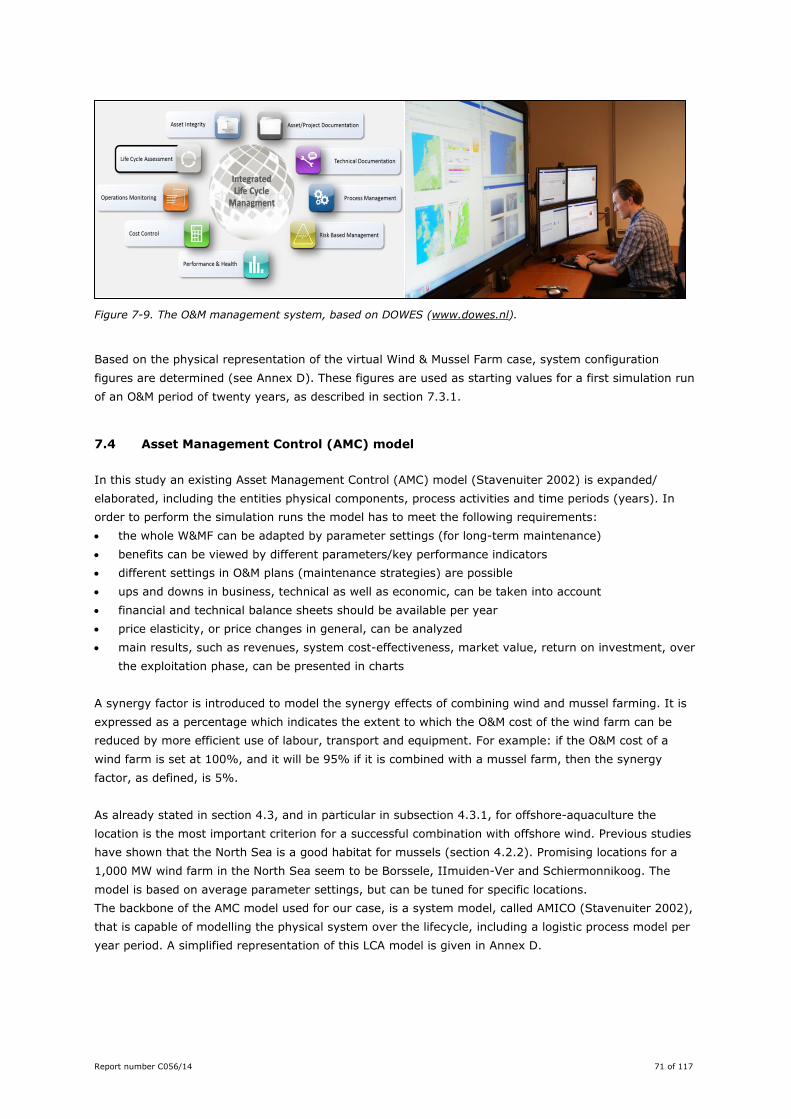
Report number C056/14 71 of 117
Figure 7-9. The O&M management system, based on DOWES (www.dowes.nl).
Based on the physical representation of the virtual Wind & Mussel Farm case, system configuration
figures are determined (see Annex D). These figures are used as starting values for a first simulation run
of an O&M period of twenty years, as described in section 7.3.1.
7.4 Asset Management Control (AMC) model
In this study an existing Asset Management Control (AMC) model (Stavenuiter 2002) is expanded/
elaborated, including the entities physical components, process activities and time periods (years). In
order to perform the simulation runs the model has to meet the following requirements:
the whole W&MF can be adapted by parameter settings (for long-term maintenance)
benefits can be viewed by different parameters/key performance indicators
different settings in O&M plans (maintenance strategies) are possible
ups and downs in business, technical as well as economic, can be taken into account
financial and technical balance sheets should be available per year
price elasticity, or price changes in general, can be analyzed
main results, such as revenues, system cost-effectiveness, market value, return on investment, over
the exploitation phase, can be presented in charts
A synergy factor is introduced to model the synergy effects of combining wind and mussel farming. It is
expressed as a percentage which indicates the extent to which the O&M cost of the wind farm can be
reduced by more efficient use of labour, transport and equipment. For example: if the O&M cost of a
wind farm is set at 100%, and it will be 95% if it is combined with a mussel farm, then the synergy
factor, as defined, is 5%.
As already stated in section 4.3, and in particular in subsection 4.3.1, for offshore-aquaculture the
location is the most important criterion for a successful combination with offshore wind. Previous studies
have shown that the North Sea is a good habitat for mussels (section 4.2.2). Promising locations for a
1,000 MW wind farm in the North Sea seem to be Borssele, IImuiden-Ver and Schiermonnikoog. The
model is based on average parameter settings, but can be tuned for specific locations.
The backbone of the AMC model used for our case, is a system model, called AMICO (Stavenuiter 2002),
that is capable of modelling the physical system over the lifecycle, including a logistic process model per
year period. A simplified representation of this LCA model is given in Annex D.
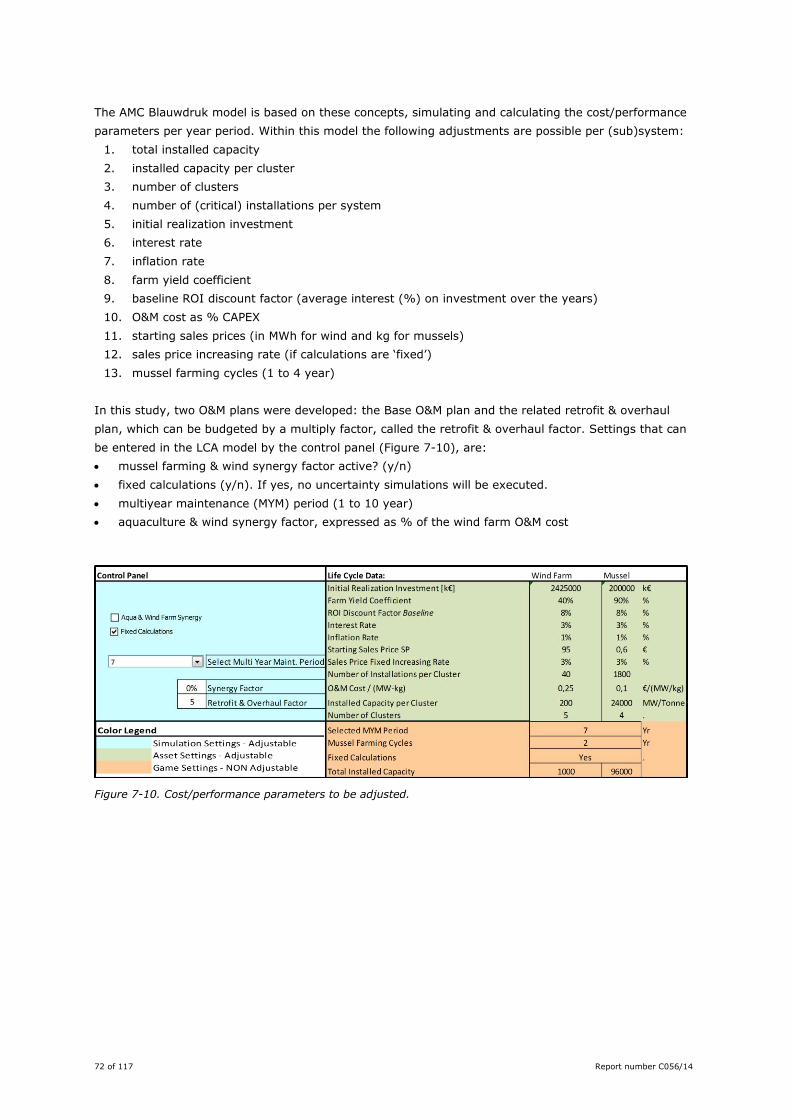
72 of 117 Report number C056/14
The AMC Blauwdruk model is based on these concepts, simulating and calculating the cost/performance
parameters per year period. Within this model the following adjustments are possible per (sub)system:
1. total installed capacity
2. installed capacity per cluster
3. number of clusters
4. number of (critical) installations per system
5. initial realization investment
6. interest rate
7. inflation rate
8. farm yield coefficient
9. baseline ROI discount factor (average interest (%) on investment over the years)
10. O&M cost as % CAPEX
11. starting sales prices (in MWh for wind and kg for mussels)
12. sales price increasing rate (if calculations are ‘fixed’)
13. mussel farming cycles (1 to 4 year)
In this study, two O&M plans were developed: the Base O&M plan and the related retrofit & overhaul
plan, which can be budgeted by a multiply factor, called the retrofit & overhaul factor. Settings that can
be entered in the LCA model by the control panel (Figure 7-10), are:
mussel farming & wind synergy factor active? (y/n)
fixed calculations (y/n). If yes, no uncertainty simulations will be executed.
multiyear maintenance (MYM) period (1 to 10 year)
aquaculture & wind synergy factor, expressed as % of the wind farm O&M cost
Figure 7-10. Cost/performance parameters to be adjusted.
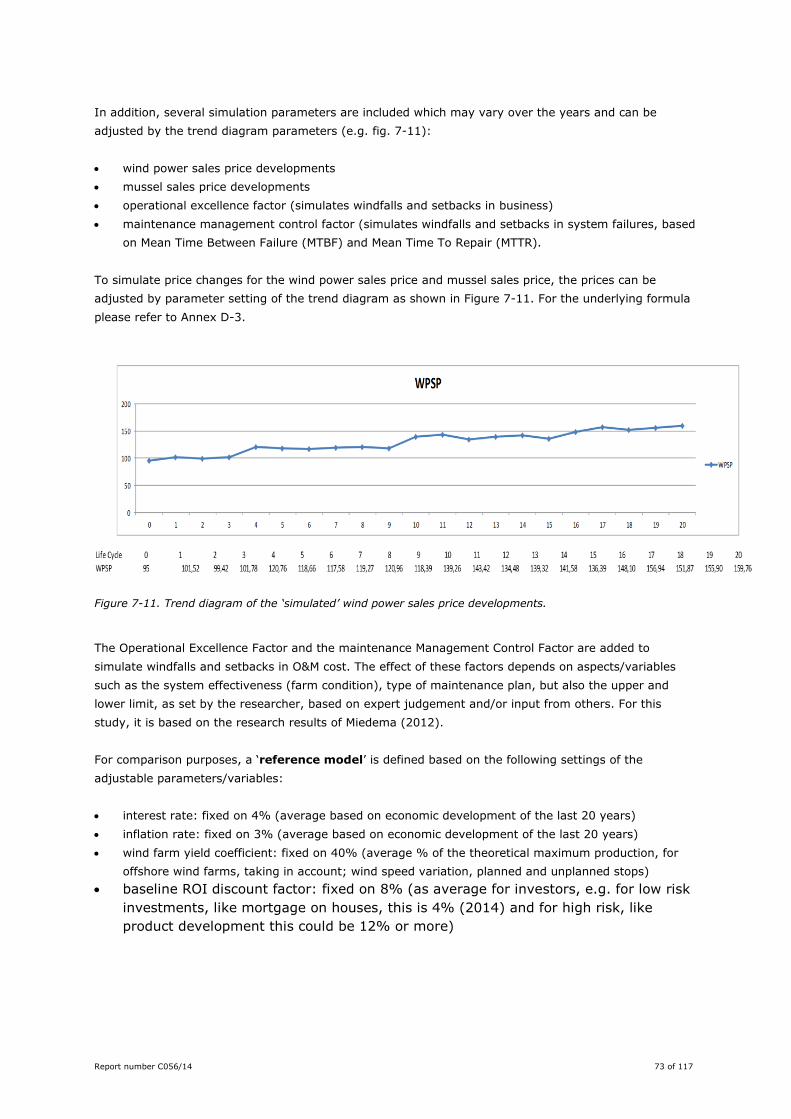
Report number C056/14 73 of 117
In addition, several simulation parameters are included which may vary over the years and can be
adjusted by the trend diagram parameters (e.g. fig. 7-11):
wind power sales price developments
mussel sales price developments
operational excellence factor (simulates windfalls and setbacks in business)
maintenance management control factor (simulates windfalls and setbacks in system failures, based
on Mean Time Between Failure (MTBF) and Mean Time To Repair (MTTR).
To simulate price changes for the wind power sales price and mussel sales price, the prices can be
adjusted by parameter setting of the trend diagram as shown in Figure 7-11. For the underlying formula
please refer to Annex D-3.
Figure 7-11. Trend diagram of the ‘simulated’ wind power sales price developments.
The Operational Excellence Factor and the maintenance Management Control Factor are added to
simulate windfalls and setbacks in O&M cost. The effect of these factors depends on aspects/variables
such as the system effectiveness (farm condition), type of maintenance plan, but also the upper and
lower limit, as set by the researcher, based on expert judgement and/or input from others. For this
study, it is based on the research results of Miedema (2012).
For comparison purposes, a ‘reference model’ is defined based on the following settings of the
adjustable parameters/variables:
interest rate: fixed on 4% (average based on economic development of the last 20 years)
inflation rate: fixed on 3% (average based on economic development of the last 20 years)
wind farm yield coefficient: fixed on 40% (average % of the theoretical maximum production, for
offshore wind farms, taking in account; wind speed variation, planned and unplanned stops)
baseline ROI discount factor: fixed on 8% (as average for investors, e.g. for low risk
investments, like mortgage on houses, this is 4% (2014) and for high risk, like
product development this could be 12% or more)
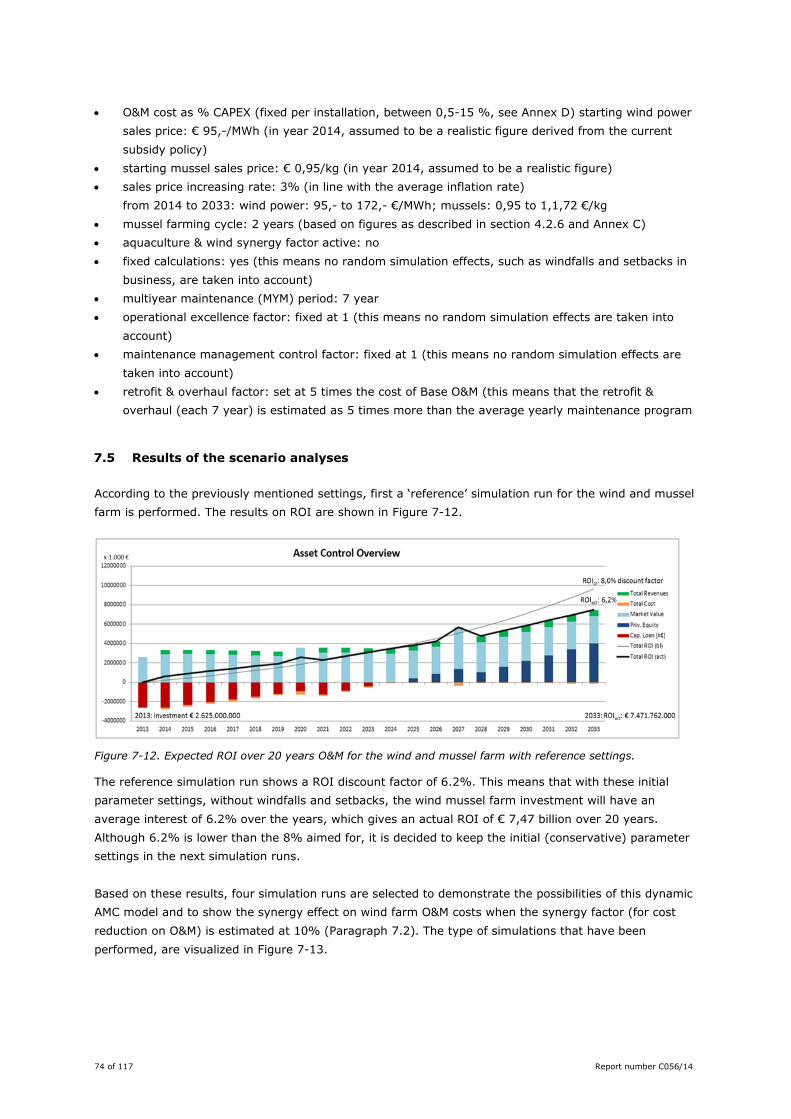
74 of 117 Report number C056/14
O&M cost as % CAPEX (fixed per installation, between 0,5-15 %, see Annex D) starting wind power
sales price: € 95,-/MWh (in year 2014, assumed to be a realistic figure derived from the current
subsidy policy)
starting mussel sales price: € 0,95/kg (in year 2014, assumed to be a realistic figure)
sales price increasing rate: 3% (in line with the average inflation rate)
from 2014 to 2033: wind power: 95,- to 172,- €/MWh; mussels: 0,95 to 1,1,72 €/kg
mussel farming cycle: 2 years (based on figures as described in section 4.2.6 and Annex C)
aquaculture & wind synergy factor active: no
fixed calculations: yes (this means no random simulation effects, such as windfalls and setbacks in
business, are taken into account)
multiyear maintenance (MYM) period: 7 year
operational excellence factor: fixed at 1 (this means no random simulation effects are taken into
account)
maintenance management control factor: fixed at 1 (this means no random simulation effects are
taken into account)
retrofit & overhaul factor: set at 5 times the cost of Base O&M (this means that the retrofit &
overhaul (each 7 year) is estimated as 5 times more than the average yearly maintenance program
7.5 Results of the scenario analyses
According to the previously mentioned settings, first a ‘reference’ simulation run for the wind and mussel
farm is performed. The results on ROI are shown in Figure 7-12.
Figure 7-12. Expected ROI over 20 years O&M for the wind and mussel farm with reference settings.
The reference simulation run shows a ROI discount factor of 6.2%. This means that with these initial
parameter settings, without windfalls and setbacks, the wind mussel farm investment will have an
average interest of 6.2% over the years, which gives an actual ROI of € 7,47 billion over 20 years.
Although 6.2% is lower than the 8% aimed for, it is decided to keep the initial (conservative) parameter
settings in the next simulation runs.
Based on these results, four simulation runs are selected to demonstrate the possibilities of this dynamic
AMC model and to show the synergy effect on wind farm O&M costs when the synergy factor (for cost
reduction on O&M) is estimated at 10% (Paragraph 7.2). The type of simulations that have been
performed, are visualized in Figure 7-13.
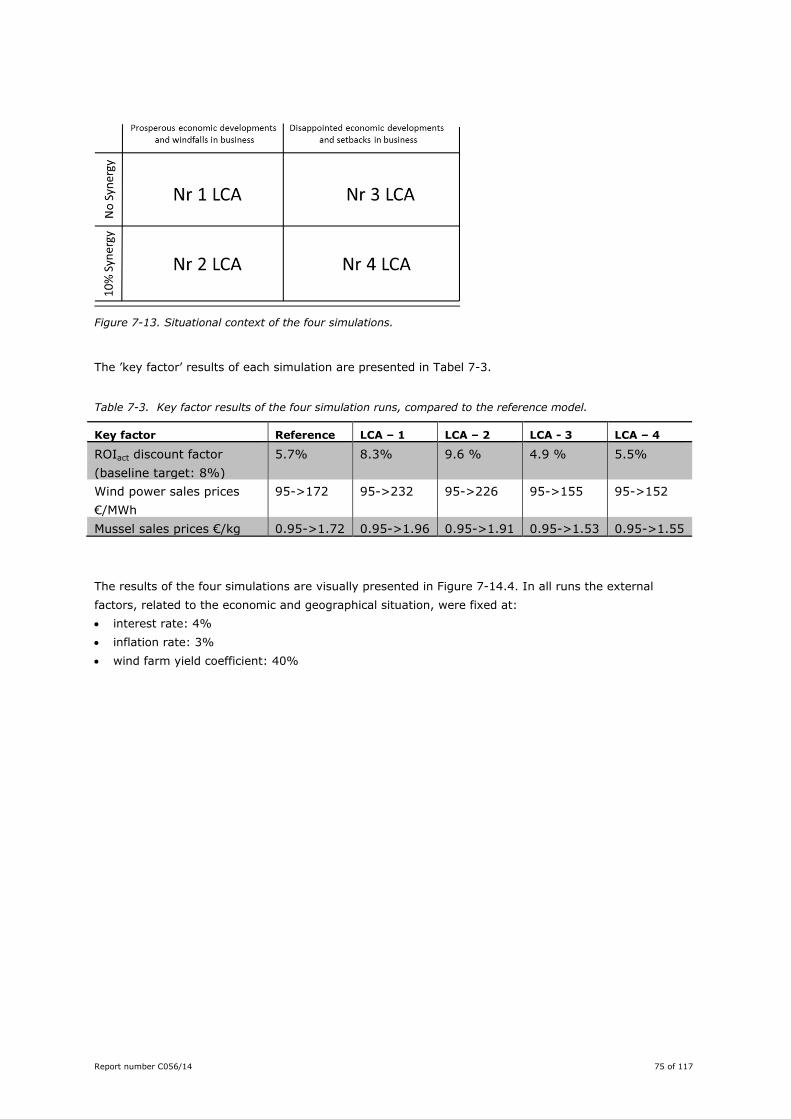
Report number C056/14 75 of 117
Figure 7-13. Situational context of the four simulations.
The ’key factor’ results of each simulation are presented in Tabel 7-3.
Table 7-3. Key factor results of the four simulation runs, compared to the reference model.
Key factor Reference LCA – 1 LCA – 2 LCA - 3 LCA – 4
ROIact discount factor
(baseline target: 8%)
5.7% 8.3% 9.6 % 4.9 % 5.5%
Wind power sales prices
€/MWh
95->172 95->232 95->226 95->155 95->152
Mussel sales prices €/kg 0.95->1.72 0.95->1.96 0.95->1.91 0.95->1.53 0.95->1.55
The results of the four simulations are visually presented in Figure 7-14.4. In all runs the external
factors, related to the economic and geographical situation, were fixed at:
interest rate: 4%
inflation rate: 3%
wind farm yield coefficient: 40%
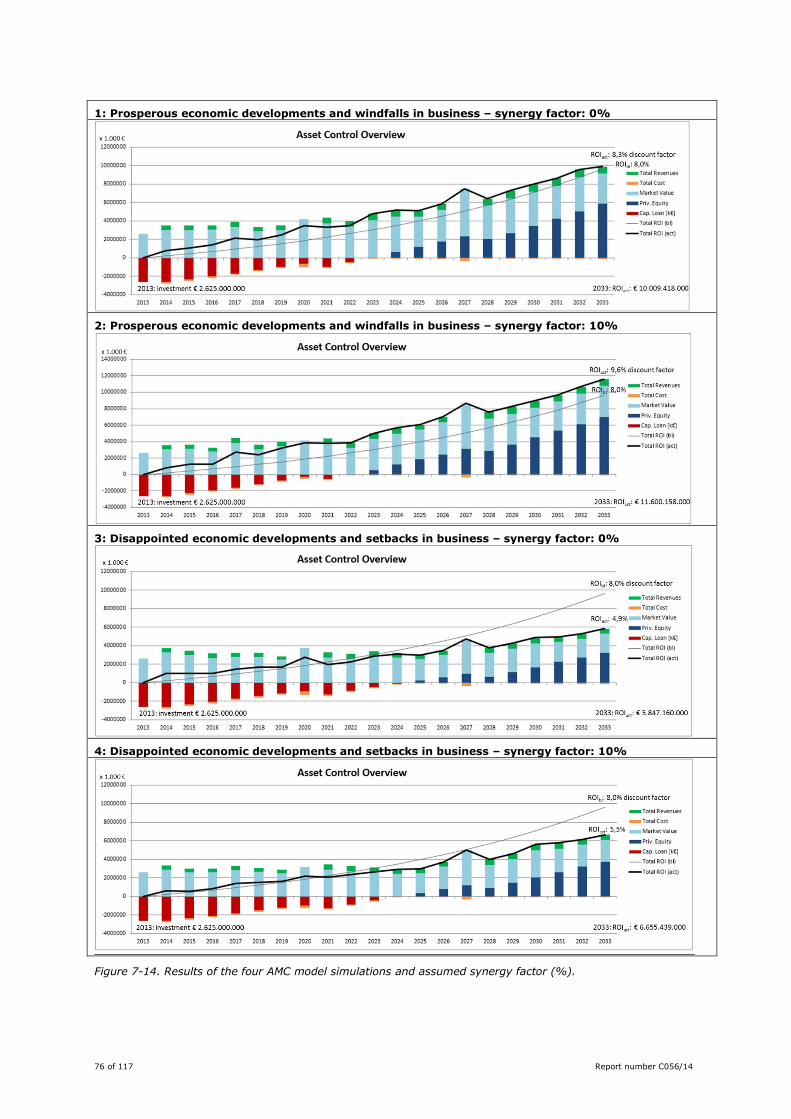
76 of 117 Report number C056/14
1: Prosperous economic developments and windfalls in business – synergy factor: 0%
2: Prosperous economic developments and windfalls in business – synergy factor: 10%
3: Disappointed economic developments and setbacks in business – synergy factor: 0%
4: Disappointed economic developments and setbacks in business – synergy factor: 10%
Figure 7-14. Results of the four AMC model simulations and assumed synergy factor (%).
Report number C056/14 77 of 117
Figure 7-14. shows the positive effect, when assuming a synergy effect of 10% reduction on the wind
farm O&M cost, as expected. The interesting thing about this way of modeling is that the influence of
synergy can be analyzed in more detail by modeling uncertainties (displayed as windfalls and setbacks).
This can be based on situations such as: Mussel prices go up
Wind power prices go down
Technical setbacks cause higher mussel farm investments than anticipated
Degradation of wind turbine performance is faster than expected
In the simulation runs above the potential improvement on ROI is demonstrated. They show an
improvement of 12 to 16% on the ROI discount factor in disappointing and prosperous economic
developments respectively.
With the dynamic AMC model it is possible to run an infinite amount of simulations. Screenshots, given in
Annex D, show all the tables with data input and resulting charts, allowing for more in-depth-analyses.
7.6 References
Anonymous 2012. Offshore renewables Resource and Development. South West Regional Development
Agency.
Board, R. A. 2010. Value breakdown for the Offshore Wind Sector.
Blanchard, B. S. 1992. Logistics Engineering and Management. Upper Saddle River: Prentice Hall Inc.
Blanchard, B. S., & Fabrycky, W. J. 1996. System Engineering and Analysis. Upper Saddle River: Prentice
Hall Inc.
Brown, J. S. 1997. On becoming a learning organization. About Campus, 1(6), 5–10.
Centraal Bureau voor de Statistiek (CBS) 2010. Hernieuwbare energie in Nederland 2010. The Hague:
CBS.
Centraal Bureau voor de Statistiek (CBS) 2011. Hernieuwbare energie; capaciteit, binnenlandse
productie en verbruik. Retrieved August 7, 2012, from
http://statline.cbs.nl/StatWeb/publication/?DM=SLNL&PA=71457NED
Christiansen, M.B. & C.B. Hasager 2005. Wake effects of large offshore wind farms identified from
satellite SAR. Remote Sensing of Environment 98.2 (2005): 251-268.
Davis, G. B., & Olson, M. H. 1985. Management Information Systems: conceptual foundations, structure
and development. New York: McGraw-Hill Inc.
Dutch Government. 2009a. National Water Plan: 2009-2015. The Hague: Dutch Government.
Dutch Government. 2009b. New energy for the climate: Clean and efficient. The Hague: Dutch
Government.
Dutch Government. 2009c. Policy Document on the North Sea: 2009-2015. The Hague: Dutch
Government.
Dutch Government. 2011a. Energierapport 2011. The Hague: Dep. of Economic Affairs, Agriculture &
Innovation.
Dutch Government; Topteam Energie 2011b. Energie in beweging: Advies Topsector Energie. The Hague:
Dutch Government.
Dutch Government; Topteam Energie 2012. Rapportage Topsector Energie bij de Innovatiecontracten
Energie maart 2012. The Hague: Dutch Government.
ECN/TU-D 2007. The ICORASS Feasibility Study. Deflt: ECN/TU-D.
Energy Online. 2012, June 29. Vestas has received a 216 MW offshore order in Belgium, for the
Northwind Offshore Wind Farm. Retrieved August 7, 2012, from http://energia-
online.eu/2012/06/29/vestas-has-received-a-216-mw-offshore-order-in-belgium-for-the-northwind-
offshore-wind-farm/
78 of 117 Report number C056/14
European Commission 2008. 20 20 by 2020: Europe's climate change opportunity. COM(2008) 30 final ,
Brussels.
European Commission 2010. Energy 2020: A strategy for competitive, sustainable and secure energy.
COM(2010) 639 final, Brussels.
European Commission 2011. A Roadmap for moving to a competitive low carbon economy in 2050.
COM(2011) 112 final, Brussels.
European Wind Energy Association (EWEA) 2011. Wind in our sails: The coming of Europe’s offshore
wind energy industry. Brussels: EWEA.
European Wind Energy Association (EWEA) 2012. The European offshore wind industry - key 2011 trends
and statistics. Brussels: EWEA.
Feargal, B. 2009. The Offshore Wind Challenge. Cranfield University.
Indepent Expert Panel 2012. Wind Turbine Health Impact Study. Boston: Massachusets Department of
Environmental Protection (MassDEP) and Massachessets Department of Public Health (MDPH).
International Energy Agency (IEA) 2011. World Energy Outlook 2011. Paris: IEA Publications.
Kjeldsen, K. (2009). Cost reduction and stochartic modelling of uncertainties for wind turbine design.
MSc Civil Engineering.
KPMG 2010. Offshore Wind in Europe: 2010 Market Report. Berlin: KPMG.
Leeuw, A. C. 1990. Organisaties: Management, Analyse, Ontwerp en Verandering; een Systeemvisie (in
Dutch). Assen: Van Gorcem.
Marca, D. A., & McGowan, C. L. 1988. Structured Analysis and Design Technique (IDEF0). New York:
McGraw-Hill Inc.
Marcelis, W. J. 1984. Onderhoudsbesturing op ontwikkeling. Deventer: Kluwer.
Machinefabriek Bakker 2013, Personal communication, CvC 22064671, Dregweg 10, 4401 LD – Yerseke,
the Netherlands.
Meewind 2012, July 8. Belwind Update. Retrieved August 7, 2012, from https://meewind.nl/166/belwind-
update
Miedema, R, 2012. Research: Offshore Wind Energy Operations & Maintenance Analysis, MSc Thesis,
Hogeschool van Amsterdam.
Musial, W., & Ram, B. (n.d.). Large-Scale Offshore Wind Power in the United States.
National Renewable Energy Laboratory (NREL) 2010. Large‐Scale Offshore Wind Energy for the United
States: Assessment of Opportunities and Barriers. Golden: NREL.
Nederlandse Wind Energie Associatie (NWEA) 2011. Factsheet Wind op zee. Retrieved August 7, 2012,
from http://www.nwea.nl/factsheet-wind-op-zee
Offshore Visie 2012, July 23. DONG, Siemens in offshore wind deal. Retrieved August 7, 2012, from
http://www.offshorevisie.nl/index.php?option=com_content&view=article&id=832%3Adong-
siemens-in-offshore-wind-deal-&catid=9%3Ainternational-news&Itemid=1
Pieterman, RP van de , H Braam, TS Obdam, LWMM Rademakers & TJJ van Zee 2011. Optimisation of
maintenance strategies for offshore wind farms. A case study performed with the OMCE-Calculator.
ECN Report nr. ECN-M-11-103. Energie Centrum Nederland Petten.
Rademakers, L., & Braam, H. 2003. O&M Aspects of the 500 MW Offshore Wind Farm at NL7.
Rijksinstituut voor Volksgezondheid en Milieu (RIVM). (2008). Windturbines: invloed op de beleving en
gezondheid van omwonenden. The Hague.
Senge, P. M. 1990. The art & practice of the learning organization. New York: Doubleday/Currency.
Sol, H. G. 1995. Dynamic Modeling. Delft: University of Delft.
Stavenuiter, J. 2002. Cost Effective Management Control of Capital Assets: An intergrated Life Cycle
Management approach, Asset Management Control Research Foundation, Medemblik, the
Netherlands.
Taskforce Windenergie op Zee 2010. Eindrapport Taskforce Windenergie op Zee. The Hague: Dutch
Government, Department of Economic Affairs.
Tideman, R. 1993. Prestatieverbetering door Business Process Redesign. Leidschendam: Lansa Publishing
BV.
Report number C056/14 79 of 117
Thomsen, K.E. 2012, Offshore wind, a comprehensive guide to successful offshore wind farm installation,
Academic Press Elsevier, Oxford UK, ISBN: 978-0-12-385936-5.
UK Energy Research Centre (UKERC) 2010. Great Expectations: The cost of offshore wind in UK waters –
understanding the pas and projecting the future. London: UKERC.
Van Leersum B, J Stavenuiter, H Sabelis, H Braam, H van der Mijle Meijer 2010, Integrated offshore
monitoring system. DOWES. A European Fund project, ATO Den Helder, The Netherlands.
www.dowes.nl
We@Sea 2011. Converting Offshore Wind into Electricity. Delft: Eburon Academic Publishers.

80 of 117 Report number C056/14
Report number C056/14 81 of 117
8 Conclusions, recommendations, perspectives and outlook
8.1 Conclusions
The main objective of the Blauwdruk project was to study the feasibility of the combination of offshore
aquaculture with offshore wind energy production on the Dutch Continental Shelf. The focus was on
installing large-scale mussel farming in the corridors within a (virtual) offshore wind farm that is
arranged in several clusters.
First, the situation and perspectives of the relevant actors was investigated, and the following
conclusions were drawn, based on the review of (scientific) publications and government documents:
The Dutch marine spatial policy stresses two main principles: (1) the need for space-efficient
use, such as multiple use of offshore platforms (e.g. offshore wind farms), and (2) the need to
follow an ecosystem approach (cf. section 2.1).
The wind energy sector committed itself to a substantial cost reduction of 40% of the total costs
per MWh (cf. section 3.2.1). To achieve this, every discipline involved in offshore energy
production is kept under constant review.
The Dutch mussel sector sees market opportunities for a total yearly production of 100,000 tons
of mussels; this is almost twice as much as the current production and can only be achieved if
new areas for mussel production become available (cf. section 4).
There are opportunities to achieve the different objectives of all actors (the government, the
wind sector, and the mussel sector) by combining offshore wind energy production with offshore
aquaculture.
Up to date, there is no offshore aquaculture in the North Sea. Based on desk research and experiences
from other seas/oceans, the current ranking of the suitability of the different types of aquaculture in the
North Sea is as follows (cf. chapter 4):
Most promising are mussel culture and seed mussel culture. The production of mussels for
consumption is especially promising in areas with low or absent spat fall.
The Dutch Continental Shelf is too shallow for the fish cages currently used in fish cultures;
therefore, commercial fish culture seems unviable at this moment. This takes away the principle
basis for Integrated Multi Trophic Aquaculture (IMTA).
It is currently not possible to assess the situation for seaweed culture due to unclear market
conditions in terms of market value and market demand.
Undoubtedly, multi-use activities offshore do have an effect on (the assessment of) risks arising from
(multiple) combined operational processes. The exact details of these operational processes are still
unknown and thus cannot be taken into account yet. Looking purely at the risks of damage due to
physical and chemical processes, it can be concluded from chapter 5 that risks are assessable and can be
mitigated by taking appropriate measures:
In a combined offshore-wind/aquaculture infrastructure the preferred foundation structure
should be monopile or gravity based rather than a jacket type, because for monopile and gravity
based foundations, the risk of high drag force (and hence of a potential collapse of the wind
turbines) in case of a stuck aquaculture construction is much smaller than for a jacket
foundation.
Whenever aquaculture structures are physically attached to offshore wind foundations, the use
of safety wires is highly recommended.
82 of 117 Report number C056/14
Maintenance aspects of materials for both offshore wind and aquaculture constructions should be
taken into account already in the design phase.
Appropriate measures should be taken to protect aquaculture and offshore wind constructions
from corrosion attack either by selection of corrosion resistant materials or by application of
suitable protective coatings.
Type and size of aquaculture activities determine the extent of effects on water and sediment
quality. In turn, water and sediment quality determine effects on corrosion resistance of the
materials used. This aspect should be dealt with in a dedicated risk assessment for the specific
location.
Ecological effects and impacts of a W&MF can pose potential risks but also benefits to the marine
ecosystem. It is difficult to summarize and weigh effects, because the different marine ecosystem
components (plankton, seabed organisms, fish, marine mammals, seabirds and bats, and the entire
ecosystem) may be affected differently by different pressures, and there is almost no scientific
knowledge available on potential ecological impacts of the subject of our study: neither of wind farms in
deeper offshore waters nor of large-scale offshore mussel farms, let alone the combination of both.
Furthermore, potential effects in the construction phase of an offshore wind (and mussel) farm can differ
from those in the operational phase. Below we highlight a few main points that are elaborated on in
chapter 6.
Potential negative effects:
During the construction phase, the sound produced by preparatory subsea works, and
construction activities such as pile driving (wind farm) and vessel traffic (wind and/or mussel
farm), can harm the marine environment. This refers particularly to underwater-noise
disturbance of marine mammals. In general, the ecological impact of placing and anchoring
longlines is minor as compared to the impact of founding wind turbines.
During the operational phase, negative impacts can arise from the physical presence of the wind
(and mussel) farm and increased shipping activities, potentially resulting in displacement of
marine mammals and seabirds, continued disturbance of the seabed sediments and seabed
communities underwater, and collision risks to birds and bats above water. Furthermore,
operating wind turbines generate noise, create electromagnetic fields and introduce energy in
the seafloor by the tower and via the subsea cables. These electromagnetic fields can have
negative impacts on fish, fish eggs or larvae.
Regarding offshore mussel farming on suspended longlines, the mechanical farming construction
and the pure presence of the mussels can lead to a physical alteration of the marine
environment, and of the hydro-sedimentary processes, in particular.
Since constructions in general provide a good, sheltered habitat/substrate for invasive epibenthic
species, there is an increased risk of introduction and settlement of unwanted invasive species
and an additional increased potential barrier effect due to the more ‘closed’ construction when
aquaculture and offshore wind are combined.
Potential beneficial effects:
Offshore constructions represent new ‘hard substrate’ habitat under water, offering food and
shelter, thus attracting sessile flora and fauna, thereby enhancing biological diversity,
production, and creating (micro-)habitats where organisms may find shelter in addition to food.
This new community may attract additional mobile species (small and large piscivores, seabirds,
marine mammals).
Report number C056/14 83 of 117
Potential beneficial ecological effects that could arise from the combination of an offshore wind
and mussel farm (W&MF) are increased shelter. A W&MF potentially protects a greater range of
marine species: those that use the wind farm as shelter and habitat (more or less by chance and
not caught thanks to the absence of fisheries) and those attracted by the increased
biomass/food availability and the type of environment.
In chapter 7, possibilities are identified to reduce operation and maintenance costs in a combined wind
and mussel farm. It seems likely that an overall cost reduction of at least 10% is feasible.
Furthermore, running the Asset Management Control Model the return of investment (ROI) for four
different scenarios was simulated. Based on the chosen economic parameter values and sales prices
estimates, the model simulations show that a ROI of 4.9% should be possible in unfavourable economic
conditions when synergy is absent. When 10% synergy can be achieved, a ROI of 5.5% seems possible.
The ROI is significantly higher when economic conditions are favourable. Even when there is no synergy,
a ROI of 8.3% should be feasible, and in case of 10% synergy the ROI is likely to reach 9.6%.
8.2 Perspectives and outlook
Roadmap for implementation of offshore mussel culture 8.2.1
The Blauwdruk project investigated the feasibility for successful development of offshore mussel
production co-located with wind farm concessions on the Dutch Continental Shelf. To estimate the
economic feasibility large-scale developments were simulated in prediction models. This scale was
necessary in order to provide reliable estimates. Development and implementation will of course not be
executed at this scale from the start, but rather a step-wise approach will be followed.
1) Design of a test site, and development of technology to support offshore aquaculture (technical
design, characteristics of materials, technical test model)
2) Pilot projects should initially test technical feasibility of different systems preferably at multiple
locations, both for mussel seed collection devices as well as for grow-out systems.
3) Carrying capacity determination, optimization of large scale farm layout, and development of an
optimized production system should be addressed.
4) Stepwise upscaling of mussel production in accordance to a sustainable development (economic,
environmental and technical).
Based on previous experiences we estimate that the development from pilot studies to full-scale
commercial cultures will take approximately 8-10 years, under the condition that pilot studies result in
positive perspectives for further development. The development may co-occur with seaweed production.
The potential for seaweed 8.2.2
Although the Blauwdruk project identified the highest potential for mussel culture in offshore areas on
the Dutch Continental Shelf for the near future, there are high expectations for the use and production of
seaweed. Worldwide seaweed is already used in many different food and health care products, but the
quantity needed for those products is limited. In contrast, for plastic products or biofuel material, the
quantity of seaweed needed is large and will most probably always be much higher than for food and
health products. Hence, efficient large-scale grow and harvest methods need to be developed.
84 of 117 Report number C056/14
Selection of the right kind of seaweed species and processing techniques, and understanding the
potential environmental impact of seaweed culture are the subjects of ongoing studies. The economic
feasibility of using seaweed as raw materials for oil production in the Netherlands is lively debated. In
short, there is consensus that seaweed will play a major role in a future bio-based economy.
The North Sea has a good potential for growing seaweed: enough space and sufficient nutrients.
Potential local effects and potential effects on the entire system, however, are as yet unknown. Chapter
4 outlined that current predictions for technical cultivation, processing and market conditions are
uncertain, having a large spread in their estimates, making it impossible to calculate reliable projections
for the economic feasibility of large scale seaweed production. Research on seaweed cultivation and
processing are however progressing quickly. In the near future it should be possible to clarify profitable
business cases, following a similar procedure as applied for mussel cultivation presented in the current
report. Hence, development and implementation of commercially viable offshore seaweed cultivation is
expected to be a longer term development.
Alternative small-scale aquaculture production approaches 8.2.3
The Blauwdruk approach focused on (semi-)intensive offshore aquaculture production. Note, however,
that initiatives for sea-ranging and small scale fisheries are recently being investigated in order to
optimize spatial use within (the vicinity of) wind farms, such as:
Integration of ‘Building with Nature’ approaches with wind farms, e.g. by growing oysters
(“oyster skirt”) around foundations to prevent scour
Development of oyster beds for nature and production purposes
Introduction of fisheries with “passive” fishing gear (such as rod, pots or longlines) within wind
farm areas, as their risk impact on turbines is expected to be much lower
Development of new fishing techniques aiming to establish sustainable fisheries within wind farm
areas, with low risk for wind farm operations
Sea-ranging and stock enhancement of lobsters, as the rocky section of turbine foundations
make a good habitat for lobster settlement. Sea ranging of flat fish with or without additional
feed sources
Stock enhancement of fish (e.g. cod) by recruitment/ refugee structures and additional feed
sources (sea ranging)
Natural habitat for ecological functions (refuge, nature development and spawning grounds). However,
most of these initiatives are merely a theoretical idea or limited data is available. Neither economic
predictions nor technical feasibility of these activities can therefore be projected yet. For an overview of
existing practices, refer to Verhaeghe et al. (2011).
8.3 Recommendations
Diversification of aquaculture species should eventually be pursued in order to optimize
economic output. The market potential of seaweed should be further explored.
The mitigation of physical and chemical processes that pose a risk to the constructions should be
investigated.
Monitoring research in a W&MF should be carried out to investigate the processes on ecosystem
level and to assess whether potential negative ecological effects actually occur and in how far
the risk of invasive species settlement is increased.
Report number C056/14 85 of 117
In collaboration with all sectors involved, it should be investigated in more detail how operational
processes in a multi-use setting can look like, thus enabling us to accurately quantify potential
synergy benefits. Only then will we be able to assess the reliability of our input values and the
robustness of the model results.
Because of the uncertainties regarding the possibilities, risks and benefits, we recommend a
stepwise learning-by-doing approach with small-scale pilot projects, instead of a large-scale
implementation from the start.
8.4 References
Verhaeghe, D, Delbare, D & Polet, H 2011. Haalbaarheidsstudie: passieve visserij en maricultuur binnen de Vlaamse windmolenparken ?. ILVO-mededeling, no. 99, Instituut voor Landbouw- en Visserijonderzoek – ILVO.

86 of 117 Report number C056/14
Report number C056/14 87 of 117
9 Quality Assurance
IMARES utilises an ISO 9001:2008 certified quality management system (certificate number: 124296-
2012-AQ-NLD-RvA). This certificate is valid until 15 December 2015. The organisation has been certified
since 27 February 2001. The certification was issued by DNV Certification B.V. Furthermore, the chemical
laboratory of the Fish Division has NEN-EN-ISO/IEC 17025:2005 accreditation for test laboratories with
number L097. This accreditation is valid until 1th of April 2017 and was first issued on 27 March 1997.
Accreditation was granted by the Council for Accreditation.

88 of 117 Report number C056/14
Report number C056/14 89 of 117
Justification
Report Number: C056/14
Project Number: 4305106902
The scientific quality of this report has been peer reviewed by a colleague scientist and the head of the
department of IMARES.
Approved: Prof. Dr. H.J. Lindeboom (Marine Ecologist)
Science Director
Signature:
Date: 28 August 2014
Approved: Drs. F.C. Groenendijk
Head of Maritime Department
Signature:
Date: 28 August 2014

90 of 117 Report number C056/14
Report number C056/14 91 of 117
Blauwdruk final report – List of Annexes
Annex A – Additional electronic links
Annex B – Mussel culture parameter overview
Annex C – Economic simulation aquaculture offshore
Annex D – Business case simulation parameter overview
Annex E – Transport system details
Annex F – Life Cycle Assessment Model – simplified

92 of 117 Report number C056/14
Report number C056/14 93 of 117
Annex A – Additional electronic links
Further reading/ links related to offshore wind energy production:
http://chriswestraconsulting.nl/expertise/offshore/ ontwikkling, expertise en onderhoud,ecologie
http://www.we-at-sea.org/ Het doel van de activiteiten van We@Sea is vanuit een onafhankelijke positie
informatie te geven over schone energie van zee, met een sterke focus op offshore windenergie.
http://www.nwea.nl/de-nederlandse-offshore-windsector De offshore windindustrie beslaat de totale
keten van het ontwerpen, bouwen en exploiteren van offshore windparken. Zo heeft Nederland
binnen haar landsgrenzen internationaal leidende bedrijven, van energieproducent tot mariene
aannemer, van fundatiebouwer tot kabellegger en van onderzoeksinstituut tot onderhoudsspecialist.
http://www.nwea.nl/greendeal Doel van de Green Deal Offshore Windenergie is tussen nu en 2020 de
kostprijs van offshore wind met minimaal 40% omlaag te brengen
http://www.4coffshore.com/ the leading source of independent, accurate global windfarms and grid
installations
http://flow-offshore.nl/ innovatie voor concurrerende Nederlandse offshore windindustrie
http://www.dowes.nl/?id=7 Het Dutch Offshore Wind Energy Services (D OWES) project is gericht op de
ontwikkeling van een innovatief ICT systeem waarmee offshore windparken optimaal beheerd
kunnen worden.
http://sciencecentre.amccentre.nl/pagina.aspx?site=3&lang=nl&pagina=25&type=p the Simulation
Portal (DGAME) uses O&M Year Scenarios to let the user determine the Operation & Maintenance
approach of the Wind Farm for the selected years. The ultimate goal of this research is to generate a
more realistic simulation. For this reason the O&M Year Scenarios has to be validated.
http://www.renewableenergyworld.com/rea/news/article/2011/09/offshore-wind-targets-cheaper-o-m
Several companies are seeking ways to trim the hefty slice of offshore wind farms' electricity costs
contributed by operation and maintenance (O&M
http://www.ato.nl/db/WAS50c1f0ccc5a87/Ecofys_6_dec_2012.pdf Reducing the Cost of Offshore O&M
(ATO, Ecofys)
http://www.ecn.nl/docs/library/report/2007/m07045.pdf ECN estimating costs of operation and
maintenance of offshore windfaerms
TNO rapport, 2008-D-R1048/A aquacultuur op open zee, 28 oktober 2008;drs th.a.M.Reijs, M.Poelman,
MsC,IMARES, e.o.
http://www.aqua.dtu.dk/English/Research/Aquaculture.aspx research that covers a wide range of
biological and technological aspects of aquaculture.
http://www.awi.de/de/forschung/neue_technologien/marine_aquaculture_maritime_technologies_and_ic
zm/research_themes/marine_aquaculture/offshore_aquaculture/ Caused by the strong natural
fluctuation of recruitment of mussels (Mytilus edulis) during the last years, research commenced in
2000 to assess whether suspended culture technique could be deployed to collect and culture seed
mussels on a commercially stable basis under the exposed conditions of the North Sea

94 of 117 Report number C056/14
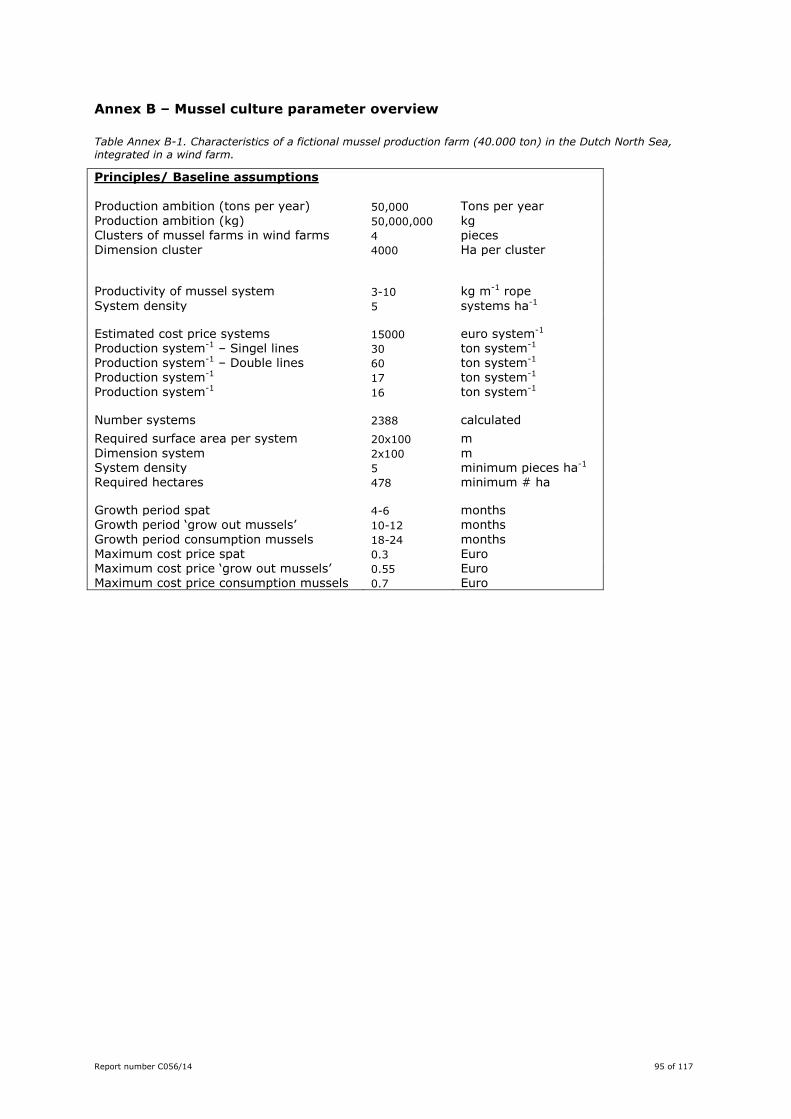
Report number C056/14 95 of 117
Annex B – Mussel culture parameter overview
Table Annex B-1. Characteristics of a fictional mussel production farm (40.000 ton) in the Dutch North Sea, integrated in a wind farm.
Principles/ Baseline assumptions Production ambition (tons per year) 50,000 Tons per year
Production ambition (kg) 50,000,000 kg Clusters of mussel farms in wind farms 4 pieces Dimension cluster 4000 Ha per cluster
Productivity of mussel system 3-10 kg m-1 rope
System density 5 systems ha-1
Estimated cost price systems 15000 euro system-1 Production system-1 – Singel lines 30 ton system-1 Production system-1 – Double lines 60 ton system-1
Production system-1 17 ton system-1 Production system-1 16 ton system-1
Number systems 2388 calculated
Required surface area per system 20x100 m
Dimension system 2x100 m System density 5 minimum pieces ha-1 Required hectares 478 minimum # ha
Growth period spat 4-6 months Growth period ‘grow out mussels’ 10-12 months
Growth period consumption mussels 18-24 months Maximum cost price spat 0.3 Euro Maximum cost price ‘grow out mussels’ 0.55 Euro Maximum cost price consumption mussels 0.7 Euro
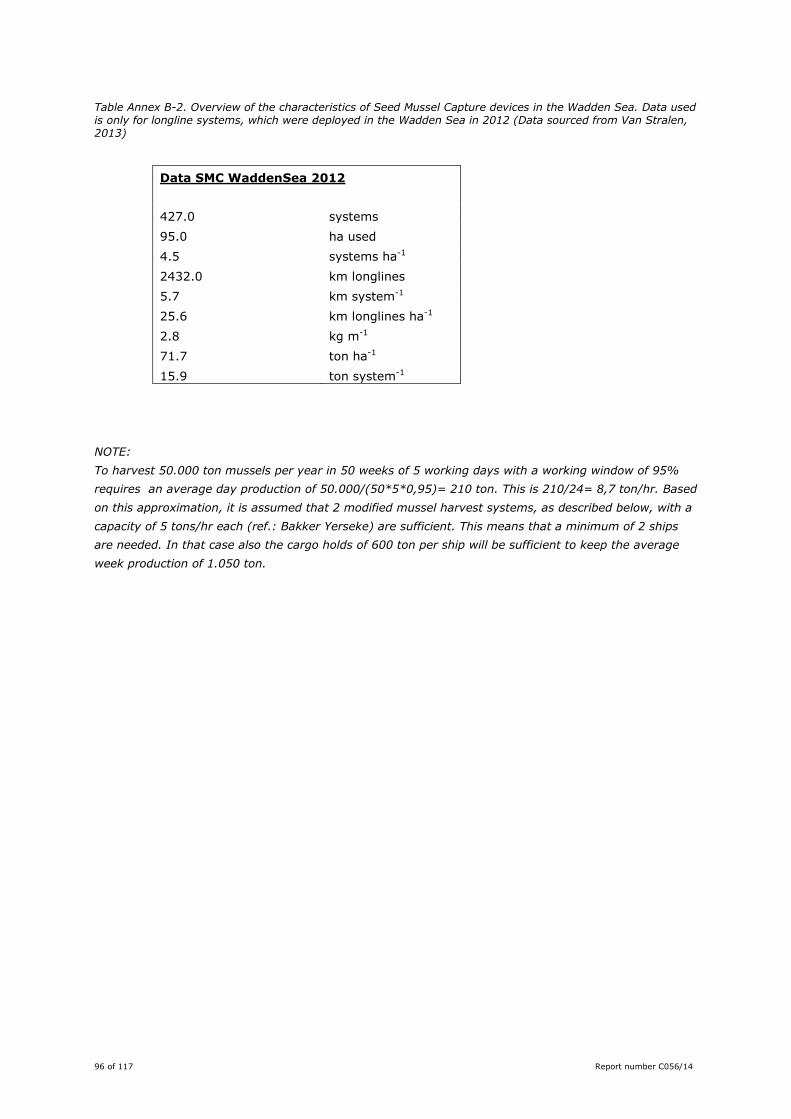
96 of 117 Report number C056/14
Table Annex B-2. Overview of the characteristics of Seed Mussel Capture devices in the Wadden Sea. Data used is only for longline systems, which were deployed in the Wadden Sea in 2012 (Data sourced from Van Stralen, 2013)
Data SMC WaddenSea 2012
427.0 systems
95.0 ha used
4.5 systems ha-1
2432.0 km longlines
5.7 km system-1
25.6 km longlines ha-1
2.8 kg m-1
71.7 ton ha-1
15.9 ton system-1
NOTE:
To harvest 50.000 ton mussels per year in 50 weeks of 5 working days with a working window of 95%
requires an average day production of 50.000/(50*5*0,95)= 210 ton. This is 210/24= 8,7 ton/hr. Based
on this approximation, it is assumed that 2 modified mussel harvest systems, as described below, with a
capacity of 5 tons/hr each (ref.: Bakker Yerseke) are sufficient. This means that a minimum of 2 ships
are needed. In that case also the cargo holds of 600 ton per ship will be sufficient to keep the average
week production of 1.050 ton.
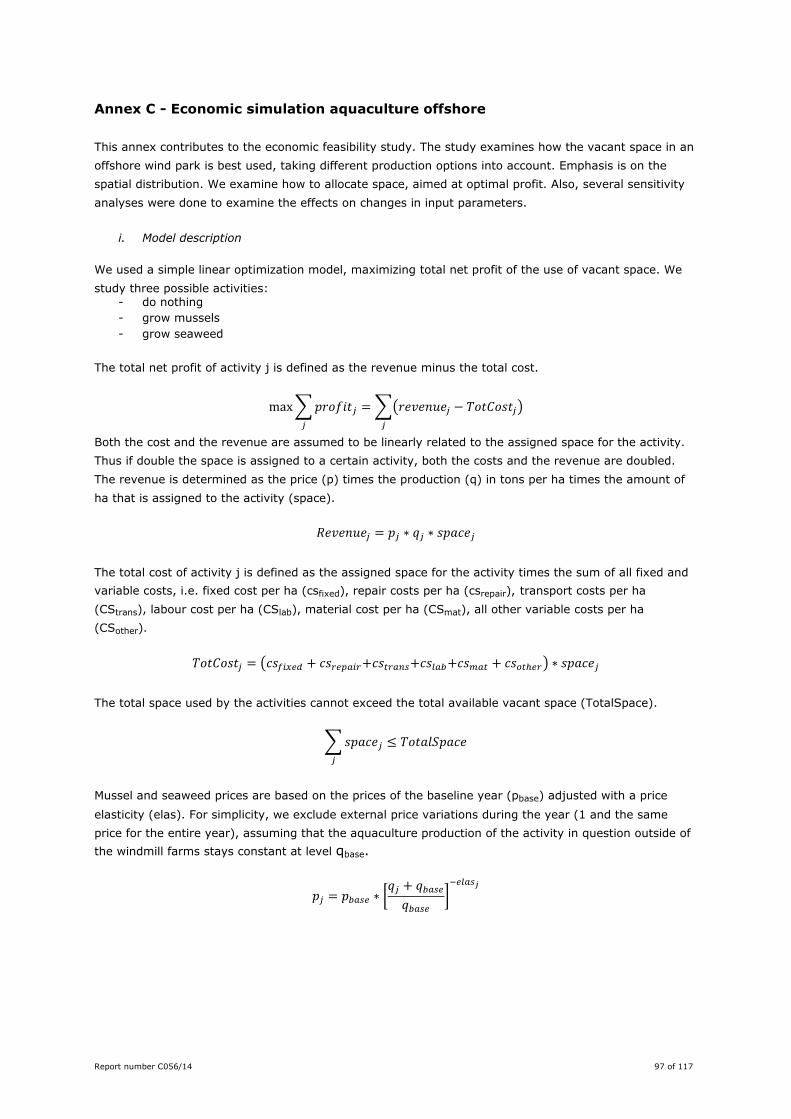
Report number C056/14 97 of 117
Annex C - Economic simulation aquaculture offshore
This annex contributes to the economic feasibility study. The study examines how the vacant space in an
offshore wind park is best used, taking different production options into account. Emphasis is on the
spatial distribution. We examine how to allocate space, aimed at optimal profit. Also, several sensitivity
analyses were done to examine the effects on changes in input parameters.
i. Model description
We used a simple linear optimization model, maximizing total net profit of the use of vacant space. We
study three possible activities: - do nothing
- grow mussels
- grow seaweed
The total net profit of activity j is defined as the revenue minus the total cost.
max∑𝑝𝑟𝑜𝑓𝑖𝑡𝑗𝑗
=∑(𝑟𝑒𝑣𝑒𝑛𝑢𝑒𝑗 − 𝑇𝑜𝑡𝐶𝑜𝑠𝑡𝑗)
𝑗
Both the cost and the revenue are assumed to be linearly related to the assigned space for the activity.
Thus if double the space is assigned to a certain activity, both the costs and the revenue are doubled.
The revenue is determined as the price (p) times the production (q) in tons per ha times the amount of
ha that is assigned to the activity (space).
𝑅𝑒𝑣𝑒𝑛𝑢𝑒𝑗 = 𝑝𝑗 ∗ 𝑞𝑗 ∗ 𝑠𝑝𝑎𝑐𝑒𝑗
The total cost of activity j is defined as the assigned space for the activity times the sum of all fixed and
variable costs, i.e. fixed cost per ha (csfixed), repair costs per ha (csrepair), transport costs per ha
(CStrans), labour cost per ha (CSlab), material cost per ha (CSmat), all other variable costs per ha
(CSother).
𝑇𝑜𝑡𝐶𝑜𝑠𝑡𝑗 = (𝑐𝑠𝑓𝑖𝑥𝑒𝑑 + 𝑐𝑠𝑟𝑒𝑝𝑎𝑖𝑟+𝑐𝑠𝑡𝑟𝑎𝑛𝑠+𝑐𝑠𝑙𝑎𝑏+𝑐𝑠𝑚𝑎𝑡 + 𝑐𝑠𝑜𝑡ℎ𝑒𝑟) ∗ 𝑠𝑝𝑎𝑐𝑒𝑗
The total space used by the activities cannot exceed the total available vacant space (TotalSpace).
∑𝑠𝑝𝑎𝑐𝑒𝑗𝑗
≤ 𝑇𝑜𝑡𝑎𝑙𝑆𝑝𝑎𝑐𝑒
Mussel and seaweed prices are based on the prices of the baseline year (pbase) adjusted with a price
elasticity (elas). For simplicity, we exclude external price variations during the year (1 and the same
price for the entire year), assuming that the aquaculture production of the activity in question outside of
the windmill farms stays constant at level qbase.
𝑝𝑗 = 𝑝𝑏𝑎𝑠𝑒 ∗ [𝑞𝑗 + 𝑞𝑏𝑎𝑠𝑒
𝑞𝑏𝑎𝑠𝑒]−𝑒𝑙𝑎𝑠𝑗
98 of 117 Report number C056/14
One of the possible activities studied is the option of doing nothing with the vacant space. This option is
included because if both mussels and seaweed provide a loss it would be less costly to do nothing then to
start aquaculture within the vacant space. However it is plausible to assume that there are some
synergies between aquaculture and wind farms, especially in transport costs and labour cost. This means
that labour cost and transport cost for wind farms will be lower if aquaculture is implemented in the
vacant space. This is because such costs can be partly shared with the aquaculture activity. Therefor it is
important to note that doing nothing will not mean making zero profit. By choosing to not include an
aquaculture activity in the vacant space, the transport cost and the labour costs can no longer be shared
with the aquaculture activity. Therefore, without any combined use, a wind farm will not synergy with
another sector, and hence, these costs will just remain the same. With a multi-use combination, such
costs are assumed to be reduced for the wind farm operator. Thus, doing nothing (no multi-use) means
higher O&M cost for the wind farm operators, and lower profit.
ii. Model input parameters
Basic assumptions
In developing the optimization model, we have used the following assumptions: Construction of the wind park is a given; this is not part of the optimisation. Instead, we analyse
what kind of co-production is most feasible, in three scenarios.
As point of departure, we assume that both wind farm and aquaculture are of the same owner. There
are no transaction costs assumed for between the two activities.
When looking for synergy between the different functions, we now assume that the construction are
not co-used. Although this is described in some researches, we believe that at this stage, there is
insufficient knowledge about the risk and opportunities of this.
Synergy is expected in the labour, harvesting and transport. We do not describe how synergy
between offshore wind energy and marine production can be realized in detail (see chapter 7.2).
Mussels
In Dutch aquaculture, mussel production is the dominant activity with highest revenues and profits.
Mussel culture is concentrated in Zeeland and the Wadden area. Around 50 companies are actively
involved, producing around 50 million kg of mussels annually during the last years. In 2011, turnover of
the sector was €56M, employing 170 FTE. EBIT was ca. €19M (STECF, 2013). Market expansion is
difficult, although there is a reported additional market demand of 50,000 tons.
The production of mussels (in tons) has declined quite a lot since 1996. In 1996 92,000 tons of mussels
were produced. In 2009 the production was only 46,000 tons, a decline of almost 50%. One of the
reasons is a shortage of spat due to environmental restrictions on the catch of wild spat and a natural
shortage of spat in the areas where catches are still allowed. The current dominant production practice
for mussels is under pressure. Mussel spat is collected in the Wadden Sea by bottom trawling. The
collected spat is attached to longlines in sheltered waters (Eastern Scheldt, Wadden Sea) where it grows
into consumption mussels. If proper size is reached, the mussels are harvested and, dependent on
market demand sold or “stored” in the Eastern Scheldt. Concerns about the ecological effects of bottom
trawling have led to increased uncertainty about the availability of mussel spat.
Report number C056/14 99 of 117
In recent years, the mussel sector has experimented with alternative collection methods. So called Seed
Mussel Collectors (SMC52), using long lines that float in the Wadden Sea, have proven successful.
Experiences with on-sea mussel spat collection in the Wadden Sea have shown the technical and
economic feasibility (Van Stralen, 2012, 2013).To increase mussel spat collection, the sector has to look
for ways to collect mussel spat and produce consumption mussels outside the Wadden Sea. Offshore
production can directly fulfil a market need, with an estimated annual value of 50M€.
Experiences with MZI can be used to gather data on the potential of offshore mussel production and
estimation of costs. Drawing on information from Buck et al (2010), Van Stralen 2013 and
Machinefabriek Bakker (2013), we came to the data on costs and benefits of mussel production. The
envisioned production system consists of long lines systems. Each hectare contains 5 systems. The
lifespan of the system is set at 4 years.
Seaweed
Currently, seaweed is not farmed at a significant scale in the North Sea. Tropical experiences with marine
and brackish water seaweed cultivation are not comparable to seaweed farming in marine temperate
waters like the North Sea. Various research projects investigate if and how seaweed farming is possible
in marine temperate waters including the North Sea. Little is known about the costs of seaweed
production. Some recent publications give indications of total expected costs but do not break-down
expenses (Reith et al, 2005, Florentinus et al, 2008). Our analysis uses various publications to construct
a breakdown of the total production costs for offshore seaweed.
In the Netherlands there are two on-going research projects experimenting with offshore seaweed
cultivation, using either net cultivation or long-line systems. Information about costs and yields are
unavailable. However, we do know that the system is labour-intensive as the seedlings need to be
attached to the rope manually and capital-intensive). A third Dutch research project (Wierderij) makes
use of a similar production method but applies this method near-shore. Based on the experiences within
this project the required technology and expected costs can be estimated. The estimated total
investments are in the order of € 25,000 to € 75,000 per ha. This includes 10 km of long-lines, (€ 1/m),
buoys, mooring and employment. The expected lifespan is 10 years (pers. Comm. Brandenburg). For
offshore application, we choose to double expected investment costs. Additionally, new ropes with
seaweed seedlings have to be added each growth cycle (year) with an expected costs of € 1/m (1 meters
rope + 1 seedling). Estimates for labour costs are unavailable.
Estimation of the labour costs is difficult since the procedures for production, monitoring and harvesting
are not yet established. It can be argued that labour cost during operation and maintenance are
relatively small. We assume that operation and maintenance of a 1,000 ha sea farm requires four man
years of work (4*261 days*8h = 8,351 hours). This would require production process mechanisation and
usage of distance, online monitoring. At labour costs of € 35/hr. total labour costs are set at €
292,320.This equals approximately € 300 per hectare per year.
Based on Lenstra et al (2011), we assume harvesting costs of €104 per ton DM. Reith et al (2005) draw
upon Suurs (2002) and Hamelinck et al (2008) to calculate costs for transport of seaweed.
52 In Dutch: MZI = mosselzaad invanginstallatie)
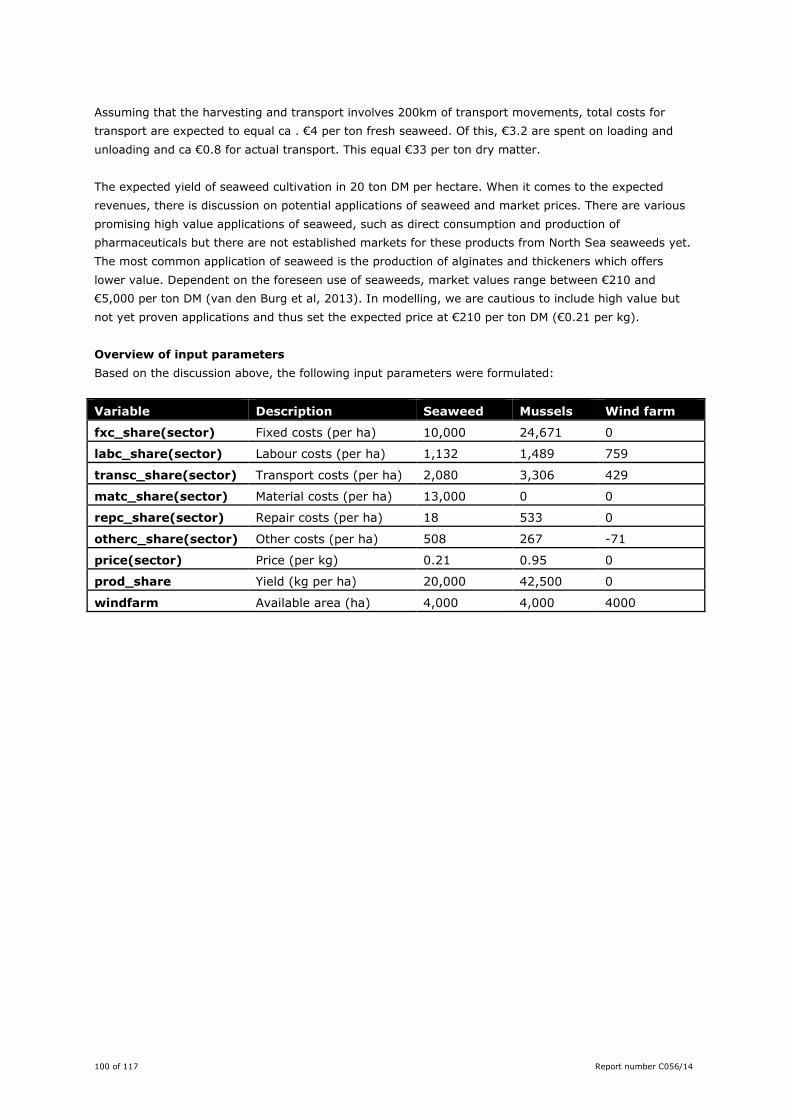
100 of 117 Report number C056/14
Assuming that the harvesting and transport involves 200km of transport movements, total costs for
transport are expected to equal ca . €4 per ton fresh seaweed. Of this, €3.2 are spent on loading and
unloading and ca €0.8 for actual transport. This equal €33 per ton dry matter.
The expected yield of seaweed cultivation in 20 ton DM per hectare. When it comes to the expected
revenues, there is discussion on potential applications of seaweed and market prices. There are various
promising high value applications of seaweed, such as direct consumption and production of
pharmaceuticals but there are not established markets for these products from North Sea seaweeds yet.
The most common application of seaweed is the production of alginates and thickeners which offers
lower value. Dependent on the foreseen use of seaweeds, market values range between €210 and
€5,000 per ton DM (van den Burg et al, 2013). In modelling, we are cautious to include high value but
not yet proven applications and thus set the expected price at €210 per ton DM (€0.21 per kg).
Overview of input parameters
Based on the discussion above, the following input parameters were formulated:
Variable Description Seaweed Mussels Wind farm
fxc_share(sector) Fixed costs (per ha) 10,000 24,671 0
labc_share(sector) Labour costs (per ha) 1,132 1,489 759
transc_share(sector) Transport costs (per ha) 2,080 3,306 429
matc_share(sector) Material costs (per ha) 13,000 0 0
repc_share(sector) Repair costs (per ha) 18 533 0
otherc_share(sector) Other costs (per ha) 508 267 -71
price(sector) Price (per kg) 0.21 0.95 0
prod_share Yield (kg per ha) 20,000 42,500 0
windfarm Available area (ha) 4,000 4,000 4000
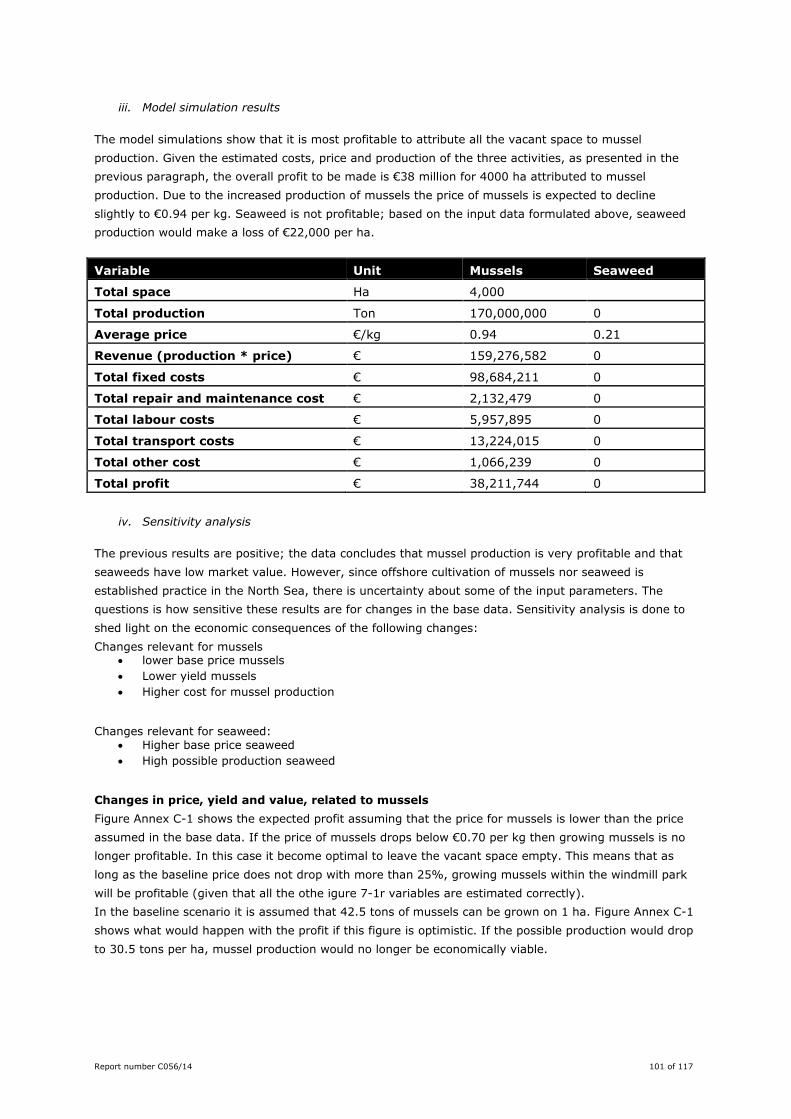
Report number C056/14 101 of 117
iii. Model simulation results
The model simulations show that it is most profitable to attribute all the vacant space to mussel
production. Given the estimated costs, price and production of the three activities, as presented in the
previous paragraph, the overall profit to be made is €38 million for 4000 ha attributed to mussel
production. Due to the increased production of mussels the price of mussels is expected to decline
slightly to €0.94 per kg. Seaweed is not profitable; based on the input data formulated above, seaweed
production would make a loss of €22,000 per ha.
Variable Unit Mussels Seaweed
Total space Ha 4,000
Total production Ton 170,000,000 0
Average price €/kg 0.94 0.21
Revenue (production * price) € 159,276,582 0
Total fixed costs € 98,684,211 0
Total repair and maintenance cost € 2,132,479 0
Total labour costs € 5,957,895 0
Total transport costs € 13,224,015 0
Total other cost € 1,066,239 0
Total profit € 38,211,744 0
iv. Sensitivity analysis
The previous results are positive; the data concludes that mussel production is very profitable and that
seaweeds have low market value. However, since offshore cultivation of mussels nor seaweed is
established practice in the North Sea, there is uncertainty about some of the input parameters. The
questions is how sensitive these results are for changes in the base data. Sensitivity analysis is done to
shed light on the economic consequences of the following changes:
Changes relevant for mussels lower base price mussels
Lower yield mussels
Higher cost for mussel production
Changes relevant for seaweed: Higher base price seaweed
High possible production seaweed
Changes in price, yield and value, related to mussels
Figure Annex C-1 shows the expected profit assuming that the price for mussels is lower than the price
assumed in the base data. If the price of mussels drops below €0.70 per kg then growing mussels is no
longer profitable. In this case it become optimal to leave the vacant space empty. This means that as
long as the baseline price does not drop with more than 25%, growing mussels within the windmill park
will be profitable (given that all the othe igure 7-1r variables are estimated correctly).
In the baseline scenario it is assumed that 42.5 tons of mussels can be grown on 1 ha. Figure Annex C-1
shows what would happen with the profit if this figure is optimistic. If the possible production would drop
to 30.5 tons per ha, mussel production would no longer be economically viable.
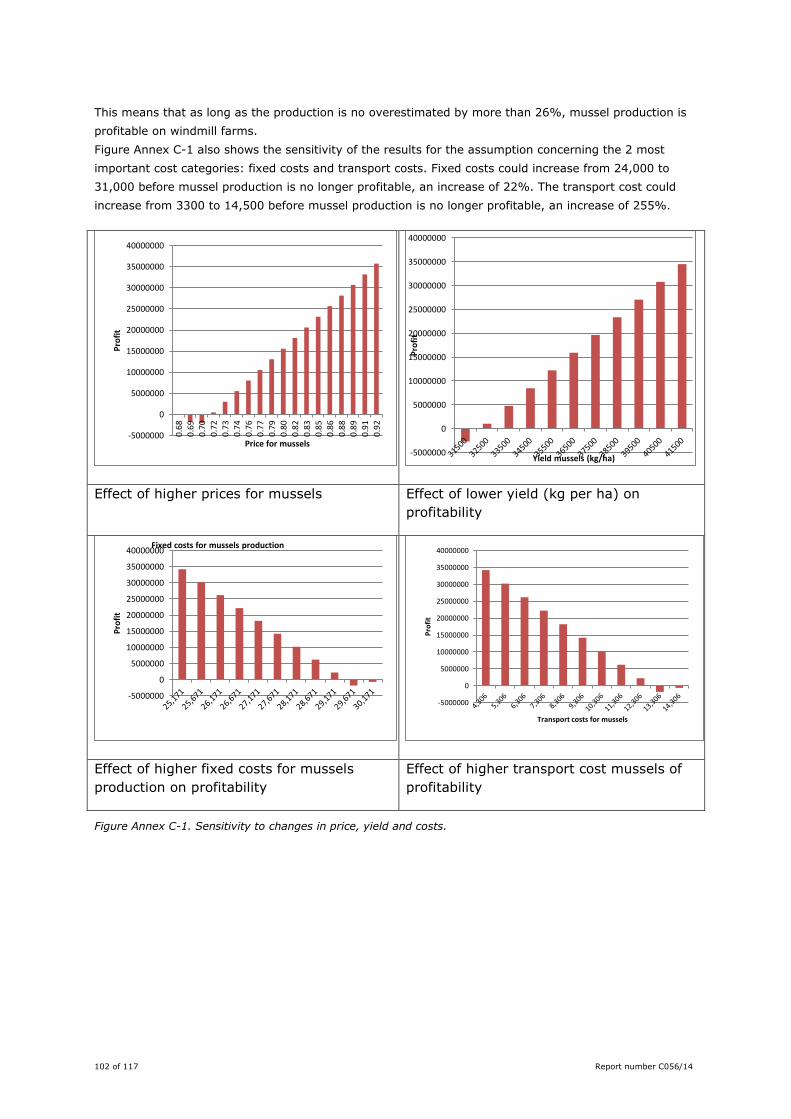
102 of 117 Report number C056/14
This means that as long as the production is no overestimated by more than 26%, mussel production is
profitable on windmill farms.
Figure Annex C-1 also shows the sensitivity of the results for the assumption concerning the 2 most
important cost categories: fixed costs and transport costs. Fixed costs could increase from 24,000 to
31,000 before mussel production is no longer profitable, an increase of 22%. The transport cost could
increase from 3300 to 14,500 before mussel production is no longer profitable, an increase of 255%.
Effect of higher prices for mussels Effect of lower yield (kg per ha) on
profitability
Effect of higher fixed costs for mussels
production on profitability
Effect of higher transport cost mussels of
profitability
Figure Annex C-1. Sensitivity to changes in price, yield and costs.
-5000000
0
5000000
10000000
15000000
20000000
25000000
30000000
35000000
40000000
0.6
8
0.6
9
0.7
0
0.7
2
0.7
3
0.7
4
0.7
6
0.7
7
0.7
9
0.8
0
0.8
2
0.8
3
0.8
5
0.8
6
0.8
8
0.8
9
0.9
1
0.9
2
Pro
fit
Price for mussels -5000000
0
5000000
10000000
15000000
20000000
25000000
30000000
35000000
40000000
Pro
fit
Yield mussels (kg/ha)
-5000000
0
5000000
10000000
15000000
20000000
25000000
30000000
35000000
40000000
Pro
fit
Fixed costs for mussels production
-5000000
0
5000000
10000000
15000000
20000000
25000000
30000000
35000000
40000000
Pro
fit
Transport costs for mussels
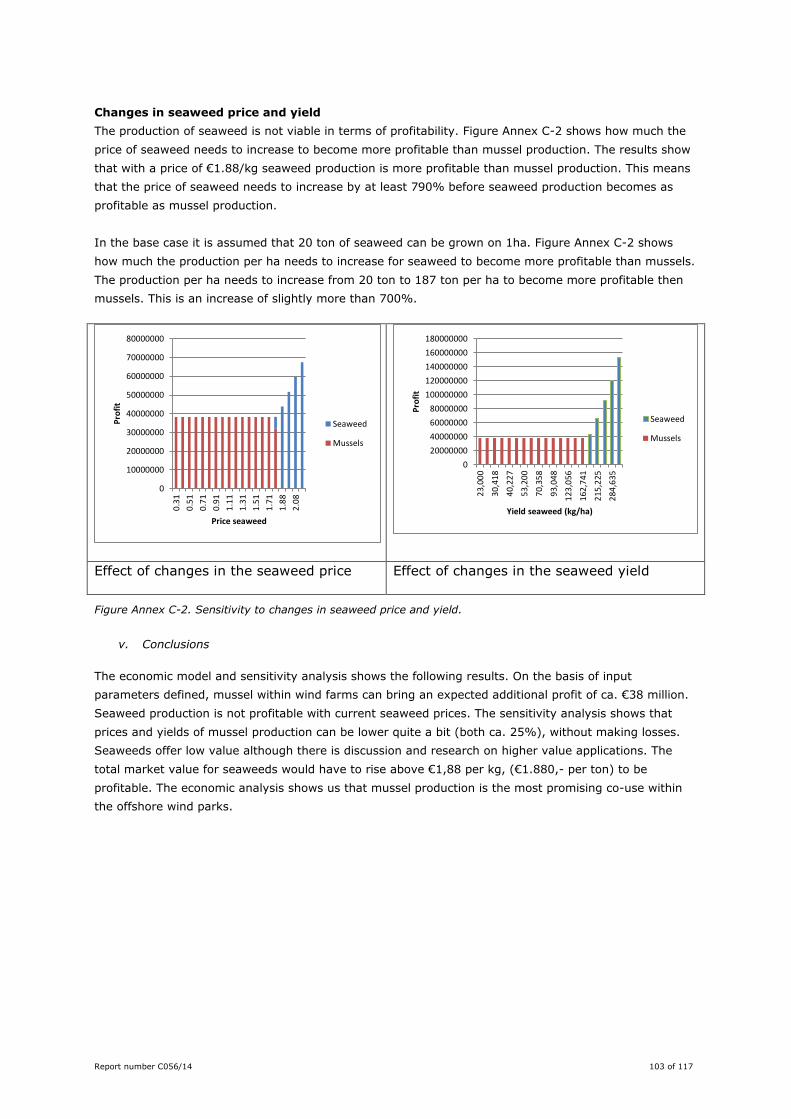
Report number C056/14 103 of 117
Changes in seaweed price and yield
The production of seaweed is not viable in terms of profitability. Figure Annex C-2 shows how much the
price of seaweed needs to increase to become more profitable than mussel production. The results show
that with a price of €1.88/kg seaweed production is more profitable than mussel production. This means
that the price of seaweed needs to increase by at least 790% before seaweed production becomes as
profitable as mussel production.
In the base case it is assumed that 20 ton of seaweed can be grown on 1ha. Figure Annex C-2 shows
how much the production per ha needs to increase for seaweed to become more profitable than mussels.
The production per ha needs to increase from 20 ton to 187 ton per ha to become more profitable then
mussels. This is an increase of slightly more than 700%.
Effect of changes in the seaweed price Effect of changes in the seaweed yield
Figure Annex C-2. Sensitivity to changes in seaweed price and yield.
v. Conclusions
The economic model and sensitivity analysis shows the following results. On the basis of input
parameters defined, mussel within wind farms can bring an expected additional profit of ca. €38 million.
Seaweed production is not profitable with current seaweed prices. The sensitivity analysis shows that
prices and yields of mussel production can be lower quite a bit (both ca. 25%), without making losses.
Seaweeds offer low value although there is discussion and research on higher value applications. The
total market value for seaweeds would have to rise above €1,88 per kg, (€1.880,- per ton) to be
profitable. The economic analysis shows us that mussel production is the most promising co-use within
the offshore wind parks.
0
10000000
20000000
30000000
40000000
50000000
60000000
70000000
80000000
0.3
1
0.5
1
0.7
1
0.9
1
1.1
1
1.3
1
1.5
1
1.7
1
1.8
8
2.0
8
Pro
fit
Price seaweed
Seaweed
Mussels
0
20000000
40000000
60000000
80000000
100000000
120000000
140000000
160000000
180000000
23,
000
30,
418
40,
227
53,
200
70,
358
93,
048
123
,056
162
,741
215
,225
284
,635
Pro
fit
Yield seaweed (kg/ha)
Seaweed
Mussels
104 of 117 Report number C056/14
References to Annex C
Stralen, M.R. van (2012). Invang van mosselzaad in MZI’s, resultaten 2011. Marinx-rapport 2012.117.
Scharendijke.
Stralen, M.R. van (2013). Invang van mosselzaad in MZI’s, resultaten 2012. Marinx-rapport 2013.126.
Scharendijke.
STECF (2013). The economic performance of the EU Aquaculture sector. 2012 exercise (STECF-13-03).
Publications Office of the European Union, Luxembourg, EUR 25975 EN, JRC 81620, 237 PP
Reith, J.H. E.P. Deurwaarder, K. Hemmes, A.P.W.M. Curvers, P. Kamermans,, W. Brandenburg and G.
Zeeman (2005). Bio-offshore: grootschalige teelt van zeewieren in combinatie met offshore
windparken in de Noordzee. Energieonderzoek Centrum Nederland, Petten.
Buck, B.H., M.W. Ebeling and T. Michler-Cieluch (2010). Mussel cultivation as a co-use in offshore wind
farms: potential and economic feasibility. Aquaculture Economics and Management, 14: 4, 255 - 281
Machinefabriek Bakker (2013) Personal communication
Florentinus, A., C. Hamelinck, et al. (2008). Worldwide potential of aquatic biomass. Utrecht, Ecofys.
Suurs, R. (2002). Long distance bioenergy logistics. An assessment of costs and energy consumption for
various biomass energy transport chains. Copernicus Institute, Universiteit Utrecht. NWS-E-2002-01.
ISBN 90-73958-83-0. January 2002.
Burg, S. van den, M. Stuiver, F. Veenstra, P. Bikker, A. López Contreras, A. Palstra, J. Broeze, H. Jansen,
R. Jak, A. Gerritsen, P. Harmsen, J. Kals, A. Blanco, W. Brandenburg, M. van Krimpen, A-P. van
Duijn, W. Mulder and L. van Raamsdonk (2012). A Triple P review of the feasibility of sustainable
offshore seaweed production in the North Sea; . Wageningen, Wageningen UR (University &
Research Centre), LEI report 13-077, The Hague
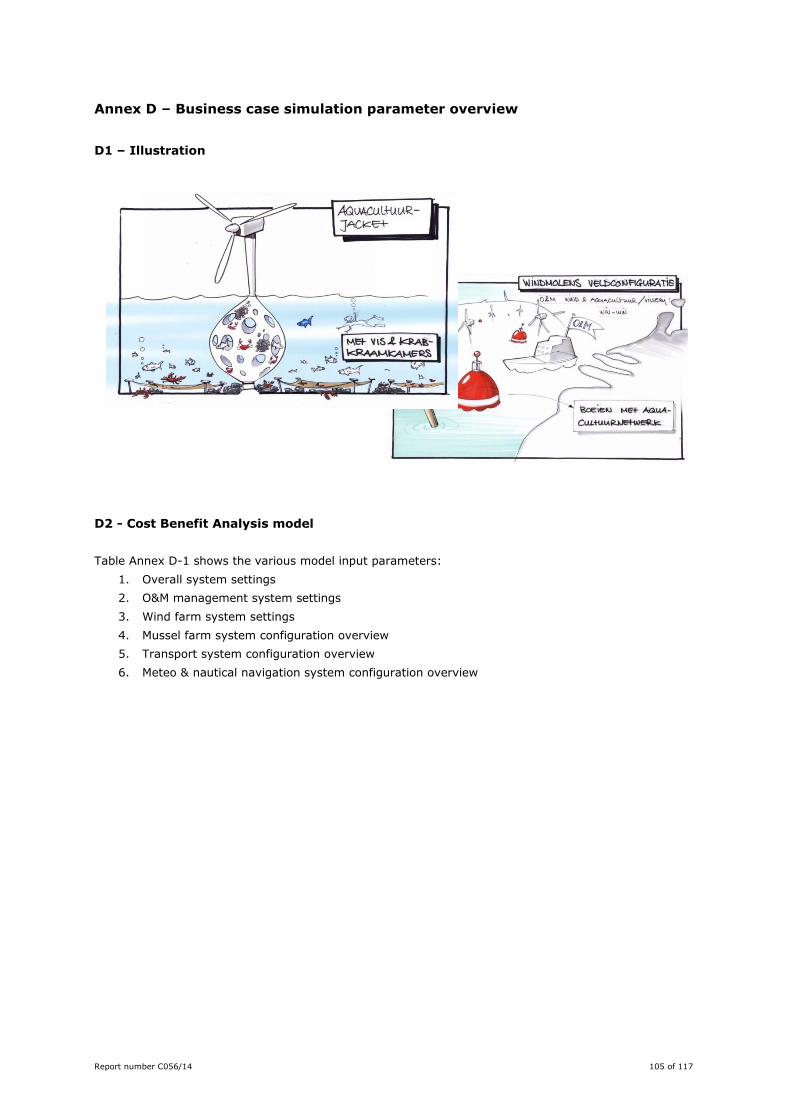
Report number C056/14 105 of 117
Annex D – Business case simulation parameter overview
D1 – Illustration
D2 - Cost Benefit Analysis model
Table Annex D-1 shows the various model input parameters:
1. Overall system settings
2. O&M management system settings
3. Wind farm system settings
4. Mussel farm system configuration overview
5. Transport system configuration overview
6. Meteo & nautical navigation system configuration overview
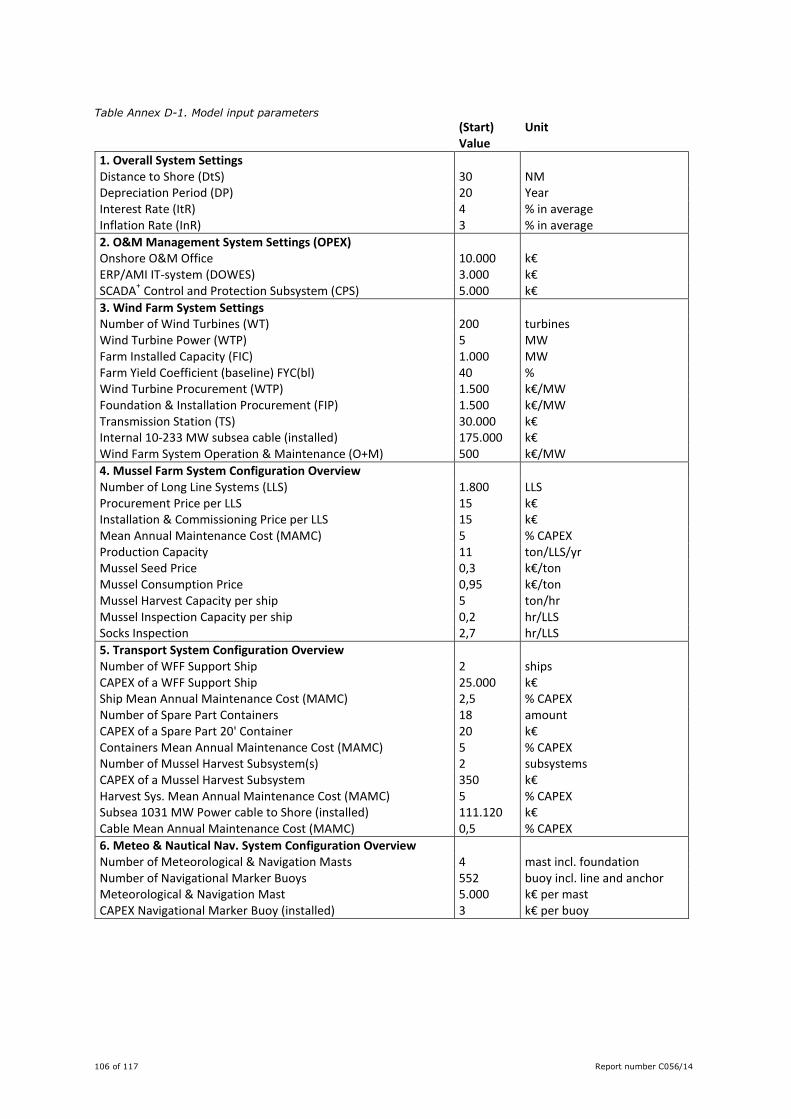
106 of 117 Report number C056/14
Table Annex D-1. Model input parameters
(Start) Value
Unit
1. Overall System Settings Distance to Shore (DtS) 30 NM Depreciation Period (DP) 20 Year Interest Rate (ItR) 4 % in average Inflation Rate (InR) 3 % in average
2. O&M Management System Settings (OPEX) Onshore O&M Office 10.000 k€ ERP/AMI IT-system (DOWES) 3.000 k€ SCADA
+ Control and Protection Subsystem (CPS) 5.000 k€
3. Wind Farm System Settings Number of Wind Turbines (WT) 200 turbines Wind Turbine Power (WTP) 5 MW Farm Installed Capacity (FIC) 1.000 MW Farm Yield Coefficient (baseline) FYC(bl) 40 % Wind Turbine Procurement (WTP) 1.500 k€/MW Foundation & Installation Procurement (FIP) 1.500 k€/MW Transmission Station (TS) 30.000 k€ Internal 10-233 MW subsea cable (installed) 175.000 k€ Wind Farm System Operation & Maintenance (O+M) 500 k€/MW
4. Mussel Farm System Configuration Overview Number of Long Line Systems (LLS) 1.800 LLS Procurement Price per LLS 15 k€ Installation & Commissioning Price per LLS 15 k€ Mean Annual Maintenance Cost (MAMC) 5 % CAPEX Production Capacity 11 ton/LLS/yr Mussel Seed Price 0,3 k€/ton Mussel Consumption Price 0,95 k€/ton Mussel Harvest Capacity per ship 5 ton/hr Mussel Inspection Capacity per ship 0,2 hr/LLS Socks Inspection 2,7 hr/LLS
5. Transport System Configuration Overview Number of WFF Support Ship 2 ships CAPEX of a WFF Support Ship 25.000 k€ Ship Mean Annual Maintenance Cost (MAMC) 2,5 % CAPEX Number of Spare Part Containers 18 amount CAPEX of a Spare Part 20' Container 20 k€ Containers Mean Annual Maintenance Cost (MAMC) 5 % CAPEX Number of Mussel Harvest Subsystem(s) 2 subsystems CAPEX of a Mussel Harvest Subsystem 350 k€ Harvest Sys. Mean Annual Maintenance Cost (MAMC) 5 % CAPEX Subsea 1031 MW Power cable to Shore (installed) 111.120 k€ Cable Mean Annual Maintenance Cost (MAMC) 0,5 % CAPEX
6. Meteo & Nautical Nav. System Configuration Overview Number of Meteorological & Navigation Masts 4 mast incl. foundation Number of Navigational Marker Buoys 552 buoy incl. line and anchor Meteorological & Navigation Mast 5.000 k€ per mast CAPEX Navigational Marker Buoy (installed) 3 k€ per buoy
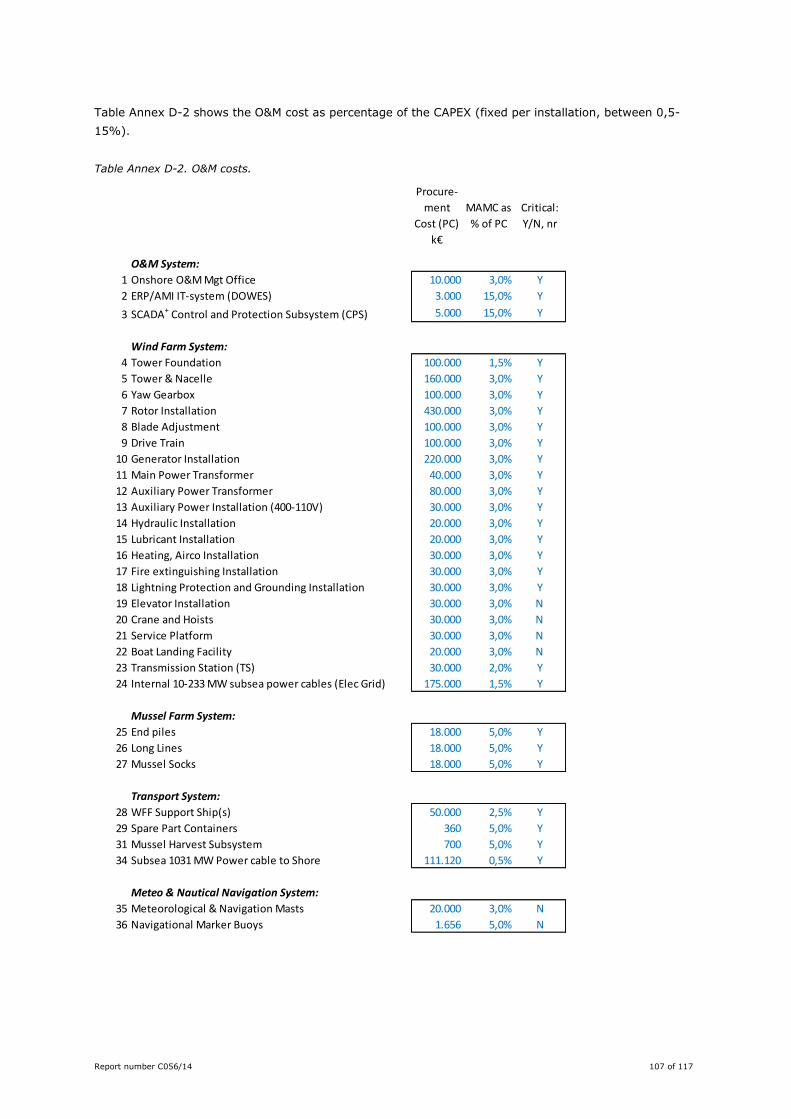
Report number C056/14 107 of 117
Table Annex D-2 shows the O&M cost as percentage of the CAPEX (fixed per installation, between 0,5-
15%).
Table Annex D-2. O&M costs.
Procure-
ment
Cost (PC)
k€
MAMC as
% of PC
Critical:
Y/N, nr
O&M System:
1 Onshore O&M Mgt Office 10.000 3,0% Y
2 ERP/AMI IT-system (DOWES) 3.000 15,0% Y
3 SCADA+ Control and Protection Subsystem (CPS) 5.000 15,0% Y
Wind Farm System:
4 Tower Foundation 100.000 1,5% Y
5 Tower & Nacelle 160.000 3,0% Y
6 Yaw Gearbox 100.000 3,0% Y
7 Rotor Installation 430.000 3,0% Y
8 Blade Adjustment 100.000 3,0% Y
9 Drive Train 100.000 3,0% Y
10 Generator Installation 220.000 3,0% Y
11 Main Power Transformer 40.000 3,0% Y
12 Auxiliary Power Transformer 80.000 3,0% Y
13 Auxiliary Power Installation (400-110V) 30.000 3,0% Y
14 Hydraulic Installation 20.000 3,0% Y
15 Lubricant Installation 20.000 3,0% Y
16 Heating, Airco Installation 30.000 3,0% Y
17 Fire extinguishing Installation 30.000 3,0% Y
18 Lightning Protection and Grounding Installation 30.000 3,0% Y
19 Elevator Installation 30.000 3,0% N
20 Crane and Hoists 30.000 3,0% N
21 Service Platform 30.000 3,0% N
22 Boat Landing Facility 20.000 3,0% N
23 Transmission Station (TS) 30.000 2,0% Y
24 Internal 10-233 MW subsea power cables (Elec Grid) 175.000 1,5% Y
Mussel Farm System:
25 End piles 18.000 5,0% Y
26 Long Lines 18.000 5,0% Y
27 Mussel Socks 18.000 5,0% Y
Transport System:
28 WFF Support Ship(s) 50.000 2,5% Y
29 Spare Part Containers 360 5,0% Y
31 Mussel Harvest Subsystem 700 5,0% Y
34 Subsea 1031 MW Power cable to Shore 111.120 0,5% Y
Meteo & Nautical Navigation System:
35 Meteorological & Navigation Masts 20.000 3,0% N
36 Navigational Marker Buoys 1.656 5,0% N
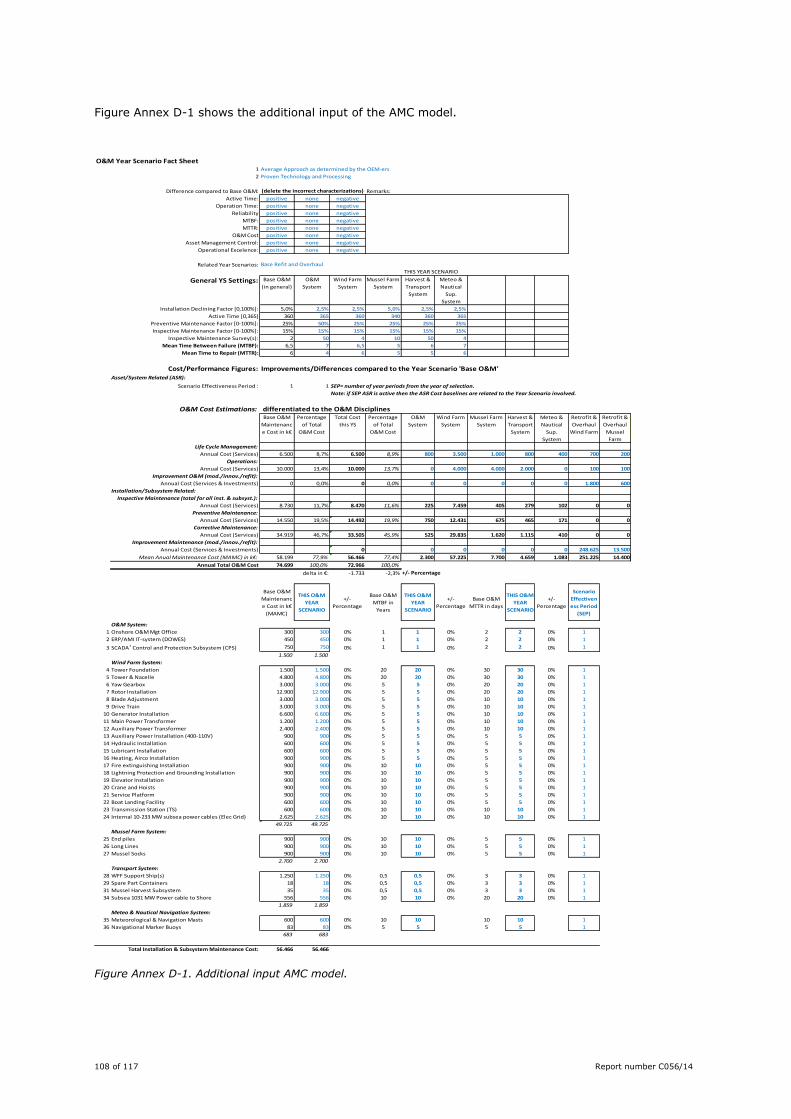
108 of 117 Report number C056/14
Figure Annex D-1 shows the additional input of the AMC model.
Figure Annex D-1. Additional input AMC model.
O&M Year Scenario Fact Sheet1 Average Approach as determined by the OEM-ers
2 Proven Technology and Processing
Difference compared to Base O&M: Remarks:
Active Time: positive none negative
Operation Time: positive none negative
Reliability positive none negative
MTBF: positive none negative
MTTR: positive none negative
O&M Cost positive none negative
Asset Management Control: positive none negative
Operational Excelence: positive none negative
Related Year Scenarios:
General YS Settings: Base O&M
(in general)
O&M
System
Wind Farm
System
Mussel Farm
System
Harvest &
Transport
System
Meteo &
Nautical
Sup.
System
Installation Declining Factor [0,100%]: 5,0% 2,5% 2,5% 5,0% 2,5% 2,5%
Active Time [0,365] 360 365 360 340 360 365
Preventive Maintenance Factor [0-100%]: 25% 50% 25% 25% 25% 25%
Inspective Maintenance Factor [0-100%]: 15% 15% 15% 15% 15% 15%
Inspective Maintenance Survey(s): 2 50 4 10 50 4
Mean Time Between Failure (MTBF): 6,5 7 6,5 5 6 7
Mean Time to Repair (MTTR): 6 4 6 5 5 6
Cost/Performance Figures: Improvements/Differences compared to the Year Scenario 'Base O&M' Asset/System Related (ASR):
Scenario Effectiveness Period : 1 1 SEP= number of year periods from the year of selection.
Note: if SEP ASR is active then the ASR Cost baselines are related to the Year Scenario involved.
O&M Cost Estimations: differentiated to the O&M DisciplinesBase O&M
Maintenanc
e Cost in k€
Percentage
of Total
O&M Cost
Total Cost
this YS
Percentage
of Total
O&M Cost
O&M
System
Wind Farm
System
Mussel Farm
System
Harvest &
Transport
System
Meteo &
Nautical
Sup.
System
Retrofit &
Overhaul
Wind Farm
Retrofit &
Overhaul
Mussel
Farm
Life Cycle Management:
Annual Cost (Services) 6.500 8,7% 6.500 8,9% 800 3.500 1.000 800 400 700 200
Operations:
Annual Cost (Services) 10.000 13,4% 10.000 13,7% 0 4.000 4.000 2.000 0 100 100
Improvement O&M (mod./innov./refit):
Annual Cost (Services & Investments) 0 0,0% 0 0,0% 0 0 0 0 0 1.800 600
Installation/Subsystem Related:
Inspective Maintenance (total for all inst. & subsyst.):
Annual Cost (Services) 8.730 11,7% 8.470 11,6% 225 7.459 405 279 102 0 0
Preventive Maintenance:
Annual Cost (Services) 14.550 19,5% 14.492 19,9% 750 12.431 675 465 171 0 0
Corrective Maintenance:
Annual Cost (Services) 34.919 46,7% 33.505 45,9% 525 29.835 1.620 1.115 410 0 0
Improvement Maintenance (mod./innov./refit):
Annual Cost (Services & Investments) 0 0 0 0 0 0 248.625 13.500
Mean Anual Maintenance Cost (MAMC) in k€: 58.199 77,9% 56.466 77,4% 2.300 57.225 7.700 4.659 1.083 251.225 14.400
Annual Total O&M Cost 74.699 100,0% 72.966 100,0%
delta in €: -1.733 -2,3% +/- Percentage
Base O&M
Maintenanc
e Cost in k€
(MAMC)
THIS O&M
YEAR
SCENARIO
+/-
Percentage
Base O&M
MTBF in
Years
THIS O&M
YEAR
SCENARIO
+/-
Percentage
Base O&M
MTTR in days
THIS O&M
YEAR
SCENARIO
+/-
Percentage
Scenario
Effectiven
ess Period
(SEP)
O&M System:
1 Onshore O&M Mgt Office 300 300 0% 1 1 0% 2 2 0% 1
2 ERP/AMI IT-system (DOWES) 450 450 0% 1 1 0% 2 2 0% 1
3 SCADA+ Control and Protection Subsystem (CPS) 750 750 0% 1 1 0% 2 2 0% 1
1.500 1.500
Wind Farm System:
4 Tower Foundation 1.500 1.500 0% 20 20 0% 30 30 0% 1
5 Tower & Nacelle 4.800 4.800 0% 20 20 0% 30 30 0% 1
6 Yaw Gearbox 3.000 3.000 0% 5 5 0% 20 20 0% 1
7 Rotor Installation 12.900 12.900 0% 5 5 0% 20 20 0% 1
8 Blade Adjustment 3.000 3.000 0% 5 5 0% 10 10 0% 1
9 Drive Train 3.000 3.000 0% 5 5 0% 10 10 0% 1
10 Generator Installation 6.600 6.600 0% 5 5 0% 10 10 0% 1
11 Main Power Transformer 1.200 1.200 0% 5 5 0% 10 10 0% 1
12 Auxiliary Power Transformer 2.400 2.400 0% 5 5 0% 10 10 0% 1
13 Auxiliary Power Installation (400-110V) 900 900 0% 5 5 0% 5 5 0% 1
14 Hydraulic Installation 600 600 0% 5 5 0% 5 5 0% 1
15 Lubricant Installation 600 600 0% 5 5 0% 5 5 0% 1
16 Heating, Airco Installation 900 900 0% 5 5 0% 5 5 0% 1
17 Fire extinguishing Installation 900 900 0% 10 10 0% 5 5 0% 1
18 Lightning Protection and Grounding Installation 900 900 0% 10 10 0% 5 5 0% 1
19 Elevator Installation 900 900 0% 10 10 0% 5 5 0% 1
20 Crane and Hoists 900 900 0% 10 10 0% 5 5 0% 1
21 Service Platform 900 900 0% 10 10 0% 5 5 0% 1
22 Boat Landing Facility 600 600 0% 10 10 0% 5 5 0% 1
23 Transmission Station (TS) 600 600 0% 10 10 0% 10 10 0% 1
24 Internal 10-233 MW subsea power cables (Elec Grid) 2.625 2.625 0% 10 10 0% 10 10 0% 1
49.725 49.725
Mussel Farm System:
25 End piles 900 900 0% 10 10 0% 5 5 0% 1
26 Long Lines 900 900 0% 10 10 0% 5 5 0% 1
27 Mussel Socks 900 900 0% 10 10 0% 5 5 0% 1
2.700 2.700
Transport System:
28 WFF Support Ship(s) 1.250 1.250 0% 0,5 0,5 0% 3 3 0% 1
29 Spare Part Containers 18 18 0% 0,5 0,5 0% 3 3 0% 1
31 Mussel Harvest Subsystem 35 35 0% 0,5 0,5 0% 3 3 0% 1
34 Subsea 1031 MW Power cable to Shore 556 556 0% 10 10 0% 20 20 0% 1
1.859 1.859
Meteo & Nautical Navigation System:
35 Meteorological & Navigation Masts 600 600 0% 10 10 10 10 1
36 Navigational Marker Buoys 83 83 0% 5 5 5 5 1
683 683
Total Installation & Subsystem Maintenance Cost: 56.466 56.466
(delete the incorrect characterizations)
Base Refit and Overhaul
THIS YEAR SCENARIO
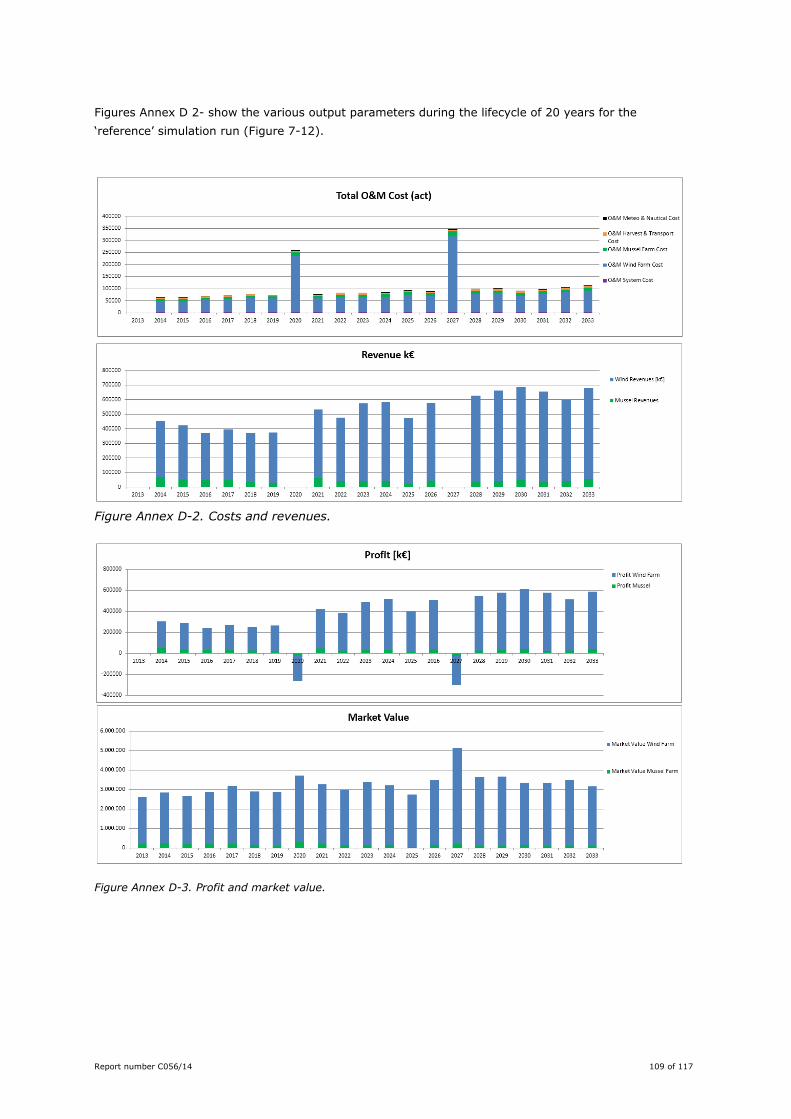
Report number C056/14 109 of 117
Figures Annex D 2- show the various output parameters during the lifecycle of 20 years for the
‘reference’ simulation run (Figure 7-12).
Figure Annex D-2. Costs and revenues.
Figure Annex D-3. Profit and market value.
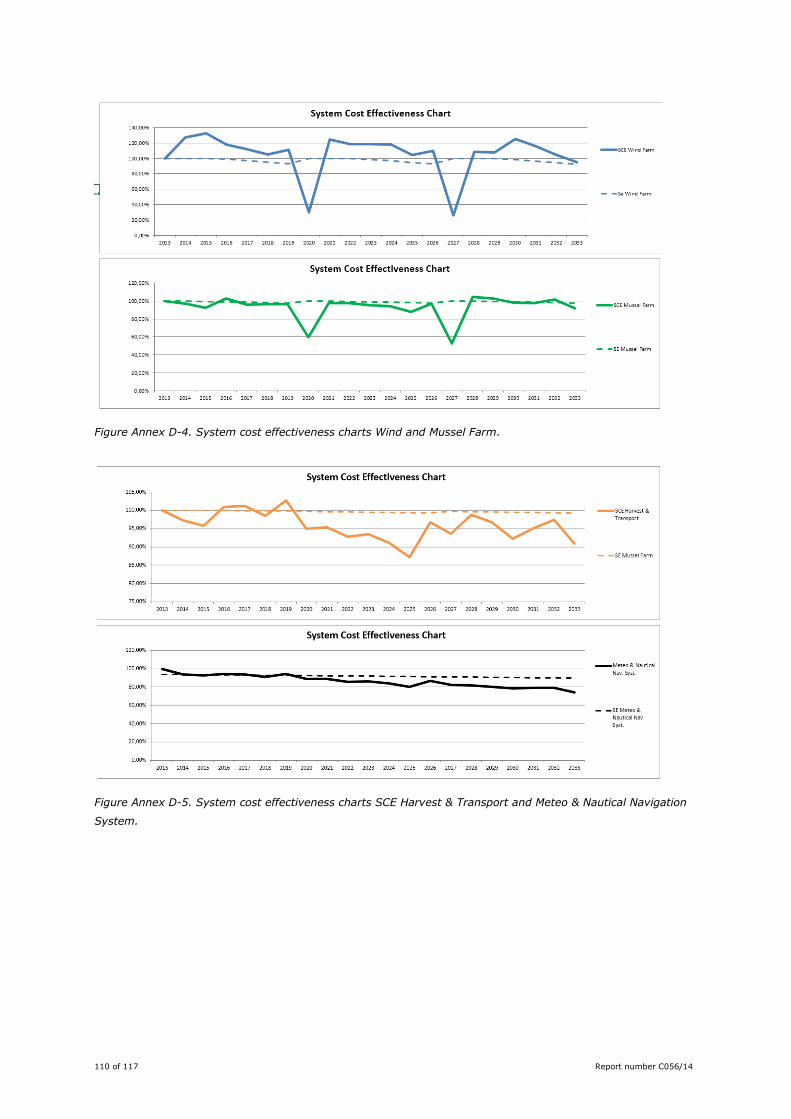
110 of 117 Report number C056/14
Figure Annex D-4. System cost effectiveness charts Wind and Mussel Farm.
Figure Annex D-5. System cost effectiveness charts SCE Harvest & Transport and Meteo & Nautical Navigation
System.
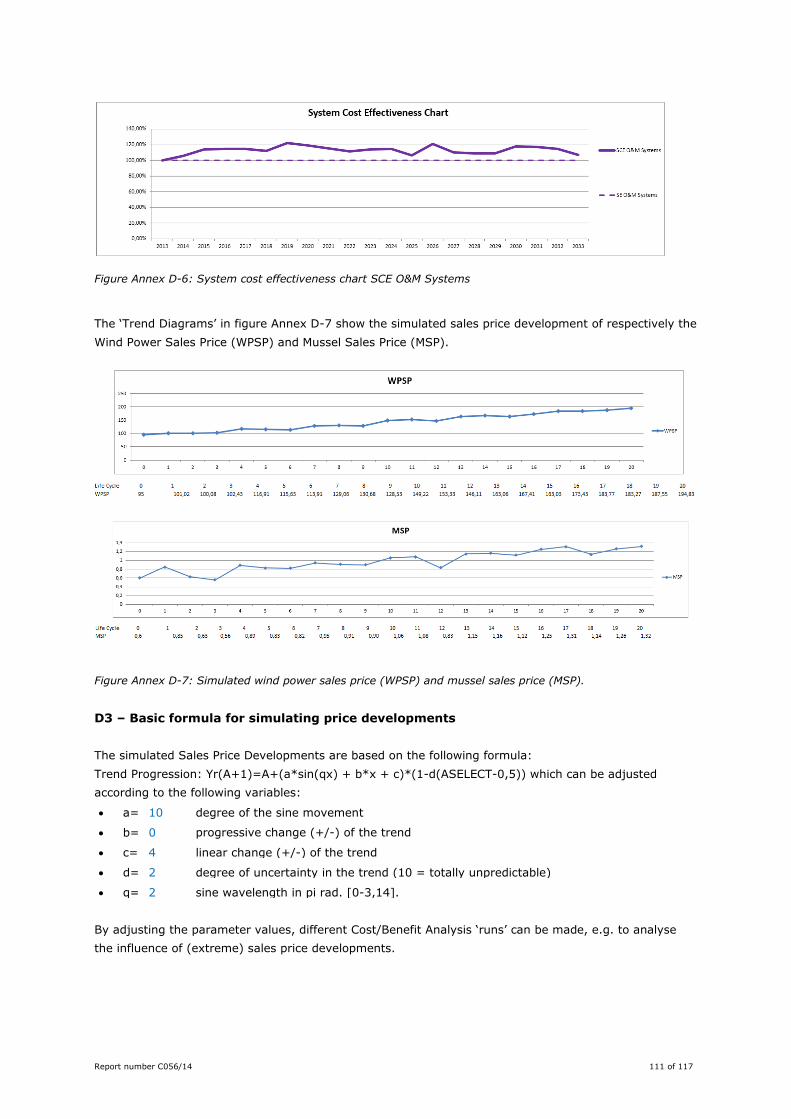
Report number C056/14 111 of 117
Figure Annex D-6: System cost effectiveness chart SCE O&M Systems
The ‘Trend Diagrams’ in figure Annex D-7 show the simulated sales price development of respectively the
Wind Power Sales Price (WPSP) and Mussel Sales Price (MSP).
Figure Annex D-7: Simulated wind power sales price (WPSP) and mussel sales price (MSP).
D3 – Basic formula for simulating price developments
The simulated Sales Price Developments are based on the following formula:
Trend Progression: Yr(A+1)=A+(a*sin(qx) + b*x + c)*(1-d(ASELECT-0,5)) which can be adjusted
according to the following variables:
a= 10 degree of the sine movement
b= 0 progressive change (+/-) of the trend
c= 4 linear change (+/-) of the trend
d= 2 degree of uncertainty in the trend (10 = totally unpredictable)
q= 2 sine wavelength in pi rad. [0-3,14].
By adjusting the parameter values, different Cost/Benefit Analysis ‘runs’ can be made, e.g. to analyse
the influence of (extreme) sales price developments.

112 of 117 Report number C056/14
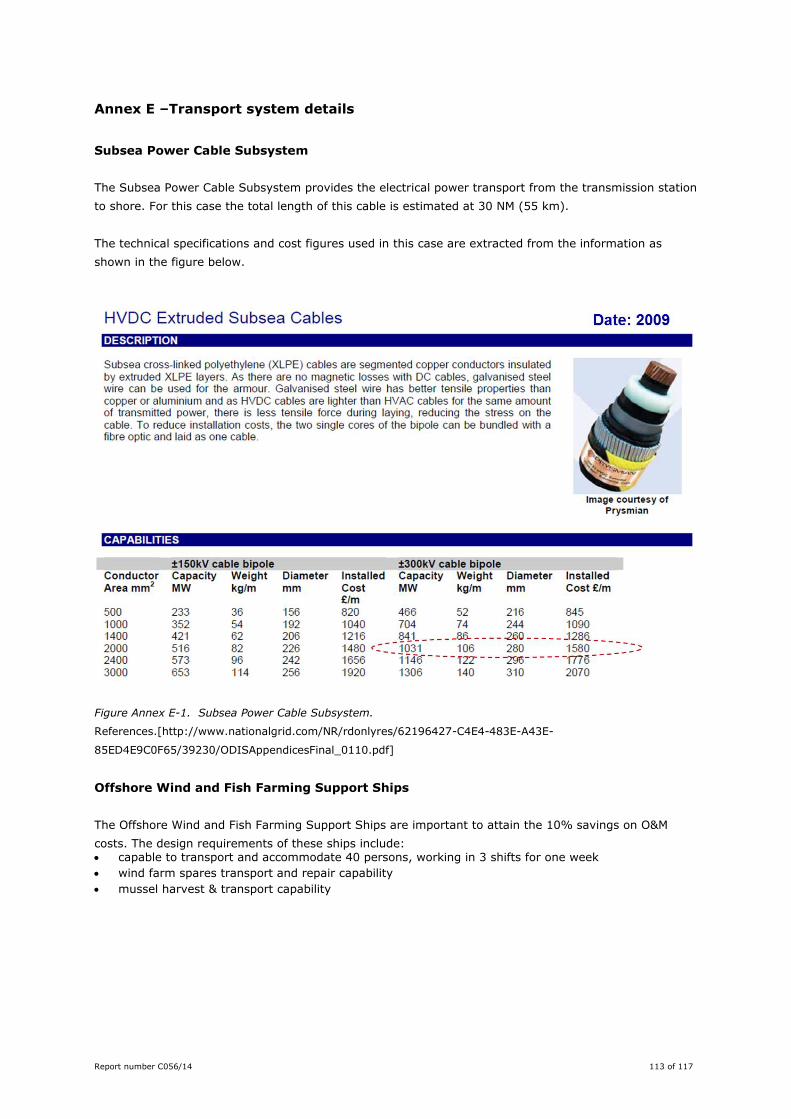
Report number C056/14 113 of 117
Annex E –Transport system details
Subsea Power Cable Subsystem
The Subsea Power Cable Subsystem provides the electrical power transport from the transmission station
to shore. For this case the total length of this cable is estimated at 30 NM (55 km).
The technical specifications and cost figures used in this case are extracted from the information as
shown in the figure below.
Figure Annex E-1. Subsea Power Cable Subsystem.
References.[http://www.nationalgrid.com/NR/rdonlyres/62196427-C4E4-483E-A43E-
85ED4E9C0F65/39230/ODISAppendicesFinal_0110.pdf]
Offshore Wind and Fish Farming Support Ships
The Offshore Wind and Fish Farming Support Ships are important to attain the 10% savings on O&M
costs. The design requirements of these ships include: capable to transport and accommodate 40 persons, working in 3 shifts for one week
wind farm spares transport and repair capability
mussel harvest & transport capability
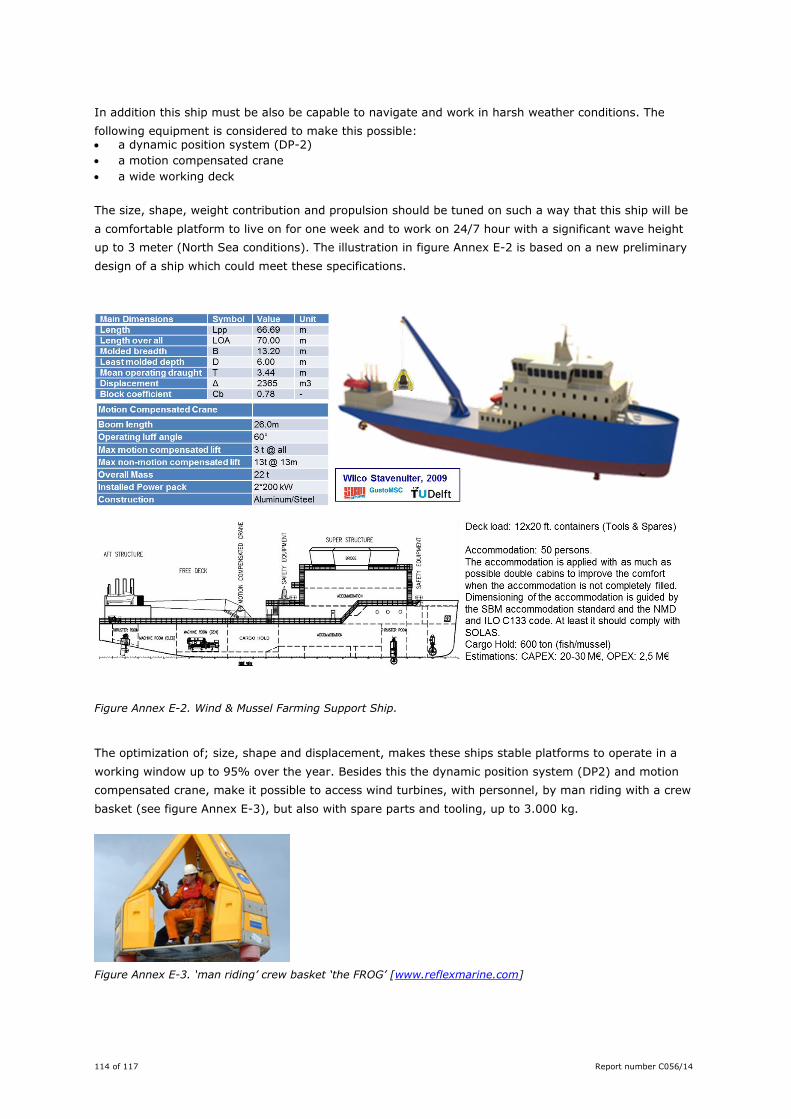
114 of 117 Report number C056/14
In addition this ship must be also be capable to navigate and work in harsh weather conditions. The
following equipment is considered to make this possible: a dynamic position system (DP-2)
a motion compensated crane
a wide working deck
The size, shape, weight contribution and propulsion should be tuned on such a way that this ship will be
a comfortable platform to live on for one week and to work on 24/7 hour with a significant wave height
up to 3 meter (North Sea conditions). The illustration in figure Annex E-2 is based on a new preliminary
design of a ship which could meet these specifications.
Figure Annex E-2. Wind & Mussel Farming Support Ship.
The optimization of; size, shape and displacement, makes these ships stable platforms to operate in a
working window up to 95% over the year. Besides this the dynamic position system (DP2) and motion
compensated crane, make it possible to access wind turbines, with personnel, by man riding with a crew
basket (see figure Annex E-3), but also with spare parts and tooling, up to 3.000 kg.
Figure Annex E-3. ‘man riding’ crew basket ‘the FROG’ [www.reflexmarine.com]
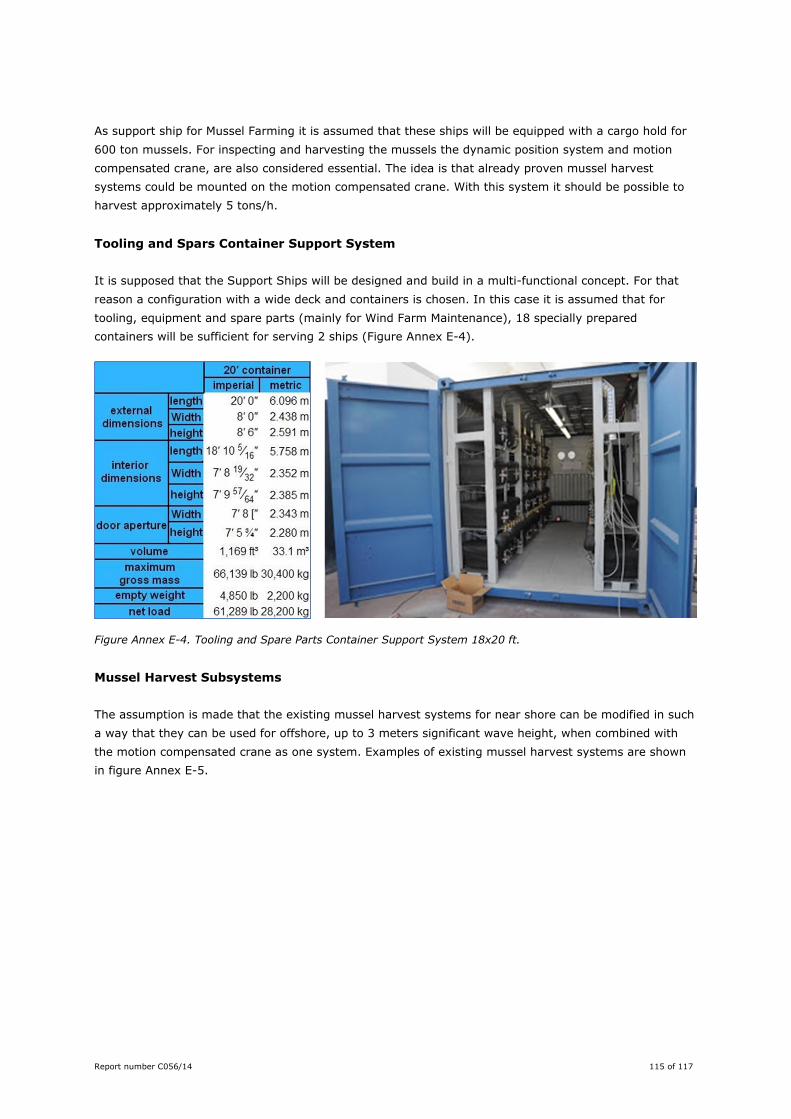
Report number C056/14 115 of 117
As support ship for Mussel Farming it is assumed that these ships will be equipped with a cargo hold for
600 ton mussels. For inspecting and harvesting the mussels the dynamic position system and motion
compensated crane, are also considered essential. The idea is that already proven mussel harvest
systems could be mounted on the motion compensated crane. With this system it should be possible to
harvest approximately 5 tons/h.
Tooling and Spars Container Support System
It is supposed that the Support Ships will be designed and build in a multi-functional concept. For that
reason a configuration with a wide deck and containers is chosen. In this case it is assumed that for
tooling, equipment and spare parts (mainly for Wind Farm Maintenance), 18 specially prepared
containers will be sufficient for serving 2 ships (Figure Annex E-4).
Figure Annex E-4. Tooling and Spare Parts Container Support System 18x20 ft.
Mussel Harvest Subsystems
The assumption is made that the existing mussel harvest systems for near shore can be modified in such
a way that they can be used for offshore, up to 3 meters significant wave height, when combined with
the motion compensated crane as one system. Examples of existing mussel harvest systems are shown
in figure Annex E-5.
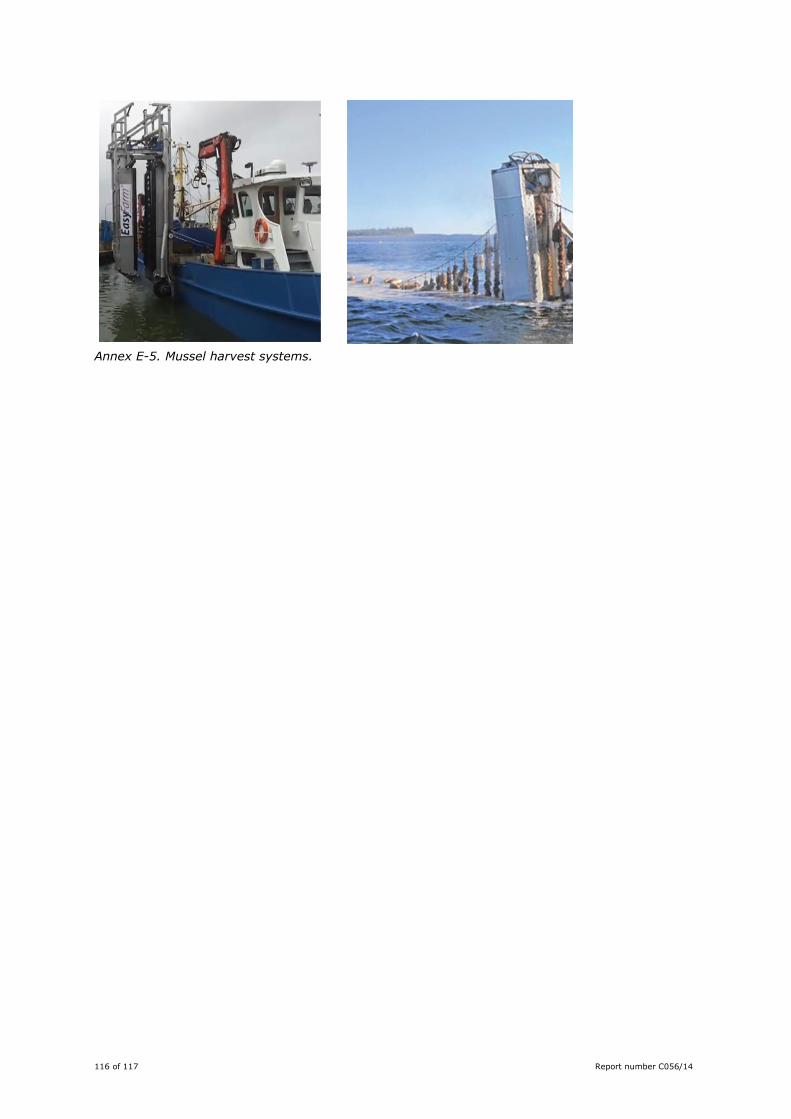
116 of 117 Report number C056/14
Annex E-5. Mussel harvest systems.
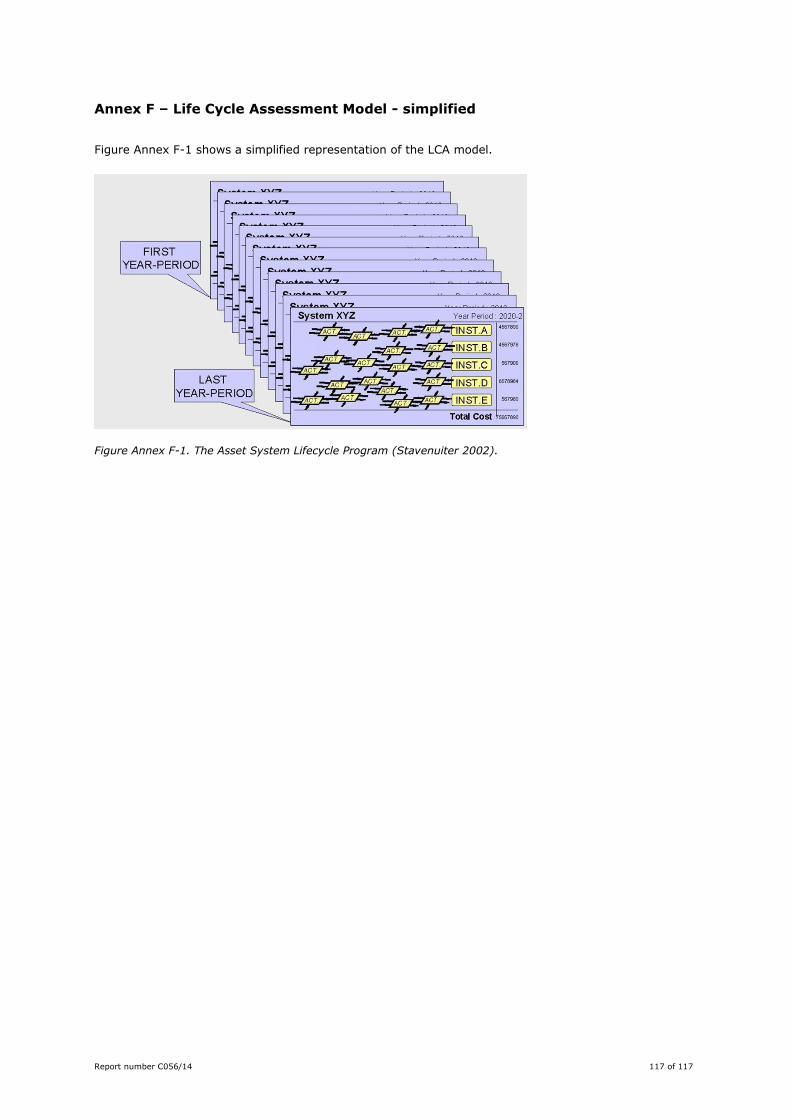
Report number C056/14 117 of 117
Annex F – Life Cycle Assessment Model - simplified
Figure Annex F-1 shows a simplified representation of the LCA model.
Figure Annex F-1. The Asset System Lifecycle Program (Stavenuiter 2002).