Global Trends in Space Volume 2 Trends by Subsector and ...
129
IDA Paper P-5242, Vol. 2 June 2015 Global Trends in Space Volume 2: Trends by Subsector and Factors that Could Disrupt Them Bhavya Lal Emily J. Sylak-Glassman Michael C. Mineiro Nayanee Gupta Lucas M. Pratt Abigail R. Azari Approved for public release; distribution is unlimited. Log: H 15-000242 SCIENCE & TECHNOLOGY POLICY INSTITUTE IDA SCIENCE & TECHNOLOGY POLICY INSTITUTE 1899 Pennsylvania Ave., Suite 520 Washington, DC 20006-3602
Transcript of Global Trends in Space Volume 2 Trends by Subsector and ...
IDA Paper P-5242, Vol. 2
June 2015
Global Trends in SpaceVolume 2: Trends by Subsector and
Factors that Could Disrupt Them
Bhavya LalEmily J. Sylak-Glassman
Michael C. MineiroNayanee GuptaLucas M. PrattAbigail R. Azari
Approved for public release;distribution is unlimited.
Log: H 15-000242
S C I E N C E & T E C H N O L O G Y P O L I C Y I N S T I T U T E
IDA SCIENCE & TECHNOLOGY POLICY INSTITUTE
1899 Pennsylvania Ave., Suite 520Washington, DC 20006-3602
AcknowledgmentsThe authors appreciate the contributions of Scott Pace, Director of the Space Policy Institute at George Washington University, and Rob Mahoney of IDA Systems and Analyses Center, who served as technical reviewers for this report.
Copyright Notice© 2015 Institute for Defense Analyses 4850 Mark Center Drive, Alexandria, Virginia 22311-1882 • (703) 845-2000.
This material may be reproduced by or for the U.S. Government pursuant to thecopyright license under the clause at FAR 52.227-14 (December 2007).
Bhavya LalEmily J. Sylak-Glassman
Michael C. MineiroNayanee GuptaLucas M. PrattAbigail R. Azari
IDA Paper P-5242, Vol. 2
S C I E N C E & T E C H N O L O G Y P O L I C Y I N S T I T U T E
Global Trends in SpaceVolume 2: Trends by Subsector and
Factors that Could Disrupt Them

iii
Contents
1. Introduction ............................................................................................................. 1-12. Earth Observation (EO) ........................................................................................... 2-1
A. Increasing Number of Countries with EO Satellites and Civil EO Programs .... 2-1 B. Continuing Improvements in Technology Related to Optical Imagery .......... 2-2 C. Growing Demand for Geospatial Data-Based Analytics and Services ........... 2-4 D. Growing Sales of Commercial EO Imagery (but National Data Policies
Will Be a Key Driver) ..................................................................................... 2-5 E. Fragmentation and Modularization of the EO Value Chain ............................ 2-7
3. Communication Satellite Services ........................................................................... 3-1A. Technological Advances ................................................................................. 3-2 B. Communications Satellite Demand Will Continue to Increase ....................... 3-3 C. New Companies Vying to Provide Space-Based Communication Services ...... 3-4
4. Space Science and Technology (S&T) and Exploration ......................................... 4-1A. More Countries Are Beginning to Participate in Space S&T and
Exploration as Mission Leads or Participants in Large-Scale International Endeavors ................................................................................... 4-1
B. Rise in Publications by Developed and Developing Countries ....................... 4-3 C. Rise in International Scientific Collaborations ............................................... 4-5
5. Launch and Access to Space ................................................................................... 5-1A. Increase in the Number of Nations with Launch Capabilities ......................... 5-1 B. More Countries Vying for Launch Opportunities and Revenues .................... 5-4 C. Diversity of Approaches to Launch ................................................................. 5-8 D. Increasing Suborbital Activity ......................................................................... 5-9 E. Potential for Significant Reduction in Launch Costs .................................... 5-10
6. Position, Navigation, and Timing (PNT) ................................................................ 6-1A. Proliferation of Space-Based PNT Global and Regional Systems .................. 6-1 B. Continued Open Access to GNSS Free of Direct User Charges ..................... 6-4 C. Growth in PNT Hardware and Services Market ............................................. 6-5 D. Alternatives to Space-Based PNT Signals ...................................................... 6-6
7. Human Space Flight ................................................................................................ 7-1A. End of the Era of the International Space Station ........................................... 7-2 B. Rise of HSF Programs in Other Countries ...................................................... 7-2 C. Advent of Commercial HSF Launch and On-Orbit Station Services ............. 7-3
iv
8. Space Situational Awareness (SSA) ........................................................................ 8-1A. Private Entities Beginning to Provide SSA Data, Analytic Products,
and Services ..................................................................................................... 8-1 B. Increasingly Difficult for the Military and Government to Control SSA ....... 8-3
9. Small Satellites: A Potentially Disruptive Platform ................................................ 9-1A. Lower Costs Spurring Greater Interest in of Small Satellites ......................... 9-2 B. Increase in Standardization Leading to Growth in Commercial Market ......... 9-4 C. Growing Emphasis on Constellation Operations ............................................ 9-5 D. Increase in Small Satellite Launches Changing the Launch Paradigm ........... 9-6 E. Increasing Commercial Interest and Capability in Private, High-
Temporal-Resolution EO Imagery and Data ................................................... 9-8 F. Growing Number of New Entrants into the Space Sector through
Small Satellites, Often Supported by Foreign Countries ................................ 9-9 G. Potential for Viable LEO Satellite Constellations ......................................... 9-10 H. Future Trajectory of Small Satellites ............................................................. 9-11
10. Wildcards: Technological Developments and Other Factors thatCould Disrupt Trends ............................................................................................ 10-1 A. Technology Developments ............................................................................ 10-1 B. Geopolitical Developments ........................................................................... 10-5 C. Other Potential Developments ....................................................................... 10-6
Appendix A. List of Interviewees ................................................................................... A-1 Appendix B. Bottom-Up Lists of Drivers, Trends, and Implications ..............................B-1 Appendix C. China and Globalization .............................................................................C-1 Appendix D. Differentiating Between Private and Commercial Space .......................... D-1 Appendix E. List of NewSpace Companies ................................................................. E-E-1 References ....................................................................................................................... G-1 Abbreviations .................................................................................................................. H-1
1-1
1. Introduction
Volume 1 of this report discusses overarching trends in the space sector, their drivers, and their implications. Chapters 2 through 8 of this volume focuses on important trends within seven individual subsectors: Earth observation; communication satellite services; space science and technology (S&T) and exploration; launch and access to space; position, navigation, and timing (PNT); human space flight; and space situational awareness (SSA). Chapter 9 looks at current developments in small satellites, which experts believe have the potential to disrupt current trends across sectors. Finally, in Chapter 10, the STPI team speculates on potential “wildcards”—technological, geopolitical, and other unexpected developments—that could disrupt trends. This volume also includes the methodological appendixes referred to in Volume 1 of the report.

2-1
2. Earth Observation (EO)
Space-based observations of the Earth can help communities to “promote sustainable agriculture, conserve biodiversity, respond to climate change and its impacts, protect itself against natural and human-induced disasters, manage ecosystems and energy resources, understand the environmental sources of health hazards, safeguard water resources, and improve weather forecasts.”1 As a result, space-based EO has attracted increasing participation and investment among governments and within private industry. In the past decade, two-thirds of government satellites were for EO (Euroconsult 2014b, 3) and between 2007 and 2013, commercial revenues increased over 300 percent (OECD (2014) and Satellite Industry Association 2014). Most recently, a Canadian company called NorStar Space Data has announced plans to launch a constellation of 40 low Earth orbiting satellites for both earth and space monitoring (Ferster 2015).
In this chapter, we describe the increasing global interest and participation in EO, technological advances in optical imagery, growing demand for data and services, and new uses of space-based data by the IT sector.
A. Increasing Number of Countries with EO Satellites and Civil EO Programs Most countries that engage in space activities participate in EO (Table 3-1 in Volume
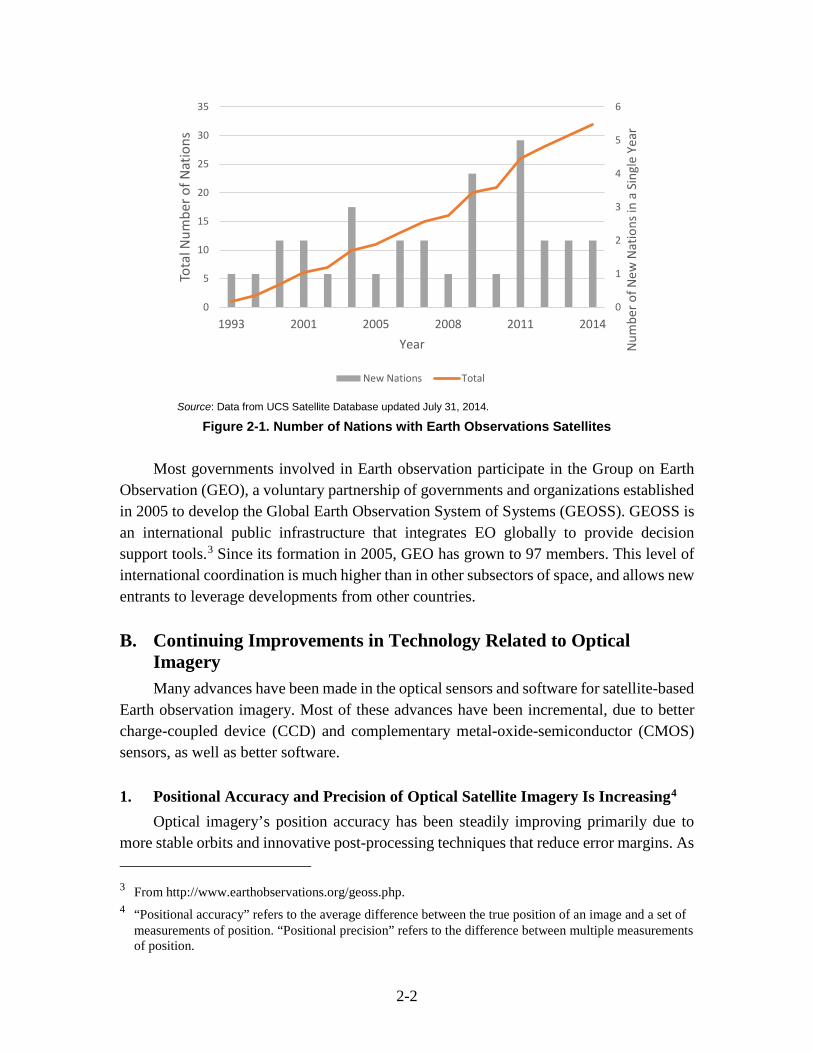
1, Chapter 3 of this report). The number of countries with satellites for EO has grown steadily since the early 1990s (Figure 2-1).2 In addition to countries that own and operate EO satellites, there are countries that use data from commercial EO satellites and countries that analyze remote sensing data from other countries’ satellites. The flexibility in the type of activity a country can engage in means that there is a wide range of costs, allowing countries with small budgets to be able to participate in Earth observation.
1 From http://www.earthobservations.org/geoss.php. 2 From UCS Satellite Database. User category must contain the term “Civil” or “Government” but can
contain other users as well. Country operating must be a single nation. Satellite purpose must include the terms “Earth observation,” “Meteorology,” “Remote Sensing,” or “Earth Science.”
2-2
Source: Data from UCS Satellite Database updated July 31, 2014.
Figure 2-1. Number of Nations with Earth Observations Satellites
Most governments involved in Earth observation participate in the Group on Earth Observation (GEO), a voluntary partnership of governments and organizations established in 2005 to develop the Global Earth Observation System of Systems (GEOSS). GEOSS is an international public infrastructure that integrates EO globally to provide decision support tools.3 Since its formation in 2005, GEO has grown to 97 members. This level of international coordination is much higher than in other subsectors of space, and allows new entrants to leverage developments from other countries.
B. Continuing Improvements in Technology Related to Optical Imagery Many advances have been made in the optical sensors and software for satellite-based
Earth observation imagery. Most of these advances have been incremental, due to better charge-coupled device (CCD) and complementary metal-oxide-semiconductor (CMOS) sensors, as well as better software.
1. Positional Accuracy and Precision of Optical Satellite Imagery Is Increasing4 Optical imagery’s position accuracy has been steadily improving primarily due to
more stable orbits and innovative post-processing techniques that reduce error margins. As 3 From http://www.earthobservations.org/geoss.php. 4 “Positional accuracy” refers to the average difference between the true position of an image and a set of
measurements of position. “Positional precision” refers to the difference between multiple measurements of position.
0
1
2
3
4
5
6
0
5
10
15
20
25
30
35
1993 2001 2005 2008 2011 2014
Num
ber o
f New
Nat
ions
in a
Sin
gle
Year
Tota
l Num
ber o
f Nat
ions
Year
New Nations Total
2-3
the quality of the data increases, the base map improves, allowing easier matching and positional accuracy of images. The increasing spatial resolution of optical satellite imagery from systems such as WorldView is now comparable to the positional precision of aerial imagery (Navulur, Pacifici, and Baugh 2013).
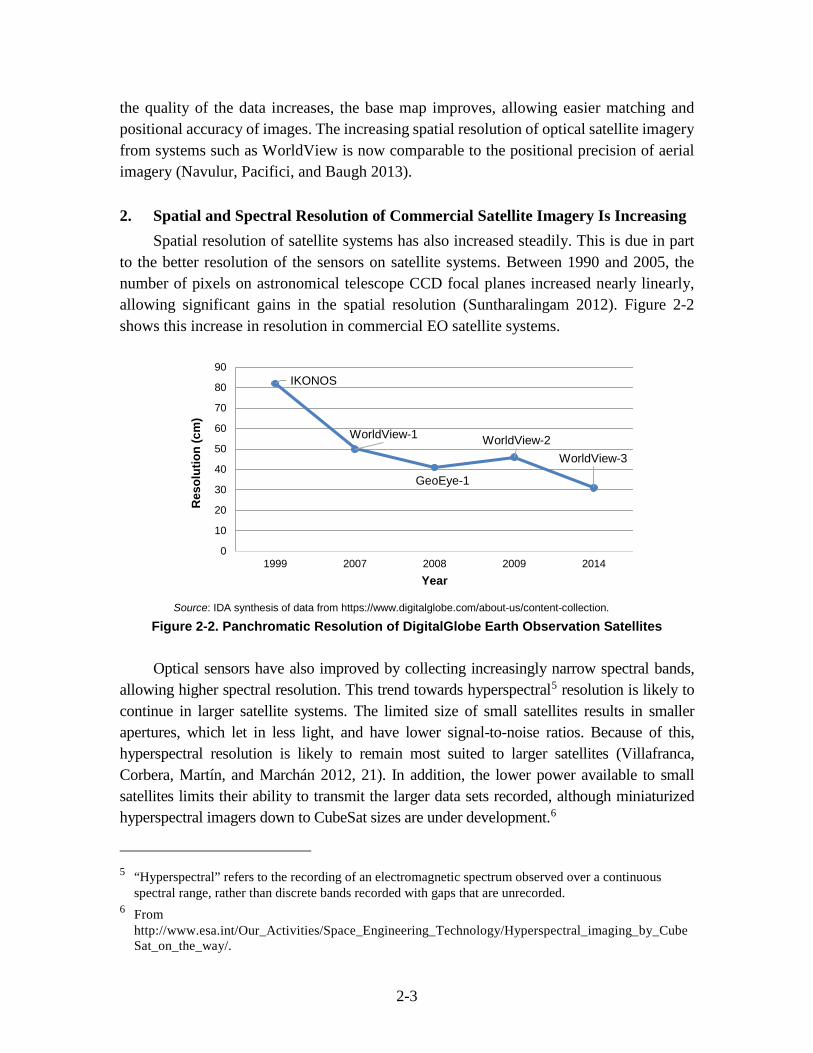
2. Spatial and Spectral Resolution of Commercial Satellite Imagery Is Increasing Spatial resolution of satellite systems has also increased steadily. This is due in part
to the better resolution of the sensors on satellite systems. Between 1990 and 2005, the number of pixels on astronomical telescope CCD focal planes increased nearly linearly, allowing significant gains in the spatial resolution (Suntharalingam 2012). Figure 2-2 shows this increase in resolution in commercial EO satellite systems.
Source: IDA synthesis of data from https://www.digitalglobe.com/about-us/content-collection.
Figure 2-2. Panchromatic Resolution of DigitalGlobe Earth Observation Satellites
Optical sensors have also improved by collecting increasingly narrow spectral bands, allowing higher spectral resolution. This trend towards hyperspectral5 resolution is likely to continue in larger satellite systems. The limited size of small satellites results in smaller apertures, which let in less light, and have lower signal-to-noise ratios. Because of this, hyperspectral resolution is likely to remain most suited to larger satellites (Villafranca, Corbera, Martín, and Marchán 2012, 21). In addition, the lower power available to small satellites limits their ability to transmit the larger data sets recorded, although miniaturized hyperspectral imagers down to CubeSat sizes are under development.6
5 “Hyperspectral” refers to the recording of an electromagnetic spectrum observed over a continuous
spectral range, rather than discrete bands recorded with gaps that are unrecorded. 6 From
http://www.esa.int/Our_Activities/Space_Engineering_Technology/Hyperspectral_imaging_by_CubeSat_on_the_way/.
IKONOS
WorldView-1
GeoEye-1
WorldView-2WorldView-3
0
10
20
30
40
50
60
70
80
90
1999 2007 2008 2009 2014
Res
olut
ion
(cm
)
Year
2-4
3. Commercial Sensing and Imaging Components Improve Small Satellites Smaller satellites typically use commercial off-the-shelf (COTS) sensors that are
developed for terrestrial applications and later adapted to space use. Larger satellites use more expensive, custom-made, radiation-hardened CCDs. Small satellites using COTS optical payloads are improving at more than three times the rate of larger satellites using custom optics7 as a result of the faster rate of technological advancement in COTS components (Yeh and Revay 2014). This advantage means that data providers employing small satellites will be able to stay on the cutting edge of technology by using COTS sensors rather than more expensive custom components.
4. Increasing Need for Streamlined Data Management The volume of EO data is increasing rapidly. The European Space Agency (ESA) has
archived over 1.5 petabytes of EO data, and estimates that it will have more than 2 petabytes in a few years (Pinna, and Mbaye 2014). The average daily archive growth in NASA’s EO data system, the Earth Observation System Data and Information System, was 1.7 terabytes per day in FY 2011 (Zhang, Wang, Liu, et al. 2013). As more EO imagery is accumulated over time, there will be an increasing need for more streamlined data processing, increased data storage capacity, and a way to integrate and organize old and new data sets.8 Many of the challenges that the EO data management community face, particularly for those involved in GEOSS, are common to those in other communities using big data (Nativi, Mazzetti, Santoro, et al. 2015). As a result of the common challenges, trends in EO data management reflect more general big data trends, including using cloud-enabled large-scale computation and search and analytics infrastructures.
C. Growing Demand for Geospatial Data-Based Analytics and Services Responding to a growing demand for geospatial data-based analytics and knowledge
services, a growing number of start-ups are launching their own satellites, such as PlanetIQ, Planet Labs, Skybox, and Spires, among others Werner (2013), or using commercially available imagery to provide geospatial data analysis.9 Large data companies (including Google, Facebook, Apple, and Microsoft in the United States, and Baidu in China), are
7 Improvements in remote sensing satellites can be measured by many metrics. In this case, the Ground
Sampling Distance, a measure of the ground resolution, is used. This relates to the resolution capabilities of the sensor electronics, which in practice may be limited by the available aperture size for the sensor.
8 Interest in developing better analytical tools for EO can be seen in the recently launched NASA Earth Exchange (NEX) platform, a collaboration and analytical tool developed by Amazon and NASA to combine state-of-the-art supercomputing, Earth system modeling, workflow management, and NASA remote-sensing data (Golubovich 2014).
9 See Appendix E for a full list of the 169 NewSpace companies STPI identified. Many of these companies focus on EO.
2-5
also investing in advancing machine-learning based automated image recognition capabilities that will be able to process larger volumes of data faster with the goal of fusing multiple data formats—even imagery data—into search and other services. These companies, most of which see themselves as IT or media companies, are treating space as just another place to gather information to distribute to a wide range of customers (Meyer 2014).
Advances in geospatial data-based analytics are driven by IT advances in large-scale data analytics and cloud-based supporting infrastructure. Improved software capabilities—particularly in image processing, machine learning, artificial intelligence (AI), and data integration—are opening up new applications in areas including space-based observation, detection, and monitoring. The goal is to convert imagery (including maps, traffic information, and movements of people and objects) into knowledge. The potential in terms of future applications and economic value is difficult to predict but likely to be disruptive and certainly high.
While the future trajectory for the imaging industry itself remains uncertain, companies providing value-added analytical insights from commercial imagery data are growing in the United States; funding for such companies is moving from the government to the private sector with growing venture capital (VC) funding and acquisitions.
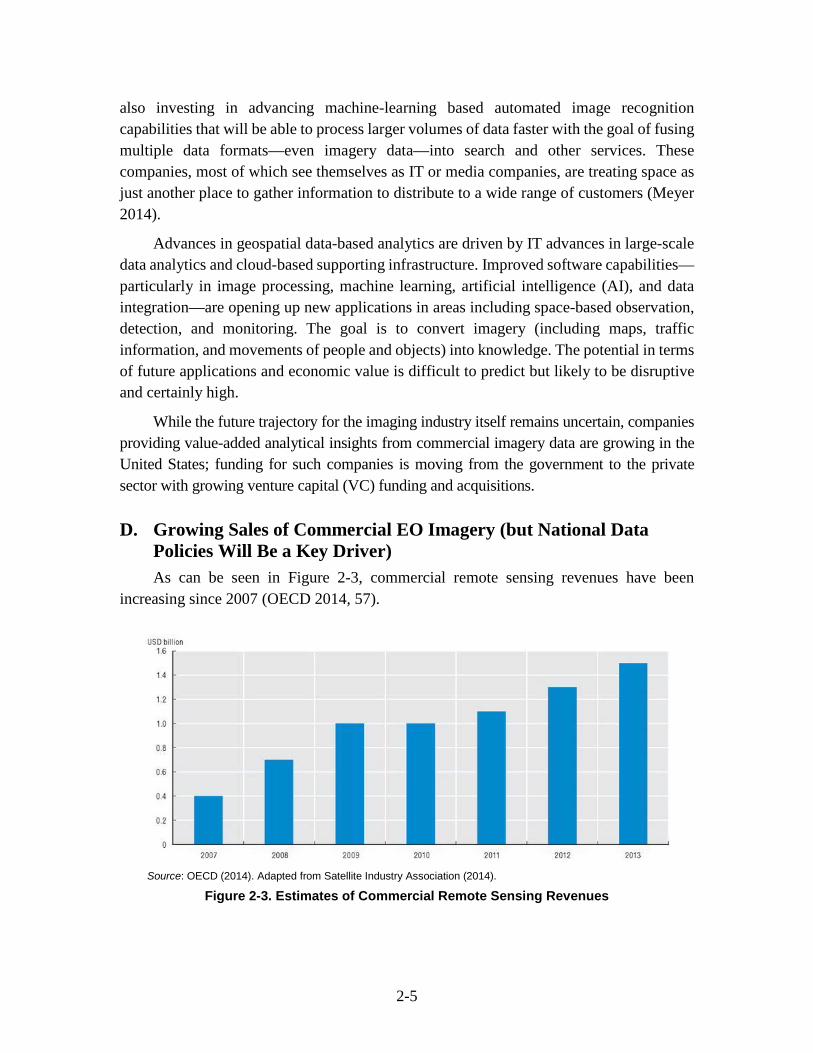
D. Growing Sales of Commercial EO Imagery (but National Data Policies Will Be a Key Driver) As can be seen in Figure 2-3, commercial remote sensing revenues have been
increasing since 2007 (OECD 2014, 57).
Source: OECD (2014). Adapted from Satellite Industry Association (2014).
Figure 2-3. Estimates of Commercial Remote Sensing Revenues
2-6
Currently, two-thirds of high-resolution commercial EO data sales come from only two companies: Airbus Defense and Space, Geo-Intelligence, and DigitalGlobe (Euroconsult 2014b, 164). While Airbus and DigitalGlobe dominate in terms of high spatial resolution, new companies are beginning to collect commercial imagery at high temporal resolution or with other desirable characteristics. Planet Labs, which built its first demonstration satellite in 2012, now has 28 satellites. While the resolution of 3 to 5 meters is not nearly as high as DigitalGlobe’s WorldView-3, which has 0.3 meter panchromatic resolution, the large number of satellites operated by Planet Labs enables higher temporal resolution because of the high revisit rate.10 PlanetiQ is planning on launching the first commercial weather satellite constellation by 2017, offering a different type of Earth observation service than has been available commercially.11 Skybox Imaging, which was bought by Google in June 2014, plans to operate 24 inexpensive, shorter-lifetime satellites that will offer high-resolution satellite imagery, video, and data (Werner 2013). These firms aim to provide geospatial imagery-based commercial services to non-governmental entities for applications like mapping, real estate services, construction, and oil and gas monitoring.
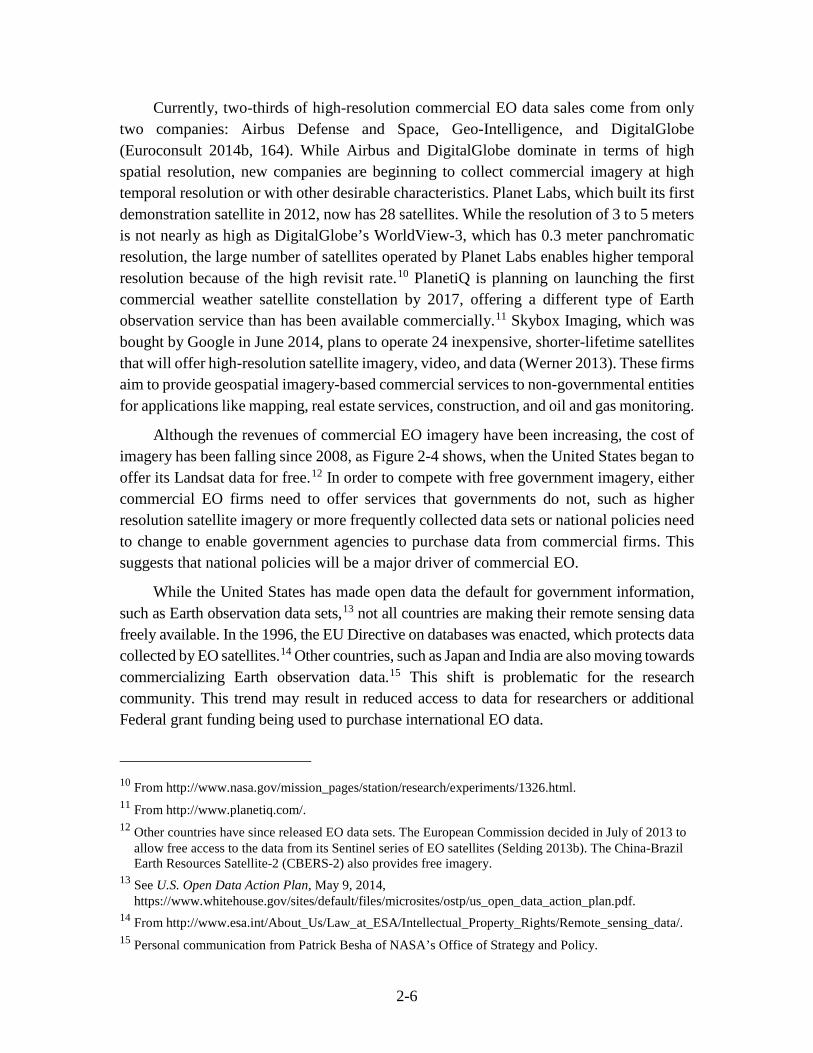
Although the revenues of commercial EO imagery have been increasing, the cost of imagery has been falling since 2008, as Figure 2-4 shows, when the United States began to offer its Landsat data for free.12 In order to compete with free government imagery, either commercial EO firms need to offer services that governments do not, such as higher resolution satellite imagery or more frequently collected data sets or national policies need to change to enable government agencies to purchase data from commercial firms. This suggests that national policies will be a major driver of commercial EO.
While the United States has made open data the default for government information, such as Earth observation data sets,13 not all countries are making their remote sensing data freely available. In the 1996, the EU Directive on databases was enacted, which protects data collected by EO satellites.14 Other countries, such as Japan and India are also moving towards commercializing Earth observation data.15 This shift is problematic for the research community. This trend may result in reduced access to data for researchers or additional Federal grant funding being used to purchase international EO data.
10 From http://www.nasa.gov/mission_pages/station/research/experiments/1326.html. 11 From http://www.planetiq.com/. 12 Other countries have since released EO data sets. The European Commission decided in July of 2013 to
allow free access to the data from its Sentinel series of EO satellites (Selding 2013b). The China-Brazil Earth Resources Satellite-2 (CBERS-2) also provides free imagery.
13 See U.S. Open Data Action Plan, May 9, 2014, https://www.whitehouse.gov/sites/default/files/microsites/ostp/us_open_data_action_plan.pdf.
14 From http://www.esa.int/About_Us/Law_at_ESA/Intellectual_Property_Rights/Remote_sensing_data/. 15 Personal communication from Patrick Besha of NASA’s Office of Strategy and Policy.
2-7
Source: Futron, as reported in Space Foundation (2014, Exhibit 5f). Note: Data includes panchromatic and multispectral images of varying resolution and geolocation accuracy.
Figure 2-4. Price Trends in Commercial Satellite Imagery, 2004–2012
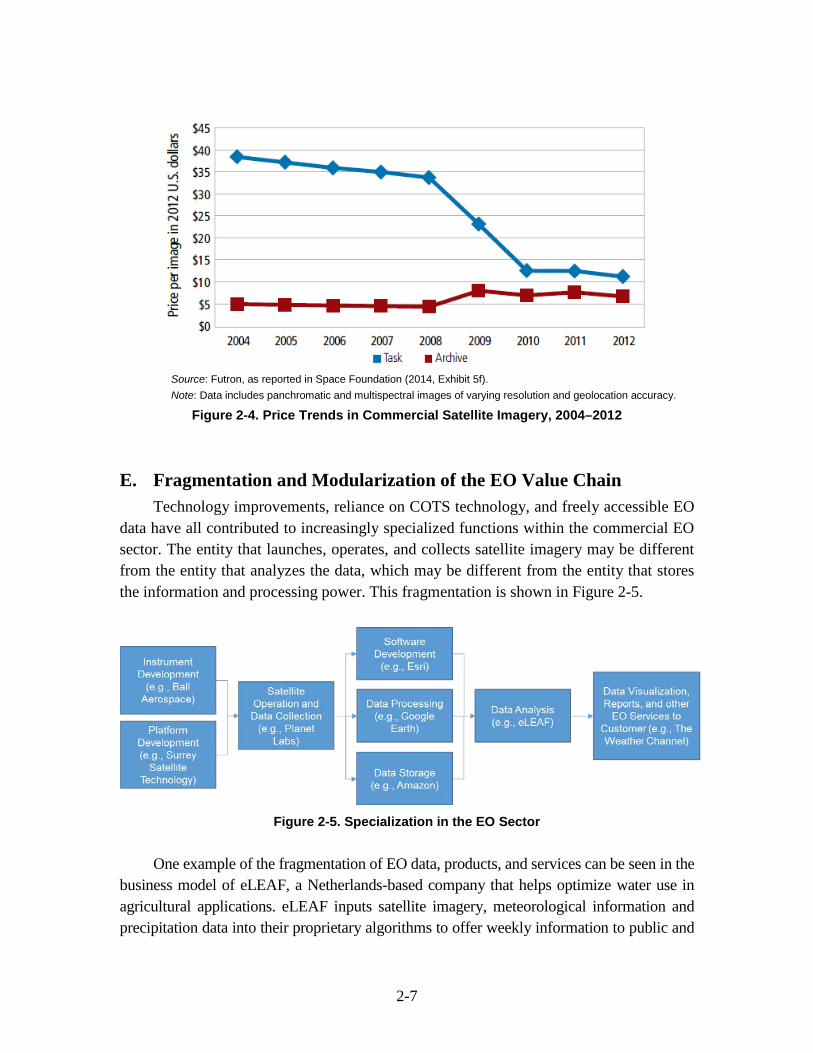
E. Fragmentation and Modularization of the EO Value Chain Technology improvements, reliance on COTS technology, and freely accessible EO
data have all contributed to increasingly specialized functions within the commercial EO sector. The entity that launches, operates, and collects satellite imagery may be different from the entity that analyzes the data, which may be different from the entity that stores the information and processing power. This fragmentation is shown in Figure 2-5.
Figure 2-5. Specialization in the EO Sector
One example of the fragmentation of EO data, products, and services can be seen in the
business model of eLEAF, a Netherlands-based company that helps optimize water use in agricultural applications. eLEAF inputs satellite imagery, meteorological information and precipitation data into their proprietary algorithms to offer weekly information to public and
2-8
private customers, including individual farmers. Farmers can receive data on their own fields (eLeaf n.d.), and governments can receive information about larger regions. Though eLEAF has developed the algorithms and information products, it does not collect remote sensing imagery itself. It uses government satellite data, such as that collected by NASA’s ASTER satellite (Terink, Droogers, van Dam, et al. n.d.). To map the output data, eLEAF uses a mapping software platform called ArcGIS, which is developed by Esri. ArcGIS is, in turn, hosted in the Amazon Cloud (Baumann 2013). This example illustrates how a single EO service or product can use products or services from a range of other entities. It also shows that the organizations involved in producing a single product may include products from public and private sources.
EO is likely the first of the space subsectors to become as modularized and fragmented. As the value chain of EO become increasingly specialized, companies are likely to continue to specialize in specific areas. This trend is similar to structural changes that have occurred in other sectors, like semiconductors.
3-1
3. Communication Satellite Services
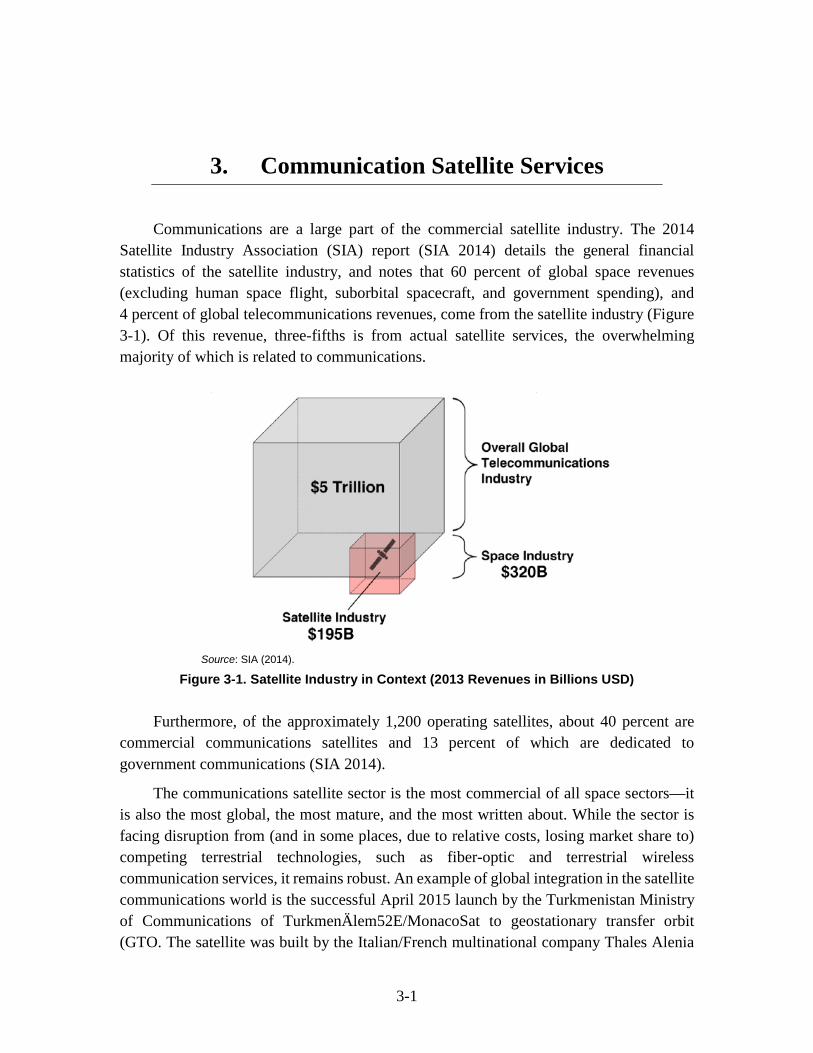
Communications are a large part of the commercial satellite industry. The 2014 Satellite Industry Association (SIA) report (SIA 2014) details the general financial statistics of the satellite industry, and notes that 60 percent of global space revenues (excluding human space flight, suborbital spacecraft, and government spending), and 4 percent of global telecommunications revenues, come from the satellite industry (Figure 3-1). Of this revenue, three-fifths is from actual satellite services, the overwhelming majority of which is related to communications.
Source: SIA (2014).
Figure 3-1. Satellite Industry in Context (2013 Revenues in Billions USD)
Furthermore, of the approximately 1,200 operating satellites, about 40 percent are commercial communications satellites and 13 percent of which are dedicated to government communications (SIA 2014).
The communications satellite sector is the most commercial of all space sectors—it is also the most global, the most mature, and the most written about. While the sector is facing disruption from (and in some places, due to relative costs, losing market share to) competing terrestrial technologies, such as fiber-optic and terrestrial wireless communication services, it remains robust. An example of global integration in the satellite communications world is the successful April 2015 launch by the Turkmenistan Ministry of Communications of TurkmenÄlem52E/MonacoSat to geostationary transfer orbit (GTO. The satellite was built by the Italian/French multinational company Thales Alenia
3-2
Space, was launched by the U.S. firm SpaceX aboard a Falcon 9 rocket, and is operated by the Monaco-based satellite operator Space System International–Monaco.
This section details trends in the communication satellite services subsector.
A. Technological Advances Communications satellites generally optimize for lifetime and communications
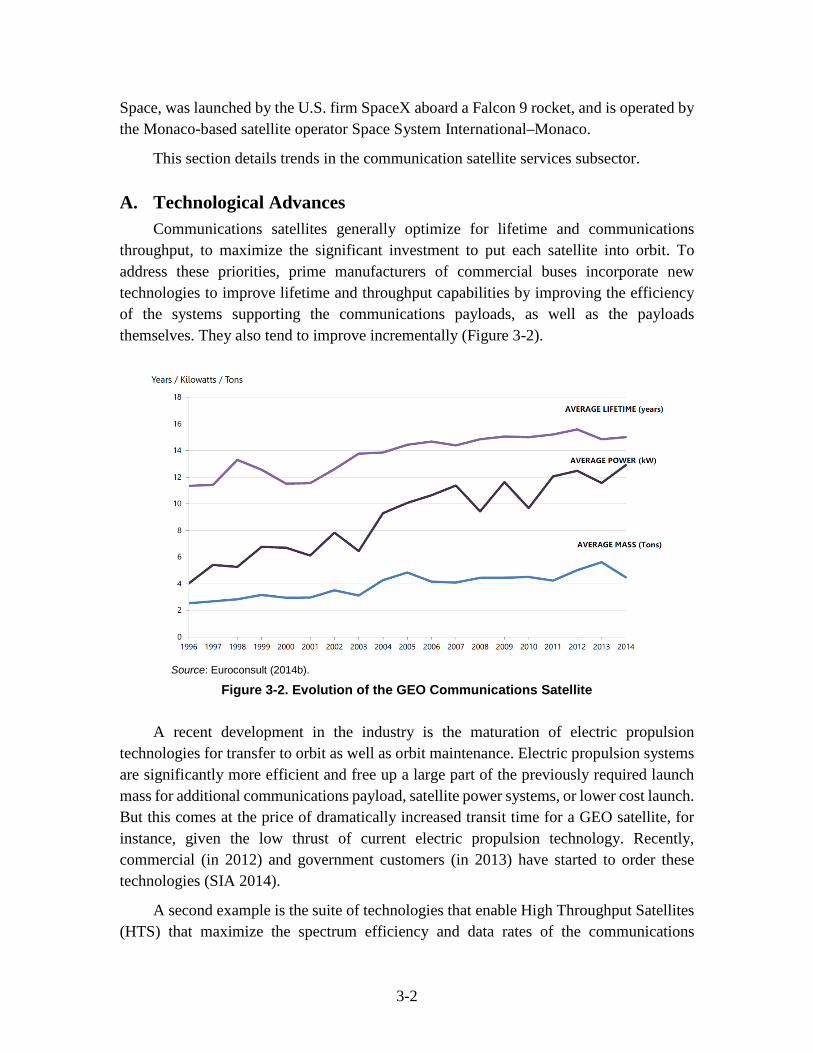
throughput, to maximize the significant investment to put each satellite into orbit. To address these priorities, prime manufacturers of commercial buses incorporate new technologies to improve lifetime and throughput capabilities by improving the efficiency of the systems supporting the communications payloads, as well as the payloads themselves. They also tend to improve incrementally (Figure 3-2).
Source: Euroconsult (2014b).
Figure 3-2. Evolution of the GEO Communications Satellite
A recent development in the industry is the maturation of electric propulsion technologies for transfer to orbit as well as orbit maintenance. Electric propulsion systems are significantly more efficient and free up a large part of the previously required launch mass for additional communications payload, satellite power systems, or lower cost launch. But this comes at the price of dramatically increased transit time for a GEO satellite, for instance, given the low thrust of current electric propulsion technology. Recently, commercial (in 2012) and government customers (in 2013) have started to order these technologies (SIA 2014).
A second example is the suite of technologies that enable High Throughput Satellites (HTS) that maximize the spectrum efficiency and data rates of the communications
3-3
payloads onboard the satellite, whether through frequency reuse, spot beams, or greater onboard processing capability for software-defined radio (SDR) payloads, among other technologies. Twenty-seven HTS-capable satellites are in orbit, with 24 more on order or under construction (SIA 2014).
More advanced technological development may enable laser-based optical communications systems, which would offer increased bandwidth and fewer spectrum licensing issues over current space communications (see sidebar).
Communications satellites are built for long but finite lifetimes. As satellites are retired and as bandwidth demands continue to increase, the market and investment in technology that increases efficiency will continue, with evidence that transitions are taking place in the adoption of HTS and electric propulsion systems. This is in line with the continued rise in demand for additional capabilities. As additional technology matures, the communications sector can be expected to adopt them, with low Earth orbit (LEO) systems more adaptive than satellites in geostationary orbit (GEO) due to lower costs for deployment, a more forgiving radiation environment, and correspondingly shorter expected lifetimes and development cycles.
B. Communications Satellite Demand Will Continue to Increase The most lucrative market in satellite communication is in direct-to-home broadcast
satellite television, which made up about 83 percent of all satellite services revenue in 2013. According to SIA (2014), India and Russia make up a significant portion of new subscribers, and growth in general is driven by emerging markets. The advantage of
Rapid Laser Communications Capability
While laser communication systems are currently in development (as on the recent Lunar Atmosphere and Dust Environment Explorer [LADEE] mission), if they quickly become more feasible and widespread, the effects for the space community could be significant. Commercial companies, the military, and the civil sector all have interest in laser communications—whether the emphasis is on high bandwidth, high security, or efficient use of spectrum. Laser communications work for all three, with the ability to encode large volumes of information as in a fiber electric cable, the high security of communication that is only detectable by those along the path of the laser, and the lack of spectrum interference to any receiver not along the path of the laser.
Widespread laser communications could essentially end spectrum and bandwidth concerns as we know them now for non-broadcast communications, both uplink and downlink, if power and size requirements enabled them to be used on a wide range of satellite sizes and if reliable transmission through the atmosphere can be achieved. For many applications, this would lower the cost of spectrum, though the number of services demanding spectrum would likely go up in response. Additionally, precise satellite tracking would become a more pressing concern for effective communication.
Long-range scientific missions would benefit the most, enabling the rapid collection of information at a relatively low power cost, even from the outer planets where power is often at a premium.
3-4
satellite infrastructure for these services is that it negates the need to install massive ground infrastructure in regions that cannot afford the cost of landlines. Satellite dishes are already prevalent in the developing world, and demand is likely to continue to grow as the countries grow and seek additional services.
Similar to cell towers in developing countries allowing them to forgo building traditional phone infrastructure, sufficiently capable and inexpensive satellite networks may become a preferable form of infrastructure for additional services, whether provided by private interests or local governments, which have traditionally entered the space sector through either Earth observation or local communications satellites.
As demand for consumer television services spreads, both in the developing and industrialized world, demand for more and more capable communications satellites will grow as well. Additionally, extrapolating from the impact of high-definition television (HDTV) reported by SIA (2014), rising standards for high-quality content such as ultra HDTV and 4K television—with four times the number of pixels of HDTV—will drive demand for augmented, high-bandwidth data to be carried over these satellites for all new and existing customers, further driving demands for greater communications payload capability.
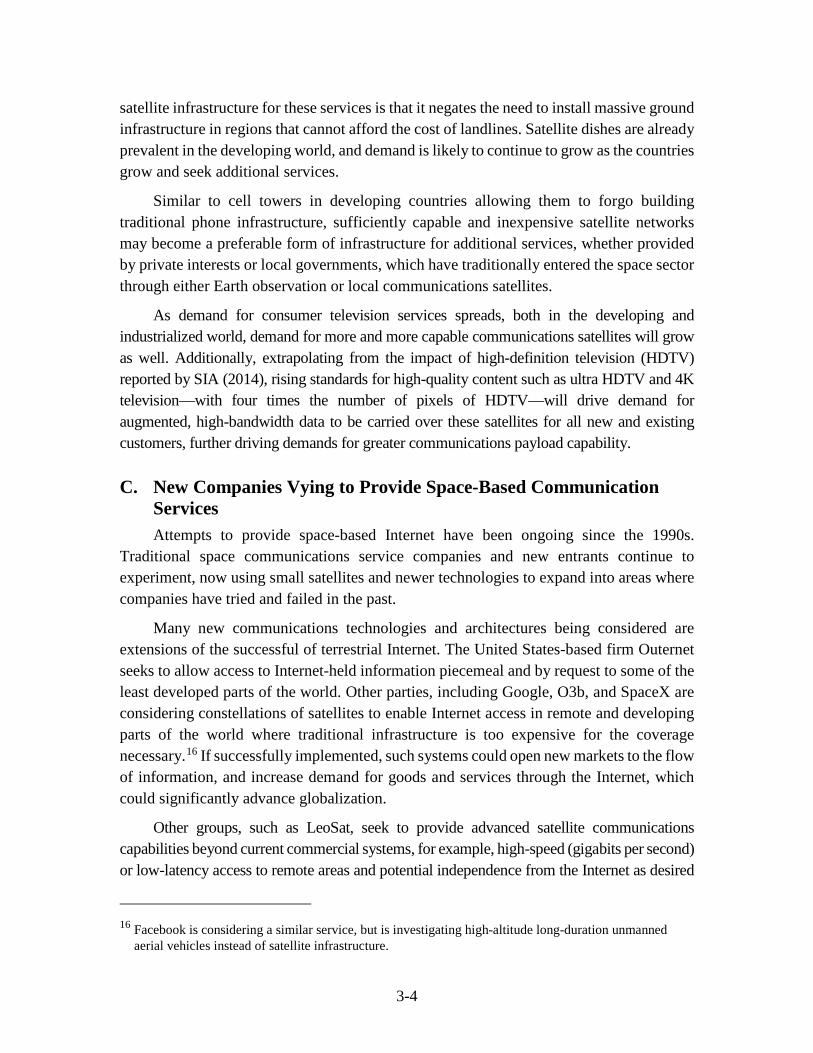
C. New Companies Vying to Provide Space-Based Communication Services Attempts to provide space-based Internet have been ongoing since the 1990s.
Traditional space communications service companies and new entrants continue to experiment, now using small satellites and newer technologies to expand into areas where companies have tried and failed in the past.
Many new communications technologies and architectures being considered are extensions of the successful of terrestrial Internet. The United States-based firm Outernet seeks to allow access to Internet-held information piecemeal and by request to some of the least developed parts of the world. Other parties, including Google, O3b, and SpaceX are considering constellations of satellites to enable Internet access in remote and developing parts of the world where traditional infrastructure is too expensive for the coverage necessary.16 If successfully implemented, such systems could open new markets to the flow of information, and increase demand for goods and services through the Internet, which could significantly advance globalization.
Other groups, such as LeoSat, seek to provide advanced satellite communications capabilities beyond current commercial systems, for example, high-speed (gigabits per second) or low-latency access to remote areas and potential independence from the Internet as desired
16 Facebook is considering a similar service, but is investigating high-altitude long-duration unmanned
aerial vehicles instead of satellite infrastructure.
3-5
for security or robustness. Such systems would expand the usefulness of current satellite communications systems, potentially reaching tipping points for new applications.
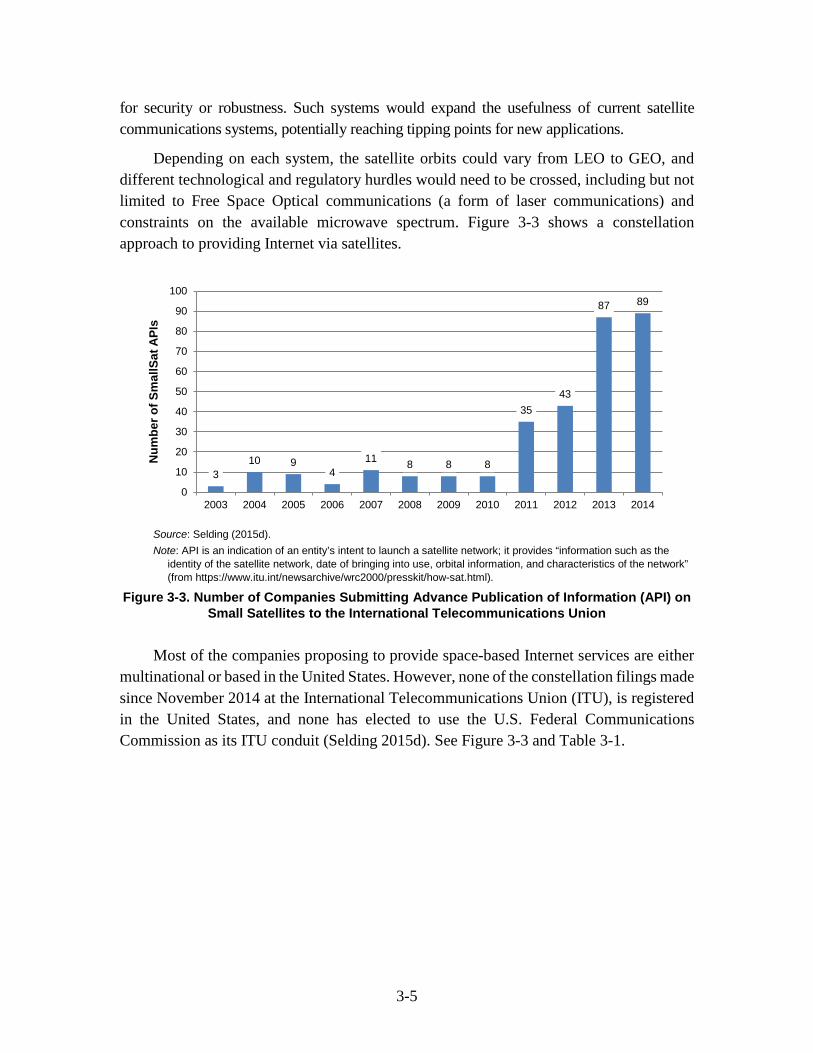
Depending on each system, the satellite orbits could vary from LEO to GEO, and different technological and regulatory hurdles would need to be crossed, including but not limited to Free Space Optical communications (a form of laser communications) and constraints on the available microwave spectrum. Figure 3-3 shows a constellation approach to providing Internet via satellites.
Source: Selding (2015d). Note: API is an indication of an entity’s intent to launch a satellite network; it provides “information such as the
identity of the satellite network, date of bringing into use, orbital information, and characteristics of the network” (from https://www.itu.int/newsarchive/wrc2000/presskit/how-sat.html).
Figure 3-3. Number of Companies Submitting Advance Publication of Information (API) on Small Satellites to the International Telecommunications Union
Most of the companies proposing to provide space-based Internet services are either
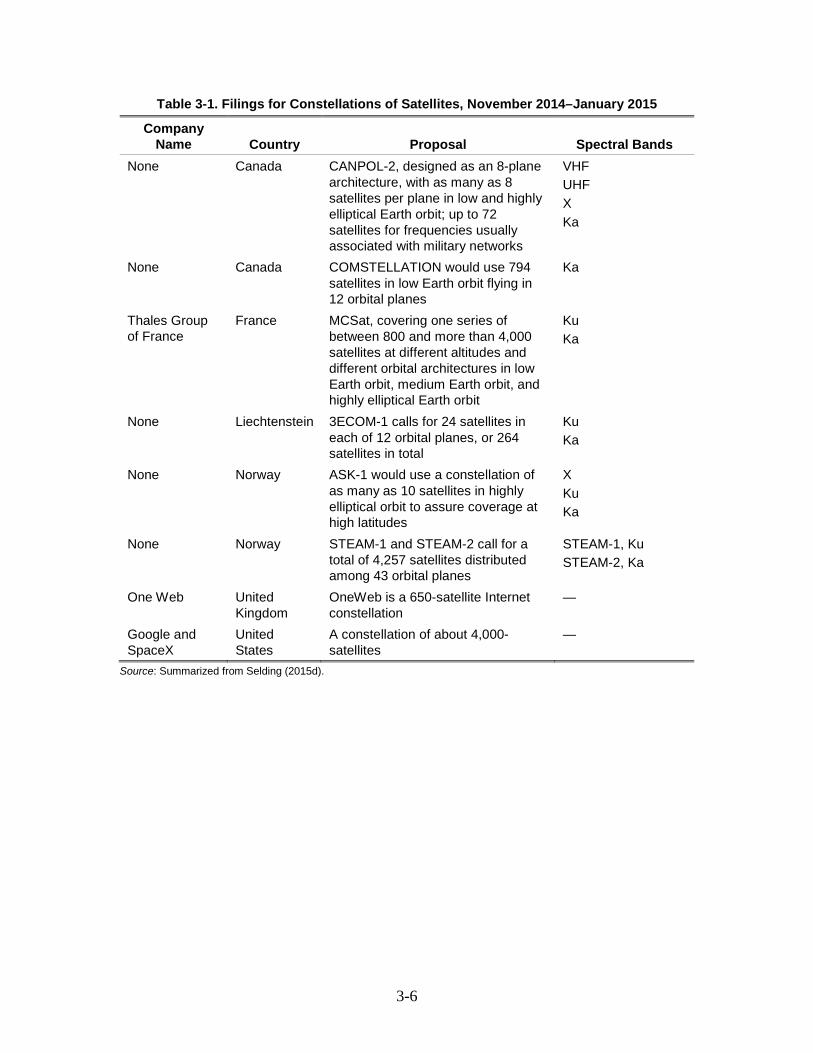
multinational or based in the United States. However, none of the constellation filings made since November 2014 at the International Telecommunications Union (ITU), is registered in the United States, and none has elected to use the U.S. Federal Communications Commission as its ITU conduit (Selding 2015d). See Figure 3-3 and Table 3-1.
310 9
411 8 8 8
3543
87 89
0
10
20
30
40
50
60
70
80
90
100
2003 2004 2005 2006 2007 2008 2009 2010 2011 2012 2013 2014
Num
ber o
f Sm
allS
at A
PIs
3-6
Table 3-1. Filings for Constellations of Satellites, November 2014–January 2015
Company Name Country Proposal Spectral Bands
None Canada CANPOL-2, designed as an 8-plane architecture, with as many as 8 satellites per plane in low and highly elliptical Earth orbit; up to 72 satellites for frequencies usually associated with military networks
VHF UHF X Ka
None Canada COMSTELLATION would use 794 satellites in low Earth orbit flying in 12 orbital planes
Ka
Thales Group of France
France MCSat, covering one series of between 800 and more than 4,000 satellites at different altitudes and different orbital architectures in low Earth orbit, medium Earth orbit, and highly elliptical Earth orbit
Ku Ka
None Liechtenstein 3ECOM-1 calls for 24 satellites in each of 12 orbital planes, or 264 satellites in total
Ku Ka
None Norway ASK-1 would use a constellation of as many as 10 satellites in highly elliptical orbit to assure coverage at high latitudes
X Ku Ka
None Norway STEAM-1 and STEAM-2 call for a total of 4,257 satellites distributed among 43 orbital planes
STEAM-1, Ku STEAM-2, Ka
One Web United Kingdom
OneWeb is a 650-satellite Internet constellation
—
Google and SpaceX
United States
A constellation of about 4,000-satellites
—
Source: Summarized from Selding (2015d).
4-1
4. Space Science and Technology (S&T) and Exploration
The space S&T and exploration subsector is traditionally seen as the domain of the wealthier space-faring nations because emerging nations typically focus their space programs on social and economic needs. There are indications that this trend is shifting as a result of the falling cost of space-based activities (and other factors discussed in Volume 1). This section examines space S&T and exploration and reveals three relevant trends.
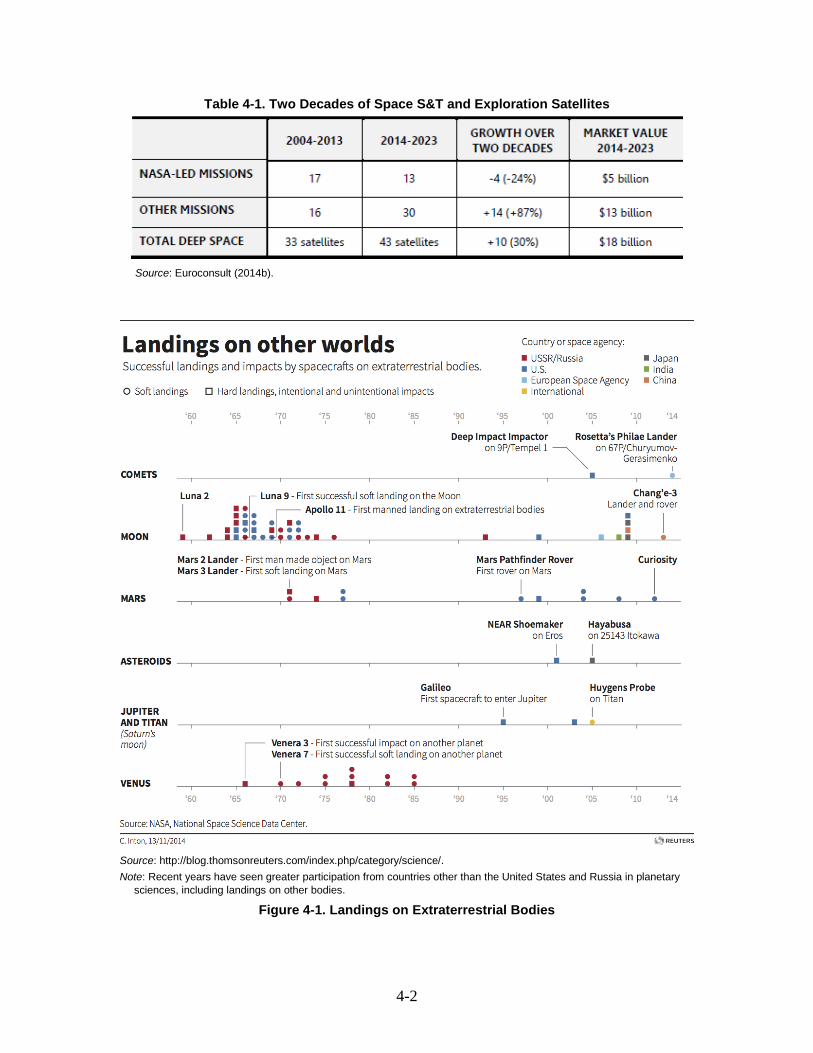
A. More Countries Are Beginning to Participate in Space S&T and Exploration as Mission Leads or Participants in Large-Scale International Endeavors Planetary science has traditionally encompassed missions characterized by relatively
large satellites that require large resources, and feasible only by the major space faring nations. Figure 4-1 shows the overwhelming presence of the United States, Russia and Europe in planetary exploration.
Three factors are changing this trend and increasing the number of participant countries. First, more countries are increasingly seeing participation in the space sector as a status symbol and an instrument of soft power. Some of India’s most recent forays into exploration (e.g., Mars Orbiter Mission) and China’s lunar missions reflect this perception. Second, there are potential indications that as small satellites become more capable, and cost of data analytics falls, the cost of doing space S&T and exploration will fall as well, enabling countries with smaller space budgets to participate in space S&T and exploration activities. Additionally, major space agencies are experiencing budgetary pressures which is expected to lead to both fewer—and smaller and cheaper—missions as well as additional international cooperation. As an illustration of this shift in balance, it is instructive to note that in the next 10 years, 43 satellites are forecasted to be launched for deep space missions, of which only 30 percent will be launched by the United States, and the vast majority by other countries (Table 4-1).
4-2
Table 4-1. Two Decades of Space S&T and Exploration Satellites
Source: Euroconsult (2014b).
Source: http://blog.thomsonreuters.com/index.php/category/science/. Note: Recent years have seen greater participation from countries other than the United States and Russia in planetary
sciences, including landings on other bodies.
Figure 4-1. Landings on Extraterrestrial Bodies
4-3
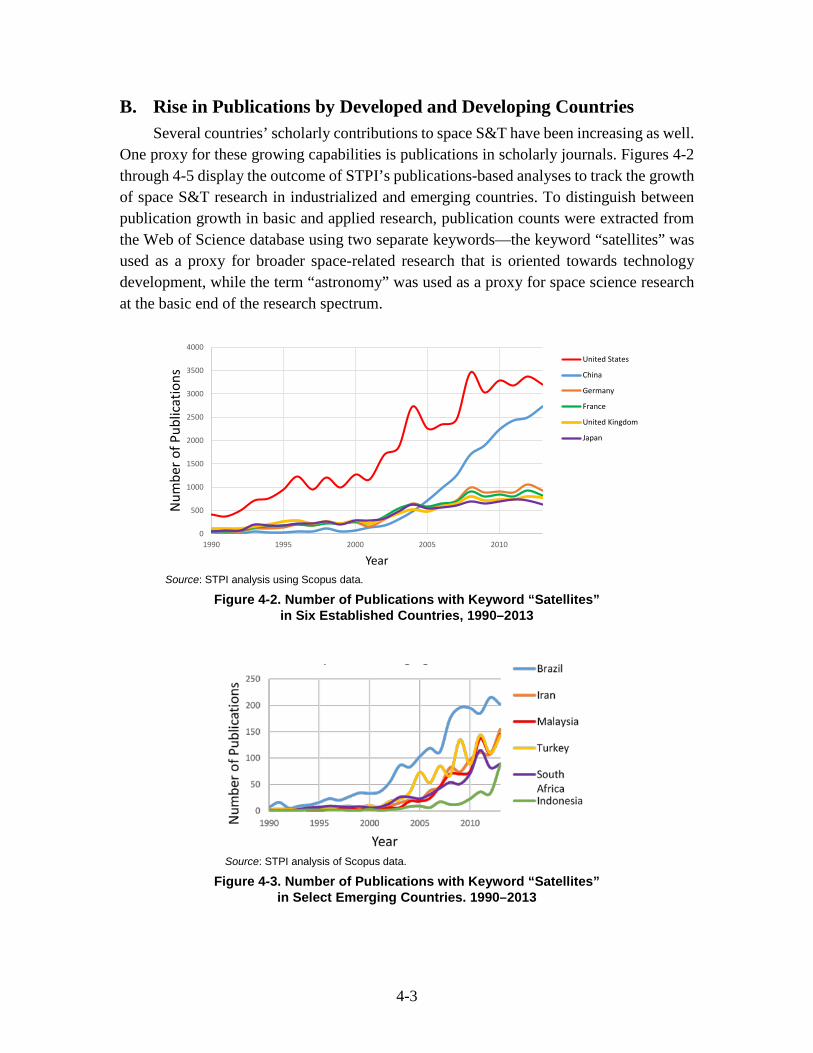
B. Rise in Publications by Developed and Developing Countries Several countries’ scholarly contributions to space S&T have been increasing as well.
One proxy for these growing capabilities is publications in scholarly journals. Figures 4-2 through 4-5 display the outcome of STPI’s publications-based analyses to track the growth of space S&T research in industrialized and emerging countries. To distinguish between publication growth in basic and applied research, publication counts were extracted from the Web of Science database using two separate keywords—the keyword “satellites” was used as a proxy for broader space-related research that is oriented towards technology development, while the term “astronomy” was used as a proxy for space science research at the basic end of the research spectrum.
Source: STPI analysis using Scopus data.
Figure 4-2. Number of Publications with Keyword “Satellites” in Six Established Countries, 1990–2013
Source: STPI analysis of Scopus data.
Figure 4-3. Number of Publications with Keyword “Satellites” in Select Emerging Countries. 1990–2013
0
500
1000
1500
2000
2500
3000
3500
4000
1990 1995 2000 2005 2010
Num
ber o
f Pub
licat
ions
Year
United States
China
Germany
France
United Kingdom
Japan
4-4
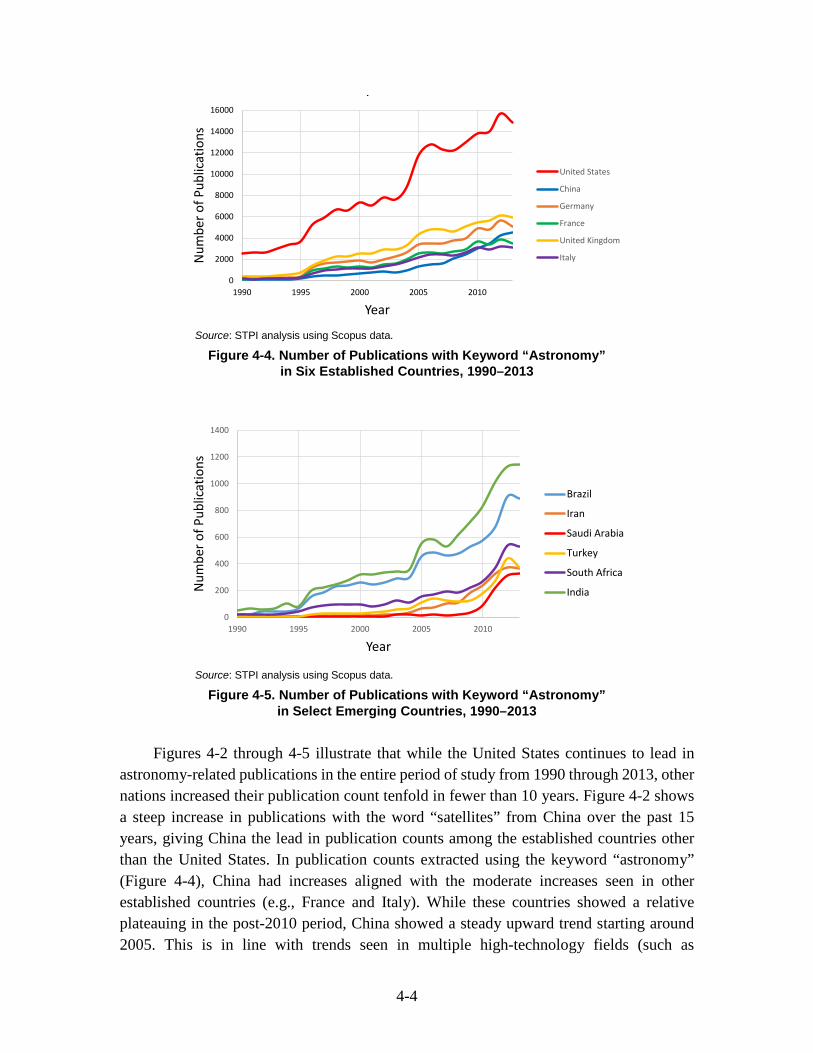
Source: STPI analysis using Scopus data.
Figure 4-4. Number of Publications with Keyword “Astronomy” in Six Established Countries, 1990–2013
Source: STPI analysis using Scopus data.
Figure 4-5. Number of Publications with Keyword “Astronomy” in Select Emerging Countries, 1990–2013
Figures 4-2 through 4-5 illustrate that while the United States continues to lead in
astronomy-related publications in the entire period of study from 1990 through 2013, other nations increased their publication count tenfold in fewer than 10 years. Figure 4-2 shows a steep increase in publications with the word “satellites” from China over the past 15 years, giving China the lead in publication counts among the established countries other than the United States. In publication counts extracted using the keyword “astronomy” (Figure 4-4), China had increases aligned with the moderate increases seen in other established countries (e.g., France and Italy). While these countries showed a relative plateauing in the post-2010 period, China showed a steady upward trend starting around 2005. This is in line with trends seen in multiple high-technology fields (such as
0
2000
4000
6000
8000
10000
12000
14000
16000
1990 1995 2000 2005 2010
Num
ber o
f Pub
licat
ions
Year
p
United States
China
Germany
France
United Kingdom
Italy
0
200
400
600
800
1000
1200
1400
1990 1995 2000 2005 2010
Num
ber o
f Pub
licat
ions
Year
Brazil
Iran
Saudi Arabia
Turkey
South Africa
India
4-5
semiconductors and information and communication technologies) and indicates that China’s publications have increased over the past decade, with the preponderance of the increase being in applied areas or development relative to basic or academic research.
Among the emerging countries, the number of publications extracted using both keywords “satellites” and “astronomy” grew significantly in the past decade, indicating a growing (and perhaps simultaneous) emphasis on both academic and application-driven research. This is borne out by the observation that emerging space aspirant countries are taking different (and multiple) pathways towards gaining capability and advancing their space sector. Some of these countries (India and Brazil) have space capabilities that are well known and studied, while space capabilities of others such as Indonesia, Malaysia, and Saudi Arabia might have potential for technological surprise.
Overall, publications related to space science (using “satellites” or “astronomy” as proxy keywords) in emerging countries showed accelerated growth starting around 2005, indicating increasing investment in and commitment to advancing the space sector. Of the established countries, China showed a steep growth in publications related to space technology development, and a slower growth in basic research publications.
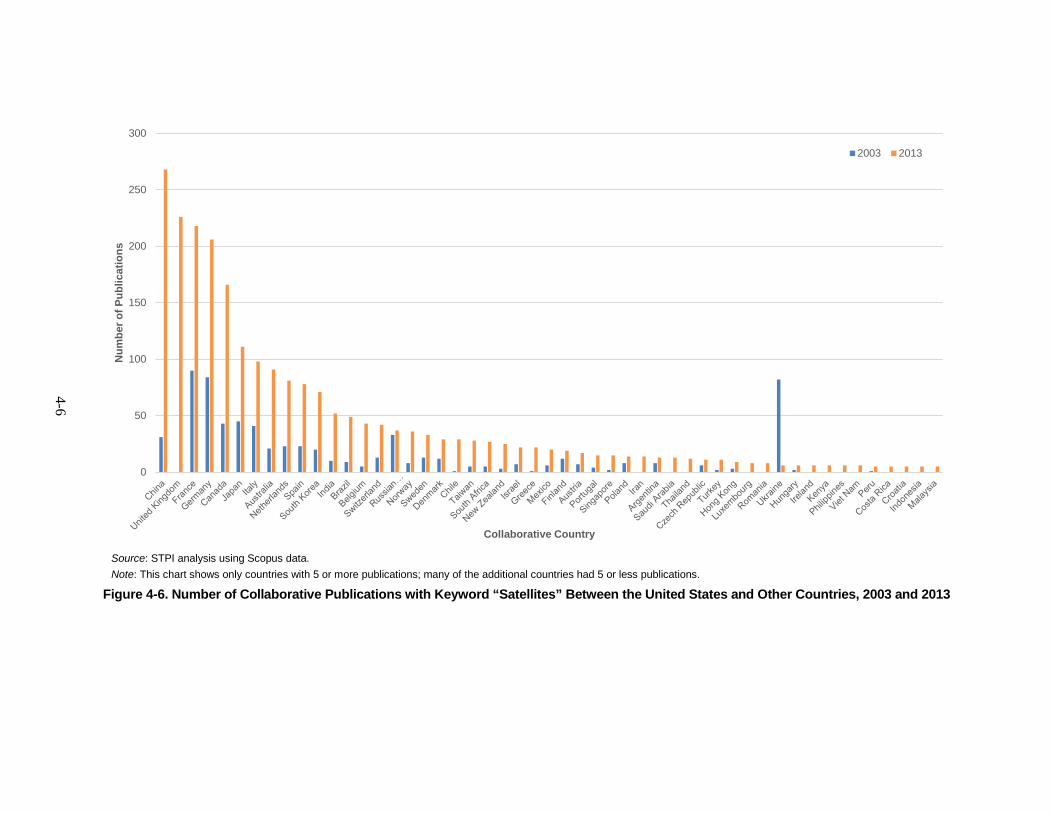
C. Rise in International Scientific Collaborations Additional global cooperation and smaller, cost-efficient missions are expected to
become more prevalent as major space agencies experience budgetary pressures. Again, using joint publications as a proxy, in Western Europe and the United States, the percentage of papers with authors from more than one country is rapidly increasing and significantly outpacing purely domestic output. Figure 4-6 shows the increase in the number of international collaborations on space-related publications with an author in the United States between 2003 and 2013. The figure shows a net of 42 additional countries collaborating on publications with the keyword “satellites.” These collaborative papers are considered to be highly impactful because they were “cited relatively more often than purely domestic papers” (Adams 2013).
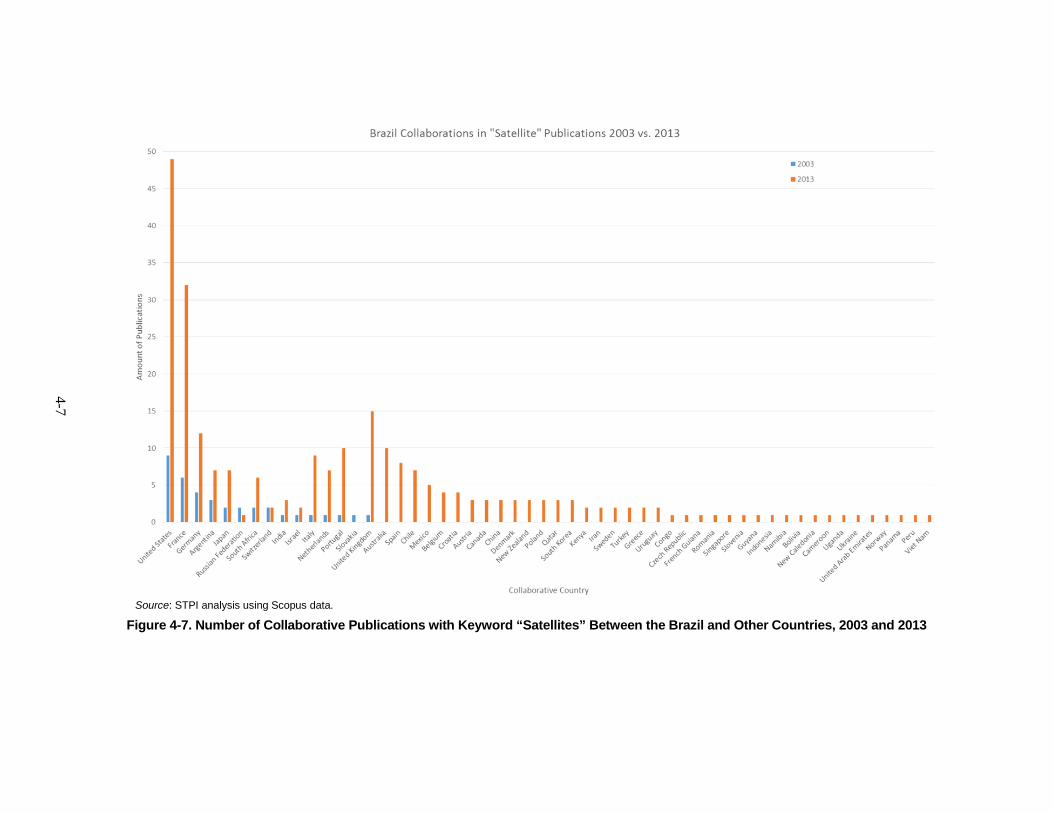
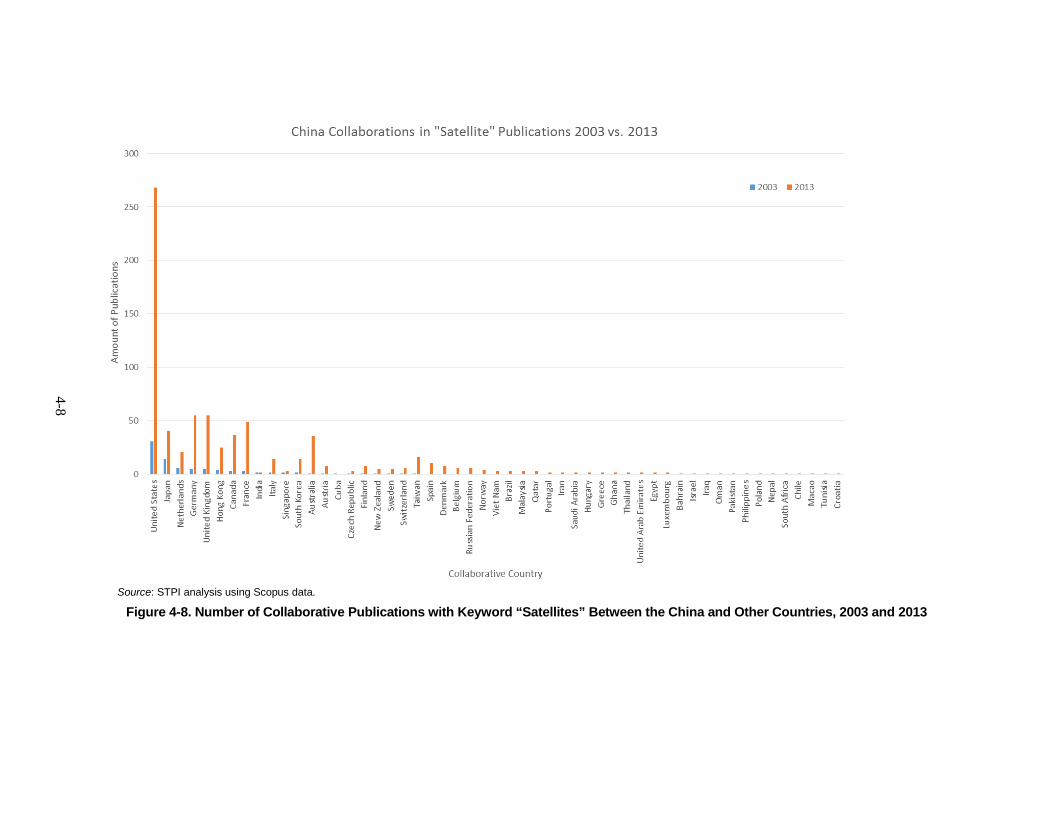
Collaborative publications with the keyword “satellites” for 2003 and 2013 were analyzed for six other countries of interest: Brazil, China, India, France, Japan, and Russia. Two—Brazil and China—are presented in Figures 4-7 and 4-8. As the figures show, Brazil has had an increasing number of collaborations with China, in particular. Interestingly, China publishes with the United States more than with any other country.
4-6
Source: STPI analysis using Scopus data. Note: This chart shows only countries with 5 or more publications; many of the additional countries had 5 or less publications.
Figure 4-6. Number of Collaborative Publications with Keyword “Satellites” Between the United States and Other Countries, 2003 and 2013
0
50
100
150
200
250
300N
umbe
r of P
ublic
atio
ns
Collaborative Country
2003 2013
4-7
Source: STPI analysis using Scopus data.
Figure 4-7. Number of Collaborative Publications with Keyword “Satellites” Between the Brazil and Other Countries, 2003 and 2013
4-8
Source: STPI analysis using Scopus data.
Figure 4-8. Number of Collaborative Publications with Keyword “Satellites” Between the China and Other Countries, 2003 and 2013
4-9
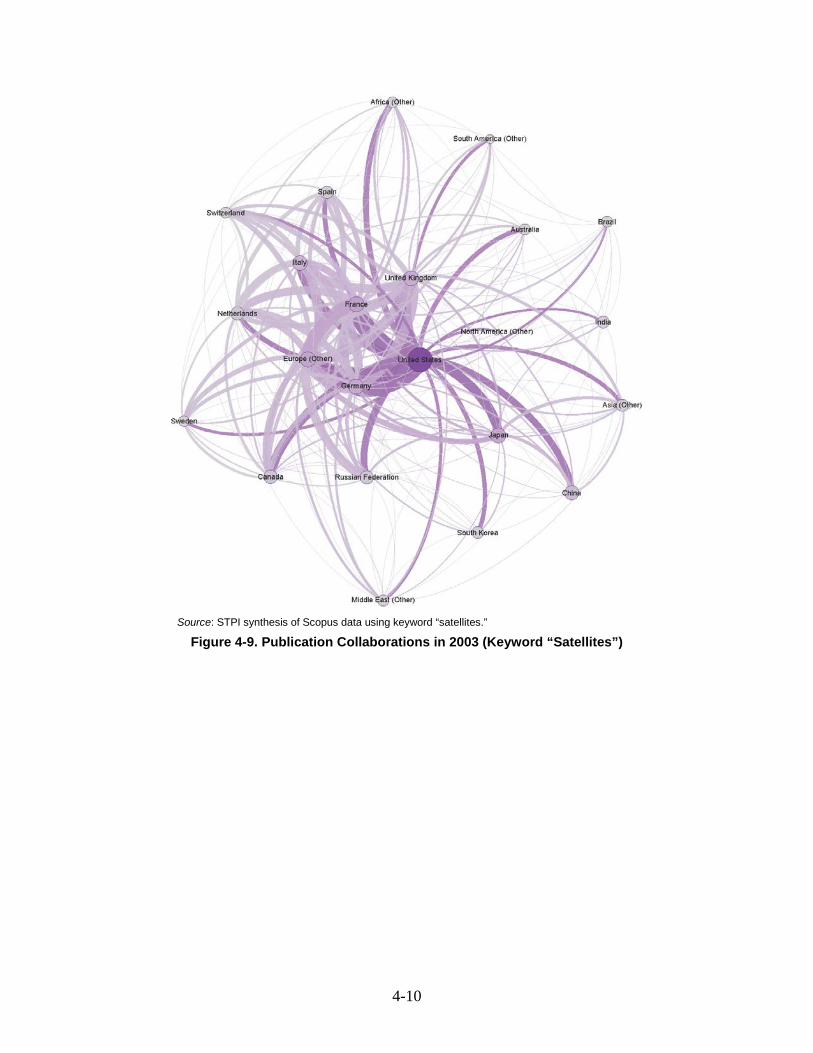
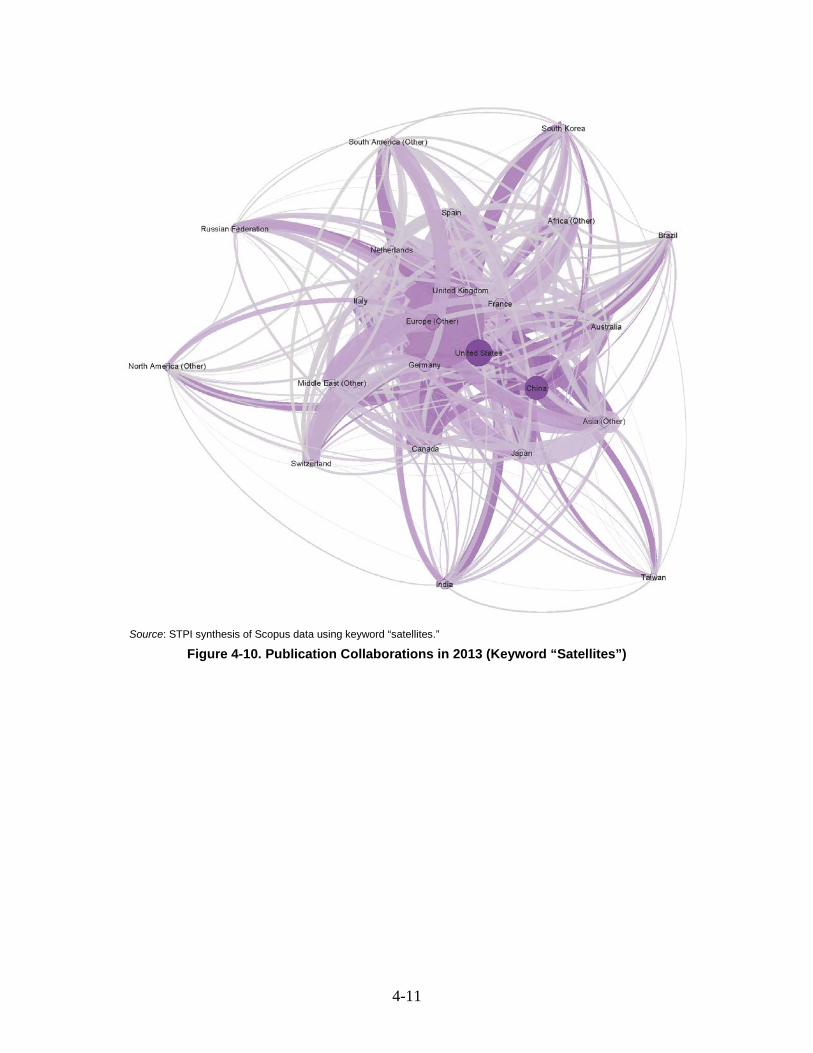
We also clustered publications by the researchers’ country affiliations.17 The results are shown in Figures 4-9 and 4-10.18 The first salient feature of the 2013 snapshot compared to the 2003 snapshot is that there were many more publications in 2013, and the entire network of countries is more interconnected. In 2003, the United States was the clear hub of publications. It had more publications than any other country, and was most closely tied to European countries, with Japan and Canada trailing behind. China had minor collaborative ties to Japan and other Asian countries but was most closely tied to the United States. African countries were tied most closely to France, and South American countries were most closely tied to the United States and the EU. In 2013, there is not a single country acting as a hub. Rather, the United States, China, and the EU all act as hubs since the largest number of publications and collaborations are between these regions. Smaller countries like Taiwan emerge as major players in space sector publications, with strong ties to the United States and China.
While the United States is currently a partner of choice for most of the world, it is expected that as space technology proliferates and global capabilities build, there will be more collaboration between less experienced countries and that these partnerships will not need the United States, China, or EU as collaborators on all projects. In its Vision 2030 document, for example, Mexico aims for greater collaboration within Latin America (Mexican Space Agency 2013). The United States is in a decreasing fraction of collaborations (even though the absolute number of collaborations that U.S. researchers participate in has increased).
Research focused on space-based applications is also experiencing an increasing amount of international collaboration, as demonstrated by the research conducted on the International Space Station (ISS) and the development of space-based patents. Scientific endeavors on the ISS, which is primarily led by the United States, Russia, Japan, and Western Europe, have in recent years begun involving investigators and developers from other space countries. The cost saving possible in shared endeavors like the ISS has been a driver for more countries to engage in such collaborative efforts. One example is Space Seeds for Asian Future 2013, a project run from March 2013 through September 2013 on Expeditions 35 and 36 that explored the difference between space-based and land-based growth for adzuki beans. Though the listed principal investigators were all based in Japan, this experiment involved collaborators from Indonesia, Malaysia, Thailand, Vietnam, and Australia. Other research projects on the ISS have involved scientists from Brazil, China, Egypt, India, Mexico, Peru, and other countries.19
17 Clustering was performed using force-directed graph drawing algorithms, which are a class of
algorithms for drawing graphs in an aesthetically pleasing way. Their purpose is to position the nodes of a graph in two-dimensional or three-dimensional space so that all the edges are of more or less equal length and there are as few crossing edges as possible.
18 In each of these images, the size of the node reflects the number of publications from a country. The width of the line connecting the country shows the number of publications that two countries co-author. The shade of the node and line reflect whether the publications from a single country or pair of countries include a country with a high number of publications, with a dark color indicating a high number of publications.
19 A list of experiments by name and other information about research on the International Space Station is available at NASA’s website, http://www.nasa.gov/mission_pages/station/research/experiments/experiments_by_name.html.
4-10
Source: STPI synthesis of Scopus data using keyword “satellites.”
Figure 4-9. Publication Collaborations in 2003 (Keyword “Satellites”)
4-11
Source: STPI synthesis of Scopus data using keyword “satellites.”
Figure 4-10. Publication Collaborations in 2013 (Keyword “Satellites”)

5-1
5. Launch and Access to Space
With the caveat that it is difficult to differentiate between military, civil, and commercial launchers, STPI researchers observed four major trends in the civil and commercial launch sector.
A. Increase in the Number of Nations with Launch Capabilities Fifty years ago (1965) globalization was not an important consideration within the
space launch and systems sectors. The United States and the Soviet Union were predominant in the early part of the space age. They were the only states with broad capabilities. Commercial firms were not major players in the space sector markets other than (in the United States) as providers of goods and services to the Federal Government. For many payloads, if the United States was not prepared to launch a foreign satellite, the Soviet Union might be the only other option.
Given this situation, it was not surprising that when Intelsat was established in 1964 to provide commercial telecommunications services it was an intergovernmental organization and not a firm. The early space era was a venue in which countries were the actors. Intelsat was not privatized until 2001.20
Some of the access the United States provided to space launch, satellites, and satellite technologies in this early era was in support of broader policy objectives (e.g., assistance to NATO allies). Some of this support could be regarded as being primarily for the benefit of an ally, not the United States.
The launch of the Symphonie satellites in the mid-1970s serves as an example of U.S. and Soviet predominance in the early era. Attempts by European states to develop their own satellite launch systems had been unsuccessful. In the early 1970s when France and the Federal Republic of Germany requested that NASA launch their Symphonie A and B satellites, the United States agreed to have NASA launch these payloads subject to the condition that these satellites only be used for telecommunications experiments and not become competitive with the commercial services provided by the U.S.-supported Intelsat satellite program. France and Germany had to agree to these conditions or to seek a Soviet launch. (This experience may have been one of the motivations for the ESA’s development
20 From http://www.intelsat.com/about-us/our-history/2000s/.
5-2
of the Arianne launchers to provide an independent of the United States space launch capability (Johnson-Freese 2007, 46–47).21
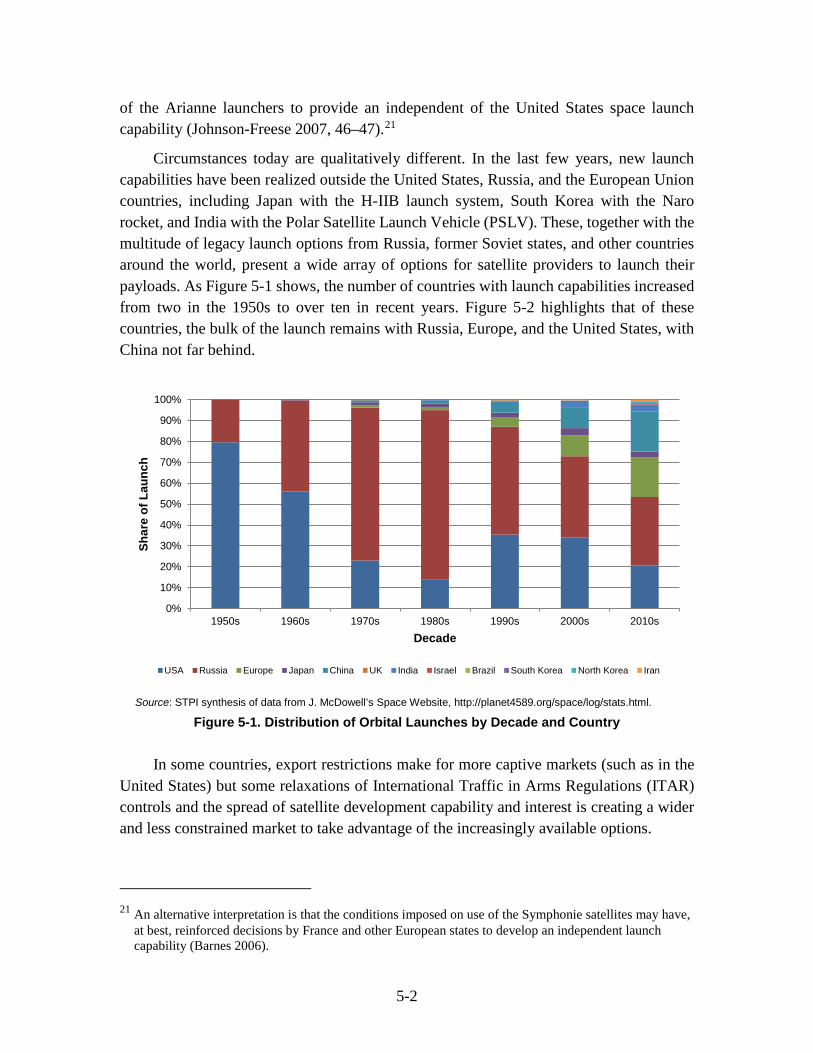
Circumstances today are qualitatively different. In the last few years, new launch capabilities have been realized outside the United States, Russia, and the European Union countries, including Japan with the H-IIB launch system, South Korea with the Naro rocket, and India with the Polar Satellite Launch Vehicle (PSLV). These, together with the multitude of legacy launch options from Russia, former Soviet states, and other countries around the world, present a wide array of options for satellite providers to launch their payloads. As Figure 5-1 shows, the number of countries with launch capabilities increased from two in the 1950s to over ten in recent years. Figure 5-2 highlights that of these countries, the bulk of the launch remains with Russia, Europe, and the United States, with China not far behind.
Source: STPI synthesis of data from J. McDowell’s Space Website, http://planet4589.org/space/log/stats.html.
Figure 5-1. Distribution of Orbital Launches by Decade and Country
In some countries, export restrictions make for more captive markets (such as in the United States) but some relaxations of International Traffic in Arms Regulations (ITAR) controls and the spread of satellite development capability and interest is creating a wider and less constrained market to take advantage of the increasingly available options.
21 An alternative interpretation is that the conditions imposed on use of the Symphonie satellites may have,
at best, reinforced decisions by France and other European states to develop an independent launch capability (Barnes 2006).
0%
10%
20%
30%
40%
50%
60%
70%
80%
90%
100%
1950s 1960s 1970s 1980s 1990s 2000s 2010s
Shar
e of
Lau
nch
Decade
USA Russia Europe Japan China UK India Israel Brazil South Korea North Korea Iran
5-3
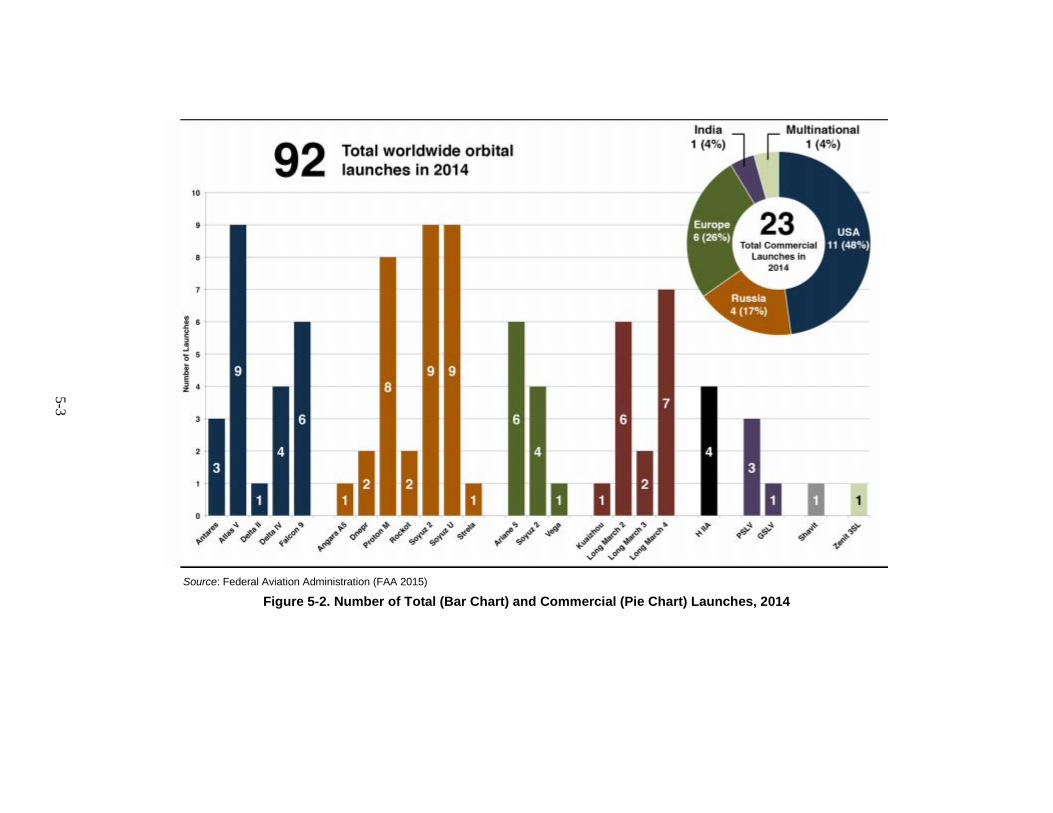
Source: Federal Aviation Administration (FAA 2015)
Figure 5-2. Number of Total (Bar Chart) and Commercial (Pie Chart) Launches, 2014
5-4
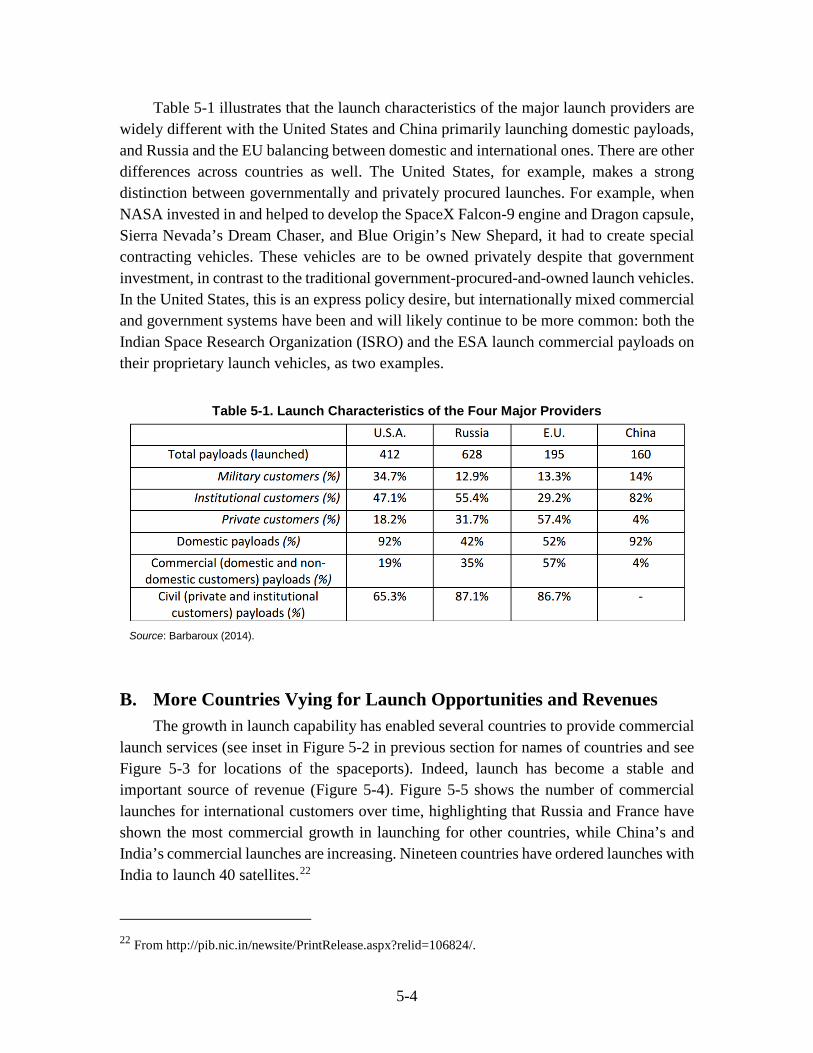
Table 5-1 illustrates that the launch characteristics of the major launch providers are widely different with the United States and China primarily launching domestic payloads, and Russia and the EU balancing between domestic and international ones. There are other differences across countries as well. The United States, for example, makes a strong distinction between governmentally and privately procured launches. For example, when NASA invested in and helped to develop the SpaceX Falcon-9 engine and Dragon capsule, Sierra Nevada’s Dream Chaser, and Blue Origin’s New Shepard, it had to create special contracting vehicles. These vehicles are to be owned privately despite that government investment, in contrast to the traditional government-procured-and-owned launch vehicles. In the United States, this is an express policy desire, but internationally mixed commercial and government systems have been and will likely continue to be more common: both the Indian Space Research Organization (ISRO) and the ESA launch commercial payloads on their proprietary launch vehicles, as two examples.
Table 5-1. Launch Characteristics of the Four Major Providers
Source: Barbaroux (2014).
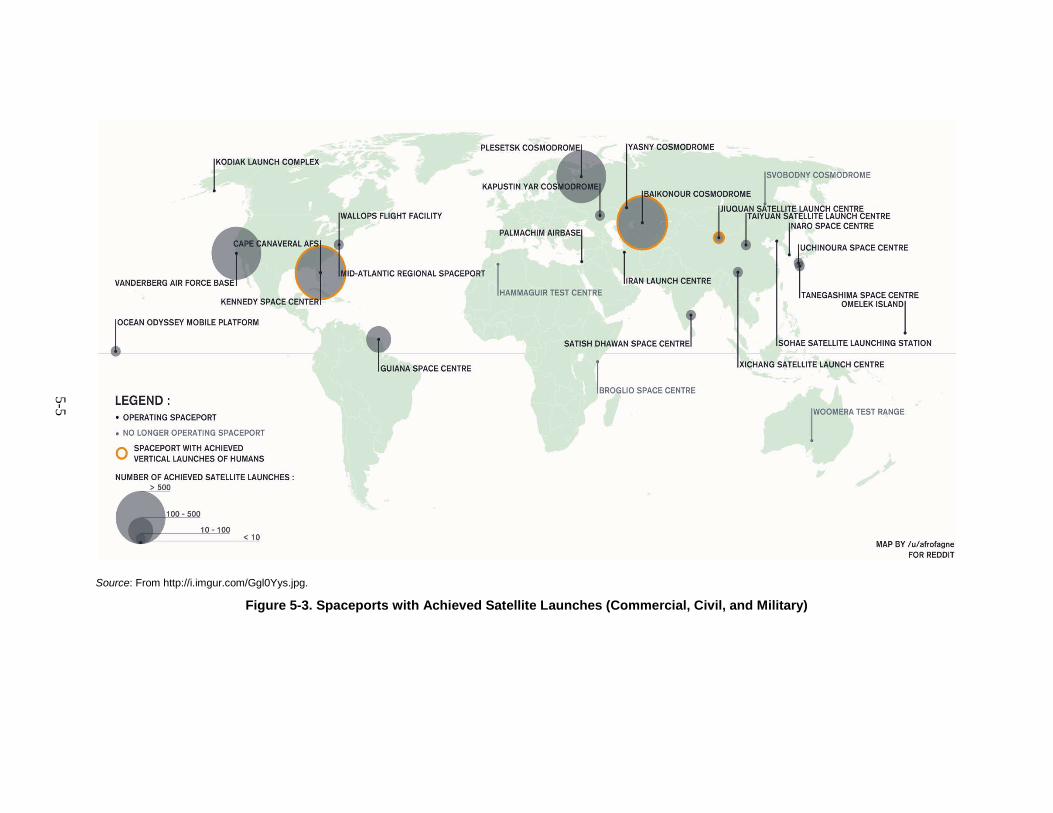
B. More Countries Vying for Launch Opportunities and Revenues The growth in launch capability has enabled several countries to provide commercial
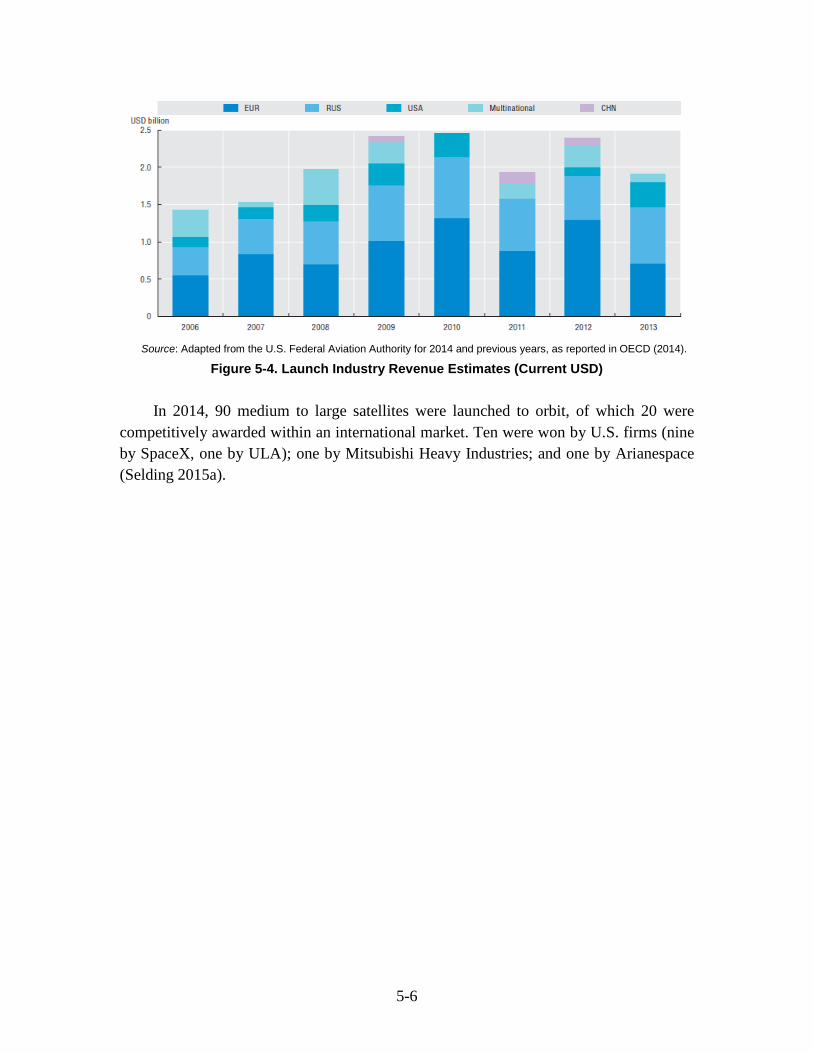
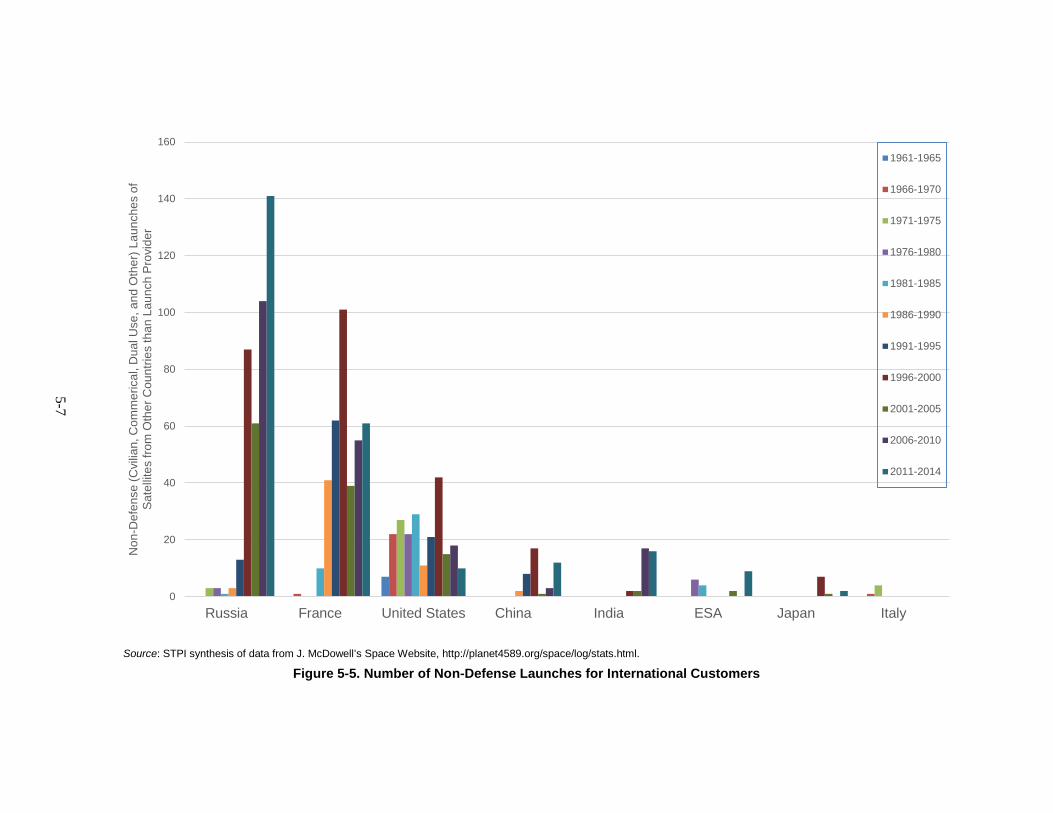
launch services (see inset in Figure 5-2 in previous section for names of countries and see Figure 5-3 for locations of the spaceports). Indeed, launch has become a stable and important source of revenue (Figure 5-4). Figure 5-5 shows the number of commercial launches for international customers over time, highlighting that Russia and France have shown the most commercial growth in launching for other countries, while China’s and India’s commercial launches are increasing. Nineteen countries have ordered launches with India to launch 40 satellites.22
22 From http://pib.nic.in/newsite/PrintRelease.aspx?relid=106824/.
5-5
Source: From http://i.imgur.com/Ggl0Yys.jpg. Figure 5-3. Spaceports with Achieved Satellite Launches (Commercial, Civil, and Military)
5-6
Source: Adapted from the U.S. Federal Aviation Authority for 2014 and previous years, as reported in OECD (2014).
Figure 5-4. Launch Industry Revenue Estimates (Current USD)
In 2014, 90 medium to large satellites were launched to orbit, of which 20 were competitively awarded within an international market. Ten were won by U.S. firms (nine by SpaceX, one by ULA); one by Mitsubishi Heavy Industries; and one by Arianespace (Selding 2015a).
5-7
Source: STPI synthesis of data from J. McDowell’s Space Website, http://planet4589.org/space/log/stats.html.
Figure 5-5. Number of Non-Defense Launches for International Customers
0
20
40
60
80
100
120
140
160
Russia France United States China India ESA Japan Italy
Non
-Def
ense
(Cvi
lian,
Com
mer
ical
, Dua
l Use
, and
Oth
er) L
aunc
hes
of
Sat
ellit
es fr
om O
ther
Cou
ntrie
s th
an L
aunc
h P
rovi
der
1961-1965
1966-1970
1971-1975
1976-1980
1981-1985
1986-1990
1991-1995
1996-2000
2001-2005
2006-2010
2011-2014
5-8
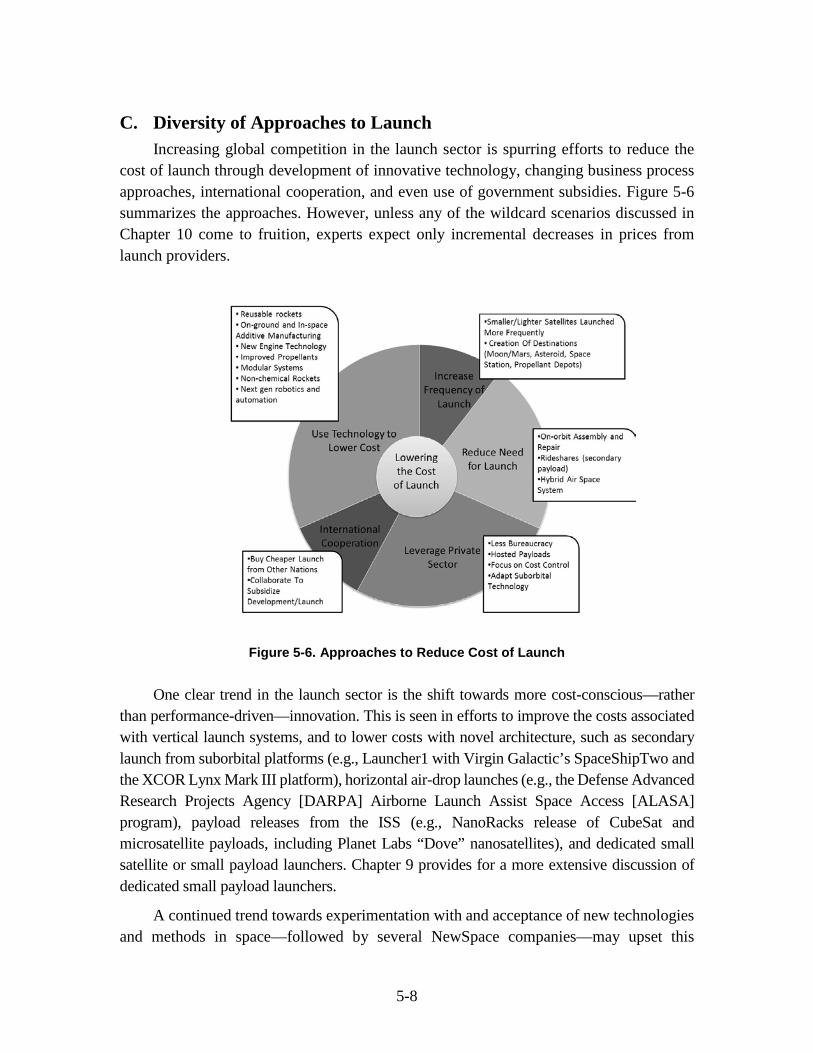
C. Diversity of Approaches to Launch Increasing global competition in the launch sector is spurring efforts to reduce the
cost of launch through development of innovative technology, changing business process approaches, international cooperation, and even use of government subsidies. Figure 5-6 summarizes the approaches. However, unless any of the wildcard scenarios discussed in Chapter 10 come to fruition, experts expect only incremental decreases in prices from launch providers.
Figure 5-6. Approaches to Reduce Cost of Launch
One clear trend in the launch sector is the shift towards more cost-conscious—rather
than performance-driven—innovation. This is seen in efforts to improve the costs associated with vertical launch systems, and to lower costs with novel architecture, such as secondary launch from suborbital platforms (e.g., Launcher1 with Virgin Galactic’s SpaceShipTwo and the XCOR Lynx Mark III platform), horizontal air-drop launches (e.g., the Defense Advanced Research Projects Agency [DARPA] Airborne Launch Assist Space Access [ALASA] program), payload releases from the ISS (e.g., NanoRacks release of CubeSat and microsatellite payloads, including Planet Labs “Dove” nanosatellites), and dedicated small satellite or small payload launchers. Chapter 9 provides for a more extensive discussion of dedicated small payload launchers.
A continued trend towards experimentation with and acceptance of new technologies and methods in space—followed by several NewSpace companies—may upset this
5-9
standard practice. But progress will be balanced against the degree of success that NewSpace entrants experience—more mishaps such as the Antares launch failure and SpaceShipTwo’s fatal crash may slow down industry development, at least in certain markets. If successful, however, demand for space-based services may be more readily met as time goes on.
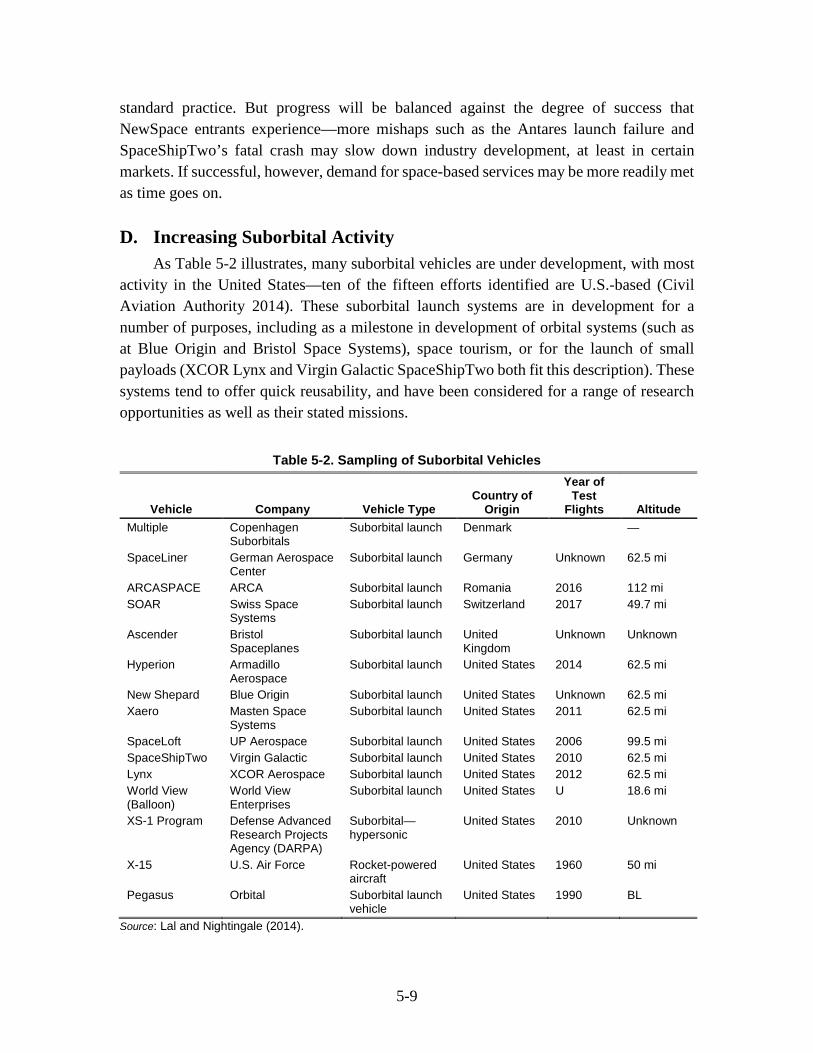
D. Increasing Suborbital Activity As Table 5-2 illustrates, many suborbital vehicles are under development, with most
activity in the United States—ten of the fifteen efforts identified are U.S.-based (Civil Aviation Authority 2014). These suborbital launch systems are in development for a number of purposes, including as a milestone in development of orbital systems (such as at Blue Origin and Bristol Space Systems), space tourism, or for the launch of small payloads (XCOR Lynx and Virgin Galactic SpaceShipTwo both fit this description). These systems tend to offer quick reusability, and have been considered for a range of research opportunities as well as their stated missions.
Table 5-2. Sampling of Suborbital Vehicles
Vehicle Company Vehicle Type Country of
Origin
Year of Test
Flights Altitude Multiple Copenhagen
Suborbitals Suborbital launch Denmark —
SpaceLiner German Aerospace Center
Suborbital launch Germany Unknown 62.5 mi
ARCASPACE ARCA Suborbital launch Romania 2016 112 mi SOAR Swiss Space
Systems Suborbital launch Switzerland 2017 49.7 mi
Ascender Bristol Spaceplanes
Suborbital launch United Kingdom
Unknown Unknown
Hyperion Armadillo Aerospace
Suborbital launch United States 2014 62.5 mi
New Shepard Blue Origin Suborbital launch United States Unknown 62.5 mi Xaero Masten Space
Systems Suborbital launch United States 2011 62.5 mi
SpaceLoft UP Aerospace Suborbital launch United States 2006 99.5 mi SpaceShipTwo Virgin Galactic Suborbital launch United States 2010 62.5 mi Lynx XCOR Aerospace Suborbital launch United States 2012 62.5 mi World View (Balloon)
World View Enterprises
Suborbital launch United States U 18.6 mi
XS-1 Program Defense Advanced Research Projects Agency (DARPA)
Suborbital—hypersonic
United States 2010 Unknown
X-15 U.S. Air Force Rocket-powered aircraft
United States 1960 50 mi
Pegasus Orbital Suborbital launch vehicle
United States 1990 BL
Source: Lal and Nightingale (2014).
5-10
Depending on their final economic performance, these suborbital launch systems may provide for a new healthy industry in space tourism. What is perhaps more likely is that they will offer a responsive space access platform (due to their rapid reusability) for either government or commercial actors interested in launching small payloads into space in the near future.
E. Potential for Significant Reduction in Launch Costs Space launch is expensive. The cost of launch is a limiting factor for use of space
systems. More spacecraft might be given consideration by more states and firms if launch were more affordable. An evolved state of the art might also enable more states and organizations to become launch service providers.
Limited public information is available concerning launch costs. Although some information is sometimes reported in press releases and media reports, commercial launch costs are typically not reported by the firms engaged in such transactions. While appropriations data is available for the cost of U.S. Government launches, it may be difficult to allocate some cost elements to specific launches.
SpaceX has changed the launch industry by offering lower cost launches to low earth and geostationary transfer orbits. SpaceX is unique in the industry in that it publishes its prices on-line. A baseline Falcon 9 launch to low Earth orbit (up to a payload of 4,850 kilograms) costs $61.2 million USD in 2016 using a standard payment plan.23 This appears to be a price that no other commercial launch firm can match. Previously China had been regarded as the lowest cost global launch services provider. However, a Chinese official has been quoted as stating that China cannot match SpaceX’s prices (Morring 2011). Estimated costs for ULA/Atlas V, a competitor to Space X/Falcon 9.1, are twice as much per launch (Smith 2015).
SpaceX is attempting to demonstrate return and reuse of the Falcon 9.1 first stage. SpaceX leadership has suggested that, if successful, SpaceX would be able to provide service as a cost of $5–7 million per launch, which is an approximate order-of-magnitude reduction (Shotwell 2014).
Organizations such as the Defense Advanced Research Projects Agency (DARPA) are developing an alternative approach for lower launch costs. This involves use of an aircraft as a surrogate first stage launcher. In the case of the DARPA Airborne Launch
23 SpaceX website, Capabilities and Services, http://www.spacex.com/about/capabilities/.
5-11
Assist Space Access Program (ALASA) the objective is to develop a capability for prompt launch of small satellites (~45 kilograms) at a target price of ~ $1 million/launch.24
The ALASA’s payload is roughly two orders of magnitude lower mass than the 4,850 kilograms to low earth orbit payload capability of the Falcon 9. On the other hand, 45 kilograms is considerably more mass/satellite than the already on orbit Planet Labs Dove imaging satellites (5.8 kilograms/satellite).25 There may also be an emerging commercial market for satellites in the 45-kilogram class. Surrey Satellite Technology U.S. has recently announced its FeatherCraft spacecraft (45–100 kilograms) with an advertised potential orbital lifetime of up to five years (Foust 2015). Larger payload aircraft-launched rocket systems are also under development (e.g., the Vulcan Aerospace Stratolauncher).26
If these or other efforts to develop reliable space launch at significantly lower cost succeed, effects could be transformational. New business cases might be enabled. Also, both the reusable Falcon 9 first stage and ALASA or other aircraft-utilizing systems would be proof of concept demonstrations that might be imitated by other launch service providers. The impact on the business cases for NewSpace firms might be particularly significant. With significantly reduced launch costs, constellations of low cost/shorter life LEO satellites might have a stronger business case. NASA might have more potential partners and launch services providers and different business cases for existing and new missions.
24 Use of an aircraft to life a launcher is not a new concept. Pegasus was employed for satellite launch 25
years ago. What is novel here is the proposal for highly responsive, low-cost launch (Graham and Bergin 2015).
25 The Planet Labs Dove earth imagery satellite is based on a 3U(nit) CubeSat form factor. A single CubeSat is 10×10×10 centimeters and a 3U CubeSat is 30×10×10 centimeters (California Polytechnic State University 2014; Planet Labs 2013).
26 From http://www.vulcan.com/News/Articles/2015/Vulcan-Aerospace-Takes-the-Next-Step-in-Space/.

6-1
6. Position, Navigation, and Timing (PNT)
In the space-based PNT sector, the upstream market for launch and operation of global navigation satellite systems (GNSS) is controlled by governments. In contrast, the downstream market, which comprises millions of institutional and individual users, is fairly democratized.
A. Proliferation of Space-Based PNT Global and Regional Systems Until recently, there were only two fully operational, space-based global PNT
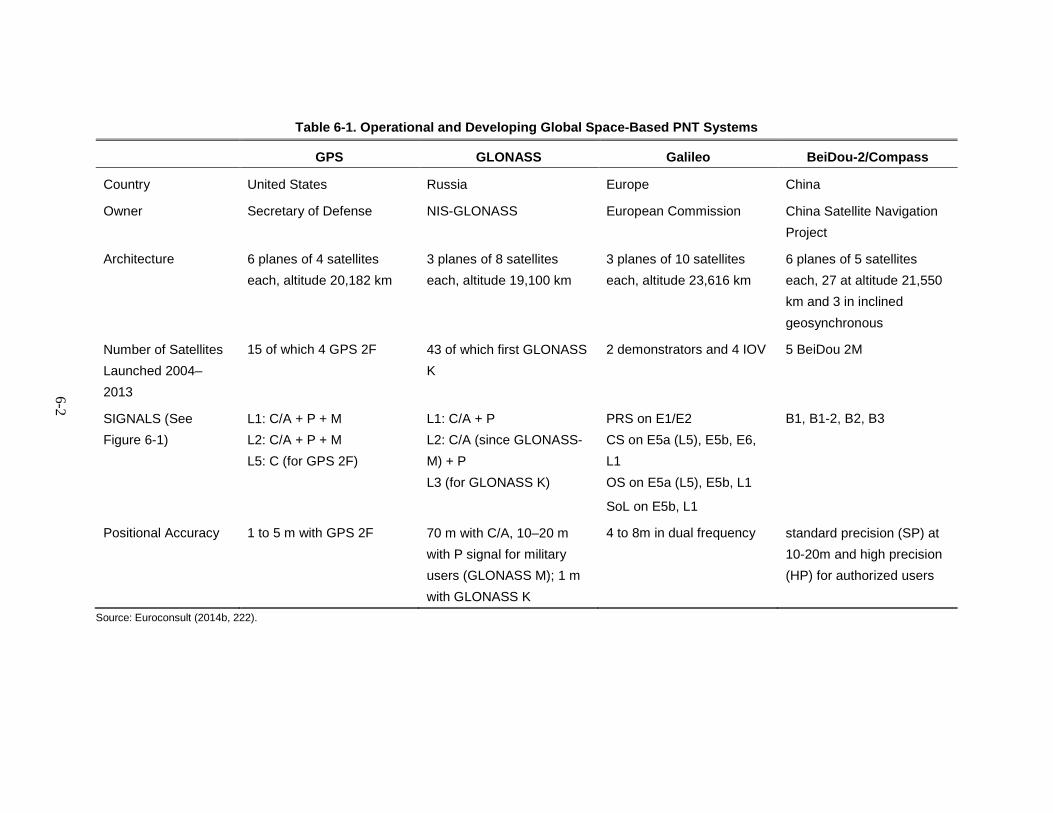
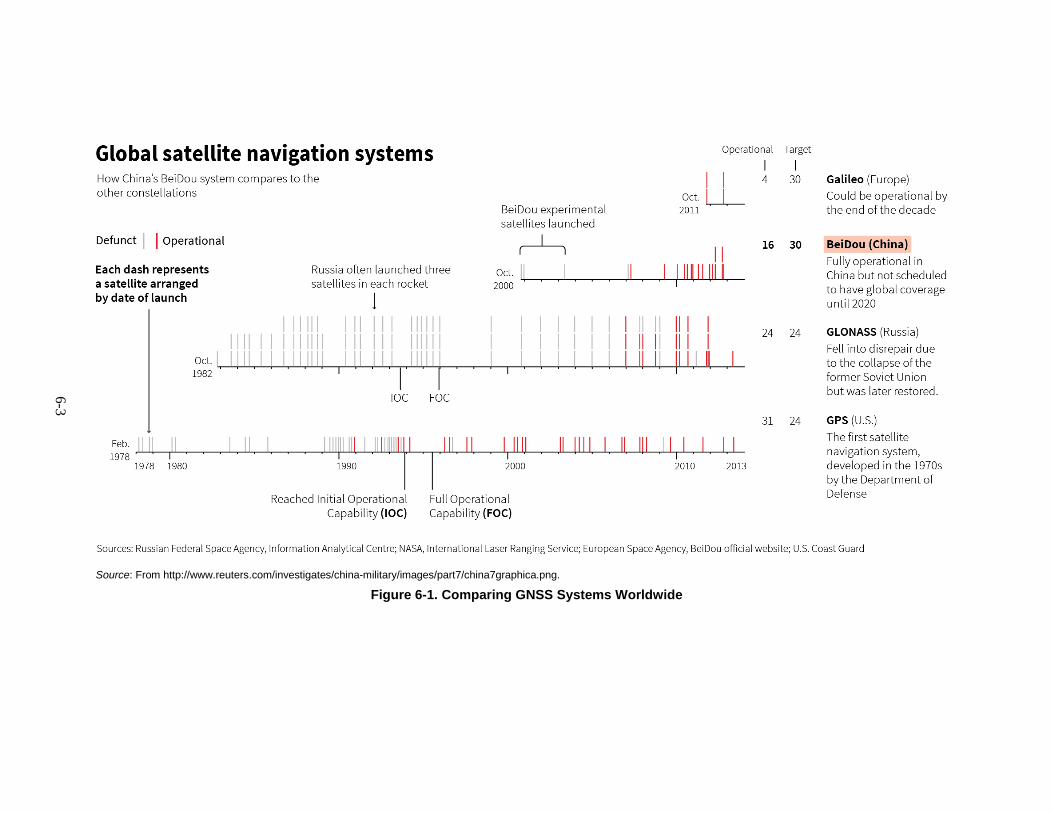
systems, the U.S. Global Positioning System (GPS) and the Russian Global Navigation Satellite System (GLONASS). However, there are new systems coming online. China’s BeiDou system is scheduled to transition from a regional system to a global system by 2020. The European Union’s Galileo system is in its initial deployment phase and is scheduled to be operational globally by 2020. Table 6-1 describes the existing and planned systems, and Figure 6-1 shows the systems’ stage of development.
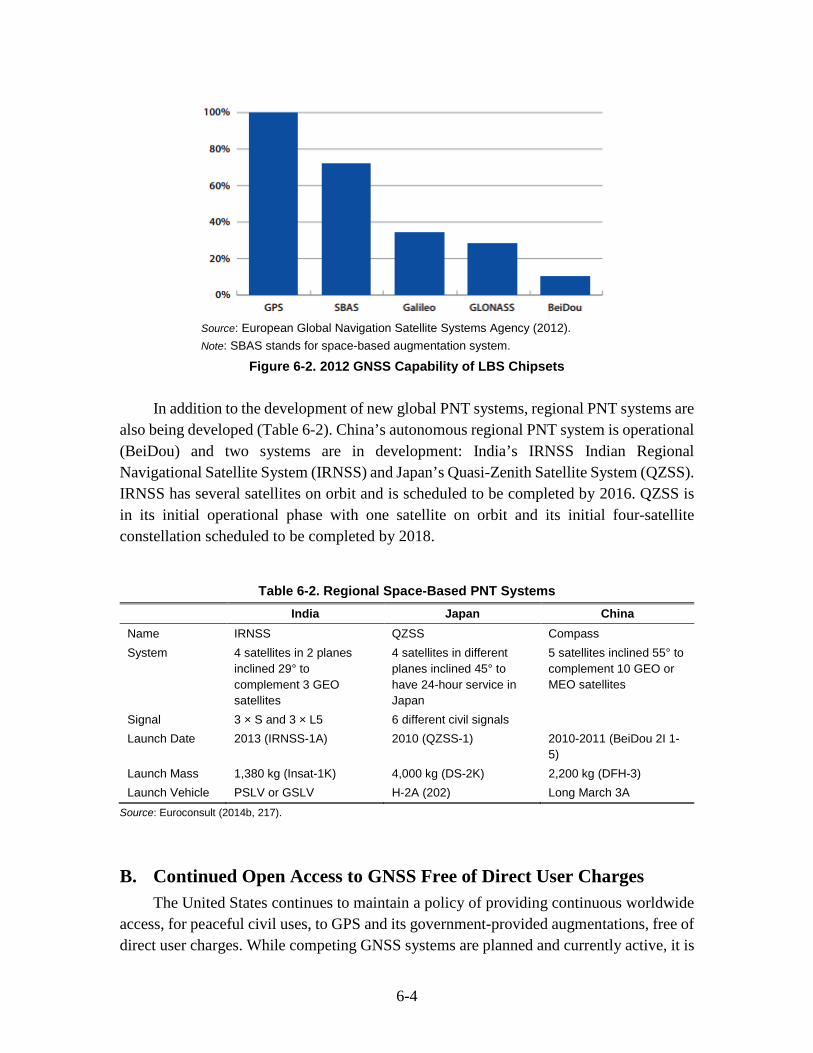
Customized location-based service chipsets are designed for each GNSS system as it comes online. Market shares of the chipsets made for the different GNSS systems, shown in Figure 6-2, reflect the dominance of GPS.
6-2
Table 6-1. Operational and Developing Global Space-Based PNT Systems
GPS GLONASS Galileo BeiDou-2/Compass
Country United States Russia Europe China
Owner Secretary of Defense NIS-GLONASS European Commission China Satellite Navigation Project
Architecture 6 planes of 4 satellites each, altitude 20,182 km
3 planes of 8 satellites each, altitude 19,100 km
3 planes of 10 satellites each, altitude 23,616 km
6 planes of 5 satellites each, 27 at altitude 21,550 km and 3 in inclined geosynchronous
Number of Satellites Launched 2004–2013
15 of which 4 GPS 2F 43 of which first GLONASS K
2 demonstrators and 4 IOV 5 BeiDou 2M
SIGNALS (See Figure 6-1)
L1: C/A + P + M L2: C/A + P + M L5: C (for GPS 2F)
L1: C/A + P L2: C/A (since GLONASS-M) + P L3 (for GLONASS K)
PRS on E1/E2 CS on E5a (L5), E5b, E6, L1 OS on E5a (L5), E5b, L1
SoL on E5b, L1
B1, B1-2, B2, B3
Positional Accuracy 1 to 5 m with GPS 2F 70 m with C/A, 10–20 m with P signal for military users (GLONASS M); 1 m with GLONASS K
4 to 8m in dual frequency standard precision (SP) at 10-20m and high precision (HP) for authorized users
Source: Euroconsult (2014b, 222).
6-3
Source: From http://www.reuters.com/investigates/china-military/images/part7/china7graphica.png.
Figure 6-1. Comparing GNSS Systems Worldwide
6-4
Source: European Global Navigation Satellite Systems Agency (2012). Note: SBAS stands for space-based augmentation system.
Figure 6-2. 2012 GNSS Capability of LBS Chipsets
In addition to the development of new global PNT systems, regional PNT systems are also being developed (Table 6-2). China’s autonomous regional PNT system is operational (BeiDou) and two systems are in development: India’s IRNSS Indian Regional Navigational Satellite System (IRNSS) and Japan’s Quasi-Zenith Satellite System (QZSS). IRNSS has several satellites on orbit and is scheduled to be completed by 2016. QZSS is in its initial operational phase with one satellite on orbit and its initial four-satellite constellation scheduled to be completed by 2018.
Table 6-2. Regional Space-Based PNT Systems
India Japan China Name IRNSS QZSS Compass System 4 satellites in 2 planes
inclined 29° to complement 3 GEO satellites
4 satellites in different planes inclined 45° to have 24-hour service in Japan
5 satellites inclined 55° to complement 10 GEO or MEO satellites
Signal 3 × S and 3 × L5 6 different civil signals Launch Date 2013 (IRNSS-1A) 2010 (QZSS-1) 2010-2011 (BeiDou 2I 1-
5) Launch Mass 1,380 kg (Insat-1K) 4,000 kg (DS-2K) 2,200 kg (DFH-3) Launch Vehicle PSLV or GSLV H-2A (202) Long March 3A
Source: Euroconsult (2014b, 217).
B. Continued Open Access to GNSS Free of Direct User Charges The United States continues to maintain a policy of providing continuous worldwide
access, for peaceful civil uses, to GPS and its government-provided augmentations, free of direct user charges. While competing GNSS systems are planned and currently active, it is
6-5
unlikely the competing systems will charge fees to direct users for services comparable to those provided by GPS because the economic viability of such services would be undermined by free GPS. That being said, StarFire and Trimble are examples of established value-added PNT services that augment GPS and charge fees.
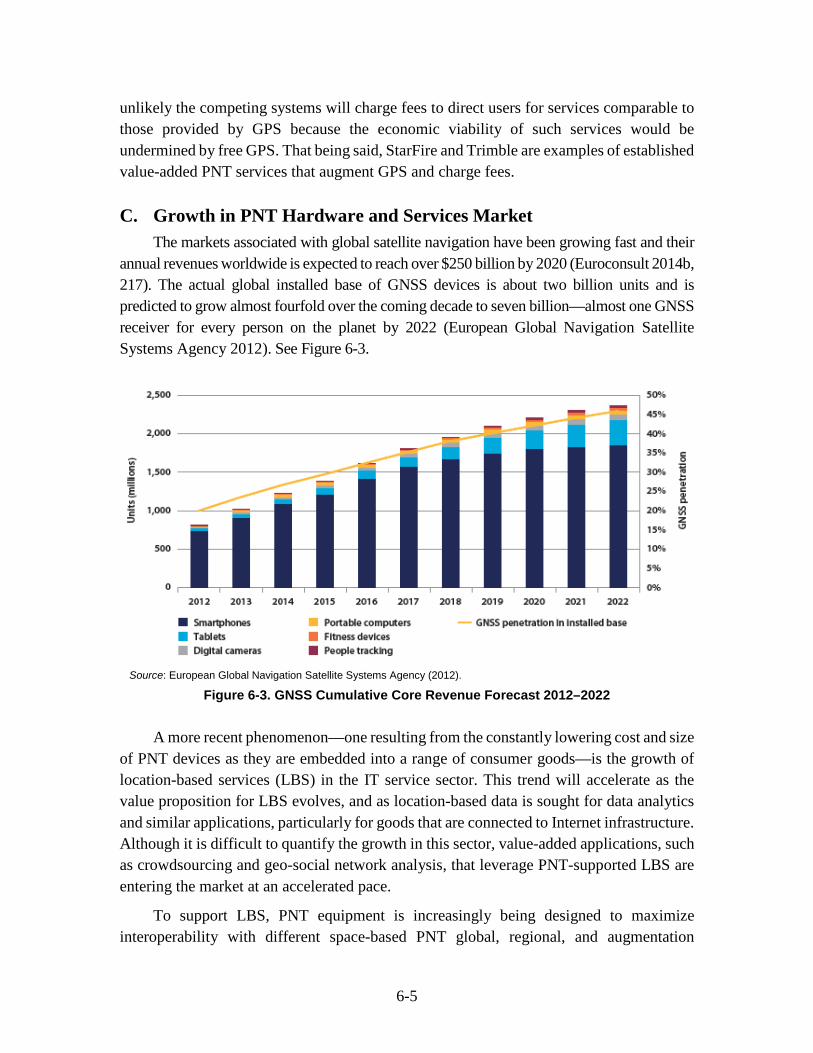
C. Growth in PNT Hardware and Services Market The markets associated with global satellite navigation have been growing fast and their
annual revenues worldwide is expected to reach over $250 billion by 2020 (Euroconsult 2014b, 217). The actual global installed base of GNSS devices is about two billion units and is predicted to grow almost fourfold over the coming decade to seven billion—almost one GNSS receiver for every person on the planet by 2022 (European Global Navigation Satellite Systems Agency 2012). See Figure 6-3.
Source: European Global Navigation Satellite Systems Agency (2012).
Figure 6-3. GNSS Cumulative Core Revenue Forecast 2012–2022
A more recent phenomenon—one resulting from the constantly lowering cost and size of PNT devices as they are embedded into a range of consumer goods—is the growth of location-based services (LBS) in the IT service sector. This trend will accelerate as the value proposition for LBS evolves, and as location-based data is sought for data analytics and similar applications, particularly for goods that are connected to Internet infrastructure. Although it is difficult to quantify the growth in this sector, value-added applications, such as crowdsourcing and geo-social network analysis, that leverage PNT-supported LBS are entering the market at an accelerated pace.
To support LBS, PNT equipment is increasingly being designed to maximize interoperability with different space-based PNT global, regional, and augmentation
6-6
systems, and to leverage non-space-based systems such as Wi-Fi, mobile telephone signals, and internal positioning tools (e.g., gyroscope, compass, and accelerometer).
D. Alternatives to Space-Based PNT Signals Due, in part, to concerns related to reliance on space-based timing systems for critical
national infrastructure, alternatives to space-based timing systems are under development, such as Enhanced Long-Range Navigation (eLORAN) and chip-scale atomic clocks. eLORAN is designed to provide PNT that is accurate enough for most applications and guaranteed to be independent from GNSS. Chip Scale Atomic Clocks, developed in part by DARPA, allow for fieldable atomic clock timing and can effectively mitigate wideband radio frequency interference, improve position and timing accuracy, and provide highly accurate position and timing in the temporary absence of space-based PNT capability.
As civilian dependence on GNSS continues to increase, it may push the growth of a service sector in both augmented GPS services and location-based information services. The demand for redundancy and improved accuracy for certain applications will drive investments for the development of alternatives to GNSS PNT systems.
7-1
7. Human Space Flight
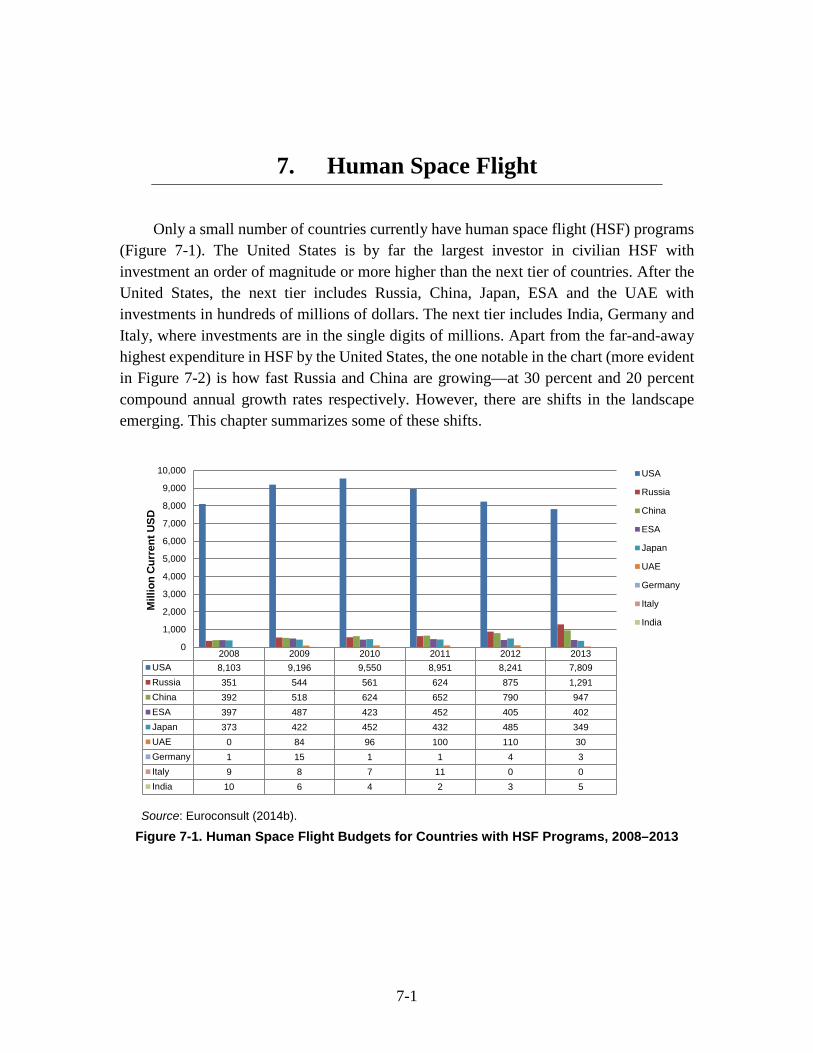
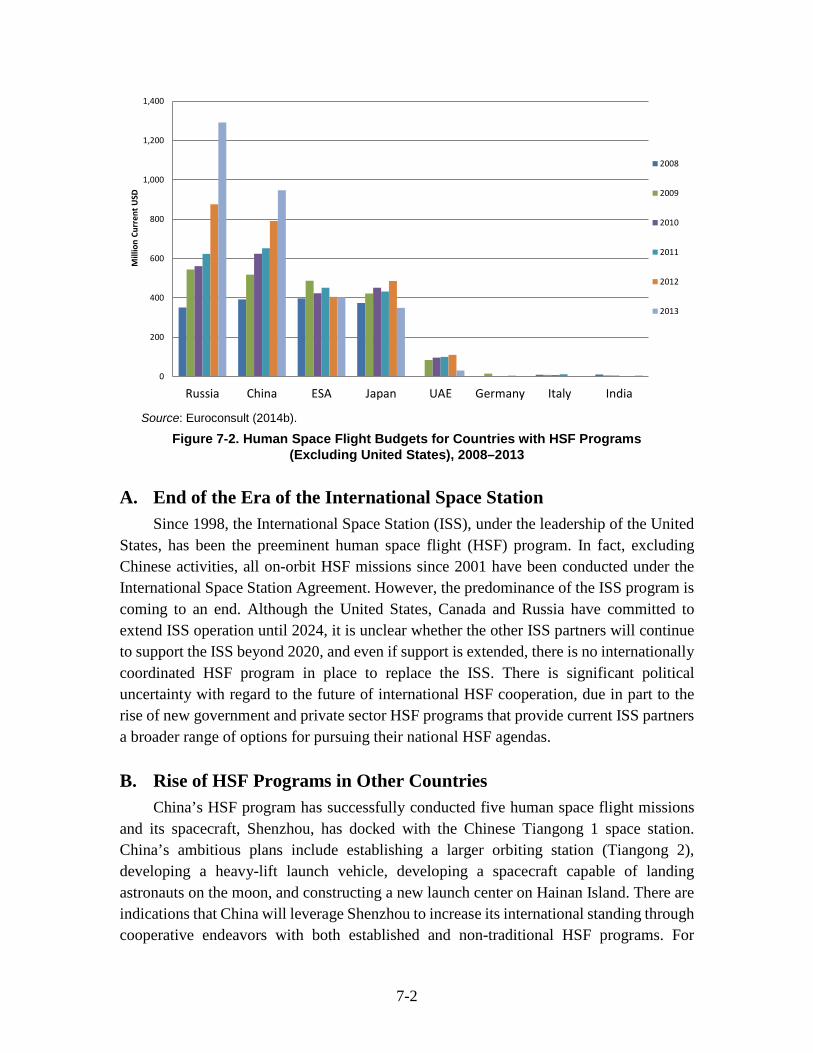
Only a small number of countries currently have human space flight (HSF) programs (Figure 7-1). The United States is by far the largest investor in civilian HSF with investment an order of magnitude or more higher than the next tier of countries. After the United States, the next tier includes Russia, China, Japan, ESA and the UAE with investments in hundreds of millions of dollars. The next tier includes India, Germany and Italy, where investments are in the single digits of millions. Apart from the far-and-away highest expenditure in HSF by the United States, the one notable in the chart (more evident in Figure 7-2) is how fast Russia and China are growing—at 30 percent and 20 percent compound annual growth rates respectively. However, there are shifts in the landscape emerging. This chapter summarizes some of these shifts.
Source: Euroconsult (2014b).
Figure 7-1. Human Space Flight Budgets for Countries with HSF Programs, 2008–2013
2008 2009 2010 2011 2012 2013USA 8,103 9,196 9,550 8,951 8,241 7,809Russia 351 544 561 624 875 1,291China 392 518 624 652 790 947ESA 397 487 423 452 405 402Japan 373 422 452 432 485 349UAE 0 84 96 100 110 30Germany 1 15 1 1 4 3Italy 9 8 7 11 0 0India 10 6 4 2 3 5
0
1,000
2,000
3,000
4,000
5,000
6,000
7,000
8,000
9,000
10,000
Mill
ion
Cur
rent
USD
USA
Russia
China
ESA
Japan
UAE
Germany
Italy
India
7-2
Source: Euroconsult (2014b).
Figure 7-2. Human Space Flight Budgets for Countries with HSF Programs (Excluding United States), 2008–2013
A. End of the Era of the International Space Station Since 1998, the International Space Station (ISS), under the leadership of the United
States, has been the preeminent human space flight (HSF) program. In fact, excluding Chinese activities, all on-orbit HSF missions since 2001 have been conducted under the International Space Station Agreement. However, the predominance of the ISS program is coming to an end. Although the United States, Canada and Russia have committed to extend ISS operation until 2024, it is unclear whether the other ISS partners will continue to support the ISS beyond 2020, and even if support is extended, there is no internationally coordinated HSF program in place to replace the ISS. There is significant political uncertainty with regard to the future of international HSF cooperation, due in part to the rise of new government and private sector HSF programs that provide current ISS partners a broader range of options for pursuing their national HSF agendas.
B. Rise of HSF Programs in Other Countries China’s HSF program has successfully conducted five human space flight missions
and its spacecraft, Shenzhou, has docked with the Chinese Tiangong 1 space station. China’s ambitious plans include establishing a larger orbiting station (Tiangong 2), developing a heavy-lift launch vehicle, developing a spacecraft capable of landing astronauts on the moon, and constructing a new launch center on Hainan Island. There are indications that China will leverage Shenzhou to increase its international standing through cooperative endeavors with both established and non-traditional HSF programs. For
0
200
400
600
800
1,000
1,200
1,400
Russia China ESA Japan UAE Germany Italy India
Mill
ion
Curr
ent U
SD
2008
2009
2010
2011
2012
2013
7-3
example, China has an active technical cooperation with Russia for its Shenzhou program, and there are discussions about the possibility of Russia and China cooperating on a future human space flight space program. China is also evaluating collaborations with various European space agencies, including the possibility of European human space flight participants.27 In December 2014 the ESA for the first time listed China alongside Russia and the United States as core ESA strategic partners, and ESA is reportedly working with China towards the goal of placing a European astronaut on a Chinese space station (Selding 2015b). Finally, China is leveraging the Shenzhou program within the Asia-Pacific Space Cooperation Organization (APSCO) by inviting APSCO members to conduct experiments on-orbit and discussing the possibility of hosting APSCO member state astronauts on future missions.
China’s regional and global influence as a space player and leader in scientific and technical activities will increase. With this change, the United States’ leadership in international HSF cooperation will be challenged, as China demonstrates technical capabilities and attracts an increasing range of international partners.
Other countries have emerging HSF programs. In 2014, India launched and returned an unmanned prototype crew module with an eye toward launching astronauts (Jayaraman 2014).
C. Advent of Commercial HSF Launch and On-Orbit Station Services HSF launch and on-orbit station services have traditionally fallen within the purview
of a handful of governments (i.e., United States, Russia, and China). However, private companies in the United States are on the cusp of providing commercial HSF launch and on-orbit station services, potentially available to a global marketplace. SpaceX, Boeing, and Sierra Nevada are three examples of U.S. companies planning to market HSF services to the U.S. Government and abroad. In addition, Bigelow Aerospace is actively marketing on-orbit stations to foreign governments as a low-cost, off-the-shelf solution to achieve national HSF agendas.28
Countries without indigenous HSF launch or LEO on-orbit capabilities will be able to engage in HSF activities without having to partner with foreign governments. The monopoly on HSF launch and on-orbit services, currently held by the United States, Russia, and China, will be broken, which may alter the value proposition for indigenous national LEO HSF programs. The commercialization of LEO HSF services will also create new
27 The German space agency has flown experiments on the unmanned flight of China’s Shenzhou program,
while France and China are jointly developing a project to measure gamma ray bursts to be flown in 2021. 28 In 2011, the Emirates Institution for Advanced Science and Technology (EIAST) signed a memorandum
of understanding with Bigelow Aerospace.

7-2
demands from private operators for safety of flight and on-orbit space situational awareness services.
8-1
8. Space Situational Awareness (SSA)
Space situational awareness (SSA) refers to the ability to view, understand, and predict the physical location of natural and man-made objects in orbit around the Earth, with the objective of avoiding collisions.
About 3,000 satellites are orbiting the Earth at present, and about 1,100 of them are active.29 About 50 percent of these active satellites are in low Earth orbit (LEO), about 40 percent are in geostationary orbit (GEO), and the remainder is either in medium Earth orbit (MEO) or elliptical orbit. In addition to satellites, more than 20,000 pieces of debris larger than a softball and 500,000 pieces the size of a marble or larger are in orbit.30 Many millions of pieces of debris are so small they cannot be tracked. With increasing numbers of actors interested in space-based activities, there is increasing interest in satellite safety and the importance of SSA.
Most SSA activity is on the military side in the United States, Russia, and China, but civil and commercial activity is beginning in the United States, Europe (ESA’s Space Surveillance and Tracking program), Japan (Japan Manned Space System Corporation), and Australia (Electro Optic Systems). With the understanding that civil and defense applications of SSA cannot be separated easily, this chapter focuses on SSA trends that are relevant to the civil and private sector only.
A. Private Entities Beginning to Provide SSA Data, Analytic Products, and Services Historically, SSA data, information, and services have been the purview of the
defense sector, which has the resources and technical knowledge to field ground-based radar and optical telescopes, as well as space-based sensors. Due to recent improvements in technologies, including COTS optical telescopes, increasingly sophisticated software and computational analysis, and increasing demand from non-government space actors for accurate and timely SSA, the private sector is investing in and providing SSA data, information, and services. Examples of new private sector SSA entrants include the Space Data Association (SDA) and U.S.-based firms Analytical Graphics, Inc. (AGI) and ExoAnalytic Solutions. The two U.S. firms are proposing commercial alternatives through
29 See http://www.pixalytics.com/how-many-eo-space/ and http://www.pixalytics.com/how-many-
satellites/. 30 From http://www.nasa.gov/mission_pages/station/news/orbital_debris.html.
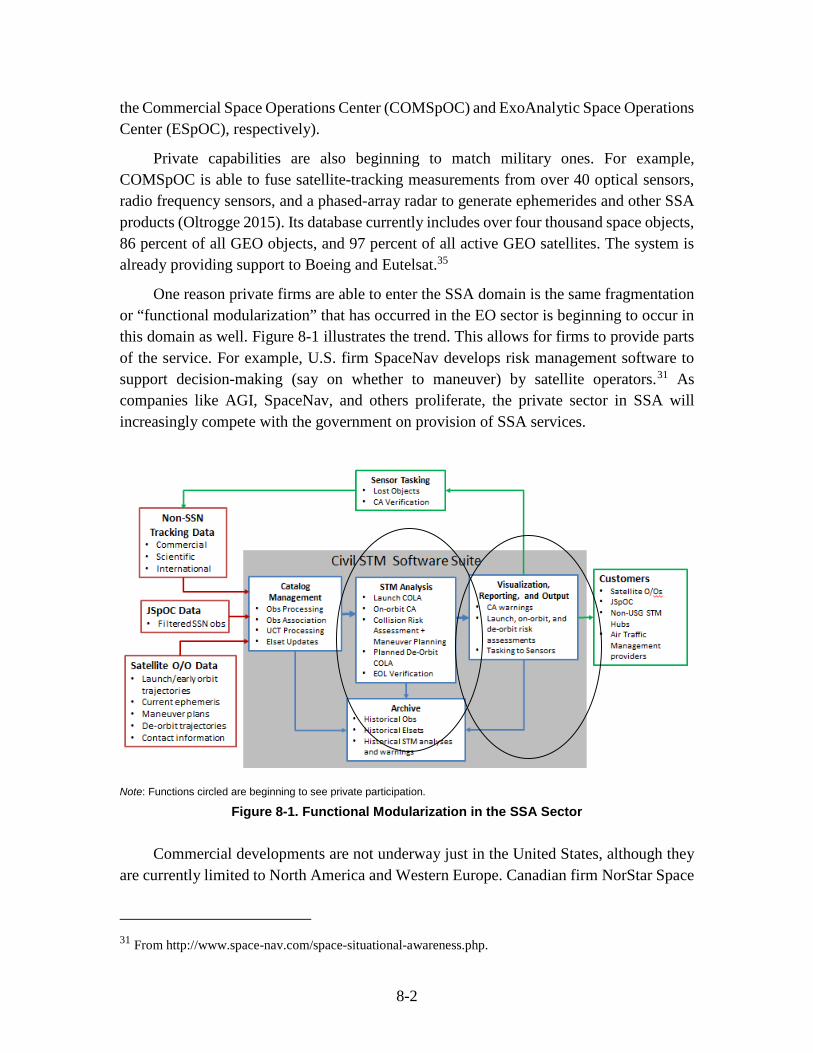
8-2
the Commercial Space Operations Center (COMSpOC) and ExoAnalytic Space Operations Center (ESpOC), respectively).
Private capabilities are also beginning to match military ones. For example, COMSpOC is able to fuse satellite-tracking measurements from over 40 optical sensors, radio frequency sensors, and a phased-array radar to generate ephemerides and other SSA products (Oltrogge 2015). Its database currently includes over four thousand space objects, 86 percent of all GEO objects, and 97 percent of all active GEO satellites. The system is already providing support to Boeing and Eutelsat.35
One reason private firms are able to enter the SSA domain is the same fragmentation or “functional modularization” that has occurred in the EO sector is beginning to occur in this domain as well. Figure 8-1 illustrates the trend. This allows for firms to provide parts of the service. For example, U.S. firm SpaceNav develops risk management software to support decision-making (say on whether to maneuver) by satellite operators.31 As companies like AGI, SpaceNav, and others proliferate, the private sector in SSA will increasingly compete with the government on provision of SSA services.
Note: Functions circled are beginning to see private participation.
Figure 8-1. Functional Modularization in the SSA Sector
Commercial developments are not underway just in the United States, although they are currently limited to North America and Western Europe. Canadian firm NorStar Space
31 From http://www.space-nav.com/space-situational-awareness.php.
8-3
Data, Inc., for example, intends to launch NORTHSTAR, a 40-satellite constellation to track space debris (in addition to providing earth observation services).32
B. Increasingly Difficult for the Military and Government to Control SSA Improvements in COTS optical telescopes and the advent of private SSA networks
and data centers means that it will be increasingly difficult for U.S. and other governments to exclusively control SSA, particularly knowledge of the existence and location of sensitive and classified assets. While amateurs and commercially oriented private sector SSA service providers will not necessarily have the same level of technical capability or precision as government-owned ground and space-based SSA systems, there will be a commoditization of SSA data, information, and services, which will incentivize improving non-government capabilities to conduct SSA. This will likely result in increased identification of uncorrelated tracks and anomalous objects (e.g., debris moving like a controlled object), including sensitive or classified government assets.
32 See http://norstar-data.com/.

9-1
9. Small Satellites: A Potentially Disruptive Platform
Small satellites are not a fundamentally new concept—even the first artificial satellite, Sputnik-1, fits most definitions of a modern small satellite.33 However, the high cost of launch into space and importance of operational missions34 has, over time, driven the production of larger, more capable, longer lived, and rigorously reliable satellites. While these satellites are highly capable, they have high production costs. Recently, there has been interest in developing small, low-mass satellites, which have more limited capabilities but cost less to produce (Euroconsult 2014b, 37).
This chapter is concerned with these smaller, more standardized, and less technologically complex satellites. Among other goals, these satellites are generally developed to achieve lower cost constellations, whether for research, technology development, or operational use.35
The small satellite movement is the result both of technical and cultural innovations that are enabling different or additional means of doing business in the satellite industry. Small satellite firms seem to have more in common with a technology start-up culture and, at times, the maker movement, both of which encourage rapid innovation, even at the expense of mission or platform assurance. This trait contrasts with a traditionally conservative space sector that emphasizes exquisite capability, long platform lifetimes, and high-reliability components.
The small satellite sector has grown quickly in recent years due to a combination of increasing demand and falling costs (which both depend on and spur more demand), in addition to technology improvements. Because of this culture of fast growth, experimentation and rapid innovation, small satellites also offer a way to see the influence of many drivers and trends discussed in the previous chapters.
33 The definition of a small satellite varies, but the classification is generally related to the dry mass of the
spacecraft. While “small” satellites are often defined as those with a dry mass below 500 kilograms, the trends discussed in this section are most applicable to the smaller end of the range, especially what are often termed “microsatellites” of 100 kilograms and below, encompassing nano-, pico-, and smaller satellite classifications as well. See SpaceWorks Enterprises, Inc. (SEI 2014); Neeck, Mander, Paules (n.d.); Venturini (2014); and National Research Council (NRC 2015).
34 Among other design constraints, such as aperture size, for many types of sensors. 35 Rigorous and reliable small satellites can and have been built, but at significantly higher costs.
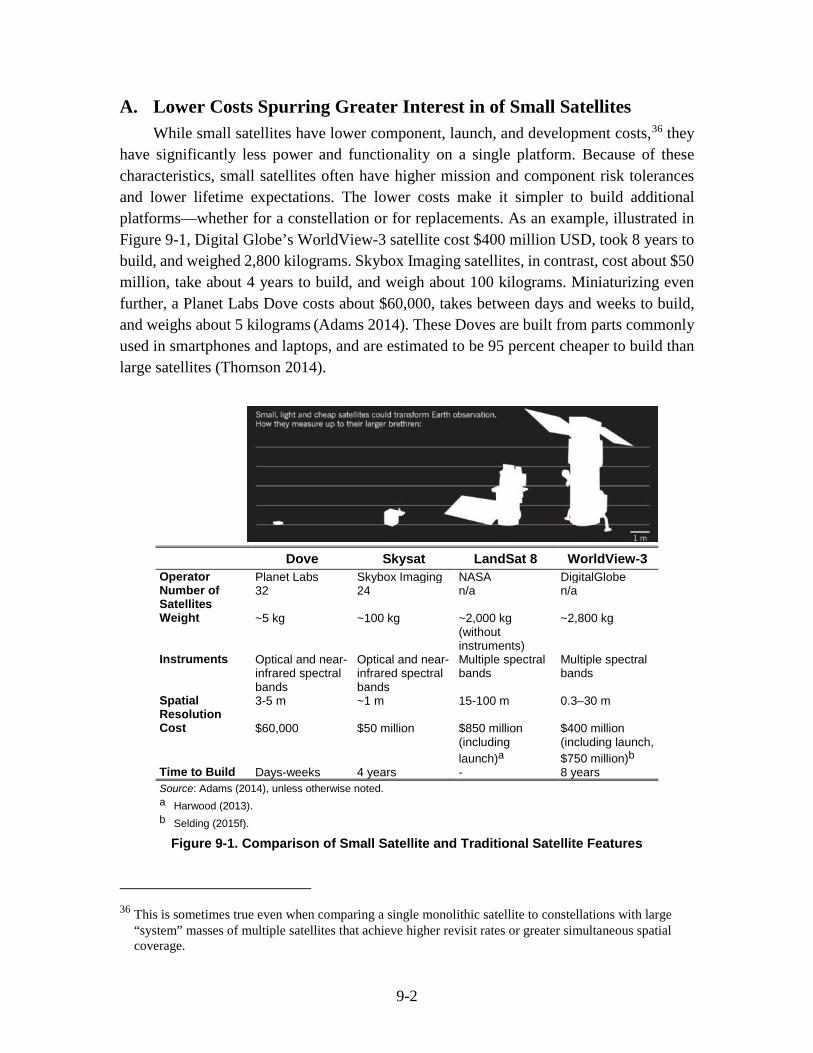
9-2
A. Lower Costs Spurring Greater Interest in of Small Satellites While small satellites have lower component, launch, and development costs,36 they
have significantly less power and functionality on a single platform. Because of these characteristics, small satellites often have higher mission and component risk tolerances and lower lifetime expectations. The lower costs make it simpler to build additional platforms—whether for a constellation or for replacements. As an example, illustrated in Figure 9-1, Digital Globe’s WorldView-3 satellite cost $400 million USD, took 8 years to build, and weighed 2,800 kilograms. Skybox Imaging satellites, in contrast, cost about $50 million, take about 4 years to build, and weigh about 100 kilograms. Miniaturizing even further, a Planet Labs Dove costs about $60,000, takes between days and weeks to build, and weighs about 5 kilograms (Adams 2014). These Doves are built from parts commonly used in smartphones and laptops, and are estimated to be 95 percent cheaper to build than large satellites (Thomson 2014).
Dove Skysat LandSat 8 WorldView-3 Operator Planet Labs Skybox Imaging NASA DigitalGlobe Number of Satellites
32 24 n/a n/a
Weight ~5 kg ~100 kg ~2,000 kg (without instruments)
~2,800 kg
Instruments Optical and near-infrared spectral bands
Optical and near-infrared spectral bands
Multiple spectral bands
Multiple spectral bands
Spatial Resolution
3-5 m ~1 m 15-100 m 0.3–30 m
Cost $60,000 $50 million $850 million (including launch)a
$400 million (including launch, $750 million)b
Time to Build Days-weeks 4 years - 8 years Source: Adams (2014), unless otherwise noted. a Harwood (2013). b Selding (2015f).
Figure 9-1. Comparison of Small Satellite and Traditional Satellite Features
36 This is sometimes true even when comparing a single monolithic satellite to constellations with large
“system” masses of multiple satellites that achieve higher revisit rates or greater simultaneous spatial coverage.
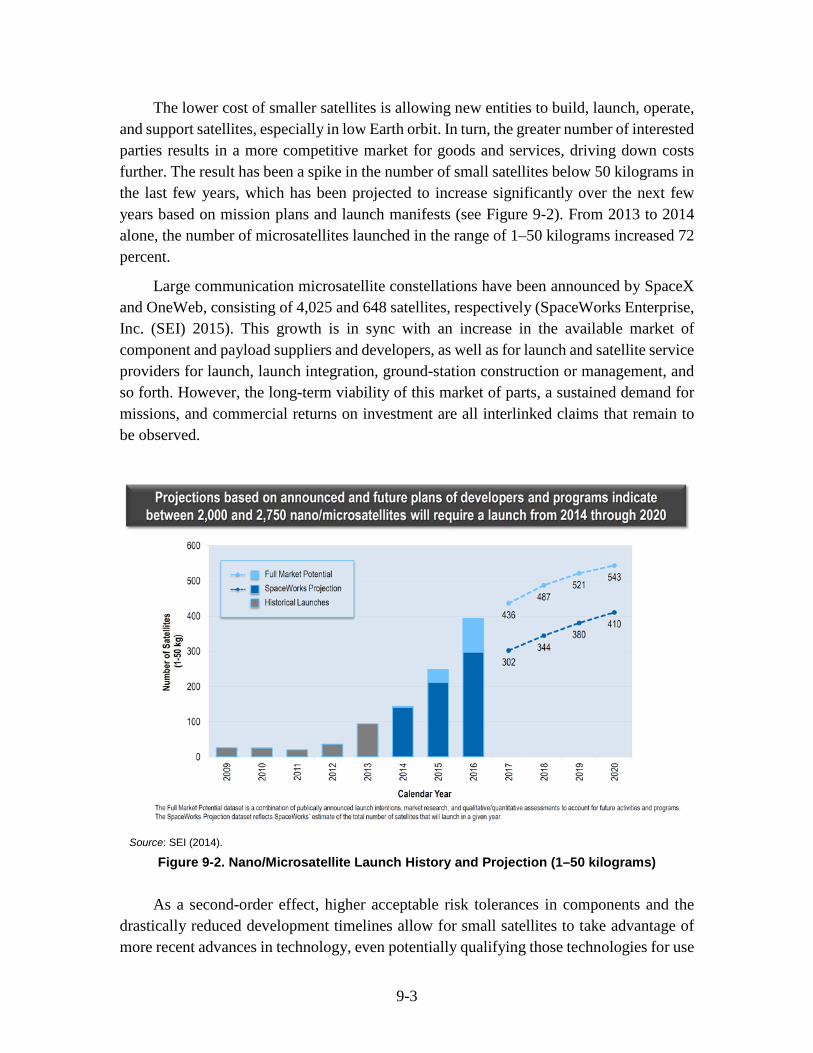
9-3
The lower cost of smaller satellites is allowing new entities to build, launch, operate, and support satellites, especially in low Earth orbit. In turn, the greater number of interested parties results in a more competitive market for goods and services, driving down costs further. The result has been a spike in the number of small satellites below 50 kilograms in the last few years, which has been projected to increase significantly over the next few years based on mission plans and launch manifests (see Figure 9-2). From 2013 to 2014 alone, the number of microsatellites launched in the range of 1–50 kilograms increased 72 percent.
Large communication microsatellite constellations have been announced by SpaceX and OneWeb, consisting of 4,025 and 648 satellites, respectively (SpaceWorks Enterprise, Inc. (SEI) 2015). This growth is in sync with an increase in the available market of component and payload suppliers and developers, as well as for launch and satellite service providers for launch, launch integration, ground-station construction or management, and so forth. However, the long-term viability of this market of parts, a sustained demand for missions, and commercial returns on investment are all interlinked claims that remain to be observed.
Source: SEI (2014).
Figure 9-2. Nano/Microsatellite Launch History and Projection (1–50 kilograms)
As a second-order effect, higher acceptable risk tolerances in components and the drastically reduced development timelines allow for small satellites to take advantage of more recent advances in technology, even potentially qualifying those technologies for use
9-4
in space beyond their use in small satellites. This aspect of technology development is part of the culture of the small satellite sector, which were initially developed through educational and government support programs for university satellites,37 which emphasized innovation in science, technology, engineering, and mathematics research and education. This culture of innovation has since been translating to small satellite development in the private sector.
B. Increase in Standardization Leading to Growth in Commercial Market While not enforced by any governing body or space agency, a degree of
standardization of small satellite hardware has supported the growth in the number and sophistication of suppliers to design and provide parts for an open market, rather than customized for particular missions. Additionally, some of these standards help ensure access to launch for small satellites.
The standards often include basic size and mass requirements. CubeSat requirements, for example, allow satellites that adhere to the standard to fit into deployers such as the Poly-Picosatellite Orbital Deployer (P-POD).38 The Evolved Expendable Launch Vehicle (EELV) Secondary Payload Adapter (ESPA) ring connection standard performs a similar function by normalizing the mounting of microsatellites up to 180 kilograms within a launch vehicle. By establishing “rules of the road” for mission planners and component producers, these standards enable the growth of a commercial market of not only COTS parts39 (see Chapter 2, Section B, of Volume 1), but also service providers for launch integration, ground segment communications systems, and satellite design, including companies such as Surrey Satellite Technology Ltd. (see Chapter 4 of Volume 1), Spaceflight Inc., NanoRacks, and others. This functional modularization of services has made it easier and cheaper than ever before for new customers without experience in the full spread of space activities to enter the space sector via the development of a small satellite.
One possible consequence of standardized parts being offered by countries tied into a global market is that prices may also become standardized rather than contracted with each individual customer, and be competitively evaluated in the marketplace. The lower and publically listed prices for components and services provides a more open and competitive market with lower barriers to entry and fewer ancillary costs to doing business
37 Two examples include NASA’s CubeSat Launch Initiative and the Air Force Research Laboratory’s
University Nanosatellite Program. 38 The standard unit of size is 10cm3. 39 These parts are not necessarily space-qualified parts, but are often “military” grade or less (Euroconsult
2014b, 32).
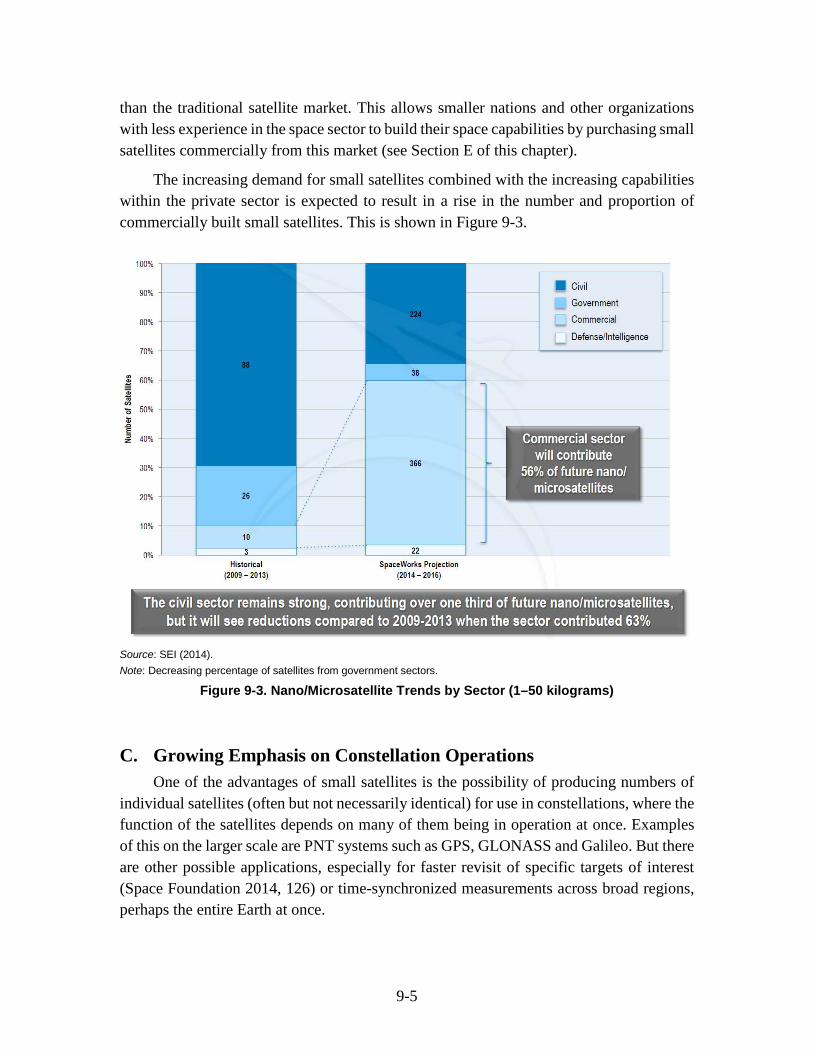
9-5
than the traditional satellite market. This allows smaller nations and other organizations with less experience in the space sector to build their space capabilities by purchasing small satellites commercially from this market (see Section E of this chapter).
The increasing demand for small satellites combined with the increasing capabilities within the private sector is expected to result in a rise in the number and proportion of commercially built small satellites. This is shown in Figure 9-3.
Source: SEI (2014). Note: Decreasing percentage of satellites from government sectors.
Figure 9-3. Nano/Microsatellite Trends by Sector (1–50 kilograms)
C. Growing Emphasis on Constellation Operations One of the advantages of small satellites is the possibility of producing numbers of
individual satellites (often but not necessarily identical) for use in constellations, where the function of the satellites depends on many of them being in operation at once. Examples of this on the larger scale are PNT systems such as GPS, GLONASS and Galileo. But there are other possible applications, especially for faster revisit of specific targets of interest (Space Foundation 2014, 126) or time-synchronized measurements across broad regions, perhaps the entire Earth at once.
9-6
Small satellites are particularly suited to constellations for a number of reasons: They are generally of lower cost per unit than larger satellites, in part because each satellite platform is designed with lower individual reliability and redundancy, instead relying on the redundancy of having many other satellites in the constellation to allow for some failures. Additionally, such failures do not suddenly result in lost capability by the system, as a rare sudden failure in an instrument of a single larger spacecraft might. Finally, by producing large numbers of these smaller, simpler satellites, the full production learning curve is exploited, lowering production costs further.
As constellations become more feasible, greater coordination between individual satellites in a constellation could become prevalent. For example, NASA’s experimental Edison Demonstration of Smallsat Networks (EDSN) constellation routes data collected by the entire constellation through a single satellite at any given time, while being robust to losses of any given satellite. This system saves bandwidth and ground-station costs for collecting information from a spatially dispersed fleet of satellites without necessarily maintaining direct communications with each of them individually.
Constellations could, in the future, employ greater networking and autonomy to collect and process data, whether to perform a particular function or to minimize the amount of information necessary to pass through to ground stations, such as in a monitoring system for specific types of disasters. Because small satellites are able to take advantage of more recent processors, their ability to process data on-orbit is generally greater than that of traditional satellite platforms. Tangentially, greater demand for constellations would drive further the demand for bulk small satellites, dedicated small satellites, or frequent rideshare launches to lift and sustain such constellation systems.
D. Increase in Small Satellite Launches Changing the Launch Paradigm Traditionally, smaller payloads have been essentially second-class citizens, and must
take great pains to ensure that no harm will come to the primary payload of a given launch—usually a much larger and more expensive satellite. Along with the growth of the small satellite market, the overall capability and flexibility of the launch of small satellites has been improving, with different approaches available and being tested.
To reduce the risk to the primary payload, small satellites have had to be tested for safe integration, adding significant cost to the mission. However, the standardization of small satellite launch hardware has lowered this burden, allowing launch providers to more reliably rideshare any small satellite compatible with those standards and avoid the additional testing (and cost) required to maintain “Do No Harm” standards for the primary payload. For example, there is an increasing number of launch providers and vehicles that
9-7
are able and willing to launch secondary payloads, whether containerized (e.g., P-POD40) or with standard interfaces (e.g. ESPA41). As more launch hardware is qualified, the interest and willingness to fly rideshare payloads will likely increase, opening greater numbers of launch slots for small satellites. These slots are, as much as possible, functionally identical from the viewpoint of the launch vehicle, and list pricing (as in parts standardization) becomes more and more feasible over time.
One of the consequences of being a non-primary payload is that small satellites do not generally command destination orbits or launch dates.42 While commanding launch date or specific orbit has often been irrelevant for research-level small satellites, specific orbit choice and choice of launch date may be vital to operational satellites for private or civil uses, which are predicted to grow.43 To accommodate the increasing demand, launch approaches specific to the small satellite sector are developing, including cluster launches incorporating only smaller payload satellites as well as a number of smaller launch systems specifically for the small satellite sector offering more control of destination and schedule. Additionally, there have been examples of chartered rideshare launches that are carrying multiple smaller payloads with no primary payload to drive the launch,44 which can be expected to continue as the demand for launch continues. This possibility is providing part of the demand for smaller launch vehicles to provide customized destinations, though usually at a higher cost compared to rideshare. The demand will be especially high if constellations of small satellites become more prevalent in operational constellations for civil or commercial purposes.
New ventures for small dedicated launchers are already proposed and in development, which, if successful, may find a significant market. Some examples include existing
40 From https://directory.eoportal.org/web/eoportal/satellite-missions/c-missions/cubesat-concept/. 41 From http://www.moog.com/products/spacecraft-payload-interfaces/heavy-lift.-excess-capacity.-small-
satellites/. 42 Rideshare payloads can also carry schedule risk if they are not ready in time for the launch date;
however, secondary payloads are usually considered “second-class citizens” and can be left behind (and replaced with mass simulators) if not ready in time for integration, negating most of the schedule risk in the current secondary payload culture.
43 Another consequence of being a secondary payload is that small satellites usually have restrictions on containing pressurized vessels or reactive substances as needed for most chemical propulsion systems. These restrictions are based in a “Do No Harm” philosophy that launch providers use to ensure that the primary payload (usually a larger satellite) reaches its destination orbit safely. In response to these restrictions, and seeking greater lifetimes and capabilities for small satellites, space technology developers are designing and building compact and inert propulsion systems, including electric propulsion systems with lower power requirements, “green” monopropellant systems, electrodynamic tethers, and other concepts. The inclusion of propulsion systems on small satellites would increase viable lifetimes for small, reliable satellites in LEO orbits and enable a wider range of missions for the smaller platforms at LEO and higher altitudes, with interplanetary missions proposed.
44 Examples include the U.S. ORS 3 launch and Dnepr cluster launches (Graham 2014).
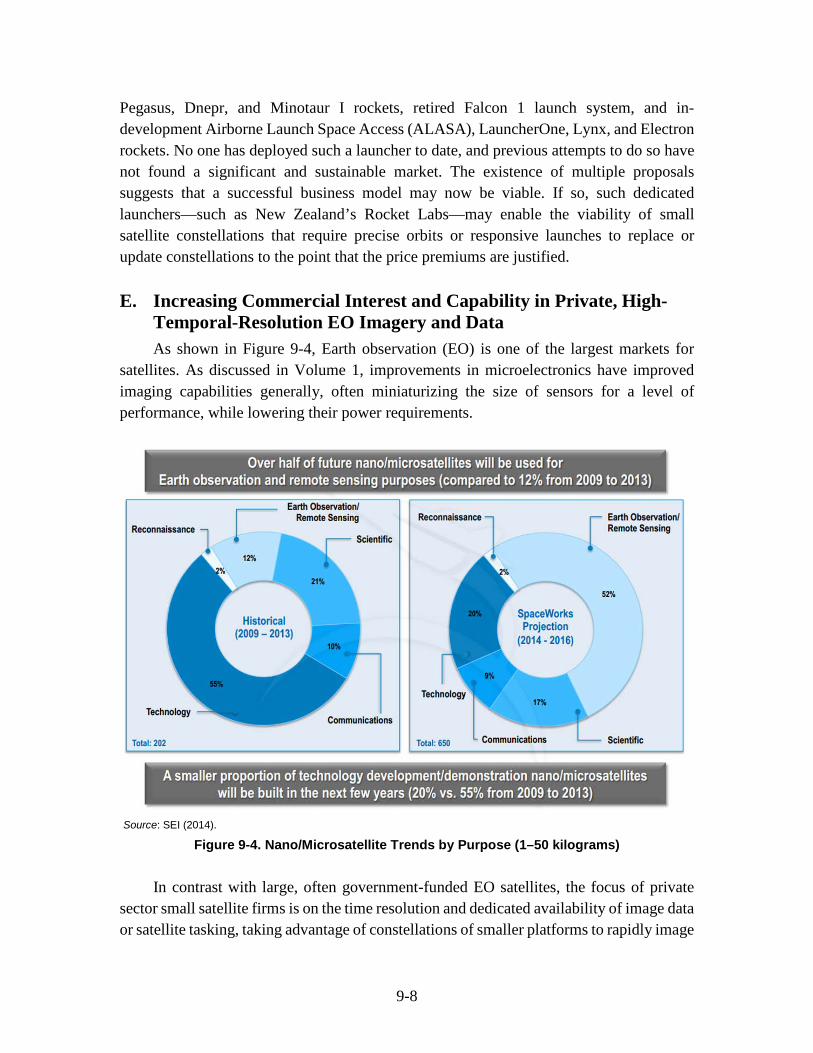
9-8
Pegasus, Dnepr, and Minotaur I rockets, retired Falcon 1 launch system, and in-development Airborne Launch Space Access (ALASA), LauncherOne, Lynx, and Electron rockets. No one has deployed such a launcher to date, and previous attempts to do so have not found a significant and sustainable market. The existence of multiple proposals suggests that a successful business model may now be viable. If so, such dedicated launchers—such as New Zealand’s Rocket Labs—may enable the viability of small satellite constellations that require precise orbits or responsive launches to replace or update constellations to the point that the price premiums are justified.
E. Increasing Commercial Interest and Capability in Private, High-Temporal-Resolution EO Imagery and Data As shown in Figure 9-4, Earth observation (EO) is one of the largest markets for
satellites. As discussed in Volume 1, improvements in microelectronics have improved imaging capabilities generally, often miniaturizing the size of sensors for a level of performance, while lowering their power requirements.
Source: SEI (2014).
Figure 9-4. Nano/Microsatellite Trends by Purpose (1–50 kilograms)
In contrast with large, often government-funded EO satellites, the focus of private sector small satellite firms is on the time resolution and dedicated availability of image data or satellite tasking, taking advantage of constellations of smaller platforms to rapidly image
9-9
the entire planet.45 Several EO small satellite firms (e.g., Skybox Imaging, Planet Labs, and OmniEarth) are looking at launching constellations to provide high time-resolution data beyond what is available from governments (e.g., Landsat) and the few imaging entities such as Digital Globe. While these firms do not necessarily offer high spectral breadth or spatial resolution, the high temporal resolution is useful for operational, often commercial, purposes. Directly observing the daily (or more often) variations and movements of ships, goods, people, river levels, crops, and so forth represent significant insight and actionable information to a number of different industries. In addition to their commercial applications, these databases can be used for scientific research purposes, such as monitoring climate change, deforestation, and migration tracking.
Often, commercial small satellite companies see themselves as data companies, providing either access to or calculations from a database they provide. The satellites used to collect that data are incidental to the end user in these cases. In addition to satellite camera improvements, improvements in dig data capabilities and software manipulation, interpretation, and analysis of images has increased the value of EO imagery by allowing information to be gleaned from the images more easily and cheaply.
These constellations could have the capability to image the entire Earth’s surface if so designed, and daily, hourly, or even several minute revisit rates may provide more information than companies or individuals may wish to disclose, which could present future privacy problems. Such problems may be difficult to regulate if data are collected by foreign companies.
F. Growing Number of New Entrants into the Space Sector through Small Satellites, Often Supported by Foreign Countries As discussed in Chapter 2 of Volume 1, countries often enter the space sector for
reasons of national pride and economic development. Due to lowered costs and commercial availability, small satellite programs are providing an easier point of entry for nations with no history in space operations to gather data for their government, add to national prestige, or train their workforces. Small satellite developers in other more developed countries may support new entrant nations’ budding space programs—examples include Surrey Space Technology Ltd. (SSTL, discussed in more detail in Volume 1), and Berlin Space Technology’s support for the National University of Singapore’s small satellite program (SSTL n.d.; Keong 2014). Figure 9-5 illustrates this type of interest by showing the composition of non-U.S. nationalities at one U.S. small satellite conference. In some cases,
45 Planet Labs has launched 71 CubeSats, Spire plans to launch 50, and SpaceX is reportedly “in the early
stages of developing advanced microsatellites operating in large formations”. In the last 5 years, demand for Clyde Space’s (a Scottish satellite manufacturing company established in 2005) products have surged an average of 40 percent per year (Werner 2014).
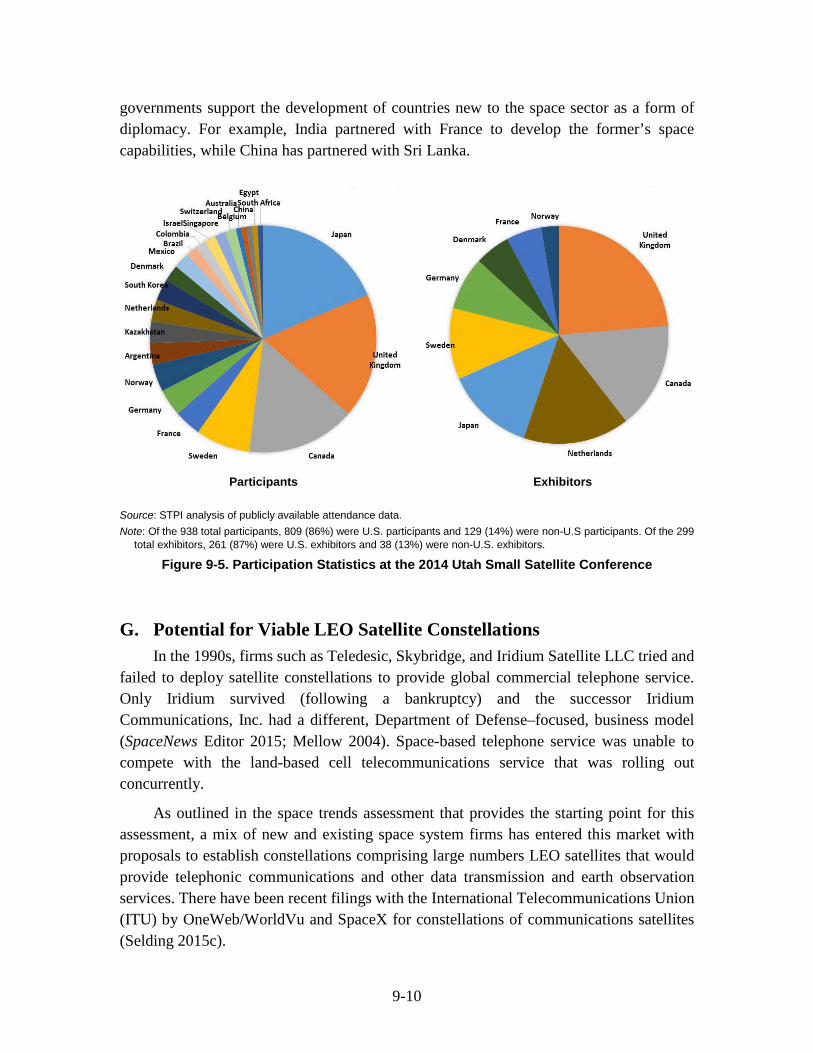
9-10
governments support the development of countries new to the space sector as a form of diplomacy. For example, India partnered with France to develop the former’s space capabilities, while China has partnered with Sri Lanka.
Participants Exhibitors Source: STPI analysis of publicly available attendance data. Note: Of the 938 total participants, 809 (86%) were U.S. participants and 129 (14%) were non-U.S participants. Of the 299
total exhibitors, 261 (87%) were U.S. exhibitors and 38 (13%) were non-U.S. exhibitors.
Figure 9-5. Participation Statistics at the 2014 Utah Small Satellite Conference
G. Potential for Viable LEO Satellite Constellations In the 1990s, firms such as Teledesic, Skybridge, and Iridium Satellite LLC tried and
failed to deploy satellite constellations to provide global commercial telephone service. Only Iridium survived (following a bankruptcy) and the successor Iridium Communications, Inc. had a different, Department of Defense–focused, business model (SpaceNews Editor 2015; Mellow 2004). Space-based telephone service was unable to compete with the land-based cell telecommunications service that was rolling out concurrently.
As outlined in the space trends assessment that provides the starting point for this assessment, a mix of new and existing space system firms has entered this market with proposals to establish constellations comprising large numbers LEO satellites that would provide telephonic communications and other data transmission and earth observation services. There have been recent filings with the International Telecommunications Union (ITU) by OneWeb/WorldVu and SpaceX for constellations of communications satellites (Selding 2015c).
9-11
There have been significant changes in enabling technologies and markets since the 1990s; such constellations may now have a viable business model.
• Internet Protocol (IP) has converged; what were distinct telephone, television, email, and other data services during the 1990s can now all be delivered efficiently using IP-encoded Internet transmissions (proposals in the 1990s focused on telephony) (GCN 2012).
• Some of the new markets for voice, television/video, telephone, and data services are in regions that are poorly served by current land and cell phone connections and are unlikely to have land-based broadband soon.
• A major expansion of the number of systems on the Internet globally is anticipated as the Internet of Things is developed, resulting in additional demand for connectivity.
• There may be opportunities for innovation in manufacturing to make satellites more affordable. Notional numbers attributed to the OneWeb (650 satellites) and SpaceX (4,000) constellations involve quantities for which there is a business case for using advanced manufacturing technologies to reduce per unit production costs (Selding 2015c).
Potential implications for NASA are diverse. Notably, there may be alternative commercial providers of space-based information services currently addressed in NASA development programs and development of alternative technical strategies that might be employed in NASA programs.
H. Future Trajectory of Small Satellites The eventual global effects and implications of the small satellites approach is
difficult to determine, as the field is too new, changing rapidly, and is highly dependent on other sectors (such as launch providers) that may affect the continued growth and viability of its market. Figure 9-6 illustrates the churn with an example from the CubeSat sector. For example, while there was a surge in the number of launches in recent years, as shown by the colors other than green, a large number of them has either failed or is dead in orbit (McDowell 2014).
Regardless, it is unlikely that small satellites (nor a small satellite approach) will replace current traditional satellite systems, as many of those missions demand (and end-users expect) the exquisite capability and reliability that the larger systems provide.
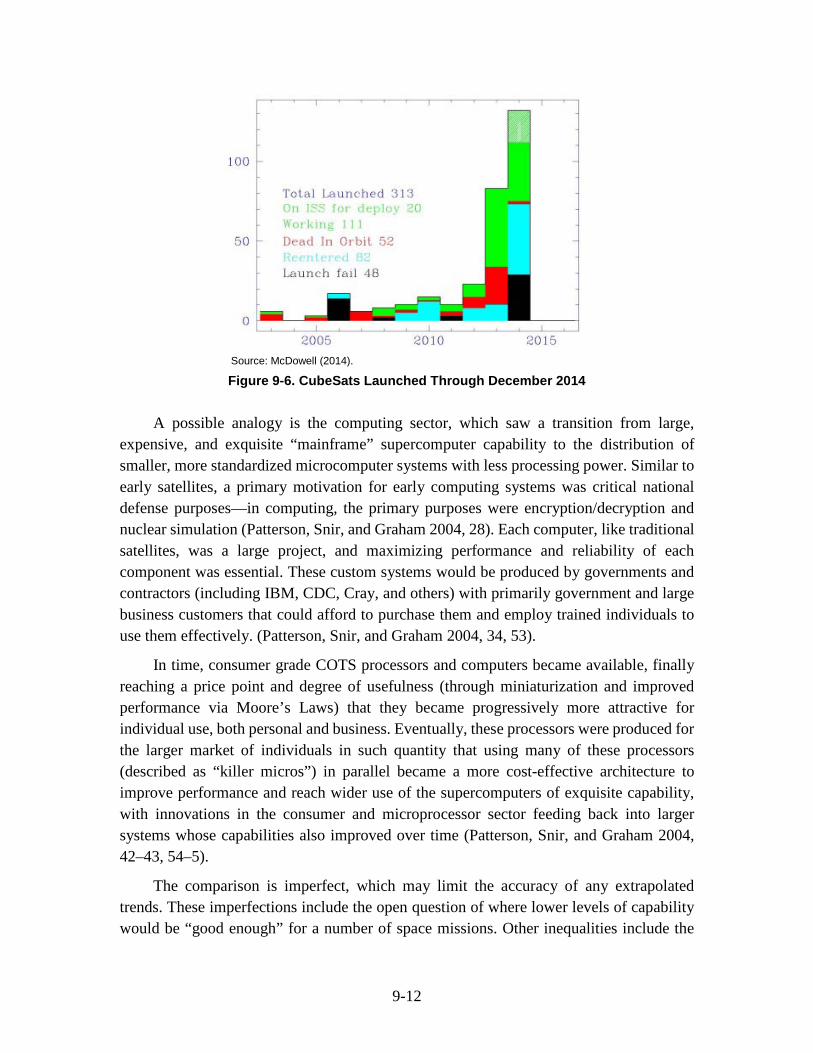
9-12
Source: McDowell (2014).
Figure 9-6. CubeSats Launched Through December 2014
A possible analogy is the computing sector, which saw a transition from large, expensive, and exquisite “mainframe” supercomputer capability to the distribution of smaller, more standardized microcomputer systems with less processing power. Similar to early satellites, a primary motivation for early computing systems was critical national defense purposes—in computing, the primary purposes were encryption/decryption and nuclear simulation (Patterson, Snir, and Graham 2004, 28). Each computer, like traditional satellites, was a large project, and maximizing performance and reliability of each component was essential. These custom systems would be produced by governments and contractors (including IBM, CDC, Cray, and others) with primarily government and large business customers that could afford to purchase them and employ trained individuals to use them effectively. (Patterson, Snir, and Graham 2004, 34, 53).
In time, consumer grade COTS processors and computers became available, finally reaching a price point and degree of usefulness (through miniaturization and improved performance via Moore’s Laws) that they became progressively more attractive for individual use, both personal and business. Eventually, these processors were produced for the larger market of individuals in such quantity that using many of these processors (described as “killer micros”) in parallel became a more cost-effective architecture to improve performance and reach wider use of the supercomputers of exquisite capability, with innovations in the consumer and microprocessor sector feeding back into larger systems whose capabilities also improved over time (Patterson, Snir, and Graham 2004, 42–43, 54–5).
The comparison is imperfect, which may limit the accuracy of any extrapolated trends. These imperfections include the open question of where lower levels of capability would be “good enough” for a number of space missions. Other inequalities include the
9-13
inherently high barriers to working in space, including limitations on power availability and a damaging radiation environment. While manufacturing technology is similar (and in many electronics more or less the same industry), space is a shared physical environment where satellites may pose risks to each other whether through impact or signal interference. Additionally, even the raw cost of energy inherent to launch (though reduced for small satellites) places a minimum cost for deployment. Finally, each of these systems is (functionally) inaccessible after deployment.46
All of these barriers work against some of the factors in the success of microcomputers and the rapid innovations in that sector. These factors include rapid and low-cost development, test, deployment, and maintenance on the ground and the capacity to operate without the possibility of affecting all other computers in the case of a failure.
Extrapolating out from the more mature computing sector, we might expect that—should small satellites become an architecture with a sustainable marketplace of COTS components, and a larger consumer base due to the lower barriers to entry—it may become a more prominent (by market) approach than large custom satellites. For similar missions demanding higher capability than physically possible for smaller systems, larger satellites might expect to derive technology improvements to greater and greater degrees from smaller satellite missions, though also for improved understanding of reliability as well as technological improvement.
46 On-orbit servicing may make this possible, but there will likely still be a relatively significant cost
associated with it.

10-1
10. Wildcards: Technological Developments andOther Factors that Could Disrupt Trends
History has shown repeatedly that technology, policy, financial, and other factors can disrupt predicted technology trends. In this study, we refer to these factors as “wildcards” that could disrupt the vector of current trends in space. For the purposes of discussion, we have clustered identified wildcards into three categories of developments: technology, geopolitical, and other.
A. Technology Developments Technological capability defines the limits of what can be physically done in space,
and sudden breakthroughs might be expected to disrupt the space sector. In the subsections that follow, we identify five technology areas that have the potential to disrupt the current trajectory of space developments.
1. In-Situ Resource Utilization MaturationBarring a massive improvement in launch technology, moving mass to space will
always carry significant expense. To reduce costs, some have considered using materials available in space (e.g., mining near-Earth asteroids or the Moon) for fuel, building materials, or even as goods to be returned to Earth. Using such resources can also represent a “bootstrapping” effect, whereby space assets and missions can become more self-sufficient. However, effectively collecting resources in space requires significant advances in robotics, three-dimensional printing, and mining technology.
In the case of goods returned to Earth, which is under study by some private firms (e.g., United States’ Planetary Resources and Deep Space Industries), there is implied a testing of the ownership rules set out in the Outer Space Treaty. While ownership has not yet become relevant, generally speaking, ownership of heavenly bodies cannot be claimed by signatory nations. However, if materials could be returned to Earth and sold, some experts believe that the precious metals in asteroids could represent trillions of dollars of value, which could disrupt those markets significantly if returned economically (a tall order). These claims have been disputed by other experts, and should be treated as just claims.
The main implication of this would be a lowered base requirement for bulk launch if building materials (for satellite hardware, base structures, etc.) or fuel could be gathered in
10-2
space instead of having to be carried from the ground. The increased self-sufficiency could also, in time, support space settlement or large independent robotic operations.
2. Technologies that Could Make Space-Based Services Redundant High-altitude vehicles with the capability to maintain themselves in the air for months
to years at a time—whether aircraft or dirigibles—could supplant many space-based functions, particularly for communication and observation. While there are some non-technical barriers (countries may not own space orbits, but they do own airspace and might object to military flights) and technical ones (fuel/power, position maintenance) the cost and area-focused advantages of simply flying over destinations of interest could be a powerful counterargument to space-based assets.
Replaceable missions include communications functions, as well as many EO missions, civil, commercial, or military (to a lesser degree). If cost-effective, this technology could cut down on the satellite and launch market and its demand for technological development. However, some missions, such as global measurements and observations, would still likely be better served from orbit.
Research on atmosphere-based substitutes is underway in the United States, United Kingdom and other countries:
• Researchers in the United Kingdom are working on the “Skimsat concept” and assert that high-resolution EO satellites can be provided at costs at least an order of magnitude lower than the current state of the art by a single change; significant reduction in orbital altitude. The platform is lower than traditional altitudes by a factor of four, leads to a 64 times reduction in radar radio frequency (RF) power, a 16 times reduction in communications RF power, and a 4 times reduction in optical aperture diameter to achieve the same performance.47
• High altitude long endurance (HALE) vehicles operate in the atmosphere above traditional civilian airspace ceilings and could theoretically operate anywhere from 60 thousand feet to near space. An iconic example of a HALE platform is the Northrop Grumman RQ-4 Global Hawk, an unmanned aerial vehicle capable of operating at an altitude of up to 65,000 feet (Symolon 2009). HALE platforms have a significant potential to disrupt the traditional business model of GEO communication satellites. In comparison with GEO communication satellites, HALE platforms should, in principle, cost less to build, launch, and operate; have lower latency; and have fewer challenges related to international radio frequency coordination. A network of HALE platforms could be used to create an inter-HALE communication network, which could serve as a global
47 From http://rispace.org/wp-content/uploads/2015/03/35_bacon.pdf.
10-3
backbone for wireless communications. HALE platforms can also be used for intelligence, surveillance, and reconnaissance (ISR) and global navigation satellite system (GNSS) augmentation.
3. Dramatic Reduction in the Cost of Launch—Launch Becomes a Commodity Access to space requires a significant investment of energy—generally enough to get
a payload moving over 9 kilometers/second—and so represents a significant cost, almost regardless of the method. In traditional rocket launches, with some exceptions, this has meant maximizing engine thrust and efficiency while minimizing the mass of the structural components that are not part of the payload being launched.
The absolute technical capability to maximize the efficiency of traditional chemical rocket engines has largely been met—Space Shuttle Main Engines were 98 percent efficient, using what are likely to be the highest performance propellants, liquid hydrogen burned with liquid oxygen. At the same time, structural components generally only make up ~10–15 percent of the mass of any given rocket, with steps taken already to minimize weight as much as possible without sacrificing too much reliability.
It is possible that alternatives to this paradigm could be developed. In the near term, these include, but are not limited to, rocket-powered aircraft (“rocket planes”) air-breathing (combined cycle) rocket systems, nuclear energy sources, beamed power, and catapults or space elevators. Solutions could also involve, as discussed in chapter 5, a combination of smaller satellites, on-orbit assembly, frequency of launch and technology (e.g., use of in-space additively manufactured parts).
Rocket planes would act as a suborbital first stage for a smaller rocket or would rely on lift-generating wings and sometimes carrier aircraft to jump-start their trips to orbit. Air-breathing rocket systems gather their heavy oxidizer from the atmosphere as modern jets do, reducing their mass and size significantly. Nuclear energy sources have been proven to be possible (e.g., the Nuclear Engine for Rocket Vehicle Application [NERVA] program), though generally release far too much radiation for the launch environment. Beamed power rockets—in one form heating a rocket’s fuel with a laser on the ground—supplies the energy for combustion from the ground, and finally space elevators, while currently limited by materials capabilities, would provide a stable platform from which to leave the atmosphere.
If any of these options were to become reality, access to space would become rather more feasible for the entire range of payload classes. Since as launch payload mass decreases, the launch cost tends to become a greater portion of a mission’s overall price, one might expect more small-payload missions and ventures to become feasible. At the same time, more missions and ventures with large mass (even if the mass were relatively cheap raw materials) would also be more feasible.
10-4
The lowering or removal of this near-fundamental barrier would change significantly how we treat space. While missions would become significantly cheaper (and reliability less paramount in importance), space would have many more entrants and in some sense no longer be a “high ground” particularly favored for U.S. interests, or those of any other country. With less care required for what can be put in space, international agreements on space debris and attempts at tracking would be put to the test, and in many instances accidents could be more likely as less careful entrants launch their own projects.
4. Space Solar Power Although the United States has rejected space solar power as a viable future
alternative for a variety of technical reasons (launch costs, complexities related to wireless power transmission, construction of large structures in orbit, satellite attitude and orbit control, power generation, and power management) as well as economic and geopolitical reasons, other nations have invested in the technology. JAXA, for instance, recently unveiled a technology roadmap that says it can make solar arrays in orbit a reality by the 2030s, and that plant could supply 1 gigawatt of energy, the equivalent of one of the country’s nuclear plants (Sasaki 2014).
If space-based solar power were to become a feasible alternative, it would represent another method of power generation that requires minimal (in this case none) sustained fuel input, a characteristic that is most important for countries with limited natural resources.
5. Technologies that Degrade GPS or Make GPS Unnecessary The basis of GPS is the transmission of radio signals carrying precise timing
information from satellites in orbit. Like all other radio transmissions, GPS signals can be subject to interference, whether intentional or accidental. In some of the most worrisome scenarios, the signals could be jammed, spoofed, or otherwise manipulated.
While a concern primarily for modern militaries, a loss of faith in the reliability of GPS, GLONASS, Galileo, or other PNT systems would be disruptive to all of the consumers of that signal, now currently used for a multitude of purposes. If the signals were found to be consistently manipulated (in a fashion perhaps analogous to modern cyber-attacks) then there would be incentive to find replacements for these PNT services around the world.
Depending on the cost and reliability, PNT may be possible by employing effects of quantum mechanics for atoms laser-cooled to near absolute-zero. At that temperature, the atoms are sensitive to external variations in magnetic or gravitational fields. If the technology can be sufficiently miniaturized, then the equivalent of a GPS system could be self-contained within a single device. This would remove the need for any GNSS satellites to provide PNT information, and is additionally more difficult (if not impossible) to jam
10-5
from afar. “In time, dependence on GPS may be as unimaginable as is the idea today of living without it.”48
In the long term, if such devices became small, portable, and cost-effective to the same degree as current GPS receivers, they would quickly replace GPS. Militaries would likely be early-adopters, as they would likely trade higher costs for reduced risk of disruption.49
B. Geopolitical Developments
1. Drastic Changes to the Outer Space Treaty or Other International Regulatory Controls of Space Currently, the activities of states and their nationals in outer space are subject to
international agreements. Among these agreements are internationally legally binding treaties governing outer space activities (e.g., Outer Space Treaty of 1967) and the International Telecommunications Union (ITU) Constitution and Convention and non-legally binding guidelines (e.g., Inter-Agency Space Debris Coordination Committee’s Space Debris Mitigation Guidelines).
An international incident could result in changes to the current status quo. Precise implications would depend on the triggering event. As an example, a cascading space debris accident would likely encourage legally binding international standards on debris mitigation, result in more stringent mitigation standards, or lead to calls for an international debris collision avoidance SSA service. As another example, the successful commercial exploitation and profit of resources mined from asteroids or the lunar surface might encourage states to resolve uncertainties in existing treaties on the question of exploitation and ownership over celestial body resources.
2. New Space Race—China/Russia Developing Lunar Bases or Increasing Militarization of Space A large-scale space program masking or in lieu of militarization by a foreign country,
whether or not in suspected violation of the Outer Space Treaty, could be undertaken. While in the past, national pride and military technology development and posturing were
48 From http://www.darpa.mil/NewsEvents/Releases/2014/07/24.aspx. 49 Because of the number of embedded systems, a legacy period would likely be required for GPS-like
programs around the world (e.g., GLONASS, Galileo, and IRNSS) before shutdown, as the public signal used around the world likely carries significant diplomatic worth. As a side concern, if GPS becomes defunct, there will still be a need for GPS Radio Occulation weather data to be replaced in some fashion, as those calculations rely on the GPS signal to function. Additionally, many if not most satellites in orbit carry GPS receivers that would be difficult to replace—another incentive to keep the system operational for at least some time after the technology is defunct.
10-6
primary motivators, access to new resources and capabilities, or response to existential threats such as an Earth-directed asteroid could be new factors.
In the presence of the Outer Space Treaty, there is less direct geopolitical motivation in the near term for an accelerated space development program, and once parity with the United States is reached, a country would have no immediately clear reason for such expensive adversarial development, whether human or robotic. Such actions by any foreign country could signal surreptitious development of capabilities, anticipation for claiming new resources, unilateral response to an existential threat, or long-term planning based on evaluations of developing technologies.
C. Other Potential Developments
1. Impact or Discovery of a Large Earth-Directed Asteroid or CometThe recent and unexpected impact of the Chelyabinsk meteor underscored the risk
from near-Earth objects and reinforced public interest in detecting and defending against them. Another impact could be unexpected like Chelyabinsk, just at a larger and more damaging scale, or could be discovered by the current (insufficient) system of observers some number of years in advance.
An impact that did not pose existential risk on its own would likely be a significant spur for the development of space technology around the world, though it would also be the case if the asteroid were to be discovered well in advance. In either case, funding and research priorities for space technology across the world would likely change abruptly, as well as potentially the institutions responsible for addressing the future or impending impacts.
Since most countries would have an interest in preventing any impact above a certain size, an international response seems warranted, though it is unclear at this point how such coordination would play out. Most disasters are regional, with response coordination centered on the relevant nations. Here, preventative measures would demand high capability with space technology, putting additional burden on the few capable nations. Any international response would also require a great deal of trust—larger nations may otherwise feel inclined to “go it alone” for their preferred solutions.
Below certain sizes and should the location of an impact be determined, additional geopolitics would come into play to determine appropriate response—prevention, or mitigation.
2. Large, Debilitating Space Weather DisasterWhile spacecraft are often shielded against radiation, a significant space weather
event, such as one similar to the 1859 Carrington Event, could do significant damage to many nations’ space assets. Depending on the precise damage, and possibility of other
10-7
pressing concerns in the immediate aftermath (such as damaged electricity distribution networks), nations may act to restore space-based systems as quickly and as cheaply as possible. Some may choose to emphasize smaller, more easily replaceable systems if all satellites were affected, or the reverse if larger systems with higher redundancy weathered the storm successfully. Alternatively, a space weather disaster could encourage the development of non-space systems to meet the same needs and to avoid the vulnerability, acting as another sector cooling effect.
3. Space Debris Cascading Event Depending upon their orbit and altitude, objects in space can remain there for long
periods of time. A significant amount of debris from prior space activities is already present, though currently collisions are rare, and larger objects are tracked by the U.S. government. The concern is that each of these objects is moving quickly—thousands of miles per hour—especially relative to other space objects in different orbits. A single large collision between debris, satellites, other spacecraft, or an anti-satellite missile could generate enough additional debris to start a chain-reaction of collisions with other spacecraft, thereby generating so much debris that impacts are all but assured.
A cascade event could destroy a number of existing space assets, particularly at the affected altitude, while denying further access to new satellites as well. Depending on the altitude, denial of the orbit could last thousands of years if not cleared artificially. Technologies to address space debris are being considered.
4. Single or Repeated Mishaps and Disasters in the Space Sector Mishaps, such as the recent Antares launch failure, and the breakup of SpaceShipTwo
during a test flight, can have a severe cooling effect on entire sectors, beyond just companies. NewSpace entrants have at times faced criticism in the past from more established entities in the aerospace sector for excessive optimism and risk-taking.
Human space flight is particularly vulnerable to this sort of cooling effect, and accidents can hobble development for years, as was the case immediately after both the Challenger and Columbia space shuttle disasters. Repeated or large accidents can cost space companies years of review and funding, even without loss of human life. A cooling effect on the entire industry could limit launch providers for human and robotic missions, driving down the supply of launches and lowering investor and public confidence in space capabilities. Costs of launch would also likely increase due to the increased standards for review after disasters.

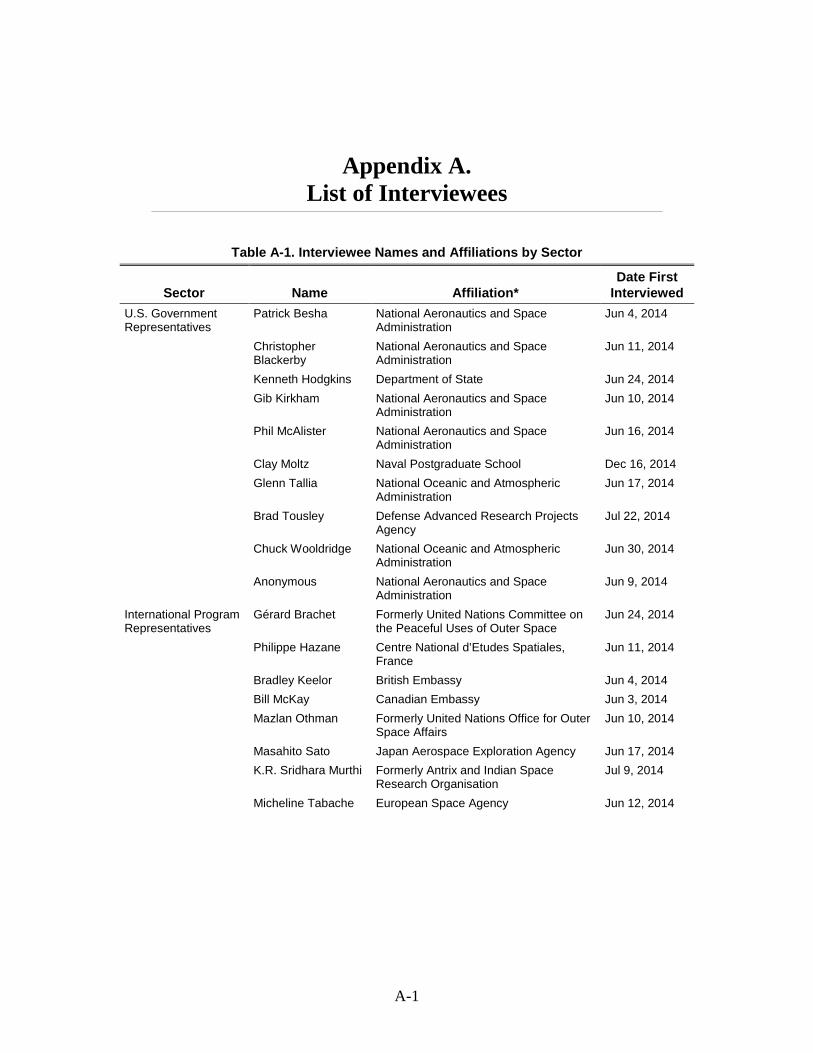
A-1
Appendix A. List of Interviewees
Table A-1. Interviewee Names and Affiliations by Sector
Sector Name Affiliation* Date First
Interviewed U.S. Government Representatives
Patrick Besha National Aeronautics and Space Administration
Jun 4, 2014
Christopher Blackerby
National Aeronautics and Space Administration
Jun 11, 2014
Kenneth Hodgkins Department of State Jun 24, 2014 Gib Kirkham National Aeronautics and Space
Administration Jun 10, 2014
Phil McAlister National Aeronautics and Space Administration
Jun 16, 2014
Clay Moltz Naval Postgraduate School Dec 16, 2014 Glenn Tallia National Oceanic and Atmospheric
Administration Jun 17, 2014
Brad Tousley Defense Advanced Research Projects Agency
Jul 22, 2014
Chuck Wooldridge National Oceanic and Atmospheric Administration
Jun 30, 2014
Anonymous National Aeronautics and Space Administration
Jun 9, 2014
International Program Representatives
Gérard Brachet Formerly United Nations Committee on the Peaceful Uses of Outer Space
Jun 24, 2014
Philippe Hazane Centre National d’Etudes Spatiales, France
Jun 11, 2014
Bradley Keelor British Embassy Jun 4, 2014 Bill McKay Canadian Embassy Jun 3, 2014 Mazlan Othman Formerly United Nations Office for Outer
Space Affairs Jun 10, 2014
Masahito Sato Japan Aerospace Exploration Agency Jun 17, 2014 K.R. Sridhara Murthi Formerly Antrix and Indian Space
Research Organisation Jul 9, 2014
Micheline Tabache European Space Agency Jun 12, 2014
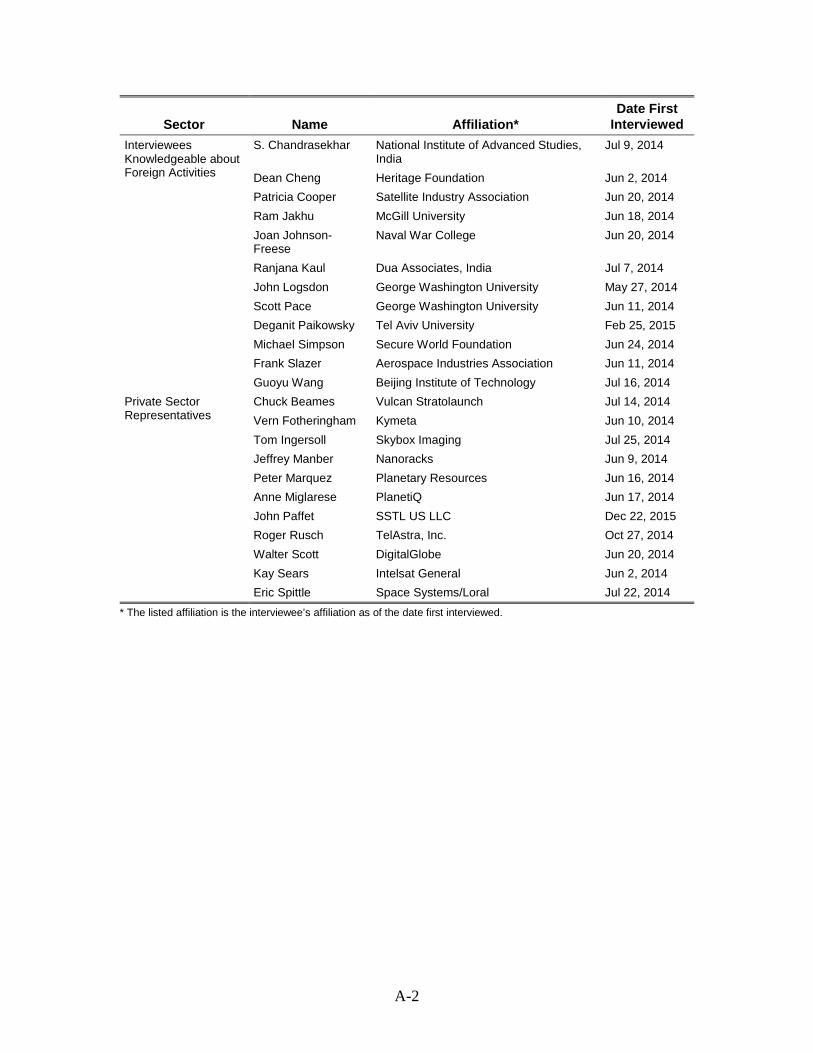
A-2
Sector Name Affiliation* Date First
Interviewed Interviewees Knowledgeable about Foreign Activities
S. Chandrasekhar National Institute of Advanced Studies, India
Jul 9, 2014
Dean Cheng Heritage Foundation Jun 2, 2014 Patricia Cooper Satellite Industry Association Jun 20, 2014 Ram Jakhu McGill University Jun 18, 2014 Joan Johnson-Freese
Naval War College Jun 20, 2014
Ranjana Kaul Dua Associates, India Jul 7, 2014 John Logsdon George Washington University May 27, 2014 Scott Pace George Washington University Jun 11, 2014 Deganit Paikowsky Tel Aviv University Feb 25, 2015 Michael Simpson Secure World Foundation Jun 24, 2014 Frank Slazer Aerospace Industries Association Jun 11, 2014 Guoyu Wang Beijing Institute of Technology Jul 16, 2014
Private Sector Representatives
Chuck Beames Vulcan Stratolaunch Jul 14, 2014 Vern Fotheringham Kymeta Jun 10, 2014 Tom Ingersoll Skybox Imaging Jul 25, 2014 Jeffrey Manber Nanoracks Jun 9, 2014 Peter Marquez Planetary Resources Jun 16, 2014 Anne Miglarese PlanetiQ Jun 17, 2014 John Paffet SSTL US LLC Dec 22, 2015 Roger Rusch TelAstra, Inc. Oct 27, 2014 Walter Scott DigitalGlobe Jun 20, 2014 Kay Sears Intelsat General Jun 2, 2014 Eric Spittle Space Systems/Loral Jul 22, 2014
* The listed affiliation is the interviewee’s affiliation as of the date first interviewed.
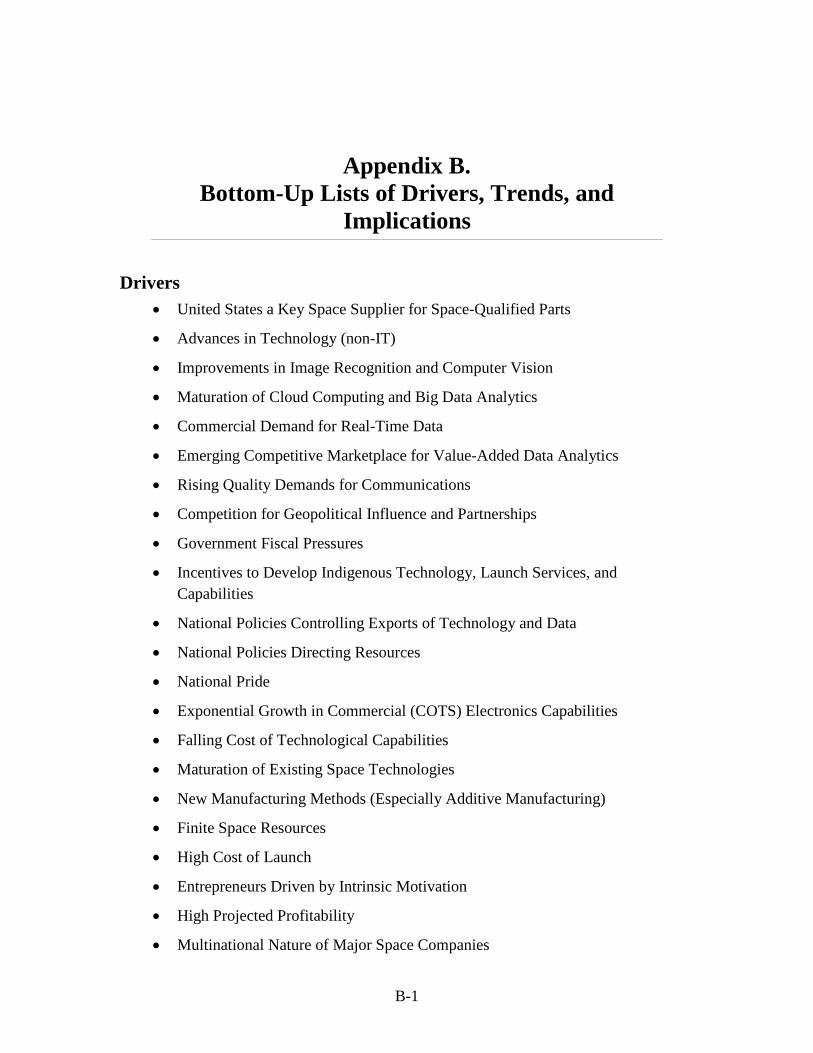
B-1
Appendix B. Bottom-Up Lists of Drivers, Trends, and
Implications
Drivers • United States a Key Space Supplier for Space-Qualified Parts
• Advances in Technology (non-IT)
• Improvements in Image Recognition and Computer Vision
• Maturation of Cloud Computing and Big Data Analytics
• Commercial Demand for Real-Time Data
• Emerging Competitive Marketplace for Value-Added Data Analytics
• Rising Quality Demands for Communications
• Competition for Geopolitical Influence and Partnerships
• Government Fiscal Pressures
• Incentives to Develop Indigenous Technology, Launch Services, andCapabilities
• National Policies Controlling Exports of Technology and Data
• National Policies Directing Resources
• National Pride
• Exponential Growth in Commercial (COTS) Electronics Capabilities
• Falling Cost of Technological Capabilities
• Maturation of Existing Space Technologies
• New Manufacturing Methods (Especially Additive Manufacturing)
• Finite Space Resources
• High Cost of Launch
• Entrepreneurs Driven by Intrinsic Motivation
• High Projected Profitability
• Multinational Nature of Major Space Companies
B-2
• Tech Startup Culture
• Demand for Connections to Remote Areas
• Demand for National Security Applications
• Desire for High-Value-Added Industrial Sector
• Government Economic Development Mandates
• National Interest in Societal Benefits
• Globalization
Trends • Increasing Interest from Second and Third World Countries in Space
• Increasing Interest and Involvement in Space from the Private Sector (Including Non-Space Sector Firms)
• Increasing Flexibility for Non-Traditional National Space Development Pathways
• Increasing Diaspora of New Innovation Models (like Prizes and Crowdsourcing) Globally
• Increasing Government Leveraging of the Private Sector
• Diversification of the Ways Government Leverages the Private Sector
• Satellite Owner-Operator Growth Outpacing that of Manufacturers
• Decreasing Proportional Inclusion of the United States in Future Partnerships
• Increasing Partnerships Generally, South-South Especially
• Greater Regional and Resource-Rich Partnerships beyond U.S. and EU Nodes
• Increasing Usefulness and Attainability of Space
• Increasing Inclusion of Commercial Solutions, Liberalization of Export Controls and Regulatory Barriers
• Acceleration of Global Proliferation of Space Technologies and Underlying Technical Knowledge
• Increasing Competition from Non-Space Data and Telecom
• Increasing Satellite Capabilities (per Unit Mass)
• Rapidly Increasing Spin-In over Spin-Out Technology in the Space Sector
B-3
• Increasing Proportion of New Entrant Nations First Satellite for EO or Science Instead of Communications
• Increasing Availability of COTS Components and Services for the Space Sector
• Increasing Interconnections Between Countries through International Forums
• Growing Number of Space-Sector Technical Publications (Scopus)
• Growing Number of Private-Sector Communications and EO Startups and Proposals
• Rapid Increase in the Number of New Space Companies
• Increasing Number of New Entrants Borrowing IT Sector Practices
• Globalization Trends from Other Sectors Increasingly Observed in Space Sector
• Competition in Major Niche Markets Is Intensifying at All Levels of the Supply Chain
• Increasing Number of Mergers and Structural Changes in the Space Sector
• Private Industry Space-Sector Supply Chains Becoming More Complex
• Increasing Contributions to Space Innovation by Non-OECD Actors
• Increasing Rate of Novel Space-Sector Patent Applications
• Government Shift toward Acquisition of Services over Products
• Greater Government Experimentation with New Procurement Tools
• Rising Fraction of Fixed-Price Contracts vs. Costs-Plus
• Improving Quality and Value—and so Demand—of EO Data
• Increasing Number and Applications of Value-Added Analytics to EO Data
• Increasing Global Interest and Participation in EO
• Increasing Spatial and Spectral Resolution in EO Sensors
• Increasing Positional Accuracy of EO Data
• More Rapid Capability Growth of COTS Sensing and Imaging Components for Small Satellites
• Increasing Need for Streamlined Data Processing
• Growing Demand for Geospatial Imagery-Based Analytics and Services
• Growing Sector for Value-Added Analytical Insights from Commercial Imagery Data
B-4
• Moving of Funding for Value-Added Analytical Insights from Government to Private Sector
• Growing Population of Commercial Providers and Customers for EO
• Increasing Commercial Remote Sensing Revenues
• Increasing Modularization of the EO Ecosystem
• Increasing Fusion of Data Products for Analytics (e.g., PNT)
• Increasing Number of Countries with EO Satellites and Civilian EO Programs
• Increasing Use of EO
• Incrementally Advancing Technology in Communication Satellites
• Increasingly Efficient Propulsion and Use of Communications Spectrum
• Increasing Demand for Communications Satellite Capacity and Services
• Increasing Interest in Space Science beyond the Wealthy Space-Faring Nations
• Increasing Range of Countries as Mission Leads or Large-Collaboration Participants in Space Science
• Growing Emphasis on both Academic and Application-Driven Research
• Increasing (both Absolute and Proportional, Space and Non-Space) International Scientific Collaborations
• Improving Launch Capabilities Worldwide
• Increasing Global Competition for Launch
• Increasing Diversity of Approaches to Launch (Primarily in the United States)
• Shifting Towards Cost-Conscious vs. Performance Driven Launch Innovation
• Increased Experimentation with and Acceptance of New Technologies and Methods (“New Space”)
• Increasing Suborbital Vehicle Activity
• Blurring Distinctions Between Government and Commercial Launch Providers and Customers
• Proliferation of Government Space-Based PNT Global and Regional Systems
• Continuing Open Access to GNSS Free of Direct User Charges (Growth in Value-Added PNT)
• Continuing Growth and Consumerization of Location-Based Services
• Continuing Development of Alternatives to Space-Based PNT
B-5
• Increasing Civilian Dependence on GNSS
• Continuing Heightened Political Uncertainty Concerning the End of the ISS Era
• Increase in New Government and Private Sector HSF Programs
• Further Development of China's HSF Program
• Advent of Commercial HSF Launch and On-Orbit Station Services
• Mounting Awareness Worldwide of the Importance of SSA
• Private Firms Increasingly Able to Provide and Commoditize SSA Data, Analytic Products, and Services
• Increasing Demand from Non-Government Space Actors for SSA
• Increasingly Difficult for Militaries and Governments to Exclusively Control SSA
• Expansion of Space-Based Services
• Shrinking Relative Role of Government in United States, Europe, and (Perhaps) Latin America—Elsewhere Government Leads
• Increasing Blurring Between Civil, Military, and Private Roles in Space
• Increasing Private Sector Interest in EO
• Increasing Demand for, and Development of, Small Satellites
• Increase in the Available Market for Small Satellite Components, Developers, Payloads, and Launch
• Increasing Use of Standards for Small Satellites Enabling Growth of the Commercial Market
• Increasing Acceptance of Standards for Launch Deployers and Interfaces for Small Satellites
• Increasing Experimentation in Different Approaches for Small Satellite Launch
• Increasing Interest in Small Satellite Constellations
• Increasing Development of and Proposals for Dedicated Small Satellite Launchers
• Increasing Commercial Interest in EO Imagery and Data from Small Satellites from Small Satellites
• Increasing Orbital Congestion from Space Debris
• Increasingly Crowded RF Spectrum
B-6
• Increasing Investment in Debris Mitigation and Remediation Technologies
• Increasing Legitimacy of International Guidelines to Mitigate Debris Generation
• Continuing Investment in New Higher Radio Frequency Bands
• Increasing Number of Governments with Space Agencies and Membership in UN COPUOS
• Increasing Government Investment in Civil and Defense Space Spending
• Rapid Increase in the Number of Companies Targeting Commercial Space Opportunities
• Increasing Philanthropic Involvement in Space
• Increasing University Program Involvement in Space
• Increasing Citizen Science and Crowdsourced Activities in the Space Sector
• Growing Global Space Stakeholder Community
• Growing Interest in NEO Existential Threat Defense Information and Coordination
• Increasing Interest in Global Space Governance Issues (e.g., Space Traffic Management, Resource Exploitation)
• Increasing Likelihood of Divergent Positions on Governance Issues
• Increasing Use of Non-Legally Binding International Arrangements to Fill Global Governance Gaps
• Increasing Degree of Space Law and Regulation
• Technology Development
• Proliferation of Actors in the Space Domain
• Diversity of Approaches
• Governance
Implications • Increasing View of Space as a Standard Economic Endeavor, Rather than tied to
National Security
• Availability of Turnkey Solution Providers for the Space Sector
• Greater Likelihoods of Technological Surprise from Certain Countries
• Despite Perceptions, United States Is Not Isolated; Instead an Overall Rise in Multipolar Collaborations
B-7
• COTS Technology Proliferation Challenging Unilateral Export Control Model
• Change in the Role of the Private Sector in Space
• More Analytic Knowledge Available from EO Data for a Variety of Sectors
• Increasing Small Country Participation in EO
• Commoditization of EO and Related Activities, Encouraging Propagation of Capability
• Opening of New Markets through Information Access
• Greater Availability of Launch Services
• Launch Market Unlikely to Become Mainly Commercial
• Challenges to U.S. Leadership in International HSF Cooperation
• Commercial HSF Launch and On-Orbit Services Enabling Less Capable Countries Independent HSF
• Demands by Private HSF Operators for Flight Safety and SSA Services
• Increased Identification of UCT and Anomalous Objects, Including Sensitive Government Assets
• Lower Costs or Other Barriers for Small Satellites
• List Pricing of Small Satellite Components Driving Down Costs
• Rise in Number and Proportion of Commercial Small Satellites
• Steps Being Taken Towards Coordinated Small Satellite Swarms
• New Commercial High Temporal Resolution and Time-Synchronized Measurement Capability
• Privacy Concerns for Companies, Countries, and Individuals from High Temporal Resolution Datasets
• Increasing New Entrants into the Space Sector through Small Satellites (Often with Foreign Support)
• Potential for Small Satellites to Become a Majority of the Market
• Political Ramification for Violating Space Debris Guidelines Likely to Increase
• Government Agencies are Under Pressure to Re-examine Export Control Policies
• Additional Time and Resources Likely Required for Space-Sector Coordination and Diplomacy Going Forward
B-8
• Innovation in the Space Sector to Become More Widely Distributed and Accelerate
• Previously Protected Sub-Sectors of Space Likely to Become Mainstream
• Increasing Difficulty to Predict Future Developments in the Space Sector
• Increasing Difficulty to Manage the Space Sector from the Top Down
• Likelihood for Waning Asymmetric Control by the United States and Other Traditional Space-Faring Nations
C-1
Appendix C. China and Globalization
China’s Prominence in Globalization China’s GDP in 2015 when expressed in terms of purchasing power parity (PPP)
international dollars is $11,976 billion. This is greater than the estimated GDP at PPP of the United States ($18,125 billion).50 See Table C-1. Using net electricity generation as a proxy for economic development, China has surpassed the United States (Angang 2015). It is common to refer to China as a rising power (Klipman 2014). From the perspective of GDP at PPP, China has already risen. Also noteworthy (and relevant for subsequent analysis) is the standing of India, which is the third wealthiest state in terms of GDP at PPP ($7,997 billions).
Over a period of several decades, China has advanced significantly in global science and engineering. China now graduates the largest number of science and engineering students globally, makes the world’s second largest investment in research and development, and is the second largest producer of scientific papers (Freeman 2015).
Technological innovation increasingly occurs within China, both by Chinese organizations and international partners. For example, GE and AVIC (Aviation Industry Association of China) have established a 50/50 joint venture to develop and market integrated, open architecture avionics systems to the global commercial aerospace industry (GE Aviation 2011). At a recent annual stockholders meeting, the business rationale for this partnership was explained in the following terms:
…people ask me a lot about the risk of doing business in China. Look, there isrisk in doing business in lots of places. But part of the answer to that question is what’s the risk of not doing business in China? If you’re in the world’s biggest—if you want to be the world’s best infrastructure company and you’re looking at the economy, which is number 2 in size today and headed to number
50 According to the World Bank:
A purchasing power parity (PPP) between two countries, A and B, is the ratio of the number of units of country A’s currency needed to purchase in country A the same quantity of a specific good or service as one unit of country B’s currency will purchase in country B. PPPs can be expressed in the currency of either of the countries. In practice, they are usually computed among large numbers of countries and expressed in terms of a single currency, with the U.S. dollar (US$) most commonly used as the base or “numeraire” currency (World Bank 2015, 4).
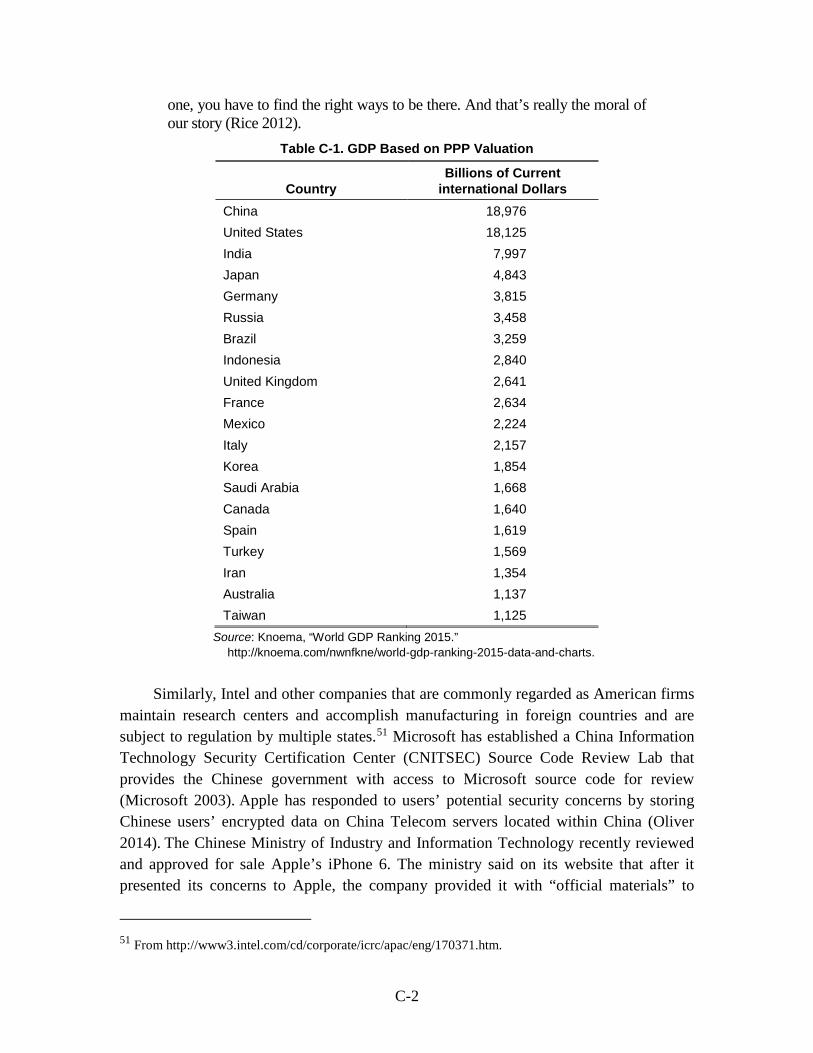
C-2
one, you have to find the right ways to be there. And that’s really the moral of our story (Rice 2012).
Table C-1. GDP Based on PPP Valuation
Country Billions of Current
international Dollars China 18,976 United States 18,125 India 7,997 Japan 4,843 Germany 3,815 Russia 3,458 Brazil 3,259 Indonesia 2,840 United Kingdom 2,641 France 2,634 Mexico 2,224 Italy 2,157 Korea 1,854 Saudi Arabia 1,668 Canada 1,640 Spain 1,619 Turkey 1,569 Iran 1,354 Australia 1,137 Taiwan 1,125
Source: Knoema, “World GDP Ranking 2015.” http://knoema.com/nwnfkne/world-gdp-ranking-2015-data-and-charts.
Similarly, Intel and other companies that are commonly regarded as American firms
maintain research centers and accomplish manufacturing in foreign countries and are subject to regulation by multiple states.51 Microsoft has established a China Information Technology Security Certification Center (CNITSEC) Source Code Review Lab that provides the Chinese government with access to Microsoft source code for review (Microsoft 2003). Apple has responded to users’ potential security concerns by storing Chinese users’ encrypted data on China Telecom servers located within China (Oliver 2014). The Chinese Ministry of Industry and Information Technology recently reviewed and approved for sale Apple’s iPhone 6. The ministry said on its website that after it presented its concerns to Apple, the company provided it with “official materials” to
51 From http://www3.intel.com/cd/corporate/icrc/apac/eng/170371.htm.
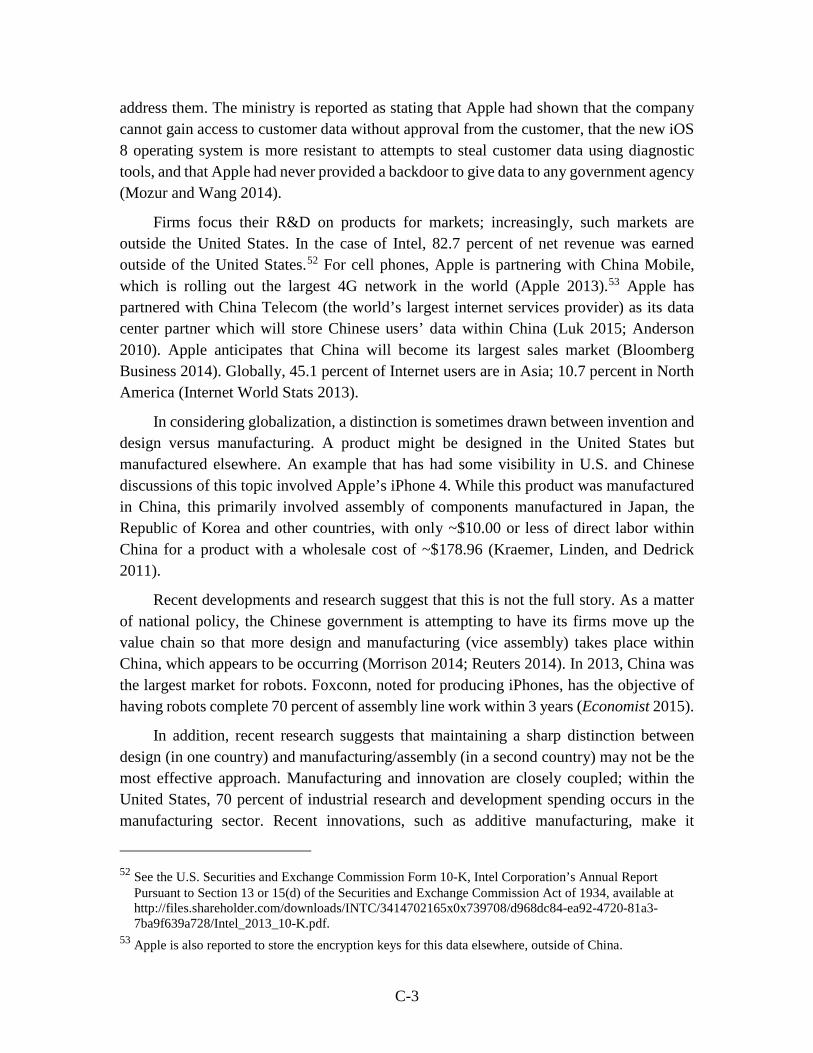
C-3
address them. The ministry is reported as stating that Apple had shown that the company cannot gain access to customer data without approval from the customer, that the new iOS 8 operating system is more resistant to attempts to steal customer data using diagnostic tools, and that Apple had never provided a backdoor to give data to any government agency (Mozur and Wang 2014).
Firms focus their R&D on products for markets; increasingly, such markets are outside the United States. In the case of Intel, 82.7 percent of net revenue was earned outside of the United States.52 For cell phones, Apple is partnering with China Mobile, which is rolling out the largest 4G network in the world (Apple 2013).53 Apple has partnered with China Telecom (the world’s largest internet services provider) as its data center partner which will store Chinese users’ data within China (Luk 2015; Anderson 2010). Apple anticipates that China will become its largest sales market (Bloomberg Business 2014). Globally, 45.1 percent of Internet users are in Asia; 10.7 percent in North America (Internet World Stats 2013).
In considering globalization, a distinction is sometimes drawn between invention and design versus manufacturing. A product might be designed in the United States but manufactured elsewhere. An example that has had some visibility in U.S. and Chinese discussions of this topic involved Apple’s iPhone 4. While this product was manufactured in China, this primarily involved assembly of components manufactured in Japan, the Republic of Korea and other countries, with only ~$10.00 or less of direct labor within China for a product with a wholesale cost of ~$178.96 (Kraemer, Linden, and Dedrick 2011).
Recent developments and research suggest that this is not the full story. As a matter of national policy, the Chinese government is attempting to have its firms move up the value chain so that more design and manufacturing (vice assembly) takes place within China, which appears to be occurring (Morrison 2014; Reuters 2014). In 2013, China was the largest market for robots. Foxconn, noted for producing iPhones, has the objective of having robots complete 70 percent of assembly line work within 3 years (Economist 2015).
In addition, recent research suggests that maintaining a sharp distinction between design (in one country) and manufacturing/assembly (in a second country) may not be the most effective approach. Manufacturing and innovation are closely coupled; within the United States, 70 percent of industrial research and development spending occurs in the manufacturing sector. Recent innovations, such as additive manufacturing, make it
52 See the U.S. Securities and Exchange Commission Form 10-K, Intel Corporation’s Annual Report
Pursuant to Section 13 or 15(d) of the Securities and Exchange Commission Act of 1934, available at http://files.shareholder.com/downloads/INTC/3414702165x0x739708/d968dc84-ea92-4720-81a3-7ba9f639a728/Intel_2013_10-K.pdf.
53 Apple is also reported to store the encryption keys for this data elsewhere, outside of China.
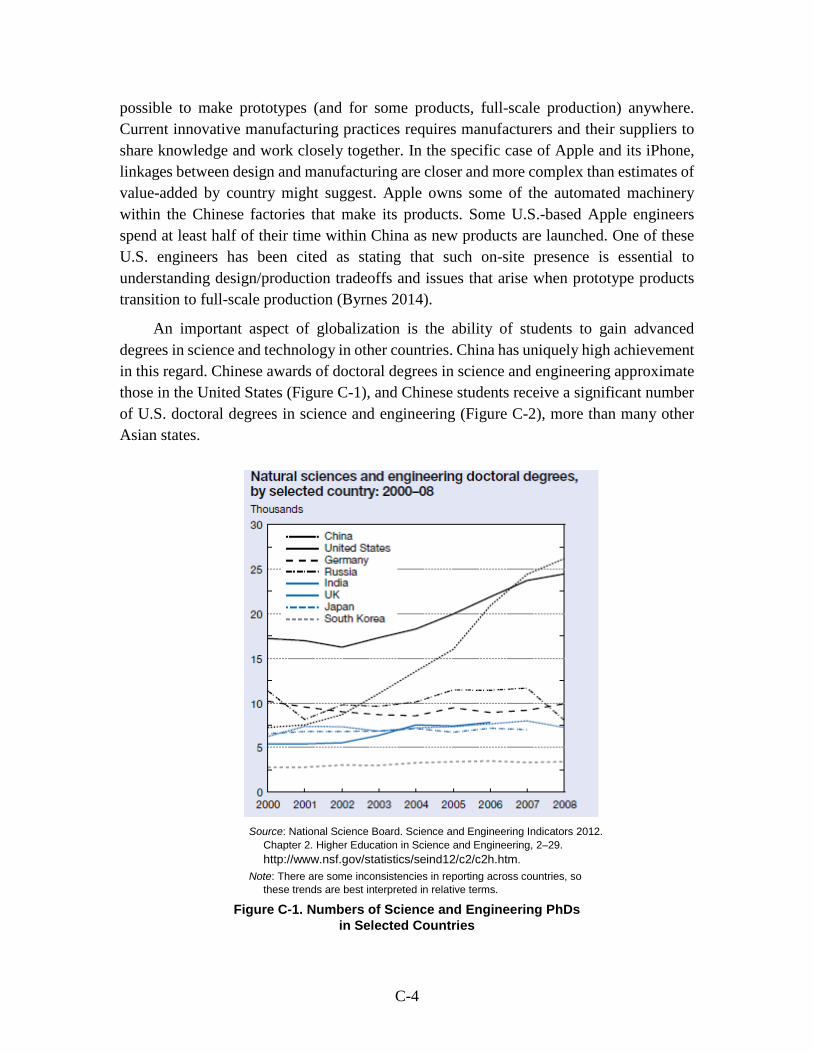
C-4
possible to make prototypes (and for some products, full-scale production) anywhere. Current innovative manufacturing practices requires manufacturers and their suppliers to share knowledge and work closely together. In the specific case of Apple and its iPhone, linkages between design and manufacturing are closer and more complex than estimates of value-added by country might suggest. Apple owns some of the automated machinery within the Chinese factories that make its products. Some U.S.-based Apple engineers spend at least half of their time within China as new products are launched. One of these U.S. engineers has been cited as stating that such on-site presence is essential to understanding design/production tradeoffs and issues that arise when prototype products transition to full-scale production (Byrnes 2014).
An important aspect of globalization is the ability of students to gain advanced degrees in science and technology in other countries. China has uniquely high achievement in this regard. Chinese awards of doctoral degrees in science and engineering approximate those in the United States (Figure C-1), and Chinese students receive a significant number of U.S. doctoral degrees in science and engineering (Figure C-2), more than many other Asian states.
Source: National Science Board. Science and Engineering Indicators 2012.
Chapter 2. Higher Education in Science and Engineering, 2–29. http://www.nsf.gov/statistics/seind12/c2/c2h.htm.
Note: There are some inconsistencies in reporting across countries, so these trends are best interpreted in relative terms.
Figure C-1. Numbers of Science and Engineering PhDs in Selected Countries
C-5
Figure C-2. Numbers of Recipients of U.S. Science and Engineering PhDs
among Selected Asian Countries, 1989–2009
The Chinese government takes a strategic approach to science and technology development. The Chinese Academy of Sciences has an S&T roadmap extending through 2050 (Lu 2010).
The current Chinese national S&T plan recognizes and takes advantage of the globalization of scientific discovery and technological innovation. Global innovation resources are to be the starting point for Chinese S&T innovation (Lu 2010, 117). International collaborations are encouraged (Lu 2010, 118), but there are limits to cooperation:
We must be clearly aware that original innovation is the source of a country’s international competitiveness. Key technologies of strategic significance can never be bought from the outside world... (Lu 2010, 118).
Chinese Space Technology Development in the Context of Globalization Space science is a specific emphasis in China’s S&T plans. For example, one
objective is to achieve (by 2030) world-class space communications data rates for almost all applications (Lu 2010, 87). A second objective for space applications is that by 2030 China will be “Mainly making use of domestic application satellite data and earth science satellite data, and making use of foreign satellite data only as a supplement” (Lu 2010, 87). There is also significant effort focused on technologies that may enhance future space
C-6
system capabilities (e.g., “post-IP” or other next generation Internet technologies) (Lu 2010, 92).
China’s space program had 16 space launches in 2014 (all successful) and ~130 active satellites on orbit (Foust 2014).54 This increase in number of launches and other space-related activities is relatively recent; China’s first successful space launch was in 1970 and for a number of years it had only a single (or no) launches annually. Since 2010, China has had 14 or more launches annually.55
China is promoting international partnerships in space sectors. At the December 2014 ministerial meeting of the ESA, indicated that it would like to increase space-related scientific with the major space powers—the United States, Russia, and China (ESA 2014). This appears to be the first time that the ESA has listed China alongside the United States and Russia as a core ESA partner (Selding 2015b).
Given its economic resources and technical talent, China can, if it so elects, have a level of achievement in the civil space launch and space system sectors comparable to that of the United States, Europe or Russia. This is not to predict that China will match other space powers’ accomplishments. States do not always attempt to exactly match others’ accomplishments. They seek sufficiency as defined by national leaders. Space sector investments are always in competition with other priorities.
In space as in other technological domains, China is seeking “S&T Innovation with Chinese Characteristics” (ESA 2014). If China’s leaders give priority to achieving a goal within one of the civil space sectors that is within the technological state of the art, it has the needed economic and technological resources has a likelihood of success comparable to the United States.56
U.S.-Chinese Technical Interchange in the Context of Globalization The U.S. 2015 National Security Strategy welcomes China’s rise and seeks partnerships.
The United States welcomes the rise of a stable, peaceful, and prosperous China. We seek to develop a constructive relationship with China that delivers benefits for our two peoples and promotes security and prosperity in Asia and around the world. We seek cooperation on shared regional and
54 UCS Satellite Database as of February 1, 2015,
http://www.ucsusa.org/nuclear_weapons_and_global_security/solutions/space-weapons/ucs-satellite-database.html#.VRqtZ_nF_Rs/.
55 See Claude Lafleur’s Spacecraft Encyclopedia, “Chinese Satellites,” http://claudelafleur.qc.ca/Scfam-chinese.html, and Wikipedia, “List of Long March Launches,” accessed March 2015, http://en.wikipedia.org/wiki/List_of_Long_March_launches/.
56 This generalization is deliberately limited to the civil space sectors. Additional considerations apply for national security space for technology applications that do not have close civil sector counterparts.
C-7
global challenges such as climate change, public health, economic growth, and the denuclearization of the Korean Peninsula. While there will be competition, we reject the inevitability of confrontation. At the same time, we will manage competition from a position of strength while insisting that China uphold international rules and norms on issues ranging from maritime security to trade and human rights. We will closely monitor China’s military modernization and expanding presence in Asia, while seeking ways to reduce the risk of misunderstanding or miscalculation. On cybersecurity, we will take necessary actions to protect our businesses and defend our networks against cyber-theft of trade secrets for commercial gain whether by private actors or the Chinese government (President of the United States 2015, 24).
Notwithstanding current National policy, since 1999 U.S. export controls have constrained use of Chinese launchers for U.S. satellites (Smith 2015). More recently, Congress has placed limitations on NASA’s cooperation with China; most recently, Section 532 of the Consolidated and Further Continuing Appropriations Act of 2015 imposes limits on NASA’s cooperation with China.

D-1
Appendix D. Differentiating Between Private and
Commercial Space
Previous STPI research on developments in private space differentiated between private and commercial space as described in this appendix.
The term “commercial space” is used frequently to describe the activities discussed in this report. However, so is the term “private space.” The terms are often used interchangeably:
It is hard to think of a better example of how routine space flight has become than the cargo missions that bring supplies to the International Space Station (ISS). But the one that docked with it at 1:03 p.m. GMT [Greenwich Mean Time] on October 10th is special … it is the first cargo flight to the station undertaken by a commercial company. Its success is a vindication of the decision by NASA, America’s space agency, to delegate such missions to the private sector [emphases added]. (Economist 2012)
Calling SpaceX a commercial company is thus appropriate because it is engaging in commerce. It is also a member of the private sector, because the company is privately held. This appendix discusses the concepts of commercial and private space to shed light on their differences.
Defining Commercial and Private Space The term commercial refers simply to engagement in commerce: buying and selling
of goods and services. All sorts of organizations (public and private) can engage in commerce or commercial transactions. In other words, calling a company commercial does not clarify its status more than to specify that it engages in buying and selling of goods and services.
The term private space is not well defined either. One could say that the “private” space sector is one where private companies, without any government support, raise capital, invest in space capabilities, operate in space, sell their products to business and consumers, and make a profit (or at least invest with the expectation that they will make a profit). In such a sector, the government’s involvement is purely regulatory (safety, export controls, international matters, tax, and so forth). If these companies sell to government customers, it is just that—same basic prices and services that consumers purchase. In private
D-2
operations, the company takes all the risks.57 If the market goes away, so does the company (bankruptcy) unless it finds another customer or produces a different product.
Commercial space refers to companies being offered some markets and opportunities to provide services that the government wishes to purchase and are related to other government goals and missions. There is significant government support for these goods and services because they are necessary for the mission (and for which the government would produce themselves and have in the past). In commercial operations, the government takes much of the risk, and, if the company fails to produce, the government may bail them out if it cannot get a substitute product elsewhere.
The claim is that if markets, through the process of competition, are not determining what is produced and consumed, the sector cannot be considered “private.” The occasional use of the term “private” in this sense can be considered aspirational, with the expectation that the space will eventually be a competitive market (like aviation is today). Most companies operating in the space sector depend on the government to act as consumer.
For historical reasons, however, government and other documents have referred to private sector space as commercial space58 and, in the discourse described a vision where actors in the private sector (whether privately owned or publicly held) are taking leadership in the space economy by taking risks (e.g., by investing non-governmental resources) and where the government is one of many customers of private-sector-developed products or services. The term commercial has therefore been used interchangeably with private space.
Many experts interviewed for prior STPI research believe that the developments in space today cannot be considered private because they are largely government funded. For them, for a market to be private, it must be guided by the rules of a competitive market where private companies—whether privately owned or publicly traded—without special government support, are raising capital, investing in space capabilities, operating in space, selling their products to business and consumers, and making a profit (or at least investing with the expectation that they will make a profit). Markets and competition drive production, with the enterprise taking all the risks. If the market goes away, so does the company (bankruptcy) unless it finds another customer or produces a different product. 57 This is not generally the case for other private sectors like banking or automotive, where the government
can step in and “bail out” the private sector. 58 The term has been defined in government documents. For example, the National Space Policy defines it
as follows:
The term “commercial,” for the purposes of this policy, refers to space goods, services, or activities provided by private sector enterprises that bear a reasonable portion of the investment risk and responsibility for the activity, operate in accordance with typical market-based incentives for controlling cost and optimizing return on investment, and have the legal capacity to offer these goods or services to existing or potential nongovernmental customers (President of the United States 2010).
D-3
Using this characterization where the only defining feature of private space is the customer, the private sector exists in some subsectors of space (e.g., telecommunications) and not in others (e.g., launch to GEO).
Several experts asserted that little is new about private sector involvement in space today. The private sector was heavily involved, for example, in all prior space activities—from producing the Project Mercury hardware in the 1950s (with involvement from firms such as North American Aviation, McDonnell Aircraft Corporation, among others) to the Space Shuttle through the 2000s (Boeing/Rockwell, Lockheed Martin, Alliant Techsystems, among others). Other experts articulated an emerging narrative of space where the private sector is playing a different role than it did.59 For example:
• Fiscal pressures that give the government the motivation and an economic development mandate that gives NASA the authority to experiment with new procurement tools;
• Building managerial skill within NASA to be able to manage external firms using new contractual vehicles;
• An emerging paradigm where government is moving in the direction of obtaining services rather than products;
• The government using a different procurement philosophy when obtaining these services, which specifies what products/services are needed rather than how they are to be provided;
• A larger fraction of these contracts being fixed price rather than cost plus, letting participating firms take a greater share of the technological and market risk and providing an incentive to be cost effective;
• Technology reaching the point where some of it (e.g., launch to LEO) has overcome some of the biggest production uncertainty challenges;
• Private sector firms having matured to the point where they are ready to leverage government-developed capabilities; and
• The presence of a new breed of entrepreneurial business leaders who are not depending on capital markets for funding and are driven not by traditional short-term business returns on investment, but rather by “intrinsic motivations” to accelerate human presence in outer space.
Building on our interviews and a review of the literature for a related task, the Science and Technology Policy Institute (STPI) constructed an operational framework that better defines private space and is likely to build consensus in the community. This framework has
59 This narrative is based on work by MacDonald (2008, 2010).
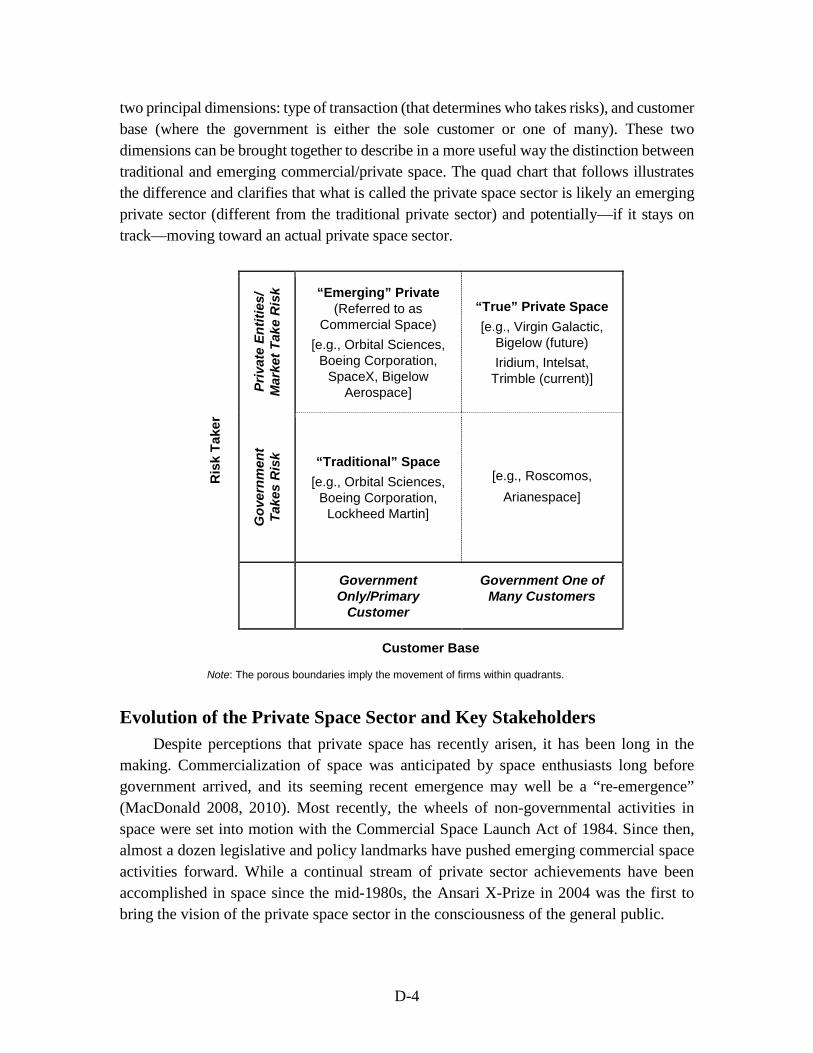
D-4
two principal dimensions: type of transaction (that determines who takes risks), and customer base (where the government is either the sole customer or one of many). These two dimensions can be brought together to describe in a more useful way the distinction between traditional and emerging commercial/private space. The quad chart that follows illustrates the difference and clarifies that what is called the private space sector is likely an emerging private sector (different from the traditional private sector) and potentially—if it stays on track—moving toward an actual private space sector.
Ris
k Ta
ker
Priv
ate
Entit
ies/
M
arke
t Tak
e R
isk “Emerging” Private
(Referred to as Commercial Space)
[e.g., Orbital Sciences, Boeing Corporation,
SpaceX, Bigelow Aerospace]
“True” Private Space [e.g., Virgin Galactic,
Bigelow (future) Iridium, Intelsat,
Trimble (current)]
Gov
ernm
ent
Take
s R
isk “Traditional” Space
[e.g., Orbital Sciences, Boeing Corporation,
Lockheed Martin]
[e.g., Roscomos, Arianespace]
Government Only/Primary
Customer
Government One of Many Customers
Customer Base
Note: The porous boundaries imply the movement of firms within quadrants.
Evolution of the Private Space Sector and Key Stakeholders Despite perceptions that private space has recently arisen, it has been long in the
making. Commercialization of space was anticipated by space enthusiasts long before government arrived, and its seeming recent emergence may well be a “re-emergence” (MacDonald 2008, 2010). Most recently, the wheels of non-governmental activities in space were set into motion with the Commercial Space Launch Act of 1984. Since then, almost a dozen legislative and policy landmarks have pushed emerging commercial space activities forward. While a continual stream of private sector achievements have been accomplished in space since the mid-1980s, the Ansari X-Prize in 2004 was the first to bring the vision of the private space sector in the consciousness of the general public.
D-5
Not only is there a perception that private sector emergence is a new phenomenon, it is also believed that the private sector in space is still playing a small role. This perception, too, could not be farther from reality. When the entirety of the space economy is included, 75 percent of the global space sector is private.
Experts interviewed for the related work pointed out that despite space’s longevity and size, an emerging paradigm is evolving in space today. This “emerging” private sector has been the focus of this report.
Summary and Conclusion This appendix provides three insights related to private space. First it clarifies that the
current definitions of the term are essentially descriptions and characterizations rather than definitions. Second it highlights the slightly misleading use of the term “commercial,” which refers to a type of transaction (one pertaining to buying or selling of goods and services) rather than a type of company. A public or a private entity can be engaged in commercial transactions. If the goal of this report is to clarify new developments in space, the change is in the types of companies or types of ways the government engages with the private sector, rather than whether commerce is involved. Lastly, it clarifies, through a framework, that whether the space market is “private” depends not only on who the customer is but also on who takes the risk of the transaction.
The unifying framework illustrates that most current descriptions of private space—referred to as “commercial space” in government reports—are visions of a future rather than an account of current activity in the space sector. Outside of the communication satellite or imagery sectors, there may not yet be an application of space that could be characterized as truly private (although firms like SpaceX, Virgin Galactic, and others are attempting to change that model).

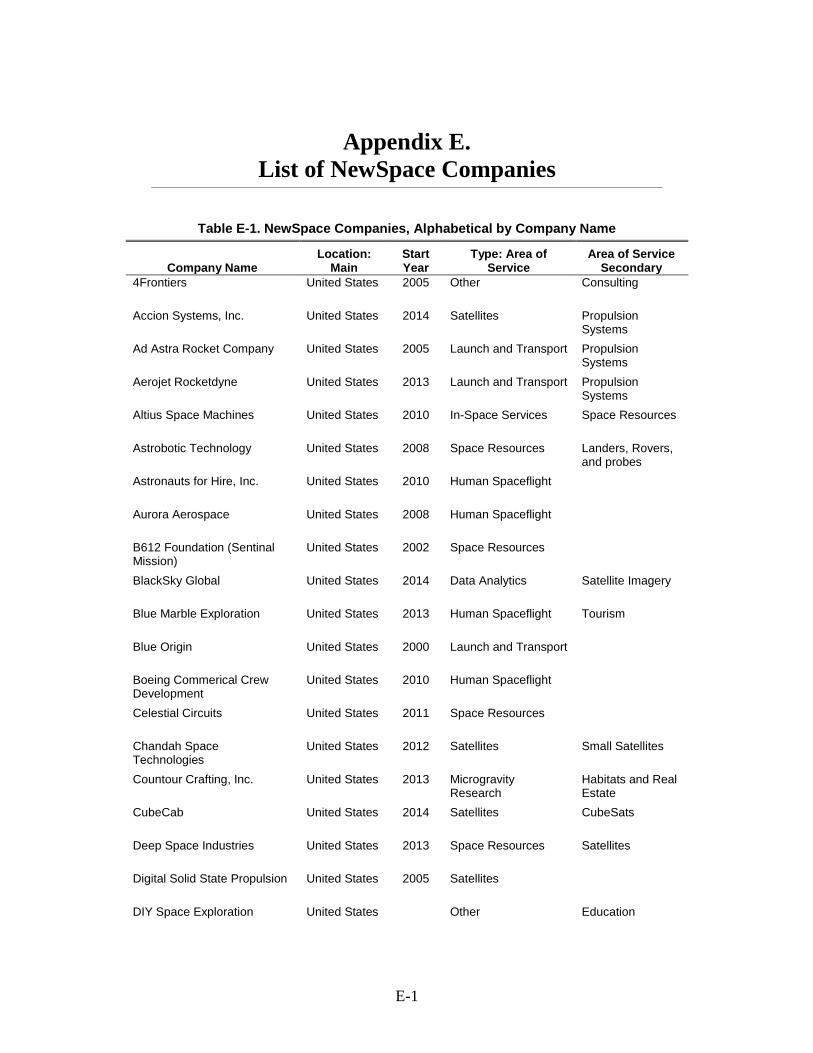
E-1
Appendix E. List of NewSpace Companies
Table E-1. NewSpace Companies, Alphabetical by Company Name
Company Name Location:
Main Start Year
Type: Area of Service
Area of Service Secondary
4Frontiers United States 2005 Other Consulting
Accion Systems, Inc. United States 2014 Satellites Propulsion Systems
Ad Astra Rocket Company United States 2005 Launch and Transport Propulsion Systems
Aerojet Rocketdyne United States 2013 Launch and Transport Propulsion Systems
Altius Space Machines United States 2010 In-Space Services Space Resources
Astrobotic Technology United States 2008 Space Resources Landers, Rovers, and probes
Astronauts for Hire, Inc. United States 2010 Human Spaceflight
Aurora Aerospace United States 2008 Human Spaceflight
B612 Foundation (Sentinal Mission)
United States 2002 Space Resources
BlackSky Global United States 2014 Data Analytics Satellite Imagery
Blue Marble Exploration United States 2013 Human Spaceflight Tourism
Blue Origin United States 2000 Launch and Transport
Boeing Commerical Crew Development
United States 2010 Human Spaceflight
Celestial Circuits United States 2011 Space Resources
Chandah Space Technologies
United States 2012 Satellites Small Satellites
Countour Crafting, Inc. United States 2013 Microgravity Research
Habitats and Real Estate
CubeCab United States 2014 Satellites CubeSats
Deep Space Industries United States 2013 Space Resources Satellites
Digital Solid State Propulsion United States 2005 Satellites
DIY Space Exploration United States Other Education
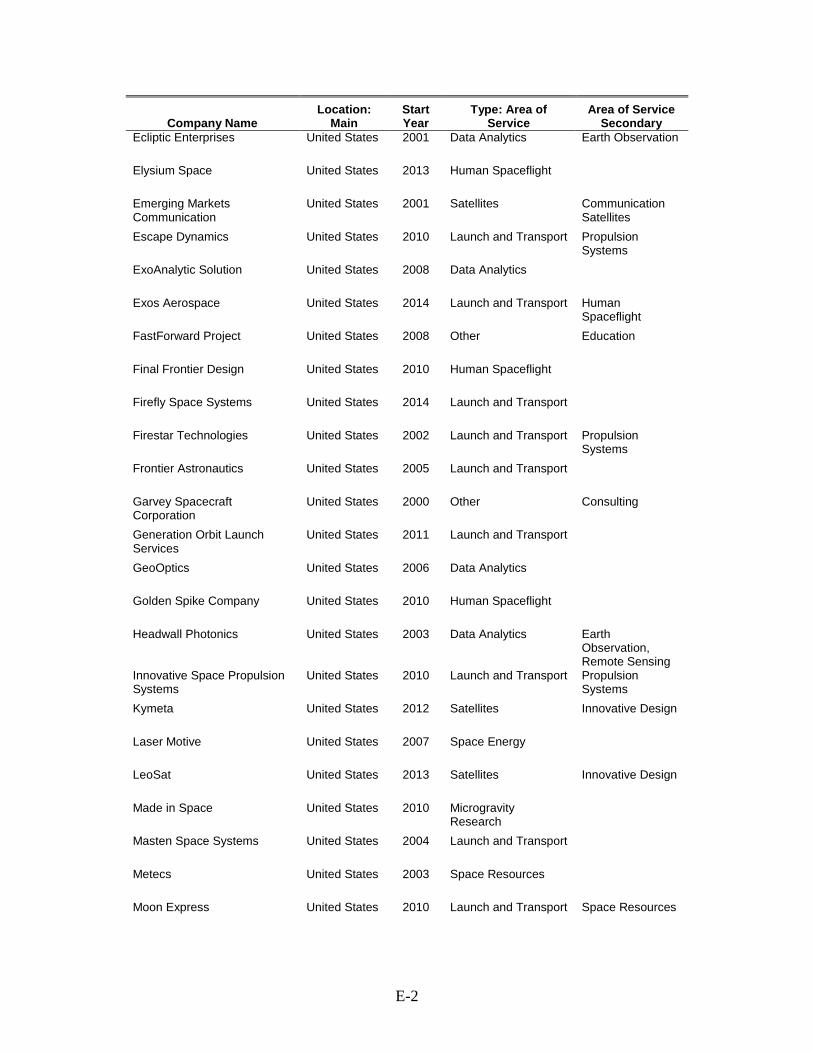
E-2
Company Name Location:
Main Start Year
Type: Area of Service
Area of Service Secondary
Ecliptic Enterprises United States 2001 Data Analytics Earth Observation
Elysium Space United States 2013 Human Spaceflight
Emerging Markets Communication
United States 2001 Satellites Communication Satellites
Escape Dynamics United States 2010 Launch and Transport Propulsion Systems
ExoAnalytic Solution United States 2008 Data Analytics
Exos Aerospace United States 2014 Launch and Transport Human Spaceflight
FastForward Project United States 2008 Other Education
Final Frontier Design United States 2010 Human Spaceflight
Firefly Space Systems United States 2014 Launch and Transport
Firestar Technologies United States 2002 Launch and Transport Propulsion Systems
Frontier Astronautics United States 2005 Launch and Transport
Garvey Spacecraft Corporation
United States 2000 Other Consulting
Generation Orbit Launch Services
United States 2011 Launch and Transport
GeoOptics United States 2006 Data Analytics
Golden Spike Company United States 2010 Human Spaceflight
Headwall Photonics United States 2003 Data Analytics Earth Observation, Remote Sensing
Innovative Space Propulsion Systems
United States 2010 Launch and Transport Propulsion Systems
Kymeta United States 2012 Satellites Innovative Design
Laser Motive United States 2007 Space Energy
LeoSat United States 2013 Satellites Innovative Design
Made in Space United States 2010 Microgravity Research
Masten Space Systems United States 2004 Launch and Transport
Metecs United States 2003 Space Resources
Moon Express United States 2010 Launch and Transport Space Resources
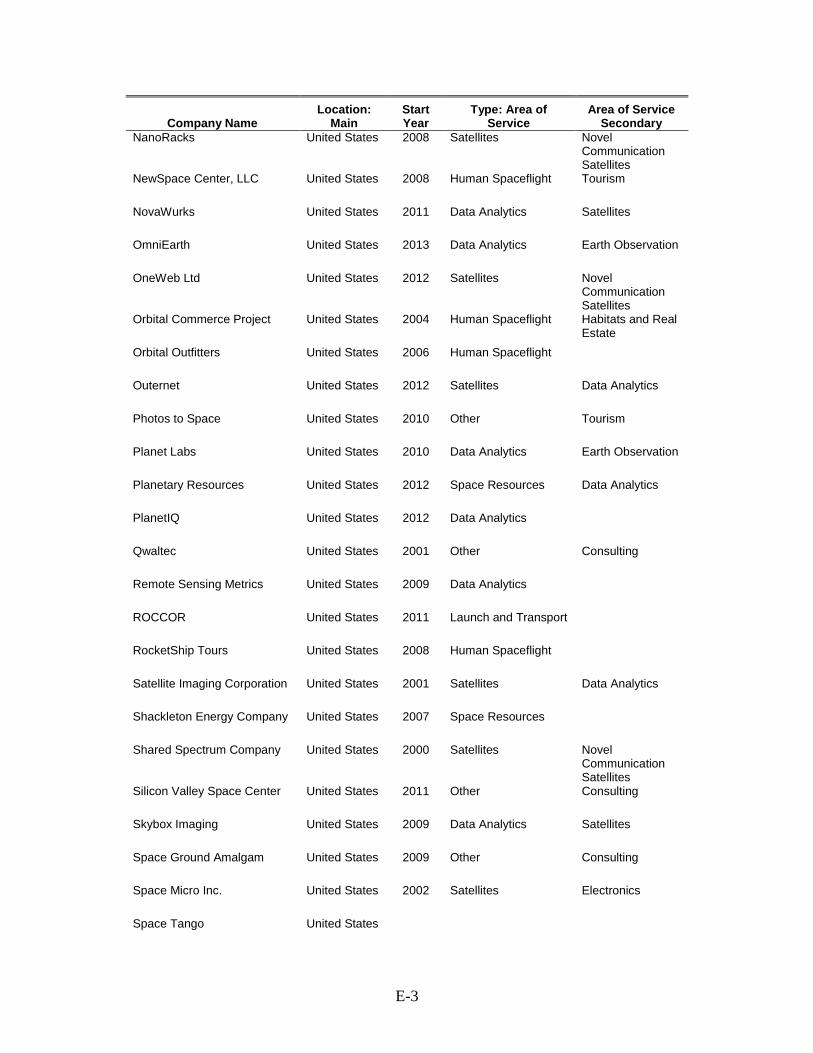
E-3
Company Name Location:
Main Start Year
Type: Area of Service
Area of Service Secondary
NanoRacks United States 2008 Satellites Novel Communication Satellites
NewSpace Center, LLC United States 2008 Human Spaceflight Tourism
NovaWurks United States 2011 Data Analytics Satellites
OmniEarth United States 2013 Data Analytics Earth Observation
OneWeb Ltd United States 2012 Satellites Novel Communication Satellites
Orbital Commerce Project United States 2004 Human Spaceflight Habitats and Real Estate
Orbital Outfitters United States 2006 Human Spaceflight
Outernet United States 2012 Satellites Data Analytics
Photos to Space United States 2010 Other Tourism
Planet Labs United States 2010 Data Analytics Earth Observation
Planetary Resources United States 2012 Space Resources Data Analytics
PlanetIQ United States 2012 Data Analytics
Qwaltec United States 2001 Other Consulting
Remote Sensing Metrics United States 2009 Data Analytics
ROCCOR United States 2011 Launch and Transport
RocketShip Tours United States 2008 Human Spaceflight
Satellite Imaging Corporation United States 2001 Satellites Data Analytics
Shackleton Energy Company United States 2007 Space Resources
Shared Spectrum Company United States 2000 Satellites Novel Communication Satellites
Silicon Valley Space Center United States 2011 Other Consulting
Skybox Imaging United States 2009 Data Analytics Satellites
Space Ground Amalgam United States 2009 Other Consulting
Space Micro Inc. United States 2002 Satellites Electronics
Space Tango United States
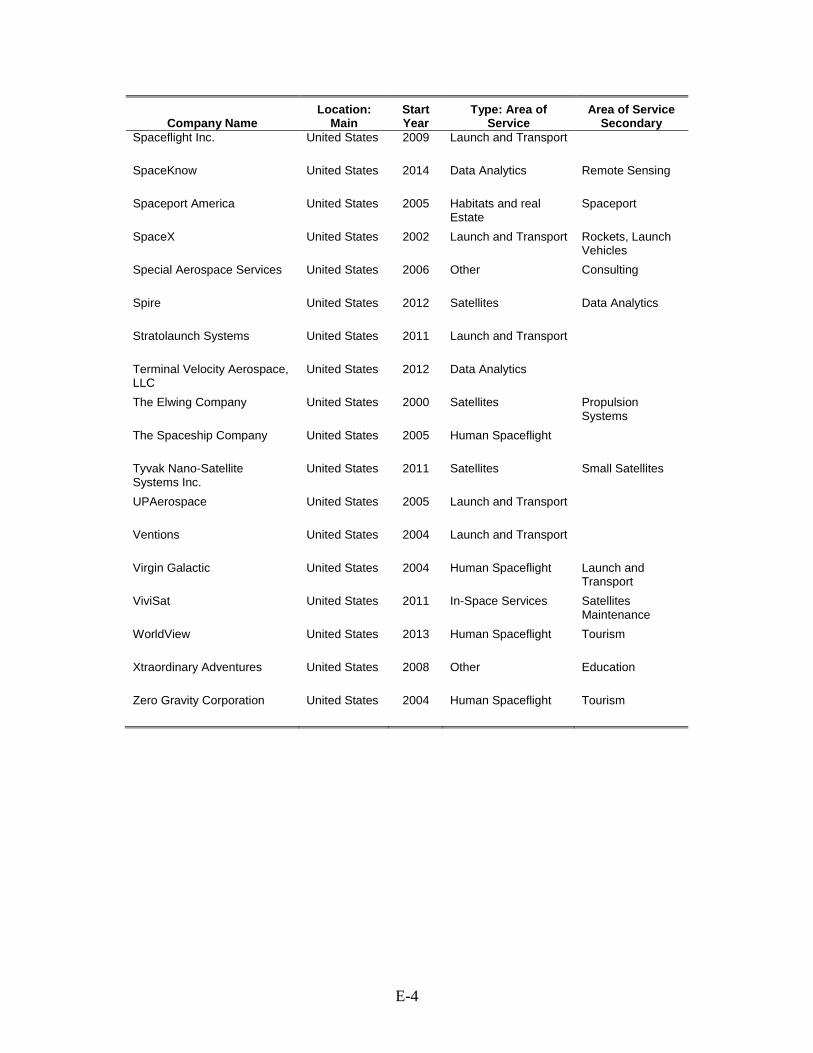
E-4
Company Name Location:
Main Start Year
Type: Area of Service
Area of Service Secondary
Spaceflight Inc. United States 2009 Launch and Transport
SpaceKnow United States 2014 Data Analytics Remote Sensing
Spaceport America United States 2005 Habitats and real Estate
Spaceport
SpaceX United States 2002 Launch and Transport Rockets, Launch Vehicles
Special Aerospace Services United States 2006 Other Consulting
Spire United States 2012 Satellites Data Analytics
Stratolaunch Systems United States 2011 Launch and Transport
Terminal Velocity Aerospace, LLC
United States 2012 Data Analytics
The Elwing Company United States 2000 Satellites Propulsion Systems
The Spaceship Company United States 2005 Human Spaceflight
Tyvak Nano-Satellite Systems Inc.
United States 2011 Satellites Small Satellites
UPAerospace United States 2005 Launch and Transport
Ventions United States 2004 Launch and Transport
Virgin Galactic United States 2004 Human Spaceflight Launch and Transport
ViviSat United States 2011 In-Space Services Satellites Maintenance
WorldView United States 2013 Human Spaceflight Tourism
Xtraordinary Adventures United States 2008 Other Education
Zero Gravity Corporation United States 2004 Human Spaceflight Tourism
F-1
References
Adams, J. 2013. “Collaborations: The Fourth Age of Research.” Nature 497, http://www.nature.com/nature/journal/v497/n7451/full/497557a.html.
Agapov, V., and I. Molotov. 2008. “International Scientific Optical Observation Network (ISON) for the Near-Earth Space Surveillance—Results of the First Years of Work and Plans for the Future.” Presentation for the 45th Session of the COPUOS STSC. (February 19).Vienna. http://lfvn.astronomer.ru/report/0000029.
Al-Ekabi, C. B. Baranes, P. Hulsroj, and A. Lahcen (eds.) 2015. Yearbook on Space Policy 2012/2013: Space in a Changing World. Springer.
Anderson, C. 2013. “Rethinking Public-Private Space Travel.” Space Policy 29 (4, November) 266–271. doi:10.1016/j.spacepol.2013.08.002.
Anderson, N. 2010. “Just Two Chinese ISPs Serve 20 Percent of World Broadband Users.” Ars Technica, July 28. http://arstechnica.com/tech-policy/2010/07/just-two-chinese-isps-serve-20-of-world-broadband-users/.
Angang, H. 2015. “Embracing China’s ‘New Normal’.” Foreign Affairs, May/June. http://www.foreignaffairs.com/articles/143336/hu-angang/embracing-chinas-new-normal.
Apple. 2013. “China Mobile and Apple Bring iPhone to China Mobile’s 4G and 3G Networks on January 17, 2014.” Press Release, December 22. http://www.apple.com/pr/library/2013/12/22China-Mobile-Apple-Bring-iPhone-to-China-Mobiles-4G-3G-Networks-on-January-17-2014.html.
Arnould, J. 2014, “The Explorer’s Complex.” Space Policy 30(4, November): 185–189. doi:10.1016/j.spacepol.2014.10.005.
Australian Government. 2013. Australia’s Satellite Utilisation Policy. http://www.space.gov.au/SPACEPOLICYUNIT/Pages/default.aspx.
Barbaroux, P. 2014. “Are Space Industries Getting ‘Normal’? Investigating Current Trends in the World Space Economy.” http://cit2014.sciencesconf.org/conference/cit2014/pages/Barbaroux_Final_Paper.pdf.
Barnes, R. 2006. “Symphonie Launch Negotiations.” News and Notes 23 (1, February): 1–5. http://history.nasa.gov/histnews.htm.
Barraud, E. 2014. “Ultra-Low Consumption for the Future of Electronics.” Phys.org, September 25. http://phys.org/news/2014-09-ultra-low-consumption-future-electronics.html#jCp.
Baumann, J. 2013. “More Crop per Drop.” ArcUser, Winter: 12–13. http://www.esri.com/esri-news/arcuser/winter-2013/more-crop-per-drop.
F-2
BBC News. 2013. “Bolivian Crowds Cheer Tupak Katari Satellite Launch.” BBC News Latin America & Caribbean, December 21. http://www.bbc.com/news/world-latin-america-25471206.
Bloomberg Business. 2014. “Apple Will More Than Double China Stores in 2 Years.” October 23. http://www.bloomberg.com/news/2014-10-23/apple-will-more-than-double-china-stores-in-2-years.html.
Brophy, J., F. Culick, L. Friedman, C. Allen, D. Baughman, J. Bellerose, B. Betts, M. Brown, J. Casani, and M. Coradini. 2012. Asteroid Retrieval Feasibility Study. Keck Institute for Space Studies, California Institute of Technology, Jet Propulsion Laboratory.
Byrnes, N. 2014. “Making Innovation.” MIT Technology Review, September 16. http://www.technologyreview.com/news/530686/making-innovation.
California Polytechnic State University. 2014. “CubeSat Design Specification. Rev. 13.” http://www.cubesat.org/images/developers/cds_rev13_final.pdf.
Carraro, G., and F. Chong. 2006. “Software as a Service (SaaS): An Enterprise Perspective.” Microsoft Corporation. https://msdn.microsoft.com/en-us/library/aa905332.aspx.
Casey, K. 2014. “Space: Next Big Data Frontier.” Information Week, September 2. http://www.informationweek.com/mobile/mobile-business/space-next-big-data-frontier/d/d-id/1306869.
Civil Aviation Authority. 2014. “UK Government Review of Commercial Spaceplane Certification and Operations: Technical Report.” https://www.gov.uk/government/uploads/system/uploads/attachment_data/file/329758/spaceplanes-tech.pdf.
Clark, S. 2011. “Chinese Rocket Launches Powerful Nigerian Satellite into Orbit.” Spaceflight Now, December 19. http://www.space.com/13975-china-rocket-launching-huge-nigeria-satellite.html.
———.2014. “Chinese-Brazilian Earth Observation Satellite Launched.” Spaceflight Now, December 7. http://spaceflightnow.com/2014/12/07/chinese-brazilian-earth-observation-satellite-launched/.
Comstock, D. 2010. “Overview of NASA’s Commercial Space Efforts,” http://www.nasa.gov/pdf/477903main_Comstock_NAC_CSC_2_16_2010.pdf.
Contant-Jorgenson, C., P. Lála, and K.-U. Schrogl. 2006. “Cosmic Study on Space Traffic Management.” International Academy of Astronautics.
Council of the European Union. 2007. “Competitiveness (Internal Market, Industry and Research)” §E (11). http://www.consilium.europa.eu/ueDocs/cms_Data/docs/pressData/en/intm/94184.pdf.
Crusan, J., M. Edeen, K. Grohs, and D. Samplatsky. 2009. “Spaceflight Hardware on a Service Contract.” Ask Magazine.
F-3
David, L. 2012. “US Military Enlists Amateurs to Track Space Junk.” Space.com, November 14. http://www.space.com/18469-space-junk-darpa-amateur-astronomy.html.
David, R. M., and B. Strevy 2014. “How the SpaceX Economy Can Make You Money.” CNBC, August 25. http://www.cnbc.com/id/101931159.
Densing, R., and N. Reinke. 2005. “The Need for European Independence in Space Application” In European .Autonomy in Space. Edited by ed. C. Al-Ekabi. Springer.
Department of the Air Force. 2014. “Fiscal Year 2015 National Defense Authorization Budget Request for Space Programs.” Presentation to the Subcommittee on Strategic Forces, House Armed Services Committee, U.S. House of Representatives. http://docs.house.gov/meetings/AS/AS29/20140403/102037/HHRG-113-AS29-Wstate-SheltonUSAirForceW-20140403.pdf.
Diamandis, P. H., and S. Kotler. 2015. Bold: How to Go Big, Create Wealth and Impact the World. New York, NY: Simon & Schuster.
Diamandis, P. 2015. “Signs Virtual Reality and Crowdfunding Are Going Mainstream.” SingularityHUB, March 31. http://singularityhub.com/2015/03/31/signs-virtual-reality-and-crowdfunding-are-going-mainstream.
Delgado-López, L. 2014. “Beyond the Moon Agreement: Norms of Responsible Behavior for Private Sector Activities on the Moon and Celestial Bodies.” Space Policy. In Press. doi:10.1016/j.spacepol.2014.08.006.
Dobbs, R. S. Ramaswamy, E. Stephenson, and S. P. Viguerie. 2014 “Management Intuition for the Next 50 Years.” McKinsey Quarterly, September. http://www.mckinsey.com/insights/strategy/management_intuition_for_the_next_50_years.
Dorrier, J. 2014. “Google to Spend a Billion or More on Internet Satellites.” SingularityHUB, June 14. http://singularityhub.com/2014/06/14/google-to-spend-a-billion-or-more-on-internet-satellites/.
Economist. 2015. “The Future of Factory Asia: A Tightening Grip.” March 14. http://www.economist.com/news/briefing/21646180-rising-chinese-wages-will-only-strengthen-asias-hold-manufacturing-tightening-grip.
Economist. 2012. “SpaceX Goes to the ISS, and This Time It Means It.” October 13. http://www.economist.com/node/21564523.
eLEAF. n.d. “Crop Monitoring.” www.eleaf.com/downloads/get?file=6.%20Crop%20Monitoring.pdf.
Euroconsult. 2014a. Profiles of Government Space Programs: Analysis of over 80 Countries & Agencies. 2014 Edition. Euroconsult Profiles Series.
———. 2014b. Satellites To Be Built & Launched by 2023: World Market Survey. 2014 Edition. Euroconsult Research Report.
F-4
European Global Navigation Satellite Systems Agency. 2012. GNSS Market Report (2, May). http://www.gsa.europa.eu/market/market-report.
European Space Agency (ESA). 2014. “Resolution on ESA Evolution Adopted on 2 December 2014.” ESA/C-M/CCXLVII/Res. 3 (Final). http://esamultimedia.esa.int/docs/corporate/Final_resolutions_1_2_3_from_CM_2014_Releasable_to_the_public.pdf.
Foust, J. 2014. “Launch Activity Hits 20-year High in 2014.” SpaceNews, December 31. http://spacenews.com/launch-activity-hits-20-year-high-in-2014/.
Fazl-e-Haider, S. 2007. “China, Pakistan Cooperate in Space.” Asia Times, April 26. http://atimes.com/atimes/South_Asia/ID26Df01.html.
Federal Aviation Administration (FAA). 2015. The Annual Compendium of Commercial Space Transportation: 2014. Washington, DC: Office of Commercial Space Transportation. http://space.taurigroup.com/reports/FAA_Annual_Compendium_2014.pdf.
Ferster, W. 2015 “Planned 40-Satellite Constellation Would Monitor Earth and Space.” SpaceNews, May 4. http://spacenews.com/planned-40-satellite-constellation-would-monitor-earth-and-space/#sthash.LP6bPYOf.dpuf.
Fichtenbaum, I. 2015. “Op-Ed: Steve Jobs, Elon Musk and the Gigafactory Approach to Space.” SpaceNews, February 10. http://spacenews.com/commentary-steve-jobs-elon-musk-and-the-gigafactory-approach-to-space/#sthash.Z6WIZjii.dpuf.
Foust, J. 2015. “Companies Offer Larger Satellite System for ISS Deployment.” SpaceNews, April 8. http://spacenews.com/companies-offer-larger-satellite-system-for-iss-deployment/.
Freeman, R. B., and W. Huang. 2015. China’s “Great Leap Forward” in Science and Engineering. National Bureau of Economic Research. http://admin.nber.org/custom?restrict_papers=yes&whichsearch=db&client=test3_fe&proxystylesheet=test3_fe&site=default_collection&entqr=0&ud=1&output=xml_no_dtd&oe=UTF-8&ie=UTF-8&sort=date%25253AD%25253AL%25253Ad1&q=Freeman.
Johnson-Freese. J. 2007. Space as a Strategic Asset. New York: Columbia University Press.
GCN. 2012. DOD Plans Base the Future on IP Convergence. Report commissioned by the Content Solutions unit, an independent editorial arm of 1105 Government Information Group. http://gcn.com/microsites/2012/snapshot-converging-communications/05-dod-transformation.aspx.
GE Aviation. 2011. “GE and AVIC Sign Agreement for Integrated Avionics Joint Venture.” Press Release, January 21. http://www.geaviation.com/press/systems/systems_20110121.html.
Gibbs, G. 2012. “An Analysis of the Space Polices of Major Space Faring Nations and Selected Emerging Nations,” Annals of Air and Space Law 37.
F-5
http://www.spacepolicyonline.com/pages/images/stories/Graham%20Gibbs%20Analysis%20of%20National%20Space%20Policies.pdf.
Golubovich, I. 2014. “How Big Data Is Fueling a New Age in Space Exploration.” Venture Beat, October 5. http://venturebeat.com/2014/10/05/how-big-data-is-fueling-a-new-age-in-space-exploration/?utm_campaign=Feed%3A+Venturebeat+%28VentureBeat%29&utm_medium=feed&utm_source=feedburner.
Graham, W. 2014. “Russian Dnepr rocket lofts record haul of 37 satellites.” NASA Spaceflight.com, June 19. http://www.nasaspaceflight.com/2014/06/russian-dnepr-rocket-record-launch-37-satellites.
Graham, W., and C. Bergin. 2015. “Pegasus Celebrates Quarter of a Century Milestone.” NASA Spaceflight.com, April 6. http://www.nasaspaceflight.com/2015/04/pegasus-celebrates-quarter-century-milestone.
Hall, D., and J. Johnsson 2015. “Galactic Gold Rush: Private Spending on Space Is Headed for a New Record.” Bloomberg Business, February 5. http://www.bloomberg.com/news/articles/2015-02-05/galactic-gold-rush-private-spending-on-space-is-headed-for-a-new-record.
Harwood, W. 2013. “NASA Launches $855 Million Landsat Mission.” CBS News, February 11. http://www.cbsnews.com/news/nasa-launches-855-million-landsat-mission/.
Hasik, J. 2014. “The Disruptive Democratization of Space,” Atlantic Council, April 15. http://www.atlanticcouncil.org/blogs/defense-industrialist/the-disruptive-democratization-of-space.
Inter-Agency Space Debris Coordination Committee. 2007. IADC Space Debris Mitigation Guidelines. http://www.iadc-online.org/Documents/IADC-2002-01,%20IADC%20Space%20Debris%20Guidelines,%20Revision%201.pdf.
Internet World Stats. “Internet Users in the World Distributed by World Regions – 2013, Q4.” http://www.internetworldstats.com/stats.htm.
Israel Space Agency. 2013. Israel Celebrates Space. http://most.gov.il/SLH/Documents/ISRAEL%20CELEBRATES%20SPACE%20final.pdf.
ITU Regulatory Framework for Space Services. n.d. http://www.itu.int/en/ITU-R/space/snl/Documents/ITU-Space_reg.pdf.
Jakhu, R. 2011. “Towards Long-term Sustainability of Space Activities: Overcoming the Challenges of Space Debris.” International Association for the Advancement of Space Safety, IAASS Legal and Regulatory Committee, 19 http://www.oosa.unvienna.org/pdf/limited/AC105_C1_2011_CRP14E.pdf.
Jason, S., A. da Silva Curiel, D. Liddle, F. Chizea, U. M. Leloğlu, M. Helvaci, M. Bekhti, D. Benachir, L. Boland, L. Gomes, and M. Sweeting. 2010. “Capacity Building in Emerging Space Nations: Experiences, Challenges and Benefits.” Advances in Space Research. 46 (5), 571-581. doi:10.1016/j.asr.2010.03.003.
F-6
Jayaraman, K. S. 2014. “India’s Prototype Space Capsule Passes Big Test.” Space.com, December 28. http://www.space.com/28114-india-space-capsule-test-flight.html.
Jet Propulsion Laboratory, Media Relations Office. 1998. “Space Pioneers Recall First U.S. Satellite Launch upon 40th Anniversary.” http://www.jpl.nasa.gov/releases/98/expl1rel.html.
Kallender-Umezu, P. 2011. “Japan, Vietnam Sign Deal for Two Radar Imaging Satellites. SpaceNews, November 4. http://spacenews.com/japan-vietnam-sign-deal-two-radar-imaging-satellites/.
Kendall, R., and P. Portanova. 2010. “Launch Vehicles Then and Now: 50 Years of Evolution.” Crosslink 11 (1, Spring): 30–39. http://www.aerospace.org/2013/12/11/launch-vehicles-then-and-now-50-years-of-evolution.
Kingwell, J. 2014. “Asian Space Race: Rhetoric or Reality?” Space Policy 30 (3, Part A, August): 138–139. doi:10.1016/j.spacepol.2014.05.001.
Klipman, D. M. 2014. “Is China the Fastest-Rising Power in History?” Foreign Policy, May 16. http://foreignpolicy.com/2014/05/16/is-china-the-fastest-rising-power-in-history.
Krolikowski, A. 2015. “Inputs into China’s Space Programs: Vision, Policy, and Organization.” Harvard University Testimony before the U.S.-China Economic and Security Review Commission Hearing on “China’s Space and Counterspace Programs” http://origin.www.uscc.gov/sites/default/files/Krolikowski_Testimony.pdf.
Keong, L. 2014. “Singapore Country Report.” Presented at the 21th Session of the Asia-Pacific Regional Space Agency Forum, Tokyo, Japan, 4–5 December. http://www.aprsaf.org/annual_meetings/aprsaf21/pdf/program/plenary/d3_1340_11_singapore.pdf.
Kraemer, K. L., G. Linden, and J. Dedrick 2011. Capturing Value in Global Networks: Apple’s iPad and IPhone. Irvine, CA: University of California Irvine, July. http://pcic.merage.uci.edu/papers/2011/Value_iPad_iPhone.pdf.
Kumagai, J. 2014. “9 Earth-Imaging Start-ups to Watch.” IEEE Spectrum, March 28. http://spectrum.ieee.org/aerospace/satellites/9-earthimaging-startups-to-watch/.
Kundra, V. 2010. 25 Point Implementation Plan to Reform Federal Information Technology Management. The White House, December 9. https://www.whitehouse.gov/sites/default/files/omb/assets/egov_docs/25-point-implementation-plan-to-reform-federal-it.pdf.
Lakshmi, R. 2014. “National Pride Soars as India Puts Spacecraft into Mars Orbit before China.” Washington Post, September 24. http://www.washingtonpost.com/world/asia_pacific/national-pride-soars-as-indian-spacecraft-reaches-mars-orbit-before-china/2014/09/24/14542c2f-4cfa-4e9a-a121-c80144646255_story.html.
F-7
Lal, B., and E. Nightingale. 2014. Where Is Space? And Why Does that Matter? 2014 Space Traffic Management Conference, Embry-Riddle Aeronautical University (ERAU) Scholarly Commons. http://commons.erau.edu/cgi/viewcontent.cgi?article=1052&context=stm.
Lauer, D. T., S. A. Morain, and V. V. Salomonson. 1997. “The Landsat Program: Its Origins, Evolution, and Impacts.” Programmatic Engineering & Remote Sensing 63 (7): 831–838.
Leloğlu, U. M. 2008. “The Small Satellite Odyssey of Turkey.” International Workshop on Small Satellites, New Missions and New Technologies, SSW08. http://www.academia.edu/1423031/the_small_satellite_odyssey_of_turkey.
Lu, Y. (ed.) 2010. Science & Technology in China: A Roadmap to 2050. Strategic General Report of the Chinese Academy of Sciences. Beijing: Science Press.
Luk, L. 2014. 2015. “Apple Adds State Controlled China Telecom as Data Center Provider.” Wall Street Journal, August 15. http://blogs.wsj.com/digits/2014/08/15/apple-adds-china-telecom-as-data-center-provider/.
MacDonald, A. 2008. “The Remote Space Age: An Economic History of Space Exploration from Galileo to Gagarin,” (doctoral dissertation at the University of Oxford).
———. 2010. “A Brief Note on the Economic History of Space Exploration in America.” http://www.cmu.edu/silicon-valley/files/pdfs/macdonald-alex/brief-history-space-explore.pdf.
———. 2012. History of Space Exploration. American History TV (C-SPAN). http://www.c-span.org/video/?306613-1/briefing-space-travel.
Markoff, J. 2012. “How Many Computers to Identify a Cat? 16,000”. The New York Times, June 25. http://www.nytimes.com/2012/06/26/technology/in-a-big-network-of-computers-evidence-of-machine-learning.html?pagewanted=all&_r=1.
McDowell, J. 2014. “The CubeSat Explosion, Ver. 2.” December 31. http://planet4589.org/space/papers/cube14.pdf.
Mellow, C. 2004. “The Rise and Fall and Rise of Iridium.” Air and Space Magazine, September. http://www.airspacemag.com/space/the-rise-and-fall-and-rise-of-iridium-5615034/?all.
Mellor, C. 2014. “Kryder’s Law Craps Out: Race to Uber-Cheap Storage Is Over.” The Register, November 10. http://www.theregister.co.uk/2014/11/10/kryders_law_of_ever_cheaper_storage_disproven.
Mexican Space Agency. 2013. Agencia Espacial Mexicana y Proméxico Lanzan con Éxito el “Plan De Órbita” Para Nuestro País. http://www.aem.gob.mx/uploads/media/COMUNICADO_075.2013.AGENCIA_ESPACIAL_MEXICANA_Y_PROMEXICO.PLAN_DE_ORBITA.pdf.
F-8
Meyer, R. 2014. “Silicon Valley’s New Spy Satellites.” The Atlantic, January 7. http://www.theatlantic.com/technology/archive/2014/01/silicon-valleys-new-spy-satellites/282580/?single_page=true.
Microsoft. 2003. “China Information Technology Security Certification Center Source Code Review Lab Opened.” Press Release, September 26. http://www.microsoft.com/en-us/news/press/2003/sep03/09-26gspchpr.aspx.
Mineiro, M. 2011. “An Inconvenient Regulatory Truth: Divergence in US and EU satellite Export Control Policies on China.” Space Policy 27 (4): 213–221.
———. 2012. Space Technology Export Controls and International Cooperation in Outer Space. Springer.
Montluc, B. de. 2009. “The New International Political and Strategic Context for Space Policies.” Space Policy 25 (1, February): 20–28. doi: 10.1016/j.spacepol.2008.12.001.
Morring, F., Jr. 2011. “China Great Wall Confounded by SpaceX Prices.” Aerospace Daily & Defense Report, April 15. http://aviationweek.com/awin/china-great-wall-confounded-spacex-prices.
Morrison, W. M. 2014. China’s Economic Rise: History, Trends, Challenges, and Implications for the United States. Washington, DC: Congressional Research Service, August 21. http://fas.org/sgp/crs/row/RL33534.pdf.
Mozur, P. and S. S. Wang. 2014. “China Approves the iPhone 6, after a Stern Look at Security.” The New York Times, September 30. http://bits.blogs.nytimes.com/2014/09/30/china-approves-the-iphone-6-after-a-stern-look-at-security/?_php=true&_type=blogs&emc=edit_tu_20140930&nl=technology&nlid=3512688&_r=0.
NASA. 2010a. NASA Historical Data Book: Volume III Programs and Projects 1969–1978. SP-4012, Table 1-33. “Chronology of Thor-Delta Development and Operations.” http://history.nasa.gov/SP-4012/vol3/table1.33.htm.
NASA. 2010b. “NASA and DARPA Sponsor International Debris Removal Conference.” Orbital Debris Quarterly News 14 (1, January): 1–2. http://orbitaldebris.jsc.nasa.gov/newsletter/pdfs/ODQNv14i1.pdf.
———. 2014a. The Evolving Landscape of 21st Century American Spaceflight. http://images.spaceref.com/docs/2014/Emerging_Space_Report.pdf.
———. 2014b. NASA Chooses American Companies to Transport U.S. Astronauts to International Space Station. http://www.nasa.gov/centers/kennedy/news/releases/2014/release-20140916b.html#.VFDxb_nF9HU.
———. 2014c. Public-Private Partnerships for Space Capability Development: Driving Economic Growth and NASA’s Mission. https://www.nasa.gov/sites/default/files/files/NASA_Partnership_Report_LR_20140429.pdf.
F-9
National Research Council (NRC). 2009. Beyond Fortress America: National Security Controls on Science and Technology in a Globalized World/.
———. n.d. 3D Printing in Space. Washington, D.C.: National Academies Press. http://www.nap.edu/catalog/18871/3d-printing-in-space.
———. 2015. The Role of Small Satellites in NASA and NOAA Earth Observation Programs. Washington D.C.: National Academy Press. http://www.nap.edu/openbook.php?record_id=9819.
Nativi, S., P. Mazzetti, M. Santoro, F. Papeschi, M. Craglia, and O. Ochiai. 2015. “Big Data Challenges in Building the Global Earth Observation System of Systems.” Environmental Modelling & Software 68: 1–26.
Navulur, K., F. Pacifici, and B. Baugh. 2013. “Trends in Optical Commercial Remote Sensing Industry” IEEE Geoscience and Remote Sensing Magazine. 57–64.
Neeck, S., T. J. Magner, G. E. Paules. n.d. “NASA’s Small Satellite Missions for Earth Observation.” http://www.dlr.de/Portaldata/49/Resources/dokumente/archiv4/IAA-B4-1001.pdf.
Oliver, S. 2014. “Apple Now Storing Local iCloud Cata in China Telecom Datacenters.” Apple Insider, August 15. http://appleinsider.com/articles/14/08/15/apple-now-storing-local-china-icloud-data-in-china-telecom-datacenters.
Oltrogge, D. 2015. “COMSPOC Update and Operational Benefits.” 31st Space Symposium, Technical Track, Colorado Springs, Colorado, April 13–14. http://www.spacesymposium.org/sites/default/files/downloads/D.Oltrogge_31st_Space_Symposium_Tech_Track_paper_0.pdf.
Organisation of Economic Co-operation and Development (OECD). 2014. The Space Economy at a Glance.
Patterson, C. A., M. Snir, and S. L. Graham (eds.). 2004. Getting Up to Speed: The Future of Supercomputing. National Academies Press.
Patton, C. 2014. “WRC-15: Winning the Spectrum War.” Via Satellite, January 21. http://www.satellitetoday.com/publications/2014/01/21/wrc-15-winning-the-spectrum-war.
Pasricha, A. 2014. “India Launches Satellites, Highlights Low Cost.” Voice of America, June 30. http://www.voanews.com/content/india-launches-satellites-highlighting-low-cost/1947595.html.
Payson, D. 2014. On Comparative Analysis of the Commercial Human Spaceflight Landscape in the Leading Space Powers. United Rocket and Space Corp. Russian 65th International Astronautical Congress (IAC-14), Toronto, Canada.
Perna, D., M. A. Barucci, and M. Falchignoni. 2013. “The Near-Earth Objects and Their Potential Threat to Our Planet.” The Astronomy and Astrophysics Review 21 (65). doi: 10.1007/s00159-013-0065-4.
F-10
Pinna, G. M., and S. Mbaye. 2014. “SAFE Archive for ENVISAT and Third Party Mission Products.” ESA Earthnet online. http://earth.esa.int/envisatsymposium/authors/CXNL_07A03_507957.htm.
Planet Labs. 2013. “Planet Labs Reveals First Images From Space. Spaceref Business, June 26. http://spaceref.biz/2013/06/planet-labs-reveals-first-images-from-space.html.
———. 2015. “Overview of the Planet Labs Constellation of Earth Imaging Satellites.” Presentation at Satellite 2015. http://www.itu.int/en/ITU-R/space/workshops/2015-prague-small-sat/Presentations/Planet-Labs-Safyan.pdf.
President of the United States. 2010. National Space Policy of the United States. https://www.whitehouse.gov/sites/default/files/national_space_policy_6-28-10.pdf.
———. 2015. National Security Strategy. https://www.whitehouse.gov/sites/default/files/docs/2015_national_security_strategy.pdf.
Reuters. 2014. “China’s Manufacturing Sector Expands at Swifter Pace.” The New York Times, July 24. http://www.nytimes.com/2014/07/25/business/international/chinas-manufacturing-sector-expands-at-swifter-pace.html?_r=0.
Rice, J. 2012. “GE – General Electric Global Growth Investor Meeting.” Edited Transcript, Thomson Reuters StreetEvents, March 7.
Rich, G. 2014. “SpaceX May Be a Bargain for NASA, if Musk Delivers.” Investor’s Business Daily, October 13. http://news.investors.com/technology/101314-721489-why-spacex-may-be-a-bargain-for-nasa.htm?p=full.
Rosenthal, D. 2014. “Talk at Seagate” DSHR’s Blog, May 14. http://blog.dshr.org/2014/05/talk-at-seagate.html.
Sample, I. 2013. “Scientists Reveal the Full Power of the Chelyabinsk meteor explosion.” The Guardian, November 7. http://www.theguardian.com/science/2013/nov/06/chelyabinsk-meteor-russia.
Sasaki, S. 2014. “How Japan Plans to Build and Orbital Solar Farm.” IEEE Spectrum, April 24. http://spectrum.ieee.org/green-tech/solar/how-japan-plans-to-build-an-orbital-solar-farm.
Satellite Industry Association (SIA). 2014. “State of the Satellite Industry Report.” http://www.sia.org/wp-content/uploads/2014/05/SIA_2014_SSIR.pdf.
Schreck, A. n.d. “Abu Dhabi Partners with Virgin Galactic Spaceship Firm.” ABCNews. http://abcnews.go.com/Business/story?id=8191703.
Secure World Foundation. 2014. The UN COPUOS Guidelines on the Long-Term Sustainability of Outer Space Activities—A Fact Sheet. http://swfound.org/media/189048/SWF_UN_COPUOS_LTS_Guidelines_Fact_Sheet_December_2014.pdf.
Selding, P. B. de. 2010. “Number of Worldwide Space Agencies on the Rise.” SpaceNews, February 25. http://www.space.com/7969-number-worldwide-space-agencies-rise.html.
F-11
———. 2013a. “Falcon 9 Selected To Launch German Military Radar Satellites.” SpaceNews, June 20. http://spacenews.com/35905falcon-9-selected-to-launch-german-military-radar-satellites/.
———. 2013b. “Taking a Cue from U.S. Landsat and GPS Programs, Europe Permits Free Access to Sentinel Earth Observation Data.” SpaceNews, July 30. http://spacenews.com/36527taking-a-cue-from-us-landsat-and-gps-programs-europe-permits-free-access-to/.
———. 2013c. “Profile: Rashad Nabiyev, Chairman, Azercosmos.” SpaceNews, January 28. http://spacenews.com/profile-rashad-nabiyev-chairman-azercosmos/.
———. 2014a. “Signal Interference Proposal Could Make the ITU a Watchdog with Some Teeth.” SpaceNews, October 10. http://spacenews.com/42147signal-interference-proposal-could-make-the-itu-a-watchdog-with-some/.
———. 2014b. “China, Venezuela To Collaborate on New Earth Observing Satellite.” SpaceNews, October 7. http://spacenews.com/42109china-venezuela-to-collaborate-on-new-earth-observing-satellite/.
———. 2015a. “Chart: Arianespace, SpaceX Battled to a Draw for 2014 Launch Contracts.” SpaceNews, January 12. http://spacenews.com/chart-arianespace-spacex-battled-to-a-draw-for-2014-launch-contracts/.
———. 2015b. “ESA Hikes Budget, Takes Steps to Send Astronaut to Chinese Space Station.” SpaceNews, January 16. http://spacenews.com/esa-hikes-budget-takes-steps-to-send-astronaut-to-chinese-space-station/.
———. 2015c. “SpaceX to Build 4000 Broadband Satellites in Seattle.” SpaceNews, January 19. http://spacenews.com/spacex-opening-seattle-plant-to-build-4000-broadband-satellites/.
———. 2015d. “Signs of a Satellite Internet Gold Rush in Burst of ITU Filing.” SpaceNews, January 23. http://spacenews.com/signs-of-satellite-internet-gold-rush/.
———. 2015e. “Arabsat Orders U.S. Satellites—with a Side of Know-How.” SpaceNews, April 30. http://spacenews.com/arabsat-orders-u-s-satellites-with-a-side-of-know-how/.
———. 2015f. “DigitalGlobe Chief Sees No Competitive Threat from Earth Imagery Startups.” SpaceNews, May 21. http://spacenews.com/digitalglobe-chief-sees-no-competitive-threat-from-earth-imagery-startups/#sthash.KDABA3r9.dpuf.
Service, R. F. 2014. “Perovskite Solar Cells Keep on Surging.” Science 322 (6183, 2 May): 458. https://www.sciencemag.org/content/344/6183/458.full.
Shipp, S. S., N. Gupta, B. Lal, J. A. Scott, C. L. Weber, M. S. Finnin, M. B. Blake, S. S. Newsome, and S. Thomas, Samuel. Emerging Global Trends in Advanced Manufacturing. Alexandria, VA: Institute for Defense Analyses. https://www.ida.org/~/media/Corporate/Files/Publications/STPIPubs/ida-p-4603.ashx.
Shotwell, G. 2014. Singapore Satellite Industry Forum 2013--Opening Keynote,” posted by D. Messier. Parabolic Arc, January 14. http://www.parabolicarc.com/2014/01/14/shotwell/.
F-12
Simpson, M., and L. Lopez, 2015. “Contested, Congested and Invested.” ROOM: The Space Journal, March. http://room.eu.com/articles?id=55/.
Smith, M. S. 2005. China’s Space Program: An Overview. Washington, DC: Congressional Research Service, October 18. www.dtic.mil/cgi-bin/GetTRDoc?AD=ADA457317.
Smith, R. 2015. “Can SpaceX Really Cut the Cost of Space Travel by 75%?” The Motley Fool, March 29. http://www.fool.com/investing/general/2015/03/29/can-spacex-cut-cost-of-space-travel-75-percent.aspx.
Space Development Promotion Act of the Republic of Korea. 2005. Translated by Y. Lee. Journal of Space Law 33: 175–189. http://www.spacelaw.olemiss.edu/library/space/Korea/Laws/33jsl175.pdf.
Space Foundation. 2014. The Space Report 2014: The Authoritative Guide to Global Space Activity. http://www.spacefoundation.org/programs/research-and-analysis/space-report/index.php.
Space IGS: The Space Innovation and Growth Strategy, Main Report. Innovation Growth Team Report. http://webarchive.nationalarchives.gov.uk/20121212135622/http://www.bis.gov.uk/assets/ukspaceagency/docs/igs/space-igs-main-report.pdf.
SpaceNews Staff. 2014 “There’s No Shortage of Space in Silicon Valley.” SpaceNews, May 26. http://spacenews.com/40696theres-no-shortage-of-space-in-silicon-valley/.
SpaceNews Editor. 2014. “Editorial: Space Meets Silicon Valley.” SpaceNews, June 30. http://spacenews.com/41082editorial-space-meets-silicon-valley/.
———. 2015 “Editorial: Constellation Choir Singing Familiar Tune.” SpaceNews, February 5. http://spacenews.com/editorial-wave-of-constellation-fever-has-a-familiar-ring/.
SpaceWorks Enterprises, Inc. (SEI). 2014. Nano / Microsatellite Market Assessment. http://www.sei.aero/eng/papers/uploads/archive/SpaceWorks_Nano_Microsatellite_Market_Assessment_January_2014.pdf.
———. 2015. 2015 Small Satellite Market Observations. http://www.spaceworksforecast.com/docs/SpaceWorks_Small_Satellite_Market_Observations_2015.pdf.
Summerer, L. 2012. “Evaluating Research for Disruptive Innovation in the Space Sector.” Acta Astronautica, 81 (2): 484—498. http://www.sciencedirect.com/science/article/pii/S0094576512003165.
Suntharalingam. V. 2012. “Advanced CCD and CMOS Image Sensor Technology at MIT Lincoln Laboratory.” http://betterphysics.org/sites/default/files/Vyshnavi%20Suntharalingham%20-%20MIT_LL.pdf.
Surrey Satellite Technology Ltd. (SSTL). n.d. “Space Mission Training and Development.” http://www.sstl.co.uk/Downloads/Brochures/Space-Mission-Training---Development-brochure.
http://www.fool.com/investing/general/2015/03/29/can-spacex-cut-cost-of-space-travel-75-percent.aspx
F-13
Symolon, W. E. 2009. “High-Altitude, Long-Endurance UAVs vs. Satellites: Potential Benefits for U.S. Army Applications.” Thesis Department of Aeronautics and Astronautics: Massachusetts Institute of Technology. http://dspace.mit.edu/handle/1721.1/54620/.
Szajnfarber, Z., M. G. Richards, and A. L. Weigel. 2011. Challenges to Innovation in the Government Space Sector. Defense Acquisition University. http://www.dtic.mil/get-tr-doc/pdf?AD=ADA546312.
Szegedy, C. 2014. “Building a Deeper Understanding of Images.” Google Research Blog (September 5). http://googleresearch.blogspot.com/2014/09/building-deeper-understanding-of-images.html.
Tauri Group. 2012. Suborbital Reusable Vehicles: A 10-year Forecast of Market Demand. http://www.spaceflorida.gov/docs/misc/srvs-10-year-forecast-of-market-demand-report.pdf.
Terink, W., P. Droogers, J. van Dam, G. Simons, M. Voogt, and A. Ines. n.d. “Satellite Based Data Mining to Support Egypt’s Agriculture.” http://www.futurewater.nl/wp-content/uploads/2013/10/swap_scales3.pdf.
Thomson, K. 2014. “Private CubeSat Start-Ups Join the Space Race.” The Saturday Paper, November 22. https://www.thesaturdaypaper.com.au/2014/11/22/private-cubesat-start-ups-join-the-space-race/14165748001263#.VK7GFCvF_HU.
Thorne, J. D., M. A. Ambroso, B. Lal, R. B. Mahoney, Jr., J. Palguta, and A. Stein. Forthcoming. Strategic Space Initiatives for Multiple Future Trends. Alexandria, VA: Institute for Defense Analyses. Paper P-5185, Draft.
Tuomi, I. 2002. “The Lives and Death of Moore’s Law.” First Monday. 7 (11). http://firstmonday.org/ojs/index.php/fm/article/view/1000/921/ .
United Kingdom, Foreign and Commonwealth Office 2015. “Brazil: Fostering space and innovation between the UK and Brazil.” Gov.uk, January 8. https://www.gov.uk/government/publications/brazil-fostering-space-and-innovation-between-uk-and-brazil/brazil-fostering-space-and-innovation-between-the-uk-and-brazil.
Union of Concerned Scientists (UCS). 2015. “UCS Satellite Database.” Launches through January 31, 2015. http://www.ucsusa.org/nuclear_weapons_and_global_security/solutions/space-weapons/ucs-satellite-database.html#.VXiJ1_m6dGp.
United Nations Office for Outer Space Affairs. 1979. Agreement Governing the Activities of States on the Moon and other Celestial Bodies (“Moon Treaty”). http://www.unoosa.org/oosa/en/SpaceLaw/gares/html/gares_34_0068.html.
———. 2010. Space Debris Mitigation Guidelines of the Committee on the Peaceful Uses of Outer Space. http://www.iadc-online.org/References/Docu/Space_Debris_Mitigation_Guidelines_COPUOS.pdf.
Van Atta, R., M. Bittmann, P. D. Collopy, B. Hartfield, B. R. Harmon, M. H. Kaplan, N. Karvonides, M. J. Lippitz, J. Mandelbaum, M. B. Marks, K. Sullivan, K. M.
F-14
Patterson, and S. Choi. 2008. Export Controls and the U.S. Defense Industrial Base, Volume 1: Summary Report and Volume 2: Appendices (Revised). Institute for Defense Analyses: Alexandria, VA. IDA Document D-3363.
Vance, A. 2015. “The New Space Race: One Man’s Mission to Build a Galactic Internet.” Bloomberg (January 22). http://www.bloomberg.com/news/features/2015-01-22/the-new-space-race-one-man-s-mission-to-build-a-galactic-internet-i58i2dp6.
Venturini, C. 2014. “Small Satellite Technology: Industry Update.” Aerospace Corporation. http://www.nesdis.noaa.gov/CRSRA/files/Cubesat_ACCRES-15May2014_final_v2.pdf.
Villafranca, A. J. Corbera, F. Martín, and J. F. Marchán. 2012. “Limitations of Hyperspectral Earth Observation on Small Satellites.” Journal of Small Satellites 1 (1): 19–29.
Walter, C. 2005. “Kryder’s Law.” Scientific American (July 25). http://www.scientificamerican.com/article/kryders-law/?page=2.
Werner, D. 2013. “Skybox Imaging’s Hopes High as Launch of First Satellites Draws Near.” SpaceNews (October 14). http://www.spacenews.com/article/civil-space/37671commercial-earth-observation-skybox-imagings-hopes-high-as-launch-of-first.
———. 2014. “Spotlight: Clyde Space Ltd.” SpaceNews (November 24). http://spacenews.com/42643spotlight-clyde-space-ltd/.
Wood, D., and A. Weigel. 2012. “Charting the Evolution of Satellite Programs in Developing Countries: The Space Technology Ladder.” Space Policy 28 (1): 15–24.
———. 2014. “Architectures of Small Satellite Programs in Developing Countries.” Acta Astronautica 97: 109–121.
World Bank. 2015. Global Purchasing Power Parities and Real Expenditures: 2005 International Comparison Program. Washington, D.C.: The World Bank. http://siteresources.worldbank.org/ICPINT/Resources/icp-final.pdf.
Yeh, J., and D. Revay. 2014. “Price per Pound: A Poor Predictor for Future Growth in the Commercial Satellite and Launch Industries. Moore’s Law, Cots, and Future Industry Drivers.” 65th International Astronautical Congress, Toronto, Canada.
Zeman, E. 2015. “Samsung Supplying Apple’s A9 Processor for Next iPhone.” Information Week (April 3). http://www.informationweek.com/mobile/mobile-devices/samsung-supplying-apples-a9-processor-for-next-iphone/a/d-id/1319766/.
Zenko, M., and D. Dillon. 2011. “A Code of Conduct for Outer Space.” Policy Innovation Memorandum No.10. Council on Foreign Relations.
Zhang, W., L. Wang, D. Liu, W. Song, Y. Ma, P. Liu, and D. Chen. 2013. “Towards Building a Multi‐Datacenter Infrastructure for Massive Remote Sensing Image Processing.” Concurrency and Computation: Practice and Experience 25 (12): 1798–1812.

F-15
Zhukov, S. and M. Kokorich. 2014. “New Breed of Startups.” ROOM: The Space Journal (December). http://room.eu.com/articles?id=26/.

G-1
Abbreviations
3D three-dimensional AGI Analytical Graphics, Inc. ALASA Airborne Launch Assist Space Access API Advance Publication of Information APRSF Asia-Pacific Regional Space Agency Forum APSCO Asia-Pacific Space Cooperation Organization CBERS China-Brazil Earth Resources Satellite CCD charge-coupled device CEO Chief Executive Officer CIS Commonwealth of Independent States CMOS complementary metal-oxide-semiconductor COMSpOC Commercial Space Operations Center COPUOS Committee on the Peaceful Uses of Outer Space COTS commercial off-the-shelf CubeSat cube satellite DARPA Defense Advanced Research Projects Agency EDSN Edison Demonstration of Smallsat Networks EELV Evolved Expendable Launch Vehicle EIAST Emirates Institution for Advanced Science and
Technology eLORAN Enhanced Long-Range Navigation EO Earth observation ESA European Space Agency ESPA EELV Secondary Payload Adapter ESpOC ExoAnalytic Space Operations Center EU European Union FAST Facilitated Access to the Space Environment for
Technology Development and Training FY fiscal year GEO geostationary orbit or Group on Earth Observations GEOSS Global Earth Observation System of Systems GLONASS Global Navigation Satellite System GNSS global navigation satellite system GPS Global Positioning System GSD ground sample distance GTO geostationary transit orbit HALE high altitude long endurance HDTV high-definition television HSF human space flight HTS High Throughput Satellites
G-2
IADC Inter-Agency Space Debris Coordination Committee IAF International Astronautical Federation IAWN International Asteroid Warning Network IDA Institute for Defense Analyses IP Internet Protocol ISEE International Sun-Earth Explorer ISON International Scientific Observational Network ISR intelligence, surveillance, and reconnaissance ISRO Indian Space Research Organization ISS International Space Station IT information technology ITAR International Trafficking in Arms Regulations ITU International Telecommunication Union ITU-D International Telecommunication Development Sector kg kilogram km kilometer LADEE Lunar Atmosphere and Dust Environment Explorer LBS location-based services LEO low Earth orbit m meter MENA Middle East and North Africa MEO medium Earth orbit NASA National Aeronautic and Space Administration NEO near-Earth object NERVA Nuclear Engine for Rocket Vehicle Application NOAA National Oceanic and Atmospheric Agency NRC National Research Council OECD Organisation for Economic Co-operation and
Development P-POD Poly-Picosatellite Orbital Deployer PNT position, navigation, and timing PSLV Polar Satellite Launch Vehicle R&D research and development RF radio frequency S&T science and technology SAARC South Asian Association of Regional Cooperation SAR synthetic aperture radar SBAS satellite-based augmentation system SDR software-defined radio SEI SpaceWorks Enterprises, Inc. SIA Satellite Industry Association SMPAG Space Mission Planning Advisory Group SSA space situational awareness SSTL Surrey Satellite Technology Ltd. STM space traffic management STPI Science and Technology Policy Institute

G-3
UAE United Arab Emirates UCS Union of Concerned Scientists UK United Kingdom UN United Nations U.S. United States USD United States dollar VC venture capital