
Travel time by public transport in Brussels: the ...
23
Brussels Studies La revue scientifique électronique pour les recherches sur Bruxelles / Het elektronisch wetenschappelijk tijdschrift voor onderzoek over Brussel / The e-journal for academic research on Brussels Collection générale | 2018 Travel time by public transport in Brussels: the accessibility of poles of activity Temps de déplacements en transport public à Bruxelles : l’accessibilité des pôles d’activités Verplaatsingstijden met het openbaar vervoer in Brussel: de bereikbaarheid van de activiteitenpolen Kevin Lebrun Translator: Jane Corrigan Electronic version URL: http://journals.openedition.org/brussels/1661 DOI: 10.4000/brussels.1661 ISSN: 2031-0293 Publisher Université Saint-Louis Bruxelles Electronic reference Kevin Lebrun, « Travel time by public transport in Brussels: the accessibility of poles of activity », Brussels Studies [Online], General collection, no 123, Online since 07 May 2018, connection on 14 August 2019. URL : http://journals.openedition.org/brussels/1661 ; DOI : 10.4000/brussels.1661 This text was automatically generated on 14 August 2019. Licence CC BY
Transcript of Travel time by public transport in Brussels: the ...
Brussels Studies
La revue scientifique électronique pour les recherches
sur Bruxelles / Het elektronisch wetenschappelijk
tijdschrift voor onderzoek over Brussel / The e-journal
for academic research on Brussels Collection générale | 2018
Travel time by public transport in Brussels: theaccessibility of poles of activityTemps de déplacements en transport public à Bruxelles : l’accessibilité des pôles
d’activités
Verplaatsingstijden met het openbaar vervoer in Brussel: de bereikbaarheid van
de activiteitenpolen
Kevin Lebrun
Translator: Jane Corrigan
Electronic versionURL: http://journals.openedition.org/brussels/1661DOI: 10.4000/brussels.1661ISSN: 2031-0293
PublisherUniversité Saint-Louis Bruxelles
Electronic referenceKevin Lebrun, « Travel time by public transport in Brussels: the accessibility of poles of activity », Brussels Studies [Online], General collection, no 123, Online since 07 May 2018, connection on 14August 2019. URL : http://journals.openedition.org/brussels/1661 ; DOI : 10.4000/brussels.1661
This text was automatically generated on 14 August 2019.
Licence CC BY
Travel time by public transport inBrussels: the accessibility of poles ofactivityTemps de déplacements en transport public à Bruxelles : l’accessibilité des pôles
d’activités
Verplaatsingstijden met het openbaar vervoer in Brussel: de bereikbaarheid van
de activiteitenpolen
Kevin Lebrun
Translation : Jane Corrigan
AUTHOR'S NOTE
This article results from a thesis written in the framework of an Anticipate research
project financed by Innoviris, l’Institut Bruxellois pour la Recherche et l’Innovation, and
sponsored by the Strategy Division of Bruxelles Mobilité as well as by STIB.
Introduction
1 In recent years, mobility has gradually become one of the main challenges faced by cities.
In Brussels, the problems encountered are exacerbated by strong demographic growth,1
which increases the demand, as well as by the high number of commuters, with the
Brussels-Capital Region (BCR) constituting the main centre of employment in Belgium
[Lebrun et al., 2012; Hubert et al., 2013].
2 In concrete terms, on a weekday, it is estimated that more than three million journeys are
made in connection with BCR [Hubert et al., 2013: 3]. Among these, the majority of
incoming and outgoing journeys in the Region are made by car2 (63 %) [Lebrun et al.,
2014: 15], whereas cars represent only half as many of the journeys within Brussels (32 %).
Travel time by public transport in Brussels: the accessibility of poles of ac...
Brussels Studies , Collection générale
1
But this observation hides another reality: despite more and more multimodal practices
[ibid.: 35], cars still account for close to half (48 %) of the distance represented by these
journeys within the city, whereas they account for two-thirds of all of the journeys in
connection with Brussels, which has an impact on the health and the quality of life of the
inhabitants of Brussels.
3 This observation shows us that the challenge of implementing more "sustainable"
mobility remains significant, for the journeys within Brussels as well. This raises the
question as to the ability of the public transport service to compete with cars. But in
addition to efficiency, the question of spatial equity is also important. In a Region with a
relatively small surface area such as Brussels, which is served by four public transport
operators, the aim for more uniform accessibility – at least to certain key destinations –
does not seem to be unrealistic and would help the inhabitants to modify their mobility
practices in a sustainable manner.
4 These two aspects must therefore be measured and discussed jointly. We shall therefore
examine the accessibility by public transport of a selection of major poles of activity from
neighbourhoods of Brussels. These results shall then provide more insight regarding
better service.
5 In practical terms, this article is structured as follows: the first section (1) presents a brief
discussion of the notion of accessibility and its use in the context of Brussels. The second
section (2) provides details regarding the study case and the methodology. The third
section (3) presents an assessment of accessibility, and the following section (4) discusses
the areas for improvement with respect to their potential impact on the accessibility of
neighbourhoods.
1. The concept of accessibility and its use in Brussels
6 Today, the concept of accessibility is used in various contexts and may have very
different meanings [Richer and Palmier, 2011]. With respect to the area of spatial mobility
alone, accessibility has been discussed very widely in the literature for many years.3 The
literature has led to many formalisations and possible measures which have also been the
subject of summaries and classifications. According to the most complete definitions,
accessibility covers up to four components, which have a mutual impact on each other:
transport, spatial, temporal and individual [Geurs and Ritsema Van Eck, 2001], without it
being possible or desirable to incorporate all of the dimensions into the measures.
7 In our study, from a geographical perspective, accessibility is defined by the degree of
ease involved in going from one place in the city to another, i.e. a more general
perspective than the physical accessibility of infrastructures and vehicles (which it might
include). It is considered above all in its transport component, with the objective being to
evaluate the performance of public transport in a simple and legible way via the
measurement of travel times.
8 Let us note that in the world of research, measurements of accessibility by public
transport in Brussels are not very abundant, even though it seems to be the subject of a
growing number of works in recent years. Thus, to our knowledge, the first study of this
type regarding Brussels was conducted in 1995 [Dobruszkes and Marissal, 1995]. It was
aimed in particular at deconstructing the rationale behind the use of cars (lower costs,
symbol of freedom, etc.) and included a series of accessibility measurements, using the
Travel time by public transport in Brussels: the accessibility of poles of ac...
Brussels Studies , Collection générale
2
Central Station as a starting point. More recently, Lebrun et al. [2012] carried out a
succinct measurement of the average accessibility of the Region and Leclercq et al. [2015]
applied a modelling of accessibility via co-modality (car and public transport) to the
Brussels metropolitan area, by targeting the big stations. Finally, Leurquin [2016]
modelled accessibility from certain residential areas and examined the question of the
establishment of Park and Ride facilities. Our work is aimed at describing the accessibility
of the Brussels area for a selection of major poles of activity from all of the
neighbourhoods, and to relate it to the population volumes concerned.
9 The regional administration uses the notion of accessibility in a more continuous manner,
in connection with the elaboration of different mobility plans (Iris) and development
plans (PRD). Nevertheless, these policy documents often explain very little about the
measures to the general public and, in terms of accessibility, only the Règlement Régional
d’Urbanisme (RRU) constitutes an exception given its regulatory nature.4
10 In this framework, our work is also an occasion to present recent results, obtained
according to a simple measurement, in the framework of a methodology which is
intended to be as clear as possible (cf. following point). It is also the result of a
collaboration with the regional administration (Bruxelles Mobilité), which recently
implemented a multimodal model of journeys (MUSTI) in 2013, i.e. a measurement and
decision-making tool concerning various problems related to mobility (flow descriptions,
tests for different scenarios, etc.).
2. Measuring the accessibility of poles of activity
11 The measurements were made using two successive tools. The first was the calculation
module of travel times of the strategic multimodal model for journeys in the Brussels-
Capital Region, which allowed the calculation and/or extraction of pertinent data from
the transport service at a detailed spatial scale, i.e. that of the 724 statistical sectors in
Brussels (hereunder referred to as either neighbourhoods or sectors). Subsequent
processing and the use of GIS software then allowed the calculation and the mapping of
indicators.
12 In concrete terms, the statistical sectors were represented by a point corresponding to
their geometric centre (also called centroid). Each point was then linked to several public
transport stops,5 chosen among those which were the closest to the point in question. The
chosen stops therefore play the role of connector, allowing travel on the public transport
networks. They were generated according to a procedure which adhered to specific rules.6
13 Accessibility was then evaluated at the origin, according to the median time required to
travel from the centre of a sector to the centre of another. As we wished to evaluate the
accessibility of the inhabitants of Brussels with respect to a selection of poles of activity
during the morning rush hour, two filters were applied: one at the origin, excluding the
inhabited or very sparsely populated sectors (less than 20 inhabitants), and the other at
the destination, by selecting ten sectors representing a panel of major destinations.
14 In detail, the significant poles of activity which we have considered include the three
major stations of the North-South railway link (Brussels-North, Brussels-Central and
Brussels-South), which correspond to major centres of employment, as well as being
important transit points, in particular to the STIB network (underground) and that of
Travel time by public transport in Brussels: the accessibility of poles of ac...
Brussels Studies , Collection générale
3
De Lijn (Brussels-North). Although it is geographically close to the Central Station, the
consideration of the Bourse neighbourhood allows us to include, more significantly,
journeys which are unrelated to work. This neighbourhood constitutes a major
commercial and cultural centre, where many journeys are made each day, in particular
by tourists, including during rush hour. As main centres of service sector employment in
the Region, the Rogier, Schuman and Luxembourg neighbourhoods also generate many
journeys during rush hour, in particular in connection with the federal and European
administrations located there.
15 These first seven destinations constitute (examples of) major destination centres during
rush hour. But in order to reflect a greater diversity in the reasons for travelling,7
four other destinations were added to these. Firstly, these included two hospitals,
Brugmann and Saint-Luc, which allowed a diversification of the geography of the
destinations, while taking into account the access to this type of service (either as a
patient or a visitor, but also as a worker and/or a student).8 Finally, the neighbourhoods
of the Solbosh university campus (ULB) and those of Place Flagey complete the panel.
They were chosen for their strong functional mix, combining a residential and a
commercial function, as well as an educational and employment centre in the case of the
ULB neighbourhood.
16 With this approach, the selected areas form a sample testifying to the possibility of
travelling during rush hour for various reasons, including work, going to hospital or
going shopping. As the selection of areas already gives particular focus to journeys
connected with work, it was decided that this part would not receive special attention,
thus giving each destination an identical weight.
17 This selection of areas is based above all on general empirical knowledge of the transport
demand in Brussels during rush hour and is not the result of a strictly quantitative
approach. We may, however, note that the destinations selected represent more than one
third (35 %) of local employment9 in Brussels and include in particular the five busiest
stations in the Region. This approach to accessibility is in keeping with that proposed by
El-Geneidy et al. who referred to the ease of reaching destinations of interest.
18 Another way to proceed would have been to weight our measurements according to the
demand, but this mainly concerns an origin-destination pair and has the disadvantage of
being poorly understood, particularly at a detailed geographical scale. Rather than
weighting the values directly with an approximation of the demand (population, jobs),
which would not have guaranteed consistency with the actual flows, we chose to apply a
filter on the origins and on the destinations in particular. This allows us to use "simple"
values of travel time, and to relate the results obtained to the number of inhabitants of
Brussels who are potentially concerned by the analysis.
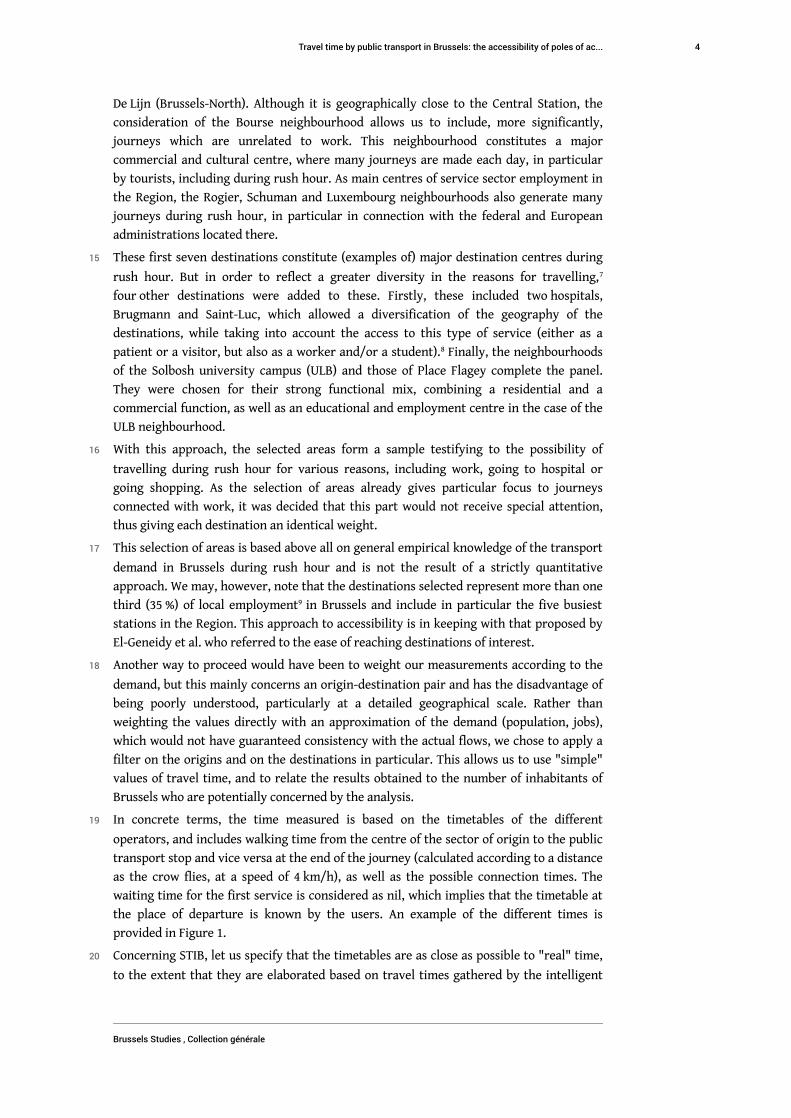
19 In concrete terms, the time measured is based on the timetables of the different
operators, and includes walking time from the centre of the sector of origin to the public
transport stop and vice versa at the end of the journey (calculated according to a distance
as the crow flies, at a speed of 4 km/h), as well as the possible connection times. The
waiting time for the first service is considered as nil, which implies that the timetable at
the place of departure is known by the users. An example of the different times is
provided in Figure 1.
20 Concerning STIB, let us specify that the timetables are as close as possible to "real" time,
to the extent that they are elaborated based on travel times gathered by the intelligent
Travel time by public transport in Brussels: the accessibility of poles of ac...
Brussels Studies , Collection générale
4
transport system (ITS) used by STIB vehicles, excluding exceptional situations [Lebrun et
al., 2012: 62].
Figure 1. Segmentation of a typical journey illustrating the different times considered
21 From a time-based perspective, we have considered the connections whose departure is
in the time period between 8am and 9am and arrival in the time period between 8am and
10am, on a weekday.
22 Finally, while several measurements of travel time were possible (best time, first decile,
etc.), we have chosen median time for two reasons. Firstly, because, with respect to more
optimistic measurements, the median time greatly limits the positive effect of efficient
yet infrequent services such as the train. Furthermore, median time has the advantage of
being representative of the journeys of a larger number of people, particularly with
respect to the best time, related to practices of people in good health, with rational
behaviour (in the usual sense) and who are able to take advantage of the best
opportunities for their journeys.
3. Accessibility of neighbourhoods in Brussels to thepoles of activity in 2016
3.1. What do STIB services offer?
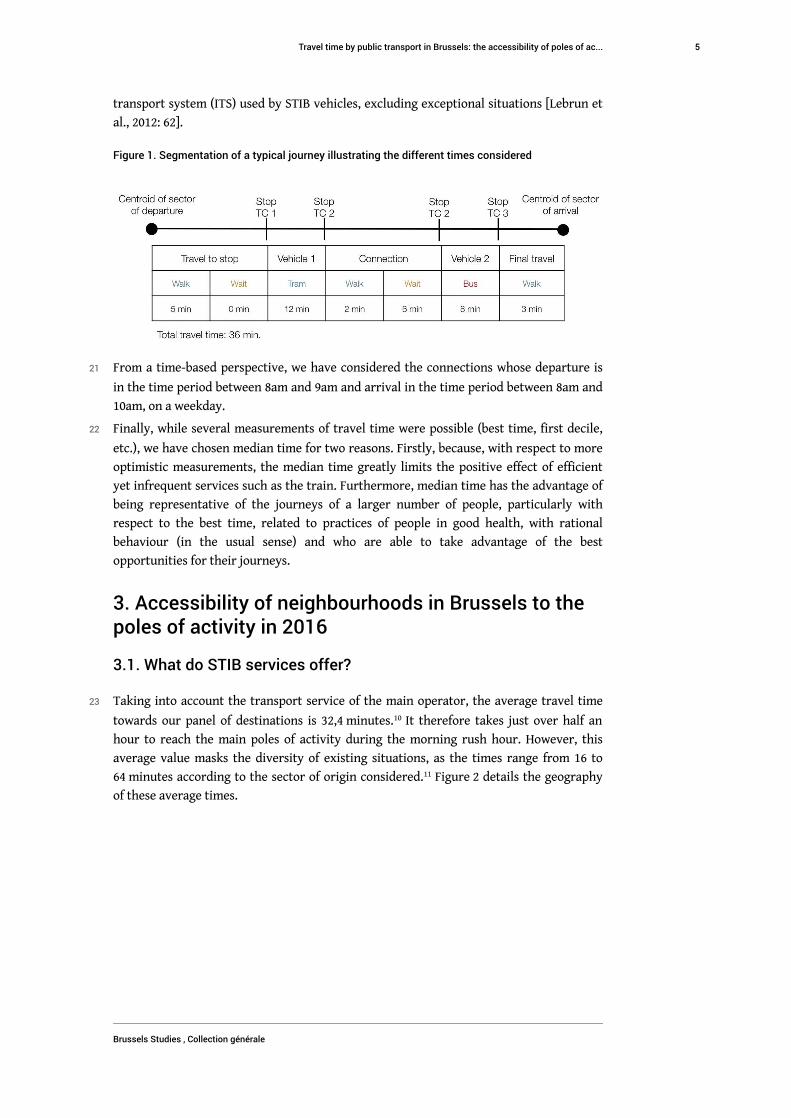
23 Taking into account the transport service of the main operator, the average travel time
towards our panel of destinations is 32,4 minutes.10 It therefore takes just over half an
hour to reach the main poles of activity during the morning rush hour. However, this
average value masks the diversity of existing situations, as the times range from 16 to
64 minutes according to the sector of origin considered.11 Figure 2 details the geography
of these average times.
Travel time by public transport in Brussels: the accessibility of poles of ac...
Brussels Studies , Collection générale
5
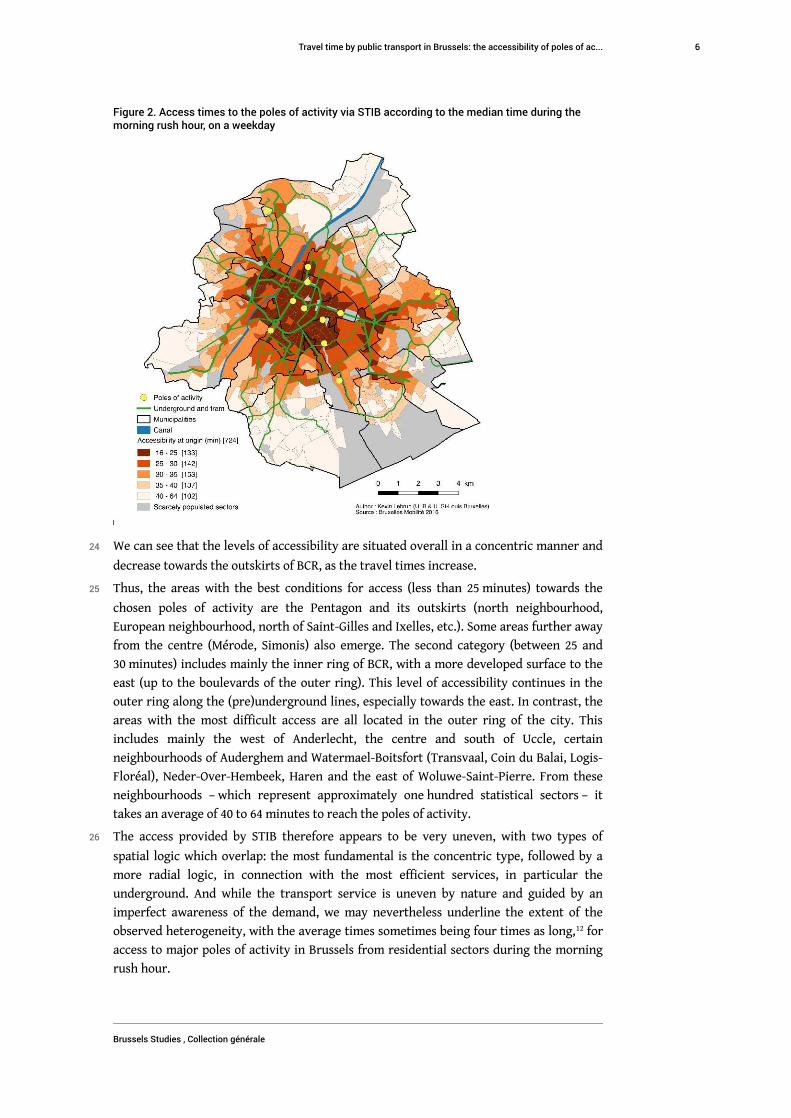
Figure 2. Access times to the poles of activity via STIB according to the median time during themorning rush hour, on a weekday
24 We can see that the levels of accessibility are situated overall in a concentric manner and
decrease towards the outskirts of BCR, as the travel times increase.
25 Thus, the areas with the best conditions for access (less than 25 minutes) towards the
chosen poles of activity are the Pentagon and its outskirts (north neighbourhood,
European neighbourhood, north of Saint-Gilles and Ixelles, etc.). Some areas further away
from the centre (Mérode, Simonis) also emerge. The second category (between 25 and
30 minutes) includes mainly the inner ring of BCR, with a more developed surface to the
east (up to the boulevards of the outer ring). This level of accessibility continues in the
outer ring along the (pre)underground lines, especially towards the east. In contrast, the
areas with the most difficult access are all located in the outer ring of the city. This
includes mainly the west of Anderlecht, the centre and south of Uccle, certain
neighbourhoods of Auderghem and Watermael-Boitsfort (Transvaal, Coin du Balai, Logis-
Floréal), Neder-Over-Hembeek, Haren and the east of Woluwe-Saint-Pierre. From these
neighbourhoods – which represent approximately one hundred statistical sectors – it
takes an average of 40 to 64 minutes to reach the poles of activity.
26 The access provided by STIB therefore appears to be very uneven, with two types of
spatial logic which overlap: the most fundamental is the concentric type, followed by a
more radial logic, in connection with the most efficient services, in particular the
underground. And while the transport service is uneven by nature and guided by an
imperfect awareness of the demand, we may nevertheless underline the extent of the
observed heterogeneity, with the average times sometimes being four times as long,12 for
access to major poles of activity in Brussels from residential sectors during the morning
rush hour.
Travel time by public transport in Brussels: the accessibility of poles of ac...
Brussels Studies , Collection générale
6
3.2. Taking into account the other operators in Brussels
27 By including the SNCB, TEC and De Lijn services, the access times to the main poles of
activity decrease slightly from 32,4 to 31,3 minutes. Likewise, the range of values
decreases somewhat, varying between 16 and 58 minutes (Figure 3).
Figure 3. Access times to the poles of activity via all operators (STIB, SNCB, TEC, De Lijn) accordingto the median time during the morning rush hour, on a weekday
28 In spatial terms, we see that the variation in accessibility is still structured in a concentric
and radial manner overall. The SNCB and De Lijn transport services are both very
centralised and are limited for the most part to a few major roads for entering the city
(Chaussée de Ninove and Chaussée de Louvain for De Lijn, for example). For journeys
originating inside the Region towards the poles of activity, this additional service
therefore has a positive effect, but appears to be limited overall.
29 The previous representation does, however, mask potentially significant absolute
differences. This is why, in Figure 4, we have subtracted the values obtained for all
operators from those obtained for STIB alone. This allows a visualisation of the
contribution made by operators other than STIB.
Travel time by public transport in Brussels: the accessibility of poles of ac...
Brussels Studies , Collection générale
7
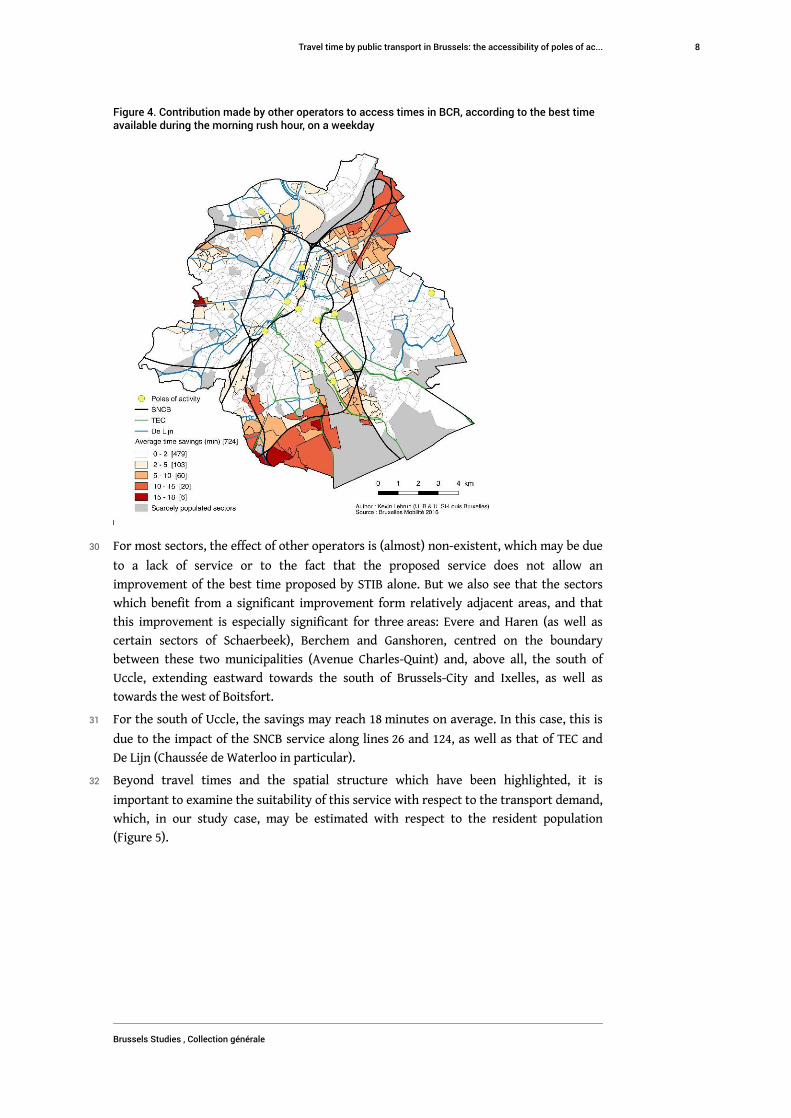
Figure 4. Contribution made by other operators to access times in BCR, according to the best timeavailable during the morning rush hour, on a weekday
30 For most sectors, the effect of other operators is (almost) non-existent, which may be due
to a lack of service or to the fact that the proposed service does not allow an
improvement of the best time proposed by STIB alone. But we also see that the sectors
which benefit from a significant improvement form relatively adjacent areas, and that
this improvement is especially significant for three areas: Evere and Haren (as well as
certain sectors of Schaerbeek), Berchem and Ganshoren, centred on the boundary
between these two municipalities (Avenue Charles-Quint) and, above all, the south of
Uccle, extending eastward towards the south of Brussels-City and Ixelles, as well as
towards the west of Boitsfort.
31 For the south of Uccle, the savings may reach 18 minutes on average. In this case, this is
due to the impact of the SNCB service along lines 26 and 124, as well as that of TEC and
De Lijn (Chaussée de Waterloo in particular).
32 Beyond travel times and the spatial structure which have been highlighted, it is
important to examine the suitability of this service with respect to the transport demand,
which, in our study case, may be estimated with respect to the resident population
(Figure 5).
Travel time by public transport in Brussels: the accessibility of poles of ac...
Brussels Studies , Collection générale
8
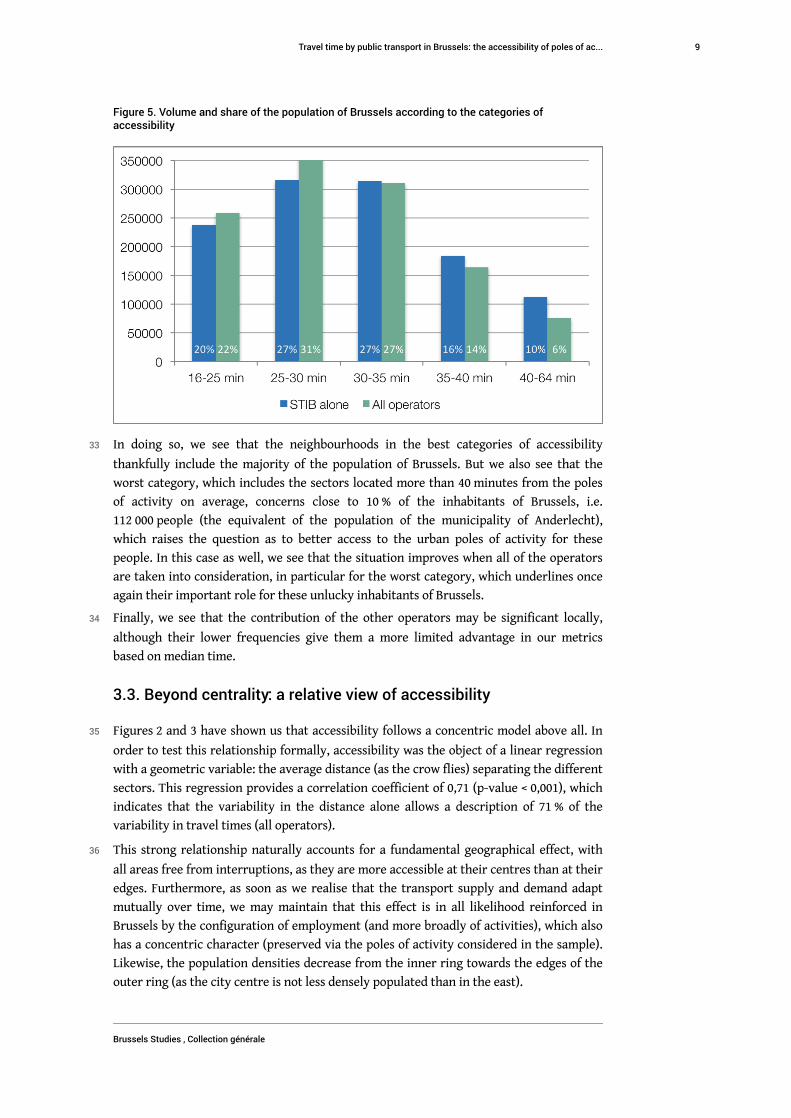
Figure 5. Volume and share of the population of Brussels according to the categories ofaccessibility
33 In doing so, we see that the neighbourhoods in the best categories of accessibility
thankfully include the majority of the population of Brussels. But we also see that the
worst category, which includes the sectors located more than 40 minutes from the poles
of activity on average, concerns close to 10 % of the inhabitants of Brussels, i.e.
112 000 people (the equivalent of the population of the municipality of Anderlecht),
which raises the question as to better access to the urban poles of activity for these
people. In this case as well, we see that the situation improves when all of the operators
are taken into consideration, in particular for the worst category, which underlines once
again their important role for these unlucky inhabitants of Brussels.
34 Finally, we see that the contribution of the other operators may be significant locally,
although their lower frequencies give them a more limited advantage in our metrics
based on median time.
3.3. Beyond centrality: a relative view of accessibility
35 Figures 2 and 3 have shown us that accessibility follows a concentric model above all. In
order to test this relationship formally, accessibility was the object of a linear regression
with a geometric variable: the average distance (as the crow flies) separating the different
sectors. This regression provides a correlation coefficient of 0,71 (p-value < 0,001), which
indicates that the variability in the distance alone allows a description of 71 % of the
variability in travel times (all operators).
36 This strong relationship naturally accounts for a fundamental geographical effect, with
all areas free from interruptions, as they are more accessible at their centres than at their
edges. Furthermore, as soon as we realise that the transport supply and demand adapt
mutually over time, we may maintain that this effect is in all likelihood reinforced in
Brussels by the configuration of employment (and more broadly of activities), which also
has a concentric character (preserved via the poles of activity considered in the sample).
Likewise, the population densities decrease from the inner ring towards the edges of the
outer ring (as the city centre is not less densely populated than in the east).
Travel time by public transport in Brussels: the accessibility of poles of ac...
Brussels Studies , Collection générale
9
37 But while geometric centrality as well as that related to supply and demand in Brussels
allows an "explanation" of approximately 70 % of the variability in accessibility in
Brussels, we may therefore wonder what accounts for the remaining 30 %. This share is
not explained by centrality – also referred to as residue in the framework of
mathematical regression – and was therefore mapped in Figure 6. This new
representation, which in a sense neutralises the effect of centrality, allows us to describe,
at an equal average distance, the areas with better or worse accessibility than expected.
The results are weighted visually by circles proportional to the resident population.
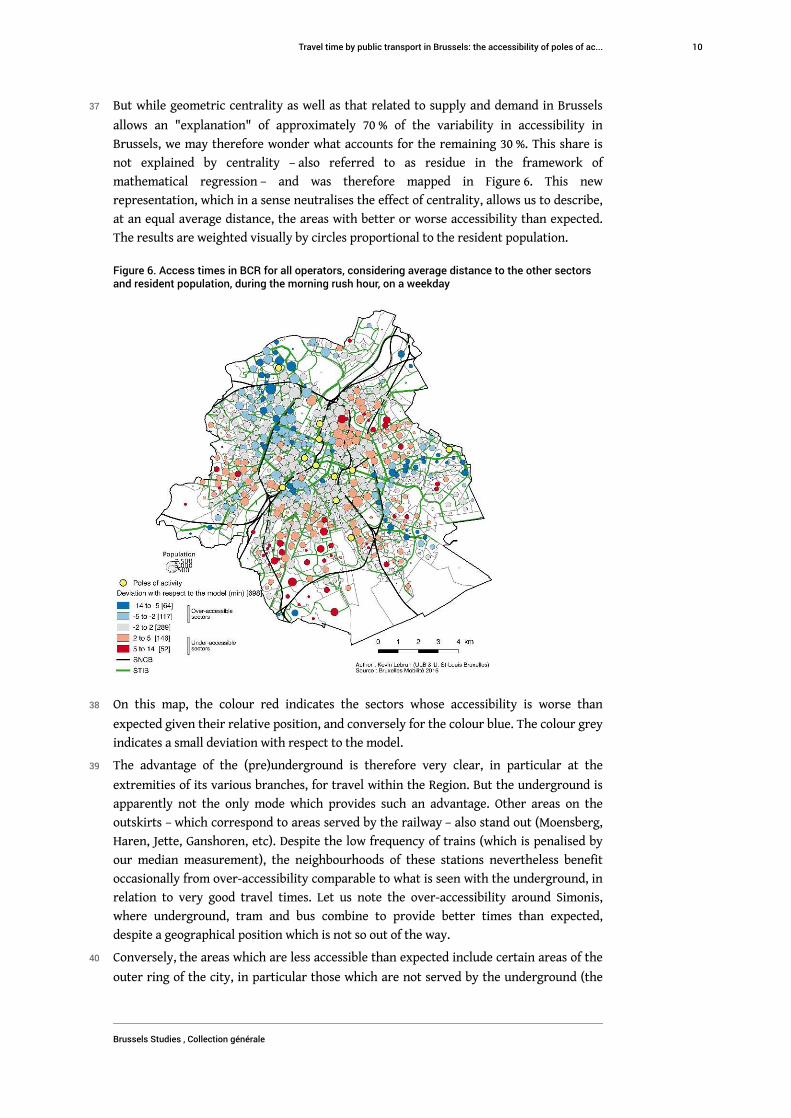
Figure 6. Access times in BCR for all operators, considering average distance to the other sectorsand resident population, during the morning rush hour, on a weekday
38 On this map, the colour red indicates the sectors whose accessibility is worse than
expected given their relative position, and conversely for the colour blue. The colour grey
indicates a small deviation with respect to the model.
39 The advantage of the (pre)underground is therefore very clear, in particular at the
extremities of its various branches, for travel within the Region. But the underground is
apparently not the only mode which provides such an advantage. Other areas on the
outskirts – which correspond to areas served by the railway – also stand out (Moensberg,
Haren, Jette, Ganshoren, etc). Despite the low frequency of trains (which is penalised by
our median measurement), the neighbourhoods of these stations nevertheless benefit
occasionally from over-accessibility comparable to what is seen with the underground, in
relation to very good travel times. Let us note the over-accessibility around Simonis,
where underground, tram and bus combine to provide better times than expected,
despite a geographical position which is not so out of the way.
40 Conversely, the areas which are less accessible than expected include certain areas of the
outer ring of the city, in particular those which are not served by the underground (the
Travel time by public transport in Brussels: the accessibility of poles of ac...
Brussels Studies , Collection générale
10
north of Anderlecht, Boitsfort and Uccle, where there is a concentration of the highest
values), but also, more surprisingly, large areas of the inner ring in Schaerbeek and
Ixelles in particular.
41 In relation to the population of Brussels, the effect of poor relative performance is rather
significant, in particular as it involves large parts of the municipalities of Uccle, Ixelles
Etterbeek and Schaerbeek. In total, the population in the neighbourhoods characterised
by under-accessibility of the poles of activity of at least two minutes on average
represents 340 000 people (29,2 % of the population of Brussels), or 65 000 people (5,6 %) if
under-accessibility of at least five minutes on average is considered.
42 Finally, while it is easy to explain the strong heterogeneity of the absolute measurement
in relation to centrality and the demand – with these two aspects overlapping greatly in
the case of Brussels – it is more surprising to see that the heterogeneity remains
significant with our relative measurement. The latter constitutes an interesting
perspective, which could serve as a basis for the elaboration of a regional objective aimed
at reducing the gaps within Brussels. Minimising the relative differences would allow
more sustainable mobility practices to be supported in connection with an easily
assessable level of accessibility, as it correlates better to centrality. At the same time it is
politically defensible, as everyone understands that it is not possible to demand an equal
level of service for those who live in the city centre and those who live on the outskirts of
the Region.
4. What are the margins for improvement?
43 If we look at Figure 6 once again and re-examine the contrasts, we notice that the
geography contrasts the efficiency of the underground networks and the worse
performances of neighbourhoods served only by surface transport (tram and bus). This is
very clearly related to the traffic conditions faced by the surface networks, which are
taken into account via the timetables.13 This reality a has already been highlighted in
Brussels [Dobruszkes and Fourneau, 2007; Courtois and Dobruszkes, 2008].
44 In order to evaluate the negative weight represented by the traffic conditions on the
accessibility of neighbourhoods, a fictional service was elaborated, including rush hour
services (identical lines and frequencies), and attributes the best existing profile of travel
times to each line. This new network therefore does not correspond to a unique
timescale: while the best times are often at the end of the evening, this is not necessarily
the case for all of the lines.
45 In doing so, we therefore compare the usual rush hour network to an identical service
with the best possible travel times in 2016, which gives an idea of the time loss, and
therefore of the potential for improvement.14 (Figure 7)
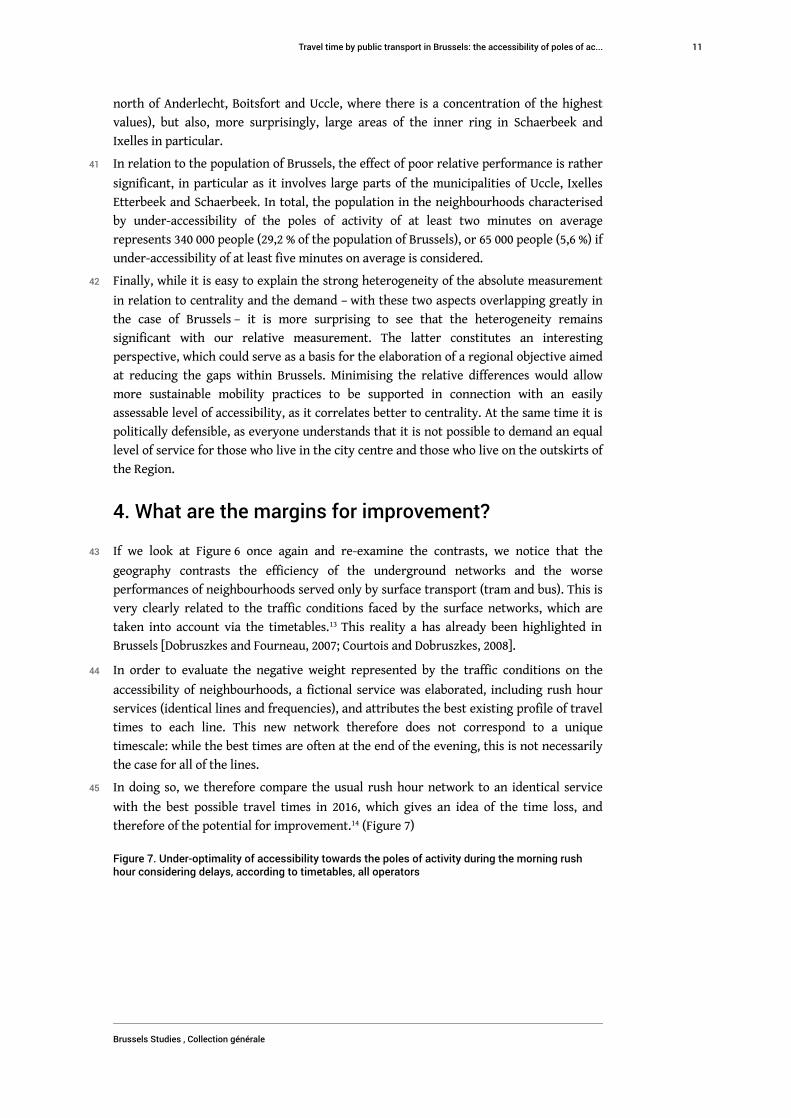
Figure 7. Under-optimality of accessibility towards the poles of activity during the morning rushhour considering delays, according to timetables, all operators
Travel time by public transport in Brussels: the accessibility of poles of ac...
Brussels Studies , Collection générale
11
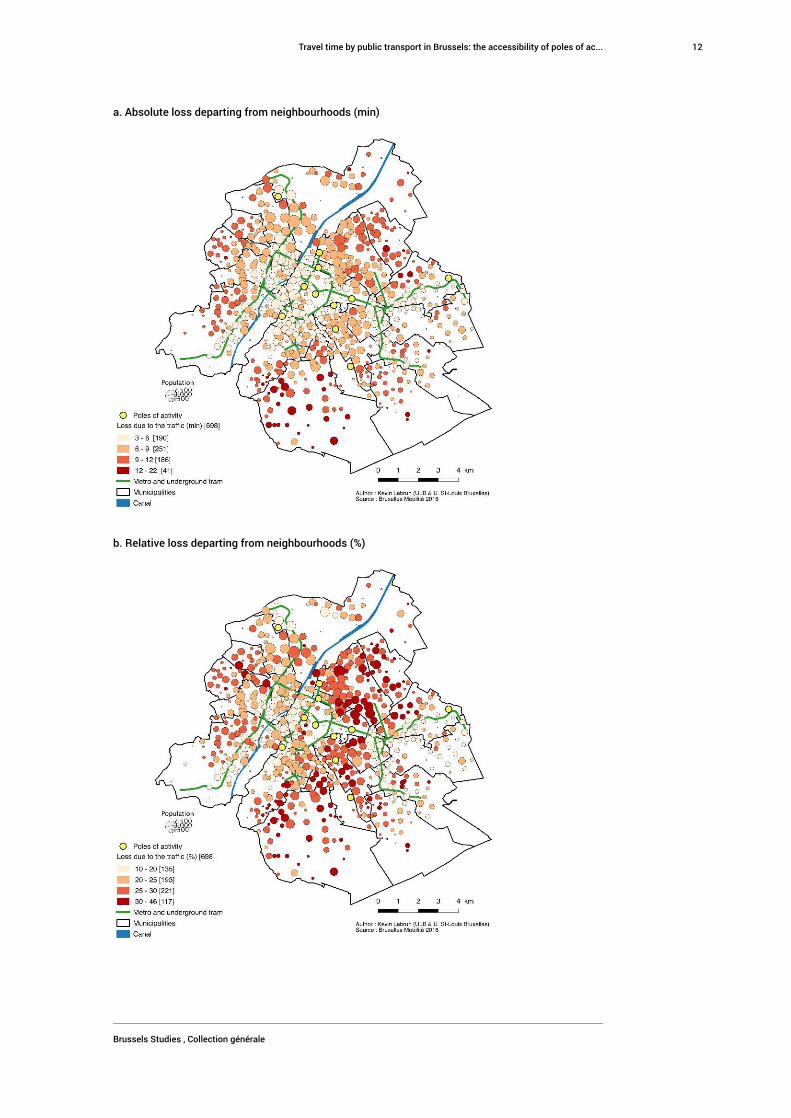
a. Absolute loss departing from neighbourhoods (min)
b. Relative loss departing from neighbourhoods (%)
Travel time by public transport in Brussels: the accessibility of poles of ac...
Brussels Studies , Collection générale
12
46 These maps therefore do not show the extent of the congestion where it is produced, but
they distinguish the neighbourhoods where traffic congestion will have a certain impact
on travelling to the poles of activity by public transport.
47 Thus, in absolute values (a), the average loss for all of the neighbourhoods amounts to
almost 8 minutes. It even exceeds 12 minutes in many sectors of Uccle. The other
neighbourhoods which are most concerned are located mainly in the northwest of the
Region. In relative terms (b), it appears that our journeys are 25 % longer on average with
respect to what the operators are already capable of today at the current level of service,
with no delays. The geography is however different, as many areas of the inner ring of the
city are included (Schaerbeek and Ixelles in particular), from which there is more than a
30 % loss of time (and up to almost 50 %) with respect to the optimal situation.
48 The delays therefore still have a strong impact on the efficiency of public transport,
despite the current policies aimed at a gradual increase in the separation or the priority
of public transport with respect to the rest of the traffic [Brandeleer et al., 2016].
49 Finally, this approach also allows an evaluation of the accessibility of neighbourhoods in
optimal traffic conditions – comparable to those seen in cities which have reintroduced
separate lanes for trams over the past decades, for example – and with centrality taken
into consideration (Figure 8).
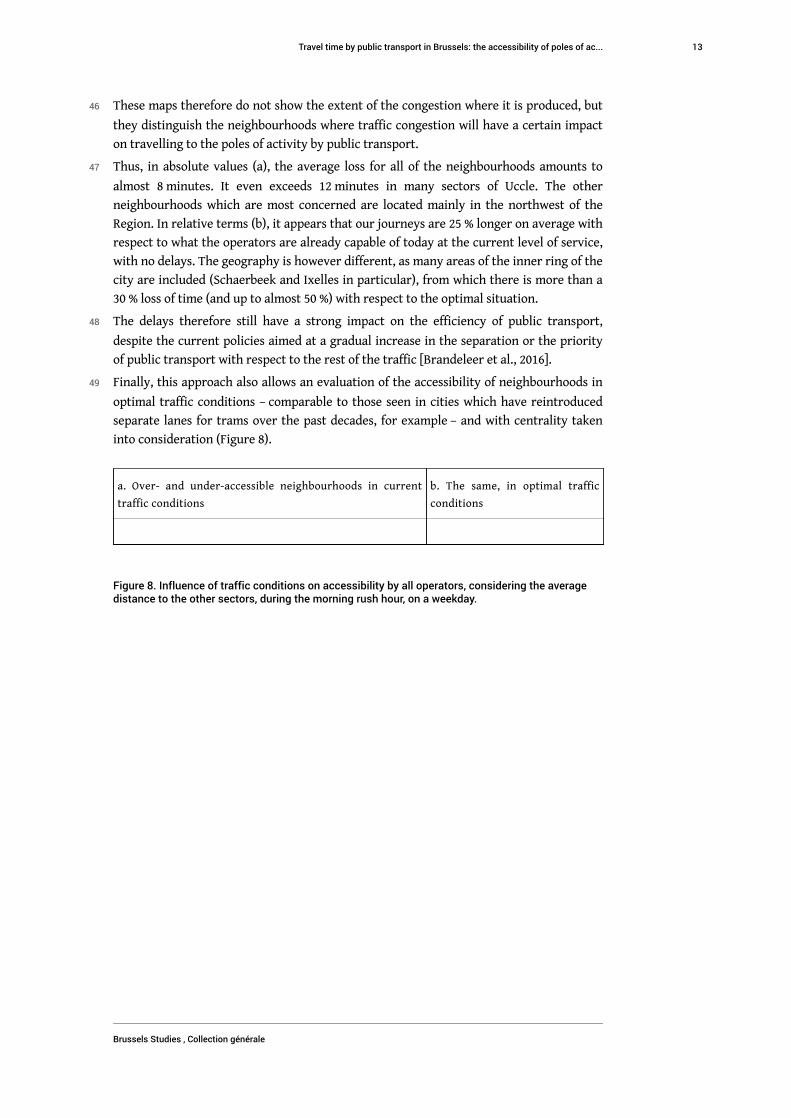
a. Over- and under-accessible neighbourhoods in current
traffic conditions
b. The same, in optimal traffic
conditions
Figure 8. Influence of traffic conditions on accessibility by all operators, considering the averagedistance to the other sectors, during the morning rush hour, on a weekday.
Travel time by public transport in Brussels: the accessibility of poles of ac...
Brussels Studies , Collection générale
13
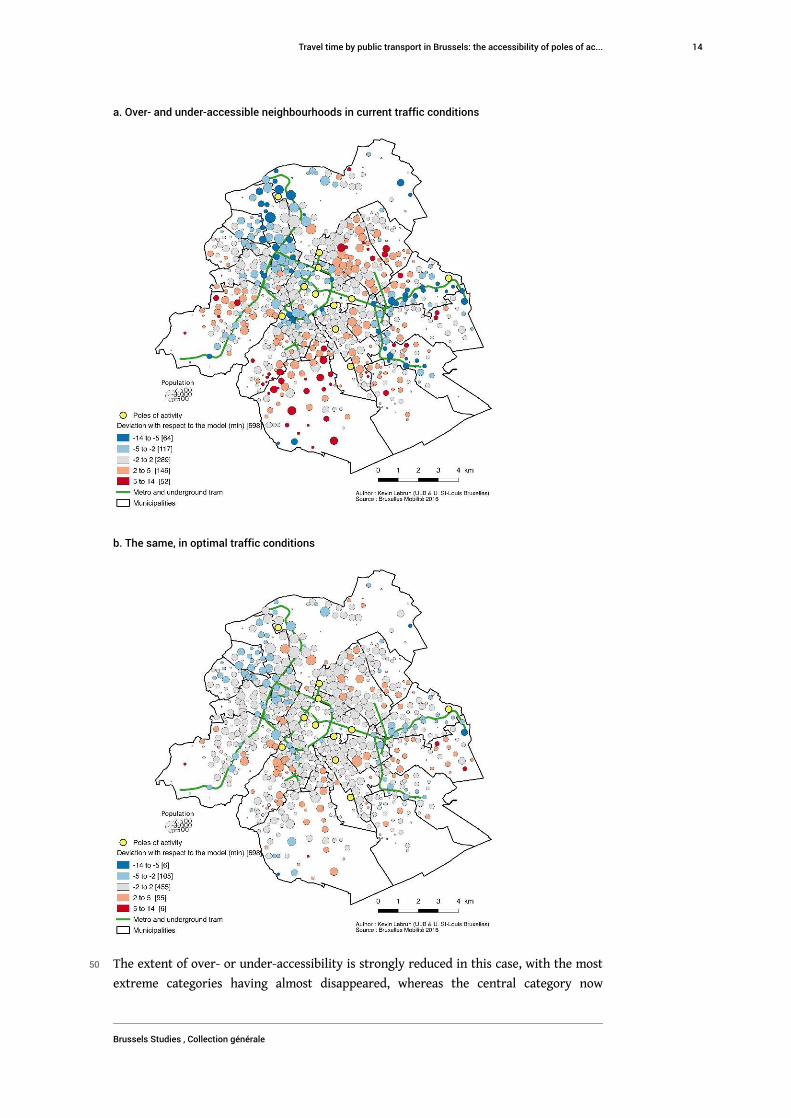
a. Over- and under-accessible neighbourhoods in current traffic conditions
b. The same, in optimal traffic conditions
50 The extent of over- or under-accessibility is strongly reduced in this case, with the most
extreme categories having almost disappeared, whereas the central category now
Travel time by public transport in Brussels: the accessibility of poles of ac...
Brussels Studies , Collection générale
14
represents 65 % of the sectors and 71 % of the population (41 % and 44 % respectively in
the current situation). The effect is especially pronounced in Uccle, which shows that
even without the underground, the tram and bus service is theoretically capable of
putting the municipality at an acceptable level of accessibility given its position in the
Region, provided that the vehicles are able to operate smoothly (and all things remaining
equal in other respects, such as vehicle use).
51 These results thus raise the question as to the means to be implemented in order to free
the services even more of car traffic.
Conclusion
A measurement of accessibility to direct public action
52 This study has shown that accessibility by public transport to the main poles of activity
during the morning rush hour presents quite a varied picture, according to absolute time
as well as considering distance to centrality.
53 The absolute perspective shows that the values can sometimes quadruple, and convey two
types of spatial logic, i.e. concentric and radial. Although this observation was partly
expected, our results show the extent to which centrality influences travel times, with
the geometric effect reinforced in Brussels by the central position of the main poles of
activity.
54 But it seems unrealistic to want to reduce the gaps by using this absolute perspective as a
reference. Apart from the question of limits to be set, this type of objective proved to be
very expensive given the low average number of users to gain in each of the potentially
concerned neighbourhoods. Furthermore, this approach aimed at greater equality proves
to be misleading in reality, to the extent that it would penalise the people who already
benefit from good accessibility as they live in more central neighbourhoods, but who are
more subject to the negative aspects related to higher densities (air pollution, noise,
smaller private outdoor spaces, etc.).
55 Combined with a socioeconomic indicator, this vision could prove to be useful in making
more targeted improvements, to the benefit of disadvantaged neighbourhoods which are
considered to be too far from the poles of activity, in order to increase spatial and
especially social cohesion in the Region.
56 The second perspective – which neutralises the effect of centrality – is more interesting,
as it shows that beyond centrality (and the demand), other aspects may influence
accessibility, such as the flow of traffic and the structure of networks via transfers. Thus,
as a whole, the areas with poor accessibility due to their location represent close to 30 %
of the population of Brussels. Surprisingly, they also concern neighbourhoods in the
south and east parts of the inner ring of the Region, which benefit from quite a dense
service network. Thus, as a whole, the areas with poor accessibility due to their location
represent close to 30 % of the population of Brussels.
57 Contrary to the first measure, this could constitute the basis for a regional objective,
which would consist in decreasing the proportion of the population in a situation of
under-accessibility, by reducing the relative differences observed between
neighbourhoods. The aim for more uniform accessibility in view of centrality seems to be
Travel time by public transport in Brussels: the accessibility of poles of ac...
Brussels Studies , Collection générale
15
more coherent with respect to the advantages and disadvantages of urbanity, and also
constitutes an interesting compromise between performance and (socio)spatial equity.
Operators other than STIB are part of the solution
58 How can the situation be improved in practical terms? Our results show that 10 % of the
inhabitants of Brussels (approximately 110 000 people) are still located 40 minutes away
from the poles of activity on average, which is not insignificant. The contribution of
operators other than STIB in certain municipalities of the outer ring, such as Uccle or
Evere, is already significant and allows this proportion to be brought down to 6 % overall.
But one must be in a position to benefit from this. In this respect, let us bear in mind that
the basic STIB pass does not provide access to the services of other operators in the
territory of Brussels. A financial supplement is therefore necessary, which means that the
inhabitants of Brussels are not inclined to discover and make use of these additional
transport services.
59 However, in Brussels, better fare integration would mean not only better accessibility in
general, but also reduced gaps, which many neighbourhoods in the outer ring would
benefit from, as they are currently not as well served by STIB. This process must
therefore be encouraged, so that the change of operator is no longer experienced at best
as an obstacle to overcome, and at worst as an option which is not even considered. In a
highly integrated system, the operator used is of secondary importance to travellers.
60 Furthermore, despite a measurement of accessibility which penalises low frequencies of
service (median time), we have shown that the gain in time – provided by the train in
particular – is sometimes so significant that it determines levels of accessibility
comparable to those provided by the underground in the outer ring of the Region. This
will not fail to support the idea that an RER could be a very useful addition to the
underground network by increasing the frequencies of service to the medium-sized and
secondary stations concerned (Uccle-Calevoet, Haren, Boitsfort, Jette, etc.). Many
inhabitants and workers in outlying neighbourhoods could therefore compensate for the
distance in a more constant manner throughout the day, with unbeatable travel times.
Controlling car traffic remains crucial
61 Our simulation shows that the impact of car traffic on travel time is substantial. Thus,
when travelling to the main poles of activity during rush hour, the traffic conditions
lengthen public transport travel time by 25 % on average, a figure which varies and may
reach 50 % according to the neighbourhood of departure.15
62 Thus, the efforts made to remove trams and buses from traffic, either by creating
separate lanes16 or using a remote controlled traffic light system [Brandeleer and Ermans,
2016], are still not enough to benefit from the full potential of the current service and
make it as efficient as it is in the cities which have reintroduced the tram in recent
decades.17 As regards the significance of the potential gain in time, while it is unrealistic
to imagine being able to benefit from it completely, in return, we must also bear in mind
that the estimate applies to an identical transport service, without the addition of any
other vehicles in the network.
Travel time by public transport in Brussels: the accessibility of poles of ac...
Brussels Studies , Collection générale
16
63 It is also ironic to note that even today, the service provided by different operators
unburdened by car traffic, would provide rather uniform accessibility given the
centrality, which is very close to the vision we have put forward.
Still other avenues to explore
64 Another potential lever for action resides in the organisation of transport networks, and
particularly that of STIB. In recent years, the regional operator increased the frequency
of many lines, potentially reducing the length of connections. But this rationale, although
positive, has probably reached its limits with respect to rush hour, as certain urban lines
are completely saturated, while our analysis of data from 2016 suggests that a reduction
in the number of connections still constitutes a factor for possible optimisation. Given the
inability to relocate the existing demand easily and quickly, the approach involving a
reorganisation of the surface network – in particular the trams – should therefore be
explored.
65 Finally, let us insist on the potential of such analyses, which have been carried out here
only with respect to accessibility within Brussels during the morning rush hour. However,
the regional travel model allows the exploration of other spatial scales (immediate
outskirts, RER area) and time-based scales (off-peak hours, evenings), which would allow
other issues to be dealt with, such as the complementarity of public transport and other
modes, or the issue of social inequality.
The author thanks the Strategy Division of Bruxelles Mobilité and STIB.
BIBLIOGRAPHY
BEAUJEU-GARNIER, Jacqueline, ANDAN, Odile and LIBAULT, André, 1975. The accessibility of big
towns in France. In: Geoforum. 1975. Vol. 6, no. 2, pp. 137-150.
BRANDELEER Céline and ERMANS, Thomas, 2016. When traffic light management prefigures
mobility choices: the strategic challenges of a technical tool. In: Brussels Studies. 19/09/2016.
no. 103. Available at: https://journals.openedition.org/brussels/1377
BRANDELEER, Céline, ERMANS, Thomas, HUBERT, Michel, JANSSENS, Isabelle, LANNOY, Pierre,
LOIR, Christophe and VANDERSTRAETEN, Pierre, 2016. Le partage de l’espace public en Région de
Bruxelles-Capitale. Bruxelles: 5e Cahier de l’Observatoire de la mobilité de la Région de Bruxelles-
Capitale. Publication de la RBC.
CEREMA, 2015. Mesurer l’accessibilité multimodale des territoires. État des lieux et analyse des pratiques.
Lyon: Éditions du CEREMA.
COURTOIS, Xavier and DOBRUSZKES, Frédéric, 2008. The (in)efficiency of trams and buses in
Brussels: a fine geographical analysis. In: Brussels Studies. 27/06/2008. no. 20. Available at: https://
journals.openedition.org/brussels/608
Travel time by public transport in Brussels: the accessibility of poles of ac...
Brussels Studies , Collection générale
17
DOBRUSZKES, Frédéric and FOURNEAU, Yves, 2007. The direct cost and geography of Brussels
mass transport’s operating delays. In: Brussels Studies. 24/05/2007. no. 7. Available at: https://
journals.openedition.org/brussels/423
DOBRUSZKES, Frédéric and MARISSAL, Pierre, 1995. La problématique des déplacements à
Bruxelles. In: Revue Belge de Géographie. 118th year, no. 3, pp. 133-153.
EL-GENEIDY, Ahmed, CERDA, Assumpta, FISCHLE, Raphaël and LUKA, Nik, 2011. Evaluating the
Impacts of Transportation Plans Using Accessibility Measures. In : Canadian Journal of Urban
Research. 08/2011. pp. 81-104.
ESPON, 2008. Territorial Dynamics in Europe. Trends in Population Development. Luxembourg: ESPON
2013 Programme. Territorial Observation.
GEURS, Karst T. and RITSEMA VAN ECK, J. R., 2001. Accessibility measures: review and applications.
Evaluation of accessibility impacts of land-use transportation scenarios, and related social and economic
impact [online]. Rijksinstituut voor Volksgezondheid en Milieu RIVM. [Retrieved on 05/11/2014].
Available at: https://www.rivm.nl/dsresource?
objectid=171931c0-1023-4d50-8a3e-99f8ea126b74&type=org&disposition=inline
HANDY, Susan L. and CLIFTON, Kelly J., 2001. Evaluating neighborhood accessibility: Possibilities
and practicalities. In: Journal of Transportation and Statistics. 2001. Vol. 4, no. 2/3, pp. 67-78.
HANSEN, Walter G., 1959. How Accessibility Shapes Land Use. In: Journal of the American Institute of
Planners. 01/05/1959. Vol. 25, no. 2, pp. 73-76.
HERMIA, Jean-Pierre, 2018. Baromètre 2017 de la Région de Bruxelles-Capitale : IBSA, Focus 22,
01/2018.
HUBERT, Michel, 2008. Expo ’58 and “the car as king”. In: Brussels Studies. 20/10/2008, no. 22.
Available at: https://journals.openedition.org/brussels/627
HUBERT, Michel, LEBRUN, Kevin, HUYNEN, Philippe and DOBRUSZKES, Frédéric, 2013. Note de
synthèse BSI. La mobilité quotidienne à Bruxelles : défis, outils et chantiers prioritaires. In :
Brussels Studies. 18/09/2013. no. 71. Available at: https://journals.openedition.org/brussels/1188
KAROU, Saleem and HULL, Angela, 2014. Accessibility modelling: predicting the impact of
planned transport infrastructure on accessibility patterns in Edinburgh, UK. In: Journal of
Transport Geography. 02/2014. Vol. 35, pp. 1-11.
LEBRUN, Kevin, HUBERT, Michel, DOBRUSZKES, Frédéric and HUYNEN, Philippe, 2012. L’offre de
transport à Bruxelles. Bruxelles: 1er Cahier de l’Observatoire de la mobilité de la Région de
Bruxelles-Capitale. Publication de la RBC.
LEBRUN, Kevin, HUBERT, Michel, HUYNEN, Philippe, DE WITTE, Astrid and MACHARIS, Cathy,
2013. Les pratiques de déplacement à Bruxelles. Bruxelles: 2e Cahier de l’Observatoire de la mobilité
de la Région de Bruxelles-Capitale. Publication de la RBC.
LEBRUN, Kevin, HUBERT, Michel, HUYNEN, Philippe and PATRIARCHE, Geoffroy, 2014. Les
pratiques de déplacement à Bruxelles : analyses approfondies. Bruxelles: 3e Cahier de l’Observatoire de
la mobilité de la Région de Bruxelles-Capitale. Publication de la RBC.
LECLERCQ, Alexandre, GRANDJEAN, Martin and HANIN, Yves, 2015. Modélisation SIG de
l’accessibilité par co-modalité en favorisant l’usage des transports en commun en Wallonie et
Fédération Wallonie-Bruxelles. In: Cybergeo. European Journal of Geography. 14/09/2015. Available
at: https://journals.openedition.org/cybergeo/27198
Travel time by public transport in Brussels: the accessibility of poles of ac...
Brussels Studies , Collection générale
18
LEURQUIN, Ulysse, 2016. Analyse quantitative de l’accessibilité multimodale en Région bruxelloise par
modélisation des réseaux présents et à venir. Master thesis. Louvain-la-Neuve: UCL.
L’HOSTIS, Alain and CONESA, Alexis, 2010. Définir l’accessibilité intermodale. In: Systèmes de
Transport Urbain.
LITMAN, Todd, 2003. Measuring transportation: Traffic, mobility and accessibility. In: Institute of
Transportation Engineers. ITE Journal. Vol. 73, no. 10, pp. 28-32.
MERLIN, Pierre, 1991. Géographie, économie et planification des transports. Paris: Presses
Universitaires de France.
MERLIN, Pierre, 1992. Les transports urbains. Paris: Presses universitaires de France. coll. Que sais-
je ?
RÉGION DE BRUXELLES-CAPITALE, 2006. Règlement Régional d’Urbanisme. Bruxelles: s.n.
RICHER, Cyprien and PALMIER, Patrick, 2011. Mesurer l’accessibilité en transport collectif aux
pôles d’excellence de Lille Métropole. In: Mobilités spatiales et ressources métropolitaines :l’accessibilité en questions / 11ème colloque du groupe de travail « Mobilités Spatiales et Fluidité Sociale » de
l’AISLF [online]. 2011. p. 26. [Retrieved on 21/01/2015]. Available at: https://halshs.archives-
ouvertes.fr/halshs-00639264/document.
VANDENBULCKE, Grégory, STEENBERGHEN, Thérèse and THOMAS, Isabelle, 2009. Mapping
accessibility in Belgium: a tool for land-use and transport planning? In: Journal of Transport
Geography. 01/2009. Vol. 17, no. 1, pp. 39-53.
NOTES
1. This phenomenon has been observed for twenty years or so, with the result that BCR has
exceeded its historical maximum of the 1960s and reached 1 191 604 inhabitants on 1 January
2017 [Hermia, 2018]. Brussels is not an isolated case, as this demographic growth is observed in
85 % of the urban regions in Europe and in most of the capital cities [ESPON, 2008].
2. With the modal shares calculated according to the main mode, which means that in the case of
an intermodal journey, only the mode covering the greatest distance is considered. More
information regarding the calculation of modal shares in Lebrun et al., 2014.
3. Let us mention in particular [Beaujeu-Garnier et al., 1975; El-Geneidy et al., 2011; Geurs,
Ritsema van Eck, 2001; Handy, Clifton, 2001; Hansen, 1959; Karou, Hull, 2014; Litman, 2003;
Merlin, 1992, 1991; Vandenbulcke et al., 2009].
4. This document divides the territory of Brussels into three areas of accessibility (A, B and C),
which have constraints concerning the number of bicycle and car parking facilities. However, it
evaluates accessibility based on mode and frequencies and not travel times [Brussels-Capital
Region, 2006].
5. A stop corresponds to a boarding point on one of the public transport networks. For example,
the number of stops at an underground station equals the number of platforms. All stops have
precise locations.
6. Three rules have been used to select the stops connected to each centroid:
1. Each statistical sector must be linked to at least one STIB stop, with no limits in terms of
distance.
2. Additional connectors are allowed according to a criterion of distance: 500 metres maximum
towards any other stop, regardless of the operator.
3. A maximum of five connectors are allowed per statistical sector, in order to shorten the
calculation time and with regard to the low value added by additional connectors.
Travel time by public transport in Brussels: the accessibility of poles of ac...
Brussels Studies , Collection générale
19
7. Journeys related to school or work represent only part of the journeys made on a weekday
[Lebrun et al., 2013: 11].
8. In detail, Brugmann was preferred above Plateau du Heysel, whose services do not start
running before 10 am for the most part, whereas our hypothesis authorises a departure between
8 am and 9 am, with an arrival at 10 am at the latest. While they are comparable overall, Saint-
Luc hospital was preferred above Érasme given its slightly bigger size: 480 000 consultations in
2014 versus 350-400 000 for Érasme, with a higher number of beds and staff as well [Cliniques
universitaires Saint-Luc, 2014; Université Libre de Bruxelles, 2017].
9. Present in the sectors located 10 minutes away on foot at most (surface mainly included at less
than 530 m from the centroid targeted by the measurement).
10. 39,4 minutes when the destinations are not filtered.
11. The standard deviation is 8 minutes, but reaches 12,2 minutes when it is calculated directly
for all connections, which testifies to greater variability at this level and shows that the network
is organised so that it favours access to the main poles of activity.
12. Furthermore, the range of the values for travel time as well as their geography remain
identical overall when the destinations are not filtered.
13. The timetables – at least those of STIB – are adapted regularly to correspond to the actual
situation. Cf. methodology.
14. Two comments:
1. This measurement also includes public transport congestion. We may nevertheless assume
that this effect is marginal with respect to that of car congestion, in addition to being related to
the irregularity of services it causes.
2. The application of new profiles of travel time also has the effect of modifying the conditions
for connections, which are unrelated to congestion. These modifications may however cause
improvements and deteriorations, and here we assume that the differences are balanced overall.
15. Apart from exceptional circumstances which could have an impact on bus and tram
circulation (works, accident, etc.).
16. With respect to STIB, approximately 70 % of the total distance of the different tram lines is
protected from car traffic, compared to only 20 % for buses (Lebrun et al., 2012).
17. The STIB tram network is the result of a long historical heritage. Unlike many other
European cities, Brussels has never dismantled its network totally, probably thanks to Expo 58,
which was an occasion to renovate it [Hubert, 2008].
ABSTRACTS
With an approach based on the modelling of travel time in the Brussels Region, this article
examines the accessibility by public transport of a selection of poles of activity in the Region
from different neighbourhoods. Measurements of travel time were thus carried out during the
morning rush hour on a weekday, taking all operators into account. The analyses highlight a
strong intraregional heterogeneity subject to radial and concentric logic, in particular in relation
to transport demand. The significant current and potential contribution of operators other than
STIB is also revealed. They also show that close to 30 % of the population of Brussels lives in
neighbourhoods with poor accessibility due to location, which raises the question as to an
objective aimed at making accessibility more uniform from this point of view. With respect to the
Travel time by public transport in Brussels: the accessibility of poles of ac...
Brussels Studies , Collection générale
20
factors which determine accessibility by public transport, it appears in particular that car traffic
still has a heavy impact on travel time, increasing it by 25 % on average, despite the policies in
recent years aimed at protecting or separating public transport from car traffic.
Par une approche s’appuyant sur la modélisation des temps de déplacements dans la Région
bruxelloise, cet article entend discuter l’accessibilité en transport public d’une sélection de pôles
d’activité de la Région au départ des différents quartiers. Des mesures de temps de déplacements
ont pour cela été réalisées à l’heure de pointe matinale d’un jour ouvrable, en tenant compte de
l’ensemble des opérateurs. Les analyses mettent en évidence une forte hétérogénéité
intrarégionale, subordonnée à des logiques radiales et concentriques, notamment en lien avec la
demande de transport. La contribution importante, actuelle et potentielle, des opérateurs autres
que la STIB est également révélée. Elles montrent aussi que près de 30 % de la population
bruxelloise réside actuellement au sein de quartiers présentant un déficit d’accessibilité compte
tenu de sa localisation, ce qui pose la question d’un objectif visant à rendre l’accessibilité plus
uniforme de ce point de vue. Concernant les déterminants de l’accessibilité en transport public, il
apparaît notamment que le trafic automobile pèse encore lourdement sur les temps de parcours,
les allongeant en moyenne de 25 %, en dépit des politiques menées ces dernières années et visant
à protéger ou séparer les transports publics du trafic automobile.
Via een benadering die gebaseerd is op een modelvorming voor de verplaatsingstijden in het
Brussels Gewest, strekt dit artikel ertoe de bereikbaarheid met het openbaar vervoer van een
selectie activiteitenpolen van het Gewest vanuit de verschillende wijken te bespreken. Daartoe
werden verplaatsingstijden gemeten tijdens de ochtendspits op een werkdag, rekening houdend
met het aanbod van alle vervoersoperatoren. De analyses wijzen op een grote heterogeniteit
binnen het Gewest, die het gevolg is van een radiale en concentrische logica, en onder meer
gelinkt is aan de vraag naar vervoer. Ook de huidige en potentiële grote bijdrage van de andere
operatoren dan de MIVB komt daaruit naar voren. De analyses tonen ook aan dat bijna 30 % van
de Brusselse bevolking thans woont in wijken die door hun ligging minder goede verbindingen
met de activiteitenpolen hebben. Dat doet de vraag rijzen of de bereikbaarheid van die polen niet
eenvormiger moet worden. Wat de doorslaggevende factoren voor de bereikbaarheid met het
openbaar vervoer betreft, blijkt onder meer dat het autoverkeer nog steeds een grote invloed op
de reistijden heeft en ze gemiddeld met 25 % verlengt, ondanks het beleid van de laatste jaren om
het openbaar vervoer te beschermen tegen of te scheiden van het autoverkeer.
INDEX
Mots-clés: mobilité, transports publics, politique régionale, développement territorial,
planification urbaine
Trefwoorden mobiliteit, openbaar vervoer, gewestelijk beleid, territoriale ontwikkeling,
stadsplanning
Subjects: 7. aménagement du territoire – logement – mobilité
Keywords: mobility, public transport, regional policy, territorial development, urban planning
AUTHORS
KEVIN LEBRUN
Kevin Lebrun, geographer, has recently finished a doctoral thesis on the accessibility of
neighbourhoods in Brussels by public transport. He is a member of Centre d’Etudes Sociologique
Travel time by public transport in Brussels: the accessibility of poles of ac...
Brussels Studies , Collection générale
21
(CES) at USL-B and of Institut de Gestion de l’Environnement et d’Aménagement du Territoire (IGEAT) at
ULB. His research focuses on the study of mobility, in particular urban and/or railway mobility.
From 2011 to 2014, he also participated actively in the implementation of the Observatoire de la
mobilité de la Région de Bruxelles-Capitale, in particular through the creation of the first three
Cahiers.
kevin.lebrun[at]usaintlouis.be
Travel time by public transport in Brussels: the accessibility of poles of ac...
Brussels Studies , Collection générale
22