State of the soft-bottom macrofauna community // Benthic ... II 2-2014... · State of the...
17
30.09.2014 State of the soft-bottom macrofauna community // Benthic Quality Index Kerstin Schiele, Alexander Darr, Michael Zettler, Torsten Berg, Mats Blomqvist, Darius Daunys, Vadims Jermakovs, Alf Josefson, Samuli Korpinen, Jonne Kotta, Henrik Nygård, Mario von Weber, Jan Warzocha Project Manager: Lena Avellan CORESET II 2/2014 workshop 29.-30. September 2014, Gothenburg
Transcript of State of the soft-bottom macrofauna community // Benthic ... II 2-2014... · State of the...
30.09.2014
State of the soft-bottom macrofauna community // Benthic Quality Index
Kerstin Schiele, Alexander Darr, Michael Zettler, Torsten Berg, Mats Blomqvist, Darius Daunys, Vadims Jermakovs, Alf Josefson, Samuli Korpinen, Jonne Kotta, Henrik Nygård, Mario von Weber, Jan Warzocha
Project Manager: Lena Avellan
CORESET II 2/2014 workshop
29.-30. September 2014, Gothenburg
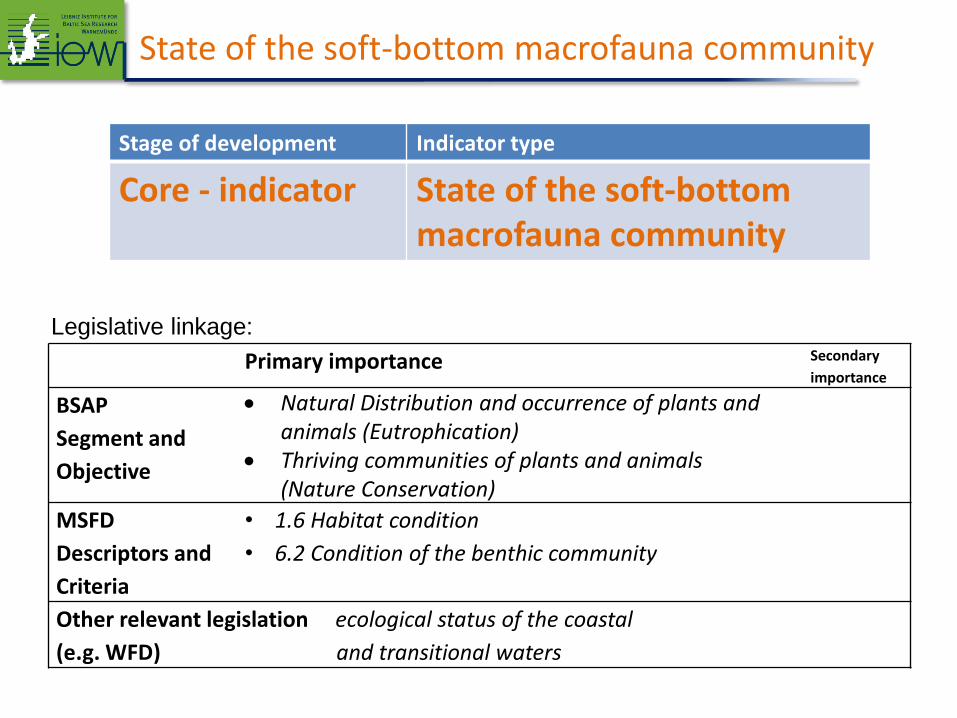
Stage of development Indicator type
Core - indicator State of the soft-bottom macrofauna community
Primary importance Secondary
importance
BSAP
Segment and
Objective
Natural Distribution and occurrence of plants and animals (Eutrophication)
Thriving communities of plants and animals (Nature Conservation)
MSFD
Descriptors and
Criteria
• 1.6 Habitat condition
• 6.2 Condition of the benthic community
Other relevant legislation ecological status of the coastal
(e.g. WFD) and transitional waters
Legislative linkage:
State of the soft-bottom macrofauna community
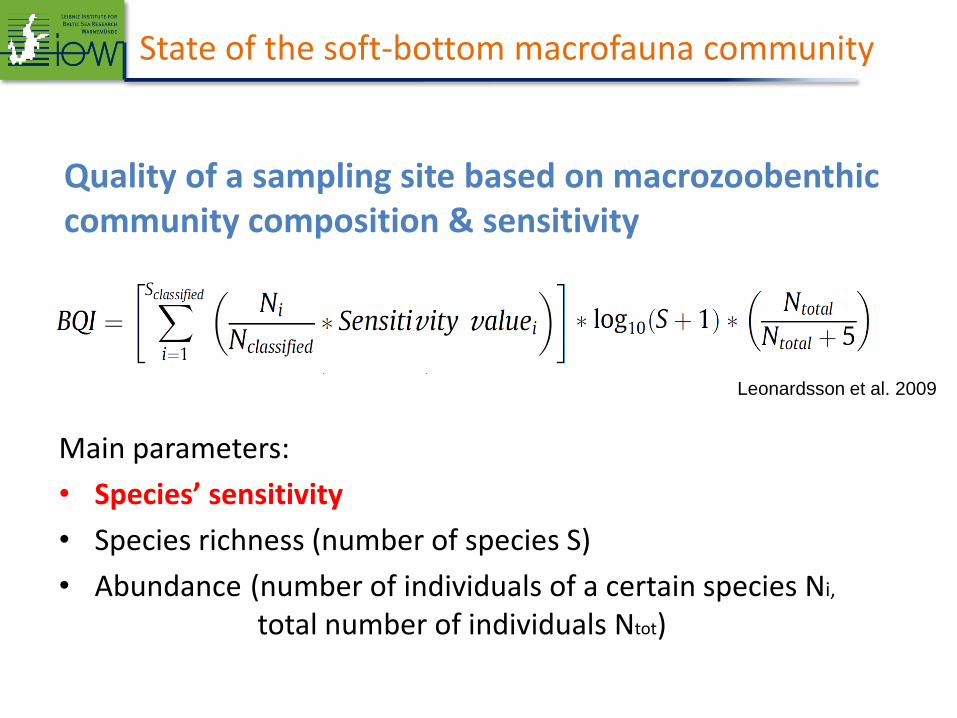
Main parameters:
• Species’ sensitivity
• Species richness (number of species S)
• Abundance (number of individuals of a certain species Ni, total number of individuals Ntot)
Quality of a sampling site based on macrozoobenthic community composition & sensitivity
Leonardsson et al. 2009
State of the soft-bottom macrofauna community
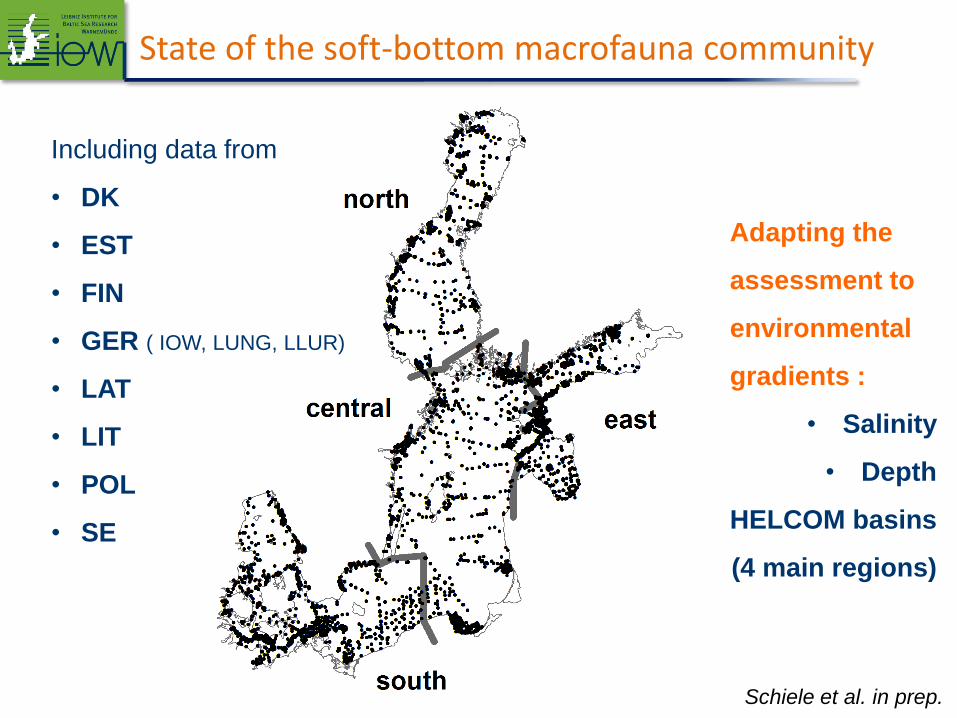
Including data from
• DK
• EST
• FIN
• GER ( IOW, LUNG, LLUR)
• LAT
• LIT
• POL
• SE
Schiele et al. in prep.
Adapting the
assessment to
environmental
gradients :
• Salinity
• Depth
HELCOM basins
(4 main regions)
State of the soft-bottom macrofauna community
subsetno of
samples
mean no of
species S
(min/max)
mean no of
individuals
(min/max)
mean Es50
(min/max)
number of
species with
ES50 0.05
value
ES50 0.05
based on >=
100 records
[%]
ES50 0.05
based on >=
300 records
[%]
mean % of
individuals
used for
BQI
salinity
range [psu]depth range [m] region
sampler
size [m²]
meshsize
[mm]
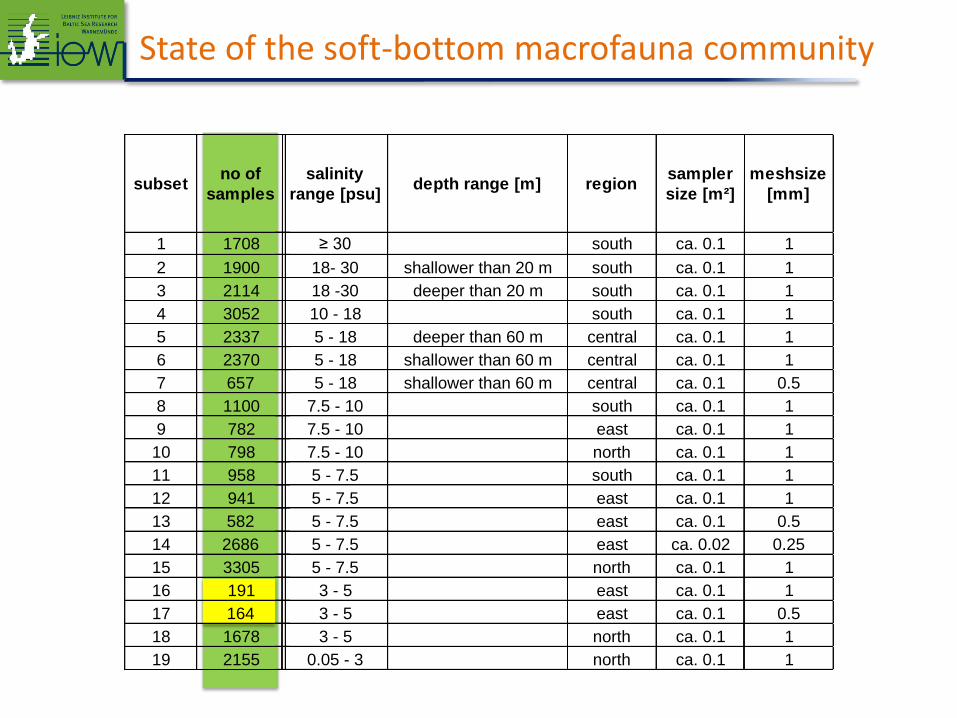
1 1708 26 (2/ 54) 199 (3/ 949) 14.25 (2.0/ 28.0) 188 51 27 98.6 ≥ 30 south ca. 0.1 1
2 1900 21 (1/ 68) 417 (1/ 7746) 11.41 (1.0/ 26.8) 190 48 19 98.6 18- 30 shallower than 20 m south ca. 0.1 1
3 2114 15 (1/ 62) 185 (1/ 2954) 9.38 (1.0/ 25.0) 140 44 20 99.0 18 -30 deeper than 20 m south ca. 0.1 1
4 3052 13 (1/ 68) 394 (1/ 11472) 7.71 (1.0/ 23.3) 147 47 25 99.3 10 - 18 south ca. 0.1 1
5 2337 3 (1/ 11) 54 (1/ 1021) 2.69 (1.0/ 9.4) 18 67 33 99.2 5 - 18 deeper than 60 m central ca. 0.1 1
6 2370 6 (1/ 19) 225 (1/ 3030) 4.79 (1.0/ 12.6) 34 56 44 99.8 5 - 18 shallower than 60 m central ca. 0.1 1
7 657 6 (1/ 12) 350 (1/ 12453) 5.19 (1.0/ 10.2) 16 75 38 99.1 5 - 18 shallower than 60 m central ca. 0.1 0.5
8 1100 11 (1/ 37) 415 (1/ 3905) 6.89 (1.0/ 15.9) 67 40 18 99.2 7.5 - 10 south ca. 0.1 1
9 782 3 (1/ 13) 81 (1/ 1033) 2.75 (1.0/ 7.2) 13 54 23 99.6 7.5 - 10 east ca. 0.1 1
10 798 3 (1/ 8) 299 (1/ 1358) 2.31 (1.0/ 6.0) 8 75 38 99.9 7.5 - 10 north ca. 0.1 1
11 958 8 (1/ 21) 256 (2/ 6896) 6.08 (1.0/ 11.4) 30 60 37 99.8 5 - 7.5 south ca. 0.1 1
12 941 3 (1/ 12) 96 (1/ 2447) 2.84 (1.0/ 9.8) 14 50 36 98.4 5 - 7.5 east ca. 0.1 1
13 582 6 (1/ 15) 284 (1/ 2280) 4.37 (1.0/ 9.3) 17 59 24 98.5 5 - 7.5 east ca. 0.1 0.5
14 2686 5 (1/ 17) 58 (1/ 2393) 4.4 (1.0/12.0) 30 77 43 99.4 5 - 7.5 east ca. 0.02 0.25
15 3305 3 (1/ 11) 262 (1/ 2619) 2.47 (1.0/ 10.0) 14 93 50 99.8 5 - 7.5 north ca. 0.1 1
16 191 4 (1/ 14) 81 (1/ 575) 3.57 (1.0/ 11.0) 8 25 na 96.8 3 - 5 east ca. 0.1 1
17 164 8 (1/ 14) 271 (1/ 669) 5.79 (1.0/ 9.1) 14 43 na 99.3 3 - 5 east ca. 0.1 0.5
18 1678 2 (1/ 10) 107 (1/ 2526) 2.1 (1.0/ 7.4) 10 80 50 99.9 3 - 5 north ca. 0.1 1
19 2155 2 (1/ 10) 81 (1/ 754) 2.11 (1.0/ 10.0) 14 50 36 98.0 0.05 - 3 north ca. 0.1 1
subsetno of
samples
mean no of
species S
(min/max)
mean no of
individuals
(min/max)
mean Es50
(min/max)
number of
species with
ES50 0.05
value
ES50 0.05
based on >=
100 records
[%]
ES50 0.05
based on >=
300 records
[%]
mean % of
individuals
used for
BQI
salinity
range [psu]depth range [m] region
sampler
size [m²]
meshsize
[mm]
1 1708 26 (2/ 54) 199 (3/ 949) 14.25 (2.0/ 28.0) 188 51 27 98.6 ≥ 30 south ca. 0.1 1
2 1900 21 (1/ 68) 417 (1/ 7746) 11.41 (1.0/ 26.8) 190 48 19 98.6 18- 30 shallower than 20 m south ca. 0.1 1
3 2114 15 (1/ 62) 185 (1/ 2954) 9.38 (1.0/ 25.0) 140 44 20 99.0 18 -30 deeper than 20 m south ca. 0.1 1
4 3052 13 (1/ 68) 394 (1/ 11472) 7.71 (1.0/ 23.3) 147 47 25 99.3 10 - 18 south ca. 0.1 1
5 2337 3 (1/ 11) 54 (1/ 1021) 2.69 (1.0/ 9.4) 18 67 33 99.2 5 - 18 deeper than 60 m central ca. 0.1 1
6 2370 6 (1/ 19) 225 (1/ 3030) 4.79 (1.0/ 12.6) 34 56 44 99.8 5 - 18 shallower than 60 m central ca. 0.1 1
7 657 6 (1/ 12) 350 (1/ 12453) 5.19 (1.0/ 10.2) 16 75 38 99.1 5 - 18 shallower than 60 m central ca. 0.1 0.5
8 1100 11 (1/ 37) 415 (1/ 3905) 6.89 (1.0/ 15.9) 67 40 18 99.2 7.5 - 10 south ca. 0.1 1
9 782 3 (1/ 13) 81 (1/ 1033) 2.75 (1.0/ 7.2) 13 54 23 99.6 7.5 - 10 east ca. 0.1 1
10 798 3 (1/ 8) 299 (1/ 1358) 2.31 (1.0/ 6.0) 8 75 38 99.9 7.5 - 10 north ca. 0.1 1
11 958 8 (1/ 21) 256 (2/ 6896) 6.08 (1.0/ 11.4) 30 60 37 99.8 5 - 7.5 south ca. 0.1 1
12 941 3 (1/ 12) 96 (1/ 2447) 2.84 (1.0/ 9.8) 14 50 36 98.4 5 - 7.5 east ca. 0.1 1
13 582 6 (1/ 15) 284 (1/ 2280) 4.37 (1.0/ 9.3) 17 59 24 98.5 5 - 7.5 east ca. 0.1 0.5
14 2686 5 (1/ 17) 58 (1/ 2393) 4.4 (1.0/12.0) 30 77 43 99.4 5 - 7.5 east ca. 0.02 0.25
15 3305 3 (1/ 11) 262 (1/ 2619) 2.47 (1.0/ 10.0) 14 93 50 99.8 5 - 7.5 north ca. 0.1 1
16 191 4 (1/ 14) 81 (1/ 575) 3.57 (1.0/ 11.0) 8 25 na 96.8 3 - 5 east ca. 0.1 1
17 164 8 (1/ 14) 271 (1/ 669) 5.79 (1.0/ 9.1) 14 43 na 99.3 3 - 5 east ca. 0.1 0.5
18 1678 2 (1/ 10) 107 (1/ 2526) 2.1 (1.0/ 7.4) 10 80 50 99.9 3 - 5 north ca. 0.1 1
19 2155 2 (1/ 10) 81 (1/ 754) 2.11 (1.0/ 10.0) 14 50 36 98.0 0.05 - 3 north ca. 0.1 1
State of the soft-bottom macrofauna community
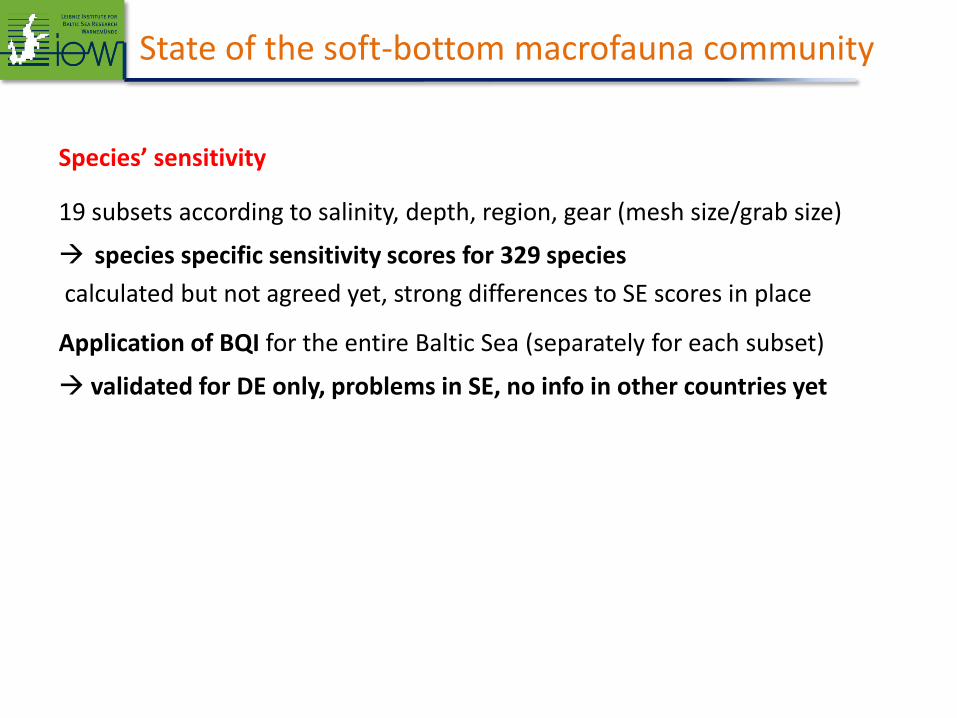
Species’ sensitivity
19 subsets according to salinity, depth, region, gear (mesh size/grab size)
species specific sensitivity scores for 329 species
calculated but not agreed yet, strong differences to SE scores in place
Application of BQI for the entire Baltic Sea (separately for each subset)
validated for DE only, problems in SE, no info in other countries yet
State of the soft-bottom macrofauna community
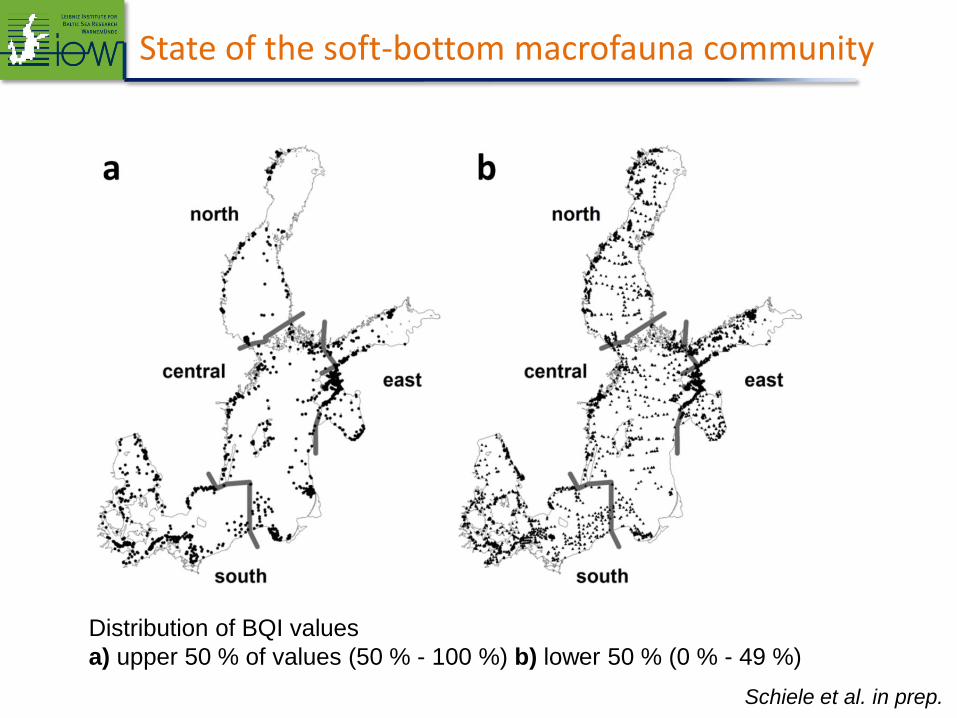
Distribution of BQI values
a) upper 50 % of values (50 % - 100 %) b) lower 50 % (0 % - 49 %)
Schiele et al. in prep.
State of the soft-bottom macrofauna community
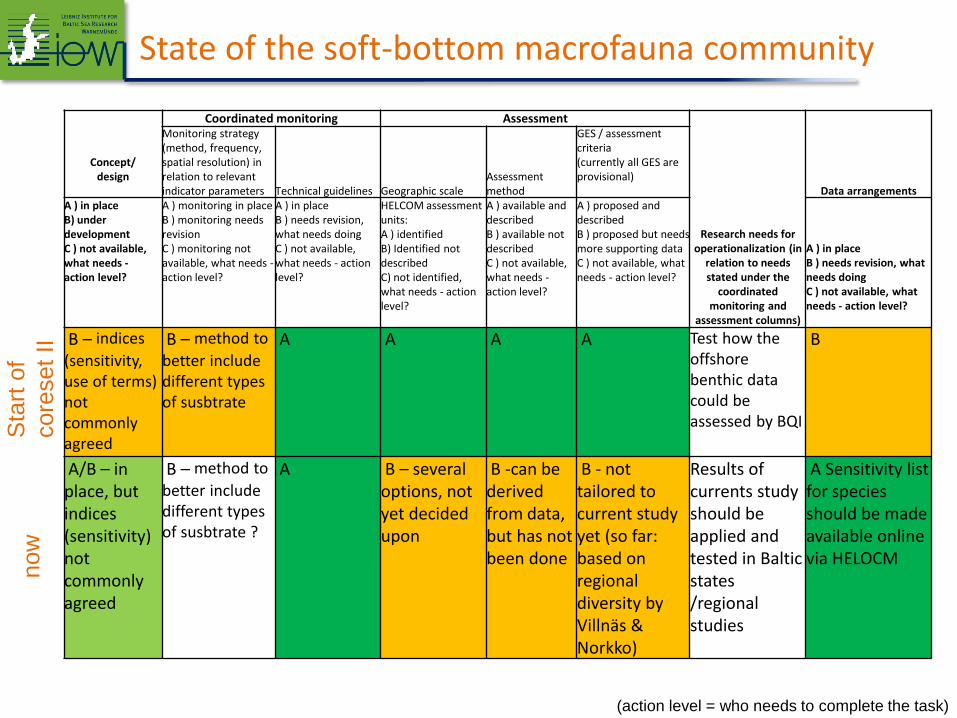
Concept/ design
Coordinated monitoring Assessment
Research needs for operationalization (in
relation to needs stated under the
coordinated monitoring and
assessment columns)
Data arrangements
Monitoring strategy (method, frequency, spatial resolution) in relation to relevant indicator parameters Technical guidelines Geographic scale
Assessment method
GES / assessment criteria (currently all GES are provisional)
A ) in place B) under development C ) not available, what needs - action level?
A ) monitoring in place B ) monitoring needs revision C ) monitoring not available, what needs - action level?
A ) in place B ) needs revision, what needs doing C ) not available, what needs - action level?
HELCOM assessment units: A ) identified B) Identified not described C) not identified, what needs - action level?
A ) available and described B ) available not described C ) not available, what needs - action level?
A ) proposed and described B ) proposed but needs more supporting data C ) not available, what needs - action level?
A ) in place B ) needs revision, what needs doing C ) not available, what needs - action level?
B – indices
(sensitivity, use of terms) not commonly agreed
B – method to
better include different types of susbtrate
A A A
A Test how the
offshore benthic data could be assessed by BQI
B
A/B – in place, but indices (sensitivity) not commonly agreed
B – method to
better include different types of susbtrate ?
A B – several options, not yet decided upon
B -can be derived from data, but has not been done
B - not tailored to current study yet (so far: based on regional diversity by Villnäs & Norkko)
Results of currents study should be applied and tested in Baltic states /regional studies
A Sensitivity list for species should be made available online via HELOCM
Sta
rt o
f
core
set
II
now
(action level = who needs to complete the task)
State of the soft-bottom macrofauna community
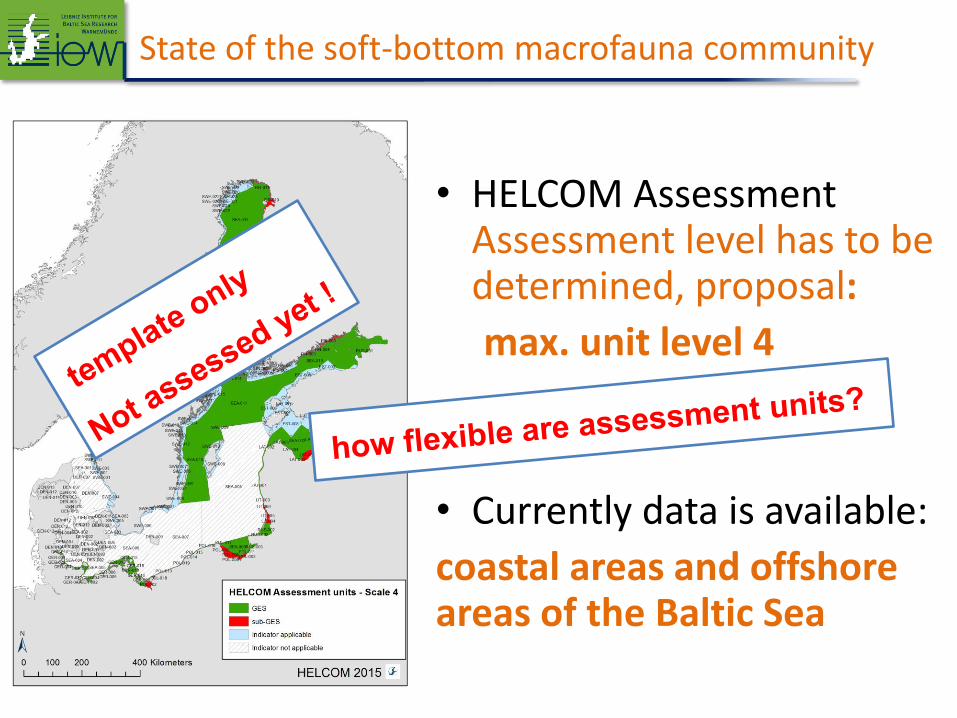
• HELCOM Assessment Assessment level has to be determined, proposal:
max. unit level 4
• Currently data is available:
coastal areas and offshore areas of the Baltic Sea
State of the soft-bottom macrofauna community
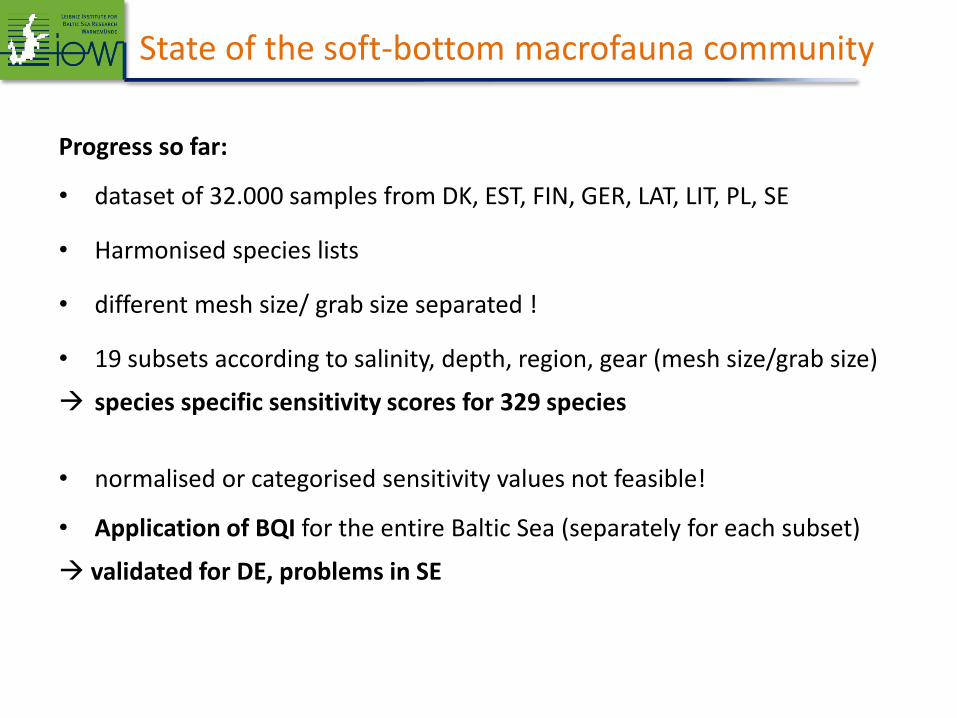
Progress so far:
• dataset of 32.000 samples from DK, EST, FIN, GER, LAT, LIT, PL, SE
• Harmonised species lists
• different mesh size/ grab size separated !
• 19 subsets according to salinity, depth, region, gear (mesh size/grab size)
species specific sensitivity scores for 329 species
• normalised or categorised sensitivity values not feasible!
• Application of BQI for the entire Baltic Sea (separately for each subset)
validated for DE, problems in SE
State of the soft-bottom macrofauna community
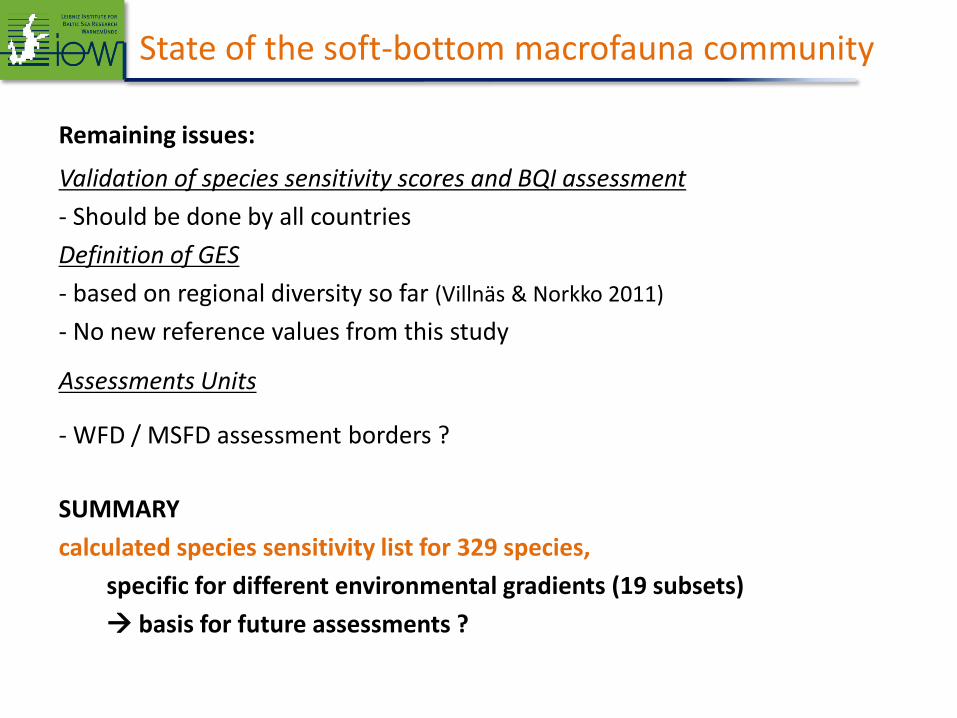
Remaining issues:
Validation of species sensitivity scores and BQI assessment
- Should be done by all countries
Definition of GES
- based on regional diversity so far (Villnäs & Norkko 2011)
- No new reference values from this study
Assessments Units
- WFD / MSFD assessment borders ?
SUMMARY
calculated species sensitivity list for 329 species,
specific for different environmental gradients (19 subsets)
basis for future assessments ?
State of the soft-bottom macrofauna community
30.09.2014
Population structure of long-lived macrozoobenthic species
Alexander Darr, Michael Zettler, Karin Fürhaupter, Mats Blomqvist, Samuli
Korpinen, Henrik Nygård, (Vadims Jermakov - MARMONI), Jan Warzocha
CORESET II 2/2014 workshop
29.-30. September 2014, Gothenburg
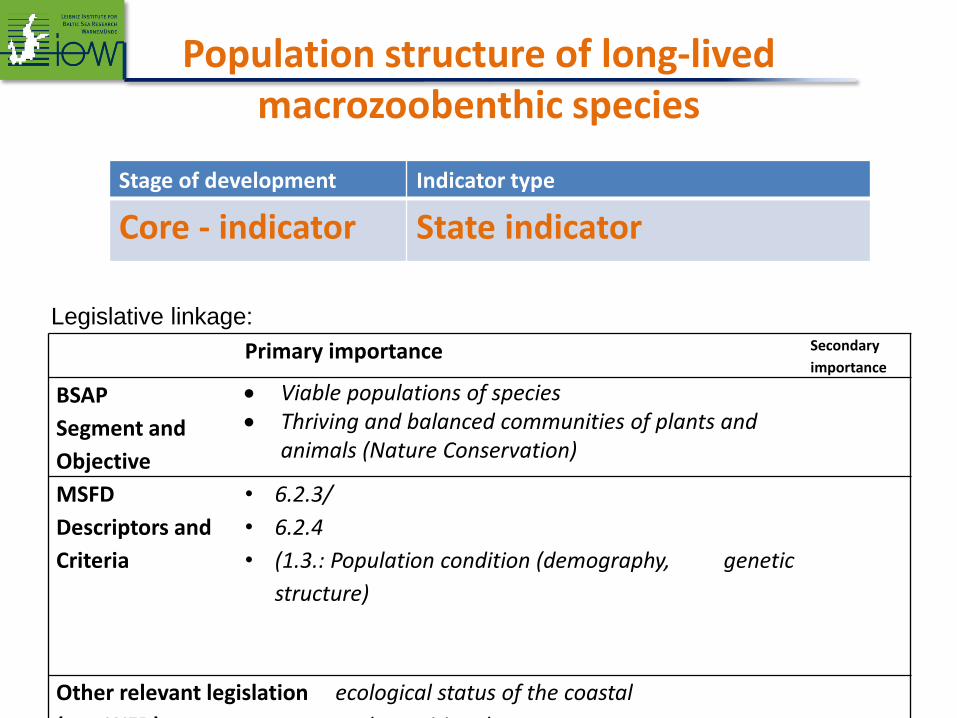
Stage of development Indicator type
Core - indicator State indicator
Primary importance Secondary
importance
BSAP
Segment and
Objective
Viable populations of species Thriving and balanced communities of plants and
animals (Nature Conservation)
MSFD
Descriptors and
Criteria
• 6.2.3/
• 6.2.4
• (1.3.: Population condition (demography, genetic
structure)
Other relevant legislation ecological status of the coastal
(e.g. WFD) and transitional waters
Legislative linkage:
Population structure of long-lived macrozoobenthic species
Progress so far:
Population structure of long-lived macrozoobenthic species
• Regional development in MARMONI-project:
• available for: Finland and Latvia
• selected species: Macoma balthica
• Finish approach: linking mean size with oxygen conditions
•Automatic software for size determination (FIN)
• Latvian approach: linking median size with BSII
• reference condition: historical data (1960th)
• target value by deviation from historical mean
Progress so far:
Population structure of long-lived macrozoobenthic species
• German approach: linking size distribution of Arctica islandica to oxygen
depletion and fishery effort
• almost no progress due to lack of man power (just started to digitalize
historical data)
Additional data:
Population structure of long-lived macrozoobenthic species
• Poland: several species,
Sandy bottoms: Mytilus edulis measurements (dredge samples);
measurements on bivalves in 1960s and 1980s (VV) 150-200samples;
same locations in 2004
but still have to be digitalized – also no man power available
• no data available from any other country as it is rarely included in
monitoring programs
Conclusions:
Population structure of long-lived macrozoobenthic species
• Indicator development will not be finished within the timeline given by
HELCOM CoreSet 2 and the indicator should be downgraded to „pre-core-
level“ as proposed by expert workshop in Feb 2014
• a common baltic-wide approach will not be possible as available/suitable
target species will vary between the countries
and historical data are most likely not available in most countries to
estimate reference conditions