RUSLAND: GAT NA BOYCOT IMPORT VERSE GROENTEN EN …
14
Factsheet Russia (october 2014) 1 FACTSHEET RUSSIA IMPORT OCTOBER 2014 Fruit&VegetableFacts; JanKeesBoon; +31654687684; [email protected] RUSLAND: GAT NA BOYCOT IMPORT VERSE GROENTEN EN FRUIT MAAR VOOR EEN DEEL OPGEVULD China, Oekraïne en Argentinië profiteren vooral Voorlopige cijfers van de Russische import van verse groenten en fruit laten zien dat vooral China, Oekraïne en Argentinië het gat in het gat zijn gesprongen dat na de boycot van de import uit vooral de EU is ontstaan. Maar daarnaast zijn er nog meer landen die op basis van de voorlopige gegevens hebben kunnen profiteren van de boycot. Dit zijn Turkije, Zuid Afrika, Servië, Israel en Armenië. Vorig jaar werd er in de periode augustus-october 330.000 ton verse groenten en fruit uit de boycotlanden ingevoerd. Het lijkt er sterk op dat dit gat in de afgelopen maanden maar voor een beperkt deel kon worden opgevuld met import product van elders. Het is zeer de vraag of de 370.000 ton die vorig jaar in november-december uit de boycotlanden werd ingevoerd ook wel goedgemaakt kan worden door andere landen. Volgens de Russische importstatistiek leverde Nederland in november en december 2013 bijna 38.000 ton verse groenten en fruit aan Rusland. Peren (13.200 ton) en tomaten (10.500 ton) waren de belangrijkste producten. Table 1: Russia: Import fresh fruit and vegetables (in tons) HScodes 0702-0710 and 0803-0810 Source: Russia customs 2011 2012 2013 2013 jan-jul 2014 jan-jul 2013 aug-okt 2014 aug-okt 2013 nov-dec Total 8.458.405 8.019.922 8.452.958 5.180.141 5.241.055 1.431.705 1.081.166 1.841.112 Boycot countries 1.861.073 2.169.865 2.194.582 1.499.138 1.459.877 326.806 33.079 368.638 Other countries 6.597.332 5.850.058 6.258.376 3.681.003 3.781.178 1.104.899 1.048.088 1.472.475 Verschuiving bij producten Omdat het om voorlopige cijfers gaat is het lastig om exacte hoeveelheden het precies gaat. Maar de hierboven genoemde landen hebben al op basis van die voorlopige cijfers in de maanden augustus, september en oktober meer in Rusland af kunnen zetten dan vorig jaar. Bij de grote producten is er een verschuiving te zien. Voor het grootste importproduct bananen geldt dat niet maar er lijken wel duidelijk minder appels , tomaten, en vooral perziken/nectarines te zijn ingevoerd. Opvallend is dat er meer druiven, sinaasappelen, soft citrus en citroenen zijn ingevoerd. Table 2: Russia: Import fresh fruit and vegetables (in tons) HScodes 0702-0710 and 0803-0810 (V=voorlopig) Fruit & vegetables Vegetables Fruit 2013 2014 2013 2014 2013 2014 jan 746.230 717.364 -4% 160.984 176.092 9% 585.246 541.272 -8% feb 774.119 751.536 -3% 183.962 221.910 21% 590.157 529.626 -10% mrt 809.015 817.125 1% 233.720 294.515 26% 575.295 522.610 -9% apr 827.340 829.878 0% 314.878 356.277 13% 512.462 473.601 -8% mei 832.763 878.990 6% 365.901 425.271 16% 466.863 453.719 -3% jun 690.221 715.575 4% 246.419 276.322 12% 443.802 439.253 -1% jul 500.453 530.588 6% 112.448 145.085 29% 388.005 385.503 -1% aug 373.106 339.477v -9% 66.508 51.476v -23% 306.598 288.002v -6% sep 433.608 365.464v -16% 85.417 56.937v -33% 348.191 308.527v -11% okt 624.991 376.225v -40% 131.707 64.602v -51% 493.285 311.623v -37% nov 848.365 194.061 654.304 dec 992.747 213.410 779.337
Transcript of RUSLAND: GAT NA BOYCOT IMPORT VERSE GROENTEN EN …

Factsheet Russia (october 2014)
1
FACTSHEET RUSSIA
IMPORT OCTOBER 2014
Fruit&VegetableFacts; JanKeesBoon; +31654687684; [email protected]
RUSLAND: GAT NA BOYCOT IMPORT VERSE GROENTEN EN FRUIT
MAAR VOOR EEN DEEL OPGEVULD
China, Oekraïne en Argentinië profiteren vooral
Voorlopige cijfers van de Russische import van verse groenten en fruit laten zien dat vooral China, Oekraïne en Argentinië het gat in het gat zijn gesprongen dat na de boycot van de import uit vooral de EU is ontstaan. Maar daarnaast zijn er nog meer landen die op basis van de voorlopige gegevens hebben kunnen profiteren van de boycot. Dit zijn Turkije, Zuid Afrika, Servië, Israel en Armenië. Vorig jaar werd er in de periode augustus-october 330.000 ton verse groenten en fruit uit de boycotlanden ingevoerd. Het lijkt er sterk op dat dit gat in de afgelopen maanden maar voor een beperkt deel kon worden opgevuld met import product van elders. Het is zeer de vraag of de 370.000 ton die vorig jaar in november-december uit de boycotlanden werd ingevoerd ook wel goedgemaakt kan worden door andere landen. Volgens de Russische importstatistiek leverde Nederland in november en december 2013 bijna 38.000 ton verse groenten en fruit aan Rusland. Peren (13.200 ton) en tomaten (10.500 ton) waren de belangrijkste producten.
Table 1: Russia: Import fresh fruit and vegetables (in tons)
HScodes 0702-0710 and 0803-0810
Source: Russia customs
2011 2012 2013 2013
jan-jul 2014
jan-jul 2013
aug-okt 2014
aug-okt 2013
nov-dec
Total 8.458.405 8.019.922 8.452.958 5.180.141 5.241.055 1.431.705 1.081.166 1.841.112
Boycot countries 1.861.073 2.169.865 2.194.582 1.499.138 1.459.877 326.806 33.079 368.638
Other countries 6.597.332 5.850.058 6.258.376 3.681.003 3.781.178 1.104.899 1.048.088 1.472.475
Verschuiving bij producten
Omdat het om voorlopige cijfers gaat is het lastig om exacte hoeveelheden het precies gaat. Maar de hierboven genoemde landen hebben al op basis van die voorlopige cijfers in de maanden augustus, september en oktober meer in Rusland af kunnen zetten dan vorig jaar. Bij de grote producten is er een verschuiving te zien. Voor het grootste importproduct bananen geldt dat niet maar er lijken wel duidelijk minder appels , tomaten, en vooral perziken/nectarines te zijn ingevoerd. Opvallend is dat er meer druiven, sinaasappelen, soft citrus en citroenen zijn ingevoerd.
Table 2: Russia: Import fresh fruit and vegetables (in tons)
HScodes 0702-0710 and 0803-0810 (V=voorlopig)
Fruit & vegetables Vegetables Fruit
2013 2014
2013 2014
2013 2014
jan 746.230 717.364 -4% 160.984 176.092 9% 585.246 541.272 -8%
feb 774.119 751.536 -3% 183.962 221.910 21% 590.157 529.626 -10%
mrt 809.015 817.125 1% 233.720 294.515 26% 575.295 522.610 -9%
apr 827.340 829.878 0% 314.878 356.277 13% 512.462 473.601 -8%
mei 832.763 878.990 6% 365.901 425.271 16% 466.863 453.719 -3%
jun 690.221 715.575 4% 246.419 276.322 12% 443.802 439.253 -1%
jul 500.453 530.588 6% 112.448 145.085 29% 388.005 385.503 -1%
aug 373.106 339.477v -9% 66.508 51.476v -23% 306.598 288.002v -6%
sep 433.608 365.464v -16% 85.417 56.937v -33% 348.191 308.527v -11%
okt 624.991 376.225v -40% 131.707 64.602v -51% 493.285 311.623v -37%
nov 848.365
194.061
654.304
dec 992.747
213.410
779.337

Factsheet Russia (october 2014)
2
-
200.000
400.000
600.000
800.000
1.000.000
jan feb mrt apr mei jun jul aug sep okt nov dec
in t
on
s
Russia: Import fresh fruit & vegetables
2011 2012 2013 2014
-
100.000
200.000
300.000
400.000
500.000
600.000
700.000
800.000
900.000
jan feb mrt apr mei jun jul aug sep okt nov dec
in t
on
s
Russia: Import fresh fruit
2011 2012 2013 2014
-
100.000
200.000
300.000
400.000
500.000
jan feb mrt apr mei jun jul aug sep okt nov dec
in t
on
s
Russia: Import fresh vegetables
2011 2012 2013 2014

Factsheet Russia (october 2014)
3
CONTENTS
RUSLAND: GAT NA BOYCOT IMPORT VERSE GROENTEN EN FRUIT MAAR VOOR EEN DEEL OPGEVULD 1
China, Oekraïne en Argentinië profiteren vooral ................................................................................ 1
Verschuiving bij producten.................................................................................................................. 1
TABLES
Table 1: Russia: Import fresh fruit and vegetables (in tons) ................................................................... 1
Table 2: Russia: Import fresh fruit and vegetables (in tons) ................................................................... 1
Table 3: Russia: Import fresh fruit and vegetables (in tons) ................................................................... 4
Table 4: Russia: Import fresh fruit and vegetables (in tons) ................................................................... 5
Table 5: Russia: Import fresh fruit and vegetables (in tons) ................................................................... 6
Table 6: Russia: Import fresh fruit and vegetables (in tons) ................................................................... 8
Table 7: Russia: Import fresh fruit and vegetables from the Netherlands (in tons) ............................... 9
Table 8: Russia: Import fresh fruit and vegetables from Turkey (in tons) ............................................ 10
Table 9: Russia: Import fresh fruit and vegetables from China (in tons) .............................................. 11
Table 10: Russia: Import fresh fruit and vegetables from Spain (in tons) ............................................. 11
Table 11: Russia: Import fresh fruit and vegetables from Ukraine (in tons) ......................................... 12
Table 12: Russia: Import apples (in tons) .............................................................................................. 13
Table 13: Russia: Import pears (in tons) ................................................................................................ 14

Factsheet Russia (october 2014)
4
Table 3: Russia: Import fresh fruit and vegetables (in tons)
HScodes 0702-0710 and 0803-0810
Source: Russian customs AUGUST SEPTEMBER OCTOBER
2012 2013 2014 2012 2013 2014 2012 2013 2014
Total 416.552 373.106 339.477 447.238 433.608 365.464 648.617 624.991 376.225
NOT BOYCOT COUNTR. 293.124 278.536 306.817 344.395 338.513 364.705 504.456 485.727 376.225
Turkey 43.124 39.540 45.553 60.194 44.547 68.235 91.937 89.820 84.469
Ecuador 69.187 69.789 77.073 66.880 96.347 88.774 97.596 88.966 75.952
China 22.393 24.204 33.572 24.853 26.876 32.716 44.291 47.307 54.595
South Africa 17.676 27.866 33.782 26.430 23.444 37.361 32.119 47.906 28.272
Azerbaijan 10.193 7.746 10.335 16.667 14.281 10.749 55.430 37.812 26.921
Ukraine 14.440 7.640 12.129 31.522 20.092 27.277 32.126 12.213 23.593
Serbia 14.128 14.086 22.062 9.790 13.422 17.623 7.570 13.594 12.230
Argentina 14.603 11.533 11.423 12.723 12.609 21.099 5.132 3.700 11.867
Moldova 23.479 27.676 4.016 31.612 34.400 3.545 39.287 48.248 8.401
Iran 2.521 1.791 2.893 2.255 3.247 2.622 12.240 11.226 7.284
Israel 1.565 4.521 2.564 2.219 2.385 3.901 4.517 8.248 5.232
Costa Rica 5.816 3.661 1.840 9.209 3.063 3.312 11.384 3.482 5.056
Egypt 429 395 546 112 1.458 1.169 4.504 2.795 3.283
Armenia 1.444 1.668 1.296 2.404 1.412 3.273 3.095 1.696 2.708
Belarus 4.207 15.643 24.236 5.109 20.861 17.444 7.391 27.891 2.237
Peru 1.499 754 821 1.392 1.375 1.755 1.279 728 2.189
Chile 5.389 5.844 3.519 2.521 2.996 2.807 1.653 1.405 2.083
Philippines 2.712 2.072 969 2.171 1.500 1.271 4.508 1.798 1.983
Macedonia 2.262 1.907 6.419 959 1.245 2.716 1.678 921 1.680
Uruguay 971 996 2.442 791 1.290 2.435 1.886 1.230 1.679
Mexico 215 403 284 2.127 1.759 781 2.260 2.898 1.679
Morocco 3 257 498 49 377 1.184 1.905 13.500 1.620
Brazil 588 434 439 631 567 986 1.077 1.133 1.357
Uzbekistan 25.386 985 181 26.949 746 382 23.435 1.260 1.251
Afghanistan 744 632 666 264 447 671 336 995 1.135
Kazakhstan 869 1.734 1.754 1.332 1.479 3.045 3.811 2.735 1.056
Other 7.284 4.761 5.505 3.232 6.293 7.571 12.010 12.220 6.416
BOYCOT COUNTRIES 123.427 94.570 32.660 102.843 95.096 759 144.162 139.265 Poland 22.291 22.112 2.576 37.774 32.692
61.127 57.132
Spain 49.249 31.172 11.963 20.777 23.624
22.053 22.845 Netherlands 10.338 12.671 4.969 10.276 13.077 735 12.422 17.960 Belgium 3.364 2.212 587 8.493 6.889
14.016 14.510
Italy 14.662 7.020 3.567 11.690 10.555
16.609 10.934 Greece 15.490 13.184 5.524 9.201 3.379
5.370 3.897
France 5.253 4.128 2.165 2.074 2.010 24 2.523 3.238 United States 102 90 14 152 643
1.457 2.718
Croatia 0 1
22 58
4.717 2.521 Germany 538 589 323 560 761
1.394 1.193
Lithuania 770 298 151 867 461
1.413 1.007 Other boycot countr. 1.371 1.092 819 960 947
1.064 1.309

Factsheet Russia (october 2014)
5
Table 4: Russia: Import fresh fruit and vegetables (in tons)
HScodes 0702-0710 and 0803-0810
Source: Russian customs AUGUST SEPTEMBER OCTOBER AUGUST-OCTOBER
2012 2013 2014 2012 2013 2014 2012 2013 2014 2012 2013 2014
Fruit& vegetables 416.552 373.106 339.477 447.238 433.608 365.464 648.617 624.991 376.225 1.512.407 1.431.705 1.149.311
Fruit 356.699 306.598 288.002 372.172 348.191 308.527 520.912 493.285 311.623 1.249.783 1.148.073 947.815
Vegetables 59.852 66.508 51.476 75.067 85.417 56.937 127.705 131.707 64.602 262.624 283.632 201.496
Bananas 75.817 74.284 78.516 77.133 101.785 91.535 118.360 99.594 81.490 271.309 275.663 261.790
Apples 41.635 40.335 32.337 68.160 57.206 37.399 115.027 96.694 39.548 224.822 194.235 129.091
Grapes 52.084 42.638 43.124 74.455 43.046 49.542 70.299 59.468 55.683 196.839 145.151 141.853
Tomatoes 21.464 24.613 20.592 38.313 38.406 24.347 54.364 55.072 16.388 114.141 118.090 75.387
Peaches/Nectarines 90.228 60.515 41.420 31.299 30.504 12.046 6.573 3.748 516 128.100 94.767 72.439
Oranges 9.248 17.406 23.509 22.607 17.563 29.566 32.949 46.519 24.705 64.804 81.487 65.777
Soft citrus 9.318 6.790 8.460 8.337 11.762 18.220 32.637 52.536 36.218 50.291 71.088 56.440
Pears 14.127 13.829 15.512 25.447 23.319 17.338 29.882 31.078 13.960 69.456 68.226 52.790
Plums and sloes 23.018 15.762 15.115 16.986 21.057 6.952 11.151 13.391 1.894 51.154 50.210 38.066
Lemons 9.889 11.680 9.379 13.475 15.668 22.336 20.998 20.243 10.839 44.362 47.590 35.885
Cucumbers 974 1.478 3.125 3.445 4.984 7.690 25.872 21.853 20.579 30.291 28.315 28.687
Carrots and turnips 8.150 8.761 7.339 5.727 9.437 5.207 7.124 8.604 2.660 21.001 26.801 19.435
Persimmons 34 71 32 4.168 2.126 1.109 35.023 20.339 9.805 39.225 22.535 11.962
Grapefruit 3.333 3.140 5.407 5.501 5.272 5.911 10.997 13.919 12.267 19.832 22.330 22.946
Other fresh fruit 1.420 1.343 1.376 3.829 4.853 5.149 15.996 14.878 12.506 21.245 21.074 18.735
Peppers 4.777 5.552 4.272 5.452 5.997 4.426 8.611 8.439 3.172 18.840 19.987 13.441
Onions (incl. shallots) 7.577 7.700 4.839 3.560 5.731 3.421 6.576 5.784 8.965 17.714 19.216 19.534
Kiwifruit 3.437 4.044 3.204 3.966 4.427 2.105 6.891 7.423 2.644 14.293 15.894 10.275
Garlic 5.715 6.098 5.851 4.278 4.665 5.165 2.807 3.351 3.941 12.800 14.114 14.457
Champignons 4.108 4.306 1.139 4.065 4.534 452 4.251 4.425 136 12.424 13.265 5.808
Red/White cabbage 1.511 1.190 627 1.699 1.833 601 3.237 4.847 1.181 6.446 7.870 3.641
Beetroot, salsify, ect 1.206 1.420 899 1.285 1.614 1.524 2.605 4.220 3.003 5.097 7.254 5.515
Other fresh fruit 27.483 20.152 13.408 24.052 17.820 13.425 26.388 28.571 14.128 77.923 66.544 45.356

Factsheet Russia (october 2014)
6
Table 5: Russia: Import fresh fruit and vegetables (in tons)
HScodes 0702-0710 and 0803-0810
Source: Russia customs 2011 2012 2013
2013 jan-jul
2014 jan-jul
2013 aug-okt
2014 aug-okt
2013 nov-dec
Total 8.458.405 8.019.922 8.452.958 5.180.141 5.241.055 1.431.705 1.081.166 1.841.112
Ecuador 1.204.862 1.130.672 1.282.060 800.147 765.701 255.102 241.799 226.812
Turkey 1.244.589 1.156.662 1.156.615 601.506 686.195 173.907 198.257 381.202
China 718.084 631.507 654.671 391.866 417.432 98.387 120.883 164.419
South Africa 214.640 209.830 244.956 117.043 91.314 99.217 99.415 28.697
Ukraine 147.069 134.978 116.932 71.261 35.930 39.945 62.998 5.726
Serbia 148.224 96.443 113.998 33.015 60.265 41.102 51.916 39.881
Azerbaijan 216.181 246.175 206.997 71.088 82.938 59.839 48.005 76.071
Argentina 283.963 225.189 225.787 197.150 135.958 27.843 44.389 794
Belarus 100.684 76.279 262.133 119.225 276.896 64.395 43.917 78.514
Moldova 225.221 188.065 239.909 58.837 37.754 110.324 15.962 70.748
Iran 166.110 156.027 184.367 123.096 118.549 16.263 12.799 45.008
Spain 378.202 414.896 412.071 244.425 262.550 77.641 11.963 90.005
Israel 294.681 267.087 308.742 240.210 247.134 15.154 11.698 53.379
Macedonia 26.560 16.605 10.722 4.748 9.308 4.073 10.815 1.901
Costa Rica 72.151 116.234 57.844 25.273 24.182 10.205 10.207 22.366
Chile 123.506 106.170 115.290 101.653 57.863 10.245 8.409 3.392
Armenia 14.600 24.877 32.699 24.977 5.053 4.775 7.276 2.947
Uruguay 11.523 10.523 13.058 6.451 6.521 3.515 6.556 3.092
Kazakhstan 12.044 8.663 12.042 3.131 9.618 5.947 5.855 2.964
Netherlands 290.419 236.660 254.990 173.691 264.374 43.709 5.704 37.590
Greece 110.935 157.997 139.905 102.699 87.451 20.460 5.524 16.746
Egypt 340.068 257.713 302.911 277.093 271.758 4.647 4.998 21.171
Peru 24.828 26.995 30.320 17.889 21.966 2.857 4.766 9.574
Philippines 36.412 38.824 24.950 15.799 12.054 5.369 4.223 3.782
Italy 178.592 173.012 118.928 63.931 69.909 28.509 3.567 26.488
New Zealand 6.914 6.386 8.147 5.927 7.941 1.861 3.521 359
Morocco 316.475 312.140 326.083 152.451 226.358 14.134 3.302 159.498
Georgia - - 11.934 - 4.524 59 3.100 11.875
Bosnia 4.076 1.437 1.035 789 417 227 2.978 19
Brazil 13.298 13.833 14.280 7.855 6.508 2.134 2.782 4.292
Mexico 5.996 7.370 10.552 3.061 2.772 5.060 2.745 2.431
Poland 460.585 844.421 976.596 734.839 559.303 111.936 2.576 129.821
Afghanistan 14.201 10.171 9.967 5.961 5.835 2.073 2.472 1.933
France 77.706 65.910 48.134 29.425 40.819 9.375 2.189 9.334
Uzbekistan 305.046 126.021 50.485 44.623 10.591 2.990 1.813 2.871
Kyrgyzstan 38.366 6.254 3.430 358 558 2.945 1.615 128
Albania 467 348 780 514 67 - 1.557 266
Swaziland 1.266 1.134 1.195 578 363 376 1.432 241
Switzerland 27 64 1 - - 1 1.011 0
Tunisia 5.503 6.608 7.789 5.405 4.555 1.396 799 987
Zimbabwe 727 1.586 1.414 275 228 455 600 684
Belgium 233.946 181.855 154.561 87.624 120.599 23.611 587 43.326
Algeria 1.547 2.299 2.407 1.492 3.395 516 527 399
Thailand 982 1.188 1.391 754 1.091 276 411 362
Romania 2.376 1.680 1.644 1.468 1.186 176 399 -
Germany 50.428 32.351 27.396 23.740 20.401 2.543 323 1.114
Viet Nam 1.300 1.312 901 437 739 269 315 195
Panama 14.374 2.954 3.102 2.060 1.560 601 275 441
SEE NEXT PAGE

Factsheet Russia (october 2014)
7
Source: Russia customs 2011 2012 2013
2013 jan-jul
2014 jan-jul
2013 aug-okt
2014 aug-okt
2013 nov-dec
continued from previous page table 5
Tajikistan 64.132 21.757 15.817 12.577 1.184 2.910 240 330
Korea,Rep 1.484 692 1.054 185 459 58 202 810
Hungary 11.931 9.833 6.228 5.904 10.293 169 190 156
India 5.781 11.333 20.808 20.166 25.178 166 172 477
Lithuania 8.331 12.354 10.266 5.820 4.995 1.766 151 2.681
Jordan 12.975 13.724 2.526 2.497 487 1 149 29
Honduras 166 189 184 160 383 5 109 19
Slovakia 97 20 35 19 63 16 87 -
Colombia 18.593 14.444 14.141 718 946 9.807 84 3.616
Kenya 397 526 612 498 332 69 58 46
Bulgaria 2.283 1.535 2.098 1.841 559 258 57 -
Lebanon 159 698 379 326 167 - 52 54
Republic Abhazia 16.632 29.247 37.696 4.322 220 818 47 32.556
Syria 9.299 6.937 6.267 6.227 3.291 40 43 -
Puerto Rico 1 3 15 15 19 - 37 -
Japan 39 81 195 28 26 14 37 152
UK 173 285 526 61 342 390 34 75
Pakistan 79.507 91.357 80.346 79.360 73.526 16 29 971
Dominican Rep 29 60 21 13 13 7 27 1
Portugal 7.663 5.437 5.676 1.912 4.454 1.395 25 2.369
Australia 2.560 2.213 3.298 2.275 2.846 619 24 404
Ethiopia 7 59 75 48 49 7 22 20
USA 27.839 16.932 24.159 11.938 14.519 3.452 14 8.769
Other 48.579 44.807 34.420 27.396 18.223 3.283 48 3.741

Factsheet Russia (october 2014)
8
Table 6: Russia: Import fresh fruit and vegetables (in tons)
HScodes 0702-0710 and 0803-0810
Source: Russian customs 2011 2012 2013
2013 jan-jul
2014 jan-jul
2013 aug-okt
2014 aug-okt
2013 nov-dec
Fruit& vegetables 8.458.405 8.019.922 8.452.958 5.180.141 5.241.055 1.431.705 1.081.166 1.841.112
Fruit 5.992.571 5.950.850 6.143.544 3.561.830 3.345.585 1.148.073 908.152 1.433.641
Vegetables 2.465.833 2.069.072 2.309.414 1.618.311 1.895.471 283.632 173.015 407.471
Bananas 1.307.599 1.255.549 1.339.142 822.598 784.038 275.663 251.540 240.881
Grapes 400.401 379.318 358.701 129.006 110.307 145.151 148.349 84.544
Apples 1.191.377 1.279.061 1.352.348 902.209 788.374 194.235 109.284 255.904
Oranges 568.555 489.150 504.391 330.115 294.047 81.487 77.780 92.788
Soft citrus 739.516 762.786 838.795 363.397 374.024 71.088 62.898 404.310
Tomatoes 755.370 799.681 855.953 582.406 651.364 118.090 61.328 155.457
Peaches/Nectarines 251.354 266.220 230.539 135.509 170.816 94.767 53.982 263
Pears 424.821 410.247 383.035 228.931 271.437 68.226 46.810 85.878
Lemons 226.634 203.079 210.390 124.393 122.288 47.590 42.553 38.408
Cucumbers 194.814 213.917 214.867 108.207 122.502 28.315 31.393 78.345
Plums and sloes 71.297 78.004 79.075 24.447 19.785 50.210 23.961 4.418
Grapefruit 122.510 121.118 147.525 86.283 68.571 22.330 23.585 38.912
Other fresh fruit 218.270 74.120 89.524 24.704 25.892 21.074 19.032 43.747
Onions (incl. shallots) 461.897 231.201 243.914 218.136 333.353 19.216 17.224 6.562
Carrots and turnips 277.578 198.254 257.710 203.327 206.464 26.801 15.205 27.582
Garlic 58.350 43.917 51.698 29.838 29.703 14.114 14.957 7.746
Peppers 114.690 142.756 166.026 103.195 112.519 19.987 11.870 42.843
Persimmons - 141.951 114.596 18.480 18.173 22.535 10.945 73.581
Kiwifruit 85.301 103.456 109.578 72.477 50.707 15.894 7.953 21.208
Pineapples 45.622 49.377 50.396 23.772 21.359 6.838 6.203 19.786
Raisens 45.628 46.110 42.676 28.657 17.356 6.840 6.102 7.180
Beetroot, salsify, ect 90.277 52.154 74.866 58.042 51.987 7.254 5.425 9.570
Figs 5.408 6.544 7.010 2.203 1.751 3.458 3.015 1.349
Avocados 9.474 11.157 13.948 7.042 7.699 2.824 2.626 4.083
Red/White cabbage 310.838 153.424 178.995 154.353 211.919 7.870 2.408 16.772
Head lettuce 16.939 21.263 28.412 16.481 19.866 5.607 2.286 6.323
Dates 20.127 19.702 21.339 14.114 12.377 3.104 2.250 4.122
Mangoes ect 7.488 8.091 9.428 5.004 5.336 2.013 1.963 2.411
Apricots 62.203 67.198 68.260 66.343 34.960 1.868 1.770 48
Champignons 51.149 58.967 61.620 34.000 32.117 13.265 1.726 14.355
Meloenen 49.062 25.041 8.894 5.213 5.934 2.471 1.633 1.210
Aubergines 21.873 25.212 29.148 18.729 19.618 3.512 1.360 6.907
Pumpkins 3 30.224 39.641 27.430 33.968 2.484 1.192 9.727
Watermelons 12.601 8.555 9.744 7.053 12.410 1.669 1.190 1.022
Cauliflowers/Broccili 20.721 25.566 29.855 16.138 19.171 5.826 1.054 7.891
Other citrus 3.695 4.151 4.189 1.201 1.824 989 690 1.999
Other lettuce 4.720 5.319 5.924 3.479 3.526 1.254 579 1.192
Celery not celeriac 13.039 15.161 17.557 10.492 13.435 2.633 539 4.431
Cherries not sour 80.308 68.200 72.914 71.152 56.000 1.556 507 205
Truffels 441 1.393 3.293 1.206 2.976 991 457 1.096
Leeks 5.100 5.631 6.759 3.951 4.348 1.286 416 1.522
Strawberries 40.813 52.438 57.175 53.779 53.013 1.550 405 1.846
Other 70.542 65.262 63.110 42.651 43.743 7.769 4.726 12.690
Factsheet Russia (october 2014)
9
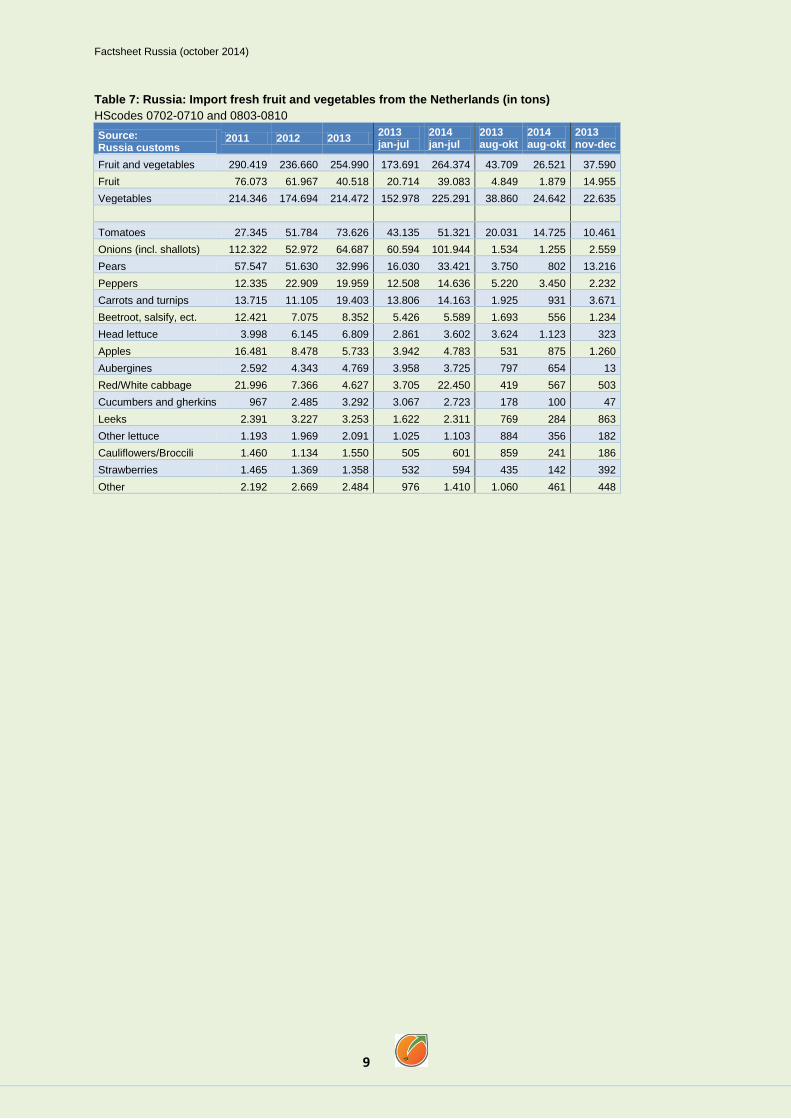
Table 7: Russia: Import fresh fruit and vegetables from the Netherlands (in tons)
HScodes 0702-0710 and 0803-0810
Source: Russia customs
2011 2012 2013 2013 jan-jul
2014 jan-jul
2013 aug-okt
2014 aug-okt
2013 nov-dec
Fruit and vegetables 290.419 236.660 254.990 173.691 264.374 43.709 26.521 37.590
Fruit 76.073 61.967 40.518 20.714 39.083 4.849 1.879 14.955
Vegetables 214.346 174.694 214.472 152.978 225.291 38.860 24.642 22.635
Tomatoes 27.345 51.784 73.626 43.135 51.321 20.031 14.725 10.461
Onions (incl. shallots) 112.322 52.972 64.687 60.594 101.944 1.534 1.255 2.559
Pears 57.547 51.630 32.996 16.030 33.421 3.750 802 13.216
Peppers 12.335 22.909 19.959 12.508 14.636 5.220 3.450 2.232
Carrots and turnips 13.715 11.105 19.403 13.806 14.163 1.925 931 3.671
Beetroot, salsify, ect. 12.421 7.075 8.352 5.426 5.589 1.693 556 1.234
Head lettuce 3.998 6.145 6.809 2.861 3.602 3.624 1.123 323
Apples 16.481 8.478 5.733 3.942 4.783 531 875 1.260
Aubergines 2.592 4.343 4.769 3.958 3.725 797 654 13
Red/White cabbage 21.996 7.366 4.627 3.705 22.450 419 567 503
Cucumbers and gherkins 967 2.485 3.292 3.067 2.723 178 100 47
Leeks 2.391 3.227 3.253 1.622 2.311 769 284 863
Other lettuce 1.193 1.969 2.091 1.025 1.103 884 356 182
Cauliflowers/Broccili 1.460 1.134 1.550 505 601 859 241 186
Strawberries 1.465 1.369 1.358 532 594 435 142 392
Other 2.192 2.669 2.484 976 1.410 1.060 461 448

Factsheet Russia (october 2014)
10
Table 8: Russia: Import fresh fruit and vegetables from Turkey (in tons)
HScodes 0702-0710 and 0803-0810
Source: Russia customs
2011 2012 2013 2013
jan-jul 2014
jan-jul 2013
aug-okt 2014
aug-okt 2013
nov-dec
Fruit and vegetables 1.244.589 1.156.662 1.156.615 601.506 686.195 173.907 198.257 381.202
Fruit 752.118 664.429 711.008 260.258 251.225 164.098 186.638 286.652
Vegetables 492.472 492.233 445.606 341.248 434.971 9.809 11.619 94.550
Tomatoes 373.387 360.648 335.010 267.875 302.706 8.300 5.597 58.835
Soft citrus 186.939 158.784 200.575 52.194 49.381 18.227 18.890 130.154
Grapes 166.197 146.083 144.435 15.484 17.366 95.558 114.782 33.393
Lemons 131.314 101.649 109.248 49.730 52.848 23.807 20.914 35.712
Oranges 102.458 69.888 66.525 30.348 31.410 1.993 - 34.185
Other fresh fruit 40.385 37.615 53.368 8.932 11.264 9.193 8.764 35.243
Grapefruit 48.811 41.595 43.689 27.373 24.603 3.205 2.415 13.111
Cucumbers 47.601 54.732 43.504 16.870 26.142 1.443 3.099 25.191
Pumpkins - 20.873 27.273 20.511 24.282 52 277 6.710
Apricots 16.483 28.503 22.468 21.949 16.788 519 299 -
Onions (incl. shallots) 39.730 41.962 22.289 22.285 66.046 4 72 -
Cherries not sour - 25.101 21.041 20.455 16.623 587 369 -
Strawberries 13.331 13.484 13.224 13.223 10.663 - - 1
Peaches/Nectarines 8.705 16.118 12.498 9.226 9.873 3.272 10.848 -
Peppers 9.553 9.990 11.093 8.422 11.132 8 112 2.663
Figs 5.229 6.407 6.805 2.110 1.680 3.382 2.539 1.314
Plums and sloes 1.468 6.108 4.944 3.857 2.256 897 1.240 190
Quinces - 3.747 4.427 1.484 1.489 475 270 2.467
Aubergines 2.914 2.956 4.174 3.101 3.637 1 362 1.072
Pears - 4.963 3.179 494 321 2.329 4.156 357
Raisens 2.581 2.564 2.974 1.865 1.426 600 1.010 510
Other 47.503 2.893 3.872 3.721 4.260 56 2.243 95

Factsheet Russia (october 2014)
11
Table 9: Russia: Import fresh fruit and vegetables from China (in tons)
HScodes 0702-0710 and 0803-0810
Source: Russia customs
2011 2012 2013 2013
jan-jul 2014
jan-jul 2013
aug-okt 2014
aug-okt 2013
nov-dec
Fruit and vegetables 718.084 631.507 654.671 391.866 417.432 98.387 120.883 164.419
Fruit 299.766 326.886 318.282 149.189 107.504 56.243 71.977 112.850
Vegetables 418.319 304.621 336.389 242.677 309.929 42.144 48.906 51.568
Apples 138.236 126.314 110.470 68.845 45.696 22.835 24.757 18.790
Soft citrus 65.988 87.067 86.928 15.761 11.093 11.509 10.501 59.658
Tomatoes 66.960 79.235 81.028 59.532 66.887 6.095 6.110 15.402
Grapefruit 28.204 42.043 56.488 28.741 22.233 6.558 10.653 21.190
Carrots and turnips 44.458 39.926 47.206 33.167 34.662 7.023 7.189 7.016
Onions (incl. shallots) 106.058 50.112 44.108 35.916 67.247 7.398 9.889 794
Garlic 55.312 39.081 43.475 22.649 24.311 13.233 14.720 7.593
Red/White cabbage 73.473 24.997 39.975 37.414 57.302 604 1.031 1.957
Cucumbers 26.065 29.679 30.131 18.914 21.777 2.403 2.305 8.814
Peppers 24.561 22.651 26.566 18.764 19.723 2.953 5.059 4.850
Pears 22.157 21.592 23.202 13.726 7.064 4.916 13.206 4.561
Beetroot, salsify, ect. 9.938 7.000 9.825 7.834 8.743 468 411 1.524
Oranges 10.348 13.980 9.636 5.484 3.976 675 127 3.477
Grapes 10.353 11.341 9.625 1.722 2.382 5.334 4.823 2.569
Peaches/Nectarines 7.671 7.831 6.522 4.847 7.128 1.675 4.399 0
Aubergines 3.598 3.637 3.820 2.473 2.726 364 343 983
Lemons 2.866 3.838 3.682 2.814 369 780 317 89
Other 21.839 21.185 21.984 13.265 14.114 3.565 5.043 5.154
Table 10: Russia: Import fresh fruit and vegetables from Spain (in tons)
HScodes 0702-0710 and 0803-0810
Source: Russia customs 2011 2012 2013
2013 jan-jul
2014 jan-jul
2013 aug-okt
2014 aug-okt
2013 nov-dec
Fruit& vegetables 378.202 414.896 412.071 244.425 262.550 77.641 11.963 90.005
Citrus 98.661 113.808 92.165 67.303 60.863 3.086 17 21.776
Other fruit 193.487 188.939 165.657 85.772 102.259 60.806 11.729 19.080
Vegetables 86.053 112.150 154.249 91.350 99.429 13.750 218 49.149
-
Peaches/Nectarines 129.096 122.623 111.821 63.457 76.390 48.337 10.201 28
Tomatoes 26.640 42.451 70.331 46.394 45.775 4.258 70 19.680
Soft citrus 57.740 59.727 47.699 28.501 20.186 2.903 - 16.295
Oranges 22.404 25.008 27.518 22.473 17.825 123 15 4.922
Cucumbers and gherkins 15.909 20.890 25.776 11.515 9.939 3.961 - 10.300
Persimmons - 16.997 18.747 5.781 5.297 1.263 - 11.703
Head lettuce 10.003 13.063 17.890 11.621 13.834 922 43 5.348
Lemons 17.801 28.694 16.510 15.964 22.552 57 2 489
Aubergines 9.303 12.189 12.628 6.839 7.724 1.757 11 4.032
Pears 14.023 15.353 12.371 1.838 2.314 8.325 840 2.209
Peppers 8.011 9.032 9.988 4.049 5.766 957 41 4.982
Pumpkins - 5.351 6.513 3.742 4.841 1.057 13 1.715
Strawberries 1.958 6.579 6.146 5.651 5.860 288 39 207
Cauliflowers/Broccili 1.702 2.551 3.579 2.570 3.880 394 12 616
Grapes 4.681 5.788 3.483 574 997 264 78 2.644
Apples 12.027 3.262 1.176 330 319 610 44 236
Other 46.905 25.339 19.897 13.127 19.052 2.168 555 4.602

Factsheet Russia (october 2014)
12
Table 11: Russia: Import fresh fruit and vegetables from Ukraine (in tons)
HScodes 0702-0710 and 0803-0810
Source: Russia customs
2011 2012 2013 2013 jan-jul
2014 jan-jul
2013 aug-okt
2014 aug-okt
2013 nov-dec
Fruit and vegetables 147.069 134.978 116.932 71.261 35.930 39.945 62.998 5.726
Fruit 42.354 22.075 15.852 7.870 3.500 5.580 18.428 2.402
Vegetables 104.714 112.903 101.080 63.391 32.430 34.364 44.570 3.325
Tomatoes 71.693 77.796 46.810 15.357 15.138 29.885 28.198 1.569
Onions (incl. shallots) 1.172 8.640 18.074 17.334 1.474 518 4.069 222
Apples 35.346 17.749 10.526 3.028 1.666 5.125 17.260 2.372
Cucumbers 17.427 13.872 10.429 8.311 8.691 2.066 7.199 53
Red/White cabbage 780 3.861 7.824 7.592 576 20 484 212
Carrots and turnips 3.803 843 7.490 7.276 1.814 - 986 214
Beetroot, salsify, ect 4.892 2.622 6.518 5.349 1.030 727 888 442
Cherries not sour - 3.459 3.914 3.914 1.534 - - -
Other fresh vegetables - 3.696 2.958 1.699 1.819 849 896 411
Apricots 1.812 52 478 478 8 - - -
Other 10.145 2.389 1.912 924 2.179 756 3.018 232

Factsheet Russia (october 2014)
13
Table 12: Russia: Import apples (in tons)
HScode 090810
Source: Russia customs
2011 2012 2013 2013
jan-jul 2014
jan-jul 2013
aug-okt 2014
aug-okt 2013
nov-dec
Total apple 1.191.377 1.279.061 1.352.348 902.209 788.374 194.235 109.284 255.904
Serbia 93.692 58.576 69.046 12.685 35.664 17.171 30.745 39.190
China 138.236 126.314 110.470 68.845 45.696 22.835 24.757 18.790
Ukraine 35.346 17.749 10.526 3.028 1.666 5.125 17.260 2.372
Azerbaijan 41.960 54.554 37.499 6.095 3.291 18.979 16.450 12.426
Chile 50.602 35.275 34.283 32.392 12.800 1.837 4.417 54
Belarus 33.653 25.915 67.268 39.146 126.414 7.549 3.221 20.573
New Zealand 4.809 4.623 6.524 5.285 7.241 1.235 3.099 4
South Africa 7.213 7.130 7.267 6.386 2.998 785 1.329 95
Argentina 59.394 29.537 22.362 22.146 11.992 215 1.186 0
Moldova, Republic Of 183.523 141.574 182.140 50.293 31.946 72.370 1.169 59.477
Poland 288.832 601.225 705.639 580.755 418.048 39.609 949 85.276
Brazil 1.202 961 380 302 58 59 679 19
Switzerland - 57 - - - - 644 -
Bosnia 1.207 94 27 - 131 8 632 19
Macedonia 7.726 2.028 142 118 154 5 515 19
Kazakhstan - - - - 9 - 397 -
France 48.319 38.464 17.332 12.064 22.008 1.131 390 4.138
Italy 71.411 55.102 26.544 21.397 30.990 1.267 355 3.880
Belgium 39.312 23.161 19.987 14.771 17.583 1.221 217 3.995
Georgia - - 49 - 220 40 204 9
Netherlands 16.481 8.478 5.733 3.942 4.783 531 182 1.260
Germany 23.594 22.846 8.866 8.471 3.250 53 137 343
Turkey - 100 276 206 - 54 100 17
Albania - - - - - - 59 -
Hungary 836 1.288 551 486 116 14 44 51
Spain 12.027 3.262 1.176 330 319 610 44 236
Korea,Republic Of 60 84 198 97 76 31 34 70
Iran - 36 3.498 3.461 114 37 33 -
Slovakia 19 3 35 19 39 16 20 -
Japan 27 27 34 16 9 1 11 17
Armenia 4 8 487 483 9 1 5 3
United States 11.676 5.958 8.703 4.624 7.053 977 - 3.103
Greece 5.207 6.697 3.216 2.527 1.970 392 - 298
Austria 6.390 4.457 1.101 1.061 228 19 - 20
Turkmenistan 352 422 488 488 347 - - -
Czech Republic 1.377 710 197 16 46 42 - 139
Uzbekistan 1.753 165 98 98 7 0 - -
Other 5.143 2.184 209 179 1.098 17 - 13

Factsheet Russia (october 2014)
14
Table 13: Russia: Import pears (in tons)
HScodes 090820/30
Source: Russia customs
2011 2012 2013 2013 jan-jul
2014 jan-jul
2013 aug-okt
2014 aug-okt
2013 nov-dec
Total pears 43.191 35.200 42.494 625.227 639.250 51.236 48.072 74.462
Argentina 39 52 13 189.955 182.213 8.556 10.895 10
China 2.953 3.463 2.531 34.470 29.314 3.396 8.161 4.396
Serbia 9 9 48 2.617 6.186 4.352 5.264 1.221
South Africa 198 85 48 29.308 27.617 3.549 4.407 194
Turkey 712 90 116 5.131 3.198 2.289 3.908 606
Belarus 297 764 763 9.369 31.186 3.372 3.601 11.712
Spain 420 908 633 16.679 13.004 5.912 2.521 4.499
France 25 0 79 5.158 4.742 4.388 1.530 253
Chile - 20 - 9.855 12.190 1.492 1.522 140
Belgium 18.950 14.625 18.873 158.755 166.473 3.668 1.309 21.539
Azerbaijan 5 15 - 873 172 146 1.076 5
Bosnia - - - 10 13 13 815 -
Netherlands 11.198 4.748 7.427 67.545 65.840 1.129 802 8.525
Poland 4.003 5.780 7.108 64.659 65.770 7.442 567 16.103
Portugal 1.106 1.417 1.714 5.950 8.451 512 119 1.351
Italy 892 1.435 689 11.968 7.689 301 65 786
USA 1.913 1.633 2.381 11.078 14.421 379 - 2.965
Other 472 157 71 1.846 772 342 1.511 157
More info: Fruit & Vegetable Facts Jan Kees Boon +31 6 54 687 684 www.fruitandvegetablefacts.com [email protected]