
Performance studies of new optics for the time-of-flight ...
14
Research Article Vol. 28, No. 13 / 22 June 2020 / Optics Express 19783 Performance studies of new optics for the time-of-flight detector of the AFP project L IBOR N OZKA , 1,* A NDREW B RANDT, 2 K AREL C ERNY, 1 MIROSLAV H RABOVSKY, 1 TOMAS KOMAREK , 1 F ILIP K RIZEK , 3 D USAN MANDAT, 4 MARKO MILOVANOVIC , 5 MICHAEL R IJSSENBEEK , 6 P ETR S CHOVANEK , 4 TOMAS S YKORA , 7 V LADIMIR U RBASEK , 4 AND J AROMIR Z ATLOUKAL 4 1 Regional Centre of Advanced Technologies and Materials, Joint Laboratory of Optics of Palacky University and Institute of Physics AS CR, Faculty of Science, Palacky University, 17. listopadu 12, 771 46 Olomouc, Czech Republic 2 The University of Texas at Arlington, Department of Physics, Box 19059, Arlington, TX 76019, USA 3 Nuclear Physics Institute of the Czech Academy of Sciences, Husinec - Rez 130, 250 68 Rez, Czech Republic 4 Institute of Physics of the Academy of Sciences of the Czech Republic, Na Slovance 2, Prague, Czech Republic 5 DESY, Platanenallee 6 D-15738 Zeuthen, Germany 6 Stony Brook University, Dept. of Physics and Astronomy, Nicolls Road, Stony Brook, NY 11794-3800, USA 7 Charles University, Faculty of Mathematics and Physics, Institute of Particle and Nuclear Physics, V Holesovickach 2, CZ - 18000 Praha 8, Czech Republic * [email protected] Abstract: We present the results of performance studies of the upgraded optical part of the time-of-flight subdetector prototype for the AFP (ATLAS Forward Proton) detector obtained during the test campaign in a synchrotron test-beam facility with 5 GeV electrons at the DESY laboratory (Hamburg, Germany) in June 2019. The detection of the particle arrival time is based on generation of Cherenkov light in an L-shaped fused silica bar. In the previous version of the ToF, all bars were made of two pieces (radiator and light guide) glued together with a dedicated glue (Epotek 305). This solution suffers from additional radiation damage of glue. We adopted a new technique of bar production without the need of glue. The new bars have a higher optical throughput by a factor of 1.6, reduced fragility, and better geometrical precision. © 2020 Optical Society of America under the terms of the OSA Open Access Publishing Agreement 1. Introduction The design and the physics motivation for the need of time-of-flight (ToF) subdetector of the AFP project itself was already described thoroughly in our previous papers: the physics concept in [1,2], simulation benchmark studies [3], details of the optics in [4], and timing studies in [4,5]. The detection of the particle arrival time is based on generation of Cherenkov light in an L-shaped fused silica bar. For clarity, the geometry of the ToF detector is depicted in Fig. 1 together with its detailed view. The ToF assemblage consists of a 4 × 4 matrix of L-shaped bars made of fused silica (SK-1300 by O’Hara). Each bar serves both as a Cherenkov radiator and a light guide towards a fast multichannel-plate photomultiplier (MCP-PMT) device (the sensor plane in Fig. 1). The rows of four bars along the beam direction are called trains and are labeled with a number. The bars in each train are labeled with letters A, B, C, and D along the direction of the incoming particles. In this way, the bars in the Train 1 are labeled 1A, 1B, 1C, and 1D and so on for the other trains. The L-shape design largely relies on a direct fast light propagation to the sensor (approximately 60% of all photon tracks in a bar accepted by the sensor). This means a bar has to be rotated #394582 https://doi.org/10.1364/OE.394582 Journal © 2020 Received 8 Apr 2020; revised 12 Jun 2020; accepted 14 Jun 2020; published 19 Jun 2020
Transcript of Performance studies of new optics for the time-of-flight ...
Research Article Vol. 28, No. 13 / 22 June 2020 / Optics Express 19783
Performance studies of new optics for thetime-of-flight detector of the AFP project
LIBOR NOZKA,1,* ANDREW BRANDT,2 KAREL CERNY,1 MIROSLAVHRABOVSKY,1 TOMAS KOMAREK,1 FILIP KRIZEK,3 DUSANMANDAT,4 MARKO MILOVANOVIC,5 MICHAEL RIJSSENBEEK,6 PETRSCHOVANEK,4 TOMAS SYKORA,7 VLADIMIR URBASEK,4 ANDJAROMIR ZATLOUKAL4
1Regional Centre of Advanced Technologies and Materials, Joint Laboratory of Optics of PalackyUniversity and Institute of Physics AS CR, Faculty of Science, Palacky University, 17. listopadu 12, 771 46Olomouc, Czech Republic2The University of Texas at Arlington, Department of Physics, Box 19059, Arlington, TX 76019, USA3Nuclear Physics Institute of the Czech Academy of Sciences, Husinec - Rez 130, 250 68 Rez, CzechRepublic4Institute of Physics of the Academy of Sciences of the Czech Republic, Na Slovance 2, Prague, CzechRepublic5DESY, Platanenallee 6 D-15738 Zeuthen, Germany6Stony Brook University, Dept. of Physics and Astronomy, Nicolls Road, Stony Brook, NY 11794-3800, USA7Charles University, Faculty of Mathematics and Physics, Institute of Particle and Nuclear Physics, VHolesovickach 2, CZ - 18000 Praha 8, Czech Republic*[email protected]
Abstract: We present the results of performance studies of the upgraded optical part of thetime-of-flight subdetector prototype for the AFP (ATLAS Forward Proton) detector obtainedduring the test campaign in a synchrotron test-beam facility with 5 GeV electrons at the DESYlaboratory (Hamburg, Germany) in June 2019. The detection of the particle arrival time is basedon generation of Cherenkov light in an L-shaped fused silica bar. In the previous version of theToF, all bars were made of two pieces (radiator and light guide) glued together with a dedicatedglue (Epotek 305). This solution suffers from additional radiation damage of glue. We adopted anew technique of bar production without the need of glue. The new bars have a higher opticalthroughput by a factor of 1.6, reduced fragility, and better geometrical precision.
© 2020 Optical Society of America under the terms of the OSA Open Access Publishing Agreement
1. Introduction
The design and the physics motivation for the need of time-of-flight (ToF) subdetector of theAFP project itself was already described thoroughly in our previous papers: the physics conceptin [1,2], simulation benchmark studies [3], details of the optics in [4], and timing studies in[4,5]. The detection of the particle arrival time is based on generation of Cherenkov light in anL-shaped fused silica bar. For clarity, the geometry of the ToF detector is depicted in Fig. 1together with its detailed view. The ToF assemblage consists of a 4 × 4 matrix of L-shaped barsmade of fused silica (SK-1300 by O’Hara). Each bar serves both as a Cherenkov radiator and alight guide towards a fast multichannel-plate photomultiplier (MCP-PMT) device (the sensorplane in Fig. 1). The rows of four bars along the beam direction are called trains and are labeledwith a number. The bars in each train are labeled with letters A, B, C, and D along the directionof the incoming particles. In this way, the bars in the Train 1 are labeled 1A, 1B, 1C, and 1D andso on for the other trains.
The L-shape design largely relies on a direct fast light propagation to the sensor (approximately60% of all photon tracks in a bar accepted by the sensor). This means a bar has to be rotated
#394582 https://doi.org/10.1364/OE.394582Journal © 2020 Received 8 Apr 2020; revised 12 Jun 2020; accepted 14 Jun 2020; published 19 Jun 2020
Research Article Vol. 28, No. 13 / 22 June 2020 / Optics Express 19784
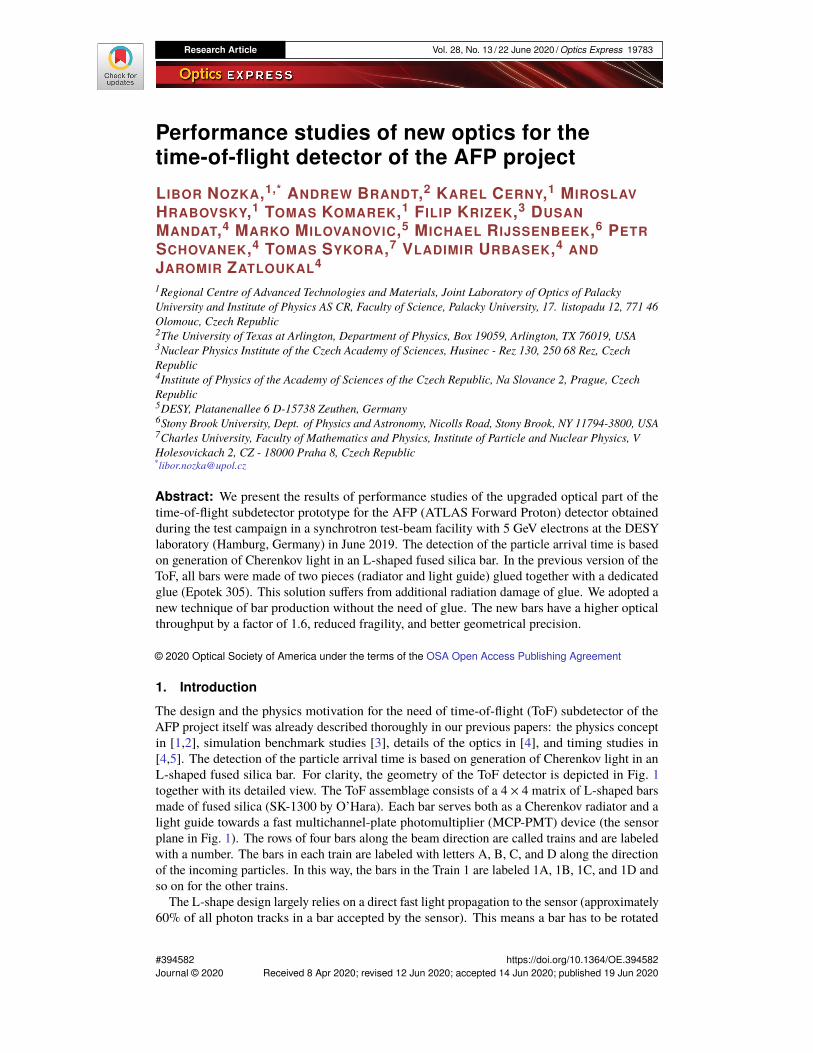
Fig. 1. (a) Geometry of the ToF subdetector, (b) a detailed view of installed ToF bars(reprint from [5]).
so that its radiator is tilted by the Cherenkov angle of 48 degrees with respect to the beam axis,Fig. 1(a). In addition, direct pathways need to be reflected on the bar elbow which means a45 degrees cut coated with an appropriate reflection layer. The part of the light propagatedusing total reflections is delayed with respect to the fast direct propagation. The aforementionedstudies [3] proposed a so-called taper to speed-up total-reflection pathways. On the other hand,adding a taper results in a correspondingly thinner radiator of a lower acceptance, see Fig. 1(a),Train 1. Moreover, a radiator cut is another design improvement allowing higher signal dueto the additional back reflection of light with details described in [3]. Geometry of each baris designed so that the cut planes of all bar radiators form an edge plane of the ToF detector,Fig. 1(a). Dimensions of the bars used in presented studies are summarized in Table 1 at the endof this section. Dimensions of all bars can be found in [4]. The passage length of beam particlesthrough a radiator is 8.1 mm given by its thickness (6 mm) and tilt (48 degrees) with respect tothe beam axis. The acceptance area of the AFP detector is 16.8× 20.0 mm2, given by dimensionsof a tracker module in front [6] and its tilt as illustrated in Fig. 1(a).
Table 1. Dimensions of bars in Train 2. The bar elbow with the 45 degrees cut is part of theradiator.
Radiator Light guide
Bar Height [mm] Thickness [mm] Length [mm] Width [mm] Thickness [mm] Length [mm]
2A 5 6 59.2 5 6 65.2
2B 5 6 53.5 5 6 65.2
2C 5 6 47.9 5 6 65.2
2D 5 6 42.3 5 6 65.2
The ToF detector was installed as a part of the AFP detectors in the forward region of theATLAS detector on the Large Hardon Collider (LHC) in March of 2017. It was inserted into amovable Roman Pot together with the tracker [7] at about 220 m on both sides downstream thetwo beamlines. The working position was 1.5 mm from the beam centre. It ran till the end of2017 in the LHC environment. The optics (and to a lesser extent the electronics) of the detectorwas exposed to high radiation at the level of 700 kGy at a distance of 5 mm from the beam centre.The bars themselves occupied a space in the region from 1.5 mm to 74.8 mm from the beam axis.There is a large gradient in the radiation level about 15 kGy/mm [7], as well as a specific shapeof the illumination of the detector. This resulted in the development of activated hot spots in thebars as measured after their removal from the LHC tunnel.
Research Article Vol. 28, No. 13 / 22 June 2020 / Optics Express 19785
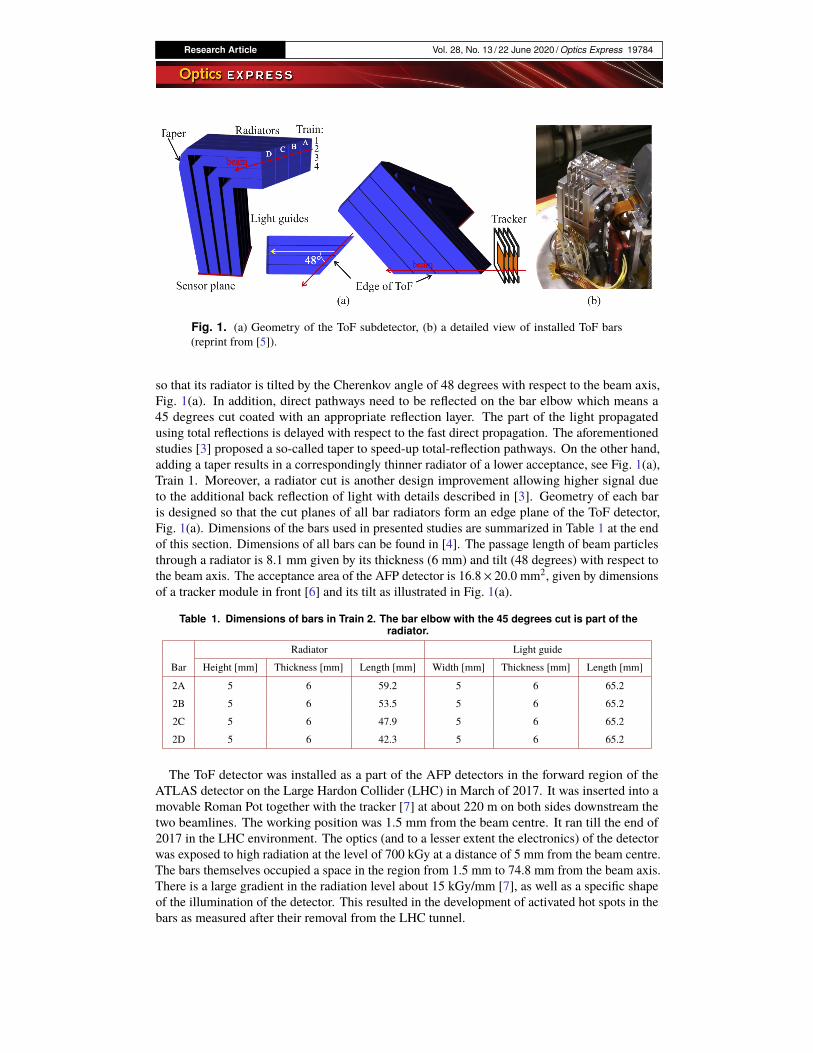
We had tested the radiation hardness of the used fused silica glass SK-1300 and the glueEpotek 305 by means of a proton beam (30 MeV) generated in the cyclotron facility in NuclearPhysics Institute of the Czech Academy of Sciences in Rez near Prague (Czech Republic) [8].We used circular samples (with outer diameter of 20 mm, and 2 mm thickness), some of themglued together with the Epotek 305 for the glue tests. The radiation effects were measured asa decrease of transmittance of the samples due to degradation of fused silica and of glue. Thespectral region was in the interval from 115 nm to 350 nm set by the vacuum spectrometer used(the region of our interest was from 200 to 400 nm [3]). Figure 2(a) summarizes results relevantfor this work. We applied radiation doses according to predicted levels in the LHC [3] (the neqstands for a neutron equivalent dose of the energy of 1 MeV): 700 kGy (neq = 3 · 1015cm−2) forpure glass samples, 20 kGy (neq = 9 · 1013cm−2) for the samples with the glue (the glue junctionwas at least 50 mm far from the beam center in the installation in the LHC).
Fig. 2. (a) Transmission spectra of the SK-1300 and Epotek 305 before and after radiation(including Fresnell losses), (b) splitting of a laser beam observed during transmittancemeasurements of irradiated bars.
The glass material of the bars was found to be sufficiently radiation hard. The transmittanceof the glass stays above 50% within the wavelength range of 200–400 nm up to 700 kGy ofirradiation dose. A significant decrease of transmittance due to irradiation occurs for wavelengthsbelow 200 nm where the quantum efficiency of the photomultipliers is unknown but is expectednot to be negligible. The glue itself deteriorates due to radiation in the order of tens of kGy andexhibits a transmittance drop around a wavelength of 292 nm, see Fig. 2(a). Thus, even while thebar material is sufficiently radiation hard, the glue reduces the radiation hardness of the full bars.This resulted in a steady decrease of their optical throughput during the operation in the LHC.
We measured the total decrease of transmittance of one of the irradiated bars (with the label1D) after the operation in the LHC. The transmittance was measured by means of a laser beam of280 nm wavelength (accidentally close to the transmittance drop of the glue). The measurementaimed to compare the signal power of the light beam passing the irradiated bar with one ofnon-irradiated bars of the same geometry. The observed decrease of transmittance was 38%± 2%due to radiation at that wavelength. Moreover, during the measurement we noticed that the laserbeam split at the glue layer as seen in Fig. 2(b). In the figure, the ordinary (expected) beam spotis labeled 2 and the parasitic spot is labelled 1. The intensity of the parasitic light beam was 40%of the signal level of the ordinary light beam.The deterioration of the optical performance of the ToF detector due to permanent radiation
damage contributed to the decline of its efficiency during operation. The efficiency is directlyproportional to the average signal-to-noise ratio of the detector which in turn depends on the gain
Research Article Vol. 28, No. 13 / 22 June 2020 / Optics Express 19786
of the photomultiplier. The gain is determined by the high voltage applied. However, the gain ofphotomultipliers for a constant high voltage decreases with higher rates of incoming light pulses[9,10]. This is critical for applications at the LHC which operates at the frequency of 40 MHz.The development of L-shaped bars without a need of glue junction was highly desirable
to improve the ToF timing performance and efficiency (including radiation hardness). Theproduction of solid one-piece L-shaped bars was not trivial. The technique was chosen suchthat the skeleton of the whole train (four bars) was produced in one step considering a designedspacing of 0.4 mm between the bars in the installation. This allowed for precise alignment ofadjacent surfaces of the bars, mainly at the edge of the ToF, see Fig. 1(a). Thus, the misalignmentof the radiator arms (which was present in the case of glued L-bars) was removed. Then barswere polished individually. Train no. 2 of four solid (glueless) bars was produced for the June2019 measurements at DESY in Hamburg. Their dimensions are summarized in Table 1.
In the following sections, we present results of the comparative measurement of the previouslydesigned bars with the glue junction. Simulations were done to estimate the increase of numberof photoelectrons compared to glued bars. We also needed to understand possible differencesdue to electron beam at the DESY test beam facility compared to the SPS (the Super ProtonSynchrontron) beam at CERN we had used previously [5] (the SPS facility was closed during2019). These studies are presented first.
2. Preparatory simulation studies
We focused on two tasks: (1) to perform studies of the effect of secondaries produced in the barsby the primary electron beam with energy of 5 GeV, (2) to assess the yield of photoelectronsgiven by solid bars compared to that of glued bars. The effect of secondaries is negligible in thecase of the SPS beam at CERN (π+ 120 GeV) as well as of the LHC beam (from this point ofview the measurements with the SPS beam suited our needs better). Simulations of primary beaminteractions with the whole Train 2 model were performed in the Geant4 framework [11]. Themodel contained the geometry of bars (Table 1), a model of the photomultiplier with its quantumefficiency [3] and a model of the stainless-steel entry window of the Roman pot which is 300 µmthick [7]. The beam goes into the Roman pot through this window. It is a thinned part of theRoman pot body. In the simulation, the photodetection efficiency (PDE) of the photomultipliermodel was extrapolated down to 160 nm as a constant function of the wavelength with the valueof 16% taken from the lowest known value at the wavelength of 200 nm.Geant4 simulated the production of secondary electrons, positrons, and gamma photons
induced by the primary electrons of the DESY beam passing the bars of the ToF detector. Thegamma particles then partly convert to other electron-positron pairs. The electrons and positronswith kinetic energy above the threshold of 0.160 MeV generate additional Cherenkov photons.A negligible number of secondary positrons is generated in the case of the SPS beam. In total,according to the simulation, the DESY beam generates more secondary particles by a factor of2.25 in the ToF detector than the SPS beam (only those secondary particles producing Cherenkovphotons are counted here).In the case showers are induced by the primary particles, the amount of secondary particles
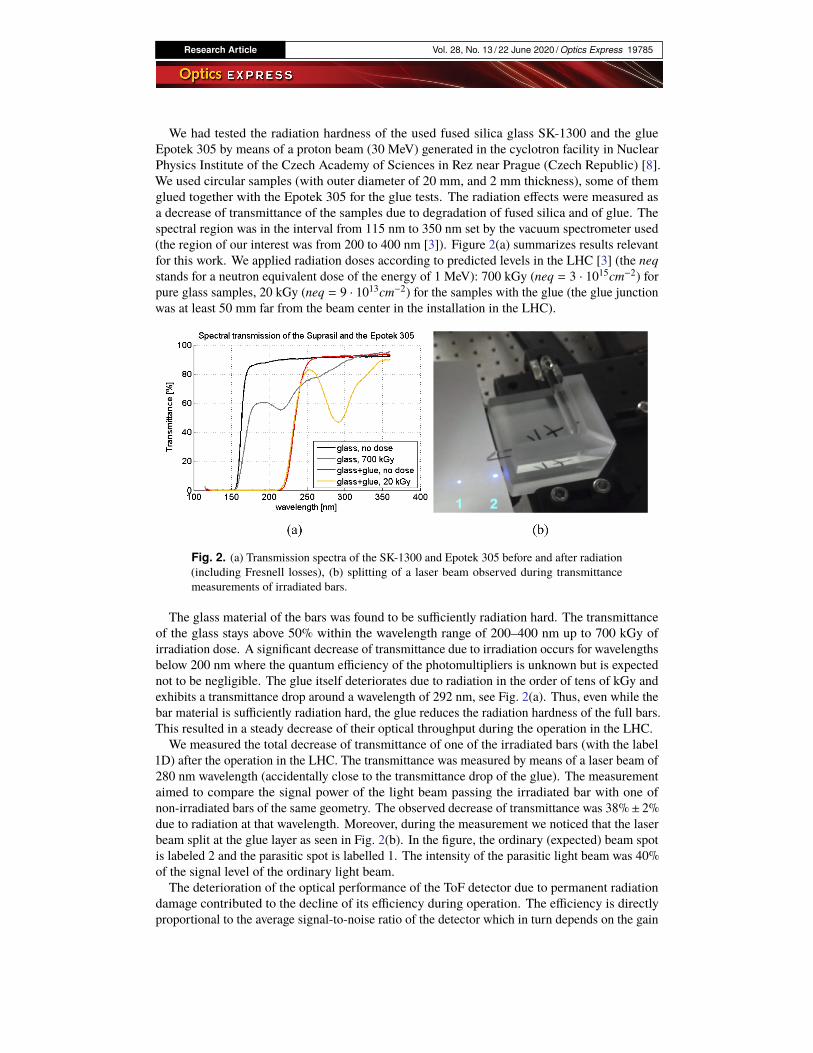
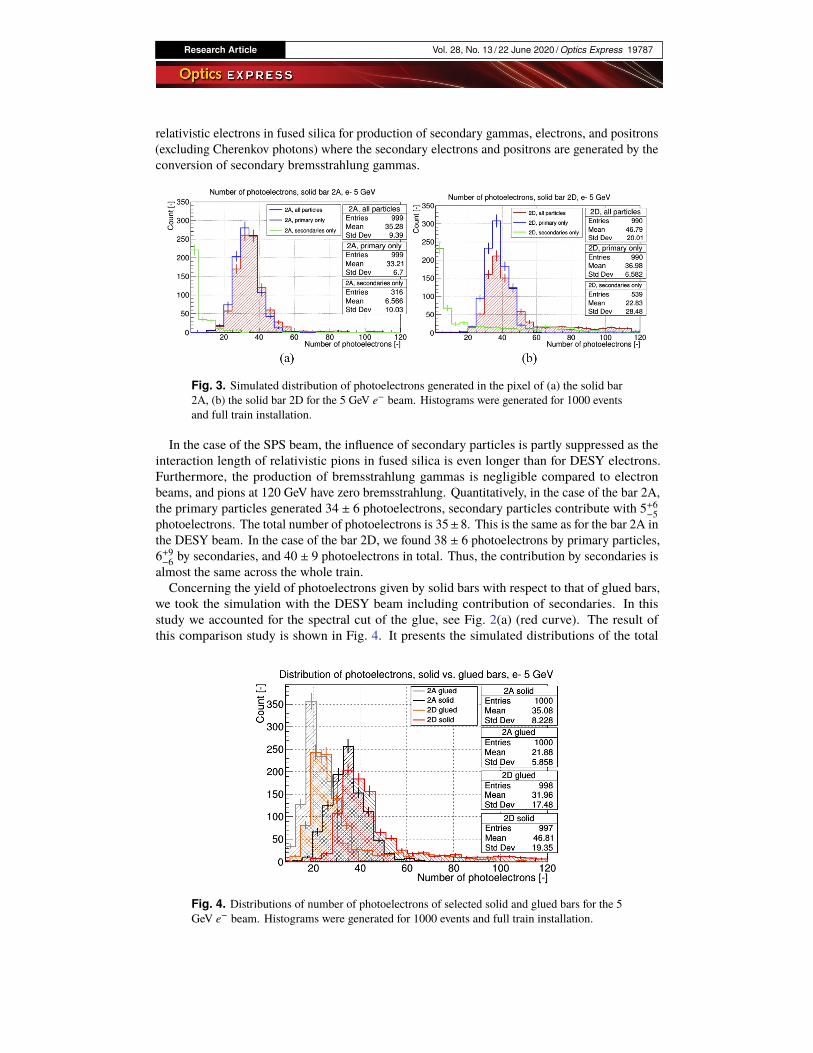
increases as the shower develops. As a result, the number of photoelectrons steadily increasesfrom bar 2A to bar 2D. The comparison of the number of photoelectrons generated in the solidand glued bars 2A and 2D in full train is shown in Fig. 3 for the case of incident electron beam.Histograms were generated for 1000 events. In the case of bar 2A, the primary particles (thebeam particles) generated 33 ± 6 photoelectrons, and secondary particles contributed with 7+10
−7photoelectrons (there are large fluctuations). The total number of photoelectrons was 36 ± 9 (thefilled histogram). In the case of bar 2D, we found 37± 6 photoelectrons by primary particles, and23+30
−23 by secondaries, and 47 ± 21 photoelectrons in total. The number of photoelectrons givenby secondary particles fluctuates strongly. This is due to relatively long interaction length of
Research Article Vol. 28, No. 13 / 22 June 2020 / Optics Express 19787
relativistic electrons in fused silica for production of secondary gammas, electrons, and positrons(excluding Cherenkov photons) where the secondary electrons and positrons are generated by theconversion of secondary bremsstrahlung gammas.
Fig. 3. Simulated distribution of photoelectrons generated in the pixel of (a) the solid bar2A, (b) the solid bar 2D for the 5 GeV e− beam. Histograms were generated for 1000 eventsand full train installation.
In the case of the SPS beam, the influence of secondary particles is partly suppressed as theinteraction length of relativistic pions in fused silica is even longer than for DESY electrons.Furthermore, the production of bremsstrahlung gammas is negligible compared to electronbeams, and pions at 120 GeV have zero bremsstrahlung. Quantitatively, in the case of the bar 2A,the primary particles generated 34 ± 6 photoelectrons, secondary particles contribute with 5+6
−5photoelectrons. The total number of photoelectrons is 35±8. This is the same as for the bar 2A inthe DESY beam. In the case of the bar 2D, we found 38 ± 6 photoelectrons by primary particles,6+9−6 by secondaries, and 40 ± 9 photoelectrons in total. Thus, the contribution by secondaries isalmost the same across the whole train.Concerning the yield of photoelectrons given by solid bars with respect to that of glued bars,
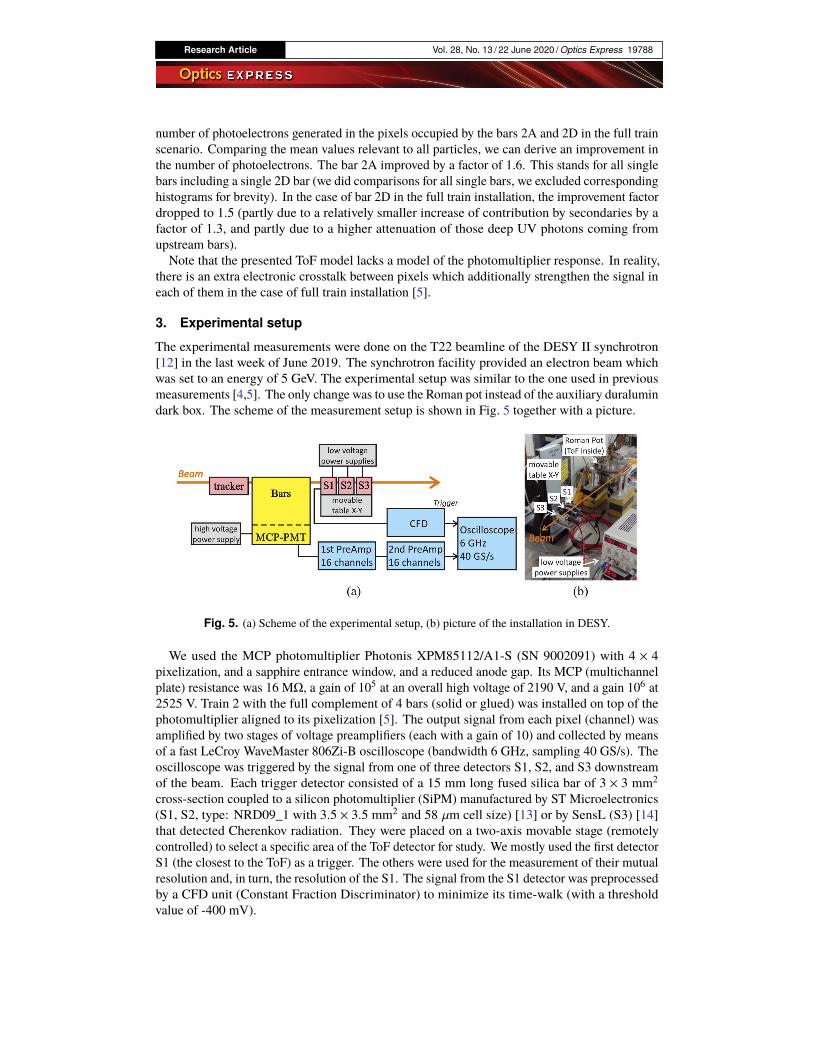
we took the simulation with the DESY beam including contribution of secondaries. In thisstudy we accounted for the spectral cut of the glue, see Fig. 2(a) (red curve). The result ofthis comparison study is shown in Fig. 4. It presents the simulated distributions of the total
Fig. 4. Distributions of number of photoelectrons of selected solid and glued bars for the 5GeV e− beam. Histograms were generated for 1000 events and full train installation.
Research Article Vol. 28, No. 13 / 22 June 2020 / Optics Express 19788
number of photoelectrons generated in the pixels occupied by the bars 2A and 2D in the full trainscenario. Comparing the mean values relevant to all particles, we can derive an improvement inthe number of photoelectrons. The bar 2A improved by a factor of 1.6. This stands for all singlebars including a single 2D bar (we did comparisons for all single bars, we excluded correspondinghistograms for brevity). In the case of bar 2D in the full train installation, the improvement factordropped to 1.5 (partly due to a relatively smaller increase of contribution by secondaries by afactor of 1.3, and partly due to a higher attenuation of those deep UV photons coming fromupstream bars).Note that the presented ToF model lacks a model of the photomultiplier response. In reality,
there is an extra electronic crosstalk between pixels which additionally strengthen the signal ineach of them in the case of full train installation [5].
3. Experimental setup
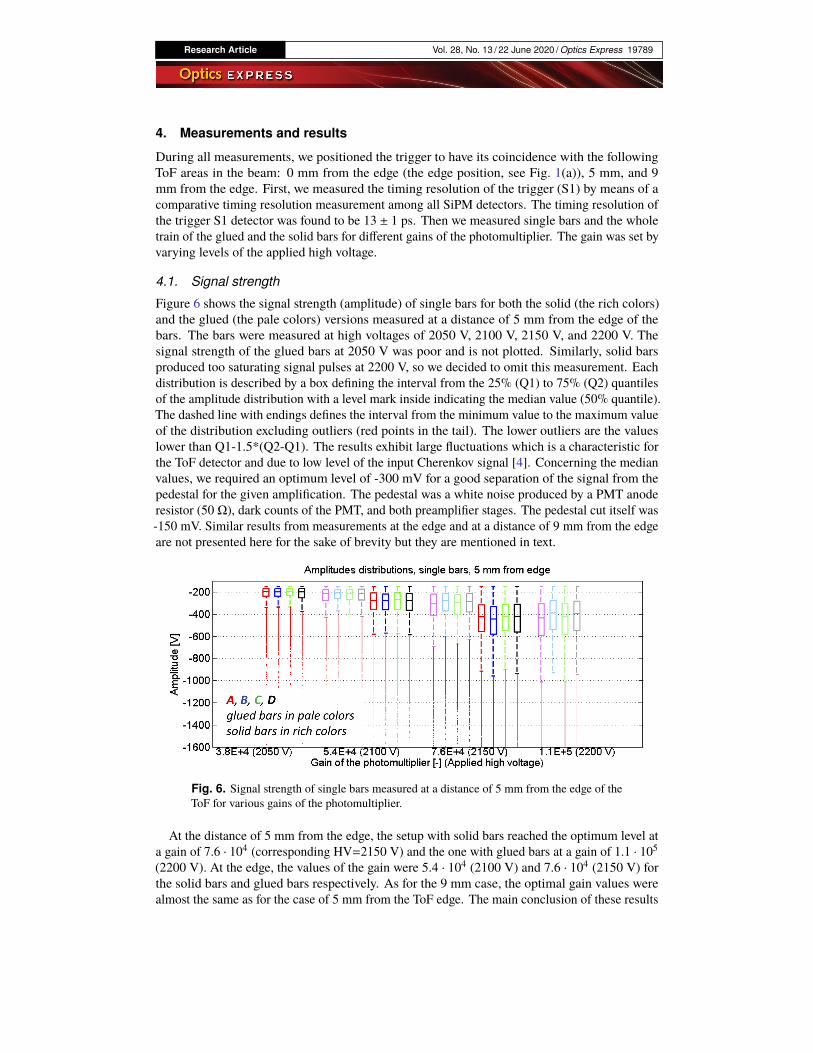
The experimental measurements were done on the T22 beamline of the DESY II synchrotron[12] in the last week of June 2019. The synchrotron facility provided an electron beam whichwas set to an energy of 5 GeV. The experimental setup was similar to the one used in previousmeasurements [4,5]. The only change was to use the Roman pot instead of the auxiliary duralumindark box. The scheme of the measurement setup is shown in Fig. 5 together with a picture.
Fig. 5. (a) Scheme of the experimental setup, (b) picture of the installation in DESY.
We used the MCP photomultiplier Photonis XPM85112/A1-S (SN 9002091) with 4 × 4pixelization, and a sapphire entrance window, and a reduced anode gap. Its MCP (multichannelplate) resistance was 16 MΩ, a gain of 105 at an overall high voltage of 2190 V, and a gain 106 at2525 V. Train 2 with the full complement of 4 bars (solid or glued) was installed on top of thephotomultiplier aligned to its pixelization [5]. The output signal from each pixel (channel) wasamplified by two stages of voltage preamplifiers (each with a gain of 10) and collected by meansof a fast LeCroy WaveMaster 806Zi-B oscilloscope (bandwidth 6 GHz, sampling 40 GS/s). Theoscilloscope was triggered by the signal from one of three detectors S1, S2, and S3 downstreamof the beam. Each trigger detector consisted of a 15 mm long fused silica bar of 3 × 3 mm2
cross-section coupled to a silicon photomultiplier (SiPM) manufactured by ST Microelectronics(S1, S2, type: NRD09_1 with 3.5 × 3.5 mm2 and 58 µm cell size) [13] or by SensL (S3) [14]that detected Cherenkov radiation. They were placed on a two-axis movable stage (remotelycontrolled) to select a specific area of the ToF detector for study. We mostly used the first detectorS1 (the closest to the ToF) as a trigger. The others were used for the measurement of their mutualresolution and, in turn, the resolution of the S1. The signal from the S1 detector was preprocessedby a CFD unit (Constant Fraction Discriminator) to minimize its time-walk (with a thresholdvalue of -400 mV).
Research Article Vol. 28, No. 13 / 22 June 2020 / Optics Express 19789
4. Measurements and results
During all measurements, we positioned the trigger to have its coincidence with the followingToF areas in the beam: 0 mm from the edge (the edge position, see Fig. 1(a)), 5 mm, and 9mm from the edge. First, we measured the timing resolution of the trigger (S1) by means of acomparative timing resolution measurement among all SiPM detectors. The timing resolution ofthe trigger S1 detector was found to be 13 ± 1 ps. Then we measured single bars and the wholetrain of the glued and the solid bars for different gains of the photomultiplier. The gain was set byvarying levels of the applied high voltage.
4.1. Signal strength
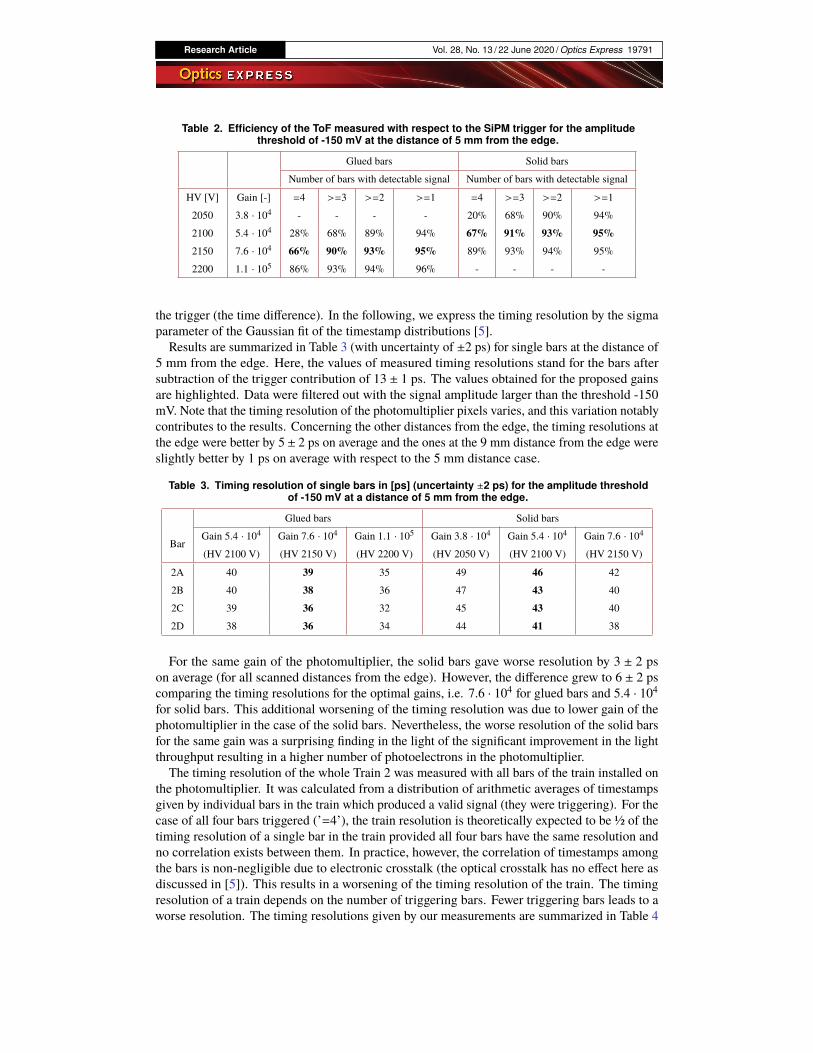
Figure 6 shows the signal strength (amplitude) of single bars for both the solid (the rich colors)and the glued (the pale colors) versions measured at a distance of 5 mm from the edge of thebars. The bars were measured at high voltages of 2050 V, 2100 V, 2150 V, and 2200 V. Thesignal strength of the glued bars at 2050 V was poor and is not plotted. Similarly, solid barsproduced too saturating signal pulses at 2200 V, so we decided to omit this measurement. Eachdistribution is described by a box defining the interval from the 25% (Q1) to 75% (Q2) quantilesof the amplitude distribution with a level mark inside indicating the median value (50% quantile).The dashed line with endings defines the interval from the minimum value to the maximum valueof the distribution excluding outliers (red points in the tail). The lower outliers are the valueslower than Q1-1.5*(Q2-Q1). The results exhibit large fluctuations which is a characteristic forthe ToF detector and due to low level of the input Cherenkov signal [4]. Concerning the medianvalues, we required an optimum level of -300 mV for a good separation of the signal from thepedestal for the given amplification. The pedestal was a white noise produced by a PMT anoderesistor (50 Ω), dark counts of the PMT, and both preamplifier stages. The pedestal cut itself was-150 mV. Similar results from measurements at the edge and at a distance of 9 mm from the edgeare not presented here for the sake of brevity but they are mentioned in text.
Fig. 6. Signal strength of single bars measured at a distance of 5 mm from the edge of theToF for various gains of the photomultiplier.
At the distance of 5 mm from the edge, the setup with solid bars reached the optimum level ata gain of 7.6 · 104 (corresponding HV=2150 V) and the one with glued bars at a gain of 1.1 · 105(2200 V). At the edge, the values of the gain were 5.4 · 104 (2100 V) and 7.6 · 104 (2150 V) forthe solid bars and glued bars respectively. As for the 9 mm case, the optimal gain values werealmost the same as for the case of 5 mm from the ToF edge. The main conclusion of these results

Research Article Vol. 28, No. 13 / 22 June 2020 / Optics Express 19790
is that single solid bars produced a signal higher by a factor of 1.6–1.8 compared to the gluedbars for the same PMT gain. Further interpretation is done in the Discussion section below.The situation changed with the bars installed in the full train as seen in Fig. 7. Due to light
leakage from the upstream bars, the downstream bars profit from the photon enrichment andconsequently register higher number of photons by a factor up to 1.4 [4]. Besides, any secondariesproduced further increase the signal level of downstream bars as mentioned earlier. As a result,the light in the downstream bars is always augmented. The first bar (A) is the only one havinga signal strength the same as in the single bar scenario (excluding the effect of the electroniccrosstalk from the adjacent bar 2B). Note a weaker signal amplitude of the 2D bar comparedto the one of the 2C bar. We presume this is due to lower signal contribution from adjacentpixels (charge sharing between pixels) - the 2D-bar pixel has only one adjacent pixel within thetrain. However, this effect was not studied in more detail (the leakage effect between pixels wasaddressed in [5], Fig. 5).
Fig. 7. Signal strength of bars installed in the train measured at a distance of 5 mm fromthe edge of the ToF for various gains of the photomultiplier.
The signal strength of the train is closely related to the efficiency of the train which is animportant performance characteristic. We directly measured the efficiency with respect to theSiPM trigger during the measurement campaign. We evaluated the train efficiency for the cases(called majority trigger cases) in which either all four bars (’=4’), at least three bars (’>=3’), atleast two bars (’>=2’), or at least one bar (’>=1’) generated a valid signal with the amplitudelarger than the signal-to-pedestal threshold of -150 mV. The ’=4’ case and the ’>=3’ case wereof the main interest (due to better train resolution, see below). The results are summarized inTable 2. The values obtained at the preferred gains are highlighted. The efficiency of the ’=4’case is affected by a lower signal strength of the bar 2A with respect to other bars in the train(there is no enrichment by photons from upstream bars). As the signal level of the solid bar 2A ismuch higher (by a factor of 1.6, as seen above), the solid train has significantly higher efficiencyas compared to its glued counterpart for the ’=4’ case. See the Discussion section below forfurther discussion of this result.
4.2. Timing resolution
Concerning the timing resolution, we measured the resolution of single bars and that of full trains.The measurements of the timing resolution of the bars and the whole trains were performed withrespect to the first SiPM detector acting as a trigger. We preprocessed the output signal by theCFD module. The timestamp of leading edge was treated as the arrival time of a signal pulse.The arrival time of a signal pulse from a PMT pixel was determined relative to the arrival time of
Research Article Vol. 28, No. 13 / 22 June 2020 / Optics Express 19791
Table 2. Efficiency of the ToF measured with respect to the SiPM trigger for the amplitudethreshold of -150 mV at the distance of 5 mm from the edge.
Glued bars Solid bars
Number of bars with detectable signal Number of bars with detectable signal
HV [V] Gain [-] =4 >=3 >=2 >=1 =4 >=3 >=2 >=1
2050 3.8 · 104 - - - - 20% 68% 90% 94%
2100 5.4 · 104 28% 68% 89% 94% 67% 91% 93% 95%2150 7.6 · 104 66% 90% 93% 95% 89% 93% 94% 95%
2200 1.1 · 105 86% 93% 94% 96% - - - -
the trigger (the time difference). In the following, we express the timing resolution by the sigmaparameter of the Gaussian fit of the timestamp distributions [5].
Results are summarized in Table 3 (with uncertainty of ±2 ps) for single bars at the distance of5 mm from the edge. Here, the values of measured timing resolutions stand for the bars aftersubtraction of the trigger contribution of 13 ± 1 ps. The values obtained for the proposed gainsare highlighted. Data were filtered out with the signal amplitude larger than the threshold -150mV. Note that the timing resolution of the photomultiplier pixels varies, and this variation notablycontributes to the results. Concerning the other distances from the edge, the timing resolutions atthe edge were better by 5 ± 2 ps on average and the ones at the 9 mm distance from the edge wereslightly better by 1 ps on average with respect to the 5 mm distance case.
Table 3. Timing resolution of single bars in [ps] (uncertainty ±2 ps) for the amplitude thresholdof -150 mV at a distance of 5 mm from the edge.
Glued bars Solid bars
BarGain 5.4 · 104 Gain 7.6 · 104 Gain 1.1 · 105 Gain 3.8 · 104 Gain 5.4 · 104 Gain 7.6 · 104
(HV 2100 V) (HV 2150 V) (HV 2200 V) (HV 2050 V) (HV 2100 V) (HV 2150 V)
2A 40 39 35 49 46 42
2B 40 38 36 47 43 40
2C 39 36 32 45 43 40
2D 38 36 34 44 41 38
For the same gain of the photomultiplier, the solid bars gave worse resolution by 3 ± 2 pson average (for all scanned distances from the edge). However, the difference grew to 6 ± 2 pscomparing the timing resolutions for the optimal gains, i.e. 7.6 · 104 for glued bars and 5.4 · 104for solid bars. This additional worsening of the timing resolution was due to lower gain of thephotomultiplier in the case of the solid bars. Nevertheless, the worse resolution of the solid barsfor the same gain was a surprising finding in the light of the significant improvement in the lightthroughput resulting in a higher number of photoelectrons in the photomultiplier.
The timing resolution of the whole Train 2 was measured with all bars of the train installed onthe photomultiplier. It was calculated from a distribution of arithmetic averages of timestampsgiven by individual bars in the train which produced a valid signal (they were triggering). For thecase of all four bars triggered (’=4’), the train resolution is theoretically expected to be ½ of thetiming resolution of a single bar in the train provided all four bars have the same resolution andno correlation exists between them. In practice, however, the correlation of timestamps amongthe bars is non-negligible due to electronic crosstalk (the optical crosstalk has no effect here asdiscussed in [5]). This results in a worsening of the timing resolution of the train. The timingresolution of a train depends on the number of triggering bars. Fewer triggering bars leads to aworse resolution. The timing resolutions given by our measurements are summarized in Table 4
Research Article Vol. 28, No. 13 / 22 June 2020 / Optics Express 19792
(with uncertainty of ±2 ps) for all assumed majority trigger cases measured at the 5 mm distanceof from the edge. The resolution contribution 13 ps from the SiPM trigger was subtracted. Thehighlighted values stand for the preferred gain levels of the PMT as were mentioned before.
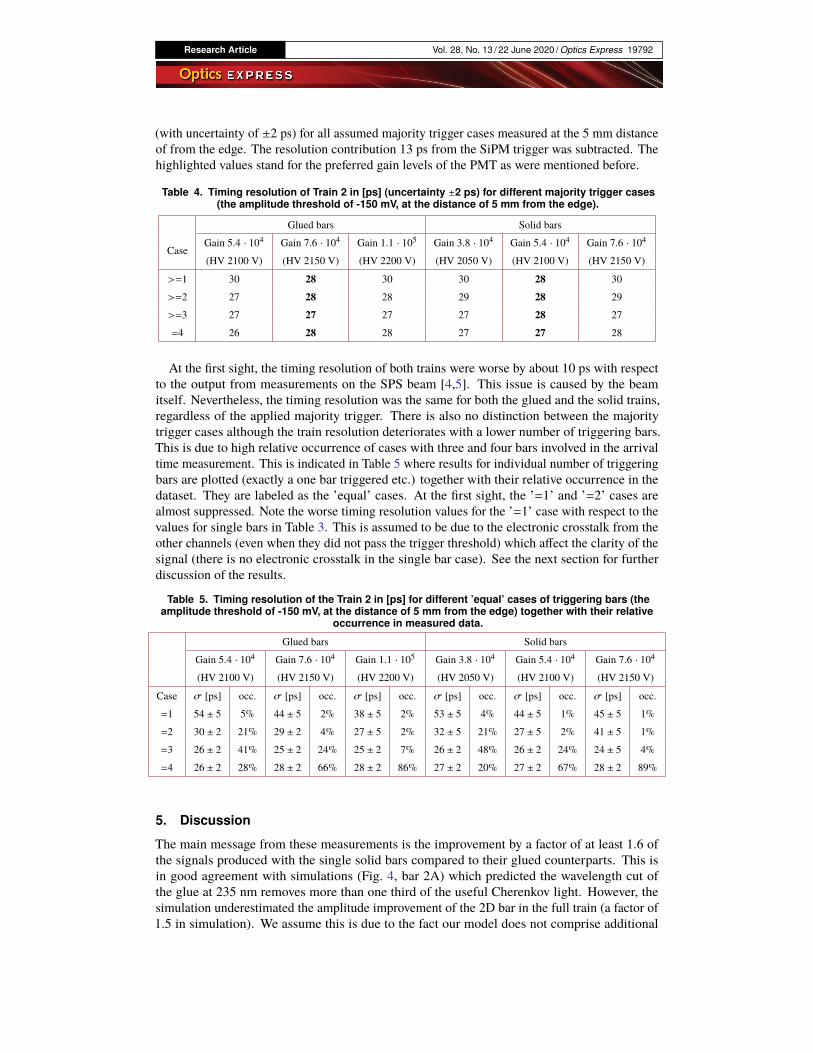
Table 4. Timing resolution of Train 2 in [ps] (uncertainty ±2 ps) for different majority trigger cases(the amplitude threshold of -150 mV, at the distance of 5 mm from the edge).
Glued bars Solid bars
CaseGain 5.4 · 104 Gain 7.6 · 104 Gain 1.1 · 105 Gain 3.8 · 104 Gain 5.4 · 104 Gain 7.6 · 104
(HV 2100 V) (HV 2150 V) (HV 2200 V) (HV 2050 V) (HV 2100 V) (HV 2150 V)
>=1 30 28 30 30 28 30
>=2 27 28 28 29 28 29
>=3 27 27 27 27 28 27
=4 26 28 28 27 27 28
At the first sight, the timing resolution of both trains were worse by about 10 ps with respectto the output from measurements on the SPS beam [4,5]. This issue is caused by the beamitself. Nevertheless, the timing resolution was the same for both the glued and the solid trains,regardless of the applied majority trigger. There is also no distinction between the majoritytrigger cases although the train resolution deteriorates with a lower number of triggering bars.This is due to high relative occurrence of cases with three and four bars involved in the arrivaltime measurement. This is indicated in Table 5 where results for individual number of triggeringbars are plotted (exactly a one bar triggered etc.) together with their relative occurrence in thedataset. They are labeled as the ’equal’ cases. At the first sight, the ’=1’ and ’=2’ cases arealmost suppressed. Note the worse timing resolution values for the ’=1’ case with respect to thevalues for single bars in Table 3. This is assumed to be due to the electronic crosstalk from theother channels (even when they did not pass the trigger threshold) which affect the clarity of thesignal (there is no electronic crosstalk in the single bar case). See the next section for furtherdiscussion of the results.
Table 5. Timing resolution of the Train 2 in [ps] for different ’equal’ cases of triggering bars (theamplitude threshold of -150 mV, at the distance of 5 mm from the edge) together with their relative
occurrence in measured data.
Glued bars Solid bars
Gain 5.4 · 104 Gain 7.6 · 104 Gain 1.1 · 105 Gain 3.8 · 104 Gain 5.4 · 104 Gain 7.6 · 104
(HV 2100 V) (HV 2150 V) (HV 2200 V) (HV 2050 V) (HV 2100 V) (HV 2150 V)
Case σ [ps] occ. σ [ps] occ. σ [ps] occ. σ [ps] occ. σ [ps] occ. σ [ps] occ.
=1 54 ± 5 5% 44 ± 5 2% 38 ± 5 2% 53 ± 5 4% 44 ± 5 1% 45 ± 5 1%
=2 30 ± 2 21% 29 ± 2 4% 27 ± 5 2% 32 ± 5 21% 27 ± 5 2% 41 ± 5 1%
=3 26 ± 2 41% 25 ± 2 24% 25 ± 2 7% 26 ± 2 48% 26 ± 2 24% 24 ± 5 4%
=4 26 ± 2 28% 28 ± 2 66% 28 ± 2 86% 27 ± 2 20% 27 ± 2 67% 28 ± 2 89%
5. Discussion
The main message from these measurements is the improvement by a factor of at least 1.6 ofthe signals produced with the single solid bars compared to their glued counterparts. This isin good agreement with simulations (Fig. 4, bar 2A) which predicted the wavelength cut ofthe glue at 235 nm removes more than one third of the useful Cherenkov light. However, thesimulation underestimated the amplitude improvement of the 2D bar in the full train (a factor of1.5 in simulation). We assume this is due to the fact our model does not comprise additional
Research Article Vol. 28, No. 13 / 22 June 2020 / Optics Express 19793
interaction between bar channels at the photomultiplier level (namely charge sharing) and theresponse of the photomultiplier overall. In the simulation, the photodetection efficiency (PDE)of the photomultiplier model was extrapolated down to 160 nm as a constant function of thewavelength with the value of 16% taken from the lowest known value at the wavelength of 200nm. The good agreement between data and the simulation proved that the PDE of the usedphotomultiplier is significant below 200 nm despite being unknown in the deep UV region.For proper operation, a good separation of the signal from the pedestal is required. In the
setup, a threshold of -150 mV was the optimum value. The required mean signal amplitude isthen -300 mV or bigger. The corresponding optimum gain for the glued bars was 7.6 · 104, and5.4 · 104 for the solid bars.The rate of our beam test events at DESY (and at the SPS in the past) was of order of kHz, a
rate that does not affect the performance of the photomultiplier. In such conditions, the efficiencyof the ToF with the solid bars was substantially higher compared to the glued counterpart for thesame gain, see Table 2. This is especially true for the ’=4’ trigger condition in which we requireall bars in the train to produce a valid signal (surpassing the signal-to-pedestal threshold of -150mV). However, if we reduce the gain from 7.6 · 104 to 5.4 · 104 for solid bars we end up with thesame efficiency as for glued bars at a gain of 7.6 · 104 (keeping in mind we operate in a low-rateregime).The timing resolution is the main performance characteristic of the ToF detector. Although
the timing resolution of the train is the decisive parameter, we also focused on the timingperformance of the single bars. According to the Table 3, the solid bars gave worse resolutionby 3 ± 1 ps in average for the same gain. This was surprising. We expected a slightly betterresolution due to higher number of photons on the photomultiplier photocathode despite thefact there is a saturation of the timing resolution of photomultipliers with the increasing numberof photoelectrons as reported in [15]. We tried to explain this deterioration as the effect ofthe Cherenkov light dispersion. As the solid bars miss the glue layer, the wavelength range ofaccepted photons spreads down to 160 nm where the index of refraction of the fused silica (andof dielectrics in general) quickly rises. However, our simulation did not reveal any significantchange of the time distribution of photons hit counts on the PMT photocathode. On the otherhand, these distinctions disappeared when all bars were installed in the train and we studied thetiming performance of the whole train. When a train average time is determined, the difference of3 ps present in the timing resolution of single bars (solid vs. glued) is suppressed. Theoretically,the resolution of the train is half of the single bar resolution. Thus, the difference is 1.5 ps in caseof the full train which is comparable with our uncertainty of measurement.
It is interesting that the train timing resolution did not change (within the uncertainty of ±2 ps)among the applied majority triggers. Thus the ’>=1’ case gave the same timing performance asthe ’>=3’ or ’=4’ cases. The explanation is found in Table 5. The relative occurrence of the’=1’ case (exactly only one of bars triggered) or the ’=2’ case was below 5%. Actually, mostfrequently all four bars triggered (66% or 67%), followed by the case in which at least three barswere triggering (24%). The best timing resolution was obtained for the case ’=3’. The ’=4’ casesuffered somewhat from the poorer timing performance of the first bar as no photon enrichmentis present from the upstream bars. Adding a fake bar in front of the first bar would solve thisissue. However, there is lack of space for such modifications. From these results we can deducewhich of the majority trigger cases to use for the ToF operation based on the timing resolutionand the efficiency. The selection criterion based on the ’>=3’ case is optimal.
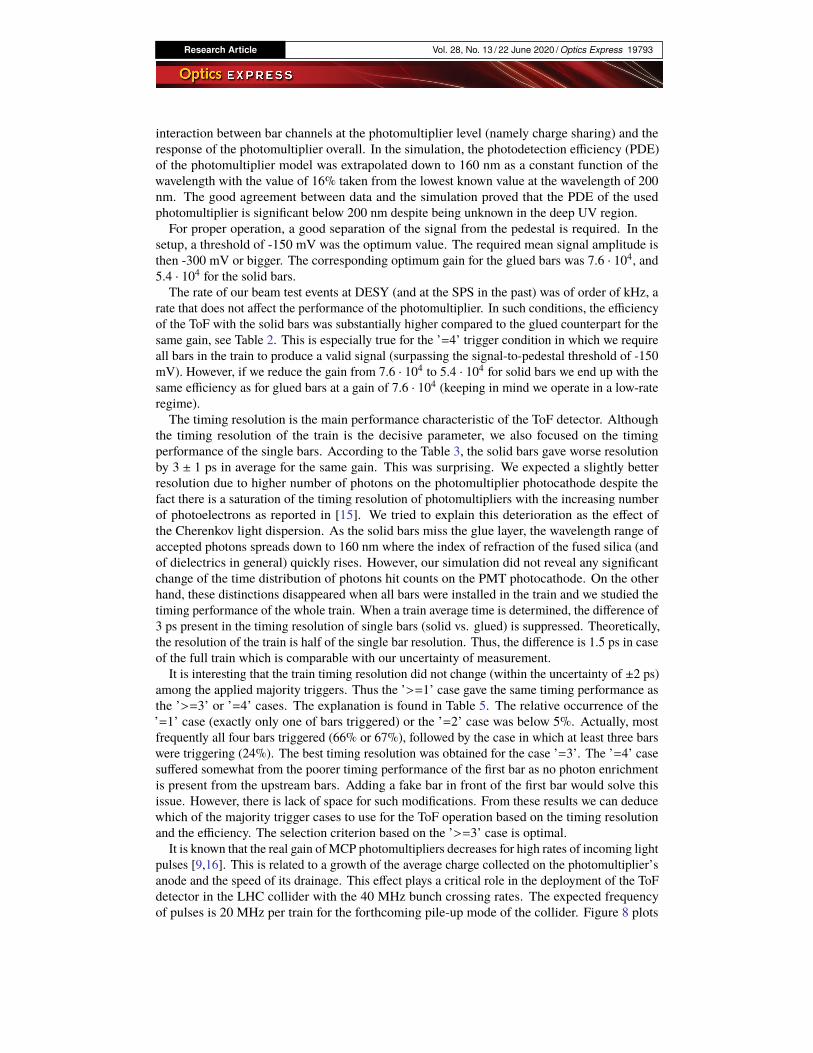
It is known that the real gain of MCP photomultipliers decreases for high rates of incoming lightpulses [9,16]. This is related to a growth of the average charge collected on the photomultiplier’sanode and the speed of its drainage. This effect plays a critical role in the deployment of the ToFdetector in the LHC collider with the 40 MHz bunch crossing rates. The expected frequencyof pulses is 20 MHz per train for the forthcoming pile-up mode of the collider. Figure 8 plots
Research Article Vol. 28, No. 13 / 22 June 2020 / Optics Express 19794
rate characteristics of the used PMT for the gains of 5.4 · 104 and 7.6 · 104 and various outputamplitudes at the low frequency of 10 kHz (the reference amplitudes). These measurements wereperformed on a picosecond laser at the wavelength of 402 nm, see [10] for details concerning themeasurement setup. The whole PMT was uniformly illuminated and only the channel (pixel) 22was measured (no Cherenkov bars were installed). Output signals were amplified with the samepreamplifiers as used in the DESY beam tests. Measurements were performed in the range of 10kHz to 50 MHz or less where the strip current exceeded the safe value of 500 µA (the black andpurple curves, see below). For each scan, the relative amplitude was calculated as the ratio of themeasured mean output amplitude to the one measured at 10 kHz, see Fig. 8(b). Note that thelevel of the noise does not depend on the pulse rates.
Fig. 8. Results of the rate scans of the PMT Photonis XPM85112/A1-S (a) in terms ofmeasured output amplitudes, (b) in terms of relative amplitudes with respect to the one at 10kHz (the lowest frequency).
In Fig. 8, the configuration with gain 5.4 · 104 and reference amplitude -200 mV (blue curve)corresponds to a single glued bar, at that gain, from the DESY test (Fig. 6). It provided the lowestattenuation at increased input rate, likely due to the lowest generated charge on the MCP-PMT.Similarly, the configuration with gain 5.4 · 104 and reference amplitude -300 mV (red curve)corresponds to a single solid bar from the same test. The configuration with gain 7.6 · 104 andreference amplitude -300 mV (green curve) corresponds to a single glued bar at that gain. Bothred and green configurations had similar rate characteristics as they produced the same charge inthe multi-channel plate.
The configurationwith gain 7.6·104 and reference amplitude -400mV (black curve) correspondsto a single solid bar at that gain. The last configuration with gain 7.6 · 104 and reference amplitude-800 mV (purple curve) corresponds to the full installed train, at that gain, from the DESY test(Fig. 7). The last case had the worst rate performance due to relatively high level of chargegenerated on the PMT anode.
At the rate of 20 MHz, all configurations (except the purple one) provide similar amplitudes ofapproximately -150 mV. This is related to the fact that there is a limited charge available in thePMT for the electron multiplication in its MCP plates. However, this amplitude is also the levelof the pedestal separation in our ToF setup. In other words, the efficiency of detection using ToFwith the photomultiplier as used is very low at the expected operating rate of 20 MHz. One canovercome this issue by decreasing of the PMT gain by for example the factor of 5 and add anextra amplification stage to compensate and get back to the optimal level for the CFD operation.But the timing resolution deteriorates due to worse signal-to-noise ratio. As indicated in [10], thetiming resolution then gets worse by a factor of 2-3. Then, an additional noise level reduction isrequired.
Research Article Vol. 28, No. 13 / 22 June 2020 / Optics Express 19795
6. Conclusion
We designed and tested new type of optical bars of the ToF detector for the AFP project. Toobtain the required L-shape, the bars were previously made by gluing together two separatelyproduced arms of the bar. This resulted in a degradation of their optical throughput. Recently anew production technique was developed allowing for a production of a glueless (solid) versionof the bars. We successfully tested these during the June 2019 campaign at DESY in a 5 GeVelectron beam. The results presented here confirmed our expectations concerning the strength ofthe signal produced by the ToF detector and its measurement efficiency. However, the timingresolution remained unchanged because of limitations on the photomultiplier side. Theoretically,there is still a room for further improvements on the optical system (a fake front bar or radiator).On the other hand, the photomultiplier is the most limiting element due to its behavior in theregime of high rates of incoming relativistic particles.
Funding
Ministerstvo Školství, Mládeže a Tělovýchovy (LM2015056, LM2018104); European RegionalDevelopment Fund (CZ.02.1.01/0.0/0.0/16_013/0001403, CZ.02.1.01/0.0/0.0/16_019/0000754,CZ.02.1.01/0.0/0.0/17_049/0008422); Univerzita Palackého v Olomouci (IGA_Prf_2020_007).
Acknowledgments
The measurements leading to these results have been performed at the Test Beam Facility atDESY Hamburg (Germany), a member of the Helmholtz Association (HGF).
Disclosures
The authors declare no conflicts of interest.
References1. A. B. Kaidalov, V. A. Khoze, A. D. Martin, and M. G. Ryskin, “Extending the study of the higgs sector at the lhc by
proton tagging,” Eur. Phys. J. C 33(2), 261–271 (2004).2. FP420 Collaboration, “The FP420 R&D project: Higgs and New Physics with forward protons at the LHC,” Nucl.
Instrum. Methods Phys. Res., Sect. A 4(10), T10001 (2009).3. L. Nozka, A. Brandt, M. Rijssenbeek, T. Sykora, T. Hoffman, J. Griffiths, J. Steffens, P. Hamal, L. Chytka, and M.
Hrabovsky, “Design of cherenkov bars for the optical part of the time-of-flight detector in geant4,” Opt. Express22(23), 28984–28996 (2014).
4. L. Nozka, L. Adamczyk, G. Avoni, A. Brandt, P. Buglewicz, E. Cavallaro, G. Chiodini, L. Chytka, K. Ciesla, P. M.Davis, M. Dyndal, S. Grinstein, P. Hamal, M. Hrabovsky, K. Janas, K. Jirakova, M. Kocian, T. Komarek, K. Korcyl, J.Lange, D. Mandat, V. Michalek, I. L. Paz, D. Northacker, M. Rijssenbeek, L. Seabra, P. Schovanek, R. Staszewski, P.Swierska, and T. Sykora, “Construction of the optical part of a time-of-flight detector prototype for the AFP detector,”Opt. Express 24(24), 27951–27960 (2016).
5. L. Chytka, G. Avoni, A. Brandt, E. Cavallaro, P. M. Davis, F. Foerster, M. Hrabovsky, Y. Huang, K. Jirakova, M.Kocian, T. Komarek, K. Korcyl, J. Lange, V. Michalek, L. Nozka, I. L. Paz, M. Rijssenbeek, P. Schovanek, T. Sykora,and V. Urbasek, “Timing resolution studies of the optical part of the AFP time-of-flight detector,” Opt. Express 26(7),8028–8039 (2018).
6. J. Lange, E. Cavallaro, S. Grinstein, and I. L. Paz, “3D silicon pixel detectors for the ATLAS Forward Physicsexperiment,” Nucl. Instrum. Methods Phys. Res., Sect. A 10(03), C03031 (2015).
7. L. Adamczyk, E. Banas, A. Brandt, M. Bruschi, S. Grinstein, J. Lange, M. Rijssenbeek, P. Sicho, R. Staszewski, T.Sykora, M. Trzebinski, J. Chwastowski, and K. Korcyl, “Technical Design Report for the ATLAS Forward ProtonDetector,” (2015) Technical Report CERN-LHCC-2015-009. ATLAS-TDR-024.
8. F. Krizek, J. Ferencei, T. Matlocha, J. Pospisil, P. Pribeli, V. Raskina, A. Isakov, J. Stursa, T. Vanat, and K. Vysoka,“Irradiation setup at the U-120M cyclotron facility,” Nucl. Instrum. Methods Phys. Res., Sect. A 894, 87–95 (2018).
9. A. Tremsin, J. Pearson, G. Fraser, W. Feller, and P. White, “Microchannel plate operation at high count rates: newresults,” Nucl. Instrum. Methods Phys. Res., Sect. A 379(1), 139–151 (1996).
10. T. Komarek, A. Brandt, V. Chirayath, L. Chytka, M. Hrabovsky, L. Nozka, M. Rijssenbeek, T. Sykora, and V. Urbasek,“Timing resolution and rate capability of Photonis miniPlanacon XPM85212/A1-S MCP-PMT,” In review process(2020).
Research Article Vol. 28, No. 13 / 22 June 2020 / Optics Express 19796
11. Geant4 Collaboration, “Recent developments in Geant4,” Nucl. Instrum. Methods Phys. Res., Sect. A 835, 186–225(2016).
12. R. Diener, J. Dreyling-Eschweiler, H. Ehrlichmann, I. M. Gregor, U. Kotz, U. Kramer, N.Meyners, N. Potylitsina-Kube,A. Schutz, P. Schutze, and M. Stanitzki, “The DESY II test beam facility,” Nucl. Instrum. Methods Phys. Res., Sect.A 922, 265–286 (2019).
13. M. Albrow, H. Kim, S. Los, M. Mazzillo, E. Ramberg, A. Ronzhin, V. Samoylenko, H. Wenzel, and A. Zatserklyaniy,“Quartz Cherenkov Counters for Fast Timing: QUARTIC,” Nucl. Instrum. Methods Phys. Res., Sect. A 7(10), P10027(2012).
14. M. Bonesini, T. Cervi, A. Menegolli, M. C. Prata, G. L. Raselli, M. Rossella, M. N. Spanu, and M. Torti, “Detectionof vacuum ultraviolet light by means of SiPM for high energy physics experiments,” Nucl. Instrum. Methods Phys.Res., Sect. A 912, 235–237 (2018).
15. J. Vavra, D. W. G. S. Leith, B. Ratcliff, E. Ramberg, M. Albrow, A. Ronzhin, C. Ertley, T. Natoli, E. May, andK. Byrum, “Beam test of a time-of-flight detector prototype,” Nucl. Instrum. Methods Phys. Res., Sect. A 606(3),404–410 (2009).
16. F. Uhlig, A. Britting, W. Eyrich, A. Lehmann, C. Schwarz, and J. Schwiening, “Performance studies of microchannelplate pmts,” Nucl. Instrum. Methods Phys. Res., Sect. A 695, 68–70 (2012).