Inhoud nummer 4 - uhdspace.uhasselt.be · die voor in hun jaarrekening? (3) Zijn alternatieve...
32
Inhoud nummer 4 Accountancy Risicorapportering door Belgische beursgenoteerde bedrijven 3 A. MICHIELS, S. VANDEMAELE en PH. VERGAUWEN De laatste jaren is de noodzaak voor effectief risicomanagement, interne controle en transparante risicorapportering erg toe- genomen. Voor ondernemingen kan risicorapportering leiden tot een meer accurate kapitaalkost en tot een verminderde kans op falen. Het kan eveneens de efficiëntie, de kwaliteit en het imago naar kredietanalisten, aandeelhouders en klanten toe verbeteren. Ondanks deze groeiende aandacht voor risico’s en onzekerheden, zijn er weinig studies beschikbaar over risicorapportering en implicaties ervan. Het doel van deze studie is om profielen te bepalen van risicorapporterende onder- nemingen op basis van een steekproef van grote en middelgrote Belgische beursgenoteerde ondernemingen. The Use of Alternative Earnings Per Share in the Annual Reports of European Listed Companies since the 2005 Introduction of IFRS 12 M. TR. HAMILL and J. BRANSON Een van de doelstellingen van de invoering van de IFRS-standaarden voor beursgenoteerde vennootschappen in de Europese Unie vanaf 2005 was een verbeterde vergelijkbaarheid tussen de jaarrekeningen van verschillende ondernemin- gen, sectoren en landen. Onder IFRS blijft het mogelijk dat ondernemingen aanvullende inlichtingen opnemen in hun jaar- rekening om de gebruikers degelijk te informeren over hun financiële toestand en hun financiële prestaties. Dit betreft onder meer de vermelding van alternatieve prestatiemaatstaven (APM’s). Het aangetaste vertrouwen van de markt in jaarrekening- informatie naar aanleiding van diverse boekhoudschandalen heeft een debat op gang gebracht over het gebruik en de bruikbaarheid van APM’s in Europa. Europese overkoepelende toezichthouders zoals CESR hebben als reactie hierop aan- bevelingen geformuleerd, in het bijzonder om misleiding van niet-professionele beleggers door het gebruik van APM’s tegen te gaan. Het in dit artikel beschreven onderzoek heeft als belangrijkste doelstelling na te gaan wat de aard en de omvang zijn van het gebruik van alternatieve Earnings Per Share (EPS)-waarden in de jaarrekeningen van Europese beursgenoteerde ven- nootschappen, en zo inzicht te verwerven in de drijfveren van ondernemingen om APM’s te gebruiken. Drie onderzoeks- vragen komen aan bod: (1) Is het aantal ondernemingen dat alternatieve EPS-waarden vermeld toegenomen in de periode van drie jaar sinds de invoering van IFRS? (2) Welke alternatieve EPS-waarden gebruiken ondernemingen en hoe stellen ze die voor in hun jaarrekening? (3) Zijn alternatieve EPS-waarden hoger of lager dan GAAP EPS-waarden en heeft dit een invloed op de aard of de omvang van voorstelling? Het onderzoek heeft betrekking op de jaarrekeningen van 31 Europese beursgenoteerde vennootschappen voor de jaren 2005, 2006 en 2007. Uit de resultaten blijkt een gestage toename van het aantal ondernemingen dat alternatieve EPS- waarden rapporteert. De meeste ondernemingen gebruiken voor hun alternatieve EPS zeer algemene termen zoals «Adjusted EPS» en «Underlying EPS». Achter die begrippen gaat een grote variëteit schuil van uitsluitingen van rubrieken en effecten op het resultaat (resultaatverhogend of -verlagend). In overeenstemming met bestaand onderzoek zijn de alter- natieve EPS-waarden meestal hoger dan de GAAP EPS-waarden. Opmerkenswaard is dat wanneer ondernemingen nog tweede of derde alternatieve EPS-waarden vermelden, deze meestal lager zijn dan de GAAP EPS-waarden. Ten slotte blijkt uit de onderzoeksresultaten dat ondernemingen verkiezen om de EPS-waarde die het hoogste resultaat oplevert eerst te vermelden. 1 Kluwer – Accountancy & Bedrijfskunde – 4/2009
Transcript of Inhoud nummer 4 - uhdspace.uhasselt.be · die voor in hun jaarrekening? (3) Zijn alternatieve...
Inhoud nummer 4
Accountancy
Risicorapportering door Belgische beursgenoteerde bedrijven 3A. MICHIELS, S. VANDEMAELE en PH. VERGAUWEN
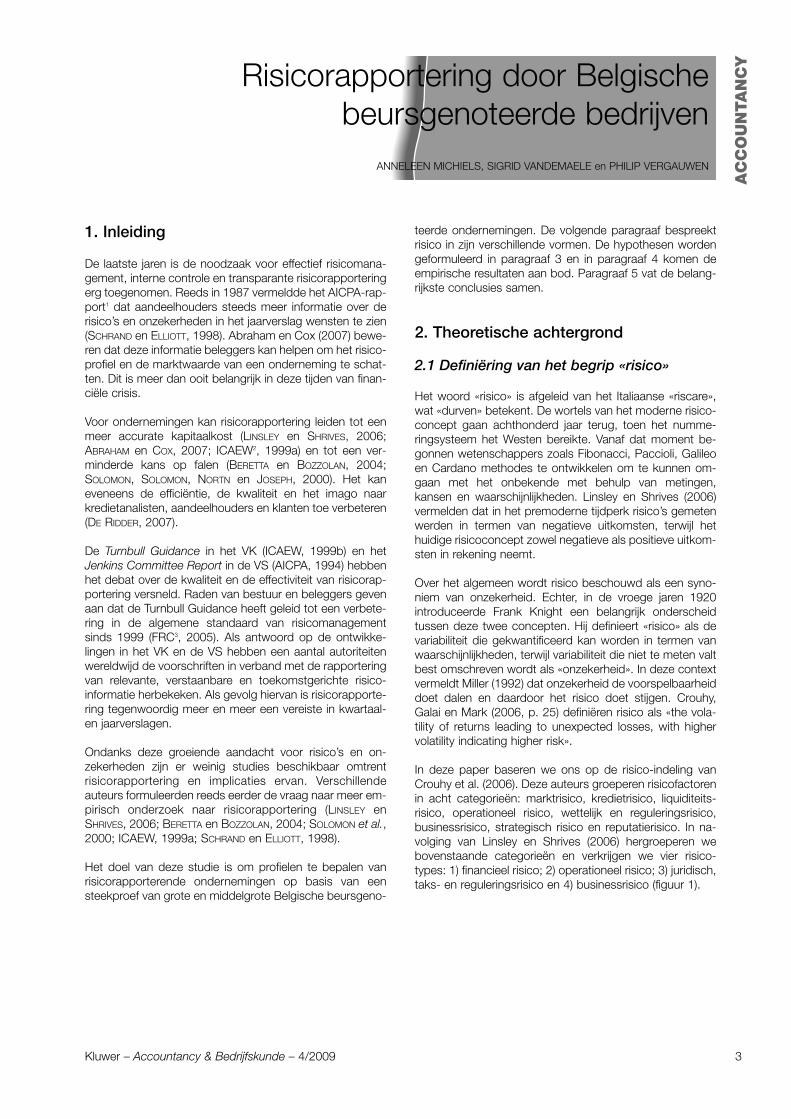
De laatste jaren is de noodzaak voor effectief risicomanagement, interne controle en transparante risicorapportering erg toe-genomen. Voor ondernemingen kan risicorapportering leiden tot een meer accurate kapitaalkost en tot een verminderdekans op falen. Het kan eveneens de efficiëntie, de kwaliteit en het imago naar kredietanalisten, aandeelhouders en klantentoe verbeteren. Ondanks deze groeiende aandacht voor risico’s en onzekerheden, zijn er weinig studies beschikbaar overrisicorapportering en implicaties ervan. Het doel van deze studie is om profielen te bepalen van risicorapporterende onder-nemingen op basis van een steekproef van grote en middelgrote Belgische beursgenoteerde ondernemingen.
The Use of Alternative Earnings Per Share in the Annual Reports of European Listed Companies sincethe 2005 Introduction of IFRS 12M. TR. HAMILL and J. BRANSON
Een van de doelstellingen van de invoering van de IFRS-standaarden voor beursgenoteerde vennootschappen in deEuropese Unie vanaf 2005 was een verbeterde vergelijkbaarheid tussen de jaarrekeningen van verschillende ondernemin-gen, sectoren en landen. Onder IFRS blijft het mogelijk dat ondernemingen aanvullende inlichtingen opnemen in hun jaar-rekening om de gebruikers degelijk te informeren over hun financiële toestand en hun financiële prestaties. Dit betreft ondermeer de vermelding van alternatieve prestatiemaatstaven (APM’s). Het aangetaste vertrouwen van de markt in jaarrekening-informatie naar aanleiding van diverse boekhoudschandalen heeft een debat op gang gebracht over het gebruik en debruikbaarheid van APM’s in Europa. Europese overkoepelende toezichthouders zoals CESR hebben als reactie hierop aan-bevelingen geformuleerd, in het bijzonder om misleiding van niet-professionele beleggers door het gebruik van APM’s tegente gaan.
Het in dit artikel beschreven onderzoek heeft als belangrijkste doelstelling na te gaan wat de aard en de omvang zijn vanhet gebruik van alternatieve Earnings Per Share (EPS)-waarden in de jaarrekeningen van Europese beursgenoteerde ven-nootschappen, en zo inzicht te verwerven in de drijfveren van ondernemingen om APM’s te gebruiken. Drie onderzoeks-vragen komen aan bod: (1) Is het aantal ondernemingen dat alternatieve EPS-waarden vermeld toegenomen in de periodevan drie jaar sinds de invoering van IFRS? (2) Welke alternatieve EPS-waarden gebruiken ondernemingen en hoe stellen zedie voor in hun jaarrekening? (3) Zijn alternatieve EPS-waarden hoger of lager dan GAAP EPS-waarden en heeft dit eeninvloed op de aard of de omvang van voorstelling?
Het onderzoek heeft betrekking op de jaarrekeningen van 31 Europese beursgenoteerde vennootschappen voor de jaren2005, 2006 en 2007. Uit de resultaten blijkt een gestage toename van het aantal ondernemingen dat alternatieve EPS-waarden rapporteert. De meeste ondernemingen gebruiken voor hun alternatieve EPS zeer algemene termen zoals«Adjusted EPS» en «Underlying EPS». Achter die begrippen gaat een grote variëteit schuil van uitsluitingen van rubrieken eneffecten op het resultaat (resultaatverhogend of -verlagend). In overeenstemming met bestaand onderzoek zijn de alter-natieve EPS-waarden meestal hoger dan de GAAP EPS-waarden. Opmerkenswaard is dat wanneer ondernemingen nogtweede of derde alternatieve EPS-waarden vermelden, deze meestal lager zijn dan de GAAP EPS-waarden. Ten slotte blijktuit de onderzoeksresultaten dat ondernemingen verkiezen om de EPS-waarde die het hoogste resultaat oplevert eerst tevermelden.
1Kluwer – Accountancy & Bedrijfskunde – 4/2009

2 Kluwer – Accountancy & Bedrijfskunde – 4/2009
Risicorapportering door Belgischebeursgenoteerde bedrijven
ANNELEEN MICHIELS, SIGRID VANDEMAELE en PHILIP VERGAUWEN
AC
CO
UN
TA
NC
Y
3Kluwer – Accountancy & Bedrijfskunde – 4/2009
1. Inleiding
De laatste jaren is de noodzaak voor effectief risicomana-gement, interne controle en transparante risicorapporteringerg toegenomen. Reeds in 1987 vermeldde het AICPA-rap-port1 dat aandeelhouders steeds meer informatie over derisico’s en onzekerheden in het jaarverslag wensten te zien(SCHRAND en ELLIOTT, 1998). Abraham en Cox (2007) bewe-ren dat deze informatie beleggers kan helpen om het risico-profiel en de marktwaarde van een onderneming te schat-ten. Dit is meer dan ooit belangrijk in deze tijden van finan-ciële crisis.
Voor ondernemingen kan risicorapportering leiden tot eenmeer accurate kapitaalkost (LINSLEY en SHRIVES, 2006;ABRAHAM en COX, 2007; ICAEW2, 1999a) en tot een ver-minderde kans op falen (BERETTA en BOZZOLAN, 2004;SOLOMON, SOLOMON, NORTN en JOSEPH, 2000). Het kaneveneens de efficiëntie, de kwaliteit en het imago naarkredietanalisten, aandeelhouders en klanten toe verbeteren(DE RIDDER, 2007).
De Turnbull Guidance in het VK (ICAEW, 1999b) en hetJenkins Committee Report in de VS (AICPA, 1994) hebbenhet debat over de kwaliteit en de effectiviteit van risicorap-portering versneld. Raden van bestuur en beleggers gevenaan dat de Turnbull Guidance heeft geleid tot een verbete-ring in de algemene standaard van risicomanagementsinds 1999 (FRC3, 2005). Als antwoord op de ontwikke-lingen in het VK en de VS hebben een aantal autoriteitenwereldwijd de voorschriften in verband met de rapporteringvan relevante, verstaanbare en toekomstgerichte risico-informatie herbekeken. Als gevolg hiervan is risicorapporte-ring tegenwoordig meer en meer een vereiste in kwartaal-en jaarverslagen.
Ondanks deze groeiende aandacht voor risico’s en on-zekerheden zijn er weinig studies beschikbaar omtrentrisicorapportering en implicaties ervan. Verschillendeauteurs formuleerden reeds eerder de vraag naar meer em-pirisch onderzoek naar risicorapportering (LINSLEY enSHRIVES, 2006; BERETTA en BOZZOLAN, 2004; SOLOMON et al.,2000; ICAEW, 1999a; SCHRAND en ELLIOTT, 1998).
Het doel van deze studie is om profielen te bepalen vanrisicorapporterende ondernemingen op basis van eensteekproef van grote en middelgrote Belgische beursgeno-
teerde ondernemingen. De volgende paragraaf bespreektrisico in zijn verschillende vormen. De hypothesen wordengeformuleerd in paragraaf 3 en in paragraaf 4 komen deempirische resultaten aan bod. Paragraaf 5 vat de belang-rijkste conclusies samen.
2. Theoretische achtergrond
2.1 Definiëring van het begrip «risico»
Het woord «risico» is afgeleid van het Italiaanse «riscare»,wat «durven» betekent. De wortels van het moderne risico-concept gaan achthonderd jaar terug, toen het numme-ringsysteem het Westen bereikte. Vanaf dat moment be-gonnen wetenschappers zoals Fibonacci, Paccioli, Galileoen Cardano methodes te ontwikkelen om te kunnen om-gaan met het onbekende met behulp van metingen,kansen en waarschijnlijkheden. Linsley en Shrives (2006)vermelden dat in het premoderne tijdperk risico’s gemetenwerden in termen van negatieve uitkomsten, terwijl hethuidige risicoconcept zowel negatieve als positieve uitkom-sten in rekening neemt.
Over het algemeen wordt risico beschouwd als een syno-niem van onzekerheid. Echter, in de vroege jaren 1920introduceerde Frank Knight een belangrijk onderscheidtussen deze twee concepten. Hij definieert «risico» als devariabiliteit die gekwantificeerd kan worden in termen vanwaarschijnlijkheden, terwijl variabiliteit die niet te meten valtbest omschreven wordt als «onzekerheid». In deze contextvermeldt Miller (1992) dat onzekerheid de voorspelbaarheiddoet dalen en daardoor het risico doet stijgen. Crouhy,Galai en Mark (2006, p. 25) definiëren risico als «the vola-tility of returns leading to unexpected losses, with highervolatility indicating higher risk».
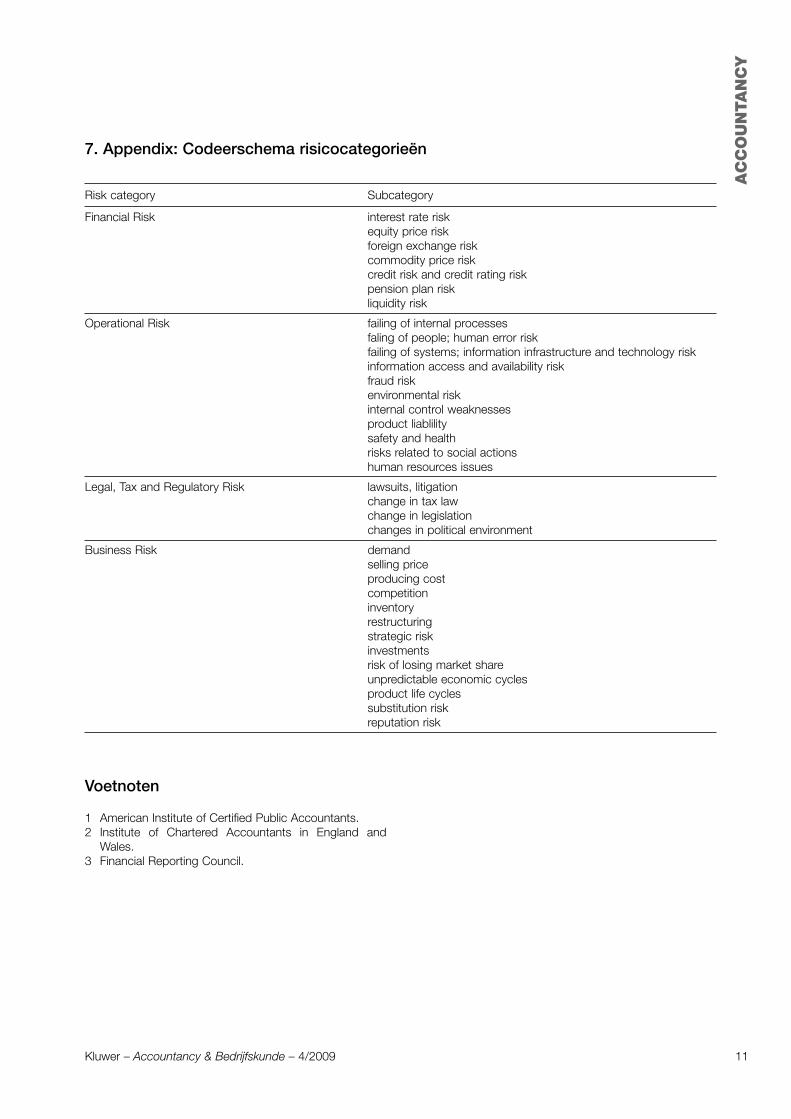
In deze paper baseren we ons op de risico-indeling vanCrouhy et al. (2006). Deze auteurs groeperen risicofactorenin acht categorieën: marktrisico, kredietrisico, liquiditeits-risico, operationeel risico, wettelijk en reguleringsrisico,businessrisico, strategisch risico en reputatierisico. In na-volging van Linsley en Shrives (2006) hergroeperen webovenstaande categorieën en verkrijgen we vier risico-types: 1) financieel risico; 2) operationeel risico; 3) juridisch,taks- en reguleringsrisico en 4) businessrisico (figuur 1).

AC
CO
UN
TA
NC
Y
Figuur 1. Risico-indeling
Operationeel risico
Volgens De Ridder (2007) is operationeel risico gerelateerdaan potentiële verliezen ten gevolge van inadequate offalende interne processen, mensen en systemen of resulte-rend uit externe gebeurtenissen. We onderscheiden viertypes operationele risico’s. Het eerste type is technologischrisico, dat door Álvarez (2001, p. 5) omschreven wordt als«loss events due to piracy, theft, failure, breakdown, orother distruption technology, data or information». Hettweede type is frauderisico door het management of perso-neelsleden. Het derde type operationeel risico is gerela-teerd aan potentiële verliezen ten gevolge van menselijkefouten (bv. per ongeluk een computerbestand verwijderen).Ten slotte voegt Álvarez (2001) een vierde type toe: externeschade (bv. ten gevolge van een natuurramp).
Juridisch, taks- en reguleringsrisico
Deze risico’s ontstaan omwille van heel diverse redenen.Een voorbeeld van juridisch risico is de betrokkenheid inrechtszaken of de overtreding van wetten. Een ander voor-beeld is de verandering van een belastingwet die verre-gaande implicaties heeft voor een onderneming.
Business-, strategisch en reputatierisico
Businessrisico, strategisch risico en reputatierisico wordensamengevoegd onder de noemer «businessrisico».Businessrisico verwijst naar de typische risico’s waar een
Financieel risico
Financieel risico is een brede en welbekende risicocate-gorie. Deze categorie omvat marktrisico, kredietrisico enliquiditeitsrisico.
Marktrisico is gerelateerd aan prijsveranderingen in finan-ciële markten (SERVAES en TUFANO, 2006). Crouhy et al.(2006, p. 27) definiëren marktrisico als «the risk that chan-ges in financial market prices and rates will reduce thevalue of a security or portfolio». Marktrisico kan ontstaanten gevolge van verschillende factoren zoals blootstellingaan rentevoeten, wisselkoersen, prijsgevoelige inkomstenof uitgaven, het bestaan van aandelenopties of pensioen-fondsen.
Kredietrisico is de kans dat de betaling van contractueleverplichtingen niet uitgevoerd wordt door de tegenpartij(CABEDO en TIRADO, 2004). Giesecke (2004, p. 3) definieertkredietrisico als «the distribution of financial losses due tounexpected changes in the credit quality of a counterpartyin a financial agreement». Voorbeelden van kredietrisicozijn: verlaging van een creditrating of faillissement.
Wanneer een onderneming niet kan voldoen aan de ge-maakte betalingsverplichtingen, ontstaat er een liquiditeits-risico (CABEDO en TIRADO, 2004).
4 Kluwer – Accountancy & Bedrijfskunde – 4/2009

AC
CO
UN
TA
NC
Y
5
onderneming mee te maken heeft: onzekerheid over devraag naar producten, de prijsonzekerheid met betrekkingtot producten, de kost van productie, opslag en levering(CROUHY et al., 2006). Het risico verbonden aan acties vanconcurrenten (SERVAES en TUFANO, 2006) en het potentiëleverlies van competitieve voordelen (CABEDO en TIRADO,2004) zijn andere voorbeelden van businessrisico. Strate-gisch risico verwijst naar het risico dat geassocieerd wordtmet investeringen met een onzeker succes of onzekerewinstgevendheid (CROUHY et al., 2006). Bijvoorbeeld, eenonderneming die investeert in onderzoek en ontwikkeling(O&O) ondervindt onzekerheid over de relatie tussen deinvestering in O&O en output onder de vorm van nieuweproducten of processen (MILLER, 1992). Reputatierisico ishet risico dat een goede reputatie, die kan leiden tot waar-decreatie, verandert in een slechte reputatie en resulteert inwaardevernietiging.
2.2 Definiëring van het begrip «risico-rapportering»
De laatste jaren is de focus verschoven van het rapporterenvan puur financiële resultaten naar het informeren van deaandeelhouders over een hele waaier van topics. Een vandeze topics is risico. Beleggers weten dat waardecreatieinhoudt dat er risico’s genomen moeten worden. Ze wen-sen daarom op de hoogte te zijn over het soort van risico’swaarmee de onderneming te maken heeft en hoe dezerisico’s worden (of zullen worden) beheerst. Als gevolg hier-van wordt de vraag naar transparante risicorapporteringsteeds groter. Beretta en Bozzolan (2004, p. 269) defi-niëren risicorapportering als «de communicatie van infor-matie over de strategie, karakteristieken en andere externefactoren die de verwachte resultaten zouden kunnen beïn-vloeden».
3. Onderzoekshypothesen en -methode
3.1 Onderzoekshypothesen
Gebaseerd op het bovenstaande theoretische raamwerk,worden in deze paragraaf de hypothesen opgesteld. Hetdoel van deze studie is om te onderzoeken of er een relatiebestaat tussen de mate van risicorapportering en bedrijfs-economische en governancekarakteristieken. Dit zal wor-den getest met behulp van een steekproef van Belgischebeursgenoteerde bedrijven.
Grote ondernemingen zijn vaak meer complex dan kleineondernemingen. Omdat complexiteit het inherente risicoverhoogt, zouden managers meer risico-informatie kunnenvrijgeven (DEUMES en KNECHEL, 2008). Verder argumenteertCooke (1989) dat adequate financiële communicatie eengrote diversiteit aan hooggeschoolde werknemers vereist.Aangezien grote ondernemingen meer mogelijkheden heb-ben om dit soort mensen aan te trekken, zou hun rappor-tering uitgebreider kunnen zijn. Gebaseerd op bovenstaan-de argumenten en voorgaand onderzoek door o.a. Linsleyen Shrives (2006a), Abraham en Cox (2007) en Deumes en
Knechel (2008) wordt de eerste hypothese geformuleerdals volgt:
H1: Er bestaat een positieve relatie tussen bedrijfsgrootteen de mate van risicorapportering.
Wanneer een onderneming goed presteert, kan de vraagnaar uitgebreide risicorapportering afnemen. Anderzijdsvoelen slecht presterende bedrijven misschien sterker denood factoren aan te duiden die de slechte prestaties kun-nen verklaren. Aan de andere kant hebben winstgevendebedrijven daarentegen meer middelen om te investeren inrisicobeheersing (DEUMES en KNECHEL, 2008). Deze ondui-delijke relatie resulteert in volgende hypothese:
H2: Er bestaat geen relatie tussen winstgevendheid en demate van risicorapportering.
Een onderneming met een groter systematisch risico zalmeer geneigd zijn te rapporteren over hoe deze risico’sworden ingeschat en gemanaged. Deze onderbouwing ende resultaten uit onderzoek van Deumes (2008) enAbraham en Cox (2007), leiden tot de derde hypothese:
H3: Er bestaat een positieve relatie tussen systematischrisico en de mate van risicorapportering.
Hoewel het de verantwoordelijkheid is van het manage-ment om het jaarverslag voor te bereiden, kan een externauditbedijf een grote impact hebben op de inhoud van hetjaarverslag (BARAKO et al., 2006). Enerzijds kan een grotekwaliteitsvolle auditor de betrouwbaarheid van de jaarreke-ningen naar de aandeelhouders toe verhogen. Een gevolgkan zijn dat aandeelhouders risicorapportering mindernoodzakelijk achten in dit geval. Anderzijds kan een kwali-teitsvolle auditor ook het belang van risicorapporteringbenadrukken, wat resulteert in een uitgebreidere risico-rapportering. Wegens deze onduidelijke relatie, formulerenwe de vierde hypothese in de nulvorm:
H4: Er bestaat geen relatie tussen de kwaliteit van deauditor en de mate van risicorapportering.
Ondernemingen met een risicocomité en/of een risicoma-nager zullen waarschijnlijk meer belang hechten aan risico-rapportering dan ondernemingen zonder een risicocomitéof risicomanager. Dit leidt tot de volgende hypothese:
H5: Er bestaat een positieve relatie tussen de aanwezigheidvan een risicocomité en/of een risicomanager en de matevan risicorapportering.
Het jaarverslag wordt goedgekeurd door de raad van be-stuur. De samenstelling van deze raad van bestuur kan duseen impact hebben op het rapporteringsbeleid (ABRAHAM
en Cox, 2007). Een aspect van deze samenstelling is hetaantal niet-uitvoerende bestuurders in de raad van bestuurin vergelijking met het totale aantal bestuurders in dezeraad. Niet-uitvoerende bestuurders zijn buitenstaanders(onafhankelijk) of «grijs» (niet onafhankelijk, maar geenfunctie uitoefenend binnen de onderneming). Deze be-
Kluwer – Accountancy & Bedrijfskunde – 4/2009
AC
CO
UN
TA
NC
Y
stuurders handelen als vertegenwoordigers van de aan-deelhouders in de raad van bestuur. De uitvoerende be-stuurders, daarentegen, oefenen wel een functie uit binnende onderneming. Hierdoor kan het voor hen moeilijk zijn omde managers te controleren (ABRAHAM en COX, 2007).Volgens Fama en Jensen (1983) zorgt de aanwezigheid vanniet-uitvoerende bestuurders in de raad van bestuur voorverminderde agentschapskosten tussen managers eneigenaars. Barako et al. (2006) stellen dat dit gereflecteerdkan worden in een meer uitgebreide rapportering. Naaraanleiding van bovenstaande redenering wordt volgendehypothese opgesteld:
H6: Er bestaat een positieve relatie tussen de proportie vanhet aantal niet-uitvoerende bestuurders in de raad van be-stuur en de mate van risicorapportering.
De combinatie van de functies «voorzitter van de raad vanbestuur» en «CEO» in één persoon resulteert in een unitaireleiderschapsstructuur. Wanneer deze functies door ver-schillende personen worden uitgevoerd, spreekt men vaneen duale leiderschapsstructuur. Volgens de agencytheoriekan een unitaire leiderschapsstructuur de toezichthou-dende functie van de raad van bestuur significant vermin-deren. Fama en Jensen (1983) argumenteren dat er bijdeze functiecombinatie geen scheiding meer is tussenbeslissingsbevoegdheid en -controle. We formuleren delaatste hypothese als volgt:
H7: De mate van risicorapportering is hoger voor onderne-mingen met een duale leiderschapsstructuur in vergelijkingmet ondernemingen met een unitaire leiderschapsstruc-tuur.
3.2 Onderzoeksmethode
De steekproef bestaat uit 46 Belgische beursgenoteerdeondernemingen. We opteren om enkel grote (marktkapi-talisatie > 1 miljard EUR) en middelgrote (marktkapitalisatietussen 150 miljoen EUR en 1 miljard EUR) in de steekproefop te nemen aangezien we verwachten dat deze onderne-mingen uitgebreider zullen rapporteren over risico’s. Zoalsbij de meeste studies over risicorapportering, verwijderenwe financiële ondernemingen uit de steekproef, omdatdeze met significant andere risicofactoren worden gecon-fronteerd in vergelijking met andere ondernemingen.
Het doel van deze studie is om de rapportering van risico-factoren in de jaarverslagen van de ondernemingen in desteekproef te onderzoeken. Een jaarverslag is niet de enigemanier van bedrijfsrapportering, maar CEO’s beschouwenjaarverslagen als een zeer belangrijke communicatietoolnaar zowel interne als externe stakeholders (BOWMAN,1984).
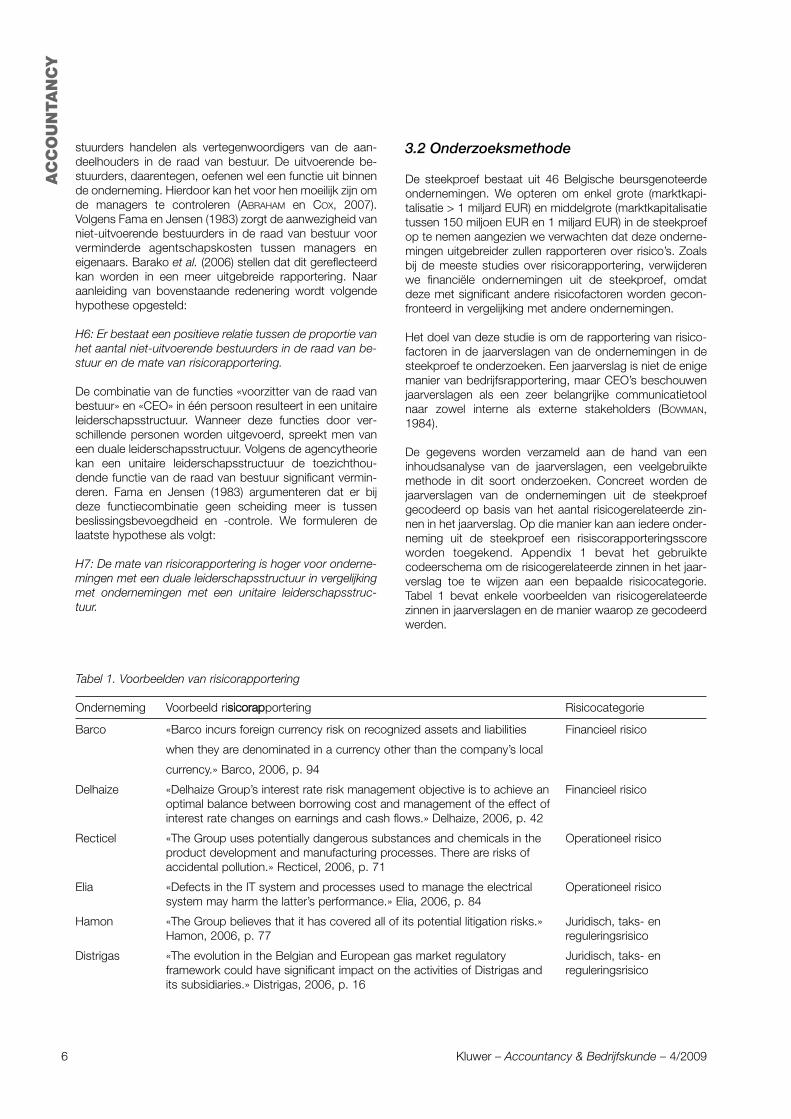
De gegevens worden verzameld aan de hand van eeninhoudsanalyse van de jaarverslagen, een veelgebruiktemethode in dit soort onderzoeken. Concreet worden dejaarverslagen van de ondernemingen uit de steekproefgecodeerd op basis van het aantal risicogerelateerde zin-nen in het jaarverslag. Op die manier kan aan iedere onder-neming uit de steekproef een risiscorapporteringsscoreworden toegekend. Appendix 1 bevat het gebruiktecodeerschema om de risicogerelateerde zinnen in het jaar-verslag toe te wijzen aan een bepaalde risicocategorie.Tabel 1 bevat enkele voorbeelden van risicogerelateerdezinnen in jaarverslagen en de manier waarop ze gecodeerdwerden.
6 Kluwer – Accountancy & Bedrijfskunde – 4/2009
Tabel 1. Voorbeelden van risicorapportering
Onderneming Voorbeeld rissiiccoorraappportering Risicocategorie
Barco «Barco incurs foreign currency risk on recognized assets and liabilities Financieel risico
when they are denominated in a currency other than the company’s local
currency.» Barco, 2006, p. 94
Delhaize «Delhaize Group’s interest rate risk management objective is to achieve an Financieel risicooptimal balance between borrowing cost and management of the effect ofinterest rate changes on earnings and cash flows.» Delhaize, 2006, p. 42
Recticel «The Group uses potentially dangerous substances and chemicals in the Operationeel risicoproduct development and manufacturing processes. There are risks ofaccidental pollution.» Recticel, 2006, p. 71
Elia «Defects in the IT system and processes used to manage the electrical Operationeel risicosystem may harm the latter’s performance.» Elia, 2006, p. 84
Hamon «The Group believes that it has covered all of its potential litigation risks.» Juridisch, taks- enHamon, 2006, p. 77 reguleringsrisico
Distrigas «The evolution in the Belgian and European gas market regulatory Juridisch, taks- enframework could have significant impact on the activities of Distrigas and reguleringsrisicoits subsidiaries.» Distrigas, 2006, p. 16
AC
CO
UN
TA
NC
Y
7
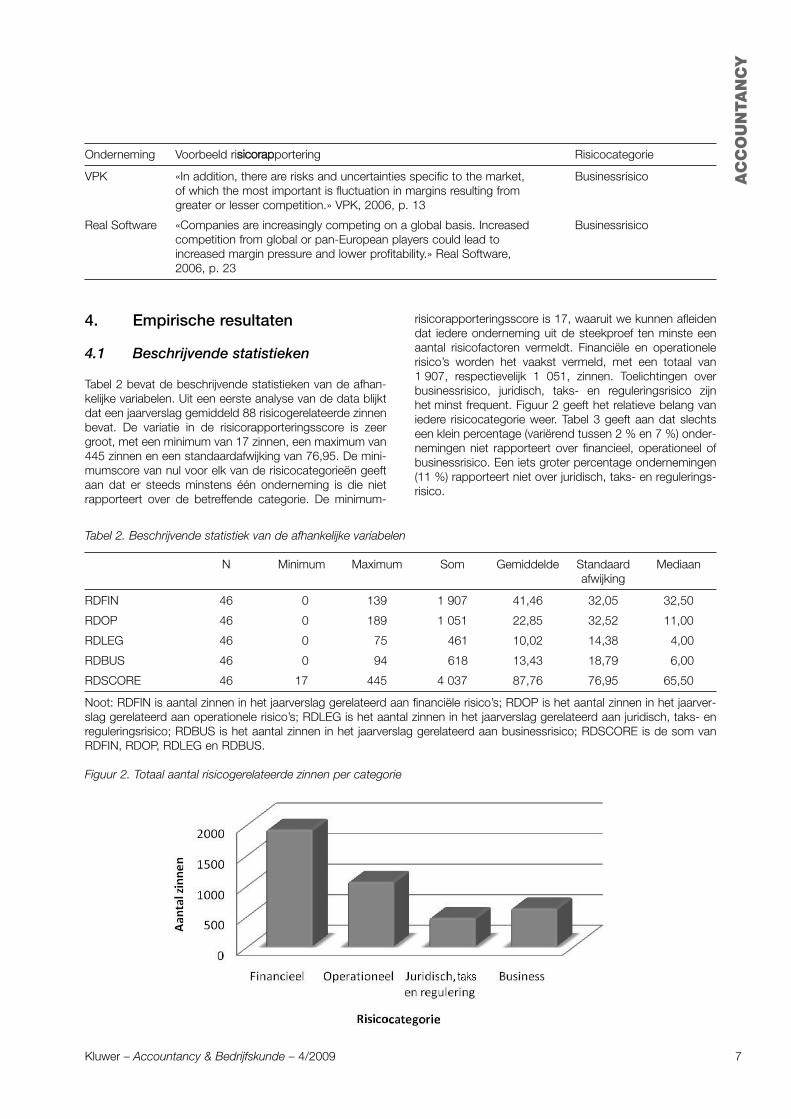
risicorapporteringsscore is 17, waaruit we kunnen afleidendat iedere onderneming uit de steekproef ten minste eenaantal risicofactoren vermeldt. Financiële en operationelerisico’s worden het vaakst vermeld, met een totaal van1 907, respectievelijk 1 051, zinnen. Toelichtingen overbusinessrisico, juridisch, taks- en reguleringsrisico zijnhet minst frequent. Figuur 2 geeft het relatieve belang vaniedere risicocategorie weer. Tabel 3 geeft aan dat slechtseen klein percentage (variërend tussen 2 % en 7 %) onder-nemingen niet rapporteert over financieel, operationeel ofbusinessrisico. Een iets groter percentage ondernemingen(11 %) rapporteert niet over juridisch, taks- en regulerings-risico.
4. Empirische resultaten
4.1 Beschrijvende statistieken
Tabel 2 bevat de beschrijvende statistieken van de afhan-kelijke variabelen. Uit een eerste analyse van de data blijktdat een jaarverslag gemiddeld 88 risicogerelateerde zinnenbevat. De variatie in de risicorapporteringsscore is zeergroot, met een minimum van 17 zinnen, een maximum van445 zinnen en een standaardafwijking van 76,95. De mini-mumscore van nul voor elk van de risicocategorieën geeftaan dat er steeds minstens één onderneming is die nietrapporteert over de betreffende categorie. De minimum-
Kluwer – Accountancy & Bedrijfskunde – 4/2009
Onderneming Voorbeeld rissiiccoorraappportering Risicocategorie
VPK «In addition, there are risks and uncertainties specific to the market, Businessrisicoof which the most important is fluctuation in margins resulting fromgreater or lesser competition.» VPK, 2006, p. 13
Real Software «Companies are increasingly competing on a global basis. Increased Businessrisicocompetition from global or pan-European players could lead toincreased margin pressure and lower profitability.» Real Software,2006, p. 23
Tabel 2. Beschrijvende statistiek van de afhankelijke variabelen
N Minimum Maximum Som Gemiddelde Standaard Mediaanafwijking
RDFIN 46 0 139 1 907 41,46 32,05 32,50
RDOP 46 0 189 1 051 22,85 32,52 11,00
RDLEG 46 0 75 461 10,02 14,38 4,00
RDBUS 46 0 94 618 13,43 18,79 6,00
RDSCORE 46 17 445 4 037 87,76 76,95 65,50
Noot: RDFIN is aantal zinnen in het jaarverslag gerelateerd aan financiële risico’s; RDOP is het aantal zinnen in het jaarver-slag gerelateerd aan operationele risico’s; RDLEG is het aantal zinnen in het jaarverslag gerelateerd aan juridisch, taks- enreguleringsrisico; RDBUS is het aantal zinnen in het jaarverslag gerelateerd aan businessrisico; RDSCORE is de som vanRDFIN, RDOP, RDLEG en RDBUS.
Figuur 2. Totaal aantal risicogerelateerde zinnen per categorie

AC
CO
UN
TA
NC
Y
Tabel 3. Ondernemingen die niet rapporteren over een risicocategorie
Categorie Percentage van de totale steekproef (N = 46)
Financieel risico 2,17 %
Operationeel risico 4,35 %
Juridisch, taks- en reguleringsrisico 10,87 %
Businessrisico 6,52 %
Tabel 4 geeft de Pearson-correlatiecoëfficiënten tussen deafhankelijke en de onafhankelijke variabelen weer.
Tabel 4. Pearson-correlaties
LNSALES PROFIT BETA AUDIT COMMIT NONEXEC LEADER
LNRDSCORE ,391(**) -,358(*) -,240 ,093(*) -,344(*)* -,236(*) -,063,007(**) -,015(*) -,108 ,539(*) -,019(**) -,114(*) -,679
LNSALES -,089(*) -,164 ,323(*) -,417(**) -,296(*) -,079-,558(*) -,276 ,029(*) -,004(**) -,046(*) -,602
PROFIT -,001 ,300(*) -,041(**) -,205(* -,045-,995 ,042(*) -,786(**) -,171(* -,767
BETA ,086(*) -,194(**) -,118(*) -,026,571(*) -,197(**) -,433(*) -,862
AUDIT ,148 -,042(*) ,016,326 -,781(*) ,918
COMMIT -,169(*) -,135-,261(*) -,370
NONEXEC -,059-,698
Noot: De eerste rij geeft de correlatiecoëfficiënten weer; p-waarden staan telkens op de tweede rij. (*) betekent significantie op 0,05-niveau; (**) betekent significantie op 0,01-niveau.
8 Kluwer – Accountancy & Bedrijfskunde – 4/2009
Uit bovenstaande tabel kunnen we afleiden dat de matevan risicorapportering (LNRDSCORE) significant positiefgecorreleerd is met de ondernemingsgrootte (LNSALES).Ook is de aanwezigheid van een risicocomité en/of eenrisicomanager (COMMIT) positief gecorreleerd met de matevan risicorapportering in het jaarverslag. Winstgevendheid(PROFIT) daarentegen is negatief gecorreleerd met demate van risicorapportering. Verder vinden we een posi-tieve correlatie tussen ondernemingsgrootte en de aanstel-ling van een big 4-auditor (AUDIT), de aanwezigheid vaneen risicocomité of -manager, en het percentage niet-uit-voerende bestuurders in de raad van bestuur (NONEXEC).
4.2 Multivariabele analyse
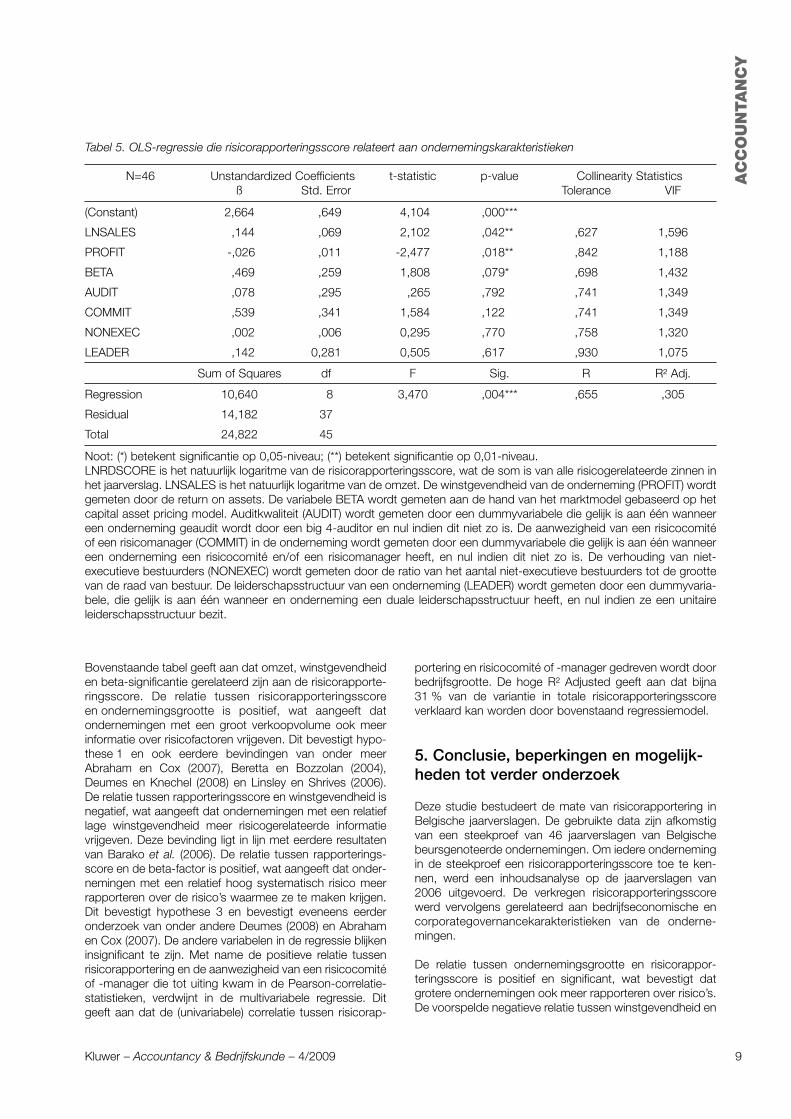
Om de hypothesen (opgesteld in paragraaf 3) te testen,stellen we volgend regressiemodel op:LNRDSCORE = ß0 + ß1*LNSALES + ß2*PROFIT +ß3*BETA + ß4*AUDIT + ß5*COMMIT + ß6*NONEXEC +ß7*LEADER + ε
De afhankelijke variabele (LNRDSCORE) is het natuurlijklogaritme van de risicorapporteringsscore. Onderstaandetabel geeft de resultaten van deze regressie weer.
AC
CO
UN
TA
NC
Y
9
Tabel 5. OLS-regressie die risicorapporteringsscore relateert aan ondernemingskarakteristieken
N=46 Unstandardized Coefficients t-statistic p-value Collinearity Statisticsß Std. Error Tolerance VIF
(Constant) 2,664 ,649 -4,104 ,000***
LNSALES ,144 ,069 -2,102 ,042*** ,627 1,596
PROFIT -,026 ,011 -2,477 ,018*** ,842 1,188
BETA ,469 ,259 -1,808 ,079*** ,698 1,432
AUDIT ,078 ,295 - ,265 ,792*** ,741 1,349
COMMIT ,539 ,341 -1,584 ,122*** ,741 1,349
NONEXEC ,002 ,006 -0,295 ,770*** ,758 1,320
LEADER ,142 0,281 -0,505 ,617*** ,930 1,075
Sum of Squares df F Sig. R R² Adj.
Regression 10,640 8 3,470 ,004*** ,655 ,305
Residual 14,182 37
Total 24,822 45
Noot: (*) betekent significantie op 0,05-niveau; (**) betekent significantie op 0,01-niveau. LNRDSCORE is het natuurlijk logaritme van de risicorapporteringsscore, wat de som is van alle risicogerelateerde zinnen inhet jaarverslag. LNSALES is het natuurlijk logaritme van de omzet. De winstgevendheid van de onderneming (PROFIT) wordtgemeten door de return on assets. De variabele BETA wordt gemeten aan de hand van het marktmodel gebaseerd op hetcapital asset pricing model. Auditkwaliteit (AUDIT) wordt gemeten door een dummyvariabele die gelijk is aan één wanneereen onderneming geaudit wordt door een big 4-auditor en nul indien dit niet zo is. De aanwezigheid van een risicocomitéof een risicomanager (COMMIT) in de onderneming wordt gemeten door een dummyvariabele die gelijk is aan één wanneereen onderneming een risicocomité en/of een risicomanager heeft, en nul indien dit niet zo is. De verhouding van niet-executieve bestuurders (NONEXEC) wordt gemeten door de ratio van het aantal niet-executieve bestuurders tot de groottevan de raad van bestuur. De leiderschapsstructuur van een onderneming (LEADER) wordt gemeten door een dummyvaria-bele, die gelijk is aan één wanneer en onderneming een duale leiderschapsstructuur heeft, en nul indien ze een unitaireleiderschapsstructuur bezit.
Kluwer – Accountancy & Bedrijfskunde – 4/2009
Bovenstaande tabel geeft aan dat omzet, winstgevendheiden beta-significantie gerelateerd zijn aan de risicorapporte-ringsscore. De relatie tussen risicorapporteringsscoreen ondernemingsgrootte is positief, wat aangeeft datondernemingen met een groot verkoopvolume ook meerinformatie over risicofactoren vrijgeven. Dit bevestigt hypo-these 1 en ook eerdere bevindingen van onder meerAbraham en Cox (2007), Beretta en Bozzolan (2004),Deumes en Knechel (2008) en Linsley en Shrives (2006).De relatie tussen rapporteringsscore en winstgevendheid isnegatief, wat aangeeft dat ondernemingen met een relatieflage winstgevendheid meer risicogerelateerde informatievrijgeven. Deze bevinding ligt in lijn met eerdere resultatenvan Barako et al. (2006). De relatie tussen rapporterings-score en de beta-factor is positief, wat aangeeft dat onder-nemingen met een relatief hoog systematisch risico meerrapporteren over de risico’s waarmee ze te maken krijgen.Dit bevestigt hypothese 3 en bevestigt eveneens eerderonderzoek van onder andere Deumes (2008) en Abrahamen Cox (2007). De andere variabelen in de regressie blijkeninsignificant te zijn. Met name de positieve relatie tussenrisicorapportering en de aanwezigheid van een risicocomitéof -manager die tot uiting kwam in de Pearson-correlatie-statistieken, verdwijnt in de multivariabele regressie. Ditgeeft aan dat de (univariabele) correlatie tussen risicorap-
portering en risicocomité of -manager gedreven wordt doorbedrijfsgrootte. De hoge R² Adjusted geeft aan dat bijna31 % van de variantie in totale risicorapporteringsscoreverklaard kan worden door bovenstaand regressiemodel.
5. Conclusie, beperkingen en mogelijk-heden tot verder onderzoek
Deze studie bestudeert de mate van risicorapportering inBelgische jaarverslagen. De gebruikte data zijn afkomstigvan een steekproef van 46 jaarverslagen van Belgischebeursgenoteerde ondernemingen. Om iedere ondernemingin de steekproef een risicorapporteringsscore toe te ken-nen, werd een inhoudsanalyse op de jaarverslagen van2006 uitgevoerd. De verkregen risicorapporteringsscorewerd vervolgens gerelateerd aan bedrijfseconomische encorporategovernancekarakteristieken van de onderne-mingen.
De relatie tussen ondernemingsgrootte en risicorappor-teringsscore is positief en significant, wat bevestigt datgrotere ondernemingen ook meer rapporteren over risico’s.De voorspelde negatieve relatie tussen winstgevendheid en
AC
CO
UN
TA
NC
Y
risicorapporteringsscore is eveneens bevestigd. De beta-factor is positief significant gerelateerd aan de mate vanrisicorapportering. Deze studie onderzoekt ook de impactvan een aantal corporategovernancevariabelen. Op basisvan de multivariabele regressie blijkt dat geen van dezevariabelen een significante invloed uitoefenen op de matevan risicorapportering.
De onderzoeksmethode van deze studie heeft en aantalbeperkingen ten gevolge van het gebruik van inhouds-analyse. Ten eerste kan subjectiviteit niet volledig wordengeëlimineerd omdat met slechts één codeerder werdgewerkt. Ten tweede heeft de benadering op basis vanzinnen haar beperkingen aangezien dit enkel de kwantiteit,niet de kwaliteit, van risicorapportering meet. Om de sub-jectiviteit tot een minimum te beperken, werden gedetail-leerde beslissingsregels en coderingsprocedures opge-steld. Een andere beperking van deze studie is dat zefocust op de aard van risico’s die worden gerapporteerd,en niet op de reden(en) van rapportering (of niet).
6. Bibliografie
ABRAHAM, S. en COX, P., «Analysing the determinants ofnarrative risk information in UK FTSE 100 annual reports»,The British Accounting Review 2007, 39 (3), 227-248.
AICPA (American Institute of Certified Public Accountants),Report of the Task Force on Risks and Uncertainties, NewYork, AICPA, 1987.
ÁLVAREZ, G., Operational Risk Event Classification. GlobalAssociation of Risk Professionals, 2001, RetrievedFebruary 12, 2008 from http://www.garp.com/resources/presentations.asp
BARAKO, D., HANCOCK, P. en IZAN, H., «Factors influencingvoluntary corporate disclosure by Kenyan companies»,Corporate Governance: an international review 2006, 14(2), 107-125.
BOWMAN, E.H., «Content analysis of annual reports for cor-porate strategy and risk», Interfaces 1984, 14(1), 61-71.
BERETTA, S. en BOZZOLAN, S., «A framework for the analysisof firm risk communication», The International Journal ofAccounting 2004, 39 (3), 265-288.
CABEDO, J.D. en TIRADO, J.M., «The disclosure of risk infinancial statements», Accounting Forum 2004, 28 (2), 181-200.
COOKE, T.E., «Disclosure in the corporate annual report ofSwedish companies», Accounting and Business Research1989, 19 (74), 113-124.
CROUHY, M., GALAI, D. en MARK, R., The Essentials of RiskManagement, New York, McGraw Hill, 2006.
DE RIDDER, W.P., «Operationeel risicomanagement: meerdan alleen compliance», Maandblad voor Accountancy enBedrijfseconomie 2007, 81 (4), 138-145.
DEUMES, R., «Corporate risk reporting: A content analysis ofnarrative risk disclosures in prospectuses», Journal ofBusiness Communication 2008, 45 (2), 120-157.
DEUMES, R. en KNECHEL, W.R., «Economic incentives forvoluntary reporting on internal risk management and con-trol systems», Auditing: A Journal of Practice and Theory2008, 27 (1), 35-66.
FAMA, E.F. en JENSEN, M.C., «Separation of ownership andcontrol», Journal of Law & Economics 1983, 26 (4), 9-15.
FRC (Financial Reporting Council), Internal Control: RevisedGuidance for Directors on the Combined Code, Londen,2005.
GIESECKE, K., Credit risk modeling and valuation: an intro-duction, Unpublished manuscript, New York, CornellUniversity, School of Operations Research and IndustrialEngineering.
ICAEW (Institute of Chartered Accountants in England andWales), No surprises: the case for better risk reporting,Londen, Institute of Chartered Accountants in England andWales, 1999.
ICAEW (Institute of Chartered Accountants in England andWales), Internal Control: Guidance for Directors on theCombined Code, Londen, Institute of Chartered Accoun-tants in England and Wales, 1999.
LINSLEY, P.M. en SHRIVES, P.J., «Risk reporting: A study ofrisk disclosures in the annual reports of UK companies»,The British Accounting Review 2006, 38 (4), 387-404.
LINSLEY, P.M., SHRIVES, P.J. en CRUMPTON, M., «Risk disclo-sure: an exploratory study of UK and Canedian banks»,Journal of Banking Regulation 2006, 7 (3/4), 268-282.
MILLER, K.D., «A framework for integrated risk-managementin international business», Journal of International BusinessStudies 1992, 23 (2), 311-331.
SCHRAND, L.M. en ELLIOTT, J.M., «Risk and financial repor-ting: a summary of the discussion at the 1997 AAA/FASBconference», Accounting Horizons 1998, 12 (3), 271-282.
SERVAES, H. en TUFANO, P., The theory and practice of cor-porate risk management policy, Deutsche Bank LiabilityStrategies Group, 2006.
SOLOMON, J.F., SOLOMON, A., NORTON, S.D. en JOSEPH, N.L.,«A conceptual framework for corporate risk disclosureemerging from the agenda for corporate governancereform», The British Accounting Review 2000, 32 (4), 447-478.
10 Kluwer – Accountancy & Bedrijfskunde – 4/2009
AC
CO
UN
TA
NC
Y
11
7. Appendix: Codeerschema risicocategorieën
Risk category Subcategory
Financial Risk interest rate riskequity price riskforeign exchange riskcommodity price riskcredit risk and credit rating riskpension plan riskliquidity risk
Operational Risk failing of internal processes faling of people; human error riskfailing of systems; information infrastructure and technology riskinformation access and availability riskfraud riskenvironmental riskinternal control weaknessesproduct liablilitysafety and healthrisks related to social actionshuman resources issues
Legal, Tax and Regulatory Risk lawsuits, litigationchange in tax lawchange in legislationchanges in political environment
Business Risk demandselling priceproducing costcompetitioninventoryrestructuringstrategic riskinvestmentsrisk of losing market shareunpredictable economic cyclesproduct life cyclessubstitution riskreputation risk
Kluwer – Accountancy & Bedrijfskunde – 4/2009
Voetnoten
1 American Institute of Certified Public Accountants.2 Institute of Chartered Accountants in England and
Wales.3 Financial Reporting Council.
The use of alternative earnings per sharein the Annual Reports of European
listed companies since the 2005introduction of IFRS
JOËL BRANSON1 and TRACEY HAMILL2
AC
CO
UN
TA
NC
Y
12 Kluwer – Accountancy & Bedrijfskunde – 4/2009
1. Abstract
The introduction of IFRS in 2005 for European publiclylisted companies was intended as a step towards theincrease in comparability of financial statements betweencompanies, sectors and countries. As such, IFRS permitsthe use of additional information in the financial statementsif it facilitates the user’s understanding of the preparer’sfinancial position. Such additional information includesAlternative Performance Measures (APMs). The damage tomarket confidence following the accounting scandals in theUnited States has no doubt influenced the debate on theuse and usefulness of APMs in Europe. European bodiessuch as CESR have attempted to address this debate byproviding their opinion and recommendations for the use ofAPMs, with the essential view towards protecting the non-professional investor from being mislead by the use ofAPMs.
The main objective of this study is to determine the natureand extent of presentation of alternative Earnings Per Share(EPS) figures in the financial statements and annual reportsof a selection of European listed companies, towards anunderstanding of the motives for using APMs. Three re-search questions were posed namely: (1) Has the numberof companies reporting an alternative EPS figure increasedover the three reporting years since the 2005 introductionof IFRS? (2) What alternative EPS terms are being used andhow are they presented in the annual report and financialstatements? (3) On average, are alternative EPS priceshigher/lower than GAAP EPS prices and does this factorinfluence the frequency of presentation?
In this study, the annual reports of 31 European listed com-panies were analyzed for the years 2005, 2006 and 2007.The results show a steady rise in companies reportingalternative EPS from 2005 to 2007. The majority of alterna-tive EPS terms used were such generic terms as «AdjustedEPS» and «Underlying EPS» behind which the variety andtype (income-increasing or decreasing) of exclusions wasvast. In line with previous research, the results indicate thatthe total primary alternative EPS prices disclosed tend tobe higher than the GAAP EPS price. Interestingly though,when companies report a second or third alternative EPSmeasure, most presentations show a lower-than-GAAPalternative EPS price. Further, the research results indicatethat companies prefer to present first in the document themeasure that portrays a better performance.
2. Background and objectives
An APM (Alternative Performance Measure), as termed bythe CESR (Committee of European Securities Regulators),is «any measure other than a defined measure (...) Definedmeasures are those included in audited financial state-ments» (CESR, 2005, 4). APMs are also known as non-GAAP (Generally Accepted Accounting Principles) or non-IFRS (International Financial Reporting Standards)measures and in the United States as pro forma earningsinformation3. APMs can be divided into two types: one typeare measures of performance used by a company for inter-nal analysis and to report non-financial, business informa-tion such as manufacturing levels; the other type are finan-cial measures which use the audited financial statementsas their basis, therefore resembling GAAP measures, butare in themselves unaudited. This second type has beenfurther subdivided into two types: «well-defined and com-monly used non-GAAP measures» such as EBITDA (Earn-ings Before Interest, Taxes, Depreciation and Amortization)and «specifically defined non-GAAP measures» such as anadjusted EPS (Earnings Per Share) figure.
2.1 Support for APMs
Supporters of non-IFRS information suggest that APMsprovide the user with more relevant, high quality and com-parable information. Supporters believe that non-recurringitems, excluded in pro forma disclosures, have no value inthe assessment of the financial position of a company andare not related to the firm’s long term performance outlook.They propose that the exclusion of exceptional itemsallows the firm to present a figure that is more comparablebetween years and with other firms. Managements want tobe able to report additionally to the GAAP figures and high-light factors that are specific to their company and ofimportance for investors to know about their firm. Further,investors are keen to use APMs, seeking information onhow the company uses the APM internally, in addition toconsistency and comparability of information (BROUWER
et al., 2007).
2.2 Criticism of APMs
The fundamental criticism of APMs is that they are used bymanagements to paint a rosier financial picture than isactually reality (CHOI et al., 2007). Since managers are freeto choose what gets excluded from the pro forma informa-tion they report, they have free reign in how they portray
AC
CO
UN
TA
NC
Y
13Kluwer – Accountancy & Bedrijfskunde – 4/2009
their company to investors (ENTWHISTLE et al., 2006). Thusthe critics are skeptical about the motivations for the use ofAPMs. Most often the pro forma figure presents a highervalue than the GAAP figure (BHATTACHARYA et al., 2003;ALLEE et al., 2007; JOHNSON and SCHWARTZ, 2003; LOUGEE
and MARQUARDT, 2003). Furthermore, the pro forma figurecan be found to be composed most often of items thatincrease income (BHATTACHARYA et al., 2004). Evidence sug-gests that firms will choose whether to emphasize (in pressreleases) the GAAP or the pro forma number based onwhich metric will show a better result (BOWEN et al., 2005).
2.3 EU Regulation
In the United States, «Regulation G» lays out rules for howAPMs can be used in earnings press releases and how toavoid misleading investors (ELLIOTT, 2006; ENTWHISTLE et al.,2006). In Europe there is no specific regulation to instructor guide preparers of financial statements and annual re-ports in their presentation of APMs; a matter whichaccounting and financial bodies have attempted to addressby other means.
In November 2006, EFRAG (European Financial ReportingAdvisory Group) as part of Europe’s PAAinE (Pro-activeAccounting Activities in Europe) initiative, published a gene-ral discussion paper on performance reporting in whichthey suggested that inconsistency of managements’ ap-proach to APMs in their financial communication to themarket is an issue which can only impede comparability forusers of financial communication. On the other hand, theyacknowledge that non-GAAP information is valued by theusers and by the managements for its additional disclosureof entity specifics.
CESR issued a recommendation in October 2005, whichhad as its inspiration the common consensus amongCESR members that APMs could be used by manage-ments to manipulate investor perceptions of the compa-nies’ financial position. Thus the «CESR Recommendationon Alternative Performance Measures» attempted toaddress the application of APMs in order to protect theuser and maintain the acknowledged usefulness of theAPM as a disclosure tool of additional entity specific infor-mation. CESR anticipated in their Recommendation thatthe use of APMs could increase following the adoption ofIFRS in Europe and their concerns primarily focus on thedefinition, prominence and consistency of APMs. The follo-wing is an overview of the main points of the Recommen-dation (CESR, 2005):Definition – companies should provide a definition of thecomponents of the APM and indicate how this measure iscalculated. Furthermore, companies should indicate thatthe measure is an unaudited, non-IFRS piece of informa-tion.
Presentation and Prominence – companies should presentthe APM alongside the defined measure and with less pro-minence than the defined measure.
Comparatives and Consistency – companies should pro-vide comparative year information and present the APMconsistently over time.
Reason for Use – companies should explain why theychoose to present an APM and how they use the APMinternally.
Overall, the common concern among these EU regulatorybodies is that the individual and non-professional investoris at risk of being misled by APMs because of the similarityto GAAP measures and the type of presentation given toAPMs in annual reports. Such concerns for the non-pro-fessional investor’s use of APMs have grounds in theresearch carried out by Bhattacharya et al. (2007) who findthat pro forma information is most relied upon by non-pro-fessional investors.
2.4 Objectives
Research on the use of pro forma information in pressreleases in the United States is widely available but therehas been no focus as yet on the presentation of APMs inthe annual report under IFRS in Europe. This study will pro-vide an insight into how European companies choose toreport one particular APM, namely, alternative EPS, in theircorporate reporting under IFRS. Further, this study pro-vides a view on how a sample of European APM-reportingcompares to the recommendations issued by CESR. Tworesearch objectives are outlined below:
Research Objective 1 – Investigate the nature and extent ofpresentation of alternative EPS measures in Europeanannual reports and financial statements since the introduc-tion of IFRS in 2005.
Research Objective 2 – Compare alternative EPS price toGAAP EPS price and the presentation frequency of thesemeasures, to explore a relationship between price differen-ce and presentation frequency.
3. Overview of prior research andresearch questions
This section provides an overview of the research carriedout to date on the topic of pro forma information in theUnited States and APMs in Europe. The large majority ofprior research has been focused on analyst reported proforma earnings and/or management reported pro formaearnings in quarterly press releases in the United States.However, the underlying concerns on use and presentationare equivalent for annual reports and financial statements,as for press releases of financial performance. The effect ofthe use and prominence of the pro forma information/APMon the user has been a particular focus, with an emphasison the different impact on professional and unsophisticatedinvestors.
AC
CO
UN
TA
NC
Y
14 Kluwer – Accountancy & Bedrijfskunde – 4/2009
3.1 APM price
A considerable research has determined that most oftenthe APM presents a higher value than GAAP (BHATTACHARYA
et al., 2003; ALLEE et al., 2007; JOHNSON and SCHWARTZ,2003; LOUGEE and MARQUARDT, 2003) and that the itemsusually included to arrive at the alternative figure, are thosewhich increase income (BHATTACHARYA et al., 2004).Moreover, Walker and Louvari (2003), in their study ofdisclosure in annual reports under UK GAAP notice lessenthusiasm among companies for disclosing an APMwhich is lower than the GAAP figure and further, concludethat companies are more likely to report an APM whichincreases a profit rather than decreases a loss.
3.2 Relative position of APM versus GAAP
Evidence assembled from press releases suggests thatmost firms report the pro forma number first (64 %), butthat firms will choose whether to emphasize the GAAP orthe pro forma number based on which measure will showa better result (BOWEN et al., 2005). Bhattacharya et al.(2003) find in their sample of press releases that the proforma figure is most often reported first (87 % of the time),of which 25 % had a higher GAAP figure, which goes someway towards supporting the argument that some manage-ments report pro forma figures because they find them tobe more informative to the user. Walker and Louvari (2003)also provide evidence of a positive correlation between dis-closure and the size of difference between the higher alter-native EPS figure versus GAAP. Notably, the position of theAPM and GAAP measures in relation to each other hasbeen found to play a part in the decision-making of non-professional investors and conversely, to play no part forprofessional investors (ALLEE et al., 2007; ELLIOTT, 2006).
3.3 Subjectivity and inconsistency
One of the main criticisms of APMs is of their prevalence ofpresentation by companies and use by investors, despitethe lack of objectivity in their definition (KOLEV et al., 2008).Companies are free to define an APM as they wish and notonly are the variety of possible exclusions myriad but thechoices made by firms also vary: «For example, two firmscould have identical special items yet one firm couldchoose to exclude those items in its pro forma earningswhile another firm does not» (DOYLE et al., 2003, 148). Assuch, it is anticipated that the comparability between com-panies is greatly reduced. Further, a lack of consistencybetween reporting periods for the same firm has beenrevealed, in which the definition of pro forma earnings wasfound to be different in each case over a three year period(BHATTACHARYA et al., 2004).
3.4 Presentation and prominence
Given the information overload society faces today, theresultant limited attention leads to the tendency of peopleto work with information as it is presented, thus the pre-sentational format can affect the way a piece of information
is processed (HIRSCHLEIFER and TEOH, 2003). In otherwords, information that is presented in a more visuallyaccessible, concise and prominent format is more likely tobe viewed and processed by the reader. In addition,findings that the graphical versus narrative presentation offinancial information affects investors’ retrieval of infor-mation and decision making differently, is further evidenceof limited attention (DESANCTIS and JARVENPAA, 1989). Also,financial data in graphical rather than tabular format isthought to be more easily processed (VESSEY and GALLETTA,1991).
3.5 Presence and prominence of APMs –effects on non-professional investors
Research has identified that it is mainly unsophisticatedinvestors, as opposed to professionals and analysts, whorely on non-GAAP information; even when the non-GAAPinformation is presented with GAAP figures, unsophisti-cated investors «focus» on the non-GAAP figures(BHATTACHARYA, 2007). Frederickson and Miller (2004) sub-mit that even the presence of a higher than GAAP proforma figure affects the investment judgments of non-pro-fessional investors towards a more positive assessment ofthe firm, whereas professional investors are unaffected.
Furthermore, research has shown that the prominence withwhich the pro forma number is presented in relation to theGAAP number bears an influence on the non-professionalinvestors’ judgment, absent among professional investors.Elliott (2006) finds that non-professional investors are moresusceptible to managements’ efforts to emphasize the proforma figure over the GAAP figure than when the GAAPfigure takes precedence over the pro forma. Similarly, Alleeet al. (2007) find evidence of increased trading activityamong unsophisticated investors when the pro forma num-ber is given more weight in the press release vis-à-viscases where a pro forma number is reported but the GAAPnumber is emphasized.
Pro forma emphasis and prominence of presentation ver-sus GAAP information increases the opportunity for thenon-professional investor to read the pro forma measure(FREDERICKSON and MILLER, 2004). Non-professional inves-tors, due to their inherently lower level of experience, lookfor cues to help them decide what information is important(MAINES and MCDANIEL, 2000). Thus, prominently presentedAPMs could be taken as such a cue to nonprofessionalinvestors leading them to attach more importance to thesemeasures (FREDERICKSON and MILLER, 2004). Likewise, theinfluential effects of emphasis and prominence on judg-ment and decision-making could result in non-professionalinvestors’ tendency to rely on prominent information and,further, the conscious decision by managements to pursuethe effects of prominence to their own advantage (ELLIOTT,2006).
AC
CO
UN
TA
NC
Y
15Kluwer – Accountancy & Bedrijfskunde – 4/2009
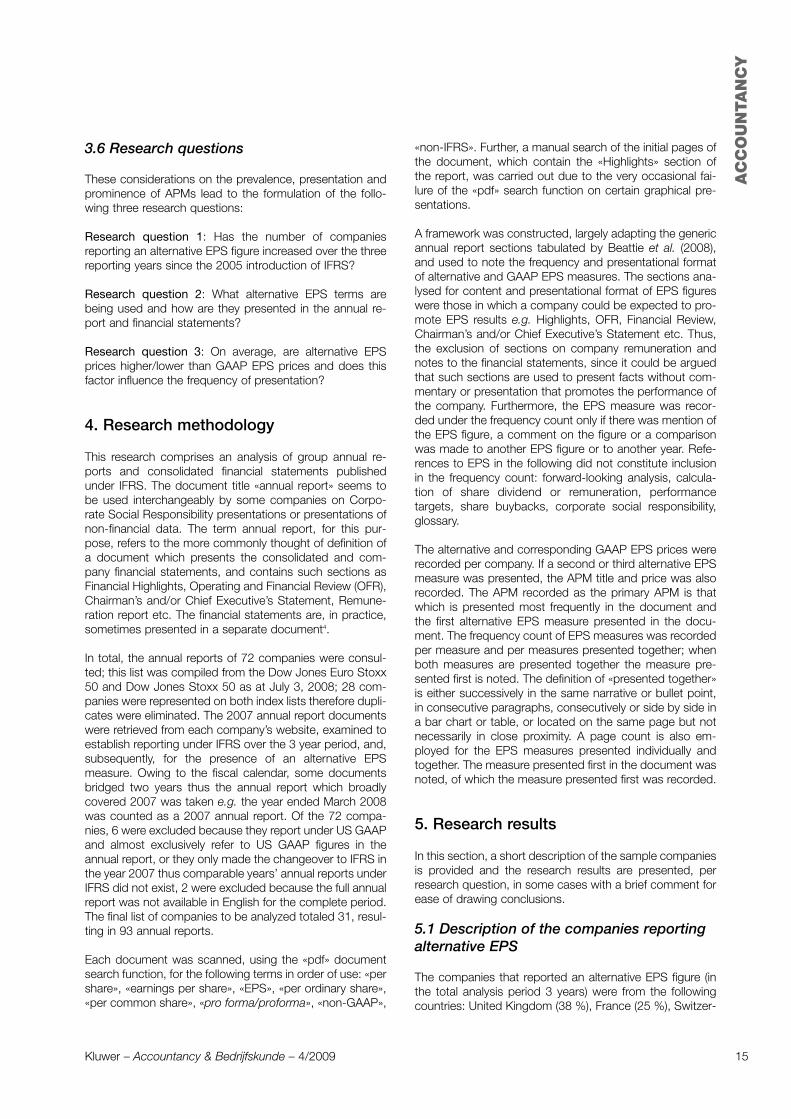
3.6 Research questions
These considerations on the prevalence, presentation andprominence of APMs lead to the formulation of the follo-wing three research questions:
Research question 1: Has the number of companiesreporting an alternative EPS figure increased over the threereporting years since the 2005 introduction of IFRS?
Research question 2: What alternative EPS terms arebeing used and how are they presented in the annual re-port and financial statements?
Research question 3: On average, are alternative EPSprices higher/lower than GAAP EPS prices and does thisfactor influence the frequency of presentation?
4. Research methodology
This research comprises an analysis of group annual re-ports and consolidated financial statements publishedunder IFRS. The document title «annual report» seems tobe used interchangeably by some companies on Corpo-rate Social Responsibility presentations or presentations ofnon-financial data. The term annual report, for this pur-pose, refers to the more commonly thought of definition ofa document which presents the consolidated and com-pany financial statements, and contains such sections asFinancial Highlights, Operating and Financial Review (OFR),Chairman’s and/or Chief Executive’s Statement, Remune-ration report etc. The financial statements are, in practice,sometimes presented in a separate document4.
In total, the annual reports of 72 companies were consul-ted; this list was compiled from the Dow Jones Euro Stoxx50 and Dow Jones Stoxx 50 as at July 3, 2008; 28 com-panies were represented on both index lists therefore dupli-cates were eliminated. The 2007 annual report documentswere retrieved from each company’s website, examined toestablish reporting under IFRS over the 3 year period, and,subsequently, for the presence of an alternative EPSmeasure. Owing to the fiscal calendar, some documentsbridged two years thus the annual report which broadlycovered 2007 was taken e.g. the year ended March 2008was counted as a 2007 annual report. Of the 72 compa-nies, 6 were excluded because they report under US GAAPand almost exclusively refer to US GAAP figures in theannual report, or they only made the changeover to IFRS inthe year 2007 thus comparable years’ annual reports underIFRS did not exist, 2 were excluded because the full annualreport was not available in English for the complete period.The final list of companies to be analyzed totaled 31, resul-ting in 93 annual reports.
Each document was scanned, using the «pdf» documentsearch function, for the following terms in order of use: «pershare», «earnings per share», «EPS», «per ordinary share»,«per common share», «pro forma/proforma», «non-GAAP»,
«non-IFRS». Further, a manual search of the initial pages ofthe document, which contain the «Highlights» section ofthe report, was carried out due to the very occasional fai-lure of the «pdf» search function on certain graphical pre-sentations.
A framework was constructed, largely adapting the genericannual report sections tabulated by Beattie et al. (2008),and used to note the frequency and presentational formatof alternative and GAAP EPS measures. The sections ana-lysed for content and presentational format of EPS figureswere those in which a company could be expected to pro-mote EPS results e.g. Highlights, OFR, Financial Review,Chairman’s and/or Chief Executive’s Statement etc. Thus,the exclusion of sections on company remuneration andnotes to the financial statements, since it could be arguedthat such sections are used to present facts without com-mentary or presentation that promotes the performance ofthe company. Furthermore, the EPS measure was recor-ded under the frequency count only if there was mention ofthe EPS figure, a comment on the figure or a comparisonwas made to another EPS figure or to another year. Refe-rences to EPS in the following did not constitute inclusionin the frequency count: forward-looking analysis, calcula-tion of share dividend or remuneration, performancetargets, share buybacks, corporate social responsibility,glossary.
The alternative and corresponding GAAP EPS prices wererecorded per company. If a second or third alternative EPSmeasure was presented, the APM title and price was alsorecorded. The APM recorded as the primary APM is thatwhich is presented most frequently in the document andthe first alternative EPS measure presented in the docu-ment. The frequency count of EPS measures was recordedper measure and per measures presented together; whenboth measures are presented together the measure pre-sented first is noted. The definition of «presented together»is either successively in the same narrative or bullet point,in consecutive paragraphs, consecutively or side by side ina bar chart or table, or located on the same page but notnecessarily in close proximity. A page count is also em-ployed for the EPS measures presented individually andtogether. The measure presented first in the document wasnoted, of which the measure presented first was recorded.
5. Research results
In this section, a short description of the sample companiesis provided and the research results are presented, perresearch question, in some cases with a brief comment forease of drawing conclusions.
5.1 Description of the companies reportingalternative EPS
The companies that reported an alternative EPS figure (inthe total analysis period 3 years) were from the followingcountries: United Kingdom (38 %), France (25 %), Switzer-
AC
CO
UN
TA
NC
Y
16 Kluwer – Accountancy & Bedrijfskunde – 4/2009
land (15 %), Germany (9 %), Spain (6 %), Italy (5 %) and theNetherlands (2 %).
The industry sectors5 represented by these companieswere diverse: Financials (35 %), Telecommunications(12 %), Basic Materials (10 %), Oil and Gas (10 %),Healthcare (9 %), Consumer Goods, Consumer Services,Industrials (each 7 %), Utilities (2 %).
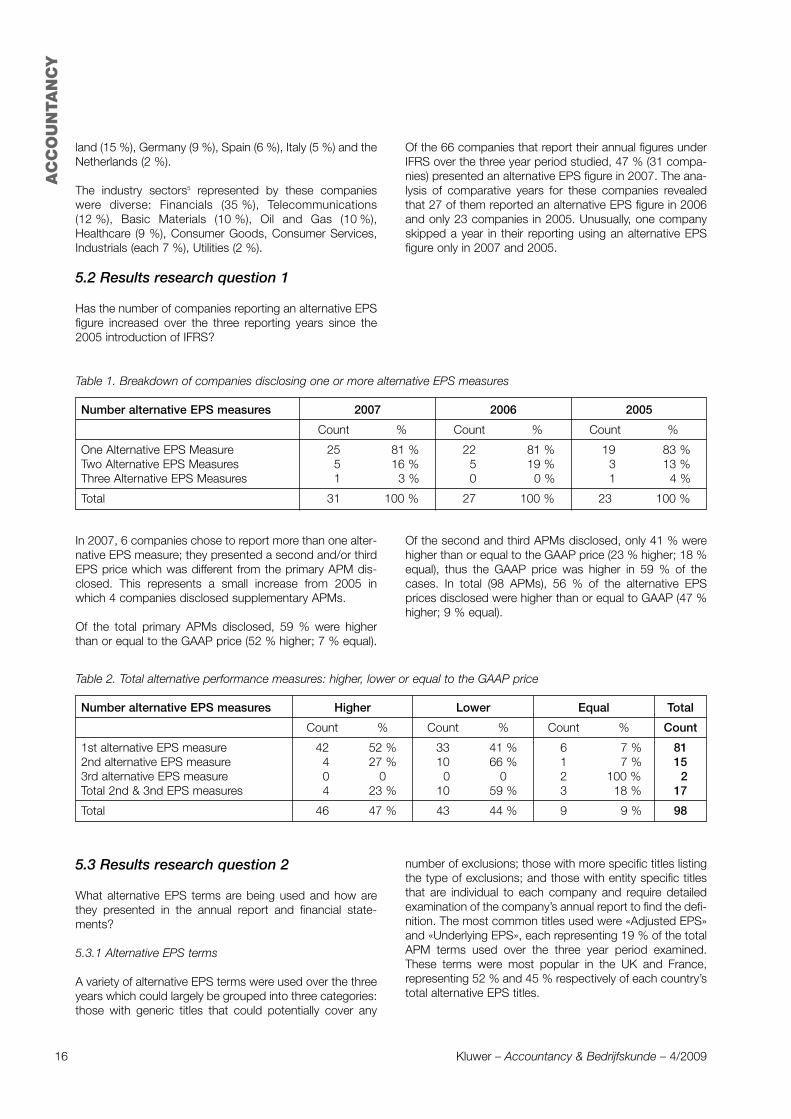
5.2 Results research question 1
Has the number of companies reporting an alternative EPSfigure increased over the three reporting years since the2005 introduction of IFRS?
Of the 66 companies that report their annual figures underIFRS over the three year period studied, 47 % (31 compa-nies) presented an alternative EPS figure in 2007. The ana-lysis of comparative years for these companies revealedthat 27 of them reported an alternative EPS figure in 2006and only 23 companies in 2005. Unusually, one companyskipped a year in their reporting using an alternative EPSfigure only in 2007 and 2005.
Table 1. Breakdown of companies disclosing one or more alternative EPS measures
Number alternative EPS measures 2007 2006 2005
Count % Count % Count %
One Alternative EPS Measure 25 81 % 22 81 % 19 83 %Two Alternative EPS Measures 5 16 % 5 19 % 3 13 %Three Alternative EPS Measures 1 3 % 0 0 % 1 4 %
Total 31 100 % 27 100 % 23 100 %
In 2007, 6 companies chose to report more than one alter-native EPS measure; they presented a second and/or thirdEPS price which was different from the primary APM dis-closed. This represents a small increase from 2005 inwhich 4 companies disclosed supplementary APMs.
Of the total primary APMs disclosed, 59 % were higherthan or equal to the GAAP price (52 % higher; 7 % equal).
Of the second and third APMs disclosed, only 41 % werehigher than or equal to the GAAP price (23 % higher; 18 %equal), thus the GAAP price was higher in 59 % of thecases. In total (98 APMs), 56 % of the alternative EPSprices disclosed were higher than or equal to GAAP (47 %higher; 9 % equal).
Table 2. Total alternative performance measures: higher, lower or equal to the GAAP price
Number alternative EPS measures Higher Lower Equal Total
Count % Count % Count % Count
1st alternative EPS measure 42 52 % 33 41 % 6 7 % 812nd alternative EPS measure 4 27 % 10 66 % 1 7 % 153rd alternative EPS measure 0 0 0 0 2 100 % 2Total 2nd & 3nd EPS measures 4 23 % 10 59 % 3 18 % 17
Total 46 47 % 43 44 % 9 9 % 98
5.3 Results research question 2
What alternative EPS terms are being used and how arethey presented in the annual report and financial state-ments?
5.3.1 Alternative EPS terms
A variety of alternative EPS terms were used over the threeyears which could largely be grouped into three categories:those with generic titles that could potentially cover any
number of exclusions; those with more specific titles listingthe type of exclusions; and those with entity specific titlesthat are individual to each company and require detailedexamination of the company’s annual report to find the defi-nition. The most common titles used were «Adjusted EPS»and «Underlying EPS», each representing 19 % of the totalAPM terms used over the three year period examined.These terms were most popular in the UK and France,representing 52 % and 45 % respectively of each country’stotal alternative EPS titles.
AC
CO
UN
TA
NC
Y
17Kluwer – Accountancy & Bedrijfskunde – 4/2009
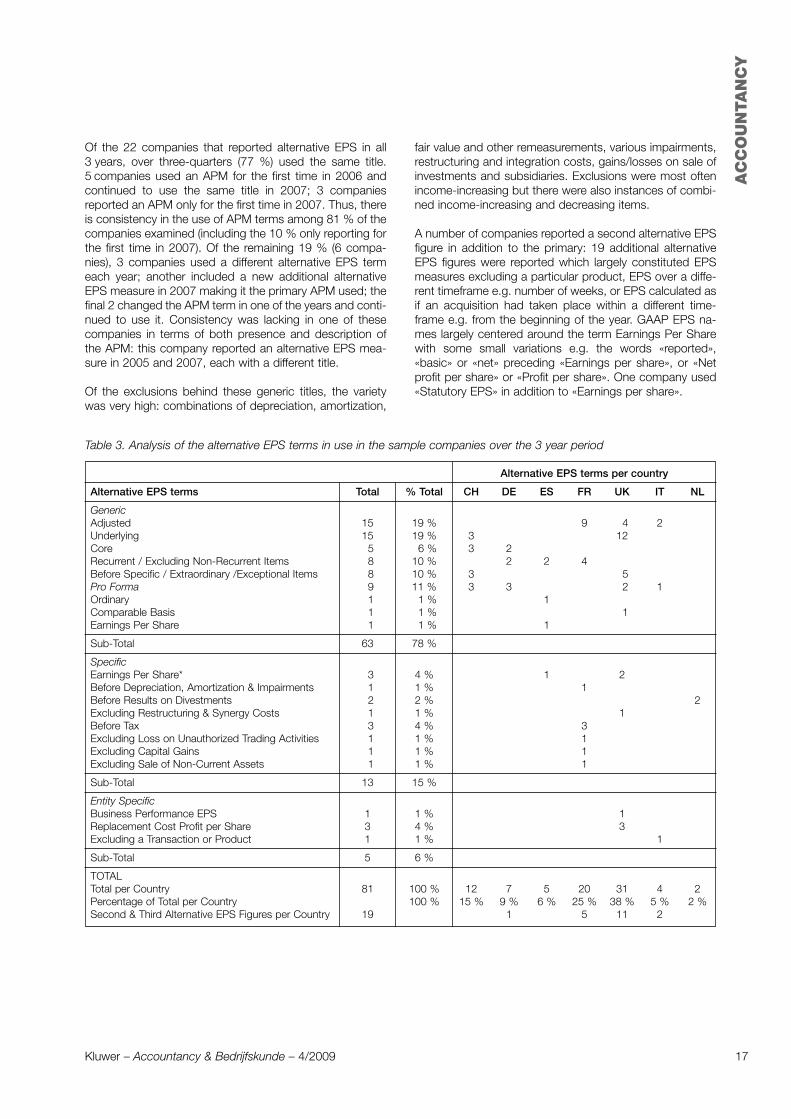
Of the 22 companies that reported alternative EPS in all3 years, over three-quarters (77 %) used the same title.5 companies used an APM for the first time in 2006 andcontinued to use the same title in 2007; 3 companiesreported an APM only for the first time in 2007. Thus, thereis consistency in the use of APM terms among 81 % of thecompanies examined (including the 10 % only reporting forthe first time in 2007). Of the remaining 19 % (6 compa-nies), 3 companies used a different alternative EPS termeach year; another included a new additional alternativeEPS measure in 2007 making it the primary APM used; thefinal 2 changed the APM term in one of the years and conti-nued to use it. Consistency was lacking in one of thesecompanies in terms of both presence and description ofthe APM: this company reported an alternative EPS mea-sure in 2005 and 2007, each with a different title.
Of the exclusions behind these generic titles, the varietywas very high: combinations of depreciation, amortization,
fair value and other remeasurements, various impairments,restructuring and integration costs, gains/losses on sale ofinvestments and subsidiaries. Exclusions were most oftenincome-increasing but there were also instances of combi-ned income-increasing and decreasing items.
A number of companies reported a second alternative EPSfigure in addition to the primary: 19 additional alternativeEPS figures were reported which largely constituted EPSmeasures excluding a particular product, EPS over a diffe-rent timeframe e.g. number of weeks, or EPS calculated asif an acquisition had taken place within a different time-frame e.g. from the beginning of the year. GAAP EPS na-mes largely centered around the term Earnings Per Sharewith some small variations e.g. the words «reported»,«basic» or «net» preceding «Earnings per share», or «Netprofit per share» or «Profit per share». One company used«Statutory EPS» in addition to «Earnings per share».
Table 3. Analysis of the alternative EPS terms in use in the sample companies over the 3 year period
Alternative EPS terms per country
Alternative EPS terms Total % Total CH DE ES FR UK IT NL
GenericAdjusted 15 19 % 9 4 2Underlying 15 19 % 3 12Core 5 6 % 3 2Recurrent / Excluding Non-Recurrent Items 8 10 % 2 2 4Before Specific / Extraordinary /Exceptional Items 8 10 % 3 5Pro Forma 9 11 % 3 3 2 1Ordinary 1 1 % 1Comparable Basis 1 1 % 1Earnings Per Share 1 1 % 1
Sub-Total 63 78 %
SpecificEarnings Per Share* 3 4 % 1 2Before Depreciation, Amortization & Impairments 1 1 % 1Before Results on Divestments 2 2 % 2Excluding Restructuring & Synergy Costs 1 1 % 1Before Tax 3 4 % 3Excluding Loss on Unauthorized Trading Activities 1 1 % 1Excluding Capital Gains 1 1 % 1Excluding Sale of Non-Current Assets 1 1 % 1
Sub-Total 13 15 %
Entity SpecificBusiness Performance EPS 1 1 % 1Replacement Cost Profit per Share 3 4 % 3Excluding a Transaction or Product 1 1 % 1
Sub-Total 5 6 %
TOTALTotal per Country 81 100 % 12 7 5 20 31 4 2Percentage of Total per Country 100 % 15 % 9 % 6 % 25 % 38 % 5 % 2 %Second & Third Alternative EPS Figures per Country 19 1 5 11 2
AC
CO
UN
TA
NC
Y
18 Kluwer – Accountancy & Bedrijfskunde – 4/2009
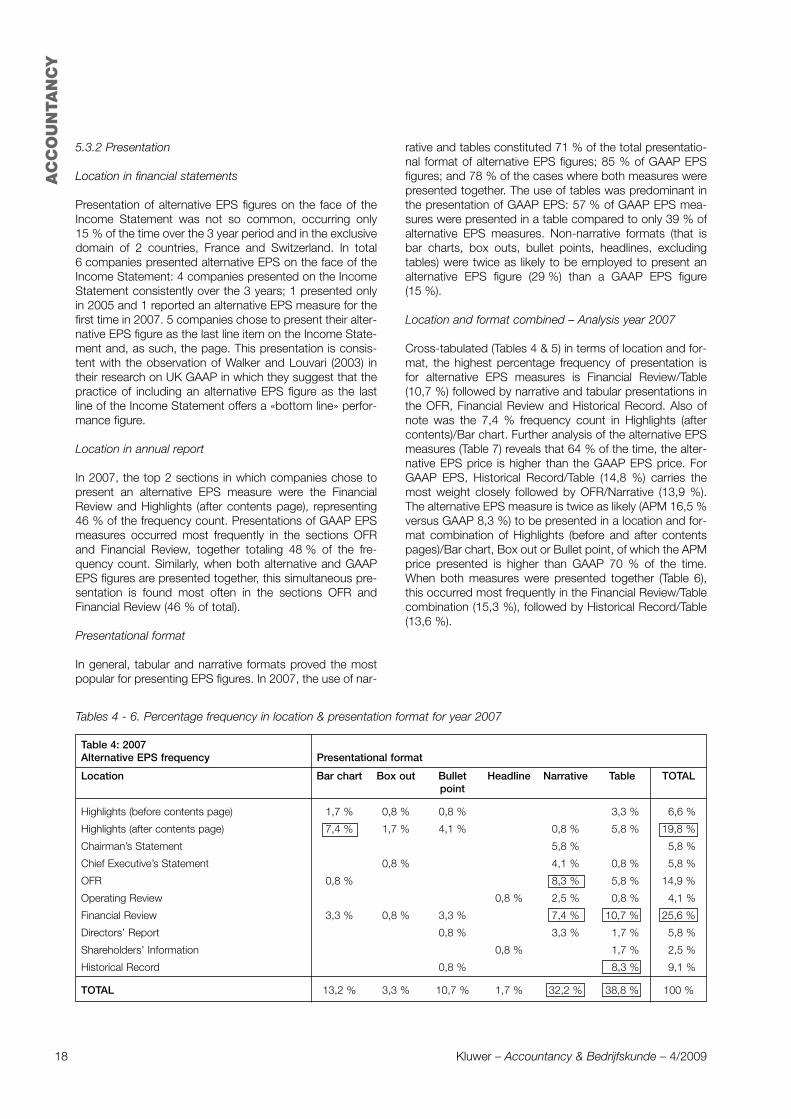
5.3.2 Presentation
Location in financial statements
Presentation of alternative EPS figures on the face of theIncome Statement was not so common, occurring only15 % of the time over the 3 year period and in the exclusivedomain of 2 countries, France and Switzerland. In total6 companies presented alternative EPS on the face of theIncome Statement: 4 companies presented on the IncomeStatement consistently over the 3 years; 1 presented onlyin 2005 and 1 reported an alternative EPS measure for thefirst time in 2007. 5 companies chose to present their alter-native EPS figure as the last line item on the Income State-ment and, as such, the page. This presentation is consis-tent with the observation of Walker and Louvari (2003) intheir research on UK GAAP in which they suggest that thepractice of including an alternative EPS figure as the lastline of the Income Statement offers a «bottom line» perfor-mance figure.
Location in annual report
In 2007, the top 2 sections in which companies chose topresent an alternative EPS measure were the FinancialReview and Highlights (after contents page), representing46 % of the frequency count. Presentations of GAAP EPSmeasures occurred most frequently in the sections OFRand Financial Review, together totaling 48 % of the fre-quency count. Similarly, when both alternative and GAAPEPS figures are presented together, this simultaneous pre-sentation is found most often in the sections OFR andFinancial Review (46 % of total).
Presentational format
In general, tabular and narrative formats proved the mostpopular for presenting EPS figures. In 2007, the use of nar-
rative and tables constituted 71 % of the total presentatio-nal format of alternative EPS figures; 85 % of GAAP EPSfigures; and 78 % of the cases where both measures werepresented together. The use of tables was predominant inthe presentation of GAAP EPS: 57 % of GAAP EPS mea-sures were presented in a table compared to only 39 % ofalternative EPS measures. Non-narrative formats (that isbar charts, box outs, bullet points, headlines, excludingtables) were twice as likely to be employed to present analternative EPS figure (29 %) than a GAAP EPS figure(15 %).
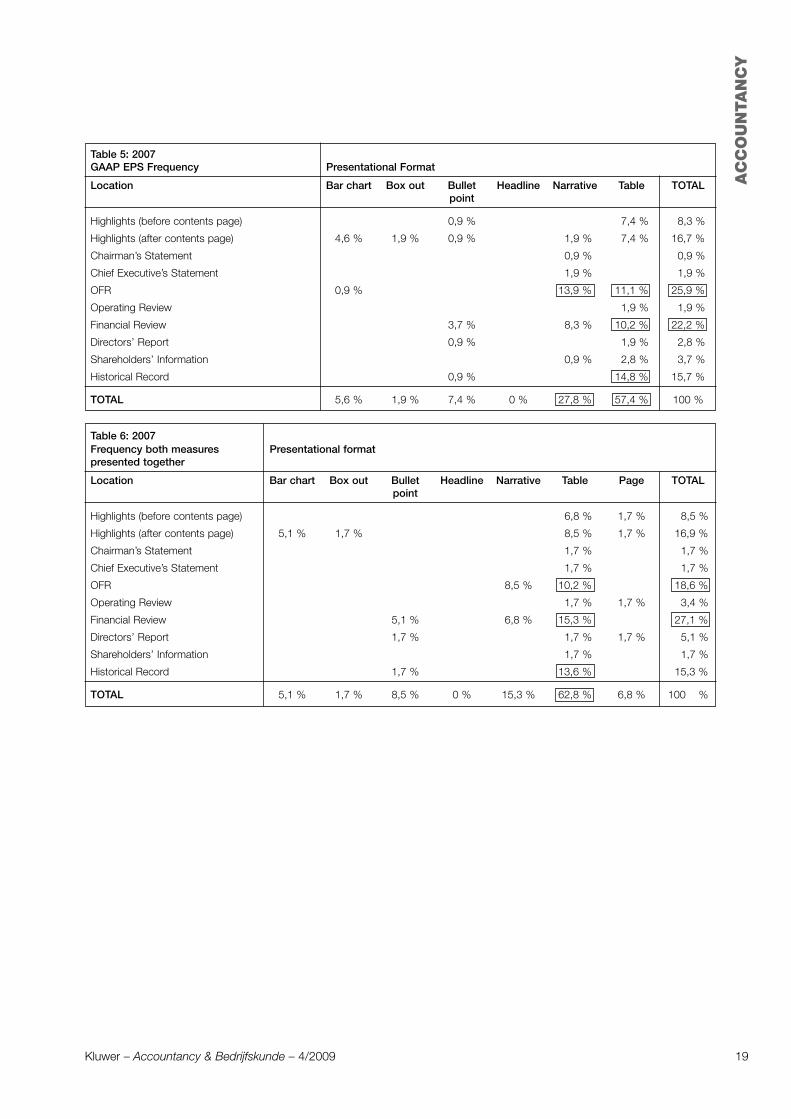
Location and format combined – Analysis year 2007
Cross-tabulated (Tables 4 & 5) in terms of location and for-mat, the highest percentage frequency of presentation isfor alternative EPS measures is Financial Review/Table(10,7 %) followed by narrative and tabular presentations inthe OFR, Financial Review and Historical Record. Also ofnote was the 7,4 % frequency count in Highlights (aftercontents)/Bar chart. Further analysis of the alternative EPSmeasures (Table 7) reveals that 64 % of the time, the alter-native EPS price is higher than the GAAP EPS price. ForGAAP EPS, Historical Record/Table (14,8 %) carries themost weight closely followed by OFR/Narrative (13,9 %).The alternative EPS measure is twice as likely (APM 16,5 %versus GAAP 8,3 %) to be presented in a location and for-mat combination of Highlights (before and after contentspages)/Bar chart, Box out or Bullet point, of which the APMprice presented is higher than GAAP 70 % of the time.When both measures were presented together (Table 6),this occurred most frequently in the Financial Review/Tablecombination (15,3 %), followed by Historical Record/Table(13,6 %).
Tables 4 - 6. Percentage frequency in location & presentation format for year 2007
Table 4: 2007Alternative EPS frequency Presentational format
Location Bar chart Box out Bullet Headline Narrative Table TOTALpoint
Highlights (before contents page) 1,7 % 0,8 % 0,8 % 3,3 % 6,6 %
Highlights (after contents page) 7,4 % 1,7 % 4,1 % 0,8 % 5,8 % 19,8 %
Chairman’s Statement 5,8 % 5,8 %
Chief Executive’s Statement 0,8 % 4,1 % 0,8 % 5,8 %
OFR 0,8 % 8,3 % 5,8 % 14,9 %
Operating Review 0,8 % 2,5 % 0,8 % 4,1 %
Financial Review 3,3 % 0,8 % 3,3 % 7,4 % 10,7 % 25,6 %
Directors’ Report 0,8 % 3,3 % 1,7 % 5,8 %
Shareholders’ Information 0,8 % 1,7 % 2,5 %
Historical Record 0,8 % 8,3 % 9,1 %
TOTAL 13,2 % 3,3 % 10,7 % 1,7 % 32,2 % 38,8 % 100 %
AC
CO
UN
TA
NC
Y
19Kluwer – Accountancy & Bedrijfskunde – 4/2009
Table 5: 2007GAAP EPS Frequency Presentational Format
Location Bar chart Box out Bullet Headline Narrative Table TOTALpoint
Highlights (before contents page) 0,9 % 7,4 % 8,3 %
Highlights (after contents page) 4,6 % 1,9 % 0,9 % 1,9 % 7,4 % 16,7 %
Chairman’s Statement 0,9 % 0,9 %
Chief Executive’s Statement 1,9 % 1,9 %
OFR 0,9 % 13,9 % 11,1 % 25,9 %
Operating Review 1,9 % 1,9 %
Financial Review 3,7 % 8,3 % 10,2 % 22,2 %
Directors’ Report 0,9 % 1,9 % 2,8 %
Shareholders’ Information 0,9 % 2,8 % 3,7 %
Historical Record 0,9 % 14,8 % 15,7 %
TOTAL 5,6 % 1,9 % 7,4 % 0 % 27,8 % 57,4 % 100 %
Table 6: 2007Frequency both measures Presentational formatpresented together
Location Bar chart Box out Bullet Headline Narrative Table Page TOTALpoint
Highlights (before contents page) 6,8 % 1,7 % 8,5 %
Highlights (after contents page) 5,1 % 1,7 % 8,5 % 1,7 % 16,9 %
Chairman’s Statement 1,7 % 1,7 %
Chief Executive’s Statement 1,7 % 1,7 %
OFR 8,5 % 10,2 % 18,6 %
Operating Review 1,7 % 1,7 % 3,4 %
Financial Review 5,1 % 6,8 % 15,3 % 27,1 %
Directors’ Report 1,7 % 1,7 % 1,7 % 5,1 %
Shareholders’ Information 1,7 % 1,7 %
Historical Record 1,7 % 13,6 % 15,3 %
TOTAL 5,1 % 1,7 % 8,5 % 0 % 15,3 % 62,8 % 6,8 % 100 %

AC
CO
UN
TA
NC
Y
20 Kluwer – Accountancy & Bedrijfskunde – 4/2009
AC
CO
UN
TA
NC
Y
Tabl
e 7.
Ana
lysi
s pr
esen
tatio
n fre
quen
cy o
f alte
rnat
ive
EPS
in t
erm
s of
AP
M p
rice
(hig
her/
low
er t
han
GA
AP
) for
the
yea
r 20
07
Pre
sent
atio
nal f
orm
at–
Dire
ctio
n al
tern
ativ
e E
PS
pri
ce a
s co
mp
ared
to
GA
AP
(hig
her
or
low
er)
Loca
tion
Bar
cha
rtB
ox
out
Bul
let
po
int
Hea
dlin
eN
arra
tive
Tab
leT
OTA
L
Hig
her
Low
erH
ighe
rLo
wer
Hig
her
Low
erH
ighe
rLo
wer
Hig
her
Low
erH
ighe
rLo
wer
Hig
her
Low
erTo
tal
Hig
hlig
hts
(bef
ore
cont
ents
pag
e)0,
8 %
0,8
%0,
8 %
0,8
%1,
7 %
1,7
%4,
1 %
2,5
%6,
6 %
Hig
hlig
hts
(afte
r co
nten
ts p
age)
5,0
%2,
5 %
0,8
%0,
8 %
3,3
%0,
8 %
0,8
%3,
3 %
2,5
%13
,2 %
6,6
%19
,8 %
Cha
irman
’s S
tate
men
t5,
0 %
0,8
%5,
0 %
0,8
%5,
8 %
Chi
ef E
xecu
tive’
s S
tate
men
t0,
8 %
1,7
%2,
5 %
0,8
%2,
5 %
3,3
%5,
8 %
OFR
0,8
%4,
1 %
4,1
%3,
3 %
2,5
%7,
4 %
7,4
%14
,9 %
Ope
ratin
g R
evie
w0,
8 %
2,5
%0,
8 %
4,1
%0
%4,
1 %
Fina
ncia
l Rev
iew
2,5
%0,
8 %
0,8
%2,
5 %
0,8
%5,
8 %
1,7
%8,
3 %
2,5
%19
,8 %
5,8
%25
,6 %
Dire
ctor
s’ R
epor
t0,
8 %
3,3
%1,
7 %
0 %
5,8
%5,
8 %
Sha
reho
lder
s’ In
form
atio
n0,
8 %
1,7
%0
%2,
5 %
2,5
%
His
toric
al R
ecor
d0,
8 %
6,6
%1,
7 %
7,4
%1,
7 %
9,1
%
TOTA
L8,
3 %
5,0
%2,
5 %
1,7
%7,
4 %
2,5
%0,
8 %
0,8
%19
,8 %
12,4
%24
,8 %
14,0
%63
,6 %
36,4
%10
0 %
Measure presented first in document
The analysis of the year 2007 in Table 8 shows that thealternative EPS measure is presented first in the document45 % of time (14 annual reports), of which, the alternativeEPS price was higher than GAAP 71 % of the time. TheGAAP measure was presented first in the document 55 %of the time: the GAAP price was higher than or equal to theAPM price 65 % of the time (53 % GAAP higher, 12 %GAAP equal). Thus, this result could be interpreted as anindication that companies prefer to present first in thedocument the measure that portrays better performance.Of the total results of which measure is presented first inthe document, 52 % of the time the alternative EPS priceswere higher than GAAP.
The most popular sections in which an EPS measure is firstreported in the document are the Highlights (before andafter contents page) representing 81 % (39 % APM, 42 %GAAP) of the total first instances of EPS reporting; thesesections are typically located within the first 10-20 pages ofthe annual report document. One company (UK) reportedtheir alternative EPS figure on the cover page of the annualreport. The GAAP measure is much more likely to be dis-played in tabular format: 88 % of GAAP measures are pre-sented in tables and 12 % in the other formats. In contrast,the APM is more often presented in a bar chart, bulletpoint, box out or narrative: 64 % of APMs are presented inone of these formats while only 36 % are presented intables.
An analysis of the 13 instances of simultaneous presenta-tion (Table 9) reveals broadly similar results: alternative EPSis presented first 46 % of the time of which the alternativeEPS is higher than GAAP 67 % of the time. GAAP is pre-sented first 54 % of the time, of which, however, the GAAPfigure is higher 71 % of the time (as compared to the total2007n = 31 in which case the GAAP price was higher only53 % of the time). This result demonstrates a higher ins-tance, not only of presenting the GAAP measure first butalso a higher instance of presenting first a GAAP price thatexceeds the APM price. Of the total results (n = 13), whenboth measures are presented together, 53 % of the timethe GAAP price was higher than the alternative EPS price.This contrasts with the analysis of the total sample (n = 31)in which the alternative EPS price was found to be higher52 % of the time.
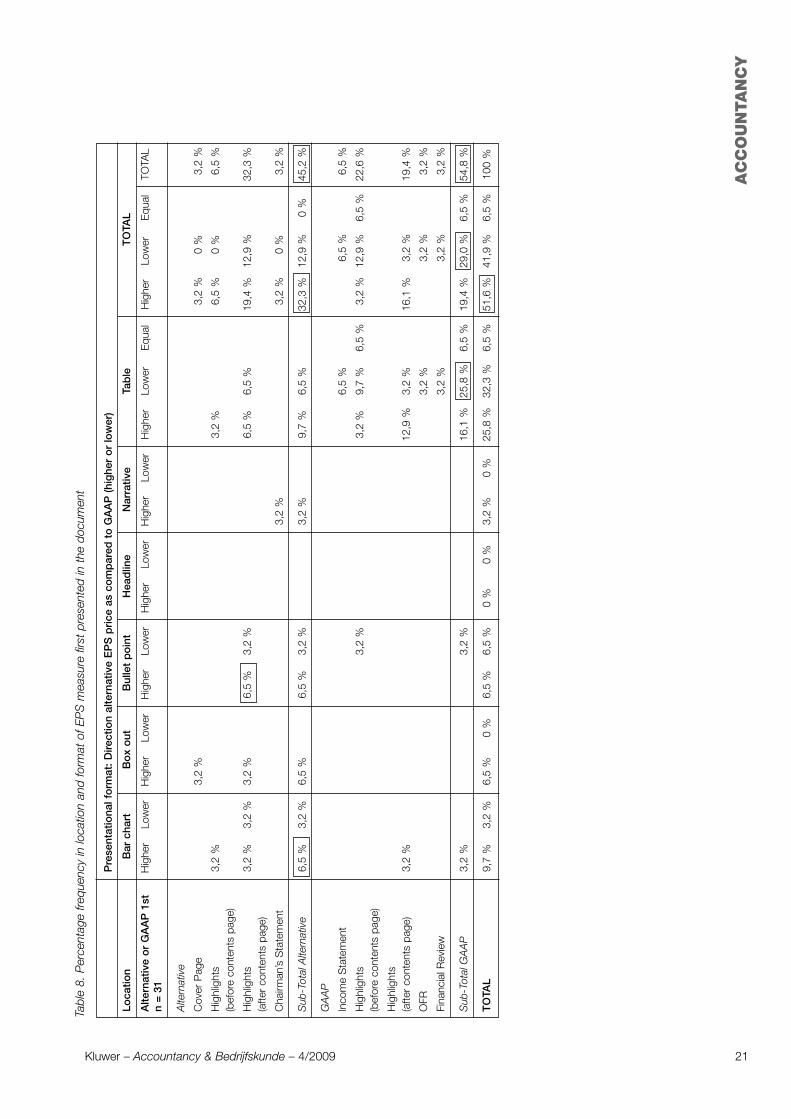
Tabl
e 8.
Per
cent
age
frequ
ency
in lo
catio
n an
d fo
rmat
of E
PS
mea
sure
firs
t pr
esen
ted
in t
he d
ocum
ent
Pre
sent
atio
nal f
orm
at: D
irect
ion
alte
rnat
ive
EP
S p
rice
as
com
par
ed t
o G
AA
P (h
ighe
r o
r lo
wer
)
Loca
tion
Bar
cha
rtB
ox
out
Bul
let
po
int
Hea
dlin
eN
arra
tive
Tab
leT
OTA
L
Alte
rnat
ive
or
GA
AP
1st
Hig
her
Low
erH
ighe
rLo
wer
Hig
her
Low
erH
ighe
rLo
wer
Hig
her
Low
erH
ighe
rLo
wer
Equ
alH
ighe
rLo
wer
Equ
alTO
TAL
n =
31
Alte
rnat
ive
Cov
er P
age
3,2
%3,
2 %
0 %
3,2
%
Hig
hlig
hts
3,2
%3,
2 %
6,5
%0
%6,
5 %
(bef
ore
cont
ents
pag
e)
Hig
hlig
hts
3,2
%3,
2 %
3,2
%6,
5 %
3,2
%6,
5 %
6,5
%19
,4 %
12,9
%32
,3 %
(afte
r co
nten
ts p
age)
Cha
irman
’s S
tate
men
t3,
2 %
3,2
%0
%3,
2 %
Sub
-Tot
al A
ltern
ativ
e6,
5 %
3,2
%6,
5 %
6,5
%3,
2 %
3,2
%9,
7 %
6,5
%32
,3 %
12,9
%0
%45
,2 %
GA
AP
Inco
me
Sta
tem
ent
6,5
%6,
5 %
6,5
%
Hig
hlig
hts
3,2
%3,
2 %
9,7
%6,
5 %
3,2
%12
,9 %
6,5
%22
,6 %
(bef
ore
cont
ents
pag
e)
Hig
hlig
hts
(afte
r co
nten
ts p
age)
3,2
%12
,9 %
3,2
%16
,1 %
3,2
%19
,4 %
OFR
3,2
%3,
2 %
3,2
%
Fina
ncia
l Rev
iew
3,2
%3,
2 %
3,2
%
Sub
-Tot
al G
AA
P3,
2 %
3,2
%16
,1 %
25,8
%6,
5 %
19,4
%29
,0 %
6,5
%54
,8 %
TO
TAL
9,7
%3,
2 %
6,5
%0
%6,
5 %
6,5
%0
%0
%3,
2 %
0 %
25,8
%32
,3 %
6,5
%51
,6 %
41,9
%6,
5 %
100
%
AC
CO
UN
TA
NC
Y
21Kluwer – Accountancy & Bedrijfskunde – 4/2009
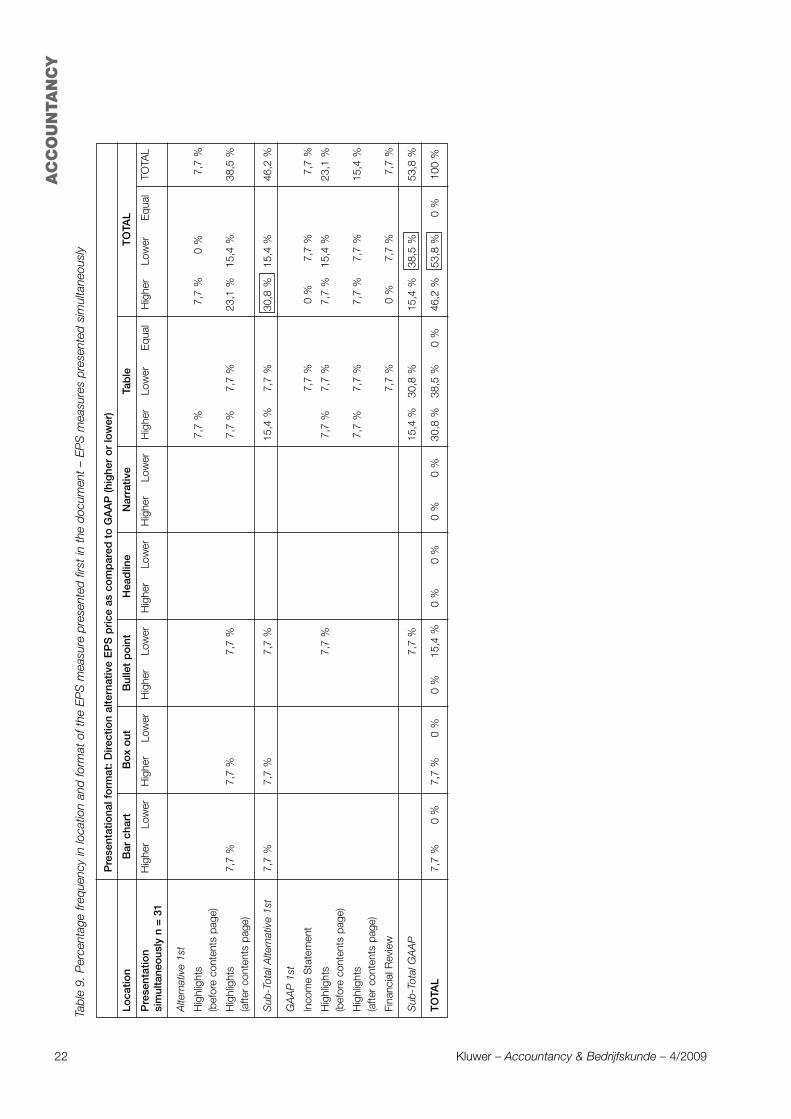
AC
CO
UN
TA
NC
Y
22 Kluwer – Accountancy & Bedrijfskunde – 4/2009
Tabl
e 9.
Per
cent
age
frequ
ency
in lo
catio
n an
d fo
rmat
of t
he E
PS
mea
sure
pre
sent
ed fi
rst
in t
he d
ocum
ent
– EP
S m
easu
res
pres
ente
d si
mul
tane
ousl
y
Pre
sent
atio
nal f
orm
at: D
irect
ion
alte
rnat
ive
EP
S p
rice
as
com
par
ed t
o G
AA
P (h
ighe
r o
r lo
wer
)
Loca
tion
Bar
cha
rtB
ox
out
Bul
let
po
int
Hea
dlin
eN
arra
tive
Tab
leT
OTA
L
Pre
sent
atio
n H
ighe
rLo
wer
Hig
her
Low
erH
ighe
rLo
wer
Hig
her
Low
erH
ighe
rLo
wer
Hig
her
Low
erE
qual
Hig
her
Low
erE
qual
TOTA
Lsi
mul
tane
ous
ly n
= 3
1
Alte
rnat
ive
1st
Hig
hlig
hts
7,7
%7,
7 %
0 %
7,7
%(b
efor
e co
nten
ts p
age)
Hig
hlig
hts
7,7
%7,
7 %
7,7
%7,
7 %
7,7
%23
,1 %
15,4
%38
,5 %
(afte
r co
nten
ts p
age)
Sub
-Tot
al A
ltern
ativ
e 1s
t7,
7 %
7,7
%7,
7 %
15,4
%7,
7 %
30,8
%15
,4 %
46,2
%
GA
AP
1st
Inco
me
Sta
tem
ent
7,7
%0
%7,
7 %
7,7
%
Hig
hlig
hts
7,7
%7,
7 %
7,7
%7,
7 %
15,4
%23
,1 %
(bef
ore
cont
ents
pag
e)
Hig
hlig
hts
7,7
%7,
7 %
7,7
%7,
7 %
15,4
%(a
fter
cont
ents
pag
e)
Fina
ncia
l Rev
iew
7,7
%0
%7,
7 %
7,7
%
Sub
-Tot
al G
AA
P7,
7 %
15,4
%30
,8 %
15,4
%38
,5 %
53,8
%
TO
TAL
7,7
%0
%7,
7 %
0 %
0 %
15,4
%0
%0
%0
%0
%30
,8 %
38,5
%0
%46
,2 %
53,8
%0
%10
0 %
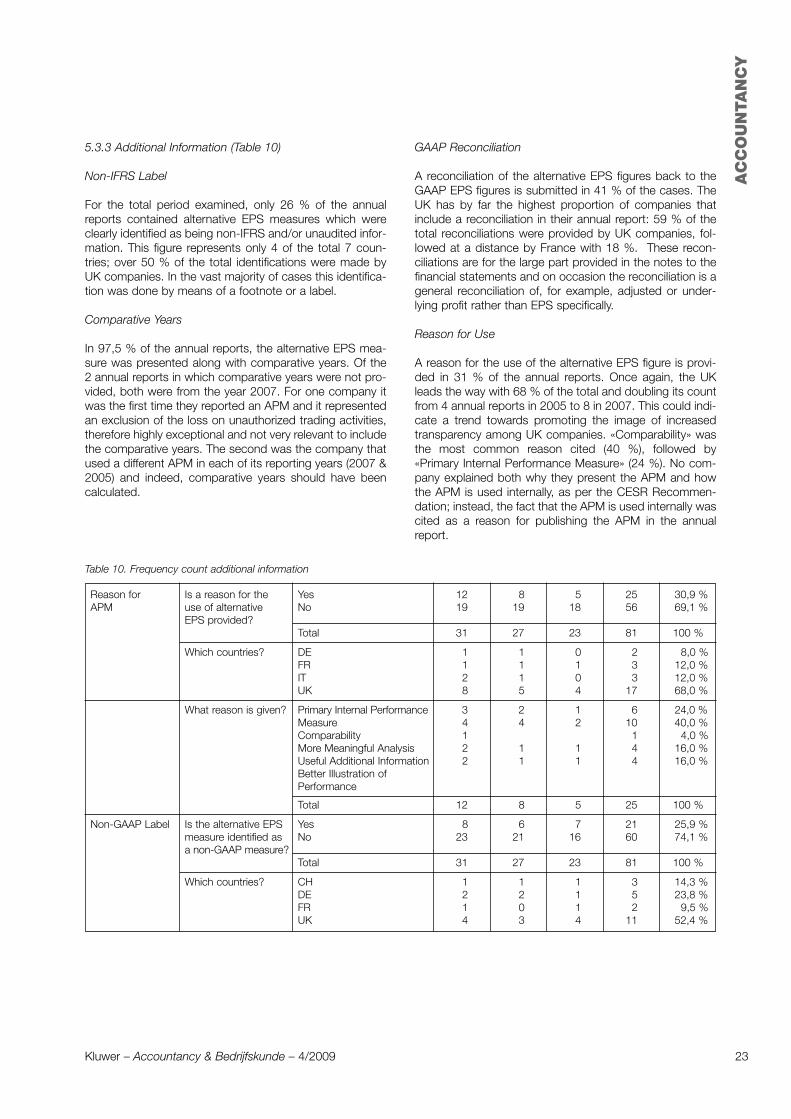
AC
CO
UN
TA
NC
Y
23Kluwer – Accountancy & Bedrijfskunde – 4/2009
5.3.3 Additional Information (Table 10)
Non-IFRS Label
For the total period examined, only 26 % of the annualreports contained alternative EPS measures which wereclearly identified as being non-IFRS and/or unaudited infor-mation. This figure represents only 4 of the total 7 coun-tries; over 50 % of the total identifications were made byUK companies. In the vast majority of cases this identifica-tion was done by means of a footnote or a label.
Comparative Years
In 97,5 % of the annual reports, the alternative EPS mea-sure was presented along with comparative years. Of the2 annual reports in which comparative years were not pro-vided, both were from the year 2007. For one company itwas the first time they reported an APM and it representedan exclusion of the loss on unauthorized trading activities,therefore highly exceptional and not very relevant to includethe comparative years. The second was the company thatused a different APM in each of its reporting years (2007 &2005) and indeed, comparative years should have beencalculated.
GAAP Reconciliation
A reconciliation of the alternative EPS figures back to theGAAP EPS figures is submitted in 41 % of the cases. TheUK has by far the highest proportion of companies thatinclude a reconciliation in their annual report: 59 % of thetotal reconciliations were provided by UK companies, fol-lowed at a distance by France with 18 %. These recon-ciliations are for the large part provided in the notes to thefinancial statements and on occasion the reconciliation is ageneral reconciliation of, for example, adjusted or under-lying profit rather than EPS specifically.
Reason for Use
A reason for the use of the alternative EPS figure is provi-ded in 31 % of the annual reports. Once again, the UKleads the way with 68 % of the total and doubling its countfrom 4 annual reports in 2005 to 8 in 2007. This could indi-cate a trend towards promoting the image of increasedtransparency among UK companies. «Comparability» wasthe most common reason cited (40 %), followed by«Primary Internal Performance Measure» (24 %). No com-pany explained both why they present the APM and howthe APM is used internally, as per the CESR Recommen-dation; instead, the fact that the APM is used internally wascited as a reason for publishing the APM in the annualreport.
Table 10. Frequency count additional information
Reason for Is a reason for the Yes 12 8 5 25 30,9 %APM use of alternative No 19 19 18 56 69,1 %
EPS provided?Total 31 27 23 81 100 %
Which countries? DE 1 1 0 2 8,0 %FR 1 1 1 3 12,0 %IT 2 1 0 3 12,0 %UK 8 5 4 17 68,0 %
What reason is given? Primary Internal Performance 3 2 1 6 24,0 %Measure 4 4 2 10 40,0 %Comparability 1 1 4,0 %More Meaningful Analysis 2 1 1 4 16,0 %Useful Additional Information 2 1 1 4 16,0 %Better Illustration ofPerformance
Total 12 8 5 25 100 %
Non-GAAP Label Is the alternative EPS Yes 8 6 7 21 25,9 %measure identified as No 23 21 16 60 74,1 %a non-GAAP measure?
Total 31 27 23 81 100 %
Which countries? CH 1 1 1 3 14,3 %DE 2 2 1 5 23,8 %FR 1 0 1 2 9,5 %UK 4 3 4 11 52,4 %
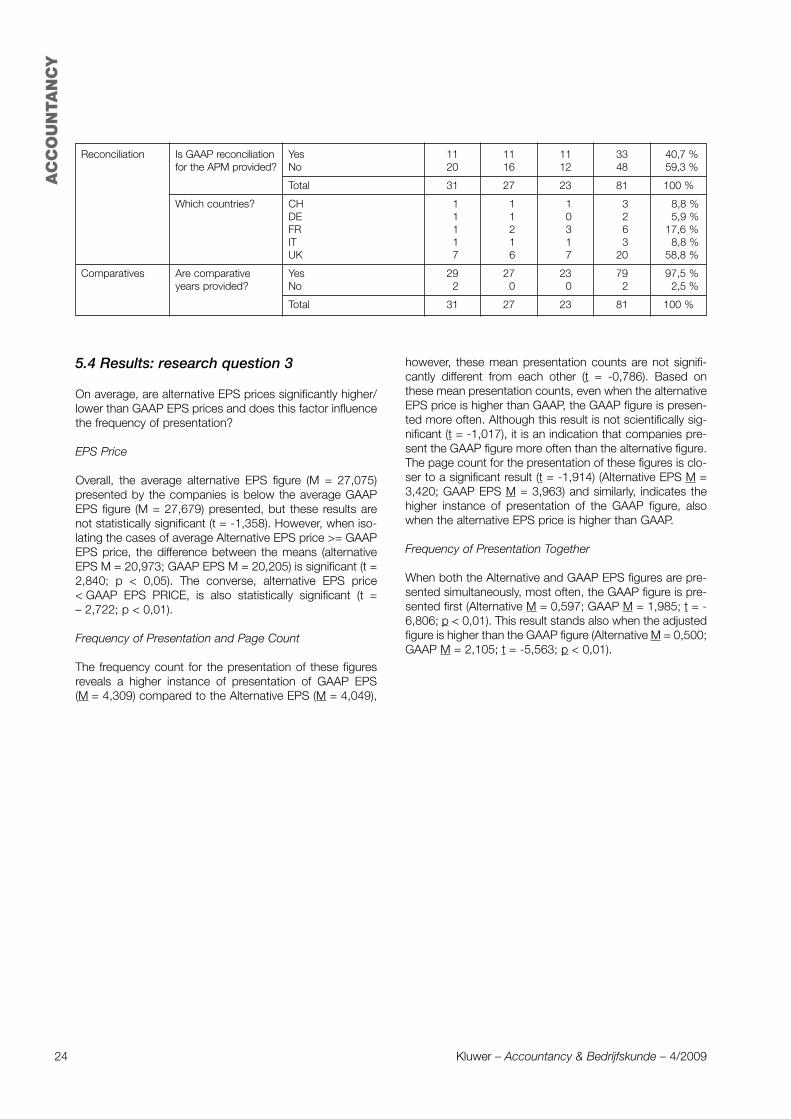
AC
CO
UN
TA
NC
Y
24 Kluwer – Accountancy & Bedrijfskunde – 4/2009
Reconciliation Is GAAP reconciliation Yes 11 11 11 33 40,7 %for the APM provided? No 20 16 12 48 59,3 %
Total 31 27 23 81 100 %
Which countries? CH 1 1 1 3 8,8 %DE 1 1 0 2 5,9 %FR 1 2 3 6 17,6 %IT 1 1 1 3 8,8 %UK 7 6 7 20 58,8 %
Comparatives Are comparative Yes 29 27 23 79 97,5 %years provided? No 2 0 0 2 2,5 %
Total 31 27 23 81 100 %
5.4 Results: research question 3
On average, are alternative EPS prices significantly higher/lower than GAAP EPS prices and does this factor influencethe frequency of presentation?
EPS Price
Overall, the average alternative EPS figure (M = 27,075)presented by the companies is below the average GAAPEPS figure (M = 27,679) presented, but these results arenot statistically significant (t = -1,358). However, when iso-lating the cases of average Alternative EPS price >= GAAPEPS price, the difference between the means (alternativeEPS M = 20,973; GAAP EPS M = 20,205) is significant (t =2,840; p < 0,05). The converse, alternative EPS price< GAAP EPS PRICE, is also statistically significant (t =– 2,722; p < 0,01).
Frequency of Presentation and Page Count
The frequency count for the presentation of these figuresreveals a higher instance of presentation of GAAP EPS(M = 4,309) compared to the Alternative EPS (M = 4,049),
however, these mean presentation counts are not signifi-cantly different from each other (t = -0,786). Based onthese mean presentation counts, even when the alternativeEPS price is higher than GAAP, the GAAP figure is presen-ted more often. Although this result is not scientifically sig-nificant (t = -1,017), it is an indication that companies pre-sent the GAAP figure more often than the alternative figure.The page count for the presentation of these figures is clo-ser to a significant result (t = -1,914) (Alternative EPS M =3,420; GAAP EPS M = 3,963) and similarly, indicates thehigher instance of presentation of the GAAP figure, alsowhen the alternative EPS price is higher than GAAP.
Frequency of Presentation Together
When both the Alternative and GAAP EPS figures are pre-sented simultaneously, most often, the GAAP figure is pre-sented first (Alternative M = 0,597; GAAP M = 1,985; t = -6,806; p < 0,01). This result stands also when the adjustedfigure is higher than the GAAP figure (Alternative M = 0,500;GAAP M = 2,105; t = -5,563; p < 0,01).
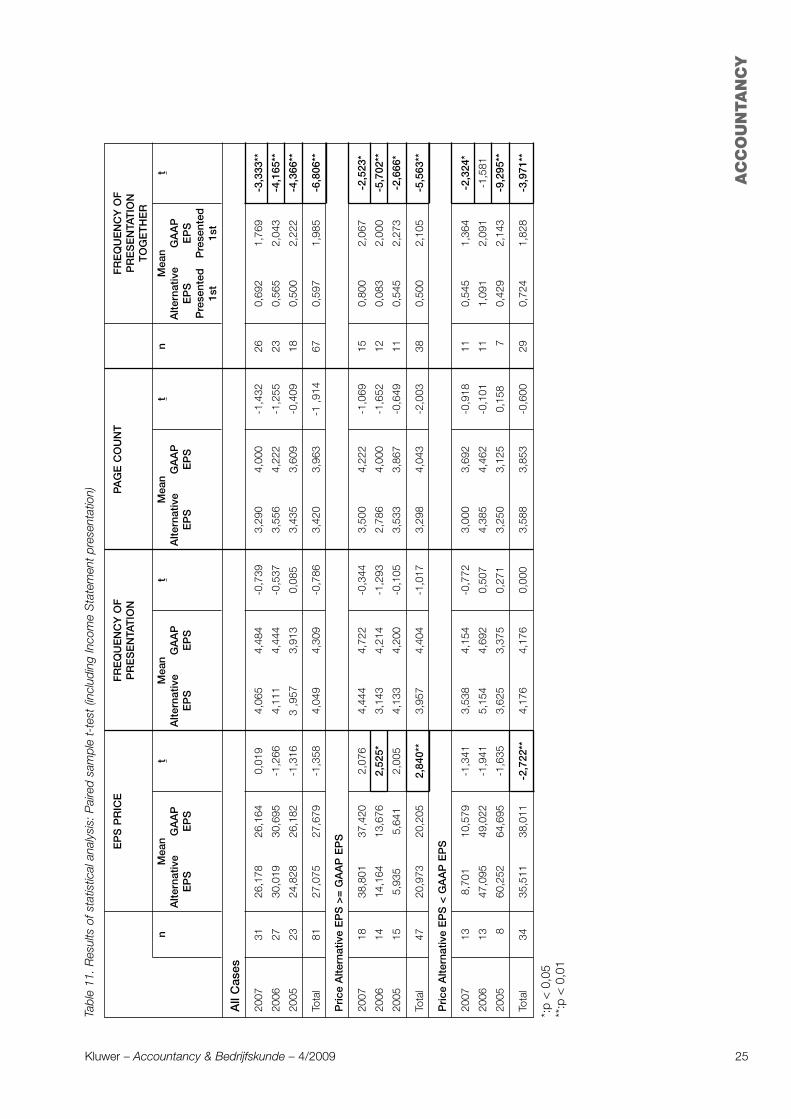
Tabl
e 11
. R
esul
ts o
f sta
tistic
al a
naly
sis:
Pai
red
sam
ple
t-te
st (i
nclu
ding
Inco
me
Sta
tem
ent
pres
enta
tion)
EP
S P
RIC
EF
RE
QU
EN
CY
OF
PA
GE
CO
UN
TF
RE
QU
EN
CY
OF
PR
ES
EN
TAT
ION
PR
ES
EN
TAT
ION
TO
GE
TH
ER
nM
ean
tM
ean
tM
ean
tn
Mea
nt
Alte
rnat
ive
GA
AP
Alte
rnat
ive
GA
AP
Alte
rnat
ive
GA
AP
Alte
rnat
ive
GA
AP
EP
SE
PS
EP
SE
PS
EP
SE
PS
EP
SE
PS
Pre
sent
edP
rese
nted
1st
1st
All
Cas
es
2007
3126
,178
26,1
640,
019
4,06
54,
484
-0,7
393,
290
4,00
0-1
,432
260,
692
1,76
9-3
,333
**
2006
2730
,019
30,6
95-1
,266
4,11
14,
444
-0,5
373,
556
4,22
2-1
,255
230,
565
2,04
3-4
,165
**
2005
2324
,828
26,1
82-1
,316
3 ,9
573,
913
0,08
53,
435
3,60
9-0
,409
180,
500
2,22
2-4
,366
**
Tota
l81
27,0
7527
,679
-1,3
584,
049
4,30
9-0
,786
3,42
03,
963
-1 ,9
14
670,
597
1,98
5-6
,806
**
Pri
ce A
ltern
ativ
e E
PS
>=
GA
AP
EP
S
2007
1838
,801
37,4
202,
076
4,44
44,
722
-0,3
443,
500
4,22
2-1
,069
150,
800
2,06
7-2
,523
*
2006
1414
,164
13,6
762,
525*
3,14
34,
214
-1,2
932,
786
4,00
0-1
,652
120,
083
2,00
0-5
,702
**
2005
155,
935
5,64
12,
005
4,13
34,
200
-0,1
053,
533
3,86
7-0
,649
110,
545
2,27
3-2
,666
*
Tota
l47
20,9
7320
,205
2,84
0**
3,95
74,
404
-1,0
173,
298
4,04
3-2
,003
380,
500
2,10
5-5
,563
**
Pri
ce A
ltern
ativ
e E
PS
< G
AA
P E
PS
2007
138,
701
10,5
79-1
,341
3,53
84,
154
-0,7
723,
000
3,69
2-0
,918
110,
545
1,36
4-2
,324
*
2006
1347
,095
49,0
22-1
,941
5,15
44,
692
0,50
74,
385
4,46
2-0
,101
111,
091
2,09
1-1
,581
2005
860
,252
64,6
95-1
,635
3,62
53,
375
0,27
13,
250
3,12
50,
158
70,
429
2,14
3-9
,295
**
Tota
l34
35,5
1138
,011
-2,7
22**
4,17
64,
176
0,00
03,
588
3,85
3-0
,600
290,
724
1,82
8-3
,971
**
*:p
< 0
,05
**:p
< 0
,01
AC
CO
UN
TA
NC
Y
25Kluwer – Accountancy & Bedrijfskunde – 4/2009
AC
CO
UN
TA
NC
Y
6. Conclusions
6.1 Findings
The steady rise in companies reporting alternative EPSfrom 2005 to 2007 supports the expectation of CESR thatthe use of APMs would increase with the introduction ofIFRS. Furthermore, as the number of companies reportingmore than one alternative EPS measure per document hasrisen from 2005, so too has the total number of APMs pre-sented per annual report. The reasons behind these in-creases could simply lie in a trend that has caught onamong companies or industries and within countries.Surveys published by the large accounting firms and publicrelations initiatives such as «Report Leadership6» in the UK,advocate the responsible use of APMs in good corporatereporting and this has undoubtedly had a degree of in-fluence on the APM trend.
Of course, the interests of managements and the desire toreport the best performance figures could also be a strongmotivator for the increases. In line with the results ofBhattacharya et al. (2003), Allee et al. (2007), Johnson andSchwartz (2003), Lougee and Marquardt (2003), in whichthe pro forma figure was found most often to present ahigher value than the GAAP figure, the results of this studyindicate that 52 % of the total primary alternative EPSprices disclosed were higher than the GAAP EPS price(7 % were equal). In each year, as the number of reportingcompanies increased, the higher-than-GAAP alternativeEPS prices were always in the majority indicating that theincrease in reporting could be linked to managements wan-ting to present the best performance figure. However, theslight increase in the number of companies reporting morethan one alternative EPS figure, of which only 23 % of thetotal are presentations of a higher-than-GAAP alternativeEPS price, leans more towards the idea that the disclosureof APMs is an unselfish act of managements to offer theirmost relevant measure of performance. Interestingly,though, the companies that report a second and third alter-native EPS measure are almost exclusively from the UK,thus this notion may have more to do with national disclo-sure trends.
If annual reports are largely read sequentially, one coulddraw the conclusion that the sections at the beginning ofthe document, particularly the Highlights sections, aremore likely to be read by the user. By extension, the infor-mation presented in these sections is more likely to beused by the companies to disclose measures and figuresthey consider important for the user to know and/or wantthe user to see. Furthermore, given, as an example, thatthe average number of pages per the 2007 annual reportsof this sample was 259, it may be a fair assumption that thedocument is not read thoroughly and completely. Thus,one could surmise that information presented in a moreprominent format such as a bar chart, is more likely tostand out on the page and therefore be examined by theuser. Further, the combination of a prominent presentatio-nal format in a non-narrative section at the beginning of the
document, is likely to stand out in the hundreds of pages ofthe document.
Based on this study, the alternative EPS measure wasmore likely to be presented in the Highlights (after contentspage), in format a primarily graphical and non-narrativesection located within the first 20 pages of the document,and the Financial Review, a largely narrative section. GAAPEPS was more likely to be presented in the OFR or Finan-cial Review sections, both of which are largely narrativebased sections. Alternative EPS was twice as likely thanGAAP to be presented in a graphical (bar chart) or non-nar-rative (box out, bullet point, headline) format. GAAP EPS(57 %) was presented more often in a table than alternativeEPS (39 %). Thus alternative EPS tends to be presented ina format more easily processed by the user.
An indication exists that companies prefer to present first inthe document, the measure that portrays a better perfor-mance. This is further evidenced in the instances whenboth measures are presented together and indicates adegree of opportunism and impression management inpresentation.
In total, although the mean GAAP presentation count andpage count was higher than the APM, the results were notstatistically different, even in the instances of the APM pricehigher than the GAAP. However, when both measures werepresented together the mean presentation of the GAAPmeasure before the APM was statistically higher. Thus, theCESR Recommendation that APMs should be not be pre-sented with more prominence than the GAAP measure isgenerally upheld, based on this sample.
The majority of alternative EPS terms used were suchgeneric terms as «Adjusted EPS» and «Underlying EPS»behind which the variety and type (income-increasing ordecreasing) of exclusions was vast. Whether the use ofsuch terms improves comparability with other companiesand industries and helps investors in acquiring informationis difficult to ascertain from this study and open to consi-derable further debate.
6.2 Recommendations
Many critics of APMs may propose it would help investorsto have standard definitions of APMs and on the face of it,it would seem sensible given the myriad of variations inexclusions even observed in this study. However, as thenature of an APM is that it allows the company to presententity-specific information, these competing intentions aredifficult to reconcile simultaneously. The CESR recommen-dations regarding additional information could be followedmore rigorously, given that so few companies chose tolabel their alternative EPS presentations as non-IFRS infor-mation, provide a reconciliation back to the GAAP figuresor explain why they present the APM and how it is used bymanagement to run the business.
26 Kluwer – Accountancy & Bedrijfskunde – 4/2009
AC
CO
UN
TA
NC
Y
27Kluwer – Accountancy & Bedrijfskunde – 4/2009
6.3 Limitations
The countries represented in this study may not be entirelyreflective of the EU as a whole; the UK was most heavilyrepresented in the sample and clearly is different in its dis-closure practices from other countries. Perhaps, furtherresearch could address this by selecting the number ofcompanies represented from each country, thereby offeringa more comprehensive view of the EU.
The choice of the measure EPS as the APM to be scruti-nized may be a measure used by certain industries morethan others and the results for this APM could be affectedby the disclosure practices of these industries. Furtherresearch could address this clustering to ensure a morerepresentative sample of industry.
Further, the consistency of APM terms and their exclusionsper year could have been analyzed further to judge com-parability between years, companies, industries and coun-tries. Further, an analysis that was beyond the scope of thisstudy, it could be interesting to examine the APM andexclusions in terms of their increased regularity: at whatpoint (after how many years) does an item excluded fromincome in an APM become regular to the company’s in-come?
7. References
ALLEE, K., BHATTACHARYA, N., BLACK, E. and CHRISTENSEN, T.,«Pro forma disclosure and investor sophistication: externalvalidation of experiments evidence using archival data»,Accounting, Organizations and Society 2007, 32 (3), 201-222.
BEATTIE, V., DHANANI, A. and JONES, M.J., «Investigating pre-sentational change in UK annual reports», Journal ofBusiness Communication 2008, 45 (2), 181-222.
BHATTACHARYA, N., BLACK, E., CHRISTENSEN, T. and LARSON, C.,«Assessing the relative informativeness and permanence ofpro forma earnings and GAAP operating earnings», Journalof Accounting and Economics 2003, 36 (1-3), 285-319.
BHATTACHARYA, N., BLACK, E., CHRISTENSEN, T. and MERGEN-THALER, R., «Empirical Evidence on Recent Trends in ProForma Reporting», Accounting Horizons 2004, 18 (1), 27-43.
BHATTACHARYA, N., BLACK, E., CHRISTENSEN, T. and MERGEN-THALER, R., «Who trades on pro forma earnings informa-tion?», The Accounting Review 2007, 82 (3), 581-619.
BOWEN, R.M., DAVIS A.K. and MATSUMOTO, D.A., «Emphasison pro forma versus GAAP earnings in quarterly pressreleases: Determinants, SEC intervention, and market reac-tions», The Accounting Review 2005, 80 (4), 1011-1038.
BROUWER, A., VAN DAM, L. and WRIGHT, I., Presentation ofincome under IFRS: flexibility and consistency explored,PricewaterhouseCoopers, 2007, 20 p.
CESR, Recommendation on Alternative PerformanceMeasures 2005, Ref: CESR/05-178b, 8 p.
CHOI, Y.-S., LIN, S., WALKER M. and YOUNG, S., «Disagree-ment Over the Persistence of Earnings Components: Evi-dence on the Properties of Management-Specific Adjust-ments to GAAP Earnings», Review of Accounting Studies2007, 12 (4), 595-622.
DESANCTIS, G. and JARVENPAA, S.L., «Graphical presentationof accounting data for financial forecasting: An experimen-tal investigation», Accounting, Organizations, and Society1989, 14 (5/6), 509-525.
DOYLE, J.T., LUNDHOLM, R.J. and SOLIMAN, M.T., «The pre-dictive value of expenses excluded from pro forma ear-nings», Review of Accounting Studies 2003, 8 (2-3), 145-174.
ELLIOTT, B., «Are investors influenced by pro forma empha-sis and reconciliations in earnings announcements?», TheAccounting Review 2006, 81 (1), 113-133.
ENTWHISTLE, G., FELTHAM, G. and MBAGWU, C., «MisleadingDisclosure of Pro Forma Earnings: An Empirical Exami-nation», Journal of Business Ethics 2006, 69 (4), 355-372.
FREDERICKSON, J.R. and MILLER, J.S., «The effects of proforma earnings disclosures on analysts’ and nonprofessio-nal investors’ equity valuation judgments», The AccountingReview 2004, 79 (3), 667-686.
HIRSCHLEIFER, D. and TEOH, S.H., «Limited attention, infor-mation disclosure, and financial reporting», Journal ofAccounting and Economics 2003, 36 (1-3), 337-386.
KOLEV, K., MARQUARDT, C. and MCVAY, S., «SEC Scrutinyand the Evolution of Non-GAAP Reporting», The Accoun-ting Review 2008, 83 (1), 157-184.
LOUGEE, B.A. and MARQUARDT, C.A., «Earnings informative-ness and strategic disclosure: an empirical examination of«pro forma» earnings», The Accounting Review 2004, 79(3), 769-795.
JOHNSON, W.B. and SCHWARTZ, W.C., «Are investors misledby «pro forma» earnings?», Contemporary AccountingResearch 2005, 22 (4), 915-963.
MAINES, L.A. and MCDANIEL, L.S., «Effects of Comprehen-sive-Income Characteristics on Nonprofessional Investors’Judgments: The Role of Financial-Statement PresentationFormat», The Accounting Review 2000, 75 (2), 179-207.
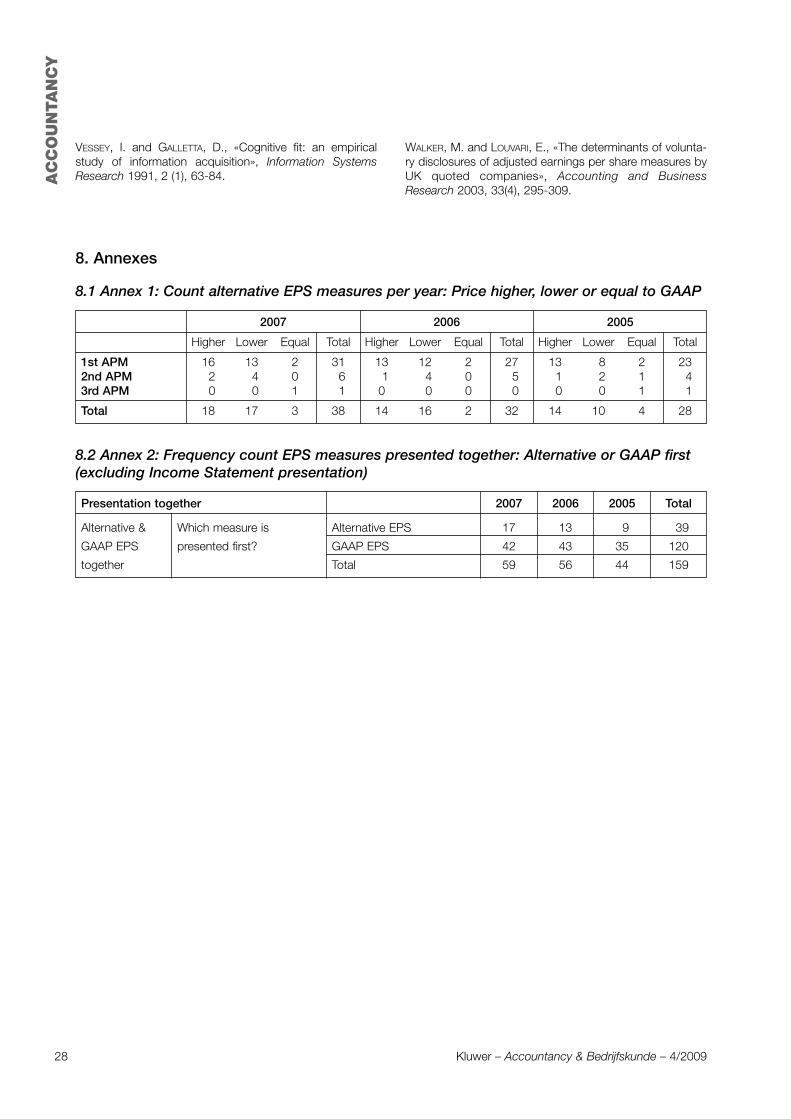
AC
CO
UN
TA
NC
Y
28 Kluwer – Accountancy & Bedrijfskunde – 4/2009
VESSEY, I. and GALLETTA, D., «Cognitive fit: an empiricalstudy of information acquisition», Information SystemsResearch 1991, 2 (1), 63-84.
WALKER, M. and LOUVARI, E., «The determinants of volunta-ry disclosures of adjusted earnings per share measures byUK quoted companies», Accounting and BusinessResearch 2003, 33(4), 295-309.
8. Annexes
8.1 Annex 1: Count alternative EPS measures per year: Price higher, lower or equal to GAAP
2007 2006 2005
Higher Lower Equal Total Higher Lower Equal Total Higher Lower Equal Total
1st APM 16 13 2 31 13 12 2 27 13 8 2 232nd APM 2 4 0 6 1 4 0 5 1 2 1 43rd APM 0 0 1 1 0 0 0 0 0 0 1 1
Total 18 17 3 38 14 16 2 32 14 10 4 28
8.2 Annex 2: Frequency count EPS measures presented together: Alternative or GAAP first(excluding Income Statement presentation)
Presentation together 2007 2006 2005 Total
Alternative & Which measure is Alternative EPS 17 13 9 39
GAAP EPS presented first? GAAP EPS 42 43 35 120
together Total 59 56 44 159
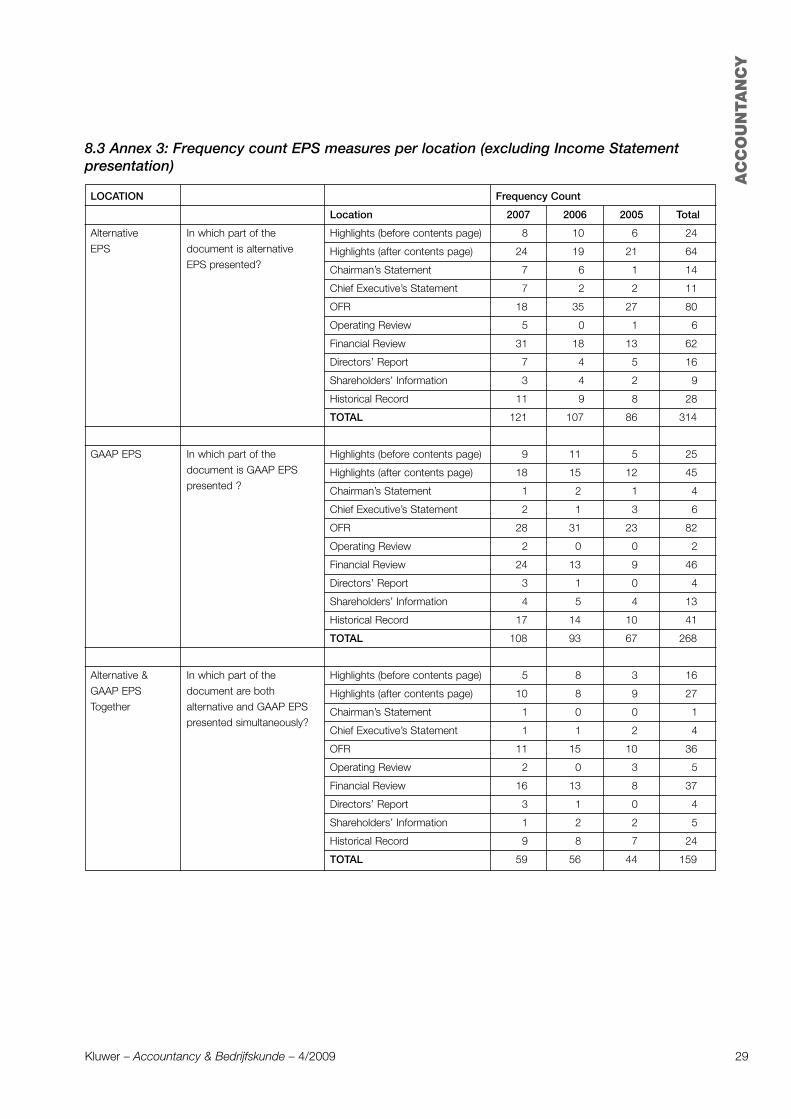
AC
CO
UN
TA
NC
Y
29Kluwer – Accountancy & Bedrijfskunde – 4/2009
8.3 Annex 3: Frequency count EPS measures per location (excluding Income Statementpresentation)
LOCATION Frequency Count
Location 2007 2006 2005 Total
Alternative In which part of the Highlights (before contents page) 8 10 6 24
EPS document is alternative Highlights (after contents page) 24 19 21 64EPS presented? Chairman’s Statement 7 6 1 14
Chief Executive’s Statement 7 2 2 11
OFR 18 35 27 80
Operating Review 5 0 1 6
Financial Review 31 18 13 62
Directors’ Report 7 4 5 16
Shareholders’ Information 3 4 2 9
Historical Record 11 9 8 28
TOTAL 121 107 86 314
GAAP EPS In which part of the Highlights (before contents page) 9 11 5 25
document is GAAP EPS Highlights (after contents page) 18 15 12 45presented ? Chairman’s Statement 1 2 1 4
Chief Executive’s Statement 2 1 3 6
OFR 28 31 23 82
Operating Review 2 0 0 2
Financial Review 24 13 9 46
Directors’ Report 3 1 0 4
Shareholders’ Information 4 5 4 13
Historical Record 17 14 10 41
TOTAL 108 93 67 268
Alternative & In which part of the Highlights (before contents page) 5 8 3 16
GAAP EPS document are both Highlights (after contents page) 10 8 9 27Together alternative and GAAP EPS Chairman’s Statement 1 0 0 1
presented simultaneously?Chief Executive’s Statement 1 1 2 4
OFR 11 15 10 36
Operating Review 2 0 3 5
Financial Review 16 13 8 37
Directors’ Report 3 1 0 4
Shareholders’ Information 1 2 2 5
Historical Record 9 8 7 24
TOTAL 59 56 44 159
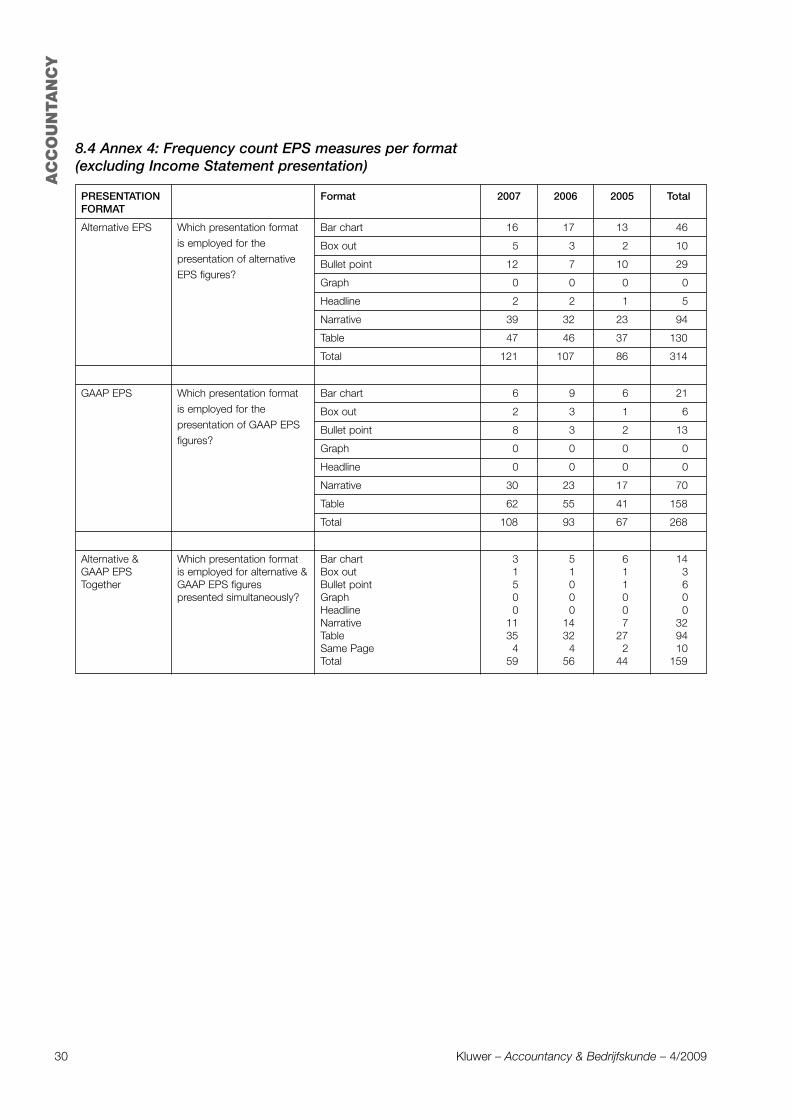
AC
CO
UN
TA
NC
Y
30 Kluwer – Accountancy & Bedrijfskunde – 4/2009
8.4 Annex 4: Frequency count EPS measures per format(excluding Income Statement presentation)
PRESENTATION Format 2007 2006 2005 TotalFORMAT
Alternative EPS Which presentation format Bar chart 16 17 13 46
is employed for the Box out 5 3 2 10presentation of alternative Bullet point 12 7 10 29EPS figures?
Graph 0 0 0 0
Headline 2 2 1 5
Narrative 39 32 23 94
Table 47 46 37 130
Total 121 107 86 314
GAAP EPS Which presentation format Bar chart 6 9 6 21
is employed for the Box out 2 3 1 6presentation of GAAP EPS Bullet point 8 3 2 13figures?
Graph 0 0 0 0
Headline 0 0 0 0
Narrative 30 23 17 70
Table 62 55 41 158
Total 108 93 67 268
Alternative & Which presentation format Bar chart 3 5 6 14GAAP EPS is employed for alternative & Box out 1 1 1 3Together GAAP EPS figures Bullet point 5 0 1 6
presented simultaneously? Graph 0 0 0 0Headline 0 0 0 0Narrative 11 14 7 32Table 35 32 27 94Same Page 4 4 2 10Total 59 56 44 159
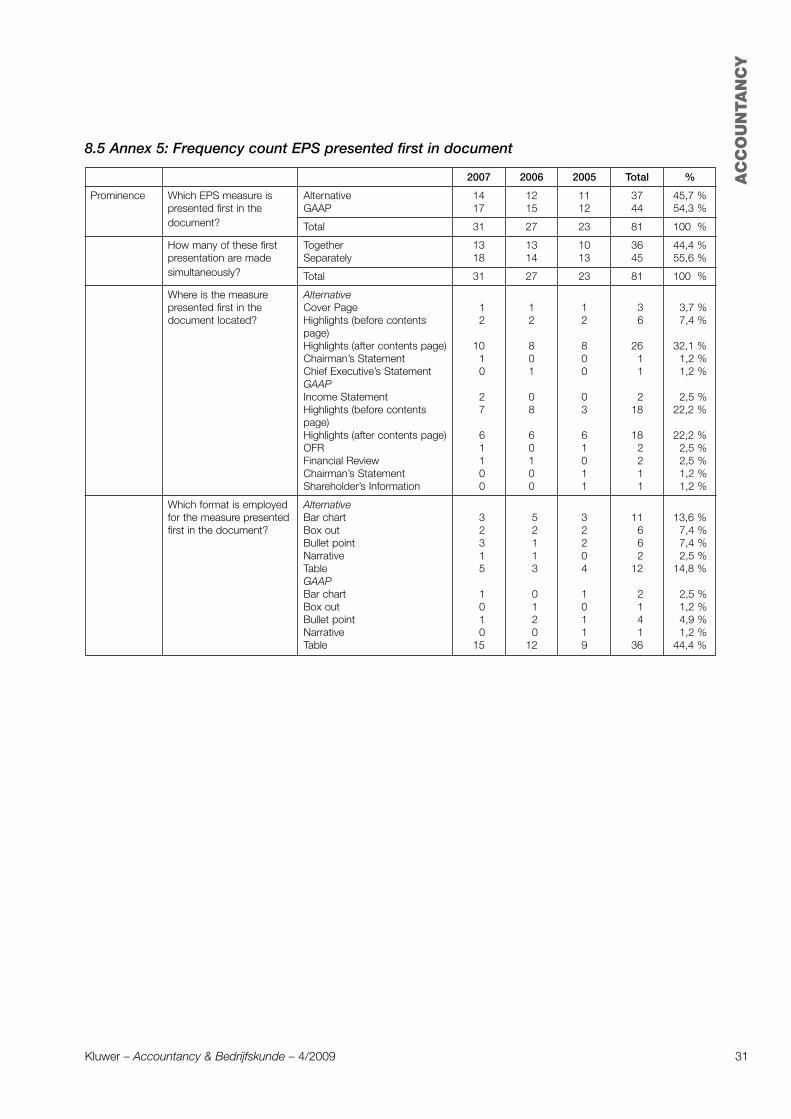
AC
CO
UN
TA
NC
Y
31Kluwer – Accountancy & Bedrijfskunde – 4/2009
8.5 Annex 5: Frequency count EPS presented first in document
2007 2006 2005 Total %
Prominence Which EPS measure is Alternative 14 12 11 37 45,7 %presented first in the GAAP 17 15 12 44 54,3 %document? Total 31 27 23 81 100 %
How many of these first Together 13 13 10 36 44,4 %presentation are made Separately 18 14 13 45 55,6 %simultaneously? Total 31 27 23 81 100 %
Where is the measure Alternativepresented first in the Cover Page 1 1 1 3 3,7 %document located? Highlights (before contents 2 2 2 6 7,4 %
page)Highlights (after contents page) 10 8 8 26 32,1 %Chairman’s Statement 1 0 0 1 1,2 %Chief Executive’s Statement 0 1 0 1 1,2 %GAAPIncome Statement 2 0 0 2 2,5 %Highlights (before contents 7 8 3 18 22,2 %page)Highlights (after contents page) 6 6 6 18 22,2 %OFR 1 0 1 2 2,5 %Financial Review 1 1 0 2 2,5 %Chairman’s Statement 0 0 1 1 1,2 %Shareholder’s Information 0 0 1 1 1,2 %
Which format is employed Alternativefor the measure presented Bar chart 3 5 3 11 13,6 %first in the document? Box out 2 2 2 6 7,4 %
Bullet point 3 1 2 6 7,4 %Narrative 1 1 0 2 2,5 %Table 5 3 4 12 14,8 %GAAPBar chart 1 0 1 2 2,5 %Box out 0 1 0 1 1,2 %Bullet point 1 2 1 4 4,9 %Narrative 0 0 1 1 1,2 %Table 15 12 9 36 44,4 %
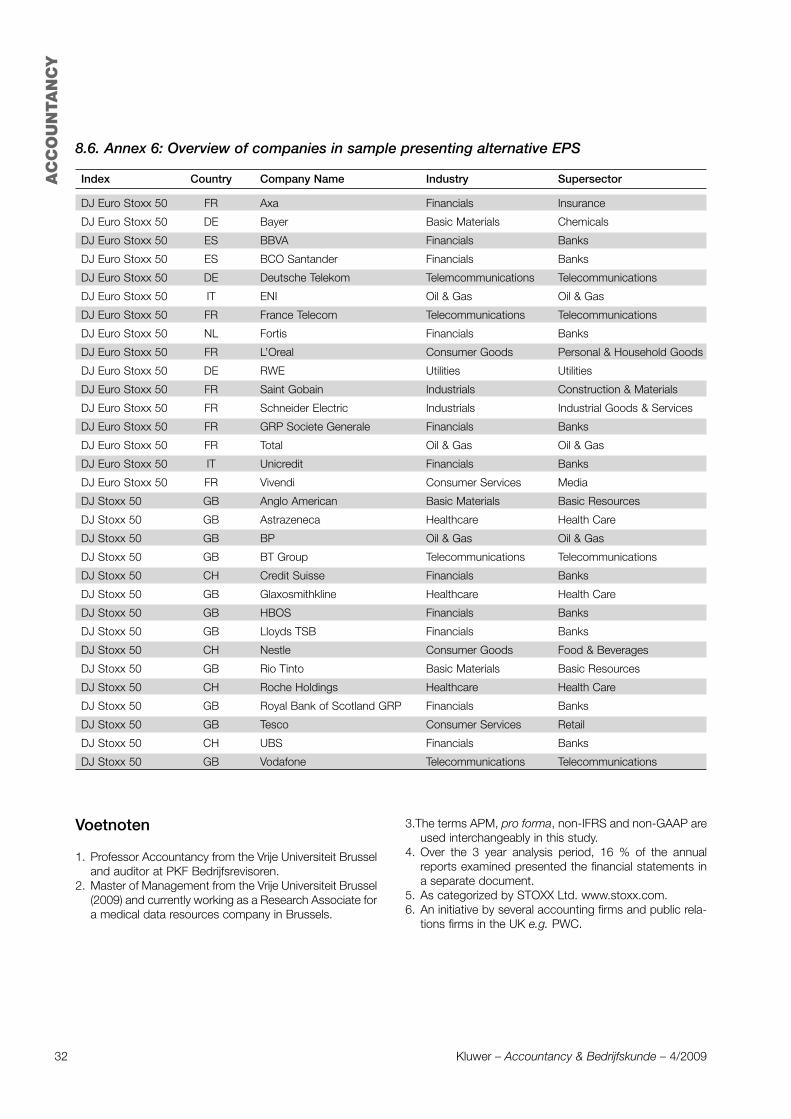
AC
CO
UN
TA
NC
Y
32 Kluwer – Accountancy & Bedrijfskunde – 4/2009
8.6. Annex 6: Overview of companies in sample presenting alternative EPS
Index Country Company Name Industry Supersector
DJ Euro Stoxx 50 FR Axa Financials Insurance
DJ Euro Stoxx 50 DE Bayer Basic Materials Chemicals
DJ Euro Stoxx 50 ES BBVA Financials Banks
DJ Euro Stoxx 50 ES BCO Santander Financials Banks
DJ Euro Stoxx 50 DE Deutsche Telekom Telemcommunications Telecommunications
DJ Euro Stoxx 50 IT ENI Oil & Gas Oil & Gas
DJ Euro Stoxx 50 FR France Telecom Telecommunications Telecommunications
DJ Euro Stoxx 50 NL Fortis Financials Banks
DJ Euro Stoxx 50 FR L’Oreal Consumer Goods Personal & Household Goods
DJ Euro Stoxx 50 DE RWE Utilities Utilities
DJ Euro Stoxx 50 FR Saint Gobain Industrials Construction & Materials
DJ Euro Stoxx 50 FR Schneider Electric Industrials Industrial Goods & Services
DJ Euro Stoxx 50 FR GRP Societe Generale Financials Banks
DJ Euro Stoxx 50 FR Total Oil & Gas Oil & Gas
DJ Euro Stoxx 50 IT Unicredit Financials Banks
DJ Euro Stoxx 50 FR Vivendi Consumer Services Media
DJ Stoxx 50 GB Anglo American Basic Materials Basic Resources
DJ Stoxx 50 GB Astrazeneca Healthcare Health Care
DJ Stoxx 50 GB BP Oil & Gas Oil & Gas
DJ Stoxx 50 GB BT Group Telecommunications Telecommunications
DJ Stoxx 50 CH Credit Suisse Financials Banks
DJ Stoxx 50 GB Glaxosmithkline Healthcare Health Care
DJ Stoxx 50 GB HBOS Financials Banks
DJ Stoxx 50 GB Lloyds TSB Financials Banks
DJ Stoxx 50 CH Nestle Consumer Goods Food & Beverages
DJ Stoxx 50 GB Rio Tinto Basic Materials Basic Resources
DJ Stoxx 50 CH Roche Holdings Healthcare Health Care
DJ Stoxx 50 GB Royal Bank of Scotland GRP Financials Banks
DJ Stoxx 50 GB Tesco Consumer Services Retail
DJ Stoxx 50 CH UBS Financials Banks
DJ Stoxx 50 GB Vodafone Telecommunications Telecommunications
Voetnoten
1. Professor Accountancy from the Vrije Universiteit Brusseland auditor at PKF Bedrijfsrevisoren.
2. Master of Management from the Vrije Universiteit Brussel(2009) and currently working as a Research Associate fora medical data resources company in Brussels.
3.The terms APM, pro forma, non-IFRS and non-GAAP areused interchangeably in this study.
4. Over the 3 year analysis period, 16 % of the annualreports examined presented the financial statements ina separate document.
5. As categorized by STOXX Ltd. www.stoxx.com.6. An initiative by several accounting firms and public rela-
tions firms in the UK e.g. PWC.