Influence of stage of maturity of grass silages on ... · Hans van Das1er, Rinus Donkers, Jos van...
156
Influence of stage of maturity of grass silages on digestion processes in dairy cows
Transcript of Influence of stage of maturity of grass silages on ... · Hans van Das1er, Rinus Donkers, Jos van...
Influence of stage of maturity of grass silages on digestion processes in dairy cows
Promotoren : dr. ir. S. Tamminga, buitengewoon hoogleraar
op het vakgebied van de veevoeding in het
bijzonder de voeding van herkauwers
dr. P.W.M, van Adrichem, hoogleraar in de
algemene- en landbouwhuisdierfysiologie
Co-promotor : dr. ir. J. van Bruchem, universitair
hoofddocent, vakgoep Fysiologie van Mens en
Dier
H ^cxl/o» ; / ^ . \ ;
M.W. Bo sch
Influence of stage of maturity of grass silages on digestion processes in dairy cows.
Proefschrift
ter verkrijging van de graad van
doctor in de landbouwwetenschappen,
op gezag avn de rector magnificus,
dr. H.C. van der Plas,
in het openbaar te verdedigen
op vrijdag 10 mei 1991
des namiddags te vier uur in de aula
van de Landbouwuniversiteit te Wageningen.
LAÏiDBOUWUNIVERSOEa WAGMWGm
fjtJOPZOl, JY7S
Stellingen
Het vloeistofvolume in de pens van koeien is sterker gerelateerd aan het lichaamsgewicht van de dieren dan aan het lactatiestadium of de voersamenstelling. (Dit proefschrift)
Afname in pensvulling van met grassilage gevoerde koeien wordt niet in de eerste plaats beperkt door verkleining van lange voerdeeltjes, maar door de afvoer van deeltjes die een zeefopening van 1,25 mm wel en één van 0,071 mm niet kunnen passeren. (Dit proefschrift)
Wanneer koeien per etmaal 9 uur of langer herkauwen, resulteert een verhoging van het celwandgehalte van het rantsoen niet in een verlenging van de herkauwtijd, maar in een verlaging van de opname. (Dit proefschrift)
Voor het bepalen van de hoeveelheid microbiëel eiwit in de pens is DAPA geen goede indicator. (Dit proefschrift)
De hoeveelheid droge stof in de pens van koeien, uitgedrukt in g per kg lichaamsgewicht, wordt voor meer 'dan 75% verklaard door de melkproduktie (g FCM/kg0-75) . (Dit proefschrift)
De verklaring van Himmelsbach et al. dat een stijging van het N-gehalte in het residu van grassilages tussen 48 en 336 uur pensincubatie waarschijnlijk veroorzaakt wordt door microbiële contaminatie, berust op een foutieve interpretatie van de resultaten. (Himmelsbach et al., 1988; In: Analytical Applications of Spectroscopy: C S . Creaser and A.M.C. Davies [Eds.], The Royal Society of Chemistry, 410-413).
Het berekenen van de DVE-waarde van een voedermiddel is een ingewikkelde zaak, het vaststellen ervan vooralsnog onmogelijk.
Het begrip ileaal verteerbare aminozuren voor varkens wordt in de CVB-tabel ten onrechte aangeduid met de term darmver-teerbare aminozuren voor varkens.
De uitspraak van de politicoloog R. Andeweg (NOS-laat, 19 maart 1991), dat kamerleden meer geïnteresseerd zijn in onze stem dan in onze mening, geeft te denken over het functioneren van onze democratie.
10. Het opstellen van een tussenbalans kan een regeringscoalitie langdurig uit evenwicht brengen.
11. De termen OIO en AIO suggereren ten onrechte dat de eerste wordt opgeleid tot onderzoeker, de tweede slechts tot assistent.
12. Positieve discriminatie bij sollicitaties is in strijd met de wet gelijke behandeling.
Proefschrift van M.W. Bosch. Influence of stage of maturity of grass silages on digestion processes in dairy cows. Wageningen, 10 mei, 1991.

Aan mijn ouders
Aan Peter
Voorwoord
Het in dit proefschrift beschreven onderzoek is uitgevoerd bij
de vakgroep Fysiologie van Mens en Dier in nauwe samenwerking met
de vakgroep Veevoeding, beiden van de Landbouw Universiteit
Wageningen. Vanaf deze plaats wil ik een woord van dank richten
aan iedereen die een bijdrage heeft geleverd aan de
totstandkoming van dit proefschrift.
Zonder het enthousiasme van prof.dr.ir. S. Tamminga, mijn
promotor, zijn bereidheid altijd over de resultaten en de
manuscripten te discussiëren en zijn kritische commentaar,
zou dit proefschrift niet tot stand zijn gekomen.
Prof.dr. P.W.M, van Adrichem, eveneens promotor, wil ik
bedanken voor het goed doornemen van de manuscripten en voor het
opereren van de dieren.
Mijn co-promotor, dr. ir. Jaap van Bruchem, wil ik bedanken voor
zijn grote inzet bij de aanvang van het onderzoek en voor het
kritisch en nauwkeurig doornemen van de manuscripten.
De uitvoering van het onderzoek was niet mogelijk geweest
zonder de hulp van zeer vele mensen.
De medewerkers van proefbedrijf "de Ossekampen", die het
inkuilen van het gras en het melken van de dieren voor hun
rekening hebben genomen. Daarvoor mijn dank.
De verzorging van de dieren tijdens de proeven en de hulp bij
het verzamelen van de vele voer-, pens-, darm- en mestmonsters
was in de goede handen van Germ Bangma, Gij s van Gelderen en Dirk
Vink.
Ton Roos en Gradus Leenders stonden altijd klaar om te hulp te
schieten bij de, natuurlijk altijd onverwachte, technische
calamiteiten.
Het ontwikkelen en nauwkeurig afstemmen van de aparatuur voor
de registratie van de (her)kauwaktiiviteit en pensmotoriek was
in deskundige handen van Wim Bijlsma.
De duizenden monsters die in snel tempo werden verzameld,
moesten daarna nog wel worden geanalyseerd. Vele mensen hebben
daaraan een belangrijke bijdrage geleverd; Toos
Lammers-Wienhoven, Tino Leffering, Dick Bongers, Truus Post en
Jane-Martine Muyleart.
Vele (ex)studenten hebben een deel van het onderzoek
zelfstandig, maar deels ook samen, uitgevoerd. Leerzame
discussies, maar daarnaast ook gezellige uren in de stal en op
het lab hielden de goede stemming erin. Daarvoor mijn dank aan
allemaal: Afke Abma, Marjan Beerthuis, Giny de Bie, Leen van den
Broek, Marjan Brouwer, Francis Brouns, Rob Buiter, Bonne van Dam,
Hans van Das1er, Rinus Donkers, Jos van Doren, Cees van Drunen,
Pascal Elegeert, Harco van Ens, Henk Frederiks, Dorine
Groenevelt, Inge Hageman, Föns Hegeman, Walter Jansen, Nicole
Janssen, Stefan Kaihatu, Hans Koole, Carla Kroonsberg, Carina
Langendoen, Machteid van Maanen, Erwin Maathuis, Monique van Os,
Jaap van Os, Hans Roelofs, Irma Schutte, Simen Stamhuis, Wilfried
van Straalen, Frank Tilly, Hugo Wijnands. Ook de stagiaires Huub
Steins en Ronald Zom hartelijk dank voor hun vele werk.
Marianne Bruining, met wie ik de laatste twee proeven samen heb
uitgevoerd, wil ik bedanken voor de prettige samenwerking, en
succes wensen met de voortgang van het onderzoek.
Verder wil ik zeker niet vergeten alle medewerkers van de
vakgroep Fysiologie van Mens en Dier, maar ook van de vakgroep
Veevoeding, te bedanken voor de vele gezellige uren tijdens de
pauzes.
Contents
Introduction 1
Influence of stage of maturity of grass silages on
digestion processes in dairy cows. 1. Composition,
nylon bag degradation rates, digestibility and intake 9
Influence of stage of maturity of grass silages on
digestion processes in dairy cows. 2. Rumen contents
and ruminai passage rates 33
Influence of stage of maturity of grass silages on
digestion processes in dairy cows. 3. Fermentation
characteristics, rumination activity and distribution
of rumen and faecal particles 49
Influence of stage of maturity of grass silages on
digestion processes in dairy cows. 4. Protein
digestion and microbial protein synthesis in the rumen 71
Ruminai passage rate as affected by Cr-NDF particle
size 59
Passage rate and total clearance rate from the rumen
of cows fed grass silages differing in cell wall
content 101
General discussion 117
Summary 139
Samenvatting 145
Chapter I
Introduction
A suitable climate, combined with a fertile soil has made the
Netherlands an attractive area for dairy production. At present
dairy production in the Netherlands is partly (50 - 55%) based
on homegrown forages (grass, grass silage, corn silage) and
partly on largely imported concentrates. Because of the large
number of dairy cows (2 million) and the limited area available
for grass production, forage production systems are highly
intensified by using high levels of N-fertilisation.
High doses of N-fertilizer result in high outputs of dry matter
per acre. To ensure a high quality, the grass is harvested in a
young stage of growth, resulting in grass silages with a high
nitrogen content and a relatively low cell wall content. The
digestibility of this cell wall fraction is high, allowing high
ad libitum intakes. A disadvantage of harvesting at this stage
is the low utilization of nitrogen. When the grass is harvested
at a later growth stage, the protein:energy ratio is more
favourable, but digestibility of the cell wall fraction decreases
(Reid etal., 1988) .
In 1984 a milk quota system was introduced in the Netherlands.
The reaction of the farmers was to sell their least productive
animals and produce their smaller amount of milk with less
animals. As a result, the number of dairy cows has decreased with
about 25% since 1984. On an increasing number of farms this has
resulted in a surplus of grass and grass silage. Increasing the
proportion of roughage in the diet seems therefore interesting.
However, roughage intake by dairy cows in early lactation is
limited. The mechanisms controlling roughage intake are still not
well understood.
In early lactation, nutrient requirements are high and when the
energy content of the ration is relatively low, rumen capacity
can be the limiting factor (Weston, 1982) . Possible factors which
limit roughage intake could be the volume of the feed, the rate
of size reduction, the rate of degradation in the rumen, passage
rate of undigested feed particles to the lower gut and removal
of fermentation end products (Tamminga & van Vuuren, 1988).
If intake is not limited physically, physiological status and
type and amount of digestion products may be controlling feed
intake.
Ruminai degradation rate.
Major components of cell walls are cellulose and hemicellulose,
which may be encrustrated with lignin. Lignin is hardly
digestible and acts as a barrier for rumen microbes. Energy
present in cell walls, can only be made available after microbial
degradation of the cellulose and hemicellulose. The rate of
degradation of the potentially digestible fraction of the cell
wall constituents of grass silages is negatively related to the
lignin content (Van Soest, 1982).
Maturing increases the undegradable cell wall fraction and the
lignin content, resulting in a decreased degradation rate.
Bacteria have to attach to the cell walls before they can digest
them. This means that a bigger surface of the particles probably
results in a faster rate of degradation.
Next to energy, protein is an important component of high
quality roughages. Of the protein, the soluble fraction is
believed to have a very high rate of degradation and to be fully
degraded in the rumen. With an increase in cell wall content of
the grass, degradation rate of the potentially digestible but
non-soluble protein decreases, mainly due to the lower digestion
rate of the surrounding cell walls.
Particle size reduction and passage from the rumen.
Before large feed particles can leave the rumen to the lower
tract, they have to be reduced in size, which is achieved by
chewing and rumination. The probability of passage of particles
is inversely related to their size (Poppi et al., 1980), but even
the finest particles have a lower rate of passage than the fluid
(Faichney, 1986).
Microbial degradation decreases rumen dry matter content, but
it has relatively little effect on particle size and thus on
reduction in rumen fill (Van Soest, 1982; Welch, 1982; Ulyatt et
al., 1986). According to McLeod & Minson (1988a, 1988b), microbial
digestion plus rumen contractions would be responsible for only
about 20% of particle size reduction. The main factor reducing
particle size is chewing during eating and rumination.
Rumination time per kg dry matter ingested increases with cell
wall content of the diet (Welch & Smith, 1969a, 1969b; Murphy et
al., 1983; Ulyatt et al., 1986). Because rumination time has a
maximum of 9 to 10 h a day (Bae etal., 1979; Welch, 1982), for
high cell wall silages the time required to reduce particle size
through rumination to a size below the CPS can be the limiting
factor for silage intake.
Particles smaller than the critical particle size (CPS), for
cattle reported to be 1.18 mm (Kennedy & Poppi, 1984), have a
high probability of passing out of the rumen.
More than half of the rumen dry matter is in the small particle
pool, with a size smaller than the CPS (Poppi etal., 1980).
Not only the size of particles, but also their functional
specific gravity (FSG) modifies their chance of leaving the rumen
(Welch, 1986; Sutherland, 1987). Fermentation gas, which lowers
the FSG of particles, is removed by rumination and rumen
contractions, resulting in an increase in FSG. As a result, the
FSG of particles which are further degraded is higher, increasing
their probability of passage. Maximal rates of passage were found
for plastic particles with a specific gravity of 1.2-1.4 (Welch,
1986).
Fermentation products.
Microbial degradation of the carbohydrates and the protein
ingested with the feed results in a production of volatile fatty
acids (VFA) and ammonia (NH3). One of the factors determining
microbial growth rate is the rate of ATP generation from the
degradation of carbohydrates. When energy becomes available for
the microbes spread over the day and other essential nutrients
(VFA, NH3, amino acids, minerals and vitamins) are available as
well, efficiency of biomass production will be highest.
The concentrations and the ratio of VFA, as well as the NH3
concentration, are the result of microbial activity on one hand
and rate of clearance from the rumen, by absorption through the
rumen wall and by passage to the omasum, on the other (Satter &
Slyter, 1974; Hoover, 1986).
The pH of rumen fluid is negatively related to the concentration
of VFA (van Soest, 1982; Hoover, 1986; Tamminga & Van Vuuren,
1988). When the degradation rate of the carbohydrates is very
high, a rapid increase in VFA concentration will take place,
resulting in a decline in pH. A pH below 6 is less favourable for
cellulolytic microbes (ßrskov, 1982) and can result in a decrease
in cell wall digestion.
Ammonia is toxic to animal cells and high concentrations of
ammonia and other non protein nitrogen (NPN) compounds, which can
be found feeding high-nitrogen silages, can limit intake (Van
Soest, 1982).
Most of the factors influencing rumen capacity discussed above
were studied in isolation. Not only that for a large number of
questions no unequivocal answer is given, very little attempts
have been made sofar to study the several aspects as an
integrated system.
The objective of this study was to quantify in an integrated
approach, the effect of the stage of maturity of grass silages
on intake, digestibility, rumen fermentation pattern, rumination
activity, passage rate from the rumen, digestion rate of the
potentially digestible fractions and composition of rumen
contents. Therefore four experiments were conducted, in which
dairy cows were fed grass silages harvested at different growth
stages ad libitum and a fixed amount of concentrates, 1 or 7 kg
depending on the stage of lactation.
The influence of maturing on chemical composition of the
silages, their nylon bag degradation rates (Mehrez & 0rskov,
1977) and the overall digestibility are described in Chapter II.
Multiple regression analysis was used to analyse the influence
of the different parameters on ad lib silage intake.
The fractional passage rates of the fluid and particulate
phases from the rumen, using CoEDTA and Cr mordanted Neutral
Detergent Fibre (Cr-NDF) as markers (Uden et al., 1980) were
measured (Chapter III). Differences in total rumen contents (kg) ,
kg dry matter (DM), organic matter (OM), crude protein (CP) and
cell wall components for the different growth stages of the
silages and stages of lactation of the animals are also
described.
Diurnal patterns of pH and NH3 concentrations were measured in
the four experiments. The average daily VFA concentrations were
measured in Exps. 1, 2 and 3, and the diurnal pattern of VFA
concentrations in Exp. 4. The results are discussed in
Chapter IV.
Eating and rumination times were also measured and distribution
of rumen and faecal particle sizes was determined. The results
are also discussed in Chapter IV.
The high losses of nitrogen (N) occuring when grass products
are fed to dairy cows can be reduced by lowering the CP content
of the grass (Van Vuuren & Meijs, 1987) . With an increase in cell
wall content usually the CP content of the grass decreases.
Changes in the rate of protein degradation in the rumen and
microbial protein synthesis were therefore measured for the
different stages of maturity and results are reported and
discussed in Chapter V.
In a separate experiment, the influence of size of particles
mordanted with Cr on the fractional passage rate from the rumen
was determined. The results and the consequences of using Cr-NDF
of different particle sizes and the differences between silages
are reported and discussed in Chapter VI.
In a last experiment, in which dry cows were fed grass silages
of two different growth stages, a simplified rumen model was used
to determine the rate limiting step in reduction in rumen fill.
Results are reported and discussed in Chapter VII.
In the General Discussion (Chapter VIII), an attempt is made
to integrate the results of all the experiments reported in the
preceding chapters.
R e f e r e n c e s .
Bae , D . H . , J . G . Welch and A.M. S m i t h , 1 9 7 9 . Forage i n t a k e and r u m i n a t i o n by s h e e p . J.Anim.Sci. 49:1292-1299.
F a i c h n e y , G . J . , 1 9 8 6 . The k i n e t i c s o f p e r t i c u l a t e m a t t e r i n t h e rumen . IN : Control of Digestion and Metabolism in Ruminants, Ed. by L.P. Milligan, W.L. Crovum and A. Dobson.
Hoover , W.H. , 1 9 8 6 . Chemica l f a c t o r s i n v o l v e d i n rumina i f i b e r d i g e s t i o n . J. Dairy Sei. 69:2755-2766.
Kennedy, P.M. and D .P . P o p p i , 1 9 8 4 . C r i t i c a l p a r t i c l e s i z e i n s h e e p and c a t t l e . I n : P.M. Kennedy (ed.), Techniques in particle size analysis of feed and digesta in ruminants. Canadian Society of Animal Science, occasional publication no. 1, Edmonton.
McLeod, M.N. and D.J. Minson, 1988a. Large particle breakdown by cattle eating ryegrass and alfalfa. J.Anim.Sci. 66:992-999.
McLeod, M.N. and D.J. Minson, 1988b. Breakdown of large particles in forage by simulated digestion and detretion. J.Anim.Sci. 66:1000-1004.
Mehrez, A.Z. and E.R. 0rskov, 1977. A study of the artificial fibre bag technique for determining the digestibility of feeds in the rumen. J Agric. Sei. 88 :645-650
Murphy, M.R., R.L. Baldwin, M.J. Ulyatt and L.J. Koong, 1983. A quantative analysis of rumination patterns. J.Anim.Sci. 56:1236-1240.
0rskov, E.R., 1982. Protein nutrition in ruminants. Academic Press, London, pp. 20-21.
Poppi, D.P., B.W. Norton, D.J. Minson and R.E. Hendricksen, 1980. The validity of the critical size theory for particles leaving the rumen. J.Agric.Sci.Camb. 94:275-280.
Reid, R.L., G.A. Jung and W.V. Thayne, 1988. Relationships between nutritive quality and fiber components of cool season ans warm season forages: a retrospective study. J.Anim. Sei. 66:1275-1291.
Satter, L.D. and L.L. Slyter, 1974. Effect of ammonia concentration on rumen microbial protein production in vitro. Br. J. Nutr. 32:199-208.
Sutherland, T.M., 1987. Particle separation in the foretomachs of sheep. In: Aspects of digestive physiology in ruminants, pp.43-73 (A. Dobson, editor). Ithaca: Cornell University Press.
Tamminga, S. and A.M. Van Vuuren, 1988. Formation and utilization of end products of lignocellulose degradation in ruminants. Anim. Feed Sei. Techno!.. 21:141-159.
Uden, P . , P . E . C o l l u c i and P . J . van S o e s t , 1 9 8 0 . I n v e s t i c a t i o n o f chromium, c e r i um and c o b a l t a s markers i n d i g e s t a . Journal of Science in Food and Agriculture 31:625-632.
U l y a t t , M . J . , D.W. D e l l o w , A. J o h n , C.W.S. R e i d and G.C. Waghorn, 1 9 8 6 . C o n t r i b u t i o n o f c h ew ing d u r i n g e a t i n g and r u m i n a t i o n t o t h e c l e a r a n c e o f d i g e s t a from t h e r u m i n o r e t i c u l u m . I n : Control of Digestion and Metabolism in Ruminants, Ed. by L.P. Milligan, W.L. Grovum and A. Dobson.
Van S o e s t , P . J . , 1 9 8 2 . N u t r i t i o n a l e c o l o g y o f t h e r u m i n a n t . O&B Books Inc., Corvallis, OR.
Van Vuuren , A.M. and J . A . C . M e i j s , 1 9 8 7 . E f f e c t s o f h e r b a g e c o m p o s i t i o n and s upp l emen t f e e d i n g on t h e e x c r e t i o n o f n i t r o g e n i n dung and u r i n e by g r a z i n g d a i r y c o w s . I n : Animal Manure on Grassland and Fodder Crops. H.G. van der Meer et al. (eds), Martinus Ni jho f Publishers, Dordrecht, the Netherlands.
Welch , J . G . and A.M. S m i t h , 1 9 6 9 a . Forage q u a l i t y and r u m i n a t i o n t i m e i n c a t t l e . J.Dairy Sei. 53:797-800.
Welch , J . G . and A.M. S m i t h , 1 969b . I n f l u e n c e o f f o r a g e q u a l i t y on r u m i n a t i o n t i m e i n s h e e p . J.Anim Sei. 28:813-818.
Welch , J . G . , 1 9 8 2 . Rumina t i on , p a r t i c l e s i z e and p a s s a g e from t h e rumen . J.Anim.Sci. 54:885-894.
Welch , J . G . , 1 9 8 6 . P h y s i c a l p a r a m e t e r s o f f i b e r a f f e c t i n g p a s s a g e from t h e rumen. J.Dairy Sei 69:2750-2754.
Weston , R . H . , 1 9 8 2 . Animal f a c t o r s a f f e c t i n g i n t a k e . I n : N u t r i t i o n a l l i m i t s t o an ima l p r o d u c t i o n from p a s t u r e s . Proceedings of an international symposium held at St Lucia, Queensland Australia, 1981. Ed. J.B. Hacker.
Chapter I I
Influence of stage of maturity of grass silages on digestion
processes in dairy cows.
1 . Composition, nylon bag degradation rates, digestibility and
intake.
M.W. Bosch1,2, S. Tamminga2 and G. Post2
department of Human and Animal Physiology, Agricultural
University, Haarweg 10, 6709 PJ Wageningen (The Netherlands)
department of Animal Nutrition, Agricultural University,
Haagsteeg 4, 6708 PM, Wageningen (The Netherlands)
submitted for publication
Abstract.
In four change-over experiments, dairy cows were fed wilted
grass silages (Gl, G2, G3, G4 and G5) ad libitum. In early
lactation, silage was supplemented with 7 kg of concentrates and
in late lactation with 1 kg. The silages were harvested at
different growth stages, resulting in different cell wall
contents (Gl 44.6%, G2 54.7%, G3 54.8%, G4 64.1% and G5 with
67.3% Neutral Detergent Fibre, NDF). With an increase in cell
wall content, crude protein (CP) content decreased (21.3% CP for
Gl to 11.2% CP for G5), and organic matter (OM) digestibility
decreased (ƒ><().001) (76.2 for Gl to 63.7 for G5) .
The degradation rates of dry matter (DM) , NDF and acid
detergent fibre (ADF) were measured using nylon bags incubated
in the rumen. The soluble fraction (fs, %) decreased, the
undegradable fraction (fR, %) increased, and the degradation rate
of the non-soluble, degradable fraction (kd, %/h) decreased with
an increase in cell wall content of the silages. High correlation
coefficients between the kd's of DM (r=-0.91, P<0.001), NDF (r=-
0.90, P<0.001), ADF (r=-0.93, i><0.001) and the NDF content of the
silages were found. The in-vivo DM digestibility was positively
related to fs (r=0.88, P<0.01) and kd (r=0.84, P<0.01) and
negatively to fR (r=-0.97, P<0.001).
Multiple regression analysis showed that the amount of
concentrates consumed, the level of milk production, the nitrogen
(N)/0M ratio of the silages and the fR, could explain almost 70%
of the variation in silage DM intake.
Introduction.
One of the barriers that prevents a substantial increase of the
roughage proportion in dairy diets in early lactation is its
limited ad libitum intake. Changing this situation seems only
possible if our, as yet inadequate, understanding of the
regulation of feed intake, especially the regulation of roughage
intake, is improved.
10
It is known, that the volume of the feed and the capacity of
the rumen to hold and turnover feed play an important role. When
the demand for nutrients is high (early lactation), and the
energy content of the feed is low, the capacity of the rumen to
turnover feed can be the limiting factor (Weston, 1982). The
maximum intake of a roughage then not only depends on the volume
of the feed, but is also related to the rate of degradation in
the rumen and the rate of passage of undigested feed particles
to the lower gut. The latter may depend on the rate of particle
size reduction through chewing during eating and rumination. If
intake is not limited physically, the type and amount of
digestion products may be controlling feed intake.
For high fibre silages maximum intake by lactating dairy cows
may be limited by the capacity of the rumen (Mertens, 1987).
Rumen dry matter (DM) content is reduced by passage of particles
to the lower gut and digestion by rumen microbes (Ulyatt etal.,
1986; Kennedy & Murphy, 1988), although the latter has relatively
little effect on reduction in rumen fill (Welch, 1982; Ulyatt et
al., 1986) . However, microbial digestion weakens the cell wall
structure, and thus facilitates particle breakdown during
rumination (Chai etal., 1984).
A dynamic model simulating fibre disappearance from the
digestive tract from ruminants was developed by Mertens & Ely
(1979). They concluded that maximum intake of digestible DM is
influenced more by the proportion of fibre that is undegradable
and the rate of particle passage to the lower gut than by the
rate of fibre digestion. A 1% increase in the undegradable
fraction (fR) resulted in a 1% decrease in maximum digestible DM
intake, and a 1% increase in digestion rate (kd) resulted in a
0.6% increase in maximum digestible DM intake. Within species
however, the fR and the kd are negatively correlated.
The objective of this study was to quantify the effect of the
stage of maturity of grass silages on intake, digestibility,
rumen fermentation pattern, degradation rate of the potentially
digestible fractions, rumination activity, size and composition
of rumen contents and passage rate from the rumen.
This paper presents the nylon bag degradation characteristics,
11
overall apparent digestibility and ad libitum intake of organic
matter and cell wall components of five grass silages, harvested
at different growth stages.
Materials and methods.
Experimental silages.
Five wilted grass silages (Gl, G2, G3, G4 and G5) were
harvested at different growth stages, resulting in different
chemical compositions. The silages were fed ad libitum to six
(Exps. 1, 2 and 3) or four (Exp. 4) dairy cows in combination
with either 1 (low, L) or 7 (high, H) kg of concentrates,
depending on the stage of lactation. The chemical composition of
the silages and the concentrates, and the ingredients (g/kg) of
the concentrates are given in Table 1.
Experimental designs.
Four experiments were conducted, whereby in each experiment two
silages were fed ad libitum to dairy cows according to a
change-over design. All cows were fitted with a rumen cannula,
and, except for two animals in Exp. 4, also fitted with a T-
cannula in the proximal duodenum. Each experiment consisted of
two experimental periods of five weeks, preceded by adaptation
periods of three weeks. An outline of the four experiments is
given in Table 2.
In all four experiments, the silages were fed at 7.00, 15.00
and 23.00 h, in such quantities that approximately 10% of what
was offered was not consumed. When the animals were fed 1 kg of
concentrates, this was offered at 14.45h. In early lactation the
7 kg of concentrates was supplied in two equal portions at 6.45
and at 14.45h. The concentrates were always consumed completely.
Left-overs from the silages were removed before feeding at 7.00
and at 15.00h. Left-overs were weighed, sampled and dried, so dry
matter (DM) intake during the experimental periods was recorded
per day. The left-overs were pooled per week and analysed for ash
content, so that organic matter (OM) intake per cow per week
12
could be calculated. Water was available ad lib. The animals were
milked twice a day and the milk yield per day was recorded.
The animals were weighed before and after each experimental
period. The intake per kg body weight was calculated, based on
the average live weights during the experimental periods.
The measurements done in the four experiments are presented in
Tables 3A (Exps. l, 2 and 3) and 3B (Exp. 4).
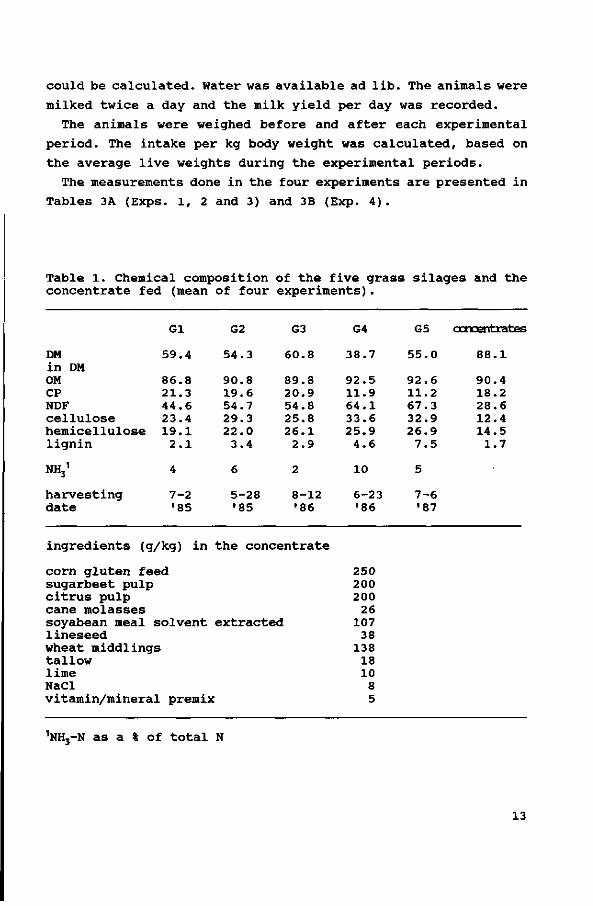
Table 1. Chemical composition of the five grass silages and the concentrate fed (mean of four experiments).
DM in DM OM CP NDF cellulose hemicellulose lignin
NHj1
harvesting date
Gl
59.4
86.8 21.3 44.6 23.4 19.1
2.1
4
7-2 '85
ingredients (g/kg) in
corn gluten feed sugarbeet pulp citrus pulp cane molasses soyabean meal solvent lineseed wheat middlings tallow lime NaCl
G2
54.3
90.8 19.6 54.7 29.3 22.0
3.4
6
5-28 •85
G3
60.8
89.8 20.9 54.8 25.8 26.1
2.9
2
8-12 '86
the concentrate
extracted
vitamin/mineral premix
G4
38.7
92.5 11.9 64.1 33.6 25.9
4.6
10
6-23 •86
250 200 200
26 107
38 138
18 10
8 5
G5
55.0
92.6 11.2 67.3 32.9 26.9
7.5
5
7-6 '87
concentrates
88.1
90.4 18.2 28.6 12.4 14.5
1.7
nNH3-N as a % of total N
13
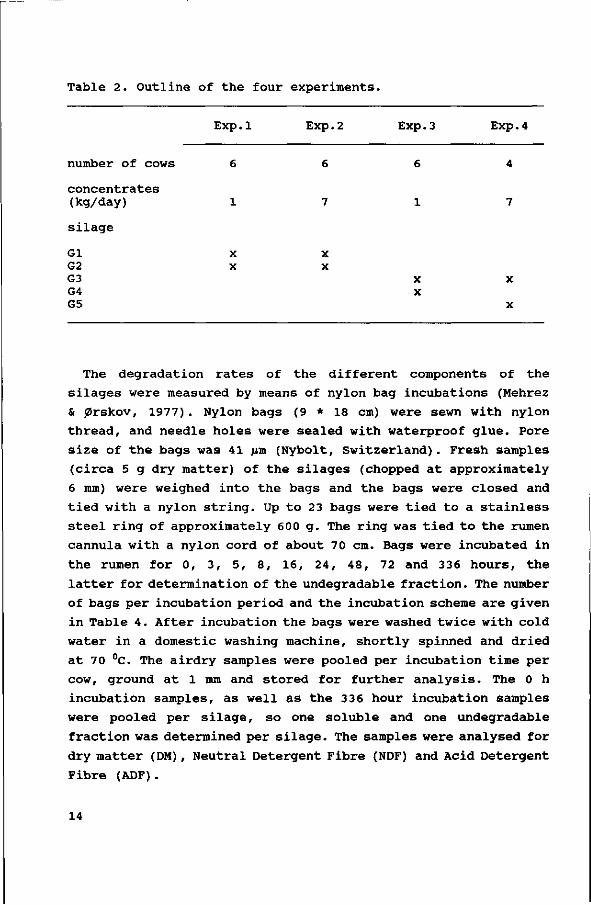
Table 2. Outline of the four experiments.
number of cows
concentrates (kg/day)
silage
Gl G2 G3 G4 G5
Exp.
6
1
X X
1 Exp.
6
7
X X
2 Exp. 3
6
1
x x
Exp. 4
4
7
X
X
The degradation rates of the different components of the
silages were measured by means of nylon bag incubations (Mehrez
& 0rskov, 1977) . Nylon bags (9 * 18 cm) were sewn with nylon
thread, and needle holes were sealed with waterproof glue. Pore
size of the bags was 41 ßm (Nybolt, Switzerland). Fresh samples
(circa 5 g dry matter) of the silages (chopped at approximately
6 mm) were weighed into the bags and the bags were closed and
tied with a nylon string. Up to 23 bags were tied to a stainless
steel ring of approximately 600 g. The ring was tied to the rumen
cannula with a nylon cord of about 70 cm. Bags were incubated in
the rumen for 0, 3, 5, 8, 16, 24, 48, 72 and 336 hours, the
latter for determination of the undegradable fraction. The number
of bags per incubation period and the incubation scheme are given
in Table 4. After incubation the bags were washed twice with cold
water in a domestic washing machine, shortly spinned and dried
at 70 °C. The airdry samples were pooled per incubation time per
cow, ground at 1 mm and stored for further analysis. The 0 h
incubation samples, as well as the 336 hour incubation samples
were pooled per silage, so one soluble and one undegradable
fraction was determined per silage. The samples were analysed for
dry matter (DM), Neutral Detergent Fibre (NDF) and Acid Detergent
Fibre (ADF).
14
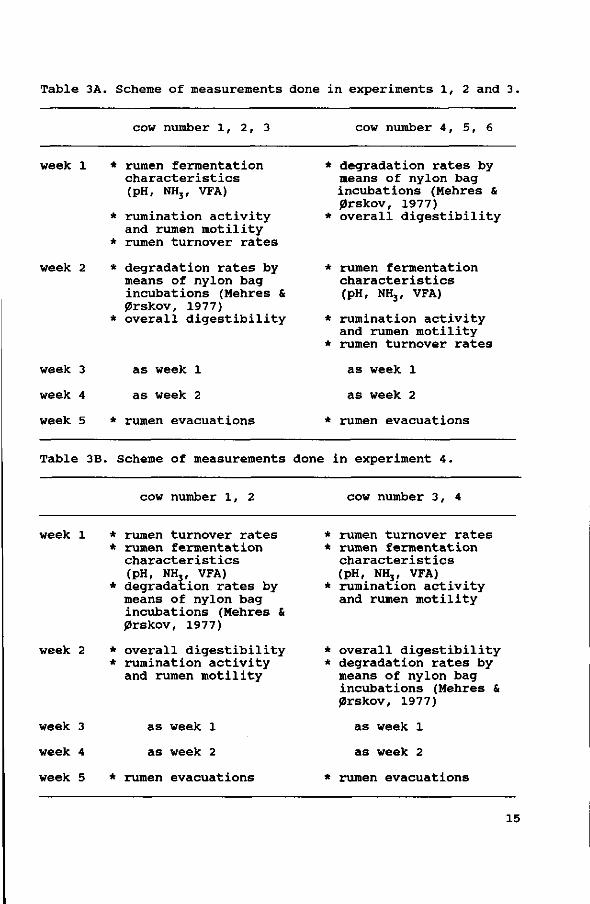
Table 3A. Scheme of measurements done in experiments 1, 2 and 3.
cow number 1, 2, 3 cow number 4, 5, 6
week 1 * rumen fermentation characteristics (pH, NH3, VFA)
* rumination activity and rumen motility
* rumen turnover rates
week 2 * degradation rates by means of nylon bag incubations (Mehres & prskov, 1977)
* overall digestibility
week 3 as week 1
week 4 as week 2
week 5 * rumen evacuations
* degradation rates by means of nylon bag incubations (Mehres & prskov, 1977)
* overall digestibility
* rumen fermentation characteristics (pH, NH3, VFA)
* rumination activity and rumen motility
* rumen turnover rates
as week 1
as week 2
* rumen evacuations
Table 3B. Scheme of measurements done in experiment 4.
cow number 1, 2 cow number 3, 4
week 1 * rumen turnover rates * rumen fermentation
characteristics (pH, NH?, VFA)
* degradation rates by means of nylon bag incubations (Mehres & JSrskov, 1977)
week 2 * overall digestibility * rumination activity
and rumen motility
week 3 as week 1
week 4 as week 2
week 5 * rumen evacuations
* rumen turnover rates * rumen fermentation
characteristics (pH, NH3, VFA)
* rumination activity and rumen motility
* overall digestibility * degradation rates by
means of nylon bag incubations (Mehres & prskov, 1977)
as week 1
as week 2
* rumen evacuations
15
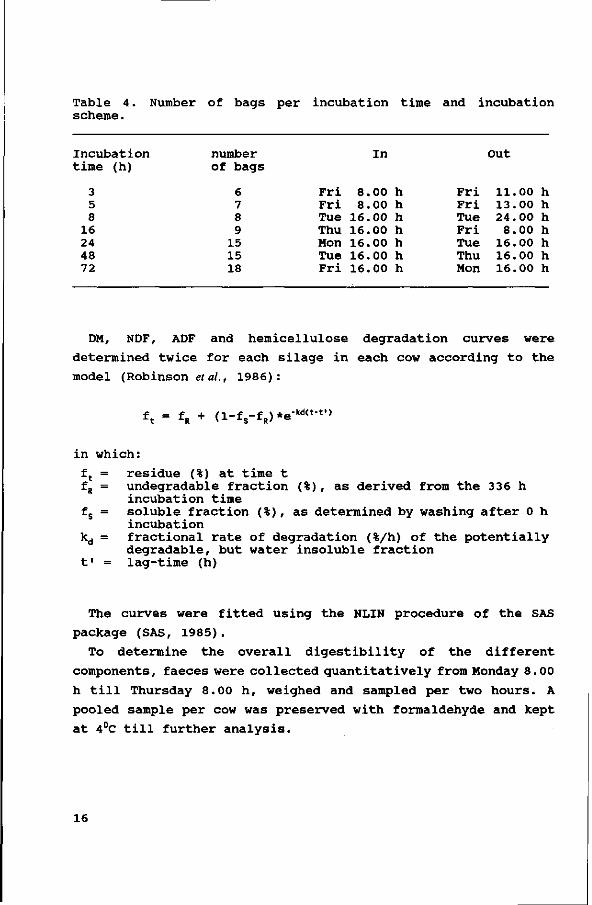
Table 4. Number of bags per incubation time and incubation scheme.
Incubation time
3 5 8
16 24 48 72
(h) number of bags
6 7 8 9
15 15 18
Fri Fri Tue Thu Mon Tue Fri
In
8.00 8.00
16.00 16.00 16.00 16.00 16.00
h h h h h h h
Fri Fri Tue Fri Tue Thu Mon
Out
11.00 h 13.00 h 24.00 h
8.00 h 16.00 h 16.00 h 16.00 h
DM, NDF, ADF and hemicellulose degradation curves were
determined twice for each silage in each cow according to the
model (Robinson et ah, 1986):
ft = f R + (i-vf,, *.-««-«•>
in which:
ft = residue (%) at time t fR = undegradable fraction (%), as derived from the 336 h
incubation time fs = soluble fraction (%), as determined by washing after 0 h
incubation kd = fractional rate of degradation (%/h) of the potentially
degradable, but water insoluble fraction t' = lag-time (h)
The curves were fitted using the NLIN procedure of the SAS
package (SAS, 1985).
To determine the overall digestibility of the different
components, faeces were collected quantitatively from Monday 8.00
h till Thursday 8.00 h, weighed and sampled per two hours. A
pooled sample per cow was preserved with formaldehyde and kept
at 4°C till further analysis.
16
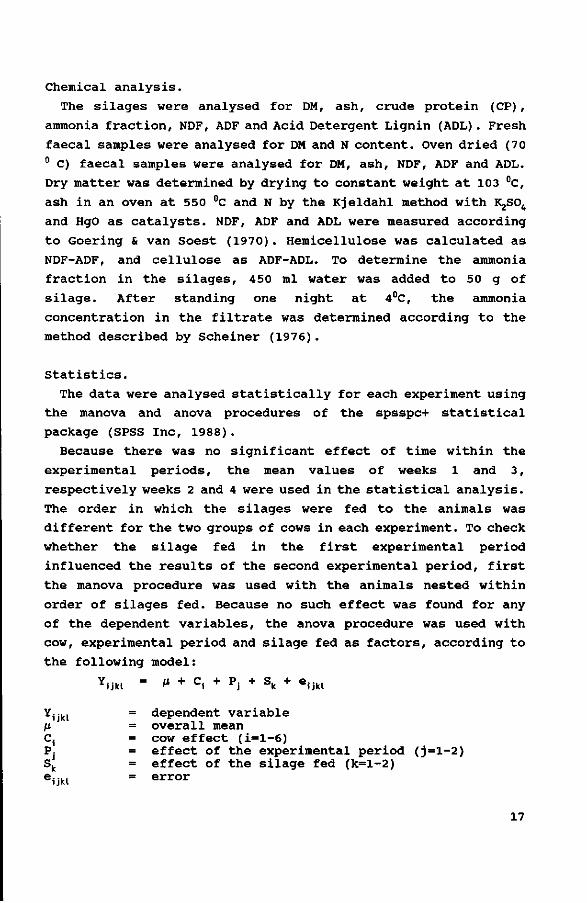
Chemical analysis.
The silages were analysed for DM, ash, crude protein (CP) ,
ammonia fraction, NDF, ADF and Acid Detergent Lignin (ADL) . Fresh
faecal samples were analysed for DM and N content. Oven dried (70 0 C) faecal samples were analysed for DM, ash, NDF, ADF and ADL.
Dry matter was determined by drying to constant weight at 103 °C,
ash in an oven at 550 °C and N by the Kjeldahl method with KjSO^
and HgO as catalysts. NDF, ADF and ADL were measured according
to Goering & van Soest (1970). Hemicellulose was calculated as
NDF-ADF, and cellulose as ADF-ADL. To determine the ammonia
fraction in the silages, 450 ml water was added to 50 g of
silage. After standing one night at 4°C, the ammonia
concentration in the filtrate was determined according to the
method described by Scheiner (1976).
Statistics.
The data were analysed statistically for each experiment using
the manova and anova procedures of the spsspc+ statistical
package (SPSS Inc, 1 9 8 8 ) .
Because there was no significant effect of time within the
experimental periods, the mean values of weeks 1 and 3,
respectively weeks 2 and 4 were used in the statistical analysis.
The order in which the silages were fed to the animals was
different for the two groups of cows in each experiment. To check
whether the silage fed in the first experimental period
influenced the results of the second experimental period, first
the manova procedure was used with the animals nested within
order of silages fed. Because no such effect was found for any
of the dependent variables, the anova procedure was used with
cow, experimental period and silage fed as factors, according to
the following model:
V U k l = " + C i + P i + S k + eijkl
Y1jkl = dependent variable ß = overall mean C, = cow effect (i=l-6) P. = effect of the experimental period (j=l-2) Sk = effect of the silage fed (k=l-2) eijki = e r r o r
17
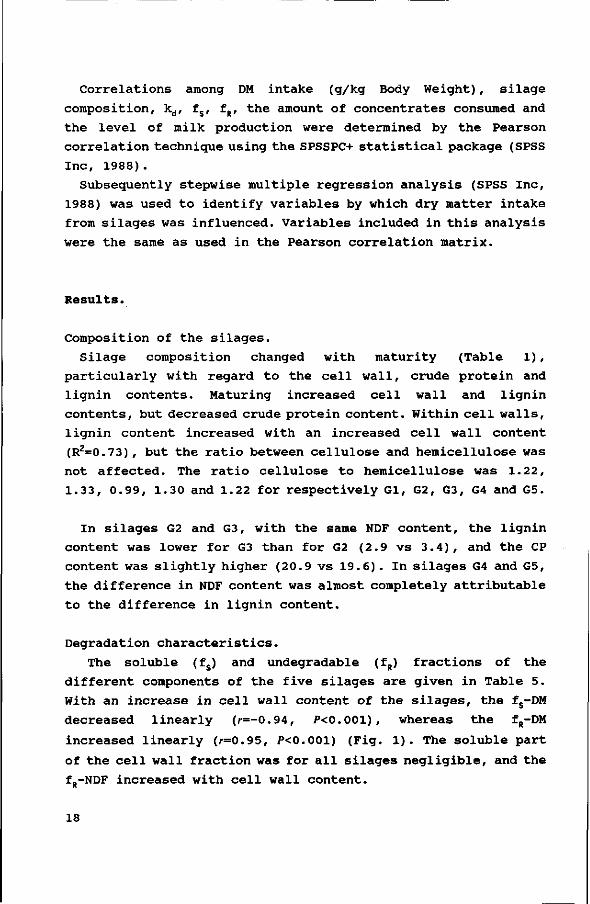
Correlations among DM intake (g/kg Body Weight), silage
composition, kd, fs, fR, the amount of concentrates consumed and
the level of milk production were determined by the Pearson
correlation technique using the SPSSPC+ statistical package (SPSS
Inc, 1988).
Subsequently stepwise multiple regression analysis (SPSS Inc,
1988) was used to identify variables by which dry matter intake
from silages was influenced. Variables included in this analysis
were the same as used in the Pearson correlation matrix.
Results.
Composition of the silages.
Silage composition changed with maturity (Table 1),
particularly with regard to the cell wall, crude protein and
lignin contents. Maturing increased cell wall and lignin
contents, but decreased crude protein content. Within cell walls,
lignin content increased with an increased cell wall content
(R2=0.73), but the ratio between cellulose and hemicellulose was
not affected. The ratio cellulose to hemicellulose was 1.22,
1.33, 0.99, 1.30 and 1.22 for respectively Gl, G2, G3, G4 and G5.
In silages G2 and G3, with the same NDF content, the lignin
content was lower for G3 than for G2 (2.9 vs 3.4), and the CP
content was slightly higher (20.9 vs 19.6). In silages G4 and G5,
the difference in NDF content was almost completely attributable
to the difference in lignin content.
Degradation characteristics.
The soluble (fs) and undegradable (fR) fractions of the
different components of the five silages are given in Table 5.
With an increase in cell wall content of the silages, the fs-DM
decreased linearly (r=-0.94, P<0.001), whereas the fR-DM
increased linearly (r=0.95, P<0.001) (Fig. 1). The soluble part
of the cell wall fraction was for all silages negligible, and the
fR-NDF increased with cell wall content.
18
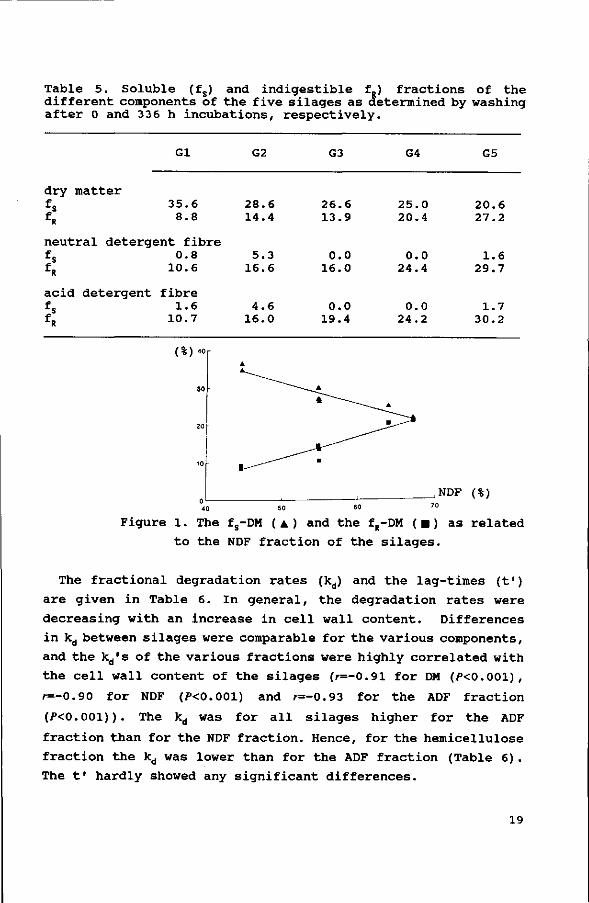
Table 5. Soluble (fs) and indigestible f.) fractions of the different components of the five silages as determined by washing after 0 and 336 h incubations, respectively.
Gl
dry matter fs 35.6 fR 8.8
neutral detergent fibre fs 0.8 f R 10.6
acid detergent fibre fs 1.6 fR 10.7
G2
28.6 14.4
5.3 16.6
4.6 16.0
G3
26.6 13.9
0.0 16.0
0.0 19.4
G4
25.0 20.4
0.0 24.4
0.0 24.2
G5
20.6 27.2
1.6 29.7
1.7 30.2
(%)<°
,NDF (%)
Figure 1. The fs-DM ( A ) and the fR-DM (•) as related
to the NDF fraction of the silages.
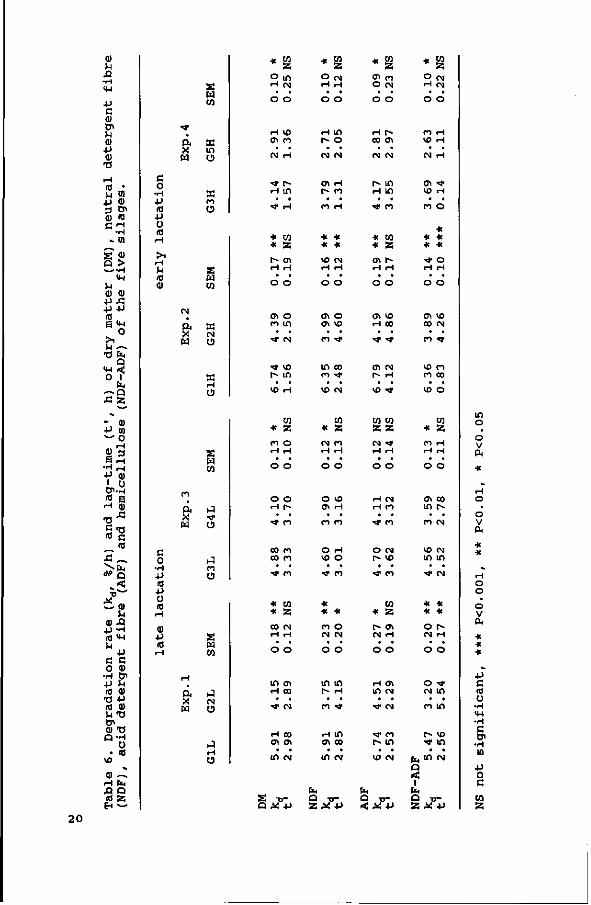
The fractional degradation rates (kd) and the lag-times (t')
are given in Table 6. In general, the degradation rates were
decreasing with an increase in cell wall content. Differences
in kd between silages were comparable for the various components,
and the kd's of the various fractions were highly correlated with
the cell wall content of the silages (r=-0.91 for DM (P<0.001) ,
r=-0.90 for NDF (P<0.001) and r=-0.93 for the ADF fraction
(P<0.001)) . The kd was for all silages higher for the ADF
fraction than for the NDF fraction. Hence, for the hemicellulose
fraction the kd was lower than for the ADF fraction (Table 6).
The t' hardly showed any significant differences.
19
0) u
- H
-p c 0)
u <D +J (U •o
<ö ;
3 O i 0) <Ö C H
- H - ta
B > — • H
<M ^1 <u a) -P.C -p -P (0 g «w
0 > 1 !H * -»
•Ü fc Q
«H < 0 1
u< - ^ Q .CS5
' • M *
* k
- ai -P W *- O
S 3 S rH
• H M •P q) L o «5 E
rH (J)
"0
S« (0 c
— * •C ~ \ f a <^Q .< TJ***^
6a» u
0) Xi •P "H <0 «M M * c c o a> -H o> •P u (0 (U T3 -P <o a> M "0 tr> 0) "0 Q-H
Ü • <0 vo
0) ~ rH ht Si Q « S H * -
C o
•H •p (0
•p 0 (0 r-i
rH )-l <0 ai
c o
• H • p 10 •p Ü 10
rH
0) •p (0
rH
^ & x H
CM
à x a
co
tt
H
ft X H
S C0
S m o
« m O
S W C0
B CM U
X rH U
S u co
• 3
•<*
•H co O
S CO
,J CM Ü
hH rH U
* to. Z
o m H CM
o o
H VO CTI co
• • fM H
• * t -H i n
>* H
* co * Z
r- en H H
• • O o
CTl o M in
• • •>* CM
^ VO r - i n
• • VO H
CO
* a co o rH rH
• • O o
o o rH r -
• * co
00 co 00 co
• • T* co
* w * z 00 M H H
O O
i n CTI c-H 00
• • •«J1 V N
H 00 CTl CTl
• • in ra
S -o-Q M +J
« £2 a
O o ] rH H
O O
H m r- o
• • CM M
CTl H r - co
CO rH
* HC * He
VO <N rH rH
• • O O
CTl O CTl VO
• • co •<*
m oo CO " *
• • VO CM
en * Z M CO rH H
• • O O
O VO CTl H
CO CO
O rH VO O
• • * J - CO
* * * co o CM CM
O O
i n i n r- H
• • CO • *
rH i n CTl 00
• • in CM
Ü4 Q - o -Z M -P
« S2 Z
CTl co O CM
O O
H P-00 CTl
• • CM CM
r» m H in • > * CO
* w * a CTi r -H rH
• • O O
CTl VO H 00
• • •* •*>•
CTl CM
r~ H
• • V O • *
w CO z z CM *# H H
• • O o
H CM H CO
«tf CO
O CM rv vo
• • •«r co
w * Z r» CTi CM rH
O O
H CTl i n CM
• • • * CM
^ CO p» i n
• • VO CM
fo Q TJ-< M -P
HC SQ. Z
O CM
H CM
O O
CO H VO H
• • CM rH
CTl • * VO rH
CO O
* HC HC HC *
^ O
H H
• • O O
CTl VO oa CM
• • co ^1
VO co co co
• • VO o
co * z CO rH rH H
• • O O
CTl CO in r̂
CO CM
VO CM
m m • • • * CM
« * * HC
o r~ CM H
o o
o •** CM m • • co m
r» vo >* in
• • fcincM
O < 1 PK Q - D -Z * +J
i n o
o v PH
HC
^ H O
• O V CU
* He
^ H O O
O V PH
HC HC
HC
* • P C <0 u - H vu • H c & l
- H 10
• p 0 C
CO
z 20
u 3 O
<tH
Q) X! • P
C • H
01 c o
•rl •P (0 u O)
X! •P
<H O
10 +J c O)
c o a 0 o
i H
(0 ü •H e ai
XI U
•P C 0J r i O)
•o
Q) X! •P
0
10 •p c 0>
•H 0
•H
d) O ü
>< +J • H rH •rH XI •W •P (0 a> 0> •
-H (0 Q -P
c • dl r> S
•H a» M
rH d) XI 0 , <0 X H Q)
c o
•H •p (0
-p Ü <0 r-i
>1 rH
(0 a>
c o
•H •P 10 •P U <0
a> •p (0
rH
' t
ft X
w
CM
à X H
co
à X H
H
s a X
S M W
S in O
S
S
W
W CM
W rH O
s W (0
J ' t O
HH CO
S W
J CM
O
J H O
* * « * VO *f CM co
o o
in r-
H co vc VO
o m
CJl H vc r -
* * « « * * in co H H
O O
co a\
co o vo r-
O CM
CM m r~ r~
* * * * * * ' t 00 H O
O O
in o
CM • * VO VO
VO t
00 o 10 ( ^
* * * * * * CM 0\ CM H
O O
CM in
00 o vo r-
O CM
co vo r- i»
e s -e o
« * * * o en CM r»
o o
t o 00
H VO vo in
CM * t
t - H vo r -
* *
* * en a\ H H
O O
t « t
VO VO vo VO
m r»
o • * vo t-~
* * * * * * H in CM O
o o
co er*
0"> CM i n vo
O 00
00 co vo t -
•K
* * * rH r -CM H
O O
t ffl
co O VO f
r» o 0> 00 vo r~
fa O, a u z
« o a\
o
co
in VO
r~
m r-
* * * CM CM
O
^,
•*t
r~
• *
rH 00
* * * r~ o o
co
a i vo
in
•* p~
* * * a\ H
o
vo
co r-
vo
* co
<D 10 0
rH 3
H •-i
a>
* * ' t r~
O
0>
o> in
H
VO c-
* * * VO CM
O
in
in vo
CO
' t r»
* * * r~ H
o
co
m vo CM
o CO
* * * 00 CM
O
CO
CM t -
O
a> r-
<U 10 O
H 1 3 H H S H ai <u
ü X! O
m o
o V 04
*
H O
O V CM
« He
^ H O O • O
V CU
* * « 21
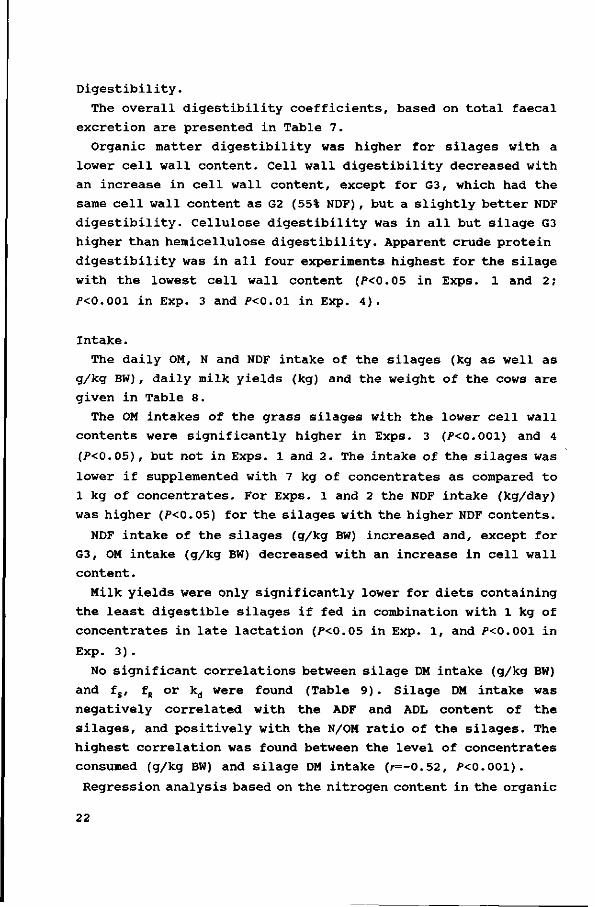
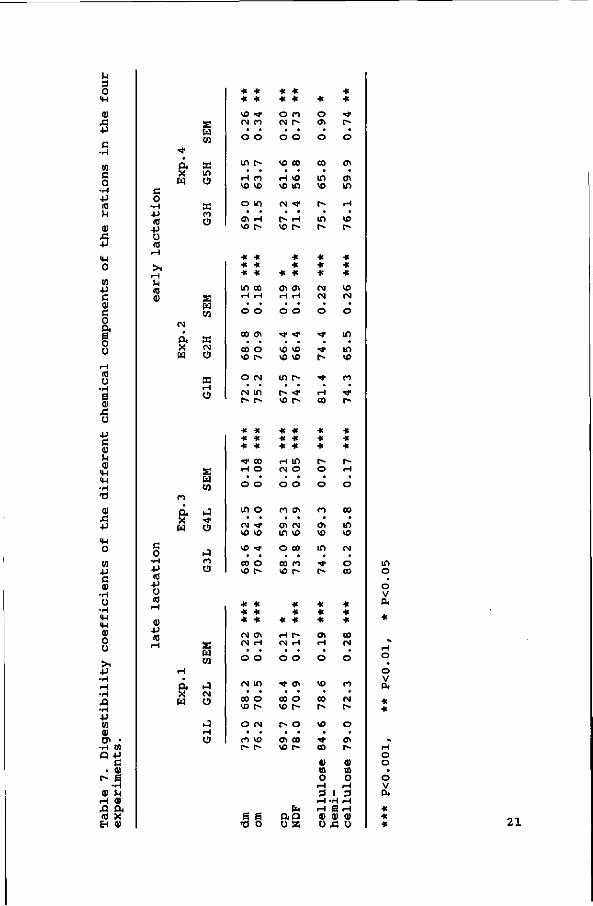
Digestibility.
The overall digestibility coefficients, based on total faecal
excretion are presented in Table 7.
Organic matter digestibility was higher for silages with a
lower cell wall content. Cell wall digestibility decreased with
an increase in cell wall content, except for G3, which had the
same cell wall content as G2 (55% NDF) , but a slightly better NDF
digestibility. Cellulose digestibility was in all but silage G3
higher than hemicellulose digestibility. Apparent crude protein
digestibility was in all four experiments highest for the silage
with the lowest cell wall content (P<0.05 in Exps. 1 and 2;
P<0.001 in Exp. 3 and P<0.01 in Exp. 4).
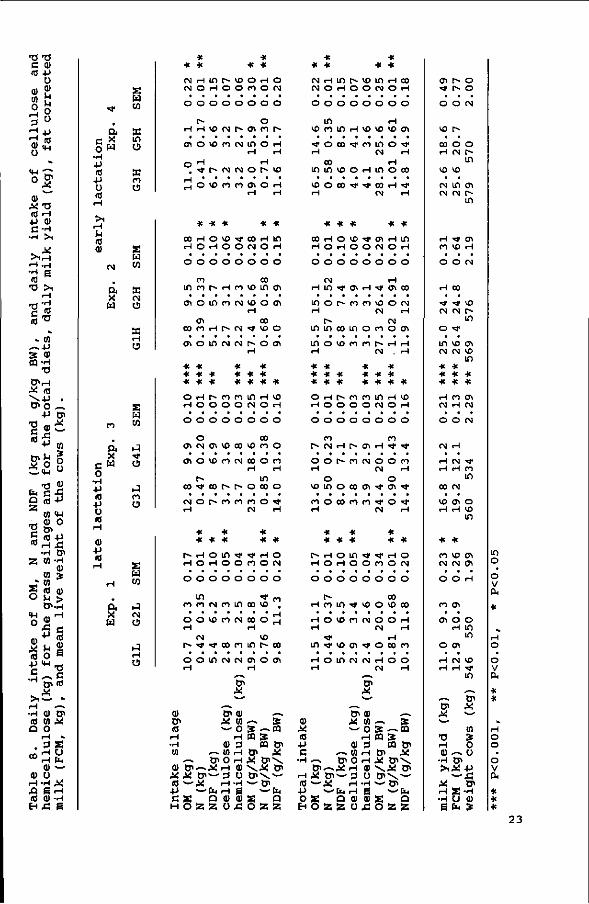
Intake.
The daily OM, N and NDF intake of the silages (kg as well as
g/kg BW), daily milk yields (kg) and the weight of the cows are
given in Table 8.
The OM intakes of the grass silages with the lower cell wall
contents were significantly higher in Exps. 3 (P<0.001) and 4
(P<0.05) , but not in Exps. 1 and 2. The intake of the silages was
lower if supplemented with 7 kg of concentrates as compared to
1 kg of concentrates. For Exps. 1 and 2 the NDF intake (kg/day)
was higher (/><0.05) for the silages with the higher NDF contents.
NDF intake of the silages (g/kg BW) increased and, except for
G3, OM intake (g/kg BW) decreased with an increase in cell wall
content.
Milk yields were only significantly lower for diets containing
the least digestible silages if fed in combination with 1 kg of
concentrates in late lactation (/><0.05 in Exp. 1, and /><0.001 in
Exp. 3).
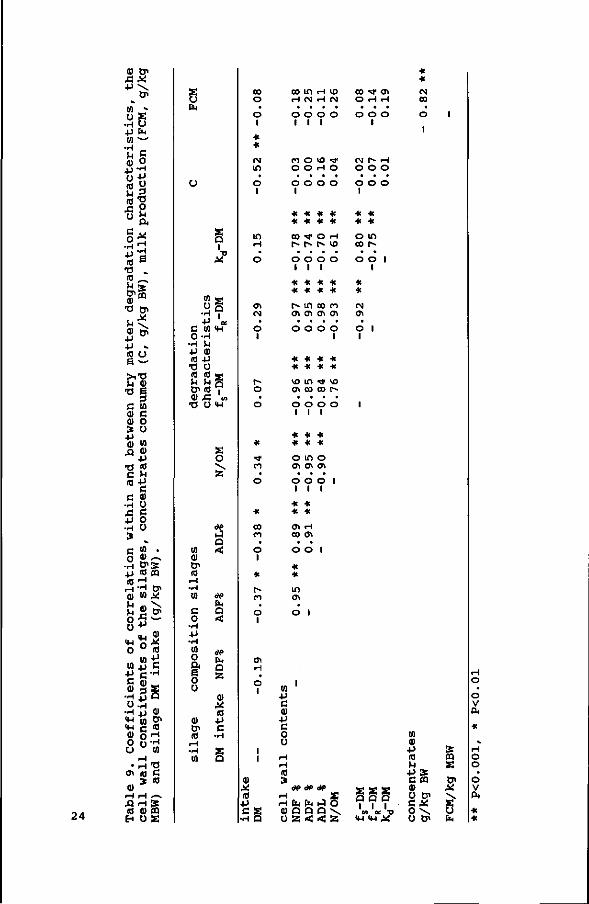
No significant correlations between silage DM intake (g/kg BW)
and fs, fR or kd were found (Table 9) . Silage DM intake was
negatively correlated with the ADF and ADL content of the
silages, and positively with the N/OM ratio of the silages. The
highest correlation was found between the level of concentrates
consumed (g/kg BW) and silage DM intake (r=-0.52, P<0.001).
Regression analysis based on the nitrogen content in the organic
22
Ti -a C Ol <Ö -P
u Q) ?
°8 3 ° r H +J a) u i o
1 .
<H c :
°? (0 rH 4-> CD C - H
• H > i
x - - H . H
ffl •O > i
rH
e ™ S« .. Ifl
S a) « • H
T3
tPrH X (0 \ - P . &> O ^
•P &
n ï ~ 10 f l
** W
DF (
kg
and for
the cow
,- <u o c o1
2 <0 -P 1 0 rH .C
•H Dl 2 W -H
S (0 (1)
o !_, > D>.H
intake
g) f
or
t
and
mea
i
X
>,«_ -r-{ — .
•H a) o< D 1 I Ü a o r-i -
. 3 a rH fcl Q) ^
0) o H - H X J3 B H (0 <D -H
H A e
•<*
t a O »
•H -P (0
•p Ü (0
rH
> 1 rH
(0 O)
CM
a X
n
t a X
c w O
•H •p (0 •p o (0
rH
a) • P (0
rH
H
. a X
g
s
as
s
X CM
s H
s u w
J
• H
n O
2
j CM
J H
* * * * * * c M H i n o v o o r H O C M O H O O C O O C M
o o o o o o o o
t-~ o riHOlNr-OlPlh
CTlOVOCOCMIflOH H H
0 H H . f l > N N O h *
— l O V O C O C O f f l O r H H H
* * * * * C O r H O l O ^ C O r H I f l H O r H O O C M O r H
O O O O O O O O
n CO i f i d O H o v o i f i f f i w o i o n t M i o o m
H
CT\ CO C O C O r H r ^ C M I ' V O O
CTioif)CMCMt>OCT\ H
* * * * * * * * * * * * * O r H r ^ n r o i f i r H v o H O O O O f M O H
O O O O O O O O
O CO CTlCMCTIVOCOVOOO
CTIOVOOCMCOOCO H H
r« ifi c o T T c o t ^ r ^ o c o o
c M O p ^ n n o O T t
* * * * * * * *
t - r H O l f l ' * T ) ' i - H O H O r H O O O O C M
O O O O O O O O
in -* „ P I n N n in « io .
O O V O C " > C N O O O _ I H H "
CM l u t ^ M - f c o n i n t ^ - c o
o o i f i c N c N C i O C T i H H
-̂* o>
r « ;
-̂* -̂* Q) OKU ~
o> x m ~* s (0 ^ o s ~ m rH rH 03 s
•H a) 3 m o> M ~ 01 rH o> X
— D > O H > ! 0 > \ d) O » - — * rH O) \ . * tP
X X t P — 3 O O i \ — -(0 ^ " * ! rH -H ^ 0> •P ~ f a rH e ^-&H C S Q d) tt) S Q
H o a a o Ä O Z z
* « * * * * C M r H l f l r ^ V O I f l r H C O C M O r H O O C M O r H
O O O O O O O O
If) rH » û n i f i H v D v o v o t n <f o œ ^ n i f t O ' i ' H CM H
CO rH
m m i o o H i n o œ V D O O O ' ^ ' l ' C O r H " * H CM H
« « « « « C O H O V O ^ C T l r H l f l H O H O O C M O H
O O O O O O O O
CM rH r H l f l ^ C T l r H ' - i ' C T l C O
i n O M I f H O O N H CM H
t> CM i f i i f i c o i f i o n o c n
i n O K J f l f l h H H H CM . rH
* * * Ht HC HC HC HC HC HC HC HC HC HC HC HC HC
O H h n n i f l r U O H O O O O C M O r H
O O O O O O O O
e> n r>cNr^r>o^r^•«J••s^•
o o r > r > C M O O n H CM rH
O O c i n o c o m M ' c n f
n o c o o n * o * H CM H
HC HC HC HC HC HC HC HC
t ^ H O i n ^ ' l ' H O H O H O O C O O C M
O O O O O O O O
r- co r H d l f l T j - V O O V O C O
H o i n n c M O O H rH CM rH
• * rH i n ^ i B u i T f O c o n
r H O i n C M C M H O O rH CM H
^ - t
D> X
*—' ^—» tn 0) —. 0) ^ w — s x ^ o s ~<a (0 rH CQ S •P 0) 3 03 O» C --» W rH 0> *
•H - v & O H A ! 0 > \ Ö< — X rH 0) \ * O«
rH A«J O l — 3 ü 0 > \ ^ -10 *~ X l-t-rl'-' Ü> +J ^ - f c rH g ^ - f c O S Q <D <D E Q
H O Z Ä Ü Ä O Ä S
en r-- O * h O
O O CM
vo r~ co o o H CM r~
in VO VO
CM m o\ CM CM t ~
I f )
H •# en CO VD rH
O O CM
H CO
•*!• M1 V£> CM CM r -
I f )
o •>*
I f) VO CD CM CM »O
I f ) HC HC HC HC He HC HC HC
H n o \ CM H CM
• • • O O CM
CM H
H CM •** H H n
I f )
CO CM
vo en o H H I O
I f )
He He
co vo a\ CM CM en
O O rH
n en CT) O O
H I f ) I f )
O CT)
H CM VO H H Tf
I f )
»̂ ^ & i 0> r«! X ~ -̂̂ m
-o s H O
ai ^ o •H o> >iM -P
^--X! « O* H 2 - H •H Ü <U
e t- >
m o o V PH
HC
H O
O V Ot
* HC
«. H O O
•
o V 04
HC HC HC
23
0> o> XiM •p \
m o
•H • P
ra •H u o> +J ü (d u (0 .c 0 c o
•H •P (0
•O (0
O) T3
U 0) •P •P (0 s
&> * E
O PK
-̂* C 0
•H •P ü 3
•O O
u ft
•H
e ^^ 1 o> .* \ CT>
^ O '-'
>iTJ M
•o
c O 0)
s •p d) Si
TJ C (0
c •H £ •p •H S
0> g 3 (0 c 0 ü
UI Cl •p IÖ M
•p c 01 o c o ü
c M
- O)
24
4J (0 CQ
H ^ & O) "i *
8S~ 0 ° «O IfljÜc
<M (O Cf> « H C « 01 o ^ O ü , H
O M
• <-\ T3 CTi (0 C
a ra o» Ä H S to ai ca H O S
o
u
§
Ifl <U •H >-l 0) •p
_ o (0 <o s* M ^ g &> «o i 0> £ . 'c/>
•O ü <H
o
Q Ifl < 01 &> (0
c o
•H •p -H Ifl O a e o o
01
(0
a
Ë
co o
fN
in H
o
(Tl eg
o
t n
co
o I
co m <H vo r l N H P )
O O O O
O O VO * * O O H O
O O O O
•te * « * « « « « 0 0 * O H t- •> r- vo
o o o o
* * * * * * * * t-~ in co n cv CV Cv Cv
o o o o
* * * * * * * * vo in • * vo cv co co t>
o o o o l l l
* * •¥ « « « o in o CV CV CV
O O O I I I
* * * * Cv H CO CV
in cv
O H tH
O O O I
N h H O O O
o o o I
* * * * o in co r»
o o i
tN co o
I
IN CV
[K D Ï5
0) ^ 10 •P c -H
a\ H
O M •p e 0) •p c o o
0)
(0 •p c §
•H Q
(0
rt*- -. S Q O Q r H f a P n J O I I I 0) Q Q Q \ «• * -o 0 Z 4 0 I Z t - H M ^
Ifl 01 •P 10 M •P » c oa 0) ü o« c X o \ O O*
s m E
o> M \ S O fa
o V CU
•K
^ H O o •
o V PH
* *
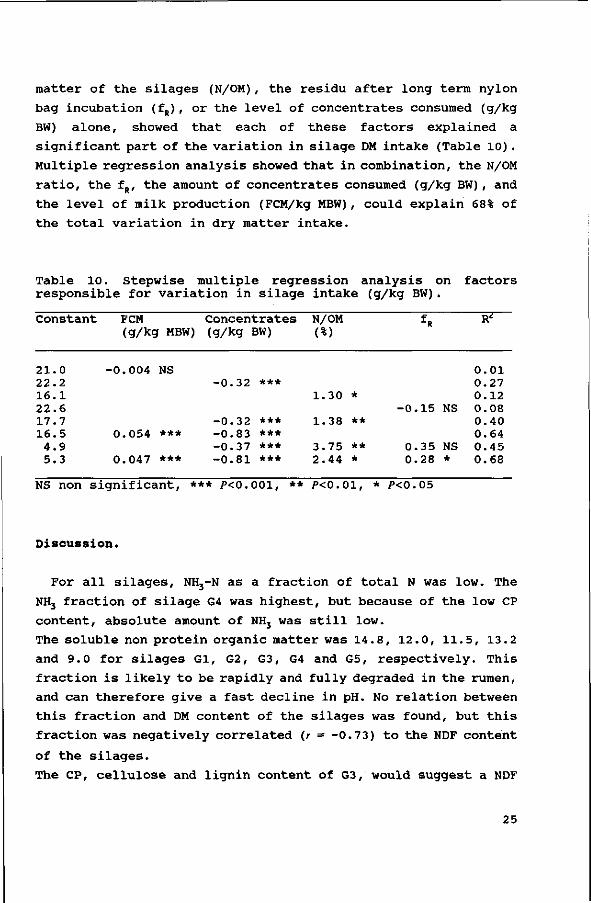
matter of the silages (N/OM), the residu after long term nylon
bag incubation (fR) , or the level of concentrates consumed (g/kg
BW) alone, showed that each of these factors explained a
significant part of the variation in silage DM intake (Table 10) .
Multiple regression analysis showed that in combination, the N/OM
ratio, the fR, the amount of concentrates consumed (g/kg BW) , and
the level of milk production (FCM/kg MBW), could explain 68% of
the total variation in dry matter intake.
Table 10. Stepwise multiple regression analysis on factors responsible for variation in silage intake (g/kg BW).
Constant
21.0 22.2 16.1 22.6 17.7 16.5
4.9 5.3
FCM (g/kg MBW)
-0.004 NS
0.054 ***
0.047 ***
Concentrates (g/kg BW)
-0.32 ***
-0.32 *** -0.83 *** -0.37 *** -0.81 ***
N/OM (%)
1.30
1.38
3.75 2.44
*
**
** *
-0
0 0
fR
15
35 28
NS
NS *
R'
0.01 0.27 0.12 0.08 0.40 0.64 0.45 0.68
NS non significant, *** /><0.001, ** P<0.01, * P<0.05
Discussion.
For all silages, NH3-N as a fraction of total N was low. The
NH3 fraction of silage G4 was highest, but because of the low CP
content, absolute amount of NH3 was still low.
The soluble non protein organic matter was 14.8, 12.0, 11.5, 13.2
and 9.0 for silages Gl, G2, G3, G4 and G5, respectively. This
fraction is likely to be rapidly and fully degraded in the rumen,
and can therefore give a fast decline in pH. No relation between
this fraction and DM content of the silages was found, but this
fraction was negatively correlated (r = -0.73) to the NDF content
of the silages.
The CP, cellulose and lignin content of G3, would suggest a NDF
25
content between that of silages Gl and G2. Because of the high
hemicellulose content however, the total cell wall content was
the same as for silage G2, but the ratio cellulose to
hemicellulose was lower for G3. Jones et al. (1988) reported a
ratio of 0.58 in Bermuda grass hay and of 1.07 in Orchard grass
hay, indicating that big differences between grasses may occur.
Bailey (1973) also reports big differences in the ratio cellulose
to hemicellulose between grasses, but also within grasses between
growth stages and growing seasons. Differences due to different
growth stages and/or differences in growing seasons may be due
to changes in leaf to stem ratios. The silages in these
experiments were harvested in different seasons and the weather
conditions during growth varied as well.
Based on the chemical parameters CP, lignin and cellulose,
however, despite the slightly higher NDF content of silage G3,
the silages can be ranked in the order of Gl, G3, G2, G4 and G5.
When the plant matures, cell wall content increases and lignin
content of the cell walls also increases. The lignin is bound to
the cellulose-hemicellulose fraction of the cell wall, and acts
as a barrier for the enzymatic degradation by rumen
microorganisms, because microbes can only ferment the cell walls
if they come into direct contact with them (Engels, 1987) .
Therefore, the degradation rate of the cell wall fraction
decreases with maturity.
Negative correlations between the rumen undegradable fraction
and the rate of degradation of the digestible fraction for DM as
well as for NDF were found (r = -0.87 and -0.84, respectively).
With respect to the composition, contents of cell wall components
(NDF, ADF, lignin) were negatively correlated with fs-DM and
kd-DM, but positively with fR-DM. This can be explained as a
result of maturation and lignification. As far as the lignin
content concerns, this relation appears to be restricted to
within species. In comparing grasses, legumes and clover, Nocek
& Grant (1987) as well as Seoane (1982) also report negative
correlations between fs and the NDF and ADF contents, but not
between fs and the lignin content of the feeds.
26
The level of concentrates fed had a variable effect on nylon
bag degradation rates of the silages. The increase in degradation
rate with an increase in concentrate level for silages Gl and G2
may have resulted from a better energy supply for the rumen
microorganisms. Robinson et al. (1986), in their experiments, fed
the same basal diet at low and high intake level. They found no
effect of level of intake on degradation rate, but the lag time
was higher (P<0.05) at the low intake level. In our experiments
lag time for DM disappearance was higher for the low intake
level, but lag times for the other components showed no
consistent relation with level of intake.
Cell walls or NDF can be looked upon as a mixture of cellulose,
hemicellulose and lignin, of which particularly hemicellulose is
encrustrated with lignin (Van Soest, 1982). This explains why
ADF, of which the degradable part is mainly cellulose, is
degraded at a faster rate than NDF. The difference in rate of
degradation between cellulose and hemicellulose is also reflected
in the apparent digestibility, except with silage G3.
It is also of interest to note that the undegradable proportion
of hemicellulose relates fairly well to the lignin/hemicellulose
ratio.
OM digestibility and NDF digestibility decrease within forages
with stage of growth (Panditharatne, 1988) and with an increase
in cell wall content and lignification (Robles, 1981; Reid et al.,
1988; Tamminga & Van Vuuren, 1988; Van Soest, 1982). In our
experiments, a linear relationship between NDF content and OM
digestibility (r=-0.99) as well as NDF digestibility (r=-0.96)
was found.
Based on undegradable cell wall contents of different
concentrate ingredients as given by Tamminga et al. (1990), the fR-NDF o f t n e concentrates was estimated to be approximately 15%.
Total cell wall intake can be divided in rumen undegradable and
rumen degradable material. The fraction of rumen degradable NDF,
excreted undigested with the faeces was calculated and increased
with an increase in cell wall content and with an increase in
concentrate level (GIL, 12.6; G3L, 12.2; G2L, 15.0,* G4L, 17.2;
27
G1H, 15.4; G3H, 15.2; G2H, 20.7 and G5H, 22.7). The fraction of
the digestible cell walls that is digested in the large
intestines increases with a decrease in apparent cell wall
digestibility (Ulyatt etal., 1975) and thus with an increase in
cell wall content. This seems, however, not enough to compensate
for the lower rumen degradability due to a lower degradation rate
of the cell wall fraction and a higher rate of passage from the
rumen (Bosch et al., submitted) . Concentrate particles have a
higher rate of passage from the rumen than roughage particles
(Owens & Goetsch, 1986). The probably higher rate of degradation
(the individual ingredients have a higher kd_N0F (Tamminga etal.,
1990) than the silage cell wall fractions) , does not seem to
compensate for the shorter rumen retention time, resulting in a
bigger degradable NDF fraction that is excreted undigested for
the high concentrate diets.
The apparent crude protein digestibility decreased with stage
of maturity (P<0.05). Two aspects are important to explain this.
1. The true protein digestibility decreases because of an
increase of protein incorporated in the cell wall fraction with
increasing cell wall content (Krishnamoorthy etal., 1982; Van
Soest, 1982). 2. The quantity of endogenous protein increases
with increasing cell wall content of the diet as induced by
higher DM passages in the intestines (Van Bruchem etal., 1989),
resulting in a higher faecal excretion.
A linear negative relationship (r=-0.58) between dry matter
intake and dietary NDF concentrations was reported by Hoover
(1986), in a review of studies with lactating dairy cows. In our
experiments a non significant decrease in DM intake (g/kg BW) was
found, with an increase in NDF content, although intake of silage
G3 was higher as would be expected. Intake of G3 was
significantly (P<0.001) higher as compared to the other four
silages, resulting in an even higher NDF intake as compared to
silages G4 and G5. For silages Gl, G2, G4 and G5 total NDF intake
(g/kg BW) significantly increased (P<0.01) with an increase in
NDF content.
28
The difference in intake of the silages in combination with 7
kg of concentrates as compared to 1 kg, was biggest for silage
G3. This is in agreement with the positive relation between
ingestibility of a forage (voluntary dry matter intake as a sole
feed) and substitution rate of forages by concentrates as
reported by Jarrige et al. (1986).
About half of the variation in silage DM intake can be
explained by the amount of concentrates consumed and the level
of milk production. Thus, physiological status of the animal
appears to be one of the main factors controlling feed intake.
After correction for concentrate intake and milk production, the
N/OM ratio in the silages and the fR of the silages, together,
explain almost half of the variation in DM intake.
Our results agree with the results of Mertens & Ely (1979), who
concluded from their simulation model, that the digestible DM
intake is influenced more by the proportion of undegradable fibre
than by the rate of degradation. In our experiments, it is clear
that ad libitum silage DM intake is influenced by silage
characteristics. It is, however, not yet possible to identify a
restricted number of components, which can be determined
accurately, and can be used to predict silage intake at a given
concentrate level and an expected milk production.
According to Forbes (1988), who compared different equations
to predict voluntary intake by dairy cows, most equations found
in literature can only be used under the same circumstances as
under which the data from which they were calculated were
collected. He concluded that the simple equation:
Total DM intake = 0.025(Body Weight, kg) + 0.1(Milk Yield, kg/d),
was not significantly worse than more complex ones. For our
experiments, this equation as well as most other equations given
by Forbes (1988), overestimate DM intake. It seems correct that
equations to predict voluntary intake can only be used under, at
least comparable, circumstances. It is therefore useful to
develop these equations per type of diet and type of animal.
29
References.
Ba i l ey , R.W. , 1973. S t ruc tura l carbohydrates . In: Chemistry and biochemistry of herbage. Ed. by G.W. Butler and R.W. Bailey, Academic Press.
Bosch, M.W., S.C.W. Lammers-Wienhoven, G.A. Bangma and H. Boer, submitted. In f luence of s t age of maturity of g ra s s s i l a g e s on d i g e s t i o n p roce s s e s i n da iry cows. 2 . Rumen con ten t s and ruminai passage r a t e s . Livest.Prod.Sei, submitted.
Chai, K., P.M. Kennedy and L .P .Mi l l i gan , 1984. Reduction in p a r t i c l e s i z e during rumination in c a t t l e . Can.J.Anim.Sci. 64(suppl):339-340.
Engels , F.M., 1987. Changes i n the phys i ca l / chemica l s t ru c tur e s of c e l l w a l l s during growth and degradat ion . In: Degradation of lignocellulosics in ruminants and in industrial processes, Ed. by J.M. van der Meer, B.A. Rijkens, M.P. Ferranti. Elsevier Applied Science Publishers, LTD.
Forbes, J .M. , 1988. The p r ed i c t i on of vo luntary in take by the da iry cow. In: Nutrition and lactation in the dairy cow. (P.C. Garnsworthy, Ed.). Butterworth, London, 294-312.
Goering, H.K. and P .J . van Soe s t , 1970. Forage f i b e r ana l y s e s . Agricultural Handbook No 379. ARS, USD A, Washington, DC, USA.
Hoover, W.H., 1986. Chemical f a c t o r s invo lved i n ruminai f i b e r d i g e s t i o n . J.Dairy Sei. 69:2755-2766.
J a r r i g e , R., C. Demarquilly, J . P . Dulphy, A. Hoden, J . Robel in , C. Beranger, Y. Geay, M. Journet , C. Mal terre , D. Micol and M. P e t i t . 1986. The INRA " f i l l un i t" system for p r ed i c t i ng the vo luntary in take of forage-based d i e t s in ruminants : A rev iew. J.Anim.Sci. 63:1737-1758.
Jones , A .L . , A.L. Goetsch, S.R. S tokes and M. Colberg, 1988. Intake and d i g e s t i o n in c a t t l e fed warm- or c oo l - s ea son g ra s s hay with or wi thout supplemental g ra in . J.Anim.Sci. 66:194-203.
Kennedy, P.M. and M.R. Murphy, 1988. The n u t r i t i o n a l imp l i ca t i on s of d i f f e r e n t i a l passage of p a r t i c l e s through the ruminant a l imentary t r a c t . Nutritional Research Revieuws 1:189-208.
Krishnamoorthy, U . , T.V. Muscato, C.J. Sn i f f en and P .J . van Soe s t , 1982. Nitrogen f r a c t i o n s i n s e l e c t e d f e e d s t u f f s . J.Dairy Sei. 65:217-225.
Mehrez, A.Z. and E.R. JSrskov, 1977. A s tudy of t he a r t i f i c i a l f i b r e bag t echnique for determining the d i g e s t i b i l i t y of f e eds i n the rumen. J.Agric.Sci. 88:645-650.
Mertens, D.R. and L.O. Ely , 1979. A dynamic model of f i b e r d i g e s t i o n and passage i n the ruminant for e va lua t ing forage
30
quality. J.Anim.Sci. 49:1085-1095.
Mertens, D.R., 1987. Predicting intake and digestibility using mathematical models of ruminai function. J.Anim.Sci. 64:1548-1558.
Nocek, J.E. and A.L. Grant, 1987. Characterization of in situ nitrogen and fiber digestion and bacterial nitrogen contamination of hay crop forages preserved at different dry matter percentages. J.Anim.Sci. 64:552-564.
Owens, F.N. and A.L. Goetsch, 1986. Digesta passage and microbial proetin synthesis. In: Control of Digestion and Metabolism in Ruminants, Ed. by L.P. Milligan, W.L. Grovum and A. Dobson.
Panditharatne, S., V.G. Allen, J.P. Fontenot and M.C.N. Jayasuriya, 1988. Effect of stage of growth and chopping length on digestibility and palatibility of guinea-'A1 grass silage. J.Anim.Sci. 66:1005-1009.
Reid, R.L., G.A. Jung and W.V. Thayne, 1988. Relationships between nutritive quality and fiber components of cool season and warm season forages: a retrospective study. J.Anim.Sci. 66:1275-1291.
Robinson, P.H., J.G. Fadel and S. Tamminga, 1986. Evaluation of mathematical models to describe neutral detergent residue in terms of its susceptibility to degradation in the rumen. An.Feed Sei. and Techn. 15:249-271.
Robles, A.Y., R.L. Belyea and F.A. Martz, 1981. Intake, digestibility, ruminai characteristics and rate of passage of alfalfa diets fed to sheep. J.Anim.Sci. 53:774-779.
SAS, 1985. SAS User's guide: Statistics, Version 5 edition. Cary, NCSAS Institute Inc.
Scheiner, D, 1976. Determination of ammonia and kjeldahl nitrogen by indophenol method. Water Research 10:31-36.
Seoane, J.R., 1982. Relationships between the physico-chemical characteristics of hays and their nutritive value. J.Anim.Sci. 55:422-431.
SPSS Inc, 1988. SPSS/PC+ Base manual. SPSS Inc., Chicago, Illinois.
Tamminga, S. and A.M. van Vuuren, 1988. Formation and utilization of end products of lignocellulose degradation in
ruminants. Anim.Feed Sei.Techn. 21:141-159.
Tamminga, S., A.M. van Vuuren, C.J. van der Koelen, R.S. Ketelaar and P.L. van der Togt, 1990. Ruminai behaviour of structural carbohydrates, non-structural carbohydrates and crude protein from concentrate ingredients in dairy cows. Neth.J.Agric.Sci. 38:513-526.
31
U l y a t t , M . J . , D.W. D e l l o w , C.S.W. R e i d and T. Bauchop , 1 9 7 5 . S t r u c t u r e and f u n c t i o n o f t h e l a r g e i n t e s t i n e o f r u m i n a n t s . I n : Digestion and Metabolism in the ruminant. Proceedings of the IV International Symposium on Ruminant Physiology. Sydney, Australia, August 1974.
U l y a t t . M . J . , D.W. D e l l o w , A. J o h n , C.S.W. R e i d and G.C. Waghorn, 1 9 8 6 . C o n t r i b u t i o n o f c h ew ing d u r i n g e a t i n g and r u m i n a t i o n t o t h e c l e a r a n c e o f d i g e s t a from t h e r u m i n o r e t i c u l u m . I n : Control of Digestion and Metabolism in Ruminants. Ed. by L.P. Milligan, W.L. Grovum and A. Dobson.
Van Bruchem, J . , L . J .G .M. B o n g e r s , S.C.W. Lammers-Wienhoven, G.A. Bangma and P.W.M. van Adr ichem, 1 9 8 9 . Apparen t and t r u e d i g e s t i b i l i t y o f p r o t e i n and amino a c i d s i n t h e s m a l l i n t e s t i n e o f s h e e p a s r e l a t e d t o t h e d u o d e n a l p a s s a g e o f p r o t e i n and n o n - p r o t e i n d ry m a t t e r . Lhest.Prod.Sci. 23:317-327.
Van S o e s t , P . J . , 1 9 8 2 . N u t r i t i o n a l e c o l o g y o f t h e r u m i n a n t . O&B Books Inc., Corvallis, OR.
Welch , J . G . , 1 9 8 2 . Rumina t i on , p a r t i c l e s i z e and p a s s a g e from t h e rumen . J.Anim.Sci. 54:885-894.
Weston , R.H. , 1 9 8 2 . Animal f a c t o r s a f f e c t i n g i n t a k e . I n : Nutritional limits to animal production from pastures. Proceedings of an international symposium held at St Lucia, Queensland Australia, 1981. Ed. J.B. Hacker.
32
Chapter I I I
Influence of stage of maturity of grass silages on digestion
processes in dairy cows.
2. Rumen contents and ruminai passage rates.
M.W. Bosch1 , 2 , S.C.W. Lammers-Wienhoven1, G.A. Bangma1 and H. Boer2
d e p a r t m e n t of Human and Animal Phys io logy , A g r i c u l t u r a l
U n i v e r s i t y , Haarweg 10, NL 6709 PJ Wageningen.
d e p a r t m e n t of Animal N u t r i t i o n , A g r i c u l t u r a l U n i v e r s i t y ,
Haags teeg 4 , NL 6708 PM, Wageningen.
s ubmi t t ed f o r p u b l i c a t i o n
33
Abstract.
In four change-over experiments, wilted grass silages,
differing in cell wall content (Neutral Detergent Fiber (NDF)
content ranging from 44.6% to 67.3% of dry matter (DM)), were fed
ad libitum to dairy cows in early and late lactation.
The influence of cell wall content of the grass silages on
rumen contents and on fractional passage rates of particulate
(k , %/h) and liquid (kt, %/h) phases, was determined using Cr-
NDF and Tritium (T) labelled hay as particulate markers and Co-
EDTA as a soluble marker.
Rumen contents (total as well as DM, kg) increased with an
increasing proportion of concentrates in the diet, but did not
show any significant relation with silage cell wall content.
The k increased with an increase in NDF content of the diet,
and with an increase in intake level, whereas the kt was not
affected by diet composition.
Introduction.
For lactating dairy cows fed rations with a high roughage
proportion, intake can be limited by the capacity of the rumen
(Mertens, 1987). Intake then depends on rumen fill and its
reduction by microbial digestion of the feed, particle size
reduction through rumination and rate of particle passage to the
lower gut (Ulyatt etal., 1986; Kennedy & Murphy, 1988).
Since microbial degradation hardly influences particle size,
rate of passage of small particles to the lower gut is the main
factor reducing rumen fill, and therefore considered an important
factor in feed intake regulation (Van Soest, 1982).
The effect of roughage characteristics, like chemical
composition and degradation characteristics, on their behaviour
in the rumen is not well documented.
In four experiments, in which the effect of cell wall content
of grass silages on intake and digestion in dairy cattle is
investigated (Bosch et al., submitted), rumen contents were
34
determined. In addition, the rate of passage of the fluid and
particulate phases to the lower gut were measured using soluble
and particulate markers.
Materials and methods.
Five wilted grass silages (Gl to G5), differing in cell wall
content were fed ad libitum to dairy cows, supplemented in early
and late lactation with 7 and 1 kg of concentrates, respectively.
In each of the four change-over experiments, two silages were fed
to six (Exps. 1, 2 and 3) or four (Exp. 4) rumen fistulated dairy
cows. In Exps. 1 and 3 the cows were in late lactation, so 1 kg
of concentrates was included in the diet, whereas in Exps. 2 and
4, when the cows were in early lactation, 7 kg of concentrates
was added to the diet. Each experiment consisted of two
experimental periods of five weeks, preceded by adaptation
periods of three weeks. Silage was offered three times a day, at
7.00, 15.00 and 23.00 h. The concentrates were fed at 14.45 h (1
kg) or at 6.45 and 14.45 h (two portions of 3.5 kg each). The
experimental designs were as described in more detail by Bosch
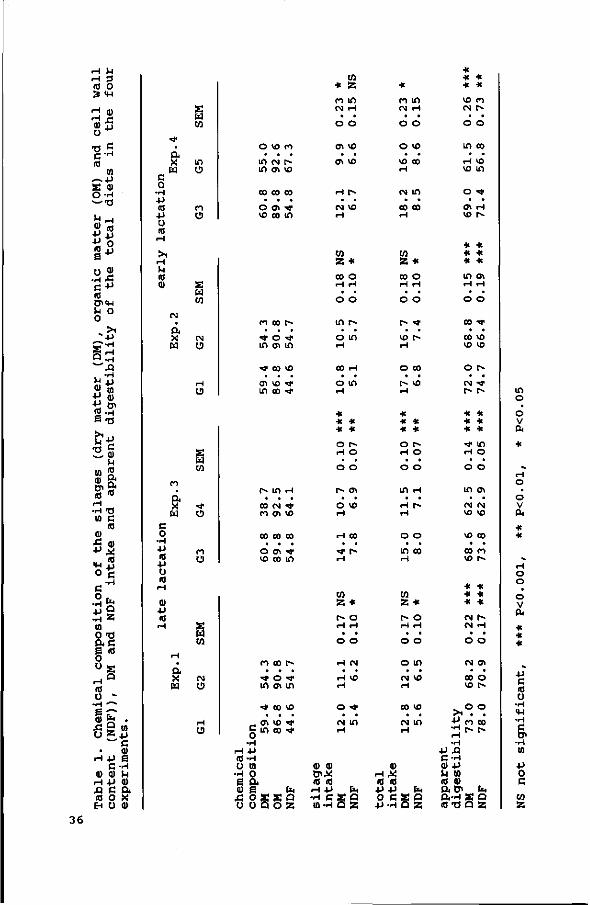
et al. (submitted) . The composition of the five silages, their
intake and the apparent digestibility of the total diet are given
in Table 1.
Rumen evacuations were done in the fifth week of each
experimental period, at approximately 2 and 4 h after the end of
the morning meal, which is assumed to be 2 h after feeding time,
in Exps. 1, 2 and 3, and at approximately 0, h, 3, 4h and 6 h
after the end of the morning meal in Exp. 4.
Rumen contents were weighed, sampled and returned into the
rumen. This procedure took about 25-30 minutes per cow. Rumen
samples (1% of rumen contents) were dried at 70°C, ground and
stored till further chemical analysis.
Dried rumen samples were analysed for dry matter (DM), ash,
crude protein (CP, N (nitrogen) * 6.25), neutral detergent fibre
(NDF), acid detergent fibre (ADF) and acid detergent lignin
(ADL). DM was determined by drying to constant weight at 103'C,
35
rH U rH 3 <a o £ <n
Tf C C ' H
<ü ui
— -P S <D O -H -—XJ
• P i j
g 4,
O 0) •H Ä
(0 0><H M 0 0
> i '4->
§3 w £ l , , - H
ft « t i ® £ tn g-H e-o
2.« ^i
Aft 10 "
rH •H "0
(0 <D Ä o) + * * , «o <H + j
o c •H
c 0 ,
• H f e + j g •H a ui 0 T3 ftC
o
rH " id o »
Chem
i N
DF
) )
ts.
e <u
•H + j e C - H
d) O M rH .p <1) A c a (0 O X En ü 0)
*r • Q<
X w
c 0
•H •P (0 •P O (0
rH
>1 rH U (0 V
PJ
Cu X w
to
a X H
C O
•H •P 10 •P Ü 10
rH
<0 •P (0 H
H • a
x H
£ CO
in O
r> O
S
PJ O
H o
s a w
• < *
o
m O
2 U CO
(M O
H U
o vo r>
• • • in (M r-in en vo
00 » 00
• • • o en ^ vo oo in
M œ r-
• • • ^ o •<* m en in
•^ 00 VO
« • • en vo >* m oo •<*
r« m H
• • • oo PJ • * f> CK VO
00 00 00
o en • * vo oo in
n oo r>
* o * m en in
•t* 00 VO
en vo t g m oo TJ-
•H r-l 4J (0 -H u Ul
•H 0
e o. <U B h fiOÏSÛ ü Ü Q O 2
to
* » « in CM H
O o
en vo
• • en vo
H t -
• • pj vo H
W Z *
00 o H H
O O
in r>
• • o in H
00 H
• • o in rH
* * * * * O P~ •H O
• • O o
• • O VO r-l
•H 00
• • *f t> r-l
co Z *
t> o r-l H
• • O o
H CM
rH VD H
O • *
pa in 1-1
O) <u Ü>X (0 10 rH 4J fa •H c s a W - H Q 2
* n in PJ r-l
o o
o vo
• • VO 00 H
pj in
• • CO 00 •H
W Z *
00 o H i-l
O o
r> <*
• • vo t> i-i
o co
• • t > VO H
* * * •K *
o r> H o
• • o o
in H • • H r>
H
O O
• • i n oo H
CO
z * r> o •H H
• • O o
o m OM VO rH
CO VO
pa m H
ai rH * 10 10 •p -p fa O C S Q • P - H Q Z
* H« *
* * vo r> PJ r>
o o
in oo
• • H VO vo i n
o ^
• • en H vo t>
* * * * * * in en H H
o o
00 •»*
• • 00 vo VO VO
o t>
• • CM •>* r> r~
* * * * * * •<* in H o
• • o o
in en
• • pj PJ VO VO
VO 00
• • 00 P I vo r -
* * * * * * PJ h-PJ H
• • O O
PJ en
00 o vo r-
*°.° •P r i 00 •^ r- p-
•H •P XI C - H 0) 4J u m «o a> O i 0> ht £ V H S Q 10 -o o z
in o o V A
*
H O
O V
& * *
^ H O O
o V CLi
« * *
4J C 10 Ü
•H
•H C 0>
•H W
•P 0 c
w z
36
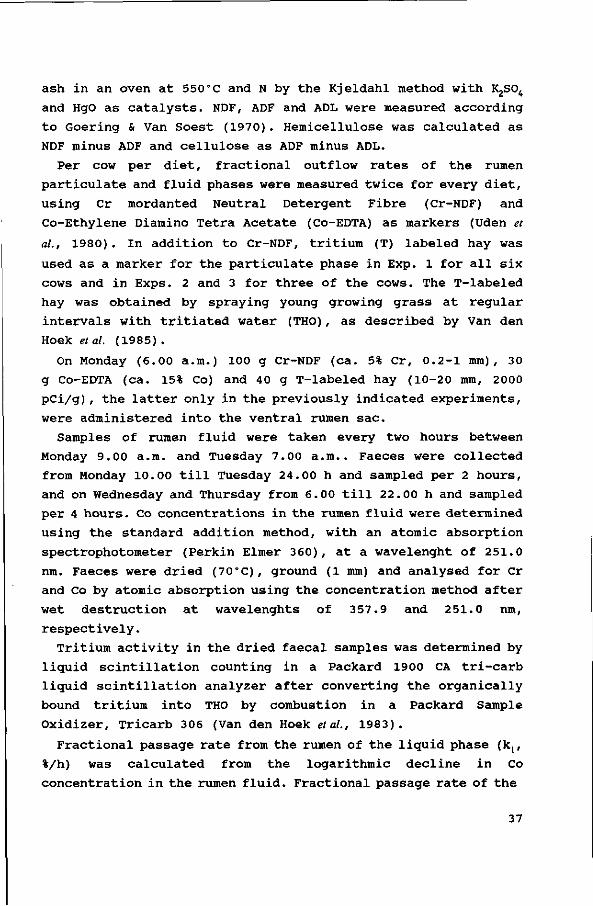
ash in an oven at 550'C and N by the Kjeldahl method with K2S04
and HgO as catalysts. NDF, ADF and ADL were measured according
to Goering & Van Soest (1970). Hemicellulose was calculated as
NDF minus ADF and cellulose as ADF minus ADL.
Per cow per diet, fractional outflow rates of the rumen
particulate and fluid phases were measured twice for every diet,
using Cr mordanted Neutral Detergent Fibre (Cr-NDF) and
Co-Ethylene Diamino Tetra Acetate (Co-EDTA) as markers (Uden et
al., 1980) . In addition to Cr-NDF, tritium (T) labeled hay was
used as a marker for the particulate phase in Exp. 1 for all six
cows and in Exps. 2 and 3 for three of the cows. The T-labeled
hay was obtained by spraying young growing grass at regular
intervals with tritiated water (THO), as described by Van den
Hoek et al. (1985) .
On Monday (6.00 a.m.) 100 g Cr-NDF (ca. 5% Cr, 0.2-1 mm), 30
g Co-EDTA (ca. 15% Co) and 40 g T-labeled hay (10-20 mm, 2000
pCi/g), the latter only in the previously indicated experiments,
were administered into the ventral rumen sac.
Samples of rumen fluid were taken every two hours between
Monday 9.00 a.m. and Tuesday 7.00 a.m.. Faeces were collected
from Monday 10.00 till Tuesday 24.00 h and sampled per 2 hours,
and on Wednesday and Thursday from 6.00 till 22.00 h and sampled
per 4 hours. Co concentrations in the rumen fluid were determined
using the standard addition method, with an atomic absorption
spectrophotometer (Perkin Elmer 360), at a wavelenght of 251.0
nm. Faeces were dried (70°C), ground (1 mm) and analysed for Cr
and Co by atomic absorption using the concentration method after
wet destruction at wavelenghts of 357.9 and 251.0 nm,
respectively.
Tritium activity in the dried faecal samples was determined by
liquid scintillation counting in a Packard 1900 CA tri-carb
liquid scintillation analyzer after converting the organically
bound tritium into THO by combustion in a Packard Sample
Oxidizer, Tricarb 306 (Van den Hoek et al., 1983).
Fractional passage rate from the rumen of the liquid phase (kt,
%/h) was calculated from the logarithmic decline in Co
concentration in the rumen fluid. Fractional passage rate of the
37
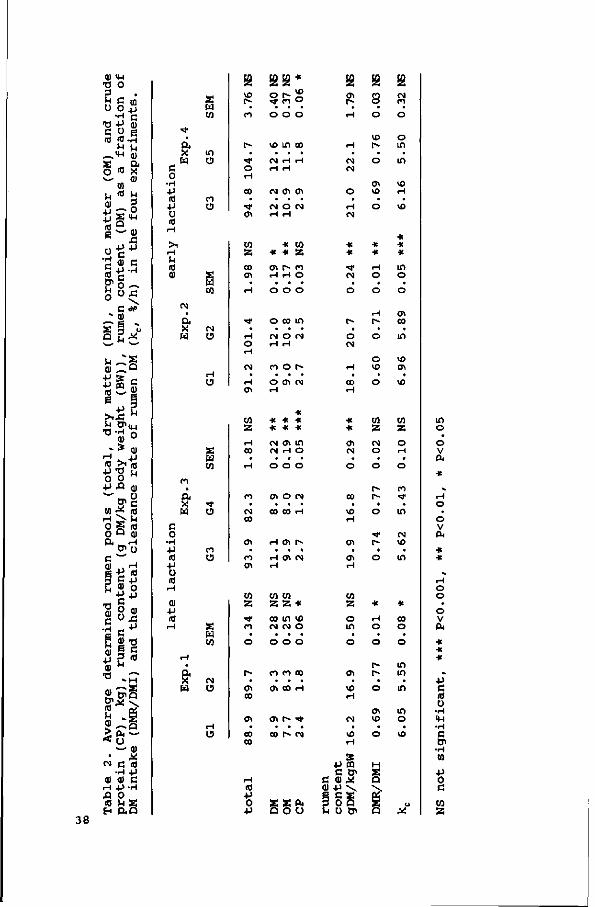
e o • H •P (O •P O (O
(O <0
X
w
w co
m C3
Pd CO
O
ë ëë ë ë ë VO
o
CTl
Z
CO ON
• < *
rH O H
CM
H
en
° ^ o
VO lf) c o
N H H
CM 0> 0>
CM O CM
* CO * •* z CT\ t - CO rH H O
O O O
o co in CM O CM
O O P»
O ffl CM
f? H
H
CM CM
O
CO O
o
VO
o
0 1 1 0
CM CO
O
O
in in
vo H
1 -CM
H in o o
[ -
• o CM
rH
rH r-• o
o vo
CTl CO
• m
VO CTl
r>
• a X w
G O
• H •P (0 •p ü (0
s w co
• *
o
co O
co • H
co • CM
co
en • co
01
co
z
ft X H
S H co
CM O
1 -CO
• o
r-• en
co
O
CO
Z
38
co co
10 •p o
•p
* * * * * * * CM en in CM H o
CT> O CM
CO CO H
H CTl [^
H en CM
CO CO
Z Z *
co in vo CM CM O
o o o
co co co CTl CO H
en r» • *
co r~ CM
2 ï f t a o o
en CM
00
VO
en
en
co Z
O in
en
vo
co Z
CM O
co Z
co
CM VO
O
O
P~
CO
O
in in
en in CM vo o
•P « C 0>
eux e c s s o Q
n
in o o v PH
O V eu
* *
o o o V CU
* * *
•p c 10 ü
• H VM • H C 0>
•H ca •p o c co
z
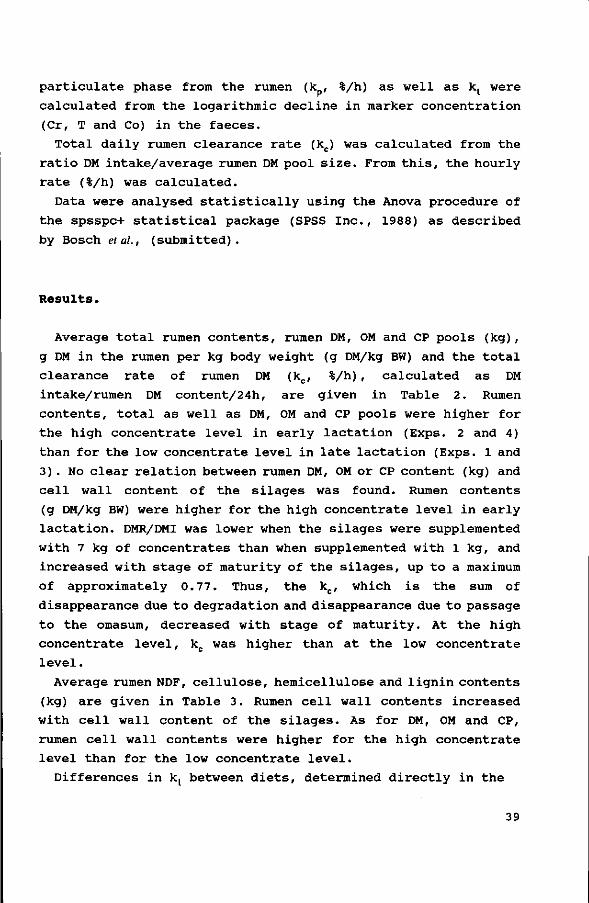
particulate phase from the rumen (k , %/h) as well as k( were
calculated from the logarithmic decline in marker concentration
(Cr, T and Co) in the faeces.
Total daily rumen clearance rate (kc) was calculated from the
ratio DM intake/average rumen DM pool size. From this, the hourly
rate (%/h) was calculated.
Data were analysed statistically using the Anova procedure of
the spsspc+ statistical package (SPSS Inc., 1988) as described
by Bosch et al., (submitted).
Results.
Average total rumen contents, rumen DM, OM and CP pools (kg),
g DM in the rumen per kg body weight (g DM/kg BW) and the total
clearance rate of rumen DM (kc, %/h) , calculated as DM
intake/rumen DM content/24h, are given in Table 2. Rumen
contents, total as well as DM, OM and CP pools were higher for
the high concentrate level in early lactation (Exps. 2 and 4)
than for the low concentrate level in late lactation (Exps. 1 and
3) . No clear relation between rumen DM, OM or CP content (kg) and
cell wall content of the silages was found. Rumen contents
(g DM/kg BW) were higher for the high concentrate level in early
lactation. DMR/DMI was lower when the silages were supplemented
with 7 kg of concentrates than when supplemented with 1 kg, and
increased with stage of maturity of the silages, up to a maximum
of approximately 0.77. Thus, the kc, which is the sum of
disappearance due to degradation and disappearance due to passage
to the omasum, decreased with stage of maturity. At the high
concentrate level, kc was higher than at the low concentrate
level.
Average rumen NDF, cellulose, hemicellulose and lignin contents
(kg) are given in Table 3. Rumen cell wall contents increased
with cell wall content of the silages. As for DM, OM and CP,
rumen cell wall contents were higher for the high concentrate
level than for the low concentrate level.
Differences in kt between diets, determined directly in the
39
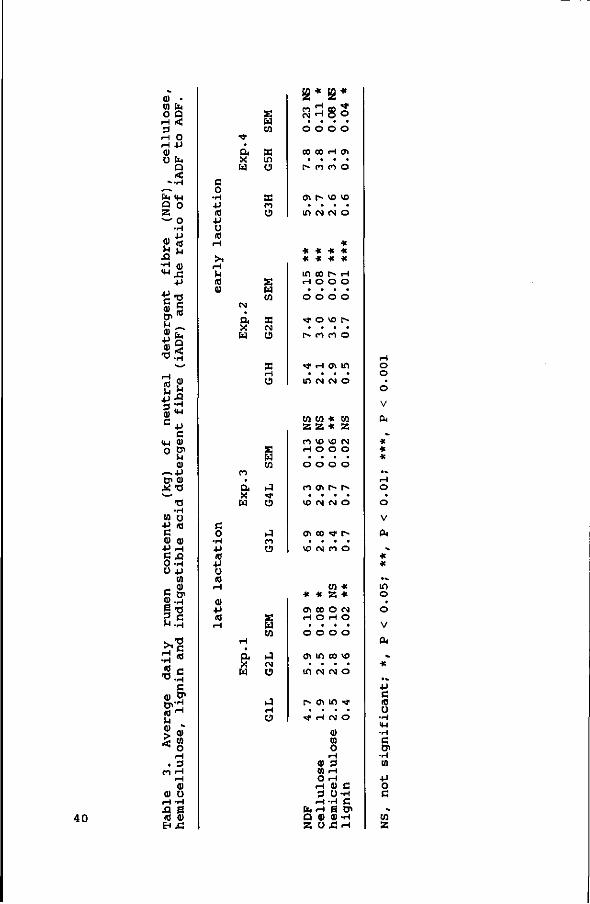
40
fl) . to fa O Q
rH < 3 -H 0 rH +J (U 0 fa
a < » • H
*-̂ fa <4-l Q 0 Z — O
• H
/.. +• ? <° £ r< Si r 1 fl) ' " Ä
• p
8, S M „ ^ fa + J Q
N - *
2§ •P-Q •g-H
c <M <D 0 O1
^ <1) ~ - P D> O , * -0 —̂' •Ü
• H W U
•y * e Q) fl)
•P rH
5-Q O - H O + J
10
r. <" S O1
S-H e -0 S c >- l -H
s* 3 * -o.S
c
Cp-H (Ö H
i H . 3
O H rM 01
O) u • H - H XI s (0 (U H Si
c 0
• H • p (d
• p o IC
rH
> 1 rH h (0 <u
e 0 • H • p 10
4J o 10
H
<u •p 10
rH
t
• a X w
eg
& X fa-
n •
a X fa
H
Q , X fa
s fa co
X in o
s ro o
s fa co
SB (N
o
SB H
o
s fa w
J "* o
• 4 co O
E fa w
hJ (N
o
J H
o
z z s 3 g S o o o o
CO CO rH 01
• • • • r- n o o
CA r» vo vo • • • • in og CN o
« * * * * « -IC « «
in co r* H H O O O
• • • • o o o o
•* o vo c» • • • • r» ei n o
«* H a\ m • • • • in CM eg o
w co * co 2 2 * 2 CO VO VO CM H O O O
• • • • O O O O
m en r» r-
• • • • l o r i N O
o> co ^* f*
• • • • VO CM CO O
CO * * * Z *
o> co o CM H O H O
o o o o
0"> I f ) CO VO
• • • • in eg M o
r- en in •>* • • • •
•>* H CM O
0> 01 O
i H 0) 3 0) rH O rH
rH fl) C 3 0 - H H - H C
fa rH 6 O» Q fl) C l ) -H Z 0 J3 rH
H O O
• O
V
PK
^ * * * •*. H O
• O
V
a< ^ *
* •* in o • o
V
fc ».
* •»
•P
c 10 ü
• H
- H
c D> • H
(fl •P O C
^ to z
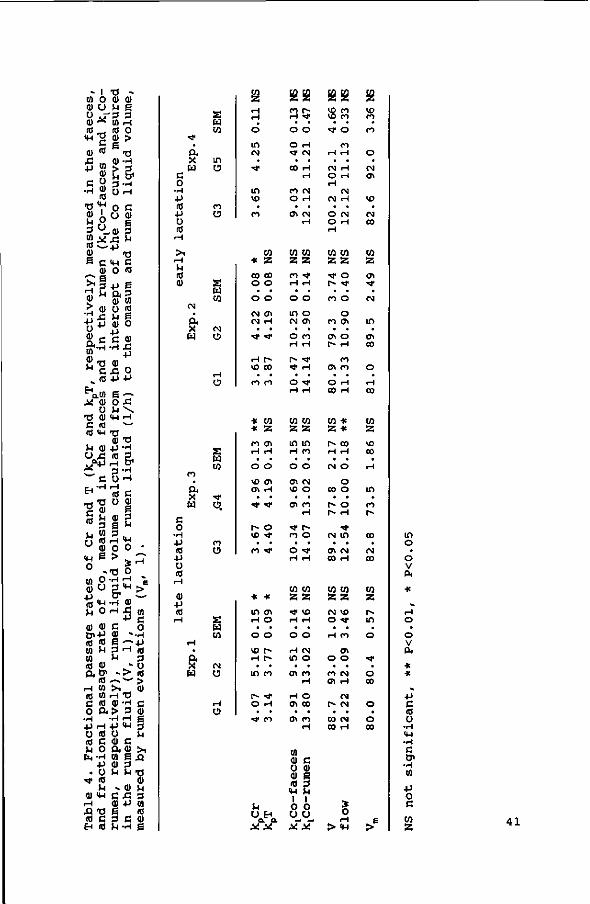
» 1 TS -Ol 0 <D <1> <u u u e ü j - 3 3 0) • * 01 rH (0 ^ , (0 0
<M 32 a> > S e (U "O -c
J3 , . fl) -H
* § & & C " 3 - H •H W 0 rH
(0 •o f 0 c 0) ' o Q> ^ r, S 3 U _ Q ) 3 !2 * -s M (0 — j j 0) <o S C <H c
0) o (0
ipec
tivel
y)
in t
he
rum
i in
terc
ept
i he
om
asum
ïi -P w C J3 O
v (0 -P -P Ho.W E c-.* <u o .c
u u \
(k C
r and
.n t
he
fae
.cula
ted f
li
quid
(1
and T
;u
red
i im
e ca
l ru
men
U m 3 .
ö S-5 o • o S ! o " »"O 0 «1 R 'd S e <U U 3 , "" >
ro <H-H 5 ^ O H i m - ^ c
d) 0) C 0 0,-P fl) - -H (0 <0 S -~-.p W U 3 H «j 01 , M 3 (0 <u * ü ft O1 ' > (0
(0 — — > H « > 1 Q) (0 01 rH "O e « 0 -rj c 0 Q. > 3 0
•H -H H g +J rH +J «H 3 O (0 ü ^ (0 e <u c U O ft <U > i
+J d) 3 . o u u -c
Q) <H C £3 3 rH O) -P W .Q T! E 10 10 C 3 C <U H 10 h -H S
» t
• ft X
c 0
- H •P (0
•p 0 (0
rH
> 1 rH SH (0 0)
CM
ft X W
co
ft X
w c 0 • H
•P (0
-p u (0
i H
d) +J (0
rH
H
• ft X W
S u w
in O
n O
CO
CM
O
H
s w w
co U
S H W
(N U
H O
g H H
d in <M
• •<f
in VO
• co
W * a CO 0 0
o o
o o
CM CTI CM H
• * «J1
H r~ VO 0 0
co n
* co * Z co <n H H
O O
I ß ff! CT! H
t- o \£> ^
co <*
* * in <n rH o
• •
o o VO f » rH r»
m co
r-~ • * O H
t CO
O. Q. * M
SS 35: • • o o
O H • * M
• • 00 H H
n CM O H
• • CT! CM rH
W CO
2 2
co • * <-H H
o o
in o CS CT!
o co H H
r - , j . • * H
o •* H H
CO CO 2 Z in m
o o
CTi f » vo o
H
co o
o •>* H PH
CO CO
z z •<* VO H H
• • O O
H CM m o
CT! n H
H O CT! 00
CTl C l H
01 0) C U 0) (U E 10 3 *H S 1 1 0 O
MM
££ 10 CO >2> n •<* o
o rH rH
• • CM rH O rH H
M CM H
• • O CM O H H
W W
Z z ^ o
co o
o CO CT!
CTl O t-- H
co CT! CO
O H CO H
CO * Z *
r~ oo H H
CM O
O CO O
r~ O t~ rH
1 -CM i n
CT! CM CO H
CO CO
z z CM VO O *!•
• • H CO
CTl O O
CO CM CT! H
CM r- CM
00 CM 00 H
> 0 > <4H
ë <0 co
co
o « CM
CTl
yo
• CM 00
co z CTl
CM
in CTl CO
O
H 00
CO
z IC co
in
co
00
CM co
co z r~ in • o
^ • o co
o
o co
E
>
in o • o
V ßt
* ^ H
O
• o V
cu
* * * •p
c ca o • H <u - r l G
• H UI
•P O c w z
41
rumen as well as determined from the faecal excretion curves were
not significant in all four experiments (/>>0.05) (Table 4).
However, the kl values derived from the faecal excretion curves
were significantly lower (P<0.001, paired Student t) than those
determined directly in the rumen (9.7 vs I3.2%h"1). Rumen liquid
volume (1) , calculated from the intercept of the curve describing
logarithmic marker decline in the rumen, was not significantly
(P>0.05) influenced by diet in all four experiments. Though rumen
liquid volume and kl did not differ significantly, the flow of
rumen liquid to the omasum (1/h) differed significantly (P<0.01)
between diets in experiment 3, giving a higher flow for silage
G3 than for silage G4 (12.5 vs 10.0 1/h). The rumen volume,
measured by rumen evacuations (Vm, 1) was significantly lower
than the rumen volume calculated from the Co-curve in Exp. 1
(P<0.001), Exp. 3 (P<0.05) and in Exp. 4 (P<0.01), but not in
Exp. 2.
The k was, except for the k in Exp. 3 based on the
T-excretion curves, higher for the silages containing the higher
cell wall content (P<0.05 in Exps. 1 and 2, P<0.01 in Exp. 3,
N.S. in Exp. 4 for the Cr-excretion curves, and P<0.05 in Exp.
1, N.S. in Exps. 2 and 3 for the T-labeled hay).
In Exp. 1, Cr-NDF gave significantly higher (P<0.001) kp values
as compared to the T-labeled hay (4.61 vs 3.46 %h"1) . However, in
Exps. 2 and 3, there were no significant differences (/>>0.05)
between the Cr and T ruminai passage rates (4.16 vs 4.03 %h_1 in
Exp. 2 and 4.40 vs 4.19 in Exp. 3).
With an increase in intake level (Exp.2 vs Exp.l), kp-Cr
decreased, whereas k -T increased.
Discussion.
Ad libitum intake of roughages can be limited by the capacity
of the rumen (Van Soest, 1982; Mertens, 1987). Total rumen
contents were higher for the high concentrate level in early
lactation than for the low concentrate level in late lactation.
Higher rumen DM contents whith an increased concentrate level,
42
are probably not only due to the higher density of the
concentrate particles, but according to Baile and Forbes (1974)
also to a higher rumen capacity during lactation.
For the low concentrate level, G3 had the highest rumen DM
content, which may be due to a higher density of this silage. The
lower rumen DM content for silage Gl supplemented with 7 kg,
indicates that, for this diet, intake is not limited by the
capacity of the rumen. As a consequence, DMR/DMI was lowest for
G1H.
Rumen contents (g DM/kg BW) are within the range of approximately
14 for dry cows to 26 in early lactation, reported by Hartneil
& Satter (1979) . Although Robinson et al. (1987a, 1987b) fed
concentrate rich diets in early lactation (2/3 concentrates, 1/3
long hay), rumen contents of approximately 20 g DM/kg BW were
comparable to those for the roughage rich diets in these
experiments, both somewhat lower than the early lactation data
reported by Hartneil & Satter (1979).
Mostly, external markers, such as Cr-NDF, are used to determine
the fractional passage rate of the particulate phase from the
rumen. In Exp.l, an average rumen content of 9.3 kg DM for silage
G2 was found. A k of 5.16 %/h, as determined with Cr-NDF, would
give a rumen outflow of 11.5 kg DM per day. This would mean that
with a DM intake of 12 kg/day, only 0.5 kg DM was degraded in the
rumen, showing that Cr-NDF does not represent total rumen DM
pool. Even if it is assumed that Cr-NDF may be regarded only as
being representative for small particles, it would not correct
this. In these experiments, between 75 and 80% of the total rumen
dry matter was in particles small enough to pass a sieve with a
pore size of 1.25 mm, meaning that Cr-NDF even overestimates
passage rate of small particles.
Small particles, however, can get trapped in the floating
material, and their gas content influences their functional
specific gravity (FSG) (Sutherland, 1987). The specific gravity
of Cr-NDF is higher as compared to most rumen particles (Ehle,
1984). Specific gravity of the Cr-NDF used in these experiments
was about 1.35. This is within the range of densities found by
Welch (1986) and Ehle (1984) with the highest passage rates,
43
indicating that Cr-NDF could only be representative for small
particles with an optimal specific gravity for passage.
The T-labeled hay, used in these experiments, is not
indigestible, one of the criteria markers used for studying
digestion kinetics, have to meet. An advantage of the T-labeled
hay, however, is its participation in the fermentation process,
resulting in a change in FSG of the particles during the period
they are retained in the rumen. Disappearance of T from the rumen
is not restricted to passage to the lower gut only, but microbial
degradation of the organically bound T may contribute as well.
According to Van Bruchem et al. (1990), who used the same type of
T-labeled hay as a marker in sheep, the digestible fraction of
the hay recovered in the faeces, is negligible at the part of the
curve used to calculate k . They simulated marker excretion
curves, assuming rumen degradation rates for the T-labeled hay
of 4 and 6%h"1 and an undegradable fraction of 15%. For a
degradation rate of 6%h"1 they only found small differences
between the total excretion curve of T and the excretion curve
of the indigestible organically bound T. They concluded that,
with this type of T-labeled hay, the k of T is measured, not a
total rumen clearance (passage plus digestion). Compared to the
undegradable fractions of our silages (Bosch eta!., submitted),
however, un undegradable fraction of 15% for this hay seems too
high. It is therefore possible that with the T-labeled hay, the
k is overestimated.
In Exp. 3, when the silages, as in Exp. 1, were supplemented
with 1 kg of concentrates, the difference between k -Cr and k̂ -T
for silage G4 was the same as the differences found in Exp. 1.
For silages Gl, G2 and G4, supplemented with 1 kg of
concentrates, a linear relation (r=0.99) between k -T and the NDF
content of the silages was found, whereas the correlation between
k -Cr and the NDF content of the silages was much lower (r=0.78).
However, the results for silage G3 in Exp. 3 deviated from the
results found for the other silages. The k -Cr of silage G3 was
lower than expected from the results on the k -Cr of GIL, G2L and
G4L, while the k -T for silage G3L was higher than expected from
the results on the k -T of GIL, G2L and G4L.
44
Both markers, except for T in Exp. 3, gave the same differences
between diets, namely a higher passage rate for the silage with
the higher cell wall content. Because of the lower
digestibilities of the high cell wall diets, more undegraded feed
particles, even as a fraction of total rumen DM contents, had to
leave the rumen by passage, explaining the higher k for both
markers for the higher cell wall diets.
Increasing the level of intake in dairy cows fed concentrate
rich diets with a constant roughage to concentrate ratio, was
reported to increase the rate of passage of Cr mordanted NDF
(Robinson et al., 1987b) . In the present experiments level of
intake was increased by increasing the amount of concentrates
fed, concomitantly resulting in a somewhat reduced intake of
silage. In this case, rate of passage of Cr mordanted NDF
decreased, suggesting that the behaviour of Cr mordanted NDF
varies with ration composition. An explanation could be the
higher dry matter % in the rumen at the higher intake, possibly
increasing the probability of an external marker to get entrapped
and therefore slowing down its rate of passage. It is of interest
in this respect that the increase in rate of passage as reported
by Robinson et al. (1987b) was not linear; between the one but
highest and the highest level of intake even a decrease was
observed. Average rumen dry matter content at both levels of
intake in the experiments of Robinson et al. (1987b) was 12.0 and
13.8%, respectively. At the high concentrate level, rumen DM% in
our experiments varied between 11.3 and 12.9%, whereas for the
low concentrate level, rumen DM% varied between 10.0 and 11.8%.
The reason for the differences in behaviour between the Cr-NDF
particles and the T-labeled hay particles with an increase in
intake is not clear.
Owens & Goetsch (1986) reviewed literature on passage of
particles from the rumen and derived regression equations which
related the rate of passage of fluid, forage particles and
concentrate particles to intake of forages and concentrates.
Applying these equations to the experiments reported here,
results in the figures shown in Table 5. It should be realised
however, that most of the results used to derive the regression
45
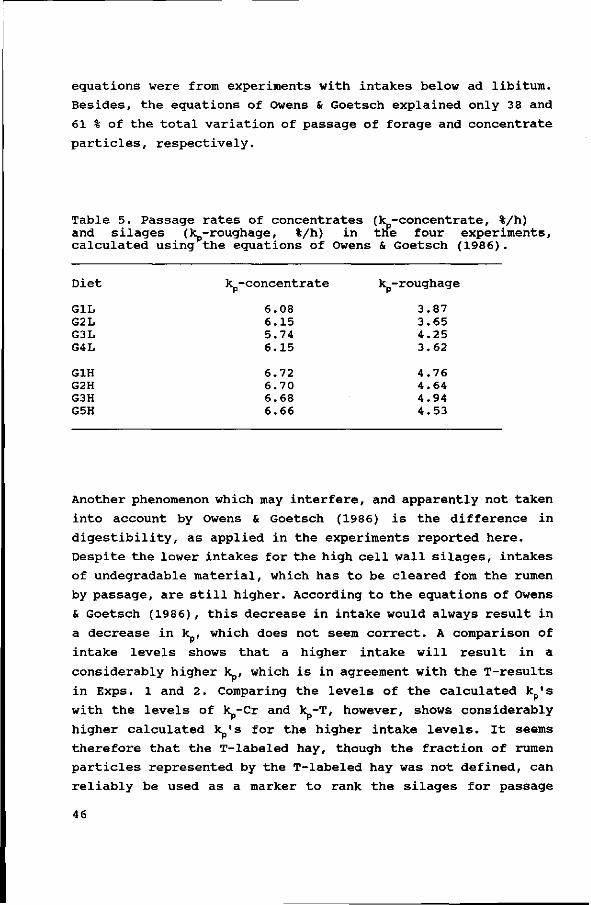
equations were from experiments with intakes below ad libitum.
Besides, the equations of Owens & Goetsch explained only 38 and
61 % of the total variation of passage of forage and concentrate
particles, respectively.
Table 5. Passage rates of concentrates (k -concentrate, %/h) and silages (k -roughage, %/h) in the four experiments, calculated using the equations of Owens & Goetsch (1986).
Diet k -concentrate k -roughage
GIL 6.08 3.87 G2L 6.15 3.65 G3L 5.74 4.25 G4L 6.15 3.62
G1H 6.72 4.76 G2H 6.70 4.64 G3H 6.68 4.94 G5H 6.66 4.53
Another phenomenon which may interfere, and apparently not taken
into account by Owens & Goetsch (1986) is the difference in
digestibility, as applied in the experiments reported here.
Despite the lower intakes for the high cell wall silages, intakes
of undegradable material, which has to be cleared fom the rumen
by passage, are still higher. According to the equations of Owens
& Goetsch (1986), this decrease in intake would always result in
a decrease in k , which does not seem correct. A comparison of
intake levels shows that a higher intake will result in a
considerably higher k , which is in agreement with the T-results
in Exps. 1 and 2. Comparing the levels of the calculated k 's
with the levels of k-Cr and k -T, however, shows considerably
higher calculated k 's for the higher intake levels. It seems
therefore that the T-labeled hay, though the fraction of rumen
particles represented by the T-labeled hay was not defined, can
reliably be used as a marker to rank the silages for passage
46
rates from the rumen.
An increased cell wall content increases rumen fill, mainly by
an increased % of dry matter. The reduced rate of degradation,
as shown with nylon bag incubation studies (Bosch et al.,
submitted), was partly compensated for by an increased rate of
passage. This compensation is however not enough to prevent a
reduction in total clearance rate, resulting in a decreased
intake.
References.
Bosch, M.W., S. Tamminga and G. Post (submitted). Influence of stage of maturity of grass silages on digestion processes. 1. Composition, nylon bag degradation rates, overall digestibility and intake, [see Chapter II, this thesis]
Baile, C.A. and J.M. Forbes, 1974. Control of feed intake and regulation of energy balance in ruminants. Physiological Reviews 54:160-214.
Ehle, F.R., 1984. Influence of feed particle density on particulate passage from rumen of holstein cow. J.Dairy sei. 67:693-697.
Goering, H.K. and P.J. van Soest, 1970. Forage fiber analyses. Agricultural Handbook No. 379. ARS, USDA, Washington, DC, USA.
Hartneil, G.F. & L.D. Satter, 1979. Determination of rumen fill, retention time and ruminai turnover rates of ingesta at different stages of lactation in dairy cows. J.Dairy Sei. 48:381-392.
Kennedy, P.M. and M.R. Murphy, 1988. The nutritional implications of differential passage of particles through the ruminant alimentary tract. Nutrition Research Reviews 1:189-208.
Mertens, D.R., 1987. Predicting intake and digestibility using mathematical models of ruminai function. J.Anim.Sci. 64:1548-1558.
Owens, F.N. and A.L. Goetsch, 1986. Digesta passage and microbial protein synthesis. In: Control of Digestion and Metabolism in Ruminants, Ed. by L.P. Milligan, W.L. Grovum and A. Dobson.
Robinson, P.H., S. Tamminga & A.M. van Vuuren, 1987a. Influence of declining level of feed intake and varying the proportion of starch in the concentrate on milk production and whole tract digetibility in dairy cows. Livest.Prod.Sci. 17:19-35.
47
Robinson, P .H . , S. Tamminga & A.M. van Vuuren, 1987b. I n f l u e n c e of d e c l i n i n g l e v e l of feed i n t a k e and v a r y i n g t h e p r o p o r t i o n of s t a r c h i n t h e c o n c e n t r a t e on rumen i n g e s t a q u a n t i t y , c ompos i t i on and k i n e t i c s of i n g e s t a t u r n o v e r i n d a i r y cows. Livest.Prod.Sci. 17:37-62.
SPSS I n c . , 1988. SPSS/PC+ Base manual . SPSS Inc., Chicago, Illinois.
S u t h e r l a n d , T.M., 1987. P a r t i c l e s e p a r a t i o n i n t h e f o re s tomachs of s heep . I n : Aspects of digestive physiology in ruminants, pp.43-73 (A. Dobson, editor). Ithaca: Cornell university Press.
Uden, P . , P .E . C o l l u c i and P . J . van S o e s t , 1980. I n v e s t i c a t i o n of chromium, ce r ium and c o b a l t a s markers i n d i g e s t a . J.Sci.Food Agric. 31:625-632.
U l y a t t , M . J . , D.W. Dellow, A. John , C.S.W. Reid and G.C. Waghorn, 1986. C o n t r i b u t i o n of chewing d u r i n g e a t i n g and r um ina t i on t o t h e c l e a r a n c e of d i g e s t a from t h e r um ino r e t i cu l um . In : Control of Digestion and Metabolism in Ruminants, pp 498-515. L.P. Milligan, W.L. Grovum & A. Dobson (editors). Englewood Cliffs, Prentice-Hall.
Van Bruchem, J . , F . Kamphuis, I . J a n s s e n , S.C.W. Lammers-Wienhoven, G.A. Bangma and J . Van den Hoek, 1990. T r i t i a t e d hay and Cr mordanted NDF a s p a r t i c u l a t e marke r s f o r d i g e s t a k i n e t i c s i n t h e r e t i c u l o - r u m e n . Neth.J.Agric.Sci. 38:1-8.
Van den Hoek, J , M.H.J, t e n Have and G.B. Ge rbe r , 1983. The metabol i sm of t r i t i u m and wa t e r i n t h e l a c t a t i n g d a i r y cow. Health Physics 44:127-133.
Van den Hoek, J . , M.H.J, t e n Have, G.B. Gerber and R. Kirchmann, 1985. The t r a n s f e r of T r i t i u m - l a b e l l e d o r g a n i c m a t e r i a l from gra s s i n t o cow's mi lk . Radiation Research 103:105-113.
Van S o e s t , P . J . , 1982. N u t r i t i o n a l e co logy of t h e r um inan t . O&B Books Inc., Corvallis, OR.
Welch, J . G . , 1986. P h y s i c a l p a r ame t e r s of f i b e r a f f e c t i n g passage from the rumen. J.Dairy Sei. 69:2750-2754.
48
Chapter IV
Influence of stage of maturity of grass silages on digestion
processes in dairy cows.
3. Fermentation characteristics, rumination activity and
distribution of rumen and faecal particles.
M.W. Bosch1-2, C.P. Leffering1 , J.M. Muylaert2
and P.W.M. van Adrichem1.
'Department of Human and Animal Physiology, Agr icu l tu ra l Univers i ty , Haarweg 10, NL 6709 PJ Wageningen.
depar tment of Animal Nu t r i t ion , Agr icu l tu ra l Univers i ty , Haagsteeg 4, NL 6708 PM, Wageningen.
submitted for pub l ica t ion
49
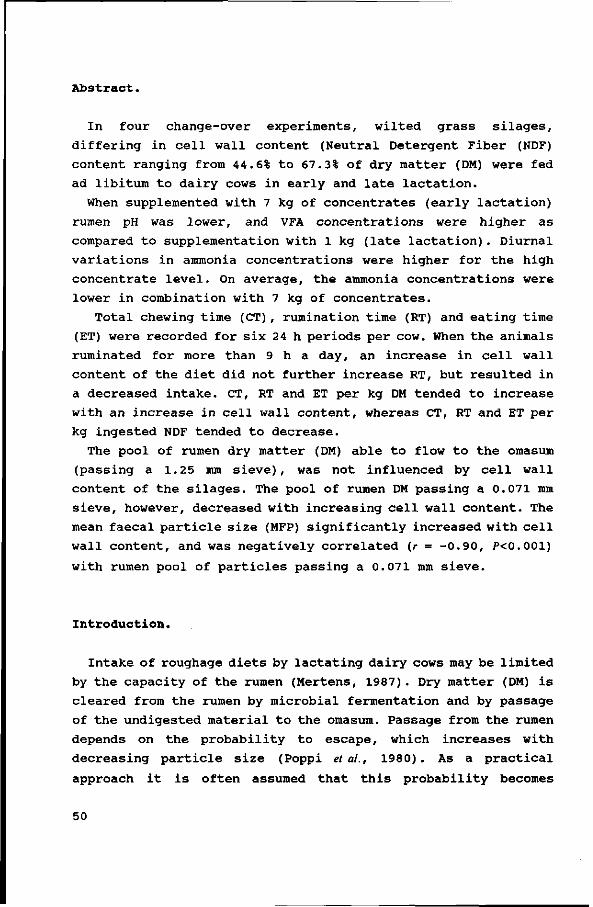
Abstract.
In four change-over experiments, wilted grass silages,
differing in cell wall content (Neutral Detergent Fiber (NDF)
content ranging from 44.6% to 67.3% of dry matter (DM) were fed
ad libitum to dairy cows in early and late lactation.
When supplemented with 7 kg of concentrates (early lactation)
rumen pH was lower, and VFÀ concentrations were higher as
compared to supplementation with 1 kg (late lactation). Diurnal
variations in ammonia concentrations were higher for the high
concentrate level. On average, the ammonia concentrations were
lower in combination with 7 kg of concentrates.
Total chewing time (CT), rumination time (RT) and eating time
(ET) were recorded for six 24 h periods per cow. When the animals
ruminated for more than 9 h a day, an increase in cell wall
content of the diet did not further increase RT, but resulted in
a decreased intake. CT, RT and ET per kg DM tended to increase
with an increase in cell wall content, whereas CT, RT and ET per
kg ingested NDF tended to decrease.
The pool of rumen dry matter (DM) able to flow to the omasum
(passing a 1.25 mm sieve), was not influenced by cell wall
content of the silages. The pool of rumen DM passing a 0.071 mm
sieve, however, decreased with increasing cell wall content. The
mean faecal particle size (MFP) significantly increased with cell
wall content, and was negatively correlated (r = -0.90, /><0.001)
with rumen pool of particles passing a 0.071 mm sieve.
Introduction.
Intake of roughage diets by lactating dairy cows may be limited
by the capacity of the rumen (Mertens, 1987). Dry matter (DM) is
cleared from the rumen by microbial fermentation and by passage
of the undigested material to the omasum. Passage from the rumen
depends on the probability to escape, which increases with
decreasing particle size (Poppi et al., 1980) . As a practical
approach it is often assumed that this probability becomes
50
sufficiently high when the size of a particle is reduced to a
size smaller than the critical particle size (CPS), by Kennedy
& Poppi (1984) defined as the nominal sieve aperture, which
retains the top 5% of the faecal particulate dry matter. They
reported a CPS for cattle of 1.18 mm.
Microbial digestion decreases rumen dry matter (DM) content,
but has relatively little effect on particle size reduction
(Welch, 1982; Ulyatt eta!., 1986). It may however weaken the cell
wall structure, so that particle breakdown during rumination is
facilitated (Chai etal., 1984). According to Ulyatt et al. (1986),
also rumen contractions do hardly contribute to particle size
reduction. Microbial digestion plus rumen contractions would
account for only about 20 % of particle size reduction (McLeod
& Minson, 1988a and 1988b). That leaves chewing during eating and
rumination as the main factors involved in particle size
reduction. Rumination time (RT) per kg DM ingested differs
between diets, and increases with an increase in cell wall
content (Murphy etal., 1983; Ulyatt etal., 1986). A high correlation
(r > 0.9) between RT and cell wall content of the diet was found
by Welch & Smith (1969a, 1969b). A grass silage with a higher
cell wall content thus reguires a longer rumination time per kg
DM. Because rumination time is limited to a maximum of 9 to 10
h per day (Bae etal., 1979; Welch, 1982), RT reguired to reduce
particle size to a size below the CPS can presumably limit forage
intake.
If intake is not limited physically, the type and amount of
digestion products may control feed intake. The pH of the rumen
fluid is mainly determined by the VFA concentrations. The
concentrations and the ratio of volatile fatty acids (VFA) and
the ammonia (NH3) concentration (Satter & Slyter, 1974; Hoover,
1986) are the result of microbial activity on one hand and the
rate of clearance from the rumen on the other. The animal's
physiological status largely controls the latter.
In four experiments, the effect of stage of maturity of grass
silages on intake and digestion in dairy cattle is investigated
(Bosch etal., submitted8). The present paper describes fermentation
characteristics, eating and rumination behaviour and rumen
51
contractions. In addition, the results of rumen and faecal
particle size distributions are reported.
Materials and Methods.
Five wilted grass silages (Gl to G5) differing in cell wall
content were fed ad libitum to dairy cows, supplemented with 7
or 1 kg of concentrates, in early and late lactation,
respectively. In each of the four change-over experiments, two
silages were fed to six (Exps.l, 2 and 3) or four (Exp.4) rumen
fistulated dairy cows. In Exps. l and 3 the cows were in late
lactation, so 1 kg of concentrates, and in Exps. 2 and 4, when
the cows were in early lactation, 7 kg of concentrates was
included in the diet. Each experiment consisted of two
experimental periods of five weeks, preceded by adaptation
periods of three weeks. The animals were offered silage three
times a day, at 7.00, 15.00 and 23.00 h. The concentrates were
fed at 14.45 h (1 kg) or at 6.45 and 14.45 h (two portions of
3.5 kg each). The experimental design was as described in more
detail by Bosch et al. (submitted8). Dry matter (DM), nitrogen (N)
and cell wall (NDF) content, intake and apparent digestibility
of the silages in the four experiments are given in Table 1.
To determine end products of rumen fermentation, samples of
rumen fluid were taken every two hours between Monday 9.00 and
Tuesday 7.00 h. The pH and the ammonia-N concentration (NH3-N)
were measured in each sample, and the average VFA concentrations
were determined in a pooled sample per cow (Exps. 1, 2 and 3),
or in each sample (Exp. 4) . The pH was deterimed immediately,
whereas the NH3-N was determined after storage for one night with
Tri Chloro Acetic acid at 4°C. The samples to determine the VFA
concentrations were preserved with 5% phosphoric acid and stored
at -20'c untill analysis.
Per experimental period, eating time, rumination activity and
rumen motility were recorded for six 24-hour periods per animal.
For recording eating and rumination, the animals were provided
52
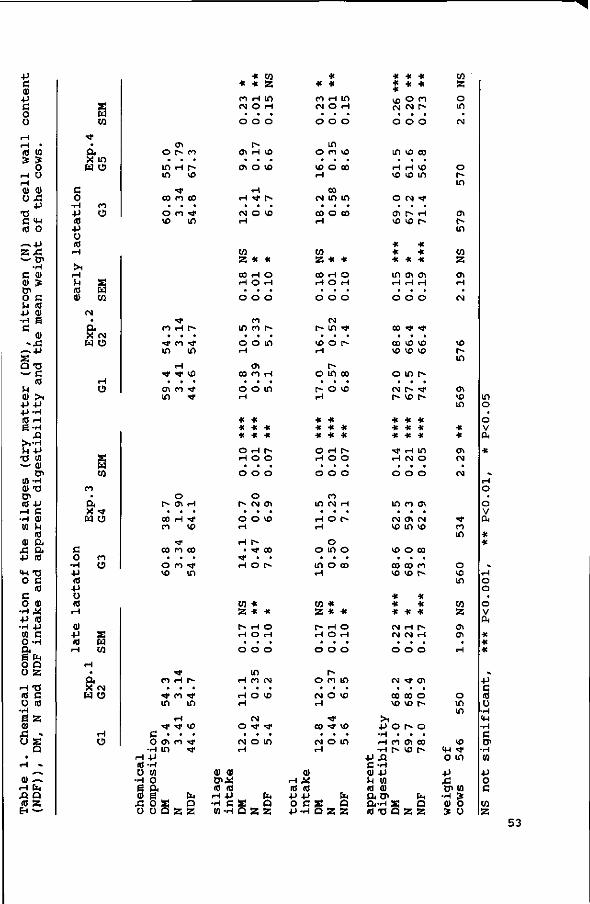
s H CO
a x in
fi o
• H •P <0
• p Ü
(0
co
r4 a) <U
CM
Q. X
S W W
CM H O
O
c o • H
• p 10
• p
» (0 rH
ai • P
<o rH
s w w
co
a X >* w o
o o
s fate
rH
« a X CM
w o
u
o • in
in
co o vo
Ol
• H
•O1
CO
CO
CO
• vo
00
in
co
• •>* in
• *
C\ m
H
• co
H • *
CO
r~
• • < *
in
vo
• *
• *
p-
co co
co
o VO
o Ol rH
VO
CO 00
CO •tf in
CO H t -
^ C I ^ in in
in
C O
•H H +J (0 -rH Ü W
•H O g a a) s ß o s
•*f T * VO
* w * * 2 co H in CM O rH
ai H vo
H
W Z * * CO H O rH O rH
CO in co r-
ai CO CO r H
* * * * * Ht
o H r> H O O
o P~ CM Ol
• • * 00
H o r~
w * Z * *
t» H O H O H
in H P 1 N
H O VO H
CM O • * TJ-
CO rH m CM O H
o « VO
rH
CM
• 00
in co • o
CO in • o
VO
• 00
in • CO
w Z * * C0 H O rH O rH
r-
VO H
O
CM m
o
in
• < *
r~
co
* * * * * * * *
i-H O O
CO in CM H
rH o r^
o o in o
in o co rH
Z * *
r~ H o rH O H
o co in
CM O VO H
C0 t VO
CM o in
fa O
0) o) ta «s
rH +J •H C S
fa O
0 0 0 5 5 5 5 W -H Q Z Z
Q>
(0 (0 -P -P fa O C S Q •P -H D Z 55
vo ° CM CM
CM O l CM vo in vo
CO 00 co vo vo r~
* * * * *
CM H p~ CM CM r H
00 00 O VO VO r~
> l •P o r» o • H • • . rH CO Ol C0 •H r- vo r»
•P XI G-H OJ -P U ifl io d) o. en a-H s
fa . . „ Q (0 -O Q Z Z
W Z o m
in vo
H H vo vo
O CM
ai r~ vo vo
* * *
in a i rH H
o o
CO •>*
co vo VO VO
o in
CM r~ r- vo
* * Ht Ht * *
<# rH H CM
00
VO
m
^,
H
* * Ht
O l H
O
>* VO vo
r~
Ht * * in o
o
m
01
in
w Z a i H
CM
VO
m
a i VO m
•K *
Oi CM
in o
o V
*
co in
o vo m
co Z ai Ol
o in in
vo
o m •P
A B> W
•H S ai o * o
•p c (0 o H
<H • H C Di H (0
•P O c w z
53
with a halter with a microswitch. Jaw movements were recorded on
paper and number of chews was recorded by a counter. Rumen
contractions were recorded using an open tip catheter.
Contractions were transformed into electrical signals by a
pressure transducer. Specifications were as follows: frequency
band 0.01-0.10 Hz, duration pressure peak > 2 s e c , pressure >
5 mm Hg. The number of rumen contractions was recorded by a
counter.
Faeces were collected quantitatively from Monday 8.00 h till
Thursday 8.00 h, weighed and sampled per two hours. A pooled
sample per cow was preserved with formaldehyde and kept at 4°C
till the end of the collection period. After the collection
period the faeces were subsampled and stored at -20°C till
further analysis. This was done twice per cow for the silages
fed. Distribution of the faecal particle size was determined in
subsamples by wet sieving.
Rumen evacuations were done in the fifth week of the
experimental periods, at two times after feeding in Exps. 1, 2
and 3, and at five times after feeding in Exp. 4.
Rumen contents were weighed, sampled (1%) and returned into the
rumen. This procedure took about 25-30 min. per cow. Rumen
samples were stored at -20°C till further analysis.
Chemical analysis.
The NH3-concentration in the rumen fluid was determined by the
indophenol method as described by Scheiner (1976). The VFA
concentrations in rumen fluid were determined by gas liquid
chromatography (Packard 419, glass column filled with chromosorb
101, carrier gas (N2) saturated with formic acid, 190 °C,
isocapronic acid as internal standard).
Sieve analyses.
Faecal and rumen samples were wet sieved with a Fritsch
Analysette 3. The lid was equiped with a shower, and at the
bottom there was a water outlet.
Faecal samples. Faecal samples of 100.0 g were soaked in water and
stirred till the suspension was free of lumps. The sieves used
54
had a mesh aperture of 1.25, 0.63, 0.315, 0.16 and 0.071 mm. The
intermediate water supply ring was placed just above the smallest
sieve, to prevent the 0.071 mm sieve from silting up. The sieving
was done with a continuous maximum vibration amplitude. The water
flow was about 4 1/minute.
The suspension was quantitatively spread out on the top sieve.
The water was turned on. After 5 min. of sieving, the water
outlet was closed till the water level had risen till 2 cm above
the top sieve. The water outlet was opened to lower the water
level till below the smallest sieve. This procedure was repeated
twice. After the third time the water outlet was opened and
sieving was continued for another five minutes. Then the water
was turned off, and the Analysette switched off. The fractions
retained on the sieves, were quantitatively collected in a dried
and weighed glass filter crucible number 2 (pore size 40-100 ßm).
The crucibles were dried at 103 i 2 'C during one night. The dry
matter retained on each sieve, was expressed as a percentage of
total dry matter. The mean faecal particle size (MFP) was
calculated using the log-normal distribution as described by
Waldo etal. (1971) .
Rumen samples. Rumen samples of 50.0 g were soaked in water and
stirred till the suspension was free of lumps. For the rumen
samples three sieves were used, with sieve apertures of 5.0, 1.25
and 0.071 mm. After removing the showerheads, the intermediate
water supply ring was placed above the top sieve, just underneath
the main water supply. The samples were sieved for 30 minutes,
with a maximal vibration with minimum intervals, and a water flow
of about 10 1/minute.
The suspension was quantitatively spread on the top sieve. The
water was turned on and the outlet tube was lifted till above the
top sieve. When the water level had risen to 2 cm above the top
sieve, the water was turned off. The water level was slowly
lowered till under the top sieve. The outlet tube was lifted
again and the water turned on till the level had risen till 2 cm
above the top sieve. This was done for 7 times during about 7.5
min. Then the water level was kept 2 cm above the top sieve for
about 7.5 minutes, while the water flow stayed on. After 15
55
minutes sieving time, the whole procedure was repeated once. Then
the water was turned off and the Analysette switched off. The
material retained on the sieves was collected and dried as
described for the faecal samples. The material retained on the
5.0 and the 1.25 mm sieve was designated as the material not able
to leave the rumen (Large Particles), while the material passing
the 1.25 mm sieve was designated as the material able to flow to
the omasum (Small Particles).
Statistics.
The data were analysed statistically using the anova procedure
of the spsspc+ statistical package (SPSS Inc., 1988) according
to the model as described by Bosch et al. (submitted8).
Results.
Chemical composition (DM, N, NDF), intake and digestibility are
shown in Table 1. Apparent digestibility and, apart from G3,
intake decreased with an increase in cell wall content of the
silages. Only in Exp. 3 silage DM intake was significantly
(P<0.001) different between silages. The cows were gaining weight
when they were fed silage G3 and loosing weight when they were
fed silage G4.
Fermentation characteristics are given in Table 2. The mean pH
was only significantly related to the cell wall content of the
silages if fed with 1 kg of concentrates (ƒ><(). 001 in Exp.l and
P<0.05 in Exp.3). Then a higher cell wall content coincided with
a slightly higher rumen pH. The rumen pH was negatively
influenced by the amount of concentrates in the diet. For the
high concentrate diets the rumen ammonia-N concentrations were
not significantly different between silages (Exps. 2 and 4) . The
amount of concentrates in the diet varied in these experiments
from 31 to 41% of the dry matter intake. A higher amount of
concentrates leveled down the differences between silages.
Contradictory to what was found in Exp.3, the NH3-concentration
in Exp.l was higher for the silage with the lower crude protein
56
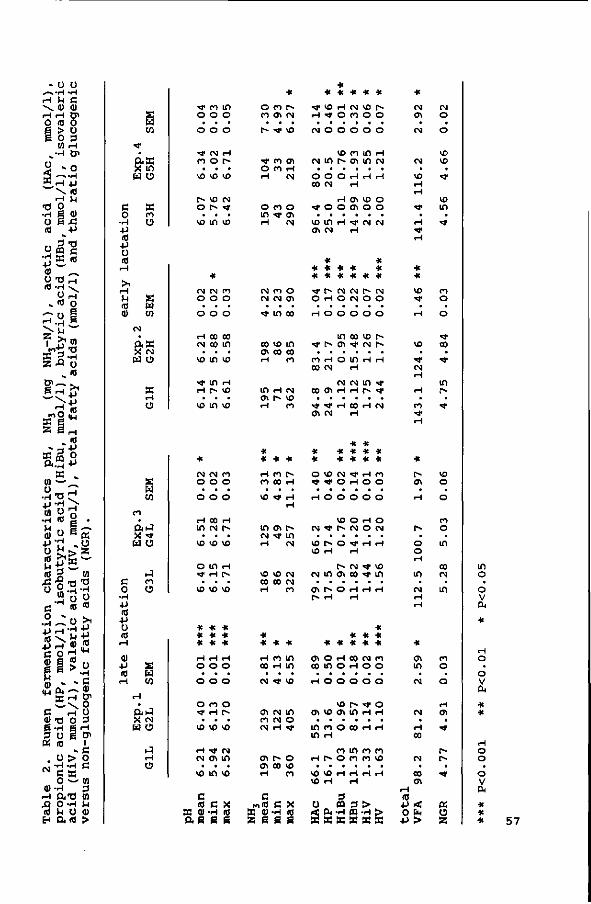
- ü ü --»•rH - H iH U C \ O) 0) H H 5 1 O (8 O
i > Ü § 0 3 M rH
•rH O i
|~2 *> rH +J \ (0
•H M -Ö 0 -H ß vT) U E 42 (0 -P
•* , . 3 -O
, aceti
acid
(H
lo
l/l)
a
NH
j-N
buty
: ic
ids
» ro
H3 (m
g
mol/
l)
fatt
y
S Ö H
PH
, iB
u,
tota
» » en »— _
istic
acid
nol/
l)
chara
cte
r .s
obuty
ric
=id
(H
V,
mi
cid
s (
NG
R)
aenta
tion
rtm
ol/
1) , i
vale
ric
a<
c f
att
y a
E
x --1 5T C . \ o C H Ü
« B O S e-H g -H 3 O ß Ö1
OS 10 1 v C
. ü > o «•23c
O ^ - W vV-H 3 r-l a - o M 43 O - H ^ (0 M ü <U b< cute >
c 0 • H • p (0 -p ü (0
rH
>1 r-t
u a>
c o - H +J (0
•p o ta
ai -p 10
H
S u CO
*r •
a s X m w o
SB ro U
S W
CM
• CuX X M w O
K H O
s CQ
co
• ttJ X <tf M Ü
iJ n O
S U W
H
• ftj X CM W U
iJ H U
• * M in o o o • • •
o o o
* N r l n o r» • • • VO VO VO
P~ VO CM 0 > < f
• • • vo i n vo
* CM CM ro o o o
o o o
H CO CO CM co i n
• • • vo in vo
t in H H p~ VD
• • * o i n t e
* CM CM CO O O O
O O O
H CO H m CM P-
• • • VO VO VO
o in H t H p»
• • • vo vo vo
* * * * * * * * * H H rH O O O
• • • O O O
O CO O <* H r̂
• • • VO VO VO
r H ' t CM CM 0"! i n
• • • vo m vo
c C0 C X S V - H D
as e e
* o co p» CO ffl CM
f~ Tj- VO
^ fO d l O CO i-l rH CM
O CO O in t ffi H CM
CM CO O CM CM ffl
•<t m co
co vo in ai co co H co
in H CM CT! P~ VO r H CO
* HC HC He
rH co r» CO CO H
VO t H H
in CT! P» CM t in rH CM
VO VD CM CO CO CM H CO
* * * HC
H co in CO rH i n
CM t VO
cri CM i n CO CM O CM H t
Ol r- o Ol CO VO H CO
c MfO C X S vT)-H (0 55 E e s
« « H C « HC «
' t vo H CM vo p-H f O CO O O
CM O O O O O
vo co in H CM in r> CT! in CM
O O O rH rH rH CO CM rH
H 01 VO O ' t O O ffl O O
VD i n rH f CM CM ff! CM H
* HC « HC HC HC HC HC HC HC HC HC HC
•*r r - CM CM p- CM O rH O CM O O
H O O O O O
i n co vo p~ • * t » en ' t CM t-»
CO rH O i n H H CO CM H
CM CM i n ' t CO ff! H H p- « t
' t ' t rH CO H CM ffl CM H
HC HC HC HC HC HC HC HC HC HC HC HC
O VO CM • * H CO t ' t O H O O
rH O O O O O
VO O rH O CM t t > CM O CM
VO r - O ' t H H VD H H
P~ CM • * VO CM in ffi co t m
ffl t - O rH H H p- rH H
HC HC HC HC
HC HC HC HC HC
CT! O r H CO CM CO CO in O rH O O
H O O O O O
VO P- f O ff! VO ffl in H H
in CO O CO rH rH in H
co in co co H P- O CO CO VO
VO VO H rH H H VD H H
3 Ü m 3 > < PH -H (0 -H >
s s s s s s
HC
CM ffi
• CM
CM
• VO H H
t
• rH
•*r rH
HC HC
vo t
rH
VO
• CM H
H
• CO • *
H
HC
P» ffl
H
P-
• O O H
in
• CM H H
HC
ffl in
• CM
CM
• rH CO
CM
• CO ffl
H (0
•P < 0 b
•P >
CM O
• O
VO VO
• t
VO in
• •*
co o
o
' t CO
• • *
in
> • t
vo o o
CO
o • in
CO CM
• m
CO
o • o
rH ffl
• t
P» P-
• t
« O z
in o • o
V Pu
*
H O
• O V Pn
HC HC
rH O O
• O V CU
* HC HC 57
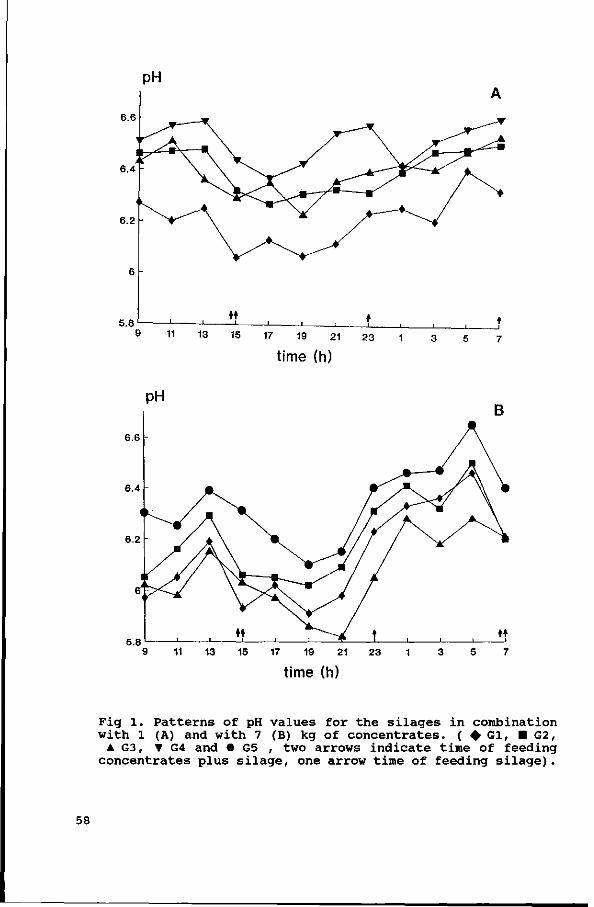
3 5 7
time (h)
6.6
6.4
6.2
5.8 15 17 19 21
time (h) 23
Fig l. Patterns of pH values for the silages in combination with 1 (A) and with 7 (B) kg of concentrates. ( • Gl, • G2,
• G3, T G4 and • G5 , two arrows indicate time of feeding concentrates plus silage, one arrow time of feeding silage).
58
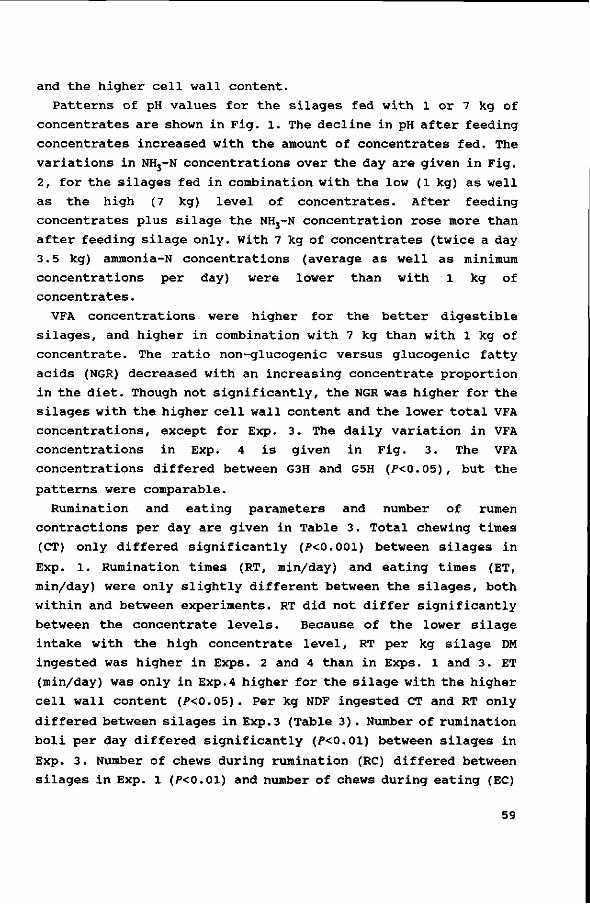
and the higher cell wall content.
Patterns of pH values for the silages fed with 1 or 7 kg of
concentrates are shown in Fig. 1. The decline in pH after feeding
concentrates increased with the amount of concentrates fed. The
variations in NH3-N concentrations over the day are given in Fig.
2, for the silages fed in combination with the low (1 kg) as well
as the high (7 kg) level of concentrates. After feeding
concentrates plus silage the NH3-N concentration rose more than
after feeding silage only. With 7 kg of concentrates (twice a day
3.5 kg) ammonia-N concentrations (average as well as minimum
concentrations per day) were lower than with 1 kg of
concentrates.
VFA concentrations were higher for the better digestible
silages, and higher in combination with 7 kg than with 1 kg of
concentrate. The ratio non-glucogenic versus glucogenic fatty
acids (NGR) decreased with an increasing concentrate proportion
in the diet. Though not significantly, the NGR was higher for the
silages with the higher cell wall content and the lower total VFA
concentrations, except for Exp. 3. The daily variation in VFA
concentrations in Exp. 4 is given in Fig. 3. The VFA
concentrations differed between G3H and G5H (P<0.05), but the
patterns were comparable.
Rumination and eating parameters and number of rumen
contractions per day are given in Table 3. Total chewing times
(CT) only differed significantly (7><0.001) between silages in
Exp. 1. Rumination times (RT, min/day) and eating times (ET,
min/day) were only slightly different between the silages, both
within and between experiments. RT did not differ significantly
between the concentrate levels. Because of the lower silage
intake with the high concentrate level, RT per kg silage DM
ingested was higher in Exps. 2 and 4 than in Exps. 1 and 3. ET
(min/day) was only in Exp.4 higher for the silage with the higher
cell wall content (P<0.05). Per kg NDF ingested CT and RT only
differed between silages in Exp.3 (Table 3) . Number of rumination
boli per day differed significantly (P<0.01) between silages in
Exp. 3. Number of chews during rumination (RC) differed between
silages in Exp. 1 (P<0.01) and number of chews during eating (EC)
59
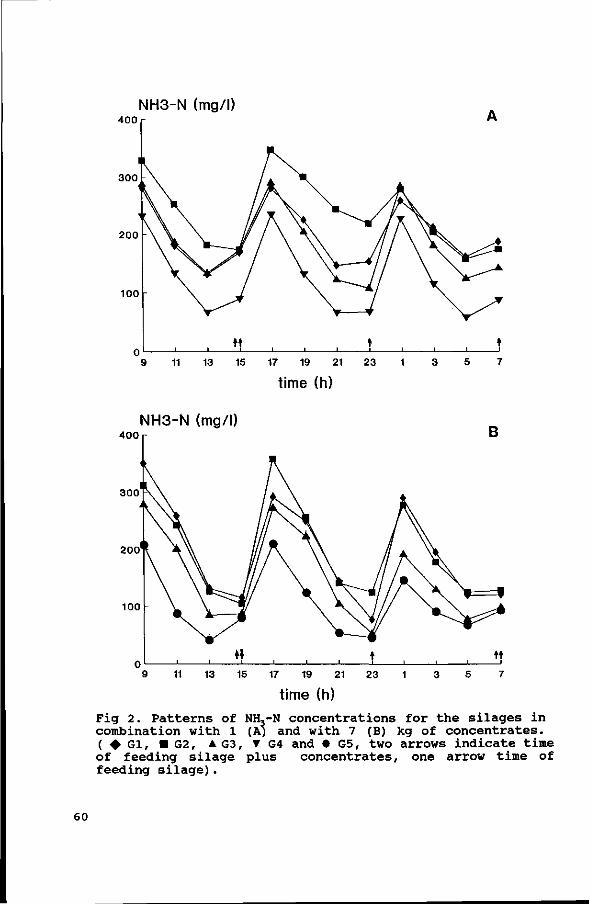
NH3-N (mg/l) 400
300
200
100 -
17 19 21
time (h)
f 400
300
20o'
100
SIH3-N (mg/l)
\ \ ^ y
i i i i , t
B
tt i i i
11 13 15 17 19 21 23
time (h)
Fig 2. Patterns of NH,-N concentrations for the silages in combination with 1 (A) and with 7 (B) kg of concentrates. ( • Gl, • G2, A G3, T G4 and • G5, two arrows indicate time of feeding silage plus concentrates, one arrow time of feeding silage).
60
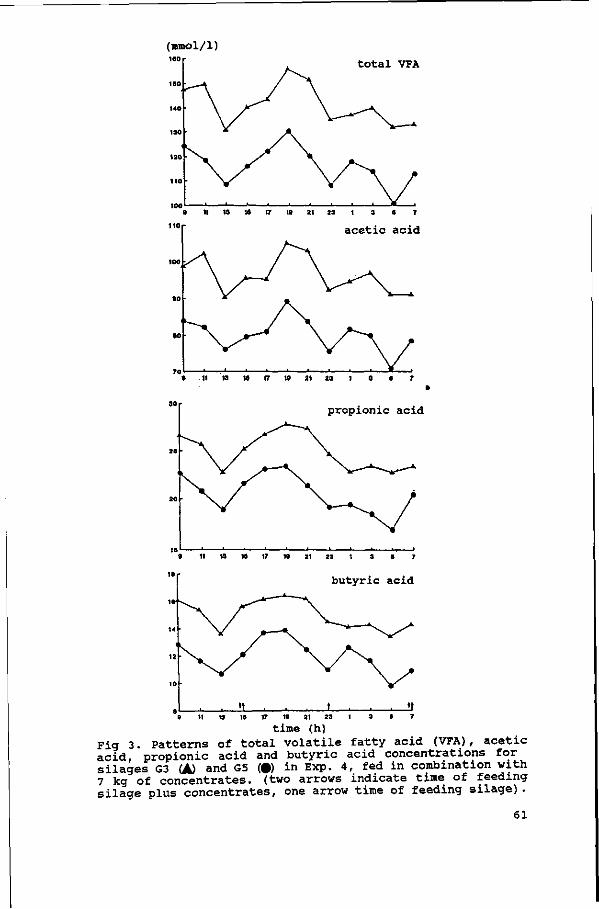
t o t a l VFA
• II » 1« 17 » 21 23 1 3 S 7
propionic acid
17 19 21 23
time (h) Fig 3. Patterns of total volatile fatty acid (VFA), acetic acid, propionic acid and butyric acid concentrations for silages G3 (A) and G5 (•) in Exp. 4, fed in combination with 7 kg of concentrates, (two arrows indicate time of feeding silage plus concentrates, one arrow time of feeding silage).
61
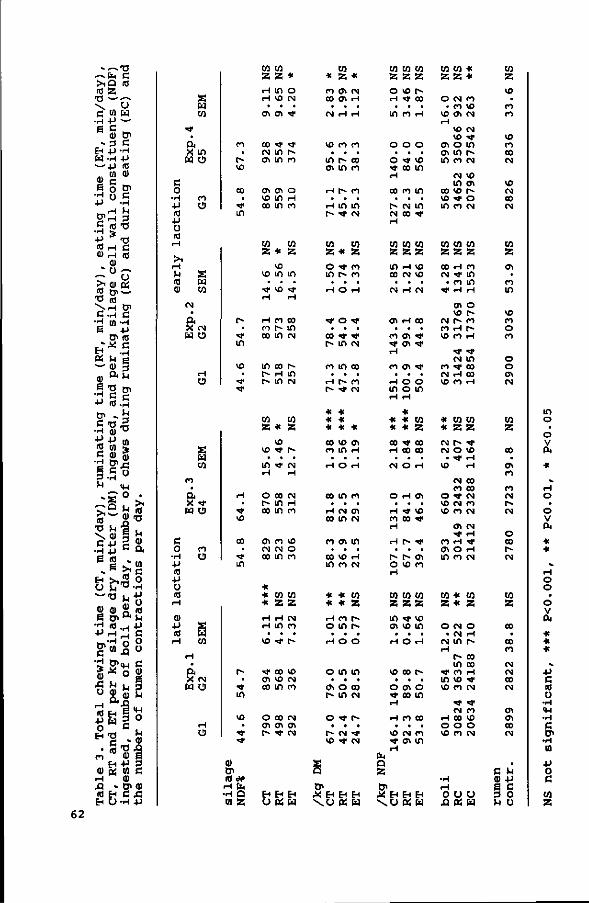
- ~ T 3 ~ C K C > I O <Ü 10 Z 73 ^ - j - .
\ „ ° c w w •rH +J ~
e c -0) t j i
- 3 e H +J -H W -H -P — .p 10
da
y)
, e
ating
time
ag
e cell
wa
ll
cons
(R
C) a
nd
during
e
\ r H 0> C .H C
•H u) -H S -P
tJ> (0 „ * . * C & - H 0i U B ~ 0) § ., a^ QJ "
§ "O oi "i c c +J < 0 - H
• H (1) T->
ru
mi
nâ
t
inge
sti
f
chews
«3e° r Q u Is S!
in/d
i tt
er
numt
S (0 •. . B >,
B & 5 - 7 3 fc
S 8.8. T! * - H ** - " "H
g*s
3. T
otal
chewi
and
ET
per
kg
e
d,
number
of
H -P a; a w H O )
• > i (0
73
U ai a c 0
• H •P Ü (0 (-1
•p
c 0 Ü
c ai s 3 U <u 0
u 0)
•i 3 C
XI » 0><U 10 H C 43 EH O -H .p
C o
• H • p (0
+J Ü (0
rH
> 1 1-1 r i (0 ai
c 0 • H • p (0
• p
o (0
0) • p (0
rH
t
• a
s H W
x w H
CM
• a x
O
co O
S H W
(M
a o
co • El
X
H U
E H W
t W O
H
« & X
co U
S U W
CM
w o
H
O
M
• t~ VO
CO
• ' t in
r» • t
in
VO
• t
•*
rH
• t 10
00
• t m
r~ • t
in
vo • t
•<t
ai o> (0 <*> H t* •H a m s
w W Z Z H H
• CTl
00 M CTl
CTl VO 00
W 2
VO
• •* rH
rH co 00
in r* r-
Kl
in vo • CTI
• *
in m
o> in in
* vo in • VO
co r~ in
00 H m
Z *
VO
• in H
o r» 00
CTI
w 00
* « * rH rH
• VO
' t cri 00
O en f »
vo • *
• •>t
00 in in
co CM m
Ha
O CM
• -̂
' t r̂ co
o H co
W Z
m •
•* rH
00 in CN
r-m CN
W Z
r-• CM
H
CM H CO
VO O CO
co W
z z H CM in • •*
co vo in
00 01 t
co • t»
VO CM co
CM
CT! CM
H H EH V « W
* CO 00
• CM
VO
« in CTl
H
• <-H
W
co z CTl CTl
• H
CO
• r~ tn
r-• in
' t
Z *
O t m • H
' t
• CO f -
CO
• rH r»
•K
* * 00 CO
• rH
00
• H 00
CO
• 00 in
* * O
• H
O
• CTl r»
o • t*
VO
2 Q
D i
r* • o
o • •* in
in • r-
•>t
* * VO in • o
m • CM
in
CTl
• VO (O
« * co in • o
in • o
in
t
• CM ' t
* CM rH
• H
CO
• 00 co
co • in
CM
co
z co co • rH
' t •
• *
CM
00
• CO CM
* CTl H
• H
CO
• CTl CM
in • H
CM
W Z
t^ • o
in • 00
CM
r-• t
CM
X EH EH EH
\ o as w
en CO CO Z Z Z
o rH
• m
o • o
>* H
00
• t-CM H
to
vo • *
• co
o • t
00
co • CM
r» 00
• H
O
• VO m
in • in
00 ' t
w w z z z m H vo 00
• CM
CTl
• CO ' t H
CO
• rH in H
Ht
* 00 H
• CM
O
• H CO H
H
• r-o H
(M
• rH
H
• CTl CTl
CTl
• O O H
HC HI
* ' t 00
• O
H
• "* 00
r~ • p»
vo
VO
• CM
00
• • * •
^ t
• O in
co Z
00 00
• H
CTl
• VO * t
t
• CTl CO
W W CO
z z z m t vo CTl
• H
VO
• O t H
H
• VO t H
Q Z
o<
VO
• o
00
• CTl 00
CO
• CM CTl
in • H
t -
• O in
CO
• co in
X EH EH EH \ o Pi W
co co HC Z Z *
o • VO
rH
CTl CTl in
00 VO in
CM co CTl
VO VO O in co
CM in vo t co
CO VO CN
CM
•̂ in e-CM
VO CTl r-o CM
co co co z z z 00 H CO CM
• ' t
CM CO vo
co CM vo
« HC
CM CM
• VO
o VO VO
co CTl in
t co H
CTl VO t -H co
' t CM
^, rH CO
CO
in m H
O
> CO r-rH
' t in 00 00 rH
w z z > o ' t
CM CO ' t CM CO
CTl ' t H O CO
co * Z *
o • CM
H
' t m vo
H O VO
- H rH
CM CM in
t-« in CO vo co
' t CM 00 o co
' t vo rH rH
00 00 CM co CM
CM H
• ^
H CM
co z o H t -
00 00 rH t CM
' t CO VO o CM
o u u XI « w
CO
z vo • co
co
vo co 00 CM
VO CM 00 CM
CO
z CTl
• CO
in
vo co o co
o o CTl CM
co z 00
• CTl co
co CM r~ CN
o co r» CM
co z 00
• 00 co CM CM 00 CM
CTl CTl 00 CM
• c u 01 4->
e c 3 O u u
62
differed between silages in Exp. 4 (P<0.01). Number of rumen
contractions was not significantly influenced by diet in all four
experiments. Though during eating frequency of rumen contractions
increased , differences in eating times did not result in
different numbers of rumen contractions per day.
The MFP (/im) and the particle size distribution of rumen
particles, the latter as kg DM of the different sizes in the
rumen, are given in Table 4. The MFP was lower when the silages
were supplemented with 7 than when supplemented with 1 kg of
concentrates. Within level of concentrates fed, the MFP increased
with stage of maturity of the silages. The fraction of faecal
particles retained on the top sieve (1.25 mm) varied between 2%
and 5%.
In the rumen, the fraction of small particles, able to pass to
the omasum considering their size (<1.25 mm), ranged from 74 to
81% of rumen DM. The pool of particles <1.25 mm was not
significantly different between silages in experiments 1 and 4.
In Exp. 2, the fraction of rumen particles smaller than 1.25 mm
was somewhat higher for silage Gl. The pool of particles <1.25
mm, however, was higher for silage G2, due to the higher rumen
DM content. In Exp. 3, the fractions of rumen particles <1.25 mm
were the same for both silages, resulting in 8.5 kg DM able to
leave the rumen for silage G3 and 6.6 kg DM for silage G4
(P<0.01).
Within the fraction of small particles (<1.25 mm), the amount
of particles <0.071 mm was highest for the silage with the lower
cell wall content in all four experiments. The pool of particles
>5 mm was also highest for the low cell wall silages in all four
experiments. A negative correlation (r = -0.90, f<0.001) between
pool sizes of particles smaller than 0.071 mm and MFP was found.
Discussion.
In Exps. 2 and 4, ammonia concentrations were not significantly
(P>0.05) influenced by diet, probably because the protein
ingested consisted of 30-50% of concentrate protein.
63
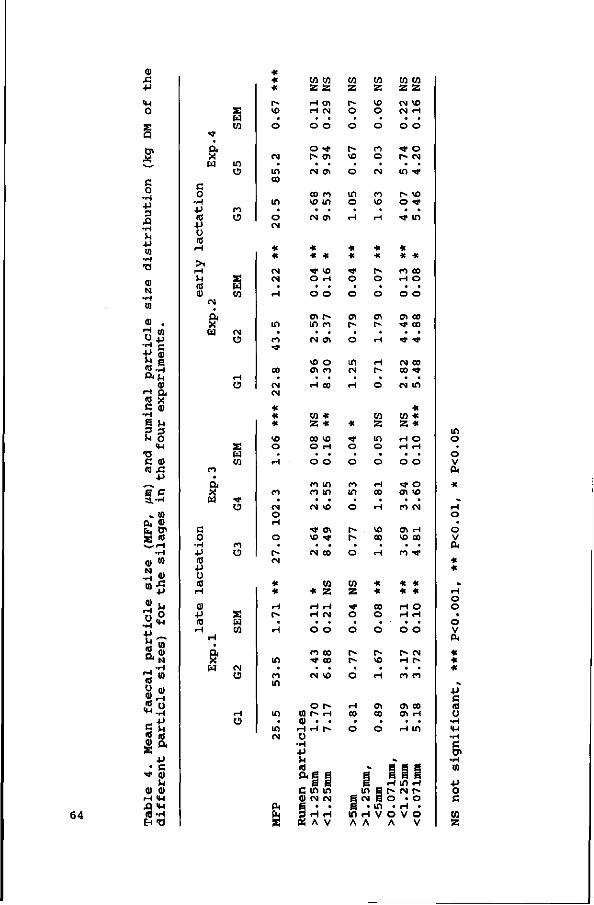
64
ai fl •p
<u o E 5 en
c 0
• H •P 3 A • H
- P Ol
• H -0
N - H 01
<u .
y -P "^ c •P <u ii B S-H ftn ai r j ft * X C a)
• H
§ n ? 3 M O
<H
•a c a> « X!
• p
-̂̂ e c a. -H
» 10
a, a> Ü, o>
• H 0) to
•H 4>
»s 2n • H * " •P Ä
O . 0 »
_ I - H
- «0 «8
-2.3 S* S * a) n.
+ j
• c •* a u
ai ai H "H .Q «M «S-H EH «
** à X W
C O
• H •p (0
• p Ü 10
> 1
U 10 ai
CM
à. X w
co •
a X w
c o • H
• P (0
• p
o (0 r-t
ai •p (0
i H H
X H
S w w
i n O
n O
2 U C0
M U
H O
S H CO
TJ-
U
n O
S H CO
(N O
H O
* « « r» i o
o
M •
i n CO
in • o
CS
* * CM
• H
i n
• co •* 00
CM CM
* * * VO o • H
n • CM
O H
O
• r~ CM
* * H r-• H
i n
• n m
i n
• i n CM
CM
£
CO M a 55 rH 0 \ H CM
O O
O < * r» en
CM o >
co co vo in
CM en
* * * •tf VO O r-t
o o
CT> r -
in co
• • CM en
VO O Cfl CO
H 00
M * 2 *
00 VO O H
O O
co in co m
CM vo
•<* en vo **
CM CO
CO * 2 H H H CM
O O
CO 00 •»»• CO
CM VO
O t -10 r- H
i H H t -ü
•iH •P h cd 0* Ë 6
€ 6 C in in 0 ) CM CN
n • • 2 rtH « A V
CO 2
r~ o
o
p-VO
o
in o i-i
HC
* O
O
en r-• o
i n CM
H
* •*• O
O
CO i n
o
r-r-
o
10 2
TC o
o
t -c-
o
H CO
O
ß 5
CG 2 VO O
o
co O
CM
co vo r4
* * O
O
en r* • H
H r~ O
W 2
in o
o
H 00
H
VO 00
H
* * CO
o o
r-VO
i-t
en co
O
^ g § m g CM s
• in
co co 2 2
CM VO CM <H
O O
T t O r- CM
i n • *
> VO o ^
• * i n
*
CO 00 H O
O O
en co •*r co
• • • * • *
CM CO CO > *
CM tn
* co * 2 *
H O H H
O O
> * O en vo
CO CM
en i n VO co
co • *
« « « * H O H H
O O
t - CM i-t r »
co co
en co en H
H in
^ B S Q § g | H in H t-» CM r~ o • o
• H . m H v o v o A A A V
in o • o
v CM
« ^ H
O •
O V CK
* * ^ H
O O
• o V
* * « ^ +J
c (0 ü
• H VU • H
c &> • H (0
• p
o c co 2
When the silages were fed supplemented with 7 kg of
concentrates, NH3-N concentrations were lower for all silages,
whereas VFA concentrations were higher for all silages as
compared to feeding the silages with 1 kg of concentrates. No
significant differences in rumen fluid volume, however, were
found between silages or between concentrate levels (Bosch etal.,
submitted6) .
Degradation rate of the concentrate protein is likely to be
lower than degradation rate of the silage protein. Ammonia
concentration in the rumen is determined by the ammonia
production by microorganisms and the ammount of NH3 available
from recycling of urea (saliva and recycling through rumen wall)
on one hand and the utilization by microorganisms, rate of
passage to the omasum and absorption through rumen wall on the
other hand. Higher digestible OM intakes result in higher VFA
productions (Haaland et al., 1982; Sutton, 1985). For the high
concentrate level, VFA production will be higher, resulting in
a better utilization of ammonia by rumen bacteria.
With 1 kg of concentrates, ammonia-N concentration was lowest
at all times for G4, due to the lower protein intake. Despite the
lower protein intake for G2L as compared to GIL and G3L, the
higher ammonia concentration peak and the slower decline after
feeding silage plus concentrates resulted in significantly higher
(P<0.05) average ammonia-N concentrations for G2L (Fig. 2).
According to Satter & Slyter (1974) at least an ammonia-N
concentration of 50 mg/1 is needed, while Hoover (1986) reports
a minimal concentration of 33 mg/1. Hoover (1986) concludes that
the ammonia-N concentration for maximum microbial growth rate is
not equal to the concentration for an optimal digestion (33 vs
80 mg/1). The lower ammonia concentrations for G4 in Exp. 3, due
to the lower protein intake, with minimum values of ammonia-N of
less than 50 mg/1 may result in a lower microbial growth rate as
compared to silage G3. For the high concentrate level, only G2
did not show ammonia-N concentrations below 80 mg/1, indicating
that for the other silages during the hours before feeding times
the ammonia-N concentrations may have been too low for an optimal
degradation.
65
Except for silage Gl in Exps. 1 and 2, rumination times
exceeded 9 hours a day for all silages, regardless of being
supplemented with 1 or 7 kg of concentrates. According to Bae et
al. (1979) and Welch (1982) that is about the maximum time the
animals can spent ruminating. Rumination time and cell wall
content of the diet are highly (r = 0.94-0.99) correlated (Welch
& Smith, 1969a, 1969b). When the animals are ruminating for more
than 9 h a day an increase in cell wall content of the diet will
not result in an increase in rumination time, but in a decrease
in intake. To be able to reduce particle size to a size below the
CPS, high cell wall diets require longer RT per kg DM ingested.
Apart from silage G3, RT (min/kg DM) increased with an increase
in cell wall content of the silage. Although not significantly,
RT and ET per kg NDF tended to decrease. According to Balch
(1971) , the total time spent chewing per kg DM is the most
suitable value to use as a roughage index. Apart from G3, total
chewing time (CT) per kg DM ingested increased with an increase
in cell wall content of the silage (r = 0.93 excluding and r =
0.70 including G3). The "structure" of the feed not only depends
on the physical form and the NDF content as such, but also seems
to depend on the composition of the NDF fraction. Of G3, the
ratio cellulose to hemicellulose of the cell wall fraction was
lower as compared to the other silages, resulting in a lower
"roughage index", and a higher ad libitum intake.
After particles have left the rumen, hardly any further
reduction in particle size takes place (Poppi etal., 1980). The
mean size of particles leaving the rumen can thus be measured in
faecal samples. The critical particle size (CPS), defined by
Kennedy & Poppi (1984) as the sieve aperture retaining the top
5% of faecal particulate dry matter, is the size above which
particles have a very low probability of leaving the rumen. They
indicated a CPS for cattle of 1.18 mm. The 1.25 mm sieve used in
our experiments approaches the CPS adequately, shown by the
fraction of faecal dry matter retained on this sieve, varying
between 2 and 5%. Therefore, the MFP will be discussed as being
the mean size of particles flowing from the rumen to the omasum.
The size of particles leaving the rumen decreased when the
66
proportion of concentrates in the diet increased, due to a bigger
pool of particles smaller than 0.071 mm, probably caused by a
smaller initial size of the concentrate particles.
There was a positive linear relation between the MFP and the
ratio of particles with a size between 1.25 mm and 0.071 mm to
particles smaller than 0.071 mm (R2=0.67, P<0.001).
Because the major part (>70%) of the rumen content consists of
particles smaller than the CPS, passage rate can not only be
limited by the size of the particles. Small particles can get
trapped in the floating material, and their gas content
influences their functional specific gravity (FSG) (Sutherland,
1987).
In experiments 1 and 3, one may assume that the NDF excreted in
the faeces is largely originating from silage. Comparing the
undegradable NDF fraction with the NDF excreted in the faeces,
shows that approximately 48, 57, 61 and 66% of the NDF excreted
is undegradable for the silages Gl, G2, G3 and G4, respectively
(Bosch et al., submitted3) . The increase in the undegradable
fraction of particles with an increase in cell wall content of
the silages probably results in a higher FSG and therefore, apart
from G3, in an increase in size of particles able to leave the
rumen.
Rumination times per kg DM ingested were lowest for silage G3,
suggesting a lower resistence to comminution by mastication
compared to the other silages. Probably, for silage G3, particles
are small enough to leave the rumen before they have a high
enough FSG, meaning that there is still considerable microbial
activity and thus gas production. These small particles then have
to be ruminated again to remove the fermentation gas and the
necessary decrease in rumen fill is therefore obtained by passage
of, on average, smaller particles.
It seems that the longer CT per kg DM ingested for silages with
higher cell wall contents does not compensate enough, resulting
in smaller fractions of the small particle pool passing a 0.071
mm sieve, and as a result higher MFP's.
67
References.
Bae, D.H., J.G. Welch and A.M. Smith, 1979. Forage intake and rumination by sheep. J.Anim.Sci. 49:1292-1299.
Balch, C.C., 1971. Proposal to use time spent chewing as an index of the extent to which diets for ruminants possess the physical proparty of fibrousness characteristics of roughages. Br.J.Nutr. 26: 383-392.
Bosch, M.W. , S. Tamminga and G. Post, submitted8. Influence of stage of maturity of grass silages on digestion processes in dairy cows. l. Composition, nylon bag degradation rates, digestibility and intake, [see Chapter II, this thesis]
Bosch, M.W., S.C.W. Lammers-Wienhoven, G.A. Bangma and H. Boer, submitted6. Influence of stage of maturity of grass silages on digestion processes in dairy cows. 2. Rumen contents and ruminai passage rates, [see Chapter III, this thesis]
Chai, K., P.M. Kennedy and L.P. Milligan, 1984. Reduction in particle size during rumination in cattle. Can.J.Anim.Sci. 64 (suppl.):339-340.
Haaland, G.L., H.F. Tyrell, P.W. Moe and W.E. Wheeler, 1982. Effect of crude protein level and limestone buffer in diets fed at two levels of intake on rumen pH, ammonia-nitrogen, buffering capacity and volatile fatty acid concentration of cattle. J.Anim.Sci. 55:943-950.
Hoover, W.H., 1986. Chemical factors involved in ruminai fiber digestion. J.Dairy Sei. 69:2755-2766.
Kennedy, P.M. and D.P. Poppi, 1984. C r i t i c a l p a r t i c l e s i z e in s h e e p and c a t t l e . I n : P.M. Kennedy (ed.), Techniques in particle size analysis of feed and digesta in ruminants. Canadian Society of Animal Science, occasional publication no. 1, Edmonton.
McLeod, M.N. and D.J. Minson, 1988a. Large particle breakdown by cattle eating ryegrass and alfalfa. J.Anim.Sci. 66:992-999.
McLeod, M.N. and D.J. Minson, 1988b. Breakdown of large particles in forage by simulated digestion and detrition. J.Anim.Sci. 66:1000-1004.
Mertens, D.R., 1987. Predicting intake and digestibility using mathematical models of ruminai function. J.Anim.Sci. 64:1548-1558.
Murphy, M.R., R.L. Baldwin, M.J. Ulyatt and L.J. Koong, 1983. A quantative analysis of rumination patterns. J.Anim.Sci. 56:1236-1240.
Poppi, D.P., B.W. Norton, D.J. Minson and R.E. Hendricksen, 1980. The validity of the critical size theory for particles leaving the rumen. J.Agric.Sci.Camb. 94:275-280.
68
Satter, L.D. and L.L. Slyter, 1974. Effect of ammonia concentration on rumen microbial protein production in vitro. Br.J.Nutr. 32:199-208.
Scheiner, D, 1976. Determination of ammonia and kjeldahl nitrogen by indophenol method. Water Research 10:31-36.
SPSS Inc., 1988. SPSS/PC+ Base manual. SPSS Inc., Chicago, Illinois.
Sutherland, T.M., 1987. Particle separation in the forestomachs of sheep. In: Aspects of digestive physiology in ruminants, pp.43-73 (A. Dobson , editor). Ithaca: Cornell Univerity Press.
Sutton, J.D., 1985. Symposium: Energy, nutrition and metabolism of the lactating cow. J. Dairy Sei. 68:3376-3393.
Ulyatt, M.J., D.W. Dellow, A.John, C.S.W. Reid and G.C. Waghorn, 1986. Contribution of chewing during eating and rumination to the clearance of digesta from the ruminoreticulum. In: Control of Digestion and Metabolism in Ruminants, Ed. by L.P. Milligan, W.L. Grovum and A. Dobson.
Waldo, D.R., L.W. Smith, E.L. Cox, B.T. Weinland and H.L. Lucas Jr., 1971. Logarithmic normal distribution for description of sieved forage materials. J. Dairy Sei. 54:1465-1469.
Welch, J.G. and A.M. Smith, 1969a. Forage quality and rumination time in cattle. J.Dairy Sei. 53:797-800.
Welch, J.G. and A.M. Smith, 1969b. Influence of forage quality on rumination time in sheep. J.Anim.Sci. 28:813-818.
Welch, J.G., 1982. Rumination, particle size and passage from the rumen. J.Anim.Sci. 54:885-894.
69
Chapter V
Influence of stage of maturity of grass silages on digestion
processes in dairy cows.
4. Protein digestion and microbial protein synthesis in the
rumen.
M.W. Bosch1,2, J. van Bruchem1, L.J.G.M. Bongers1
and S. Tamminga2
department of Human and Animal Physiology, Agricultural
University, Haarweg 10, 6709 PJ Wageningen (The Netherlands)
department of Animal Nutrition, Agricultural University,
Haagsteeg 4, 6708 PM, Wageningen (The Netherlands)
submitted for publication
71
Abstract.
In four change-over experiments, wilted grass silages,
differing in cell wall content, were fed ad libitum to dairy cows
in early and late lactation.
Ruminai degradation rate of the crude protein (CP) fraction of
the silages was investigated using nylon bag incubations. No
significant relation between the degradation rate (kd, %h"1) and
the cell wall content of the silages was found. The soluble (fs,
%) and undegradable (fR, %) fractions of the CP both increased
with an increase in silage cell wall content. The fraction of
dietary protein escaping rumen fermentation (fE, %) increased
with cell wall content.
In duodenal protein, the fraction originating from the diet
decreased with cell wall content.
Introduction.
Feeding grass products to dairy cows usually results in
considerable losses of nitrogen (N) . These losses can be reduced
if the N intake is decreased by lowering the crude protein (CP)
content of the grass (Van Vuuren & Meijs, 1987). Ensiling the
grass at a more mature stage, results in lower CP contents, but
normally also reduces its digestibility (Van Soest, 1982).
The protein entering the small intestine of ruminants consists
of microbial protein synthesized in the rumen, dietary protein
which escaped rumen fermentation and endogenous protein. The
digestion of this protein mixture in the small intestine
determines the amount of amino acids coming available for the
ruminant.
The degradability of feed protein in the rumen can be estimated
using the nylon-bag technique (Mehrez & 0rskov, 1977). This
technique gives information on the fraction of feed protein
escaping rumen fermentation, though not on the microbial protein
synthesis in the rumen.
Different methods to estimate the fraction of duodenal protein
72
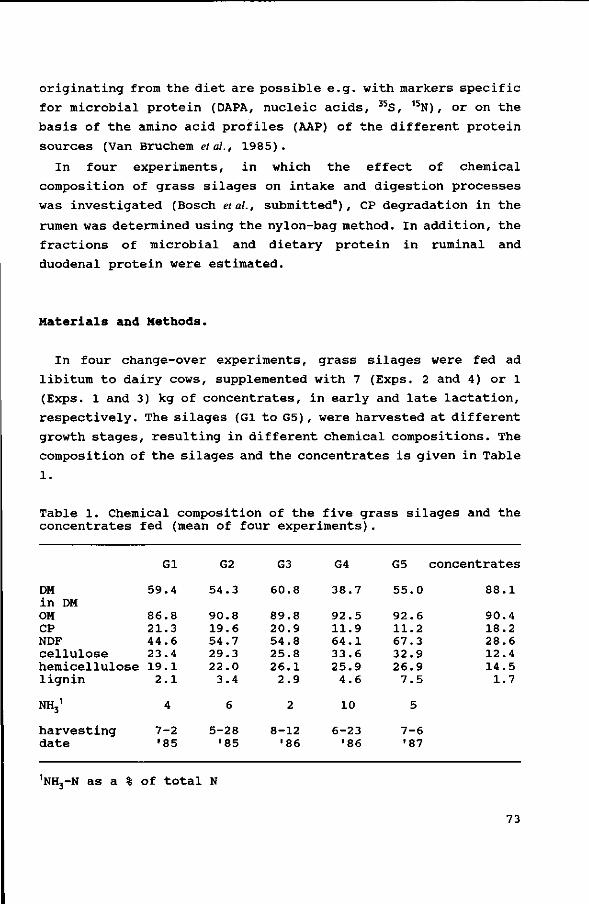
originating from the diet are possible e.g. with markers specific
for microbial protein (DAPA, nucleic acids, 35S, 1 5N), or on the
basis of the amino acid profiles (AAP) of the different protein
sources (Van Bruchem eta!., 1985).
In four experiments, in which the effect of chemical
composition of grass silages on intake and digestion processes
was investigated (Bosch etal., submitted8), CP degradation in the
rumen was determined using the nylon-bag method. In addition, the
fractions of microbial and dietary protein in ruminai and
duodenal protein were estimated.
Materials and Methods.
In four change-over experiments, grass silages were fed ad
libitum to dairy cows, supplemented with 7 (Exps. 2 and 4) or 1
(Exps. 1 and 3) kg of concentrates, in early and late lactation,
respectively. The silages (Gl to G5) , were harvested at different
growth stages, resulting in different chemical compositions. The
composition of the silages and the concentrates is given in Table
1.
Table 1. Chemical composition of the five grass silages and the concentrates fed (mean of four experiments).
DM in DM OM CP NDF cellulose hemicellulose lignin
NHj1
harvesting date
Gl
59.4
86.8 21.3 44.6 23.4 19.1
2.1
4
7-2 •85
G2
54.3
90.8 19.6 54.7 29.3 22.0
3.4
6
5-28 •85
G3
60.8
89.8 20.9 54.8 25.8 26.1
2.9
2
8-12 '86
G4
38.7
92.5 11.9 64.1 33.6 25.9
4.6
10
6-23 '86
G5
55.0
92.6 11.2 67.3 32.9 26.9
7.5
5
7-6 •87
concentrates
88.1
90.4 18.2 28.6 12.4 14.5
1.7
1NH3-N as a % of total N
73
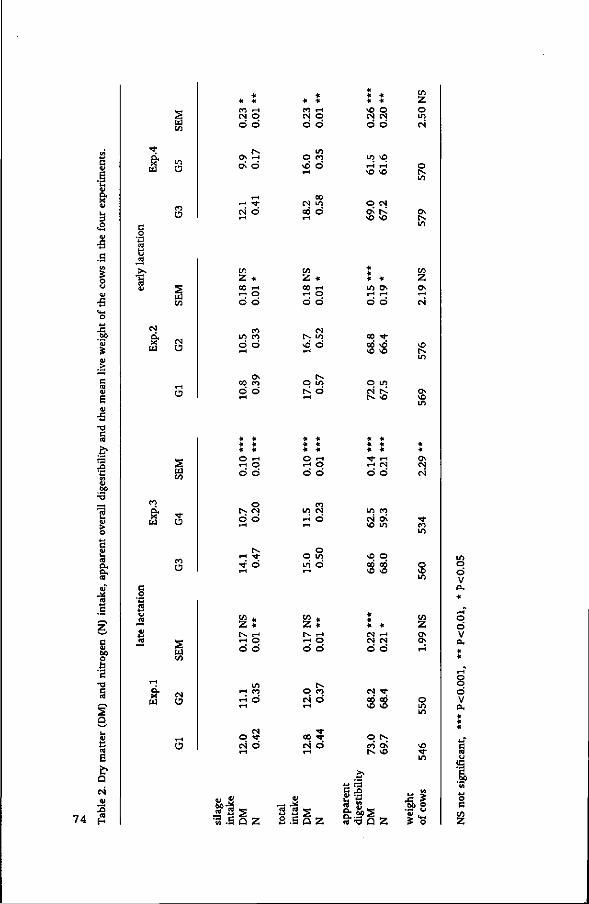
UJ
* * * CO t-H es o o o
t v O t-H 0\ o
1-1
CS O t-H
* CO CS O
O
t - H
CS CO r-t
* * l-H O O
m co o
co LO
o
* +
CM O
m t - H
O O vO
* * O CS O
vO t-H vO
CS t v vO
C/3
Z o CS
o tv LO
t v
•s a
•6 es
C/3
CS
O
O
C/3
z C/3 z * 00 I-H rH O O Ó
m o t-t i-t
o ó
C/3 Z Ov
m co o o t-H
O 00 co o o l-H
t v L/3 vO O f - t
t v O 1/3 t v O t-H
co •<)-
8 8
o m CS t v t v v£>
t v L/3
ra 'O VI Ë?
•3
a ex
o b c
T3
Q
co
& w
PJ c/3
co
2 w C/3
CS
O
O
O .-H rt O
o o
o tv CN O o
tv •>1-
ó
C/3
Z
T-H co
es' ö
O t-i
co m es r-i Ó
q in ui ó
Z « tV >-H <-< O
o o
tv O CO
co ? CS C3
<-> cs ö o
cs o-vo m
oo oo vO vO
CS <-< cs cs o ö
SS
co o tv vO
IJ V
7 4 . g l s « .s Q z
2 . S Q Z
c xi
« '-5 a z
es es
o v0 to
C/3
z
o LO L/3
vO
«> .9
o V o.
o o V o.
8 Ö V ex
s 'I o c
C/3
Z
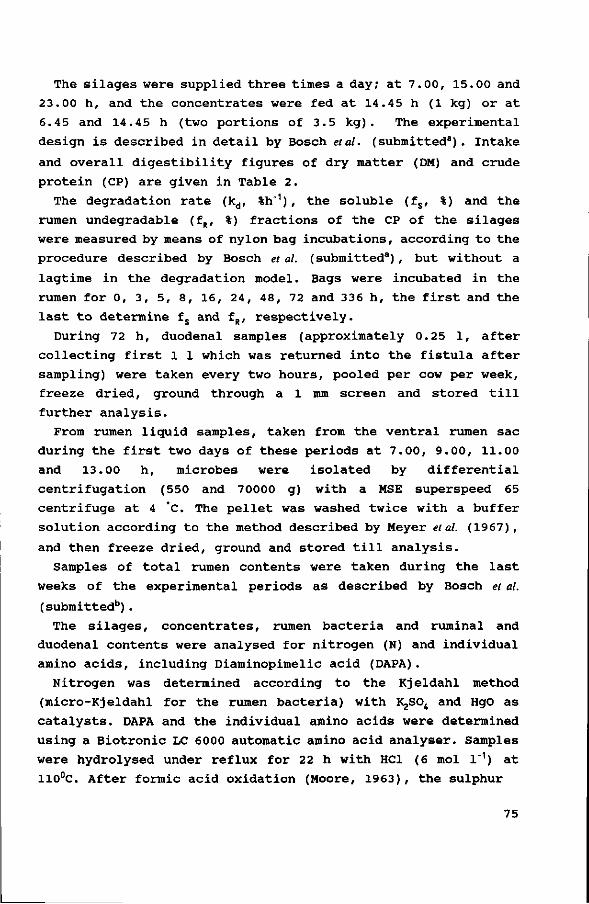
The silages were supplied three times a day; at 7.00, 15.00 and
23.00 h, and the concentrates were fed at 14.45 h (1 kg) or at
6.45 and 14.45 h (two portions of 3.5 kg). The experimental
design is described in detail by Bosch etal. (submitted8). Intake
and overall digestibility figures of dry matter (DM) and crude
protein (CP) are given in Table 2.
The degradation rate (kd, %h"1) , the soluble (fs, %) and the
rumen undegradable (fR, %) fractions of the CP of the silages
were measured by means of nylon bag incubations, according to the
procedure described by Bosch et al. (submitted3) , but without a
lagtime in the degradation model. Bags were incubated in the
rumen for 0, 3, 5, 8, 16, 24, 48, 72 and 336 h, the first and the
last to determine fs and fR, respectively.
During 72 h, duodenal samples (approximately 0.25 1, after
collecting first 1 1 which was returned into the fistula after
sampling) were taken every two hours, pooled per cow per week,
freeze dried, ground through a 1 mm screen and stored till
further analysis.
From rumen liquid samples, taken from the ventral rumen sac
during the first two days of these periods at 7.00, 9.00, 11.00
and 13.00 h, microbes were isolated by differential
centrifugation (550 and 70000 g) with a MSE superspeed 65
centrifuge at 4 °C. The pellet was washed twice with a buffer
solution according to the method described by Meyer etal. (1967),
and then freeze dried, ground and stored till analysis.
Samples of total rumen contents were taken during the last
weeks of the experimental periods as described by Bosch et al.
(submitted6) .
The silages, concentrates, rumen bacteria and ruminai and
duodenal contents were analysed for nitrogen (N) and individual
amino acids, including Diaminopimelic acid (DAPA).
Nitrogen was determined according to the Kjeldahl method
(micro-Kjeldahl for the rumen bacteria) with K2S04 and HgO as
catalysts. DAPA and the individual amino acids were determined
using a Biotronic LC 6000 automatic amino acid analyser. Samples
were hydrolysed under reflux for 22 h with HCl (6 mol l"1) at
110°C. After formic acid oxidation (Moore, 1963), the sulphur
75
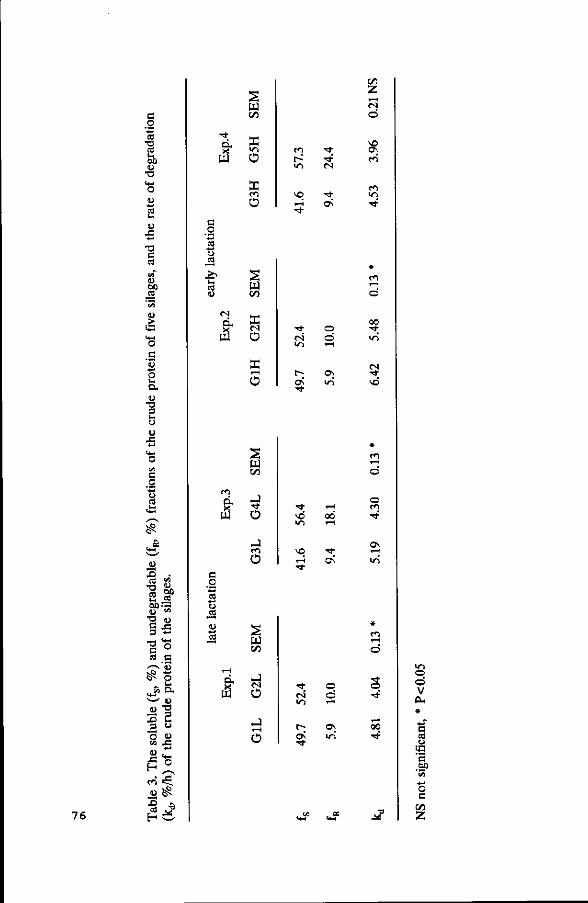
c o «
•a CB
oo u •o <+-! O u 'S u u
• o c ca
u CO
o S '5 o t-i ex <u 3
43
c O o ca
^
76
•o ca
60 tu
•o c 3 •o c ca
^ CA
<+-! —̂' CU
S J3 "o t/i
en to
43 ca H
u 60 ca
r73 W5
U 43
O O
'S o t »
QM
u T3 S u o CU
43 < * * O
5 <̂ r .
w
c o
o ca
ca
ei
(2
en
c .o • * - •
ca • 4 - *
O
u ca
w C/3
in Ü
DC m
O
cri
O
X 1—I
o
co
•<*•
Ü
Ü
PP co
[2 O
Ü
m -4-
•* o
c4 ö t n ^n
r-OS i n
M3 m
»-H
00
Os
Z5
Ö
en in
en T—i
©
en *—i
Ö
o
OS
in
Ö
•* o es ö i n *—<
0\ Os in
CX3
i n O Ö V
O L .
C CB u
n 60
o G
co Z
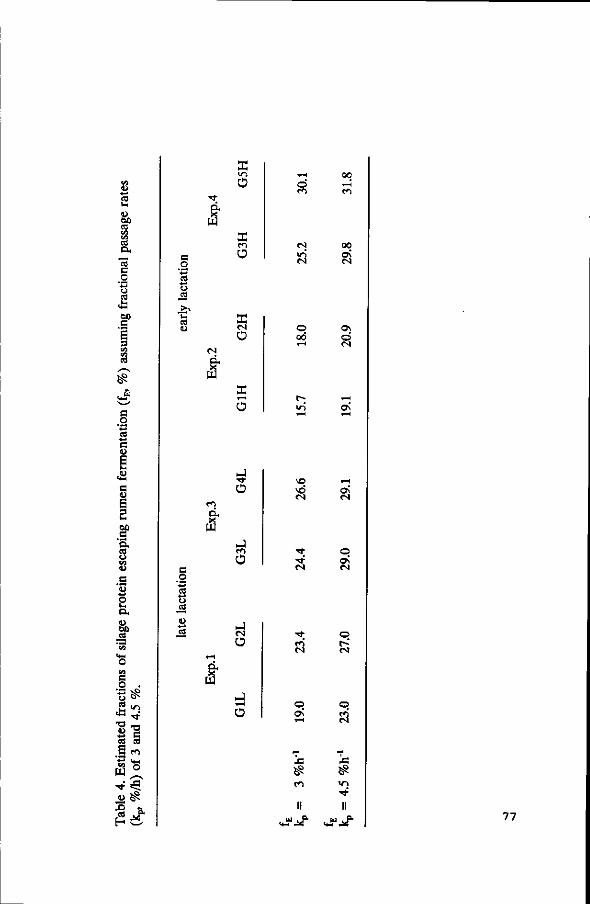
u bû ca vi SO ca o .
13 a
.o - * -» o ca
ci
s o
CS • * - <
O ca
Ü
X co O
o 00
en
00
tN
60
*
a o
a u
g S
v e s s 'a. S CO
U .g '53 O ex u bO cd
ca tu
.o o ca *3 •o u
•«-» CS
.§ V» to
-* u
S es I—,
ë *r> T f
•a c ca
co
(*-< o •£ *
r .
*t
tN
I B O
u ca u ca
I
SC tN
Ü
O
Ü
tN Ü
Ü
o od
vd tN
tN
CO tN
o
0 \ tN
O
© r-* tN
9\
À * CO
II
tN
^ 43
!/"> •<t
II
^".^ 77
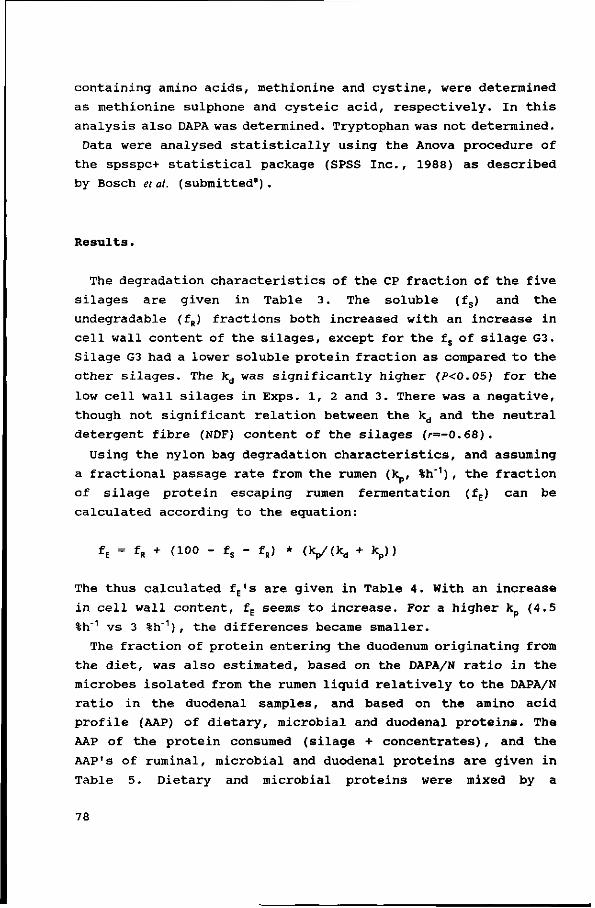
containing amino acids, methionine and cystine, were determined
as methionine sulphone and cysteic acid, respectively. In this
analysis also DAPA was determined. Tryptophan was not determined.
Data were analysed statistically using the Anova procedure of
the spsspc+ statistical package (SPSS Inc., 1988) as described
by Bosch et al. (submitted8).
Results.
The degradation characteristics of the CP fraction of the five
silages are given in Table 3. The soluble (fs) and the
undegradable (fR) fractions both increased with an increase in
cell wall content of the silages, except for the fs of silage G3.
Silage G3 had a lower soluble protein fraction as compared to the
other silages. The kd was significantly higher (P<0.05) for the
low cell wall silages in Exps. 1, 2 and 3. There was a negative,
though not significant relation between the kd and the neutral
detergent fibre (NDF) content of the silages (r=-0.68).
Using the nylon bag degradation characteristics, and assuming
a fractional passage rate from the rumen (k , %h"1) , the fraction
of silage protein escaping rumen fermentation (fE) can be
calculated according to the equation:
fE = fR + (100 - fs - fR) * (kp/(kd + kp))
The thus calculated fE's are given in Table 4. With an increase
in cell wall content, fE seems to increase. For a higher k (4.5
%h"1 vs 3 %h"1) , the differences became smaller.
The fraction of protein entering the duodenum originating from
the diet, was also estimated, based on the DAPA/N ratio in the
microbes isolated from the rumen liquid relatively to the DAPA/N
ratio in the duodenal samples, and based on the amino acid
profile (AAP) of dietary, microbial and duodenal proteins. The
AAP of the protein consumed (silage + concentrates) , and the
AAP's of ruminai, microbial and duodenal proteins are given in
Table 5. Dietary and microbial proteins were mixed by a
78
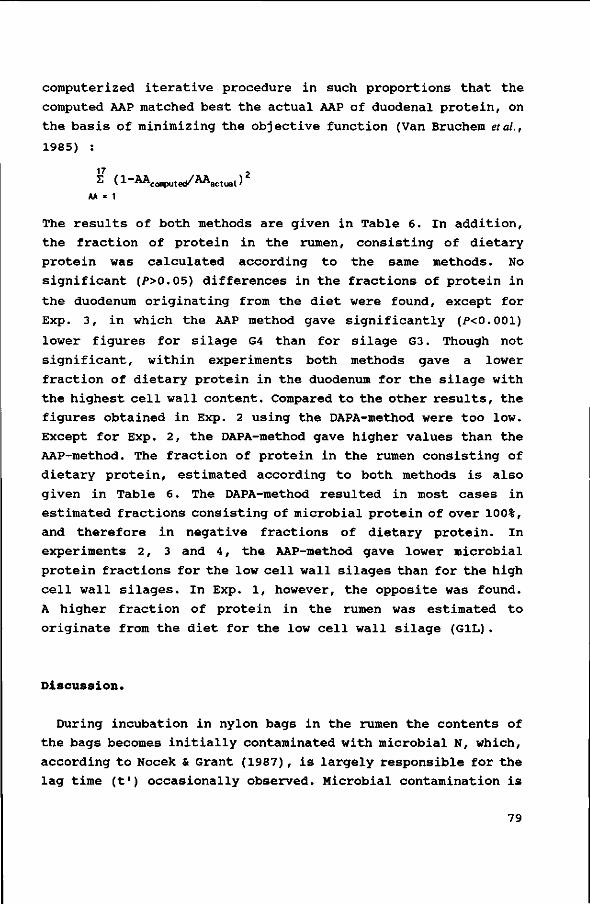
computerized iterative procedure in such proportions that the
computed AAP matched best the actual AAP of duodenal protein, on
the basis of minimizing the objective function (Van Bruchem etal.,
1985) :
17 2
2 ( 1 - AAC0(I]puted/ AAact( ja t ) AA = 1
The results of both methods are given in Table 6. In addition,
the fraction of protein in the rumen, consisting of dietary
protein was calculated according to the same methods. No
significant (/>>0.05) differences in the fractions of protein in
the duodenum originating from the diet were found, except for
Exp. 3, in which the AAP method gave significantly (P<0.001)
lower figures for silage G4 than for silage G3. Though not
significant, within experiments both methods gave a lower
fraction of dietary protein in the duodenum for the silage with
the highest cell wall content. Compared to the other results, the
figures obtained in Exp. 2 using the DAPA-method were too low.
Except for Exp. 2, the DAPA-method gave higher values than the
AAP-method. The fraction of protein in the rumen consisting of
dietary protein, estimated according to both methods is also
given in Table 6. The DAPA-method resulted in most cases in
estimated fractions consisting of microbial protein of over 100%,
and therefore in negative fractions of dietary protein. In
experiments 2, 3 and 4, the AAP-method gave lower microbial
protein fractions for the low cell wall silages than for the high
cell wall silages. In Exp. 1, however, the opposite was found.
A higher fraction of protein in the rumen was estimated to
originate from the diet for the low cell wall silage (GIL).
Discussion.
During incubation in nylon bags in the rumen the contents of
the bags becomes initially contaminated with microbial N, which,
according to Nocek & Grant (1987), is largely responsible for the
lag time (t') occasionally observed. Microbial contamination is
79
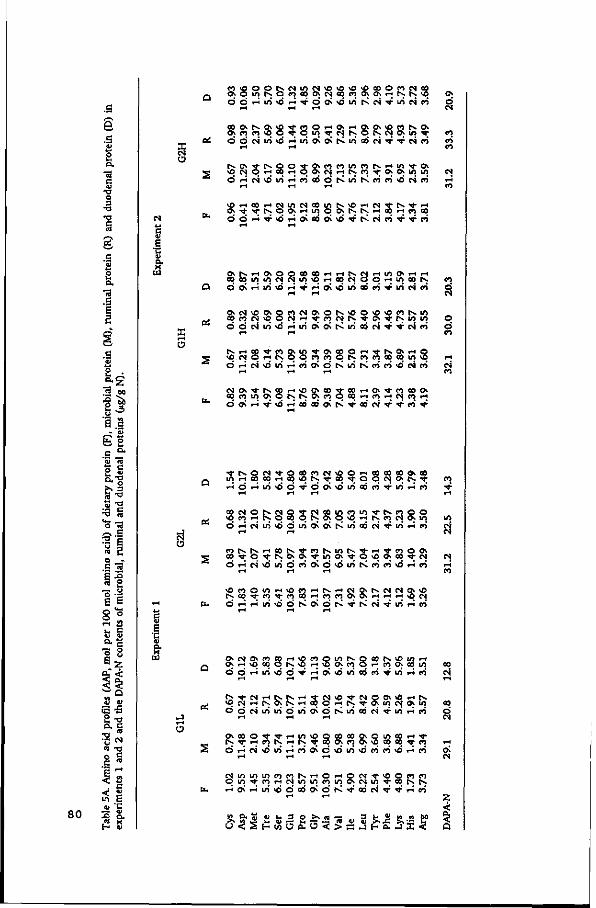
80
•S3
I * Vi
E -S s-s
• a "
n» -O
c ">
a; *C •5 « « X h- V
X es a
o o i - i i n v O i - i T r o o v v o m t ^ M ^ i n N m
t - j t^rt -^ovOvini / î d r J N v û u i r i p j o 6 d N w N c n p î » d M t n
O T j - ^ r ^ O O r H l O O O f ^ r ^ r H C O r H C J C O
rH rH
H H N C S H l r t O » H r t H C O N O O H i n c q N
O o o i t - î t i S ^ r - î - ^ - ï H O v ^ i / i Q Ô e n ^ - i n c S r t
O i S H O i O O » oo » m w es N i/> <
O
o d N i n K J H i n o i o l N i r i a N ^ ^ c i r i
S r i » * « 0 ) B | i f » C O O n * S » H O
O o J r t T f O r l o Ó B O i t v ^ : o 6 M " f < l : r i + i O "̂ O O) o*
" r H Ö r - l i r J v u ö - ^ - ó o i ^ i f t o o c ó ^ ' i n r H e ó
es
a
o O N O t - > C N 0 5 - ( S o o m t o i O T f t ^ c n g o O P I H N O C O O N O k O O r t N n N C i o .-< es i/> vó
l ^ W> W *W *~l l~* t ' l Vi
d u i c S c S t v i n o ó o J T r i n I-H
d i - i ( S \ d i f l d r i c  d * o i / i p C n ( » J O H i-t rH rH
rH ^" CO O O - - — es
[x,
O
N C O ^ C O I i n C O H n c O ^ C A H r l r l i û « d r H i - i i n * o d N o J d N * N M ^ : i r t H r i
o \ H \ o c û q N * r i v o c > c o q H n o ; c o i n d d i H i n ' O d ^ ' H 0 v < i i r t c ö n ^ i / J H r i
^ N r t N a K r i c i l q H N ^ O ; « « » ! « o d M u i u î d i ô o i d N i n c Ô M ^ i f i r i r i
o \ c o o * t H i n * o o o o c o * o i r t c e H t N ^ ; i H r t N H I s ^ c 0 O ; n O ; * Û C 0 C O ^ ; n
2 d r H p i O t f Î H r i o » d i d » n > d r i r i O r i p î rH rH rH
p i r j - ^ c n r - j c s i n i n c r j i n o ^ c s ï i n ^ o q c ^ t ^ ; bu H o Î H u î i o d c ô a o N ' t c ô p i ^ ^ r î n
.<* 3 *? •- *»r- fc-7S-a * v w >»J3 >»Z3 rj
d es
CS rH
en
O d
ci es
es
eo es
a) d es
es
Z
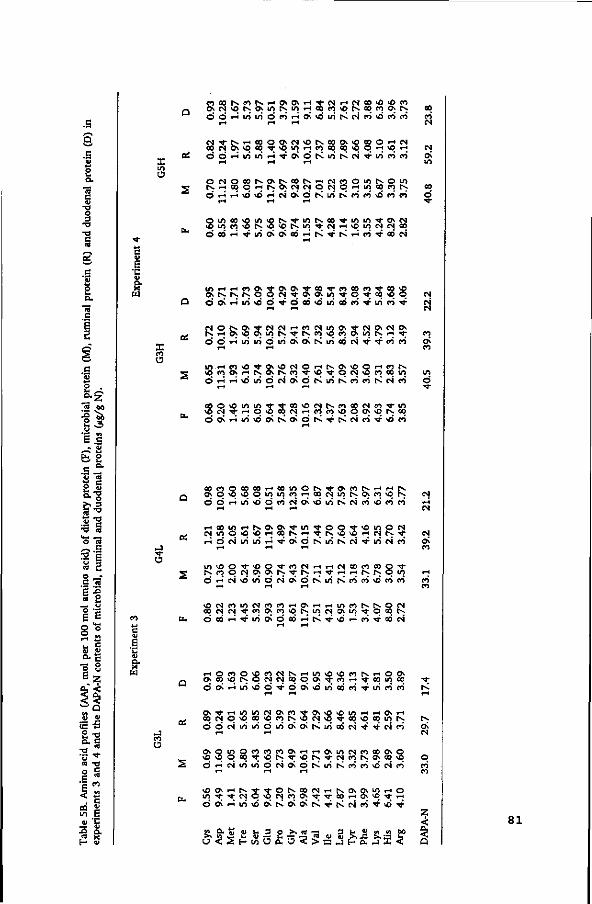
.s
2 o.
•o o 3 •o
c e 2
« 60
'U 6 .S
fe
o lx o.
0>
^ **-. O s-^
3
o c E co o
e 8 r- i i_i at
o. o S
O j *
5 "—s t/J a> S 2 o. 3 "C CQ
O c
1 CQ m V
ra e
•o o 3 •o •o c ra ra C
S 2 "ra 'S S (J
e tfcH O
ö c <U
C o V
z <i % a 01
•5 •o e ra -̂•o c ra
vt
*-* C
E •c
X O
I m O
O
O
O v t s > û N O \ i n N i n H c û P i ^ N o q n o \ N
» N » * » » * W H n e 0 1 0 < ! O r H i p r ; d d r i i n i n i - i ^ o i d K i n i s M ^ u i r i r i
O N O B S O i M O N n N n O i n N O Ï I N H ( o q r | N O \ M N O M O r H i n c o n s d r J i - î \ d » û r J N o i d K i r t N n p i o r i n
O O O r - i T f l O O ^ O ^ O O r - t K ^ K i - i c O ^ O O C S
» N N N O O N ^ ; » O v u j * q * c O i O q d o ^ H i n t o d ^ - d f l ó ^ o u ï o d n ^ - i r t r i - *
N O N O l t N N r i n n u ) O v t r l » N O v d d t H u i i n d i n o i o i N i n c Ó M ^ ^ - p i p )
voeoovf-j[N;ov[Ss(*5'^;vû^pc>jsqer>ooin O H H ^ u î d N O Î d K i n N n n N N n
> O N T H q * c o N r j r t n ^ q o ; i û N c o d o ^ H i n i o o l t s O v d t s ^ t s N n ^ ^ û r i
c o n o c o c O H C o i n O N ^ o i n S H H N ^ q O ' û q i o i r t n r H C û p i u i N ^ n ' û t ' v d O H i r t O d p ) N 0 i > û i n N N r i ^ r i r t
i - i c o w i - » r * » e j * c > ^ i n ^ ' 0 0 * f * o i n o c s r l d w i n u i r i ^ o i d t s ü i t s M ^ - i / i N n
d H c s ^ i r t O N O v d K i n C N n C T O n c ï
óeór -J ' f i r iovÓeör - i tV '^vd ' - tcö '^oocs
H O P i o o ( n N S H u n o « o n N H O * o v c q i O N O N N o o q o v ^ n i - i ' i r i o i n » ÖOvt-iinxdÖ-^-ÓOsvOi/icdeo-ïJ-uSfnco
coc>)p*ûcqvqcot-; 'OcsvqT^cq*qcqinrv d d N i n u i d u i o v o î t s i n c Ô p i ^ - ^ - N P î
\qvqpcqTr\qr* :^vqt^ : '^CNicnt^.o;oqvq d r H N t / i i r i d « o I d N i r t K n n * û M p i
i n f l | * N q \ q i N n i ) ; i ; » « ) H O ; ^ ï r t
eS
co ó •o-
es es es
es
es
es e>
R S - « 2 (J < S H ( / l O O . O < > = j S - Q .
3 ** 5-15 z <: S! Q
8 1
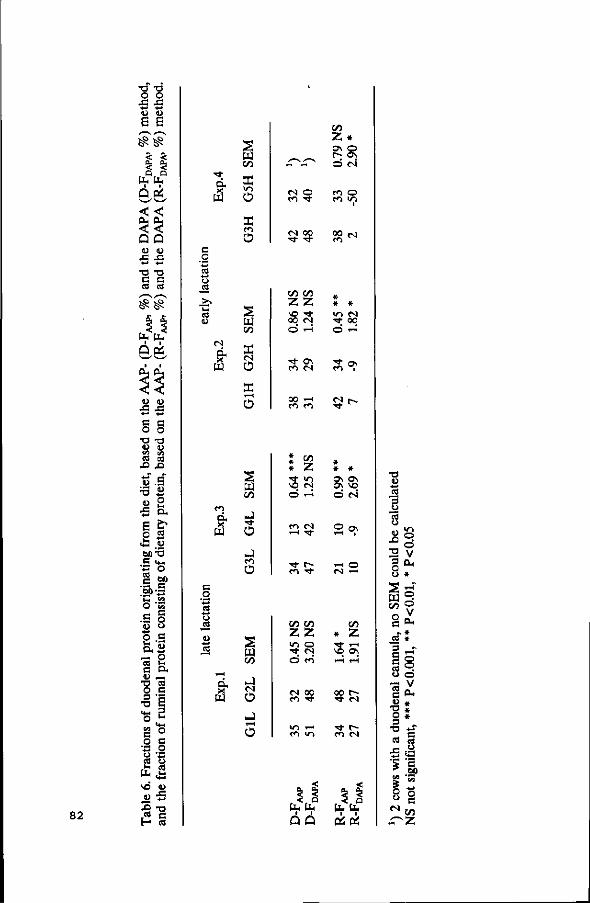
o o
e e ^ ^
<: < 5| Si o o
P-, PL, Q tf
< <
u <u
•O T3 e c es ca
ÏSÏ£
82
u 4 3
• * - •
c o
T3 <U CA CB
. O
•3
4 3
a o t l
u 4 3 • • -»
a o
•o u EA CS X
g 'S •* -» o WH O ,
e* CS -4-»
u BOX) .g +-• CS
g '§) 'C o c '53 • * - •
o
i
CS a <u •o o 3
T3 <+4 O
c _o • « - •
o CS u Pu v© U
X) CS
H
f*-4 O
60
_g _c« 'w a o o .g 'S •* -» o t . cx ^̂ CS B
e t-4
«4-H O
S
o 4 - J
o CS <c cu
4 3
•o c CS
I
s C/2
DC
PC Ü
• ^
«s m
tN •«*•
£~*
O
-*
00
C/5
Z 0 \ r~-ö
f«-> c>
00 Cl
* o o CN
O
tN
O
CS
o CS
> • t-H
es u
tN
w
s p-l C/5
DC tN O
DC i -H
Ü
w C/5
Ü
co Ü
C/5 1/5
z z 00 tN Ö r-i
en tN
00 i-H
I C/5 5 Z • * »O *0 tN Ö »-5
a o M O
JSÇj
u CS
T — 1
1
s W C/5
tN
O
O
C/5 C/5
z z m o t ^ Ö ró
CN 00
»O H co >n
• * 00
en i
3 ^
C3\ ON
Ö tN
2 <*
1-H O t N ^H
C/5
* z S OS
00 r-•*t fN
O tN
i l sä Q Q CCP6
T3
3 o
<L> 42
3 O O
o ö V
OH
c/5 o G
es" 's e e CS O
V
* * * •4-T
S
3 en '5 00
^ c/5 ^ Z
proportionally higher for feeds high in cell walls and lower for
higher protein feeds (Varvikko & Lindberg, 1985; Varvikko, 1986).
After correcting for this microbial protein, the t1 decreases and
the degradation pattern of the protein changes. For different
feeds, N-disappearance from the nylon bags as well as
DM-disappearance was in all cases lower if not corrected for
microbial contamination. Because of microbial contamination, a
lag time was particularly observed for the high roughage diets
in these experiments. It may be assumed that in the course of
degradation, not only the feed protein but also microbial protein
dissappears from the nylon bag, resulting in a too fast decline
of protein in the bags. Thus, if the kd-CP is calculated using a
model without a lag-time, the kd will be less biassed due to
microbial contamination.
Disappearance rate from the nylon bags of DM and cell wall
components was negatively related to the cell wall content of the
silages (Bosch et al., submitted8). A decrease in kd for the cell
wall fraction makes the protein, which is in the cell content or
associated with the cell walls, less accessible for the bacteria.
As a result, the kd-CP is, though not significantly, decreasing
with cell wall content of the silages.
The fs-CP seems to increase with cell wall content, except for
silage G3, which had an even lower fs-CP than silage Gl. Tamminga
et al. (1990) showed, that the fs-CP of grass silages was best
described by a regression equation with DM content of the silage
and number of days elapsed since May 1st at harvesting. Both
factors had a negative effect on fs-CP. For the silages used in
our experiments, this regression equation predicted the lowest
fs-CP for silage G3, which agrees with our observations.
It is often assumed that the fs is rapidly and fully degraded
in the rumen. The fs is likely to have a high degradation rate,
but also a higher outflow rate from the rumen. Therefore it does
not seem correct to assume a 100% degradation of fs in the rumen.
This underestimation is considered to compensate the slight
overestimation which may result from microbial contamination. It
is, however, not possible to give a precise estimate of the
fraction of fs that is escaping rumen fermentation.
83
According to Bosch et al. ( submitted0) , the k increases with an
increase in cell wall content of the silage. As shown in Table
4, the differences in fE between silages will be bigger when
passage rate is higher for the high cell wall diets than for the
low cell wall diets. The higher fE for the high cell wall diets
mainly consists of rumen undegradable protein. The rumen
undegradable protein fraction is also undegradable in the small
intestines (Tamminga etal., 1990), and therefore not available for
the animal. The fraction of dietary protein escaping rumen
fermentation and digestible in the small intestine is thus higher
for the low cell wall diets.
The DAPA-N/N ratio in total rumen contents was in most cases
higher than the DAPA-N/N ratio in bacteria isolated from the
rumen fluid. According to McAllan and Smith (1983) , the DAPA-N
content of mixed rumen bacteria is rather constant. In our
experiments however, DAPA-N content in bacteria isolated from the
rumen fluid, varies from approximately 16 /imol/g to 23 /imol/g.
In duodenal samples, the DAPA-N/N ratio was lower than in the
isolated rumen bacteria, resulting in positive fractions of the
protein originating from the feed. A larger fraction of duodenal
microbial protein, in comparison with total rumen microbial
protein, seems to originate from bacteria normally present in
rumen fluid. A smaller fraction then comes from bacteria attached
to the feed particles, which seem to have a higher DAPA-N/N
ratio. Hence, using DAPA as a marker for microbial protein does
not seem to give very reliable results.
The amino acid composition of bacterial cell wall is close to the
amino acid composition of bacterial cell content, with the
exception of DAPA, which is only in the cell wall fraction
(Hoogenraad & Hird, 1970). Probably the bacteria in the rumen
fluid have a lower cell wall fraction than the bacteria attached
to the feed particles.
The amino acid composition of the undegraded feed protein can
differ considerably from the amino acid composition of the
original feed protein (Varvikko, 1986; Susmel etal., 1989). The
AAP of mixed rumen bacteria, however, is very constant and is not
really affected by the dietary amino acid profile (Storm &
84
prskov, 1983). Differences between the dietary AAP and the AAP
of undegraded feed protein probably interfere with the AAP-method
to estimate the fraction of duodenal protein consisting of
dietary protein.
According to van Soest (1982), the amount of amino acid
nitrogen absorbed in the intestines exceeds the dietary intake
of nitrogen below about 12.5% CP in the diet. The amount of N
entering the duodenum on cell wall rich diets (G4) can be
considerably higher than the N-intake, whereas on protein rich
diets, great losses of N in the rumen occur. A high fraction of
dietary protein escaping rumen fermentation on diets low in
protein, still results in a low absolute dietary-N flow to the
duodenum. When the N-flow to the duodenum exceeds N-intake, the
fraction of duodenal protein originating from the diet will be
lower than fE.
In general, despite the higher fE-values for the high cell wall
silages, the fraction of duodenal protein originating from the
diet is bound to decrease with cell wall content. An increase in
fE with cell wall content, still results in a low dietary protein
content in the duodenum, which consists for a higher proportion
of indigestible protein.
References.
Bosch, M.W., S. Tamminga and G. Post, submitted8. Influence of stage of maturity of grass silages on digestion processes in dairy cows. 1. Composition, nylon bag degradation rates, digestibility and intake, [see Chapter II, this thesis]
Bosch, M.W., S.C.W. Lammers-Wienhoven, G.A. Bangma and H. Boer, submitted6. Influence of stage of maturity of grass silages on digestion processes in dairy cows. 2. Rumen contents and ruminai passage rates, [see Chapter III, this thesis]
Hoogenraad, N.J. and F.J.R. Hird, 1970. The chemical composition of rumen bacteria and cell walls from rumen bacteria. Br.J.Nutr. 24:119-127.
McAllan, A.B. and R.H. Smith, 1983. Estimation of flows of organic matter and nitrogen components in postruminal
85
digesta and effects of level of dietary intake and physical form of protein supplement on such estimates. BrJ.Nutr.49:119-127.
Mehrez, A.Z. and E.R. 0rskov, 1977. A study of the artificial fibre bag technique for determining the digestibility of feeds in the rumen. J.Agric.Sci. 88:645-650.
Meyer, R.M., E.E. Bartley, C.W. Deyoe and V.F. Colenbrander, 1967. Feed processing. 1. Ration effects on rumen microbial protein synthesis and amino acid composition. J.Dairy Sei. 50:1327-1331.
Moore, S., 1963. On the determination of cystin as cysteic acid. J.Biol.Chem. 238:235-237.
Nocek, J.E. and A.L. Grant, 1987. Characterization of in situ nitrogen and fiber digestion and bacterial nitrogen contamination of hay crop forages preserved at different dry matter percentages. J.Anim.Sci. 64:552-564.
SPSS Inc., 1988. SPSS/PC+ Base manual. SPSS Inc., Chicago. Illinois.
Storm, E. and E.R. prskov, 1983. The nutritive value of rumen micro-organisms in ruminants. 1. Large-scale isolation and chemical composition of rumen micro-organisms. Br.J.nutr. 50:463-470.
Susmel, P., B. Stefanon, C.R. Mills and M. Candido, 1989. Change in amino acid composition of different protein sources after rumen incubation. Anim.Prod. 49:375-383.
Tamminga, S., R. Ketelaar and A.M. van Vuuren, 1990. Degradation of N in conserved forages in the rumen of dairy cows. Grass and Forage Sei., in press.
Van Bruchem, J., S.M.G. Rouwers, G.A. Bangma, S.C.W. Lammers-Wienhoven and P.W.M. van Adrichem, 1985. Digestion of proteins of varying degradability in sheep. 2. Amount and composition of the protein entering the small intestine. Neth.J.Agric.Sci. 33:273-284.
Van Soest, P.J., 1982. Nutritional ecology of the ruminant. O&B Books Inc., Corvallis, OR.
Van Vuuren, A.M. and J.A.C. Meijs, 1987. Effects of herbage composition and supplement feeding on the excretion of nitrogen in dung and urine by grazing dairy cows. ImAnimal Manure on Grassland and Fodder Crops. H.G. van der Meer et al. (eds), Martinus Nijhoff Publishers, Dordrecht, the Netherlands.
Varvikko, T. and J.E. Lindberg, 1985. Estimation of microbial nitrogen in nylon-bag residues by feed 15N dilution. BrJ.Nutr. 54:473-481.
86
Varvikko, T., 1986. Microbially corrected amino acid composition of rumen-undegraded feed protein and amino acid degradability in the rumen of feeds enclosed in nylon bags. BrJ.Nutr. 56:131-140.
87
Chapter VI
Ruminai passage rate as affected by Cr-NDF particle size.
M. Bruining1 and M.W. Bosch1,2.
1 Department of Animal Nutrition, Agricultural University,
Haagsteeg 4, NL 6708 PM Wageningen. 2 Department of Human and Animal Physiology, Agricultural
University, Haarweg 10, NL 6709 PJ Wageningen.
submitted for publication
89
Abstract.
Fractional rumen passage rates of three particle sizes CrNDF
(<0.3 mm, 0.6-1.0 mm and 15-25 mm) and of CoEDTA were
estimated in an experiment with three lactating and three non-
lactating rumen fistulated cows, fed grass silage ad lib and 7
and 1 kg of concentrates, respectively. Total feed intake was
higher for the lactating cows, but silage intake did not
differ significantly.
Fractional passage rates of CrNDF and CoEDTA were derived
from the descending parts of the faecal excretion curves and
from CoEDTA measured directly in the rumen fluid, following a
pulse dose into the rumen. The faecal excretion curves of the
15-25 mm CrNDF particles showed no decline until the last
sampling time at 86 h after dosage, so fractional passage
rates of these particles could not be determined. Fractional
passage rates did not differ significantly between lactating
and non-lactating cows and were on average 2.0, 4.1, 8.6 and
14.9 %h"1 for CrNDF (0.6-1.0 mm), CrNDF (<0.3 mm), CoEDTA-
faeces and CoEDTA-rumen, respectively.
The results of this experiment indicate that particle size of
the CrNDF marker has a great influence on the determined
passage rates.
Introduction.
Nutrient supply in ruminants is for a considerable part
determined by reticulorumen contents and clearance rate of the
ingested feed.
Reticulorumen contents depend among others on the animal's
physiological demands for energy and the chemical and physical
characteristics of the feed. Values for cattle range from 10
to 20 % of body weight (Owens & Goetsch, 1988; Van Soest,
1982). Reticulorumen contents can be subdivided in a liquid
and a particulate phase. The liquid phase partly contains
particles and nutrients which behave like liquid and is partly
90
bound to particles. The particulate phase consists of
particles which are able, and of particles which are as yet
not able to leave the reticulorumen (Owens & Goetsch, 1986).
The limits between the different particle pools depend on
particle size, particle shape and functional specific gravity
(Kennedy & Murphy, 1988). When particle size is considered,
particles smaller than 0.15 mm are expected to behave like
liquid (Faichney, 1986). Particles passing a sieve with 1.18
mm pore size are believed to have a relatively high
probability to leave the reticulorumen; on the other hand
particles retained on this sieve have a low probability to
leave and hence need further physical size reduction before
they can leave (Poppi etal., 1980; Kennedy & Poppi, 1984).
Clearance rate of the ingested feed from the reticulorumen
is the result of microbial degradation and of passage to the
omasum. The extent of microbial degradation within the
reticulorumen depends, in addition to the chemical and
physical feed characteristics, on the retention time of the
feed in this compartment (Van Soest, 1982) . Passage rate is
inversely related to rumen retention time and depends amongst
others on feed intake, chemical composition of the feed,
particle size, functional specific gravity and site of
sampling. Passage rate increases with a higher feed intake
level and decreases with high concentrate levels in the diet
(Colucci et al., 1984; Owens & Goetsch, 1986). Particle size
influences passage rate by the increased probability of
smaller particles to leave the reticulorumen (Kennedy & Poppi,
1984) . A higher functional specific gravity results in an
increased probability to escape from the reticulorumen
(Sutherland, 1987). Welch (1986) observed maximal passage
rates of plastic particles with a specific gravity of 1.17 to
1.42. The site of sampling results in higher estimated passage
rates by ruminai sampling compared with faecal sampling
(Snijder etal., 1984; Bosch & Bruining, submitted).
Passage rates of the particulate (kp) and the liquid (kt)
phases can be estimated with the external markers CrNDF and
CoEDTA, respectively. The objective of this investigation was
91
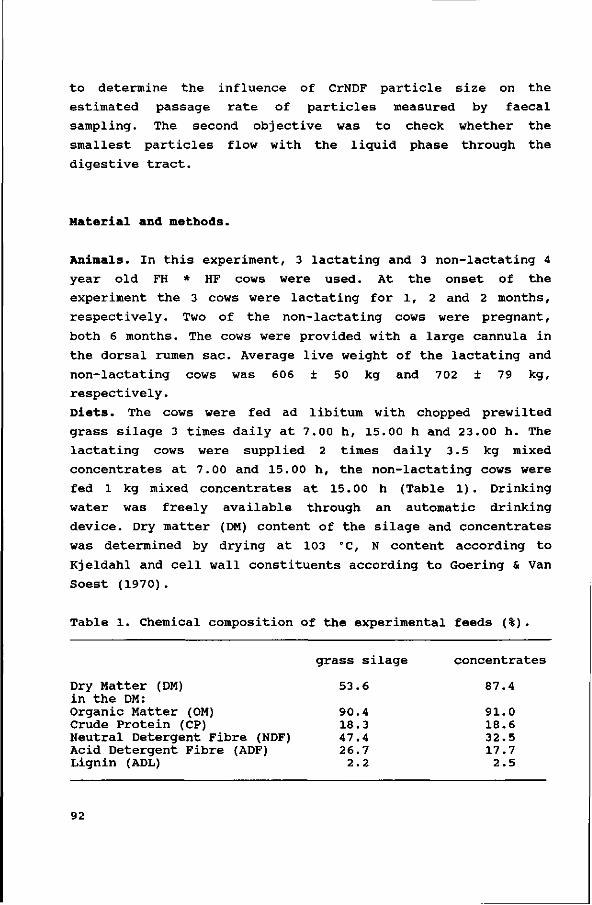
to determine the influence of CrNDF particle size on the
estimated passage rate of particles measured by faecal
sampling. The second objective was to check whether the
smallest particles flow with the liquid phase through the
digestive tract.
Material and methods.
Animals. In this experiment, 3 lactating and 3 non-lactating 4
year old FH * HF cows were used. At the onset of the
experiment the 3 cows were lactating for 1, 2 and 2 months,
respectively. Two of the non-lactating cows were pregnant,
both 6 months. The cows were provided with a large cannula in
the dorsal rumen sac. Average live weight of the lactating and
non-lactating cows was 606 ± 50 kg and 702 ± 79 kg,
respectively.
Diets. The cows were fed ad libitum with chopped prewilted
grass silage 3 times daily at 7.00 h, 15.00 h and 23.00 h. The
lactating cows were supplied 2 times daily 3.5 kg mixed
concentrates at 7.00 and 15.00 h, the non-lactating cows were
fed 1 kg mixed concentrates at 15.00 h (Table 1). Drinking
water was freely available through an automatic drinking
device. Dry matter (DM) content of the silage and concentrates
was determined by drying at 103 'C, N content according to
Kjeldahl and cell wall constituents according to Goering & Van
Soest (1970).
Table 1. Chemical composition of the experimental feeds (%).
grass silage concentrates
Dry Matter (DM) 53.6 87.4 in the DM: Organic Matter (OM) 90.4 91.0 Crude Protein (CP) 18.3 18.6 Neutral Detergent Fibre (NDF) 47.4 32.5 Acid Detergent Fibre (ADF) 26.7 17.7 Lignin (ADL) 2.2 2.5
92
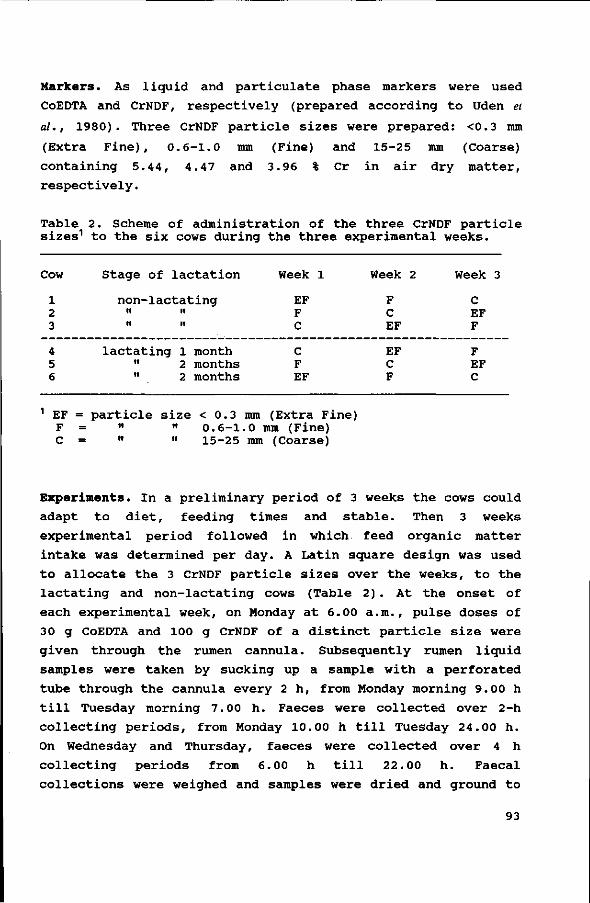
Markers. As liquid and particulate phase markers were used
CoEDTA and CrNDF, respectively (prepared according to Uden et
al., 1980). Three CrNDF particle sizes were prepared: <0.3 mm
(Extra Fine), 0.6-1.0 mm (Fine) and 15-25 mm (Coarse)
containing 5.44, 4.47 and 3.96 % Cr in air dry matter,
respectively.
Table 2. Scheme of administration of the three CrNDF particle sizes1 to the six cows during the three experimental weeks.
Cow Stage of lactation Week 1 Week 2 Week 3
1 non-lactating EF F C 2 M H F C EF 3 ii H C EF F
4 lactating 1 month C EF F 5 " 2 months F C EF 6 " 2 months EF F C
1 EF = particle size < 0.3 mm (Extra Fine) F = " " 0.6-1.0 mm (Fine) C = " " 15-25 mm (Coarse)
Experiments. In a preliminary period of 3 weeks the cows could
adapt to diet, feeding times and stable. Then 3 weeks
experimental period followed in which feed organic matter
intake was determined per day. A Latin square design was used
to allocate the 3 CrNDF particle sizes over the weeks, to the
lactating and non-lactating cows (Table 2) . At the onset of
each experimental week, on Monday at 6.00 a.m., pulse doses of
30 g CoEDTA and 100 g CrNDF of a distinct particle size were
given through the rumen cannula. Subsequently rumen liquid
samples were taken by sucking up a sample with a perforated
tube through the cannula every 2 h, from Monday morning 9.00 h
till Tuesday morning 7.00 h. Faeces were collected over 2-h
collecting periods, from Monday 10.00 h till Tuesday 24.00 h.
On Wednesday and Thursday, faeces were collected over 4 h
collecting periods from 6.00 h till 22.00 h. Faecal
collections were weighed and samples were dried and ground to
93
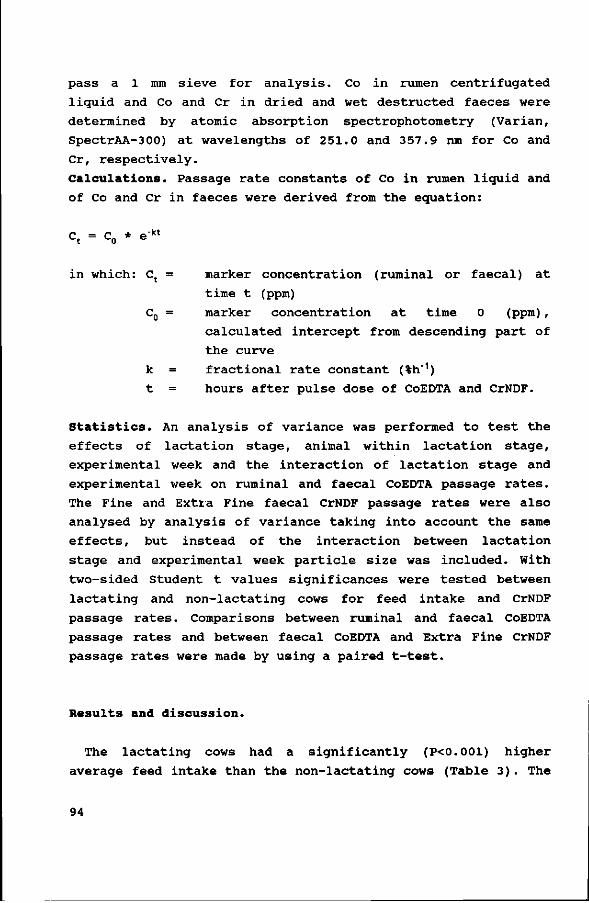
pass a 1 mm sieve for analysis. Co in rumen centrifugated
liquid and Co and Cr in dried and wet destructed faeces were
determined by atomic absorption spectrophotometry (Varian,
SpectrAA-300) at wavelengths of 251.0 and 357.9 nm for Co and
Cr, respectively.
Calculations. Passage rate constants of Co in rumen liquid and
of Co and Cr in faeces were derived from the equation:
Ct = C„ * e"kt
in which: Ct = marker concentration (ruminai or faecal) at
time t (ppm)
C0 = marker concentration at time 0 (ppm) ,
calculated intercept from descending part of
the curve
k = fractional rate constant (%h"1)
t = hours after pulse dose of CoEDTA and CrNDF.
Statistics. An analysis of variance was performed to test the
effects of lactation stage, animal within lactation stage,
experimental week and the interaction of lactation stage and
experimental week on ruminai and faecal CoEDTA passage rates.
The Fine and Extra Fine faecal CrNDF passage rates were also
analysed by analysis of variance taking into account the same
effects, but instead of the interaction between lactation
stage and experimental week particle size was included. With
two-sided Student t values significances were tested between
lactating and non-lactating cows for feed intake and CrNDF
passage rates. Comparisons between ruminai and faecal CoEDTA
passage rates and between faecal CoEDTA and Extra Fine CrNDF
passage rates were made by using a paired t-test.
Results and discussion.
The lactating cows had a significantly (P<0.001) higher
average feed intake than the non-lactating cows (Table 3). The
94
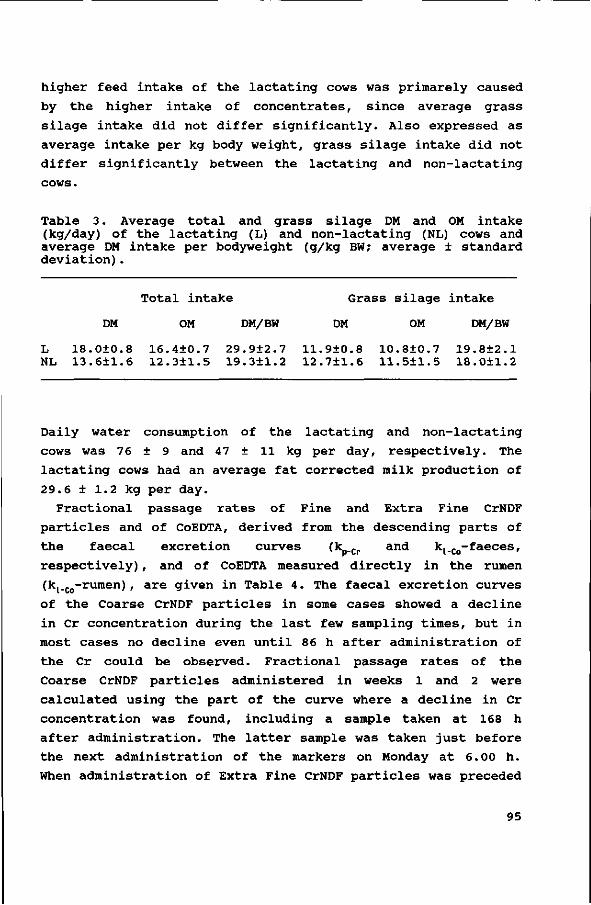
higher feed intake of the lactating cows was primarely caused
by the higher intake of concentrates, since average grass
silage intake did not differ significantly. Also expressed as
average intake per kg body weight, grass silage intake did not
differ significantly between the lactating and non-lactating
Table 3. Average total and grass silage DM and OM intake (kg/day) of the lactating (L) and non-lactating (NL) cows and average DM intake per bodyweight (g/kg BW; average ± standard deviation).
Total intake Grass silage intake
DM OM DM/BW DM OM DM/BW
L NL
18 13
0±0 6±1
8 6
16 12
4 + 0 3±1
7 5
29 19
9±2 3 + 1
7 2
11 12
9+0 7±1
8 6
10 11
8±0 5±1
7 5
19 18
8±2 0±1
1 2
Daily water consumption of the lactating and non-lactating
cows was 76 ± 9 and 47 ± 11 kg per day, respectively. The
lactating cows had an average fat corrected milk production of
29.6 ± 1.2 kg per day.
Fractional passage rates of Fine and Extra Fine CrNDF
particles and of CoEDTA, derived from the descending parts of
the faecal excretion curves (kp-cr a n d ki-co-faeces'
respectively), and of CoEDTA measured directly in the rumen
(kj.,.-rumen), are given in Table 4. The faecal excretion curves
of the Coarse CrNDF particles in some cases showed a decline
in Cr concentration during the last few sampling times, but in
most cases no decline even until 86 h after administration of
the Cr could be observed. Fractional passage rates of the
Coarse CrNDF particles administered in weeks 1 and 2 were
calculated using the part of the curve where a decline in Cr
concentration was found, including a sample taken at 168 h
after administration. The latter sample was taken just before
the next administration of the markers on Monday at 6.00 h.
When administration of Extra Fine CrNDF particles was preceded
95
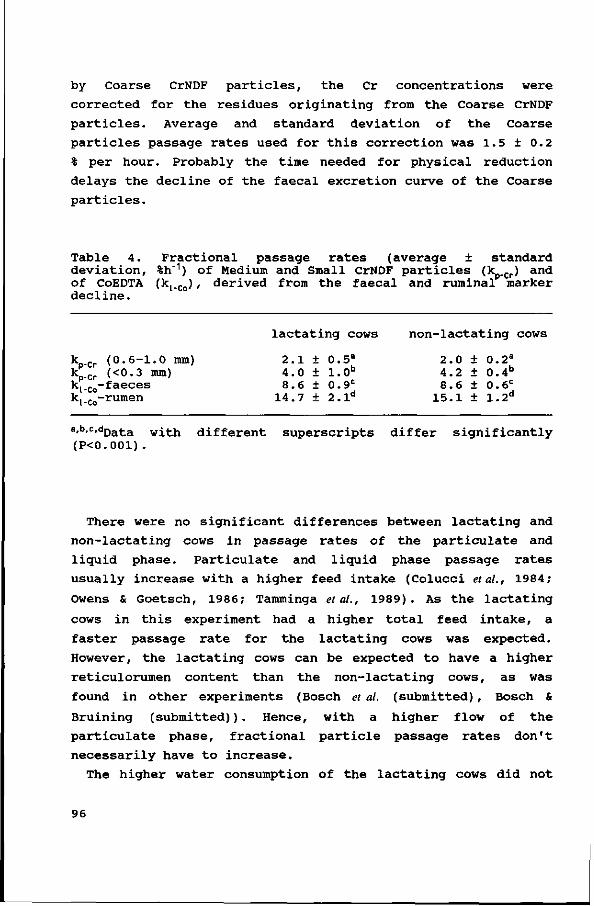
by Coarse CrNDF particles, the Cr concentrations were
corrected for the residues originating from the Coarse CrNDF
particles. Average and standard deviation of the Coarse
particles passage rates used for this correction was 1.5 ± 0.2
% per hour. Probably the time needed for physical reduction
delays the decline of the faecal excretion curve of the Coarse
particles.
Table 4. Fractional passage rates (average ± standard deviation, %h~1) of Medium and Small CrNDF particles (k Cr) and of CoEDTA (k̂ c,,) i derived from the faecal and ruminai marker decline.
k Cr ( 0 . 6 - 1 . 0 mm) k
P-cr ( < 0 - 3 """J k i - c o - f a e c e s
l a c t a t i n g cows n o n - l a c t a t i n g cows
2 . 1 ± 0 . 5 a 2 . 0 ± 0 . 2 a
4 . 0 ± 1 . 0 b 4 . 2 ± 0 . ' Kp-Cr ( < U - J I™1) 4 . 0 ± 1 . 0 - 4 . ^ Z 0 . 4 ~ k ^ . C o - f a e c e s 8 . 6 ± 0 . 9 C 8 . 6 ± 0 . 6 C
k, r„-rumen 1 4 . 7 ± 2 . l d 1 5 . 1 ± 1 .2 d ^ i - co - 1 " 1 1 1 1 1 6 1 1
a,b,c,dData with different superscripts differ significantly (P<0.001).
There were no significant differences between lactating and
non-lactating cows in passage rates of the particulate and
liquid phase. Particulate and liquid phase passage rates
usually increase with a higher feed intake (Colucci et al., 1984;
Owens & Goetsch, 1986; Tamminga etal., 1989). As the lactating
cows in this experiment had a higher total feed intake, a
faster passage rate for the lactating cows was expected.
However, the lactating cows can be expected to have a higher
reticulorumen content than the non-lactating cows, as was
found in other experiments (Bosch et al. (submitted) , Bosch &
Bruining (submitted)). Hence, with a higher flow of the
particulate phase, fractional particle passage rates don't
necessarily have to increase.
The higher water consumption of the lactating cows did not
96
result in faster particulate or liquid passage rates. This
agrees with results of Harrison et al. (1975) . They found in
sheep no significant effect of water infusions into the rumen
on the proportion of rumen volume leaving the rumen per unit
of time. In this experiment, rumen liquid volume was
calculated as the amount of Co administered in the rumen
divided by the Co concentration at time zero established by
regression analysis. Although fractional liquid passage rates
were the same, because the lactating cows had a greater rumen
liquid volume than the non-lactating cows (86 ± 11 versus 75 ±
17 kg) the flow of liquid was higher for the lactating cows.
Analysis of variance of the CrNDF and CoEDTA passage rates
showed significant between animal within stage of lactation
effects (/><(). 05 for CrNDF and P<0.01 for ruminai and faecal
CoEDTA passage rates). Differences between cows within
lactation stage were considerably greater than average
differences between lactating and non-lactating cows. For the
lactating cows there was no relation between milk production
and CrNDF or CoEDTA passage rates.
The kl.Co-rumen was significantly higher (/><0.001) than the
kj.,.,,-faeces. This agrees with other observations (Bosch &
Bruining (submitted)). The postruminal delay is possibly due
to mixing and flow resistance in omasum, abomasum and gut.
Passage rate of the Extra Fine CrNDF particles was
significantly lower (/><0.001) than passage rate of the liquid
phase as measured in the faeces. This means that CrNDF
particles <0.3 mm flow more slowly than the liquid through the
gastrointestinal tract. This is in line with findings of
Faichney (1986), who observed that particles passing the
finest sieve (0.15 mm) and expected to behave as solutes, had
a larger retention time than the fluid. The longer retention
time of the Extra Fine CrNDF particles is presumably caused by
sieving effects of the reticuloruminal mass (Sutherland,
1987) . It is not likely that the longer retention time was
caused by more flow resistance of the Extra Fine particles
compared to the liquid phase in the digestive tract after the
rumen, because other observations (Bosch & Bruining
97
(submitted)) showed a greater proportional decline between
ruminai and faecal passage rates for ^•l.Co than for k Cr.
Passage rate of CrNDF particles <0.3 mm was significantly
(P<0.001) higher than passage rate of CrNDF particles 0.6-1.0
mm. According to Kennedy & Poppi (1984), particles which are
able to pass a sieve with a pore size of 1.18 mm, have a high
probability of leaving the rumen of cattle, while bigger
particles have a lower probability. So the Fine and Extra Fine
CrNDF particles both have a high probability to pass. However,
size of reticuloruminal particles alone does not regulate rate
of passage (Martz & Belyea, 1986). In the present experiment,
the difference in passage rate is presumably caused by a
variation in interaction with the reticuloruminal filterbed
matrix. The Fine particles might stay longer in this matrix.
However, according to Welch (1982), specific gravity has a
bigger influence on passage rate of small particles than the
sieving effects of the reticuloruminal mass. In general,
passage rate increases with increasing specific gravity
(Sutherland, 1987). This might be of influence in this
experiment because the Extra Fine CrNDF particles contained
relatively more Cr than the Fine CrNDF particles (5.44 and
4.47 % Cr, respectively). Also Ehle (1984) found that rumen
turnover rate was positively related to chromium concentration
and density of particles.
In the air dry CrNDF material without gas spaces, a specific
gravity of the Fine and Extra Fine particles can be calculated
(1.35-1.45 and 1.36-1.46, respectively) with the by Lange
(1966) mentioned range of 1.3-1.4 for the specific gravity of
cellulose, which is also likely for the hemicelluloses
(Sutherland, 1987) and used here for the specific gravity of
NDF. In the reticulorumen the Extra Fine particles can be
expected to contain less water than the Fine particles,
because the relative enclosed spaces which can be occupied by
liquid, are less for the Extra Fine particles. So, the
specific gravity of the Fine particles is presumably more
decreased by the liquid than of the Extra Fine particles.
These results indicate that, in experiments in which passage
98
rates are determined using CrNDF as a marker, the particle
size of the marker has a great influence on the calculated
passage rates. Perhaps CrNDF is only representative for the
fraction of rumen particles with the same size and density as
the marker. Hence care should be taken that particle
distribution of the marker should be comparable to that of the
particles leaving the reticulorumen.
References.
Bosch, M.W. and M. Bruining, submitted. Passage rate and total clearance rate from the rumen of cows fed grass silages differing in cell wall content, [see Chapter VI, this thesis]
Bosch, M.W., S.C.W. Lammers-Wienhoven, G.A. Bangma and H. Boer, submitted. Influence of stage of maturity of grass silages on digestion processes in dairy cows. 2. Rumen contents and ruminai passage rates, [see Chapter III, this thesis]
Colucci, P.E., G.K. MacLeod, W.L. Grovum and I. McMillan, 1984. Comparative digestion and digesta kinetics in sheep and cattle. Can J. Anim. Sei. 64 (Suppl): 173-174.
Ehle, F.R., 1984. Influence of feed particle density on particulate passage from rumen of Holstein cow. J. Dairy Sei.
67: 693-697.
Faichney, G.J., 1986. The kinetics of particulate matter in the rumen. In: Control of Digestion and Metabolism in Ruminants. L.P. Milligan, W.L. Grovum and A. Dobson (Editors). Prentice-H all, Englewood Cliffs, NJ, pp. 173-195.
Harrison, D.G., D.E. Beever, D.J. Thomson and D.F. Osbourn, 1975. Manipulation of rumen fermentation in sheep by increasing the rate of flow of water from the rumen. J.Agr.
Sei. 85: 93-101.
Kennedy, P.M. and M. R. Murphy, 1988. The nutritional implications of differential passage of particles through the ruminant alimentary tract. Nutrition Research Reviews, I: 189-208.
Kennedy, P.M. and D.P. Poppi, 1984. C r i t i c a l p a r t i c l e s i z e in s h e e p and c a t t l e . I n : Techniques in particle size analysis of feed and digesta in ruminants. P.M. Kennedy (Editor). Canadian Society of Animal Science, occasional publication no. 1, Edmonton.
Lange, N.A. , 1966. Handbook of chemistry . 10th ed . New York: McGraw-Hill Book Company.
Martz, F.A. and R.L. Be lyea , 1986. Role of p a r t i c l e s i z e and
99
f o r age q u a l i t y i n d i g e s t i o n and p a s s age by c a t t l e and s h e e p . J. Dairy Sei. 69: 1996-2008.
Owens, F.N. and A.L. Goe tsch , 1986. D ige s t a p a s s age and m i c r o b i a l p r o t e i n s y n t h e s i s . I n : Control of Digestion and Metabolism in Ruminants. L.P. Milligan, W.L. Grovum and A. Dobson (Editors). Prentice-Hall, Englewood Cliffs, NJ, pp. 196-223.
Owens, F.N. and A.L. Goe t sch , 1988. Ruminai F e rmen t a t i o n . I n : Digestive Physiology and Nutrition. D.C. Church (Editor), pp.145-171.
Poppi , D .P . , B.W. Nor ton , D . J . Minson and R.E. Hendr i cksen , 1980. The v a l i d i t y of t h e c r i t i c a l s i z e t h e o r y f o r p a r t i c l e s l e a v i n g t h e rumen. J. Agr. Sei. 94: 275-280.
S n i j d e r , T . J . , L.D. Mu l l e r , J .A . Rogers and S.M. Abrams, 1984. D ige s t a p a s s age measured by marke r s i n d a i r y cows fed two r a t i o s of co rn s i l a g e : g r a i n w i t h 0 o r 1.2 % sodium b i c a r b o n a t e . J. Dairy Sei. 67: 1953-1964.
S u t h e r l a n d , T.M., 1987. P a r t i c l e s e p a r a t i o n i n t h e f o r e s t o m a c h s o f s h e e p . I n : Aspects of digestive physiology in ruminants. A. Dobson (Editor). Ithaca: Cornell University Press, pp: 43-73.
Tamminga, S . , P .H. Robinson, M. Vogt and H. Boer , 1989. Rumen i n g e s t a k i n e t i c s of c e l l w a l l components i n d a i r y cows. Anim. Feed Sei. Techn. 25: 89-98.
Uden, P . , P .E . Co lucc i and P . J . Van S o e s t , 1980. I n v e s t i g a t i o n of chromium, cer ium and c o b a l t a s marke r s i n d i g e s t a . J. Sei. Food Agric. 31: 625-632.
Van S o e s t , P . J . , 1982. N u t r i t i o n a l e co logy of t h e r um inan t . O&B Books Inc., Corvallis, OR.
Welch, J . G . , 1982. Ruminat ion , p a r t i c l e s i z e and p a s s ag e from t h e rumen. J. Anim. Sei. 54: 885-894.
Welch, J . G . , 1986. P h y s i c a l p a r ame t e r s of f i b e r a f f e c t i n g p a s s a g e from t h e rumen. J. Dairy Sei. 69: 2750-2754.
100
Chapter VII
Passage rate and total clearance rate from the rumen of cows
fed grass silages differing in cell wall content.
M.W. Bosch1,2 and M. Bruining2.
1 Department of Human and Animal Physiology, Agricultural
University, Haarweg 10, NL 6709 PJ Wageningen. 2 Department of Animal Nutrition, Agricultural University,
Haagsteeg 4, NL 6708 PM Wageningen.
submitted for publication
101
Abstract.
Four dry, rumen fistulated cows were fed ad libitum grass
silages (silages G6 and G7) harvested at different growth stages,
resulting in different crude protein (CP) and neutral detergent
fibre (NDF) contents (G6, 21.0 % CP, 44.2% NDF and G7, 15.2 % CP,
51.5 % NDF).
Voluntary intake and rumen contents, total as well as kg
organic matter (OM) were higher for silage G7. Ruminai passage
rate, calculated from the logarithmic decline in Cr-NDF rumen
pool, was higher for silage G7 (3.95%/h and 4.46%/h for silages
G6 and G7, respectively). When ruminai passage rates were
calculated by dividing the intake of indigestible organic matter
(iOM) by the mean rumen pool of this fraction, the same
differences between silages were found, although the level was
much lower (2.58%/h and 3.00%/h for silages G6 and G7,
respectively).
The results from this experiment suggest that disappearance
rate from the rumen of particles with a size between 1.25mm and
0.071mm is the rate limiting step in reduction in rumen fill.
Introduction.
Nutrient supply and as a result production in dairy cows is
influenced by the capacity of the rumen to clear the ingested
feed, either by microbial degradation or by passage to the lower
gut. Rate of microbial degradation in the rumen has been
investigated widely and was shown to be very variable and to
depend on feed component, type of feedstuff, particle size and
pH in the rumen. Much less is known on passage of undegraded feed
particles to the lower gut and its variation. Aspects which are
considered important in this respect are chewing during eating,
rumination, (rate of) particle size reduction, particle size
distribution and extent of degradation and functional specific
gravity (Sutherland, 1987). The probability of feed particles to
escape from the rumen is inversely related to particle size
(Poppi etal., 1980) , but passage rate from the rumen of the finest
102
particles is still lower than of the fluid (Faichney, 1986;
Bruining & Bosch, submitted). Particles with a size above the
critical particle size (CPS), defined by Kennedy & Poppi (1984)
as the sieve aperture retaining the top 5% of faecal particulate
dry matter, have a low probability of leaving the rumen. Not only
(rate of) degradation and (rate of) passage are important for the
total rumen capacity, so is rumen fill. Degradation and passage
are usually expressed as fractional rate constants. For the total
capacity the pool sizes from which such fractional rate constants
are derived may be equally important.
Rate of passage of particles from the rumen is often determined
using Cr-Neutral Detergent Fibre (Cr-NDF) as a marker. Robinson
et al. (1987) and Bosch et al. (1988, submitted3) suggest that the
rate of passage (k , %h"1) , as calculated from the Cr-NDF faecal
excretion curve, is likely to overestimate ruminai passage as a
fraction of total rumen contents. It is not clear for which part
of rumen contents Cr-NDF can be regarded as representative and
if differences between diets can be measured using Cr-NDF.
An experiment with dry cows, fed grass silages differing in
quality because of different growth stages, was conducted.
Objectives of the experiment were: (1) How rumen content is
influenced by silage quality, (2) How kinetics of rumen particles
are influenced by silage quality, (3) To establish if particle
size reduction can act as a limiting factor for total rumen
capacity and (4) Whether Cr-NDF is a reliable marker for
measuring passage rate from the rumen.
Materials and methods.
Two grass silages, from the same field, were harvested at
different growth stages, resulting in different cell wall and
crude protein (CP, N*6.25) contents. The chemical composition of
the two silages is given in Table 1. The silages were fed ad
libitum to four rumen fistulated non-lactating cows in a
change-over design. The cows were offered feed twice a day, at
7.00 and 19.00 h. Left overs were removed at 9.00 and 7.00 h.
103
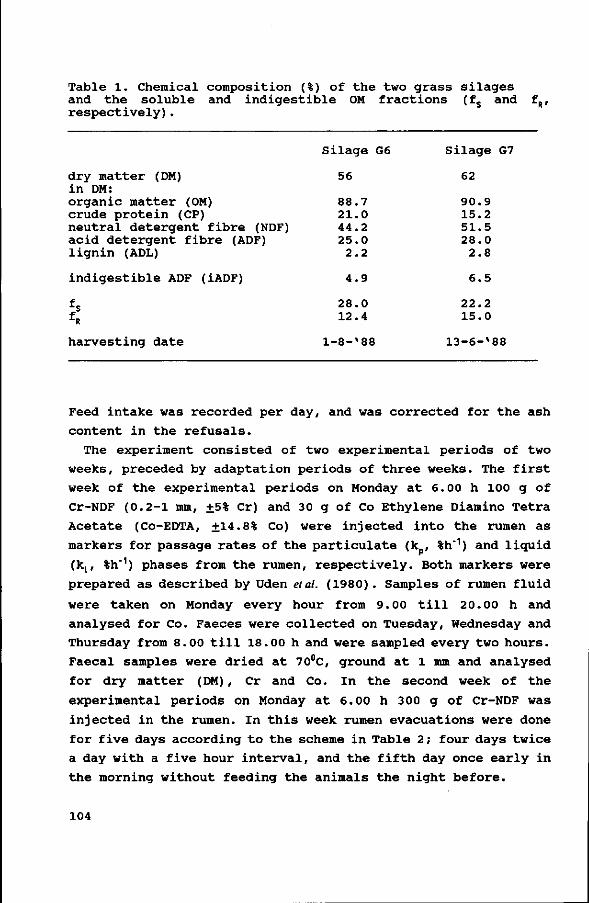
Table 1. Chemical composition (%) of the two grass silages and the soluble and indigestible OM fractions (fs and fR, respectively).
Silage G6 Silage G7
dry matter (DM) 56 62 in DM: organic matter (OM) 88.7 90.9 crude protein (CP) 21.0 15.2 neutral detergent fibre (NDF) 44.2 51.5 acid detergent fibre (ADF) 25.0 28.0 lignin (ADL) 2.2 2.8
indigestible ADF (iADF) 4.9 6.5
fs 28.0 22.2 fR 12.4 15.0
harvesting date l-8-*88 lS-ô-'SS
Feed intake was recorded per day, and was corrected for the ash
content in the refusals.
The experiment consisted of two experimental periods of two
weeks, preceded by adaptation periods of three weeks. The first
week of the experimental periods on Monday at 6.00 h 100 g of
Cr-NDF (0.2-1 mm, +5% Cr) and 30 g of Co Ethylene Diamino Tetra
Acetate (Co-EDTA, +14.8% Co) were injected into the rumen as
markers for passage rates of the particulate (k , %h"1) and liquid
(kt, %h"1) phases from the rumen, respectively. Both markers were
prepared as described by Uden et al. (1980) . Samples of rumen fluid
were taken on Monday every hour from 9.00 till 20.00 h and
analysed for Co. Faeces were collected on Tuesday, Wednesday and
Thursday from 8.00 till 18.00 h and were sampled every two hours.
Faecal samples were dried at 70°C, ground at 1 mm and analysed
for dry matter (DM) , Cr and Co. In the second week of the
experimental periods on Monday at 6.00 h 300 g of Cr-NDF was
injected in the rumen. In this week rumen evacuations were done
for five days according to the scheme in Table 2 ; four days twice
a day with a five hour interval, and the fifth day once early in
the morning without feeding the animals the night before.
104
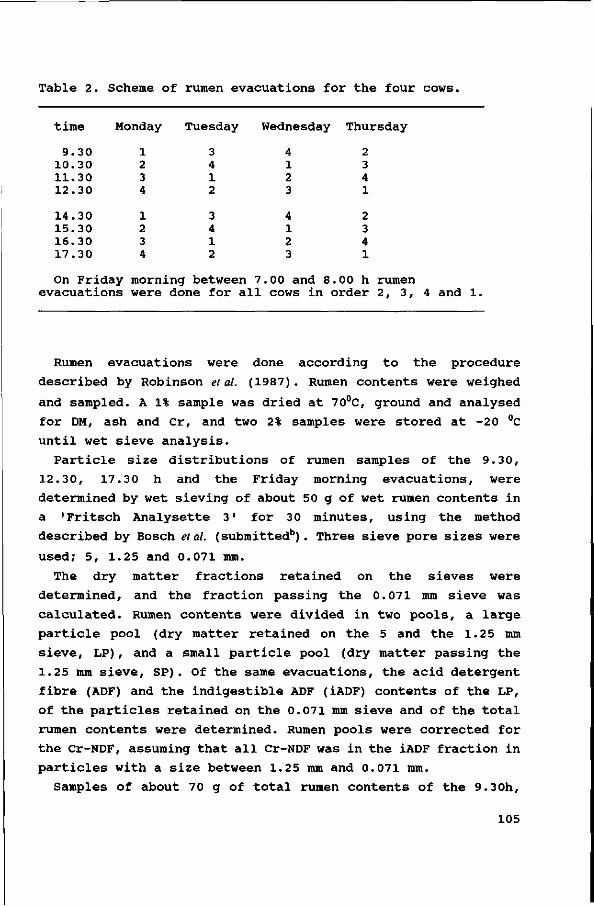
Table 2. Scheine of rumen evacuations for the four cows.
time Monday Tuesday Wednesday Thursday
9 . 3 0 1 0 . 3 0 1 1 . 3 0 1 2 . 3 0
1 4 . 3 0 1 5 . 3 0 1 6 . 3 0 1 7 . 3 0
1 2 3 4
1 2 3 4
3 4 1 2
3 4 1 2
4 1 2 3
4 1 2 3
2 3 4 1
2 3 4 1
On Friday morning between 7.00 and 8.00 h rumen evacuations were done for all cows in order 2, 3, 4 and 1.
Rumen evacuations were done according to the procedure
described by Robinson et al. (1987). Rumen contents were weighed
and sampled. A 1% sample was dried at 70°C, ground and analysed
for DM, ash and Cr, and two 2% samples were stored at -20 °c
until wet sieve analysis.
Particle size distributions of rumen samples of the 9.30,
12.30, 17.30 h and the Friday morning evacuations, were
determined by wet sieving of about 50 g of wet rumen contents in
a 'Fritsch Analysette 3' for 30 minutes, using the method
described by Bosch etal. (submitted6). Three sieve pore sizes were
used; 5, 1.25 and 0.071 mm.
The dry matter fractions retained on the sieves were
determined, and the fraction passing the 0.071 mm sieve was
calculated. Rumen contents were divided in two pools, a large
particle pool (dry matter retained on the 5 and the 1.25 mm
sieve, LP), and a small particle pool (dry matter passing the
1.25 mm sieve, SP). Of the same evacuations, the acid detergent
fibre (ADF) and the indigestible ADF (iADF) contents of the LP,
of the particles retained on the 0.071 mm sieve and of the total
rumen contents were determined. Rumen pools were corrected for
the Cr-NDF, assuming that all Cr-NDF was in the iADF fraction in
particles with a size between 1.25 mm and 0.071 mm.
Samples of about 70 g of total rumen contents of the 9.30h,
105
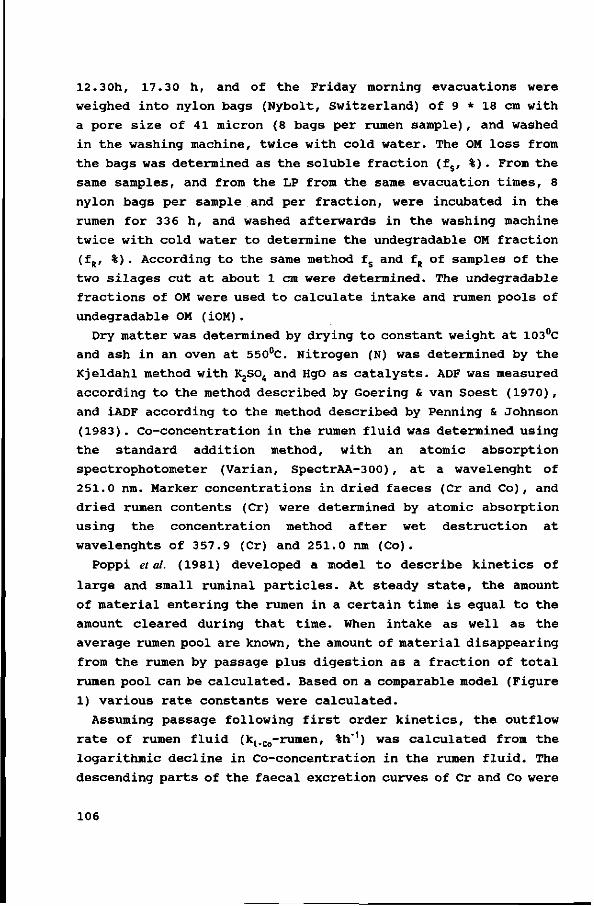
12.30h, 17.30 h, and of the Friday morning evacuations were
weighed into nylon bags (Nybolt, Switzerland) of 9 * 18 cm with
a pore size of 41 micron (8 bags per rumen sample), and washed
in the washing machine, twice with cold water. The OM loss from
the bags was determined as the soluble fraction (fs, %) . From the
same samples, and from the LP from the same evacuation times, 8
nylon bags per sample and per fraction, were incubated in the
rumen for 336 h, and washed afterwards in the washing machine
twice with cold water to determine the undegradable OM fraction
(fR, % ) . According to the same method fs and fR of samples of the
two silages cut at about 1 cm were determined. The undegradable
fractions of OM were used to calculate intake and rumen pools of
undegradable OM (iOM).
Dry matter was determined by drying to constant weight at 103°C
and ash in an oven at 550°C. Nitrogen (N) was determined by the
Kjeldahl method with K2S04 and HgO as catalysts. ADF was measured
according to the method described by Goering & van Soest (1970),
and iADF according to the method described by Penning & Johnson
(1983) . Co-concentration in the rumen fluid was determined using
the standard addition method, with an atomic absorption
spectrophotometer (Varian, SpectrAA-300), at a wavelenght of
251.0 nm. Marker concentrations in dried faeces (Cr and Co), and
dried rumen contents (Cr) were determined by atomic absorption
using the concentration method after wet destruction at
wavelenghts of 357.9 (Cr) and 251.0 nm (Co).
Poppi et al. (1981) developed a model to describe kinetics of
large and small ruminai particles. At steady state, the amount
of material entering the rumen in a certain time is equal to the
amount cleared during that time. When intake as well as the
average rumen pool are known, the amount of material disappearing
from the rumen by passage plus digestion as a fraction of total
rumen pool can be calculated. Based on a comparable model (Figure
1) various rate constants were calculated.
Assuming passage following first order kinetics, the outflow
rate of rumen fluid (kj.^-rumen, %h'1) was calculated from the
logarithmic decline in Co-concentration in the rumen fluid. The
descending parts of the faecal excretion curves of Cr and Co were
106
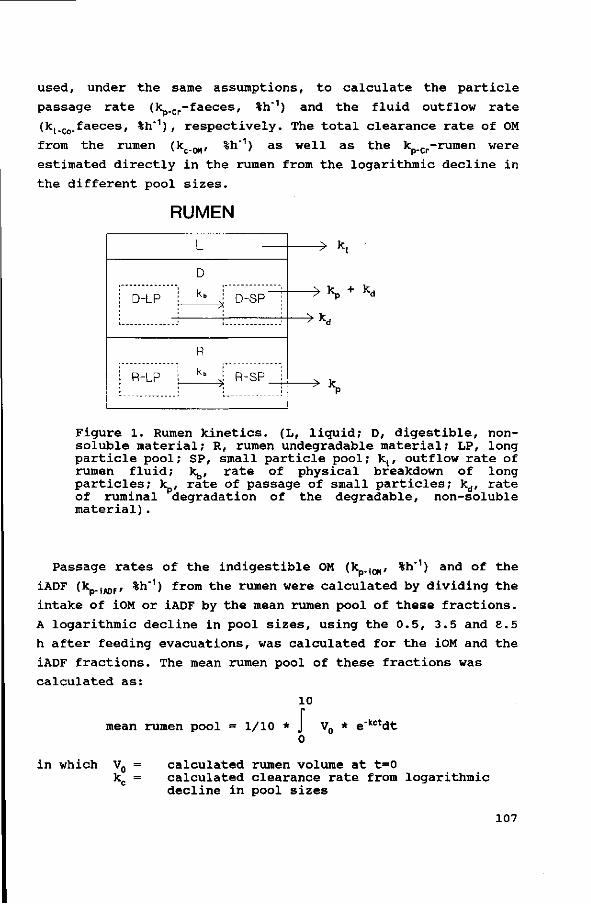
used, under the same assumptions, to calculate the particle
passage rate (k Cr-faeces, %h_1) and the fluid outflow rate
(k^^.faeces, %h"1), respectively. The total clearance rate of OM
from the rumen (k,..,̂ , %h"1) as well as the k Cr-rumen were
estimated directly in the rumen from the logarithmic decline in
the different pool sizes.
RUMEN
D-LP
R-LP
L
D
k„
R
k„
'-
-4,
D-SP :
R-SP :
^ V > K l
N^ y + ^ J / r 'p d
>̂ lr ' Kd
> k p
Figure 1. Rumen kinetics. (L, liquid; D, digestible, non-soluble material; R, rumen undegradable material; LP, long particle pool; SP, small particle pool; kt, outflow rate of rumen fluid; kb, rate of physical breakdown of long particles; k , rate of passage of small particles; kd, rate of ruminai degradation of the degradable, non-soluble material).
Passage rates of the indigestible OM (k i0H, %h'1) and of the
iADF (kp.)A0Ff %h"1) from the rumen were calculated by dividing the
intake of iOM or iADF by the mean rumen pool of these fractions.
A logarithmic decline in pool sizes, using the 0.5, 3.5 and 8.5
h after feeding evacuations, was calculated for the iOM and the
iADF fractions. The mean rumen pool of these fractions was
calculated as:
10
mean rumen poo l = 1/10 * J V0 * e ' k e tdt 0
in which V„ = kc =
calculated rumen volume at t=0 calculated clearance rate from logarithmic decline in pool sizes
107
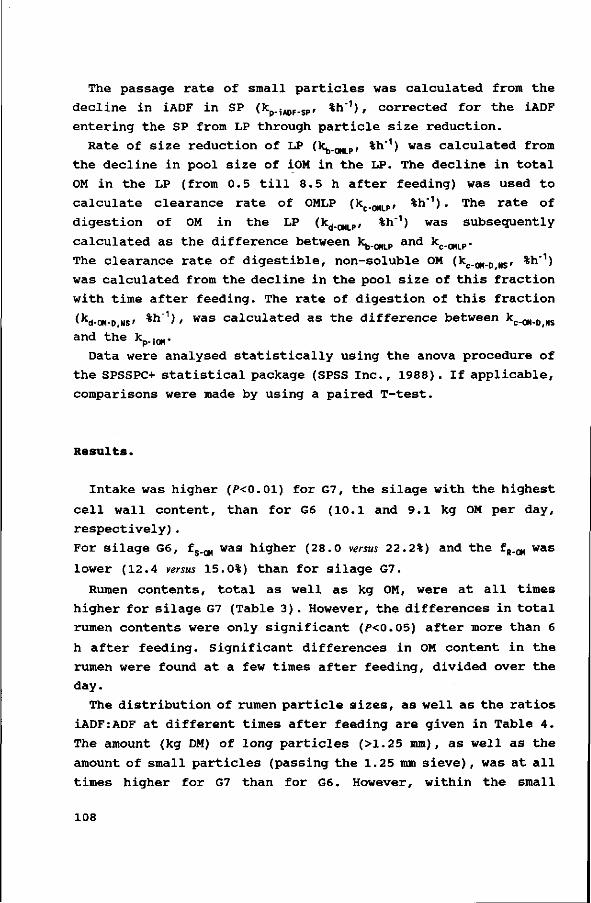
The passage rate of small particles was calculated from the
decline in iADF in SP (k jA0F.SP, %h"1) , corrected for the iADF
entering the SP from LP through particle size reduction.
Rate of size reduction of LP (k^^p, %h"1) was calculated from
the decline in pool size of iOM in the LP. The decline in total
OM in the LP (from 0.5 till 8.5 h after feeding) was used to
calculate clearance rate of OMLP (k^^p, %h_1) . The rate of
digestion of OM in the LP (kd_mLP, %h"1) was subsequently
calculated as the difference between k^^p and \.mLP-
The clearance rate of digestible, non-soluble OM (k̂ .̂p NS< %h"1)
was calculated from the decline in the pool size of this fraction
with time after feeding. The rate of digestion of this fraction
(kd-on-D MS' % n 1) i w a s calculated as the difference between ̂ .^.p NS
and the k ._.. p-10M
Data were analysed statistically using the anova procedure of
the SPSSPC+ statistical package (SPSS Inc., 1988). If applicable,
comparisons were made by using a paired T-test.
Results.
Intake was higher (P<0.01) for G7, the silage with the highest
cell wall content, than for G6 (10.1 and 9.1 kg OM per day,
respectively).
For silage G6, fs.w was higher (28.0 versus 22.2%) and the f,,.̂ was
lower (12.4 versus 15.0%) than for silage G7.
Rumen contents, total as well as kg OM, were at all times
higher for silage G7 (Table 3) . However, the differences in total
rumen contents were only significant (P<0.05) after more than 6
h after feeding. Significant differences in OM content in the
rumen were found at a few times after feeding, divided over the
day.
The distribution of rumen particle sizes, as well as the ratios
iADF:ADF at different times after feeding are given in Table 4.
The amount (kg DM) of long particles (>1.25 mm), as well as the
amount of small particles (passing the 1.25 mm sieve), was at all
times higher for G7 than for G6. However, within the small
108
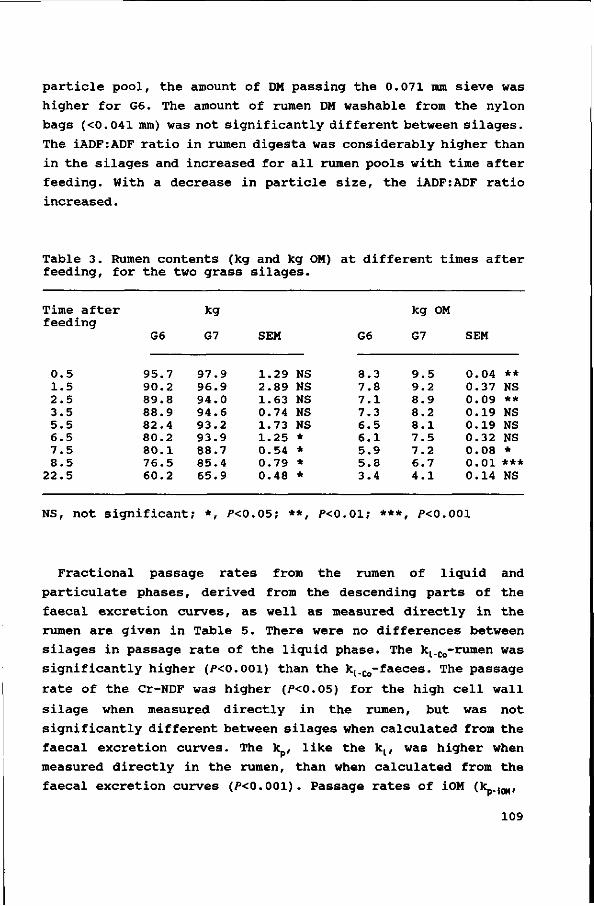
partiele pool, the amount of DM passing the 0.071 mm sieve was
higher for G6. The amount of rumen DM washable from the nylon
bags (<0.041 mm) was not significantly different between silages.
The iADF:ADF ratio in rumen digesta was considerably higher than
in the silages and increased for all rumen pools with time after
feeding. With a decrease in particle size, the iADF:ADF ratio
increased.
Table 3. Rumen contents (kg and kg OM) at different times after feeding, for the two grass silages.
Time after feeding
0.5 1.5 2.5 3.5 5.5 6.5 7.5 8.5
22.5
G6
95.7 90.2 89.8 88.9 82.4 80.2 80.1 76.5 60.2
kg
G7
97.9 96.9 94.0 94.6 93.2 93.9 88.7 85.4 65.9
SEM
1.29 2.89 1.63 0.74 1.73 1.25 0.54 0.79 0.48
NS NS NS NS NS * * * *
G6
8.3 7.8 7.1 7.3 6.5 6.1 5.9 5.8 3.4
kg OM
G7
9.5 9.2 8.9 8.2 8.1 7.5 7.2 6.7 4.1
SEM
0.04 ** 0.37 NS 0.09 ** 0.19 NS 0.19 NS 0.32 NS 0.08 * 0.01 *** 0.14 NS
NS, not significant; *, P<0.05; **, P<0.01; ***, /><0.001
Fractional passage rates from the rumen of liquid and
particulate phases, derived from the descending parts of the
faecal excretion curves, as well as measured directly in the
rumen are given in Table 5. There were no differences between
silages in passage rate of the liquid phase. The k^^-rumen was
significantly higher (f<0.001) than the k^^-faeces. The passage
rate of the Cr-NDF was higher (P<0.05) for the high cell wall
silage when measured directly in the rumen, but was not
significantly different between silages when calculated from the
faecal excretion curves. The k , like the kt, was higher when
measured directly in the rumen, than when calculated from the
faecal excretion curves (P<0.001). Passage rates of iOM (k̂ .j0M,
109
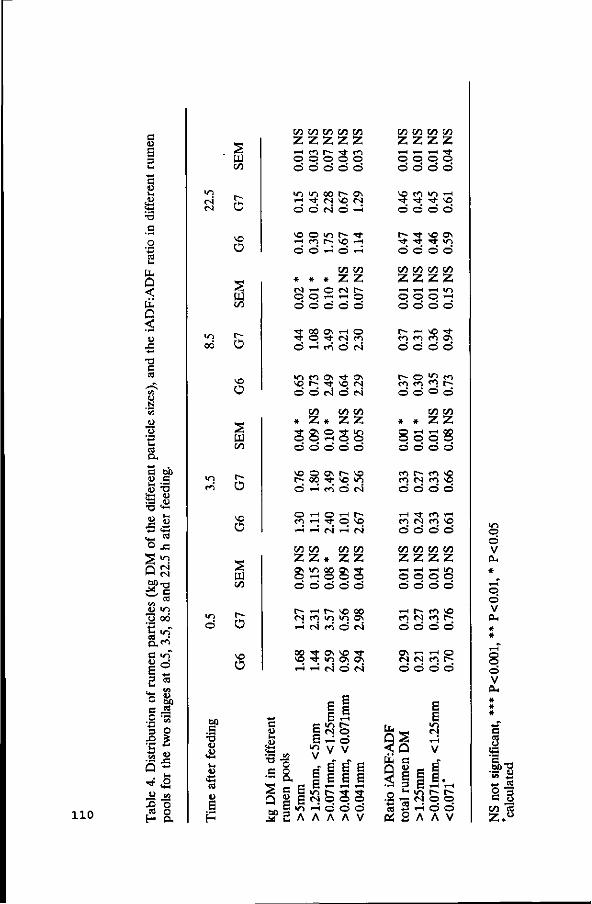
ca ex
60 c •6 u
si <*H w
O J 3
0 0 73
CA
73 00
t u-T
i-•g s
CS c .o
3
•8
110
o
Q ~ •H
'rf.s •2 o
« o
H &
CN f »
VI
oö
en
Ö
60 a
'•3 u
CS
u E p
PJ
en
O
Ü
w co
r-
O
Ü
2 w c/i
Ü
PJ to
r-
Ü
co co co c/3 c/3 z z z z z I -H C l r - ' t <-<-> o o o o o ö ö ö ö o
ui m oo r» a\ O Ö <N Ö TH
^O O <n t~- T t *-H co r~ *o TH o o T-H o T-H
CO co Z Z
<N <-i O O O T-H
ö ö ö ö ö ,-H O
^ 00 » TH O ' t O ' t <N c> ö T-H «ri ö o i
«o <-<-> O • * Os so r- ' t so cN ö ö tN ö c-3
co Z *
co co Z Z
^ Os O ' t «o O O T-H o o
ö ö ö ö ö SO O Os t— s© r-; oo ' t sq u-j O H t » i d i N
O T-H O T-H t— « H - J C O I H rt r i ,-i N
co co Z Z
co co Z Z
o\ o o
T-H
00
T-H
o
T-H
<N
' t ' t
00
o o
n
o\
S 3 o
SO »o O
Os
o
00 Os tN
' t os
Q 60
M
T-H T-H (S o <M
il „ t N O S T-H Ö
"Ç V V
e 6 E" E S E E S C T-H T-H T H
v, r^ ->t ' t C-l o o o T-H Ö Ö Ö A A A V
o o &, c E 1 e g m 2 A
CO CO CO C/3 Z Z Z Z T-H T-H T-H ^ *
o o o o ö ö ö ö vo <n u-> T-H T t Tf ' t « © o ' © ©
e - r f t t
VO Os m d o o d
C/3 C/3 CO C/3 z z z z T-H T-H T-H l/->
O O O T-H
ö ö ö ©
r - T-H vo ' t <-<"> O <"•"> Q S
ö o ö ö
r- o £> <-<-i
<r> m <̂ > r~
o o o © C/3 CO
* • z z T-H T-H 0 0
o o o ö o ö ©
g
<-<i r~- e-i so Ö O Ö O
T-H ^ - < n T-H
ö o ' ö o '
CO C/3 co co Z Z Z Z T-H T-H T-H I O
o o o o © © © ©
<n <N m t— © ö ö ö
0 \ T-H T-H ©
<rs ts o t -© O O O
s Q a <u
E 3
E E
v~t
O __ E C «
T-H T-H
«o r - t--tN O O T-H © Ö A A V
© o' V
PH
O © V
O H
S O V
PH
c n !S
a o G
co Z
T3 111 cd 3
CS
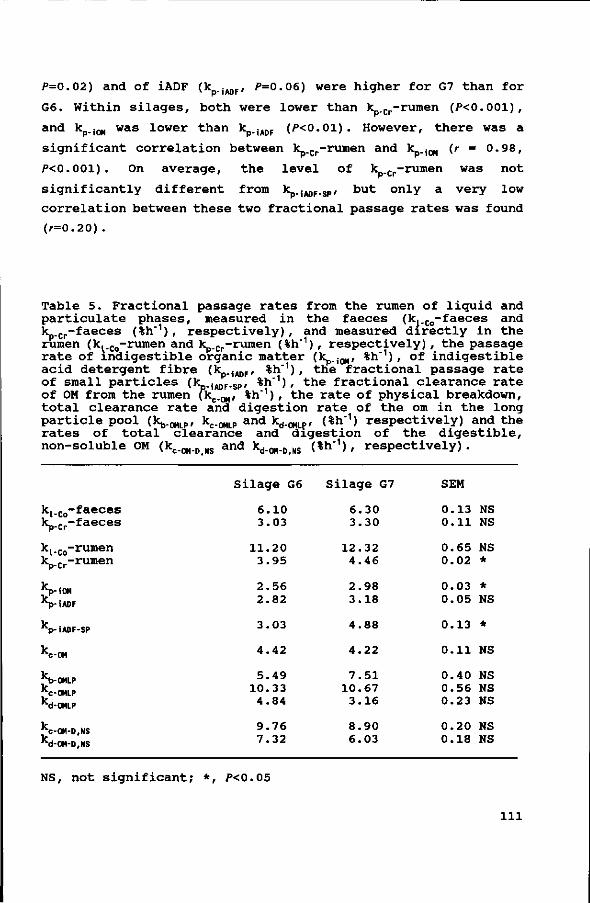
P=0.02) and of iADF (k A0F, P=0.06) were higher for G7 than for
G6. Within silages, both were lower than k Cr-rumen (/><0.001),
and k j0M was lower than k iA0F (P<0.01) . However, there was a
significant correlation between )e_Cr-rumen and k i0M {r = 0.98,
P<0.00X) . On average, the level of k Cr-rumen was not
significantly different from k̂ -jAop-sp' b u t only a very low
correlation between these two fractional passage rates was found
(r=0.20) .
Table 5. Fractional passage rates from the rumen of liquid and particulate phases, measured in the faeces (k._Co-faeces and k Cr-faeces (%h"1), respectively), and measured directly in the rumen (k, Co-rumen and k Cr-rumen (%h"1) , respectively) , the passage rate of indigestible organic matter (K,.)0M, %h"1) , of indigestible acid detergent fibre (K,.jADF, %h"1) , the fractional passage rate of small particles (k AD[:.Sp, %h'1) , the fractional clearance rate of OM from the rumen (kc-w * n 1) > t n e r a t e °f physical breakdown, total clearance rate and digestion rate of the om in the long particle pool (k^,^, k,..̂ and k^^, (%h"1) respectively) and the rates of total clearance and digestion of the digestible, non-soluble OM (k^^,^ NS and kj.̂ .p MS (%h"1) , respectively) •
kj.^-faeces V e r " f a e c e s
k i -co - r u i n e n
kp.Cr-rumen
Kp-iADF
V 'V iADF-SP
kc-0M
^b-OMLP
•̂C-OMLP kd-0MLP
*c-0M-D,N$ V-'Nj-OM-D.NS
Silage G6
6.10 3.03
11.20 3.95
2.56 2.82
3.03
4.42
5.49 10.33
4.84
9.76 7.32
/><0.05
Silage G7
6.30 3.30
12.32 4.46
2.98 3.18
4.88
4.22
7.51 10.67
3.16
8.90 6.03
SEM
0.13 NS 0.11 NS
0.65 NS 0.02 *
0.03 * 0.05 NS
0.13 *
0.11 NS
0.40 NS 0.56 NS 0.23 NS
0.20 NS 0.18 NS
NS, not s i g n i f i c an t ; *,
111
Total clearance rate of OM from the rumen did not differ
between silages, but was for silage G7 even lower than the k
calculated from the decline in rumen Cr-pool (Table 5). Though
not significant (/>=(). 13), the rate of breakdown of large
particles (k^^p, %h"1) , calculated from the decline of the iOM
pool in the LP, was highest for G7. The k,..,̂^ was not different
for both silages. Although differences were not significant, the
higher k^^p in combination with the same kg.^p resulted in a
somewhat lower (P=0.07) degradation rate of OM in the LP pool
(kd-oMLP' %n 1) o f silage G7.
Total clearance rate of digestible, non-soluble OM, the k,.̂ .
D NS, was, though not significant (P=0.16), higher for G6,
resulting in a somewhat higher degradation rate of this fraction
for G6 (kd-oH-D̂ s, %h"1, Table 5).
Discussion.
Cell wall content and lignin content of the cell walls increase
when the plant matures (Van Soest, 1982), resulting in a decrease
in digestibility (Reid et al., 1988) . The silages in this
experiment were grown at the same field and were harvested at
different growth stages. Lignin content of silage G7 was highest,
and thus this silage was expected to have the lowest
digestibility.
The capacity of the rumen can be limiting roughage intake in
high producing dairy cows (Mertens, 1987) . Because the cows in
this experiment were not in lactation and nutrient requirements
of the animals was relatively low, feed intake was not limited
by the capacity of the rumen, but probably chemostatically by
digestion products. Therefore intake of silage G7 could be
higher.
Rumen content is determined by feed intake on one hand and
clearance rate from the rumen on the other. The higher intake of
silage G7, in combination with the same total clearance rate
(kc-wi) ' resulted in a constant higher rumen content for G7.
The rumen DM pool can be divided into two pools: the large
112
partiele pool (LP, in this experiment defined as the material
retained on a 1.25 mm sieve) and the small particle pool (SP,
here defined as the material passing a 1.25 mm sieve) . Both pools
exist of a degradable fraction (dOM) and an undegradable fraction
(iOM) (Figure 1) . The dOM in the LP pool can be physically broken
down to small particles (with a fractional rate constant 1^, %h~ 1) , or can be fermentatively degraded by rumen microbes (k^^p,
%h"1) . The iOM in the LP pool can move over to the SP by particle
size reduction only, mainly through rumination (Ulyatt et al.,
1986) . The dOM in the SP can pass to the omasum undegraded or can
be fermented by rumen microbes. The iOM in the SP can pass to the
omasum only. According to Poppi et al. (1981), clearance rate of
small particles from the rumen is the most important factor
influencing DM retention time in the rumen.
In most experiments reported in literature, )e is calculated from
the faecal excretion curve of Cr-NDF. Bosch et al. (1988,
submitted8) reported a 25-30% lower ^.Zo when derived from the
faeces than when measured directly in the rumen. The same
observation was made in this experiment, except that the
differences here were much larger with 45 to 50% lower values
when measured in the faeces. For the particulate marker, a
similar delay as for the soluble marker is found when measured
in the faeces as compared to measured directly in the rumen.
However, in this case the difference was is only 25%. This
indicates that, after the rumen, there is also another mixing
compartment for the particulate phase. When the decline in rumen
Cr-NDF pool is measured, this results in an even greater
overestimation of the k than when measured in the faeces. Cr-NDF
can be considered to be representative only for particles able
to leave the rumen (passing a 1.25 mm sieve). Compared to the
clearance of undegradable material from the small particle pool,
which has to be corrected for undegradable material entering the
SP pool from the LP pool, here calculated as the )e.lADF.SP, the
k Cr-rumen was not significantly different from the fractional
passage rate of undegradable material in small particles. The
high correlation between k Cr-rumen and k̂ .i0M (r=0.98, /><0.001),
suggests that differences between silages in rates of passage
113
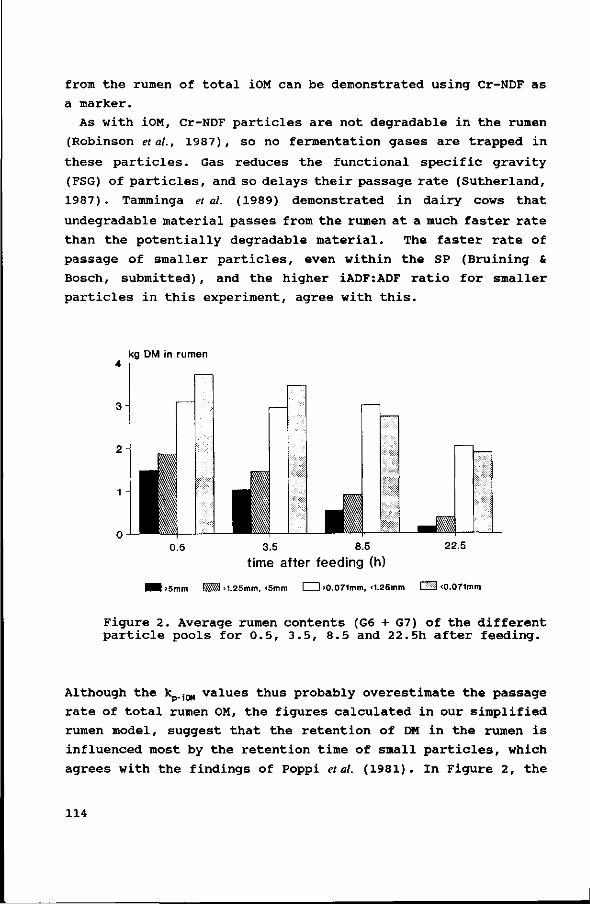
from the rumen of total iOM can be demonstrated using Cr-NDF as
a marker.
A s with iOM, Cr-NDF particles are not degradable in the rumen
(Robinson et al., 1 9 8 7 ) , so no fermentation gases are trapped in
these particles. Gas reduces the functional specific gravity
(FSG) of particles, and so delays their passage rate (Sutherland,
1987) . Tamminga et al. (1989) demonstrated in dairy cows that
undegradable material passes from the rumen at a much faster rate
than the potentially degradable material. The faster rate of
passage of smaller particles, even within the SP (Bruining &
Bosch, s u b m i t t e d ) , and the higher iADF:ADF ratio for smaller
particles in this experiment, agree with t h i s .
kg DM in rumen
0.5 3.5 8.5 time after feeding (h)
22.5
I >1.25mm, <5mm I I >0.071mm, <1.25mm L__J <0.071mm
Figure 2. Average rumen contents (G6 + G7) of the different particle pools for 0.5, 3.5, 8.5 and 22.5h after feeding.
Although the k )0H values thus probably overestimate the passage
rate of total rumen OM, the figures calculated in our simplified
rumen model, suggest that the retention of DM in the rumen is
influenced most by the retention time of small particles, which
agrees with the findings of Poppi et al. (1981). In Figure 2, the
114
average rumen contents (G6 + G7) of the different partiele pools
at different times after feeding are given. This figure shows a
decline for all pools with time after feeding, except for the
pool containing particles with a size between 1.25mm and 0.071mm.
The latter fraction seems to be rather constant for at least 8.5h
after feeding, indicating that during this time the amount of
material cleared from this pool is close to the amount entering
this pool. This suggests that clearance rate from this pool is
the rate limiting step in reduction in rumen fill, and that
particle size reduction as such is not the only limiting factor
for rumen capacity. A combination of size reduction and extent
of digestion, the latter influencing the FSG of the particles,
seems more likely.
References.
Bosch, M.W., I.M. Janssen, J. van Bruchem, H. Boer and G. Hof, 1988. Digestion of alfalfa and grass silages in sheep, l. Rates of fermentation in and passage from the reticulorumen. Neth. J. Agric. Sei. 36:175-185.
Bosch, M.W., S.C.W. Lammers-Wienhoven, H. Boer and G.A. Bangma, submitted3. Influence of stage of maturity of grass silages on digestion processes in dairy cows. 2. Rumen contents and ruminai passage rates. [see Chapter III, this thesis]
Bosch, M.W., C.P. Leffering, J.M. Muylaert and P.W.M. van Adrichem, submitted15. Influence of stage of maturity of grass silages on digestion processes in dairy cows. 3. Fermentation characteristics, rumination activity and distribution of rumen and faecal particles. /see Chapter IV', this thesis]
Bruining, M. and M.W. Bosch, submitted. Ruminai passage rate as affected by Cr-NDF particle size, f see Chapter VI. this thesis]
Faichney, G.J., 1986. The kinetics of particulate matter in the rumen. In: Control of Digestion and Metabolism in Ruminants, Ed. by L.P. Millgan, W.L. Grovum and A. Dobson.
Goering, H.K. and P.J. van Soest, 1070. Forage fiber analyses. Agricultural Handbook No 379. ARS, USD A, Washinton, DC, USA.
Kennedy, P.M. and D.P. Poppi, 1984. Critical particle size in sheep and cattle. In: P.M.Kennedy (ed.),Techniques in particle size analysis of feed and digesta in ruminants. Canadian Society of Animal Science, occasional publication no 1, Edmonton.
115
Mertens, D.R., 1987. Predicting intake and digestibility using mathematical models of ruminai function. J. Anim. Sei. 64:1548-1558.
Penning, P.D. and R.H. Johnson, 1983. The use of internal markers to estimate herbage digestibility and intake. 2. Indigestible acid detergent fibre. J.Agric.Sci.,Camb. 100:133-138.
Poppi, D.P., B.W. Norton, D.J. Minson and R.e. Hendricksen, 1980. The validity of the critical size theory for particles leaving the rumen. J. Agric. Sei. Camb. 94:275-280.
Poppi, D.P., D.J. Minson and J.H. Ternouth, 1981. Studies of cattle and sheep eating leaf and stem fractions of grasses. Ill The retention time in the rumen of large feed particles. Aust. J. Agric. Sei. 32:123-137.
Reid, R.L., G.A. Jung and W.V. Thayne, 1988. Relationships between nutritive quality and fiber components of cool season and warm season forages: a retrospective study. J.Anim. Sei. 66:1275-1291.
Robinson, P.H., S. Tamminga and A.M. van Vuuren, 1987. Influence of declining level of feed intake and varying the proportion of starch in the concentrate on rumen ingesta quantity, composition and kinetics of ingesta turnover in dairy cows. Livestock Prod. Sei. 17:37-62.
SPSS Inc., 1988. SPSS/PC+ Base manual. SPSS Inc., Chicago, Illinois.
Sutherland, T.M., 1987. Particle separation in the forestomachs of sheep. In: Aspects of digestive physiology in ruminants, pp.43-73 (A. Dobson, editor). Ithaca: Cornell University Press.
Tamminga, S., P.H. Robinson, M. Vogt and H. Boer, 1989. Rumen ingesta kinetics of cell wall components in dairy cows. Anim. Feed Sei. Techn. 25:89-98.
Uden, P., P.E. Colluci and P.J. van Soest, 1980. Investigation of chromium, cerium and cobalt as markers in digesta. J.Sei. Food Agric. 31:625-632.
Ulyatt, M.J., D.W. Dellow, A. John, C.S.W. Reid and G.C. Waghorn, 1986. Contribution of chewing during eating and rumination to the clearance of digesta from the ruminoreticulum. In : Control of Digestion and Metabolism in Ruminants, Ed. by L.P. Miligan, W.L. Grovum and A. Dobson.
Van Soest, 1982. Nutritional ecology of the ruminant. O&B Books Inc., Corvallis, OR.
116
Chapter VIII
General discussion
117
The mechanisms controlling feed intake, especially roughage
intake, in dairy cows are still not fully understood. Since the
introduction of a milk quota system in 1984 in the Netherlands,
on an increasing number of farms there's a surplus of grass and
grass silage. Therefore, increasing the roughage proportion in
dairy diets seems interesting. This is, however, only possible
if our knowledge concerning the regulation of roughage intake is
improved.
It is generally accepted that many factors, such as
digestibility and volume of the feed, demand of the animal for
nutrients, rumen volume and clearance rate of feed from the
rumen, and for good quality forages probably also amount and type
of fermentation end products (Van Soest, 1982), are influencing
ad libitum intake of forages in ruminants.
When energy requirements are high (early lactation), the ad
libitum intake of forages can be limited by the capacity of the
rumen. Capacity of the reticulorumen may be limited by rumen fill
(Mertens, 1987), or by rates of clearance, determining the
throughput capacity of the rumen (Weston, 1982). Rumen fill (kg
dry matter, DM) can be limited by rumen volume or by a maximum
packing density (DM%). According to Grovum (1987), there is a
large excess capacity to transport bulk in the intestines, but
rumen volume and throughput capacity of the rumen can limit
roughage intake.
1. Rumen fill
The rumen pool (kg DM) is determined by input (intake) and output
(passage + digestion) (Fig. 1) . The rumen pool can be determined
by rumen evacuation of fistulated animals. Rumen pools vary
between animals, feeds, level of feed intake and feeding scheme.
In Table 1, a literature overview of maximum rumen contents (g
DM/kg Body Weight) and rumen clearance, calculated as average
rumen fill times clearance rate (kc, %h"1 (DM Intake/average rumen
DM content)) of different animals fed different diets is given.
Maximum rumen DM contents (g DM/kg BW) were calculated as
determined rumen contents corrected for the estimated amounts
that had disappeared between the end of the meal (2 hours after
118
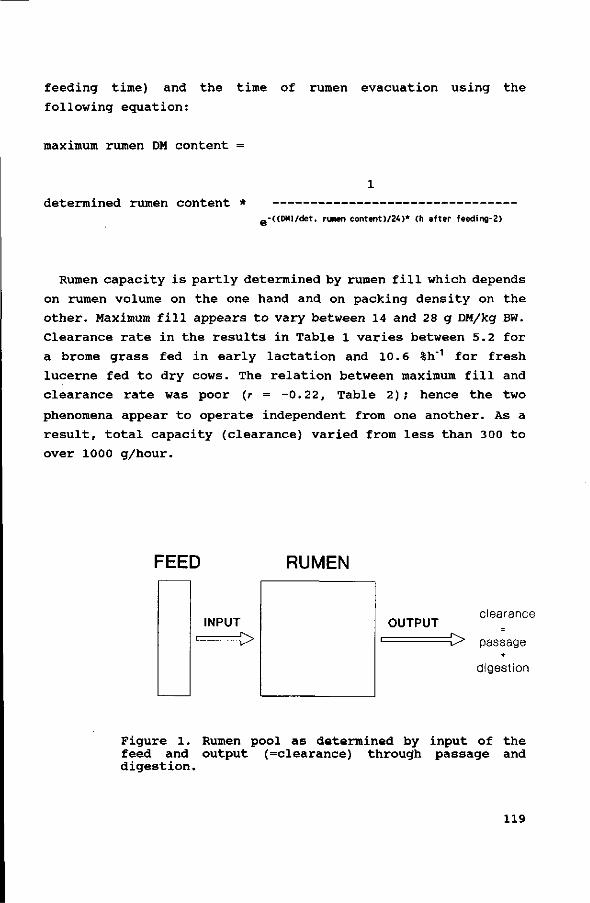
feeding time) and the time of rumen evacuation using the
following equation:
maximum rumen DM content =
determined rumen content * _-((DMI/det. rumen content)/24)* (h after feeding-2)
Rumen capacity is partly determined by rumen fill which depends
on rumen volume on the one hand and on packing density on the
other. Maximum fill appears to vary between 14 and 28 g DM/kg BW.
Clearance rate in the results in Table 1 varies between 5.2 for
a brome grass fed in early lactation and 10.6 %h_1 for fresh
lucerne fed to dry cows. The relation between maximum fill and
clearance rate was poor (r = -0.22, Table 2); hence the two
phenomena appear to operate independent from one another. As a
result, total capacity (clearance) varied from less than 300 to
over 1000 g/hour.
FEED RUMEN
INPUT OUTPUT clearance
=C> passage +
digestion
Figure 1. Rumen pool as determined by input of the feed and output (=clearance) through passage and digestion.
119
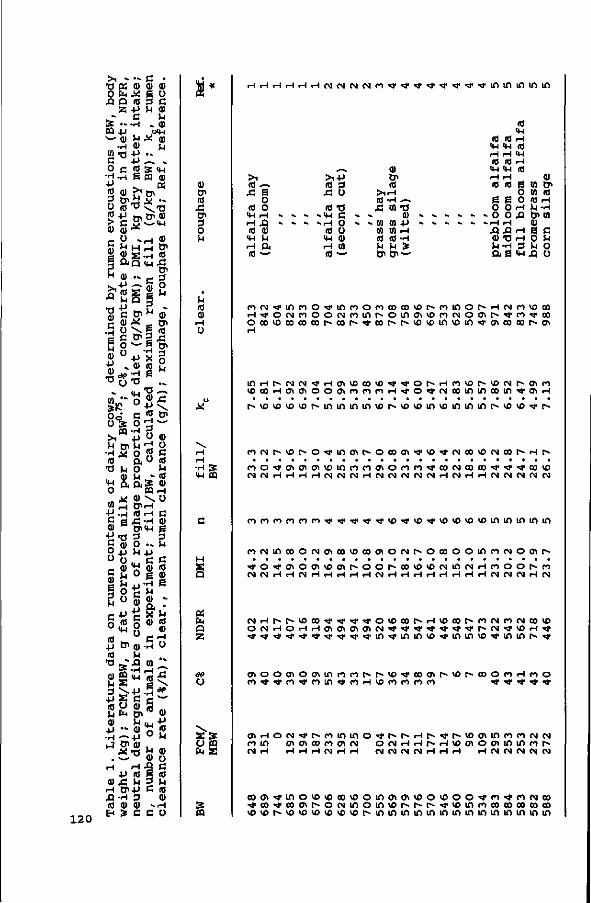
120
> i - •« c •O Pi d) 0> 0 &H X ß XI Q 10 3
Z -P (H
_.- c S • > -H »
. 0) o c 0) H <u DQ JJ oU-l
~ 0 ) > H * •rH 0)
W -O -P -C +J ^
(D JH
^ o c i s a i H
•H . H g m •(£ »_.
3 o>id .ï
01 « • *
U (0 ° ^ / f l K-U CnO> S S *
Lne
d by
rum
en
centr
ate
perc
/k
g DM
) ; D
MI,
im
rum
en f
ill
R o — S
lete
: %
, c
iet
max
i
<-> 0 -o
ow
s,
0.7
5.
n of
.ate
d
os og PQ -H 3 >i +» o
w o> ^ "2 • H j j O " * ftO "O h O
01 U _*• <w a a £ t
0) MH
a> o> (0 X! O* 3 O
<u Öl (0 XI Di 3 O U
• t
S" Ol w
(U o c (0 h (0 ai
O CQ rH . M 0) \ 0
™rH CPrH •U -H (0 rH S ß -Ö-H 01 0>MH y -o 3 Ç ( | O K O - P H + J ° o „ , e _ o) *y S
a on
rum
er
fat
corr
<
conte
nt c
n
experi
m
+j o> a> -H (0 ^
ure
d
[/M
BW
, t f
ib
imal
s
+» fï c c
•P " Q> o
J Cn 01 , * - o fc . w " 0)
H rH XJ •P 10 g
0> XI w 3 rH 0>-P C X I - H 3 to ai ai » H > c c
c ai ß 3 M
C 10 0) ß
ri C0 ai H O
** S" \ <*> »"* 0) •p (0 M
ai 0 c 10 u (0 ai H O
Ï*
ai &> (0
XI o> 3 O U
ù (0 ai
rH 0
u
\ rH r-( -H S in m
c
H S Q
fa Q Z
<*> CJ
\ ss o « h s
£ CQ
d r i r i H H H ( i i N i N n n < j ' * f * ^ > i , ' i " * i n i n m i n i f l
(0 ^ XI ß
O (0 O
MH rH rH Xi co ai
MH M rH a (0 * -
-̂̂ >1-p (0 3 X! O
(0 T3
0) Oi (0
>1rH (0 -H - ^ X! «1 -O
« H C » » Ol rH O » - tfl «1 -P (0 o <M O) rH V) (0 » -
B B H (0 (0 -H ÎH <H | ï O Oi —
(0
10 MH
(0 rH MH MH <Ö r-t (0
rH MH (0 rH
MH MH (0 rH (0
ß O o rH
rH «0 ß
O ß 0 O rH O XI rH
XI XI rH 0) T3 rH (H •H 3
VI VI
ai o> 10
(0 rH u •rt 0> UI 01 ß 0 M
ftß MHXt
c M O o
n < N ^ , m n o ^ i ' i n r ) 0 < v ) c o < » v o t > r > i f ) o r » r H f M < v ) v o o o H ' * O t N ( v l O O < M < v ) m t > O i n 0 1 « 5 n C M O C T l I - « ' J ' n ^ f 0 0 o œ w t o c o c o h i » r > ^ ' o r > t » » i o i f l > o i n ^ , o \ e o » r ~ ( j i
i
l f ) r H t > < N < N ' * H ( J l V D e O V D T l , T l ' O t > r H < " > V O r > \ 0 ( N t » - a i r >
K i c o H m o i o o i s n n n H ^ o ^ i N c c i n i n t o i n f i i i H
r > v o v o \ D v D t > i n i f i i n i n v o r - » o v o i r ) v o m i f ) i n t ~ » > o v o T i ' t >
r ) < N r > v o t > o - * i r ) o i t - - o c o a i ' j ' « 3 ^ j ' < N o o v O ( N c o r - H t >
< N ( N H r H i - H r H ( N ( N < N H t N < M C N t N t N H < N r H H < N < N t N M ( N
n i N i o c o o t M t j i o o v o c o w o t N r ^ o o o o o i n n t N O O i o
^ • O T f a i o o i > o o i r > o o r » o o v o v O ( N i f l < N H n o o t > f o ( N < N H H r M H r H r H r H H ( N H H H H H H H H t M ( N < N H e N
< N H I > P ~ V O C O T t ' ! ) ' ^ ' ' < t O V O e O ( > r H V O ( » t ~ - ( v ) < N < v l ( N O O V O
o i o o a i o o i i n n r n r - r - i o < * c o c j i t - - v o t ~ - e o o M r H ( » ) 0
O l H O t N ' « i , I s « r l i n i f ) 0 ' » * I > r » H t > > i l ' I > > 0 0 1 1 f ) < » 1 C 1 t N < N <*> in ai «MD n oi M o i N H i - H r - f - H v o f f i o o i w i n n r » IN H H r H H t N H r H <N CM (N <N H H H rH (N IN <N <N CN
a a i ^ i n o t o t o o o t o o i n o i a t t o o i o o o ^ n ^ n N t o T j - o O ' * o o o i i > o ( N i r ) o i n > o i - - t - t - - T r v o i n n » c o » c o a ) v o \ o t > v o v o » o > £ > > o v D t ~ - i f > i n i f ) i n i n m i n i f > m i n i n i n i n i n
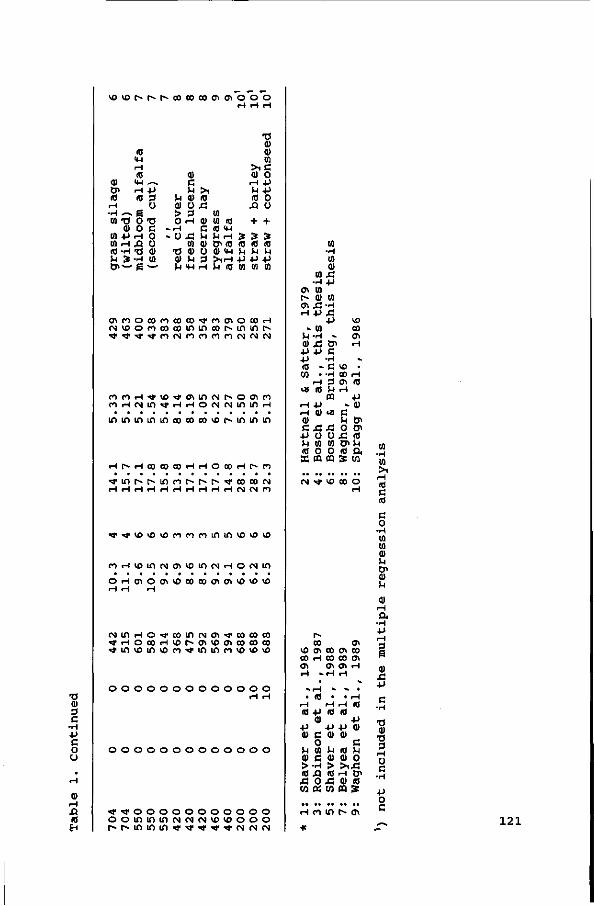
« > v o t ^ r - » r ^ c o c o c o o > C A o o o
IC <u H <C
<U <*H ^ en -H +J «0 10 3
rH u H — g !fl TJ 0 "Ö
0) 0 C B l + J H 0 M H Ä ü <0 -H -Ö CD
Q) G ^ > i
M (U (0 0) O J3 > 3 O H «
- r H C > Ü Ä ^
10 cu •0 <D o
co CO (0 IC <M ^1 rH & (0 CU <t-i
* 10 VJ
dl CU w
> i C 0) 0 rH JJ U JJ <Ö 0 Ä o
+ + s * (C IC
u u U S - H CO Ö > — g —
O) M 3 > 1 r H JJ JJ JJ
•o CD 3 C
•ri +J c o o
Si (0 En
C A n o c o m c o c o t n c A O c o H t N v o o f o o o o o i o i n c o r - i n i n i ^
n d H M - v D T j - f f i m f M p ^ O C T i n n H N « l < ( H H O N N i n i / l H
i n i n i n i n i n c o e o c o v o r - t n i n m
r H t - ^ r H C O C O C O r H i - H O C O H t ^ n
^• i r t r^ r^ innt -»r^ r - '< ï 'cococM riHHHHrlriHHHNNfl
* ^ i £ n o > D f i n n i n i f t ( i 3 ^ «
n d l O l O N O M O I f l N H O N I f l
O H C A O C A V O C O C O C A C A « > < O V D
< N i n H O ^ , c o m c N C A * i , c o e o c o ^ H o e o H O M n o o K o a n
o o o o o o o o o o o o o H H
O O O O O O O O O O O O O
« t ^ o o o o o o o o o o o O O i n i O I D M O I C M V O V O O O O
10
10 0)
co A •rl +J
CA ui t-~ <D w 0"> J3 - H rH JJ .G
JJ - 0)
U-M -01 j - Oi
•P +J c JJ
CO CA
ie - c i o W • - H CO .
r-H 3 Ol <JS «S U <-t
m rH JJ H 1 1 4 CD c Ä ja j j o •• M co
IC
J J » Q)
c u 0>
. O o> ü J3 (0 CO O* M
U O O I t P i E f f i C Q S M
CM «* VO CO O
co CA 10 cri co CA co CO H CO CO O CA CA CA H
IC 4-> CD
IC IC
JJ CD
JJ 4J 0) 0)
JJ CU
C
O fc (0 r4 <0 CD C <D CD _ > - H > > , J 3 (0 J3 10 i-H 0 i
J3 O A 0) (0
w a c o a s
H n in r~ CA
co • H (0 > i
rH 10
e 10 e o
•H co 10 CU
^ 0)
o.
CU a j j
c • H
• o CU
• o 3
rH O e
• H
JJ o c
121
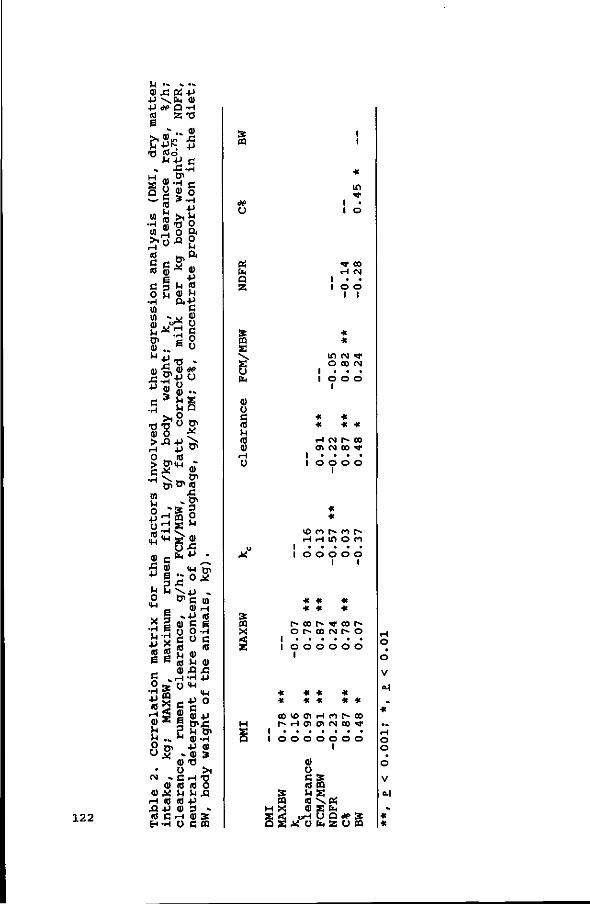
122
u •» ^ -Q) .C « -P
•P \ f o 0) • P # D - H
* fie* -S "O (Do
M +J c si
s (D
MI,
L
eara
nce
od
y w
eigh
port
ion i
:
H ^ f l S (0 ( j , D<
S S * 0> e . t i c 3 ^ ? O h « * i
-H ft+J w G W - I J <u
ï . . a 8
he r
L
ght
:ted
C
%,
in t
we:
ir
rec
DM
;
>, ° Q) O "
r4 +J ^ O 10 > 0<IH * c * 2.
tyi o 1 (d
dl r- &< * • . • ' S i - o * « ^ \ 0 J
matr
ix f
o
max
imum
ara
nce,
g
re c
onte
n ^ UI
rH (0
e H
c 10
(U w a xi R » i H - H •p
<H 0
•P !» 5 O i . e
^ . . W Q»
r°i 0» +* " ^ -« 0) -o
o
0> •H 0)
» > 1
M - C rH T3 © (0 (0 o (1) X M r4 JQ
H (0 (0 +J X> 4-1 Q) 3 ^ (O C rH O) * H H O C O
1
« h Q S
S CO
s \ § fc
0) Ü
c (0
(0 0)
rH Ü
u X
s n X
3
H
g
1
*
00
r-1 o
S DQ
H X s << o S
i i
VO rH
1 O
* *
r-- oo o r« o o
* *
H ffl
O O
0) ü
1
*
in
1 o
' t eo H M
1 • a
1 o o 1 1
* *
If) fM • * O CO (N
1 O O O 1
« * * * * rH CO f - 00 (Tl CM 00 t
• • • • O O O O 1
n r- o r>-H m O M
o o o o 1 i
« * * * e- t oo r-oo M r- o o o o o
* * * * * H n r-- oo ON CM 00 ' t
o o o o 1
C Ä (0 03 H * ~ (0 \ 0 S 0)
orH Ö Q # S Ü O f c Z U f f l
H
o o v o-l
* .̂ O O
O
V
o-l
^ * «
In the experiments described in chapters II to V, maximum rumen
contents varied from approximately 19 g DM/kg BW in late
lactation (ad lib grass silage, 1 kg of concentrates) to
approximately 23 g DM/kg BW in early lactation (ad lib grass
silage, 7 kg of concentrates) . Dry matter percentage in the rumen
increased when the proportion of concentrates in the diet
increased. No effect of roughage composition on the DM% in the
rumen was found. Rumen liquid volume (kg/kg BW) in these
experiments varied between 0.14 and 0.16 kg/kg BW and was not
different between diets, cows or stages of lactation. Hence, not
only rumen volume is an important factor for the holding capacity
of the rumen, packing density even seems to be of more
importance.
For dry cows (Chapter VII), maximum rumen DM content was
influenced by silage quality and was 14 g DM/kg BW for the grass
silage containing 44% NDF and 16 g DM/kg BW for the grass silage
containing 52% NDF.
According to Baile & Forbes (1974), the capacity of the rumen is
increased during early lactation. When energy deficit is high,
there is a strong signal to stimulate intake in spite of the
level of fill in the reticulum and cranial sac (Grovum, 1987) .
In those parts of the forestomachs the tension receptors are
located, and probably fill in these organs determines whether or
not satiety is signalled. The threshold value might be higher
during lactation. Gill et al. (1988), pointed out the fact that
the receptors for rumen distension respond to stretch or
mechanical stimulation. The weight of the digesta in the rumen
may therefore not be the most appropriate index of distension.
However, measuring the exact volume of the rumen, including the
gas, has not yet been done. As mentioned earlier, in our
experiments with lactating cows, only a higher proportion of
concentrates increased rumen fill, indicating that the density
of the feed would be of more influence than the volume of the
rumen.
Regression analysis, using the data presented in Table 1 (of
which the correlation matrix is given in Table 2), based on milk
production (g FCM/kg Metabolic Body Weight, MBW), the proportion
123
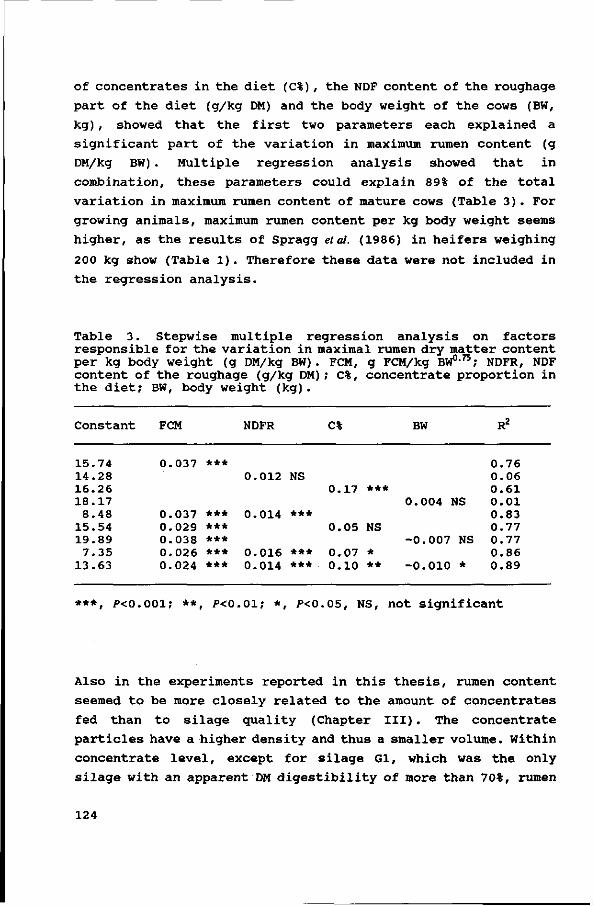
of concentrates in the diet (C%) , the NDF content of the roughage
part of the diet (g/kg DM) and the body weight of the cows (BW,
kg) , showed that the first two parameters each explained a
significant part of the variation in maximum rumen content (g
DM/kg BW) . Multiple regression analysis showed that in
combination, these parameters could explain 89% of the total
variation in maximum rumen content of mature cows (Table 3). For
growing animals, maximum rumen content per kg body weight seems
higher, as the results of Spragg et al. (1986) in heifers weighing
200 kg show (Table 1). Therefore these data were not included in
the regression analysis.
Table 3. Stepwise multiple regression analysis on factors responsible for the variation in maximal rumen dry matter content per kg body weight (g DM/kg BW) . FCM, g FCM/kg BW0-75; NDFR, NDF content of the roughage (g/kg DM) ; C%, concentrate proportion in the diet; BW, body weight (kg).
Constant FCM NDFR C%
15.74 14.28 16.26 18.17
8.48 15.54 19.89
0.037
0.037 0.029 0.038
***
*** *** ***
0.012
0.014
NS
***
BW
0.004 NS
-0.007 NS
-0.010 *
R2
0.76 0.06 0.61 0.01 0.83 0.77 0.77 0.86 0.89
0.17 ***
0.05 NS
7 . 3 5 0 . 0 2 6 *** 0 . 0 1 6 *** 0 . 0 7 * 1 3 . 6 3 0 . 0 2 4 *** 0 . 0 1 4 *** 0 . 1 0 **
***, P<0.001; **, P<0.01; *, /><0.05, NS, not significant
Also in the experiments reported in this thesis, rumen content
seemed to be more closely related to the amount of concentrates
fed than to silage quality (Chapter III) . The concentrate
particles have a higher density and thus a smaller volume. Within
concentrate level, except for silage Gl, which was the only
silage with an apparent DM digestibility of more than 70%, rumen
124
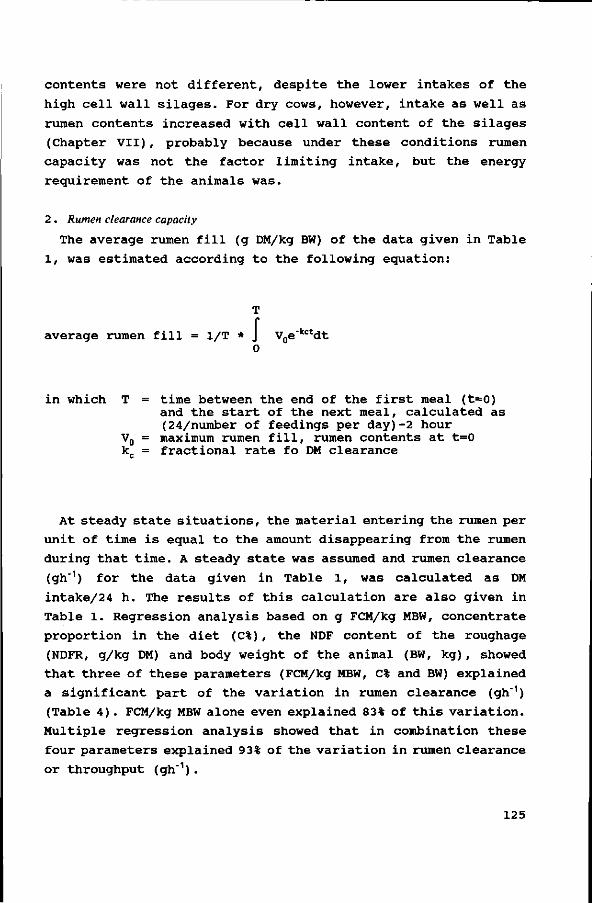
contents were not different, despite the lower intakes of the
high cell wall silages. For dry cows, however, intake as well as
rumen contents increased with cell wall content of the silages
(Chapter VII), probably because under these conditions rumen
capacity was not the factor limiting intake, but the energy
requirement of the animals was.
2 . Rumen clearance capacity
The average rumen fill (g DM/kg BW) of the data given in Table
1, was estimated according to the following equation:
T
I v.--""' average rumen fill = 1/T * J V„e" "dt 0
in which T = time between the end of the first meal (t=0) and the start of the next meal, calculated as (24/number of feedings per day)-2 hour
V0 = maximum rumen fill, rumen contents at t=0 k„ = fractional rate fo DM clearance
At steady state situations, the material entering the rumen per
unit of time is equal to the amount disappearing from the rumen
during that time. A steady state was assumed and rumen clearance
(gh"1) for the data given in Table 1, was calculated as DM
intake/24 h. The results of this calculation are also given in
Table 1. Regression analysis based on g FCM/kg MBW, concentrate
proportion in the diet (C%) , the NDF content of the roughage
(NDFR, g/kg DM) and body weight of the animal (BW, kg), showed
that three of these parameters (FCM/kg MBW, C% and BW) explained
a significant part of the variation in rumen clearance (gh"1)
(Table 4) . FCM/kg MBW alone even explained 83% of this variation.
Multiple regression analysis showed that in combination these
four parameters explained 93% of the variation in rumen clearance
or throughput (gh"1) .
125
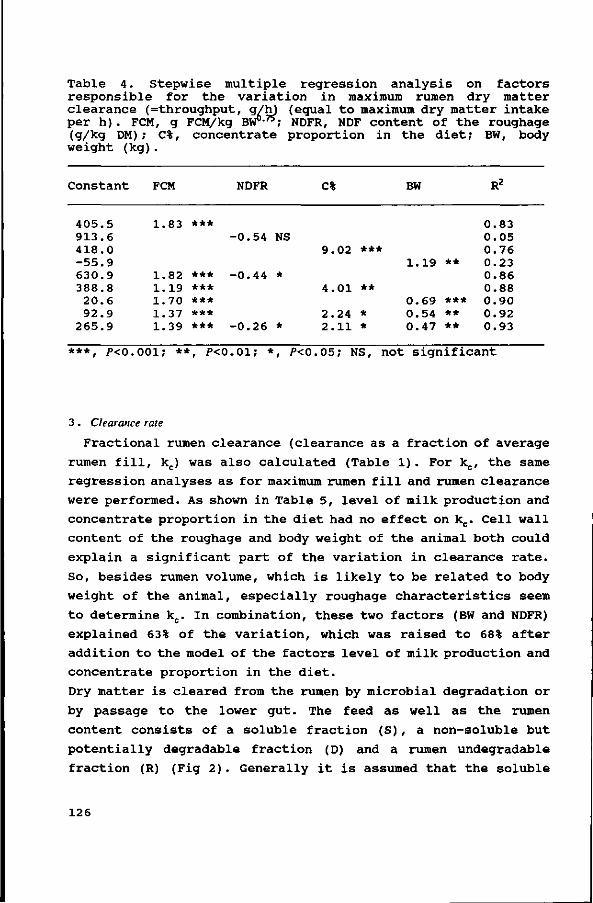
Table 4. Stepwise multiple regression analysis on factors responsible for the variation in maximum rumen dry matter clearance (=throughput, g/h) (equal to maximum dry matter intake per h) . FCM, g FCM/kg BW6-7*; NDFR, NDF content of the roughage (g/kg DM) ; C%, concentrate proportion in the diet; BW, body weight (kg).
Constant FCM NDFR C% BW
405.5 913.6 418.0 -55.9 630.9 388.8
20.6 92.9
265.9
1
1 1 1 1 1
83
82 19 70 37 39
***
*** *** *** *** ***
-0.54 NS
-0.44 *
9.02
4.01
2.24 2.11
***
**
* *
1.19
0.69 0.54 0.47
**
*** ** **
0.83 0.05 0.76 0.23 0.86 0.88 0.90 0.92 0.93 -0.26 *
***, P<0.001; **, P<0.01; *, /><0.05; NS, not significant
3. Clearance rate
Fractional rumen clearance (clearance as a fraction of average
rumen fill, kc) was also calculated (Table 1). For kc, the same
regression analyses as for maximum rumen fill and rumen clearance
were performed. As shown in Table 5, level of milk production and
concentrate proportion in the diet had no effect on kc. Cell wall
content of the roughage and body weight of the animal both could
explain a significant part of the variation in clearance rate.
So, besides rumen volume, which is likely to be related to body
weight of the animal, especially roughage characteristics seem
to determine kc. In combination, these two factors (BW and NDFR)
explained 63% of the variation, which was raised to 68% after
addition to the model of the factors level of milk production and
concentrate proportion in the diet.
Dry matter is cleared from the rumen by microbial degradation or
by passage to the lower gut. The feed as well as the rumen
content consists of a soluble fraction (S), a non-soluble but
potentially degradable fraction (D) and a rumen undegradable
fraction (R) (Fig 2). Generally it is assumed that the soluble
126
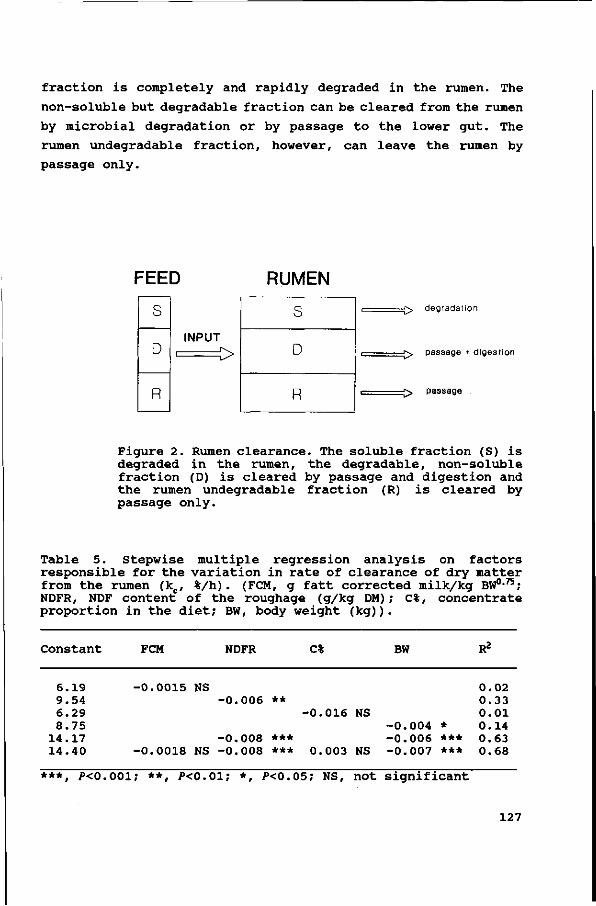
fraction is completely and rapidly degraded in the rumen. The
non-soluble but degradable fraction can be cleared from the rumen
by microbial degradation or by passage to the lower gut. The
rumen undegradable fraction, however, can leave the rumen by
passage only.
FEED RUMEN
S
D
R
INPUT r L
£> degradation
£> passage * digestion
£> passage
Figure 2. Rumen clearance. The soluble fraction (S) is degraded in the rumen, the degradable, non-soluble fraction (D) is cleared by passage and digestion and the rumen undegradable fraction (R) is cleared by passage only.
Table 5. Stepwise multiple regression analysis on factors responsible for the variation in rate of clearance of dry matter from the rumen (kc, %/h) . (FCM, g fatt corrected milk/kg BW0-75; NDFR, NDF content of the roughage (g/kg DM) ; c%, concentrate proportion in the diet; BW, body weight (kg)).
Constant
6 . 1 9 9 . 5 4 6 . 2 9 8 . 7 5
1 4 . 1 7 1 4 . 4 0
FCM
- 0 . 0 0 1 5 NS
- 0 . 0 0 1 8 NS
NDFR
- 0 . 0 0 6
- 0 . 0 0 8 - 0 . 0 0 8
**
*** ***
C%
- 0 . 0 1 6 NS
0 . 0 0 3 NS
BW
- 0 . 0 0 4 - 0 . 0 0 6 - 0 . 0 0 7
* *** ***
R2
0 . 0 2 0 . 3 3 0 . 0 1 0 . 1 4 0 . 6 3 0 . 6 8
***, /><0.001; **, P<0.01; *, P<0.05; NS, not significant
127
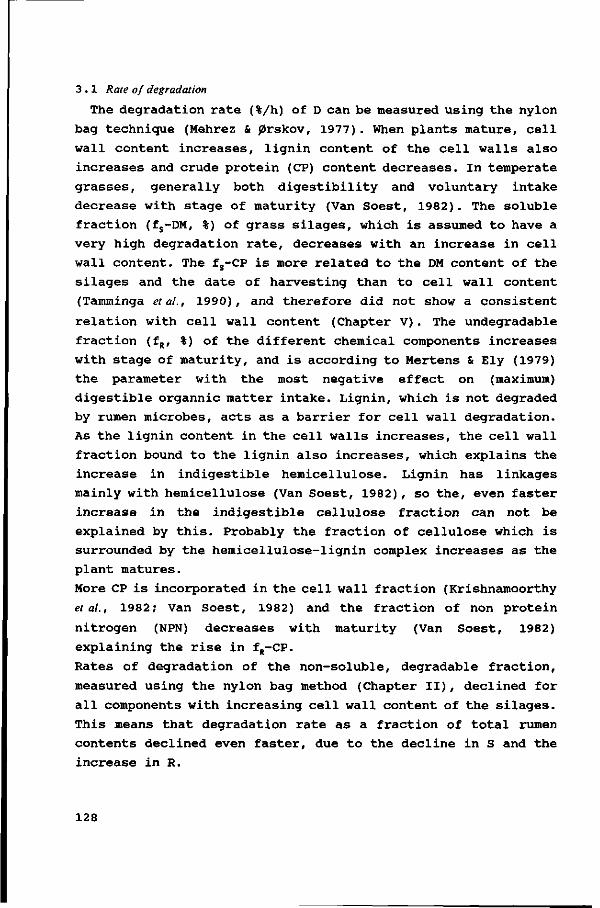
3 . 1 Rate of degradation
The degradation rate (%/h) of D can be measured using the nylon
bag technique (Mehrez & jSrskov, 1977). When plants mature, cell
wall content increases, lignin content of the cell walls also
increases and crude protein (CP) content decreases. In temperate
grasses, generally both digestibility and voluntary intake
decrease with stage of maturity (Van Soest, 1982). The soluble
fraction (fs-DM, %) of grass silages, which is assumed to have a
very high degradation rate, decreases with an increase in cell
wall content. The fs-CP is more related to the DM content of the
silages and the date of harvesting than to cell wall content
(Tamminga el ah, 1990), and therefore did not show a consistent
relation with cell wall content (Chapter V) . The undegradable
fraction (fR, %) of the different chemical components increases
with stage of maturity, and is according to Mertens & Ely (1979)
the parameter with the most negative effect on (maximum)
digestible organnic matter intake. Lignin, which is not degraded
by rumen microbes, acts as a barrier for cell wall degradation.
As the lignin content in the cell walls increases, the cell wall
fraction bound to the lignin also increases, which explains the
increase in indigestible hemicellulose. Lignin has linkages
mainly with hemicellulose (Van Soest, 1982) , so the, even faster
increase in the indigestible cellulose fraction can not be
explained by this. Probably the fraction of cellulose which is
surrounded by the hemicellulose-lignin complex increases as the
plant matures.
More CP is incorporated in the cell wall fraction (Krishnamoorthy
et ah, 1982; Van Soest, 1982) and the fraction of non protein
nitrogen (NPN) decreases with maturity (Van Soest, 1982)
explaining the rise in fR-CP.
Rates of degradation of the non-soluble, degradable fraction,
measured using the nylon bag method (Chapter II), declined for
all components with increasing cell wall content of the silages.
This means that degradation rate as a fraction of total rumen
contents declined even faster, due to the decline in S and the
increase in R.
128
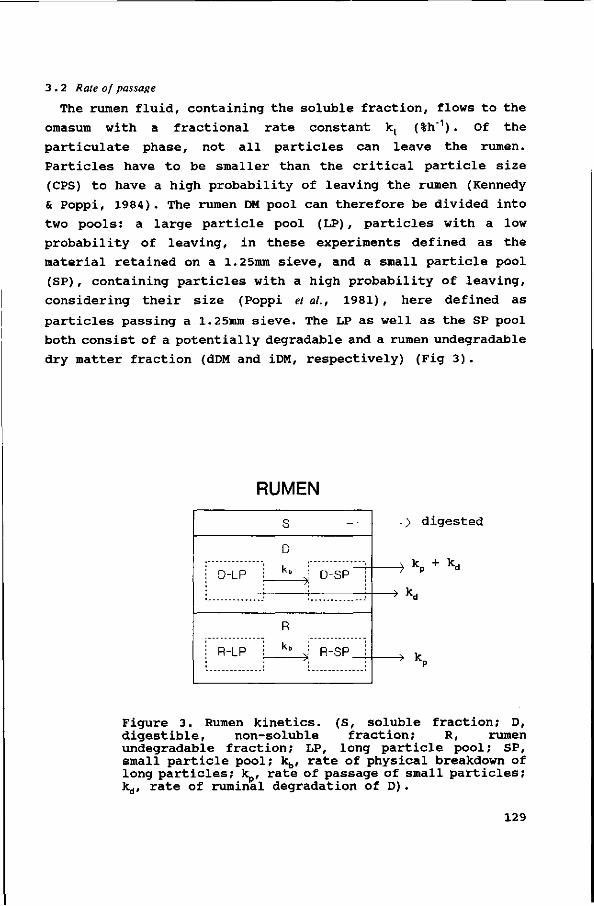
3 . 2 Rate of passage
The rumen fluid, containing the soluble fraction, flows to the
omasum with a fractional rate constant kt (%h'1) . Of the
particulate phase, not all particles can leave the rumen.
Particles have to be smaller than the critical particle size
(CPS) to have a high probability of leaving the rumen (Kennedy
& Poppi, 1984). The rumen DM pool can therefore be divided into
two pools: a large particle pool (LP) , particles with a low
probability of leaving, in these experiments defined as the
material retained on a 1.25mm sieve, and a small particle pool
(SP), containing particles with a high probability of leaving,
considering their size (Poppi et al., 1981) , here defined as
particles passing a 1.25mm sieve. The LP as well as the SP pool
both consist of a potentially degradable and a rumen undegradable
dry matter fraction (dDM and iDM, respectively) (Fig 3).
RUMEN
D-LP
R-LP
S
D
k„
R
/
-4,
D-SP ;
R-SP i
\ k + kd
) \> ° -> y > ^d
^ lr > kp
Figure 3. Rumen kinetics. (S, soluble fraction; D, digestible, non-soluble fraction; R, rumen undegradable fraction; LP, long particle pool; SP, small particle pool; 1̂ , rate of physical breakdown of long particles; k , rate of passage of small particles; kd, rate of ruminai degradation of D).
129
The material not degradable in the rumen has to leave by passage,
whereas the potentially degradable fraction can disappear from
the rumen by either microbial fermentation or by passage to the
lower gut. Particles from the LP pool can enter the SP pool after
being reduced in size, mainly through rumination (Ulyatt et al.,
1986).
The fraction of rumen DM in the SP pool was slightly decreased
(r = -0.57) by an increase in cell wall content of the silages
(Table 6) . The distribution of particles within this pool changed
with cell wall content, resulting in a smaller fraction passing
the 0.071mm sieve with increasing cell wall content (Chapter IV) .
Rumination time per kg DM ingested increased with cell wall
content, but not enough to achieve the same distribution in
particle sizes in the rumen. The probability of passage from the
rumen is inversily related to particle size (Poppi etal., 1980),
resulting in a negative correlation between the mean faecal
particles size (MFP) and the rumen pool passing a 0.071mm sieve
(Chapter IV, Table 6).
Rate of passage increases with cell wall content because more
undegradable material has to leave the rumen. This does not seem
to agree with the fact that smaller particles have a better
chance of leaving by passage and that for silages low in cell
walls the mean rumen particle size is lower. Hence, not only the
size of particles, but also their functional specific gravity
(FSG) determines their chance of passage (Sutherland, 1987).
Fermentation gas lowers the FSG, but can be removed from the
particles by rumination and rumen contractions. Within
concentrate level, high correlations between Cr-NDF passage rate
and rumination time per kg silage DM ingested were found (r=0.97
and 0.96 for the low and high concentrate level, respectively
(Table 6) ) . When particles have a higher fraction of undegradable
material, the FSG will be higher, raising their chance for
passage (Sutherland, 1987), although their size is likely to
remain larger. The higher fraction of undegradable material, the
slower rate of degradation in the rumen and the longer RT/kg
silage DM for the high cell wall silages can explain the higher
rates of passage from the rumen.
130
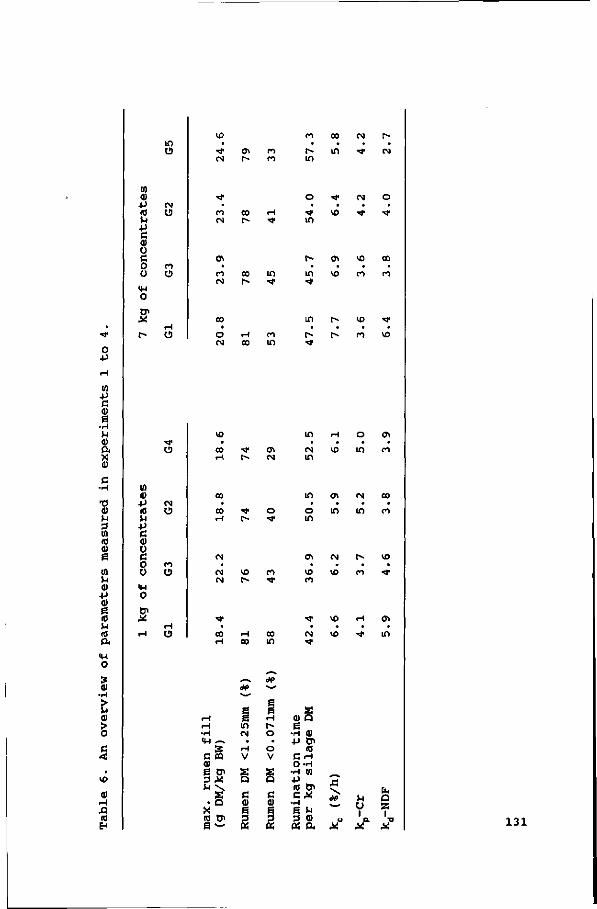
o •p
UI <u •p <ö u •p c 0> o c o ü
o O*
in o
VO
• •* M
o* P~
ro co
M
• r» in
00
• in
CM
• t
P-
• CM
CM O
Cl O
O
co CM
CO 1 -in
vo CM o
ffl
n CM
00 r»
in • *
t -
in **
Ol
VO
VO
n
co
co
co
o CM
H co
co in
in
r* **
r-
r»
VO
co •* vo
UI +J c 0>
s •H a) a. x ai c
•H -o ai u 3 V) (0 ai g
w n a) •p ai g <a u a ft
<H
o
ai > o
5 VO
ai i-i Si 10
10 ai •p (0 M •P C ai o c o Ü
<H
o
2
•4/
CM
o
co U
O
CTl
CM
O
CM
in
o in
ai m
o in
CM
in
CT\
co co
CM
CM CM
VO r~
CO • " *
ai
10 co
CM
vo
r~
co
vo
^
** co H
i-l 00
co in
^ CM ' t
VO
vo
H
•* <n
in
i - i i H H
<U - ^
s C CD ai E ö> S X
<0 Ö l g ~
<*> *— g g m CM
• cH V
s a e ai
3 04
<*>
1 H r-o • o
V
X a c ai g 3 04
S ai a g
-H ai •P D>
« C H O-H
•H (0 •P
ex •H g fc 3 ai 04 a.
U
A!
1 a
X
a
T X 1 3 1
More than 70% of rumen DM is in the SP pool (Chapters IV, VII) ,
and this fraction increases with time after feeding (Chapter
VII). Rate of particle size reduction through rumination can
therefore not be regarded as the rate limiting factor in
reduction in rumen fill.
For lactating dairy cows fed rations high in cell walls, the
capacity of the rumen to contain DM seems to be limiting intake.
Rumen DM content does not increase, while intake decreases when
the cell wall content of the silage further increases. When rumen
DM content has come to a point where a further increase is not
possible, rate of clearance of feed from the rumen determines
feed intake. Because of a higher fraction of undegradable
material for the high cell wall silages, rate of passage of
(undegraded) small feed particles to the lower gut seems to be
of more importance than rate of degradation of the potentially
degradable fraction.
The influence of the NDF content of grass silages on the
parameters determined in the experiments described in this
thesis, are summarized in Table 7.
4. Markers
Generally, rate of particle passage is determined using
particulate markers. In literature, a lot of different markers
have been described. Commonly used external markers (added to the
diet or given separately) are among others Chromic oxide (Cr203)
and Chromium mordanted Neutral Detergent Fibre (Cr-NDF). As an
internal marker (occurs naturally in the diet) often lignin is
used. In the experiments reported here, Cr-NDF with a particle
size of 0.2-1 mm was used, and in some of the experiments also
Tritium (T) labeled hay (particle size 10-20 mm). A single pulse
dose of external markers results in a marker excretion curve in
the faeces. The fractional rate of passage from the rumen (k ,
%h"1) of the marker is defined as the slope of the logarithmic
decline of marker concentration in the faeces (Grovum & Williams,
1973) . A marker has to be representative for the fraction that
132
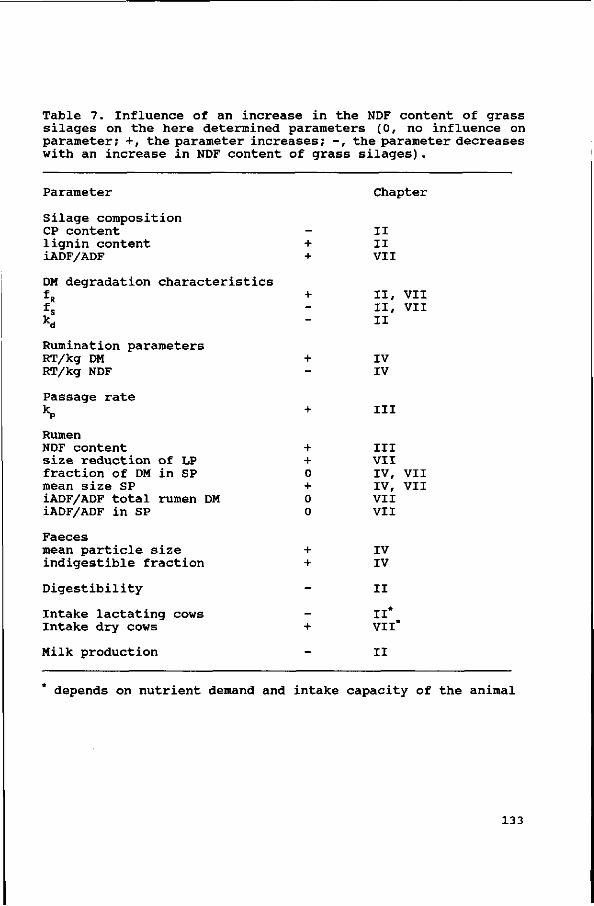
Table 7. Influence of an increase in the NDF content of grass silages on the here determined parameters (0, no influence on parameter; +, the parameter increases; -, the parameter decreases with an increase in NDF content of grass silages).
Parameter Chapter
Silage composition CP content - II lignin content + II iADF/ADF + VII
DM degradation characteristics fR + 1 1 , VII fs - II, VII kd - I I
Rumination parameters RT/kg DM + IV RT/kg NDF - IV
Passage rate k P
Rumen NDF content size reduction of LP fraction of DM in SP mean size SP iADF/ADF total rumen DM iADF/ADF in SP
Faeces mean particle size indigestible fraction
Digestibility
Intake lactating cows Intake dry cows
Milk production
+
+ + 0 + 0 0
+ +
-
-+
-
Ill
III VII IV, VII IV, VII VII VII
IV IV
II
I I* VII*
II
depends on nutrient demand and intake capacity of the animal
133
has to be measured. Assuming the marker is representative for the
particulate fraction in the rumen, rumen particulate DM pool
times k should give total passage of DM from the rumen to the
lower gut. Calculations of total DM escaping rumen fermentation
according to this equation (Chapter III) , show that the so
determined k can not be the fraction of rumen particles escaping
per hour. As shown in Figure 3, particles have to be reduced to
a size below the CPS to have a high probability of leaving the
rumen by passage. Based on particle size, the Cr-NDF can only be
respresentative for particles smaller than the CPS, meaning that
when this marker is used, also the distribution of particle sizes
in the rumen has to be measured. However, as mentioned earlier,
not just the size of particles, but also their FSG determines
their change for passage. Because the Cr-NDF is not fermented in
the rumen and thus no fermentation gas is produced within the
particles, their FSG does probably not change. The density as
well as the size of Cr-NDF particles results in a faster outflow
rate of these particles than of the feed particles. In this
respect, T labeled hay should be a better marker than Cr-NDF. The
T labeled hay particles have to be reduced in size through
rumination and have a changing FSG due to microbial fermentation.
However, rate of particle size reduction (k^ Fig. 3) is
influenced by the physical structure of the particles. The latter
differs between feeds, and the ideal marker would need the same
kjj as the feed particles.
One of the criteria markers have to meet is indigestibility (Kotb
& Luckey, 1972), which is not accounted for with the T labeled
hay. T not only disappears from the rumen by passage, but also
by degradation. Van Bruchem et al. (1990), after simulation of
faecal excretion curves assuming degradation rates of 4 and 6 %/h
and an undegradable fraction of 15% of the T labeled hay,
concluded that the fraction of the T hay used to calculate kp was
almost completely indigestible. Compared to the undegradable
fractions of the grass silages used in the experiments described
in this thesis (Chapter II) , however, a fR of 15% seems too high.
This would mean that the degradable fraction of the T labeled hay
was higher at the part of the curve used to calculate Je than
134
assumed by Van Bruchem et al. (1990) , probably resulting in an
overestimation of k.
Despite the differences between Cr-NDF and the T labeled hay,
both markers gave a considerable overestimation of the rate of
passage of particles from the rumen and even the ratio k -Cr/k -T
varied between diets and concentrate levels.
Therefore, in the experiment described in Chapter VII, k was
also calculated from the decline in rumen indigestible material
with time after feeding (k i0M, %h"1) . Besides this, fractional
rate of passage of Cr-NDF from the rumen was calculated from the
decline in rumen Cr pool as well as measured in the faeces. It
was shown that the clearance rate of Cr even gave a bigger
overestimation of k than would be expected from the faecal
excretion curves.
Comparing the different values of k with the total clearance
rate from the rumen (kc) , it can be concluded that using the
undegradable fraction of the feed as an internal marker and
calculating the k from the decline in rumen pool of this
fraction presumably gives the best estimate of ruminai passage
rate.
References.
Baile, C.A. and J.M. Forbes, 1974. Control of feed intake and regulation of energy balance in ruminants. Physiol.Rev. 54:160-214.
Belyea, R.L., F.A. Martz and G.A. Mbagaya, 1989. Effect of particle size of alfalfa hay on intake, digestibility, milk yield and ruminai cell wall of dairy cattle. J.Dairy Sei. 72:958-963.
Gill, M., A.J. Rook and L.R.S. Thiago, 1988. Factors affecting the voluntary intake of roughages by the dairy cow. In: Nutrition and lactation in the dairy cow, (P.C. Gams-worthy, Ed.), Butterworth, London, p. 262-279.
Grovum W.L. and V.J. Williams, 1973. Rate of passage of digesta in sheep. Br.J.Nutr. 30:313-329.
Grovum, W.L., 1987. A new look at what is controlling feed intake. In : F.N. Owens (Ed.), Feed intake by beef cattle. Proceedings Symposium: Feed intake by beef cattle, Nov.20-22 1986, An.Sci.Dept., Oklahoma State Univ. p. 1-39.
135
Hartnell G.F. and L.D. Satter, 1979. Determination of rumen fill, retention time and ruminai turnover rates of ingesta at different stages of lactation in dairy cows. J.Anim.Sci. 48:381-392.
Kennedy, P.M. and D.P. Poppi, 1984. Critical particle size in sheep and cattle. In: P.M. Kennedy (ed.), Techniques in particle size analysis of feed and digesta in ruminants. Canadian Society of Animal Science, occasional publication no. I, Edmonton.
Kotb, A.R. and T.D. Luckey, 1972. Markers in nutrition. Nutrition abstracts and reviews 42:813-845.
Krishnamoorthy, U., T.V. Muscato, C.J. Sniffen and P.J. van Soest, 1982. Nitrogen fractions in selected feedstuffs. J.DairySci. 65:217-225.
Mehrez, A.Z. and E.R. 0rskov, 1977. A study of the artificial fibre bag technique for determining the digestibilityof feeds in the rumen. J.Agric.Sci. 88:645-650.
Mertens, D.R. and L.O. Ely, 1979. A dynamic model of fiber digestion and passage in the ruminant for evaluating forage quality. J.Anim.Sci. 49:1085-1095.
Mertens, D.R., 1987. Predicting intake and digestibility using mathematical models of ruminai function. J.Anim.Sci. 64:1548-1558.
Poppi, D.P., B.W. Norton, D.J. Minson and R.E. Hendricksen, 1980. The validity of the critical size theory for particles leaving the rumen. J.Agric.Sci.Camb. 94:275-280.
Poppi, D.P., D.J. Minson and J.H. Ternouth, 1981. Studies of cattle and sheep eating leaf and stem fractions of grasses. Ill The retention time in the rumen of large feed particles. Aust.J.Agric.Sci. 32:123-137.
Shaver, R.D., A.J. Nytes, L.D. Satter and N.A. Jorgensen, 1986. Influence of amount of feed intake and forage physical form on digestion and passage of prebloom alfalfa hay in dairy cows. J.Dairy Sei. 69:1545-1559.
Shaver, R.D., L.D. Satter and N.A. Jorgensen, 1988. Impact of forage fiber content on digestion and digesta passage in lactating dairy cows. J.Dairy Sei. 71:1556-1565.
Spragg, J.C., R.C. Kellaway and J. Leibholz, 1986. Effects of supplements on intake, rumen function and nutrient supply and growth in cattle eating alkali-treated oat straw. Br.J.Nutr. 56:478-495.
Sutherland, T.M., 1987. Particle separation in the forestomachs of sheep. In: Aspects of digestive physiology in ruminants, pp.43-7'3 (A. Dobson, editor). Ithaca: Cornell University Press.
136
Tamminga, S., R. Ketelaar and A.M. van Vuuren, 1990. Degradation of N in conserved forages in the rumen of dairy cows. Crass and Forage Sei., in press.
Ulyatt, M.J., D.W. Dellow, A. John, C.W.S. Reid and G.C. Waghorn, 1986. Contribution of chewing during eating and rumination to the clearance of digesta from the ruminoreticulum. In : Control of Digestion and Metabolism in Ruminants, Ed. by L.P. Milligan, W.L. Grovum and A. Dobson.
Van Bruchem, J., F. Kamphuis, I. Janssen, S.C.W. Lammers, G.A. Bangma and J. Van den Hoek, 1990. Tritiated hay and Cr mordanted NDF as particulate markers for digesta kinetics in the reticulorumen. Neth. J.Agric. Sei. 38:1-8.
Van Soest, P.J., 1982. Nutritional ecology of the ruminant. O&B Books Inc., Corvallis, OR.
Waghorn, G.C., 1986. Changes in rumen digesta of cows during a restricted feeding period when offered fresh clover, lucerne, or lucerne hay. New Zealand J.Agric.Res. 29:233-241.
Waghorn, G.C, I.D. Shelton and V.J. Thomas, 1989. Particle breakdown and rumen digestion of fresh ryegrass (Lolium perenne L. ) and lucerne (Medicago sativa L. ) fed to cows during a restricted feeding period. Br.J.Nutr. 61:409-423.
Weston, R.H. , 1982. Animal f a c t o r s a f f e c t i n g i n take . In: Nutritional limits to animal production from pastures. Proceedings of an international symposium held at St Lucia, Queensland Australia, 1981. Ed. J.B. Hacker.
137
Summary
139
Because of the introduction of a milk quota system in 1984 and
the subsequent decrease of the number of dairy cows with some
25%, an increasing number of farms in the Netherlands has a
surplus of grass and grass silage, which makes it interesting to
increase the roughage proportion in the diet. However, roughage
intake by dairy cows in early lactation is limited and the
mechanisms controlling roughage intake are still insufficiently
understood. Factors presumably influencing roughage intake are
the volume of the feed, the rate of physical size reduction,
degradation rate in the rumen, passage rate of undigested
particles from the rumen and the removal of fermentation end
products.
In literature, the results of various experiments are reported
in which one or a few of these factors, though not all together
in an integrated system, were studied. Therefore, in the
experiments described in this thesis, the effect of stage of
maturity of grass silages on intake, digestibility, rumen
fermentation pattern, rumination activity, passage rate from the
rumen, degradation rate of the potentially degradable fractions
and composition of the rumen contents was studied in an
integrated approach.
Four experiments with lactating dairy cows fed grass silages
harvested at different growth stages ad libitum and a fixed
amount of concentrates, 1 or 7 kg depending on stage of latation,
were performed.
When grasses matured, the chemical composition changed, the
cell wall content (Neutral Detergent Fibre) of the silages and
the lignin content of the cell wall fraction increased while
crude protein (CP) content decreased. Together with this change
in composition, the degradation characteristics changed. The
soluble fraction (fs,%), which is supposed to be fully and
rapidly degraded in the rumen decreased, the rumen undegradable
fraction (residue after 336 h nylon bag incubation, fR, %)
increased whereas the rate of degradation of the degradable,
non-soluble fraction (kd, %h"1) decreased. This resulted in a
decrease in digestibility of the silages (Chapter II). Of the CP
140
fraction of the silages, fs as well as fR increased with an
increase in cell wall content of the silages. The soluble
fraction of the CP was more closely related to the DM content
than to the NDF content of the silages. The fs-CP decreased with
an increase in DM content of the silage. Rate of degradation of
the CP decreased, as for the other components, with an increase
in cell wall content. Thus, the fraction of dietary protein
escaping rumen fermentation increased with an increase in cell
wall content, mainly because of the higher undegradable fraction.
The latter fraction, however, is also not digestible in the
intestines. Thus, the fraction of dietary protein escaping rumen
fermentation and digestible in the intestines was presumably
higher for the low cell wall silages (Chapter V ) .
Milk production (g Fat Corrected Milk/kg Metabolic Body Weight)
and the amount of concentrates consumed (g/kg BW) together
explained 64% of the variation in silage dry matter (DM) intake.
Silage DM intake decreased with an increase in concentrate
intake. A significant contribution to the explanation of
variation in intake was given by the N/OM ratio in the silage and
the fR. The addition of these factors increased the percentage of
the variation in silage DM intake explained to 68% (Chapter II).
The pH in the rumen declined with an increase in concentrate
intake, whereas VFA concentrations increased. Diurnal variations
in ammonia concentrations were higer for the high concentrate
level, but the average ammonia concentrations were lower for the
high concentrate level (Chapter IV).
Chewing and rumination time were recorded for six 24 h periods
per cow. When rumination time (RT) exceeded 9 h a day, an
increase in cell wall content of the silages did not result in
a further increase in RT, but in a decrease in intake. RT per kg
silage DM ingested increased with an increase in NDF content of
the silages, whereas RT per kg silage NDF tended to decrease.
Average size of particles in the rumen increased with maturity
of the silages, resulting in an increased faecal particle size
(Chapter IV).
Total rumen contents (kg) and rumen DM contents (kg) increased
when the proportion of concentrates in the diet increased, but
141
no significant relation with cell wall content of the silages was
found. Passage rate of the fluid from the rumen was not affected
by diet composition. Rate of passage of undigested particles from
the rumen, calculated from the logarithmic decline in faecal
marker excretion, increased with an increase in NDF content of
the silages and with an increase in intake level (Chapter III).
In these experiments, it was concluded that the marker used to
measure particle passage rate, Cr mordanted NDF, was not
representative for total rumen contents. Cr-NDF particles with
a size of 0.2-lmm do not have to be reduced in size, but it was
calculated that not even they could be representative for
particles with a size able to leave the rumen. Therefore an
experiment was conducted in which three different particle sizes
of Cr-NDF (<0.3 mm, 0.6-1.0 mm and 15-25 mm) were used to
determine particle passage rate. In this experiment, 3 lactating
and 3 non-lactating dairy cows were fed grass silage ad libitum,
with 7 or 1 kg of concentrates, respectively. No significant
differences between lactating and non-lactating cows were found,
but rate of passage decreased with an increase in Cr-NDF particle
size. Passage rate of the smallest particles (<0.3 mm) was
considerably lower than passage rate of the fluid phase. The size
of the particulate marker has a great influence on the calculated
passage rates (Chapter IV).
Kinetics of rumen particles are considered to be important in
intake regulation, but the rate limiting step in reduction in
rumen fill was still not identified. In an experiment with four
dry rumen fistulated cows, rumen contents and rates of
disappearance of different ruminai fractions were determined
(Chapter VII). The cows were fed ad libitum grass silages,
differing in cell wall content. Ruminai passage rates were
calculated from the logarithmic decline in rumen Cr pool, as well
as by dividing the intake of undegradable organic matter (iOM)
or indigestible acid detergent fibre (iADF) by the mean rumen
pool of these fractions. The thus calculated passage rates using
the pools of iOM or iADF were much lower than using the Cr-NDF
(particle size 0.2-1 mm), but the differences between silages
142
were comparable.
Particle size distributions of rumen contents, collected at
different times after feeding were determined. The iADF content
of particles passing a 1.25 mm, but retained on a 0.071 mm sieve
was determined. From the results of this experiment it was
concluded that clearance rate of particles with a size between
1.25 mm and 0.071 mm is the rate limiting step in reduction in
rumen fill, which in turn seems to depend on the degree of
digestion.
In the General Discussion (Chapter VIII), the results from
these experiments were combined with literature data on rumen
fill and clearance rate from the rumen. Multiple regression
analysis showed that milk yield and concentrate proportion of the
diet explained 77% of the variation in rumen fill. Roughage
characteristics did not have a significant influence on rumen DM
fill. Rate of clearance, however, significantly decreased with
an increase in roughage NDF content. Rumen fill and rate of
clearance were not significantly correlated.
From this study it may be concluded that important factors such
as intake, digestibility and milk production all three were
negatively influenced by an increase in silage cell wall content.
When intake is not limited by the capacity of the rumen, as for
the dry cows in the experiment described in chapter VII, intake
increases with an increase in silage cell wall content.
143
Samenvatting
145
Vanwege de invoering van de superheffing in 1984 en de, als
gevolg daarvan, afname van het aantal melkkoeien met ongeveer
25%, is in Nederland op een toenemend aantal bedrijven een
overschot aan gras en grassilages ontstaan. Om deze reden is het
interessant om het ruwvoer aandeel in de rantsoenen te verhogen.
In het begin van de lactatie is de ruwvoeropname door melkkoeien
echter beperkt, en de mechanismen waardoor de ruwvoeropname
bepaald wordt zijn nog niet geheel bekend. Factoren die mogelijk
een invloed op de ruwvoeropname hebben zijn het volume van het
voer, de snelheid van voerdeeltjes-verkleining, de microbiële
afbraaksnelheid in de pens, de passage snelheid van onverteerde
voerdeeltjes uit de pens en de snelheid waarmee de eindprodukten
van de fermentatie worden afgevoerd.
In de literatuur worden vele proeven gerapporteerd waarin één
of enkele van deze factoren onderzocht werden, doch niet allen
tezamen in een geïntegreerd systeem. Daarom zijn in de proeven
beschreven in dit proefschrift, de effecten van het groeistadium
van grassilages op opname, vertering, pensfermentatie patroon,
herkauwaktiviteit, passage snelheid uit de pens, afbraaksnelheid
van de potentieel verteerbare fractie in de pens en samenstelling
van de pensinhoud onderzocht in een geïntegreerd systeem.
Vier proeven met lacterende koeien, ad libitum gevoerd met
grassilages geoogst in verschillende groeisatdia, en een
gefixeerde hoeveelheid krachtvoer, 1 of 7 kg, afhankelijk van
lactatiestadium, werden uitgevoerd.
Bij het ouder worden van het gras veranderde de chemische
samenstelling. Het celwandgehalte (Neutral Detergent Fibre) en
het lignine gehalte in de celwandfractiename toe, en het ruw
eiwitgehalte (CP) nam af. Met deze verandering in samenstelling
veranderden ook de afbraak krakteristieken. De oplosbare fractie
(fs, % ) , waarvan aangenomen wordt dat ze volledig en snel in de
pens wordt afgebroken, daalde. De in de pens onverteerbare
fractie (residu na 336 uur incubatie in de pens in nylon zakjes,
fR, %) nam toe en de afbraaksnelheid van de verteerbare, niet
oplosbare fractie (kd, %h'1) nam af. Dit resulteerd in een daling
van de verteerbaarheid van de silages (Hoofdstuk II). Van de ruw
146
eiwitfractie van de silages, de fs zowel als de fR, namen toe met
een toename van het celwand-gehalte van de silages. De oplosbare
fractie van het ruw eiwit was meer gerelateerd aan het droge stof
(DM) gehalte dan aan het NDF gehalte van de silages. De fs-CP nam
af met een toename van het DM gehalte van de silages.
Afbraaksnelheid van ruw eiwit nam, evenals voor de andere
componenten, af met een toename in het celwandgehalte. De fractie
van het voereiwit die aan fermentatieve afbraak in de pens
ontsnapte, nam toe met een toename van het celwandgehalte, vooral
vanwege de grotere onverteerbare fractie. De in de pens
onverteerbare fractie is echter ook in de dunne darm niet
verteerbaar. Het aandeel van het voereiwit dat aan fermentâtie
ontsnapt en verteerbaar is in de darm was dus hoger voor de
silages met de lagere celwandgehalten (Hoofdstuk V).
Melkproduktie (g meetmelk/kg metabool gewicht) en de hoeveelheid
opgenomen krachtvoer (g/kg lichaamsgewicht) samen verklaarden 64%
van de variatie in DM opname uit silage. De droge stof opname uit
silage nam af met een toename in de krachtvoeropname. De hoeveel
heid stikstof in de organische stof in de silages en de fR,
droegen beide significant bij aan de verklaring van de variatie
in DM opname uit silage. Een toevoeging van deze factoren
verhoogde het percentage van de variatie in DM opname uit silage
dat door het model verklaard werd naar 68% (Hoofdstruk II).
De pH in de pens daalde met een toename in krachtvoeropname,
terwijl de concentratie aan vluchtige vetzuren in de pens toenam.
De dagelijkse variaties in de ammoniak concentraties in de pens
waren hoger, maar de gemiddelde concentraties waren lager voor
het hoge krachtvoer niveau dan voor het lage krachtvoer niveau
(Hoofdstuk IV).
Kauw- en herkauwtijden werden geregistreerd gedurende 6 x 24
uur per koe. Wanneer er langer dan 9 uur per dag herkauwd werd,
resulteerde een toename in het celwandgehalte van de silages niet
in een verdere stijging van de herkauwtijden, maar in een daling
van de opname. Herkauwtijden per kg opgenomen DM uit silage name
toe met een toename in het celwandgehalte. Per kg opgenomen
celwanden werd er echter een dalende tendens in herkauwtijden
waargenomen.
147
De gemiddelde deeltjesgrootte in de pens nam toe met het ouder
worden van het gras, wat resulteerde in een toename van de
deeltjesgrootte in de mest (Hoofdstuk IV).
De totale pensinhoud (kg) en de DM inhoud (kg) namen toe
wanneer het krachtvoeraandeel in het rantsoen toenam, maar er
werd geen significante relatie met het celwandgehalte van de
silages gevonden. Passagesnelheid van de vloeistof uit de pens
werd niet beinvloedt door de samenstelling van het rantsoen.
Passagesnelheid van onverteerde voerdeeltjes, berekend uit de
logaritmische afname van de mestconcentratie van de indicator,
steeg met een toename in celwandgehalte van de silages en met een
toename in opnameniveau (Hoofdstuk III).
In deze proeven werd geconcludeerd dat de indicator, gebruikt om
de passage van de deeltjes te meten (Cr-NDF) , niet representatief
was voor de gehele pensinhoud. Cr-NDF deeltjes, met een grootte
van 0.2-lmm behoeven niet verkleind te worden, maar uit
berekeningen bleek dat zij zelfs niet representatief konden zijn
voor deeltjes die gezien hun grootte de pens konden verlaten.
Daarom werd een proef uitgevoerd waarin Cr-NDF met drie
verschillende deeltjesgroottes (<0.3 mm, 0.6-1.0 mm and 15-25 mm)
gebruikt werd om de snelheid van deeltjespassage te bepalen. In
deze proef werden drie lacterende en drie droge koeien ad libitum
gevoerd met grassilage, gesupplementeerd met respectievelijk 7
en 1 kg krachtvoer. Er werd geen verschil gevonden in passage
snelheid van deeltjes tussen lacterende en droge koeien. De
snelheid van passage nam af met een toename van de
deeltjesgrootte van het Cr-NDF. De passage van de kleinste
deeltjes (<0.3 mm) was echter nog aanzienlijk langzamer dan van
de vloeistof. De deeltjesgrootte van de indicator heeft een grote
invloed op de berekende passage snelheid (Hoofdstuk VI).
Het is algemeen aanvaard dat de kinetiek van de deeltjes in de
pens een grote invloed heeft in de opnameregulatie. Wat de
beperkende factor is in de afname van de pensinhoud is echter nog
niet bekend. In een proef met vier droge koeien, werden de
pensinhouden en de verdwijningssnelheden van de verschillende
fracties uit de pens bepaald (Hoofdstuk VII). De dieren werden
148
ad libitum gevoerd met grassilages met verschillende celwand-
gehalten. De passagesnelheid uit de pens werd berekend uit de
logaritmische afname in Cr hoeveelheid in de pens. Door de opname
aan onverteerbare organische stof (iOM) of onverteerbare
celwandbestanddelen (iADF) te delen door de gemiddelde penspool
van deze fracties, werden de passage-snelheden eveneens berekend.
De op deze laatste manier berekende passagesnelheden waren
aanzienlijk lager dan de uit de Cr (deeltjesgrootte 0.2-1 mm)
afname berekende waarden, hoewel de verschillen tussen de silages
vergelijkbaar waren.
Van pensinhouden verzameld op verschillende tijden na voeren werd
de deeltjesgrootte verdeling bepaald. Het iADF gehalte van
deeltjes >0.071mm, en <1.25mm, werd bepaald. Uit de resultaten
van deze proef werd geconcludeerd dat verdwijnings-snelheid van
deeltjes met een grootte tussen 0.071 en 1.25 mm de beperkende
factor is in de afname van de pensinhoud. De afname van de
pensinhoud hangt eveneens af van de mate van verteerd zijn van
de deeltjes.
In de General Discussion (Hoofdstuk VIII) worden de gegevens
uit deze proeven gecombineerd met gegevens uit de literatuur
omtrent pensinhoud en verdwijningssnelheid uit de pens. Multipele
regressie analyse toonde aan dat melk produktie en krachtvoer
aandeel in het rantsoen, 77% van de variatie in pensinhoud konden
verklaren, kenmerken van het ruwvoer hadden geen significante
invloed op pensinhoud. Verdwijningssnelheid echter, nam
significant af met een toename van het celwandgehalte van het
ruwvoer. Pensinhoud en verdwijningssnelheid waren niet
significant gecorreleerd.
Uit deze studie kan geconcludeerd worden dat belangrijke
factoren, zoals opname, vertering en melkproduktie alle drie
negatief beïnloed worden bij een toename in het celwandgehalte
van grassilage. Indien de opname niet beperkt wordt door de
capaciteit van de pens, zoals voor de droge koeien in de proef
beschreven in Hoofdstuk VII, neemt de opname toe met een toename
van het celwandgehalte van grassilages.
149
Curriculum vitae
Maria Wilhelmina Bosch werd op 1 februari 1960 geboren te Hulst.
Zij behaalde in 1978 het Atheneum-B diploma aan het Jansenius
Lyceum te Hulst. In september van datzelfde jaar begon zij met
haar studie Zöotechniek aan de toenmalige Landbouw-hogeschool te
Wagenningen. In juli 1985 behaalde zij het doctoraalexamen, met
Veevoeding en Dierfysiologie als hoofdvakken en Agrarische
Bedrijfseconomie als bijvak. Op 1 september 1985 werd zij
aangesteld bij de vakgroep Fysiologie van Mens en Dier als
universitair docent in tijdelijke dienst, en werkte zij o.a. aan
het onderzoek wat resulteerde in dit proefschrift. Van 1 oktober
1989 tot 15 februari 1991 was zij werkzaam als veevoedkundig
onderzoeker bij TNO afdeling ILOB. Sinds 15 februari 1991 is zij
werkzaam als universitair docent bij de vakgroep Veevoeding van
de Landbouwuniversiteit.
150