IMF Staf Report
37
© 2010 International Monetary Fund September 2010 IMF Country Report No. 10/295 September 10, 2010 September 15, 2010 January 29, 2001 January 29, 2001 January 29, 2001 Pakistan: Use of Fund Resources—Request for Emergency Assistance—Staff Report; Press Release on the Executive Board Discussion; and Statement by the Executive Director for Pakistan. In the context of the use of fund resources—request for emergency assistance, the following documents have been released and are included in this package: The staff report for the Use of Fund Resources—Request for Emergency Assistance, prepared by a staff team of the IMF, following discuss ions that ended on September 3, 2010, with the officials of Pakistan on economic developments and policies. Based on information available at the time of these discussions, the staff report was completed on September 10, 2010. The views expressed in the staff report are those of the staff team and do not necessarily reflect the views of the Executive Board of the IMF. A Press Release summarizing the views of the Executive Board as expressed during its September 15, 2010 discussion of the staff report that completed the request and/or review. A statement by the Executive Director for Pakistan. The document listed below has been or will be separately released. Letter of Intent sent to the IMF by the authorities of Pakistan* *Also included in Staff Report The policy of publication of staff reports and other documents allows for the deletion of market-sensitive information. Copies of this report are available to the public from International Monetary Fund Publication Services 700 19 th Street, N.W. Washington, D.C. 20431 Telephone: (202) 623-7430 Telefax: (202) 623-7201 E-mail: [email protected] Internet: http://www.imf.org International Monetary Fund Washington, D.C.
-
Upload
mehtaz-sultan-khan -
Category
Documents
-
view
224 -
download
0
Transcript of IMF Staf Report
8/8/2019 IMF Staf Report
http://slidepdf.com/reader/full/imf-staf-report 1/36
© 2010 International Monetary Fund September 2010
IMF Country Report No. 10/295
September 10, 2010 September 15,
2010
January 29, 2001
January 29, 2001 January 29, 2001
Pakistan: Use of Fund Resources—Request for Emergency Assistance—Staff Report;Press Release on the Executive Board Discussion; and Statement by the Executive
Director for Pakistan.
In the context of the use of fund resources—request for emergency assistance, the following
documents have been released and are included in this package:
The staff report for the Use of Fund Resources—Request for Emergency Assistance, prepared
by a staff team of the IMF, following discussions that ended on September 3, 2010, with the
officials of Pakistan on economic developments and policies. Based on information available
at the time of these discussions, the staff report was completed on September 10, 2010. The
views expressed in the staff report are those of the staff team and do not necessarily reflect
the views of the Executive Board of the IMF.
A Press Release summarizing the views of the Executive Board as expressed during its
September 15, 2010 discussion of the staff report that completed the request and/or review.
A statement by the Executive Director for Pakistan.
The document listed below has been or will be separately released.
Letter of Intent sent to the IMF by the authorities of Pakistan*
*Also included in Staff Report
The policy of publication of staff reports and other documents allows for the deletion of market-sensitive
information.
Copies of this report are available to the public from
International Monetary Fund Publication Services
700 19th Street, N.W. Washington, D.C. 20431
Telephone: (202) 623-7430 Telefax: (202) 623-7201E-mail: [email protected] Internet: http://www.imf.org
International Monetary Fund
Washington, D.C.
8/8/2019 IMF Staf Report
http://slidepdf.com/reader/full/imf-staf-report 2/36
INTERNATIONAL MONETARY FUND
PAKISTAN
Use of Fund Resources—Request for Emergency Assistance
Prepared by the Middle East and Central Asia Department
(In consultation with other departments)
Approved by Alfred Kammer and James Roaf
September 10, 2010
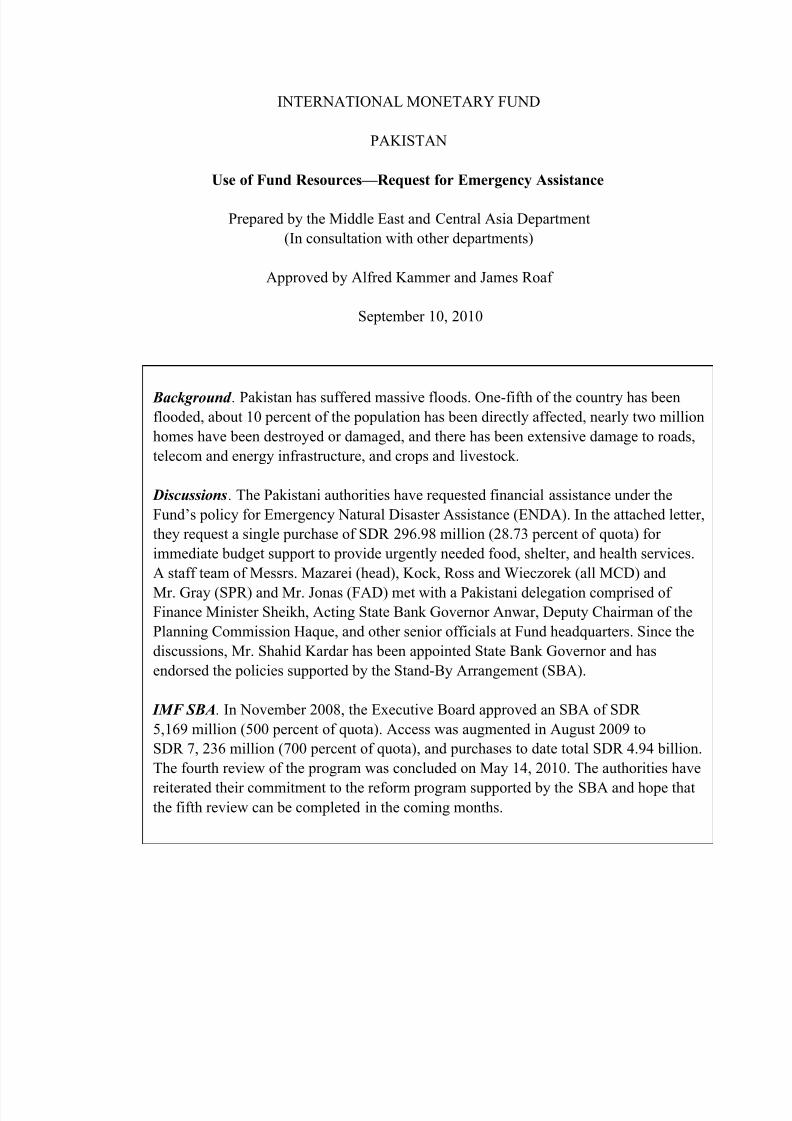
Background .
Pakistan has suffered massive floods. One-fifth of the country has beenflooded, about 10 percent of the population has been directly affected, nearly two million
homes have been destroyed or damaged, and there has been extensive damage to roads,
telecom and energy infrastructure, and crops and livestock.
Discussions. The Pakistani authorities have requested financial assistance under the
Fund’s policy for Emergency Natural Disaster Assistance (ENDA). In the attached letter,
they request a single purchase of SDR 296.98 million (28.73 percent of quota) for
immediate budget support to provide urgently needed food, shelter, and health services.
A staff team of Messrs. Mazarei (head), Kock, Ross and Wieczorek (all MCD) and
Mr. Gray (SPR) and Mr. Jonas (FAD) met with a Pakistani delegation comprised of Finance Minister Sheikh, Acting State Bank Governor Anwar, Deputy Chairman of the
Planning Commission Haque, and other senior officials at Fund headquarters. Since the
discussions, Mr. Shahid Kardar has been appointed State Bank Governor and has
endorsed the policies supported by the Stand-By Arrangement (SBA).
IMF SBA. In November 2008, the Executive Board approved an SBA of SDR
5,169 million (500 percent of quota). Access was augmented in August 2009 to
SDR 7, 236 million (700 percent of quota), and purchases to date total SDR 4.94 billion.
The fourth review of the program was concluded on May 14, 2010. The authorities have
reiterated their commitment to the reform program supported by the SBA and hope thatthe fifth review can be completed in the coming months.
8/8/2019 IMF Staf Report
http://slidepdf.com/reader/full/imf-staf-report 3/36
2
Contents Page
Executive Summary .......................................................................................................................... 3
I. Introduction ................................................................................................................................... 4
II. Performance Prior to the Floods ................................................................................................... 5
III. The Impact of the Floods ............................................................................................................ 7
IV. The Authorities’ Response and the Need for Assistance............................................................ 9
V. Access and Capacity to Repay ................................................................................................... 11
VI. Staff Appraisal .......................................................................................................................... 11
Text Table
1. Macroframework 2009/10–2010/11 ......................................................................................... 8
Figures1. Selected Economic Indicators ................................................................................................. 13
2. Financial Market Indicators .................................................................................................... 14
3. Real and External Sectors, 2006/07–2010/11 ......................................................................... 15
4. Fiscal Policy Indicators, 2007/08–2010/11 ............................................................................ 16
Tables1. Selected Economic Indicators, 2008/09–2010/11................................................................... 17
2. Balance of Payments, 2008/09–2010/11................................................................................. 18
3a. Consolidated Government Budget, 2008/09–2010/11 (in billions of Pakistani rupees) ........ 19
3b. Consolidated Government Budget, 2008/09–2010/11 (in percent of GDP) ........................... 20
4. Monetary Survey and Analytical Balance Sheet of the State Bank of Pakistan,
2007/08–2010/11 ................................................................................................................ 21
5. Medium-Term Macroeconomic Framework, 2007/08–2014/15 ............................................ 22
6. Indicators of Fund Credit, 2008/09–2015/16 .......................................................................... 23
Appendix
I. Relations with the Fund .............................................................................................................. 24
Attachment
I. Letter of Intent ........................................................................................................................ 27
8/8/2019 IMF Staf Report
http://slidepdf.com/reader/full/imf-staf-report 4/36

8/8/2019 IMF Staf Report
http://slidepdf.com/reader/full/imf-staf-report 5/36
4
I. INTRODUCTION
1. The floods in Pakistan are a natural disaster of massive proportions. Large parts of
the country—from Gilgit-Baltistan and Kashmir, through Khyber Pakhtunkhwa province and
all along the Indus River through Punjab and Sindh—are flooded. Eighteen million people
(over 10 percent of the population) have been directly affected. Although the number of casualties is much lower than in the 2005 earthquake, the damage to economic infrastructure
and private property is much larger.1 1.8 million homes have been destroyed or damaged and
there is extensive damage to roads, telecom and energy infrastructure, and crops and
livestock. Precise estimates are not yet available, but it is clear that the costs arising from
the floods (for humanitarian relief and reconstruction) will be in the billions of dollars.2
2. Beyond the immediate humanitarian impact, the floods will likely have a
significant implication for growth, the balance of payments, and public finances.
Preliminary estimates suggest a considerable loss of output. The overall impact will critically
depend on how the floods will affect agricultural output along the Indus and its tributaries
(a 10 percent decline in agricultural output would reduce GDP by over 2 percent). Floods are
also disrupting trade, with exports and imports being held up in ports, and electricity
production as fuel cannot be delivered to power plants. Public finances are affected with
lower revenue collections and higher outlays for needed humanitarian assistance. A revision
of the 2010/11 budget will be necessary.
3. The Pakistani authorities request financial assistance under the Fund’s policy for
Emergency N atural Disaster Assistance (E N DA). In the attached letter, they request a single
purchase of SDR 296.98 million (28.73 percent of quota) for immediate budget support.3 The
assistance will be used to provide urgently needed food, shelter, and health services.
Financial assistance from the IMF will help meet these financing needs of the government
without over-burdening domestic financial markets and depleting foreign exchange reserves,
and encourage financing from other sources. In the attached letter, the authorities reiterate
their commitment to the reform program supported by the Stand-By Arrangement (SBA) and
hope that the fifth review can be completed in the coming months.
1 The main sources for information on the disaster and donors’ emergency relief responses are the UN Officefor the Coordination of Humanitarian Affairs (www.pakresponse.info/index.php) and the Pakistan Federal
Flood commission (www.ffc.gov.pk/lood).2 The World Bank estimates that damage to crops alone is at least US$1 billion. Researchers at Ball State Universityestimate damage to buildings, content, agriculture assets and transportation infrastructure at US$5.1–7.1 billion(www.cms.bsu.edu/Academics/CentersandInstitutes/BBR/CurrentStudiesandPublications.aspx).
3 A Memorandum of Understanding between the SBP and the ministry of finance clarifies the treatment of Fundresources for budgetary support, including the ministry of finance’s responsibility for meeting debt servicecharges. The authorities are regularly reporting on balances outstanding at the SBP for budgetary financing.
8/8/2019 IMF Staf Report
http://slidepdf.com/reader/full/imf-staf-report 6/36
5
II. PERFORMANCE PRIOR TO THE FLOODS
4. Before the floods, growth was picking up, but inflation was high and persistent .
Provisional estimates indicate real GDP growth of 4 percent in 2009/10, led by large-scale
manufacturing, which grew 5 percent annually. In 2009/10 annual average inflation was
11.7 percent, end-period headline inflation 12.7 percent, and core inflation 10.4 percent(broadly unchanged since January).4 Based on these developments, prior to the floods, staff
had projected a GDP growth rate of 4¼ percent and an annual inflation rate of 11.5 percent
for 2010/11.
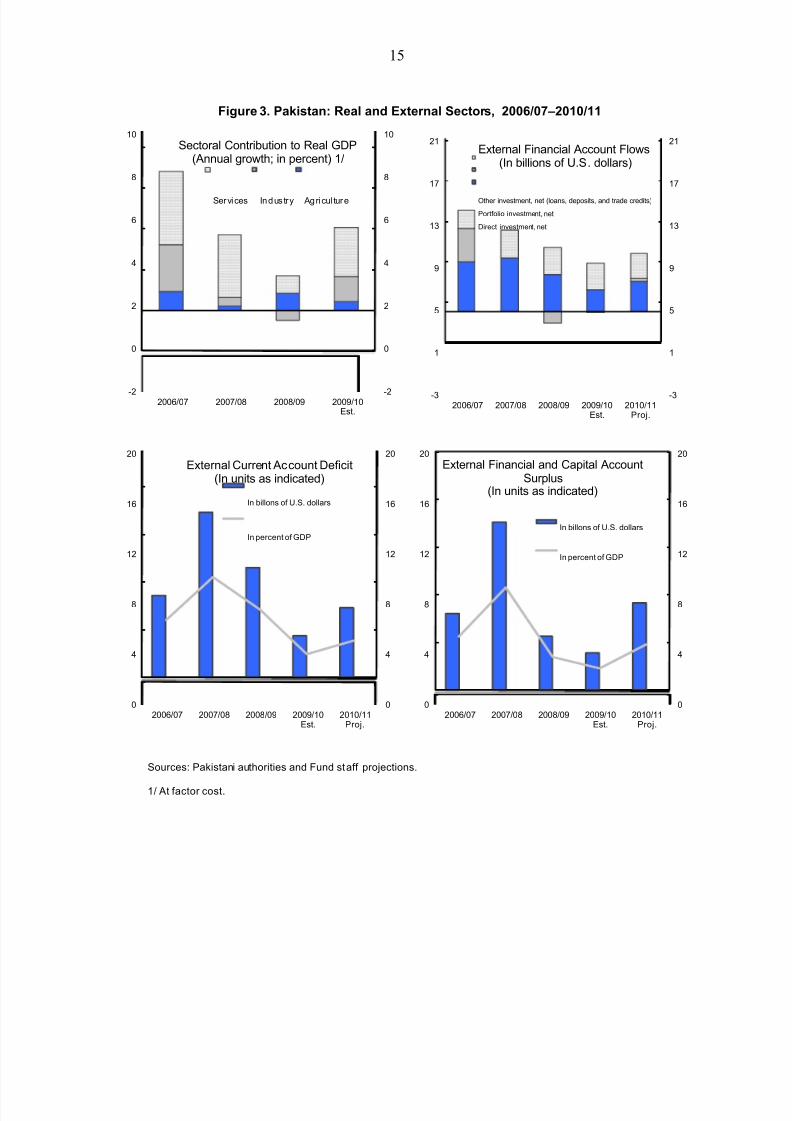
5. Official reserves had increased and the nominal exchange rate remained stable.
The current account deficit narrowed sharply to US$3.5 billion in 2009/10 (2 percent of
GDP) due to a sharper-than-expected import compression, a continued rebound in exports,
and continued growth of remittances. The smaller current account deficit offset lower than
expected FDI due to delays in privatization, and large shortfalls in official capital inflows.
Official reserves rose to about US$13 billion at end-June (compared with a projectedUS$13.5 billion), but the net foreign assets position of the State Bank of Pakistan (SBP)
remained weak at US$5.9 billion, the equivalent of 1.7 months of import cover. The
exchange rate was 85–86 rupee per dollar in May–July and the real exchange rate has
appreciated.
6. The 2009/10 budget deficit target was missed by a significant margin. The deficit
(excluding grants) reached 6.3 percent of GDP compared to an unadjusted target of
5.1 percent of GDP. Lower revenue and higher provincial spending contributed equally
(0.6 percent of GDP each) to the deficit overrun. Tax revenue was about 0.3 percentage
points of GDP lower than projected, in part related to reorganization of the tax administration
and court appeals by taxpayers. Nontax revenue also fell short of target due to lower
dividends and profit transfers. While federal spending was tightly controlled and ended up
slightly lower than projected, provincial spending—both current and development
spending—accelerated at year’s end, resulting in an overrun. Meanwhile, the shortfall in
foreign financing (including privatization receipts) caused the adjusted program deficit target
to tighten by 0.5 percent of GDP to 4.6 percent of GDP; as a result, the margin of
nonobservance was 1.7 percent of GDP. The end-June target on government borrowing from
the SBP was missed by 0.3 percent of GDP and shortfalls in donor financing meant the
ministry of finance was unable to repay to the SBP part of the IMF bridge loan, which at end-
June was US$400 million higher than programmed.5
4 In July 2010, year-on-year headline and core inflation declined to 12.3 and 10.3 percent, respectively.
5 Part of the third, fourth, and fifth purchases under the SBA were available for budget financing in 2009/10to meet urgent spending needs (for internally displaced persons and social spending) and were originallyenvisaged to be repaid by the budget to the SBP as disbursements of the pledges, made at the Tokyo donorsconference in April 2009, were received.
8/8/2019 IMF Staf Report
http://slidepdf.com/reader/full/imf-staf-report 7/36
6
7. The 2010/11 approved federal budget targeted a general government deficit of
4 percent of GDP and the authorities immediately implemented a number of measures.
On July 1, they raised the general sales tax (GST) rate by 1 percentage point to 17 percent.
In addition, they have taken measures to boost the collection of excise and direct taxes that
include the withdrawal of capital gains tax exemptions and an increase in the federal excise
duty on cigarettes, natural gas, and some other items. Savings on the spending side includecuts in subsidies and a nominal freeze in federal current spending.
8. The further devolution of revenue and spending to provinces has increased the
importance of provincial fiscal discipline. The share of tax revenues distributed to provinces
rose significantly in 2010/11 under the Seventh National Finance Commission Award. As
spending responsibilities have not yet been transferred, the federal budget expected provinces
to save most of the additional funds and run surpluses this fiscal year. However, their
approved budgets targeted a small deficit and implied a consolidated general government
would reach a deficit of 5 percent of GDP, one percentage point higher than targeted. During
a staff visit in July, measures were discussed with the authorities to ensure the deficit targetof 4 percent of GDP could be met.
9. The prompt introduction of a broad-based VAT (reformed GST) remains a central
plank of the authorities’ strategy to boost tax revenues. The authorities believe it politically
easier to reform the GST to include the substantive features of the VAT (broader base,
reduced exemptions, and input crediting) rather than introducing a VAT. Following intensive
negotiations with the provinces, an agreement has been reached in principle on the allocation
of revenues of a reformed GST on services. A decision has yet to be made on the exact
modalities of the introduction of the reformed GST. Fund and Bank staffs are actively
discussing these modalities with the ministry of finance and the Federal Board of Revenue(FBR).
10. Efforts continue to improve tax administration to make it taxpayer-friendly and
improve compliance. A new annual tax audit plan for FY 2010/11 has been approved.
Following the review of experience with tax audits that started last year, the authorities are
now moving to risk-based selection criteria. The SBP, together with the FBR, have finalized
the design of the Electronic Payment and Refund System that would allow electronic
payment of taxes and crediting of refunds by the FBR.
11. Monetary policy was tightened in late July. On July 30, the SBP announced an
increase in its policy rate by 50 basis points to 13 percent (with effect from August 2). Theaccompanying monetary policy statement noted concerns about inflation, fiscal imbalances,
8/8/2019 IMF Staf Report
http://slidepdf.com/reader/full/imf-staf-report 8/36
7
lower than expected inflows from external sources, and weak revenue. Growth of bank credit
to the private sector remains weak at 4½ percent y-o-y as of August 21.
12. Financial Soundness Indicators through end-March 2010 deteriorated .
Nonperforming loans (NPLs) increased from 12.2 percent at end-December 2009 to
13.1 percent at end-March 2010. Further, the risk-weighted capital-to-assets ratio declinedfrom 14.1 to 13.7 percent. An increase in the net NPL-to-capital ratio prompted the SBP to
contemplate tightening provisioning requirements, especially in systemically important
banks. At the same time, due to the increasing share of t-bills in banks’ portfolios, bank
liquidity remains high and return on assets and equity has improved.
13. Electricity reform has been delayed . The tariff increase on July 1 was larger than
planned earlier (7.6 rather than 6 percent) to help offset the financial impact of the three-
month delay. Discussions on a comprehensive reform strategy for the electricity sector with
the World Bank and the Asian Development Bank (ADB) have recently restarted, but
an agreement, which is needed to release about US$1 billion of program loans to finance the2010/11 budget, has not yet been reached. Nevertheless, subsidy needs for the electricity
sector are to be determined and will likely exceed the Rs. 30 billion (0.2 percent of GDP)
provided in the budget. Meanwhile, new “circular debt” (inter-enterprise arrears) in the
energy sector continues to accumulate.
III. THE IMPACT OF THE FLOODS
14. The economic outlook has deteriorated sharply as a result of the floods. The
agriculture sector—which accounts for 21 percent of GDP and 45 percent of employment—
has been hit particularly hard. An estimated 8 percent of total cropped area has been flooded,
with very significant damage to industrial crops (i.e., cotton and sugarcane), wheat,
vegetables and fruits, and livestock. Lower agricultural output will reduce domestic demand.
Manufacturing output and exports have also been affected. The staff’s initial assessment is
that real GDP growth is unlikely to exceed 2¾ percent in 2010/11, mainly because of sharply
lower agricultural output growth. GDP growth could be even lower if damage to crops
exceeds preliminary assessments or if the floods recede at a slower pace than expected.
Disruption of supply chains and the agricultural damage have already started to push up
prices, especially for food items, while additional demand for building material, medicine,
and social services will also contribute to price pressures. Accordingly, the staff projects
average annual inflation of 13½ percent in 2010/11 compared to 11.7 percent in 2009/10.
Inflation jumped in August due to a sharp increase in the prices of perishable foods. Headline
month-on-month inflation increased by 2.5 percent and year-on-year inflation was
13.2 percent, while core inflation declined to 9.8 percent.
8/8/2019 IMF Staf Report
http://slidepdf.com/reader/full/imf-staf-report 9/36
8
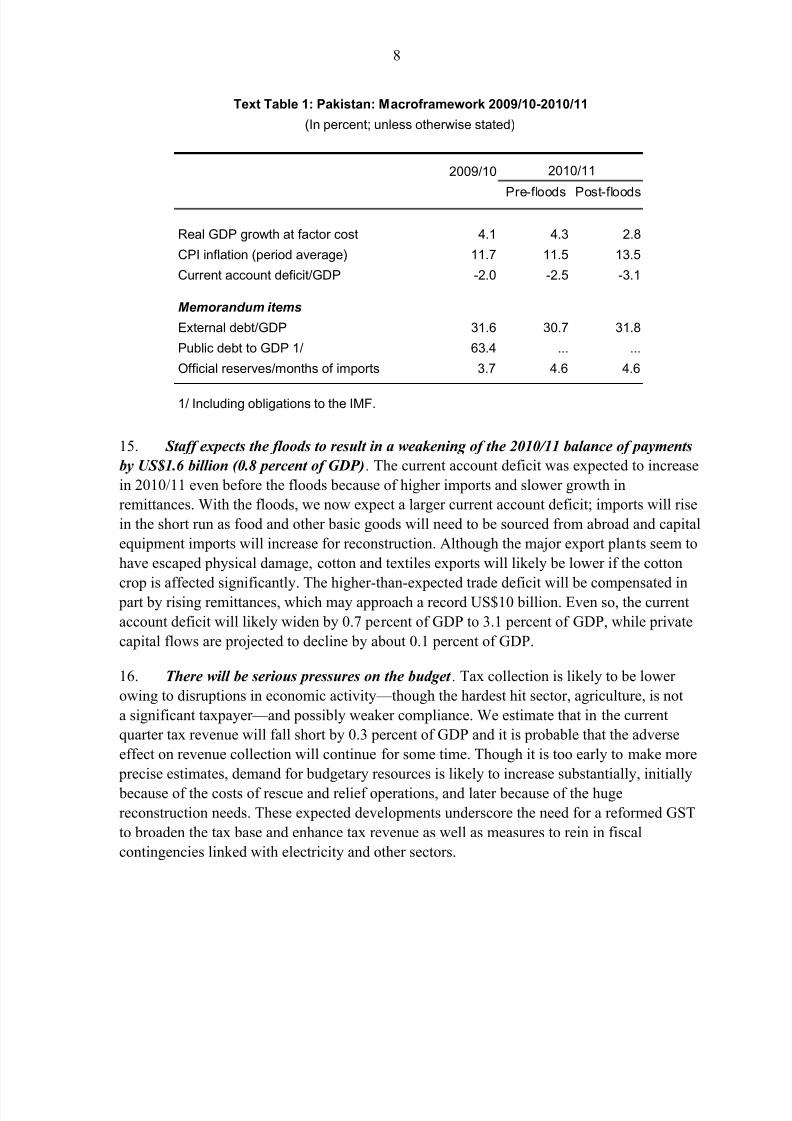
15. Staff expects the floods to result in a weakening of the 2010/11 balance of payments
by US$1.6 billion (0.8 percent of GDP). The current account deficit was expected to increase
in 2010/11 even before the floods because of higher imports and slower growth in
remittances. With the floods, we now expect a larger current account deficit; imports will rise
in the short run as food and other basic goods will need to be sourced from abroad and capital
equipment imports will increase for reconstruction. Although the major export plants seem to
have escaped physical damage, cotton and textiles exports will likely be lower if the cotton
crop is affected significantly. The higher-than-expected trade deficit will be compensated in part by rising remittances, which may approach a record US$10 billion. Even so, the current
account deficit will likely widen by 0.7 percent of GDP to 3.1 percent of GDP, while private
capital flows are projected to decline by about 0.1 percent of GDP.
16. There will be serious pressures on the budget . Tax collection is likely to be lower
owing to disruptions in economic activity—though the hardest hit sector, agriculture, is not
a significant taxpayer—and possibly weaker compliance. We estimate that in the current
quarter tax revenue will fall short by 0.3 percent of GDP and it is probable that the adverse
effect on revenue collection will continue for some time. Though it is too early to make more
precise estimates, demand for budgetary resources is likely to increase substantially, initially
because of the costs of rescue and relief operations, and later because of the huge
reconstruction needs. These expected developments underscore the need for a reformed GST
to broaden the tax base and enhance tax revenue as well as measures to rein in fiscal
contingencies linked with electricity and other sectors.
2009/10
Pre-floods Post-floods
Real GDP growth at factor cost 4.1 4.3 2.8
CPI inflation (period average) 11.7 11.5 13.5
Current account deficit/GDP -2.0 -2.5 -3.1
Memorandum items
External debt/GDP 31.6 30.7 31.8
Public debt to GDP 1/ 63.4 ... ...
Official reserves/months of imports 3.7 4.6 4.6
1/ Including obligations to the IMF.
2010/11
Text Table 1: Pakistan: Macroframework 2009/10-2010/11
(In percent; unless otherwise stated)
8/8/2019 IMF Staf Report
http://slidepdf.com/reader/full/imf-staf-report 10/36
9
17. N PLs are expected to rise, especially for banks with large exposure to the
agriculture sector . Initial estimates from the SBP put loan losses related to the floods at
about Rs. 54 billion, of which Rs. 34 billion are loans to agriculture. Although significant,
this is unlikely to materially affect the banking system as total private sector loans amount
to close to Rs. 3 trillion.
18. Financial market indicators have deteriorated somewhat . The stock market had
picked up in July, but lost 6 percent between end-July and September 8, against an average
gain of 2 percent for peer markets. Pakistan’s sovereign spread increased by some 80 basis
points to 643 basis points between end-July and September 8, against a broadly stable
composite index. Ratings agencies have indicated that the probability of securing an upgrade
of sovereign credit ratings in the coming months is lower because of the floods. However, the
exchange rate has remained stable.
IV. THE AUTHORITIES’ R ESPONSE AND THENEED FOR ASSISTANCE
19. The authorities’ initial response has focused on emergency and relief efforts and
donor mobilization. The UN has launched an appeal for funding of emergency response
efforts to provide food, shelter, water and sanitation, and health services. It has appealed for
US$460 million to finance Pakistan’s Initial Floods Emergency Response Plan. As of
August 25, about 60 percent has been committed. Moreover, humanitarian assistance pledges
(some outside the UN appeal) amount to US$725 million as of September 1, with Saudi
Arabia, the United Kingdom, and the United States, among the largest donors. Private
individuals and organizations have pledged US$93 million for humanitarian assistance so far.
In the absence of a damage assessment, pledges for reconstruction financing are still at an
early stage. The World Bank and the ADB have pledged to reprogram loans of US$1 andUS$2 billion, respectively, in previously committed lending to finance reconstruction and
relief efforts in flood-hit areas.
20. The authorities’ plan to work with World Bank staff on establishing an enhanced
framework for monitoring of donor contributions. Such a framework is needed to ensure
that aid reaches the people harmed by the floods, especially the poor and vulnerable groups.
The framework will seek to increase transparency of these flows and accountability for their
use and so encourage larger and swifter aid disbursements that will help alleviate hardships
suffered by these groups.
21. The fiscal framework will need to be revised to accommodate the cost of emergencyoperations and reconstruction. Prior to the floods, a consolidated budget deficit target of
4 percent of GDP was seen as consistent with the need to manage pressures in domestic
financial markets in order to regain disinflation momentum and avoid crowding out of the
private sector. The floods have created substantial need for expenditure on rescue and relief
8/8/2019 IMF Staf Report
http://slidepdf.com/reader/full/imf-staf-report 11/36
10
operations and rehabilitation and reconstruction that will increase the deficit.6 Accordingly,
the budget deficit target will need to take account of these needs. However, to avoid
inflationary pressure and crowding out of the private sector, the additional outlays should
be financed mainly by external assistance. Hence, additional external financing is urgently
needed, preferably in the form of budgetary grants or on highly concessional terms, to
finance flood-related spending.
22. The government plans budget measures. To boost budgetary resources, the
government has decided to introduce a temporary 10 percent income tax surcharge, which
could generate up to 0.4 percent of GDP. Furthermore, the government will shift resources
from nonpriority current and development spending to relief and reconstruction spending.
As an initial assistance, the authorities are planning to provide Rs. 20,000 (US$230) to
people receiving benefits under the Benazir Income Support Program that have been affected
by the floods (about 1 million people). Provinces have agreed to scale back their spending
plans which should limit the consolidated deficit. Nonetheless, the pre-flood deficit is
currently projected to be 4.4 percent of GDP, so additional measures will be needed to bringit to 4 percent of GDP and create fiscal space for flood-related spending and because room
for additional domestic financing is limited.
23. N o monetary policy announcements have been made since the floods hit, but the
SBP is facing a difficult balancing act . An estimated Rs. 2 trillion in t-bills needs to be
rolled over this year and there may be higher domestic net financing needs of the government
on account of the floods. On the other hand, domestic private demand will soften and so
undermine the already weak recovery in private sector credit growth. These considerations
will have to be weighted carefully in deciding on the monetary policy stance in the coming
months. The next monetary policy statement in expected in late September.
24. The SBP has focused on ensuring smooth functioning of the payment system . It has
set up mobile banking facilities and made sure that ample currency was available in areas hit
by the floods. It is closely monitoring banks with large exposures in the flood-hit areas. It has
announced measures to encourage banks to supply sufficient credit in flood-hit areas,
especially as the wheat financing season gets underway in October. It is also considering
using existing SBP refinancing schemes to encourage credit in flood-hit areas. The SBP is
discussing with donors expansion and modification of a loan-guarantee program to support
agriculture and small and medium enterprises. The SBP is considering relaxations in
provisioning for loans that have become delinquent because of the floods by allowing a
higher for-sale-value of some collateral assets, which are currently zero for real assets.
6 The flood-related additional spending for humanitarian needs and rehabilitation and reconstruction cannot be projected yet; an estimate should be available after the completion of damage and needs assessment by mid-October.
8/8/2019 IMF Staf Report
http://slidepdf.com/reader/full/imf-staf-report 12/36
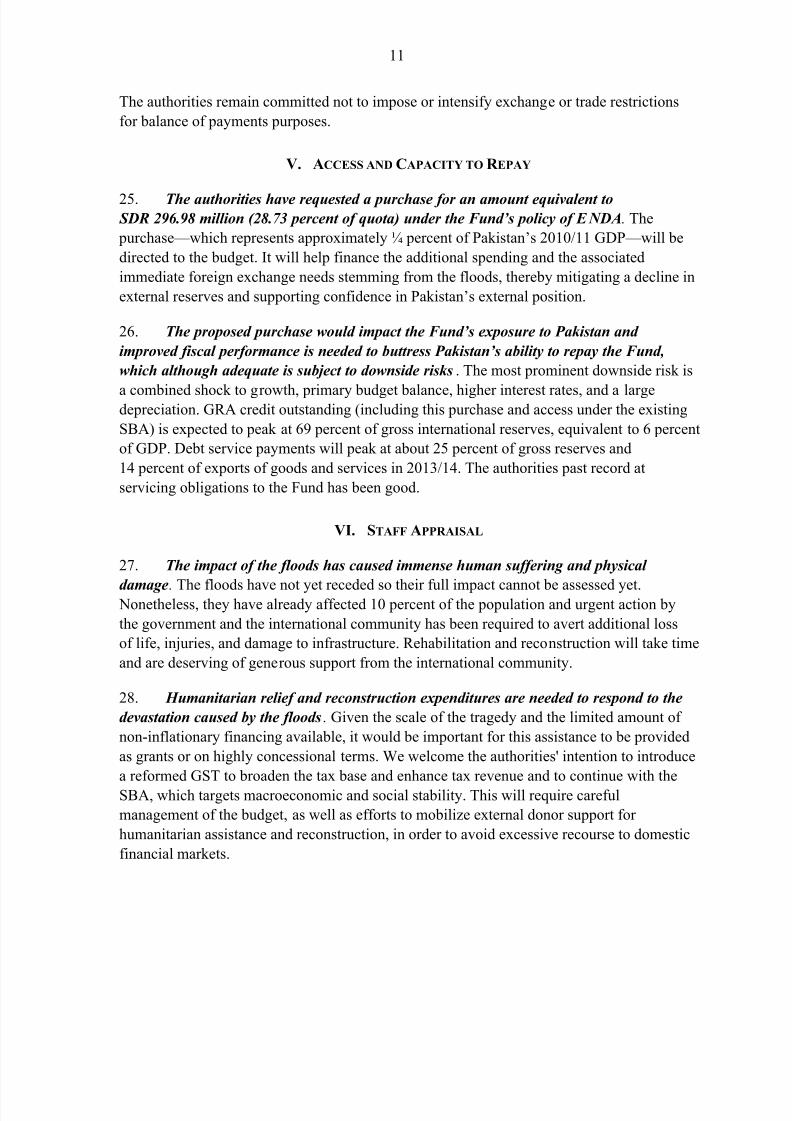
11
The authorities remain committed not to impose or intensify exchange or trade restrictions
for balance of payments purposes.
V. ACCESS AND CAPACITY TO R EPAY
25. The authorities have requested a purchase for an amount equivalent to SDR 296.98 million (28.73 percent of quota) under the Fund’s policy of E N DA. The
purchase—which represents approximately ¼ percent of Pakistan’s 2010/11 GDP—will be
directed to the budget. It will help finance the additional spending and the associated
immediate foreign exchange needs stemming from the floods, thereby mitigating a decline in
external reserves and supporting confidence in Pakistan’s external position.
26. The proposed purchase would impact the Fund’s exposure to Pakistan and
improved fiscal performance is needed to buttress Pakistan’s ability to repay the Fund,
which although adequate is subject to downside risks. The most prominent downside risk is
a combined shock to growth, primary budget balance, higher interest rates, and a largedepreciation. GRA credit outstanding (including this purchase and access under the existing
SBA) is expected to peak at 69 percent of gross international reserves, equivalent to 6 percent
of GDP. Debt service payments will peak at about 25 percent of gross reserves and
14 percent of exports of goods and services in 2013/14. The authorities past record at
servicing obligations to the Fund has been good.
VI. STAFF APPRAISAL
27. The impact of the floods has caused immense human suffering and physical
damage.
The floods have not yet receded so their full impact cannot be assessed yet. Nonetheless, they have already affected 10 percent of the population and urgent action by
the government and the international community has been required to avert additional loss
of life, injuries, and damage to infrastructure. Rehabilitation and reconstruction will take time
and are deserving of generous support from the international community.
28. Humanitarian relief and reconstruction expenditures are needed to respond to the
devastation caused by the floods. Given the scale of the tragedy and the limited amount of
non-inflationary financing available, it would be important for this assistance to be provided
as grants or on highly concessional terms. We welcome the authorities' intention to introduce
a reformed GST to broaden the tax base and enhance tax revenue and to continue with the
SBA, which targets macroeconomic and social stability. This will require careful
management of the budget, as well as efforts to mobilize external donor support for
humanitarian assistance and reconstruction, in order to avoid excessive recourse to domestic
financial markets.
8/8/2019 IMF Staf Report
http://slidepdf.com/reader/full/imf-staf-report 13/36
12
29. The authorities recognize the importance of closely monitoring the disbursement
and use of aid flows to ensure accountability and transparency. We welcome the
authorities’ plan to work with the World Bank on establishing an enhanced framework for
this monitoring. Accountability and transparency will increase the amounts of aid and its
speed of disbursement, so bringing quicker relief to the population, especially the poor who
have been hurt most by this natural catastrophe.
30. We welcome the authorities’ intention to move ahead with measures for the
completion of the fifth review under the SBA. In the coming weeks, we will work with the
authorities to re-evaluate the macroeconomic framework once the damage needs assessment
has been completed. The floods will impact the economy significantly in 2010/11 and
necessitate revisions to the budget, which will be submitted for approval to the cabinet and
parliament. This will take some time but the authorities hope that the fifth review under the
SBA can be completed later this year.
31. We support the authorities’ request for a purchase under the Fund’s policy onemergency assistance for natural disasters. The purchase will facilitate needed imports and
avoid depleting Pakistan’s international reserves, pending completion of the fifth review
under the SBA. The steps taken by the authorities and proposed so far and the international
support that has been promised are encouraging signs.
8/8/2019 IMF Staf Report
http://slidepdf.com/reader/full/imf-staf-report 14/36
13
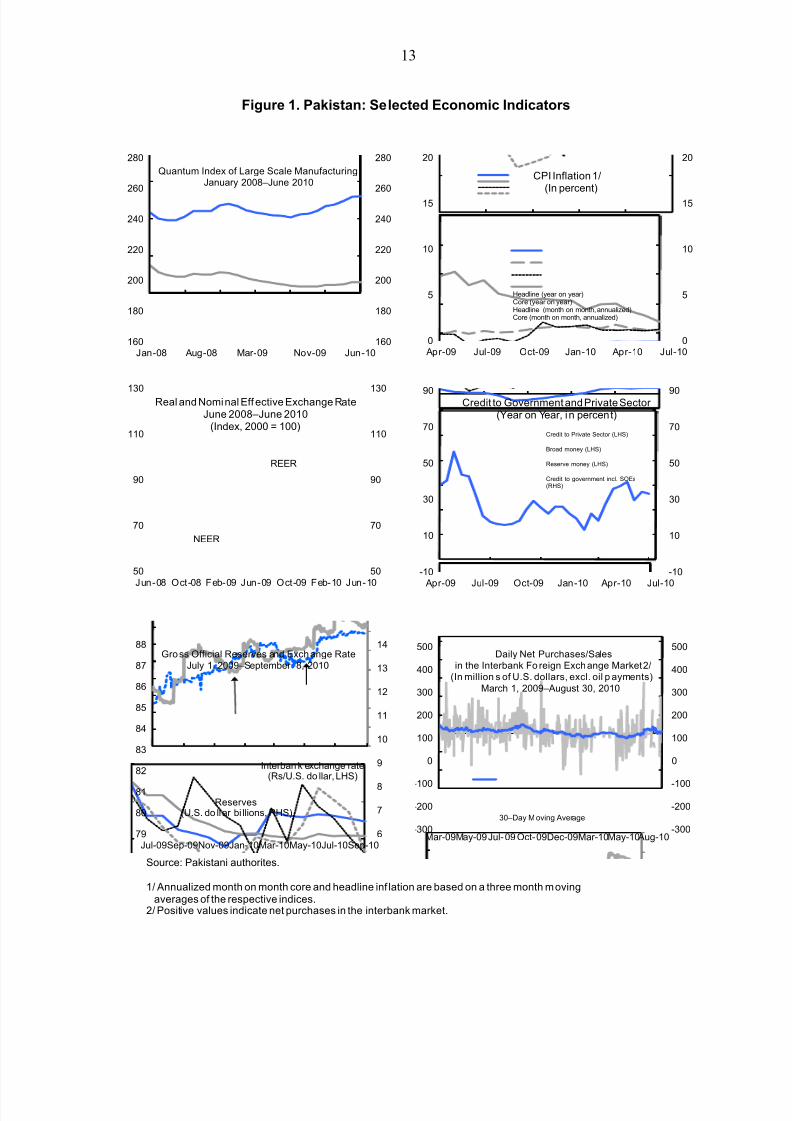
Figure 1. Pakistan: Selected Economic Indicators
Source: Pakistani authorites.
1/ Annualized month on month core and headline inf lation are based on a three month movingaverages of the respective indices.
2/ Positive values indicate net purchases in the interbank market.
160
180
200
220
240
260
280
160
180
200
220
240
260
280
Jan-08 Aug-08 Mar-09 Nov-09 Jun-10
Quantum Index of Large Scale ManufacturingJanuary 2008–June 2010
0
5
10
15
20
0
5
10
15
20
Apr-09 Jul-09 Oct-09 Jan-10 Apr-10 Jul-10
Headline (year on year)Core (year on year)Headline (month on month, annualized)Core (month on month, annualized)
REER
NEER
50
70
90
110
130
50
70
90
110
130
Jun-08 Oct-08 Feb-09 Jun-09 Oct-09 Feb-10 Jun-10
Real and Nominal Eff ective Exchange RateJune 2008–June 2010
(Index, 2000 = 100)
-10
10
30
50
70
90
-10
10
30
50
70
90
Apr-09 Jul-09 Oct-09 Jan-10 Apr-10 Jul-10
Credit to Government and Private Sector (Year on Year, in percent)
Credit to Private Sector (LHS)
Broad money (LHS)
Reserve money (LHS)
Credit to government incl. SOEs(RHS)
CPI Inflation 1/(In percent)
-300
-200
-100
0
100
200
300
400
500
-300
-200
-100
0
100
200
300
400
500
Mar-09May-09Jul-09 Oct-09Dec-09Mar-10May-10Aug-10
Daily Net Purchases/Salesin the Interbank Fo reign Exchange Market 2/
(In million s of U.S. dollars, excl. oil p ayments)March 1, 2009–August 30, 2010
30–Day M oving Average
6
7
8
9
10
11
12
13
14
79
80
81
82
83
84
85
86
87
88
Jul-09Sep-09Nov-09Jan-10Mar-10May-10Jul-10Sep-10
Gross Official Reserves and Exchange RateJuly 1, 2009–September 8, 2010
Interban k exchange rate(Rs/U.S. do llar, LHS)
Reserves(U.S. do llar bi llions, RHS)
8/8/2019 IMF Staf Report
http://slidepdf.com/reader/full/imf-staf-report 15/36
14
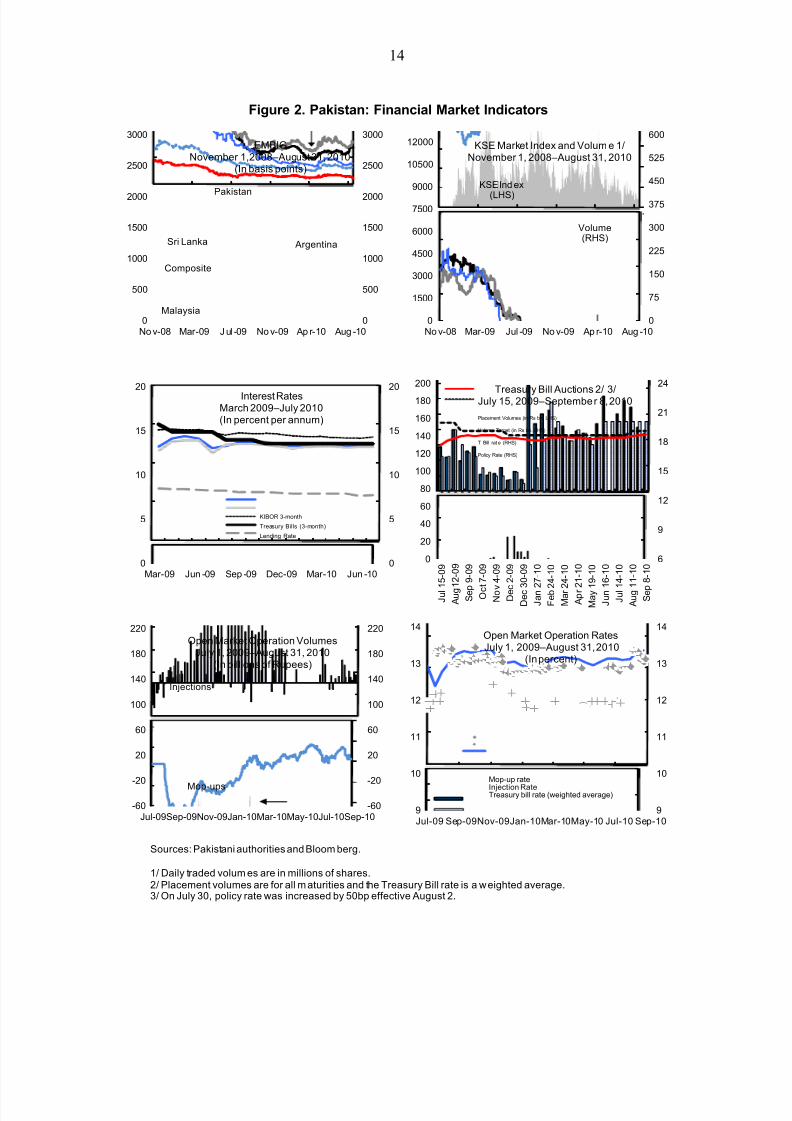
Figure 2. Pakistan: Financial Market Indicators
Pakistan
Composite
ArgentinaSri Lanka
Malaysia0
500
1000
1500
2000
2500
3000
0
500
1000
1500
2000
2500
3000
No v-08 Mar-09 J ul -09 No v-09 Ap r-10 Aug -10
EMBIGNovember 1,2008–August 31, 2010
(In basis points)
KSE Ind ex
(LHS)
0
75
150
225
300
375
450
525
600
0
1500
3000
4500
6000
7500
9000
10500
12000
No v-08 Mar-09 Jul -09 No v-09 Ap r-10 Aug -10
KSE Market Index and Volum e 1/November 1, 2008–August 31, 2010
6
9
12
15
18
21
24
0
20
40
60
80
100
120
140
160
180
200
J u l 1 5 - 0 9
A u g
1 2 - 0 9
S e p
9 - 0 9
O c
t 7 - 0 9
N o v
4 - 0 9
D e c
2 - 0 9
D e c 3 0 - 0 9
J a n 2 7 - 1 0
F e b 2 4 - 1 0
M a r 2 4 - 1 0
A p r 2 1 - 1 0
M a y 1 9 - 1 0
J u n 1 6 - 1 0
J u l 1 4 - 1 0
A u g 1 1 - 1 0
S e p
8 - 1 0
Treasury Bill Auctions 2/ 3/July 15, 2009–September 8, 2010
Placement Volumes (in Rs bn. LHS)
Volume Target (in Rs bn. LHS)
T Bill rat e (RHS)
Policy Rate (RHS)
-60
-20
20
60
100
140
180
220
-60
-20
20
60
100
140
180
220
Jul-09Sep-09Nov-09Jan-10Mar-10May-10Jul-10Sep-10
Open Market Operation VolumesJuly 1, 2009–August 31, 2010
(In billions of Rupees)
Mop-ups
Injections
9
10
11
12
13
14
9
10
11
12
13
14
Jul-09 Sep-09Nov-09Jan-10Mar-10May-10 Jul-10 Sep-10
Open Market Operation RatesJuly 1, 2009–August 31, 2010
(In percent)
Mop-up rate
Injection RateTreasury bill rate (weighted average)
Volume(RHS)
Sources: Pakistani authorities and Bloom berg.
1/ Daily traded volum es are in millions of shares.2/ Placement volumes are for all maturities and the Treasury Bill rate is a weighted average.3/ On July 30, policy rate was increased by 50bp effective August 2.
0
5
10
15
20
0
5
10
15
20
Mar-09 Jun -09 Sep -09 Dec-09 Mar-10 Jun -10
Interest RatesMarch 2009–July 2010(In percent per annum)
KIBOR 3-month
Treasury Bills (3-month)
Lending Rate
Policy rate
Deposit Rate
8/8/2019 IMF Staf Report
http://slidepdf.com/reader/full/imf-staf-report 16/36
15
Figure 3. Pakistan: Real and External Sectors, 2006/07–2010/11
Sources: Pakistani authorities and Fund staff projections.
1/ At factor cost.
-2
0
2
4
6
8
10
-2
0
2
4
6
8
10
2006/07 2007/08 2008/09 2009/10Est.
Sectoral Contribution to Real GDP(Annual growth; in percent) 1/
Services Industry Agricul ture
-3
1
5
9
13
17
21
-3
1
5
9
13
17
21
2006/07 2007/08 2008/09 2009/10Est.
2010/11Proj.
External Financial Account Flows(In billions of U.S. dollars)
Other investment, net (loans, deposits, and trade credits)
Portfolio investment, net
Direct investment, net
0
4
8
12
16
20
0
4
8
12
16
20
2006/07 2007/08 2008/09 2009/10Est.
2010/11Proj.
External Current Account Deficit(In units as indicated)
In billons of U.S. dollars
In percent of GDP
0
4
8
12
16
20
0
4
8
12
16
20
2006/07 2007/08 2008/09 2009/10Est.
2010/11Proj.
External Financial and Capital AccountSurplus
(In units as indicated)
In billons of U.S. dollars
In percent of GDP

8/8/2019 IMF Staf Report
http://slidepdf.com/reader/full/imf-staf-report 17/36
16
Figure 4. Pakistan: Fiscal Policy Indicators
Sources: Pakistani authorities and Fund staff estimates and projections.
1/ Excluding IMF lending.
0
1
2
3
4
5
6
7
8
9
10
0
1
2
3
4
5
6
7
8
9
10
2007/08 2008/09 2009/10Est.
2010/11Budget
Fiscal Deficit and SBP Financing(In percent of GDP)
Fiscal Deficit Excluding Grants (4th Review)Fiscal Deficit Excluding Grants (Current)SBP Financing
0
10
20
30
40
50
60
70
80
0
10
20
30
40
50
60
70
80
2007/08 2008/09 2009/10Est.
2010/11Budget
Total Public Debt 1/(In percent of GDP)
DomesticExternal
Total debt (4th Review)
0
2
4
6
8
10
12
14
16
18
20
0
2
4
6
8
10
12
14
16
18
20
2008/09 2009/10Proj.
2009/10Est.
2010/11Budget
Tax and Non-Tax Revenue(In percent of GDP)
Non Tax RevenuePetroleum surchargeOther Tax RevenueSales TaxDirect Tax
4th Review
0
4
8
12
16
20
24
0
4
8
12
16
20
24
2008/09 2009/10Proj.
2009/10Est.
2010/11Budget
Development Spending and Current Spending(In percent of GDP)
Federal development expenditureProvincial development expenditureInterestFederal primary expenditureProvincial expenditure
4th Review
8/8/2019 IMF Staf Report
http://slidepdf.com/reader/full/imf-staf-report 18/36
17
Provisional2009/10
Pre-flood Post-flood
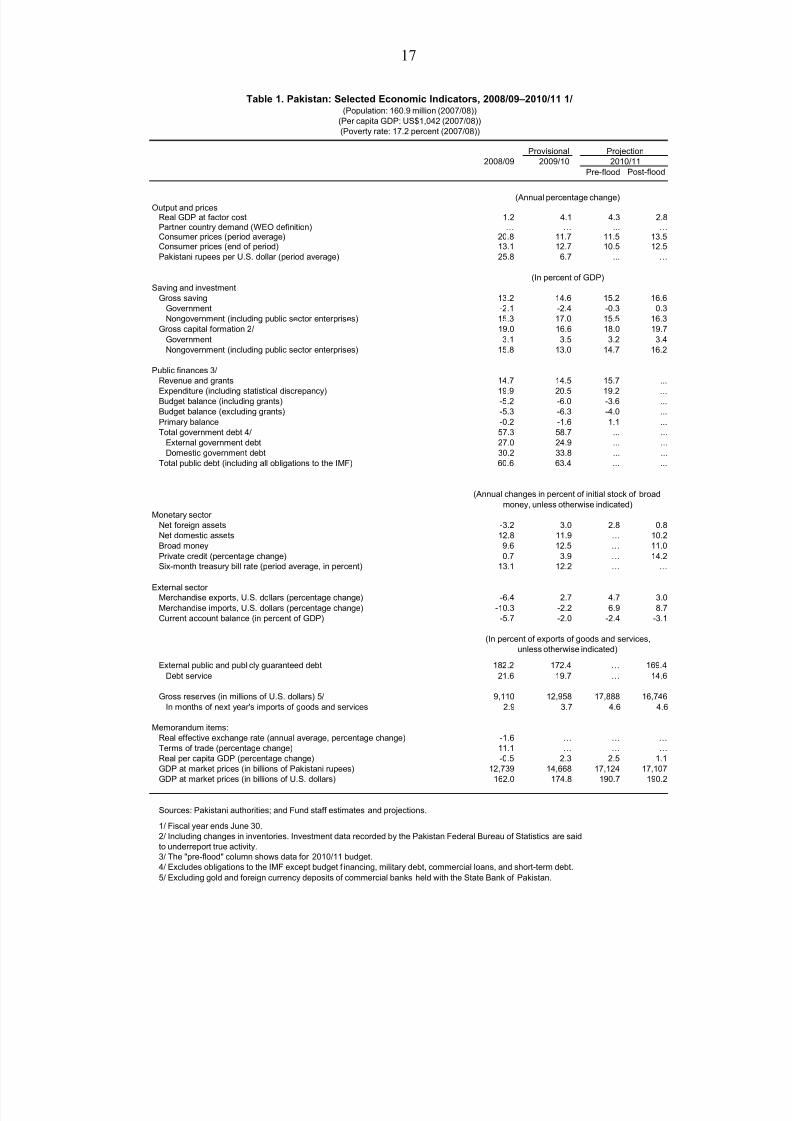
Output and pricesReal GDP at factor cost 1.2 4.1 4.3 2.8Partner country demand (WEO definition) … … ... …Consumer prices (period average) 20.8 11.7 11.5 13.5Consumer prices (end of period) 13.1 12.7 10.5 12.5Pakistani rupees per U.S. dollar (period average) 25.8 6.7 ... …
Saving and investmentGross saving 13.2 14.6 15.2 16.6
Government -2.1 -2.4 -0.3 0.3Nongovernment (including public sector enterprises) 15.3 17.0 15.5 16.3
Gross capital formation 2/ 19.0 16.6 18.0 19.7
Government 3.1 3.5 3.2 3.4Nongovernment (including public sector enterprises) 15.8 13.0 14.7 16.2
Public finances 3/Revenue and grants 14.7 14.5 15.7 ...
Expenditure (including statistical discrepancy) 19.9 20.5 19.2 ...Budget balance (including grants) -5.2 -6.0 -3.6 ...Budget balance (excluding grants) -5.3 -6.3 -4.0 ...
Primary balance -0.2 -1.6 1.1 ...Total government debt 4/ 57.3 58.7 ... ...
External government debt 27.0 24.9 ... ...Domestic government debt 30.2 33.8 ... ...
Total public debt (including all obligations to the IMF) 60.6 63.4 ... ...
Monetary sector Net foreign assets -3.2 3.0 2.8 0.8Net domestic assets 12.8 11.9 … 10.2Broad money 9.6 12.5 … 11.0
Private credit (percentage change) 0.7 3.9 … 14.2Six-month treasury bill rate (period average, in percent) 13.1 12.2 … …
External sector Merchandise exports, U.S. dollars (percentage change) -6.4 2.7 4.7 3.0
Merchandise imports, U.S. dollars (percentage change) -10.3 -2.2 6.9 8.7Current account balance (in percent of GDP) -5.7 -2.0 -2.4 -3.1
External public and publicly guaranteed debt 182.2 172.4 … 169.4
Debt service 21.6 19.7 … 14.6
Gross reserves (in millions of U.S. dollars) 5/ 9,110 12,958 17,888 16,746
In months of next year's imports of goods and services 2.9 3.7 4.6 4.6
Memorandum items:Real effective exchange rate (annual average, percentage change) -1.6 … … …Terms of trade (percentage change) 11.1 … … …Real per capita GDP (percentage change) -0.5 2.3 2.5 1.1GDP at market prices (in billions of Pakistani rupees) 12,739 14,668 17,124 17,107GDP at market prices (in billions of U.S. dollars) 162.0 174.8 190.7 190.2
Sources: Pakistani authorities; and Fund staff estimates and projections.
1/ Fiscal year ends June 30.2/ Including changes in inventories. Investment data recorded by the Pakistan Federal Bureau of Statistics are saidto underreport true activity.3/ The "pre-flood" column shows data for 2010/11 budget.4/ Excludes obligations to the IMF except budget f inancing, military debt, commercial loans, and short-term debt.
5/ Excluding gold and foreign currency deposits of commercial banks held with the State Bank of Pakistan.
Table 1. Pakistan: Selected Economic Indicators, 2008/09–2010/11 1/(Population: 160.9 million (2007/08))
(Per capita GDP: US$1,042 (2007/08))(Poverty rate: 17.2 percent (2007/08))
(In percent of exports of goods and services,
2010/11Projection
unless otherwise indicated)
(Annual changes in percent of initial stock of broad
money, unless otherwise indicated)
2008/09
(In percent of GDP)
(Annual percentage change)
8/8/2019 IMF Staf Report
http://slidepdf.com/reader/full/imf-staf-report 19/36
18
Est. Pre-Flood Post-Flood
2008/09
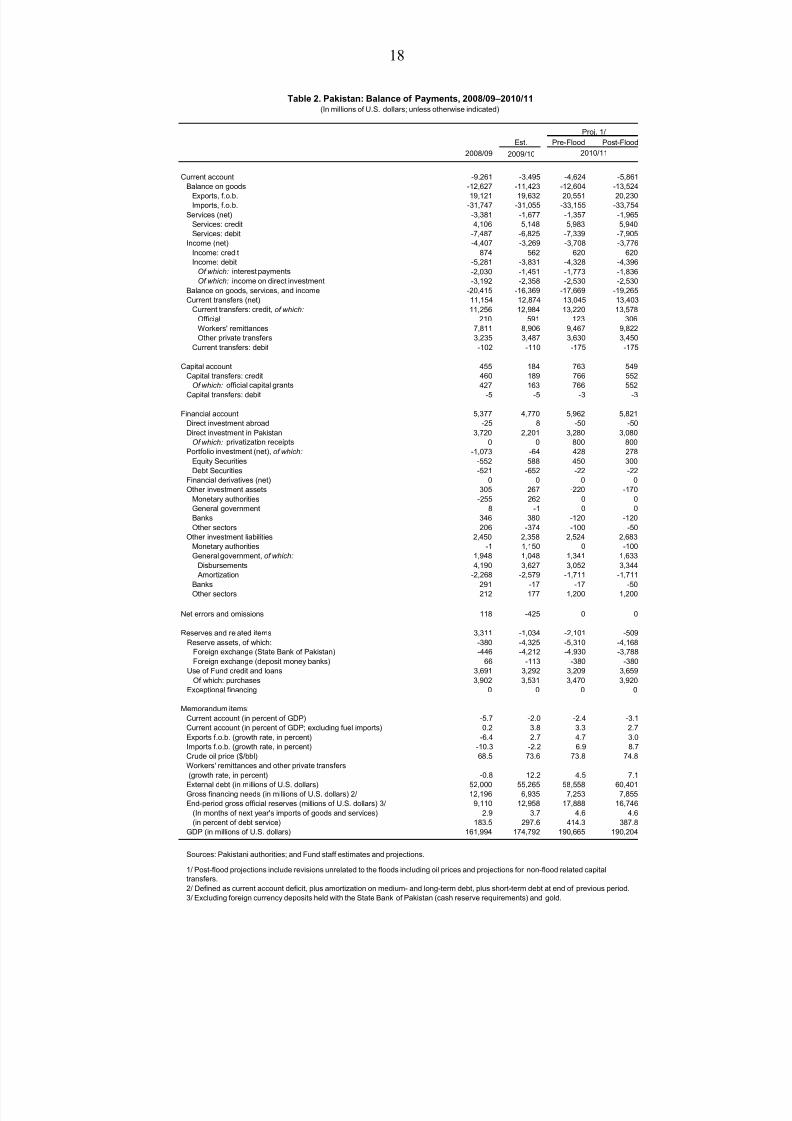
Current account -9,261 -3,495 -4,624 -5,861
Balance on goods -12,627 -11,423 -12,604 -13,524
Exports, f.o.b. 19,121 19,632 20,551 20,230Imports, f.o.b. -31,747 -31,055 -33,155 -33,754
Services (net) -3,381 -1,677 -1,357 -1,965
Services: credit 4,106 5,148 5,983 5,940
Services: debit -7,487 -6,825 -7,339 -7,905
Income (net) -4,407 -3,269 -3,708 -3,776
Income: credit 874 562 620 620
Income: debit -5,281 -3,831 -4,328 -4,396Of which: interest payments -2,030 -1,451 -1,773 -1,836Of which: income on direct investment -3,192 -2,358 -2,530 -2,530
Balance on goods, services, and income -20,415 -16,369 -17,669 -19,265
Current transfers (net) 11,154 12,874 13,045 13,403
Current transfers: credit, of which: 11,256 12,984 13,220 13,578
Official 210 591 123 306
Workers' remittances 7,811 8,906 9,467 9,822
Other private transfers 3,235 3,487 3,630 3,450
Current transfers: debit -102 -110 -175 -175
Capital account 455 184 763 549
Capital transfers: credit 460 189 766 552Of which: official capital grants 427 163 766 552
Capital transfers: debit -5 -5 -3 -3
Financial account 5,377 4,770 5,962 5,821
Direct investment abroad -25 8 -50 -50
Direct investment in Pakistan 3,720 2,201 3,280 3,080Of which: privatization receipts 0 0 800 800
Portfolio investment (net), of which: -1,073 -64 428 278
Equity Securities -552 588 450 300
Debt Securities -521 -652 -22 -22
Financial derivatives (net) 0 0 0 0
Other investment assets 305 267 -220 -170
Monetary authorities -255 262 0 0
General government 8 -1 0 0
Banks 346 380 -120 -120
Other sectors 206 -374 -100 -50
Other investment liabilities 2,450 2,358 2,524 2,683
Monetary authorities -1 1,150 0 -100
General government, of which: 1,948 1,048 1,341 1,633
Disbursements 4,190 3,627 3,052 3,344
Amortization -2,268 -2,579 -1,711 -1,711
Banks 291 -17 -17 -50
Other sectors 212 177 1,200 1,200
Net errors and omissions 118 -425 0 0
Reserves and related items 3,311 -1,034 -2,101 -509
Reserve assets, of which: -380 -4,325 -5,310 -4,168Foreign exchange (State Bank of Pakistan) -446 -4,212 -4,930 -3,788
Foreign exchange (deposit money banks) 66 -113 -380 -380
Use of Fund credit and loans 3,691 3,292 3,209 3,659
Of which: purchases 3,902 3,531 3,470 3,920
Exceptional financing 0 0 0 0
Memorandum items:
Current account (in percent of GDP) -5.7 -2.0 -2.4 -3.1
Current account (in percent of GDP; excluding fuel imports) 0.2 3.8 3.3 2.7
Exports f.o.b. (growth rate, in percent) -6.4 2.7 4.7 3.0
Imports f.o.b. (growth rate, in percent) -10.3 -2.2 6.9 8.7
Crude oil price ($/bbl) 68.5 73.6 73.8 74.8
Workers' remittances and other private transfers
(growth rate, in percent) -0.8 12.2 4.5 7.1
External debt (in millions of U.S. dollars) 52,000 55,265 58,558 60,401Gross financing needs (in millions of U.S. dollars) 2/ 12,196 6,935 7,253 7,855
End-period gross official reserves (millions of U.S. dollars) 3/ 9,110 12,958 17,888 16,746
(In months of next year's imports of goods and services) 2.9 3.7 4.6 4.6
(in percent of debt service) 183.5 297.6 414.3 387.8
GDP (in millions of U.S. dollars) 161,994 174,792 190,665 190,204
Sources: Pakistani authorities; and Fund staff estimates and projections.
2/ Defined as current account deficit, plus amortization on medium- and long-term debt, plus short-term debt at end of previous period.
3/ Excluding foreign currency deposits held with the State Bank of Pakistan (cash reserve requirements) and gold.
Table 2. Pakistan: Balance of Payments, 2008/09–2010/11(In millions of U.S. dollars; unless otherwise indicated)
2009/10
Proj. 1/
2010/11
1/ Post-flood projections include revisions unrelated to the floods including oil prices and projections for non-flood related capitaltransfers.
8/8/2019 IMF Staf Report
http://slidepdf.com/reader/full/imf-staf-report 20/36
19
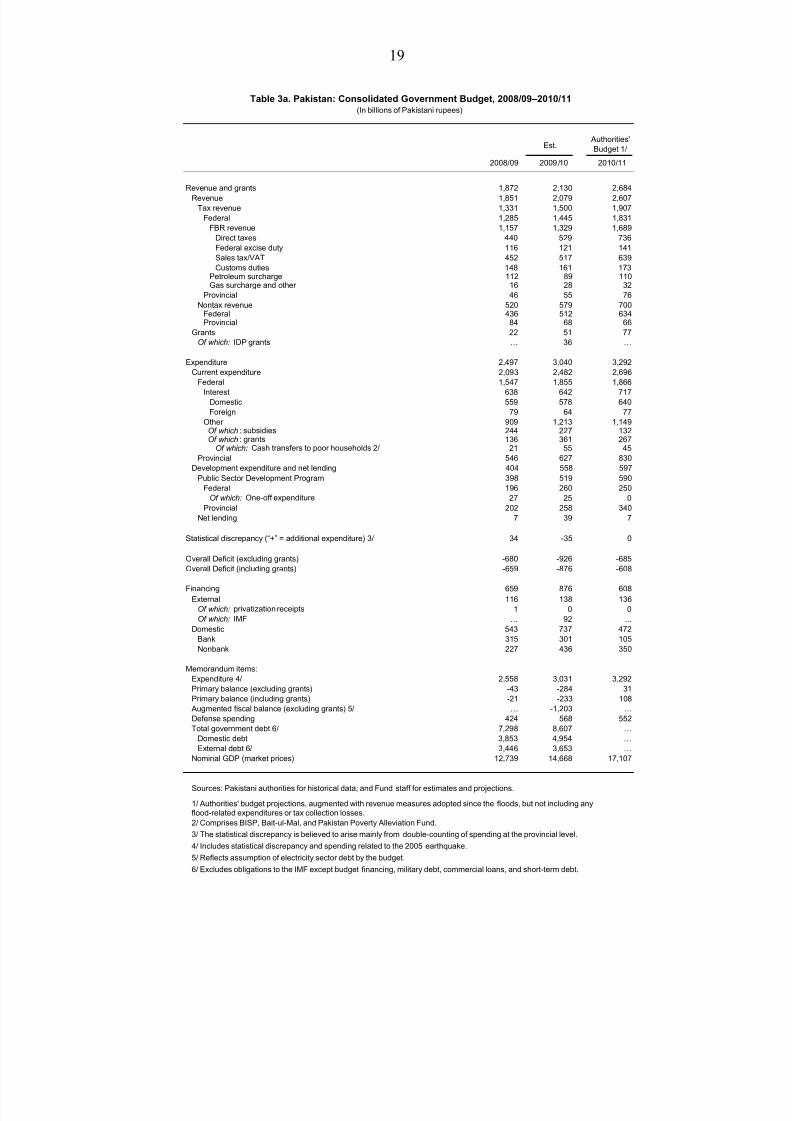
Est.Authorities'Budget 1/
Revenue and grants 1,872 2,130 2,684
Revenue 1,851 2,079 2,607Tax revenue 1,331 1,500 1,907
Federal 1,285 1,445 1,831
FBR revenue 1,157 1,329 1,689
Direct taxes 440 529 736
Federal excise duty 116 121 141
Sales tax/VAT 452 517 639
Customs duties 148 161 173Petroleum surcharge 112 89 110Gas surcharge and other 16 28 32
Provincial 46 55 76
Nontax revenue 520 579 700Federal 436 512 634Provincial 84 68 66
Grants 22 51 77Of which: IDP grants … 36 …
Expenditure 2,497 3,040 3,292
Current expenditure 2,093 2,482 2,696
Federal 1,547 1,855 1,866
Interest 638 642 717Domestic 559 578 640
Foreign 79 64 77
Other 909 1,213 1,149 Of which : subsidies 244 227 132 Of which : grants 136 361 267
Of which: Cash transfers to poor households 2/ 21 55 45
Provincial 546 627 830
Development expenditure and net lending 404 558 597
Public Sector Development Program 398 519 590
Federal 196 260 250Of which: One-off expenditure 27 25 0
Provincial 202 258 340
Net lending 7 39 7
Statistical discrepancy (“+” = additional expenditure) 3/ 34 -35 0
Overall Deficit (excluding grants) -680 -926 -685
Overall Deficit (including grants) -659 -876 -608
Financing 659 876 608External 116 138 136
Of which: privatization receipts 1 0 0Of which: IMF … 92 ...
Domestic 543 737 472
Bank 315 301 105
Nonbank 227 436 350
Memorandum items:
Expenditure 4/ 2,558 3,031 3,292
Primary balance (excluding grants) -43 -284 31
Primary balance (including grants) -21 -233 108
Augmented fiscal balance (excluding grants) 5/ … -1,203 …
Defense spending 424 568 552
Total government debt 6/ 7,298 8,607 …
Domestic debt 3,853 4,954 …
External debt 6/ 3,446 3,653 …
Nominal GDP (market prices) 12,739 14,668 17,107
Sources: Pakistani authorities for historical data; and Fund staff for estimates and projections.
1/ Authorities' budget projections, augmented with revenue measures adopted since the floods, but not including anyflood-related expenditures or tax collection losses.
2/ Comprises BISP, Bait-ul-Mal, and Pakistan Poverty Alleviation Fund.
3/ The statistical discrepancy is believed to arise mainly from double-counting of spending at the provincial level.
4/ Includes statistical discrepancy and spending related to the 2005 earthquake.
5/ Reflects assumption of electricity sector debt by the budget.
6/ Excludes obligations to the IMF except budget financing, military debt, commercial loans, and short-term debt.
2008/09
Table 3a. Pakistan: Consolidated Government Budget, 2008/09–2010/11(In billions of Pakistani rupees)
2009 /10 2010/11
8/8/2019 IMF Staf Report
http://slidepdf.com/reader/full/imf-staf-report 21/36
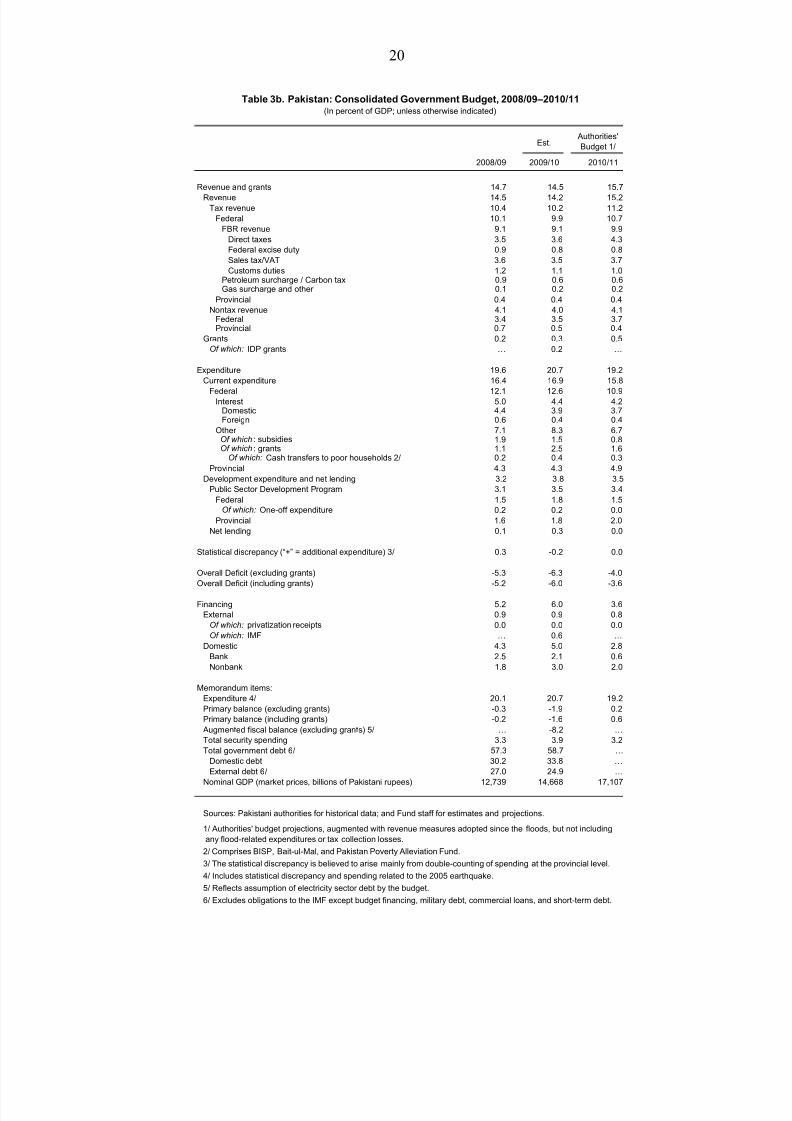
20
Est.Authorities'
Budget 1/
2008/09
Revenue and grants 14.7 14.5 15.7
Revenue 14.5 14.2 15.2Tax revenue 10.4 10.2 11.2
Federal 10.1 9.9 10.7
FBR revenue 9.1 9.1 9.9
Direct taxes 3.5 3.6 4.3
Federal excise duty 0.9 0.8 0.8
Sales tax/VAT 3.6 3.5 3.7
Customs duties 1.2 1.1 1.0Petroleum surcharge / Carbon tax 0.9 0.6 0.6Gas surcharge and other 0.1 0.2 0.2
Provincial 0.4 0.4 0.4
Nontax revenue 4.1 4.0 4.1Federal 3.4 3.5 3.7Provincial 0.7 0.5 0.4
Grants 0.2 0.3 0.5Of which: IDP grants … 0.2 …
Expenditure 19.6 20.7 19.2
Current expenditure 16.4 16.9 15.8
Federal 12.1 12.6 10.9Interest 5.0 4.4 4.2
Domestic 4.4 3.9 3.7Foreign 0.6 0.4 0.4
Other 7.1 8.3 6.7 Of which : subsidies 1.9 1.5 0.8 Of which : grants 1.1 2.5 1.6
Of which: Cash transfers to poor households 2/ 0.2 0.4 0.3
Provincial 4.3 4.3 4.9
Development expenditure and net lending 3.2 3.8 3.5
Public Sector Development Program 3.1 3.5 3.4
Federal 1.5 1.8 1.5Of which: One-off expenditure 0.2 0.2 0.0
Provincial 1.6 1.8 2.0
Net lending 0.1 0.3 0.0
Statistical discrepancy (“+” = additional expenditure) 3/ 0.3 -0.2 0.0
Overall Deficit (excluding grants) -5.3 -6.3 -4.0
Overall Deficit (including grants) -5.2 -6.0 -3.6
Financing 5.2 6.0 3.6
External 0.9 0.9 0.8
Of which: privatization receipts 0.0 0.0 0.0
Of which: IMF … 0.6 …
Domestic 4.3 5.0 2.8
Bank 2.5 2.1 0.6
Nonbank 1.8 3.0 2.0
Memorandum items:
Expenditure 4/ 20.1 20.7 19.2
Primary balance (excluding grants) -0.3 -1.9 0.2
Primary balance (including grants) -0.2 -1.6 0.6
Augmented fiscal balance (excluding grants) 5/ … -8.2 …
Total security spending 3.3 3.9 3.2
Total government debt 6/ 57.3 58.7 …
Domestic debt 30.2 33.8 …
External debt 6/ 27.0 24.9 …
Nominal GDP (market prices, billions of Pakistani rupees) 12,739 14,668 17,107
Sources: Pakistani authorities for historical data; and Fund staff for estimates and projections.
1/ Authorities' budget projections, augmented with revenue measures adopted since the floods, but not including
any flood-related expenditures or tax collection losses.
2/ Comprises BISP, Bait-ul-Mal, and Pakistan Poverty Alleviation Fund.
3/ The statistical discrepancy is believed to arise mainly from double-counting of spending at the provincial level.
4/ Includes statistical discrepancy and spending related to the 2005 earthquake.
5/ Reflects assumption of electricity sector debt by the budget.
6/ Excludes obligations to the IMF except budget financing, military debt, commercial loans, and short-term debt.
Table 3b. Pakistan: Consolidated Government Budget, 2008/09–2010/11(In percent of GDP; unless otherwise indicated)
2009/10 2010/11

8/8/2019 IMF Staf Report
http://slidepdf.com/reader/full/imf-staf-report 22/36
21
Proj
Jun. 3/ Jun. 4/ Jun. 4/
2007/08 2008/09
Monetary survey
Net foreign assets (NFA) 668 517 670 545 593Net domestic assets (NDA) 4,022 4,620 5,107 5,232 5,820
Net claims on government, of which: 1,473 1,997 2,403 2,403 2,509Budget support, of which: 1,325 1,630 1,935 1,935 2,040
Banks 310 500 763 763 910
Commodity operations 127 336 413 413 413
Credit to nongovernment 3,018 3,190 3,389 3,389 3,917
Private sector 2,904 2,924 3,037 3,037 3,467
Public sector enterprises 114 266 352 352 450
Privatization account -3 -3 -3 -3 -3
Other items, net -466 -564 -682 -557 -604
Broad money 4,689 5,137 5,777 5,777 6,413
Currency outside scheduled banks 982 1,152 1,295 1,295 1,496
Rupee deposits 3,443 3,705 4,136 4,136 4,528
Foreign currency deposits 263 280 345 345 389
State Bank of Pakistan (SBP)NFA 480 324 504 379 374
NDA 1,000 1,183 1,175 1,300 1,512
Net claims on government 1,015 1,144 1,187 1,187 1,145Of which: budget support 1,016 1,130 1,171 1,171 1,130
Claims on nongovernment -7 -7 -6 -6 -7
Claims on scheduled banks 227 303 313 313 425
Privatization account -3 -3 -3 -3 -3
Other items, net -231 -254 -316 -191 -49Reserve money, of which: 1,480 1,508 1,679 1,679 1,886
Banks' reserves 425 274 290 290 297
Currency 1,051 1,229 1,383 1,383 1,584
Broad money 15.3 9.6 12.5 ... 11.0
NFA, banking system (in percent of broad money) 1/ -7.8 -3.2 3.0 ... 0.8
NDA, banking system (in percent of broad money) 1/ 23.2 12.8 11.9 ... 10.2
Budgetary support (in percent of broad money) 1/ 12.5 6.5 5.9 ... 1.8
NFA, banking system -32.2 -22.5 29.6 ... 8.7
NDA, banking system 30.6 14.9 10.5 ... 11.2
Budgetary support 62.4 23.0 18.7 ... 5.4
Private credit 16.4 0.7 3.9 ... 14.2Currency 16.9 17.3 12.4 ... 15.5
Reserve money 22.3 1.9 11.4 ... 12.3
NFA, SBP (in percent of reserve money) 1/ -25.4 -10.5 11.9 ... -0.3
NDA, SBP (in percent of reserve money) 1/ 47.7 12.4 -0.5 ... 12.6
Net claims on government (in percent of reserve money) 1/ 56.9 8.6 2.6 ... -2.5
Memorandum items:
Velocity 2.2 2.5 2.5 ... 2.7
Money multiplier 3.2 3.4 3.4 ... 3.4
Currency to broad money ratio (percent) 20.9 22.4 22.4 ... 23.3
Currency to deposit ratio (percent) 26.5 28.9 28.9 ... 30.4
Foreign currency to deposit ratio (percent) 7.1 7.0 7.7 ... 7.9
Reserves to deposit ratio (percent) 11.5 6.9 6.5 ... 6.0Budget bank financing (billions of Pakistani rupees), of which: 509 305 305 ... 105.0
By commercial banks -167 191 263 ... 147
By SBP 677 114 42 ... -42
NFA of SBP (change from beginning of the year in billions of U.S. dollars) 2/ -4.5 -3.1 1.9 ... -0.5
NFA of commercial banks (millions of U.S. dollars) 2,748 2,370 1,948 ... 2,328
NDA of commercial banks (billions of Pakistani rupees) 3,022 3,437 3,931 ... 4,308Excess reserves in percent of broad money 1.5 0.3 -0.2 ... ...
Sources: Pakistani authorities for historical data; and Fund staff estimates and projections.
1/ Denominator is the stock of broad (reserve) money at the end of the previous year.
2/ Includes valuation adjustments.
3 / SDR allociation treated as Equity.
4 / SDR allociation treated as SBP Foreign Liability.
(Annual percentage change, unless otherwise indicated)
Table 4. Pakistan: Monetary Survey and Analytical Balance Sheet of the State Bank of Pakistan, 2007/08–2010/11
2010/112009/10
(In billions of Pakistani rupees)
Act.
8/8/2019 IMF Staf Report
http://slidepdf.com/reader/full/imf-staf-report 23/36
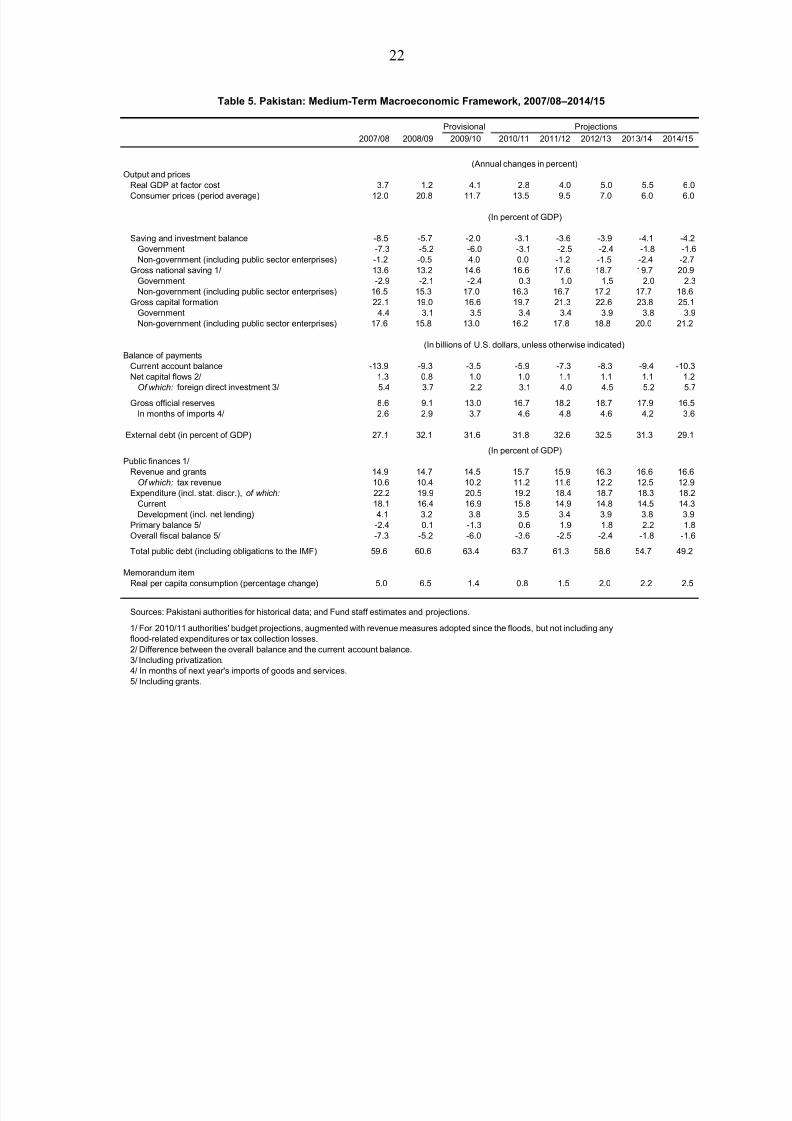
22
Provisional
2007/08 2008/09 2009/10 2010/11 2011/12 2012/13 2013/14 2014/15
Output and pricesReal GDP at factor cost 3.7 1.2 4.1 2.8 4.0 5.0 5.5 6.0
Consumer prices (period average) 12.0 20.8 11.7 13.5 9.5 7.0 6.0 6.0
Saving and investment balance -8.5 -5.7 -2.0 -3.1 -3.6 -3.9 -4.1 -4.2Government -7.3 -5.2 -6.0 -3.1 -2.5 -2.4 -1.8 -1.6Non-government (including public sector enterprises) -1.2 -0.5 4.0 0.0 -1.2 -1.5 -2.4 -2.7
Gross national saving 1/ 13.6 13.2 14.6 16.6 17.6 18.7 19.7 20.9Government -2.9 -2.1 -2.4 0.3 1.0 1.5 2.0 2.3Non-government (including public sector enterprises) 16.5 15.3 17.0 16.3 16.7 17.2 17.7 18.6
Gross capital formation 22.1 19.0 16.6 19.7 21.3 22.6 23.8 25.1Government 4.4 3.1 3.5 3.4 3.4 3.9 3.8 3.9Non-government (including public sector enterprises) 17.6 15.8 13.0 16.2 17.8 18.8 20.0 21.2
Balance of paymentsCurrent account balance -13.9 -9.3 -3.5 -5.9 -7.3 -8.3 -9.4 -10.3Net capital flows 2/ 1.3 0.8 1.0 1.0 1.1 1.1 1.1 1.2
Of which: foreign direct investment 3/ 5.4 3.7 2.2 3.1 4.0 4.5 5.2 5.7
Gross official reserves 8.6 9.1 13.0 16.7 18.2 18.7 17.9 16.5In months of imports 4/ 2.6 2.9 3.7 4.6 4.8 4.6 4.2 3.6
External debt (in percent of GDP) 27.1 32.1 31.6 31.8 32.6 32.5 31.3 29.1
Public finances 1/Revenue and grants 14.9 14.7 14.5 15.7 15.9 16.3 16.6 16.6
Of which: tax revenue 10.6 10.4 10.2 11.2 11.6 12.2 12.5 12.9Expenditure (incl. stat. discr.), of which: 22.2 19.9 20.5 19.2 18.4 18.7 18.3 18.2
Current 18.1 16.4 16.9 15.8 14.9 14.8 14.5 14.3Development (incl. net lending) 4.1 3.2 3.8 3.5 3.4 3.9 3.8 3.9
Primary balance 5/ -2.4 0.1 -1.3 0.6 1.9 1.8 2.2 1.8Overall fiscal balance 5/ -7.3 -5.2 -6.0 -3.6 -2.5 -2.4 -1.8 -1.6
Total public debt (including obligations to the IMF) 59.6 60.6 63.4 63.7 61.3 58.6 54.7 49.2
Memorandum itemReal per capita consumption (percentage change) 5.0 6.5 1.4 0.8 1.5 2.0 2.2 2.5
Sources: Pakistani authorities for historical data; and Fund staff estimates and projections.
1/ For 2010/11 authorities' budget projections, augmented with revenue measures adopted since the floods, but not including anyflood-related expenditures or tax collection losses.2/ Difference between the overall balance and the current account balance.3/ Including privatization.4/ In months of next year's imports of goods and services.5/ Including grants.
(In percent of GDP)
(Annual changes in percent)
Table 5. Pakistan: Medium-Term Macroeconomic Framework, 2007/08–2014/15
(In percent of GDP)
(In billions of U.S. dollars, unless otherwise indicated)
Projections

8/8/2019 IMF Staf Report
http://slidepdf.com/reader/full/imf-staf-report 24/36
23
2008/09 2009/10 2010/11 2011/12 2012/13 2013/14 2014/15 2015/16
ECF
Principal 2/ 137.7 155.0 172.3 163.6 120.6 51.7 17.2 0.0
Interest and charges 2/ 4.0 1.7 0.0 0.3 0.3 0.1 0.0 0.0
Stand-By Arrangements and Proposed purchase under ENDA
Principal 0.0 0.0 0.0 587.9 1,726.1 2,493.8 1,969.3 755.8
Interest and charges 42.9 55.6 133.9 179.1 166.7 89.4 28.0 6.6
Total 3,316.4 5,461.5 7,886.1 7,134.5 5,287.8 2,742.3 755.8 0.0
ECF Arrangements 680.5 525.5 353.2 189.6 69.0 17.3 0.0 0.0
Stand-By Arrangements and Proposed purchase under ENDA 2,635.9 4,936.0 7,532.9 6,945.0 5,218.9 2,725.1 755.8 0.0
Total 2/ 184.6 212.4 306.2 931.0 2,013.6 2,635.0 2,014.5 762.4
Of which:
Principal 137.7 155.0 172.3 751.6 1,846.7 2,545.5 1,986.5 755.8
Interest and charges 46.9 57.4 133.9 179.4 167.0 89.5 28.0 6.6
In percent of exports of goods and non-factor services 1.2 1.3 1.8 5.3 10.9 13.5 9.8 3.5In percent of GDP 0.2 0.2 0.2 0.7 1.5 1.8 1.3 0.4
In percent of end-period gross international reserves 3.0 2.4 2.8 7.7 16.3 22.2 18.5 6.7
Memorandum items
Exports of goods and NFS (in millions of U.S. dollars) 23,227 24,780 26,170 26,758 28,199 29,803 31,323 32,825
Quota 1,034
GDP (in millions of U.S. dollars) 161,994 174,792 190,204 198,958 211,912 226,990 244,385 263,112
Fund credit outstanding (in percent of GDP) 3.2 4.6 6.3 5.4 3.8 1.8 0.5 0.0
Of which : SBA and proposed purchase under ENDA 2.5 4.2 6.0 5.3 3.7 1.8 0.5 0.0
Gross international reserves (in millions of U.S. dollars) 9,110 12,958 16,746 18,249 18,701 17,950 16,534 17,167
Source: Fund staff projections.
1/ Including proposed purchase under the ENDA.
2/ For 2008/09, debt service includes payments related to EFF.
Projections
Table 6. Pakistan: Indicators of Fund Credit, 2008/09–2015/16 1/(In millions of SDR unless otherwise specified)
(Projected Debt Service to the Fund based on Existing and Prospective Drawings)
(Projected Level of Credit Outstanding based on Existing and Prospective Drawings)
(Projected Debt Service to the Fund based on Existing and Prospective Drawings)
8/8/2019 IMF Staf Report
http://slidepdf.com/reader/full/imf-staf-report 25/36
24
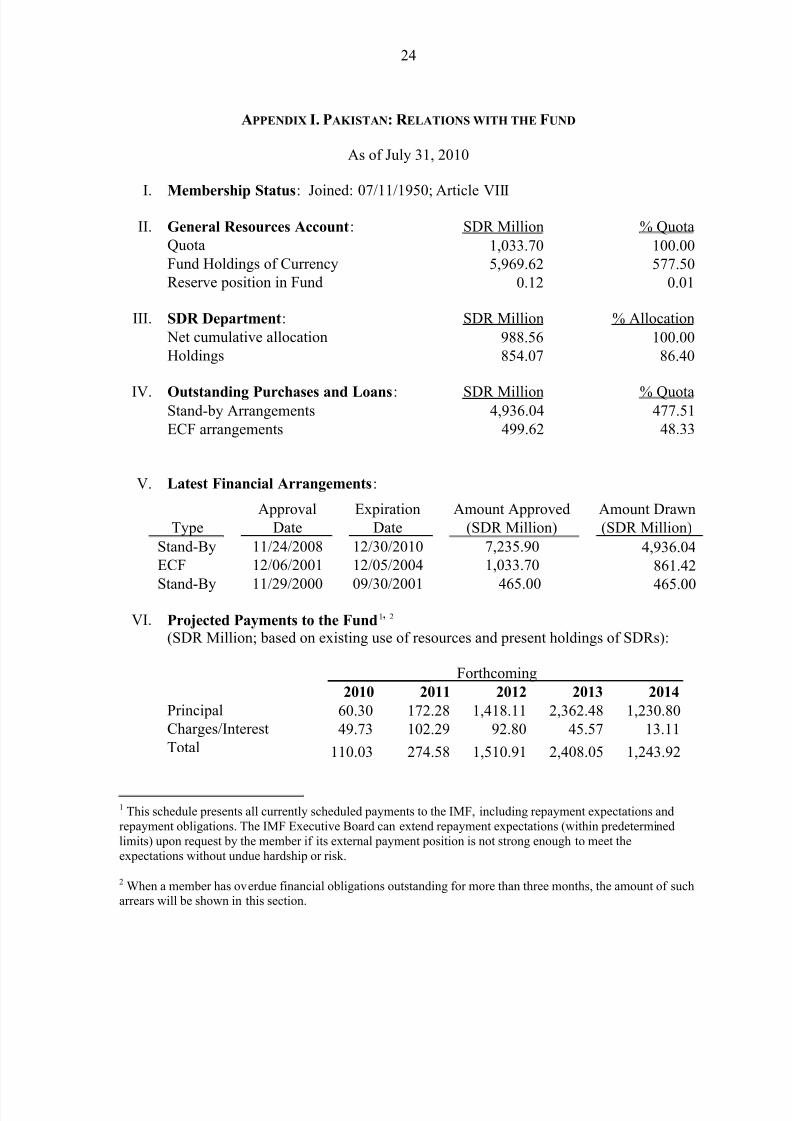
APPENDIX I. PAKISTAN: R ELATIONS WITH THE FUND
As of July 31, 2010
I. Membership Status: Joined: 07/11/1950; Article VIII
II. General Resources Account: SDR Million % Quota
Quota 1,033.70 100.00
Fund Holdings of Currency 5,969.62 577.50
Reserve position in Fund 0.12 0.01
III. SDR Department: SDR Million % Allocation
Net cumulative allocation 988.56 100.00
Holdings 854.07 86.40
IV. Outstanding Purchases and Loans: SDR Million % QuotaStand-by Arrangements 4,936.04 477.51
ECF arrangements 499.62 48.33
V. Latest Financial Arrangements:
Approval Expiration Amount Approved Amount Drawn
Type Date Date (SDR Million) (SDR Million)
Stand-By 11/24/2008 12/30/2010 7,235.90 4,936.04ECF 12/06/2001 12/05/2004 1,033.70 861.42
Stand-By 11/29/2000 09/30/2001 465.00 465.00
VI. Projected Payments to the Fund1, 2
(SDR Million; based on existing use of resources and present holdings of SDRs):
Forthcoming
2010 2011 2012 2013 2014
Principal 60.30 172.28 1,418.11 2,362.48 1,230.80
Charges/Interest 49.73 102.29 92.80 45.57 13.11
Total 110.03 274.58 1,510.91 2,408.05 1,243.92
1 This schedule presents all currently scheduled payments to the IMF, including repayment expectations andrepayment obligations. The IMF Executive Board can extend repayment expectations (within predeterminedlimits) upon request by the member if its external payment position is not strong enough to meet theexpectations without undue hardship or risk.
2 When a member has overdue financial obligations outstanding for more than three months, the amount of sucharrears will be shown in this section.
8/8/2019 IMF Staf Report
http://slidepdf.com/reader/full/imf-staf-report 26/36
25
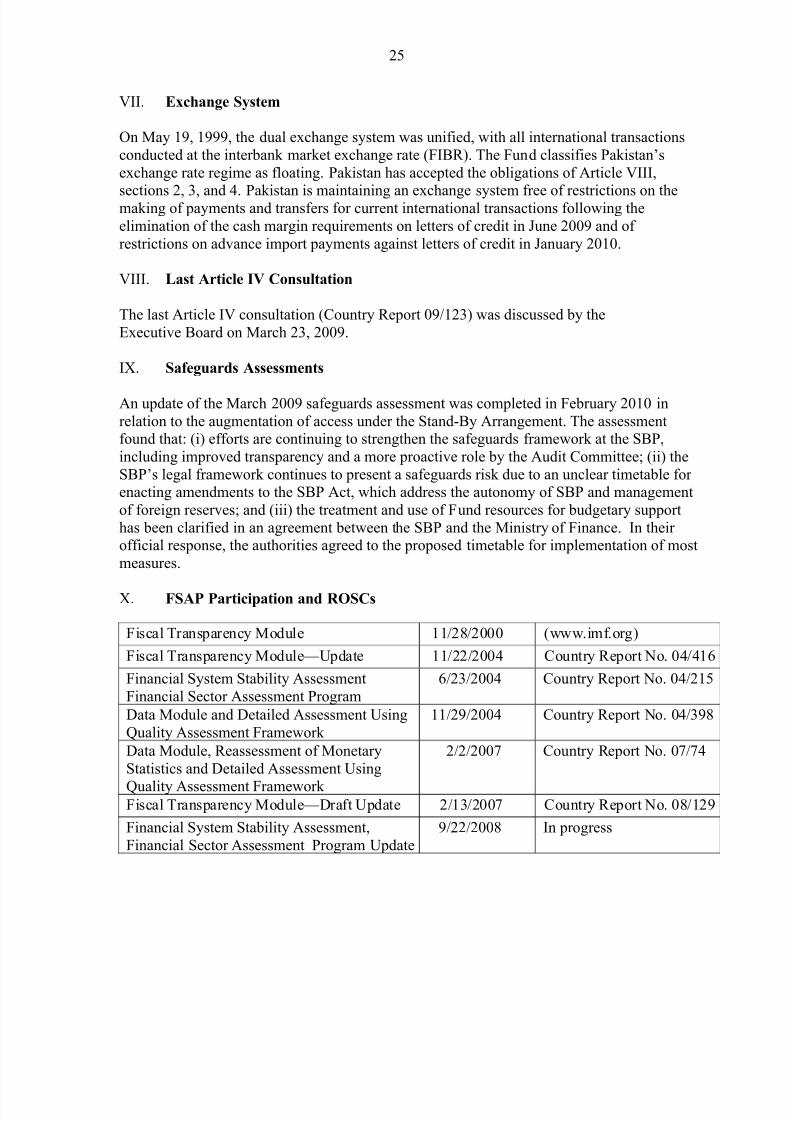
VII. Exchange System
On May 19, 1999, the dual exchange system was unified, with all international transactionsconducted at the interbank market exchange rate (FIBR). The Fund classifies Pakistan’sexchange rate regime as floating. Pakistan has accepted the obligations of Article VIII,
sections 2, 3, and 4. Pakistan is maintaining an exchange system free of restrictions on themaking of payments and transfers for current international transactions following theelimination of the cash margin requirements on letters of credit in June 2009 and of restrictions on advance import payments against letters of credit in January 2010.
VIII. Last Article IV Consultation
The last Article IV consultation (Country Report 09/123) was discussed by theExecutive Board on March 23, 2009.
IX. Safeguards Assessments
An update of the March 2009 safeguards assessment was completed in February 2010 inrelation to the augmentation of access under the Stand-By Arrangement. The assessmentfound that: (i) efforts are continuing to strengthen the safeguards framework at the SBP,including improved transparency and a more proactive role by the Audit Committee; (ii) theSBP’s legal framework continues to present a safeguards risk due to an unclear timetable for enacting amendments to the SBP Act, which address the autonomy of SBP and managementof foreign reserves; and (iii) the treatment and use of Fund resources for budgetary supporthas been clarified in an agreement between the SBP and the Ministry of Finance. In their official response, the authorities agreed to the proposed timetable for implementation of mostmeasures.
X. FSAP Participation and ROSCs
Fiscal Transparency Module 11/28/2000 (www.imf.org)
Fiscal Transparency Module—Update 11/22/2004 Country Report No. 04/416
Financial System Stability AssessmentFinancial Sector Assessment Program
6/23/2004 Country Report No. 04/215
Data Module and Detailed Assessment UsingQuality Assessment Framework
11/29/2004 Country Report No. 04/398
Data Module, Reassessment of MonetaryStatistics and Detailed Assessment Using
Quality Assessment Framework
2/2/2007 Country Report No. 07/74
Fiscal Transparency Module—Draft Update 2/13/2007 Country Report No. 08/129
Financial System Stability Assessment,Financial Sector Assessment Program Update
9/22/2008 In progress
8/8/2019 IMF Staf Report
http://slidepdf.com/reader/full/imf-staf-report 27/36
26
XI. Recent Technical Assistance
FAD
January 2002: Fiscal data management, quality, and transparency.January 2003: Tax administration.February/March 2003: Customs administration.April 2004: Fiscal reporting.April 2007: Public financial management.July and November 2009: Valued Added Tax law.
MCM November/December 2004: Public debt reform and capacity building program (joint withWorld Bank).March/April 2005: Development of the Insurance Sector.December 2006: Monetary policy framework.April 2007: Monetary policy framework, the SBP’s balance sheet, and the Banking ServicesCorporation.
STA
February 2002: External sector statistics/SDDS subscription.April/May 2005: National accounts and consumer price statistics.May 2007: Statistics on the international investment position.October 2009: Multisector statistics (remote technical assistance).
LEG
July 2008: Deposit Protection Fund.
July 2008: Central Bank Law.August 2008: Banking Law.
XII. Resident Representative
A resident representative has been stationed in Islamabad since August 1991. The currentresident representative Mr. Paul Ross took up his post in October 2008.
8/8/2019 IMF Staf Report
http://slidepdf.com/reader/full/imf-staf-report 28/36
8/8/2019 IMF Staf Report
http://slidepdf.com/reader/full/imf-staf-report 29/36
28
had come down from 25 percent in October 2008 to 12–13 percent in recent months. Tocontain inflation, in July the State Bank increased its policy interest rate by 50 basis pointsto 13 percent. Gross reserves reached US$13 billion in June 2010, and the exchange rate has been stable around 85–86 rupees per dollar. The pickup in reserves resulted from a steadynarrowing of the current account deficit, to US$3.5 billion (2 percent of GDP) in 2009/10.
Fiscal policy faced a number of challenges in 2009/10. The reorganization of the taxadministration had a temporary adverse impact on tax collection and, despite our efforts, taxcollection fell short of target. At the same time, there were overruns in security spending dueto the difficult security situation, and provincial spending was higher than expected.Consequently, the 2009/10 fiscal deficit reached 6.3 percent of GDP, compared with anunadjusted program target of 5.1 percent and an adjusted target of 4.6 percent of GDP.Although we were able to draw on domestic bank and non-bank financing, we also had torely on central bank financing, which exceeded the target by Rs. 42 billion. We have met allother end-June performance criteria under the Fund-supported program.
Our budget for fiscal year 2010/11, set before the floods, targets a deficit of 4 percent of GDP—a federal fiscal deficit of 5 percent of GDP combined with a provincial surplus of 1 percent of GDP. To achieve this target, we have raised the general sales tax (GST) rate by1 percent and increased some excise and direct taxes. We have also resumed tax audits, usingrisk-based selection criteria to increase their efficacy.
We have also worked closely with the provinces to ensure they run the desired surpluses.The share of tax revenues distributed to them increased significantly under the 7th NationalFinance Commission award. As spending responsibilities have not yet been transferred to the provinces as envisaged following the 18
thconstitutional amendment, the provinces were
expected to save the additional funds and run surpluses. They have agreed to revise initial budgets and scale back spending plans.
Economic and Budgetary Impact of the Floods
The floods have destroyed infrastructure and seriously undermined the economic outlook.Agriculture, which accounts for 21 percent of GDP and 45 percent of employment, has beenhit particularly hard. There is significant damage to cotton, rice, and sugarcane crops as wellas livestock. This will hurt our export performance, especially in the textile sector, and willlower domestic demand in other sectors. We expect GDP growth to be 2½–3 percent thisyear, about 1¾ percentage points lower than would have been possible without the floods.Furthermore, the damage to crops and the disruption of supply chains in rural areas willinevitably lead to higher inflation for food and other items. Additional demand for building
material, medicine, and social services will also contribute to price pressures. We expect theaverage annual inflation rate to increase from 11.7 percent to 13½ percent this year. Thefinancial sector is also suffering, with dozens of bank branches closed in flood-hit areas.
While it is presently difficult to estimate with any accuracy, the floods will have considerable budgetary impact. The rescue and relief operations and the costs of repairing and rebuilding
8/8/2019 IMF Staf Report
http://slidepdf.com/reader/full/imf-staf-report 30/36
29
public infrastructure will place a heavy burden on public finances at both the provincial andthe federal level. At the same time, tax revenues are likely to fall as economic activityweakens. The floods will likely hurt the balance of payments. Imports will rise in the shortrun as food and other basic goods will need to be sourced from abroad, while capitalequipment imports will increase when reconstruction begins.
Our Response to the Floods
The Government of Pakistan has moved swiftly to provide relief and mobilize resources. The National Disaster Management Authority, its provincial counterparts, and other agencieshave made great efforts to provide rescue and relief operations in the areas affected by thefloods. Thousands of people have been evacuated, food and medicine have been distributedto displaced persons, and some emergency repairs have been made to roads and other infrastructure.
Donors have responded with emergency assistance, aid pledges, and reallocation of resources. The United Nations has led the effort for early recovery and assistance operations
for which it needs US$460 million, of which so far it has secured US$275 million from public and private international donors. Also, the World Bank and the ADB have committedto reallocate US$1 and US$2 billion, respectively, to help us finance reconstruction.
The cost of emergency operations and the reconstruction that lies ahead will compel us toadapt our fiscal framework to boost budgetary resources and enable the government toaddress the emergency, improve service delivery to the population, and increase publicinvestment to raise growth. We will, therefore, shift resources from non-priority current anddevelopment spending to relief and reconstruction spending. We will also introduce atemporary 10 percent income tax surcharge. Despite these efforts, there is no doubt that themassive spending needs and the revenue shortfall that are being caused by the floods will
push the deficit above 4 percent of GDP. Given the limitations on domestic resources,additional external financing is urgently needed, preferably in the form of budgetary grants.
The SBP is taking steps to limit the damage to the economy and the financial sector. It isworking closely with banks to facilitate the flow of credit and also with internationaldevelopment agencies to expand and redirect the existing financing facilities to small andmedium-size enterprises and microfinance projects in the areas hit by the floods. And, tomake sure Pakistan’s international trade and financial relations continue to functionnormally, we will not impose any restrictions on the making of payments and transfers for current international transactions nor introduce any trade restrictions or enter into any bilateral payment agreements that are inconsistent with Article VIII of the Fund’s Articles
of Agreement.
We will continue to co-operate closely with the Fund in the context of our SBA, both to provide support for our reform efforts and help provide a consistent economic and financialframework in the challenging period ahead. Specifically, the existing GST will betransformed through the introduction of a reformed GST capturing the features of a VAT,enabling us to start raising the tax revenues required for sustainable growth. We also remaincommitted to reform the electricity sector in order to eliminate tariff differential subsidies
8/8/2019 IMF Staf Report
http://slidepdf.com/reader/full/imf-staf-report 31/36
30
and resolve circular debt, and to address the quasi-fiscal implications of commodity credit.We will adopt measures to cap the fiscal deficit at 4 percent of GDP before the impact of theflood. The macroeconomic framework will be re-evaluated once the damage needsassessment has been completed, and a revised budget will be submitted for approval to thecabinet and presented to the standing committees on finance and revenue of the National
Assembly and the Senate of Pakistan. We are working actively to deliver these reforms andthus remain confident that the fifth review under the SBA can be completed later this year.
Sincerely,
/s/ /s/
Abdul Hafeez Shaikh Shahid H. Kardar
Minister of Finance Governor of the State Bank of Pakistan
8/8/2019 IMF Staf Report
http://slidepdf.com/reader/full/imf-staf-report 32/36
Press Release No. 10/344
FOR IMMEDIATE RELEASE
September 15, 2010
IMF Executive Board Approves US$451 Million Disbursement in Emergency Natural
Disaster Assistance for Pakistan
The Executive Board of the International Monetary Fund (IMF) today approved a
disbursement of an amount equivalent to SDR 296.98 million (about US$451 million) under
the Emergency Natural Disaster Assistance (ENDA) for Pakistan to help the country manage
the immediate aftermath of the massive and devastating floods that have hit the country. The
Board’s approval enables the immediate disbursement of the full amount of this emergency
assistance; with the hope that this disbursement will catalyze and speed an adequate level of
disbursements by other members of the international community.
Pakistan’s economic outlook has deteriorated sharply as a result of the floods. The
agriculture sector, which accounts for 21 percent of Gross Domestic Product (GDP) and 45
percent of employment, has been hit particularly hard. Initial and preliminary assessments
suggest that real GDP growth is unlikely to exceed 2¾ percent in 2010/11, mainly because of
sharply lower agricultural output. Owing to the disruptions in economic activity, pressure on
the country’s budget is expected as well as a weakening of the balance of payments position.
An updated estimate on the economic impact of the floods should be available after the
completion of damage and needs assessment in the fall.
The US$451 million in emergency assistance will be directed to the country’s budget. It will
help finance the additional spending to help the population affected by the floods and the
associated immediate foreign exchange needs, thereby mitigating a decline in external
reserves and supporting confidence in Pakistan’s external position.
The ENDA, which provides rapid and flexible financial assistance for countries affected by
natural disasters with an urgent balance of payments need, is not linked to any program-
based conditionality or review. Pakistan’s financing under the ENDA carries the IMF’s basic
rate of charge, has a three-year and three month grace period, and is repaid in eight equal
installments with a final maturity of 5 years.
International Monetary FundWashington, D.C. 20431 USA
8/8/2019 IMF Staf Report
http://slidepdf.com/reader/full/imf-staf-report 33/36
2
Following the Executive Board’s discussion on the Pakistan, Mr. Naoyuki Shinohara, Deputy
Managing Director and Acting Chair, stated:
“The IMF extends its deep sympathy to the people of Pakistan for the loss of life, human
suffering, and extensive damage to property and infrastructure caused by catastrophic floodssince late July. The adverse impact of the floods has resulted in significant fiscal and balance
of payments needs related to relief operations.
“The authorities’ immediate response to provide relief to victims and mobilize humanitarian
aid is commendable. The Fund’s emergency assistance to Pakistan will help finance needed
imports and is expected to catalyze additional external support—preferably in the form of
grants or highly concessional financing—which is critical to help meet the immediate
budgetary and balance of payments needs and avoid excessive recourse to domestic
financing. The authorities will work with the World Bank on an enhanced monitoring of aid
flows to help target assistance to the poor and vulnerable and bolster transparency andaccountability.
“The authorities’ commitment to move ahead with the introduction of a reformed general
sales tax, aimed at broadening the tax base, and a strategy for reforming the electricity sector
will be important in addressing the budgetary situation and help facilitate the completion of
the fifth review under the Stand-By Arrangement.”
8/8/2019 IMF Staf Report
http://slidepdf.com/reader/full/imf-staf-report 34/36
Statement by Jafar Mojarrad, Executive Director for Pakistan
My Pakistani authorities wish to convey their deepest appreciation to the Fund Executive
Board and management for their continued support and invaluable advice. They also thank
Fund staff for their constructive engagement with the authorities and their hard work. My
authorities broadly agree with the staff’s assessment, in particular with the challenges facingthe country at this very difficult time, and look forward to continued close cooperation with
the Fund.
Performance Prior to the Floods
The key economic indicators for 2009/10 confirm that before the floods, the Pakistani
economy was picking up. Estimates showed that real GDP, led by manufacturing, grew at
4.1 percent; annual average inflation fell to 11.7 percent (with core inflation at 10.4 percent);
the current account deficit narrowed sharply to 2 percent of GDP; official reserves increased
to about US$13 billion; and the nominal exchange rate remained broadly stable. This
performance, which owed much to the authorities’ perseverance with reform, despite a
complex and costly security situation and a difficult external environment, brought rating
agencies to consider upgrading the sovereign credit rating just before the country was hit by
the most devastating catastrophe in recent history.
While program targets on growth, and the external position were met, and average inflation
was only marginally above the target, the fiscal situation did not improve as expected, mainly
reflecting increased spending on security and the fight against terrorism, higher provincial
spending, and a temporary shortfall in tax revenue following the reorganization of the tax
administration and court appeals by taxpayers. Nontax revenue also fell below target due to
lower dividends and profit transfers. As a result, the fiscal deficit (excluding grants) reached
6.3 percent of GDP, compared to an unadjusted target of 5.1 percent of GDP, and the end-
June target on government borrowing from the State Bank of Pakistan (SBP) was missed by
0.3 percent of GDP. My authorities are committed to bringing the SBA-supported program
back on track, including through strengthened fiscal consolidation efforts.
The 2010/11 approved federal budget targets a general government deficit of 4 percent of
GDP. Towards its realization, my authorities immediately implemented a number of
measures. On July 1, the general sales tax (GST) rate was raised by 1 percentage point to
17 percent. In addition, some excise and direct taxes were increased and capital gains tax
exemptions withdrawn. Sustained efforts are being made to improve tax administration,
including through strengthened audits. Moreover, following extensive consultations with the
provinces, active discussions with the Fund and World Bank staffs on the modalities for the
introduction of a reformed GST are underway. Savings are also contemplated on the
spending side, including cuts in subsidies and a nominal freeze in federal current spending.
8/8/2019 IMF Staf Report
http://slidepdf.com/reader/full/imf-staf-report 35/36
2
Monetary policy remains focused on price stability while supporting stable growth. To this
end, in late July the policy rate was raised by 50 basis points. Banking sector liquidity
remained high and return on assets and equity improved.
Progress was also made on electricity reforms. The tariff was raised on July 1 by
7.6 percent—rather than 6 percent—to offset the financial impact of the three-month delay.Discussions on a comprehensive reform strategy for the electricity sector with the World
Bank and the Asian Development Bank (ADB) resumed with the objective of reaching an
early agreement needed to release about US$1 billion of program loans to help finance the
2010/11 budget.
The Floods and their Impact
The catastrophic floods that have hit Pakistan have led to an immense human tragedy and
severely harmed the economy. As a result, the economic outlook has weakened considerably.
Growth is expected to be lower, and the fiscal, BOP, and inflation situations are expected toworsen.
More than two million families have been displaced and over twenty million people have
been affected. There is extensive damage to roads, telecommunication, energy infrastructure,
and private property. Precise estimates are not yet available because of the scale of the
disaster, but the costs arising from the floods will amount to billions of dollars. The World
Bank and ADB will submit a Damages and Needs assessment by mid-October.
Agriculture, which accounts for 21 percent of GDP and 45 percent of employment, has been
particularly hard hit. An estimated 8 percent of total cropped area has been flooded, withvery significant damage to food and industrial crops that will hurt export performance,
especially in the textile sector. Manufacturing output and exports have also been affected. As
a result, GDP growth is expected to drop to 2.5-3.0 percent in 2010/11, much lower than the
4.25 percent projected before the floods. The decline in output growth could be higher if the
damage to crops exceeds preliminary assessments or if the floods recede at a slower pace
than expected. Furthermore, inflation is expected to be higher due to lower agricultural
output, disruptions in the supply chains, and demand pressures on building materials,
medicines, and social services.
The floods are expected to weaken the BOP by close to 1 percent of GDP. The current
account deficit is projected to increase, as a result of larger imports of food and other basic
goods as well as capital equipment imports for reconstruction, which will only be partially
offset by increased remittances. This would lead to pressure on reserves, which have already
fallen by US$700 million since end-June.
Tax revenues are likely to be lower than projected before the floods because of the flood-
induced weakening of economic activity. At the same time demand for budgetary resources
8/8/2019 IMF Staf Report
http://slidepdf.com/reader/full/imf-staf-report 36/36
3
is expected to increase significantly because of the rescue and relief operations and the huge
reconstruction needs. Cognizant of this need, my authorities are committed to the reform
efforts aimed at increasing internal revenue generation and putting public finances on a
sustainable footing.
The Authorities’ Response
The Government has moved swiftly to provide relief to victims and mobilize resources for
humanitarian purposes. Thousands of people have been evacuated, food and medicines have
been distributed to displaced persons, and some roads and other infrastructure have seen
some emergency repairs. Donors have responded with emergency assistance, aid pledges,
and reallocation of resources, for which the authorities are grateful.
In addition to the needed donor support, the huge cost of emergency operations and
reconstruction will require a redeployment of budgetary resources. Accordingly, my
authorities plan to shift resources from nonpriority current and development spending torelief and reconstruction spending. They will also introduce a temporary 10 percent income
tax surcharge. The large spending needs and revenue shortfall caused by the floods will push
the deficit in 2010/11 above 4 percent of GDP. Given the limited domestic resources and in
view of the urgent need for additional external financing at this crucial juncture, my
authorities are requesting emergency financing under the Fund’s ENDA. This financing will
help meet the urgent food, shelter, and health services needs without overburdening the
domestic financial markets or the reserves position. Full support of the Executive Board for
my authorities’ request would be much appreciated.
Despite some potential increase in NPLs, the impact of the floods on the banking system islikely to be limited. Moreover, the SBP is taking steps to limit this impact. It is working
closely with banks to facilitate the flow of credit and also with the international development
agencies to expand and redirect the existing financing facilities to small- and medium-sized
enterprises and microfinance projects in areas hit by the floods.
Conclusion
My authorities are fully committed to the current SBA-supported program and are
endeavoring to put the program back on track, as in addition to sustaining the needed
resource flow, it provides the framework for economic reforms. My authorities have
demonstrated commitment by remaining focused on the objectives of the SBA even in the
face of the massive natural disaster. Accordingly, they plan to cap the budget deficit target to
4 percent of GDP, excluding the impact of the floods, introduce a reformed GST that
captures the features of VAT on October 1, reform the electricity sector in order to eliminate
subsidies and resolve circular debt, and address the quasi-fiscal implications of commodity
credit.
In view of the pressing challenges brought about by the floods, support from the Fund and