
Human–computer interaction in production scheduling - Technische
136
Humancomputer interaction in production scheduling Analysis and design of decision support systems for production scheduling tasks PROEFSCHRIFT ter verkrijging van de graad van doctor aan de Technische Universiteit Eindhoven, op gezag van de Rector Magnificus, prof.dr. M. Rem, voor een commissie aangewezen door het College van Decanen in het openbaar te verdedigen op donderdag 12 juni 1997 om 16.00 uur door Vincent Constantijn Sebastiaan Wiers geboren te Schiedam
Transcript of Human–computer interaction in production scheduling - Technische

Human�computer interaction in production scheduling
Analysis and design of decision support systems for production scheduling tasks
PROEFSCHRIFT
ter verkrijging van de graad van doctor aan de Technische Universiteit Eindhoven, op gezag van de Rector Magnificus, prof.dr. M. Rem, voor een commissie aangewezen door het College van Decanen in het openbaar te verdedigen op donderdag 12 juni 1997 om 16.00 uur
door
Vincent Constantijn Sebastiaan Wiers
geboren te Schiedam

Dit proefschrift is goedgekeurd door de promotoren:
prof.dr. P.M. Bagchus
en
prof.dr.ir. J.W.M. Bertrand
en de copromotor:
dr. T.W. van der Schaaf
CIP�data Library Technische Universiteit Eindhoven
Wiers, Vincent Constantijn Sebastiaan
Human�computer interaction in production scheduling: analysis and design of decision support systems for production scheduling tasks / by Vincent Constantijn Sebastiaan Wiers. � Eindhoven: Technische Universiteit Eindhoven, 1997. � Proefschrift. �
ISBN 90�386�0355�X
NUGI 684
Subject headings: Production scheduling / Decision support systems
Cover designer: Bart Massee
Printer: Ponsen & Looijen, Wageningen
BETA Central Secretary, pav. A03, P.O. Box 513, 5600 MB Eindhoven, The Netherlands. Phone: +31 40 247 3983. Fax: +31 40 245 0258. E�mail: [email protected]
© 1997, V.C.S.Wiers, Eindhoven All rights reserved. No part of this publication may be reproduced, stored in or introduced into a retrieval system, or transmitted, in any form, or by any means (electronic, mechanical, photocopying, recording, or otherwise), without the prior written permission of the author.
iii
Table of contents
PREFACE .................................................................................................................................. VII
QUOTATIONS..............................................................................................................................IX
1. INTRODUCTION AND PROBLEM DEFINITION 1
1.1 What is scheduling? .....................................................................................................1 1.2 The gap between theory and practice..........................................................................3 1.3 Overview of this thesis.................................................................................................3
2. A REVIEW OF TECHNIQUES AND HUMANS IN PRODUCTION SCHEDULING 5
2.1 Techniques ...................................................................................................................5 2.1.1 Operations research...................................................................................................................5 2.1.2 Artificial intelligence..................................................................................................................7 2.1.3 Information presentation..........................................................................................................9
2.2 Humans ..................................................................................................................... 10 2.2.1 Scheduling task models ...........................................................................................................11 2.2.2 Cognitive scheduling models..................................................................................................11 2.2.3 Use of techniques ....................................................................................................................13 2.2.4 Individual differences ..............................................................................................................14
2.3 Conclusion and discussion ........................................................................................ 15 2.4 Implications for the research..................................................................................... 16
3. A DESCRIPTIVE QUANTITATIVE FIELD STUDY 17
3.1 Introduction ............................................................................................................... 17 3.2 The production units ................................................................................................. 17 3.3 The scheduling process ............................................................................................. 18 3.4 The model .................................................................................................................. 19
3.4.1 Performance variables .............................................................................................................20 3.4.2 Disturbance variables ..............................................................................................................20 3.4.3 Action variables ........................................................................................................................21 3.4.4 Relationships.............................................................................................................................21
3.5 Data gathering and analysis ......................................................................................22 3.6 Results........................................................................................................................23 3.7 Conclusion and discussion ........................................................................................25
iv
4. RESEARCH DESIGN AND METHODS 27
4.1 Research questions ....................................................................................................27 4.2 Research strategy.......................................................................................................27 4.3 Research design .........................................................................................................28
4.3.1 Components..............................................................................................................................28 4.3.2 Quality .......................................................................................................................................28 4.3.3 Replication ................................................................................................................................29
4.4 Conceptual framework...............................................................................................29 4.4.1 Production units .......................................................................................................................30 4.4.2 Production control structure ..................................................................................................31 4.4.3 Scheduling information system..............................................................................................32 4.4.4 Scheduling task .........................................................................................................................33
4.5 Collecting and analyzing data ...................................................................................33 4.5.1 Protocol .....................................................................................................................................33 4.5.2 Analytic strategy .......................................................................................................................33 4.5.3 Sources of evidence.................................................................................................................35 4.5.4 Documentation.........................................................................................................................35
5. FOUR EXPLANATORY CASE STUDIES 37
5.1 Case I: potato starch production................................................................................37 5.1.1 Production units .......................................................................................................................37 5.1.2 Production control...................................................................................................................39 5.1.3 Scheduling information system..............................................................................................40 5.1.4 Scheduling task .........................................................................................................................40 5.1.5 Evaluation of human computer interaction ........................................................................42 5.1.6 Discussion .................................................................................................................................42
5.2 Case II: corrugated fiberboard production ...............................................................43 5.2.1 Production unit.........................................................................................................................43 5.2.2 Production control...................................................................................................................44 5.2.3 Scheduling information system..............................................................................................45 5.2.4 Scheduling task .........................................................................................................................46 5.2.5 Evaluation of human computer interaction ........................................................................46
5.3 Case III: corrugated fiberboard packaging production............................................48 5.3.1 Production unit.........................................................................................................................48 5.3.2 Production control...................................................................................................................49 5.3.3 Scheduling information system..............................................................................................49 5.3.4 Scheduling task .........................................................................................................................50 5.3.5 Evaluation of human computer interaction ........................................................................50
5.4 Case IV: metal ceiling systems production ...............................................................52 5.4.1 Production unit.........................................................................................................................52 5.4.2 Production control...................................................................................................................54 5.4.3 Scheduling information system..............................................................................................55 5.4.4 Scheduling task .........................................................................................................................55 5.4.5 Evaluation of human computer interaction ........................................................................56
5.5 Clustering of results ..................................................................................................57
v
5.5.1 Functionality .............................................................................................................................57 5.5.2 Information presentation........................................................................................................57
6. ANALYSIS AND DESIGN OF DECISION SUPPORT SYSTEMS IN PRODUCTION SCHEDULING TASKS 59
6.1 Introduction ...............................................................................................................59 6.2 Functionality ..............................................................................................................60
6.2.1 Autonomy..................................................................................................................................60 6.2.2 Transparency.............................................................................................................................65 6.2.3 Level of support.......................................................................................................................65
6.3 Information presentation...........................................................................................67 6.3.1 Aggregation...............................................................................................................................67 6.3.2 Display types.............................................................................................................................69 6.3.3 Feedback....................................................................................................................................69
6.4 An explanatory and a design model for decision support.........................................69
7. IMPLEMENTATION OF A SCHEDULING DECISION SUPPORT SYSTEM 73
7.1 Production analysis ....................................................................................................73 7.1.1 The company ............................................................................................................................73 7.1.2 Production process ..................................................................................................................74 7.1.3 Operational characteristics......................................................................................................76
7.2 Task analysis ..............................................................................................................78 7.2.1 Autonomy..................................................................................................................................78 7.2.2 Scheduling task analysis...........................................................................................................79
7.3 Task redesign.............................................................................................................83 7.3.1 Assign quays to ships...............................................................................................................84 7.3.2 Construct unloading sequence ...............................................................................................84 7.3.3 Assign unloaders to holds.......................................................................................................84 7.3.4 Assign stacker/reclaimers, barge loaders, ship loaders.......................................................85 7.3.5 Estimate unloading throughput time ....................................................................................85 7.3.6 Accept barges ...........................................................................................................................86 7.3.7 Monitor progress of production............................................................................................86 7.3.8 Summary of task redesign phase ...........................................................................................87
7.4 Decision support design............................................................................................87 7.4.1 Data structure ...........................................................................................................................87 7.4.2 Functionality .............................................................................................................................88 7.4.3 Information presentation........................................................................................................91
7.5 Discussion and evaluation .........................................................................................92
8. DISCUSSION AND CONCLUSIONS 95
8.1 General conclusion.....................................................................................................95 8.2 Methodology ..............................................................................................................95 8.3 Artificial intelligence and human schedulers ............................................................96

vi
8.4 Performance of scheduling .......................................................................................97 8.5 What is scheduling? ...................................................................................................98
8.5.1 Input........................................................................................................................................ 100 8.5.2 Process.................................................................................................................................... 100 8.5.3 Output .................................................................................................................................... 101
8.6 Can humans be replaced?........................................................................................ 101
REFERENCES .......................................................................................................................... 103
SUMMARY................................................................................................................................111
SAMENVATTING (SUMMARY IN DUTCH) ................................................................................. 117
CURRICULUM VITAE .............................................................................................................. 123
vii
Preface
After three years and a few months, I have finally reached the point where I may write the pref-ace of the now finished thesis. The past three years have been incredibly interesting and instruc-tive, and I am sure that I will always enjoy looking back at them. This thesis could not have been written without the support of many persons, and I now would like to thank those who have in one way or another contributed to this book.
During my study I was supervised by Paul Bagchus and Tjerk van der Schaaf. Their commitment, interest, support and enthusiasm for the research has always been undiminished, and it is difficult to imagine how I would have reached the same results without them. The numerous discussions we had were held in a relaxed and friendly atmosphere, in which each idea and opinion would be heard and taken seriously. In such sessions, Paul�s apparently naïve questions often hit exactly the right spot, and he would be able to lead even the most complex and vague discussions to a satis-fying result. To Tjerk I am very grateful for the fact that he would always either have or make time for me, hence applying safety management for my mental well�being.
Despite their huge agenda problems, both Will Bertrand and Hans Wortmann managed to ex-press their views on the research as additional supervisors. Although I only managed to organize a few sessions per year that were attended by both, driving myself and quite a few secretaries crazy in the process, their contribution has been invaluable. When needed, Corné Dirne provided additional feedback, in particular in the field of production planning and control. I am also grate-ful to Jacob Wijngaard for participating in the dissertation committee, and to Jim Browne and Jan Karel Lenstra for their contribution to the defense of this thesis.
Throughout the research, numerous email messages crossed the Atlantic ocean between Ken McKay and me. A visit to Ken at the Memorial University of Newfoundland boosted my re-search; our long and intensive discussions turned out to be an effective mental scheduling floss. What began as commenting on each other�s ideas ended up with redefining scheduling, soon for the world to read (if not, well, we had some good hikes anyway). And, contrary to his own words, Ken gets seasick (almost as bad as I do).
During the project I greatly appreciated the company of the other Ph.D. candidates. In particular I would like to mention Marcel �t Hart, Mark Euwe, Werner Schippers, Paul Stoop, and Finn Wijnstra. Also, I would like to thank the members of the Information and Organization network, and my colleagues at the department of Technology and Work. In this department I would espe-cially like to thank Paul Janssen for his psychoanalyses and resume training sessions, Frans van Eijnatten for the discussions about methodology and various other quasi�philosophical subjects, and Petra Siemons for being the motherly backbone of the department.
Conducting the research would have been absolutely impossible without the cooperation of a large number of persons in a variety of industrial organizations. I am very grateful to the follow-ing managers responsible for production planning and control that allowed me to poke my nose in their daily affairs: Hille Oomen, Jos Smetsers, Robert Swinkels, Peter Rothuizen, Paul Schreuders, Halbe Akker, Hans Verduyn, Jan van Dongen, Tom van Gerven, Cees van Maanen, and Ton Uitenbroek. I am also grateful to the following planners and schedulers that tolerated my presence closely behind their left shoulder: André, Michel, Paul van Helmont, Paul Lindner, Henk Moorman, Jacky van Roij, Oeds�Jan Veenstra, Hildebrand Wiersema, Kees Akkermans,

viii
Jan van �t Hof, Ron Jongenelen, Ronald Slabbekoorn, Edgar Wijnen, Luut Brink, Ron van de Erve, Wout van Holt, Sjaak Oudijn, Koos Sjerp, Annemarie Tol, and Hans Valk. A special ac-knowledgment goes to Bert Pothoven, not only for accepting my offer to design a scheduling sys-tem, but also for the very pleasant cooperation during the analysis and design of the system.
Furthermore, I am grateful to all friends and family members who expressed interest in my work during the last few years. Special thanks go to Bart Massee, for designing the cover of this book, and to Christine Shea, for the laborious job of proofreading this thesis. It�s amazing what people do for a bottle of good whisky� ;)
With Ellis I did everything not related to this thesis, and I enjoyed it very much. But that�s a different story�
Eindhoven, March 1997 Vincent Wiers

ix
Quotations
�Plans are nothing; planning is everything� � Dwight D. Eisenhower
�Planning without action is futile, action without planning is fatal� � Unknown
�There is nothing more frightful than ignorance in action� � Goethe
�If a man will begin with certainties he shall end in doubts; but if he will be content to begin with doubts he shall end in certainties� � Francis Bacon
�It is always wise to look ahead, but difficult to look further than you can see� � Sir Winston Churchill
�The best executive has the sense enough to pick good men, and the self�restraint enough to keep from meddling� � Theodore Roosevelt
�Is it not a tragedy that so much of the world�s most valuable resource (brains), is being squandered, in attempts to solve an obsolete problem?� � J.L. Burbidge (Burbidge, 1994)
�Why is it that such a vast amount of research is being conducted and financial and intellectual resources being wasted generating useless solutions to unrealistic problems?� � S.F. Hurley (Hurley, 1996)
�The problem definition (for scheduling) is so far removed from job�shop reality that perhaps a different name for the research should be considered.� � K.N. McKay, F.R. Safayeni, and J.A. Buzacott (McKay et al., 1988)
Once, I was in a book shop with Kenneth McKay. I was standing at the fantasy section and explained to him: �I read fantasy once in a while.� Ken said: �Me too. It�s name is OR.�
�No amount of planning will ever replace dumb luck� � seen on the wall of a planning office
�Mind the gap� � heard in the London Underground

Introduction and problem definition 1
1. Introduction and problem definition
1.1 What is scheduling? Time is the scarcest resource to humans. Scheduling is about making the most of a limited amount of time. Scheduling emerges in various domains, such as nurse scheduling, airplane land-ing scheduling, train scheduling, production scheduling. This thesis focuses on production sched-uling. Production scheduling is an essential part of the management of production systems: it lies at the very heart of the performance of manufacturing organizations. Effective scheduling can lead to due date performance that results in meeting the company�s customer service goals, and reducing work�in�process inventories and production lead times (Vollmann et al., 1988). Sadowski & Medeiros (1982) state: �The priority planning and shop floor control and scheduling elements ultimately determine the performance of the production system� (p. 11.2.3).
Once, before scheduling existed in the heads of production management, there was a time when the factories did not know when work was starting, where it was, how it moved through the plant and when it would be done. A time when:
��most of the industrial plants of the world are still in the stage of civilization of which as to transportation the old freight wagons and prairie schooners across the plains were types. They started when they got ready, they arrived some time, and nobody knew where they were nor what route they were taking in between� (Emerson, 1913; p. 251).
The early industrial engineers and management consultants were busy trying to sort out many as-pects of �modern manufacturing,� and production control did not escape their attention. From the famous planning charts of Gantt (1919) to mechanic scheduling systems similar in respect to today�s Kanban systems, the ancients observed, pondered and advised. It was clear to them that something had to be done about the chaos: they talked about �despatching� and schedulers who could be charged with this type of orchestration. The schedulers were responsible for short term decision making and for �anticipating problems and discounting them.� An early definition of what a scheduler is supposed to do suggested that:
�The schedule man1 must necessarily be thorough, because inaccurate and misleading information is much worse than useless. It seems trite to make that statement but experience makes it seem wise to restate it. He must have imaginative powers to enable him to interpret his charts and foresee trouble. He must have aggressiveness and initiative and perseverance, so that he will get the reasons underly-ing conditions which point to future difficulties and bring the matter to the attention of the Depart-ment Head or Heads involved and keep after them until they take the necessary action. He is in ef-fect required to see to it that future troubles are discounted� (Coburn, circa 1918; p. 172).
Hence, in the beginning of this century, the scheduler was seen as a problem anticipator and solver. From then on, scheduling has primarily been subject to research from a mathematical point of view, embodied by the operations research community. Some of the first books on
1 For ease of reading, hereafter the traditional masculine singular pronoun will be used for generic reference, rather than cumbersome forms such as he/she, he or she, etc.
Chapter 1 2
scheduling theory were written by Conway et al. (1967) and Baker (1974). Since then, operations research has produced over 20,000 publications about the scheduling problem (Dessouky et al., 1995). In the operations research community, scheduling is usually defined as �allocating a set of resources to perform a set of tasks.� In production systems, this typically concerns allocating a set of machines to perform a set of jobs within a certain time period. The result of scheduling is a schedule, which can be defined as: �a plan with reference to the sequence of and time allocated for each item or operation necessary to its completion� (Vollmann et al., 1988; p. 536).
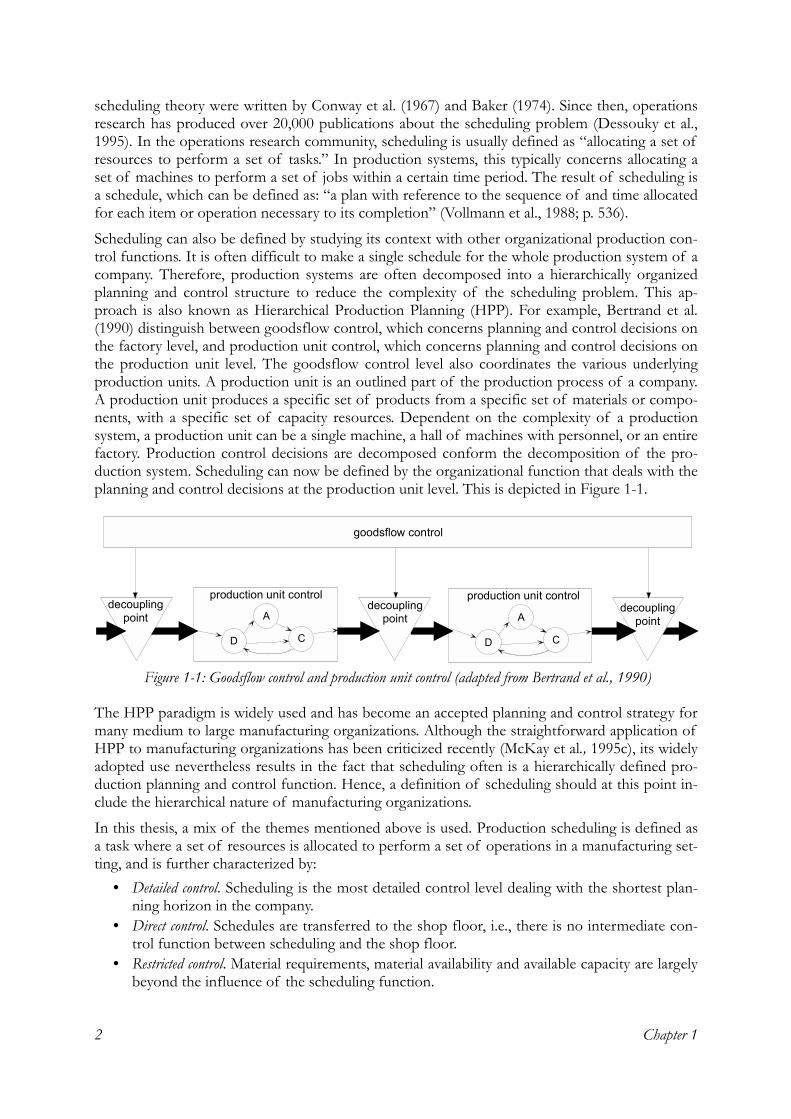
Scheduling can also be defined by studying its context with other organizational production con-trol functions. It is often difficult to make a single schedule for the whole production system of a company. Therefore, production systems are often decomposed into a hierarchically organized planning and control structure to reduce the complexity of the scheduling problem. This ap-proach is also known as Hierarchical Production Planning (HPP). For example, Bertrand et al. (1990) distinguish between goodsflow control, which concerns planning and control decisions on the factory level, and production unit control, which concerns planning and control decisions on the production unit level. The goodsflow control level also coordinates the various underlying production units. A production unit is an outlined part of the production process of a company. A production unit produces a specific set of products from a specific set of materials or compo-nents, with a specific set of capacity resources. Dependent on the complexity of a production system, a production unit can be a single machine, a hall of machines with personnel, or an entire factory. Production control decisions are decomposed conform the decomposition of the pro-duction system. Scheduling can now be defined by the organizational function that deals with the planning and control decisions at the production unit level. This is depicted in Figure 1-1.
The HPP paradigm is widely used and has become an accepted planning and control strategy for many medium to large manufacturing organizations. Although the straightforward application of HPP to manufacturing organizations has been criticized recently (McKay et al., 1995c), its widely adopted use nevertheless results in the fact that scheduling often is a hierarchically defined pro-duction planning and control function. Hence, a definition of scheduling should at this point in-clude the hierarchical nature of manufacturing organizations.
In this thesis, a mix of the themes mentioned above is used. Production scheduling is defined as a task where a set of resources is allocated to perform a set of operations in a manufacturing set-ting, and is further characterized by:
• Detailed control. Scheduling is the most detailed control level dealing with the shortest plan-ning horizon in the company.
• Direct control. Schedules are transferred to the shop floor, i.e., there is no intermediate con-trol function between scheduling and the shop floor.
• Restricted control. Material requirements, material availability and available capacity are largely beyond the influence of the scheduling function.
A
D C
A
D C
goodsflow control
production unit control production unit controldecoupling
pointdecoupling
pointdecoupling
point
Figure 1-1: Goodsflow control and production unit control (adapted from Bertrand et al., 1990)
Introduction and problem definition 3
• Sustained control. Scheduling monitors the progress of production and solves problems if the actual situation deviates from the scheduled situation.
In practice, a particular scheduling function is often tightly coupled with an individual employee, i.e., the scheduler. It is the individual scheduler who is the focus of research in this thesis, which means that relationships between multiple scheduling functions or schedulers are not studied ex-plicitly. Although there is a large variety in responsibilities and roles that are fulfilled by schedul-ers, it is possible to mention some common characteristics. Often, a scheduler is somebody who almost naturally assumes responsibility for the progress and timeliness of production activities, regardless of formal responsibilities. This feeling of being responsible is strengthened by the fact that the scheduler is an essential source of information for many colleagues, customers and sup-pliers. Usually, only a small portion of the time of the scheduler is spent on constructing an ini-tial schedule, whereas a large portion of the time is spent on monitoring the execution of the schedule. The aim of the monitoring activities is to identify problems, which are often solved by the scheduler, using a variety of skills such as communication, negotiation and intuition. Schedul-ers also try to anticipate possible problems, with varying success.
1.2 The gap between theory and practice As stated above, a vast amount of literature about scheduling problems has been produced in the last few decades. Yet, in spite of the vast body of research, and the fact that many practitioners in operations management are convinced of the fact that manual scheduling is to a great extent sub-ject for improvement, the use of scheduling techniques in practice is scarce. For example, Pinedo (1992) states:
�In spite of the fact that during this last decade many companies have made large investments in the development as well as in the implementation of scheduling systems, not that many systems appear to be used on a regular basis. Systems, after being implemented, often remain in use for only a limited amount of time; after a while they often are, for one reason or another, ignored altogether� (p. 2151).
This leads to the following initial research questions: • Why are scheduling techniques often not used in manufacturing practice? • How can this situation be improved?
In the research presented in this thesis, the human aspects of using scheduling techniques are the focus. This emphasis is triggered by the fact that the idea that human schedulers can be replaced by techniques and information systems is past (e.g., Anthonisse et al., 1988; Ho & Sculli, 1997). Consequently, the reason to study human aspects of production scheduling lies in the fact that human schedulers ultimately determine the success of techniques by deciding whether to use or not to use them.
The above definition of scheduling is used as a guideline for the research to identify possible ob-jects of interest to be studied in practice. However, although the given definition gives adequate support for conducting the research, it is felt that it at most represents the sheer sum of several scheduling theories, and that the underlying principles are somewhat unclear as a result. Apart from answering the research questions, this research might also result in new insights regarding the underlying principles of scheduling.
1.3 Overview of this thesis The structure of this thesis is as follows: in Chapter 2, a literature review of the role of human schedulers and the use of scheduling techniques and information systems in practice is given. In Chapter 3, a descriptive field study of the decision behavior of four production schedulers is pre-

Chapter 1 4
sented. In Chapter 4, the methodological outline of the research is presented, and the research elements are described. In Chapter 5, four explanatory case studies are presented. In Chapter 6, the results from the case studies are translated to an explanatory and a design model for decision support systems in production scheduling tasks. In Chapter 7, an implementation of such a sys-tem is described. Lastly, in Chapter 8, general conclusions and a discussion of the research are presented.
A review of techniques and humans in production scheduling 5
2. A review of techniques and humans in production scheduling
In this chapter, literature about the role of humans, techniques and information systems in scheduling is reviewed. At the end of this chapter, the common themes of the work reviewed are explained and discussed, and implications for the research described in this thesis are presented. Parts of the contents of this chapter have previously been published in a journal paper, see Wiers (1997a).
2.1 Techniques
2.1.1 Operations research From its emergence at the beginning of this century, scheduling has generally been perceived by academia as a mathematical problem. Hence, research on scheduling has primarily been the do-main of operations research (OR). The amount of reported research on scheduling in the opera-tions research community is immense. The intention here is not to give a review of scheduling theory in general; instead, this review is focused on papers that discuss the applicability of tech-niques. There are many excellent reviews of scheduling theory: a review of single�machine re-search can be found in Gupta & Kyparisis (1987); a review of dynamic scheduling research can be found in Ramasesh (1990); multi�constrained job shops are reviewed in Gargeya & Deane (1996); the job shop scheduling problem is reviewed by Blazewicz et al. (1996); and heuristic scheduling systems are treated in Morton & Pentico (1993).
To enable modeling and solving the problem in a mathematically feasible way, many researchers greatly simplified the scheduling problem. It turned out that analytical solutions to the scheduling problem were unmanageable for problems of any complexity. Therefore, problems were assumed to be deterministic and static, only a small number of resources and operations were considered, and constraints and relations were ignored, etc. These assumptions greatly reduced the applicabil-ity of techniques in practice. King (1976) was one of the first who explicitly recognized the gap between theory and practice in production scheduling. King attributed this gap to the oversimpli-fication of complex real�world situations in order to construct mathematical models. In his well�known review article about production scheduling, Graves (1981) also addressed this problem, and stressed the need for research on the following six problems which remain highly relevant today: performance measurement of production systems; robustness in scheduling; interaction between scheduling decisions and other types of organizational decisions; data availability and accuracy; specialized scheduling functions such as expediting; and scheduling of computerized manufacturing systems.
Another aspect that hampered the implementation of scheduling techniques in practice was that for a number of decades, scheduling techniques needed too much computing power. Most of the scientific research had been directed towards relatively small�scale optimization programs that were highly iterative. In contrast, almost all software suppliers considered iterative algorithms to be very risky. For builders of software who must retrieve each single record from a disk there was
Chapter 2 6
only one overall guideline: avoid any situation in which a record needs to be addressed more than once (Wortmann et al., 1996).
Two recent developments therefore seemed promising for the applicability of scheduling tech-niques in practice. First, with the arrival of cheap computing power in the 1960�s, an important obstacle for the application of scheduling techniques in practice seemed to disappear. Second, where scientific research initially focused on greatly simplified problems, it moved to solving problems that more closely resembled real�world settings. With integer and dynamic program-ming techniques, more realistic scheduling problems could be modeled and solved. Heuristic search algorithms were introduced that were able to find (near�) optimal schedules from a large number of feasible schedules (Morton & Pentico, 1993). As these algorithms became �smarter� they were better able to find a good solution within a reasonable amount of time using com-puters.
However, despite these developments, the impact of academia on industrial scheduling remains small. From various reports in literature, it can be concluded that the complexity and instability of production systems are still underestimated in many scheduling techniques. A survey by Hal-sall et al. (1994) on the use of scheduling techniques and information systems in smaller manu-facturing companies in the UK shows that the scheduling process is greatly facilitated by a stable and predictable environment, and that uncertainties need to be taken into account when design-ing a scheduling system. Also, a scheduling system should be able to revise only the affected parts of the schedule in case of disturbances and to check if the resulting schedule is feasible. Like-wise, Pinedo (1992, 1995) observes that most theoretical scheduling models do not sufficiently emphasize the rescheduling problem. Pinedo (1995) gives 12 differences between theoretical models and real�world scheduling. He states that, as opposed to many theoretical models, in the real�world: (1) jobs are constantly added to the system, (2) the rescheduling problem is impor-tant, (3) complexity is high, (4) different jobs have different priorities, that vary over time, (5) preferences in the selection of machines are important, (6) machine availability is defined by shift patterns, (7) penalty functions are not linear, (8) more than one objective is often considered, (9) the inputs of scheduling (e.g., available capacity) can be influenced, (10) processing times do not follow statistical distributions, (11) processing times on one machine are often positively corre-lated, and (12) processing times may be subject to change due to learning or deterioration. Somewhat similarly, Parunak (1991) distinguishes between the following five �challenges� that make scheduling difficult: (1) Desirability, i.e., some costs are more important than others; (2) Stochasticity, i.e., the real�world changes unexpectedly; (3) Tractability, i.e., the real�world is too complex to model; (4) Chaos, i.e., in the real world, small uncertainties may lead to widely diver-gent predictions; and (5) Decidability, i.e., no algorithms exist that can predict certain real�world behavior. Pinedo (1995) states that despite these differences, the general consensus in OR is that the theoretical research done in the past has not been a complete waste of time, because it has given valuable insight in the scheduling problem. However, Pinedo�s statement does indicate that the relevancy of much of the scheduling research can at least be questioned. Furthermore, Pinedo observes that in practice, scheduling problems are often tackled by seemingly crude heu-ristics, and that more sophisticated procedures can often not be applied due to the high fre-quency of random events.
Problems regarding the applicability of operations research techniques are also discussed by Buxey (1989), who reviews the role that operations research has played in production planning and scheduling. He concludes that where operations research has tried to optimize one stage of a hierarchical system, e.g., the production unit, it has had little impact. Four reasons are given for this: (1) the complexity of the problem, (2) the interdependence of scheduling problems with other control functions, (3) uncertainty, and (4) the absence of a relationship between mathe-matical optimization and real productivity, which is achieved by experienced humans.
A review of techniques and humans in production scheduling 7
As illustrated by the last aspect mentioned by Buxey, researchers in the operations research com-munity are beginning to realize that the human scheduler cannot be replaced and must be con-sidered when developing scheduling techniques. Anthonisse et al. (1988) state that the role of human insight is as vital as the use of quantitative techniques. The survey of Halsall et al. (1994) also showed that companies felt that scheduling systems should support instead of replace the human scheduler. The same issue is stressed by McKay et al. (1988). They give a number of rea-sons why the theoretical approach from operations research does not work in practice. Schedul-ers have to handle a very large variety of elements which are prone to disturbances. Humans are able to use hard and soft information in scheduling: they use intuition to fill blank spots in the information. Furthermore, schedulers are able to influence some constraints of the shop floor, e.g., altering the short�term capacity.
Despite the problems and issues that have arisen in the last years and that have been discussed above, the recent survey of Halsall et al. (1994) shows that the focus of scientific research in scheduling has not changed significantly. Halsall et al. classify recent operations research and management science literature on production scheduling into three categories: theoretical papers, practical papers and mixed papers, i.e., theoretical but based on a real�life framework, but with-out actual application. The period considered is 1986 � 1990. The results show that theoretical papers by far dominate the reported work, which is regarded as unfavorable, because there is a great need to report on and learn from successful and failed implementations of scheduling sys-tems.
2.1.2 Artificial intelligence Partly triggered by the limited success of operations research in improving industrial scheduling practice, and partly triggered by the emergence of artificial intelligence technology, some re-searchers and practitioners in production scheduling began to realize that to capture the schedul-ing problem, an altogether new approach had to be used. Artificial intelligence (AI) appeared to provide a better basis for modeling and solving the scheduling problem: artificial intelligence re-search had already achieved significant successes in solving complex problems in a number of scientific fields. In particular, artificial intelligence was expected to be capable of capturing for-merly intangible human decision behavior in scheduling.
In Grant (1986), the potential use of artificial intelligence in scheduling is advocated by compar-ing operations research and artificial intelligence methods in the context of developing a schedul-ing system for repair job scheduling. Artificial intelligence techniques, by modeling human exper-tise, turn out to be useful to develop more efficient search strategies than would have been possi-ble with operations research techniques. A prototype scheduler is developed, but the author does not indicate whether the system has been implemented or not.
The applicability of expert systems to job shop scheduling is also investigated by Randhawa & McDowell (1990). The problem of job shop scheduling is described from two perspectives: in-dustry and academia. Industry has generally focused on pragmatic approaches to job shop sched-uling, such as Just�In�Time (JIT), Manufacturing Resource Planning (MRP), and Optimized Pro-duction Technology (OPT). Academia has attempted to solve the job shop scheduling problem by mathematical approaches or to predict system performance by using simulation. Randhawa and McDowell state that these efforts from academia show that mathematical techniques are not suited for solving real�world problems. They also discuss the potential benefits of artificial intel-ligence techniques because of the limited applicability of operations research techniques in job shop scheduling.
However, from other reports on the applicability of artificial intelligence in scheduling in prac-tice, it can be concluded that the same problems that hampered the implementation of schedul-
Chapter 2 8
ing techniques from operations research in practice, also arise in the application of artificial intel-ligence to production scheduling. Kathawala & Allen (1993) list a number of existing expert sys-tems for scheduling and mention some issues that should be taken into account when developing expert systems for job shop scheduling. The problem solving domain should be well�understood, stable, and not subject to negotiation. Furthermore, human experts should be available and will-ing to cooperate; they could fear losing their jobs and therefore obstruct expert systems devel-opment. Also, the costs of expert systems, which can become very high, should be carefully evaluated against the potential profits.
In Kanet & Adelsberger (1987), the applicability of expert systems to production scheduling is discussed. A state�of�the�art review is given, along with the remark that the area of expert sys-tems in production scheduling is still in its infancy. They indicate that in order to encompass sole mimicking of human scheduling behavior, successful scheduling systems of the future should be able to enumerate more alternatives than a human scheduler can, and be able to learn from ex-perience. This leads to the observation that artificial intelligence not only inherited problems of operations research, but that some additional pitfalls were introduced as well. This is illustrated in the work of Randhawa & McDowell (1990), who indicate that a prerequisite for developing an expert system for production scheduling is the availability of expert knowledge. Unfortunately, this knowledge is dispersed among operators, foremen, supervisors, schedulers, and so on (Patten, 1968). They envisage tackling this problem by simulating the job shop and training ex-perts through simulations. The resulting expert system then has to be evaluated and modified in the real job shop.
Another issue is discussed by Byrd & Hauser (1991), who indicate that although expert system technology provides a means for organizations to achieve faster and more consistent decision making by removing human errors and inefficiencies, even highly automated systems need hu-man beings for supervision, adjustment, maintenance, expansion and improvement. The intro-duction of expert systems may also lead to cognitive starvation which endangers the essential human contribution to the scheduling process. In other words, if tasks are transferred from the human to the system, the human loses experience in and of his work. The risks of cognitive star-vation have for example, been experienced in the process industry (Bainbridge, 1983). If too many tasks are allocated to the computer system, the human does not have opportunities to build a mental model of the system. As a result, exceptions which the system is not able to handle, can not be solved by the human either.
Some researchers have recognized that for scheduling techniques to be successful, they have to be reactive, i.e., be able to handle rescheduling actions. In Szelke & Kerr (1994), an overview of knowledge based reactive scheduling techniques is given. They describe the nature of reactive scheduling according to past literature and present a number of requirements for a reactive scheduling system. A number of strategies to represent and solve the problem are discussed. Two general approaches to the reactive scheduling problem can be distinguished: (1) the problem is closely coupled with predictive scheduling; or (2) the problem is regarded as a real�time process emerging in the execution of schedules on the shop floor, and greatly stresses the need for fast response times. However, when Szelke and Kerr discuss the application of AI�based schedulers in practice, they observe that �Disparity can be observed between the number of papers which report AI�based scheduling tools and the number of systems actually in daily use by manufactur-ing engineers.� They state that problems are partly due to technical problems encountered in im-plementing techniques in live manufacturing environments, and partly due to so�called �people problems.�
The problems of artificial intelligence techniques that have been discussed above hampered the implementations of such systems. Kerr (1992) describes the failed implementation of an expert system that was at length aimed at replacing the human scheduler. Even a simplified system that
A review of techniques and humans in production scheduling 9
was developed after the initial failure, was abandoned by the scheduler. Five reasons are given for the lack of success: (1) complexity of knowledge elicitation; (2) complexity of the relationship between the human scheduler and the system; (3) uncertainty; (4) difficulties in human�computer interaction; and (5) oversimplification of the problem. In a panel discussion report by Kempf et al. (1991), implementation problems of AI based schedulers are discussed. They observe that there is a great disparity between the number of papers that have been published about AI based scheduling tools and the number of systems actually in use. A number of cases are discussed where attempts have been made to implement scheduling systems. Only one of these cases has proven successful, and, moreover, it was realized in a relatively simple manufacturing environ-ment. Five main problems regarding implementations of AI based scheduling systems are identi-fied: (1) inadequate understanding of the problem domain, such as the existence of a bottle�neck; (2) inappropriate reliance on locally greedy strategies, which do not guarantee good overall performance; (3) misuse of shallow expert knowledge, which is caused by the fact that experts tend to give inaccurate knowledge to the developers; (4) excess concern about trivialities, for ex-ample to label a schedule with one minute overlap as unmanageable; and (5) improper problem segmentation, which happens when a part of the problem is inappropriately generalized to the whole problem. Other problems that are mentioned in the report are inadequate data availability and accuracy, and a negative disposition of personnel towards computers.
In Zweben & Fox (1994), a number of implementations of intelligent systems are given. Many reports focus on technical aspects of projects; however, some authors include a discussion re-garding the human and organizational aspects of implementing a scheduling system. It is note-worthy that nearly all implementations have been realized in relatively simple manufacturing processes, namely: flow oriented manufacturing, process manufacturing, or defense logistics. One of the implementations, that was conducted in semiconductor wafer fabrication, is described by Kempf (1994). Kempf emphasizes cultural problems that have to be overcome by high quality solutions. A crucial aspect of the project proved to be scoping the project so that it could be de-livered in pieces small enough to be adopted by the users but large enough to be useful, thereby generating pull for the next piece. Kempf indicates that techniques for managing customer ex-pectations and cultural change are at least as important as the techniques of artificial intelligence in delivering practical scheduling systems. Similarly, in a report by Fargher & Smith (1994), the importance of gaining the confidence of the users is stressed. This is achieved by involving the end users in the development project from the start. Prietula et al. (1994) explicitly recognize the gap between new advanced techniques to solve the scheduling problem and the methods actually being used by the human schedulers. They argue that an approach of value can only be one that integrates operations research, artificial intelligence and human computer interaction to improve the problem solving capacity of the human scheduler. Hence, their report includes an analysis of the scheduling task to build a knowledge based scheduling system.
2.1.3 Information presentation Both in the OR community and in the applied psychology community, research has been done on the effectiveness of various types of information presentation in scheduling tasks. In the OR community, the Gantt chart is generally seen as an effective means to represent scheduling prob-lems to humans. Regarding the presentation of information to human schedulers, OR theory and practice seem to agree on the usefulness of Gantt charts; most commercial scheduling informa-tion systems are centered around an electronic and interactive Gantt chart. A well�known exam-ple of a type of information system where the Gantt chart is used to represent the scheduling problem is the electronic Leitstand (Kanet & Adelsberger, 1987; Kanet & Sridharan, 1990; Köhler, 1993). Besides an electronic Gantt chart, manipulation functions, evaluation functions, and automatic algorithms are offered in these systems. An example of such a system is given in Speranza & Woerlee (1991), where a decision support system for production scheduling is pre-
Chapter 2 10
sented, combining algorithmic procedures and interactive manipulation. The manual functions and the graphical representation of the production system give the user significant influence over the scheduling process. Moreover, automatic algorithms can be used to propose schedules to the user. The applicability of the system in practice looks promising according to various authors, al-though reports about implementations are difficult to find in literature. A similar system is re-ported by Verbraeck (1991), who developed a scheduling system that should be able to incorpo-rate the knowledge of the human scheduler, to adapt to changes in the environment, and to sup-port the human scheduler. The system is developed and implemented in a can factory.
Nearly all commercial standard software packages for production scheduling are based on an in-teractive Gantt chart. Moreover, as these systems often do not incorporate scheduling techniques from either operations research or artificial intelligence, heavy emphasisis is put on graphical in-teractive scheduling. However, although the Gantt chart has proven its effectiveness in practice many times, it would not be appropriate to assume without questioning that Gantt charts are the ultimate way of presenting information to human schedulers. There are studies of types of in-formation presentation in scheduling that show that graphical displays such as electronic Gantt charts do not guarantee better performance. This was first demonstrated in an experiment by Sharit (1985), where the effect of display type on scheduling performance was studied. In Kerr (1992), the failed implementation of an expert system is followed by an attempt to implement a much simpler system, based on an electronic Gantt chart. However, the simple system was also rejected by the scheduler in favor of the chart on the wall of the scheduler�s office that was used before the system was implemented. There was considerable reluctance on the part of the sched-uler to move to an unfamiliar representation of the scheduling problem on a screen where only part of the schedule could be seen at once, and on which jobs could only be manipulated by mouse or keyboard.
The applicability of the Gantt chart for presenting information can be differentiated by studying its effectiveness in various types of scheduling tasks. In a study by Danek & Koubek (1995), the effect of information presentation types on performance in a scheduling task is studied in a labo-ratory experiment. Integral information presentation facilities turned out to increase performance in scheduling tasks where integration of information is required, i.e., where the number of task elements to be handled simultaneously is high. If the number of task elements is relatively low and therefore focused attention is required from the human scheduler, integral information rep-resentation by means of information technology will be counterproductive, because in these cases the image has to be mentally decomposed to extract the necessary information. Higgins (1996) also discusses the (in)adequacies of Gantt charts for different aspects of the scheduling task. He states that a Gantt chart is a display of output in which detailed information about ele-ments in the chart is hidden. Therefore, according to Higgins, it is not suited for decision making. Higgins presents job screens as additions to the Gantt chart that may be useful in interactive scheduling situations.
2.2 Humans Sanderson (1989) summarizes and reviews 25 years of work done on the human role in schedul-ing. Two types of studies are discussed in the review: laboratory studies and field studies. Sander-son also discusses methodological and conceptual aspects of the literature reviewed. The labora-tory studies summarized in Sanderson�s review have mainly focused on three themes: comparing unaided humans with scheduling techniques, studying interactive systems of humans and tech-niques, and studying the effect of display types on scheduling performance. However, there are almost as many tasks studied as there are laboratory studies, and therefore, generalizations from these studies are difficult to make. Moreover, the research questions which mainly focus on com-parisons of humans and techniques are no longer relevant today. Field studies have mainly fo-
A review of techniques and humans in production scheduling 11
cused on highly experienced schedulers with very little decision support. Unfortunately, field studies in production scheduling have received little attention in the last few decades.
Sanderson concludes with the observation that more and better coordinated research on the hu-man factor in scheduling is required. The research reported in the review is widely dispersed over a variety of research journals and the reported works are often carried out in isolation from each other. She also notes that a common research question that is addressed in much of the literature reviewed�i.e., which is better, humans or algorithms�is no longer relevant. Humans and algo-rithms seem to have complementary strengths which could be combined. To be able to do this, a sound understanding of the human scheduler is needed. In the following two subsections, litera-ture on scheduling task models and cognitive scheduling models is discussed.
2.2.1 Scheduling task models Despite Sanderson�s call, recent field studies on the human role in scheduling are scarce. An ex-ception to this can be found in McKay (1992), where two extensive case studies on the schedul-ing task are reported in the context of research on the effectiveness of the hierarchical produc-tion planning (HPP) paradigm in dealing with uncertainty. A task analysis at a printed circuit board (PCB) factory was used to identify the decisions made in response to uncertainties in the manufacturing system. The human scheduler turned out to be especially important in managing uncertainty (see also McKay et al., 1989). The field study in the PCB factory is also reported in McKay et al. (1995a). In this paper, the formal versus the informal scheduling practices are com-pared in the context of managing uncertainty. Several interesting aspects of the scheduling prac-tices are mentioned in this study. The scheduler worked with multiple schedules: a political schedule for the world to see, a realistic schedule, an idealistic schedule, and an optimistic sched-ule that was orally communicated to the line. The scheduler did not take the current situation for granted; instead, he endeavored to influence the amount and allocation of capacity, the amount of customer demand, the technical characteristics of machines (e.g., to minimize setups). The scheduler employed a large number of heuristics (more than hundred) to anticipate possible problems and take precautionary measures.
In Wiers (1996), the decision behavior of four production schedulers in a truck manufacturing company is investigated by means of a quantitative model. This model consisted of three parts: performance variables, action variables and disturbance variables. The results show that schedul-ers who control equal production units show quite different decision behaviors. Also, a �good� schedule turned out to be no guarantee for good performance. Moreover, some scheduling ac-tions work positively in the short term but negatively in the longer term. However, the methodo-logical discussion of the case made clear that it is very difficult to construct a reliable quantitative model of production scheduling. The case study is described in more detail in Chapter 3 of this thesis.
2.2.2 Cognitive scheduling models The area of modeling cognitive processes in complex tasks�such as the scheduling task�still is in a relatively preliminary stage. The number of cognitive models of complex tasks is almost as large as the number of research projects being carried out in real�world tasks. In a special issue of Ergonomics about cognitive processes in complex tasks, Van der Schaaf (1993) notes that the process of developing a cognitive task model is more useful than the model itself. In an article about task allocation, Price (1985) observes that there is no universally applicable �cookie cutter� for task allocation decisions; moreover, the ultimate configuration of tasks in a specific situation has to be determined throughout the design cycle. According to Price, covert and cognitive in-formation processing tasks have not been adequately considered in systems design, or by human factors scientists generally. However, the decision models of Rasmussen (1986) are mentioned by
Chapter 2 12
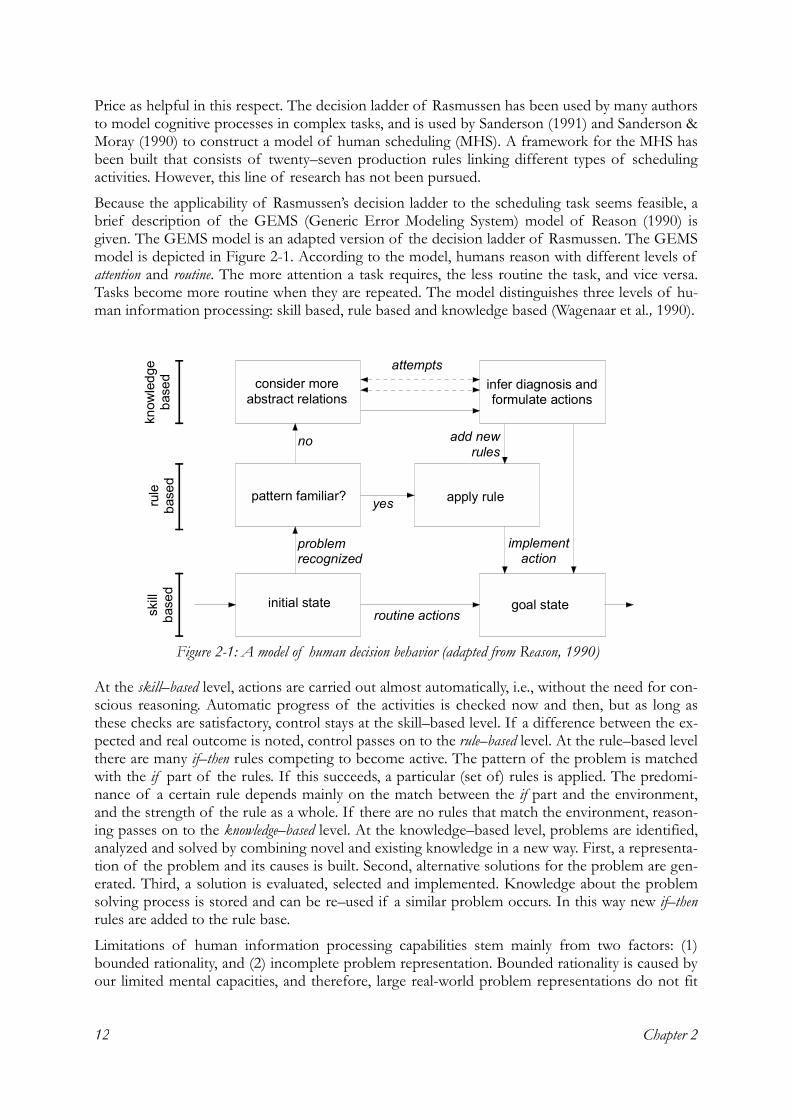
Price as helpful in this respect. The decision ladder of Rasmussen has been used by many authors to model cognitive processes in complex tasks, and is used by Sanderson (1991) and Sanderson & Moray (1990) to construct a model of human scheduling (MHS). A framework for the MHS has been built that consists of twenty�seven production rules linking different types of scheduling activities. However, this line of research has not been pursued.
Because the applicability of Rasmussen�s decision ladder to the scheduling task seems feasible, a brief description of the GEMS (Generic Error Modeling System) model of Reason (1990) is given. The GEMS model is an adapted version of the decision ladder of Rasmussen. The GEMS model is depicted in Figure 2-1. According to the model, humans reason with different levels of attention and routine. The more attention a task requires, the less routine the task, and vice versa. Tasks become more routine when they are repeated. The model distinguishes three levels of hu-man information processing: skill based, rule based and knowledge based (Wagenaar et al., 1990).
At the skill�based level, actions are carried out almost automatically, i.e., without the need for con-scious reasoning. Automatic progress of the activities is checked now and then, but as long as these checks are satisfactory, control stays at the skill�based level. If a difference between the ex-pected and real outcome is noted, control passes on to the rule�based level. At the rule�based level there are many if�then rules competing to become active. The pattern of the problem is matched with the if part of the rules. If this succeeds, a particular (set of) rules is applied. The predomi-nance of a certain rule depends mainly on the match between the if part and the environment, and the strength of the rule as a whole. If there are no rules that match the environment, reason-ing passes on to the knowledge�based level. At the knowledge�based level, problems are identified, analyzed and solved by combining novel and existing knowledge in a new way. First, a representa-tion of the problem and its causes is built. Second, alternative solutions for the problem are gen-erated. Third, a solution is evaluated, selected and implemented. Knowledge about the problem solving process is stored and can be re�used if a similar problem occurs. In this way new if�then rules are added to the rule base.
Limitations of human information processing capabilities stem mainly from two factors: (1) bounded rationality, and (2) incomplete problem representation. Bounded rationality is caused by our limited mental capacities, and therefore, large real-world problem representations do not fit
initial state
pattern familiar? apply rule
consider moreabstract relations
infer diagnosis andformulate actions
goal state
problemrecognized
routine actions
yes
no
attempts
add newrules
implementaction
know
ledg
eba
sed
rule
base
dsk
illba
sed
Figure 2-1: A model of human decision behavior (adapted from Reason, 1990)
A review of techniques and humans in production scheduling 13
into our memory. Even if our mental capacities were large enough to encompass the problems mentioned, then incomplete problem representation, i.e., insufficient knowledge about the prob-lem, would still impede our full understanding of the problem and its context. The relation be-tween bounded rationality and limited problem representation can be compared to a beam of light that shines on a screen with information. The size of the light beam on the screen repre-sents bounded rationality; the fact that not all information is visible within the beam of light represents incomplete problem representation (Wagenaar et al., 1990).
2.2.3 Use of techniques The question of why humans still prefer to use their heads instead of decision techniques, given the fact that cognition is bounded and that techniques can help humans to increase performance, is discussed by Kleinmuntz (1990). A common explanation is that people are unwilling to settle for techniques they know are imperfect. Possibly erroneously, people also believe that increased mental effort improves performance. According to Kleinmuntz, this is particularly true for situa-tions where they are confident about their expertise.
The issue of trust in automation has also been studied by Muir (1994) and Muir & Moray (1996). The former paper presents a theoretical model of human trust in machines. In the latter paper, two experiments are reported to examine operators� trust in and use of automation in a simulated supervisory process control task. Results showed that operators� ratings of trust were mainly de-termined by their perception of its competence. Trust was reduced following any sign of incom-petence in the automation, even one which had no effect on overall system performance. An-other finding of Muir & Moray�s experiments is that operators� trust changes very little with ex-perience; whereas Kleinmuntz concludes that the use of decision aids decreases with the subject�s belief in his experience.
The question of how to improve decision rule use is studied by Davis & Kotteman (1995). They investigated the determinants of decision rule use in a production planning task. Decision rule use can be improved by offering feedback in which actual performance is compared to perform-ance that would have been realized if the rule had been used. However, measuring the perform-ance of production scheduling has recently been highlighted as a very complex problem (Gary et al., 1995; Stoop, 1996). Apart from basic criteria such as the absence of possibilities for minor improvements and feasibility, no objective criteria can be set. Performance feedback can be given by monitoring performance over time, however, this is of limited value when the manufacturing environment is unstable. Davis & Kotteman (1995) indicate that a somewhat less effective meas-ure to improve decision rule use is to explicitly describe the performance characteristics (i.e., the way a certain rule effects a certain performance) to humans, in this way making the rule more transparent. According to Norman (1988), the transparency of a decision rule is especially important in situations where critical, novel or ill�specified problems have to be solved. In these cases, humans want to be in direct control, without the visible existence of a technique. This is referred to by Norman as �first�person� interaction. On the other hand, if the task that has to be performed is laborious or repetitive, the visible existence of a technique is preferred. In these cases, humans give commands to the (computerized) technique which then solves the problem. This is referred to by Norman as �third�person� interaction.
Apart from problems regarding the measurement of performance in production scheduling, there might be another reason against offering performance feedback to human schedulers. While performance feedback has been found to improve decision rule use, it has also been found to impair effective learning in complex tasks. Though feedback about the effectiveness of behav-ior has long been recognized as essential for learning in tasks, and, as found more recently, stimu-lating decision rule use, such feedback at least has to be specific and timely to be effective. In complex tasks where the relationship between actions and outcomes is unclear, only offering
Chapter 2 14
feedback about performance may be counterproductive. This is because outcome feedback might cue a focus on evaluating one�s competence rather than on increasing competence, which could result in a maladaptive behavior pattern (Johnson et al., 1993). Furthermore, because action�effect relations in production systems are very hard to grasp, mental models of schedulers are prone to become inaccurate and variable. This is confirmed by Moray (1995), where a supervi-sory task controlling a simulated discrete production system is studied. The study of the indi-viduals� behavior shows that there is variability between individual operators in system interven-tion. Some operators decide to manually schedule parts of the system even when no faults are occurring, possibly to prevent faults from occurring, while others decide to leave the scheduling decisions to the system.
There appears to be consensus in literature that to improve decision behavior in complex tasks, cognitive feedback is required (e.g., Brehmer, 1980; Jacoby et al., 1984; Early et al., 1990; Johnson et al., 1993). In a recent experiment by DeShon & Alexander (1996) this is confirmed for tasks with implicit learning; however, in tasks with explicit learning, setting specific goals does gradu-ally increase performance. Tasks with implicit learning can be characterized by the acquisition of knowledge through repeated exposure to problem exemplars without intention or awareness. In these tasks, it is very difficult for the subject to verbalize the rules used. In tasks with explicit learning, the first step in the solution of any problem is the development of an internal represen-tation of the problem that consists of the perceived initial state of the problem, a goal state, al-lowable transformations for achieving the goal, and boundary conditions (Newell & Simon, 1972). DeShon and Alexander state that while explicit learning requires cognitive resources and is sensitive to distraction, implicit learning is relatively resource independent.
2.2.4 Individual differences Though believed to be of great importance, there is insufficient knowledge about the effect of individual differences between humans on the use of computers in general, or on the use of scheduling information systems in particular. According to Wærn (1989), individual differences that influence human�computer interaction from most stable to least stable are: personality fac-tors, cognitive styles, learning styles, and personal knowledge (i.e., user experience). Wærn (1989) argues that user experience is both the most important and the least stable aspect of individual variation. In studies of a supervisory task in a simulated discrete production system, Moray (1995) also finds that differences in mental models, which are built by experience, cause differ-ences in decision behavior.
In Levy et al. (1995), a production scheduling task in a laboratory setting is used to study feed-back seeking behavior. More specifically, the effect of individual differences and situational char-acteristics on feedback seeking intent, reconsideration of intent and modifying of intent was studied. The results show that seeking feedback depends on the perceived privacy of the feed-back seeking context. Also, individuals in organizational settings may want feedback but those in public contexts may be very concerned about how they appear to others, especially for individu-als with high self�esteem. A finding that relates to individual differences is that people with high public self�consciousness and social anxiety desire feedback more than others.
Self�efficacy, which refers to beliefs in one�s capabilities to mobilize the motivation, cognitive re-courses, and courses of action needed to meet certain situational demands, is frequently found to determine computer usage. Individuals who consider computers too complex and believe that they will never be able to control these computers will prefer to avoid them and are less likely to use them. The effect of self�efficacy on computer usage was studied in Igbaria & Iivari (1995) through a survey of 450 microcomputer users in Finland. It was found that self�efficacy influ-
A review of techniques and humans in production scheduling 15
ences computer usage through perceived ease of use and perceived usefulness. Also, computer experience and organizational support appeared to increase self�efficacy.
2.3 Conclusion and discussion In this chapter an overview has been given on the applicability of techniques and the role of humans in production scheduling. The studies on the human factor in scheduling have shown that much expertise is used by humans to manage instability in the manufacturing process. A large amount of the scheduler�s time is spent on identifying, communicating and negotiating about constraints. The literature about the applicability of operations research and artificial intel-ligence techniques gives various reasons for the shortcomings of these techniques in practice. When summarizing these problems, the following issues are found to be inadequately covered:
1. Robustness. Robustness refers to the extent to which a schedule will remain unchanged when the information on which a schedule is based changes. Robustness avoids nervousness in scheduling in situations with uncertainty. Most authors recognize that nervousness should be avoided as much as possible.
2. Complexity. Complexity is an oft used construct, and can be defined in many ways. In this context, complexity refers to the number of real�world elements that are relevant for the scheduling problem, and the relationships between these elements. Some of the issues mentioned in this chapter are linked to the complexity of the problem, such as: oversimplification, and knowledge of the problem domain.
3. Performance measurement. The optimization criteria of many scheduling techniques do not meet the criteria used in practice. In practice, performance is often a matter of judgment by the human scheduler, and can be subject to negotiation.
4. Fixed vs. changeable input. Most scheduling techniques assume that information input is a given and cannot be changed. However, in practice, the situation is often not taken for granted: inputs, such as available capacity, might be changed if judged necessary.
5. Organizational embedding. The relationship of scheduling decision making to other parts of an organization is generally not considered in scheduling techniques.
6. Availability and accuracy of data. The scheduling process predominantly depends on the avail-ability of accurate data. If this condition is not met, the schedule will be incorrect and can-not be executed properly.
7. Interaction with human scheduler. It is recognized by many authors that the human scheduler will remain an indispensable factor in the scheduling process. However, many techniques do not account for interaction with the human scheduler.
8. Learning from experience (artificial intelligence techniques). The intelligence that is built into artificial intelligence scheduling techniques is often not stable in practice. Therefore, these systems should learn from experience to keep their intelligence base up to date. However, most artificial intelligence scheduling techniques are not able to learn from experience, and therefore may become outdated.
9. Availability and reliability of human experts (artificial intelligence techniques). The intelligence of AI based scheduling systems sometimes comprises expertise that must be elicited from human experts. However, in many cases, this expertise cannot be adequately acquired.
Most authors agree that humans play an essential role in scheduling as long as these problems re-garding techniques persist. Moreover, from a conceptual point of view, techniques and humans seem to have complementary capabilities, and should work together. Decision support systems should be used to capitalize on the strengths of humans and to compensate for their weaknesses (Hoch & Schkade, 1996). Therefore, techniques, usually incorporated in a computerized informa-tion system, have to interact with the human scheduler. However, the following issues regarding human computer interaction in production scheduling remain unclear:
Chapter 2 16
• Task allocation. Task allocation decisions should be based on knowledge about the strengths and weaknesses of humans and information systems. In the scheduling task, there is insuf-ficient knowledge about how to allocate tasks between a scheduling system and a human scheduler.
• Information presentation requirements. The electronic Gantt chart is often seen as an effective means to represent scheduling problems to humans. However, it has also been shown that this type of information representation does not guarantee successful use of the system. It seems that different activities within the scheduling task require different information pres-entation. The question remains, what characteristics of information presentation are rele-vant in the scheduling task?
• Importance of individual differences. Individual differences could have a significant effect on de-cision behavior in the scheduling task, and therefore on the use of the system. There is in-sufficient knowledge about the relevance of individual differences to human�computer in-teraction.
• Importance of production unit characteristics. Although various reports indicate that the success of scheduling information systems in practice depends on production unit factors such as uncertainty, the importance of these characteristics is not clear.
• Importance of organizational factors. Although the organizational embedding of scheduling sys-tems is frequently mentioned as an important factor in the success of scheduling tech-niques, almost no research on this problem has been done.
These problems persist because research on production scheduling is highly fragmented in vari-ous research communities, and publications are widely dispersed over a variety of journals on ar-tificial intelligence, psychology, operational research, production control, decision science, indus-trial engineering and so on. This problem was also recognized by Sanderson in 1989, and the situation has not improved much since. Most of the literature reports commonly give little indica-tion of whether the theoretical constructs were implemented in manufacturing practice, and for those that were implemented, what types of implementation problems were encountered. The majority of reports focus on scheduling algorithms or system architectures while implementation issues are apparently regarded as trivial. The success of scheduling techniques in practice can only improve when researchers are aware of implementation pitfalls through learning from each other�s experiences.
2.4 Implications for the research From the literature review presented in this chapter it follows that many questions exist regarding the applicability of production scheduling techniques in practice. These questions have to be molded into a manageable research design. In Chapter 4, considerations regarding these research questions are explained.
Another issue that must be resolved concerns the research design and method. As described in the previous section, there is a great need for field studies in production scheduling. However, because of the lack of field studies, there is little experience to draw on about how to study pro-duction scheduling in practice. Therefore, the first field study has to be aimed at gaining insight into the problem area. Moreover, it is felt that a first case study should be of a descriptive nature, setting the stage for subsequent explanatory and prescriptive case studies. In the next chapter, a descriptive quantitative field study is presented in which the relation between a number of vari-ables in the scheduling task is studied. At the end of Chapter 3 and in Chapter 4, methodological implications from this field study are discussed.
A descriptive quantitative field study 17
3. A descriptive quantitative field study
This chapter describes a field study in which a quantitative model is used to study the decision behavior of four schedulers in a truck manufacturing company. This chapter has previously been published as a journal paper, see Wiers (1996).
3.1 Introduction As stated in the previous chapter, little insight into the decision behavior of human schedulers in practice exists. The descriptive field study in this chapter aims to get a grip on the problem space of production scheduling by using a quantitative model. The method of research that is used in the case study presented in this chapter is known as the paramorphic representation of judgment (Hoffman, 1960). This method can be applied in situations where the input and output are known or capable of quantification. In these situations, one may postulate relationships between input and output and assess their adequacy by determining the accuracy with which each is capa-ble of predicting judgment.
Previous quantitative research about the decision behavior of production schedulers has essen-tially been oriented towards some particular aspect of scheduling, for example, the job runtime estimator of the scheduler (Dutton & Starbuck, 1971). However, all aspects of the decision be-havior of the scheduler are of interest for this study, and therefore, the model used in this case study consists of the following three elements: performance criteria, actions, and disturbances. The elements in the model are operationalized by sixteen variables, which have been measured weekly during a period of four months. By means of statistical techniques, relationships between the variables are studied. A similar approach was used by Den Boer (1992) for studying the deci-sion behavior of material requirements planners. However, Den Boer did not study the variables in time; instead, mean values were collected per planner, and the correlation analysis focused on identifying patterns over a number of planners.
3.2 The production units The field study is carried out in a truck manufacturing company. At the time the case study was conducted, approximately 60 trucks were manufactured daily in the company; a number that was rising as a result of increasing market demand. The company uses an assemble�to�order (ATO) production strategy, which means that there are a number of standard models of trucks with a variety of options that are built according to customer specifications. The company uses a cus-tomer lead�time of six weeks.
In the company, four schedulers who control four separate production units are included in the field study. Scheduler one controls a welding production unit that consists of a number of paral-lel workplaces. Scheduler two controls a pipe production unit with a flow�oriented production organization. Scheduler three controls a metal cutting and punching work cell and a bending ma-chine. Scheduler four controls a pressing production unit that consists of seven large presses. The operational characteristics of the production units are given in Table 3-1 (note: this table shows
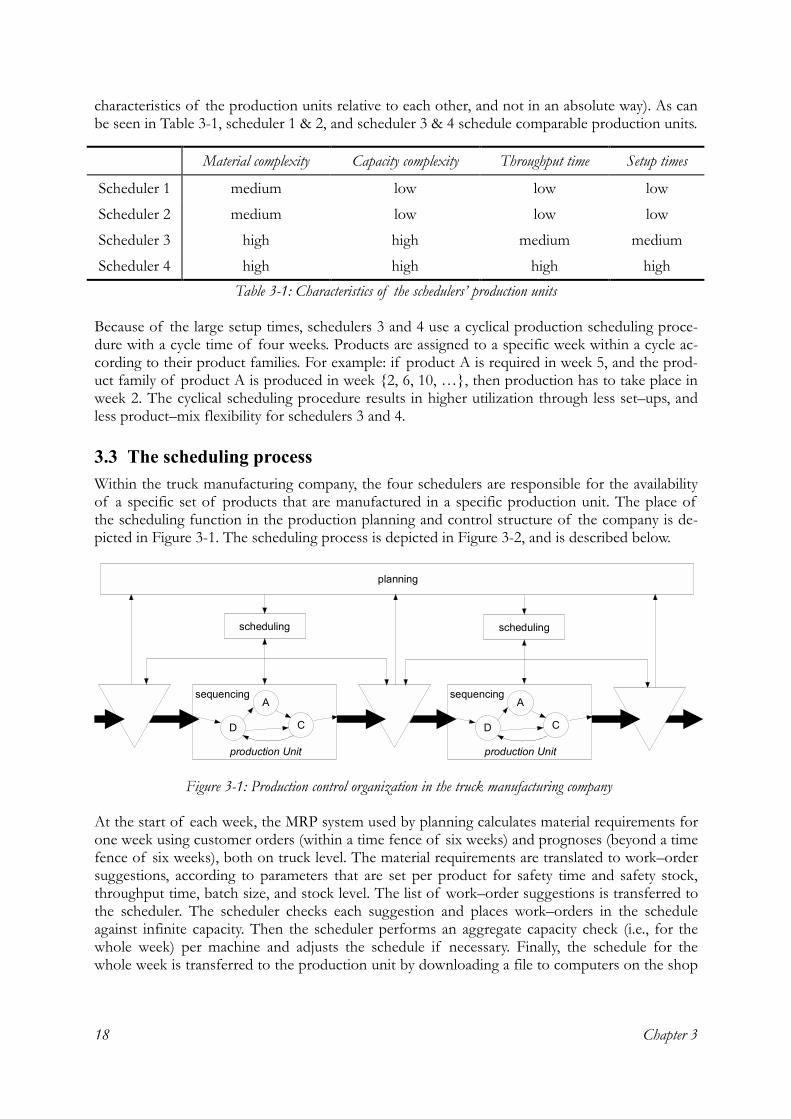
Chapter 3 18
characteristics of the production units relative to each other, and not in an absolute way). As can be seen in Table 3-1, scheduler 1 & 2, and scheduler 3 & 4 schedule comparable production units.
Because of the large setup times, schedulers 3 and 4 use a cyclical production scheduling proce-dure with a cycle time of four weeks. Products are assigned to a specific week within a cycle ac-cording to their product families. For example: if product A is required in week 5, and the prod-uct family of product A is produced in week {2, 6, 10, �}, then production has to take place in week 2. The cyclical scheduling procedure results in higher utilization through less set�ups, and less product�mix flexibility for schedulers 3 and 4.
3.3 The scheduling process Within the truck manufacturing company, the four schedulers are responsible for the availability of a specific set of products that are manufactured in a specific production unit. The place of the scheduling function in the production planning and control structure of the company is de-picted in Figure 3-1. The scheduling process is depicted in Figure 3-2, and is described below.
At the start of each week, the MRP system used by planning calculates material requirements for one week using customer orders (within a time fence of six weeks) and prognoses (beyond a time fence of six weeks), both on truck level. The material requirements are translated to work�order suggestions, according to parameters that are set per product for safety time and safety stock, throughput time, batch size, and stock level. The list of work�order suggestions is transferred to the scheduler. The scheduler checks each suggestion and places work�orders in the schedule against infinite capacity. Then the scheduler performs an aggregate capacity check (i.e., for the whole week) per machine and adjusts the schedule if necessary. Finally, the schedule for the whole week is transferred to the production unit by downloading a file to computers on the shop
Material complexity Capacity complexity Throughput time Setup times
Scheduler 1 medium low low low
Scheduler 2 medium low low low
Scheduler 3 high high medium medium
Scheduler 4 high high high high Table 3-1: Characteristics of the schedulers� production units
A
D C
sequencing
production Unit
A
D C
planning
scheduling scheduling
sequencing
production Unit
Figure 3-1: Production control organization in the truck manufacturing company
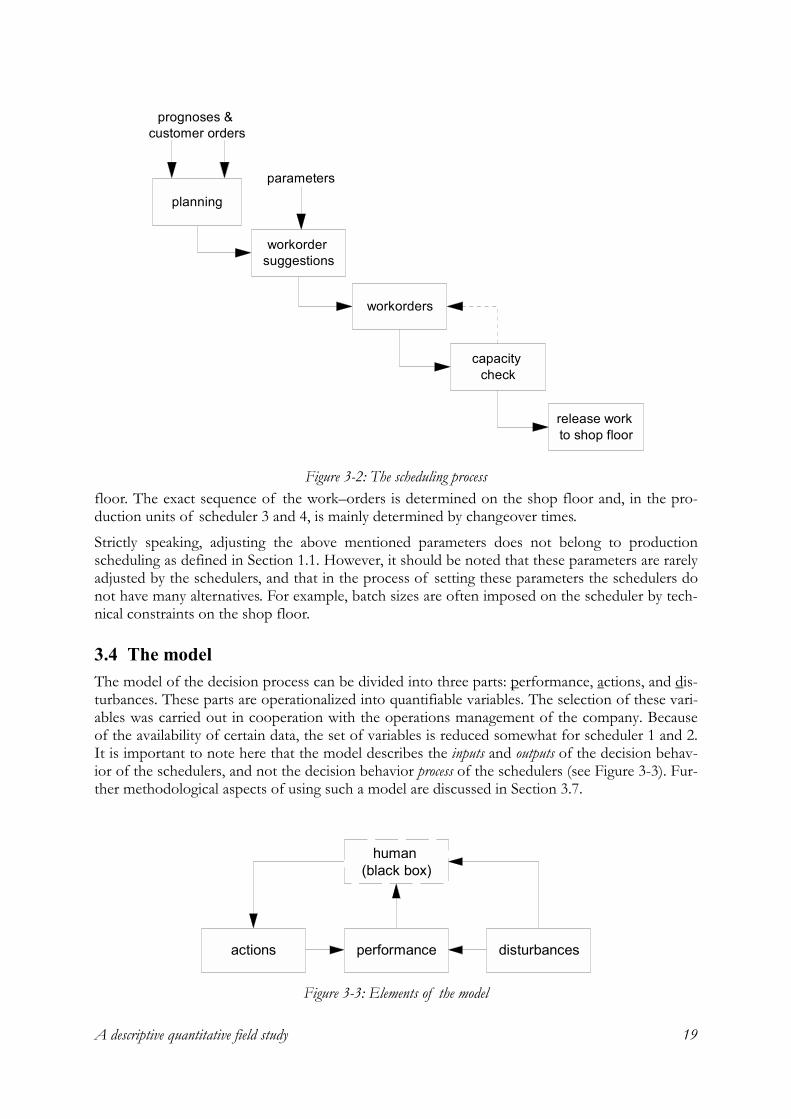
A descriptive quantitative field study 19
floor. The exact sequence of the work�orders is determined on the shop floor and, in the pro-duction units of scheduler 3 and 4, is mainly determined by changeover times.
Strictly speaking, adjusting the above mentioned parameters does not belong to production scheduling as defined in Section 1.1. However, it should be noted that these parameters are rarely adjusted by the schedulers, and that in the process of setting these parameters the schedulers do not have many alternatives. For example, batch sizes are often imposed on the scheduler by tech-nical constraints on the shop floor.
3.4 The model The model of the decision process can be divided into three parts: performance, actions, and dis-turbances. These parts are operationalized into quantifiable variables. The selection of these vari-ables was carried out in cooperation with the operations management of the company. Because of the availability of certain data, the set of variables is reduced somewhat for scheduler 1 and 2. It is important to note here that the model describes the inputs and outputs of the decision behav-ior of the schedulers, and not the decision behavior process of the schedulers (see Figure 3-3). Fur-ther methodological aspects of using such a model are discussed in Section 3.7.
planning
workorder suggestions
workorders
capacity check
release work to shop floor
prognoses & customer orders
parameters
Figure 3-2: The scheduling process
actions performance disturbances
human (black box)
Figure 3-3: Elements of the model
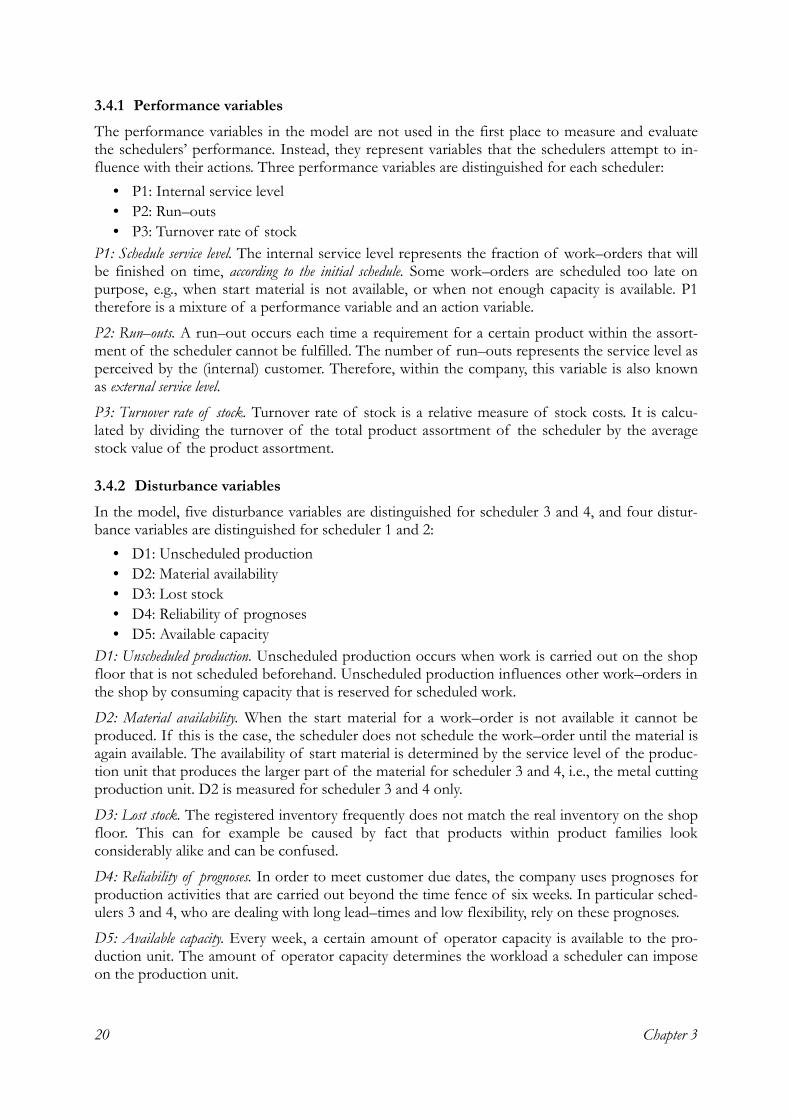
Chapter 3 20
3.4.1 Performance variables The performance variables in the model are not used in the first place to measure and evaluate the schedulers� performance. Instead, they represent variables that the schedulers attempt to in-fluence with their actions. Three performance variables are distinguished for each scheduler:
• P1: Internal service level • P2: Run�outs • P3: Turnover rate of stock
P1: Schedule service level. The internal service level represents the fraction of work�orders that will be finished on time, according to the initial schedule. Some work�orders are scheduled too late on purpose, e.g., when start material is not available, or when not enough capacity is available. P1 therefore is a mixture of a performance variable and an action variable.
P2: Run�outs. A run�out occurs each time a requirement for a certain product within the assort-ment of the scheduler cannot be fulfilled. The number of run�outs represents the service level as perceived by the (internal) customer. Therefore, within the company, this variable is also known as external service level. P3: Turnover rate of stock. Turnover rate of stock is a relative measure of stock costs. It is calcu-lated by dividing the turnover of the total product assortment of the scheduler by the average stock value of the product assortment.
3.4.2 Disturbance variables In the model, five disturbance variables are distinguished for scheduler 3 and 4, and four distur-bance variables are distinguished for scheduler 1 and 2:
• D1: Unscheduled production • D2: Material availability • D3: Lost stock • D4: Reliability of prognoses • D5: Available capacity
D1: Unscheduled production. Unscheduled production occurs when work is carried out on the shop floor that is not scheduled beforehand. Unscheduled production influences other work�orders in the shop by consuming capacity that is reserved for scheduled work.
D2: Material availability. When the start material for a work�order is not available it cannot be produced. If this is the case, the scheduler does not schedule the work�order until the material is again available. The availability of start material is determined by the service level of the produc-tion unit that produces the larger part of the material for scheduler 3 and 4, i.e., the metal cutting production unit. D2 is measured for scheduler 3 and 4 only.
D3: Lost stock. The registered inventory frequently does not match the real inventory on the shop floor. This can for example be caused by fact that products within product families look considerably alike and can be confused.
D4: Reliability of prognoses. In order to meet customer due dates, the company uses prognoses for production activities that are carried out beyond the time fence of six weeks. In particular sched-ulers 3 and 4, who are dealing with long lead�times and low flexibility, rely on these prognoses.
D5: Available capacity. Every week, a certain amount of operator capacity is available to the pro-duction unit. The amount of operator capacity determines the workload a scheduler can impose on the production unit.
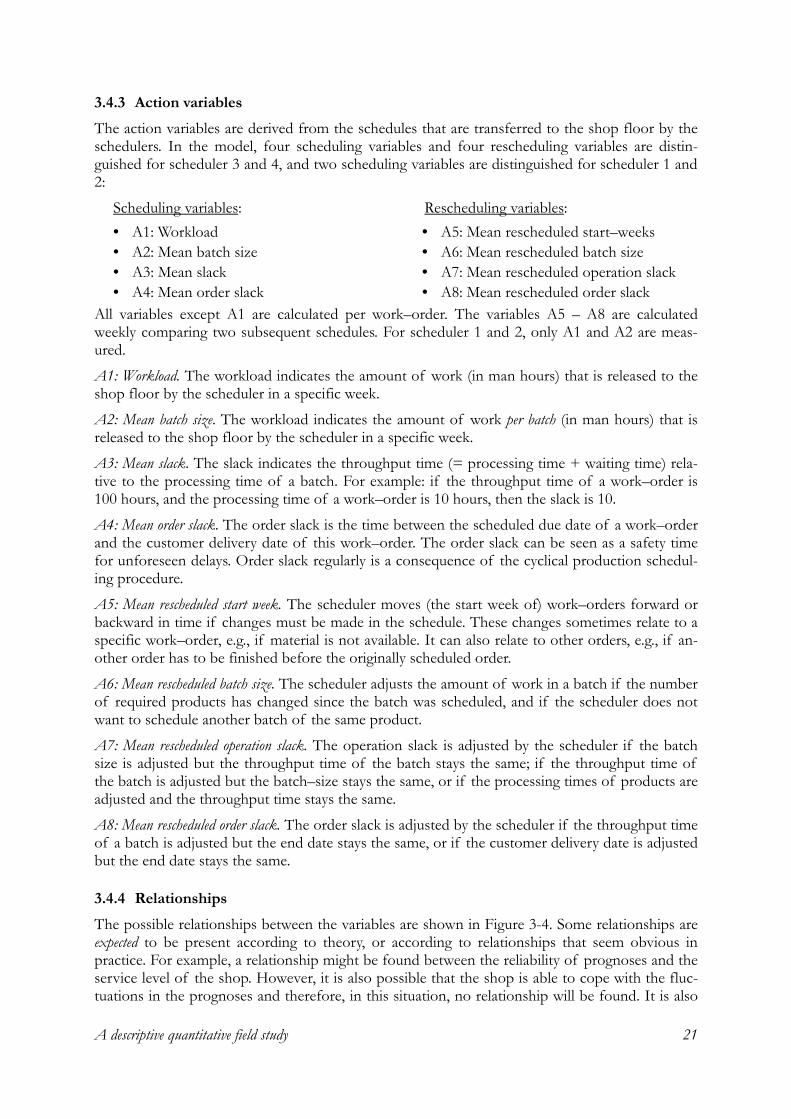
A descriptive quantitative field study 21
3.4.3 Action variables The action variables are derived from the schedules that are transferred to the shop floor by the schedulers. In the model, four scheduling variables and four rescheduling variables are distin-guished for scheduler 3 and 4, and two scheduling variables are distinguished for scheduler 1 and 2:
Scheduling variables: Rescheduling variables: • A1: Workload • A5: Mean rescheduled start�weeks • A2: Mean batch size • A6: Mean rescheduled batch size • A3: Mean slack • A7: Mean rescheduled operation slack • A4: Mean order slack • A8: Mean rescheduled order slack
All variables except A1 are calculated per work�order. The variables A5 � A8 are calculated weekly comparing two subsequent schedules. For scheduler 1 and 2, only A1 and A2 are meas-ured.
A1: Workload. The workload indicates the amount of work (in man hours) that is released to the shop floor by the scheduler in a specific week. A2: Mean batch size. The workload indicates the amount of work per batch (in man hours) that is released to the shop floor by the scheduler in a specific week.
A3: Mean slack. The slack indicates the throughput time (= processing time + waiting time) rela-tive to the processing time of a batch. For example: if the throughput time of a work�order is 100 hours, and the processing time of a work�order is 10 hours, then the slack is 10.
A4: Mean order slack. The order slack is the time between the scheduled due date of a work�order and the customer delivery date of this work�order. The order slack can be seen as a safety time for unforeseen delays. Order slack regularly is a consequence of the cyclical production schedul-ing procedure.
A5: Mean rescheduled start week. The scheduler moves (the start week of) work�orders forward or backward in time if changes must be made in the schedule. These changes sometimes relate to a specific work�order, e.g., if material is not available. It can also relate to other orders, e.g., if an-other order has to be finished before the originally scheduled order.
A6: Mean rescheduled batch size. The scheduler adjusts the amount of work in a batch if the number of required products has changed since the batch was scheduled, and if the scheduler does not want to schedule another batch of the same product. A7: Mean rescheduled operation slack. The operation slack is adjusted by the scheduler if the batch size is adjusted but the throughput time of the batch stays the same; if the throughput time of the batch is adjusted but the batch�size stays the same, or if the processing times of products are adjusted and the throughput time stays the same. A8: Mean rescheduled order slack. The order slack is adjusted by the scheduler if the throughput time of a batch is adjusted but the end date stays the same, or if the customer delivery date is adjusted but the end date stays the same.
3.4.4 Relationships The possible relationships between the variables are shown in Figure 3-4. Some relationships are expected to be present according to theory, or according to relationships that seem obvious in practice. For example, a relationship might be found between the reliability of prognoses and the service level of the shop. However, it is also possible that the shop is able to cope with the fluc-tuations in the prognoses and therefore, in this situation, no relationship will be found. It is also
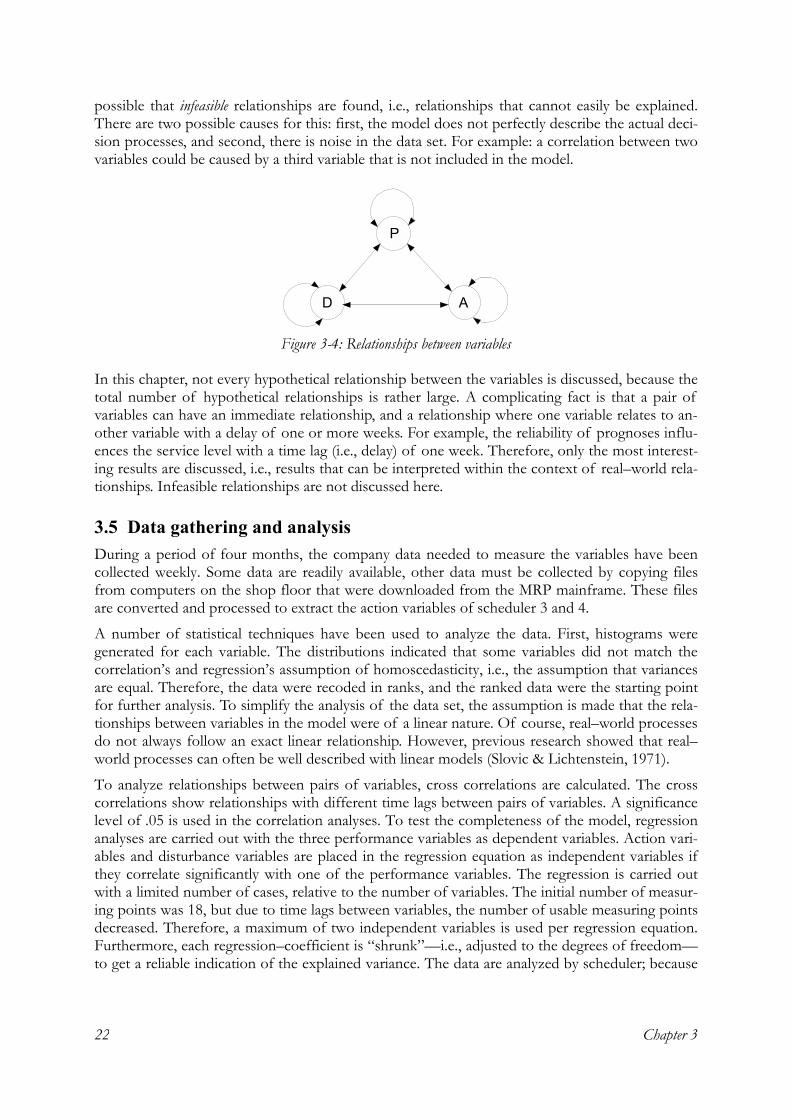
Chapter 3 22
possible that infeasible relationships are found, i.e., relationships that cannot easily be explained. There are two possible causes for this: first, the model does not perfectly describe the actual deci-sion processes, and second, there is noise in the data set. For example: a correlation between two variables could be caused by a third variable that is not included in the model.
In this chapter, not every hypothetical relationship between the variables is discussed, because the total number of hypothetical relationships is rather large. A complicating fact is that a pair of variables can have an immediate relationship, and a relationship where one variable relates to an-other variable with a delay of one or more weeks. For example, the reliability of prognoses influ-ences the service level with a time lag (i.e., delay) of one week. Therefore, only the most interest-ing results are discussed, i.e., results that can be interpreted within the context of real�world rela-tionships. Infeasible relationships are not discussed here.
3.5 Data gathering and analysis During a period of four months, the company data needed to measure the variables have been collected weekly. Some data are readily available, other data must be collected by copying files from computers on the shop floor that were downloaded from the MRP mainframe. These files are converted and processed to extract the action variables of scheduler 3 and 4.
A number of statistical techniques have been used to analyze the data. First, histograms were generated for each variable. The distributions indicated that some variables did not match the correlation�s and regression�s assumption of homoscedasticity, i.e., the assumption that variances are equal. Therefore, the data were recoded in ranks, and the ranked data were the starting point for further analysis. To simplify the analysis of the data set, the assumption is made that the rela-tionships between variables in the model were of a linear nature. Of course, real�world processes do not always follow an exact linear relationship. However, previous research showed that real�world processes can often be well described with linear models (Slovic & Lichtenstein, 1971).
To analyze relationships between pairs of variables, cross correlations are calculated. The cross correlations show relationships with different time lags between pairs of variables. A significance level of .05 is used in the correlation analyses. To test the completeness of the model, regression analyses are carried out with the three performance variables as dependent variables. Action vari-ables and disturbance variables are placed in the regression equation as independent variables if they correlate significantly with one of the performance variables. The regression is carried out with a limited number of cases, relative to the number of variables. The initial number of measur-ing points was 18, but due to time lags between variables, the number of usable measuring points decreased. Therefore, a maximum of two independent variables is used per regression equation. Furthermore, each regression�coefficient is �shrunk��i.e., adjusted to the degrees of freedom�to get a reliable indication of the explained variance. The data are analyzed by scheduler; because
P
D A
Figure 3-4: Relationships between variables
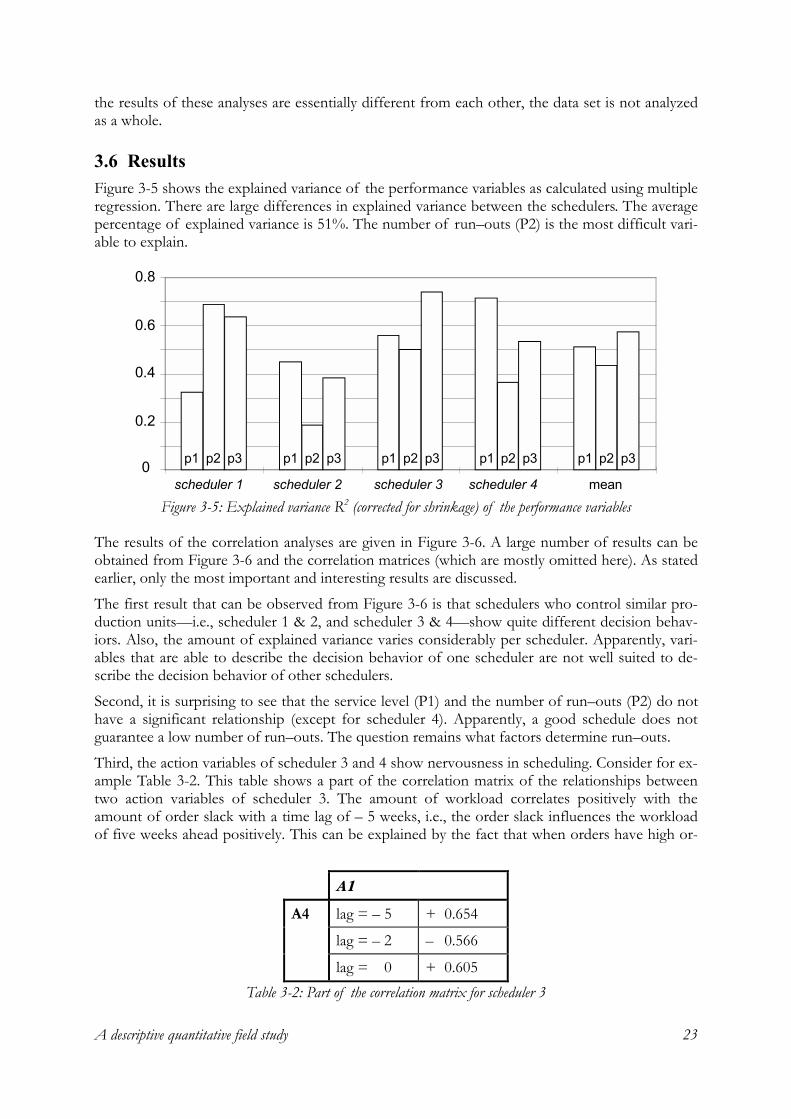
A descriptive quantitative field study 23
the results of these analyses are essentially different from each other, the data set is not analyzed as a whole.
3.6 Results Figure 3-5 shows the explained variance of the performance variables as calculated using multiple regression. There are large differences in explained variance between the schedulers. The average percentage of explained variance is 51%. The number of run�outs (P2) is the most difficult vari-able to explain.
The results of the correlation analyses are given in Figure 3-6. A large number of results can be obtained from Figure 3-6 and the correlation matrices (which are mostly omitted here). As stated earlier, only the most important and interesting results are discussed.
The first result that can be observed from Figure 3-6 is that schedulers who control similar pro-duction units�i.e., scheduler 1 & 2, and scheduler 3 & 4�show quite different decision behav-iors. Also, the amount of explained variance varies considerably per scheduler. Apparently, vari-ables that are able to describe the decision behavior of one scheduler are not well suited to de-scribe the decision behavior of other schedulers.
Second, it is surprising to see that the service level (P1) and the number of run�outs (P2) do not have a significant relationship (except for scheduler 4). Apparently, a good schedule does not guarantee a low number of run�outs. The question remains what factors determine run�outs.
Third, the action variables of scheduler 3 and 4 show nervousness in scheduling. Consider for ex-ample Table 3-2. This table shows a part of the correlation matrix of the relationships between two action variables of scheduler 3. The amount of workload correlates positively with the amount of order slack with a time lag of � 5 weeks, i.e., the order slack influences the workload of five weeks ahead positively. This can be explained by the fact that when orders have high or-
0.8
0.6
0.4
0.2
0scheduler 1 scheduler 2 scheduler 3 scheduler 4 mean
p1 p2 p3 p1 p2 p3 p1 p2 p3 p1 p2 p3 p1 p2 p3
Figure 3-5: Explained variance R2 (corrected for shrinkage) of the performance variables
A1
A4 lag = � 5 + 0.654
lag = � 2 � 0.566
lag = 0 + 0.605 Table 3-2: Part of the correlation matrix for scheduler 3
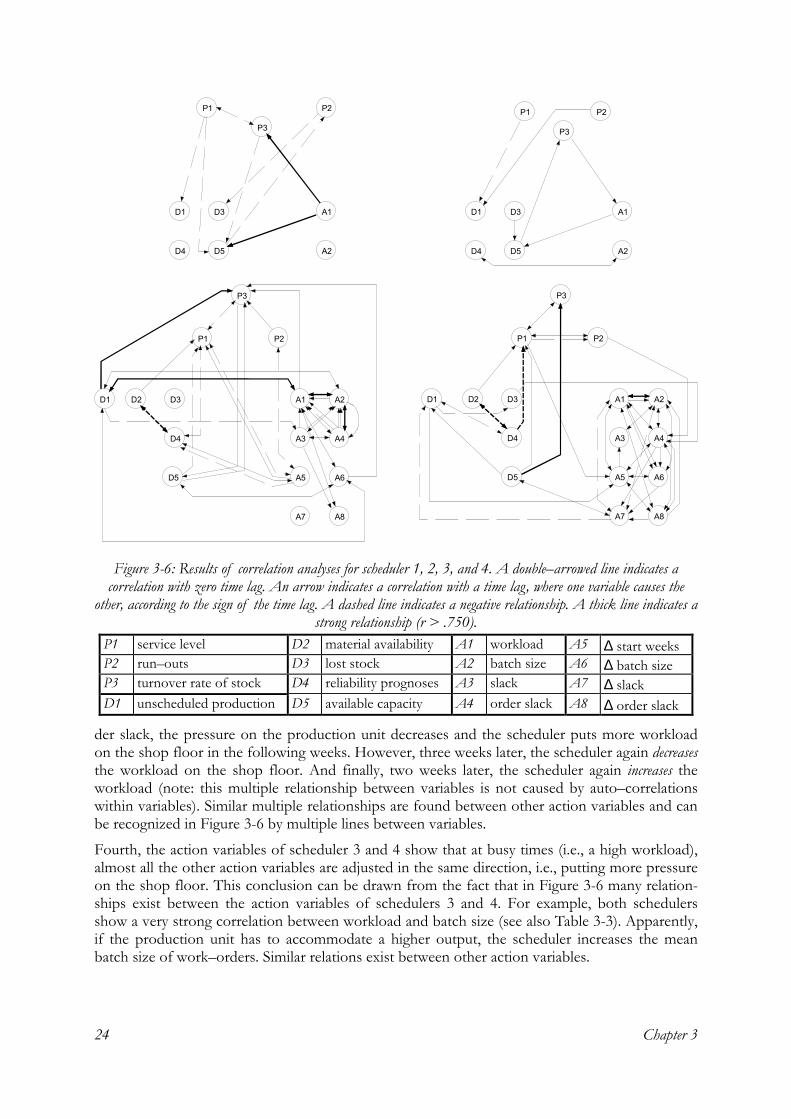
Chapter 3 24
der slack, the pressure on the production unit decreases and the scheduler puts more workload on the shop floor in the following weeks. However, three weeks later, the scheduler again decreases the workload on the shop floor. And finally, two weeks later, the scheduler again increases the workload (note: this multiple relationship between variables is not caused by auto�correlations within variables). Similar multiple relationships are found between other action variables and can be recognized in Figure 3-6 by multiple lines between variables.
Fourth, the action variables of scheduler 3 and 4 show that at busy times (i.e., a high workload), almost all the other action variables are adjusted in the same direction, i.e., putting more pressure on the shop floor. This conclusion can be drawn from the fact that in Figure 3-6 many relation-ships exist between the action variables of schedulers 3 and 4. For example, both schedulers show a very strong correlation between workload and batch size (see also Table 3-3). Apparently, if the production unit has to accommodate a higher output, the scheduler increases the mean batch size of work�orders. Similar relations exist between other action variables.
P1 P2
P3
D1 D3
D4 D5
A1
A2
P1 P2
P3
D1 D3
D4 D5
A1
A2
P1 P2
P3
D1 D2 D3
D4
D5
A1 A2
A3 A4
A5 A6
A7 A8
P1 P2
P3
D1 D2 D3
D4
D5
A1 A2
A3 A4
A5 A6
A7 A8
Figure 3-6: Results of correlation analyses for scheduler 1, 2, 3, and 4. A double�arrowed line indicates a correlation with zero time lag. An arrow indicates a correlation with a time lag, where one variable causes the
other, according to the sign of the time lag. A dashed line indicates a negative relationship. A thick line indicates a strong relationship (r > .750).
P1 service level D2 material availability A1 workload A5 ∆ start weeks P2 run�outs D3 lost stock A2 batch size A6 ∆ batch size P3 turnover rate of stock D4 reliability prognoses A3 slack A7 ∆ slack D1 unscheduled production D5 available capacity A4 order slack A8 ∆ order slack
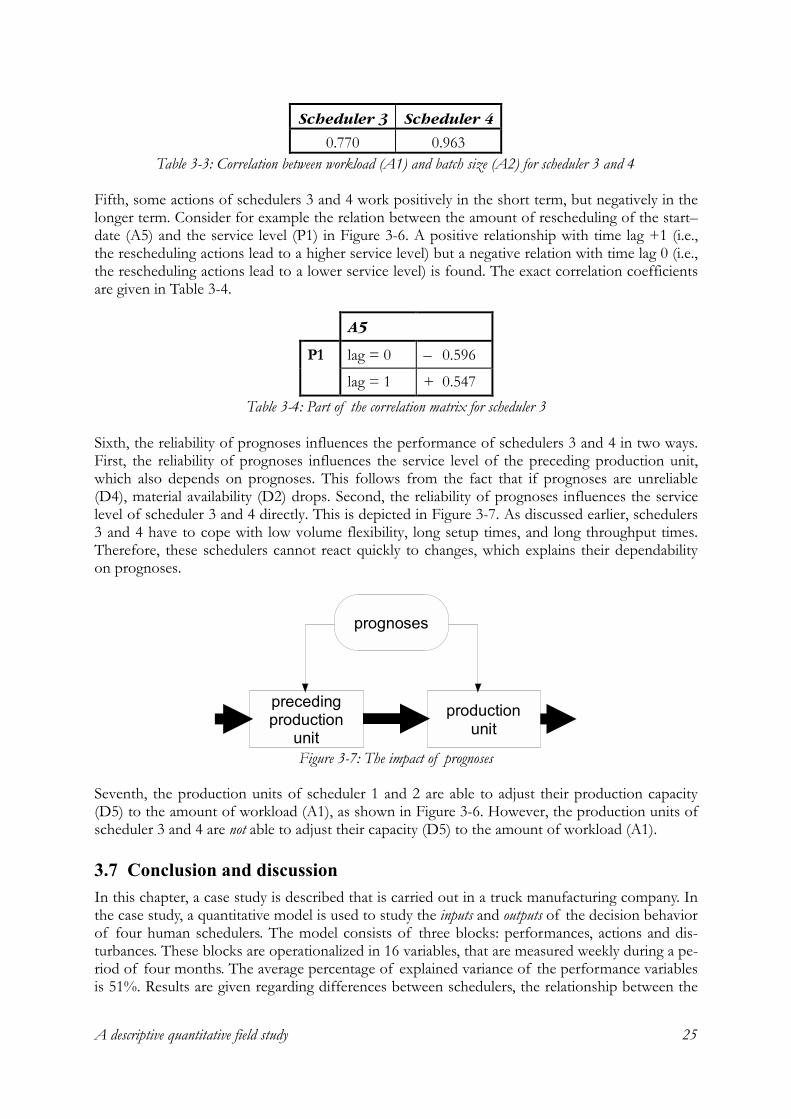
A descriptive quantitative field study 25
Fifth, some actions of schedulers 3 and 4 work positively in the short term, but negatively in the longer term. Consider for example the relation between the amount of rescheduling of the start�date (A5) and the service level (P1) in Figure 3-6. A positive relationship with time lag +1 (i.e., the rescheduling actions lead to a higher service level) but a negative relation with time lag 0 (i.e., the rescheduling actions lead to a lower service level) is found. The exact correlation coefficients are given in Table 3-4.
Sixth, the reliability of prognoses influences the performance of schedulers 3 and 4 in two ways. First, the reliability of prognoses influences the service level of the preceding production unit, which also depends on prognoses. This follows from the fact that if prognoses are unreliable (D4), material availability (D2) drops. Second, the reliability of prognoses influences the service level of scheduler 3 and 4 directly. This is depicted in Figure 3-7. As discussed earlier, schedulers 3 and 4 have to cope with low volume flexibility, long setup times, and long throughput times. Therefore, these schedulers cannot react quickly to changes, which explains their dependability on prognoses.
Seventh, the production units of scheduler 1 and 2 are able to adjust their production capacity (D5) to the amount of workload (A1), as shown in Figure 3-6. However, the production units of scheduler 3 and 4 are not able to adjust their capacity (D5) to the amount of workload (A1).
3.7 Conclusion and discussion In this chapter, a case study is described that is carried out in a truck manufacturing company. In the case study, a quantitative model is used to study the inputs and outputs of the decision behavior of four human schedulers. The model consists of three blocks: performances, actions and dis-turbances. These blocks are operationalized in 16 variables, that are measured weekly during a pe-riod of four months. The average percentage of explained variance of the performance variables is 51%. Results are given regarding differences between schedulers, the relationship between the
Scheduler 3 Scheduler 4
0.770 0.963 Table 3-3: Correlation between workload (A1) and batch size (A2) for scheduler 3 and 4
A5
P1 lag = 0 � 0.596
lag = 1 + 0.547 Table 3-4: Part of the correlation matrix for scheduler 3
prognoses
preceding production
unit
productionunit
Figure 3-7: The impact of prognoses
Chapter 3 26
schedule and production unit performance, nervousness in decision behavior, putting pressure on the shop floor in busy times, actions that work positively in the short term but negatively in the longer term, the impact of prognoses, and the flexibility of production units regarding capacity. The case study shows that the quantitative research method has its advantages as well as its dis-advantages. Two disadvantages of this method are:
• Simplification. The main drawback of using a quantitative model is the danger of oversimpli-fication of a complex real�world process. Because variables are chosen before data analysis starts, it is not possible to intermediately redirect the research efforts to possibly relevant data.
• Causality. A quantitative model only shows (a part of) the inputs and outputs of the deci-sion behavior of the schedulers; the actual scheduling process remains hidden in a black�box. Although many relationships are found in the statistical analyses, the causality of many of these relationships is difficult to understand.
Hence, a methodological insight that results from this case study is that a quantitative research method is not very well suited to gain a sufficiently deep understanding of the relationships be-tween the research elements.
Another drawback of the method is of a more practical nature. Research as described in this chapter is not applicable to any production unit. The reason for this is that data about actions, performance, and disturbances are not available in many production units. Even in this case study, limited data availability had to be managed, particularly with schedulers 1 and 2. Because these schedulers use a different information system than scheduler 3 and 4 to transfer work�orders to the shop floor, their schedule could not be copied.
Nevertheless, the case study succeeded in gaining more insight into the problem area of produc-tion scheduling. Detailed results, such as exact beta�coefficients of relationships between vari-ables were not aimed for, and therefore, many interesting conclusions could nevertheless be drawn from the complex results of the analysis, as shown in Section 3.6. These results can be discussed in the context of a number of methodological aspects of the research as given below.
• Production units. The case study shows large differences between schedulers who schedule apparently similar production units. This indicates that differences in production units may be of importance for the scheduling task. This hypothesis is strengthened by the fact that some schedulers are able to influence the capacity of the production unit in busy times whereas others are not.
• Individual differences. The case study shows large differences between schedulers that sched-ule apparently similar production units. This indicates that individual differences between units may be of importance for the scheduling task.
• Performance. The case study shows that the performance of the production units is not di-rectly controlled by the quality of the schedule. This finding strengthens the suggestion given in Section 2.2.3 that schedulers may not be interested in performance feedback. Also, this finding suggests that performance should not be regarded as a very important factor in the decision behavior of human schedulers.
• Scheduling task. The case study shows that the scheduling task is quite complex. This can be illustrated by the spaghetti of relations shown in Figure 3-4, and by the finding that sched-ulers show nervous decision behavior.
Lastly, it can be concluded that, in the context of making theoretical statements, the contribution of this case study to the research described in this thesis is scant. Rather, this case study contrib-utes to the development of an appropriate research design and method for the remainder of the research.

Research design and methods 27
4. Research design and methods
In this chapter, the research design and methods used in the remainder of this thesis are pre-sented. The research design and methods are based on the case study methodology as presented by Yin (1989) and the qualitative data analysis methods as presented by Miles & Huberman (1994).
4.1 Research questions In Chapter 1, two research questions are proposed regarding the use of scheduling techniques in practice. Based on the results of the literature review and the descriptive case study presented in the previous chapter, it is now possible to refine these questions. Chapter 2 showed that schedul-ing techniques have a number of shortcomings, and that scheduling in practice is primarily a manual task. Chapter 3 showed that the scheduling task is quite complex, which strengthens the expectation posed in Chapter 2 that humans and techniques have complementary capabilities. Together with the issues mentioned in Chapter 1 this leads to the following main research ques-tions regarding human�computer interaction in production scheduling:
• Why are scheduling information systems (not) used by human schedulers in practice? • How can human schedulers in practice be supported by scheduling information systems?
4.2 Research strategy The research strategy followed in this thesis has been derived from the research situation. Yin (1989) gives three conditions regarding the research situation and relates these conditions to sev-eral possible research strategies. The conditions regarding the research situation are: the type of research question posed; the extent of control an investigator has over actual behavioral events; and the degree of focus on contemporary as opposed to historical events.
A basic categorization scheme for research questions is the series: �who,� �what,� �where,� �how,� and �why.� Yin explains that �how� and �why� questions as stated in the previous section are more explanatory and likely to lead to the use of case studies, histories and experiments. Be-cause the research in this thesis focuses on contemporary events, the history is not a feasible al-ternative. The third condition concerns the question whether the researcher has control over the actual events. If no control is present, a case study is the preferred strategy; in contrast, if there is direct, precise and systematic control, an experiment is preferred.
The research situation in this thesis uses a twofold approach. The first research question, which begins with �why,� requires explanatory research activities regarding the use of scheduling in-formation systems in practice. After answering this question, the second research question, which begins with �how,� is addressed by constructing a design model for scheduling information sys-tems and by testing its validity in practice. Therefore, two somewhat different research strategies are used: the first part of the research is conducted by a number of explanatory case studies; the second part of the research is conducted by a case study where a model is applied in a real�world situation. The research design for both parts of the research is largely similar; hence, one meth-odological setup is described in this chapter, and differences are highlighted if relevant.
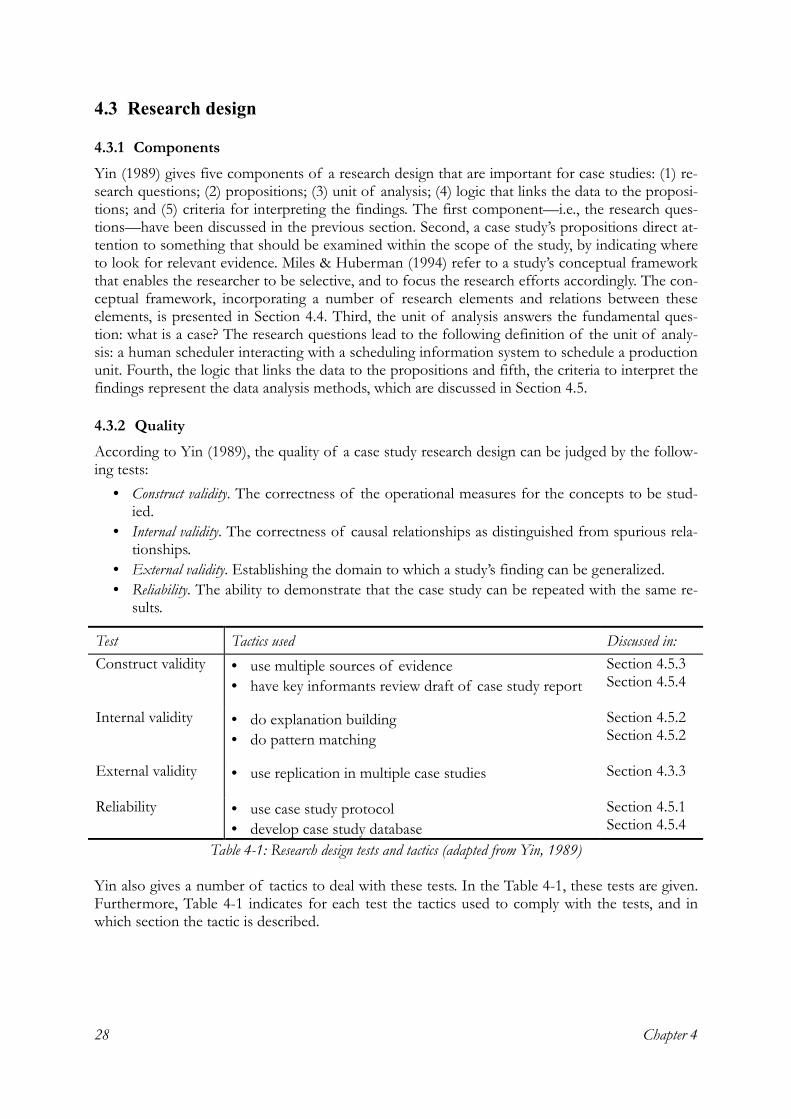
Chapter 4 28
4.3 Research design
4.3.1 Components Yin (1989) gives five components of a research design that are important for case studies: (1) re-search questions; (2) propositions; (3) unit of analysis; (4) logic that links the data to the proposi-tions; and (5) criteria for interpreting the findings. The first component�i.e., the research ques-tions�have been discussed in the previous section. Second, a case study�s propositions direct at-tention to something that should be examined within the scope of the study, by indicating where to look for relevant evidence. Miles & Huberman (1994) refer to a study�s conceptual framework that enables the researcher to be selective, and to focus the research efforts accordingly. The con-ceptual framework, incorporating a number of research elements and relations between these elements, is presented in Section 4.4. Third, the unit of analysis answers the fundamental ques-tion: what is a case? The research questions lead to the following definition of the unit of analy-sis: a human scheduler interacting with a scheduling information system to schedule a production unit. Fourth, the logic that links the data to the propositions and fifth, the criteria to interpret the findings represent the data analysis methods, which are discussed in Section 4.5.
4.3.2 Quality According to Yin (1989), the quality of a case study research design can be judged by the follow-ing tests:
• Construct validity. The correctness of the operational measures for the concepts to be stud-ied.
• Internal validity. The correctness of causal relationships as distinguished from spurious rela-tionships.
• External validity. Establishing the domain to which a study�s finding can be generalized. • Reliability. The ability to demonstrate that the case study can be repeated with the same re-
sults.
Yin also gives a number of tactics to deal with these tests. In the Table 4-1, these tests are given. Furthermore, Table 4-1 indicates for each test the tactics used to comply with the tests, and in which section the tactic is described.
Test Tactics used Discussed in: Construct validity • use multiple sources of evidence
• have key informants review draft of case study report Section 4.5.3 Section 4.5.4
Internal validity • do explanation building • do pattern matching
Section 4.5.2 Section 4.5.2
External validity • use replication in multiple case studies Section 4.3.3
Reliability • use case study protocol • develop case study database
Section 4.5.1 Section 4.5.4
Table 4-1: Research design tests and tactics (adapted from Yin, 1989)
Research design and methods 29
4.3.3 Replication Case study designs can be single or multiple: in a single case study design, one case is studied; in the multiple case study design, more than one case is studied. Thus, in a multiple case study de-sign, the concept of replication is applied. A general consideration in the replication of case stud-ies is the following: the more cases that are used, the more certain the results of the research will be. However, the exact number of required replications of a case is very difficult to determine. Hence, deciding upon the number of cases is primarily a matter of judgment for the researcher. Moreover, as in many research projects, the possible number of cases used here was constrained by the available time. This is particularly true in the case study where the design model is applied, as the analysis, design and implementation of a software system in practice consume much time. The following replication tactic has been used: explanatory case studies have been repeatedly car-ried out until it was judged that sufficiently strong theoretical statements could be made. The theoretical statements have been implemented in a subsequent case study.
Once the multiple case study design has been selected, the question arises as to which sample strategy to use, i.e., how to select individual cases. Miles & Huberman (1994) indicate that qualita-tive samples tend to be purposive rather than random. The primary aim of such sampling strate-gies is to be able to generalize to theory, rather than generalizing to the total population. The re-search question regarding the explanatory case studies concerns the use of scheduling informa-tion systems by human schedulers. Therefore, in selecting individual explanatory case studies, variation has been sought in the use of systems by humans. Two cases were selected where the system is partly used; one case was selected where the system is used fully; and one case was se-lected where the system is not used at all. Furthermore, to see whether patterns would hold over varying cases, it was decided to vary industrial characteristics between the cases. Although qualita-tive case studies often are not primarily aimed at generalizing the results of the sample to the population, it was nevertheless felt that if cases were selected from a variety of industrial situa-tions, the generalizability of the results of the cases would improve. Hence, one case has been carried out in semi�process industry; two cases have been carried out in job�shops of varying complexity, and one case has been carried out in a large batch shop (see also Figure 4-2). The case where the design model is applied in practice is carried out in a large bulk transshipment terminal. The operational characteristics of this company can be compared to semi�process in-dustry (see Section 7.1.3).
4.4 Conceptual framework The following aspects have been mentioned in the previous chapters as relevant for human�computer interaction in production scheduling:
• Production unit • Production control structure • Scheduling information system • Scheduling task • Human scheduler
The above mentioned elements and their relationships are depicted in Figure 4-1 and are ex-plained in the following subsections. Regarding the element �human scheduler,� two types of questions can be asked: first, what are relevant generic characteristics of humans, and second, what are relevant individual characteristics of humans? It has been decided not to include indi-vidual characteristics of humans in this research, although there is still insufficient knowledge about these individual differences, as has been stated in Chapter 2. Moreover, this finding from literature has been strengthened by the descriptive case study presented in the previous chapter. Individual differences have not been incorporated in the study because analyzing multiple mental
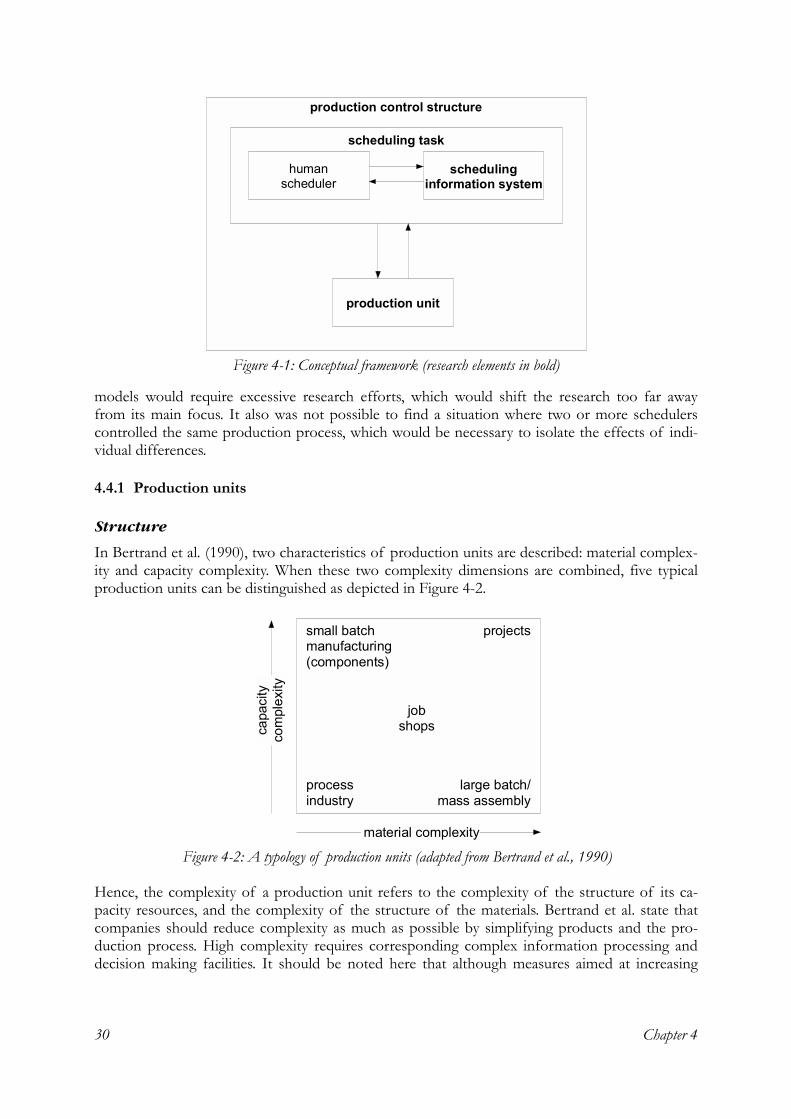
Chapter 4 30
models would require excessive research efforts, which would shift the research too far away from its main focus. It also was not possible to find a situation where two or more schedulers controlled the same production process, which would be necessary to isolate the effects of indi-vidual differences.
4.4.1 Production units
Structure
In Bertrand et al. (1990), two characteristics of production units are described: material complex-ity and capacity complexity. When these two complexity dimensions are combined, five typical production units can be distinguished as depicted in Figure 4-2.
Hence, the complexity of a production unit refers to the complexity of the structure of its ca-pacity resources, and the complexity of the structure of the materials. Bertrand et al. state that companies should reduce complexity as much as possible by simplifying products and the pro-duction process. High complexity requires corresponding complex information processing and decision making facilities. It should be noted here that although measures aimed at increasing
humanscheduler
scheduling information system
production unit
scheduling task
production control structure
Figure 4-1: Conceptual framework (research elements in bold)
capa
city
com
plex
ity
material complexity
small batchmanufacturing(components)
projects
jobshops
processindustry
large batch/mass assembly
Figure 4-2: A typology of production units (adapted from Bertrand et al., 1990)
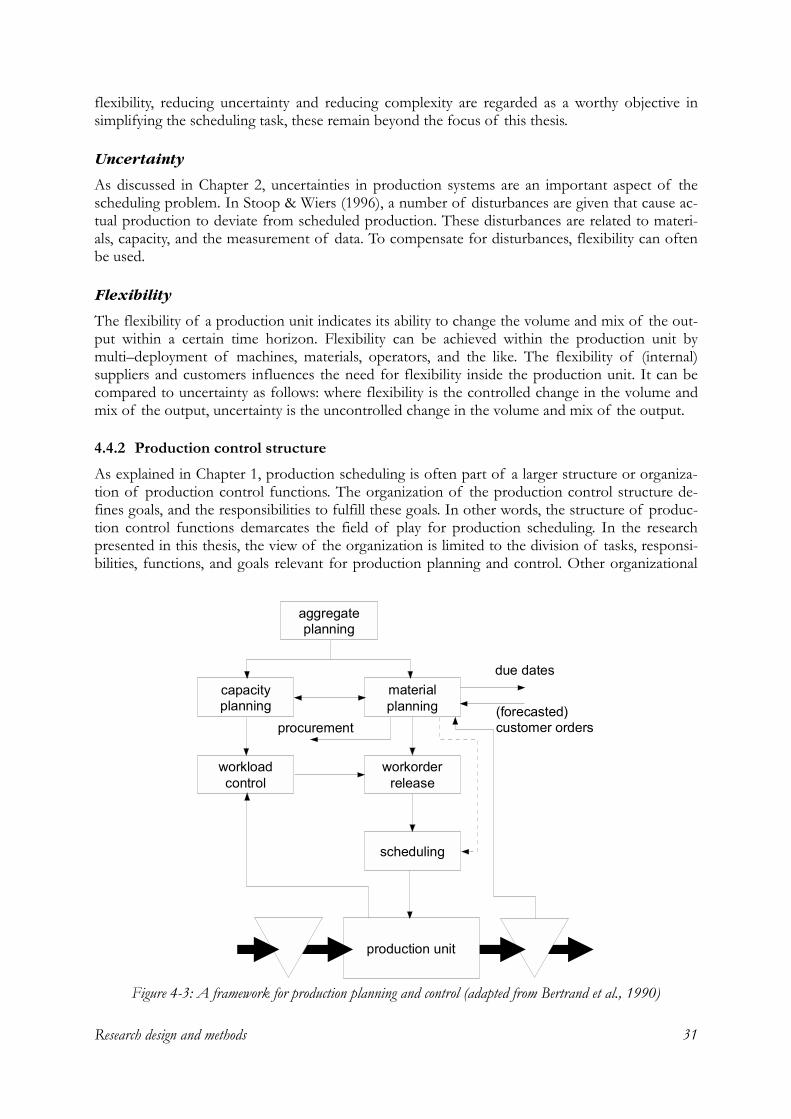
Research design and methods 31
flexibility, reducing uncertainty and reducing complexity are regarded as a worthy objective in simplifying the scheduling task, these remain beyond the focus of this thesis.
Uncertainty
As discussed in Chapter 2, uncertainties in production systems are an important aspect of the scheduling problem. In Stoop & Wiers (1996), a number of disturbances are given that cause ac-tual production to deviate from scheduled production. These disturbances are related to materi-als, capacity, and the measurement of data. To compensate for disturbances, flexibility can often be used.
Flexibility
The flexibility of a production unit indicates its ability to change the volume and mix of the out-put within a certain time horizon. Flexibility can be achieved within the production unit by multi�deployment of machines, materials, operators, and the like. The flexibility of (internal) suppliers and customers influences the need for flexibility inside the production unit. It can be compared to uncertainty as follows: where flexibility is the controlled change in the volume and mix of the output, uncertainty is the uncontrolled change in the volume and mix of the output.
4.4.2 Production control structure As explained in Chapter 1, production scheduling is often part of a larger structure or organiza-tion of production control functions. The organization of the production control structure de-fines goals, and the responsibilities to fulfill these goals. In other words, the structure of produc-tion control functions demarcates the field of play for production scheduling. In the research presented in this thesis, the view of the organization is limited to the division of tasks, responsi-bilities, functions, and goals relevant for production planning and control. Other organizational
capacity planning
materialplanning
workorderrelease
scheduling
workloadcontrol
procurement
aggregate planning
due dates
(forecasted) customer orders
production unit
Figure 4-3: A framework for production planning and control (adapted from Bertrand et al., 1990)
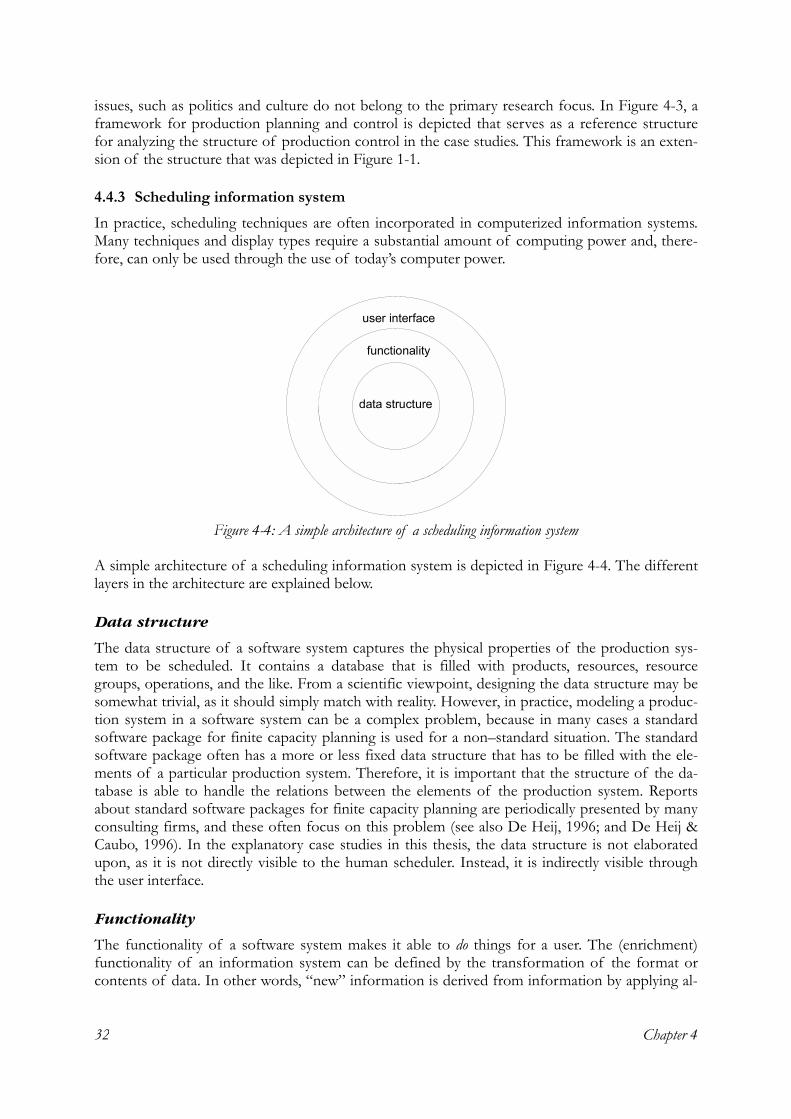
Chapter 4 32
issues, such as politics and culture do not belong to the primary research focus. In Figure 4-3, a framework for production planning and control is depicted that serves as a reference structure for analyzing the structure of production control in the case studies. This framework is an exten-sion of the structure that was depicted in Figure 1-1.
4.4.3 Scheduling information system In practice, scheduling techniques are often incorporated in computerized information systems. Many techniques and display types require a substantial amount of computing power and, there-fore, can only be used through the use of today�s computer power.
A simple architecture of a scheduling information system is depicted in Figure 4-4. The different layers in the architecture are explained below.
Data structure
The data structure of a software system captures the physical properties of the production sys-tem to be scheduled. It contains a database that is filled with products, resources, resource groups, operations, and the like. From a scientific viewpoint, designing the data structure may be somewhat trivial, as it should simply match with reality. However, in practice, modeling a produc-tion system in a software system can be a complex problem, because in many cases a standard software package for finite capacity planning is used for a non�standard situation. The standard software package often has a more or less fixed data structure that has to be filled with the ele-ments of a particular production system. Therefore, it is important that the structure of the da-tabase is able to handle the relations between the elements of the production system. Reports about standard software packages for finite capacity planning are periodically presented by many consulting firms, and these often focus on this problem (see also De Heij, 1996; and De Heij & Caubo, 1996). In the explanatory case studies in this thesis, the data structure is not elaborated upon, as it is not directly visible to the human scheduler. Instead, it is indirectly visible through the user interface.
Functionality
The functionality of a software system makes it able to do things for a user. The (enrichment) functionality of an information system can be defined by the transformation of the format or contents of data. In other words, �new� information is derived from information by applying al-
data structure
functionality
user interface
Figure 4-4: A simple architecture of a scheduling information system
Research design and methods 33
gorithms, rules, and the like (�t Hart, 1997). In this thesis, discussions about functionality are pri-marily focused on the function of generating schedules. Schedule generation functionality can be accomplished by scheduling techniques, which were reviewed in Sections 2.1.1 and 2.1.2. Many scheduling techniques are available in standard software systems: an overview is given in Wort-mann et al. (1996). In this thesis, scheduling techniques are assumed to be part of a system�s schedule generation functionality.
User interface
Another aspect of an information system is the way it interacts with a human user, i.e., the user interface. The user interface of an information system has two aspects: manipulation and presen-tation. Through a keyboard, a mouse, etc., the information system can be manipulated by the user. By information presentation, an information system presents itself to the human user. In Section 2.1.3, it was stated that the Gantt chart is an often used way of information presentation of scheduling information systems.
4.4.4 Scheduling task The scheduling task consists of the activities that are carried out by the scheduler to fulfill his re-sponsibilities that are assigned within the context of the production control structure. Most of these activities are of a repetitive nature; the cycle time usually being the same as the scheduling horizon within the company. In particular, attention is given to the interaction between the scheduler and the scheduling information system.
4.5 Collecting and analyzing data
4.5.1 Protocol During the case studies, a case study protocol is used to guide the research activities. The case study protocol is a means to improve the reliability of case studies, particularly in multiple�case study designs. The protocol gives an overview of: (1) the case study project, (2) the field proce-dures, (3) the case study questions, and (4) a guide for the case study report.
First, an overview of the case study project is made, which is often used to gain access to a po-tential company. Second, the field procedures indicate: (a) the data collection activities that are conducted; (b) which persons are involved; and (c) the key person within the organization to whom results and difficulties should be addressed. Third, the case study questions are derived from the research questions presented in Section 4.1. Fourth, the case study report is structured conform the research elements presented in Section 4.4; furthermore, an overview of the case study project is presented in the first chapter, and an additional last chapter contains the explana-tion of the usage of the scheduling information system.
4.5.2 Analytic strategy The analytic strategy in the explanatory part of the research is focused on explaining human computer interaction in production scheduling. In particular, explanations regarding the use of scheduling information systems by human schedulers are sought by identifying causal links be-tween characteristics of production units, scheduling information systems, scheduling tasks, and the organization of production control.
The process of explaining in the light of qualitative data analysis has for example been discussed by Miles & Huberman (1994). They indicate that good explanations link the explanations given by the people that are studied with explanations that are developed by researchers. The explana-
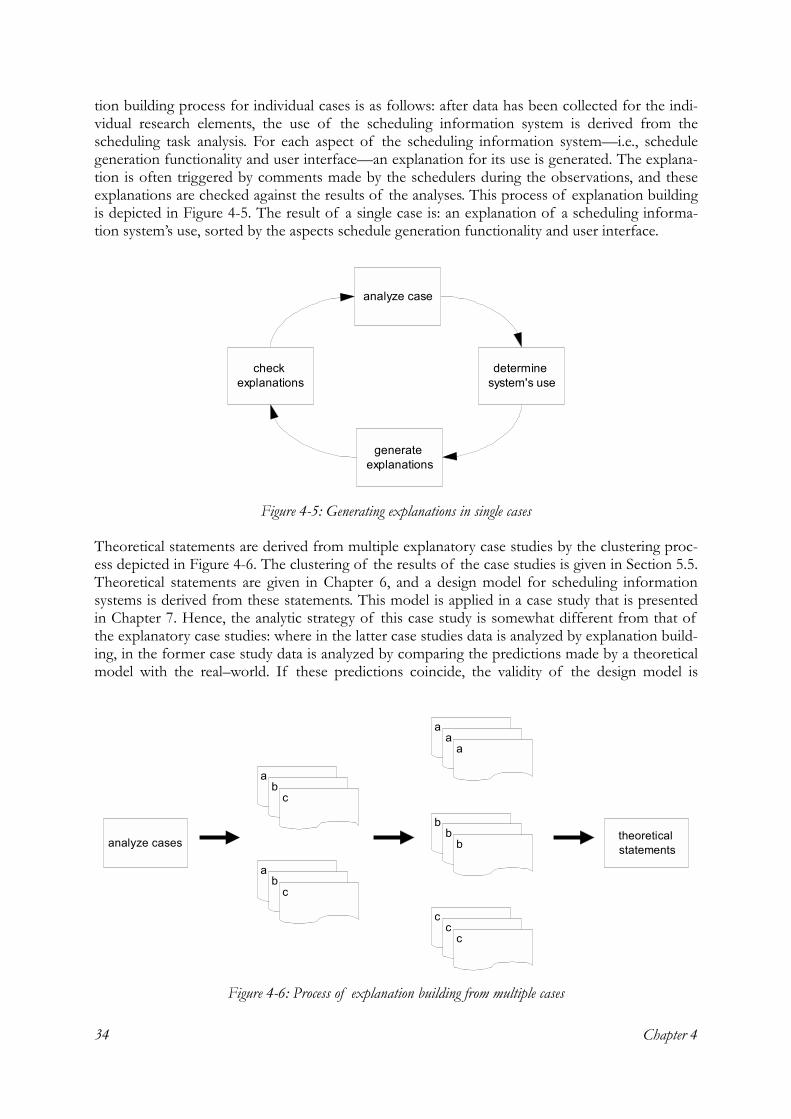
Chapter 4 34
tion building process for individual cases is as follows: after data has been collected for the indi-vidual research elements, the use of the scheduling information system is derived from the scheduling task analysis. For each aspect of the scheduling information system�i.e., schedule generation functionality and user interface�an explanation for its use is generated. The explana-tion is often triggered by comments made by the schedulers during the observations, and these explanations are checked against the results of the analyses. This process of explanation building is depicted in Figure 4-5. The result of a single case is: an explanation of a scheduling informa-tion system�s use, sorted by the aspects schedule generation functionality and user interface.
Theoretical statements are derived from multiple explanatory case studies by the clustering proc-ess depicted in Figure 4-6. The clustering of the results of the case studies is given in Section 5.5. Theoretical statements are given in Chapter 6, and a design model for scheduling information systems is derived from these statements. This model is applied in a case study that is presented in Chapter 7. Hence, the analytic strategy of this case study is somewhat different from that of the explanatory case studies: where in the latter case studies data is analyzed by explanation build-ing, in the former case study data is analyzed by comparing the predictions made by a theoretical model with the real�world. If these predictions coincide, the validity of the design model is
analyze case
determine system's use
check explanations
generate explanations
Figure 4-5: Generating explanations in single cases
ab
c
analyze cases
ab
c
aa
a
bb
b
cc
c
theoretical statements
Figure 4-6: Process of explanation building from multiple cases
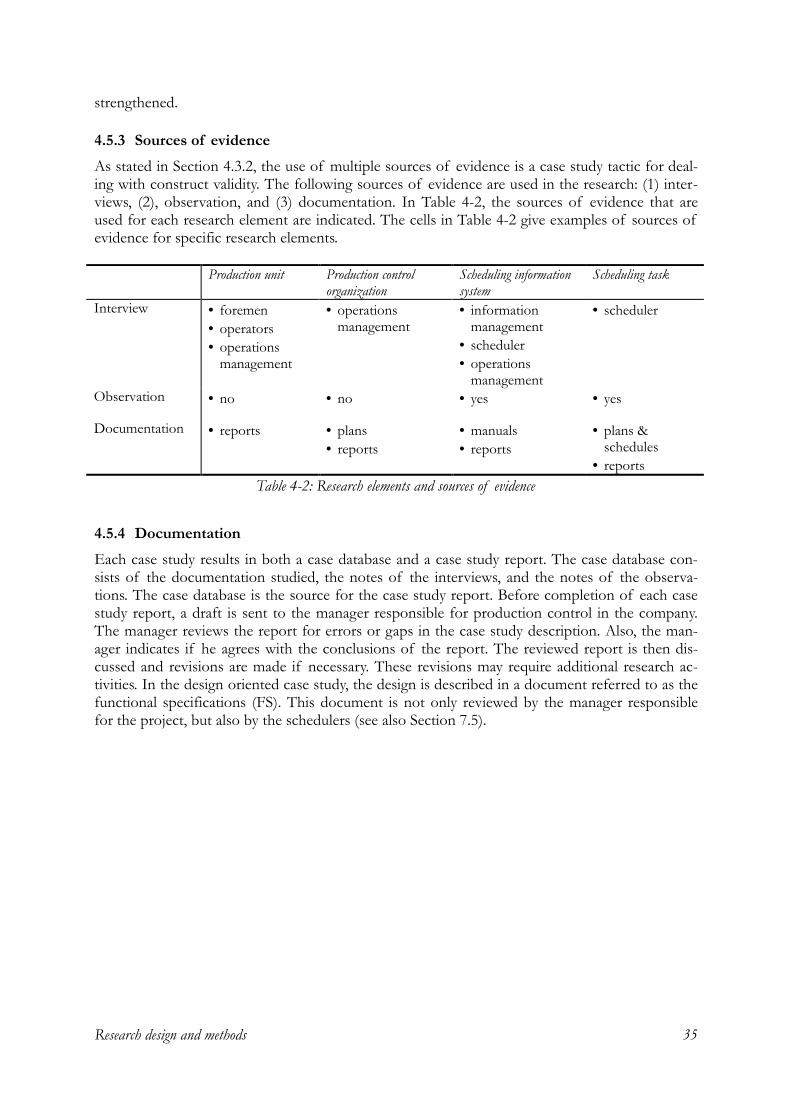
Research design and methods 35
strengthened.
4.5.3 Sources of evidence As stated in Section 4.3.2, the use of multiple sources of evidence is a case study tactic for deal-ing with construct validity. The following sources of evidence are used in the research: (1) inter-views, (2), observation, and (3) documentation. In Table 4-2, the sources of evidence that are used for each research element are indicated. The cells in Table 4-2 give examples of sources of evidence for specific research elements.
4.5.4 Documentation Each case study results in both a case database and a case study report. The case database con-sists of the documentation studied, the notes of the interviews, and the notes of the observa-tions. The case database is the source for the case study report. Before completion of each case study report, a draft is sent to the manager responsible for production control in the company. The manager reviews the report for errors or gaps in the case study description. Also, the man-ager indicates if he agrees with the conclusions of the report. The reviewed report is then dis-cussed and revisions are made if necessary. These revisions may require additional research ac-tivities. In the design oriented case study, the design is described in a document referred to as the functional specifications (FS). This document is not only reviewed by the manager responsible for the project, but also by the schedulers (see also Section 7.5).
Production unit Production control organization
Scheduling information system
Scheduling task
Interview • foremen • operators • operations
management
• operations management
• information management
• scheduler • operations
management
• scheduler
Observation • no • no • yes • yes
Documentation • reports • plans • reports
• manuals • reports
• plans & schedules
• reports Table 4-2: Research elements and sources of evidence

Four explanatory case studies 37
5. Four explanatory case studies
This chapter presents four explanatory case studies where the research elements presented in the previous chapter are studied. Furthermore, the interaction between the human and the schedul-ing information system is explained by the research elements. Explanations are given for the two aspects of the research element scheduling information system: functionality and information presentation. At the end of this chapter, the results of the various cases are summarized by clus-tering them according to the two aspects of the research element scheduling information system.
5.1 Case I: potato starch production The first case study was carried out in a potato starch company. The company was founded in 1919 acting for a major part of the a cooperative potato starch industry in the Netherlands. To-day, the company is the world�s largest manufacturer of potato starch and derivative products. Production facilities are in the Netherlands, Sweden, Germany, France, Thailand and America. The case study was conducted at one of the production facilities in the Netherlands and focused on the production of derivatives.
5.1.1 Production units
Material structure
Potato starch is by and large the most important raw material in approximately 500 different de-rivatives. Starch is made from potatoes supplied by farmers in the period between August and February. Each year, approximately four million tons of potatoes are processed into starch. The starch that is not used immediately for producing derivatives is stocked in large silos. The com-pany closely monitors the amount of starch available for production: if the company runs out of starch, most production activities are jeopardized.
The derivatives are used throughout the world in numerous industries, including the food and drink industry and the paper, textiles and adhesives industries. Derivatives are also used in gas� and oil�winning, in pharmaceuticals, in animal feed, mining and in the preparation of drinking water. For the production of derivatives, a variety of chemical additives are used. These chemi-cals are externally procured from a variety of suppliers. Procurement lead times of chemicals vary from a few days to about 5 weeks. Approximately 50 derivatives are used in the production of other derivatives.
Capacity structure
Derivatives are produced on dedicated and highly automated installations by chemically and/or physically modifying potato starch. There are fourteen of these installations with similar opera-tional characteristics. A typical configuration of two installations is depicted in Figure 5-1. Each installation produces a variety of similar derivatives which typically consist of a small number of fastmovers and a large number of slowmovers. The number of derivatives produced per installa-tion varies from 5 to 45. The production capacity of the installations is measured in tons per
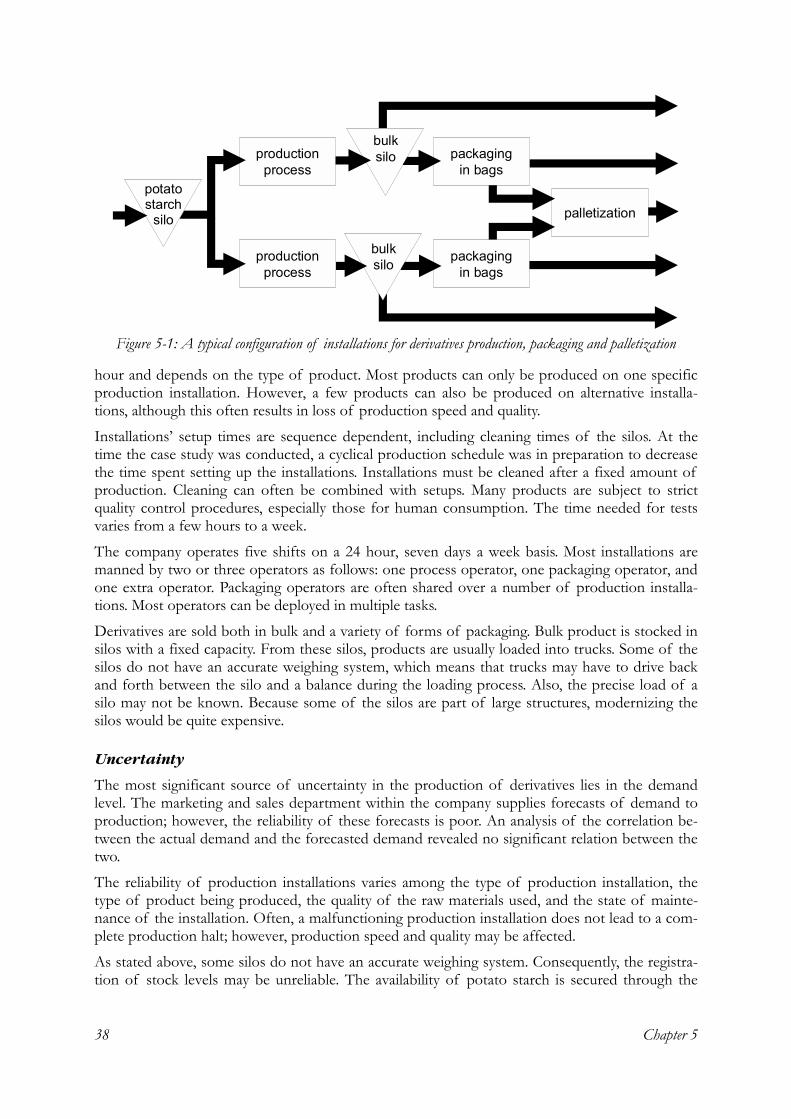
Chapter 5 38
hour and depends on the type of product. Most products can only be produced on one specific production installation. However, a few products can also be produced on alternative installa-tions, although this often results in loss of production speed and quality.
Installations� setup times are sequence dependent, including cleaning times of the silos. At the time the case study was conducted, a cyclical production schedule was in preparation to decrease the time spent setting up the installations. Installations must be cleaned after a fixed amount of production. Cleaning can often be combined with setups. Many products are subject to strict quality control procedures, especially those for human consumption. The time needed for tests varies from a few hours to a week.
The company operates five shifts on a 24 hour, seven days a week basis. Most installations are manned by two or three operators as follows: one process operator, one packaging operator, and one extra operator. Packaging operators are often shared over a number of production installa-tions. Most operators can be deployed in multiple tasks.
Derivatives are sold both in bulk and a variety of forms of packaging. Bulk product is stocked in silos with a fixed capacity. From these silos, products are usually loaded into trucks. Some of the silos do not have an accurate weighing system, which means that trucks may have to drive back and forth between the silo and a balance during the loading process. Also, the precise load of a silo may not be known. Because some of the silos are part of large structures, modernizing the silos would be quite expensive.
Uncertainty
The most significant source of uncertainty in the production of derivatives lies in the demand level. The marketing and sales department within the company supplies forecasts of demand to production; however, the reliability of these forecasts is poor. An analysis of the correlation be-tween the actual demand and the forecasted demand revealed no significant relation between the two.
The reliability of production installations varies among the type of production installation, the type of product being produced, the quality of the raw materials used, and the state of mainte-nance of the installation. Often, a malfunctioning production installation does not lead to a com-plete production halt; however, production speed and quality may be affected.
As stated above, some silos do not have an accurate weighing system. Consequently, the registra-tion of stock levels may be unreliable. The availability of potato starch is secured through the
palletization
packagingin bags
productionprocess
productionprocess
bulksilo packaging
in bags
bulksilo
potato starch
silo
Figure 5-1: A typical configuration of installations for derivatives production, packaging and palletization
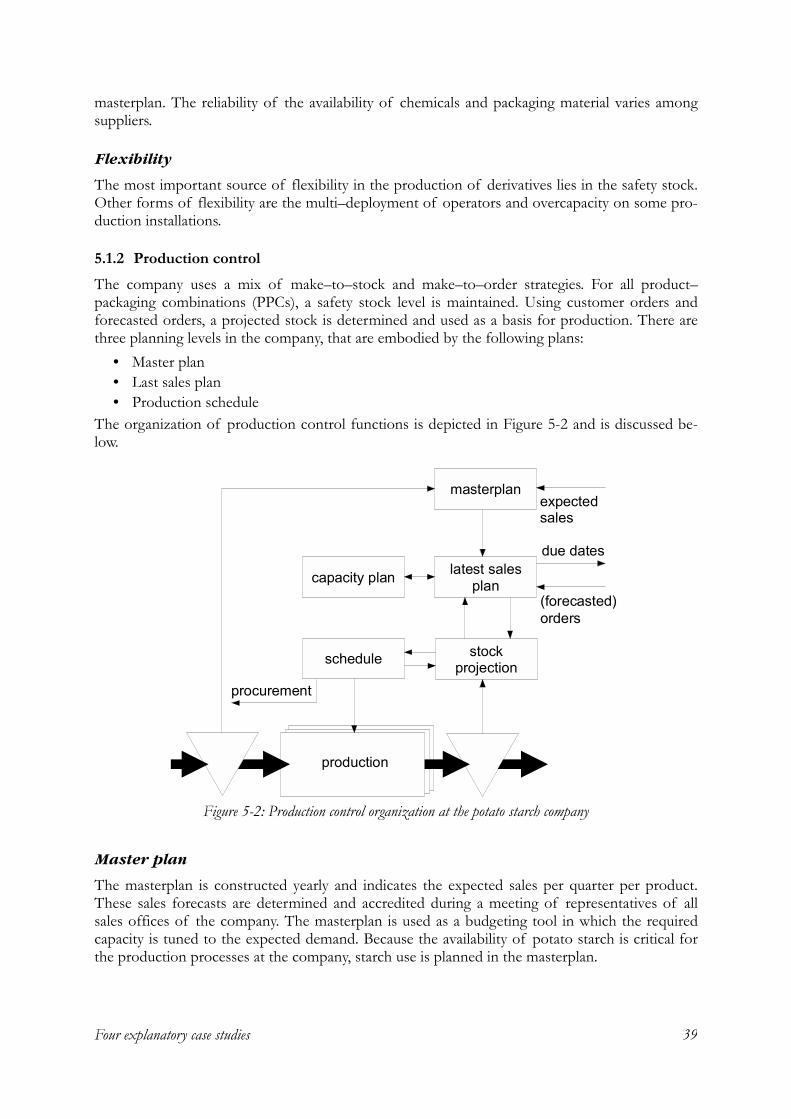
Four explanatory case studies 39
masterplan. The reliability of the availability of chemicals and packaging material varies among suppliers.
Flexibility
The most important source of flexibility in the production of derivatives lies in the safety stock. Other forms of flexibility are the multi�deployment of operators and overcapacity on some pro-duction installations.
5.1.2 Production control The company uses a mix of make�to�stock and make�to�order strategies. For all product�packaging combinations (PPCs), a safety stock level is maintained. Using customer orders and forecasted orders, a projected stock is determined and used as a basis for production. There are three planning levels in the company, that are embodied by the following plans:
• Master plan • Last sales plan • Production schedule
The organization of production control functions is depicted in Figure 5-2 and is discussed be-low.
Master plan
The masterplan is constructed yearly and indicates the expected sales per quarter per product. These sales forecasts are determined and accredited during a meeting of representatives of all sales offices of the company. The masterplan is used as a budgeting tool in which the required capacity is tuned to the expected demand. Because the availability of potato starch is critical for the production processes at the company, starch use is planned in the masterplan.
masterplan
capacity plan latest sales plan
schedule
(forecasted) orders
due dates
production
procurement
stockprojection
expected sales
Figure 5-2: Production control organization at the potato starch company
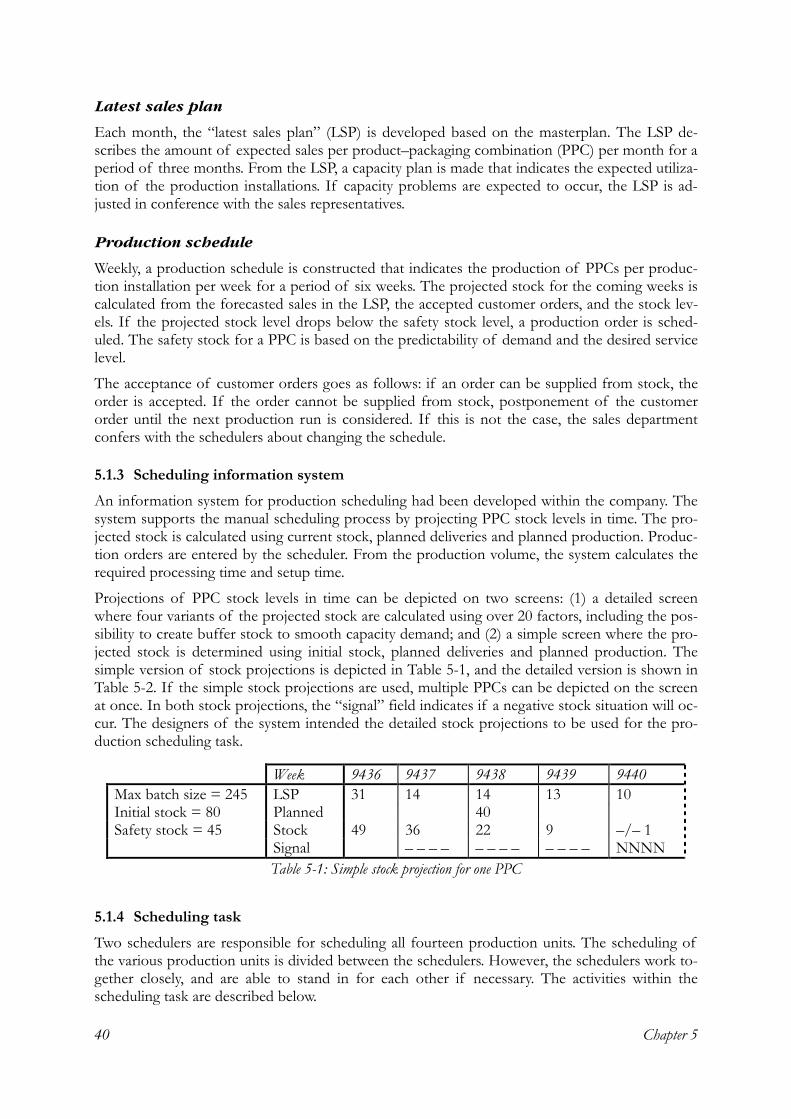
Chapter 5 40
Latest sales plan
Each month, the �latest sales plan� (LSP) is developed based on the masterplan. The LSP de-scribes the amount of expected sales per product�packaging combination (PPC) per month for a period of three months. From the LSP, a capacity plan is made that indicates the expected utiliza-tion of the production installations. If capacity problems are expected to occur, the LSP is ad-justed in conference with the sales representatives.
Production schedule
Weekly, a production schedule is constructed that indicates the production of PPCs per produc-tion installation per week for a period of six weeks. The projected stock for the coming weeks is calculated from the forecasted sales in the LSP, the accepted customer orders, and the stock lev-els. If the projected stock level drops below the safety stock level, a production order is sched-uled. The safety stock for a PPC is based on the predictability of demand and the desired service level.
The acceptance of customer orders goes as follows: if an order can be supplied from stock, the order is accepted. If the order cannot be supplied from stock, postponement of the customer order until the next production run is considered. If this is not the case, the sales department confers with the schedulers about changing the schedule.
5.1.3 Scheduling information system An information system for production scheduling had been developed within the company. The system supports the manual scheduling process by projecting PPC stock levels in time. The pro-jected stock is calculated using current stock, planned deliveries and planned production. Produc-tion orders are entered by the scheduler. From the production volume, the system calculates the required processing time and setup time.
Projections of PPC stock levels in time can be depicted on two screens: (1) a detailed screen where four variants of the projected stock are calculated using over 20 factors, including the pos-sibility to create buffer stock to smooth capacity demand; and (2) a simple screen where the pro-jected stock is determined using initial stock, planned deliveries and planned production. The simple version of stock projections is depicted in Table 5-1, and the detailed version is shown in Table 5-2. If the simple stock projections are used, multiple PPCs can be depicted on the screen at once. In both stock projections, the �signal� field indicates if a negative stock situation will oc-cur. The designers of the system intended the detailed stock projections to be used for the pro-duction scheduling task.
5.1.4 Scheduling task Two schedulers are responsible for scheduling all fourteen production units. The scheduling of the various production units is divided between the schedulers. However, the schedulers work to-gether closely, and are able to stand in for each other if necessary. The activities within the scheduling task are described below.
Week 9436 9437 9438 9439 9440 Max batch size = 245 LSP 31 14 14 13 10 Initial stock = 80 Planned 40 Safety stock = 45 Stock 49 36 22 9 �/� 1 Signal � � � � � � � � � � � � NNNN
Table 5-1: Simple stock projection for one PPC
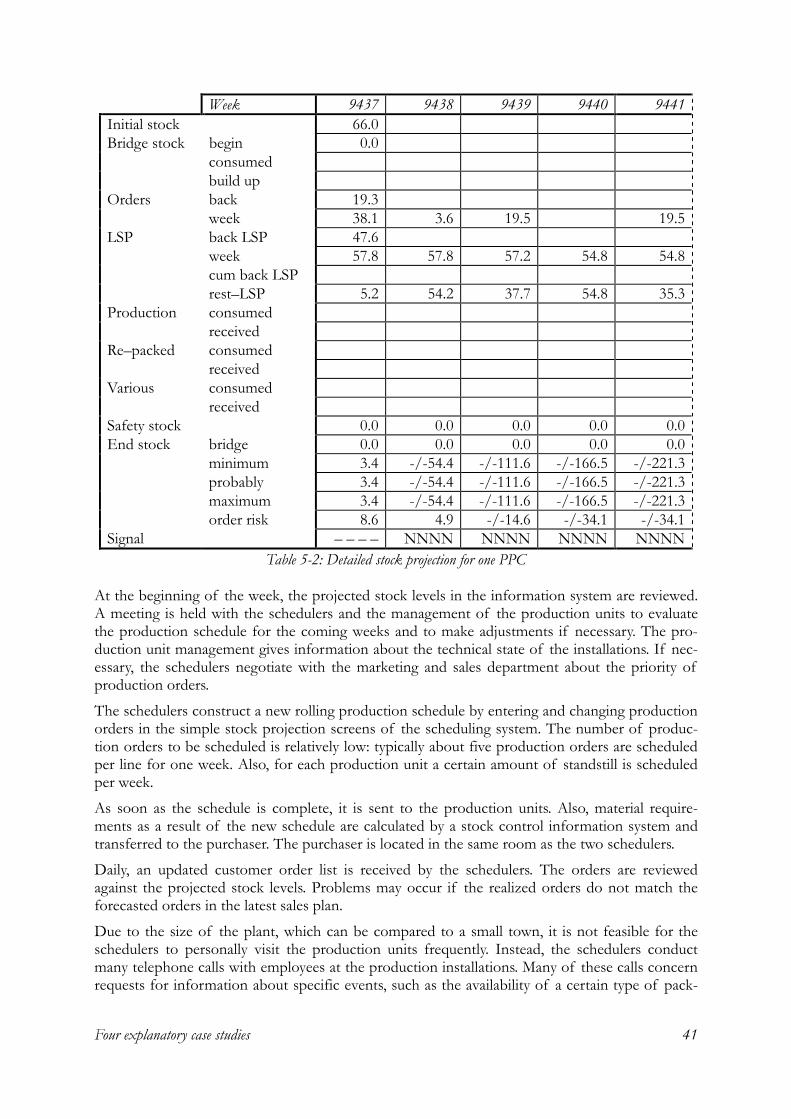
Four explanatory case studies 41
At the beginning of the week, the projected stock levels in the information system are reviewed. A meeting is held with the schedulers and the management of the production units to evaluate the production schedule for the coming weeks and to make adjustments if necessary. The pro-duction unit management gives information about the technical state of the installations. If nec-essary, the schedulers negotiate with the marketing and sales department about the priority of production orders.
The schedulers construct a new rolling production schedule by entering and changing production orders in the simple stock projection screens of the scheduling system. The number of produc-tion orders to be scheduled is relatively low: typically about five production orders are scheduled per line for one week. Also, for each production unit a certain amount of standstill is scheduled per week.
As soon as the schedule is complete, it is sent to the production units. Also, material require-ments as a result of the new schedule are calculated by a stock control information system and transferred to the purchaser. The purchaser is located in the same room as the two schedulers.
Daily, an updated customer order list is received by the schedulers. The orders are reviewed against the projected stock levels. Problems may occur if the realized orders do not match the forecasted orders in the latest sales plan.
Due to the size of the plant, which can be compared to a small town, it is not feasible for the schedulers to personally visit the production units frequently. Instead, the schedulers conduct many telephone calls with employees at the production installations. Many of these calls concern requests for information about specific events, such as the availability of a certain type of pack-
Week 9437 9438 9439 9440 9441Initial stock 66.0 Bridge stock begin 0.0 consumed build up Orders back 19.3 week 38.1 3.6 19.5 19.5LSP back LSP 47.6 week 57.8 57.8 57.2 54.8 54.8 cum back LSP rest�LSP 5.2 54.2 37.7 54.8 35.3Production consumed received Re�packed consumed received Various consumed received Safety stock 0.0 0.0 0.0 0.0 0.0End stock bridge 0.0 0.0 0.0 0.0 0.0 minimum 3.4 -/-54.4 -/-111.6 -/-166.5 -/-221.3 probably 3.4 -/-54.4 -/-111.6 -/-166.5 -/-221.3 maximum 3.4 -/-54.4 -/-111.6 -/-166.5 -/-221.3 order risk 8.6 4.9 -/-14.6 -/-34.1 -/-34.1Signal � � � � NNNN NNNN NNNN NNNN
Table 5-2: Detailed stock projection for one PPC
Chapter 5 42
aging material, the exact completion time of a production run to coordinate the arrival of trucks, or the testing of the suitability of an alternative product.
5.1.5 Evaluation of human computer interaction A remarkable finding within this case regarding the interaction between the human schedulers and the scheduling information system is the fact that the detailed stock projections are not used by the schedulers. As stated before, the detailed screen was intended by the designers of the sys-tem to be used by the schedulers. However, this screen was judged much too complicated by the schedulers, and they switched to using the simple screen instead.
Apart from the detailed stock projections, the screens of the scheduling system�which are text based�adequately match the information requirements of the schedulers. There is a limited amount of information that has to be taken into account by the schedulers simultaneously: typi-cally, about five production orders per week per line. Therefore, there is no need for graphical representations of the scheduling problem.
The scheduling information system has almost no functionality for generating schedules. Instead, the system calculates projected stock to support the schedulers in determining the required pro-duction. It is felt by the schedulers that strong schedule generation functions of the system would not be useful in this case, because the schedule construction process is strongly interwoven with communication and negotiation processes. For example, the uncertainty in demand and the dis-turbances in the production process lead to frequent communication with production manage-ment and the sales department. The schedulers feel that automatic scheduling functionality would only get in their way when solving problems.
The packaging and palletization machines are not scheduled explicitly by the schedulers. They as-sume that the operators on the shop floor are able to make decisions regarding the allocation of these machines by themselves. To enable the operators on the shop floor to make these decisions, a certain amount of standstill is scheduled per week for each production installation.
5.1.6 Discussion The task that is analyzed in this case study includes certain activities that do not seem to belong to scheduling as defined in Section 1.1. In particular, determining material requirements as de-scribed in Section 5.1.3 appears to violate the criterion of restricted control, i.e., material re-quirements should be out of the influence of scheduling. However, the scheduler has very little influence on how material requirements are calculated: the material requirements, leading to pro-jected stock as depicted in Table 5-1, are presented to the scheduler to notify him about the ne-cessity to schedule a work�order. The scheduler also has limited decision freedom in determining the size of work�orders, as batch sizes are imposed by technical constraints. Hence, it is con-cluded that the task studied in this case complies to the definition of scheduling as given in Sec-tion 1.1.
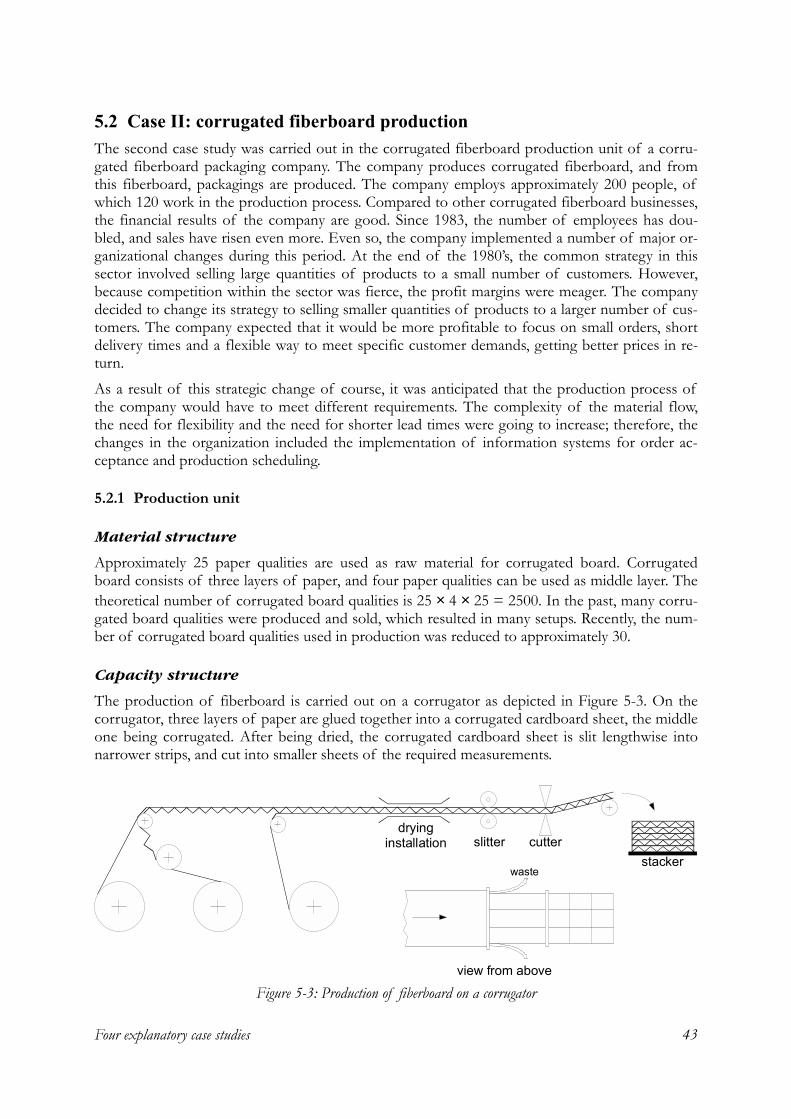
Four explanatory case studies 43
5.2 Case II: corrugated fiberboard production The second case study was carried out in the corrugated fiberboard production unit of a corru-gated fiberboard packaging company. The company produces corrugated fiberboard, and from this fiberboard, packagings are produced. The company employs approximately 200 people, of which 120 work in the production process. Compared to other corrugated fiberboard businesses, the financial results of the company are good. Since 1983, the number of employees has dou-bled, and sales have risen even more. Even so, the company implemented a number of major or-ganizational changes during this period. At the end of the 1980�s, the common strategy in this sector involved selling large quantities of products to a small number of customers. However, because competition within the sector was fierce, the profit margins were meager. The company decided to change its strategy to selling smaller quantities of products to a larger number of cus-tomers. The company expected that it would be more profitable to focus on small orders, short delivery times and a flexible way to meet specific customer demands, getting better prices in re-turn.
As a result of this strategic change of course, it was anticipated that the production process of the company would have to meet different requirements. The complexity of the material flow, the need for flexibility and the need for shorter lead times were going to increase; therefore, the changes in the organization included the implementation of information systems for order ac-ceptance and production scheduling.
5.2.1 Production unit
Material structure
Approximately 25 paper qualities are used as raw material for corrugated board. Corrugated board consists of three layers of paper, and four paper qualities can be used as middle layer. The theoretical number of corrugated board qualities is 25 × 4 × 25 = 2500. In the past, many corru-gated board qualities were produced and sold, which resulted in many setups. Recently, the num-ber of corrugated board qualities used in production was reduced to approximately 30.
Capacity structure
The production of fiberboard is carried out on a corrugator as depicted in Figure 5-3. On the corrugator, three layers of paper are glued together into a corrugated cardboard sheet, the middle one being corrugated. After being dried, the corrugated cardboard sheet is slit lengthwise into narrower strips, and cut into smaller sheets of the required measurements.
drying installation slitter cutter
stacker
view from above
waste
Figure 5-3: Production of fiberboard on a corrugator
Chapter 5 44
The corrugator is a highly automated machine and is controlled by a small team of operators. Setup times are relatively low: setting up a different fiberboard quality takes approximately 10 minutes.
The width of the fiberboard that comes out of the corrugator is fixed at 2.5 meters. Because five centimeters of board is wasted anyway, the usable width is 2.45 meters. Also, fiberboard is wasted if the widths of the production orders do not add up to the total available width of the board.
Uncertainty
There is little uncertainty in the corrugated board production process. One of the few significant sources of disturbance lies in breakdowns of the corrugator. The corrugator is the only machine in the corrugated fiberboard production unit. Because it produces continuously, a standstill can-not be recovered by overwork. Another source of uncertainty lies in the availability of paper.
Flexibility
An important source of flexibility lies in the commonality of some paper qualities. If a particular paper quality is not available, sometimes another quality can be used.
5.2.2 Production control The company uses a make�to�order production strategy. The following production control func-tions in the company are discussed:
• Sales support • Paper procurement • Scheduling
The organization of production control functions is depicted in Figure 5-4 and is discussed be-low.
Sales support
Each year, approximately 30,000 customer orders are received by the sales department. Most or-ders concern standard packaging designs with varying features, such as size and fiberboard qual-ity. The sales department uses an information system to generate a routing, which is used to check the available capacity per workcenter. The resulting delivery time and a price can be com-municated to the customer on�line. The available capacity of the company is divided into quota and allocated to the three following sales categories:
• account sales (50%), • rayon sales (25%), and • fast orders (10%).
The remaining 15% is reserved as buffer capacity. A separate department�i.e., �sales support��guards the effects of order acceptances on capacity usage. If problems occur, representatives of the sales categories must negotiate about the division of capacity. The sales support department intercedes in these negotiations and decides if buffer capacity is added to a quota.
Regular orders have a delivery lead time of approximately 2 weeks, dependent on the current workload. Fast orders have a delivery time of 5 days, which is maintained even in busy times. Product specifications of fast orders are somewhat restricted.
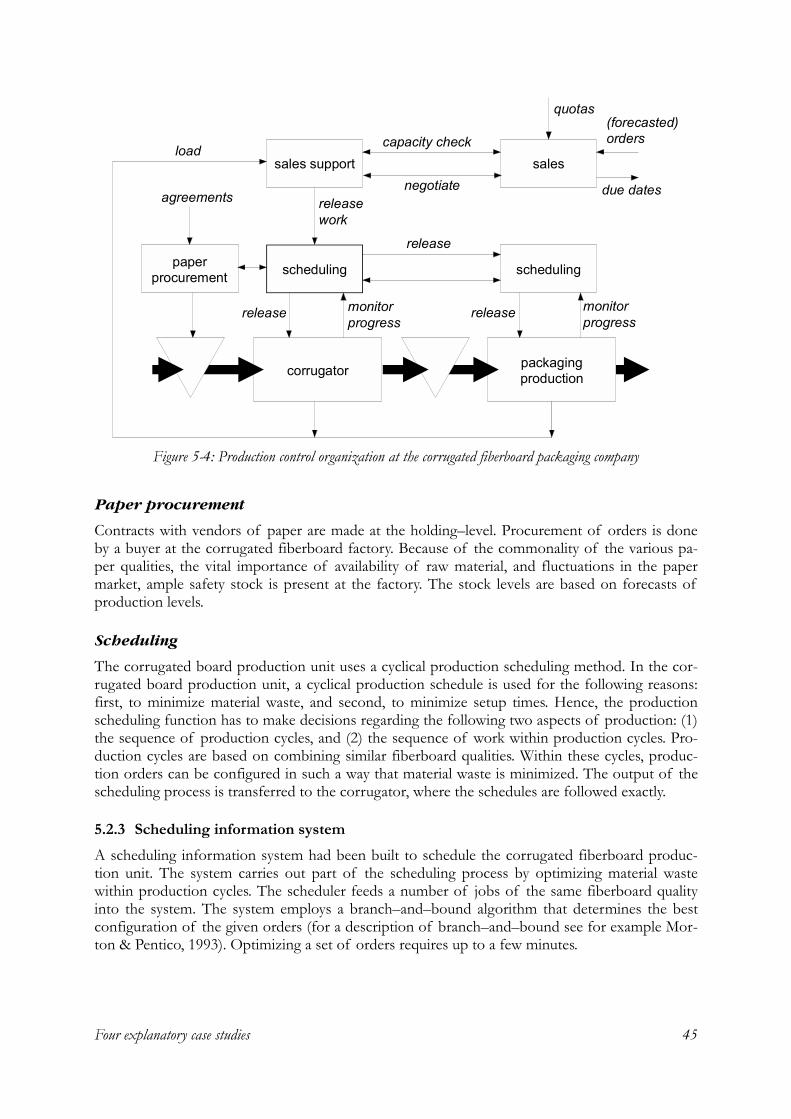
Four explanatory case studies 45
Paper procurement
Contracts with vendors of paper are made at the holding�level. Procurement of orders is done by a buyer at the corrugated fiberboard factory. Because of the commonality of the various pa-per qualities, the vital importance of availability of raw material, and fluctuations in the paper market, ample safety stock is present at the factory. The stock levels are based on forecasts of production levels.
Scheduling
The corrugated board production unit uses a cyclical production scheduling method. In the cor-rugated board production unit, a cyclical production schedule is used for the following reasons: first, to minimize material waste, and second, to minimize setup times. Hence, the production scheduling function has to make decisions regarding the following two aspects of production: (1) the sequence of production cycles, and (2) the sequence of work within production cycles. Pro-duction cycles are based on combining similar fiberboard qualities. Within these cycles, produc-tion orders can be configured in such a way that material waste is minimized. The output of the scheduling process is transferred to the corrugator, where the schedules are followed exactly.
5.2.3 Scheduling information system A scheduling information system had been built to schedule the corrugated fiberboard produc-tion unit. The system carries out part of the scheduling process by optimizing material waste within production cycles. The scheduler feeds a number of jobs of the same fiberboard quality into the system. The system employs a branch�and�bound algorithm that determines the best configuration of the given orders (for a description of branch�and�bound see for example Mor-ton & Pentico, 1993). Optimizing a set of orders requires up to a few minutes.
corrugator
schedulingpaper procurement
sales support sales
(forecasted)orders
due dates
capacity check
negotiatereleasework
load
agreements
release
quotas
monitorprogress
release
scheduling
packaging production
monitorprogress
release
Figure 5-4: Production control organization at the corrugated fiberboard packaging company
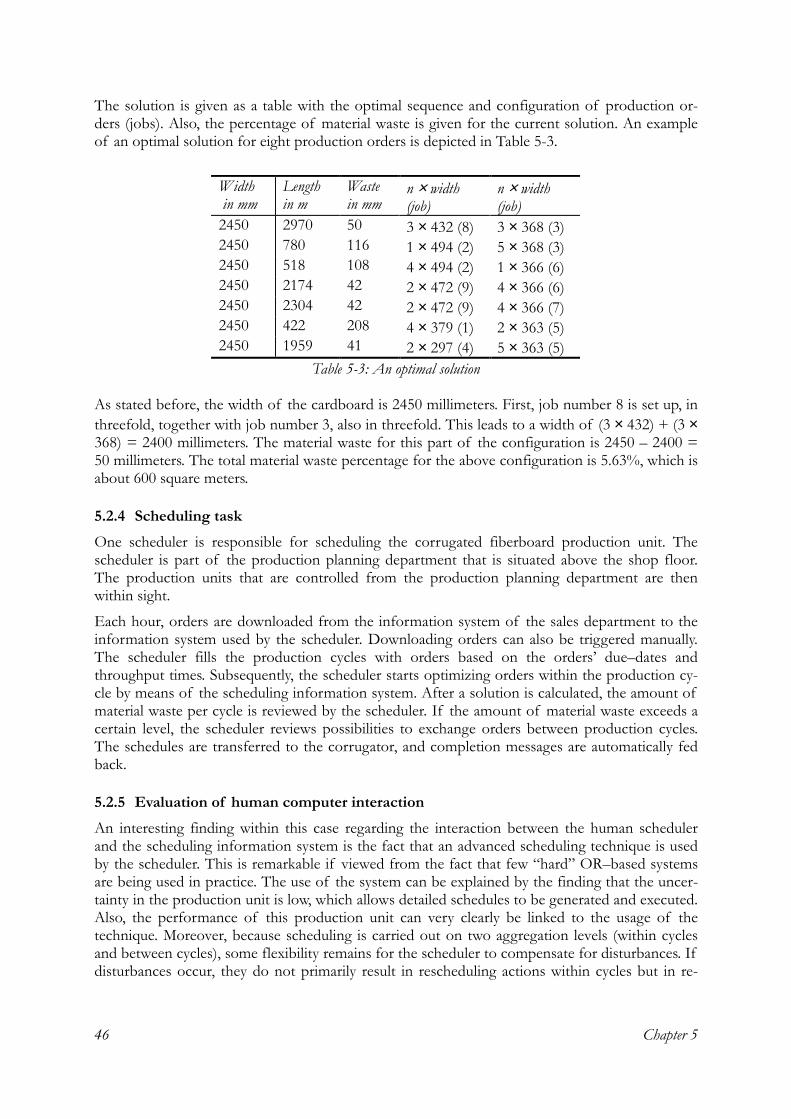
Chapter 5 46
The solution is given as a table with the optimal sequence and configuration of production or-ders (jobs). Also, the percentage of material waste is given for the current solution. An example of an optimal solution for eight production orders is depicted in Table 5-3.
As stated before, the width of the cardboard is 2450 millimeters. First, job number 8 is set up, in threefold, together with job number 3, also in threefold. This leads to a width of (3 × 432) + (3 × 368) = 2400 millimeters. The material waste for this part of the configuration is 2450 � 2400 = 50 millimeters. The total material waste percentage for the above configuration is 5.63%, which is about 600 square meters.
5.2.4 Scheduling task One scheduler is responsible for scheduling the corrugated fiberboard production unit. The scheduler is part of the production planning department that is situated above the shop floor. The production units that are controlled from the production planning department are then within sight.
Each hour, orders are downloaded from the information system of the sales department to the information system used by the scheduler. Downloading orders can also be triggered manually. The scheduler fills the production cycles with orders based on the orders� due�dates and throughput times. Subsequently, the scheduler starts optimizing orders within the production cy-cle by means of the scheduling information system. After a solution is calculated, the amount of material waste per cycle is reviewed by the scheduler. If the amount of material waste exceeds a certain level, the scheduler reviews possibilities to exchange orders between production cycles. The schedules are transferred to the corrugator, and completion messages are automatically fed back.
5.2.5 Evaluation of human computer interaction An interesting finding within this case regarding the interaction between the human scheduler and the scheduling information system is the fact that an advanced scheduling technique is used by the scheduler. This is remarkable if viewed from the fact that few �hard� OR�based systems are being used in practice. The use of the system can be explained by the finding that the uncer-tainty in the production unit is low, which allows detailed schedules to be generated and executed. Also, the performance of this production unit can very clearly be linked to the usage of the technique. Moreover, because scheduling is carried out on two aggregation levels (within cycles and between cycles), some flexibility remains for the scheduler to compensate for disturbances. If disturbances occur, they do not primarily result in rescheduling actions within cycles but in re-
Width in mm
Length in m
Waste in mm
n × width (job)
n × width (job)
2450 2970 50 3 × 432 (8) 3 × 368 (3) 2450 780 116 1 × 494 (2) 5 × 368 (3) 2450 518 108 4 × 494 (2) 1 × 366 (6) 2450 2174 42 2 × 472 (9) 4 × 366 (6) 2450 2304 42 2 × 472 (9) 4 × 366 (7) 2450 422 208 4 × 379 (1) 2 × 363 (5) 2450 1959 41 2 × 297 (4) 5 × 363 (5)
Table 5-3: An optimal solution

Four explanatory case studies 47
scheduling actions between cycles. This protects the algorithm from becoming superfluous as a result of disturbances.
The scheduling information system offers scant information presentation functions. However, the scheduler only needs numeric information about the production orders. The scheduler uses a spreadsheet program to keep an overview of the cycles that are scheduled for the next few hours. Because problem solving activities regarding the scheduler are few, the scheduler does not need more advanced information presentation functions. The scheduler is able to communicate di-rectly with the scheduler of the following production unit and with the paper procurer, because they are seated next to each other.
Chapter 5 48
5.3 Case III: corrugated fiberboard packaging production The third case study was carried out in the packaging production unit of the corrugated fiber-board packaging factory where the second case was also conducted. Information about the com-pany can be found in Section 5.2.
5.3.1 Production unit
Material structure
Approximately 30 types of corrugated fiberboard are used as raw material for packagings. Addi-tional materials required for the production of packagings are glue and ink. These packagings vary from standard boxes to special packagings that are produced only once. All packagings are made to customer specifications and may vary by size, form, print, quality, etc. Compartment di-viders are made to divide boxes in sections, for example, to pack six bottles in one box.
Capacity structure
The packaging production unit consists of four die cut machines and two punching machines. Each machine is manned by a team of operators. Operators can be multi�deployed on similar machines, such as die�cutting or punching machines.
A die cut machine produces standard packagings, i.e., a variety of boxes. Sheets of corrugated board are fed into the machine at one end, and after passing through the printing unit they are fed into the die�cutting unit where they are cut and molded. At the end of the line, the cut and printed sheets are stacked and transported to the forwarding department. The four die cut ma-chines are largely identical, however, there are some differences regarding the size a machine can handle. Also, differences exist regarding the number of colors that can be printed. Finally, some differences exist regarding the punching capabilities of the machines. It is estimated by the pro-duction manager that approximately 50% of the die�cutting machines� products can be made on more than one die�cutter.
The punching machines are mainly used to produce non�standard packagings. The two punching machines are largely the same, however, the number of colors that can be printed differs by ma-chine. After punching, the products are stacked and transported to the forwarding department.
Setup times of the machines depend on the type of setup required, and in particular depend on the number and types of color used. The setup times vary from 1 minute to 30 minutes.
Uncertainty
There is some uncertainty in the packaging process due to breakdowns of machines and the du-ration of setups. Other, minor causes of disturbances include: operators� sickness, and the avail-ability of raw material.
Flexibility
There are many sources of flexibility in the corrugated fiberboard packaging production process. Many products can be made by more than one routing. Furthermore, the capacity of the packag-ing production unit can be temporarily increased by overwork. Lastly, multi�deployment of op-erators is a source of flexibility.
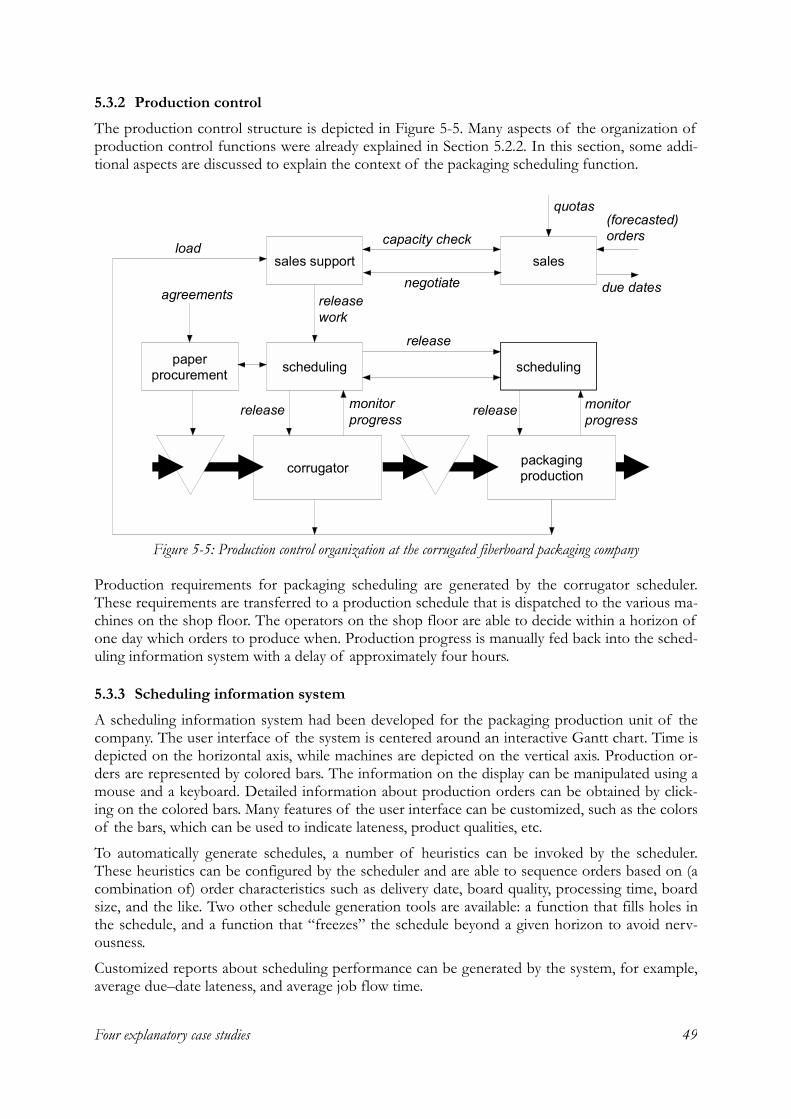
Four explanatory case studies 49
5.3.2 Production control The production control structure is depicted in Figure 5-5. Many aspects of the organization of production control functions were already explained in Section 5.2.2. In this section, some addi-tional aspects are discussed to explain the context of the packaging scheduling function.
Production requirements for packaging scheduling are generated by the corrugator scheduler. These requirements are transferred to a production schedule that is dispatched to the various ma-chines on the shop floor. The operators on the shop floor are able to decide within a horizon of one day which orders to produce when. Production progress is manually fed back into the sched-uling information system with a delay of approximately four hours.
5.3.3 Scheduling information system A scheduling information system had been developed for the packaging production unit of the company. The user interface of the system is centered around an interactive Gantt chart. Time is depicted on the horizontal axis, while machines are depicted on the vertical axis. Production or-ders are represented by colored bars. The information on the display can be manipulated using a mouse and a keyboard. Detailed information about production orders can be obtained by click-ing on the colored bars. Many features of the user interface can be customized, such as the colors of the bars, which can be used to indicate lateness, product qualities, etc.
To automatically generate schedules, a number of heuristics can be invoked by the scheduler. These heuristics can be configured by the scheduler and are able to sequence orders based on (a combination of) order characteristics such as delivery date, board quality, processing time, board size, and the like. Two other schedule generation tools are available: a function that fills holes in the schedule, and a function that �freezes� the schedule beyond a given horizon to avoid nerv-ousness.
Customized reports about scheduling performance can be generated by the system, for example, average due�date lateness, and average job flow time.
paper procurement
sales support sales
(forecasted)orders
due dates
capacity check
negotiatereleasework
load
agreements
release
quotas
monitorprogress
release
scheduling
packaging production
monitorprogress
release
scheduling
corrugator
Figure 5-5: Production control organization at the corrugated fiberboard packaging company
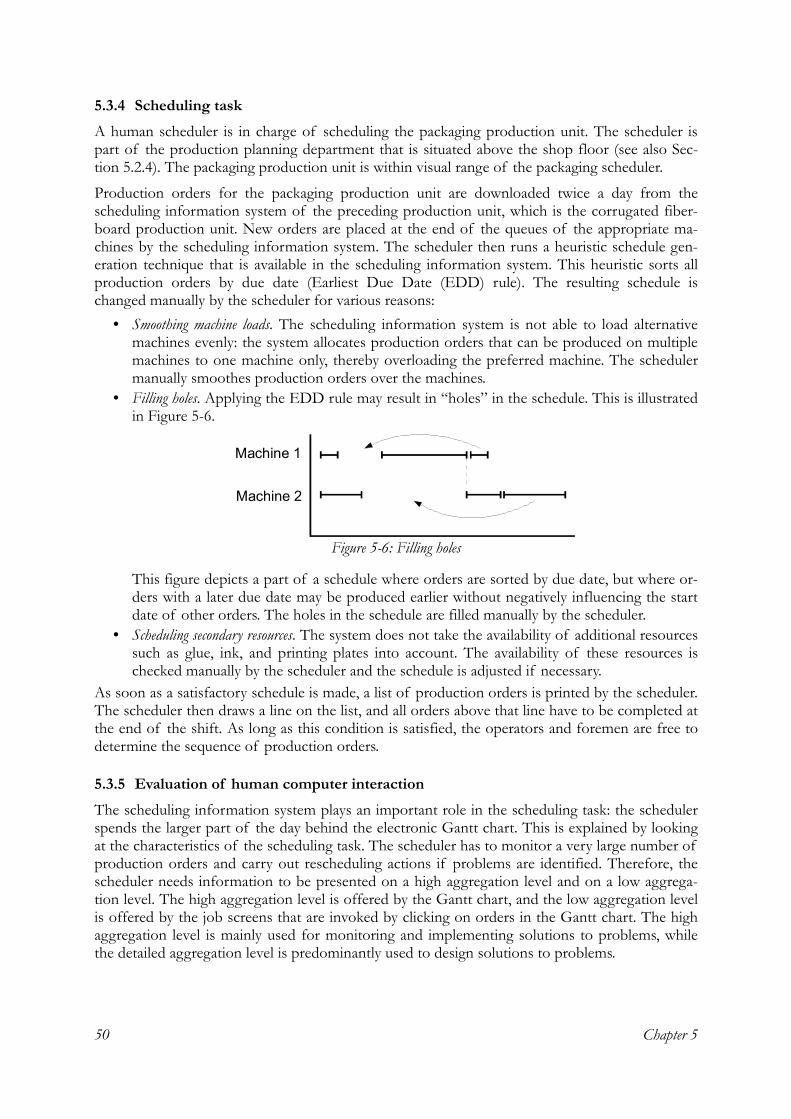
Chapter 5 50
5.3.4 Scheduling task A human scheduler is in charge of scheduling the packaging production unit. The scheduler is part of the production planning department that is situated above the shop floor (see also Sec-tion 5.2.4). The packaging production unit is within visual range of the packaging scheduler.
Production orders for the packaging production unit are downloaded twice a day from the scheduling information system of the preceding production unit, which is the corrugated fiber-board production unit. New orders are placed at the end of the queues of the appropriate ma-chines by the scheduling information system. The scheduler then runs a heuristic schedule gen-eration technique that is available in the scheduling information system. This heuristic sorts all production orders by due date (Earliest Due Date (EDD) rule). The resulting schedule is changed manually by the scheduler for various reasons:
• Smoothing machine loads. The scheduling information system is not able to load alternative machines evenly: the system allocates production orders that can be produced on multiple machines to one machine only, thereby overloading the preferred machine. The scheduler manually smoothes production orders over the machines.
• Filling holes. Applying the EDD rule may result in �holes� in the schedule. This is illustrated in Figure 5-6.
This figure depicts a part of a schedule where orders are sorted by due date, but where or-ders with a later due date may be produced earlier without negatively influencing the start date of other orders. The holes in the schedule are filled manually by the scheduler.
• Scheduling secondary resources. The system does not take the availability of additional resources such as glue, ink, and printing plates into account. The availability of these resources is checked manually by the scheduler and the schedule is adjusted if necessary.
As soon as a satisfactory schedule is made, a list of production orders is printed by the scheduler. The scheduler then draws a line on the list, and all orders above that line have to be completed at the end of the shift. As long as this condition is satisfied, the operators and foremen are free to determine the sequence of production orders.
5.3.5 Evaluation of human computer interaction The scheduling information system plays an important role in the scheduling task: the scheduler spends the larger part of the day behind the electronic Gantt chart. This is explained by looking at the characteristics of the scheduling task. The scheduler has to monitor a very large number of production orders and carry out rescheduling actions if problems are identified. Therefore, the scheduler needs information to be presented on a high aggregation level and on a low aggrega-tion level. The high aggregation level is offered by the Gantt chart, and the low aggregation level is offered by the job screens that are invoked by clicking on orders in the Gantt chart. The high aggregation level is mainly used for monitoring and implementing solutions to problems, while the detailed aggregation level is predominantly used to design solutions to problems.
Machine 1
Machine 2
Figure 5-6: Filling holes
Four explanatory case studies 51
A number of functions to generate schedules are available in the scheduling information system. However, only a priority rule to sort production orders by due dates is used by the scheduler, and the generated schedule is adjusted manually.
One reason for using a simple instead of a more advanced priority rule is that the schedule is not executed exactly within the production unit. The operators are allowed to determine the se-quence of production within set boundaries. The division of scheduling decisions between the scheduler and the production unit is the result of extensive discussions during the implementa-tion of the system. During these discussions, the schedulers argued that performance would be better off if schedules would be generated with advanced heuristics and executed exactly in the production unit. On the other hand, operators argued that some autonomy should be allocated to them. They reasoned that their extensive experience would enable them to consider information not available to the scheduler, and that they would be better able to react quickly to disturbances. An important role in this discussion was played by the management of the company. As ex-plained in Section 5.2, changes in the manufacturing strategy were being implemented. The man-agement knew that these changes required a complete turnaround. The management decided that a new type of organization was necessary, where responsibilities were handed down as much as possible to the shop floor. The management was also very aware that existing values such as keeping costs low and concentrating on production speed should be replaced by new ones, such as flexibility, reliability and customer service. It was finally decided that the operators would re-ceive a certain amount of autonomy regarding the sequencing of production.
The function of the scheduling information system to fill holes in the schedule is not used by the scheduler. There are two reasons for this: first, it is not clear to the scheduler how the scheduling information system fills holes. Second, if the system is used to fill holes, production orders are no longer sorted by delivery day. This is not convenient for the scheduler, as schedules are released to the production unit sorted by delivery days.
The function of the scheduling information system that freezes production orders is also not used by the scheduler for two reasons: first, schedule re�generation by using the EDD rule does not significantly change the part of the schedule close to being produced anyway. Second, it is unclear to the scheduler how to set the frozen horizon, because production orders that share the same horizon may not share the same robustness requirements.
Another reason for the lack of use of available schedule generation techniques was found: the scheduler indicated that he wanted to be in control, instead of letting the system �mess around.� The need for control by the scheduler is partly triggered by the critical nature of the task, caused by the short and strict lead times.
Lastly, the performance evaluation functions of the scheduling information system are not used. The scheduler explained that the reason for this was that these aggregated measures could not be related to individual actions or production orders.
Chapter 5 52
5.4 Case IV: metal ceiling systems production The fourth case study was carried out in a metal ceiling systems factory. The company was founded in 1941 as a shop for lighting products. At the end of the 1950�s, the production of metal ceilings was started. In the decades that followed, new products (such as cable management systems) were introduced, financial ups and downs were experienced, and foreign markets were explored. These developments eventually led to the establishment of one holding company with four divisions, which includes the metal ceiling systems company.
Due to declining financial results in the beginning of the 1990�s, a major restructuring was con-ducted at the metal ceiling systems company. Production capacity was cut down one�third, and half of the personnel were made redundant. The strategy of the company was changed to focus more strongly on standard products. After restructuring, the company employed 65 people, of which 40 on the shop floor. Restructuring was completed in 1995, and financial results have im-proved substantially since.
5.4.1 Production unit
Material structure
A metal ceiling system consists of a number of metal tiles and suspension equipment. The shape of the tiles is determined by the design of the ceiling and the shape of the structure where the ceiling will be suspended. A number of standard catalogue designs are available that can be tai-lored to specific customer requirements. A customer order usually consists of many standard tiles, suspension equipment, and some specially formed tiles to fit the ceiling in the required shape of the building.
Five qualities of sheet steel with various widths are used as raw material for metal ceiling systems. Normal machining involves sheet steel and aluminum with a thickness of 0.5 millimeters up to 1.0 millimeters, these being the gauges used for most ceiling system components. Heavier sheet steel�from 1.0 to 3.0 millimeters�is used for more basic construction products, such as brack-ets.
Capacity structure
The production process of the company is depicted in Figure 5-7. The principal stages of the production of a typical tile�a product that normally undergoes the full range of machining processes, including punched perforations�is described below.
First, metal sheet is coil�fed into the perforation presses and perforation patterns are punched. Each tile length is sheared to size by a cutting system. The sheet then passes through a leveling press that consists of a number of adjustable rollers with electronic pressure sensors. The tile blank can be palletized or fed directly into the next machine.
Second, the tile blank is converted into a specially shaped �outline,� with cut�outs at corners, or inset within the metal. The sheet is now ready for folding, bending and forming into the three�dimensional product. Some products may require another leveling prior to forming. The forming process can be carried out on different machines, depending on the required shape and lot size of the tiles.
• The automatic punch and bending line combines several forming functions, all within one automated production run. In several stages it can fold all four sides within one production run.
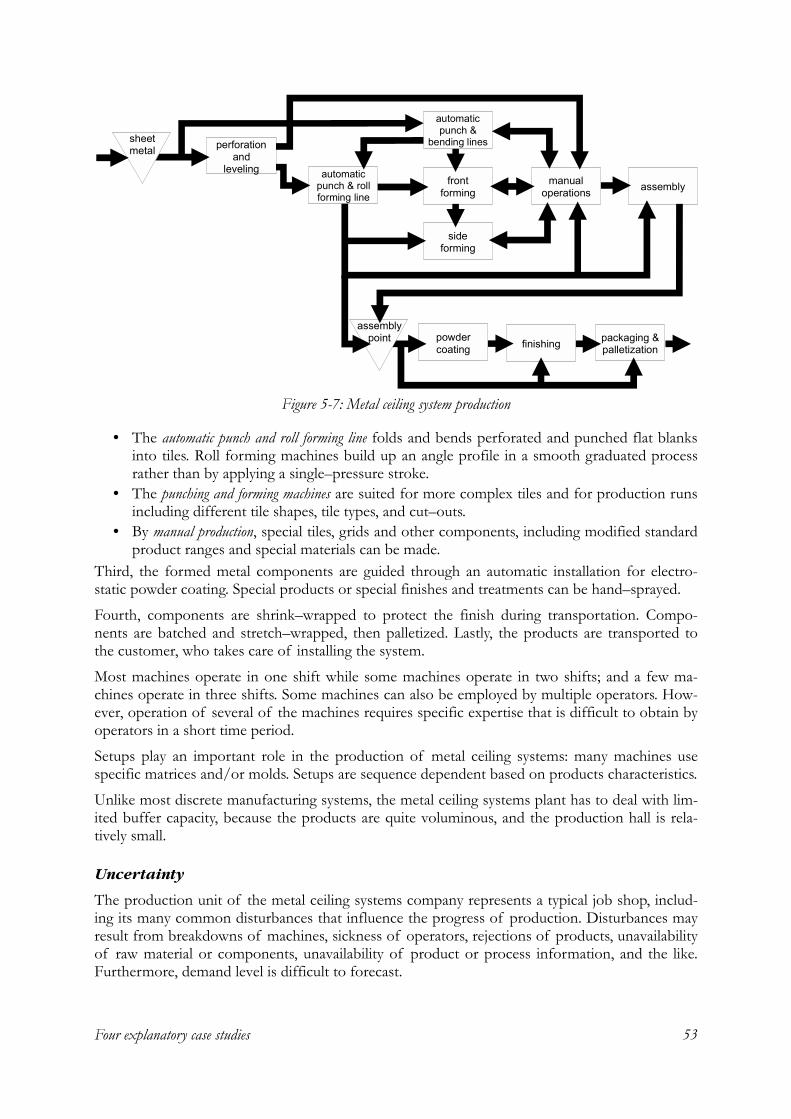
Four explanatory case studies 53
• The automatic punch and roll forming line folds and bends perforated and punched flat blanks into tiles. Roll forming machines build up an angle profile in a smooth graduated process rather than by applying a single�pressure stroke.
• The punching and forming machines are suited for more complex tiles and for production runs including different tile shapes, tile types, and cut�outs.
• By manual production, special tiles, grids and other components, including modified standard product ranges and special materials can be made.
Third, the formed metal components are guided through an automatic installation for electro-static powder coating. Special products or special finishes and treatments can be hand�sprayed.
Fourth, components are shrink�wrapped to protect the finish during transportation. Compo-nents are batched and stretch�wrapped, then palletized. Lastly, the products are transported to the customer, who takes care of installing the system.
Most machines operate in one shift while some machines operate in two shifts; and a few ma-chines operate in three shifts. Some machines can also be employed by multiple operators. How-ever, operation of several of the machines requires specific expertise that is difficult to obtain by operators in a short time period.
Setups play an important role in the production of metal ceiling systems: many machines use specific matrices and/or molds. Setups are sequence dependent based on products characteristics.
Unlike most discrete manufacturing systems, the metal ceiling systems plant has to deal with lim-ited buffer capacity, because the products are quite voluminous, and the production hall is rela-tively small.
Uncertainty
The production unit of the metal ceiling systems company represents a typical job shop, includ-ing its many common disturbances that influence the progress of production. Disturbances may result from breakdowns of machines, sickness of operators, rejections of products, unavailability of raw material or components, unavailability of product or process information, and the like. Furthermore, demand level is difficult to forecast.
packaging & palletization
powder coating
assemblyautomatic
punch & roll forming line
finishing
manual operations
perforationand
leveling
automatic punch &
bending lines
frontforming
sideforming
sheet metal
assemblypoint
Figure 5-7: Metal ceiling system production
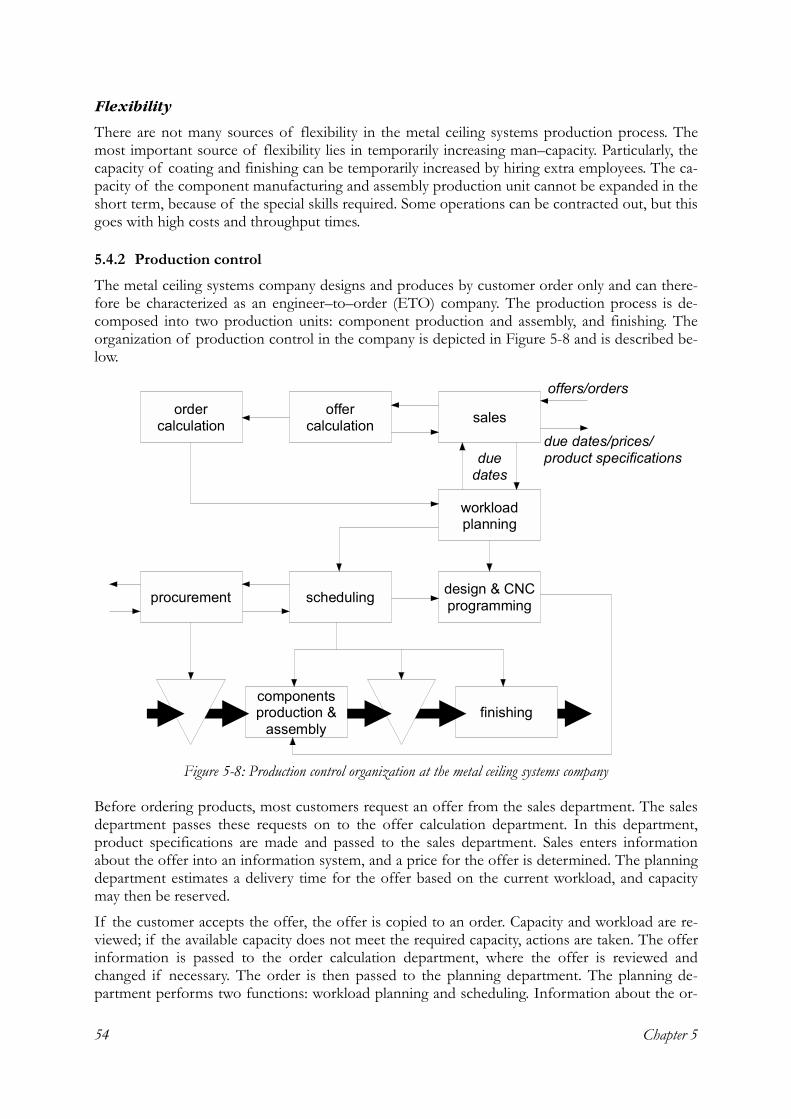
Chapter 5 54
Flexibility There are not many sources of flexibility in the metal ceiling systems production process. The most important source of flexibility lies in temporarily increasing man�capacity. Particularly, the capacity of coating and finishing can be temporarily increased by hiring extra employees. The ca-pacity of the component manufacturing and assembly production unit cannot be expanded in the short term, because of the special skills required. Some operations can be contracted out, but this goes with high costs and throughput times.
5.4.2 Production control The metal ceiling systems company designs and produces by customer order only and can there-fore be characterized as an engineer�to�order (ETO) company. The production process is de-composed into two production units: component production and assembly, and finishing. The organization of production control in the company is depicted in Figure 5-8 and is described be-low.
Before ordering products, most customers request an offer from the sales department. The sales department passes these requests on to the offer calculation department. In this department, product specifications are made and passed to the sales department. Sales enters information about the offer into an information system, and a price for the offer is determined. The planning department estimates a delivery time for the offer based on the current workload, and capacity may then be reserved.
If the customer accepts the offer, the offer is copied to an order. Capacity and workload are re-viewed; if the available capacity does not meet the required capacity, actions are taken. The offer information is passed to the order calculation department, where the offer is reviewed and changed if necessary. The order is then passed to the planning department. The planning de-partment performs two functions: workload planning and scheduling. Information about the or-
components production &
assemblyfinishing
design & CNC programmingschedulingprocurement
sales
workload planning
offer calculation
order calculation
duedates
offers/orders
due dates/prices/product specifications
Figure 5-8: Production control organization at the metal ceiling systems company
Four explanatory case studies 55
der is passed from the planning department to the technical planning department, which makes drawings and CNC programs. At the same time, raw materials are procured. When all drawings, CNC programs, and materials are available, production can be started.
5.4.3 Scheduling information system An information system for production scheduling had been developed for the company. More-over, the company used a standard information system for production planning and control and financial administration, based on the manufacturing resources planning (MRP�II) framework.
The development of the scheduling information system had been initiated by the management, who desired to decrease setup costs and to improve due date reliability. By combining similar jobs on machines it was expected that higher utilization could be achieved. The scheduling informa-tion system works as follows: first, information is generated by the MRP system and downloaded to the scheduling system. Four text files are generated with information about the following ele-ments: production orders, bills of material, routings and machines. Second, the scheduling in-formation system constructs a schedule by generating an initial schedule using priority rules, and subsequently, by improving the schedule using taboo search (for a description of taboo search see for example Morton & Pentico, 1993). The output of the scheduling information system con-sists of a list of production orders.
The user interface of the system is based on pull down menus that provide the options to carry out the schedule generation activities as described above.
5.4.4 Scheduling task There is one scheduler that schedules both the component production and assembly production unit and the finishing production unit. The scheduling task for both production units is described below.
Weekly, a list of customer orders, which are referred to as projects, is passed from the head of the planning department, who carries out the workload planning, to the scheduler. The scheduler reviews the capacity requirements of the list against capacity requirements of the component production and assembly production unit. If problems regarding capacity are found, the sched-uler tries to smooth capacity demand by leveling production orders. If capacity problems cannot be solved by leveling, the scheduler communicates with the head of the planning department, who then negotiates with the sales department.
Daily, a list of projects is printed by the scheduler using the MRP system. The list contains de-tailed information about projects, such as the production orders that make up the project, opera-tions, start�dates, and due�dates. Here a difference between the scheduling of the components and assembly production unit and the finishing production unit can be observed. The MRP sys-tem uses the production order as unit to release to the production unit. However, all production orders of a project must undergo the finishing process as a whole to prevent different production orders of the same project receiving the slightest difference in color. Therefore, the scheduler constructs a separate finishing list to ensure that whole projects are painted together. The sched-uler also checks the available finishing capacity while making the finishing list. If the available ca-pacity is insufficient, the scheduler tries to smooth capacity demand by leveling work. If this is not possible, extra capacity can be created by temporarily hiring extra personnel.
The lists are released to the production unit. The scheduler puts a list on each machine that indi-cates the production orders that have to be processed on that machine.
The scheduling activities require plenty of information related to customers, production proc-esses, products, materials, suppliers, transports, and the like. Twice a week, the scheduler attends a
Chapter 5 56
meeting with the sales department and another meeting with the production unit management. Further, the scheduler frequently visits the production unit, and completion messages are person-ally collected from the production units daily by the scheduler. Much informal communication takes place between the scheduler, the foremen, and the machine operators.
5.4.5 Evaluation of human computer interaction The most remarkable finding regarding the interaction between the human scheduler and the scheduling information system is that the system is not used at all, despite considerable efforts from consultancy firms, software suppliers, several employees of the metal ceiling systems com-pany, and academic researchers to implement the system.
The information presented by the system simply does not fit the viewpoint of the scheduler. The presentation of information by the scheduling information system is based on production orders, while the scheduler sees projects as the building blocks of the schedule.
By combining similar production orders from separate projects, the system attempts to decrease setup times. However, as explained above, projects must undergo the finishing processes as a whole. If projects do not flow as a whole through the metal working production unit, much co-ordination is required to collect all production orders of the same project at the assembly point. Another reason to let projects flow as a whole through production is that all production orders of a project have the same due date and similar processing times. Moreover, combining produc-tion orders from separate projects may lead to a higher workload in the production unit, which is not preferred considering the limited space on the shop floor. Finally, if the scheduler has to con-centrate on production orders instead of projects, his mental workload will increase dramatically. This also holds for the operators on the shop floor.
The scheduler must deal with many disturbances which often result in adjustments in the sched-ule. The system does not offer functionality to adjust the schedule; only complete schedules can be generated, which may take more than an hour. Moreover, problems are often solved through co�operation with the shop floor operators and foremen, not behind the desk of a single sched-uler.
Four explanatory case studies 57
5.5 Clustering of results
5.5.1 Functionality The following is a brief overview of the findings of the cases regarding functionality of the scheduling information system (the corresponding case numbers are given in parentheses):
• (I) The system does not offer functionality to generate schedules apart from calculating some inputs for the scheduling process, which fits the schedulers� tasks adequately due to the large number of disturbances.
• (I) The palletization machines are not included in the scheduling information system, which is not a problem because their availability is coordinated on the shop floor. This co-ordination is enabled by the scheduled standstill.
• (II) An algorithm for the generation of optimal schedules is useful because there is little uncertainty and performance can easily be defined.
• (III) From a range of schedule generation functions, only one simple technique is used be-cause: (1) the scheduler wants to be in control, and (2) because decisions are made on the shop floor.
• (IV) The schedule generation functions of the system are excessive; a schedule is generated based on production orders whereas the scheduler bases his schedule mainly on projects.
• (IV) The scheduling information system only offers the possibility to generate a complete schedule automatically whereas the scheduler needs to carry out many rescheduling actions.
5.5.2 Information presentation The following is a brief overview of the findings of the cases regarding information presentation of the scheduling information systems (the corresponding case numbers are given in parenthe-ses):
• (I) The detailed stock projections are not used in favor of the simple stock projections. • (I) The text�based user interface offers information in an adequate way. • (II) The system does not offer information presentation functions, however, these are not
required as the scheduler does not have to carry out many rescheduling actions within cy-cles.
• (III) The information presentation functions of the system are very useful for several as-pects of the scheduling task: (1) the Gantt chart is particularly useful for maintaining an overview of the situation, identifying problems and implementing alternatives, and (2) the job screens are particularly useful for designing alternatives in the problem solving process.
• (IV) No information presentation functions are offered, whereas the scheduler might need support in problem solving processes regarding rescheduling actions.

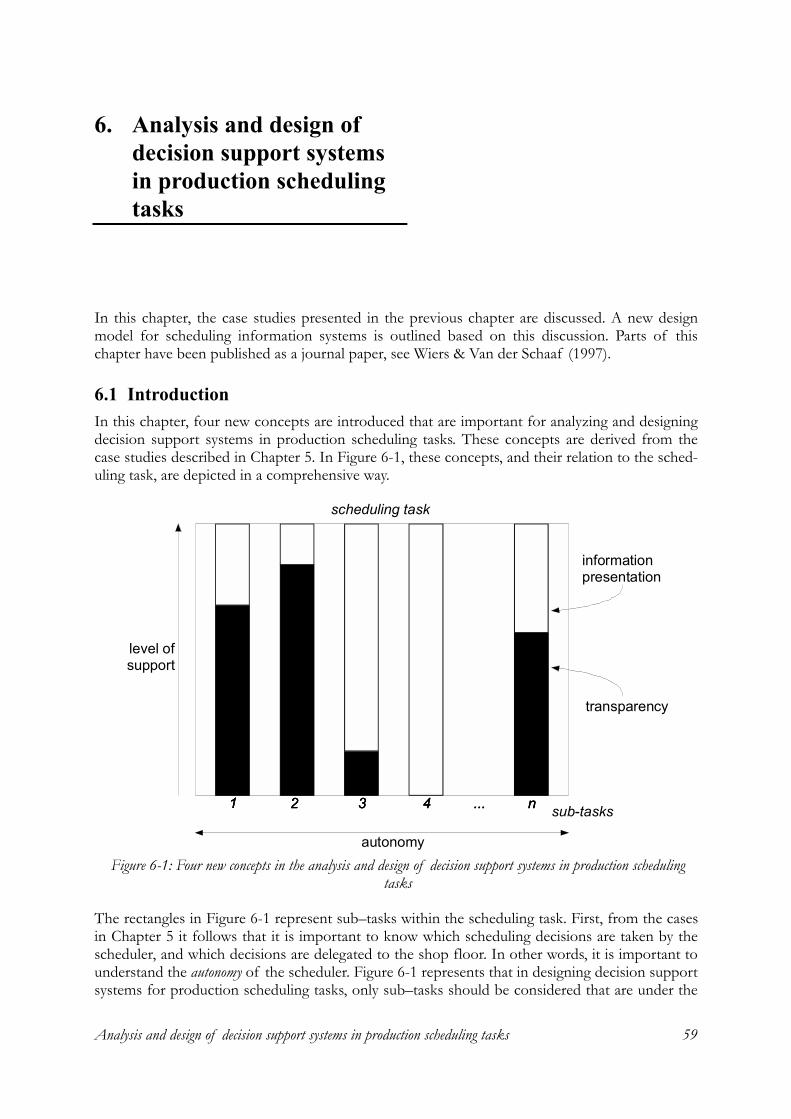
Analysis and design of decision support systems in production scheduling tasks 59
6. Analysis and design of decision support systems in production scheduling tasks
In this chapter, the case studies presented in the previous chapter are discussed. A new design model for scheduling information systems is outlined based on this discussion. Parts of this chapter have been published as a journal paper, see Wiers & Van der Schaaf (1997).
6.1 Introduction In this chapter, four new concepts are introduced that are important for analyzing and designing decision support systems in production scheduling tasks. These concepts are derived from the case studies described in Chapter 5. In Figure 6-1, these concepts, and their relation to the sched-uling task, are depicted in a comprehensive way.
The rectangles in Figure 6-1 represent sub�tasks within the scheduling task. First, from the cases in Chapter 5 it follows that it is important to know which scheduling decisions are taken by the scheduler, and which decisions are delegated to the shop floor. In other words, it is important to understand the autonomy of the scheduler. Figure 6-1 represents that in designing decision support systems for production scheduling tasks, only sub�tasks should be considered that are under the
sub-tasks1 2 3 4 ... n1 2 3 4 ... n1 2 3 4 ... n
level ofsupport
autonomy
informationpresentation
transparency
scheduling task
Figure 6-1: Four new concepts in the analysis and design of decision support systems in production scheduling
tasks
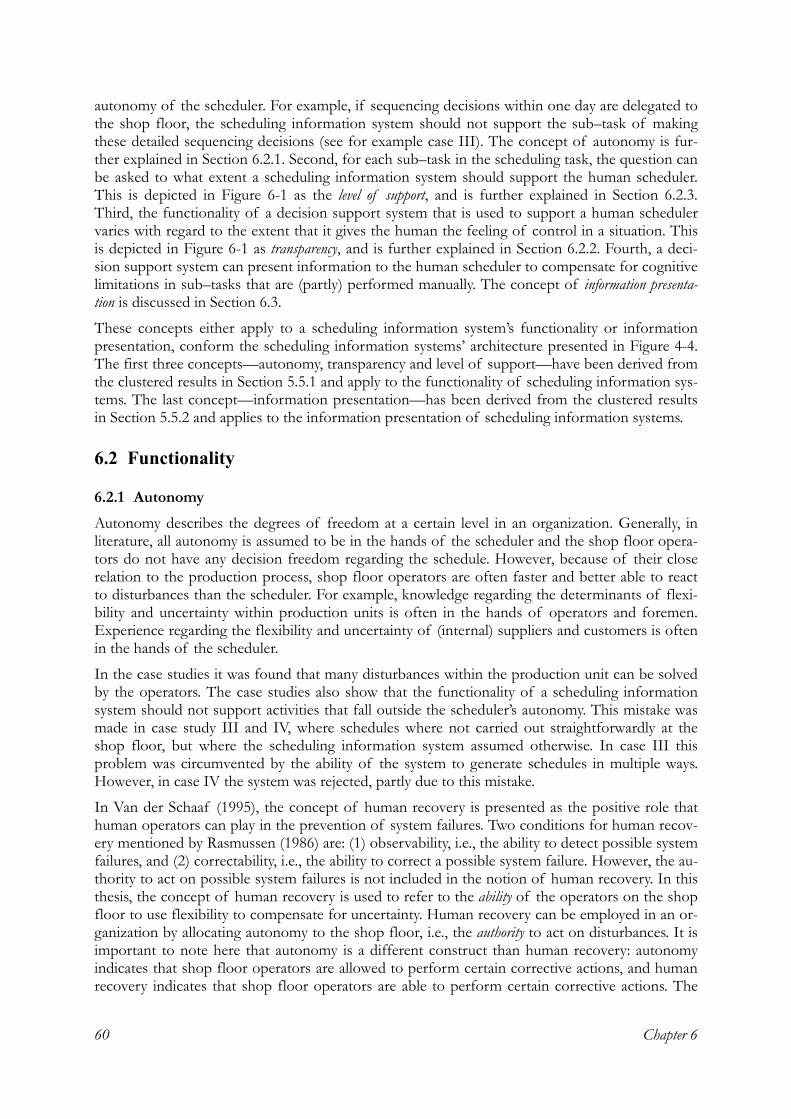
Chapter 6 60
autonomy of the scheduler. For example, if sequencing decisions within one day are delegated to the shop floor, the scheduling information system should not support the sub�task of making these detailed sequencing decisions (see for example case III). The concept of autonomy is fur-ther explained in Section 6.2.1. Second, for each sub�task in the scheduling task, the question can be asked to what extent a scheduling information system should support the human scheduler. This is depicted in Figure 6-1 as the level of support, and is further explained in Section 6.2.3. Third, the functionality of a decision support system that is used to support a human scheduler varies with regard to the extent that it gives the human the feeling of control in a situation. This is depicted in Figure 6-1 as transparency, and is further explained in Section 6.2.2. Fourth, a deci-sion support system can present information to the human scheduler to compensate for cognitive limitations in sub�tasks that are (partly) performed manually. The concept of information presenta-tion is discussed in Section 6.3.
These concepts either apply to a scheduling information system�s functionality or information presentation, conform the scheduling information systems� architecture presented in Figure 4-4. The first three concepts�autonomy, transparency and level of support�have been derived from the clustered results in Section 5.5.1 and apply to the functionality of scheduling information sys-tems. The last concept�information presentation�has been derived from the clustered results in Section 5.5.2 and applies to the information presentation of scheduling information systems.
6.2 Functionality
6.2.1 Autonomy Autonomy describes the degrees of freedom at a certain level in an organization. Generally, in literature, all autonomy is assumed to be in the hands of the scheduler and the shop floor opera-tors do not have any decision freedom regarding the schedule. However, because of their close relation to the production process, shop floor operators are often faster and better able to react to disturbances than the scheduler. For example, knowledge regarding the determinants of flexi-bility and uncertainty within production units is often in the hands of operators and foremen. Experience regarding the flexibility and uncertainty of (internal) suppliers and customers is often in the hands of the scheduler.
In the case studies it was found that many disturbances within the production unit can be solved by the operators. The case studies also show that the functionality of a scheduling information system should not support activities that fall outside the scheduler�s autonomy. This mistake was made in case study III and IV, where schedules where not carried out straightforwardly at the shop floor, but where the scheduling information system assumed otherwise. In case III this problem was circumvented by the ability of the system to generate schedules in multiple ways. However, in case IV the system was rejected, partly due to this mistake.
In Van der Schaaf (1995), the concept of human recovery is presented as the positive role that human operators can play in the prevention of system failures. Two conditions for human recov-ery mentioned by Rasmussen (1986) are: (1) observability, i.e., the ability to detect possible system failures, and (2) correctability, i.e., the ability to correct a possible system failure. However, the au-thority to act on possible system failures is not included in the notion of human recovery. In this thesis, the concept of human recovery is used to refer to the ability of the operators on the shop floor to use flexibility to compensate for uncertainty. Human recovery can be employed in an or-ganization by allocating autonomy to the shop floor, i.e., the authority to act on disturbances. It is important to note here that autonomy is a different construct than human recovery: autonomy indicates that shop floor operators are allowed to perform certain corrective actions, and human recovery indicates that shop floor operators are able to perform certain corrective actions. The
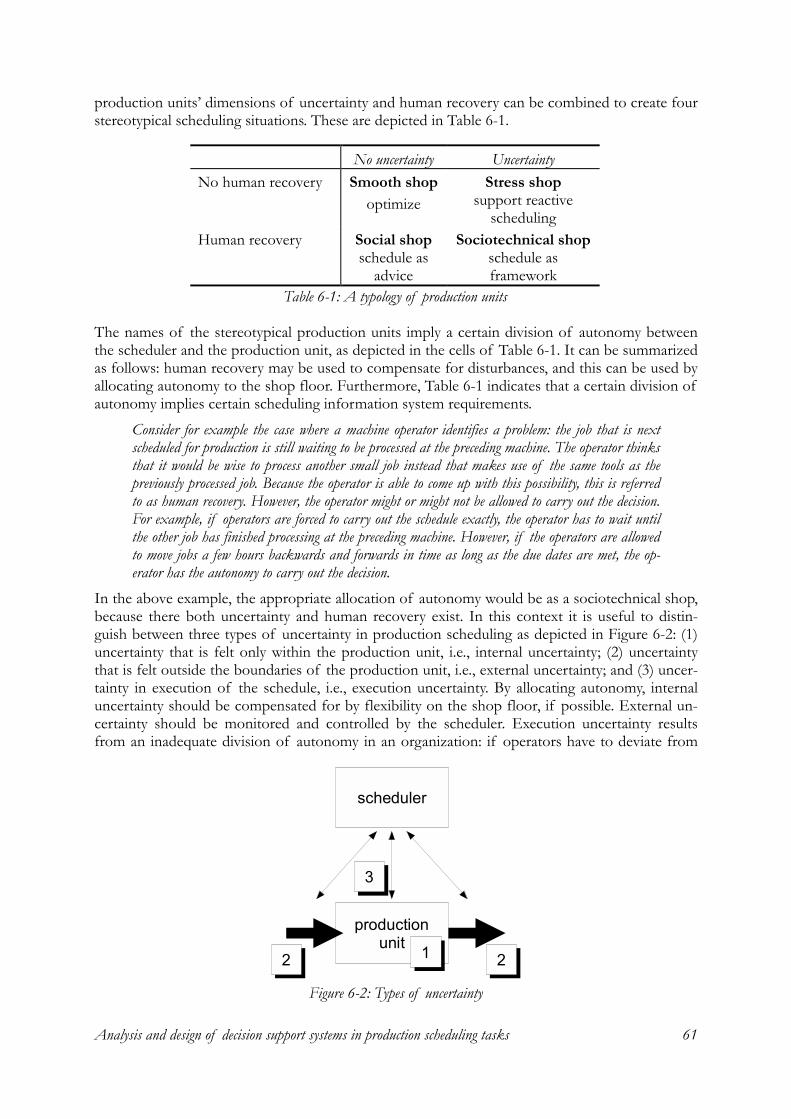
Analysis and design of decision support systems in production scheduling tasks 61
production units� dimensions of uncertainty and human recovery can be combined to create four stereotypical scheduling situations. These are depicted in Table 6-1.
The names of the stereotypical production units imply a certain division of autonomy between the scheduler and the production unit, as depicted in the cells of Table 6-1. It can be summarized as follows: human recovery may be used to compensate for disturbances, and this can be used by allocating autonomy to the shop floor. Furthermore, Table 6-1 indicates that a certain division of autonomy implies certain scheduling information system requirements.
Consider for example the case where a machine operator identifies a problem: the job that is next scheduled for production is still waiting to be processed at the preceding machine. The operator thinks that it would be wise to process another small job instead that makes use of the same tools as the previously processed job. Because the operator is able to come up with this possibility, this is referred to as human recovery. However, the operator might or might not be allowed to carry out the decision. For example, if operators are forced to carry out the schedule exactly, the operator has to wait until the other job has finished processing at the preceding machine. However, if the operators are allowed to move jobs a few hours backwards and forwards in time as long as the due dates are met, the op-erator has the autonomy to carry out the decision.
In the above example, the appropriate allocation of autonomy would be as a sociotechnical shop, because there both uncertainty and human recovery exist. In this context it is useful to distin-guish between three types of uncertainty in production scheduling as depicted in Figure 6-2: (1) uncertainty that is felt only within the production unit, i.e., internal uncertainty; (2) uncertainty that is felt outside the boundaries of the production unit, i.e., external uncertainty; and (3) uncer-tainty in execution of the schedule, i.e., execution uncertainty. By allocating autonomy, internal uncertainty should be compensated for by flexibility on the shop floor, if possible. External un-certainty should be monitored and controlled by the scheduler. Execution uncertainty results from an inadequate division of autonomy in an organization: if operators have to deviate from
No uncertainty Uncertainty No human recovery Smooth shop
optimize Stress shop
support reactive scheduling
Human recovery Social shop schedule as
advice
Sociotechnical shop schedule as framework
Table 6-1: A typology of production units
production unit
scheduler
2 1 2
3
Figure 6-2: Types of uncertainty
Chapter 6 62
the schedule whereas no autonomy is allocated to them this type of uncertainty will be created, possibly amplifying external uncertainty.
If in the above example, no autonomy would be allocated to the shop floor, there is a risk that the operator would process the small job before the scheduled job anyway, resulting in execution uncer-tainty. The small job would be finished earlier as scheduled; however, problems may arise if the scheduler is not aware of this, e.g., following operations scheduled for this job might be unnecessarily postponed.
The allocation of autonomy in the stereotypical production units as depicted in the cells of Table 6-1 is described below.
Smooth shop
In the smooth shop, there is little internal nor external uncertainty and as a result, there is little need for human intervention and problem solving, i.e., human recovery. In these shops, sched-ules can be carried out exactly, and in these cases it makes sense to generate schedules that are (near�)optimal conform specified performance criteria. This usually requires generating many feasible schedules and choosing the best performing schedule. The generation and evaluation of large numbers of schedules is computationally unmanageable for humans and must be carried out by computerized schedule generation techniques. The selection of a specific schedule genera-tion technique depends on requirements regarding performance goals, domain�specific con-straints, computing time, and the like (Tsang, 1995).
Social shop
In the social shop, there is limited internal and external uncertainty in the macro or aggregate lev-els and possibly some minor uncertainty in the detailed situation. From an operational point of view, a detailed optimized schedule may be constructed and executed on the shop floor. How-ever, from a social and motivational point of view, it might be preferable to give some autonomy to the operators to avoid execution uncertainty, as experienced in case III.
Another problem regarding the execution of schedules stems from remainders of past view-points about production planning and control. A number of years ago, a widely adopted per-formance goal within production planning and control was to achieve maximum utilization. Con-sequently, priorities on the shop floor were set by the operators and foremen to prevent machine idleness. These goals have changed due to market demands regarding flexibility, costs, order flow times, reliability, and the like. However, in many companies, foremen and shop floor operators have never been regarded explicitly as a part of the production planning and control system. Therefore, they were not trained to work to the new goals, which resulted in conflicting perform-ance goals between different organizational levels. To tackle this problem, clear goals should be set for all organizational levels, and the foremen and operators on the shop floor should be trained to work with these goals (see also Stoop & Wiers, 1996).
In social shops, the scheduler can lay out the basic schedule with sequences and timing, but allow for autonomy on the shop floor to tune the final work sequence at any resource. The scheduler may provide an optimized recommendation, but acknowledges that some recovery or adjustment might be necessary. Ideally, the schedule identifies the operation sequence, recommended timing, and possible bounds for advancing or delaying the work.
Sociotechnical shop
In the sociotechnical shop, it is neither necessary nor possible to a priori imbed the necessary flexibility into the schedule. As Sweet (1885) noted, it is impossible to know everything in ad-
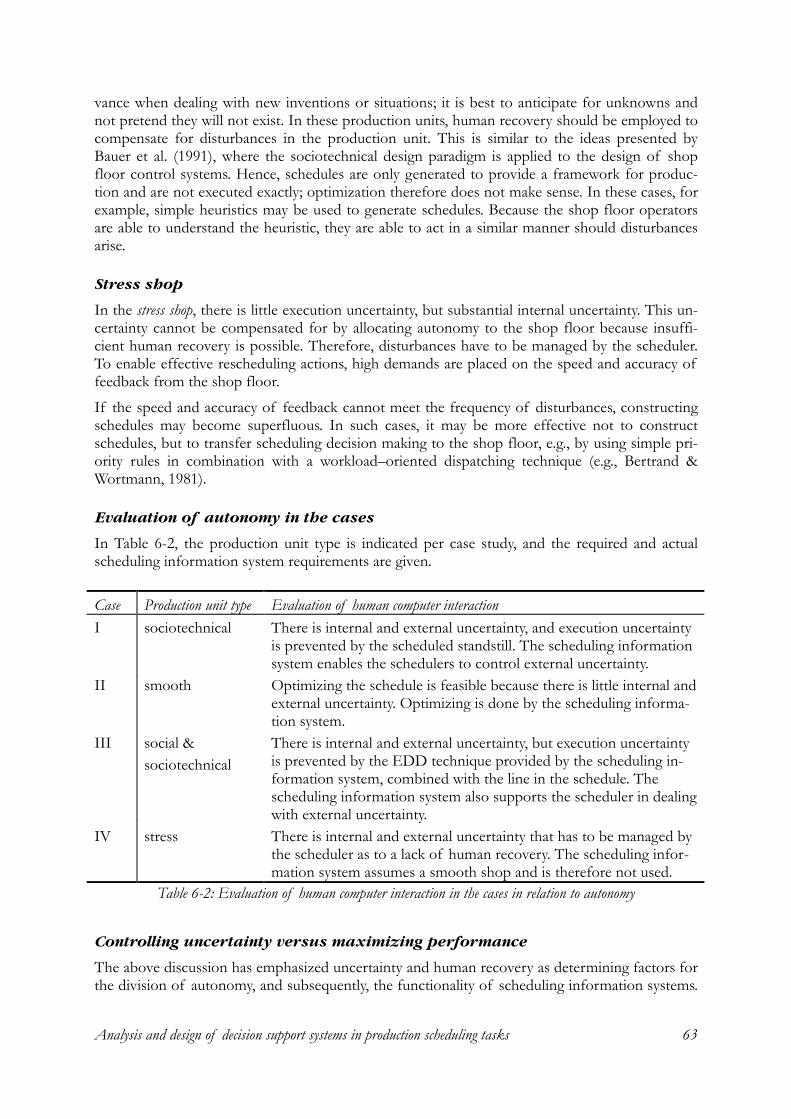
Analysis and design of decision support systems in production scheduling tasks 63
vance when dealing with new inventions or situations; it is best to anticipate for unknowns and not pretend they will not exist. In these production units, human recovery should be employed to compensate for disturbances in the production unit. This is similar to the ideas presented by Bauer et al. (1991), where the sociotechnical design paradigm is applied to the design of shop floor control systems. Hence, schedules are only generated to provide a framework for produc-tion and are not executed exactly; optimization therefore does not make sense. In these cases, for example, simple heuristics may be used to generate schedules. Because the shop floor operators are able to understand the heuristic, they are able to act in a similar manner should disturbances arise.
Stress shop
In the stress shop, there is little execution uncertainty, but substantial internal uncertainty. This un-certainty cannot be compensated for by allocating autonomy to the shop floor because insuffi-cient human recovery is possible. Therefore, disturbances have to be managed by the scheduler. To enable effective rescheduling actions, high demands are placed on the speed and accuracy of feedback from the shop floor.
If the speed and accuracy of feedback cannot meet the frequency of disturbances, constructing schedules may become superfluous. In such cases, it may be more effective not to construct schedules, but to transfer scheduling decision making to the shop floor, e.g., by using simple pri-ority rules in combination with a workload�oriented dispatching technique (e.g., Bertrand & Wortmann, 1981).
Evaluation of autonomy in the cases
In Table 6-2, the production unit type is indicated per case study, and the required and actual scheduling information system requirements are given.
Controlling uncertainty versus maximizing performance
The above discussion has emphasized uncertainty and human recovery as determining factors for the division of autonomy, and subsequently, the functionality of scheduling information systems.
Case Production unit type Evaluation of human computer interaction I sociotechnical
There is internal and external uncertainty, and execution uncertainty is prevented by the scheduled standstill. The scheduling information system enables the schedulers to control external uncertainty.
II smooth
Optimizing the schedule is feasible because there is little internal and external uncertainty. Optimizing is done by the scheduling informa-tion system.
III social & sociotechnical
There is internal and external uncertainty, but execution uncertainty is prevented by the EDD technique provided by the scheduling in-formation system, combined with the line in the schedule. The scheduling information system also supports the scheduler in dealing with external uncertainty.
IV stress
There is internal and external uncertainty that has to be managed by the scheduler as to a lack of human recovery. The scheduling infor-mation system assumes a smooth shop and is therefore not used.
Table 6-2: Evaluation of human computer interaction in the cases in relation to autonomy
Chapter 6 64
However, there is a converse situation to the allocation of autonomy to production units: while local problems can be solved very efficiently, a more global view of problems is missing at this level. Therefore, the allocation of autonomy to the shop floor must include a compromise be-tween handling uncertainty and optimization.
Hence, the functionality of scheduling systems should be derived from two, conflicting criteria: (1) controlling uncertainty, and (2) optimizing the system. These two criteria present an interest-ing conflict that can be compared to the controversy between traditional production control lit-erature and sociotechnical literature. In traditional production control literature, usually only the criterion of optimizing the system is chosen. This leads to the view that as much autonomy as possible should be �squeezed� out of production units as possible to enable tight control at higher control levels. For example in Wight (1974), the need for schedule �discipline� is stressed. Vollmann et al. (1988) argue that: �All informal systems must be killed off and not allowed to re-appear. No hot lists or other informal scheduling can be allowed, since these come at the cost of degradation in the formal system� (p. 194). On the other hand, the sociotechnical paradigm be-lieves that as much autonomy as possible should be allocated to the lowest hierarchical level, i.e., the production unit.
Considering these observations, a middle ground can be proposed by taking both criteria into ac-count. However, in three of the four cases studied, the problem of controlling uncertainty was more prevalent than optimizing the system. Only in case II did the scheduler closely guard one aspect of the performance of the production system. Moreover, it was often not possible to measure performance in an objective way, as was illustrated by the lack of use of performance feedback. Although performance of scheduling techniques is of considerable importance in theoretical studies, in practice, a combination of service level and costs is often used. The man-ner in which these performance measures are used can be illustrated by stating that the term per-formance guidelines would be a more appropriate term than performance criteria.
Therefore, the use of scheduling systems in unstable manufacturing systems�i.e., most manufac-turing systems�will primarily be determined by a system�s capability to handle uncertainty. In other words, the benefits of a scheduling system mainly lie in making the life of the scheduler easier, by supporting the human scheduler to monitor and make changes to the schedule. Tangi-bly improving the performance of the production system is in many cases at most a secondary reason for implementing a scheduling information system.
Decision making horizon
The cases show that the decision making horizon is an important organizational means used to allocate autonomy. It was already noted that production processes are decomposed in production units to reduce control complexity. Congruous with the decomposition of a production system into production units, the planning horizon of a company is also decomposed into fixed periods of time, i.e., decision making horizons, which are bounded by milestones. The milestones indi-cate the planned results and the planned use of resources at the end of the decision making hori-zons. The decisions within the decision making horizons are now delegated to the lower control levels. These levels are independent in their decision making, as long as their decisions do not en-danger realization of the milestones, i.e., endanger the realization of plans at higher control lev-els.
In the case studies, the decision making horizon of the production units varied from zero in cases I and II, to a day in cases III and IV. The information for coordinating the decision making of the production units and the scheduler can for example be achieved by drawing a line in a schedule that is sorted on due dates, which was done in case III. However, the boundaries often were not sharply set: if necessary, the operators in the production units would take decisions that
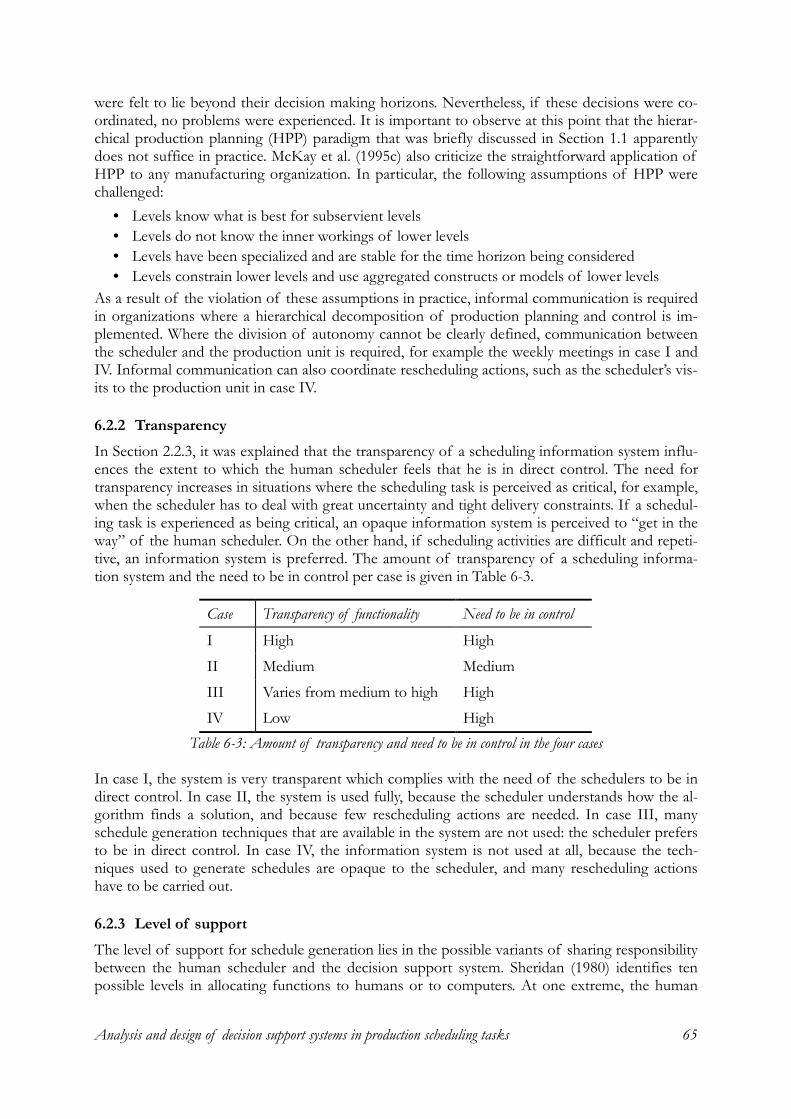
Analysis and design of decision support systems in production scheduling tasks 65
were felt to lie beyond their decision making horizons. Nevertheless, if these decisions were co-ordinated, no problems were experienced. It is important to observe at this point that the hierar-chical production planning (HPP) paradigm that was briefly discussed in Section 1.1 apparently does not suffice in practice. McKay et al. (1995c) also criticize the straightforward application of HPP to any manufacturing organization. In particular, the following assumptions of HPP were challenged:
• Levels know what is best for subservient levels • Levels do not know the inner workings of lower levels • Levels have been specialized and are stable for the time horizon being considered • Levels constrain lower levels and use aggregated constructs or models of lower levels
As a result of the violation of these assumptions in practice, informal communication is required in organizations where a hierarchical decomposition of production planning and control is im-plemented. Where the division of autonomy cannot be clearly defined, communication between the scheduler and the production unit is required, for example the weekly meetings in case I and IV. Informal communication can also coordinate rescheduling actions, such as the scheduler�s vis-its to the production unit in case IV.
6.2.2 Transparency In Section 2.2.3, it was explained that the transparency of a scheduling information system influ-ences the extent to which the human scheduler feels that he is in direct control. The need for transparency increases in situations where the scheduling task is perceived as critical, for example, when the scheduler has to deal with great uncertainty and tight delivery constraints. If a schedul-ing task is experienced as being critical, an opaque information system is perceived to �get in the way� of the human scheduler. On the other hand, if scheduling activities are difficult and repeti-tive, an information system is preferred. The amount of transparency of a scheduling informa-tion system and the need to be in control per case is given in Table 6-3.
In case I, the system is very transparent which complies with the need of the schedulers to be in direct control. In case II, the system is used fully, because the scheduler understands how the al-gorithm finds a solution, and because few rescheduling actions are needed. In case III, many schedule generation techniques that are available in the system are not used: the scheduler prefers to be in direct control. In case IV, the information system is not used at all, because the tech-niques used to generate schedules are opaque to the scheduler, and many rescheduling actions have to be carried out.
6.2.3 Level of support The level of support for schedule generation lies in the possible variants of sharing responsibility between the human scheduler and the decision support system. Sheridan (1980) identifies ten possible levels in allocating functions to humans or to computers. At one extreme, the human
Case Transparency of functionality Need to be in control
I High High
II Medium Medium
III Varies from medium to high High
IV Low High Table 6-3: Amount of transparency and need to be in control in the four cases
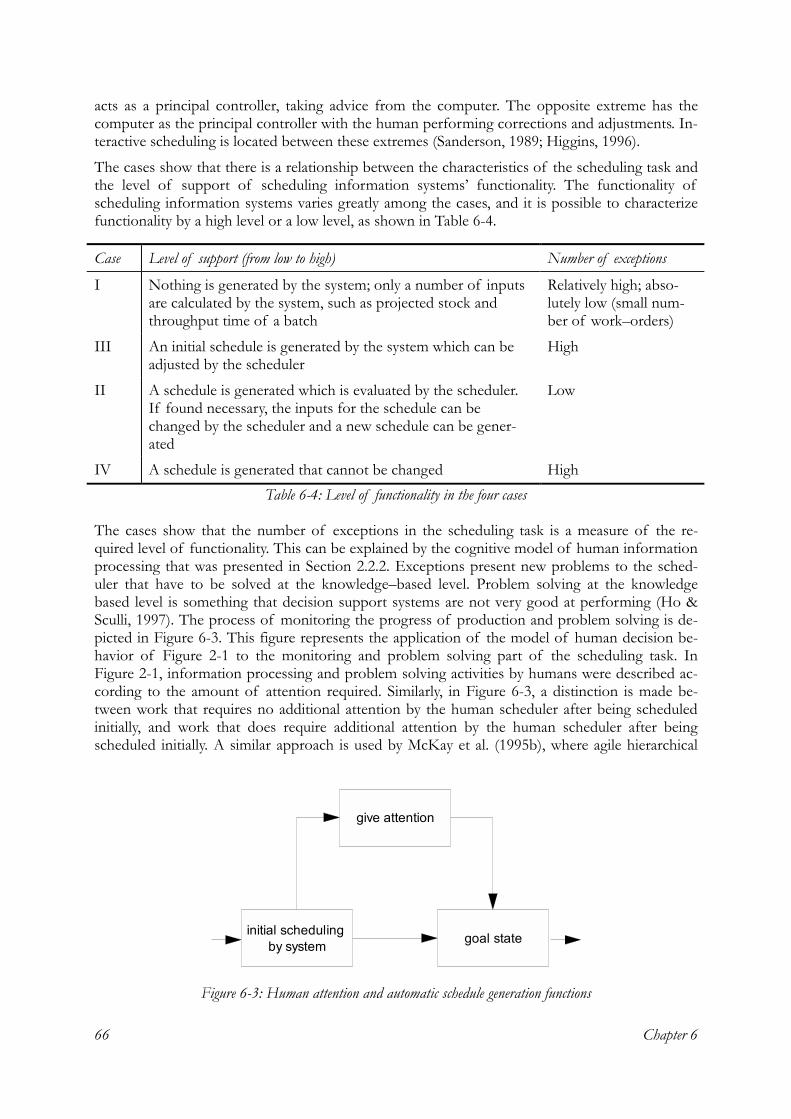
Chapter 6 66
acts as a principal controller, taking advice from the computer. The opposite extreme has the computer as the principal controller with the human performing corrections and adjustments. In-teractive scheduling is located between these extremes (Sanderson, 1989; Higgins, 1996).
The cases show that there is a relationship between the characteristics of the scheduling task and the level of support of scheduling information systems� functionality. The functionality of scheduling information systems varies greatly among the cases, and it is possible to characterize functionality by a high level or a low level, as shown in Table 6-4.
The cases show that the number of exceptions in the scheduling task is a measure of the re-quired level of functionality. This can be explained by the cognitive model of human information processing that was presented in Section 2.2.2. Exceptions present new problems to the sched-uler that have to be solved at the knowledge�based level. Problem solving at the knowledge based level is something that decision support systems are not very good at performing (Ho & Sculli, 1997). The process of monitoring the progress of production and problem solving is de-picted in Figure 6-3. This figure represents the application of the model of human decision be-havior of Figure 2-1 to the monitoring and problem solving part of the scheduling task. In Figure 2-1, information processing and problem solving activities by humans were described ac-cording to the amount of attention required. Similarly, in Figure 6-3, a distinction is made be-tween work that requires no additional attention by the human scheduler after being scheduled initially, and work that does require additional attention by the human scheduler after being scheduled initially. A similar approach is used by McKay et al. (1995b), where agile hierarchical
Case Level of support (from low to high) Number of exceptions
I Nothing is generated by the system; only a number of inputs are calculated by the system, such as projected stock and throughput time of a batch
Relatively high; abso-lutely low (small num-ber of work�orders)
III An initial schedule is generated by the system which can be adjusted by the scheduler
High
II A schedule is generated which is evaluated by the scheduler. If found necessary, the inputs for the schedule can be changed by the scheduler and a new schedule can be gener-ated
Low
IV A schedule is generated that cannot be changed High Table 6-4: Level of functionality in the four cases
initial scheduling by system goal state
give attention
Figure 6-3: Human attention and automatic schedule generation functions
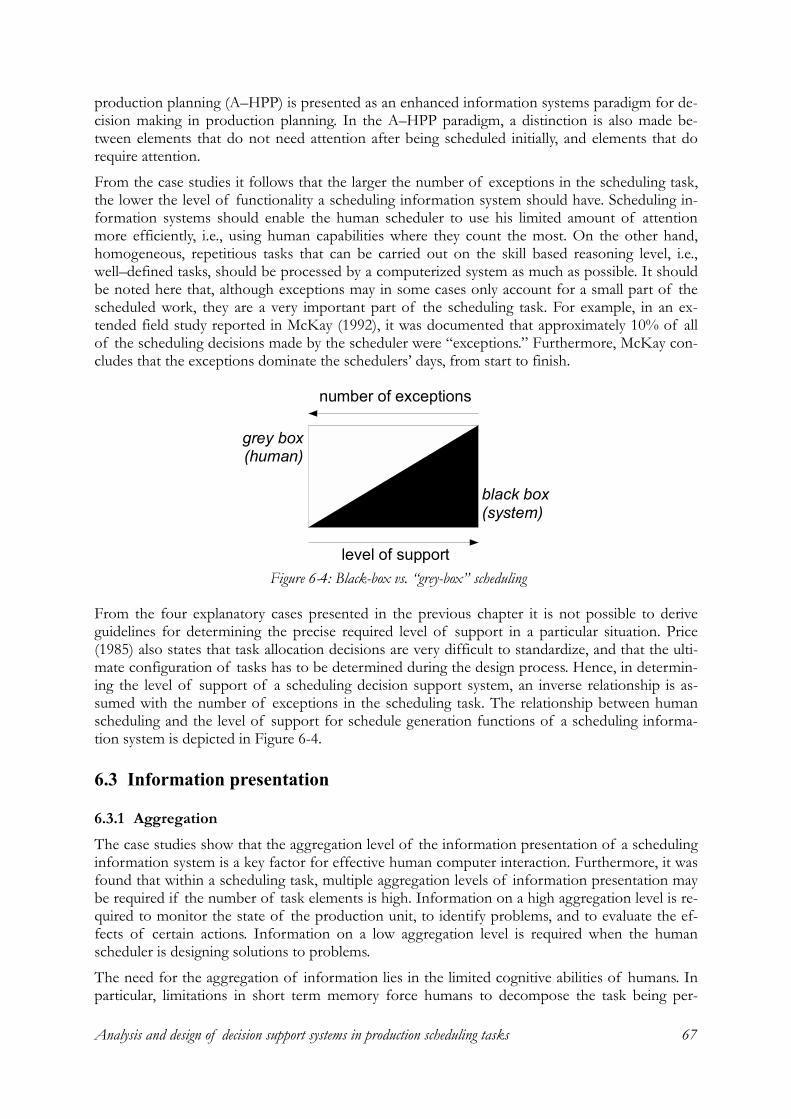
Analysis and design of decision support systems in production scheduling tasks 67
production planning (A�HPP) is presented as an enhanced information systems paradigm for de-cision making in production planning. In the A�HPP paradigm, a distinction is also made be-tween elements that do not need attention after being scheduled initially, and elements that do require attention.
From the case studies it follows that the larger the number of exceptions in the scheduling task, the lower the level of functionality a scheduling information system should have. Scheduling in-formation systems should enable the human scheduler to use his limited amount of attention more efficiently, i.e., using human capabilities where they count the most. On the other hand, homogeneous, repetitious tasks that can be carried out on the skill based reasoning level, i.e., well�defined tasks, should be processed by a computerized system as much as possible. It should be noted here that, although exceptions may in some cases only account for a small part of the scheduled work, they are a very important part of the scheduling task. For example, in an ex-tended field study reported in McKay (1992), it was documented that approximately 10% of all of the scheduling decisions made by the scheduler were �exceptions.� Furthermore, McKay con-cludes that the exceptions dominate the schedulers� days, from start to finish.
From the four explanatory cases presented in the previous chapter it is not possible to derive guidelines for determining the precise required level of support in a particular situation. Price (1985) also states that task allocation decisions are very difficult to standardize, and that the ulti-mate configuration of tasks has to be determined during the design process. Hence, in determin-ing the level of support of a scheduling decision support system, an inverse relationship is as-sumed with the number of exceptions in the scheduling task. The relationship between human scheduling and the level of support for schedule generation functions of a scheduling informa-tion system is depicted in Figure 6-4.
6.3 Information presentation
6.3.1 Aggregation The case studies show that the aggregation level of the information presentation of a scheduling information system is a key factor for effective human computer interaction. Furthermore, it was found that within a scheduling task, multiple aggregation levels of information presentation may be required if the number of task elements is high. Information on a high aggregation level is re-quired to monitor the state of the production unit, to identify problems, and to evaluate the ef-fects of certain actions. Information on a low aggregation level is required when the human scheduler is designing solutions to problems.
The need for the aggregation of information lies in the limited cognitive abilities of humans. In particular, limitations in short term memory force humans to decompose the task being per-
black box (system)
grey box(human)
level of support
number of exceptions
Figure 6-4: Black-box vs. �grey-box� scheduling
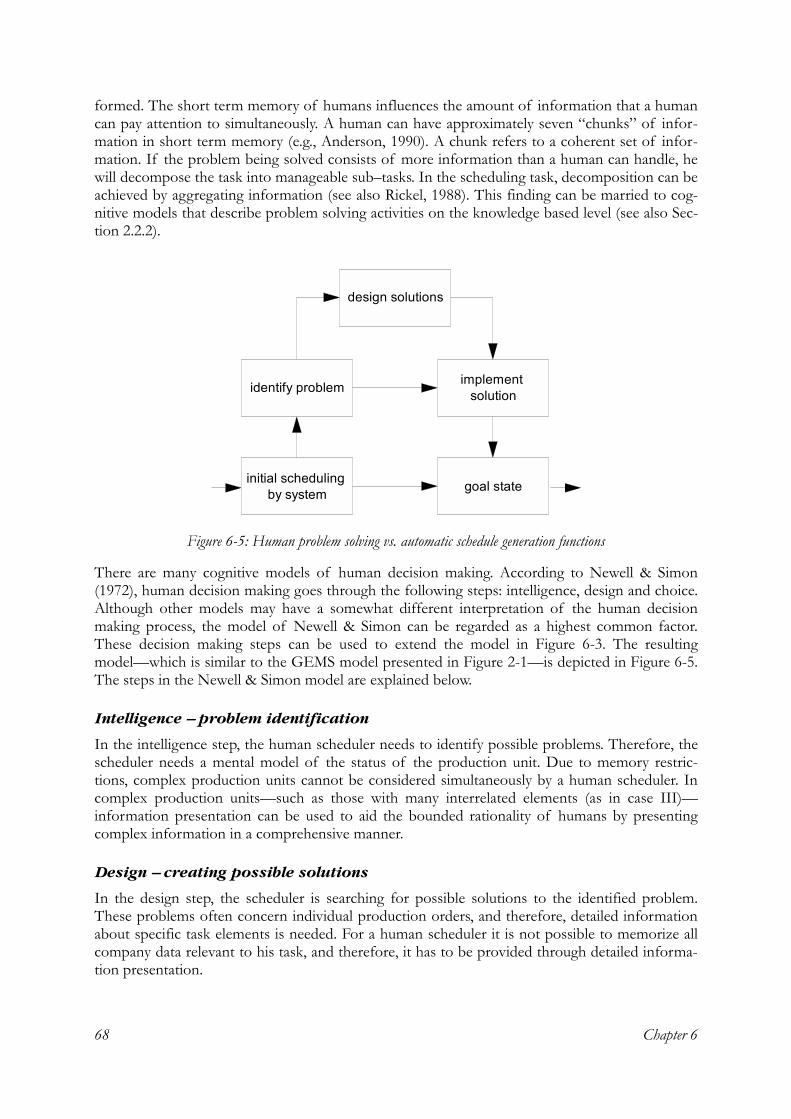
Chapter 6 68
formed. The short term memory of humans influences the amount of information that a human can pay attention to simultaneously. A human can have approximately seven �chunks� of infor-mation in short term memory (e.g., Anderson, 1990). A chunk refers to a coherent set of infor-mation. If the problem being solved consists of more information than a human can handle, he will decompose the task into manageable sub�tasks. In the scheduling task, decomposition can be achieved by aggregating information (see also Rickel, 1988). This finding can be married to cog-nitive models that describe problem solving activities on the knowledge based level (see also Sec-tion 2.2.2).
There are many cognitive models of human decision making. According to Newell & Simon (1972), human decision making goes through the following steps: intelligence, design and choice. Although other models may have a somewhat different interpretation of the human decision making process, the model of Newell & Simon can be regarded as a highest common factor. These decision making steps can be used to extend the model in Figure 6-3. The resulting model�which is similar to the GEMS model presented in Figure 2-1�is depicted in Figure 6-5. The steps in the Newell & Simon model are explained below.
Intelligence – problem identification
In the intelligence step, the human scheduler needs to identify possible problems. Therefore, the scheduler needs a mental model of the status of the production unit. Due to memory restric-tions, complex production units cannot be considered simultaneously by a human scheduler. In complex production units�such as those with many interrelated elements (as in case III)�information presentation can be used to aid the bounded rationality of humans by presenting complex information in a comprehensive manner.
Design – creating possible solutions
In the design step, the scheduler is searching for possible solutions to the identified problem. These problems often concern individual production orders, and therefore, detailed information about specific task elements is needed. For a human scheduler it is not possible to memorize all company data relevant to his task, and therefore, it has to be provided through detailed informa-tion presentation.
initial scheduling by system goal state
identify problem
design solutions
implement solution
Figure 6-5: Human problem solving vs. automatic schedule generation functions
Analysis and design of decision support systems in production scheduling tasks 69
Choice – implementing a solution
In the choice step, alternative solutions are evaluated and a solution is implemented. To evaluate and implement solutions, the relationship of the action to the rest of the schedule is considered.
6.3.2 Display types In the case studies, textual displays turned out to be sufficient for information representation on a low aggregation level. Graphical displays were suitable to represent information on a high ag-gregation level in a comprehensive manner. Based on these findings, and from the literature re-viewed in Section 2.1.3, it is expected that if the number of task elements is relatively low, inte-gral information representation by means of information technology will be superficial. In tasks where focused attention is needed on one piece of information, integral displays will be counter-productive, because in these cases the image has to be mentally decomposed to extract the neces-sary information.
6.3.3 Feedback The case studies show that the effectiveness of feedback follows the same pattern as the effec-tiveness of information presentation. The use of feedback offered by the information system depends on the possibility to causally relate feedback to specific actions. Aggregate feedback, such as the average percentage of customer orders that are delivered on time, is difficult to relate to specific actions and therefore not found useful by schedulers. Aggregate feedback presented by the system rarely triggers corrective actions by the schedulers. The identification of problems usually takes place outside the system, often by means of informal communication.
In cases I, III, and IV, the aggregate feedback offered by the system is not used by the human schedulers. Instead, these schedulers felt that performance feedback cannot be used to improve their decision behavior, because the causal relationship between their actions and performance is not clear. In case II, feedback offered by the system is used by the human scheduler, because this feedback, which concerns material waste, can easily be linked to a specific decision, i.e., a con-figuration of a block.
6.4 An explanatory and a design model for decision support In the previous sections, answers have been formulated to the first research question that was given in Section 4.1: Why are scheduling information systems (not) used by human schedulers in practice? Based on the concepts presented in the previous sections of this chapter, it is now pos-sible to give a preliminary answer to the second research question: How can human schedulers be supported by scheduling information systems? This is done by presenting a design model for scheduling information systems.
The following concepts have been introduced as determinants of human�computer interaction in production scheduling:
• Autonomy. The division of autonomy between the scheduling task and the production unit results from various types of uncertainty and possibilities to compensate for these uncer-tainties in the production unit. It was stated that a scheduling information system should take the division of autonomy into account.
• Transparency. The wish of the human scheduler to be in control results from the amount of uncertainty and the criticality of the scheduling task. It was stated that the transparency of a scheduling information system�s functionality should comply to the human schedulers� need for control.
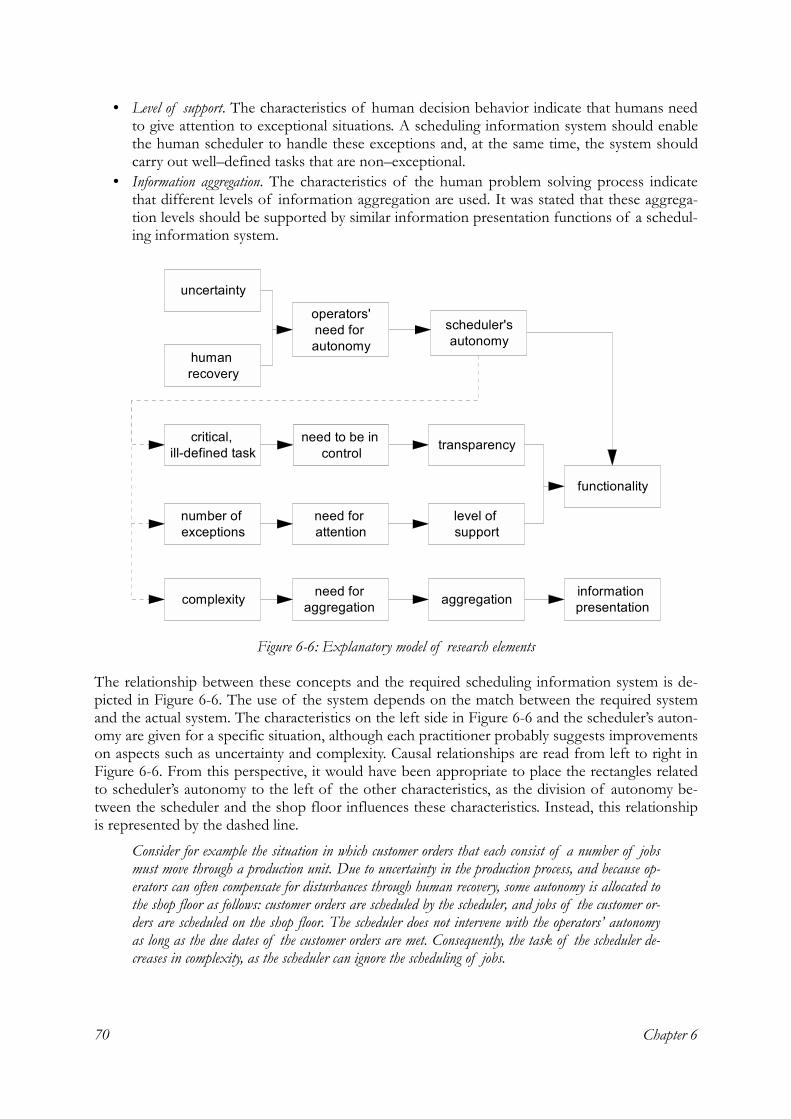
Chapter 6 70
• Level of support. The characteristics of human decision behavior indicate that humans need to give attention to exceptional situations. A scheduling information system should enable the human scheduler to handle these exceptions and, at the same time, the system should carry out well�defined tasks that are non�exceptional.
• Information aggregation. The characteristics of the human problem solving process indicate that different levels of information aggregation are used. It was stated that these aggrega-tion levels should be supported by similar information presentation functions of a schedul-ing information system.
The relationship between these concepts and the required scheduling information system is de-picted in Figure 6-6. The use of the system depends on the match between the required system and the actual system. The characteristics on the left side in Figure 6-6 and the scheduler�s auton-omy are given for a specific situation, although each practitioner probably suggests improvements on aspects such as uncertainty and complexity. Causal relationships are read from left to right in Figure 6-6. From this perspective, it would have been appropriate to place the rectangles related to scheduler�s autonomy to the left of the other characteristics, as the division of autonomy be-tween the scheduler and the shop floor influences these characteristics. Instead, this relationship is represented by the dashed line.
Consider for example the situation in which customer orders that each consist of a number of jobs must move through a production unit. Due to uncertainty in the production process, and because op-erators can often compensate for disturbances through human recovery, some autonomy is allocated to the shop floor as follows: customer orders are scheduled by the scheduler, and jobs of the customer or-ders are scheduled on the shop floor. The scheduler does not intervene with the operators� autonomy as long as the due dates of the customer orders are met. Consequently, the task of the scheduler de-creases in complexity, as the scheduler can ignore the scheduling of jobs.
operators' need for autonomy
critical, ill-defined task
need to be in control
uncertainty
human recovery
number of exceptions
need for attention
complexity need for aggregation
transparency
level of support
information presentation
functionality
aggregation
scheduler's autonomy
Figure 6-6: Explanatory model of research elements
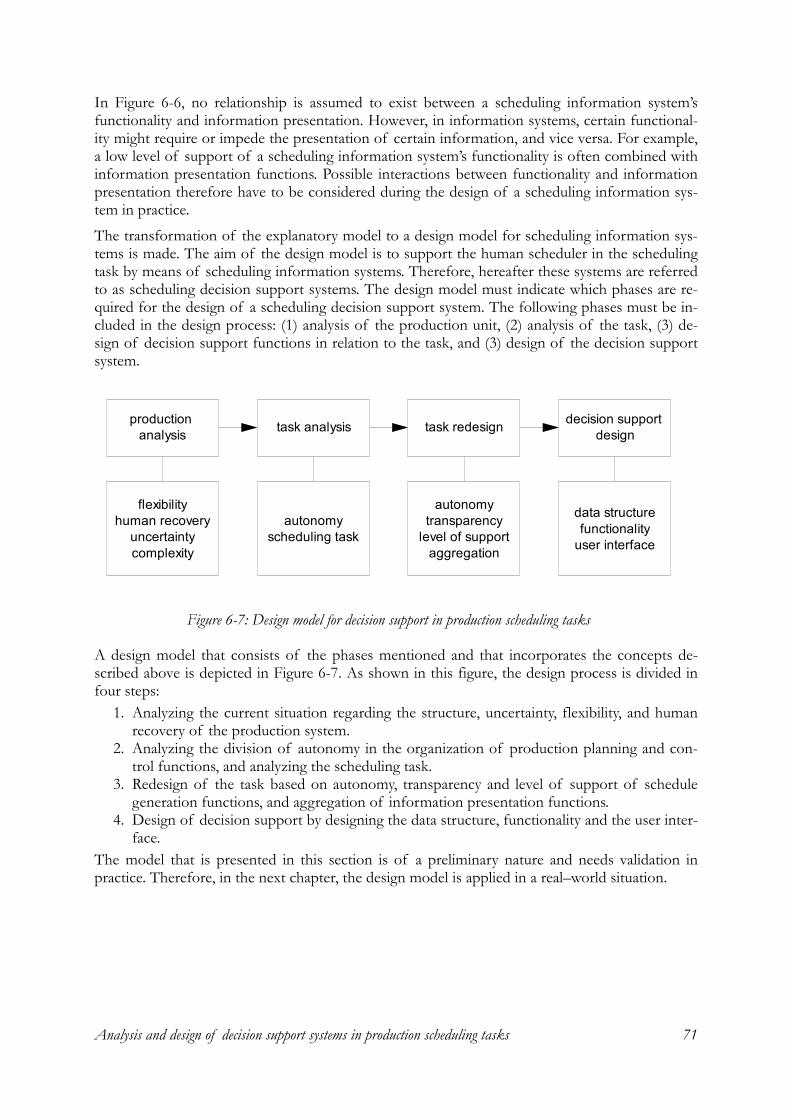
Analysis and design of decision support systems in production scheduling tasks 71
In Figure 6-6, no relationship is assumed to exist between a scheduling information system�s functionality and information presentation. However, in information systems, certain functional-ity might require or impede the presentation of certain information, and vice versa. For example, a low level of support of a scheduling information system�s functionality is often combined with information presentation functions. Possible interactions between functionality and information presentation therefore have to be considered during the design of a scheduling information sys-tem in practice.
The transformation of the explanatory model to a design model for scheduling information sys-tems is made. The aim of the design model is to support the human scheduler in the scheduling task by means of scheduling information systems. Therefore, hereafter these systems are referred to as scheduling decision support systems. The design model must indicate which phases are re-quired for the design of a scheduling decision support system. The following phases must be in-cluded in the design process: (1) analysis of the production unit, (2) analysis of the task, (3) de-sign of decision support functions in relation to the task, and (3) design of the decision support system.
A design model that consists of the phases mentioned and that incorporates the concepts de-scribed above is depicted in Figure 6-7. As shown in this figure, the design process is divided in four steps:
1. Analyzing the current situation regarding the structure, uncertainty, flexibility, and human recovery of the production system.
2. Analyzing the division of autonomy in the organization of production planning and con-trol functions, and analyzing the scheduling task.
3. Redesign of the task based on autonomy, transparency and level of support of schedule generation functions, and aggregation of information presentation functions.
4. Design of decision support by designing the data structure, functionality and the user inter-face.
The model that is presented in this section is of a preliminary nature and needs validation in practice. Therefore, in the next chapter, the design model is applied in a real�world situation.
production analysis task analysis task redesign decision support
design
flexibility human recovery
uncertainty complexity
autonomy scheduling task
autonomy transparency
level of support aggregation
data structure functionality
user interface
Figure 6-7: Design model for decision support in production scheduling tasks

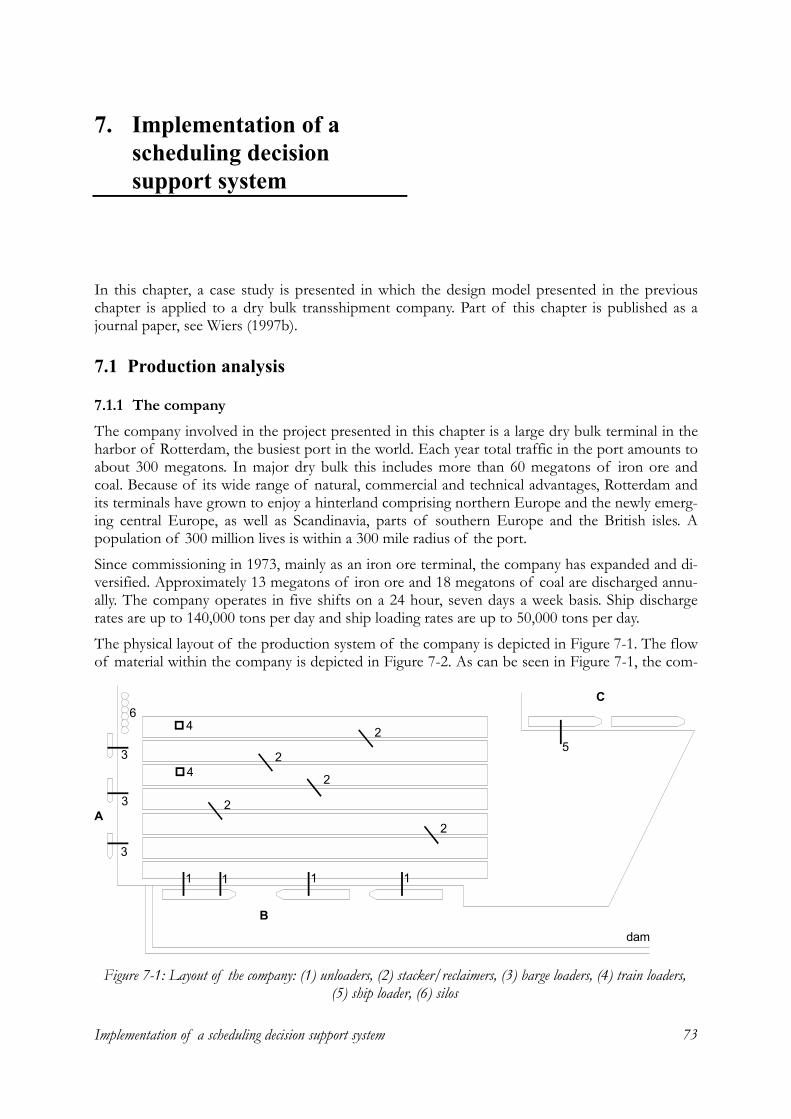
Implementation of a scheduling decision support system 73
7. Implementation of a scheduling decision support system
In this chapter, a case study is presented in which the design model presented in the previous chapter is applied to a dry bulk transshipment company. Part of this chapter is published as a journal paper, see Wiers (1997b).
7.1 Production analysis
7.1.1 The company The company involved in the project presented in this chapter is a large dry bulk terminal in the harbor of Rotterdam, the busiest port in the world. Each year total traffic in the port amounts to about 300 megatons. In major dry bulk this includes more than 60 megatons of iron ore and coal. Because of its wide range of natural, commercial and technical advantages, Rotterdam and its terminals have grown to enjoy a hinterland comprising northern Europe and the newly emerg-ing central Europe, as well as Scandinavia, parts of southern Europe and the British isles. A population of 300 million lives is within a 300 mile radius of the port.
Since commissioning in 1973, mainly as an iron ore terminal, the company has expanded and di-versified. Approximately 13 megatons of iron ore and 18 megatons of coal are discharged annu-ally. The company operates in five shifts on a 24 hour, seven days a week basis. Ship discharge rates are up to 140,000 tons per day and ship loading rates are up to 50,000 tons per day.
The physical layout of the production system of the company is depicted in Figure 7-1. The flow of material within the company is depicted in Figure 7-2. As can be seen in Figure 7-1, the com-
dam
6
43
3
3
1 1 1 1
2
2
2
2
2
5
A
B
C
4
Figure 7-1: Layout of the company: (1) unloaders, (2) stacker/reclaimers, (3) barge loaders, (4) train loaders,
(5) ship loader, (6) silos
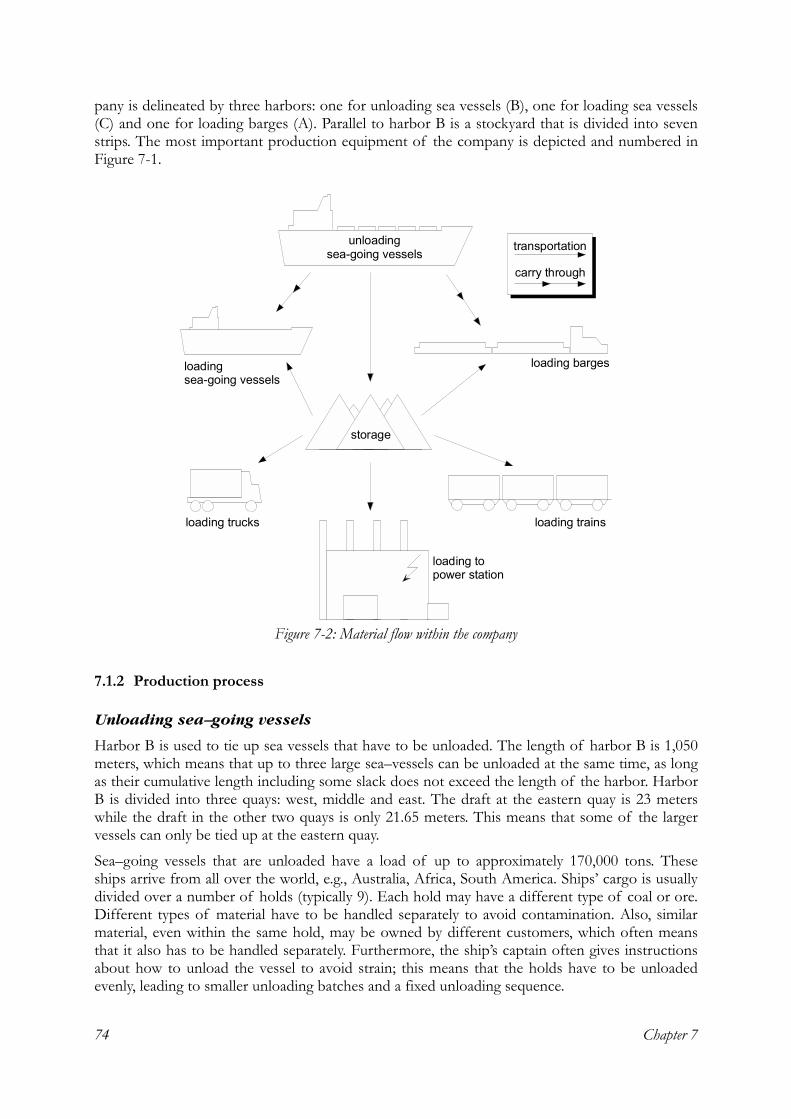
Chapter 7 74
pany is delineated by three harbors: one for unloading sea vessels (B), one for loading sea vessels (C) and one for loading barges (A). Parallel to harbor B is a stockyard that is divided into seven strips. The most important production equipment of the company is depicted and numbered in Figure 7-1.
7.1.2 Production process
Unloading sea–going vessels
Harbor B is used to tie up sea vessels that have to be unloaded. The length of harbor B is 1,050 meters, which means that up to three large sea�vessels can be unloaded at the same time, as long as their cumulative length including some slack does not exceed the length of the harbor. Harbor B is divided into three quays: west, middle and east. The draft at the eastern quay is 23 meters while the draft in the other two quays is only 21.65 meters. This means that some of the larger vessels can only be tied up at the eastern quay.
Sea�going vessels that are unloaded have a load of up to approximately 170,000 tons. These ships arrive from all over the world, e.g., Australia, Africa, South America. Ships� cargo is usually divided over a number of holds (typically 9). Each hold may have a different type of coal or ore. Different types of material have to be handled separately to avoid contamination. Also, similar material, even within the same hold, may be owned by different customers, which often means that it also has to be handled separately. Furthermore, the ship�s captain often gives instructions about how to unload the vessel to avoid strain; this means that the holds have to be unloaded evenly, leading to smaller unloading batches and a fixed unloading sequence.
loading sea-going vessels
loading barges
storage
loading trainsloading trucks
loading to power station
transportationunloadingsea-going vessels
carry through
Figure 7-2: Material flow within the company
Implementation of a scheduling decision support system 75
Ships are unloaded by four unloaders, (1) in Figure 7-1, that are able to move parallel to harbor B. The two unloaders on the left have a lift capacity of 50 tons each; the two other unloaders on the right have a lift capacity of 80 tons each. The leftmost unloader cannot reach the eastern quay; the rightmost unloader cannot reach the western quay. Moreover, unloaders cannot pass each other, and a minimum distance has to be maintained between the unloaders, which means that unloaders cannot work on adjacent holds. The average unloading capacity is approximately 100,000 tons per twenty�four hours. Different grabbers can be attached to an unloader, of which the largest has a volume of 60 cubic meters.
At this point it is useful to distinguish between two types of unloading operations in the com-pany: material that is unloaded and transported to the stockyard, and material that is unloaded and directly transported to barges or other sea�going vessels. The first type of operation is re-ferred to as ashore, the second type of operation is referred to as carry through. This is also depicted in Figure 7-2.
The conveyor belt system
The material that is unloaded can be dumped on one of three conveyor belts that run adjacently to the quays of harbor B; these are referred to as quay�belts. Because there are four unloaders and only three quay�belts, the two leftmost unloaders often operate as a unit. Moreover, the two leftmost unloaders cannot reach one of the three quay�belts. The quay�belts can be linked to several other conveyor belts of the conveyor belt system; in total the conveyor belt system con-tains 47 conveyor belts with a total length of about 20 kilometers (note: the conveyor belt system is omitted in Figure 7-1). By linking belts to each other and to production equipment, over 300 routes can be temporarily created. If a certain routing has to be configured, the conveyor belt system is set up by moving the ends of individual conveyors.
Storage
Material can be stored on a large stockyard of 100 hectares. As can be seen in Figure 7-1, the stockyard is divided into seven sections, of which six are bounded by five conveyor belts. The first strip of the stockyard that is the closest to harbor B can be reached directly by the unloaders. This section is used to store material temporarily if the material cannot be transported elsewhere immediately. The company prefers not to use this part of the stockyard as its use eventually evokes two handling operations instead of one. The other six sections of the stockyard can be reached by five stacker/reclaimers, (2) in Figure 7-1, that are able to move between these sections. Because the stockyard is over one kilometer long and unloaders and stacker/reclaimers cannot move very fast, moving these machines from one end to another may take hours. A stacker/re-claimer is a machine capable of dumping and excavating material in the stockyard. The material is transported to and from the stacker/reclaimer by a conveyor belt that runs between the sec-tions of the stockyard. On the one hand, each stacker/reclaimer can reach two sections of the stockyard; on the other hand, some sections can only be reached by one stacker/reclaimer.
The average stocking capacity of the stockyard is 6 megatons and varies according to product mix, i.e., density and pile configuration. Also, many small piles use more space than a few large piles of the same load and density. Usually, about 80 types of material are stocked in the stock-yard. Identical materials for different customers have to be stocked separately. Occasionally, two batches of identical material of the same customer must be stocked separately. Ore and coal are stocked in separate areas as far as possible to avoid contamination. Adjacent to harbor C there is also a stockyard which is mainly used to store material that is to be loaded on sea�going vessels. There are no stacker/reclaimers in this stockyard; material is stacked and reclaimed by conveyors and bulldozers.
Chapter 7 76
Loading sea–going vessels
Harbor C is used to tie up sea vessels that have to be loaded. The length of harbor C is 800 me-ters; the draft of harbor C is 21.65 meters. Harbor C is also divided into three quays: west, middle and east. However, this is of less importance in this harbor than it is in harbor B, as there is only one ship loader, (5) in Figure 7-1, that is able to reach all quays by moving parallel to harbor C. The ship loader can be fed by the conveyor belt system, or it can be fed by moveable conveyor belts that again are fed by bulldozers. The ship loader has a capacity of 5,000 tons per hour. Sea�going vessels typically have a load of about 50,000 tons. These vessels usually transport material to countries within Europe, such as Germany and Great Britain. Generally, only one type of ma-terial must be loaded in a sea vessel.
Loading barges
Harbor A is used to tie up inland shipping barges and pushed barges that have to be loaded. The length of harbor A is 950 meters. Because of the relatively small length of the vessels that are tied up here, the length of the harbor never poses a constraint. Barges typically have a load of 1,000 � 3,000 tons. They are loaded by three barge loaders, (3) in Figure 7-1, that have a capacity of 3,500 tons per hour. These barge loaders are able to move parallel to the quay for a short dis-tance in order to load evenly. Two of the three barge loaders have a small buffer, which means that if the loader has to stop for a moment to switch barges or to reposition the loader, the pro-duction group connected to the loader does not have to stop operating. Barges are always loaded with one type of material only. Either the material comes directly from a sea�going vessel in har-bor B, from a stacker/reclaimer at the stockyard, or from the silos (6) adjacent to harbor A. The silos are fed by the conveyor belt system and have a capacity of 7,000 tons each. In the silos, up to six types of coal can be blended to customer specifications by means of a computer controlled discharge system.
Loading trains, trucks and the power station
Freight trains are loaded at one of the train loading stations, (4) in Figure 7-1, at a rate of 2,500 tons per hour. There is one train loading station for loading ore, and one for loading coal. The maximum train load per station is 5,000 tons at a maximum car capacity of 120 tons. The train loading stations can be fed by the conveyor belt system, however, it is also possible to feed train loading by bulldozers. A special characteristic of train loading is that trains have to depart accord-ing to a tight schedule.
Trucks can be loaded by means of bulldozers. The amount of material that leaves by truck is in-significantly small, and loading trucks is therefore regarded as a special service to the customer. Lastly, a conveyor belt connects the company with a power station that is situated a few kilome-ters away.
7.1.3 Operational characteristics
Typology of the situation
Although the production system of the company may seem to be considerably different from �normal� production systems, these differences are largely of a mere visual nature. Regarding the operational characteristics of the company, there is a large similarity between this company and companies within the semi�process industry. The following operational characteristics are shared with typical semi�process businesses (see also Fransoo & Rutten, 1994):
• Materials involved are process oriented
Implementation of a scheduling decision support system 77
• Capacity is not well�defined (different configurations, complex routings) • Resources can be physically linked together temporarily • Large number of process steps • Large number of products (about 200 material types) • Buffer capacity is limited • Less impact of changeover times as in process flow industries, but more than in typical dis-
crete production processes • Material flow can be both convergent and divergent • Long lead times (for unloading operations), much work in process • Production involves manual labor that has to be shared by different operations
A number of operational characteristics are not necessarily typical for semi�process industries. First, materials are not transformed into other materials regarding composition. However, mate-rials are transformed regarding quantity, and the composition of materials is changed by mixing materials from the silos. Second, there are no fixed recipes. Third, production is done only on customer order; however, although not necessary typical, this is not exceptionally unusual for semi�process industries. Fourth, some of the companies� customers�i.e., ships� crews�are pre-sent at the production process. This aspect might appear of minor importance; however, produc-tion scheduling is continuously scrutinized by crews that all wish to leave the harbor as early as possible. Fifth, instead of the common situation where customer orders drive production at the output side of the material flow, in the company the customer orders drive the production proc-ess at the input side of the material flow. This means that the production process is to a large ex-tent driven by the sea�going vessels that arrive at the port. However, some semi�process indus-tries also base production on their material inflow, such as the potato starch production in the case study that is described in Section 5.1. In that case, the company has an obligation to process all potatoes that are supplied to the company by the farmers.
Uncertainty and flexibility
There are many factors causing disturbances in the production process. The most important are: • Uncertainty in unloading throughput times • Uncertainty in the availability of production equipment • Uncertainty in the arrival time of ships and barges
Disturbances can sometimes be compensated for by flexibility in the production system. The most important forms of flexibility are:
• Floating unloaders can be hired to increase unloading capacity • Alternative routings can be used to get around defective production equipment • Bulldozers can be used to move material to adjacent sections, so that stacker/reclaimers
can be used that normally would not be able to reach the section where the material was located
• It is possible, though not preferable, to load barges in harbor C • The first strip in the stockyard can be used to store material if the material that is unloaded
cannot be transported elsewhere
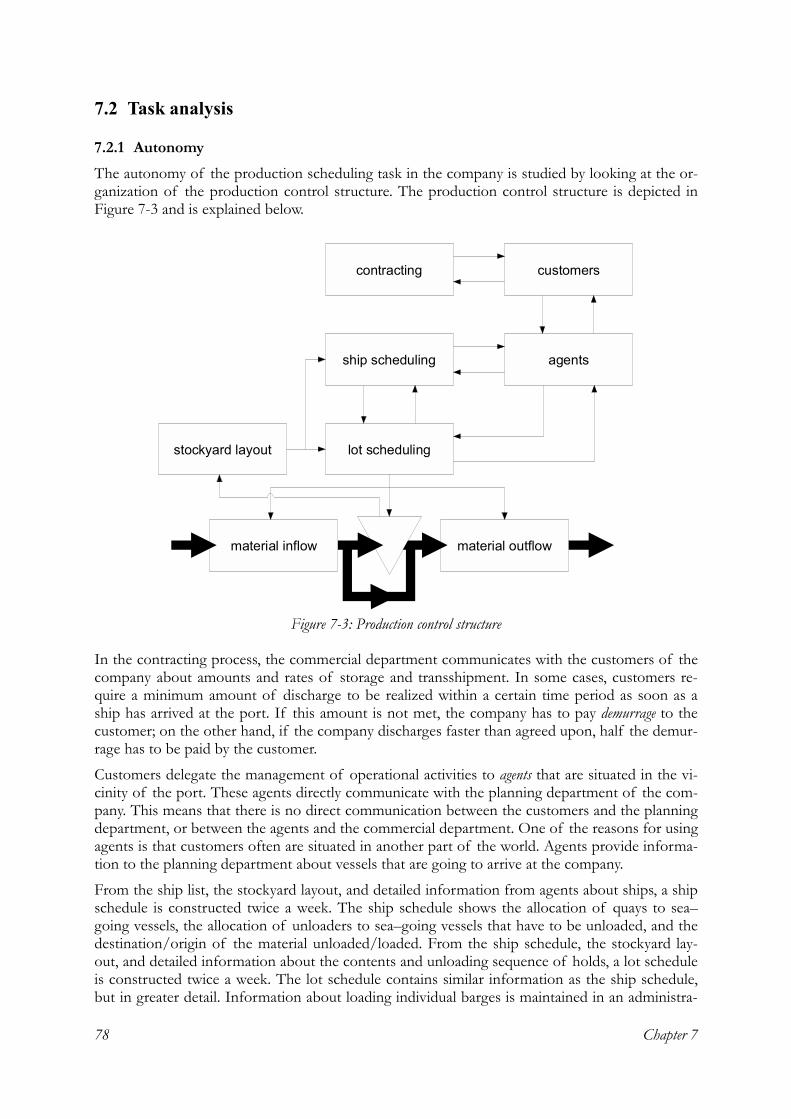
Chapter 7 78
7.2 Task analysis
7.2.1 Autonomy The autonomy of the production scheduling task in the company is studied by looking at the or-ganization of the production control structure. The production control structure is depicted in Figure 7-3 and is explained below.
In the contracting process, the commercial department communicates with the customers of the company about amounts and rates of storage and transshipment. In some cases, customers re-quire a minimum amount of discharge to be realized within a certain time period as soon as a ship has arrived at the port. If this amount is not met, the company has to pay demurrage to the customer; on the other hand, if the company discharges faster than agreed upon, half the demur-rage has to be paid by the customer.
Customers delegate the management of operational activities to agents that are situated in the vi-cinity of the port. These agents directly communicate with the planning department of the com-pany. This means that there is no direct communication between the customers and the planning department, or between the agents and the commercial department. One of the reasons for using agents is that customers often are situated in another part of the world. Agents provide informa-tion to the planning department about vessels that are going to arrive at the company.
From the ship list, the stockyard layout, and detailed information from agents about ships, a ship schedule is constructed twice a week. The ship schedule shows the allocation of quays to sea�going vessels, the allocation of unloaders to sea�going vessels that have to be unloaded, and the destination/origin of the material unloaded/loaded. From the ship schedule, the stockyard lay-out, and detailed information about the contents and unloading sequence of holds, a lot schedule is constructed twice a week. The lot schedule contains similar information as the ship schedule, but in greater detail. Information about loading individual barges is maintained in an administra-
contracting customers
agentsship scheduling
lot schedulingstockyard layout
material inflow material outflow
Figure 7-3: Production control structure
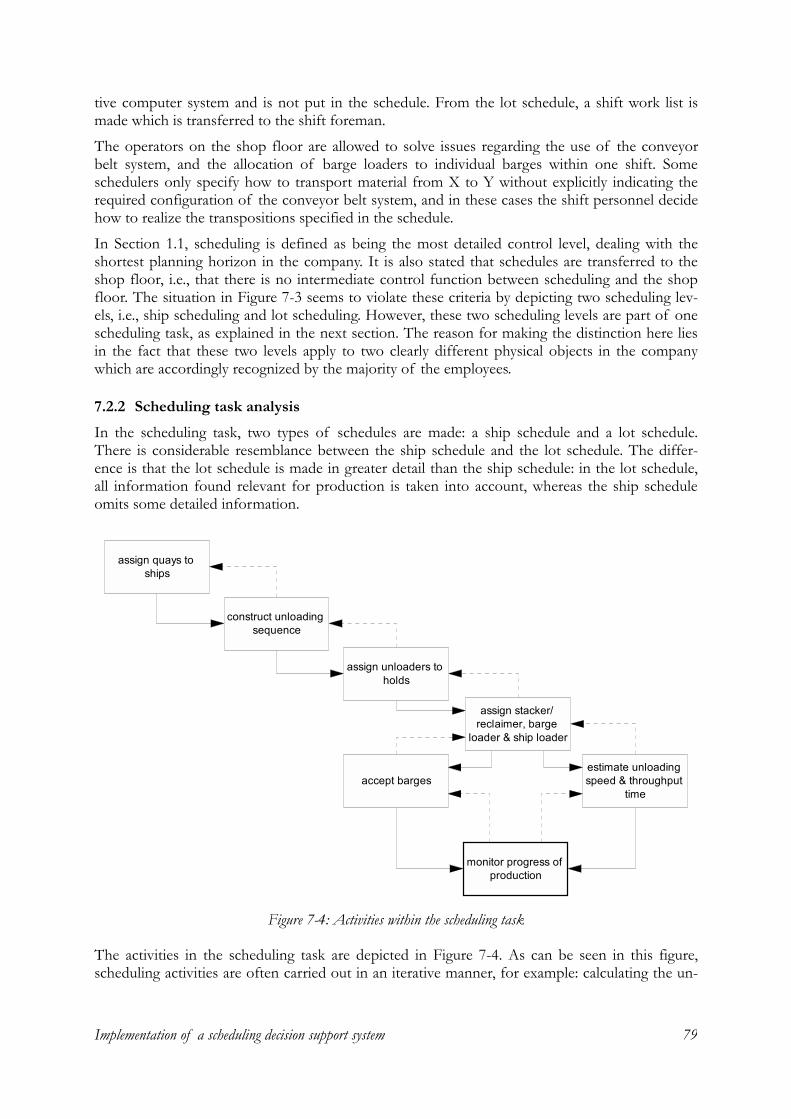
Implementation of a scheduling decision support system 79
tive computer system and is not put in the schedule. From the lot schedule, a shift work list is made which is transferred to the shift foreman.
The operators on the shop floor are allowed to solve issues regarding the use of the conveyor belt system, and the allocation of barge loaders to individual barges within one shift. Some schedulers only specify how to transport material from X to Y without explicitly indicating the required configuration of the conveyor belt system, and in these cases the shift personnel decide how to realize the transpositions specified in the schedule.
In Section 1.1, scheduling is defined as being the most detailed control level, dealing with the shortest planning horizon in the company. It is also stated that schedules are transferred to the shop floor, i.e., that there is no intermediate control function between scheduling and the shop floor. The situation in Figure 7-3 seems to violate these criteria by depicting two scheduling lev-els, i.e., ship scheduling and lot scheduling. However, these two scheduling levels are part of one scheduling task, as explained in the next section. The reason for making the distinction here lies in the fact that these two levels apply to two clearly different physical objects in the company which are accordingly recognized by the majority of the employees.
7.2.2 Scheduling task analysis In the scheduling task, two types of schedules are made: a ship schedule and a lot schedule. There is considerable resemblance between the ship schedule and the lot schedule. The differ-ence is that the lot schedule is made in greater detail than the ship schedule: in the lot schedule, all information found relevant for production is taken into account, whereas the ship schedule omits some detailed information.
The activities in the scheduling task are depicted in Figure 7-4. As can be seen in this figure, scheduling activities are often carried out in an iterative manner, for example: calculating the un-
assign quays to ships
construct unloading sequence
assign unloaders to holds
assign stacker/ reclaimer, barge
loader & ship loader
estimate unloading speed & throughput
time
monitor progress of production
accept barges
Figure 7-4: Activities within the scheduling task
Chapter 7 80
unloading time can lead to reconsidering the assignment of unloaders to ships. The activities within the scheduling task are depicted below.
Planners and schedulers
The planning department within the company has seven employees: two planners and five schedul-ers who schedule on duty successively. Note that the duties of the five schedulers are not based on a 24 hour, seven days a week basis: schedulers are only present at the company during the day-time. The planners do not have a duty system: their work conforms to normal office hours. There are two types of scheduling duties: midweek (Tuesday to Thursday) and weekend (Thurs-day to Tuesday). The reason for the duty system is that a scheduler needs to be present at the company seven days a week. Moreover, the registration of the stockyard layout needs to be kept up to date, which is done by another scheduler while doing his outside duty. The outside duty is done by the scheduler in the days before his normal duty. Another reason for the duty system is that scheduling in the company is perceived as a very stressful task, and it is assumed that there should be some breathing space between two duties of the same scheduler.
Assign quays
The ship schedule is made from a list of ships that are going to arrive at the terminal. Barges are not put on the ship list. The ships on the ship list are sorted according to their estimated time of arrival (ETA). Generally, more information about a specific ship is available as its ETA ap-proaches. For example, if a ship�s ETA is two weeks away, the planning department may not yet know what cargo the ship is carrying, the total load of the ship, or even the name of the ship. One reason for this is that the destination of cargo can change even if the ship is on its way to the port. Another reason is that some agents prefer to withhold information from the company for some time.
All sea�going vessels with an ETA that lies within a time horizon of three weeks from now, and that must be unloaded are put in the ship schedule. The ship schedule has two horizons: the first horizon depicts the occupation of the quays for sea�going vessels for the coming week, and the second horizon depicts the same information for the two weeks after the first week. The ship schedule is updated twice a week. A ship is scheduled as follows: first, a quay is assigned to the ship. If the draught of a ship exceeds 21.65 meters, the eastern quay of harbor B must be as-signed to the ship. Usually, the sequence of the ships in the ship schedule is based on the FIFO (first in first out) principle. However, the assignment of quays to ships also depends on commer-cial factors, such as possible demurrage claims.
Construct unloading sequence
When ships are assigned to quays, detailed information about the ships is used to assign unload-ers and other production equipment to unload the cargo. For each ship, the following informa-tion is needed:
• per customer: material type, amount and destination (ashore or carry through) • per hold: material type, amount
This information is referred to as hold configuration. In many cases the ship�s captain gives instruc-tions about how to discharge the ship, which limits the degrees of freedom in determining an unloading sequence. The relationship between ships, holds, lots and material is depicted in Figure 7-5.
The relationships that are depicted in Figure 7-5 should be read as follows: a ship can have more than one hold, but a hold belongs to one ship only. Holds can contain more than one lot (of the
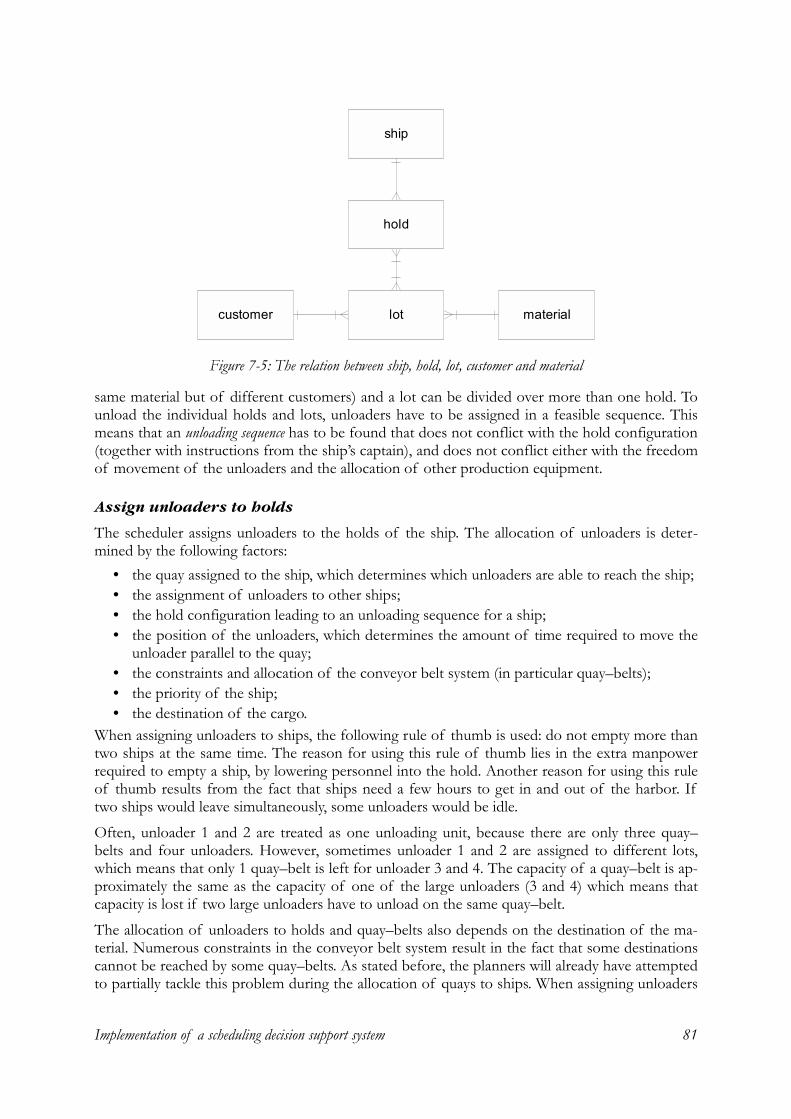
Implementation of a scheduling decision support system 81
same material but of different customers) and a lot can be divided over more than one hold. To unload the individual holds and lots, unloaders have to be assigned in a feasible sequence. This means that an unloading sequence has to be found that does not conflict with the hold configuration (together with instructions from the ship�s captain), and does not conflict either with the freedom of movement of the unloaders and the allocation of other production equipment.
Assign unloaders to holds
The scheduler assigns unloaders to the holds of the ship. The allocation of unloaders is deter-mined by the following factors:
• the quay assigned to the ship, which determines which unloaders are able to reach the ship; • the assignment of unloaders to other ships; • the hold configuration leading to an unloading sequence for a ship; • the position of the unloaders, which determines the amount of time required to move the
unloader parallel to the quay; • the constraints and allocation of the conveyor belt system (in particular quay�belts); • the priority of the ship; • the destination of the cargo.
When assigning unloaders to ships, the following rule of thumb is used: do not empty more than two ships at the same time. The reason for using this rule of thumb lies in the extra manpower required to empty a ship, by lowering personnel into the hold. Another reason for using this rule of thumb results from the fact that ships need a few hours to get in and out of the harbor. If two ships would leave simultaneously, some unloaders would be idle.
Often, unloader 1 and 2 are treated as one unloading unit, because there are only three quay�belts and four unloaders. However, sometimes unloader 1 and 2 are assigned to different lots, which means that only 1 quay�belt is left for unloader 3 and 4. The capacity of a quay�belt is ap-proximately the same as the capacity of one of the large unloaders (3 and 4) which means that capacity is lost if two large unloaders have to unload on the same quay�belt.
The allocation of unloaders to holds and quay�belts also depends on the destination of the ma-terial. Numerous constraints in the conveyor belt system result in the fact that some destinations cannot be reached by some quay�belts. As stated before, the planners will already have attempted to partially tackle this problem during the allocation of quays to ships. When assigning unloaders
ship
hold
lot materialcustomer
Figure 7-5: The relation between ship, hold, lot, customer and material
Chapter 7 82
to holds, constraints in the transportation system again have to be taken into account. The desti-nation of the material also depends on the stockyard layout. The materials that are stocked on the stockyard are monitored and registered continuously by the scheduler that has outside duty. Registration takes place on a piece of paper that shows the layout of the stockyard, and on a large board hanging on the wall of the planning department.
Assign stacker/reclaimer, barge loader and ship loader
The scheduler determines how to transport the unloaded material to its destination. In the case of lots that go ashore, the scheduler decides which stacker/reclaimer will be used to stack the ma-terial in the stockyard. The selection of a stacker/reclaimer to transport material to the stockyard depends on:
• the type of material, which determines in what section of the stockyard the material should be stocked;
• the stockyard layout, which indicates where free space is available; • the availability of stacker/reclaimers, which is not only determined by the unloading of
ships but also the loading of barges from the stockyard and the loading of sea�going ves-sels from the stockyard;
• the position of stacker/reclaimers, which determines the amount of time required to move the stacker/reclaimer between the sections of the stockyard;
• the constraints and allocation of the conveyor belt system. In the case of lots that are carried through, the scheduler selects a barge loader or allocates the ship loader. The selection of a barge loader depends on:
• the availability of barges, i.e., enough barges have to be present at the same time as the ship is unloaded;
• the availability of barge loaders, which depends on other barges to be loaded. Scheduling of ships that have to be loaded is much less complex than scheduling ships that have to be unloaded, as there is only one ship loader. Furthermore, the hold configuration of the load-ing ships is much simpler, and in some cases, the schedulers can even decide themselves which material from a fixed assortment to load. Material that has to be loaded can be transported to the ship loader in three ways, depending on its origin:
1. material lies in the main stockyard: a stacker/reclaimer reclaims the material from the stockyard and the conveyor belt system transports it to the ship loader;
2. material lies in the stockyard adjacent to the ship loader: it is transported to the ship loader by bulldozers and mobile conveyor belts;
3. material comes directly from a sea�going vessel: it is unloaded and transported to the ship loader by a direct connection via the conveyor belt system.
When assigning production equipment, the schedulers have to take the limited number of work-ers into account. There are some operations that are labor�intensive and if these have to be scheduled simultaneously, a problem can arise. In the previous section, emptying ships was de-scribed as a labor�intensive activity; this also holds for activities where bulldozers are used, such as loading a train without using the train loading station, loading trucks, and loading material on the mobile conveyors in harbor C.
Accept barges
The loading of barges is not scheduled in detail: depending on the allocation of production equipment to other operations, a fixed tonnage of barges is accepted per shift. If a barge is going to arrive at the port it is put in an administrative computer system and scheduled for a particular
Implementation of a scheduling decision support system 83
shift. Within the 8 hours of the shift, the workmen on the shop floor may choose which barge to serve when. The loading of trains and trucks is also not scheduled in detail. Trains have to be loaded within the strict time schedule of the railway company; however, this does not usually pose a problem because of the relatively small loads on trains.
Estimate unloading throughput time
When the production equipment is assigned, the scheduler determines the throughput times of the ships that are unloaded. A rough estimation of the unloading speed can be made by taking into account the number of unloaders used to discharge a ship, and the destination of the mate-rial, i.e., ashore or carry through. However, the unloading capacity depends on many other fac-tors, of which the most important (and tangible) ones relate to the type of material handled and the type of ship involved. These are explained below.
• Material type. The density of ore is higher than that of coal, and therefore, ore can be un-loaded faster than coal. Moreover, some types of material are more difficult to unload than others: if material is wet, sticky and powdery, unloading will probably take longer than if material is dry, smooth and coarse.
• Shape of holds. Some holds have profiles or other irregular shapes on the inside which means that material may stick between these irregularities. People and bulldozers are low-ered into the hold to remove the material to enable the unloader to reach it. Other holds are smooth on the inside which means that the material will subside during unloading. Emptying a hold will take less time in these cases. Furthermore, the openings of holds vary in size which means that if these openings are small, unloaders have to be more careful.
There are other, less tangible factors influencing the unloading capacity, such as weather condi-tions, safety regulations, material heating, personnel, disposition of the captain, etc.
Monitor progress of production
From the completed schedule a list of work�orders per shift is made and transferred to the shift foreman. During the rest of the scheduler�s duty, the progress of production is closely monitored and actions are taken if real production deviates from the schedule. Hence, the scheduler com-municates with agents, ships� crews, bargemasters, shift foremen, shift personnel, safety inspec-tors, inspectors of weights and measures, the planners, the outdoor duty scheduler, the commer-cial department, etc.
7.3 Task redesign In the task redesign phase, the role of a decision support system in the scheduling task is out-lined, based on the concepts discussed in the previous chapter. In the models presented in Figure 6-6 and Figure 6-7, it is shown that the functionality and information presentation of a schedul-ing decision support system should be derived from the following aspects of the scheduling task: autonomy, transparency, level of support and aggregation. Therefore, questions that should be answered for each activity in the scheduling task are:
• What is the autonomy of the scheduler? • Is the task of a critical and ill�defined nature? • Is the task of a routine nature, or are there many exceptions? • Is the task complex, i.e., does it require the simultaneous consideration of many informa-
tion cues? In the following subsections, the redesign process is described for each activity in the scheduling task.
Chapter 7 84
7.3.1 Assign quays to ships By assigning ships to quays, and by making a preliminary assignment of unloaders to ships, start times and preliminary throughput times of ships are determined. The ship schedule is made manually; thus, generating and in particular maintaining the ship schedule is very labor intensive. Changes in information regarding ships often lead to laborious updating activities. The questions mentioned at the beginning of this section can be answered as follows:
• The scheduler has the autonomy to make decisions regarding the allocation of ships to quays. In some cases, the allocation of ships to quays has to be communicated and negoti-ated with the commercial department.
• The task is not of a critical and ill�defined nature. • The task has a certain amount of routine; however, it is not without exceptions. • The task is moderately complex.
From these answers, it follows that a decision support system should support the human sched-ulers in making changes to the schedule. Also, a system can support human cognition in manag-ing complexity, by presenting an overview of the ship schedule. It should be possible to make changes to the schedule manually in the system, because sometimes the schedule is the result of communicating and negotiating with the commercial department, which cannot be captured by the system.
7.3.2 Construct unloading sequence The hold configuration of a ship restricts the freedom of the scheduler in unloading the ship. As stated in Section 7.2, different lots have to be unloaded separately to avoid contamination, and holds have to be unloaded evenly to avoid strain. For each hold configuration, the scheduler has to construct an unloading sequence. The questions mentioned at the beginning of this section can be answered as follows:
• The autonomy for constructing an unloading sequence lies partly with the scheduler, and partly at the ship�s captain.
• The task is not of a critical or ill�defined nature. • The task has a certain amount of routine. • The task is not complex.
Because the scheduler does not have complete autonomy in making an unloading sequence, a scheduling system should at most support the human scheduler in constructing an unloading se-quence. A problem that is of a more practical nature is that to construct an unloading sequence, detailed information is needed about the dimensions of the ship and the position of the unload-ers is needed. This means that many modeling efforts would have to be made in order to support only a minor aspect of the scheduling task. Therefore, it might be preferable to exclude this sub�task from the design of the system.
7.3.3 Assign unloaders to holds Assigning unloaders to ships and holds requires problem solving activities by the human sched-uler. Many criteria, both well� and ill�defined have to be taken into account when assigning un-loaders. Hence, assigning unloaders requires much expertise. Moreover, assigning unloaders to ships is a critical task as it largely determines the productivity of the unloading process. Hence, the questions mentioned at the beginning of this section can be answered as follows:
• The autonomy lies with the scheduler. • The task is of a critical and ill�defined nature.
Implementation of a scheduling decision support system 85
• The task has a small amount of routine. • The task is very complex.
Because this activity has a small amount of routine, assigning unloaders to ships is an activity that needs the human scheduler as principal controller. As a result, the level of support of a decision support system should be low: it could for example be used to warn the scheduler if impossible assignments have been made, such as the case where unloaders would have to pass each other. Because the task is of a critical and ill�defined nature, the need to be in control is high, and the transparency of a decision support system should be high. Because many elements have to be taken into account simultaneously, a decision support system could be used to support the hu-man scheduler by means of the presentation of information.
7.3.4 Assign stacker/reclaimers, barge loaders, ship loaders The activity of assigning stacker/reclaimers, barge loaders, and ship loaders is of a similar nature to the activity of assigning unloaders to ships/holds. An additional factor that has to be consid-ered in this activity is the availability of the conveyor belt system. Therefore, the questions men-tioned at the beginning of this section can be answered as follows:
• The autonomy lies with the scheduler. • The task is of a critical and ill�defined nature. • The task has a small amount of routine. • The task is very complex.
Hence, decision support in this activity should be of the same nature as in the activity of assign-ing unloaders to holds. Because of the small amount of routine, this is an activity that needs much attention of the human scheduler, and the level of support of a decision support system should be low. A possibly useful way to support the human scheduler lies in managing the avail-ability of the conveyor belts. As described in Section 7.2.1, checking the availability of individual components of the conveyor belt system is often delegated to the operators on the shop floor. Also, it has been agreed in the company that schedules that are transferred to the shop floor, whilst not necessarily decisive, should at least be feasible. Therefore, the scheduler does not want to explicitly schedule each conveyor belt individually. However, a warning signal will be useful when an impossible combination of routings has been scheduled. Because the task is of a critical and ill�defined nature, the need to be in control is high, and the transparency of a decision sup-port system should be high. Because many elements have to be taken into account simultane-ously, a decision support system could be used to support the human scheduler by means of in-formation presentation.
7.3.5 Estimate unloading throughput time Based on the assignment decisions made in the previously described activities, an estimate of the throughput time of unloading operations is made. As described in Section 0, unloading through-put times are hard to grasp in the company. Estimates are based on a number of well� and ill�defined factors, and the result of this process is an estimate of the number of tons that are dis-charged per shift. As soon as the estimate is made, calculating the throughput time becomes a la-borious task, as the total tonnage of a ship has to be divided by the estimate, and the scheduler needs to know the remaining tonnage per ship at the end of each shift. During the unloading process the real unloading speed may deviate from the estimate, and the scheduler has to per-form the calculations again. For these reasons, the questions mentioned at the beginning of this section can be answered as follows:
• The autonomy lies with the scheduler. • The task is of a critical and ill�defined nature.
Chapter 7 86
• The activity of estimating has a small amount of routine, and the activity of calculating has a large amount of routine.
• The task is moderately complex. Therefore, a decision support system should calculate the unloading time for a given estimate of the unloading speed. Furthermore, the decision support system may make a preliminary estimate of the unloading speed based on a small number of factors that have proven to be important in the estimation process. The scheduler then is able to deviate positively or negatively from this es-timate, based on his knowledge about a specific instance.
7.3.6 Accept barges Based on the assignments of production equipment that are made in the previous activities, a certain amount of capacity remains to load barges. Also, if material has to be carried through, barges have to be ordered to carry off the material. Barges are not scheduled for a specific time; rather, they are scheduled for a specific shift. The exact sequence of barges in a shift partly de-pends on the sequence of arrival of the barges, and the operators on the shop floor can some-times decide which barge to serve first. Hence, the questions mentioned at the beginning of this section can be answered as follows:
• The autonomy of scheduling barges in shifts lies with the scheduler, and the autonomy of scheduling barges during shifts lies with the operators on the shop floor.
• The task is of a moderately critical and ill�defined nature if it concerns barges for carry�through operations.
• The activity has a large amount of routine. • The task is not complex.
Because the scheduler does not have total autonomy in scheduling barges, a scheduling system should at most support the human scheduler for this activity. An important aspect of this activity is that the allocation of barge loaders should be consistent with the unloading operations of ma-terial that has to be carried through. Also, the scheduler can be supported in determining the amount remaining of barge loading capacity.
7.3.7 Monitor progress of production The progress of production is monitored closely by the scheduler on duty, and deviations from the schedule are identified and acted upon. This activity requires intense problem solving by the human scheduler, and it often involves dealing with ill�defined factors that cause reality to devi-ate from scheduled production. Many disturbances are identified during communications with humans. These activities are often of a critical nature as the progress of production may be en-dangered if the problems identified are not solved quickly. If changes to the schedule have to be made, many elements have to be considered simultaneously, and laborious calculations may re-sult. The questions mentioned at the beginning of this section can thus be answered as follows:
• Autonomy lies partly with the scheduler and partly with the commercial department, the ship�s captain, and the operators on the shop floor.
• The task is of a critical and ill�defined nature. • The task has a very small amount of routine. • The task is of varying complexity.
In this activity, a decision support system could be used to support the human scheduler by pro-viding an overview and by facilitating schedule updates. The decision support system compo-nents that support this activity should be transparent.
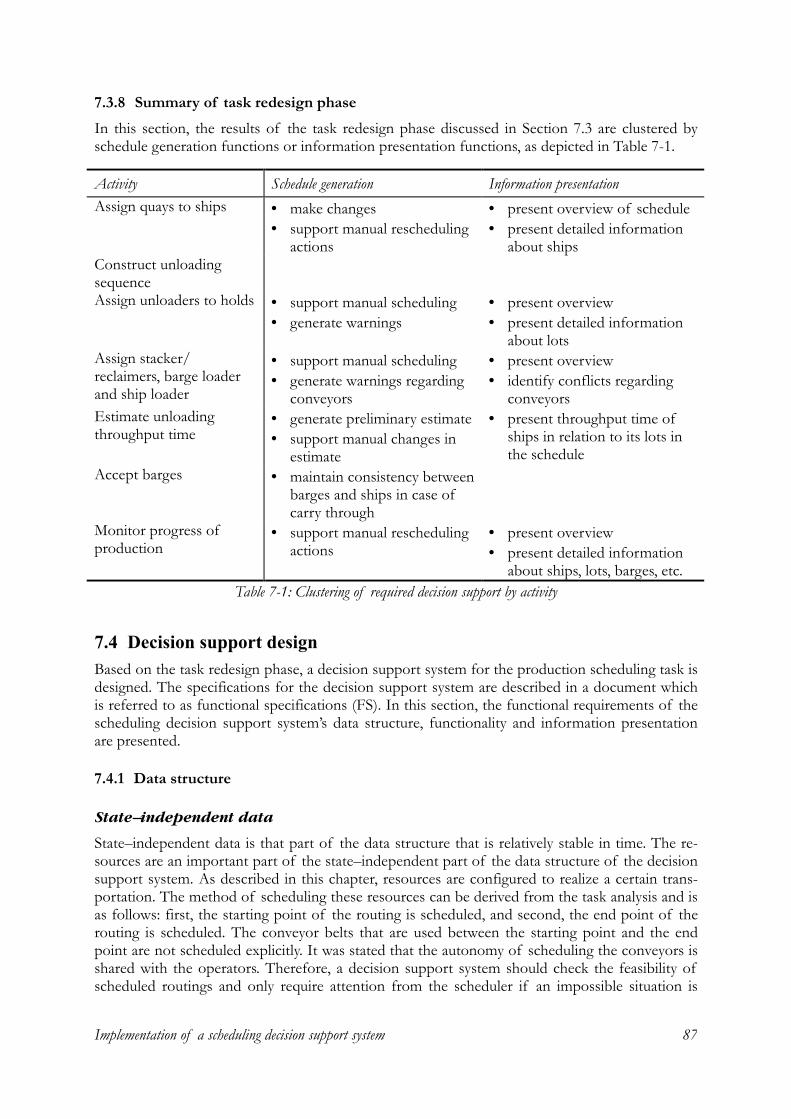
Implementation of a scheduling decision support system 87
7.3.8 Summary of task redesign phase In this section, the results of the task redesign phase discussed in Section 7.3 are clustered by schedule generation functions or information presentation functions, as depicted in Table 7-1.
7.4 Decision support design Based on the task redesign phase, a decision support system for the production scheduling task is designed. The specifications for the decision support system are described in a document which is referred to as functional specifications (FS). In this section, the functional requirements of the scheduling decision support system�s data structure, functionality and information presentation are presented.
7.4.1 Data structure
State–independent data
State�independent data is that part of the data structure that is relatively stable in time. The re-sources are an important part of the state�independent part of the data structure of the decision support system. As described in this chapter, resources are configured to realize a certain trans-portation. The method of scheduling these resources can be derived from the task analysis and is as follows: first, the starting point of the routing is scheduled, and second, the end point of the routing is scheduled. The conveyor belts that are used between the starting point and the end point are not scheduled explicitly. It was stated that the autonomy of scheduling the conveyors is shared with the operators. Therefore, a decision support system should check the feasibility of scheduled routings and only require attention from the scheduler if an impossible situation is
Activity Schedule generation Information presentation Assign quays to ships • make changes
• support manual rescheduling actions
• present overview of schedule • present detailed information
about ships Construct unloading sequence
Assign unloaders to holds • support manual scheduling • generate warnings
• present overview • present detailed information
about lots Assign stacker/ reclaimers, barge loader and ship loader
• support manual scheduling • generate warnings regarding
conveyors
• present overview • identify conflicts regarding
conveyors Estimate unloading throughput time
• generate preliminary estimate • support manual changes in
estimate
• present throughput time of ships in relation to its lots in the schedule
Accept barges • maintain consistency between barges and ships in case of carry through
Monitor progress of production
• support manual rescheduling actions
• present overview • present detailed information
about ships, lots, barges, etc. Table 7-1: Clustering of required decision support by activity
Chapter 7 88
scheduled. A possible way to meet the mentioned requirements is to define the following types of resources in the data structure:
• Resources • Associated resources • Invisible resources
Excluding the conveyor belts, a specific piece of production equipment can both act as resource and associate resource, depending on which is scheduled first. For example, if a transportation is scheduled from unloader 3 to barge loader 1, the latter is the associated resource. Conveyor belts are modeled as �invisible resources.� Invisible resources have similar capacity restrictions as �normal� resources, but are not explicitly scheduled by the scheduler. This means that if a trans-portation from resource X to associate resource Y is scheduled, the system must check the avail-ability of the conveyor belt system in between these resources in an invisible manner. Moreover, it must be possible to schedule maintenance activities of these resources.
Similar resources are said to be part of a resource group or category, e.g., stacker reclaimers all belong to the stacker/reclaimers resource group. The data structure must contain the following resource categories: barge loaders, harbor B quays in combination with the unloaders, harbor C quays in combination with the ship loader, train loading stations, silos, stacker/reclaimers, con-veyor belts. The quays of harbor A are not explicitly mentioned here, as the barges are much smaller than the quays, and, therefore, the quays do not have to be scheduled separately.
Modeling the quays of harbor B and the unloaders presents an interesting problem, because these two resource types have to be combined in order to unload ships. Moreover, at any time, the sequence of the unloaders along the quays of harbor B must be in ascending order, if viewed from the west quay to the east quay. For example: if unloader 1 is in the middle quay, unloader 2, 3, and 4 must be in either the middle or the east quay. The unloaders take material out of the ships and drop it on one of the three conveyor belts that run parallel to harbor B (the so called �quay belts�). There are three quay belts which means that there is a maximum of 3 unloading streams. Because the capacity of unloaders 1 and 2 is less than that of unloaders 3 and 4, unload-ers 1 and 2 are often used as a pair which load together onto one quay belt. However, other combinations of unloaders are regularly used. Unloaders 1 and 2 can only be used to unload onto two of the three quay belts.
Resources are consumed in time by means of operations. In this case, operations apply to rout-ings instead of individual resources. As stated in Section 7.2.2, the processing time of operations can be difficult to estimate. Two factors that may be used by a decision support system to give a preliminary estimate are: (1) the routing used, in particular the question of which unloaders are used and if the material is carried through or goes ashore; and (2) material type, in particular the question whether ore or coal is discharged.
State–dependent data
The state�dependent part of the data structure contains the data that changes over time. In this case, the state�dependent part of the data structure consists of data about ships, lots, holds, cus-tomers, materials and work�orders (see also Figure 7-5). It should be noted that lots are a special type of work�orders, i.e., work�orders that are related to a ship. Work�orders that are not related to a ship can for example be generated for loading trains.
7.4.2 Functionality The scheduling decision support system should encompass the following functions, as summa-rized in Table 7-1: support making changes to the activity of assigning quays to ships; support
Implementation of a scheduling decision support system 89
manual changes in the estimation of operation times and in the assignment of quays to ships, unloaders to holds, and stacker/reclaimers, barge loaders and ship loaders; generate warnings re-garding constraints of unloaders and conveyor belts; and maintain consistency between resources and associated resources.
Scheduling lots
Ships contain lots that have to be unloaded, and both items levels must be scheduled in a consis-tent manner. The viewpoint that is used here is that ships themselves can not be scheduled, but that only lots can be scheduled. The start time of a ship must be derived from the start time of the earliest starting lot, and the end time must be derived from the end time of the latest finish-ing lot. The system must derive this information from the unloading of lots to show the throughput time of a ship.
As soon as information about lots is available, it is added to the lot list, which is grouped by ship. The scheduler must be able to select lots from the list to put onto the schedule. The lots will be scheduled at the earliest possible moment of the selected resource. When lots are scheduled on a specific resource, the sequence of the lots will be the similar to the sequence in the list. If priori-ties for the lots are specified; the sequence will obey these priorities.
The scheduler must also be able to schedule one or more lots on multiple resources at the same time. If lots are selected in the list, a dialogue is invoked, in which the following data is available: (1) quay (when the first lot of a ship is being scheduled the quay will be unknown, so this needs to be defined); (2) unloader(s); (3) associated resources (optional); (4) method for balancing work on resources (unloaders). Lots can be balanced on unloaders based on (a) quantity, i.e., this op-tion ensures that the selected quantity of the lots is spread equally over the selected resources; and (b) time, i.e., this option ensures that the selected lot(s) are spread over the selected resources so that the end time of all selected resources are the same. As a consequence of these balancing options, it might be necessary to split a lot.
Scheduling work–orders
Similar to scheduling lots, the scheduler must be able to select one or more work�orders from a list to put onto the schedule. When a selection of work�orders scheduled on a resource in the schedule, the sequence will be the similar to the sequence in the list. However, if priorities of the work�orders are specified, the sequence must obey these priorities. The work�orders will be scheduled at the earliest possible moment of the selected resource. As with scheduling lots, scheduling associated resources is optional. By scheduling an associated resource, the capacity of that resources is reserved.
Rescheduling
The scheduler must be able to move all objects in the schedule to an alternative position. The system must then retain the consistency between ships and lots, and resources and associate re-sources. The scheduler can move ships backwards and forwards in time and move it to another quay. All lots of that ship are then automatically moved with the ship, and the sequence of the lots is be retained. However, the lots may be delayed because unloaders may not be available im-mediately. This may also mean that other ships allocated to the same quay are be moved, which is done automatically. If a ship is moved to another quay a dialogue is invoked to define which un-loader(s) are used in place of the original unloader(s).
Chapter 7 90
Scheduling unloaders
Typically, scheduling concerns the allocation of tasks to resources. However, in this case, the re-verse is also true: resources are also allocated to tasks. Unloaders can be allocated to lots and vice versa in two different ways, either based on time or based on quantity. Both methods of schedul-ing must be handled in the system.
For example, the scheduler wants to move unloader 3 from a ship�s lots at the western quay and allocate it to a ship�s lots at the eastern quay. The scheduler invokes a menu with the option �Move to�� When the scheduler chooses this option, a dialogue will be showed with the follow-ing fields:
• change to: quay (east, middle, west) • effective from: for example, the start time of the ship on the eastern quay or a specified
time • connect to lot: select a lot from the available lots of the specified ship • connect until: end of lot, specified time, specified quantity
Unloading speed
The scheduler needs to be able to specify that at a specific time a certain quantity has been unloaded from an ongoing unloading operation. A dialogue can be selected with the following inputs:
• time (this will be updated when the following data is changed) • scheduled quantity unloaded/still to unload • scheduled unloading speed
The scheduler will then be able to enter the following data in the dialogue: • actual quantity unloaded/still to unload • actual unloading speed
• new unloading speed related to the remaining quantity (if this option is selected the lot/work�order will automatically be split)
• new unloading speed related to total quantity When one of these two cases is used, the other data will automatically be updated.
Scheduling associated resources
The scheduler must be able to specify that a certain associated resource is allocated to a work�order. The system must control the availability of the associated resource and the needed invisi-ble resources to connect it to the resource, and give a warning that a conflict is created.
Constraints
Constraints which must be enforced by the system�i.e., �hard� constraints�are: • A (lot related to a) ship can not be scheduled earlier than its ETA • A ship is empty when all holds on the ship are empty • Unloaders can not pass each other • Lots can not be moved to another quay unless the whole ship is moved • A ship can only unload at one quay at a time • Resources can not be used on two lots/work�orders at the same time
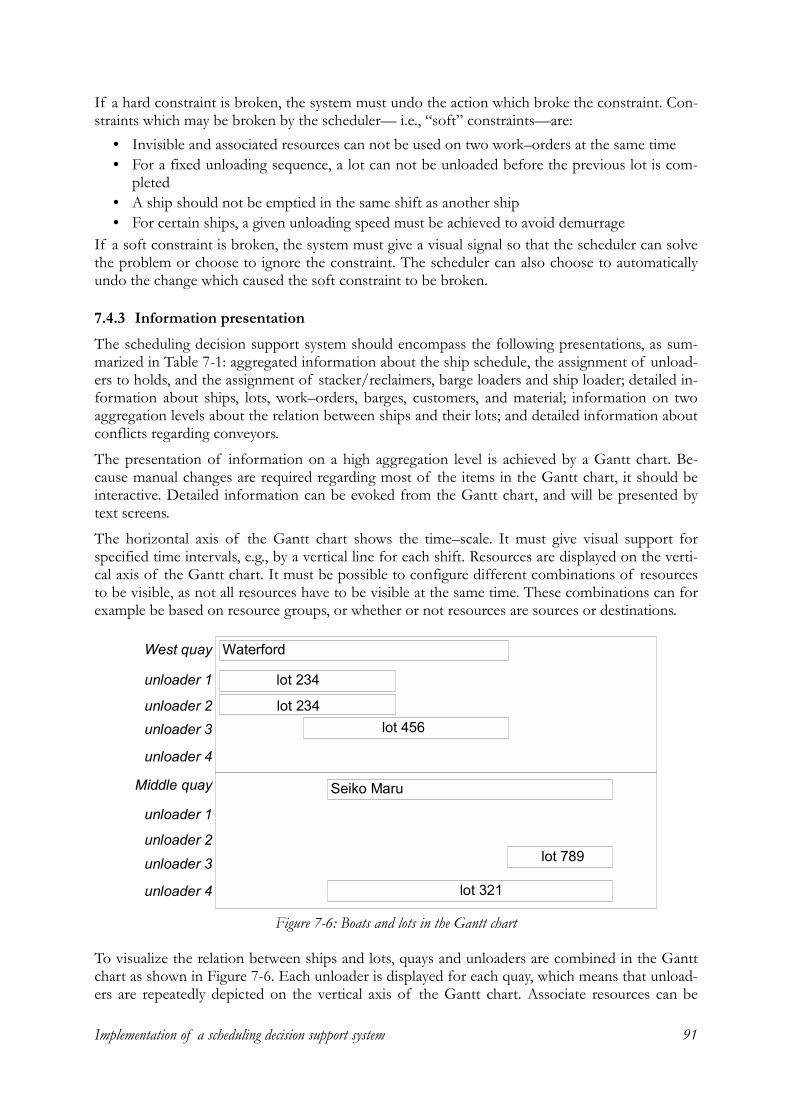
Implementation of a scheduling decision support system 91
If a hard constraint is broken, the system must undo the action which broke the constraint. Con-straints which may be broken by the scheduler� i.e., �soft� constraints�are:
• Invisible and associated resources can not be used on two work�orders at the same time • For a fixed unloading sequence, a lot can not be unloaded before the previous lot is com-
pleted • A ship should not be emptied in the same shift as another ship • For certain ships, a given unloading speed must be achieved to avoid demurrage
If a soft constraint is broken, the system must give a visual signal so that the scheduler can solve the problem or choose to ignore the constraint. The scheduler can also choose to automatically undo the change which caused the soft constraint to be broken.
7.4.3 Information presentation The scheduling decision support system should encompass the following presentations, as sum-marized in Table 7-1: aggregated information about the ship schedule, the assignment of unload-ers to holds, and the assignment of stacker/reclaimers, barge loaders and ship loader; detailed in-formation about ships, lots, work�orders, barges, customers, and material; information on two aggregation levels about the relation between ships and their lots; and detailed information about conflicts regarding conveyors.
The presentation of information on a high aggregation level is achieved by a Gantt chart. Be-cause manual changes are required regarding most of the items in the Gantt chart, it should be interactive. Detailed information can be evoked from the Gantt chart, and will be presented by text screens.
The horizontal axis of the Gantt chart shows the time�scale. It must give visual support for specified time intervals, e.g., by a vertical line for each shift. Resources are displayed on the verti-cal axis of the Gantt chart. It must be possible to configure different combinations of resources to be visible, as not all resources have to be visible at the same time. These combinations can for example be based on resource groups, or whether or not resources are sources or destinations.
To visualize the relation between ships and lots, quays and unloaders are combined in the Gantt chart as shown in Figure 7-6. Each unloader is displayed for each quay, which means that unload-ers are repeatedly depicted on the vertical axis of the Gantt chart. Associate resources can be
West quay
Middle quay
unloader 1
unloader 2unloader 3
unloader 4
unloader 1
unloader 2unloader 3
unloader 4
Waterford
Seiko Maru
lot 234
lot 234lot 456
lot 789
lot 321
Figure 7-6: Boats and lots in the Gantt chart
Chapter 7 92
visualized by text labels in the bars that represent lots. In the above figure, unloader 3 is moved from lot 456 of the ship named Waterford to lot 789 to the ship named Seiko Maru. Unloader 1 and 2 are discharging lot 234 together. Figure 7-6 also shows that the throughput time of a ship is derived from the throughput times of its lots.
7.5 Discussion and evaluation The application of the design model results in a specific scheduling decision support system. The validity of the design model has to be tested by evaluating the decision support system. This evaluation should be based on the use of the decision support system by the schedulers, corre-sponding to the research questions stated in Chapter 4. Another, possibly obvious criterion for validating the design model might be the performance of scheduling. In other words, the ques-tion can be asked if applying the design model in practice will improve performance. However, as discussed in Section 2.2.3, the performance of scheduling in practice is very difficult to meas-ure objectively and unambiguously (Gary et al., 1995; Stoop, 1996). Moreover, it would be very difficult to causally relate a change in scheduling performance to the implementation of the deci-sion support system. Hence, in the context of validating the design model, the performance of scheduling is not used; instead, the use of the system by the schedulers is evaluated. Such an evaluation is similar to the procedure that was outlined in Chapter 4 and followed in the explana-tory case studies in Chapter 5.
A methodological condition for the validation of the design model is that it should be clear how the model is translated into the specific design. Applying the design model to this specific situa-tion in practice has resulted in characteristics of the designed system that would not easily have been realized otherwise. For example, the issue of autonomy in allocating conveyor belts resulted in the invisible checking of these conveyors in the system. Another example is the explicit way of aggregating information regarding the presented schedule, i.e., ships versus lots. In this chapter, an attempt was made to clearly link the design of the system to the design model. In particular, the following measures were used: (1) the structure of the chapter is analogous to the phases of the design model; (2) in Section 7.3 where the task redesign is described, four questions are asked and answered that represent the new concepts of the design model for each sub�task; (3) the an-swers to these questions, which lead to certain requirements for the decision support system, are summarized in Table 7-1; and (4) the requirements in Table 7-1 are translated into the design of the system in Section 7.4. The design of the system as described in Section 7.4 is derived from the functional specifications document, which was used by software suppliers to prepare offers.
However, applying the design model in practice, which means implementing a scheduling deci-sion support system in practice, is a time�consuming activity. At the time of printing this thesis, the project is approximately one year old, and the implementation of the system is not finished. Hence, in this thesis it is unfortunately not possible to include an evaluation of the design model by evaluating the use of the decision support system. However, although evaluating the opera-tionalization of the design model�i.e., the system�is not possible at this moment, it is possible to evaluate the process of designing a scheduling decision support system with the design model. A number of aspects regarding the application of the design model are discussed.
• Phasing the project. The design model breaks down the project into a number of phases. This turned out to be very useful for setting milestones; moreover, it is easier to estimate throughput times per phase than to estimate throughput times for the whole project. Al-though it was the first time that the design model was applied in practice, all phases were realized on time.
• Communicating milestones. During the project, it is important to keep the responsible manag-ers informed about its progress. The design model�s phasing of the project turned out to
Implementation of a scheduling decision support system 93
be very suitable to deliver partial results. After completing a number of phases, the partial reports simply were combined into one document.
• Obtaining commitment. The interdisciplinary approach that is inherent in the design model made it necessary to contact a large variety of people within the organization. Because the design model includes a task analysis of the schedulers, a considerable amount of time was spent at the scheduler�s office. In this way, commitment for the project could be obtained and increased.
• Gaining insight. The design model decomposes the problem of designing a system into a number of sub�problems. It was found that this procedure naturally leads the people in-volved to gain insight in the problem and its possible solutions.
• Translation of analysis to design. Although designing a scheduling decision support system with the design model requires much creativity, it was found that the results of the analysis could be rather seamlessly translated into the design of the system.
Before using the FS document for selecting a software supplier, the FS were assessed by the schedulers. This resulted in correcting a number of minor errors; however, they agreed with most of the aspects of the FS. To select a software supplier to build the specified system, a number of suppliers were invited to illustrate if and how they would be able to implement the FS. These ses-sions were also attended by two schedulers. Based on these sessions, a software supplier was se-lected, who made an offer to implement the FS using customized software. Most suppliers of standard software packages for scheduling were not able to capture the requirements in the FS adequately. In particular, the specified presentation of information and modeling of some of the specified constraints turned out be difficult to tackle with standard solutions.

Discussion and conclusions 95
8. Discussion and conclusions
The main objectives of this study were: (1) to explain why scheduling techniques are (not) used in practice, and (2) to construct a model for designing decision support for human schedulers. In this chapter, the results of the study are discussed, and recommendations for future research are given.
8.1 General conclusion In this thesis, the question of why scheduling information systems are not often used in practice is addressed. The use and design of decision support systems for production scheduling tasks are studied by means of a number of case studies. Many of the real�world phenomena that are found in the case studies can be explained by means of existing cognitive theories. A model is constructed to design scheduling decision support systems from the perspective of human�computer interaction.
Apart from the new concepts and models that are presented in this thesis, the integrated ap-proach�based on cognitive psychology, operations management and information technology�is regarded as an innovative and valuable contribution to the field. This thesis demonstrates that several disciplines can be married in one approach to solve a particular problem, and clears the way for future multi�disciplinary research efforts.
8.2 Methodology The research design has been aimed at getting as much insight as possible in the limited time available. Many compromises had to be made, resulting in a focused and narrowed research ef-fort. It is felt that the answers to the research questions are satisfactory in the context of the available research resources. However, a number of gaps in the problem remain that might need further research.
The research elements in the conceptual framework have not been studied on a very detailed level. Certain aspects of the research elements and their relation to human computer interaction need further research. Consequently, the models that have been presented in this thesis still need considerable creativity and judgment to be used in practice. An important element that was ex-cluded from the empirical part of the research are the detailed cognitive processes of the human scheduler. A better understanding of a human scheduler�s cognitive processes can contribute to better support of these processes. Furthermore, more insight into these cognitive processes is needed to explain individual differences between schedulers. Related to individual differences is the issue of the level of education of schedulers. The level of education and training of schedul-ers is in most cases relatively low, especially if related to the great amount of control the schedul-ers have over production processes. Often, schedulers have advanced from blue�collar functions on the shop floor, and do not have an educational background in relevant disciplines such as op-erations management. It is felt that this limits their strategic and tactical decision making, and the mental ability to translate the manual scheduling task to a computer�supported scheduling task.
Chapter 8 96
Individual differences have been excluded from the research for two reasons: (1) analyzing multi-ple mental models would require huge research efforts, thereby distracting attention from other research elements; and (2) it turned out to be impossible to find an industrial setting where more than one scheduler controlled the same production unit. Ironically, such a setting was found eventually in the company where the design model was applied. However, at that phase of the research, it was too late to include individual differences in the explanatory part of the research.
Another shortcoming of the study lies in the limited number of case studies, and specifically, in the single case where the design model was applied. It is felt that the design model needs more validation by applying it to real�world situations, such as in Chapter 7. However, it would not be appropriate to solely derive the validity of the design model from the single case in Chapter 7. The model was constructed using four explanatory case studies, and is strengthened by findings in literature. Hence, it is felt that the design model deserves more credit than can be inferred from the one case study where it has been applied. Of course, the application of the design model does not guarantee successful implementation, and it is not the intention to make such a claim in this thesis. Many potential pitfalls can be identified that cause scheduling systems to fail: from political factors to the fact that the scheduling system is installed in the wrong office. How-ever, not taking into account the aspects that have been incorporated in the design model will greatly decrease the chance of successful implementation.
8.3 Artificial intelligence and human schedulers The research questions apply to all sorts of scheduling techniques, including AI based techniques. However, no AI techniques were studied in the case studies. This is due to the fact that no im-plementations of AI based systems could be found in practice. However, from the literature re-view in Chapter 2 it is concluded that most AI based techniques do not substantially differ from OR based techniques in how they generate solutions. An exception to this are expert systems that incorporate human scheduling expertise to solve the scheduling problem. Although expert sys-tems could not be empirically studied in the research described in this thesis, a number of con-siderations regarding the interaction between intelligent systems and human schedulers are given. These considerations have previously been published as a conference paper, see Wiers & McKay (1996).
In Section 2.2.2, a cognitive task model is presented that was applied to the scheduling task by a number of authors. The models presented in Figure 6-3 and Figure 6-5 are somewhat simplified versions of the model presented in Section 2.2.2 and only make a distinction between tasks that do need attention and tasks that do not need attention. In the context of expert systems, it might be useful to focus on the human decision making processes at the rule�based level. The notion of well�defined vs. ill�defined sub�tasks can be introduced to identify possibilities for intelligent scheduling systems. This notion of well� and ill�defined rule based tasks is important for under-standing a specific problem solving situation, and has been discussed at length in AI literature (Camerer & Johnson, 1991; Chi et al., 1988).
Another aspect regarding the possible advantage of expert systems over human schedulers is task complexity. It is stated that intelligent scheduling systems could be useful in tasks with moderate complexity (a similar approach is used by �t Hart, 1997). This means that in order to gain an ad-vantage over a human scheduler, the problem domain should be complex in terms of reasoning rules. There should also be a relatively large number of possible solutions since a tightly con-strained problem might be relatively straightforward, i.e., when there is only one choice or value for each attribute or decision.
In Section 6.2.2, the concept of transparency is introduced as a determinant for the confidence a human scheduler has in a scheduling system. It is explained that in critical and ill�defined tasks,
Discussion and conclusions 97
the human scheduler needs to be in control, without the �visible� presence of a scheduling tech-nique. It is very likely that the same can be said for the interaction between a human scheduler and an intelligent scheduling system. It is felt that the subject of how to allocate tasks to humans and intelligent system is a very interesting and relevant research topic for the near future. More-over, the success of future expert systems in practice will be highly dependent on such research.
An expert system needs to be filled with domain specific expertise. This expertise must be elic-ited from human experts and programmed into the �intelligence�base� of an intelligent schedul-ing system. However, in production scheduling, there is not a finite set of completely specified rules that can lead a problem to its solution. In other words, there is no complete, specified and documented set of characteristics that tell you what the problem is. A game of chess or bridge is well�defined; production scheduling is not. However, there may be components of production scheduling task that might be suitable for inclusion in an intelligent scheduling system. Compre-hensive pieces of rule�based decision behavior have to be picked out through a thorough prob-lem analysis. Therefore, in the development of an intelligent scheduling system, great emphasis should be put into the knowledge modeling process. As stated above, if the expert knowledge elicited is not conceptualized, a �flat� intelligence base will be the result, i.e., a knowledge base without a conceptual structure. If, for example, verbal protocols are used to elicit knowledge, the raw expert knowledge may be inconsistent and incomplete. This may lead to a situation where invalid outputs are generated in the testing phase and that subsequent additional knowledge elici-tation is necessary to correct the invalid outputs. Also, expert knowledge that turns out to be in-valid, out of date or incorrect during testing has to be removed from the intelligence base. This process may repeat itself without substantially improving performance. For the same reasons, a flat knowledge base is almost impossible to maintain.
8.4 Performance of scheduling In theory, the performance of a scheduling technique is regarded as very important. The useful-ness of techniques is often evaluated by one or a set of specified performance criteria, such as makespan. However, in practice, the performance of a scheduling technique is not perceived as important as it is in theory. In practice, a single performance criterion is never used, and a com-promise has to be made between multiple performance criteria. Moreover, in practice, objective performance norms do not exist for a number of reasons. The performance of a production unit is influenced by numerous factors. Therefore, the performance of a production unit fluctuates over time, and it is not possible to causally relate a decrease or increase in performance to specific scheduling actions or specific disturbances (see also Chapter 3). Also, the performance of a pro-duction unit in a specific time period could have been achieved at the cost of its performance in subsequent time periods, or at the cost of the performance of other production units in the same production chain. Therefore, the performance of production units can only be judged to a lim-ited extent by comparing the realized performance to past performance. As stated in Section 0, in many companies, schedulers more or less direct their efforts at service level, while also keeping costs under control.
The current situation in practice is that most schedulers are hardly interested in feedback about their performance. The fact that scheduling performance is very difficult to assess is only one possible explanation. Another possible explanation is that performance goals are very difficult to causally relate to scheduling actions. In the case study described in Chapter 3 of this thesis, no significant relationship was found between scheduled performance and real performance. In Sec-tion 2.2.3 it was indicated that performance feedback in complex task might be counterproduc-tive. This is unfortunate, because performance feedback might have been a measure to improve the motivation of human schedulers to use scheduling techniques. However, it was also stated that recent research has refined the consensus in literature that performance feedback does not
Chapter 8 98
work in complex tasks: in tasks with explicit learning, performance feedback was shown to gradually improve performance. The question of how to offer feedback to schedulers to improve the performance of the scheduling task, and to improve the use of scheduling techniques, is re-garded as an important area for future research.
8.5 What is scheduling? At the beginning of the research, difficulties were encountered in answering the question: what is scheduling? It was felt that, although the definitions that were briefly reviewed in Chapter 1 gave adequate support to conduct the research, these definitions did not adequately represent the key issues of scheduling in practice. Moreover, it is felt that the early literature on scheduling that was cited in Chapter 1 gives a better definition of scheduling than the recent literature. Throughout the research, the notion has grown that the common definition of scheduling�i.e., allocating a set of resources to perform a set of tasks�is inadequate and should be revised.
The current state of affairs regarding most of the research in production scheduling cannot be regarded as very positive. Furthermore, it is not to be expected that this situation will change within a short time period. Although scheduling research is still trying to solve more complex problems, the assumptions that underlie these research activities are inadequate in the light of real�world scheduling. If these underlying fundaments are not changed, the gap between theory and practice will persist: academia will continue to model and solve nonexistent problems, and practitioners will continue to move around in the dark. Pinedo (1995) states that despite the the-ory�practice gap in production scheduling, the general consensus in operations research is that the theoretical research done in the past has not been a complete waste of time, because it has given insight into the scheduling problem. However, Pinedo�s statement does indicate that the relevancy of much of the scheduling research can at least be questioned. Similarly, in a letter about operation scheduling, Burbidge (1994) states: �Is it not a tragedy that so much of the world�s most valuable resource (brains), is being squandered, in attempts to solve an obsolete problem?�
A good definition of scheduling needs to include a simplified representation of the real�world, while at the same time explaining a large number of aspects of the real�world. Consequently, de-scriptive studies of real�world (scheduling) situations should be the guiding principle for any (scheduling) definition. Hence, the common definition of scheduling as it is used by researchers has to be reconsidered. It is simply not based on informative studies of the real�world. It is felt that the current definition has evolved during extensive efforts to attack the scheduling problem, thereby leading to a greatly simplified problem representation. This problem is also recognized by McKay et al. (1988), who state: �The problem definition is so far removed from job�shop reality that perhaps a different name for the research should be considered.�
Although the gap between theory and practice in production scheduling has been discussed by many authors, the definition of scheduling has been kept out of harm�s way. A possible reason for the fact that the current definition of scheduling has persisted for so long without being sub-ject to substantial tests of validation might be the fact that descriptive field studies on production scheduling are scarce. Because scheduling in practice is often a (largely) manual task, such re-search should focus on the human factor in practical scheduling situations. This was also con-cluded by Sanderson (1989). As has been emphasized in Chapter 2 of this thesis, Sanderson ar-gues that more and better coordinated research on the human factor in scheduling is required.
Despite the differences between the traditional approach to scheduling and studies on scheduling in practice that have been reviewed in Section 2.2.1 and that have been presented in this thesis, it is believed that, in order to construct a new theory of scheduling, these viewpoints should be married into a single unified theoretical approach. The traditional approach from operations re-
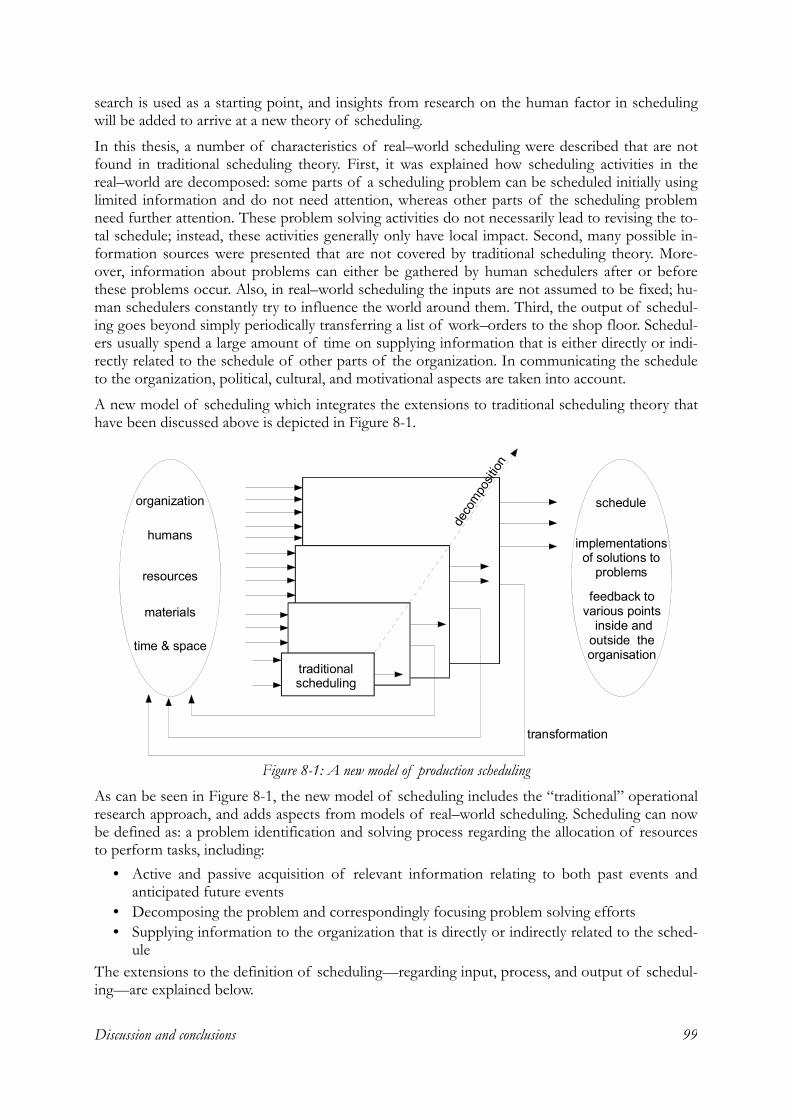
Discussion and conclusions 99
search is used as a starting point, and insights from research on the human factor in scheduling will be added to arrive at a new theory of scheduling.
In this thesis, a number of characteristics of real�world scheduling were described that are not found in traditional scheduling theory. First, it was explained how scheduling activities in the real�world are decomposed: some parts of a scheduling problem can be scheduled initially using limited information and do not need attention, whereas other parts of the scheduling problem need further attention. These problem solving activities do not necessarily lead to revising the to-tal schedule; instead, these activities generally only have local impact. Second, many possible in-formation sources were presented that are not covered by traditional scheduling theory. More-over, information about problems can either be gathered by human schedulers after or before these problems occur. Also, in real�world scheduling the inputs are not assumed to be fixed; hu-man schedulers constantly try to influence the world around them. Third, the output of schedul-ing goes beyond simply periodically transferring a list of work�orders to the shop floor. Schedul-ers usually spend a large amount of time on supplying information that is either directly or indi-rectly related to the schedule of other parts of the organization. In communicating the schedule to the organization, political, cultural, and motivational aspects are taken into account.
A new model of scheduling which integrates the extensions to traditional scheduling theory that have been discussed above is depicted in Figure 8-1.
As can be seen in Figure 8-1, the new model of scheduling includes the �traditional� operational research approach, and adds aspects from models of real�world scheduling. Scheduling can now be defined as: a problem identification and solving process regarding the allocation of resources to perform tasks, including:
• Active and passive acquisition of relevant information relating to both past events and anticipated future events
• Decomposing the problem and correspondingly focusing problem solving efforts • Supplying information to the organization that is directly or indirectly related to the sched-
ule The extensions to the definition of scheduling�regarding input, process, and output of schedul-ing�are explained below.
resources
materials
organization
humans
time & space
schedule
feedback to various points
inside and outside the organisation
traditional scheduling
deco
mpo
sition
transformation
implementations of solutions to
problems
Figure 8-1: A new model of production scheduling
Chapter 8 100
8.5.1 Input It has been explained that many information sources are addressed by scheduling. The question can be asked if these information sources are too elaborate and might be disregarded when mod-eling the scheduling problem. Indeed, in the process of modeling real�world artifacts, one of the essential activities is simplification. However, unlike many other business processes, a particularly tricky aspect of scheduling is that it deals directly with production without any intermediate con-trol levels. In other words, there is no �control buffer� to deal with inadequacies in the scheduling model.
Another aspect of information acquisition in real�world scheduling is that schedulers are able to anticipate future events: they are able to identify and solve problems some time before they will actually occur. Hence, uncertainty can be detected and solved in different ways: it can be antici-pated and solved by the scheduler before actual disturbances happen, and it can be detected as soon as a disturbance happens. These two ways of problem identification are somewhat com-plementary: if a scheduler is able to identify many problems in advance they might be solved be-fore they happen. Contrarily, if many existing problems have to be solved, little time remains to detect problems that may occur in the future. Moreover, if an existing problem has to be solved, the sense of urgency will be higher and violation of constraints, organizational procedures and the like will be more feasible. If a future problem has to be solved, the scheduler needs to ma-neuver more carefully within these boundaries.
8.5.2 Process The scheduler will use his judgment to determine if attention is needed for a certain part of scheduling. The attention given depends on the sense of urgency experienced by the scheduler. There are a number of possible constraints regarding work that influence the sense of urgency: a scheduler will pay attention to the following types of constraint:
• critically • tightly • extensively • stochastically
Work is critically constrained if it endangers the performance goals of scheduling. The scheduler wants to prevent or minimize violation of these goals; therefore, the scheduler wishes to be abso-lutely sure that this work is scheduled in a specific way. For example, if a scheduler arrives at the factory in the morning and scheduled production for the night shift has not been carried out due to a technical problem, the scheduler will want to make sure that the work that is delayed is pro-duced as soon as possible. Work is tightly constrained if the number of alternatives to produce the work is low. For example, if a certain amount of work can only be scheduled on one machine in a day shift, the scheduler will make sure that it is scheduled this way. Hence, tightly constrained work is scheduled first and the rest of the work is scheduled �around� it. Work is extensively con-strained if it needs the consideration of many information sources. As stated earlier in this paper, a large variety of information sources may be used in real�world scheduling. Moreover, these in-formation sources are not stable: they change over time. For example: personnel motivation on Tuesday morning will be higher than on Friday afternoon, and on Monday mornings people may turned out to be ill or less concentrated. Work that may cause problems is preferably not sched-uled in the night shift because the scheduler will not be present to solve problems if they arise. Also, at the end of a planning horizon the scheduler may want to make sure that the goals that were set for that time horizon are met. Work is stochastically constrained if history has proved that a specific set of work is often troubled by disturbances. For example, the throughput time of a particular product may be determined by many tacit factors. A scheduler will give attention to
Discussion and conclusions 101
this type of work, because it has a chance to become critically constrained. However, the sched-uler still has the possibility to anticipate the stochastic nature of the work.
8.5.3 Output Solutions to the problem are implemented through formal communication channels such as schedules and informal communication channels such as telephone calls with a supplier. The scheduler supplies information to various points in the organization, such as the shop floor, op-erations management, maintenance personnel, and the like. Also, information about the schedul-ing process is fed back to suppliers and customers. Both formal and informal communication channels are used to communicate information about the scheduling process.
There are various ways to solve problems: they can be ignored, their impact can be reduced, the constraints that keep the problem in existence can be relaxed, etc. (McKay et al., 1995b). Hence, in real�world scheduling, the outputs and inputs of the scheduling process are strongly interre-lated. Human schedulers do not take their inputs for granted; they are constantly influencing the world around them. For example, if there is not enough production capacity for a particular op-eration the scheduler may try to increase capacity by requesting overwork. Hence, the scheduling constraints mentioned above are transformed by the scheduler if possible and necessary.
8.6 Can humans be replaced? In this thesis, the assumption has been made that humans cannot be replaced by computers in all production control situations, and therefore, that human computer interaction in production scheduling is a useful field of study. With the current pace of technological advancement, the question can be asked if computers will gradually reduce the human component in production scheduling from an active role to at most a supervisor�s role. A logical next question would then be: �Is human�computer interaction in production scheduling a useful field of study?�
However, it is felt that the relevancy of the research described in this thesis is to a large extent independent from the importance of the human component in a scheduling situation. Many of the concepts that have been described in the context of human�computer interaction also go for more comprehensive scheduling information systems. For example, making a distinction between elements that do not need attention after being scheduled initially, and elements that do need ad-ditional attention will continue to be an important issue as long as uncertainty exists in the physi-cal world. Therefore, apart from the numerous objections and problems that are associated with replacing humans by computers (e.g., Bainbridge, 1983; Ho & Sculli, 1997), the question if hu-mans can be replaced is found to be irrelevant in the context of this research. In other words, human�computer interaction in production scheduling is not a field aimed at temporarily mend-ing the gap between theory and practice while waiting for the exact sciences to catch up. Contrar-ily, as has been illustrated by the proposed new model for production scheduling that was pre-sented in Section 8.5, the various approaches to the production scheduling problem should be married to a focused and coordinated research community.
Lastly, I sincerely hope that the research in this thesis will inspire other researchers in the schedul-ing community to use a more interdisciplinary view, and not to sacrifice empirical validation in favor of ease of modeling.

References 103
References
Anderson, J.R. (1990). Cognitive psychology and its implications (3rd edition). New York: Freeman.
Anthonisse, J.M., Lenstra, J.K., & Savelsbergh, M. (1988). Behind the screen: DSS from an OR point of view. Decision Support Systems, 4, 413�419.
Bainbridge, L. (1983). Ironies of automation. Automatica, 19, 775�779.
Baker, K.R. (1974). Introduction to scheduling and sequencing. New York: Wiley.
Bauer, A., Rowden, R., Browne, J., Duggan, J., & Lyons, G. (1991). Shop floor control systems: From design to implementation. London: Chapman & Hall.
Bertrand, J.W.M., & Wortmann, J.C. (1981). Production control and information systems for component manufacturing shops. New York: Elsevier Science Publishers, Ph.D. Thesis Eindhoven Univer-sity of Technology.
Bertrand, J.W.M., Wortmann, J.C., & Wijngaard, J. (1990). Production control: A structured and design oriented approach. New York: Elsevier Science Publishers.
Blazewicz, J., Domschke, W., & Pesch, E. (1996). The job shop scheduling problem: Conven-tional and new solution techniques. European Journal of Operational Research, 93, 1�33.
Boer, A.A.A. den (1992). Beslissingsondersteuning voor materiaalplanners. Enschede, The Netherlands: Febo, Ph.D. Thesis Eindhoven University of Technology [�Decision support for material planners� � in Dutch, with summary in English].
Brehmer, B. (1980). In one word: Not from experience. Acta Psychologica, 45, 223�241.
Burbidge, J.L. (1994). Operation scheduling (letter). Production Planning & Control, 5(3), 320.
Buxey, G. (1989). Production scheduling: Practice and theory. European Journal of Operational Re-search, 39, 17�31.
Byrd, T.A., & Hauser Jr., R.D. (1991). Expert systems in production and operations management: Possible human side effects in implementation. Production and Inventory Management Journal, Fourth Quarter, 53�57.
Camerer, C.F. & E.J. Johnson (1991). The process�performance paradox in expert judgement: How can experts know so much and predict so badly. In K.A. Ericsson & J. Smith (Eds.), Toward a general theory of expertise: Prospects and limits (pp. 195�217). Cambridge: Cambridge University Press.
Chi, M.T.H, Glaser, R., & M.J. Farr (Eds.) (1988). The Nature of Expertise. Hillsdale, NJ: Lawrence Erlbaum Associates.

104
Coburn F.G. (circa 1918). Scheduling: The coordination of effort. In I. Mayer (Ed.), Organizing for Production and Other Papers on Management 1912�1924 (1981, pp. 149�172). Easton: Hive Pub-lishing.
Conway, R.N., Maxwell, W.L. & Miller, L.W. (1967). Theory of scheduling. Reading, MA: Addison�Wesley.
Danek, A., & Koubek, R.J. (1995). Mapping perceptual and cognitive processing for the effective use of graphical displays in shop floor scheduling tasks. International Journal of Human Factors in Manufacturing, 5(4), 401�415.
Davis, F.D., & Kotteman, J.E. (1995). Determinants of decision rule use in a production planning task. Organizational Behavior and Human Decision Processes, 63(2), 145�157.
DeShon, R.P., & Alexander, R.A. (1996). Goal setting effects on implicit and explicit learning of complex tasks. Organizational Behavior and Human Decision Processes, 65(1), 18�36.
Dessouky, M.I., Moray, N., & Kijowski, B. (1995). Strategic behavior and scheduling theory. Hu-man Factors, 37(3), 443�472.
Dutton, J.M., & Starbuck, W.H. (1971). Finding Charlie�s runtime estimator. In J.M. Dutton & W. Starbuck (Eds.), Computer Simulation of Human Behavior (pp. 218�242). New York: John Wiley & Sons.
Early, P.C., Northcraft, G.B., Lee, C., & Lituchy, T.R. (1990). Impact of process and outcome feedback on the relation of goal setting to task performance. Academy of Management Journal, 33(1), 87�105.
Emerson, H. (1913). Twelve principles of efficiency. The Engineering Magazine, New York.
Fargher, H.E., & Smith, R.A. (1994). Planning in a flexible semiconductor manufacturing envi-ronment. In M. Zweben & M.S. Fox (Eds.), Intelligent scheduling (pp. 545�580). San Fran-cisco: Morgan Kaufmann Publishers.
Fransoo, J.C., & Rutten, W.G.M.M. (1994). A typology of production control situations in proc-ess industries. International Journal of Operations and Production Management, 14(12), 47�57.
Gantt, H.L. (1919). Organizing for work. London: Allen and Unwin.
Gargeya, V.B., & Deane, R.H. (1996). Scheduling research in multiple resource constrained job shops: A review and a critique. International Journal of Production Research, 34(8), 2077�2097.
Gary, K., Uzsoy, R., Smith, S.P., & Kempf, K.G. (1995). Measuring the quality of manufacturing schedules. In D.E. Brown & W.T. Scherer (Eds.), Intelligent scheduling systems (pp. 129�154). Boston: Kluwer Academic Publishers.
Grant, T.J. (1986). Lessons for OR from AI: A scheduling case study. Journal of the Operational Re-search Society, 37(1), 41�57.
Graves, S.C. (1981). A review of production scheduling. Operations Research, 29, 646�675.
References 105
Gupta, S.K., & Kyparisis, J. (1987). Single machine scheduling research. OMEGA � International Journal of Management Science, 15(3), 207�227.
Halsall, D., Muhlemann, A., & Price, D. (1994). A review of production planning and scheduling in smaller manufacturing companies in the UK. Production Planning & Control, 5(5), 485�493.
Hart, M.W. �t (1997). Designing IT�support for professionals: A knowledge management approach. Eindho-ven, The Netherlands: Eindhoven University of Technology Press, Ph.D. Thesis.
Heij, J.C.J. de (1996). Assessment of business information systems by data structures. Deventer, The Neth-erlands: Kluwer Bedrijfsinformatie B.V., Ph.D. Thesis Eindhoven University of Technol-ogy.
Heij, J.C.J. de, & Caubo, R.M.A. (1996). Assessment of logistics software by means of data mod-els: Applied to bills of material, routings and recipes. Computers in Industry, 31(1), 31�43.
Higgins, P. (1996). Interaction in hybrid intelligent scheduling. International Journal of Human Factors in Manufacturing, 6(3), 185�203.
Ho, J.K.K., & Sculli, D. (1997). The scientific approach to problem solving and decision support systems. International Journal of Production Economics, 48(3), 249�257.
Hoch, S.J., & Schkade, D.A. (1996). A psychological approach to decision support systems. Man-agement Science, 42(1), 51�64
Hoffman, P.J. (1960). The paramorphic representation of clinical judgment. Psychological Bulletin, 57(2), 116�131.
Hurley, S.F. (1996). OR�based scheduling investigations: An issue of quality in research (letter). Production Planning & Control, 7(3), 339.
Igbaria, M., & Iivari, J. (1995). The effects of self�efficacy on computer usage. OMEGA � Inter-national Journal of Management Science, 23(6), 587�605.
Jacoby, J., Mazursky, D., Troutman, T., & Kuss, A. (1984). When feedback is ignored: Disutility of outcome feedback. Journal of Applied Psychology, 69(3), 531�545.
Johnson, D.S., Perlow, R., & Pieper, K.F. (1993). Differences in task performance as a function of type of feedback: Learning�oriented versus performance�oriented feedback. Journal of Ap-plied Social Psychology, 23(4), 303�320.
Kanet, J.J., & Adelsberger, H.H. (1987). Expert systems in production scheduling. European Journal of Operational Research, 29, 51�59.
Kanet, J.J., & Sridharan, V. (1990). The electronic Leitstand: A new tool for shop scheduling. Manufacturing Review, 3(3), 161�169.
Kathawala, Y., & Allen, W.R. (1993). Expert systems and job shop scheduling. International Journal of Operations and Production Management, 13(2), 23�35.
Kempf, K.G. (1994). Scheduling semiconductor wafer production. In M. Zweben & M.S. Fox (Eds.), Intelligent scheduling (pp. 517�544). San Francisco: Morgan Kaufmann Publishers.
106
Kempf, K.G., Russell, B., Sidhu, S., & Barett, S. (1991). AI�based schedulers in manufacturing practice: Report of a panel discussion. AI Magazine, 5, 46�55.
Kerr, R.M. (1992). Expert systems in production scheduling: Lessons from a failed implementa-tion. Journal of Systems Software, 19, 123�130.
King, J.R. (1976). The theory�practice gap in job�shop scheduling. The Production Engineer, 55(March), 137�143.
Kleinmuntz, B. (1990). Why we still use our heads instead of formulas: Toward an integrative ap-proach. Psychological Bulletin, 107(3), 296�310.
Köhler, C. (1993). New technological and organisational solutions to shop floor control. Computer Integrated Manufacturing Systems, 6, 44�52.
Levy, P.E., Albright, M.D., Cawley, B.D., & Williams, J.R. (1995). Situational and individual deter-minants of feedback seeking: A closer look at the process. Organizational Behavior and Hu-man Decision Processes, 62(1), 23�27.
McKay, K.N. (1992). Production planning and scheduling: A model for manufacturing decisions requiring judgement. Waterloo, Ontario: University of Waterloo, Ph.D. Thesis.
McKay, K.N., Buzacott, J.A., & Safayeni, F.R. (1989). The scheduler�s knowledge of uncertainty: The missing link. In J. Browne (Ed.), Knowledge based production management systems (pp. 171�189). New York: Elsevier Science Publishers.
McKay, K.N., Safayeni, F.R., & Buzacott, J.A. (1988). Job�shop scheduling theory: What is rele-vant? Interfaces, 18, 84�90.
McKay, K.N., Safayeni, F.R., & Buzacott, J.A. (1995a). Common sense realities of planning and scheduling in printed circuit board production. International Journal of Production Research, 33(6), 1587�1603.
McKay, K.N., Safayeni, F.R., & Buzacott, J.A. (1995b). An information systems paradigm for de-cisions in rapidly changing industries. Control Engineering Practice, 3(1), 77�88.
McKay, K.N., Safayeni, F.R., & Buzacott, J.A. (1995c). A review of hierarchical production plan-ning and its applicability for modern manufacturing. Production Planning & Control, 6(5), 384�394.
Miles, M.B., & Huberman, A.M. (1994). Qualitative data analysis: An expanded sourcebook (2nd edi-tion). Thousand Oaks, CA: Sage Publications.
Moray, N. (1995). Mental models, strategies and operator intervention in supervisory control. In H.G. Stassen & P.A. Wieringa (Eds.), Proceedings of the XIV European Annual Conference on Human Decision Making and Manual Control, The Netherlands, June 14�16 (pp. 4.3.1�4.3.10). Delft, The Netherlands: Delft University of Technology.
Morton, T.E., & Pentico, D.W. (1993). Heuristic scheduling systems: With applications to production systems and project management. New York: John Wiley & Sons.

References 107
Muir, B.M. (1994). Trust in automation part I: Theoretical issues in the study of trust and human intervention in automated systems. Ergonomics, 37(11), 1905�1922.
Muir, B.M., & Moray, N. (1996). Trust in automation part II: Experimental studies of trust and human intervention in a process control simulation. Ergonomics, 39(3), 429�460.
Newell, A., & Simon, H.A. (1972). Human problem solving. Englewood Cliffs, NJ: Prentice�Hall Inc.
Norman, D.A. (1988). The psychology of everyday things. New York: Basic Books Inc. Publishers.
Parunak, H.V.D. (1991). Characterizing the manufacturing scheduling problem. Journal of Manufac-turing Systems, 10(3), 241�259
Patten, T.H. (1968). The foreman: Forgotten man of management. New York: American Management Association.
Pinedo, M. (1992). Scheduling. In G. Salvendy (Ed.), Handbook of Industrial Engineering (2nd edi-tion) (pp. 2131�2153). Chichester: Wiley�Interscience.
Pinedo, M. (1995). Scheduling: Theory, algorithms, and systems. Englewood Cliffs, NJ: Prentice Hall.
Price, H.E. (1985). The allocation of functions in systems. Human Factors, 27(1), 33�45.
Prietula, M.J., Hsu, W.L., Ow, P.S., & Thompson, G.L. (1994). MacMerl: Mixed�initiative schedul-ing with coincident problem spaces. In M. Zweben & M.S. Fox (Eds.), Intelligent scheduling (pp. 655�682). San Francisco: Morgan Kaufmann Publishers.
Ramasesh, R. (1990). Dynamic job shop scheduling: A survey of simulation research. OMEGA � International Journal of Management Science, 18(1), 43�57.
Randhawa, S.U., & McDowell, E.D. (1990). An investigation of the applicability of expert sys-tems to job shop scheduling. International Journal of Man�Machine Studies, 32, 203�213.
Rasmussen, J. (1986). Information processing and human computer interaction: An approach to cognitive engi-neering. Amsterdam: North�Holland.
Reason, J.T. (1990). Human error. Cambridge: Cambridge University Press.
Rickel, J. (1988). Issues in the design of scheduling systems. In M. Oliff (Ed.), Expert systems and intelligent manufacturing (pp. 70�89). New York: Elsevier Science Publishers.
Sadowski, R.P., & Medeiros, D.J. (1982). Planning and control for manufacturing systems and projects. In G. Salvendy (Ed.), Handbook of industrial engineering (pp. 11.2.1�11.2.24). New York: Wiley.
Sanderson, P.M. (1989). The human planning and scheduling role in advanced manufacturing sys-tems: An emerging human factors domain. Human Factors, 31(6), 635�666.
Sanderson, P.M. (1991). Towards the model human scheduler. International Journal of Human Factors in Manufacturing, 1(3), 195�219.
108
Schaaf, T.W. van der (1993). Developing and using cognitive task typologies. Ergonomics, 7(4), 1439�1444.
Schaaf, T.W. van der (1995). Human recovery of errors in man�machine systems. In T.B. Sheri-dan (Ed.), Proceedings of the 6th IFAC/IFIP/IFORS/IEA Symposium on Analysis, Design, and Evaluation of Man�Machine Systems, USA, June 27�29 (pp. 91�96). Cambridge, MA: Massa-chusetts Institute of Technology.
Sharit, J. (1985). Supervisory control of a flexible manufacturing system. Human Factors, 27(1), 47�59.
Sheridan, T.B. (1980). Theory of man�machine interaction as related to computerized automa-tion. In E.J. Kompass & T.J. Williams (Eds.), Man�machine interfaces for industrial control (pp. 35�50). Barrington, IL: Control Engineering.
Slovic, P., & Lichtenstein, S. (1971). Comparison of bayesian and regression approaches to the study of information processing in judgment. Organizational Behavior and Human Performance, 6, 649�744.
Speranza, M.G., & Woerlee, A.P. (1991). A decision support system for operational production scheduling. European Journal of Operational Research, 75, 112�135.
Stoop, P.P.M. (1996). Performance measurement in manufacturing: A method for short term performance evaluation and diagnosis. Wageningen, The Netherlands: Ponsen & Looijen, Ph.D. Thesis Eindhoven University of Technology.
Stoop, P.P.M., & Wiers, V.C.S. (1996). The complexity of scheduling in practice. International Jour-nal of Operations and Production Management, 16(10), 37�53.
Sweet, J.E. (1885). The unexpected which often happens. Transactions of the American Society of Me-chanical Engineers, 7, 152�163.
Szelke, E., & Kerr, R. (1994). Knowledge�based reactive scheduling. Production Planning & Control, 5(2), 124�145.
Tsang, E.P.K. (1995). Scheduling techniques: A comparative case study. British Telecom Technology Journal, 13(1), 16�28.
Verbraeck, A. (1991). Developing an adaptive scheduling support environment. Delft, The Netherlands: Delft University of Technology, Ph.D. Thesis.
Vollmann, T.E., Berry, W.L., & Whybark, D.C. (1988). Manufacturing planning and control systems. Homewood, IL: Irwin.
Wærn, Y. (1989). Cognitive aspects of computer supported tasks. New York: John Wiley & Sons.
Wagenaar, W.A., Hudson, P.T., & Reason, J. (1990). Cognitive failures and accidents. Applied Cogni-tive Psychology, 4, 273�294.
Wiers, V.C.S. (1996). A quantitative field study of the decision behaviour of four shop floor schedulers. Production Planning & Control, 7(4), 383�392.

References 109
Wiers, V.C.S. (1997a). A review of the applicability of OR and AI scheduling techniques in prac-tice. To appear in OMEGA � The International Journal of Management Science, 25(2).
Wiers, V.C.S. (1997b). Decision support systems for production scheduling tasks � part I of a case study: analysis and task redesign. Accepted for publication in Production Planning & Control.
Wiers, V.C.S., & McKay, K.N. (1996). Task allocation: Human computer interaction in intelligent scheduling. In Proceedings of the 15th Workshop of the UK Planning & Scheduling Special Interest Group, UK, November 21�22 (pp. 333�344). Liverpool, UK: Liverpool John Moores Univer-sity.
Wiers, V.C.S., & Schaaf, T.W. van der, (1997). A framework for decision support in production scheduling tasks. To appear in Production Planning & Control, 8(6).
Wight, O.W. (1974). Production and inventory management in the computer age. Boston: CBI Publishing Company.
Wortmann, J.C., Euwe, M.J., Taal, M., & Wiers, V.C.S. (1996). A review of capacity planning techniques within standard software packages. Production Planning & Control, 7(2), 117�128.
Yin, R.K. (1989). Case study research: Design and methods. London: Sage Publications.
Zweben, M., & Fox, M.S. (Eds.) (1994). Intelligent scheduling. San Francisco: Morgan Kaufmann Publishers.

Summary 111
Summary
Production scheduling, the subject of this thesis, is both an essential and intangible part of the organization and coordination of production activities in an organization. Intangible, because the implementation of scheduling techniques in practice still is scarce, despite many efforts from both academia and practitioners. The research described in this thesis attempts to answer the fol-lowing questions: first, why are techniques for production scheduling often not used by human schedulers in practice, and second, how can human schedulers in practice be supported by scheduling techniques, incorporated in scheduling information systems.
A survey of the available literature on the role of techniques and humans in the area of produc-tion scheduling shows that techniques, that originate from the operations research and the artifi-cial intelligence research community, suffer from a number of serious drawbacks that have ham-pered implementation of these techniques in practice. A number of common themes can be identified when studying literature on the applicability of scheduling techniques: (1) most tech-niques lack robustness, i.e., small changes in the scheduling environment lead to large changes in the schedule; (2) many techniques cannot deal with any real�world complexity; (3) most tech-niques are not able to handle the performance criteria that are used in real�world situations; (4) all techniques assume that the information that is used to generate a schedule is fixed, whereas in practice this often is not the case; (5) most techniques do not consider the organization of pro-duction control functions; (6) techniques need accurate data to generate schedules, which often is not available; (7) many techniques ignore a human scheduler that shares responsibilities with the technique, let alone the fact how to interact with the human. In addition to the above mentioned problems, techniques from artificial intelligence suffer from the following additional problems: (8) AI techniques suffer from the inability to learn from experience; and (9) the availability of human experts, which is indispensable for the development of AI based systems, is often a prob-lem in practice.
The human factor in production scheduling has received scant attention from scientific research-ers. However, from the limited number of field studies reviewed it can be concluded that humans are particularly important in handling uncertainty. There are no known efforts to comprehensibly model human cognition in scheduling, although some preliminary attempts indicate that Rasmus-sen�s decision ladder might be suitable to capture some of the schedulers� decision behavior. Ac-cording to this model, humans reason with varying levels of attention and routine. Apart from these cognitive aspects, the issue why humans often prefer to use their own head instead of tech-niques, given the fact that cognition is bounded and that techniques can help humans to increase performance is discussed, based on the available literature. Humans seem to prefer their own ca-pabilities to techniques in cases where they are confident about their own expertise, although a human�s trust in a technique does not vary with real expertise. The use of techniques can be im-proved by offering feedback in which the actual performance is compared to the performance that would have been realized if the rule had been used. However, there are two problems related to offering performance feedback to human schedulers: (a) the performance of scheduling can often not be measured objectively, and (b) performance feedback does not seem to improve per-formance in complex tasks, although this also seems to depend on the question if the task is
112
learned implicitly or explicitly. A second way to improve decision rule use is to explicitly describe the workings of a technique to the human, thus making the technique transparent.
A potentially very important, and at the same time very intangible aspect of the human factor in scheduling are individual differences. Not much is known yet about the precise influence of these differences to computer usage in general, or, more specifically, to the use of scheduling tech-niques. Some aspects that are related to individual differences are experience, self�efficacy, self�esteem, and self�consciousness.
To set the stage for the body of the research, a descriptive case study is carried out in a truck manufacturing company. In this case, a quantitative model is used to study the actions, distur-bances and performances in the scheduling task. The method of research that is used is known as the paramorphic representation of judgment. In this setting, the human scheduler remains hidden in a black box; from the results of the analyses, relationships are postulated between the elements of the scheduling task, along with its conceivable human decision behavior. The meas-ured variables in the model were analyzed using cross correlation and regression techniques. Many relationships were found, of which a subset is discussed. However, more importantly, this case study showed that the quantitative research setting has two major disadvantages: (1) the real�world is simplified in an early phase of the study, which probably resulted in missing many rele-vant aspects, and (2) the causality between variables is very hard to understand. Nevertheless, the case study confirmed some of the issues identified in the literature review, such as the influence of differences in the scheduled production units, and the importance of individual differences.
Based on the findings of the literature review and the descriptive case study, a research design was constructed based on the case study methodology and methods for qualitative data analysis. The research can be split in two parts: (1) an explanatory part, and (2) a design oriented part. In the explanatory part, case studies are carried out to understand the relationships between charac-teristics of the following research elements: (a) production units, (b) production control organiza-tions, (c) scheduling information systems, and (d) scheduling tasks. Human schedulers are not studied on a cognitive level because this would require extensive research efforts which would cause the research to deviate from its main focus. The results of the explanatory case studies are clustered and translated into a design model for decision support systems for production schedul-ing tasks. This model is then applied to a design oriented case study, i.e., a case where a schedul-ing information system is implemented.
The first explanatory case study is carried out in a plant that produces derivatives from potato starch. A scheduling information system was designed and build to support the schedulers in this company. Product requirements are based on stock replenishment; hence, the schedulers need to know for each product if the stock level will fall below its minimum. The scheduling information system offers both a detailed and a simple way to calculate stock projections in time. Although the detailed screen was intended by the designers of the system to be used by the schedulers, the simple screen is being used. Apart from this shortcoming, the system adequately matches the re-quirements of the schedulers.
The second explanatory case study was carried out in a production unit for corrugated fiber-board. The scheduler of this production unit schedules jobs on the single machine in this pro-duction unit�i.e., the corrugator�using an advanced operations research technique. There are three reasons for the technique�s success: (1) the uncertainty is low, (2) the performance is clearly linked with the usage of the technique, and (3) the two aggregation levels in the scheduling task result in sufficient flexibility for the human scheduler.
The third explanatory case study is carried out in a production unit for corrugated fiberboard packagings. This production unit is part of the same company as the production unit studied in the second case. In this production unit, a number of machines transform fiberboard in a large
Summary 113
variety of packagings, that are made and sold according to customer specifications. The scheduler of this production unit is effectively assisted by a scheduling information system that is centered around an electronic Gantt chart. The Gantt chart offers information on a high aggregation level so that the large number of jobs that flows through this production unit can be monitored and manipulated simultaneously. Individual job screens offer information on a low aggregation level, which is needed to solve problems. Not all schedule generation functions available in the system are used by the scheduler; he indicated that he wanted to be in control. Moreover, some of the autonomy is allocated to the operators on the shop floor, and the scheduler does not want to in-terfere with their decision making by using sophisticated scheduling algorithms.
The fourth explanatory case study is carried out in a metal ceiling systems company. In this com-pany, a scheduling information system was designed that incorporates advanced search algo-rithms. However, the system is not used at all by the scheduler, because of the following short-comings: (1) the system uses production orders as scheduling units, whereas the scheduler uses projects; (2) the system ignores the coordination required for the finishing operation; (3) the sys-tem is not robust, i.e., it cannot deal with uncertainties without generating complete new sched-ules.
By clustering the results of the separate explanatory case studies, an explanatory model is con-structed that is based on the following concepts: (1) autonomy, (2) transparency, (3) level of sup-port, and (4) aggregation of information presentation. The first three concepts apply to a sched-uling information system�s functions, the fourth concept applies to a scheduling information sys-tem�s presentation of information.
The amount of autonomy at a certain level in an organization applies to the degrees of freedom at that level in the organization. This concept is introduced because in practice, the scheduler often shares responsibilities with operators on the shop floor. The division of autonomy between the operators and the scheduler results from the following two operational characteristics: (1) flexibil-ity and (2) uncertainty. Compensating for disturbances by using flexibility is also referred to as human recovery. With the characteristics uncertainty and human recovery, four typical produc-tion unit types, with corresponding requirements for the division of autonomy can be identified: (a) the smooth shop has no uncertainty and no human recovery, and all autonomy should be allo-cated to the scheduler; (b) the social shop has no uncertainty but it has human recovery, and some autonomy should be allocated to the operators; (c) the sociotechnical shop has both uncer-tainty and human recovery, and some autonomy should be allocated to the operators to compen-sate for disturbances; and (d) the stress shop has uncertainty but no human recovery, and all dis-turbances have to be handled by the scheduler. The division of autonomy has important conse-quences for the functionality of a scheduling information system: the explanatory cases showed that ignoring the division of autonomy leads to non�usage of the system or ignoring of sched-ules on the shop floor. Autonomy can be allocated to organizational units by means of decision making horizons. This means that decisions can freely be made within the horizon as long as cer-tain milestones at the end of the horizon are realized. Formal and informal communication can be used to coordinate decisions between organizational units.
The transparency of a scheduling information system�s functionality indicates the extent that it gives the human scheduler the feeling that he is in control. A human�s need to be in control of a situation depends on the criticality and ill�definedness of the situation. In the scheduling task, this translates to the amount of uncertainty that has to be handled. In uncertain situations, an opaque scheduling information system is perceived to get in the way of the human scheduler, and will probably be circumvented. On the other hand, repetitive and laborious activities can be automated in an opaque way.
114
The level of support of a scheduling information system lies in the possible variants of sharing re-sponsibilities between the human scheduler and the scheduling information system. At one ex-treme, the human acts as a principal controller, possibly taking advice of receiving information from the system; at the other, the system acts as a principal controller, with the human as super-visor. The level of control of the functionality of a scheduling information system should be de-rived from the number of exceptional situations that occur in the scheduling task. This is based on the fact that humans are better at solving new problems, and that systems are better at han-dling routine problems. On the one hand, if the level of support is too low, the added value of the scheduling information system is doubtful; on the other hand, if the level of support is too high, the system will be ignored.
Scheduling information systems can present information to the human scheduler to overcome cogni-tive limitations. The complexity of the scheduling task can be reduced by decomposing the in-formation that has to be processed into chunks. However, in the scheduling task, most informa-tion cues are interrelated, and decomposition can only be achieved by aggregating information. Thus, a scheduling information system should present information on adequate aggregation lev-els, conform the complexity of the scheduling task and human problem solving processes. A high level of aggregation can often be achieved by graphical displays; a low level of aggregation can often be achieved by textual displays.
To validate these concepts, the explanatory model is translated into a design model that consists of the following phases: (1) production analysis, (2) task analysis, (3) task redesign and (4) deci-sion support design. The design model is applied to a real�world situation to design a scheduling decision support system. The company involved in the design oriented case study is a large dry bulk terminal in the harbor of Rotterdam. At the company, approximately 13 megatons of iron ore and 18 megatons of coal are discharged yearly from large sea�going vessels. The discharged material is transshipped into smaller ships, barges, trains, trucks or transported to a nearby power station, whereas some material is stocked temporarily at the stockyard.
The production analysis phase results in a detailed description of the physical layout of the terminal. The physical layout of the company is delineated by three harbors: a harbor that is used to tie up ships for unloading, a harbor that is used to tie up ships for loading, and a harbor that is used to load barges. Ships are unloaded with four unloaders that grab the material out of the ships� holds and put it on one of the three conveyor belts that run parallel to this harbor. These conveyors are connected to the conveyor belt system, which consists of 47 conveyors. By connecting individual conveyors, hundreds of possible routings can be configured to transport the material on the ter-minal. Material that is discharged can either be stocked on the stockyard or directly be carried through to barges or other ships. Material is stacked on the stockyard by a machine called stacker/reclaimer. This machine can either stack or reclaim material from the stockyard and it is connected to the conveyor belt system. The stockyard is divided in seven strips, and each stacker/reclaimers is able to move between two strips. Most of the material that is reclaimed from the stockyard is loaded in barges at the barge loading harbor. At this harbor, three barge loading machines are available for this task. Material can also be loaded into sea�going vessels us-ing the one ship loader at the third harbor. Smaller amounts of material are loaded into trains at one of the two train loading stations, and even smaller amounts of material are loaded into trucks. Lastly, there is a direct conveyor connection between the terminal and a nearby power sta-tion.
The operational characteristics of this production system show great similarities with semi�process industries. For example: materials are process�oriented, resources can be linked together temporarily, buffer capacity is limited, etc. Uncertainty in the production system mainly comes from the following three sources: (i) unloading throughput times, (ii) availability of production equipment, and (iii) arrival times of ships and barges. However, the following sources of flexibil-

Summary 115
ity are present: (I) unloading capacity can temporarily be increased, (II) alternative routings can be used, (III) bulldozers can be used to move material, (IV) barges can be loaded in the ship loading harbor, and (V) the first strip of the stockyard can be used to temporarily stock material.
The task analysis phase consists of an analysis of the autonomy and an analysis of the scheduling task itself. The autonomy of scheduling is analyzed by studying the organization of production control activities in the organization. The commercial department accepts orders from custom-ers, and the operational management of these activities is delegated to agents that are in the vicinity of the company. Hence, the commercial department does not directly communicate with agents, and neither do customers directly communicate with the schedulers. The schedulers con-struct a detailed schedule, based on the incoming ships, barges, trains, etc. The operators in the shifts are allowed to specify which conveyors will be used to realize a scheduled transportation. They can also make sequencing decisions regarding the loading of barges within a shift. The scheduling task consists of the following activities: (1) assign quays to ships, (2) construct unload-ing sequences, (3) assign unloaders to holds, (4) assign stacker/reclaimers, barge loaders and ship loaders, (5) estimate unloading speed and throughput times, (6) accept barges, and (7) monitor the progress of production, solve problems, and adjust the schedule if necessary.
In the task redesign phase, for each activity in the scheduling task the following questions are asked: what is the autonomy of the scheduler; is the task of a critical and ill�defined nature; is the task of a routine nature, or are there many exceptions; is the task complex, i.e., does it require the si-multaneous consideration of many information cues? These questions follow from the concepts that build up the explanatory model. By answering these questions for each sub�task, the re-quirements for a scheduling decision support system�s functionality and information presentation can be identified. In the decision support design phase, these requirements are translated into a specific design by specifying the data structure, the functionality and the presentation of information of the system.
An evaluation of the design model is not possible at this moment, because the implementation of the system still is being carried out. However, it is possible to evaluate some aspects of the application of the model in practice. It is felt that the design model has contributed in a positive way to the following aspects of the project: phasing of the project, communication of mile-stones, obtaining commitment, gaining insight, and translation of analysis into design.

Samenvatting (summary in Dutch) 117
Samenvatting (summary in Dutch)
Productie�scheduling2, het onderwerp van dit proefschrift, is zowel een essentiële als een ongrijpbare factor voor de organisatie en coördinatie van productie�activiteiten. Ongrijpbaar, omdat de toepassing van technieken voor scheduling in de praktijk nog steeds zeldzaam is, ondanks de vele inspanningen van zowel wetenschappers als uitvoerenden. Het onderzoek dat in dit proefschrift wordt beschreven probeert een antwoord te geven op de volgende vragen: ten eerste, waarom worden technieken voor productie�scheduling vaak niet gebruikt door menselijke schedulers in de praktijk, en ten tweede, hoe kunnen menselijke schedulers in de praktijk ondersteund worden met behulp van schedulingstechnieken, die ingebed zijn in informatiesystemen.
Een literatuuronderzoek over de rol van technieken en mensen in productie�scheduling laat zien dat technieken, die afkomstig zijn uit de operationele research (OR) en de artificiële intelligentie (AI), een aantal ernstige tekortkomingen hebben die de implementatie van deze technieken in de weg staat. Een aantal gemeenschappelijke zaken kan worden waargenomen bij het bestuderen van de literatuur over de toepasbaarheid van schedulingstechnieken: (1) de meeste technieken zijn niet robuust genoeg, hetgeen als gevolg heeft dat kleine veranderingen in de omgeving tot grote veranderingen in het schedule kunnen leiden; (2) de meeste technieken kunnen niet met de complexiteit van realistische problemen omgaan; (3) de meeste technieken kunnen niet met de prestatie�criteria omgaan die in de praktijk worden gebruikt; (4) technieken nemen aan dat de informatie die wordt gebruikt om een schedule te genereren vaststaat, terwijl in de praktijk niet het geval is; (5) de meeste technieken negeren de organisatie van de productiebeheersing in bedrijven; (6) technieken hebben een grote verscheidenheid aan nauwkeurige gegevens nodig om een schedule te maken, terwijl de informatie in de praktijk vaak niet aan deze criteria voldoet; (7) de meeste technieken negeren het feit dat er een menselijke scheduler is die verantwoordelijkheden deelt met de techniek. Naast de genoemde problemen gelden er voor technieken uit de AI de volgende twee additionele problemen: (8) AI technieken zijn niet in staat te leren van ervaring; en (9) voor de ontwikkeling van AI systemen is de beschikbaarheid van betrouwbare menselijke experts vereist, hetgeen in de praktijk vaak een probleem is.
Uit de literatuur blijkt verder dat de menselijke factor in productie�scheduling zeer weinig aandacht heeft gekregen. Echter, uit de weinige veldstudies naar de menselijke scheduler kan geconcludeerd worden dat de mens vooral belangrijk is voor het omgaan met onzekerheid. Er is geen literatuur bekend waarin de menselijke cognitieve processen in de productie�schedulingstaak op een samenhangende manier zijn gemodelleerd; echter, aanzetten tot een dergelijke modellering laten zien dat het beslissingsmodel van Rasmussen van toepassing lijkt te zijn op de menselijke scheduler. Dit model gaat uit van verschillende niveaus in het menselijke beslissingsgedrag, uitgaande van een variërende attentie en routine. Afgezien van deze cognitieve aspecten kan de vraag gesteld worden waarom mensen er de voorkeur aan geven om hun eigen hersens te gebruiken in plaats van technieken, gegeven het feit dat mensen beperkt zijn in hun
2 Nederlandse vertalingen van het Engelse woord �schedule,� zoals �rooster,� �schema,� �lijst,� of
�dienstregeling� geven een vertekend en onjuist beeld van het begrip weer.

118
mentale capaciteiten en technieken hun zouden kunnen helpen om het beslissingsgedrag te verbeteren. Mensen lijken hun eigen mentale capaciteiten te prefereren boven het gebruik van technieken in situaties waarin ze zelfverzekerd zijn ten aanzien van hun eigen expertise, alhoewel het vertrouwen in technieken niet lijkt te variëren met de werkelijke expertise. Het gebruik van technieken kan verbeterd worden door terugkoppeling aan te bieden, waarin de gerealiseerde prestatie wordt vergeleken met de prestatie die gerealiseerd zou zijn bij het gebruik van de techniek. Echter, aan het aanbieden van prestatie�terugkoppeling zijn twee problemen verbonden: (a) de prestatie van de schedulingstaak kan vaak niet objectief gemeten worden, en (b) prestatie�terugkoppeling lijkt de prestatie in complexe taken niet te verbeteren, alhoewel dit ook afhankelijk lijkt te zijn van de vraag of de taak impliciet of expliciet wordt aangeleerd. Een tweede manier om het gebruik van technieken te verbeteren ligt in het begrijpelijk maken van de manier waarop de techniek werkt, waarmee de techniek transparant wordt gemaakt.
Een mogelijk zeer belangrijk, maar tevens zeer moeilijk grijpbaar aspect van de menselijke factor in productie�scheduling zijn individuele verschillen. Er is nog niet veel bekend over de precieze invloed van deze verschillen op het gebruik van computers in het algemeen, laat staan op het gebruik van technieken of computersystemen voor productie�scheduling. Een aantal aspecten die verband houden met individuele verschillen zijn ervaring, zelfwerkzaamheid, eigenwaarde en zelfbewustzijn.
Ter voorbereiding op het hoofdonderzoek is een beschrijvende case�studie uitgevoerd in een productiebedrijf voor vrachtwagens. In deze case is een kwantitatief model gebruikt om de acties, de prestaties en de verstoringen in de schedulingstaak te onderzoeken. Deze methode van onderzoek staat bekend onder de naam paramorfe beslissingsanalyse. In een dergelijke opzet blijft de menselijke scheduler onzichtbaar in een black�box; echter, met de resultaten van de analyses kunnen relaties gepostuleerd worden tussen de onderzoekselementen, met het hieruit voortvloeiende gedrag van de menselijke scheduler. De analyses zijn uitgevoerd met behulp van de berekening van kruis�correlaties en lineaire regressie. Een groot aantal relaties is hierbij gevonden, en een deel van deze relaties is besproken. Echter, een belangrijker resultaat van deze case�studie ligt in de methodologie. De case�studie laat zien dat de kwantitatieve paramorfe benadering twee nadelen heeft: (1) de realiteit wordt in een vroeg stadium van de studie ingeperkt door de keuze van de variabelen, hetgeen mogelijk als gevolg heeft dat veel relevante aspecten niet meegenomen worden in het onderzoek, en (2) de causaliteit tussen de variabelen is vaak moeilijk te begrijpen. Desalniettemin bevestigt deze case�studie een aantal aspecten die ook in het literatuuroverzicht genoemd werden, zoals de invloed van de verschillen in de productie�afdelingen, en de belangrijkheid van de individuele verschillen.
Uitgaande van de resultaten van het literatuuronderzoek en de beschrijvende case�studie is er een onderzoeksopzet gemaakt die gebaseerd is op de case�studie methodologie en methoden voor kwalitatieve gegevensanalyse. Het onderzoek valt uiteen in twee delen: (1) een verklarend deel, en (2) een ontwerpgericht deel. In het verklarende deel van het onderzoek wordt een aantal case�studies uitgevoerd die erop gericht zijn de relaties tussen de volgende onderzoekselementen te verduidelijken: (a) productie�afdelingen, (b) organisatie van de productiebeheersing, (c) informatiesystemen voor productie�scheduling, (d) schedulingstaken. De menselijke scheduler wordt niet in detail bestudeerd omdat dit teveel aandacht op zou eisen, waardoor het onderzoek van de belangrijkste focus zou worden afgeleid. De resultaten van de verklarende case�studies worden geclusterd en vervolgens vertaald naar een ontwerpmodel voor beslissingsondersteunende systemen voor schedulingstaken. Dit model zal vervolgens toegepast worden in een ontwerpcase door het implementeren van een beslissingsondersteunend schedulingssysteem.
De eerste verklarende case�studie is uitgevoerd in een fabriek waar aardappelzetmeel en derivaten daarvan worden geproduceerd. In deze fabriek is een schedulingssysteem in eigen beheer
Samenvatting (summary in Dutch) 119
ontworpen en gebouwd ter ondersteuning van de twee schedulers. De productie wordt aangestuurd aan de hand van minimum voorraadniveaus; de schedulers dienen derhalve voor elk product te weten of de voorraad onder het vastgestelde niveau gaat dalen. Het informatiesysteem berekent hiertoe projecties van het voorraadverloop voor elk product, en presenteert dit op twee manieren aan de schedulers: middels een gedetailleerd scherm en een eenvoudig scherm. Alhoewel het gedetailleerde scherm aanvankelijk door de ontwerpers bedoeld was om gebruikt te worden geven de schedulers de voorkeur aan het eenvoudige scherm. Verder voldoet het systeem aan de eisen en wensen van de schedulers.
De tweede verklarende case�studie is uitgevoerd in een productie�afdeling in een fabriek voor golfkarton verpakkingen. In deze productie�afdeling wordt het golfkarton geproduceerd op één grote golfkartonmachine. De scheduler deelt productie�orders in op deze machine met behulp van een schedulingssysteem waarin een geavanceerd algoritme aanwezig is. Er zijn drie redenen waarom dit systeem in deze productie�afdeling succesvol is: (1) de onzekerheid is laag, (2) de prestatie van de productie�afdeling kan duidelijk gerelateerd worden aan het gebruik van de techniek, en (3) dankzij de organisatie van de scheduling, die op twee aggregatieniveaus plaatsvindt, heeft de scheduler toch nog enige beslissingsvrijheid.
De derde verklarende case�studie is uitgevoerd in een productie�afdeling in dezelfde fabriek voor golfkarton verpakkingen. In deze productie�afdeling wordt het golfkarton verwerkt tot een grote variëteit aan verpakkingen, die geproduceerd en verkocht worden op basis van klantorders. De scheduler van deze productie�afdeling wordt ondersteund door een schedulingssysteem dat gebaseerd is op een elektronisch planbord. Dit planbord biedt de scheduler informatie op een hoog aggregatieniveau, zodat het grote aantal productie�orders dat door de afdeling stroomt op een overzichtelijke wijze voor de scheduler beschikbaar zijn. Gedetailleerde informatie wordt door het systeem aangeboden in het orderscherm; dit soort informatie wordt voornamelijk gebruikt voor het oplossen van problemen. Het systeem bevat een aantal technieken om schedules te genereren; echter, slechts een klein aantal technieken wordt daadwerkelijk gebruikt. Dit heeft twee redenen: ten eerste gaf de scheduler aan graag in controle van de situatie te zijn, en ten tweede wilde de scheduler zich niet bemoeien met het beslisgedrag van de mensen op de werkvloer door geavanceerde technieken te gebruiken.
De vierde verklarende case�studie is uitgevoerd in een fabriek voor metalen plafondsystemen. In dit bedrijf is een schedulingssysteem ontworpen dat gebruik maakt van geavanceerde zoekalgoritmen. Echter, het systeem wordt niet gebruikt door de scheduler vanwege de volgende tekortkomingen: (1) het systeem behandelt werkopdrachten als bouwstenen voor het schedule, terwijl de scheduler gehele projecten als bouwstenen ziet; (2) het systeem negeert noodzakelijke coördinatie van de productie bij de eindbewerking; (3) het systeem is niet robuust, het genereert totaal nieuwe schedules wanneer er een kleine verandering plaatsvindt.
Door de resultaten van de verklarende cases te clusteren kan een verklarend model opgesteld worden dat gebaseerd is op de volgende vier concepten: (1) autonomie, (2) transparantie, (3) ondersteuningsniveau, en (4) aggregatie van de informatie�presentatie. De eerste drie concepten zijn op de functionaliteit van een schedulingssysteem van toepassing; het laatste concept is van toepassing op de presentatie van informatie door een schedulingssysteem.
De autonomie op een bepaald niveau in een organisatie betreft de beslissingsvrijheid op dat niveau. Dit concept wordt hier geïntroduceerd omdat uit de verklarende cases blijkt dat de schedulers vaak verantwoordelijkheden delen met de medewerkers op de werkvloer. De verdeling van de autonomie tussen de scheduler en de werkvloer wordt bepaald door de volgende twee eigenschappen van productie�situaties: (1) flexibiliteit en (2) onzekerheid. Het compenseren van onzekerheid met behulp van flexibiliteit wordt aangeduid met het begrip menselijk herstelgedrag. Wanneer de begrippen onzekerheid en menselijk herstelgedrag gecombineerd worden kunnen de

120
volgende vier typische productie�afdelingen, met bijbehorende eisen voor de verdeling van de autonomie onderscheiden worden: (a) de soepele situatie waar onzekerheid noch menselijk herstelgedrag aanwezig is, en waar alle autonomie aan de scheduler toegekend kan worden; (b) de sociale situatie, waar geen onzekerheid maar wel menselijk herstelgedrag aanwezig is, en waar een bepaalde hoeveelheid autonomie aan de medewerkers op de werkvloer toegekend moet worden; (c) de sociotechnische situatie, waarbij zowel onzekerheid als menselijk herstelgedrag aanwezig is, en waar een bepaalde hoeveelheid autonomie, benodigd voor het omgaan met de onzekerheid, aan de medewerkers op de werkvloer toegekend moet worden; en (d) de stress situatie, waarbij wel onzekerheid maar geen menselijk herstelgedrag aanwezig is, en waarbij alle verstoringen door de scheduler afgehandeld dienen te worden. De verdeling van autonomie heeft belangrijke gevolgen voor de vereiste functionaliteit van een schedulingssysteem: de verklarende case�studies laten zien dat wanneer het systeem de verdeling van autonomie doorkruist, het systeem ofwel niet gebruikt zal worden ofwel de schedules op de werkvloer niet uitgevoerd zullen worden. Autonomie kan toegekend worden door een bepaalde beslissingshorizon te definiëren: binnen de horizon mogen door de betreffende functie de beslissingen zelfstandig genomen worden, zolang bepaalde randvoorwaarden gerealiseerd worden, die verbonden zijn aan het einde van de horizon. Formele en informele communicatie kan gebruikt worden om de beslissingen tussen de verschillende functies in de organisatie te coördineren.
De transparantie van een schedulingssysteem geeft aan in hoeverre het de mens het gevoel geeft de touwtjes in handen te hebben. Deze behoefte van de menselijke scheduler is afhankelijk van de mate waarin een situatie kritiek en slecht gedefinieerd is. Dit is bijvoorbeeld het geval wanneer met een grote mate van onzekerheid moet worden omgegaan, in combinatie met strakke levertijden. In onzekere situaties zal een ondoorzichtig systeem de mens in de weg zitten, hetgeen tot gevolg zal hebben dat het systeem niet gebruikt wordt. Echter, in situaties waarbij saaie en repetitieve activiteiten uitgevoerd moeten worden kan een ondoorzichtig systeem goede diensten bewijzen.
Het ondersteuningsniveau van een schedulingssysteem bepaald de manier waarop de verantwoordelijkheden tussen de mens en het systeem verdeeld zijn. De mens kan bijvoorbeeld alle taken op zich nemen waarbij het systeem hoogstens een adviserende rol vervult. Aan de andere kant kan het systeem vrijwel alle taken op zich nemen, waarbij het de mens hoogstens informeert over de te nemen beslissingen. De gedachte is dat mensen beter zijn in taken waarin nieuwe problemen moeten worden opgelost, terwijl systemen beter zijn in het afhandelen van routinetaken. Wanneer het ondersteuningsniveau van het systeem te laag is heeft het systeem te weinig toegevoegde waarde; wanneer het ondersteuningsniveau van het systeem te hoog is zal het systeem genegeerd worden door de mens.
Schedulingssystemen kunnen informatie presenteren aan de mens zodat bepaalde cognitieve beperkingen deels gecompenseerd worden. De complexiteit van de schedulingstaak kan gereduceerd worden door het decomponeren van de benodigde informatie. Echter, in de schedulingstaak is een sterke samenhang tussen veel elementen, en decompositie kan meestal dan ook alleen worden uitgevoerd door informatie te aggregeren. Derhalve dient een schedulingssysteem informatie op de benodigde aggregatieniveaus aan te bieden, hetgeen voortvloeit uit de complexiteit van de taak en de manier waarop mensen problemen oplossen. Een hoog aggregatieniveau kan vaak gerealiseerd worden met behulp van grafische schermen; een laag aggregatieniveau kan vaak gerealiseerd worden met behulp van tekstuele schermen.
Het verklarende model is vertaald naar een ontwerpmodel teneinde de bovengenoemde concepten te valideren. Het ontwerpmodel bestaat uit de volgende fasen: (1) analyse van de productie, (2) taakanalyse, (3) herontwerp van de taak, en (4) ontwerp van het beslissingsondersteunend systeem. Het ontwerpmodel is toegepast in een praktijksituatie, waarin een beslissingsondersteunend schedulingssysteem is ontworpen. De toepassing is gerealiseerd in
Samenvatting (summary in Dutch) 121
een massagoed�overslagbedrijf in de Rotterdamse haven. In dit bedrijf wordt jaarlijks ongeveer 13 miljoen ton ijzererts en 18 miljoen ton kolen gelost uit grote zeeschepen. Het geloste materiaal wordt overgeslagen naar kleinere zeeschepen, binnenvaartschepen, treinen, vrachtwagens, en getransporteerd naar een nabijgelegen elektriciteitscentrale. Vaak wordt het geloste materiaal eerst een tijd opgeslagen op het terrein voordat het naar de bestemming getransporteerd wordt.
De eerste fase van het ontwerpmodel, de analyse van de productie, resulteert in een gedetailleerde beschrijving van de fysieke structuur van het bedrijf. Het bedrijf wordt begrensd door drie havens: een haven waar zeeschepen aanleggen die gelost worden, een haven waar zeeschepen aanleggen die geladen worden, en een haven waar binnenvaartschepen geladen worden. Zeeschepen worden gelost door vier losbruggen die het materiaal uit de ruimen grijpen en op één van de drie transportbanden, de zogenaamde kadebanden storten. De kadebanden lopen parallel aan de kades en zijn verbonden met het transportbandensysteem dat uit 47 banden bestaat. Door individuele banden aan elkaar te koppelen kunnen honderden mogelijke routes geconfigureerd worden, waarmee het materiaal over de terminal getransporteerd kan worden. Het geloste materiaal kan ofwel opgeslagen worden op het terrein ofwel direct doorgevoerd worden naar een zeeschip of binnenvaartschepen. Het materiaal wordt op het terrein gestort door machines die zowel materiaal kunnen storten als afgraven; dit zijn de zogenaamde combi�s. Deze combi�s zijn gekoppeld aan het transportbandensysteem. Het terrein is in lengterichting verdeeld in zeven stroken, waartussen vijf combi�s zich kunnen bewegen. Het grootste deel van het materiaal dat wordt afgevoerd wordt geladen in binnenvaartschepen. Deze binnenvaartschepen worden geladen in een speciaal hiervoor ingerichte haven, waar drie beladers aan de kades opgesteld staan. Materiaal kan ook in zeeschepen geladen worden in de derde haven. Kleinere hoeveelheden materiaal worden door goederentreinen afgevoerd, welke worden beladen bij één van de twee treinlaadstations. Nog kleinere hoeveelheden worden afgevoerd per vrachtwagen. Tenslotte is er een directe verbinding per transportband naar een elektriciteitscentrale een paar kilometers verderop.
De karakteristieken van het bedrijf komen sterk overeen met die van de semi�procesindustrie. Dit geldt bijvoorbeeld voor de volgende kenmerken: de materialen zijn proces�georiënteerd, de capaciteitsbronnen kunnen tijdelijk gekoppeld worden, de buffercapaciteit is beperkt, etc. Met name de volgende aspecten veroorzaken onzekerheid in het bedrijf: (i) lossnelheden, (ii) de beschikbaarheid van machines, en (iii) de aankomsttijd van zeeschepen en binnenvaartschepen. Echter, de volgende aspecten zorgen voor flexibiliteit: (I) de loscapaciteit kan tijdelijk uitgebreid worden, (II) er kunnen alternatieve routes gebruikt worden, (III) bulldozers kunnen gebruikt worden om materiaal te verplaatsen, (IV) binnenvaartschepen kunnen met de zeebootbelader beladen worden, en (V) de eerste strook van het terrein kan gebruikt worden om tijdelijk materiaal op te slaan.
De taakanalyse omvat een analyse van de autonomie en een analyse van de taakinhoud van de schedulers. De autonomie van de scheduling kan bestudeerd worden door de organisatie van de productiebeheersing binnen het bedrijf te analyseren. De afdeling commercie accepteert opdrachten van klanten, en de operationele activiteiten die voortvloeien uit deze opdrachten worden door de klanten gedelegeerd aan agenten. De afdeling commercie communiceert derhalve niet direct met de agenten, en de schedulers communiceren niet direct met de klanten. De schedulers maken op basis van de binnenkomende schepen, binnenvaartschepen, treinen, etc. een gedetailleerd schedule. De mensen op de werkvloer kunnen hierbinnen beslissingen nemen met betrekking tot de keuze voor een bepaalde configuratie van transportbanden om een bepaalde verplaatsing in het schedule te realiseren. Ook kunnen zij soms binnen een horizon van één ploeg bepalen in welke volgorde binnenvaartschepen geladen worden. De schedulingstaak bestaat uit de volgende activiteiten: (1) toewijzen van ligplaatsen aan zeeschepen, (2) opstellen van losvolgordes, (3) toewijzen van losbruggen aan ruimen, (4) toewijzen van combi�s, beladers

122
van binnenvaartschepen en de zeebootbelader, (5) schatten van lostijden en doorlooptijden, (6) accepteren van binnenvaartschepen, en (7) monitoren van de productievoortgang, oplossen van problemen en, indien nodig, aanpassen van het schedule.
In de fase waarin een herontwerp van de taak wordt gemaakt worden voor elke activiteit in de schedulingstaak de volgende vragen gesteld: wat is de autonomie van de scheduler, is de taak kritiek en slecht gedefinieerd, is de taak routinematig, of heeft deze veel uitzonderingen, is de taak complex voor wat betreft de gelijktijdige verwerking van grote hoeveelheden informatie? Deze vragen vloeien voort uit de concepten die samen het verklarende model vormen. Door deze vragen voor elke deeltaak te beantwoorden kunnen de eisen voor de functionaliteit en de informatie�presentatie van een beslissingsondersteunend schedulingssysteem geïdentificeerd worden. In de fase waarin het ontwerp van het beslissingsondersteunend systeem wordt opgesteld worden de genoemde eisen vertaald naar specificaties voor de gegevensstructuur, de functionaliteit en de presentatie van informatie.
Een evaluatie van het ontwerpmodel is op het moment waarop dit proefschrift wordt geschreven nog niet mogelijk, omdat de implementatie van het systeem op dit moment nog niet voltooid is. Het is echter wel mogelijk om het ontwerpmodel te toetsen aan een aantal proceskarakteristieken met betrekking tot de toepassing van het model. Het ontwerpmodel heeft een positieve bijdrage geleverd met betrekking tot de volgende karakteristieken van het project: het faseren van het project, het communiceren van mijlpalen, het verkrijgen van betrokkenheid, het verkrijgen van inzicht, en de vertaling van de analyse naar het ontwerp.

Curriculum Vitae 123
Curriculum Vitae
Vincent Wiers was born on February 24, 1969, in Schiedam, the Netherlands. In 1987, he re-ceived his VWO diploma from the Alberdingk Thijm College in Hilversum, after which he started his study of Industrial Engineering and Management Science at the Eindhoven University of Technology. He graduated from the master�s program in 1993, after which he started his Ph.D. work at the same university as a member of the department of Technology and Work in the fac-ulty of Industrial Engineering and Management Science. The Ph.D. research concerned the inter-action between humans and scheduling information systems in production scheduling. This thesis concludes the research. Apart from this thesis, the Ph.D. research has resulted in a number of papers that have been presented at various international conferences, and published in Produc-tion Planning & Control, the International Journal of Production and Operations Management, and OMEGA � the International Journal of Management Science. During his Ph.D. project, he cooperated with a number of management consultancy firms, software suppliers and industrial organizations in the Netherlands, including the largest bulk transshipment company in Europe, situated in Rotterdam. Other activities during the project include contributing to a written course on computer science from the Open University in the Netherlands; managing the editorial office of the Elsevier Science journal Computers in Industry; and contributing to a report on standard software packages for finite capacity planning, in cooperation with the Dutch organization for applied scientific research (TNO). During a working visit to the Memorial University of New-foundland in 1996, he worked together with Kenneth McKay on fundamental issues regarding production scheduling. From April 1997, Vincent Wiers is employed as a knowledge engineer at Bolesian in Helmond, the Netherlands, a member of the Cap Gemini Group.


![[Ht] human computer interaction 1](https://static.fdocuments.nl/doc/165x107/55a70ab71a28ab2b0b8b47c4/ht-human-computer-interaction-1.jpg)