
Flex: High-Availability Datacenters With Zero Reserved Power
14
Flex: High-Availability Datacenters With Zero Reserved Power Chaojie Zhang *§ , Alok Gautam Kumbhare * , Ioannis Manousakis † , Deli Zhang *¶ , Pulkit A. Misra * , Rod Assis † , Kyle Woolcock † , Nithish Mahalingam † , Brijesh Warrier † , David Gauthier ‡ , Lalu Kunnath ‡ , Steve Solomon ‡ , Osvaldo Morales ‡ , Marcus Fontoura † , Ricardo Bianchini * * Microsoft Research † Microsoft Azure ‡ Microsoft CO+I Abstract—Cloud providers, like Amazon and Microsoft, must guarantee high availability for a large fraction of their workloads. For this reason, they build datacenters with redundant infras- tructures for power delivery and cooling. Typically, the redundant resources are reserved for use only during infrastructure failure or maintenance events, so that workload performance and availability do not suffer. Unfortunately, the reserved resources also produce lower power utilization and, consequently, require more datacenters to be built. To address these problems, in this paper we propose “zero-reserved-power” datacenters and the Flex system to ensure that workloads still receive their desired performance and availability. Flex leverages the existence of software-redundant workloads that can tolerate lower infrastruc- ture availability, while imposing minimal (if any) performance degradation for those that require high infrastructure availability. Flex mainly comprises (1) a new offline workload placement policy that reduces stranded power while ensuring safety during failure or maintenance events, and (2) a distributed system that monitors for failures and quickly reduces the power draw while respecting the workloads’ requirements, when it detects a failure. Our evaluation shows that Flex produces less than 5% stranded power and increases the number of deployed servers by up to 33%, which translates to hundreds of millions of dollars in construction cost savings per datacenter site. We end the paper with lessons from our experience bringing Flex to production in Microsoft’s datacenters. Index Terms—Datacenter power management, redundant power, power capping, workload availability. I. I NTRODUCTION Motivation. As the demand for cloud services (e.g., In- frastructure as a Service or IaaS) keeps growing unabated, cloud providers must build datacenters to keep up. Highly utilizing the infrastructure (e.g., power, space, cooling) of each datacenter is critical to reduce the number of datacenters that must be built and save cost. As power is often the bot- tleneck resource, large providers use power oversubscription coupled with power capping (via performance throttling) to safely increase utilization by deploying more servers to each datacenter [3], [8], [14], [15], [37]. They carefully select the amount of oversubscription to prevent excessive performance degradation due to capping. § Chaojie Zhang is affiliated with the University of Chicago, but was at Microsoft Research during this work. ¶ Deli Zhang is now affiliated with Facebook, but was at Microsoft Research during this work. However, as providers must maintain high infrastructure availability, especially for their IaaS offerings, a large source of inefficiency remains. Specifically, providers provision re- dundant resources [32], including power and cooling, in data- centers to ensure availability in case of planned maintenance or infrastructure failures (aka unplanned maintenance). These redundant resources are typically “reserved” for use only during relatively rare (planned or unplanned) maintenance. For example, the reserved power is used only when part of the supply of power is lost. Worse, existing power oversubscrip- tion approaches ignore these reserves and aim to restrict the peak power utilization so performance does not need to suffer during maintenance. In other words, even during normal (non- maintenance) operation, the peak power draw cannot exceed the failover power budget. The reserved resources provide an enormous opportunity for increasing datacenter utilization and reducing costs. For example, in a typical high-availability datacenter, 10%-50% of the power and cooling resources are reserved [20], [32], [36]. Leveraging these resources to deploy more servers would significantly increase power usage, reduce the overall cost per provisioned watt, reduce the number of new datacenters that need to be built, and improve the sustainability of cloud providers. The downside is the potential performance and/or availability impact of having to bring the power draw below the failover budget during maintenance events. Our work. In this paper, we propose “zero-reserved-power” datacenters and how to manage them so that workloads still receive their desired availability and performance. In more detail, we demonstrate that large cloud providers can allocate all reserved resources in highly available datacenters for deploying additional servers, while minimizing the impact of maintenance events. Our work relies on three key observations: 1) Cloud services typically exhibit relatively low power utilization with occasional peaks. Hence, the joint probability of critical infrastructure failure (or planned maintenance) and power peaks is small, even after employing state-of-the-art oversubscription strategies. 2) Providers typically host a mix of workloads with differ- ent infrastructure availability requirements in each datacenter, where some software-redundant workloads (e.g., Web search, data analytics) can tolerate infrastructure failures due to their built-in redundancy.
Transcript of Flex: High-Availability Datacenters With Zero Reserved Power
Flex: High-Availability Datacenters WithZero Reserved Power
Chaojie Zhang∗§, Alok Gautam Kumbhare∗, Ioannis Manousakis†, Deli Zhang∗¶, Pulkit A. Misra∗,Rod Assis†, Kyle Woolcock†, Nithish Mahalingam†, Brijesh Warrier†, David Gauthier‡,
Lalu Kunnath‡, Steve Solomon‡, Osvaldo Morales‡, Marcus Fontoura†, Ricardo Bianchini∗
∗Microsoft Research †Microsoft Azure ‡Microsoft CO+I
Abstract—Cloud providers, like Amazon and Microsoft, mustguarantee high availability for a large fraction of their workloads.For this reason, they build datacenters with redundant infras-tructures for power delivery and cooling. Typically, the redundantresources are reserved for use only during infrastructure failureor maintenance events, so that workload performance andavailability do not suffer. Unfortunately, the reserved resourcesalso produce lower power utilization and, consequently, requiremore datacenters to be built. To address these problems, in thispaper we propose “zero-reserved-power” datacenters and theFlex system to ensure that workloads still receive their desiredperformance and availability. Flex leverages the existence ofsoftware-redundant workloads that can tolerate lower infrastruc-ture availability, while imposing minimal (if any) performancedegradation for those that require high infrastructure availability.Flex mainly comprises (1) a new offline workload placementpolicy that reduces stranded power while ensuring safety duringfailure or maintenance events, and (2) a distributed system thatmonitors for failures and quickly reduces the power draw whilerespecting the workloads’ requirements, when it detects a failure.Our evaluation shows that Flex produces less than 5% strandedpower and increases the number of deployed servers by upto 33%, which translates to hundreds of millions of dollars inconstruction cost savings per datacenter site. We end the paperwith lessons from our experience bringing Flex to production inMicrosoft’s datacenters.
Index Terms—Datacenter power management, redundantpower, power capping, workload availability.
I. INTRODUCTION
Motivation. As the demand for cloud services (e.g., In-
frastructure as a Service or IaaS) keeps growing unabated,
cloud providers must build datacenters to keep up. Highly
utilizing the infrastructure (e.g., power, space, cooling) of
each datacenter is critical to reduce the number of datacenters
that must be built and save cost. As power is often the bot-
tleneck resource, large providers use power oversubscription
coupled with power capping (via performance throttling) to
safely increase utilization by deploying more servers to each
datacenter [3], [8], [14], [15], [37]. They carefully select the
amount of oversubscription to prevent excessive performance
degradation due to capping.
§Chaojie Zhang is affiliated with the University of Chicago, but was atMicrosoft Research during this work.
¶Deli Zhang is now affiliated with Facebook, but was at Microsoft Researchduring this work.
However, as providers must maintain high infrastructure
availability, especially for their IaaS offerings, a large source
of inefficiency remains. Specifically, providers provision re-
dundant resources [32], including power and cooling, in data-
centers to ensure availability in case of planned maintenance
or infrastructure failures (aka unplanned maintenance). These
redundant resources are typically “reserved” for use only
during relatively rare (planned or unplanned) maintenance. For
example, the reserved power is used only when part of the
supply of power is lost. Worse, existing power oversubscrip-
tion approaches ignore these reserves and aim to restrict the
peak power utilization so performance does not need to suffer
during maintenance. In other words, even during normal (non-
maintenance) operation, the peak power draw cannot exceed
the failover power budget.
The reserved resources provide an enormous opportunity
for increasing datacenter utilization and reducing costs. For
example, in a typical high-availability datacenter, 10%-50%
of the power and cooling resources are reserved [20], [32],
[36]. Leveraging these resources to deploy more servers would
significantly increase power usage, reduce the overall cost
per provisioned watt, reduce the number of new datacenters
that need to be built, and improve the sustainability of cloud
providers. The downside is the potential performance and/or
availability impact of having to bring the power draw below
the failover budget during maintenance events.
Our work. In this paper, we propose “zero-reserved-power”
datacenters and how to manage them so that workloads still
receive their desired availability and performance. In more
detail, we demonstrate that large cloud providers can allocate
all reserved resources in highly available datacenters for
deploying additional servers, while minimizing the impact of
maintenance events. Our work relies on three key observations:
1) Cloud services typically exhibit relatively low power
utilization with occasional peaks. Hence, the joint probability
of critical infrastructure failure (or planned maintenance) and
power peaks is small, even after employing state-of-the-art
oversubscription strategies.
2) Providers typically host a mix of workloads with differ-
ent infrastructure availability requirements in each datacenter,
where some software-redundant workloads (e.g., Web search,
data analytics) can tolerate infrastructure failures due to their
built-in redundancy.

3) Workloads that are not inherently redundant (e.g., in-
dividual IaaS virtual machines) cannot tolerate infrastructure
unavailability. However, some of them (e.g., first-party VMs)
can often tolerate slight levels of performance throttling. In
fact, the existence of such workloads was the motivation for
combining power oversubscription and capping via throttling.
Observation #1 suggests that maintenance events would
rarely require corrective actions to bring the power draw down,
given that the power utilization of the servers provisioned us-
ing the reserved resources would also only spike occasionally.
Observation #2 and #3 suggest that some workloads can be
shut down (by cutting off their power) and others throttled
upon those rare events.
Unfortunately, accomplishing all this is challenging. First,
since we allocate the reserve power for servers, the infrastruc-
ture must immediately transfer the load under a failed power
supply to the remaining supplies, and temporarily support
overdraw while corrective actions are being taken to lower the
power draw below the failover budget. Second, the provider
must place the workloads across the datacenter so as to
guarantee safety against failures while minimizing “stranded”
power (i.e., power fragmentation). Third, during a maintenance
event, the provider must take corrective actions within the
short duration over which overdraw can be sustained. Failure
to bring the power down within this time will cause a power
outage. As the infrastructure does not have information about
workload characteristics and requirements, the actions must be
performed in software and in the presence of potential server
and communication failures. These constraints make managing
zero-reserved-power datacenters even more challenging.
To address these challenges, we build the Flex system.
First, we extend the (highly available) power infrastructure of
the most recent generation of Microsoft datacenters to ensure
it can draw more power and to create enough time to take
corrective actions in software.
Second, we introduce a new offline workload placement
policy that reduces stranded power while ensuring safety
during maintenance events. The policy leverages mathematical
programming and optimization to select an efficient placement
for each workload (e.g., the servers for a Web search engine,
servers for running IaaS VMs) in a batch of workload deploy-
ments. We call this policy Flex-Offline.
Third, we build a highly available distributed system that
dynamically monitors for infrastructure failures and takes
corrective actions to bring the power down below the failover
budget within a few seconds. The monitoring relies on a
highly available power telemetry pipeline that we also build.
The actions, including throttling or shutting down workloads,
respect pre-defined workload performance and availability
requirements. We call this system Flex-Online.
We have deployed Flex-Online in production in multiple
datacenters; Flex-Offline will come next. We discuss the
lessons from bringing the system to production.
Our evaluation shows that Flex-Offline produces less than
4% median stranded power when we batch Microsoft’s work-
load deployments, whereas simpler policies strand at least
ReservedUtilized(a)
Maximum utilization target
Slack
Increase utilization through oversubscription
Flex CapacityUtilized(b) Slack
Increase utilization using reserved power Additional oversubscription
ReservedUtilized(a) Slack
Increase utilization through oversubscription
Flex CapacityUtilized(b)
Maximum utilization target
Slack
Fig. 1. Difference between traditional oversubscription (a) and Flex (b).
37% more power at the median. Using simulation, emulation,
and large-scale experiments, we also show that Flex-Online
manages power quickly and effectively, while respecting the
workloads’ performance and availability requirements. Over-
all, Flex can increase the server deployments to each data-
center by up to 33%. Depending on the exact building costs
per Watt, this increase translates to savings between $211M
($5/W) and $422M ($10/W) for each 128MW site (multiple
datacenters). The savings can be passed on to customers via
differentiated pricing based on their workloads’ requirements.
Related work. Prior work [3], [4], [6], [8], [9], [11], [13]–
[18], [22], [28], [31], [34], [37], [39] has focused on power
oversubscription and capping under normal (non-maintenance)
operation.. These works did not explicitly consider allocating
reserved power for additional server deployments. Figure 1
illustrates this difference. Oversubscription leverages under-
utilization of the allocated power for deploying more servers,
while keeping the peak power draw under a budget. In con-
trast, Flex enables fully allocating the reserved power, while
mitigating supply of power disruptions. Allocating reserved
power is orthogonal to power oversubscription, i.e. allocated
power that is underutilized can be oversubscribed.
CapMaestro [15] is the only prior system that uses the
reserved power to deploy more servers. However, it does
not consider each workload’s availability requirements in
workload placement or for runtime decisions during a failover.
This limits the amount of reserved power that can be used. In
contrast, Flex can use the entire reserved power for server
deployment and provide each workload’s desired availability.
Summary. We make the following main contributions:
• We propose the notion of highly available, zero-reserved-
power datacenters and demonstrate that it can be achieved by a
combination of infrastructure support and distributed software.
• We design and implement Flex, a system for manag-
ing zero-reserved-power datacenters with minimal impact to
workloads. Flex comprises an offline component responsible
for smartly placing workloads and an online component for
dynamically managing power, availability, and performance.
• We thoroughly evaluate Flex, via simulations and exper-
imentation with realistic workloads, to show that it reduces
stranded power at the same time as managing power with
minimal impact to workloads.
• We made changes to the power infrastructure of Mi-
crosoft’s datacenters and deployed Flex in production with live
loads. We present lessons from this experience.
II. BACKGROUND AND MOTIVATION
A. Distributed redundant power infrastructure
To provide a high-availability infrastructure, cloud providers
build datacenters with redundant power devices and lines,
such as Uninterruptible Power Supplies (UPSes), Generators,
Transformers, and Power Distribution Units (PDUs) [32]. The
redundancy may take several forms, e.g. single-backup (N+1),
full (2N) [25], [30], [36], [37], or distributed (xN/y) [20], each
with its own tradeoff in cost, maintainability, and fault toler-
ance. Based on these tradeoffs, designers often use different
redundancy patterns at different levels in the power hierarchy.
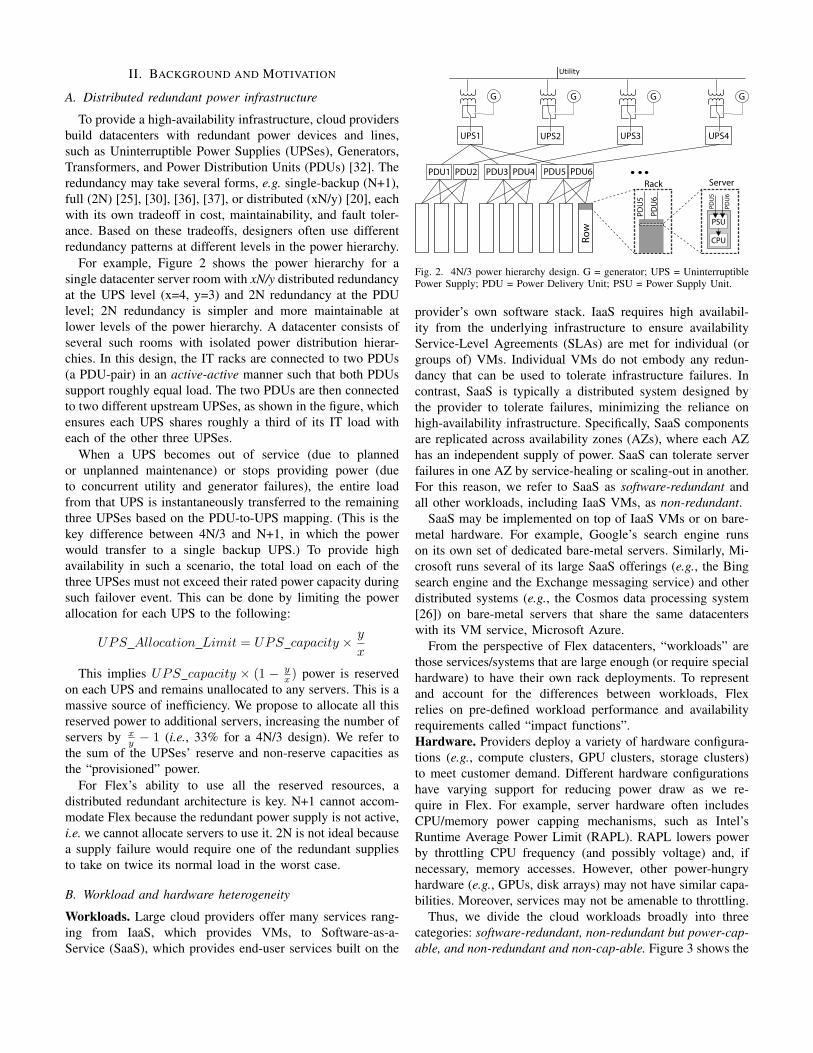
For example, Figure 2 shows the power hierarchy for a
single datacenter server room with xN/y distributed redundancy
at the UPS level (x=4, y=3) and 2N redundancy at the PDU
level; 2N redundancy is simpler and more maintainable at
lower levels of the power hierarchy. A datacenter consists of
several such rooms with isolated power distribution hierar-
chies. In this design, the IT racks are connected to two PDUs
(a PDU-pair) in an active-active manner such that both PDUs
support roughly equal load. The two PDUs are then connected
to two different upstream UPSes, as shown in the figure, which
ensures each UPS shares roughly a third of its IT load with
each of the other three UPSes.
When a UPS becomes out of service (due to planned
or unplanned maintenance) or stops providing power (due
to concurrent utility and generator failures), the entire load
from that UPS is instantaneously transferred to the remaining
three UPSes based on the PDU-to-UPS mapping. (This is the
key difference between 4N/3 and N+1, in which the power
would transfer to a single backup UPS.) To provide high
availability in such a scenario, the total load on each of the
three UPSes must not exceed their rated power capacity during
such failover event. This can be done by limiting the power
allocation for each UPS to the following:
UPS Allocation Limit = UPS capacity ×y
x
This implies UPS capacity × (1 − yx) power is reserved
on each UPS and remains unallocated to any servers. This is a
massive source of inefficiency. We propose to allocate all this
reserved power to additional servers, increasing the number of
servers by xy− 1 (i.e., 33% for a 4N/3 design). We refer to
the sum of the UPSes’ reserve and non-reserve capacities as
the “provisioned” power.
For Flex’s ability to use all the reserved resources, a
distributed redundant architecture is key. N+1 cannot accom-
modate Flex because the redundant power supply is not active,
i.e. we cannot allocate servers to use it. 2N is not ideal because
a supply failure would require one of the redundant supplies
to take on twice its normal load in the worst case.
B. Workload and hardware heterogeneity
Workloads. Large cloud providers offer many services rang-
ing from IaaS, which provides VMs, to Software-as-a-
Service (SaaS), which provides end-user services built on the
Utility
Rack
G
UPS1
PDU1 PDU2 PDU3 PDU4 PDU5 PDU6
G
UPS2
G
UPS3
G
UPS4
Row
Server
PSU
CPU
PDU5
PDU6
PDU5
PDU6
Fig. 2. 4N/3 power hierarchy design. G = generator; UPS = UninterruptiblePower Supply; PDU = Power Delivery Unit; PSU = Power Supply Unit.
provider’s own software stack. IaaS requires high availabil-
ity from the underlying infrastructure to ensure availability
Service-Level Agreements (SLAs) are met for individual (or
groups of) VMs. Individual VMs do not embody any redun-
dancy that can be used to tolerate infrastructure failures. In
contrast, SaaS is typically a distributed system designed by
the provider to tolerate failures, minimizing the reliance on
high-availability infrastructure. Specifically, SaaS components
are replicated across availability zones (AZs), where each AZ
has an independent supply of power. SaaS can tolerate server
failures in one AZ by service-healing or scaling-out in another.
For this reason, we refer to SaaS as software-redundant and
all other workloads, including IaaS VMs, as non-redundant.
SaaS may be implemented on top of IaaS VMs or on bare-
metal hardware. For example, Google’s search engine runs
on its own set of dedicated bare-metal servers. Similarly, Mi-
crosoft runs several of its large SaaS offerings (e.g., the Bing
search engine and the Exchange messaging service) and other
distributed systems (e.g., the Cosmos data processing system
[26]) on bare-metal servers that share the same datacenters
with its VM service, Microsoft Azure.
From the perspective of Flex datacenters, “workloads” are
those services/systems that are large enough (or require special
hardware) to have their own rack deployments. To represent
and account for the differences between workloads, Flex
relies on pre-defined workload performance and availability
requirements called “impact functions”.
Hardware. Providers deploy a variety of hardware configura-
tions (e.g., compute clusters, GPU clusters, storage clusters)
to meet customer demand. Different hardware configurations
have varying support for reducing power draw as we re-
quire in Flex. For example, server hardware often includes
CPU/memory power capping mechanisms, such as Intel’s
Runtime Average Power Limit (RAPL). RAPL lowers power
by throttling CPU frequency (and possibly voltage) and, if
necessary, memory accesses. However, other power-hungry
hardware (e.g., GPUs, disk arrays) may not have similar capa-
bilities. Moreover, services may not be amenable to throttling.
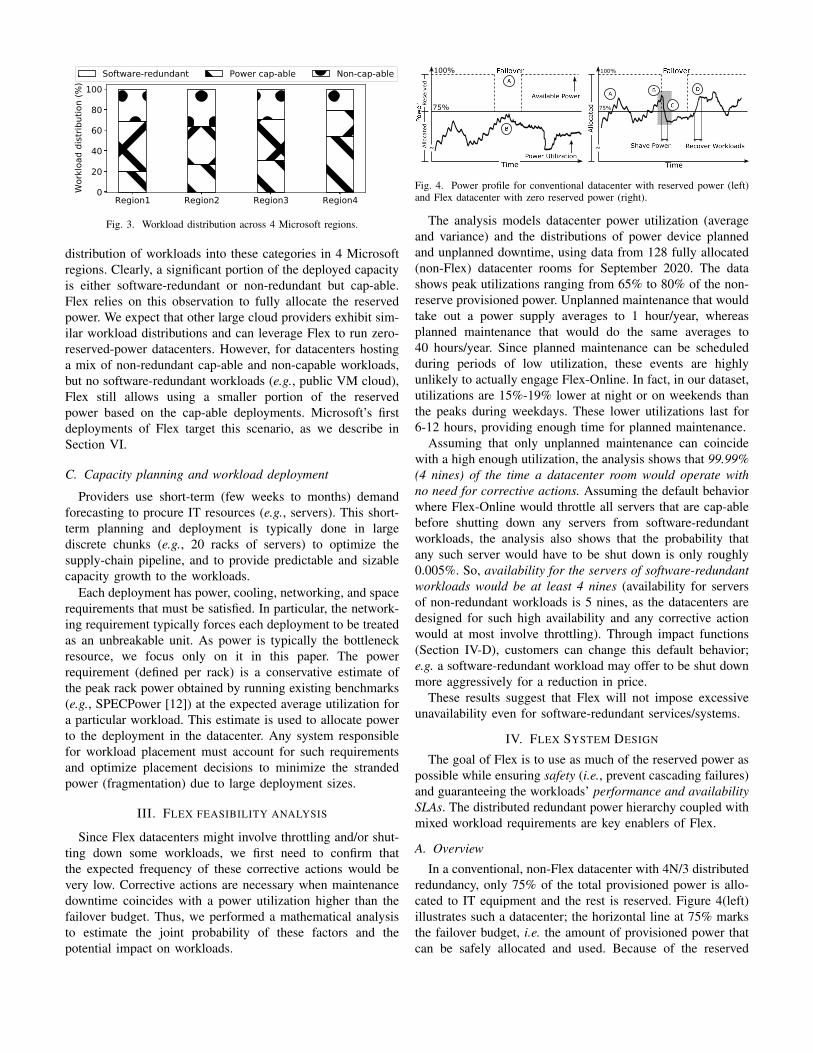
Thus, we divide the cloud workloads broadly into three
categories: software-redundant, non-redundant but power-cap-
able, and non-redundant and non-cap-able. Figure 3 shows the
Region1 Region2 Region3 Region40
20
40
60
80
100W
orkl
oad
dist
ribut
ion
(%)
Software-redundant Power cap-able Non-cap-able
Fig. 3. Workload distribution across 4 Microsoft regions.
distribution of workloads into these categories in 4 Microsoft
regions. Clearly, a significant portion of the deployed capacity
is either software-redundant or non-redundant but cap-able.
Flex relies on this observation to fully allocate the reserved
power. We expect that other large cloud providers exhibit sim-
ilar workload distributions and can leverage Flex to run zero-
reserved-power datacenters. However, for datacenters hosting
a mix of non-redundant cap-able and non-capable workloads,
but no software-redundant workloads (e.g., public VM cloud),
Flex still allows using a smaller portion of the reserved
power based on the cap-able deployments. Microsoft’s first
deployments of Flex target this scenario, as we describe in
Section VI.
C. Capacity planning and workload deployment
Providers use short-term (few weeks to months) demand
forecasting to procure IT resources (e.g., servers). This short-
term planning and deployment is typically done in large
discrete chunks (e.g., 20 racks of servers) to optimize the
supply-chain pipeline, and to provide predictable and sizable
capacity growth to the workloads.
Each deployment has power, cooling, networking, and space
requirements that must be satisfied. In particular, the network-
ing requirement typically forces each deployment to be treated
as an unbreakable unit. As power is typically the bottleneck
resource, we focus only on it in this paper. The power
requirement (defined per rack) is a conservative estimate of
the peak rack power obtained by running existing benchmarks
(e.g., SPECPower [12]) at the expected average utilization for
a particular workload. This estimate is used to allocate power
to the deployment in the datacenter. Any system responsible
for workload placement must account for such requirements
and optimize placement decisions to minimize the stranded
power (fragmentation) due to large deployment sizes.
III. FLEX FEASIBILITY ANALYSIS
Since Flex datacenters might involve throttling and/or shut-
ting down some workloads, we first need to confirm that
the expected frequency of these corrective actions would be
very low. Corrective actions are necessary when maintenance
downtime coincides with a power utilization higher than the
failover budget. Thus, we performed a mathematical analysis
to estimate the joint probability of these factors and the
potential impact on workloads.
~
75%
100%
~
75%
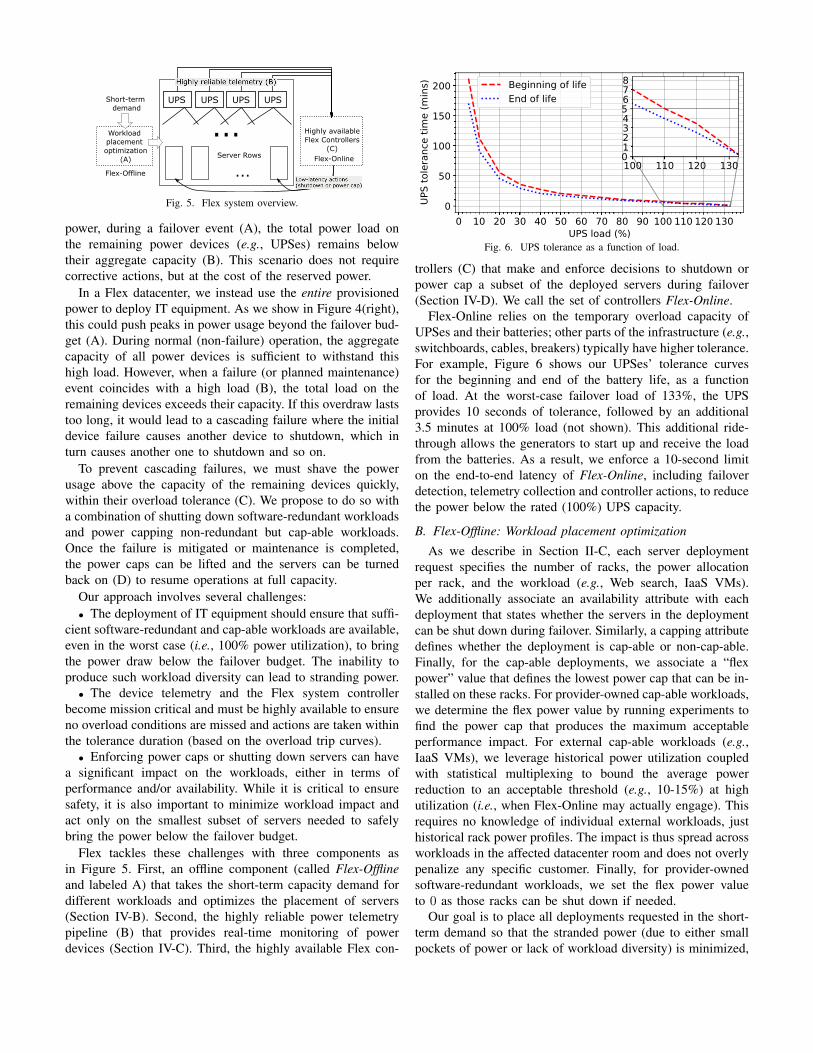
100%
Fig. 4. Power profile for conventional datacenter with reserved power (left)and Flex datacenter with zero reserved power (right).
The analysis models datacenter power utilization (average
and variance) and the distributions of power device planned
and unplanned downtime, using data from 128 fully allocated
(non-Flex) datacenter rooms for September 2020. The data
shows peak utilizations ranging from 65% to 80% of the non-
reserve provisioned power. Unplanned maintenance that would
take out a power supply averages to 1 hour/year, whereas
planned maintenance that would do the same averages to
40 hours/year. Since planned maintenance can be scheduled
during periods of low utilization, these events are highly
unlikely to actually engage Flex-Online. In fact, in our dataset,
utilizations are 15%-19% lower at night or on weekends than
the peaks during weekdays. These lower utilizations last for
6-12 hours, providing enough time for planned maintenance.
Assuming that only unplanned maintenance can coincide
with a high enough utilization, the analysis shows that 99.99%
(4 nines) of the time a datacenter room would operate with
no need for corrective actions. Assuming the default behavior
where Flex-Online would throttle all servers that are cap-able
before shutting down any servers from software-redundant
workloads, the analysis also shows that the probability that
any such server would have to be shut down is only roughly
0.005%. So, availability for the servers of software-redundant
workloads would be at least 4 nines (availability for servers
of non-redundant workloads is 5 nines, as the datacenters are
designed for such high availability and any corrective action
would at most involve throttling). Through impact functions
(Section IV-D), customers can change this default behavior;
e.g. a software-redundant workload may offer to be shut down
more aggressively for a reduction in price.
These results suggest that Flex will not impose excessive
unavailability even for software-redundant services/systems.
IV. FLEX SYSTEM DESIGN
The goal of Flex is to use as much of the reserved power as
possible while ensuring safety (i.e., prevent cascading failures)
and guaranteeing the workloads’ performance and availability
SLAs. The distributed redundant power hierarchy coupled with
mixed workload requirements are key enablers of Flex.
A. Overview
In a conventional, non-Flex datacenter with 4N/3 distributed
redundancy, only 75% of the total provisioned power is allo-
cated to IT equipment and the rest is reserved. Figure 4(left)
illustrates such a datacenter; the horizontal line at 75% marks
the failover budget, i.e. the amount of provisioned power that
can be safely allocated and used. Because of the reserved
UPS
...
...
Server Rows
Workload
placement
optimization
(A)
Short-term
demand
Flex-Offline
Highly available
Flex Controllers
(C)
UPS UPS UPS
Flex-Online
Fig. 5. Flex system overview.
power, during a failover event (A), the total power load on
the remaining power devices (e.g., UPSes) remains below
their aggregate capacity (B). This scenario does not require
corrective actions, but at the cost of the reserved power.
In a Flex datacenter, we instead use the entire provisioned
power to deploy IT equipment. As we show in Figure 4(right),
this could push peaks in power usage beyond the failover bud-
get (A). During normal (non-failure) operation, the aggregate
capacity of all power devices is sufficient to withstand this
high load. However, when a failure (or planned maintenance)
event coincides with a high load (B), the total load on the
remaining devices exceeds their capacity. If this overdraw lasts
too long, it would lead to a cascading failure where the initial
device failure causes another device to shutdown, which in
turn causes another one to shutdown and so on.
To prevent cascading failures, we must shave the power
usage above the capacity of the remaining devices quickly,
within their overload tolerance (C). We propose to do so with
a combination of shutting down software-redundant workloads
and power capping non-redundant but cap-able workloads.
Once the failure is mitigated or maintenance is completed,
the power caps can be lifted and the servers can be turned
back on (D) to resume operations at full capacity.
Our approach involves several challenges:
• The deployment of IT equipment should ensure that suffi-
cient software-redundant and cap-able workloads are available,
even in the worst case (i.e., 100% power utilization), to bring
the power draw below the failover budget. The inability to
produce such workload diversity can lead to stranding power.
• The device telemetry and the Flex system controller
become mission critical and must be highly available to ensure
no overload conditions are missed and actions are taken within
the tolerance duration (based on the overload trip curves).
• Enforcing power caps or shutting down servers can have
a significant impact on the workloads, either in terms of
performance and/or availability. While it is critical to ensure
safety, it is also important to minimize workload impact and
act only on the smallest subset of servers needed to safely
bring the power below the failover budget.
Flex tackles these challenges with three components as
in Figure 5. First, an offline component (called Flex-Offline
and labeled A) that takes the short-term capacity demand for
different workloads and optimizes the placement of servers
(Section IV-B). Second, the highly reliable power telemetry
pipeline (B) that provides real-time monitoring of power
devices (Section IV-C). Third, the highly available Flex con-
0 10 20 30 40 50 60 70 80 90 100 110 120 130UPS load (%)
0
50
100
150
200
UPS
tole
ranc
e tim
e (m
ins) Beginning of life
End of life
100 110 120 1300
5
1234678
Fig. 6. UPS tolerance as a function of load.
trollers (C) that make and enforce decisions to shutdown or
power cap a subset of the deployed servers during failover
(Section IV-D). We call the set of controllers Flex-Online.
Flex-Online relies on the temporary overload capacity of
UPSes and their batteries; other parts of the infrastructure (e.g.,
switchboards, cables, breakers) typically have higher tolerance.
For example, Figure 6 shows our UPSes’ tolerance curves
for the beginning and end of the battery life, as a function
of load. At the worst-case failover load of 133%, the UPS
provides 10 seconds of tolerance, followed by an additional
3.5 minutes at 100% load (not shown). This additional ride-
through allows the generators to start up and receive the load
from the batteries. As a result, we enforce a 10-second limit
on the end-to-end latency of Flex-Online, including failover
detection, telemetry collection and controller actions, to reduce
the power below the rated (100%) UPS capacity.
B. Flex-Offline: Workload placement optimization
As we describe in Section II-C, each server deployment
request specifies the number of racks, the power allocation
per rack, and the workload (e.g., Web search, IaaS VMs).
We additionally associate an availability attribute with each
deployment that states whether the servers in the deployment
can be shut down during failover. Similarly, a capping attribute
defines whether the deployment is cap-able or non-cap-able.
Finally, for the cap-able deployments, we associate a “flex
power” value that defines the lowest power cap that can be in-
stalled on these racks. For provider-owned cap-able workloads,
we determine the flex power value by running experiments to
find the power cap that produces the maximum acceptable
performance impact. For external cap-able workloads (e.g.,
IaaS VMs), we leverage historical power utilization coupled
with statistical multiplexing to bound the average power
reduction to an acceptable threshold (e.g., 10-15%) at high
utilization (i.e., when Flex-Online may actually engage). This
requires no knowledge of individual external workloads, just
historical rack power profiles. The impact is thus spread across
workloads in the affected datacenter room and does not overly
penalize any specific customer. Finally, for provider-owned
software-redundant workloads, we set the flex power value
to 0 as those racks can be shut down if needed.
Our goal is to place all deployments requested in the short-
term demand so that the stranded power (due to either small
pockets of power or lack of workload diversity) is minimized,
while ensuring enough power can be shaved in the worst case
(i.e., 100% utilization) during any maintenance scenario. Thus,
we assume that the maximum power that can be shaved from
software-redundant racks is the entire allocated power, and for
non-redundant but cap-able racks it is the difference between
the allocated and the flex power. No power can be recovered
from the non-redundant and non-cap-able racks.
Historically, this placement has been done manually to
each datacenter room one deployment at a time using simple
approaches, like first-fit or round-robin across the UPSes in
the room. Simple modifications to these approaches can bal-
ance the shave-able and non-shave-able workloads across the
UPSes, and ensure that power constraints are met during both
normal and failover operation. However, simple approaches
could cause high stranded power due to suboptimal placement.
Thus, we propose Flex-Offline as an automated workload
placement algorithm based on Integer Linear Programming
(ILP) that seeks an optimal placement for all the requests in
the short-term demand at the same time. Next, we present a
simplified formulation focusing on UPS power during normal
and failover operation. For brevity, we omit other constraints
(e.g., space, cooling) and other power devices (e.g., PDUs).
Let d be a set of deployment requests in the short-term
demand, u be the set of UPSes, and p the set of PDU-pairs.
Map(p ∈ p) → (u1, u2) | u1, u2 ∈ u models the mapping
from the PDU-pair p to the two upstream UPSes. Let Powd
be the total allocated power to deployment d ∈ d. We associate
an indicator variable, Pd,p, representing whether a deployment
d ∈ d is placed under the PDU-pair p ∈ p.
Each deployment must be placed at most once:
∀d ∈ d,∑
p ∈ p
Pd,p ≤ 1 (1)
During normal operation, the total allocated power is con-strained by UPS power capacities accounting for distributedredundancy (i.e., distribute half the load across the two UPSesconnected to each PDU-pair).
∀u ∈ u,
Loadu =∑
d∈dp∈p
0.5×Pd,p×Powd|u∈Map(p)
≤Capacityu
(2)
During failover of UPS f , in addition to its regular load,each UPS u must take its share of f ’s load. Let CapPowd
be the power for each deployment d after capping or shuttingdown the servers based on their workloads.
CapPowd =
0 d ∈ Software-redundant
FlexPowd d ∈ Non-redundant, cap-able
Powd d ∈ Non-redundant, non-cap-able
(3)
IT loadMech.load
UPS
M
MM
M
Total load
Redundant power meters per UPS Tier-0
n/w switch
diversity
S1
S2
Redundant
Pollers
Pub/sub
Pub/subP2
P1
Flex Controllers
To S1
To S1
To S2
To S2
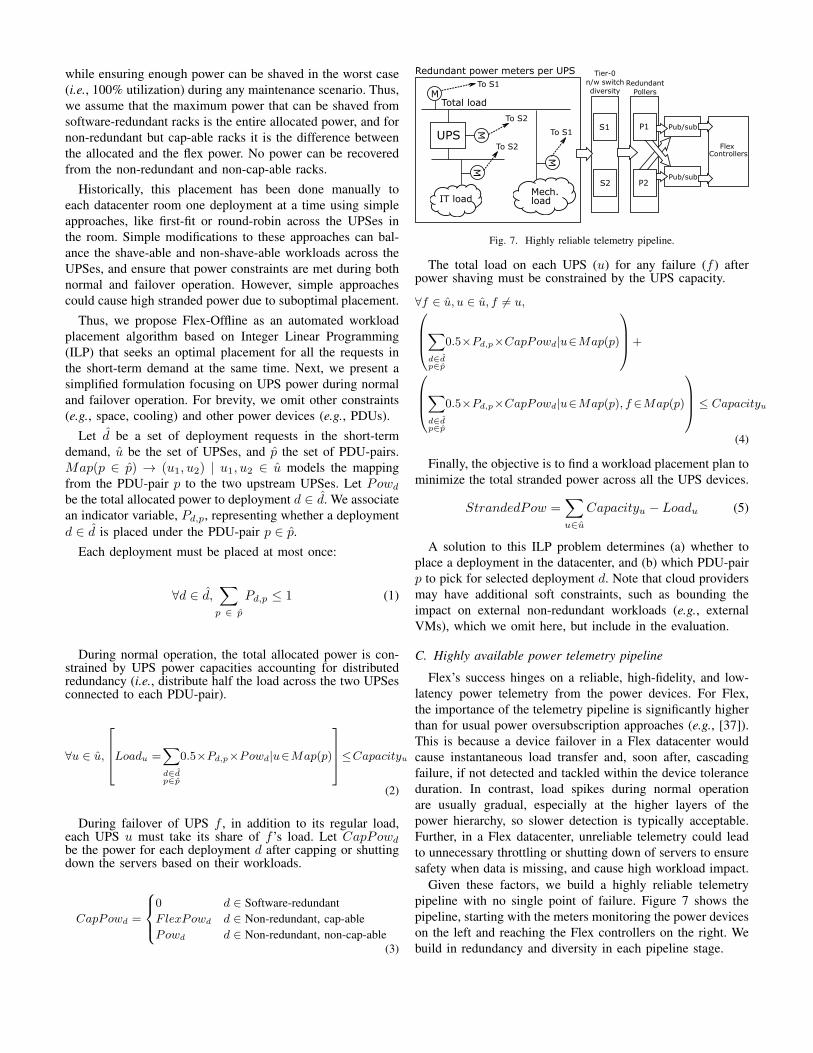
Fig. 7. Highly reliable telemetry pipeline.
The total load on each UPS (u) for any failure (f ) afterpower shaving must be constrained by the UPS capacity.
∀f ∈ u, u ∈ u, f 6= u,
∑
d∈dp∈p
0.5×Pd,p×CapPowd|u∈Map(p)
+
∑
d∈dp∈p
0.5×Pd,p×CapPowd|u∈Map(p), f ∈Map(p)
≤ Capacityu
(4)
Finally, the objective is to find a workload placement plan to
minimize the total stranded power across all the UPS devices.
StrandedPow =∑
u∈u
Capacityu − Loadu (5)
A solution to this ILP problem determines (a) whether to
place a deployment in the datacenter, and (b) which PDU-pair
p to pick for selected deployment d. Note that cloud providers
may have additional soft constraints, such as bounding the
impact on external non-redundant workloads (e.g., external
VMs), which we omit here, but include in the evaluation.
C. Highly available power telemetry pipeline
Flex’s success hinges on a reliable, high-fidelity, and low-
latency power telemetry from the power devices. For Flex,
the importance of the telemetry pipeline is significantly higher
than for usual power oversubscription approaches (e.g., [37]).
This is because a device failover in a Flex datacenter would
cause instantaneous load transfer and, soon after, cascading
failure, if not detected and tackled within the device tolerance
duration. In contrast, load spikes during normal operation
are usually gradual, especially at the higher layers of the
power hierarchy, so slower detection is typically acceptable.
Further, in a Flex datacenter, unreliable telemetry could lead
to unnecessary throttling or shutting down of servers to ensure
safety when data is missing, and cause high workload impact.
Given these factors, we build a highly reliable telemetry
pipeline with no single point of failure. Figure 7 shows the
pipeline, starting with the meters monitoring the power devices
on the left and reaching the Flex controllers on the right. We
build in redundancy and diversity in each pipeline stage.

The pipeline comprises meters, network switches, pollers,
and publish/subscribe (pub/sub) systems. As we explain in the
next section, it is sufficient to monitor only the power of the
power devices (UPS in the figure); there is no need to monitor
explicitly for device failures. However, relying on a single
meter is subject to errors due to meter failure or misreadings.
Hence, we use three logical meters that provide the equivalent
of the device power (after accounting for losses). For example,
in Figure 7, UPSMeter ∼ ITMeter ∼ (TotalMeter −MechMeter) measure the equivalent of the power drawn by
the UPS. This redundancy allows a consensus-based approach
that tolerates failure or misreading of one meter.
To prevent a single point of failure at the network switch,
we build network diversity by connecting these logical meters
to management switches in two datacenter rooms (network
paths beyond this are also redundant). Similarly, we deploy
independent data pollers (on separate fault domains and phys-
ically separated), as well as independent pub/sub systems to
which Flex controllers connect.
Our experimental observations show a telemetry pipeline
latency of less than 1 second, which is fast enough to meet
the 10-second end-to-end limit for Flex.
D. Flex-Online: Runtime decision-making
Controller operation: The Flex controllers are responsible
for detecting failover and taking corrective actions. While
several failure or maintenance events (e.g. UPS, generator,
utility transformer, main switch board, busways) could lead
to failover from one UPS to the others, the Flex controllers
only need to monitor for power overdraw on individual UPS
devices (vs for specific failures). This is sufficient because
the distributed redundant architecture coupled with workload
placement constraints ensure that UPS overdraw occurs only
during failover (even at 100% utilization).
Like the telemetry pipeline, the controllers must be highly
available. Thus, we run the controllers in a multi-primary
configuration with each instance running in a separate fault
domain (e.g., different PDU and top-of-the-rack switch). As
the power telemetry from the UPSes (∼1.5s frequency) and
individual racks (∼2s frequency) may arrive at each controller
instance at different times, each instance could take different
actions. This could lead to overcorrection as the throttle and
shutdown actions are idempotent and are taken independently,
but does not compromise safety.
Algorithm 1 shows the policy the controllers execute to
select a subset of racks to throttle or shut down when power
overdraw is detected at any UPS. The goal is to ensure
safety and to minimize the overall impact on the workloads.
The policy first picks a candidate workload w that is either
software-redundant or non-redundant but cap-able (line 6). The
PickRack(w) function returns a rack from the given workload
either randomly or as prioritized by the workload (line 7). It
then decides the corresponding action Ar (line 8), computes
the estimated recovered power Rr (line 9), and calculates the
estimated total impact Iw on the workload due to capping
or throttling the selected rack (line 10). To complete the
Algorithm 1 Online decision policy based on impact functions
1: Actions← { }2: Pu ← {UPSPowerSnapshotu}3: Pr ← {RackPowerSnapshotr}4: while any(Pu > Limitu − buffer) do
5: C ← { }6: for w ∈ workloads do
7: r ← PickRack(w)
8: Ar ←
{
Shutdown w ∈ Software-redundant
Throttle w ∈ Non-redundant, cap-able
9: Rr ←
{
Pr w ∈ Software-redundant
Pr − FlexPowr w ∈ Non-redundant, cap-able
10: Iw ← Impact(w,Actions ∪ (r, Iw, Ar, Rr))11: C ← C ∪ (r, Iw, Ar, Rr)12: end for
13: a← argminc∈C{Ic}14: Actions← Actions ∪ a
15: Pu ← Pu −Rua
16: end while
17: return Actions
inner loop, the policy accumulates the candidate racks with
the corresponding impacts, actions, and estimated recovered
powers across workloads (line 11). It finally selects the single
rack from the candidates with minimum impact (line 13)
and updates the estimated UPS power based on the rack’s
portion of load on each UPS (line 15). This continues until
the estimated power for all UPS devices is lowered below their
limits. The policy returns the set of actions to be taken.
As the policy needs to estimate the amount of power that
can be recovered from the candidate racks, the Flex controllers
need to continuously monitor all racks in the datacenter. A
recent snapshot or an estimate based on time series models
can be used (line 3). To ensure safety, we add a small buffer
to account for mis-estimation (line 4).
Flex-Online enforces the corrective actions by limiting the
selected non-redundant cap-able racks to their corresponding
flex power value (e.g., using RAPL) or by shutting down
software-redundant racks. To prevent instability due to auto-
recovery or scaling-out, Flex-Online sends a notification about
the power emergency to the software-redundant workloads,
which in turn recover or scale out in a different AZ.
Once the actions are enforced, the controllers must continue
to monitor the power draw as any changes in the workload
characteristics could again increase the power over the device
limits and additional actions may be needed. Conversely, if the
power draw falls significantly, some power caps may be lifted
or servers restored to reduce the impact (not shown here).
The policy also needs to estimate an action’s impact on the
workload to pick a candidate (line 10). We allow each work-
load to define the perceived performance or availability impact
as a function of the percentage of its affected (either shut down
or throttled) racks. For this, we use impact functions.
Impact functions: Figure 8 shows a few example functions.
Each workload defines the impact from 0 to 1 (Y-axis), given

0 20 40 60 80 100% impacted racks
0.0
0.2
0.4
0.6
0.8
1.0W
orkl
oad
Impa
ct
AB
C
Fig. 8. Impact functions for different workloads.
the percentage of the racks of the workload that have been
impacted (X-axis). y = 0 means that throttling or shutting
down a percentage of racks would have no perceivable impact
on the workload performance or availability, whereas y = 1means that a percentage of racks is critical and should not
be touched (unless this would be absolutely vital for safety).
0 < y < 1 means that a percentage of racks can be throttled
or shut down with incremental impact on the workload. Note
that y = 1 does not mean a complete halt to forward progress,
as workloads can implement business continuation processes
and failover to another datacenter. All software-redundant
workloads typically plan for such a scenario.
In Figure 8, functions A, B, and C illustrate potential impact
functions for three large-scale services operated by Microsoft.
Function (A) represents a typical non-redundant but cap-able
workload (e.g., VM service) with incremental impact of throt-
tling any rack, and a set of critical management racks that must
be protected. In contrast, function (B) is a software-redundant
stateless workload where shutting down a large percentage of
racks has no impact as the load is migrated seamlessly to the
remaining racks or another datacenter. Finally, function (C)
is a software-redundant stateful workload partitioned across
racks with a growth buffer (which can be shut down with no
impact), a set of racks performing useful work (incremental
impact from shutting down), and a set of critical management
racks that must be protected.
In the absence of impact functions for any software-redun-
dant workloads, Flex-Online only acts on them if necessary,
after non-redundant cap-able workloads have been throttled.
Summary. The deployment time workload placement opti-
mizations (Flex-Offline) coupled with the runtime Flex con-
trollers (Flex-Online) allow us to use the reserved power and
safely lower power during failover scenarios, while providing
the desired performance and availability to the workloads.
V. EVALUATION
A. Workload placement with Flex-Offline
We evaluate Flex-Offline using simulations of short-term
demand based on Microsoft’s historical production workload
deployments. We also simulate our datacenter server room size
and power delivery infrastructure.
Methodology. Our workload placement simulator faithfully
models a 4N/3 distributed redundant power hierarchy (Fig-
ure 2) in a 9.6MW room. The simulator models the placement
of each deployment of racks to a specific row in the room. It
validates the space, cooling, and power constraints, including
normal and failover limits for all power devices, and rejects de-
ployments that cannot be placed without violating constraints.
We drive the simulator with a trace containing short-term
demand deployment requests. Each request specifies the num-
ber of racks (e.g., 10, 20), provisioned power per rack (e.g.,
14.4kW, 17.2kW), flags indicating software redundancy and
capping capability coupled with the flex power value.
We evaluate the placement policies using a trace repre-
senting the typical deployments at Microsoft. For example,
a typical deployment size is 20 racks, but there are also a
few smaller deployments of 10 and 5 racks. For the workload
distribution, we use an average 13% software-redundant, 56%
non-redundant but cap-able, and the rest 31% non-redundant
and non-capable workloads (Figure 3). For the flex power
values, we use 75-85% of the corresponding allocated rack
power. We generate the trace with 15% more power demand
than the provisioned power, which gives flexibility to the
placement policies. The undeployable requests can be routed
to other rooms for placement. Finally, to study the impact of
the order of deployment requests, we shuffle the trace to create
10 variations in total. With these data, the simulator solves the
Flex-Offline ILP problem using the Gurobi [24] solver.
Evaluation metrics. We evaluate the effectiveness of Flex-
Offline using the following metrics:
• Stranded power is the unusable, unallocated power due
to fragmentation (Equation 5 in Section IV-B). We seek
placements that reduce this metric, so lower values are better.
• Throttling imbalance indicates the fairness of throttling
impact for all non-redundant, cap-able workloads across any
UPS failure. We seek to reduce this metric by selecting
placements that balance the power that is recoverable via
throttling as evenly as possible across all possible UPS main-
tenance events. Better balance means that no workload will
be unduly penalized, regardless of the event. We calculate
this metric as follows. For a given UPS maintenance (f ), we
determine the worst-case power to be recovered from each
of the other UPSes through throttling (as a fraction, rfu, of
provisioned power) after shutting down software-redundant
workloads. We then calculate the throttling imbalance as
∀fu(max(rfu)) − ∀fu(min(rfu)). A value of 0 means perfect
balance, so lower values are better.
Placement policies. We evaluate the following policies:
• Random randomly places a single deployment at a time.
This is the simplest policy but is also clearly naive.
• Balanced Round-Robin places deployments from each
category (software-redundant, non-redundant cap-able, or non-
redundant non-cap-able) across the PDU pairs in a round-robin
manner. The goal is to roughly balance the demand from each
category under each UPS. This simple policy can be imple-
mented as a set of guidelines to datacenter administrators.
• Flex-Offline optimizes the placement for all deployment
requests in the short-term demand horizon. Depending on the
length of the horizon (i.e., batch size), we consider three varia-
tions: Flex-Offline-Short, which batches demand worth about
Random BalancedRound-Robin
Short Long Oracle0
2
4
6
8
10
Stra
nded
Pow
er(%
of P
rovi
sione
d Po
wer)
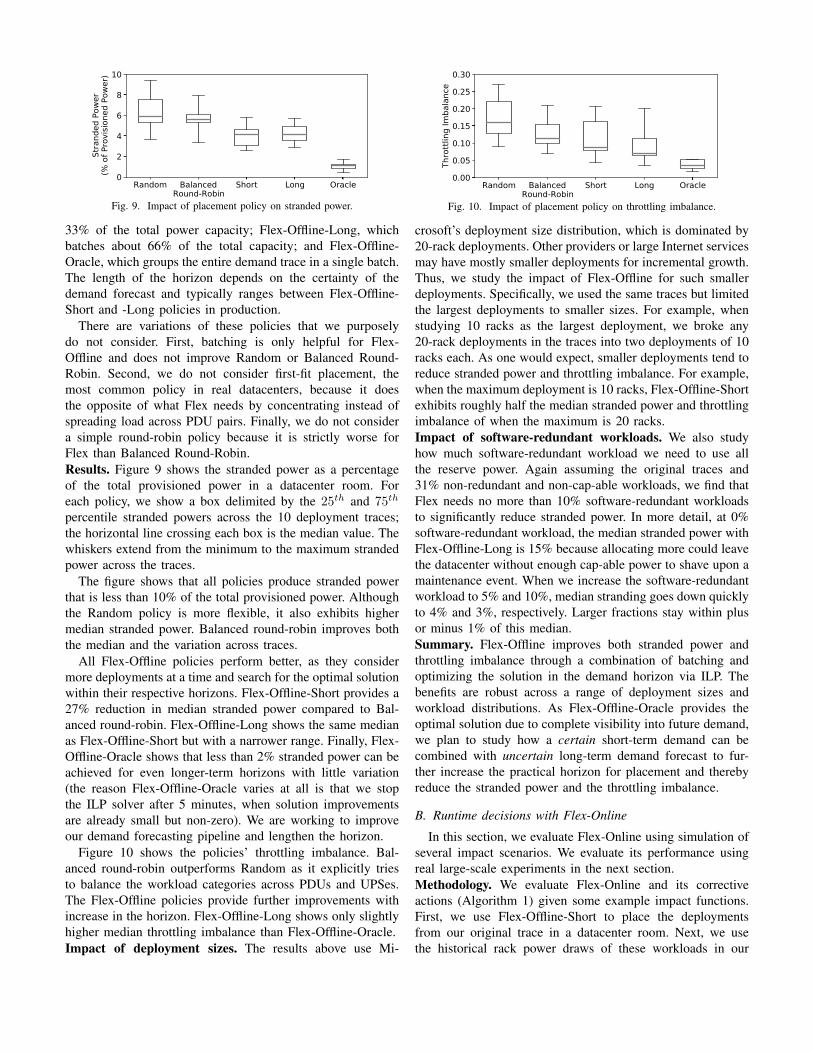
Fig. 9. Impact of placement policy on stranded power.
33% of the total power capacity; Flex-Offline-Long, which
batches about 66% of the total capacity; and Flex-Offline-
Oracle, which groups the entire demand trace in a single batch.
The length of the horizon depends on the certainty of the
demand forecast and typically ranges between Flex-Offline-
Short and -Long policies in production.
There are variations of these policies that we purposely
do not consider. First, batching is only helpful for Flex-
Offline and does not improve Random or Balanced Round-
Robin. Second, we do not consider first-fit placement, the
most common policy in real datacenters, because it does
the opposite of what Flex needs by concentrating instead of
spreading load across PDU pairs. Finally, we do not consider
a simple round-robin policy because it is strictly worse for
Flex than Balanced Round-Robin.
Results. Figure 9 shows the stranded power as a percentage
of the total provisioned power in a datacenter room. For
each policy, we show a box delimited by the 25th and 75th
percentile stranded powers across the 10 deployment traces;
the horizontal line crossing each box is the median value. The
whiskers extend from the minimum to the maximum stranded
power across the traces.
The figure shows that all policies produce stranded power
that is less than 10% of the total provisioned power. Although
the Random policy is more flexible, it also exhibits higher
median stranded power. Balanced round-robin improves both
the median and the variation across traces.
All Flex-Offline policies perform better, as they consider
more deployments at a time and search for the optimal solution
within their respective horizons. Flex-Offline-Short provides a
27% reduction in median stranded power compared to Bal-
anced round-robin. Flex-Offline-Long shows the same median
as Flex-Offline-Short but with a narrower range. Finally, Flex-
Offline-Oracle shows that less than 2% stranded power can be
achieved for even longer-term horizons with little variation
(the reason Flex-Offline-Oracle varies at all is that we stop
the ILP solver after 5 minutes, when solution improvements
are already small but non-zero). We are working to improve
our demand forecasting pipeline and lengthen the horizon.
Figure 10 shows the policies’ throttling imbalance. Bal-
anced round-robin outperforms Random as it explicitly tries
to balance the workload categories across PDUs and UPSes.
The Flex-Offline policies provide further improvements with
increase in the horizon. Flex-Offline-Long shows only slightly
higher median throttling imbalance than Flex-Offline-Oracle.
Impact of deployment sizes. The results above use Mi-
Random BalancedRound-Robin
Short Long Oracle0.00
0.05
0.10
0.15
0.20
0.25
0.30
Thro
ttlin
g Im
bala
nce
Fig. 10. Impact of placement policy on throttling imbalance.
crosoft’s deployment size distribution, which is dominated by
20-rack deployments. Other providers or large Internet services
may have mostly smaller deployments for incremental growth.
Thus, we study the impact of Flex-Offline for such smaller
deployments. Specifically, we used the same traces but limited
the largest deployments to smaller sizes. For example, when
studying 10 racks as the largest deployment, we broke any
20-rack deployments in the traces into two deployments of 10
racks each. As one would expect, smaller deployments tend to
reduce stranded power and throttling imbalance. For example,
when the maximum deployment is 10 racks, Flex-Offline-Short
exhibits roughly half the median stranded power and throttling
imbalance of when the maximum is 20 racks.
Impact of software-redundant workloads. We also study
how much software-redundant workload we need to use all
the reserve power. Again assuming the original traces and
31% non-redundant and non-cap-able workloads, we find that
Flex needs no more than 10% software-redundant workloads
to significantly reduce stranded power. In more detail, at 0%
software-redundant workload, the median stranded power with
Flex-Offline-Long is 15% because allocating more could leave
the datacenter without enough cap-able power to shave upon a
maintenance event. When we increase the software-redundant
workload to 5% and 10%, median stranding goes down quickly
to 4% and 3%, respectively. Larger fractions stay within plus
or minus 1% of this median.
Summary. Flex-Offline improves both stranded power and
throttling imbalance through a combination of batching and
optimizing the solution in the demand horizon via ILP. The
benefits are robust across a range of deployment sizes and
workload distributions. As Flex-Offline-Oracle provides the
optimal solution due to complete visibility into future demand,
we plan to study how a certain short-term demand can be
combined with uncertain long-term demand forecast to fur-
ther increase the practical horizon for placement and thereby
reduce the stranded power and the throttling imbalance.
B. Runtime decisions with Flex-Online
In this section, we evaluate Flex-Online using simulation of
several impact scenarios. We evaluate its performance using
real large-scale experiments in the next section.
Methodology. We evaluate Flex-Online and its corrective
actions (Algorithm 1) given some example impact functions.
First, we use Flex-Offline-Short to place the deployments
from our original trace in a datacenter room. Next, we use
the historical rack power draws of these workloads in our
0.00.20.40.60.81.0
Wor
kloa
d Im
pact
a) Extreme 1 b) Extreme 2
0 20 40 60 80 100% impacted racks
0.00.20.40.60.81.0
Wor
kloa
d Im
pact
c) Realistic 1
0 20 40 60 80 100% impacted racks
d) Realistic 2
non-redundant cap-able software-redundant
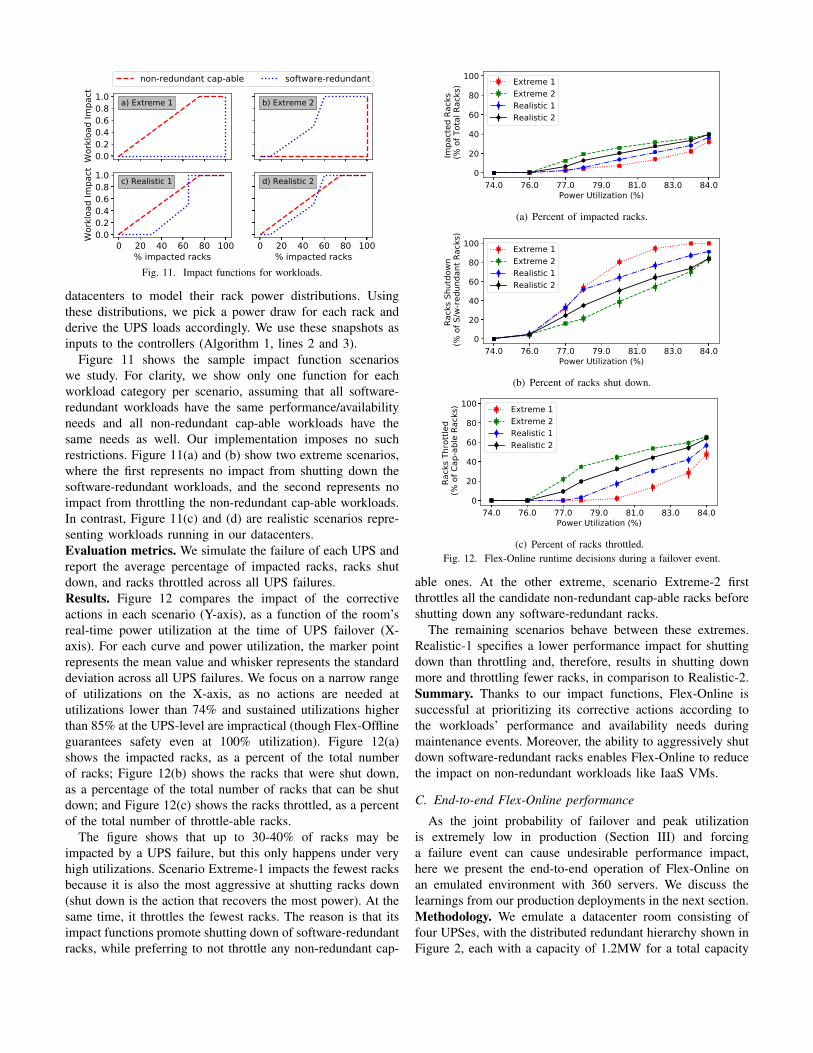
Fig. 11. Impact functions for workloads.
datacenters to model their rack power distributions. Using
these distributions, we pick a power draw for each rack and
derive the UPS loads accordingly. We use these snapshots as
inputs to the controllers (Algorithm 1, lines 2 and 3).
Figure 11 shows the sample impact function scenarios
we study. For clarity, we show only one function for each
workload category per scenario, assuming that all software-
redundant workloads have the same performance/availability
needs and all non-redundant cap-able workloads have the
same needs as well. Our implementation imposes no such
restrictions. Figure 11(a) and (b) show two extreme scenarios,
where the first represents no impact from shutting down the
software-redundant workloads, and the second represents no
impact from throttling the non-redundant cap-able workloads.
In contrast, Figure 11(c) and (d) are realistic scenarios repre-
senting workloads running in our datacenters.
Evaluation metrics. We simulate the failure of each UPS and
report the average percentage of impacted racks, racks shut
down, and racks throttled across all UPS failures.
Results. Figure 12 compares the impact of the corrective
actions in each scenario (Y-axis), as a function of the room’s
real-time power utilization at the time of UPS failover (X-
axis). For each curve and power utilization, the marker point
represents the mean value and whisker represents the standard
deviation across all UPS failures. We focus on a narrow range
of utilizations on the X-axis, as no actions are needed at
utilizations lower than 74% and sustained utilizations higher
than 85% at the UPS-level are impractical (though Flex-Offline
guarantees safety even at 100% utilization). Figure 12(a)
shows the impacted racks, as a percent of the total number
of racks; Figure 12(b) shows the racks that were shut down,
as a percentage of the total number of racks that can be shut
down; and Figure 12(c) shows the racks throttled, as a percent
of the total number of throttle-able racks.
The figure shows that up to 30-40% of racks may be
impacted by a UPS failure, but this only happens under very
high utilizations. Scenario Extreme-1 impacts the fewest racks
because it is also the most aggressive at shutting racks down
(shut down is the action that recovers the most power). At the
same time, it throttles the fewest racks. The reason is that its
impact functions promote shutting down of software-redundant
racks, while preferring to not throttle any non-redundant cap-
74.0 76.0 77.0 79.0 81.0 83.0 84.0Power Utilization (%)
0
20
40
60
80
100
Impa
cted
Rac
ks
(% o
f Tot
al R
acks
) Extreme 1Extreme 2Realistic 1Realistic 2
(a) Percent of impacted racks.
74.0 76.0 77.0 79.0 81.0 83.0 84.0Power Utilization (%)
0
20
40
60
80
100
Rack
s Shu
tdow
n (%
of S
/w-re
dund
ant R
acks
)
Extreme 1Extreme 2Realistic 1Realistic 2
(b) Percent of racks shut down.
74.0 76.0 77.0 79.0 81.0 83.0 84.0Power Utilization (%)
0
20
40
60
80
100
Rack
s Thr
ottle
d (%
of C
ap-a
ble
Rack
s) Extreme 1Extreme 2Realistic 1Realistic 2
(c) Percent of racks throttled.
Fig. 12. Flex-Online runtime decisions during a failover event.
able ones. At the other extreme, scenario Extreme-2 first
throttles all the candidate non-redundant cap-able racks before
shutting down any software-redundant racks.
The remaining scenarios behave between these extremes.
Realistic-1 specifies a lower performance impact for shutting
down than throttling and, therefore, results in shutting down
more and throttling fewer racks, in comparison to Realistic-2.
Summary. Thanks to our impact functions, Flex-Online is
successful at prioritizing its corrective actions according to
the workloads’ performance and availability needs during
maintenance events. Moreover, the ability to aggressively shut
down software-redundant racks enables Flex-Online to reduce
the impact on non-redundant workloads like IaaS VMs.
C. End-to-end Flex-Online performance
As the joint probability of failover and peak utilization
is extremely low in production (Section III) and forcing
a failure event can cause undesirable performance impact,
here we present the end-to-end operation of Flex-Online on
an emulated environment with 360 servers. We discuss the
learnings from our production deployments in the next section.
Methodology. We emulate a datacenter room consisting of
four UPSes, with the distributed redundant hierarchy shown in
Figure 2, each with a capacity of 1.2MW for a total capacity
of 4.8MW with no reserved power. The room has 36 rows,
with space for 10 racks per row. We generate a trace of short-
term demand with the same distribution of workload categories
as in Section V-A, but with one workload per category. We
then use the Flex-Offline-Short policy to determine workload
placement. We emulate each rack placed in the room with
a single server and run synthetic benchmarks to emulate
workload execution. We scale the server power utilization
to a rack by a pre-defined scale factor based on the server
peak power and the rack provisioned power. We use a flex
power value of 85% of the provisioned rack power for non-
redundant, cap-able workloads. We run benchmarks we use
internally to evaluate our software stack. Specifically, we run
TeraSort [23] to represent the software-redundant workload
and a latency-sensitive TPC-E-like [7] benchmark to represent
both the non-redundant cap-able and non-cap-able workloads.
Each workload instance runs independently in its own VM.
We configure the benchmark parameters, including number
of instances running on each server, to emulate an aggregate
utilization of 80% of the provisioned power at the UPS level.
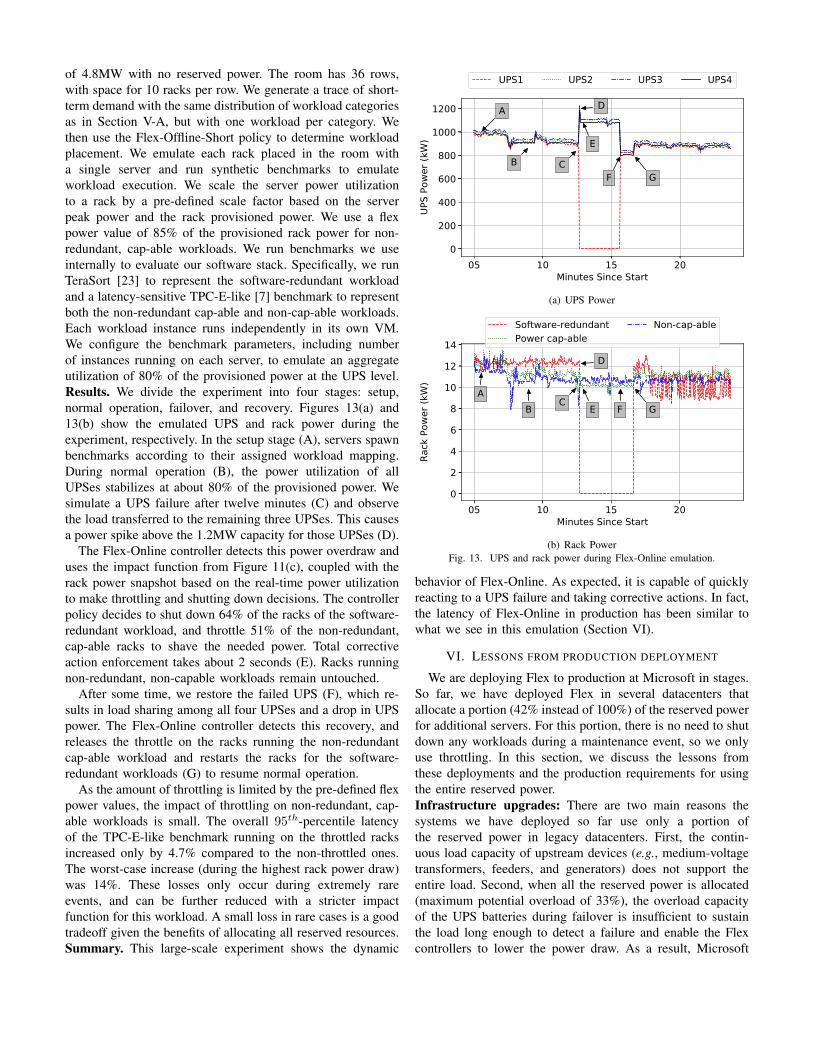
Results. We divide the experiment into four stages: setup,
normal operation, failover, and recovery. Figures 13(a) and
13(b) show the emulated UPS and rack power during the
experiment, respectively. In the setup stage (A), servers spawn
benchmarks according to their assigned workload mapping.
During normal operation (B), the power utilization of all
UPSes stabilizes at about 80% of the provisioned power. We
simulate a UPS failure after twelve minutes (C) and observe
the load transferred to the remaining three UPSes. This causes
a power spike above the 1.2MW capacity for those UPSes (D).
The Flex-Online controller detects this power overdraw and
uses the impact function from Figure 11(c), coupled with the
rack power snapshot based on the real-time power utilization
to make throttling and shutting down decisions. The controller
policy decides to shut down 64% of the racks of the software-
redundant workload, and throttle 51% of the non-redundant,
cap-able racks to shave the needed power. Total corrective
action enforcement takes about 2 seconds (E). Racks running
non-redundant, non-capable workloads remain untouched.
After some time, we restore the failed UPS (F), which re-
sults in load sharing among all four UPSes and a drop in UPS
power. The Flex-Online controller detects this recovery, and
releases the throttle on the racks running the non-redundant
cap-able workload and restarts the racks for the software-
redundant workloads (G) to resume normal operation.
As the amount of throttling is limited by the pre-defined flex
power values, the impact of throttling on non-redundant, cap-
able workloads is small. The overall 95th-percentile latency
of the TPC-E-like benchmark running on the throttled racks
increased only by 4.7% compared to the non-throttled ones.
The worst-case increase (during the highest rack power draw)
was 14%. These losses only occur during extremely rare
events, and can be further reduced with a stricter impact
function for this workload. A small loss in rare cases is a good
tradeoff given the benefits of allocating all reserved resources.
Summary. This large-scale experiment shows the dynamic
05 10 15 20Minutes Since Start
0
200
400
600
800
1000
1200
UPS
Powe
r (kW
)
A
B C
D
E
F G
UPS1 UPS2 UPS3 UPS4
(a) UPS Power
05 10 15 20Minutes Since Start
0
2
4
6
8
10
12
14
Rack
Pow
er (k
W)
AB C
D
E F G
Software-redundantPower cap-able
Non-cap-able
(b) Rack Power
Fig. 13. UPS and rack power during Flex-Online emulation.
behavior of Flex-Online. As expected, it is capable of quickly
reacting to a UPS failure and taking corrective actions. In fact,
the latency of Flex-Online in production has been similar to
what we see in this emulation (Section VI).
VI. LESSONS FROM PRODUCTION DEPLOYMENT
We are deploying Flex to production at Microsoft in stages.
So far, we have deployed Flex in several datacenters that
allocate a portion (42% instead of 100%) of the reserved power
for additional servers. For this portion, there is no need to shut
down any workloads during a maintenance event, so we only
use throttling. In this section, we discuss the lessons from
these deployments and the production requirements for using
the entire reserved power.
Infrastructure upgrades: There are two main reasons the
systems we have deployed so far use only a portion of
the reserved power in legacy datacenters. First, the contin-
uous load capacity of upstream devices (e.g., medium-voltage
transformers, feeders, and generators) does not support the
entire load. Second, when all the reserved power is allocated
(maximum potential overload of 33%), the overload capacity
of the UPS batteries during failover is insufficient to sustain
the load long enough to detect a failure and enable the Flex
controllers to lower the power draw. As a result, Microsoft
is building its new datacenters with higher rated upstream
devices and larger UPS batteries, which will allow Flex to
use all reserved resources at a small additional cost (∼3%).
Implications on cooling infrastructure: Flex must consider
the available cooling capacity to safely deploy servers using
the reserved power. Thus, in production, we include rack
cooling requirements, measured in cubic feet per minute
per watt (CFM/W), as constraints in our offline workload
placement optimization. In our experience, these constraints
have not been the bottleneck even with increased server density
for two reasons: (1) there has been a significant drop in server
CFM/W requirements as server airflow and heatsink designs
improve, and (2) datacenters are designed to support much
higher cooling needs for backward compatibility.
Further, just as redundant power, Flex can leverage the
redundancy in cooling for deploying additional servers. Upon
the loss of this redundant cooling, unlike losing redundant
power, several minutes are available for mitigation as datacen-
ter temperature rise is gradual. Hence, other mitigations, such
as workload migration to another cooling domain, can be used
before enacting strict Flex capping/shutdown actions. Thus,
we envision no extra cooling infrastructure cost to support
additional servers with Flex even at zero reserved power.
Power meter fidelity: As we state in Section IV-C, reliable
telemetry is critical for Flex-Online. However, some power
devices like UPSes are not designed for such high-fidelity
external monitoring. For example, in our experience, repeated
polling of the UPS meters would often return the same value
for up to 5 seconds, due to meter inaccuracy. As a result, we
had to deploy additional UPS output meters to compensate.
Further, there are multiple systems in the datacenter that
monitor these and other devices. As these meters only provide
pull-based readings, contention between various systems could
cause a drop in fidelity. We solved this problem with dedicated
Flex meters and careful coordination between these systems,
reducing polling intervals from ∼3 to ∼1 seconds.
Firmware and network status: We use out-of-band mecha-
nisms supported by the rack manager (RM) and the baseboard
management controller (BMC) [21] to throttle or shutdown
servers. It is critical to keep the firmware on the RMs and
BMCs up-to-date, especially when deploying new servers or
when existing servers are serviced or replaced due to failures.
In addition, to ensure that the actions take effect, the RMs
and BMCs must be reachable during a maintenance event. To
ensure both of these, we built a separate background service
that monitors both firmware status and network reachability for
all RMs. It is also responsible for periodically injecting failures
and taking fake actions to ensure no firmware regressions,
software bugs, or other issues cause actions to fail during an
actual maintenance event. If such issues occur, the service
warns operators and engineers to take immediate remedial
actions, e.g. redeployment of firmware or bug fixes.
Performance characteristics: The two key metrics we con-
sider in production are the “data latency”, i.e. the time to detect
a failure, and the latency to take corrective actions. So far, we
have observed the 99.9th percentile data latency in production
to be under 1.5 seconds, including the windowing delay to
consolidate the several physical data points for a given logical
meter. Further, we observe the latency to take throttling or
shutdown actions to be around 2 seconds at 99.9th percentile
for a ∼10MW room in the DC. The end-to-end latency (3.5
seconds) is well below the limits imposed by the power devices
towards their end-of-life (∼10 seconds).
Financial incentives for lower availability workloads: To
use the entire reserved power, it is critical to deploy enough
workloads that are amenable to lower infrastructure availabil-
ity. Microsoft has many such workloads. Unfortunately, not all
existing workloads have been built with this capability (and
some, like individual IaaS VMs, are inherently not redundant).
Still, it is possible to redesign some of them with greater
software redundancy and fault-tolerance. We are currently
developing new charge models that incentivize workloads with
relaxed performance and availability requirements.
VII. RELATED WORK
To our knowledge, this work is the first to propose data-
centers that use their entire reserved power for server deploy-
ments, guarantee safety during failover using offline workload
placement, and provide workloads with their desired availabil-
ity. Nevertheless, works on power oversubscription, workload
awareness, and energy storage are related.
Power oversubscription. Many works have addressed power
oversubscription, typically with power capping for preventing
circuit breaker trips [2]–[4], [8], [11], [14], [15], [28], [30],
[31], [34], [35]. Some authors underprovision the infrastruc-
ture and either discharge batteries [4], [34] and/or throttle
workloads [19] when needed, again during normal operation.
Some recent papers [11], [14], [30], [37] treat workloads
differently based on their priority, interactivity, or availability
requirements for higher oversubscription or lower performance
impact. These works focused on power management during
normal (non-maintenance, non-failover) operation without re-
gard for fully utilizing reserved resources and the associated
challenges. Flex focuses on allocating all reserved resources
for additional servers and managing maintenance events, so it
is orthogonal and can be combined with these prior works.
CapMaestro [15] combines oversubscription with the power
redundancy provided by 2N-redundant datacenters to deploy
more servers. It uses priorities to selectively throttle work-
loads, but does not consider their availability requirements
during placement or failover. This approach ensures safety
but limits the amount of reserved power that can be used. In
contrast, our infrastructure- and availability-aware workload
placement, and the highly-available power telemetry allow
Flex to use the entire reserved power and still guarantee safety.
Oversubscription can be used in addition to Flex to further
increase server density, if the observed utilization is low.
Workload priority awareness. Some prior oversubscription
works recognize the potential performance degradation of
power capping and include some notion of workload pri-
ority [11], [14], [15], [29], [30], [37]. For example, IBM’s
CapMaestro [15] shifts power to servers running high-priority
workloads by throttling servers running low-priority ones
harder even across PDUs. Li et al. provide quality of service
for tasks running on the same server [14]. In contrast, Flex
implements a much more detailed and descriptive approach
to workload awareness. With impact functions, it accounts for
explicit descriptions of workload performance and availability
impact, in both placement and runtime decision-making.
Energy storage and flexible power infrastructure. Re-
searchers have considered repurposing energy storage devices
(ESD) to shave power peaks [1], [5], [10], [33], [38]. Most of
them focus on distributed ESDs that attach to either servers
or racks. These approaches are vulnerable to long-lasting or
unbalanced peaks, which may deplete all or some of the ESDs
quickly. In Flex datacenters, we keep centralized ESDs and use
them as backup until software can react.
Finally, Power Routing [27] adds more connections from
racks and rows to other PDUs so that they form shuffled
distribution topologies. The design lowers the need for re-
served capacity, but does not eliminate it. Moreover, for
the common dual-corded power supply architecture, costly
infrastructure upgrades must be made to enable such richer
physical connectivity.
VIII. CONCLUSIONS
We introduced zero-reserved-power datacenters and the Flex
system to manage them. Flex leverages the lower infrastructure
availability requirements of software-redundant workloads and
combines static workload placement with dynamic power
management to safely allocate the reserved power. Using
simulation and large-scale experiments, we showed that Flex
significantly reduces stranded power while quickly and effec-
tively managing workload availability and performance. Flex
decreases construction costs significantly, producing savings of
hundreds of millions of dollars from each datacenter site. Our
experience deploying Flex in production at Microsoft drew
many lessons that should benefit any other provider.
ACKNOWLEDGMENTS
We would like to thank the anonymous shepherd and re-
viewers for helping us improve this paper. We would also like
to thank several people who helped bring Flex to production:
Dong Wei, Ganesh Narayanan, and Dave Lalor for building the
telemetry pipeline; Keith Krueger and Kris Redding for their
design on management network diversity; Sriram Govindan for
improving the reliability and latency of rack manager opera-
tions; Sunny Gautam and Sagar Dharia for implementing the
platform-agnostic BMC interfaces; and Ajay Gudehosahalli
and Pratish Kumar for their contributions towards building
Flex-Online and the background monitoring services.
REFERENCES
[1] B. Aksanli, E. Pettis, and T. Rosing, “Architecting efficient peak powershaving using batteries in data centers,” in Proceedings of the 21st
International Symposium on Modelling, Analysis and Simulation of
Computer and Telecommunication Systems, 2013.[2] R. Azimi, M. Badiei, X. Zhan, N. Li, and S. Reda, “Fast decentralized
power capping for server clusters.” in Proceedings of the 23rd Interna-
tional Symposium on High-Performance Computer Architecture, 2017.
[3] X. Fan, W.-D. Weber, and L. A. Barroso, “Power provisioning for awarehouse-sized computer,” in Proceedings of the 34th International
Symposium on Computer Architecture, 2007.
[4] S. Govindan, J. Choi, B. Urgaonkar, A. Sivasubramaniam, and A. Bal-dini, “Statistical profiling-based techniques for effective power provi-sioning in data centers,” in Proceedings of the 4th European Conference
on Computer Systems, 2009.
[5] S. Govindan, D. Wang, A. Sivasubramaniam, and B. Urgaonkar, “Lever-aging stored energy for handling power emergencies in aggressivelyprovisioned datacenters,” in Proceedings of the 17th International
Conference on Architectural Support for Programming Languages and
Operating Systems, 2012.
[6] A. Guliani and M. M. Swift, “Per-Application Power Delivery,” inProceedings of the European Conference on Computer Systems, 2019.
[7] T. Hogan, “Overview of tpc benchmark e: The next generation ofoltp benchmarks,” in Proceedings of the Technology Conference on
Performance Evaluation and Benchmarking, 2009.
[8] C.-H. Hsu, Q. Deng, J. Mars, and L. Tang, “Smoothoperator: Reducingpower fragmentation and improving power utilization in large-scaledatacenters,” in Proceedings of the 23rd International Conference on
Architectural Support for Programming Languages and Operating Sys-
tems, 2018.
[9] C. Isci, A. Buyuktosunoglu, C.-Y. Cher, P. Bose, and M. Martonosi,“An analysis of efficient multi-core global power management policies:Maximizing performance for a given power budget,” in Proceedings of
the 39th International Symposium on Microarchitecture, 2006.
[10] V. Kontorinis, L. E. Zhang, B. Aksanli, J. Sampson, H. Homayoun,E. Pettis, D. M. Tullsen, and T. S. Rosing, “Managing distributed upsenergy for effective power capping in data centers,” in Proceedings of
the 39th International Symposium on Computer Architecture, 2012.
[11] A. Kumbhare, R. Azimi, I. Manousakis, A. Bonde, F. Frujeri, N. Ma-halingam, P. Misra, S. A. Javadi, B. Schroeder, M. Fontoura, andR. Bianchini, “Prediction-based power oversubscription in cloud plat-forms,” in Proceedings of the USENIX Annual Technical Conference,2021, to appear.
[12] K.-D. Lange, “Identifying shades of green: The specpower benchmarks,”Computer, no. 3, 2009.
[13] C. Lefurgy, X. Wang, and M. Ware, “Server-level power control,” in Pro-
ceedings of the 4th International Conference on Autonomic Computing,2007.
[14] S. Li, X. Wang, X. Zhang, V. Kontorinis, S. Kodakara, D. Lo,and P. Ranganathan, “Thunderbolt: Throughput-optimized, quality-of-service-aware power capping at scale,” in Proceedings of the 14th
Symposium on Operating Systems Design and Implementation, 2020.
[15] Y. Li, C. R. Lefurgy, K. Rajamani, M. S. Allen-Ware, G. J. Silva,D. D. Heimsoth, S. Ghose, and O. Mutlu, “A Scalable Priority-AwareApproach to Managing Data Center Server Power,” in Proceedings of the
International Symposium on High Performance Computer Architecture,2019.
[16] Y. Liu, G. Cox, Q. Deng, S. C. Draper, and R. Bianchini, “Fastcap: Anefficient and fair algorithm for power capping in many-core systems,” inProceedings of the International Symposium on Performance Analysis
of Systems and Software, 2016.
[17] D. Lo, L. Cheng, R. Govindaraju, P. Ranganathan, and C. Kozyrakis,“Heracles: Improving resource efficiency at scale,” in Proceedings of the
42nd Annual International Symposium on Computer Architecture, 2015.
[18] K. Ma, X. Li, M. Chen, and X. Wang, “Scalable power control for many-core architectures running multi-threaded applications,” in Proceedings
of the 38th Annual International Symposium on Computer Architecture,2011.
[19] I. Manousakis, I. Goiri, S. Sankar, T. D. Nguyen, and R. Bianchini,“Coolprovision: Underprovisioning datacenter cooling,” in Proceedings
of the 6th Symposium on Cloud Computing, 2015.
[20] K. McCarthy and V. Avelar, “Comparing ups system design configu-rations,” APC white paper 75, Schneider electric Data center science
center, 2016.
[21] S. Mills and P. Sarti, “Open rack specification v2.2,” 2019.[Online]. Available: https://www.opencompute.org/wiki/Open Rack/SpecsAndDesigns
[22] A. K. Mishra, S. Srikantaiah, M. Kandemir, and C. R. Das, “Cpmin cmps: Coordinated power management in chip-multiprocessors,” inProceedings of the International Conference for High Performance
Computing, Networking, Storage and Analysis, 2010.
[23] O. O’Malley, “Terabyte sort on apache hadoop,” Yahoo, available online
at: http://sortbenchmark.org/Yahoo-Hadoop.pdf, 2008.[24] G. I. Optimization, “Gurobi optimizer reference manual,” 2018.
[Online]. Available: http://www.gurobi.com[25] G. Parise and L. Parise, “Electrical distribution for a reliable data center,”
IEEE Transactions on Industry Applications, vol. 49, no. 4, 2013.[26] H. Patel, A. Jindal, and C. Szyperski, “Big data processing at microsoft:
Hyper scale, massive complexity, and minimal cost,” in Proceedings of
the 10th Symposium on Cloud Computing, 2019.[27] S. Pelley, D. Meisner, P. Zandevakili, T. F. Wenisch, and J. Underwood,
“Power routing: Dynamic power provisioning in the data center,” inProceedings of the Fifteenth International Conference on Architectural
Support for Programming Languages and Operating Systems, 2010.[28] R. Raghavendra, P. Ranganathan, V. Talwar, Z. Wang, and X. Zhu,
“No “power” struggles: Coordinated multi-level power management forthe data center,” in Proceedings of the 13th International Conference
on Architectural Support for Programming Languages and Operating
Systems, 2008.[29] P. Ranganathan, P. Leech, D. Irwin, and J. Chase, “Ensemble-level power
management for dense blade servers,” in Proceedings of the 33rd Annual
International Symposium on Computer Architecture, 2006.[30] V. Sakalkar, V. Kontorinis, D. Landhuis, S. Li, D. De Ronde, T. Bloom-
ing, A. Ramesh, J. Kennedy, C. Malone, J. Clidaras, and P. Ranganathan,“Data center power oversubscription with a medium voltage power planeand priority-aware capping,” in Proceedings of the 25th International
Conference on Architectural Support for Programming Languages and
Operating Systems, 2020.[31] R. Sakamoto, T. Cao, M. Kondo, K. Inoue, M. Ueda, T. Patki,
D. Ellsworth, B. Rountree, and M. Schulz, “Production Hardware Over-provisioning: Real-world Performance Optimization Using an ExtensiblePower-Aware Resource Management Framework,” in Proceedings of the
International Parallel and Distributed Processing Symposium, 2017.[32] W. P. Turner IV, J. PE, P. Seader, and K. Brill, “Tier classification define
site infrastructure performance,” Uptime Institute, vol. 17, 2006.[33] D. Wang, C. Ren, A. Sivasubramaniam, B. Urgaonkar, and H. Fathy,
“Energy storage in datacenters: what, where, and how much?” inProceedings of the 12th Joint International Conference on Measurement
and Modeling of Computer Systems, 2012.[34] G. Wang, S. Wang, B. Luo, W. Shi, Y. Zhu, W. Yang, D. Hu, L. Huang,
X. Jin, and W. Xu, “Increasing large-scale data center capacity by sta-tistical power control,” in Proceedings of the 11th European Conference
on Computer Systems, 2016.[35] X. Wang, M. Chen, C. Lefurgy, and T. W. Keller, “Ship: Scalable
hierarchical power control for large-scale data centers,” in Proceedings
of the 18th International Conference on Parallel Architectures and
Compilation Techniques, 2009.[36] M. Wiboonrat, “An optimal data center availability and investment
trade-offs,” in Proceedings of the 9th ACIS International Conference
on Software Engineering, Artificial Intelligence, Networking, and Par-
allel/Distributed Computing, 2008.[37] Q. Wu, Q. Deng, L. Ganesh, C.-H. Hsu, Y. Jin, S. Kumar, B. Li, J. Meza,
and Y. J. Song, “Dynamo: Facebook’s data center-wide power manage-ment system,” in Proceedings of the 43rd International Symposium on
Computer Architecture, 2016.[38] J. Yao, X. Liu, W. He, and A. Rahman, “Dynamic control of electricity
cost with power demand smoothing and peak shaving for distributed in-ternet data centers,” in Proceedings of the 32nd International Conference
on Distributed Computing Systems, 2012.[39] H. Zhang and H. Hoffmann, “Maximizing Performance Under a Power
Cap: A Comparison of Hardware, Software, and Hybrid Techniques,” inProceedings of the International Conference on Architectural Support
for Programming Languages and Operating Systems, 2016.