COVID-19 Dashboard of Economic Indicators
101
COVID-19 Dashboard of Economic Indicators 28 October 2020
Transcript of COVID-19 Dashboard of Economic Indicators

COVID-19 Dashboardof Economic Indicators
28 October 2020

2
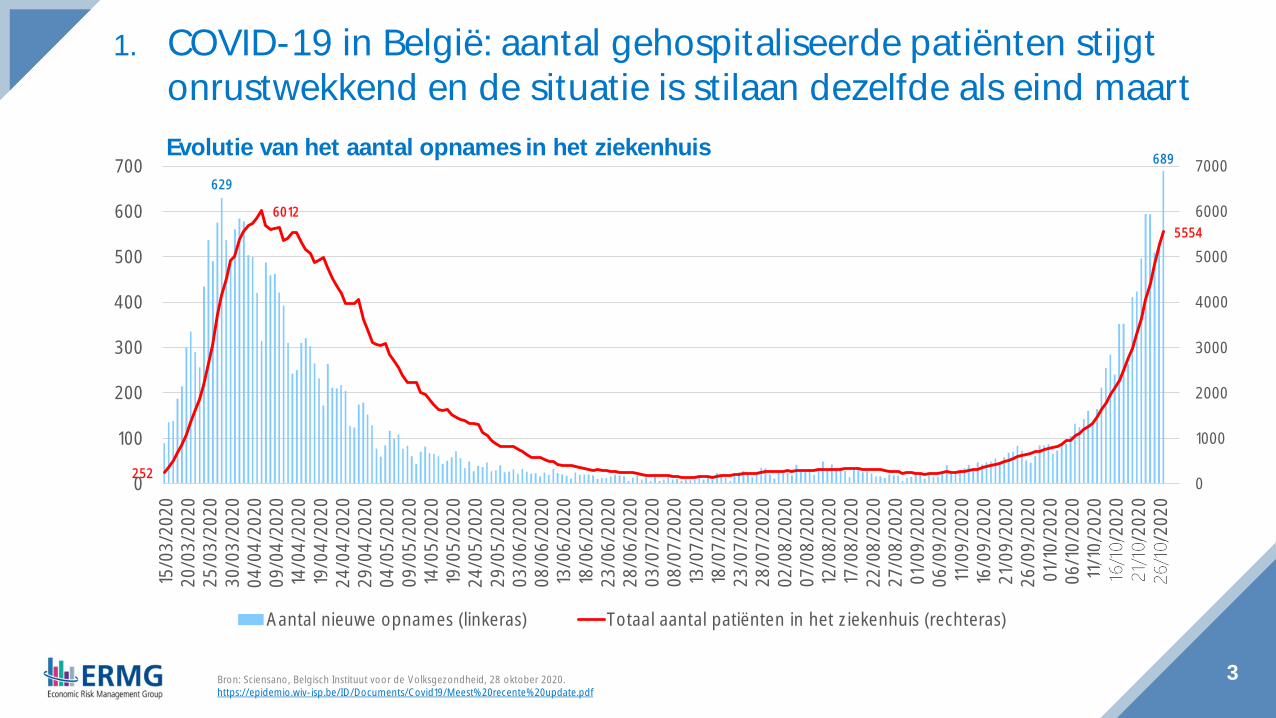
COVID-19 in België
Evolutie van het aantal opnames in het ziekenhuis629
689
252
60125554
0
1000
2000
3000
4000
5000
6000
7000
0
100
200
300
400
500
600
70015
/03/
2020
20/0
3/20
2025
/03/
2020
30/0
3/20
2004
/04/
2020
09/0
4/20
2014
/04/
2020
19/0
4/20
2024
/04/
2020
29/0
4/20
2004
/05/
2020
09/0
5/20
2014
/05/
2020
19/0
5/20
2024
/05/
2020
29/0
5/20
2003
/06/
2020
08/0
6/20
2013
/06/
2020
18/0
6/20
2023
/06/
2020
28/0
6/20
2003
/07/
2020
08/0
7/20
2013
/07/
2020
18/0
7/20
2023
/07/
2020
28/0
7/20
2002
/08/
2020
07/0
8/20
2012
/08/
2020
17/0
8/20
2022
/08/
2020
27/0
8/20
2001
/09/
2020
06/0
9/20
2011
/09/
2020
16/0
9/20
2021
/09/
2020
26/0
9/20
2001
/10/
2020
06/1
0/20
2011
/10/
2020
16/1
0/20
2021
/10/
2020
26/1
0/20
20
Aantal nieuwe opnames (linkeras) Totaal aantal patiënten in het ziekenhuis (rechteras)
3Bron: Sciensano, Belgisch Instituut voor de Volksgezondheid, 28 oktober 2020.https://epidemio.wiv-isp.be/ID/Documents/Covid19/Meest%20recente%20update.pdf
1. COVID-19 in België: aantal gehospitaliseerde patiënten stijgtonrustwekkend en de situatie is stilaan dezelfde als eind maart

4
GDP and confidence indicatorsfor Belgium
70
75
80
85
90
95
100
105
110
Current statistics
70
75
80
85
90
95
100
105
11020
19Q
1
2019
Q2
2019
Q3
2019
Q4
2020
Q1
2020
Q2
2020
Q3
2020
Q4
2021
Q1
2021
Q2
2021
Q3
2021
Q4
2022
Q1
2022
Q2
2022
Q3
2022
Q4
p.m. NBB Autumn projections NBB Spring projections FPB projections (June)
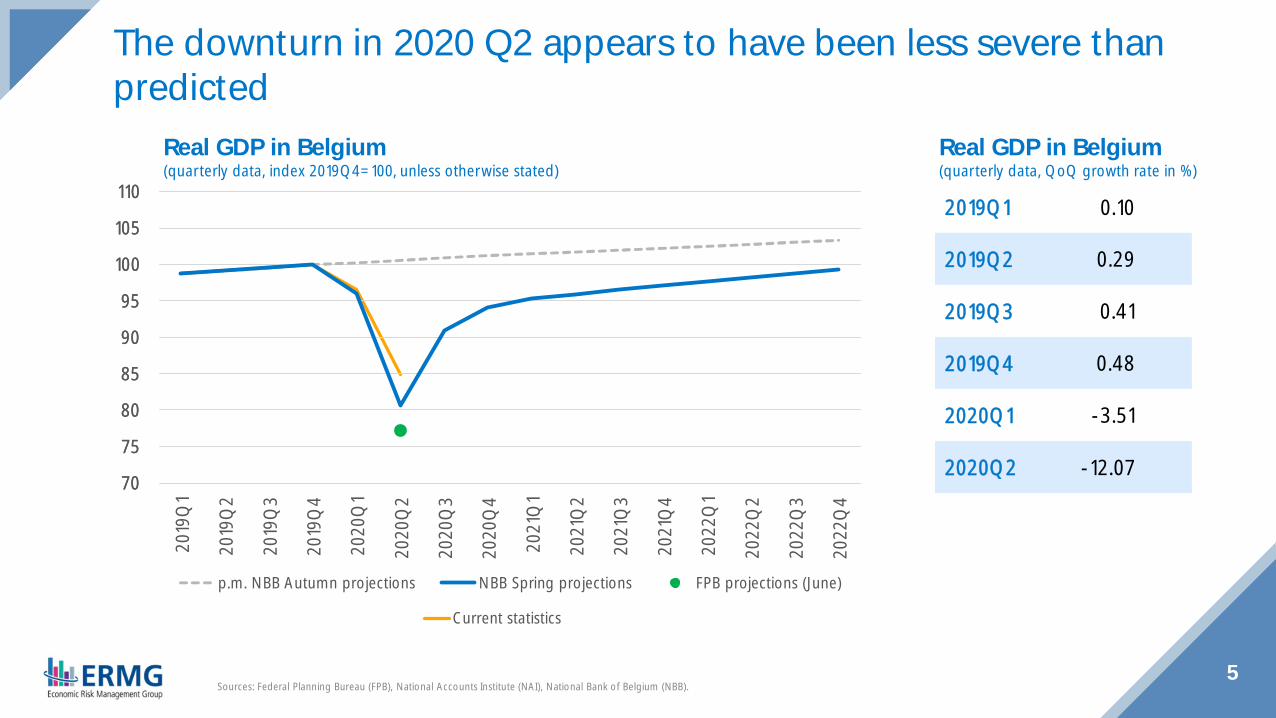
5Sources: Federal Planning Bureau (FPB), National Accounts Institute (NAI), National Bank of Belgium (NBB).
Real GDP in Belgium(quarterly data, index 2019Q4=100, unless otherwise stated)
The downturn in 2020 Q2 appears to have been less severe thanpredicted
2019Q1 0.10
2019Q2 0.29
2019Q3 0.41
2019Q4 0.48
2020Q1 -3.51
2020Q2 -12.07
Real GDP in Belgium(quarterly data, QoQ growth rate in %)
6
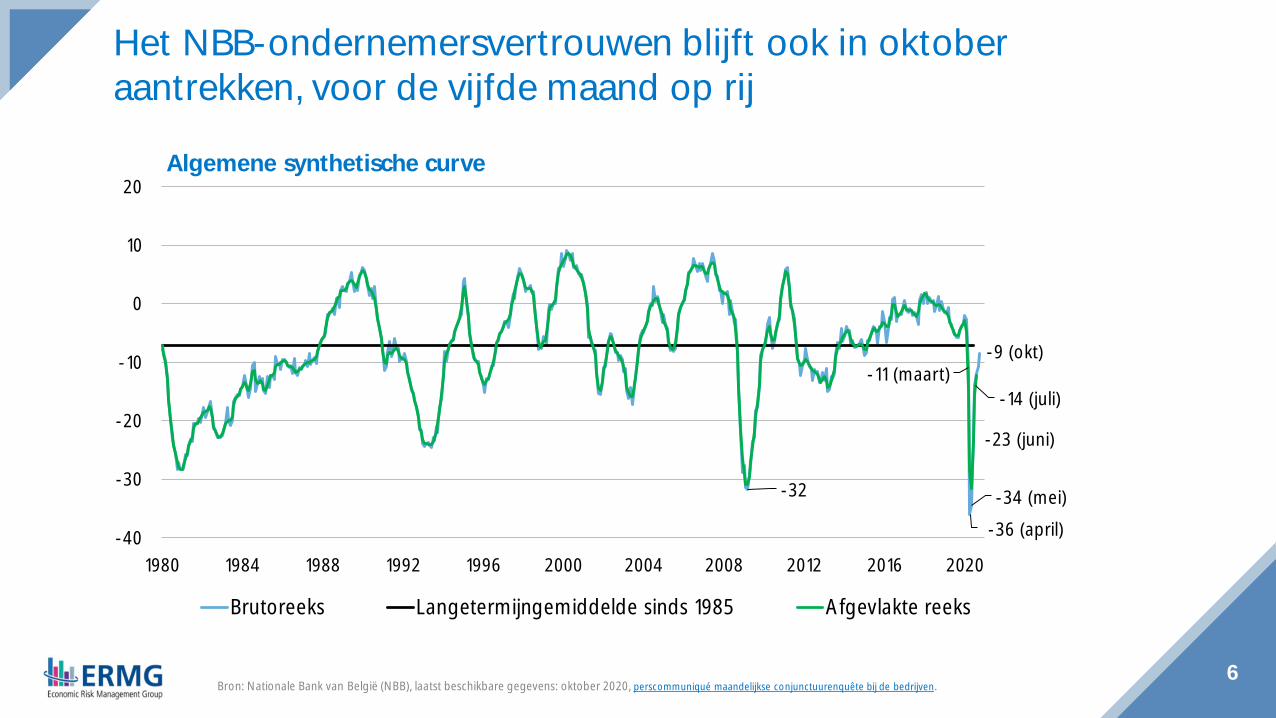
Het NBB-ondernemersvertrouwen blijft ook in oktoberaantrekken, voor de vijfde maand op rij
-32
-11 (maart)
-36 (april)-34 (mei)
-23 (juni)
-14 (juli)
-9 (okt)
-40
-30
-20
-10
0
10
20
1980 1984 1988 1992 1996 2000 2004 2008 2012 2016 2020
Brutoreeks Langetermijngemiddelde sinds 1985 Afgevlakte reeks
Algemene synthetische curve
Bron: Nationale Bank van België (NBB), laatst beschikbare gegevens: oktober 2020, perscommuniqué maandelijkse conjunctuurenquête bij de bedrijven.
-70-60-50-40-30-20-10
01020
2015 2016 2017 2018 2019 2020
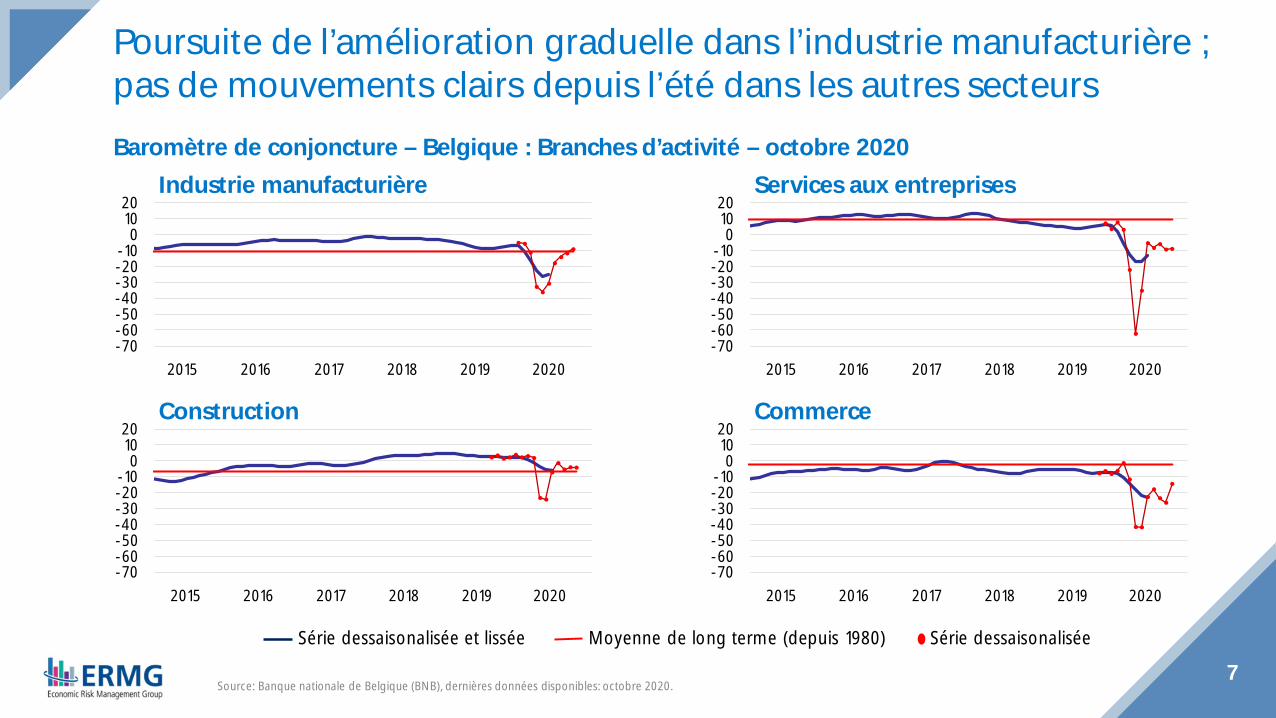
Baromètre de conjoncture – Belgique : Branches d’activité – octobre 2020
Poursuite de l’amélioration graduelle dans l’industrie manufacturière ;pas de mouvements clairs depuis l’été dans les autres secteurs
7
Industrie manufacturière
CommerceConstruction
Services aux entreprises
-70-60-50-40-30-20-10
01020
2015 2016 2017 2018 2019 2020
-70-60-50-40-30-20-10
01020
2015 2016 2017 2018 2019 2020
-70-60-50-40-30-20-10
01020
2015 2016 2017 2018 2019 2020
Moyenne de long terme (depuis 1980)Série dessaisonalisée et lissée Série dessaisonalisée
Source: Banque nationale de Belgique (BNB), dernières données disponibles: octobre 2020.
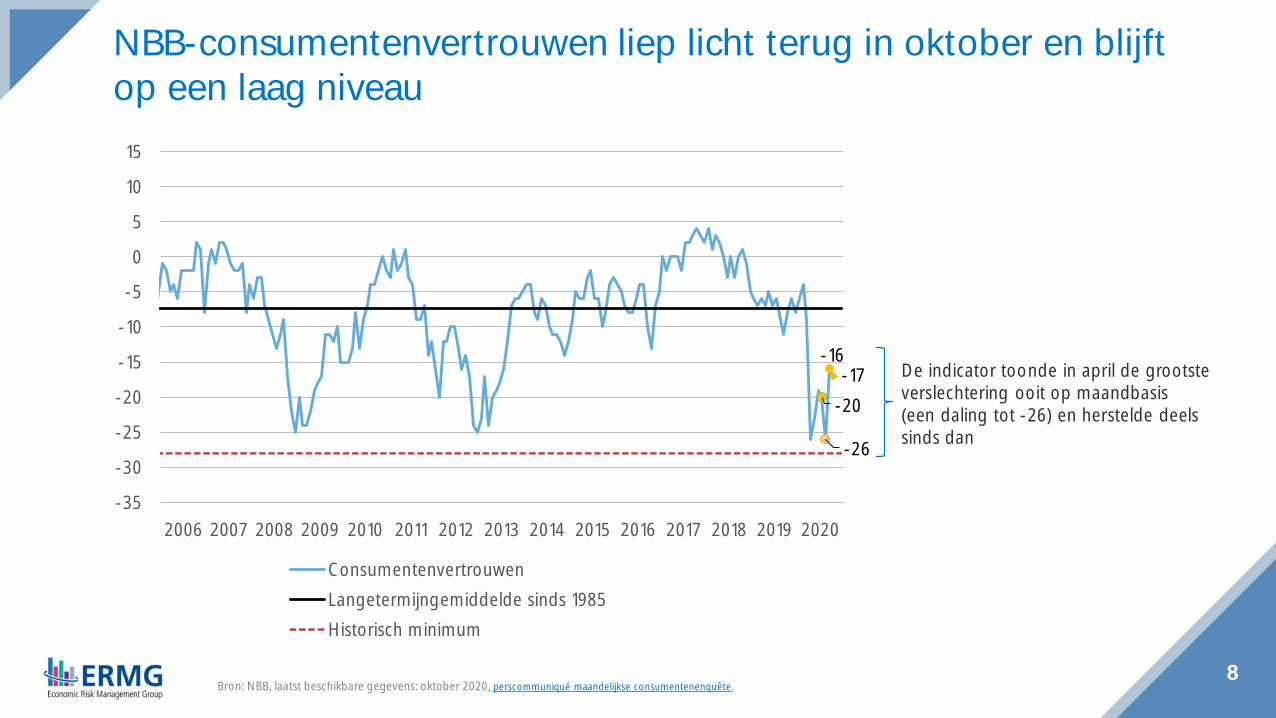
-20
-26
-16-17
-35
-30
-25
-20
-15
-10
-5
0
5
10
15
2006 2007 2008 2009 2010 2011 2012 2013 2014 2015 2016 2017 2018 2019 2020
ConsumentenvertrouwenLangetermijngemiddelde sinds 1985Historisch minimum
8
NBB-consumentenvertrouwen liep licht terug in oktober en blijftop een laag niveau
De indicator toonde in april de grootsteverslechtering ooit op maandbasis(een daling tot -26) en herstelde deelssinds dan
Bron: NBB, laatst beschikbare gegevens: oktober 2020, perscommuniqué maandelijkse consumentenenquête.
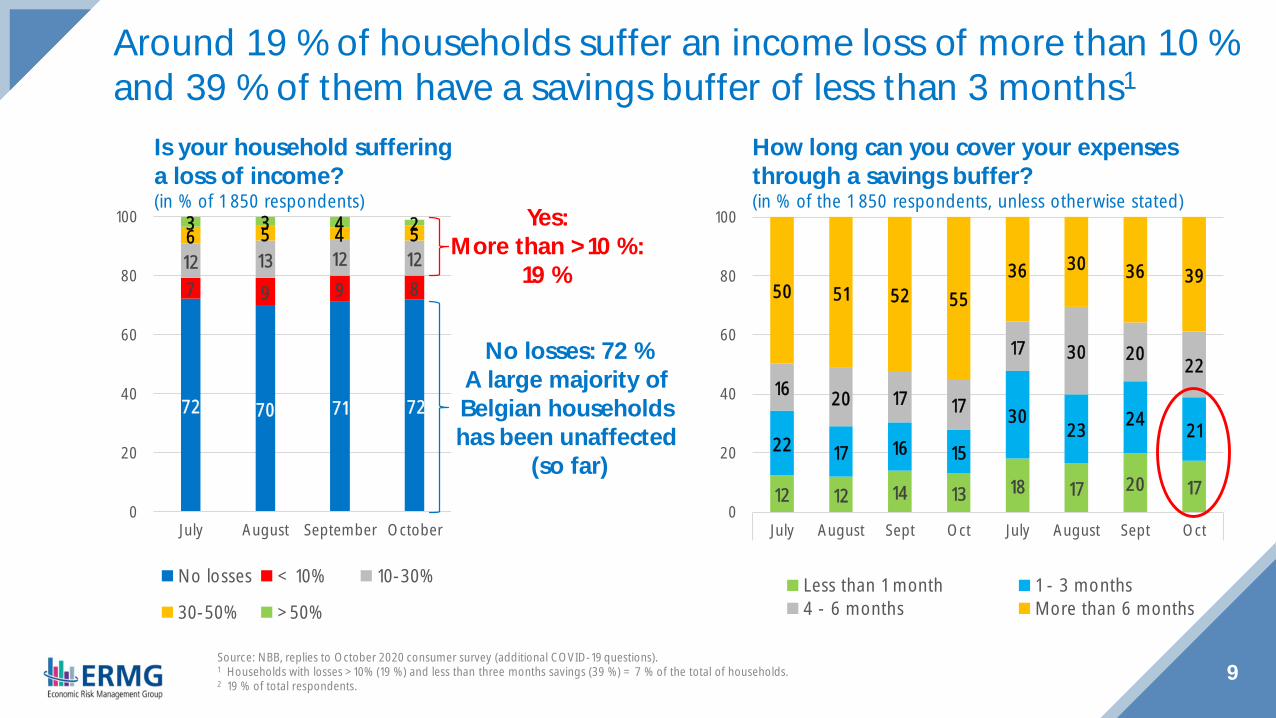
9Source: NBB, replies to October 2020 consumer survey (additional COVID-19 questions).1 Households with losses >10% (19 %) and less than three months savings (39 %) = 7 % of the total of households.2 19 % of total respondents.
How long can you cover your expensesthrough a savings buffer?(in % of the 1 850 respondents, unless otherwise stated)
Is your household sufferinga loss of income?(in % of 1 850 respondents)
Around 19 % of households suffer an income loss of more than 10 %and 39 % of them have a savings buffer of less than 3 months1
Yes:More than >10 %:
19 %
72 70 71 72
7 9 9 812 13 12 126 5 4 53 3 4 2
0
20
40
60
80
100
July August September October
No losses < 10% 10-30%
30-50% >50%
12 12 14 13 18 17 20 17
22 17 16 15
3023 24 21
16 20 17 17
17 30 20 22
50 51 52 5536 30 36 39
0
20
40
60
80
100
July August Sept Oct July August Sept Oct
Less than 1 month 1 - 3 months4 - 6 months More than 6 months
No losses: 72 %A large majority ofBelgian householdshas been unaffected
(so far)
0
20
40
60
80
100Ju
ly
Augu
st
Sept Oct
July
Augu
st
Sept Oct
July
Augu
st
Sept Oct
July
Augu
st
Sept Oct
No losses < 10% 10 - 30 % 30 - 50% > 50%
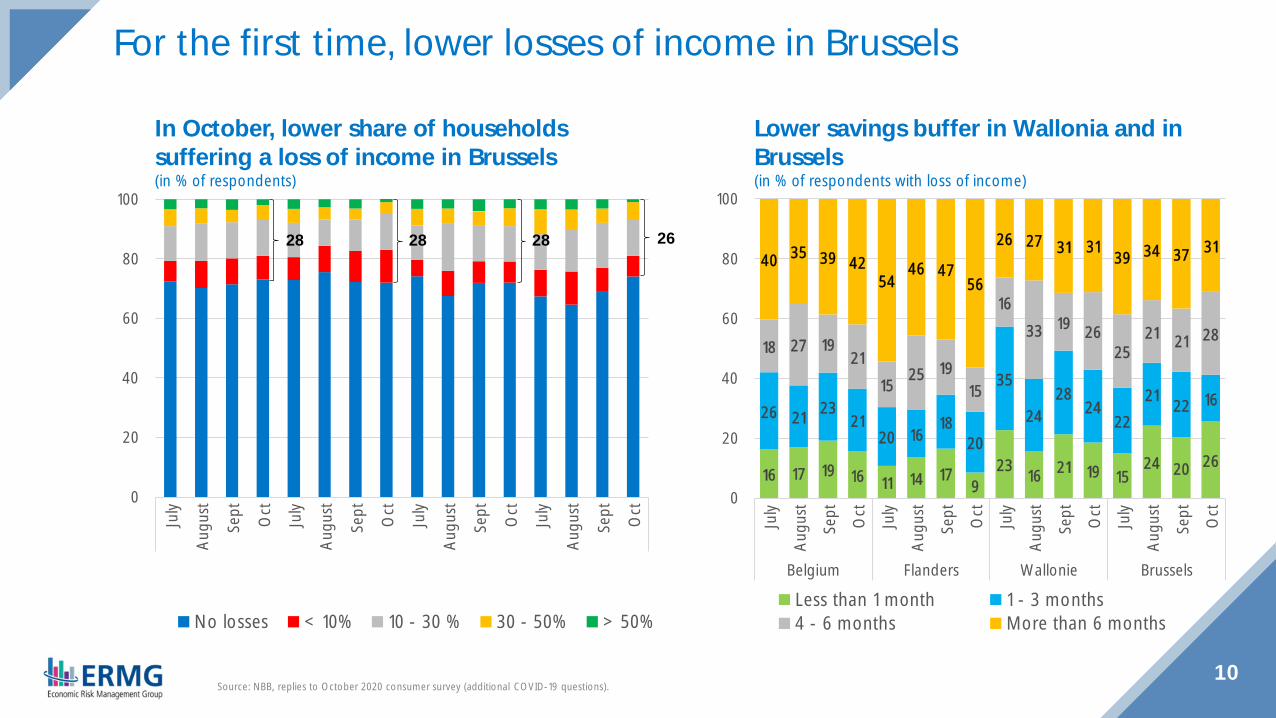
10Source: NBB, replies to October 2020 consumer survey (additional COVID-19 questions).
Lower savings buffer in Wallonia and inBrussels(in % of respondents with loss of income)
In October, lower share of householdssuffering a loss of income in Brussels(in % of respondents)
For the first time, lower losses of income in Brussels
26282828
16 17 19 16 11 14 179
23 16 21 19 1524 20 26
26 21 2321
20 1618
20
35
2428
2422
21 22 16
18 27 1921
1525 19
15
1633 19 26
2521 21 28
40 35 39 4254
46 4756
26 27 31 31 39 34 37 31
0
20
40
60
80
100
July
Augu
st
Sept Oct
July
Augu
st
Sept Oct
July
Augu
st
Sept Oct
July
Augu
st
Sept Oct
Belgium Flanders Wallonie Brussels
Less than 1 month 1 - 3 months4 - 6 months More than 6 months
0
50
100
150
200
250
300
350
400
2001 2002 2003 2004 2005 2006 2007 2008 2009 2010 2011 2012 2013 2014 2015 2016 2017 2018 2019 2020
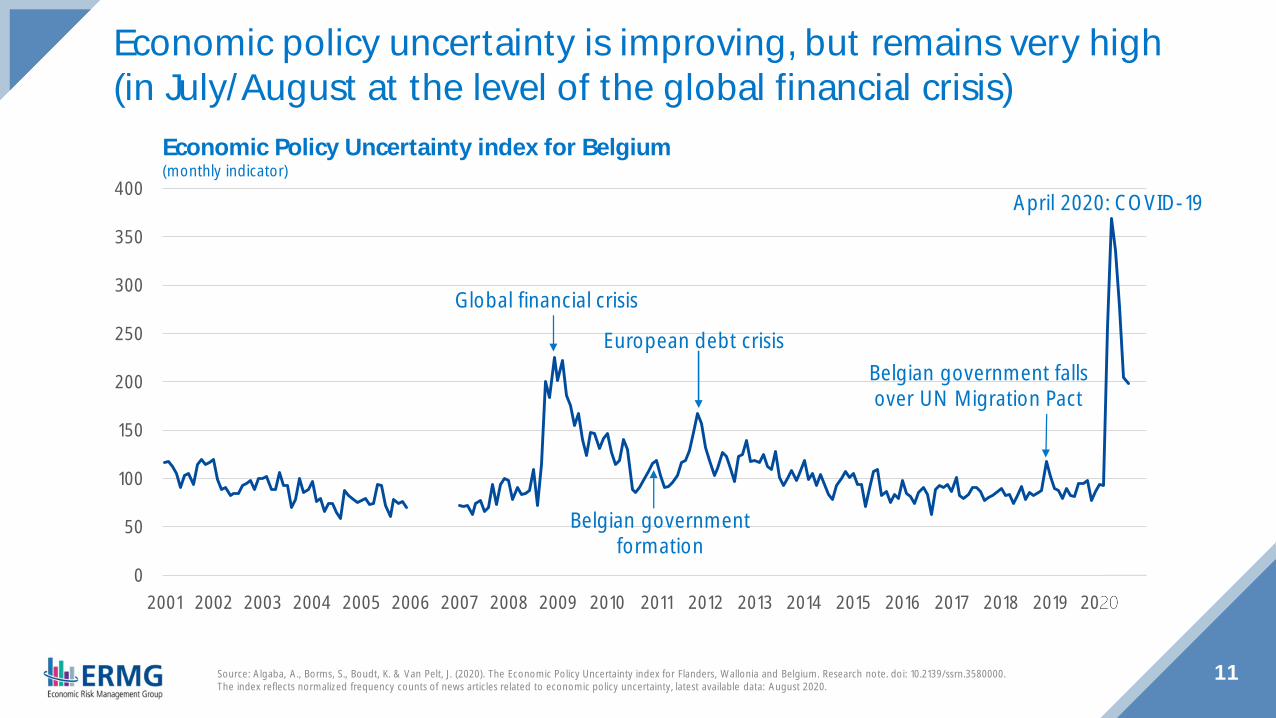
11Source: Algaba, A., Borms, S., Boudt, K. & Van Pelt, J. (2020). The Economic Policy Uncertainty index for Flanders, Wallonia and Belgium. Research note. doi: 10.2139/ssrn.3580000.The index reflects normalized frequency counts of news articles related to economic policy uncertainty, latest available data: August 2020.
Economic Policy Uncertainty index for Belgium(monthly indicator)
Economic policy uncertainty is improving, but remains very high(in July/August at the level of the global financial crisis)
Belgian governmentformation
April 2020: COVID-19
Belgian government fallsover UN Migration Pact
European debt crisis
Global financial crisis

12
Labour market

13Source: Institut des Comptes Nationaux (ICN), dernières données disponibles: deuxième trimestre 2020.
L’emploi salarié plus durement impacté au 1er semestre 2020 quel’emploi indépendant(emploi en personnes - variation trimestrielle en %)
0,50,4 0,4 0,4
-0,2
-0,7
-1,0
-0,8
-0,6
-0,4
-0,2
0,0
0,2
0,4
0,6
0,8
2019-T1 2019-T2 2019-T3 2019-T4 2020-T1 2020-T2
Indépendants Salariés Emploi total
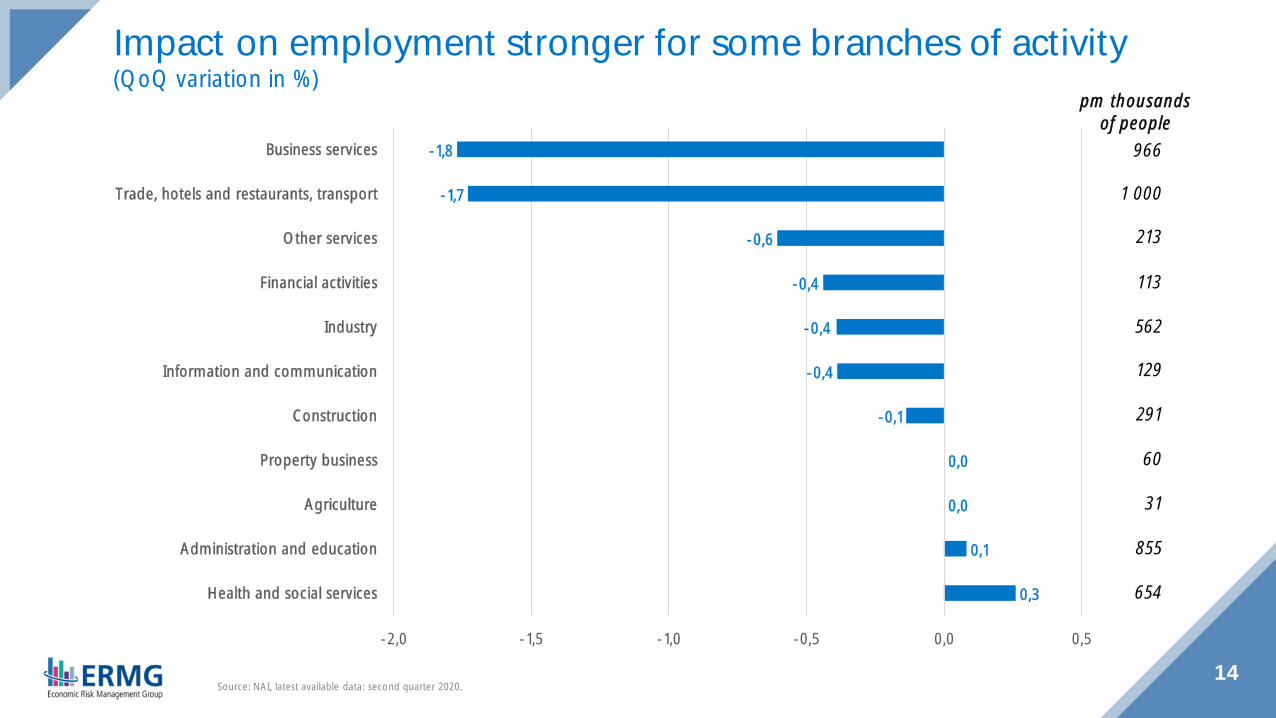
0,3
0,1
0,0
0,0
-0,1
-0,4
-0,4
-0,4
-0,6
-1,7
-1,8
-2,0 -1,5 -1,0 -0,5 0,0 0,5
Health and social services
Administration and education
Agriculture
Property business
Construction
Information and communication
Industry
Financial activities
Other services
Trade, hotels and restaurants, transport
Business services
Source: NAI, latest available data: second quarter 2020.14
Impact on employment stronger for some branches of activity(QoQ variation in %)
pm thousandsof people
966
1 000
213
113
562
129
291
60
31
855
654
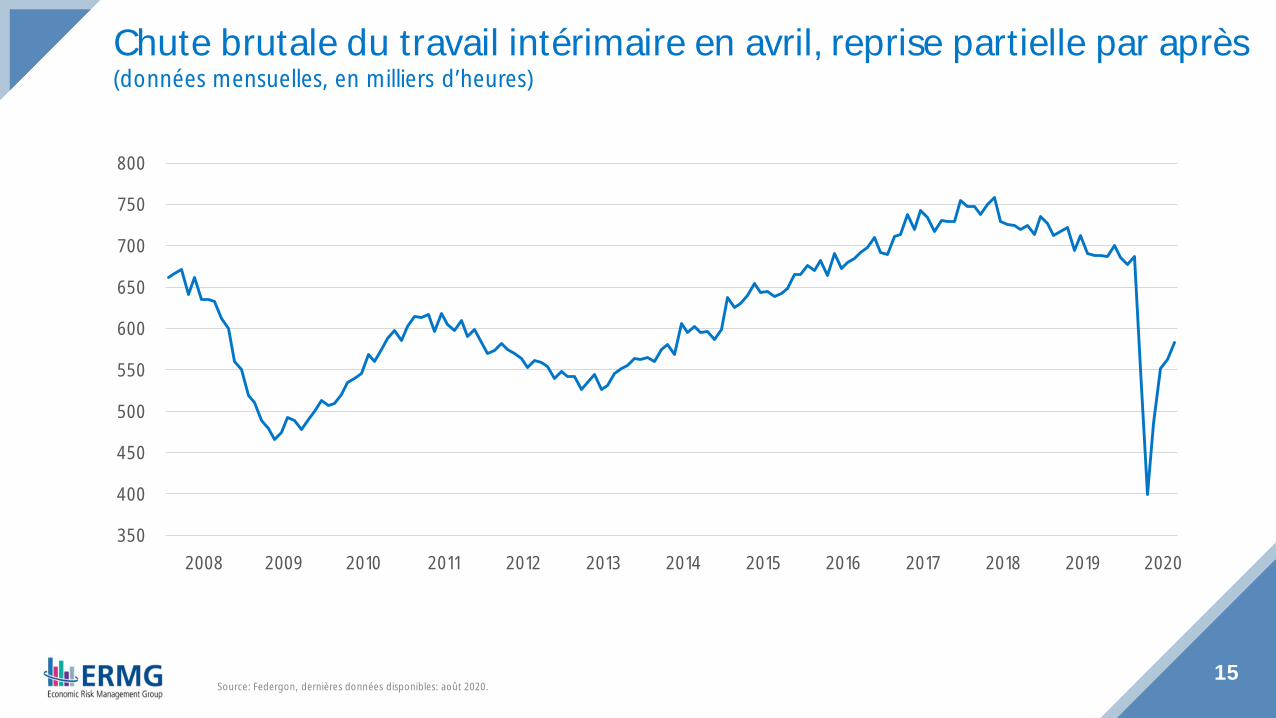
15Source: Federgon, dernières données disponibles: août 2020.
Chute brutale du travail intérimaire en avril, reprise partielle par après(données mensuelles, en milliers d’heures)
350
400
450
500
550
600
650
700
750
800
2008 2009 2010 2011 2012 2013 2014 2015 2016 2017 2018 2019 2020
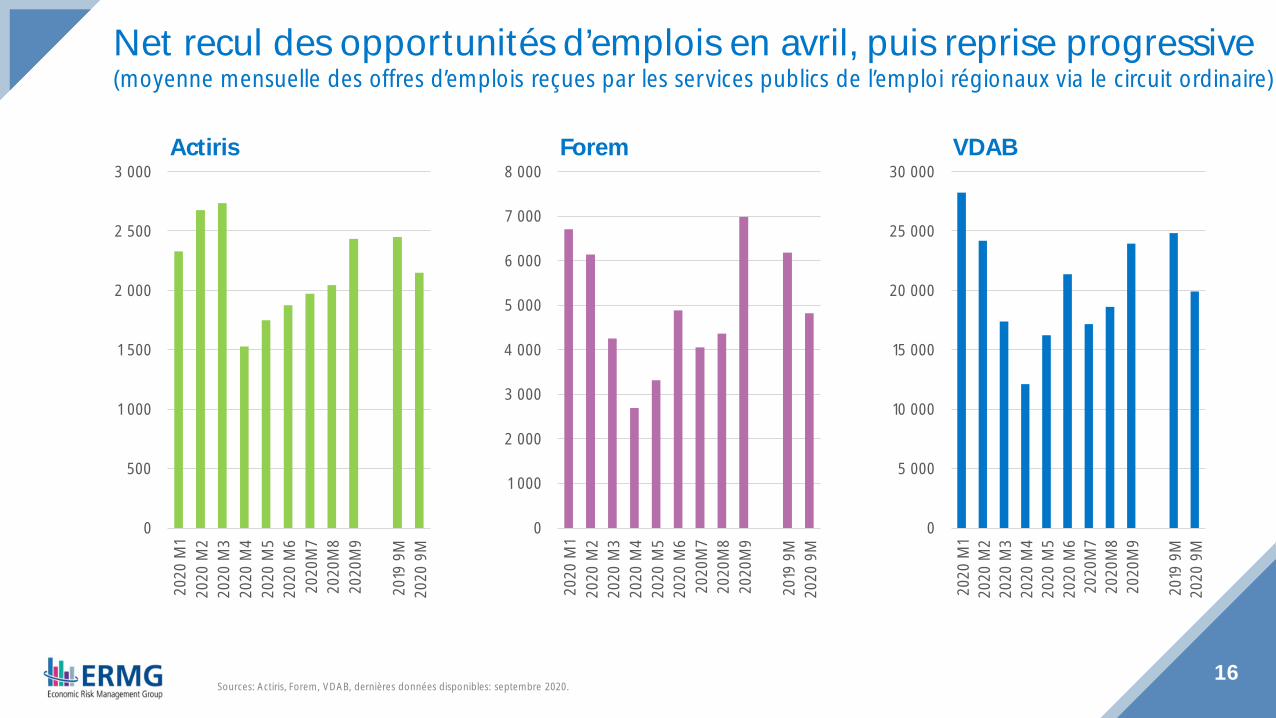
16Sources: Actiris, Forem, VDAB, dernières données disponibles: septembre 2020.
VDABActiris
Net recul des opportunités d’emplois en avril, puis reprise progressive(moyenne mensuelle des offres d’emplois reçues par les services publics de l’emploi régionaux via le circuit ordinaire)
Forem
0
500
1 000
1 500
2 000
2 500
3 00020
20 M
120
20 M
220
20 M
320
20 M
420
20 M
520
20 M
620
20M
720
20M
820
20M
9
2019
9M
2020
9M
0
5 000
10 000
15 000
20 000
25 000
30 000
2020
M1
2020
M2
2020
M3
2020
M4
2020
M5
2020
M6
2020
M7
2020
M8
2020
M9
2019
9M
2020
9M
0
1 000
2 000
3 000
4 000
5 000
6 000
7 000
8 000
2020
M1
2020
M2
2020
M3
2020
M4
2020
M5
2020
M6
2020
M7
2020
M8
2020
M9
2019
9M
2020
9M
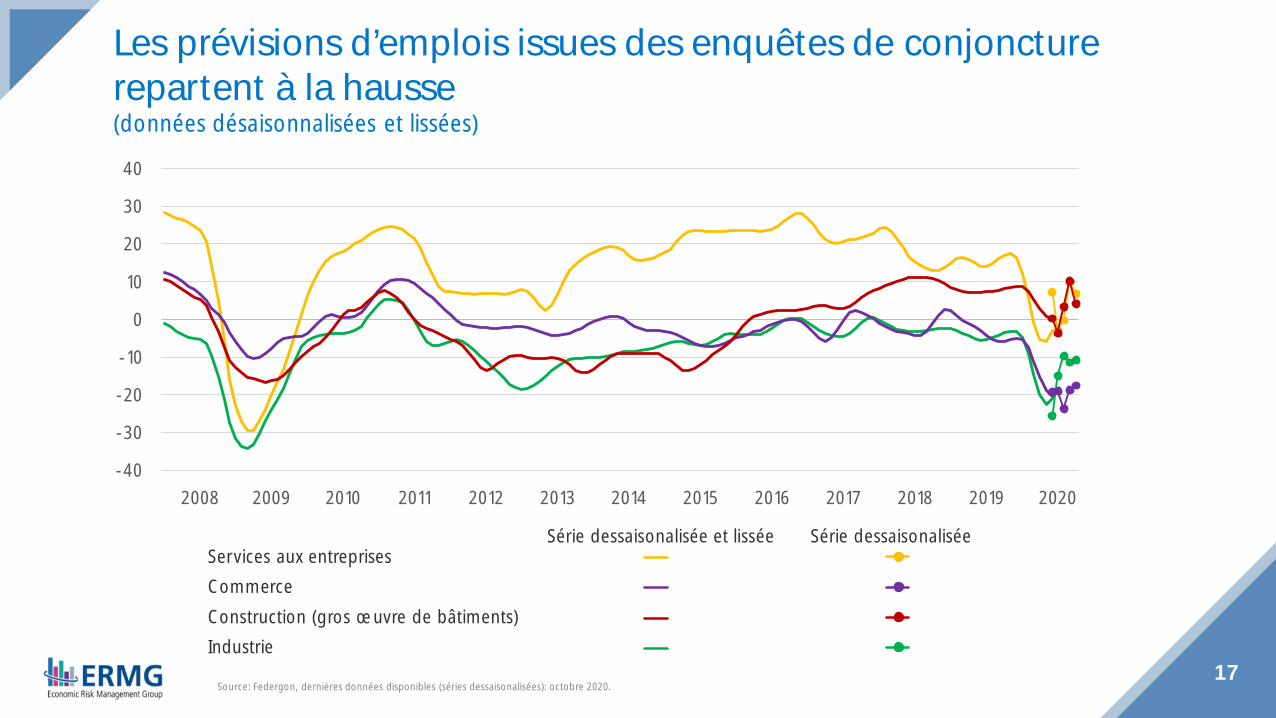
17Source: Federgon, dernières données disponibles (séries dessaisonalisées): octobre 2020.
Les prévisions d’emplois issues des enquêtes de conjoncturerepartent à la hausse(données désaisonnalisées et lissées)
-40
-30
-20
-10
0
10
20
30
40
2008 2009 2010 2011 2012 2013 2014 2015 2016 2017 2018 2019 2020
IndustrieConstruction (gros œuvre de bâtiments)CommerceServices aux entreprises
Série dessaisonalisée et lissée Série dessaisonalisée

Mass redundancy procedures: already above 2019 average
◆ Since lockdown (April 2020)
◇ 74 procedures
◇ 6 688 workers concerned
◆ pm January 2019 – December 2019
◇ 81 procedures
◇ 5 087 workers concerned
18Source: Federal Public Service Employment, Labour and Social Dialogue (FPS ELSD), latest data available: 26 October 2020.
0
5
10
15
20
25
0
500
1 000
1 500
2 000
2 500
Janu
ary
Febr
uary
Mar
ch
April
May
June July
Augu
st
Sept
embe
r
Oct
ober
Workers (LHS) pm Average 2019 (LHS)
Cases (RHS) pm Average 2019 (RHS)
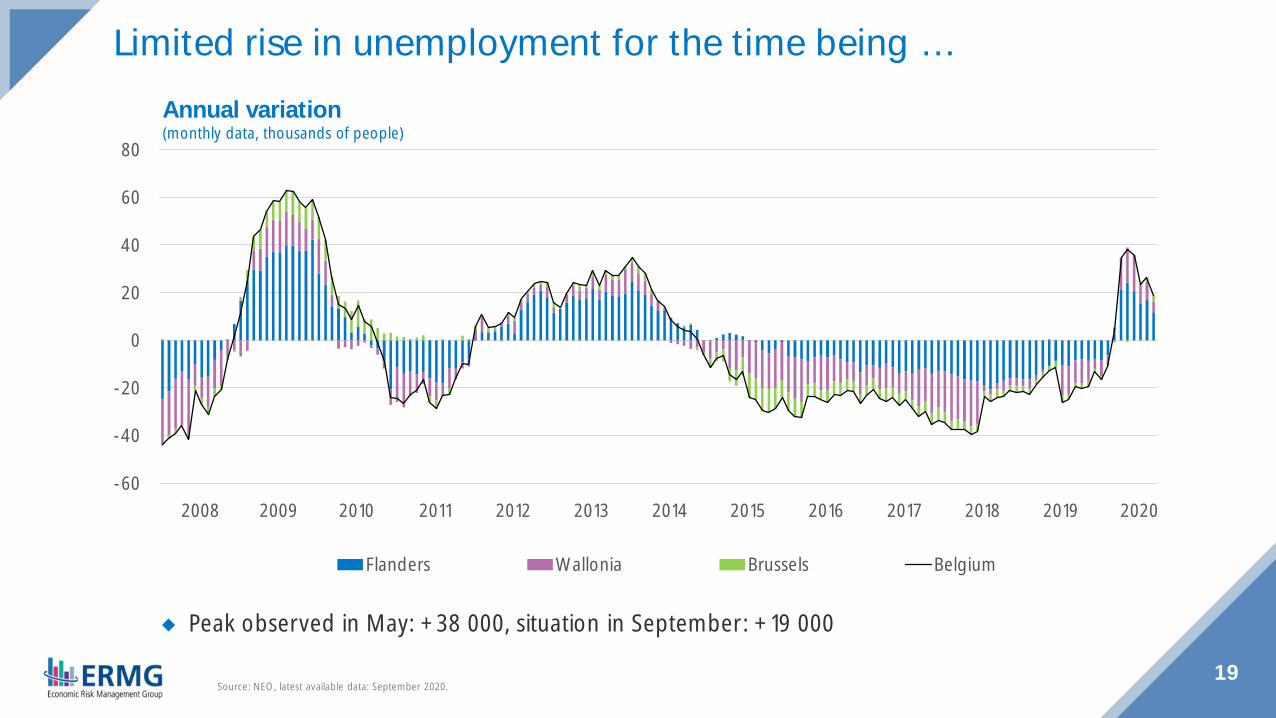
19Source: NEO, latest available data: September 2020.
Annual variation(monthly data, thousands of people)
Limited rise in unemployment for the time being …
-60
-40
-20
0
20
40
60
80
2008 2009 2010 2011 2012 2013 2014 2015 2016 2017 2018 2019 2020
Flanders Wallonia Brussels Belgium
◆ Peak observed in May: +38 000, situation in September: +19 000

20Source: NEO, latest available data: August 2020.
… concentrated on young educated peopleAnnual variation(monthly data)
-5
0
5
10
15
20
25M
en
Wom
en
Less
than
6 m
onth
s
6-12
mon
ths
1 yea
r and
mor
e
Youn
ger t
han
20
20-3
0 ye
ars
30-5
0 ye
ars
50 a
nd o
lder
Low-
educ
ated
Med
ium
-edu
cate
d
High
ly-ed
ucat
ed
In thousands of people In %
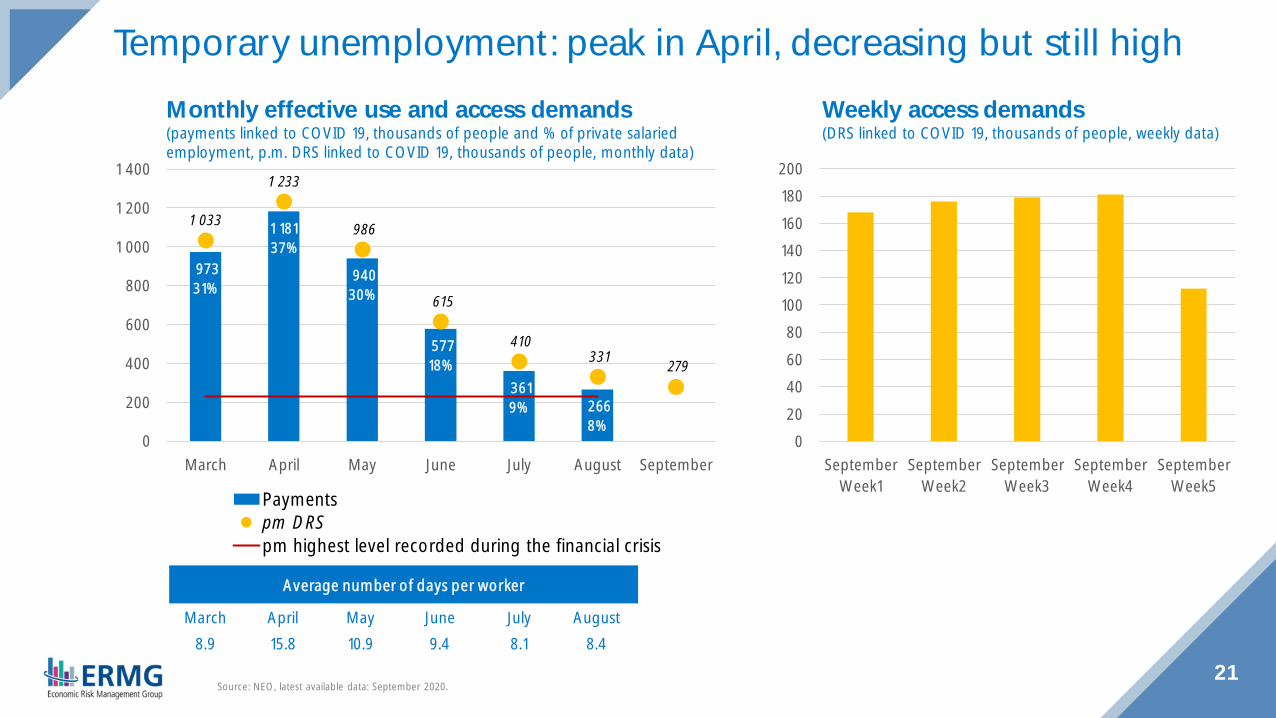
Monthly effective use and access demands(payments linked to COVID 19, thousands of people and % of private salariedemployment, p.m. DRS linked to COVID 19, thousands of people, monthly data)
21Source: NEO, latest available data: September 2020.
Temporary unemployment: peak in April, decreasing but still high
97331%
1 18137%
94030%
57718%
3619% 266
8%
1 033
1 233
986
615
410331 279
0
200
400
600
800
1 000
1 200
1 400
March April May June July August September
Paymentspm DRSpm highest level recorded during the financial crisis
Weekly access demands(DRS linked to COVID 19, thousands of people, weekly data)
Average number of days per worker
March April May June July August8.9 15.8 10.9 9.4 8.1 8.4
020406080
100120140160180200
SeptemberWeek1
SeptemberWeek2
SeptemberWeek3
SeptemberWeek4
SeptemberWeek5
22Source: Federal Public Service Social Security, confidential data, latest available data: August 2020.1 Data related to payments.
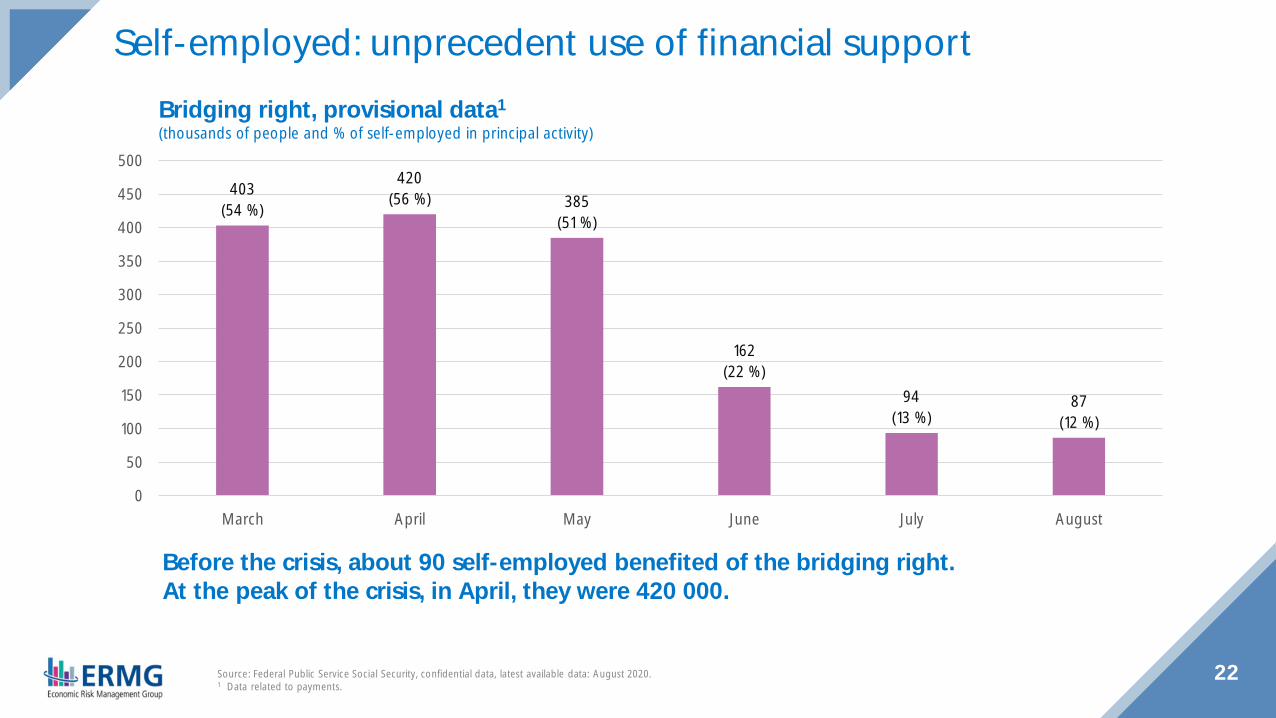
Bridging right, provisional data1
(thousands of people and % of self-employed in principal activity)
Self-employed: unprecedent use of financial support
403(54 %)
420(56 %) 385
(51 %)
162(22 %)
94(13 %)
87(12 %)
0
50
100
150
200
250
300
350
400
450
500
March April May June July August
Before the crisis, about 90 self-employed benefited of the bridging right.At the peak of the crisis, in April, they were 420 000.

23Source: Statbel, dernières données disponibles: août 2020.1 Les indicateurs mensuels sont sujets à de plus fortes fluctuations aléatoires que les résultats trimestriels et annuels car ils reposent sur un douzième de l’échantillon annuel. Pour juin 2020 par
exemple, il s’agit d’environ 8 600 répondants. Les variations d’une période à l’autre doivent être interprétés avec prudence.
Taux de chômage(15-64)
Taux d’emploi(20-64)
La crise sanitaire a interrompu une dynamique positive(taux harmonisés issus des enquêtes force de travail1)
64
65
66
67
68
69
70
71
7220
16T1
2016
T220
16T3
2016
T420
17T1
2017
T220
17T3
2017
T420
18T1
2018
T220
18T3
2018
T420
19T1
2019
T220
19T3
2019
T420
20T1
2020
T2
2020
M7
e20
20M
8 e
Trimestriel Mensuel
0
1
2
3
4
5
6
7
8
9
2016
T120
16T2
2016
T320
16T4
2017
T120
17T2
2017
T320
17T4
2018
T120
18T2
2018
T320
18T4
2019
T120
19T2
2019
T320
19T4
2020
T120
20T2
2020
M7
e20
20M
8 e

24
ERMG survey
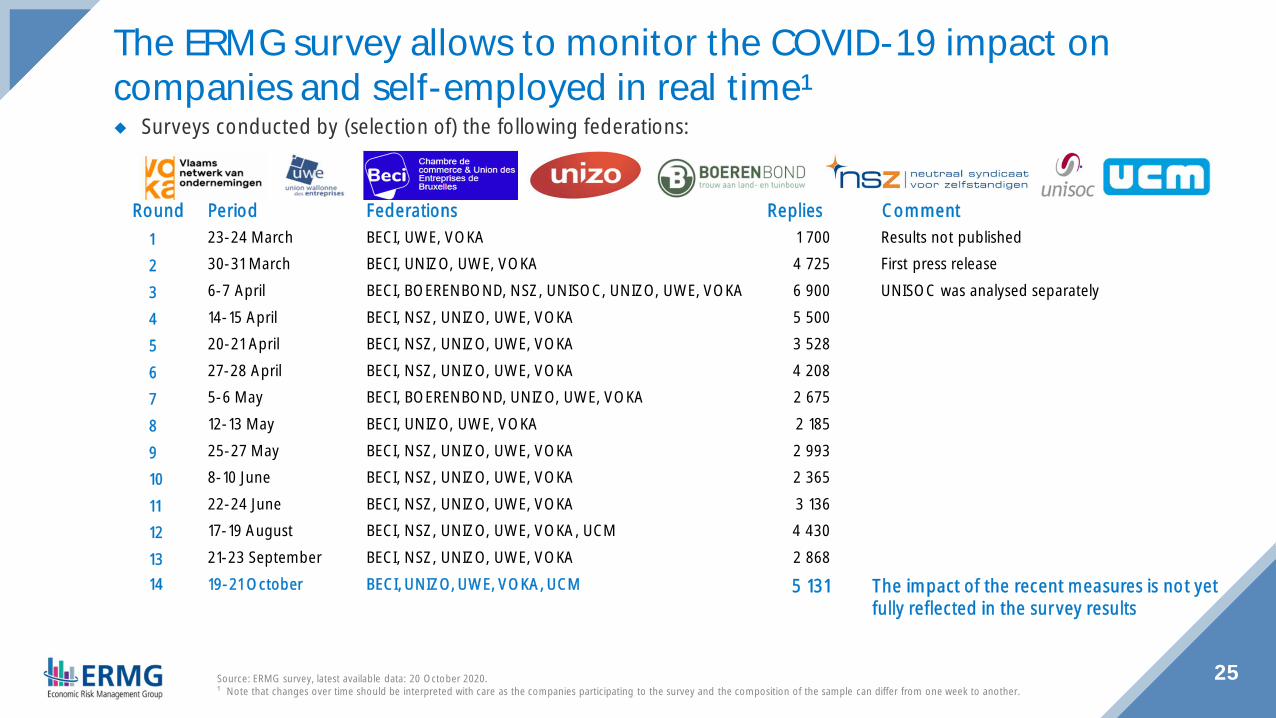
The ERMG survey allows to monitor the COVID-19 impact oncompanies and self-employed in real time¹◆ Surveys conducted by (selection of) the following federations:
25
Round Period Federations Replies Comment1 23-24 March BECI, UWE, VOKA 1 700 Results not published
2 30-31 March BECI, UNIZO, UWE, VOKA 4 725 First press release
3 6-7 April BECI, BOERENBOND, NSZ, UNISOC, UNIZO, UWE, VOKA 6 900 UNISOC was analysed separately
4 14-15 April BECI, NSZ, UNIZO, UWE, VOKA 5 500
5 20-21 April BECI, NSZ, UNIZO, UWE, VOKA 3 528
6 27-28 April BECI, NSZ, UNIZO, UWE, VOKA 4 208
7 5-6 May BECI, BOERENBOND, UNIZO, UWE, VOKA 2 675
8 12-13 May BECI, UNIZO, UWE, VOKA 2 185
9 25-27 May BECI, NSZ, UNIZO, UWE, VOKA 2 993
10 8-10 June BECI, NSZ, UNIZO, UWE, VOKA 2 365
11 22-24 June BECI, NSZ, UNIZO, UWE, VOKA 3 136
12 17-19 August BECI, NSZ, UNIZO, UWE, VOKA, UCM 4 430
13 21-23 September BECI, NSZ, UNIZO, UWE, VOKA 2 86814 19-21 October BECI, UNIZO, UWE, VOKA, UCM 5 131 The impact of the recent measures is not yet
fully reflected in the survey results
Source: ERMG survey, latest available data: 20 October 2020.¹ Note that changes over time should be interpreted with care as the companies participating to the survey and the composition of the sample can differ from one week to another.
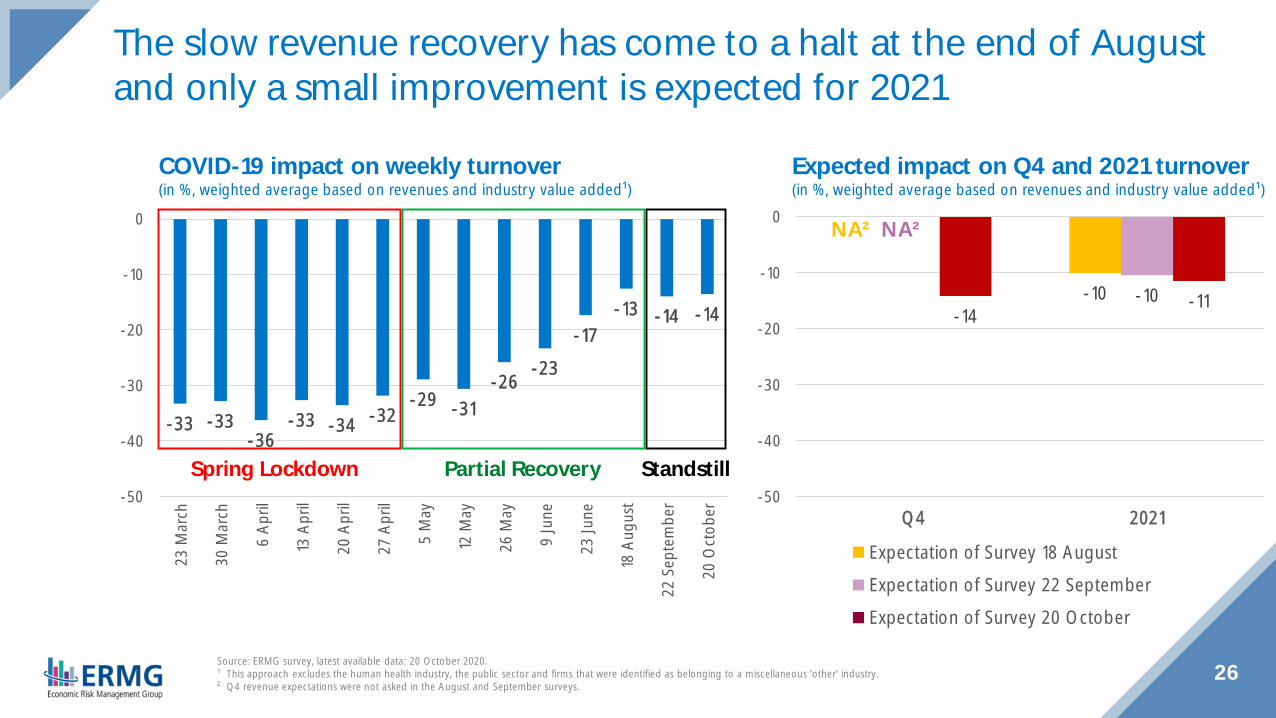
-33 -33-36
-33 -34 -32-29 -31
-26-23
-17-13 -14 -14
-50
-40
-30
-20
-10
0
23 M
arch
30 M
arch
6 Ap
ril
13 A
pril
20 A
pril
27 A
pril
5 M
ay
12 M
ay
26 M
ay
9 Ju
ne
23 Ju
ne
18 A
ugus
t
22 S
epte
mbe
r
20 O
ctob
er
26Source: ERMG survey, latest available data: 20 October 2020.¹ This approach excludes the human health industry, the public sector and firms that were identified as belonging to a miscellaneous ‘other’ industry.² Q4 revenue expectations were not asked in the August and September surveys.
Expected impact on Q4 and 2021 turnover(in %, weighted average based on revenues and industry value added¹)
COVID-19 impact on weekly turnover(in %, weighted average based on revenues and industry value added¹)
-10 -10-14
-11
-50
-40
-30
-20
-10
0
Q4 2021
Expectation of Survey 18 August
Expectation of Survey 22 September
Expectation of Survey 20 October
The slow revenue recovery has come to a halt at the end of Augustand only a small improvement is expected for 2021
Spring Lockdown Partial Recovery
NA² NA²
Standstill
-100
-80
-60
-40
-20
0
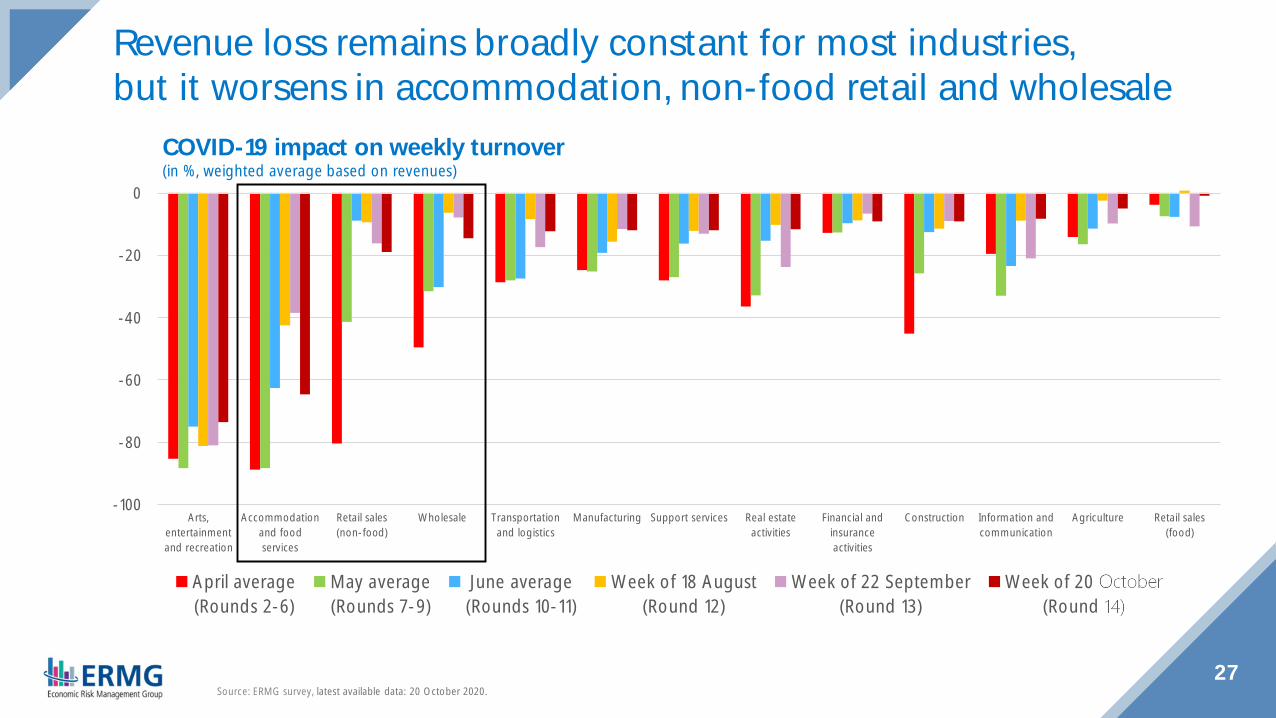
Arts,entertainmentand recreation
Accommodationand foodservices
Retail sales(non-food)
Wholesale Transportationand logistics
Manufacturing Support services Real estateactivities
Financial andinsuranceactivities
Construction Information andcommunication
Agriculture Retail sales(food)
April average(Rounds 2-6)
May average(Rounds 7-9)
June average(Rounds 10-11)
Week of 18 August(Round 12)
Week of 22 September(Round 13)
Week of 20 October(Round 14)
27
Revenue loss remains broadly constant for most industries,but it worsens in accommodation, non-food retail and wholesale
Source: ERMG survey, latest available data: 20 October 2020.
COVID-19 impact on weekly turnover(in %, weighted average based on revenues)
-100
-80
-60
-40
-20
0
Arts,entertainmentand recreation
Accommodationand foodservices
Retail sales(non-food)
Wholesale Transportationand logistics
Manufacturing Support services Real estateactivities
Financial andinsuranceactivities
Construction Information andcommunication
Agriculture Retail sales(food)
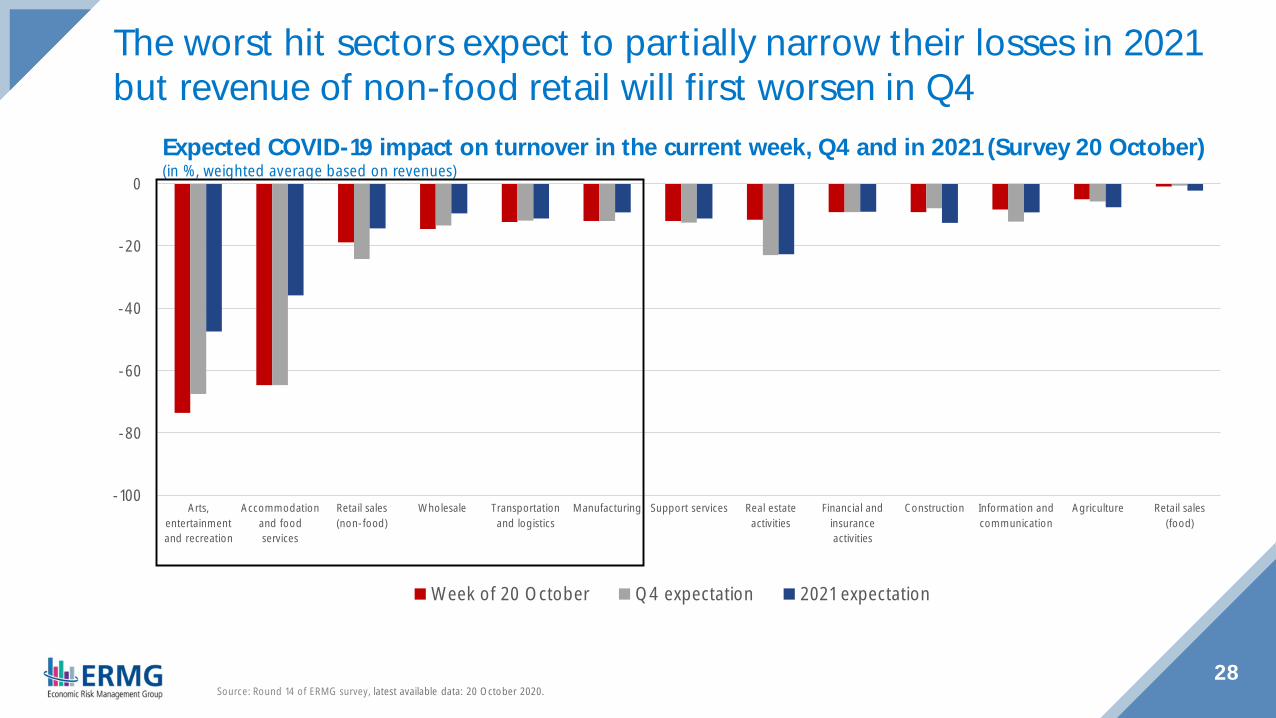
Week of 20 October Q4 expectation 2021 expectation
28
The worst hit sectors expect to partially narrow their losses in 2021but revenue of non-food retail will first worsen in Q4
Source: Round 14 of ERMG survey, latest available data: 20 October 2020.
Expected COVID-19 impact on turnover in the current week, Q4 and in 2021 (Survey 20 October)(in %, weighted average based on revenues)

29Source: ERMG survey, latest available data: 20 October 2020.¹ Weighted average based on the industry value added.² The results for this sector are based on only a few respondents and should therefore be interpreted with caution.
Impact of the COVID-19 crisis on company turnover by industry(in %, weighted average based on revenues)
< -25%in October
≥ -10%in October
-10 to -25%in October
-70
-60
-50
-40
-30
-20
-10
0
Self-employed 1 - 10 10 - 20 20 - 50 50 - 250 250 - 1000 > 1000
April average(Rounds 2-6)
May average(Rounds 7-9)
June average(Rounds 10-11)
Week of 18 August(Round 12)
Week of 22 September(Round 13)
Week of 20 October(Round 14)
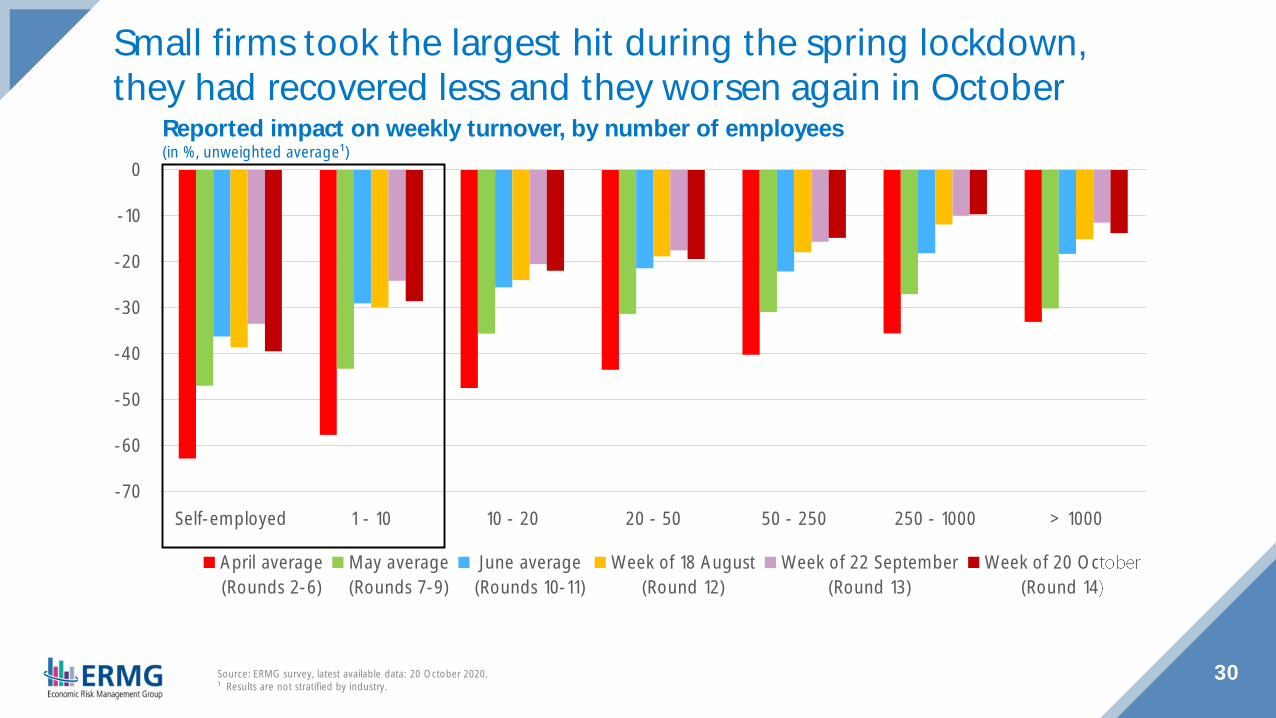
30Source: ERMG survey, latest available data: 20 October 2020.¹ Results are not stratified by industry.
Reported impact on weekly turnover, by number of employees(in %, unweighted average¹)
Small firms took the largest hit during the spring lockdown,they had recovered less and they worsen again in October
-50
-45
-40
-35
-30
-25
-20
-15
-10
-5
0
Self-employed 1 - 10 10 - 20 20 - 50 50 - 250 250 - 1000 > 1000
Flemish Region Walloon Region Brussels-Capital Region
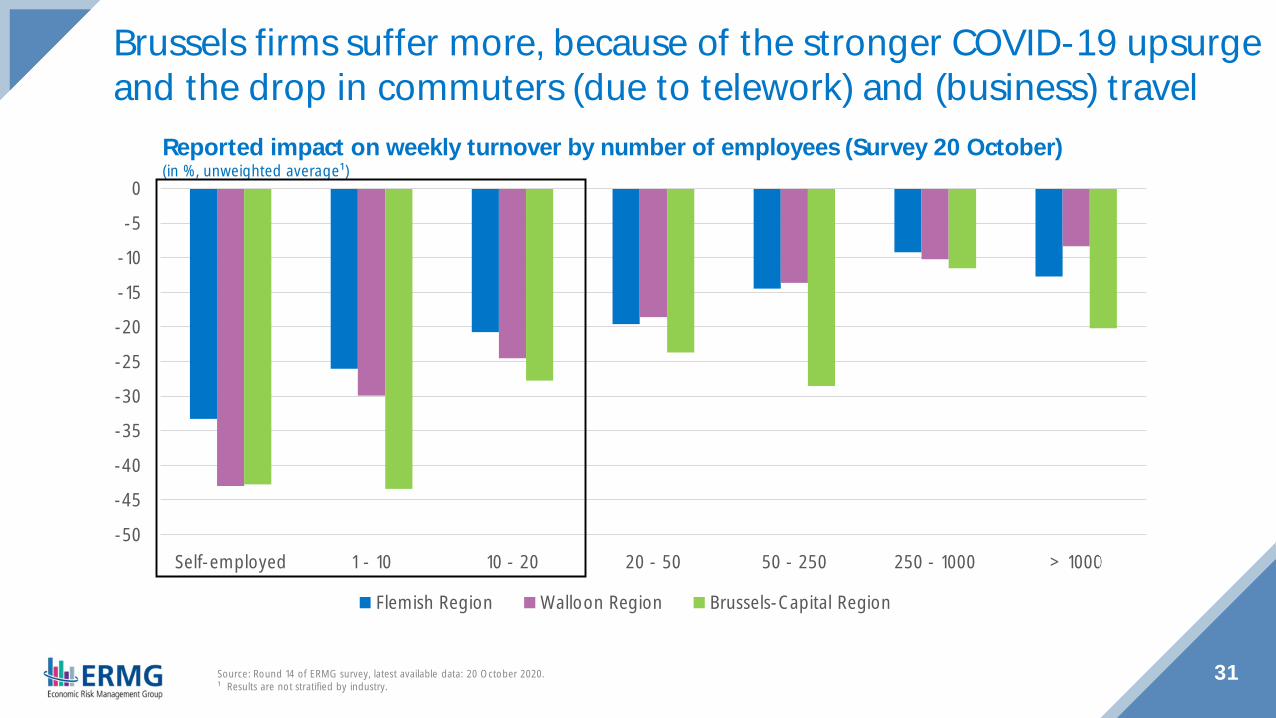
31Source: Round 14 of ERMG survey, latest available data: 20 October 2020.¹ Results are not stratified by industry.
Reported impact on weekly turnover by number of employees (Survey 20 October)(in %, unweighted average¹)
Brussels firms suffer more, because of the stronger COVID-19 upsurgeand the drop in commuters (due to telework) and (business) travel
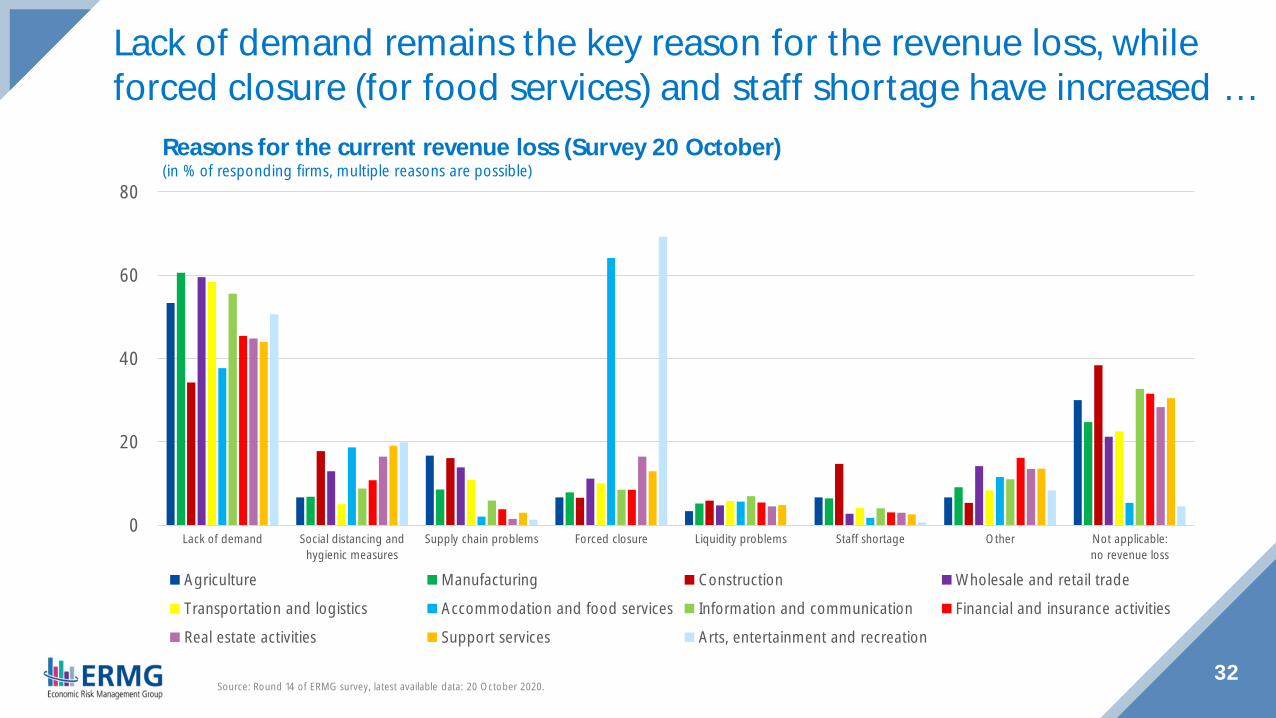
32Source: Round 14 of ERMG survey, latest available data: 20 October 2020.
Reasons for the current revenue loss (Survey 20 October)(in % of responding firms, multiple reasons are possible)
Lack of demand remains the key reason for the revenue loss, whileforced closure (for food services) and staff shortage have increased …
0
20
40
60
80
Lack of demand Social distancing andhygienic measures
Supply chain problems Forced closure Liquidity problems Staff shortage Other Not applicable:no revenue loss
Agriculture Manufacturing Construction Wholesale and retail trade
Transportation and logistics Accommodation and food services Information and communication Financial and insurance activities
Real estate activities Support services Arts, entertainment and recreation
33Source: ERMG survey of 20 October.
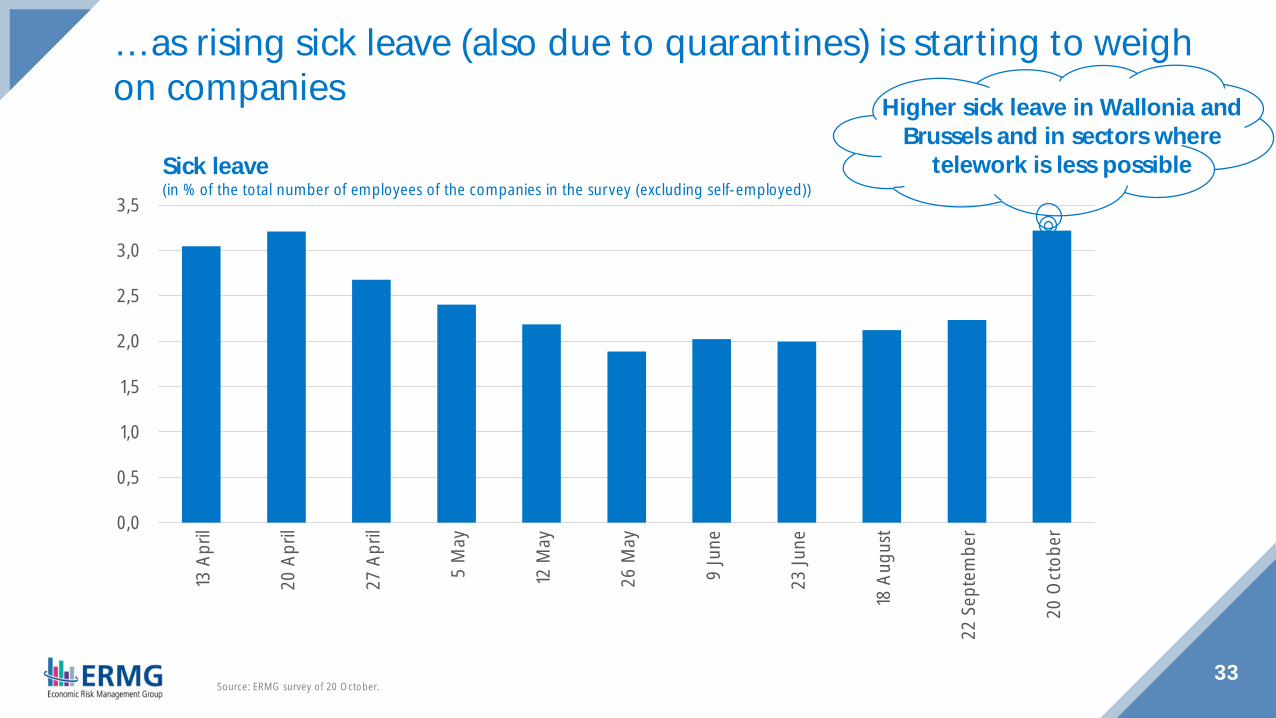
… as rising sick leave (also due to quarantines) is starting to weighon companies
0,0
0,5
1,0
1,5
2,0
2,5
3,0
3,513
Apr
il
20 A
pril
27 A
pril
5 M
ay
12 M
ay
26 M
ay
9 Ju
ne
23 Ju
ne
18 A
ugus
t
22 S
epte
mbe
r
20 O
ctob
er
Sick leave(in % of the total number of employees of the companies in the survey (excluding self-employed))
Higher sick leave in Wallonia andBrussels and in sectors where
telework is less possible
34Source: ERMG survey, latest available data: 20 October 2020.1 Weighted average based on the industry value added.
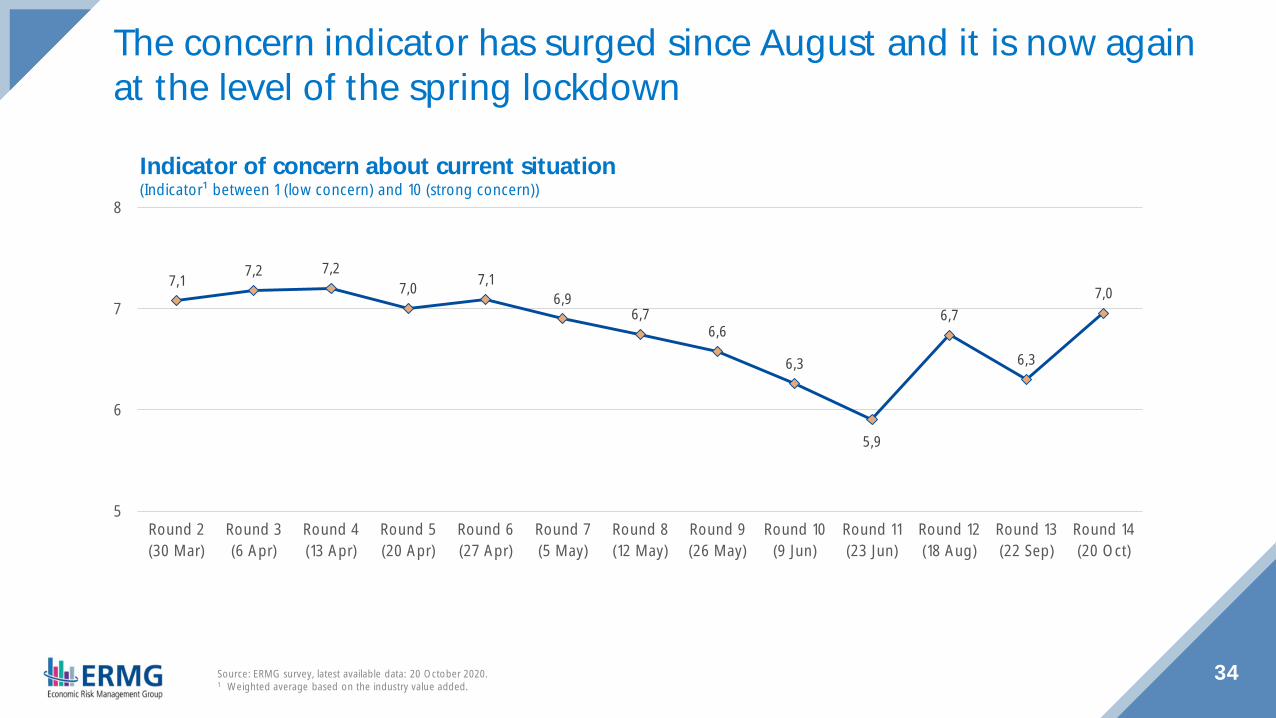
The concern indicator has surged since August and it is now againat the level of the spring lockdown
Indicator of concern about current situation(Indicator¹ between 1 (low concern) and 10 (strong concern))
7,1 7,2 7,27,0 7,1
6,96,7
6,6
6,3
5,9
6,7
6,3
7,0
5
6
7
8
Round 2(30 Mar)
Round 3(6 Apr)
Round 4(13 Apr)
Round 5(20 Apr)
Round 6(27 Apr)
Round 7(5 May)
Round 8(12 May)
Round 9(26 May)
Round 10(9 Jun)
Round 11(23 Jun)
Round 12(18 Aug)
Round 13(22 Sep)
Round 14(20 Oct)
34
35
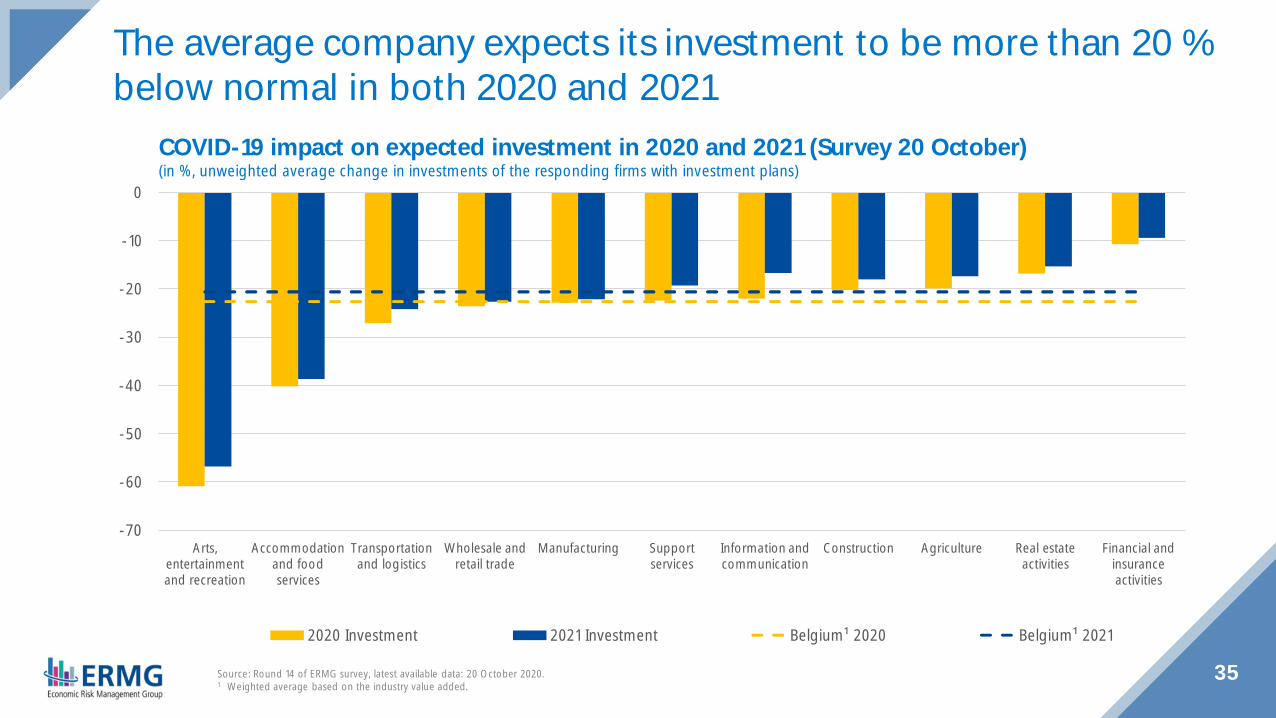
The average company expects its investment to be more than 20 %below normal in both 2020 and 2021
-70
-60
-50
-40
-30
-20
-10
0
Arts,entertainmentand recreation
Accommodationand foodservices
Transportationand logistics
Wholesale andretail trade
Manufacturing Supportservices
Information andcommunication
Construction Agriculture Real estateactivities
Financial andinsuranceactivities
2020 Investment 2021 Investment Belgium¹ 2020 Belgium¹ 2021
COVID-19 impact on expected investment in 2020 and 2021 (Survey 20 October)(in %, unweighted average change in investments of the responding firms with investment plans)
35Source: Round 14 of ERMG survey, latest available data: 20 October 2020.1 Weighted average based on the industry value added.

0
10
20
30
40
50
60
70
80
No, I do not have liquidityproblems
Yes, due to revenue loss Yes, due to late payments of ourclients
Yes, due to delayed governmentpayments
Yes, due to insufficient credit lines
April average(Rounds 2-6)
May average(Rounds 7-9)
June average(Rounds 10-11)
Week of 18 August(Round 12)
Week of 22 September(Round 13)
Week of 20 October(Round 14)
36
The liquidity of the companies had improved since the lockdown,but it deteriorates again in October …
Source: ERMG survey, latest available data: 20 October 2020.¹ Weighted average based on the industry value added.
Do you have liquidity problems?(in % of responding firms¹, multiple answers are possible)

0
10
20
30
40
50
60
70
80
90
100
Belgium¹ Arts,entertainmentand recreation
Accommodationand food services
Information andcommunication
Agriculture Retail sales(non-food)
Wholesale Construction Support services Real estateactivities
Manufacturing Transportationand logistics
Retail sales(food)
Financial andinsuranceactivities
< 1 month 1 - 3 months 3 - 6 months 6 - 12 months >12 months
37
… as 60 % of firms need additional financing in the short run to meettheir current financial obligations
Source: Round 14 of ERMG survey, latest available data: 20 October 2020.¹ Weighted average based on the industry value added.
How long can you still meet your current financial obligations (debt repayment, rent, taxes, …)without having to rely on additional equity or credit? (Survey 20 October)(in % of responding firms)
0
5
10
15
20
25
30
35
Belgium¹ Accommodationand food services
Arts,entertainmentand recreation
Transportationand logistics
Real estateactivities
Retail sales(food)
Retail sales(non-food)
Information andcommunication
Support services Agriculture Manufacturing Construction Financial andinsuranceactivities
Wholesale
April average(Rounds 2-6)
May average(Rounds 7-9)
June average(Rounds 10-11)
Week of 18 August(Round 12)²
Week of 22 September(Round 13)
Week of 20 October(Round 14)²
38
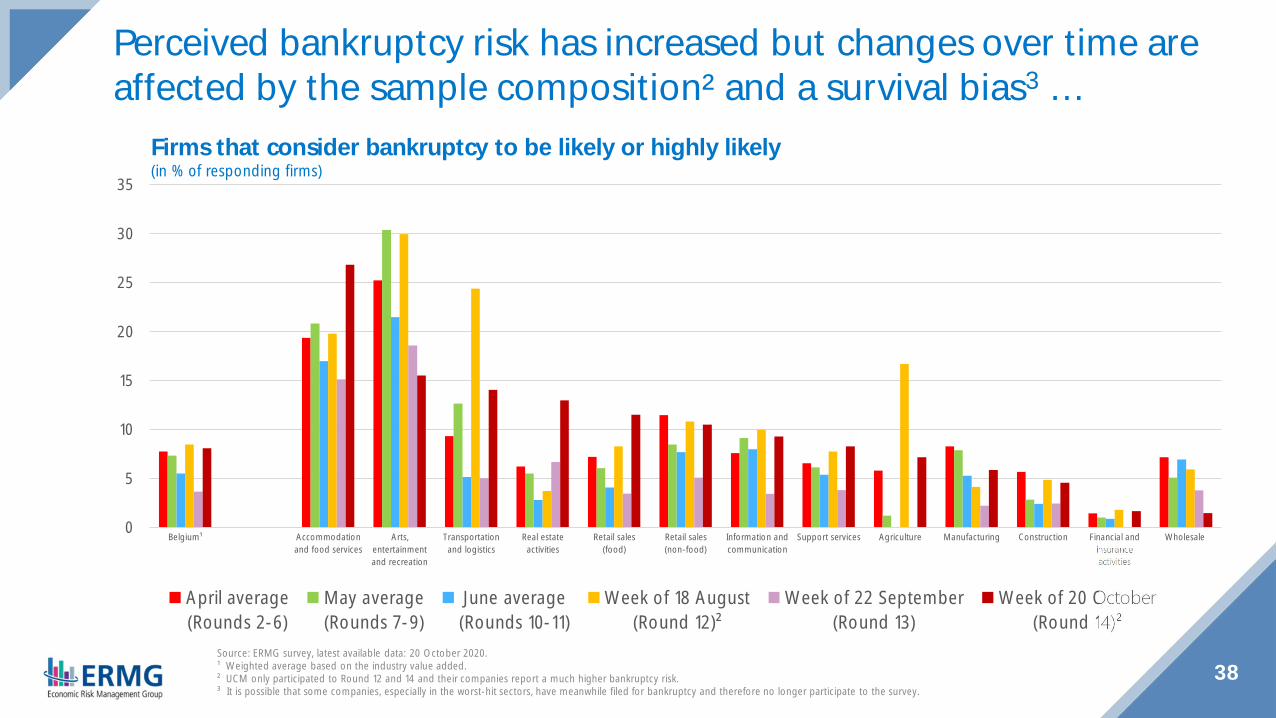
Perceived bankruptcy risk has increased but changes over time areaffected by the sample composition² and a survival bias3 …
Source: ERMG survey, latest available data: 20 October 2020.¹ Weighted average based on the industry value added.² UCM only participated to Round 12 and 14 and their companies report a much higher bankruptcy risk.³ It is possible that some companies, especially in the worst-hit sectors, have meanwhile filed for bankruptcy and therefore no longer participate to the survey.
Firms that consider bankruptcy to be likely or highly likely(in % of responding firms)
0
5
10
15
20
25
30
35
Belgium¹ Arts,entertainmentand recreation
Accommodationand food services
Retail sales (non-food)
Transportationand logistics
Retail sales (food) Information andcommunication
Construction Wholesale Support services Manufacturing Real estateactivities
Agriculture Financial andinsuranceactivities
Survey 18 August Survey 22 September Survey 20 October
39
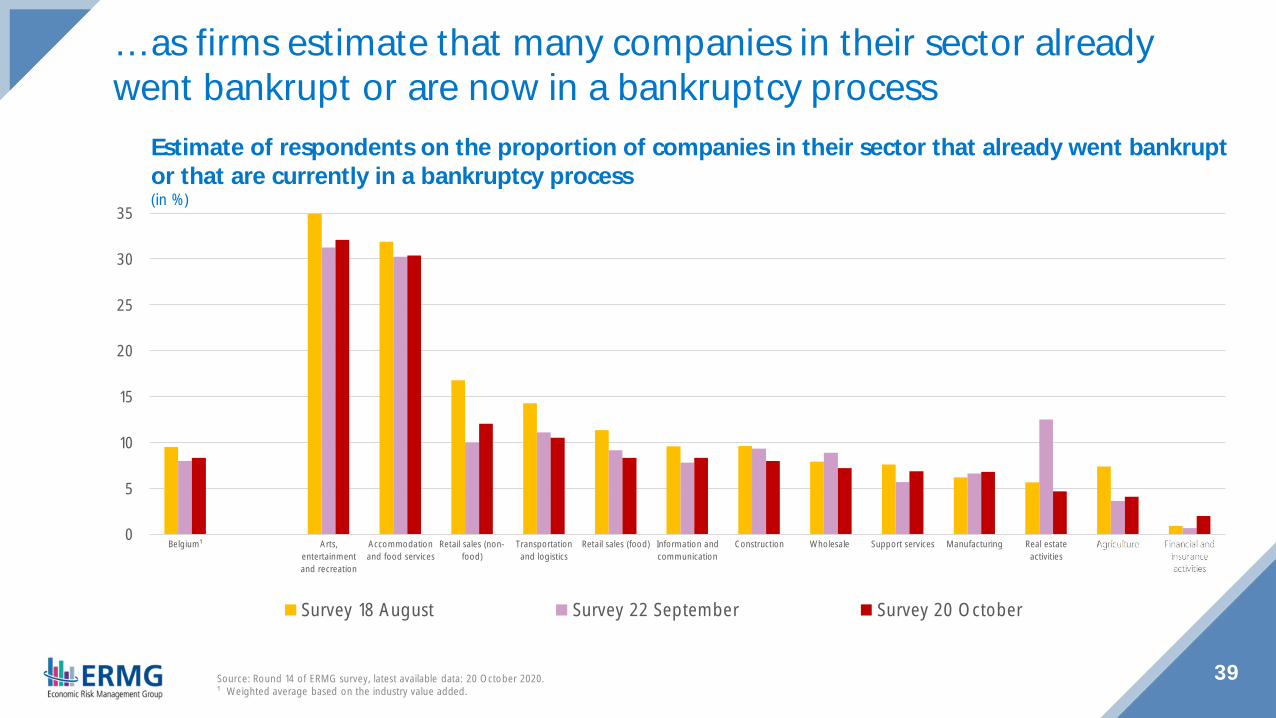
… as firms estimate that many companies in their sector alreadywent bankrupt or are now in a bankruptcy process
Source: Round 14 of ERMG survey, latest available data: 20 October 2020.¹ Weighted average based on the industry value added.
Estimate of respondents on the proportion of companies in their sector that already went bankruptor that are currently in a bankruptcy process(in %)
-35
-30
-25
-20
-15
-10
-5
0
5
Belgium¹ Arts,entertainmentand recreation
Accommodationand foodservices
Retail sales(non-food)
Financial andinsuranceactivities
Transportationand logistics
Wholesale Manufacturing Retail sales(food)
Construction Agriculture Support services Information andcommunication
Real estateactivities
2020 202140Source: ERMG survey, latest available data: 20 October 2020.
1 Average, weighted by the number of private sector employees in the industries.
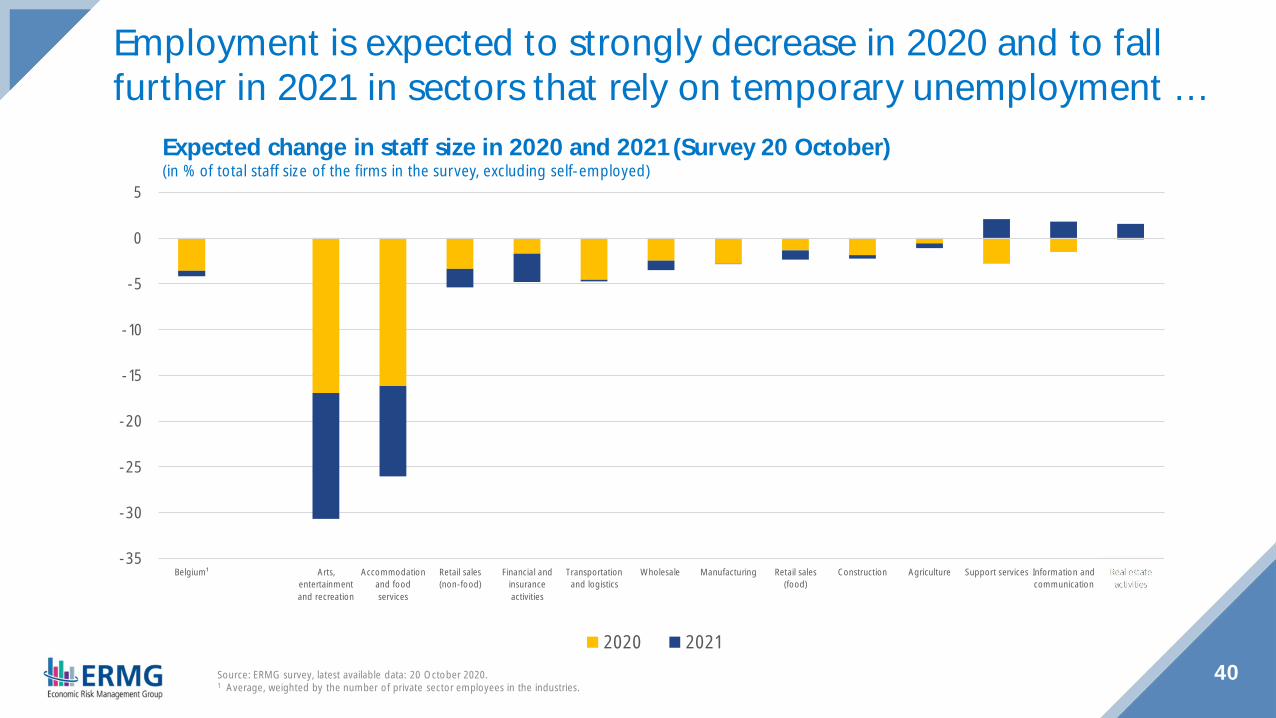
Expected change in staff size in 2020 and 2021 (Survey 20 October)(in % of total staff size of the firms in the survey, excluding self-employed)
Employment is expected to strongly decrease in 2020 and to fallfurther in 2021 in sectors that rely on temporary unemployment …
41Source: ERMG survey, latest available data: 20 October 2020.1 Average, weighted by the number of private sector employees in the industries.
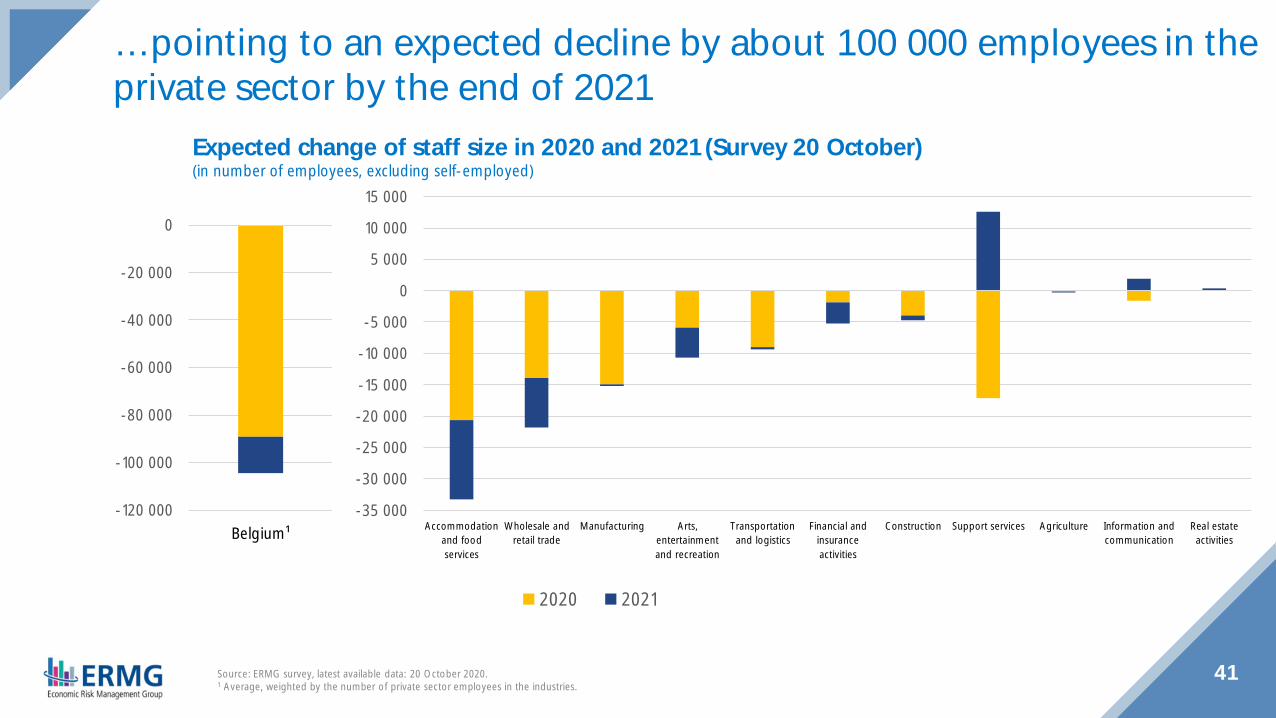
Expected change of staff size in 2020 and 2021 (Survey 20 October)(in number of employees, excluding self-employed)
… pointing to an expected decline by about 100 000 employees in theprivate sector by the end of 2021
-120 000
-100 000
-80 000
-60 000
-40 000
-20 000
0
Belgium¹-35 000
-30 000
-25 000
-20 000
-15 000
-10 000
-5 000
0
5 000
10 000
15 000
Accommodationand foodservices
Wholesale andretail trade
Manufacturing Arts,entertainmentand recreation
Transportationand logistics
Financial andinsuranceactivities
Construction Support services Agriculture Information andcommunication
Real estateactivities
2020 2021
42Source: ERMG survey, latest available data: 20 October 2020.¹ Average, weighted by the number of the private sector employees of the industries in the Belgian economy.
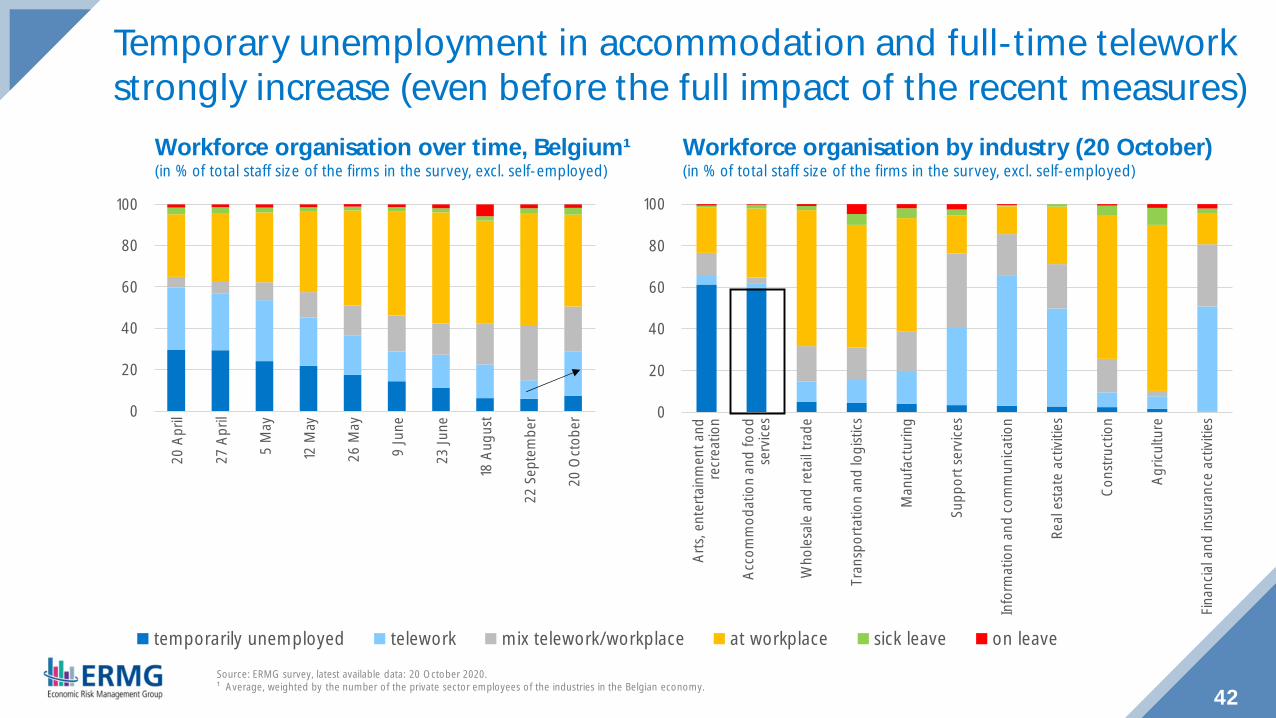
Workforce organisation over time, Belgium¹(in % of total staff size of the firms in the survey, excl. self-employed)
Temporary unemployment in accommodation and full-time teleworkstrongly increase (even before the full impact of the recent measures)
0
20
40
60
80
10020
Apr
il
27 A
pril
5 M
ay
12 M
ay
26 M
ay
9 Ju
ne
23 Ju
ne
18 A
ugus
t
22 S
epte
mbe
r
20 O
ctob
er
temporarily unemployed telework mix telework/workplace at workplace sick leave on leave
0
20
40
60
80
100
Arts,
ent
erta
inm
ent a
ndre
crea
tion
Acco
mm
odat
ion
and
food
serv
ices
Who
lesa
le a
nd re
tail t
rade
Tran
spor
tatio
n an
d lo
gisti
cs
Man
ufac
turin
g
Supp
ort s
ervic
es
Info
rmat
ion
and
com
mun
icatio
n
Real
esta
te a
ctivi
ties
Cons
truct
ion
Agric
ultu
re
Finan
cial a
nd in
sura
nce
activ
ities
Workforce organisation by industry (20 October)(in % of total staff size of the firms in the survey, excl. self-employed)
0,0
0,5
1,0
1,5
2,0
2,5
3,0
3,5
4,0
4,5
5,0
Belgium¹ Support services Information andcommunication
Financial andinsuranceactivities
Real estateactivities
Manufacturing Transportationand logistics
Arts,entertainmentand recreation
Wholesale andretail trade
Construction Agriculture Accommodationand foodservices
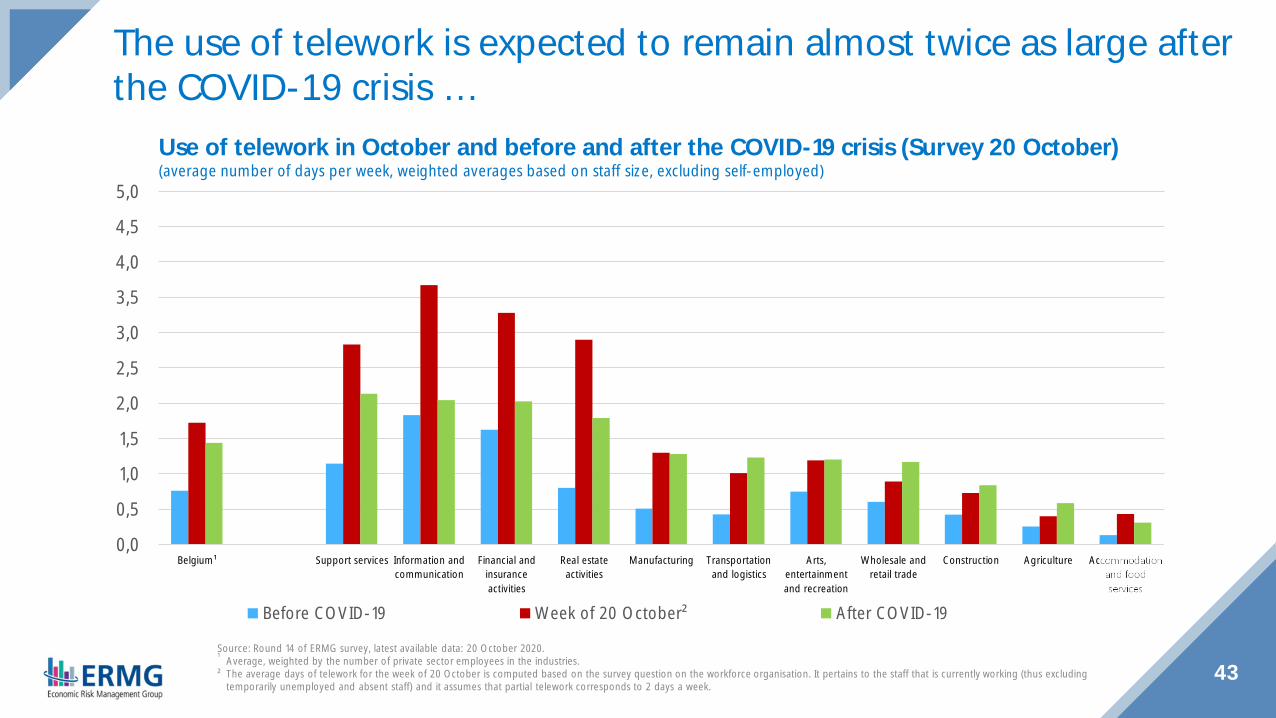
Before COVID-19 Week of 20 October² After COVID-19
43Source: Round 14 of ERMG survey, latest available data: 20 October 2020.¹ Average, weighted by the number of private sector employees in the industries.² The average days of telework for the week of 20 October is computed based on the survey question on the workforce organisation. It pertains to the staff that is currently working (thus excluding
temporarily unemployed and absent staff) and it assumes that partial telework corresponds to 2 days a week.
Use of telework in October and before and after the COVID-19 crisis (Survey 20 October)(average number of days per week, weighted averages based on staff size, excluding self-employed)
The use of telework is expected to remain almost twice as large afterthe COVID-19 crisis …
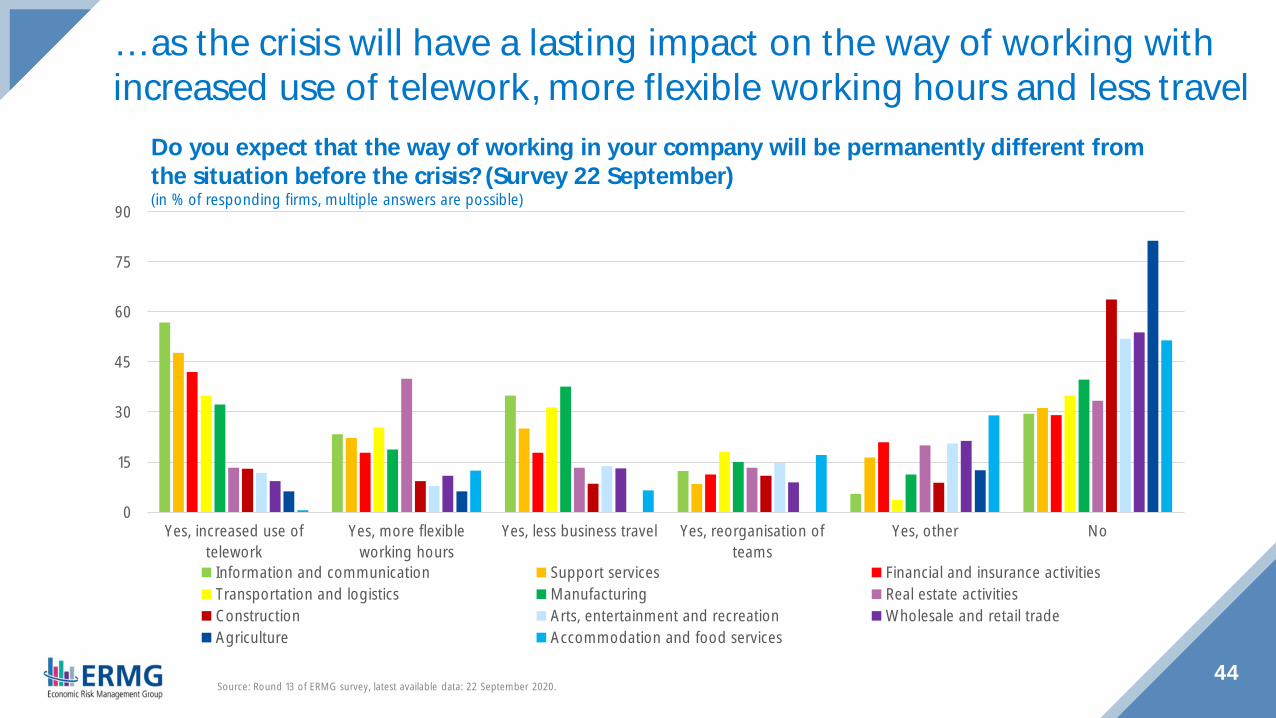
44Source: Round 13 of ERMG survey, latest available data: 22 September 2020.
Do you expect that the way of working in your company will be permanently different fromthe situation before the crisis? (Survey 22 September)(in % of responding firms, multiple answers are possible)
… as the crisis will have a lasting impact on the way of working withincreased use of telework, more flexible working hours and less travel
0
15
30
45
60
75
90
Yes, increased use oftelework
Yes, more flexibleworking hours
Yes, less business travel Yes, reorganisation ofteams
Yes, other No
Information and communication Support services Financial and insurance activitiesTransportation and logistics Manufacturing Real estate activitiesConstruction Arts, entertainment and recreation Wholesale and retail tradeAgriculture Accommodation and food services

45Source: Round 12 of ERMG survey, latest available data: 18 August 2020.
Do you expect that, as a result of the COVID-19 crisis, the production of your company that iscurrently produced outside the EU will be moved to a country within the EU? (Round 12)(In % of responding firms)
Few firms have non-EU production and the vast majority of thesefirms will not reshore this production
0
20
40
60
80
100
Yes, 100% of ournon-EU production
Yes, 20-50% of ournon-EU production
Yes, 0-50% of ournon-EU production
No, we keep ournon-EU production
Not applicable:I do not have
non-EU production
Agriculture Manufacturing Financial and insurance activities Transportation and logisticsInformation and communication Wholesale and retail trade Support services Arts, entertainment and recreationAccommodation and food services Construction Real estate activities

46
Credit indicatorshouseholds
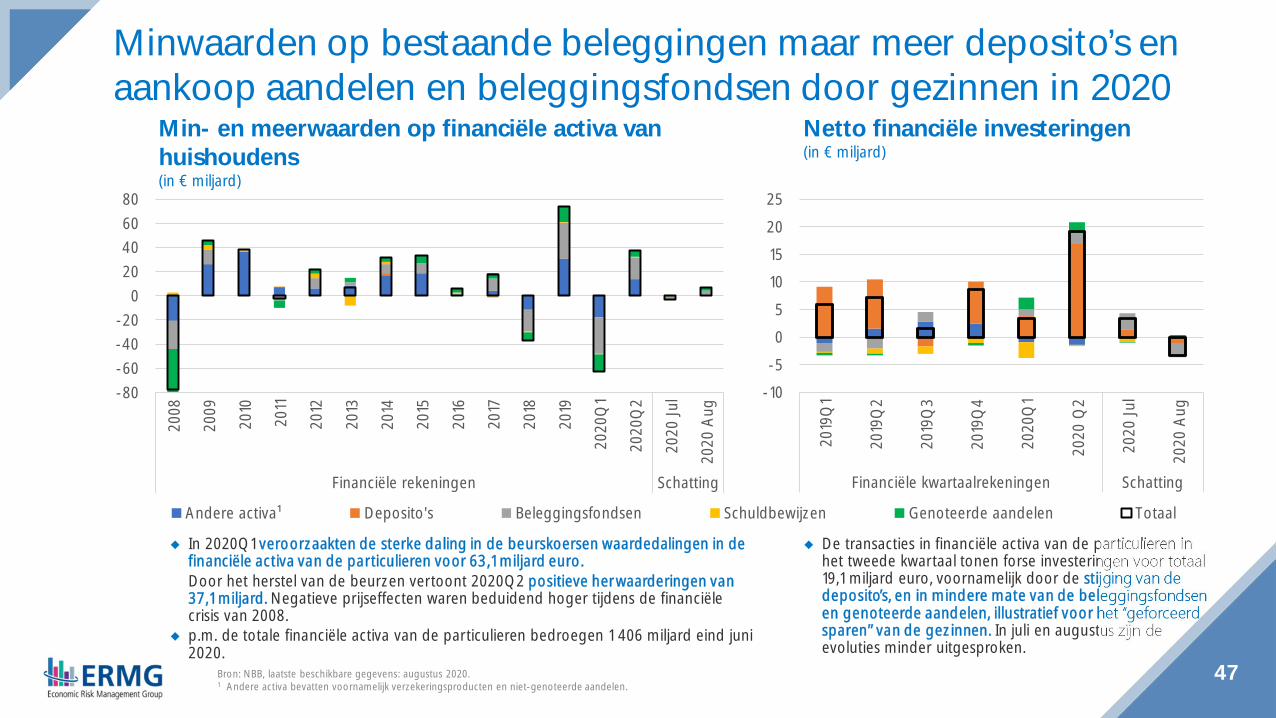
◆ De transacties in financiële activa van de particulieren inhet tweede kwartaal tonen forse investeringen voor totaal19,1 miljard euro, voornamelijk door de stijging van dedeposito’s, en in mindere mate van de beleggingsfondsenen genoteerde aandelen, illustratief voor het “geforceerdsparen” van de gezinnen. In juli en augustus zijn deevoluties minder uitgesproken.
47Bron: NBB, laatste beschikbare gegevens: augustus 2020.1 Andere activa bevatten voornamelijk verzekeringsproducten en niet-genoteerde aandelen.
Minwaarden op bestaande beleggingen maar meer deposito’s enaankoop aandelen en beleggingsfondsen door gezinnen in 2020
Netto financiële investeringen(in € miljard)
Min- en meerwaarden op financiële activa vanhuishoudens(in € miljard)
◆ In 2020Q1 veroorzaakten de sterke daling in de beurskoersen waardedalingen in definanciële activa van de particulieren voor 63,1 miljard euro.Door het herstel van de beurzen vertoont 2020Q2 positieve herwaarderingen van37,1 miljard. Negatieve prijseffecten waren beduidend hoger tijdens de financiëlecrisis van 2008.
◆ p.m. de totale financiële activa van de particulieren bedroegen 1 406 miljard eind juni2020.
-80-60-40-20
020406080
2008
2009
2010
2011
2012
2013
2014
2015
2016
2017
2018
2019
2020
Q1
2020
Q2
2020
Jul
2020
Aug
Financiële rekeningen Schatting
Andere activa¹ Deposito's Beleggingsfondsen Schuldbewijzen Genoteerde aandelen Totaal
-10-505
10152025
2019
Q1
2019
Q2
2019
Q3
2019
Q4
2020
Q1
2020
Q2
2020
Jul
2020
Aug
Financiële kwartaalrekeningen Schatting
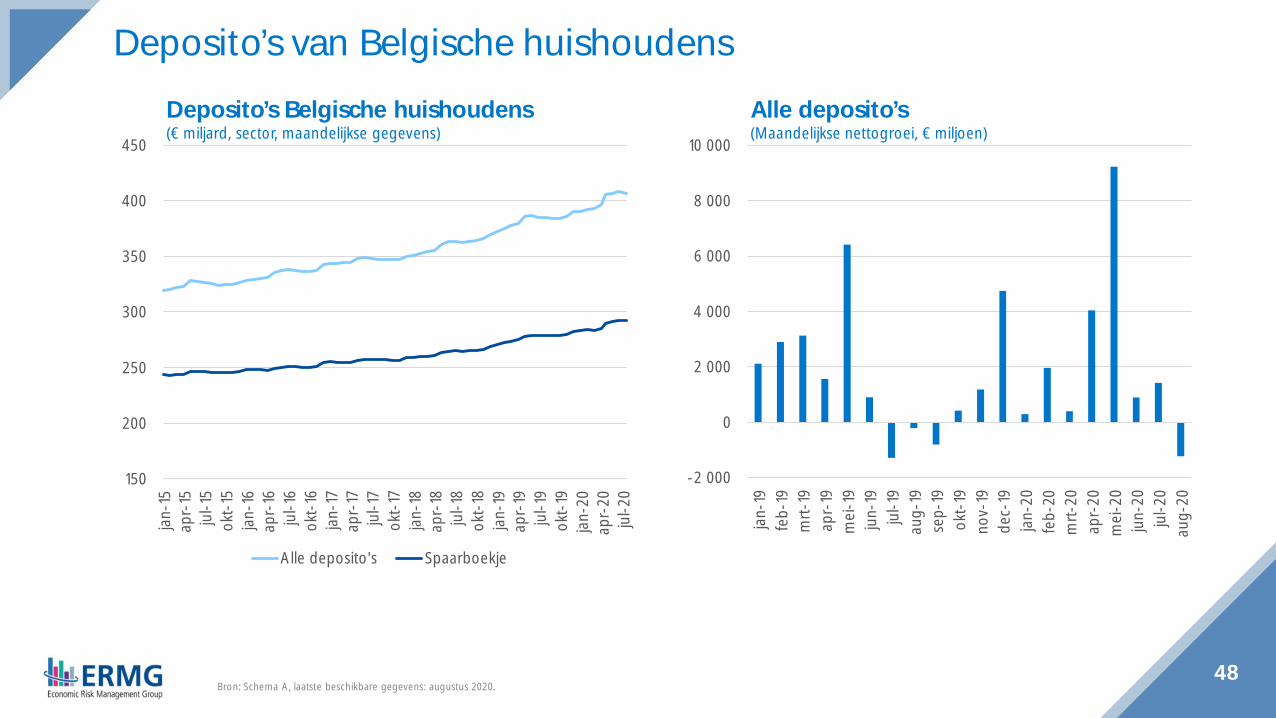
48Bron: Schema A, laatste beschikbare gegevens: augustus 2020.
Alle deposito’s(Maandelijkse nettogroei, € miljoen)
Deposito’s Belgische huishoudens(€ miljard, sector, maandelijkse gegevens)
Deposito’s van Belgische huishoudens
150
200
250
300
350
400
450jan
-15
apr-
15ju
l-15
okt-
15jan
-16
apr-
16ju
l-16
okt-
16jan
-17
apr-
17ju
l-17
okt-
17jan
-18
apr-
18ju
l-18
okt-
18jan
-19
apr-
19ju
l-19
okt-
19jan
-20
apr-
20ju
l-20
Alle deposito's Spaarboekje
-2 000
0
2 000
4 000
6 000
8 000
10 000
jan-1
9fe
b-19
mrt-
19ap
r-19
mei
-19
jun-
19ju
l-19
aug-
19se
p-19
okt-
19no
v-19
dec-
19jan
-20
feb-
20m
rt-20
apr-
20m
ei-2
0ju
n-20
jul-2
0au
g-20
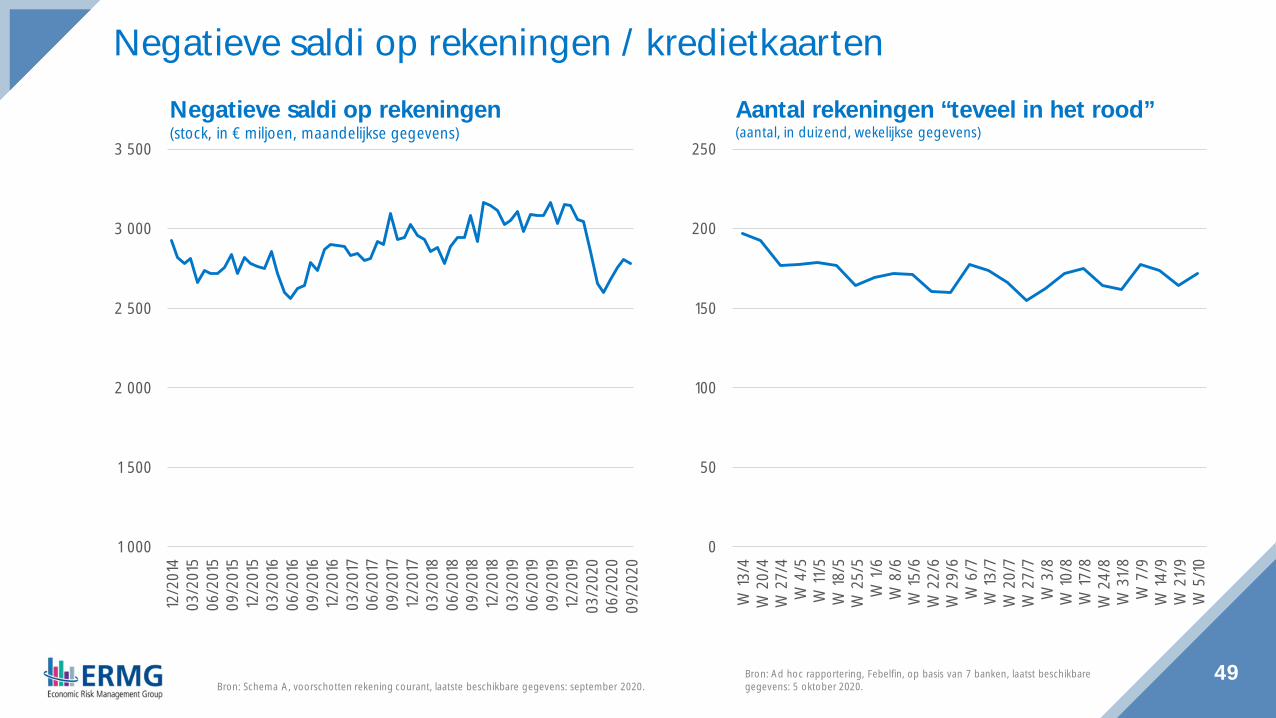
Negatieve saldi op rekeningen / kredietkaarten
49
Negatieve saldi op rekeningen(stock, in € miljoen, maandelijkse gegevens)
Bron: Ad hoc rapportering, Febelfin, op basis van 7 banken, laatst beschikbaregegevens: 5 oktober 2020.Bron: Schema A, voorschotten rekening courant, laatste beschikbare gegevens: september 2020.
Aantal rekeningen “teveel in het rood”(aantal, in duizend, wekelijkse gegevens)
1 000
1 500
2 000
2 500
3 000
3 50012
/201
403
/201
506
/201
509
/201
512
/201
503
/201
606
/201
609
/201
612
/201
603
/201
706
/201
709
/201
712
/201
703
/201
806
/201
809
/201
812
/201
803
/201
906
/201
909
/201
912
/201
903
/202
006
/202
009
/202
0
0
50
100
150
200
250
W 13
/4W
20/
4W
27/
4W
4/5
W 11
/5W
18/5
W 2
5/5
W 1/
6W
8/6
W 15
/6W
22/
6W
29/
6W
6/7
W 13
/7W
20/
7W
27/
7W
3/8
W 10
/8W
17/8
W 2
4/8
W 3
1/8
W 7
/9W
14/9
W 2
1/9
W 5
/10
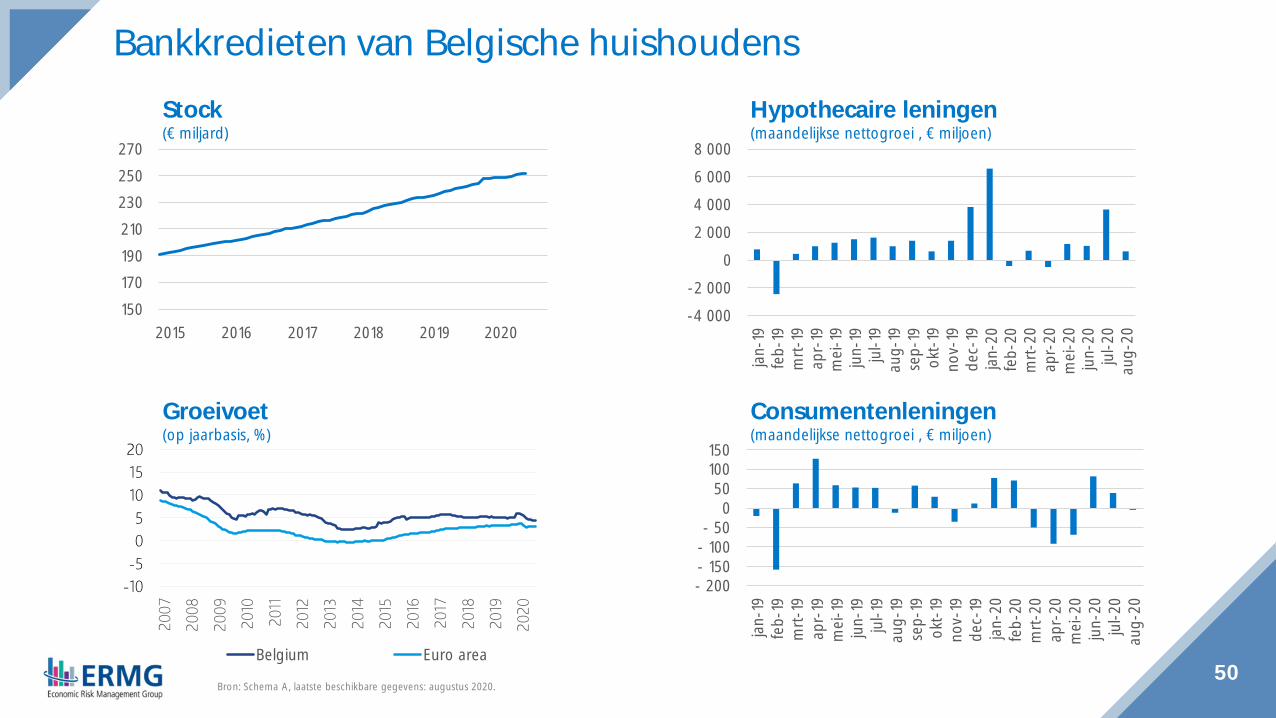
Bankkredieten van Belgische huishoudens
50Bron: Schema A, laatste beschikbare gegevens: augustus 2020.
Hypothecaire leningen(maandelijkse nettogroei , € miljoen)
Stock(€ miljard)
Consumentenleningen(maandelijkse nettogroei , € miljoen)
Groeivoet(op jaarbasis, %)
-10-505101520
2007
2008
2009
2010
2011
2012
2013
2014
2015
2016
2017
2018
2019
2020
Belgium Euro area
150170190210230250270
2015 2016 2017 2018 2019 2020-4 000-2 000
02 0004 0006 0008 000
jan-1
9fe
b-19
mrt-
19ap
r-19
mei
-19
jun-
19ju
l-19
aug-
19se
p-19
okt-
19no
v-19
dec-
19jan
-20
feb-
20m
rt-20
apr-
20m
ei-2
0ju
n-20
jul-2
0au
g-20
- 200- 150- 100- 50
0 50
100 150
jan-1
9fe
b-19
mrt-
19ap
r-19
mei
-19
jun-
19ju
l-19
aug-
19se
p-19
okt-
19no
v-19
dec-
19jan
-20
feb-
20m
rt-20
apr-
20m
ei-2
0ju
n-20
jul-2
0au
g-20
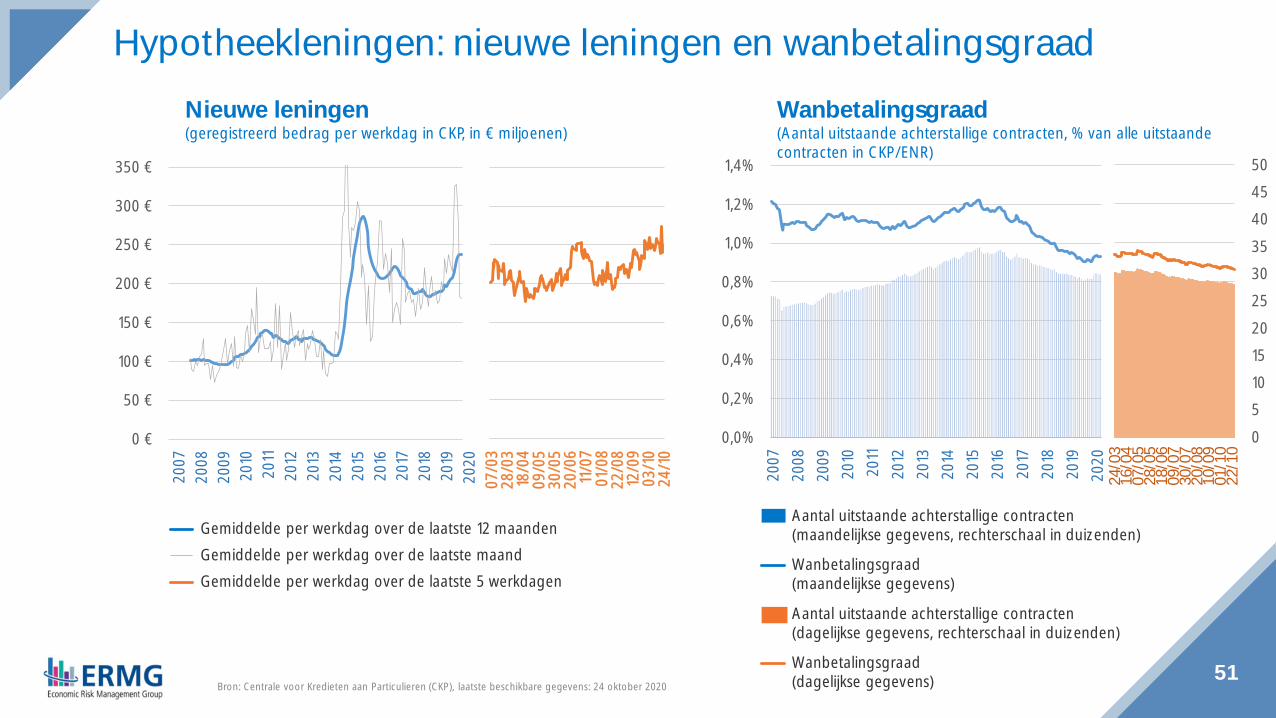
51Bron: Centrale voor Kredieten aan Particulieren (CKP), laatste beschikbare gegevens: 24 oktober 2020
Wanbetalingsgraad(Aantal uitstaande achterstallige contracten, % van alle uitstaandecontracten in CKP/ENR)
Nieuwe leningen(geregistreerd bedrag per werkdag in CKP, in € miljoenen)
Hypotheekleningen: nieuwe leningen en wanbetalingsgraad
Gemiddelde per werkdag over de laatste 12 maandenGemiddelde per werkdag over de laatste maandGemiddelde per werkdag over de laatste 5 werkdagen
Aantal uitstaande achterstallige contracten(dagelijkse gegevens, rechterschaal in duizenden)
Aantal uitstaande achterstallige contracten(maandelijkse gegevens, rechterschaal in duizenden)
Wanbetalingsgraad(dagelijkse gegevens)
Wanbetalingsgraad(maandelijkse gegevens)
0 €
50 €
100 €
150 €
200 €
250 €
300 €
350 €20
0720
0820
0920
1020
1120
1220
1320
1420
1520
1620
1720
1820
1920
2007
/03
28/0
318
/04
09/0
530
/05
20/0
611
/07
01/0
822
/08
12/0
903
/10
24/1
0
-
5
10
15
20
25
30
35
40
45
50
0,0%
0,2%
0,4%
0,6%
0,8%
1,0%
1,2%
1,4%
2007
2008
2009
2010
2011
2012
2013
2014
2015
2016
2017
2018
2019
2020
05101520253035404550
0,0%
0,2%
0,4%
0,6%
0,8%
1,0%
1,2%
1,4%
24/0
316
/04
07/0
528
/05
18/0
609
/07
30/0
720
/08
10/0
901
/10
22/1
0
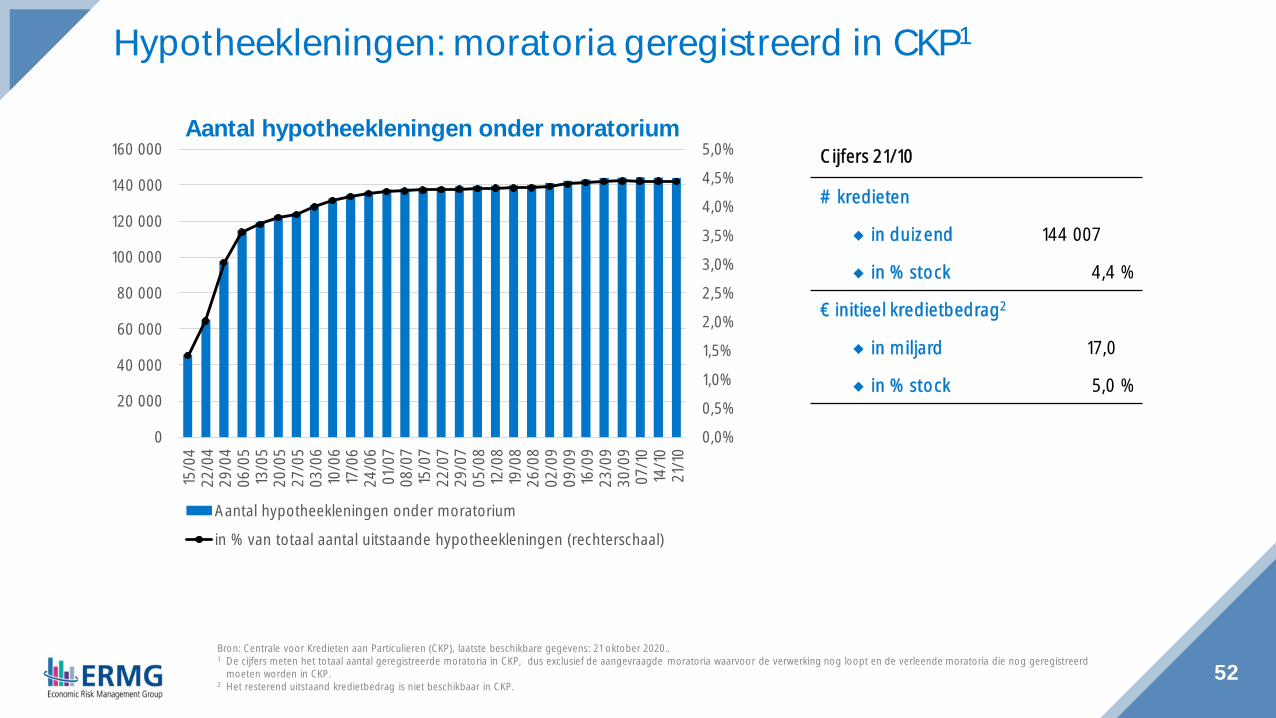
52Bron: Centrale voor Kredieten aan Particulieren (CKP), laatste beschikbare gegevens: 21 oktober 2020..1 De cijfers meten het totaal aantal geregistreerde moratoria in CKP, dus exclusief de aangevraagde moratoria waarvoor de verwerking nog loopt en de verleende moratoria die nog geregistreerd
moeten worden in CKP.2 Het resterend uitstaand kredietbedrag is niet beschikbaar in CKP.
Aantal hypotheekleningen onder moratorium
Hypotheekleningen: moratoria geregistreerd in CKP1
Cijfers 21/10
# kredieten
in duizend 144 007
in % stock 4,4 %
€ initieel kredietbedrag2
in miljard 17,0
in % stock 5,0 %
0,0%
0,5%
1,0%
1,5%
2,0%
2,5%
3,0%
3,5%
4,0%
4,5%
5,0%
0
20 000
40 000
60 000
80 000
100 000
120 000
140 000
160 000
15/0
422
/04
29/0
406
/05
13/0
520
/05
27/0
503
/06
10/0
617
/06
24/0
601
/07
08/0
715
/07
22/0
729
/07
05/0
812
/08
19/0
826
/08
02/0
909
/09
16/0
923
/09
30/0
907
/10
14/1
021
/10
Aantal hypotheekleningen onder moratorium
in % van totaal aantal uitstaande hypotheekleningen (rechterschaal)
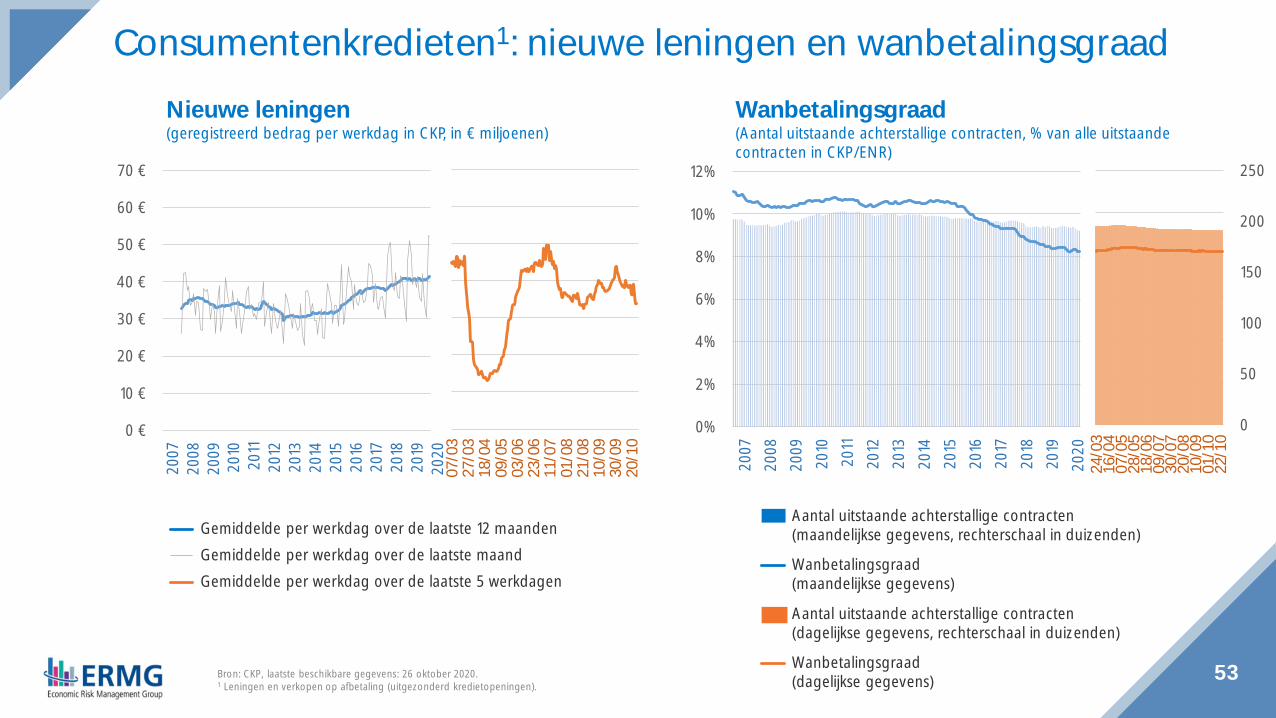
53Bron: CKP, laatste beschikbare gegevens: 26 oktober 2020.1 Leningen en verkopen op afbetaling (uitgezonderd kredietopeningen).
Wanbetalingsgraad(Aantal uitstaande achterstallige contracten, % van alle uitstaandecontracten in CKP/ENR)
Nieuwe leningen(geregistreerd bedrag per werkdag in CKP, in € miljoenen)
Consumentenkredieten1: nieuwe leningen en wanbetalingsgraad
Gemiddelde per werkdag over de laatste 12 maandenGemiddelde per werkdag over de laatste maandGemiddelde per werkdag over de laatste 5 werkdagen
Aantal uitstaande achterstallige contracten(dagelijkse gegevens, rechterschaal in duizenden)
Aantal uitstaande achterstallige contracten(maandelijkse gegevens, rechterschaal in duizenden)
Wanbetalingsgraad(dagelijkse gegevens)
Wanbetalingsgraad(maandelijkse gegevens)
0 €
10 €
20 €
30 €
40 €
50 €
60 €
70 €20
0720
0820
0920
1020
1120
1220
1320
1420
1520
1620
1720
1820
1920
200
50.00 0
10 0.000
15 0.000
200.0 00
250.0 00
0%
2%
4%
6%
8%
10%
12%
2007
2008
2009
2010
2011
2012
2013
2014
2015
2016
2017
2018
2019
2020
07/0
327
/03
18/0
409
/05
03/0
623
/06
11/0
701
/08
21/0
810
/09
30/0
920
/10
0
50
100
150
200
250
0,0%
2,0%
4,0%
6,0%
8,0%
10,0%
12,0%
24/0
316
/04
07/0
528
/05
18/0
609
/07
30/0
720
/08
10/0
901
/10
22/1
0
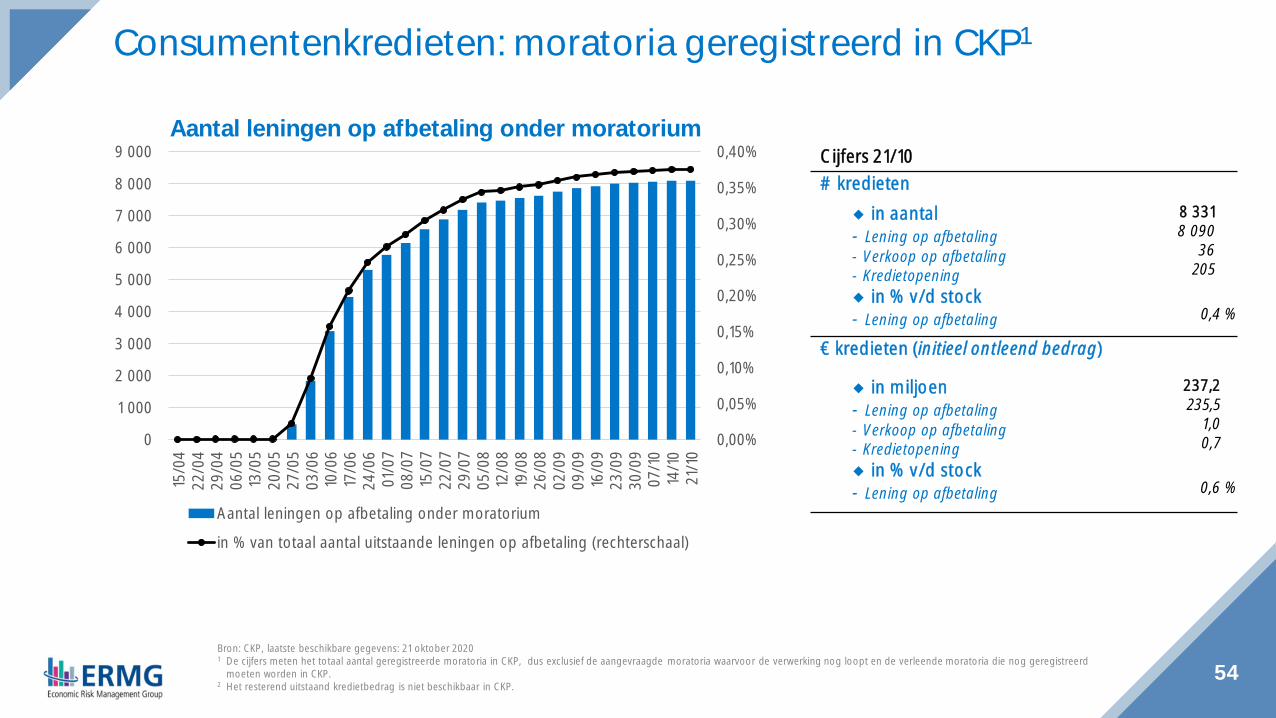
54Bron: CKP, laatste beschikbare gegevens: 21 oktober 20201 De cijfers meten het totaal aantal geregistreerde moratoria in CKP, dus exclusief de aangevraagde moratoria waarvoor de verwerking nog loopt en de verleende moratoria die nog geregistreerd
moeten worden in CKP.2 Het resterend uitstaand kredietbedrag is niet beschikbaar in CKP.
Aantal leningen op afbetaling onder moratorium
Consumentenkredieten: moratoria geregistreerd in CKP1
Cijfers 21/10# kredieten
in aantal- Lening op afbetaling- Verkoop op afbetaling- Kredietopening
8 3318 090
36205
in % v/d stock- Lening op afbetaling 0,4 %
€ kredieten (initieel ontleend bedrag)
in miljoen- Lening op afbetaling- Verkoop op afbetaling- Kredietopening
237,2235,5
1,00,7
in % v/d stock- Lening op afbetaling 0,6 %
0,00%
0,05%
0,10%
0,15%
0,20%
0,25%
0,30%
0,35%
0,40%
0
1 000
2 000
3 000
4 000
5 000
6 000
7 000
8 000
9 00015
/04
22/0
429
/04
06/0
513
/05
20/0
527
/05
03/0
610
/06
17/0
624
/06
01/0
708
/07
15/0
722
/07
29/0
705
/08
12/0
819
/08
26/0
802
/09
09/0
916
/09
23/0
930
/09
07/1
014
/10
21/1
0
Aantal leningen op afbetaling onder moratorium
in % van totaal aantal uitstaande leningen op afbetaling (rechterschaal)

55Bron: Febelfin, laatste beschikbare gegevens: 5 oktober 2020.
Betalingsachterstand (1-30 dagen) op hypothecaire leningen en consumentenleningen(wekelijkse gegevens)
Achterstanden bij leningen aan huishoudens stabiel sinds juni
0,0%
0,5%
1,0%
1,5%
2,0%
2,5%
3,0%
3,5%
4,0%
4,5%13
/4
20/4
27/4 4/5
11/5
18/5
25/5 1/6
8/6
15/6
22/6
29/6 6/7
13/7
20/7
27/7 3/8
10/8
17/8
24/8
31/8 7/9
14/9
21/9
5/10
Hypothecaire leningen Consumentenkredieten

56
Credit indicatorscorporates
57Sources: ECB, NBB.
Impact of the COVID-19 crisis on lending to non-financialcorporations (NFCs)◆ Credit developments: (see next slides)
◇ While annual NFC growth of utilised loans had accelerated in March and April (in large part due todrawdowns of credit lines by multinationals), it has slowed since May.
◇ The annual growth rate of authorised (granted) credit is comparable to that observed before the pandemic◇ Monthly growth rates of utilised and authorised were negative in June◇ Loan arrears have been stable since May◇ Small or medium-sized enterprises (SMEs) have larger proportions of loans in moratorium than larger firms
◆ According to the July 2020 Bank lending survey:◇ Demand for loans from Belgian enterprises in 2020Q2 was driven by liquidity needs, but also curbed by a
decline in fixed investment◇ Slight tightening in credit standards prompted by higher risk perception and lower risk tolerance

58Sources: ECB, NBB.
Firms perceived less favorable credit conditions◆ Belgian firms reported for the second time a deterioration of their credit conditions in 2020Q2
◇ Deterioration in the assessment of the general credit conditions by firms- In all branches of activity and all categories of firms irrespective of size- From 2020, the balance of the opinions (favorable vs unfavorable) is below the historical mean
◇ Small deterioration with respect to 2020Q1 regarding requirements for collateral, costs other thaninterest rates and level of interest rates(source: NBB survey on credit conditions)
◆ SMEs feared a significant impact on bank loan availability in 2020Q2◇ No significant changes regarding obstacles impeding access to bank financing between October 2019
and March 2020- Proportion of SMEs not applying for bank credit because of possible rejection, or applying for a loan but only
receiving a limited part of the amount requested, refusing credit because the cost was too high, or having theirapplication rejected = 5,2 % (against 5,9 % on average in 2017-2019)
◇ But SMEs expected a sharp deterioration in availability of bank loans over the next six months(April-September 2020)- Widespread across sectors
(source: SAFE survey, conducted between 2 March and 8 April 2020.)
59
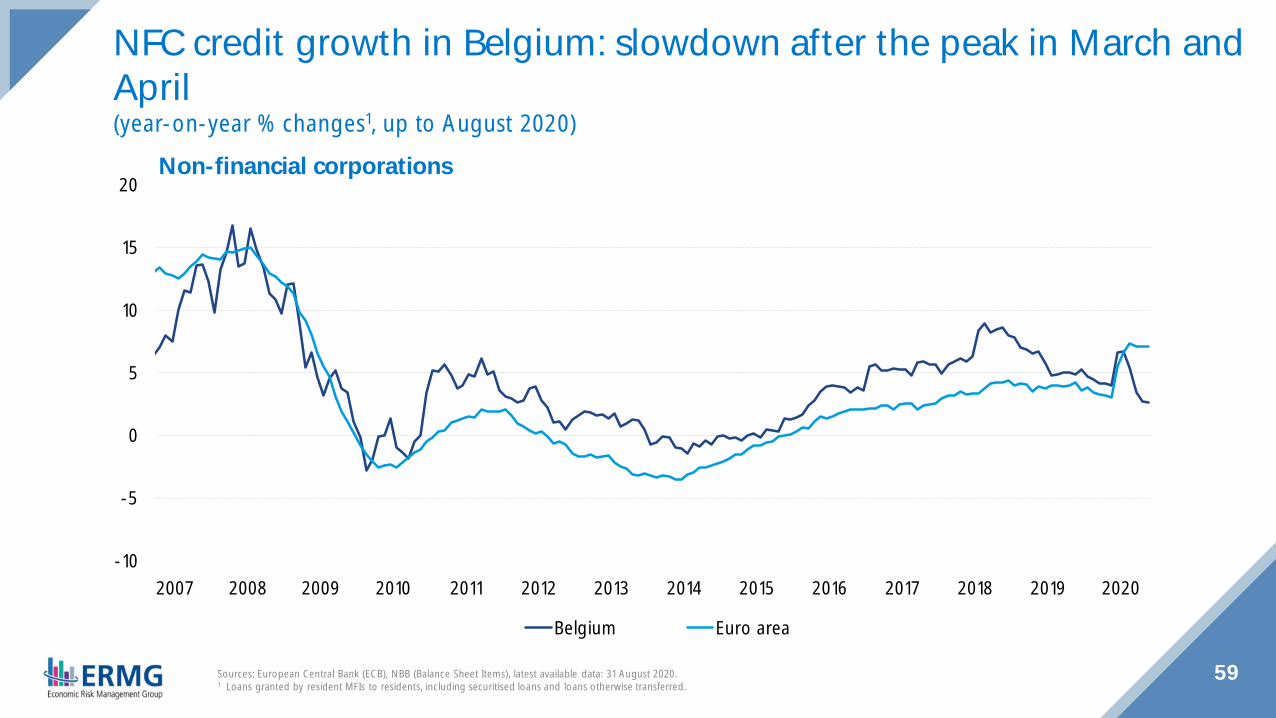
Non-financial corporations
NFC credit growth in Belgium: slowdown after the peak in March andApril(year-on-year % changes1, up to August 2020)
-10
-5
0
5
10
15
20
2007 2008 2009 2010 2011 2012 2013 2014 2015 2016 2017 2018 2019 2020
Belgium Euro area
Sources: European Central Bank (ECB), NBB (Balance Sheet Items), latest available data: 31 August 2020.1 Loans granted by resident MFIs to residents, including securitised loans and loans otherwise transferred.
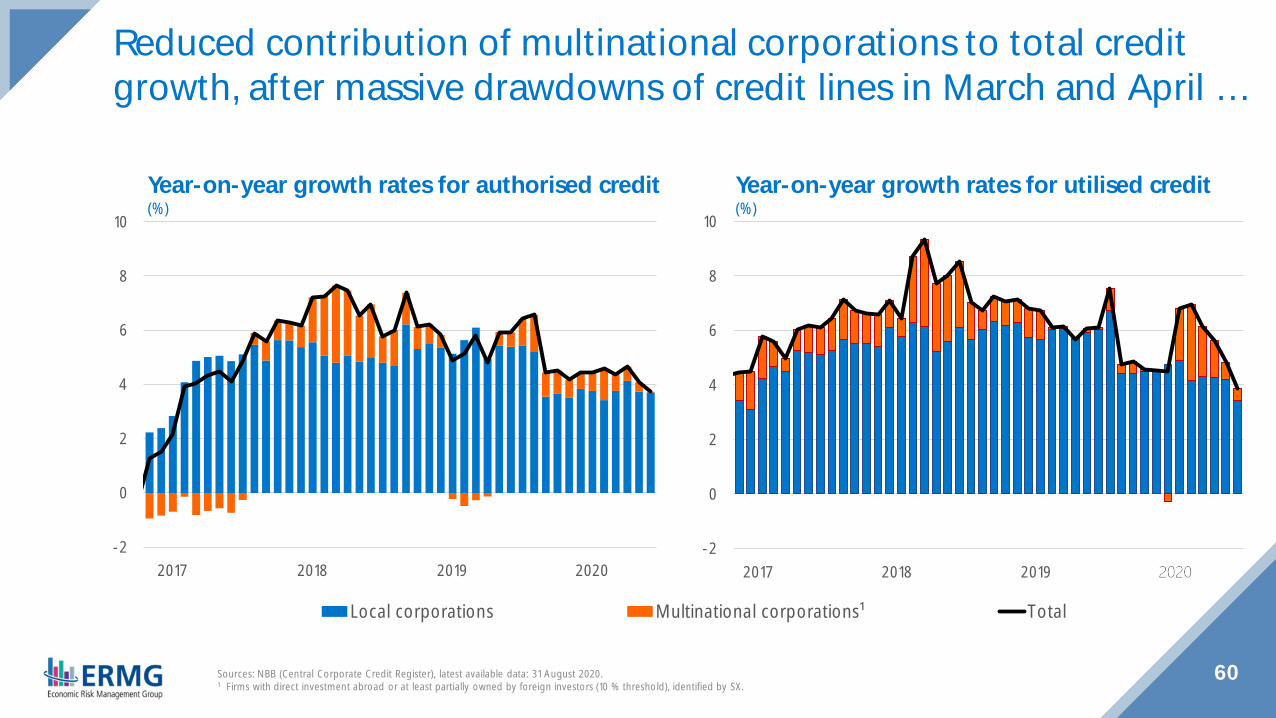
Reduced contribution of multinational corporations to total creditgrowth, after massive drawdowns of credit lines in March and April …
-2
0
2
4
6
8
10
2017 2018 2019 2020
Local corporations Multinational corporations¹ Total
-2
0
2
4
6
8
10
2017 2018 2019 2020
60Sources: NBB (Central Corporate Credit Register), latest available data: 31 August 2020.1 Firms with direct investment abroad or at least partially owned by foreign investors (10 % threshold), identified by SX.
Year-on-year growth rates for utilised credit(%)
Year-on-year growth rates for authorised credit(%)

-2
0
2
4
6
8
10
2017 2018 2019 2020
Up to one year (or undefined) One to two years Two to five years Over five years Total
-2
0
2
4
6
8
10
2017 2018 2019 2020
61Source: NBB (Central Corporate Credit Register), latest available data: 31 August 2020.
Decomposition of YoY used corporate creditgrowth by maturity(%)
… which also translates into a lower contribution of short-term loans
Decomposition of YoY authorized corporatecredit growth by maturity(%)
-2
-1
0
1
2
3
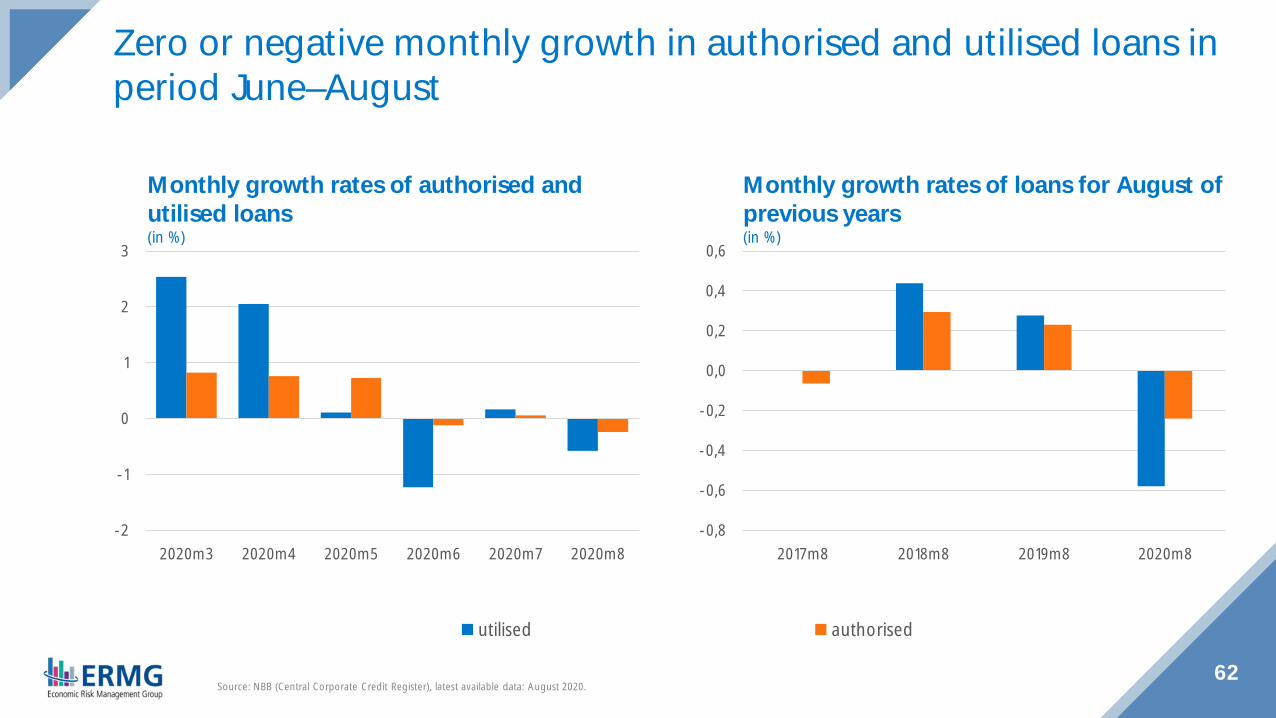
2020m3 2020m4 2020m5 2020m6 2020m7 2020m8
utilised authorised
Zero or negative monthly growth in authorised and utilised loans inperiod June–August
62Source: NBB (Central Corporate Credit Register), latest available data: August 2020.
Monthly growth rates of loans for August ofprevious years(in %)
Monthly growth rates of authorised andutilised loans(in %)
-0,8
-0,6
-0,4
-0,2
0,0
0,2
0,4
0,6
2017m8 2018m8 2019m8 2020m8

63Source: NBB (Central Corporate Credit Register), latest available data: August 2020.Note: Sectors are ordered based on the initial fall in sales due to the crisis (greater declines from right to left). “Other” contains all other sectors in the economy.
March-August growth rates of utilised loans(in %)
March-August growth rates of authorised loans(in %)
March–August growth in authorised and utilised loans is belowhistorical averages for many vulnerable sectors
- 4- 2 0 2 4 6 8
10 12
Arts,
ent
erta
inm
ent
and
recr
eatio
n
Hore
ca
Who
lesa
le a
ndre
tail t
rade
Real
esta
te a
ctivi
ties
Cons
truct
ion
Man
ufac
turin
g
Tran
spor
tatio
nan
d sto
rage
Info
rmat
ion
and
com
mun
icatio
n
Supp
ort s
ervic
es
Agric
ultu
re, f
ores
try
and
fishi
ngFin
ancia
l and
insu
ranc
eac
tiviti
es
Oth
er
Mar-Aug 2020 4-y average Mar-Aug
-4-202468
1012
Arts,
ent
erta
inm
ent
and
recr
eatio
n
Hore
ca
Who
lesa
le a
ndre
tail t
rade
Real
esta
te a
ctivi
ties
Cons
truct
ion
Man
ufac
turin
g
Tran
spor
tatio
nan
d sto
rage
Info
rmat
ion
and
com
mun
icatio
n
Supp
ort s
ervic
es
Agric
ultu
re, f
ores
try
and
fishi
ngFin
ancia
l and
insu
ranc
eac
tiviti
es
Oth
er
60
98
57
92
47
84
20
91
48
89
0
10
20
30
40
50
60
70
80
90
100
ShortTerm
LongTerm
ShortTerm
LongTerm
ShortTerm
LongTerm
ShortTerm
LongTerm
ShortTerm
LongTerm
Self-employed(1)
SMEs(2)
Corporates(3)
Public(4)
Sum of(1) to (4)= total
64
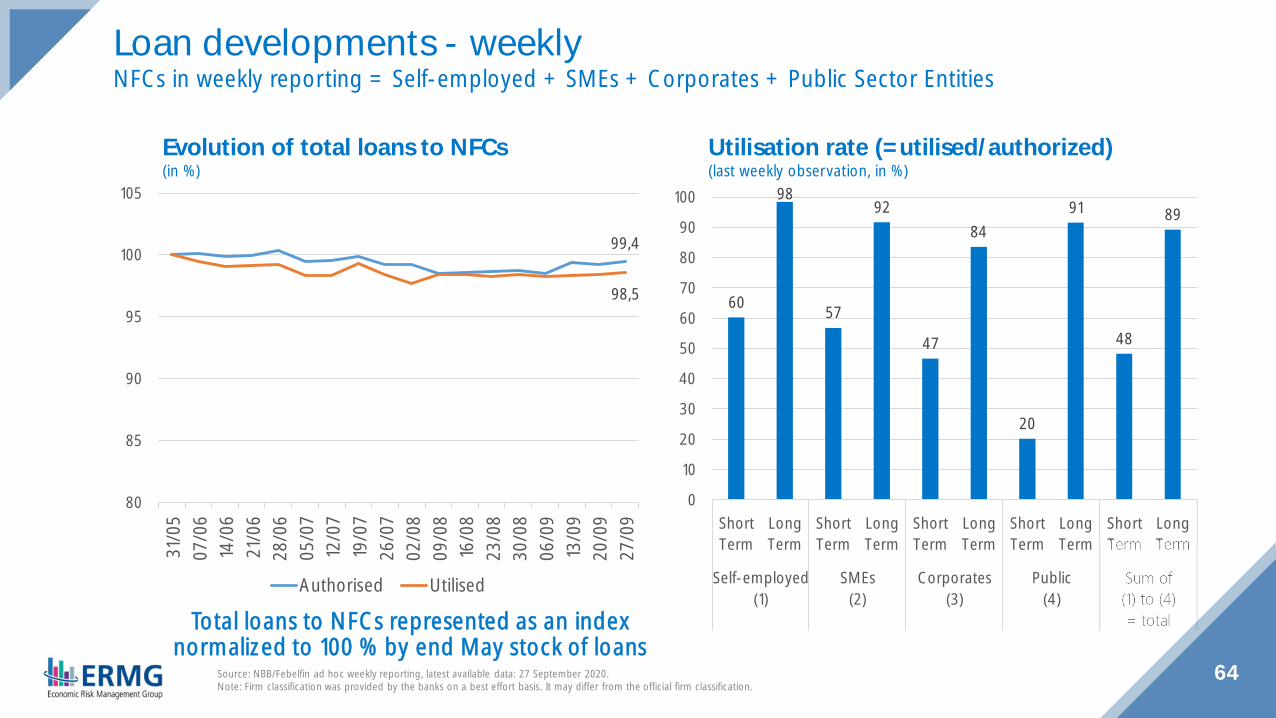
Loan developments - weeklyNFCs in weekly reporting = Self-employed + SMEs + Corporates + Public Sector Entities
Utilisation rate (=utilised/authorized)(last weekly observation, in %)
Evolution of total loans to NFCs(in %)
99,4
98,5
80
85
90
95
100
10531
/05
07/0
614
/06
21/0
628
/06
05/0
712
/07
19/0
726
/07
02/0
809
/08
16/0
823
/08
30/0
806
/09
13/0
920
/09
27/0
9
Authorised Utilised
Total loans to NFCs represented as an indexnormalized to 100 % by end May stock of loans
Source: NBB/Febelfin ad hoc weekly reporting, latest available data: 27 September 2020.Note: Firm classification was provided by the banks on a best effort basis. It may differ from the official firm classification.
102,0
101,0
90
95
100
105
31/0
507
/06
14/0
621
/06
28/0
605
/07
12/0
719
/07
26/0
702
/08
09/0
816
/08
23/0
830
/08
06/0
913
/09
20/0
927
/09
97,2
95,2
9092949698
100102
31/0
507
/06
14/0
621
/06
28/0
605
/07
12/0
719
/07
26/0
702
/08
09/0
816
/08
23/0
830
/08
06/0
913
/09
20/0
927
/09
Authorised Utilised
100,6
100,8
9092949698
100102
31/0
507
/06
14/0
621
/06
28/0
605
/07
12/0
719
/07
26/0
702
/08
09/0
816
/08
23/0
830
/08
06/0
913
/09
20/0
927
/09
Total loans to NFCs represented as an index normalized to 100 % by end May stock of loans65
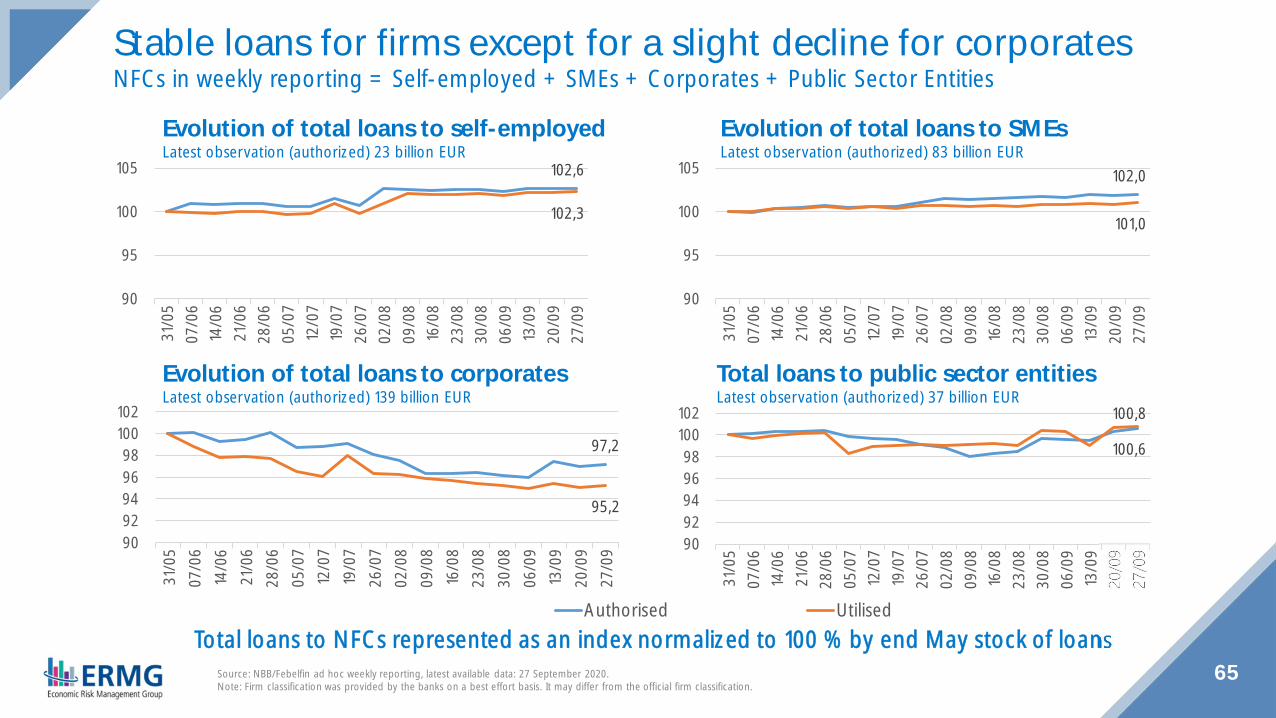
Stable loans for firms except for a slight decline for corporatesNFCs in weekly reporting = Self-employed + SMEs + Corporates + Public Sector Entities
Evolution of total loans to SMEsLatest observation (authorized) 83 billion EUR
Evolution of total loans to self-employedLatest observation (authorized) 23 billion EUR
102,6
102,3
90
95
100
10531
/05
07/0
614
/06
21/0
628
/06
05/0
712
/07
19/0
726
/07
02/0
809
/08
16/0
823
/08
30/0
806
/09
13/0
920
/09
27/0
9
Total loans to public sector entitiesLatest observation (authorized) 37 billion EUR
Evolution of total loans to corporatesLatest observation (authorized) 139 billion EUR
Source: NBB/Febelfin ad hoc weekly reporting, latest available data: 27 September 2020.Note: Firm classification was provided by the banks on a best effort basis. It may differ from the official firm classification.
0
200
400
600
800
1000
1200
1400
1600
3/05
10/0
517
/05
24/0
531
/05
7/06
14/0
621
/06
28/0
65/
0712
/07
19/0
726
/07
2/08
9/08
16/0
823
/08
30/0
86/
0913
/09
20/0
927
/09
Self-employed SMEs Corporates Public
66
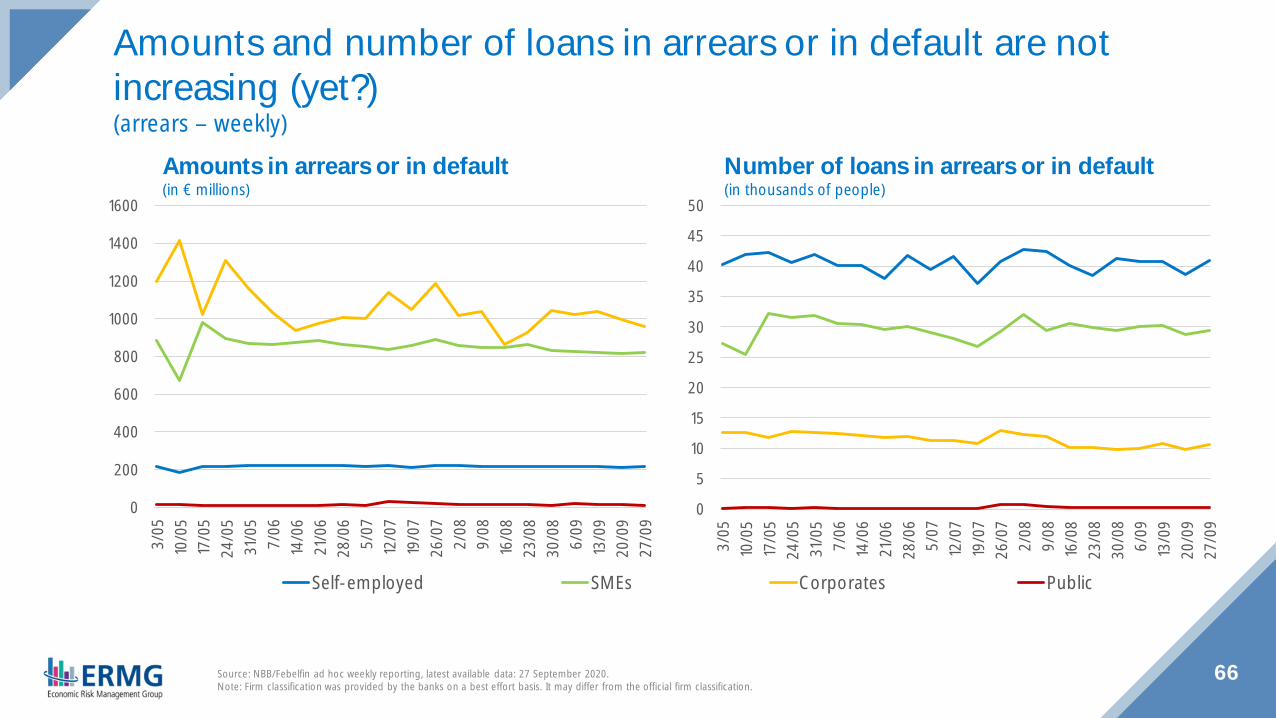
Amounts and number of loans in arrears or in default are notincreasing (yet?)(arrears – weekly)
Number of loans in arrears or in default(in thousands of people)
Amounts in arrears or in default(in € millions)
0
5
10
15
20
25
30
35
40
45
50
3/05
10/0
517
/05
24/0
531
/05
7/06
14/0
621
/06
28/0
65/
0712
/07
19/0
726
/07
2/08
9/08
16/0
823
/08
30/0
86/
0913
/09
20/0
927
/09
Source: NBB/Febelfin ad hoc weekly reporting, latest available data: 27 September 2020.Note: Firm classification was provided by the banks on a best effort basis. It may differ from the official firm classification.

4%
54%
39%
3%
Self-employed SMEs Corporates Public
8%
30%
49%
13%
67
Total loan amounts by type of counterpartyLoan amounts in moratorium by type of counterparty
SMEs are the main beneficiaries of moratorium relative to their shareof total loans(moratorium – weekly)
Source: NBB/Febelfin ad hoc weekly reporting, latest available data: 27 September 2020.Note: Firm classification was provided by the banks on a best effort basis. It may differ from the official firm classification.
68
0,3
7,9
0,7
16,7
3,5
19,3
1,2 1,0 0,9
13,1
02468
101214161820
Short Term Long Term Short Term Long Term Short Term Long Term Short Term Long Term Short Term Long Term
Self-employed(1)
SMEs(2)
Corporates(3)
Public(4)
Sum of(1) to (4) = total
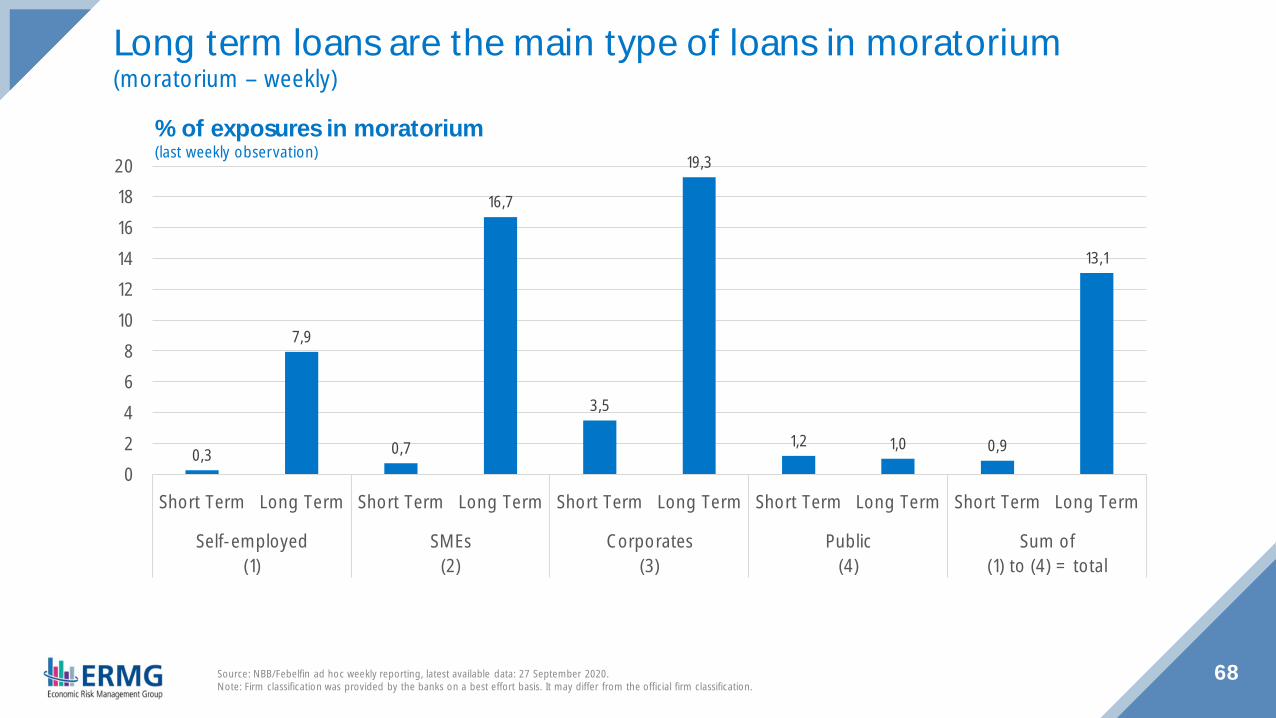
Long term loans are the main type of loans in moratorium(moratorium – weekly)
% of exposures in moratorium(last weekly observation)
Source: NBB/Febelfin ad hoc weekly reporting, latest available data: 27 September 2020.Note: Firm classification was provided by the banks on a best effort basis. It may differ from the official firm classification.
69
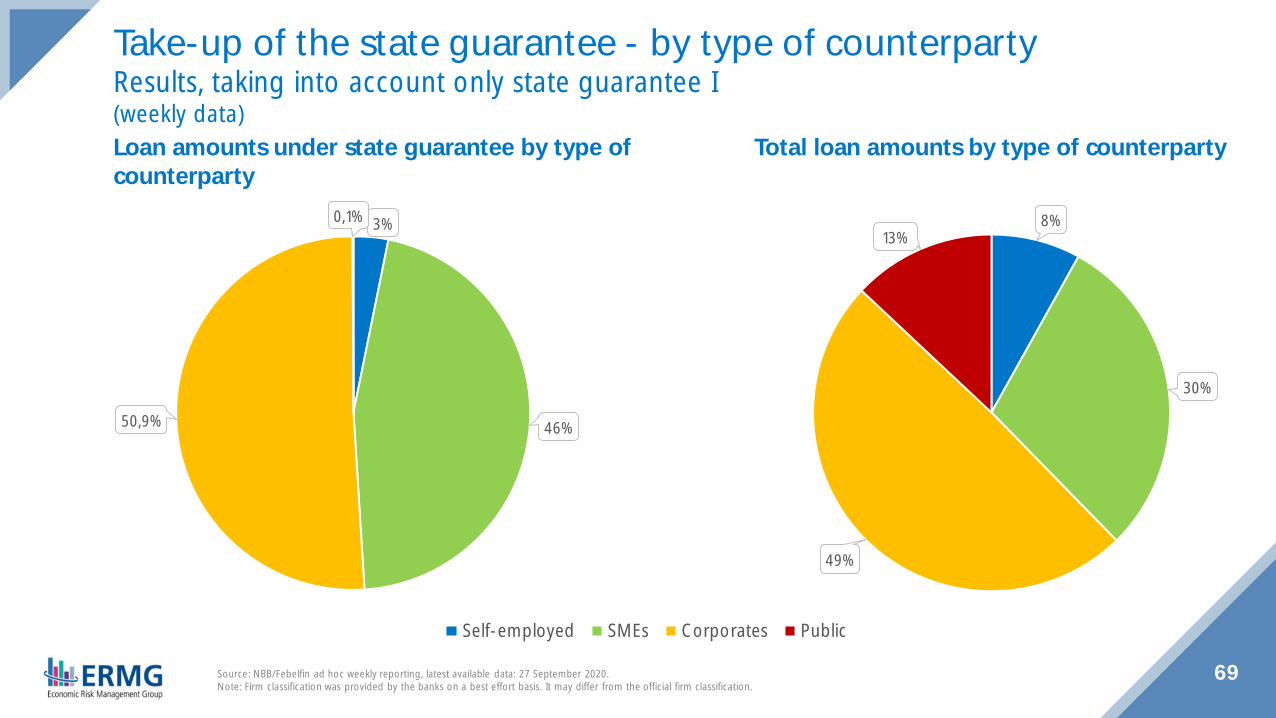
Total loan amounts by type of counterpartyLoan amounts under state guarantee by type ofcounterparty
Take-up of the state guarantee - by type of counterpartyResults, taking into account only state guarantee I(weekly data)
3%
46%50,9%
0,1%
Self-employed SMEs Corporates Public
8%
30%
49%
13%
Source: NBB/Febelfin ad hoc weekly reporting, latest available data: 27 September 2020.Note: Firm classification was provided by the banks on a best effort basis. It may differ from the official firm classification.

70
Bankruptcies andnew business registrations

0
100
200
300
400
500
600
700
August 2020 September 2020 Mid-October 2020(current month)
71Source: Statbel, latest available data: 18 October 2020.1 March, April & May: limited activities from business courts. 24 April to 17 June: temporary moratorium on filings for bankruptcy. July & August: judicial summer recess.2 Declaration of bankruptcy by the company court.3 Such as the deferment of payment of social security contributions (until 15 December 2020) and of the annual company contribution (until 31 October 2020).
(# by activity)Bankruptcies(# by region)
Despite a marked growth in September after the summer recess1,the number of bankruptcies2 remains lower than in September 2019... with some supporting measures to enterprises still in place3
Transport & other servicesHotel & restaurantTradeBuildingIndustries & energyAgriculture & fisheries
◆ About 96 % of bankruptcies are within the ‘0 to 9 workers’company size class
0
200
400
600
800
1 000
1 200
1 400
Jan Feb Mar Apr May Jun Jul Aug Sep Oct Nov Dec
2020 VLA 2020 BRU 2020 WAL 2019 Belgium
72Source: Statbel, latest available data: 18 October 2020.1 Declaration of bankruptcy by the company court.
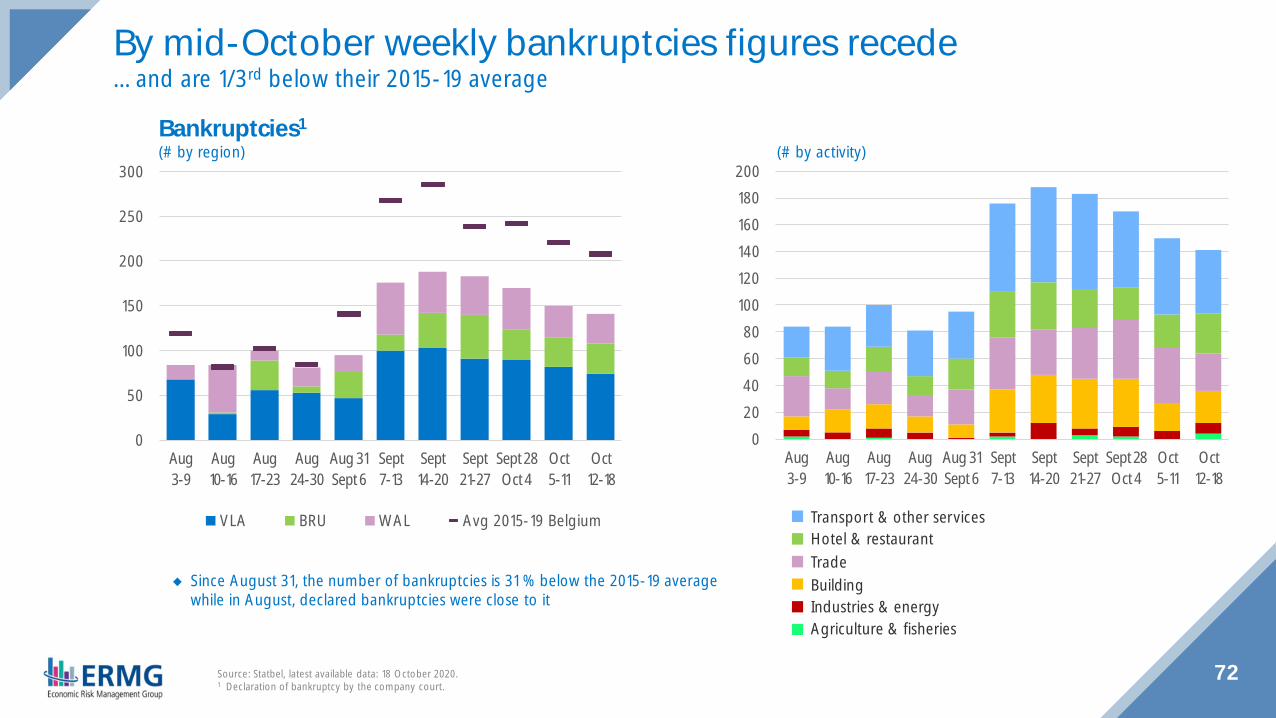
(# by activity)Bankruptcies1
(# by region)
By mid-October weekly bankruptcies figures recede… and are 1/3rd below their 2015-19 average
Transport & other servicesHotel & restaurantTradeBuildingIndustries & energyAgriculture & fisheries
0
50
100
150
200
250
300
Aug3-9
Aug10-16
Aug17-23
Aug24-30
Aug 31Sept 6
Sept7-13
Sept14-20
Sept21-27
Sept 28Oct 4
Oct5-11
Oct12-18
VLA BRU WAL Avg 2015-19 Belgium
◆ Since August 31, the number of bankruptcies is 31 % below the 2015-19 averagewhile in August, declared bankruptcies were close to it
020406080
100120140160180200
Aug3-9
Aug10-16
Aug17-23
Aug24-30
Aug 31Sept 6
Sept7-13
Sept14-20
Sept21-27
Sept 28Oct 4
Oct5-11
Oct12-18
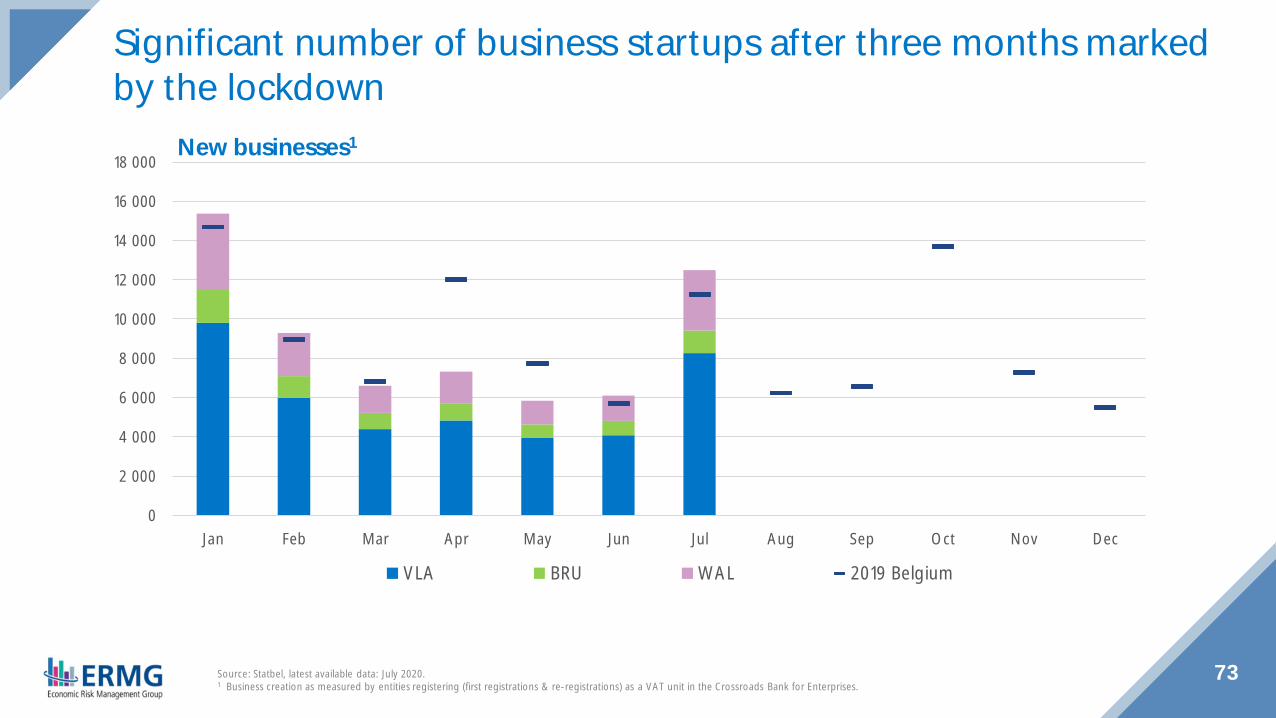
73Source: Statbel, latest available data: July 2020.1 Business creation as measured by entities registering (first registrations & re-registrations) as a VAT unit in the Crossroads Bank for Enterprises.
New businesses1
Significant number of business startups after three months markedby the lockdown
0
2 000
4 000
6 000
8 000
10 000
12 000
14 000
16 000
18 000
Jan Feb Mar Apr May Jun Jul Aug Sep Oct Nov Dec
VLA BRU WAL 2019 Belgium

74
Financial markets
Financial markets are still affected by the pandemic
60
70
80
90
100
110
120
130
04/2
018
06/2
018
08/2
018
10/2
018
12/2
018
02/2
019
04/2
019
06/2
019
08/2
019
10/2
019
12/2
019
02/2
020
04/2
020
06/2
020
08/2
020
10/2
020
BEL 20 Euro Stoxx 50 FTSE 100 S&P 500
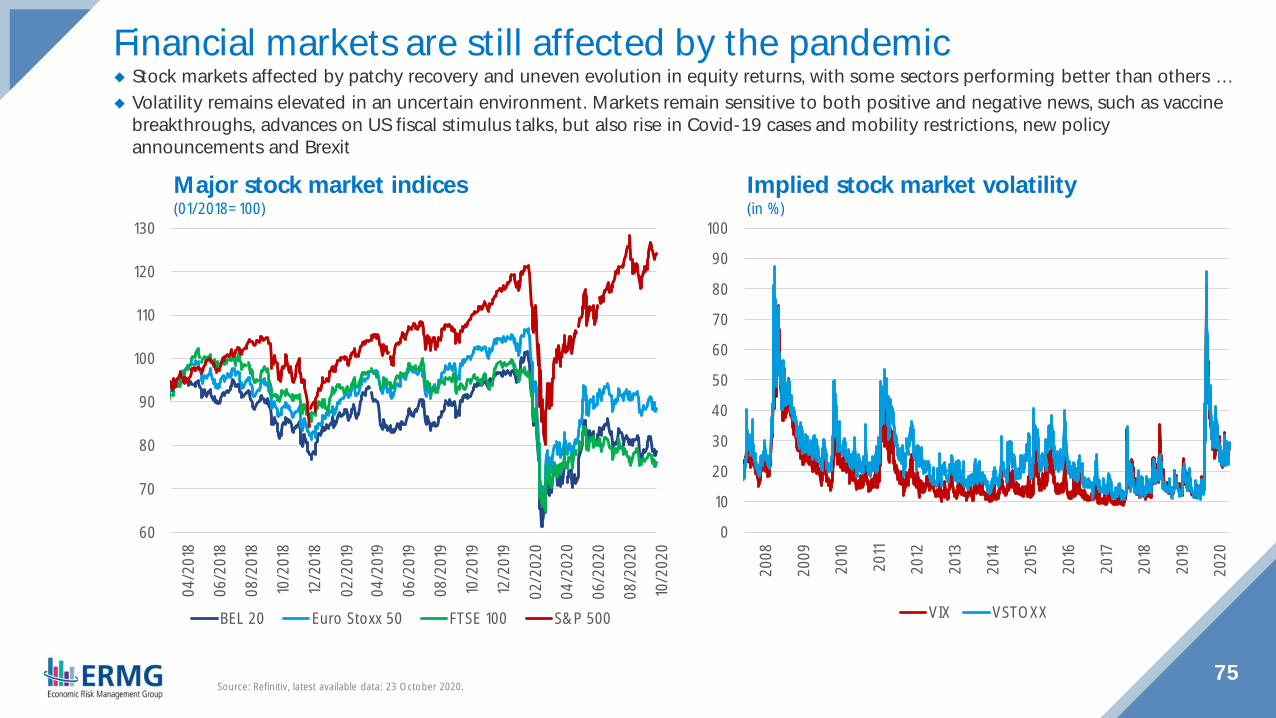
◆ Stock markets affected by patchy recovery and uneven evolution in equity returns, with some sectors performing better than others …◆ Volatility remains elevated in an uncertain environment. Markets remain sensitive to both positive and negative news, such as vaccine
breakthroughs, advances on US fiscal stimulus talks, but also rise in Covid-19 cases and mobility restrictions, new policyannouncements and Brexit
75Source: Refinitiv, latest available data: 23 October 2020.
Major stock market indices(01/2018=100)
Implied stock market volatility(in %)
0
10
20
30
40
50
60
70
80
90
100
2008
2009
2010
2011
2012
2013
2014
2015
2016
2017
2018
2019
2020
VIX VSTOXX
-80-60-40-20
020406080
100120140160
07/2
019
08/2
019
09/2
019
10/2
019
11/2
019
12/2
019
01/2
020
02/2
020
03/2
020
04/2
020
05/2
020
06/2
020
07/2
020
08/2
020
09/2
020
10/2
020
Crude Oil WTI Metals index
Copper Gold
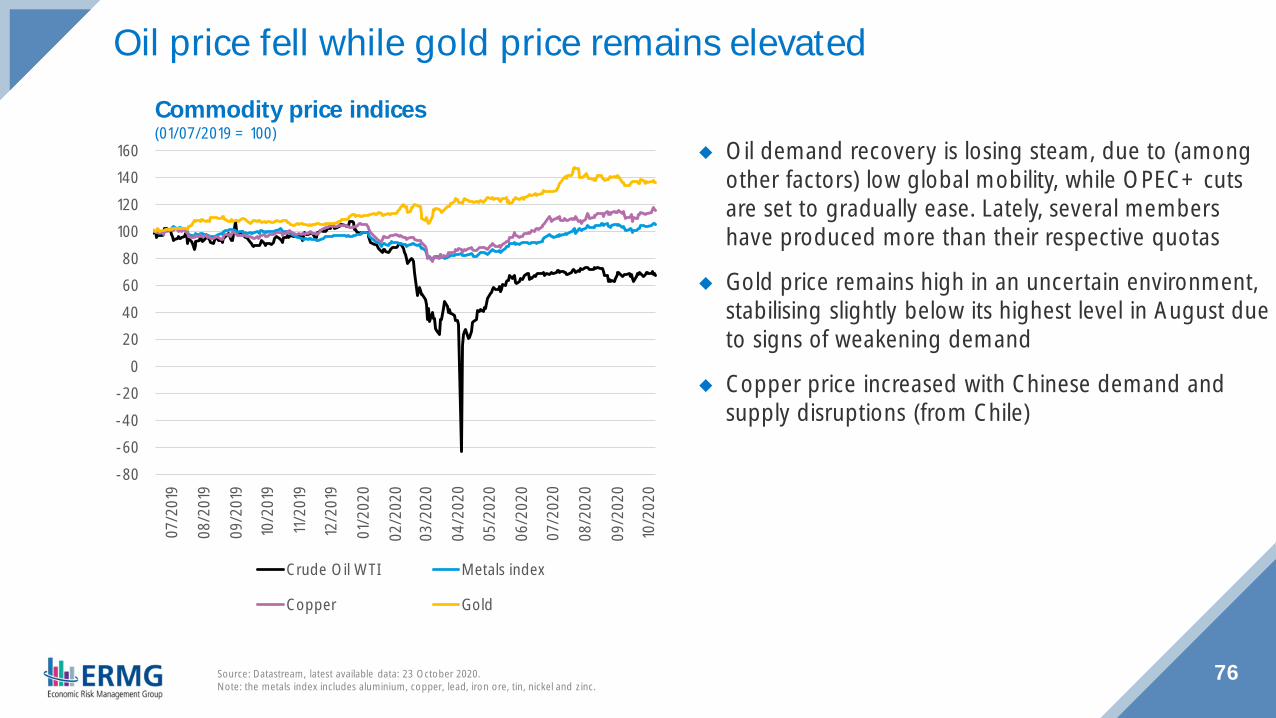
◆ Oil demand recovery is losing steam, due to (amongother factors) low global mobility, while OPEC+ cutsare set to gradually ease. Lately, several membershave produced more than their respective quotas
◆ Gold price remains high in an uncertain environment,stabilising slightly below its highest level in August dueto signs of weakening demand
◆ Copper price increased with Chinese demand andsupply disruptions (from Chile)
76Source: Datastream, latest available data: 23 October 2020.Note: the metals index includes aluminium, copper, lead, iron ore, tin, nickel and zinc.
Commodity price indices(01/07/2019 = 100)
Oil price fell while gold price remains elevated
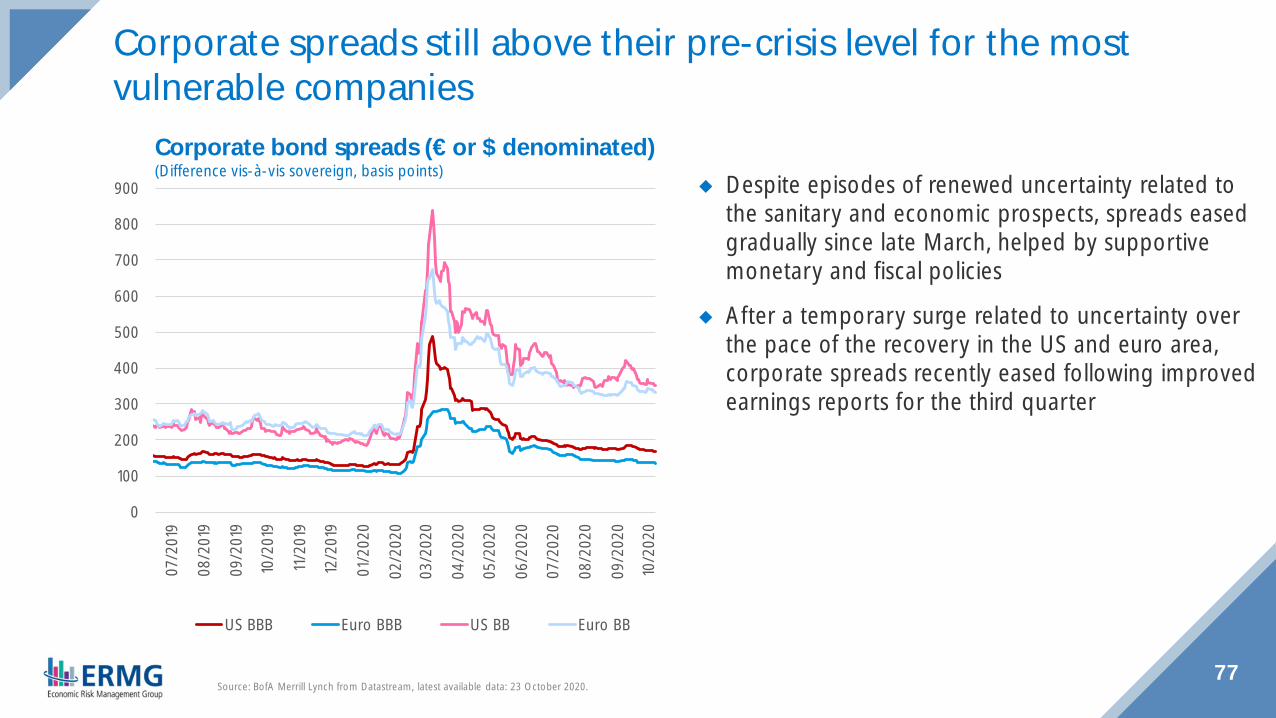
Corporate spreads still above their pre-crisis level for the mostvulnerable companies
0
100
200
300
400
500
600
700
800
90007
/201
9
08/2
019
09/2
019
10/2
019
11/2
019
12/2
019
01/2
020
02/2
020
03/2
020
04/2
020
05/2
020
06/2
020
07/2
020
08/2
020
09/2
020
10/2
020
US BBB Euro BBB US BB Euro BB
◆ Despite episodes of renewed uncertainty related tothe sanitary and economic prospects, spreads easedgradually since late March, helped by supportivemonetary and fiscal policies
◆ After a temporary surge related to uncertainty overthe pace of the recovery in the US and euro area,corporate spreads recently eased following improvedearnings reports for the third quarter
77Source: BofA Merrill Lynch from Datastream, latest available data: 23 October 2020.
Corporate bond spreads (€ or $ denominated)(Difference vis-à-vis sovereign, basis points)
0,0
0,5
1,0
1,5
2,0
2,5
3,0
3,501
/201
8
03/2
018
05/2
018
07/2
018
09/2
018
11/2
018
01/2
019
03/2
019
05/2
019
07/2
019
09/2
019
11/2
019
01/2
020
03/2
020
05/2
020
07/2
020
09/2
020
Belgium Spain France Italy Netherlands
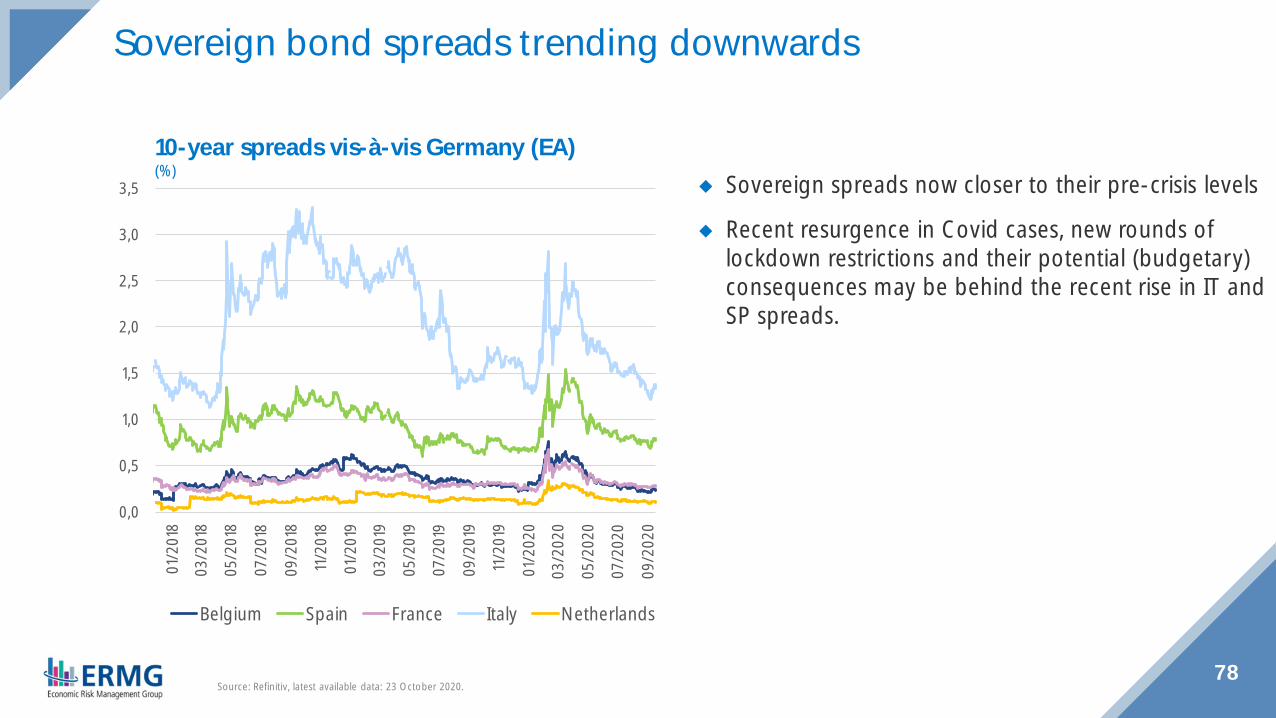
Sovereign bond spreads trending downwards
◆ Sovereign spreads now closer to their pre-crisis levels
◆ Recent resurgence in Covid cases, new rounds oflockdown restrictions and their potential (budgetary)consequences may be behind the recent rise in IT andSP spreads.
78Source: Refinitiv, latest available data: 23 October 2020.
10-year spreads vis-à-vis Germany (EA)(%)

79
International outlook
80
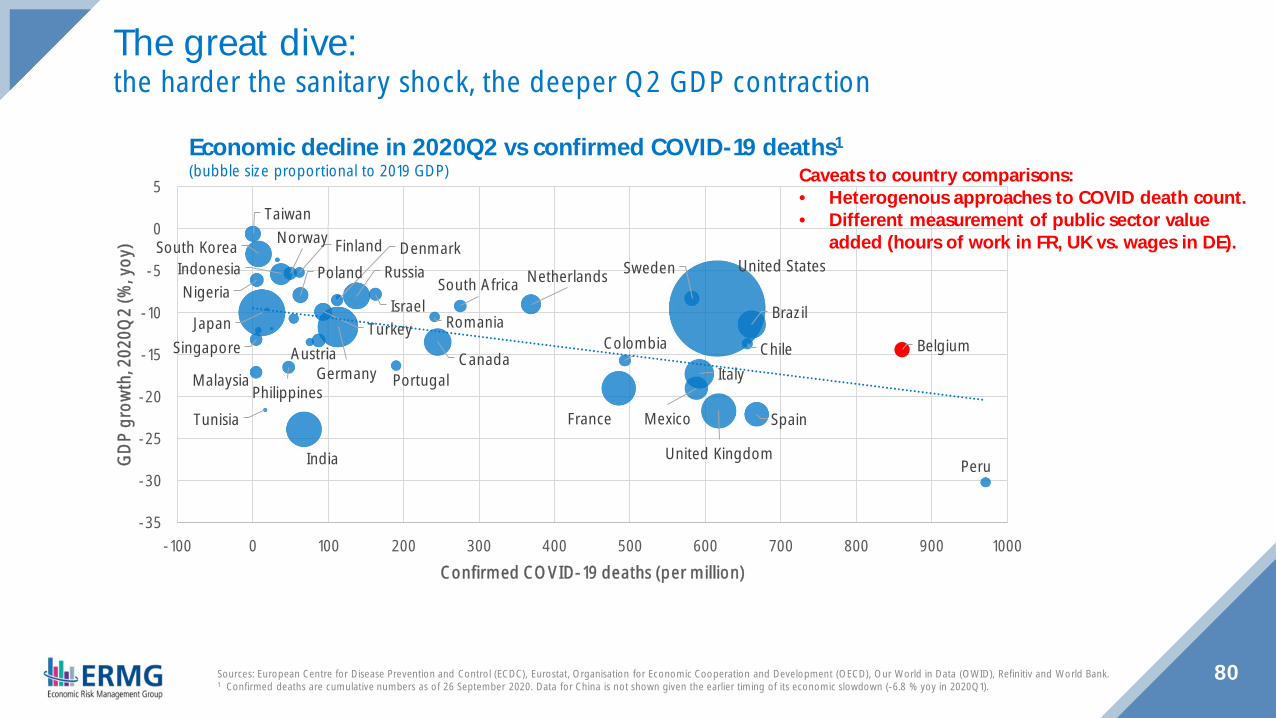
Economic decline in 2020Q2 vs confirmed COVID-19 deaths1
(bubble size proportional to 2019 GDP)
The great dive:the harder the sanitary shock, the deeper Q2 GDP contraction
Austria Belgium
Brazil
Canada ChileColombia
Germany
Denmark
Spain
Finland
France
United Kingdom
Indonesia
India
Israel
Italy
Japan
South Korea
Mexico
Malaysia
NigeriaNetherlands
Norway
Peru
Philippines
Poland
Portugal
Romania
Russia
Singapore
Sweden
Tunisia
Turkey
United States
Taiwan
South Africa
-35
-30
-25
-20
-15
-10
-5
0
5
-100 0 100 200 300 400 500 600 700 800 900 1000
GDP
grow
th, 2
020Q
2 (%
, yoy
)
Confirmed COVID-19 deaths (per million)
Sources: European Centre for Disease Prevention and Control (ECDC), Eurostat, Organisation for Economic Cooperation and Development (OECD), Our World in Data (OWID), Refinitiv and World Bank.1 Confirmed deaths are cumulative numbers as of 26 September 2020. Data for China is not shown given the earlier timing of its economic slowdown (-6.8 % yoy in 2020Q1).
Caveats to country comparisons:• Heterogenous approaches to COVID death count.• Different measurement of public sector value
added (hours of work in FR, UK vs. wages in DE).
81
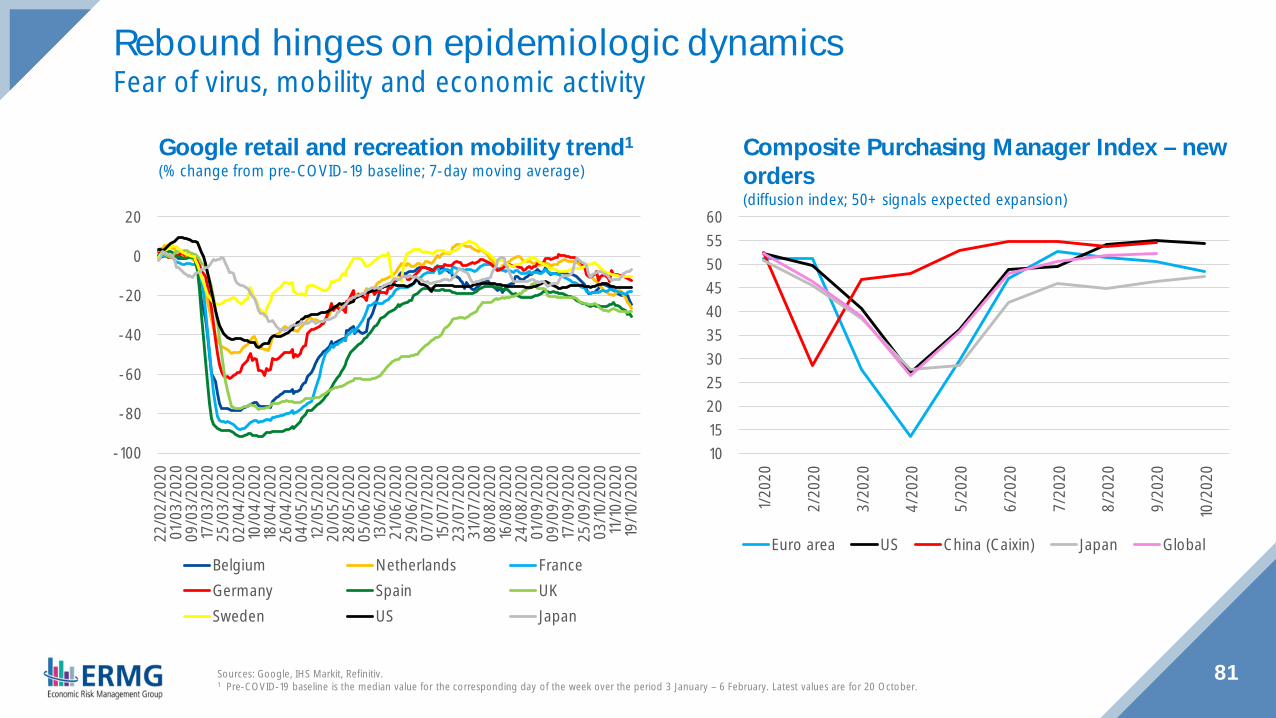
Composite Purchasing Manager Index – neworders(diffusion index; 50+ signals expected expansion)
Google retail and recreation mobility trend1
(% change from pre-COVID-19 baseline; 7-day moving average)
Rebound hinges on epidemiologic dynamicsFear of virus, mobility and economic activity
-100
-80
-60
-40
-20
0
20
22/0
2/20
2001
/03/
2020
09/0
3/20
2017
/03/
2020
25/0
3/20
2002
/04/
2020
10/0
4/20
2018
/04/
2020
26/0
4/20
2004
/05/
2020
12/0
5/20
2020
/05/
2020
28/0
5/20
2005
/06/
2020
13/0
6/20
2021
/06/
2020
29/0
6/20
2007
/07/
2020
15/0
7/20
2023
/07/
2020
31/0
7/20
2008
/08/
2020
16/0
8/20
2024
/08/
2020
01/0
9/20
2009
/09/
2020
17/0
9/20
2025
/09/
2020
03/1
0/20
2011
/10/
2020
19/1
0/20
20
Belgium Netherlands FranceGermany Spain UKSweden US Japan
1015202530354045505560
1/20
20
2/20
20
3/20
20
4/20
20
5/20
20
6/20
20
7/20
20
8/20
20
9/20
20
10/2
020
Euro area US China (Caixin) Japan Global
Sources: Google, IHS Markit, Refinitiv.1 Pre-COVID-19 baseline is the median value for the corresponding day of the week over the period 3 January – 6 February. Latest values are for 20 October.
82
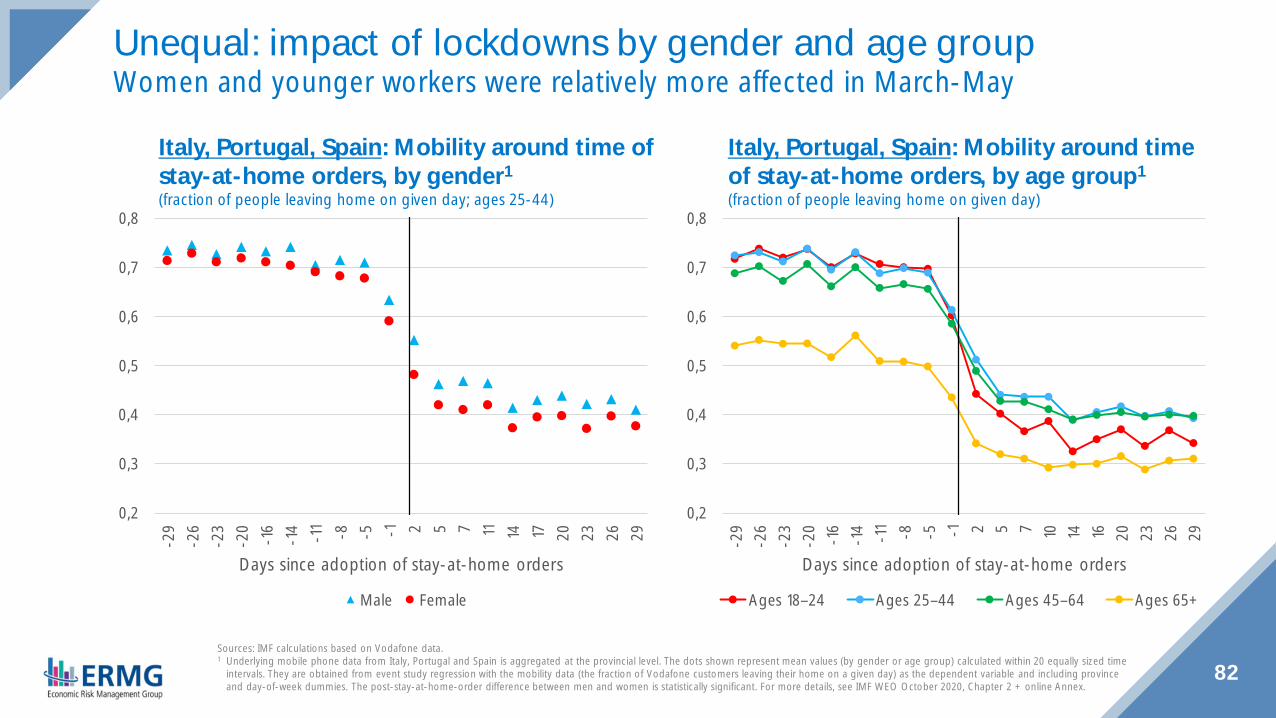
Italy, Portugal, Spain: Mobility around timeof stay-at-home orders, by age group1
(fraction of people leaving home on given day)
Italy, Portugal, Spain: Mobility around time ofstay-at-home orders, by gender1
(fraction of people leaving home on given day; ages 25-44)
Unequal: impact of lockdowns by gender and age groupWomen and younger workers were relatively more affected in March-May
0,2
0,3
0,4
0,5
0,6
0,7
0,8
-29
-26
-23
-20
-16
-14 -11 -8 -5 -1 2 5 7 11 14 17 20 23 26 29
Days since adoption of stay-at-home orders
Male Female
Sources: IMF calculations based on Vodafone data.1 Underlying mobile phone data from Italy, Portugal and Spain is aggregated at the provincial level. The dots shown represent mean values (by gender or age group) calculated within 20 equally sized time
intervals. They are obtained from event study regression with the mobility data (the fraction of Vodafone customers leaving their home on a given day) as the dependent variable and including provinceand day-of-week dummies. The post-stay-at-home-order difference between men and women is statistically significant. For more details, see IMF WEO October 2020, Chapter 2 + online Annex.
0,2
0,3
0,4
0,5
0,6
0,7
0,8
-29
-26
-23
-20
-16
-14 -11 -8 -5 -1 2 5 7 10 14 16 20 23 26 29
Days since adoption of stay-at-home orders
Ages 18–24 Ages 25–44 Ages 45–64 Ages 65+

83
Euro area: extra-EA-19 goods export volumes2
(% change yoy)World goods trade volumes1
(average of exports and imports, % change yoy)
World tradeTowards a protracted repair of global value chains?
-30
-25
-20
-15
-10
-5
0
5
10
15
20
1/20
18
4/20
18
7/20
18
10/2
018
1/20
19
4/20
19
7/20
19
10/2
019
1/20
20
4/20
20
7/20
20World Advanced economiesEmerging economies Euro areaChina
-40-35-30-25-20-15-10-505
101520
1/20
18
3/20
18
5/20
18
7/20
18
9/20
18
11/2
018
1/20
19
3/20
19
5/20
19
7/20
19
9/20
19
11/2
019
1/20
20
3/20
20
5/20
20
7/20
20
Consumer goods (excl. transport eqp.)
Intermediate goods
Capital goodsSources: Central Planning Bureau (CPB), Eurostat, Refinitiv.1 Latest available data: August 2020.2 Latest available data: July 2020.
Chinese exportsboosted by demandfor COVID-19-relatedproducts, incl. PPE,medical equipment,work-from-homeelectronics.
84
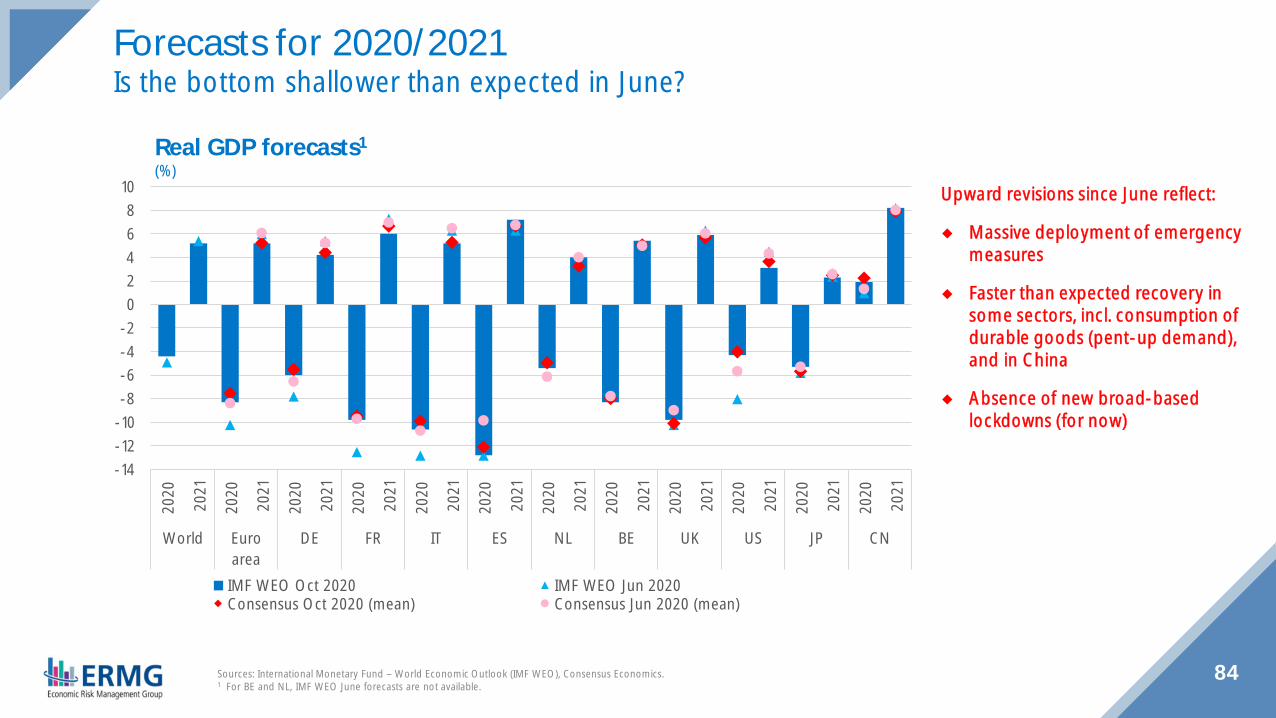
Real GDP forecasts1
(%)
Forecasts for 2020/2021Is the bottom shallower than expected in June?
-14-12-10-8-6-4-202468
1020
20
2021
2020
2021
2020
2021
2020
2021
2020
2021
2020
2021
2020
2021
2020
2021
2020
2021
2020
2021
2020
2021
2020
2021
World Euroarea
DE FR IT ES NL BE UK US JP CN
IMF WEO Oct 2020 IMF WEO Jun 2020Consensus Oct 2020 (mean) Consensus Jun 2020 (mean)
Upward revisions since June reflect:
◆ Massive deployment of emergencymeasures
◆ Faster than expected recovery insome sectors, incl. consumption ofdurable goods (pent-up demand),and in China
◆ Absence of new broad-basedlockdowns (for now)
Sources: International Monetary Fund – World Economic Outlook (IMF WEO), Consensus Economics.1 For BE and NL, IMF WEO June forecasts are not available.
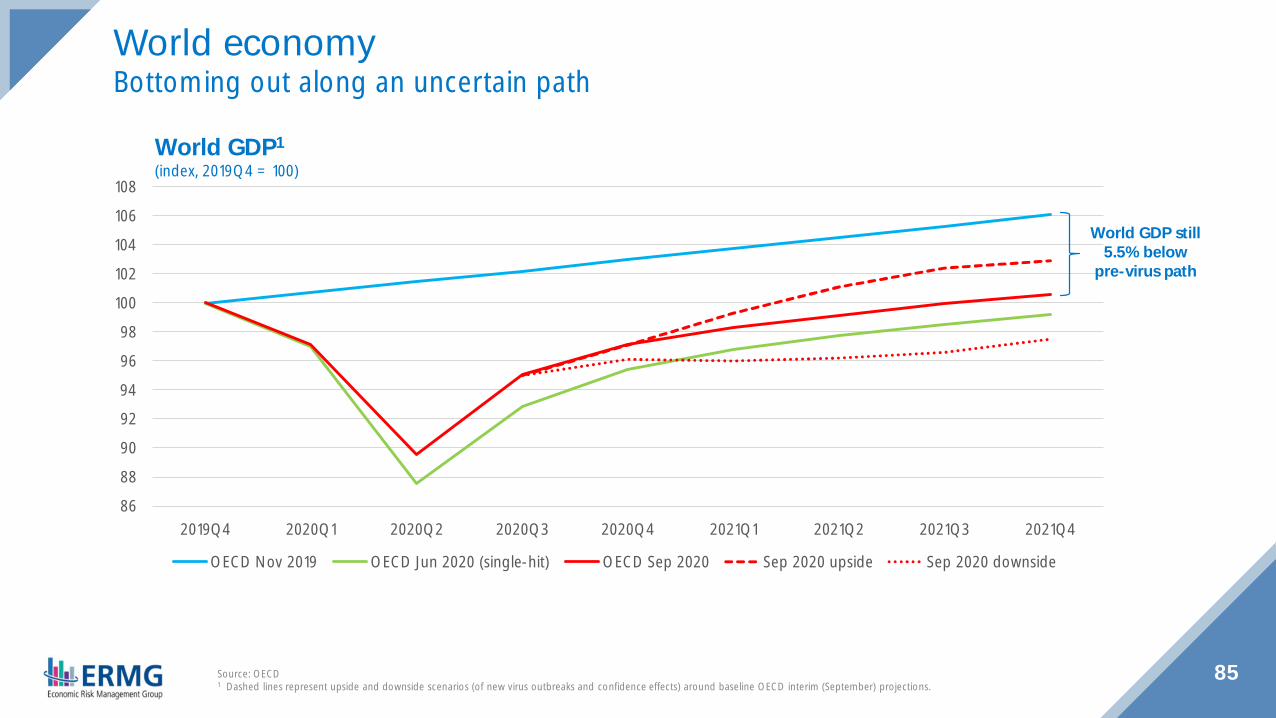
85
World GDP1
(index, 2019Q4 = 100)
World economyBottoming out along an uncertain path
86
88
90
92
94
96
98
100
102
104
106
108
2019Q4 2020Q1 2020Q2 2020Q3 2020Q4 2021Q1 2021Q2 2021Q3 2021Q4
OECD Nov 2019 OECD Jun 2020 (single-hit) OECD Sep 2020 Sep 2020 upside Sep 2020 downside
World GDP still5.5% below
pre-virus path
Source: OECD1 Dashed lines represent upside and downside scenarios (of new virus outbreaks and confidence effects) around baseline OECD interim (September) projections.
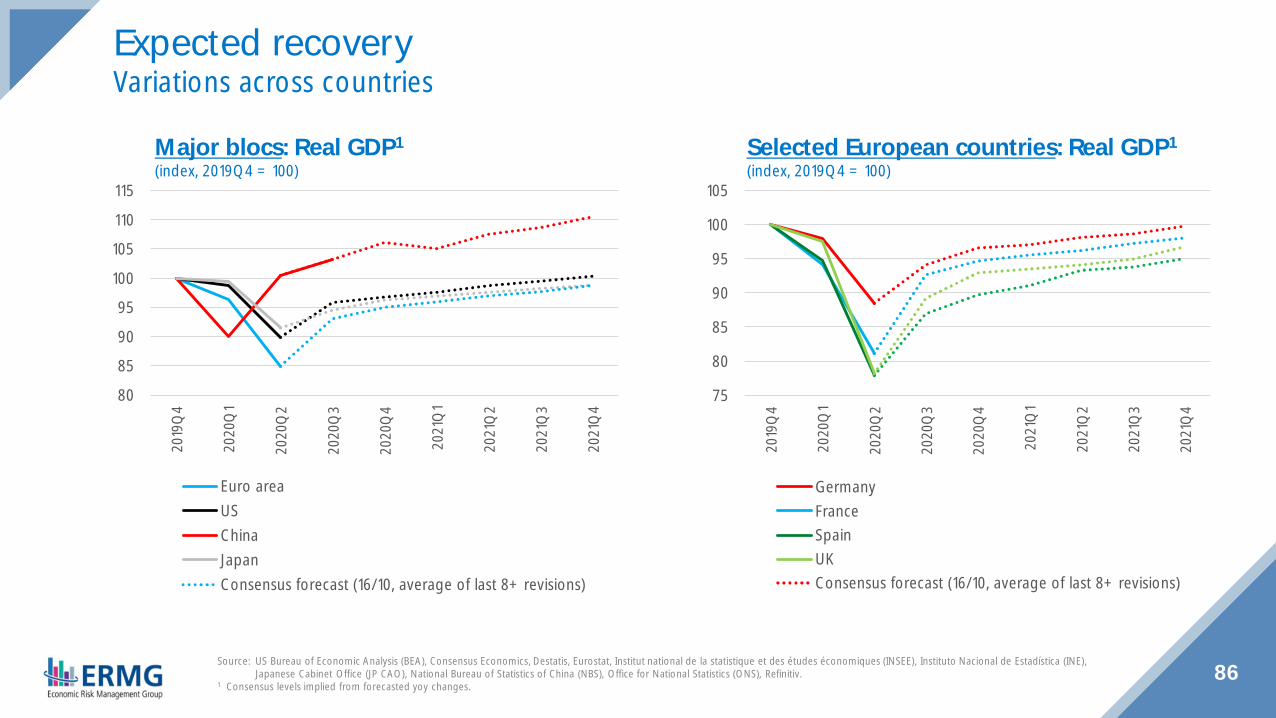
86
Selected European countries: Real GDP1
(index, 2019Q4 = 100)Major blocs: Real GDP1
(index, 2019Q4 = 100)
Expected recoveryVariations across countries
80
85
90
95
100
105
110
11520
19Q
4
2020
Q1
2020
Q2
2020
Q3
2020
Q4
2021
Q1
2021
Q2
2021
Q3
2021
Q4
Euro areaUSChinaJapanConsensus forecast (16/10, average of last 8+ revisions)
75
80
85
90
95
100
105
2019
Q4
2020
Q1
2020
Q2
2020
Q3
2020
Q4
2021
Q1
2021
Q2
2021
Q3
2021
Q4
GermanyFranceSpainUKConsensus forecast (16/10, average of last 8+ revisions)
Source: US Bureau of Economic Analysis (BEA), Consensus Economics, Destatis, Eurostat, Institut national de la statistique et des études économiques (INSEE), Instituto Nacional de Estadística (INE),Japanese Cabinet Office (JP CAO), National Bureau of Statistics of China (NBS), Office for National Statistics (ONS), Refinitiv.
1 Consensus levels implied from forecasted yoy changes.
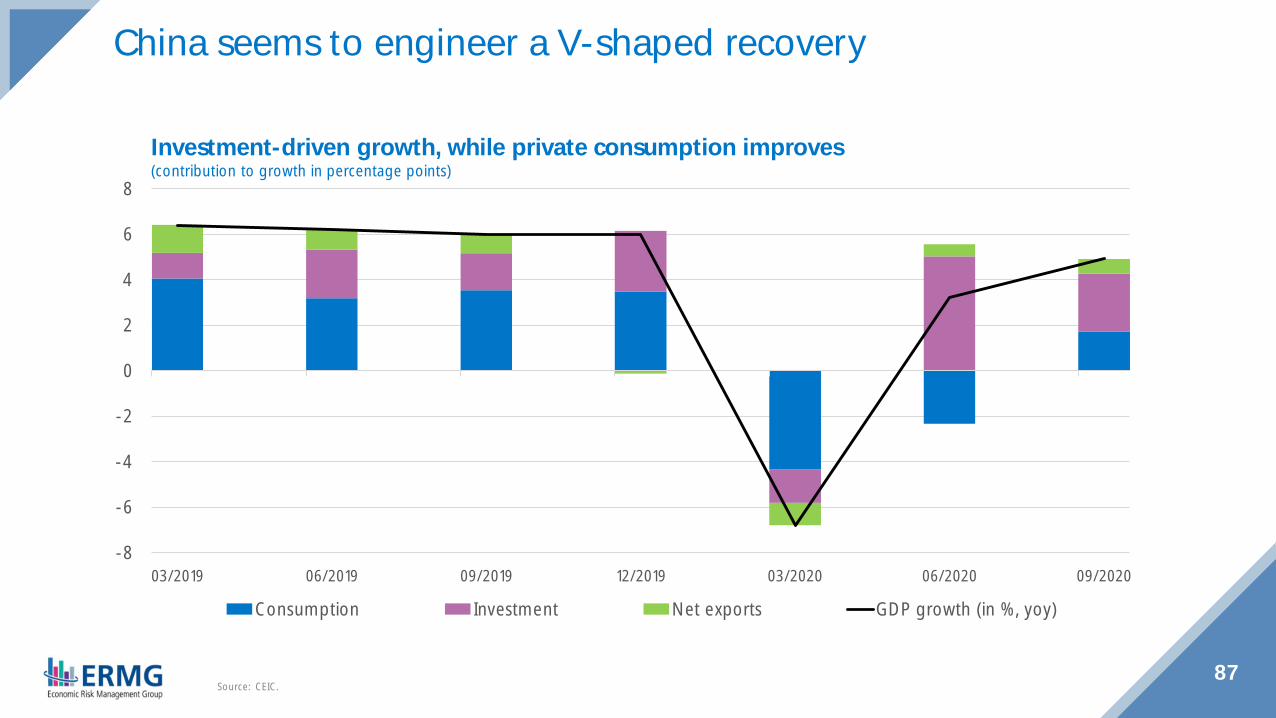
87
Investment-driven growth, while private consumption improves(contribution to growth in percentage points)
China seems to engineer a V-shaped recovery
-8
-6
-4
-2
0
2
4
6
8
03/2019 06/2019 09/2019 12/2019 03/2020 06/2020 09/2020
Consumption Investment Net exports GDP growth (in %, yoy)
Source: CEIC.
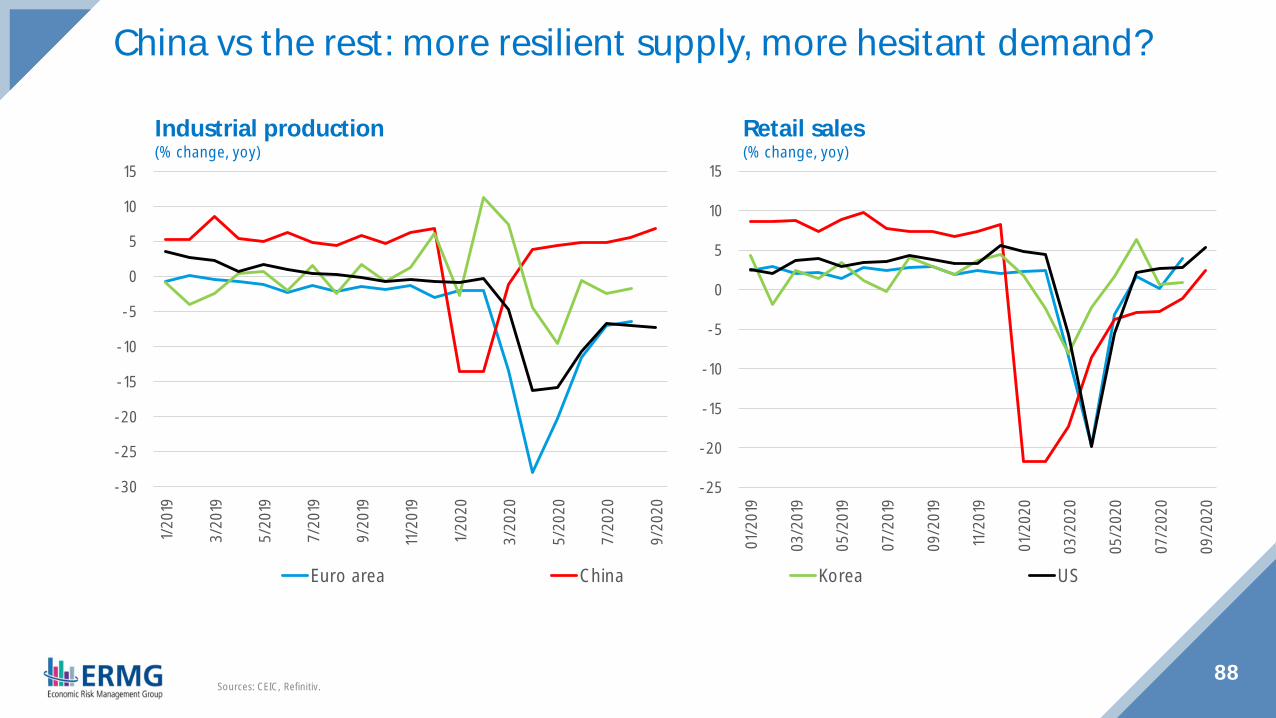
88Sources: CEIC, Refinitiv.
Retail sales(% change, yoy)
Industrial production(% change, yoy)
China vs the rest: more resilient supply, more hesitant demand?
-30
-25
-20
-15
-10
-5
0
5
10
151/
2019
3/20
19
5/20
19
7/20
19
9/20
19
11/2
019
1/20
20
3/20
20
5/20
20
7/20
20
9/20
20
Euro area China Korea US
-25
-20
-15
-10
-5
0
5
10
15
01/2
019
03/2
019
05/2
019
07/2
019
09/2
019
11/2
019
01/2
020
03/2
020
05/2
020
07/2
020
09/2
020
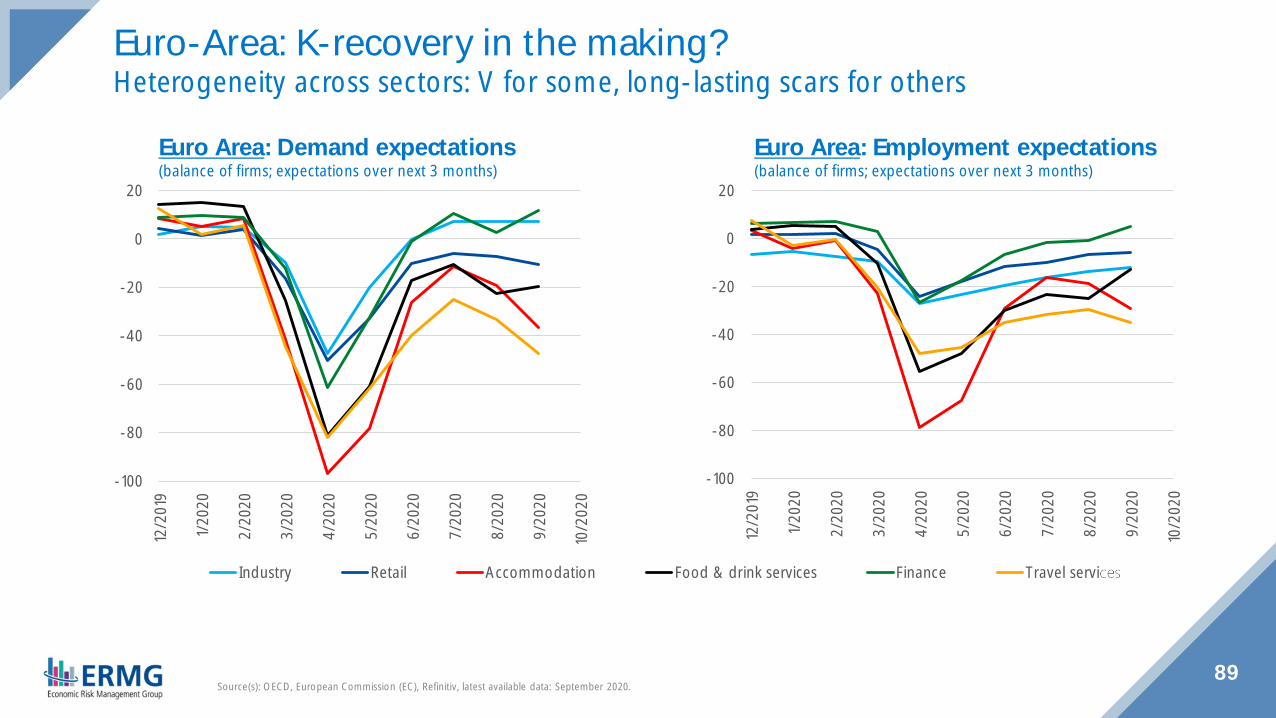
-100
-80
-60
-40
-20
0
20
12/2
019
1/20
20
2/20
20
3/20
20
4/20
20
5/20
20
6/20
20
7/20
20
8/20
20
9/20
20
10/2
020
Industry Retail Accommodation Food & drink services Finance Travel services
-100
-80
-60
-40
-20
0
20
12/2
019
1/20
20
2/20
20
3/20
20
4/20
20
5/20
20
6/20
20
7/20
20
8/20
20
9/20
20
10/2
020
89
Euro Area: Employment expectations(balance of firms; expectations over next 3 months)
Euro Area: Demand expectations(balance of firms; expectations over next 3 months)
Euro-Area: K-recovery in the making?Heterogeneity across sectors: V for some, long-lasting scars for others
Source(s): OECD, European Commission (EC), Refinitiv, latest available data: September 2020.
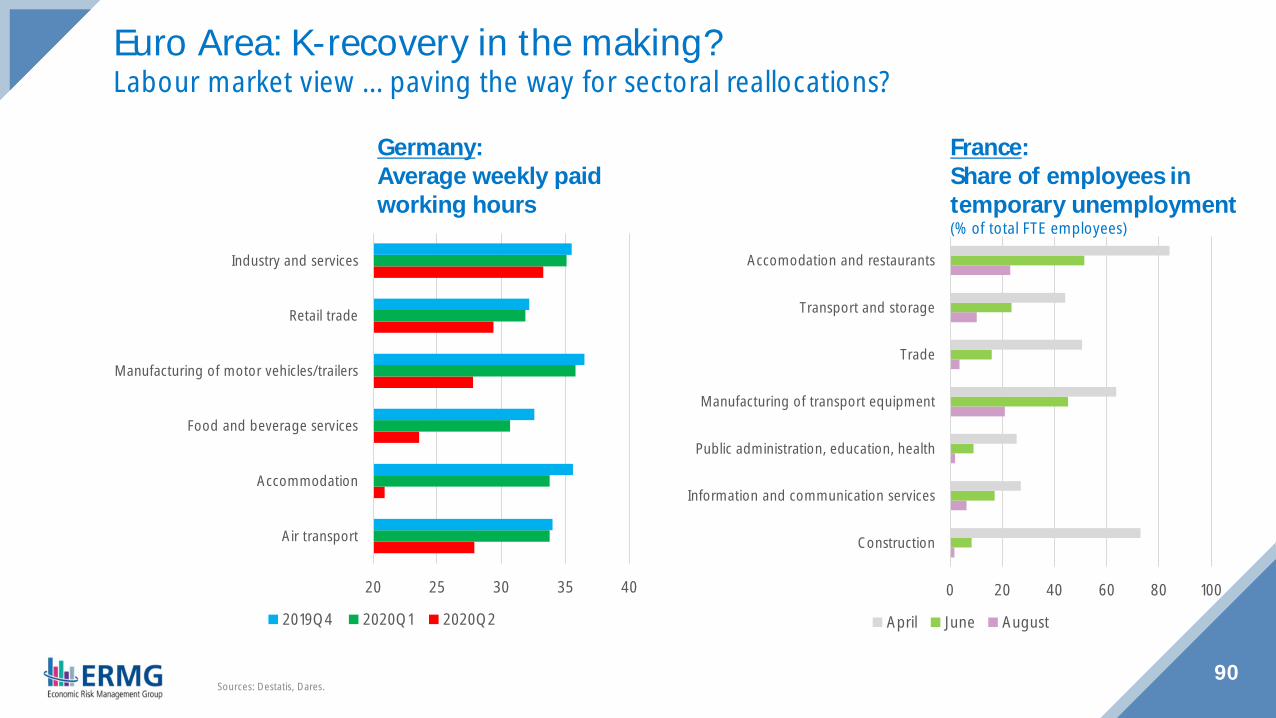
90
France:Share of employees intemporary unemployment(% of total FTE employees)
Germany:Average weekly paidworking hours
Euro Area: K-recovery in the making?Labour market view … paving the way for sectoral reallocations?
20 25 30 35 40
Air transport
Accommodation
Food and beverage services
Manufacturing of motor vehicles/trailers
Retail trade
Industry and services
2019Q4 2020Q1 2020Q2
0 20 40 60 80 100
Construction
Information and communication services
Public administration, education, health
Manufacturing of transport equipment
Trade
Transport and storage
Accomodation and restaurants
April June August
Sources: Destatis, Dares.

91
France: Company failures(number of legal entities, seasonally and working day-adjusted)
Germany: Company insolvencyproceedings(number of insolvencies filed)
Euro Area: Zombification or creative destruction?Too early to tell as temporary measures protect against destruction
0
300
600
900
1 200
1 500
0
50
100
150
200
250
1/20
19
3/20
19
5/20
19
7/20
19
9/20
19
11/2
019
1/20
20
3/20
20
5/20
20
7/20
20
9/20
20
ManufacturingConstructionWholesale, retail trade, repair of motor vehiclesTransport and storageAccommodation and restaurantsInformation and communication servicesBusiness support servicesAll sectors (right-hand scale)
Obligation to file forinsolvency suspendeduntil end September 2020
0
1 000
2 000
3 000
4 000
5 000
0
200
400
600
800
1 000
1/20
19
3/20
19
5/20
19
7/20
19
9/20
19
11/2
019
1/20
20
3/20
20
5/20
20
7/20
20
9/20
20
IndustryConstructionSale, maintenance and repair of motor vehiclesTransport and storageAccommodation and restaurantsInformation and communication servicesBusiness support servicesAll sectors (right-hand scale)
Sources: Destatis, Banque de France (BdF), latest available data: July (Germany) - August 2020 (France).
Obligation to file forinsolvency suspendeduntil end August 2020

92
NBB online surveysin cooperation with the
Microsoft Innovation Center
93
NBB Survey on impact on households’ income
7-24 May
Press release
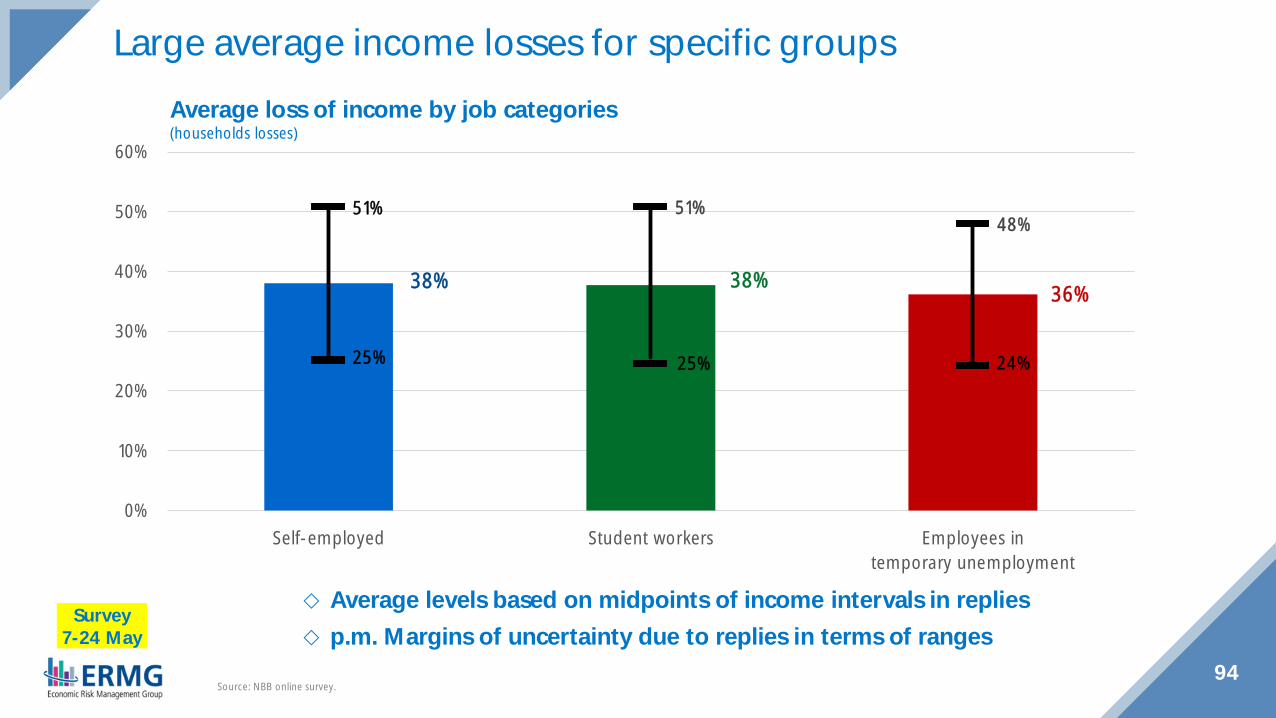
Average levels based on midpoints of income intervals in replies p.m. Margins of uncertainty due to replies in terms of ranges
94Source: NBB online survey.
Average loss of income by job categories(households losses)
Large average income losses for specific groups
38% 38% 36%
25% 25% 24%
51% 51%48%
0%
10%
20%
30%
40%
50%
60%
Self-employed Student workers Employees intemporary unemployment
Survey7-24 May

95Source: NBB online survey.
Average loss of income by (monthly) net income ranges and job categories(household losses)
Low-income households suffer higher relative income losses
62%
48%
36%
27%
47%
39%34%
27%
0%
10%
20%
30%
40%
50%
60%
70%
Less than 1 000€ Between 1 000€ and 2 500€ Between 2 500€ and 4 000€ More than 4 000€
Self-employed Employees in temporary unemploymentSurvey7-24 May
96
NBB Survey on changes in consumer patterns
14 – 21 July
Perscommuniqué
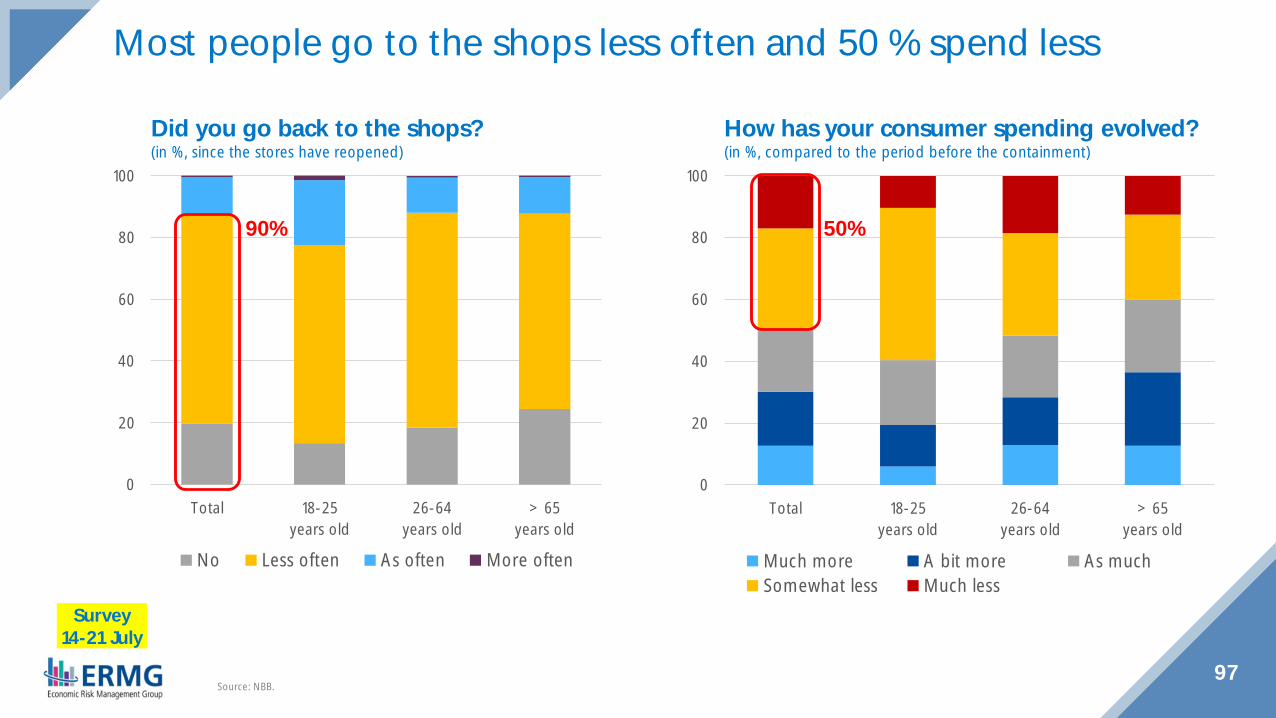
97Source: NBB.
How has your consumer spending evolved?(in %, compared to the period before the containment)
Did you go back to the shops?(in %, since the stores have reopened)
Most people go to the shops less often and 50 % spend less
0
20
40
60
80
100
Total 18-25years old
26-64years old
> 65years old
No Less often As often More often
90%
0
20
40
60
80
100
Total 18-25years old
26-64years old
> 65years old
Much more A bit more As muchSomewhat less Much less
50%
Survey14-21 July
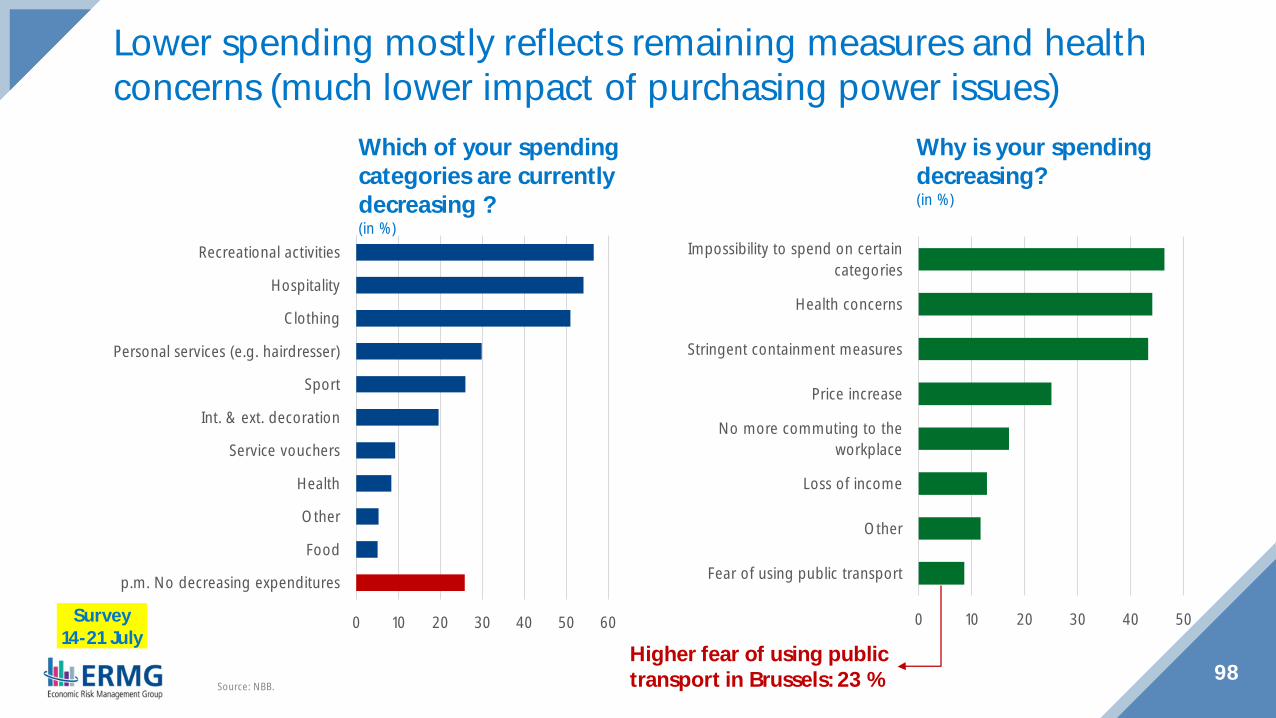
Lower spending mostly reflects remaining measures and healthconcerns (much lower impact of purchasing power issues)
98Source: NBB.
Why is your spendingdecreasing?(in %)
Which of your spendingcategories are currentlydecreasing ?(in %)
0 10 20 30 40 50 60
p.m. No decreasing expenditures
Food
Other
Health
Service vouchers
Int. & ext. decoration
Sport
Personal services (e.g. hairdresser)
Clothing
Hospitality
Recreational activities
0 10 20 30 40 50
Fear of using public transport
Other
Loss of income
No more commuting to theworkplace
Price increase
Stringent containment measures
Health concerns
Impossibility to spend on certaincategories
Higher fear of using publictransport in Brussels: 23 %
Survey14-21 July
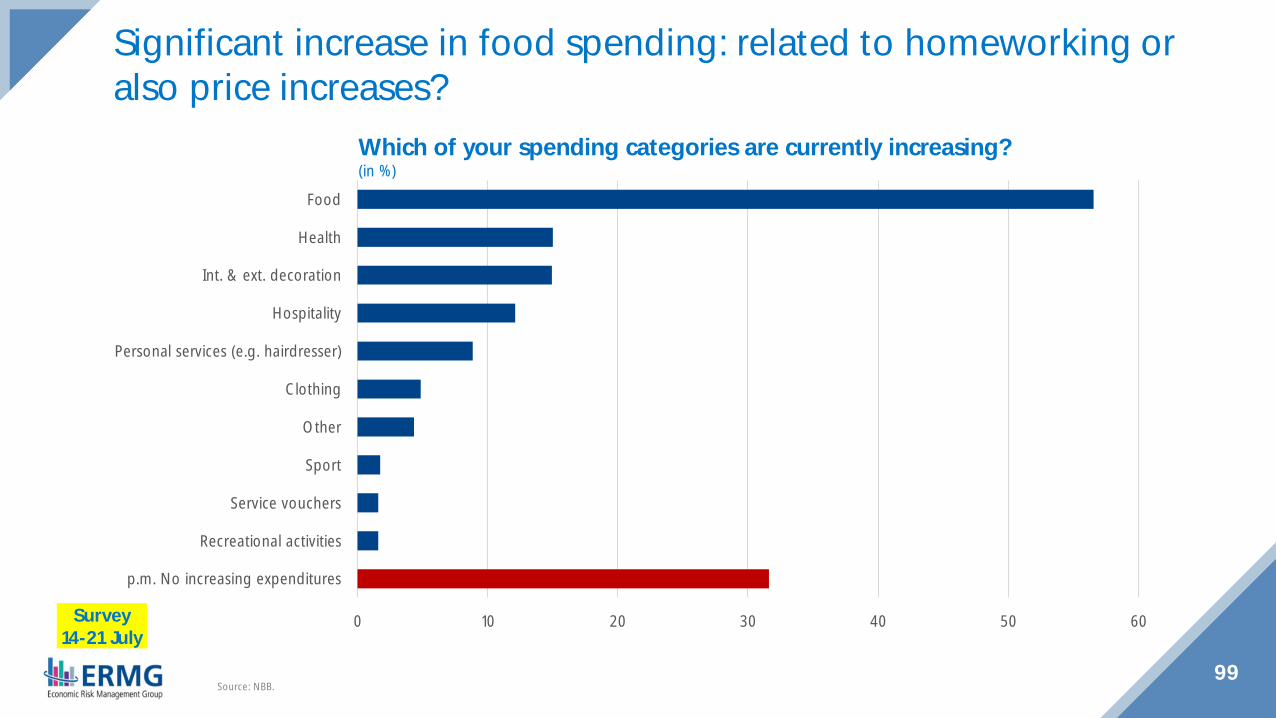
99Source: NBB.
Which of your spending categories are currently increasing?(in %)
Significant increase in food spending: related to homeworking oralso price increases?
0 10 20 30 40 50 60
p.m. No increasing expenditures
Recreational activities
Service vouchers
Sport
Other
Clothing
Personal services (e.g. hairdresser)
Hospitality
Int. & ext. decoration
Health
Food
Survey14-21 July
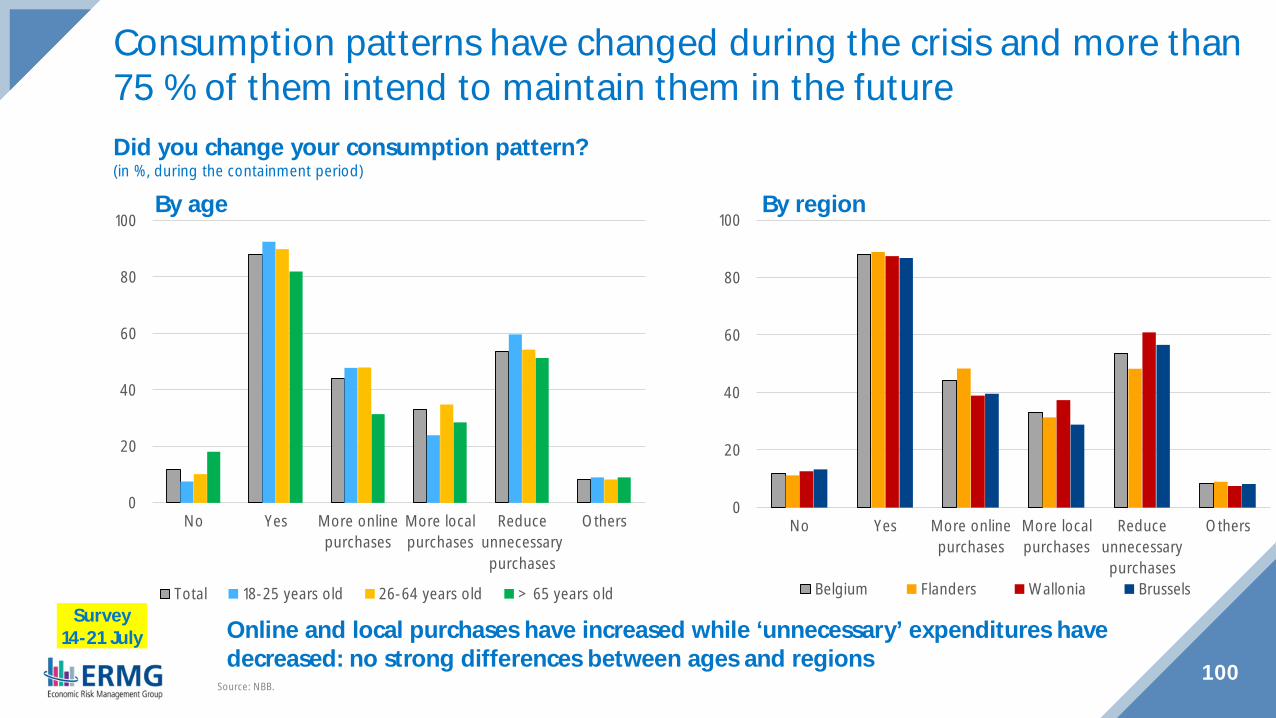
Did you change your consumption pattern?(in %, during the containment period)
Consumption patterns have changed during the crisis and more than75 % of them intend to maintain them in the future
100Source: NBB.
By age
0
20
40
60
80
100
No Yes More onlinepurchases
More localpurchases
Reduceunnecessarypurchases
Others
Total 18-25 years old 26-64 years old > 65 years old
0
20
40
60
80
100
No Yes More onlinepurchases
More localpurchases
Reduceunnecessarypurchases
Others
Belgium Flanders Wallonia Brussels
By region
Online and local purchases have increased while ‘unnecessary’ expenditures havedecreased: no strong differences between ages and regions
Survey14-21 July

Only 40 % of respondents expect to spend more in the comingweeks, particularly in the hospitality industry
101Source: NBB.
What activities are you planning in thecoming weeks?(in %, by age)
How your household's consumer spendingwill evolve?(in %, by age, compared to the period before the containment)
0
20
40
60
80
100
Total 18-25 years old 26-64 years old > 65 years old
Strongly increase Increase slightly Remain similarDecrease slightly Strongly decrease
40%
0
10
20
30
40
50
60
70
Go to
the
resta
uran
t
Go to
the
cinem
a/th
eatre
Go to
bars
/disc
os
Do sp
orts
Take
the
plan
e
Non
e of
thes
e po
ssib
ilitie
s
Total 18-25 years old 26-64 years old > 65 years old
Younger respondents plan to do more activities in the coming weeksp.m. these results do not yet reflect the current deterioration in the health situation
Survey14-21 July