
27 28 October 2016, Ourense, Spain
78
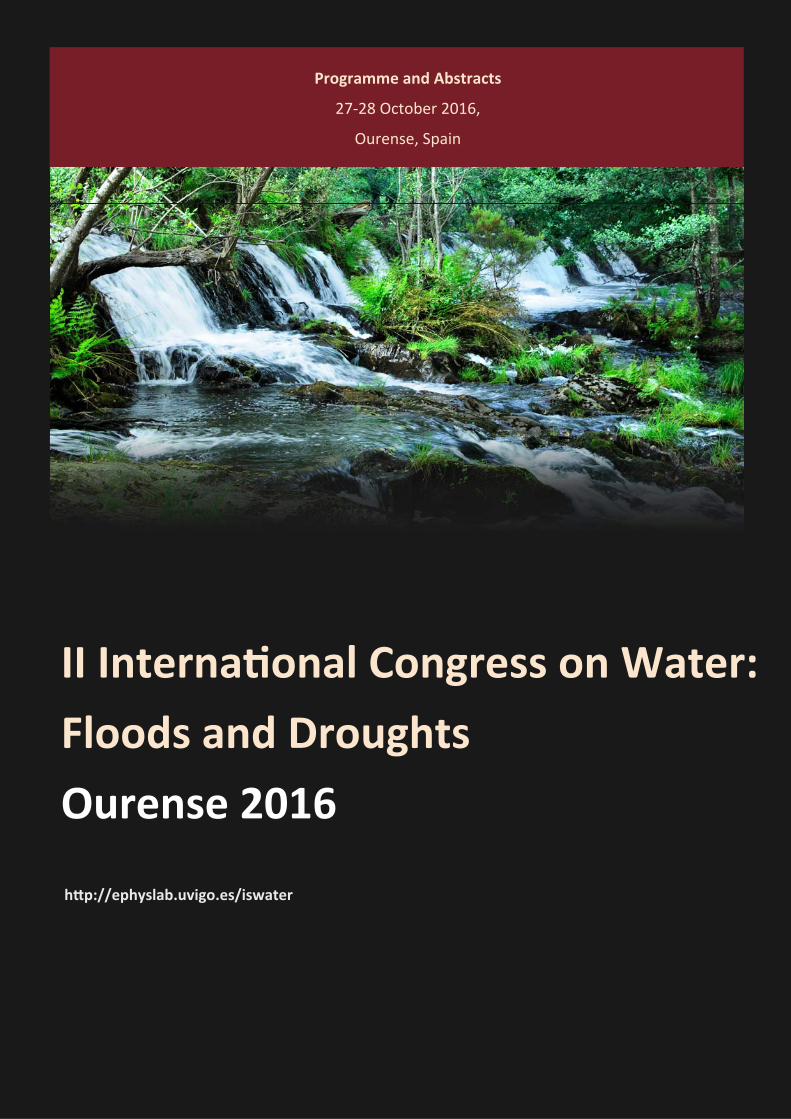
Programme and Abstracts 27‐28 October 2016, Ourense, Spain II InternaƟonal Congress on Water: Floods and Droughts Ourense 2016 hƩp://ephyslab.uvigo.es/iswater
Transcript of 27 28 October 2016, Ourense, Spain
Programme and Abstracts
27‐28 October 2016,
Ourense, Spain
II Interna onal Congress on Water:
Floods and Droughts
Ourense 2016
h p://ephyslab.uvigo.es/iswater


II International Congress on Water:
Floods and Drought
Programme and abstracts
27-28 October 2016
Ourense

II International Congress on Water:
Floods and Drought
Programme and abstracts
27-28 October 2016
Ourense

Cover photograph by Orlando García Feal
Editors: Gómez Gesteira, Ramón; Ruiz del Portal, Carlos
Edited by Campus da Auga
ISBN: 9788461760497

Honorary Committee
Prof. Salustiano Mato de la Iglesia Rector Magnífico de la Universidad de Vigo
Dr. Jesús Vázquez Abad Alcalde de Ourense
Mr. José Manuel Baltar Blanco Presidente de la Excelentísima Diputación Provincial de
Ourense Mr. Francisco Marín Muñoz
Presidente de la Confederación Hidrográfica del Miño-Sil Dr. Virxilio Rodríguez Vázquez
Vicerreitor do Campus de Ourense da Universidade de Vigo
Symposium address
II International Congres on Water: Floods and Droughts
Marcos Valcarcel Building, Rúa do Progreso, 30,
32003 Ourense
Spain
Email: Web: http://ephyslab.uvigo.es/iswater/
Sponsors
Organizing Entities Collaborating Entities
Organizing Committee Scientific Committee
Chairman: Moncho Gómez Gesteira Campus da Auga, University of Vigo,Spain
Alejandro Jacobo Cabrera Crespo University of Vigo, Spain
Vice‐chairman: Carlos Guillermo Ruiz del Portal Florido Confederación Hidrográfica del Miño‐Sil
Juan Antonio Añel Cabanelas University of Vigo, Spain Juan Taboada
Organizing Commitee members Meteogalicia Jerónimo Puertas Agudo
Alejandro Jacobo Cabrera Crespo University of Vigo, Spain
University of Coruña Luis Cea Gómez
Juan Antonio Añel Cabanelas University of Vigo, Spain
University of Coruña Sergio M. Vicente Serrano
Mª Teresa de Castro University of Vigo, Spain
CSIC ‐ Instituto Pirenaico de Ecología Ricardo Trigo
Mª de las Nieves Lorenzo González University of Vigo, Spain
University of Lisboa Carlos Guillermo Ruiz del Portal Florido
Mª Inés Álvarez University of Vigo, Spain
Confederación Hidrográfica del Miño‐Sil Rodrigo Maia
Luis Gimeno Presa University of Vigo, Spain
University of Porto Arnaldo Machado
Raquel Olalla Nieto Muñiz University of Vigo, Spain
Administração da Região Hidrográfica do Norte
Jose Antonio Fraiz Brea Faculty of Business Sciences and Tourism, University of Vigo, Spain
Fermín Pérez Losada Campus da Auga, University of Vigo, Spain
Fermín Pérez Losada Campus da Auga, University of Vigo, Spain
Patricio Sánchez Fernández Campus da Auga, University of Vigo, Spain
Patricio Sánchez Fernández Campus da Auga, University of Vigo, Spain
Susana Álvarez González University of Vigo, Spain Arno Fornella
Susana Álvarez González University of Vigo, Spain
Campus da Auga, University of Vigo, Spain
Arno Fornella Campus da Auga, University of Vigo, Spain
David López CEDEX Fco. Javier Sánchez Martínez
Local Organizing Commitee
Ángel Álvarez FernándezXurxo Costoya Noguerol Diego Fernández Nóvoa Orlando García Feal José González Cao Laura Rodríguez Diaz Rubén Varela Rodríguez
Subdirección General de Gestión Integrada del Dominio Público Hidráulico Xoán Nóvoa Rodríguez Confederación Hidrográfica del Miño‐Sil Alberto de Anta Montero Confederación Hidrográfica del Miño‐Sil Helder Chaminé ISEP, Instituto Superior de Engenharia do Porto

11
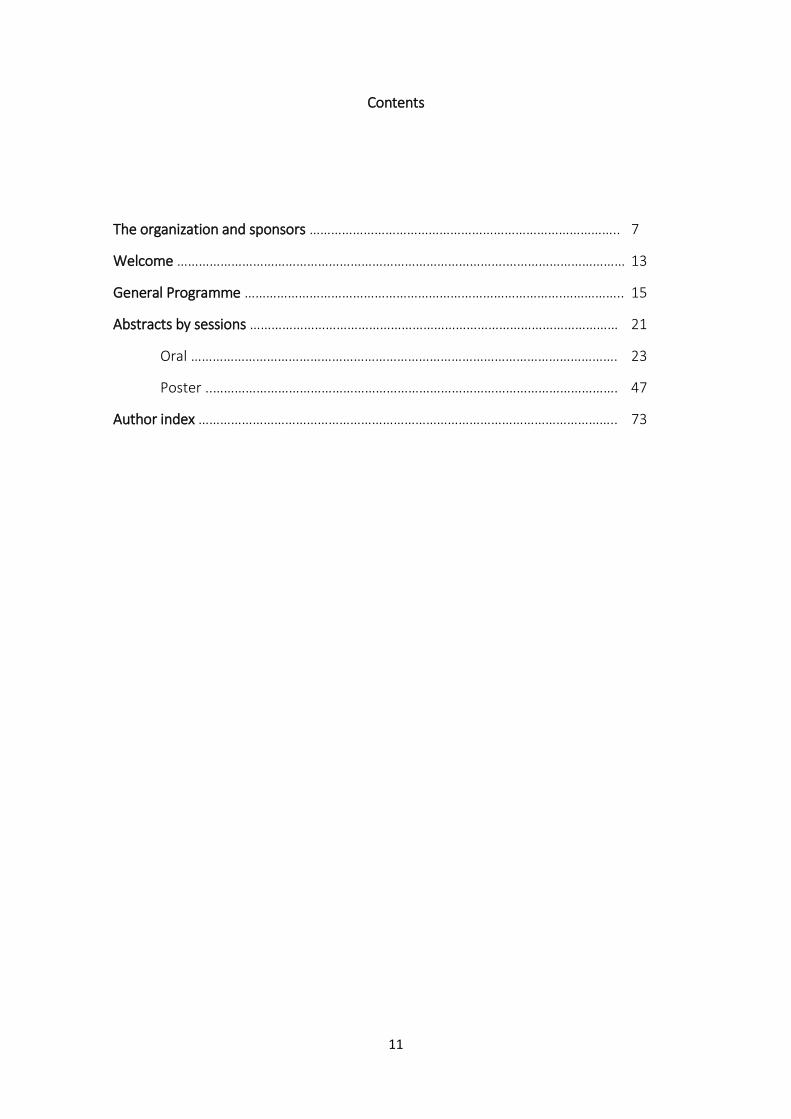
Contents
The organization and sponsors ………………………………………………………………………….. 7
Welcome ……………………………………………………………………………….…………………………… 13
General Programme …………………………………………………………………………….…………….. 15
Abstracts by sessions ………………………………………………………………………………………… 21
Oral ………………………………………………………………………………………………………. 23
Poster ..…………………………………………………………………………………………………. 47
Author index …………………………………………………………………………………………………….. 73


13
Welcome
Campus Auga is an initiative of the University of Vigo supported by the Local Government (Xunta de Galicia) to create a specialized campus in Ourense, aiming to become an international leader in research and teaching on topics of water resources. The first International Congress on Water, focused on Healing Spa and Life Quality, took placed in Ourense in September 2015. The success of the experience, both in terms of the number of attendants and the quality of the communications, encouraged us to organize this second edition focused on Floods and Droughts.
Within the current context of global climate change, it is an undeniable fact that the incidence of extreme events such as floods and droughts will increase in the coming decades, becoming a major concern for developed and developing countries. Warning and mitigation protocols must be created to face these new challenges.
The aim of the symposium is to bring together worldwide scientists in order to know the latest advances in the analysis, prevention and mitigation of floods and droughts. Likewise, the symposium aims to bring together different agents responsible for the management of water at local, regional and national levels, such as the basin authorities (Confederaciones Hidrográficas), as well as productive sectors strongly dependent on water (farmers, power companies, water suppliers, ...) in order to achieve a valuable exchange of information between scientists, stake holders and decision makers.
Prof. M. Gómez Gesteira University of Vigo
Eng.Carlos Ruiz del Portal. Miño-Sil River Basin District Authority


GENERAL PROGRAMME
II International Congress on Water, Ourense General Programme
16
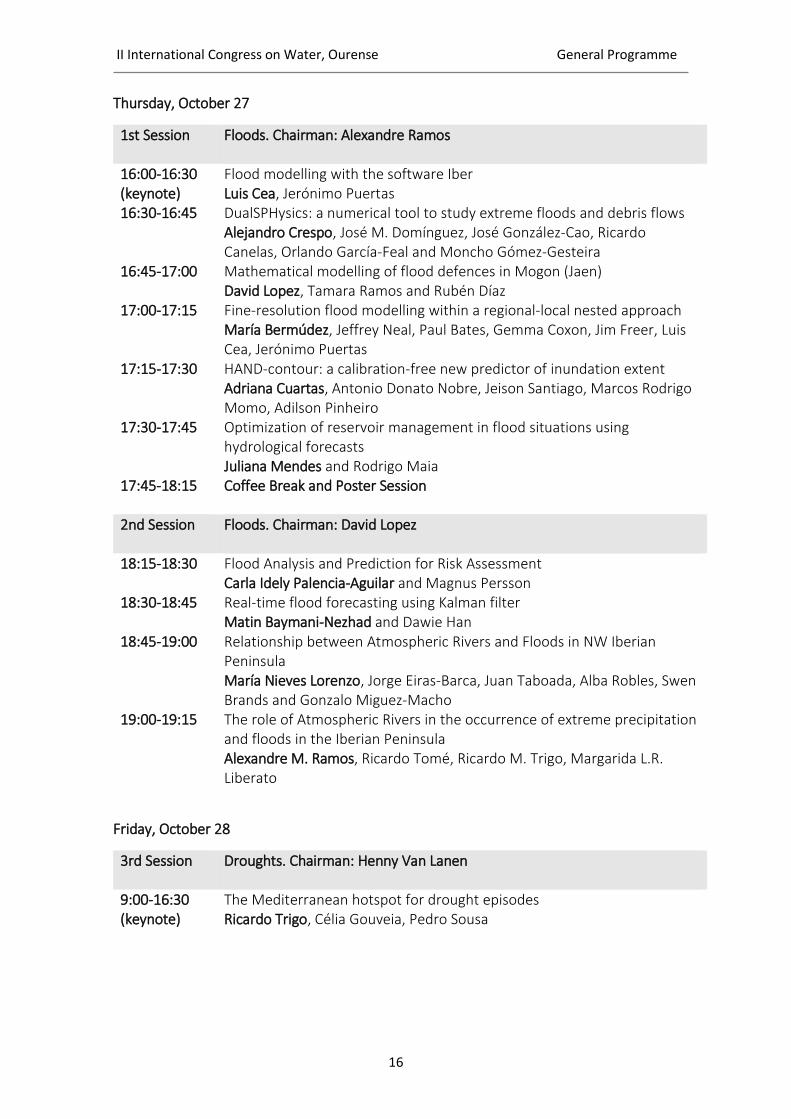
Thursday, October 27
1st Session Floods. Chairman: Alexandre Ramos
16:00-16:30 (keynote)
Flood modelling with the software Iber Luis Cea, Jerónimo Puertas
16:30-16:45 DualSPHysics: a numerical tool to study extreme floods and debris flows Alejandro Crespo, José M. Domínguez, José González-Cao, Ricardo Canelas, Orlando García-Feal and Moncho Gómez-Gesteira
16:45-17:00 Mathematical modelling of flood defences in Mogon (Jaen) David Lopez, Tamara Ramos and Rubén Díaz
17:00-17:15 Fine-resolution flood modelling within a regional-local nested approach María Bermúdez, Jeffrey Neal, Paul Bates, Gemma Coxon, Jim Freer, Luis Cea, Jerónimo Puertas
17:15-17:30 HAND-contour: a calibration-free new predictor of inundation extent Adriana Cuartas, Antonio Donato Nobre, Jeison Santiago, Marcos Rodrigo Momo, Adilson Pinheiro
17:30-17:45 Optimization of reservoir management in flood situations using hydrological forecasts Juliana Mendes and Rodrigo Maia
17:45-18:15 Coffee Break and Poster Session
2nd Session Floods. Chairman: David Lopez
18:15-18:30 Flood Analysis and Prediction for Risk Assessment Carla Idely Palencia-Aguilar and Magnus Persson
18:30-18:45 Real-time flood forecasting using Kalman filter Matin Baymani-Nezhad and Dawie Han
18:45-19:00 Relationship between Atmospheric Rivers and Floods in NW Iberian Peninsula María Nieves Lorenzo, Jorge Eiras-Barca, Juan Taboada, Alba Robles, Swen Brands and Gonzalo Miguez-Macho
19:00-19:15 The role of Atmospheric Rivers in the occurrence of extreme precipitation and floods in the Iberian Peninsula Alexandre M. Ramos, Ricardo Tomé, Ricardo M. Trigo, Margarida L.R. Liberato
Friday, October 28
3rd Session Droughts. Chairman: Henny Van Lanen
9:00-16:30 (keynote)
The Mediterranean hotspot for drought episodes Ricardo Trigo, Célia Gouveia, Pedro Sousa
General Programme II International Congress on Water, Ourense
17
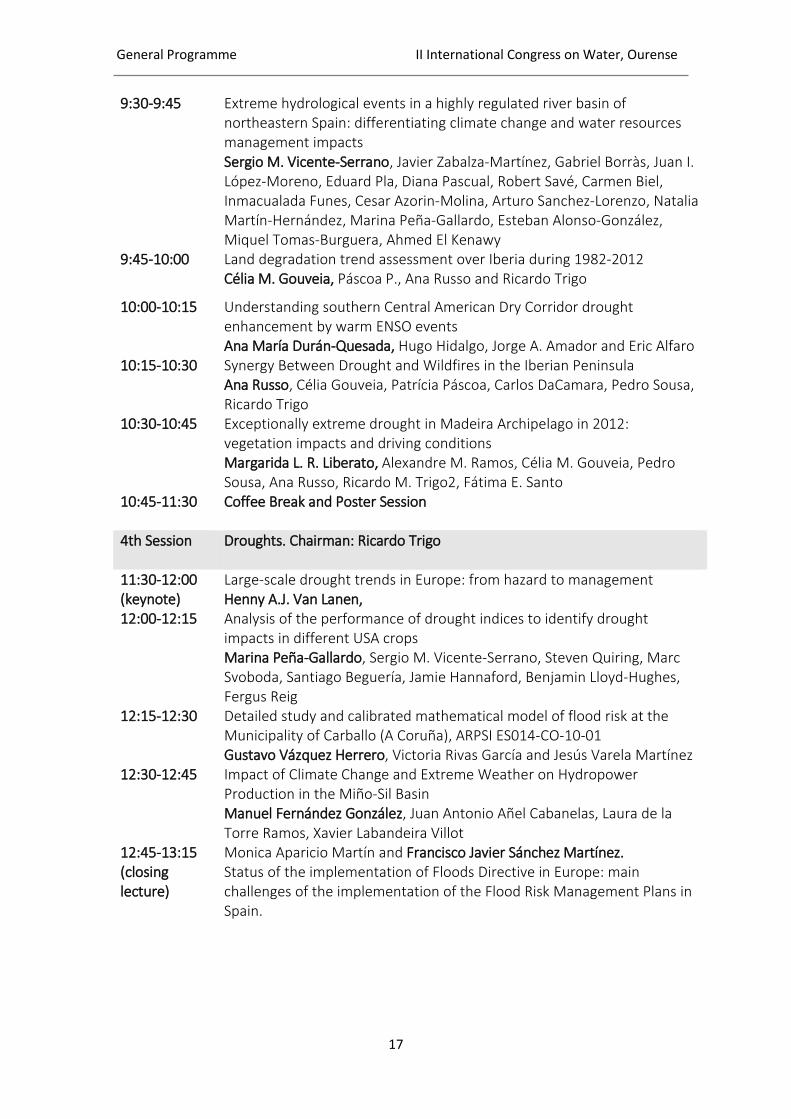
9:30-9:45 Extreme hydrological events in a highly regulated river basin of northeastern Spain: differentiating climate change and water resources management impacts Sergio M. Vicente-Serrano, Javier Zabalza-Martínez, Gabriel Borràs, Juan I. López-Moreno, Eduard Pla, Diana Pascual, Robert Savé, Carmen Biel, Inmacualada Funes, Cesar Azorin-Molina, Arturo Sanchez-Lorenzo, Natalia Martín-Hernández, Marina Peña-Gallardo, Esteban Alonso-González, Miquel Tomas-Burguera, Ahmed El Kenawy
9:45-10:00 Land degradation trend assessment over Iberia during 1982-2012 Célia M. Gouveia, Páscoa P., Ana Russo and Ricardo Trigo
10:00-10:15 Understanding southern Central American Dry Corridor drought enhancement by warm ENSO events Ana María Durán-Quesada, Hugo Hidalgo, Jorge A. Amador and Eric Alfaro
10:15-10:30 Synergy Between Drought and Wildfires in the Iberian Peninsula Ana Russo, Célia Gouveia, Patrícia Páscoa, Carlos DaCamara, Pedro Sousa, Ricardo Trigo
10:30-10:45 Exceptionally extreme drought in Madeira Archipelago in 2012: vegetation impacts and driving conditions Margarida L. R. Liberato, Alexandre M. Ramos, Célia M. Gouveia, Pedro Sousa, Ana Russo, Ricardo M. Trigo2, Fátima E. Santo
10:45-11:30 Coffee Break and Poster Session
4th Session Droughts. Chairman: Ricardo Trigo
11:30-12:00 (keynote)
Large-scale drought trends in Europe: from hazard to management Henny A.J. Van Lanen,
12:00-12:15 Analysis of the performance of drought indices to identify drought impacts in different USA crops Marina Peña-Gallardo, Sergio M. Vicente-Serrano, Steven Quiring, Marc Svoboda, Santiago Beguería, Jamie Hannaford, Benjamin Lloyd-Hughes, Fergus Reig
12:15-12:30 Detailed study and calibrated mathematical model of flood risk at the Municipality of Carballo (A Coruña), ARPSI ES014-CO-10-01 Gustavo Vázquez Herrero, Victoria Rivas García and Jesús Varela Martínez
12:30-12:45 Impact of Climate Change and Extreme Weather on Hydropower Production in the Miño-Sil Basin Manuel Fernández González, Juan Antonio Añel Cabanelas, Laura de la Torre Ramos, Xavier Labandeira Villot
12:45-13:15 (closing lecture)
Monica Aparicio Martín and Francisco Javier Sánchez Martínez. Status of the implementation of Floods Directive in Europe: main challenges of the implementation of the Flood Risk Management Plans in Spain.
II International Congress on Water, Ourense General Programme
18
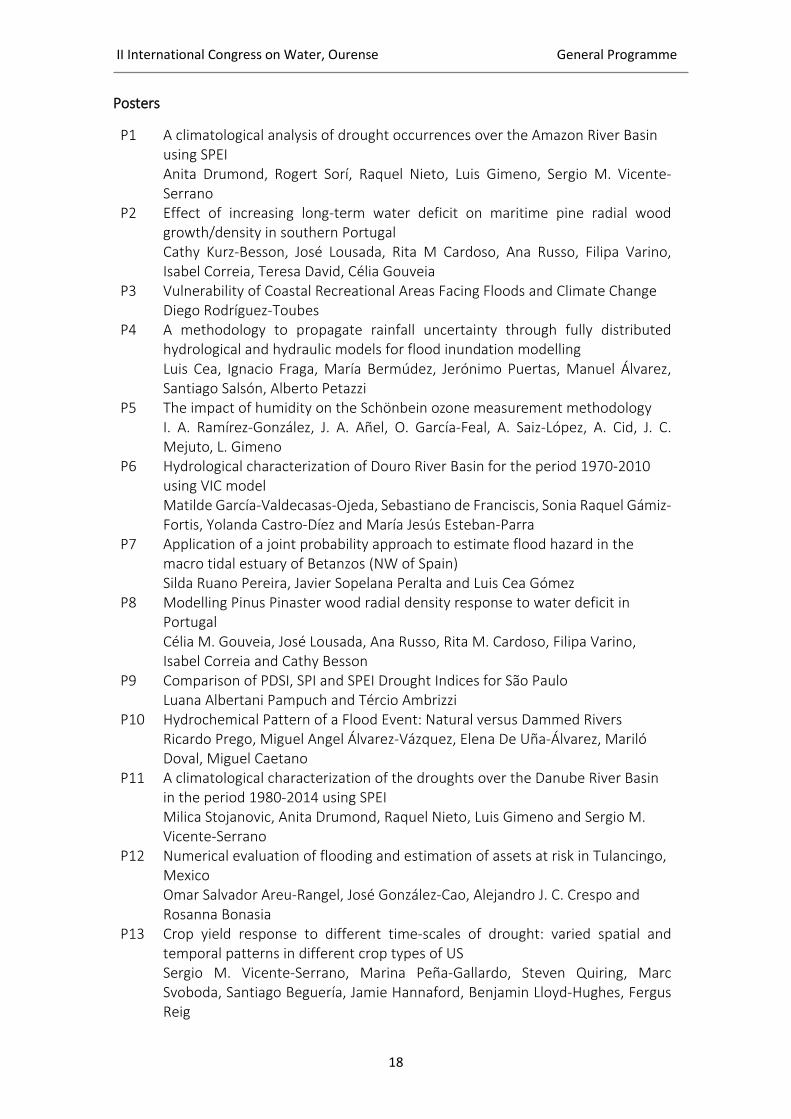
Posters
P1 A climatological analysis of drought occurrences over the Amazon River Basin using SPEI Anita Drumond, Rogert Sorí, Raquel Nieto, Luis Gimeno, Sergio M. Vicente-Serrano
P2 Effect of increasing long-term water deficit on maritime pine radial wood growth/density in southern Portugal Cathy Kurz-Besson, José Lousada, Rita M Cardoso, Ana Russo, Filipa Varino, Isabel Correia, Teresa David, Célia Gouveia
P3 Vulnerability of Coastal Recreational Areas Facing Floods and Climate Change Diego Rodríguez-Toubes
P4 A methodology to propagate rainfall uncertainty through fully distributed hydrological and hydraulic models for flood inundation modelling Luis Cea, Ignacio Fraga, María Bermúdez, Jerónimo Puertas, Manuel Álvarez, Santiago Salsón, Alberto Petazzi
P5 The impact of humidity on the Schönbein ozone measurement methodology I. A. Ramírez-González, J. A. Añel, O. García-Feal, A. Saiz-López, A. Cid, J. C. Mejuto, L. Gimeno
P6 Hydrological characterization of Douro River Basin for the period 1970-2010 using VIC model Matilde García-Valdecasas-Ojeda, Sebastiano de Franciscis, Sonia Raquel Gámiz-Fortis, Yolanda Castro-Díez and María Jesús Esteban-Parra
P7 Application of a joint probability approach to estimate flood hazard in the macro tidal estuary of Betanzos (NW of Spain) Silda Ruano Pereira, Javier Sopelana Peralta and Luis Cea Gómez
P8 Modelling Pinus Pinaster wood radial density response to water deficit in Portugal Célia M. Gouveia, José Lousada, Ana Russo, Rita M. Cardoso, Filipa Varino, Isabel Correia and Cathy Besson
P9 Comparison of PDSI, SPI and SPEI Drought Indices for São Paulo Luana Albertani Pampuch and Tércio Ambrizzi
P10 Hydrochemical Pattern of a Flood Event: Natural versus Dammed Rivers Ricardo Prego, Miguel Angel Álvarez-Vázquez, Elena De Uña-Álvarez, Mariló Doval, Miguel Caetano
P11 A climatological characterization of the droughts over the Danube River Basin in the period 1980-2014 using SPEI Milica Stojanovic, Anita Drumond, Raquel Nieto, Luis Gimeno and Sergio M. Vicente-Serrano
P12 Numerical evaluation of flooding and estimation of assets at risk in Tulancingo, Mexico Omar Salvador Areu-Rangel, José González-Cao, Alejandro J. C. Crespo and Rosanna Bonasia
P13 Crop yield response to different time-scales of drought: varied spatial and temporal patterns in different crop types of US Sergio M. Vicente-Serrano, Marina Peña-Gallardo, Steven Quiring, Marc Svoboda, Santiago Beguería, Jamie Hannaford, Benjamin Lloyd-Hughes, Fergus Reig

General Programme II International Congress on Water, Ourense
19
P14 Wet Spells across Danube River Basin during 1980-2014 Danica Ciric, Raquel Nieto, Anita Drumond, Luis Gimeno and Alex M. Ramos
P15 Influence of Okhotsk high on spring river discharge in eastern Siberia Kazuhiro Oshima, Hotaek Park, Yasuhiro Yoshikawa
P16 Projected changes in the evolution of drought in the 21st century over the Czech Republic Vera Potopová, Petr Štěpánek, Pavel Zahradníček, Aleš Farda, Luboš Türkott, Josef Soukup
P17 A preliminary assessment of hydroclimatic drought indicators in the trans-boundary Prut River Basin: A case study in the Republic of Moldova Vera Potopová, Valeriu Cazac, Boris Boincean
P18 Meteorological Droughts in the Niger River Basin and its link with atmospheric moisture transport Rogert Sorí, Anita Drumond, Raquel Nieto Sergio M. Vicente-Serrano, Luis Gimeno
P19 Evolution of drought episodes assessed with the Standardized Precipitation Evapotranspiration Index (SPEI) over Fertile Crescent Zeinab Salah, Anita Drumond, Raquel Nieto, Luis Gimeno and Sergio M. Vicente-Serrano
P20 Determination of flood areas of Sidi Ifni city (South Morocco) Aicha Saad, Ahmad El Kanti
P21 A Composited Drought Model for Mongolia Pasture based on Satellite Image Sheng Chang, Bingfang Wu, Nana Yan, Davdai Bulgan, Nasanbat Elbegjargal, Tuvdendorj Battsetseg
P22 Multipurpose water resource planning and management using Nile basin dss in the upper Blue Basin, ethiopia Habtam A. Mekonen, Melese M. Wondim, Addisu G. Dagnew, Mikiyas G. Etichie
P23 Impacts of Flooding on the Thermal Tourism Diego Rodríguez-Toubes

ABSTRACTS BY SESSIONS
Oral
Poster


Oral


Oral, Floods and Droughts II International Congress on Water, Ourense
25
Flood modelling with the software Iber
Luis Cea1*, Jerónimo Puertas1
1*Water and Environmental Engineering Group, University of A Coruña, Spain, [email protected]
ABSTRACT
Flood inundation models are widely used tools for hazard mapping in river floodplains and urban areas. In this context the software Iber was launched in 2010 as the result of a collaboration between the Water and Environmental Engineering Group (University of A Coruña), the Flumen Institute (Polytechnic University of Cataluña) and the International Centre for Numerical Methods in Engineering (CIMNE), and it was initially sponsored by the Centre for Hydrographic Studies (CEDEX). The first version of the software included some of the research results of the previous groups in the field of numerical modelling of river flow and tidal currents.
The hydrodynamic module of Iber solves the 2D shallow water equations using an explicit unstructured finite volume solver and shock-capturing schemes. It includes specific numerical implementations to account for the hydrodynamic effects of bridges, weirs and embankments, as well as a dam failure module. These features make the model especially suitable for flood hazard studies, which is the main application of the model nowadays. The basic input data required for such applications are the topography of the river and floodplains, the spatial distribution of the bed roughness (or land uses), and the water discharge flowing through the reach under study. The model output is the spatial distribution of water depths and depth-averaged velocities, which can be combined according to different existing criteria in order to obtain a flood hazard map.
Recent developments in the numerical schemes for solving the shallow water equations have incorporated the possibility to use Iber as a fully distributed event-based hydrological model in small catchments (up to a few km2). The model can then be used to compute the flood hydrograph generated at the outlet of a small catchment during a storm rainfall event, as well as to account for rainfall-runoff contributions to the river discharge downstream of the input boundary. Linked to a sewer network model (which is under development), it will extend the application field of the model to urban drainage computations.
This presentation shows some of the present capabilities and near future developments of the software Iber in the context of flood modelling, including of rainfall-runoff transformation and flood hazard mapping. Iber can be downloaded for free from www.iberaula.es. The public version of the software includes most of the model capabilities, although some of the latest developments are not yet implemented in the official version of Iber.
Keywords: flood inundation modelling, fully distributed hydrological modelling, shallow water equations, Iber
Oral, Floods and Droughts II International Congress on Water, Ourense
26
DualSPHysics: a numerical tool to study extreme floods and debris flows
Alejandro Crespo1, José Domínguez1, José González-Cao1, Ricardo Canelas2,
Orlando García-Feal1 and Moncho Gómez-Gesteira1
1Environmental Physics Laboratory EPHYSLAB, Universidade de Vigo, SPAIN
2CEHIDRO, Instituto Superior Tecnico, Lisbon, Portugal
ABSTRACT
Smoothed Particle Hydrodynamics (SPH) is a technique developed to solve fluid dynamics problems under extreme conditions, especially when water and solids are involved. The emergence of graphics processing units (GPUs) has enabled the acceleration of the code for desktop applications without the need of massive high-performance computing. Hence, DualSPHysics code, based on the SPH model, puts the power of mini-supercomputers in the hands of engineers (www.dual.sphysics.org). Dedicated pre- and post-processing software enables different input geometries and measurement of physical properties at any location.
During the last decade, the model has been successfully applied to the study of the interaction between water waves and structures, including protection and flooding of coastal areas, analysis of extreme run-off and design of partially submerged structures such as docks, oil rigs or power generation devices.
The model has also been adapted to the study of areas at risk from flood. These zones are not necessarily riverine areas, but also urban areas that suffer the periodic threat of heavy rains. DualSPHysics can be used to simulate both the level attained by water and its destructiveness in terms of the forces exerted on objects. In particular, the model allows including solid objects like cars or pieces of urban furniture that can be detached and moved by water. In addition, debris flows can also be simulated. Both debris flows and moving objects can be handled using a special module of DualSPHysics expanded with the Discrete Element Method (DEM) in order to explicitly solve both phases (fluid and solid). In this way the code is applicable to granular-fluid mixtures featuring high spatial and temporal resolution, being capable of resolving the motion of individual particles, including interparticle contacts.
Maps of risk can be elaborated by taking advantage of the information provided by DualSPHysics. This information allows identifying the areas that can be potentially flooded and the forecasted destructiveness of the water and the transported solids.
Keywords: numerical modelling, SPH, GPU, floods, fluid-structure interaction
II International Congress on Water, Ourense Oral, Floods and Droughts
27
Mathematical modelling of flood defences in Mogon (Jaen)
David Lopez1, Tamara Ramos2 and Rubén Díaz3
1Centre for Hydrographic Studies (CEH), CEDEX, Spain, [email protected]
2 Centre for Hydrographic Studies (CEH), CEDEX, Spain
3 Centre for Hydrographic Studies (CEH), CEDEX, Spain
ABSTRACT
The urban area of Mogon, placed next to the Guadalquivir river, stretches about 1200 m downstream of the confluence of the Guadalquivir and Aguascebas rivers.
In some areas of Mogon, the houses are near the riverbed what has forced to evacuate the population several times, in order to ensure the safety.
In this context, Guadalquivir River Basin Authority has projected flood defences in order to protect the area and to allow higher flow rates without negative effects in the nearest houses of Mogon. Therefore, the main aim of this study is to check the hydraulic behaviour of these flood defences.
Several bridges, which are placed on the river, affect to the hydraulic behaviour, reducing the flow capacity. Nowadays, there is an emergency embankment throughout Barquero street to allow 150 m3/s without overflow.
The current situation and the projected solution have been analysed in the study. Two operating hypotheses have been established. The first scenario simulates a flow rate of 450 m3/s by the Guadalquivir river. The second one drains by the Guadalquivir river a flow rate of 300 m3/s, when the Aguascebas river has a flow rate of 150 m3/s.
The study was conducted with the Iber model. Iber is a two-dimensional mathematical model for the simulation of free surface flow in rivers and estuaries. Several design options of protection embankment have been analysed by hydraulic simulation. As a result, some modifications have been implemented in the trace and height of the defences in order to avoid any channel narrowing, and to design the minimum embankment height, for the studied hypotheses. After a process of several improvements, the final proposed solution was obtained.
Keywords: River, flood, mathematical modelling, embankments.

Oral, Floods and Droughts II International Congress on Water, Ourense
28
Fine-resolution flood modelling within a regional-local nested approach
María Bermúdez1,2*, Jeffrey Neal2, Paul Bates2, Gemma Coxon2, Jim Freer2, Luis Cea1, Jerónimo Puertas1
1*Water and Environmental Engineering Group, University of A Coruña, Spain, [email protected]
2School of Geographical Sciences, University of Bristol, United Kingdom
ABSTRACT
Flood inundation models require appropriate boundary conditions to be specified at the limits of the domain, which are usually derived from river gauge data. For fine-resolution local-scale models, the sparsity of the gauge network often requires flow to be routed from upstream gauge stations to the boundary of the model domain. The straightforward approach of extending the model domain involves an increase of computational cost which is not justified in practical applications. Besides, it is also necessary to evaluate the rainfall-runoff contributions to the modelled domain downstream of the gauging locations.
In this study, a hydrological-hydraulic modelling cascade is proposed to overcome these difficulties. Discharge data are acquired from the available river gauges closest to the local hydraulic model domain. Measured rainfall downstream from these locations is cascaded into a hydrological model to quantify additional inflows along the main channel. A regional simplified-physics hydraulic model is then applied to combine these inputs and generate the upstream and downstream boundary conditions for the local hydraulic model.
The methodology is applied to the July 2007 floods of the River Severn in the UK, considering a 7 km urban reach as the area of interest. For this domain, the catchment area between flow gauging stations extends over 540 km2. Hydrological models from the FUSE framework were set up to simulate the rainfall-runoff dynamics over this area. At this regional scale, the 2-dimensional hydraulic model LISFLOOD-FP, which solves the local approximation of the shallow equations, was applied to route the flow from the gauging sites and to incorporate the additional inflows from the hydrological models. At the local scale, the 2-dimensional hydraulic model Iber, which solves the full form of the shallow water equations, was used to predict the flow field.
The results show that this nested regional-local scale model approach provides and effective and efficient way of producing hydraulic model simulations for the common situation where a fine scale local model is required (e.g. to simulate an urban area) but there are no gauges sufficiently close to the local model domain that can be reliable employed.
Keywords: flood inundation modelling, hydrologic/hydraulic modelling, river gauge data

II International Congress on Water, Ourense Oral, Floods and Droughts
29
HAND-contour: a calibration-free new predictor of inundation extent
Adriana Cuartas,1 Antonio Donato Nobre,2 Jeison Santiago,2
Marcos Rodrigo Momo,3 Adilson Pinheiro3
1Center for Monitoring and Alert of Natural Disasters, CEMADEN - MCTic, Brazil
2Center for Earth System Science, INPE - MCTic, Brazil,
3Fundação Universidade de Blumenau, Brazil
ABSTRACT
Height Above the Nearest Drainage (HAND) is a new terrain model generated from a Digital Elevation Model. Using the principle of relative gravitational potential, a HAND model is an elevation topology normalized for the drainage network. It is a version of a DEM, with a topology that represents distributed relative gravitational potentials. The HAND model algorithm uses the network of flowpaths to compute relative-height differences of each grid cell to a corresponding channel-cell, belonging to the same discharge flowpath. Using only topography as input, the HAND model is a good predictor for the depth of the water table, and has been used in a host of applications from hydrological modeling to land-use planning. We applied the HAND model to inundation-risk prediction, developing a simple static approach to map flood potential based on the hydrostatic equilibrium principle. It assumes that each flowpath on surrounding terrain, discharging on a river-channel, when flooded, keep water level, in lateral pressure equilibrium with the surging waters from the channel.
A HAND-contour delineates on the terrain an equidistant drop to the nearest river. And the HAND-delineated relative drop is an effective distributed predictor of flood potential, which is directly related to the river stage height. Because it is a method that does not depend on flood observations, and only associates river gauge heights to HAND-contours on the terrain, estimating the potential extent of inundation does not require calibration. The HAND contour map is a normalized stepwise scale of drop to the river. Such a scale matches an equivalent stepwise scale of normalized HAND stage heights at the river. A HAND contour map can be divided into flood hazard levels using flood hazard classification criteria in which contour are classified. We validated the HAND contour approach using a high-resolution flood event in Southern Brazil. The results indicated that the new flood hazard-mapping method accurately predicted the inundation extent of the channel carrying the flood wave and the channels influenced by flooding. HAND contour maps can be applied to any location for which digital topography is available, which creates opportunities for the development of ubiquitous hydrologic hazard mapping.
Keywords: gravitational potential, flooding, terrain model, inundation risk map
Oral, Floods and Droughts II International Congress on Water, Ourense
30
Optimization of reservoir management in flood situations using hydrological forecasts
Juliana Mendes1 and Rodrigo Maia2
1Hydraulics, Water Resources and Environment Division, Civil Engineering Department, Faculty of Engineering of University of Porto, Portugal, [email protected]
2Hydraulics, Water Resources and Environment Division, Civil Engineering Department, Faculty of Engineering of University of Porto, Portugal, [email protected]
ABSTRACT
Reservoirs enable the spatial and temporal redistribution of the rivers’ water flow, and their operational management is usually subject to multiple goals. A reservoir management model is a key piece in a forecasting and decision support system for flood control in regularized river basins, since it provides the means to evaluate different management alternatives and thus determine the choice of the most effective strategy to minimize downstream effects. Nevertheless, few existing forecasting systems that include this component currently exist. Due to conflicts that may arise in meeting the various uses, reservoir management can be complex for operators, whilst the stochastic nature of inflows tends to exacerbate this complexity.
The goal of this study was the development of a decision support model to optimize the operational management of reservoir systems in flood risk situations where the downstream flood control function can be a constraining factor for the remaining uses of these systems. This optimization model, based on daily forecasts of inflows to reservoirs for the next 10 days’ period, allows the computation of the volume to be discharged in the next 24 hours by each reservoir in the system, in order: i) to minimize downstream impacts when a flood occurs; ii) not to constrain the remaining uses of the reservoirs, when there is no forecast of flood occurrences, keeping water levels as high as possible without risking the safety of their structures (dams and discharge devices).
The model was designed based on the application to the management of the multi-purpose system composed by the reservoirs of Aguieira and Fronhas, which is located in the Mondego river basin, in Portugal. Two wet periods, associated with the occurrence of severe flooding, were selected for the calibration and verification of the model, while four additional flood periods were used for the evaluation of its performance using hydrological forecasts previously obtained through a rainfall-runoff model with ensemble precipitation forecasts as input. The results of the study show that the model performs well in optimizing reservoir management in flood situations, when compared with the rules currently in operation, which do not take into account the hydrological forecast data. In addition, this model enables high water levels to be maintained in the reservoirs during periods in which there are no significant inflows are forecasted, which is beneficial for other uses, in particular energy production.
Keywords: reservoir management, optimization, hydrological forecasts, floods.
II International Congress on Water, Ourense Oral, Floods and Droughts
31
Flood Analysis and Prediction for Risk Assessment
Carla Idely Palencia-Aguilar1 and Magnus Persson2*
1Water Resource Department, Lund University, Sweden
2*Water Resource Department, Lund University, Sweden
ABSTRACT
In order to determine the flood characteristics of the main Rivers at Guasca Municipality in Colombia, three methodologies were employed. First, the program HEC-RAS modelled critical zones from 103 measured cross sections and the suggested changes to be implemented in order to reduce the velocities and obtain Froude numbers less than 1, for risk assessment. Second, the software GLOBAL MAPPER was employed to visualize the most vulnerable flood zones. Two situations were analysed: the former under the assumption where 2 meters of water would rise during floods and the latter, when water level would increase 50 cm. The results show that only at heights of 2600 m the changes correspond to variable flood surface area of 33%, all other changes for higher altitudes were not significant. Third, the NDVI (from MODIS images) was used to compare different periods of time when floods had happened. Values lower than 0.14 were considered floods in the studied area represented by 4 sections of 1 km2 each, along the rivers. The results showed that if more than 19 mm of rain took place and the accumulated days in 8 periods of time (of 16 days each) are greater than 238 mm then, there is a high probability to get floods, either during the studied period or the following period. When phenomena such as the NIÑA were present (as it was the case in 2009), an additional parameter was introduced. It refers to the soil water content measured by a Campbell Scientific probe in a CR1000 datalogger, to determine how much water was present in the soil. The results showed that if soil volumetric water content was lower than 0.241, then no floods took place, meaning that there was enough infiltration and groundwater had flown freely toward the outlet, represented by the Tomine Reservoir.
Keywords: HEC-RAS, Global Mapper, NDVI, MODIS.

Oral, Floods and Droughts II International Congress on Water, Ourense
32
Real-time flood forecasting using Kalman filter
Matin Baymani-Nezhad* and Dawie Han**
*Assistant Professor in Hydroinformatics, Department of Civil Engineering, College of Engineering, Karaj Branch, Islamic Azad University, Karaj, Iran
** Professor in Hydroinformatics, Water and Environmental Manager Center, University
of Bristol, Bristol, UK
ABSTRACT
During the last decades, the application of numerical filters in data assimilation has been
increased significantly in many fields of science, engineering and technology. Basically, the
numerical filters update the model states (or parameters) based on a series of the model
observation obtained by measurement features. In fact, a prediction between the simulated
states based on its linkage with observed data will be provided according to the existing error on
system and model observations. Kalman filter is a well-known numerical filter developed to use
in data assimilation and has been considered widely in hydrological sciences over 20 years. The
Kalman filter and its application on real-time flood forecasting could be found in the literatures
to update the model states (e.g. soil moisture) and increase the efficiency of the model to achieve
the reliable forecasts. In the current study, the Kalman filter is coupled with the ERM model (new
developed lumped hydrological model) proposed in 2013 to use in real-time flood forecasting.
Also, the performance of the Kalman filter in model updating, will be evaluated in forecasting the
whole shape of forecasted hydrograph and peak of flood events which are attractive information
for hydrologists to get more knowledge about the imminent flood events.
Keywords: Kalman filter, ERM model, flood forecasting

II International Congress on Water, Ourense Oral, Floods and Droughts
33
Relationship between Atmospheric Rivers and Floods in NW Iberian Peninsula
María Nieves Lorenzo1*, Jorge Eiras-Barca2, Juan Taboada3, Alba Robles1, Swen Brands3 and Gonzalo Miguez-Macho2
1*EPhysLab, Facultade de Ciencias, University of Vigo, Spain, [email protected]
2Non-Linear Physics Group, University of Santiago de Compostela, Spain
3Meteogalicia, Xunta de Galicia, Spain
ABSTRACT
Atmospheric rivers (ARs) transport large amounts of water vapor from (sub) tropical areas poleward. In coastal areas of the middle latitudes, intense rainfall events, in some cases producing harmful floods, are frequently associated with the arrival of ARs. The link between ARs and floods has been proven for areas such as the west coast of North America or Great Britain. The aim of this work is to study the existence of such a relationship for Galicia, in the NW area of the Iberian Peninsula.
Flooding episodes have been obtained from official reports from the civil protection service of Spain between 1979 and 2010, and the existence of ARs affecting the region during these events has been investigated. In addition, we have also analyzed the weather types in those dates, taken from an objective classification in the area. Results for the wettest part of the year, between October and March, show that floods are associated mainly with W, SW and Cyclonic situations. The situation is quite different in drier months, between April and September. In this case, Anticyclonic situations are frequently associated to floods, with precipitation being of convective nature, rather than frontal.
Regarding ARs, we look for their existence on the wettest day of each flood episode. In coastal areas, an AR appears in 80% of the episodes, while in basins further inland this relationship is not so strong, with only 60% of coincidence between maximum rain and AR.
The main conclusion is that flooding episodes in the period between October and March in coastal areas of Galicia are associated to weather types of W, SW and C, with an AR as a critical factor providing water vapor to increase accumulated rainfall. This link is not so evident in coastal areas in summer months or inland in any season, probably due to a more convective nature of precipitation in extreme events far from the coast, or in the summer in general.
Keywords: Atmospheric River, Floods, Weather Types.
Oral, Floods and Droughts II International Congress on Water, Ourense
34
The role of Atmospheric Rivers in the occurrence of extreme precipitation and floods in the Iberian Peninsula
Alexandre M. Ramos1*, Ricardo Tomé1, Ricardo M. Trigo1, Margarida L.R. Liberato1,2
1 Instituto Dom Luiz, Universidade de Lisboa, Lisbon, Portugal, [email protected] 2 Escola de Ciências e Tecnologia, U. de Trás-os-Montes e Alto Douro, Portugal
ABSTRACT
Extreme precipitation events in the Iberian Peninsula during the winter half of the year have often
major socio-economic impacts associated with floods, landslides, extensive property damage and
life losses. In recent years, a number of works have shed new light on the role played by
Atmospheric Rivers (ARs) in the occurrence of extreme precipitation events in Europe. ARs are
relatively narrow regions of concentrated WV responsible for anomalous water vapor transport
in the lower atmosphere.
Historical extreme precipitation and floods events in the Iberian Peninsula have been associated
with the presence of an ARs such as the record precipitation and flood event in southern Iberia
in December 1876 or the exceptional hydro-geomorphological event of December 1909 in the
Duero basin. More recently, other examples of the serious human and socio-economic impacts
that AR can produce were observed in with the floods in the Pyrenees (November 1982), the
extreme precipitation in the Lisbon region (November 1983) or the flash floods event in Madeira
(February 2012).
We have developed an automated ARs detection algorithm for the North Atlantic Ocean Basin
allowing the identification and a comprehensive characterization of the major AR events that
affected the Iberian Peninsula over the 1948-2012 period. Extreme precipitation days in the
Iberian Peninsula were assessed recently by authors and their association (or not) with the
occurrence of AR was analyzed Results show that the association between ARs and extreme
precipitation days in the western domains (Portugal, Minho, Tagus and Duero) is noteworthy,
while for the eastern and southern basins (Ebro, Guadiana and Guadalquivir) the impact of ARs is
reduced.
Keywords: Atmospheric Rivers, Iberian Peninsula, extreme precipitation, floods, socio-economic impacts
II International Congress on Water, Ourense Oral, Floods and Droughts
35
The Mediterranean hotspot for drought episodes
Ricardo Trigo1, Célia Gouveia1, Pedro Sousa1
1IDL, Faculdade de Ciências, Universidade de Lisboa, Portugal [email protected]
ABSTRACT
Climatic droughts are relatively frequent in the Mediterranean region as a consequence of the large interannual variability of precipitation and recurrent incidence of prolonged periods with low precipitation (Sousa et al., 2011). Large drought episodes are responsible for the most negative impacts on vegetation, often implying substantial losses of crop yield, increasing risk of forest fires and even forest decline (Gouveia et al., 2012).
The last IPCC Assessment Report (IPCC, 2013) confirmed the Mediterranean region as a climate change and biodiversity “hot spot” with an increasing likelihood of future drought episodes and severe heat waves. In fact, most studies using global and regional climate model results suggest that the Mediterranean will experience a general trend towards drier conditions during the 21st century.
However, the Mediterranean has been already hit by outstanding drought events in both the eastern and western sectors of the basin. For example, during the hydrological years of 2004/2005 and 2011/2012, the western Mediterranean region, particularly Iberia, was hit by two of the worst drought episodes ever recorded in this semi-arid region (Trigo et al., 2013; Vicente Serrano et al., 2014). Likewise, the historical region of Fertile Crescent (FC) in the eastern Mediterranean was struck by an intense and prolonged drought episode between 2007 and 2009, provoking widespread socio-economic impacts.
All these drought episodes were extreme in both its magnitude and spatial extent. Furthermore, they appear to fit the region’s tendency towards an increase in the frequency of drought events partially driven by anthropogenic greenhouse gases emissions (Hoerling et al., 2012; Trigo et al., 2013).
Keywords: Iberia, Fertile Crescent, Extreme dry events, heatwaves, IPCC
Gouveia et al. (2012) NHESS, 12, 3123–3137, doi:10.5194/nhess-12-3123-2012
Hoerling M et al. (2012) Journal of Climate, 25, 2146-2161.
Sousa P. et al. NHESS, 11, 33-51, doi:10.5194/nhess-11-33-2011
Trigo R.M. et al. (2010), Agricultural and Forest Meteorology, 150, 1245-1257
Trigo R.M. et al., (2013) Bulletin of the Am. Meteor.Society, 94 (9), S41-S45.
Vicente-Serrano et al. (2014) Environmental Research Letters, 9, 044001.

Oral, Floods and Droughts II International Congress on Water, Ourense
36
Extreme hydrological events in a highly regulated river basin of northeastern Spain: differentiating climate change
and water resources management impacts
Sergio M. Vicente-Serrano1, Javier Zabalza-Martínez1, Gabriel Borràs2, Juan I. López-Moreno1, Eduard Pla3, Diana Pascual3, Robert Savé4, Carmen Biel4, Inmacualada Funes4, Cesar Azorin-
Molina1, Arturo Sanchez-Lorenzo1, Natalia Martín-Hernández1, Marina Peña-Gallardo1, Esteban Alonso-González1, Miquel Tomas-Burguera5, Ahmed El Kenawy6
1Instituto Pirenaico de Ecología, Consejo Superior de Investigaciones Científicas (IPE–CSIC), Spain
2Oficina Catalana del Canvi Climàtic, Generalitat de Catalunya Spain
3CREAF, Spain;
4IRTA, Environmental Horticulture, Spain;
5Estación Experimental de Aula Dei (EEAD-CSIC), Spain,
6Department of Geography, Mansoura University, Egypt.
ABSTRACT
In this study we assessed the impact of river regulation on the evolution of extreme climate and hydrological events in the past five decades in the Segre basin (northeastern Spain). Rivers of the basin are extensively regulated through a dense network of dams that were constructed during the second half of the 20th century. We assessed whether the occurrence of floods and hydrological droughts has changed in recent decades, and if these changes have differed between the headwater and lower areas of the basin, the latter downstream of the reservoir network. Between 1950 and 2013 there was a general reduction in the occurrence of the extreme precipitation events, and the streamflows measured at various gauging stations in the basin have shown a general reduction of high flows. The patterns of decrease in streamflow have differed between the headwaters and the lower parts of the basin, associated with intense water regulation to supply the demand for water for irrigated lands and livestock farms. Nevertheless, there has not been a reduction in the frequency of extraordinary floods associated with the changes in river regulation. The changes that have occurred in water management and use in the Segre basin have affected the frequency, duration, and severity of hydrological droughts downstream of the main dams, as the response of hydrological droughts to climate droughts has been found to differ markedly between the headwaters and the lower areas of the basin.
Keywords: droughts, floods, Segre, hydrological trends, dams, reservoir effects
II International Congress on Water, Ourense Oral, Floods and Droughts
37
Land degradation trend assessment over Iberia during 1982-2012
Célia M. Gouveia1, Páscoa P.1, Ana Russo1 and Ricardo Trigo1
1IDL, Faculdade de Ciências, Universidade de Lisboa, Portugal [email protected]
ABSTRACT
Within the present context of climate change, land degradation has been accepted as a core problem in arid and semi-arid regions, namely due to its impacts in environmental and social sectors.
The Mediterranean basin has been affected, in the last few decades, by more frequent droughts, affecting large region often lasting longer than one year. In particular, this is the case of the Iberian Peninsula that has been affected by intense and frequent drought events since the 1980s.
The latest IPCC report pointed out that the hydrological stress expected for the coming decades will hit the Mediterranean region as a consequence of a combined decrease in precipitation and increase of both the average and extreme temperatures. This climatic outlook, together with land abandonment and/or intensification, highlights the need of a continuous monitoring and early detection of degradation.
Here we have used Normalized Difference Vegetation Index (NDVI) as an indicator of land degradation over Iberia, from 1982 to 2012. The precipitation influence on NDVI was removed and the negative trends of the obtained residuals were presumed to indicate land degradation. Overall the Iberian Peninsula is dominated by widespread land improvement with only a few hot spots of land degradation located in central and southern sectors and also in east Mediterranean and Atlantic coasts. Less than 20% of the area presenting land degradation is associated with regions where land cover changes were observed, being the new land cover types associated with transitional woodland-shrub, permanent and annual crops and permanently irrigated land areas. Moreover, the comparison of spatial patterns of residual trends with dryness for different aridity regions over Iberian Peninsula highlighted the relatively small fraction of land degradation that experiences an increased dryness, although virtually all pixels belong to semi-arid region. On the other hand, land improvement is associated with a tendency of wetness in the northeastern humid sector.
Keywords: Land Degradation, NDVI, Precipitation, Aridity, Land Cover Change, SPEI-SPI
Acknowledgements: This work was partially supported by national funds through FCT (Fundação para a Ciência e a Tecnologia, Portugal) under project IMDROFLOOD (WaterJPI/0004/2014). Ana Russo thanks FCT for granted support (SFRH/BPD/99757/2014).
Oral, Floods and Droughts II International Congress on Water, Ourense
38
Understanding southern Central American Dry Corridor drought enhancement by warm ENSO events
Ana María Durán-Quesada1,2 , Hugo Hidalgo1,2 , Jorge A. Amador1,2 and Eric Alfaro1,2
1Atmospheric, Oceanic and Planetary Physics Department / School of Physics, University of Costa Rica, Costa Rica [email protected]
2Center for Geophysical Research, University of Costa Rica, Costa Rica
3Research Center of Marine Sciences and Limnology, University of Costa Rica, Costa Rica
ABSTRACT
According to observation records, the Central American Pacific slope, as part of the Central American Dry Corridor (CADC) has been affected by drought conditions with a well defined frequency. It has been identified that such frequency is bounded to the temporal variability of the El Nino-Southern Oscillation and more specifically to the warm ENSO events. Here we explore how observations confirm this warm ENSO - drought relationship, how severe these dry episodes can be and which are the main mechanisms that allow warm ENSO conditions to intensify dry conditions in this portion of the CADC. Besides of analysing rainfall deficits linked to dry conditions, the length of the wet and dry seasons was considered to determine drops in rainfall and duration of these dry spells. The latter is a key factor to quantify several aspects of the impact of droughts. It was found that in the recent years, drought in certain locations of the CADC can be attributed to the combination of warm ENSO and a sustained precipitation deficit in the area. A set of rain gauges were used to provide further details on how important the detected precipitation deficit is and how it is driven. Preliminar results are presented with the corresponding analysis and proposed mechanisms hypothesis.
Keywords: dry corridor, ENSO, drought, climate projections.

II International Congress on Water, Ourense Oral, Floods and Droughts
39
Synergy Between Drought and Wildfires in the Iberian Peninsula
Ana Russo 1, Célia Gouveia 1, Patrícia Páscoa 1, Carlos DaCamara 1, Pedro Sousa 1, Ricardo Trigo 1
1 Instituto Dom Luiz (IDL), Faculdade de Ciências, Universidade de Lisboa, Lisboa, Portugal, [email protected]
ABSTRACT
Wildfires have a major role in the dynamics of a variety of terrestrial ecosystems, in particular the Mediterranean ones, affecting both biodiversity and human activities. Southern European countries are particularly affected by summer wildfires and drought events. The occurrence of extreme meteorological conditions during the months preceding and contemporaneous to the summer wildfire season amplifies the risk of accumulating large burned area totals.
The main scope of this study was to investigate the impact of drought periods on burned areas in the Iberian Peninsula. This was achieved through the comparison of two widely used multi-scalar drought indices (SPI and SPEI) with the burned areas during the summer fire season. Both SPI and SPEI were calculated for the Iberian Peninsula’s provinces at 12 time scales for each month for the period between 1980 and 2005. Based on the regression analysis between both drought indicators and the burned areas data, the months that present lowest errors where identified for each province. The obtained results show that the relation between wildfires and drought occurrence is better explained by the influence of the previous spring precipitation on the central Iberian sector and by the influence of temperature and evapotranspiration during the summer wildfire season on most of the Portuguese provinces.
Keywords: Drought; Fires; Standard Precipitation Index (SPI); Standard Precipitation Evapotranspiration Index (SPEI); Iberian Peninsula
Acknowledgments: Ana Russo thanks FCT for granted support (SFRH/BPD/99757/2014).

Oral, Floods and Droughts II International Congress on Water, Ourense
40
Exceptionally extreme drought in Madeira Archipelago in 2012: vegetation impacts and driving conditions
Margarida L. R. Liberato1,2, Alexandre M. Ramos2, Célia M. Gouveia2, Pedro Sousa2, Ana Russo2, Ricardo M. Trigo2, Fátima E. Santo3
1* Escola de Ciências e Tecnologia, Universidade de Trás-os-Montes e Alto Douro, UTAD, Quinta de Prados, Vila Real, Portugal, [email protected]
2 Instituto Dom Luiz (IDL), Faculdade de Ciências, Universidade de Lisboa, Lisboa, Portugal
3 The Portuguese Sea and Atmosphere Institute, I. P. (IPMA, IP), Lisbon, Portugal
ABSTRACT
This work aims at characterizing the exceptional drought that affected Madeira Archipelago (Portugal) during the 2011-2012 hydrological year including climatic and vegetation dynamics impacts but also the atmospheric circulation associated with the event. Precipitation records from 6 meteorological stations are used to assess the extreme drought episode. The assessment of the drought duration and severity is corroborated by the Standardized Precipitation Index (SPI) computed for the 3, 6, 12 and 24 months’ time scales. We confirmed that this episode was one the events with higher drought intensity over a wide range of time scales, being classified as extreme at the 6-month time sale (SPI6<-1.65) from December 2011 until May 2012 on the majority of the meteorological stations analysed. Long-term precipitation data available since 1865 for the station of Funchal confirms the exceptional dryness of this episode, corresponding to the driest winter in 150 years.
Vegetation activity was evaluated through anomalies of NDVI (Normalized Difference Vegetation Index), showing several large sectors of Madeira under vegetative stress. The southern sector of Madeira Island suffered up to seven months (out of nine) of extremely negative NDVI anomalies. From an operational point of view and despite its relative small area, obtained results reveal the ability of the developed methodology to monitor vegetation stress and droughts in Madeira. The extreme dryness of the Island favoured an unusually intense summer fire season of 2012 in Madeira. The main fire hotspots of the 2012 fire season were coincident with the areas affected by drought.
The large-scale atmospheric circulation responsible for the setting and intensification of the drought is evaluated using reanalysis data. An extensive high pressure anomaly persisted over the North Atlantic during the extended winter months, centred between the Azores Islands and the UK. We have also applied a Weather Types (WTs) methodology at the synoptic scale. We show that the region was characterised by a significant drop of “wet” WTs such as cyclonic or those with and western flow component being substituted by “dry” WTs with an eastern flow component.
Keywords: Extreme drought; vegetation impacts; wildfires; Euro-Atlantic atmospheric circulation; Madeira 2012.
Acknowledgments: This work was supported by FCT through UID/GEO/50019/2013 - Instituto Dom Luiz. Ana Russo thanks FCT for grant support (SFRH/BPD/99757/2014).

II International Congress on Water, Ourense Oral, Floods and Droughts
41
Large-scale drought trends in Europe: from hazard to management
Henny A.J. Van Lanen, Wageningen University, the Netherlands / European Drought Centre
ABSTRACT
Drought is one of the most costly weather-related natural hazards. Droughts regularly occurred in Europe and had major socio-economic and environmental impacts. We show that different drought types (meteorological, soil water and hydrological) need to be distinguished to understand and to manage droughts. The influence of climate on the development of meteorological, soil water and hydrological (groundwater and streamflow) drought is illustrated for different climates (climate control). In addition, we demonstrate that catchment control has major effect on drought characteristics. We show some recent databases that provide information on major droughts across Europe over the last 50-60 years (European Drought Catalogue, European Drought Reference, EDR). These databases are essential to answer the question, if drought has become more severe in Europe. We show that in general annual river flow became higher in northern Europe and lower in southern Europe over the last half a century. However, the streamflow in August decreased in most of Europe. A multi-model analysis confirms that decline in August flow also likely happened in south-eastern and eastern Europe. Similar analyses show that the frequency of future meteorological droughts will increase in multiple European regions. An analysis using reasonably-performing models in the past, points out that hydrological drought in snow-affected river basins will decrease, but in other basins it will increase, particularly during the dry season. We demonstrate that the influence of climate change on duration and severity of hydrological drought is dependent on possible adaptation. Drought management aims to reduce impacts of the drought hazard. Impacts of historic drought (about 5000 events) from text sources for different sectors have been systematically collected in the European Drought Impact Inventory (EDII). We will show the likelihood of occurrence (risk proxy) of drought impacts for different sectors dependent on the meteorological drought severity. Clear differences occur across countries and among impacted sectors. Vulnerability factors have been identified in Drought Dialogue Fora (DDFs) at different scales (river basin, national, European Union). Maps have been compiled. We will illustrate that about 30% of the European population is living in regions that have a high to very high vulnerability. The high risk associated with drought in many European regions requires a pro-active risk management supported by an adequate drought policy rather than a reactive crises management that was common in the past. Templates are available that describes the different steps to achieve at a national drought policy and Drought Management Plans (DMPs). We will illustrate drought policy options that have been identified for different cases in Europe. A key element in a DMP is, how an ongoing drought is managed. An example is provided that describes key elements that are needed. We will conclude with some research challenges about trend studies, drought projections, forecasting, impact collation, drought management including its context, and the influence of people. We make clear that there is no one-size jacket that fits all.
Oral, Floods and Droughts II International Congress on Water, Ourense
42
Analysis of the performance of drought indices to identify drought impacts in different USA crops
Marina Peña-Gallardo1 , Sergio M. Vicente-Serrano1 ,Steven Quiring2, Marc Svoboda3, Santiago Beguería4, Jamie Hannaford5, Benjamin Lloyd-Hughes6, Fergus Reig1
1Instituto Pirenaico de Ecología, Consejo Superior de Investigaciones Científicas (IPE–CSIC), Zaragoza, Spain.
[email protected] / [email protected] 2* Department of Geography. Texas A&M University. Eller O&M Building. College Station, Texas.
3 National Drought Mitigation Center, University of Nebraska-Lincoln, Lincoln, Nebraska 4Estación Experimental de Aula Dei, Consejo Superior de Investigaciones Científicas (EEAD- CSIC), Zaragoza,
Spain. 5Center for Ecology and Hydrology, Maclean Building, Crowmarsh Gifford, Oxfordshire, UK.
6Institute for Environmental Analytics. Philip Lyle Building. University of Reading. Whiteknights Campus. Reading RG6 6BX, UK
ABSTRACT
Drought is a recurring climatic phenomena originated from a lack of precipitation over a prolonged period of time. The impact of droughts are diverse, the many different types of impact are usually classify as ‘economic’, ‘environmental’, and ‘social’ impacts, among others, drought leads to reduced water supply, deteriorated water quality, diminished hydroelectric power generation, disturbed habitats (loss of wetlands, poor soil quality or lower water levels in reservoirs, lakes and ponds), and but also crop failure and reduced range productivity. Due to this, drought is among the most devastating of natural hazards. Drought can also develop over short periods (weeks or months) or longer periods (seasons, years, or even decades)
In North America the occurrence of extreme drought events has increased significantly in number and severity, this situation has contributed to lower agricultural productivity in major farming and ranching areas across, especially in the United States where during the past several years it has created concerns about agriculture and farming interests.
The aim of this work is evaluate the relationship between drought events and crop productions across US for the period.
Eight drought indices commonly used to monitor drought conditions were calculated in order to assess the correlations with yields: Palmer Drought Indices (PDSI, ZIndex, PHDI, scPDSI, scZIndex and scPHDI), the Standardized Precipitation Index (SPI) and the Standardized Precipitation and Evapotranspiration Index (SPEI) at time scales from 1 to 12 months for the period 1961-2014. The different crops selected for the analysis are: barley, corn, cotton, soybean and winter wheat.
The results obtained demonstrate that multiscalar indices allow to identify drought vulnerabilities in the different types of crops at a wide range. The differences of spatial and temporal distribution of the correlations are noticeable depending on the crop and time-scale analysed but also in the same type of crop.

II International Congress on Water, Ourense Oral, Floods and Droughts
43
Detailed study and calibrated mathematical model of flood risk at the Municipality of Carballo (A Coruña), ARPSI ES014-
CO-10-01
Gustavo Vázquez Herrero1, Victoria Rivas García1 and Jesús Varela Martínez1
1CIMARQ Consultora de Ingeniería, Medio Ambiente y Arquitectura, A Coruña, Spain
ABSTRACT
The implementation of the Methodological Guide for Development of the National System for Flood Mapping (Guía Metodológica para el Desarrollo del Sistema Nacional de Cartografía de Zonas Inundables) at the Municipality of Carballo presents several issues when it is performed in further detail. Overcoming those difficulties is a challenge for all the stakeholders, as engineers, authorities, companies and individual owners.
The development of the calculation models, specially their calibration (which is essential), must be done with the maximum technical stringency, because flooding areas are determined based on them. Furthermore, contrasted spatial information is required in order to calibrate models and, by this way, results that represent reality as adequately as possible can be obtained.
An intensive field campaign was carried out in the study of the Carballo ARPSI. These works were aimed to collect and analyse the existing data related to flood events. During this phase, difficulties to obtain and validate this historical information were highlighted. It was necessary to resort to multiple sources of contrast allowing the selection of adequate calibration events.
At the same time, cartographic base models were corrected and updated based on geographical survey data. The representation of the physical characteristics of surroundings, where natural spaces are combined with fully developed urban areas, required a distinguished definition of the different domains. The full implementation of all its singularities was a challenge concerning the mathematical modelling.
After running the model and calibrating according to the collected data in previous phases, flood prone boundaries were defined. In addition, the calibrated model was used to define and design the actions to mitigate adverse effects of flooding. These corrective measures were also designed by conducting cost-benefit analysis based on sustainability criteria.
Keywords: floods, modelling, calibration, risks, corrective measures.

Oral, Floods and Droughts II International Congress on Water, Ourense
44
Impact of Climate Change and Extreme Weather on Hydropower Production in the Miño-Sil Basin
Manuel Fernández González1, Juan Antonio Añel Cabanelas1,2, Laura de la Torre Ramos1, Xavier Labandeira Villot3,4
1EPhysLab, Universidade de Vigo, Campus de Ourense, Spain. [email protected], [email protected], [email protected]
2 Smith School of Enterprise and the Environment, University of Oxford, Oxford, UK. 3 REDE, Universidade de Vigo, Campus As Lagoas Marcosende, Vigo, Pontevedra, Spain.
[email protected] 4FSR-Climate, European University Institute, Firenze, Italy.
ABSTRACT
Galicia is a region in the northwestern Iberian Peninsula. In this region four hydrological basins coexist: Galicia Costa, Miño-Sil, Cantábrica Occidental and Duero. In the Miño-Sil there are 76 dams and 90 hydropower stations. These power stations totalize 3,010.752 MW of installed power capacity, 83% of the total power capacity installed in Galicia. This also represents almost 9% of the total power capacity installed in the Iberian Peninsula.
Extreme weather events of precipitation are a great problem when managing hydropower stations. These events have a huge impact on population, infrastructure (specifically on dams), energy security and the energy market. All these are exhacerbated because of climate change.
Here we take data of precipitation for the Belesar, Castrelo and Velle dams in the Miño-Sil basin. We study extreme events of cumulated precipitation (exceptional great and low values) over the last 50 years and analyse the impact of climate change on their probability of ocurrence.
Keywords: extreme events, water management, climate change, dams, hydropower production
II International Congress on Water, Ourense Oral, Floods and Droughts
45
Status of the implementation of Floods Directive in Europe: main challenges of the implementation of the Flood Risk
Management Plans in Spain.
Monica Aparicio Martín1 and Francisco Javier Sánchez Martínez 2
1Ministry of Agriculture, Food and Environment. General Directorate of Water
2Ministry of Agriculture, Food and Environment. Directorate General of water.
ABSTRACT
In response to the severe floods in 2002, the Commission therefore took the initiative to launch concerted action at Community level to help reduce the severity of flood events and the damage caused by these floods, which was reflected in the Directive 2007/60/EC, on the assessment and management of flood risks, adopted in October 2007.
Through the implementation of Floods Directive, around 8,000 areas of potential significant flood risk (APSFRs) have been identified by 23 Member States with Croatia identifying the most (2,976). Flooding from rivers was, as for historic floods, the most common source associated with flood risk areas and the economy was the most common aspect to be potentially impacted in these areas. More than 18,400 historic flood events were reported and considered by Member States in their preliminary flood risk assessments. At the European level the most common source of potential future flooding was again river water floods (76% of the derived potential events) and the least, from groundwater and from artificial structures containing water (both 2%).
Maps showing the hazards and risks of flooding have been prepared and made available to the public by December 2013. These maps have already been carried out and show the potential extent and the depth of flood water, as well as the potential adverse consequences associated with floods in three different probability scenarios of flooding: low, medium and high.
Finally, MSs have developed the flood risk management plans (FRMP), which address all aspects of flood risk management focusing on prevention, protection, preparedness, including flood forecasts and early warning systems and taking into account the characteristics of the particular river basin or sub-basin.
After a general overview of the status of the implementation around Europe, the presentation will focus on the Spanish experience, and the main challenges in the implementation of the Spanish FRMPs.
Keywords: Floods Directive, Flood Risk Management Plans, Flood Mapping, Preliminary Flood Risk Assessment, Flood hazard and risk maps.


Poster

II International Congress on Water, Ourense Poster
49
P1
A Climatological Analysis of Drought Occurrences over the Amazon River Basin using SPEI
Anita Drumond1* , Rogert Sorí1, Raquel Nieto12, Luis Gimeno1, Sergio M. Vicente-Serrano3
1*EPhysLab (Environmental Physics Laboratory), Facultade de Ciencias, Universidade de Vigo, Ourense, Spain. [email protected]
2Department of Atmospheric Sciences, Institute of Astronomy, Geophysics and Atmospheric Sciences, University of São Paulo, São Paulo, Brazil.
3Instituto Pirenaico de Ecología, Consejo Superior de Investigaciones Científicas (IPE-CSIC), Zaragoza, Spain.
ABSTRACT
It is known that the Amazon rainforest plays an important role in the global energy and hydrological budgets, and has been suffering for some time from intense deforestation. Amazon River Basin (ARB) has suffered from severe droughts in recent years, generating serious socio-economic impacts, particularly in water resources, ecosystems and agriculture. Here we use the Standardized Precipitation Evapotranspiration Index (SPEI) together with the CRU (TS3.23) precipitation and potential evapotranspiration data set to investigate the drought occurrences over the ARB during the period 1980-2014. CRU data is available at a monthly scale with a spatial resolution of 0.5 degrees. The monthly SPEI index is applied to identify the onset and end drought episodes in different time scales, and their respective characteristics including duration, severity and intensity.
Keywords: drought, SPEI, Amazon River Basin

Poster II International Congress on Water, Ourense
50
P2
Effect of increasing long-term water deficit on maritime pine radial wood growth/density in southern Portugal
Cathy Kurz-Besson1*, José Lousada2, Rita M Cardoso1, Ana Russo1, Filipa Varino3, Isabel Correia4, Teresa David4, Célia Gouveia1
1*Instituto Dom Luiz (IDL), Faculdade de Ciências, Universidade de Lisboa, Portugal, [email protected]
2 Centro de Investigação e de Tecnologias Agro-Ambientais e Biológicas,
Universidade de Trás-os-Montes e Alto Douro, Portugal.
3 Centre National de Recherches Météorologiques, Meteo-France/CNRS, France.
4 Instituto Nacional de Investigação Agraria e Veterinária, Av. da República, Quinta do Marquês, Portugal.
ABSTRACT
We investigated whether Pinus pinaster (Ait), one of the main agroforestry pine species explored in Portugal, has been affected by short to long-term droughts in Alentejo, a region who experienced an increase of dryness. In this study, we analyze how wood radial growth and density responded to the evolution of drought events since the 1950s.
There was a sharp decline of spring precipitation from 1950 to 2012, progressively spreading from spring to the previous late winter. This, combined with a raise of temperature, induced a higher evapotranspiration rate, which is reflected by a negative trend in the SPEI multi-scalar drought index (1 to 24-months) since the 1980s.
Tree radial growth was consistently and positively correlated to winter total precipitation while negatively correlated to winter dry spells. The significant correlations were mostly concentrated in the months of November-January preceding the ring formation. Tree-ring width appears to benefit from the minimum temperature increase in this period, whereas the negative effects of long-term droughts significantly prevail on tree-ring density. We found significant positive relationships between wood ring indices and SPEI accumulated over 8-12 month. The latter points out the increasing long-term water deficit as a key-factor of the loss of productivity and quality for P. pinaster wood in southern Portugal.
Our results highlight the relevance of deep water storage and the depth of the capillary fringe for Maritime pine in a semi-arid environment. The accumulation of recent inauspicious years with negative SPEI indexes and insufficient stored water at the beginning of the growing season tended to decrease the length of the growing period and consequently resulted in thinner cell walls and thus in lower wood width, density and quality.
Keywords: Minimum temperature change, Spring precipitation changes, multi-scalar drought index SPEI, wood growth/density, Pinus pinaster.
Acknowledgements: This work was partially supported by the project PIEZAGRO (PTDC/AAG-REC/7046/2014) funded by the Fundação para a Ciência e a Tecnologia (FCT), Portugal. Ana Russo thanks FCT for granted support (SFRH/BPD/99757/2014).

II International Congress on Water, Ourense Poster
51
P3
Vulnerability of Coastal Recreational Areas Facing Floods and Climate Change
Diego Rodríguez-Toubes
1 Business Organization, University of Vigo, Spain
ABSTRACT
Floods are the most significant natural disaster in Spain, they cause an average of 20 victims per year and annual economic losses estimated at 800 million euros. On the other hand, tourism is a key sector in Spain’s economy, despite the importance of tourism in the country’s life and economy -it is considered a strategic sector- research has hardly addressed the association or inter-relationship confluence between floods and tourism.
The reality of climate change will add, and is no doubt already adding, a new dimension and complexity to the relationship between tourism and flooding. Some works and reports about the impact of climate change in Spain include a section on tourism, besides others studies have addressed impacts on Spanish tourism, most of them generally focus on the Mediterranean area and more specifically on demand behaviour in expected temperature increase scenarios. However one of the most threatened resources due to its natural value and its ability of tourist attraction are the beaches and other coastal recreational areas. These areas are threatened by the impact of both river and marine flooding, and is expected that other variables as weather conditions, rain falls and the average sea level will also affect because the action of climate change.
This paper presents a case assessment of the recreational areas of the coast of Galicia. An identification of bathing areas with potential risk of flooding is performed. The study analyses the vulnerability of coastal tourism of Galicia to the impact of floods and the effect of climate change in the environmental value and touristic attraction of the beaches.
Keywords: beach, climate change, coastal tourism, flooding, vulnerability
Poster II International Congress on Water, Ourense
52
P4
A methodology to propagate rainfall uncertainty through fully distributed hydrological and hydraulic models for flood
inundation modelling
Luis Cea1*, Ignacio Fraga1, María Bermúdez1,2, Jerónimo Puertas1, Manuel Álvarez1, Santiago Salsón3, Alberto Petazzi3
1*Water and Environmental Engineering Group, University of A Coruña, Spain, [email protected]
2School of Geographical Sciences, University of Bristol, United Kingdom
3MeteoGalicia. Xunta de Galicia, Spain
ABSTRACT
Any numerical prediction should include an estimation of its uncertainty bounds in order to make sensible interpretations of model results. Model output uncertainty stems from several factors as observation errors in the data used for calibration, uncertainty in initial conditions and input data, parameter estimation, and mathematical simplifications.
In this paper we present a methodology to propagate rainfall uncertainty through fully distributed hydrological and hydraulic models for flood risk assessment. First, a series of possible rainfall fields are generated from conditional simulations, using the rainfall data measured at a regional rain gauge network. The rainfall fields are used as input data of a fully distributed hydrological model, which produces a storm hydrograph for each rainfall field. In this way, a numerical hydrograph with uncertainty bounds due to rainfall uncertainty is obtained. These hydrographs are then propagated through a high resolution 2D flood model in order to obtain the water depth and velocity fields in the study area. Since the CPU time of the flood model is relatively high, and a large number of simulations must be done, a non-parametric surrogate model of the high-resolution flood model is used in order to reduce the CPU time.
Using this methodology a different inundation field is obtained for each conditional rainfall field generated from the measured rainfall data. The statistical analysis of these inundation fields allow us to obtain mean inundation levels and their uncertainty bounds in all the study area.
The methodology is applied to a coastal urban area (Vilagarcía de Arousa) located at the outlet of a 24 km2 catchment in the northwest of Spain. The rainfall fields which serve as input for the hydrological model were obtained from the rain gauge network of MeteoGalicia and from 3 new rain gauges which were installed within the CAPRI project (Probabilistic flood prediction with high resolution hydrologic models from radar rainfall estimates) funded by the Spanish Ministry of Economy and Competitiveness (CGL2013-46245-R). The numerical simulations were done with the software Iber (www.iberaula.es).
Keywords: flood inundation modelling, rainfall uncertainty, hydrologic model, shallow water equations, Iber
II International Congress on Water, Ourense Poster
53
P5
The impact of humidity on the Schönbein ozone measurement methodology
I. A. Ramírez-González1, J. A. Añel1.2, O. García-Feal1, A. Saiz-López3, A. Cid4,5, J. C. Mejuto5, L.
Gimeno1
1 EPhysLab, Campus de As Lagoas, Universidade de Vigo, Ourense, Spain 2 Smith School of Enterprise and the Environment, University of Oxford, Oxford, UK
3Department of Atmospheric Chemistry and Climate, Institute of Physical Chemistry Rocasolano, CSIC, Madrid, Spain
4 UCIBIO, REQUIMTE, Departamento de Química, Faculdade de Ciências e Tecnología, Universidade NOVA de Lisboa, Caparica, Portugal
5 Department of Physical–Chemistry,Fac. of Sciences of Ourense, Universidade de Vigo, Ourense, Spain, [email protected]
ABSTRACT Through the 19th century the Schönbein method was used as the primordial method to measure tropospheric ozone. Traditionally it has been considered that measurements using this methodology are not accurate enough to be useful. Detractors of this method argue that it is sensitive to meteorological conditions, being the most important the influence of relative humidity. As a consequence the data obtained by this method have usually been discarded. Here we revisit this method having into account the influence of relative humidity. We explore several concentrations of starch and potassium iodide, the basis for this measurement method, exposing them to very different atmospheric conditions. We found that different concentrations work better than others for ozone measurement. In order to improve the objectivity of the measurement we developed a software that calculates Schönbein values automatically. Having into account the values of relative humidity we correct the ozone measurements. Finally the validation of the Schönbein methodology is discussed. Keywords: Schönbein method, ozone, relative humidity.

Poster II International Congress on Water, Ourense
54
P6
Hydrological characterization of Douro River Basin for the period 1970-2010 using VIC model
Matide García-Valdecasas-Ojeda, Sebastiano de Franciscis, Sonia Raquel Gámiz-Fortis, Yolanda Castro-Díez and María Jesús Esteban-Parra
Department of Applied Physics
University of Granada, Spain, [email protected]
ABSTRACT
This study analyzes the evolution of different hydrological variables, such as real evapotranspiration and soil moisture, for the last 30 years, in the Douro Basin, which is the most extensive basin within the Iberian Peninsula. The different components of the real evaporation are connected to the soil moisture content. These variables can be important when analyzing the intensity of droughts and heat waves, and particularly relevant for the study of the climate change impacts. The current evapotranspiration and soil moisture data are provided by simulations obtained using the Variable Infiltration Capacity (VIC) hydrological model. This model is a large-scale hydrologic model and allows estimates of different variables in the hydrological system of a basin. Land surface is modeled as a grid of large and uniform cells with sub-grid heterogeneity (e.g. land cover), while water influx is local, only depending from the interaction between grid cells and local atmosphere environment. As input variables for VIC model observational data of temperature and precipitation from Spain02 dataset are being used. Additionally, estimates of current evapotranspiration will be also analyzed using as input variables for VIC temperature, precipitation, wind, humidity and radiation obtained from a dynamical downscaling of ERA-Interim data with the Weather Research and Forecasting (WRF) model. The simulations have a spatial resolution about 9 km, and the analysis will be carried out on a seasonal time-scale. Preliminary results obtained from Spain02 data show a decrease in current evapotranspiration and soil moisture for this basin, particularly significant during spring. Keywords: Current evapotranspiration, soil moisture, Douro Basin, VIC hydrological model, WRF model. Acknowledgements: This work has been financed by the projects P11-RNM-7941 (Junta de Andalucía-Spain) and CGL2013-48539-R (MINECO-Spain, FEDER).

II International Congress on Water, Ourense Poster
55
P7
Application of a joint probability approach to estimate flood hazard in the macro tidal estuary of Betanzos
(NW of Spain)
Silda Ruano Pereira1*, Javier Sopelana Peralta2 and Luis Cea Gómez3
1Universidade da Coruña, Spain, [email protected] 2
Aquática Ingeniería, Areal 42 2º Dcha, Vigo, Spain, [email protected]
3 Environmental and Water Engineering Group, Departamento de Métodos Matemáticos y de Representación, Universidade da Coruña, Spain. [email protected]
ABSTRACT
Most of the flood hazard studies, which are undertaken nowadays in estuaries, do not account properly for the probability of simultaneous occurrence of extreme sea levels and river discharges. Usually both variables are assumed to be independent or an arbitrary combination of return periods for each one is used. However, if both processes are assumed to be independent the likelihood of flooding will be considerably underestimated. Following the Spanish Government recommendations, the standard procedure calculates the water level for a return period, by combining sea level for this return period and river discharge associated to the same return period. This paper presents the application of a joint probability methodology by defining the “historical reconstruction” of the water level in order to evaluate flood hazard in the city of Betanzos, which is located at the mouth of the river Mandeo, in the meso/macro tidal estuary of Betanzos (NW of Spain). Basically, the employed method calculates a long series of water level (predictand) based on the results short cases of numerical simulations (Iber) selected from long series of tide and river discharge (predictors). First, long term synthetic time series of daily sea levels and river discharges at the boundaries of the study area are generated. From the long term time series, a reduced number of characteristic cases (clusters) are selected using the Maximum Dissimilarity Algorithm. Maximum water levels are then computed in the study area for each cluster using the 2D hydrodynamic model Iber. Finally, a reconstruction of the water level long term time series is done by interpolation techniques taking into account the cluster results and the long term of the predictors at the boundaries of the study area. The water level results obtained with the joint probability approach for different return periods show that the traditional methodology oversizes in a considerable manner the floodplains, which has important legal implications regarding land use limitations. Keywords: flood hazard, meso and macro tidal estuary, joint probability, Iber.
Poster II International Congress on Water, Ourense
56
P8
Modelling Pinus Pinaster wood radial density response to water deficit in Portugal
Célia M. Gouveia1, José Lousada2, Ana Russo1, Rita M. Cardoso1, Filipa Varino3, Isabel Correia4
and Cathy Besson1
1IDL, Faculdade de Ciências, Universidade de Lisboa, Portugal, [email protected]
2 Centro de Investigação e de Tecnologias Agro-Ambientais e Biológicas,
Universidade de Trás-os-Montes e Alto Douro, Portugal.
3 Centre National de Recherches Météorologiques, Meteo-France/CNRS, France.
4 Instituto Nacional de Investigação Agraria e Veterinária, Av. da República, Quinta do Marquês, Portugal.
ABSTRACT
Trees are responding physiologically to the prevailing climatic conditions. Wood formation is recognized to be strongly affected by climate conditions at different observation scales, from the plant to the region. Using monthly means of climate variables (maximum, minimum and mean temperature, precipitation), climate indices (dry spell, heat sum) and drought indicators (SPEI for the times scales from 1 to 24 months), we analysed the vulnerability of Pinus Pinaster wood radial density to climate variability and change. Wood ring cores (ten cores per location and only one core per tree) were sampled under contrasting climate conditions and altitude from North to centre-South Portugal. Wood radial density tend to highly benefit from the strong decline of cold days and the increase of minimum temperature. On the other hand tree ring density tend to recently increasingly suffers from the higher occurrence of short to long term droughts, especially in drier Portuguese areas. . Two linear regression models were developed with the aim of forecasting Pinus Pinaster wood radial density in Alentejo region using separately climate variables and indices, as well as the different time scales of SPEI. Both models performed well in terms of robustness and reliability. Limitations result from the linear nature of the model, and disregarded effects due to the increase in CO2. Nevertheless, our results reflects the strong impact of changes in minimum temperature and precipitation in interannual variability of Pinus Pinaster wood radial density. Keywords: Pinus Pinaster wood radial density, drought, climate variability, Standard Precipitation-Evapotranspiration Index (SPEI), regression models
Acknowledgements: This work was partially supported by national funds through FCT (Fundação para a Ciência e a Tecnologia, Portugal) under project PIEZAGRO (PTDC/AAG-REC/7046/2014). Also Ana Russo thanks FCT for granted support (SFRH/BPD/99757/2014).
II International Congress on Water, Ourense Poster
57
P9
Comparison of PDSI, SPI and SPEI Drought Indices for São Paulo
Pampuch (Luana Albertani)1* and Ambrizzi (Tércio)2
1*UNESP- Univ Estadual Paulista, Campus São José dos Campos, São Jose dos Campos, Brazil , [email protected]
2USP – University of São Paulo, São Paulo, Brazil
ABSTRACT
Drought is a phenomenon originated by a lack of rainfall, but it is a complex event that can be classified according to its application, location and time of occurrence. Several indices where studied to identify the beginning, ending, duration and magnitude of droughts. The PDSI index (Palmer Drought Severity Index) is based on water balance equation, calculating periods of supply and demand of water. This index is calculated in an unique time scale (between 9 and 12 months), using precipitation and temperature data, and a constant for Available Water Holding Capacity of the location. Another index currently used is the SPI (Standardized Precipitation Index). This index convert the precipitation data into probabilities that are transformed into standardized series. This index uses only precipitation data, but allows the use of different time scales. The SPEI index (Standardized Precipitation-Evapotranspiration Index) is a more recent index that takes into account not only the precipitation but also the temperature to consider the evapotranspiration in the calculations. As the SPI, SPEI can be calculated in different time scales. The city of São Paulo is the biggest geo-economics centre in South America and it is the most populous city in Brazil. The drought events in this city can affect the water reservoirs for human consumption and electricity generation, as it occurred during a major drought in 2014. A better understanding and monitoring of this phenomenon in São Paulo can help to predict it and minimize the effects for population. In this study, we calculate PDSI, SPI and SPEI indices using the São Paulo University Meteorological Station (São Paulo - IAG) from 1933 to 2015. We used a self-calibrated PDSI (sc-PDSI) program (developed by Nathan Wells, Steve Goddard and Michael J. Hayes) to calculate PDSI index; and two other programs (developed by Santiago Beguería and Sergio M. Vicente Serrano) to calculate SPI and SPEI in 6, 12 and 18 months time scales. The three indices can capture the most severe droughts in the recent years (2001 and 2014) in different time scales. The analysis of SPI and SPEI indices for 6 month scale allows the identification of droughts in a small scale that is not possible with PDSI. We intend to perform changes on precipitation and temperature data, simulating a reduction on precipitation and a temperature increase to analyse how each index behaves for São Paulo. In a climate change scenario, these changes could affect the duration and magnitude of the droughts. Keywords: Drought, Drought Indices, extreme events.
Poster II International Congress on Water, Ourense
58
P10
Hydrochemical Pattern of a Flood Event: Natural versus Dammed Rivers
Ricardo Prego1, Miguel Angel Álvarez-Vázquez1,2, Elena De Uña-Álvarez2,
Mariló Doval3, Miguel Caetano4
1Instituto de Investigaciones Marinas (CSIC), Spain. 2Grupo GEAAT (University of Vigo), Spain.
3INTECMAR (Xunta de Galicia), Spain. 4Instituto Português do Mar e da Atmosfera (IPMA), Portugal.,
ABSTRACT
The hydrological and hydrochemical impact of extreme events on coastal systems, such as floods in the Galician Rias, should be different depending on the presence or absence of dams in the river network. So, environmental information is a key question in order to make protocols about warning and mitigation. In this way this communication will address a flood event in the Ria of Ares-Betanzos, analyzed by comparison between (i) the fluxes before, during and after the event in the Eume and Mandeo rivers, and (ii) the changes in the Eume River caused by the presence of an impoundment, using the Mandeo River as reference. This study is a contribution of the MEFIO project, ref. CTM2011-28792-C02-02, financed by MINECO. The Eume and Mandeo rivers were sampled before (Dec. 11, 2012) during (Jan. 24, 2013) and after (Feb. 20) a flood event. Daily flow data were supplied by ‘Augas-de-Galicia’ Co. There, (i) electric conductivity (EC), temperature and pH were in situ measured, and fluvial water sampled to determine (ii) dissolved oxygen saturation (DOS), concentrations of nitrate, nitrite, ammonium, phosphate, silicate and the dissolved trace elements (TEs) Al, As, Cd, Co, Cr, Cu, Fe, Mn, Mo, Ni, Pb, V and Zn, (iii) concentrations of suspended particulate matter (SPM), particulate organic carbon and nitrogen (POC & PON), chlorophyll-a (Chl-a) and contents of TEs in the SPM. Trace-analysis clean techniques were performed and procedures checked using CRMs. During the flood event, compared to non-flood condictions, EC increased in the Mandeo and decreased in the Eume; SPM raised from twice (Eume) to twelve times higher (Mandeo); DOS did not change; POC, PON and Chl-a increased 20-80%; in Mandeo, nitrate and silicate decreased 30% while ammonium was 80% higher; phosphate increased 60% in both rivers; dissolved TEs in Eume were higher for Al, As, Cr, Fe, Mo and V (2-3 times), Cu and Zn (x9), and Mn (x45) while in Mandeo did for Cd, Co and V (x2), Al and Pb (x5-6), Cu, Ni and Zn (x16-18). Particulate ETs in SPM decreased around one half (Cd, Co, Cu, Pb) or less (0.2 for V and Zn in Mandeo), except for Fe (16 times higher) in Mandeo, and Cr (x14) and Pb (x4) in Eume. The Eume River showed the half of water flow than Mandeo River during the flood event although their basin surface and land-uses are similar. Moreover, 30% of POC and PON, 40% of ammonium and 80% of SPM (particulate TEs contents increased in SPM) and most of dissolved TEs were trapped inside the dam. These hydrochemical changes must be considered in the management of fluvial flooding. Keywords: flood, hydrochemistry, pristine, dam, Galicia

II International Congress on Water, Ourense Poster
59
P11
A climatological characterization of the droughts over the Danube River Basin in the period 1980-2014 using SPEI
Milica Stojanovic1*, Anita Drumond1, Raquel Nieto1, Luis Gimeno1 and Sergio M. Vicente-Serrano2
1EPhysLab (Environmental Physics Laboratory), Facultade de Ciencias, Universidade de Vigo, Ourense, Spain, [email protected]
2Instituto Pirenaico de Ecología, Consejo Superior de Investigaciones Científicas (IPE-CSIC), Zaragoza, Spain
ABSTRACT
The Danube is the second longest river in Europe extending from Central Europe to southeastern Europe cutting across the territories of many countries. It is one of the most utilized waterways in the world, represents a natural resource of water for agriculture, industry, domestic water and plays an important role in the ecological balance of the area. It is likely that climate change favors conditions for the development extreme climate events such as drought in many regions of Europe. Drought is one of the most complex hazards particularly because it is very difficult to identify its onset and end due to its multi-scalar nature. Here we will identify the drought episodes occurred over Danube River Basin area in the period 1980-2014. The drought episodes are identified through the Standardized Precipitation Evapotranspiration Index (SPEI), calculated using monthly CRU (TS3.23) precipitation and potential evapotranspiration data set with a spatial resolution of 0.5 degrees.The monthly SPEI-1, SPEI-3, SPEI-6, SPEI-12 and SPEI-24 indexes were used to identify the drought episodes in different time scales and their respective indicators including duration, intensity, and frequency.
Keywords: Danube River Basin, Drought, Standardized Precipitation Evapotranspiration Index (SPEI)
Poster II International Congress on Water, Ourense
60
P12
Numerical evaluation of flooding and estimation of assets at risk in Tulancingo, Mexico
Omar Salvador Areu-Rangel1*, José González-Cao2, Alejandro J. C. Crespo2 and Rosanna Bonasia1
1Escuela Superior de Ingeniería y Arquitectura, Instituto Politécnico Nacional, México
2EPHYSLAB (Environmental Physics Laboratory), Universidad de Vigo, España
ABSTRACT
Estimation of damage caused by flooding in a given population is a crucial task in making decisions to minimize human and economic losses associated with this phenomenon. This assessment of damage is based on criteria of risk estimation.
In this work the risk associated to a flooding was estimated in Tulancingo city (Mexico), according to different rainfall scenarios calculated for six return periods (from 5 to 1000 years). The risk was estimated using the criterion defined by CENAPRED (Zepeda & Sánchez, 2001) based on three parameters: hazard, vulnerability and degree of exposure.
Using numerical simulations, performed with IBER software, hazard maps associated to each return period for the study area were obtained. The hazard is classified as low, medium or high depending on the values of the hydraulic variables of depth and velocity obtained with IBER.
From high hazard areas obtained with IBER and using population and housing census data of INEGI (Instituto Nacional de Estadística y Geografía, Mexico) to define the type and number of lots located in high hazard areas, a risk map for high hazard was constructed.
The results indicate that there are 1294 lots at high risk of flooding in Tulancingo city, where at least 174 have a probability of occurrence greater than 20%. The records of the past three decades confirm these results.
Keywords: flooding, hazard, IBER
Zepeda Ramos, O., & Sánchez Pérez, T. A. (2001). Diagnóstico de Peligros e Identificación de Riesgos de Desastres en México. Atlas Nacional de Riesgos de la República Mexicana. In Diagnóstico de Peligros e Identificación de Riesgos de Desastres en México. Atlas Nacional de Riesgos de la República Mexicana. Centro Nacional de Prevención de Desastres.
II International Congress on Water, Ourense Poster
61
P13
Crop yield response to different time-scales of drought: varied spatial and temporal patterns in different crop types
of US
Sergio M. Vicente-Serrano1, Marina Peña-Gallardo1, Steven Quiring2, Marc Svoboda3, Santiago Beguería4, Jamie Hannaford5, Benjamin Lloyd-Hughes6, Fergus Reig1
1Instituto Pirenaico de Ecología, Consejo Superior de Investigaciones Científicas (IPE–CSIC), Spain
2Ohio State University, USA
3National Drought Mitigation Center, University of Nebraska-Lincoln, USA
4 Estación Experimental de Aula Dei (EEAD-CSIC), Spain
5Centre for Ecology and Hydrology, United Kingdom
6University of Reading, United Kingdom.
ABSTRACT
We have processed the crop yield records from five main cultivations at the county level in the USA and developed a harmonised dataset covering more than 40 years of records. We focussed on wheat, corn, soybean, cotton and barley. Annual crop yields were detrended to remove the increased crop yields associated to technological innovations, and related county crop yield anomalies with the temporal variability of the detrended Standardized Precipitation Evapotranspiration Index (SPEI). This index was obtained from high resolution gridded precipitation and reference evapotranspiration data also at the county level. Results show very different response of crop yields to the different time-scales of the SPEI. This is identified among different crop types but also spatially for each crop type. The obtained spatial patterns are coherent and they identify large areas with a homogeneous response of the crop yield to SPEI time-scales. We explained the different crop-response patterns analysing the average climate conditions, the vegetation activity obtained by means of remote sensing imagery, phenology statistics and the soil water capacity. For this purpose we used one-way ANOVA analysis and post-hoc contrasts among the different patterns of response to drought and the different climate and environmental variables used in the analysis.
Keywords: Standardized Precipitation Evapotranspiration Index, drought impacts, wheat, soybean, corn.
Poster II International Congress on Water, Ourense
62
P14
Wet Spells across Danube River Basin during 1980-2014
Danica Ciric1*, Raquel Nieto1, Anita Drumond1, Luis Gimeno1 and Alex M. Ramos2
1*EPhysLab (Environmental Physics Laboratory), Facultade de Ciencias, Universidade de Vigo, Ourense, Spain, [email protected]
2Instituto Dom Luiz, Universidade de Lisboa, Portugal
ABSTRACT
The Danube River Basin is the second longest catchment basin in Europe and exhibits intense climatological diversity inside it. During the recent decades, frequency and intensity of daily precipitation extremes have suffered from an increment in many parts of the world, including central and eastern Europe. Wet spells are defined as the number of consecutive rainy days with different thresholds. The identification of wet spells and their trends in the rainfall time is very important for many sectors such as agriculture, ecology, hydrology and water resources. They can lead extreme events and cause floods and other disasters. In this study, we will attempt to characterize precipitation globally in the context of wet spells and associated precipitation depth in wet spells in the Danube River Basin area using daily precipitation data and a set different approaches to identify wet spells.
Keywords: Wet spell, Precipitation, Danube River Basin.

II International Congress on Water, Ourense Poster
63
P15
Influence of Okhotsk high on spring river discharge in eastern Siberia
Kazuhiro Oshima1, Hotaek Park1, Yasuhiro Yoshikawa2
1Institute of Arctic Climate and Environment Research, Japan Agency for Marine-Earth Science and Technology, Japan, [email protected]
2Department of Civil and Environmental Engineering, Kitami Institute of Technology, Japan.
ABSTRACT
Arctic rivers start to freeze in autumn and the river ice melts in spring. The frozen rivers provide convenience as ice road to local inhabitants, while the breakup of river ice sometimes causes a spring flood, incurring damage to local habitants. Broken ice sheets occasionally accumulates in a river channel and the ice jam induces sudden rise in the water level and flood. Concomitant with ice breakup, rapid increase of the river discharge occurs. Therefore, it is important to understand amount and timing of the spring discharge.
In this study, we examined spring discharge at Tabaga in the upper Lena River of eastern Siberia. The seasonal cycle of the discharge showed a rapid increase in May and maximum peak in June. The amount of spring discharge (May to June) was related to precipitation over the upper Lena basin during winter. On the other hand, the timing of increase in the spring discharge had correlation with temperature in May. When the May temperature is high (low) around this region, the increase of discharge is early (late). This reflects the influence of spring warming on snow and ice melting. Sea level pressure regressed on the May temperature showed positive anomaly over the Sea of Okhotsk. Accompanied with the Okhotsk high, warm advection from the south rises temperature over eastern Siberia. This anomalous warming induces early melting of snow and river ice, and early rising of the spring discharge in the midstream of the Lena River. In addition to this, solar radiation may affect the spring warming.
Keywords: River discharge, Eastern Siberia, Spring warming, Snow and ice melting, Okhotsk high
Poster II International Congress on Water, Ourense
64
P16
Projected changes in the evolution of drought in the 21st century over the Czech Republic
Vera Potopová1, Petr Štěpánek 2,3, Pavel Zahradníček 2,3, Aleš Farda2, Luboš Türkott1, Josef Soukup1
1 Department of Agroecology and Biometeorology, Czech University of Life Sciences Prague, Czech Republic [email protected]
2Global Change Research Centre ASCR, Czech Republic
3Czech Hydrometeorological Institute, Czech Republic
ABSTRACT
This study investigates how drought is expected to change in the 21th century, using the multi-scalar drought indices and the newest source of climate projections for three regions in the Czech Republic. Based on the representative concentration pathway (RCP) scenarios, projected changes in drought/wetness conditions during the growing season were investigated using a set of eight recent regional climate models simulations driven by five different global circulation models carried out in the frame of EURO-CORDEX. Drought projections from the perspective of Standardized Precipitation Evapotranspiration Index (SPEI) and Standardized Precipitation Index (SPI) over the 21st century were performed using the RCP4.5 and RCP8.5 scenarios.
Using the above mentioned models and scenarios, future drought projections were developed for two time periods, 2041-2070 and 2071-2100, and compared to the historical period 1981-2010. To derive the reference evapotranspiration and subsequently the drought indices for several lags (1-, 3-, 6-, 12 and 24-month), the climate variables from observations and model outputs with horizontal grid spacing of 10 km used in this study are the maximum and minimum temperatures, wind speed, sunshine duration, relative air humidity and precipitation amount. Changes in the interannual variability, frequency, length, and magnitude of drought events are investigated. The results show (i) a substantial variation of temporal drought patterns and their dependence on model, and the type of indices applied. (ii) Future drought scenarios also depend on the time scale considered: the magnitude of change in the SPEI/SPI at the time scale of 24 months is nearly twice as great as that at 1 month. (iii) Some models are more sensitive to changes in greenhouse gas concentrations than others, which results that the high-end RCP 8.5 scenario shows lower percentage of drought occurrence than the moderate RCP 4.5 scenario even at the end of the century. (iv) The SPEI projections indicate drier conditions in the late 21st century, while the SPI indicates wetter climates in the future. Thus, the SPEI consistently projects more severe drought conditions than the SPI. (v) For the SPEI, both scenarios RCP 4.5 and 8.5 projects a tendency toward dry conditions, and shows a drop in the percentage of time under normal conditions compared to historical period. (vi) Conversely, the SPI projects wetter-than-normal conditions tended to prevail longer over the occurrence of drier conditions in all regions (lowland, highland and mountainous), highlighting the inability of the SPI to capture temperature-controlled droughts.
Keywords: EURO-CORDEX, drought, wetness, RCP4.5/RCP8.5, SPI/SPEI

II International Congress on Water, Ourense Poster
65
P17
A preliminary assessment of hydroclimatic drought indicators in the trans-boundary Prut River Basin: A case
study in the Republic of Moldova
Vera Potopová1, Valeriu Cazac2, Boris Boincean3
1 Department of Agroecology and Biometeorology/Czech University of Life Sciences Prague, Czech Republic, [email protected]
2Hydrology Department/State Hydrometeorologic Service, Republic of Moldova
3Research Institute of Field Crops "Selectia", Republic of Moldova
ABSTRACT
In the last decades, a series of severe and extensive droughts (2007 and 2012) and floods (2008 and 2010) have swept over the Republic of Moldova, resulting in tremendous economic losses. The trans-boundary Prut River Basin is one of the most vulnerable areas in the Republic of Moldova, due to high water exploitation indexes and to environmental and water quality problems when droughts appear. Drought and flood episodes are highly common within its territory, even during the same year (e.g., 1994), and the balance between water supply and demand is very fragile. Moreover, in the Prut River Basin, climate change is predicted to cause chronic reductions in water availability (press-droughts) through reduced precipitation and increased temperatures as well as increase the frequency and intensity of short-term extreme droughts (pulse-droughts). Society needs information about when and where drought conditions translate into impacts and to improve the mitigation of the impact of droughts and floods at the catchment level.
This paper is a preliminary report of a wider study which is carried out in the frame of IMDROFLOOD project "Improving Drought and Flood Early Warning, Forecasting and Mitigation using real-time hydroclimatic indicators”. Our study integrated hydrological and climatological observational networks such as five hydrological posts (from north to south: Sireuti, Braneste, Ungheni, Leova and Brinza) and four climatological stations (Briceni, Falesti, Leova and Cahul), which cover the Prut River Basin key area of the Republic of Moldova from State Hydrometeorlogical Service. To finding the best hydro-climatic indicators for drought impact mitigation in several areas (agriculture, irrigation, and insures companies), we applied historical hydro-climatic records and spatial layers integrated in Geographical Information Systems. Daily data of 8 meteorological variables (daily values of the maximum and minimum temperatures, mean temperature, wind speed, sunshine duration, relative air humidity, soil moisture and precipitation amount) and four hydrological variables (measured water surface evaporation, discharges, water storage and groundwater) over a 30-year period were used.
Keywords: drought, flood, hydro-climatic drought indicator, Prut River Basin
Poster II International Congress on Water, Ourense
66
P18
Meteorological Droughts in the Niger River Basin and its link with atmospheric moisture transport
Rogert Sorí1*, Anita Drumond1, Raquel Nieto1,2, Sergio M. Vicente-Serrano3, Luis Gimeno1
1*Environmental Physics Laboratory (EPhysLab), Facultad de Ciencias, Universidade de Vigo, Ourense, Spain, [email protected]
2Department of Atmospheric Sciences, Institute of Astronomy, Geophysics and Atmospheric Sciences, University of São Paulo, São Paulo, Brazil.
3Instituto Pirenaico de Ecología, Consejo Superior de Investigaciones Científicas (IPE-CSIC), Zaragoza, Spain.
ABSTRACT
On West Africa, the Niger River Basin (NRB) spreads north-south in the Sahel region, an important transitional zone of climate conditions between the Sahara and the wet central Africa. Due to the socioeconomic importance of the NRB, the goal of this work is to identify the main meteorological drought episodes in the NRB during 35 years, from 1980 to 2014 and investigate the moisture contribution to the basin during these events. To do it, was calculated the Standardized Precipitation-Evapotranspiration Index (SPEI) at 1, 3, 6, 12, 18 and 24 months (temporal scales) for the whole basin and were identified the drought episodes according to the criterion of Mckee et al. (1993). The Lagrangian model FLEXPART v9.0 was utilized to track 10 days backward in time the air masses residing over the NRB during drought episodes identified with the SPEI at 12 months scale. The analysis permitted: Identify over which region the parcels gain more or less humidity and the verify the importance of the already documented climatological moisture sources of the NRB during these drought episodes. With the SPEI-12months were identified five main drought episodes, in order of occurrence are: First (6/1982 - 8/1988) and the longest with 75 months and most severe; second (8/1990 - 4/1991); third (9/2000 - 5/2003) the second more severe; fourth (11/2005 - 11/2006) and fifth (7/2011 - 5/2012). The anomalies of (E – P)>0 during these five drought episodes are mainly negatives, being more intense over the NRB itself and the surrounding Sahel regions. Over the tropical-east South Atlantic Ocean, the Mediterranean Sea and the Red Sea are also observed negative anomalies. It means a decrease on the moisture contribution to the basin from these regions; previously identified as the main moisture sources of the NRB. The results here obtained give knowledge about meteorological mechanisms of the hydrological cycle associated with meteorological drought periods in the NRB.
Keywords: Drought, Moisture contribution, Niger River Basin
II International Congress on Water, Ourense Poster
67
P19
Evolution of drought episodes assessed with the Standardized Precipitation Evapotranspiration
Index (SPEI) over Fertile Crescent
Zeinab Salah1*, Anita Drumond1, Raquel Nieto1,2, Luis Gimeno1, and Sergio M. Vicente-Serrano3
1*EPhysLab (Environmental Physics Laboratory), Facultade de Ciencias, Universidade de Vigo, Ourense, Spain. [email protected]
2Department of Atmospheric Sciences, Institute of Astronomy, Geophysics and Atmospheric Sciences, University of São Paulo, São Paulo, Brazil.
3Instituto Pirenaico de Ecología, Consejo Superior de Investigaciones Científicas (IPE–CSIC), Zaragoza, Spain.
ABSTRACT
Fertile Crescent region (FC), as a part of the Middle East, is considered a highly water- stressed area and a hotspot of climate change. This region is prone to severe droughts and all their complex economic-social impacts. Standardized Precipitation Evapotranspiration Index (SPEI) was used to identify the drought episodes experienced by the FC during 1980-2014. Beside to the simplicity of its calculation and its multi-temporal nature, SPEI is based on the climatic water balance (the difference between PRE and PET), including the role of temperature and the sensitivity of evaporative demand, which makes it be suitable for studying droughts in arid and semi-arid regions as FC.
Using the monthly precipitation and potential evapotranspiration of Climatic Research Unit (CRU) climate dataset with a spatial resolution of 0.5 degree, the monthly SPEI values were classified into 4 categories: Mild (-0.99<SPEI<0), Normal (-1.49 < SPEI ≤ -1), Severe (-1.99 < SPEI ≤ -1.5), and Extreme (SPEI≤ -2). A drought episode was defined as a period of one month (or more) starting with negative SPEI value followed by a value of -1 or less and ends when SPEI returns again to positive values. For the FC, more than 50% of the different categories identified by several SPEI timescales started and happened in the wet season from October to May, and their occurrence increased after 1998. In addition, most of the extreme SPEI values were detected during two events: 1998-2000 and 2007-2009, both periods showed the highest intensities and were detected by all SPEI timescales with some differences in the months of onset and duration.
Keywords: Fertile Crescent – drought – SPEI – extreme droughts.
Poster II International Congress on Water, Ourense
68
P20
Determination of flood areas of Sidi Ifni city
(South Morocco)
Aicha Saad 1, Ahmad El Kanti2*
1Faculty Polydisciplinary of Taroudant –Ibn Zohr University Agadir- Morocco
2* Hydraulique basin agency of Sakia el Hamra and Oued Ed-Dahab
ABSTRACT
Morocco has known in 2014 severe floods that particularly affected the city of Sidi Ifni declared disaster city. This natural disaster has made many human and material damage (47 dead, several injured and damage to city infrastructure). Ifni wadi, dried generally, becomes a raging torrent during floods.
The old techniques are no longer efficient to manage these floods that previously constituted a source of irrigation in the city.
Therefore, the present study is necessary to determine the flood areas of the region with a view to develop a flood risk management plan. The GIS tool has identified the flood character soil constituting the study area, according to different scenarios.
L’outil SIG a permis d’identifier le caractère inondable des sols constituant la zone d’étude suivant différents scenarios.
Keywords: Flood hazard; Sidi-Ifni, GIS, Morocco.
II International Congress on Water, Ourense Poster
69
P21
A Composited Drought Model for Mongolia Pasture based on Satellite Image
Sheng Chang1, Bingfang Wu1*, Nana Yan1, Davdai Bulgan2, Nasanbat Elbegjargal2, Tuvdendorj Battsetseg2
1Institute of Remote Sensing and Digital Earth, Chinese Academy of Science, China
2 National Remote Sensing Center, Mongolia
[email protected], [email protected]
ABSTRACT
Drought may influence the livestock production, bring to economic damage, and accelerate desertification processes associated with destructive human activities (i.e., overgrazing) in semi-arid pastureland areas of Mongolia. Drought is a recurrent climate process occurring with uneven temporal, rainfall and spatial characteristics over a broad area and over an extended period of time. In the last decades, observations showed that the frequency and intensity of droughts had increased in some parts of the world (Hulme, 1993) including the Mongolian Gobi (Adyasuren, 1998). Regional climate warming in southern Mongolia has increased by 0.1 to 3.7 °C during last 60 years. In this region, there is also evidence that spring precipitation has decreased by 17%, while summer precipitation has increased by 11% (Natsagdorj, 2000). Remote sensing has been taken as a useful tool for droughts monitoring in large-scale area in terms of moisture content in the top few centimeter of soil. Satellite-based indices have been developed and used to effectively detect and monitor droughts all over the world.
The objective of this paper was to try to find the suitable method and drought monitoring model for accurate describing the pasture drought in Mongolia. According to the existed drought indices, select some of them to test and analyse adaptability in different agro-ecological zones and different grass growing periods. Then develop the new integrated remotely sensed drought model for accurate monitoring pasture drought.
Measurement of field campaign in 2014-2015 was carried out, and precipitation, soil moisture, biomass and statistics drought materials were collected for comparing and validating the new combined drought monitoring model. The results show that the model can well reflect the drought extent and change, there are high relations between them and have more consistent results with the actual situation. The monitoring results can be used for stakeholders and decision makers to prevent and mitigate disaster.
Keywords: Drought, Pasture, Remote Sensing, Composited monitoring model.

Poster II International Congress on Water, Ourense
70
P22
Multipurpose water resource planning and management using Nile Basin DSS in the upper Blue Basin, Ethiopia
Habtam A. Mekonen1*, Melese M. Wondim 2, Addisu G. Dagnew3, Mikiyas G. Etichie4
1Water Resource Specialist, Dept. of Water Resource Engineering, Tana Sub Basin Org.,
Abay Basin Authority, Ethiopia [email protected]
2GIS and Remote Sensing Specialist, Dept. of GIS and Remote Sensing, Tana Sub Basin Org,
Abay Basin Authority, Ethiopia [email protected]
3Hydrologists, Dept. Hydrology, Tana Sub Basin Org., Abay Basin Authority, Ethiopia [email protected]
4 Hydrologists, Dept. Hydrology, Tana Sub Basin Org., Abay Basin Authority, Ethiopia [email protected]
ABSTRACT:
The DSS is considered to comprise (i) a knowledge base, and (ii) modeling tools. These two elements are to have in-built internal interfaces, and the DSS as a whole, through input and output systems, is to have strong linkages with the separately developed BIS and WIS and The Authority is carrying out a study using the Nile Basin Decision Support System (NB-DSS) to providing the inputs needed for a water resources management and development plan for the Tana Sub-Basin.
KeyWords: Nile Basin DSS, Tana Sub Basin, Scenarios, Indicators, Melt-criteria Analysis

II International Congress on Water, Ourense Poster
71
P23
Impacts of Flooding on the Thermal Tourism
Diego Rodríguez-Toubes
Business Organization, University of Vigo, Spain,
ABSTRACT
One of the sectors for which it has been particularly difficult to assess the impacts of climate change is the tourism industry. Recent researches claim that tourism will be strongly affected by climate change as many tourist activities are dependent on weather conditions.
Tourism and specifically thermal tourism and the facilities and business related are an industry strongly dependent on water. Thermal tourism infrastructures usually are located in areas at risk of flooding, this fact often causes the shutdown of business and facilities until the water level drops and they can set up to normality. This problem occurs several times each winter causing both economic losses and social and environmental damages. The largest floods occur in low season (October-March) this fact adversely affects the value of non-seasonal attached to the thermal tourism.
A review of literature reveals a lack of studies about the impact of floods on tourist areas and infrastructure and fluvial areas usually located in high flood risk areas. Thus, this scarcely studied area requires further research and attention by planning and policy management authorities.
This paper analyses how floods affect tourism demand in the thermal sector and suggests possible adaptation strategies to develop for tourism businesses.
Keywords: climate change, flooding, thermal, tourism business


AUTHOR INDEX

II International Congress on Water, Ourense Author Index
75
Álvarez, Manuel 52 Albertani Pampunch, Luana 57 Alfaro, Enric 38 Alonso-González, Esteban 36 Álvarez-Vázquez, Miguel Angel 58 Amador, Jorge A. 38 Ambrizzi, Tércio 57 Añel Cabanelas, , Juan Antonio 44, 53 Aparicio Martín, Monica 45 Areu-Rangel, Omar Salvador 60 Azorin-Molina, Cesar 36
Bates, Paul 28 Battsetseg, Tuvdendorj 69 Baymani-Nezhad, Matin 32 Beguería, Santiago 42, 61 Bermúdez, María 28, 52 Biel, Carmen 36 Boincean, Boris 65 Bonasia, Rosana 60 Borràs, Gabriel 36 Brands, Swen 33 Bulgan, Davdai 69
Caetano, Miguel 58 Canelas, Ricardo 26 Cardoso, Rita M 50, 56 Castro-Díez, Yolanda 54 Cazac, Valeriu 65 Cea, Luis 25, 28, 52, 55 Chang, Sheng 69 Ciric, Danica 62 Correia, Isabel 50, 56 Coxon, Gemma 28 Crespo, Alejandro J. C. 26, 60 Cuartas, Adriana 29
DaCamara, Carlos 39 Dagnew, Addisu G. 70 David, Teresa 50 de Franciscis, Sebastiano 54 de la Torre Ramos, Laura 44 De Uña-Álvarez, Elena 58 Díaz, Rubén 27
Domínguez, José M. 26 Donato Nobre, Antonio 29 Doval, Mariló 58 Drumond, Anita 49, 59, 62, 66.,67 Durán-Quesada, Ana María 38
Eiras-Barca, Jorge 33 El Kanti, Ahmad 68 El Kenawy, Ahmed 36 Elbegjargal, Nasanbat 69 Esteban-Parra, María Jesús 54 Etichie, Mikiyas G. 70
Farda, Aleš 64 Fernández González, Manuel 44 Fraga, Ignacio 52 Freer, Jim 28 Funes, Inmacualada 36
Gámiz-Fortis, Sonia Raquel 54 García-Feal, Orlando 26, 53 García-Valdecasas-Ojeda, Matilde 54 Gimeno, Luis 49,53, 59, 62, 66, 67 Gómez-Gesteira, Moncho 26 González-Cao, José 24, 60 Gouveia, Célia M. 35, 37, 39, 40, 50, 56,
Han, Dawie 32 Hannaford, Jamie 42, 61 Hidalgo, Hugo 38
Idely Palencia-Aguilar, Carla 31
Kurz-Besson, Cathy 50
Labandeira Villot, Xavier 44 Liberato, Margarida L.R. 34, 40 Lloyd-Hughes, Benjamin 42, 61 Lopez, David 27 López-Moreno, Juan I. 36 Lorenzo, María Nieves 33 Lousada, José 50, 56
Author Index II International Congress on Water, Ourense
76
Maia, Rodrigo 30 Martín-Hernández, Natalia 36 Mejuto, J. C. 53 Mekonen, Habtam A. 70 Mendes, Juliana 30 Miguez-Macho, Gonzalo 31 Momo, Marcos Rodigo 29
Neal, Jeffrey Nieto, Raquel
28 49, 59, 62, 66, 67
Oshima, Kazuhiro 63
Park, Hotaek 63 Páscoa, Patricia. 37, 39 Pascual, Diana 36 Peña-Gallardo, Marina 36, 46, 61 Persson, Magnus 31 Petazzi, Alberto 52 Pinheiro, Adilson 29 Pla, Eduard 36 Potopová, Vera 64, 65 Prego, Ricardo 58 Puertas, Jerónimo 25, 28, 52
Quiring, Steven 61
Ramírez-González, I. A. 53 Ramos, Alexandre M. 34, 40, 62 Ramos, Tamara 27 Reig, Fergus 42, 61 Rivas García, Victoria 43 Robles, Alba 33 Rodríguez-Toubes, Diego 51, 71 Ruano Pereira, Silda 55 Russo, Ana 37, 39, 40, 50, 56
Saad, Aicha 68 Saiz-López, A. 53 Salah, Zeinab 67 Salsón, Santiago 52 Sánchez Martínez, Francisco Javier 45 Sanchez-Lorenzo, Arturo 36 Santiago, Jeison 29
Santo, Fátima E. 40 Savé, Robert 36 Sopelana Peralta, Javier 55 Sorí, Rogert 49, 66 Soukup, Josef 64 Sousa, Pedro 35, 39, 40 Štěpánek, Petr 64 Stojanovic, Milica 59 Svoboda, Marc 42, 61
Taboada, Juan 33 Tomas-Burguera, Miquel 36 Tomé, Ricardo 34 Trigo, Ricardo M. 34, 35, 37, 39, 40 Türkott, Luboš 64
Van Lanen, Henny A.J. 41 Varela Martínez, Jesús 43 Varino, Filipa 50, 56 Vázquez Herrero, Gustavo 43 Vicente-Serrano, Sergio M.
36, 42, 49, 59, 61, 66, 67,
Wondim, Melese M. 70 Wu, Bingfang 69
Yan, Nana 69 Yoshikawa, Yasuhiro 63
Zabalza-Martínez, Javier 36 Zahradníček, Pavel 64