TIE Kinetix 30 March AGM 2018 · • EU projecten eind Genormaliseerde EBITDA 9.1% (2017) tegenover...
37
TIE Kinetix 30 March AGM 2018
Transcript of TIE Kinetix 30 March AGM 2018 · • EU projecten eind Genormaliseerde EBITDA 9.1% (2017) tegenover...
TIE Kinetix 30 March AGM 2018
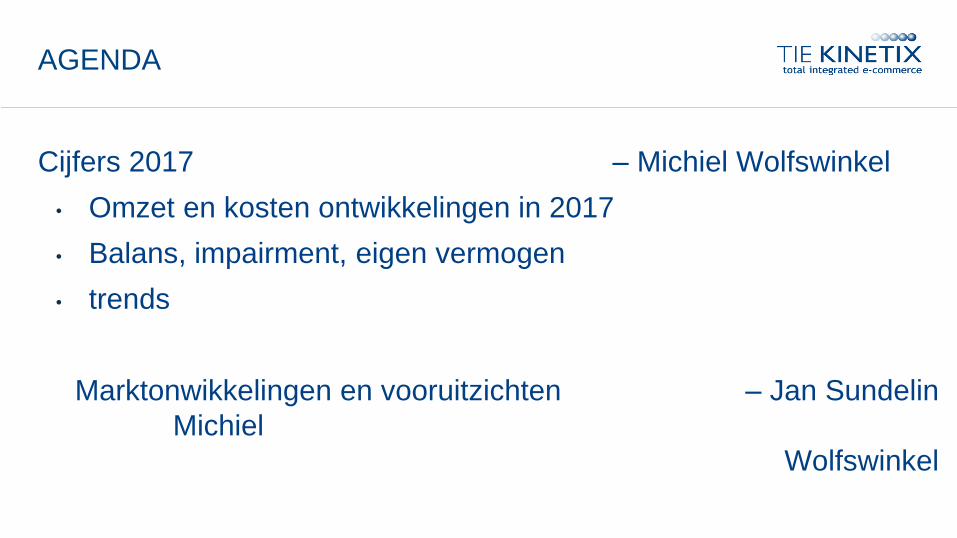
AGENDA
Cijfers 2017 – Michiel Wolfswinkel
• Omzet en kosten ontwikkelingen in 2017
• Balans, impairment, eigen vermogen
• trends
Marktonwikkelingen en vooruitzichten – Jan Sundelin
Michiel
Wolfswinkel
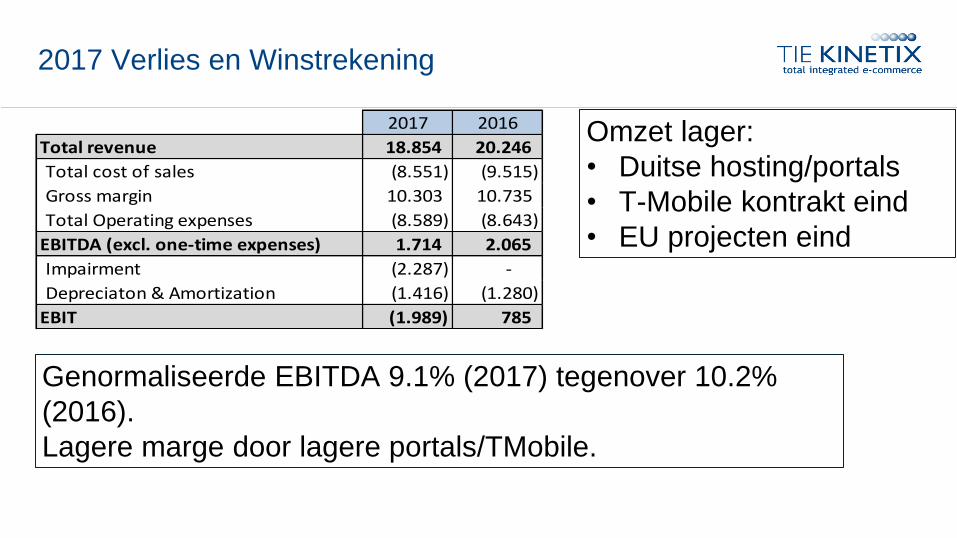
2017 Verlies en Winstrekening
Omzet lager:
• Duitse hosting/portals
• T-Mobile kontrakt eind
• EU projecten eind
Genormaliseerde EBITDA 9.1% (2017) tegenover 10.2%
(2016).
Lagere marge door lagere portals/TMobile.
2017 2016
Total revenue 18.854 20.246
Total cost of sales (8.551) (9.515)
Gross margin 10.303 10.735
Total Operating expenses (8.589) (8.643)
EBITDA (excl. one-time expenses) 1.714 2.065
Impairment (2.287) -
Depreciaton & Amortization (1.416) (1.280)
EBIT (1.989) 785
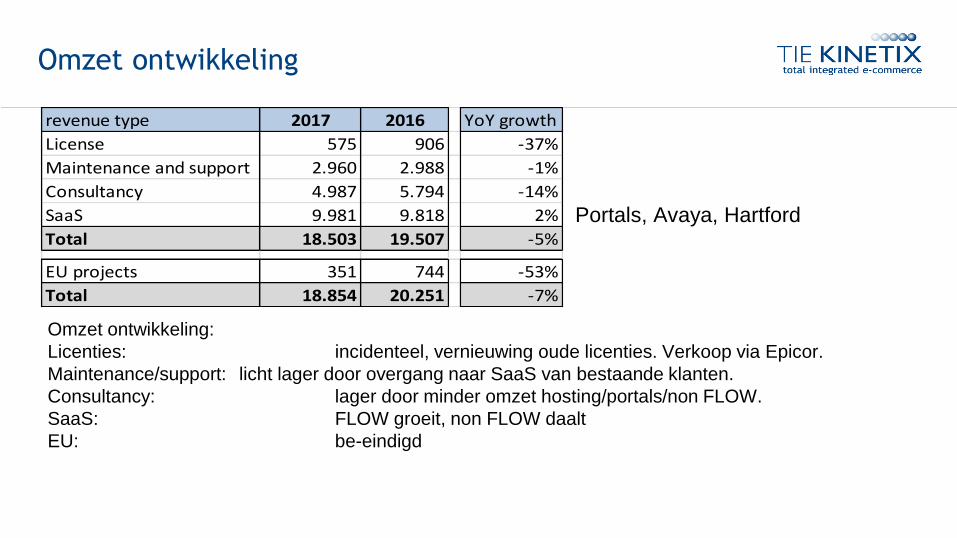
Omzet ontwikkeling
revenue type 2017 2016 YoY growth
License 575 906 -37%
Maintenance and support 2.960 2.988 -1%
Consultancy 4.987 5.794 -14%
SaaS 9.981 9.818 2%
Total 18.503 19.507 -5%
EU projects 351 744 -53%
Total 18.854 20.251 -7%
Omzet ontwikkeling:
Licenties: incidenteel, vernieuwing oude licenties. Verkoop via Epicor.
Maintenance/support: licht lager door overgang naar SaaS van bestaande klanten.
Consultancy: lager door minder omzet hosting/portals/non FLOW.
SaaS: FLOW groeit, non FLOW daalt
EU: be-eindigd
Portals, Avaya, Hartford
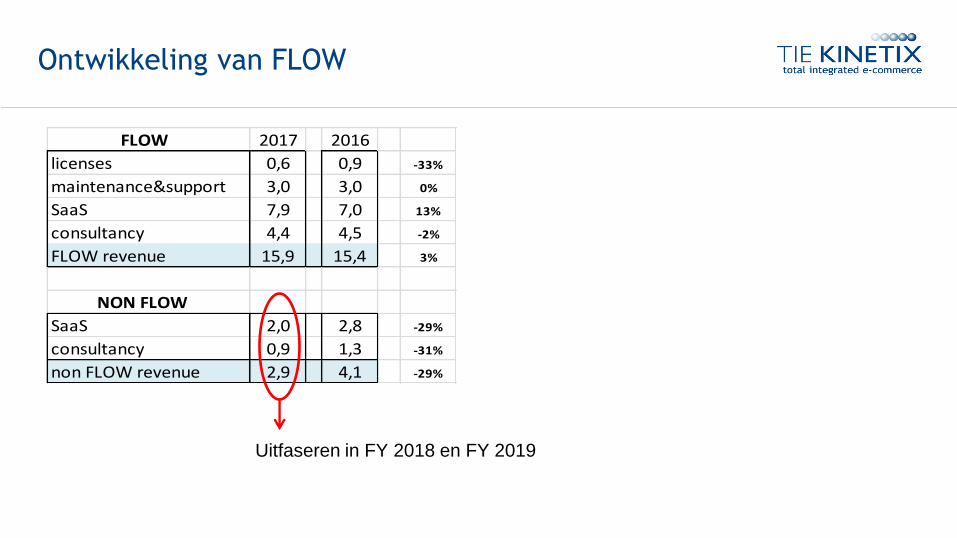
Ontwikkeling van FLOW
FLOW 2017 2016
licenses 0,6 0,9 -33%
maintenance&support 3,0 3,0 0%
SaaS 7,9 7,0 13%
consultancy 4,4 4,5 -2%
FLOW revenue 15,9 15,4 3%
NON FLOW
SaaS 2,0 2,8 -29%
consultancy 0,9 1,3 -31%
non FLOW revenue 2,9 4,1 -29%
Uitfaseren in FY 2018 en FY 2019
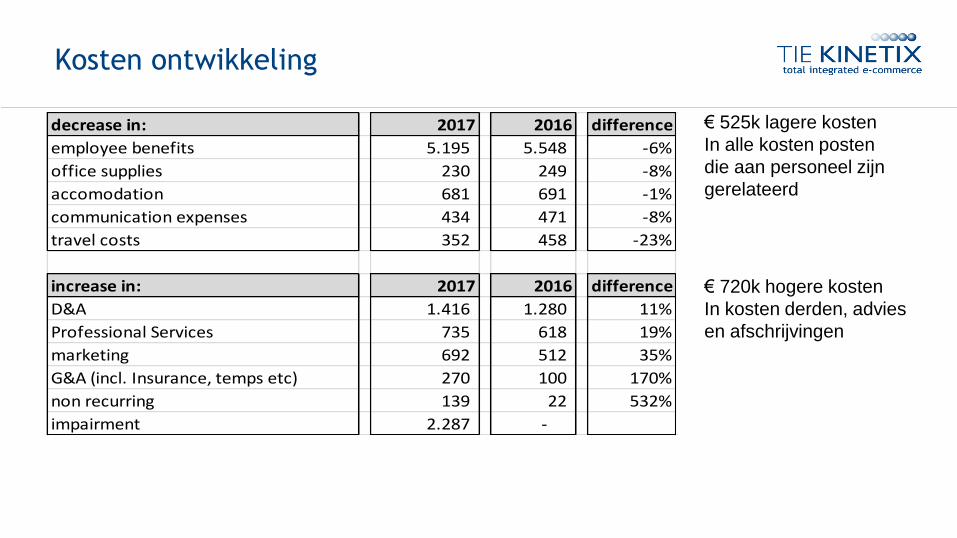
Kosten ontwikkeling
decrease in: 2017 2016 difference
employee benefits 5.195 5.548 -6%
office supplies 230 249 -8%
accomodation 681 691 -1%
communication expenses 434 471 -8%
travel costs 352 458 -23%
increase in: 2017 2016 difference
D&A 1.416 1.280 11%
Professional Services 735 618 19%
marketing 692 512 35%
G&A (incl. Insurance, temps etc) 270 100 170%
non recurring 139 22 532%
impairment 2.287 -
€ 525k lagere kosten
In alle kosten posten
die aan personeel zijn
gerelateerd
€ 720k hogere kosten
In kosten derden, advies
en afschrijvingen
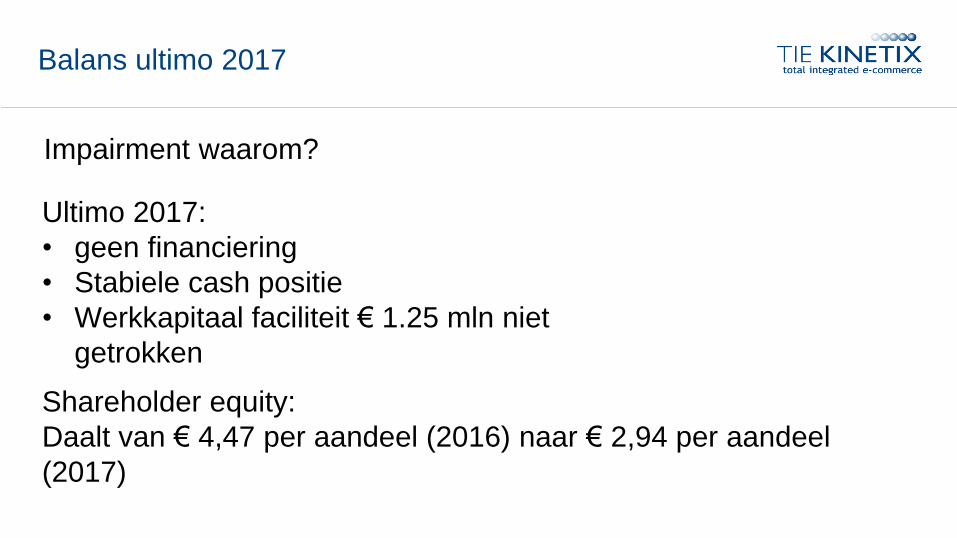
Balans ultimo 2017
Ultimo 2017:
• geen financiering
• Stabiele cash positie
• Werkkapitaal faciliteit € 1.25 mln niet
getrokken
Shareholder equity:
Daalt van € 4,47 per aandeel (2016) naar € 2,94 per aandeel
(2017)
Impairment waarom?

HAND OVER TO JAN SUNDELIN
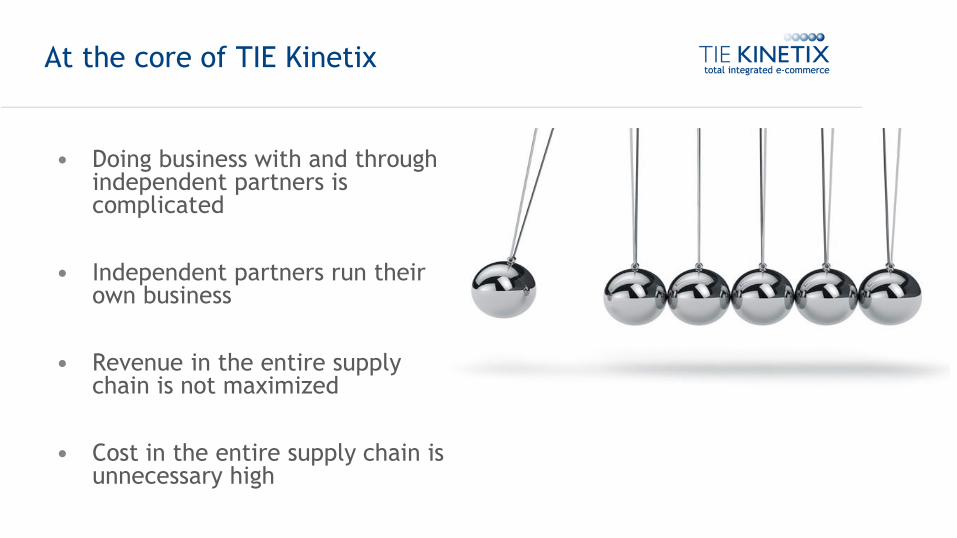
At the core of TIE Kinetix
• Doing business with and through independent partners is complicated
• Independent partners run their own business
• Revenue in the entire supply chain is not maximized
• Cost in the entire supply chain is unnecessary high
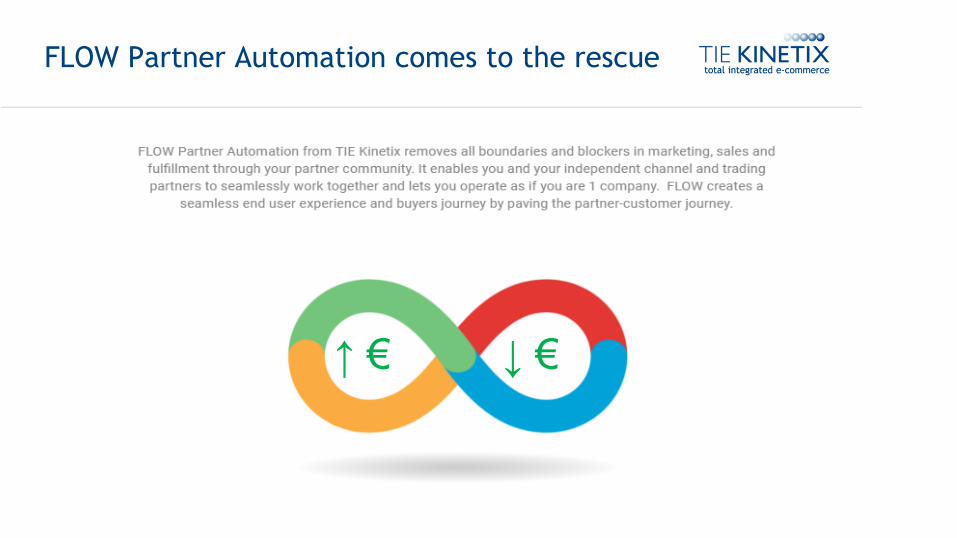
FLOW Partner Automation comes to the rescue
↑ € ↓ €
System & Supply Chain Integration
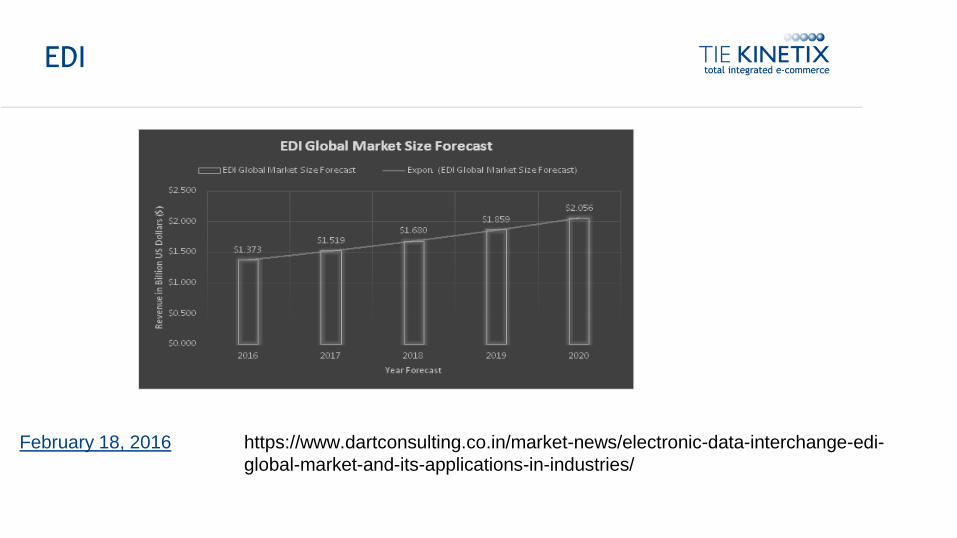
EDI
https://www.dartconsulting.co.in/market-news/electronic-data-interchange-edi-
global-market-and-its-applications-in-industries/
February 18, 2016
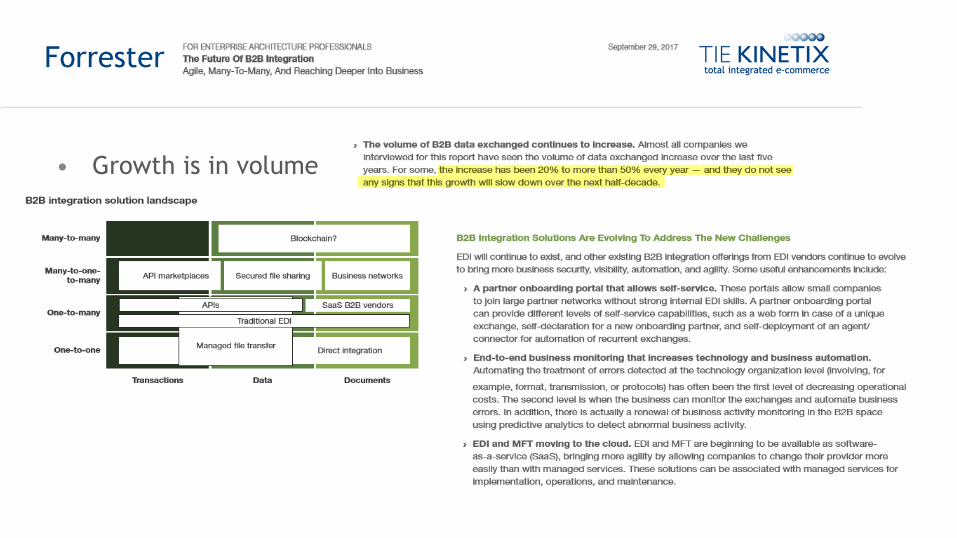
Forrester
• Growth is in volume
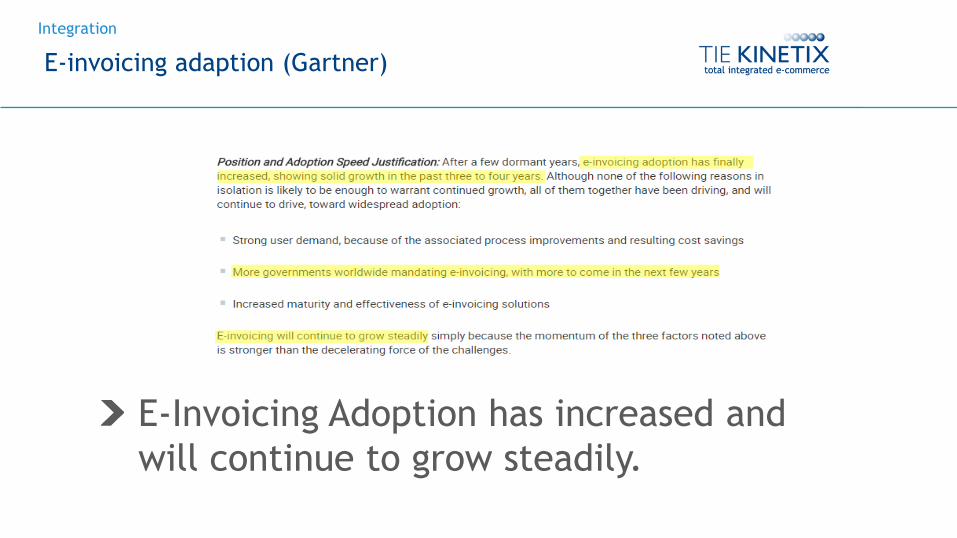
Integration
E-invoicing adaption (Gartner)
E-Invoicing Adoption has increased and
will continue to grow steadily.
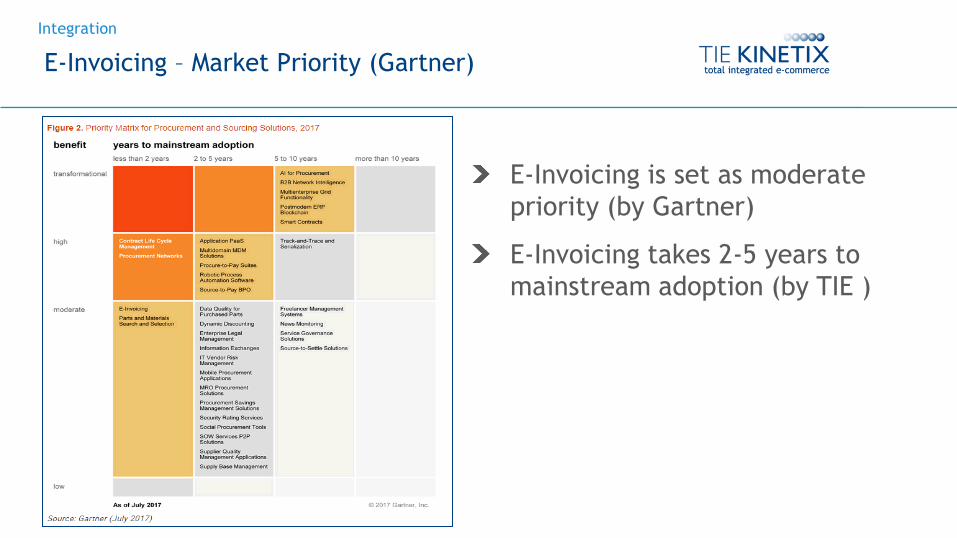
Integration
E-Invoicing – Market Priority (Gartner)
E-Invoicing is set as moderate
priority (by Gartner)
E-Invoicing takes 2-5 years to
mainstream adoption (by TIE )
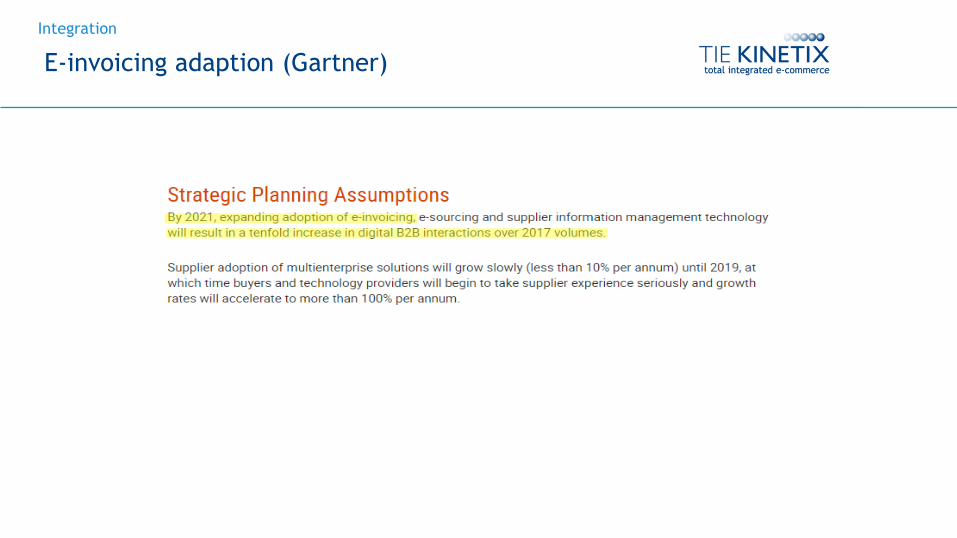
Integration
E-invoicing adaption (Gartner)
Demand Generation Side of FLOW –
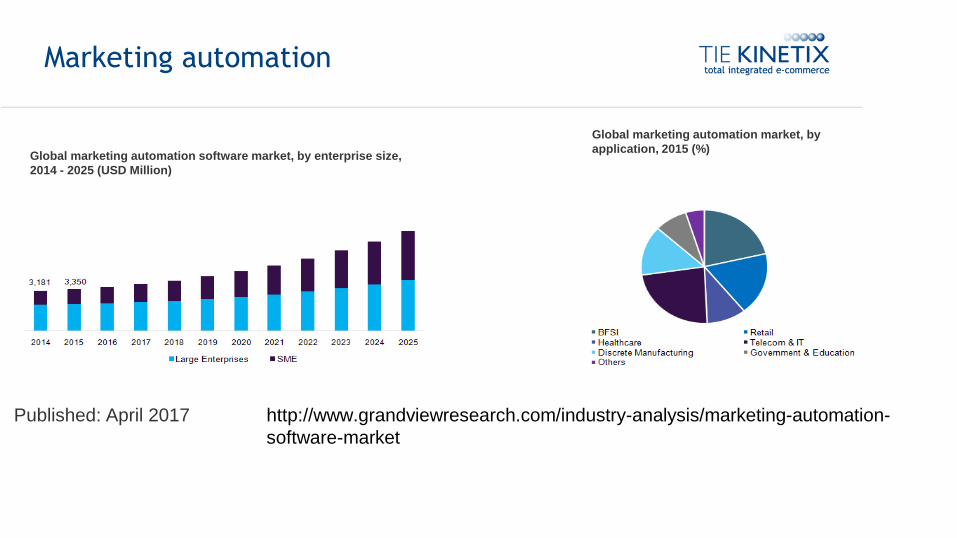
Marketing automation
http://www.grandviewresearch.com/industry-analysis/marketing-automation-
software-market
Global marketing automation software market, by enterprise size,
2014 - 2025 (USD Million)
Global marketing automation market, by
application, 2015 (%)
Published: April 2017
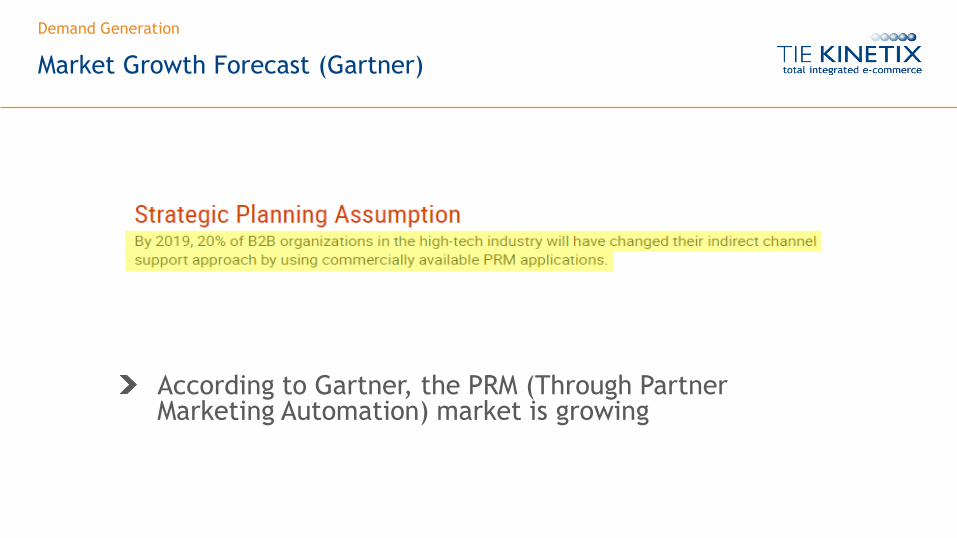
Demand Generation
Market Growth Forecast (Gartner)
According to Gartner, the PRM (Through Partner Marketing Automation) market is growing
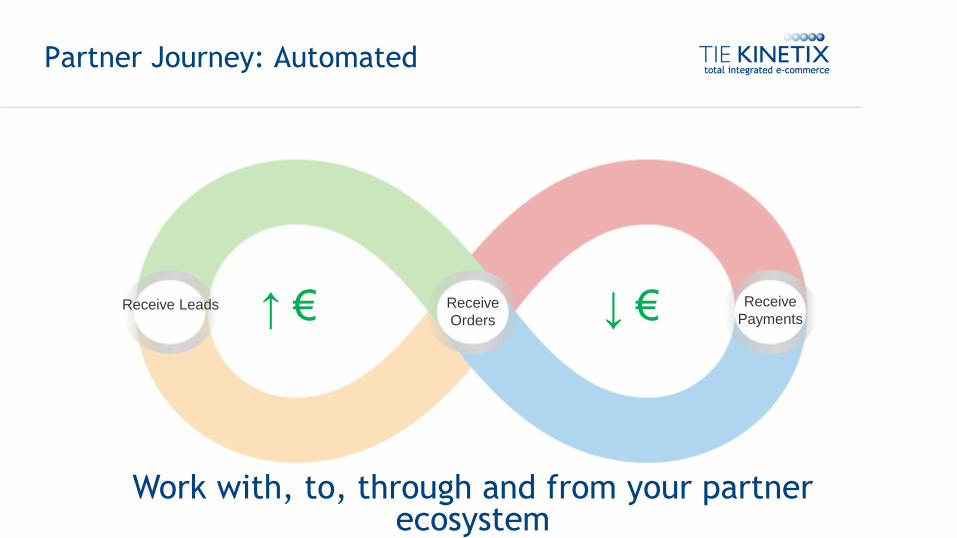
Partner Journey: Automated
Receive Leads Receive
Orders
Receive
Payments
Work with, to, through and from your partner ecosystem
↑ € ↓ €
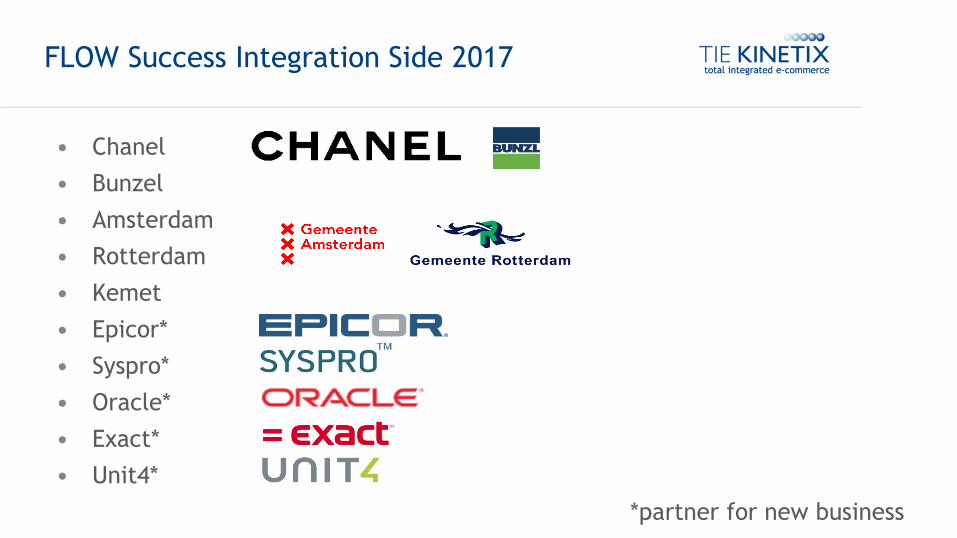
FLOW Success Integration Side 2017
• Chanel
• Bunzel
• Amsterdam
• Rotterdam
• Kemet
• Epicor*
• Syspro*
• Oracle*
• Exact*
• Unit4*
*partner for new business
FLOW Success Demand Side 2017
• Parker
• Unify
• Xerox
• Hon
• Michelin
• Syspro
• Motorola
• Google*
• RIFF*
• Red Hot Penny*
*partner for new business
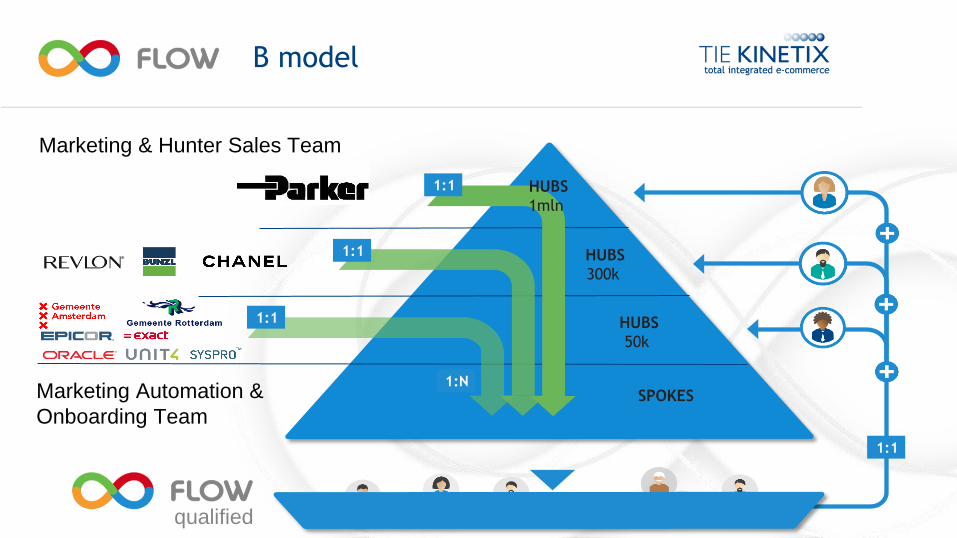
Marketing & Hunter Sales Team
Marketing Automation &
Onboarding Team
HUBS
300k
HUBS
50k
HUBS
1mln
SPOKES
1:1
1:N
1:1
1:1
1:1
B model
qualified
Targets
• Main Targets: HUB’s via Supply our Demand Side
• Secondary Targets: Spokes via the Hubs
HUB’s
• Companies with a large partner eco system (> 1,000) where we can
sell pay per document or pay per click as AdWords.
makes it scalable for growth
• Local Governments
• ERP companies
Lead sources for HUB’s
• ERP companies (Epicor, Exact, Unit 4, Oracle, SysPro)
• Existing Google relation ship NEW offer AdWords for the channel
• List building marketing action via LinkedIN
• Existing customers
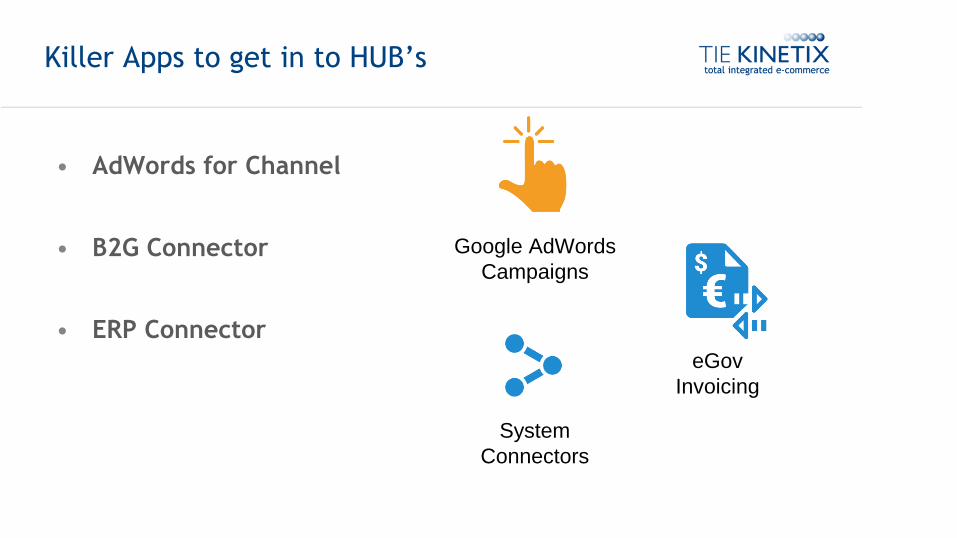
Killer Apps to get in to HUB’s
• AdWords for Channel
• B2G Connector
• ERP Connector
Google AdWords
Campaigns
eGov
Invoicing
System
Connectors
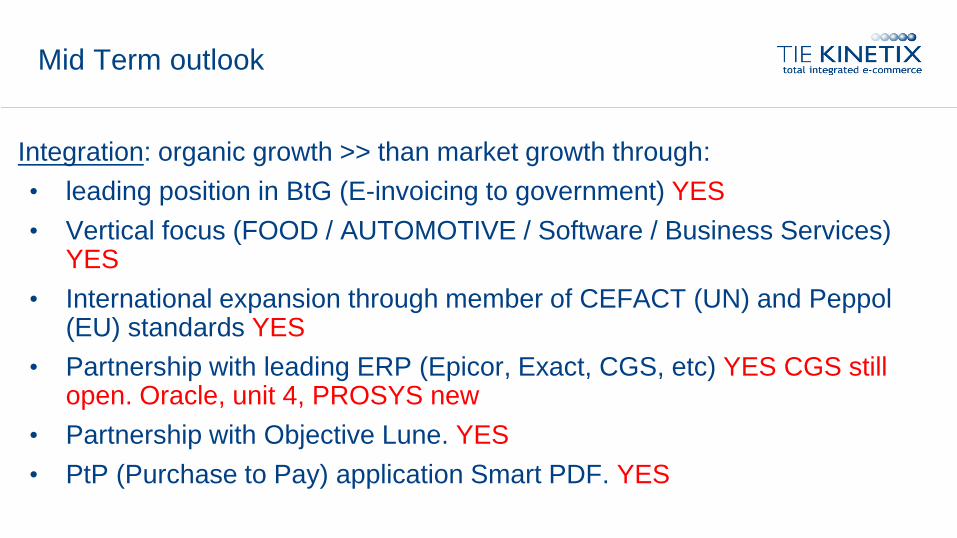
Mid Term outlook
Integration: organic growth >> than market growth through:
• leading position in BtG (E-invoicing to government) YES
• Vertical focus (FOOD / AUTOMOTIVE / Software / Business Services) YES
• International expansion through member of CEFACT (UN) and Peppol (EU) standards YES
• Partnership with leading ERP (Epicor, Exact, CGS, etc) YES CGS still open. Oracle, unit 4, PROSYS new
• Partnership with Objective Lune. YES
• PtP (Purchase to Pay) application Smart PDF. YES
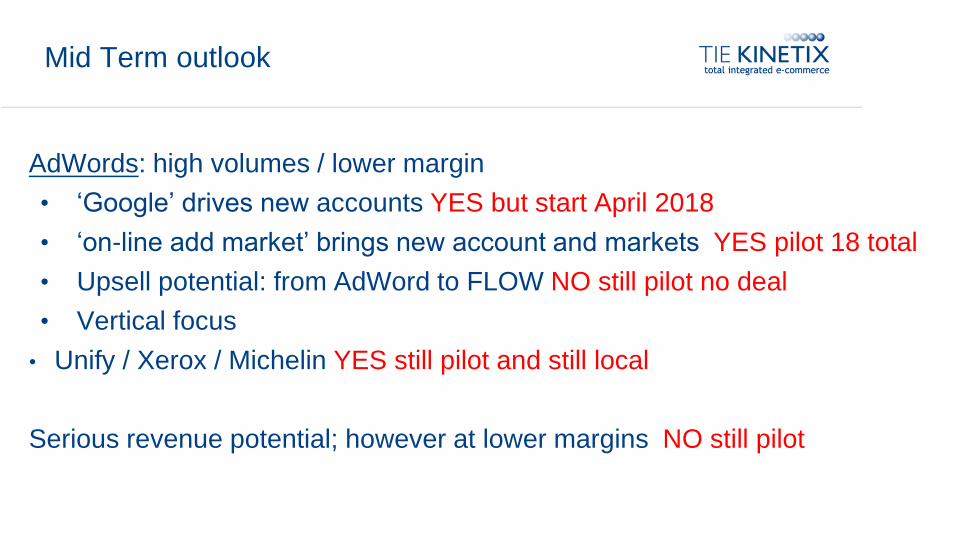
Mid Term outlook
AdWords: high volumes / lower margin
• ‘Google’ drives new accounts YES but start April 2018
• ‘on-line add market’ brings new account and markets YES pilot 18 total
• Upsell potential: from AdWord to FLOW NO still pilot no deal
• Vertical focus
• Unify / Xerox / Michelin YES still pilot and still local
Serious revenue potential; however at lower margins NO still pilot
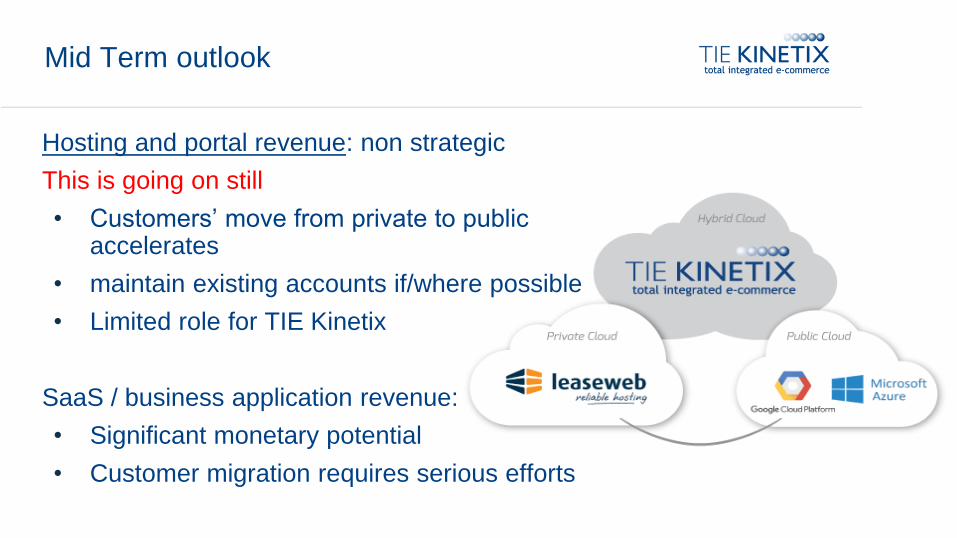
Mid Term outlook
Hosting and portal revenue: non strategic
This is going on still
• Customers’ move from private to public accelerates
• maintain existing accounts if/where possible
• Limited role for TIE Kinetix
SaaS / business application revenue:
• Significant monetary potential
• Customer migration requires serious efforts
Mid term ambition:
100% revenue growth, with margin % decline:
1. loss of non strategic revenue (≈ € 3 million in 2017) ≈ € 1,5
million in 2018
2. Replace with FLOW
• Sales fte’s solution selling YES
• Mass market (self service / low prices) YES
• Deep penetration in less verticals YES
3. Funding to scale (organic / non organic) Organic

HANDOVER TO MICHIEL WOLFSWINKEL
Hoog Groei scenario
Kenmerk: hogere groei met op langere termijn +/- 0% EBITDA marges
Omzet verwachting:
Daling non FLOW omzet op korte termijn
Daling FLOW consultancy omzet o.a. door self service
Groei in FLOW SaaS omzet
Verschil met huidig scenario: sterkere groei in SaaS door extra sales fte
EBITDA marge:
EBITDA meerjarig ingezet om groei te financieren
EBITDA meerjarig naar +/- 0%
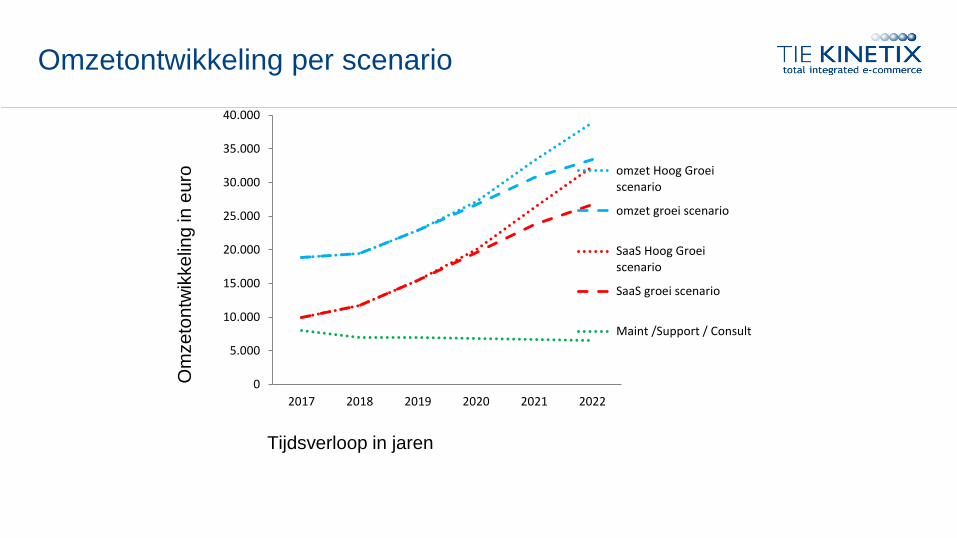
Omzetontwikkeling per scenario
Tijdsverloop in jaren
Om
ze
ton
twik
ke
ling
in e
uro
0
5.000
10.000
15.000
20.000
25.000
30.000
35.000
40.000
2017 2018 2019 2020 2021 2022
omzet Hoog Groeiscenario
omzet groei scenario
SaaS Hoog Groeiscenario
SaaS groei scenario
Maint /Support / Consult
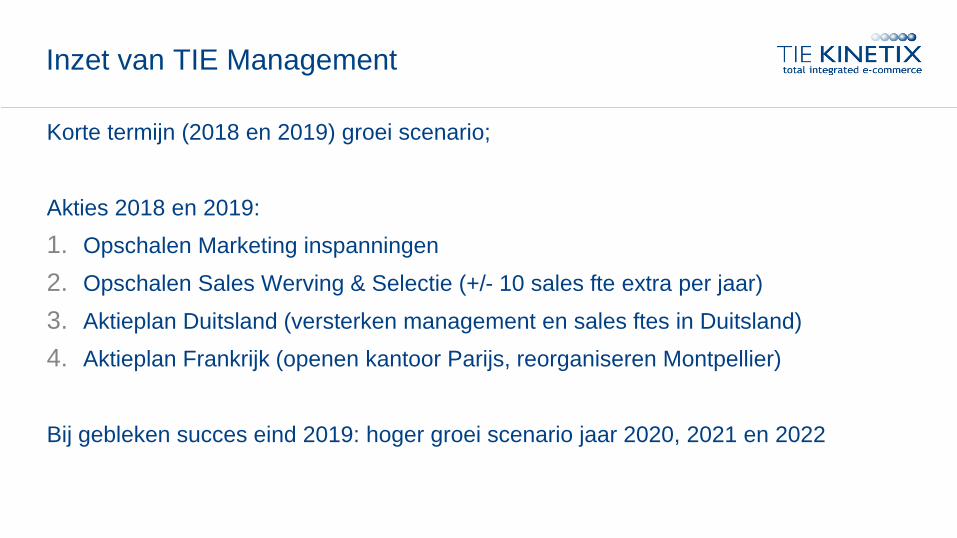
Inzet van TIE Management
Korte termijn (2018 en 2019) groei scenario;
Akties 2018 en 2019:
1. Opschalen Marketing inspanningen
2. Opschalen Sales Werving & Selectie (+/- 10 sales fte extra per jaar)
3. Aktieplan Duitsland (versterken management en sales ftes in Duitsland)
4. Aktieplan Frankrijk (openen kantoor Parijs, reorganiseren Montpellier)
Bij gebleken succes eind 2019: hoger groei scenario jaar 2020, 2021 en 2022
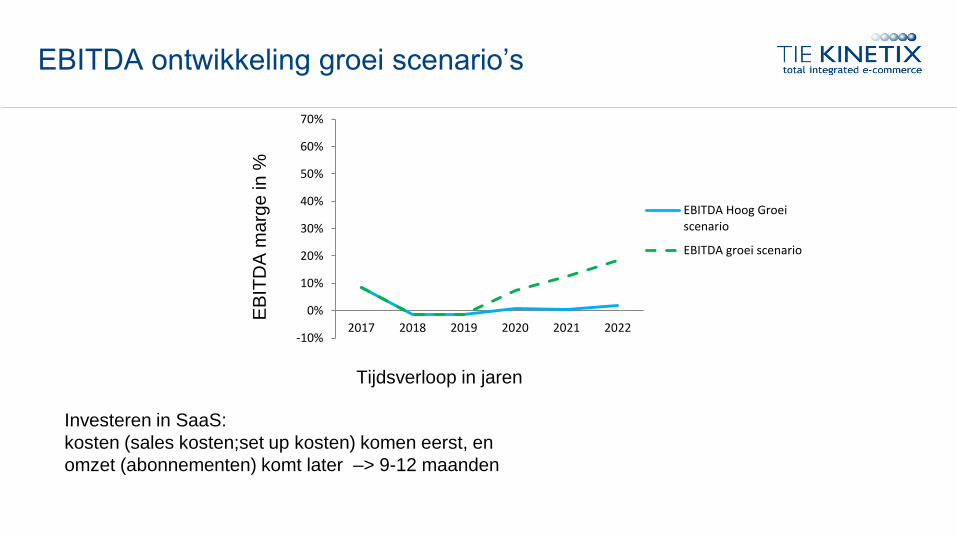
EBITDA ontwikkeling groei scenario’s
Tijdsverloop in jaren
EB
ITD
A m
arg
e in
%
Investeren in SaaS:
kosten (sales kosten;set up kosten) komen eerst, en
omzet (abonnementen) komt later –> 9-12 maanden
-10%
0%
10%
20%
30%
40%
50%
60%
70%
2017 2018 2019 2020 2021 2022
EBITDA Hoog Groeiscenario
EBITDA groei scenario
The Netherlands – T +31-88-369-8000 – www.TIEKinetix.com
Demand Generation | E-Commerce | Integration | Analytics & Optimization
Thank you!