The distribution and regeneration of Boswellia papyrifera ...
144
The distribution and regeneration of Boswellia papyrifera (Del.) Hochst. in Eritrea
Transcript of The distribution and regeneration of Boswellia papyrifera ...
The distribution and regeneration of Boswellia
papyrifera (Del.) Hochst. in Eritrea
Promotor: Prof. Dr. M. Wessel Emeritus hoogleraar Tropische Plantenteelt
Co-promotor: Dr. F. Bongers
Universitair hoofddocent, Departement Omgevingswetenschappen
^fJ0£%>^3&
The distribution and regeneration of Boswellia
papyrifera (Del.) Hochst. in Eritrea
Woldeselassie Ogbazghi
Proefschrift
ter verkrijgen van de graad van doctor
op gezag van de rector magnificus
van Wageningen Universiteit,
prof. dr. ir. L. Speelman
in het openbaar te verdedigen
op dinsdag 23 januari 2001
des namiddags te half twee uur in de Aula.
bol(ySZ
Ogbazghi, Woldeselassie
The distribution and regeneration of Boswellia papyrifera (Del.) Hochst. in Eritrea -
Woldeselassie Ogbazghi.
Thesis Wageningen University - With ref. - With summary in English and Dutch
ISBN: 90-5808-368-3
Also published in the series Tropical Resource Management Papers / Documents sur la
Gestion des Ressources Tropicales, No. 35 - Wageningen University, ISSN: 0926-9495
Subject headings: distribution / tree development and morphology / population structure /
regeneration
Cover design: Piet Kostense, Beeldgroep Wageningen UR
Cover photos: Woldeselassie Ogbazghi
jjjuo£2£> i.̂ ^a
Propositions 1. Before effective measures can be taken to prevent Boswellia papyrifera from
disappearing, information is needed on its distribution, ecological requirements, population structure and natural regeneration, and on the factors and processes leading to the decline of the natural Boswellia population. (This thesis)
2. As long as farmers have no rights to tap Boswellia trees and have no title on their land, efforts to counter-act the decline of the Boswellia woodlands should be directed towards solving the prevailing regeneration problem. (This thesis)
3. The absence of recruitment in natural Boswellia stands is largely due to low production of viable seed by tapped mother trees. (This thesis)
4. By delivering both products and services, and by spreading the risk of crop failure, agroforestry has the potential to strengthen the economic and ecological basis of agricultural production systems. (M. Wessel and K.F. Wiersum 1999)
5. Great civilizations have risen where water supply was plentiful and fallen when supplies failed. Therefore, water is bom slave and master. Treat the slave well and the master will be served better. (I.H. Zahid)
6. A time of crisis is also a time of opportunity, for changes do not occur in time of stability and prosperity. (Tewolde B.G. Egziangher).
7. The sandwich of a Dutch PhD fellowship is filled with chocolate rain and peanut butter.
Woldeselassie Ogbazghi The distribution and regeneration of Boswellia papyrifera (Del.) Hochst. In Eritrea. January 23,2001
Dedicated to the memory of my father Ogbazghi Temnewo,
my mother Dikan Abraham and my brother Solomon Ogbazghi
Dedicated to my beloved wife Tsegeweini Woldemichael
and my children Biniam, Lidia, Hanna and Nahom.
'When they saw the star, they were overjoyed. On coming to the house, they saw the child with his
mother Mary and they bowed down and worshiped him. Then, they opened their treasures and
presented him with gifts of gold, and frankincense, and of myrrh " (Matthew 2: 11)
Abstract
Title: Woldeselassie Ogbazghi, The distribution and regeneration of Boswellia papyri/era
(Del.) Hochst. in Eritrea. Ph.D. thesis, Department of Environmental Sciences, Silviculture
and Forest Ecology Group, Wageningen University.
Boswellia papyrifera (Del.) Hochst. is a deciduous gum-producing multipurpose
perennial tree species growing in Sudanian and Sahelian regions. The tree is tapped on the
stem for oleo-gum called olibanum (true frankincense). Land clearing for agriculture and un
regulated grazing are threatening the future of the natural Boswellia woodlands in Eritrea.
Against this background, a study was carried out to investigate the distribution of the species
and the factors determining its distribution in Eritrea, to study the structure and dynamics of
Boswellia populations, including the natural regeneration, and to identify the factors causing
the decline of Boswellia woodlands and measures which can reverse this situation. At
macro-level, the distribution of the species was found to be limited to the southwestern and
southern parts of the country between 800-1850 m altitude receiving a mean annual rainfall
of 375-700 mm with a dependable length of growing period of 45-100 days. At micro-level,
the abundance and distribution of the species was found to be affected in order of importance
by altitude, land use intensity, soil organic matter, and to a lesser extent by silt and pH. Tree
development studies showed that trees in the lowlands were twice as high as those in the
highlands. The most important outcome of the population structure study is the lack of
regeneration. Out of five areas investigated regeneration was only found at two sites where
trees were not tapped and which were not accessible to livestock. Further research showed
that the present system of intensive annual tapping throughout the dry season leads to low
production of non-viable seeds and that where viable seeds are produced, seedlings and
saplings are usually destroyed by livestock. Establishment of enclosures in which tapping
and grazing is not allowed were found to be an effective measure to promote natural
regeneration. Further research is needed to refine this system and to investigate the
feasibility of replanting former Boswellia areas.
Keywords: gum, frankincense, distribution, altitude, rainfall, temperature, land use intensity, topography, soil characteristics, tree development and morphology, population structure, seed production, regeneration, tapping, grazing.
Preface
Many indigenous tree species including Boswellia papyri/era have become endangered.
Some useful tree species have disappeared completely as the result of human and
environmental factors. So far, not much has been done to identify the factors affecting the
distribution of these endangered species, also the factors affecting their regeneration process.
All afforestation activities so far carried out in Eritrea, heavily depended on scientific results
generated elsewhere. Nonetheless, commendable reforestation activities and area closures
have been under taken to rehabilitate degraded lands. Further steps are necessary to identify
the ecological requirements of the indigenous species and to promote the regeneration. The
distribution and regeneration study of Boswellia papyrifera was carried out against these
backgrounds and it is anticipated that, the results of this study will contribute positively to
the restoration of Boswellia papyrifera in Eritrea. During the inception of this research
proposal many individuals have stimulated my ideas and I would like to thank them all.
I would like to express my sincere gratitude to Prof. Dr. M. Wessel and Dr. Frans
Bongers for their endurance and much-needed support. Their invaluable scientific guidance
and stimulating discussions made my education fruitful both at Wageningen University and
Research Centre and in Eritrea. In addition to their scientific guidance, their advice and
comments in the structuring of this thesis has been extremely helpful. Without their
vivacious support, the work could not have the quality it has now. I highly appreciate the
encouragement and support provided by Prof. M. Wessel during his visits of the research
site. In addition to this, I really enjoyed the warm friendliness and hospitality of both the
Wessel and Bongers families, especially of Mrs. P.C. Wessel-Riemens and Yvonne
Geraedts.
This thesis was supported by a MHO-NUFFIC co-operation project between the
Wageningen University and Research Centre, the Netherlands and University of Asmara,
Eritrea. I wish to express my special thanks to both institutions. During my research period
in Eritrea, I was exempted from the normal teaching load and could fully focus on my
research. I would like to thank the University of Asmara for its overall support, and
specifically the College of Agriculture and Aquatic Sciences.
A rewarding aspect of my study at Wageningen University and Research Centre has
been the warm welcome and friendship I have had with a number of academic and
administrative staff at the Sub-Department of Forestry. I would like to thank them all. My
special thanks go to Dr. Lourens Poorter and Mr. Toon Rijkers who read some of the
Chapters of the thesis and provided many constructive comments, and to Mrs. Joke Jansen,
Miss. Kathinca Huisman and Mr. Ruud Plas, who greatly facilitated my work. I also would
like to thank Mr. Willem Scholten and his colleagues of Unifarm for their continuous
support and their work in raising seedlings under controlled conditions at Wageningen. I
would like to extend my gratitude to Mr. Piet Kostense, graphic designer, for the preparation
of the various maps.
Many individuals and institutions facilitated my field data collection and the
experiments in Eritrea. My special thanks go to Mr. Semere Amlesom (Director of the
Institute of Agricultural Research and Training, Ministry of Agriculture), and Mr. Tecleab
Mesghina (Director of the Department of Environment, Ministry of Land, Water and
Environment). Mr Iyassu Gebre-Tatios and Mrs Ghidey Gebreselassie (both staff of the soil
laboratory) took care of the chemical soil analyses. The Ministry of Agriculture and Local
government staff was extremely helpful in the execution of the fieldwork and I would like to
thank them all. In Debub region, Mr Yemane Kibrom (Adi-Quala sub-region) and Mr. Zeray
Mesghina (Mai-Mine sub-region) kindly provided land to carry out establishment trials and
to raise seedlings in the nurseries of Sheka-Iyammo, Mai-Tsebri and Mai-Mine. They also
gave permission to carry out tapping experiments and regeneration studies in permanent
plots at Atawen and Adi-Ketina. In North Red Sea region, the late Mr. Amaneul Kidane
(Ghinda, Ministry of Agriculture) and the late Dr. Jaeffer Abubaker and Habtom Gudum
(Management Institute, Embatkalla) allowed access to land for establishment trials at Ghinda
and Embatkalla respectively. In the Anseba region Mr Yohannes Asfeha (local government,
Elabered) facilitated the inventory studies and the experiments on the effect of tapping on
regeneration in Ferhen.
A good balance between my Ph.D. research and teaching task in a sandwich model
could be maintained thanks to the generous co-operation and encouragement of the
colleagues at the College of Agriculture and Aquatic Science. In this respect, Dr. Berhane
Kifle-Wahid and Dr. Bessrat Ghebru (Deans of the College) did all they could to facilitate
the research. My special thanks go to Mr. Mehari Zewde, of the Department of Soil and
Water Conservation, who took part in the collection of soil samples.
While undertaking the fieldwork, I had the support of many individuals, too
numerous to mention here. Thank you all. A special thanks go to Mr. Naizghi Haile (Gash-
Barka, Ministry of Agriculture), Mr. Tekle Berhane (Gash-Barka local government) and the
local government staff in Molki and Laelay-Gash sub-regions. They are acknowledged for
their support in facilitating the fieldwork and for providing field guides. Among the various
areas included in the study, the following sub-zones and village administrations are
particularly acknowledged for their participation in the inventory studies in: (1) Anseba
(Yegar, Azefa, Ferhen, and Fredareb) (2) Gash-Barka (Molki, Mai-Lam and Dembe-Doran)
(3) Laelay Gash (Shilalo, Sheshebit, Mai-Kokah, Dersenay and Deda-laelay) (4) Debub
region (Mai-Mine, Adi-Ketina, Meker-Tsablla and Berakit), (5) Adi-Quala sub-region (Adi-
Abraham and Bete-Tsion). I can not conclude this note without thanking the communities
residing in vicinities of the Boswellia papyriferu woodland for providing valuable
information on the distribution and the state of the species in their neighbourhood. I warmly
appreciate their friendship and hospitality and will remain indebted to them for the years to
come. Without their co-operation this thesis would not have been written.
My most dearest gratitude goes to my beloved wife Tsegeweini Woldemichael, my
dear children Biniam, Lidia, Hanna and Nahom, and all my family members for their
encouragement and their support. They had to endure my absence for long periods, not only
when I was in the Netherlands, but also during fieldwork back home in Eritrea. I hope to be
more at home in the future.
Woldeselassie Ogbazghi, September 2000.
Contents
1 General introduction 1
/. / Boswellia papyrifera in Eritrea: its importance and decline I
1.2 The need for research 2
1.3 Research objectives and hypotheses 3
1.4 Theoretical framework of the thesis 3
1.5 Outline of the thesis 4
2 General background: environment, natural resources and population of Eritrea 7
2.1 Geographic location 7
2.2 Geology, topography and soils 7
2.3 Climate 8
2.4 Agroecological zones 8
2.5 Vegetation of Eritrea 11
2.6 Forest cover and its decline 13
2.7 Population and livelihood 15
2.8 Land tenure and consequences for the vegetation 16
3 Macro-distribution of Boswellia papyrifera 19
3.1 Introduction 19
3.2 Methodology 21
3.2.1 Selection of survey areas 21
3.2.2 Data collection 22
3.2.3 Data analysis 22
3.3 Results 23
3.3.1 Geographical distribution 23
3.3.2 Combined effects of altitude, rainfall and growing period 27
3.3.3 Occurrence in relation to individual factors 29
3.4 Discussion 31
3.5 Conclusion 32
4 The micro-distribution of Boswellia papyrifera 33
4.1 Introduction 33
4.2 Material and methods 34
4.2.1 Selection of study areas 34
4.2.2 Placement of sample plots 34
4.2.3 Description of sample plots 35
4.2.4 Soil sampling and analysis 36
4.2.5 Plant measurements and counts 36
4.2.6 Data analysis 36
4.3 Results 39
4.3.1 Topography and soil conditions 39
4.3.2 Abundance in relation to altitude 39
4.3.3 Abundance in relation to land and soil characteristics 41
4.3.4 The abundance of Boswellia across the whole altitude gradient 43
4.3.5 The abundance of Boswellia in relation to land use and topography 44
4.3.6 Abundance in relation to topographic position 45
4.3.7 Abundance in relation to aspect 46
4.4 Discussion 47
4.5 Conclusion 49
Tree development and morphology of Boswellia papyrifera 51
5.1 Introduction 51
5.2 Methodology 51
5.2.1 The study areas 51
5.2.2 Plant size measurements 52
5.2.3 Data analysis 52
5.3 Results 53
5.3.1 Tree size variation 53
5.3.2 Tree development 54
5.3.3 Tree size in relation to land and soil properties 57
5.3.4 Tree size in relation to land use types 58
5.4 Discussion 60
5.5 Conclusion 62
Population structure of Boswellia stands 63
6.1 Introduction 63
6.2 Materials and Methods 64
6.2.1 Selection of study areas 64
6.2.2 Placement of sample plots 64
6.2.3 Plant measurements 65
6.2.4 Comparison between sites and land use types 65
6.3 Results 66
6.3.1 Differences in population structure among study areas 66
6.3.2 Population structure in relation to land use 68
6.3.3 Relationship between size classes 70
6.3.4 Size class distribution in relation to altitude 71
6.4 Discussion 72
6 5 Conclusion 74
7 Possible reasons for lack of regeneration of Boswellia papyrifera 75
7. / Introduction 75
7.2 The effect of grazing on establishment 76
7.2.1 Materials and Methods 77
7.2.2 Results 78
7.2.3 Discussion 82
7.3 The effects of tapping on the reproductive cycle o/Boswellia papyrifera 83
7.3.1 Materials and Methods 83
7.3.2 Results 85
7.3.3 Discussion 87
7.3.4 Conclusion 89
8 General discussion 91
8.1 Review of results 91
8.2 Conclusions 94
8.3 Recommendations 95
References 97
Appendices 107
Summary 123
Samenvatting 127
Curriculum Vitae 131
CHAPTER 1
1 General introduction
1.1 Boswellia papyrifera in Eritrea: its importance and decline
Boswellia papyrifera (Del.) Hochst. belongs to the family Burseraceae. It is a deciduous tree
species reaching a height of up to 12 m with thick branches tipped with clusters of leaves. Its
bark is smooth, pale yellow-brown, pealing off in large papery pieces. A cut in the bark
looks red-brown and a fragrant milky gum comes out of it. The leaves are large pinnately
compound on a stalk about 45 cm long consisting of 6-8 pairs of leaflets and one at the tip.
Each leaflet is oval in shape, 4-8 cm in size and densely haired below, the edge sharp or
rounded-toothed, some times double toothed. Flowers are sweet smelling developing on
pubescent panicles at the ends of thick branchlets, appearing when the leaves have fallen off.
The red flower stalk is to 35 cm long and bears the white-pink flowers with 5 petals and 10
yellow stamens. The fruit is a red capsule about 2 cm long, three-sided, consisting of three
hard seeds with apical horn (Weiss 1987, Vollesen 1989, Bein et al. 1996).
Boswellia papyrifera is an indigenous gum producing multipurpose perennial tree
species that grows in drier parts of Africa from Nigeria in the west to Eritrea and Ethiopia in
the east. Boswellia papyrifera produces an oleo-gum called olibanum (true frankincense) by
tapping the stem. This frankincense has been in use since 1700 BC (Howes 1950), and it is
still widely used in churches all over the world. It is also the main source of frankincense
used in the orthodox churches in Eritrea and Ethiopia (Demissew 1993, 1996). The gum is
also a source of essential oils, which are used in the perfume industry, in the fabrication of
varnishes and paints and as a laxative ingredient in the pharmaceutical industry (Ahmed
1982, Stiles 1988, Ammon et al. 1993, Kuchar 1995).
Boswellia wood is used for poles and timber by rural communities and to a lesser
extent also for industrial manufacturing of wooden products such as match boxes, boards and
ply wood (Mueller-Eckhardt 1967, James 1968). The leaves provide dry-season fodder for
livestock, while the flowers are a good source of nectar for bees. Leaves, bark, and roots are
also used as traditional medicines for various diseases and gums are sometimes used to
quench thirst (Bekele et al. 1993, Bein et al. 1996, Gebremedhin and Negash 1999). The
species is one of the tree species recommended for economic development and
desertification control in arid and semi-arid areas (Stiles 1988, Michele 1993).
Large-scale exploitation of Boswellia trees for gum did not start until 1932, when the
Italians introduced a concession system to stimulate the frankincense export (Maugini 1932).
Chapter 1
As Boswellia papyrifera is not yet domesticated, gum collection takes place from naturally
growing trees in the woodlands. Since the introduction of the concession system in Eritrea,
gum collection and commercialisation is still an exclusive right of concessionaires.
The ecological functions of Boswellia papyrifera have not been systematically studied,
but they are thought to play a significant role in soil and water conservation and greening of
the landscape. For instance, in some parts of the lowlands, the species constitutes a major
plant cover. It could be used in other, ecologically similar, areas as well. Today the species is
found mainly on land that is unsuitable for agricultural purposes.
At present, Boswellia papyrifera is threatened as the result of several interrelated
factors. Increasing population pressure has resulted in the conversion of woodlands to
agricultural land while unregulated grazing by which young seedlings are either eaten or
trampled by livestock, is hindering the natural regeneration. In part, all this happens because
the local community has no interest to protect trees, which they are not allowed to exploit
and thus regard as an obstacle on their land.
Another factor causing the decline of Boswellia papyrifera is the exploitation system.
Trees are tapped every year in the dry season. The frankincense tappers are contracted by the
concessionaires and are paid based on the amount of gum collected. This easily can lead to
over-tapping. Intensive tapping is thought to have resulted in the death of many trees,
especially during periods of drought. Furthermore, there are indications that over-tapping
may lead to poor seed production and hence poor regeneration. The decrease in the number
of gum-yielding trees is reflected in the decline in gum export which dropped from 2000
tons in 1974 to 400 tons in 1998 (Asmara Chamber of Commerce 1974, Ministry of
Agriculture 1999). Long-term export statistics are found in Appendix 1.
1.2 The need for research
Despite the actual and potential uses of Boswellia papyrifera, no attempts have been made to
improve its utilisation. Nor have attempts been made to understand the reasons for the
decline of the population in the country. The occurrence of the species in Eritrea is well
documented but detailed information on its distribution, abundance, and stand structure is
not available. It goes without saying that before effective measures can be taken to prevent
the species from total disappearance, information will be needed on its present distribution
and ecological requirements, population structure and natural regeneration, and on the
factors and processes leading to the decline of the Boswellia population.
General introduction
1.3 Research objectives and hypotheses
The general objectives of the research presented in this thesis are:
to investigate the distribution of Boswellia papyrifera (Del.) Hochst. in Eritrea
and the factors determining the distribution limits.
to study the population structure and population dynamics of remnant Boswellia
populations, including the natural regeneration.
to identify the factors causing the decline of the Boswellia woodlands and
measures which can reverse this situation.
The main hypotheses are:
Boswellia papyrifera occurs in southwestern parts of Eritrea within an altitude range
between 850-1800 m above sea level. Its absence from the central highlands and eastern
escarpment suggests that low temperature limits its spread eastwards and that low rainfall
prevents its spread to the north and northwest. Within the present distribution limits,
intensive land use and unregulated grazing affect the abundance and stand development of
the Boswellia woodlands. Tapping of the trees for gum has a negative effect on the
reproduction of the species.
1.4 Theoretical framework of the thesis
Boswellia papyrifera is a sexually reproducing tree species. Generally, a tree's life cycle
consists of four major developmental stages, namely seed, seedling, sapling, and adult
reproductive tree. Plants maintain and expand their populations over time by the process of
regeneration (Alder and Synnott 1992, Barnes et al. 1998). Regeneration includes seed
production and maturation of seeds so that they are ready for dispersal. In sexually
reproducing plants, seed production is followed by dispersal of fruits and seeds, germination,
and finally, the establishment of the seedlings in the area. The establishment of seedlings is
followed by vegetative development of saplings and later to an adult reproductive tree. The
growth and development of each life stage of plants is affected by internal and external
factors (Harper 1977, Larcher 1995, Richards 1996). In this research, the focus is on the
external factors affecting the distribution and regeneration of Boswellia papyrifera.
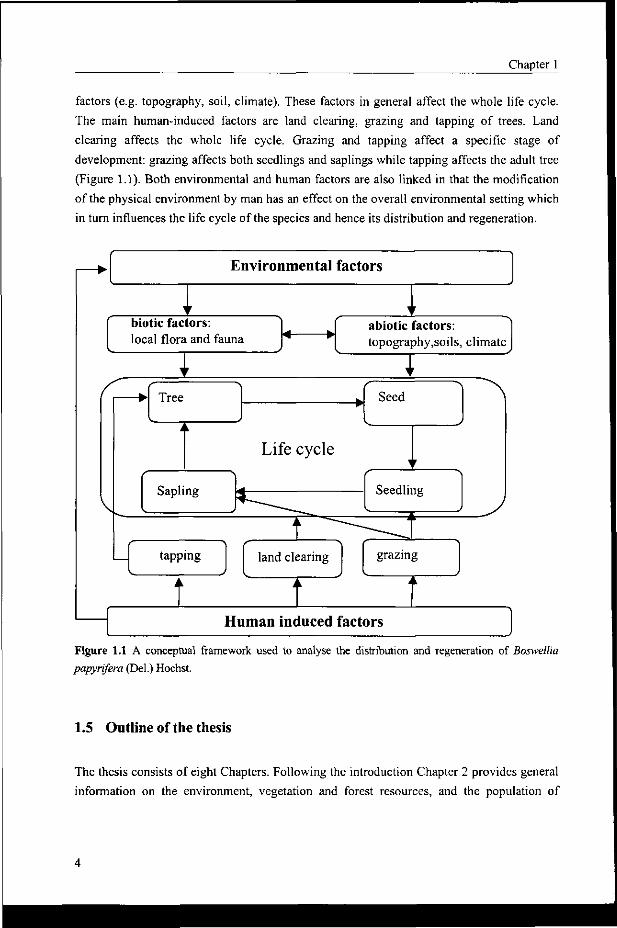
Based on this model, the life cycle of Boswellia papyrifera is divided into four major
stages: seed, seedling, sapling, and tree (Figure 1.1). The transition from one developmental
stage to the next is affected by two major factors: environmental and human induced factors.
The environmental factors are sub-divided into biotic (e.g. local flora and fauna) and abiotic
Chapter 1
factors (e.g. topography, soil, climate). These factors in general affect the whole life cycle.
The main human-induced factors are land clearing, grazing and tapping of trees. Land
clearing affects the whole life cycle. Grazing and tapping affect a specific stage of
development: grazing affects both seedlings and saplings while tapping affects the adult tree
(Figure 1.1). Both environmental and human factors are also linked in that the modification
of the physical environment by man has an effect on the overall environmental setting which
in turn influences the life cycle of the species and hence its distribution and regeneration.
Environmental factors
i f
biotic factors: local flora and fauna
V
abiotic factors: topogra )hy,soils, climate
1
Figure 1.1 A conceptual framework used to analyse the distribution and regeneration of Boswellia papyrifera (Del.) Hochst.
1.5 Outlineofthethesis
The thesis consists of eight Chapters. Following the introduction Chapter 2 provides general
information on the environment, vegetation and forest resources, and the population of
General introduction
Eritrea. Furthermore, it pays attention to the land use and land tenure and its impact on tree
planting and forest conservation.
In Chapter 3, the macro-distribution of Boswellia papyrifera is presented. The
geographical locations where the species occurs and areas from where it has disappeared are
identified. Its occurrence is described and analysed in relation to three factors: altitude,
rainfall, and length of growing period.
After identifying the major Boswellia papyrifera growing areas in Eritrea, the
distribution of the species is studied at micro-level in five representative sites in Chapter 4.
Its distribution and abundance are quantified and described in relation to the major site
conditions (landforms, soils, and land use).
In Chapter 5, the tree development and morphological characteristics of Boswellia are
described. The variations in tree size are determined and analysed in relation to site
conditions and altitude.
Chapter 6 deals with the population structure of Boswellia papyrifera stands in five
representative sites. The size class distribution is described and the regeneration status of the
species in those areas is analysed in relation to the land use.
Possible reasons for lack of regeneration of Boswellia papyrifera stands in Eritrea are
analysed in Chapter 7. The effects of two major factors, e.g. land use and exploitation of the
trees for gum, on recruitment and establishment are studied in detail.
Finally, in Chapter 8 a general discussion and synthesis of the research results is
presented. Practical measures and research priorities are proposed, to counteract the decline
and degradation in Boswellia woodlands.

CHAPTER 2
2 General background: environment, natural resources and
population of Eritrea
2.1 Geographic location
Eritrea is situated in the northeastern part of Africa between latitudes 12°40' and 18°02' and
longitudes 36°30' and 43°23'. It borders on Sudan in the north and west, on Ethiopia in the
south, on Djibouti in the southeast and on the Red Sea in the east and northeast (Figure 2.1).
The land surface area of the country is 125,700 km2 (Department of Environment 1998).
2.2 Geology, topography and soils
The geology of Eritrea is variable due to continuous uplifting and faulting. Geologically
Eritrea is divided into two distinct regions: the central and northern highlands, and the
coastal areas. The central and northern highlands consist of the Pre-Cambrian Basement
complex of the oldest formations found in Africa. The western highlands with their typical
flat-topped mountains are mostly covered by tertiary basaltic flows. In western Eritrea, the
basement complex was later covered by young quaternary sediments but locally rocky
outcrops of the basement complex occur (Mohr 1970, Drury et al. 1994). The formations
along the Red Sea coasts and the southern Danakil plains are younger and consist of tertiary
and quaternary sediments and volcanic rocks. The latter are associated with the Red Sea and
the Afar rift system, which cuts through the area from south to north, accompanied by many
fault lines. During the Tertiary, sandstone and limestone were formed along the eastern
coast, where at present lagoons and salt plains are found (Mohr 1961, 1987).
Eritrea can be divided into three topographic regions: eastern coastal zone, the
highlands, and the western lowlands (Jones 1991). The highlands stretch from south to north
dividing the country into the eastern and western lowlands. In the south, the highland is
predominantly a plateau while in the north dissected hills, mountains, and escarpments
dominate. The western and eastern lowlands are predominantly flat areas with dome-shaped
hills (Haggag 1961). The highland is an extension of the high land of East Africa. The
descent to the west and the east are different in that the land slopes gradually to Sudan in the
west and abruptly towards the Red Sea, where over a distance of 50 km the altitude changes
from 3030 m above to 100 m below sea level. These variations in the topography greatly
influence the temperature and rainfall regimes of the country.
Chapter 2
Information on the Eritrean soils is scarce. Some local studies on surface soils are
reported by Murphy (1968), Maskey (1985), and Haile et al. (1998). In view of this
constraint, the soils can only be considered in a general way referring to some of the soil
groups described by FAO (1994). According to an updated version of their classification
(FAO 1997a), nine major soil types distributed over six agroecological zones are identified
(see section 2.4, Agroecological zones).
2.3 Climate
The climate of Eritrea ranges from hot and arid adjacent to the Red Sea to temperate in the
highlands and sub-humid in isolated micro-catchment area in the sub-humid on the eastern
escarpment. It can be described in general terms as follows. Most parts of the country (70%)
is classified as hot to very hot with mean annual temperature of more than 27°C; about
(25%) as warm to mild with a mean temperature of about 22 °C, and the remaining parts
(5%) as cool with a mean annual temperature of less than 19 °C. The total annual rainfall
increases from the north to south and varies from less than 200 mm in the northwest
lowlands to more than 700 mm in the southwestern lowlands. Besides, the amount of rainfall
also increases with altitude. While the coastal lowlands are very dry, some areas on the
eastern escarpment get more than 1000 mm. As to areas covered by the different rainfall
regimes, about 50% of the country receives less than 300 mm, 40% between 300 and 600
mm and about 10% more than 600 mm of rain per annum (FAO 1994, Haile et al. 1998).
Representative data of the major agroecological zones are given in Appendix 2.
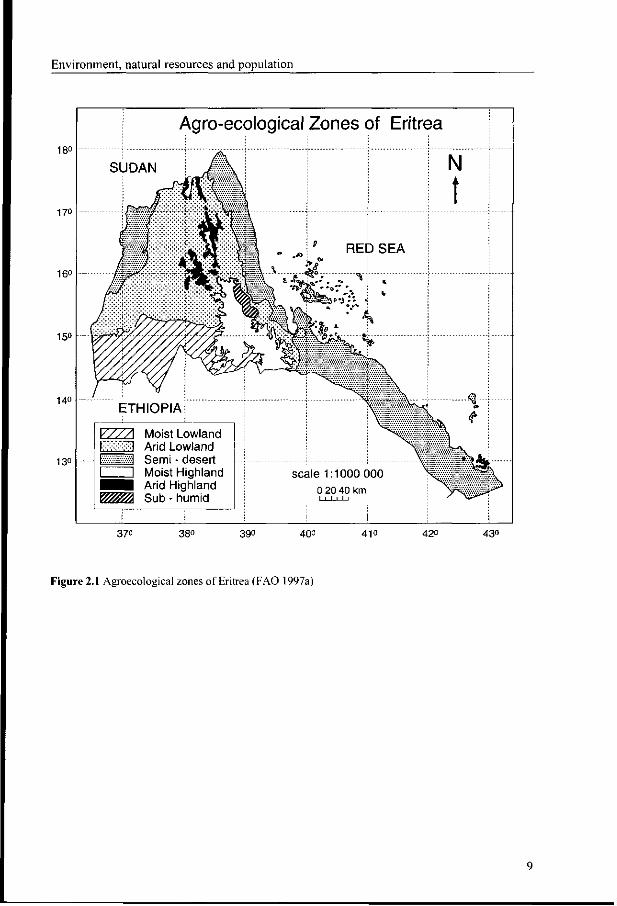
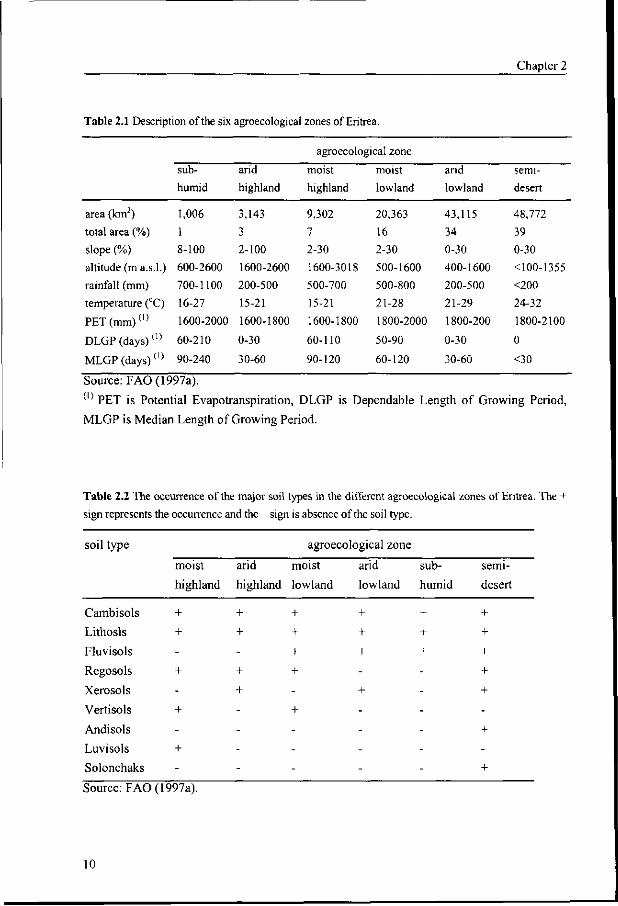
2.4 Agroecological zones
As shown in the previous sections, Eritrea has a large variation in landscape and climatic
features (Haggag 1961). The agroecological map (FAO 1997a) has six major agroecological
zones: moist lowland, moist highland, arid lowland, arid highland, semi-desert and sub-
humid (Figure 2.1). The general characteristics of the agroecological zones in terms of area,
topography, altitude and climate are specified in Table 2.1.
The major soil types of these zones are given in Table 2.2. The Cambisols and
Lithosols are found in all six agroecological zones, while the Regosols Fluvisols are found in
four of them. Soils with the highest agricultural potential e.g. the Luvisols, Fluvisols, and
Vertic Cambisols are found in the moist highland and moist lowland of Eritrea. Limited soil
depth and steep slopes limit their potential in many places.
Environment, natural resources and population
180
170
16°
150
140
13°
Agro-ecological Zones of Eritrea
V//A Moist Lowland Arid Lowland
j Semi - desert I I Moist Highland
Arid Highland Sub - humid
370 380 390 400 410 420 430
Figure 2.1 Agroecological zones of Eritrea (FAO 1997a)
Chapter 2
Table 2.1 Description of the six agroecological zones of Eritrea.
area (km2)
total area (%)
slope (%)
altitude (m a.s.l.)
rainfall (mm)
temperature (°C)
PET(mm)(1)
DLGP(days)(1)
MLGP (days)(1)
sub-
humid
1,006
1
8-100
600-2600
700-1100
16-27
1600-2000
60-210
90-240
arid
highland
3,143
3
2-100
1600-2600
200-500
15-21
1600-1800
0-30
30-60
agroecolo
moist
highland
9,302
7
2-30
1600-3018
500-700
15-21
1600-1800
60-110
90-120
gical zone
moist
lowland
20,363
16
2-30
500-1600
500-800
21-28
1800-2000
50-90
60-120
arid
lowland
43,115
34
0-30
400-1600
200-500
21-29
1800-200
0-30
30-60
semi-
desert
48,772
39
0-30
<100-1355
<200
24-32
1800-2100
0
<30
Source: FAO (1997a). (1) PET is Potential Evapotranspiration, DLGP is Dependable Length of Growing Period,
MLGP is Median Length of Growing Period.
Table 2.2 The occurrence of the major soil types in the different agroecological zones of Eritrea. The + sign represents the occurrence and the - sign is absence of the soil type.
soil type agroecological zone
moist arid moist highland highland lowland
arid
lowland
+
+
+
sub-
humid
+
+
+
semi-
desert
+
+
+
Cambisols
Lithosls
Fluvisols
Regosols
Xerosols
Vertisols
Andisols
Luvisols
Solonchaks
+ +
Source: FAO (1997a).
10
Environment, natural resources and population
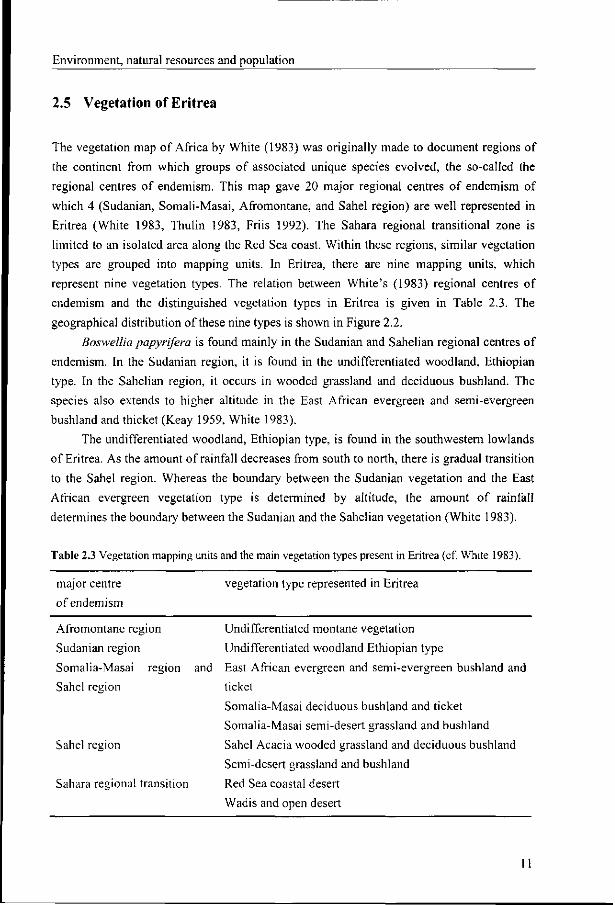
2.5 Vegetation of Eritrea
The vegetation map of Africa by White (1983) was originally made to document regions of
the continent from which groups of associated unique species evolved, the so-called the
regional centres of endemism. This map gave 20 major regional centres of endemism of
which 4 (Sudanian, Somali-Masai, Afromontane, and Sahel region) are well represented in
Eritrea (White 1983, Thulin 1983, Friis 1992). The Sahara regional transitional zone is
limited to an isolated area along the Red Sea coast. Within these regions, similar vegetation
types are grouped into mapping units. In Eritrea, there are nine mapping units, which
represent nine vegetation types. The relation between White's (1983) regional centres of
endemism and the distinguished vegetation types in Eritrea is given in Table 2.3. The
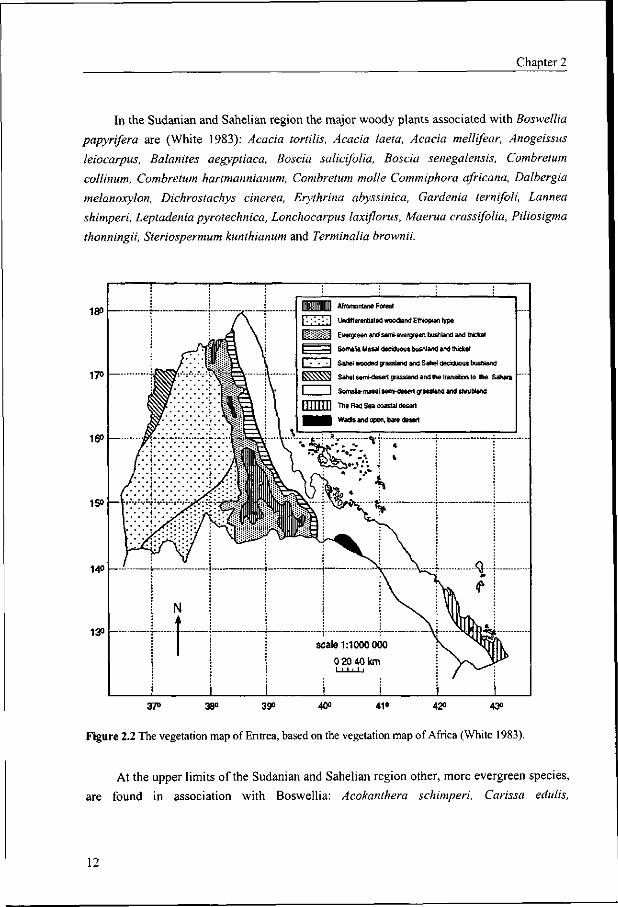
geographical distribution of these nine types is shown in Figure 2.2.
Boswellia papyrifera is found mainly in the Sudanian and Sahelian regional centres of
endemism. In the Sudanian region, it is found in the undifferentiated woodland, Ethiopian
type. In the Sahelian region, it occurs in wooded grassland and deciduous bushland. The
species also extends to higher altitude in the East African evergreen and semi-evergreen
bushland and thicket (Keay 1959, White 1983).
The undifferentiated woodland, Ethiopian type, is found in the southwestern lowlands
of Eritrea. As the amount of rainfall decreases from south to north, there is gradual transition
to the Sahel region. Whereas the boundary between the Sudanian vegetation and the East
African evergreen vegetation type is determined by altitude, the amount of rainfall
determines the boundary between the Sudanian and the Sahelian vegetation (White 1983).
Table 2.3 Vegetation mapping units and the main vegetation types present in Eritrea (cf. White 1983).
major centre vegetation type represented in Eritrea
of endemism
Afromontane region Undifferentiated montane vegetation
Sudanian region Undifferentiated woodland Ethiopian type
Somalia-Masai region and East African evergreen and semi-evergreen bushland and
Sahel region ticket
Somalia-Masai deciduous bushland and ticket
Somalia-Masai semi-desert grassland and bushland
Sahel region Sahel Acacia wooded grassland and deciduous bushland
Semi-desert grassland and bushland
Sahara regional transition Red Sea coastal desert
Wadis and open desert
Chapter 2
In the Sudanian and Sahelian region the major woody plants associated with Boswellia
papyrifera are (White 1983): Acacia tortilis, Acacia laeta, Acacia mellifear, Anogeissus
leiocarpus, Balanites aegyptiaca, Boscia salicifolia, Boscia senegalensis, Combretum
collinum, Combretum hartmannianum, Combretum molle Commiphora africana, Dalbergia
melanoxylon, Dichrostachys cinerea, Erythrina abyssinica, Gardenia ternifoli, Lannea
shimperi, Leptadenia pyrotechnica, Lonchocarpus laxiflorus, Maerua crassifolia, Piliosigma
thonningii, Steriospermum kunthianum and Terminalia brownii.
Afromorrtane Forest
Undrtferentiated woodland Ethiopian type
t::::::j:-::i3 Evergreen and semi-evergreen bushland and thicket
I I Somalia Masai deciduous bushland and thicket
j Sahel wooded grassland and Sahel deciduous bushland
Sahel semi-desert grassland and the transition to the Sahara
37° 38° 39° 40° 41° 42° 43°
Figure 2.2 The vegetation map of Eritrea, based on the vegetation map of Africa (White 1983).
At the upper limits of the Sudanian and Sahelian region other, more evergreen species,
are found in association with Boswellia: Acokanthera schimperi, Carissa edulis,
12
Environment, natural resources and population
Commiphora africana, Dodonea ungustifolia, Euclea schimperi, Euphorbia candelabrum,
Olea africana, Rhus natalensis, and Teclea spp. A comprehensive list of all woody plants
found in association with Boswellia papyrifera along its entire altitude range is given in
Appendix 7.
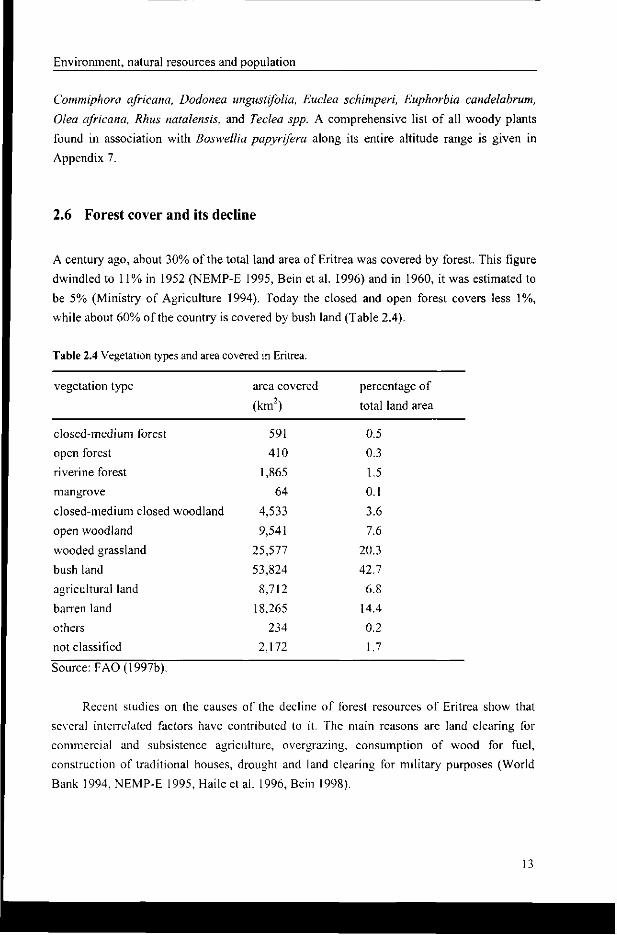
2.6 Forest cover and its decline
A century ago, about 30% of the total land area of Eritrea was covered by forest. This figure
dwindled to 11% in 1952 (NEMP-E 1995, Bein et al. 1996) and in 1960, it was estimated to
be 5% (Ministry of Agriculture 1994). Today the closed and open forest covers less 1%,
while about 60% of the country is covered by bush land (Table 2.4).
Table 2.4 Vegetation types and area covered in Eritrea.
vegetation type
closed-medium forest
open forest
riverine forest
mangrove
closed-medium closed woodland
open woodland
wooded grassland
bush land
agricultural land
barren land
others
not classified
area covered
(km2)
591
410
1,865
64
4,533
9,541
25,577
53,824
8,712
18,265
234
2,172
percentage of
total land area
0.5
0.3
1.5
0.1
3.6
7.6
20.3
42.7
6.8
14.4
0.2
1.7
Source: FAO (1997b).
Recent studies on the causes of the decline of forest resources of Eritrea show that
several interrelated factors have contributed to it. The main reasons are land clearing for
commercial and subsistence agriculture, overgrazing, consumption of wood for fuel,
construction of traditional houses, drought and land clearing for military purposes (World
Bank 1994, NEMP-E 1995, Haile et al. 1996, Bein 1998).
13
Chapter 2
During the long history of subsistence agriculture and especially after the introduction
of commercial agriculture many forests were converted into agricultural land. The
seriousness of the problem was noted already during the Italian colonial period (Fiori 1912).
With the increase in population, land clearing was extended to steep areas unsuitable for
cultivation. Furthermore, increased demands for firewood and the use of wood for the
construction of traditional houses had adversely effected the forest cover (Haile et al. 1996).
Licensed commercial exploitation of timber, fuel-wood, and charcoal has further aggravated
the problem (Jones 1991, Bein 1998). This is likely to remain as it is because the main
source of domestic energy in the country is still wood (Habtesion 1997, FAO 1997b).
Grazing pressure has intensified during the last century. As a result of improved
veterinary services the livestock population has increased substantially. For instance, from
1946 to 1976, the number of goats, sheep and cattle increased by 46% (Bein 1998). Recent
estimates gave 1.65 million Tropical Livestock Units (FAO 1994, Haile et al. 1996). Grazing
pressure is widespread throughout the country and is particularly severe during the dry
season. There are no systematic data on the effect of the size of the livestock population on
the forest cover but widespread degradation and lack of regeneration of many tree species
due to overgrazing is evident everywhere.
Land tenure, particularly the 'Dessa' system involving the periodic redistribution of
arable land among villagers, provides no incentive for farmers to carry out permanent
improvement to the land. Lack of tree tenure is the cause for neglect by the local
communities to protect and plant new trees (Kebreab 1996, Bein et al. 1996).
During the past decades a persistent fluctuation of rainfall has been recorded. Rainfall
records in Asmara (1903-1932) show that out of the 30 years only in 13 years the rainfall
exceeded the mean annual rainfall of 518 mm and that in the remaining 17 years, it was
much less (Civil Aviation Authority, Asmara unpublished data). Later rainfall records (1933-
1962) of the same area and other meteorological stations in the country show a similar
pattern. The effects of drought on the vegetation are unknown but many people living in
areas affected by drought observed that a period of drought is usually followed by tree
mortality. Many tree species have been severely affected following the drought of 1968-
1973 in the Sahel region. The effect of drought in this area was exacerbated by increased
population pressure (White 1983, Workineh 1987).
The negative effects of the 30 years liberation war (1961-1991) on forest resources
have been emphasised in the Environmental Management and Action Plan of Eritrea
(NEMP-E 1995, Bein 1996). It is, however, difficult to give precise figures on the extent of
deforestation caused by three decades of war. Frequent bombardment and fire killed trees
and many were cut to provide firewood and to construct trenches and military sheds. As the
14
Environment, natural resources and population
forest and woodlands were regarded as hiding place for guerrilla fighters they were regarded
a nuisance and recklessly cleared (Haile et al. 1998).
In Eritrea, there are opportunities to rehabilitate and restore the degraded forests and
woodlands. There are still remnant stands of secondary forest and woodlands that can be
used for spontaneous regeneration and to raise seedlings. In the highlands, many forest tree
species have been preserved in sacred sanctuaries and areas inaccessible to livestock grazing.
These places are important sources of information on the environmental requirements for
conservation and rehabilitation activities (Lamprecht 1989). So far, no clear plan has been
developed on the conservation of endangered species and on the introduction of new ones. In
many areas, various large-scale replanting schemes have been launched but their success has
been limited so far.
2.7 Population and livelihood
To date, there is no complete census of the population of Eritrea. Various estimates indicated
that the population has increased four fold during the past five decades. In the early 1940's,
the population size was 757,000 of which 565,000 were sedentary farmers and the remaining
192,000 nomads (Longridge 1974). In 1952 the population size increased to 1,031,000
(Trevaskis 1975). Tedla (1964) estimated the population to be 1,500,000. The latest estimate
by the World Bank (1994) puts this figure to 3 million.
Agriculture is the largest sector of the economy in Eritrea. It occupies 80 % of the
labour force, and contributes 26% of the gross domestic product (World Bank 1994). The
rural communities live on subsistence agriculture comprising mainly cereal crop and
livestock production (Cliffe 1988). Some coastal communities depend on fisheries as their
means of livelihood. Agricultural production ranges from nomadic systems to small-scale
irrigated horticultural production. Cliffe (1988) recognises three major agricultural systems,
namely nomadic, semi-nomadic and sedentary agriculture, which are practised by 11, 22,
and 67% of the population, respectively. Because crop cultivation entirely depends on
animal traction, Haile et al. (1995) and Haile et al. (1996) classify the rural population as
predominantly agro-pastoral.
Because of its ecological diversity, Eritrea produces a wide range of cereals,
vegetables, pulses, and fibre crops (Mesghina and Ghebru 1997, Araia et al. 1994). In the
highlands, fanners grow taff, barley, wheat, oil seeds including niger seed, and various
legumes such as lentils, chickpeas, and faba beans. In the lowlands, the main crops are pearl
millet, sorghum, finger millet, sesame, groundnuts, cotton, fruits, and vegetable crops. In the
lowlands, sorghum is the most important crop and accounts for about 46% of annual yield in
Chapter 2
the country (Cliffe 1988, World Bank 1994) followed by pearl millet (16%) and barley
(15%)(Araiaetal. 1994).
In spite of the wealth of crop diversity in Eritrea, historical records show a chronic
crop production deficit due to recurrent droughts and pest out-breaks. Cliffe (1988)
estimated a normal harvest under non-disastrous situations to be between 220-250 thousand
metric tons of cereals covering about 55-65% of annual national demand. During the
liberation struggle and immediately after it, most of the rural communities in the country
were dependent on food aid. In the early 1990's about 72% of the population was food-aid
dependent (Appleton et al. 1992). Since then, the situation has improved because of
increased food production, which resulted from a change in policy of food-aid dependence to
food security programmes.
2.8 Land tenure and consequences for the vegetation
In Eritrea, three major land tenure systems have coexisted for many years. These are the
'Rsti' (family ownership), 'Dessa' (village or collective ownership), and 'Demaniale' (state
ownership (Nadel 1946, Zekarias 1966, Jordan 1989, Menghisteab 1992). The land tenure
system varies from place to place. A new land law issued in 1994 has officially replaced the
three traditional land tenure systems, but in practice, the situation has not changed
(Government of Eritrea 1994).
Individual family land ownership (Rsti)
The individual family ownership of land refers to a system in which land could be acquired
by settlement in a vacant area, purchase, or granting land by rulers (Zekarias 1966). A Rsti
owner could be an individual, an institution such as a church, or an extended family. In many
cases the extended family has lived in the area for several generations and considers itself as
the founder of a settlement. In the Rsti system, in fact the individual ownership is always
belonging to the extended family. An individual holder of Rsti land can cultivate or lease it
or arrange share cropping, but can not sell it, nor give it away to an outsider without the
consent of family members. Thus, individual Rsti holders do not have absolute right over
their lands. Haile et al. (1998) mentioned that, although individual families have legitimate
rights over their agricultural lands, grazing areas and fallow lands are communally used.
Trees within a holding belong to the landholder who has the right to use them when needed.
This, however, is not the case for tapping Boswellia trees for frankincense: here
concessionaires have the complete right of tapping. Streams, wells, and land around
16
Environment, natural resources and population
settlements are communally owned and managed by a council elected by the villagers
(Zekarias 1966).
Village land ownership (Dessa)
Dessa is a traditional land tenure system of village-wide communal ownership of land. How
the Dessa land tenure system came into being in Eritrea is not clearly known. Some sources
(e.g. Nadel 1946, Trevaskis 1975, Jordan 1989) report that the Italians introduced it as a
means of settling land disputes in the Rsti systems. Within the Dessa system, the village
elders form a committee that establishes criteria for eligibility to a full share or a half share
of a crop field. An adult member who permanently establishes a household in a village is
entitled to a full or to a half share depending on criteria such as marritial status and the
number of children in the household. The Dessa system involves land re-distribution every
five to seven years by which each eligible household receives, often scattered, fields of
different fertility classes. This situation discourages the landholders to make long-term
investment such as planting of trees or the construction of soil and water conservation
structures. After each land redistribution farmers have often to build new houses, and this
puts extra pressure on the remaining forest resources.
State ownership (Demaniale)
During the Italian colonisation and later the British administration (1890-1940), traditional
individual lands were confiscated in favour of Italian commercial agriculture (Longridge
1974, Trevaskis 1975,). In the highlands, Demaniale lands were limited to the fertile lands
used for irrigated agriculture and dairy farms. In the lowlands, however, all areas below 850
m a.s.l. were declared state lands (Mesghina 1988). The latter status allowed open access to
lands resulting in massive clearing of land and extensive unsustainable land use.
Both Dessa and Demaniale systems and the rapid population growth have led to land
degradation and unscrupulous cutting of the natural vegetation similar to what Hardin (1968)
described it as " the tragedy of commons". The consequence can easily be seen in the
highlands where more than 60% of the population lives in about 8% of the total area of
Eritrea.
17

CHAPTER 3
3 Macro-distribution of Boswellia papyrifera
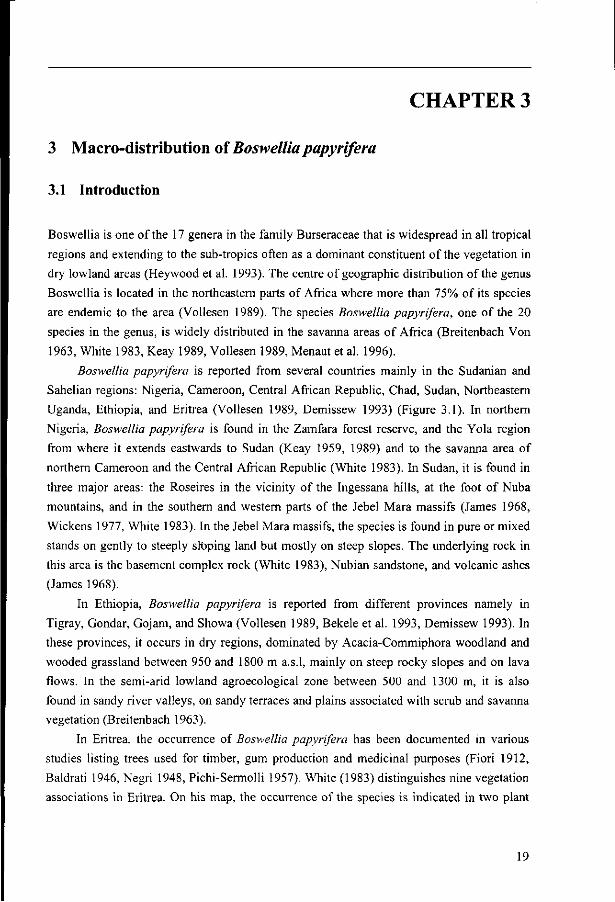
3.1 Introduction
Boswellia is one of the 17 genera in the family Burseraceae that is widespread in all tropical
regions and extending to the sub-tropics often as a dominant constituent of the vegetation in
dry lowland areas (Heywood et al. 1993). The centre of geographic distribution of the genus
Boswellia is located in the northeastern parts of Africa where more than 75% of its species
are endemic to the area (Vollesen 1989). The species Boswellia papyrifera, one of the 20
species in the genus, is widely distributed in the savanna areas of Africa (Breitenbach Von
1963, White 1983, Keay 1989, Vollesen 1989, Menaut et al. 1996).
Boswellia papyrifera is reported from several countries mainly in the Sudanian and
Sahelian regions: Nigeria, Cameroon, Central African Republic, Chad, Sudan, Northeastern
Uganda, Ethiopia, and Eritrea (Vollesen 1989, Demissew 1993) (Figure 3.1). In northern
Nigeria, Boswellia papyrifera is found in the Zamfara forest reserve, and the Yola region
from where it extends eastwards to Sudan (Keay 1959, 1989) and to the savanna area of
northern Cameroon and the Central African Republic (White 1983). In Sudan, it is found in
three major areas: the Roseires in the vicinity of the Ingessana hills, at the foot of Nuba
mountains, and in the southern and western parts of the Jebel Mara massifs (James 1968,
Wickens 1977, White 1983). In the Jebel Mara massifs, the species is found in pure or mixed
stands on gently to steeply stoping land but mostly on steep slopes. The underlying rock in
this area is the basement complex rock (White 1983), Nubian sandstone, and volcanic ashes
(James 1968).
In Ethiopia, Boswellia papyrifera is reported from different provinces namely in
Tigray, Gondar, Gojam, and Showa (Vollesen 1989, Bekele et al. 1993, Demissew 1993). In
these provinces, it occurs in dry regions, dominated by Acacia-Commiphora woodland and
wooded grassland between 950 and 1800 m a.s.l, mainly on steep rocky slopes and on lava
flows. In the semi-arid lowland agroecological zone between 500 and 1300 m, it is also
found in sandy river valleys, on sandy terraces and plains associated with scrub and savanna
vegetation (Breitenbach 1963).
In Eritrea, the occurrence of Boswellia papyrifera has been documented in various
studies listing trees used for timber, gum production and medicinal purposes (Fiori 1912,
Baldrati 1946, Negri 1948, Pichi-Sermolli 1957). White (1983) distinguishes nine vegetation
associations in Eritrea. On his map, the occurrence of the species is indicated in two plant
19
Chapter 3
associations: in the undifferentiated woodland, Ethiopian type and in the Sahel Acacia
wooded grassland and deciduous bushland. The flora of Ethiopia (Vollesen 1989) briefly
mentioned its occurrence in different parts of Ethiopia and Eritrea. Two more recently
published monographs on useful trees and shrubs in Ethiopia and Eritrea (Bekele et al. 1993,
Bein et al. 1996) also mention the occurrence of Boswellia papyrifera in western Eritrea.
20°
10°
0*
r^~. ^ >
V 20°
/ |
F^>-X • m
- \ ^ L £ r ^
i 20°
10s
;;••• J ^
. . i . T - -
1 10°
0° 1
. xvn i \ _ . . . • • "
• . . v - "
. .XVI
~ ',_ -?^L°->-*.
•-. . '
i>^T^
i 0'
10* ••._ 1
.-' <:••• ^3
/'..
y ^ J J C l '/ ' • • *
&••• 1 ? .:
10°
20° 1
„ •
'""
, I 1
20°
30* I
xvn
XVI
m
^--^ \ \ ]?&£?
30°
40s
\ 1
i i l 1 / V1H
f^M
V "•-• i l
40°
50° 1 1000 kn
- y v m
%-JX_^-"-—' ""7-
rv ,••' f
50°
20°
10°
0°
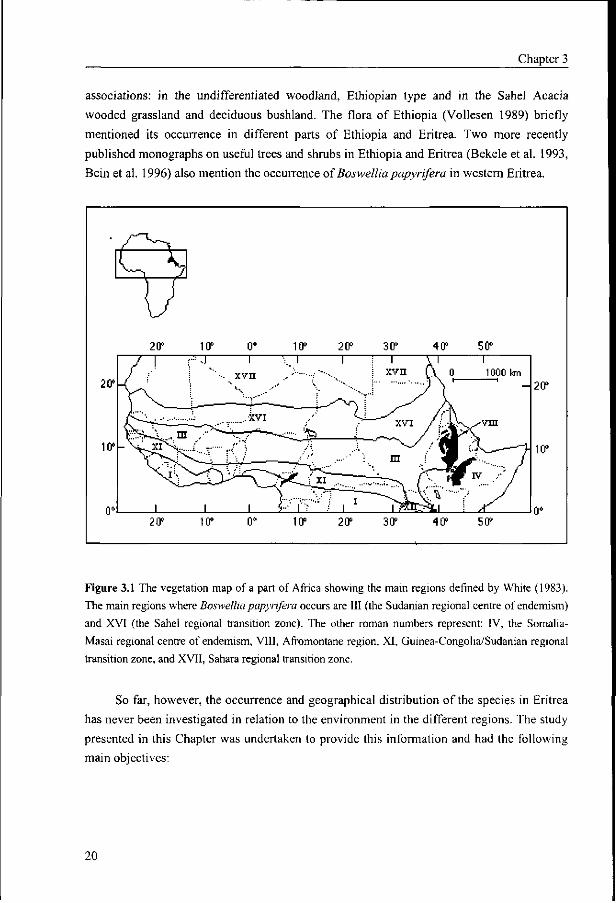
Figure 3.1 The vegetation map of a part of Africa showing the main regions defined by White (1983).
The main regions where Boswellia papyrifera occurs are III (the Sudaman regional centre of endemism)
and XVI (the Sahel regional transition zone). The other roman numbers represent: IV, the Somalia-
Masai regional centre of endemism, VIII, Afromontane region, XI, Guinea-Congolia/Sudanian regional
transition zone, and XVII, Sahara regional transition zone.
So far, however, the occurrence and geographical distribution of the species in Eritrea
has never been investigated in relation to the environment in the different regions. The study
presented in this Chapter was undertaken to provide this information and had the following
main objectives:
20
Macro-distribution
to relate the occurrence of the species to environmental factors and describe its
ecological niche. The underlying research hypothesis is that low temperature in
the highlands and low and short duration of rainfall in the lowlands limit the
Boswellia papyrifera distribution to southwestern Eritrea.
to identify Boswellia papyrifera woodlands for detailed studies on the abundance
and population structure in Eritrea.
3.2 Methodology
3.2.1 Selection of survey areas
The major frankincense collection areas in the country were located on the basis of the
information provided by the Ministry of Agriculture head office, which controls
frankincense production, and by the concessionaires involved in the collection and
commercialisation of frankincense in Eritrea. Both sources provided a preliminary list of
gum collection areas in the different regions of the country and this information was used as
a starting point to select the regions and sub-regions for the study. Because there were no
indications about the past and present occurrence of Boswellia papyrifera in the North Red
Sea and South Red Sea administrative regions these were not included in this study. In the
remaining regions (Centre, Debub, Anseba and Gash-Barka) the occurrence of Boswellia
papyrifera was investigated in all 39 sub-regions. To cover the complete altitude range all
accessible villages (113 in total) were visited (see Table 3.1). In addition, observations were
made along roads linking various villages.
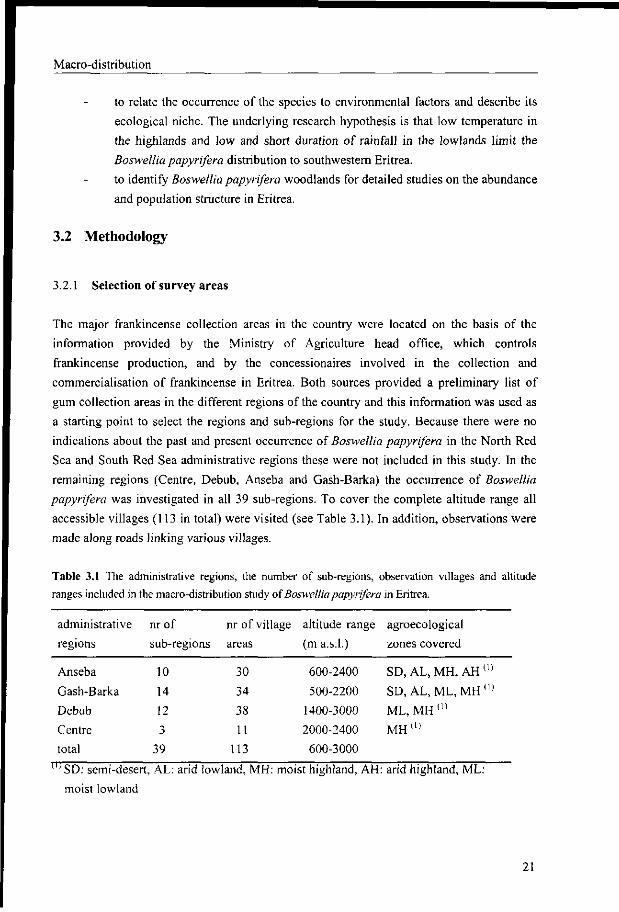
Table 3.1 The administrative regions, the number of sub-regions, observation villages and altitude ranges included in the macro-distribution study of Boswellia papyrifera in Eritrea.
administrative nr of nr of village altitude range agroecological
regions sub-regions areas (m a.s.l.) zones covered
Anseba
Gash-Barka
Debub
Centre
total
10
14
12
3
39
30
34
38
11
113
600-2400
500-2200
1400-3000
2000-2400
600-3000
SD, AL, MH, AH (1)
SD, AL,ML, MH ( I )
ML, MH ( I )
MH ( , )
^ S D : semi-desert, AL: arid lowland, MH: moist highland, AH: arid highland, ML:
moist lowland
21
Chapter 3
3.2.2 Data collection
In all 113 village areas, field observations were made to see whether Boswellia was present
or absent. If no Boswellia trees were found in the vicinity of the villages, the villagers were
asked if the species was present in the area or had grown there in the past. The local resource
persons included people who were directly involved in the tapping and gum collection
activities. Their information was very useful to obtain a general impression of the abundance
of the species and to describe its present and past geographical distribution. The location of
each village area was mapped and its altitude recorded with an altimeter.
Rainfall data were collected from the sub-region meteorological stations of the
Ministry of Agriculture and from the regional offices of the National Civil Aviation Service.
The minimum, maximum and mean temperatures for each village area were calculated on
the basis of altitude using temperature-altitude regression equations (Appendix 3). These
equations are based on long-term records from 12 meteorological stations in Eritrea and two
from northern Ethiopia (FAO 1997a). The mean annual potential evapotranspiration (PET)
was calculated with the PET-altitude regression equation (FAO 1997).
The dependable length of growing period (DLGP) in days was compiled for each
village from the FAO (1997a) agroecological map. The length of growing period (LGP) is
defined as the time of the year when moisture and temperature are suitable for plant growth
and development. In Eritrea, LGP is mainly determined by moisture availability and hence it
is defined as a continuous period of the year when precipitation exceeds 50% of the potential
evapotranspiration plus the time required for the evapotranspiration of stored soil moisture.
The length of growing periods used by FAO are based on ten days rainfall and potential
evapotranspiration totals as recorded at the various meteorological stations in Eritrea.
3.2.3 Data analysis
The occurrence of Boswellia papyrifera in relation to altitude, rainfall and the length of
growing period were analysed using a logistic regression analysis (Huisman et al. 1993,
Bongers et al. 1999). The binary data on the presence (+) or absence (-) were converted to
numerical values of 1 and 0 respectively (Ter Braak and Gremmen 1987). Regression
methods are useful in the analysis of the relationship between a response variable and one or
more explanatory variables and it is preferred as a practical method for summarising species
distribution along environmental gradients (Ter Braak and Looman 1986, Peeters and
Gardeniers 1998). The analyses were carried out at two-levels. First, using a forward
stepwise analysis the likelihood ratio was determined to identify the main factor influencing
the occurrence of the species by including all the 113 village areas covered in the study.
22
Macro-distribution
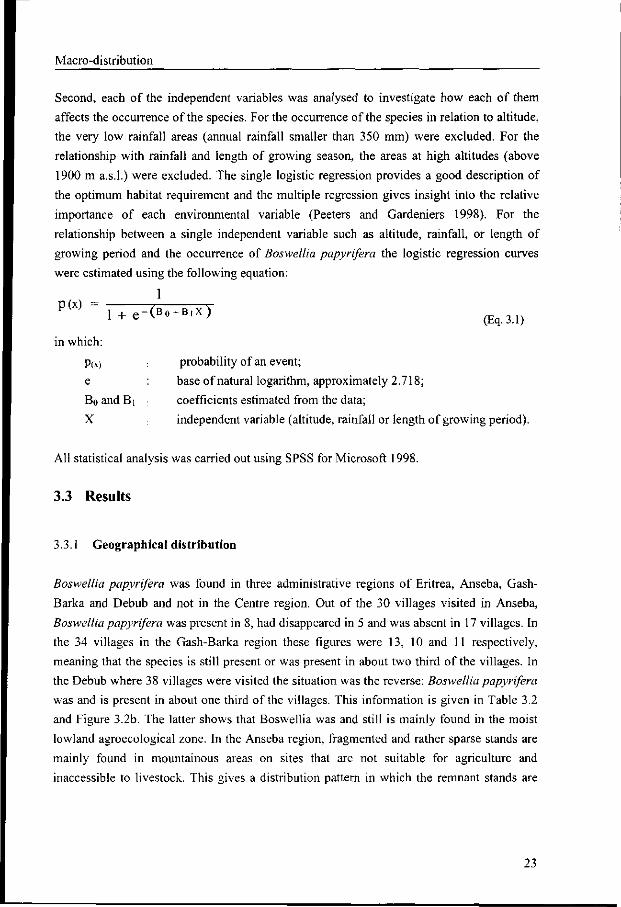
Second, each of the independent variables was analysed to investigate how each of them
affects the occurrence of the species. For the occurrence of the species in relation to altitude,
the very low rainfall areas (annual rainfall smaller than 350 mm) were excluded. For the
relationship with rainfall and length of growing season, the areas at high altitudes (above
1900 m a.s.l.) were excluded. The single logistic regression provides a good description of
the optimum habitat requirement and the multiple regression gives insight into the relative
importance of each environmental variable (Peeters and Gardeniers 1998). For the
relationship between a single independent variable such as altitude, rainfall, or length of
growing period and the occurrence of Boswellia papyrifera the logistic regression curves
were estimated using the following equation:
1 P(x) = T =j-^^ 1 + e - ( B 0 + B , X )
in which:
P(x) e
Bo and B i
X
(Eq.3.1)
probability of an event;
base of natural logarithm, approximately 2.718;
coefficients estimated from the data;
independent variable (altitude, rainfall or length of growing period).
All statistical analysis was carried out using SPSS for Microsoft 1998.
3.3 Results
3.3.1 Geographical distribution
Boswellia papyrifera was found in three administrative regions of Eritrea, Anseba, Gash-
Barka and Debub and not in the Centre region. Out of the 30 villages visited in Anseba,
Boswellia papyrifera was present in 8, had disappeared in 5 and was absent in 17 villages. In
the 34 villages in the Gash-Barka region these figures were 13, 10 and 11 respectively,
meaning that the species is still present or was present in about two third of the villages. In
the Debub where 38 villages were visited the situation was the reverse: Boswellia papyrifera
was and is present in about one third of the villages. This information is given in Table 3.2
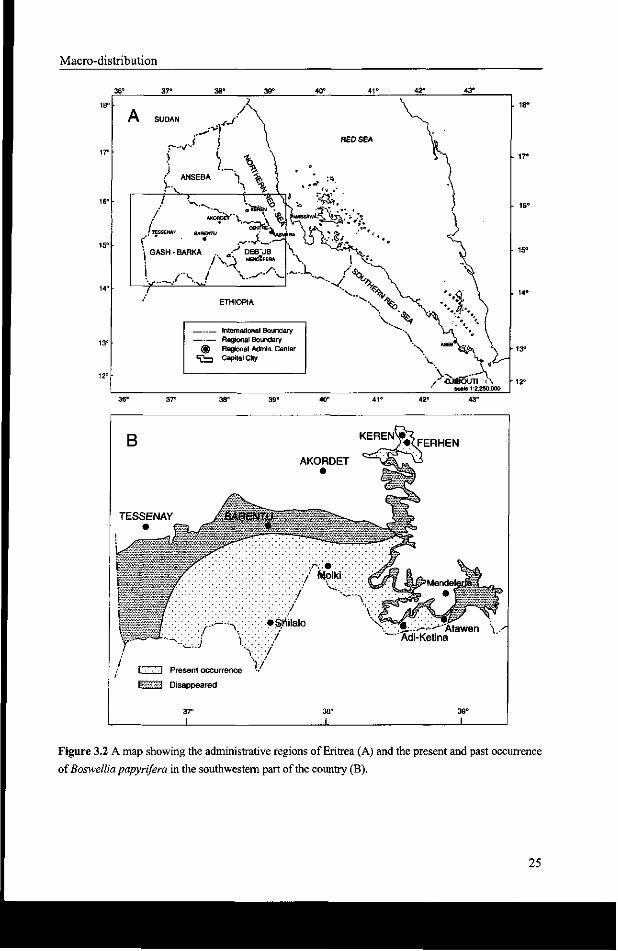
and Figure 3.2b. The latter shows that Boswellia was and still is mainly found in the moist
lowland agroecological zone. In the Anseba region, fragmented and rather sparse stands are
mainly found in mountainous areas on sites that are not suitable for agriculture and
inaccessible to livestock. This gives a distribution pattern in which the remnant stands are
23
Chapter 3
separated by vast plains and riverine areas. In the Gash-Barka region on the other hand, a
relatively large area of intact Boswellia papyrifera woodlands are found (Figure 3.2b).
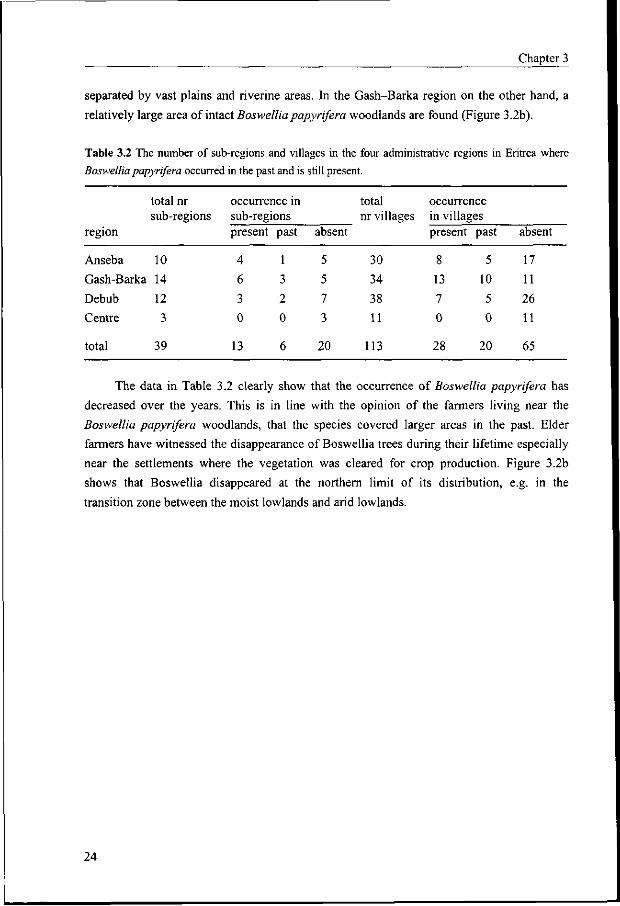
Table 3.2 The number of sub-regions and villages in the four administrative regions in Eritrea where
Boswellia papyrifera occurred in the past and is still present.
region
Anseba
Gash-Barka
Debub
Centre
total
total sub-
10
14
12
3
39
nr regions
occurrence in sub-regions present past
4
6
3
0
13
1
3
2
0
6
absent
5
5
7
3
20
total nr villages
30
34
38
11
113
occurrence in villag present
8
13
7
0
28
es past
5
10
5
0
20
absent
17
11
26
11
65
The data in Table 3.2 clearly show that the occurrence of Boswellia papyrifera has
decreased over the years. This is in line with the opinion of the farmers living near the
Boswellia papyrifera woodlands, that the species covered larger areas in the past. Elder
farmers have witnessed the disappearance of Boswellia trees during their lifetime especially
near the settlements where the vegetation was cleared for crop production. Figure 3.2b
shows that Boswellia disappeared at the northern limit of its distribution, e.g. in the
transition zone between the moist lowlands and arid lowlands.
24
Macro-distribution
Present occurrence
fssim Disappeared
37° I
39° I
Figure 3.2 A map showing the administrative regions of Eritrea (A) and the present and past occurrence
of Boswellia papyrifera in the southwestern part of the country (B).
25
Chapter 3
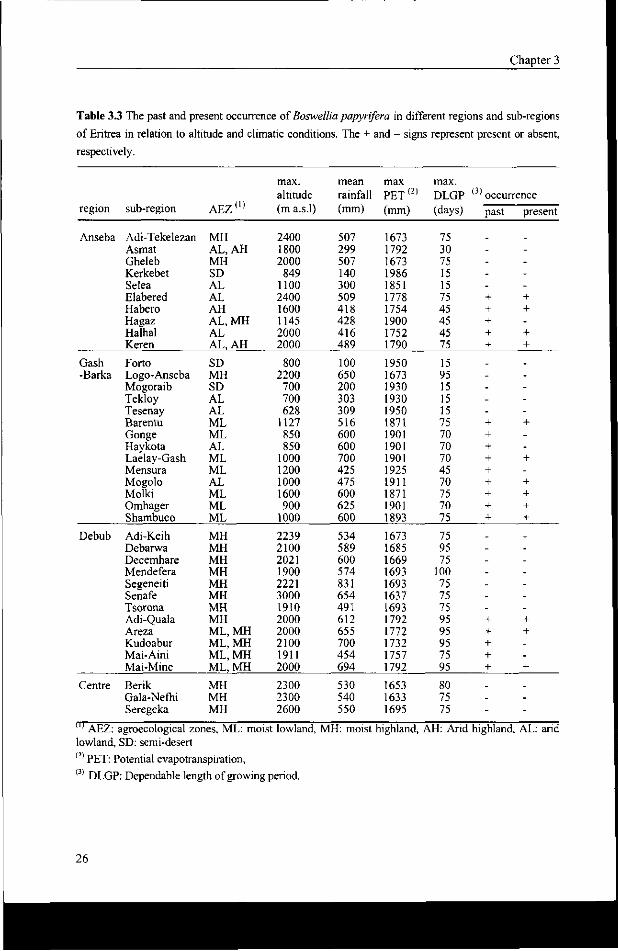
Table 3.3 The past and present occurrence of Boswellia papyrifera in different regions and sub-regions
of Eritrea in relation to altitude and climatic conditions. The + and - signs represent present or absent,
respectively.
region
Anseba
Gash -Barka
Debub
sub-region
Adi-Tekelezan Asmat Gheleb Kerkebet Selea Elabered Habero Hagaz Halhal Keren
Forto Logo-Anseba Mogoraib Tekloy Tesenay Barentu Gonge Haykota Laelay-Gash Mensura Mogolo Molki Omhager Shambuco
Adi-Keih Debarwa Decemhare Mendefera Segeneiti Senafe Tsorona Adi-Quala Areza Kudoabur Mai-Aini Mai-Mine
AEZ
MH AL, MH SD AL AL AH AL, AL AL,
SD MH SD AL AL ML ML AL ML ML AL ML ML ML
MH MH MH MH MH MH MH MH ML, ML, ML, ML,
( i )
AH
MH
AH
MH MH MH MH
max. altitude (m a.s.l)
2400 1800 2000 849
1100 2400 1600 1145 2000 2000
800 2200 700 700 628
1127 850 850
1000 1200 1000 1600 900
1000
2239 2100 2021 1900 2221 3000 1910 2000 2000 2100 1911 2000
mean rainfall (mm)
507 299 507 140 300 509 418 428 416 489
100 650 200 303 309 516 600 600 700 425 475 600 625 600
534 589 600 574 831 654 491 612 655 700 454 694
max PET (2)
(mm)
1673 1792 1673 1986 1851 1778 1754 1900 1752 1790
1950 1673 1930 1930 1950 1871 1901 1901 1901 1925 1911 1871 1901 1893
1673 1685 1669 1693 1693 1637 1693 1792 1772 1732 1757 1792
max. DLGP (days)
75 30 75 15 15 75 45 45 45 75
15 95 15 15 15 75 70 70 70 45 70 75 70 75
75 95 75
100 75 75 75 95 95 95 75 95
' ' occurrence past
----+ + + + + _ ----+ + + + + + + + + _ ------+ + + + +
present
----+ + -+ + _ ----+ --+ -+ + + + _ ------+ + --+
Centre Benk MH 2300 530 1653 80 Gala-Nefhi MH 2300 540 1633 75 Seregeka MH 2600 550 1695 75
>j' AEZ: agroecological zones, ML: moist lowland, MH: moist highland, AH: Arid highland, AL: arid lowland, SD: semi-desert <_) PET: Potential evapotranspiration, <3) DLGP: Dependable length of growing period.
26
Macro-distribution
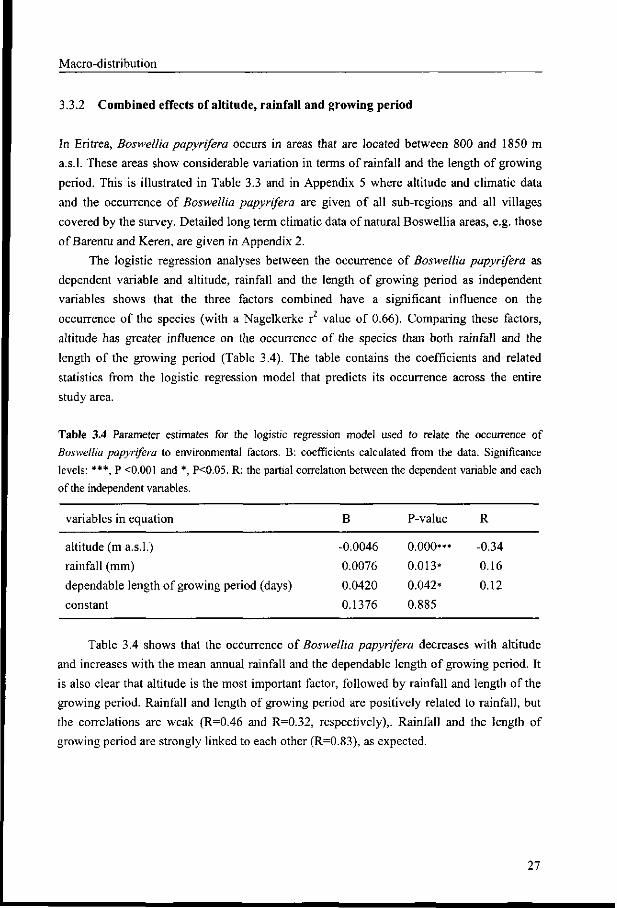
3.3.2 Combined effects of altitude, rainfall and growing period
In Eritrea, Boswellia papyrifera occurs in areas that are located between 800 and 1850 m
a.s.l. These areas show considerable variation in terms of rainfall and the length of growing
period. This is illustrated in Table 3.3 and in Appendix 5 where altitude and climatic data
and the occurrence of Boswellia papyrifera are given of all sub-regions and all villages
covered by the survey. Detailed long term climatic data of natural Boswellia areas, e.g. those
of Barentu and Keren, are given in Appendix 2.
The logistic regression analyses between the occurrence of Boswellia papyrifera as
dependent variable and altitude, rainfall and the length of growing period as independent
variables shows that the three factors combined have a significant influence on the
occurrence of the species (with a Nagelkerke r value of 0.66). Comparing these factors,
altitude has greater influence on the occurrence of the species than both rainfall and the
length of the growing period (Table 3.4). The table contains the coefficients and related
statistics from the logistic regression model that predicts its occurrence across the entire
study area.
Table 3.4 Parameter estimates for the logistic regression model used to relate the occurrence of
Boswellia papyrifera to environmental factors. B: coefficients calculated from the data. Significance
levels: ***, P <0.001 and *, P<0.05. R: the partial correlation between the dependent variable and each
of the independent variables.
variables in equation
altitude (m a.s.l.)
rainfall (mm)
dependable length of growing period (days)
constant
B
-0.0046
0.0076
0.0420
0.1376
P-value
0.000***
0.013*
0.042*
0.885
R
-0.34
0.16
0.12
Table 3.4 shows that the occurrence of Boswellia papyrifera decreases with altitude
and increases with the mean annual rainfall and the dependable length of growing period. It
is also clear that altitude is the most important factor, followed by rainfall and length of the
growing period. Rainfall and length of growing period are positively related to rainfall, but
the correlations are weak (R=0.46 and R=0.32, respectively),. Rainfall and the length of
growing period are strongly linked to each other (R=0.83), as expected.
27
8 o
o o O
Chapter 3
1.0 -
0.8 -
0.6 -
0.4 •
0.2 •
0.0 •
(a) r^O.74
o o
i D OOD & D © O
<3DD<TDO<I!CD~lXHJ—O-O O O
700 1050 1400 1750 2100 2450
Altitude (m)
2800
CI)
() c
3 o o
1.0 •
0.8 •
0.6 J 0.4 -
0.2 -
0.0 •
(b) r^O.83
O 0
100 200 300 400
Rainfall (mm)
500 600 700
1.0
0.8
0.6
0.4
0.2 ^
0.0
(c) ^=0.85
o o 0
0
o
15 30 45 60 75 90
DLGP (days)
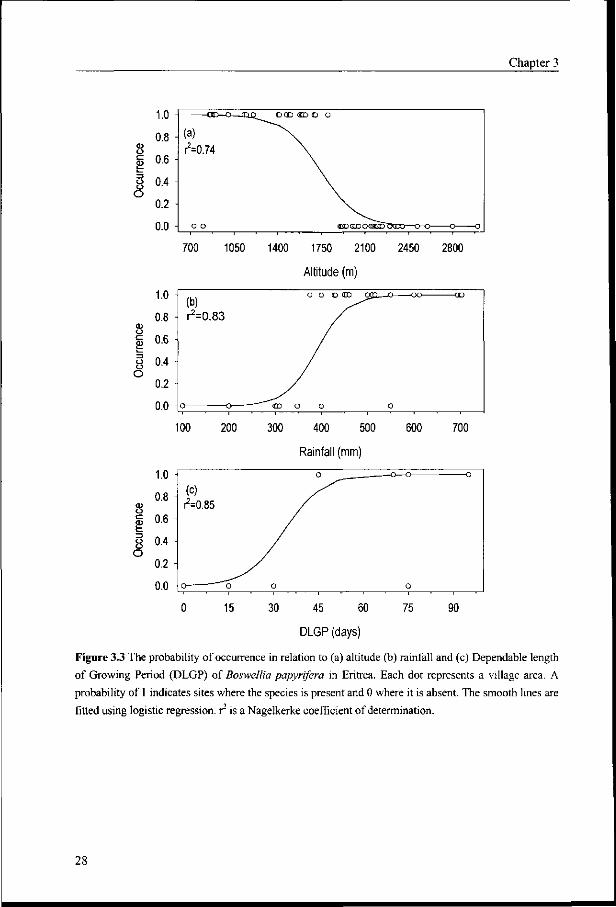
Figure 3.3 The probability of occurrence in relation to (a) altitude (b) rainfall and (c) Dependable length
of Growing Period (DLGP) of Boswellia papyrifera in Eritrea. Each dot represents a village area. A
probability of 1 indicates sites where the species is present and 0 where it is absent. The smooth lines are
fitted using logistic regression, r is a Nagelkerke coefficient of determination.
28
Macro-distribution
3.3.3 Occurrence in relation to individual factors
Altitude
Boswellia papyrifera in its habitat is exposed to the combined action of different
environmental factors. Although the altitude covered by the study ranges between 600 and
3000 m a.s.l., Boswellia trees were found only in areas located between 800 and 1850 m.
The probability of occurrence of the species decreases with altitude (Figure 3.3a).
Rainfall
Rainfall is an additional important factor affecting the distribution of the species. The
amount of rainfall is not uniform throughout the country. Generally, its amount gradually
increases from the north to the south and from the lowlands to the highland parts of the
country. Within its altitude limits, the probability of finding the species in a given area
increases with increase in rainfall (Figure 3.3b).
Throughout the survey, no Boswellia papyrifera stands or isolated trees were found in
areas receiving an annual rainfall less than 375 mm. The probability of occurrence of the
species increases from 0.1 at 300 mm to 1.0 at 550 mm. In the southwestern lowland where
the most important Boswellia woodlands are found, the annual rainfall ranges between 500
and 700 mm. In the northwestern lowlands of Eritrea, the species is absent because of the
low rainfall (less that 200 mm). Besides shortage of rainfall, these areas are also affected by
high evapotranspiration (exceeding 2000 mm per annum) which also increases the soil
moisture deficit. This shows that rainfall is an important ecological factor limiting the
macro-distribution of Boswellia papyrifera in Eritrea.
Growing period
The probability of occurrence of Boswellia papyrifera increased with the length of growing
period.(Figure 3.3c). The species does not occur in places with a dependable growing period
of less than 45 days. Within its appropriate altitude ranges, the species grows in areas with a
growing period of 45-100 days. The likelihood of the occurrence of the species increases
from 0.1 at 30 days to 1.0 at 60. Areas with DLGP values between 45-100 days are found in
the moist lowlands and the lower parts of the moist and arid highlands.
Following the rainfall pattern in the country, the length of growing period increases
from north to south. Because of short growing season, the species is absent in northwestern
semi-desert lowland and arid lowland agroecological zones.
29
Chapter 3
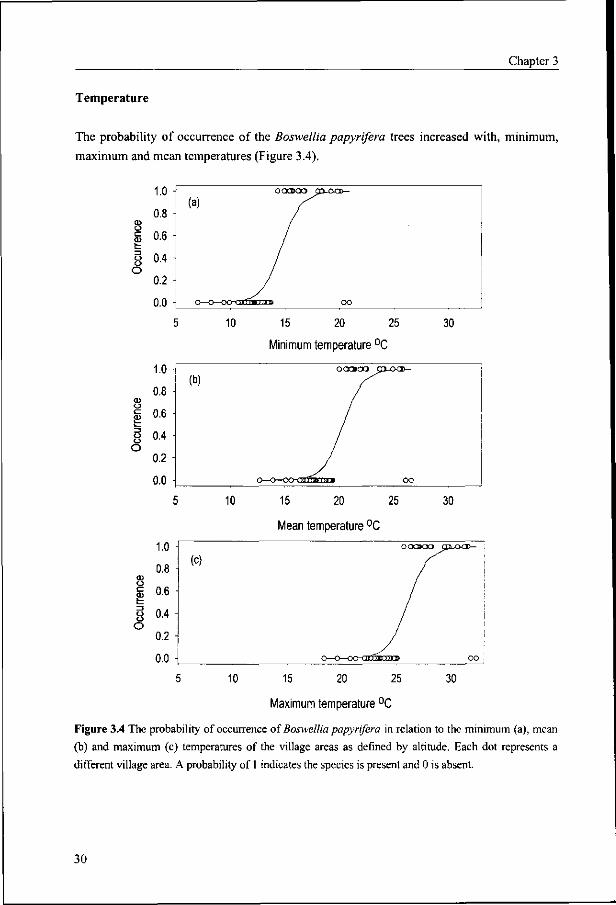
Temperature
The probability of occurrence of the Boswellia papyrifera trees increased with, minimum,
maximum and mean temperatures (Figure 3.4).
8 o
CD
(1) o <1>
3 O O O
1.0 -
0.8 -
0.6 1
0.4 •
0.2 -
0.0 -
1.0
0.8
0.6
8 0.4 o
0.2
0.0
(b)
10 15 20 25
Minimum temperature °C
30
o—o—QO~a3GJamjuBi
10 15 20 25 30
Mean temperature °C
10 15 20 25
Maximum temperature °C
30
Figure 3.4 The probability of occurrence of Boswellia papyrifera in relation to the minimum (a), mean
(b) and maximum (c) temperatures of the village areas as defined by altitude. Each dot represents a
different village area. A probability of 1 indicates the species is present and 0 is absent.
30
Macro-distribution
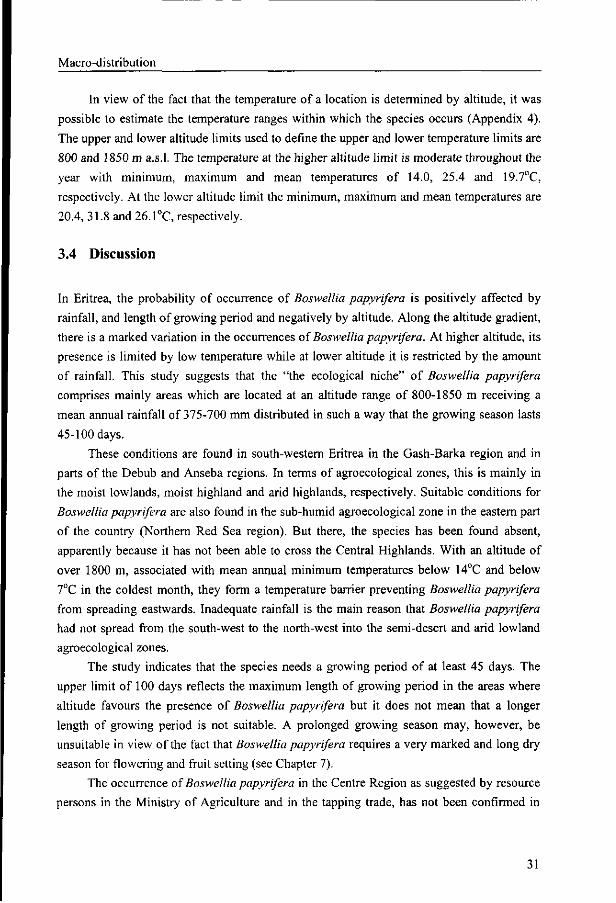
In view of the fact that the temperature of a location is determined by altitude, it was
possible to estimate the temperature ranges within which the species occurs (Appendix 4).
The upper and lower altitude limits used to define the upper and lower temperature limits are
800 and 1850 m a.s.l. The temperature at the higher altitude limit is moderate throughout the
year with minimum, maximum and mean temperatures of 14.0, 25.4 and 19.7°C,
respectively. At the lower altitude limit the minimum, maximum and mean temperatures are
20.4, 31.8 and 26.1°C, respectively.
3.4 Discussion
In Eritrea, the probability of occurrence of Boswellia papyri/era is positively affected by
rainfall, and length of growing period and negatively by altitude. Along the altitude gradient,
there is a marked variation in the occurrences of Boswellia papyri)"era. At higher altitude, its
presence is limited by low temperature while at lower altitude it is restricted by the amount
of rainfall. This study suggests that the "the ecological niche" of Boswellia papyrifera
comprises mainly areas which are located at an altitude range of 800-1850 m receiving a
mean annual rainfall of 375-700 mm distributed in such a way that the growing season lasts
45-100 days.
These conditions are found in south-western Eritrea in the Gash-Barka region and in
parts of the Debub and Anseba regions. In terms of agroecological zones, this is mainly in
the moist lowlands, moist highland and arid highlands, respectively. Suitable conditions for
Boswellia papyrifera are also found in the sub-humid agroecological zone in the eastern part
of the country (Northern Red Sea region). But there, the species has been found absent,
apparently because it has not been able to cross the Central Highlands. With an altitude of
over 1800 m, associated with mean annual minimum temperatures below 14°C and below
7°C in the coldest month, they form a temperature barrier preventing Boswellia papyrifera
from spreading eastwards. Inadequate rainfall is the main reason that Boswellia papyrifera
had not spread from the south-west to the north-west into the semi-desert and arid lowland
agroecological zones.
The study indicates that the species needs a growing period of at least 45 days. The
upper limit of 100 days reflects the maximum length of growing period in the areas where
altitude favours the presence of Boswellia papyrifera but it does not mean that a longer
length of growing period is not suitable. A prolonged growing season may, however, be
unsuitable in view of the fact that Boswellia papyrifera requires a very marked and long dry
season for flowering and fruit setting (see Chapter 7).
The occurrence of Boswellia papyrifera in the Centre Region as suggested by resource
persons in the Ministry of Agriculture and in the tapping trade, has not been confirmed in
31
Chapter 3
our survey. This is due to the fact that, in the past, the administrative Centre Region was
larger and it included parts of the lowlands, which now belong to the Gash-Barka and
Anseba regions.
Looking at the distribution of Boswellia papyrifera in Africa as a whole, a more or less
continuous vegetation belt of the species can be observed stretching from Nigeria eastwards
till it reaches the temperature barrier of the highlands of Eritrea and Ethiopia. Northwards,
this belt is delineated by low rainfall and southwards most likely by a prolonged rainy season
which prevents Boswellia papyrifera from flowering and thus from reproduction.
The macro-distribution survey has clearly shown that the species has disappeared in
many village areas lying in the transition between the moist lowland in the south and arid
lowland further north. Farmers attribute this mainly to land clearing for crop production.
Factors causing inadequate regeneration such as overgrazing and poor seed production may
play a role as well. These are treated later in Chapters 6 and 7.
3.5 Conclusion
Altitude, amount of rainfall, and the length of growing period determine the macro-
distribution of Boswellia papyrifera. It mainly occurs in the south-western lowlands (Gash-
Barka region) and the south (Debub region) at an altitude range of 800-1850 m a.s.l. The
absence of the species from the central highlands and the eastern lowlands with a
comparable climate as found in the western lowlands, suggest that low temperature impedes
its spread from the western lowlands eastwards across the highlands.
The species occurs in areas with mean annual rainfall range of 375-700 mm per annum
distributed over a dependable growing period of 45-100 days. The absence of the species in
the northern lowlands and in areas located at higher altitudes clearly suggest that a low
rainfall and a short length growing period limit its spread into these areas.
Boswellia papyrifera has disappeared from some areas especially from the drier transition
zone between the moist lowlands and arid lowlands. Also, it has declined in the heavily
populated areas bordering with the highlands. Its disappearance is mainly due to land
clearing for agriculture, grazing and also by intensive tapping of trees for gum as will be
discussed later on (Chapter 7).
32
CHAPTER 4
4 The micro-distribution of Boswellia papyrifera
4.1 Introduction
The distribution of a species in an area is influenced by various environmental factors. These
factors include climate (Krebs 1994), soil moisture and nutrient content (Veenendaal and
Swaine 1996, Swaine 1996), historical events, disturbances, interaction with local fauna,
competition with other plant species for space and human influence (Bongers et al. 1999).
The fundamental niche of a species is the result of a combination of environmental
conditions and resources, which allow the species to maintain a viable population (Begon et
al. 1995). The realised niche is much more restricted because of biotic interactions and
historic perturbations.
In Eritrea, detailed studies of individual tree species are scarce. Some reviews show
that vegetation greatly varies with altitude and moisture regime and that the distribution of
plants follows more or less the altitude gradient (Bein et al. 1996). How the abundance and
distribution of individual plant species vary in relation to specific environmental factors is
not yet well documented. Besides these environmental factors, human induced factors have
also modified the composition and distribution of the local flora (Jones 1991). Especially the
pressure on the scarce forest and woody vegetation resources has resulted in changes in
distribution pattern and decline of abundance of several tree species (Jones 1991). The
National Environment and Management Plan for Eritrea (NEMP-E) clearly stipulates that
several useful tree species in the highlands and lowlands are listed as endangered and that
Boswellia papyrifera is one of threatened plant species (NEMP-E 1995, Bein et al. 1996).
The result of the study on the macro-distribution of Boswellia papyrifera in Eritrea
(Chapter 3) shows that the species occurs in the southwestern and southern parts of the
country. Within these regions, it is found in areas at an altitude between 800 and 1850 m
with a mean annual rainfall between 375 and 700 mm and a growing season ranging between
45 and 100 days in length. In areas where it occurs its distribution and abundance is not
uniform across the entire area. It varies from isolated trees to sizeable stands following
certain site conditions such as the topography and the local land use practices. To what
extent the observed distribution pattern reflects its ecological preference for specific
topographic features, soil properties, or human influence is not yet well understood.
This Chapter reports on a study on the micro-distribution of Boswellia papyrifera in
five representative sites covering the Boswellia woodlands in the lowlands and the
highlands. It includes quantification of land and soil factors and attempts to establish
33
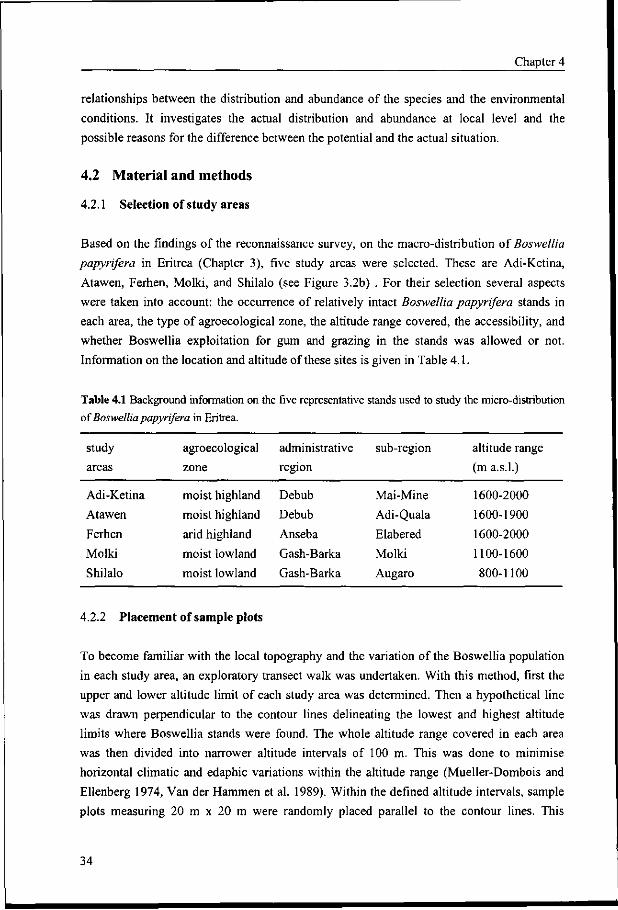
Chapter 4
relationships between the distribution and abundance of the species and the environmental
conditions. It investigates the actual distribution and abundance at local level and the
possible reasons for the difference between the potential and the actual situation.
4.2 Material and methods
4.2.1 Selection of study areas
Based on the findings of the reconnaissance survey, on the macro-distribution of Boswellia
papyrifera in Eritrea (Chapter 3), five study areas were selected. These are Adi-Ketina,
Atawen, Ferhen, Molki, and Shilalo (see Figure 3.2b) . For their selection several aspects
were taken into account: the occurrence of relatively intact Boswellia papyrifera stands in
each area, the type of agroecological zone, the altitude range covered, the accessibility, and
whether Boswellia exploitation for gum and grazing in the stands was allowed or not.
Information on the location and altitude of these sites is given in Table 4.1.
Table 4.1 Background information on the five representative stands used to study the micro-distribution of Boswellia papyrifera in Eritrea.
study
areas
agroecological administrative sub-region altitude range zone region (m a.s.l.)
Adi-Ketina moist highland Debub Mai-Mine 1600-2000
Atawen moist highland Debub Adi-Quala 1600-1900
Ferhen arid highland Anseba Elabered 1600-2000
Molki moist lowland Gash-Barka Molki 1100-1600
Shilalo moist lowland Gash-Barka Augaro 800-1100
4.2.2 Placement of sample plots
To become familiar with the local topography and the variation of the Boswellia population
in each study area, an exploratory transect walk was undertaken. With this method, first the
upper and lower altitude limit of each study area was determined. Then a hypothetical line
was drawn perpendicular to the contour lines delineating the lowest and highest altitude
limits where Boswellia stands were found. The whole altitude range covered in each area
was then divided into narrower altitude intervals of 100 m. This was done to minimise
horizontal climatic and edaphic variations within the altitude range (Mueller-Dombois and
Ellenberg 1974, Van der Hammen et al. 1989). Within the defined altitude intervals, sample
plots measuring 20 m x 20 m were randomly placed parallel to the contour lines. This
34
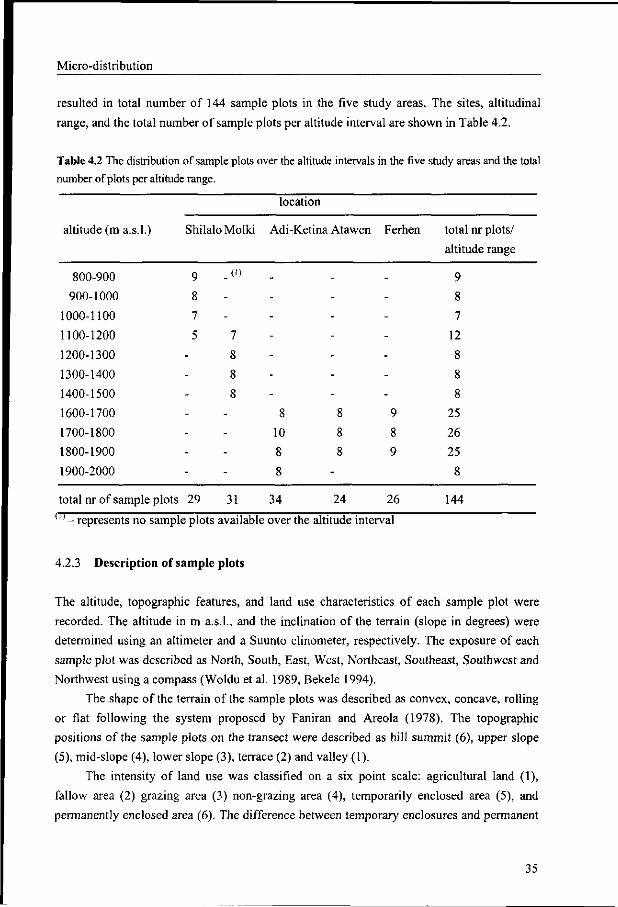
Micro-distribution
resulted in total number of 144 sample plots in the five study areas. The sites, altitudinal
range, and the total number of sample plots per altitude interval are shown in Table 4.2.
Table 4.2 The distribution of sample plots over the altitude intervals in the five study areas and the total number of plots per altitude range.
altitude (m a.s.l.)
location
Shilalo Molki Adi-Ketina Atawen Ferhen total nr plots/
altitude range
800-900
900-1000
1000-1100
1100-1200
1200-1300
1300-1400
1400-1500
1600-1700
1700-1800
1800-1900
1900-2000
9 _C>
8
7
5 7
10
7
12
9 8
9
25
26
25
total nr of sample plots 29 31 34 24 26 (TT
144
represents no sample plots available over the altitude interval
4.2.3 Description of sample plots
The altitude, topographic features, and land use characteristics of each sample plot were
recorded. The altitude in m a.s.l., and the inclination of the terrain (slope in degrees) were
determined using an altimeter and a Suunto clinometer, respectively. The exposure of each
sample plot was described as North, South, East, West, Northeast, Southeast, Southwest and
Northwest using a compass (Woldu et al. 1989, Bekele 1994).
The shape of the terrain of the sample plots was described as convex, concave, rolling
or flat following the system proposed by Faniran and Areola (1978). The topographic
positions of the sample plots on the transect were described as hill summit (6), upper slope
(5), mid-slope (4), lower slope (3), terrace (2) and valley (1).
The intensity of land use was classified on a six point scale: agricultural land (1),
fallow area (2) grazing area (3) non-grazing area (4), temporarily enclosed area (5), and
permanently enclosed area (6). The difference between temporary enclosures and permanent
35
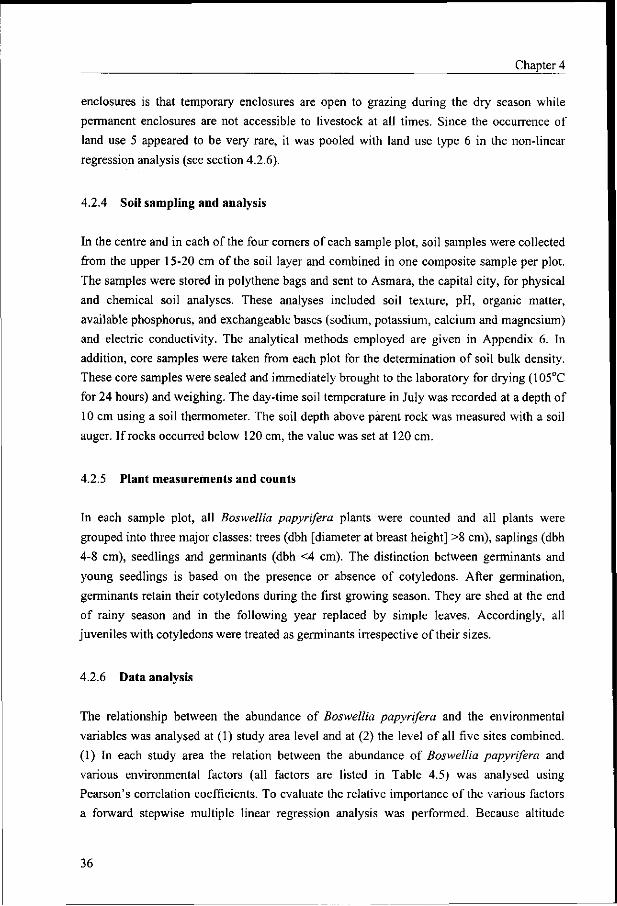
Chapter 4
enclosures is that temporary enclosures are open to grazing during the dry season while
permanent enclosures are not accessible to livestock at all times. Since the occurrence of
land use 5 appeared to be very rare, it was pooled with land use type 6 in the non-linear
regression analysis (see section 4.2.6).
4.2.4 Soil sampling and analysis
In the centre and in each of the four corners of each sample plot, soil samples were collected
from the upper 15-20 cm of the soil layer and combined in one composite sample per plot.
The samples were stored in polythene bags and sent to Asmara, the capital city, for physical
and chemical soil analyses. These analyses included soil texture, pH, organic matter,
available phosphorus, and exchangeable bases (sodium, potassium, calcium and magnesium)
and electric conductivity. The analytical methods employed are given in Appendix 6. In
addition, core samples were taken from each plot for the determination of soil bulk density.
These core samples were sealed and immediately brought to the laboratory for drying (105°C
for 24 hours) and weighing. The day-time soil temperature in July was recorded at a depth of
10 cm using a soil thermometer. The soil depth above parent rock was measured with a soil
auger. If rocks occurred below 120 cm, the value was set at 120 cm.
4.2.5 Plant measurements and counts
In each sample plot, all Boswellia papyrifera plants were counted and all plants were
grouped into three major classes: trees (dbh [diameter at breast height] >8 cm), saplings (dbh
4-8 cm), seedlings and germinants (dbh <4 cm). The distinction between germinants and
young seedlings is based on the presence or absence of cotyledons. After germination,
germinants retain their cotyledons during the first growing season. They are shed at the end
of rainy season and in the following year replaced by simple leaves. Accordingly, all
juveniles with cotyledons were treated as germinants irrespective of their sizes.
4.2.6 Data analysis
The relationship between the abundance of Boswellia papyrifera and the environmental
variables was analysed at (1) study area level and at (2) the level of all five sites combined.
(1) In each study area the relation between the abundance of Boswellia papyrifera and
various environmental factors (all factors are listed in Table 4.5) was analysed using
Pearson's correlation coefficients. To evaluate the relative importance of the various factors
a forward stepwise multiple linear regression analysis was performed. Because altitude
36
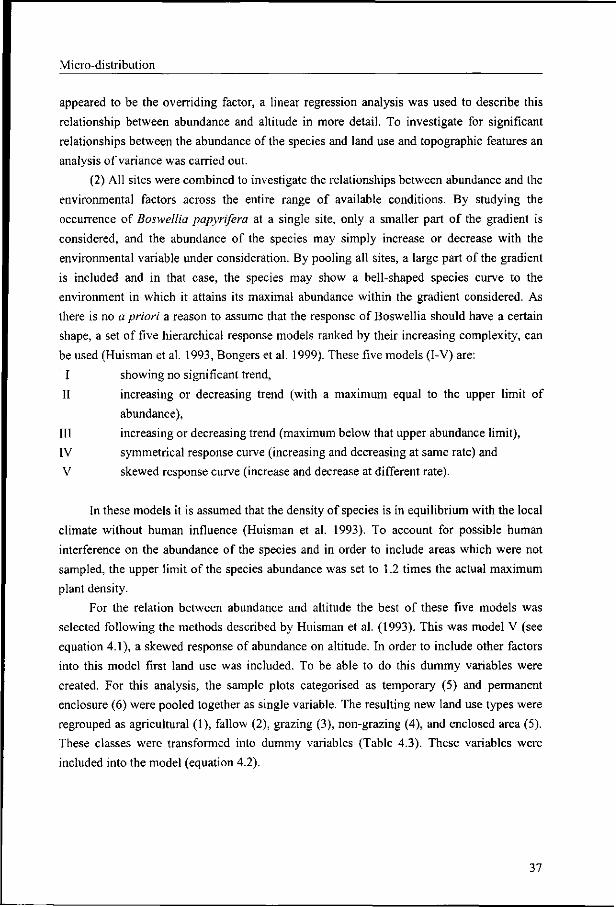
Micro-distribution
appeared to be the overriding factor, a linear regression analysis was used to describe this
relationship between abundance and altitude in more detail. To investigate for significant
relationships between the abundance of the species and land use and topographic features an
analysis of variance was carried out.
(2) All sites were combined to investigate the relationships between abundance and the
environmental factors across the entire range of available conditions. By studying the
occurrence of Boswellia papyrifera at a single site, only a smaller part of the gradient is
considered, and the abundance of the species may simply increase or decrease with the
environmental variable under consideration. By pooling all sites, a large part of the gradient
is included and in that case, the species may show a bell-shaped species curve to the
environment in which it attains its maximal abundance within the gradient considered. As
there is no a priori a reason to assume that the response of Boswellia should have a certain
shape, a set of five hierarchical response models ranked by their increasing complexity, can
be used (Huisman et al. 1993, Bongers et al. 1999). These five models (I-V) are:
I showing no significant trend,
II increasing or decreasing trend (with a maximum equal to the upper limit of
abundance),
III increasing or decreasing trend (maximum below that upper abundance limit),
IV symmetrical response curve (increasing and decreasing at same rate) and
V skewed response curve (increase and decrease at different rate).
In these models it is assumed that the density of species is in equilibrium with the local
climate without human influence (Huisman et al. 1993). To account for possible human
interference on the abundance of the species and in order to include areas which were not
sampled, the upper limit of the species abundance was set to 1.2 times the actual maximum
plant density.
For the relation between abundance and altitude the best of these five models was
selected following the methods described by Huisman et al. (1993). This was model V (see
equation 4.1), a skewed response of abundance on altitude. In order to include other factors
into this model first land use was included. To be able to do this dummy variables were
created. For this analysis, the sample plots categorised as temporary (5) and permanent
enclosure (6) were pooled together as single variable. The resulting new land use types were
regrouped as agricultural (1), fallow (2), grazing (3), non-grazing (4), and enclosed area (5).
These classes were transformed into dummy variables (Table 4.3). These variables were
included into the model (equation 4.2).
37
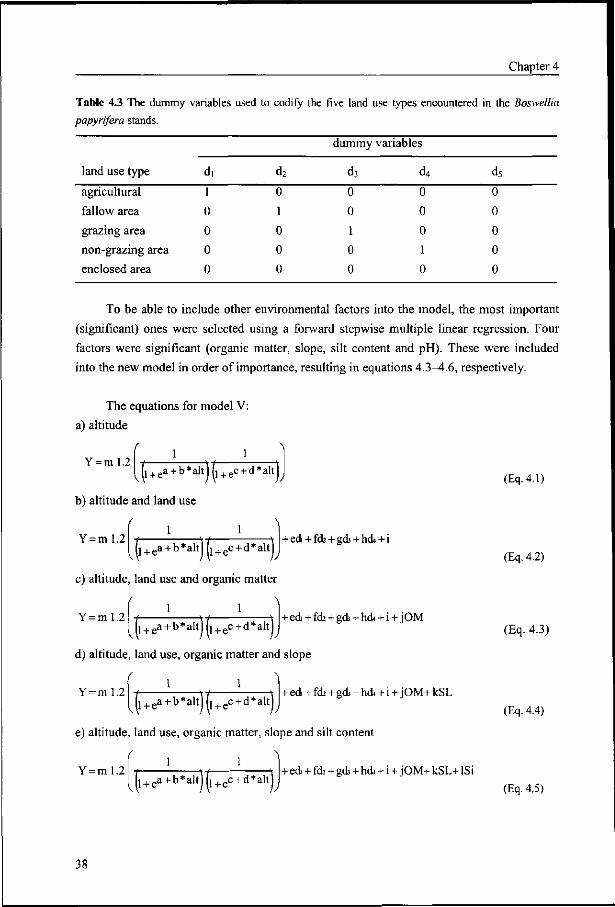
Chapter 4
Table 4.3 The dummy variables used to codify the five land use types encountered in the Boswellia
papyrifera stands.
land use type
agricultural
fallow area
grazing area
non-grazing area
enclosed area
d,
1
0
0
0
0
d2
0
1
0
0
0
dummy
d3
0
0
1
0
0
variables
d4
0
0
0
1
0
d5
0
0
0
0
0
To be able to include other environmental factors into the model, the most important
(significant) ones were selected using a forward stepwise multiple linear regression. Four
factors were significant (organic matter, slope, silt content and pH). These were included
into the new model in order of importance, resulting in equations 4.3-4.6, respectively.
The equations for model V:
a) altitude
Y = m l . 2 (l + ea + b*alt)(1 + ec + d*altj
b) altitude and land use
Y = ml .2
V ( 1 + e a+b*a l t j ( 1 + e c+d*ak | "
+ ed+fd> + gd3 + hd4+i
c) altitude, land use and organic matter
Y = ml .2 1 1
(1 + ea +b*a l t ) ( l + ec +d*a l t ) +ed + fd> + gdi + hck + i + jOM
d) altitude, land use, organic matter and slope
Y = ml .2 (1 + ea+b*altjj1 + ec + d*altj
+ ed + f<i + get + hdt + i + JOM+ kSL
e) altitude, land use, organic matter, slope and silt content
Y = m l . 2
\
(1 + ea + b*alt)(1+ec + d*alt) + ed + fd: + get + hdj + i + JOM+ kSL+ ISi
(Eq.4.1)
(Eq. 4.2)
(Eq. 4.3)
(Eq. 4.4)
(Eq. 4.5)
38
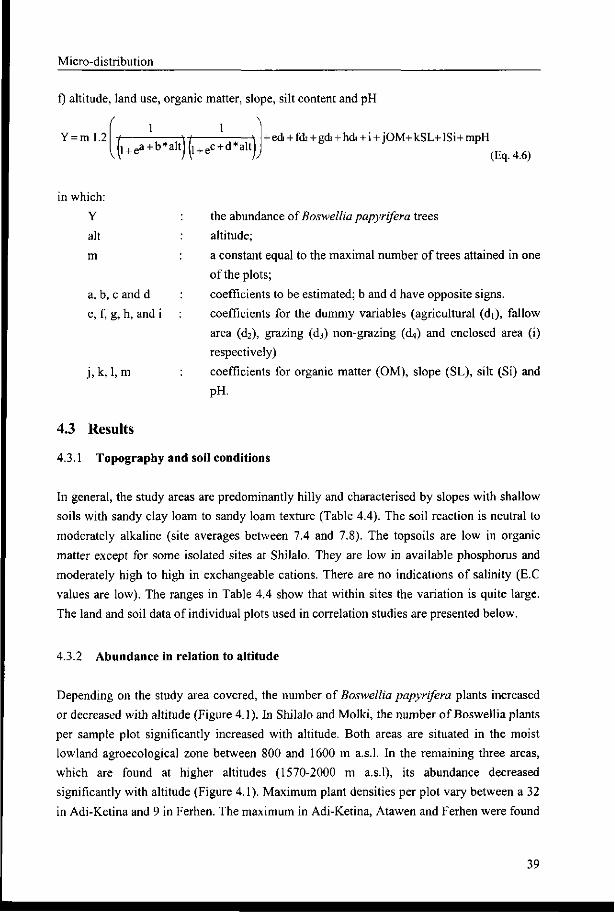
Micro-distribution
f) altitude, land use, organic matter, slope, silt content and pH
Y = ml .2 \+& + b*al t] |1 + ec + d*alt
hedi + fck + gd + hdi + i + jOM+kSL+lSi+mpH
(Eq. 4.6)
in which:
Y
alt
m
a, b, c and d
e, f, g, h, and i
j , k, 1, m
the abundance of Boswellia papyrifera trees
altitude;
a constant equal to the maximal number of trees attained in one
of the plots;
coefficients to be estimated; b and d have opposite signs.
coefficients for the dummy variables (agricultural (di), fallow
area (d2), grazing (d3) non-grazing (d4) and enclosed area (i)
respectively)
coefficients for organic matter (OM), slope (SL), silt (Si) and
pH.
4.3 Results
4.3.1 Topography and soil conditions
In general, the study areas are predominantly hilly and characterised by slopes with shallow
soils with sandy clay loam to sandy loam texture (Table 4.4). The soil reaction is neutral to
moderately alkaline (site averages between 7.4 and 7.8). The topsoils are low in organic
matter except for some isolated sites at Shilalo. They are low in available phosphorus and
moderately high to high in exchangeable cations. There are no indications of salinity (E.C
values are low). The ranges in Table 4.4 show that within sites the variation is quite large.
The land and soil data of individual plots used in correlation studies are presented below.
4.3.2 Abundance in relation to altitude
Depending on the study area covered, the number of Boswellia papyrifera plants increased
or decreased with altitude (Figure 4.1). In Shilalo and Molki, the number of Boswellia plants
per sample plot significantly increased with altitude. Both areas are situated in the moist
lowland agroecological zone between 800 and 1600 m a.s.l. In the remaining three areas,
which are found at higher altitudes (1570-2000 m a.s.l), its abundance decreased
significantly with altitude (Figure 4.1). Maximum plant densities per plot vary between a 32
in Adi-Ketina and 9 in Ferhen. The maximum in Adi-Ketina, Atawen and Ferhen were found
39
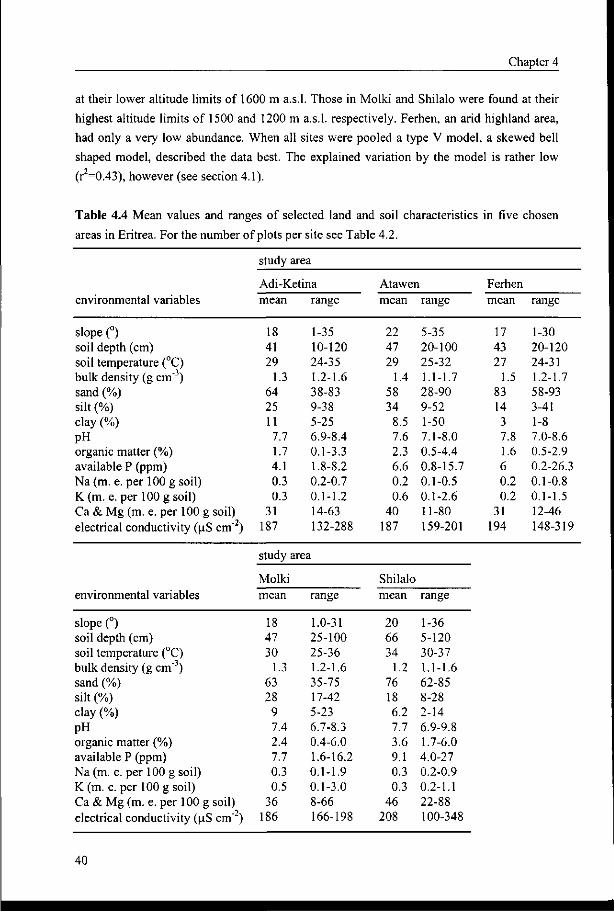
Chapter 4
at their lower altitude limits of 1600 m a.s.l. Those in Molki and Shilalo were found at their
highest altitude limits of 1500 and 1200 m a.s.l. respectively. Ferhen, an arid highland area,
had only a very low abundance. When all sites were pooled a type V model, a skewed bell
shaped model, described the data best. The explained variation by the model is rather low
(r =0.43), however (see section 4.1).
Table 4.4 Mean values and ranges of selected land and soil characteristics in five chosen
areas in Eritrea. For the number of plots per site see Table 4.2.
environmental variables
slope (°) soil depth (cm) soil temperature (°C) bulk density (g cm"3) sand (%) silt (%) clay (%) pH organic matter (%) available P (ppm) Na (m. e. per 100 g soil) K (m. e. per 100 g soil) Ca & Mg (m. e. per 100 g soil) electrical conductivity (uS cm"2)
environmental variables
slope (°) soil depth (cm) soil temperature (°C) bulk density (g cm"3) sand (%) silt (%) clay (%) pH organic matter (%) available P (ppm) Na (m. e. per 100 g soil) K (m. e. per 100 g soil) Ca & Mg (m. e. per 100 g soil) electrical conductivity (|j.S cm" )
study area
Adi-Ketina mean
18 41 29
1.3 64 25 11 7.7 1.7 4.1 0.3 0.3
31 187
range
1-35 10-120 24-35 1.2-1.6 38-83 9-38 5-25 6.9-8.4 0.1-3.3 1.8-8.2 0.2-0.7 0.1-1.2 14-63 132-288
study area
Molki mean
18 47 30
1.3 63 28 9 7.4 2.4 7.7 0.3 0.5
36 186
range
1.0-31 25-100 25-36 1.2-1.6 35-75 17-42 5-23 6.7-8.3 0.4-6.0 1.6-16.2 0.1-1.9 0.1-3.0 8-66 166-198
Atawen mean
22 47 29
1.4 58 34
8.5 7.6 2.3 6.6 0.2 0.6
40 187
Shilalc mean
20 66 34
1.2 76 18 6.2 7.7 3.6 9.1 0.3 0.3
46 208
range
5-35 20-100 25-32 1.1-1.7 28-90 9-52 1-50 7.1-8.0 0.5-4.4 0.8-15.7 0.1-0.5 0.1-2.6 11-80 159-201
range
1-36 5-120 30-37 1.1-1.6 62-85 8-28 2-14 6.9-9.8 1.7-6.0 4.0-27 0.2-0.9 0.2-1.1 22-88 100-348
Ferhen mean
17 43 27
1.5 83 14 3 7.8 1.6 6 0.2 0.2
31 194
range
1-30 20-120 24-31 1.2-1.7 58-93 3-41 1-8 7.0-8.6 0.5-2.9 0.2-26.3 0.1-0.8 0.1-1.5 12-46 148-319
40
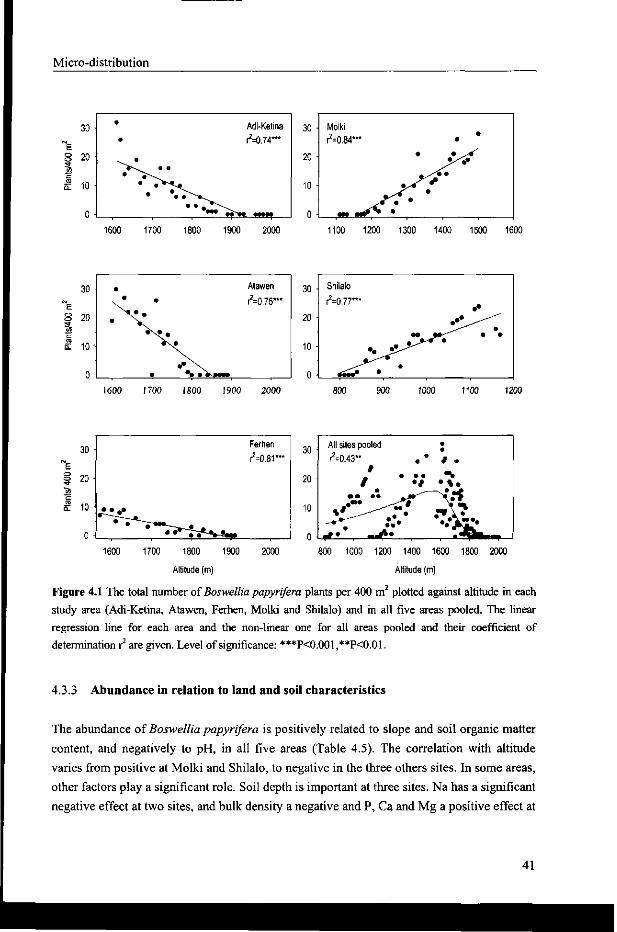
Micro-distribution
30
20 -
10
0 •
Molki
r2=0.84"*
9m N T
•
"% •
•
•
1600 1700 1800 1900 2000 1100 1200 1300 1400 1500 1600
30
8 20
OJ
Ql 10"
0
• •
• • •
•
Atawen
^=0.75***
1600 1700 1800 1900 2000
30 -
20 -
10
0 •
Shilalo
^=0.77™
M
g^lm •
••
9**-*^ • • r •
800 900 1000 1100 1200
30
20
10
(1
All sites pooled
r2=0.43"
# / •
• • • • mM
^r •••• - * • _ J * «
• • • • t .
^ • • *
•*>ir* **^^*~^ 800 1000 1200 1400 1600
Altitude (m)
2
1800 2000
Figure 4.1 The total number of Boswellia papyrifera plants per 400 m plotted against altitude in each study area (Adi-Ketina, Atawen, Ferhen, Molki and Shilalo) and in all five areas pooled. The linear regression line for each area and the non-linear one for all areas pooled and their coefficient of determination r2 are given. Level of significance: ***P<0.001,**P<0.01.
4.3.3 Abundance in relation to land and soil characteristics
The abundance of Boswellia papyrifera is positively related to slope and soil organic matter
content, and negatively to pH, in all five areas (Table 4.5). The correlation with altitude
varies from positive at Molki and Shilalo, to negative in the three others sites. In some areas,
other factors play a significant role. Soil depth is important at three sites. Na has a significant
negative effect at two sites, and bulk density a negative and P, Ca and Mg a positive effect at
41
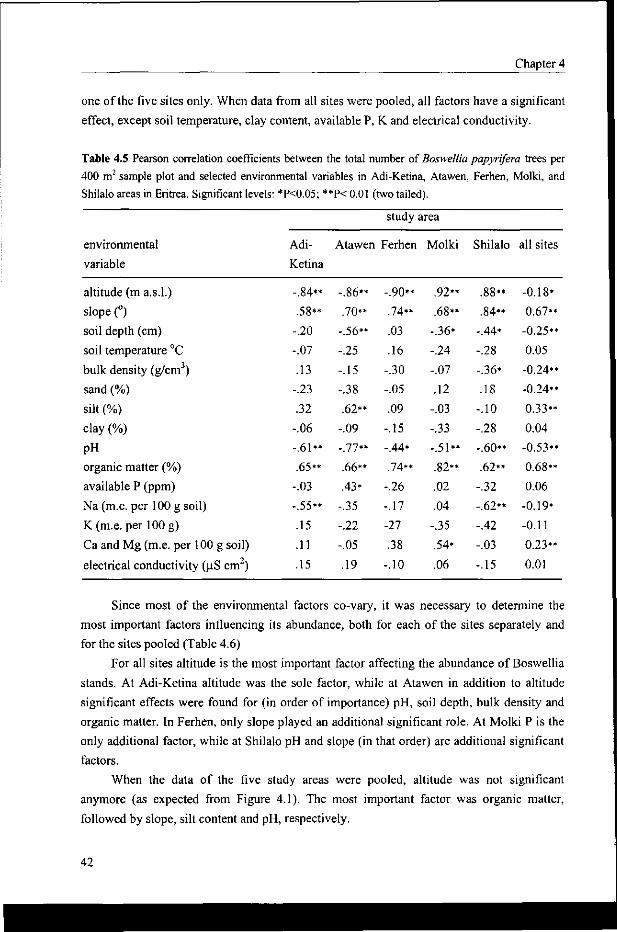
Chapter 4
one of the five sites only. When data from all sites were pooled, all factors have a significant
effect, except soil temperature, clay content, available P, K and electrical conductivity.
Table 4.5 Pearson correlation coefficients between the total number of Boswellia papyrifera trees per
400 m2 sample plot and selected environmental variables in Adi-Ketina, Atawen, Ferhen, Molki, and
Shilalo areas in Eritrea. Significant levels: *P<0.05; **P< 0.01 (two tailed).
environmental
variable
altitude (m a.s.l.)
slope (°)
soil depth (cm)
soil temperature °C
bulk density (g/cm3)
sand (%)
silt (%)
clay (%)
pH
organic matter (%)
available P (ppm)
Na (m.e. per 100 g soil)
K(m.e. per 100 g)
Ca and Mg (m.e. per 100 g soil)
electrical conductivity (p.S cm )
Adi-
Ketina
-.84**
.58**
-.20
-.07
.13
-.23
.32
-.06
-.61**
.65**
-.03
-.55**
.15
.11
.15
study area
Atawen Ferhen
-.86**
.70**
-.56**
-.25
-.15
-.38
.62**
-.09
-.77**
.66**
.43*
-.35
-.22
-.05
.19
-.90**
74**
.03
.16
-.30
-.05
.09
-.15
-.44*
.74**
-.26
-.17
-27
.38
-.10
Molki
.92**
.68**
-.36*
-.24
-.07
.12
-.03
-.33
-.51**
.82**
.02
.04
-.35
.54*
.06
Shilalo
.88**
.84**
-.44*
-.28
-.36*
.18
-.10
-.28
-.60**
.62**
-.32
-.62**
-.42
-.03
-.15
all sites
-0.18*
0.67**
-0.25**
0.05
-0.24**
-0.24**
0.33**
0.04
-0.53**
0.68**
0.06
-0.19*
-0.11
0.23**
0.01
Since most of the environmental factors co-vary, it was necessary to determine the
most important factors influencing its abundance, both for each of the sites separately and
for the sites pooled (Table 4.6)
For all sites altitude is the most important factor affecting the abundance of Boswellia
stands. At Adi-Ketina altitude was the sole factor, while at Atawen in addition to altitude
significant effects were found for (in order of importance) pH, soil depth, bulk density and
organic matter. In Ferhen, only slope played an additional significant role. At Molki P is the
only additional factor, while at Shilalo pH and slope (in that order) are additional significant
factors.
When the data of the five study areas were pooled, altitude was not significant
anymore (as expected from Figure 4.1). The most important factor was organic matter,
followed by slope, silt content and pH, respectively.
42
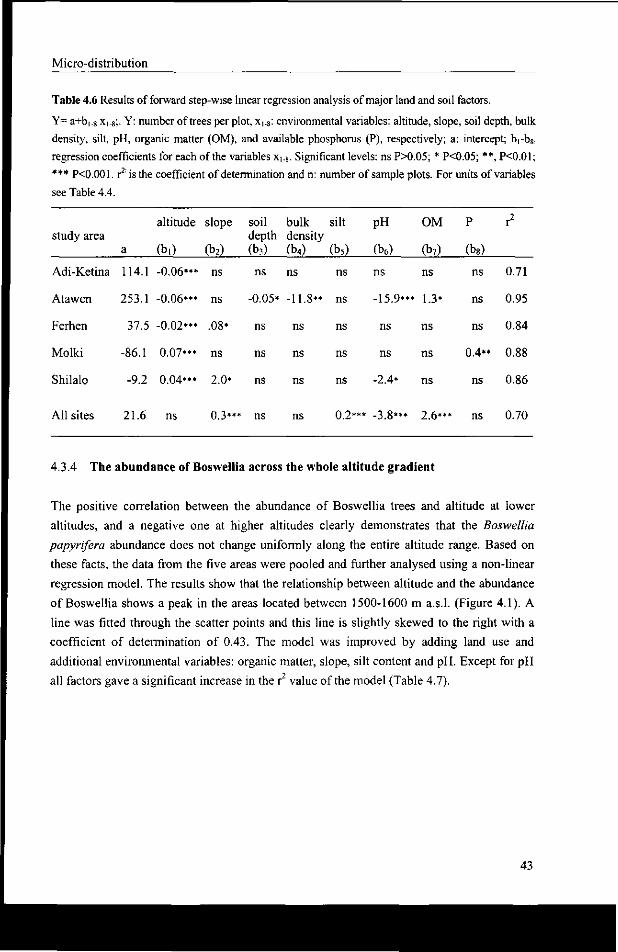
Micro-distribution
Table 4.6 Results of forward step-wise linear regression analysis of major land and soil factors. Y= a+b]_8 X!.8;. Y: number of trees per plot, X].8: environmental variables: altitude, slope, soil depth, bulk density, silt, pH, organic matter (OM), and available phosphorus (P), respectively; a: intercept; brb8:
regression coefficients for each of the variables x,.8. Significant levels: ns P>0.05; * P<0.05; **, PO.01; *** P<0.001. r is the coefficient of determination and n: number of sample plots. For units of variables see Table 4.4.
altitude slope soil bulk silt study area depth density
a (b,) (b2) (b3) (b4) (b5)
pH OM P xl
(b6) (b7) (b8)
Adi-Ketina 114.1 -0.06*** ns
Atawen 253.1 -0.06*** ns
Ferhen 37.5 -0.02*** .08*
Molki -86.1 0.07*** ns
Shilalo -9.2 0.04*** 2.0*
ns
0.05*
ns
ns
ns
ns
-11.8**
ns
ns
ns
ns
ns
ns
ns
ns
ns
-15 9***
ns
ns
-2.4*
ns
1.3*
ns
ns
ns
ns
ns
ns
0.4**
ns
0.71
0.95
0.84
0.88
0.86
All sites 21.6 ns 0.3* ns ns 0.2*** -3.8*** 2.6*** ns 0.70
4.3.4 The abundance of Boswellia across the whole altitude gradient
The positive correlation between the abundance of Boswellia trees and altitude at lower
altitudes, and a negative one at higher altitudes clearly demonstrates that the Boswellia
papyrifera abundance does not change uniformly along the entire altitude range. Based on
these facts, the data from the five areas were pooled and further analysed using a non-linear
regression model. The results show that the relationship between altitude and the abundance
of Boswellia shows a peak in the areas located between 1500-1600 m a.s.l. (Figure 4.1). A
line was fitted through the scatter points and this line is slightly skewed to the right with a
coefficient of determination of 0.43. The model was improved by adding land use and
additional environmental variables: organic matter, slope, silt content and pH. Except for pH
all factors gave a significant increase in the r2 value of the model (Table 4.7).
43
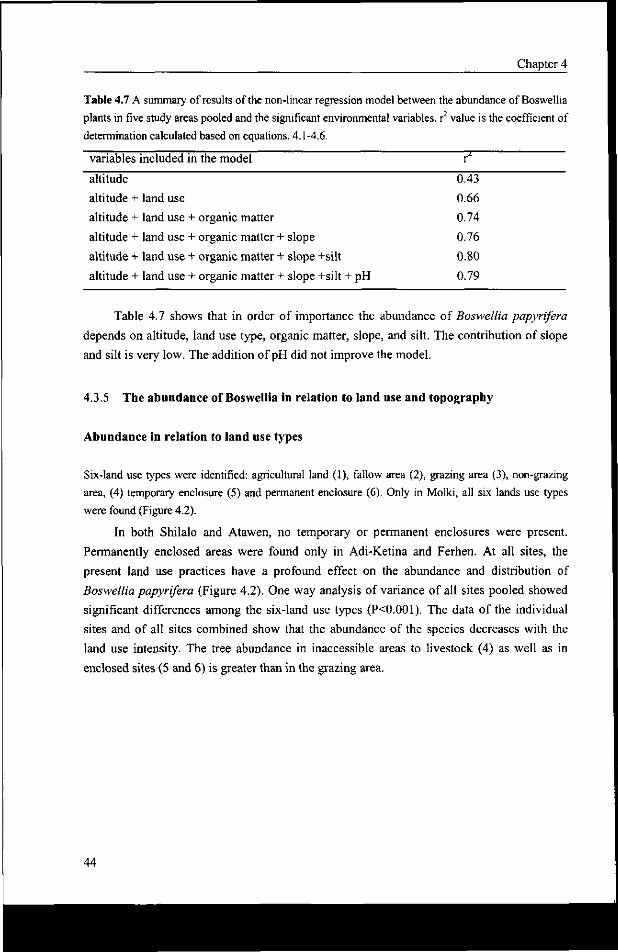
Chapter 4
Table 4.7 A summary of results of the non-linear regression model between the abundance of Boswellia
plants in five study areas pooled and the significant environmental variables, r2 value is the coefficient of
determination calculated based on equations. 4.1-4.6.
variables included in the model r7
altitude
altitude + land use
altitude + land use + organic matter
altitude + land use + organic matter + slope
altitude + land use + organic matter + slope +silt
altitude + land use + organic matter + slope +silt + pH
0.43
0.66
0.74
0.76
0.80
0.79
Table 4.7 shows that in order of importance the abundance of Boswellia papyrifera
depends on altitude, land use type, organic matter, slope, and silt. The contribution of slope
and silt is very low. The addition of pH did not improve the model.
4.3.5 The abundance of Boswellia in relation to land use and topography
Abundance in relation to land use types
Six-land use types were identified: agricultural land (1), fallow area (2), grazing area (3), non-grazing
area, (4) temporary enclosure (5) and permanent enclosure (6). Only in Molki, all six lands use types
were found (Figure 4.2).
In both Shilalo and Atawen, no temporary or permanent enclosures were present.
Permanently enclosed areas were found only in Adi-Ketina and Ferhen. At all sites, the
present land use practices have a profound effect on the abundance and distribution of
Boswellia papyrifera (Figure 4.2). One way analysis of variance of all sites pooled showed
significant differences among the six-land use types (PO.001). The data of the individual
sites and of all sites combined show that the abundance of the species decreases with the
land use intensity. The tree abundance in inaccessible areas to livestock (4) as well as in
enclosed sites (5 and 6) is greater than in the grazing area.
44
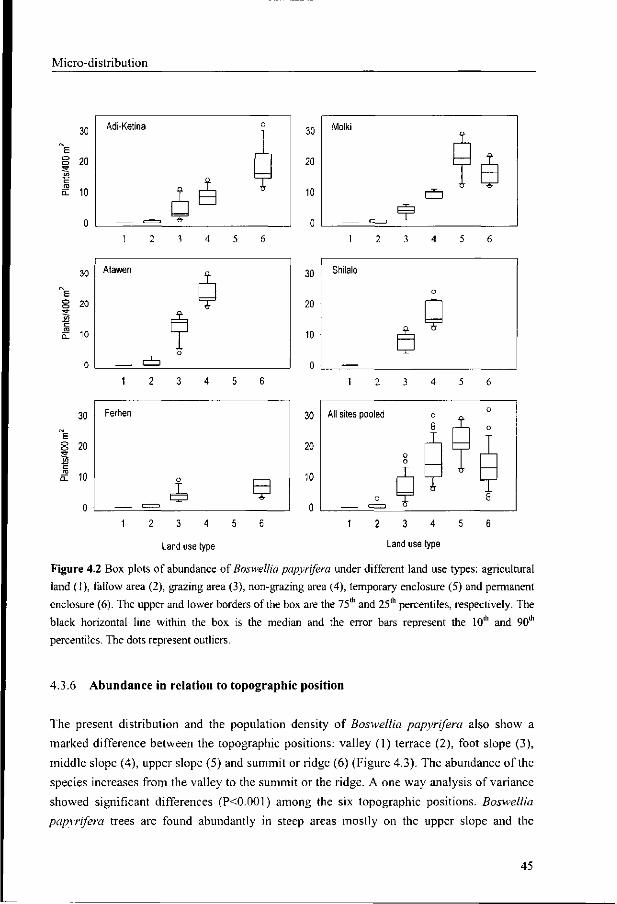
Micro-distribution
30
20
10
n
Adi-Ketina
C = 3
c 3
^
3 4 5 6
30
"E
8 20
Pla
nts/
o
0
Atawen
^ O
J_
I T
30
20
10
0
Molki
, , ^
r^D
t
1 t
2 3 4 5 6
30
20
10
0
Shilalo
?
O
*
_1_
30
20
10
0
Ferhen
o
?
30
20
10
0
1 1 2 3 4
Land use type
All sites pooled
o C = 3
O O
T
i
o
8 r-2-1 o
1
i T
T T 8
2 3 4 5 6
Land use type
Figure 4.2 Box plots of abundance of Boswellia papyrifera under different land use types: agricultural
land (1), fallow area (2), grazing area (3), non-grazing area (4), temporary enclosure (5) and permanent
enclosure (6). The upper and lower borders of the box are the 75th and 25"1 percentiles, respectively. The
black horizontal line within the box is the median and the error bars represent the 10"' and 90th
percentiles. The dots represent outliers.
4.3.6 Abundance in relation to topographic position
The present distribution and the population density of Boswellia papyrifera also show a
marked difference between the topographic positions: valley (1) terrace (2), foot slope (3),
middle slope (4), upper slope (5) and summit or ridge (6) (Figure 4.3). The abundance of the
species increases from the valley to the summit or the ridge. A one way analysis of variance
showed significant differences (P<0.001) among the six topographic positions. Boswellia
papyrifera trees are found abundantly in steep areas mostly on the upper slope and the
45
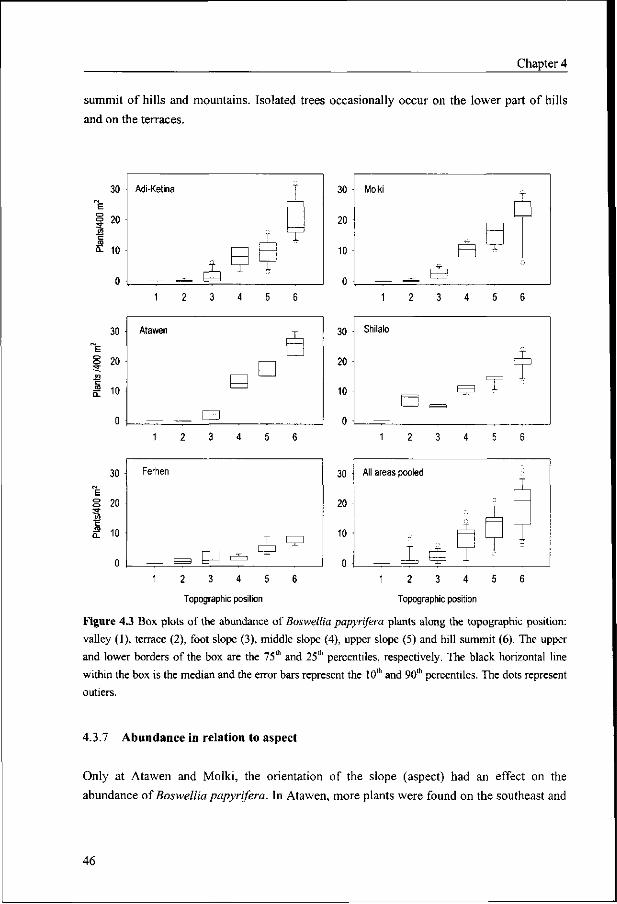
Chapter 4
summit of hills and mountains. Isolated trees occasionally occur on the lower part of hills
and on the terraces.
K 10
30
20
10
n
Adi-Ketina
f
_ ^ ? V
T
X
30
2U
10
I) i
Molki
s ̂ s
n
1 2 3 4 5 6
30
E
1 20 V}
1 10
0
Atawen
BB
B
T
30 i All areas pooled
20
10
0
1
1 2 3 4 5 6
2 3 4 5 6 1 2 3 4 5 6
Topographic position Topographic position
Figure 4.3 Box plots of the abundance of Boswellia papyrifera plants along the topographic position:
valley (1), terrace (2), foot slope (3), middle slope (4), upper slope (5) and hill summit (6). The upper
and lower borders of the box are the 75th and 25lh percentiles, respectively. The black horizontal line
within the box is the median and the error bars represent the 10lh and 90th percentiles. The dots represent
outiers.
4.3.7 Abundance in relation to aspect
Only at Atawen and Molki, the orientation of the slope (aspect) had an effect on the
abundance of Boswellia papyrifera. In Atawen, more plants were found on the southeast and
46
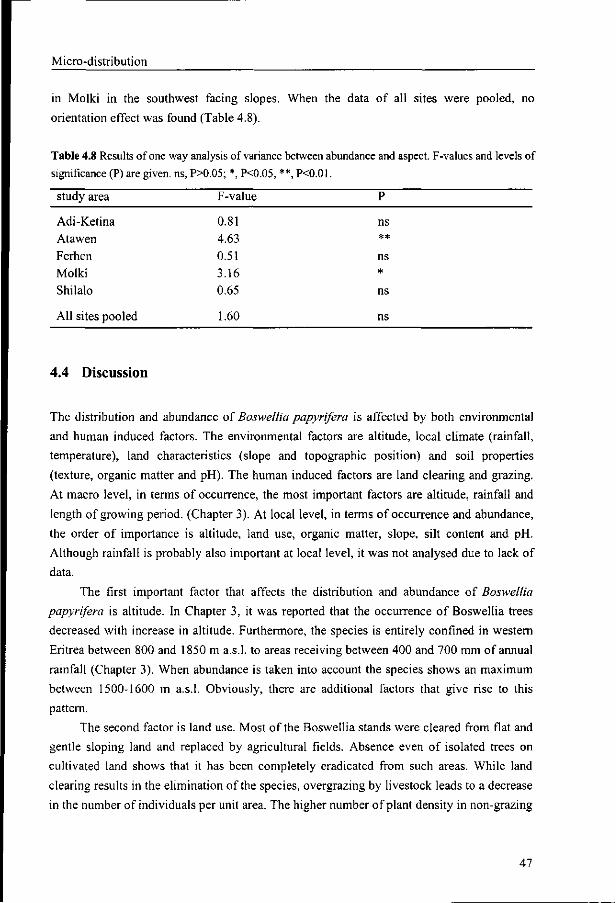
Micro-distribution
in Molki in the southwest facing slopes. When the data of all sites were pooled, no
orientation effect was found (Table 4.8).
Table 4.8 Results of one way analysis of variance between abundance and aspect. F-values and levels of significance (P) are given, ns, P>0.05; *, P<0.05, **, PO.01.
study area F-value
Adi-Ketina Atawen Ferhen Molki Shilalo
All sites pooled
0.81 4.63 0.51 3.16 0.65
1.60
ns ** ns *
ns
4.4 Discussion
The distribution and abundance of Boswellia papyrifera is affected by both environmental
and human induced factors. The environmental factors are altitude, local climate (rainfall,
temperature), land characteristics (slope and topographic position) and soil properties
(texture, organic matter and pH). The human induced factors are land clearing and grazing.
At macro level, in terms of occurrence, the most important factors are altitude, rainfall and
length of growing period. (Chapter 3). At local level, in terms of occurrence and abundance,
the order of importance is altitude, land use, organic matter, slope, silt content and pH.
Although rainfall is probably also important at local level, it was not analysed due to lack of
data.
The first important factor that affects the distribution and abundance of Boswellia
papyrifera is altitude. In Chapter 3, it was reported that the occurrence of Boswellia trees
decreased with increase in altitude. Furthermore, the species is entirely confined in western
Eritrea between 800 and 1850 m a.s.l. to areas receiving between 400 and 700 mm of annual
rainfall (Chapter 3). When abundance is taken into account the species shows an maximum
between 1500-1600 m a.s.l. Obviously, there are additional factors that give rise to this
pattern.
The second factor is land use. Most of the Boswellia stands were cleared from flat and
gentle sloping land and replaced by agricultural fields. Absence even of isolated trees on
cultivated land shows that it has been completely eradicated from such areas. While land
clearing results in the elimination of the species, overgrazing by livestock leads to a decrease
in the number of individuals per unit area. The higher number of plant density in non-grazing
47
Chapter 4
areas compared to heavily grazed areas demonstrates the negative impact of grazing on tree
abundance. Livestock directly eats a whole plant or parts of it and indirectly it tramples
seedlings, which results in soil compaction (Vetaas 1993, Breman and Kessler 1995, Teketay
1996, Barnes et al. 1998). In Eritrea, overgrazing is particularly severe at the beginning of
the rainy season because this is the critical moment when seedlings and trees resprout after a
long dry season of seven to nine months. Moreover, the concentration of livestock in small,
especially flat areas results also in soil compaction that hinders recruitment and seedling
establishment.
It was expected to find more Boswellia trees in the permanent enclosures as opposed to
temporary ones. The reverse, however, was true. This can be explained by studying the time
since establishment of these enclosures. The temporary enclosure is a traditional land use
practice in which an area is protected from grazing during the rainy season and used under
controlled grazing during the dry season. These sites thus existed in this condition for a long
time already. The permanent enclosures on the other hand are installed recently by the
government with the aim of promoting the natural regeneration of the local flora. Hence, the
presence of greater number of trees under the temporary enclosures is probably due to
differences in time that allow trees to grow without a strong grazing constraint.
Third, landform (slope and topographic position) affects the distribution and
abundance. The largest population density of Boswellia papyrifera was found in areas with
steep terrain on the upper slopes and ridges of hills and mountains. Two major reasons might
account for this distribution pattern. First, there is a direct link between slope and the land
use (intensive land use on flat and gently sloping areas). Secondly, the topographic
characteristics also affect directly or indirectly the site conditions that in turn influence the
development of the species (Faniran and Areola 1978, Barnes et al. 1998, Walsh 1996). On
flat areas, the vertical movement of water is fast in sandy and very slow in heavy clay soils.
While the former results in excessive drainage, the latter may result in water logging
situations. In addition, flat areas, surrounded by highlands are natural sinks for the
accumulation of cold air, which may restrict growth and development of plants (Walsh 1996,
Barnes, 1998).
Fourth, the abundance of Boswellia papyrifera is significantly affected by the soil
properties organic matter, silt content and pH (in this order of importance). The soils of the
investigated areas generally are poor in organic matter. The abundance of Boswellia trees
increases with slight increases in organic matter content. The soil organic matter influences
the physical, chemical and biological properties of the soil, which has, direct or indirect
consequences for plants (Shahar-Ben 1991, Archibold 1995, Brady 1990, Barnes et al.
1998). It may contribute in the soil aggregate formation, which in turn affects the soil
moisture holding capacity of the soils. It stores plant nutrient mainly nitrogen and enhances
nutrient recycling. These effects may greatly favour the recruitment, growth and
48
Micro-distribution
development of Boswellia papyrifera which results in higher abundance of the species in
areas having higher organic matter. In West Africa, Swaine (1996) also found that the
distribution of forest plant species was affected by soil fertility.
The abundance of the species increased with silt and decreased with clay and with sand
content. Soil texture affects the amount of surface area exposed by the soil and the amount
and size of the pores, and thus the amount of surface area available for the adsorption of
water and nutrients and the rate at which air and water flow in the soil (Brady 1990, Landon
1991). The increase in number of Boswellia plants in sites with higher silt content suggests
that the species regenerates and grows better on soils with a loamy texture. This may be
mainly because silty soils have a higher water holding capacity than sandy soils and provide
better drainage conditions for plants than clayey soils (Barnes et al. 1998). In establishment
trials on vertisols not far from Atawen, it was clearly shown that impeded drainage during
the wet season resulted in the death of Boswellia seedlings (Ogbazghi unpublished data).
The pH of the soil where Boswellia stands are found, is mostly neutral, with slight
variations. With a slight increase in soil pH, however, the abundance of the species
decreased, probably because of impeded availability of the essential elements (Walsh 1996).
The negative effect of soil depth (although not always significant) is unexpected,
because generally trees grow well on deep soils. The fact that Boswellia papyrifera trees are
especially found on shallow soils reflects that these occur on rocky slopes not suitable for
crop production and not accessible to livestock.
4.5 Conclusion
Within its altitude range (800-1850 m a.s.l.), the abundance of Boswellia papyrifera peaks in
areas between 1500 and 1600 m. As to soil properties, the abundance of Boswellia was
positively related with organic matter content and negatively with soil pH.
The abundance of the species decreased with land use intensity. The highest abundance
was found in sites not suitable for agricultural production and inaccessible to livestock, e.g.
on rocky slopes and enclosed areas. As land use and slope position are closely linked, no
distinction between their effects could be made. When the data of five study areas were
pooled the most important variables affecting the abundance of Boswellia papyrifera were
altitude and land use. Apart from these also organic matter, slope, silt and pH had an effect.
Because of the large effect of land use, the actual distribution is much smaller than was
expected based on environmental factors only.
49

50
CHAPTER 5
5 Tree development and morphology of Boswellia papyrifera
5.1 Introduction
In Eritrea, the distribution of Boswellia papyrifera at macro-level is determined by altitude
and climate (Chapter 3). Its occurrence decreases with altitude and increases with the amount
and the duration of rainfall. At local level, however, the distribution and abundance of the
species is mainly influenced by factors such as altitude, the intensity of land use, the texture
of the soil and organic matter content and pH (Chapter 4). The abundance of exploitable
Boswellia trees has decreased mainly owing to land clearing for agriculture, overgrazing,
and the extraction of gum (see Chapter 7). Because of these human factors, the remaining
Boswellia trees are found frequently on steep terrain unsuitable for agricultural use. The
decline in annual gum export from more than 2000 tons in 1974 to about 400 in 1998
(Asmara Chamber of Commerce 1974, Ministry of Agriculture 1999) is an evidence for the
decrease in abundance of trees in Eritrea
To sustain and possibly increase, the existing gum exploitation levels, there is a need
for maintaining the existing Boswellia stands. Moreover, it is important to explore additional
locations for expanding its population. In order to achieve these goals, it is essential to
understand how the various environmental factors and the current land use practices affect
Boswellia tree development and morphology. The study presented below intends to provide
this understanding. It describes tree growth and development in terms of diameter, height
and crown size and the effects of environment and land use on these characteristics.
5.2 Methodology
5.2.1 The study areas
The study was conducted in the following five areas in Eritrea: Adi-Ketina, Atawen, Ferhen,
Molki, and Shilalo. These represent the altitude ranges and the various agroecological zones
of the major Boswellia papyrifera stands in the country (Chapter 4, Table 4.1). In each area,
study plots of 20 m x 20 m were selected at 100 m altitude intervals. At each interval, several
plots were used (see Chapter 4 for details on choice and number of plots).
51
Chapter 5
5.2.2 Plant size measurements
In each plot, all Boswellia papyrifera plants were measured. Plants were divided into two
groups based on the diameter of their stem. Of the plants with a dbh >4cm (i.e. saplings and
trees), height (H), crown depth (CD) and crown diameter (CW), and dbh were measured.
The dbh and height were measured respectively using a diameter tape and a telescopic pole
(Philip 1994, Martin 1995). The crown depth was calculated as total tree height minus the
distance between the ground and the point at which a tree produces its major branches. The
mean crown diameter was measured as the average measurement of the longest and shortest
crown diameter with both axes passing across the bole. For plants with dbh<4 cm (seedlings)
collar diameter and height were measured using callipers and a measuring stick, respectively.
From each sample plot, composite soil samples were collected for physical and chemical
analyses. The description of the topographic and soil properties is given in Chapter 4.
5.2.3 Data analysis
Box plots were used to illustrate the variation in morphological characteristics (dbh, height,
crown depth, and crown diameter) of Boswellia plants in the five study areas and in relation
to land use types encountered. The changes in tree height, crown depth, and crown diameter
with increasing dbh were described using the following non-linear asymptotic regression
model (Thomas 1996).
Y - X m a x
in which:
Y
e
D
^ m a x
a and P
a D P 1 1 - e
Eq. 5.1
plant height (H), crown depth (CD) and crown diameter (CW) in m
the exponential function
dbh (cm)
asymptotic maximal for H, CD, and CW in m
constants used to describe static allometry.
In the regression analysis diameter was taken as an independent and height, crown
depth, and crown diameter as dependent variables. This model was suitable for this type of
analysis because of the following reasons. First, it uses static data from an uneven aged tree
population and provides an estimate of the maximum value for a given tree morphological
trait. Second, trees show an asymptotic growth relationship with increasing diameter.
Finally, it assumes no differences among the cohorts in allometry (Thomas 1996).
52
Tree development and morphology
In order to understand how the various morphological characteristics of Boswellia
trees are related among themselves, Pearson correlation coefficients were calculated. In
addition, the tree characteristics were correlated with selected soil properties and the slope.
Linear regression analysis was used to describe how the various morphological
characteristics of the species vary with altitude. In this case, from each study plot, a single
tree having the maximum diameter, height, crown depth and diameter was selected.
A total of five land use types, representing all the study plots, was found. These were
coded as follows: agricultural field (1), fallow field (2), grazing area (3), none-grazing area
(4) and enclosures (5). A higher code indicates a lower land use intensity level. Since trees
were not found in the agricultural areas, these could not be included in the analysis.
Spearman rank correlation coefficients were used to investigate the correlation between plant
morphological traits (height, dbh, crown depth and crown diameter) and land use intensity
(the five land use types).
5.3 Results
5.3.1 Tree size variation
The range in tree diameter, tree height, crown depth and crown diameter of Boswellia trees
was different among the five study areas (Figure 5.1). The maximum tree diameter of all
plants pooled per site, ranged between 36 cm in Adi-Ketina and 46 cm in Atawen and the
maximum tree height ranged between 6.5 m in Ferhen and 12.5 m in Shilalo. At lower
altitude (e.g. at Shilalo and Molki) taller trees with deeper crowns were found than at the
higher altitude sites (e.g. Adi-Ketina, Atawen and Ferhen). While trees with the smallest
maximum crown depth were found in Adi-Ketina, those with the largest were found in
Shilalo. The largest maximum crown diameter was found in Atawen and the smallest one in
Adi-Ketina (Table 5.1).
53
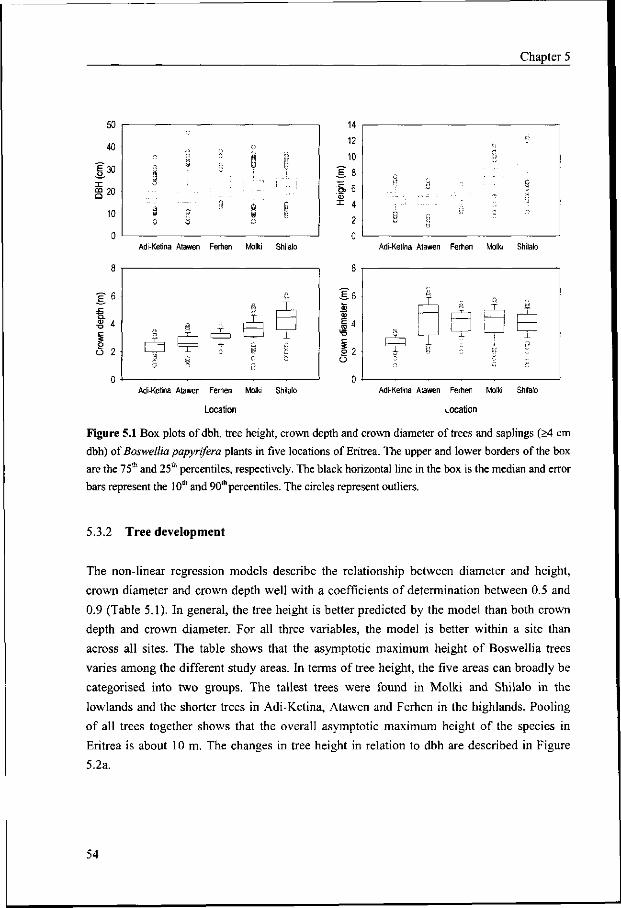
Chapter 5
Adi-Ketina Atawen Ferhen Molki Shilalo Adi-Ketina Atawen Ferhen Molki Shilalo
Adi-Ketina Atawen Ferhen Molki Shilalo
Location
Adi-Ketina Atawen Ferhen Molki Shilalo
Location
Figure 5.1 Box plots of dbh, tree height, crown depth and crown diameter of trees and saplings (>4 cm dbh) of Boswellia papyrifera plants in five locations of Eritrea. The upper and lower borders of the box are the 75th and 25th percentiles, respectively. The black horizontal line in the box is the median and error bars represent the 10lh and 90"' percentiles. The circles represent outliers.
5.3.2 Tree development
The non-linear regression models describe the relationship between diameter and height,
crown diameter and crown depth well with a coefficients of determination between 0.5 and
0.9 (Table 5.1). In general, the tree height is better predicted by the model than both crown
depth and crown diameter. For all three variables, the model is better within a site than
across all sites. The table shows that the asymptotic maximum height of Boswellia trees
varies among the different study areas. In terms of tree height, the five areas can broadly be
categorised into two groups. The tallest trees were found in Molki and Shilalo in the
lowlands and the shorter trees in Adi-Ketina, Atawen and Ferhen in the highlands. Pooling
of all trees together shows that the overall asymptotic maximum height of the species in
Eritrea is about 10 m. The changes in tree height in relation to dbh are described in Figure
5.2a.
54
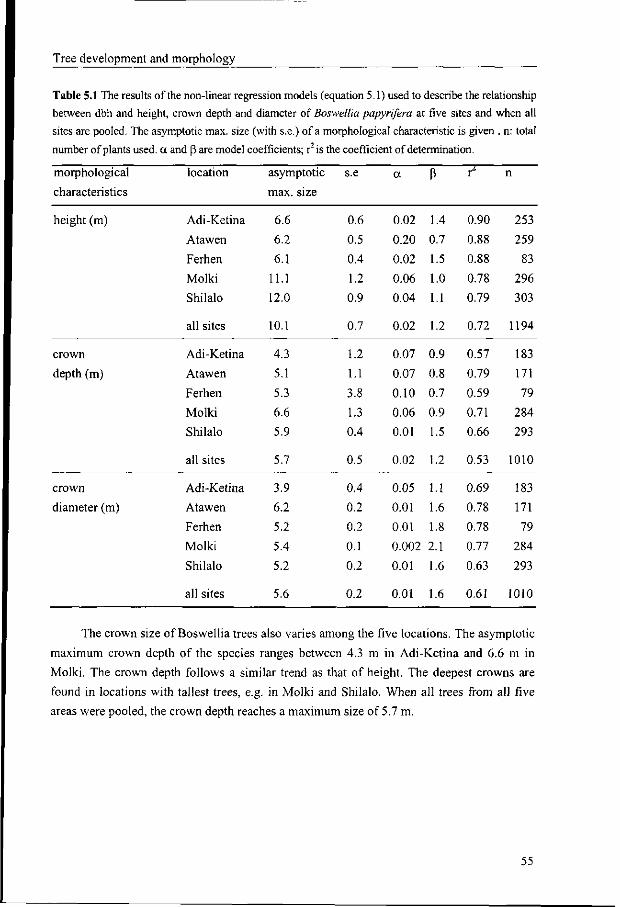
Tree development and morphology
Table 5.1 The results of the non-linear regression models (equation 5.1) used to describe the relationship
between dbh and height, crown depth and diameter of Boswellia papyrifera at five sites and when all
sites are pooled. The asymptotic max. size (with s.e.) of a morphological characteristic is given . n: total
number of plants used, a and P are model coefficients; r is the coefficient of determination.
morphological
characteristics
height (m)
crown
depth (m)
crown
diameter (m)
location
Adi-Ketina
Atawen
Ferhen
Molki
Shilalo
all sites
Adi-Ketina
Atawen
Ferhen
Molki
Shilalo
all sites
Adi-Ketina
Atawen
Ferhen
Molki
Shilalo
all sites
asymptotic
max. size
6.6
6.2
6.1
11.1
12.0
10.1
4.3
5.1
5.3
6.6
5.9
5.7
3.9
6.2
5.2
5.4
5.2
5.6
s.e
0.6
0.5
0.4
1.2
0.9
0.7
1.2
1.1
3.8
1.3
0.4
0.5
0.4
0.2
0.2
0.1
0.2
0.2
a
0.02
0.20
0.02
0.06
0.04
0.02
0.07
0.07
0.10
0.06
0.01
0.02
0.05
0.01
0.01
0.002
0.01
0.01
P
1.4
0.7
1.5
1.0
1.1
1.2
0.9
0.8
0.7
0.9
1.5
1.2
1.1
1.6
1.8
2.1
1.6
1.6
x1
0.90
0.88
0.88
0.78
0.79
0.72
0.57
0.79
0.59
0.71
0.66
0.53
0.69
0.78
0.78
0.77
0.63
0.61
n
253
259
83
296
303
1194
183
171
79
284
293
1010
183
171
79
284
293
1010
The crown size of Boswellia trees also varies among the five locations. The asymptotic
maximum crown depth of the species ranges between 4.3 m in Adi-Ketina and 6.6 m in
Molki. The crown depth follows a similar trend as that of height. The deepest crowns are
found in locations with tallest trees, e.g. in Molki and Shilalo. When all trees from all five
areas were pooled, the crown depth reaches a maximum size of 5.7 m.
55
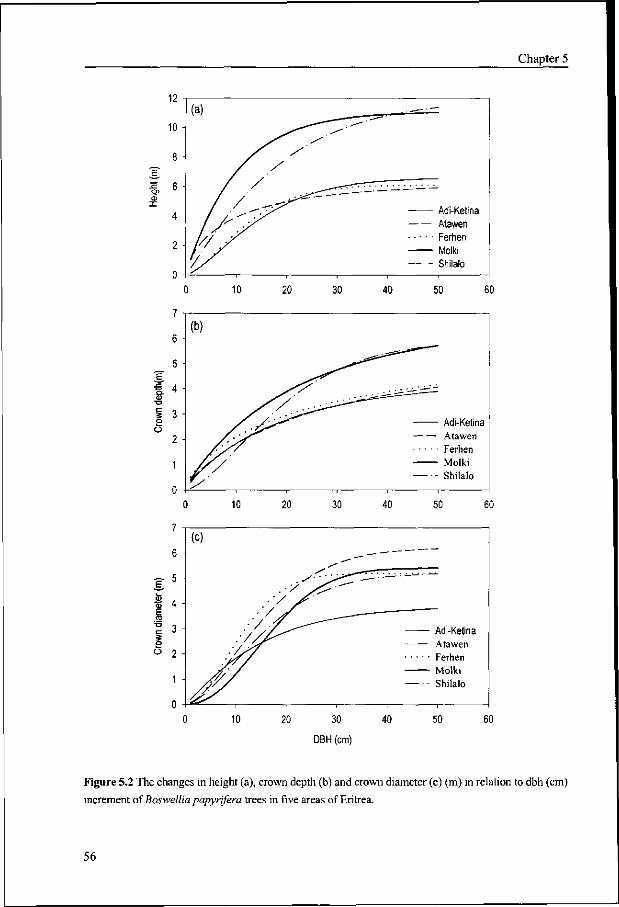
Chapter 5
12
10
8
6
4
2
0
7
6
5
4
3
2
1
0
o o
Adi-Ketina Atawen Ferhen Molki Shilalo
0 10 20 30 40 50 60
(b)
Adi-Ketina — Atawen • •• Ferhen — Molki — - Shilalo
0 10 20 30 40 50 60
0 10 20 30
DBH (cm)
Figure 5.2 The changes in height (a), crown depth (b) and crown diameter (c) (m) in relation to dbh (cm)
increment of Boswellia papyrifera trees in five areas of Eritrea.
56
Tree development and morphology
The results of crown diameter measurements are not consistent with those found in the
case of tree height and crown depth. Trees with the narrowest crowns were found in the
stand of Adi-Ketina and the widest ones in Atawen (6.2 m), both of which are situated within
a similar altitude and agroecological zone (Figure 5.3.c). In the remaining three areas
(Ferhen, Molki and Shilalo), the crown diameter lies within this range. It is, therefore,
difficult to classify the study areas in terms of this specific morphological trait. The crown
diameter of Boswellia is much more variable than both height and crown depth.
The changes in height, crown depth and crown diameter with increase in diameter are
different at the five sites. At the lowland sites, Molki and Shilalo, height growth is much
faster per unit of diameter and reaches a higher values than at the other sites. At a dbh of 10
cm, for example, tree height at Molki and Shilalo and at Adi-Ketina, Atawen and Ferhen are
7.0, 4.7, and 2.6, 3.9 and 2.9, respectively. Crown depth follows a similar pattern except that
it has a slow start at Shilalo. At most sites, crown diameter growth starts to take off after the
diameter has reached a value of about 5 cm (Figure 5c).
5.3.3 Tree size in relation to land and soil properties
All four morphological characteristics (dbh, height, crown depth and crown diameter) of all
Boswellia papyrifera plants in the five study areas lumped are positively correlated among
themselves. Tree diameter and crown diameter are positively correlated. The best correlation
is between tree height and crown depth, while the weakest is between tree height and crown
width (Table 5.2).
All four maximum tree measurements were negatively correlated with altitude and
positively with the organic matter (diameter not significantly) and the exchangeable Ca and
Mg content. This means that the size of Boswellia trees decreases with altitude and increases
with organic matter and exchangeable Ca and Mg. In addition tree height and crown depth
are positively related to soil depth and soil temperatures and negatively with bulk density.
Crown depth is also influenced by sand and silt content. The tree height and crown diameter
are positively correlated with available phosphorous.
The Pearson correlation coefficients (Table 5.2) show that altitude affects most tree
height and crown depth. Further linear regression analyses of the relationship between
maximum plant size and altitude show that especially tree height and crown depth sharply
decrease with altitude (Figure 5.3 b, c) and that dbh and crown diameters are far less affected
by altitude (Figure 5.3 a,d).
57
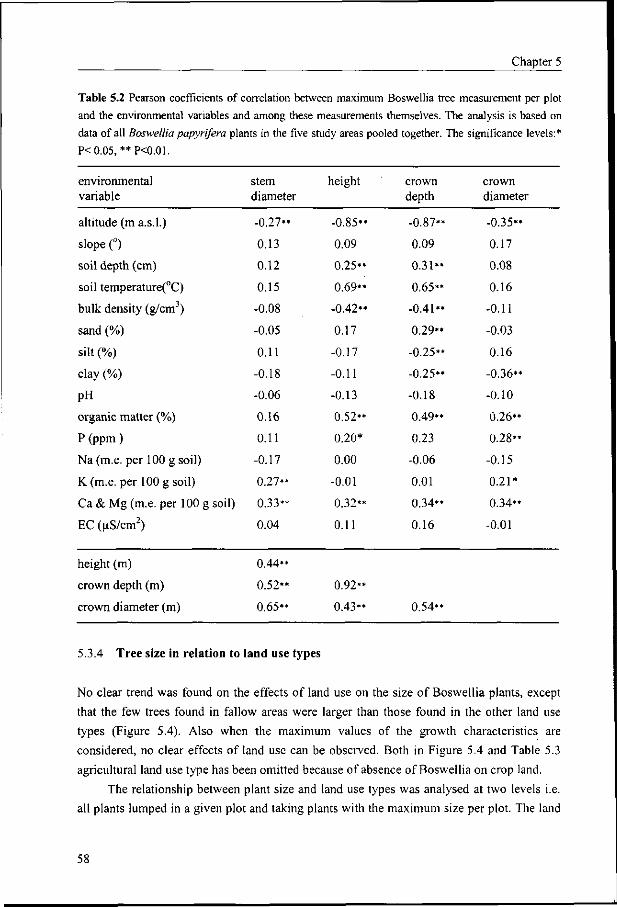
Chapter 5
Table 5.2 Pearson coefficients of correlation between maximum Boswellia tree measurement per plot
and the environmental variables and among these measurements themselves. The analysis is based on
data of all Boswellia papyrifera plants in the five study areas pooled together. The significance levels:*
P<0.05 **P<0.01.
environmental variable
altitude (m a.s.l.)
slope (°)
soil depth (cm)
soil temperature(°C)
bulk density (g/cm3)
sand(%)
silt (%)
clay (%)
PH
organic matter (%)
P (ppm)
Na (m.e. per 100 g soil)
K(m.e. per 100 g soil)
Ca & Mg (m.e. per 100 g soil)
EC (uS/cm2)
height (m)
crown depth (m)
crown diameter (m)
stem diameter
-0.27**
0.13
0.12
0.15
-0.08
-0.05
0.11
-0.18
-0.06
0.16
0.11
-0.17
0.27**
0.33**
0.04
0.44**
0.52**
0.65**
height
-0.85**
0.09
0.25**
0.69**
-0.42**
0.17
-0.17
-0.11
-0.13
0.52**
0.20*
0.00
-0.01
0.32**
0.11
0.92**
0.43**
crown depth
-0.87**
0.09
0.31**
0.65**
-0.41**
0.29**
-0.25**
-0.25**
-0.18
0.49**
0.23
-0.06
0.01
0.34**
0.16
0.54**
crown diameter
-0.35**
0.17
0.08
0.16
-0.11
-0.03
0.16
-0.36**
-0.10
0.26**
0.28**
-0.15
0.21*
0.34**
-0.01
5.3.4 Tree size in relation to land use types
No clear trend was found on the effects of land use on the size of Boswellia plants, except
that the few trees found in fallow areas were larger than those found in the other land use
types (Figure 5.4). Also when the maximum values of the growth characteristics are
considered, no clear effects of land use can be observed. Both in Figure 5.4 and Table 5.3
agricultural land use type has been omitted because of absence of Boswellia on crop land.
The relationship between plant size and land use types was analysed at two levels i.e.
all plants lumped in a given plot and taking plants with the maximum size per plot. The land
58
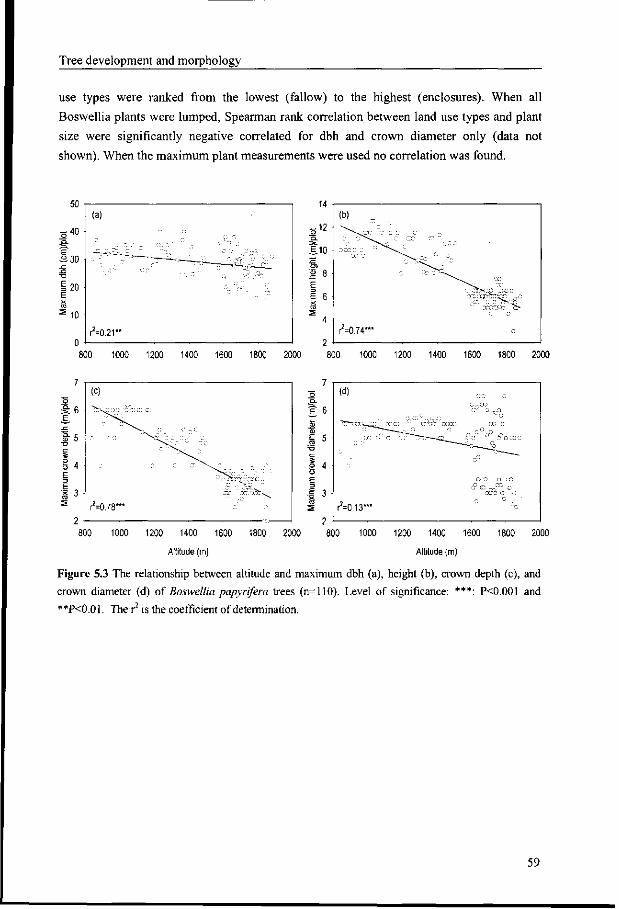
Tree development and morphology
use types were ranked from the lowest (fallow) to the highest (enclosures). When all
Boswellia plants were lumped, Spearman rank correlation between land use types and plant
size were significantly negative correlated for dbh and crown diameter only (data not
shown). When the maximum plant measurements were used no correlation was found.
. .1? Q .
E.10
-~ CD
JB 8
e
1 fi X CO
4
i
(b) _ • v . ~
^^-•^IX: 'S:
.-̂ :: ;: -
r2=0.74***
:: ex: cr
7>%--~~
""̂ ^ c -<.- :
„ . .
---" ;?*>•:;- " ,^C;
1 ' CCOZf-'JZ c -
c.
2000 800
7 7
1000 1200 1400 1600 1800 2000
1" 6
S 5
2 4 O E
.§ 3
1200 1400
Altitude (m)
1600 1800 2000
2 J-
800
(d)
., ,:I:
r^O.13*"
'• ~rc; O O
..„ -c o o
O ^ ' O .C-,
O O O OO
^a?6 o ""•-
" 1000 1200 1400
Altitude (m)
1600 1800 2000
Figure 5.3 The relationship between altitude and maximum dbh (a), height (b), crown depth (c), and crown diameter (d) of Boswellia papyrifera trees (n=110). Level of significance: ***: P<0.001 and **P<0.01. The r is the coefficient of determination.
59
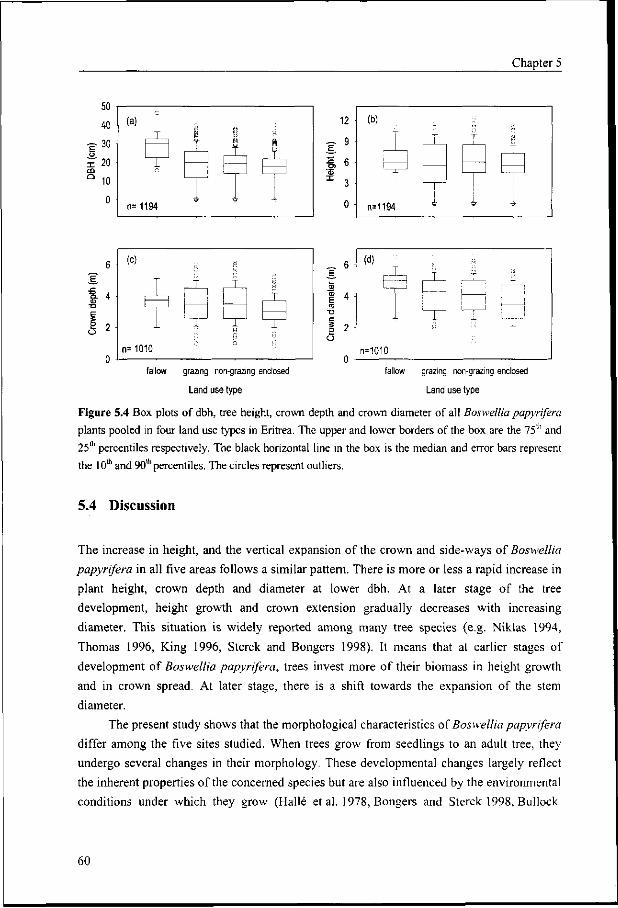
Chapter 5
50
40
•g- 30
x 20 CD Q 1 0 H
0
<a) C s T 8 1 K
T Y fi 1 | — I
T 1 . n= 1194
12
9
6
3
0
(b) - -.;•
j_ -i-
I
f
!
n=1194 i ^ A
9- 4
0 l
(c)
i n= 1010
1
>•-'
s
I
1
f
1 s •;
fallow grazing non-grazing enclosed
Land use type
fallow grazing non-grazing enclosed
Land use type
Figure 5.4 Box plots of dbh, tree height, crown depth and crown diameter of all Boswellia papyrifera
plants pooled in four land use types in Eritrea. The upper and lower borders of the box are the 75°' and
25th percentiles respectively. The black horizontal line in the box is the median and error bars represent
the 101'1 and 90th percentiles. The circles represent outliers.
5.4 Discussion
The increase in height, and the vertical expansion of the crown and side-ways of Boswellia
papyrifera in all five areas follows a similar pattern. There is more or less a rapid increase in
plant height, crown depth and diameter at lower dbh. At a later stage of the tree
development, height growth and crown extension gradually decreases with increasing
diameter. This situation is widely reported among many tree species (e.g. Niklas 1994,
Thomas 1996, King 1996, Sterck and Bongers 1998). It means that at earlier stages of
development of Boswellia papyrifera, trees invest more of their biomass in height growth
and in crown spread. At later stage, there is a shift towards the expansion of the stem
diameter.
The present study shows that the morphological characteristics of Boswellia papyrifera
differ among the five sites studied. When trees grow from seedlings to an adult tree, they
undergo several changes in their morphology. These developmental changes largely reflect
the inherent properties of the concerned species but are also influenced by the environmental
conditions under which they grow (Halle et al. 1978, Bongers and Sterck 1998, Bullock
60
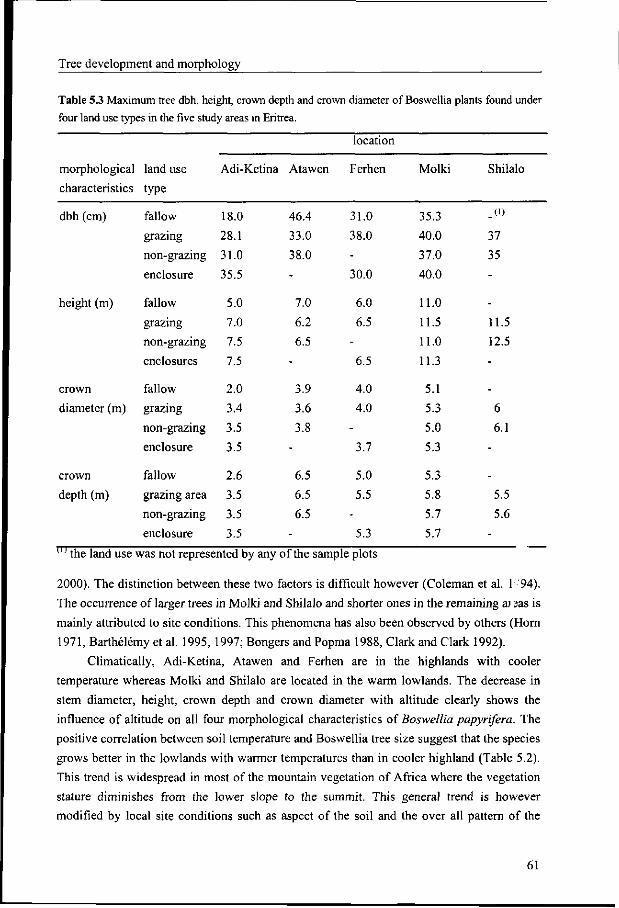
Tree development and morphology
Table 5.3 Maximum tree dbh, height, crown depth and crown diameter of Boswellia plants found under four land use types in the five study areas in Eritrea.
morphological
characteristics
dbh (cm)
height (m)
crown
diameter (m)
crown
depth (m)
land use
type
fallow
grazing
non-grazing
enclosure
fallow
grazing
non-grazing
enclosures
fallow
grazing
non-grazing
enclosure
fallow
grazing area
non-grazing
enclosure
Adi-Ketina
18.0
28.1
31.0
35.5
5.0
7.0
7.5
7.5
2.0
3.4
3.5
3.5
2.6
3.5
3.5
3.5
Atawen
46.4
33.0
38.0
-
7.0
6.2
6.5
-
3.9
3.6
3.8
-
6.5
6.5
6.5
-
location
Ferhen
31.0
38.0
-
30.0
6.0
6.5
-
6.5
4.0
4.0
-
3.7
5.0
5.5
-
5.3
Molki
35.3
40.0
37.0
40.0
11.0
11.5
11.0
11.3
5.1
5.3
5.0
5.3
5.3
5.8
5.7
5.7
Shilalo
.")
37
35
-
-
11.5
12.5
-
-
6
6.1
-
-
5.5
5.6
-
the land use was not represented by any of the sample plots
2000). The distinction between these two factors is difficult however (Coleman et al. 1'-'94).
The occurrence of larger trees in Molki and Shilalo and shorter ones in the remaining ai 2as is
mainly attributed to site conditions. This phenomena has also been observed by others (Horn
1971, Barthelemy et al. 1995, 1997; Bongers and Popma 1988, Clark and Clark 1992).
Climatically, Adi-Ketina, Atawen and Ferhen are in the highlands with cooler
temperature whereas Molki and Shilalo are located in the warm lowlands. The decrease in
stem diameter, height, crown depth and crown diameter with altitude clearly shows the
influence of altitude on all four morphological characteristics of Boswellia papyrifera. The
positive correlation between soil temperature and Boswellia tree size suggest that the species
grows better in the lowlands with warmer temperatures than in cooler highland (Table 5.2).
This trend is widespread in most of the mountain vegetation of Africa where the vegetation
stature diminishes from the lower slope to the summit. This general trend is however
modified by local site conditions such as aspect of the soil and the over all pattern of the
61
Chapter 5
local climate (White 1983, Crawford 1990). At higher altitude and at exposed sites, wind
may play a significant role in shaping the height of trees and crown characteristics
(Barthelemy et al. 1995, 1997; Sterck and Bongers 1998).
It was thought that the length of the growing period (LGP) would be another important
factor determining the tree size of Boswellia papyrifera. But when comparing the highland
data of Ferhen with an LGP of 45 days and those of Adi-Ketina and Atawen both with a
LGP of 95 days, this is apparently not the case (Table 5.1). As expected (minor) positive
effects on growth were found of soil fertility parameters e.g. organic matter, exchangeable
Ca and Mg contents and soil depth (Table 5.2).
That land use, especially grazing, has no clear effect on tree size, is most likely due to
the fact that almost all measured trees were already above grazing height, a stage which the
heavily browsed ones have never reached. The presence of few large isolated trees or left
over in fallow fields probably reflects absence of competition from other trees (Weiner and
Thomas 1992).
The role of tree management could not be investigated in this study. Harvesting of
leaves and branches for fodder and fuel and especially tapping are certainly key factors
determining tree size. In analogy with the well documented evidence that latex tapping in
rubber (Hevea brasiliensis) is at the expense of vegetative growth (Simmonds 1989,
Premakumari et al. 1997), similar effects in Boswellia papyrifera can be expected. Because
of unknown and variable management practices in the past this cannot be studied on existing
tapped and non-tapped trees. For this research, long term trials with uniform Boswellia trees,
from the tappable age onwards subject to different tapping regimes, are needed.
5.5 Conclusion
The morphological characteristics of Boswellia papyrifera trees vary considerably between
the lowlands and highlands. The distinction in tree size between the lowland and the
highland is clear. In highlands, trees are short and in the lowlands tall trees with deep crowns
are found. Apparently, the main factor affecting the size of Boswellia trees in Eritrea is
altitude, e.g. temperature. There are indications that tree size increases with organic matter
and exchangeable Ca and Mg and soil depth.
No clear effects of land use could be established. It is thought that land use, especially
grazing, plays an important role during the establishment phase only, but not later on when
trees are above grazing and browsing height. The effect of management practices, e.g.
harvesting of leaves and branches and tapping could not be established in this study. It is
likely that tapping is on the expense of vegetative growth. Experiments with uniform trees,
and from tappable age onwards subject to different tapping regimes, are needed to
investigate this hypothesis.
62
CHAPTER 6
6 Population structure of Boswellia stands
6.1 Introduction
The most important factors determining the occurrence of Boswellia papyrifera stands are
altitude (temperature regimes), the amount of rainfall, and the length of growing period.
Altitude sets the upper and lower distribution limits of the species at macro-level. Within its
climatological distribution range, however, its abundance is largely influenced by land use
practices at local level, topography and soil properties especially soil texture, organic matter
content and pH (see Chapter 4). In areas where the species occurs, the physiognomy of its
stands is heterogeneous and there are clear signs of widespread decline in its distribution and
abundance as well as lack of regeneration in most places. This decline is related to various
human induced factors, directly or indirectly. The most important factors are land clearing,
grazing, and possibly tapping.
There is a widespread degradation of the Boswellia stands in Eritrea. In most stands,
regeneration is lacking but this has not been quantitatively documented and it's causes is not
yet fully understood. The historical records of frankincense production in the country show
that there has been a gradual decline in the annual frankincense production for export
presumably because of the decline in the abundance of gum yielding Boswellia trees. These
observations need further investigation through a regeneration diagnostic study involving a
systematic collection of data on population structure of the species in different areas of the
country. The description and analysis of population structure is a widely used method to
determine the regeneration of tree species. The population structure reflects its current size
class distribution and its long-term population dynamics as well. This approach of
regeneration study provides a clear picture about the current regeneration status of the
species and it is a foundation for further species conservation and management (Richards
1996, Peters 1996).
After describing the population structure of Boswellia stands in areas covering
different ecological settings, it is equally important to identify the main factors affecting its
regeneration. The regeneration constraints may not be the same across the various stands of
Boswellia papyrifera and these factors need to be studied in relation to local site conditions.
In order to enhance the natural regeneration of the species in the future, these regeneration
constraints should be identified so as to relieve the species from these factors in the different
locations.
63
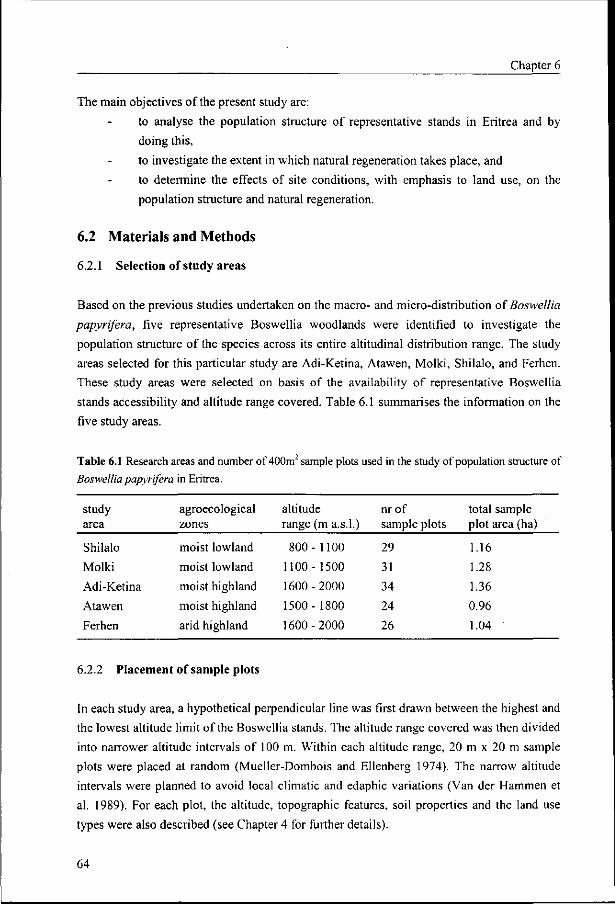
Chapter 6
The main objectives of the present study are:
to analyse the population structure of representative stands in Eritrea and by
doing this,
to investigate the extent in which natural regeneration takes place, and
to determine the effects of site conditions, with emphasis to land use, on the
population structure and natural regeneration.
6.2 Materials and Methods
6.2.1 Selection of study areas
Based on the previous studies undertaken on the macro- and micro-distribution of Boswellia
papyrifera, five representative Boswellia woodlands were identified to investigate the
population structure of the species across its entire altitudinal distribution range. The study
areas selected for this particular study are Adi-Ketina, Atawen, Molki, Shilalo, and Ferhen.
These study areas were selected on basis of the availability of representative Boswellia
stands accessibility and altitude range covered. Table 6.1 summarises the information on the
five study areas.
Table 6.1 Research areas and number of 400m" sample plots used in the study of population structure of
Boswellia papyrifera in Eritrea.
study area
Shilalo
Molki
Adi-Ketina
Atawen
Ferhen
agroecological zones
moist lowland
moist lowland
moist highland
moist highland
arid highland
altitude range (m a.s.l.)
800- 1100
1100- 1500
1600-2000
1500- 1800
1600-2000
nr of sample
29
31
34
24
26
plots total sample plot area (ha)
1.16
1.28
1.36
0.96
1.04
6.2.2 Placement of sample plots
In each study area, a hypothetical perpendicular line was first drawn between the highest and
the lowest altitude limit of the Boswellia stands. The altitude range covered was then divided
into narrower altitude intervals of 100 m. Within each altitude range, 20 m x 20 m sample
plots were placed at random (Mueller-Dombois and Ellenberg 1974). The narrow altitude
intervals were planned to avoid local climatic and edaphic variations (Van der Hammen et
al. 1989). For each plot, the altitude, topographic features, soil properties and the land use
types were also described (see Chapter 4 for further details).
64
Population structure
6.2.3 Plant measurements
In each sample plot, the diameter of all Boswellia plants (trees1, saplings2, seedlings3, and
germinants4) were systematically measured. For trees and saplings, the diameter at breast
height (dbh) were measured at 1.3 m above the ground using a diameter tape. For seedlings
and germinants, basal diameters were taken at the base of each individual plant using
callipers. Both germinants and seedlings have similar diameter but essentially differ by the
presence or absence of the cotyledons. While germinants retain their cotyledons during the
first growing season, seedlings lack them and develop well-developed leaves.
With the intention of giving more emphasis to the juvenile development stage of
Boswellia individuals and to use them as indicators of natural regeneration in the different
areas, smaller diameter class intervals were used especially for plants having diameters
below 8 cm. For that reason, all individual plants within each sample plot were categorised
into one of the following nine size classes: <1 cm, 1-2, 2-4, 4-8, 8-16, 16-24, 24-32, 32-40,
>40 cm. These size classes were used to construct size class frequency diagrams per plot.
6.2.4 Comparison between sites and land use types
To identify regional differences in population structure of Boswellia papyrifera stands size
frequency distribution diagrams were constructed for each of the study areas. All plots found
within a study area were lumped together and the percentage of individuals in each of the
nine-size classes described above was calculated.
To describe the effect of land use type on the population structure, size class
distributions were calculated for each land use type per site. Five land use types were
recognised. These are agricultural, fallow, grazing, non-grazing and enclosed areas. The
fallow areas represent abandoned agricultural fields in the Boswellia papyrifera woodland
area. While grazing areas are readily accessible to livestock throughout the year, the non-
grazing areas are inaccessible to livestock owing to their topographic positions. The
enclosures are recently introduced conservation areas where trees are protected against
grazing and the collection of firewood and construction materials. All individual sample
plots in each of the study area were categorised in these five land use types. All plants were
classified into one of the nine size classes per study area. All plots found within a land use
type were lumped together and the percentage of individuals in each of the nine-size class
was calculated.
' Trees are plants dbh >8 cm " Saplings are within the range of dbh >4-8 cm " Seedlings all Boswellia plants dbh < 4 cm excluding germinants Germinants are characterised by the presence of cotyledons and are less than three months old
65
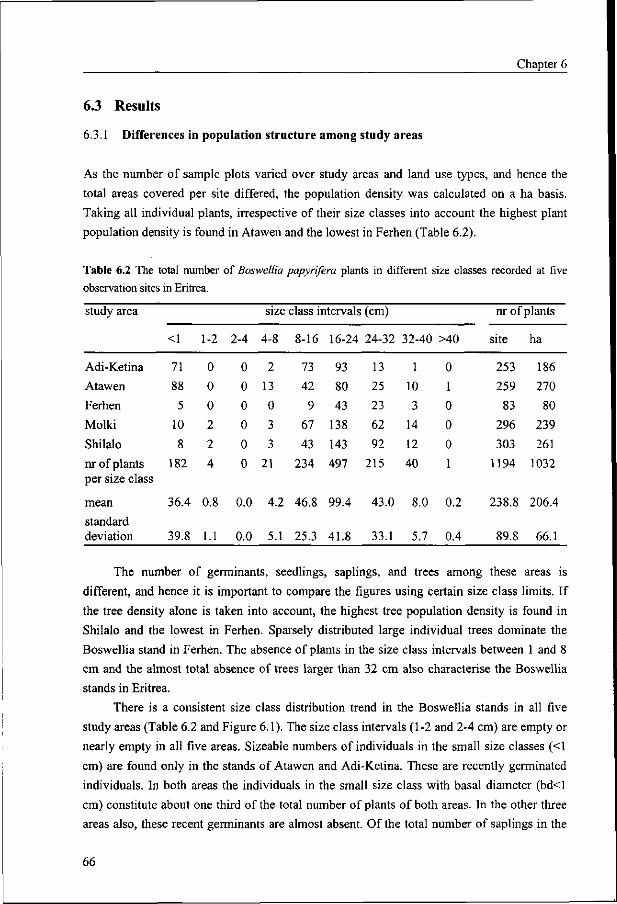
Chapter 6
6.3 Results
6.3.1 Differences in population structure among study areas
As the number of sample plots varied over study areas and land use types, and hence the
total areas covered per site differed, the population density was calculated on a ha basis.
Taking all individual plants, irrespective of their size classes into account the highest plant
population density is found in Atawen and the lowest in Ferhen (Table 6.2).
Table 6.2 The total number of Boswellia papyrifera plants in different size classes recorded at five observation sites in Eritrea.
study area
Adi-Ketina
Atawen
Ferhen
Molki
Shilalo
nr of plants per size class
mean
standard deviation
<1
71
88
5
10
8
182
36.4
39.8
1-2
0
0
0
2
2
4
0.8
1.1
2-4
0
0
0
0
0
0
0.0
0.0
size
4-8
2
13
0
3
3
21
4.2
5.1
class intervals (cm)
8-16
73
42
9
67
43
234
46.8
25.3
16-24
93
80
43
138
143
497
99.4
41.8
24-32
13
25
23
62
92
215
43.0
33.1
32-40
1
10
3
14
12
40
8.0
5.7
>40
0
1
0
0
0
1
0.2
0.4
nr of
site
253
259
83
296
303
1194
238.8
89.8
plants
ha
186
270
80
239
261
1032
206.4
66.1
The number of germinants, seedlings, saplings, and trees among these areas is
different, and hence it is important to compare the figures using certain size class limits. If
the tree density alone is taken into account, the highest tree population density is found in
Shilalo and the lowest in Ferhen. Sparsely distributed large individual trees dominate the
Boswellia stand in Ferhen. The absence of plants in the size class intervals between 1 and 8
cm and the almost total absence of trees larger than 32 cm also characterise the Boswellia
stands in Eritrea.
There is a consistent size class distribution trend in the Boswellia stands in all five
study areas (Table 6.2 and Figure 6.1). The size class intervals (1-2 and 2-4 cm) are empty or
nearly empty in all five areas. Sizeable numbers of individuals in the small size classes (<1
cm) are found only in the stands of Atawen and Adi-Ketina. These are recently germinated
individuals. In both areas the individuals in the small size class with basal diameter (bd<l
cm) constitute about one third of the total number of plants of both areas. In the other three
areas also, these recent germinants are almost absent. Of the total number of saplings in the
66
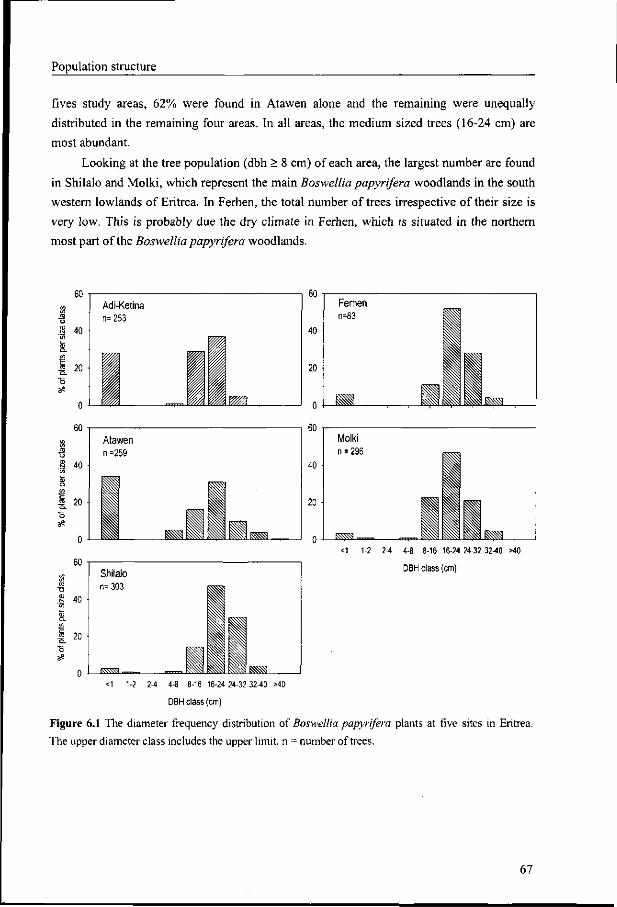
Population structure
fives study areas, 62% were found in Atawen alone and the remaining were unequally
distributed in the remaining four areas. In all areas, the medium sized trees (16-24 cm) are
most abundant.
Looking at the tree population (dbh > 8 cm) of each area, the largest number are found
in Shilalo and Molki, which represent the main Boswellia papyri/era woodlands in the south
western lowlands of Eritrea. In Ferhen, the total number of trees irrespective of their size is
very low. This is probably due the dry climate in Ferhen, which is situated in the northern
most part of the Boswellia papyrifera woodlands.
.8 40
<1 1-2 24 4-8 8-16 16-24 24-32 3240 >40
DBH class (cm)
Figure 6.1 The diameter frequency distribution of Boswellia papyrifera plants at five sites in Eritrea. The upper diameter class includes the upper limit, n = number of trees.
67
Chapter 6
6.3.2 Population structure in relation to land use
The diameter frequency distribution of Boswellia plants in the five land use types per study
area is given in Table 6.3. All plots that are categorised within the agricultural areas were
found devoid of Boswellia trees. In these areas trees have been deliberately cleared for
cultivation of arable crops. Also in fallow areas very few trees were found. This population
is primarily composed of large isolated trees without any juveniles, suggesting the existence
of heavy grazing pressure in those areas
The grazing areas hardly contain juvenile individuals except for Atawen where a
considerable number of germinants and younger seedlings is found. These plants (<1 cm) are
in contrast are well represented in the non-grazing areas at both Adi-Ketina and Atawen and
in the enclosed area of Adi-Ketina. Irrespective of the type of land use, the stands of Molki,
Shilalo and Ferhen lack germinants which is a clear evidence of lack of regeneration in those
areas. A more detailed comparison of the results is complicated by the fact that not all land
use types are present at each site or represented in the observation plots used in this study.
68
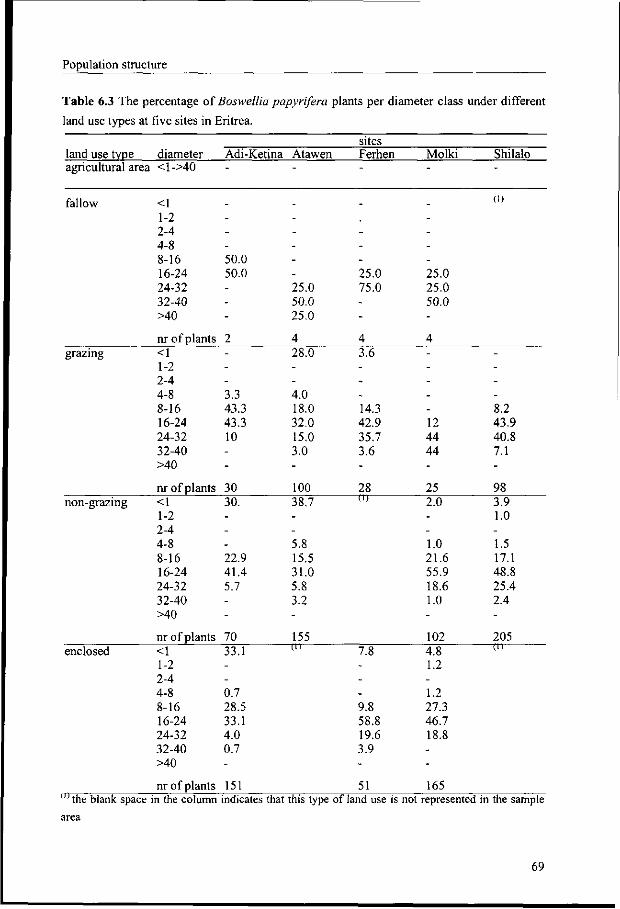
Population structure
Table 6.3 The percentage of Boswellia papyrifera plants per diameter class under different
land use types at five sites in Eritrea.
land use type agricultural area
fallow
grazing
non-grazing
enclosed
diameter <l->40
<1 1-2 2-4 4-8 8-16 16-24 24-32 32-40 >40
nr of plants <1 1-2 2-4 4-8 8-16 16-24 24-32 32-40 >40
nr of plants <1 1-2 2-4 4-8 8-16 16-24 24-32 32-40 >40
nr of plants <1 1-2 2-4 4-8 8-16 16-24 24-32 32-40 >40
nr of plants
Adi-Ketina -
_ ---50.0 50.0 ---
2 ---3.3 43.3 43.3 10 --
30 30. ---22.9 41.4 5.7 --
70 33.1 --0.7 28.5 33.1 4.0 0.7 -
151
Atawen -
_ -----25.0 50.0 25.0
4 28.0 --4.0 18.0 32.0 15.0 3.0 -
100 38.7 --5.8 15.5 31.0 5.8 3.2 -
155 (i)
sites Ferhen -
_
---25.0 75.0 --
4 3.6 ---14.3 42.9 35.7 3.6 -
28 ( i )
7.8 ---9.8 58.8 19.6 3.9 -
51
Molki -
_ ----25.0 25.0 50.0 -
4 -----12 44 44 -
25 2.0 --1.0 21.6 55.9 18.6 1.0 -
102 4.8 1.2 -1.2 27.3 46.7 18.8 --
165
Shilalo -
( i )
----8.2 43.9 40.8 7.1 -
98 3.9 1.0 -1.5 17.1 48.8 25.4 2.4 -
205 ( i )
the blank space in the column indicates that this type of land use is not represented in the sample
69
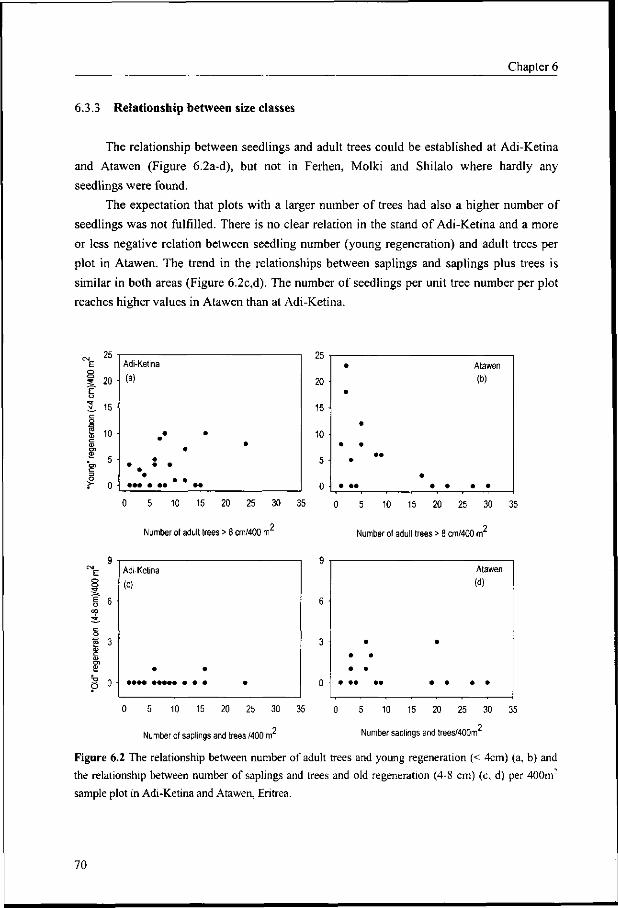
Chapter 6
6.3.3 Relationship between size classes
The relationship between seedlings and adult trees could be established at Adi-Ketina
and Atawen (Figure 6.2a-d), but not in Ferhen, Molki and Shilalo where hardly any
seedlings were found.
The expectation that plots with a larger number of trees had also a higher number of
seedlings was not fulfilled. There is no clear relation in the stand of Adi-Ketina and a more
or less negative relation between seedling number (young regeneration) and adult trees per
plot in Atawen. The trend in the relationships between saplings and saplings plus trees is
similar in both areas (Figure 6.2c,d). The number of seedlings per unit tree number per plot
reaches higher values in Atawen than at Adi-Ketina.
2b -
20 -
15
10 -
5 -
0
Adi-Ketina
(a)
•
• • • • • • •• • •
10 15 20 25 30 35
Number of adult trees > 8 cm/400 m
5 10 15 20 25
Number of adult trees > 8 cm/400 m'
35
§ 6 -
2 3
0 -
Number of saplings and trees MOO m'
• • • • •
• •• ••
•
• •
Atawen
(d)
• •
10 15 20 25 30 35
Number saplings and trees/400m
Figure 6.2 The relationship between number of adult trees and young regeneration (< 4cm) (a, b) and the relationship between number of saplings and trees and old regeneration (4-8 cm) (c, d) per 400m2
sample plot in Adi-Ketina and Atawen, Eritrea.
70
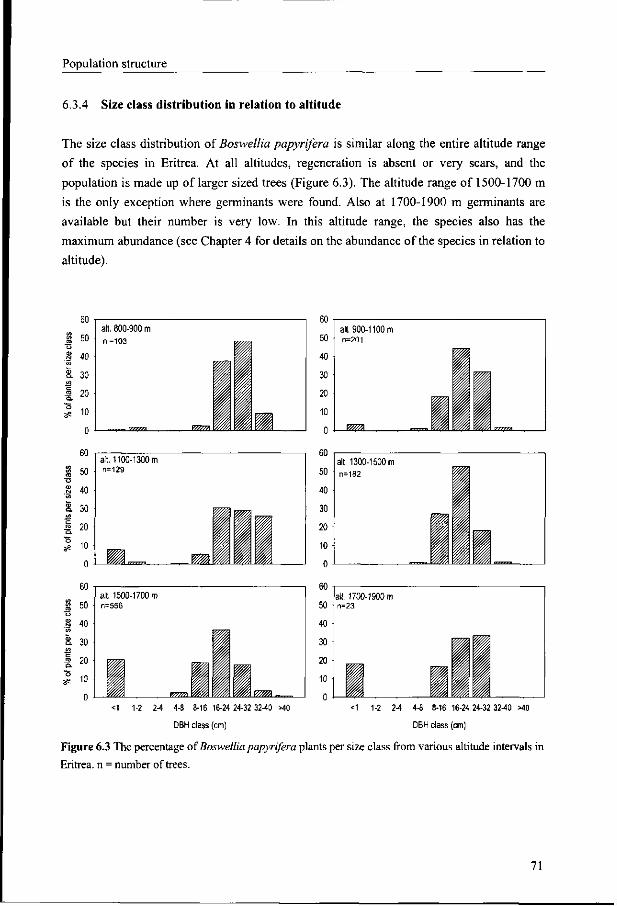
Population structure
6.3.4 Size class distribution in relation to altitude
The size class distribution of Boswellia papyrifera is similar along the entire altitude range
of the species in Eritrea. At all altitudes, regeneration is absent or very scars, and the
population is made up of larger sized trees (Figure 6.3). The altitude range of 1500-1700 m
is the only exception where germinants were found. Also at 1700-1900 m germinants are
available but their number is very low. In this altitude range, the species also has the
maximum abundance (see Chapter 4 for details on the abundance of the species in relation to
altitude).
Figure Eritrea.
<1 1-2 24 4-8 8-16 16-24 24-32 3240 >40 <1 1-2 24 4-8 8-16 16-24 24-32 3240 >40
DBH class (cm) DBH class (cm)
6.3 The percentage of Boswellia papyrifera plants per size class from various altitude intervals in n = number of trees.
71
Chapter 6
6.4 Discussion
In this study, it is very important to note that the population distribution described in the
previous sections is based on size class distribution and not age distribution. In most cases,
there is a good relationship between size and age of trees (Poorter et al. 1996, Smith et al.
1997). Therefore, the population structure of Boswellia papyrifera is taken as the reflection
of its regeneration process at a certain moment in time (see also Kumar and Pandey 1993,
Conditetal. 1998).
The five Boswellia stands covered in this study are predominantly composed of larger
trees and show lack of regeneration reflected by the absence of seedlings and saplings both
in absolute as in relative (compared to the adult tree numbers) terms. Some recent
regeneration has been observed in only two (Adi-Ketina and Atawen) out of the five areas
investigated. There are several possible reasons for these variations in size class distribution.
Differences in size class distribution could arise due to (1) size specific recruitment, growth
and mortality, provided local conditions are the same (Swaine 1997), (2) different local
conditions giving rise to differences in population dynamics (recruitment, growth and
mortality) (Poorter et al. 1996, Hulme 1996, Richards 1996) (3) lack of regeneration sites in
space and time (Hubbell and Foster 1986), and human induced factors.
Some important local environmental conditions that adversely affect the abundance of
recruitment include factors related with soil, climate, and the local topography. The soils and
local topography where Boswellia papyrifera occurs do not vary largely. The climate of
Eritrea is characterised by a long dry season, erratic rainfall, and recurrent droughts (Hien
1995). The areas of Adi-Ketina and Atawen which present some recruitment, are found in
moist areas similar to those found in Shilalo and Molki but differ in altitude. As discussed
later, this factor in itself does not offer an explanation for the differences observed.
There are several human induced factors which affect the population structure of the
Boswellia stands. The main ones are land clearing, grazing and tapping trees for gum. The
first is the extreme case where trees are completely removed from cultivated land. The
second is grazing which affects seedling survival and establishment as well as sapling
growth and development. The negative impact of grazing on the regeneration of woody plant
species is well-documented (Gijsbers 1994, Pilarski 1994, Breman and Kessler 1995).
Studies on the restoration of montane tree species in the northern highlands and other areas
of Eritrea showed that grazing remains a bottleneck to the regeneration of woody plant
species in the country (Jones 1991, FAO 1997b). Grazing disrupts regeneration both directly
and indirectly. Directly, it involves the removal of the whole plant or parts of the vegetative
or reproductive structures of a plant. Indirectly, livestock trample the soil surface resulting in
seedling mortality and in soil compaction, which limits recruitment and seedling
72
Population structure
establishment (Crawley 1983, 1992, Breman and Kessler 1995, Barnes et al. 1998). In
Eritrea, the long dry season and recurrent droughts exacerbate the consequences of grazing.
Slow growing Boswellia papyrifera seedlings are unable to escape grazing during the
prolonged juvenile stage of their development. Livestock can easily damage germinants and
young seedlings. Their leaves are succulent and plants lack defensive morphological
structures such as thorns or spines.
The fact that regeneration is absent in some non-grazed areas (e.g. the enclosed sample
plots at Molki and Ferhen and the non-grazing area in Shilalo) while it is present in others
(enclosed area in Adi-Ketina established in 1994), shows that grazing is not the only factor
determining the absence of regeneration. Unlike in the Atawen area where more advanced
regeneration ( dbh 4-8 cm) was found, in Adi-Ketina the regeneration is mainly composed of
recent recruitment (<1 cm). This finding indicates that the Boswellia papyrifera stand in
Adi-Ketina was under pressure for a longer period of time resulting in lack of advanced
regeneration.
A third important factor which affects the population structure of Boswellia stands is
tapping of trees for gum. Seedling abundance depends, among other factors on the
availability of viable seeds. These may come from the soil seed bank, or from the seed rain
(from the local trees or from elsewhere). A large proportion of seeds reaching the ground is
usually destroyed by insects or become infected by fungi (Kimmins 1996, Richards 1996). In
spite of the enormous losses, it is normally expected that some germinate and contribute to
the population (Ng 1978).
Germination tests (Ogbazghi unpublished data) have shown that seeds from healthy
looking Boswellia trees in tapped stands showed a very low germination percentage while
those from un-tapped trees had a very high germination percentage. Most seeds coming from
the tapped stands were empty. As trees in the stands in Ferhen, Molki, and Shilalo were
continuously tapped this may be the reason for the lack of recruitment in those areas. In
Ferhen which is located in the driest part of the woodland, complete lack of recruitment,
young seedlings, and saplings suggest that the effects of tapping has been aggravated by the
dry climatic condition of the area.
There is lack of regeneration across the entire altitude gradient where Boswellia occurs
except in areas located at 1500-1700 m. The occurrence of recruitment at this altitude
reflects the fact that these stands are untapped (e.g. those of Adi-Ketina and Atawen) rather
than being the consequences of altitude per se. The presence of this recruitment coincides
with the maximum abundance of the species as found on the western escarpment with less
intensive land use.
73
Chapter 6
6.5 Conclusion
The population structure of Boswellia papyrifera demonstrates that there is a serious lack of
regeneration in all the five study areas. There is a general trend of not having young plants.
Some recruitment was found in un-tapped stands. The germinants, seedlings and also the
saplings found in these untapped areas resulted from recent recruitment and seedling
establishment. Their long term performance in the face of the current land use and
environmental conditions remains to be seen. For this, long-term monitoring of population
dynamics is needed.
Based on the population structure analysis, it is hypothesised that lack of establishment
is primarily caused by grazing pressure but that absence of recruitment is largely caused by
lack of viable seed production by the mother trees as the result of tapping. In addition to
these factors, inadequate soil moisture and lack of safe sites may be important. These
hypotheses are dealt with in Chapter 7.
74
CHAPTER 7
7 Possible reasons for lack of regeneration of Boswellia papyrifera
7.1 Introduction
In the population structure studies (Chapter 6), it was found that regeneration was lacking in
almost all parts of the Boswellia papyrifera stands in Eritrea. In five areas studied, at only
two areas recruitment was found, while seedlings and saplings were invariably absent in all
remaining areas. Recruitment was mainly confined to areas not accessible to livestock. This
allows for the conclusion that grazing through removal and trampling of aerial parts of the
plants is a major factor limiting the regeneration of Boswellia papyrifera. However, in some
of the non-grazed plots and permanently enclosed plots regeneration did not take place
suggesting that other regeneration constraints are also involved. One of those factors may be
the non-availability of viable seeds. The author, while collecting seeds for nursery and
establishment trials repeatedly found that Boswellia papyrifera trees flower regularly and
produce fruits but that the seeds from tapped stands were empty and viable seeds could only
be obtained from non-tapped trees.
In this chapter both the grazing and tapping issues are studied in depths with the
following two hypotheses:
where viable seeds are produced, lack of seedlings in the Boswellia stands is due
to high seedling mortality resulting from grazing
tapping of trees for gum, especially intensive tapping gives rise to the production
of empty, non-viable seeds that leads to lack of recruitment.
In this chapter, first, the effect of grazing and establishment will be analysed (section 7.2)
and then the effect of tapping on seed production and seed viability will be treated (section
7.3).
In the analysis of the effects of grazing and tapping on the life cycle of Boswellia
papyrifera, it is important to have a general framework describing the life cycle of the
species. This enables to grasp how each factor intervenes in the cycle and its consequence
for the regeneration of the species. The life cycle of the species like other sexually
reproducing tree species consists of four major stages i.e. seed, seedling, sapling, and tree.
Each life stage is influenced by biotic and abiotic environmental factors. Besides, human
induced factors, in this case grazing and tapping trees for gum, are thought to influence the
cycle. The development stages at which these factors affect the life cycle and hence the
75
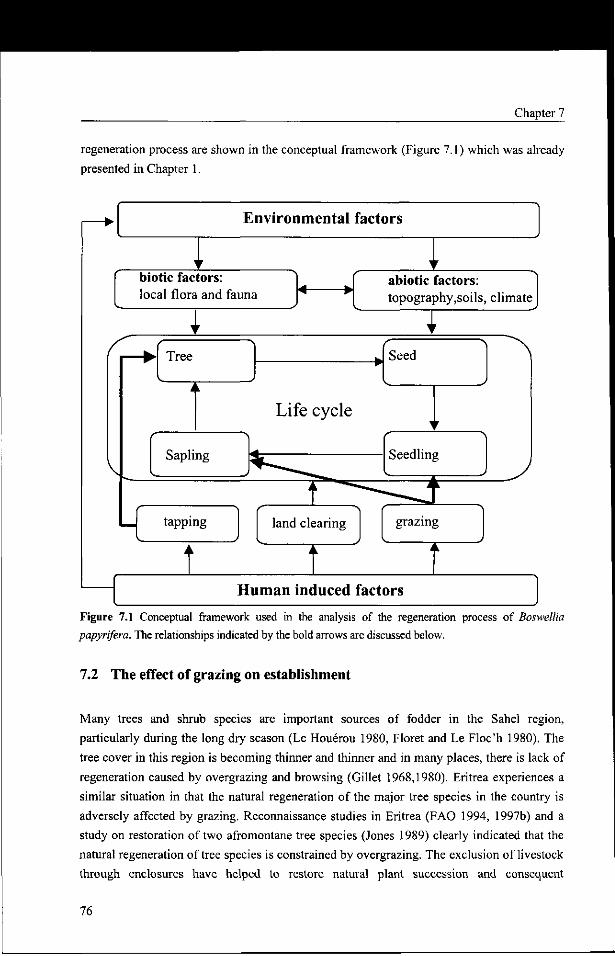
Chapter 7
regeneration process are shown in the conceptual framework (Figure 7.1) which was already
presented in Chapter 1.
Environmental factors
^ ' biotic factors: local flora and fauna
4 w ^ w
yr
abiotic factors: topography,soils, climate
1
V
Tree Seed
Life cycle
Sapling Seedling
LC tapping land clearing grazing
t I I Human induced factors
Figure 7.1 Conceptual framework used in the analysis of the regeneration process of Boswellia papyrifera. The relationships indicated by the bold arrows are discussed below.
7.2 The effect of grazing on establishment
Many trees and shrub species are important sources of fodder in the Sahel region,
particularly during the long dry season (Le Houerou 1980, Floret and Le Floc'h 1980). The
tree cover in this region is becoming thinner and thinner and in many places, there is lack of
regeneration caused by overgrazing and browsing (Gillet 1968,1980). Eritrea experiences a
similar situation in that the natural regeneration of the major tree species in the country is
adversely affected by grazing. Reconnaissance studies in Eritrea (FAO 1994, 1997b) and a
study on restoration of two afromontane tree species (Jones 1989) clearly indicated that the
natural regeneration of tree species is constrained by overgrazing. The exclusion of livestock
through enclosures have helped to restore natural plant succession and consequent
76
Possible reasons for lack of regeneration
establishment (Namddeo et al. 1989). In Eritrea, reforestation efforts through hillside
closures5, establishment of plantations and planting trees at community and household-level
have been undertaken for the last two decades. Today, the Ministry of Agriculture uses
enclosures to rehabilitate degraded vegetation. In total more than 120,000 ha of land, some
times with Boswellia papyrifera stands, have been enclosed (FAO 1997b). There are
indications that the vegetation cover of the woody plants is improving but the performance
of individual species is unknown.
The main objectives of the present study were to evaluate the recruitment,
establishment and growth of Boswellia papyrifera plants (dbh<10 cm) in enclosed and non-
enclosed areas and in grazing (accessible to livestock) and non-grazing areas (inaccessible to
livestock).
7.2.1 Materials and Methods
Site selection, establishment of observation plots and plant measurements
The study was undertaken in the moist highlands at Adi-Ketina and Atawen from July 1997
till July 1999. These areas (described in Chapter 4) were selected because of the presence of
untapped Boswellia stands and sites protected from grazing.
In Adi-Ketina, some of the Boswellia papyrifera stands have been protected by
enclosures from grazing since 1994. Within an enclosure, collection of wood for fuel or
construction and grazing by livestock are illegal activities. In addition, tapping of Boswellia
trees for gum has been banned inside and outside the enclosure. Since these enclosures are
not fenced, livestock occasionally grazes along the edges of the area. Because of this, a
grazing pressure gradient is created from the central (enclosed area) to outside the enclosed
area.
Before placing the permanent plots, the boundary of the enclosure was delineated in
collaboration with the forest guards. Subsequently, the study area was divided into three
sections: central (non-grazed), border (moderately grazed), and non-enclosed (heavily
grazed). In each of these three sections eight permanent quadrats each measuring 20 m x 20
m were laid out.
In Atawen, where no enclosures are found, five observation plots (of the same size as
those in Adi-Ketina) were located at sites accessible to livestock and five at sites not
accessible to livestock.
Enclosures arc large areas legally protected against grazing and all sorts of human activities. Forest guards hired by the government watch these enclosures against intruding livestock and humans.
77
Chapter 7
The first plant measurements were made at the beginning of the rainy season in July
1997 and repeated one and two years later. For plants with a dbh < 4 cm their height was
measured with a measuring rod and the basal diameter with callipers. For plants with a dbh
between 4 and 10 cm, height was determined with a telescopic pole and dbh with a diameter
tape. Trees with a diameter > 10 cm were only counted. All individuals were labelled and
mapped and the boundaries of the plots marked with waterproof paint.
Data analysis
Individuals were classified as germinants, seedlings, saplings, and trees as described in
Chapter 4. A two-way analysis of variance was used to see whether the initial differences in
population composition between grazed and non-grazed areas had changed in subsequent
years. The mortality and the growth of individuals from one size class to the next higher size
class were analysed using a transition matrix (Bruner 1973, Miles et al 1985, Tohru 1991).
As Boswellia plants are slow growing a narrow size class interval of 0.5 cm was used for
plants with basal diameter less than 1 cm and a 1 cm interval was used for plants with larger
basal diameters. The mortality per size class was calculated as the ratio between the number
of dead individuals and the total number of individuals per size class and expressed in
percentage.
7.2.2 Results
Plant numbers under different grazing regimes
The initial (1997) population composition showed much higher recruitment in non-grazed
plots than in grazed ones. At Atawen higher numbers of germinants, seedlings and saplings
were found than at Adi-Ketina. This reflects that at Atawen the inaccessibility of sites to
livestock is a permanent condition and that tapping was discontinued much earlier (in 1983)
than at Adi-Ketina were enclosures and non-tapping were recently introduced (in 1994). In
the non-grazed plots at both sites the number of seedlings increased from 1997 onwards,
while the number of germinants and saplings remained much the same. At Adi-Ketina
recruitment clearly decreased with increasing grazing intensity (Table 7.1 and Figure 7.2).
Statistical analysis showed that the negative effect of grazing on the number of seedlings and
germinants was highly significant at both sites and that the increase in the number of
seedlings with time was only significant at Atawen (Table 7.2).
78
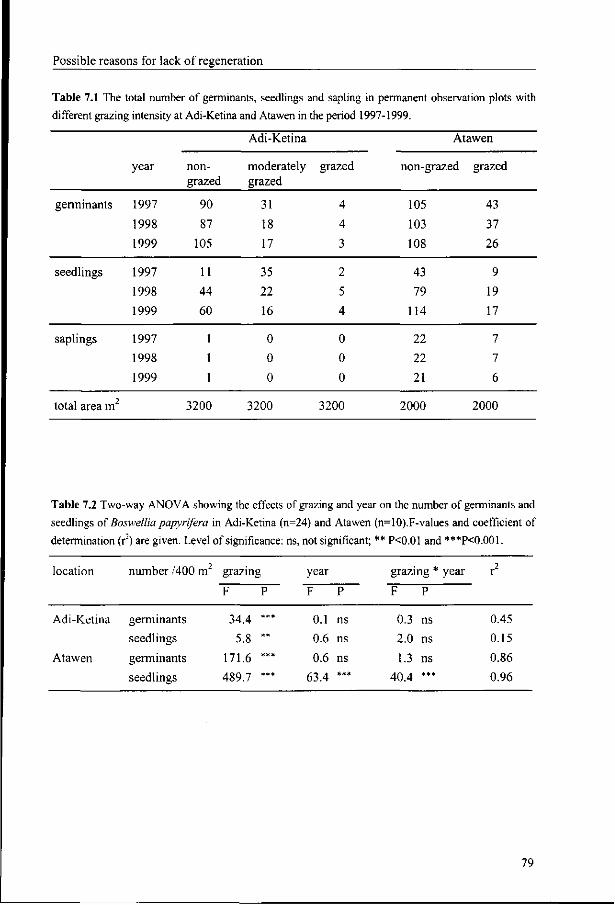
Possible reasons for lack of regeneration
Table 7.1 The total number of germinants, seedlings and sapling in permanent observation plots with
different grazing intensity at Adi-Ketina and Atawen in the period 1997-1999.
germinants
seedlings
saplings
total area m2
year
1997
1998
1999
1997
1998
1999
1997
1998
1999
non-grazed
90
87
105
11
44
60
1
1
1
3200
Adi-Ketina
moderately grazed
31
18
17
35
22
16
0
0
0
3200
grazed
4
4
3
2
5
4
0
0
0
3200
non-gi
105
103
108
43
79
114
22
22
21
2000
Atawen
•azed grazed
43
37
26
9
19
17
7
7
6
2000
Table 7.2 Two-way ANOVA showing the effects of grazing and year on the number of germinants and
seedlings of Boswellia papyrifera in Adi-Ketina (n=24) and Atawen (n=10).F-values and coefficient of
determination (r) are given. Level of significance: ns, not significant; ** PO.01 and ***P<0.001.
location number MOO m grazing year grazing * year
Adi-Ketina
Atawen
germinants
seedlings
germinants
seedlings
F P
34.4 " *
5.8 **
171.6 ***
489 7 ***
F P
0.1 ns
0.6 ns
0.6 ns
63.4 ***
F P
0.3 ns
2.0 ns
1.3 ns
40.4 ***
0.45
0.15
0.86
0.96
79
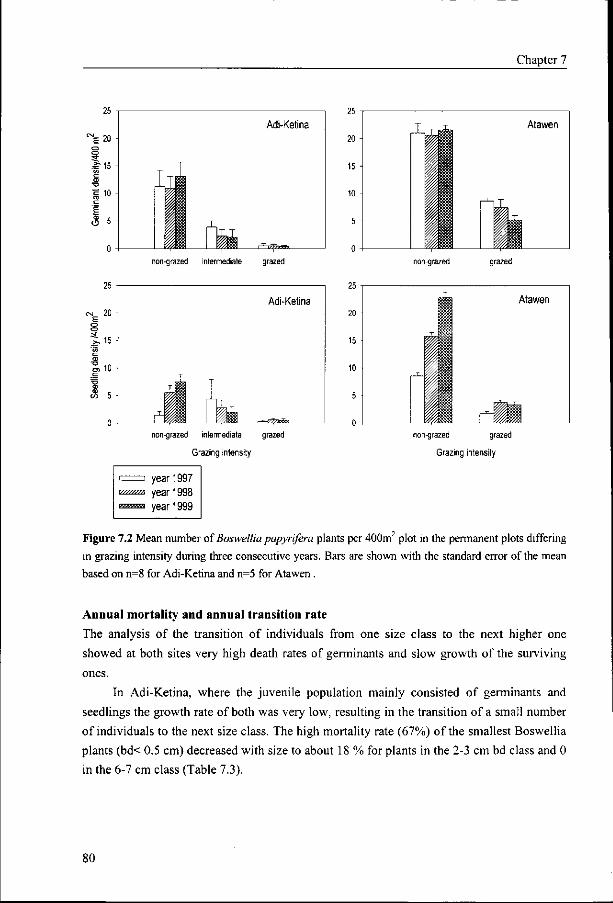
^ 2 0 -O O
. ^15 -ZZ CD
T3
s 10 -
E
O 5 "
0 i
Adi-Ketina
ITI m
ifl i "//?&$& i •^-trpinani
non-grazed intermediate grazed
T
T B§ | T
Adi-Ketina
•vyysVK r=-rf77)r?™
Chapter 7
Atawen
non-grazed grazed
Atawen
non-grazed intermediate grazed
Grazing intensity
non-grazed grazed
Grazing intensity
Figure 7.2 Mean number of Boswellia papyrifera plants per 400m" plot in the permanent plots differing
in grazing intensity during three consecutive years. Bars are shown with the standard error of the mean
based on n=8 for Adi-Ketina and n=5 for Atawen .
Annual mortality and annual transition rate
The analysis of the transition of individuals from one size class to the next higher one
showed at both sites very high death rates of germinants and slow growth of the surviving
ones.
In Adi-Ketina, where the juvenile population mainly consisted of germinants and
seedlings the growth rate of both was very low, resulting in the transition of a small number
of individuals to the next size class. The high mortality rate (67%) of the smallest Boswellia
plants (bd< 0.5 cm) decreased with size to about 18 % for plants in the 2-3 cm bd class and 0
in the 6-7 cm class (Table 7.3).
80
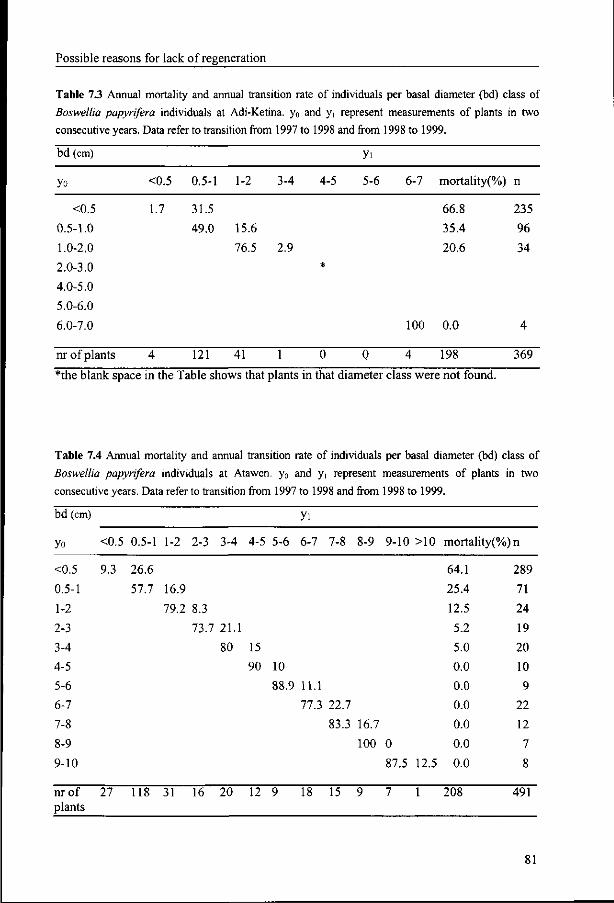
Possible reasons for lack of regeneration
Table 7.3 Annual mortality and annual transition rate of individuals per basal diameter (bd) class of
Boswellia papyrifera individuals at Adi-Ketina. y0 and yi represent measurements of plants in two
consecutive years. Data refer to transition from 1997 to 1998 and from 1998 to 1999.
bd (cm) yi
66.8
35.4
20.6
235
96
34
y0 <0.5 0.5-1 1-2 3-4 4-5 5-6 6-7 mortality(%) n
<0.5 1.7 31.5
0.5-1.0 49.0 15.6
1.0-2.0 76.5 2.9
2.0-3.0 *
4.0-5.0
5.0-6.0
6.0-7.0 100 0.0 4
nr of plants 4 121 41 I 0 0 4 198 369~
*the blank space in the Table shows that plants in that diameter class were not found.
Table 7.4 Annual mortality and annual transition rate of individuals per basal diameter (bd) class of
Boswellia papyrifera individuals at Atawen. y0 and yi represent measurements of plants in two
consecutive years. Data refer to transition from 1997 to 1998 and from 1998 to 1999.
bd (cm)
yo
<0.5
0.5-1
1-2
2-3
3-4
4-5
5-6
6-7
7-8
8-9
9-10
nr of plants
<0.5
9.3
27
0.5-1
26.6
57.7
118
1-2
16.9
79.2
31
2-3 3-4
8.3
73.7 21.1
80
16 20
4-5
15
90
12
yi
5-6 6-7
10
88.9 11.1
77.3
9 18
7-8
22.7
83.3
15
8-9
16.7
100
9
9-10
0
87.5
7
>10
12.5
1
mortality(%)
64.1
25.4
12.5
5.2
5.0
0.0
0.0
0.0
0.0
0.0
0.0
208
n
289
71
24
19
20
10
9
22
12
7
8
491
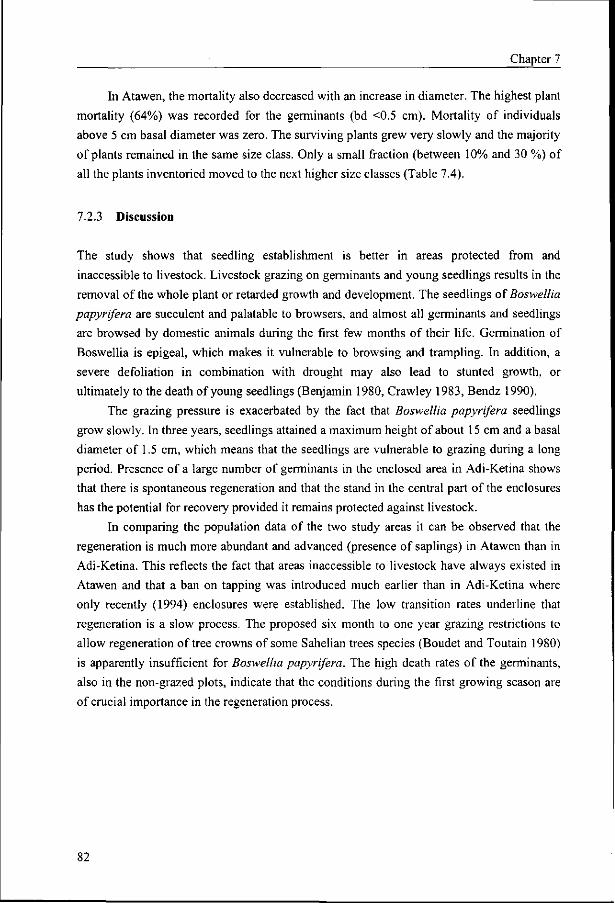
Chapter 7
In Atawen, the mortality also decreased with an increase in diameter. The highest plant
mortality (64%) was recorded for the germinants (bd <0.5 cm). Mortality of individuals
above 5 cm basal diameter was zero. The surviving plants grew very slowly and the majority
of plants remained in the same size class. Only a small fraction (between 10% and 30 %) of
all the plants inventoried moved to the next higher size classes (Table 7.4).
7.2.3 Discussion
The study shows that seedling establishment is better in areas protected from and
inaccessible to livestock. Livestock grazing on germinants and young seedlings results in the
removal of the whole plant or retarded growth and development. The seedlings of Boswellia
papyrifera are succulent and palatable to browsers, and almost all germinants and seedlings
are browsed by domestic animals during the first few months of their life. Germination of
Boswellia is epigeal, which makes it vulnerable to browsing and trampling. In addition, a
severe defoliation in combination with drought may also lead to stunted growth, or
ultimately to the death of young seedlings (Benjamin 1980, Crawley 1983, Bendz 1990).
The grazing pressure is exacerbated by the fact that Boswellia papyrifera seedlings
grow slowly. In three years, seedlings attained a maximum height of about 15 cm and a basal
diameter of 1.5 cm, which means that the seedlings are vulnerable to grazing during a long
period. Presence of a large number of germinants in the enclosed area in Adi-Ketina shows
that there is spontaneous regeneration and that the stand in the central part of the enclosures
has the potential for recovery provided it remains protected against livestock.
In comparing the population data of the two study areas it can be observed that the
regeneration is much more abundant and advanced (presence of saplings) in Atawen than in
Adi-Ketina. This reflects the fact that areas inaccessible to livestock have always existed in
Atawen and that a ban on tapping was introduced much earlier than in Adi-Ketina where
only recently (1994) enclosures were established. The low transition rates underline that
regeneration is a slow process. The proposed six month to one year grazing restrictions to
allow regeneration of tree crowns of some Sahelian trees species (Boudet and Toutain 1980)
is apparently insufficient for Boswellia papyrifera. The high death rates of the germinants,
also in the non-grazed plots, indicate that the conditions during the first growing season are
of crucial importance in the regeneration process.
82
Possible reasons for lack of regeneration
7.3 The effects of tapping on the reproductive cycle of Boswellia papyrifera
Tapping of Boswellia trees takes place during the dry season. It starts in September and
continues until March. Tapping involves making incisions in the bark and the phloem with a
special axe locally known as "mngaf'. The gum is left to solidify while on the trees and it is
collected every three weeks. Gum olibanum is available in small tears or lumps of white-
yellowish-reddish colour. This gum is a mixture of a resin and an acidic polysaccharide
(Anderson et al. 1965, Hillis 1989). A typical composition of gum olibanum includes oil (5-
9%), resin acids (13-17%), polysaccharides (20-30%) and residues, mainly boswellic acid
(40-60%). After collecting the dried gum, the original wound is re-opened to allow a steady
flow of the gum. Each tree is revisited and wounded at least seven times per harvest season.
Off-season rains may interrupt tapping and gum collection activities.
Theoretically, according to the tappers, the number of tapping points per individual
tree is fixed in relation to tree size. Small trees ranging 10-20 cm in diameter should be
tapped at four points and larger trees at six points. The tapping points should be facing east
and west wards. According to the tappers, this enhances the yield. In spite of these
guidelines, over-tapping and use of inappropriate tapping methods by unskilled labourers
take place and cause substantial damage to Boswellia trees (Ogbazghi personal observation).
Many people, including the tappers themselves, think that tapping is a non-destructive
exploitation system because trees are not felled for wood. This view is challenged in this
paper, because of indications that the present intensive tapping practices negatively affect the
regeneration of Boswellia papyrifera and thus threatens the survival of the species. These
indications are that the author could only obtain viable seeds for establishment trials from
un-tapped trees (Ogbazghi unpublished data) and that natural regeneration was only found in
non-grazing areas with un-tapped Boswellia stands. How tapping affects the reproductive
cycle, particularly the production of viable seeds is still unknown. The aim of the present
study is to investigate how tapping fits into the phenological cycle of the tree and how it
influences seed quantity and quality.
7.3.1 Materials and Methods
The effect of tapping on seed viability at stand-level
The effect of tapping on viable seed production at stand level was studied in the stands of
Adi-Ketina, Atawen, Ferhen, Molki, and Shilalo (for details about these sites see Chapter 4).
These areas represent the whole altitude range of Boswellia papyrifera stands. Among the
five study areas, three stands are tapped every year (Ferhen, Molki, and Shilalo). At the start
83
Chapter 7
of the study, in 1997, tapping had been abandoned in Adi-Ketina since 4 years and in
Atawen since 14 years. Seeds were collected from the five study areas for three consecutive
years (1997-1999). From each area, 200 randomly selected seeds were put to germinate in
growth chambers. Before placing seeds in the germination chambers, they were soaked with
tap water for 12 hours, which provides the best condition for germination of Boswellia
papyrifera (Ogbazghi unpublished results). The conditions inside the cabinet were 12 hours
minimum night and maximum day temperatures of 20°C and 30°C, respectively, and a
relative humidity of 80%. The moisture levels of the petri dishes were kept constant by
watering throughout the experimental period. Every day the germination was monitored and
the number of germinated seeds recorded (Hartmann et al. 1990).
The effect of tapping on flowering and seed production at tree level
Field experiments simulating the present gum exploitation systems in Eritrea were carried
out in three areas. Trees at Atawen were untapped for fourteen years, at Adi-Ketina for four
years and at Ferhen trees were tapped every year. All areas are located at an altitude of 1600
m a.s.l. and found under similar topographic and soil conditions. The phenological cycle is
described by following the different phenophases in the same area (Grouzis and Sicot 1980).
In each study area, a homogeneous area was delineated for the selection of trees.
Within each area, trees having diameters of 10, 20 and 30 cm were randomly selected and
mapped. For each diameter class, fifteen trees were taken and labelled. These trees were then
allocated to three different tapping categories (n=5 per tapping intensity): un-tapped, tapped
at six points, and tapped at twelve points. Following the local practices the selected trees
were tapped at an interval of three weeks and the gum obtained from each tree was collected.
The experimental design consisted of three sites, three size classes, three tapping intensities
and five trees making it forty-five trees per study area.
In this experiment, two sets of data were gathered. In the field, the number of
inflorescences per tree was counted during the peak flowering period. The number of fruits
and seeds per tree was estimated by taking five randomly selected inflorescences, one from
the centre and four from corners of the crown. The fruits and seeds of these five
inflorescences were taken to the laboratory for further seed analysis and germination
experiments. Seed length and width were determined on thirty randomly selected seeds per
tree. Furthermore, the seed dry mass (the weight in g of 1000 seeds) was determined.
A total of 200 seeds from each tree were put to germinate. The 200 seeds (50 seeds per
dish) were placed in dishes lined with moist filter papers and placed inside a germination
cabinet. The conditions inside the cabinet were 12 hours minimum night and maximum day
temperatures of 20°C and 30°C, respectively, and a relative humidity of 80%. The moisture
level of the petri dishes was kept constant by pouring enough water to keep them moist
84
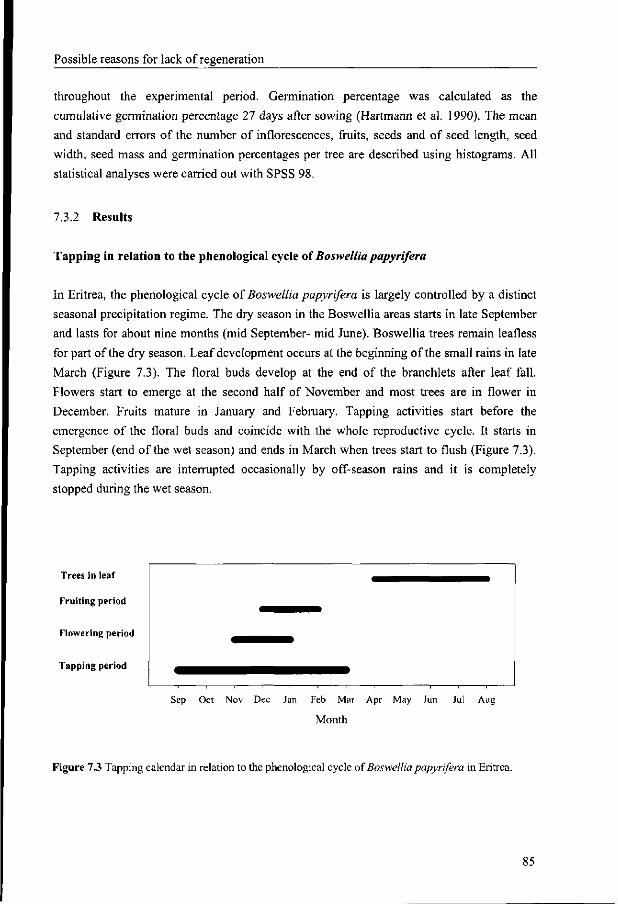
Possible reasons for lack of regeneration
throughout the experimental period. Germination percentage was calculated as the
cumulative germination percentage 27 days after sowing (Hartmann et al. 1990). The mean
and standard errors of the number of inflorescences, fruits, seeds and of seed length, seed
width, seed mass and germination percentages per tree are described using histograms. All
statistical analyses were carried out with SPSS 98.
7.3.2 Results
Tapping in relation to the phenological cycle of Boswelliapapyrifera
In Eritrea, the phenological cycle of Boswellia papyrifera is largely controlled by a distinct
seasonal precipitation regime. The dry season in the Boswellia areas starts in late September
and lasts for about nine months (mid September- mid June). Boswellia trees remain leafless
for part of the dry season. Leaf development occurs at the beginning of the small rains in late
March (Figure 7.3). The floral buds develop at the end of the branchlets after leaf fall.
Flowers start to emerge at the second half of November and most trees are in flower in
December. Fruits mature in January and February. Tapping activities start before the
emergence of the floral buds and coincide with the whole reproductive cycle. It starts in
September (end of the wet season) and ends in March when trees start to flush (Figure 7.3).
Tapping activities are interrupted occasionally by off-season rains and it is completely
stopped during the wet season.
Trees in leaf
Fruiting period
Flowering period
Tapping period
Sep Oct Nov Dec Jan Feb Mar Apr May Jun Jul Aug
Month
Figure 7.3 Tapping calendar in relation to the phenological cycle of Boswellia papyrifera in Eritrea.
85
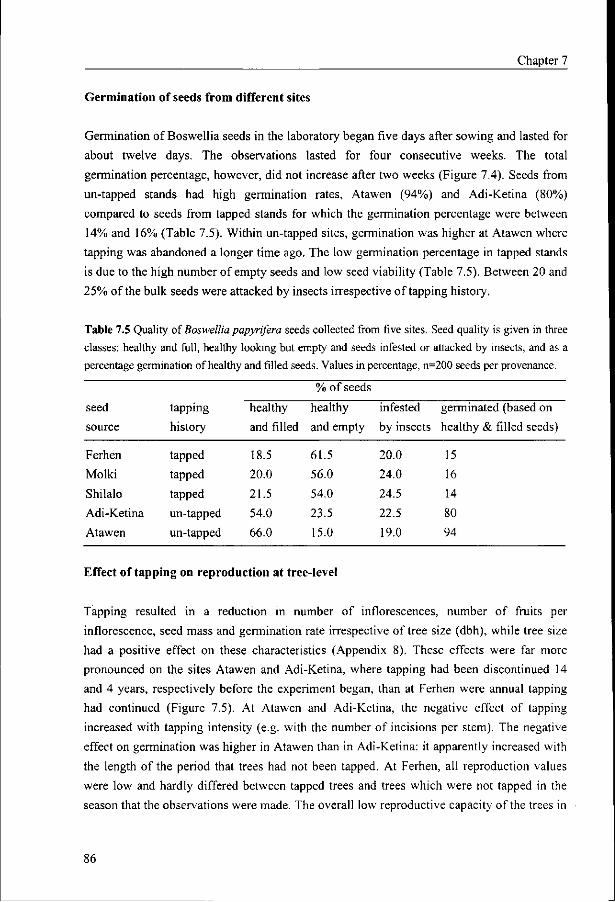
Chapter 7
Germination of seeds from different sites
Germination of Boswellia seeds in the laboratory began five days after sowing and lasted for
about twelve days. The observations lasted for four consecutive weeks. The total
germination percentage, however, did not increase after two weeks (Figure 7.4). Seeds from
un-tapped stands had high germination rates, Atawen (94%) and Adi-Ketina (80%)
compared to seeds from tapped stands for which the germination percentage were between
14%o and 16% (Table 7.5). Within un-tapped sites, germination was higher at Atawen where
tapping was abandoned a longer time ago. The low germination percentage in tapped stands
is due to the high number of empty seeds and low seed viability (Table 7.5). Between 20 and
25% of the bulk seeds were attacked by insects irrespective of tapping history.
Table 7.5 Quality of Boswellia papyrifera seeds collected from five sites. Seed quality is given in three
classes: healthy and full, healthy looking but empty and seeds infested or attacked by insects, and as a
percentage germination of healthy and filled seeds. Values in percentage, n=200 seeds per provenance.
seed
source
% of seeds
tapping
history
healthy healthy infested germinated (based on
and filled and empty by insects healthy & filled seeds)
Ferhen
Molki
Shilalo
Adi-Ketina
Atawen
tapped
tapped
tapped
un-tapped
un-tapped
18.5
20.0
21.5
54.0
66.0
61.5
56.0
54.0
23.5
15.0
20.0 24.0
24.5
22.5
19.0
15 16
14
80
94
Effect of tapping on reproduction at tree-level
Tapping resulted in a reduction in number of inflorescences, number of fruits per
inflorescence, seed mass and germination rate irrespective of tree size (dbh), while tree size
had a positive effect on these characteristics (Appendix 8). These effects were far more
pronounced on the sites Atawen and Adi-Ketina, where tapping had been discontinued 14
and 4 years, respectively before the experiment began, than at Ferhen were annual tapping
had continued (Figure 7.5). At Atawen and Adi-Ketina, the negative effect of tapping
increased with tapping intensity (e.g. with the number of incisions per stem). The negative
effect on germination was higher in Atawen than in Adi-Ketina: it apparently increased with
the length of the period that trees had not been tapped. At Ferhen, all reproduction values
were low and hardly differed between tapped trees and trees which were not tapped in the
season that the observations were made. The overall low reproductive capacity of the trees in
86
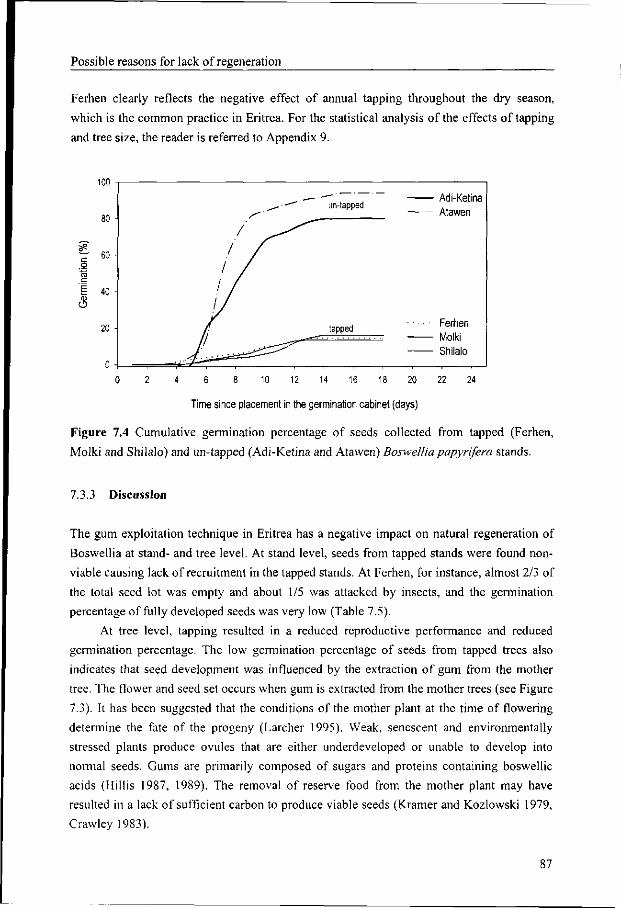
Possible reasons for lack of regeneration
Ferhen clearly reflects the negative effect of annual tapping throughout the dry season,
which is the common practice in Eritrea. For the statistical analysis of the effects of tapping
and tree size, the reader is referred to Appendix 9.
E CD
o
6 8 10 12 14 16 18 20
Time since placement in the germination cabinet (days)
Figure 7.4 Cumulative germination percentage of seeds collected from tapped (Ferhen,
Molki and Shilalo) and un-tapped (Adi-Ketina and Atawen) Boswellia papyrifera stands.
7.3.3 Discussion
The gum exploitation technique in Eritrea has a negative impact on natural regeneration of
Boswellia at stand- and tree level. At stand level, seeds from tapped stands were found non
viable causing lack of recruitment in the tapped stands. At Ferhen, for instance, almost 2/3 of
the total seed lot was empty and about 1/5 was attacked by insects, and the germination
percentage of fully developed seeds was very low (Table 7.5).
At tree level, tapping resulted in a reduced reproductive performance and reduced
germination percentage. The low germination percentage of seeds from tapped trees also
indicates that seed development was influenced by the extraction of gum from the mother
tree. The flower and seed set occurs when gum is extracted from the mother trees (see Figure
7.3). It has been suggested that the conditions of the mother plant at the time of flowering
determine the fate of the progeny (Larcher 1995). Weak, senescent and environmentally
stressed plants produce ovules that are either underdeveloped or unable to develop into
normal seeds. Gums are primarily composed of sugars and proteins containing boswellic
acids (Hillis 1987, 1989). The removal of reserve food from the mother plant may have
resulted in a lack of sufficient carbon to produce viable seeds (Kramer and Kozlowski 1979,
Crawley 1983).
87
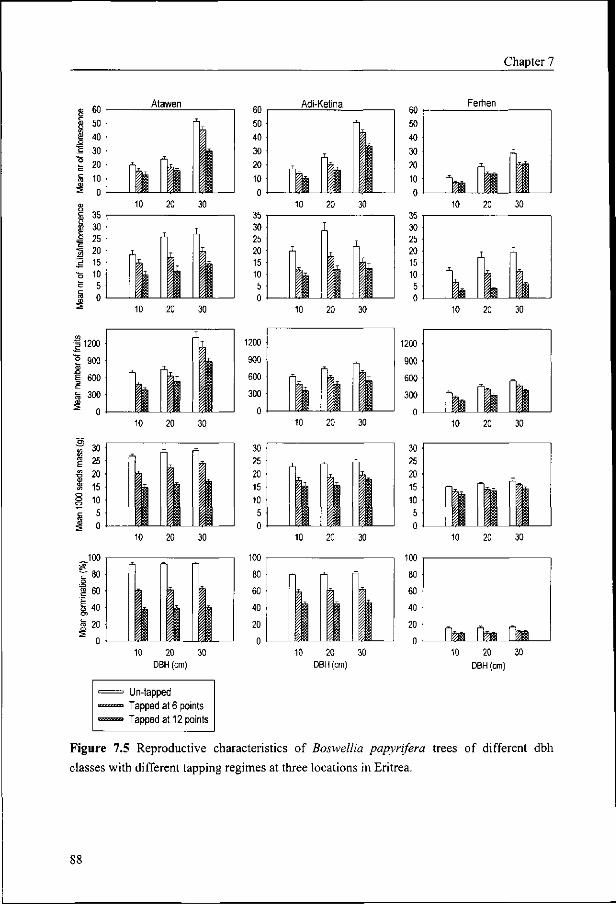
Chapter 7
Atawen Adi-Ketina Ferhen
10 20 30 DBH (cm)
10 20 30 DBH (cm)
10 20 30 DBH (cm)
Un-tapped
Tapped at 6 points
Tapped at 12 points
Figure 7.5 Reproductive characteristics of Boswellia papyrifera trees of different dbh
classes with different tapping regimes at three locations in Eritrea.
Possible reasons for lack of regeneration
The appearance of floral buds in both tapped and untapped Boswellia trees at both
stand and tree level give the impression that tapping does not completely disrupt the
reproductive cycle of the species. Annually, trees were seen in flower. Tapping, however,
quantitatively reduced the number of reproductive parts which shows that overexploitation
of the species for gum has both short and long-term effects on the regeneration of the
species. In the short term it may be manifested by non-viable seeds but in the long-term, the
reproductive cycle may be blocked.
The study also revealed that the germination success differed among the three areas
investigated depending on their tapping history. The non-tapped (control) trees in Ferhen,
which were tapped annually before the start of experiment, had the lowest germination
percentage followed by the control trees at Adi-Ketina and Atawen where tapping has been
abandoned, respectively four and fourteen years ago. This suggests that the tapping cycle has
a long-term impact on the overall regeneration process. The longer trees are being tapped the
worst is the seed quality produced. Because of this, the trees in Ferhen, which were tapped
annually, had a very low germination percentage and an overall poor seed quality.
Germination success of non-tapped control trees in Atawen is nearly 100%. This indicates
that stands need between 4-14 years to recuperate in order to attain their full potential for
viable seed production.
There are few cases were harvesting of plants or plant parts are considered sustainable
at levels of individual organisms (Ros-Tonen et al. 1995, Broekhoven 1996). The extraction
of plant elements without killing the plant itself is generally considered sustainable.
However, this is not always true, as the extraction of fluids of latex producing plant species
has resulted in local extinction. According to Dominguez and Gomez (1990), cited in Ros-
Tonen et al. (1995), Quinine (Cinchona Sp.) producing species became extinct in parts of
Amazonia because of overexploitation. Moreover, rosewood oil of Lareto was depleted five
years after its exploitation started (Coomes 1991). In tropical primary forest, the rubber tree
has been tapped for more than a century but only very few observations exist on the
consequence of tapping on the survival, biomass increment, life expectancy and reproduction
including the number of seeds and seed size (Hall and Bawa 1993). In the same region,
however, mortality of tapped trees has been reported in northern Bolivia (Ros-Tonen et al.
1995).
7.3.4 Conclusion
In areas with adequate supply of viable seeds, grazing is the main factor limiting the natural
regeneration of Boswellia papyri]"era. In view of the slow initial growth of Boswellia plants,
long-term measures are needed to protect germinants, seedlings, and probably saplings, from
grazing. Establishment of enclosures is a promising approach to regenerate existing
Chapter 7
Boswellia stands if the ban on grazing is strictly implemented over a long period. The length
of this period has still to be determined. In view of the fact that also in non-grazed plots high
mortality of germinants occurred in the first growing season, additional measures might be
needed to optimise regeneration conditions.
In areas unaffected by livestock grazing, lack of viable seeds due to tapping is the
major cause for lack of recruitment. Tapping, through its effects on the various reproductive
processes of Boswellia papyrifera trees, disrupts the regeneration process at the seed
production stage. The mechanism by which tapping affects the seed production is not well
understood. Especially the physiological basis of this mechanism should be further
investigated.
A less intense gum extraction mechanism should be introduced to minimise the
adverse effects of the exploitation. In this respect, the optimum number of tapping points per
tree diameter should be defined. The present study suggests that the number of tapping
points should be less than six points per tree. Moreover, the tapping cycle should be further
investigated to define the recovery time needed for plants after a tapping period. In order to
recover, trees probably need at least a four year resting period. As this time seems to be long,
as an alternative un-tapped mother trees might be permanently retained on strategic locations
in the woodlands in a way that allows a good seed dispersal.
The influx of hired tappers from outside the Boswellia areas exacerbate the problem of
over-tapping. These migrant workers lack sufficient knowledge of tapping procedures and
are in many cases not interested in the fate of the trees. The combined lack of awareness,
lack of skill and tree tenure lies at the heart of the shortcomings of the present exploitation
system of Boswellia papyrifera.
90
CHAPTER 8
8 General discussion
8.1 Review of results
Boswellia papyrifera is a deciduous tree species growing in drier parts of Africa. The
centre of diversity of the genus Boswellia lies in northeast Africa. The distribution of the
species is entirely within the Sudanian and Sahelian centre of endemism that forms more or
less a continuous vegetation belt stretching from North Nigeria eastwards till it reaches the
highlands of Eritrea and Ethiopia in the east (Keay 1959, White 1983, Vollesen 1989).
In spite of the ecological diversity found in Eritrea, the geographical distribution of
Boswellia papyrifera is limited to areas in the southwestern and southern part of the country.
Here it is found in areas between 800 and 1850 m a.s.l., with a mean annual rainfall between
375 and 750 mm and a dependable length of growing period (DLGP) of 45 - 100 days. The
mean annual maximum and mean minimum temperatures corresponding with the higher
altitude limit are about 25 and 14°C, respectively and with the lower limit about 32 and
20°C, respectively. Based on a survey including 113 villages it was found that the probability
of the occurrence of Boswellia papyrifera increases to a value of 1 when mean annual
maximum and minimum temperatures reach values higher than 30 and 18°C respectively, the
annual rainfall is at least 500 mm and the DLGP exceeds 60 days. These conditions are close
to those found at Barentu (Appendix 2), which are considered to be a representative for the
climatic conditions in the moist low lands where the largest Boswellia trees were found
(Chapter 5).
The above mentioned climatic limits are subject to the prevailing conditions in
southwestern Eritrea. They explain why Boswellia papyrifera has not spread into and across
the central highlands (too low minimum temperatures) and into the arid lowlands (lack of
rainfall) but they cannot be considered as absolute limits. In controlled condition
experiments, young Boswellia seedlings showed the highest growth rate at a constant day
and night temperature of 35°C (the highest experimental temperature), hardly any growth at
temperatures below 15°C and death of seedlings below 10°C. This indicates that the upper
temperature limit certainly exceeds 32°C and most likely also 35°C. The 100 day upper limit
for the DLGP does not imply that a longer period is not suitable for the species. A prolonged
growing season, however, is certainly not suitable as Boswellia papyrifera requires a marked
dry season for flowering and fruit setting. This is a common phenomenon in tropical freely
branching tree species, which need a period of quiescence in shoot growth for flower
differentiation. In Boswellia, the balance between vegetative and generative growth was
found to be very sensitive. This was observed at Ferhen when erratic rains in November
91
Chapter 8
1998 triggered off new leaf growth and suppressed flowering, The macro distribution study
has confirmed the general idea that the Boswellia area has decreased over the last 50 years.
Especially in the transition zone between the moist and arid lowlands, the species has
disappeared, probably as a result of a combination of population pressure and recurrent
droughts.
The micro distribution study conducted at three highland- and two lowland Boswellia
sites indicated that the main environmental factors, locally affecting the distribution and
abundance of the species, are in order of importance altitude, land use intensity, soil organic
matter content and slope angle and to a lesser extent also silt content and pH of the soil. At
the three highland sites, the abundance decreased with altitude while the reverse trend was
observed at the lowland sites. When the results of all sites were combined a maximum
population density was found between 1500 and 1600 m (Chapter 4). These results,
however, are highly dependent on the choice of the sites. If for example three lowland sites
and two highland sites had been chosen a maximum at lower altitude would have been
found. The fact that in the lowlands, situated between 800 and 1400 m, the abundance
increases with altitude and slope is probably mainly due to land use. At the flat bottom land
and gentle lower slopes most Boswellia stands have been cleared for crop production.
Intensive livestock grazing has resulted in a situation in which Boswellia is only found on
steep upper slopes and ridges which are not accessible to livestock. In areas with vertisols,
flat areas are seasonally waterlogged and this may be another reason why under those
conditions the species is found on slopes.
After the studies on the occurrence and abundance of Boswellia papyrifera at
regional and site level, tree growth and population structure were studied in different
environments. As a general trend it was found that at earlier stages of development
Boswellia papyrifera invests more of its biomass in height and crown depth and at a later
stage in stem diameter growth. This can be considered as a strategy to shorten the time that
the species might be subject to livestock browsing. So far, no growth analysis studies have
been made but some information on seedling growth has become available from the
population studies reported in Chapter 6 and recent establishment trials (Ogbazghi
unpublished data). These trials indicate very slow initial growth of the aerial parts, but a
marked development of a thick taproot. The reserves stored in the taproot enable the plant to
re-sprout after the dry season in which plants die back to soil level. The time it takes before a
permanent stem is formed is not yet known. The priority given to root development makes
the plants well adapted to a short growing season. The observations on mature trees showed
that growth is strongly affected by altitude. The maximum tree height at the lowland sites
was twice the value found at the high land sites. Furthermore, a strong negative linear
relationship was found between mean tree height and crown depth and altitude. This
92
General discussion
suggests that the species grows better in the warm moist lowlands than in the moist
highlands.
The most important outcome of the population study is the lack of natural
regeneration of Boswellia papyrifera. In almost all stands of the five study-areas seedlings
and saplings were absent and only larger trees were found. Only at two sites with untapped
trees recruitment was found in plots not accessible for or closed to livestock. This prompted
further research on the effects of grazing and tapping on regeneration (Chapter 7).
The effect of grazing is well illustrated by the 1997 observations at Adi-Ketina where
in non-grazed areas 280 germinants per ha were found versus 12 in grazed plots. Detailed
population studies revealed that also in the non-grazed plots about 60 % of the seedlings died
during the first year. This indicates that growing conditions during this period play a crucial
role. Non-published results of establishment trials suggest that survival largely depends on
adequate moisture supply during the first months after germination. Furthermore, the
population study data showed that tree mortality decreases with increasing basal diameter
and virtually stops when a diameter of 3 cm is reached. Field observations over a three year
period revealed that most seedlings remained in the same basal diameter class during this
period, illustrating that it will take several years before seedlings reach the low mortality
stage.
The tapping studies at stand level clearly showed that tapped trees hardly produced
viable seeds. Most seeds were empty and most of the filled ones failed to germinate.
Observations on individual trees indicated that tapping resulted in a reduction in
inflorescence, number of fruits, seed mass and seed viability. When tapping was resumed
after a resting period this effect was directly apparent. The germination percentage
immediately dropped from over 90 % in the control trees to about 60 % in trees tapped at six
points and to 40 % in trees tapped at 12 points. These percentages are still high enough to
produce recruitment. Annually tapped trees, however, produced hardly any viable seeds.
With germination rates of about five percent and a high seedling mortality, tapped trees
apparently cannot provide recruitment. How tapping affects flowering, fruit and seed
production and seed viability is not yet known. It is likely that competition for assimilates for
gum production and for generative growth and seed filling is involved. In rubber (Hevea
brasiliensis) the competition for assimilates between latex production and vegetative growth
is well documented. By regulating the tapping-intensity a good balance between these
processes was found, which has turned latex tapping into a sustainable production system. In
Boswellia papyrifera the competition is more complicated because it probably involves
competition between three processes: vegetative growth, gum production and generative
growth. The favourable effect of tapping rests suggests however that tapping regimes can be
developed in which acceptable levels of gum and viable-seed production can be combined. A
93
Chapter 8
practical solution for the lack of viable-seed production in the existing stands could be to
retain untapped mother trees as a seed source for recruitment.
8.2 Conclusions
The main conclusions covering the objectives and hypotheses are:
1. The occurrence of Boswellia papyrifera is restricted to the southwestern and southern
part of Eritrea. Here it is found in areas between 800 and 1850 m. a.s.l. with a mean
annual rainfall of 350 -700 mm and a DLGP of 45-100 days. There is more or less a
continuous belt with Boswellia woodlands in the moist lowland and part of the moist
highland agroecological zone and a small separate Boswellia area further north in the
arid highland zone. Boswellia has disappeared from the transition zone between the
moist lowland and arid highlands and this explains the isolated position of the population
in arid highland zone.
2. The future existence of the natural Boswellia woodlands is threatened for two reasons:
a decline in area as a result of land clearing for agriculture. Under the present
concession-based exploitation system farmers have no interest in keeping Boswellia
trees on their fields.
a lack of natural regeneration in the remaining Boswellia stands. The present systems
of intensive annual tapping throughout the dry season leads to low production of
mainly non viable seeds. Where viable seeds are produced seedlings and saplings
usually are destroyed by livestock.
3. Establishment of enclosures in which no tapping and grazing is allowed was found to be
an effective measure to reintroduce and promote natural regeneration in existing
Boswellia woodlands.
94
General discussion
8.3 Recommendations
Measures to counteract the decline and degradation of the Boswellia woodlands
As the land clearing problem and its underlying causes can not be solved in the near future
practical measures and research efforts should be directed towards solving the regeneration
problem. First of all the enclosure system should be examined on the following points:
How long should trees be left untapped before they have regained their full viable
seed producing capacity, and how long after tapping has been resumed will seed
production remain adequate for natural regeneration?
Is the retention of strategically situated untapped mother trees as permanent seed
sources for recruitment a feasible and effective alternative for a tapping ban on
complete Boswellia stands?
- How long does it take for new seedling classes to develop into trees with enough
branches above browsing height and a ban on grazing can be lifted?
Is a cut and carry grass harvesting system an alternative for a ban of grazing, can it be
implemented with minimal damage to recruitment and is it acceptable to farmers ?
Which additional measures have to be taken in the enclosures to reduce seedling
mortality during establishment?
If this research is conducted in the existing permanent observation plots at Adi-Ketina
and Atawen (Chapter 7) within a few years recommendations can be made for establishment
of better defined enclosure systems.
In the longer term, a comprehensive research effort should be made to arrive at a
sustainable tapping system. This requires trials with uniform trees in which the effects of
combinations of tapping intervals between- and within seasons, and the number of tapping
points per tree on gum yield and seed production are investigated. However, as long as the
tappers can not be forced to adhere to a less intensive-tapping regime, improved exploitation
systems cannot be implemented. A detailed outlook on the future of Boswellia papyrifera in
Eritrea with emphasis on domestication is given in Appendix 10.
Restoration of former Boswellia papyrifera areas
As a second priority attention should be paid to replanting of former Boswellia areas. The
basis for this research has already been laid in ongoing nursery- and establishment trials.
Long term monitoring of seedling growth and development after field planting is now
95
Chapter 8
needed. Before embarking on large-scale replanting, high gum-yielding mother trees have to
be identified (and multiplied) for seed supply.
Establishment of a Boswellia research and development unit
The above recommendations outline the research and development actions, which should be
taken to halt the disappearance and degradation of the Boswellia woodlands in Eritrea. Given
the urgency of the issue and the size of the proposed research programme, the establishment
of a special Boswellia research and development unit is strongly recommended.
96
References
Ahmed, T., 1982. The Swiss, Italian and Finish markets for Ethiopian gum oliban
programme for development. Market research report N° 5. The Helsinki School of
Economics.
Alder, D.T., and Synnott, T.J., 1992. Permanent sample plot technique for mixed tropical
forest. Tropical Forestry Papers N°. 25. Oxford Forestry Institute, Department of Plant
Sciences, University of Oxford. 124 pp.
Amnion, H.P.T., Safayhi, H., Mack, T., Sabieraj, J., and Samuelsson, G., 1993. Mechanism
of anti-inflammatory actions of curcumine and boswellic acids. Journal of
Ethnopharmacology 38(2-3): 113-119.
Anderson, D.M.W., Cree, G.M., Marshall, J.J., and Rahman, S., 1965. The oleoresin from
Boswellia papyrifera (Del.) Hochst. Carbohydrate Research 1 (4): 320-323).
Appleton, J.A., Bellmans, M.S., and Reynolds J.E., 1992. Observation on food security
nutrition and demands for fish. Department of Fish Resources and Inland Fisheries,
Asmara. 32 pp.
Araia, W., Omer, M.K., Haile, A., and Ogbazghi, W., 1994. Resource-base, food policies
and food security, the case of Eritrea. In: Mohamed-Salih, M.A., (editor): Inducing
food insecurity: perspectives on food policies in eastern and Southern Africa. Seminar
proceeding N°. 30. The Nordic African Institute. Uppsala, Sweden, pp. 84-103.
Archibold, O.W., 1995. Ecology of world vegetation. Chapman and Hall. 510 pp.
Asmara Chamber of Commerce, 1974. Industry, agriculture and handcrafts of Eritrea. Trade
and Development 12: 22-27.
Baldrati, I., 1946. Piante officinali dell'Africa orientale. Universita degli Studi di Firense
Centro di Studi Coloniali, 33, Firenze.
Barnes, B.V., Zak, D.R., Denton, S.R., and Spuur, S.H., 1998. Forest ecology. 4th edition.
John Wiley and Sons Inc. New York, Chichester, Weinheim, Brisbane, Singapore,
Toronto. 774 pp.
Barthelemy D., Sabatier, S., and Pascal, O., 1995. Le developpement architectural du noyer
noir, Juglans nigra L. (Juglandaceae). Recherche 115:61-68.
Barthelemy D., Sabatier, S. and Pascal, O., 1997. Le developpement architectural du noyer
noir, Juglans nigra L. (Juglandaceae). Recherche 73:40-48.
Begon, M., Harper, J.L., and Townsend, C.R., 1995. Ecology: individuals, populations, and
communities. 3rd edition. Blackwell Science, Oxford. 945 pp.
Bein, E., 1998. The effect of deforestation on climate change in Eritrea. A paper presented in
the initiation workshop on climate change issues organised by the Department of
Environment, September 3-4, 1998, Asmara. 8 pp.
97
References
Bein, E., Habte, B., Jaber, A., Birnie, A. and Tengas, B., 1996. Useful trees and shrubs in
Eritrea: identification propagation and management for agricultural and pastoral
communities. Technical Hand Book N° 12. Nairobi Regional Soil Conservation Unit,
Nairobi. 422 pp.
Bekele, A., Birnie, A. and Tengas, B., 1993. Useful trees and shrubs of Ethiopia,
identification, propagation, and management for agricultural and pastoral communities.
Technical Hand Book N° 5. Nairobi Regional Soil Conservation Unit, Nairobi. 474 pp.
Bekele, T., 1994. Vegetation ecology of remnant afromontane forest on the central plateau of
Shewa, Ethiopia. Acta Phytogeogr. Suec. 79: 3-64.
Bendz, M., 1990. Survival of planted tree seedlings an inventory in Wollo, Ethiopia, minor
fields study. Swedish University of Agricultural Sciences. 47 pp.
Benjamin, R.W., 1980. The use of forage in the Norte Chico region of Chile. In: Le
Houerou, HN (editor): Browse in Africa, the current state of knowledge. International
Livestock Centre for Africa, Addis Ababa, pp. 299-303.
Bongers, F. and Popma, J., 1988. Trees and gaps in Mexican tropical rain forest. Ph.D.
thesis, Utrecht University. 185 pp.
Bongers, F. and Sterck, F.J., 1998. Architecture and development of rain forest trees:
response to light variation. In: Newbery, D.M., Prins, H.H.T, and Brown, N.D.
(editors): The dynamics of tropical communities. The British ecological society.
Blackwell Science, pp. 125-162.
Bongers, F., Poorter, L., Van Rompaey, R.S.A.R. and Parren, M.P.E., 1999. Distribution of
twelve moist forest canopy tree species in Liberia and Cote d'lvoire: response curves
to climate gradient. Journal of Vegetation Science 10: 371-382.
Boudet, G.C., and Toutain, B., 1980. Integration of browse plants within pastoral and
agropastoral system in Africa. In: Le Houerou, H.N., 1980 (editor): Browse in Africa
the current state of knowledge. International Livestock Centre for Africa, pp. 427-431.
Brady, N.C., 1990., The nature and properties of soils (10th edition). Macmillan, New York.
618 pp.
Breitenbach Von, F., 1963. The indigenous trees of Ethiopia. 1st edition. Addis Ababa. 305
pp.
Breman, H., and Kessler, J.J., 1995. Woody plants in agroecosystems of semi-arid regions
with emphasis on the Sahelian countries. Springer-Verlag Berlin Heidelberg, New
York, London, Paris, Hong Kong, Budapest, Barcelona, Tokyo. 340 pp.
Broekhoven, G., 1996. Non-timber forest products: ecological and economic aspects of
exploitation in Colombia, Ecuador, and Bolivia. The World Conservation Union
(IUCN). Department of plant ecology and evolutionary Biology University of Utrecht.
125 pp.
98
References
Bruner, H., 1973. A Markove chain approach to prediction of diameter distribution in
uneven-aged forest stands. Can. J. For. Res. 3: 409-417.
Bullock, H.S., 2000. Development patterns of tree dimensions in a neo-tropical deciduous
forest. Biotropica 32 (l):42-52.
Clark, D.A., and Clark, D.B., 1992. Life history diversity of canopy an emergent trees in
neo-tropical rain forest. Ecological Monographs, 62: 315-344.
Cliffe, L., 1988. Food and agricultural production assessment study, an independent
evaluation of the food situation in Eritrea. Agriculture and Rural Development Studies.
University of Leeds. 288 pp.
Coleman, J.S., Mc-Connaughay, K.D.M., and Ackerly, D., 1994. Interpreting phenotypic
variation in plants. Trends in Ecology and Evolution 9: 187-191.
Condit, R. Sukumar, R., Hubbell, S.P., and Foster, R.B., 1998. Predicting population trends
from size distribution: a direct test in a tropical tree community. American naturalist
152 (4): 495-509.
Coomes, O.T., 1991. Rainforest extraction, agroforestry and biodiversity loss: an
environmental history from the northwestern Peruvian Amazon. Paper presented to the
16th International Congress of the Latin American Studies Association, Washington
D.C.
Crawford, R.M.M., 1990. Studies in plant survival: ecological case histories of plant
adaptation to adversity. Blackwell Scientific publication, Oxford, London, Edinburgh,
Boston Melbourne. 296 pp.
Crawley, M.J., 1983. Herbivory studies in ecology 10. University of California Press
Berkeley, California, USA. 437 pp.
Crawley, M.J., 1992. Seed predators and plant population dynamics. In: Fenner, M.,
(Editor): Seeds: the ecology of regeneration in plant communities, pp. 157-191.
Demissew, S., 1993. The Ethiopian herbs: their aromatic and medicinal uses. Selamta, 13
(3): 16-22.
Demissew, S., 1996. A description of some essential oil bearing plants in Ethiopia and their
indigenous uses. Journal of Essential Oils Research 5: 465-479.
Department of Environment, 1998. Terrestrial biodiversity. Ministry of Land Water and
Environment, Asmara. 93 pp.
Dominguez, C , and Gomez, A., 1990. The extractive economy in the Colombian Amazon
1850-1930. Tropenbos-Colombia and Corporacion, Santa Fe de Bogota, Colombia.
Drury, S.A., Kelley, S.P., and Berhe, S.M., 1994. Structure related to the Red Sea evolution
in northern Eritrea. Tectonic, 13 (6): 1371-1380.
Faniran, A. and Areola, O., 1978. Essentials of soil study with special reference to tropical
area. Heinemann, London. 150 pp.
FAO, 1994. Eritrea: Agricultural sector review and project identification 2, Rome.
99
References
FAO, 1997a. Agroecological zones map of Eritrea legend. Department of Land, Ministry of
Land Water and Environment. Project FAO/TCP/ERI/4554 (A) field document 2. 67
pp.
FAO, 1997b. Support to Forestry and Wildlife sub-sector, pre-investment study
TCP/ERI/6712 (F). FAO Investment Centre, Rome. 125 pp.
Fiori, A., 1912. Boschi e piante legnose dell'Eritrea. Istituto Agricolo Coloniale Italiano,
Firenze. 44 pp.
Floret, C. and Le Floc'h, E., 1980. Contribution of browse species to the pastoral value of
southern Tunisia steppes. In: Le Houreou, H.N., (editor): Browse in Africa, the current
state of knowledge. International Livestock centre for Africa, pp. 131-135.
Friis, I., 1992. Forest and forest trees in northeast tropical Africa: their natural habitats and
distribution patterns in Ethiopia, Djibouti, and Somalia. London: HMSO. 396 pp.
Gebremedhin, T., and Negash, L., 1999. The effect of different seed treatments on the
germination of Boswellia papyrifera, a key dry land tree. Ethiopian Journal of Natural
Resources 1 (10): 37-55.
Gijsbers, H.J.M., Kessler, J. and Knevel, M.K., 1994. Dynamics and natural regeneration of
woody species in farmed parklands in the Sahel region, province of Passore, Burkina-
Fasso. Forest Ecology and Management 64: 1-12.
Gillet, H., 1968. Le peuplement vegetal du massif d'Ennedi (Tchad). C.R. Somm. Soc.
Biogeogr. 44:383-388.
Gillet, H., 1980. Observation on the causes of devastation of ligneous plants in Sahel and
their resistance to destruction. In: Le Houerou, H.N., (editor): Browse in Africa the
current state of knowledge. International Livestock Centre For Africa, Addis Ababa.
pp. 127-137.
Government of Eritrea, 1994. Proclamations of the State of Eritrea, N° 58/1994: on changes
on land holding and uses procedures. Government of the State of Eritrea, Asmara. 20
pp.
Grouzis, M., and Sicot, M., 1980. A method for the phenological study of browse
populations in the Sahel, the influence of some ecological factors. In: Le Houerou,
H.N., (editor): Browse in Africa the current state of knowledge. International
Livestock Centre for Africa, Addis Ababa, pp. 233-238.
Habtetson, S., 1997. Energy development and environmental sustainability. Eritrea Profile of
1/2/1997.
Haggag, Y., 1961. A Contribution to the physiography of northern Ethiopia. University of
London. 120 pp.
Haile, A., Araia, W., Omer, M.K., Ogbazghi, W. and Tewolde, M., 1995. Diagnostic
farming systems survey in southwestern Hamassien, Eritrea. Bulletin N°. 1/95,
University of Asmara. 85 pp.
100
References
Haile, A., Gebretatios, I., Ogbazghi, W., Omer, M.K., Araia, W., Gebremariam, T. and
Ogbay, T., 1996. Rehabilitation of degraded lands in Eritrea. 1st edition. University of
Asmara. Asmara. 60 p.
Haile, A., Gebretatios, I., Ogbazghi, W., Omer, M.K., Araia, W., Gebremariam, T. and
Gebreselassie, G., 1998. Rehabilitation of degraded lands in Eritrea. 2nd edition.
University of Asmara. Asmara. 135 pp.
Hall, P., and Bawa, K., 1993. Methods to assess the impact of extraction of non-timber
tropical forest products on plant populations. Economic Botany 47: 234-247.
Halle, F., Oldeman, R.A.A., and Tomlinson, P.B., 1978. Tropical trees and forest, an
architectural analysis. Springier-Verlag, Berlin Heidelberg, New York. 441 pp.
Hardin, G., 1968. The tragedy of commons. Science 162:1243-1248.
Harper, J.L., 1977. Population biology of plants. Academic Press, London, New York,
Toronto, Sydney, San Francisco. 892 pp.
Hartmann, H.T., Kester, D.E., and Davis, F.T., 1990. Plant propagation: principles and
practices. 5" edition. Prentice-Hall, Englewood Cliffs, New Jersey. 270 pp.
Heywood, V.H., Moore, D.M., Richardson, I.B.K., and Stearn, W.T., 1993. The flowering
plants of the world. 2n edition. BT Batsford Ltd. London. 335 pp.
Hien, G.F., 1995. La Regeneration de l'espace sylvo-pastoral au Sahel, Une etude de l'effet
de mesures de conservation des eaux et des sols au Burkina Fasso. Tropical Resource
Management Papers 7. Wageningen. 240 pp.
Hillis, W.E., 1987. Hard wood and tree exudes. Springer-Verlag, Berlin, Heidelberg, New
York, Paris, Tokyo, pp. 46-51.
Hillis, W.E., 1989. Historical uses of extractives and exudates. In: Rowe, J.W., (editor):
Natural products of woody plants. Springer-Verlag, Berlin, Heidelberg, New York,
Paris, Tokyo, pp. 1-13.
Horn, H.S., 1971. The adaptive geometry of trees. Princeton University Press, Princeton,
New Jersey. 144 pp.
Howes, F.N., 1950. Age-old resin of the Mediterranean region and their uses. Economic
Botany 4:1307-1316.
Hubbell, S.P., and Foster, R.B., 1986. Commonness and rarity in the neotropical forest:
implications for tropical tree conservation. In: Soule, M., (editor): Conservation
biology: the science of scarcity and diversity. Sinauer Sunderland, MA. pp. 205-231.
Huisman, J., Olff, H., and Fresco, L.F.M., 1993. A hierarchical set of models for species
response analysis. Journal of Vegetation Science 4: 37-46.
Hulme, P.E., 1996. Herbivory, plant regeneration and species coexistence. Journal of
Ecology 84:609-616.
James, C.L., 1968. Report to the government of Sudan. A forest resources survey program.
FAON°TA2515. 15 pp.
101
References
Jones, S., 1989. The influence of stratification, scarification and hot water and maternal plant
on germination of Juniperus excelsa seeds from Eritrea. The International Tree Crop
Journal 5: 221-235.
Jones, S., 1991. Restoration of Juniperus exelsa and Olea africana in Rora Habab woodland
of Eritrea. PhD. thesis, University of Stirlings, UK. 304 pp.
Jordan, G., 1989. Peasant and nationalism in Eritrea. Red Sea Press, Trenton, New Jersey
150 pp.
Keay, R.W.J., 1959. Vegetation map of Africa south of the tropic of cancer. A.E.T.F.A.T.,
and UNESCO. Oxford University Press. 23 pp.
Keay, R.W.J., 1989. Trees of Nigeria. Oxford, Clarendon Press. 476 pp.
Kebreab, G., 1996. People on the edge of the horn. Red Sea Press, New Jersey. 166 pp.
Kimmins, J.P., 1996. Forest ecology. 2nd edition. Prentice Hall, upper saddle river, New
Jersey. 596 pp.
King, D.A., 1996. Allometry and life history of tropical trees. Journal of Tropical Ecology
12: 25-44.
Kramer P. J., and Kozlowski, T.T., 1979. The physiology of woody plants. Academic Press.
Inc. Orlando, San Diego, New York, Austin, Boston, London, Sydney, Tokyo,
Toronto. 811 pp.
Krebs, C.J., 1994. Ecology: the experimental analysis of distribution and abundance. Harper
Collins, College Publishers, New York. 801 pp.
Kuchar, P., 1995. Characterising and identifying Burseraceae {Boswellia and Commiphora)
in southeast Ethiopia. Southeast range lands project, Technical Report. 58 pp.
Kumar, R., and Pandey, O.N., 1993. Population structure of protected and disturbed forest
communities. Journal of Tropical Forestry 9 (1): 21-26.
Lamprecht, H., 1989. Silviculture in the tropics, GTZ, Eschborn. 296 pp.
Landon, J.R., 1991. Booker tropical soil manual: A handbook for soil survey and agricultural
land evaluation in the tropics and sub-topics. Longman Booker Tate. 459 pp.
Larcher, W., 1995. Physiological plant ecology: ecophysiology and stress physiology of
functional groups. (3rd edition). Springer-Verlag Berlin. 506 pp.
Le Houerou, H.N., 1980. The role of browse in the Sahelian and Sudanian zones. In: Le
Houerou, H.N., (editor): Browse in Africa, the current state of knowledge.
International Livestock Centre For Africa, pp. 83-109.
Longridge, S.H., 1974. A short history of Eritrea. Westport Connecticut: Greenwood press.
140 pp.
Martin, G.J., 1995. Ethnobotany: a people and plants' conservation manual. Chapman and
Hall. 268 pp.
Maskey, R.B., 1985. Soils their fertility and management in Eritrea. University of Asmara.
34 pp.
102
References
Maugini, A., 1932. L'economia Eritrea nel cinquantenno dell'occupazione d'Assab (1882-
1932). Istituto Agricola Coloniale Italiano Firenze. pp. 30-40.
Menaut, J.C., Lepage, M., and Abbadie, L., 1996. Savannas, woodlands and dry forests in
Africa. In: Bullock, S.H., Mooney, H. A. and Medina, E., (Editors): Seasonally dry
tropical forests. Cambridge University Press, pp. 64-88.
Menghisteab, K., 1992. Rehabilitation of degraded lands in Eritrea's agricultural policy, an
explanatory study. In: Gebrehiwot, T., (editor): Eritrea: challenges of economic
development. Proceedings of conference, Asmara July 22-24, 1991. pp. 110-117.
Mesghina, T., and Ghebru, B., 1997. Analytical review of the National Research System
(NARS) in Eritrea. Ministry of Agriculture Asmara. 40 pp.
Mesghina, Y., 1988. Italian colonialism: the case study of Eritrea (1869-1934) motive, praxis
and result. Lund, Sweden. 256 pp.
Michele, M.N.D., 1993. La culture in vitro a Jijbouti un outil de la lutte contre la
desertification. Rivista di-Agricoltura Sub-Tropicale-e-Tropicaopicale 87 (1): 85-96.
Miles, J., French, D.D., Zhen-Bang, X. and Ling-Zhi, C , 1985. Transition matrix models of
succession in a stand of mixed broad-leaved Pinus koraiensis, northeast China. Journal
of Environmental Management 20: 357-375.
Ministry of Agriculture, 1994. Evaluation of existing forestry activities and
recommendations for action. Asmara, Eritrea. 70 pp.
Ministry of Agriculture 1999. Frankincense production. Ministry of Agriculture of Eritrea
(archive document).
Mohr, P. A., 1961. The geology of Ethiopia. Ethiopia Observer 5 (3): 186-193.
Mohr, P. A., 1970. The geology of Ethiopia. Addis Ababa press, Addis Ababa. 268 pp.
Mohr, P.A., 1987. Structural style of continental rifting in Ethiopia: Reverse decollements.
Eos 68 (35) 721, 729-730.
Mueller-Dombois, D., and Ellenberg, H., 1974. Aims and methods of vegetation ecology.
John Wiley and Sons, New York, London, Sydney, Toronto. 547 pp.
Mueller-Eckhardt, H., 1967. Final report to the Government of Sudan on wood-based
materials. FAO report N° TA 2402 and UNDP, FAO, Rome. 16 pp.
Murphy, H. F., 1968. A report on the fertility status and other data on some soils of Ethiopia.
College of Agriculture, Haileselassie I University Experimental Station Bulletin N° 44.
Dire Dawa. 551 pp.
Nadel, S.F., 1946. Land tenure on the Eritrean plateau. Africa 16: 1-12.
Namdeo, R.K., Prasad, R., and Chaubey, O.P., 1989. Impact of grazing-closure on some
ecological aspects of Sal (Shore robusta roxb.) natural forest with special reference to
its natural regeneration in Madhya Pradesh. Journal of Tropical Forest 5 (2): 82-85.
Negri, G., 1948. Piante officinali deH'Africa orientale. Universita Studi di Firenze Centro di
Studi Coloniale Firenze. 32 pp.
103
References
NEMP-E., 1995. National Environmental Management Plan for Eritrea. Government of
Eritrea. 219 pp.
Ng, F.S.P., 1978. Strategies of establishment in Malaysian forest trees. In: Tomlinson, P.B.
and Zimmermann, M.H., (editors): Tropical trees as living systems. Cambridge
University Press, pp. 129-162.
Niklas, K. J., 1994. Plant allometry: the scaling of form and process. The University of
Chicago Press, Chicago. 395 pp.
Peeters, E.T.H.M., and Gardeniers, J.J.P., 1998. Logistic regression as a tool for defining
habitat requirement of two common gammarids. Fresh Water Biology 39: 605-615.
Peters, CM., 1996. The ecology and management of non-timber forest resources. World
Bank technical paper N° 322. Washington DC. 157 pp.
Philip, M.S., 1994. Measuring trees and forests. Wallingford: CAB International. 310 pp.
Pichi-Sermolli, R.E.G., 1957. Una carta geobotanica deH'Africa orientale (Eritrea, Ethiopia,
Somalia). Webbia 13: 15-132.
Pilarski, M., 1994. A synopsis of some restoration forestry practices and principles. In:
Pilarski, M., (editor): Restoration forestry an international guide to sustainable forestry
practices. Kivaki press, Durango, Colorado, pp. 32-38.
Poorter L., Bongers, F., Van Rompaey, R.S.A.R. and De Klerk, M., 1996. Regeneration of
canopy tree species at five sites in west African moist forest. Forest Ecology and
Management 84: 61-69.
Premakumari, D., Panikkar, A.O.N., Sethuraj, M.R, and Marattukalam, J.G., 1997.
Associations of structural traits, yield, girth and occurrence of tapping panel dryness in
Hevea Arasiliensis. Indian Journal of Natural Rubber-Research 10: (1-2): 27-33.
Richards, P.W., 1996. The tropical rain forest. Cambridge University Press. 575 pp.
Ros-Tonen, M., Dijkman, W. and Lammert Van Bueren, E., 1995. Commercial, and
sustainable extraction of non-timber forest products, towards policy and management
oriented research strategy. The Tropenbos foundation, Wageningen. 32 pp.
Shahar-Ben, R., 1991. Abundance of tree and grassland in a woodland savanna in relation to
environmental factors. Journal of Vegetation Science 2: 345-350.
Simmonds, R.W., 1989. Rubber Breeding. In: Webster, C.C., and Baulkwill, W.J., (editors):
Rubber. Tropical Agriculture Series, Longman, Singapore pp. 85-124.
Smith, D.M., Larson, B.C., Kelty, M.J. and Ashton, P.M.S., 1997. The practice of
silviculture: applied forest ecology. 9th edition. John Wiley and Sons Inc. New York,
Chichester, Brisbane, Toronto, Singapore, Weinhem. 537 pp.
Sterck, F.J., and Bongers, F., 1998. Ontogenetic changes in size, allometry, and mechanical
designs of tropical rain forest trees. American Journal of Botany 85 (2): 267-272.
Stiles, D., 1988. Arid land plants for economic development and desertification control.
Desertification Control Bulletin 17:18-21.
104
References
Swaine, M.D., 1996. Rainfall and soil fertility as factors limiting forest species distribution
in Ghana. Journal of Ecology 84:419-428.
Swaine, M.D., 1997. Ecology of forest trees in Ghana. The Overseas Development
Administration (ODA) Forest Service No 7. 57 pp.
Swaine, M.D., and Lieberman, D., 1987. The dynamics of tree populations in tropical forest.
Journal of Tropical Ecology 3 (4): 289-369.
Tedla, A., 1964. Facts about Eritrea. 45 pp.
Teketay, D., 1996. Seed ecology and regeneration in dry afromontane forest of Ethiopia.
Ph.D thesis. Swedish University of Agricultural Sciences Umea. 187 pp.
Ter Braak, C.J.F., and Gremmen, N.J.M., 1987. Ecological amplitude of plant species and
the internal consistency of Ellensburg's indicator values for moisture. Vegetatio 65: 3-
11.
Ter Braak, C.J.F., and Looman, C.W.N., 1986. Weighted average, logistic regression and the
Gaussian response model. Vegetatio 65: 3-11.
Thomas, S.C., 1996. Asymptotic height as a predictor of growth and allometric
characteristics in Malaysian rain forest trees. American Journal of Botany 83 (5): 556-
566.
Thulin, M., 1983. Leguminosae of Ethiopia. Council of Nordic Publication in Botany,
Stockholm. 223 pp.
Tohru, N., 1991. Population dynamics of coniferous and broad-leaved trees in a Japan
temperate mixed forest. Journal of Vegetation Science 2: 413-418.
Trevaskis, G.K.N., 1975. Eritrea: a colony in transition (1941-1952). Westport, Connecticut:
Greenwood press. 110 pp.
Van der Hammen, T.D., Mueller-Dombois, D., and Little, M.A., 1989. Manual of methods
for mountain transect studies. International Union of Biological Sciences. 69 pp.
Veenendaal, E.M., and Swaine, M.D., 1996. Limits to tree species distribution in lowland
tropical rainforest. In: Newbery, D.M., Prins, H.H.T., and Brown, N.D., (editors): The
dynamics of tropical communities. Blackwell Science, pp. 163-191.
Veenendaal, E.M., Swaine, M.D., Blay, M., Yelifari, N.B., and Mullins, C.E., 1996.
Seasonal and long-term soil water regime in west African tropical forest. Journal of
Vegetation Science 7: 473-482.
Vetaas, O.R., 1993. Spatial and temporal vegetation changes along moisture gradient in
northern Sudan. Biotropica25 (2):164-175.
Vollesen, K., 1989. Burseraceae. In: Hedberg, I., and Edwards, S., (editors): Flora of
Ethiopia, Volume 3. Addis Ababa University, Asmara University and the Department
of Systematic Botany, Uppsala University, Sweden, pp. 442-447
Walsh, R.P.D., 1996. Climate. In: Richards, P.W., (editor): The tropical rain forest. 2nd
edition). Cambridge University Press, pp. 159-189.
105
References
Weiner, J., and Thomas, S.C., 1992. Competition and allometry in three species of annual
plants. Ecology 73 (2): 651-656.
Weiss, E., 1987. Guide to plants tolerant to arid and semi-arid conditions: nomenclature and
potential uses. Ministry of Agriculture and German Agricultural Team, Nairobi. 540
pp.
White, F., 1983. The Vegetation of Africa a descriptive memoir to accompany the
UNESCO/AETFAT/UNSO vegetation map of Africa. UNESCO, Paris, pp. 356
Wickens, G.E., 1977. The flora of Jebel Marra, Sudan republic, and geographical affinities.
Kew Bull. Add. Ser. 5, 1-368 pp.
Woldu, Z., Feolie, E. and Nigatu, L., 1989. Partitioning an elevation gradient of vegetation
from southern Ethiopia by probabilistic method. Vegetatio 81: 189-198.
Workineh, D., 1987. Some aspects of meteorological drought in Ethiopia. In: M.H. Glantz
(editor): Drought and hunger in Africa. Cambridge University Press, Cambridge, pp.
23-36.
World Bank, 1994. Eritrea options and strategies for growth Vol. I-II. Report N° 12930-ER.
Washington D.C. pp. 59-87.
Zekarias, A., 1966. Land tenure in Eritrea. Addis Ababa printing press. 66 pp.
106
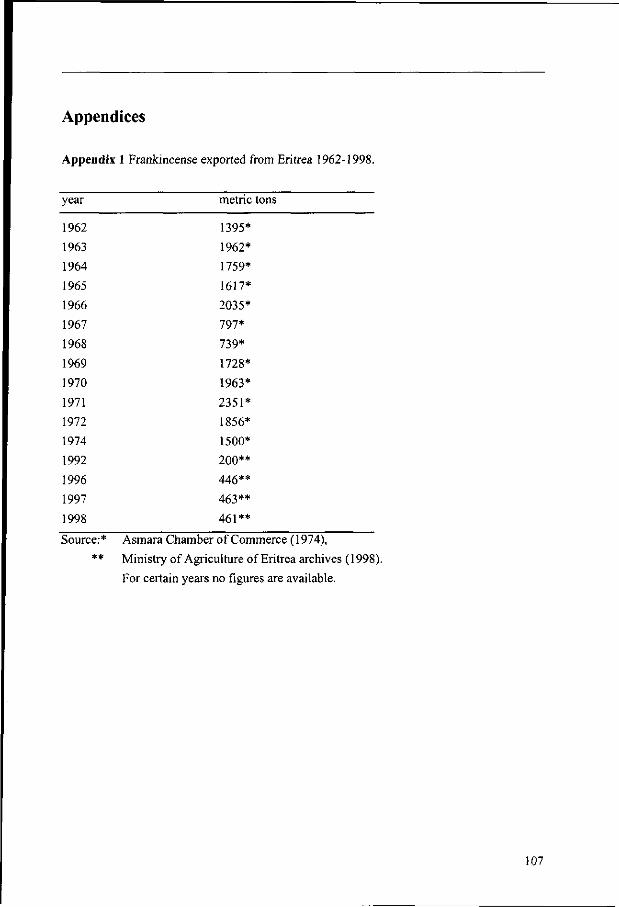
Appendices
Appendix 1 Frankincense exported from Eritrea 1962-1998.
year metric tons
1962 1395*
1963 1962*
1964 1759*
1965 1617*
1966 2035*
1967 797*
1968 739*
1969 1728*
1970 1963*
1971 2351*
1972 1856*
1974 1500*
1992 200**
1996 446**
1997 463**
1998 461**
Source:* Asmara Chamber of Commerce (1974),
** Ministry of Agriculture of Eritrea archives (1998).
For certain years no figures are available.
107
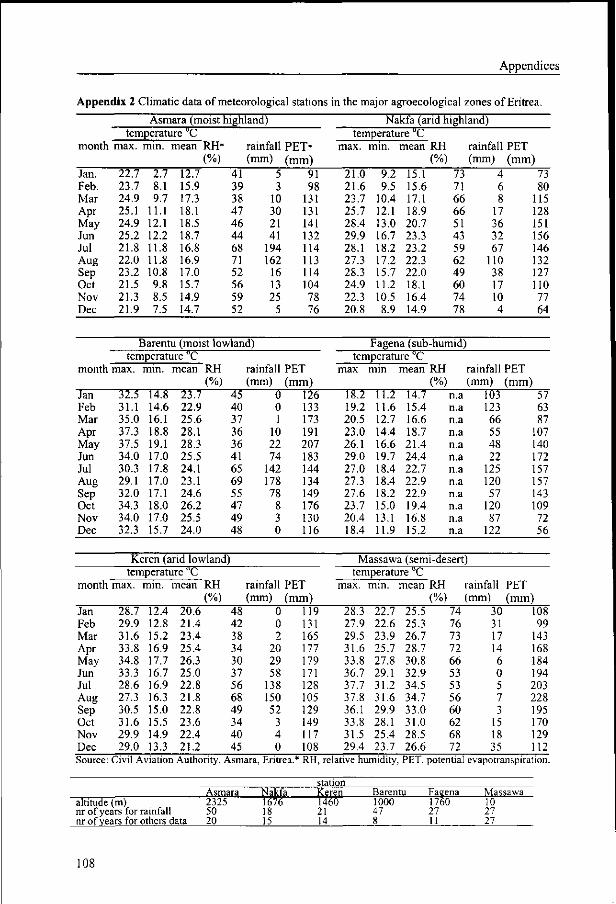
Appendices
Appendix 2 Climatic data of meteorological
month
Jan. Feb. Mar Apr May Jun Jul Aug Sep Oct Nov Dec
Asmara (moist highland) temperature "C
max. min. mean
22.7 23.7 24.9 25.1 24.9 25.2 21.8 22.0 23.2 21.5 21.3 21.9
2.7 8.1 9.7
11.1 12.1 12.2 11.8 11.8 10.8 9.8 8.5 7.5
12.7 15.9 17.3 18.1 18.5 18.7 16.8 16.9 17.0 15.7 14.9 14.7
RH*
(%)
stations
rainfall PET» (mm) (mm)
41 39 38 47 46 44 68 71 52 56 59 52
5 3
10 30 21 41
194 162
16 13 25
5
91 98
131 131 141 132 114 113 114 104 78 76
in the major agroecolo gical zones of Eritrea.
Nakfa (arid highland) temperature "C
max. min. mean RH
21.0 21.6 23.7 25.7 28.4 29.9 28.1 27.3 28.3 24.9 22.3 20.8
9.2 9.5
10.4 12.1 13.0 16.7 18.2 17.2 15.7 11.2 10.5 8.9
(° 15.1 15.6 17.1 18.9 20.7 23.3 23.2 22.3 22.0 18.1 16.4 14.9
/o)
73 71 66 66 51 43 59 62 49 60 74 78
-ainfall PET jnm) (mm)
4 6 8
17 36 32 67
110 38 17 10 4
73 80
115 128 151 156 146 132 127 110 77 64
month
Jan Feb Mar Apr May Jun Jul Aug Sep Oct Nov Dec
Barentu (moist lowland) temperature "C
max. min. mean
32.5 31.1 35.0 37.3 37.5 34.0 30.3 29.1 32.0 34.3 34.0 32.3
14.8 14.6 16.1 18.8 19.1 17.0 17.8 17.0 17.1 18.0 17.0 15.7
23.7 22.9 25.6 28.1 28.3 25.5 24.1 23.1 24.6 26.2 25.5 24.0
RH
(%) rainfall PET (mm) (mm)
45 40 37 36 36 41 65 69 55 47 49 48
0 0 1
10 22 74
142 178 78
8 3 0
126 133 173 191 207 183 144 134 149 176 130 116
Fagena (sub-humid) temperature "C
max min mean RH rainfall PET
18.2 19.2 20.5 23.0 26.1 29.0 27.0 27.3 27.6 23.7 20.4 18.4
11.2 11.6 12.7 14.4 16.6 19.7 18.4 18.4 18.2 15.0 13.1 11.9
V 14.7 15.4 16.6 18.7 21.4 24.4 22.7 22.9 22.9 19.4 16.8 15.2
'•) ( n.a n.a n.a n.a n.a n.a n.a n.a n.a n.a n.a n.a
mm) (mrr 103 123 66 55 48 22
125 120 57
120 87
122
0 57 63 87
107 140 172 157 157 143 109 72 56
month
Jan Feb Mar Apr May Jun Jul Aug Sep Oct Nov Dec Source:
Keren (arid lowland) temperature UC
max. min. mean
28.7 29.9 31.6 33.8 34.8 33.3 28.6 27.3 30.5 31.6 29.9 29.0
12.4 12.8 15.2 16.9 17.7 16.7 16.9 16.3 15.0 15.5 14.9 13.3
20.6 21.4 23.4 25.4 26.3 25.0 22.8 21.8 22.8 23.6 22.4 21.2
RH
(%)
Civil Aviation Authority,
altitude (m) nr of years for rainfall nr of years for others data
rainfall PET (mm) (mm)
48 42 38 34 30 37 56 68 49 34 40 45
Asmara
Asmara 232. 50 20
0 0 2
20 29 58
138 150 52
3 4 0
Eritrea
Nakfa 1676 18 15
119 131 165 177 179 171 128 105 129 149 117 108
Massawa (semi- desert) temperature °C
max. min. mean RH rainfall PET
28.3 27.9 29.5 31.6 33.8 36.7 37.7 37.8 36.1 33.8 31.5 29.4
22.7 22.6 23.9 25.7 27.8 29.1 31.2 31.6 29.9 28.1 25.4 23.7
* RH, relative humidity,
station Keren 1460 21 14
(°' 25.5 25.3 26.7 28.7 30.8 32.9 34.5 34.7 33.0 31.0 28.5 26.6
'•) ( 74 76 73 72 66 53 53 56 60 62 68 72
nm) (mm) 30 31 17 14 6 0 5 7 3
15 18 35
108 99
143 168 184 194 203 228 195 170 129 112
PET, potential evapotranspiration.
Barentu Fagena 1000 47 8
1760 27 11
Massawa 10 27 27
108
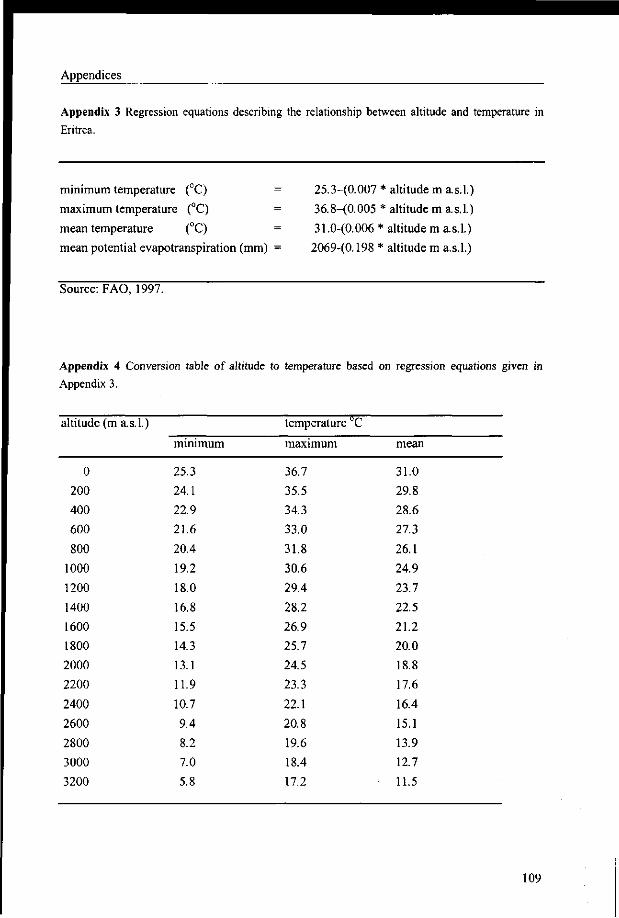
Appendices
Appendix 3 Regression equations describing the relationship between altitude and temperature in
Eritrea.
minimum temperature (CC)
maximum temperature (°C)
mean temperature (°C)
mean potential evapotranspiration (mm)
25.3^(0.007 * altitude m a.s.1.)
36.8-(0.005 * altitude m a.s.1.)
31.0-(0.006 * altitude ma.s.1.)
2069-(0.198 * altitude m a.s.1.)
Source: FAO, 1997.
Appendix 4 Conversion table of altitude to temperature based on regression equations given in
Appendix 3.
altitude (m as
0
200
400
600
800
1000
1200
1400
1600
1800
2000
2200
2400
2600
2800
3000
3200
1.) minimum
25.3
24.1
22.9
21.6
20.4
19.2
18.0
16.8
15.5
14.3
13.1
11.9
10.7
9.4
8.2
7.0
5.8
temperature °C
maximum
36.7
35.5
34.3
33.0
31.8
30.6
29.4
28.2
26.9
25.7
24.5
23.3
22.1
20.8
19.6
18.4
17.2
mean
31.0
29.8
28.6
27.3
26.1
24.9
23.7
22.5
21.2
20.0
18.8
17.6
16.4
15.1
13.9
12.7
11.5
109
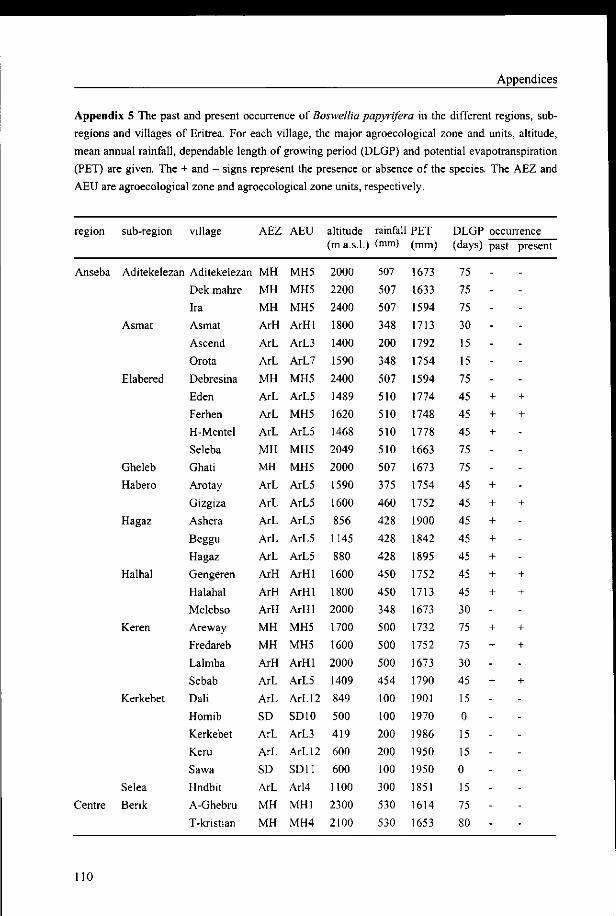
Appendices
Appendix 5 The past and present occurrence of Boswellia papyrifera in the different regions, sub-
regions and villages of Eritrea. For each village, the major agroecological zone and units, altitude,
mean annual rainfall, dependable length of growing period (DLGP) and potential evapotranspiration
(PET) are given. The + and - signs represent the presence or absence of the species. The AEZ and
AEU are agroecological zone and agroecological zone units, respectively.
region sub-region village
Anseba Aditekelezan Aditekelezan
Asmat
Elabered
Gheleb
Habero
Hagaz
Halhal
Keren
Kerkebet
Selea
Centre Berik
Dek mahre
Ira
Asmat
Ascend
Orota
Debresina
Eden
Ferhen
H-Mentel
Seleba
Ghati
Arotay
Gizgiza
Ashera
Beggu
Hagaz
Gengeren
Halahal
Melebso
Areway
Fredareb
Lalmba
Sebab
Dali
Homib
Kerkebet
Keru
Sawa
Hndbit
A-Ghebru
T-kristian
AEZ
MH
MH
MH
ArH
ArL
ArL
MH
ArL
ArL
ArL
MH
MH
ArL
ArL
ArL
ArL
ArL
ArH
ArH
ArH
MH
MH
ArH
ArL
ArL
SD
ArL
ArL
SD
ArL
MH
MH
AEU
MH5
MH5
MH5
ArHl
ArL3
ArL7
MH5
ArL5
MH5
ArL5
MH5
MH5
ArL5
ArL5
ArL5
ArL5
ArL5
ArHl
ArHl
ArHl
MH5
MH5
ArHl
ArL5
ArL 12
SD10
ArL3
ArL 12
SD11
Arl4
MH1
MH4
altitude (m a.s.l.)
2000
2200
2400
1800
1400
1590
2400
1489
1620
1468
2049
2000
1590
1600
856
1145
880
1600
1800
2000
1700
1600
2000
1409
849
500
419
600
600
1100
2300
2100
rainfall PET (mm)
507
507
507
348
200
348
507
510
510
510
510
507
375
460
428
428
428
450
450
348
500
500
500
454
100
100
200
200
100
300
530
530
(mm)
1673
1633
1594
1713
1792
1754
1594
1774
1748
1778
1663
1673
1754
1752
1900
1842
1895
1752
1713
1673
1732
1752
1673
1790
1901
1970
1986
1950
1950
1851
1614
1653
DLGP (days)
75
75
75
30
15
15
75
45
45
45
75
75
45
45
45
45
45
45
45
30
75
75
30
45
15
0
15
15
0
15
75
80
occurrence past
-------+
+
+
--+
+
+
+
+
+
+
-+
+
-+
--------
present
-------+
+
----+
---+
+
-+
+
-+
--------
110
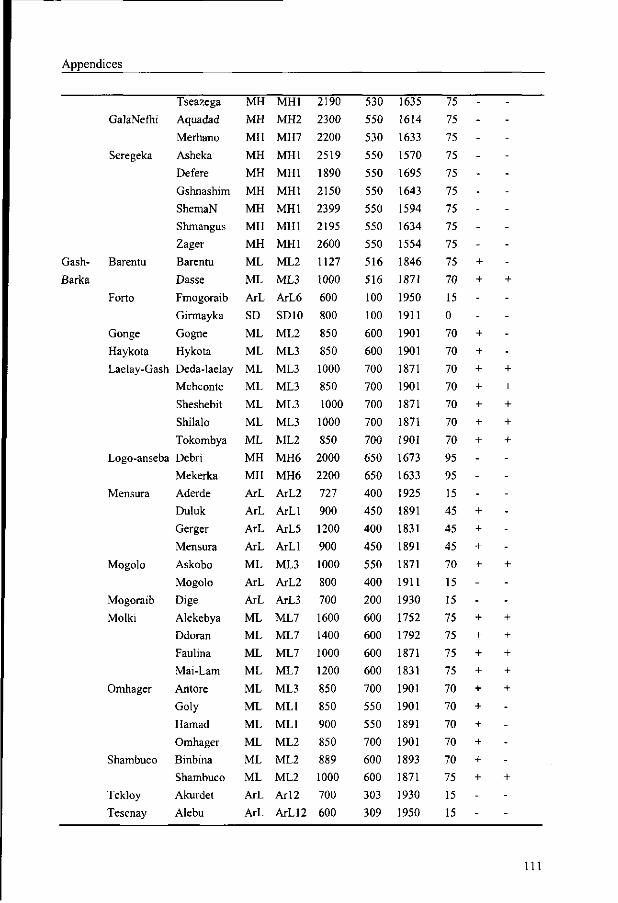
Appendices
GalaNefhi
Seregeka
Gash- Barentu
Barka
Forto
Gonge
Haykota
Laelay-Gash
Tseazega
Aquadad
Merhano
Asheka
Defere
Gshnashim
ShemaN
Shmangus
Zager
Barentu
Dasse
Fmogoraib
Girmayka
Gogne
Hykota
Deda-laelay
Mchconte
Sheshebit
Shilalo
Tokombya
Logo-anseba Debri
Mensura
Mogolo
Mogoraib
Molki
Omhager
Shambuco
Tekloy
Tesenay
Mekerka
Aderde
Duluk
Gerger
Mensura
Askobo
Mogolo
Dige
Alekebya
Ddoran
Faulina
Mai-Lam
Antore
Goly
Hamad
Omhager
Binbina
Shambuco
Akurdet
Alebu
MH
MH
MH
MH
MH
MH
MH
MH
MH
ML
ML
ArL
SD
ML
ML
ML
ML
ML
ML
ML
MH
MH
ArL
ArL
ArL
ArL
ML
ArL
ArL
ML
ML
ML
ML
ML
ML
ML
ML
ML
ML
ArL
ArL
MH1
MH2
MH7
MH1
MH1
MH1
MH1
MH1
MH1
ML2
ML3
ArL6
SD10
ML2
ML3
ML3
ML3
ML3
ML3
ML2
MH6
MH6
ArL2
ArLl
ArL5
ArLl
ML3
ArL2
ArL3
ML7
ML7
ML7
ML7
ML3
ML1
ML1
ML2
ML2
ML2
Arl2
ArL12
2190
2300
2200
2519
1890
2150
2399
2195
2600
1127
1000
600
800
850
850
1000
850
1000
1000
850
2000
2200
727
900
1200
900
1000
800
700
1600
1400
1000
1200
850
850
900
850
889
1000
700
600
530
550
530
550
550
550
550
550
550
516
516
100
100
600
600
700
700
700
700
700
650
650
400
450
400
450
550
400
200
600
600
600
600
700
550
550
700
600
600
303
309
1635
1614
1633
1570
1695
1643
1594
1634
1554
1846
1871
1950
1911
1901
1901
1871
1901
1871
1871
1901
1673
1633
1925
1891
1831
1891
1871
1911
1930
1752
1792
1871
1831
1901
1901
1891
1901
1893
1871
1930
1950
75
75
75
75
75
75
75
75
75
75
70
15
0
70
70
70
70
70
70
70
95
95
15
45
45
45
70
15
15
75
75
75
75
70
70
70
70
70
75
15
15
---------+
+
--+
+
+
+
+
+
+
---+
+
+
+
--+
+
+
+
+
+
+
+
+
+
--
----------+
----+
+
+
+
+
------+
--+
+
+
+
+
----+
--
I l l
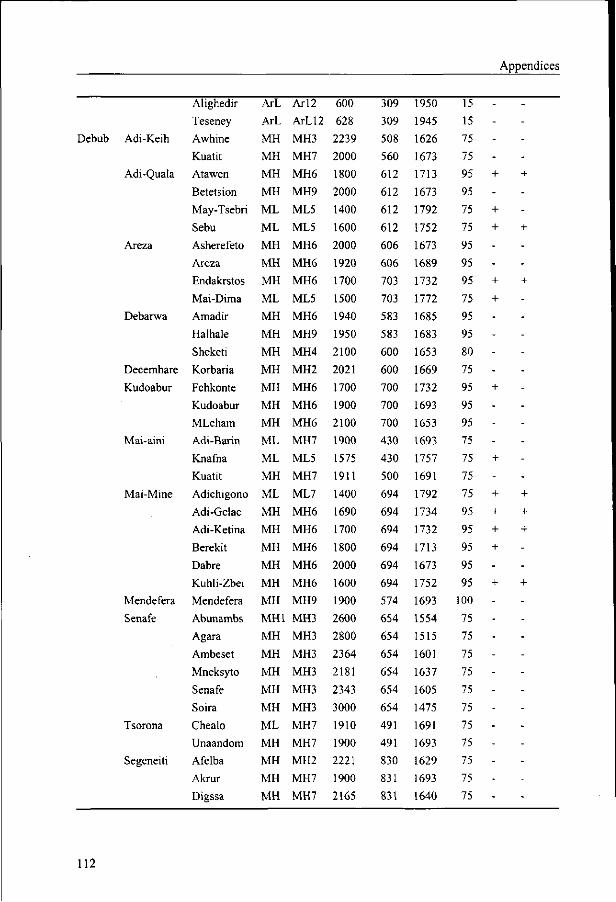
Appendices
Debub Adi-Keih
Adi-Quala
Areza
Debarwa
Decemhare
Kudoabur
Mai-aini
Mai-Mine
Mendefera
Senafe
Tsorona
Segeneiti
Alighedir
Teseney
Awhine
Kuatit
Atawen
Betetsion
May-Tsebri
Sebu
Asherefeto
Areza
Endakrstos
Mai-Dima
Amadir
Halhale
Sheketi
Korbaria
Fchkonte
Kudoabur
MLeham
Adi-Barin
Knafna
Kuatit
Adichigono
Adi-Gelae
Adi-Ketina
Berekit
Dabre
Kuhli-Zbei
Mendefera
Abunambs
Agara
Ambeset
Mneksyto
Senafe
Soira
Chealo
Unaandom
Afelba
Akrur
Digssa
ArL
ArL
MH
MH
MH
MH
ML
ML
MH
MH
MH
ML
MH
MH
MH
MH
MH
MH
MH
ML
ML
MH
ML
MH
MH
MH
MH
MH
MH
MH1
MH
MH
MH
MH
MH
ML
MH
MH
MH
MH
Arl2
ArL 12
MH3
MH7
MH6
MH9
ML5
ML5
MH6
MH6
MH6
ML5
MH6
MH9
MH4
MH2
MH6
MH6
MH6
MH7
ML5
MH7
ML7
MH6
MH6
MH6
MH6
MH6
MH9
MH3
MH3
MH3
MH3
MH3
MH3
MH7
MH7
MH2
MH7
MH7
600
628
2239
2000
1800
2000
1400
1600
2000
1920
1700
1500
1940
1950
2100
2021
1700
1900
2100
1900
1575
1911
1400
1690
1700
1800
2000
1600
1900
2600
2800
2364
2181
2343
3000
1910
1900
2221
1900
2165
309
309
508
560
612
612
612
612
606
606
703
703
583
583
600
600
700
700
700
430
430
500
694
694
694
694
694
694
574
654
654
654
654
654
654
491
491
830
831
831
1950
1945
1626
1673
1713
1673
1792
1752
1673
1689
1732
1772
1685
1683
1653
1669
1732
1693
1653
1693
1757
1691
1792
1734
1732
1713
1673
1752
1693
1554
1515
1601
1637
1605
1475
1691
1693
1629
1693
1640
15
15
75
75
95
95
75
75
95
95
95
75
95
95
80
75
95
95
95
75
75
75
75
95
95
95
95
95
100
75
75
75
75
75
75
75
75
75
75
75
----+ +
-+
+ +
--+ +
+
----+
---+
-+ +
+ +
+ +
+
-+ +
------------
112
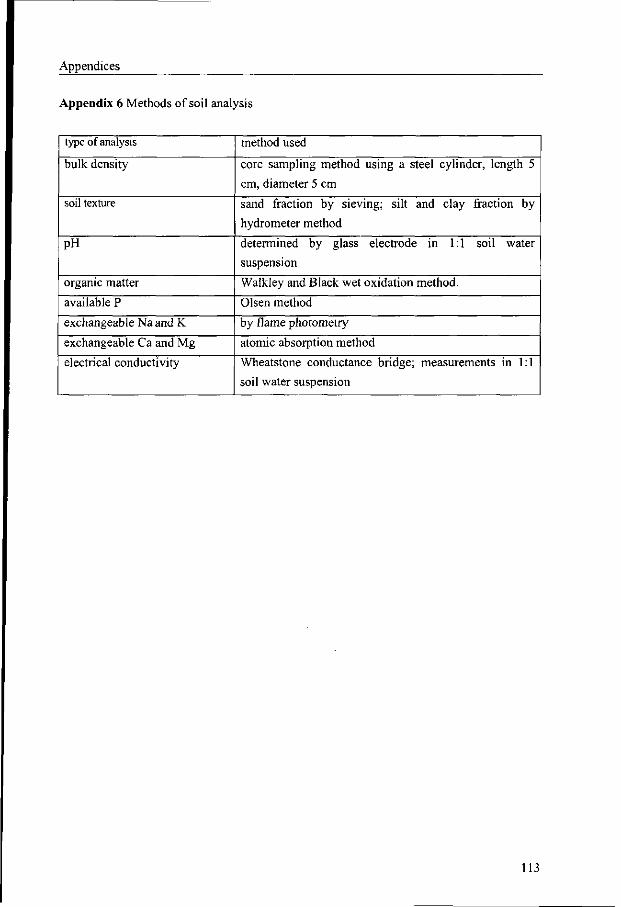
Appendices
Appendix 6 Methods of soil analysis
type of analysis
bulk density
soil texture
pH
organic matter
available P
exchangeable Na and K
exchangeable Ca and Mg
electrical conductivity
method used
core sampling method using a steel cylinder, length 5
cm, diameter 5 cm
sand fraction by sieving; silt and clay fraction by
hydrometer method
determined by glass electrode in 1:1 soil water
suspension
Walkley and Black wet oxidation method.
Olsen method
by flame photometry
atomic absorption method
Wheatstone conductance bridge; measurements in 1:1
soil water suspension
113
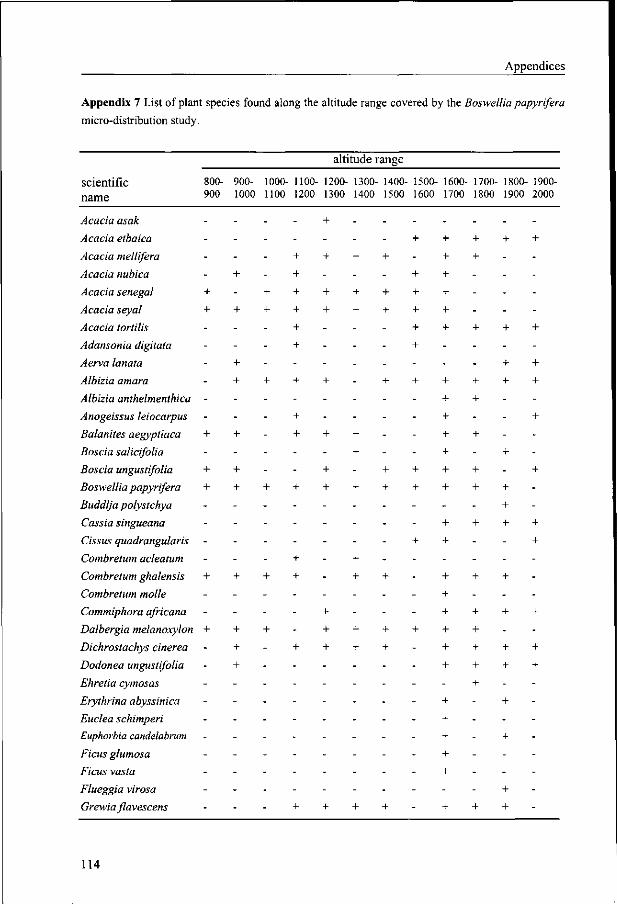
Appendices
Appendix 7 List of plant species found along the altitude range covered by the Boswellia papyrifera
micro-distribution study.
scientific name
Acacia asak
Acacia etbaica
Acacia mellifera
Acacia nubica
Acacia Senegal
Acacia seyal
Acacia tort His
Adansonia digitata
Aerva lanata
Albizia amara
Albizia anthelmenthica
Anogeissus leiocarpus
Balanites aegyptiaca
Boscia salicifolia
Boscia ungustifolia
Boswellia papyrifera
Buddlja polystchya
Cassia singueana
Cissus quadrangularis
Combretum acleatum
Combretum ghalensis
Combretum molle
Commiphora africana
Dalbergia melanoxylon
Dichrostachys cinerea
Dodonea ungustifolia
Ehretia cymosas
Erythrina abyssinica
Euclea schimperi
Euphorbia candelabrum
Ficus glumosa
Ficus vasta
Flueggia virosa
Grewia flavescens
800-900
-
-
-
-
+
+
-
-
-
-
-
-
+
-
+
+
-
-
-
+
-
-
+
-
-
-
-
-
-
-
-
-
900-1000
-
-
-
+
-
+
-
-
+
+
-
-
+
-
+
+
-
-
-
+
-
-
+
+
+
-
-
-
-
-
-
-
1000 1100
-
-
-
-
+
+
-
-
-
+
-
-
-
-
-
+
-
-
-
+
-
-
+
-
-
-
-
-
-
-
-
-
1100 1200
-
-
+
+
+
+
+
+
-
+
-
+
+
-
-
+
-
-
+
+
-
-
-
+
-
-
-
-
-
-
-
+
altitude
1200 1300
+
-
+
-
+
+
-
-
-
+
-
-
+
-
+
+
-
-
-
-
-
+
+
+
-
-
-
-
-
-
-
+
1300 1400
-
-
+
-
+
+
-
-
-
-
-
-
+
+
-
+
-
-
+
+
-
-
+
+
-
-
-
-
-
-
-
+
range
1400-1500
-
-
+
-
+
+
-
-
-
+
-
-
-
-
+
+
-
-
-
+
-
-
+
+
-
-
-
-
-
-
-
+
1500 1600
-
+
-
+
+
+
+
+
-
+
-
-
-
-
+
+
-
+
-
-
-
-
+
-
-
-
-
-
-
-
-
-
1600 1700
-
+
+
+
+
+
+
-
-
+
+
+
+
+
+
+
+
+
-
+
+
+
+
+
+
-
+
+
+
+
+
+
1700 1800
-
+
+
-
-
-
+
-
-
+
+
-
+
-
+
+
+
-
-
+
-
+
+
+
+
+
-
-
-
-
-
+
1800 1900
-
+
-
-
-
-
+
-
+
+
-
-
-
+
-
+
+
+
-
-
+
-
+
-
+
+
-
+
-
+
-
-
+
+
1900-2000
-
+
-
-
-
-
+
-
+
+
-
+
-
-
+
-
-
+
+
-
-
-
+
-
+
+
-
-
-
-
-
-
-
-
114
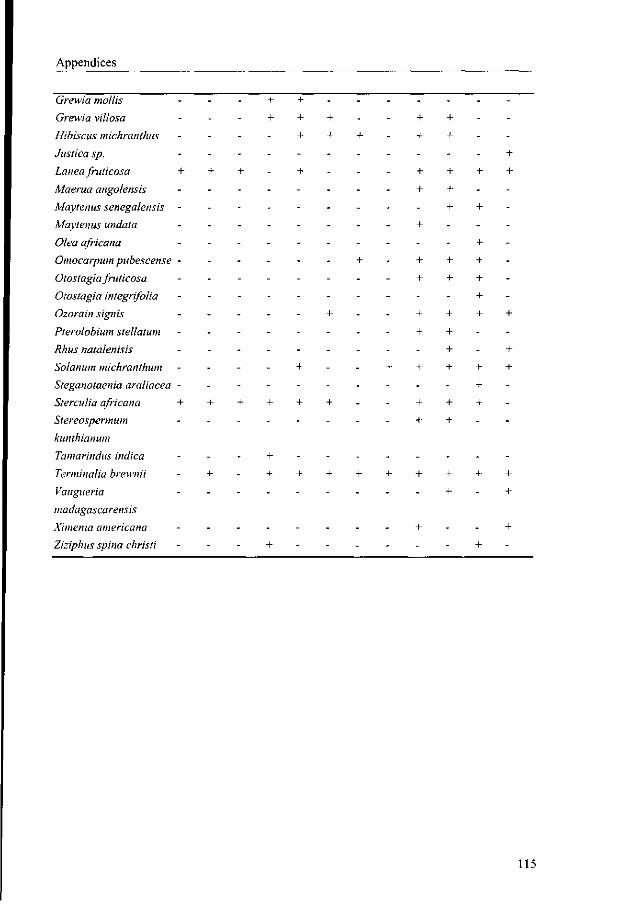
Appendices
Grewia mollis . . . + + . . . . . . .
Grewia villosa . . . + + + . . + + . .
Hibiscus michranthus . . . . + + + . + + . .
Justica sp. . . . . . . . . . . . +
Lanea fruticosa + + + . + . - - + + + +
Maerua angolensis . . . . . . . . + + . -
Maytenus senegalensis - . - . - . . . - + + -
Maytenus undata . . . . . . . . + . . .
Olea africana . . . . . . . . . . + .
Omocarpum pubescense - - - - - - + - + + + -
Otostagia fruticosa . . . . . . . . + + + .
Otostagia integrifolia . . . . . . . . . . + .
Ozorain signis . . . . . + . . + + + +
Pterolobium stellatum - - - - - - . - + + - -
Rhus natalenisis . . . . . . . . . + . +
Solarium michranthum . - - - + - - + + + + +
Steganotaenia araliacea - - - - - - - - - - + -
Sterculia africana + + + + + + - - + + + .
Stereospermum . . . . . . . . + + . .
kunthianum
Tamarindus indica . . . + . - . . . . . .
Terminalia brewnii - + - + + + + + + + + +
Vangueria . . . . . . . . . + . +
madagascarensis
Ximenia americana . . . . - . . . + . . +
Ziziphus spina christi - - - + - - . . . - + -
115
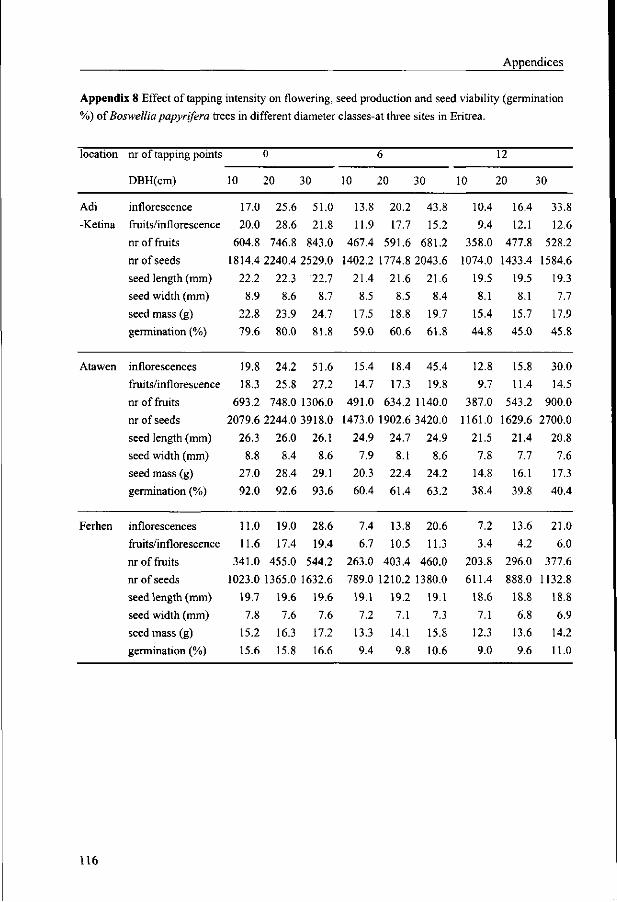
Appendices
Appendix 8 Effect of tapping intensity on flowering, seed production and seed viability (germination
%) of Boswellia papyrifera trees in different diameter classes-at three sites in Eritrea.
location
Adi
-Retina
Atawen
Ferhen
nr of tapping points
DBH(cm)
inflorescence
fruits/inflorescence
nr of fruits
nr of seeds
seed length (mm)
seed width (mm)
seed mass (g)
germination (%)
inflorescences
fruits/inflorescence
nr of fruits
nr of seeds
seed length (mm)
seed width (mm)
seed mass (g)
germination (%)
inflorescences
fruits/inflorescence
nr of fruits
nr of seeds
seed length (mm)
seed width (mm)
seed mass (g)
germination (%)
(
10 :
17.0
20.0
604.8
)
20 :
25.6
28.6
746.8
50
51.0
21.8
843.0
1814.4 2240.4 2529.0
22.2
8.9
22.8
79.6
19.8
18.3
693.2
22.3
8.6
23.9
80.0
24.2
25.8
22.7
8.7
24.7
81.8
51.6
27.2
748.0 1306.0
2079.6 2244.0 3918.0
26.3
8.8
27.0
92.0
11.0
11.6
341.0
26.0
8.4
28.4
92.6
19.0
17.4
455.0
26.1
8.6
29.1
93.6
28.6
19.4
544.2
1023.0 1365.0 1632.6
19.7
7.8
15.2
15.6
19.6
7.6
16.3
15.8
19.6
7.6
17.2
16.6
10
13.8
11.9
467.4
5
20 30
20.2
17.7
591.6
43.8
15.2
681.2
1402.2 1774.8 2043.6
21.4
8.5
17.5
59.0
15.4
14.7
491.0
21.6
8.5
18.8
60.6
18.4
17.3
21.6
8.4
19.7
61.8
45.4
19.8
634.2 1140.0
1473.0 1902.6 3420.0
24.9
7.9
20.3
60.4
7.4
6.7
263.0
24.7
8.1
22.4
61.4
13.8
10.5
403.4
24.9
8.6
24.2
63.2
20.6
11.3
460.0
789.0 1210.2 1380.0
19.1
7.2
13.3
9.4
19.2
7.1
14.1
9.8
19.1
7.3
15.8
10.6
10
10.4
9.4
358.0
1074.0
19.5
8.1
15.4
44.8
12.8
9.7
387.0
1161.0
21.5
7.8
14.8
38.4
7.2
3.4
203.8
611.4
18.6
7.1
12.3
9.0
12
20
16.4
12.1
477.8
1433.4
19.5
8.1
15.7
45.0
15.8
11.4
543.2
1629.6
21.4
7.7
16.1
39.8
13.6
4.2
296.0
888.0
18.8
6.8
13.6
9.6
30
33.8
12.6
528.2
1584.6
19.3
7.7
17.9
45.8
30.0
14.5
900.0
2700.0
20.8
7.6
17.3
40.4
21.0
6.0
377.6
1132.8
18.8
6.9
14.2
11.0
116
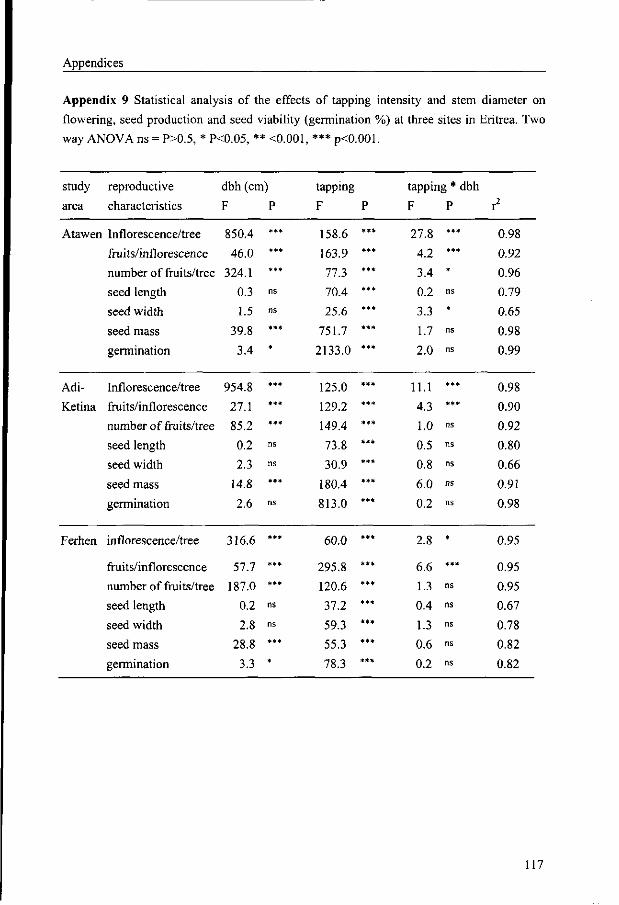
Appendices
Appendix 9 Statistical analysis of the effects of tapping intensity and stem diameter on
flowering, seed production and seed viability (germination %) at three sites in Eritrea. Two
way ANOVA ns = P>0.5, * PO.05, ** O.001, *** pO.001.
study
area
reproductive
characteristics
Atawen Inflorescence/tree
Adi-
Ketina
Ferhen
fruits/inflorescence
number of fruits/tree
seed length
seed width
seed mass
germination
Inflorescence/tree
fruits/inflorescence
number of fruits/tree
seed length
seed width
seed mass
germination
inflorescence/tree
fruits/inflorescence
number of fruits/tree
seed length
seed width
seed mass
germination
dbh (cm)
F
850.4
46.0
324.1
0.3
1.5
39.8
3.4
954.8
27.1
85.2
0.2
2.3
14.8
2.6
316.6
57.7
187.0
0.2
2.8
28.8
3.3
P
***
***
***
ns
ns
***
*
***
***
***
ns
ns
***
ns
***
*##
***
ns
ns
***
*
tapping
F
158.6
163.9
77.3
70.4
25.6
751.7
2133.0
125.0
129.2
149.4
73.8
30.9
180.4
813.0
60.0
295.8
120.6
37.2
59.3
55.3
78.3
P
***
***
***
*** ***
***
***
***
***
***
***
***
**%
***
***
***
***
***
***
***
***
tapping * dbh
F
27.8
4.2
3.4
0.2
3.3
1.7
2.0
11.1
4.3
1.0
0.5
0.8
6.0
0.2
2.8
6.6
1.3
0.4
1.3
0.6
0.2
P
***
***
*
ns
*
ns
ns
***
***
ns
ns
ns
ns
ns
*
***
ns
ns
ns
ns
ns
r2
0.98
0.92
0.96
0.79
0.65
0.98
0.99
0.98
0.90
0.92
0.80
0.66
0.91
0.98
0.95
0.95
0.95
0.67
0.78
0.82
0.82
117
Appendices
Appendix 10 Long-term perspectives for the development of Boswellia papyrifera in
Eritrea
What should be done to alleviate regeneration constraints?
In areas with adequate supply of viable seeds, grazing is the main factor limiting regeneration of Boswellia papyrifera. In view of the slow seedling growth, long-term measures are needed to protect germinants, seedlings, and probably saplings, from grazing. Establishment of enclosures in many ways is a promising approach towards that end provided grazing is strictly implemented over a long period. The length of this period has still to be determined. In view of the observed high mortality of germinants during the first growing season, additional measures are also needed to improve the regeneration sites. Such measures include the construction of soil and water conservation structures on hillsides to reduce erosion and conserve moisture into the soil.
In areas unaffected by livestock grazing, lack of viable seeds due to tapping is the major cause for lack of recruitment. Tapping through its effects on the various reproductive characteristics of Boswellia papyrifera trees disrupts the regeneration process at the seed production stage. The mechanism by which tapping affects the seed production is not yet understood. The physiological basis should be further investigated.
Given the economic and social importance of the tree and its potential for watershed protection in an area where erosion is severe, Boswellia papyrifera is a candidate not only for conservation but also for afforestation. So far, no attempt has been made to domesticate the species. All the frankincense harvest comes entirely from naturally growing trees. This study has demonstrated that there are sufficient indications that the species might go extinct at local level. If the present exploitation continues, it is likely that the species will soon disappear even from the remaining Boswellia stands.
In order to avoid this undesirable situation from happening, there is a dire need for intervention. In this respect, four major areas where intervention are proposed:
restoration of the woodland from areas where it has disappeared, rehabilitation of existing Boswellia papyrifera stands through spontaneous regeneration, integration of Boswellia papyrifera in the farming systems, and security of land and tree tenure.
a. Restoration of the original Boswellia woodland
In areas where isolated trees and stands still exist measures are need to be taken to restore the original Boswellia papyrifera woodland by taking these stands as nucleus for expansion. In order for the vegetation succession to proceed, these areas should be protected against livestock grazing. Moreover, the local environment should be improved by constructing soil and water conservation structures in the hills so as to reduce runoff and enhance the infiltration of water in the soil. Since the restoration of the original vegetation take many
Appendices
years before tangible economic benefits could be obtained, this strategy should be taken as a long-term project aiming at biodiversity and environmental protection.
b. Rehabilitation of Existing Boswellia papyrifera woodlands
In most cases, the natural regeneration of indigenous vegetation is enhanced if the remaining forests of an area are conserved and massive efforts are made to rehabilitate the degraded vegetation (Teketay 1996, Haile et al. 1998). The success of such regeneration strategy largely depends on our understanding of the underlying ecological factors that affect the regeneration process of the species concerned. In many cases, the exclusions of all forms of biotic pressure from an area have proven successful in restoring the natural plant succession and subsequent establishments of plant cover (Prasad and Pandey 1989). Area closure from livestock has positive effects on the rehabilitation of degraded lands through plant succession and natural regeneration. The physical, chemical and biological properties of the soil in enclosed area is improved and provides a favourable growing conditions for plants growing there (Namdeo et al. 1989, Bendz 1990).
Area closure alone does not necessarily bring a successful regeneration of Boswellia stands. Even if the remaining stands are enclosed, lack of viable seeds caused by intensive tapping still remains a serious problem. Hence, area closure in combination with a less intensive tapping practices should be introduced. Area closure is a straightforward action, the regulation of the tapping regimes, however, is more complex. This is because of difficulties arising over the control of tapping intensity for every plant. To be able to control the present tapping practices reasonably, a rotation tapping should be introduced. The length of the tapping cycle and also the number of tapping points per tree should be further investigated. In any event, over-tapping should be prohibited. The control over the current tapping practice should be able to allow trees produce viable seeds to compensate for the loss incurred during the tapping period.
The problem of migrant workers in tapping trees should be re-considered. The conflicting interest between migrant workers and the local community should be addressed seriously. The desire by the migrant workers to maximise gum collection without considering the well being of the Boswellia trees on one hand and the reluctant attitude of local communities towards the species (because of lack of incentive) calls for a new tree tenure arrangement and change in the collection and the commercialisation of frankincense as a whole.
c. Integration of Boswellia papyrifera in the farming systems
Since the abundance and distribution of Boswellia stands in Eritrea is declining, it is difficult to maintain the current supply of frankincense for local consumption and export. If the current exploitation continues, it is likely that the species would even disappear. In this respect an alternative measure i.e. agroforestry intervention is needed so as to integrate the species into the farming system. This means a gradual domestication of the species. According to Simons (1997), the idea of domestication is to identify and improve agroforestry trees species according to farmers and market demands and to make the planting material available to farmers.
119
Appendices
The development of any crop for domestic or commercial purpose and especially for the latter ultimately depends on its market potential (Booth and Wickens 1988, Leakey and Newton 1994, Simons 1994, 1997). The fact that Boswellia papyrifera is already a cash generating tree is a sufficient ground to justify for its integration in the farming system. What in general trigger domestication is not clearly known. In most cases, it is argued that increased commercialisation of non-timber forest product leads to depletion, which may promote domestication or deforestation (Godoy et al. 1993). This is true for products with no tenurial right of indigenous communities (Homma 1992). Godoy et al. (1993) underlines that in areas with high population pressure, even the traditional harvesting techniques of non-timber products could deplete forest resources. Generally goods extracted for export and sale outside the village are more likely to be depleted than good extracted for local consumption (Godoy et al. 1993). Some gum is locally consumed as frankincense, most of the product is exported
To complement to the naturally growing Boswellia trees and through to enhance the domestication process, Boswellia tree planting at farm level should be initiated. This could be done at various places (1) on the edge of agricultural areas, (2) on land less suitable for cultivation. This intervention has both economic and environmental benefits. Economically, the extraction and prudent marketing of the plants increases the income of rural communities (Godoy et al. 1993) through the sale of frankincense and provision of nectar for bees during dry season. Environmentally, appropriate and well-managed agroforestry systems have the potential to: control runoff and erosion, maintain soil organic matter and physical properties; and promote nutrient cycling and efficient nutrient use (Baumer 1990, Young 1997).
Boswellia papyrifera is a multipurpose perennial tree species that has already the above stated qualities. Its present economic benefits generated from the sale of frankincense makes it attractive to farmers for its integration in the farming system. It grows in dry and marginal areas that are less suitable for arable crop production and avoids the competition for arable land. To this end, there is adequate information on its germination requirements and early seedling growth and development. These silvicultural knowledge should be used to raise seedlings needed for planting.
d. Security of land and tree tenure
The various traditional land tenure systems in Eritrea all have detrimental effects on the conservation of the natural forests in general and of Boswellia woodland in particular. In these land tenure systems, the tree tenure is not explicitly indicated. In all cases, trees within a holding belong to the land holder but that is not the case for the exploitation of Boswellia trees. The problem of land tenure and ownership of trees is a fundamental one for agro forestry intervention (Baumer 1990, Zeeuw 1995).
Land re-distribution every 5-7 years (dessa system) discourages the landholder to make long-term investment such as planting of trees. Increasing population pressure in most areas with this kind of land tenure system has lead to unscrupulous cutting of the vegetation. The new land law that has been promulgated in 1994 provides lifelong ownership of land and in principle, it is expected to replace the old land tenure systems.
Baumer (1990) noted that, if the tree in a field automatically belongs to the owner of that field, there is no problem. But in most cases ownership of trees is complex and poses a
120
Appendices
serious setbacks to the integration of trees in the farming systems. In the case of Boswellia papyrifera tree ownership, land ownership itself does not allow farmers to exploit gum from Boswellia trees even within their holdings. This is mainly because Boswellia trees are legally owned and exploited by licensed concessionaires. In this respect, the land tenure reform and the existing Boswellia papyrifera tree tenure system should be re-evaluated in such a way that ensures a sustainable exploitation of the species. Ideally, the old tree tenure should be replaced by a new one that guarantees individuals or community based ownership of trees. The transfer of Boswellia tree ownership from a concession system to individual or household based tenure, is a positive step towards a sustainable management. If local communities are expected to participate in the conservation and eventual integration in the farming system, the communities residing in the vicinity of Boswellia woodlands should be beneficiaries of the species. It is believed that this would bring a change in attitude of the local communities towards the species.
References
Baumer, M., 1990. Agroforestry and desertification, the potential role of agroforestry in combating desertification and environmental degradation. Technical Centre for Agricultural and Rural Co-operation, Wageningen. 250 pp.
Bendz, M., 1990. Survival of planted tree seedlings an inventory in Wollo, Ethiopia, minor fields study. Swedish University of Agricultural Sciences. 47 pp.
Booth, F.E.M., and Wickens, G.E., 1988. None-timber uses of selected arid zone trees and shrubs in Africa. FAO, Rome. pp. i-v.
Godoy, R. A. and. Bawa, K.S., 1993. The economic value and sustainable harvest of plants and animals from the tropical forest: assumptions, hypotheses and methods. Economic Botany 47 (3): 215-219.
Haile, A., Araia, W., Omer, M.K., Ogbazghi, W. and Tewolde, M., 1995. Diagnostic farming systems survey in southwestern Hamassien, Eritrea. Bulletin N°. 1/95, University of Asmara. 85 pp.
Haile, A., Gebretatios, I., Ogbazghi, W., Omer, M.K., Araia, W., Gebremariam, T. and Ogbay, T., 1996. Rehabilitation of degraded lands in Eritrea. 1st edition. University of Asmara. Asmara. 60 p.
Homma, A.K.O., 1992. The dynamics of extraction in Amazonian, a historical perspective. In: Nepstad, D.C., and Schwartzman, S., (editors): Non-timber forest products from tropical forest evaluation of a conservation and development strategy. Advances in economic Botany Vol. 9. The New York Botanical Garden. Bronx, New York. pp. 23-31.
Leakey, R.R.B., and Newton, A.C., 1994. Domestication of tropical trees for timber and
non-timber products. UNESCO, Paris. 94 pp. Namdeo, R.K., Prasad, R., and Chaubey, O.P., 1989. Impact of grazing-closure on some
ecological aspects of Sal (Shore robusta roxb.) natural forest with special reference to its natural regeneration in Madhya Pradesh. Journal of Tropical Forest 5 (2): 82-85.
121
Appendices
Prasad, R., and Pandey, R.K., 1989. An observation on the effect of closure for rehabilitation
of degraded forestlands, a case study of protected and un protected wastelands at
Bhopal. Journal of Tropical Forestry 5 (3) 128-137.
Simons, A J., MacQueen, D.J., and Stewart, J.L., 1994. Strategic concepts in the domestication of non-industrial trees. In: Leakey, R.R.B., and Newton, A.C., (editors), Tropical trees: the potential for domestication and the rebuilding the forest resources. The proceedings of a conference organised by the Edinburgh Centre for tropical forest, held at Heriot-Watt university of Edinburgh, on August 23-28 August 1992, as part of the IUFOR Centennial year (1892-19920. HMSO, London, pp. 91-102.
Simons, T., 1997. Tree domestication-better trees for rural prosperity. Agroforestry Today (April-June 1997). pp. 4-10.
Teketay, D., 1996. Seed ecology and regeneration in dry afromontane forest of Ethiopia. Ph.D thesis. Swedish University of Agricultural Sciences Umea. 187 pp.
Young, A., 1997. Agro forestry for Soil management. Second edition. CAB International in association with ICRAF. 320 pp.
Zeeuw, F. de., 1995. Securite fonciere et gestion des ressources naturelles dans la Boucle du Mouhoun- Burkina-Faso. Tropical Resource Management Papers 9.
122
Summary
Boswellia papyrifera is a deciduous, gum producing multipurpose tree species, that grows in
a savanna belt that stretches from northern Nigeria eastwards till it reaches the highlands of
Ethiopia and Eritrea. The trees are tapped on the stem for an oleo-gum called olibanum (true
frankincense). Despite its economic importance Boswellia papyrifera is a threatened species
in Eritrea. The natural Boswellia woodlands are converted into agricultural fields while
unregulated grazing hinders the natural regeneration. In part this happens because the local
population has no interest in protecting trees which under the prevailing regulations may
only be tapped by concessionaires. It goes without saying that before effective measures can
be taken to prevent the species from disappearance, information will be needed on its present
distribution and ecological requirements, population structure and natural regeneration, and
on the factors and processes leading to the decline of the Boswellia population. The research
presented in this paper was undertaken to provide this information.
The distribution of Boswellia papyrifera was investigated both at macro and micro
level. The macro-level study showed that the geographical distribution of Boswellia
papyrifera is limited to areas in the southwestern and southern part of the country. Here it is
found in areas between 800 and 1850 m a.s.l., with a mean annual rainfall between 375 and
750 mm and a dependable length of growing period (DLGP) of 45 - 100 days. The mean
annual maximum and mean minimum temperatures corresponding with the higher altitude
limit are about 25 and 14°C respectively and with the lower altitude limit about 32 and 20°C.
Based on a survey including 113 villages it was found that the probability of the occurrence
of Boswellia papyrifera increases to a value of 1 when mean annual maximum and minimum
temperatures reach values higher than 30 and 18°C respectively, the annual rainfall is at least
500 mm. and the DLGP exceeds 60 days. The above mentioned climatic limits are subject to
the prevailing conditions in south western Eritrea. They explain why Boswellia papyrifera
has not spread into and across the central highlands (too low minimum temperatures) and
into the arid lowlands (lack of rainfall), but they cannot be considered as absolute limits. The
macro distribution study has confirmed the general idea that the Boswellia area has
decreased over the last 50 years. Especially in the transition zone between the moist and arid
lowland agroecological zone, the species has probably disappeared as a result of a
combination of population pressure and recurrent droughts.
The micro distribution study was conducted at three highland sites (altitude between
1600 and 2000 m) and two lowland sites ( altitude between 800 and 1600 m) with Boswellia
woodlands. To cover the whole altitude range, at each site 20 x 20 m sample plots were
placed at 100 m altitude intervals parallel to the contour lines. Results from observations on
144 plots indicated that the main environmental factors locally affecting the distribution and
123
Summary
abundance of the species are in order of importance altitude, land use intensity, soil organic
matter content and slope angle and to a lesser extent also silt content and pH of the soil. At
the three highland sites, the abundance decreased with altitude while the reverse trend was
observed at the lowland sites. At all sites, the abundance decreased with increasing land use
intensity. As land use is linked with local topographic features the abundance of Boswellia
increased with slope angle and from valley bottoms to hill and mountain tops, which are
unsuitable for crop production and not accessible to livestock. Soil organic matter and silt
content had positive effects on population density and pH (mainly ranging from 8.5 to 7.0)
had a negative effect.
After the studies on the occurrence and abundance of Boswellia papyrifera at
regional and site level, tree growth and population structure were studied in different
environments. As a general trend it was found that at earlier stages of development
Boswellia papyrifera invests more of its biomass in height and crown depth and at a later
stage in stem diameter growth. This can be considered as a strategy to shorten the time that
the species might be subject to livestock browsing. The observations on mature trees showed
that growth is strongly affected by altitude. The maximum tree height at the lowland sites
was twice the value found at the highland sites. Furthermore, a strong negative linear
relationship was found between mean tree height and crown depth and altitude. This
suggests that the species grows better in the warm moist lowlands than in the moist
highlands.
The most important outcome of the population study is the lack of natural
regeneration of Boswellia papyrifera. In almost all stands of the five study-areas seedlings
and saplings were absent and only larger trees were found. Only at two sites with untapped
trees recruitment was found in plots not accessible for or closed to livestock. This prompted
further research on the effects of grazing and tapping on regeneration.
The effect of grazing is well illustrated by the observations that at one of the research
sites 280 germinants per ha were found in the non-grazed plots versus 12 in the grazed plots.
Detailed population studies revealed that also in the non-grazed plots about 60 % of the
seedlings died during the first year. Tree mortality was found to decrease with increasing
basal diameter, and found to be substantially reduced when a diameter of 3 cm is reached.
Three years of field observations revealed that most seedlings remained in the same basal
diameter class during this period, illustrating that it will take several years before seedlings
reach the low mortality stage.
The tapping studies at stand level clearly showed that tapped trees hardly produced
viable seeds. Most seeds were empty and most of the filled ones failed to germinate.
Observations on individual trees indicated that tapping resulted in a reduction in
inflorescence, the number of fruits, seed mass and seed viability. When tapping was resumed
after a resting period this effect was directly apparent. The germination percentage
124
Summary
immediately dropped from over 90 % in the control trees to about 60 % in trees tapped at six
points and to 40 % in trees tapped at 12 points. These percentages are still high enough to
produce recruitment. Annually tapped trees, however, produced hardly any viable seeds.
With germination rates of about five percent and a high seedling mortality, tapped trees
apparently cannot provide recruitment. How tapping affects flowering, fruit and seed
production and seed viability is not yet known. It is likely that competition for assimilates for
gum production and for generative growth and seed filling is involved. The favourable effect
of non-tapping periods suggests, however, that tapping regimes can be developed in which
acceptable levels of gum and viable-seed production can be combined. A practical solution
for the lack of viable-seed production in the existing stands could be to retain untapped
mother trees as a seed source for recruitment.
The main conclusions are that:
Because of climatic conditions the occurrence of Boswellia papyrifera is restricted to
the southwestern and southern part of Eritrea. Within this region a more or less
continuous area of Boswellia woodland exists in the moist lowland- and moist
highland agroecological zones. In addition a small, isolated Boswellia area exists
further north in the arid highland zone, while the species has disappeared from the
transition zone between the moist lowlands and arid highlands.
The future existence of the natural Boswellia woodlands is threatened for two reasons:
(1) a reduction in area as a result of land clearing for agriculture, a process which
under the present concession-based exploitation system leads to complete removal of
Boswellia trees, (2) a lack of natural regeneration in the remaining Boswellia stands.
The present system of intensive annual tapping throughout the dry season, leads to low
production of mainly non-viable seeds and where viable seeds are produced, seedlings
and saplings usually are destroyed by livestock.
Establishment of enclosures in which no tapping and grazing is allowed was found to
be an effective measure to reintroduce and promote natural regeneration in existing
Boswellia woodlands.
Based on these conclusions the following recommendations were made:
As the land clearing problem and its underlying causes can not be solved in the near
future, practical measures and research efforts should be directed towards solving the
regeneration problem. Given the promising results of the enclosure system further
research is needed to make this system operational in terms of the required length and
frequency of the non-tapping period and the duration of the non-grazing period.
125
Summary
At the same time has to be investigated whether or not retention of untapped mother
trees as permanent seed source for recruitment and the introduction of a cut and carry
grass harvesting system are feasible and acceptable alternatives for a comprehensive
ban on tapping and grazing.
As a second priority attention should be paid to the replanting of former Boswellia
areas. This requires, amongst others, identification of high gum-yielding mother trees
for seed supply and selection of suitable replanting areas.
Given the urgency of the Boswellia problem and the size of the research programme,
the establishment of a special Boswellia research and development unit is strongly
recommended
126
Samenvatting
Boswellia papyrifera is een bladverliezende boomsoort, voorkomend in de
savannegordel, die van Noord Nigeria tot aan de hooglanden van Ethiopie en Eritrea loopt.
De stam van de boom wordt getapt voor een gom, die wierook levert. Ondanks het grote
economische belang van de gomproductie, is Boswellia papyrifera een bedreigde boomsoort:
de natuurlijke Boswellia vegetatie moet plaats maken voor landbouwgewassen, terwijl
begrazing de natuurlijke verjonging verhindert. Ten dele komt dit doordat alleen
concessiehouders de bomen mogen tappen en de boeren er derhalve geen belang bij hebben
om de bomen te beschermen. Alvorens maatregelen kunnen worden genomen om het
verdwijnen van Boswellia tegen te gaan, zal inzicht moeten worden verkregen in de
verspreiding en de ecologische niche van Boswellia papyrifera, in de populatie-opbouw en
de verjonging van de natuurlijke vegetatie en de processen die tot de achteruitgang ervan
leiden. Het onderzoek dat in deze publicatie is vastgelegd, had ten doel om deze kermis te
verschaffen.
De verspreiding van Boswellia papyrifera werd op macro- en op microschaal
bestudeerd. Op macroniveau werd geconstateerd dat de geografische verspreiding van de
soort beperkt is tot gebieden in het zuidwesten en het zuiden van het land. Hier komt
Boswellia voor in gebieden op 800 - 1850 m. boven zeeniveau, met een gemiddelde
jaarlijkse regenval tussen 350 en 750 mm en een betrouwbaar groeiseizoen van 45 tot 100
dagen. De gemiddelde jaarlijkse maximum- en minimum temperaturen die met de boven- en
benedengrens van de hoogteligging overeenkomen, bedragen respectievelijk 32 en 20 °C.
Een onderzoek waarin 113 dorpen in drie provincien werden bezocht, liet zien dat de
waarschijnlijkheid van het voorkomen van Boswellia papyrifera de waarde 1 haalde wanneer
de gemiddelde jaarlijkse maximum- en minimum temperaturen respectievelijk boven de 30
en 18 °C lagen en de gemiddelde jaarlijkse regenval minimaal 500 mm en de lengte van het
groeiseizoen minimaal 60 dagen bedroeg. Deze klimaatsgrenzen weerspiegelen de
omstandigheden in Eritrea. Ze laten zien waarom Boswellia papyrifera zich niet in en over
het hoogland heen (te lage minimum temperaturen) oostwaarts heeft kunnen uitbreiden en
ook niet in noordelijke richting (vanwege te lage regenval), maar zij kunnen niet als absolute
grenzen worden opgevat. De macrostudie heeft voorts bevestigd dat het Boswellia areaal de
laatste 50 jaar sterk is afgenomen en dat Boswellia vrijwel geheel verdwenen is in het
overgangsgebied tussen de "moist lowland" en "arid lowland" agro-ecologische zone.
De studie over de verspreiding op microniveau werd uitgevoerd op vijf locaties met
Boswellia vegetatie, drie in het hoogland (gelegen tussen 1600 en 2000 m boven zeeniveau)
127
Samenvatting
en twee in het laagland (gelegen tussen 800 en 1600 m boven zeeniveau)Om per locatie het
gehele hoogtetraject in het onderzoek te betrekken, werden per 100 meter hoogteverschil,
evenwijdig aan de hoogtelijnen bemonsteringsvelden van 20 x 20 m gemarkeerd. De
resultaten van 144 velden lieten zien dat op lokaal niveau de verspreiding van Boswellia in
volgorde van belangrijkheid bepaald wordt door de hoogteligging, het landgebruik, het
organische-stofgehalte van de bovengrond, en de hellingshoek van het terrein en in zekere
mate ook door de textuur en de zuurgraad van de bodem. Op de hooglandlocaties nam het
aantal Boswellia bomen af met de hoogteligging terwijl het omgekeerde het geval was op de
laaglandlocaties. Op alle locaties nam het aantal Boswellia bomen af met toenemende
intensiteit van het landgebruik. Aangezien het landgebruik verband houdt met de topografie
was het aantal Boswellia bomen het grootst op steile hellingen en op heuvel- en bergtoppen,
die ongeschikt zijn voor landbouw en onbereikbaar voor vee. Het organische-stofgehalte en
het siltgehalte van de bovengrond had een positief effect en de pH (binnen het traject van 8.5
- 7.0) een negatief effect op het aantal Boswellia bomen.
Na de studies over het voorkomen en de dichtheid van Boswellia papyrifera op
regionaal en plaatselijk niveau, werd op de reeds genoemde locaties de groei en
ontwikkeling van Boswellia bomen bestudeerd. Hierbij werd gevonden dat aanvankelijk
vooral lengtegroei en verticale kroonontwikkeling plaatsvindt en pas in een later stadium de
diktegroei van de stam. De maximale boomhoogte was op de laaglandlocaties twee keer zo
groot als op de hooglandlocaties. Voorts werd een uitgesproken, significante negatieve
lineaire relatie gevonden tussen de hoogte en kroondiepte van de bomen en de hoogteligging.
Dit wijst er op dat de bomen beter in het warme, vochtige laagland groeien dan in het koele
hoogland.
De belangrijkste uitkomst van het onderzoek naar de populatieopbouw van de
natuurlijke Boswellia vegetatie was het ontbreken van natuurlijke verjonging. Op de vijf
locaties werden alleen grote bomen maar geen zaailingen aangetroffen. Slechts op twee
locaties werd op plaatsen, waar de bomen niet getapt werden en waar het vee niet kon
doordringen, natuurlijke verjonging gevonden. Deze constatering was de aanleiding om de
invloed van begrazing en van tappen op het regeneratieproces nader te onderzoeken.
Begrazing bleek een sterke negatieve invloed te hebben op de natuurlijke verjonging.
Zo werden op een van de onderzoekslocaties in niet-begraasde terreinen 280 zaailingen per
ha aangetroffen tegenover 12 op begraasde velden. Gedetailleerde populatiestudies toonden
aan dat ook bij afwezigheid van begrazing meer dan 60 procent van de zaailingen in het
eerste levensjaar dood gingen. De zaailingensterfte nam daarna af en was vrijwel verdwenen
128
Samenvatting
wanneer de stamdiameter 3 cm bedroeg. Veldwaarnemingen over een periode van drie jaar
lieten zien dat het enige jaren duurt voordat dit stadium wordt bereikt.
Getapte bomen bleken bijna geen kiemkrachtige zaden te produceren. De meeste
zaden bleken leeg te zijn, terwijl de gevulde zaden niet kiemden. Waarnemingen aan
individuele bomen toonden aan dat tappen leidde tot aanleg van minder bloeiwijzen, een
geringer aantal vruchten, tot lichtere zaden en afname van de kiemkracht. Ook wanneer
bomen na een rustperiode opnieuw getapt werden, trad dit verschijnsel op. Na het op nieuw
in tap nemen, liep het kiemingspercentage, dat bij zaden van niet getapte bomen boven de 90
% lag, terug tot 60 % bij bomen die op zes punten en tot 40 % bij bomen die op 12 punten
werden aangesneden. Deze percentages zijn waarschijnlijk voldoende om verjonging
mogelijk te maken, maar dit is niet het geval bij bomen die jaarlijks worden getapt. Deze
produceerden weinig zaden waarvan slechts ongeveer 5 % kiemkrachtig was, terwijl onder
veldomstandigheden de overlevingskans van zaailingen minder dan 40 % bleek te zijn. Hoe
tappen de bloei, de zaadproductie en de kiemkracht bei'nvloedt is nog niet bekend.
Waarschijnlijk is er sprake van concurrentie tussen gomproductie enerzijds en generatieve
groei en zaadvulling anderzijds. Het gunstige effect van taprust lijkt er te wijzen dat
tapsystemen kunnen worden ontwikkeld waarbij de productie van gom en van kiemkrachtige
zaden in evenwicht zijn. Het aanhouden van een voldoende aantal niet-getapte bomen voor
zaadproductie zou een andere mogelijkheid kunnen zijn om het regeneratievraagstuk op te
lossen.
De belangrijkste conclusies van het onderzoek zijn de volgende:
Klimatologische omstandigheden beperken het voorkomen van Boswellia papyrifera
tot het zuidwesten en zuiden van Eritrea. In het gebied, dat tot het vochtig laagland en
het vochtig hoogland gerekend wordt, ligt een min of meer continue Boswellia
vegetatiezone. Verder noordwaarts ligt in het droge hoogland een klein Boswellia
gebied, dat geisoleerd is geraakt van de zuidelijke zone, doordat Boswellia in het
overgangsgebied van het vochtige- naar het droge laagland verdwenen is.
De toekomst van de natuurlijke Boswellia vegetatie wordt bedreigd door het
oprukkende landbouwfront en door het ontbreken van natuurlijke verjonging. Dit
laatste komt omdat intensief getapte bomen geen kiemkrachtige zaden leveren en de
zaailingen onder niet-getapte bomen door het grazende vee gedood of beschadigd
worden.
129
Samenvatting
Het instellen van z.g. gesloten gebieden, waarin niet getapt mag worden en geen vee
mag grazen, blijkt een effectieve maatregel te zijn om de natuurlijke verjonging te
herstellen.
Op grond van deze conclusies worden de volgende aanbevelingen gedaan:
Aangezien op korte termijn geen oplossing kan worden gevonden voor het verdwijnen
van Boswellia tengevolge van landontginning, zal het onderzoek zich allereerst moeten
richten op het verjongingsvraagstuk. Gezien het succes van het instellen van gesloten
gebieden moet nagegaan worden hoe lang de taprust en de daarop volgende tapperiode
moet zijn om de zaadproductie op peil te houden. Voorts moet bepaald worden hoe
lang het graasverbod moet gelden.
Tegelijkertijd moet onderzocht worden of het aanhouden van enkele niet getapte
bomen voor zaadproductie en het invoeren van een "cut and carry" gras-oogstsysteem
een algeheel tap- en graasverbod kunnen vervangen.
Als tweede prioriteit zal aandacht besteed moeten worden aan de herbeplanting van
vroegere Boswellia velden. Dit houdt o.a. in: selectie van moederbomen voor
zaadproductie en het uitzoeken van terreinen die geschikt zijn voor herbeplanting.
Gezien de urgentie en de veelzijdigheid van het Boswellia vraagstuk, wordt tenslotte
aanbevolen om een speciale Boswellia onderzoekseenheid in het leven te roepen.
130
Curriculum Vitae
Woldeselassie Ogbazghi Temnewo was born on 12 August 1958 in Ropto, Eritrea. He
received his primary education in his home village, and his secondary education at Keren
and Asmara (1973-1981). In 1981, he was admitted to the University of Asmara. After
graduation in 1985, he worked as a graduate assistant and later as an assistant lecturer in the
same University (1985-1987). In 1988-1989 he completed his Diplome d'Etude Approfondi
(DEA) in Tropical Plant Biology at the University of Pierre Marie Curie (Paris VI), France.
From January 1990-1995, he was a lecturer and head of the department of Soil and
Water Conservation, College of Agriculture and Aquatic Sciences of the University of
Asmara. During this period, he participated in various professional ad-hoc committees of the
University. In 1993 he attended a course on irrigation and soil management in Bet-Dagan,
Israel and in 1995 a course on a remote sensing at the University of Stockholm.
From 1994-1996, he was a member of a research team on rehabilitation of degraded
lands in Eritrea sponsored by IDRC, Canada. From September 1996 to September 2000 he
investigated the distribution and regeneration of Boswellia papyrifera. The results of this
research are given in this thesis.
Woldeselassie Ogbazghi Temnewo is married and father of two sons and two
daughters.
131