
RAC Performance myths - Oracle database internals by Riyaj©OraInternals Riyaj Shamsudeen 2 Me 23+...
52
©OraInternals Riyaj Shamsudeen -MEMORY By Riyaj Shamsudeen IN TERNALS
Transcript of RAC Performance myths - Oracle database internals by Riyaj©OraInternals Riyaj Shamsudeen 2 Me 23+...
©OraInternals Riyaj Shamsudeen
-MEMORY
By
Riyaj Shamsudeen
INTERNALS
©OraInternals Riyaj Shamsudeen 2
Me
23+ years as DBA
OakTable member
Oracle ACE Director
Specializes in RAC,
performance tuning and
Internals.
Slowly in to BigData
orainternals.wordpress.com
Web: www.orainternals.com
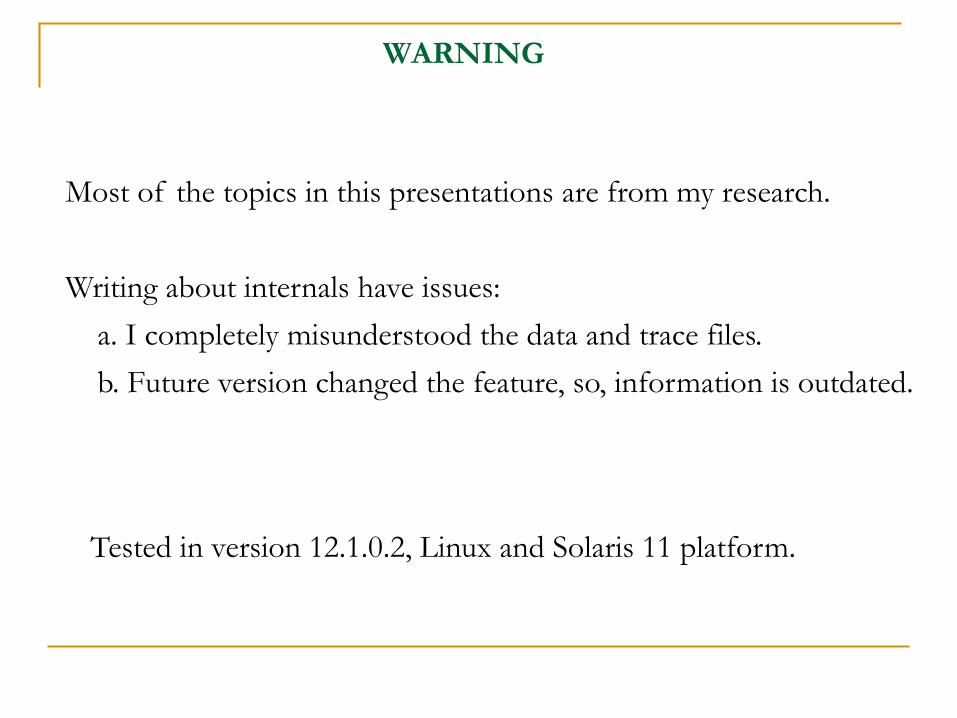
WARNING
Most of the topics in this presentations are from my research.
Writing about internals have issues:
a. I completely misunderstood the data and trace files.
b. Future version changed the feature, so, information is outdated.
Tested in version 12.1.0.2, Linux and Solaris 11 platform.
AGENDA
In-mem memory areas
Background processes
Optimizer & in-memory
tidbits
Interesting observations
Learnings
Conclusion
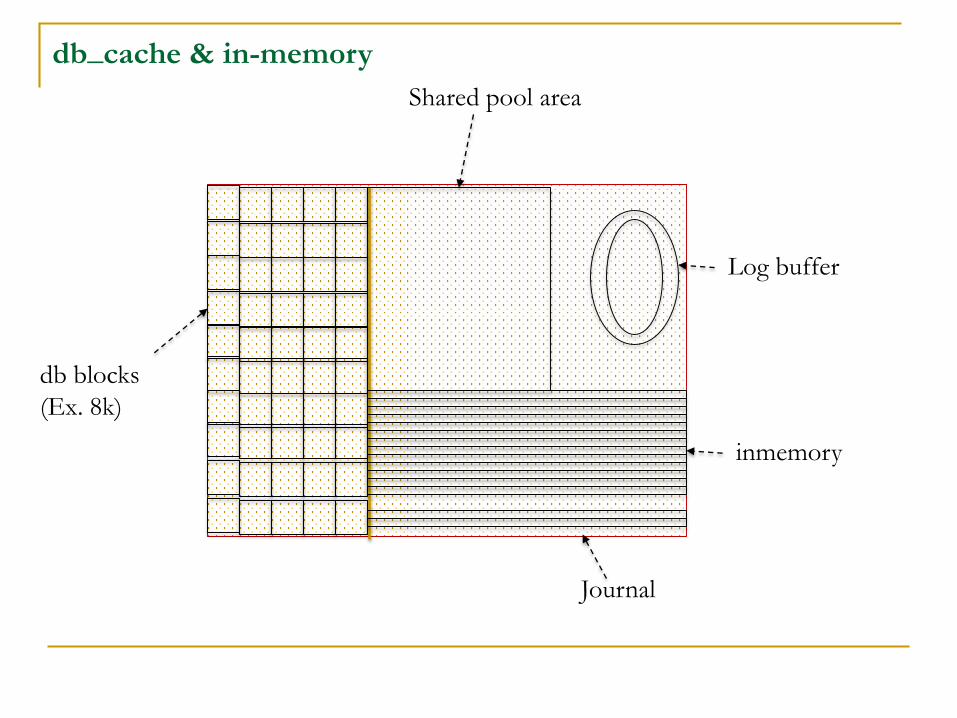
Journal
db_cache & in-memory
inmemory
db blocks
(Ex. 8k)
Shared pool area
Log buffer
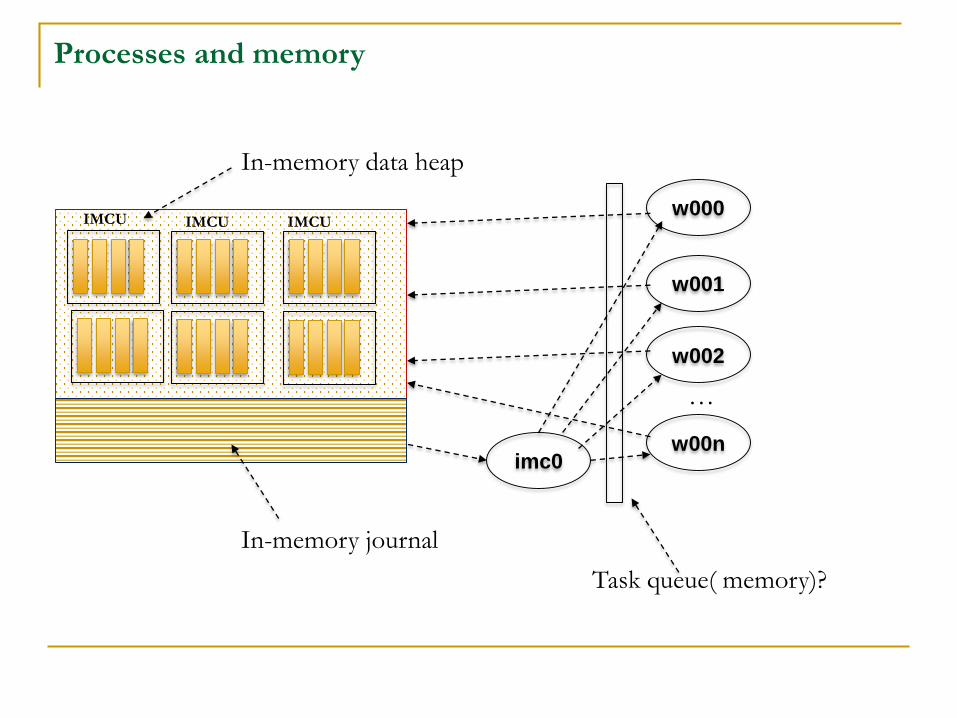
w000
imc0
w001
w002
w00n
…
In-memory journal
In-memory data heap
Processes and memory
Task queue( memory)?
IMCU IMCU IMCU
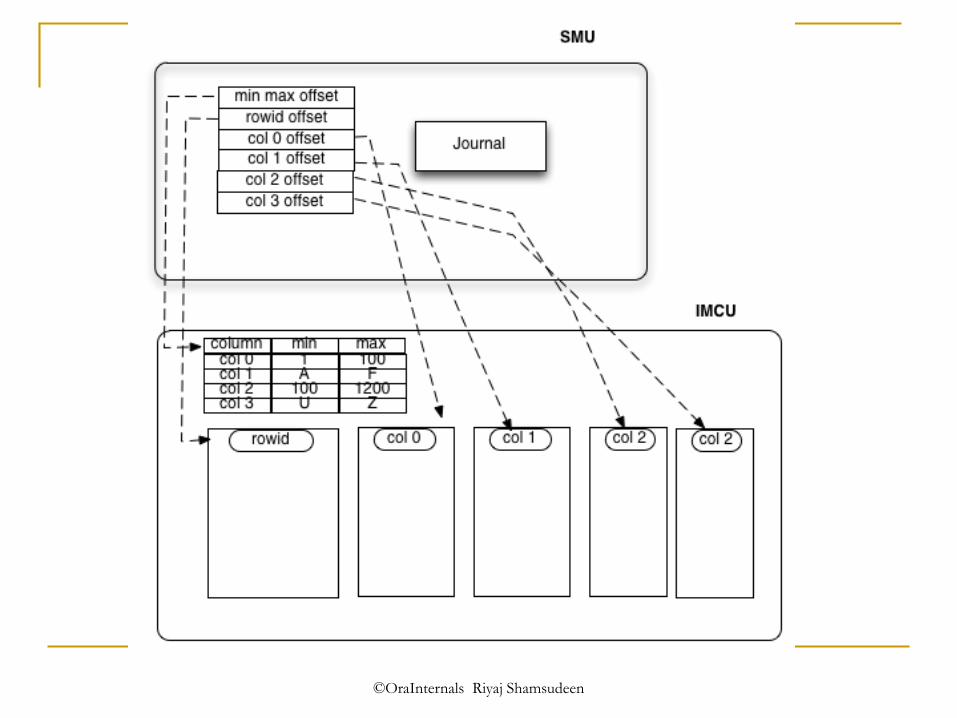
©OraInternals Riyaj Shamsudeen
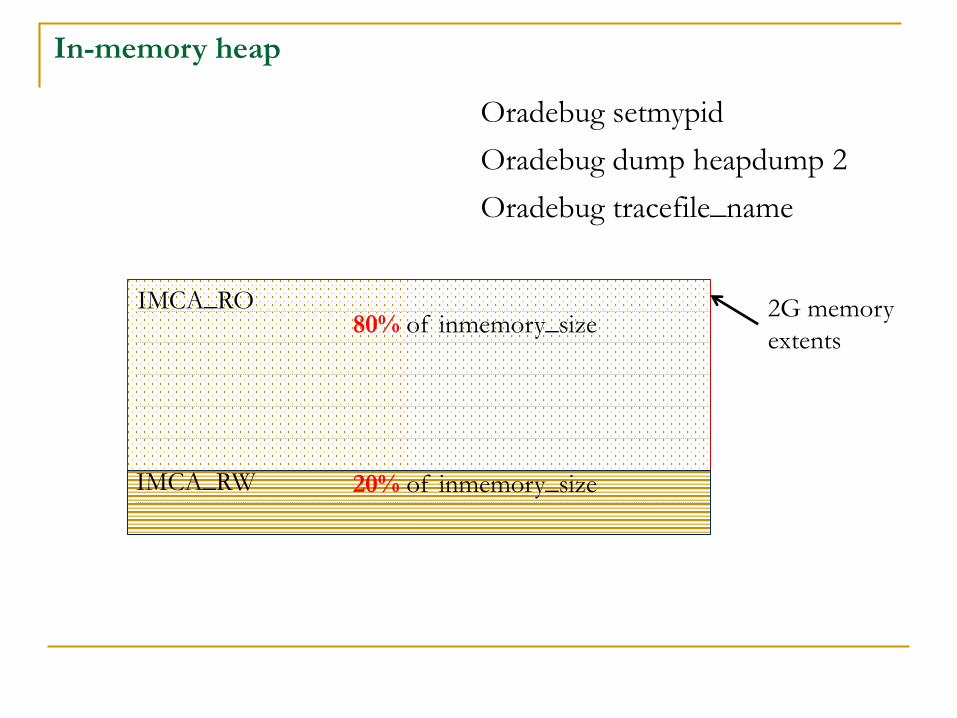
In-memory heap
Oradebug setmypid
Oradebug dump heapdump 2
Oradebug tracefile_name
IMCA_RO
IMCA_RW
80% of inmemory_size
20% of inmemory_size
2G memory
extents
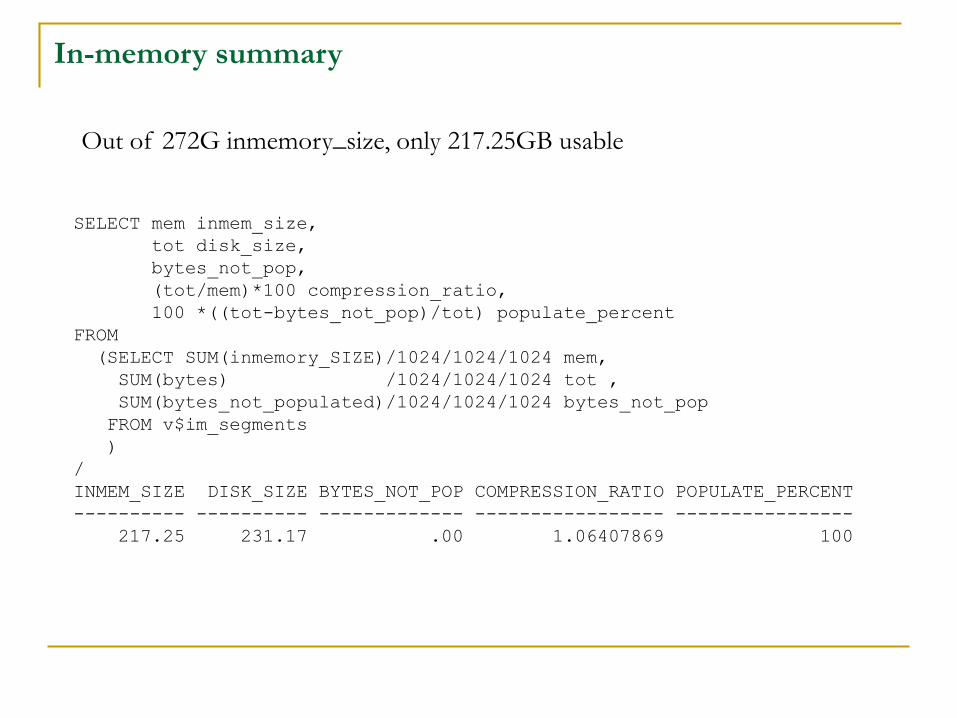
In-memory summary
SELECT mem inmem_size,
tot disk_size,
bytes_not_pop,
(tot/mem)*100 compression_ratio,
100 *((tot-bytes_not_pop)/tot) populate_percent
FROM
(SELECT SUM(inmemory_SIZE)/1024/1024/1024 mem,
SUM(bytes) /1024/1024/1024 tot ,
SUM(bytes_not_populated)/1024/1024/1024 bytes_not_pop
FROM v$im_segments
)
/
INMEM_SIZE DISK_SIZE BYTES_NOT_POP COMPRESSION_RATIO POPULATE_PERCENT
---------- ---------- ------------- ----------------- ----------------
217.25 231.17 .00 1.06407869 100
Out of 272G inmemory_size, only 217.25GB usable
AGENDA
In-mem memory areas
Background processes
Optimizer & in-memory
tidbits
Interesting observations
Learnings
Conclusion
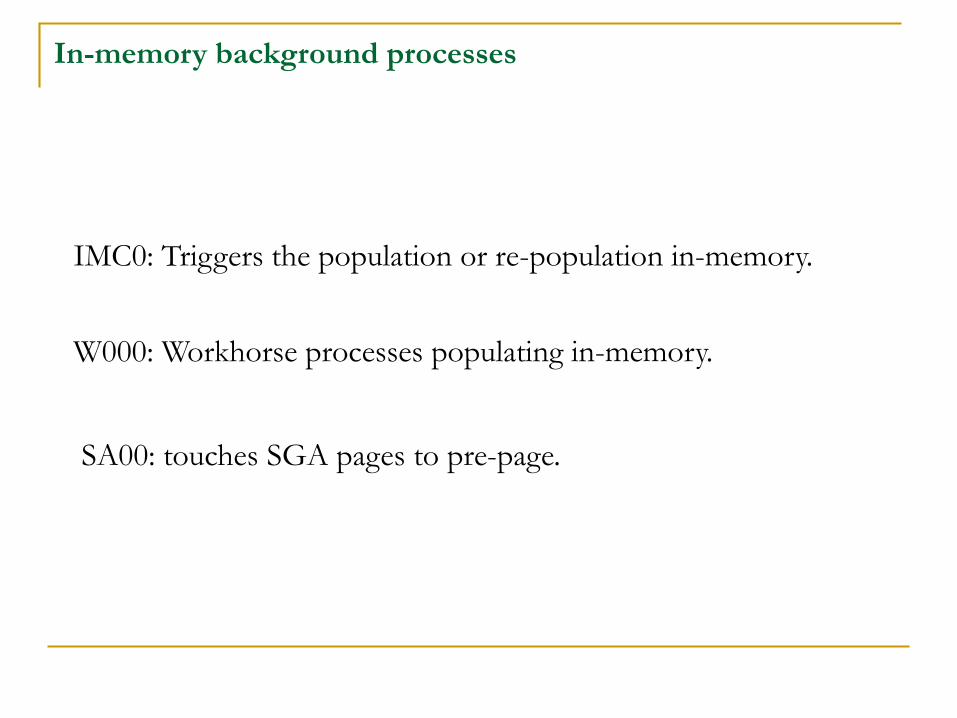
In-memory background processes
IMC0: Triggers the population or re-population in-memory.
W000: Workhorse processes populating in-memory.
SA00: touches SGA pages to pre-page.
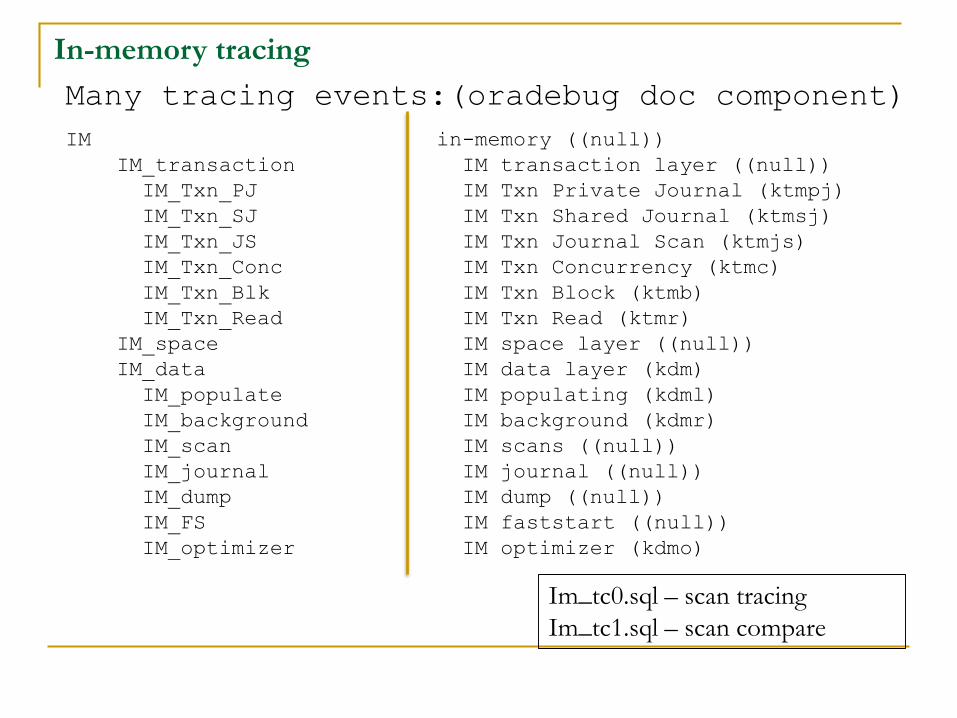
In-memory tracing
Im_tc0.sql – scan tracing
Im_tc1.sql – scan compare
IM in-memory ((null))
IM_transaction IM transaction layer ((null))
IM_Txn_PJ IM Txn Private Journal (ktmpj)
IM_Txn_SJ IM Txn Shared Journal (ktmsj)
IM_Txn_JS IM Txn Journal Scan (ktmjs)
IM_Txn_Conc IM Txn Concurrency (ktmc)
IM_Txn_Blk IM Txn Block (ktmb)
IM_Txn_Read IM Txn Read (ktmr)
IM_space IM space layer ((null))
IM_data IM data layer (kdm)
IM_populate IM populating (kdml)
IM_background IM background (kdmr)
IM_scan IM scans ((null))
IM_journal IM journal ((null))
IM_dump IM dump ((null))
IM_FS IM faststart ((null))
IM_optimizer IM optimizer (kdmo)
Many tracing events:(oradebug doc component)
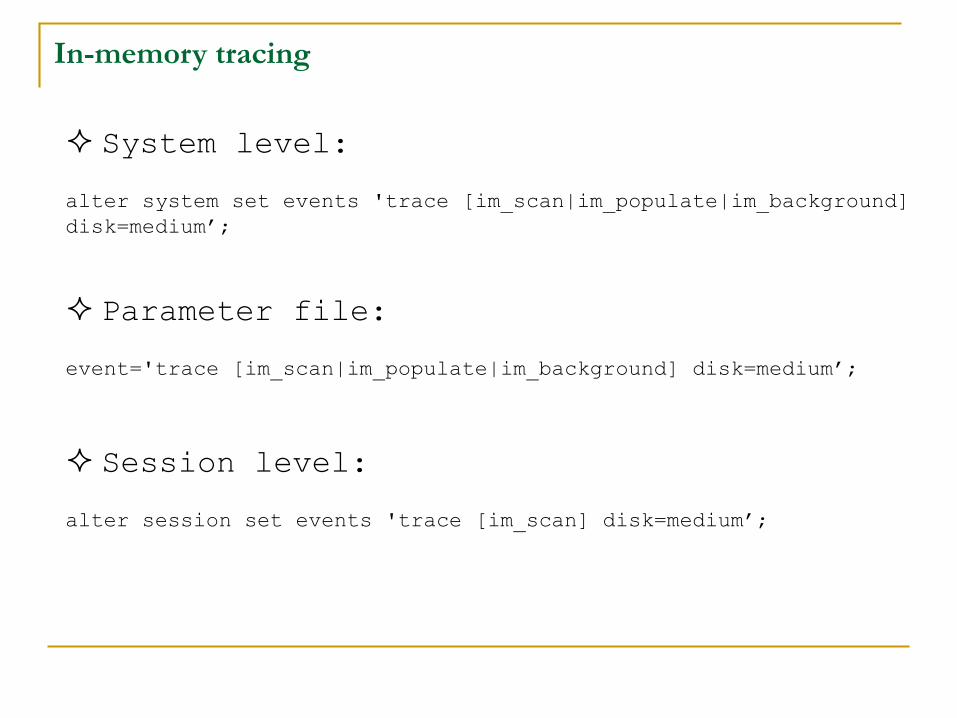
In-memory tracing
System level:
alter system set events 'trace [im_scan|im_populate|im_background]
disk=medium’;
Parameter file:
event='trace [im_scan|im_populate|im_background] disk=medium’;
Session level:
alter session set events 'trace [im_scan] disk=medium’;
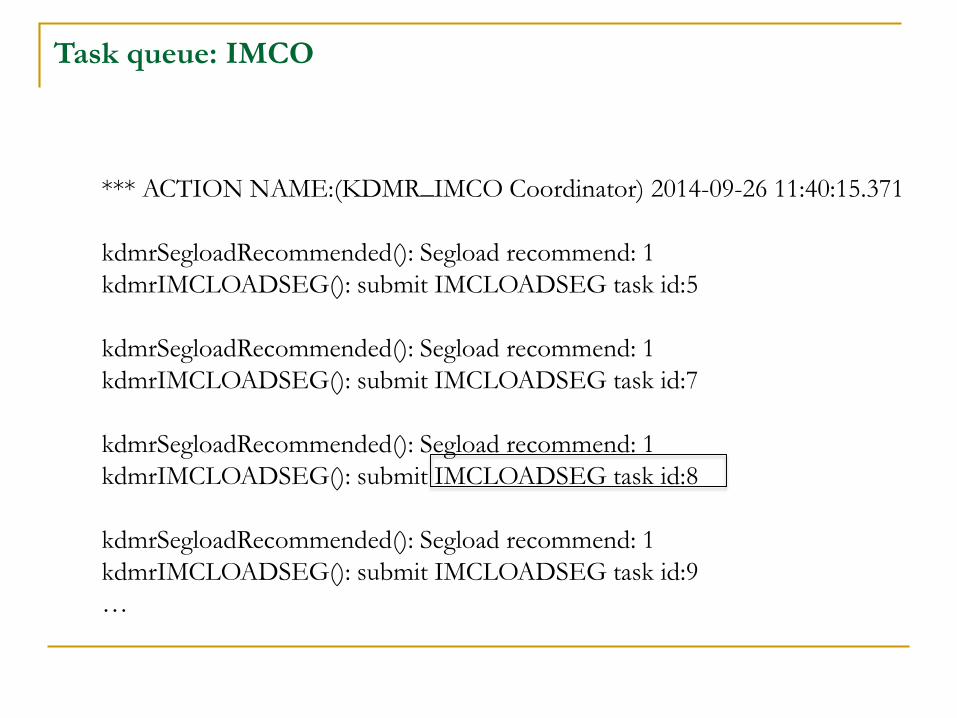
Task queue: IMCO
*** ACTION NAME:(KDMR_IMCO Coordinator) 2014-09-26 11:40:15.371
kdmrSegloadRecommended(): Segload recommend: 1
kdmrIMCLOADSEG(): submit IMCLOADSEG task id:5
kdmrSegloadRecommended(): Segload recommend: 1
kdmrIMCLOADSEG(): submit IMCLOADSEG task id:7
kdmrSegloadRecommended(): Segload recommend: 1
kdmrIMCLOADSEG(): submit IMCLOADSEG task id:8
kdmrSegloadRecommended(): Segload recommend: 1
kdmrIMCLOADSEG(): submit IMCLOADSEG task id:9
…
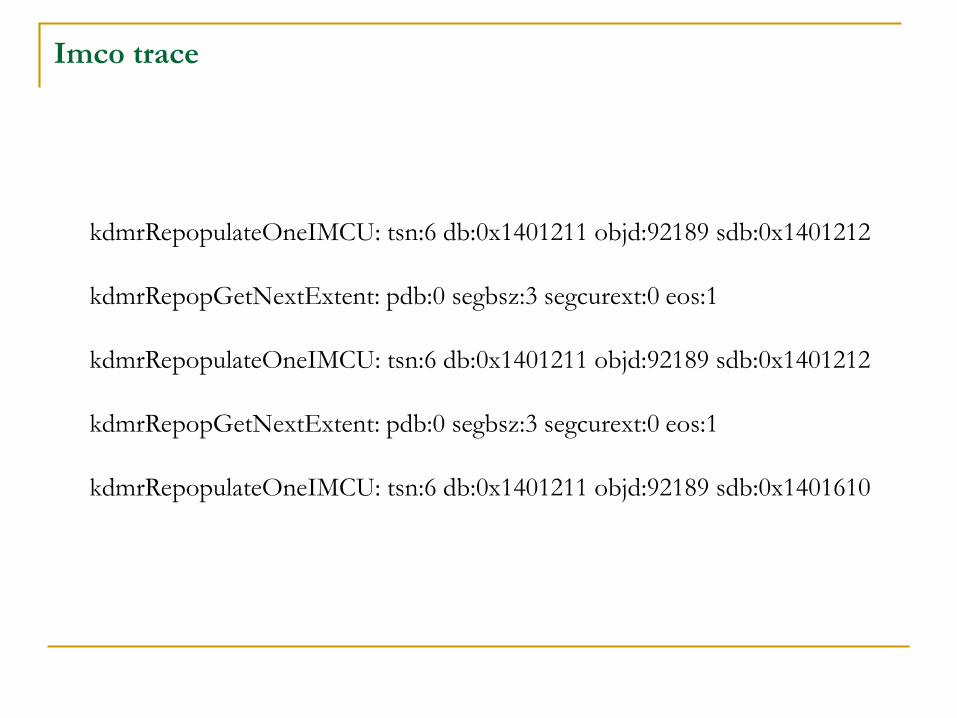
Imco trace
kdmrRepopulateOneIMCU: tsn:6 db:0x1401211 objd:92189 sdb:0x1401212
kdmrRepopGetNextExtent: pdb:0 segbsz:3 segcurext:0 eos:1
kdmrRepopulateOneIMCU: tsn:6 db:0x1401211 objd:92189 sdb:0x1401212
kdmrRepopGetNextExtent: pdb:0 segbsz:3 segcurext:0 eos:1
kdmrRepopulateOneIMCU: tsn:6 db:0x1401211 objd:92189 sdb:0x1401610
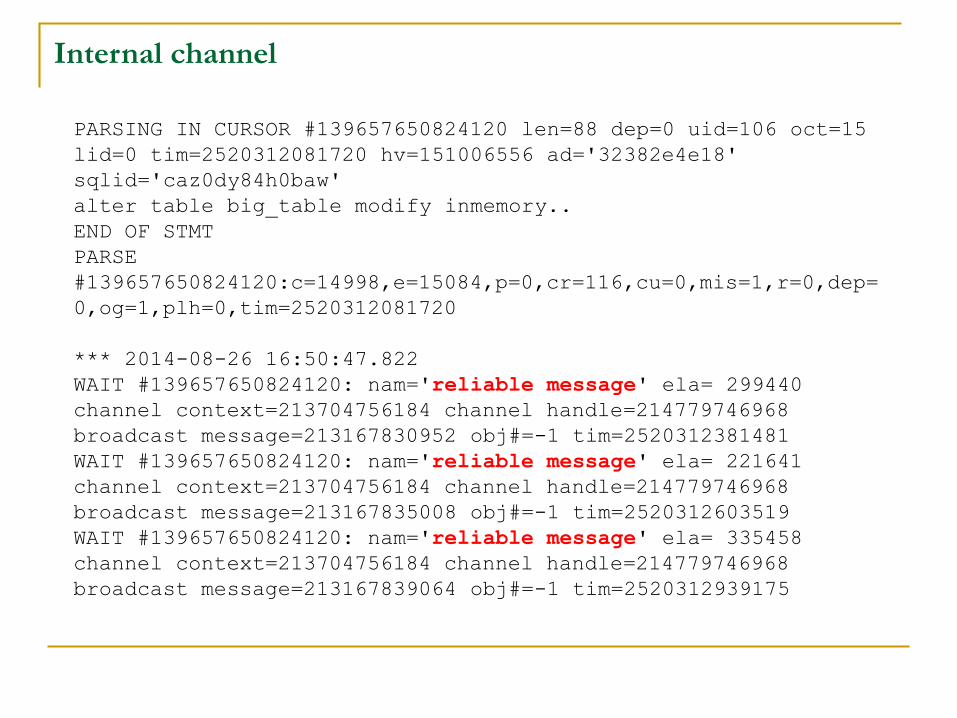
Internal channel
PARSING IN CURSOR #139657650824120 len=88 dep=0 uid=106 oct=15
lid=0 tim=2520312081720 hv=151006556 ad='32382e4e18'
sqlid='caz0dy84h0baw'
alter table big_table modify inmemory..
END OF STMT
PARSE
#139657650824120:c=14998,e=15084,p=0,cr=116,cu=0,mis=1,r=0,dep=
0,og=1,plh=0,tim=2520312081720
*** 2014-08-26 16:50:47.822
WAIT #139657650824120: nam='reliable message' ela= 299440
channel context=213704756184 channel handle=214779746968
broadcast message=213167830952 obj#=-1 tim=2520312381481
WAIT #139657650824120: nam='reliable message' ela= 221641
channel context=213704756184 channel handle=214779746968
broadcast message=213167835008 obj#=-1 tim=2520312603519
WAIT #139657650824120: nam='reliable message' ela= 335458
channel context=213704756184 channel handle=214779746968
broadcast message=213167839064 obj#=-1 tim=2520312939175
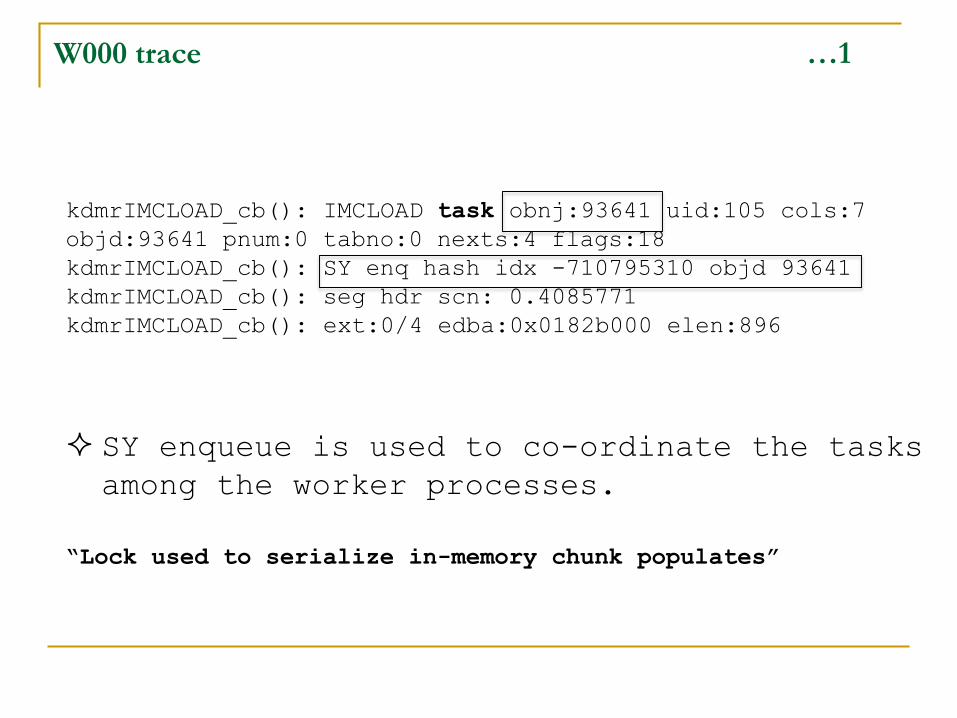
W000 trace …1
kdmrIMCLOAD_cb(): IMCLOAD task obnj:93641 uid:105 cols:7
objd:93641 pnum:0 tabno:0 nexts:4 flags:18
kdmrIMCLOAD_cb(): SY enq hash idx -710795310 objd 93641
kdmrIMCLOAD_cb(): seg hdr scn: 0.4085771
kdmrIMCLOAD_cb(): ext:0/4 edba:0x0182b000 elen:896
SY enqueue is used to co-ordinate the tasks
among the worker processes.
“Lock used to serialize in-memory chunk populates”
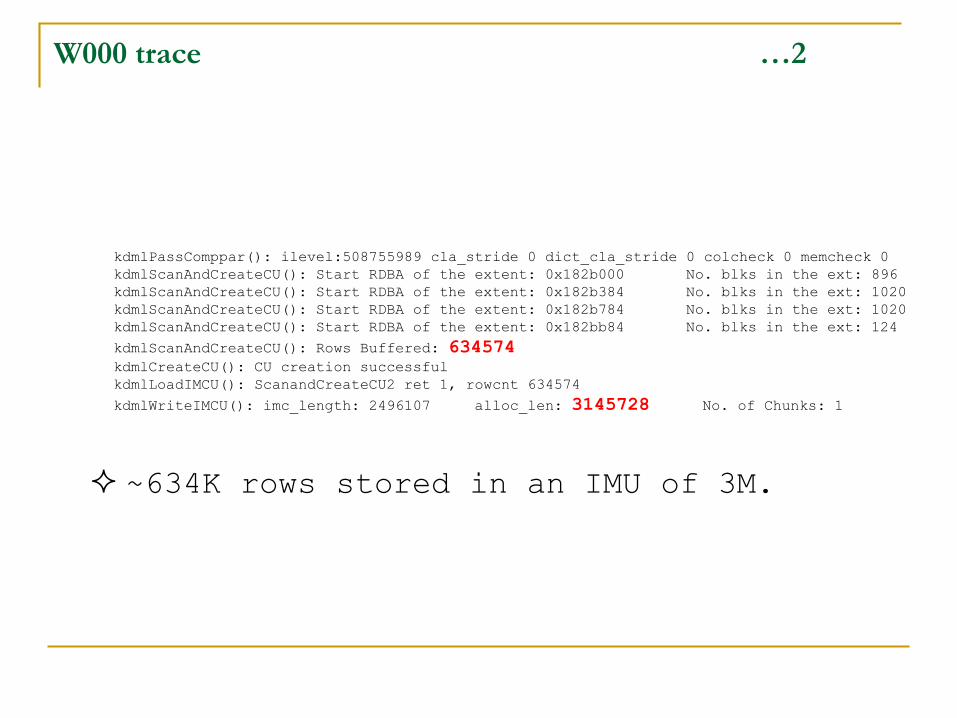
W000 trace …2
kdmlPassComppar(): ilevel:508755989 cla_stride 0 dict_cla_stride 0 colcheck 0 memcheck 0
kdmlScanAndCreateCU(): Start RDBA of the extent: 0x182b000 No. blks in the ext: 896
kdmlScanAndCreateCU(): Start RDBA of the extent: 0x182b384 No. blks in the ext: 1020
kdmlScanAndCreateCU(): Start RDBA of the extent: 0x182b784 No. blks in the ext: 1020
kdmlScanAndCreateCU(): Start RDBA of the extent: 0x182bb84 No. blks in the ext: 124
kdmlScanAndCreateCU(): Rows Buffered: 634574kdmlCreateCU(): CU creation successful
kdmlLoadIMCU(): ScanandCreateCU2 ret 1, rowcnt 634574
kdmlWriteIMCU(): imc_length: 2496107 alloc_len: 3145728 No. of Chunks: 1
~634K rows stored in an IMU of 3M.
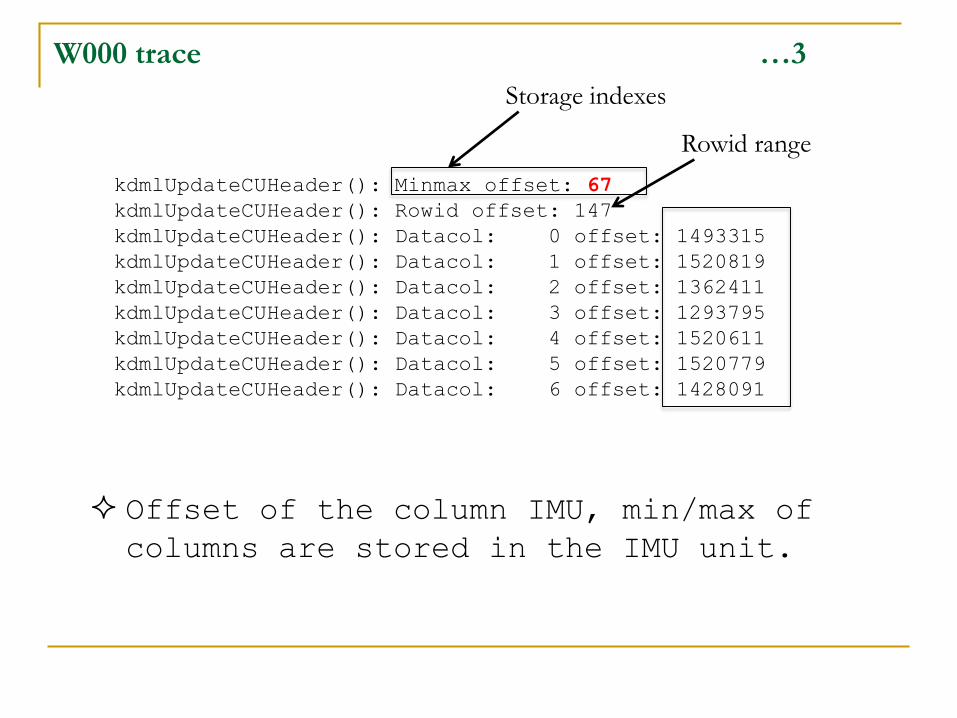
W000 trace …3
kdmlUpdateCUHeader(): Minmax offset: 67
kdmlUpdateCUHeader(): Rowid offset: 147
kdmlUpdateCUHeader(): Datacol: 0 offset: 1493315
kdmlUpdateCUHeader(): Datacol: 1 offset: 1520819
kdmlUpdateCUHeader(): Datacol: 2 offset: 1362411
kdmlUpdateCUHeader(): Datacol: 3 offset: 1293795
kdmlUpdateCUHeader(): Datacol: 4 offset: 1520611
kdmlUpdateCUHeader(): Datacol: 5 offset: 1520779
kdmlUpdateCUHeader(): Datacol: 6 offset: 1428091
Offset of the column IMU, min/max of
columns are stored in the IMU unit.
Storage indexes
Rowid range
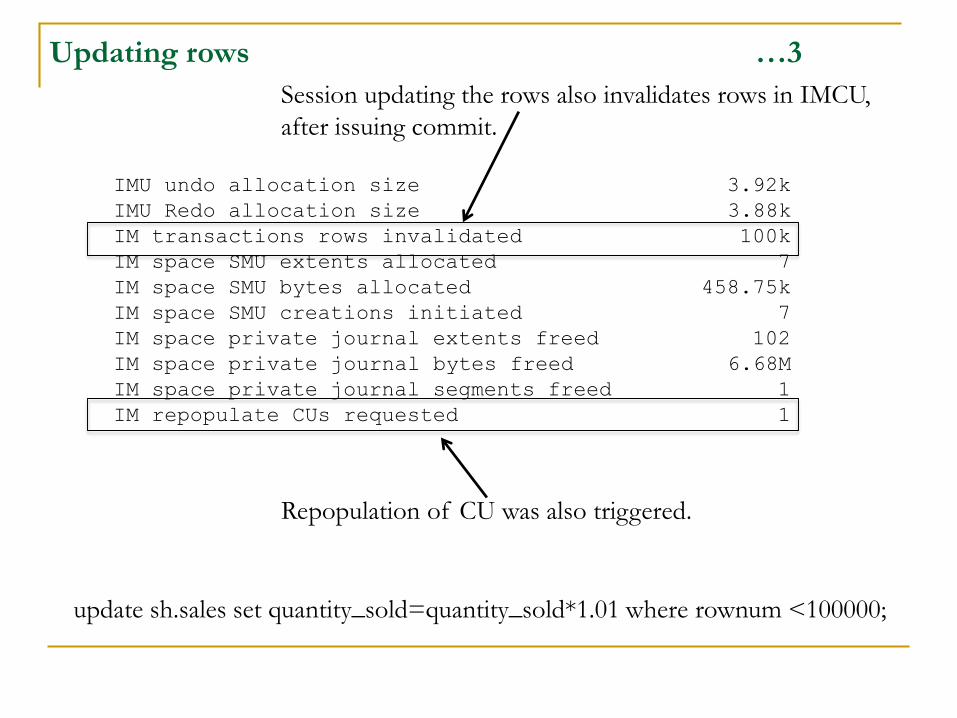
Updating rows …3
IMU undo allocation size 3.92k
IMU Redo allocation size 3.88k
IM transactions rows invalidated 100k
IM space SMU extents allocated 7
IM space SMU bytes allocated 458.75k
IM space SMU creations initiated 7
IM space private journal extents freed 102
IM space private journal bytes freed 6.68M
IM space private journal segments freed 1
IM repopulate CUs requested 1
Session updating the rows also invalidates rows in IMCU,
after issuing commit.
Repopulation of CU was also triggered.
update sh.sales set quantity_sold=quantity_sold*1.01 where rownum <100000;
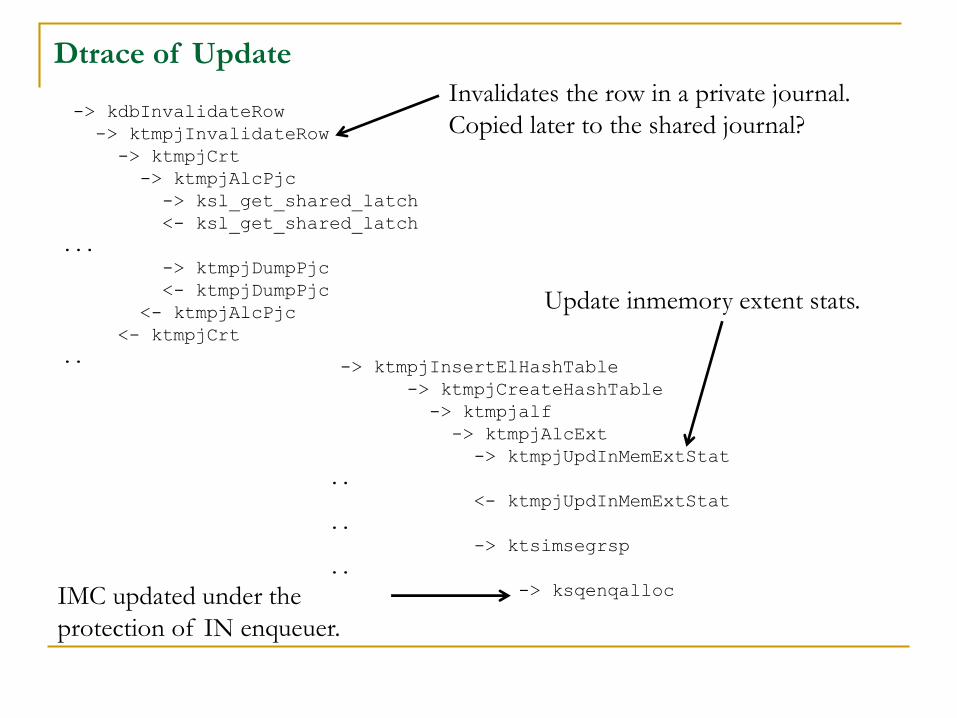
Dtrace of Update
-> kdbInvalidateRow
-> ktmpjInvalidateRow
-> ktmpjCrt
-> ktmpjAlcPjc
-> ksl_get_shared_latch
<- ksl_get_shared_latch
...
-> ktmpjDumpPjc
<- ktmpjDumpPjc
<- ktmpjAlcPjc
<- ktmpjCrt
..-> ktmpjInsertElHashTable
-> ktmpjCreateHashTable
-> ktmpjalf
-> ktmpjAlcExt
-> ktmpjUpdInMemExtStat
..
<- ktmpjUpdInMemExtStat
..
-> ktsimsegrsp
..
-> ksqenqalloc
Invalidates the row in a private journal.
Copied later to the shared journal?
Update inmemory extent stats.
IMC updated under the
protection of IN enqueuer.
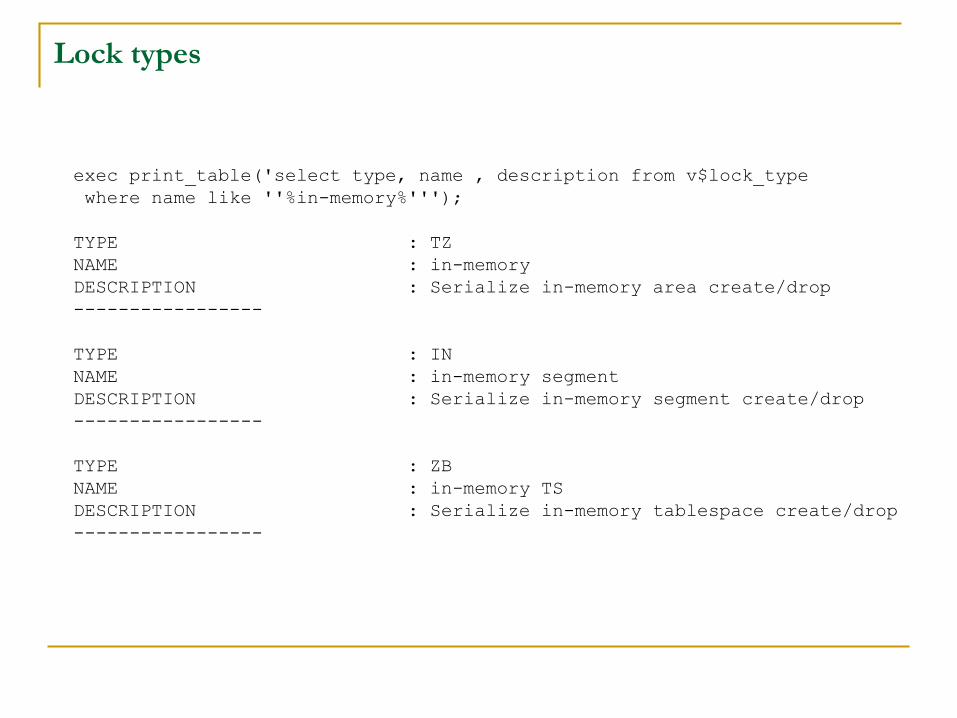
Lock types
exec print_table('select type, name , description from v$lock_type
where name like ''%in-memory%''');
TYPE : TZ
NAME : in-memory
DESCRIPTION : Serialize in-memory area create/drop
-----------------
TYPE : IN
NAME : in-memory segment
DESCRIPTION : Serialize in-memory segment create/drop
-----------------
TYPE : ZB
NAME : in-memory TS
DESCRIPTION : Serialize in-memory tablespace create/drop
-----------------
AGENDA
In-mem memory areas
Background processes
Optimizer & in-memory
tidbits
Interesting observations
Learnings
Conclusion
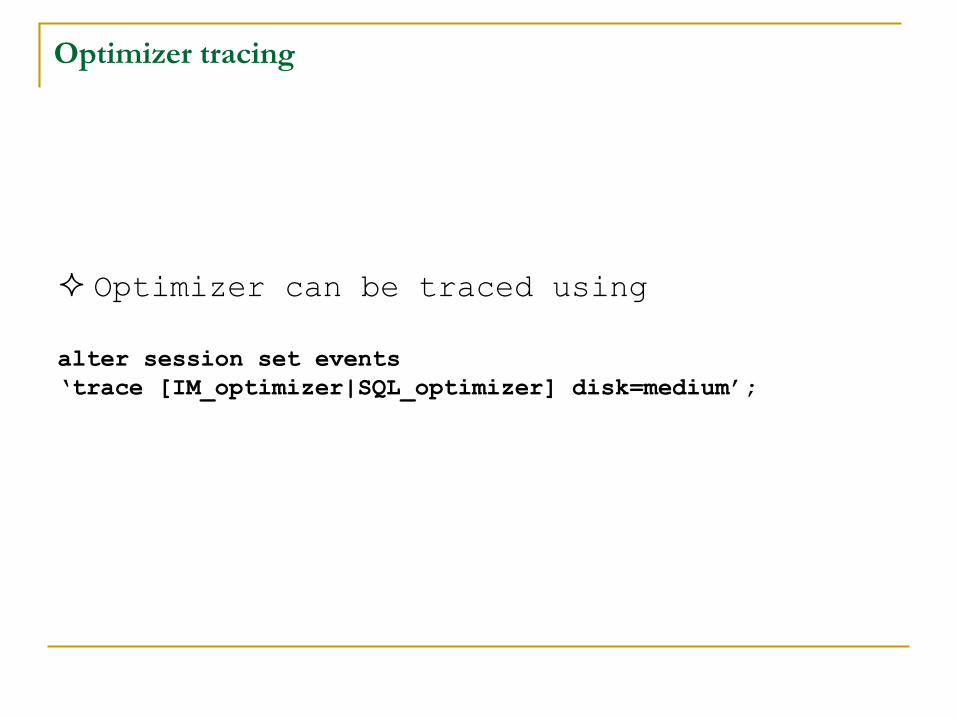
Optimizer tracing
Optimizer can be traced using
alter session set events
‘trace [IM_optimizer|SQL_optimizer] disk=medium’;
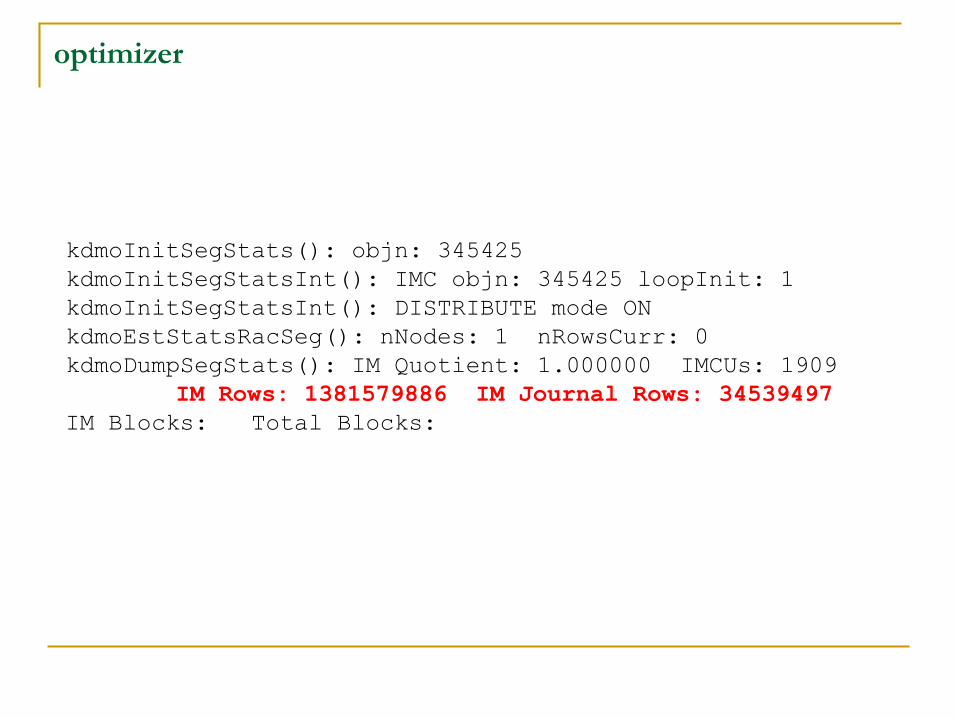
optimizer
kdmoInitSegStats(): objn: 345425
kdmoInitSegStatsInt(): IMC objn: 345425 loopInit: 1
kdmoInitSegStatsInt(): DISTRIBUTE mode ON
kdmoEstStatsRacSeg(): nNodes: 1 nRowsCurr: 0
kdmoDumpSegStats(): IM Quotient: 1.000000 IMCUs: 1909
IM Rows: 1381579886 IM Journal Rows: 34539497
IM Blocks: Total Blocks:
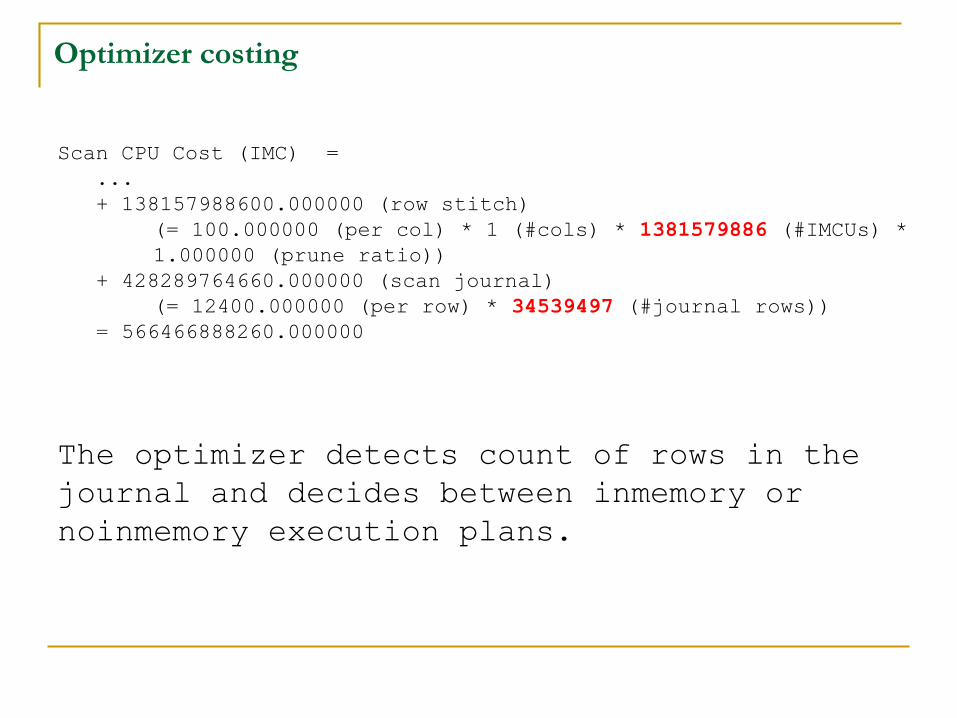
Optimizer costing
Scan CPU Cost (IMC) =
...
+ 138157988600.000000 (row stitch)
(= 100.000000 (per col) * 1 (#cols) * 1381579886 (#IMCUs) *
1.000000 (prune ratio))
+ 428289764660.000000 (scan journal)
(= 12400.000000 (per row) * 34539497 (#journal rows))
= 566466888260.000000
The optimizer detects count of rows in the
journal and decides between inmemory or
noinmemory execution plans.
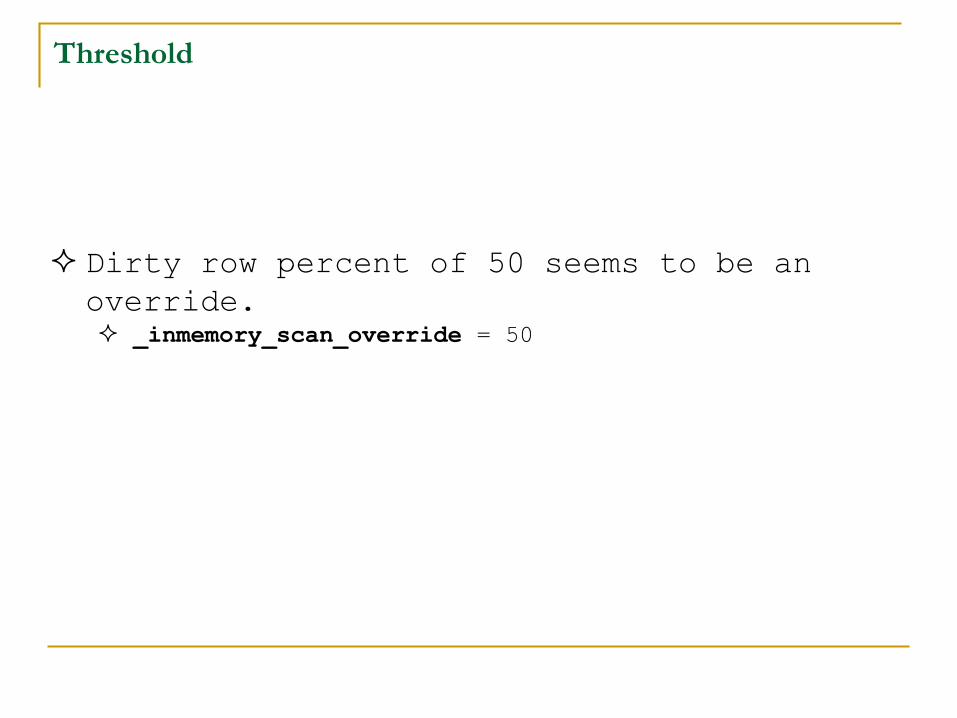
Threshold
Dirty row percent of 50 seems to be an
override. _inmemory_scan_override = 50
AGENDA
In-mem memory areas
Background processes
Optimizer & in-memory
tidbits
Interesting observations
Learnings
Conclusion
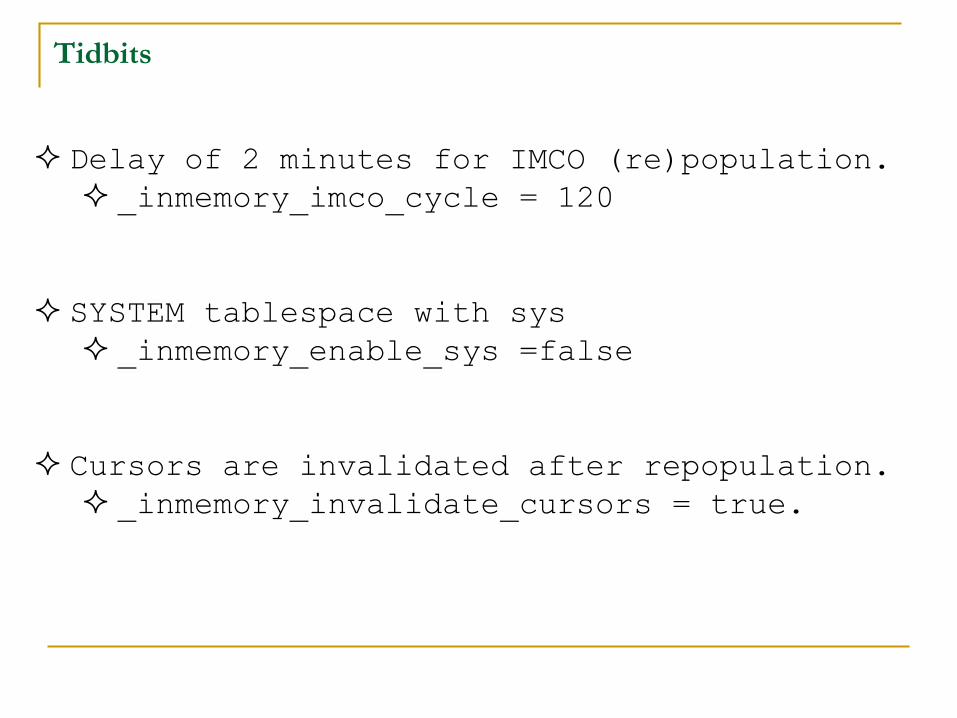
Tidbits
Delay of 2 minutes for IMCO (re)population.
_inmemory_imco_cycle = 120
SYSTEM tablespace with sys
_inmemory_enable_sys =false
Cursors are invalidated after repopulation.
_inmemory_invalidate_cursors = true.
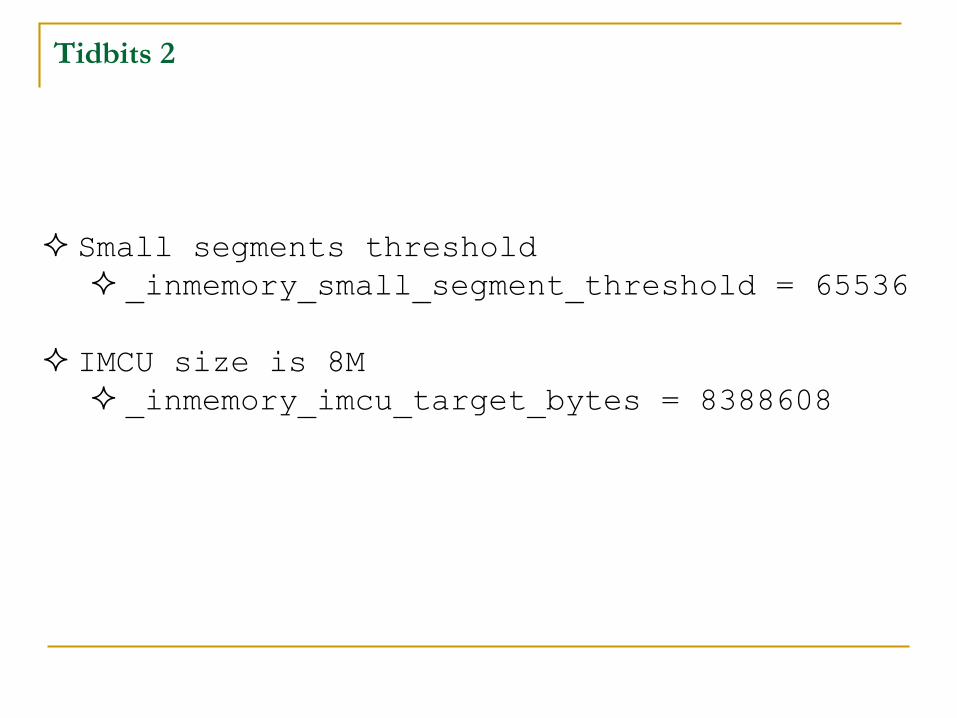
Tidbits 2
Small segments threshold
_inmemory_small_segment_threshold = 65536
IMCU size is 8M
_inmemory_imcu_target_bytes = 8388608
AGENDA
In-mem memory areas
Background processes
Optimizer & in-memory
tidbits
Interesting observations
Learnings
Conclusion
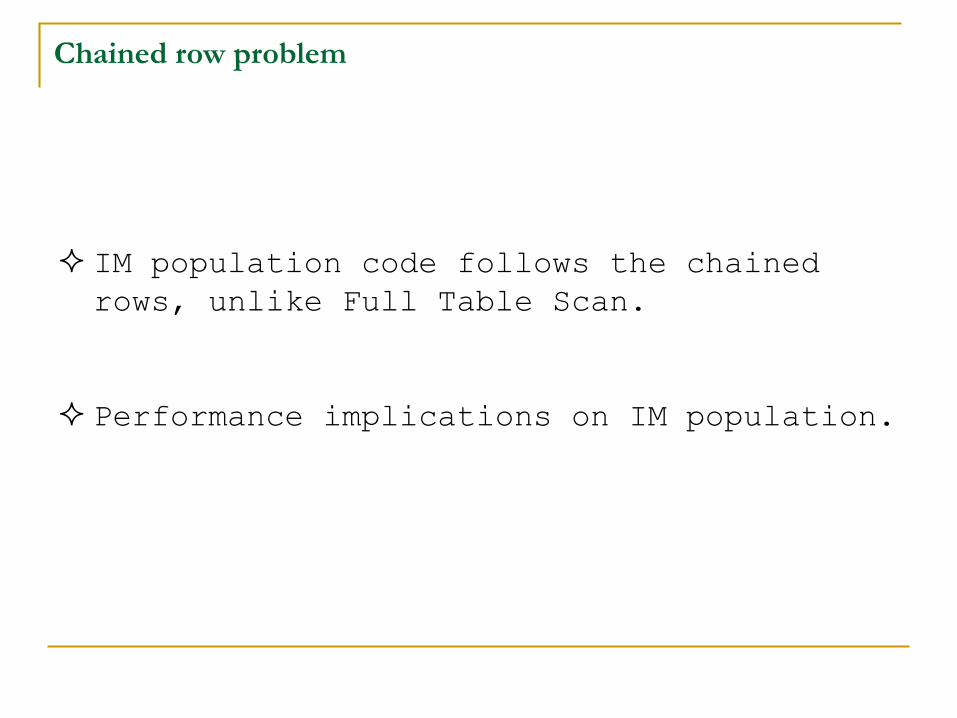
Chained row problem
IM population code follows the chained
rows, unlike Full Table Scan.
Performance implications on IM population.
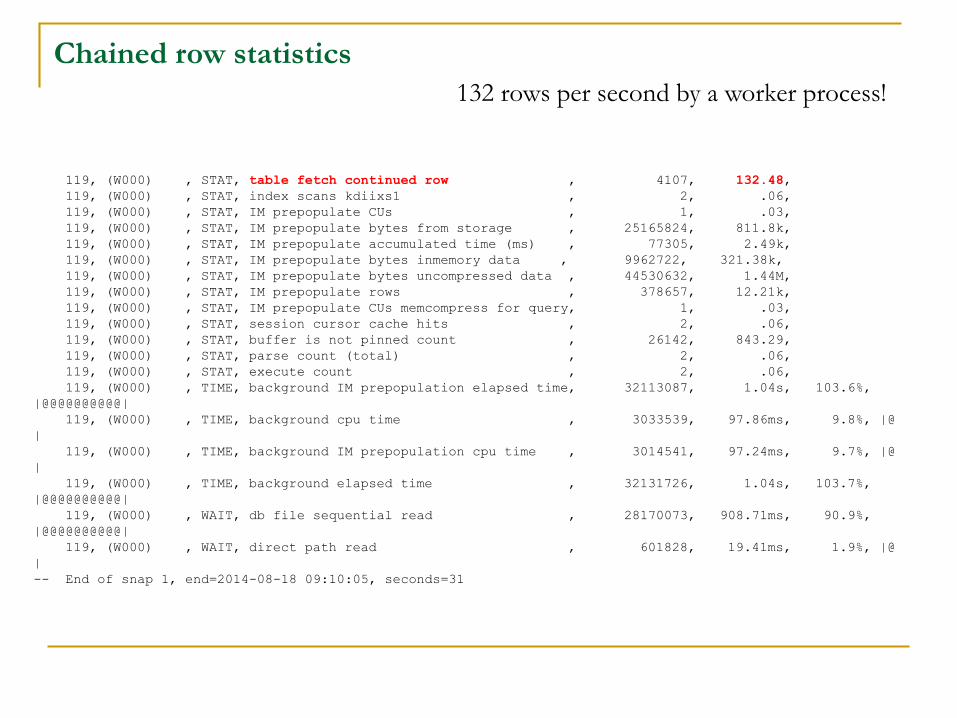
119, (W000) , STAT, table fetch continued row , 4107, 132.48,
119, (W000) , STAT, index scans kdiixs1 , 2, .06,
119, (W000) , STAT, IM prepopulate CUs , 1, .03,
119, (W000) , STAT, IM prepopulate bytes from storage , 25165824, 811.8k,
119, (W000) , STAT, IM prepopulate accumulated time (ms) , 77305, 2.49k,
119, (W000) , STAT, IM prepopulate bytes inmemory data , 9962722, 321.38k,
119, (W000) , STAT, IM prepopulate bytes uncompressed data , 44530632, 1.44M,
119, (W000) , STAT, IM prepopulate rows , 378657, 12.21k,
119, (W000) , STAT, IM prepopulate CUs memcompress for query, 1, .03,
119, (W000) , STAT, session cursor cache hits , 2, .06,
119, (W000) , STAT, buffer is not pinned count , 26142, 843.29,
119, (W000) , STAT, parse count (total) , 2, .06,
119, (W000) , STAT, execute count , 2, .06,
119, (W000) , TIME, background IM prepopulation elapsed time, 32113087, 1.04s, 103.6%,
|@@@@@@@@@@|
119, (W000) , TIME, background cpu time , 3033539, 97.86ms, 9.8%, |@
|
119, (W000) , TIME, background IM prepopulation cpu time , 3014541, 97.24ms, 9.7%, |@
|
119, (W000) , TIME, background elapsed time , 32131726, 1.04s, 103.7%,
|@@@@@@@@@@|
119, (W000) , WAIT, db file sequential read , 28170073, 908.71ms, 90.9%,
|@@@@@@@@@@|
119, (W000) , WAIT, direct path read , 601828, 19.41ms, 1.9%, |@
|
-- End of snap 1, end=2014-08-18 09:10:05, seconds=31
Chained row statistics
132 rows per second by a worker process!
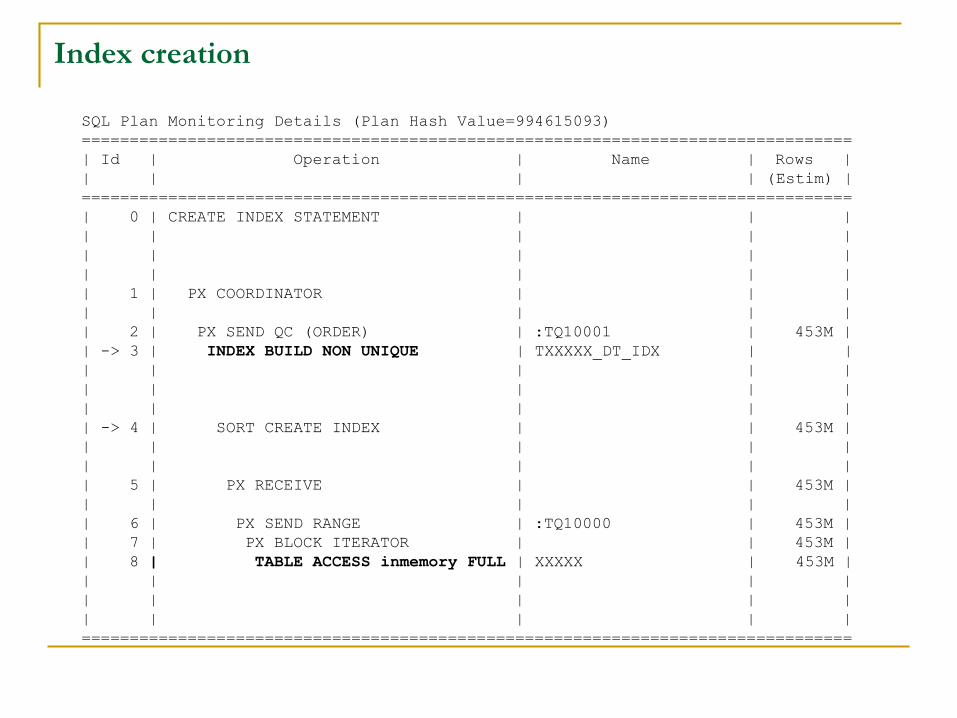
Index creation
SQL Plan Monitoring Details (Plan Hash Value=994615093)
================================================================================
| Id | Operation | Name | Rows |
| | | | (Estim) |
================================================================================
| 0 | CREATE INDEX STATEMENT | | |
| | | | |
| | | | |
| | | | |
| 1 | PX COORDINATOR | | |
| | | | |
| 2 | PX SEND QC (ORDER) | :TQ10001 | 453M |
| -> 3 | INDEX BUILD NON UNIQUE | TXXXXX_DT_IDX | |
| | | | |
| | | | |
| | | | |
| -> 4 | SORT CREATE INDEX | | 453M |
| | | | |
| | | | |
| 5 | PX RECEIVE | | 453M |
| | | | |
| 6 | PX SEND RANGE | :TQ10000 | 453M |
| 7 | PX BLOCK ITERATOR | | 453M |
| 8 | TABLE ACCESS inmemory FULL | XXXXX | 453M |
| | | | |
| | | | |
| | | | |
================================================================================
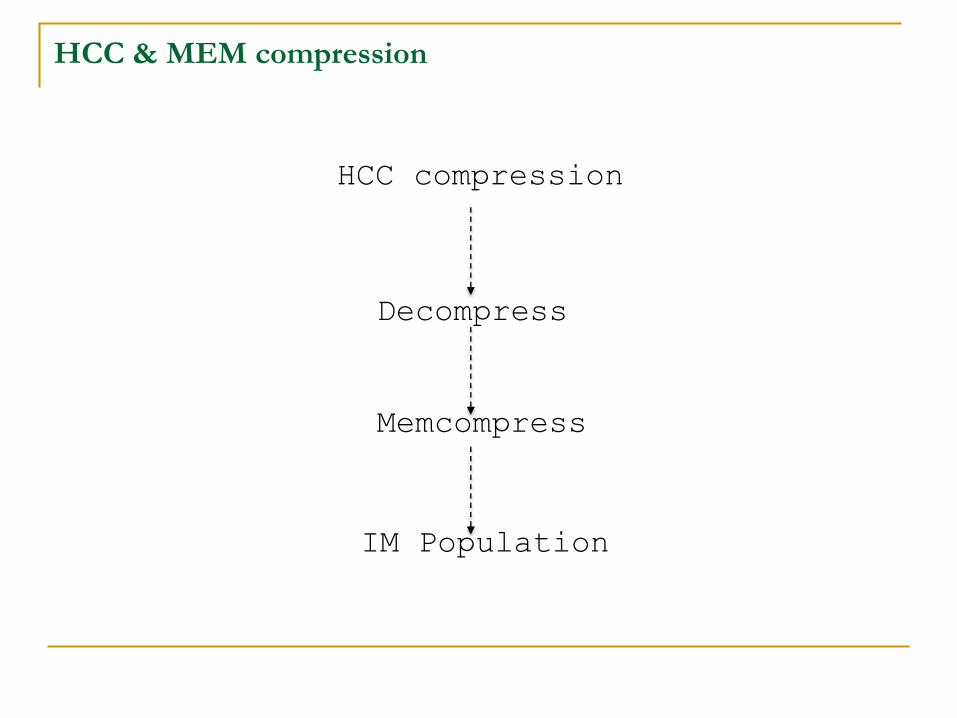
HCC & MEM compression
HCC compression
Decompress
Memcompress
IM Population
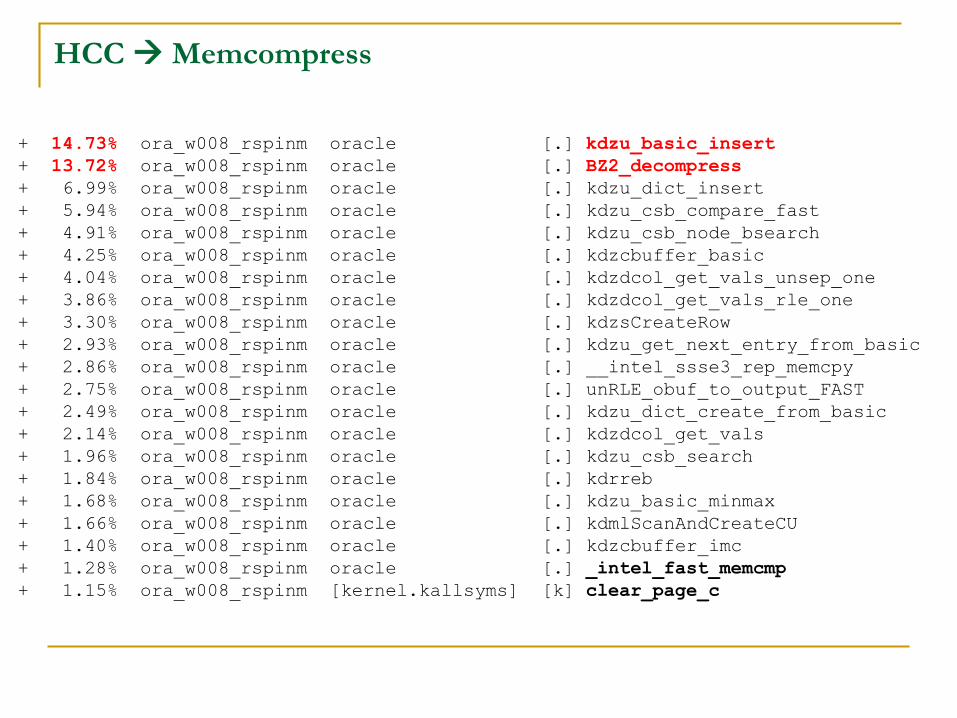
HCCMemcompress
+ 14.73% ora_w008_rspinm oracle [.] kdzu_basic_insert
+ 13.72% ora_w008_rspinm oracle [.] BZ2_decompress
+ 6.99% ora_w008_rspinm oracle [.] kdzu_dict_insert
+ 5.94% ora_w008_rspinm oracle [.] kdzu_csb_compare_fast
+ 4.91% ora_w008_rspinm oracle [.] kdzu_csb_node_bsearch
+ 4.25% ora_w008_rspinm oracle [.] kdzcbuffer_basic
+ 4.04% ora_w008_rspinm oracle [.] kdzdcol_get_vals_unsep_one
+ 3.86% ora_w008_rspinm oracle [.] kdzdcol_get_vals_rle_one
+ 3.30% ora_w008_rspinm oracle [.] kdzsCreateRow
+ 2.93% ora_w008_rspinm oracle [.] kdzu_get_next_entry_from_basic
+ 2.86% ora_w008_rspinm oracle [.] __intel_ssse3_rep_memcpy
+ 2.75% ora_w008_rspinm oracle [.] unRLE_obuf_to_output_FAST
+ 2.49% ora_w008_rspinm oracle [.] kdzu_dict_create_from_basic
+ 2.14% ora_w008_rspinm oracle [.] kdzdcol_get_vals
+ 1.96% ora_w008_rspinm oracle [.] kdzu_csb_search
+ 1.84% ora_w008_rspinm oracle [.] kdrreb
+ 1.68% ora_w008_rspinm oracle [.] kdzu_basic_minmax
+ 1.66% ora_w008_rspinm oracle [.] kdmlScanAndCreateCU
+ 1.40% ora_w008_rspinm oracle [.] kdzcbuffer_imc
+ 1.28% ora_w008_rspinm oracle [.] _intel_fast_memcmp
+ 1.15% ora_w008_rspinm [kernel.kallsyms] [k] clear_page_c
AGENDA
In-mem memory areas
Background processes
Optimizer & in-memory
tidbits
Interesting observations
Learnings
Conclusion
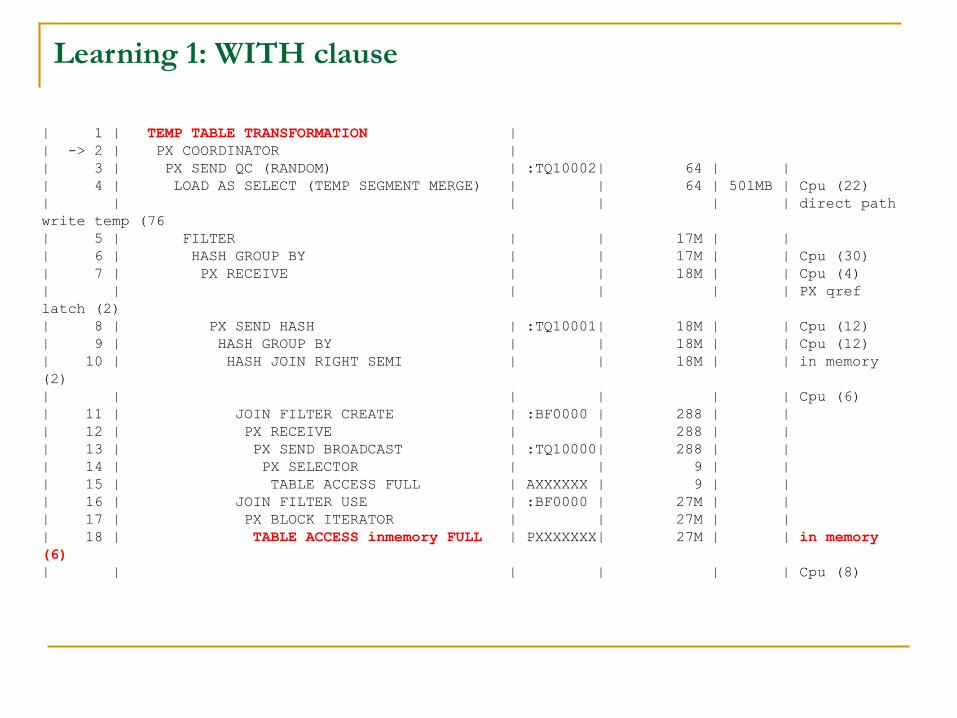
Learning 1: WITH clause
| 1 | TEMP TABLE TRANSFORMATION |
| -> 2 | PX COORDINATOR |
| 3 | PX SEND QC (RANDOM) | :TQ10002| 64 | |
| 4 | LOAD AS SELECT (TEMP SEGMENT MERGE) | | 64 | 501MB | Cpu (22)
| | | | | | direct path
write temp (76
| 5 | FILTER | | 17M | |
| 6 | HASH GROUP BY | | 17M | | Cpu (30)
| 7 | PX RECEIVE | | 18M | | Cpu (4)
| | | | | | PX qref
latch (2)
| 8 | PX SEND HASH | :TQ10001| 18M | | Cpu (12)
| 9 | HASH GROUP BY | | 18M | | Cpu (12)
| 10 | HASH JOIN RIGHT SEMI | | 18M | | in memory
(2)
| | | | | | Cpu (6)
| 11 | JOIN FILTER CREATE | :BF0000 | 288 | |
| 12 | PX RECEIVE | | 288 | |
| 13 | PX SEND BROADCAST | :TQ10000| 288 | |
| 14 | PX SELECTOR | | 9 | |
| 15 | TABLE ACCESS FULL | AXXXXXX | 9 | |
| 16 | JOIN FILTER USE | :BF0000 | 27M | |
| 17 | PX BLOCK ITERATOR | | 27M | |
| 18 | TABLE ACCESS inmemory FULL | PXXXXXXX| 27M | | in memory
(6)
| | | | | | Cpu (8)
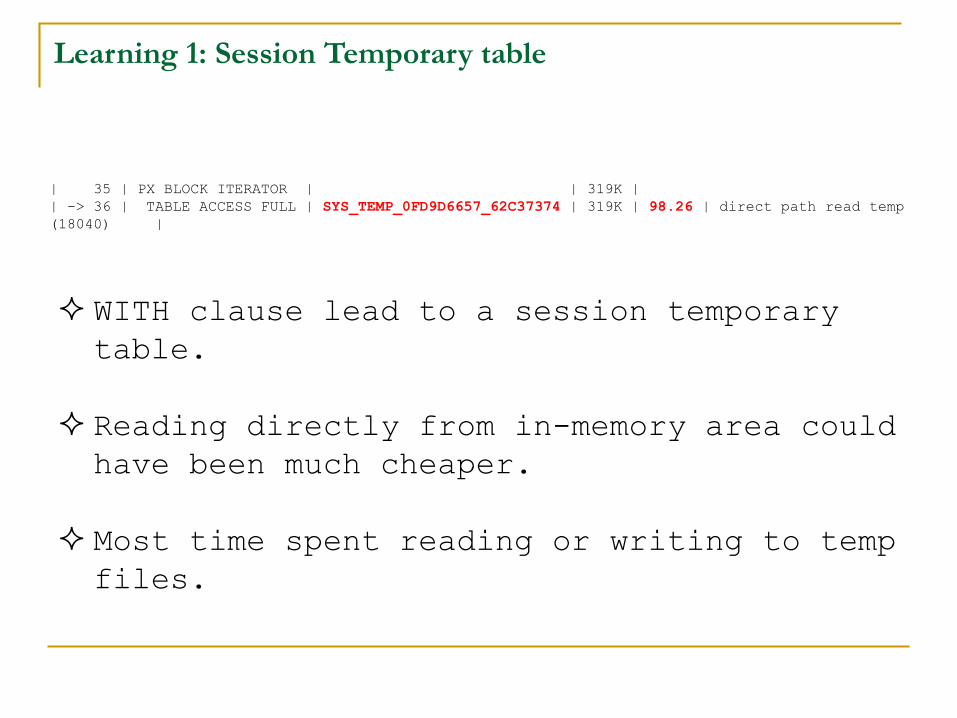
Learning 1: Session Temporary table
| 35 | PX BLOCK ITERATOR | | 319K |
| -> 36 | TABLE ACCESS FULL | SYS_TEMP_0FD9D6657_62C37374 | 319K | 98.26 | direct path read temp
(18040) |
WITH clause lead to a session temporary
table.
Reading directly from in-memory area could
have been much cheaper.
Most time spent reading or writing to temp
files.
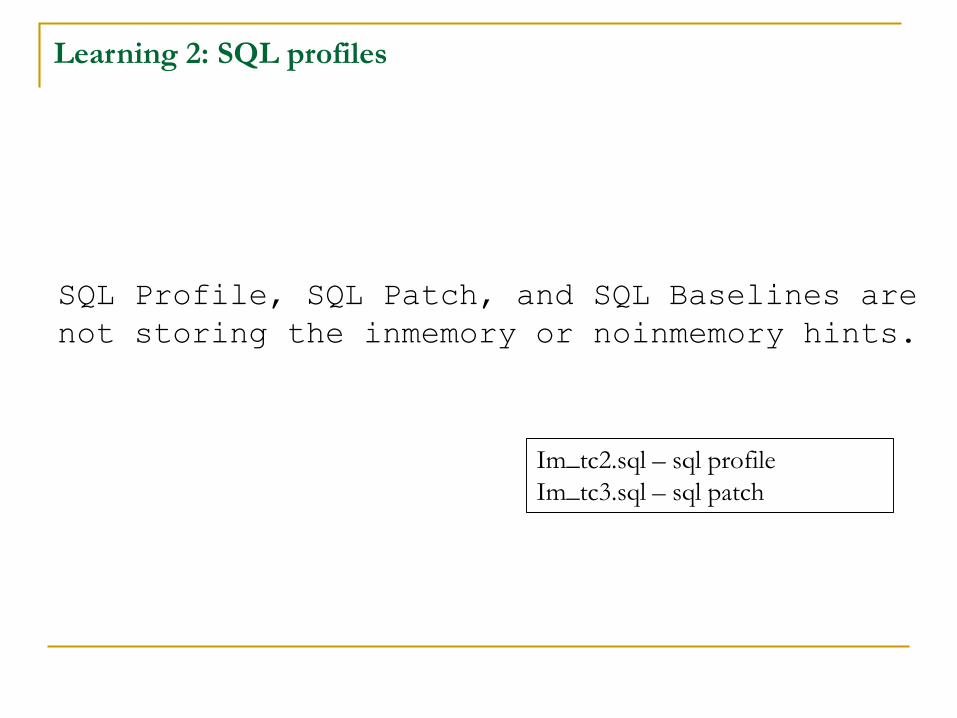
Learning 2: SQL profiles
SQL Profile, SQL Patch, and SQL Baselines are
not storing the inmemory or noinmemory hints.
Im_tc2.sql – sql profile
Im_tc3.sql – sql patch
Learning 3: DML statement
DML statements operate in the buffer cache.
You can’t reduce buffer cache or completely
eliminate indexes in a mixed workload
environment.
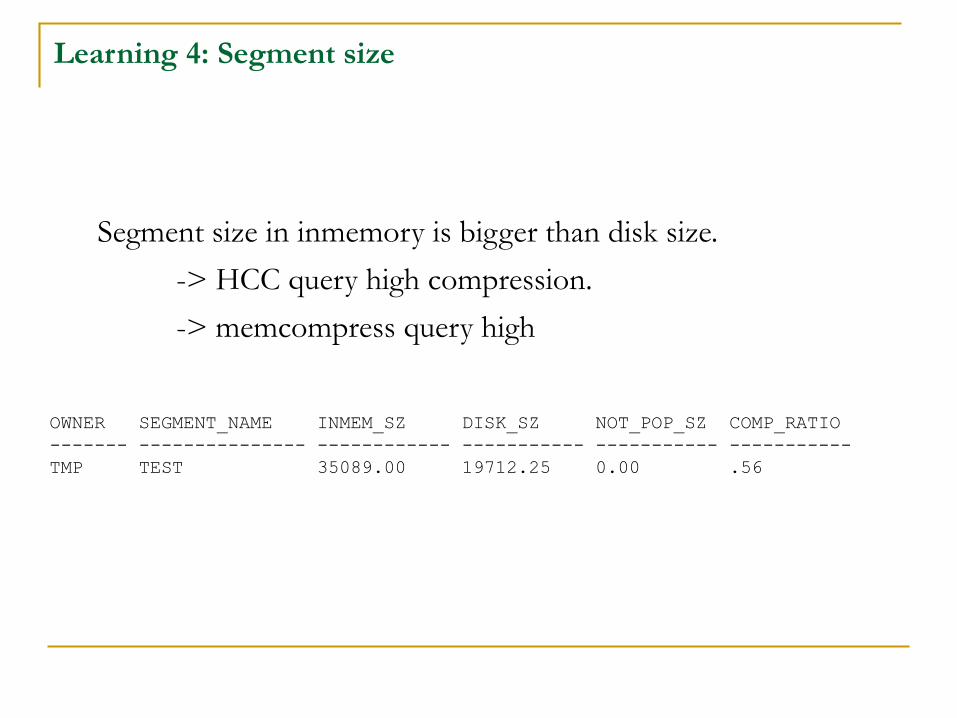
Learning 4: Segment size
OWNER SEGMENT_NAME INMEM_SZ DISK_SZ NOT_POP_SZ COMP_RATIO
------- --------------- ------------ ----------- ----------- -----------
TMP TEST 35089.00 19712.25 0.00 .56
Segment size in inmemory is bigger than disk size.
-> HCC query high compression.
-> memcompress query high
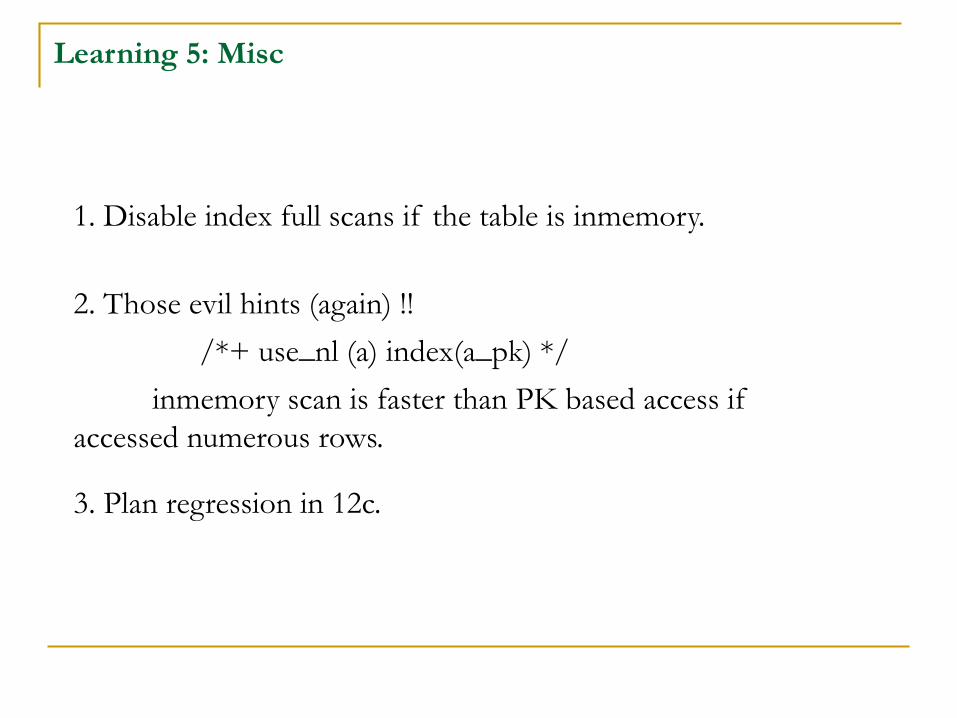
Learning 5: Misc
1. Disable index full scans if the table is inmemory.
2. Those evil hints (again) !!
/*+ use_nl (a) index(a_pk) */
inmemory scan is faster than PK based access if
accessed numerous rows.
3. Plan regression in 12c.
©OraInternals Riyaj Shamsudeen 44
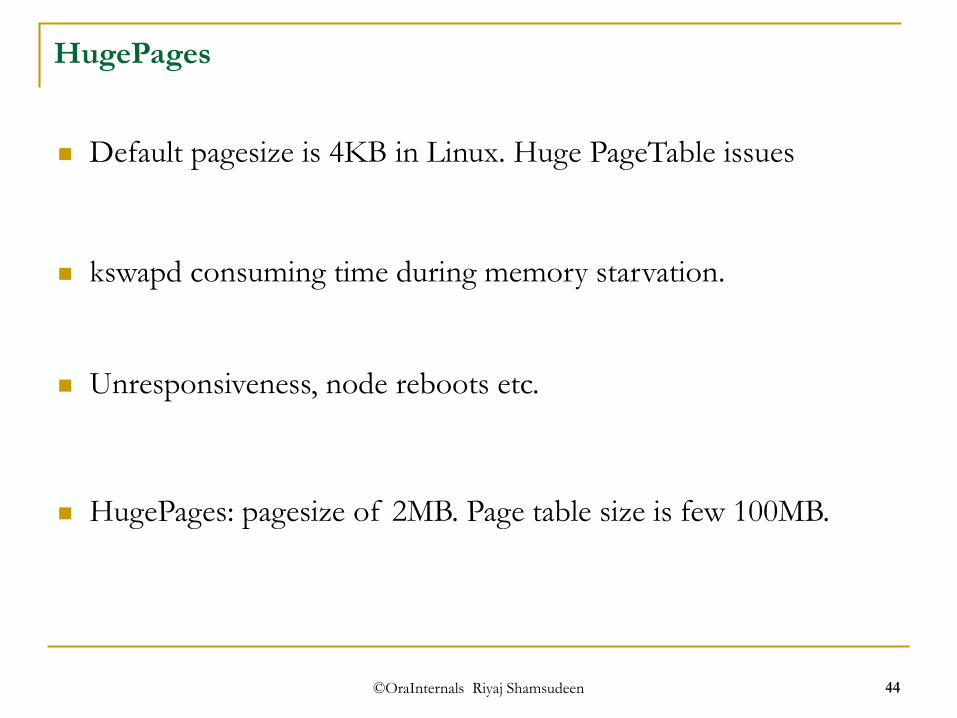
HugePages
Default pagesize is 4KB in Linux. Huge PageTable issues
kswapd consuming time during memory starvation.
Unresponsiveness, node reboots etc.
HugePages: pagesize of 2MB. Page table size is few 100MB.
©OraInternals Riyaj Shamsudeen 45
Should we use hugepage?
SGA is very big. 80% of physical memory for SGA+PGA.
Memory is completely locked for SGA.
We chose to use hugepages after testing with and without
hugepages. Remember the memory is locked!
©OraInternals Riyaj Shamsudeen 46
NUMA
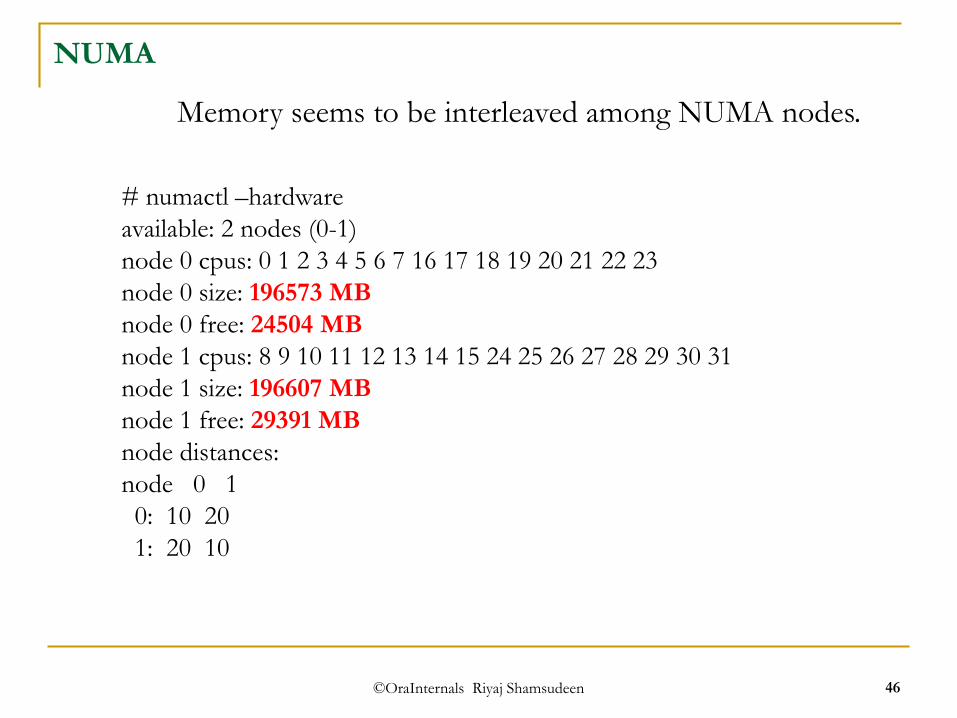
# numactl –hardware
available: 2 nodes (0-1)
node 0 cpus: 0 1 2 3 4 5 6 7 16 17 18 19 20 21 22 23
node 0 size: 196573 MB
node 0 free: 24504 MB
node 1 cpus: 8 9 10 11 12 13 14 15 24 25 26 27 28 29 30 31
node 1 size: 196607 MB
node 1 free: 29391 MB
node distances:
node 0 1
0: 10 20
1: 20 10
Memory seems to be interleaved among NUMA nodes.
Prepage: sa00
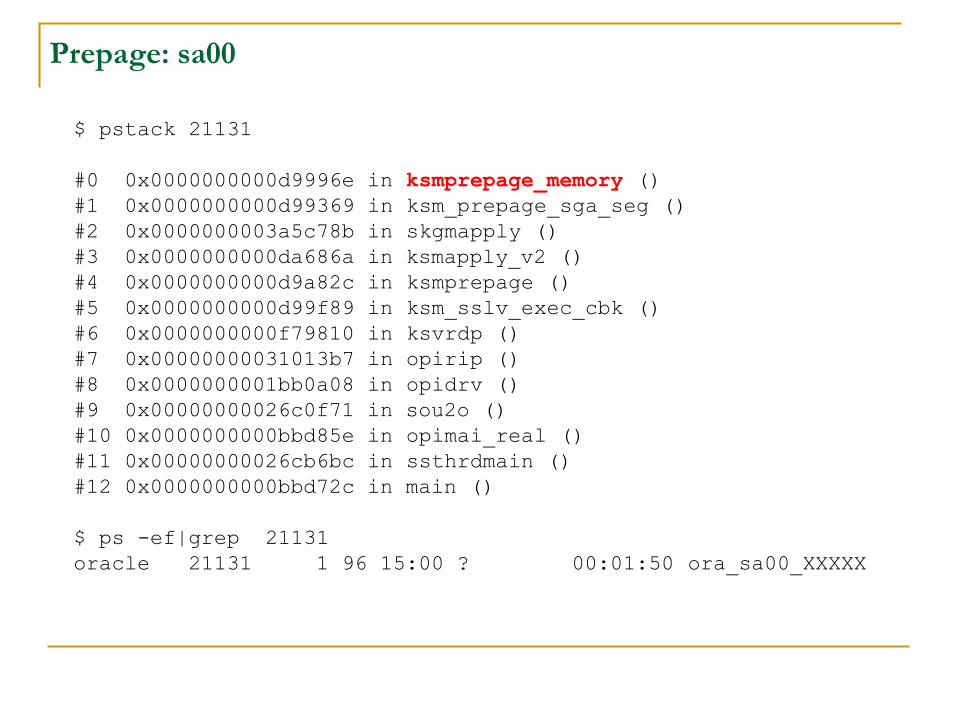
$ pstack 21131
#0 0x0000000000d9996e in ksmprepage_memory ()
#1 0x0000000000d99369 in ksm_prepage_sga_seg ()
#2 0x0000000003a5c78b in skgmapply ()
#3 0x0000000000da686a in ksmapply_v2 ()
#4 0x0000000000d9a82c in ksmprepage ()
#5 0x0000000000d99f89 in ksm_sslv_exec_cbk ()
#6 0x0000000000f79810 in ksvrdp ()
#7 0x00000000031013b7 in opirip ()
#8 0x0000000001bb0a08 in opidrv ()
#9 0x00000000026c0f71 in sou2o ()
#10 0x0000000000bbd85e in opimai_real ()
#11 0x00000000026cb6bc in ssthrdmain ()
#12 0x0000000000bbd72c in main ()
$ ps -ef|grep 21131
oracle 21131 1 96 15:00 ? 00:01:50 ora_sa00_XXXXX
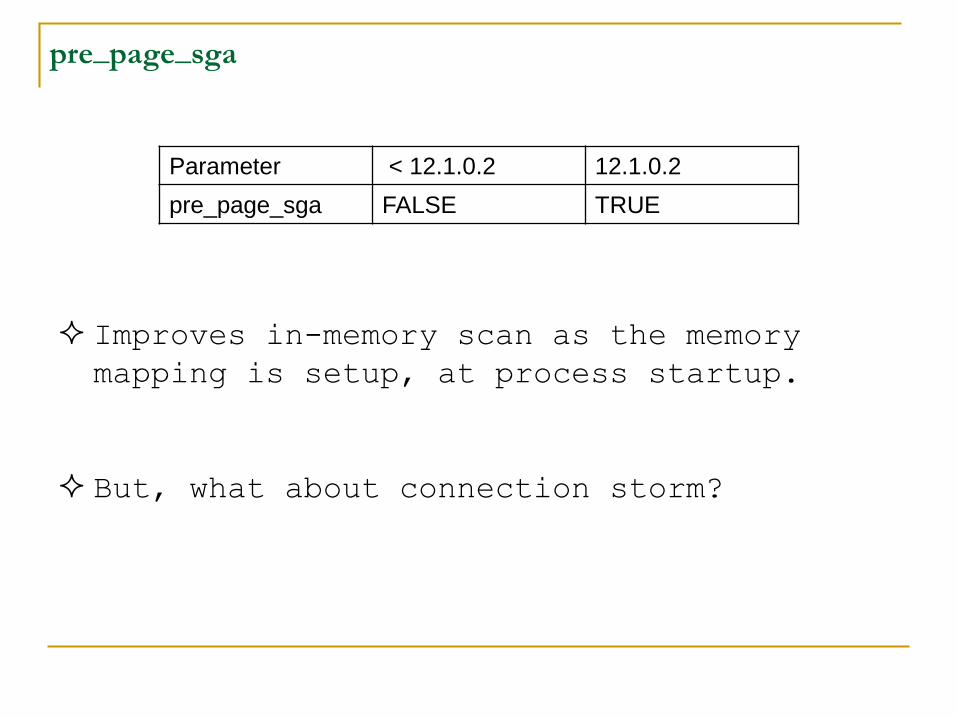
Improves in-memory scan as the memory
mapping is setup, at process startup.
But, what about connection storm?
Parameter < 12.1.0.2 12.1.0.2
pre_page_sga FALSE TRUE
pre_page_sga
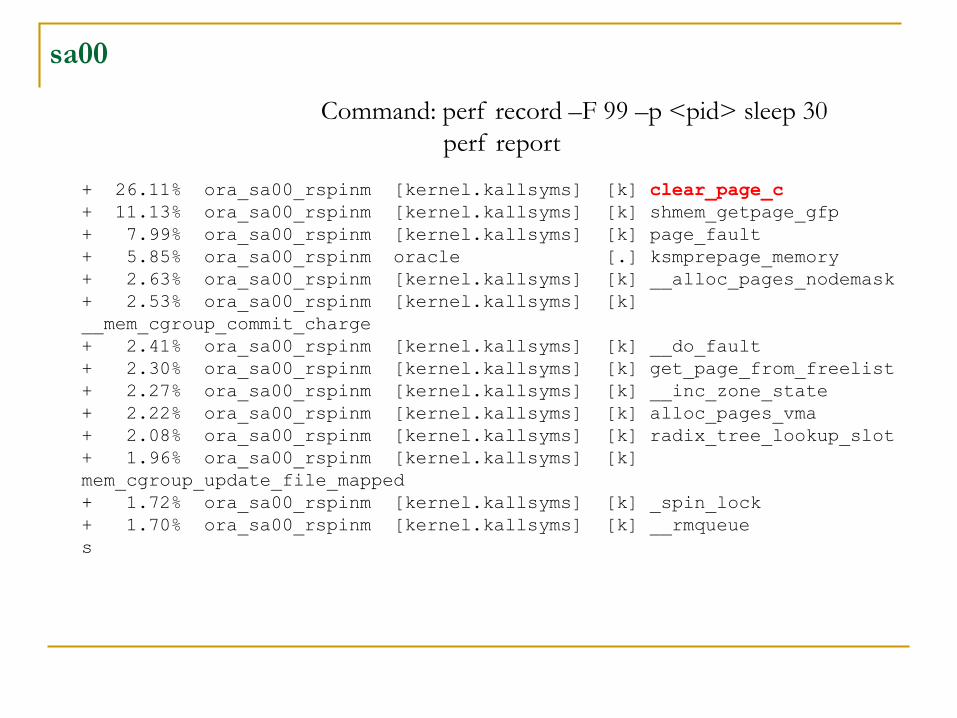
sa00
+ 26.11% ora_sa00_rspinm [kernel.kallsyms] [k] clear_page_c
+ 11.13% ora_sa00_rspinm [kernel.kallsyms] [k] shmem_getpage_gfp
+ 7.99% ora_sa00_rspinm [kernel.kallsyms] [k] page_fault
+ 5.85% ora_sa00_rspinm oracle [.] ksmprepage_memory
+ 2.63% ora_sa00_rspinm [kernel.kallsyms] [k] __alloc_pages_nodemask
+ 2.53% ora_sa00_rspinm [kernel.kallsyms] [k]
__mem_cgroup_commit_charge
+ 2.41% ora_sa00_rspinm [kernel.kallsyms] [k] __do_fault
+ 2.30% ora_sa00_rspinm [kernel.kallsyms] [k] get_page_from_freelist
+ 2.27% ora_sa00_rspinm [kernel.kallsyms] [k] __inc_zone_state
+ 2.22% ora_sa00_rspinm [kernel.kallsyms] [k] alloc_pages_vma
+ 2.08% ora_sa00_rspinm [kernel.kallsyms] [k] radix_tree_lookup_slot
+ 1.96% ora_sa00_rspinm [kernel.kallsyms] [k]
mem_cgroup_update_file_mapped
+ 1.72% ora_sa00_rspinm [kernel.kallsyms] [k] _spin_lock
+ 1.70% ora_sa00_rspinm [kernel.kallsyms] [k] __rmqueue
s
Command: perf record –F 99 –p <pid> sleep 30
perf report
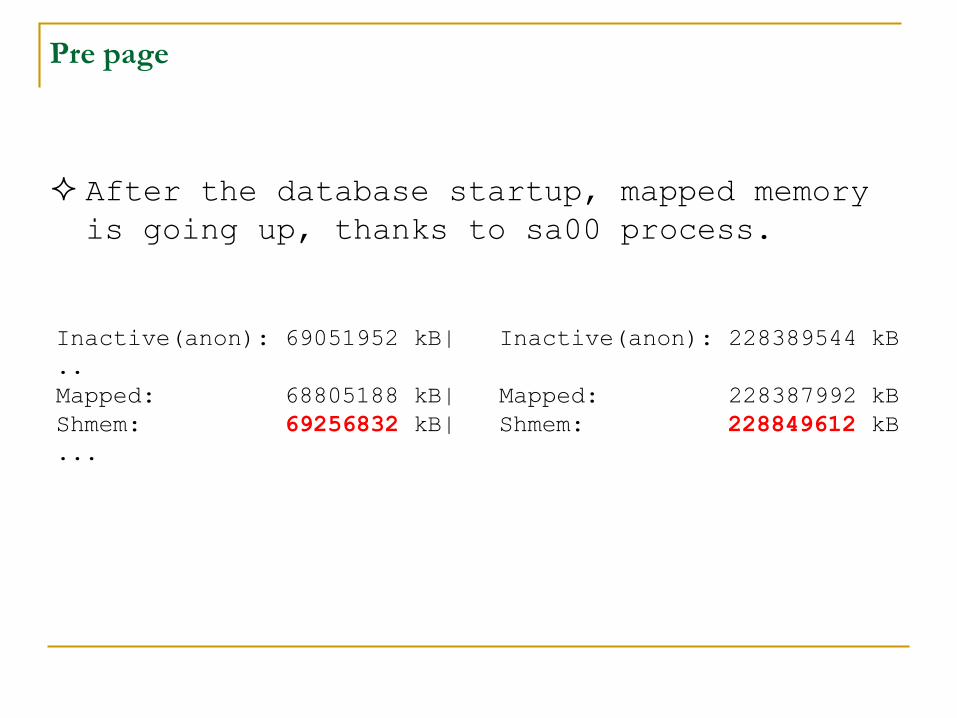
Pre page
Inactive(anon): 69051952 kB| Inactive(anon): 228389544 kB
..
Mapped: 68805188 kB| Mapped: 228387992 kB
Shmem: 69256832 kB| Shmem: 228849612 kB
...
After the database startup, mapped memory
is going up, thanks to sa00 process.
©OraInternals Riyaj Shamsudeen 51
Summary
inmemory scans are faster, much faster in parallel!!
Initial learning curve will be steep.
You learnt how to understand and debug inmemory issues!
©OraInternals Riyaj Shamsudeen 52
THANK YOU
Email: [email protected]
Blog : orainternals.wordpress.com
Web: www.orainternals.com