

Ifpschool2016
120
gabriel.plassat @ ademe.fr http://gabrielplassat.fr Mobility & Transportation System for the Future Which Mobility for the future ? For every one, everywhere In a world of less raw material and more intelligence …
-
Upload
les-transports-du-futur -
Category
Education
-
view
1.036 -
download
0
Transcript of Ifpschool2016
gabriel.plassat @ ademe.fr
http://gabrielplassat.fr
Mobility & Transportation System for the Future
Which Mobility for the future ? For every one, everywhere
In a world of less raw material and more intelligence …
gabriel.plassat @ ademe.fr
Agence De l’Environnement et de la Maîtrise de l’Energie Service Transports et Mobilité, en charge des Energies et de la Prospective
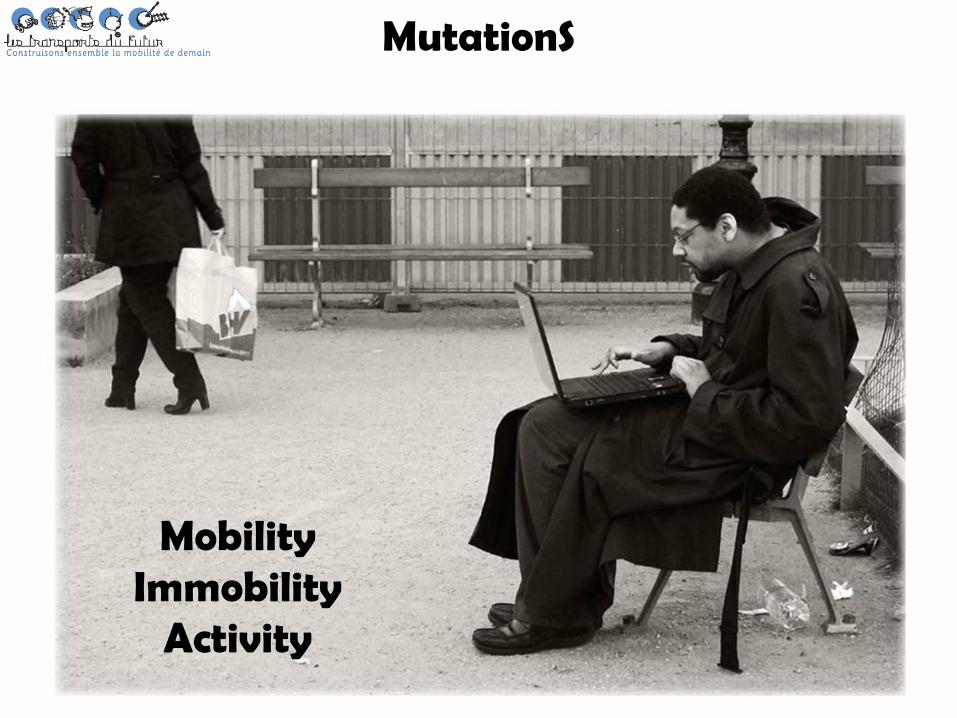
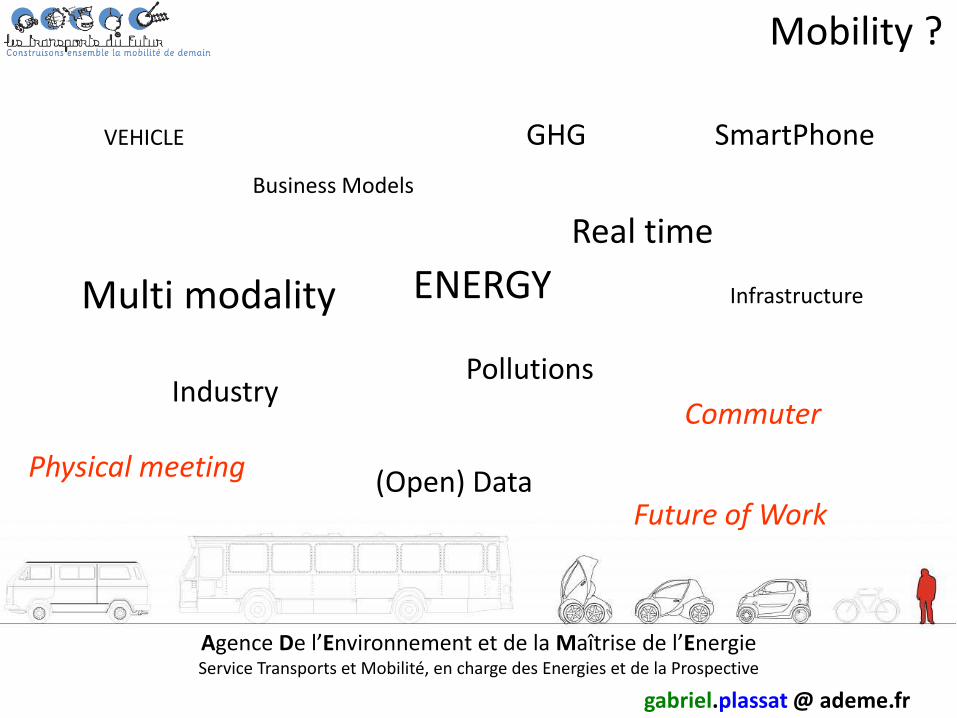
Mobility ?
Business Models
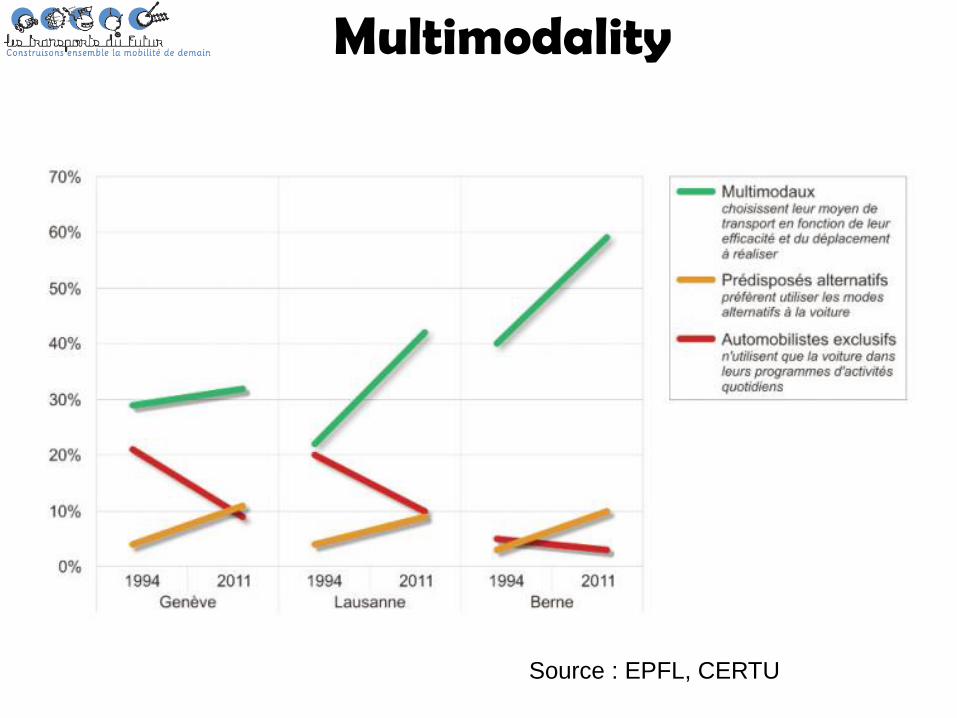
Multi modality
Real time
Pollutions Industry
GHG
Commuter
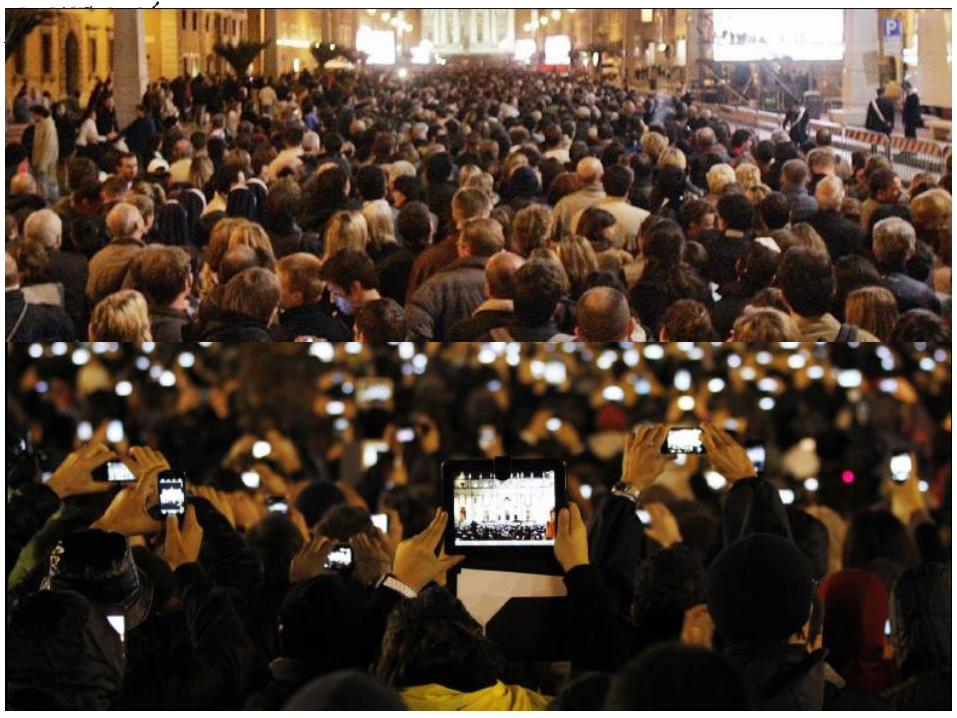
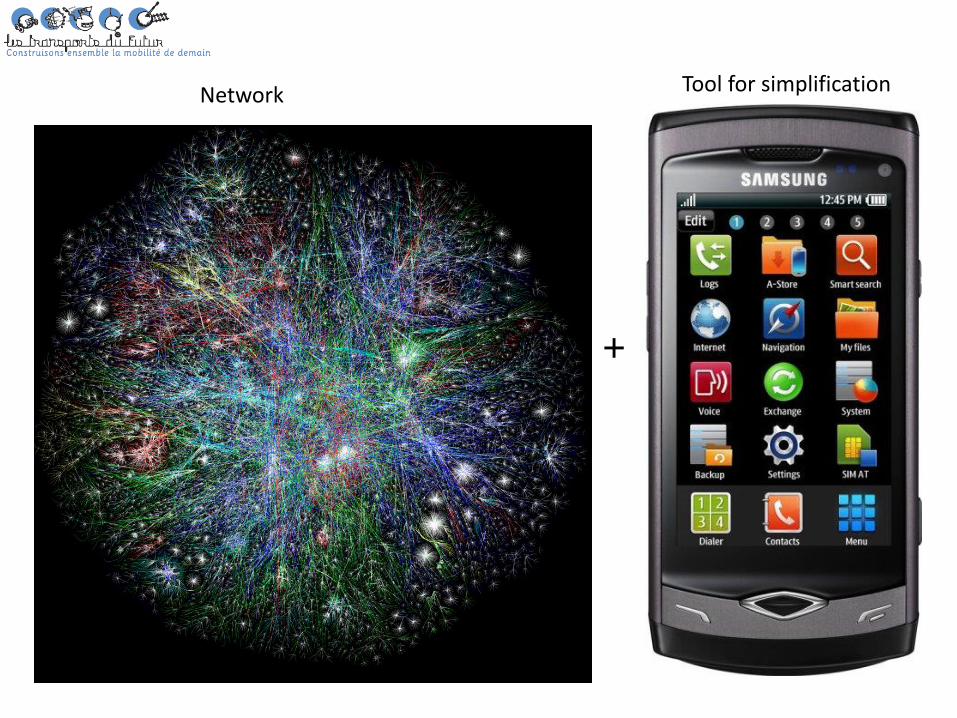
(Open) Data
SmartPhone
Physical meeting
VEHICLE
ENERGY Infrastructure
Future of Work
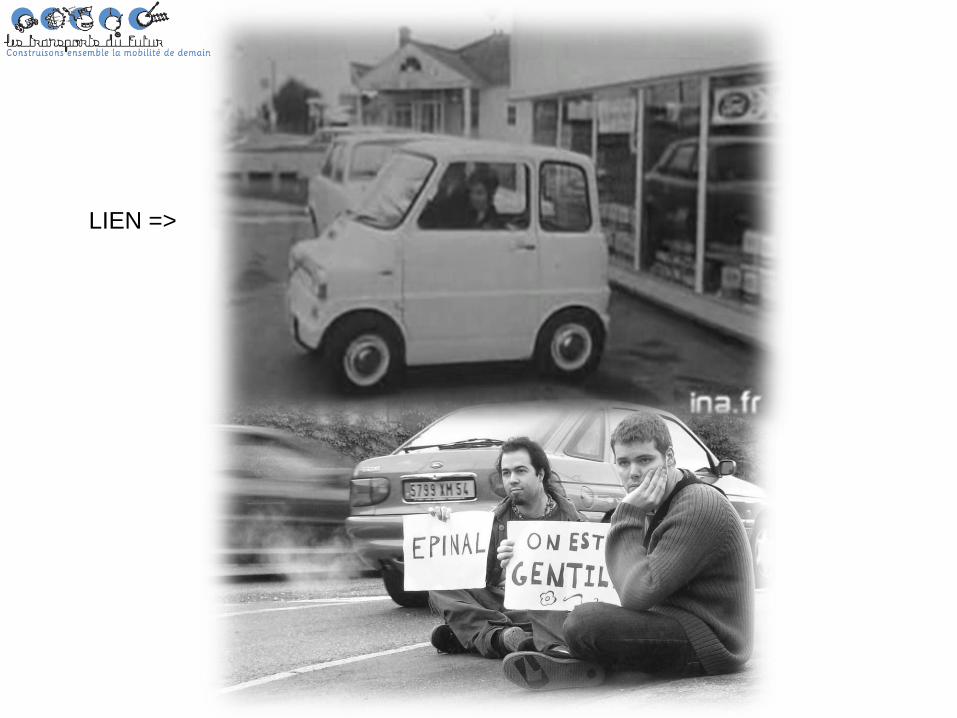
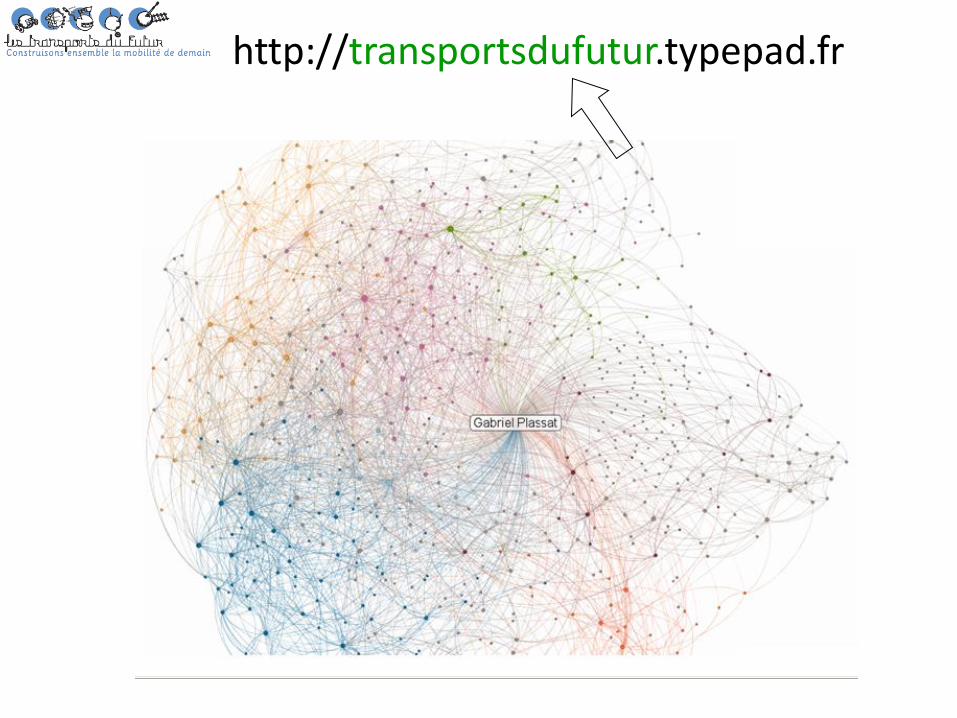
LIEN =>
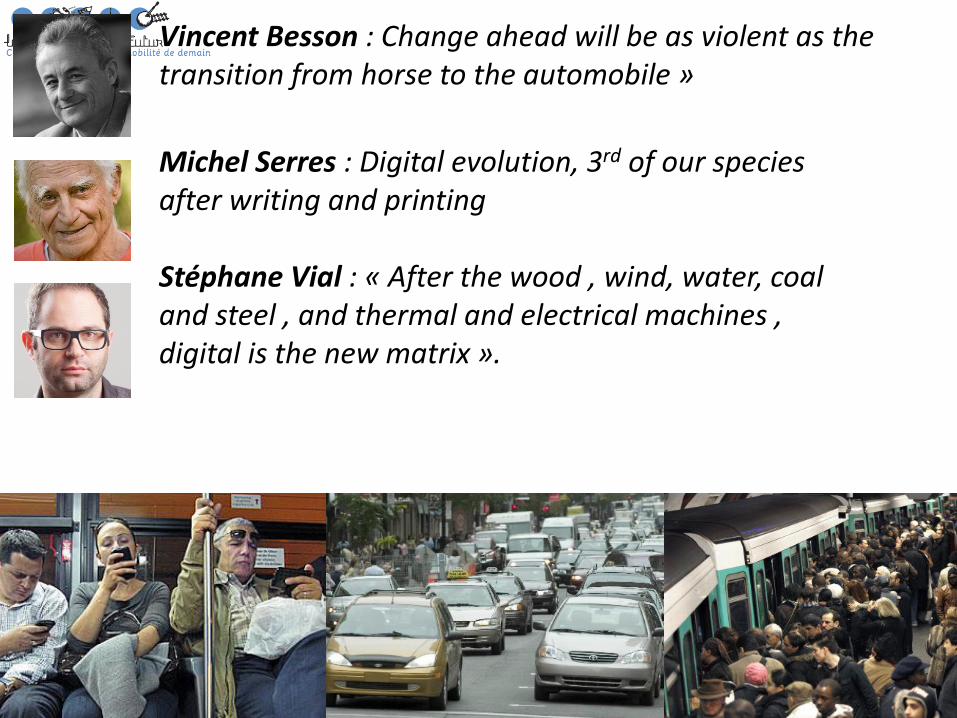
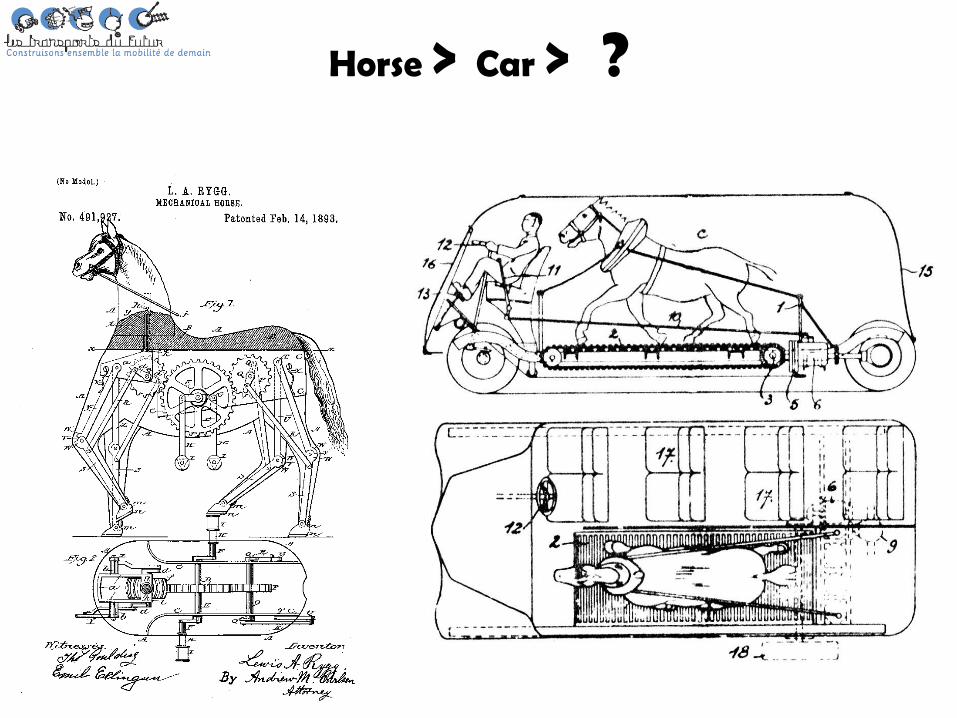
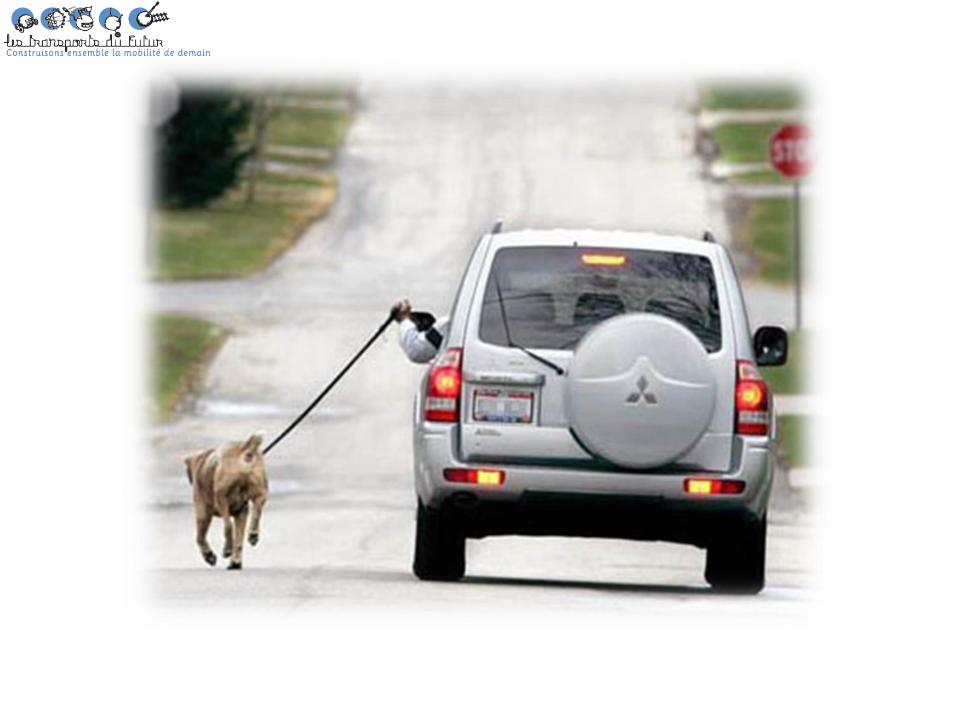
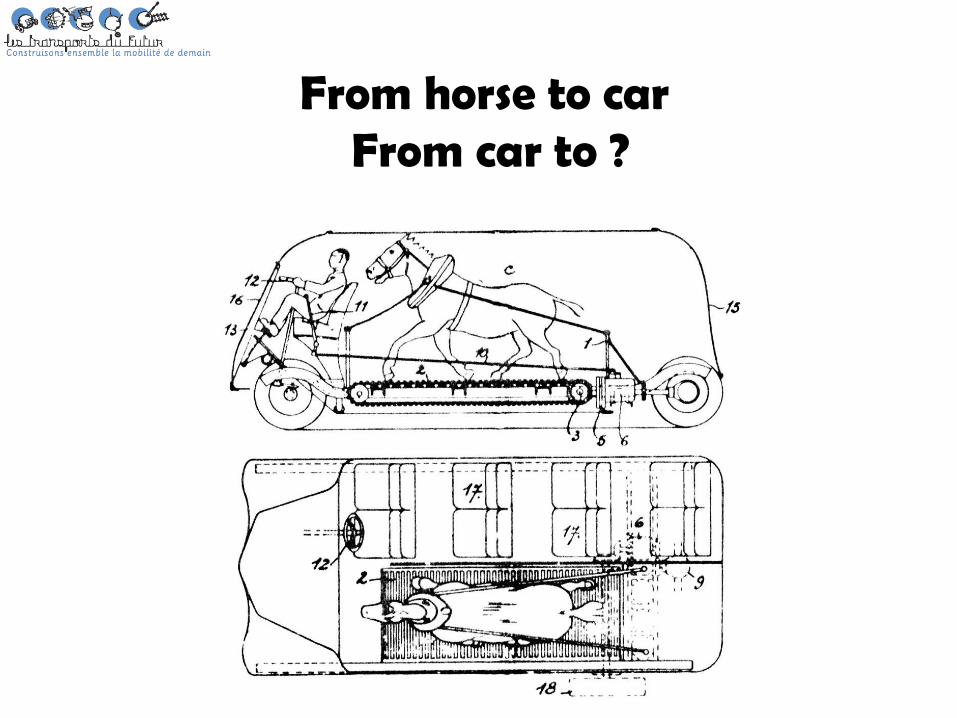
Vincent Besson : Change ahead will be as violent as the transition from horse to the automobile »
Michel Serres : Digital evolution, 3rd of our species after writing and printing Stéphane Vial : « After the wood , wind, water, coal and steel , and thermal and electrical machines , digital is the new matrix ».
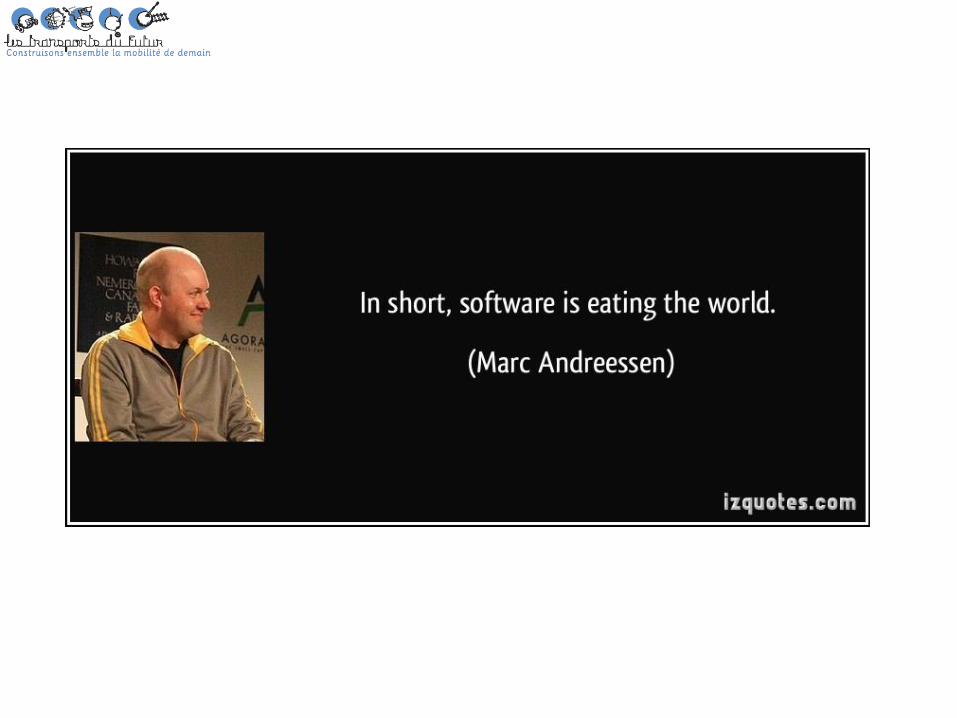
• The digital becomes the dominant technique. New Industrial
empires are built around
• The mutation of the object in the service is a chance
• A new ecosystem is created , users are at the center , the
data is the fuel ( renewable)
• Innovations are carried by start-ups
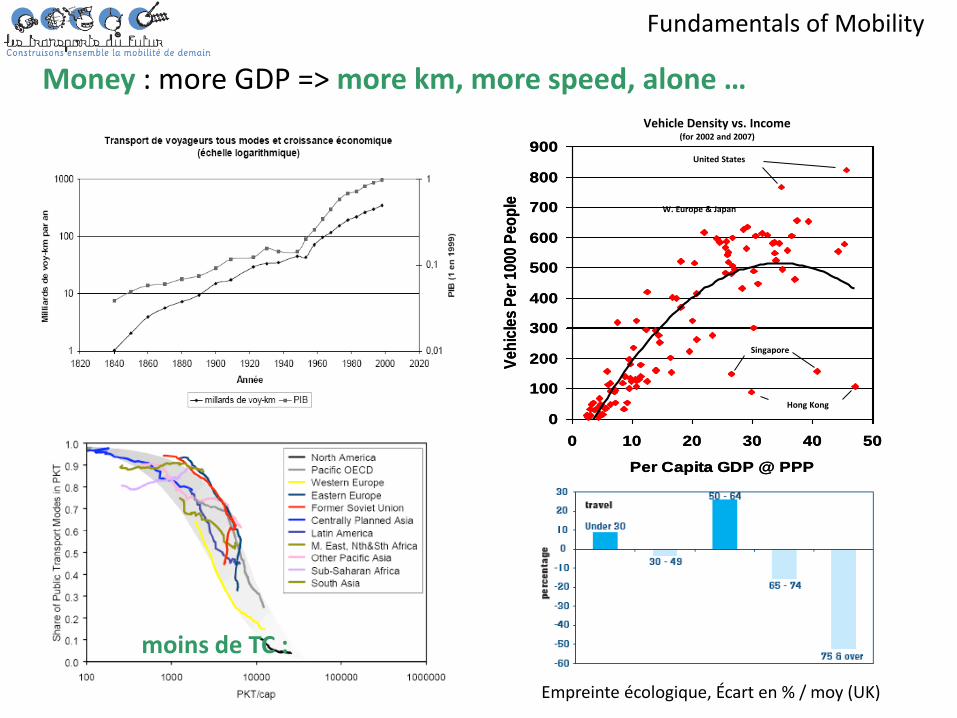
Money : more GDP => more km, more speed, alone …
moins de TC :
0
100
200
300
400
500
600
700
800
900
0 10 20 30 40 50
Per Capita GDP @ PPP
Ve
hic
les
Pe
r 1
00
0 P
eo
ple
0
100
200
300
400
500
600
700
800
900
0 10 20 30 40 50
Per Capita GDP @ PPP
Ve
hic
les
Pe
r 1
00
0 P
eo
ple
Vehicle Density vs. Income (for 2002 and 2007)
Singapore
Hong Kong
United States
W. Europe & Japan
Empreinte écologique, Écart en % / moy (UK)
Fundamentals of Mobility
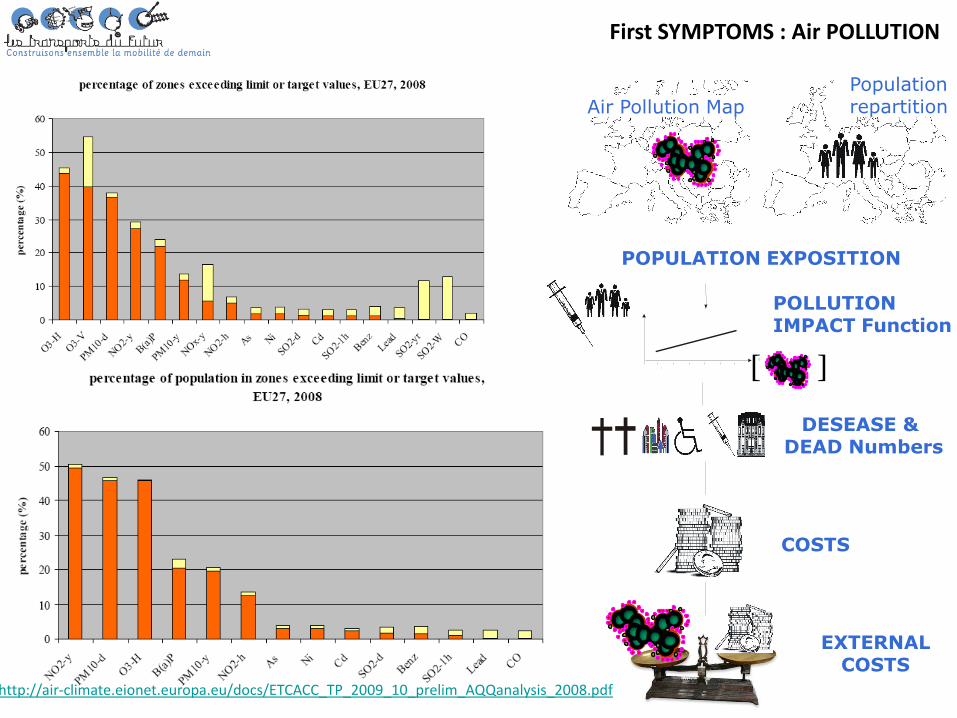
http://air-climate.eionet.europa.eu/docs/ETCACC_TP_2009_10_prelim_AQQanalysis_2008.pdf
First SYMPTOMS : Air POLLUTION
Cadastre population
POPULATION EXPOSITION
POLLUTION IMPACT Function
DESEASE & DEAD Numbers
0
EXTERNAL COSTS
Air Pollution Map Population repartition
COSTS
[ ]
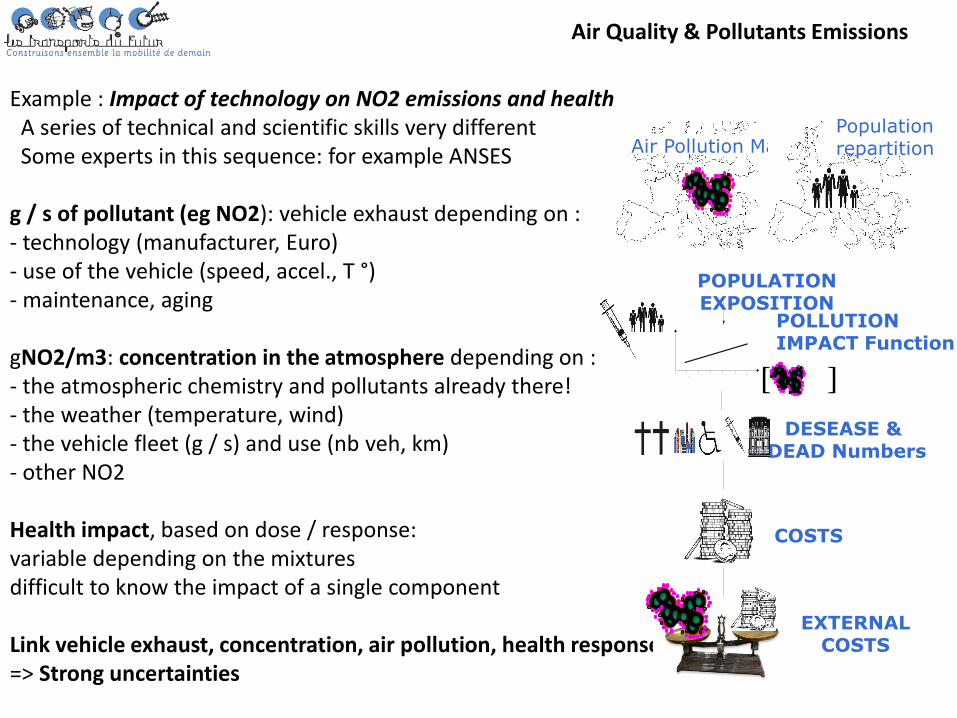
Example : Impact of technology on NO2 emissions and health A series of technical and scientific skills very different Some experts in this sequence: for example ANSES g / s of pollutant (eg NO2): vehicle exhaust depending on : - technology (manufacturer, Euro) - use of the vehicle (speed, accel., T °) - maintenance, aging gNO2/m3: concentration in the atmosphere depending on : - the atmospheric chemistry and pollutants already there! - the weather (temperature, wind) - the vehicle fleet (g / s) and use (nb veh, km) - other NO2 Health impact, based on dose / response: variable depending on the mixtures difficult to know the impact of a single component Link vehicle exhaust, concentration, air pollution, health response … => Strong uncertainties
Air Quality & Pollutants Emissions
Cadastre population
POPULATION EXPOSITION
POLLUTION IMPACT Function
DESEASE & DEAD Numbers
0
EXTERNAL COSTS
Air Pollution Map Population repartition
COSTS
[ ]
Need for a method and tools to choose
Need tools to select, adapt / user / criteria: •Tool to create and / or access to new strategic data, •Multi criteria aggregation tool: pollutant, CO2, €, ... •Tool for comparison and selection Some examples ...
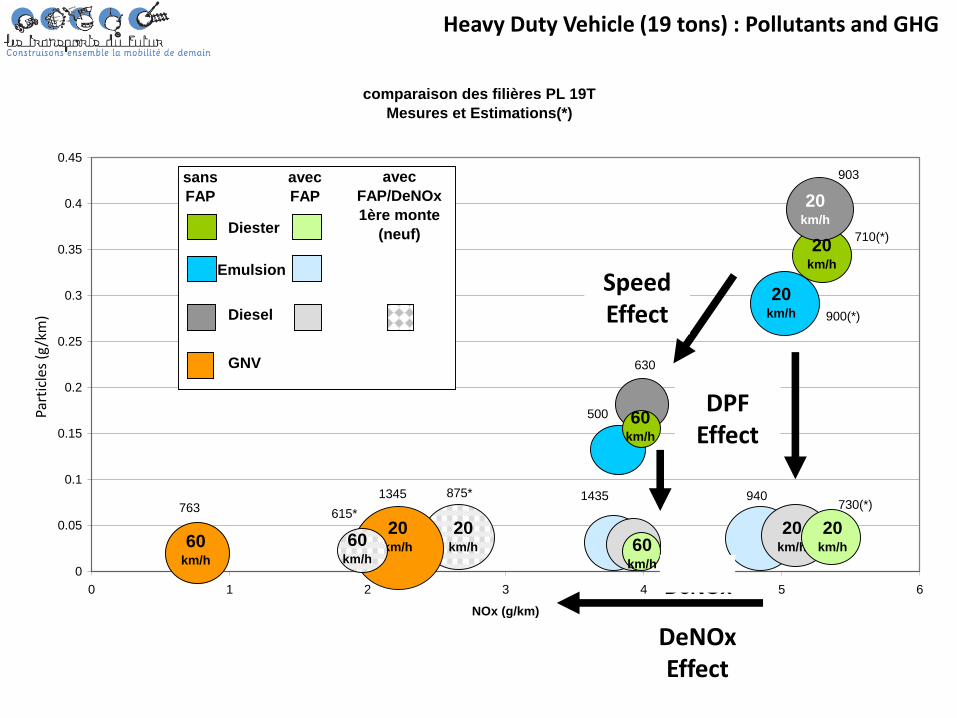
comparaison des filières PL 19T
Mesures et Estimations(*)
0
0.05
0.1
0.15
0.2
0.25
0.3
0.35
0.4
0.45
0 1 2 3 4 5 6
NOx (g/km)
Part
icu
les (
g/k
m)
60km/h
903
500
763
900(*)
710(*)20
km/h
20km/h
20km/h
60km/h 60
km/h
60km/h
60km/h
20km/h
20km/h
Diester
Emulsion
Diesel
GNV
sans
FAP
avec
FAP
avec
FAP/DeNOx
1ère monte
(neuf)
20km/h
9401345730(*)
EFFET
du FAP
EFFET de
l'usage
630
615*
875*
60km/h EFFET
DeNOx
1435
20km/h
Heavy Duty Vehicle (19 tons) : Pollutants and GHG Pa
rtic
les
(g/k
m)
Speed Effect
DPF Effect
DeNOx Effect
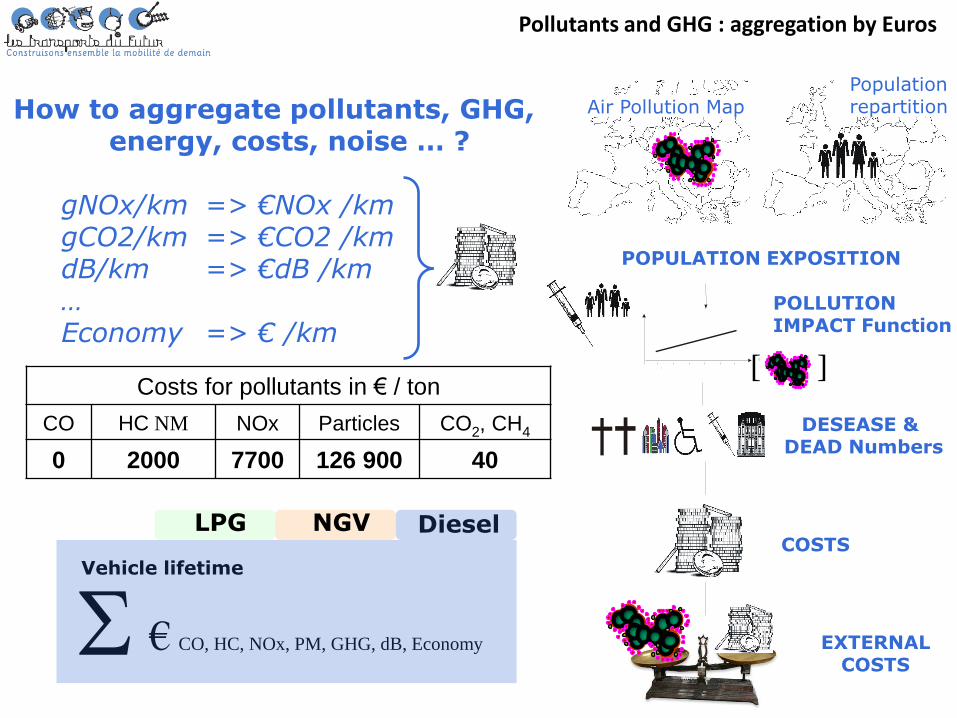
How to aggregate pollutants, GHG, energy, costs, noise … ?
gNOx/km => €NOx /km gCO2/km => €CO2 /km dB/km => €dB /km … Economy => € /km 3
Vehicle lifetime
€ CO, HC, NOx, PM, GHG, dB, Economy
Cadastre population
POPULATION EXPOSITION
POLLUTION IMPACT Function
DESEASE & DEAD Numbers
0
EXTERNAL COSTS
Air Pollution Map Population repartition
COSTS
[ ]
Diesel NGV LPG
Costs for pollutants in € / ton
CO HC NM NOx Particles CO2, CH4
0 2000 7700 126 900 40
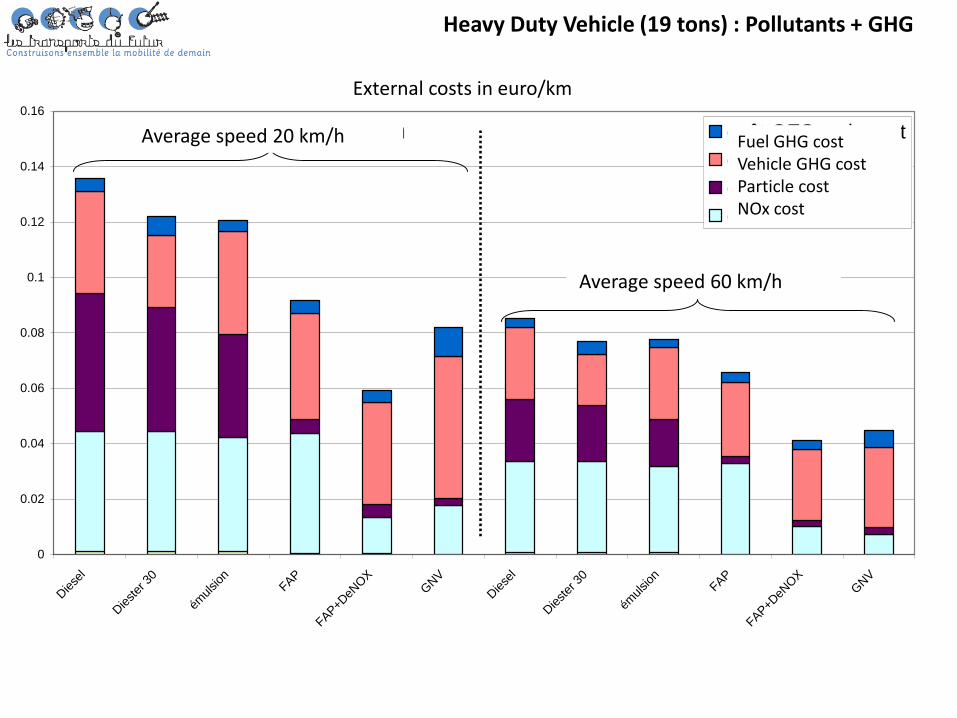
Pollutants and GHG : aggregation by Euros
0
0.02
0.04
0.06
0.08
0.1
0.12
0.14
0.16
Diese
l
Diester
30
émulsion
FAP
FAP+D
eNOX
GNV
Diese
l
Diester
30
émulsion
FAP
FAP+D
eNOX
GNV
coût GES carburant
coût GES véhicule
coût Part.
coût Nox
Vitesse moyenne 20 km/h
Vitesse moyenne 60 km/h
Coût externe en euro/km
Heavy Duty Vehicle (19 tons) : Pollutants + GHG
External costs in euro/km
Average speed 60 km/h
Average speed 20 km/h Fuel GHG cost Vehicle GHG cost Particle cost NOx cost
0
500
1000
1500
2000
2500
3000
3500
0 50 100 150 200 250 300
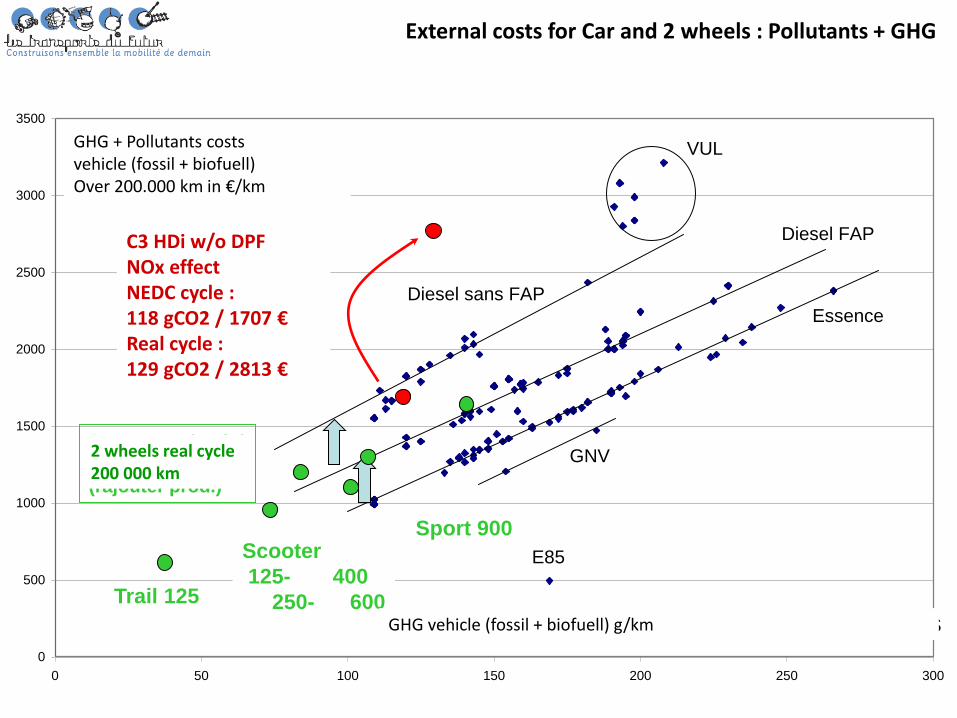
CO2 Véhicule (fossile et renouvelable) g/km => BONUS / MALUS
Coût puits à la roue (euros)
CO2 fossile et polluants
sur 200 000 km
GNV
Essence
Diesel FAP
Diesel sans FAP
VUL
E85
C3 HDi sans FAP
Effet NOx !!
Cycle NEDC : 118 gCO2 / 1707 €
Cycle réel :
129 gCO2 / 2813 €
Trail 125
Scooter
125- 400
250- 600
Sport 900
2 roues cycle réel
200 000 km
(rajouter prod.)
External costs for Car and 2 wheels : Pollutants + GHG
GHG vehicle (fossil + biofuell) g/km
GHG + Pollutants costs vehicle (fossil + biofuell) Over 200.000 km in €/km
C3 HDi w/o DPF NOx effect NEDC cycle : 118 gCO2 / 1707 € Real cycle : 129 gCO2 / 2813 €
2 wheels real cycle 200 000 km
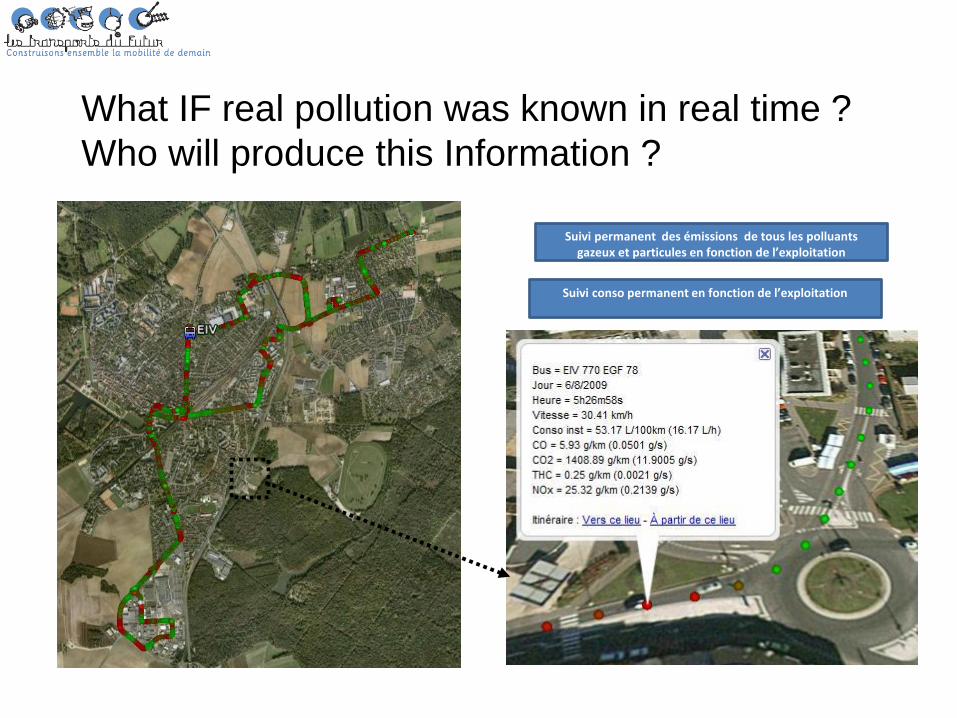
Suivi conso permanent en fonction de l’exploitation
Suivi permanent des émissions de tous les polluants gazeux et particules en fonction de l’exploitation
What IF real pollution was known in real time ?
Who will produce this Information ?
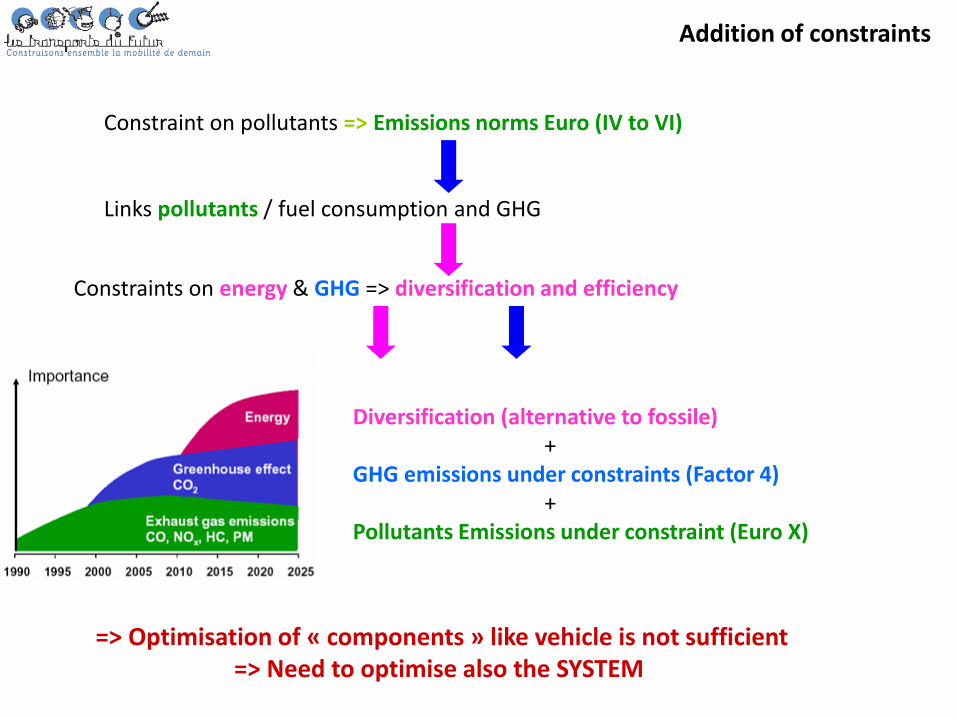
Constraint on pollutants => Emissions norms Euro (IV to VI) Links pollutants / fuel consumption and GHG
Le transport du futur devra concilier les 3 aspects :
Diversification (alternative to fossile) + GHG emissions under constraints (Factor 4) + Pollutants Emissions under constraint (Euro X)
=> Optimisation of « components » like vehicle is not sufficient => Need to optimise also the SYSTEM
Constraints on energy & GHG => diversification and efficiency
Addition of constraints
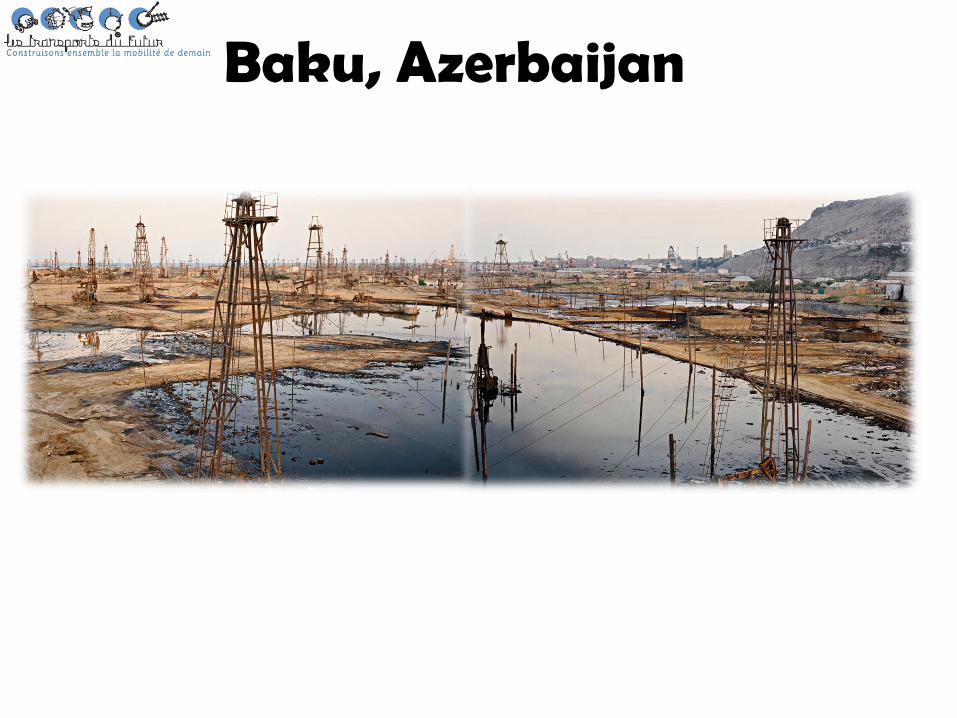
Baku, Azerbaijan
The finding is the result elements studied today separately, in silos. While locks & solutions are mainly in the interstices. We are looking for solutions in each "silo" where we used to look ... « You looking for your key during the night under lamp, simply because you can see … »
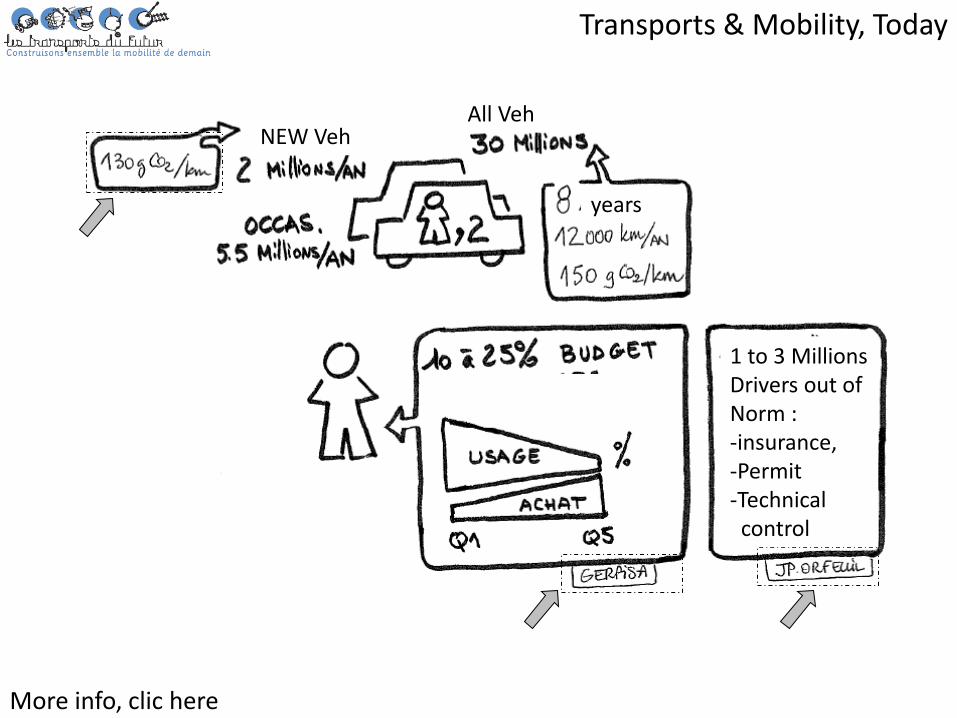
Transports & Mobility, Today
More info, clic here
NEW Veh All Veh
1 to 3 Millions Drivers out of Norm : -insurance, -Permit -Technical control
years
More info, clic here
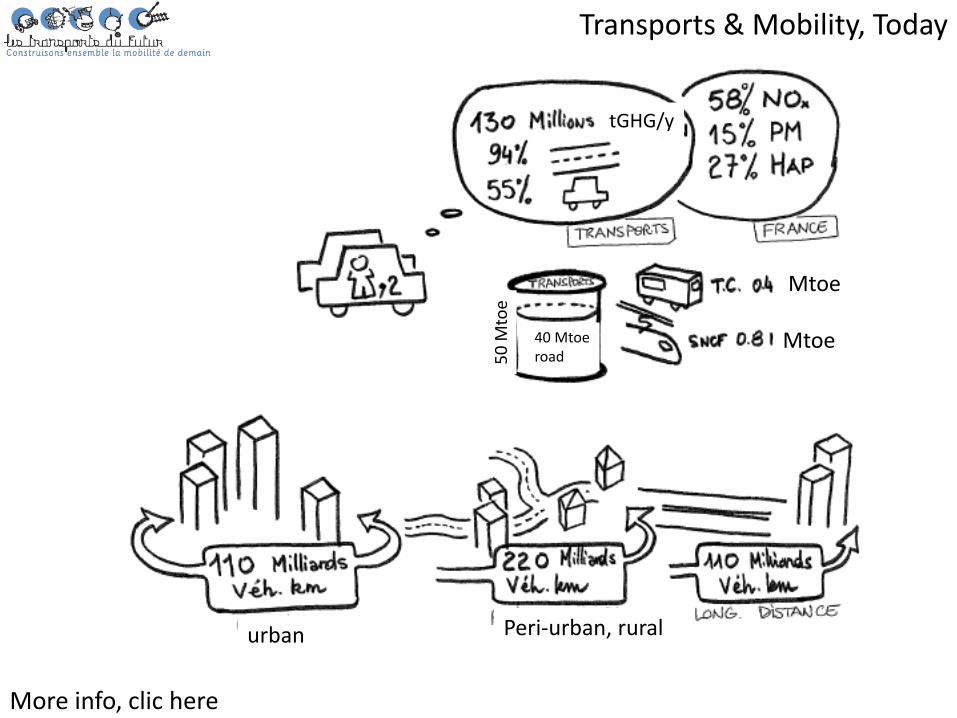
Transports & Mobility, Today
urban Peri-urban, rural
Mtoe
Mtoe 40 Mtoe road 5
0 M
toe
tGHG/y
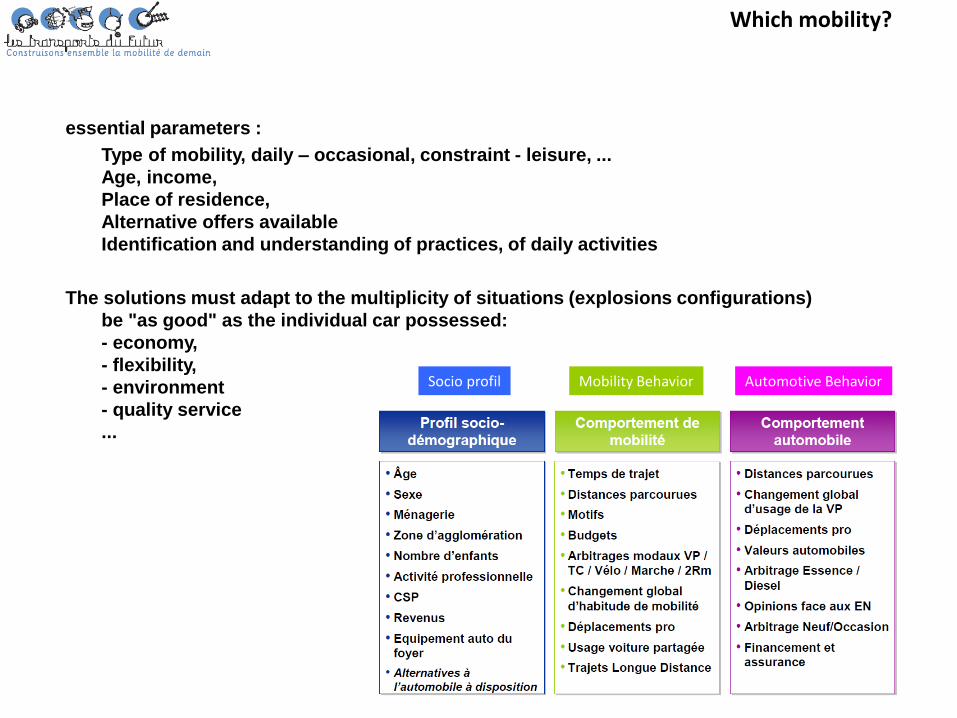
essential parameters :
Type of mobility, daily – occasional, constraint - leisure, ...
Age, income,
Place of residence,
Alternative offers available
Identification and understanding of practices, of daily activities
The solutions must adapt to the multiplicity of situations (explosions configurations)
be "as good" as the individual car possessed:
- economy,
- flexibility,
- environment
- quality service
...
Which mobility?
Socio profil Mobility Behavior Automotive Behavior
Which mobility?
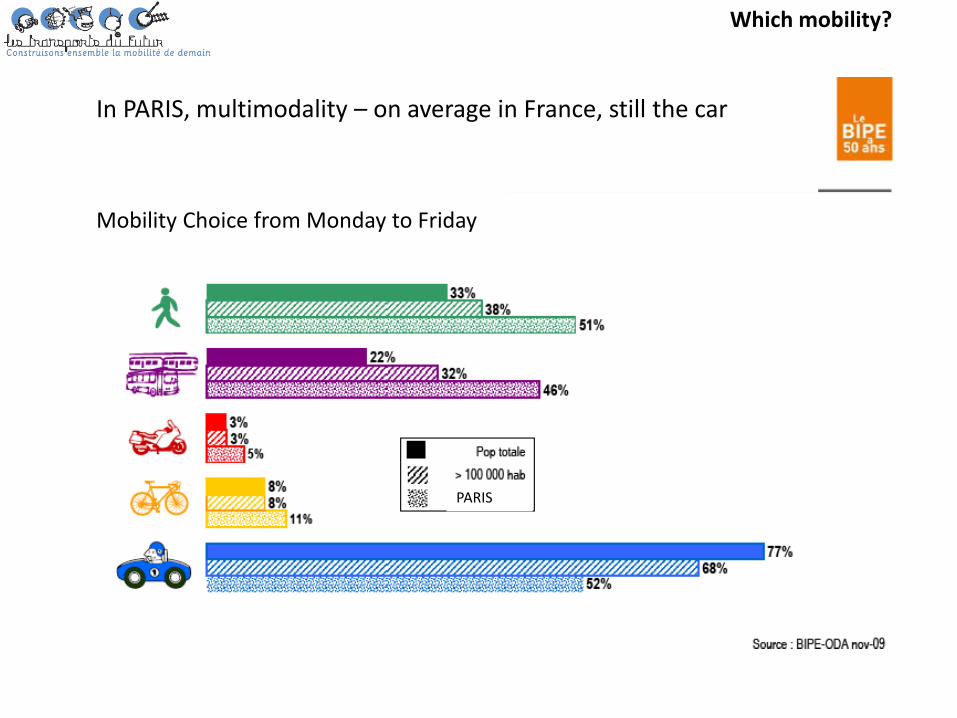
PARIS
Mobility Choice from Monday to Friday
In PARIS, multimodality – on average in France, still the car
Which mobility?
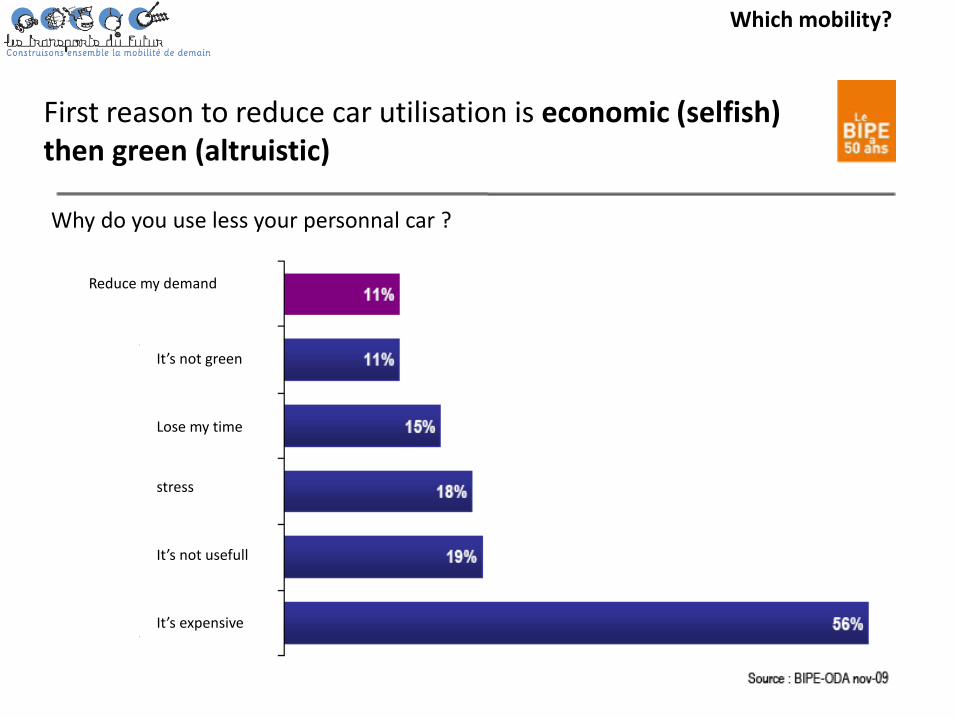
Why do you use less your personnal car ?
Reduce my demand
It’s not green
Lose my time
stress
It’s not usefull
It’s expensive
First reason to reduce car utilisation is economic (selfish) then green (altruistic)
Which mobility?
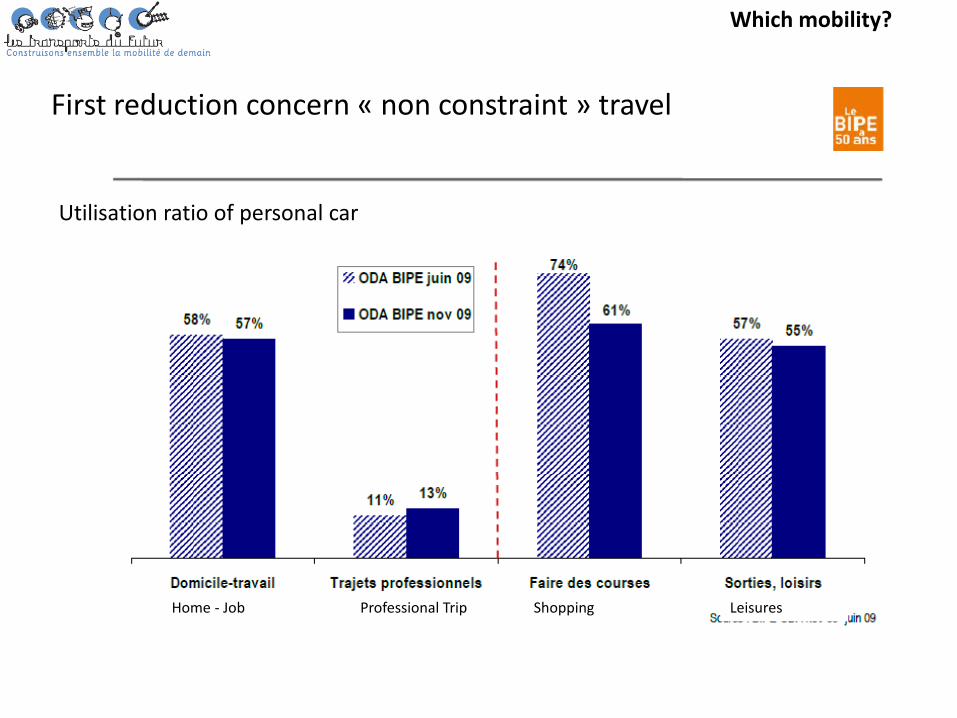
First reduction concern « non constraint » travel
Utilisation ratio of personal car
Home - Job Professional Trip Shopping Leisures
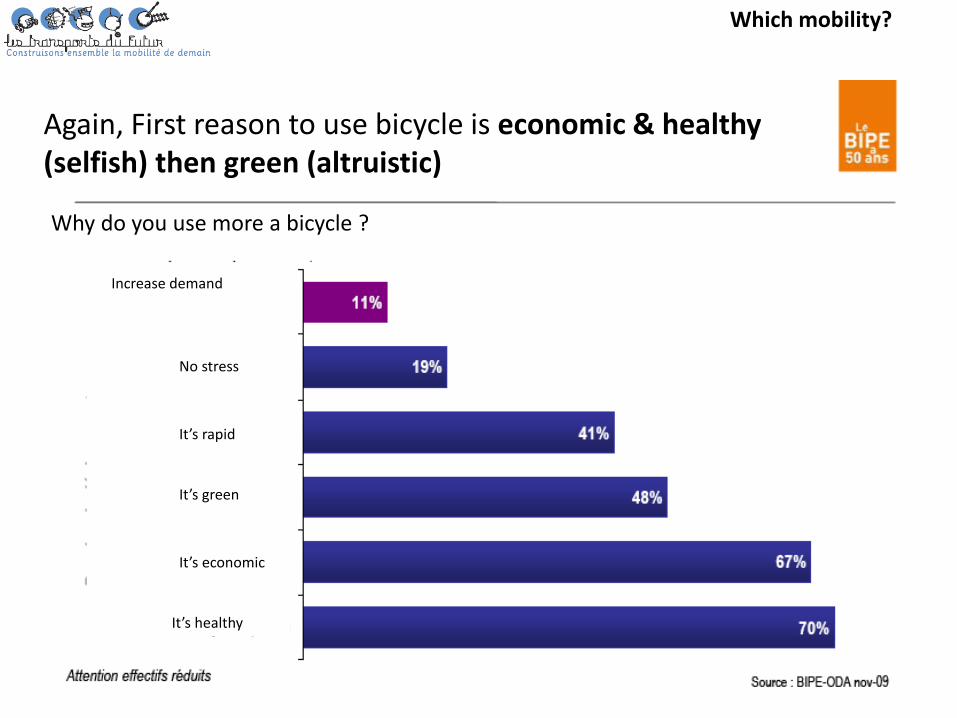
Again, First reason to use bicycle is economic & healthy (selfish) then green (altruistic)
Why do you use more a bicycle ?
Increase demand
It’s green
It’s economic
It’s healthy
It’s rapid
No stress
Which mobility?
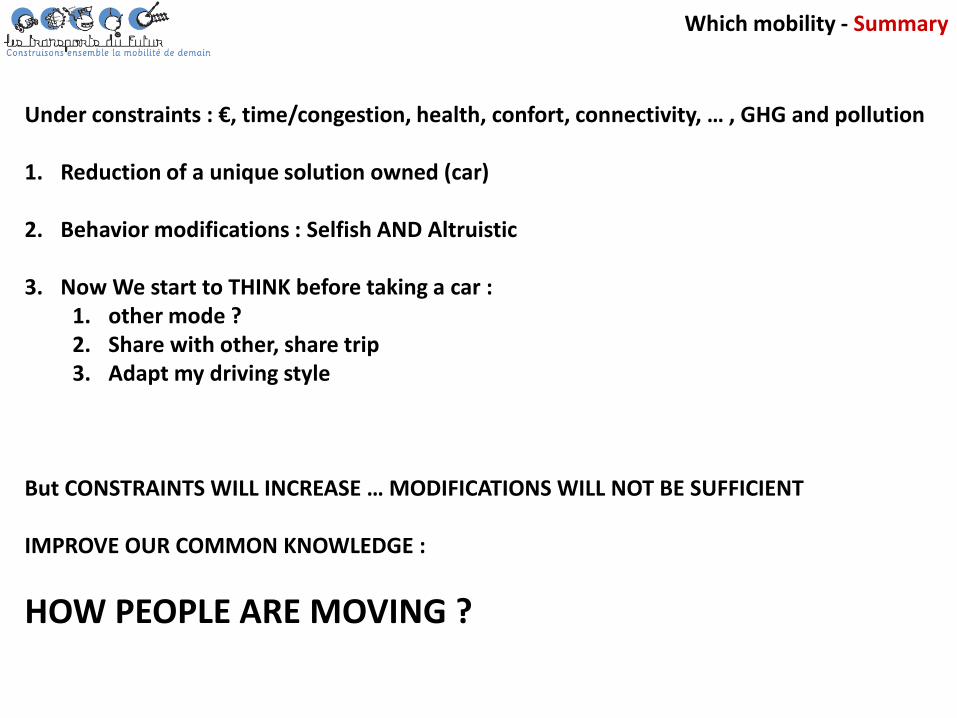
Under constraints : €, time/congestion, health, confort, connectivity, … , GHG and pollution 1. Reduction of a unique solution owned (car)
2. Behavior modifications : Selfish AND Altruistic
3. Now We start to THINK before taking a car :
1. other mode ? 2. Share with other, share trip 3. Adapt my driving style
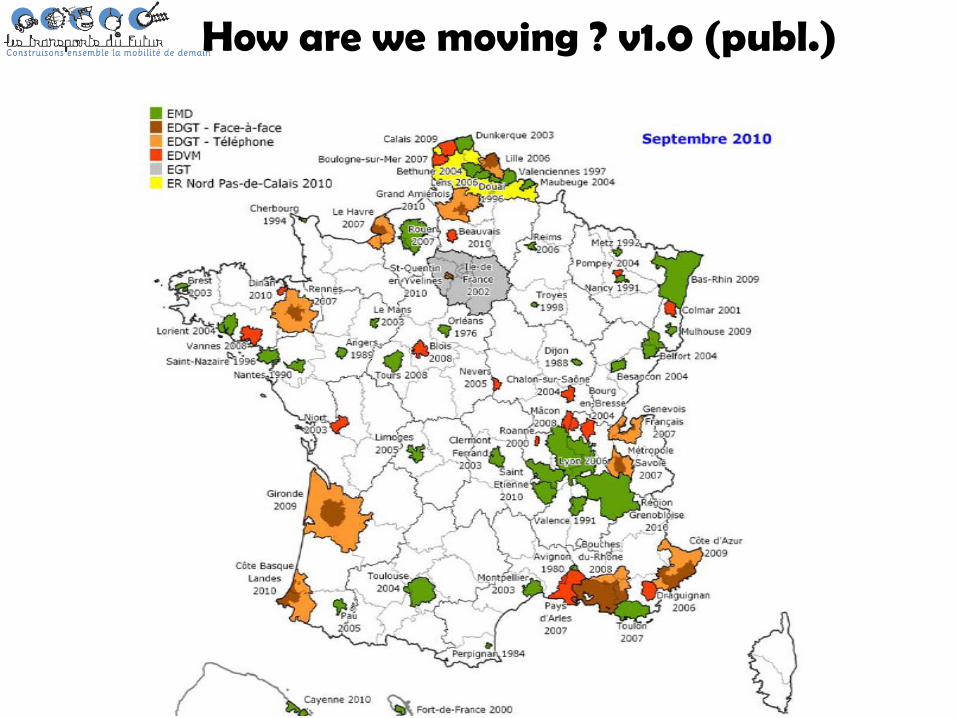
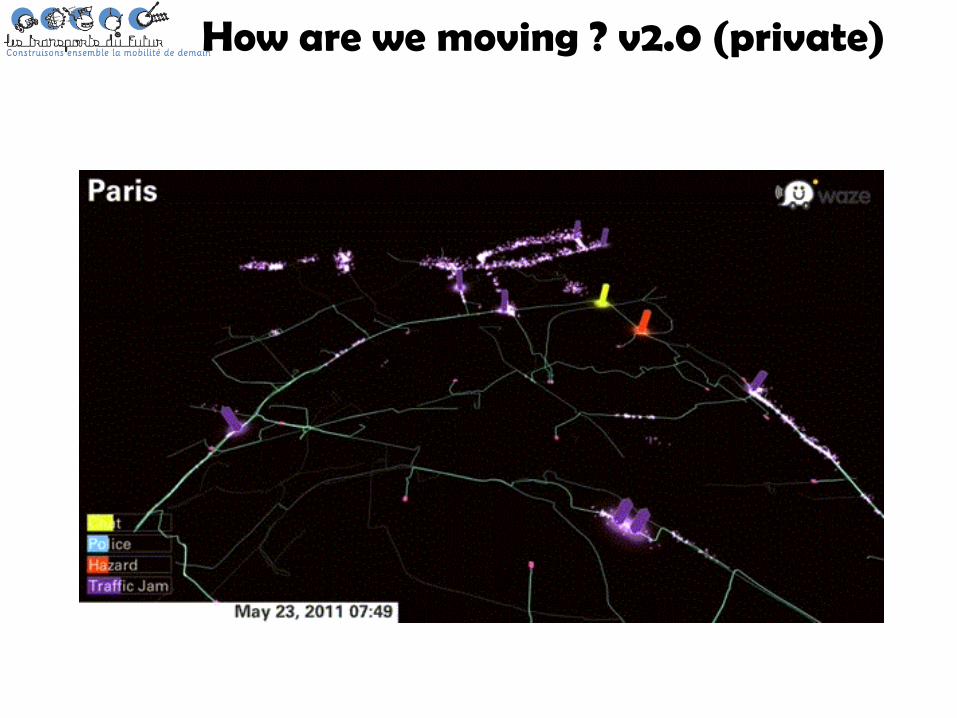
But CONSTRAINTS WILL INCREASE … MODIFICATIONS WILL NOT BE SUFFICIENT IMPROVE OUR COMMON KNOWLEDGE :
HOW PEOPLE ARE MOVING ?
Which mobility - Summary

Which route toward Factor 4 ?
New Technology
New Vehicle on the road : • €, • too slow ! • If less FC then more km !
TODAY NO CLEAR and SHARED VISIONS TO REACH F4, Air Quality, reduce congestions
GHG, Air Quality AQ
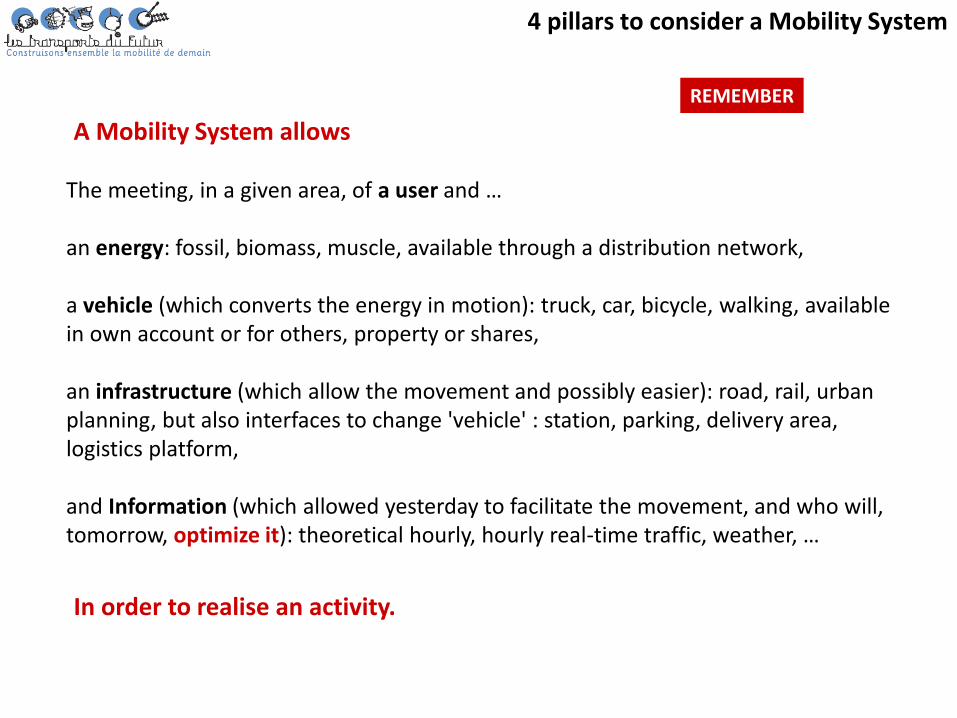
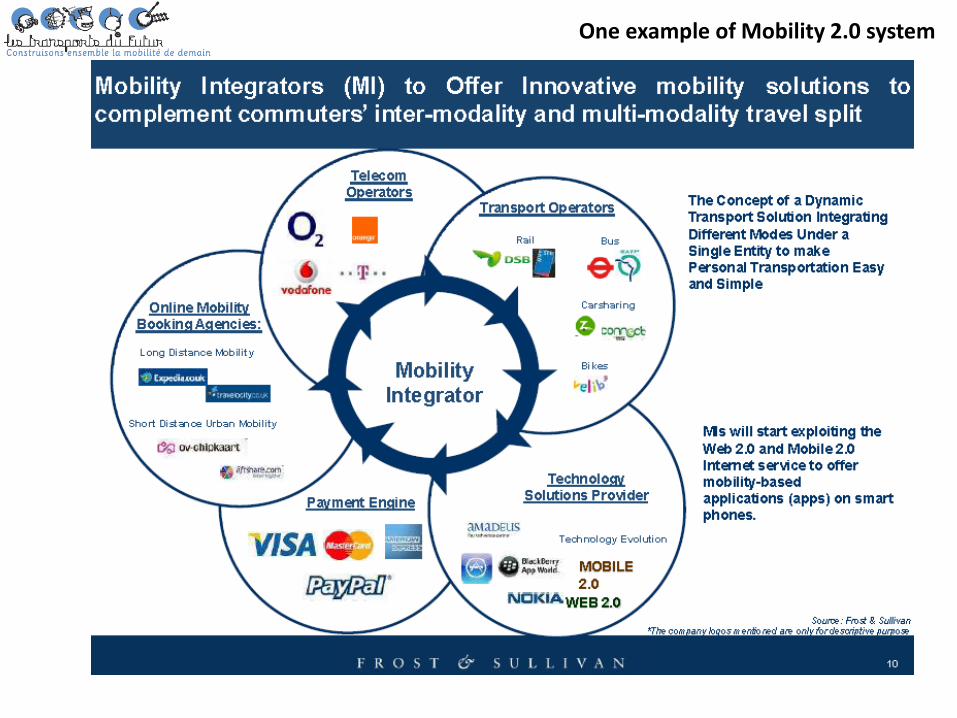
4 pillars to consider a Mobility System
The meeting, in a given area, of a user and … an energy: fossil, biomass, muscle, available through a distribution network, a vehicle (which converts the energy in motion): truck, car, bicycle, walking, available in own account or for others, property or shares, an infrastructure (which allow the movement and possibly easier): road, rail, urban planning, but also interfaces to change 'vehicle' : station, parking, delivery area, logistics platform, and Information (which allowed yesterday to facilitate the movement, and who will, tomorrow, optimize it): theoretical hourly, hourly real-time traffic, weather, …
A Mobility System allows
In order to realise an activity.
REMEMBER
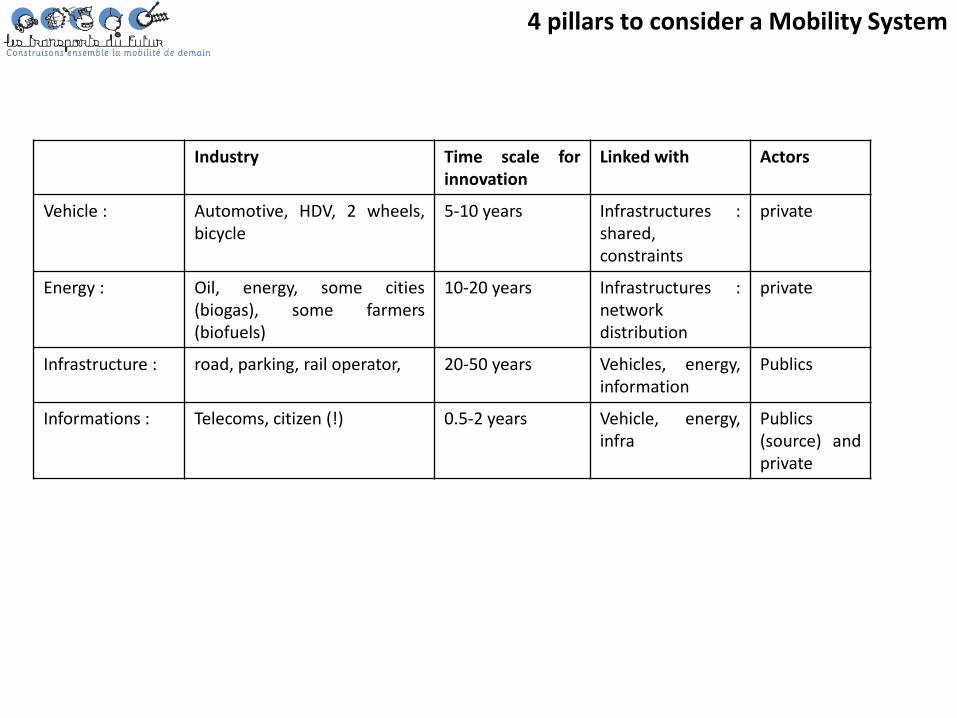
Industry Time scale for innovation
Linked with Actors
Vehicle : Automotive, HDV, 2 wheels, bicycle
5-10 years Infrastructures : shared, constraints
private
Energy : Oil, energy, some cities (biogas), some farmers (biofuels)
10-20 years Infrastructures : network distribution
private
Infrastructure : road, parking, rail operator, 20-50 years Vehicles, energy, information
Publics
Informations : Telecoms, citizen (!) 0.5-2 years Vehicle, energy, infra
Publics (source) and private
4 pillars to consider a Mobility System
What performance criteria for a solution Mobility and Transport
• Time door to door • Cost: investment, km • Quality: robustness to uncertainties, always-on connectivity or zero noise • Security: perceived real • Environmental performance: known or unknown, knowledge generally leads to
optimization. The fact that they are known is already a step forward: • pollutants, GHG • Energy diversification, • Waste direct and indirect • noise • urban land use • link health / mobility (soft modes, pollution cabin)
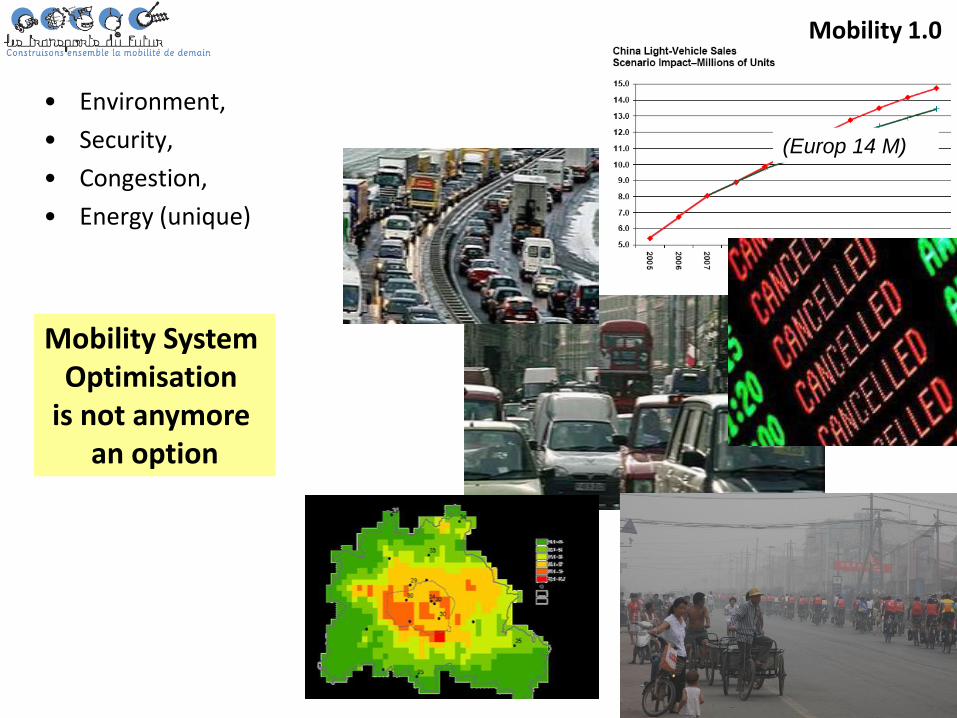
• Environment,
• Security,
• Congestion,
• Energy (unique)
(Europ 14 M)
Mobility 1.0
Mobility System Optimisation
is not anymore an option
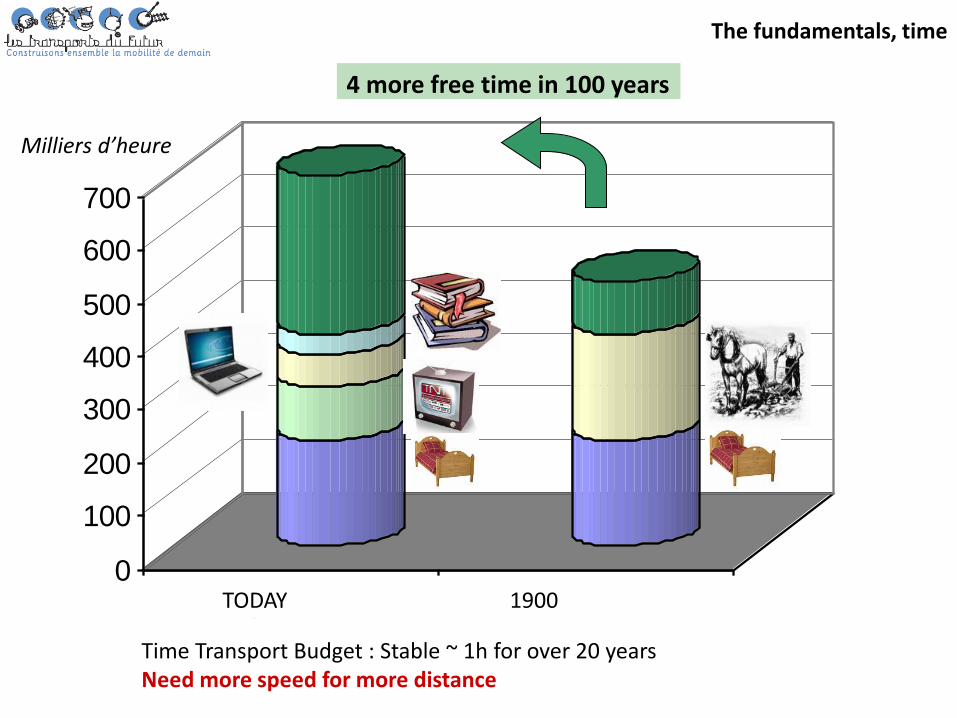
4 more free time in 100 years
0
100
200
300
400
500
600
700
aujourd'hui début siècle
Time Transport Budget : Stable ~ 1h for over 20 years Need more speed for more distance
Milliers d’heure
The fundamentals, time
TODAY 1900
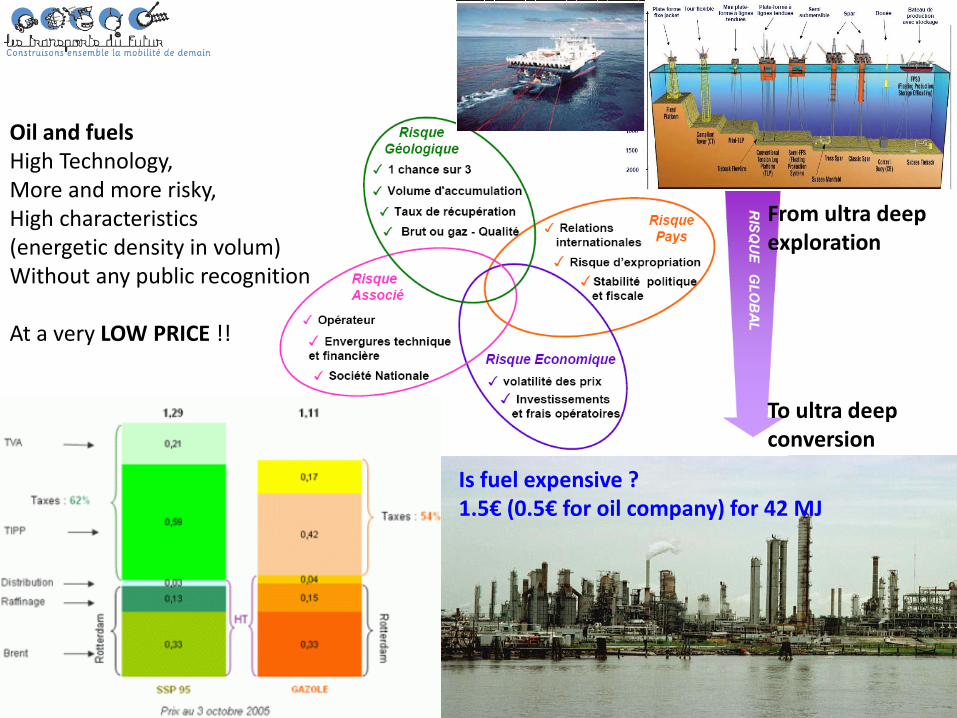
From ultra deep exploration
To ultra deep conversion
Is fuel expensive ? 1.5€ (0.5€ for oil company) for 42 MJ
Oil and fuels High Technology, More and more risky, High characteristics (energetic density in volum) Without any public recognition At a very LOW PRICE !!
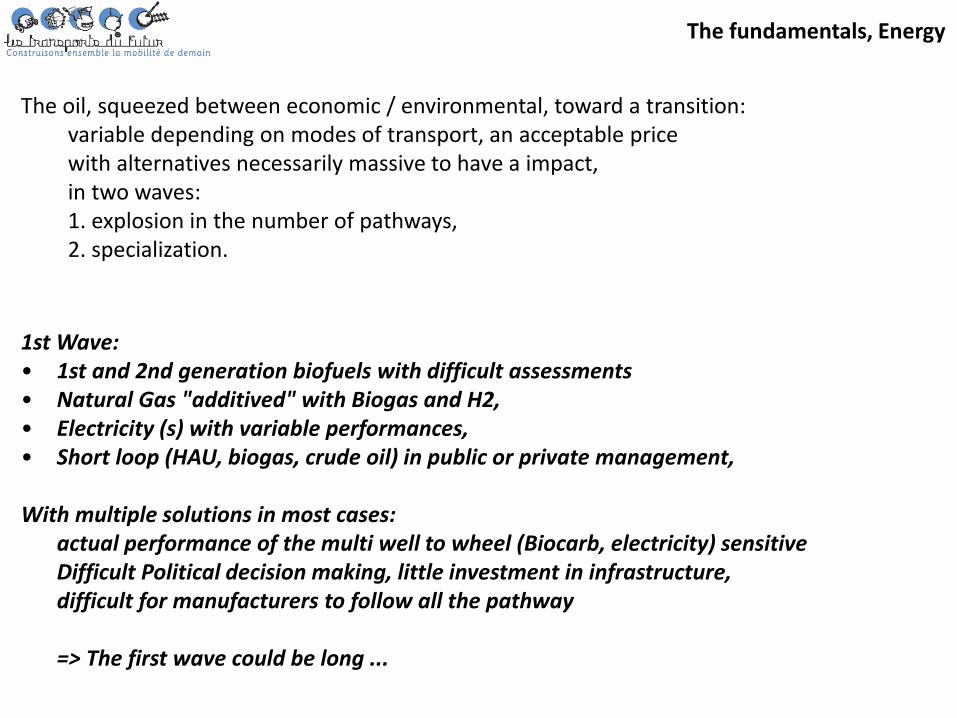
The oil, squeezed between economic / environmental, toward a transition:
variable depending on modes of transport, an acceptable price with alternatives necessarily massive to have a impact, in two waves: 1. explosion in the number of pathways, 2. specialization.
1st Wave: • 1st and 2nd generation biofuels with difficult assessments • Natural Gas "additived" with Biogas and H2, • Electricity (s) with variable performances, • Short loop (HAU, biogas, crude oil) in public or private management,
With multiple solutions in most cases:
actual performance of the multi well to wheel (Biocarb, electricity) sensitive Difficult Political decision making, little investment in infrastructure, difficult for manufacturers to follow all the pathway => The first wave could be long ...
The fundamentals, Energy
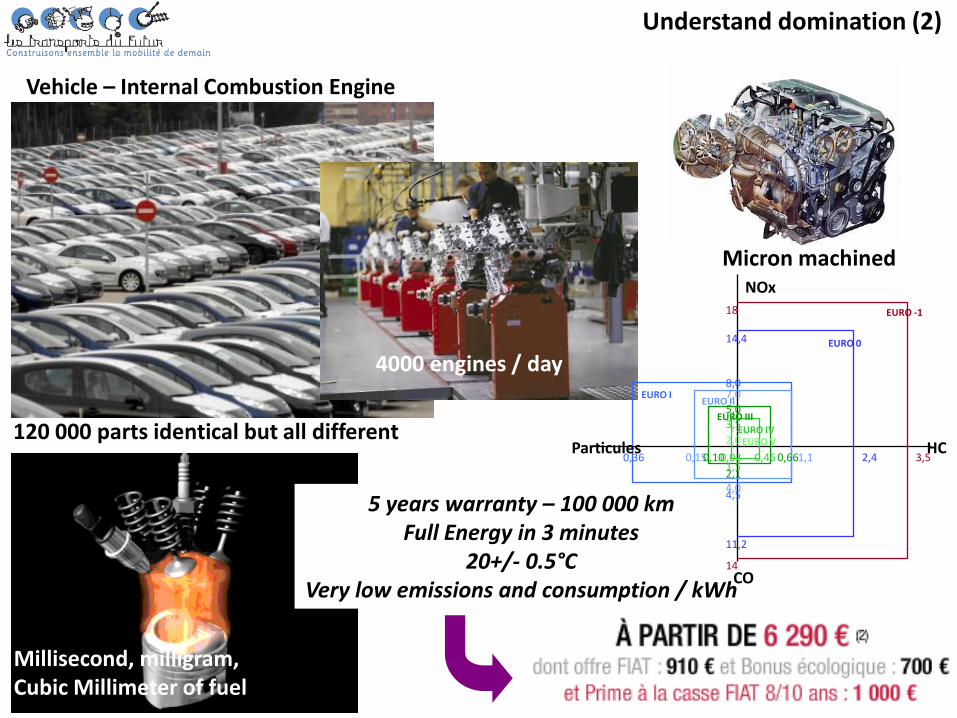
4000 engines / day
Millisecond, milligram, Cubic Millimeter of fuel
Micron machined
120 000 parts identical but all different
5 years warranty – 100 000 km Full Energy in 3 minutes
20+/- 0.5°C Very low emissions and consumption / kWh
Vehicle – Internal Combustion Engine
Particules
NOx
HC
CO
EURO III
EURO 0
EURO -1
EURO I EURO II
EURO IV
18
14,4
11,2
14
2,4 3,5 0,36 0,15 1,1 0,10
5,0
3,5
8,0 7,0
0,02 0,66 0,46
4,5 4,0 2,1 1,5
EURO V 2,0
Understand domination (2)
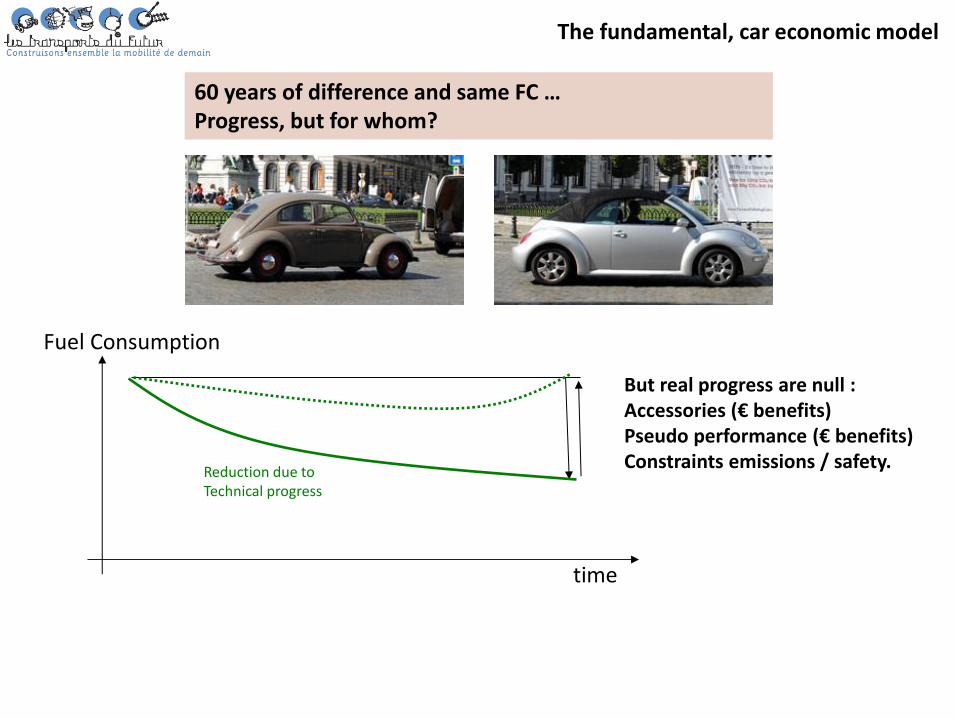
time
Fuel Consumption
Reduction due to Technical progress
But real progress are null : Accessories (€ benefits) Pseudo performance (€ benefits) Constraints emissions / safety.
60 years of difference and same FC … Progress, but for whom?
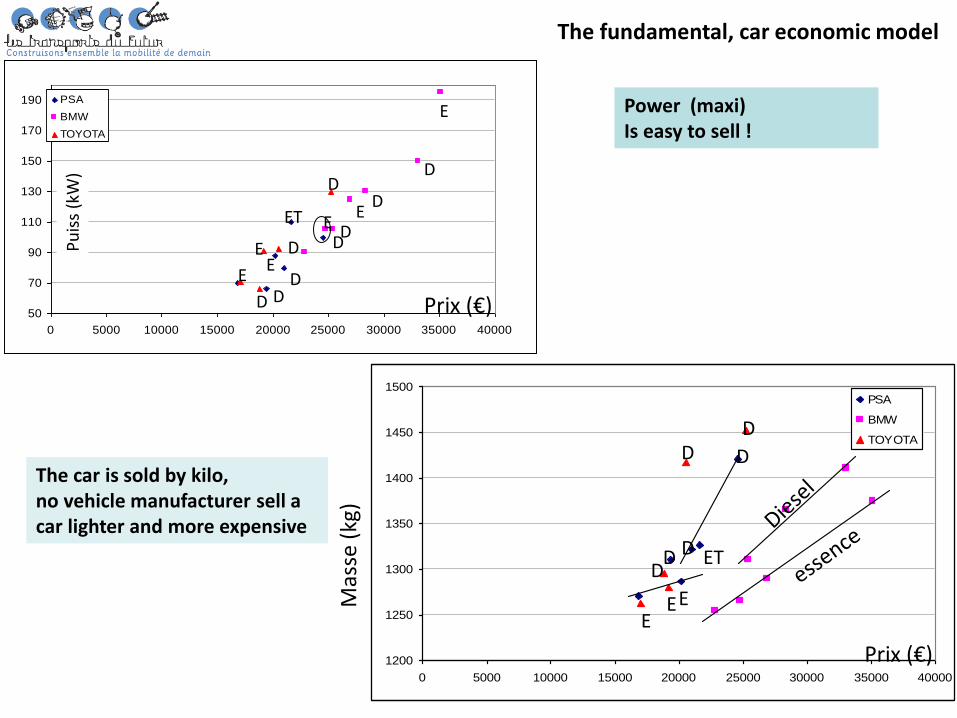
The fundamental, car economic model
50
70
90
110
130
150
170
190
0 5000 10000 15000 20000 25000 30000 35000 40000
PSA
BMW
TOYOTA
Pu
iss
(kW
)
Prix (€)
E
E E
ET
D
E
D D
D D
D
D
D
E E
D
Power (maxi) Is easy to sell !
1200
1250
1300
1350
1400
1450
1500
0 5000 10000 15000 20000 25000 30000 35000 40000
PSA
BMW
TOYOTA
Prix (€)
Mas
se (
kg)
The car is sold by kilo, no vehicle manufacturer sell a car lighter and more expensive
D D
D
D D
D
E E E
ET
The fundamental, car economic model
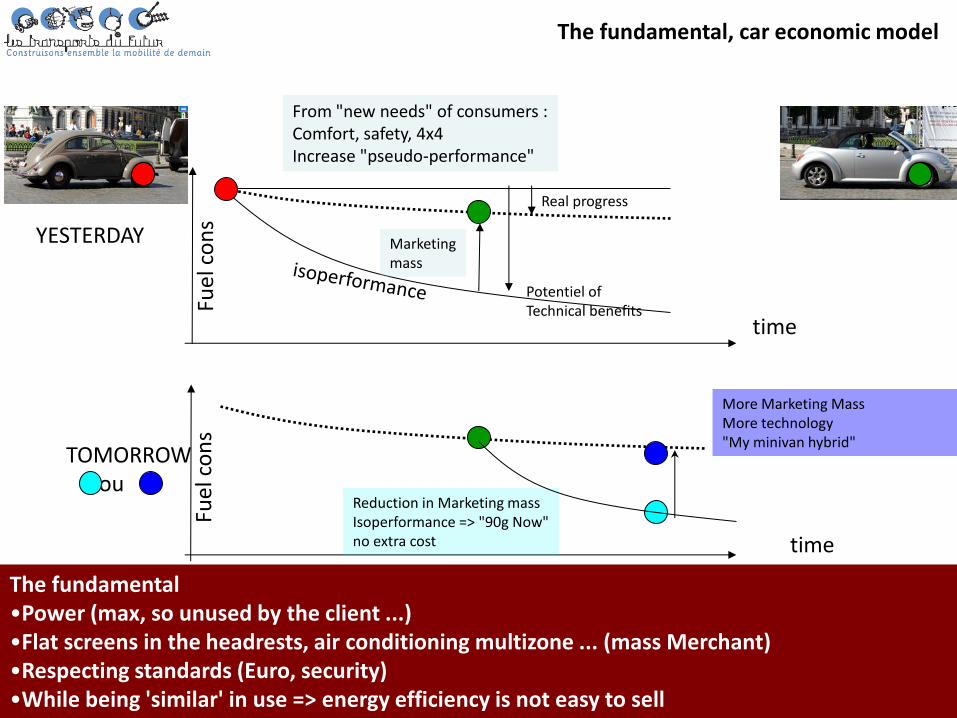
time
Fue
l co
ns
Potentiel of Technical benefits
Marketing mass
Real progress
From "new needs" of consumers : Comfort, safety, 4x4 Increase "pseudo-performance"
YESTERDAY
The fundamental •Power (max, so unused by the client ...) •Flat screens in the headrests, air conditioning multizone ... (mass Merchant) •Respecting standards (Euro, security) •While being 'similar' in use => energy efficiency is not easy to sell
time
Fue
l co
ns
Reduction in Marketing mass Isoperformance => "90g Now" no extra cost
More Marketing Mass More technology "My minivan hybrid"
TOMORROW ou
The fundamental, car economic model
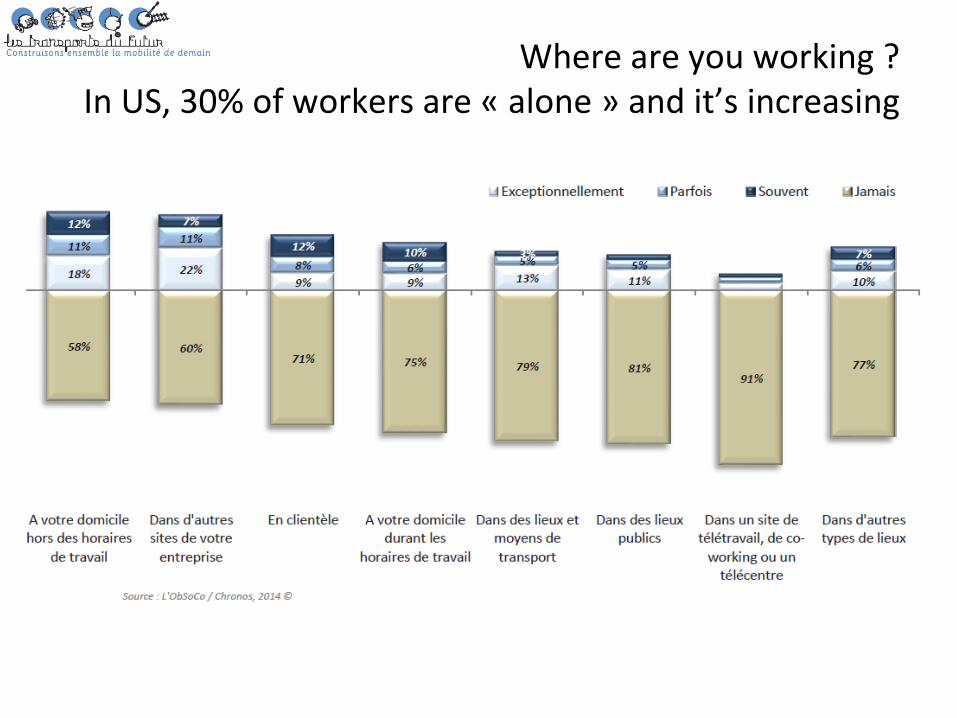
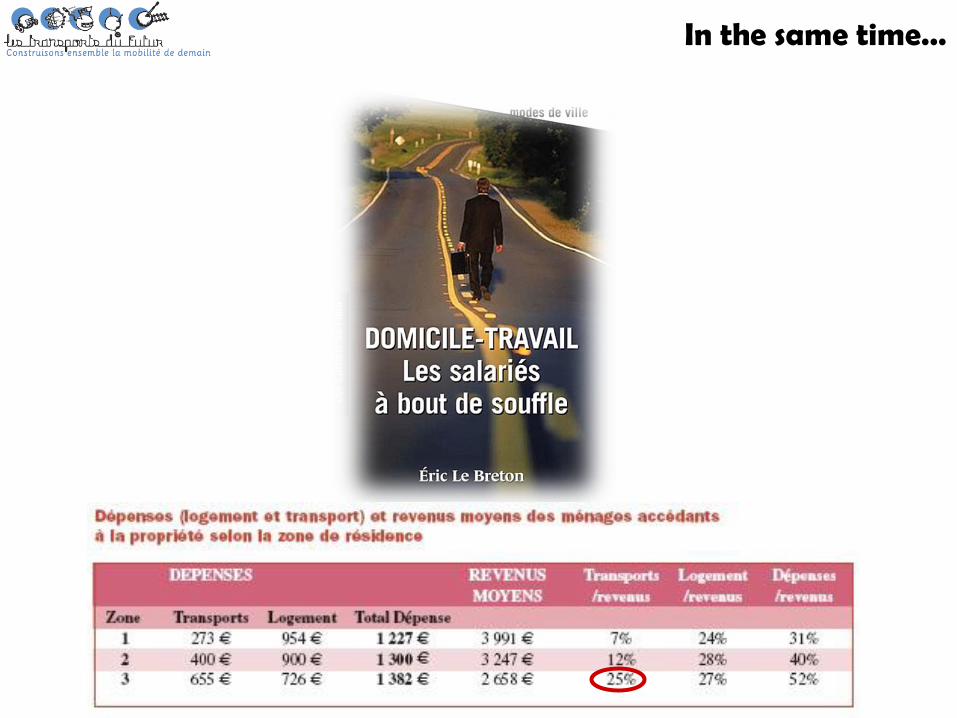
Where are you working ? In US, 30% of workers are « alone » and it’s increasing
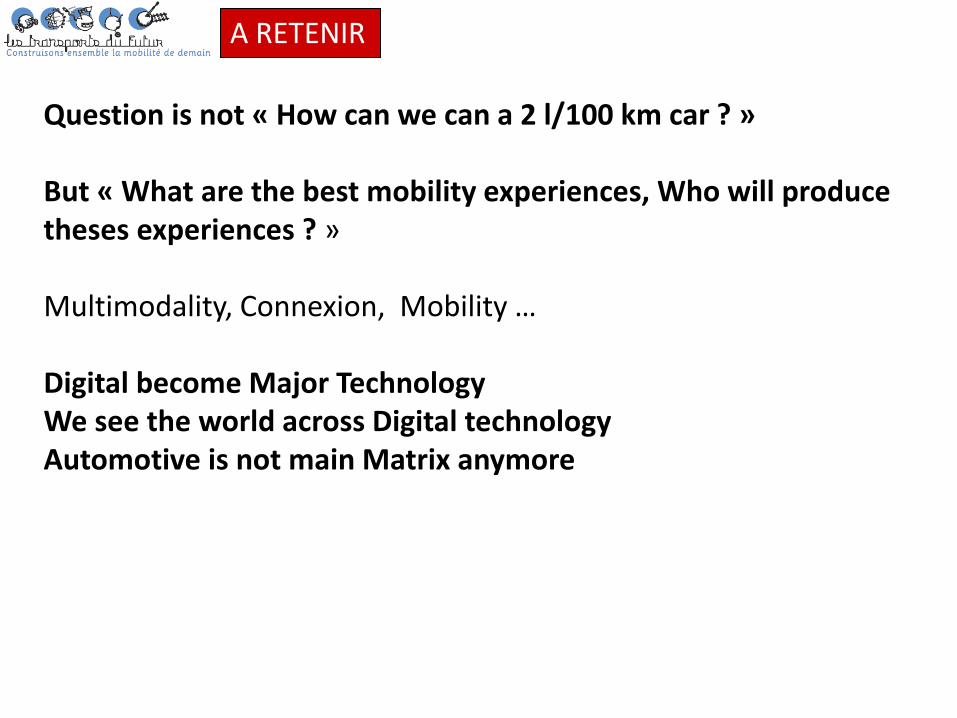
Question is not « How can we can a 2 l/100 km car ? » But « What are the best mobility experiences, Who will produce theses experiences ? » Multimodality, Connexion, Mobility … Digital become Major Technology We see the world across Digital technology Automotive is not main Matrix anymore
A RETENIR
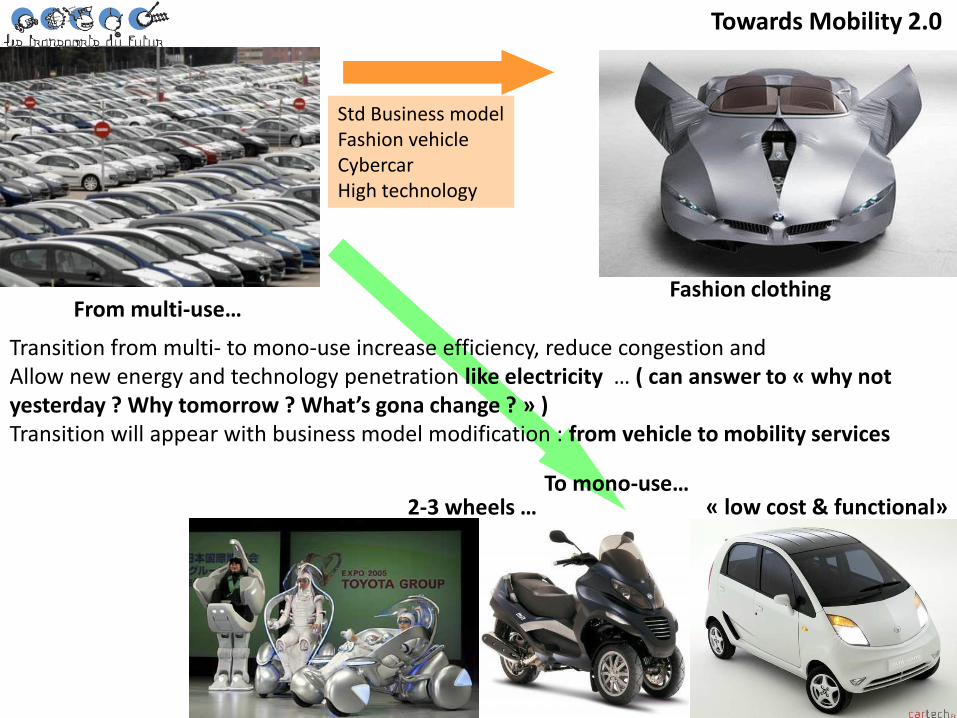
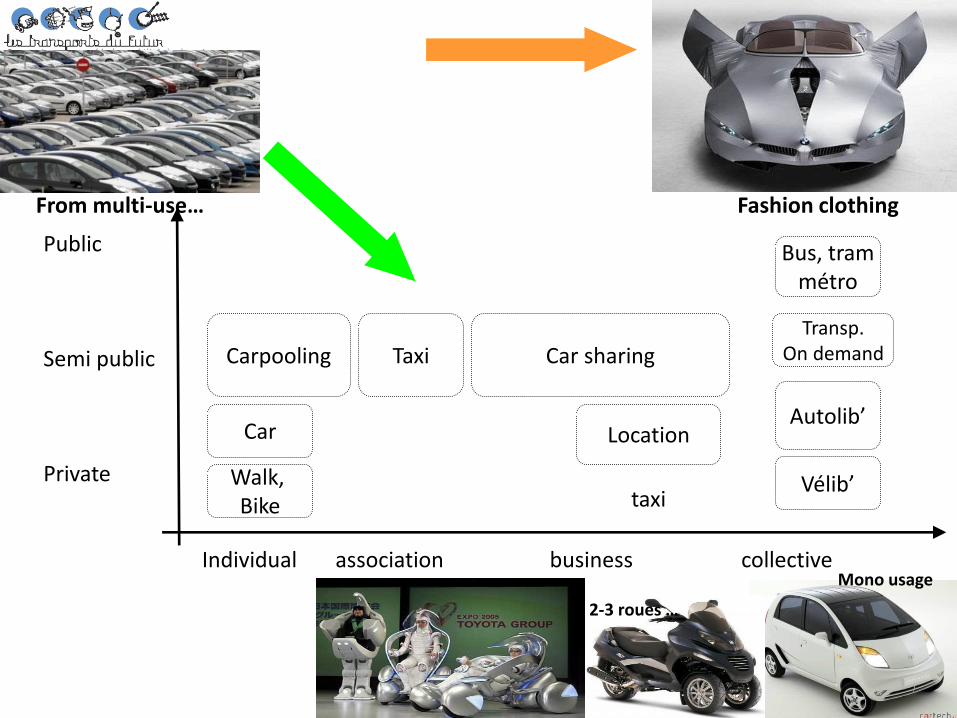
Fashion clothing
« low cost & functional» 2-3 wheels …
From multi-use…
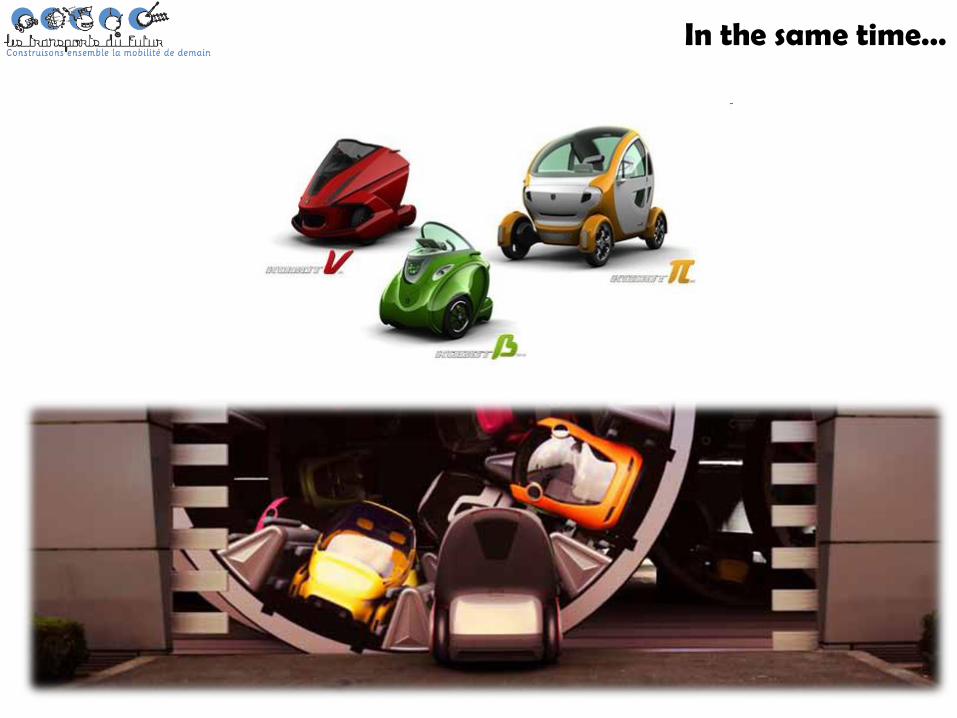
Std Business model Fashion vehicle Cybercar High technology
Transition from multi- to mono-use increase efficiency, reduce congestion and Allow new energy and technology penetration like electricity … ( can answer to « why not yesterday ? Why tomorrow ? What’s gona change ? » ) Transition will appear with business model modification : from vehicle to mobility services
To mono-use…
Towards Mobility 2.0
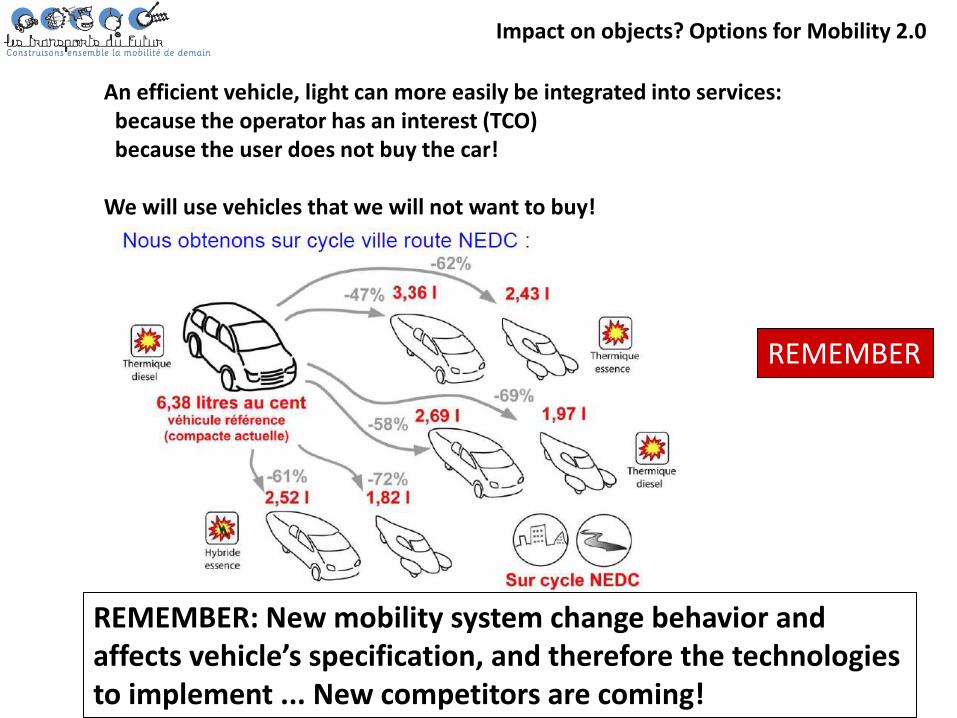
Impact on objects? Options for Mobility 2.0
An efficient vehicle, light can more easily be integrated into services: because the operator has an interest (TCO) because the user does not buy the car! We will use vehicles that we will not want to buy!
REMEMBER
REMEMBER: New mobility system change behavior and affects vehicle’s specification, and therefore the technologies to implement ... New competitors are coming!
Mono usage
2-3 roues …
From multi-use… Fashion clothing
Walk, Bike
Vélib’
Car
Car sharing
Location Autolib’
Carpooling Taxi Transp.
On demand
Bus, tram métro
taxi
Individual association business collective
Public Semi public Private
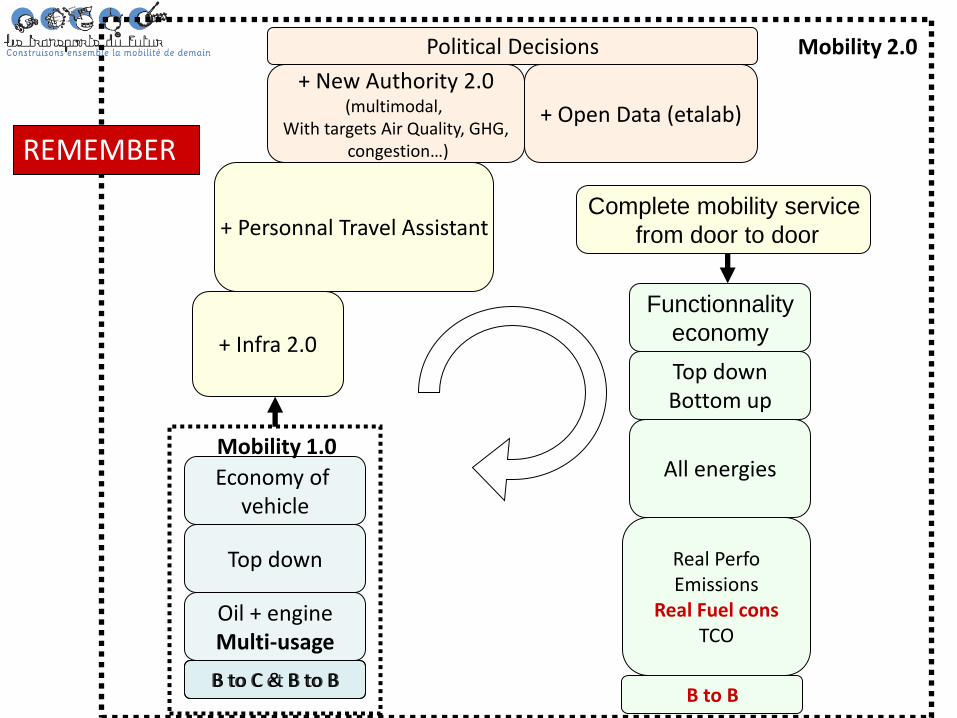
All energies
B to C et B to B
Functionnality
economy
Top down Bottom up
B to B
Real Perfo Emissions
Real Fuel cons TCO
Mobility 2.0
Complete mobility service
from door to door
Oil + engine Multi-usage
Economy of vehicle
Top down
B to C & B to B
Mobility 1.0
+ Infra 2.0
+ New Authority 2.0 (multimodal,
With targets Air Quality, GHG, congestion…)
+ Personnal Travel Assistant
+ Open Data (etalab)
Political Decisions
REMEMBER
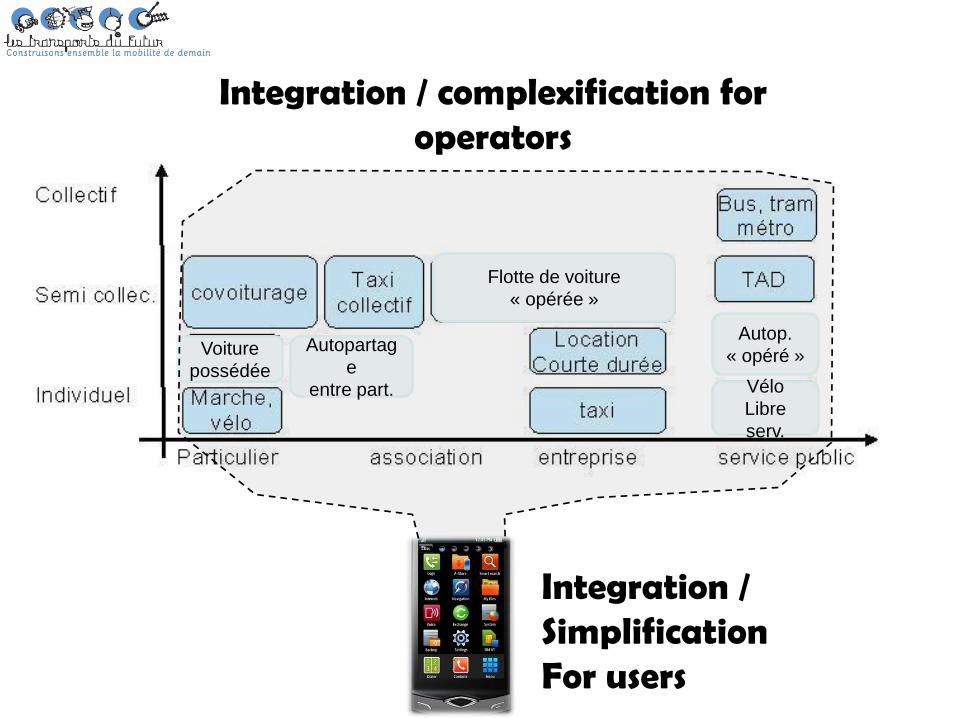
Autopartag
e
entre part.
Autop.
« opéré »
Flotte de voiture
« opérée »
Vélo
Libre
serv.
Voiture
possédée
Integration / complexification for operators
Integration / Simplification For users
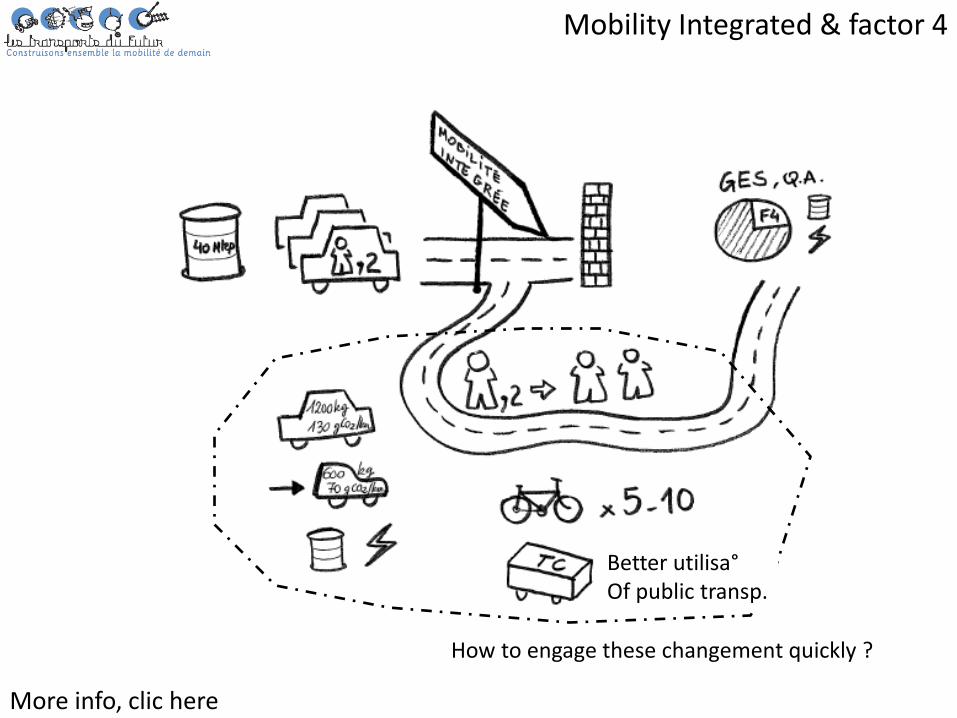
Mobility Integrated & factor 4
More info, clic here
How to engage these changement quickly ?
Better utilisa° Of public transp.
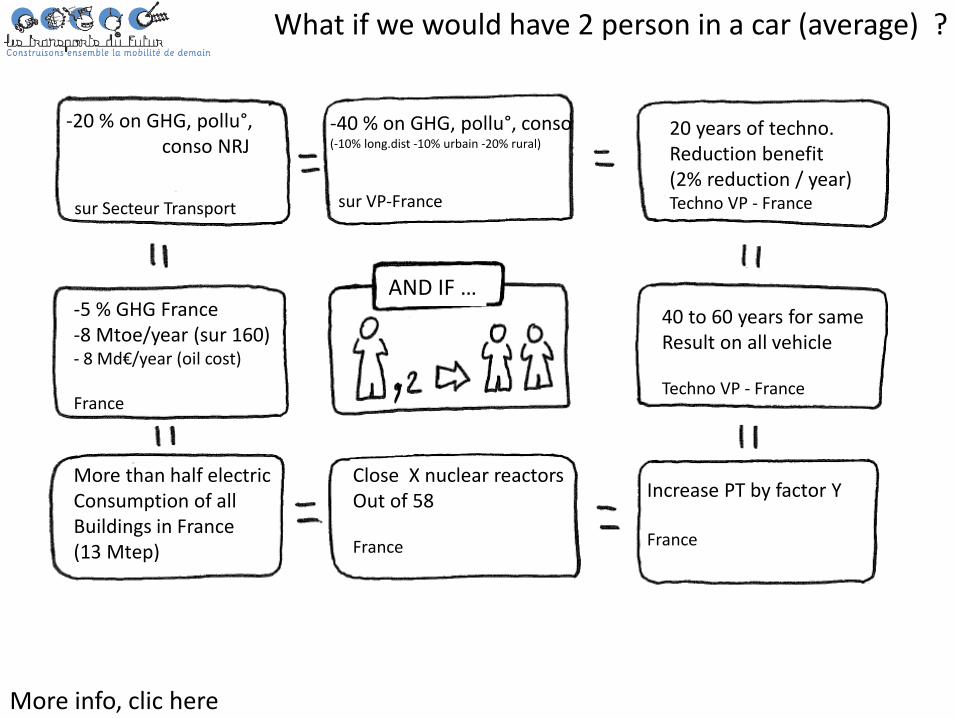
What if we would have 2 person in a car (average) ?
More info, clic here
-40 % on GHG, pollu°, conso (-10% long.dist -10% urbain -20% rural)
sur VP-France
-20 % on GHG, pollu°, conso NRJ
sur Secteur Transport
-5 % GHG France -8 Mtoe/year (sur 160) - 8 Md€/year (oil cost) France
More than half electric Consumption of all Buildings in France (13 Mtep)
20 years of techno. Reduction benefit (2% reduction / year) Techno VP - France
40 to 60 years for same Result on all vehicle Techno VP - France
Increase PT by factor Y France
Close X nuclear reactors Out of 58 France
AND IF …
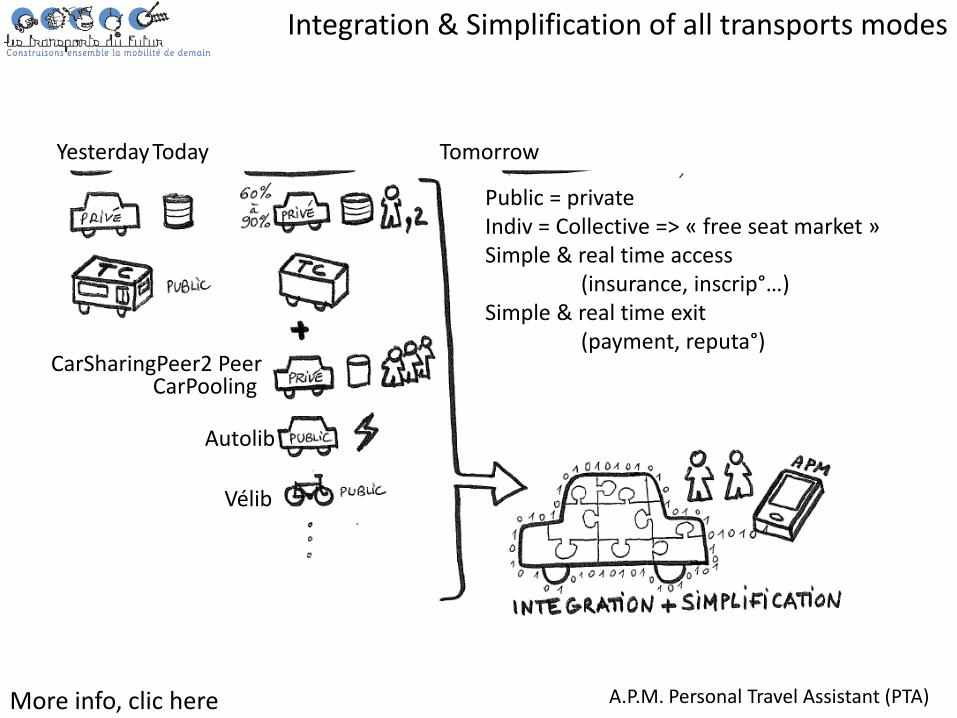
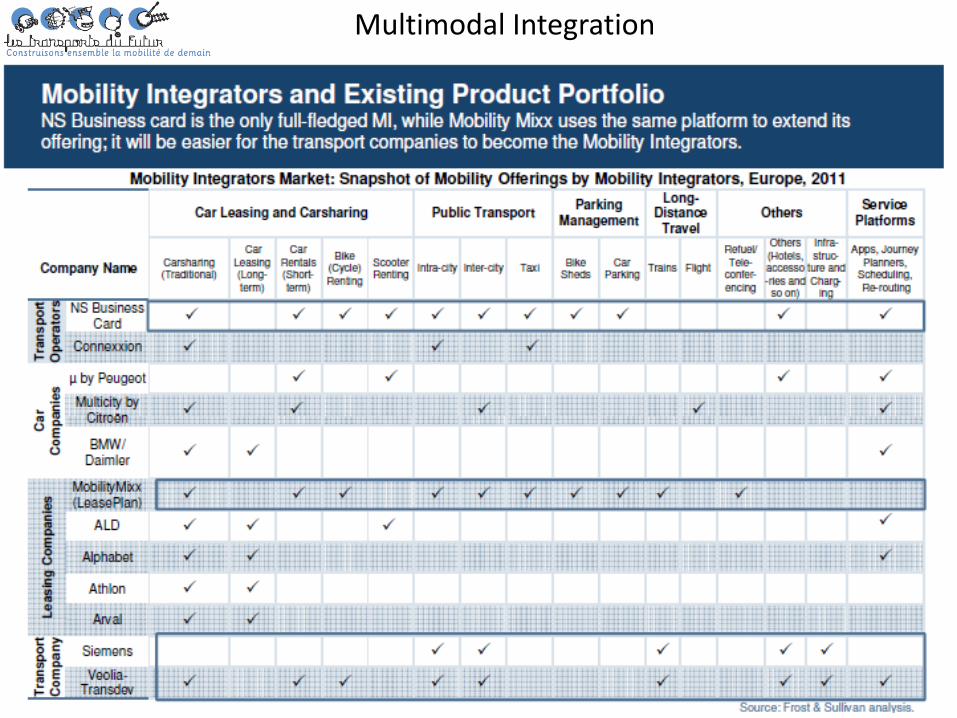
Integration & Simplification of all transports modes
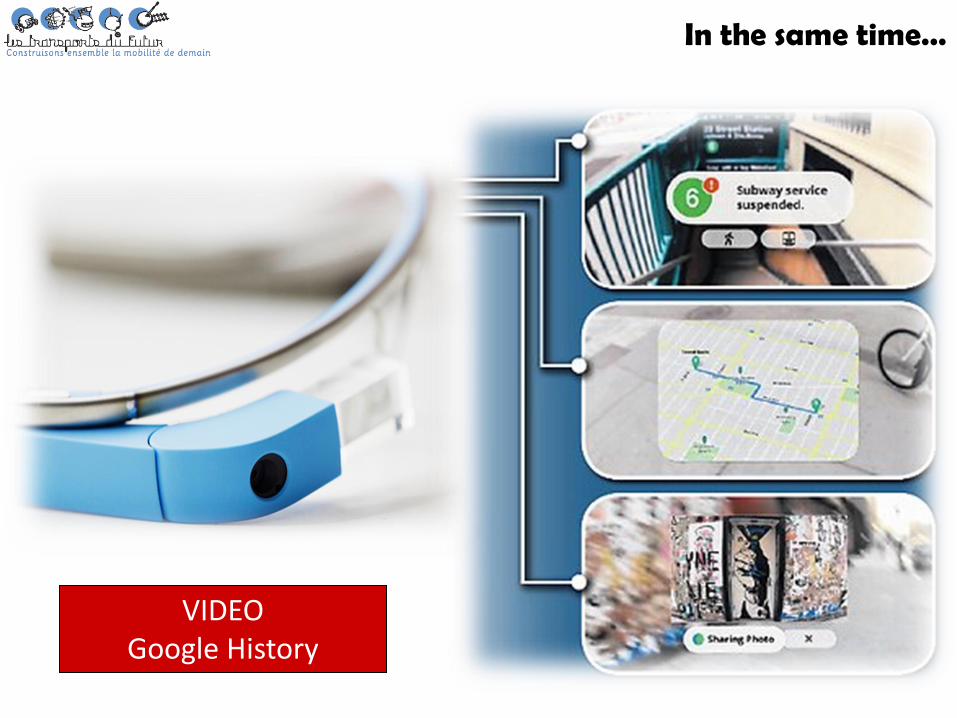
More info, clic here A.P.M. Personal Travel Assistant (PTA)
Autolib
Vélib
CarSharingPeer2 Peer CarPooling
Yesterday Today Tomorrow
Public = private Indiv = Collective => « free seat market » Simple & real time access (insurance, inscrip°…) Simple & real time exit (payment, reputa°)
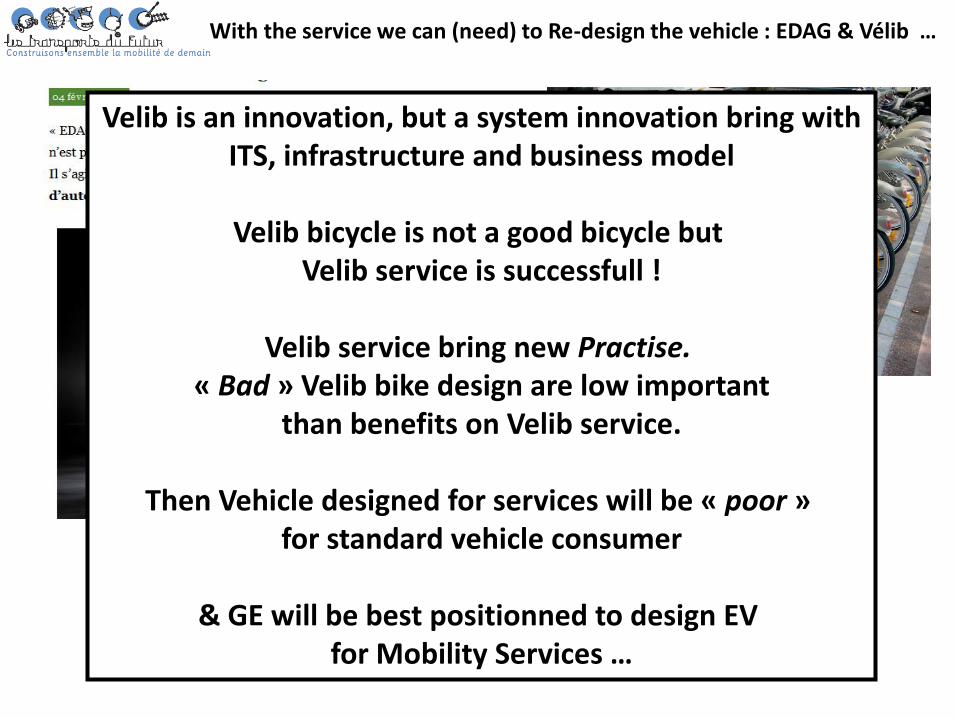
With the service we can (need) to Re-design the vehicle : EDAG & Vélib …
Velib is an innovation, but a system innovation bring with ITS, infrastructure and business model
Velib bicycle is not a good bicycle but
Velib service is successfull !
Velib service bring new Practise. « Bad » Velib bike design are low important
than benefits on Velib service.
Then Vehicle designed for services will be « poor » for standard vehicle consumer
& GE will be best positionned to design EV
for Mobility Services …
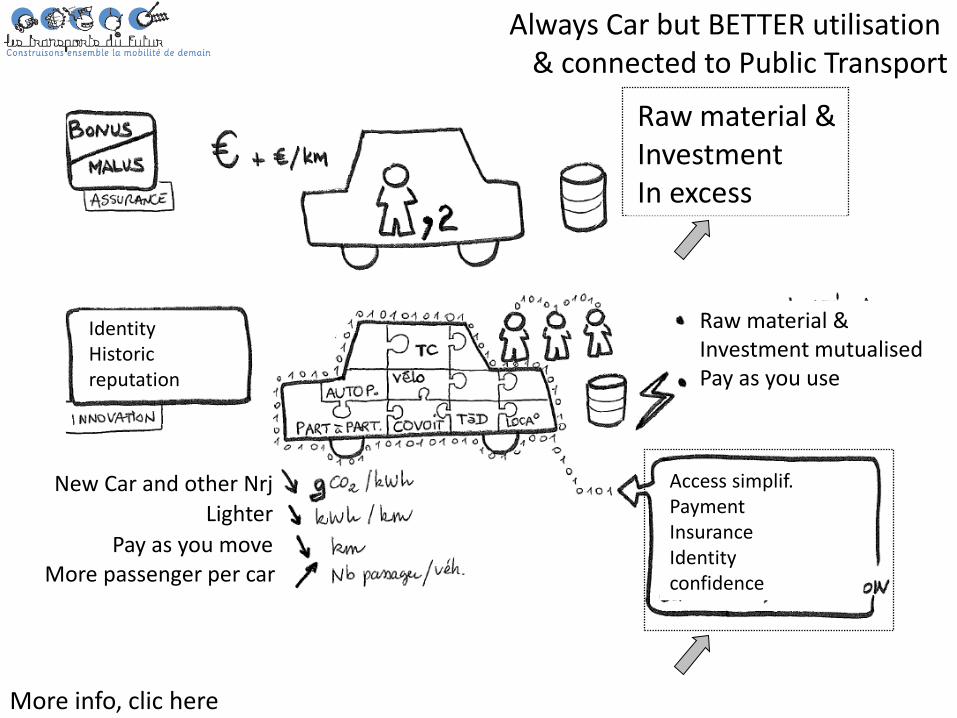
Always Car but BETTER utilisation & connected to Public Transport
More info, clic here
New Car and other Nrj
Lighter
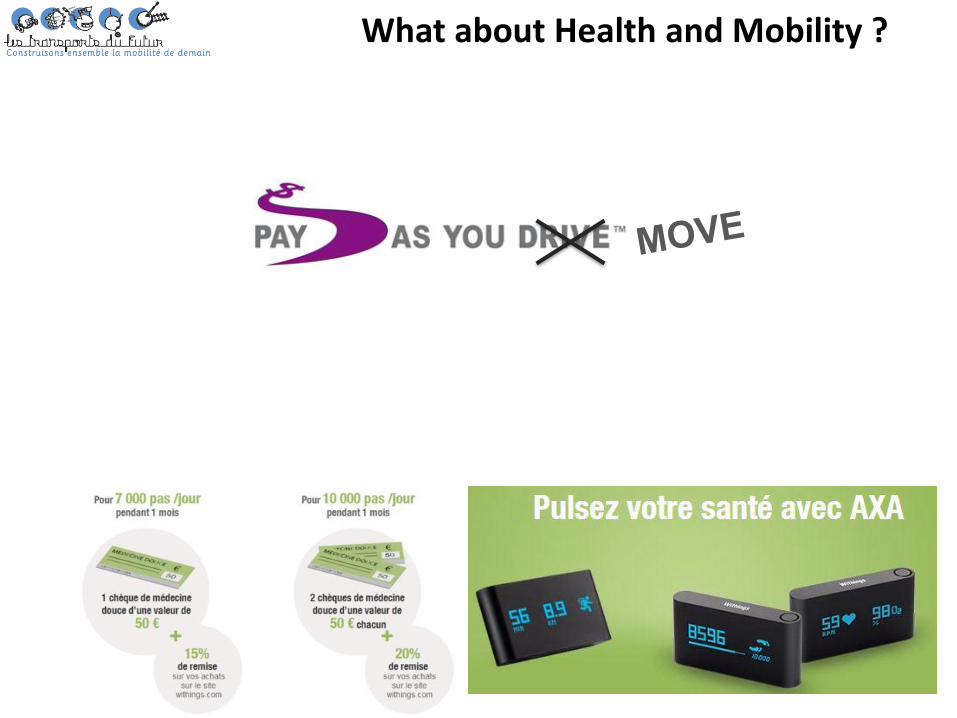
Pay as you move More passenger per car
Raw material & Investment In excess
Raw material & Investment mutualised Pay as you use
Access simplif. Payment Insurance Identity confidence
Identity Historic reputation
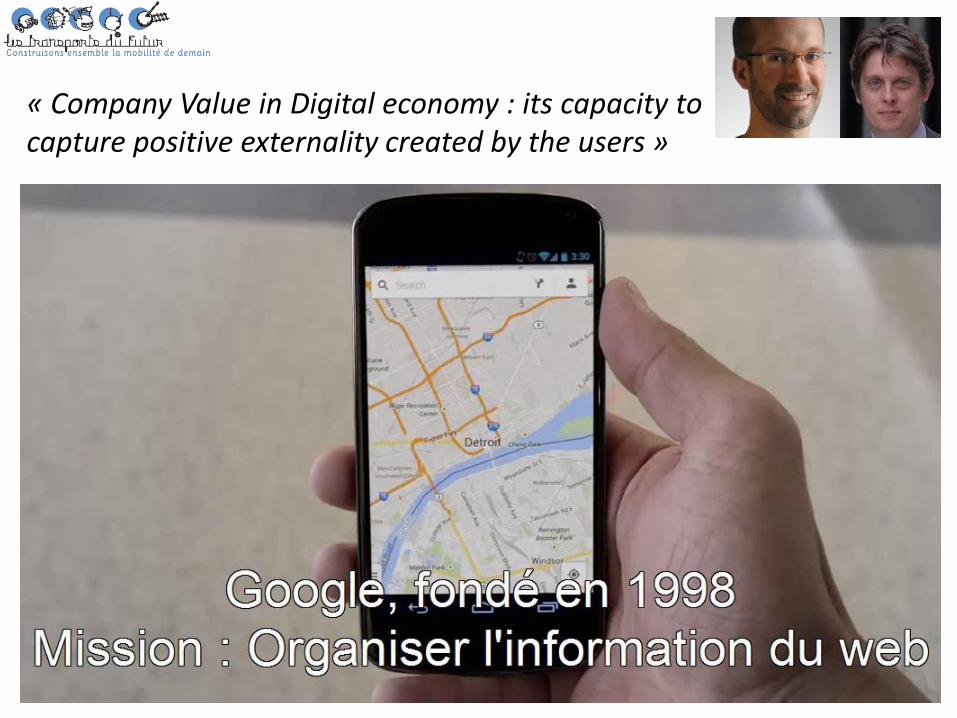
« Company Value in Digital economy : its capacity to capture positive externality created by the users »
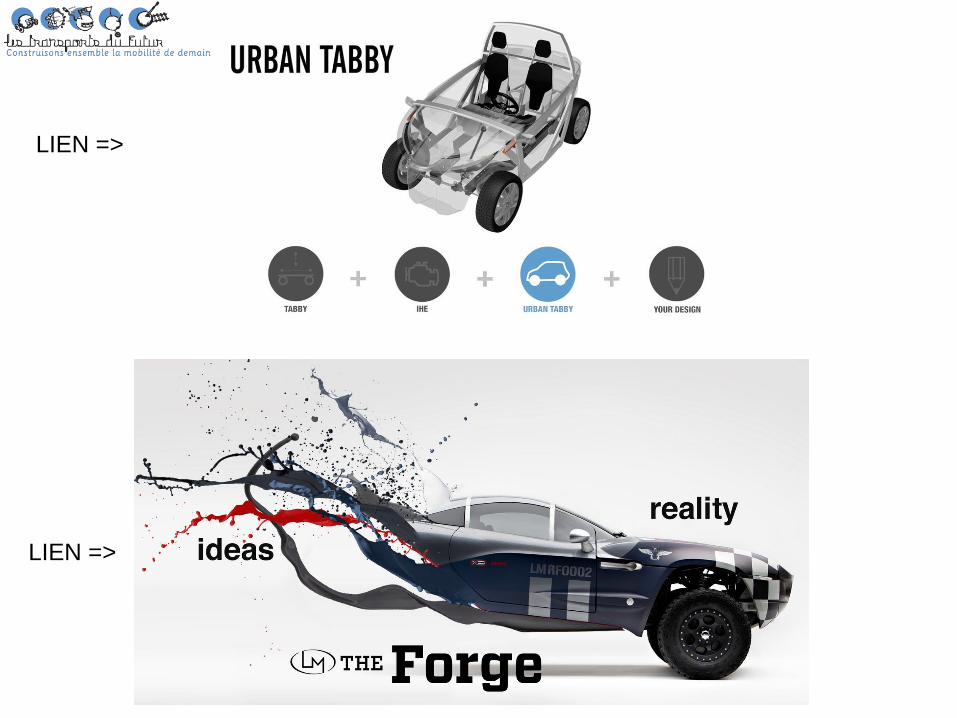
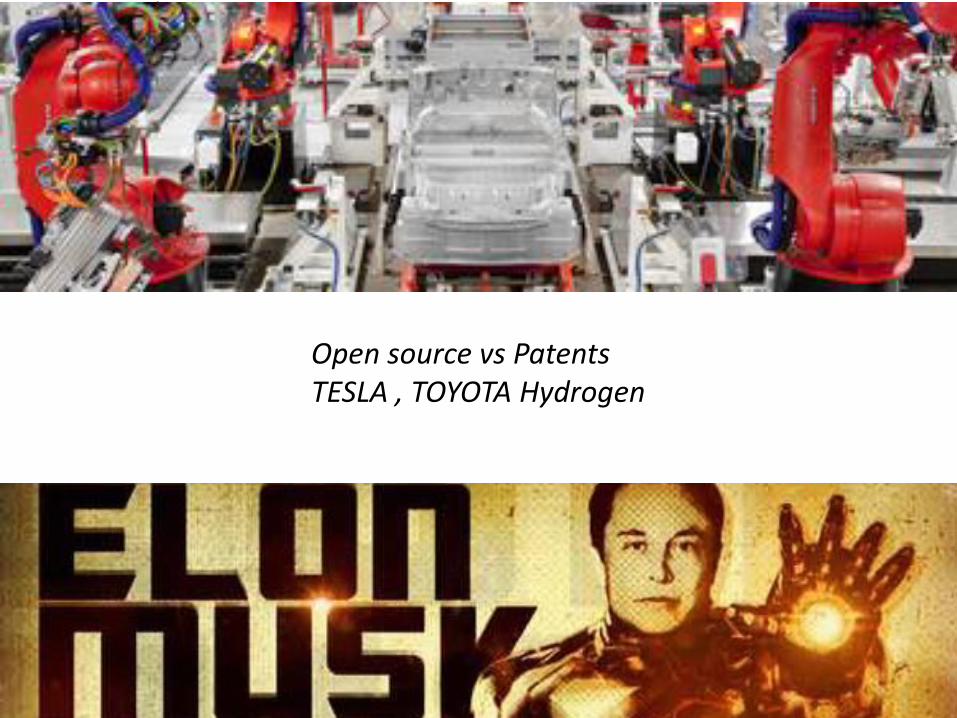
LIEN =>
LIEN =>
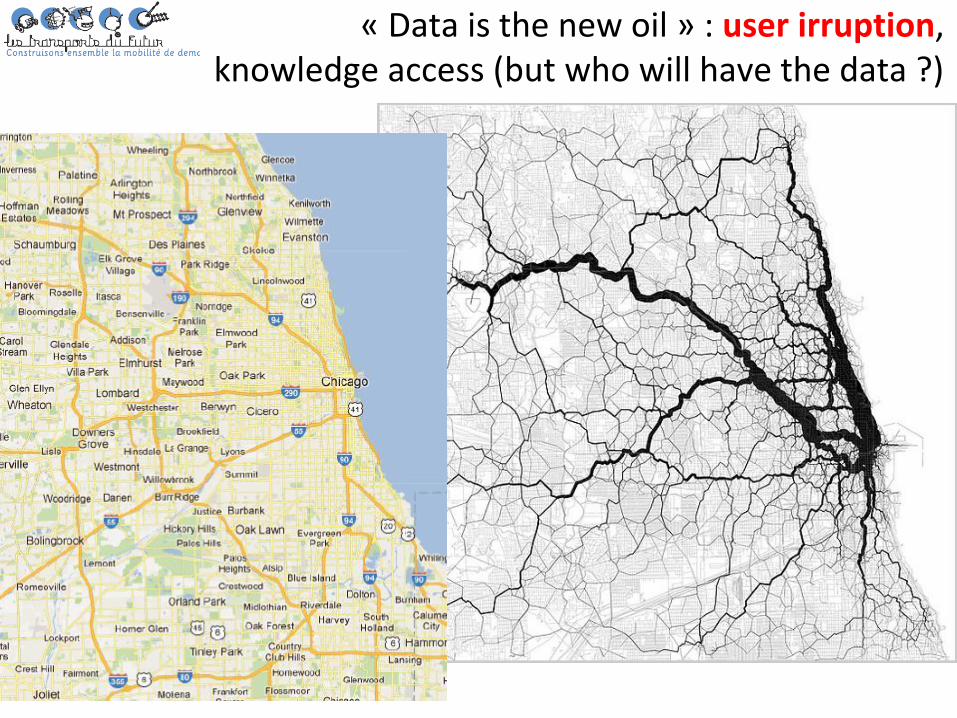
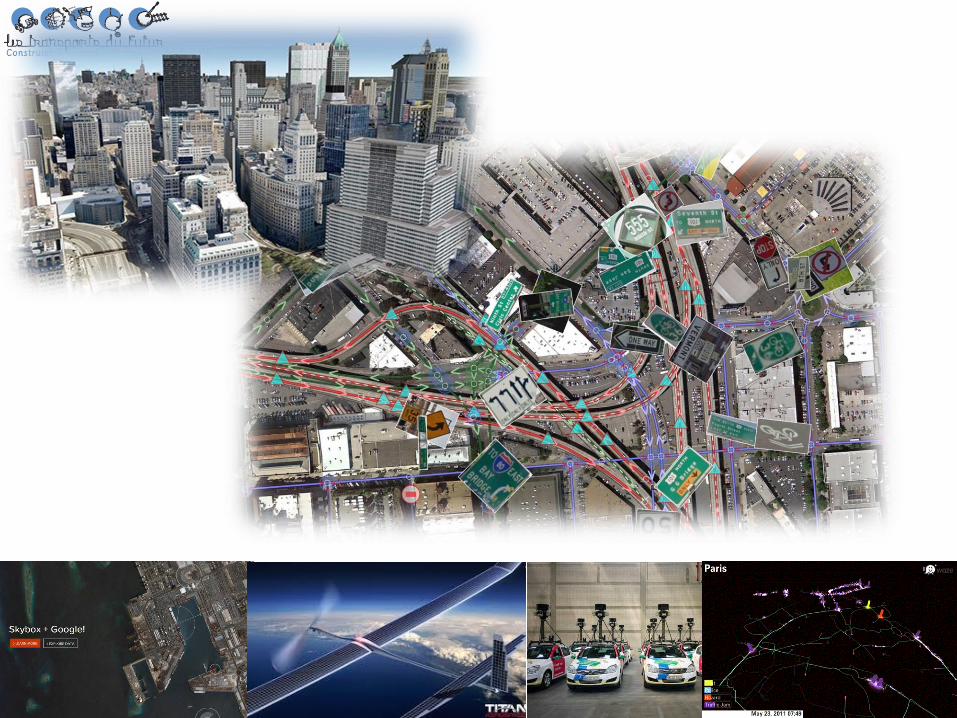
« Data is the new oil » : user irruption, knowledge access (but who will have the data ?)
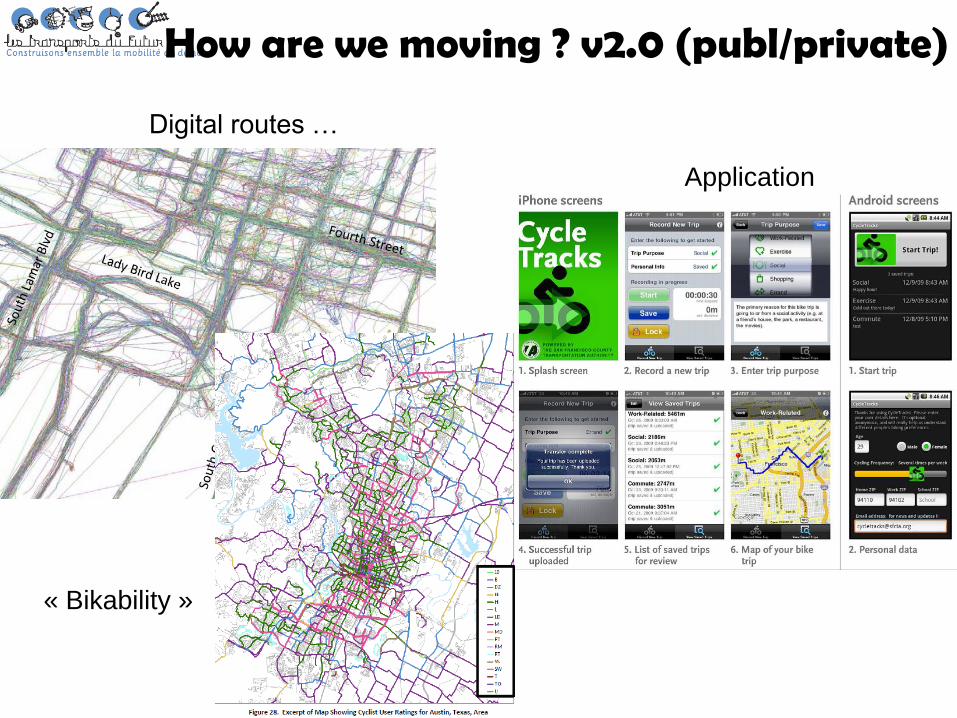
Application
Digital routes …
« Bikability »
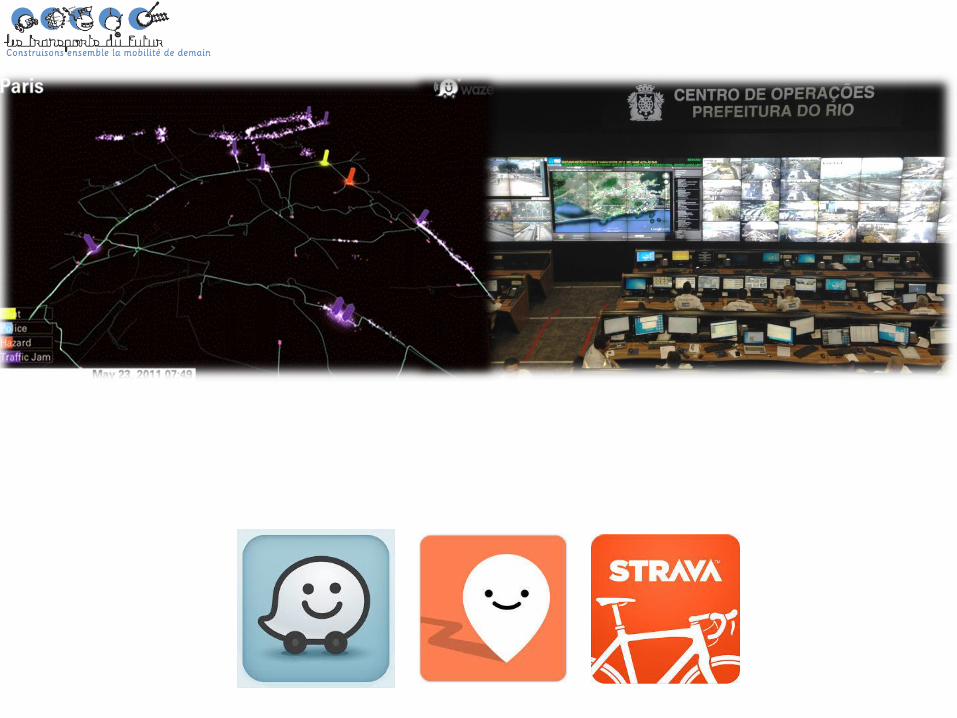
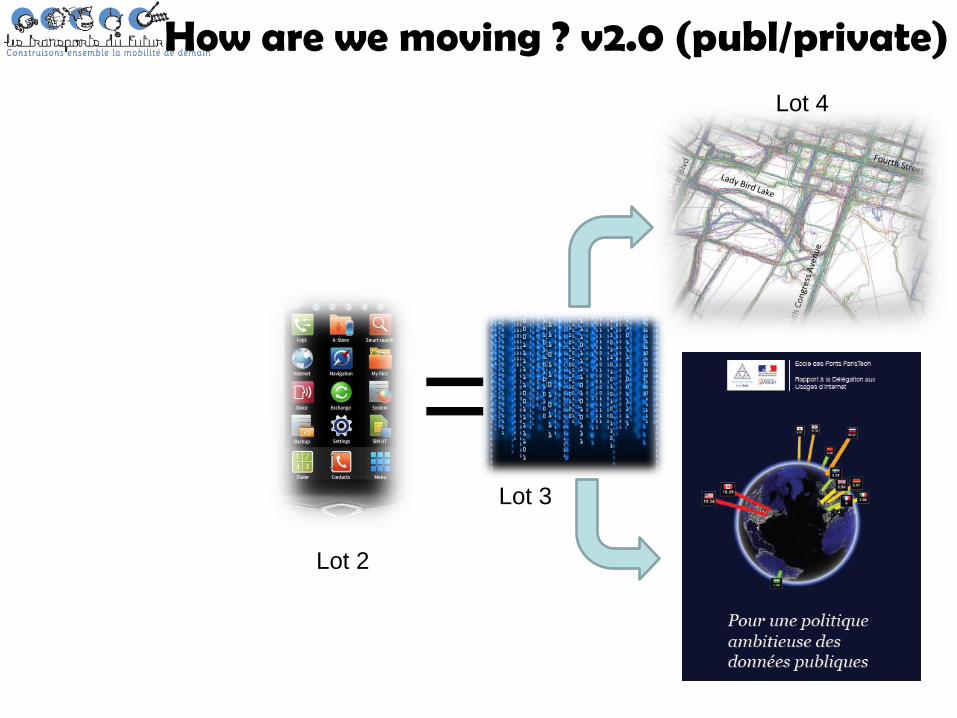
How are we moving ? v2.0 (publ/private)
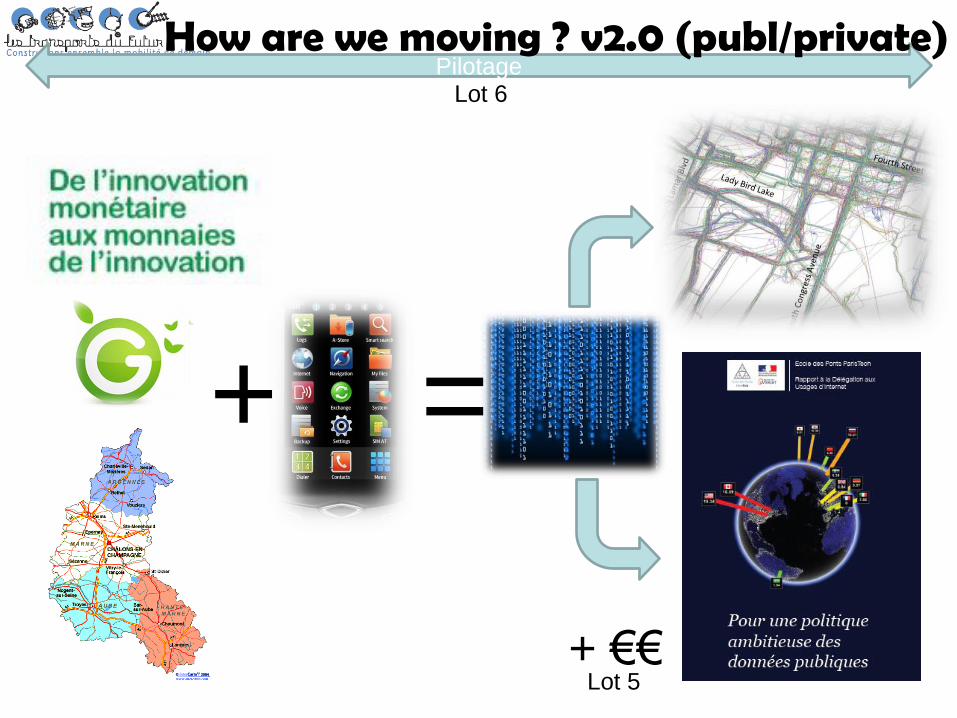
+ =
Lot 6 Pilotage
+ €€ Lot 5
How are we moving ? v2.0 (publ/private)
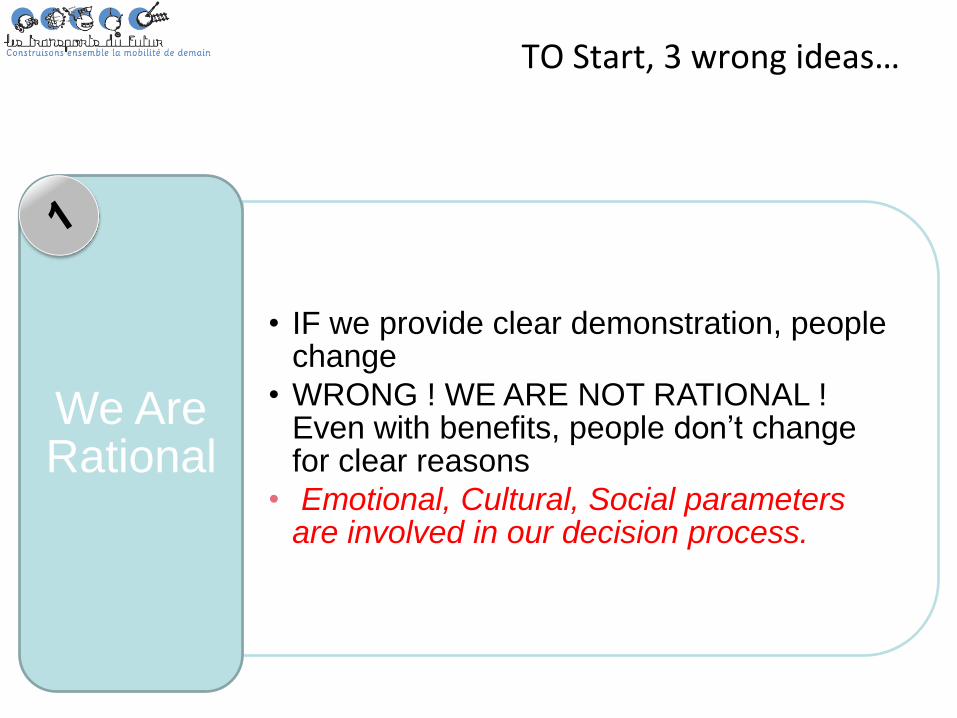
TO Start, 3 wrong ideas…
• IF we provide clear demonstration, people change
• WRONG ! WE ARE NOT RATIONAL ! Even with benefits, people don’t change for clear reasons
• Emotional, Cultural, Social parameters are involved in our decision process.
We Are Rational
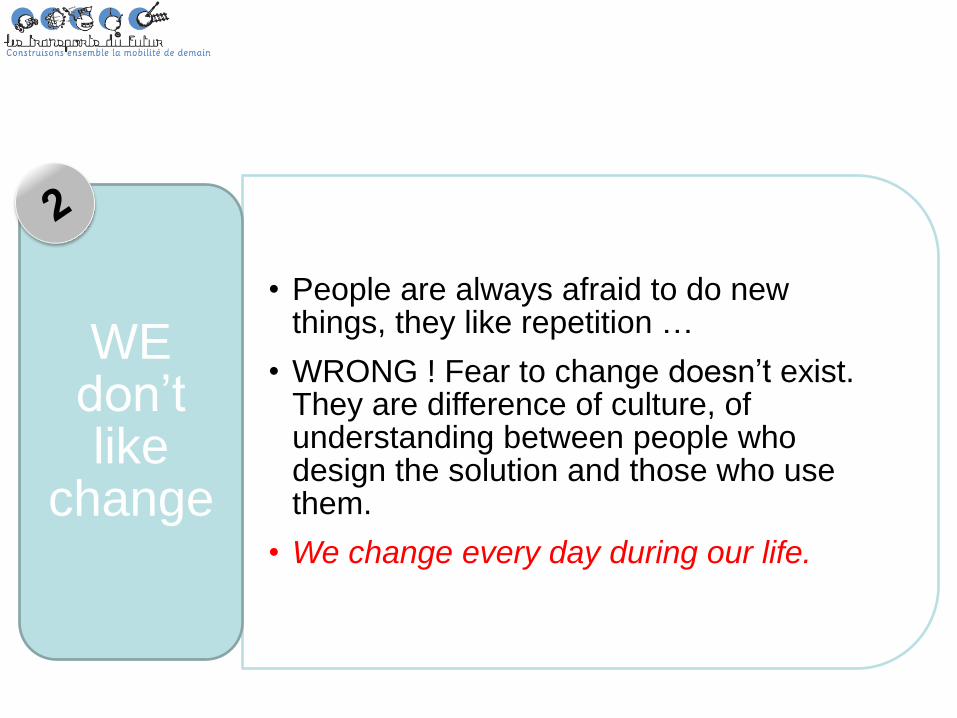
• People are always afraid to do new things, they like repetition …
• WRONG ! Fear to change doesn’t exist. They are difference of culture, of understanding between people who design the solution and those who use them.
• We change every day during our life.
WE don’t like
change
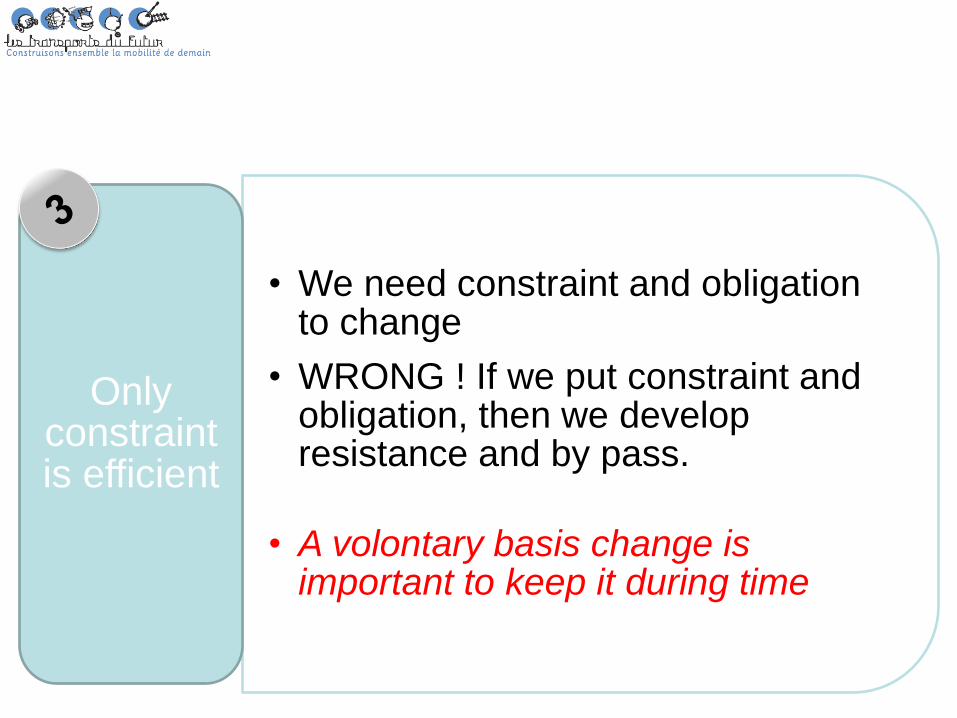
• We need constraint and obligation to change
• WRONG ! If we put constraint and obligation, then we develop resistance and by pass.
• A volontary basis change is important to keep it during time.
Only constraint is efficient
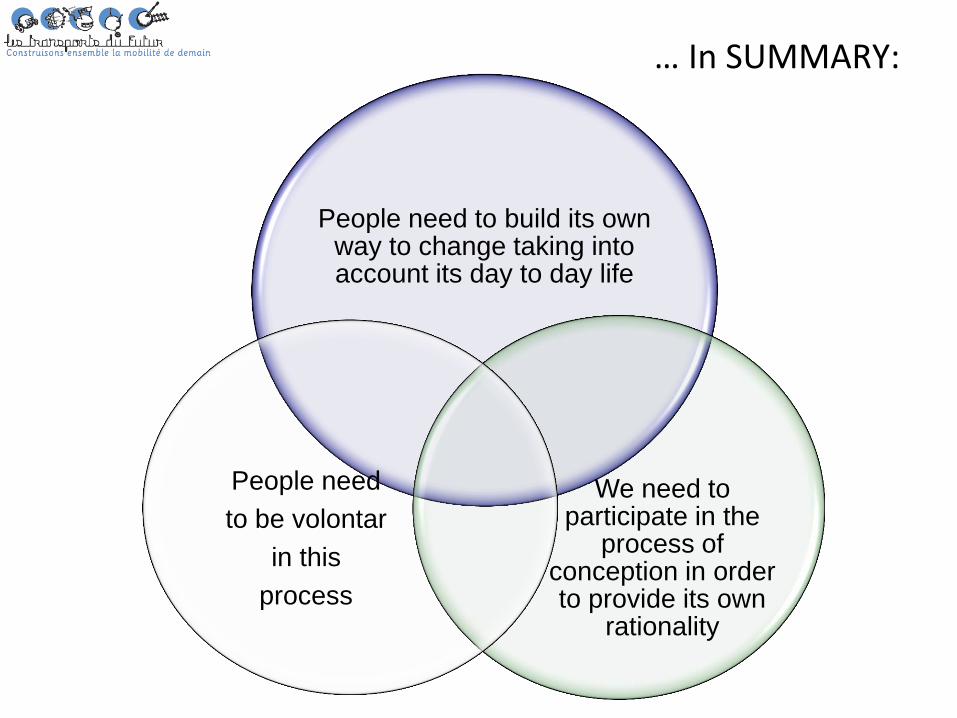
People need to build its own way to change taking into account its day to day life
We need to participate in the
process of conception in order to provide its own
rationality
People need
to be volontar
in this
process
… In SUMMARY:
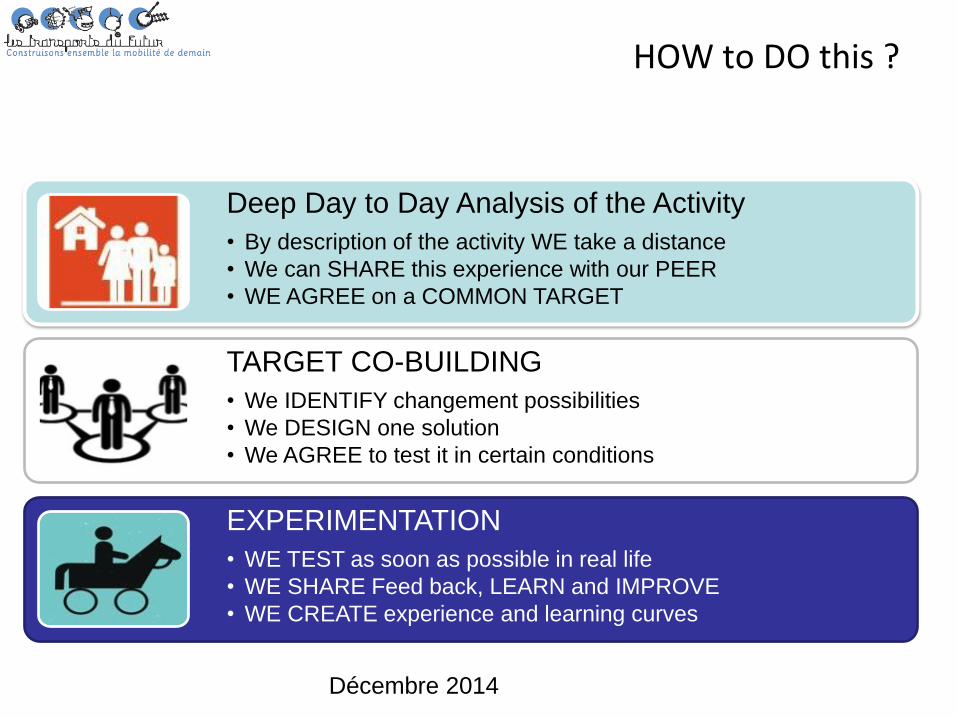
Deep Day to Day Analysis of the Activity
• By description of the activity WE take a distance
• We can SHARE this experience with our PEER
• WE AGREE on a COMMON TARGET
TARGET CO-BUILDING
• We IDENTIFY changement possibilities
• We DESIGN one solution
• We AGREE to test it in certain conditions
EXPERIMENTATION
• WE TEST as soon as possible in real life
• WE SHARE Feed back, LEARN and IMPROVE
• WE CREATE experience and learning curves
HOW to DO this ?
Décembre 2014
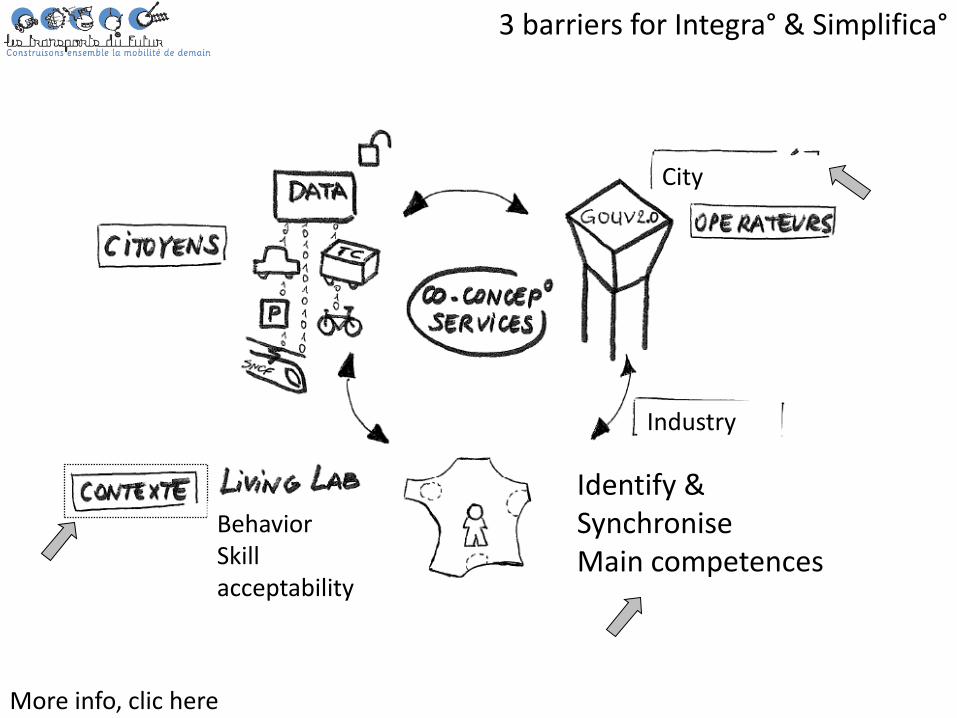
3 barriers for Integra° & Simplifica°
More info, clic here
Identify & Synchronise Main competences
Industry
Behavior Skill acceptability
City
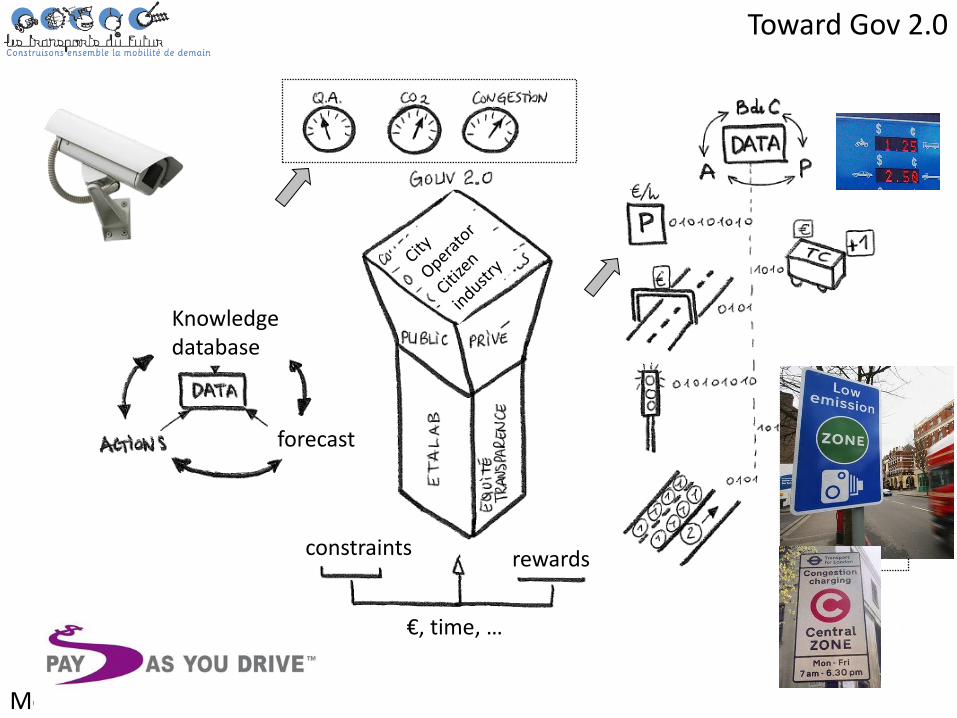
Toward Gov 2.0
More info, clic here
constraints rewards
€, time, …
Knowledge database
forecast
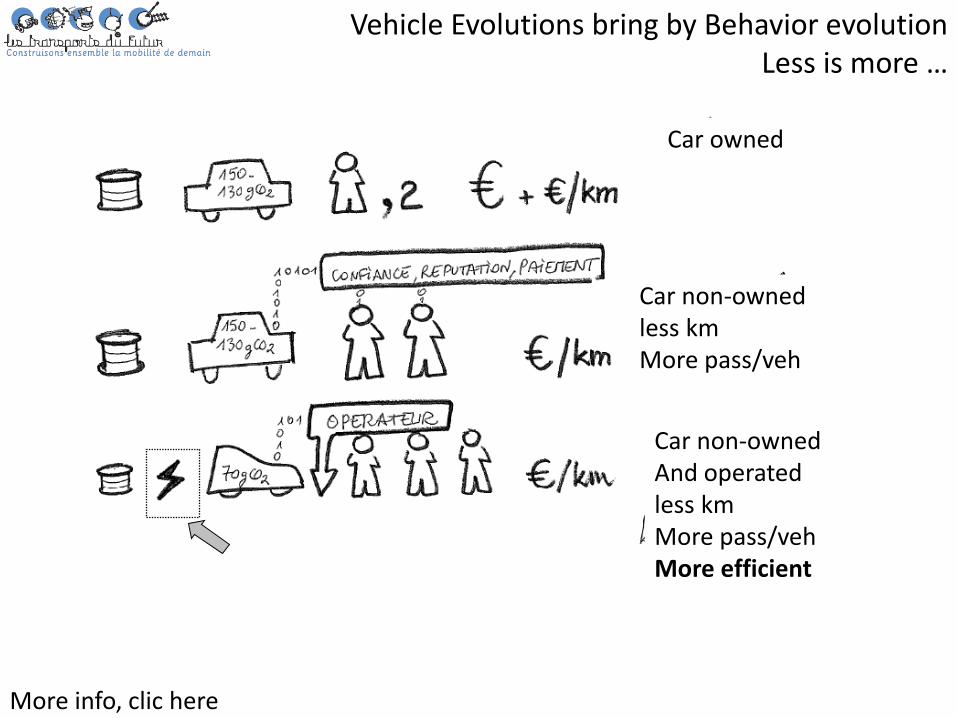
Vehicle Evolutions bring by Behavior evolution Less is more …
More info, clic here
Car owned
Car non-owned less km More pass/veh
Car non-owned And operated less km More pass/veh More efficient

Integration & Simplification – DOUBLE Benefit !
More info, clic here
Service Mobility brings : •Non-owned car •With New specifications •Used by citizens but not owned •Shared & operated •Using other energy •And much more efficient
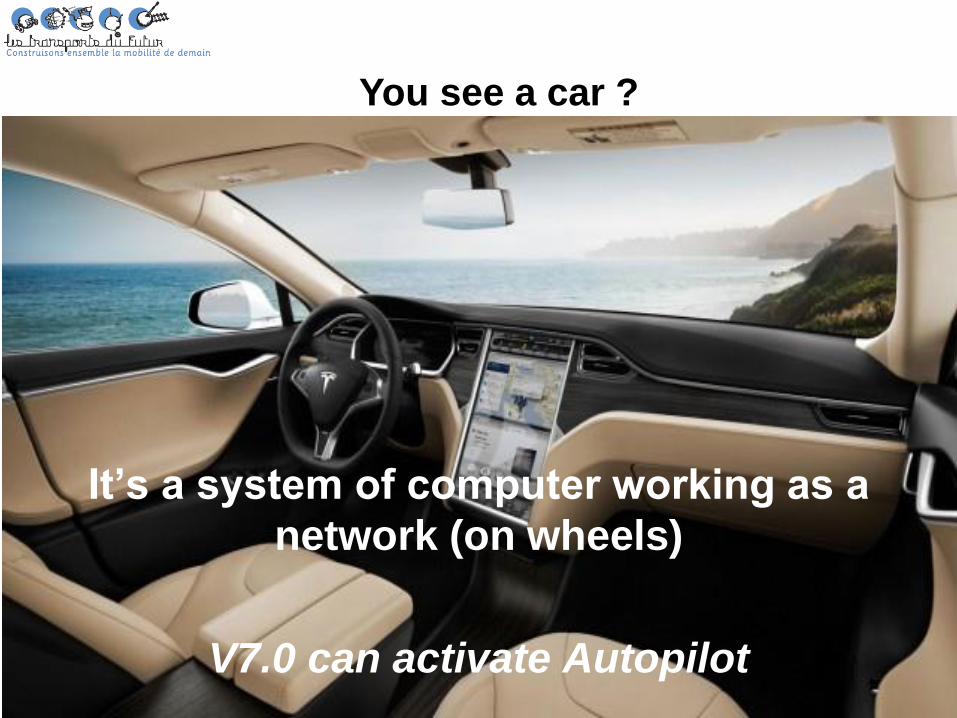
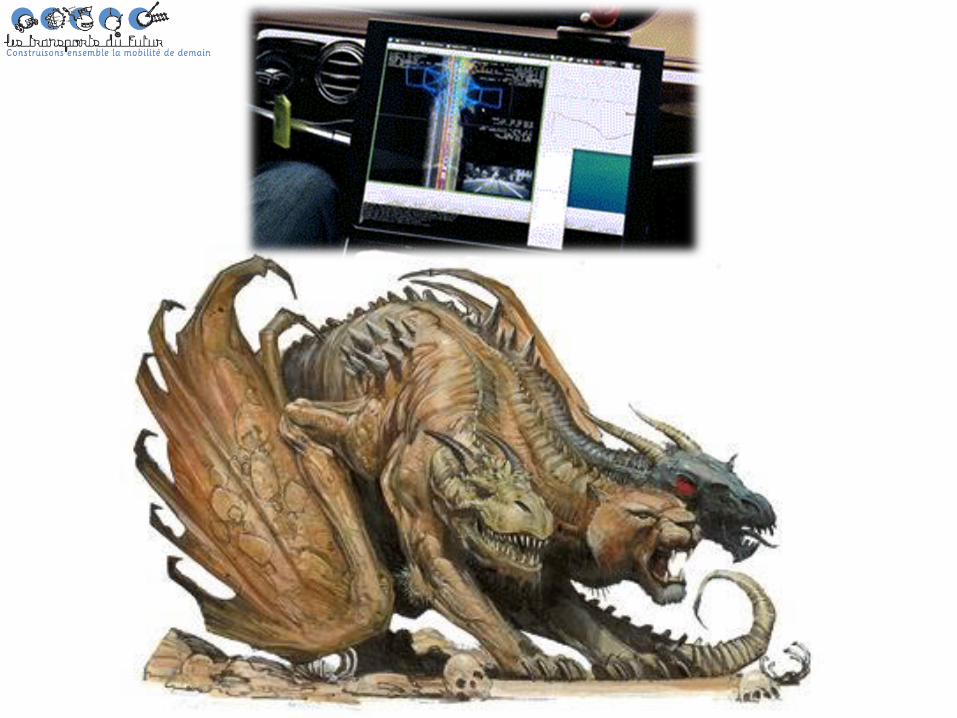
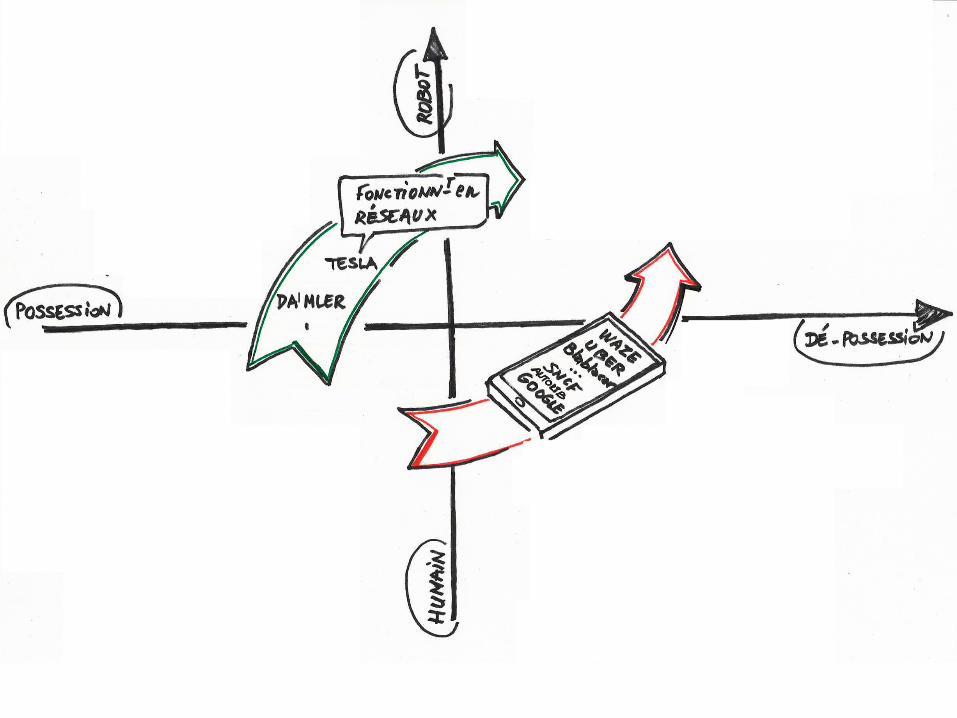
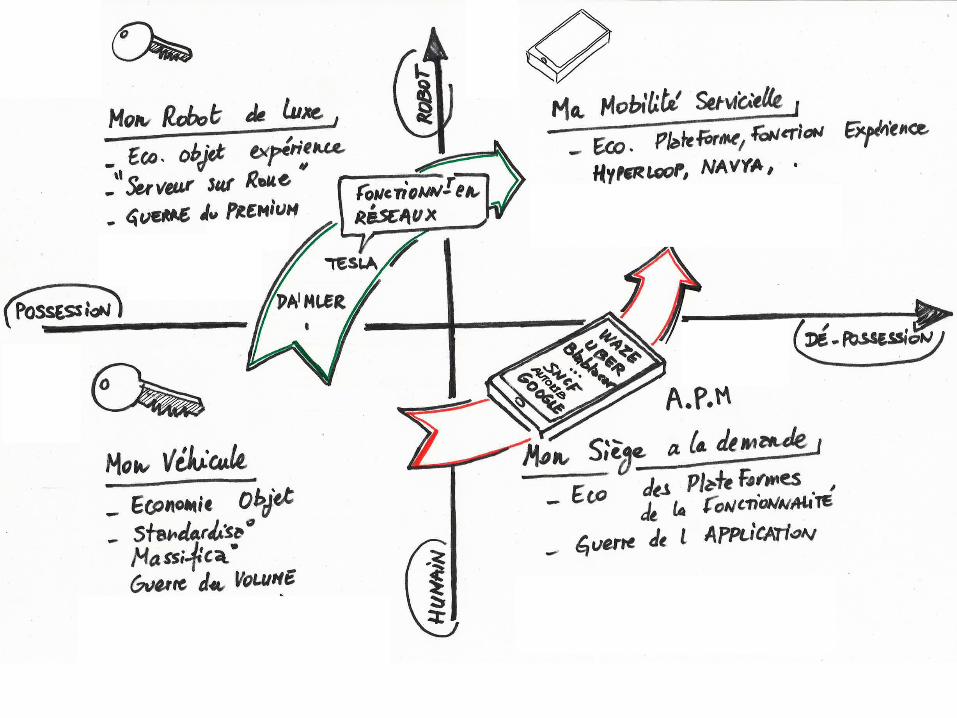
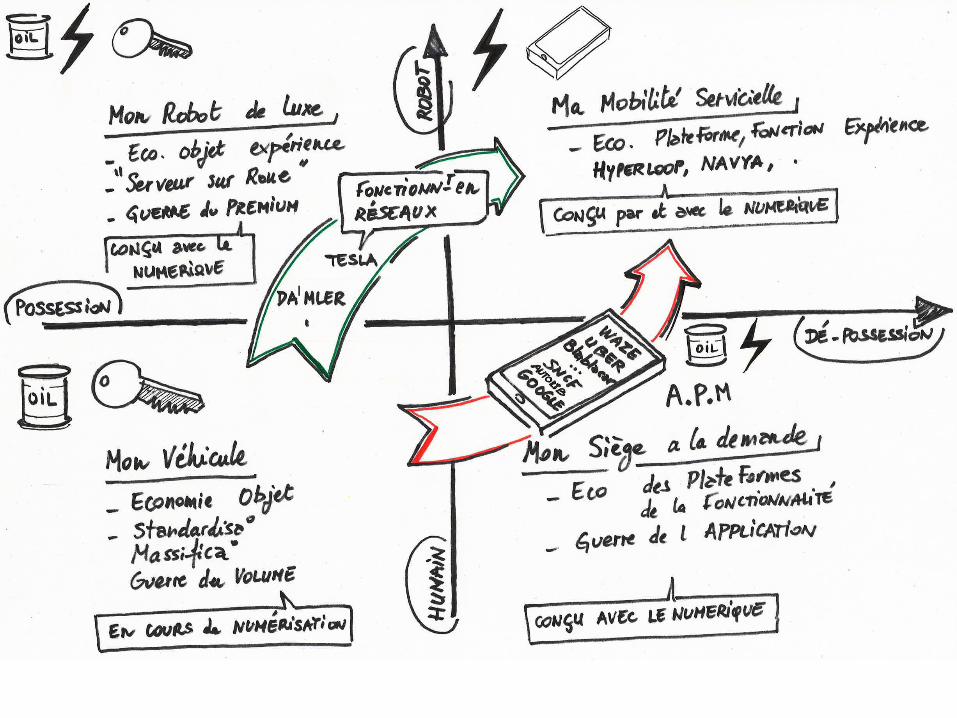
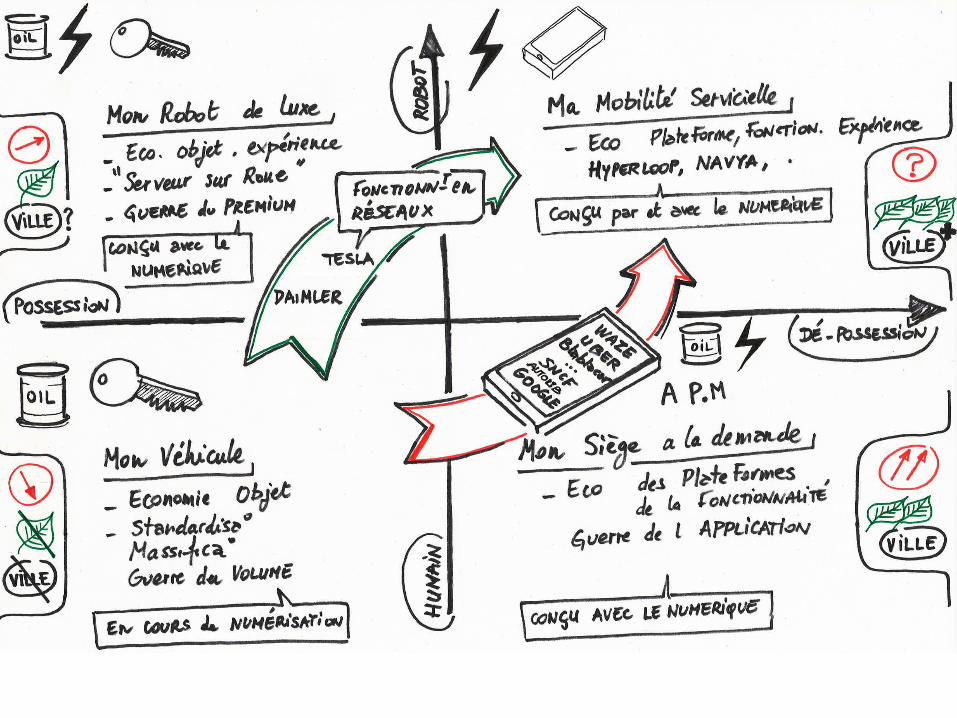
It’s a system of computer working as a
network (on wheels)
V7.0 can activate Autopilot
You see a car ?
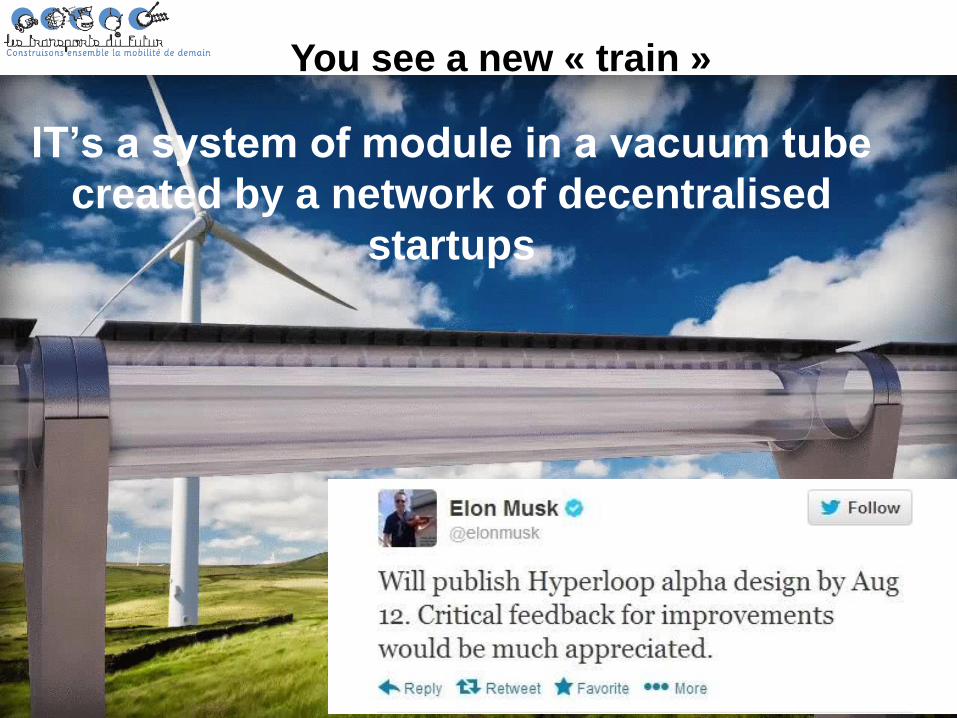
IT’s a system of module in a vacuum tube
created by a network of decentralised
startups
You see a new « train »
The major innovation will be
not to own a car..
Smartphone,
= new key
106
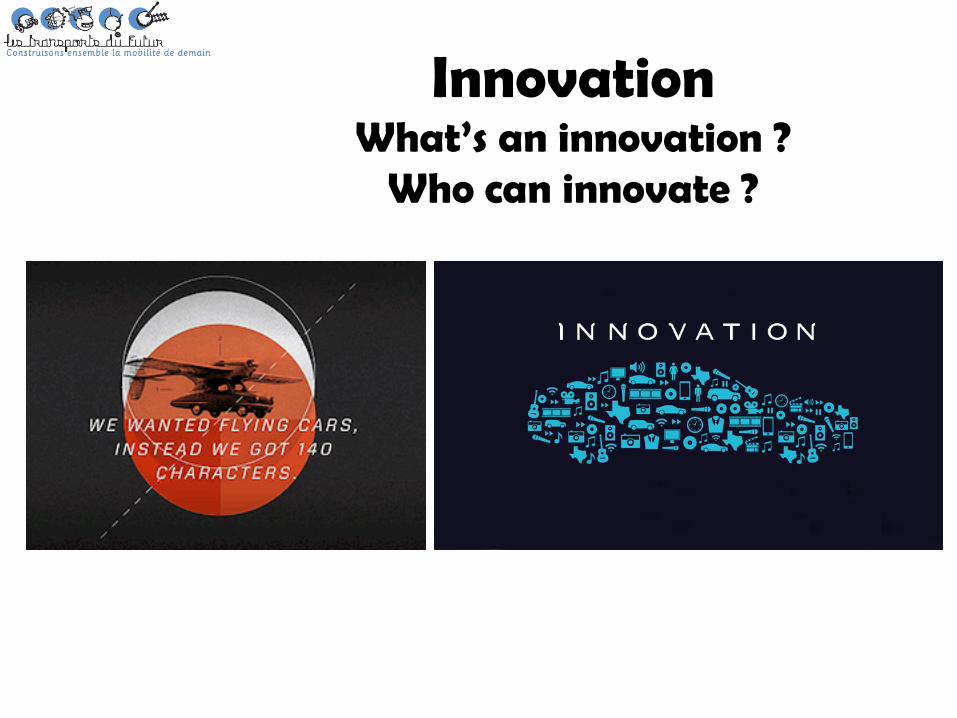
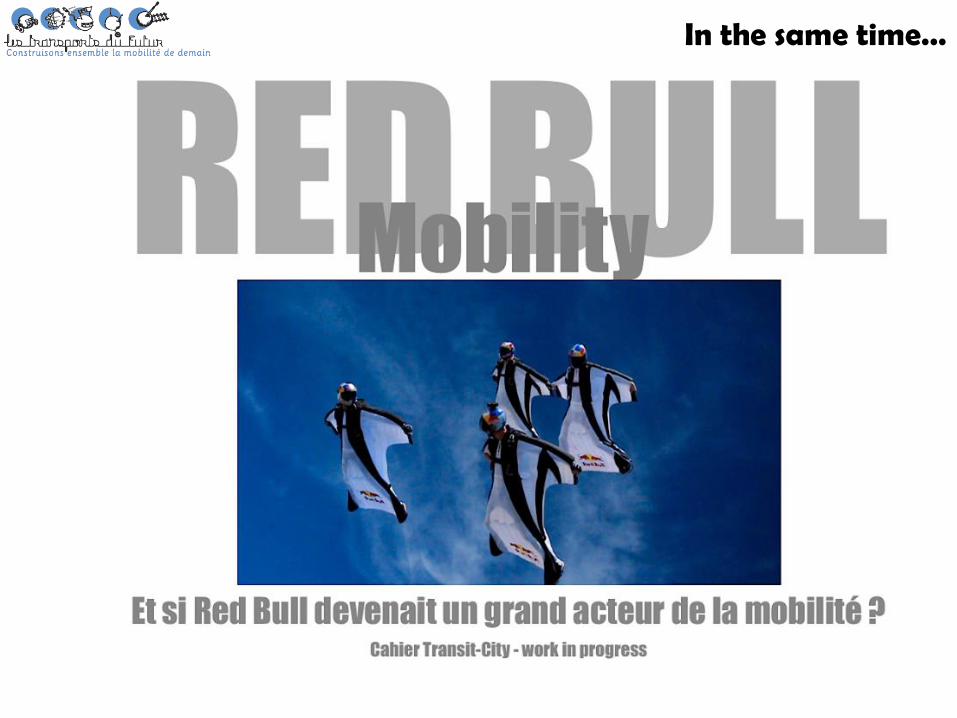
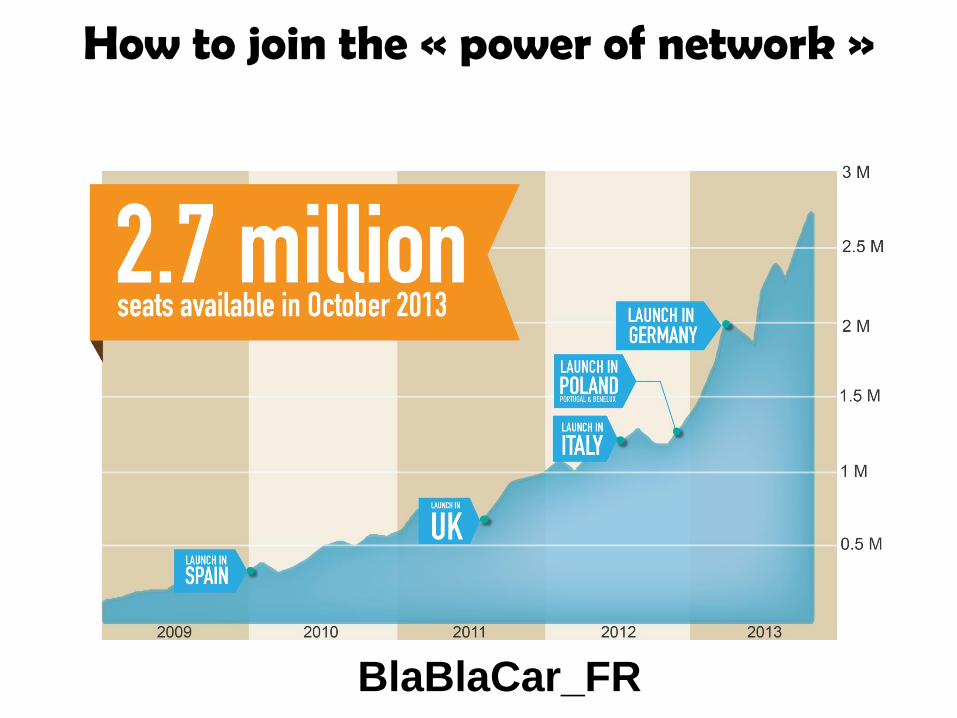
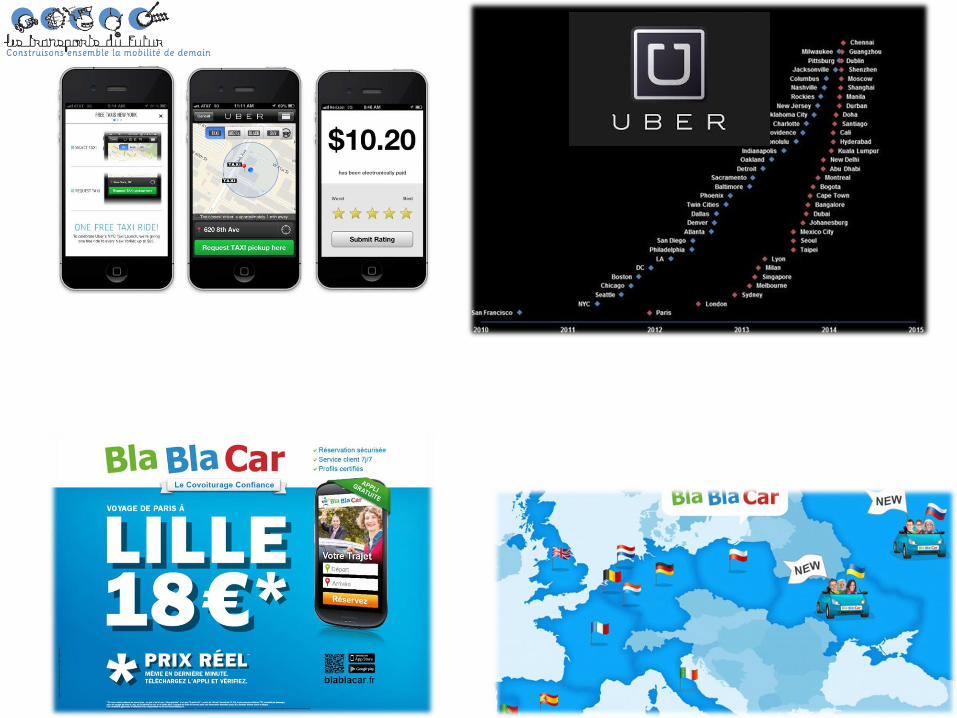
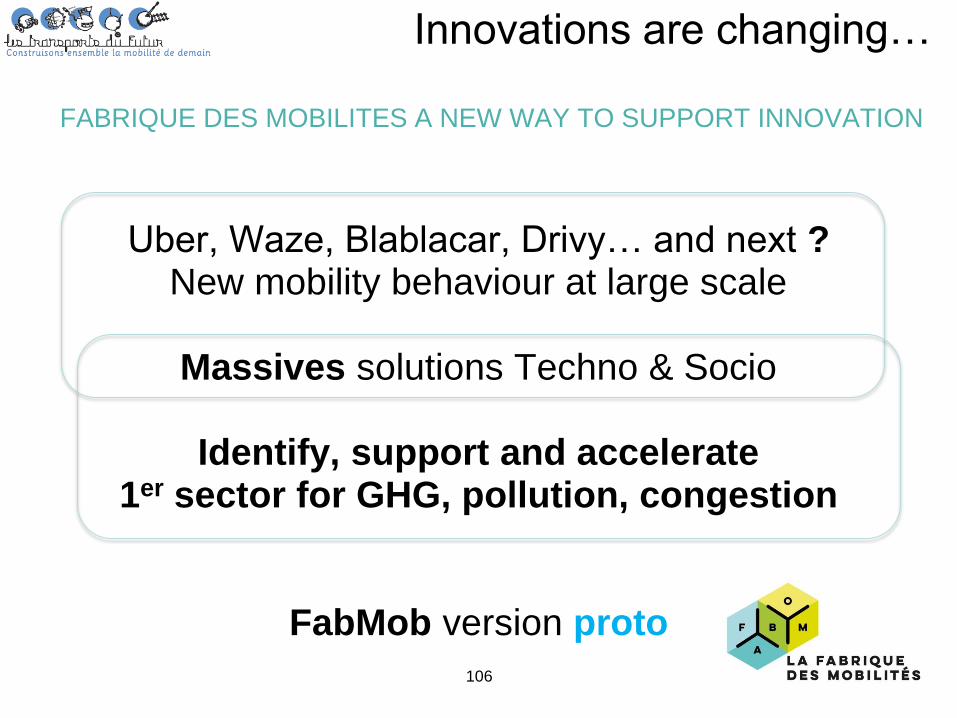
Innovations are changing…
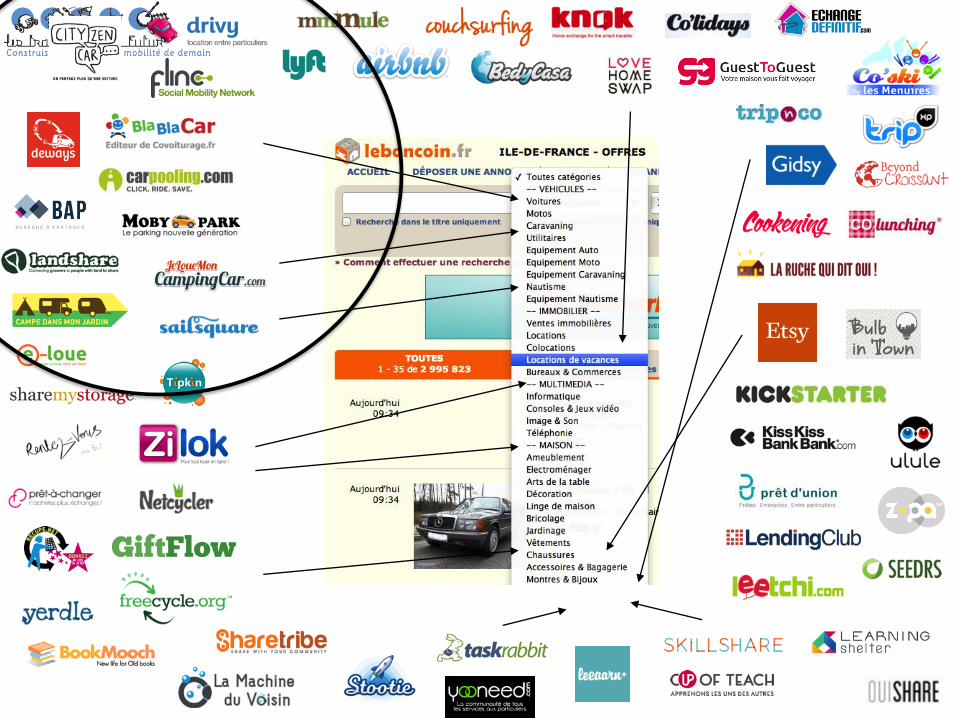
Uber, Waze, Blablacar, Drivy… and next ? New mobility behaviour at large scale
Massives solutions Techno & Socio
Identify, support and accelerate
1er sector for GHG, pollution, congestion
FabMob version proto
FABRIQUE DES MOBILITES A NEW WAY TO SUPPORT INNOVATION
107 MOOC Challenges et enjeux de la mobilité 2.0
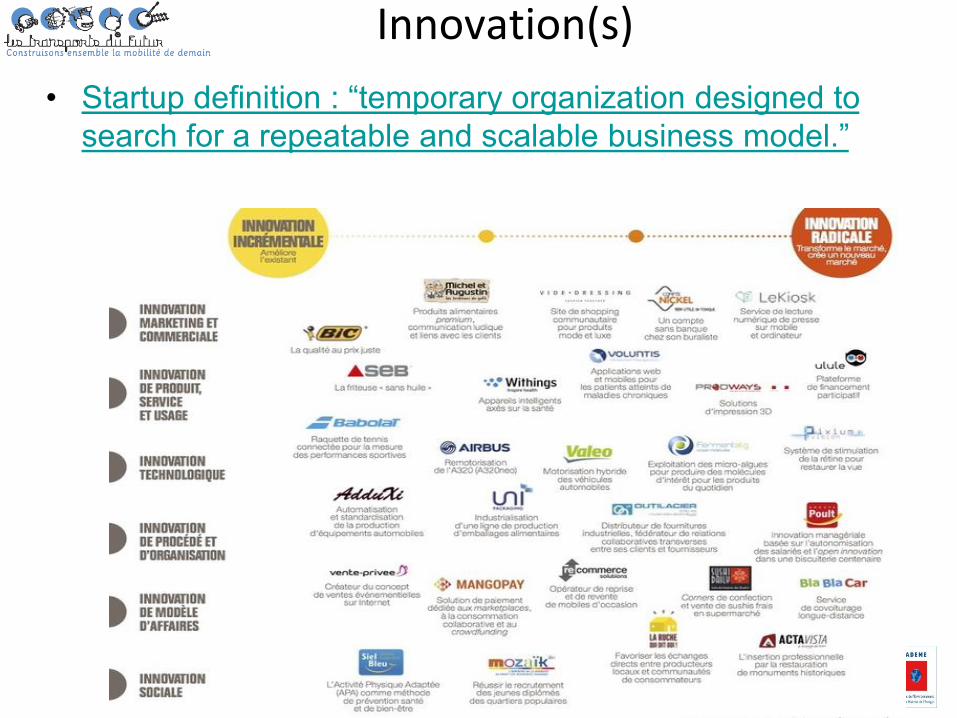
• Startup definition : “temporary organization designed to
search for a repeatable and scalable business model.”
Innovation(s)
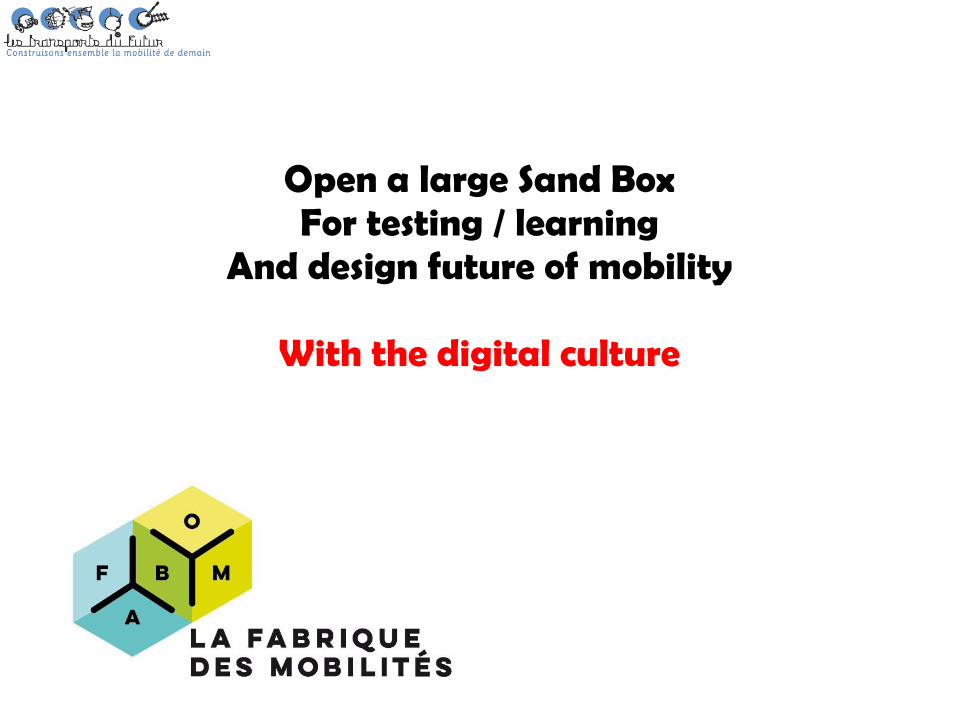
Open a large Sand Box For testing / learning
And design future of mobility
With the digital culture
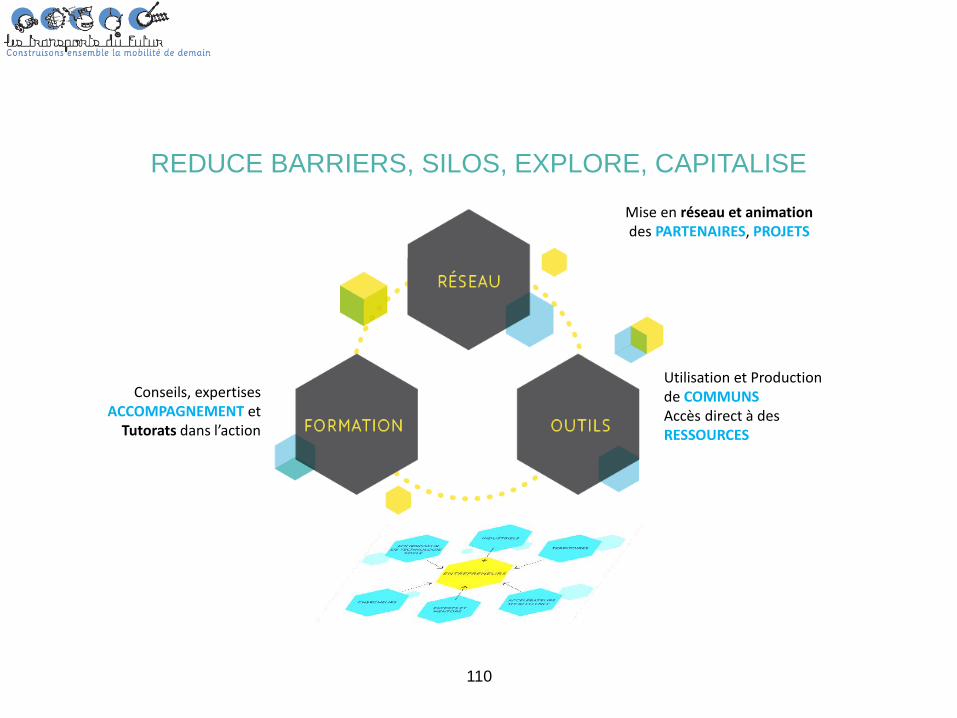
110
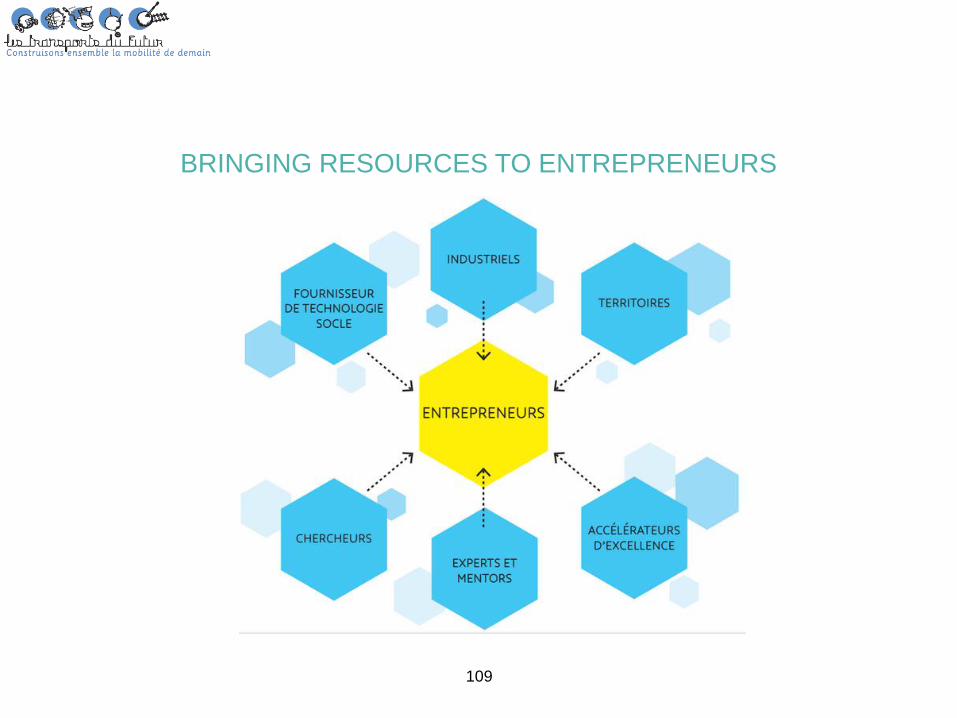
Mise en réseau et animation des PARTENAIRES, PROJETS
Utilisation et Production de COMMUNS Accès direct à des RESSOURCES
Conseils, expertises ACCOMPAGNEMENT et
Tutorats dans l’action
REDUCE BARRIERS, SILOS, EXPLORE, CAPITALISE
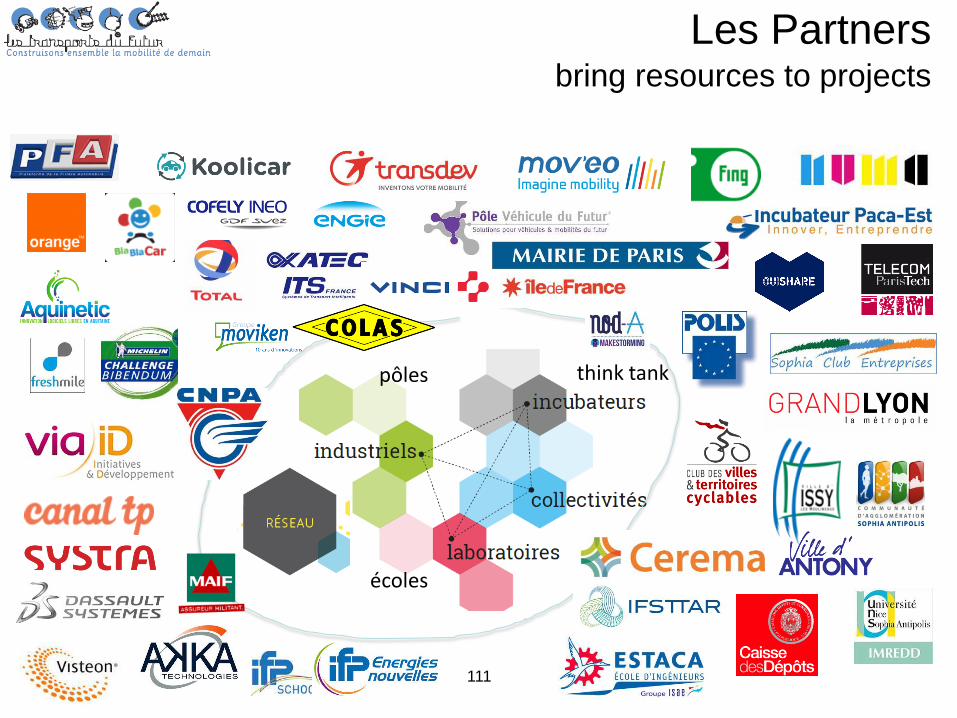
111
Les Partners bring resources to projects
think tank
écoles
pôles
112
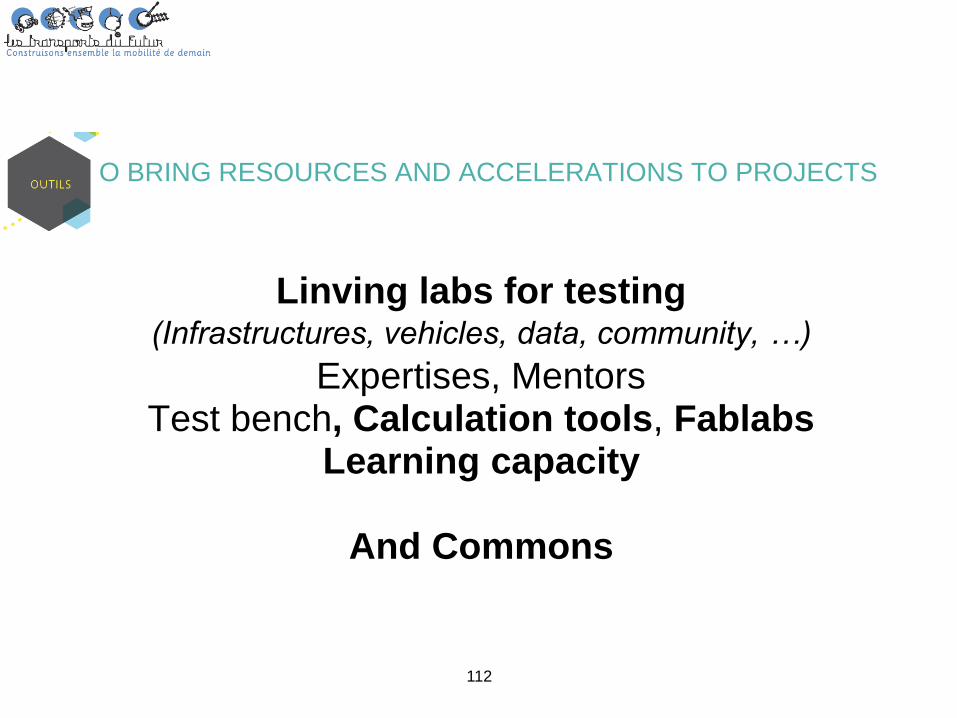
Linving labs for testing (Infrastructures, vehicles, data, community, …)
Expertises, Mentors Test bench, Calculation tools, Fablabs
Learning capacity
And Commons
TO BRING RESOURCES AND ACCELERATIONS TO PROJECTS
113
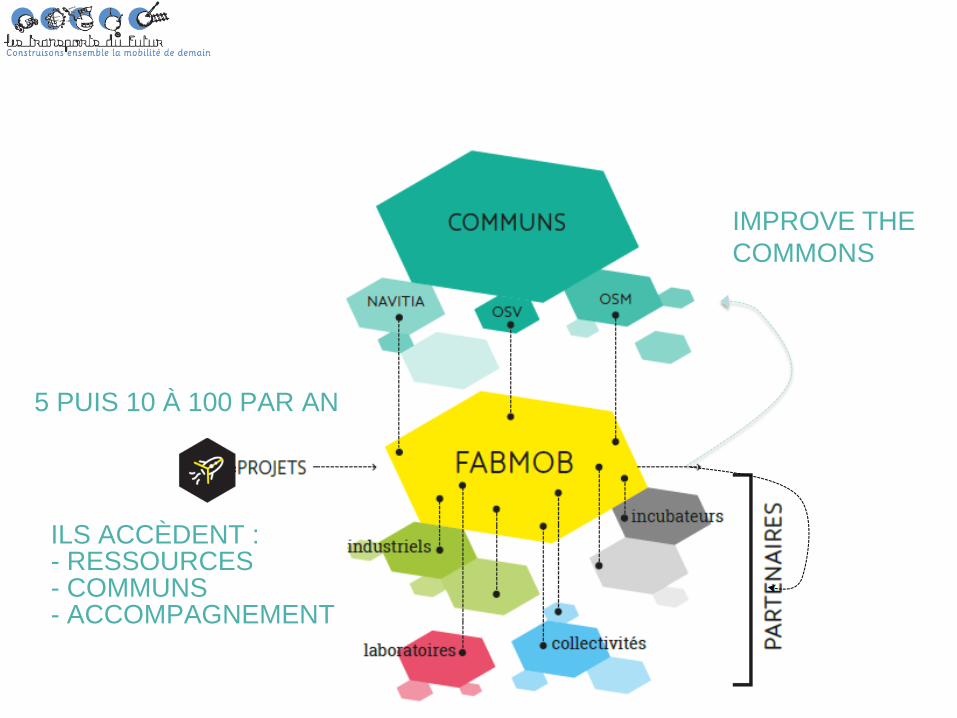
ILS ACCÈDENT : - RESSOURCES - COMMUNS - ACCOMPAGNEMENT
IMPROVE THE
COMMONS
5 PUIS 10 À 100 PAR AN
114
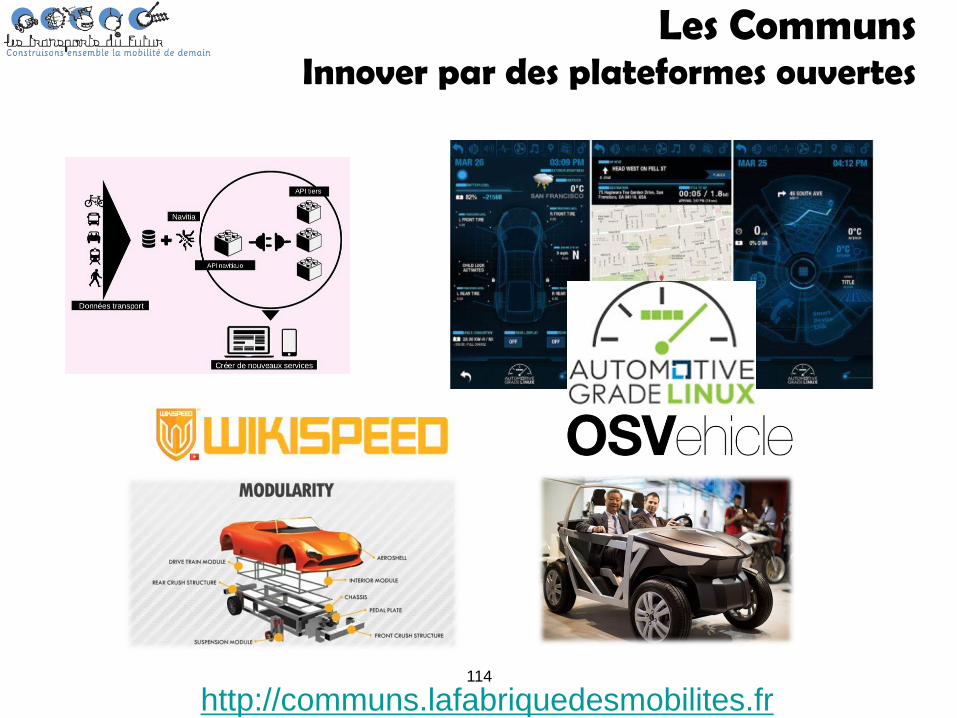
Les Communs Innover par des plateformes ouvertes
http://communs.lafabriquedesmobilites.fr
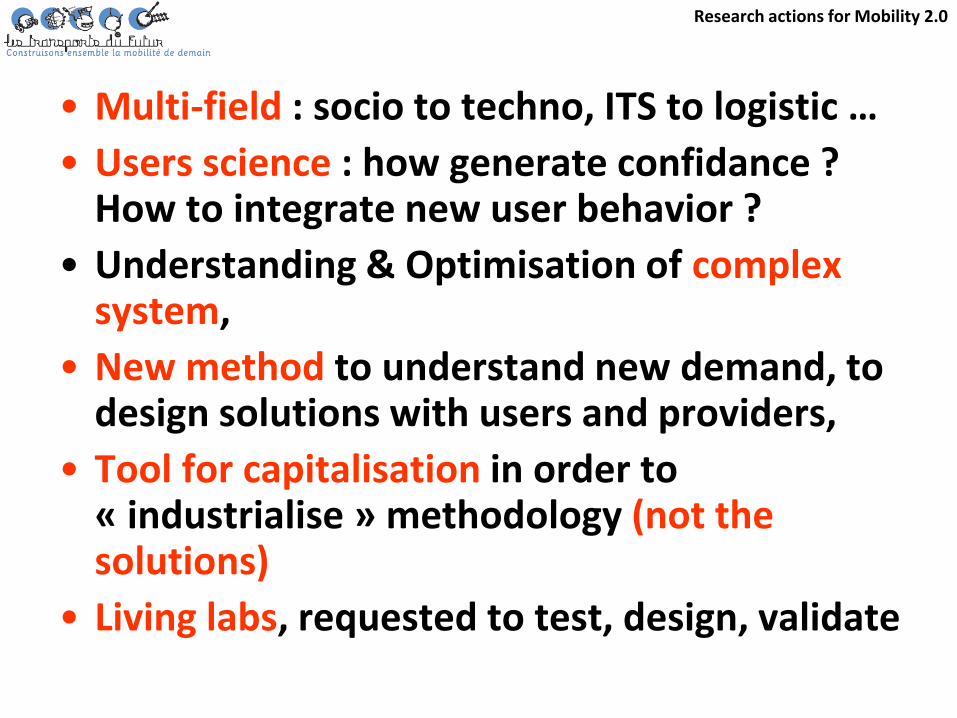
Research actions for Mobility 2.0
• Multi-field : socio to techno, ITS to logistic …
• Users science : how generate confidance ? How to integrate new user behavior ?
• Understanding & Optimisation of complex system,
• New method to understand new demand, to design solutions with users and providers,
• Tool for capitalisation in order to « industrialise » methodology (not the solutions)
• Living labs, requested to test, design, validate
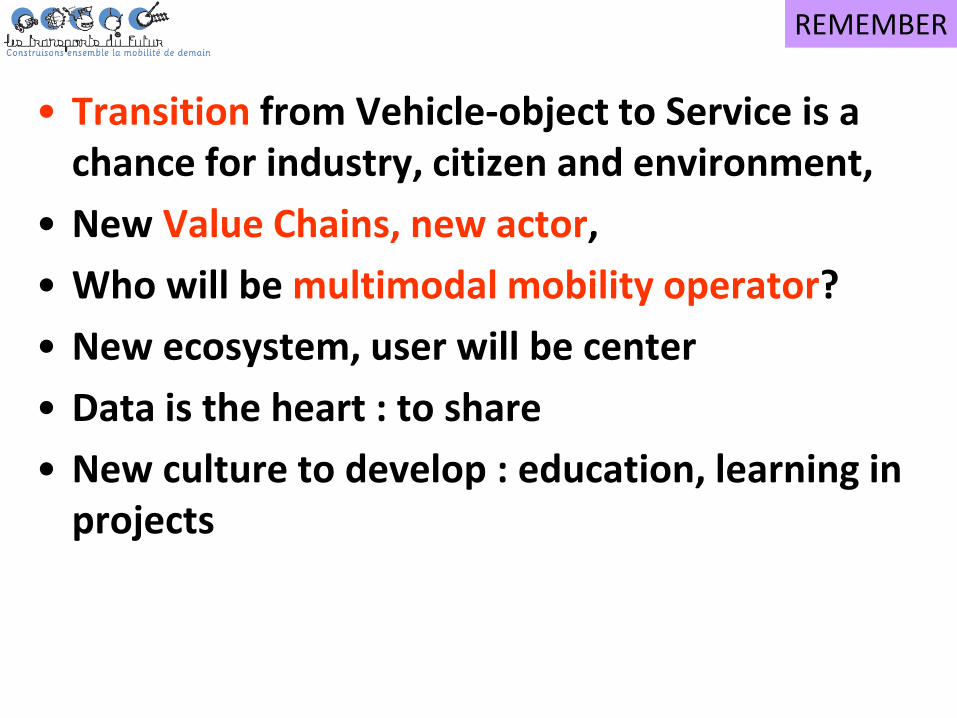
• Transition from Vehicle-object to Service is a chance for industry, citizen and environment,
• New Value Chains, new actor,
• Who will be multimodal mobility operator?
• New ecosystem, user will be center
• Data is the heart : to share
• New culture to develop : education, learning in projects
REMEMBER
REMEMBER
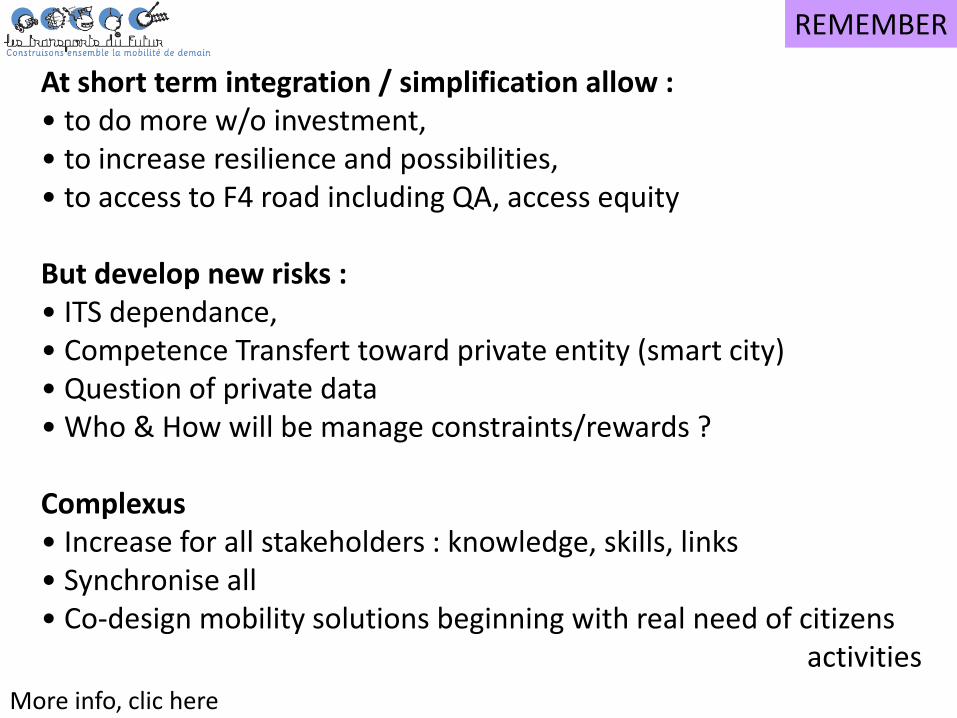
At short term integration / simplification allow : • to do more w/o investment, • to increase resilience and possibilities, • to access to F4 road including QA, access equity
But develop new risks : • ITS dependance, • Competence Transfert toward private entity (smart city) • Question of private data • Who & How will be manage constraints/rewards ?
Complexus • Increase for all stakeholders : knowledge, skills, links • Synchronise all • Co-design mobility solutions beginning with real need of citizens
activities More info, clic here
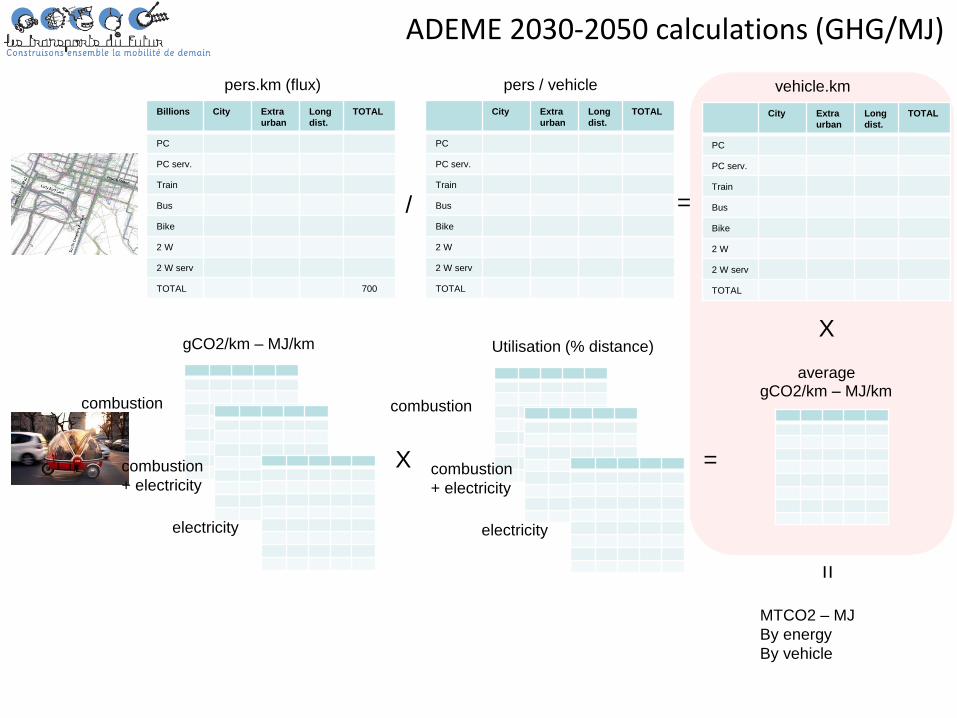
pers.km (flux)
Billions City Extra
urban
Long
dist.
TOTAL
PC
PC serv.
Train
Bus
Bike
2 W
2 W serv
TOTAL 700
City Extra
urban
Long
dist.
TOTAL
PC
PC serv.
Train
Bus
Bike
2 W
2 W serv
TOTAL
/
pers / vehicle
=
City Extra
urban
Long
dist.
TOTAL
PC
PC serv.
Train
Bus
Bike
2 W
2 W serv
TOTAL
vehicle.km
combustion
combustion
+ electricity
electricity
gCO2/km – MJ/km
combustion
combustion
+ electricity
electricity
Utilisation (% distance)
average gCO2/km – MJ/km
X =
X
=
MTCO2 – MJ
By energy
By vehicle
ADEME 2030-2050 calculations (GHG/MJ)
ADEME 2030-2050 calculations (GHG/MJ)
200,0
300,0
400,0
500,0
600,0
700,0
800,0
900,0
2005 2010 2015 2020 2025 2030 2035 2040 2045 2050 2055
Voyageurs
March
Voiture
VUL
Camion
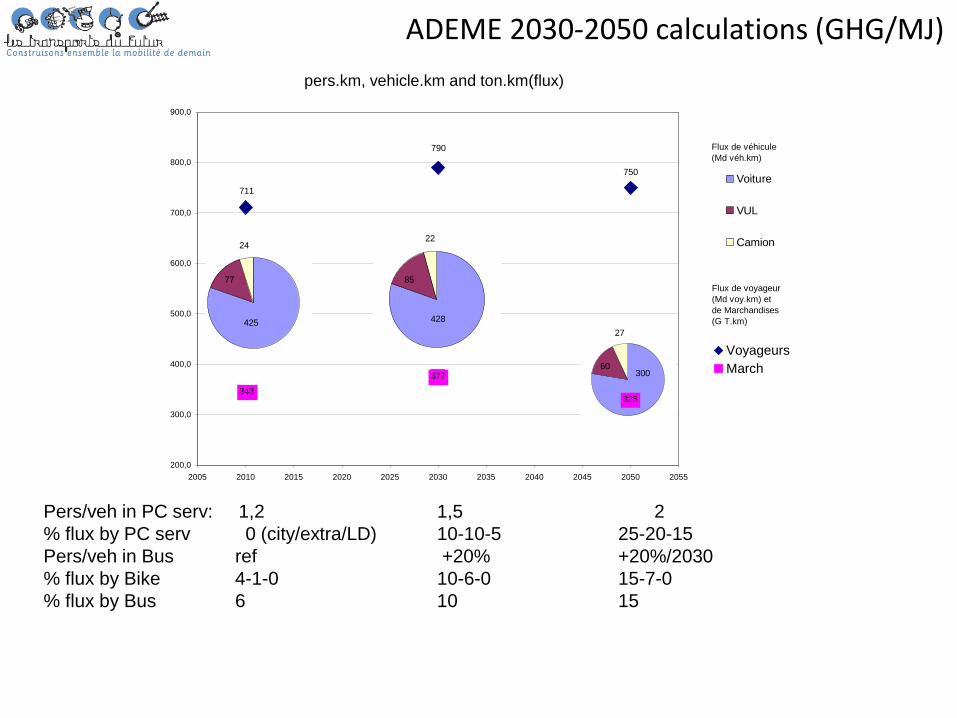
325
Flux de véhicule
(Md véh.km)
Flux de voyageur
(Md voy.km) et
de Marchandises
(G T.km)
343
377
711
790
750
425 428
300
77 85
60
2422
27
pers.km, vehicle.km and ton.km(flux)
Pers/veh in PC serv: 1,2 1,5 2
% flux by PC serv 0 (city/extra/LD) 10-10-5 25-20-15
Pers/veh in Bus ref +20% +20%/2030
% flux by Bike 4-1-0 10-6-0 15-7-0
% flux by Bus 6 10 15
ADEME 2030-2050 calculations (GHG/MJ) Emissions de GES en MTCO2 et facteur de réduction (réf 1990)
0,0
0,5
1,0
1,5
2,0
2,5
3,0
3,5
4,0
4,5
2005 2010 2015 2020 2025 2030 2035 2040 2045 2050 2055
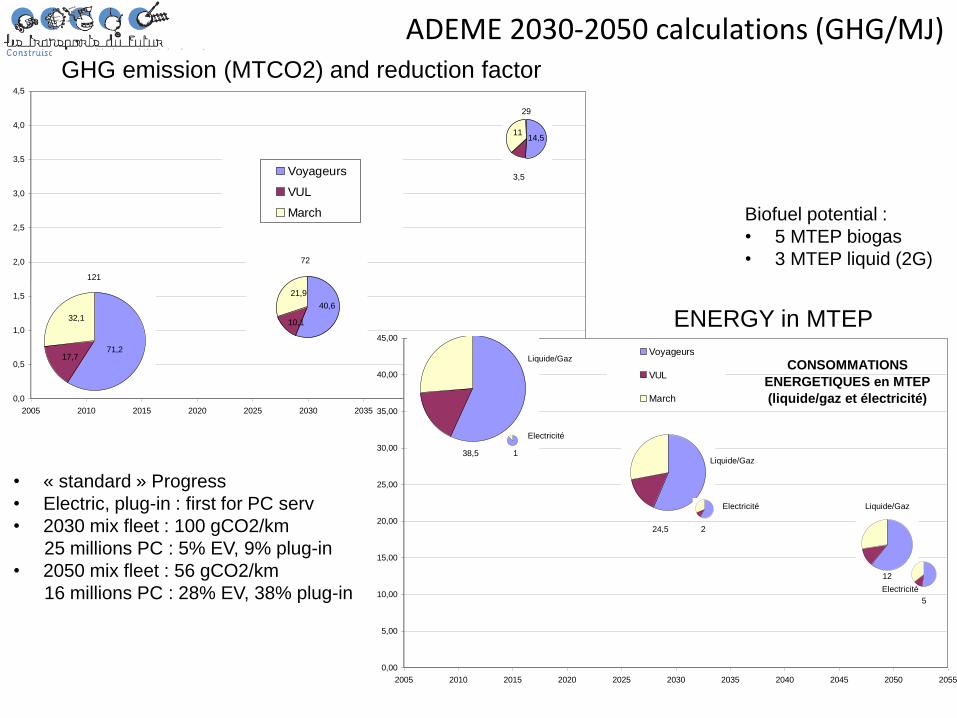
71,217,7
32,1
40,6
21,9
10,1
14,511
3,5
121
72
29
Voyageurs
VUL
March
0,00
5,00
10,00
15,00
20,00
25,00
30,00
35,00
40,00
45,00
2005 2010 2015 2020 2025 2030 2035 2040 2045 2050 2055
Voyageurs
VUL
March
38,5 1
24,5 2
12
5
CONSOMMATIONS
ENERGETIQUES en MTEP
(liquide/gaz et électricité)
Liquide/Gaz
Liquide/Gaz
Liquide/Gaz
Electricité
Electricité
Electricité
GHG emission (MTCO2) and reduction factor
ENERGY in MTEP
• « standard » Progress
• Electric, plug-in : first for PC serv
• 2030 mix fleet : 100 gCO2/km
25 millions PC : 5% EV, 9% plug-in
• 2050 mix fleet : 56 gCO2/km
16 millions PC : 28% EV, 38% plug-in
Biofuel potential :
• 5 MTEP biogas
• 3 MTEP liquid (2G)