
High-Resolution Measurements of Face-to-Face Contact ... · High-Resolution Measurements of...
13
High-Resolution Measurements of Face-to-Face Contact Patterns in a Primary School Juliette Stehle ´ 1 , Nicolas Voirin 2,3 , Alain Barrat 1,4 *, Ciro Cattuto 4 , Lorenzo Isella 4 , Jean-Franc ¸ois Pinton 5 , Marco Quaggiotto 4 , Wouter Van den Broeck 4 , Corinne Re ´ gis 3 , Bruno Lina 6,7 , Philippe Vanhems 2,3 1 Centre de Physique The ´orique de Marseille, CNRS UMR 6207, Marseille, France, 2 Hospices Civils de Lyon, Ho ˆ pital Edouard Herriot, Service d’Hygie `ne, Epide ´miologie et Pre ´vention, Lyon, France, 3 Universite ´ de Lyon, Universite ´ Lyon 1, CNRS UMR 5558, Laboratoire de Biome ´trie et de Biologie Evolutive, Equipe Epide ´miologie et Sante ´ Publique, Lyon, France, 4 Data Science Laboratory, Institute for Scientific Interchange (ISI) Foundation, Torino, Italy, 5 Laboratoire de Physique de l’Ecole Normale Supe ´rieure de Lyon, CNRS UMR 5672, Lyon, France, 6 Hospices Civils de Lyon, National Influenza Centre, Laboratory of Virology, Lyon, France, 7 VIRPATH, CNRS FRE 3011, UCBL, Universite ´ de Lyon, Faculte ´ de Me ´decine RTH Laennec, Lyon, France Abstract Background: Little quantitative information is available on the mixing patterns of children in school environments. Describing and understanding contacts between children at school would help quantify the transmission opportunities of respiratory infections and identify situations within schools where the risk of transmission is higher. We report on measurements carried out in a French school (6–12 years children), where we collected data on the time-resolved face-to- face proximity of children and teachers using a proximity-sensing infrastructure based on radio frequency identification devices. Methods and Findings: Data on face-to-face interactions were collected on Thursday, October 1 st and Friday, October 2 nd 2009. We recorded 77,602 contact events between 242 individuals (232 children and 10 teachers). In this setting, each child has on average 323 contacts per day with 47 other children, leading to an average daily interaction time of 176 minutes. Most contacts are brief, but long contacts are also observed. Contacts occur mostly within each class, and each child spends on average three times more time in contact with classmates than with children of other classes. We describe the temporal evolution of the contact network and the trajectories followed by the children in the school, which constrain the contact patterns. We determine an exposure matrix aimed at informing mathematical models. This matrix exhibits a class and age structure which is very different from the homogeneous mixing hypothesis. Conclusions: We report on important properties of the contact patterns between school children that are relevant for modeling the propagation of diseases and for evaluating control measures. We discuss public health implications related to the management of schools in case of epidemics and pandemics. Our results can help define a prioritization of control measures based on preventive measures, case isolation, classes and school closures, that could reduce the disruption to education during epidemics. Citation: Stehle ´ J, Voirin N, Barrat A, Cattuto C, Isella L, et al. (2011) High-Resolution Measurements of Face-to-Face Contact Patterns in a Primary School. PLoS ONE 6(8): e23176. doi:10.1371/journal.pone.0023176 Editor: Ce ´cile Viboud, National Institutes of Health, United States of America Received April 8, 2011; Accepted July 7, 2011; Published August 16, 2011 Copyright: ß 2011 Stehle ´ et al. This is an open-access article distributed under the terms of the Creative Commons Attribution License, which permits unrestricted use, distribution, and reproduction in any medium, provided the original author and source are credited. Funding: This project was partially supported by a grant from the ‘‘Programme de Recherche, A(H1N1)’’ co-ordinated by the ‘‘Institut de Microbiologie et Maladies Infectieuses’’. L.I. acknowledges the support of the EC FET-Open project DYNANETS (contract number 233847). The funders had no role in study design, data collection and analysis, decision to publish, or preparation of the manuscript. Competing Interests: The authors have declared that no competing interests exist. * E-mail: [email protected] Introduction The role of children in the community spread of respiratory infections such as influenza is a challenging epidemiological issue [1,2]. Children are thought to act as a reservoir as they are the first to be infected by various respiratory infections such as influenza, respiratory syncytial virus, or rhinovirus. They can be infected at school because of the numerous close contacts occurring between school children, and then act as sources of infection into their households from where infections can further spread in the community [1,2]. However, little is known about how children actually mix in a school environment [3–5]. An accurate description and under- standing of the contacts between children at the school level would help to quantify the transmission opportunities of respiratory infections, and to identify the situations during school days where the risk of transmission is higher. Ultimately, one goal of such quantification would be to assess which control and containment measures have the best performance. In addition the availability of quantitative descriptions of the contact patterns between young individuals has the potential to inform mathematical models that aim at describing the propagation of diseases in populations. In order to reduce this knowledge gap, the research priorities comprise collecting data on activities and interactions of children, in particular in schools. Until recently, most empirical studies have relied on self-reported information such as questionnaire-based surveys to determine mixing patterns [6–10]. Such surveys may however suffer from biases due to self-reporting. Recent advances PLoS ONE | www.plosone.org 1 August 2011 | Volume 6 | Issue 8 | e23176
Transcript of High-Resolution Measurements of Face-to-Face Contact ... · High-Resolution Measurements of...
High-Resolution Measurements of Face-to-Face ContactPatterns in a Primary SchoolJuliette Stehle1, Nicolas Voirin2,3, Alain Barrat1,4*, Ciro Cattuto4, Lorenzo Isella4, Jean-Francois Pinton5,
Marco Quaggiotto4, Wouter Van den Broeck4, Corinne Regis3, Bruno Lina6,7, Philippe Vanhems2,3
1 Centre de Physique Theorique de Marseille, CNRS UMR 6207, Marseille, France, 2 Hospices Civils de Lyon, Hopital Edouard Herriot, Service d’Hygiene, Epidemiologie et
Prevention, Lyon, France, 3 Universite de Lyon, Universite Lyon 1, CNRS UMR 5558, Laboratoire de Biometrie et de Biologie Evolutive, Equipe Epidemiologie et Sante
Publique, Lyon, France, 4 Data Science Laboratory, Institute for Scientific Interchange (ISI) Foundation, Torino, Italy, 5 Laboratoire de Physique de l’Ecole Normale
Superieure de Lyon, CNRS UMR 5672, Lyon, France, 6 Hospices Civils de Lyon, National Influenza Centre, Laboratory of Virology, Lyon, France, 7 VIRPATH, CNRS FRE 3011,
UCBL, Universite de Lyon, Faculte de Medecine RTH Laennec, Lyon, France
Abstract
Background: Little quantitative information is available on the mixing patterns of children in school environments.Describing and understanding contacts between children at school would help quantify the transmission opportunities ofrespiratory infections and identify situations within schools where the risk of transmission is higher. We report onmeasurements carried out in a French school (6–12 years children), where we collected data on the time-resolved face-to-face proximity of children and teachers using a proximity-sensing infrastructure based on radio frequency identificationdevices.
Methods and Findings: Data on face-to-face interactions were collected on Thursday, October 1st and Friday, October 2nd
2009. We recorded 77,602 contact events between 242 individuals (232 children and 10 teachers). In this setting, each childhas on average 323 contacts per day with 47 other children, leading to an average daily interaction time of 176 minutes.Most contacts are brief, but long contacts are also observed. Contacts occur mostly within each class, and each child spendson average three times more time in contact with classmates than with children of other classes. We describe the temporalevolution of the contact network and the trajectories followed by the children in the school, which constrain the contactpatterns. We determine an exposure matrix aimed at informing mathematical models. This matrix exhibits a class and agestructure which is very different from the homogeneous mixing hypothesis.
Conclusions: We report on important properties of the contact patterns between school children that are relevant formodeling the propagation of diseases and for evaluating control measures. We discuss public health implications related tothe management of schools in case of epidemics and pandemics. Our results can help define a prioritization of controlmeasures based on preventive measures, case isolation, classes and school closures, that could reduce the disruption toeducation during epidemics.
Citation: Stehle J, Voirin N, Barrat A, Cattuto C, Isella L, et al. (2011) High-Resolution Measurements of Face-to-Face Contact Patterns in a Primary School. PLoSONE 6(8): e23176. doi:10.1371/journal.pone.0023176
Editor: Cecile Viboud, National Institutes of Health, United States of America
Received April 8, 2011; Accepted July 7, 2011; Published August 16, 2011
Copyright: � 2011 Stehle et al. This is an open-access article distributed under the terms of the Creative Commons Attribution License, which permitsunrestricted use, distribution, and reproduction in any medium, provided the original author and source are credited.
Funding: This project was partially supported by a grant from the ‘‘Programme de Recherche, A(H1N1)’’ co-ordinated by the ‘‘Institut de Microbiologie etMaladies Infectieuses’’. L.I. acknowledges the support of the EC FET-Open project DYNANETS (contract number 233847). The funders had no role in study design,data collection and analysis, decision to publish, or preparation of the manuscript.
Competing Interests: The authors have declared that no competing interests exist.
* E-mail: [email protected]
Introduction
The role of children in the community spread of respiratory
infections such as influenza is a challenging epidemiological issue
[1,2]. Children are thought to act as a reservoir as they are the first
to be infected by various respiratory infections such as influenza,
respiratory syncytial virus, or rhinovirus. They can be infected at
school because of the numerous close contacts occurring between
school children, and then act as sources of infection into their
households from where infections can further spread in the
community [1,2].
However, little is known about how children actually mix in a
school environment [3–5]. An accurate description and under-
standing of the contacts between children at the school level would
help to quantify the transmission opportunities of respiratory
infections, and to identify the situations during school days where
the risk of transmission is higher. Ultimately, one goal of such
quantification would be to assess which control and containment
measures have the best performance. In addition the availability of
quantitative descriptions of the contact patterns between young
individuals has the potential to inform mathematical models that
aim at describing the propagation of diseases in populations.
In order to reduce this knowledge gap, the research priorities
comprise collecting data on activities and interactions of children,
in particular in schools. Until recently, most empirical studies have
relied on self-reported information such as questionnaire-based
surveys to determine mixing patterns [6–10]. Such surveys may
however suffer from biases due to self-reporting. Recent advances
PLoS ONE | www.plosone.org 1 August 2011 | Volume 6 | Issue 8 | e23176
in distributed sensing systems, based on mobile devices and
wearable sensors, provide new ways of gathering data on human
contacts and allow to mine the proximity relations and close-range
interactions of individuals in real-world large-scale settings [3,11–
17]. In this framework, a recent study [3] has for instance given
important insights into the proximity patterns of students, teachers
and staff in a US high school. As the data available to a broad
research community remain scarce, additional measurement
campaigns in different settings and covering different schools,
countries, and age groups are much needed, in particular to test
for common patterns and differences, and to understand their
public health implications.
We deployed a proximity-sensing infrastructure based on radio-
frequency identification devices (RFID) in a French primary
school, and used it to collect, in an unsupervised manner [15],
time-resolved data on the face-to-face proximity of children and
teachers. We report the number and duration of contacts, and
their dependence on age, class, daytime and school spatial
structure. Based on the results, we highlight specific situations
where children are in contact and during which infections may be
transmitted, and discuss the potential impact of containment
measures such as class or school closures during seasonal
epidemics or pandemics of respiratory infections.
Methods
SettingThe study took place in a primary school in Lyon, France
during two days in October 2009. The age of the students
(elementary cycle, composed of 5 grades) ranges between 6 and 12
years. In this school, each of the 5 grades is divided in two classes,
for a total of 10 classes. Each class has an assigned room and an
assigned teacher. The smallest class has 22 children and the largest
26, for a total of 241 children and 10 teachers. 232 children and all
teachers participated in the data collection. The school day runs
from 8.30am to 4.30pm, with a lunch break from 12pm to 2pm,
and two breaks of 20–25 min around 10.30am and 3.30pm.
Lunches are served in a common canteen, and a shared
playground is located outside the main building. As the
playground and the canteen do not have enough capacity to host
all the students at the same time, only two or three classes have
breaks at the same time, and lunches are taken in two consecutive
turns.
Study design/Ethics statement and privacyThe French national bodies responsible for ethics and privacy,
the Comission Nationale de l’Informatique et des Libertes (CNIL,
http://www.cnil.fr) and the ‘‘Comite de Protection des personnes’’
(http://www.cppsudest2.com/), were notified of the study, which
was approved by the relevant academic authorities (by the
‘directeur de l’enseignement catholique du diocese de Lyon’, as
the school in which the study took place is a private catholic
school). In preparation for the study, parents and teachers were
invited to a meeting in which the details and the aims of the study
were illustrated. Verbal informed consent was then obtained from
parents, teachers and from the director of the school. All
participants were given a Radio-Frequency Identification (RFID)
badge and were asked to wear it at all times. Special care was paid
to the privacy and data protection aspects of the study: The
communication between RFID badges, the readers, and the
computer system used to collect data were fully encrypted. No
personal information of participants was associated with the
identifier of the corresponding RFID badge. The only piece of
information associated with the unique identifier of the badge was
the class the corresponding individual was associated with.
Data collection infrastructureThe measurement infrastructure, developed in the context of
the SocioPatterns project [16], is based on active RFID devices,
embedded in unobtrusive wearable badges. Detailed information
on how this technology is used to monitor social interactions and
to identify contact patterns is available in Refs. [17–19].
Individuals are asked to wear the devices on their chests, so that
badges can exchange radio packets only when the individuals
wearing them face each other at close range (about 1 to 1.5 m).
This range was chosen as a proxy of a close-range encounter
during which a communicable disease infection can be transmit-
ted, for example, either by cough or sneeze, or directly by hands
contact. The infrastructure parameters are tuned so that the
proximity of two individuals wearing the RFID badges can be
assessed with a probability in excess of 99% over an interval of
20 seconds [15,16]. This time scale allows an adequate description
of person-to-person interactions that includes brief encounters. We
define that a ‘‘contact’’ occurs between two individuals during an
interval of 20 s if and only if the RFID devices worn by the
individuals exchanged at least one radio packet during that
interval. After a contact is established, it is considered ongoing as
long as the devices continue to exchange at least one such packet
for every subsequent 20 s interval. Conversely, a contact is
considered broken if a 20 s interval elapses with no exchange of
radio packets. The detected proximity relations are relayed from
the RFID devices to receivers installed in the monitored
environment and eventually stored in a central system.
Collected dataData on face-to-face interactions between 232 children (96%
coverage) and 10 teachers (100% coverage) across 10 classes were
collected over two days (Thursday, October 1st 2009 and Friday,
October 2nd 2009, see Table 1). Data were collected from 8.45am
to 5.20pm on the first day, and from 8.30am to 5.05pm on the
second day. Contacts were not recorded outside of these time
intervals. Radio receivers (RFID readers) covered all the
classrooms, the canteen, the stairways, and the playground. No
information on contacts taking place outside the school or during
sports activities was gathered.
Data analysisThe patterns of contacts between children, and the correspond-
ing mixing patterns between classes and age groups are analyzed
through several quantities describing the number of contacts
between individuals, the duration of these contacts, and the
cumulated time spent in contact by each pair of individuals, as well
as their statistical distributions characterized in particular by
average and coefficient of variation squared (CV2, defined as the
squared ratio of the standard deviation to the mean of the
distribution). A CV 2v1 indicates a distribution with low variance
while a CV 2w1 indicates a high-variance distribution.
More precisely, we define the following weights quantifying the
proximity relations of a pair of individuals i and j:
– the occurrence oij is equal to 1 if at least one contact event
between i and j was recorded during the measurement period,
and 0 otherwise; this is a symmetric quantity (oji~oij );
– the frequency nij gives the number of times that a contact event
between i and j was recorded (hence nij~0 if and only if oij~0,
and nji~nij );
Face-to-Face Contact Patterns in a Primary School
PLoS ONE | www.plosone.org 2 August 2011 | Volume 6 | Issue 8 | e23176
– the cumulative duration wij is the sum of the durations of the
nij contacts between i and j (wji~wij ).
As children are grouped into classes, we also compute:
– the total number of contacts between children of classes A and
B, nAB~P
i[A,j[Bnij (for A=B ; for A~B we have
nAA~1
2
Pi,j[A
nij ), and the average number of contacts of a child
of class A with children of class B, nAB=NA , where NA is the
number of children in class A;
– the total time spent in contact between children of classes A
and B wAB~P
i[A,j[B wij (for A=B ; for A~B we have
wAA~1
2
Pi,j[A
wij ), and the average contact time of a child of
class A with children of class B, wAB=NA;
– the total number of contacts of children of class A,P
B nAB,
and the average number of contacts of a child of class A,1
NA
PB nAB (where the sums on B include the case B = A);
– the total contact time of children of class AP
B wAB, and the
average time spent in contact by a child of class A,1
NA
PB wAB
(where the sums on B include the case B = A).
The quantities nAB and wAB define symmetric contact matrices
at the class level, while the quantities nAB=NA and wAB=NA yield
non-symmetric matrices taking into account the different class
sizes [8]. All these quantities are computed both for the entire
study duration and separately for each day.
In order to study the temporal structure of the interaction
network, we also measure for each child i, and as a function of time,
the number ki of other distinct children whom s/he was in contact
with, as well as the total time si the child i spent in contact with other
children since the beginning of the measurements. In other terms, ki
is the degree of node i in the contact network aggregated since the
start of the first day, and si is the corresponding node strength, i.e.,
the sum of the weights of the links inciding on i. In each case, we
distinguish between contacts with children in the same class (kini ,sin
i )
and with children of different classes (kouti , sout
i ). In terms of the
proximity relations defined above, these quantities are therefore
defined according to the following formulae (we consider in these
formulae the example of a child i of class A): ki~P
j oij ,
si~P
j wij , kini ~
Pj[A oij , sin
i ~P
j[A wij , kouti ~
Pj=[A oij , sout
i ~
Pj=[A wij , where oij and wij are computed since the beginning of the
first day. The temporal evolution of these quantities indicates how
fast the overall contact patterns build up between the children, both
at the class and at the school level.
We also build contact networks aggregated on a 20-minute
timescale: each day is divided in sliding windows of 20 minutes,
starting at intervals of 5 minutes and, for each 20-minute period, edges
are drawn between those pairs of individuals for which at least one
contact was recorded during this period. The average degree of each
20-minute network gives the average number of individuals with whom
a given individual has been in contact with during the corresponding
time window. By using these 20-minute sliding windows we filter out
the fast fluctuations of the dynamical contact network and only retain
the slowly-varying information on the network evolution.
As a summary of the contacts of each day, we additionally build
two daily aggregated networks in which edges are drawn between a
pair of individuals whenever at least one contact was recorded for that
pair during the considered day. Each edge is weighted by the total
time the corresponding individuals spent in contact during that day.
The two daily aggregated networks are compared using various
measures. We compute the Pearson correlation coefficients between
the characteristic parameters (number of contacts, total time spent in
contact, etc.) measured for each individual in day 1 and in day 2. We
also compare the network structures at a more detailed level,
measuring the similarity between the neighborhoods of each node
across the two days. A simple measure of similarity is given by the
respective numbers of new and repeated distinct persons contacted in
day 2 with respect to day 1. This can be further refined by specifying if
these new and repeated contacts occur within the same class or with
individuals of other classes. Moreover, as each link i2j in the
aggregated network is weighted by the total time i and j spent in face-
to-face proximity (denoted by wij,1 for day 1 and by wij,2 for day 2),
the similarity between the neighborhoods of an individual i in days 1
and 2 can be also quantified by the cosine similarity
sim(i)~
Pj
(wij,1wij,2), ffiffiffiffiffiffiffiffiffiffiffiffiffiffiffiffiP
j w2ij,1
q ffiffiffiffiffiffiffiffiffiffiffiffiffiffiffiffiPj w2
ij,2
q� �
This quantity is 1 if i had contacts in both days with exactly the
same individuals, spending the same fraction of time in proximity
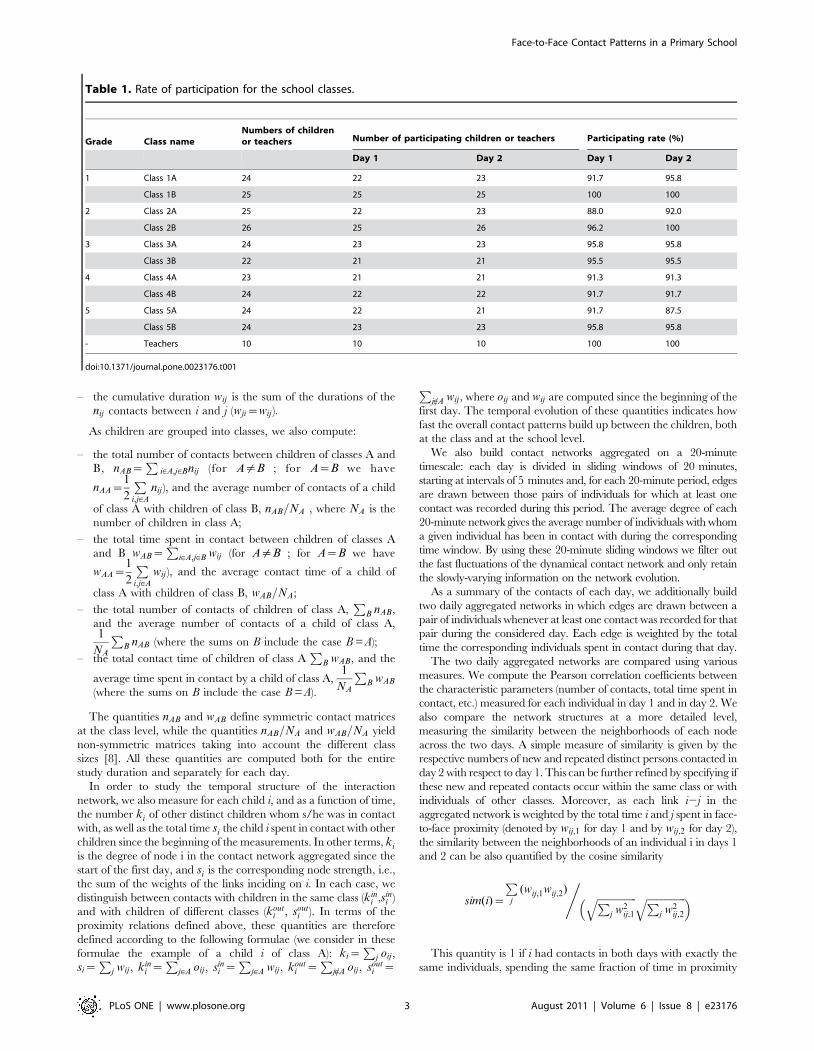
Table 1. Rate of participation for the school classes.
Grade Class nameNumbers of childrenor teachers Number of participating children or teachers Participating rate (%)
Day 1 Day 2 Day 1 Day 2
1 Class 1A 24 22 23 91.7 95.8
Class 1B 25 25 25 100 100
2 Class 2A 25 22 23 88.0 92.0
Class 2B 26 25 26 96.2 100
3 Class 3A 24 23 23 95.8 95.8
Class 3B 22 21 21 95.5 95.5
4 Class 4A 23 21 21 91.3 91.3
Class 4B 24 22 22 91.7 91.7
5 Class 5A 24 22 21 91.7 87.5
Class 5B 24 23 23 95.8 95.8
- Teachers 10 10 10 100 100
doi:10.1371/journal.pone.0023176.t001
Face-to-Face Contact Patterns in a Primary School
PLoS ONE | www.plosone.org 3 August 2011 | Volume 6 | Issue 8 | e23176
of each one, and 0 if, on the contrary, i had contact in day 2 with
totally different persons with respect to day 1.
Finally, by measuring the relative rates at which the RFID
readers receive the packets emitted by individual badges, it is
possible to perform approximate localization of the badges, and
tell which RFID reader is closest to any given badge. Since the
readers were installed in the classrooms, in the canteen, and in the
courtyard, it is possible to detect in which of these areas each
badge was situated at any point in time. This allows to construct
the trajectories that children followed in space as they move within
the school premises.
Results
Number of contactsWe recorded a total of 77,602 contact events involving 242
individuals (37,414 contacts on day 1 and 40,188 on day 2), with
an average of about 317 contacts per individual on the first day
(coefficient of variation squared CV 2~0:22) and 338 contacts per
individual on the second day (CV 2~0:27).
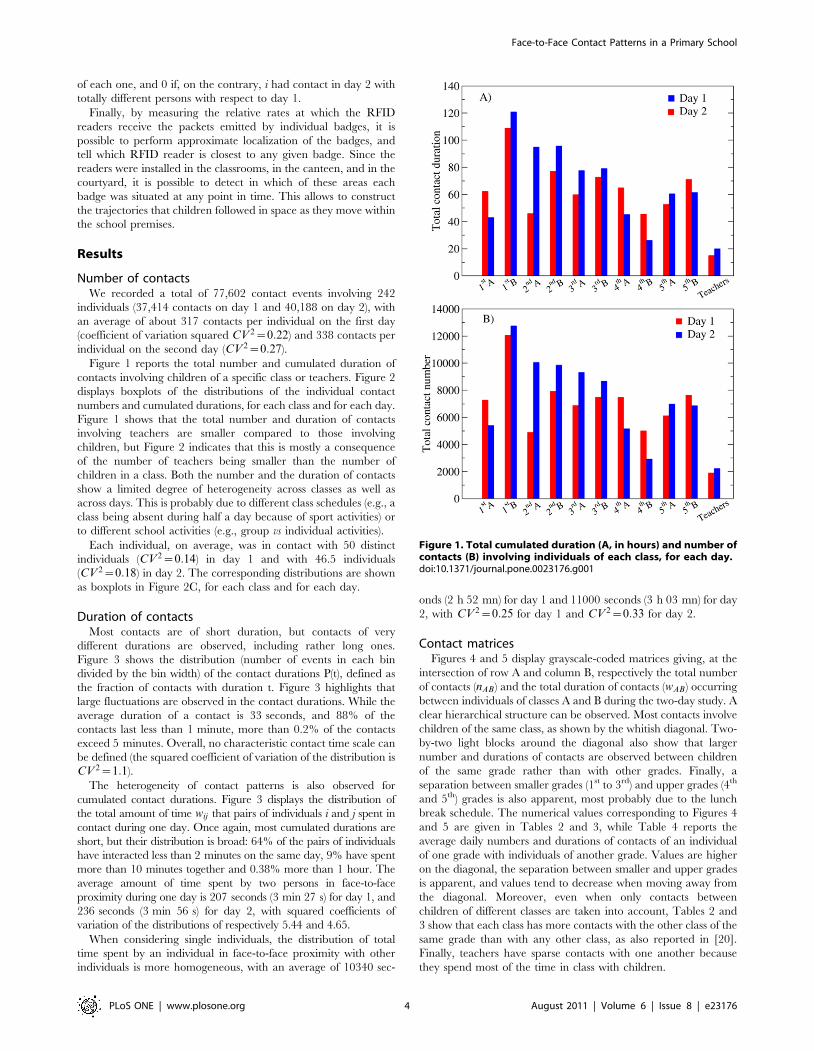
Figure 1 reports the total number and cumulated duration of
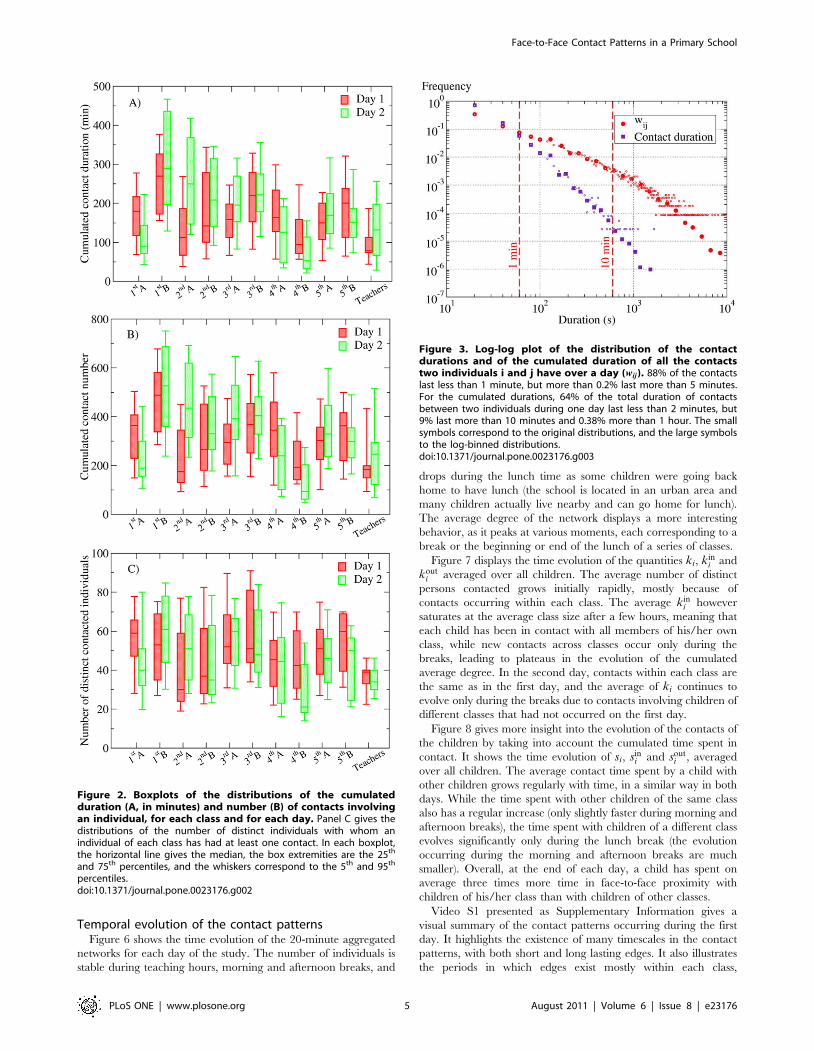
contacts involving children of a specific class or teachers. Figure 2
displays boxplots of the distributions of the individual contact
numbers and cumulated durations, for each class and for each day.
Figure 1 shows that the total number and duration of contacts
involving teachers are smaller compared to those involving
children, but Figure 2 indicates that this is mostly a consequence
of the number of teachers being smaller than the number of
children in a class. Both the number and the duration of contacts
show a limited degree of heterogeneity across classes as well as
across days. This is probably due to different class schedules (e.g., a
class being absent during half a day because of sport activities) or
to different school activities (e.g., group vs individual activities).
Each individual, on average, was in contact with 50 distinct
individuals (CV2~0:14) in day 1 and with 46.5 individuals
(CV 2~0:18) in day 2. The corresponding distributions are shown
as boxplots in Figure 2C, for each class and for each day.
Duration of contactsMost contacts are of short duration, but contacts of very
different durations are observed, including rather long ones.
Figure 3 shows the distribution (number of events in each bin
divided by the bin width) of the contact durations P(t), defined as
the fraction of contacts with duration t. Figure 3 highlights that
large fluctuations are observed in the contact durations. While the
average duration of a contact is 33 seconds, and 88% of the
contacts last less than 1 minute, more than 0.2% of the contacts
exceed 5 minutes. Overall, no characteristic contact time scale can
be defined (the squared coefficient of variation of the distribution is
CV 2~1:1).
The heterogeneity of contact patterns is also observed for
cumulated contact durations. Figure 3 displays the distribution of
the total amount of time wij that pairs of individuals i and j spent in
contact during one day. Once again, most cumulated durations are
short, but their distribution is broad: 64% of the pairs of individuals
have interacted less than 2 minutes on the same day, 9% have spent
more than 10 minutes together and 0.38% more than 1 hour. The
average amount of time spent by two persons in face-to-face
proximity during one day is 207 seconds (3 min 27 s) for day 1, and
236 seconds (3 min 56 s) for day 2, with squared coefficients of
variation of the distributions of respectively 5.44 and 4.65.
When considering single individuals, the distribution of total
time spent by an individual in face-to-face proximity with other
individuals is more homogeneous, with an average of 10340 sec-
onds (2 h 52 mn) for day 1 and 11000 seconds (3 h 03 mn) for day
2, with CV2~0:25 for day 1 and CV 2~0:33 for day 2.
Contact matricesFigures 4 and 5 display grayscale-coded matrices giving, at the
intersection of row A and column B, respectively the total number
of contacts (nAB) and the total duration of contacts (wAB) occurring
between individuals of classes A and B during the two-day study. A
clear hierarchical structure can be observed. Most contacts involve
children of the same class, as shown by the whitish diagonal. Two-
by-two light blocks around the diagonal also show that larger
number and durations of contacts are observed between children
of the same grade rather than with other grades. Finally, a
separation between smaller grades (1st to 3rd) and upper grades (4th
and 5th) grades is also apparent, most probably due to the lunch
break schedule. The numerical values corresponding to Figures 4
and 5 are given in Tables 2 and 3, while Table 4 reports the
average daily numbers and durations of contacts of an individual
of one grade with individuals of another grade. Values are higher
on the diagonal, the separation between smaller and upper grades
is apparent, and values tend to decrease when moving away from
the diagonal. Moreover, even when only contacts between
children of different classes are taken into account, Tables 2 and
3 show that each class has more contacts with the other class of the
same grade than with any other class, as also reported in [20].
Finally, teachers have sparse contacts with one another because
they spend most of the time in class with children.
Figure 1. Total cumulated duration (A, in hours) and number ofcontacts (B) involving individuals of each class, for each day.doi:10.1371/journal.pone.0023176.g001
Face-to-Face Contact Patterns in a Primary School
PLoS ONE | www.plosone.org 4 August 2011 | Volume 6 | Issue 8 | e23176
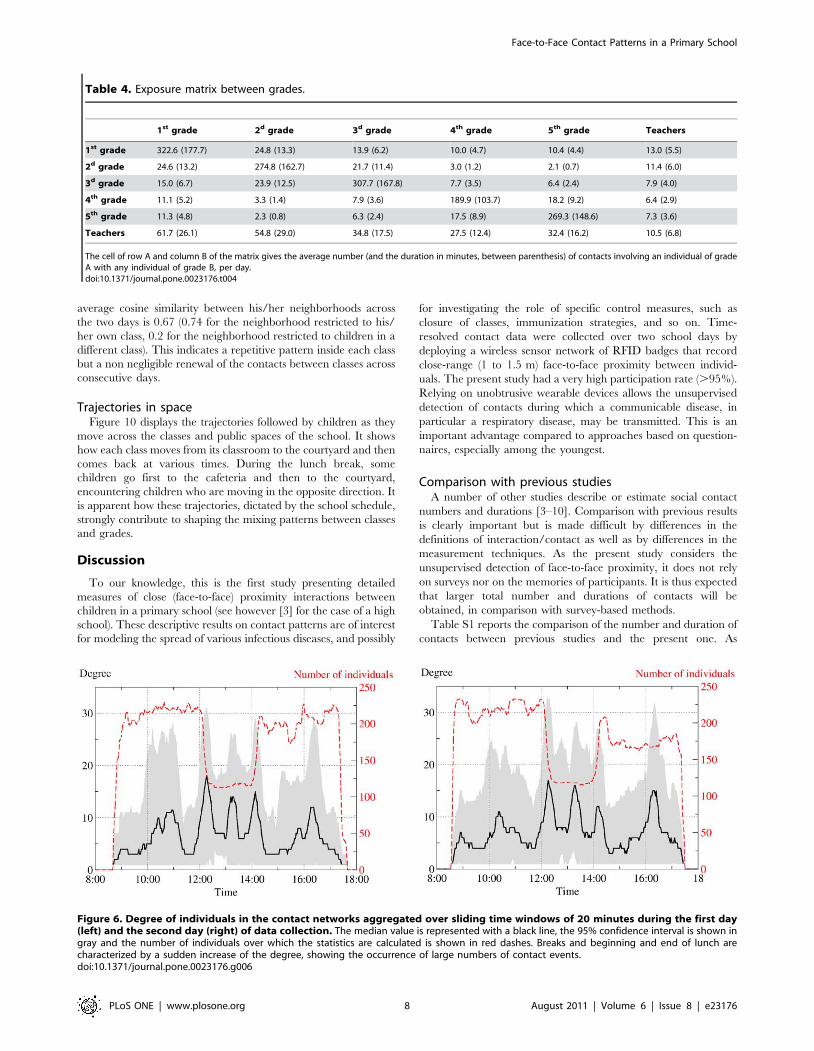
Temporal evolution of the contact patternsFigure 6 shows the time evolution of the 20-minute aggregated
networks for each day of the study. The number of individuals is
stable during teaching hours, morning and afternoon breaks, and
drops during the lunch time as some children were going back
home to have lunch (the school is located in an urban area and
many children actually live nearby and can go home for lunch).
The average degree of the network displays a more interesting
behavior, as it peaks at various moments, each corresponding to a
break or the beginning or end of the lunch of a series of classes.
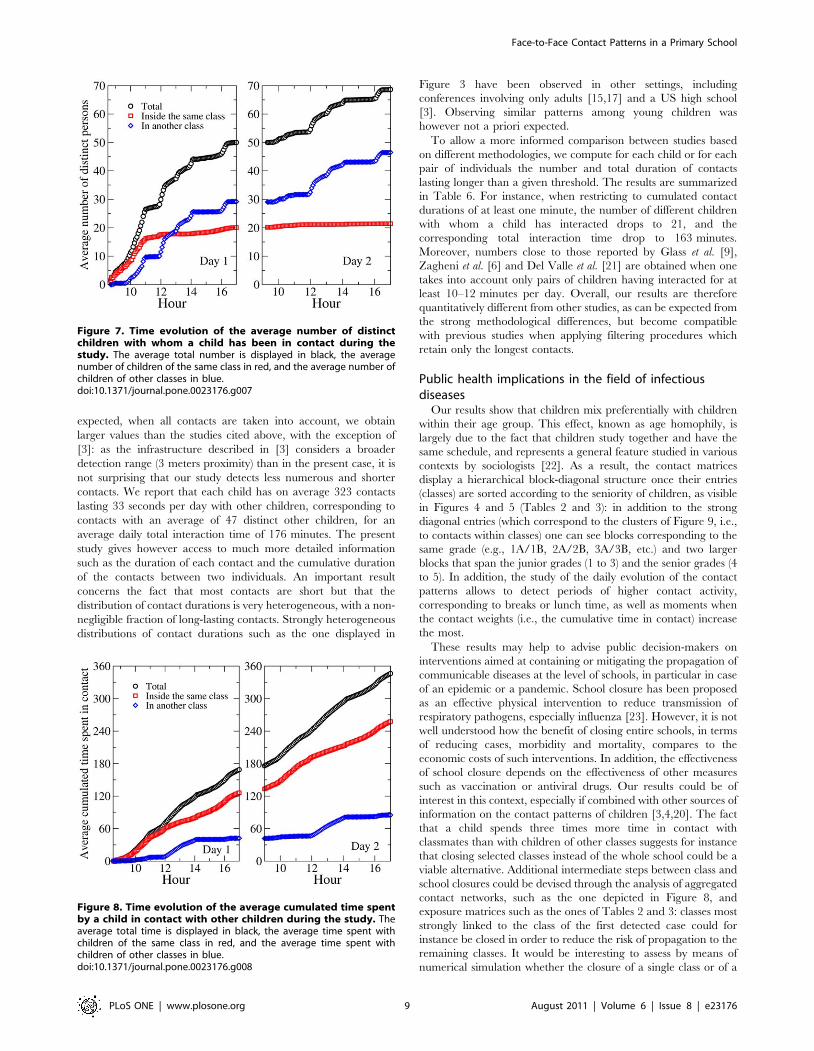
Figure 7 displays the time evolution of the quantities ki, kini and
kouti averaged over all children. The average number of distinct
persons contacted grows initially rapidly, mostly because of
contacts occurring within each class. The average kini however
saturates at the average class size after a few hours, meaning that
each child has been in contact with all members of his/her own
class, while new contacts across classes occur only during the
breaks, leading to plateaus in the evolution of the cumulated
average degree. In the second day, contacts within each class are
the same as in the first day, and the average of ki continues to
evolve only during the breaks due to contacts involving children of
different classes that had not occurred on the first day.
Figure 8 gives more insight into the evolution of the contacts of
the children by taking into account the cumulated time spent in
contact. It shows the time evolution of si, sini and sout
i , averaged
over all children. The average contact time spent by a child with
other children grows regularly with time, in a similar way in both
days. While the time spent with other children of the same class
also has a regular increase (only slightly faster during morning and
afternoon breaks), the time spent with children of a different class
evolves significantly only during the lunch break (the evolution
occurring during the morning and afternoon breaks are much
smaller). Overall, at the end of each day, a child has spent on
average three times more time in face-to-face proximity with
children of his/her class than with children of other classes.
Video S1 presented as Supplementary Information gives a
visual summary of the contact patterns occurring during the first
day. It highlights the existence of many timescales in the contact
patterns, with both short and long lasting edges. It also illustrates
the periods in which edges exist mostly within each class,
Figure 2. Boxplots of the distributions of the cumulatedduration (A, in minutes) and number (B) of contacts involvingan individual, for each class and for each day. Panel C gives thedistributions of the number of distinct individuals with whom anindividual of each class has had at least one contact. In each boxplot,the horizontal line gives the median, the box extremities are the 25th
and 75th percentiles, and the whiskers correspond to the 5th and 95th
percentiles.doi:10.1371/journal.pone.0023176.g002
Figure 3. Log-log plot of the distribution of the contactdurations and of the cumulated duration of all the contactstwo individuals i and j have over a day (wij). 88% of the contactslast less than 1 minute, but more than 0.2% last more than 5 minutes.For the cumulated durations, 64% of the total duration of contactsbetween two individuals during one day last less than 2 minutes, but9% last more than 10 minutes and 0.38% more than 1 hour. The smallsymbols correspond to the original distributions, and the large symbolsto the log-binned distributions.doi:10.1371/journal.pone.0023176.g003
Face-to-Face Contact Patterns in a Primary School
PLoS ONE | www.plosone.org 5 August 2011 | Volume 6 | Issue 8 | e23176
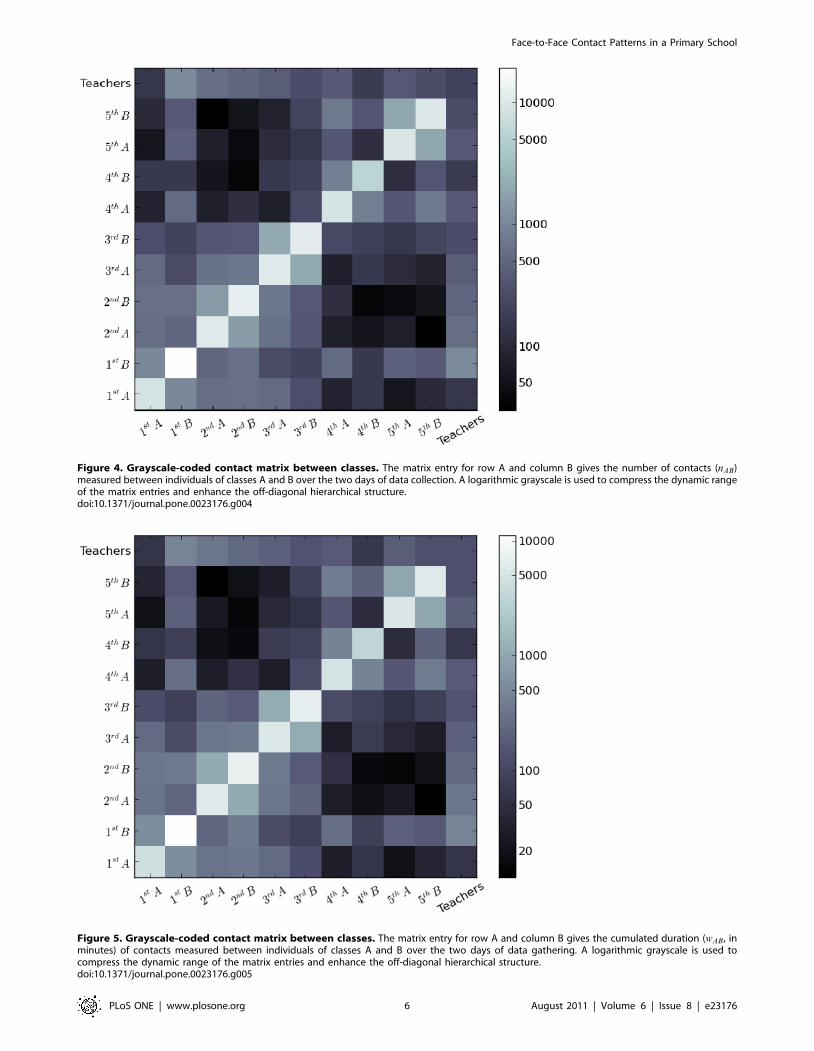
Figure 4. Grayscale-coded contact matrix between classes. The matrix entry for row A and column B gives the number of contacts (nAB)measured between individuals of classes A and B over the two days of data collection. A logarithmic grayscale is used to compress the dynamic rangeof the matrix entries and enhance the off-diagonal hierarchical structure.doi:10.1371/journal.pone.0023176.g004
Figure 5. Grayscale-coded contact matrix between classes. The matrix entry for row A and column B gives the cumulated duration (wAB , inminutes) of contacts measured between individuals of classes A and B over the two days of data gathering. A logarithmic grayscale is used tocompress the dynamic range of the matrix entries and enhance the off-diagonal hierarchical structure.doi:10.1371/journal.pone.0023176.g005
Face-to-Face Contact Patterns in a Primary School
PLoS ONE | www.plosone.org 6 August 2011 | Volume 6 | Issue 8 | e23176
contrasted with periods such as breaks, during which mixing
between classes takes place. In the latter case, it allows to
understand which classes have most frequent contacts with one
another.
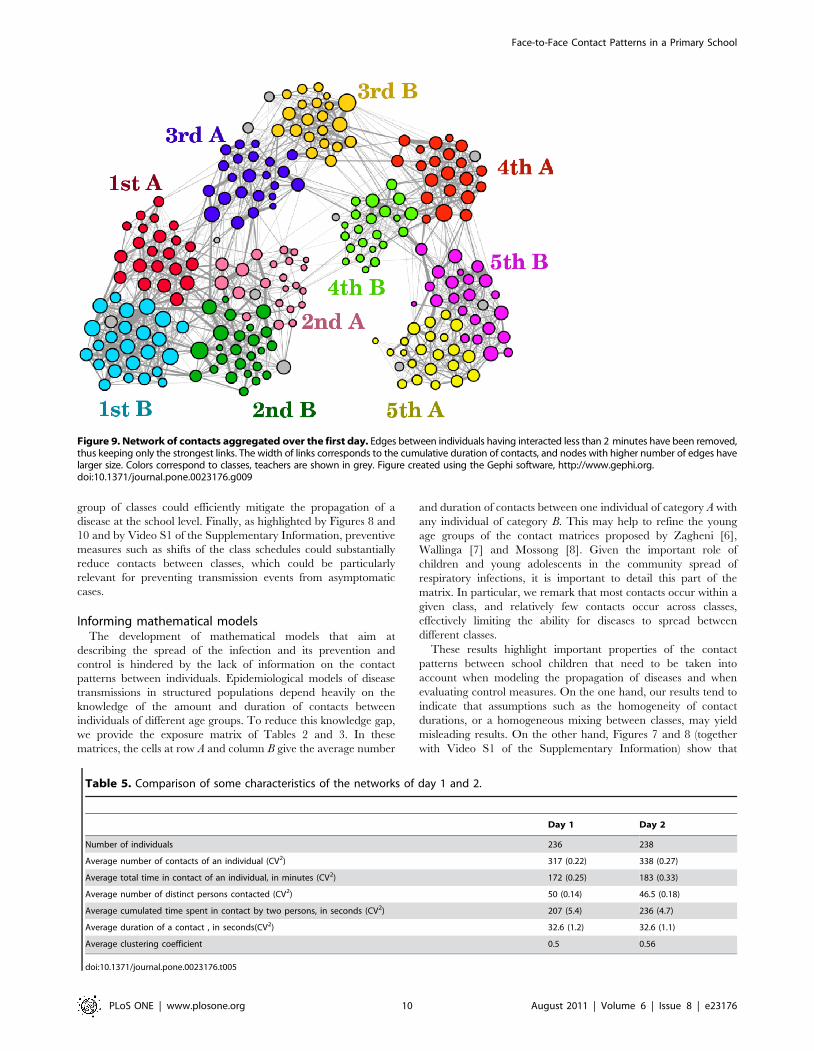
Daily aggregated networksFigure 9 displays the aggregated contact network for the first
day of the study. For ease of interpretation, edges between
individuals who spent together a cumulated time smaller than
2 minutes during the day have been removed. This corresponds to
keeping only the strongest 33.2% of all edges. The figure highlights
the mixing patterns between children of different classes and how
children preferentially mix within the same class or age group.
Classes within the same grade tend indeed to be more connected
than classes belonging to different grades. The daily aggregated
contact networks and the association between badge identification
number and class are provided as Supplementary Information
datasets S1, S2, S3.
Comparison between day 1 and day 2A comparison between the characteristics of the overall face-to-
face contact patterns in the two days of the deployment is reported
in Table 5. Statistical quantities such as the average total number
and durations of contacts, the number of different persons
contacted, or the contact durations are extremely close across
the two days. As shown in Figure 2 at the class level, the whole
distributions are in fact similar.
At a more detailed level, the Pearson correlation coefficients
between the number of contacts of an individual in the first and
second day is 0.53; for the time spent in contact, it is 0.54; for the
number of distinct persons contacted it is 0.53. These values show
an overall strong correlation between the behavior of individuals
from one day to the next.
Moreover, each child, on average, has 26 repeated contacts on
the second day with children met during the first day (19 in the
same class and 7 in a different class), and new contacts with 20
other children (1.4 in the same class, 18.4 in a different class). The
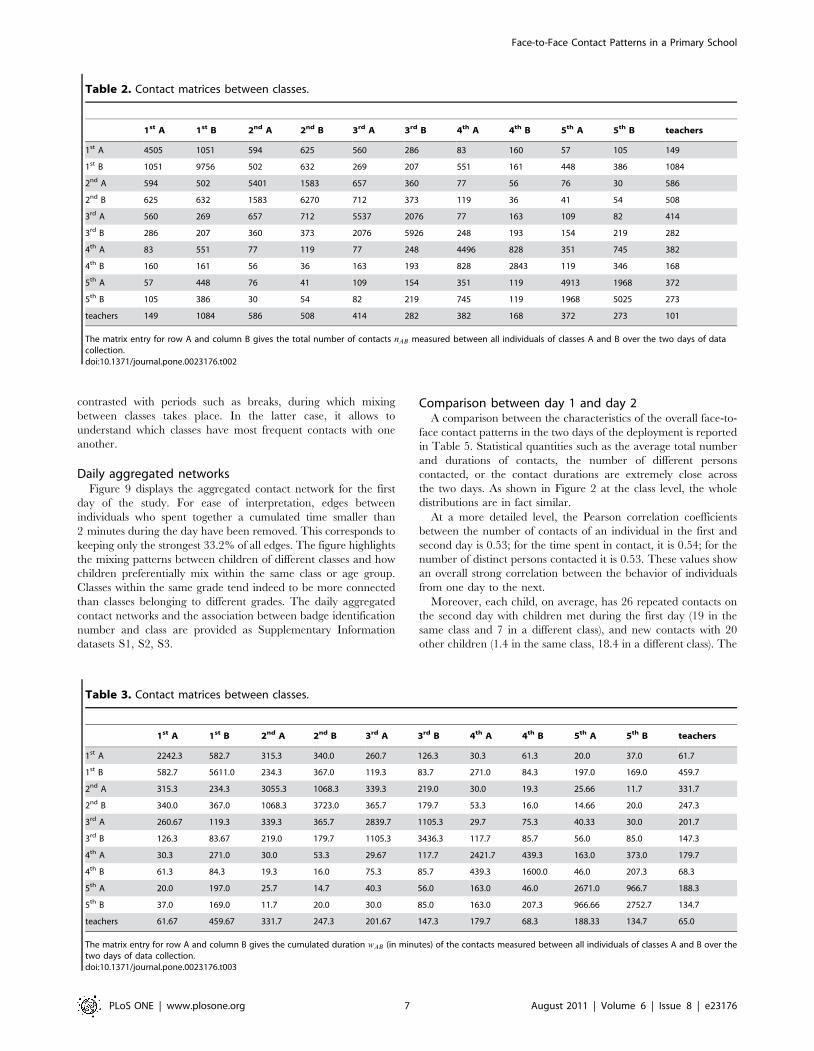
Table 2. Contact matrices between classes.
1st A 1st B 2nd A 2nd B 3rd A 3rd B 4th A 4th B 5th A 5th B teachers
1st A 4505 1051 594 625 560 286 83 160 57 105 149
1st B 1051 9756 502 632 269 207 551 161 448 386 1084
2nd A 594 502 5401 1583 657 360 77 56 76 30 586
2nd B 625 632 1583 6270 712 373 119 36 41 54 508
3rd A 560 269 657 712 5537 2076 77 163 109 82 414
3rd B 286 207 360 373 2076 5926 248 193 154 219 282
4th A 83 551 77 119 77 248 4496 828 351 745 382
4th B 160 161 56 36 163 193 828 2843 119 346 168
5th A 57 448 76 41 109 154 351 119 4913 1968 372
5th B 105 386 30 54 82 219 745 119 1968 5025 273
teachers 149 1084 586 508 414 282 382 168 372 273 101
The matrix entry for row A and column B gives the total number of contacts nAB measured between all individuals of classes A and B over the two days of datacollection.doi:10.1371/journal.pone.0023176.t002
Table 3. Contact matrices between classes.
1st A 1st B 2nd A 2nd B 3rd A 3rd B 4th A 4th B 5th A 5th B teachers
1st A 2242.3 582.7 315.3 340.0 260.7 126.3 30.3 61.3 20.0 37.0 61.7
1st B 582.7 5611.0 234.3 367.0 119.3 83.7 271.0 84.3 197.0 169.0 459.7
2nd A 315.3 234.3 3055.3 1068.3 339.3 219.0 30.0 19.3 25.66 11.7 331.7
2nd B 340.0 367.0 1068.3 3723.0 365.7 179.7 53.3 16.0 14.66 20.0 247.3
3rd A 260.67 119.3 339.3 365.7 2839.7 1105.3 29.7 75.3 40.33 30.0 201.7
3rd B 126.3 83.67 219.0 179.7 1105.3 3436.3 117.7 85.7 56.0 85.0 147.3
4th A 30.3 271.0 30.0 53.3 29.67 117.7 2421.7 439.3 163.0 373.0 179.7
4th B 61.3 84.3 19.3 16.0 75.3 85.7 439.3 1600.0 46.0 207.3 68.3
5th A 20.0 197.0 25.7 14.7 40.3 56.0 163.0 46.0 2671.0 966.7 188.3
5th B 37.0 169.0 11.7 20.0 30.0 85.0 163.0 207.3 966.66 2752.7 134.7
teachers 61.67 459.67 331.7 247.3 201.67 147.3 179.7 68.3 188.33 134.7 65.0
The matrix entry for row A and column B gives the cumulated duration wAB (in minutes) of the contacts measured between all individuals of classes A and B over thetwo days of data collection.doi:10.1371/journal.pone.0023176.t003
Face-to-Face Contact Patterns in a Primary School
PLoS ONE | www.plosone.org 7 August 2011 | Volume 6 | Issue 8 | e23176
average cosine similarity between his/her neighborhoods across
the two days is 0.67 (0.74 for the neighborhood restricted to his/
her own class, 0.2 for the neighborhood restricted to children in a
different class). This indicates a repetitive pattern inside each class
but a non negligible renewal of the contacts between classes across
consecutive days.
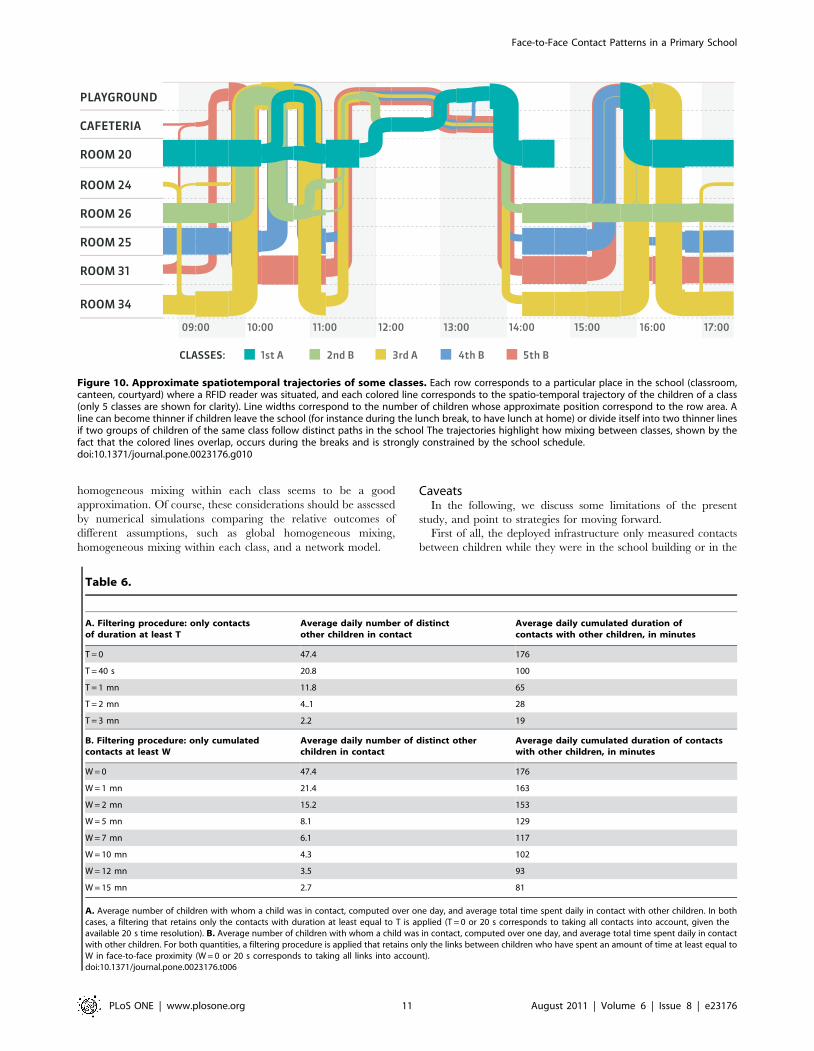
Trajectories in spaceFigure 10 displays the trajectories followed by children as they
move across the classes and public spaces of the school. It shows
how each class moves from its classroom to the courtyard and then
comes back at various times. During the lunch break, some
children go first to the cafeteria and then to the courtyard,
encountering children who are moving in the opposite direction. It
is apparent how these trajectories, dictated by the school schedule,
strongly contribute to shaping the mixing patterns between classes
and grades.
Discussion
To our knowledge, this is the first study presenting detailed
measures of close (face-to-face) proximity interactions between
children in a primary school (see however [3] for the case of a high
school). These descriptive results on contact patterns are of interest
for modeling the spread of various infectious diseases, and possibly
for investigating the role of specific control measures, such as
closure of classes, immunization strategies, and so on. Time-
resolved contact data were collected over two school days by
deploying a wireless sensor network of RFID badges that record
close-range (1 to 1.5 m) face-to-face proximity between individ-
uals. The present study had a very high participation rate (.95%).
Relying on unobtrusive wearable devices allows the unsupervised
detection of contacts during which a communicable disease, in
particular a respiratory disease, may be transmitted. This is an
important advantage compared to approaches based on question-
naires, especially among the youngest.
Comparison with previous studiesA number of other studies describe or estimate social contact
numbers and durations [3–10]. Comparison with previous results
is clearly important but is made difficult by differences in the
definitions of interaction/contact as well as by differences in the
measurement techniques. As the present study considers the
unsupervised detection of face-to-face proximity, it does not rely
on surveys nor on the memories of participants. It is thus expected
that larger total number and durations of contacts will be
obtained, in comparison with survey-based methods.
Table S1 reports the comparison of the number and duration of
contacts between previous studies and the present one. As
Table 4. Exposure matrix between grades.
1st grade 2d grade 3d grade 4th grade 5th grade Teachers
1st grade 322.6 (177.7) 24.8 (13.3) 13.9 (6.2) 10.0 (4.7) 10.4 (4.4) 13.0 (5.5)
2d grade 24.6 (13.2) 274.8 (162.7) 21.7 (11.4) 3.0 (1.2) 2.1 (0.7) 11.4 (6.0)
3d grade 15.0 (6.7) 23.9 (12.5) 307.7 (167.8) 7.7 (3.5) 6.4 (2.4) 7.9 (4.0)
4th grade 11.1 (5.2) 3.3 (1.4) 7.9 (3.6) 189.9 (103.7) 18.2 (9.2) 6.4 (2.9)
5th grade 11.3 (4.8) 2.3 (0.8) 6.3 (2.4) 17.5 (8.9) 269.3 (148.6) 7.3 (3.6)
Teachers 61.7 (26.1) 54.8 (29.0) 34.8 (17.5) 27.5 (12.4) 32.4 (16.2) 10.5 (6.8)
The cell of row A and column B of the matrix gives the average number (and the duration in minutes, between parenthesis) of contacts involving an individual of gradeA with any individual of grade B, per day.doi:10.1371/journal.pone.0023176.t004
Figure 6. Degree of individuals in the contact networks aggregated over sliding time windows of 20 minutes during the first day(left) and the second day (right) of data collection. The median value is represented with a black line, the 95% confidence interval is shown ingray and the number of individuals over which the statistics are calculated is shown in red dashes. Breaks and beginning and end of lunch arecharacterized by a sudden increase of the degree, showing the occurrence of large numbers of contact events.doi:10.1371/journal.pone.0023176.g006
Face-to-Face Contact Patterns in a Primary School
PLoS ONE | www.plosone.org 8 August 2011 | Volume 6 | Issue 8 | e23176
expected, when all contacts are taken into account, we obtain
larger values than the studies cited above, with the exception of
[3]: as the infrastructure described in [3] considers a broader
detection range (3 meters proximity) than in the present case, it is
not surprising that our study detects less numerous and shorter
contacts. We report that each child has on average 323 contacts
lasting 33 seconds per day with other children, corresponding to
contacts with an average of 47 distinct other children, for an
average daily total interaction time of 176 minutes. The present
study gives however access to much more detailed information
such as the duration of each contact and the cumulative duration
of the contacts between two individuals. An important result
concerns the fact that most contacts are short but that the
distribution of contact durations is very heterogeneous, with a non-
negligible fraction of long-lasting contacts. Strongly heterogeneous
distributions of contact durations such as the one displayed in
Figure 3 have been observed in other settings, including
conferences involving only adults [15,17] and a US high school
[3]. Observing similar patterns among young children was
however not a priori expected.
To allow a more informed comparison between studies based
on different methodologies, we compute for each child or for each
pair of individuals the number and total duration of contacts
lasting longer than a given threshold. The results are summarized
in Table 6. For instance, when restricting to cumulated contact
durations of at least one minute, the number of different children
with whom a child has interacted drops to 21, and the
corresponding total interaction time drop to 163 minutes.
Moreover, numbers close to those reported by Glass et al. [9],
Zagheni et al. [6] and Del Valle et al. [21] are obtained when one
takes into account only pairs of children having interacted for at
least 10–12 minutes per day. Overall, our results are therefore
quantitatively different from other studies, as can be expected from
the strong methodological differences, but become compatible
with previous studies when applying filtering procedures which
retain only the longest contacts.
Public health implications in the field of infectiousdiseases
Our results show that children mix preferentially with children
within their age group. This effect, known as age homophily, is
largely due to the fact that children study together and have the
same schedule, and represents a general feature studied in various
contexts by sociologists [22]. As a result, the contact matrices
display a hierarchical block-diagonal structure once their entries
(classes) are sorted according to the seniority of children, as visible
in Figures 4 and 5 (Tables 2 and 3): in addition to the strong
diagonal entries (which correspond to the clusters of Figure 9, i.e.,
to contacts within classes) one can see blocks corresponding to the
same grade (e.g., 1A/1B, 2A/2B, 3A/3B, etc.) and two larger
blocks that span the junior grades (1 to 3) and the senior grades (4
to 5). In addition, the study of the daily evolution of the contact
patterns allows to detect periods of higher contact activity,
corresponding to breaks or lunch time, as well as moments when
the contact weights (i.e., the cumulative time in contact) increase
the most.
These results may help to advise public decision-makers on
interventions aimed at containing or mitigating the propagation of
communicable diseases at the level of schools, in particular in case
of an epidemic or a pandemic. School closure has been proposed
as an effective physical intervention to reduce transmission of
respiratory pathogens, especially influenza [23]. However, it is not
well understood how the benefit of closing entire schools, in terms
of reducing cases, morbidity and mortality, compares to the
economic costs of such interventions. In addition, the effectiveness
of school closure depends on the effectiveness of other measures
such as vaccination or antiviral drugs. Our results could be of
interest in this context, especially if combined with other sources of
information on the contact patterns of children [3,4,20]. The fact
that a child spends three times more time in contact with
classmates than with children of other classes suggests for instance
that closing selected classes instead of the whole school could be a
viable alternative. Additional intermediate steps between class and
school closures could be devised through the analysis of aggregated
contact networks, such as the one depicted in Figure 8, and
exposure matrices such as the ones of Tables 2 and 3: classes most
strongly linked to the class of the first detected case could for
instance be closed in order to reduce the risk of propagation to the
remaining classes. It would be interesting to assess by means of
numerical simulation whether the closure of a single class or of a
Figure 7. Time evolution of the average number of distinctchildren with whom a child has been in contact during thestudy. The average total number is displayed in black, the averagenumber of children of the same class in red, and the average number ofchildren of other classes in blue.doi:10.1371/journal.pone.0023176.g007
Figure 8. Time evolution of the average cumulated time spentby a child in contact with other children during the study. Theaverage total time is displayed in black, the average time spent withchildren of the same class in red, and the average time spent withchildren of other classes in blue.doi:10.1371/journal.pone.0023176.g008
Face-to-Face Contact Patterns in a Primary School
PLoS ONE | www.plosone.org 9 August 2011 | Volume 6 | Issue 8 | e23176
group of classes could efficiently mitigate the propagation of a
disease at the school level. Finally, as highlighted by Figures 8 and
10 and by Video S1 of the Supplementary Information, preventive
measures such as shifts of the class schedules could substantially
reduce contacts between classes, which could be particularly
relevant for preventing transmission events from asymptomatic
cases.
Informing mathematical modelsThe development of mathematical models that aim at
describing the spread of the infection and its prevention and
control is hindered by the lack of information on the contact
patterns between individuals. Epidemiological models of disease
transmissions in structured populations depend heavily on the
knowledge of the amount and duration of contacts between
individuals of different age groups. To reduce this knowledge gap,
we provide the exposure matrix of Tables 2 and 3. In these
matrices, the cells at row A and column B give the average number
and duration of contacts between one individual of category A with
any individual of category B. This may help to refine the young
age groups of the contact matrices proposed by Zagheni [6],
Wallinga [7] and Mossong [8]. Given the important role of
children and young adolescents in the community spread of
respiratory infections, it is important to detail this part of the
matrix. In particular, we remark that most contacts occur within a
given class, and relatively few contacts occur across classes,
effectively limiting the ability for diseases to spread between
different classes.
These results highlight important properties of the contact
patterns between school children that need to be taken into
account when modeling the propagation of diseases and when
evaluating control measures. On the one hand, our results tend to
indicate that assumptions such as the homogeneity of contact
durations, or a homogeneous mixing between classes, may yield
misleading results. On the other hand, Figures 7 and 8 (together
with Video S1 of the Supplementary Information) show that
Figure 9. Network of contacts aggregated over the first day. Edges between individuals having interacted less than 2 minutes have been removed,thus keeping only the strongest links. The width of links corresponds to the cumulative duration of contacts, and nodes with higher number of edges havelarger size. Colors correspond to classes, teachers are shown in grey. Figure created using the Gephi software, http://www.gephi.org.doi:10.1371/journal.pone.0023176.g009
Table 5. Comparison of some characteristics of the networks of day 1 and 2.
Day 1 Day 2
Number of individuals 236 238
Average number of contacts of an individual (CV2) 317 (0.22) 338 (0.27)
Average total time in contact of an individual, in minutes (CV2) 172 (0.25) 183 (0.33)
Average number of distinct persons contacted (CV2) 50 (0.14) 46.5 (0.18)
Average cumulated time spent in contact by two persons, in seconds (CV2) 207 (5.4) 236 (4.7)
Average duration of a contact , in seconds(CV2) 32.6 (1.2) 32.6 (1.1)
Average clustering coefficient 0.5 0.56
doi:10.1371/journal.pone.0023176.t005
Face-to-Face Contact Patterns in a Primary School
PLoS ONE | www.plosone.org 10 August 2011 | Volume 6 | Issue 8 | e23176
homogeneous mixing within each class seems to be a good
approximation. Of course, these considerations should be assessed
by numerical simulations comparing the relative outcomes of
different assumptions, such as global homogeneous mixing,
homogeneous mixing within each class, and a network model.
CaveatsIn the following, we discuss some limitations of the present
study, and point to strategies for moving forward.
First of all, the deployed infrastructure only measured contacts
between children while they were in the school building or in the
Figure 10. Approximate spatiotemporal trajectories of some classes. Each row corresponds to a particular place in the school (classroom,canteen, courtyard) where a RFID reader was situated, and each colored line corresponds to the spatio-temporal trajectory of the children of a class(only 5 classes are shown for clarity). Line widths correspond to the number of children whose approximate position correspond to the row area. Aline can become thinner if children leave the school (for instance during the lunch break, to have lunch at home) or divide itself into two thinner linesif two groups of children of the same class follow distinct paths in the school The trajectories highlight how mixing between classes, shown by thefact that the colored lines overlap, occurs during the breaks and is strongly constrained by the school schedule.doi:10.1371/journal.pone.0023176.g010
Table 6.
A. Filtering procedure: only contactsof duration at least T
Average daily number of distinctother children in contact
Average daily cumulated duration ofcontacts with other children, in minutes
T = 0 47.4 176
T = 40 s 20.8 100
T = 1 mn 11.8 65
T = 2 mn 4..1 28
T = 3 mn 2.2 19
B. Filtering procedure: only cumulatedcontacts at least W
Average daily number of distinct otherchildren in contact
Average daily cumulated duration of contactswith other children, in minutes
W = 0 47.4 176
W = 1 mn 21.4 163
W = 2 mn 15.2 153
W = 5 mn 8.1 129
W = 7 mn 6.1 117
W = 10 mn 4.3 102
W = 12 mn 3.5 93
W = 15 mn 2.7 81
A. Average number of children with whom a child was in contact, computed over one day, and average total time spent daily in contact with other children. In bothcases, a filtering that retains only the contacts with duration at least equal to T is applied (T = 0 or 20 s corresponds to taking all contacts into account, given theavailable 20 s time resolution). B. Average number of children with whom a child was in contact, computed over one day, and average total time spent daily in contactwith other children. For both quantities, a filtering procedure is applied that retains only the links between children who have spent an amount of time at least equal toW in face-to-face proximity (W = 0 or 20 s corresponds to taking all links into account).doi:10.1371/journal.pone.0023176.t006
Face-to-Face Contact Patterns in a Primary School
PLoS ONE | www.plosone.org 11 August 2011 | Volume 6 | Issue 8 | e23176
playground. Badges were not worn during sport activities, which
often involve close proximity situations and physical contacts.
Moreover, even though the children would not be in school during
a school closure, they would still mix with other children and
adults in the community and spread the virus through these
contacts. It would be interesting to use the data collection
infrastructure to combine school data with household data and
data on contact patterns during school closure [24,25]. Coupling
the dynamical contacts patterns at school and at home would
allow to improve our understanding of the role of children as a
reservoir in the community spread of infections.
Another potential issue concerns the possibility that children
changed their behaviour because they were wearing badges and
knew they were participating in a scientific measure. According to
observers familiar with the environment (teachers and staff),
however, no significant change could be detected in the children’s
behavior, and the children seemed to rapidly forget about the
badges. In addition, while detailed explanations were given to the
parents about the study and the badges, details on the role of the
RFID badges (e.g., their detection range) were not given to the
children.
From a public health perspective, it has to be emphasized that
the collected data provide information on the mutual proximity of
badges (and therefore of the persons wearing the badges), but not
on the occurrence of physical contacts. Our measurements may
thus be used in the context of, e.g., respiratory-spread pathogens
but not for infectious agents transmitted by skin contact. Note
however that physical contact can only occur between persons
who are already in spatial proximity. Therefore, it would be very
interesting to study the fraction of close encounters that result in a
physical contact. In the future, the use of devices that can directly
sense physical contact (e.g., body-area networks) may be explored.
The short period of time (two days) of data collection also limits
the ability to draw conclusions on what happens at longer time
scales. Deployment of the sensing infrastructure over much longer
timescales is needed in order to confirm the present results.
Finally, the data presented in this study depend on the school
schedule and spatial structure, and the generalization of our results
to other schools should be carried out with caution. Some
properties are however expected to be rather general, such as the
heterogeneity of the contact durations and of the cumulated
contact durations, that has been observed in several other settings
[3,11,15,18,19] and seems to be ubiquitous in human interactions.
PerspectivesFurther research will use the gathered data to simulate the
transmission of infectious agents (e.g. respiratory or gastro-enteric
viruses) inside a school, to evaluate the role of the index case, and
to assess the impact of various containment measures (e.g. class
closure, homogeneous partial vaccination vs. vaccination of whole
classes, at fixed coverage, etc). Further deployments in other
schools with different schedules, other countries, and possibly for
longer periods, will also be very useful to cross-validate our
findings.
Supporting Information
Video S1 Movie representing the dynamical evolution of the
contacts during the first day of the deployment. Each dot
represents an individual, and an edge is drawn when a contact
between two individuals occurs. Only contacts lasting at least 40 s
are retained. Each frame corresponds to an aggregation of the
contact network over a time window of 20 mn, and successive
frames correspond to aggregation time windows shifted by 10 s;
the movie is then built using 20 frames per second. Nodes are
disposed in circles corresponding to the various classes, with the
teacher at the center, and color-coded according to the grade
(teachers are shown in black).
(AVI)
Table S1 Comparison of the measured average numbers and
durations of contacts across several studies.
(DOC)
Dataset S1 Cumulative contact network for day 1, in gml
format; each edge is weighted by the total time in face-to-face
proximity (‘‘duration’’) and the number of events of face-to-face
proximity (‘‘count’’) detected between the two corresponding
RFID badges.
(GML)
Dataset S2 Cumulative contact network for day 2, in gml
format; each edge is weighted by the total time in face-to-face
proximity (‘‘duration’’) and the number of events of face-to-face
proximity (‘‘count’’) detected between the two corresponding
RFID badges.
(GML)
Dataset S3 List of tags and corresponding class of the person
who wore it.
(TXT)
Acknowledgments
We warmly thank Bitmanufaktur, the Openbeacon project and Truelite for
their technical support. We are particularly grateful to all children, their
parents and the school staff who volunteered to participate in the data
collection.
Author Contributions
Conceived and designed the experiments: AB CC LI BL J-FP JS WVdB
PV NV. Performed the experiments: AB CC J-FP CR NV. Analyzed the
data: AB CC LI MQ JS WVdB NV. Wrote the paper: AB CC J-FP JS NV.
References
1. Longini IM, Jr., Koopman JS, Monto AS, Fox JP (1982) Estimating household
and community transmission parameters for influenza. Am J Epidemiol 115(5):
736–51.
2. Viboud C, Boelle PY, Cauchemez S, Lavenu A, Valleron AJ, et al. (2004) Risk
factors of influenza transmission in households. Br J Gen Pract 54(506): 684–9.
3. Salathe M, Kazandjieva M, Lee JW, Levis P, Feldman MW, et al. (2010) A
High-Resolution Human Contact Network for Infectious Disease Transmission.
Proc Natl Acad USA 107: 22020–22025.
4. Mikolajczyk RT, Akmatov MK, Rastin S, Kretzschmar M (2008) Social contacts
of school children and the transmission of respiratory-spread pathogens.
Epidemiol Infect 136(6): 813–22.
5. Glass LM, Glass RJ (2008) Social contact networks for the spread of pandemic
influenza in children and teenagers. BMC Public Health 8: 61.
6. Zagheni E, Billari FC, Manfredi P, Melegaro A, Mossong J, et al. (2008) Using
time-use data to parametrize models for the spread of close-contact infectious
diseases. Am J of Epidemiology 168, No 9.
7. Wallinga J, Teunis P, Kretzschmar M (2006) Using data on social contacts to
estimate age-specific transmission parameters for respiratory-spread infectious
agents. Am J Epidemiol 164(10): 936–44.
8. Mossong J, Hens N, Jit M, Beutels P, Auranen K, et al. (2008) Social contacts
and mixing patterns relevant to the spread of infectious diseases. PloS Medicine
5(3): e74.
9. Beutels P, Shkedy Z, Aerts M, Van Damme P (2006) Social mixing patterns for
transmission models of close contact infections: exploring self-evaluation and
diary-based data collection through a web-based interface. Epidemiol Infect
134(6): 1158–66.
Face-to-Face Contact Patterns in a Primary School
PLoS ONE | www.plosone.org 12 August 2011 | Volume 6 | Issue 8 | e23176
10. Hens N, Goeyvaerts N, Aerts M, Shkedy Z, Van Damme P, et al. (2009) Mining
social mixing patterns for infectious disease models based on a two-daypopulation survey in Belgium. BMC Infect Dis 20;9: 5.
11. Hui P, Chaintreau A, Scott J, Gass R, Crowcroft J, et al. (2005) Pocket switched
networks and human mobility in conference environments. In WDTN ’05: Proc.2005 ACM SIGCOMM workshop on Delay-tolerant networking. New York,
NY, USA: ACM, 2005.12. Eagle N, Pentland A (2006) Reality mining: sensing complex social systems.
Personal Ubiquitous Comput 10: 255–268.
13. O’Neill E, Kostakos V, Kindberg T, Fatah gen Schieck A, Penn A, et al. (2006)Instrumenting the city: Developing methods for observing and understanding
the digital cityscape. In Ubicomp, Lecture Notes in Computer ScienceDourish P, Friday A, eds. vol. 4206. Springer. pp 315–332.
14. Pentland A (2008) Honest Signals: how they shape our world MIT Press,Cambridge MA.
15. Cattuto C, Van den Broeck W, Barrat A, Colizza V, Pinton JF, et al. (2010)
Dynamics of person-to-person interactions from distributed RFID sensornetworks. PLoS ONE 5(7): e11596.
16. The SocioPatterns project. Available: http://www.sociopatterns.org/. Accessed2011 Jul 28.
17. Alani H, Szomsor M, Cattuto C, Van den Broeck W, Correndo G, et al. (2009)
Live Social Semantics, 8th International Semantic Web Conference ISWC2009.Lecture Notes in Computer Science 5823: 698–714.
18. Isella L, Stehle J, Barrat A, Cattuto C, Pinton JF, et al. (2011) What’s in a crowd?
Analysis of face-to-face behavioral networks. Journal of Theoretical Biology 271:
166–180.
19. Isella L, Romano M, Barrat A, Cattuto C, Colizza V, et al. (2011) Close
encounters in a pediatric ward: measuring face-to-face proximity and mixing
patterns with wearable sensors. PLoS ONE 6(2): e17144.
20. Conlan AJ, Eames KT, Gage JA, von Kirchbach JC, Ross JV, et al. (2011)
Measuring social networks in British primary schools through scientific
engagement. Proc Biol Sci 278: 1467–75.
21. Del Valle SY, Hyman JM, Hethcote HW, Eubank SG (2007) Mixing patterns
between age groups in social networks. Social Networks 29: 539–554.
22. McPherson M, Smith-Lovin L, Cook JM (2001) Birds of a Feather: Homophily
in Social Networks}. Annual Review of Sociology 27: 415–444.
23. Cauchemez S, Ferguson NM, Wachtel C, Tegnell A, Saour G, et al. (2009)
Closure of schools during an influenza pandemic. Lancet Infect Dis 9(8): 473–81.
24. Jackson C, Mangtani P, Vynnycky E, Fielding K, Kitching A, et al. (2011)
School closures and student contact patterns. Emerging Infectious Diseases
17(2): 245–247.
25. Eames KTD, Tilston NL, Edmunds JW (2011) The impact of school holidays on
the social mixing patterns of school children. Epidemics 3: 103–108.
Face-to-Face Contact Patterns in a Primary School
PLoS ONE | www.plosone.org 13 August 2011 | Volume 6 | Issue 8 | e23176