Estimation of denitrification potential with respiration ...
200
Estimation of denitrification potential with respiration based techniques Katarzyna Kujawa-Roeleveld \*N ^ 0^
Transcript of Estimation of denitrification potential with respiration ...
Estimation of denitrification potential
with respiration based techniques
Katarzyna Kujawa-Roeleveld
\*N ^ 0 ^

Promoter: dr. ir. W.H. Rulkens hoogleraar in de milieutechnologie
Copromotor: dr. ir. A. Klapwijk universitair hoofddocent bij de sectie Milieutechnologie van het Departement Agrotechnologie en Voedingswetenschappen
j j / v K t f ' Z ^ , ^ o 3
Estimation of denitrification potential
with respiration based techniques
Katarzyna Kujawa-Roeleveld
Proefschrift ter verkrijging van de graad van doctor op gezag van de rector magnificus van Wageningen Universiteit, dr. CM. Karssen, in het openbaar te verdedigen op dinsdag 6 juni 2000 des namiddags te vier uur in de Aula
iSo'..lKo£t
Cover page: Surface of aeration basin of wastewater treatment plant in Poznan, Poland
Photo: Wtodzimierz Dudlik
BIBUOTK'": K lANDBOUV/UNlvri'.-". .
CIP-DATA KONESfKLUKE BIBLIOTHEEK, DEN HAAG
Kujawa-Roeleveld, Katarzyna
Estimation denitrification potential with respiration based techniques/ Katarzyna Kujawa-Roeleveld. - [S.I: s.n.]
Thesis Wageningen University. - With ref. - With summary in Dutch ISBN 90-5808-228-8
Subject headings: nitrogen removal/activated sludge/ denitrification/ respirometry
^uoTzo\, ^go3
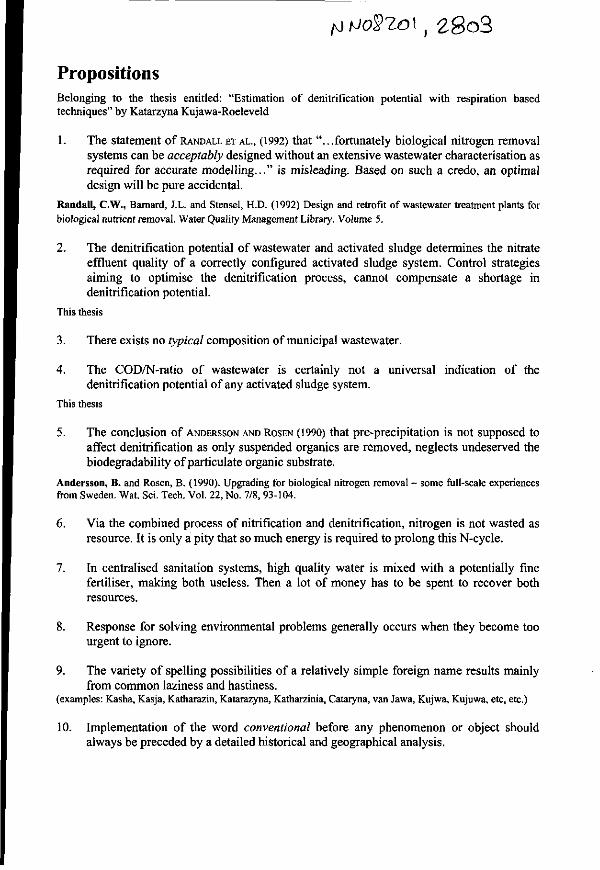
Propositions Belonging to the thesis entitled: "Estimation of denitrification potential with respiration based techniques" by Katarzyna Kujawa-Roeleveld
1. The statement of RANDALL ET AL., (1992) that "...fortunately biological nitrogen removal systems can be acceptably designed without an extensive wastewater characterisation as required for accurate modelling..." is misleading. Based on such a credo, an optimal design will be pure accidental.
Randall, C.W., Barnard, J.L. and Stensel, H.D. (1992) Design and retrofit of wastewater treatment plants for biological nutrient removal. Water Quality Management Library. Volume 5.
2. The denitrification potential of wastewater and activated sludge determines the nitrate effluent quality of a correctly configured activated sludge system. Control strategies aiming to optimise the denitrification process, cannot compensate a shortage in denitrification potential.
This thesis
3. There exists no typical composition of municipal wastewater.
4. The COD/N-ratio of wastewater is certainly not a universal indication of the denitrification potential of any activated sludge system.
This thesis
5. The conclusion of ANDERSSON AND ROSEN (1990) that pre-precipitation is not supposed to affect denitrification as only suspended organics are removed, neglects undeserved the biodegradability of particulate organic substrate.
Andersson, B. and Rosen, B. (1990). Upgrading for biological nitrogen removal - some full-scale experiences from Sweden. Wat. Sci. Tech. Vol. 22, No. 7/8, 93-104.
6. Via the combined process of nitrification and denitrification, nitrogen is not wasted as resource. It is only a pity that so much energy is required to prolong this N-cycle.
7. In centralised sanitation systems, high quality water is mixed with a potentially fine fertiliser, making both useless. Then a lot of money has to be spent to recover both resources.
8. Response for solving environmental problems generally occurs when they become too urgent to ignore.
9. The variety of spelling possibilities of a relatively simple foreign name results mainly from common laziness and hastiness.
(examples: Kasha, Kasja, Katharazin, Katarazyna, Katharzinia, Cataryna, van Jawa, Kujwa, Kujuwa, etc, etc.)
10. Implementation of the word conventional before any phenomenon or object should always be preceded by a detailed historical and geographical analysis.

Moim rodzicom
Aan Paul
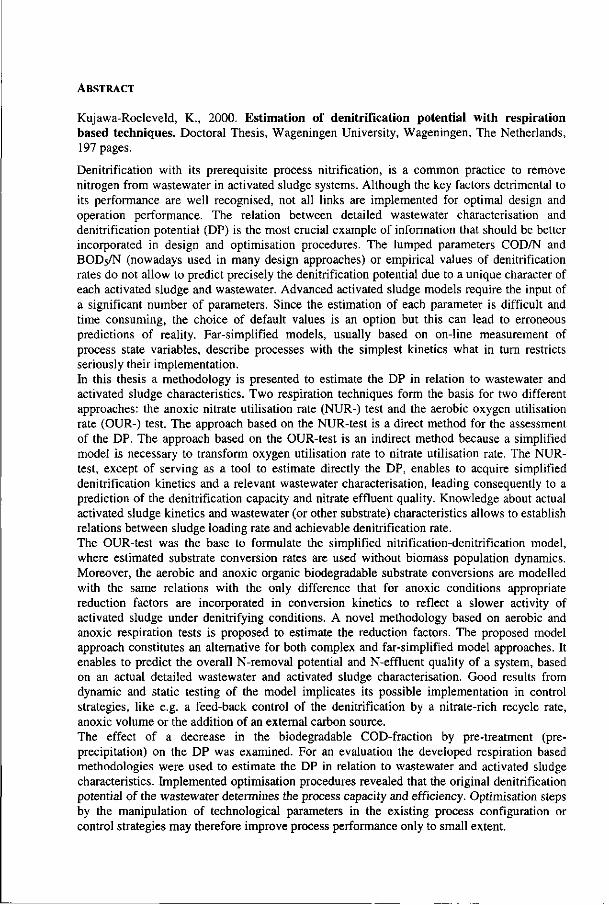
ABSTRACT
Kujawa-Roeleveld, K., 2000. Estimation of denitrification potential with respiration based techniques. Doctoral Thesis, Wageningen University, Wageningen, The Netherlands, 197 pages.
Denitrification with its prerequisite process nitrification, is a common practice to remove nitrogen from wastewater in activated sludge systems. Although the key factors detrimental to its performance are well recognised, not all links are implemented for optimal design and operation performance. The relation between detailed wastewater characterisation and denitrification potential (DP) is the most crucial example of information that should be better incorporated in design and optimisation procedures. The lumped parameters COD/N and BOD5/N (nowadays used in many design approaches) or empirical values of denitrification rates do not allow to predict precisely the denitrification potential due to a unique character of each activated sludge and wastewater. Advanced activated sludge models require the input of a significant number of parameters. Since the estimation of each parameter is difficult and time consuming, the choice of default values is an option but this can lead to erroneous predictions of reality. Far-simplified models, usually based on on-line measurement of process state variables, describe processes with the simplest kinetics what in turn restricts seriously their implementation. In this thesis a methodology is presented to estimate the DP in relation to wastewater and activated sludge characteristics. Two respiration techniques form the basis for two different approaches: the anoxic nitrate utilisation rate (NUR-) test and the aerobic oxygen utilisation rate (OUR-) test. The approach based on the NUR-test is a direct method for the assessment of the DP. The approach based on the OUR-test is an indirect method because a simplified model is necessary to transform oxygen utilisation rate to nitrate utilisation rate. The NUR-test, except of serving as a tool to estimate directly the DP, enables to acquire simplified denitrification kinetics and a relevant wastewater characterisation, leading consequently to a prediction of the denitrification capacity and nitrate effluent quality. Knowledge about actual activated sludge kinetics and wastewater (or other substrate) characteristics allows to establish relations between sludge loading rate and achievable denitrification rate. The OUR-test was the base to formulate the simplified nitrification-denitrification model, where estimated substrate conversion rates are used without biomass population dynamics. Moreover, the aerobic and anoxic organic biodegradable substrate conversions are modelled with the same relations with the only difference that for anoxic conditions appropriate reduction factors are incorporated in conversion kinetics to reflect a slower activity of activated sludge under denitrifying conditions. A novel methodology based on aerobic and anoxic respiration tests is proposed to estimate the reduction factors. The proposed model approach constitutes an alternative for both complex and far-simplified model approaches. It enables to predict the overall N-removal potential and N-effluent quality of a system, based on an actual detailed wastewater and activated sludge characterisation. Good results from dynamic and static testing of the model implicates its possible implementation in control strategies, like e.g. a feed-back control of the denitrification by a nitrate-rich recycle rate, anoxic volume or the addition of an external carbon source.
The effect of a decrease in the biodegradable COD-fraction by pre-treatment (pre-precipitation) on the DP was examined. For an evaluation the developed respiration based methodologies were used to estimate the DP in relation to wastewater and activated sludge characteristics. Implemented optimisation procedures revealed that the original denitrification potential of the wastewater determines the process capacity and efficiency. Optimisation steps by the manipulation of technological parameters in the existing process configuration or control strategies may therefore improve process performance only to small extent.
Acknowledgements
This thesis with its fragile basis (financial and structural) would not be finalised without supervision, assistance and mental support of many people. First of all I would like to thank Bram Klapwijk, my 'daily' guide and co-promotor, for enabling my 'attachment' to Wageningen University and sewing up all pieces of fellowships to create a reasonable PhD program and searching for a 'rode draad' in these denitrification considerations. Wim Rulkens, my promotor, for his support and detailed review with valuable comments on the manuscript. Henk Rensink who supported friendly my first steps in the Netherlands. The work in that period was then not yet related to this thesis. However, the first assessment of denitrification aspects provided finally the results for chapter 6. Undoubtfully Harry Brouwer, the creator of RESCUE, who introduced me into the meanders of aerobic respiration and provided some data to test the nitrification-denitrification model. A part of his work became a starting point for the developments in this study, hopefully worth to be implemented and further improved. Henry Spanjers for his time and valuable comments on a part of this work. The technical staff of the Proefhal Bennekom: the laboratory assistance of Dieke van Doom and Rob Roersma and the technical assistance of Bert Willemsen. I cannot remember any tiny problem related to our cooperation. Additionally, I want to thank Dieke for her friendship and hours of cosy talks, leading to a slow but happy solution of serious problems, certainly not in any way related to the estimation of the denitrification potential. Heleen was patient in arranging every fellowship and Liesbeth was always ready to help. I want to thank Justyna Nowicka for her significant contribution into the estimation of the effect of pre-precipitation on the denitrification potential and Elbert Majoor and Jakub Owedyk for performing a large number of batch denitrification tests. My ex-team from Poznan University of Technology with Prof. Marek M. Sozanski, who step by step was getting used to the idea of loosing me for his department, and Marek Sowinski, arranging the fellowships to Wageningen. The Bennekom crew created a friendly and free sphere, contributing in acquiring my Dutch skill. Especially I would like to name Grietje, Hardy, Wendy, Michiel, Adriaan and many students and foreign visitors. My parents, a perfect combination of charm and strength, stimulating me the most by just asking from time to time a little tiny question: 'when you will finish?' They are the best example of how much can be achieved in life. Paul, a strong base of trust, love and friendship that makes life easy and simple, and quite funny too. Be sure that I will never underestimate your significant scientific contribution to this work. Finally I want to express my thanks to my family and friends: Polish, giving me the feeling that I have never left them and Dutch who made the adaptation process practically manageable.
ESTIMATION OF DENITRIFICATION POTENTIAL
WITH RESPIRATION BASED TECHNIQUES
CONTENT
Chapter 1 1 General introduction
Chapter 2 33 A method to estimate denitrification potential for pre-denitrification system using batch NUR- test
Chapter 3 53 Methodology to estimate reduction factors for denitrification with respiration based techniques
Chapter 4 83 Respiration based simplified nitrification-denitrification model Part I: model development
Chapter 5 107 Respiration based simplified nitrification-denitrification model Part II: model testing
Chapter 6 129 Effect of pre-precipitation on denitrification potential
Chapter 7 153 Optimisation with a control strategy of a pre-denitrification system fed with pre-precipitated wastewater
Chapter 8 169
Discussion
Summary 185
Samenvatting 191
Curriculum vitae 197
Chapter 1
General introduction
CONTENT
1.1 Nitrogen in domestic wastewater 3 1.2 Conventional nitrogen removal 3
1.2.1 Assimilation of nitrogen 3 1.2.2 Nitrification 4 1.2.3 Denitrification 4
1.3 Conditions for denitrification 4 1.3.1 Presence of N-oxides 5 1.3.2 Presence of facultative heterotrophic biomass 5 1.3.3 Absence or low level of dissolved oxygen 5 1.3.4 Presence of a suitable electron donor 6 1.3.5 Requirement for biodegradable COD 6
1.4 Denitrification in relation to wastewater characteristics 7 1.4.1 Parameters describing denitrification performance 7 1.4.2 Wastewater characteristics 8 1.4.3 COD/N- or BODs/N-ratio and effect of pre-treatment on denitrification 9 1.4.4 Necessity for external carbon source addition 11
1.5 Design approaches forN-removal 11 1.6 N-removal process configurations 12 1.7 Control aspects forN-removal 14 1.8 Model aspects for denitrification 15 1.9 Non-conventional N-conversions 17 1.10 Objectives of the thesis 19 1.11 Structure of the thesis 20
List of symbols and abbreviations 25 Literature 26
Chapter I
1.1 NITROGEN IN DOMESTIC WASTEWATER
Various nitrogen (N) forms in municipal wastewater originate primarily from protein
metabolisms in human bodies (VAN DER WUST AND GROOT-MARCUS, 1998). The main fraction of
nitrogen in municipal wastewater constitutes Kjeldahl-N (Nig), which is the sum of ammonia-
N (SNH) and organic-N (Norg) (e.g. RAUCH, 1994). The fraction SNH is in general the prevailing
fraction of the influent-N (HENZEETAL., 1987, 1996). According to the IAWQ Activated Sludge
Models (ASM) (HENZE ET AL., 1987, 1996) four sub-fractions can be distinguished within Norg:
inert soluble and inert particulate (SNI and XNI), soluble readily biodegradable (SND) and
particulate slowly biodegradable (XND)- In the sewer system and activated sludge system,
biodegradable Norg will be decomposed to SNH as a consequence of hydrolysis and
ammonification, and this normally takes place at a high rate. Nitrate (SNo3) and nitrite (SNOZ)
concentrations are usually negligible, but can occur in cases where some types of industrial
wastewater are discharged to the sewer system. When nitrogen is not removed, municipal
wastewater forms a significant source of the external nitrogen load to surface waters (CUWVO,
1991).
Since the early 70's a dynamic development in advanced activated sludge wastewater
treatment methods has been noticed and the primary function of activated sludge for
carbonaceous material removal has been subsequently extended to biological nitrogen
removal with the processes nitrification and denitrification. Besides nitrogen removal, also
phosphorus removal was introduced via chemical and/or biological processes.
1.2 CONVENTIONAL NITROGEN REMOVAL
Nitrogen compounds from wastewater can undergo numerous biological conversions in
wastewater treatment plants. In conventional biological treatment plants, assimilation and
conversion to nitrogen gas via nitrification and denitrification are the dominant activated
sludge processes for nitrogen removal.
1.2.1 ASSIMILATION OF NITROGEN
Since N constitutes an essential nutrient for activated sludge micro-organisms, a part of the
influent SNH will be assimilated for the synthesis of cellular material. If SNH is limiting, SN03
or SNO2 can be used for the assimilative requirement, after being reduced to SNH
(METCALF&EDDY, 1991). Assimilatory N-removal occurs under aerobic, anoxic and anaerobic
conditions (CASEY ETAL., 1994).
The overall removal of N via assimilation depends on the daily sludge production, which on
itself is generally proportional to the organic sludge loading rate and inversely proportional to
the activated sludge retention time (SRT). In high loaded systems, the nitrogen assimilation
may attain a significant rate, especially when treating concentrated wastewater in terms of
COD and N. In the treatment of municipal wastewater the percentage of N removal via
assimilation may range from 8 to 30% (v. HAANDELET AL. 1981b, SDA, 1989). However, if the
General introduction
treatment plant involves sludge handling processes, a portion of the assimilated N will return
in the form of SNH to the activated sludge tank via reject waters. For design purposes, the re
load from reject waters has to be included in the total N-load.
1.2.2 NITRIFICATION
The nitrification process is a prerequisite for a dissimilatory N-removal. The SNH from the
influent and formed from hydrolysis and ammonification of biodegradable Norg, is oxidised in
a two-step reaction to SNO3 by many species of autotrophic nitrifying bacteria which derive
energy from inorganic compounds. The oxidation of SNH is generally attributed to
Nitrosomonas europaea and the oxidation of SNO2 to Nitrobacter agilis.
NH/ + Ao2 M - — " " )MV +2H++H20 + 352kJ I mol 2 (1.1,1.2)
-* _ Nitrobacter _ . _ __ . „ , . NOf + -02 >NOf +73kJ I mol
There is no organism described which is able to perform the overall nitrification process (v.
LOOSDRECHT AND JETTEN, 1998). Due to a low yield and substrate (SNH) level, compared with
COD, nitrifiers constitute only 2-5% of the total activated sludge population (RANDALL ET AL.,
1992). The autotrophic nitrifiers are considered to be more susceptible to pH, temperature and
toxic chemicals than heterotrophs.
1.2.3 DENITRIEICATION
In the dissimilatory N-removal, denitrification is the reduction of SNo3 or SNo2 via a chain of
intermediates to the end product nitrogen gas (N2), as a consequence of redox reactions to
obtain energy from organic material. The pathway of denitrification consists of a number of
steps by which electrons are passed from the electron transport pathway to one of the N-
oxides to produce a more reduced N-oxide. The generally accepted entire denitrification
pathway can be described as (PAYNE, 1973):
NO~3(J+5) -» N02(aJ
+3) -> iVOfe/+2» -» N20(g™ -» N2(g) (1.3)
Each N-oxide (NO3", NO2", NO and N20) can serve thus as electron acceptor (e.g. HADJIPETROU
AND STOUTHAMER, 1965, MCCARTHY ET AL., 1981).
1.3 CONDITIONS FOR DENITRIFICATION
In order to perform a satisfactory denitrification, a number of conditions is necessary to be
accomplished (e.g.KLAPWUK, 1978, VANHAANDEL, 1981a,b, EKAMAETAL., 1984):
- presence of N-oxides;
- presence of facultative heterotrophic biomass;
- absence or low level of dissolved oxygen;
- and presence of a suitable electron donor.
Chapter 1
1.3.1 PRESENCE OF N-OXIDES
To assure the nitrate and/or nitrite level, denitrification has to be proceeded (in time or place) by nitrification or N-oxides have to be available in the wastewater.
1.3.2 PRESENCE OF FACULTATIVE HETEROTROPHIC BIOMASS.
In the respiratory metabolism of heterotrophic organisms, organic substrate is oxidised to the end products CO2 and H20. During oxidation, organisms are able to capture energy for substrate utilisation, maintenance and growth. The energy becomes available via a serie of internally mediated redox reactions, involving electron and proton transport from an electron donor (organic substrate) to the final electron acceptor (oxygen or N-oxides) through a number of intermediate enzyme complexes. A large fraction of heterotrophic organisms -facultative heterotrophs - in biological treatment plants is capable for dissimilative denitrification. When dissolved oxygen (DO) becomes limiting, they can metabolise organic substrate with nitrate and/or nitrite as terminal electron acceptor.
Not the entire active biomass fraction that respires aerobically, is expected to use N-oxides as terminal electron acceptor (e.g. KLAPWUK, 1978, HENZE, 1986, ORHON ET AL., 1996). Also not all denitrifying organisms can execute the entire pathway of denitrification (CASEY ET AL., 1994) but only part of it, i.e. from one ionic N-compound (NO3" or NO2") to one of the gaseous N compounds (NO, N2O or N2). Such organisms are referred as partial denitrifiers. Other organisms reduce nitrate only to nitrite and they are called nitrate reducers. The electron transport pathways for aerobic and anoxic respiration have common enzyme complexes for a substantial part, which are utilised under both conditions. Other enzyme complexes are specific to only aerobic or anoxic respiration. Reduction of each N-oxide is catalysed by the corresponding N-oxide reductase (CHONG AND MORRIS, 1962, WPCF, 1983, CASEY ETAL., 1994).
1.3.3 ABSENCE OR LOW LEVEL OF DISSOLVED OXYGEN
When oxygen is absent or present at very low concentrations, nitrate/nitrite will act as electron acceptor. Such conditions are termed anoxic in the field of wastewater treatment in contrast to microbiology and biochemistry (CASEYETAL., 1994). The synthesis of N-oxide reductases can be executed at the absence or low levels of DO and the presence of the specific N-oxide, the reactant for a reductase. When the environment for facultative organisms is changed from aerobic to anoxic conditions, the synthesis of some oxidases - enzymes specific for aerobic respiration - is inhibited and the synthesis of reductases is initiated. When the facultative organisms are transferred to aerobic conditions the formation of reductases is inhibited (CHONG AND MORRIS, 1962, WPCF, 1983, WILD ETAL., 1994). According to PAYNE (1981), reductases of some facultative organisms are inactivated by DO, whereas of others the synthesis of reductases is repressed but the existing enzymes disappear gradually.
General introduction
Different electron transport pathways have a significant influence on the energy conservation.
It can be deduced or proved experimentally (e.g., DELWICHE, 1970, VAN VERSEVELD ET AL., 1981,
EKAMA ET AL., 1984, CASEY ET AL., 1994) that free energy released in presence of organic material
and oxygen is higher than in the presence of N-oxides. It means, that if both are present, the
more energy yielding process will take place preferentially. An example of the oxidation-
reduction reaction with glucose and nitrate or oxygen shows this difference:
5C6H1206 + 24NO; -» 30CO2 + 18H20 + 240H~ + 12N2 + 2394kJ I mol
C6H1206 + 602 -> 6C02 + 6H20 + 2881U I mol
The inhibitory effect of DO on denitrification has been extensively reported in literature and a
high variety in reported DO levels can be found. SKERMAN AND MACRAE (1957) and WUHRMANN
(1960) reported that denitrification can proceed at a DO concentration of 0.2 - 0.5 m%Q>2.lA
while CARLSSON (1971) found that at 0.2 mg02.f' no significant denitrification was obtained.
CHRISTENSEN AND HARREMOES (1977) define a critical DO concentration of lower than 0.5mgO2.f',
where facultative heterotrophs are able to switch from oxygen to N-oxides as electron
acceptor. For practical purposes the SDA (1989) states that denitrification can be ignored when
DO is greater than 1.0 mg02.^"'. The high variety in reported DO levels can be explained by
the existence of a DO gradient in bacterial floes, where despite of aerobic conditions in the
environment outside the floe, anoxic conditions prevail in its centre (KRUL, 1976). The structure
of activated sludge floes, their size as well as mixing conditions may play an important role in
the process performance and different results can be found on the limiting DO level.
1.3.4 PRESENCE OF A SUITABLE ELECTRON DONOR
The oxidation of biodegradable organic compounds provides energy for facultative
heterotrophs for the synthesis of new biomass and endogenous respiration. The energy for
denitrification from organic compounds can be categorised as follows:
internal present in the influent wastewater;
- self-generated in the system from decay and lysis of biomass;
external carbon source as e.g. methanol, ethanol, acetic acid, starch, etc.
The composition and concentration of organic compounds (HENZE, 1986, GRABINSKA-LONIEWSKA,
1991) determine the denitrification rate. When wastewater forms the only source of organic
substrate the availability of biodegradable COD can be a shortcoming.
1.3.5 REQUIREMENT FOR BIODEGRADABLE COD
When nitrate serves as electron acceptor, the stoichiometrically equivalent mass of oxygen is
used: 1 mg N-N0 3 (SN03) = 2.86 mg 0 2 (S02) (e.g. KLAPWUK, 1978, v. HAANDEL ET AL., 1981,
EKAMA ET AL., 1984). COD is required for two purposes during denitrification. One portion (1-
YHD) is oxidised by denitrifying heterotrophs to CO2 and H2O, from which process energy is
released and this energy is utilised for the assimilation of a second portion of COD (YHD)- The
Chapter 1
anoxic heterotrophic yield (YHD) is equal to the efficiency of the cell to convert organic substrate into biomass (COPP AND DOLD, 1998). The total COD consumption to reduce 1 mg SN03 will be 2 .86/(1-YHD) (UCT, 1984). When assuming according to ASM1 (HENZEET AL„ 1987) YHD
= 0.67, a theoretical demand of organic biodegradable substrate of 8.67 mg COD is required to reduce 1 mg SNo3- In practice the theoretical COD-requirement for heterotrophic denitrification will be determined by the net biomass yield of activated sludge (including biomass decay). The amount of COD for biomass synthesis will depend on the chemical structure of the COD compounds in the influent (MCCARTY ET AL., 1969, CHUDOBA ET AL., 1989, GRABINSKA-LONEEWSKA,
1991, HER AND HUANG (1995) and within one group of organic compounds on the number of C-atoms (GRABINSKA-LONEWSKA, 1991).
1.4 DENITRIFICATION IN RELATION TO WASTEWATER CHARACTERISTICS
1.4.1 PARAMETERS DESCRIBING DENITRMCATION PERFORMANCE
To describe the denitrification performance in an activated sludge system, different parameters are used: denitrification rate, denitrification potential, denitrification capacity and denitrification efficiency. To avoid any confusion they will be first generally defined while in the course of the thesis the definitions will get extended and relations between them will be established.
To characterise the denitrifying sludge activity, the specific denitrification rate (ko) can be used. Most commonly, kD is defined as a mass of SNo3 removed per time unit (t) per mass of volatile suspended solids (MLVSS, Xv) (WPCF, 1983):
* D = - ^ ^ ; m g N . g V S S - V (1.6) at Xy
For an on-going process, the denitrification rate is calculated from the nitrate balance over the anoxic reactor (PURTSCHERTETAL., 1996).
^ ^ • / ^ ^ m g N . g V S S - ' . / T 1 (1.7) "D XV
where Q,,e refers to any flows (wastewater, sludge recycle, nitrate-rich recycle) entering and leaving the denitrification volume (VD) and SNO3« is the nitrate concentration assigned to a given flow. The denitrification potential (DP, mgNX1) is the maximal mass of nitrate that can be denitrified in the anoxic volume(s) of a considered system per unit of influent flow (VAN HAANDELETAL., 1982, EKAMAETAL., 1983). The DP depends on the concentration of biodegradable COD in the influent and the sludge activity. The denitrification capacity (DC, mgN.-f') is related to the DP and system configuration. It is the concentration of nitrate per influent flow that is denitrified in the system. In the most beneficial conditions the DC is equal to the DP. When, for instance, DO is present in the recycle streams entering the anoxic reactor the availability of biodegradable COD for
General introduction
denitrification is decreased and the DC is lower than the DP. Anoxic volumes determine how
much of biodegradable COD is utilised for the denitrification process and this affects the
denitrification capacity. The DC is also affected by environmental factors as temperature, pH
(HENZE AND BUNDGAARD, 1982) and toxic components (RANDALLETAL., 1992).
Another indication of denitrification performance is the denitrification efficiency that can be
defined as the reduction rate of 'denitrifiable N' , the amount of SNO3 that can be denitrified in
a given system. This can be assessed from a N-balance that can attain different rates of
complexity concerning the number of defined N-fractions and the number of involved re
conversions.
1.4.2 WASTEWATER CHARACTERISTICS
In the field of activated sludge modelling it has been established that, with respect to the
response of activated sludge, organic matter of wastewater is generally divided into soluble
readily biodegradable COD (Ss), particulate slowly biodegradable COD (Xs) and inert soluble
and particulate COD (Si and Xi respectively) (e.g. MARAIS AND EKAMA, 1976, DOLD ET AL., 1980,
HENZE ET AL., 1987). Several approaches were developed to characterise wastewater, generally
divided into physical-chemical and biological methods (STOWA, 1996a). Indirect determination
of S s and X s can be obtained with the oxygen utilisation rate (OUR) test (EKAMA ET AL., 1986,
SOLLFRANK AND GUJER, 1991, KAPPELER AND GUJER, 1992) or with the nitrate utilisation rate (NUR)
test (EKAMA ET AL., 1986, KRISTENSEN ET AL., 1992, SCHEER AND SEYFRIED, 1994). Both techniques are
considered to be rather complex in their performance and interpretation (SCHEER AND SEYFRED,
1994).
The Ss-fraction constitutes usually a small fraction in domestic wastewater (7-20%) (HENZE,
1992, SCHEER, 1995, NAIDOOET AL., 1998). Higher values can be found in cases were the fraction of
industrial wastewater is high and in case of sewer systems with long pressure mains. The X$-
fraction forms usually a major part of the total biodegradable COD (40-60%) (HENZE, 1992) and
is assumed to consist of relatively complex molecules. They will adsorb to activated sludge
floes and hydrolysed to simple molecules by extracellular enzymes. According to the IAWQ
ASM's (HENZE ETAL., 1987,1996), S s is the product of the Xs-hydrolysis.
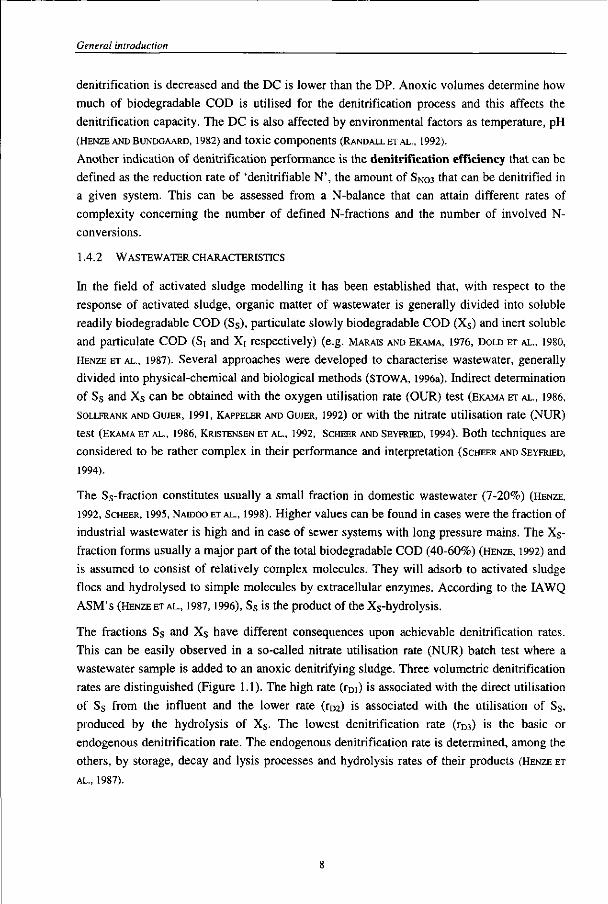
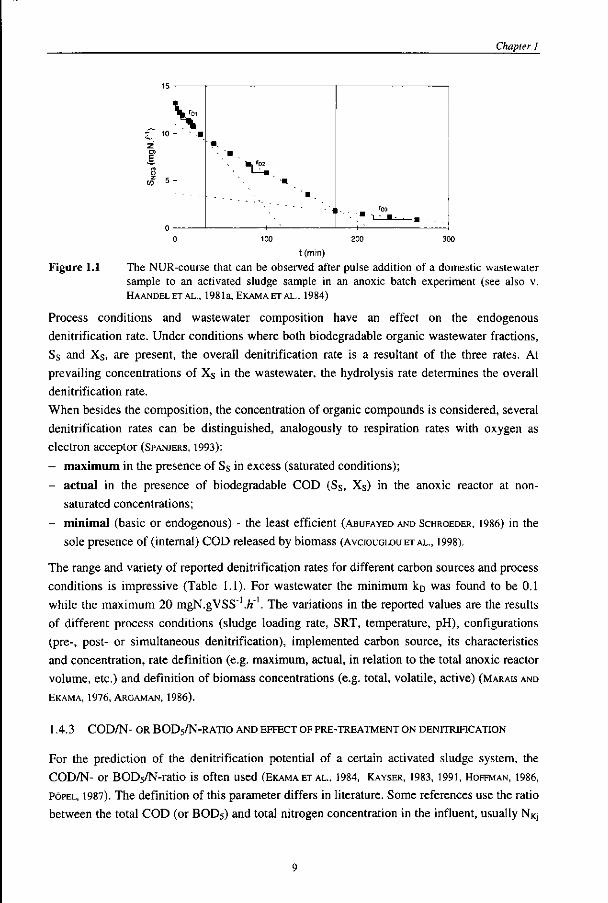
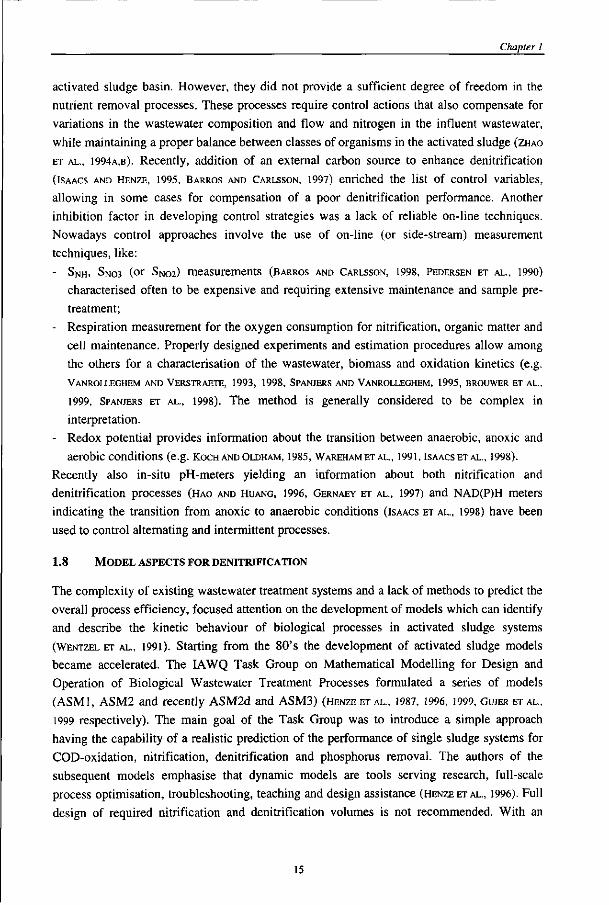
The fractions Ss and Xs have different consequences upon achievable denitrification rates.
This can be easily observed in a so-called nitrate utilisation rate (NUR) batch test where a
wastewater sample is added to an anoxic denitrifying sludge. Three volumetric denitrification
rates are distinguished (Figure 1.1). The high rate (rDj) is associated with the direct utilisation
of S s from the influent and the lower rate (rD2) is associated with the utilisation of Ss,
produced by the hydrolysis of Xs. The lowest denitrification rate (rD3) is the basic or
endogenous denitrification rate. The endogenous denitrification rate is determined, among the
others, by storage, decay and lysis processes and hydrolysis rates of their products (HENZE ET
AL., 1987).
Chapter I
z E. o
CO 5
1
' • •
•m.
" i - - - • r ° 3
1 " * ' ' •
t (min) Figure 1.1 The NUR-course that can be observed after pulse addition of a domestic wastewater
sample to an activated sludge sample in an anoxic batch experiment (see also v. HAANDELETAL., 1981a, EKAMAETAL., 1984)
Process conditions and wastewater composition have an effect on the endogenous
denitrification rate. Under conditions where both biodegradable organic wastewater fractions,
Ss and Xs, are present, the overall denitrification rate is a resultant of the three rates. At
prevailing concentrations of X s in the wastewater, the hydrolysis rate determines the overall
denitrification rate.
When besides the composition, the concentration of organic compounds is considered, several
denitrification rates can be distinguished, analogously to respiration rates with oxygen as
electron acceptor (SPANJERS, 1993):
- maximum in the presence of Ss in excess (saturated conditions);
- actual in the presence of biodegradable COD (Ss, Xs) in the anoxic reactor at non-
saturated concentrations;
- minimal (basic or endogenous) - the least efficient (ABUFAYED AND SCHROEDER, 1986) in the
sole presence of (internal) COD released by biomass (AVCIOUGLOUET AL„ 1998).
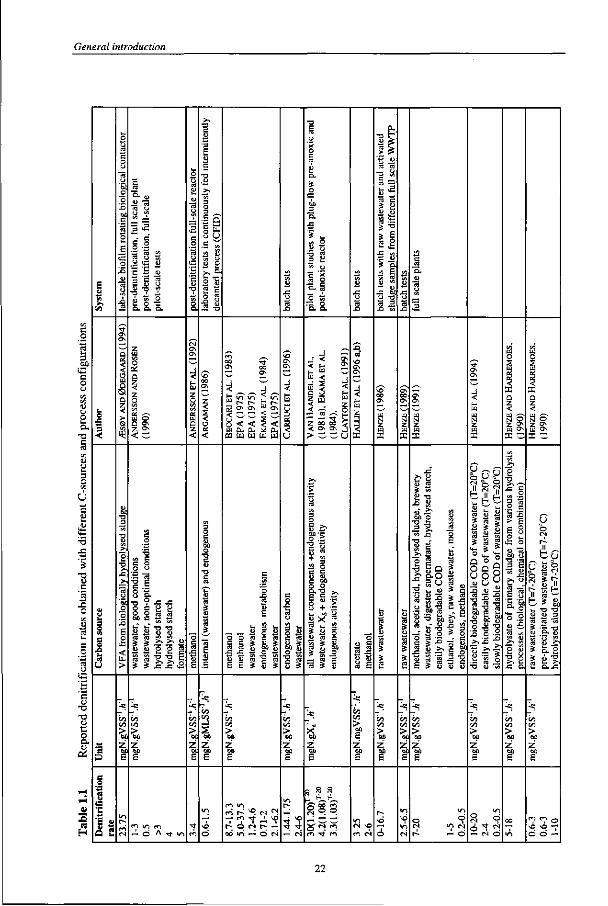
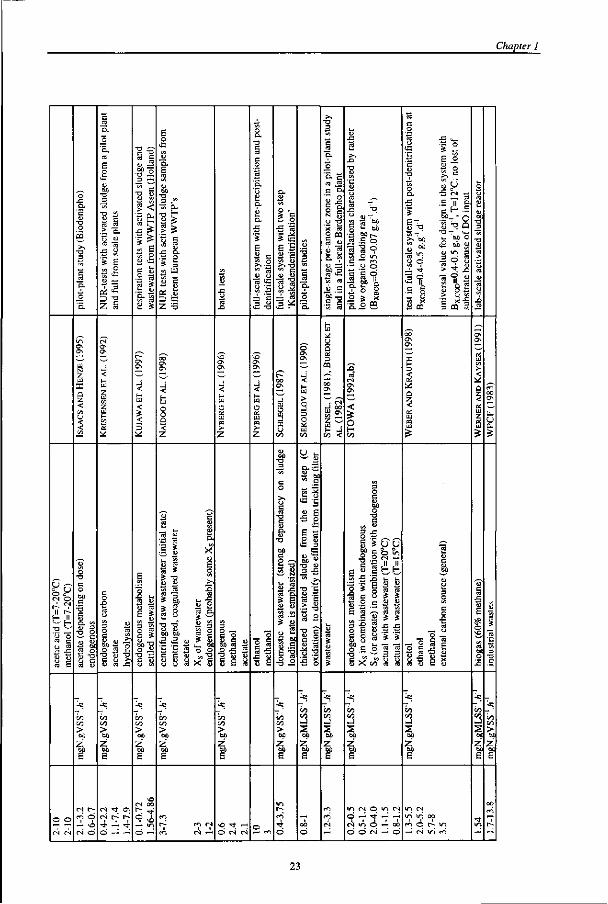
The range and variety of reported denitrification rates for different carbon sources and process
conditions is impressive (Table 1.1). For wastewater the minimum krj was found to be 0.1
while the maximum 20 mgN.gVSS'./j"1. The variations in the reported values are the results
of different process conditions (sludge loading rate, SRT, temperature, pH), configurations
(pre-, post- or simultaneous denitrification), implemented carbon source, its characteristics
and concentration, rate definition (e.g. maximum, actual, in relation to the total anoxic reactor
volume, etc.) and definition of biomass concentrations (e.g. total, volatile, active) (MARAIS AND
EKAMA, 1976, ARGAMAN, 1986).
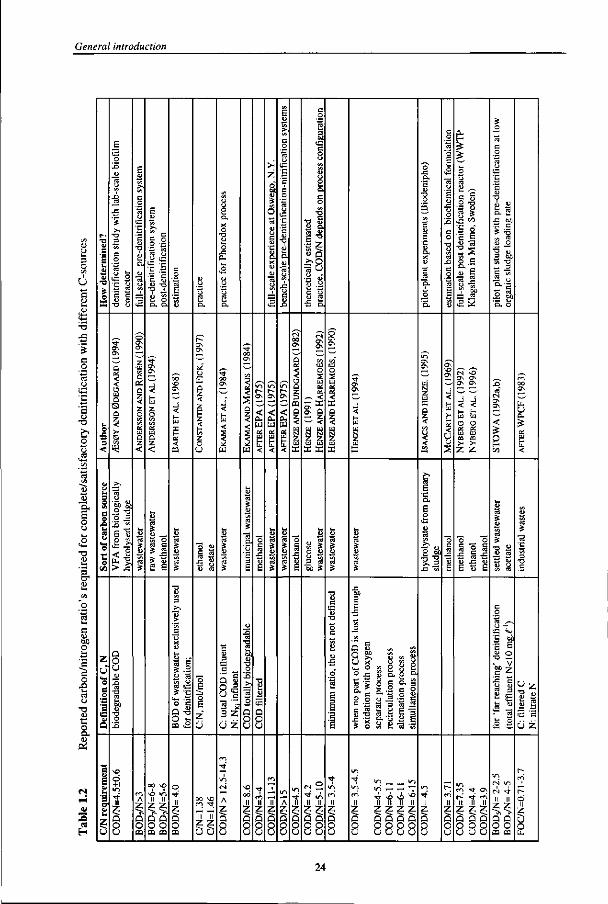
1.4.3 COD/N- OR BOD5/N-RATIO AND EFFECT OF PRE-TREATMENT ON DENITRIFICATION
For the prediction of the denitrification potential of a certain activated sludge system, the
COD/N- or BOD5/N-ratio is often used (EKAMAETAL., 1984, KAYSER, 1983, 1991, HOFFMAN, 1986,
POPEL, 1987). The definition of this parameter differs in literature. Some references use the ratio
between the total COD (or BOD5) and total nitrogen concentration in the influent, usually NKj
General introduction
(e.g. EKAMA ET AL., 1984, KAYSER, 1983). Others describe it as the ratio between total COD (or
BOD5) and nitrate entering the anoxic zone (e.g. WPCF, 1983, STOWA, I992a,b, RAUCH, 1994) or as
the ratio between total COD (or BOD5) and nitrate that exclusively are participating in the
denitrification process (e.g. MCCARTYETAL., 1969, HENZE AND HARREMOES, 1992, HENZEETAL., 1994).
Detailed wastewater characteristics, regarding COD- and N-fractions as defined in § 1.1 and §
1.4.2, can carry valuable information for a prediction of the denitrification potential. However,
in the COD/N- or BODs/N-ratio's these characteristics are hidden. Next to a variation in
process conditions and configurations, the variety in reported practical requirements for
COD/N-ratio (Table 1.2) result from wastewater characteristics that can vary meaningfully for
different locations.
With the BOD5/N-ratio, the biodegradability of COD is considered but a shortcoming of the
BODs-value is that it does not represent the total amount of biodegradable COD for activated
sludge systems (METCALF&EDDY, 1991). Depending on wastewater characteristics concerning S s
and X s , the ratio of BOD5 to total biodegradable COD can vary from 0.5 to 0.8 (ROELEVELD AND
KRUIT, 1998). In a report about pre-denitrification (STOWA, 1992a) it is claimed that the
BOD5/N-ratio is not a universal term to characterise wastewater for denitrification. The high
variations in COD/N- and BOD5/N-ratio's (Table 1.2) suggest that these parameters can be
only a very rough indication for a prediction of the denitrification capabilities.
For municipal wastewater a few factors will effect the COD/N- or BOD5/N-ratio (MAER, 1993):
high fractions of industrial wastewater, removal of organics in the sewer system, a shift of
peaks in concentrations for organic material and nitrogen, the recycle of nitrogen from reject
waters and the introduction of biological phosphorus removal. In the course of this thesis
COD will be used as a general parameter characterising the organic wastewater fraction. This
is dictated mainly by the fact that in many model approaches COD is used also because its
analytical determination is far simpler than of BOD5.
The implementation of various pre-treatment methods (e.g. pre-aeration, sedimentation, pre-
precipitation) will change the COD- and N-profile of the wastewater (COD/N-ratio) and will
influence biological treatment processes (KRISTENSEN ET AL., 1992) including denitrification
(HENZE AND HAREMOES, 1992, GIESEN AND PEETERS, 1994). Regarding the often-implemented pre-
precipitation, conflictive opinions exist on its effect on the denitrification potential. According
to some authors a significantly reduced denitrification potential is already observed when pre-
settling is introduced ahead of an activated sludge reactor (EKAMA ET AL., 1984, HENZE AND
HARREMOES 1992) while the others state that the settleable COD-fraction of wastewater has a
negligible contribution in the denitrification potential of a plant (UUTERLINDE AND V.D. ROEST,
1994). ANDERSSON AND ROSEN (1990) and KARLSSON AND SMITH (1991) state that pre-precipitation
decreases the COD/N-ratio, but that denitrification is hardly affected because the remaining
fraction of organics shows the highest denitrification rate. An extremely different point of
view is represented by NYBERG ET AL. (1996) who states that all particulate organic material is
removed by pre-precipitation and that required COD has to be provided in an external form.
10
Chapter 1
1.4.4 NECESSITY FOR EXTERNAL CARBON SOURCE ADDITION
On plants where wastewater is characterised generally by low COD/N-ratio or low availability
of Ss and Xs, insufficient denitrification potential and capacity can be increased by the
addition of an external carbon source (HASSELBLAD AND HALLIN, (1994), KRISTENSEN AND J0RGENSEN,
(1994), 0DEGAARD ET AL., 1995). Possible carbon sources are methanol, ethanol, acetic acid,
industrial waste products and products from sludge hydrolysis (RABINOWITZ AND OLDHAM, 1986,
HENZE AND HAREMOES, 1992, ISAACS ET AL., 1994a, HALLIN ET AL., 1996a,b, PURTSCHERT ET AL., 1996, 1998,
NYBERG ET AL., 1996). Some, mainly experimental, attempts to enhance denitrification were
made with raw primary sludge (ANDERSSON AND ROSEN, 1990), surplus activated sludge (SEKOULOV
ET AL., 1990) and biogas (WERNER AND KAYSER, 1991).
Sometimes there is a need to elevate denitrification potential only in stress situations like at
winter conditions (HENZE, 1991) or at peak nitrogen loads (ISAACS ET AL., 1994a). In these cases it
is important that conditions, with regard to the necessity of an adaptation of activated sludge
to several substrates, are taken into account (NYBERG ET AL., 1992, 1996, HER AND HUANG, 1995, LEE
ETAL., 1995, HALLIN ETAL., 1996 a,b, PURTSCHERT ET AL., 1996).
1.5 DESIGN APPROACHES FOR N-REMOVAL
The objective of design is to ensure upper limits for effluent standards with given wastewater
characteristics and environmental conditions. When both do not allow satisfying those limits
an optimal (or highest possible) removal of required wastewater compounds is aimed (EKAMA
ETAL., 1984). In nitrogen removal systems the most essential is to find the optimal volumes and
division between aerated and un-aerated (anoxic) biomass fractions to ensure optimal
nitrification and denitrification efficiencies and a required effluent quality concerning COD.
The optimal aeration and mixing as well as effect of temperature and pH on process
performance have to be considered (RANDALETAL., 1992) and prevention against oxygen input to
the anoxic zones has to be taken into account. The introduction of biological phosphorus
removal can interact with denitrification and this makes the design for N-removal more
complex.
One of the first design approaches for N-removing activated sludge systems was a static
model, developed at the University of Cape Town (EKAMA ET AL., 1984). Based on wastewater
characterisation (NKj, total and biodegradable COD) the maximum unaerated (anoxic) sludge
mass fraction and nitrification capacity for a selected sludge age is calculated. The anoxic
fraction is further divided into primary and secondary anoxic sludge mass fraction and this
division fixes denitrification potential. A proper choice of recycle ratios aims to utilise
completely the present denitrification potential. With the UCT-model, information can be
gained about the feasibility of a complete denitrification. Apart from South Africa and
partially the United States (RANDALLETAL., 1992), no broader acceptance was noted till now for
the advanced UCT-model.
General introduction
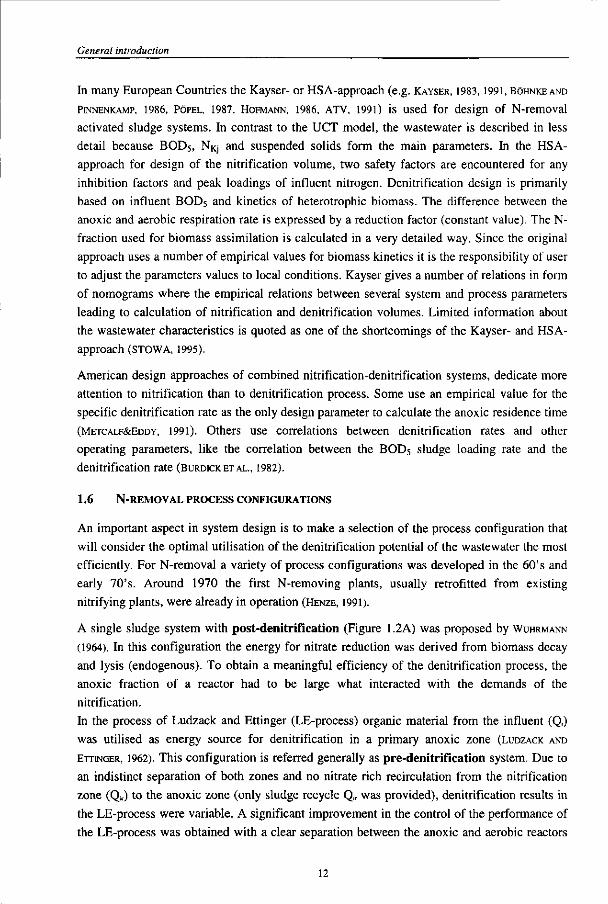
In many European Countries the Kayser- or HSA-approach (e.g. KAYSER, 1983,1991, BOHNKE AND
PINNENKAMP, 1986, POPEL, 1987, HOFMANN, 1986, ATV, 1991) is used for design of N-removal
activated sludge systems. In contrast to the UCT model, the wastewater is described in less
detail because BOD5, NKj and suspended solids form the main parameters. In the HSA-
approach for design of the nitrification volume, two safety factors are encountered for any
inhibition factors and peak loadings of influent nitrogen. Denitrification design is primarily
based on influent BOD5 and kinetics of heterotrophic biomass. The difference between the
anoxic and aerobic respiration rate is expressed by a reduction factor (constant value). The In
fraction used for biomass assimilation is calculated in a very detailed way. Since the original
approach uses a number of empirical values for biomass kinetics it is the responsibility of user
to adjust the parameters values to local conditions. Kayser gives a number of relations in form
of nomograms where the empirical relations between several system and process parameters
leading to calculation of nitrification and denitrification volumes. Limited information about
the wastewater characteristics is quoted as one of the shortcomings of the Kayser- and HSA-
approach (STOWA, 1995).
American design approaches of combined nitrification-denitrification systems, dedicate more
attention to nitrification than to denitrification process. Some use an empirical value for the
specific denitrification rate as the only design parameter to calculate the anoxic residence time
(METCALF&EDDY, 1991). Others use correlations between denitrification rates and other
operating parameters, like the correlation between the BOD5 sludge loading rate and the
denitrification rate (BURDICK ET AL., 1982).
1.6 N-REMOVAL PROCESS CONFIGURATIONS
An important aspect in system design is to make a selection of the process configuration that
will consider the optimal utilisation of the denitrification potential of the wastewater the most
efficiently. For N-removal a variety of process configurations was developed in the 60's and
early 70's. Around 1970 the first N-removing plants, usually retrofitted from existing
nitrifying plants, were already in operation (HENZE, 1991).
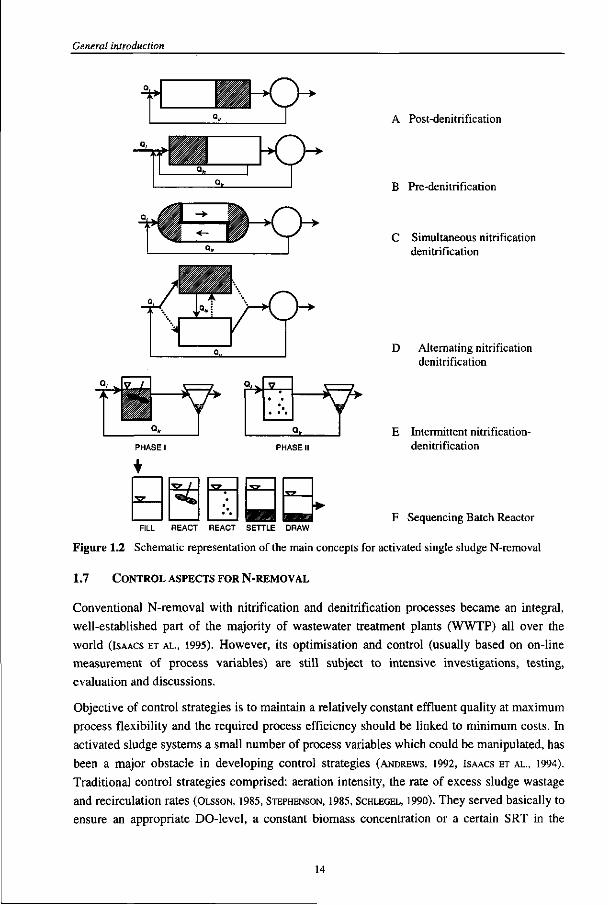
A single sludge system with post-denitrification (Figure 1.2A) was proposed by WUHRMANN
(1964). In this configuration the energy for nitrate reduction was derived from biomass decay
and lysis (endogenous). To obtain a meaningful efficiency of the denitrification process, the
anoxic fraction of a reactor had to be large what interacted with the demands of the
nitrification.
In the process of Ludzack and Ettinger (LE-process) organic material from the influent (Q,)
was utilised as energy source for denitrification in a primary anoxic zone (LUDZACK AND
ETTINGER, 1962). This configuration is referred generally as pre-denitrification system. Due to
an indistinct separation of both zones and no nitrate rich recirculation from the nitrification
zone (QJ to the anoxic zone (only sludge recycle Q,r was provided), denitrification results in
the LE-process were variable. A significant improvement in the control of the performance of
the LE-process was obtained with a clear separation between the anoxic and aerobic reactors
12
Chapter 1
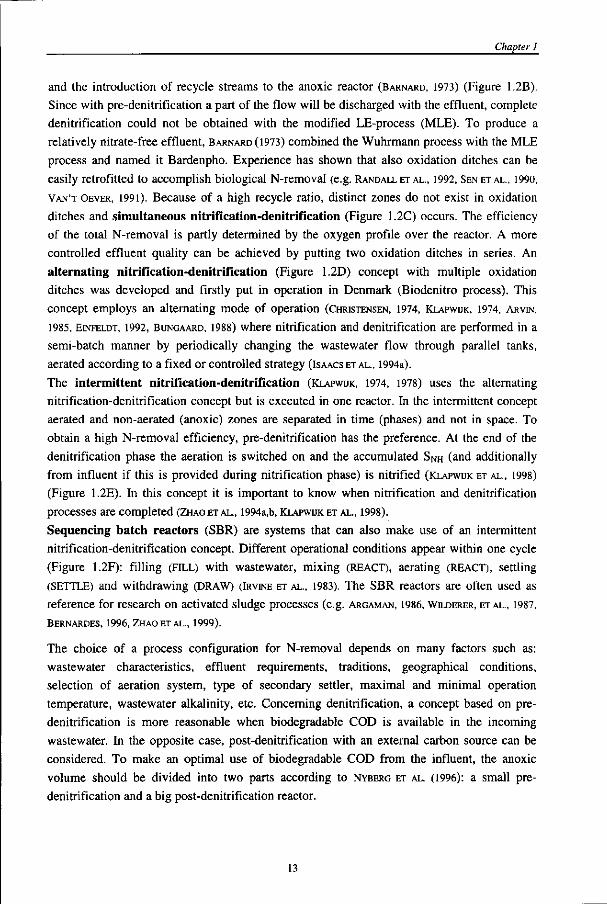
and the introduction of recycle streams to the anoxic reactor (BARNARD, 1973) (Figure 1.2B).
Since with pre-denitrification a part of the flow will be discharged with the effluent, complete
denitrification could not be obtained with the modified LE-process (MLE). To produce a
relatively nitrate-free effluent, BARNARD (1973) combined the Wuhrmann process with the MLE
process and named it Bardenpho. Experience has shown that also oxidation ditches can be
easily retrofitted to accomplish biological N-removal (e.g. RANDALL ET AL., 1992, SENETAL., 1990,
VAN'T OEVER, 1991). Because of a high recycle ratio, distinct zones do not exist in oxidation
ditches and simultaneous nitrification-denitrification (Figure 1.2C) occurs. The efficiency
of the total N-removal is partly determined by the oxygen profile over the reactor. A more
controlled effluent quality can be achieved by putting two oxidation ditches in series. An
alternating nitrification-denitrification (Figure 1.2D) concept with multiple oxidation
ditches was developed and firstly put in operation in Denmark (Biodenitro process). This
concept employs an alternating mode of operation (CHRISTENSEN, 1974, KLAPWUK, 1974, ARVIN,
1985, EINFELDT, 1992, BUNGAARD, 1988) where nitrification and denitrification are performed in a
semi-batch manner by periodically changing the wastewater flow through parallel tanks,
aerated according to a fixed or controlled strategy (ISAACS ETAL., 1994a).
The intermittent nitrification-denitrification (KLAPWUK, 1974, 1978) uses the alternating
nitrification-denitrification concept but is executed in one reactor. In the intermittent concept
aerated and non-aerated (anoxic) zones are separated in time (phases) and not in space. To
obtain a high N-removal efficiency, pre-denitrification has the preference. At the end of the
denitrification phase the aeration is switched on and the accumulated SNH (and additionally
from influent if this is provided during nitrification phase) is nitrified (KLAPWUK ET AL., 1998)
(Figure 1.2E). In this concept it is important to know when nitrification and denitrification
processes are completed (ZHAO ETAL., 1994a,b, KLAPWUK ET AL., 1998).
Sequencing batch reactors (SBR) are systems that can also make use of an intermittent
nitrification-denitrification concept. Different operational conditions appear within one cycle
(Figure 1.2F): filling (FILL) with wastewater, mixing (REACT), aerating (REACT), settling
(SETTLE) and withdrawing (DRAW) (IRVINE ET AL., 1983). The SBR reactors are often used as
reference for research on activated sludge processes (e.g. ARGAMAN, 1986, WILDERER, ETAL., 1987,
BERNARDES, 1996, ZHAO ETAL., 1999).
The choice of a process configuration for N-removal depends on many factors such as:
wastewater characteristics, effluent requirements, traditions, geographical conditions,
selection of aeration system, type of secondary settler, maximal and minimal operation
temperature, wastewater alkalinity, etc. Concerning denitrification, a concept based on pre-
denitrification is more reasonable when biodegradable COD is available in the incoming
wastewater. In the opposite case, post-denitrification with an external carbon source can be
considered. To make an optimal use of biodegradable COD from the influent, the anoxic
volume should be divided into two parts according to NYBERG ET AL. (1996): a small pre-
denitrification and a big post-denitrification reactor.
13
General introduction
»
T&-
°« I K> A Post-denitrification
B Pre-denitrification
C Simultaneous nitrification denitrification
D Alternating nitrification denitrification
E Intermittent nitrification-denitrification
v / s .s: 2 _ «C ;. =
F Sequencing Batch Reactor FILL REACT REACT SETTLE DRAW
Figure 1.2 Schematic representation of the main concepts for activated single sludge N-removal
1.7 CONTROL ASPECTS FOR N-REMOVAL
Conventional N-removal with nitrification and denitrification processes became an integral,
well-established part of the majority of wastewater treatment plants (WWTP) all over the
world (ISAACS ET AL., 1995). However, its optimisation and control (usually based on on-line
measurement of process variables) are still subject to intensive investigations, testing,
evaluation and discussions.
Objective of control strategies is to maintain a relatively constant effluent quality at maximum
process flexibility and the required process efficiency should be linked to minimum costs. In
activated sludge systems a small number of process variables which could be manipulated, has
been a major obstacle in developing control strategies (ANDREWS, 1992, ISAACS ET AL., 1994).
Traditional control strategies comprised: aeration intensity, the rate of excess sludge wastage
and recirculation rates (OLSSON, 1985, STEPHENSON, 1985, SCHLEGEL, 1990). They served basically to
ensure an appropriate DO-level, a constant biomass concentration or a certain SRT in the
14
Chapter 1
activated sludge basin. However, they did not provide a sufficient degree of freedom in the
nutrient removal processes. These processes require control actions that also compensate for
variations in the wastewater composition and flow and nitrogen in the influent wastewater,
while maintaining a proper balance between classes of organisms in the activated sludge (ZHAO
ET AL., 1994A,B). Recently, addition of an external carbon source to enhance denitrification
(ISAACS AND HENZE, 1995, BARROS AND CARLSSON, 1997) enriched the list of control variables,
allowing in some cases for compensation of a poor denitrification performance. Another
inhibition factor in developing control strategies was a lack of reliable on-line techniques.
Nowadays control approaches involve the use of on-line (or side-stream) measurement
techniques, like:
- SNH, SNo3 (or SNo2) measurements (BARROS AND CARLSSON, 1998, PEDERSEN ET AL., 1990)
characterised often to be expensive and requiring extensive maintenance and sample pre-
treatment;
- Respiration measurement for the oxygen consumption for nitrification, organic matter and
cell maintenance. Properly designed experiments and estimation procedures allow among
the others for a characterisation of the wastewater, biomass and oxidation kinetics (e.g.
VANROLLEGHEM AND VERSTRAETE, 1993, 1998, SPANJERS AND VANROLLEGHEM, 1995, BROUWER ET AL.,
1999, SPANJERS ET AL., 1998). The method is generally considered to be complex in
interpretation.
- Redox potential provides information about the transition between anaerobic, anoxic and
aerobic conditions (e.g. KOCH AND OLDHAM, 1985, WAREHAMET AL., 1991, ISAACS ET AL., 1998).
Recently also in-situ pH-meters yielding an information about both nitrification and
denitrification processes (HAO AND HUANG, 1996, GERNAEY ET AL., 1997) and NAD(P)H meters
indicating the transition from anoxic to anaerobic conditions (ISAACS ET AL., 1998) have been
used to control alternating and intermittent processes.
1.8 MODEL ASPECTS FOR DENITRIFICATION
The complexity of existing wastewater treatment systems and a lack of methods to predict the
overall process efficiency, focused attention on the development of models which can identify
and describe the kinetic behaviour of biological processes in activated sludge systems
(WENTZEL ET AL., 1991). Starting from the 80's the development of activated sludge models
became accelerated. The IAWQ Task Group on Mathematical Modelling for Design and
Operation of Biological Wastewater Treatment Processes formulated a series of models
(ASM1, ASM2 and recently ASM2d and ASM3) (HENZE ET AL., 1987, 1996, 1999, GUJER ET AL.,
1999 respectively). The main goal of the Task Group was to introduce a simple approach
having the capability of a realistic prediction of the performance of single sludge systems for
COD-oxidation, nitrification, denitrification and phosphorus removal. The authors of the
subsequent models emphasise that dynamic models are tools serving research, full-scale
process optimisation, troubleshooting, teaching and design assistance (HENZE ET AL., 1996). Full
design of required nitrification and denitrification volumes is not recommended. With an
15
General introduction
accurate calibration of ASM's a wide range of operational decisions can be evaluated.
Especially ASM1 became a major reference for many scientific and practical applications (e.g.
SlEGRIST AND TSCHUI, 1992, LESOUEF ET AL., 1992, OTTERPOHLET AL., 1994, NOVAK, 1995).
For an estimation of the denitrification potential with ASM1, ASM2 and ASM2d, the
knowledge about the difference between anoxic and aerobic population behaviour is essential.
The growth rate of heterotrophs (|IH) and hydrolysis rate of X s (kH) are slower at anoxic
conditions in comparison with aerobic conditions what is expressed by the reduction factors
rii and T|2 respectively (also symbols r\g and r]H are used). In ASM3 the introduced anoxic
endogenous respiration rate is lower than the corresponding aerobic rate and this is expressed
with the reduction factor r|3.
Although the reduction factors in ASM's are certainly essential for an assessment of the
denitrification potential, no fundamental and practical consensus has been reached till now
regarding their choice, and the nature of this fact is still not explained. Most researchers
agreed that the utilisation rate of Xs is lower under anoxic conditions (e.g. VANHAANDELETAL.,
1981a, HENZEET AL., 1987, WENTZEL ET AL., 1991, 1992, HENZE AND MLADENOWSKI, 1991, KAYSER, 1997)
but others found that anoxic conditions do not cause a reduced anoxic hydrolysis rate (e.g.
KRISTENSEN ET AL., 1992, GOEL ET AL., 1998, 1999). A reduced growth of heterotrophs under anoxic
conditions is supported by experimental results (e.g. SOZEN ET AL„ 1998, SPERANDIO ET AL., 1999),
calibration of ASM's (e.g. HENZE ET AL„ 1987, 1996, 1999, GUJER ET AL., 1999, KAYSER, 1997) but it
can also be explained based on energetic aspects (e.g. CASEY ET AL., 1994). In contrast the same
growth rate was observed in anoxic and aerobic conditions by e.g. WUHRMANN (1964), VAN
HAANDELET AL. (1981a,b) and STILL ET AL. (1986).
Introduction of endogenous respiration in ASM3 started a discussion on its magnitude in the
presence of oxygen and nitrate. Reduced anoxic, endogenous respiration rates are postulated
by MCCLINTOCK ET AL. (1988), KAYSER (1997), GUJER ET AL. (1999) and AVCIOUGLU ET AL. (1998).
Another question for a reliable description of the denitrification process using activated sludge
models is a proper choice of the value for the anoxic heterotrophic yield coefficient (YHD),
which is suspected to be lower than the corresponding aerobic value (KLAPWIJK, 1978, SCHEER
AND SEYFRIED, 1994, ORHON ET AL., 1996, COKGHOR ET AL., 1998, COPP AND DOLD, 1998, SPERANDIO ET AL.,
1999).
Advanced mathematical models such as ASM's, although simplified with respect to the
complexity of the activated sludge process itself, are still substantially complex for the user.
Estimation of a significant number of model parameters is complex and time consuming. On
the other hand, use of default values for parameters may lead to an erroneous estimation of the
process performance. For practical implementation such as process control, simplified models
have been successfully used (e.g. ZHAO ET AL., 1994 a,b, 1995, 1999, ISAACS AND HENZE, 1995,
BERNARDES, 1996, BROUWER ET AL., 1999). Simplified models of the chosen activated sludge
processes are characterised by a reduced number of model components and biomass
population dynamics are not explicitly modelled. For a successful implementation of
16
Chapter 1
simplified models usually on-line measurement of some process variables is necessary.
Limited information on process performance can be attained by their implementation.
1.9 NON-CONVENTIONAL N-CONVERSIONS
For the removal of nitrogen from wastewater, the conventional N-conversion through
nitrification and denitrification (via nitrate) is a wide implemented technology. Nevertheless,
several authors (e.g. POTH, 1986, REMDE AND CONRAD, 1990, ABELIOVICH AND VONSHAK, 1992, BOCKET
AL., 1995, PATUREAU ET AL„ 1997, LOOSDRECHT AND JETTEN, 1998) reported 'new' microbial nitrogen
conversions that will be referred here as non-conventional N-conversions.
heterotrophic nitrification and aerobic denitrification
Aerobic denitrification is carried out by bacteria that can co-respire nitrate and oxygen, like
Thiosphaera pantotropha, Alcaligenes faecalis and Comamonas Sp. strain SGLY2 (ROBERTSON
AND KUENEN, 1984, 1990, BONIN AND GILEWICZ, 1991, PATUREAU ET AL., 1997). The same micro
organisms were found to be capable of heterotrophic nitrification (ROBERTSON AND KUENEN, 1987,
ROBERTSON ETAL., 1988). Conflictive opinions categorise the rate of these processes as negligible
(V.LOOSDRECHT AND JETTEN, 1998) or substantial (MUNCH ETAL., 1996, PATUREAU ETAL., 1997).
According to ROBERTSON AND KUENEN (1990) only at a high wastewater COD/N-ratio (>10) a
portion of N can be denitrified aerobically. Aerobic denitrification can be confused with
conventional denitrification in aerobic reactors subjected to oxygen diffusion limitation and
formation of anoxic zones inside floes or biofilms (KRUL, 1976).
autotrophic denitrification
Autotrophic nitrifiers (e.g. Nitrosomonas europaea) were observed to be responsible for a
substantial production of N-gases (N2O, NO or N2) that may indicate that they can carry
denitrification of nitrite with ammonium or hydrogen as electron donor - autotrophic
denitrification (ANDERSON ANDLEVINE, 1986, BOCKET AL., 1995). The conversion rates are however
an order of magnitude slower than these for conventional nitrification and denitrification
reactions.
anaerobic ammonia oxidation (Anammox)
In 1995, MULDER ET AL. observed the removal of ammonium in a fluidised denitrification bed
reactor. This brought them to a hypothesis of microbial catalysis of two autotrophic
conversions: anaerobic oxidation of ammonia to N-gas (Anammox) and anaerobic oxidation
of nitrite to nitrate (VAN DE GRAAF ET AL„ 1996). The Anammox process, when once established,
may be characterised by high conversion rates (MULDER ET AL., 1995). When the Anammox
process is combined with a process in which nitrite is produced a nitrogen removal process
can be developed which requires less oxygen and no COD (V.LOOSDRECHT AND JETTEN, 1998).
nitrogen removal via the nitrite-route
Another promising non-conventional technology in activated sludge systems, operating
especially at low COD/N-ratio's, is the N-removal via the nitrite-route (STOWA, 1997). The
process consists of two sub-processes (1) the oxidation of SNH by ammonium oxidisers to
17
General introduction
SN02 and (2) the reduction of SN02 by denitrifiers to N2. In comparison with the conventional N-removal process, nitrite forms the intermediate between nitrification and denitrification instead of nitrate. The absence of nitrite-oxidisers is controlled by the maintenance of a low aerobic SRT while ammonium-oxidisers have to be regularly supplemented. This technology causes the (theoretical) decrease of the COD demand for denitrification up to 40%. The additional stimulation of denitrification via the nitrite-route is ensured by low-DO conditions in the reactor. This causes that a bigger part of the bacterial floe is anoxic which contributes in a lower nitrification- and higher denitrification rate. It is essential to find an optimal DO concentration that will ensure a proper balance between both conversion rates and an optimal N-removal.
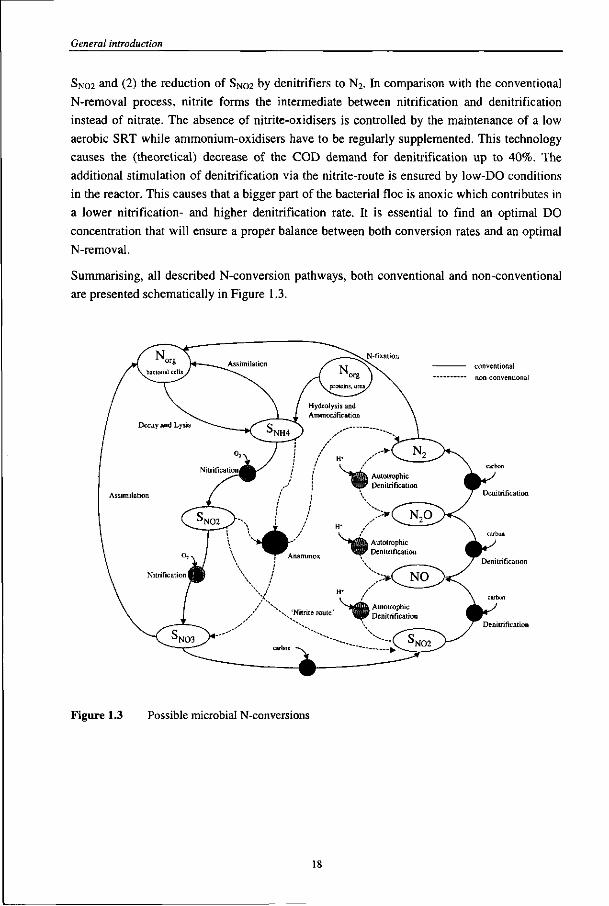
Summarising, all described N-conversion pathways, both conventional and non-conventional are presented schematically in Figure 1.3.
conventional
non-conventional
Denitrification
Denitrification
Figure 1.3 Possible microbial N-conversions
Chapter I
1.10 OBJECTIVES OF THE THESIS
Denitrification is a well established process for biological N-removal in activated sludge wastewater treatment plants and it is generally agreed that the availability of organic biodegradable matter, process configuration and activated sludge characteristics determine predominantly the denitrification potential and capacity. Nevertheless, regarding the estimation of denitrification potential in relation to a detailed wastewater and sludge characterisation, there is still requirement to establish a reliable estimation method.
Many design approaches use empirical values of denitrification kinetic parameters and/or use general COD/N- or BOD5/N-ratios, which are characterised by a high rate of 'hidden information'. More detailed models exist (ASM) but despite their additional value they are complex and require a significant effort to choose or estimate properly a large number of parameters. Incompetent use of ASM's may bring erroneous prediction and interpretations of the process capabilities. A simplification of models will result in a decrease of number of parameters but the use of simplified models is usually restricted to the necessity of measurement techniques and provides limited information on process capabilities.
The main goal of this thesis was to develop and validate a methodology to predict the denitrification potential for activated sludge systems. Aerobic and anoxic respiration techniques formed the basis of the methodology. They enabled to estimate wastewater- and activated sludge characteristics. Attention was paid on the relation between the respiration of activated sludge under aerobic and anoxic conditions and its relevance to the mathematical description of denitrification processes. This formed a basis for the development of a simplified denitrification model, which was integrated with an existing nitrification/aerobic COD-oxidation model (BROUWER AND KLAPWUK, 1995). The simplicity of the presented approach resulted from the modelling of substrate conversion rates, while activated sludge population dynamics were not explicitly described. Testing and validation of developed methodologies to estimate the denitrification potential and overall N-removal potential were performed using several case studies (batch tests, pilot plants) where the characteristics of activated sludge and wastewater varied.
Regardless how the denitrification potential can be estimated, interacting opinions are traced in literature on the effect of pre-treatment (pre-precipitation) on the denitrification potential. Statements about a change in wastewater characteristics by pre-precipitation are evident, but in literature the connection between this fact and denitrification potential is somehow unclear. To evaluate the effect of changed wastewater characteristics on the denitrification potential two experiments were performed. Two reactors, lab- and pilot-scale, characterised by different influent characteristics and process conditions, were fed with pre-precipitated influent. Using the developed methodology to estimate the denitrification potential, an attempt was undertaken to formulate more precise statements about the denitrification behaviour in systems fed with low-strength wastewater. Several optimisation steps, including the implementation of an advanced respiration based control strategy and modelling with the developed simplified denitrification model, supported the considerations.
19
General introduction
1.11 STRUCTURE OF THE THESIS
In chapter 1 (this chapter) a literature survey on N-removal aspects is given with a special impact on denitrification. Process fundamentals are followed by a description of conditions and factors determining the denitrification performance. Attention is paid on the relation between the requirement for biodegradable COD and the denitrification potential. The denitrification rate, potential and capacity are, as important operational parameters, defined in relation to wastewater and activated sludge characteristics. It is emphasised that both the magnitude of denitrification rate and COD requirement for denitrification (expressed by COD/N or BOD5/N) are very specific for different conditions (Table 1.1 and Table 1.2). The effect of pre-precipitation on a change of wastewater characteristics and denitrification efficiency is briefly reviewed. The survey of the variety of N-removal configuration concepts is given and existing control strategies for N-removal processes are briefly described. Furthermore, model approaches for design, optimisation and control of denitrification are mentioned.
In chapter 2 the nitrate utilisation rate (NUR) test is presented as a simple anoxic respiration method to estimate the denitrification potential of existing activated sludge systems. A methodology to estimate the denitrification potential and capacity in relation to wastewater characteristics, process configuration and activated sludge characteristics is given. The procedure to extract maximum information from a NUR-test, like wastewater characterisation and kinetic and stoichiometric parameters is worked out. The implementation of a simple model, based on estimated parameters, allows for the prediction of a relation between the organic anoxic sludge loading rate and the denitrification rate. A NUR-test with acetate allows estimating an anoxic heterotrophic yield in a simplified way. Using the developed approach also a relational model between the attainable denitrification rate and the required amount of external carbon source can be easily formulated.
Modelling of the denitrification process uses often currently aerobic kinetics, multiplied with reduction factors, reflecting the decreased activated sludge activity under anoxic conditions. A methodology to obtain reduction factors for Ss-oxidation, Xs-hydrolysis and endogenous respiration is proposed in chapter 3. It is based on a respiration response of activated sludge under aerobic and anoxic conditions. Other aspects are briefly discussed, like the choice of a heterotrophic yield coefficient and wastewater characterisation under aerobic and anoxic conditions. The dependency of reduction factors on activated sludge characteristics and process conditions is supported by some results with several activated sludge samples, originating from different pilot-plant configurations.
A possible implementation of the information about activated sludge kinetics and wastewater characterisation acquired from respirometric measurements (both aerobic and anoxic) is presented in chapter 4. A simplified respiration based denitrification model is developed to estimate the denitrification potential. Its integration with an existing nitrification/aerobic COD-oxidation model (BROUWER AND KLAPWUK, 1995) leads to the formulation of an overall
20
Chapter I
simplified N-removal activated sludge model. The model is simplified because it is based on substrate conversion rates while activated sludge population dynamics are not explicitly modelled. For a frequent update of model parameters, one type of measurement is used: the aerobic respiration test. The simplified nitrification-denitrification model is validated for two pilot-scale N-removal plants (chapter 5), characterised by a significantly different wastewater composition and process parameters.
Denitrification potential and capacity in systems fed with low-strength, pre-precipitated wastewater is analysed in the chapters 6 and 7. The effect of pre-precipitation on wastewater composition, the overall removal efficiency and sludge activity in an ultra-low loaded lab-scale SBR-system, with fixed nitrification and denitrification phases, is described in chapter 6. With help of a simplified N-removal model, the denitrification potential of the system is examined when optimising the system performance. In chapter 7 it is studied to which extend process optimisation steps, such as an increase of the sludge loading rate and anoxic volume fraction, or implementing an effective control strategy, can increase the overall denitrification potential and capacity of the system. General considerations about possibilities to attain a satisfactory denitrification performance in systems fed with low-strength wastewater are carried out in light of literature statements.
In chapter 8 a general discussion is given, summarising the developed methodologies and indicating their possible applications and bottlenecks in practice.
21
General introduction
"35
5
a. -a
o
z o-< O
< H 2
»/l w-i 2 <^ o^
e t a .
< — a.
m a i u u B
UJ Q Z
X
< >
s 5 w — Tf 00 oo ON CT\ w ^
< Z O H
1 <J
N O N O 7 I j l 7 O l z a z 2 1 Z <^ z o^ n- — T ~
— >» ~
B 2 o o
Si £2 "S *£ e
° £ * * 8 P • s s e i 1 a - O TJ
3 U
•= -r 3 5
B E S
2 X
4)
« * "c3
0)
#
c W) o
cd o
™ c
B S
3 <G -a .SP « &
> 6
I -* S. M
£ II
S i s I ? o"
•8 -5
' .G B ^ >>
00
t- "o
GO bfl
*? v i en
r^ t^ « <N ^ —« m Tt _^ ^O l> © (N I— - i oo « i « d ts
o
— o ^ \D 7 © © —
22
Chapter I
S E
Pi *-O "2
OS u
D is Z =e
•s a
I'2 1 ^ c ~ « .9 £
• ^ "O JS
O CQ
1> 3
cd c q
I "8 9 i« o in c -~ co
— u o c S cs • a& ' f e £ • 0 § o > x
i . l a
S o
c/3
o
'5
> * DO
o o
3 O "= II
.s 8
u 0' • S CM
• ^ u ^
TD -
4> W> = O
> ^ 1 II <U O
a
O Q
n
u
«
o
a;
00 •a 3
flj
rt fl> «
13 «
§ 1 o ,£
<u q 60 cd
o -S § S - p <LI P
S B
e-s
•5 p
£ •-
o c 60 O
s * o rn £
* c o c3 c
s o c
£
GG o m
fob M ea
* * <D <U
# * o g u :
§ X M
60
£
o o m o cs r- r-4 ~ 4 — i n
o ~ m cs v£> T f —I
© CS CS
<n cs © m cs
CS IT) O — 00
o © cs —'• d
IT) CS v i v i oo m o r- u~> - ^ CS i n " rn
23
General introduction
U
o
o
c o
o CL. o
oi
a H
u
o as
o 5 s
<
CJ
u § e o
X ( -0 o X, o
en
Z
u o c
• a e Q
1 '3 a V u
E
o 15 JD TO O
X i
TO X
> . T3 3
3
« .
B 8 3 3 4) O
T3 O
ON ON
a a: < < o UJ D
S i D 2 < >-St CO
«>
XT'
'1« 5 "a
E u
a 2 < s > £
Q O <J ej
1 • o 2 6J) 4>
•o 2
X t
NO
II
z Q O U
e >-> s
_o TO o
"C
'E 1)
T3 1)
a jy ' « u
2
© ON ON
2 •UJ 1/] o o£ a 2 < z o co to OS UJ Q
2 <
TO 5
A
z Q O CQ
E a>
!>>
il w TO
r | E g
"O J ,
t o ex a
ON ON
_J < H UJ
z o o i UJ Q 2 <
ra w —. t o O eg 3 S J s s s e
00 MD
II II
Q Q O O CQ ca
e o
E
4>
C O
O N
J < UJ
X H
< 03
a3 TO
cd
4)
3
> _3 " o X <u u . -
II £ cd
J? iff!
S -c (4-1 . t i o c
2
o *
II
5 a o CQ
a.
^ U
Q z < z p z < H Z O
u
"o 3
•is o
E "o
e z o
OO * 0
*ii IT z z DO
4) O O
a. X o
T3 4)
o CL
«2 4> O
CJ TO a.
C O O N
J <
<
j5
c 1> 3
.5 *-Q |
8 1 3 1 3 Z <J z
A
Q O U
00
o\
< < s Q Z < < s
• a a
'E 3
E
4> T3 O
X
O
Q O
u
C O
II
? Q O u
i n r-C3\
< a. w 0^
m
<
1 •B 4)
E
Q O U
II
1 o V
> z 6 oc 4)
6 4) u c 4)
• c 4) a X 4>
_4)
[9
r-
< a. W OS UJ
<
4)
1 O u
E 4)
C O
cd 0
t S • c • 5 c 0
t3 0
•c "c 4)
4)
J5 CJ C 4)
J2
r-
ON
< UJ
4)
i n
A
1 0 0
00 ON
• a. < < 0 Q Z
CQ D Z < s z u ac
"3 c CO
s :
1
>n
if 1 O U
c 0
3
IG n 0 4»
IS) 4) U g a c 0
•a
4) a
1? u Q
• a <-> .a B-S -a 0 0 CJ Cd
•S D
O N ON
£ 0
s a: a : ^ <
O N Q
a a z z X X
ej
si O 4)
3 03
II II
z z S S 0 0 0 u
0 O N O N
CO :tU O
s UJ
< X Q 2 < N 2 UJ
33
4J
4)
cd
• 0 4> c
«n i )
T3 O C
4) X j
O
E
1 _5
i n en II
Z Q O O
ON O N
J <
z UJ
X
4>
4)
cd
X 00 3 g
X j
O
Q § M u i
P S 8 . § " § 8 s 8 s 0 X J «3 ( X 0 & « S C O - 0 0- c a- -s g § g O 4) J2 •= c = r a 3 s s 4) T3 5 . 3 h 3
x ' 3 0 . u a E > O w) C cd c«
i n
^ t i n i n i n u- ; ^ „ - 7
^ 4 \o o ^° II II II II II
z z z z z Q Q Q S Q 0 0 0 0 0 0 0 u u u
0 X a, '5 4)
•O O
s C
1 "C 4> O . X 4)
1 CL
_o 'a.
i n C7N O N
ui N 2 UJ X Q 2 < CO U < < CO
£ • c
a. B 0
B cd
>, 1 a X (A
i n
II
1 O U
c 0
CJ
E 4)
X
0 X
3 O
T3 4) cd
X 3 O
E c« 4J
ON"
O N
J <
>•
< u u S
3
1 E
II
z Q O O
0 t j
4) ^
0 - 0 ' 3 4) cd >
££ '£ o -
•5 6 • S • «
2 s 0 E
f bo — cd
a 5
ON ON ON O N
J J < < UJ UJ O O PC Di UJ UJ co m >- >• z z
0 0 § 0 g
E 4) 3
i n m r t o \ > < t r n II II II
Z Z Z Q Q Q O O O U U U
_o
rt 3
_o
t d
• c
3 4)
T3 4J «
X W) • — 3
* =5 1> O
TJ u 3 tJ)
tS -a
11 ^ CJ) ' a . 0
X cd'
<N ON
O N
< 8 C/3.
]5 TO 4J
Cfl cd
_4) TO
(U CJ
3 O
TO ^ - v O -7
t H ^
•s e •S 2
V
g > z
1 ^ 4) ,3 - "TO
a I
>n
o i v n
CN -ri
l l II
5 5 Q Q O O CQ CQ
m 00 a\
B. U 0.
UJ
<
4)
TO
"TO 'S 3
3
u z "S 2
s s E '3 u z
r~ 0 II
5 u 0 1 1 .
24
Chapter 1
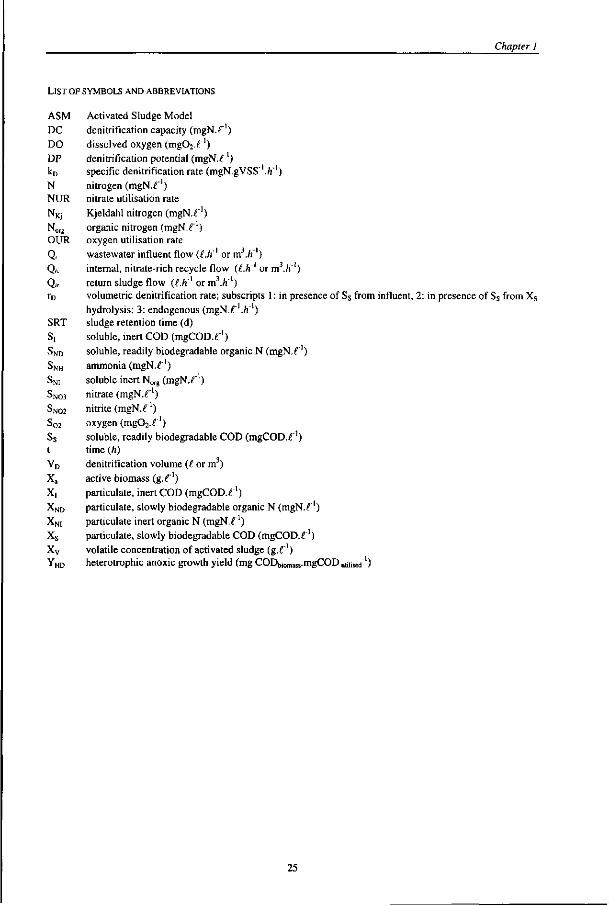
L I S T O F SYMBOLS A N D ABBREVIATIONS
ASM Activated Sludge Model DC denitrification capacity (mgN. f 1 ) DO dissolved oxygen (mgC^ . f ' ) DP denitrification potential (mgN . f 1 ) kD specific denitrification rate (mgN.gVSS 1 . / ! 1 ) N nitrogen (mgN . f 1 ) NUR nitrate utilisation rate NKJ Kjeldahl nitrogen (mgN . r 1 ) No rg organic nitrogen (mgN . f 1 ) OUR oxygen utilisation rate Q, wastewater influent flow ((..h"' or m3.ft"') Qic internal, nitrate-rich recycle flow (l.h~l or m3 . /!1) Q„ return sludge flow (l.h'1 or m3 . /!1) rD volumetric denitrification rate; subscripts 1: in presence of Ss from influent, 2: in presence of Ss from X s
hydrolysis; 3: endogenous (mgN.f ' . / !" ' ) SRT sludge retention t ime (d) Si soluble, inert C O D (mgCOD. f 1 ) SN D soluble, readily biodegradable organic N ( m g N . f ' ) SNH ammonia (mgN . f 1 ) SNI soluble inert No r g (mgN . f 1 ) S N 0 3 nitrate (mgN . f 1 ) S N 0 2 nitrite (mgN . f 1 ) S 0 2 oxygen ( m g 0 2 . f ' ) S s soluble, readily biodegradable C O D ( m g C O D . f ' ) t t ime (h) V D denitrification volume (( or m3) X a active biomass ( g . f ! ) X, particulate, inert COD (mgCOD. f ' ) XN D particulate, slowly biodegradable organic N (mgN.f 1 ) XNI particulate inert organic N (mgN. f 1 ) X s particulate, slowly biodegradable COD (mgCOD. f ' ) X v volatile concentration of activated sludge ( g . f ' ) YHD heterotrophic anoxic growth yield (mg CODblomass.mgCODuuiised"')
25
General introduction
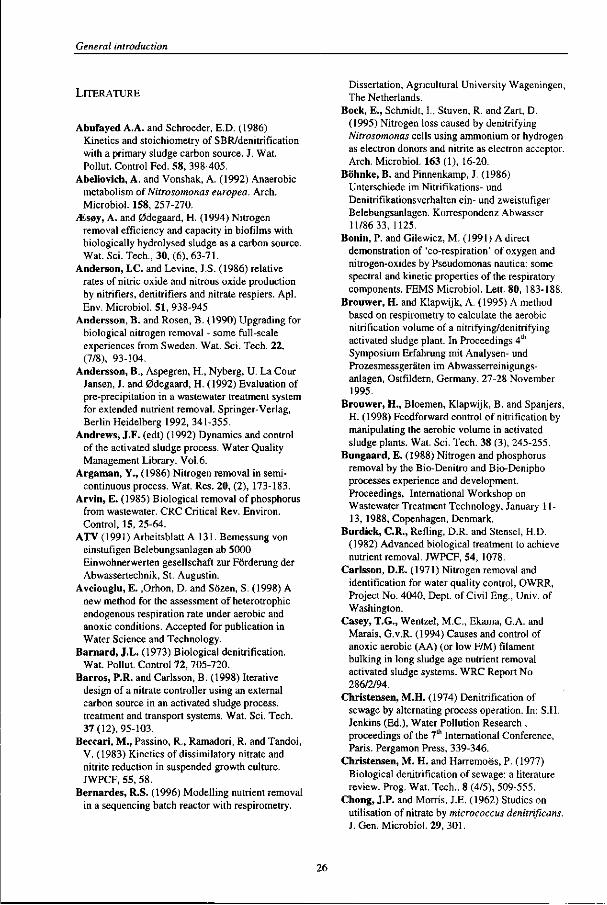
LITERATURE
Abufayed A.A. and Schroeder, E.D. (1986) Kinetics and stoichiometry of SBR/denitrification with a primary sludge carbon source. J. Wat. Pollut. Control Fed. 58, 398-405.
Abeliovich, A. and Vonshak, A. (1992) Anaerobic metabolism of Nitrosomonas europea. Arch. Microbiol. 158, 257-270.
iEs0y, A. and 0degaard, H. (1994) Nitrogen removal efficiency and capacity in biofilms with biologically hydrolysed sludge as a carbon source. Wat. Sci. Tech., 30, (6), 63-71.
Anderson, I.C. and Levine, J.S. (1986) relative rates of nitric oxide and nitrous oxide production by nitrifiers, denitrifiers and nitrate respiers. Apl. Env. Microbiol. 51, 938-945
Andersson, B. and Rosen, B. (1990) Upgrading for biological nitrogen removal - some full-scale experiences from Sweden. Wat. Sci. Tech. 22, (7/8), 93-104.
Andersson, B., Aspegren, H., Nyberg, U. La Cour Jansen, J. and 0degaard, H. (1992) Evaluation of pre-precipitation in a wastewater treatment system for extended nutrient removal. Springer-Verlag, Berlin Heidelberg 1992, 341-355.
Andrews, J.F. (edt) (1992) Dynamics and control of the activated sludge process. Water Quality Management Library. Vol.6.
Argaman, Y., (1986) Nitrogen removal in semi-continuous process. Wat. Res. 20, (2), 173-183.
Arvin, E. (1985) Biological removal of phosphorus from wastewater. CRC Critical Rev. Environ. Control, 15, 25-64.
ATV (1991) Arbeitsblatt A 131. Bemessung von einstufigen Belebungsanlagen ab 5000 Einwohnerwerten gesellschaft zur Forderung der Abwassertechnik, St. Augustin.
Avciouglu, E. ,Orhon, D. and Sozen, S. (1998) A new method for the assessment of heterotrophic endogenous respiration rate under aerobic and anoxic conditions. Accepted for publication in Water Science and Technology.
Barnard, J.L. (1973) Biological denitrification. Wat. Pollut. Control 72, 705-720.
Barros, P.R. and Carlsson, B. (1998) Iterative design of a nitrate controller using an external carbon source in an activated sludge process, treatment and transport systems. Wat. Sci. Tech. 37(12), 95-103.
Beccari, M., Passino, R., Ramadori, R. and Tandoi, V. (1983) Kinetics of dissimilatory nitrate and nitrite reduction in suspended growth culture. JWPCF, 55, 58.
Bernardes, R.S. (1996) Modelling nutrient removal in a sequencing batch reactor with respirometry.
Dissertation, Agricultural University Wageningen, The Netherlands.
Bock, E., Schmidt, I., Stuven, R. and Zart, D. (1995) Nitrogen loss caused by denitrifying Nitrosomonas cells using ammonium or hydrogen as electron donors and nitrite as electron acceptor. Arch. Microbiol. 163 (1), 16-20.
Bb'hnke, B. and Pinnenkamp, J. (1986) Unterschiede im Nitrifikations- und Denitrifikationsverhalten ein- und zweistufiger Belebungsanlagen. Korrespondenz Abwasser 11/86 33, 1125.
Bonin, P. and Gilewicz, M. (1991) A direct demonstration of 'co-respiration' of oxygen and nitrogen-oxides by Pseudomonas nautica: some spectral and kinetic properties of the respiratory components. FEMS Microbiol. Lett. 80, 183-188.
Brouwer, H. and Klapwijk, A. (1995) A method based on respirometry to calculate the aerobic nitrification volume of a nitrifying/denitrifying activated sludge plant. In Proceedings 4th
Symposium Erfahrung mit Analysen- und Prozesmessgeraten im Abwasserreinigungs-anlagen, Ostfildern, Germany, 27-28 November 1995.
Brouwer, H., Bloemen, Klapwijk, B. and Spanjers, H. (1998) Feedforward control of nitrification by manipulating the aerobic volume in activated sludge plants. Wat. Sci. Tech. 38 (3), 245-255.
Bungaard, E. (1988) Nitrogen and phosphorus removal by the Bio-Denitro and Bio-Denipho processes experience and development. Proceedings, International Workshop on Wastewater Treatment Technology, January 11 -13, 1988, Copenhagen, Denmark.
Burdick, C.R., Refling, D.R. and Stensel, H.D. (1982) Advanced biological treatment to achieve nutrient removal. JWPCF, 54, 1078.
Carlsson, D.E. (1971) Nitrogen removal and identification for water quality control, OWRR, Project No. 4040, Dept. of Civil Eng., Univ. of Washington.
Casey, T.G., Wentzel, M.C., Ekama, G.A. and Marais, G.v.R. (1994) Causes and control of anoxic aerobic (AA) (or low F/M) filament bulking in long sludge age nutrient removal activated sludge systems. WRC Report No 286/2/94.
Christensen, M.H. (1974) Denitrification of sewage by alternating process operation. In: S.H. Jenkins (Ed.), Water Pollution Research , proceedings of the 7th International Conference, Paris. Pergamon Press, 339-346.
Christensen, M. H. and Harremoes, P. (1977) Biological denitrification of sewage: a literature review. Prog. Wat. Tech., 8 (4/5), 509-555.
Chong, J.P. and Morris, J.E. (1962) Studies on utilisation of nitrate by micrococcus denitrificans. J. Gen. Microbiol. 29, 301.
26
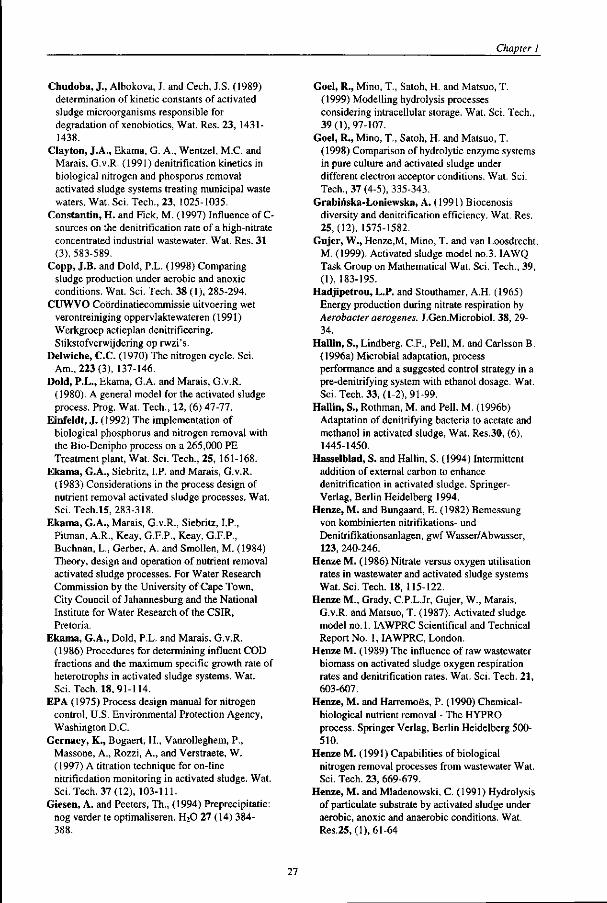
Chapter 1
Chudoba, J., Albokova, J. and Cech, J.S. (1989) determination of kinetic constants of activated sludge microorganisms responsible for degradation of xenobiotics, Wat. Res. 23, 1431-1438.
Clayton, J.A., Ekama, G. A., Wentzel, M.C. and Marais, G.v.R. (1991) denitrification kinetics in biological nitrogen and phosporus removal activated sludge systems treating municipal waste waters. Wat. Sci. Tech., 23, 1025-1035.
Constantin, H. and Fick, M. (1997) Influence of C-sources on the denitrification rate of a high-nitrate concentrated industrial wastewater. Wat. Res. 31 (3), 583-589.
Copp, J.B. and Dold, P.L. (1998) Comparing sludge production under aerobic and anoxic conditions. Wat. Sci. Tech. 38 (1), 285-294.
CUWVO Cobrdinatiecommissie uitvoering wet verontreiniging oppervlaktewateren (1991) Werkgroep actieplan denitrificering. Stikstofverwijdering op rwzi's.
Delwiche, C.C. (1970) The nitrogen cycle. Sci. Am., 223 (3), 137-146.
Dold, P.L., Ekama, G.A. and Marais, G.v.R. (1980). A general model for the activated sludge process. Prog. Wat. Tech., 12, (6) 47-77.
Einfeldt, J. (1992) The implementation of biological phosphorus and nitrogen removal with the Bio-Denipho process on a 265,000 PE Treatment plant, Wat. Sci. Tech., 25, 161-168.
Ekama, G.A., Siebritz, LP. and Marais, G.v.R. (1983) Considerations in the process design of nutrient removal activated sludge processes. Wat. Sci. Tech.15, 283-318.
Ekama, G.A., Marais, G.v.R., Siebritz, I.P., Pitman, A.R., Keay, G.F.P., Keay, G.F.P., Buchnan, L., Gerber, A. and Smollen, M. (1984) Theory, design and operation of nutrient removal activated sludge processes. For Water Research Commission by the University of Cape Town, City Council of Jahannesburg and the National Institute for Water Research of the CSIR, Pretoria.
Ekama, G.A., Dold, PL. and Marais, G.v.R. (1986) Procedures for determining influent COD fractions and the maximum specific growth rate of heterotrophs in activated sludge systems. Wat. Sci. Tech. 18,91-114.
EPA (1975) Process design manual for nitrogen control, U.S. Environmental Protection Agency, Washington D.C.
Gernaey, K., Bogaert, H., Vanrolleghem, P., Massone, A., Rozzi, A., and Verstraete, W. (1997) A titration technique for on-line nitrificdation monitoring in activated sludge. Wat. Sci. Tech. 37(12), 103-111.
Giesen, A. and Peeters, Th., (1994) Preprecipitatie: nog verder te optimaliseren. H2O 27 (14) 384-388.
Goel, R., Mino, T., Satoh, H. and Matsuo, T. (1999) Modelling hydrolysis processes considering intracellular storage. Wat. Sci. Tech., 39(1), 97-107.
Goel, R., Mino, T., Satoh, H. and Matsuo, T. (1998) Comparison of hydrolytic enzyme systems in pure culture and activated sludge under different electron acceptor conditions. Wat. Sci. Tech., 37 (4-5), 335-343.
Grabiriska-Loniewska, A. (1991) Biocenosis diversity and denitrification efficiency. Wat. Res. 25,(12), 1575-1582.
Gujer, W., Henze,M, Mino, T. and van Loosdrecht, M. (1999). Activated sludge model no.3. IAWQ Task Group on Mathematical Wat. Sci. Tech., 39, (1), 183-195.
Hadjipetrou, L.P. and Stouthamer, A.H. (1965) Energy production during nitrate respiration by Aerobacter aerogenes. J.Gen.Microbiol. 38, 29-34.
Hallin, S., Lindberg. C.F., Pell, M. and Carlsson B. (1996a) Microbial adaptation, process performance and a suggested control strategy in a pre-denitrifying system with ethanol dosage. Wat. Sci. Tech. 33, (1-2), 91-99.
Hallin, S., Rothman, M. and Pell, M. (1996b) Adaptation of denitrifying bacteria to acetate and methanol in activated sludge, Wat. Res.30, (6), 1445-1450.
Hasselblad, S. and Hallin, S. (1994) Intermittent addition of external carbon to enhance denitrification in activated sludge. Springer-Verlag, Berlin Heidelberg 1994.
Henze, M. and Bungaard, E. (1982) Bemessung von kombinierten nitrifikations- und Denitrifikationsanlagen, gwf Wasser/Abwasser, 123, 240-246.
Henze M. (1986) Nitrate versus oxygen utilisation rates in wastewater and activated sludge systems Wat. Sci. Tech. 18, 115-122.
Henze M., Grady, C.P.L.Jr, Gujer, W., Marais, G.v.R. and Matsuo, T. (1987). Activated sludge model no.l. IAWPRC Scientifical and Technical Report No. 1, IAWPRC, London.
Henze M. (1989) The influence of raw wastewater biomass on activated sludge oxygen respiration rates and denitrification rates. Wat. Sci. Tech. 21, 603-607.
Henze, M. and Harremoes, P. (1990) Chemical-biological nutrient removal - The HYPRO process. Springer Verlag, Berlin Heidelberg 500-510.
Henze M. (1991) Capabilities of biological nitrogen removal processes from wastewater Wat. Sci. Tech. 23, 669-679.
Henze, M. and Mladenowski, C. (1991) Hydrolysis of particulate substrate by activated sludge under aerobic, anoxic and anaerobic conditions. Wat. Res.25, (1), 61-64
27

General introduction
Henze M. (1992) Characterisation of wastewater for modelling of activated sludge processes. Wat. Sci. Tech. 25, (6), 1-15.
Henze, M. and Harremoes, P. (1992) Characterization of the Wastewater. The Effect of Chemical Precipitation on the Wastewater Composition and its Consequences for Biological Denitrification", Klute, R. and Hahn, H. (Eds.), Springer Verlag Berlin (299-311).
Henze,M., Kristensen, G.H., Strube, R. (1994) Rate-capacity characterisation of wastewater for nutrient removal processes. Wat. Sci. Tech. 29, (7) 101-107.
Henze M., Gujer, W., Mino, T., Matsuo, T., Wentzel, M.C., Marais, G.v.R. (1996) Activated Sludge Model No.2.Scientifical and Technical Report No.3.
Henze M., Gujer, W., Mino, T., Matsuo, T., Wentzel, M.C., Marais, G.v.R. and van Loosdrecht, M.C.M. (1999) Outline Activated sludge model no.2d by IAWQ Task Group on Mathematical Modelling for Design and operation of Biological Wastewater Treatment Processes. Wat. Sci. Tech., 39, (1), 165-183.
Her Jiunn-Jye and Huang Ju-Sheng (1995) Influences of carbon source and C/N ratio on nitrate/nitrite denitrification and carbon breakthrough. Bioresource Technology 54, 45-51.
Hoffman, H. (1986) Konzept und Bemessung der vorgeschalteten Denitrifikation beim Belebungsverfahren. Ber. Wassergiitewirtschaft Gesundheitsing. TU Miinchen 72, 1-43.
Irvine, R.L., Ketchum, L.H., Breyfogle, R. and Barth, E.F. (1983) Municipal application of sequencing batch treatment. JWPCF, 55 (5), 984.
Isaacs, S.H., Henze, M., S0eberg, H. and Kummel, M. (1994a) External carbon source addition as a means to control an activated sludge nutrient removal process. Water Research, 28, (3), 511-520.
Isaacs, S.H., Henze, M. S0eberg, H. and Kummel, M. (1994b) Modelling the nitrogen dynamics in an alternating activated sludge process. Mathmod Vienna, Feb. 2-4, 1994
Isaacs, S.H. and Henze, M. (1995) Controlled carbon source addition to an alternating nitrification-denitrification wastewater treatment process including biological P removal. Wat. Res., 29, (1), 77-89
Isaacs, S., Mah, T. and Maneshin, S.K. (1998) Automatic monitoring of denitrification rates and capacities in activated sludge processes using fluorescence and redox potential. Wat. Sci. Tech. 37(12), 121-131.
Karlsson, I. and Smith, G. (1991) Pre-precipitation facilities nitrogen removal without tank expansion. Wat. Sci. Tech. 23, 811-817.
Kappeler, J. and Gujer, W. (1992). Estimation of kinetic parameters of heterotrophic biomass under
aerobic conditions and characterization of wastewater for activated sludge modelling. Wat. Sci. Tech. 25, (6), 125-139.
Kayser, R. (1983) Ein Ansatz zur Bemessung einstufiger Belebungsanlagen fur nitrifikation-Denitrifikation. GWF Wasser/Abwasser 124, 419-427.
Kayser, R. (1991) Stickstoffelimination durch simultane Nitrifikation und Denitrifikation. Ber. Wassergiite-/Abfallwirtschaft. TU Miinchen 105, 95-111.
Kayser, R., (1997) Ein neuer Ansatz zur Berechnung der Denitrifikationskapazitat in Belebungsanlagen. gwf Wasser - Abwasser, 138, (5), 251-254.
Klapwijk, A. (1974) Nitrificatie en denitrificatie. H20, 7, 299-340.
Klapwijk, A. (1978) Eliminatie van stikstof uit afvalwater door denitrificatie. Dissertation, Agricultural University Wageningen, The Netherlands.
Klapwijk, A., Brouwer, H., Vrolijk, E. and Kujawa, K. (1998) Control of intermittently aerated nitrogen removal plants by detection endpoints of nitrification and denitrification using respirometry only. Wat. Res. 32, (5), 1700-1703.
Koch, F.A., and Oldham, W.K. (1985) ORP - a tool for monitoring, control and optimisation of biological nutrient removal systems. Wat. Sci. Tech. 17, 259-281.
Kristensen, G.H., J0rgensen, P.E. and Henze, M. (1992) Characterisation of functional microorganisms groups and substrate in activated sludge and wastewater by AUR, NUR and OUR. Wat. Sci. Tech., 25 (6), 43-57.
Kristensen, G.H. and J0rgensen, P.E. (1994) Pre-precipitation followed by biological denitrification supported by addition of biological or thermal/chemical hydrolysis products. Springer-Verlag, Berlin
Krul, J.M. (1976) The relationship between dissimilatory nitrate reduction and oxygen uptake by cells of an Alcaligenes strain in floes and in suspension and by activated sludge floes. Wat. Res., 10, 337-341.
Kujawa, K., Klapwijk, B., Maas, v.d. Peter and Majoor, E. (1997). Estimation of nitrogen removal potential on WWTP Assen. Rapport of Agricultural University Wageningen.
Lee, Sang-IJI, Koopman, B., Park, Seyung-kk and Cadee, K. (1995). Effect of fermented wastes on denitrification in activated sludge. Research note. Water Environment research, 67, (7), 1119-1122.
Lesouef, A., Payraudeau, M., Rogalla, F. and Kleiber, B. (1992) Optimizing nitrogen removal reactor configurations by on-site calibration of the IAWPRC activated sludge model. Wat. Sci. Tech. 25 (6), 105-124.
28
Chapter 1
Ludzack, F.J. and Ettinger, M.B. (1962) Controlling operation to minimize activated sludge effluent nitrogen. J. Wat. Poll. Control Fed. 34, 920-931.
Maier, W. (1993) Externe Kohlenstofftrager zur Verbesserung der Denitrifikationsleistung. Vergleich von Acetol mit bisher untersuchten C-Quellen. JAT Ingenieurberatung fiir Abwassertechnik.
Marais G.v.R. and Ekama, G.A. (1976) The activated sludgge process. Part 1: steady state behaviour. Water S.A., 2, (94), 163-200.
McCarty, P.L., Beck, L. and Amant, P.St. (1969) Biological denitrification of wastewaters by addition of organic materials. Proceedings of the 24th Purdue Ind. Waste Conf. Purdue University, Lafayette, Ind.
McClintock, S.A., Sherrard, J.H., Novak, J.T. and Randall C.W.(1988). Nitrate versus oxygen respiration in the activated sludge process. Journal WPCF, 60, (3), 342-350.
Metcalf and Eddy, Inc. (1991) Wastewater engineering. Treatment, disposal and reuse. 3r
edition, McGraw-Hill. Mulder, A., Van de Graaf, A.A., Robertson, L.A.
and Kuenen, J.G. (1995) Anaerobic ammonium oxidation discovered in a denitrifying fluidised bed reactor. FEMS Microbiol. Ecol. 16, 177-184.
Munch, E.V., Lant, P. and Keller, J. (1996) Simultaneous nitrification and denitrification in bench-scale sequencing batch reactor. Wat. Res., 30, (2), 277-284.
Naidoo, V., Urbain, V. and Buckley, C.A. (1998) Characterisation of wastewater and activated sludge from European municipal wastewater treatment plant using the NUR test. Wat. Sci. Tech. 38(1), 303-310.
Novak, L. (1995) Comment on "Modification to the IAWPRC task group general activated sludge model" by Grifiths, Wat. Res. 28, 657-664 (1994) and Author's reply. Wat. Res. 29 (2), 761-766.
Nyberg, U., Aspegren, H., Andersson, B., Jansen, J. la C. and Villadsen, I.S. (1992). Full-scale application of nitrogen removal with methanol as carbon source. Wat. Sci. Tech. 26, (5-6), 1077-1086.
Nyberg, U., Andersson, B. and Aspegren, H. (1996) Long-term experiences with external C-sources for nitrogen removal. Wat. Sci. Tech. 33, (12), 109-116.
0degaard, H., Barlindhaug, J., Bbhleng, A. and £ss0y, A. (1994) Wastewater treatment and resources reuse based on pre-precipitation, biofilm reactors and thermal sludge hydrolysis. Springer Verlag.
Olsson, G. (1985) Control strategies for the activated sludge process. In: Comprehensive Biotechnology, Moo-Young (edt.) 1107-1119.
Orhon, D., Sozen, S. and Artan, N. (1996) The effect of heterotrophic yield on the assement of the correction factor for anoxic growth. Wat. Sci. Tech. 34 (5-6), 67-74.
Otterpohl, R., Rolfs, t. and Londong, J. (1994) optimising operation of wastewater treatment plants by offline and online computer simulation. Wat. Sci. Tech., 30, (2), 165-174.
Patureau, D., Bernet, N. and Molleta, R. (1997) Combined nitrification and denitrification in a single aerated reactor using the aerobic denitrifier Comamonas Sp. Strain SGLY2. Wat. Res. 31, (6), 1363-1370.
Payne, W.J. (1973) Reduction of nitrogenous oxides by microorganisms. Bacteriol. Rev. 37, 409-452.
Payne, W.J. (1981) Denitrification. Willey, New York.
Pedersen, K.M., Kummel, M. and S0eberg, H. (1990) Monitoring and control of biological removal of phosphorus and nitrogen by flow-injection analysers in a municipal pilot-scale waste-water treatment plant. Analitical Chimica Acfa238, 191-199.
Pbpel, H.J. (1987) Grundlagen und Bemessung der biologischen Stickstoffelimination: Teil 1 und 2, GWF - Wasser/Abwasser 128, Heft 8 und 9.
Poth, M. (1986) Dinitrogen production from nitrite by a Nitrosomonas isolate. Appl. Env. Microbiol. 52 (4), 957-959.
Purtschert, I., Siegrist H. and Gujer, W. (1996) Enhanced denitrification with methanol at WWTP Ziirich-Werdholzli. Wat. Sci. Tech. 33, (12), 117-126.
Purtschert, I. and Gujer, W. (1998) Population dynamics by methanol addition in denitrifying wastewater treatment plants. Wat. Sci. Tech., 39, (1), 43-51.
Rabinowitz, B. and Oldham, W.K. (1986) Excess biological phosphorus removal in the activated sludge process using primary sludge fermentation. Can.Journ. of Civil Eng. 13, 345-351.
Randall, C.W., Barnard, J.L. and Stensel, H.D. (1992) Design and retrofit of wastewater treatment plants for biological nutrient removal. Water Quality Management Library. Volume 5.
Rauch, W. (1994) Ein vereinfachtes dynamisches Modell zur Einschatzung der Stickstoffelimination in komunalen Klaranlagen mit vorgeschalteter denitrifikationstufe. Korespondenz Abwasser, 6, 908-925.
Remde, A. and Conrad, R. (1990) Production of nitric oxide in Nitrosomonas europaea by reduction of nitrite. Arch. Microbiol. 154, 187-191.
Robertson, L.A. and Kuenen, J.G. (1984) Aerobic denitrification: a controversy revived. Arch. Microbiol. 139, 351-354.
29
General introduction
Robertson, L.A. and Kuenen, J.G. (1987) Heterotrophic nitrification in Thiosphaera pantotropha: Oxygen uptake and enzyme studies. J. of Gen. Microb.,134, 857-863.
Robertson, L.A., Van Niel, E.W.J., Torremans, R.A.M. and Kuenen, J.G. (1988) Simultaneous nitrification and denitrification in aerobic chemostat cultures of Thiosphaera pantotropha. Appl. environ. Microbiol. 54(11), 2812-2818.
Roeleveld, P.J. and Kruit, J. (1998) Richtlinien fur die Charakterisierung von Abwasser in den Niederlanden. Korrespondenz Abwasser 54 (3), 465-468.
Robertson, L.A. and Kuenen, J.G. (1990) Combined heterotrophic nitrification and aerobic denitrification in Thiosphaera pantotropha and other bacteria. Antonie van Leeuwenhoek 57, 139-152.
Scheer, H. and Seyfried, C.F. (1994) Concepts for determining the readily biodegradable substrate in the sewage and procedures for dimensioning the biological phosphorus removal. Korrespondenz Abwasser, 41, 3/94.
Scheer, H. (1995) Moglichkeiten zur Erfassung der Konzentration an leicht abbaubaren organischen Kohlenstoffverbindungen im Abwasser. Symposium: "Erfahrungen mit Analysen und ProzeBmeBgeraten im Abwasserreinigungs-anlagen". November, 1995 Ostfildern (Nellingen).
Schlegel, S., (1987) Bemessung und Ergebnisse von Belebungsanlagen mit Nitrifikation und vorgeschalteter Kaskadendenitrification. Wasser -Abwasser, 128, 422-431.
Schlegel, S. (1990) Operational experience with different control systems and control loops in sewage treatment plants. In Proceedings of the 5"* IAWPRC Workshop Yokohama and Kyoto, Japan, July 1990.
SDA (1989) Principles and practice of phosphorus and nitrogen removal from municipal wastewater. The Soap and Detergents Association, New York.
Sen, D., Randall, C.W. and Grizzard, T.J. (1990) Biological nitrogen and phosphorus removal in oxidation ditch and high nitrate recycle systems. CBP/TRS47/90, Chesapeake Bay Program, U.S.E.P.A. 120 pages.
Sekoulov, I., Addicks, R. and Oles, J. (1990) Post-denitrification with controlled feeding of activated sludge as H donator. Wat. Sci. Tech. 22, (7/8), 161-170.
Siegrist, H. and Tschui, M. (1992) Interpretation of experimental data with regard to the activated sludge model no. 1 and calibration of the model foor municipal wastewater treatment plants. Wat. Sci. Tech. 25, (6), 167-183.
Skerman, V.B.D. and Macrae, I.C. (1957) The influence of oxygen on the reduction of nitrate by addapted cells of Pseudomonas Denitrifwans. Can. J. Microbiol., 3215.
Sollfrank, U. and Gujer, W. (1991) Characterisation of domestic wastewater for mathematical modelling of the activated sludge process. Wat. Sci. Tech., 23, (4-6), 1057-1066.
Sozen, S., Cokgor, E.U., Orhon, D. and Henze, M. (1998) Respirometric analysis of activated sludge behaviour - II. Heterotrophic growth under aerobic and anoxic conditions. Wat. Res., 32, (2), 476-488.
Spanjers, H. (1993) Respirometry in activated sludge. Dissertation, Agricultural University Wageningen, The Netherlands
Spanjers, H. and Vanrolleghem, P. (1995) Respirometry as a tool for rapid characterization of wastewater and activated sludge. Wat. Sci. Tech., 31(2), 105-114.
Spanjers, H., Vangolleghem, P.A., Olsson, G. and Dold, P.L. (1998) Respirometry in control of the activated sludge process: principles. IAWQ Scientific and technical report No.7.
Sperandio, M., Urbain, V., Audic, J.M. and Paul, E. (1999) Use of carbon dioxide evolution rate for determining heterotrophic yield and characterising denitrifying biomass. Wat. Sci. Tech., 39, (1), 139-147.
Stensel, H.D. (1981) Biological nitrogen removal system design. Water Amer. Inst, of Chem. Engrs., 237
Stephenson, J.P. (1985) Practices in activated sludge process control. Waste management and pollution control. In: Comprehensive Biotechnology, Moo-Young (edt.) 1131 -1142.
Still, D., Blackbeard, J.R., Ekama, G.A. and Marais, G.v.R. (1986). The effect of feeding pattern on sludge growth rate and sludge settleability. Res. Rept. No.W55, Dept. Civil Eng., Univ. of Cape Town.
Stowa (1992a) Voordenitrificatie. Onderzoek en richtlijnen. Programma PN-1992.
Stowa (1992b) Handboek stikstofverwijdering. Stowa (1995) Evaluatie van het HSA-model voor
toepassing in Nederland, 95-19. Stowa (1996a) Methoden voor
influentkarakterisering. Inventarisatie en richtlijnen. 96-08.
Stowa (1996b) Varianten op voorbezinking. Een haalbaarheidsstudie.
Stowa (1997) Stikstofverwijdering bij lage BZV/N-verhouding. Stikstofeliminatie via nitrite in de hoofdstromm van actiefslibprocessen. 97-34.
Uijterlinde, C.A., v.d. Roest, H.F. (1994) Toch verrast met preprecipitatie op de rwzi Nieuwegein! H20, 27, (17), 518-521.
Van de Graaf, A.A., De Bruijn, P., Robertson, L.A., Jetten, M.S.M and Kuenen, J.G. (1996) Autotrophic growth of anaerobic ammonium oxidising micro-organisms in a fluidised bed reactor. Microbiology 142: 2187-2196.
30
Chapter 1
Van Haandel, A.C., Ekama, G.A. and Marais, G.v.R. (1981a) The activated sludge process - 3. Single sludge denitrification. Wat. Res., 15, 1135-1152.
Van Haandel, A.C. and Marais, G.v.R. (1981b) Nitrification and denitrification kinetics in the activated sludge process. Research report W39, Dept. of Civil Eng., University of Cape Town, Rondebosch, 7700, South Africa.
Van Haandel, A .C, Dold, P.and Marais, G.v.R. (1982) Optimisation of nitrogen removal in the single sludge activated sludge process. Wat. Sci. Tech., 14(6/7), 443-461.
Vanrolleghem, P. and Verstraete, W. (1993) Simultanous biokinetic characterisation of heterotrophic and nitrifying populations of activated sludge with an on-line respirographic biosensor. Wat. Sci. Tech. 28 (11/12), 377-387.
Vanrolleghem, P., Spanjers, H., Petersen, B., Ginestet, P. and Takacs, I. (1999) Estimating (combination of) activated sludge model No.l parameters and components by respirometry. Wat. Sci. Tech., 39, (1), 195-214.
Van't Oever, E. (1991) Stikstofverwijdering in oxidatiesloten. NVA-themadag "N-totaal verwijderen?", Amsterdam, November 1991.
Van Verseveld, H.W., Krab, K. and Stouthamer, A.H. (1981) Proton pump coupled to cytochrome c oxidase in Paracoccus denitrificans. Biochim. Biophys. Acta. 635, 525-534.
Wareham, D.G., Hall, K.J. and Mavinic, D.S. (1991) Real-time control of aerobic anoxic sludge digestion using ORP. Presented at the 1991 ASCE National Conference on Environmental Engineering, July 8-10, Reno, Nev. U.S.
Weber, R and Krauth, K. (1998) Nachgeschaltete Denitrifikation im Belebungsverfahren. Korrespondenz Abwasser, 45, No.l, 97-105.
Wentzel, M.C., Loewenthal, R.E., Ekama, G.A. and Marais, G.v.R. (1988) Enhanced polyphosphate organism cultures in activated sludge system - Part 1: Enhanced culture development. Wat. SA, 14 (2), 81-92.
Wentzel, M.C., Ekama, G.A. and Marais, G.v.R. (1991) Kinetics of nitrification denitrification biological excess phosphorus removal systems - a review. Wat. Sci. Tech., 23 (4-6) 555-565.
Wentzel, M.C., Ekama, G.A. and Marais, G.v.R. (1992) Processes and modelling of nitrification denitrification biological excess phosphorus removal systems - a review. Wat. Sci. Tech., 25, 6, 59-82.
Werner, M. and Kayser, R. (1991) Denitrification with biogas as external carbon source. Wat. Sci. Tech. 23,701-708.
Wijst, van der, M. and Groot-Marcus, A.P. (1998) Huishoudelijk afvalwater. Berekening van de zuurstofvraag. H&C (Huishoud en
Consumentenstudie) onderzoeksrapport 1, Wageningen, 1998
Wild, D., Schulthess, R.von and Gujer, W. (1994) Synthesis of denitrification enzymes in activated sludge: modelling with structured biomass. Wat. Sci. Tech. 30, (6), 113-122.
Wilderer, P.A., Jones, W.L. and Dau, U. (1987) Competition in denitrification systems affecting reduction rate and accumulation of nitrite. Wat. Res., 21 (2), 239-245.
WPCF, (1983) Nutrient control. Manual of practice FD-7. Facilities design. Water Pollution Control Federation.
Wuhrmann, K. (1960) Effect of oxygen tension on biochemical reactions in sewage purification plants. In "Advances in biological waste treatment". Proc. 3rd Conf. Biol. Waste Treat., Munich, 27.
Wuhrmann, K. (1964) Nitrogen removal in sewage treatment processes. Vehr. Int. Ver. Theor. Angew. Limnol. 15, (in German)
Zhao, H., Isaacs, S.H., S0eberg, H. and Kiimmel, M. (1994a) A novel control strategy for improved nitrogen removal in an alternating activated sludge process - part I. Process analysis. Wat. Res.28, (3), 521-534.
Zhao, H., Isaacs, S.H., S0eberg, H. and Kiimmel, M. (1994b) A novel control strategy for improved nitrogen removal in an alternating activated sludge process - part II. Control development. Wat. Res.28, (3), 535-542.
Zhao, H., Isaacs, S.H., Soeberg, H. and Kummel, H. (1995). An analysis of nitrogen removal and control in an alternating activated sludge process, Wat. Res., 29, 535-544.
Zhao, H., Hao, O.J. and McAvoy, T.J. (1999). Modelling approaches to a SBR: as model no.2., simple model and neural nets. Wat. Sci. Tech., Vol.39, (1), 227-235.
31
Chapter 2
A method to estimate denitrification potential for pre-denitrification system using batch NUR-test
CONTENT
Abstract 34 2.1 Introduction 35 2.2 Material and methods 36
2.2.1 Activated sludge and wastewater 36 2.2.2 Experimental set-up 37
2.3 Results and discussion 38 2.3.1 Simplified denitrification kinetics 38 2.3.2 Denitrification potential and capacity 42 2.3.3 Wastewater characterisation for biological N-removal system 44 2.3.4 Wastewater characterisation for biological N&P-removal systems 44 2.3.5 Denitrification potential in relation to sludge loading rate 45
2.4 Conclusions 49 List of symbols 50 Literature 51
Modified version of article published under the same title in Water Research (1999) 33, (10), 2291-2300. The main modifications refer to
introduction content.
33
A method to estimate denitrification potential for pre-denitrification system using batch NUR- test
ABSTRACT
Nitrate utilisation rate (NUR) batch tests with wastewater or acetate as carbon source were carried out
for systems with pre-denitrification. A pulse dosage of wastewater to activated sludge in anoxic
conditions enabled to estimate the denitrification potential of the considered wastewater and the
endogenous denitrification potential of the considered activated sludge. From the same NUR-test the
concentration of readily and slowly biodegradable COD-fractions (Ss and Xs respectively) and the
resulting denitrification rates on wastewater fractions and endogenous material could be determined.
Based on the denitrification rates the anoxic utilisation rates of Ss and Xs could be estimated. The
denitrification potential of the wastewater, defined as the amount of nitrate that can be reduced with
both biodegradable COD-fractions, and the endogenous denitrification allow to calculate the overall
denitrification potential of a given treatment plant. In combination with system characteristics it is
possible to predict the denitrification capacity and the theoretical nitrate effluent quality. With the
estimated denitrification kinetics, the overall denitrification rate could be modelled as a function of
the anoxic sludge loading in the pre-denitrification volume by using a simple model.
If the denitrification potential of a plant is not sufficient to satisfy required effluent quality standards,
the addition of an external carbon source may be considered to enhance denitrification. The
denitrification kinetics from a NUR-test with acetate was used to model the relation between the
obtainable denitrification rate and the acetate sludge loading rate. Such a relational model can be
implemented to design the rate of an external carbon dosage or it can be used for the design of the
volume of a post-anoxic reactor where the external carbon source has to be utilised. The relational
model can also be used for the development of a control strategy.
The possible transfer of the presented methodology to practical conditions is considered and
bottlenecks in the performance of a NUR-test are mentioned. For a correct interpretation of results
from a batch NUR-test, attention should be paid on an accumulation of nitrite. When nitrite is formed,
it should be included in any calculations. The feasibility of the NUR-test for wastewater
characterisation is limited for activated sludge with an enhanced biological phosphorus removal
activity. Further, the estimation of the wastewater characteristics is sensitive for the value of the yield
factor YHD-
34
Chapter 2
2.1 INTRODUCTION
When it was observed that, in terms of respiration activity, the activated sludge behaviour in
aerobic and anoxic conditions is not the same for different wastewater biodegradable organic
fractions, the need for a detailed wastewater characterisation appeared. In activated sludge
models (e.g. DOLD ET AL., 1980, HENZE ET AL., 1987, 1996) the assumption was made that a large
number of specific organic wastewater compounds can be grouped into soluble readily
biodegradable (Ss), particulate slowly biodegradable (Xs) and inert soluble and particulate (Si,
X! respectively) COD-fractions. For respiration processes, like aerobic respiration and
denitrification, Ss- and Xs-fractions are of significant importance, while to predict the sludge
production the knowledge about Xi is necessary. Compared with the general lump parameters
like COD or BOD5, the introduction of Ss and X s can be considered as an important step
towards a more adequate estimation of the denitrification potential of an activated sludge
system and it may allow for a more precise design and optimisation of the overall
denitrification process and an optimal usage of carbon sources in the wastewater.
Existing methods for wastewater characterisation can be divided into physical-chemical and
biological methods. For activated sludge processes the biological methods deserve more
attention since they allow to gain characteristic results about the activity of the heterotrophic
biomass, due to a stoichiometric relation between biomass growth and electron acceptor
utilisation (SOLLFRANK AND GUJER, 1991). The biological methods are generally based on the
measurement of the respiration rate under aerobic or anoxic conditions, respectively the
oxygen utilisation rate (OUR) or the nitrate utilisation rate (NUR). OUR-tests have been often
used for the characterisation of biomass kinetics (e.g. EKAMA ET AL., 1986, SPANJERS AND
VANROLLEGHEM, 1995, VANROLLEGHEM ET AL., 1999), wastewater characterisation (e.g. EKAMA ETAL.,
1986, SOLLFRANK AND GUJER, 1991, SPANJERS AND VANROLLEGHEM, 1995, BROUWER ET AL., 1998) and
estimation of the heterotrophic yield coefficient (e.g. CECH ET AL., 1984, SOLLFRANK AND GUJER,
1991). The NUR-tests were used to characterise denitrification kinetics (CLAYTON ET AL., 1991,
NAIDOO ET AL„ 1998), the fraction of denitrifiers (HENZE, 1986, 1992, KRISTENSEN ET AL., 1992) and
biodegradable COD-fractions of the wastewater (SCHEER AND SEYFRED, 1994, SCHEER, 1995,
COKGOR UBAY ET AL., 1998, NAJDOO ET AL., 1998). NUR-tests in combination with OUR-tests allow
for an estimation of the reduction factors for the biomass respiration activities under anoxic
conditions in comparison with aerobic conditions, like growth, Xs-hydrolysis and endogenous
respiration (HENZE, 1986, KRISTENSEN ET AL., 1992, ORHONET AL., 1996). These reduction factors are
used in several model approaches. Besides, NUR-tests can be used for the estimation of the
required COD/N-ratio to attain a complete nitrate reduction for a specific wastewater and
activated sludge.
The heterotrophic yield (YH), defined as mass of biomass COD produced per mass of
consumed COD, is of great importance in model and design approaches for the estimation of
the amount of produced biological sludge and for the estimation of the electron acceptor
35
A method to estimate denitrification potential for pre-denitrification system using batch NUR- test
consumption during the utilisation of a given amount of substrate (SPERANDIO ET AL„ 1999). In
activated sludge models (DOLD ET AL., 1980, HENZE ET AL., 1987) and in respirometric procedures
for wastewater characterisation (e.g. EKAMA ET AL„ 1986) it is assumed that YH has the same
numerical value under aerobic and anoxic conditions (Y H =Y H D) - However, it is known that the
use of nitrate as electron acceptor will affect the energy released by the oxidation reaction and
consequently anoxic yield factors are lower than aerobic yield factors (e.g. ORHONET AL., 1996,
NAIDOO ET AL., 1998, SPERANDIO ET AL., 1999). To obtain a reliable wastewater characterisation
using respirometric techniques a proper choice of YH or YHD is of significant importance
(SCHEER AND SEYFRIED, 1994).
Some denitrification design approaches use the denitrification rate for the calculation of the
anoxic volumes (EKAMA ET AL., 1984, SDA, 1989, RANDAL ET AL., 1992). Denitrification rates are
often related to the implemented anoxic sludge loading rate (STENSEL, 1981, BURDICKETAL., 1982,
HOFMANN, 1985, POPEL, 1986, METCALF&EDDY, 1991) based on BOD5 or COD, while subsequent
wastewater fractions are usually not taken into account. Design procedures employing
empirical parameters may under- or overestimate the required denitrification volume because
of the unique characteristics of each wastewater and activated sludge.
This chapter describes an experimental procedure to determine the denitrification potential for
systems with pre-denitrification. Batch NUR-tests with pulse addition of wastewater enables
to make a distinction between denitrification rates on Ss, Xs and endogenous material and in
addition, the concentrations of Ss and Xs can be estimated. Via the estimated denitrification
potential the effluent nitrate concentration can be predicted and this information and can be
used for an optimisation of the overall denitrification efficiency of an existing WWTP. A
simplified denitrification model, based on estimated parameters and wastewater
characteristics, enables to predict the denitrification rate as a function of the sludge loading.
This approach was tested in a set-up for NUR-tests with a continuous dosage of substrate. The
same type of relational model can be formulated for systems using external carbon sources not
requiring biomass adaptation. A relation between the external carbon addition rate and
attainable denitrification rate can be employed, for instance for calculating the required dose
of carbon, volume of the post-denitrification reactor and in control strategies for a temporary
enhancement of denitrification in stress conditions (ISAACS AND HENZE, 1995). Implementation of
the presented methodology is further discussed and obstacles regarding interpretation are
named.
2.2 MATERIAL AND METHODS
2.2.1 ACTIVATED SLUDGE AND WASTEWATER
The activated sludge for the experiments originated from a compartmentalised plug-flow N-
removal pilot-plant with pre-denitrification, characterised by an organic sludge loading rate
(BXCOD) of approximately 0.1 gCOD.gMLSS'.d"1. The activated sludge samples were taken
from the last compartment of the pilot plant.
36
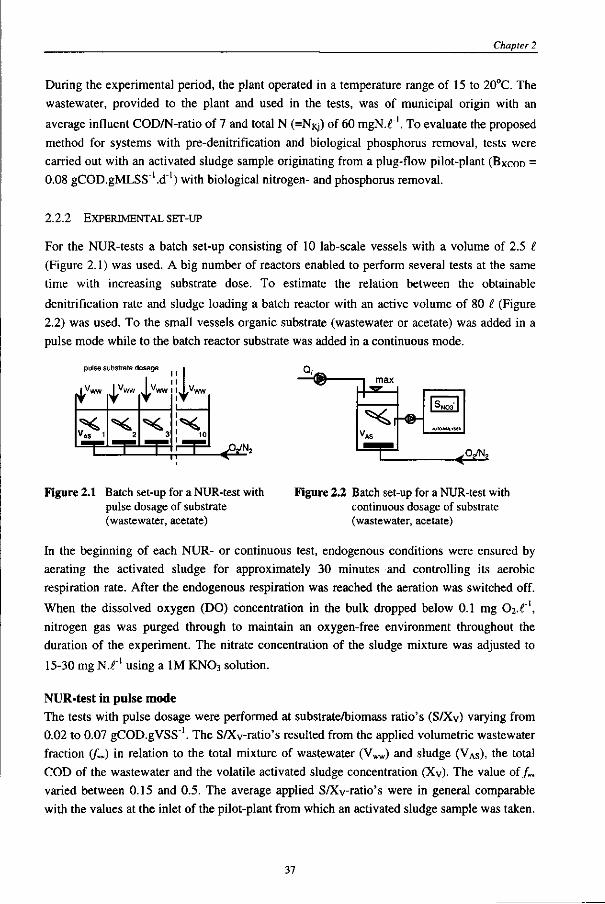
Chapter 2
During the experimental period, the plant operated in a temperature range of 15 to 20°C. The
wastewater, provided to the plant and used in the tests, was of municipal origin with an
average influent COD/N-ratio of 7 and total N (=NKj) of 60 mgN.f'. To evaluate the proposed
method for systems with pre-denitrification and biological phosphorus removal, tests were
carried out with an activated sludge sample originating from a plug-flow pilot-plant (BXCOD =
0.08 gCOD.gMLSS'.d"') with biological nitrogen- and phosphorus removal.
2.2.2 EXPERIMENTAL SET-UP
For the NUR-tests a batch set-up consisting of 10 lab-scale vessels with a volume of 2.5 £
(Figure 2.1) was used. A big number of reactors enabled to perform several tests at the same
time with increasing substrate dose. To estimate the relation between the obtainable
denitrification rate and sludge loading a batch reactor with an active volume of 80 i (Figure
2.2) was used. To the small vessels organic substrate (wastewater or acetate) was added in a
pulse mode while to the batch reactor substrate was added in a continuous mode.
pulse substrate dosage
I Vuvuu I "ww I Vw ,vww
K ^4
>
^
i l -Q,
^ <
•,<VN2
^ > SN03"
Figure 2.1 Batch set-up for a NUR-test with pulse dosage of substrate (wastewater, acetate)
Figure 2.2 Batch set-up for a NUR-test with continuous dosage of substrate (wastewater, acetate)
In the beginning of each NUR- or continuous test, endogenous conditions were ensured by
aerating the activated sludge for approximately 30 minutes and controlling its aerobic
respiration rate. After the endogenous respiration was reached the aeration was switched off.
When the dissolved oxygen (DO) concentration in the bulk dropped below 0.1 mg 02l'x,
nitrogen gas was purged through to maintain an oxygen-free environment throughout the
duration of the experiment. The nitrate concentration of the sludge mixture was adjusted to
15-30 mg NX1 using a 1M KNO3 solution.
NUR-test in pulse mode The tests with pulse dosage were performed at substrate/biomass ratio's (S/Xv) varying from 0.02 to 0.07 gCOD.gVSS"1. The S/Xv-ratio's resulted from the applied volumetric wastewater fraction (fm) in relation to the total mixture of wastewater (Vww) and sludge (VAs), the total COD of the wastewater and the volatile activated sludge concentration (Xv). The value of/„„ varied between 0.15 and 0.5. The average applied S/Xy-ratio's were in general comparable with the values at the inlet of the pilot-plant from which an activated sludge sample was taken.
37
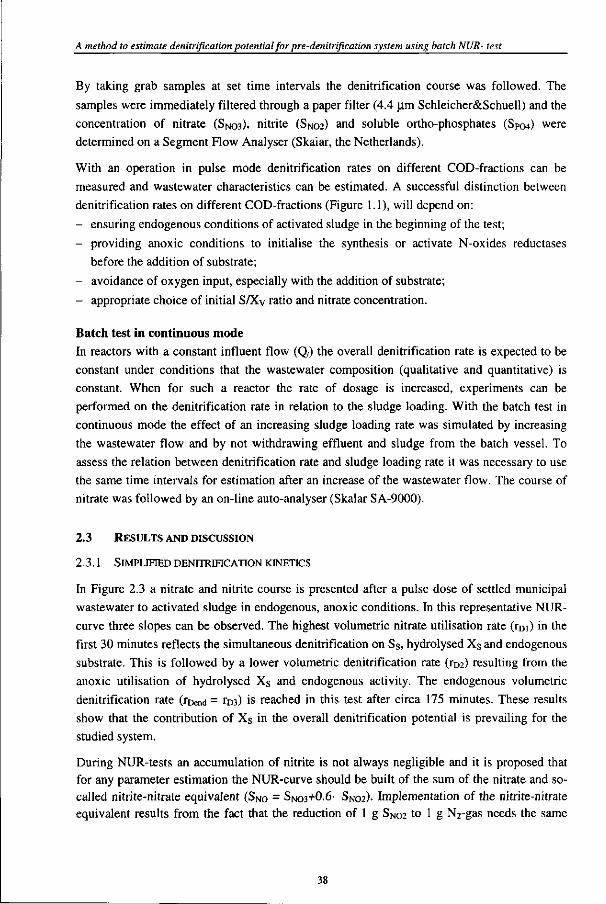
A method to estimate denitrification potential for pre-denitrification system using batch NUR- test
By taking grab samples at set time intervals the denitrification course was followed. The samples were immediately filtered through a paper filter (4.4 (im Schleicher&Schuell) and the concentration of nitrate (SNO3), nitrite (SNO2) and soluble ortho-phosphates (SP04) were determined on a Segment Flow Analyser (Skaiar, the Netherlands).
With an operation in pulse mode denitrification rates on different COD-fractions can be measured and wastewater characteristics can be estimated. A successful distinction between denitrification rates on different COD-fractions (Figure 1.1), will depend on:
- ensuring endogenous conditions of activated sludge in the beginning of the test;
- providing anoxic conditions to initialise the synthesis or activate N-oxides reductases before the addition of substrate;
- avoidance of oxygen input, especially with the addition of substrate;
- appropriate choice of initial S/Xv ratio and nitrate concentration.
Batch test in continuous mode In reactors with a constant influent flow (Q,) the overall denitrification rate is expected to be constant under conditions that the wastewater composition (qualitative and quantitative) is constant. When for such a reactor the rate of dosage is increased, experiments can be performed on the denitrification rate in relation to the sludge loading. With the batch test in continuous mode the effect of an increasing sludge loading rate was simulated by increasing the wastewater flow and by not withdrawing effluent and sludge from the batch vessel. To assess the relation between denitrification rate and sludge loading rate it was necessary to use the same time intervals for estimation after an increase of the wastewater flow. The course of nitrate was followed by an on-line auto-analyser (Skaiar SA-9000).
2.3 RESULTS AND DISCUSSION
2.3.1 SIMPLIFIED DENITRIFICATION KINETICS
In Figure 2.3 a nitrate and nitrite course is presented after a pulse dose of settled municipal wastewater to activated sludge in endogenous, anoxic conditions. In this representative NUR-curve three slopes can be observed. The highest volumetric nitrate utilisation rate (xm) in the first 30 minutes reflects the simultaneous denitrification on Ss, hydrolysed Xs and endogenous substrate. This is followed by a lower volumetric denitrification rate (rD2) resulting from the anoxic utilisation of hydrolysed Xs and endogenous activity. The endogenous volumetric denitrification rate (rDend = rD3) is reached in this test after circa 175 minutes. These results show that the contribution of Xs in the overall denitrification potential is prevailing for the studied system.
During NUR-tests an accumulation of nitrite is not always negligible and it is proposed that for any parameter estimation the NUR-curve should be built of the sum of the nitrate and so-called nitrite-nitrate equivalent (SNo = SNO3+0.6- SN02)- Implementation of the nitrite-nitrate equivalent results from the fact that the reduction of 1 g SNO2 to 1 g N2-gas needs the same
38
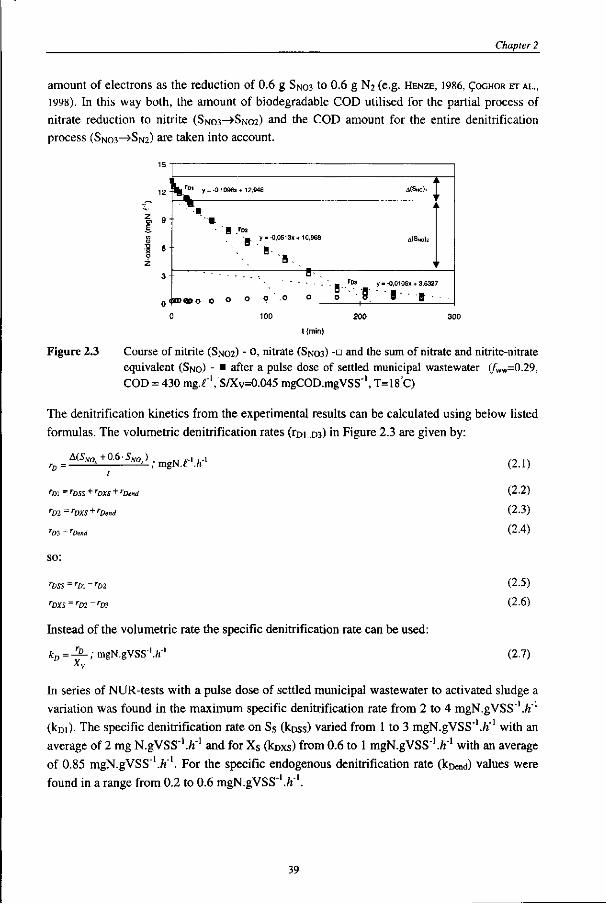
Chapter 2
amount of electrons as the reduction of 0.6 g SNO3 to 0.6 g N2 (e.g. HENZE, 1986, (JOGHOR ET AL.,
1998). In this way both, the amount of biodegradable COD utilised for the partial process of nitrate reduction to nitrite (SNO3—>SNO2) and the COD amount for the entire denitrification process (SNO3—>SN2)
a r e t ak en m t o account.
12 "
9 "
6 -
.1 -
L r » ' " ' y = -0.1096x<-12,946
' •
•_ y = -0.0513x +10.968
' • . . B ' B . .
B- .
oiroaoo o o o o \o o "5'"-"f — i — -
ik a(S«o)i
i L
A(SNO)2
•
y = -0.010Sxt 3.6327
" • • • • • » - • •
t(min)
Figure 2.3 Course of nitrite (SNO2) - 0, nitrate (SNO3) -• and the sum of nitrate and nitrite-nitrate equivalent (SNO) - • after a pulse dose of settled municipal wastewater (/"ww=0.29, COD = 430 mg.r1, S/Xv=0.045 mgCOD.mgVSS"1, T=18 C)
The denitrification kinetics from the experimental results can be calculated using below listed formulas. The volumetric denitrification rates (rDi..D3) in Figure 2.3 are given by:
;A^,+°^V).m g N / l^ (2.1)
rD\ = rDSS + rDXS + rDend
rDl~rDXS + rDend
rD3 = rDend
(2.2)
(2.3)
(2.4)
so:
rDSS ~ rD\ ~ rD2
rDxs-rm~rm
(2.5)
(2.6)
Instead of the volumetric rate the specific denitrification rate can be used:
kD = - ^ - ; mgN.gVSS"1./!"1
Xv
(2.7)
In series of NUR-tests with a pulse dose of settled municipal wastewater to activated sludge a variation was found in the maximum specific denitrification rate from 2 to 4 mgN.gVSS'./i"1
(kDi). The specific denitrification rate on Ss (koss) varied from 1 to 3 mgN.gVSS'V/i"1 with an average of 2 mg N.gVSS"1./?"1 and for Xs (kDxs) from 0.6 to 1 mgN.gVSS"1./?"1 with an average of 0.85 mgN.gVSS'./i"1. For the specific endogenous denitrification rate (koend) values were found in a range from 0.2 to 0.6 mgN.gVSS"'./f'.
39
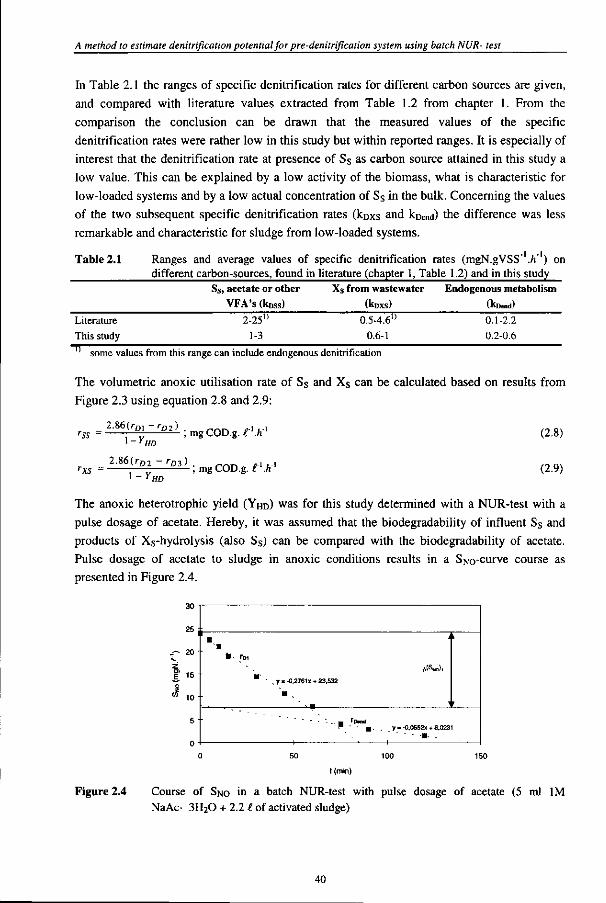
A method to estimate denitrification potential for pre-denitrification system using batch NUR- test
In Table 2.1 the ranges of specific denitrification rates for different carbon sources are given,
and compared with literature values extracted from Table 1.2 from chapter 1. From the
comparison the conclusion can be drawn that the measured values of the specific
denitrification rates were rather low in this study but within reported ranges. It is especially of
interest that the denitrification rate at presence of S s as carbon source attained in this study a
low value. This can be explained by a low activity of the biomass, what is characteristic for
low-loaded systems and by a low actual concentration of Ss in the bulk. Concerning the values
of the two subsequent specific denitrification rates (kDXs and kDcncj) the difference was less
remarkable and characteristic for sludge from low-loaded systems.
Table 2.1 Ranges and average values of specific denitrification rates (mgN.gVSS" .h" ) on different carbon-sources, found in literature (chapter 1, Table 1.2) and in this study
Ss, acetate or other VFA's (kDSS)
Xs from wastewater (kDxs)
Endogenous metabolism (kDend)
Literature This study
2-25' 1-3
0.5-4.6 0.6-1
i) 0.1-2.2 0.2-0.6
TT some values from this range can include endogenous denitrification
The volumetric anoxic utilisation rate of Ss and Xs can be calculated based on results from
Figure 2.3 using equation 2.8 and 2.9:
rSs = 2*6,rDrrD2);™$con.s.t\h->
r x s ^ ^ r ^ ;mgCOD.g. f ' i 1 1 _ ' HD
(2.8)
(2.9)
The anoxic heterotrophic yield (Y H D) was for this study determined with a NUR-test with a
pulse dosage of acetate. Hereby, it was assumed that the biodegradability of influent S s and
products of Xs-hydrolysis (also Ss) can be compared with the biodegradability of acetate.
Pulse dosage of acetate to sludge in anoxic conditions results in a Sno-curve course as
presented in Figure 2.4.
30
25
T— 20
z s. 15
o
" 10
5
0
• ' •
l i .
-
•
•
TDI
• . . y = -0,2761 x + 23.532
• .
1 ^
,
i(SNo)l
'
L
'
y = -0.0552X + 8.0231 " " " - - • - -
-H —
t (min)
Figure 2.4 Course of SNO in a batch NUR-test with pulse dosage of acetate (5 ml 1M NaAc- 3H20 + 2.2 I of activated sludge)
40
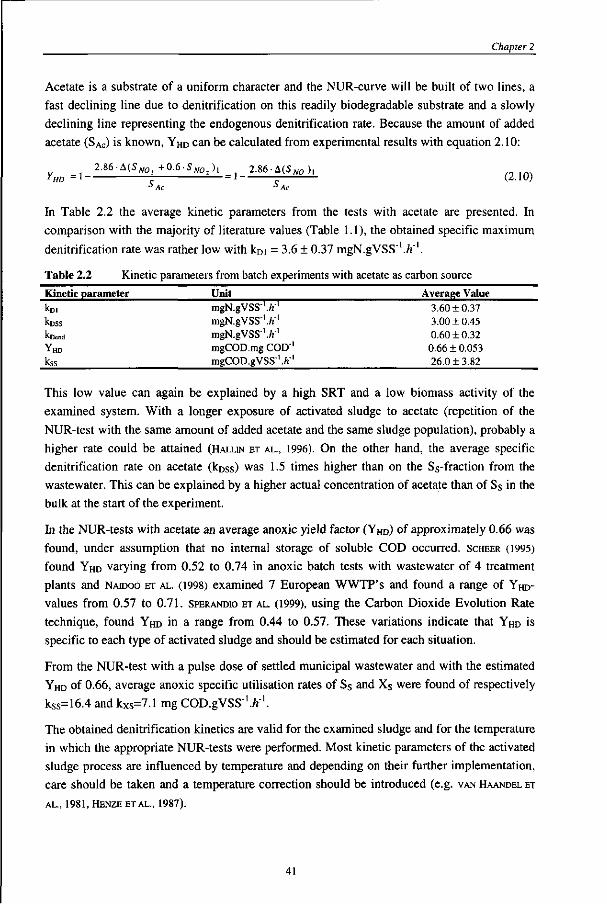
Kinetic parameter
kDi kDSS
^Dend
YHD
kss
Unit mgN.gVSS"1./!"1
mgN.gVSS"1./!"1
mgN.gVSS"1./!"1
mgCOD.mg COD mgCOD.gVSS"1./!
Chapter 2
Acetate is a substrate of a uniform character and the NUR-curve will be built of two lines, a
fast declining line due to denitrification on this readily biodegradable substrate and a slowly
declining line representing the endogenous denitrification rate. Because the amount of added
acetate (SAC) is known, YHD can be calculated from experimental results with equation 2.10:
2.86.A(SW O ! +0.6.SW O 2 ) , t 2.86-A(SW0), rtfD - ' J - 1 ~ 1/-1U)
* Ac ^ Ac
In Table 2.2 the average kinetic parameters from the tests with acetate are presented. In
comparison with the majority of literature values (Table 1.1), the obtained specific maximum
denitrification rate was rather low with kDi = 3.6 + 0.37 mgN.gVSS"1.h'\
Table 2.2 Kinetic parameters from batch experiments with acetate as carbon source
Average Value 3.60 ±0.37 3.00 ±0.45 0.60 ±0.32 0.66 ± 0.053 26.0 + 3.82
This low value can again be explained by a high SRT and a low biomass activity of the
examined system. With a longer exposure of activated sludge to acetate (repetition of the
NUR-test with the same amount of added acetate and the same sludge population), probably a
higher rate could be attained (HALLIN ET AL., 1996). On the other hand, the average specific
denitrification rate on acetate (koss) was 1.5 times higher than on the Ss-fraction from the
wastewater. This can be explained by a higher actual concentration of acetate than of Ss in the
bulk at the start of the experiment.
In the NUR-tests with acetate an average anoxic yield factor (Y H D) of approximately 0.66 was
found, under assumption that no internal storage of soluble COD occurred. SCHEER (1995)
found YHD varying from 0.52 to 0.74 in anoxic batch tests with wastewater of 4 treatment
plants and NAIDOO ET AL. (1998) examined 7 European WWTP's and found a range of YHD-
values from 0.57 to 0.71. SPERANDIO ET AL. (1999), using the Carbon Dioxide Evolution Rate
technique, found Y H D in a range from 0.44 to 0.57. These variations indicate that YHD is
specific to each type of activated sludge and should be estimated for each situation.
From the NUR-test with a pulse dose of settled municipal wastewater and with the estimated
YHD of 0.66, average anoxic specific utilisation rates of Ss and X s were found of respectively
kss=16.4 and kXs=7.1 mg COD.gVSS'.fc"1.
The obtained denitrification kinetics are valid for the examined sludge and for the temperature
in which the appropriate NUR-tests were performed. Most kinetic parameters of the activated
sludge process are influenced by temperature and depending on their further implementation,
care should be taken and a temperature correction should be introduced (e.g. VAN HAANDEL ET
AL., 1981, HENZE ET AL., 1987).
41
A method to estimate denitrification potential for pre-denitrification system using batch NUR- test
2.3.2 DENITRIFICATION POTENTIAL AND CAPACITY
The denitrification potential (DP) of a pre-denitrification system primarily depends on
wastewater characteristics and can be calculated using the results of a NUR-test as presented
in Figure 2.3. In the following equations the DP is expressed as the amount of nitrate (mg N)
that can be denitrified with the Ss- and Xs-fractions in one litre (£) of wastewater.
DPss__A(SNOj+0.6.SNO2)l , m g N f l ( 2 l ) )
J WW
DPXS = A ( 5 ^ + 0 6 5 w ° - ) 2 ; mgN.f > (2.12)
Jww
The denitrification potential of the wastewater fractions does not depend on the biomass
concentration (MLSS or VSS) in the mixed liquor. In case of a varying MLSS level the
amount of nitrate that can be denitrified on different wastewater fractions remains the same,
only the reduction rate is changing. When the sum of Ss and Xs in the wastewater is not
sufficient to denitrify completely the required amount of nitrate formed from the nitrification
of ammonia-N, the effluent standards for total nitrogen may be fulfilled with the endogenous
denitrification potential (DPend)- When this is still not sufficient an external carbon source has
to be supplied. The DPend (basic DP of activated sludge) depends on the volumetric
endogenous denitrification rate (roend). the total denitrification volume (VQ, including pre- and
post-denitrification if any) and the wastewater flow (Q,):
DPenii = rD^VD;mSK.t' (2.13)
In case of systems operating with varying biomass concentrations, the specific endogenous
denitrification potential (DPe„d(Xv)) should be used:
DPendw =r!fL^L= kDmdnVD i mgN.gVSS-1 (2.14)
The total denitrification potential (EDP) of the system depends on the characteristics of the
wastewater and the basic denitrifying activity of the sludge.
£ DP = DPSS + DPXS + DPendiXv, • Xy ; mgN.f' (2.15)
Using SDP, the theoretical concentration of nitrate and nitrite (SNo,e<theor)) in the effluent from
a N-removal activated sludge system, where biodegradable COD is exclusively used for
denitrification (optimised pre-denitrification and alternating systems), can be predicted by:
SNOM^or)=NKj,i ~SNH,e-Norgte -JL-JL-XDP , mgN.f' (2.16)
* Q, in e.<rl
42
Chapter 2
where:
SNo.e(theor) theoretical concentration of nitrate and nitrite in the effluent ( m g N X ); Nig.,- NKJ in influent ( m g N . r ); SNH.C ammonia-N in effluent (mgN.^~ ); Norg,e organic N in effluent (mgN.^~ ); iN N fraction in sludge (-); Px amount of daily removed excess sludge (= sludge growth) (mg.d" ).
To use equation 2.16 for predicting the nitrate effluent quality, one has to make sure that S s
and X s are exclusively utilised in the pre-denitrification volume and are not transported into
the aeration volume (thus lost for denitrification). When the organic biodegradable wastewater
fractions, their anoxic utilisation rates and endogenous denitrification rate are known it can be
estimated which part of wastewater denitrification potential is indeed utilised in the system.
From the Ss- and Xs-load entering the pre-denitrification volume and their anoxic substrate
utilisation rates, the required denitrification volume can be calculated for a complete
utilisation of Ss (V D.SS):
V'D,SS= SS Q' \l (2.17) kSS • Xy
and X s (V*D>xs):
v'D.xs=^£-;t (2.18) kXS • Xy
When V DSs and V D,XS are smaller than the available pre-denitrification volume (VPD)
equation 2.16 is valid to estimate the nitrate effluent quality. In the opposite situation the
calculated wastewater denitrification potentials have to be reduced with a factor VPD/V*D. To
obtain a more realistic nitrate effluent quality, equation 2.16 should be modified to:
SN0,e =NK]J SNlu-Norg,e -OLJj<-(^£B-DPss +-£e-DPxs+DPend); mgN.f' (2.19)
* Qj in £.d'1
The denitrification capacity (DC), the amount of nitrate that can be removed from a system
with given wastewater characteristics, process configuration and activated sludge
characteristics can be estimated using equation 2.20, which constitutes part of eq. 2.19:
DC=l£^DPss+^DPxs+DPmd; mgN.f1 (2.20) VD,SS VD,XS
From a series of NUR-tests with settled wastewater and activated sludge from a N-removal
pilot-plant, a number of wastewater denitrification potentials was obtained with average
values of DPSs = 8.7 and DPXs = 16 mgN.r ' . With the total denitrification potential of the
wastewater, approximately 4 1 % of the influent NKJ could be denitrified. These values
characterised wastewater of an average total COD of 430 mg J'[ and NKj of 60 mgN.r ' .
43
A method to estimate denitrification potential for pre-denitrifwation system using batch NUR- test
Equation 2.19 was implemented to predict the nitrate effluent quality of the pilot plant, fed
with the same wastewater as examined in the NUR-tests. Taking into consideration the
amount of N removed via biomass assimilation (7.6 mgN..f', 13% of total N load), the basic
potential of the biomass (DPend=13.7 mgN.f', 23% of total N load), SNHe = 0.5 and Norg>e= 0.7
mgN.r1, the predicted effluent nitrate quality was 12.8 mg NX1. This was in close accordance
with the average results from the pilot plant measured at this time.
2.3.3 WASTEWATER CHARACTERISATION FOR BIOLOGICAL N-REMOVAL SYSTEM
NUR-tests with a pulse dose of wastewater enable to characterise the wastewater for Ss and Xs. The biodegradable fractions be estimated from a NUR-test (Figure 2.3) with the following equations:
^ = 2.86-A(S^ + 0 . 6 - 5 ^ j _ = 2&6- A(SNo)l J _ . ^ ^ ( 2 2 J )
1 ~ ^HD fww 1~~ ^HD fmw
2.S6-A(SNOi+0.6-Sm2h^=2S6.A{S^2J_ 1 - V f 1 _ Y f 1 'HD Jww L 'HD Jmw
With the characterisation of wastewater, by following the denitrification rate in a NUR-test, problems can appear when a possible nitrite accumulation is not taken into account. When the accumulation of nitrite is negligible, the nitrite gradient in equation 2.21 and 2.22 can be neglected. When accumulation of nitrite attains a certain level but it was neglected, the wastewater characterisation will be less accurate regarding Ss and Xs. For instance, a presence of 10% SNO2 on every mg of SNO3 (e.g. SNO2=2 mg.-T1, SNO3=20 mgl'x), when not included in calculations, causes approximately 6% underestimation for both Ss and Xs.
For the estimation of wastewater characteristics an improper choice of YHD has even more significant consequences for the accuracy of the method. For example, a change of YHD from 0.6 (measured value) to 0.67 (default value, e.g. HENZEET AL., 1996) causes an overestimation of Ss with 21%. This shows that the measurement or a proper choice of YHD is advisable.
2.3.4 WASTEWATER CHARACTERISATION FOR BIOLOGICAL N&P-REMOVAL SYSTEMS
For activated sludge systems with biological P-removal the presented method to estimate the denitrification potential and capacity can be used but precaution is recommended, especially for the interpretation of the wastewater characterisation. Due to co-existing processes of denitrification and release and uptake of phosphates at anoxic conditions the clear difference between denitrification rates on Ss, Xs and endogenous substrate can be deteriorated. In Figure 2.5 a NUR-test result is presented with a pulse dose of acetate to activated sludge from a plant with biological N&P-removal. Two substrate denitrification rates are observed. In phase 1, according to recent reports (BARKER AND DOLD, 1996), three processes occur simultaneously:
44
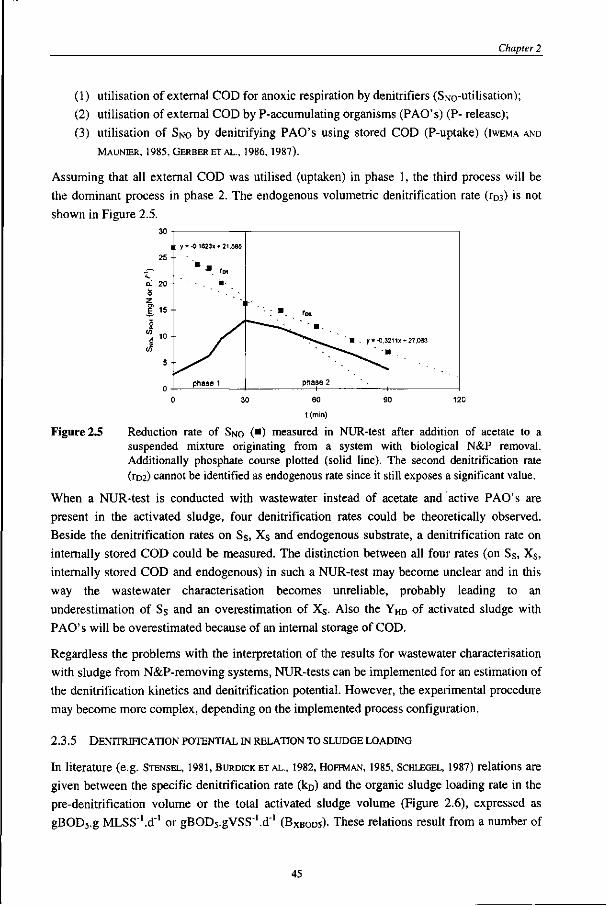
Chapter 2
(1) utilisation of external COD for anoxic respiration by denitrifiers (SNo-utilisation);
(2) utilisation of external COD by P-accumulating organisms (PAO's) (P- release);
(3) utilisation of SNO by denitrifying PAO's using stored COD (P-uptake) (IWEMA AND
MAUNffiR, 1985, GERBERETAL., 1986, 1987).
Assuming that all external COD was utilised (uptaken) in phase 1, the third process will be
the dominant process in phase 2. The endogenous volumetric denitrification rate (^3) is not
shown in Figure 2.5.
y = -0.1623x + 21,585
phase 1
• . y = -0,3211x +27,063
' •
phase 2
60
t (min)
Figure 2.5 Reduction rate of SNO (•) measured in NUR-test after addition of acetate to a suspended mixture originating from a system with biological N&P removal. Additionally phosphate course plotted (solid line). The second denitrification rate (ro2) cannot be identified as endogenous rate since it still exposes a significant value.
When a NUR-test is conducted with wastewater instead of acetate and active PAO's are
present in the activated sludge, four denitrification rates could be theoretically observed.
Beside the denitrification rates on Ss, X$ and endogenous substrate, a denitrification rate on
internally stored COD could be measured. The distinction between all four rates (on Ss, Xs,
internally stored COD and endogenous) in such a NUR-test may become unclear and in this
way the wastewater characterisation becomes unreliable, probably leading to an
underestimation of Ss and an overestimation of Xs. Also the YHD of activated sludge with
PAO's will be overestimated because of an internal storage of COD.
Regardless the problems with the interpretation of the results for wastewater characterisation
with sludge from N&P-removing systems, NUR-tests can be implemented for an estimation of
the denitrification kinetics and denitrification potential. However, the experimental procedure
may become more complex, depending on the implemented process configuration.
2.3.5 DENITRIFICATION POTENTIAL IN RELATION TO SLUDGE LOADING
In literature (e.g. STENSEL, 1981, BURDICK ET AL., 1982, HOFFMAN, 1985, SCHLEGEL, 1987) relations are
given between the specific denitrification rate (kD) and the organic sludge loading rate in the
pre-denitrification volume or the total activated sludge volume (Figure 2.6), expressed as
gBOD5.g MLSS'.d"1 or gBOD5.gVSS"1.d"1 (BXBODS)- These relations result from a number of
45
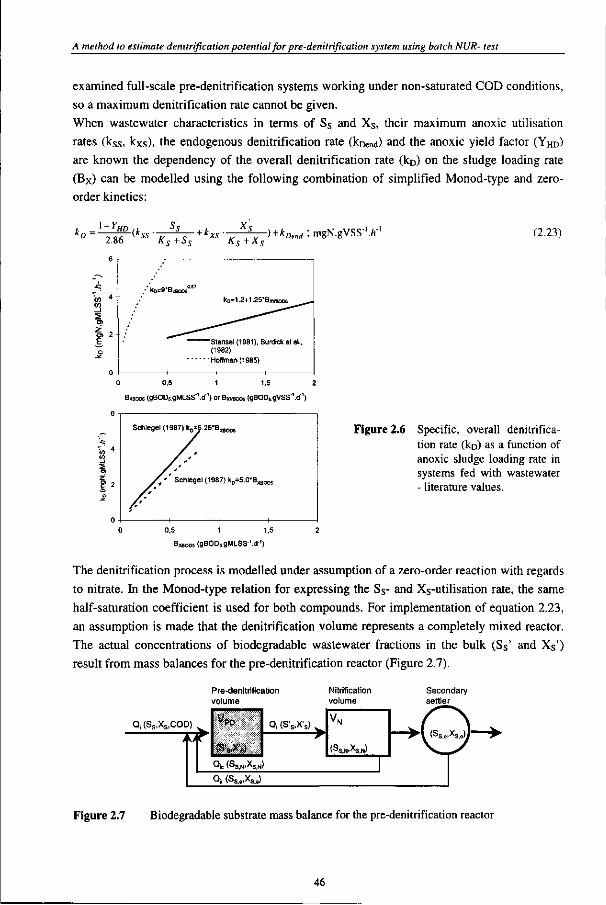
A method to estimate denitrification potential for pre-denitrification system using batch NUR- test
examined full-scale pre-denitrification systems working under non-saturated COD conditions,
so a maximum denitrification rate cannot be given.
When wastewater characteristics in terms of Ss and Xs, their maximum anoxic utilisation
rates (kSs, kXs), the endogenous denitrification rate (knend) and the anoxic yield factor (YHD)
are known the dependency of the overall denitrification rate (kp) on the sludge loading rate
(Bx) can be modelled using the following combination of simplified Monod-type and zero-
order kinetics:
kn=~ 2.86
-(ks K r + S r
- + jty
Ks + X. "> + W ; mgN.gVSS1./!-' (2.23)
D> 2
£
kD=1.2+1.25-BxvK>DS
"Stensel (1981), Burdick et a (1982)
•Hoffman (1985)
0 0.5 1 1.5 2
BXBOOS (gBODs.gMLSS'.d"') or BXVBOOS(gBODs.gVSS'.d'1)
Schlegel(1987)kD=6.25-BXBC>D5
f ' Schlegel(1987)ko=5.0*BXBOO5
Figure 2.6 Specific, overall denitrification rate (ko) as a function of anoxic sludge loading rate in systems fed with wastewater - literature values.
0 0,5 1 1,5 2
BXBODS (gBOD5gMLSS-'.d-')
The denitrification process is modelled under assumption of a zero-order reaction with regards
to nitrate. In the Monod-type relation for expressing the Ss- and Xs-utilisation rate, the same
half-saturation coefficient is used for both compounds. For implementation of equation 2.23,
an assumption is made that the denitrification volume represents a completely mixed reactor.
The actual concentrations of biodegradable wastewater fractions in the bulk (Ss' and X s ' )
result from mass balances for the pre-denitrification reactor (Figure 2.7).
Q, (Ss,Xs,COD) ^
> k> r
Pre-denitrification
volume
VP0
Qjc (Ss.N'^S.N
Q. (S's.X's
) Qr(Ss,..Xs.J
Nitrification
volume
(SS,N-XS,N)
Secondary
settler
> - ( ( S s . . . X s , ^
Figure 2.7 Biodegradable substrate mass balance for the pre-denitrification reactor
46
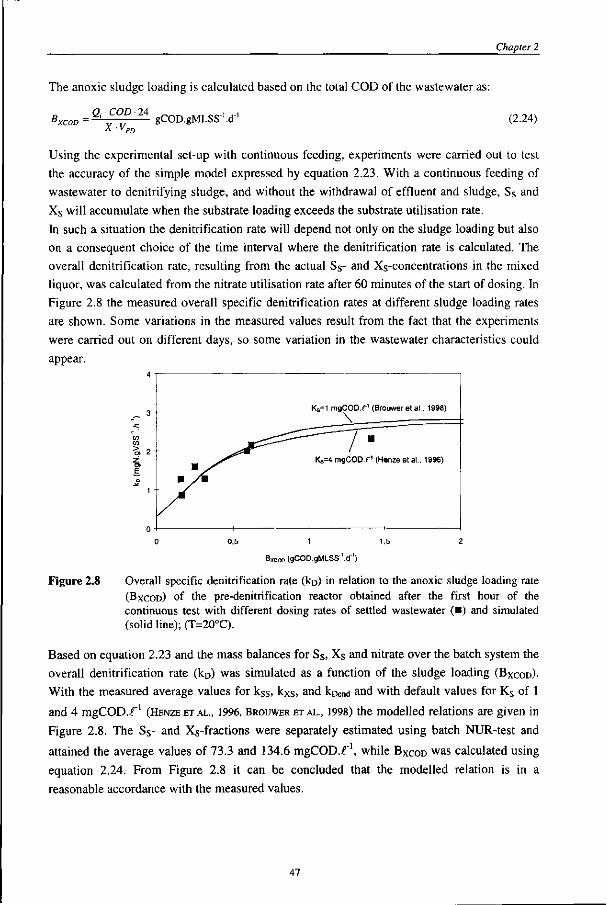
Chapter 2
The anoxic sludge loading is calculated based on the total COD of the wastewater as:
Q, COD 24 B
xv„. gCOD.gMLSS'.d1 (2.24)
Using the experimental set-up with continuous feeding, experiments were carried out to test
the accuracy of the simple model expressed by equation 2.23. With a continuous feeding of
wastewater to denitrifying sludge, and without the withdrawal of effluent and sludge, S s and
Xs will accumulate when the substrate loading exceeds the substrate utilisation rate.
In such a situation the denitrification rate will depend not only on the sludge loading but also
on a consequent choice of the time interval where the denitrification rate is calculated. The
overall denitrification rate, resulting from the actual Ss- and Xs-concentrations in the mixed
liquor, was calculated from the nitrate utilisation rate after 60 minutes of the start of dosing. In
Figure 2.8 the measured overall specific denitrification rates at different sludge loading rates
are shown. Some variations in the measured values result from the fact that the experiments
were carried out on different days, so some variation in the wastewater characteristics could
appear.
Ks=1 mgCOD.f' (Brouwer etal., 19
Ks=4 mgCOD.f' (Henze et al., 1996)
0,5
Bxcoo (gCOD.gMLSS'.d')
Figure 2.8 Overall specific denitrification rate (ko) in relation to the anoxic sludge loading rate (BXCOD) of the pre-denitrification reactor obtained after the first hour of the continuous test with different dosing rates of settled wastewater (•) and simulated (solid line); (T=20°C).
Based on equation 2.23 and the mass balances for Ss, X s and nitrate over the batch system the
overall denitrification rate (kD) was simulated as a function of the sludge loading (BXCOD)-
With the measured average values for kSs, kXs, and kDend and with default values for Ks of 1
and 4 mgCOD.f' (HENZE ET AL., 1996, BROUWER ET AL., 1998) the modelled relations are given in
Figure 2.8. The Ss- and Xs-fractions were separately estimated using batch NUR-test and
attained the average values of 73.3 and 134.6 mgCOD.f \ while BXCOD was calculated using
equation 2.24. From Figure 2.8 it can be concluded that the modelled relation is in a
reasonable accordance with the measured values.
47
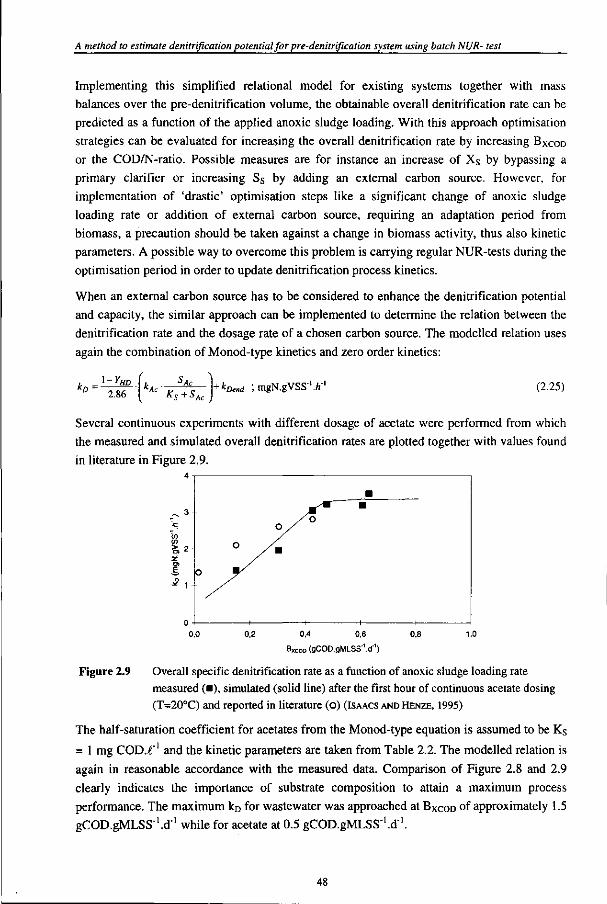
A method to estimate denitrification potential for pre-denitrification system using batch NUR- test
Implementing this simplified relational model for existing systems together with mass
balances over the pre-denitrification volume, the obtainable overall denitrification rate can be
predicted as a function of the applied anoxic sludge loading. With this approach optimisation
strategies can be evaluated for increasing the overall denitrification rate by increasing BXCOD
or the COD/N-ratio. Possible measures are for instance an increase of Xs by bypassing a
primary clarifier or increasing Ss by adding an external carbon source. However, for
implementation of 'drastic' optimisation steps like a significant change of anoxic sludge
loading rate or addition of external carbon source, requiring an adaptation period from
biomass, a precaution should be taken against a change in biomass activity, thus also kinetic
parameters. A possible way to overcome this problem is carrying regular NUR-tests during the
optimisation period in order to update denitrification process kinetics.
When an external carbon source has to be considered to enhance the denitrification potential
and capacity, the similar approach can be implemented to determine the relation between the
denitrification rate and the dosage rate of a chosen carbon source. The modelled relation uses
again the combination of Monod-type kinetics and zero order kinetics:
2.86 K. + S. + kDend ; mgN.gVSS'.ft'' (2.25)
Several continuous experiments with different dosage of acetate were performed from which
the measured and simulated overall denitrification rates are plotted together with values found
in literature in Figure 2.9.
0,2 0,4 0,6
BXCOD (gCOD.gMLSS'.d'1)
Figure 2.9 Overall specific denitrification rate as a function of anoxic sludge loading rate
measured (•), simulated (solid line) after the first hour of continuous acetate dosing
(T=20°C) and reported in literature (o) (ISAACS AND HENZE, 1995)
The half-saturation coefficient for acetates from the Monod-type equation is assumed to be Ks
= 1 mg COD.f' and the kinetic parameters are taken from Table 2.2. The modelled relation is
again in reasonable accordance with the measured data. Comparison of Figure 2.8 and 2.9
clearly indicates the importance of substrate composition to attain a maximum process
performance. The maximum kD for wastewater was approached at BXCOD of approximately 1.5
gCOD.gMLSS'.d"1 while for acetate at 0.5 gCOD.gMLSS'.d1 .
48
Chapter 2
The information about the relation between the sludge loading rate and the obtainable denitrification rate for the external carbon source is of interest in processes where denitrification has to be enhanced. Possible implementations are the design or optimisation of the anoxic reactor volume, calculation of the dosage rate of the carbon source and for the development of control strategies where the rate of external carbon dosage constitutes a control variable.
2.4 CONCLUSIONS
Anoxic NUR-tests, with a pulse dosage of wastewater to activated sludge from pre-denitrification systems, can provide with a detailed description of the denitrification kinetics. Denitrification rates associated with the influent Ss- and Xs-fractions, endogenous denitrification rate and anoxic utilisation rate of Ss and Xs can be estimated. With the same anoxic batch experiment the wastewater characterisation regarding biodegradable COD fractions (Ss and Xs) can be determined. The estimation of the anoxic yield factor (YHD) for the examined activated sludge and for the given wastewater is hereby essential.
For a successful and comprehensive interpretation of the NUR-test results, the endogenous denitrification rate must be reached and this depends on the initial nitrate concentration of the experiment and the applied S/Xv-ratio. For estimating the kinetic parameters or the wastewater characterisation precaution should be taken against the accumulation of nitrite and biological phosphorus removal activity. Beside nitrate, it is advised to follow nitrite and phosphate throughout the duration of a NUR-test.
A NUR-test allows to determine the denitrification potential of the wastewater and to estimate the overall denitrification potential of the plant. In that way the minimal obtainable nitrate effluent quality can be predicted and decisions can be made about improving the process when necessary. Determining the denitrification potential based on the wastewater and activated sludge characteristics in combination with a good description of the existing system give more precise information about the denitrification capacity than the COD/N-ratio, which is often used for design and optimisation decisions.
When kinetic parameters are known the relation between the overall denitrification rate and the applied anoxic sludge loading of the pre-denitrification volume can be modelled. This relation provides information for optimising the denitrification by, for instance, increasing the organic load or COD/N-ratio with respect to Ss and/or Xs and this can be useful for decision making about enhancing the process with e.g. an external carbon source.
49
A method to estimate denitrification potential for pre-denitrification system using batch NUR- test
LIST OF SYMBOLS
BXCOD COD sludge loading rate (g COD.g MLSS'.d"1)
BXBOD5 BOD 5 sludge loading rate (g BOD5 .g MLSS'.d"1)
COD total COD concentration of wastewater (mg . f ' )
DO dissolved oxygen (mg02-f ' )
DP denitrification potential, subscripts: Ss-on S s , X s-on X s and end- endogenous (mg N . f ' )
ZDP total denitrification potential of a system (mg N . f ' )
/»» volumetric wastewater fraction in the total volume of mixed liquor (-) iN fraction of N in activated sludge (mgN.mgMLSS1) k anoxic maximum specific substrate utilisation rate; subscripts: Ac - of acetate-COD, Ss - of Ss, X s -
ofXstmgCOD.gVSS-'V) kD specific denitrification rate; subscripts: Ac - on acetate, end - endogenous, tot - total, Ss, X s on the
Ss-, Xs-fraction (mgN.gVSS \hA)
K s half-saturation coefficient from Monod-type equation for S s or X s utilisation (mg COD. f ' )
ML(V)SS mixed liquor (volatile) suspended solids ( g . f ' )
NKj Kjeldahl-N; subscript: (' - influent; in COD/N ratio N=NKj (mg N . f ' )
Norg Organic nitrogen (mg N.£"')
NUR nitrate utilisation rate OUR oxygen utilisation rate Px removal rate of surplus sludge (mg MLSS.d"1)
Q flow; subscr. i,e - influent, effluent, t - total, ic - internal recycle, ir - return sludge (t.hA)
r volumetric substrate utilisation rate, subscr. S s- of S s , X s- of X s (mg C O D X '.h') re volumetric actual denitrification rate: subscripts: Ss-on Ss, X s-on X s , end-endogenous, 1,2,3 -
subsequent as measured in the NUR-test (mg N.r ' . /T1)
S/Xv initial substrate to microorganisms ratio (g COD.g VSS"1)
SAC concentration of acetate in the bulk, subscript: i - initial (mgCOD.f 1 )
S, soluble inert COD (mgCOD.f ' )
SNH soluble ammonia-N (mg N . f ' )
S N 0 sum of nitrate and nitrite-nitrate equivalent (mgN. f ' )
SN 0 2 nitrite-N (mgN.f 1 )
SN 0 3 nitrate-N (mgN.f 1 )
Sp04 ortho-phosphate (mgP. f ' )
S s soluble, readily biodegradable COD; superscript: ' - actual in the bulk, N - in nitrification zone, e -
effluent (mg C O D . f ' )
t time interval (h)
VAS activated sludge volume (I)
V volume; subscripts : PD - pre-anoxic, SD - secondary anoxic, N - nitrification (()
VD total anoxic volume (including pre- and post-anoxic zone) volume (I)
V D required denitrification volume; subscripts: S s , X s - required to utilise all S s , X s respectively (()
V w w wastewater volume (f.)
X, particulate inert COD (mgCOD.f ' )
Xs particulate, slowly biodegradable COD; superscript: ' - actual in the bulk, N - in nitrification zone,
e - effluent (mg COD. f 1 )
X v volatile activated sludge (gVSS. f ' )
YH heterotrophic aerobic yield (mg CODbiomass.mgCODuli,isKf •) YHD heterotrophic anoxic yield (mg CODbiomass.mgCODuli] ised ' ) 2.86 oxygen equivalent of nitrate-N in oxidation-reduction reaction (mgCOD.mgN 1)
50
LITERATURE
Chapter 2
Barker P. S. and Dold P.L. (1996) Denitrification behaviour in biological excess phosphorus removal activated sludge systems. Wat. Res. 30, (4), 769-780.
Brouwer, H., Klapwijk, A., Keesman, K.J. (1998) Identification of activated sludge and wastewater characteristics using respirometric batch-experiments. Wat. Res. 32 (4), 1240-1254.
Burdick, C.R., Refling, D.R., Stensel, H.D. (1982) Advanced biological treatment to achieve nutrient removal. J. Wat. Poll. Cont. Fed., 54: 1078.
Cech, J .S. , Chudoba, J., and Grau, P. (1984) Determination of kinetic constants of activated sludge microorganisms. Wat. Sci. Tech., 17, 259-272.
Clayton, J.A., Ekama, G. A., Wentzel, M.C. and Marais, G.v.R. (1991) Denitrification kinetics in biological nitrogen and phosporus removal activated sludge systems treating municipal waste waters. Wat. Sci. Tech. 23, 1025-1035.
Cokgor Ubay, E., Sozen, S., Orhon, D. and Henze, M. (1998) Respirometric analysis of activated sludge behaviour - II. Assesment of the readily biodegradable substrate. Wat. Res. 32, (2), 461-475.
Dold, P.L., Ekama, G.A. and Marais G.v.R. (1980) A general model for activated sludge process. Prog. Wat. Technol., 12 (6), 47-77.
Ekama, G.A., Marais, G.v.R., Siebritz, I.P., Pitman, A.R., Keay, G.F.P., Keay, G.F.P., Buchnan, L., Gerber, A. and Smollen, M. (1984) Theory, design and operation of nutrient removal activated sludge processes. For Water Research Commission by the University of Cape Town, City Council of Jahannesburg and the National Institute for Water Research of the CSIR, Pretoria.
Ekama, G.A., Dold, P.L. and Marais, G.v.R. (1986) Procedures for determining influent COD fractions and the maximum specific growth rate of heterotrophs in activated sludge system. Wat. Sci. Tech., 18(6), 91-114.
Gerber, A., Mostert, E.S., Winter, C.T. and de Villiers, R.H. (1986) the effect of acetate and other short-chain carbon compounds on the kinetics of biological nutrient removal. Water SA 12,7-12.
Gerber, A., de Villiers, R.H., Mostert, E.S. and van Riet, C. J. (1987) The phenomenon of simultaneous phosphate uptake and release and its importance in biological nutrient removal. In Biological Phosphate Removal from Wastewaters (Edt. Ramadori, R.), Pergamon Press, Oxford.
Hallin, S., Rothman, M., and Pell, M. (1996) Adaptation of denitrifying bacteria to acetate and
methanol in activated sludge. Wat. Res. 30, (6), 1445-1450.
Henze M., (1986) Nitrate versus oxygen utilisation rates in wastewater and activated sludge systems. Wat. Sci.Tech. 18, 115-122.
Henze M., Grady, C.P., Leslie, Gujer, W., Marais, G.v.R. and Matsuo, T. (1987) Activated Sludge Model No.l, Scientifical and Technical Report No.l.IAWPRC, London.
Henze M., (1992) Characterisation of wastewater for modelling of activated sludge processes. Wat. Sci. Tech. 25, (6), 1-6.
Henze M., Gujer, W., Mino, T., Matsuo, T., Wentzel, M.C, Marais, G.v.R. (1996) Activated Sludge Model No.2.Scientifical and Technical Report No.3.
Hofmann, H. (1985) Bemessungsvorschlag fur die vorgeschaltete Denitrifikation. Berichte aus Wassergiigutewirtschaft und Gesundheitsingeniurwesen, Bd.69, TU Munchen, 302-333.
Isaacs, S.H., Henze, M., S0eberg H., and Kiimmel, M. (1994) External carbon source addition as a means to control an activated sludge nutrient removal process. Wat. Res., 28 (3), 511-520.
Isaacs, S.H. and Henze, M. (1995) Controlled carbon source addition to an alternating nitrification-denitrification wastewater treatment process including biological P removal. Wat. Res. 29(1), 77-89.
Iwema, A. and Maunier, A. (1985) Influence of nitrate on acetic acid induced biological phosphate removal. Wat. Sci. Tech. 17 (11), 289-294.
Kristensen, G.H., J0rgensen, P.E. and Henze, M. (1992) Characterisation of functional microorganisms groups and substrate in activated sludge and wastewater by AUR, NUR and OUR. Wat. Sci. Tech.,25 (6), 43-57.
Metcalf and Eddy (1991) Wastewater engineering. Treatment, disposal and reuse. 3rd edition, McGraw-Hill.
Naidoo, V., Urbain, V. and Buckley, C.A. (1998) Characterisation of wastewater and activated sludge from European municipal wastewater treatment plant using the NUR-test. Wat. Sci. Tech. 38(1), 303-310.
Orhon, D., Sozen, S. and Artan, N. (1996) The effect of heterotrophic yield on the assement of the correction factor for anoxic growth. Wat. Sci. Tech. 34 (5-6), 67-74.
Popel, H.J. (1986) Bemessungsansatze zur Nitrifikation unde Denitrifikation in Belebunganlagen. ATV-Seminar Weitergehende Abwasserreinigung. 22-23 May, Essen.
51
A method to estimate denitrification potential for pre-denitrification system using batch NUR- test
Randall, C.W., Barnard, J.L. and Stensel, H.D. (1992) Design and retrofit of wastewater treatment plants for biological nutrient removal. Water Quality Management Library. Volume 5.
Scheer, H. and Seyfried, C.F. (1994) Concepts for determining the readily biodegradable substrate in the sewage and procedures for dimensioning the biological phosphorus removal. Korrespondenz Abwasser, 41, 3/94.
Scheer, H. (1995) Moglichkeiten zur Erfassung der Konzentration an leicht abbaubaren organischen Kohlenstoffverbindungen im Abwasser. Proceedings of the 4th Symposium: Erfahrungen mit Analysen- und ProceBmeBsgeraten in Abwasserreinigungs-anlagen. Ostfildern (Nellingen), Germany, 27-28 November.
Schlegel, S., (1987) Bemessung und Ergebnisse von Belebungsanlagen mit Nitrifikation und vorgeschalteter Kaskadendenitrification. Wasser -Abwasser, 128, 422-431.
SDA (1989) Principles and practice of phosphorus and nitrogen removal from municipal wastewater. The Soap and Detergents Association, New York.
Sollfrank, U. and Gujer, W. (1991) Characterisation of domestic wastewater for mathematical modelling of the activated sludge process. Wat. Sci. Tech., 23 (4-6), 1057-1066.
Spanjers, H. and Vanrolleghem, P. (1995) Respirometry as a tool for rapid characterisation of wastewater and activated sludge. Wat. Sci. Tech., 31(2), 105-114.
Sperandio, M., Urbain, V., Audic, J.M. and Paul, E. (1999) Use of carbon dioxide evolution rate for determining heterotrophic yield and characterising denitrifying biomass. Wat. Sci. Tech., 39, (1), 139-147.
Stensel, H.D., (1981) Biological nitrogen removal system design. Water Amer. Inst, of Chem. Engrs.,237.
Vanrolleghem, P., Spanjers, H., Petersen, B., Ginestet, P. and Takacs, I. (1999) Estimating (combination of) Activated Sludge Model No. 1 parameters and components by respirometry. Wat. Sci. Tech., 39, (1), 195-214.
Van Haandel, A.C., Ekama, G.A. and Marais, G.v.R. (1981a) The activated sludge process - 3. Single sludge denitrification. Wat. Res. 15, 1135-1152.
52
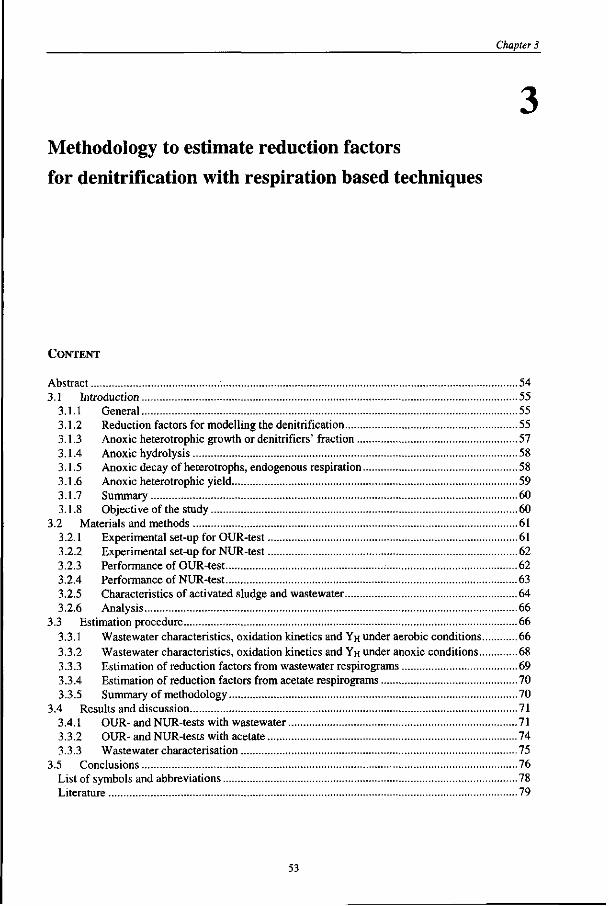
Chapter 3
Methodology to estimate reduction factors for denitrification with respiration based techniques
CONTENT
Abstract 54 3.1 Introduction 55
3.1.1 General 55 3.1.2 Reduction factors for modelling the denitrification 55 3.1.3 Anoxic heterotrophic growth or denitrifiers' fraction 57 3.1.4 Anoxic hydrolysis 58 3.1.5 Anoxic decay of heterotrophs, endogenous respiration 58 3.1.6 Anoxic heterotrophic yield 59 3.1.7 Summary 60 3.1.8 Objective of the study 60
3.2 Materials and methods 61 3.2.1 Experimental set-up for OUR-test 61 3.2.2 Experimental set-up for NUR-test 62 3.2.3 Performance of OUR-test 62 3.2.4 Performance of NUR-test 63 3.2.5 Characteristics of activated sludge and wastewater 64 3.2.6 Analysis 66
3.3 Estimation procedure 66 3.3.1 Wastewater characteristics, oxidation kinetics and YH under aerobic conditions 66 3.3.2 Wastewater characteristics, oxidation kinetics and YH under anoxic conditions 68 3.3.3 Estimation of reduction factors from wastewater respirograms 69 3.3.4 Estimation of reduction factors from acetate respirograms 70 3.3.5 Summary of methodology 70
3.4 Results and discussion 71 3.4.1 OUR- and NUR-tests with wastewater 71 3.3.2 OUR-and NUR-tests with acetate 74 3.3.3 Wastewater characterisation 75
3.5 Conclusions 76 List of symbols and abbreviations 78 Literature 79
53
Methodology to estimate reduction factors for denitrifwation with respiration based techniques
ABSTRACT
Activated sludge, exposed under anoxic and aerobic conditions to organic substrate, shows a similar
respirometric behaviour pattern. Depending on the type of organic substrate different respiration rates
are observed. The subsequent respiration rates are usually observed to be smaller under anoxic
conditions. To describe mathematically the denitrification process, the aerobic activated sludge model
can be used if appropriate reduction factors (T|) are included in the equations describing the
subsequent respiration rates.
In this chapter a methodology is presented to estimate three reduction factors for anoxic respiration
rates: Ss-utilisation (T|i), Xs-hydrolysis (T|2) and endogenous respiration (T|3), under assumption that
the same distribution of organic wastewater fractions was recognised under aerobic and anoxic
conditions. The methodology consists of two integrated parts: an experimental part and an estimation
procedure. The experimental part implemented two respiration tests: oxygen utilisation rate (OUR)
and nitrate utilisation rate (NUR) performed under well-defined and analogous experimental
conditions. For the estimation procedure two simplified models were used: an aerobic COD-oxidation
model and a denitrification model. The type of substrate determined the range of information that
could be attained from the series of respiration tests. Except of conversion kinetics (Ss-oxidation, Xs-
hydrolysis and endogenous respiration) some attention was paid on the magnitude of difference for
the heterotrophic yield coefficient and biodegradable organic wastewater fractions as found under
aerobic and anoxic conditions. A differentiation between the anoxic and aerobic heterotrophic yield
coefficient may contribute in a more precise description of the denitrification process.
Some respiration tests were performed with settled domestic wastewater and different activated
sludge samples. Inherent estimation procedures were implemented. It revealed that the values of
reduction factors vary strongly in function of activated sludge characteristics and process
configuration.
54
Chapter 3
3.1 INTRODUCTION
3.1.1 GENERAL
Pulse addition of a wastewater sample to activated sludge, under aerobic and anoxic
conditions, shows usually a similar three-phase behaviour of respectively the oxygen and
nitrate consumption. In the first phase a high respiration rate results from utilisation of soluble
readily biodegradable COD (Ss). It is followed by a slower respiration on hydrolysis products
of particulate slowly biodegradable COD (Xs). Finally the slowest, endogenous respiration is
reached when all extracellular substrate is terminated (STERN AND MARAIS, 1974, WILSON AND
MARAIS, 1976, MARSDEN AND MARAIS, 1976). The first attempts to model denitrification with the
same equations as for aerobic substrate oxidation, resulted in a higher simulated anoxic
respiration than measured (VAN HAANDEL ET AL., 1981a,b). This suggested the introduction of
reduction factors, which enabled to model the aerobic and anoxic kinetics with the same
relations. Several approaches appeared, some suggesting that all respiration rates are retarded
under anoxic conditions and others that only anoxic respiration on Ss is slower. No consensus
has been reached till now. The following literature review describes some approaches.
3.1.2 REDUCTION FACTORS FOR MODELLING THE DENITRIFICATION
VAN HAANDEL ETAL. (1981a,b) undertook an attempt to incorporate denitrification kinetics into the
aerobic kinetic model of DOLD ET AL. (1980), by assuming a bi-substrate character of the
wastewater, regarding the biodegradable organic fractions S s and Xs. For an experimental
plug-flow reactor the oxygen profile was simulated and compared with the measured nitrate
profile expressed in nitrate-oxygen equivalents (1 mg SNO3 = 2.86 mg O2). A three-phase
behaviour appeared in both profiles with comparable slopes in the primary phase (Ss-
oxidation) and less steep slopes in the second and third phase of the denitrification profile
(Figure 3.1). Furthermore, the removed amount of nitrate-oxygen equivalents in the primary
phase was equal to the removed amount of oxygen in the primary phase. This allowed them to
conclude that under anoxic conditions the same amount of Ss is utilised as under aerobic
conditions, at approximately the same rate. This was confirmed by STILL ET AL. (1986) with
aerobic and anoxic tests using sludge from systems with an anoxic-aerobic sequence.
The similarity of the nitrate and oxygen profiles was sufficiently evident to accept in general
the aerobic kinetic model of DOLD ET AL. (1980) as a basis for the modelling of denitrification
behaviour. However, to allow a quantitative description, a modification had to be made.
Because the removal rate of nitrate-oxygen equivalents in the second and third phase was
lower than the corresponding simulated removal of oxygen, the utilisation rate of X s and/or
the endogeneous respiration in an anoxic environment must have been lower. With a
reduction factor r\n- 0.38 expressing the decreased anoxic hydrolysis rate of X s , it was
possible to simulate the experimental nitrate profile in the second and third respiration phase
with close correspondence. The authors hypothesised that the reduced anoxic activity
concerning the last two respiration phases, can be a result of reduced enzymatic activity.
55
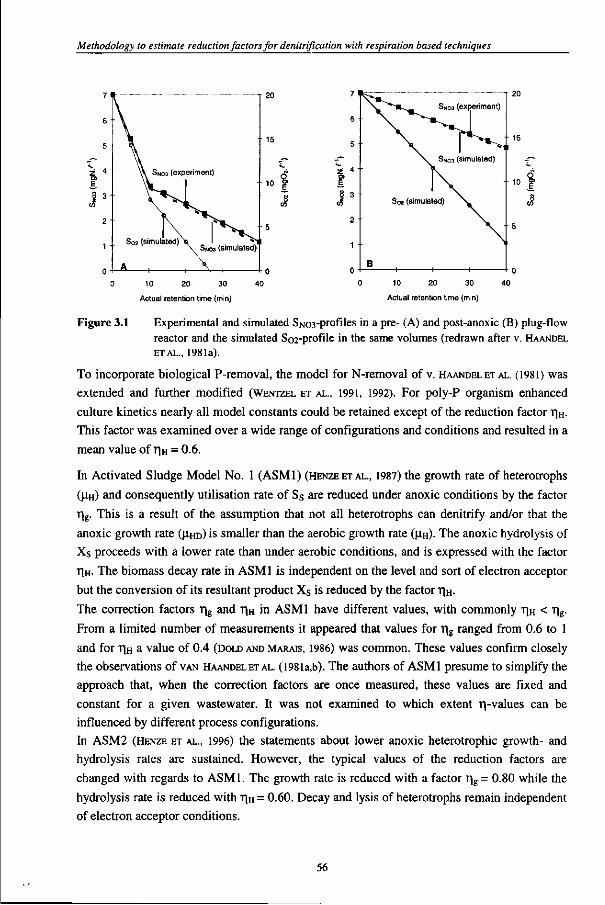
Methodology to estimate reduction factors for denitrification with respiration based techniques
o 10 20 30
Actual retention time (min)
0 10 20 30 40
Actual retention time (min)
Figure 3.1 Experimental and simulated SN03-Pr°files in a pre- (A) and post-anoxic (B) plug-flow reactor and the simulated So2-profile in the same volumes (redrawn after v. HAANDEL ETAL., 1981a).
To incorporate biological P-removal, the model for N-removal of v. HAANDEL ETAL. (1981) was
extended and further modified (WENTZEL ET AL., 1991, 1992). For poly-P organism enhanced
culture kinetics nearly all model constants could be retained except of the reduction factor r\H-
This factor was examined over a wide range of configurations and conditions and resulted in a
mean value of T]H = 0.6.
In Activated Sludge Model No. 1 (ASM1) (HENZEETAL., 1987) the growth rate of heterotrophs
((XH) and consequently utilisation rate of Ss are reduced under anoxic conditions by the factor
rig. This is a result of the assumption that not all heterotrophs can denitrify and/or that the
anoxic growth rate (U.HD) is smaller than the aerobic growth rate (U.H)- The anoxic hydrolysis of
Xs proceeds with a lower rate than under aerobic conditions, and is expressed with the factor
r|H. The biomass decay rate in ASM1 is independent on the level and sort of electron acceptor
but the conversion of its resultant product Xs is reduced by the factor T|H.
The correction factors r|g and T|H in ASM1 have different values, with commonly T|H < "Hg-
From a limited number of measurements it appeared that values for r|g ranged from 0.6 to 1
and for T|H a value of 0.4 (DOLD AND MARAIS, 1986) was common. These values confirm closely
the observations of VAN HAANDEL ETAL. (I981a,b). The authors of ASM1 presume to simplify the
approach that, when the correction factors are once measured, these values are fixed and
constant for a given wastewater. It was not examined to which extent revalues can be
influenced by different process configurations.
In ASM2 (HENZE ET AL., 1996) the statements about lower anoxic heterotrophic growth- and
hydrolysis rates are sustained. However, the typical values of the reduction factors are
changed with regards to ASM1. The growth rate is reduced with a factor r|g = 0.80 while the
hydrolysis rate is reduced with r|H = 0.60. Decay and lysis of heterotrophs remain independent
of electron acceptor conditions.
56
Chapter 3
In ASM2d (HENZE ET AL„ 1999) the overall process description becomes more complicated
because bio-P organisms (phosphate accumulating organisms, XPA0) are divided into
organisms that can and cannot denitrify. This fact induced the necessity to introduce
additional reduction factors, for the anoxic storage rate of polyphosphate (0.60) and for the
growth rate of XpAo (0.60).
In ASM3 (GUJER ET AL., 1999) the decay approach is replaced by an endogenous respiration,
which describes all forms of biomass loss and energy requirement for its maintenance. The
endogenous respiration rates under anoxic conditions are in ASM3 50% of these under
aerobic conditions. Hydrolysis of X$ is active with the same rate, independent of electron
acceptor conditions.
In design approaches that use the general parameter BOD5 instead of detailed wastewater
characteristics, one overall reduction factor (r|) is used. KAYSER (1983) assumes that the
degradation of BOD5 under anoxic condition is 25% slower than under aerobic conditions.
The same reduction factor (r)=0.75) is introduced in the steady state HSA-model (BOHNKE ET
AL., 1989, ATV, (1991)). ARGAMAN (1995 a,b) implements a reduction coefficient r|=0.85 for
modelling the removal rate of 'effective' BOD under anoxic conditions. In recent design
approaches of KAYSER (1997) a bi-substrate character of wastewater is introduced by a division
of BOD into soluble and particulate BOD. For the growth, hydrolysis and endogenous
respiration rates under denitrifying conditions he introduced three different reduction factors,
respectively r\g = 0.9, r\H - 0.7 and r)E = 0.6, based on experimental evidences of ERMEL (1983),
TEICHGRABER(1988), HARTWIG(1993) and KRAUTH ANDSCHWENTER( 1994).
In the following paragraphs, justifications are given for the necessity to apply reduction
factors in activated sludge models as proposed by different authors for different respiration
phases. Further, more examples of proposed numerical values are listed.
3.1.3 ANOXIC HETEROTROPHIC GROWTH OR DENITRIFIERS ' FRACTION
A general agreement to introduce a reduction factor for the anoxic growth rate of heterotrophs
or the amount of denitrifiers in a heterotrophic population was supported by many
investigations and associated hypothesis on the nature of this phenomena. KLAPWUK (1978)
found a fraction of denitrifiers of 20-40% in activated sludge populations from aerobic
systems. He concluded that conditions where organic substrate becomes oxidised, determines
the denitrifying capacity of heterotrophs or the fraction of denitrifiers. A high fraction will be
found in systems where the organic substrate is oxidised mainly under anoxic conditions.
POPEL (1986) postulated that the lower anoxic substrate oxidation rate (circa 20 to 30%) is a
consequence of the fact that not all heterotrophs are able to use nitrate as a terminal electron
acceptor. HENZE (1986), basing on respiration experiments, concluded that the denitrifying
respiration activity may range from 0 to 80% of the aerobic activity, depending on wastewater
and activated sludge. A fully aerated system will expose a lower ratio (average r|g=0.2) than
an adapted denitrifying plant (average r|g= 0.6). In his further attempt to estimate the fraction
57
Methodology to estimate reduction factors for denitrification with respiration based techniques
of denitrifiers (HENZE, 1987), r|g was estimated in a range from 0.4 to 0.9 for different plant
configurations, wastewater composition and process parameters. The fraction of denitrifiers
was also supposed to be influenced by factors as inlet fraction of denitrifiers and sludge
retention time (SRT). By performing OUR- and NUR-tests, KRISTENSEN ET AL. (1992) found a
fraction of denitrifiers of 41-73% in denitrifying plants while in nitrifying plants this fraction
was only 15-20%. BERNARDES (1996) calibrated the fraction of denitrifiers in a model study at
45%. He represents the opinion that variations in denitrifying fraction are a result of a change
in wastewater characteristics, biomass composition and activity.
ARGAMAN (1985) found by using a bacterial count that in the most cases the denitrifiers count
was equal to the total count, what indicated that practically all heterotrophs (XH) in the
activated sludge are denitrifiers (XHD)- Based on this, he hypothesised that a reduced oxidation
activity under anoxic conditions should be a result of a lower u.H under anoxic conditions
( |W^H<1) -
In the respirometric study of SOZENET AL. (1998), the correction factor for the reduced growth of
denitrifiers (T)g) varied from 0.32 to 0.98 with a mean value of 0.58 for domestic wastewater.
In the estimation procedure the same heterotrophic yield for aerobic and anoxic conditions
( Y H = Y H D ) was used. SPERANDIO ET AL. (1999), using a carbon dioxide evolution rate technique for
two different activated sludge samples and substrate, obtained a value for T)g in the range of
0.37 to 0.72. In the last study YHD was separately assessed and not taken as default value.
3.1.4 ANOXIC HYDROLYSIS
The introduction of a reduction factor for modelling the anoxic hydrolysis (T|H) is often
considered as a significant simplification, resulting from limited knowledge on the nature of
the hydrolysis process (HENZE ETAL., 1987, GUJER AND HENZE, 1991, GOELETAL., 1999).
HENZE AND MLADENOWSKI (1991) followed the hydrolysis through the conversion of suspended
organic nitrogen to soluble organic nitrogen and further to ammonia under aerobic, anoxic and
anaerobic conditions. From their results the anoxic hydrolysis reduction factor appeared to be
very low (r|H = 0.25) but the question arose whether the hydrolysis of particulate nitrogenous
compounds can be directly compared with the hydrolysis of particulate organic compounds.
GOEL ET AL. (1999) concluded from studies on enzymatic activities in SBR-reactors, that the
hydrolysis rate was not affected by different electron acceptor conditions because of the low
turn-over, stability and nature of extracellular hydrolytic enzymes. Although the electron
acceptor might affect the synthesis of enzymes, the activity of the synthesised enzymes is not.
SOZEN ET AL„ (1998) performing OUR- and NUR-tests found a mean T]H value of 0.90 for
domestic wastewater.
3.1.5 ANOXIC DECAY OF HETEROTROPHS, ENDOGENOUS RESPIRATION
The same biomass decay coefficients under anoxic or aerobic conditions (bHD = bn) were
stated by STERN ANDMARAIS (1974) and HEIDE(1975). Performing aerobic and anoxic endogenous
58
Chapter 3
respiration tests, KRISTENSEN ET AL. (1992) indicated that the hydrolysis of sludge-COD
(endogenous respiration) takes place with the same rate under aerobic and anoxic conditions.
KLAPWUK (1978) determined endogenous respiration rates and found that the anoxic rate was
approximately 0.4 of the aerobic rate (% = 0.4). AVCIOUGLU ET AL. (1998), testing a respiration
based procedure, found bHD to be 0.55 of bH under assumption that all XH participates in the
anoxic respiration. SEGRIST ET AL. (1999) suggest that in the absence of oxygen a reduced decay
rate of heterotrophs (bHD< bn) may explain the reduced anoxic endogenous respiration rate.
3.1.6 ANOXIC HETEROTROPHIC YIELD
Based on experimental evidence, STERN AND MARAIS (1974) and HEIDE (1975) indicated that the
sludge production in an activated sludge system with an anoxic volume fraction < 40%, does
not appear to be significantly different from this generated in a completely aerobic system.
They concluded that the heterotrophic yield (YH) is not significantly affected by anoxic
conditions if the anoxic volume fraction does not exceed 40%. Also PAYNE AND WIEBE (1978)
assumed that the electron transfer rates and yield for denitrifying organisms are close to those
for oxygen respiring organisms. All IAWQ-models (ASM1..ASM3) do not relate the electron
acceptor environment to a difference in YH. For a multicomponent substrate (e.g. wastewater)
default values of YH = YHD = 0.67 (HENZE ET AL., 1987) or 0.63 (HENZE ET AL., 1996, 1998, GUJER ET
AL., 1999) are recommended.
In contrast, based on the electron transport pathway and related formation of the high energy
compound ATP, it can be deduced that the yield with N-oxides (YHD) will be substantially
lower than with oxygen (MCCARTY, 1972, CASEY ET AL„ 1994). Literature reports experimental
evidence for Y H D to be approximately two-third of YH (HADJIPETROU AND STOUTHAMER, 1965,
KOIKE AND HATTORI, 1975, JUSTIN AND KELLY, 1978, STOUTHAMER, 1988, COPP AND DOLD, 1998). SPERANDIO
ET AL. (1999) estimated YHD to be 0.66 - 0.85 of YH.
ORHON ET AL. (1996) calculated YH and YHD based on energetics of the related metabolic
processes. For different organic substrates (domestic sewage, protein and lactate) they
obtained YHD 20% lower than YH- Since the reduction factor r|g from ASM's is a conjunction
between X H D and UH they propose a YHD of 0.5 gCODbJomass.gCOD"1 as a default value for
domestic sewage. Also COKGOR UBAYETAL. (1998) reported a significantly lower YHD, based on
an an energetic basis. MCCLINTOCK ET AL., (1988) found in experiments with synthetic wastewater
a maximum microbial anoxic yield to be circa 50% of the value found under aerobic
conditions (0.40 versus 0.74 g/g).
From extended series of batch experiments SCHEER AND SEYFRIED (1994) found a slightly lower
anoxic than aerobic yield. This confirmed the statement of OBERMANN (1982) that the surplus
energy to anoxic metabolism stages is only 5 to 10% lower than of the aerobic metabolism
stage. KLAPWUK (1978) estimated heterotrophic yields theoretically on energetic basis and
experimentally using several model substrates and found also a negligible difference between
YHD and YH.
59
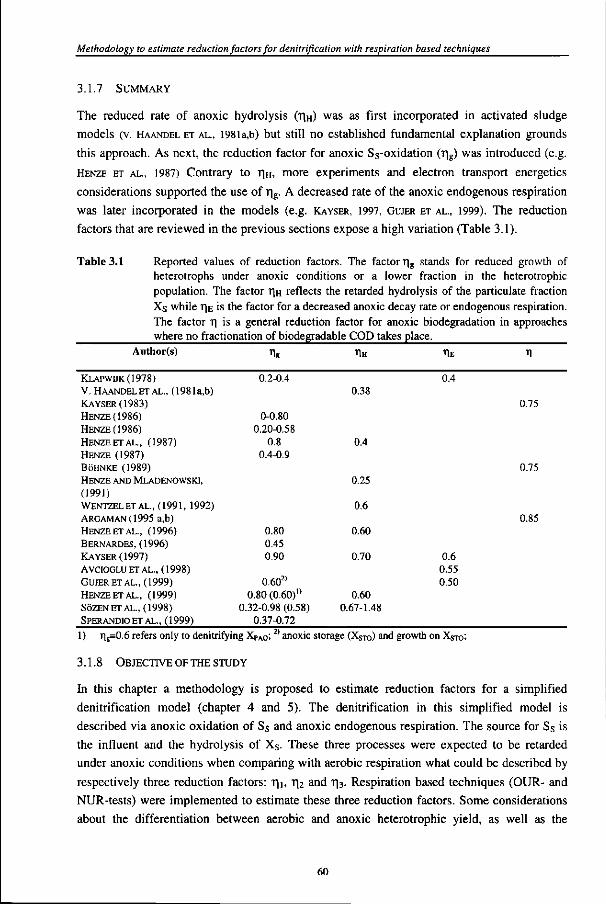
Methodology to estimate reduction factors for denitrification with respiration based techniques
3.1.7 SUMMARY
The reduced rate of anoxic hydrolysis (T|H) was as first incorporated in activated sludge
models (v. HAANDEL ET AL., I98la,b) but still no established fundamental explanation grounds
this approach. As next, the reduction factor for anoxic Ss-oxidation (r\g) was introduced (e.g.
HENZE ET AL., 1987) Contrary to T|H, more experiments and electron transport energetics
considerations supported the use of rig. A decreased rate of the anoxic endogenous respiration
was later incorporated in the models (e.g. KAYSER, 1997, GUJER ET AL., 1999). The reduction
factors that are reviewed in the previous sections expose a high variation (Table 3.1).
Table 3.1 Reported values of reduction factors. The factor r|g stands for reduced growth of heterotrophs under anoxic conditions or a lower fraction in the heterotrophic population. The factor T)H reflects the retarded hydrolysis of the particulate fraction Xs while T|E is the factor for a decreased anoxic decay rate or endogenous respiration. The factor r) is a general reduction factor for anoxic biodegradation in approaches where no fractionation of biodegradable COD takes place.
Author(s) T|g T|H % n
0.75
0.75
0.85
KLAPWUK(1978)
V. HAANDELETAL., (1981a,b) KAYSER (1983) HENZE (1986) HENZE (1986) HENZE ETAL., (1987)
HENZE (1987) BOHNKE (1989) HENZE AND MLADENOWSKI,
(1991) WENTZELET AL., (1991, 1992) ARGAMAN(1995 a,b)
HENZE ETAL., (1996)
BERNARDES, (1996) KAYSER (1997) AVCIOGLU ET AL., (1998) GUJER ETAL., (1999)
HENZE ETAL., (1999)
SOZENETAL., (1998) SPERANDIOETAL., (1999)
0.2-0.4
0-0.80 0.20-0.58
0.8 0.4-0.9
0.80 0.45 0.90
0.602)
0.80 (0.60)n
0.32-0.98 (0.58) 0.37-0.72
0.38
0.4
0.25
0.6
0.60
0.70
0.60 0.67-1.48
0.4
0.6 0.55 0.50
1) T|g=0.6 refers only to denitrifying XPAo; 2> anoxic storage (XSTO) and growth on XSTO;
3.1.8 OBJECTIVE OF THE STUDY
In this chapter a methodology is proposed to estimate reduction factors for a simplified
denitrification model (chapter 4 and 5). The denitrification in this simplified model is
described via anoxic oxidation of Ss and anoxic endogenous respiration. The source for Ss is
the influent and the hydrolysis of Xs. These three processes were expected to be retarded
under anoxic conditions when comparing with aerobic respiration what could be described by
respectively three reduction factors: T|I, r|2 and r)3. Respiration based techniques (OUR- and
NUR-tests) were implemented to estimate these three reduction factors. Some considerations
about the differentiation between aerobic and anoxic heterotrophic yield, as well as the
60
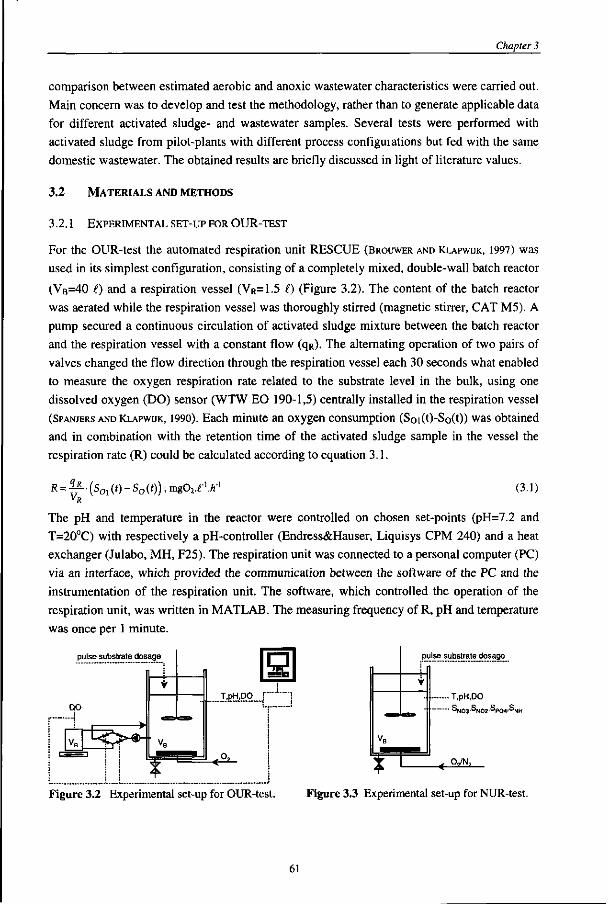
Chapter 3
comparison between estimated aerobic and anoxic wastewater characteristics were carried out. Main concern was to develop and test the methodology, rather than to generate applicable data for different activated sludge- and wastewater samples. Several tests were performed with activated sludge from pilot-plants with different process configurations but fed with the same domestic wastewater. The obtained results are briefly discussed in light of literature values.
3.2 MATERIALS AND METHODS
3.2.1 EXPERIMENTAL SET-UP FOR OUR-TEST
For the OUR-test the automated respiration unit RESCUE (BROUWER AND KLAPWUK, 1997) was used in its simplest configuration, consisting of a completely mixed, double-wall batch reactor (VB=40 €) and a respiration vessel (VR=1.5 t) (Figure 3.2). The content of the batch reactor was aerated while the respiration vessel was thoroughly stirred (magnetic stirrer, CAT M5). A pump secured a continuous circulation of activated sludge mixture between the batch reactor and the respiration vessel with a constant flow (qR). The alternating operation of two pairs of valves changed the flow direction through the respiration vessel each 30 seconds what enabled to measure the oxygen respiration rate related to the substrate level in the bulk, using one dissolved oxygen (DO) sensor (WTW EO 190-1,5) centrally installed in the respiration vessel (SPANJERS AND KLAPWUK, 1990). Each minute an oxygen consumption (Soi(t)-So(t)) was obtained and in combination with the retention time of the activated sludge sample in the vessel the respiration rate (R) could be calculated according to equation 3.1.
R = ^"(s0 l(f)-S0(f));mgOj. c'.h-' (3.1)
The pH and temperature in the reactor were controlled on chosen set-points (pH=7.2 and T=20°C) with respectively a pH-controller (Endress&Hauser, Liquisys CPM 240) and a heat exchanger (Julabo, MH, F25). The respiration unit was connected to a personal computer (PC) via an interface, which provided the communication between the software of the PC and the instrumentation of the respiration unit. The software, which controlled the operation of the respiration unit, was written in MATLAB. The measuring frequency of R, pH and temperature was once per 1 minute.
pulse substrate dosage
T.pH.DO
S N 0 3 ' ® N 0 2 ' S P 0 4 ' S N H
pulse substrate dos
QO
v . ^ $?^
age
v
' v B
TpH.DO i
0„
n '
Figure 3.2 Experimental set-up for OUR-test. Figure 3.3 Experimental set-up for NUR-test.
61
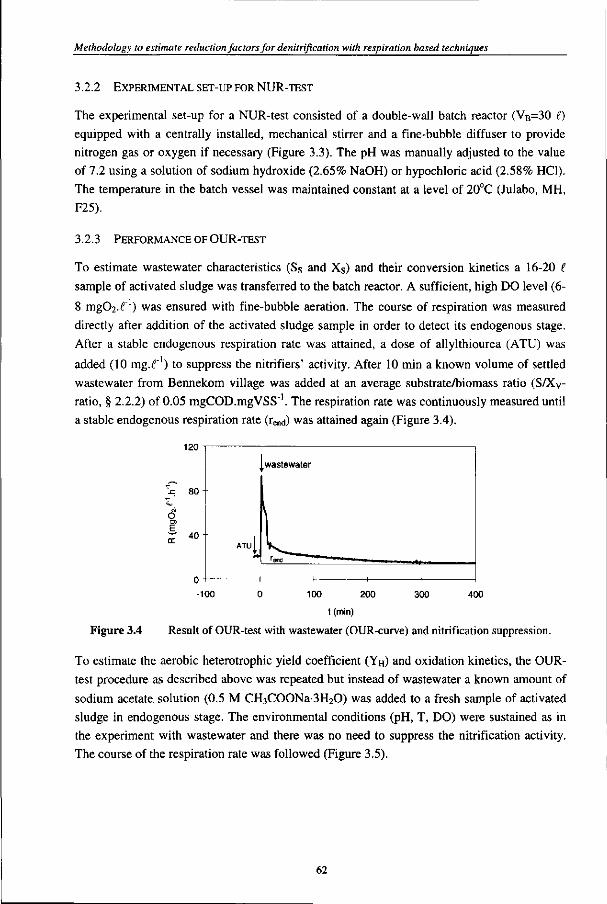
Methodology to estimate reduction factors for denitrification with respiration based techniques
3.2.2 EXPERIMENTAL SET-UP FOR NUR-TEST
The experimental set-up for a NUR-test consisted of a double-wall batch reactor (VB=30 ()
equipped with a centrally installed, mechanical stirrer and a fine-bubble diffuser to provide
nitrogen gas or oxygen if necessary (Figure 3.3). The pH was manually adjusted to the value
of 7.2 using a solution of sodium hydroxide (2.65% NaOH) or hypochloric acid (2.58% HC1).
The temperature in the batch vessel was maintained constant at a level of 20°C (Julabo, MH,
F25).
3.2.3 PERFORMANCE OF OUR-TEST
To estimate wastewater characteristics (Ss and Xs) and their conversion kinetics a 16-20 £
sample of activated sludge was transferred to the batch reactor. A sufficient, high DO level (6-
8 mg02.f ' ) was ensured with fine-bubble aeration. The course of respiration was measured
directly after addition of the activated sludge sample in order to detect its endogenous stage.
After a stable endogenous respiration rate was attained, a dose of allylthiourea (ATU) was
added (10 mg.r1) to suppress the nitrifiers' activity. After 10 min a known volume of settled
wastewater from Bennekom village was added at an average substrate/biomass ratio (S/Xy-
ratio, § 2.2.2) of 0.05 mgCOD.mgVSS" . The respiration rate was continuously measured until
a stable endogenous respiration rate (rend) was attained again (Figure 3.4).
120
o E
80
40 ATU
^
wastewater
Tend * *
1 -H 1
-100 300 400
Figure 3.4
0 100 200
t (min)
Result of OUR-test with wastewater (OUR-curve) and nitrification suppression.
To estimate the aerobic heterotrophic yield coefficient (YH) and oxidation kinetics, the OUR-
test procedure as described above was repeated but instead of wastewater a known amount of
sodium acetate solution (0.5 M CH3COONa-3H20) was added to a fresh sample of activated
sludge in endogenous stage. The environmental conditions (pH, T, DO) were sustained as in
the experiment with wastewater and there was no need to suppress the nitrification activity.
The course of the respiration rate was followed (Figure 3.5).
62
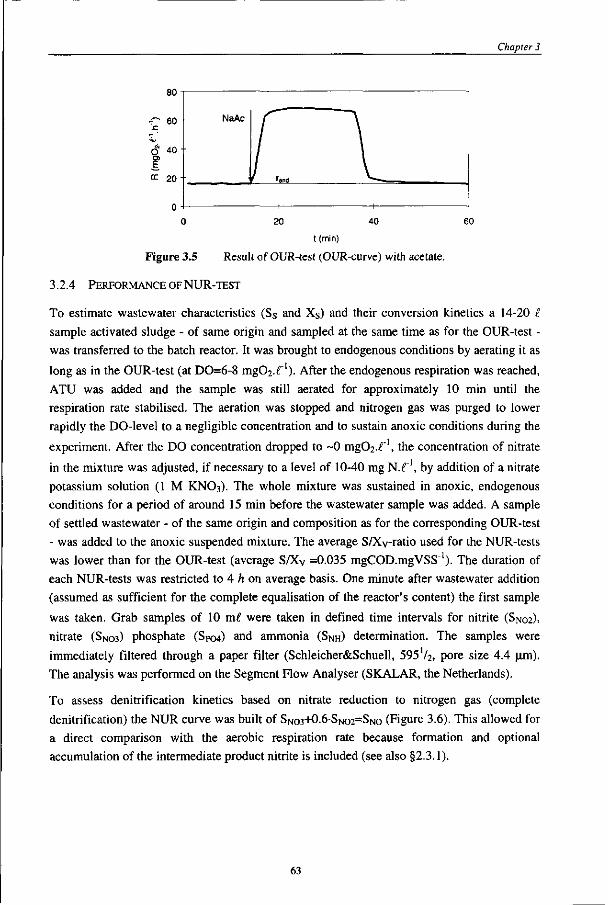
Chapter 3
t (min)
Figure 3.5 Result of OUR-test (OUR-curve) with acetate.
3.2.4 PERFORMANCE OF NUR-TEST
To estimate wastewater characteristics (Ss and Xs) and their conversion kinetics a 14-20 I
sample activated sludge - of same origin and sampled at the same time as for the OUR-test -
was transferred to the batch reactor. It was brought to endogenous conditions by aerating it as
long as in the OUR-test (at DO=6-8 mg02./~'). After the endogenous respiration was reached,
ATU was added and the sample was still aerated for approximately 10 min until the
respiration rate stabilised. The aeration was stopped and nitrogen gas was purged to lower
rapidly the DO-level to a negligible concentration and to sustain anoxic conditions during the
experiment. After the DO concentration dropped to ~0 mg02.f\ the concentration of nitrate
in the mixture was adjusted, if necessary to a level of 10-40 mg N.f', by addition of a nitrate
potassium solution (1 M KNO3). The whole mixture was sustained in anoxic, endogenous
conditions for a period of around 15 min before the wastewater sample was added. A sample
of settled wastewater - of the same origin and composition as for the corresponding OUR-test
- was added to the anoxic suspended mixture. The average S/Xv-ratio used for the NUR-tests
was lower than for the OUR-test (average S/Xv =0.035 mgCOD.mgVSS"1). The duration of
each NUR-tests was restricted to 4 h on average basis. One minute after wastewater addition
(assumed as sufficient for the complete equalisation of the reactor's content) the first sample
was taken. Grab samples of 10 m£ were taken in defined time intervals for nitrite (SN02X
nitrate (SNO3) phosphate (Spew) and ammonia (SNH) determination. The samples were
immediately filtered through a paper filter (Schleicher&Schuell, 595V2, pore size 4.4 |im).
The analysis was performed on the Segment Flow Analyser (SKALAR, the Netherlands).
To assess denitrification kinetics based on nitrate reduction to nitrogen gas (complete denitrification) the NUR curve was built of SNO3+0.6SNO2=SNO (Figure 3.6). This allowed for a direct comparison with the aerobic respiration rate because formation and optional accumulation of the intermediate product nitrite is included (see also §2.3.1).
63
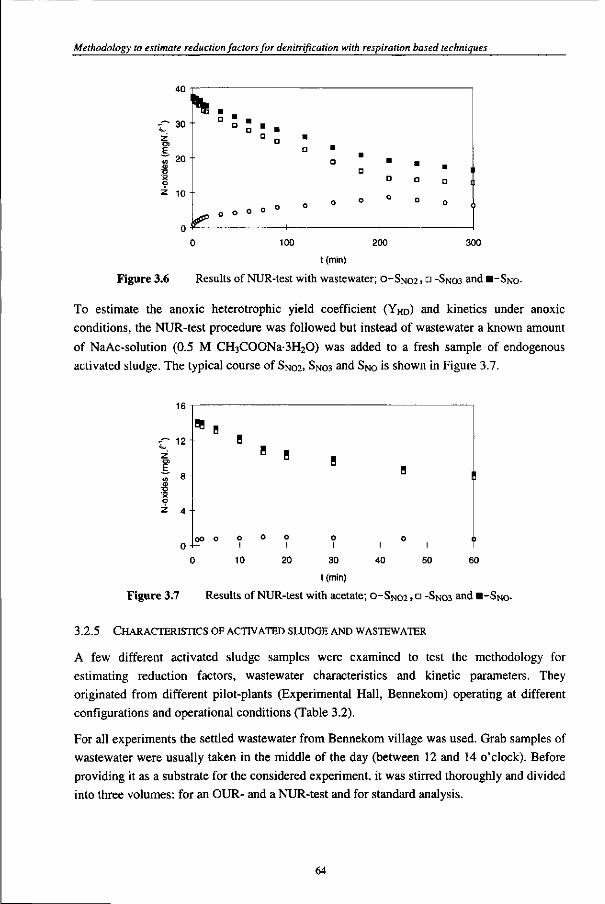
Methodology to estimate reduction factors for denitrification with respiration based techniques
100 200 300
t (min)
Figure 3.6 Results of NUR-test with wastewater; O-SNO2 > n -SNO3 and •-SNO-
To estimate the anoxic heterotrophic yield coefficient (YHD) and kinetics under anoxic
conditions, the NUR-test procedure was followed but instead of wastewater a known amount
of NaAc-solution (0.5 M CH3COONa-3H20) was added to a fresh sample of endogenous
activated sludge. The typical course of SN02, SN03 and SN0 is shown in Figure 3.7.
16
12
«
oo
n
o
B
o — I —
B
o
B
o — I
B
o 1
H !
O ( — I 1
10 20 30
t (min)
40 50 60
Figure 3.7 Results of NUR-test with acetate; O-SN02 > o -SNO3 and B-SNO-
3.2.5 CHARACTERISTICS OF ACTIVATED SLUDGE AND WASTEWATER
A few different activated sludge samples were examined to test the methodology for estimating reduction factors, wastewater characteristics and kinetic parameters. They originated from different pilot-plants (Experimental Hall, Bennekom) operating at different configurations and operational conditions (Table 3.2).
For all experiments the settled wastewater from Bennekom village was used. Grab samples of wastewater were usually taken in the middle of the day (between 12 and 14 o'clock). Before providing it as a substrate for the considered experiment, it was stirred thoroughly and divided into three volumes: for an OUR- and a NUR-test and for standard analysis.
64
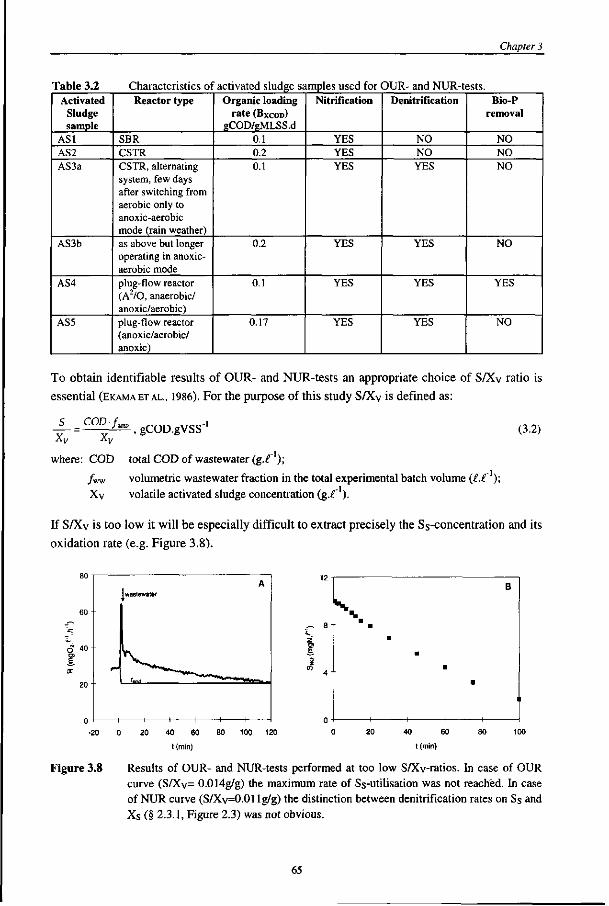
Chapter 3
Table 3.2 Activated
Sludge sample
AS1 AS2 AS3a
AS3b
AS4
ASS
Characteristics of activated sludge sz Reactor type
SBR CSTR CSTR, alternating system, few days after switching from aerobic only to anoxic-aerobic mode (rain weather)
as above but longer operating in anoxic-aerobic mode plug-flow reactor (A2/0, anaerobic/ anoxic/aerobic) plug-flow reactor (anoxic/aerobic/ anoxic)
Organic loading rate (BX C OD)
gCOD/gMLSS.d 0.1 0.2 0.1
0.2
0.1
0.17
imples used for OUR- and NUR-tests. Nitrification
YES YES YES
YES
YES
YES
Denitrification
NO NO YES
YES
YES
YES
Bio-P removal
NO NO NO
NO
YES
NO
To obtain identifiable results of OUR- and NUR-tests an appropriate choice of S/Xv ratio is
essential (EKAMAETAL., 1986). For the purpose of this study S/Xv is defined as:
S gCOD.gVSS" (3.2)
where: COD total COD of wastewater (g.f );
/ww volumetric wastewater fraction in the total experimental batch volume (if ); Xv volatile activated sludge concentration (g.(~ ).
If S/Xv is too low it will be especially difficult to extract precisely the Ss-concentration and its
oxidation rate (e.g. Figure 3.8).
d t o ol E
-
»~
H
[wastewater
1 1 1
A
— I 1
Figure 3.8
40 60
t (min)
100 120
Results of OUR- and NUR-tests performed at too low S/Xv-ratios. In case of OUR curve (S/Xv= 0.014g/g) the maximum rate of Ss-utilisation was not reached. In case of NUR curve (S/Xv=0.01 lg/g) the distinction between denitrification rates on Ss and Xs (§ 2.3.1, Figure 2.3) was not obvious.
65
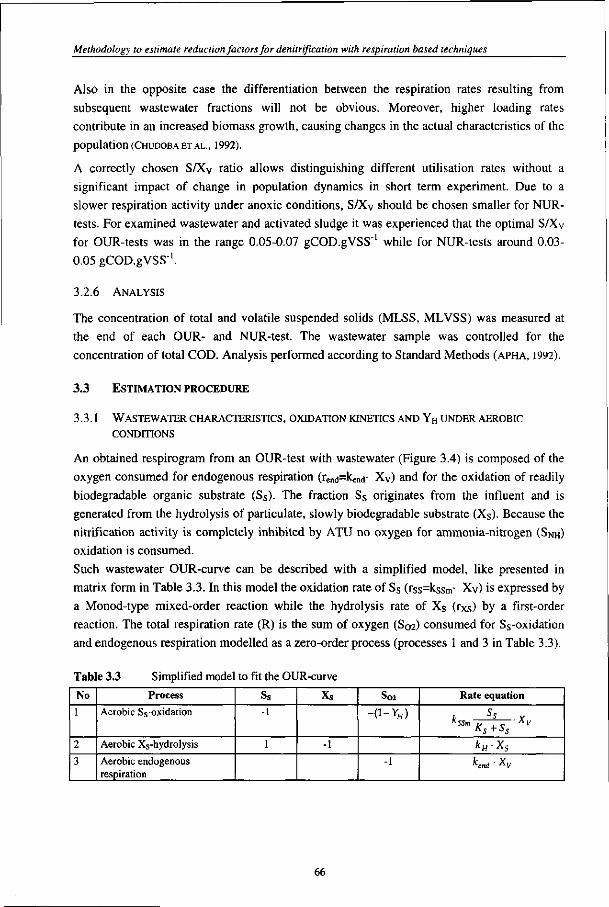
Methodology to estimate reduction factors for denitrification with respiration based techniques
Also in the opposite case the differentiation between the respiration rates resulting from subsequent wastewater fractions will not be obvious. Moreover, higher loading rates contribute in an increased biomass growth, causing changes in the actual characteristics of the population (CHUDOBA ET AL„ 1992).
A correctly chosen S/Xv ratio allows distinguishing different utilisation rates without a significant impact of change in population dynamics in short term experiment. Due to a slower respiration activity under anoxic conditions, S/Xy should be chosen smaller for NUR-tests. For examined wastewater and activated sludge it was experienced that the optimal S/Xv
for OUR-tests was in the range 0.05-0.07 gCOD.gVSS"1 while for NUR-tests around 0.03-0.05 gCOD.gVSS'1.
3.2.6 ANALYSIS
The concentration of total and volatile suspended solids (MLSS, MLVSS) was measured at the end of each OUR- and NUR-test. The wastewater sample was controlled for the concentration of total COD. Analysis performed according to Standard Methods (APHA, 1992).
3.3 ESTIMATION PROCEDURE
3.3.1 WASTEWATER CHARACTERISTICS, OXIDATION KINETICS AND YH UNDER AEROBIC
CONDITIONS
An obtained respirogram from an OUR-test with wastewater (Figure 3.4) is composed of the oxygen consumed for endogenous respiration (rend=kend- Xv) and for the oxidation of readily biodegradable organic substrate (Ss). The fraction Ss originates from the influent and is generated from the hydrolysis of particulate, slowly biodegradable substrate (Xs). Because the nitrification activity is completely inhibited by ATU no oxygen for ammonia-nitrogen (SNH) oxidation is consumed.
Such wastewater OUR-curve can be described with a simplified model, like presented in matrix form in Table 3.3. In this model the oxidation rate of Ss (rss=kssm- Xy) is expressed by a Monod-type mixed-order reaction while the hydrolysis rate of Xs (rXs) by a first-order reaction. The total respiration rate (R) is the sum of oxygen (S02) consumed for Ss-oxidation and endogenous respiration modelled as a zero-order process (processes 1 and 3 in Table 3.3).
Table 3.3 Simplified model to fit the OUR-curve
No
1
2
3
Process
Aerobic Ss-oxidation
Aerobic Xs-hydrolysis
Aerobic endogenous respiration
Ss
-1
1
Xs
-1
S02
- ( 1 - V H )
-1
Rate equation
/• Ss Y KSSm „ c A V
^H ' X$
Kend ' Xy
66
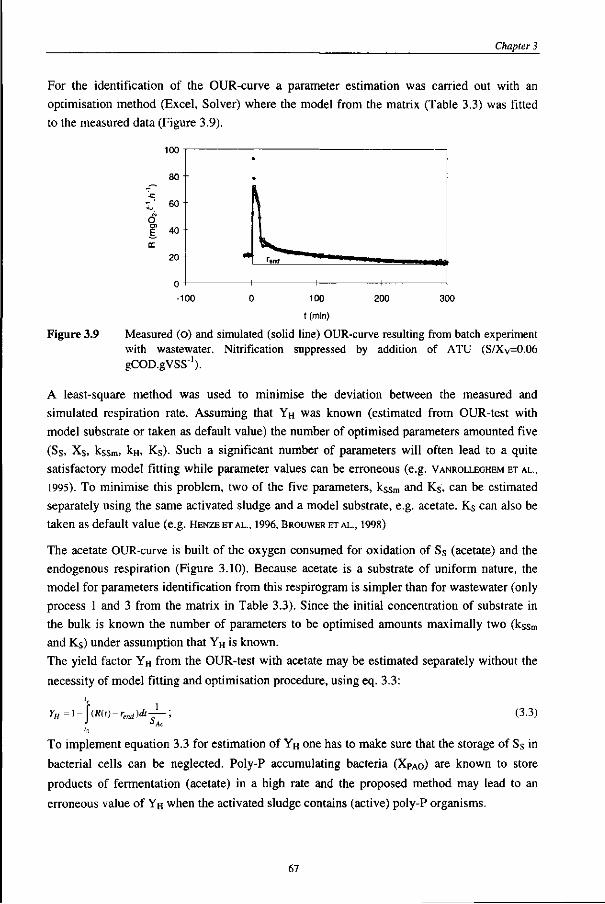
Chapter 3
For the identification of the OUR-curve a parameter estimation was carried out with an
optimisation method (Excel, Solver) where the model from the matrix (Table 3.3) was fitted
to the measured data (Figure 3.9).
^ -e
O E. H
80 -
60
40
20
n 1 1
n
0
^end ^ ^ ^ — p — m in ffla
1 1
-100 100
t (min)
200 300
Figure 3.9 Measured (O) and simulated (solid line) OUR-curve resulting from batch experiment with wastewater. Nitrification suppressed by addition of ATU (S/Xy=0.06 gCOD.gVSS1).
A least-square method was used to minimise the deviation between the measured and
simulated respiration rate. Assuming that YH was known (estimated from OUR-test with
model substrate or taken as default value) the number of optimised parameters amounted five
(Ss, Xs, kssm, kH, Ks). Such a significant number of parameters will often lead to a quite
satisfactory model fitting while parameter values can be erroneous (e.g. VANROLLEGHEM ET AL.,
1995). To minimise this problem, two of the five parameters, kssm and Ks, can be estimated
separately using the same activated sludge and a model substrate, e.g. acetate. Ks can also be
taken as default value (e.g. HENZEETAL., 1996, BROUWER ET AL., 1998)
The acetate OUR-curve is built of the oxygen consumed for oxidation of Ss (acetate) and the
endogenous respiration (Figure 3.10). Because acetate is a substrate of uniform nature, the
model for parameters identification from this respirogram is simpler than for wastewater (only
process 1 and 3 from the matrix in Table 3.3). Since the initial concentration of substrate in
the bulk is known the number of parameters to be optimised amounts maximally two (kssm
and Ks) under assumption that YH is known.
The yield factor YH from the OUR-test with acetate may be estimated separately without the
necessity of model fitting and optimisation procedure, using eq. 3.3:
\(R(l)-r.)dt4- (3.3)
To implement equation 3.3 for estimation of YH one has to make sure that the storage of Ss in
bacterial cells can be neglected. Poly-P accumulating bacteria (XpAo) are known to store
products of fermentation (acetate) in a high rate and the proposed method may lead to an
erroneous value of YH when the activated sludge contains (active) poly-P organisms.
67
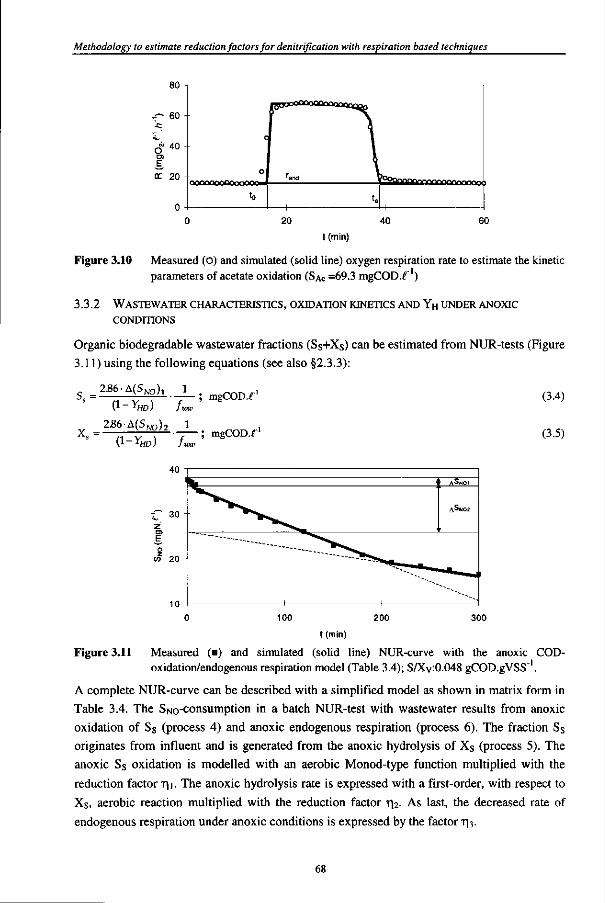
Methodology to estimate reduction factors for denitrification with respiration based techniques
t (min)
Figure 3.10 Measured (O) and simulated (solid line) oxygen respiration rate to estimate the kinetic parameters of acetate oxidation (SAC =69.3 mgCOD.r )
3.3.2 WASTEWATER CHARACTERISTICS, OXIDATION KINETICS AND Y H UNDER ANOXIC
CONDITIONS
Organic biodegradable wastewater fractions (Ss+Xs) can be estimated from NUR-tests (Figure 3.11) using the following equations (see also §2.3.3):
2.86 A ^ h 1 . ___,., U - 'HD> Jitm
2S6A(SNO)2 1 , x» = n Y \ r ; m g C O D f
(3.4)
(3.5)
100 200 300
t (min)
Figure 3.11 Measured (•) and simulated (solid line) NUR-curve with the anoxic COD-oxidation/endogenous respiration model (Table 3.4); S/Xy:0.048 gCOD.gVSS" .
A complete NUR-curve can be described with a simplified model as shown in matrix form in Table 3.4. The SNo-consumption in a batch NUR-test with wastewater results from anoxic oxidation of Ss (process 4) and anoxic endogenous respiration (process 6). The fraction Ss
originates from influent and is generated from the anoxic hydrolysis of Xs (process 5). The anoxic Ss oxidation is modelled with an aerobic Monod-type function multiplied with the reduction factor T|i. The anoxic hydrolysis rate is expressed with a first-order, with respect to Xs, aerobic reaction multiplied with the reduction factor r|2- As last, the decreased rate of endogenous respiration under anoxic conditions is expressed by the factor ri3.
68
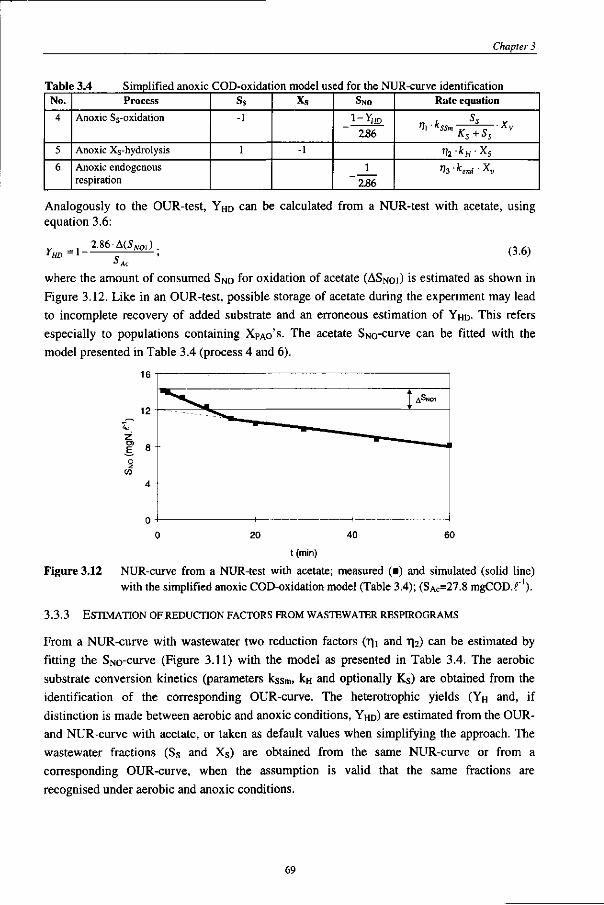
Table 3.4 Simplified anoxic No.
4
5
6
Process
Anoxic Ss-oxidation
Anoxic Xs-hydrolysis
Anoxic endogenous respiration
Chapter 3
COD-oxidation model used for the NUR-curve identification
Ss
-1
1
Xs
-1
SNO
2.86
1
~2.86
Rate equation
Jfc few ' ^ s
% ' end ' X„
Analogously to the OUR-test, YHD can be calculated from a NUR-test with acetate, using equation 3.6:
= 1-2.86-A(5„01). (3.6)
where the amount of consumed SNo for oxidation of acetate (ASNoi) is estimated as shown in Figure 3.12. Like in an OUR-test, possible storage of acetate during the experiment may lead to incomplete recovery of added substrate and an erroneous estimation of YHD- This refers especially to populations containing XPAo's. The acetate Swo-curve can be fitted with the model presented in Table 3.4 (process 4 and 6).
16
12 -
t (min) Figure 3.12 NUR-curve from a NUR-test with acetate; measured (•) and simulated (solid line)
with the simplified anoxic COD-oxidation model (Table 3.4); (SAC=27.8 mgCOD.r ).
3.3.3 ESTIMATION OF REDUCTION FACTORS FROM WASTEWATER RESPIROGRAMS
From a NUR-curve with wastewater two reduction factors (r)i and TI2) can be estimated by fitting the Sno-curve (Figure 3.11) with the model as presented in Table 3.4. The aerobic substrate conversion kinetics (parameters kssm, kH and optionally Ks) are obtained from the identification of the corresponding OUR-curve. The heterotrophic yields (YH and, if distinction is made between aerobic and anoxic conditions, YHD) are estimated from the OUR-and NUR-curve with acetate, or taken as default values when simplifying the approach. The wastewater fractions (Ss and Xs) are obtained from the same NUR-curve or from a corresponding OUR-curve, when the assumption is valid that the same fractions are recognised under aerobic and anoxic conditions.
69
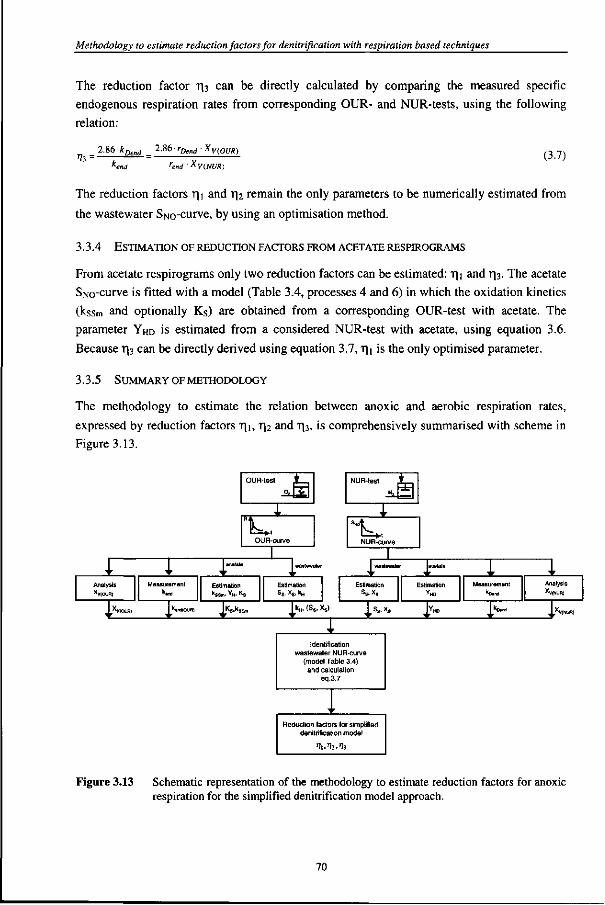
Methodology to estimate reduction factors for denitrification with respiration based techniques
The reduction factor T|3 can be directly calculated by comparing the measured specific endogenous respiration rates from corresponding OUR- and NUR-tests, using the following relation:
1 3 = 2.86kDend ~&(>rDendXv(OUR)
^end rend ' ^V(NUR) (3.7)
The reduction factors T)i and r)2 remain the only parameters to be numerically estimated from
the wastewater SNo-curve, by using an optimisation method.
3.3.4 ESTIMATION OF REDUCTION FACTORS FROM ACETATE RESPIROGRAMS
From acetate respirograms only two reduction factors can be estimated: r\\ and r|3. The acetate Sno-curve is fitted with a model (Table 3.4, processes 4 and 6) in which the oxidation kinetics (kssm and optionally Ks) are obtained from a corresponding OUR-test with acetate. The parameter YHD is estimated from a considered NUR-test with acetate, using equation 3.6. Because r|3 can be directly derived using equation 3.7, T|i is the only optimised parameter.
3.3.5 SUMMARY OF METHODOLOGY
The methodology to estimate the relation between anoxic and aerobic respiration rates,
expressed by reduction factors T|i, T)2 and T|3, is comprehensively summarised with scheme in
Figure 3.13.
i Analysis
^V(OUR)
'
Measurement
*V(OUR)
0 UR-test
0, i
y
1 1
acetate
f
OUR
Estimation kSSmi ^Hi K S
k«nd(OUR) Ks^sSm
-curve
1 wastewater
Estimation Ss, X 8 ,1^
^ kH, (Ss, > r
<s)
^
NUR-test
i
* *
NUR-curve
1 wastewater
Estimation ss.xs
1 S S ,X S
r
r
Identification wastewater NUR-curve
(model Table 3.4) and calculation
eq.3.7
' * Reduction factors for simplified
denitrification model
Estimation Measurement k0.nd
'HD
Analysis XV(NUR)
kD«nd *V(NUR)
Figure 3.13 Schematic representation of the methodology to estimate reduction factors for anoxic respiration for the simplified denitrification model approach.
70
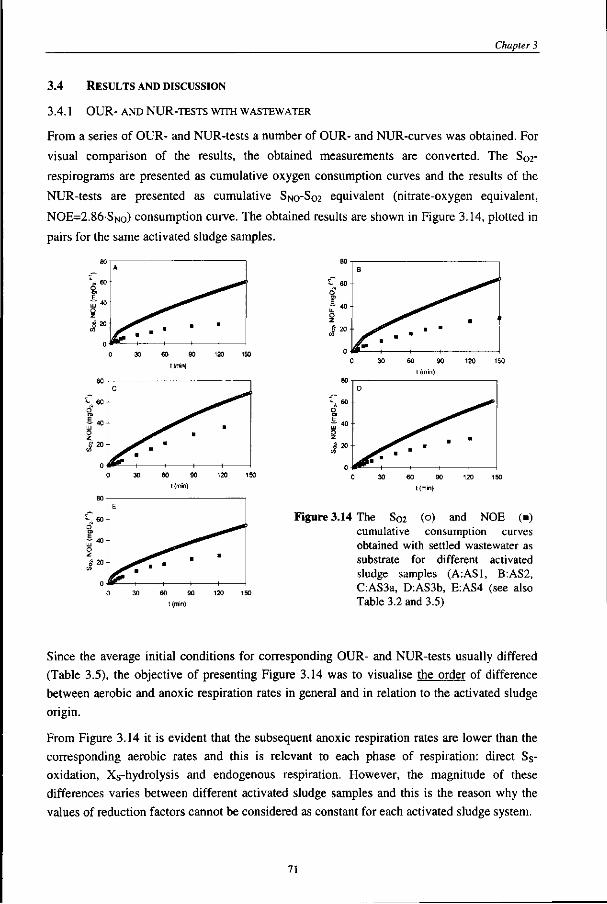
Chapter 3
3.4 RESULTS AND DISCUSSION
3.4.1 OUR- AND NUR-TESTS WITH WASTEWATER
From a series of OUR- and NUR-tests a number of OUR- and NUR-curves was obtained. For
visual comparison of the results, the obtained measurements are converted. The S02-
respirograms are presented as cumulative oxygen consumption curves and the results of the
NUR-tests are presented as cumulative SNO-SO2 equivalent (nitrate-oxygen equivalent,
NOE=2.86'SNO) consumption curve. The obtained results are shown in Figure 3.14, plotted in
pairs for the same activated sludge samples.
V 60-
o z 8 20
1/1
0
B
&~ • • • • •
.
Figure 3.14 The S02 (o) and NOE (•) cumulative consumption curves obtained with settled wastewater as substrate for different activated sludge samples (A:AS1, B:AS2, C:AS3a, D:AS3b, E:AS4 (see also Table 3.2 and 3.5)
Since the average initial conditions for corresponding OUR- and NUR-tests usually differed (Table 3.5), the objective of presenting Figure 3.14 was to visualise the order of difference between aerobic and anoxic respiration rates in general and in relation to the activated sludge origin.
From Figure 3.14 it is evident that the subsequent anoxic respiration rates are lower than the corresponding aerobic rates and this is relevant to each phase of respiration: direct Ss-oxidation, Xs-hydrolysis and endogenous respiration. However, the magnitude of these differences varies between different activated sludge samples and this is the reason why the values of reduction factors cannot be considered as constant for each activated sludge system.
71
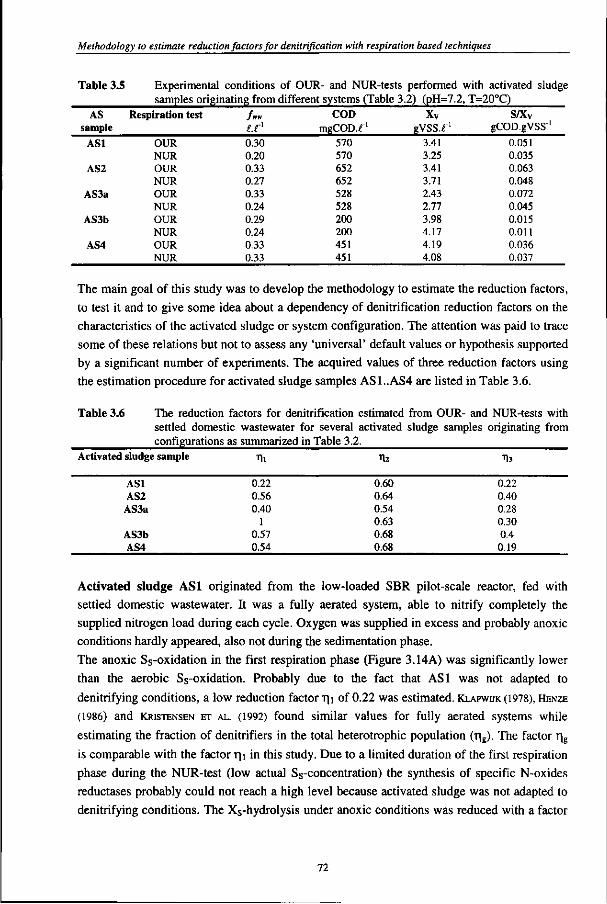
Methodology to estimate reduction factors for denitrification with respiration based techniques
Table 3.5 Experimental conditions of OUR- and NUR-tests performed with activated sludge samples originating from different systems (Table 3,2) (pH=7.2, T=20°C)
AS sample
Respiration test Jw\ COD mgCOD.< gvss.r
s/xv gCOD.gVSS1
AS1
AS2
AS3a
AS3b
AS4
OUR NUR OUR NUR OUR NUR OUR NUR OUR NUR
0.30 0.20 0.33 0.27 0.33 0.24 0.29 0.24 0.33 0.33
570 570 652 652 528 528 200 200 451 451
3.41 3.25 3.41 3.71 2.43 2.77 3.98 4.17 4.19 4.08
0.051 0.035 0.063 0.048 0.072 0.045 0.015 0.011 0.036 0.037
The main goal of this study was to develop the methodology to estimate the reduction factors,
to test it and to give some idea about a dependency of denitrification reduction factors on the
characteristics of the activated sludge or system configuration. The attention was paid to trace
some of these relations but not to assess any 'universal' default values or hypothesis supported
by a significant number of experiments. The acquired values of three reduction factors using
the estimation procedure for activated sludge samples AS1..AS4 are listed in Table 3.6.
Table 3.6 The reduction factors for denitrification estimated from OUR- and NUR-tests with settled domestic wastewater for several activated sludge samples originating from configurations as summarized in Table 3.2.
Activated sludge sample t\i 13
AS1 AS2 AS3a
AS3b AS4
0.22 0.56 0.40
1 0.57 0.54
0.60 0.64 0.54 0.63 0.68 0.68
0.22 0.40 0.28 0.30 0.4 0.19
Activated sludge AS1 originated from the low-loaded SBR pilot-scale reactor, fed with
settled domestic wastewater. It was a fully aerated system, able to nitrify completely the
supplied nitrogen load during each cycle. Oxygen was supplied in excess and probably anoxic
conditions hardly appeared, also not during the sedimentation phase.
The anoxic Ss-oxidation in the first respiration phase (Figure 3.14A) was significantly lower
than the aerobic Ss-oxidation. Probably due to the fact that AS1 was not adapted to
denitrifying conditions, a low reduction factor T|i of 0.22 was estimated. KLAPWUK (1978), HENZE
(1986) and KRISTENSEN ET AL. (1992) found similar values for fully aerated systems while
estimating the fraction of denitrifiers in the total heterotrophic population (T|g). The factor T)g
is comparable with the factor r)i in this study. Due to a limited duration of the first respiration
phase during the NUR-test (low actual Ss-concentration) the synthesis of specific N-oxides
reductases probably could not reach a high level because activated sludge was not adapted to
denitrifying conditions. The Xs-hydrolysis under anoxic conditions was reduced with a factor
72
Chapter 3
r\2 = 0.6. This value is similar to other findings and often used as default for modelling
purposes (e.g. HENZE ET AL„ 1987). The estimated reduction factor for the anoxic endogenous
respiration of T|3 = 0.22 was low as compared with literature values (Table 3.1).
Activated sludge AS2 originated also from a fully aerated reactor (Table 3.2) but subjected to
a two-fold higher sludge loading (BXCOD) than AS 1. The oxygen supply was controlled on a
level just needed for a complete nitrification and probably the activated sludge was subjected
to anoxic conditions in the secondary settler or due to difussion limitation of oxygen, the
activated sludge floe was partly anoxic. Although AS2 was not really adapted to anoxic
conditions, it exposed higher anoxic respiration rates than AS1 (Figure 3.14B). The reduction
factors Tii and r|2 amounted 0.56 and 0.64 respectively. Similar values are also proposed in
new ASM versions (i"|g and T|H =0.6) (HENZE ET AL„ 1999, GUJER ET AL., 1999). The factor 713 was
estimated at 0.4, which is close to the values proposed in literature (e.g. KLAPWUK 1978,
AVCIOGLU ET AL., 1998, GUJER ET AL., 1999). Higher values for all reduction factors might suggest
that AS2, except of partial adaptation to anoxic conditions, was characterised by higher
biomass activity (higher BXCOD) resulting in a higher enzymatic activity.
Activated sludge AS3a originated from the same pilot-plant as AS2 but the plant operation
was switched from an aerobic- to an alternating anoxic-aerobic mode. Although the
wastewater influent flow to the pilot-plant did not change, BXCOD was lowered due to rain
weather conditions during the experimental period. Two series of respiration tests were
performed with sludge AS3a. From the first tests (Figure 3.14C) it turned out that all anoxic
reduction factors decreased in relation to AS2. The reduced values of r)i (=0.4), T|2 (=0.54) and
•n.3 (=0.28) could be explained by a temporary lowered activity of activated sludge because it
was fed with a low-strength wastewater. Moreover, the air supply for the nitrification was not
controlled and this could lead to an excessive DO-concentration in the beginning of the anoxic
phase. All these facts could contribute in decreased anoxic respiration rates of AS3a.
The NUR-test was repeated with the same sludge (AS3a) after 12 h of endogenous anoxic
conditions. The estimated anoxic Ss-oxidation rate was equal to the aerobic rate (T|=l) and
higher values for TI2 (0.63) and r|3 (0.30) were found. The higher level of specific N-oxides
reductases and enzymes for Xs-hydrolysis after a long exposure of activated sludge to anoxic
conditions could explain the higher estimated values of the reduction factors.
Activated sludge AS3b originated from the same pilot-plant as mentioned above. After 2
weeks of operation in an alternating anoxic/aerobic mode, the respiration tests were performed
(Figure 3.14D). The subsequent reduction factors seemed to be hardly effected with regards to
the same sludge when it was only aerated (AS2).
Activated sludge AS4 (Figure 3.14E) originated from a low-loaded plug flow reactor,
operating in an A 2 /0 configuration with an additional post-anoxic zone. In this configuration
complete nitrification, a high-rate biological P-removal and a partial denitrification were
performed. The ability of this sludge to oxidise S s anoxically was reduced with a factor of
73
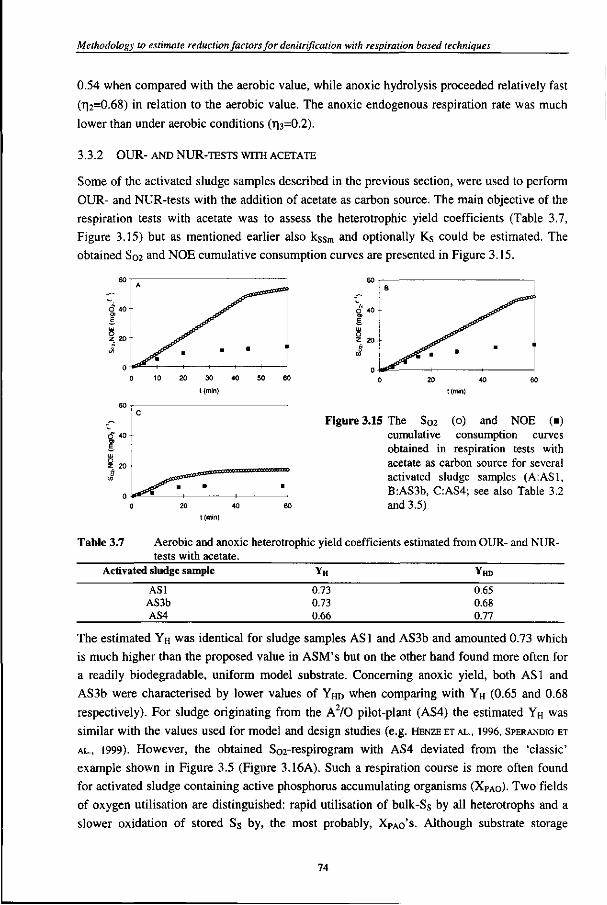
Methodology to estimate reduction factors for denitrification with respiration based techniques
0.54 when compared with the aerobic value, while anoxic hydrolysis proceeded relatively fast
(r)2=0.68) in relation to the aerobic value. The anoxic endogenous respiration rate was much
lower than under aerobic conditions (r|3=0.2).
3.3.2 OUR-AND NUR-TESTS WTTH ACETATE
Some of the activated sludge samples described in the previous section, were used to perform
OUR- and NUR-tests with the addition of acetate as carbon source. The main objective of the
respiration tests with acetate was to assess the heterotrophic yield coefficients (Table 3.7,
Figure 3.15) but as mentioned earlier also kssm and optionally Ks could be estimated. The
obtained S02 and NOE cumulative consumption curves are presented in Figure 3.15.
t (min)
Figure 3.15 The S02 (o) and NOE (•) cumulative consumption curves obtained in respiration tests with acetate as carbon source for several activated sludge samples (A:AS1, B:AS3b, C:AS4; see also Table 3.2 and 3.5)
t (min)
Table 3.7 Aerobic and anoxic heterotrophic yield coefficients estimated from OUR- and NUR-tests with acetate.
Activated sludge sample Y„
AS1 AS3b AS4
0.73 0.73 0.66
0.65 0.68 0.77
The estimated YH was identical for sludge samples AS 1 and AS3b and amounted 0.73 which
is much higher than the proposed value in ASM's but on the other hand found more often for
a readily biodegradable, uniform model substrate. Concerning anoxic yield, both AS1 and
AS3b were characterised by lower values of YHD when comparing with YH (0.65 and 0.68
respectively). For sludge originating from the A2 /0 pilot-plant (AS4) the estimated YH was
similar with the values used for model and design studies (e.g. HENZEETAL., 1996, SPERANDIO ET
AL., 1999). However, the obtained Scc-respirogram with AS4 deviated from the 'classic'
example shown in Figure 3.5 (Figure 3.16A). Such a respiration course is more often found
for activated sludge containing active phosphorus accumulating organisms (XPAo)- Two fields
of oxygen utilisation are distinguished: rapid utilisation of bulk-Ss by all heterotrophs and a
slower oxidation of stored Ss by, the most probably, XPAo's- Although substrate storage
74
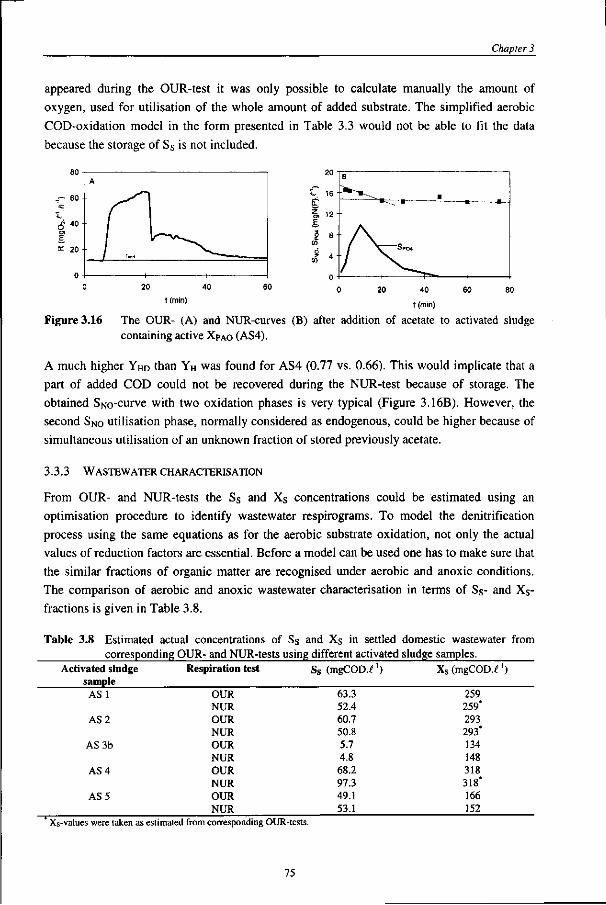
Chapter 3
appeared during the OUR-test it was only possible to calculate manually the amount of oxygen, used for utilisation of the whole amount of added substrate. The simplified aerobic COD-oxidation model in the form presented in Table 3.3 would not be able to fit the data because the storage of Ss is not included.
t (min)
Figure 3.16 The OUR- (A) and NUR-curves (B) after addition of acetate to activated sludge containing active XPAO (AS4).
A much higher YHD than YH was found for AS4 (0.77 vs. 0.66). This would implicate that a part of added COD could not be recovered during the NUR-test because of storage. The obtained SiMo-curve with two oxidation phases is very typical (Figure 3.16B). However, the second SNO utilisation phase, normally considered as endogenous, could be higher because of simultaneous utilisation of an unknown fraction of stored previously acetate.
3.3.3 WASTEWATER CHARACTERISATION
From OUR- and NUR-tests the Ss and Xs concentrations could be estimated using an optimisation procedure to identify wastewater respirograms. To model the denitrification process using the same equations as for the aerobic substrate oxidation, not only the actual values of reduction factors are essential. Before a model can be used one has to make sure that the similar fractions of organic matter are recognised under aerobic and anoxic conditions. The comparison of aerobic and anoxic wastewater characterisation in terms of Ss- and Xs-fractions is given in Table 3.8.
Table 3.8 Estimated actual concentrations of Ss and Xs in settled domestic wastewater from corresponding OUR- and NUR-tests using different activated sludge samples.
Activated sludge sample AS 1
AS 2
AS 3b
AS 4
AS 5
Respiration test
OUR NUR OUR NUR OUR NUR OUR NUR OUR NUR
Ss (mgCOD.f1)
63.3 52.4 60.7 50.8 5.7 4.8 68.2 97.3 49.1 53.1
Xs (mgCOD.f')
259 259* 293 293* 134 148 318 318* 166 152
Xs-values were taken as estimated from corresponding OUR-tests.
75
Methodology to estimate reduction factors for denitrification with respiration based techniques
The estimation of wastewater fractions was performed using the estimated values of YH and YHD- For wastewater samples where yield was not estimated or where the estimated value was doubtful (e.g. AS4), the value of YH=0.67 was used while for YHD a 10% lower value was used (YHD=0.6)
The results listed in Table 3.8 show in general similarities in obtained Ss-fractions. The smallest deviation occurred in the tests performed with activated sludge AS3b and AS5 (Table 3.2) adapted to denitrifying conditions. The biggest deviation was noted from the tests with activated sludge from an A2/0-system (AS4) where storage of COD disabled to obtain a reliable fractionation of biodegradable COD (see also §2.3.4).
More insight in the topic of equality of wastewater fractions recognised under aerobic and anoxic conditions can be obtained through a validation of the simplified denitrification model with wastewater characteristics obtained from an OUR-test.
3.5 CONCLUSIONS
Anoxic and aerobic respiration of activated sludge expose commonly three rates after addition of wastewater as organic carbon source: high respiration on Ss, a lower respiration on products of Xs-hydrolysis, and the lowest on endogenous substrate. The majority of observations reported in literature, as well as experimental results of this study indicate that all three respiration rates expose lower values with N-oxides than with oxygen as electron acceptor. In denitrification model approach three reductions factors: TJI, T|2 and r\i reflect decreased rates of subsequent processes under anoxic conditions.
In this chapter a methodology is proposed to estimate reduction factors enabling to model the denitrification process using the same equation as for aerobic substrate utilisation. This methodology implements two respiration tests: the oxygen utilisation rate (OUR)- and the nitrate utilisation rate (NUR)-test.
Based on literature and results from the methodology validation it can be concluded that the values of the reduction factors are not uniform and not constant but vary as a function of characteristics of activated sludge, influenced in turn by operational conditions, wastewater characteristics and process configuration.
The most sensitive and varying is the factor r|i for a decreased rate of the Ss-oxidation. In this
study the lowest r|i= 0.22 was found for a fully aerated low loaded system, subjected
'suddenly' to denitrifying conditions in the NUR-test. For activated sludge that was exposed
for some days to anoxic conditions this value was somewhat higher (r|i=0.4). For two
denitrifying sludge samples, from an alternating and A2/0 systems, r\\ showed higher values
(0.57 and 0.54).
76
Chapter 3
The reduction factor T|2 for hydrolysis under anoxic conditions exposed less variations than r|i
and oscillated around 0.6-0.7. The configuration of the system and the operational parameters
did not have an evident influence on T)2- The estimated r|2 is in the range reported in literature
and advised as default value for modelling practice. The results of this study would not
promote the necessity to carry extensive investigations on this parameter.
The third reduction factor, T|3, exposed values in the range of 0.2 to 0.4, and these are much
lower than reported in literature. The r|3 can be calculated from a direct comparison of
endogenous SNo-oxygen equivalent (NOE) respiration rate with the oxygen respiration rate.
The discrepancy with literature values as well as the simplicity of the estimation method
promotes the necessity of the estimation of T|3 for a particular activated sludge.
From a limited number of respiration tests with acetate, the aerobic heterotrophic yield (YH) turned out to be approximately 10% higher than the corresponding anoxic yield (YHD) from nitrifying and nitrifying-denitrifying systems what confirms some reports from literature. The estimation of YH and YHD using activated sludge containing XPAO with the proposed methodology is not advised because processes of substrate storage and storage product utilisation are not modelled. Default values from accepted model approaches are then an option.
The characterisation of biodegradable wastewater fractions, Ss and Xs, under aerobic and anoxic conditions result in similar values for activated sludge originating from nitrifying-denitrifying systems. Non-adapted activated sludge exposed more deviation between the estimated Ss-fractions from OUR- and NUR-tests. The most 'problematic' is wastewater characterisation with the presence of XPAO in activated sludge. To prove the equality of the magnitude of Ss and Xs under aerobic and anoxic conditions, the validation of the simplified denitrification model should be carried out with wastewater characteristics from one type of respiration measurement (OUR or NUR).
77
Methodology to estimate reduction factors for denitriftcation with respiration based techniques
LIST OF SYMBOLS AND ABBREVIATIONS
ASM Activated Sludge Model ATU allylthiourea bH aerobic decay coefficient of heterotrophic biomass (d"1 ) bHD anoxic decay coefficient of heterotrophic biomass ( d 1 ) CSTR completely stirred-tank reactor DO dissolved oxygen concentration ( m g 0 2 . f ) /„»• vo lumet r ic was tewate r fraction in the total exper imenta l ba tch vo lume (I.I'') kDend specific e ndogenous denitr if ication rate (mgN.gVSS" .ft"1) kend specific aerobic endogenous respiration rate (mg02.gVSS" .ft" ) kH hydrolysis rate of X s (ft"' or d"1) k s s specific S s oxidation rate, subscript: m - maximum (mgCOD.gVSS '.ft) K s half-saturation coefficient for S s oxidation (mgCOD. f 1 ) NOE nitrate oxygen equivalent (mg02 . f ' ) NUR nitrate utilisation rate (mgN.f ] .ft"') OUR oxygen utilisation rate (mg02.f ' . f t '1) qR wastewater flow through the respiration vessel ( f ft"1) R aerobic respiration rate (mg02- f ' . f t ' ) rDend endogenous volumetric denitrification rate ( m g 0 2 . f ' . f t ' ) ren(i aerobic volumetric endogenous respiration rate ( m g 0 2 . f ' . f t ' ) SAc acetate concentration in respiration test (mgCOD. f 1 ) SBR sequencing batch reactor SRT solid retention t ime (d) S/X v initial substrate to biomass ratio in respiration batch test (g COD.gVSS"') SNH ammonia-nitrogen ( m g N . f ' )
S N 0 sum nitrate and nitrite-nitrate equivalent nitrogen (mgN. f ) SN02 nitrite-nitrogen (mgN . f 1 ) SNo3 nitrate-nitrogen (mgN. f 1 ) S02 oxygen concentration ( m g 0 2 . f ' ) S s soluble, readily biodegradable C O D ( m g C O D . f ' ) VB total volume of the batch for respiration tests ((.) VR total volume of the respiration vessel in OUR-test (i) XH heterotrophic biomass fraction (mgCOD. f 1 ) X H D heterotrophic denitrifying biomass fraction (mgCOD. f 1 ) X P A 0 phosphate accumulating organisms (mgCOD. f 1 ) X s particulate, slowly biodegradable COD (mgCOD. f 1 ) XSTO internal cell storage products (mgCOD. f 1 ) X v concentration of volatile fraction of biomass ( g . f ! ) YH aerobic heterotrophic yield (mgCOD.mgCOD 1 ) YH D anoxic heterotrophic yield (mgCOD.mgCOD 1 ) r | reduction factor for anoxic substrate utilisation; often BOD5 (literature) T|No reduction factor(s) other than T|g, r\H and T|E (literature) r |E reduction factor for anoxic endogenous respiration (literature) r |g reduction factor for heterotrophs growth under anoxic conditions (literature) T)H r educt ion factors for anoxic hydrolysis (literature) T]i reduct ion factor for anoxic oxidation of S s ( this s tudy) T|2 r educt ion factors for anoxic hydrolysis (this s tudy) T)3 r educt ion factor for anoxic endogenous respiration (this s tudy) P-H aerobic specific growth of heterotrophs (d" ) HHD anoxic specific growth of heterotrophs ( d 1 )
78
LITERATURE
Chapter 3
APHA, AWWA, WEF (1992) Standard Methods for examination of water and wastewater. 18th edition. Edts.: Greenberg, A.E., Clesceni, L.S. and Eaton, A.D.
Argaman, Y., (1985) Energetics of single-sludge nitrogen removal. Wat. Res. 19, (12), 1505-1513.
Argaman, Y. (1995a) A steady state model for the single sludge activated sludge system - 1 . Model description. Wat. Res., 29, (1), 137-145.
Argaman, Y. (1995b) A steady state model for the single sludge activated sludge system - II. Model application. Wat. Res., 29, (1), 147-153.
ATV-A131(1991)ArbeitsblattA 131, Bemessung von einstufigen Belebungsanlagen ab 5000 Einwohnerwerten, Regelwerk der ATV, St. Augustin, Febr. 1991.
Avciouglu, E. ,Orhon, D. and Sozen, S. (1998) A new method for the assessment of heterotrophic endogenous respiration rate under aerobic and anoxic conditions. Accepted for publication in Water Science and Technology.
Bernardes, R.S. (1996) Modelling nutrient removal in a sequencing batch reactor with respirometry. Dissertation, Agricultural University Wageningen, The Netherlands.
B6hnke,B. (1989) Bemessung der Stickstof-felimination in der Abwasserreinigung -Ergebnisse eines Erfahrungsaustausches der Hochschulen, Korrespondenz Abwasser, 36, 1046-1061.
Brouwer, H. and Klapwijk, B. (1997) Model-gebaseerde sturing van het aerobe volume in een propstroomaktiefslibinstallatie op basis van respirometrie. Rapport of Departement Agro-milieu- en systeemtechnologie (AMST), Landbouwuniversiteit Wageningen (in Dutch).
Casey, T.G., Wentzel, M.C., Ekama, G.A. and Marais, G.v.R. (1994) Causes and control of anoxic aerobic (AA) (or low F/M) filament bulking in long sludge age nutrient removal activated sludge systems. WRC Report No 286/2/94.
Chudoba, P., Capdeville, B. and Chudoba, J. (1992) Explanation of biological meaning of the S(/Xo ratio in batch cultivation. Wat. Sci. Tech., 26, (3/4), 743-751.
Copp, J.B. and Dold, P.L. (1998) Comparing sludge production under aerobic and anoxic conditions. Wat. Sci. Tech. 38 (1), 285-294.
Cokgor Ubay, E., Sozen, S., Orhon, D. and Henze, M. (1998) Respirometrie analysis of activated sludge behaviour - II. Assesment of the readily biodegradable substrate. Wat. Res. 32 (2), 461-475.
Dold, P.L., Ekama G.A. and Marais G.v.R. (1980) A general model for the activated sludge process. Prog. Wat. Technol. 12, 47-77.
Dold, P.L. and Marais, G.v.R. (1986). Evaluation of the general activated sludge model proposed by the IAWPRC Task Group. Wat. Sci. Tech., 18, (6) 63-89.
Ekama G.A., Dold, P.L. and Marais, G.v.R. (1986) Procedures for determining influent COD fractions and the maximum specific growth rate of heterotrophs in activated sludge systems. Wat. Sci. Tech., 18 (6), 91-114.
Ermel, G. (1983) Stickstoffentfernung in einstufigen Belebungsanlagen - Steuerung der Denitrifikation. Veroff. des Inst, fiir Stadtbauwesen, TU Braunschweig, Nr 35.
Goel, R., Mino, T., Satoh, H. and Matsuo, T. (1999) Modelling hydrolysis processes considering intracellular storage. Wat. Sci. Tech., 39(1), 97-106.
Gujer, W. and Henze, M. (1991) Activated sludge modelling and simulation. Wat. Sci. Tech. 23, 1011-1023.
Gujer, W., Henze.M, Mino, T. and van Loosdrecht, M. (1999). Activated sludge model no.3. IAWQ Task Group on Mathematical Modelling for Design and operation of Biological Wastewater Treatment. Wat. Sci. Tech., 39 (1), 183-195.
Hadjipetrou, L.P. and Stouthamer, A.H. (1965) Energy production during nitrate respiration by Aerobacter aerogenes. J.Gen.Microbiol. 38, 29-34.
Hartwig, P. (1993) Beitrag zur Bemessung von Belebungsanlagen mit Stickstoff- und Phosphorelimination. Veroff. des Inst, fiir Siedlungswasserwirtschaft und Abfall-technik, Universitat Hannover, Nr 84.
Heide, B.A. (1975) Aerobe en verdergaande zuivering van afvalwater in zeer laagbelaste actief-slib systemen, deel II, Rapport A 77. Inst, voor Mileuhygiene en Gezondheidstechniek TNO, Delft.
Henze M., (1986) Nitrate versus oxygen utilisation rates in wastewater and activated sludge systems Wat. Sci. Tech. 18, 115-122.
Henze M., (1987) Theories for estimation of the fraction of denitrifiers in combined nitrifying-denitrifying treatment plants. Wat. Res.,Vol. 21 (12), 1521-1524.
Henze M., Grady, C.P.LJr, Gujer, W., Marais, G.v.R. and Matsuo, T. (1987). Activated sludge model no.l. IAWPRC Scientifical and Technical Report No. 1, IAWPRC, London.
Henze, M. and Mladenowski, C. (1991) Hydrolysis of particulate substrate by activated sludge under
79
Methodology to estimate reduction factors for denitrification with respiration based techniques
aerobic, anoxic and anaerobic conditions. Wat. Res. 25 (1), 61-64
Henze M., Gujer, W., Mino, T., Matsuo, T„ Wentzel, M.C., Marais, G.v.R. (1996) Activated sludge model no.2.Scientifical and Technical Report No.3.
Henze M., Gujer, W., Mino, T., Matsuo, T., Wentzel, M.C., Marais, G.v.R. and van Loosdrecht, M.C.M. (1999) Outline Activated Sludge Model No.2d by IAWQ Task Group on Mathematical Modelling for Design and operation of Biological Wastewater Treatment Processes. Wat. Sci. Tech., 39, (1), 165-183.
Justin, P. and Kelly, D.P. (1978) Metabolic changes in Thiobacillus denitrificans accompanying the transition from aerobic to anaerobic growth in continuous chemostat culture. J.Gen. Microbiol. 107, 131-137.
Kayser, R., (1983) Ein Ansatz zur Bemessung der vorgeschalteten Denitrifikation fur Nitrifikation -Denitrifikation. gwf Wasser - Abwasser, 124, 419-427.
Kayser, R., (1997) Ein neuer Ansatz zur Berechnung der Denitrifikationskapazitat in Belebungsanlagen. gwf Wasser - Abwasser, 138, (5), 251-254.
Klapwijk, A. (1978) Eliminatie van stikstof uit afvalwater door denitrificatie. Dissertation, Agricultural University Wageningen, The Netherlands.
Koike, I. and Hattori, A. (1975) Growth yield of denitrifying bacterium, Pseudomonas denitrificans, under aerobic and denitrifying conditions. J. Gen. Microbiol., 88,1-10.
Krauth, Kh. and Schwenter, G. (1994) Auswirkungen der Feststoffe im Abwasser auf die Denitrifikation. Korrespondenz Abwasser 41, 569.
Kristensen, G.H., Jorgensen, P.E. and Henze, M. (1992) Characterisation of functional microorganisms groups and substrate in activated sludge and wastewater by AUR, NUR and OUR. Wat. Sci. Tech., 25 (6), 43-57.
Marsden, M.G. and Marais, G.v.R. (1976) The role of the primary anoxic reactor in denitrification and biological phosphorus removal. Research report No. 19. Dept. of Civil Eng., University of Cape Town.
McCarty, P.L. (1972) Energetics of organic matter degradation. Wat. Pollut. Micr. (ed. R. Mitchel), 91-118.
McClintock, S.A., Sherrard, J.H., Novak, J.T. and Randall C.W. (1988) Nitrate versus oxygen respiration in the activated sludge process. Journal WPCF, 60 (3), 342-350.
Obermann, P. (1982) Hydrochemische /hydromechanische Untersuchungen zum Stofgehalt von Grundwasser bei landwirt-schaftlicher Nutzung, Besondere Mitteilun-gen zum Dtsch. GewasserkundT. Jahrbuch 42, 2.
edition, publisher: Vereinigung Dtsch. Gewasserschutz e.V., Bonn.
Orhon, D., Sozen, S. and Artan, N. (1996) The effect of heterotrophic yield on the assessment of the correction factor for the anoxic growth. Wat. Sci. Tech., 34 (5-6), 67-74.
Payne, W.J. and Wiebe, W.J. (1978) Growth yield and efficiency in Chemisynthetic Microorganisms. Annual Review of Microbiology, 32, 155-183.
Popel, H.J. (1986) Grundlagen der nitrification und denitrification. ATV -Seminar Weitergehende Abwasserreinigung, 22-23rd May, Essen, Germany.
Scheer, H. and Seyfried, (1994) Concepts for determining the readily biodegradable substrate in the sewage and procedures for dimensioning the biological phosphorus removal. Korrespondenz Abwasser, 41, 3/94.
Schlegel, S. (1987) Bemessung und Ergebnisse von Belebungsanlagen mit Nitrifikation und vorgeschalteter Kaskadendenitrifikation. gwf Wasser - Abwasser, 128, (8), 422-431
Siegrist, H., Brunner, I., Koch, G., Linh Con Phan and Van Chieu Le (1999) Reduction of biomass decay rate under anoxic and anaerobic conditions. Wat. Sci. Tech., 39, (1), 129-138.
Sozen, S., Cokgor, E.U., Orhon, D. and Henze, M. (1998) Respirometric analysis of activated sludge behaviour - II. Heterotrophic growth under aerobic and anoxic conditions. Wat. Res. 32 (2), 476-488.
Spanjers, H. and Klapwijk, A. (1990) On-line meter for respiration rate and short-term biochemical oxygen demand in the control of activated sludge process. In Instrumentation, Control and Automation of Water and Wastewater Treatment and Transport Systems (Adv. Wat. Pollut. Control no. 10) (ed. R. Briggs), pp. 67-77, Pergamon Press, Oxford.
Sperandio, M., Urbain, V., Audic, J.M. and Paul, E. (1999) Use of carbon dioxide evolution rate for determining heterotrophic yield and characterising denitrifying biomass. Wat. Sci. Tech., 39, (1), 139-146.
Stern, L.B. and Marais, G.v.R. (1974) Sewage as an electron donor in biological denitrification. Research report No. 7. Dept. of Civil Eng., University of Cape Town.
Still, D., Blackbeard, J.R., Ekama, G.A. and Marais, G.v.R. (1986). The effect of feeding pattern on sludge growth rate and sludge settleability. Res. Rept. No.W55, Dept. Civil Eng., Univ. of Cape Town.
Stouthamer, A.H. (1988) Dissimilatory reduction of oxidised nitrogen compounds. Biology of anaerobic microorganisms. Zehnder, A.J.B. (Edt) John Willey and Sons, New York, 245-303.
Teichgraber, B. (1988) Zur Nitrifikation von Abwassern mit geringer Sauerkapazitat.
80
Chapter 3
Veroffentlichung des instituts fiir Siedlungs-wasserwirtschaft der TU Braunschweig, 45.
Van Haandel, A.C., Ekama, G.A. and Marais, G.v.R. (1981a) The activated sludge process -Part 3. Single sludge denitrification. Wat. Res. 15, 1135-1152.
Van Haandel, A.C. and Marais, G.v.R. (1981b) Nitrification and denitrification kinetics in the activated sludge process, research report W39, Dept. of Civil Eng., Univ. of Cape Town.
Van Loosdrecht, M.C.M. and Jetten, M.S.M. (1998) Microbiological conversions in nitrogen removal. Wat. Sci. Tech. 38 (1), 1-8.
Vanrolleghem, P.A., van Daele, M. and Dochain, D. (1995) Practical identifiability of a biokinetic model of activated sludge respiration. Wat. Res. 29 (11), 2561-2570.
Wentzel, M.C., Ekama, G.A. and Marais, G.v.R. (1991) Kinetics of nitrification-denitrification biological excess phosphorus removal - a review. Wat. Sci. Tech., 23 (4/6), 555-565.
Wentzel, M.C., Ekama, G.A. and Marais, G.v.R. (1992) Processes and modelling of nitrification denitrification biological excess phosphorus removal systems - a review. Wat. Sci. Tech., 25, 6, 59-82.
Wilson D.E. and Marais, G.v.R. (1976) Adsorption phase in biological denitrification. Research report No. 11. Dept. of Civil Eng., University of Cape Town
Chapter 4
Respiration based simplified nitrification-denitrification model. Part I: model development
CONTENT
Abstract 84 4.1 Introduction: denitrification aspects in activated sludge models 85
4.1.1 General 85 4.1.2 Steady-state nitrification-denitrification models 85 4.1.3 Advanced dynamic models 86 4.1.4 Simplified dynamic models 89 4.1.5 Objective of the study 91
4.2 Development of a new simplified nitrification-denitrification model 92 4.2.1 Aerobic model for nitrification and biodegradable COD-oxidation 92 4.2.2 Extension of the aerobic model with the denitrification process 93
4.3 Estimation procedure for model parameters 95 4.3.1 Introduction 95 4.3.2 The respiration based control unit RESCUE 95 4.3.3 Aerobic respiration tests for parameter estimation 96 4.3.4 Anoxic respiration tests 98 4.3.5 Model parameters 98
4.5 Conclusions 101 List of symbols and abbreviations (for chapters 4&5) 103 Literature 105
83
Respiration based simplified nitrification-denitrification model. Part I: model development
ABSTRACT
Many models have been proposed in the last decades for the description of the activated sludge
process. The most advanced allow for dynamic simulation of a single sludge process involving
nitrification, denitrification and biological phosphorus removal. Calibration of advanced models
requires an input of a significant number of parameters. Since the estimation of each parameter is
difficult and time consuming, the choice of default values is an option but it can lead to erroneous
predictions of reality. Use of complex models is inconvenient for applications like control or
monitoring because it creates computational and analytical efforts. Simplified models, describing a
reduced number of processes, and involving a small number of parameters, constitute an alternative.
For an optimal implementation of simplified models a reliable method to obtain its actual parameters
is required.
In this chapter a model is presented in which the existing simplified model for nitrification and
aerobic oxidation of biodegradable COD, as described by BROUWER AND KLAPWUK (1997) and BROUWER
ET AL., (1998) was extended with a denitrification step. A characteristic feature of the resulting
simplified nitrification-denitrification model was that substrate conversion was not modelled via the
growth of appropriate groups of micro-organisms. Instead, experimentally estimated conversion rates
were used, what contributed in a reduction of model components with regards to advanced
approaches. When the conversion rates are frequently actualised, changes in biomass activity are
included, despite of a variation in operational and environmental conditions. Regarding wastewater
characterisation a compromise between complexity and simplicity was chosen by defining only three
fractions for COD- and nitrogen conversion. These are the previously introduced fractions Ss and X$
and additionally nitrifiable nitrogen (SNHII)- For a frequent assessment of the majority of model
parameters and wastewater characterisation, a side-stream aerobic respiration based control unit is
necessary.
84
Chapter 4
4.1 INTRODUCTION: DENITRIFICATION ASPECTS IN ACTIVATED SLUDGE MODELS
4.1.1 GENERAL
A lack of methods to predict the potential of treatment systems to remove required groups of wastewater components focused the attention on the development of mathematical models to identify and describe the kinetics of the systems. The development of mechanistic activated sludge models has passed through several stages by incorporating an increasing number of processes from which organic matter removal, nitrification, denitrification and phosphorus removal are the most significant. Improving fundamental knowledge about these processes and the availability of measurement techniques for the estimation of model parameters were driving forces in the improvement of models. Due to the fact that processes occur mostly in single sludge systems, models are obviously complex and characterised by a large number of reactions and a large number of components.
Several approaches are the conceptual base for the creation of a mechanistic model (e.g.
ANDREWS, 1992, VAN LOOSDRECHT, 1995). For the purpose of this chapter two general model
groups are of importance. Regarding the rate of complexity the models are divided into:
- complex models - attempting to include a high number of processes, and
- simplified models - restricted to a minimum number of processes.
Concerning the dynamics of the process description the models can be further grouped into:
- steady state models - restricted to constant wastewater flow and composition, and
- dynamic models - facing changes in wastewater flow and composition.
There exists no unified model to serve all model objectives as design, optimisation and control. For design purposes usually steady-state models are used and dynamic models can be used for optimisation, training and design assistance. A large number of model objectives is the main reason why a large number of model approaches exist.
In this section some representatives of the activated sludge model categories were briefly reviewed. Especially model aspects were presented that relate to biological nitrogen removal with a special attention on the denitrification process in single, suspended growth activated sludge systems. The objective was to give an impression about the variety and the rate of complexity or simplicity of the existing approaches in any way relevant to the developed simplified nitrification-denitrification model as described further in this chapter.
4.1.2 STEADY-STATE NiTRMCATiON-DENrrRMCATiON MODELS
The steady state denitrification model of VAN HAANDEL ET AL. (I98la,b, 1982) was one of the first denitrification approaches serving design purposes. It was developed based on the results from intensive investigations in a plug-flow Wuhrmann (post-denitrification) system and a modified Ludzack-Ettinger (pre-denitrification) system. By measuring the nitrate concentration along the length of the plug-flow anoxic reactors typical concentration profiles were observed. In a pre-denitrification reactor a two-phase linear profile was measured: (1) a
85
Respiration based simplified nitrification-denitrification model. Part I: model development
fast primary phase with a short duration and (2) a slower secondary phase that persisted for the
balance of time in a reactor. In a post-denitrification reactor a single linear nitrate reduction
profile (3) was observed (STERN AND MARAIS, 1974, WILSON AND MARAIS, 1976, MARSDEN AND MARAIS,
1976, Figure 3.1). It was found that the amount of nitrate reduced in the first phase (ANis,
mgN.f1) was proportional to the influent biodegradable COD-concentration (Sbi) and
independent on temperature, sludge concentration and recycle ratio (STERN AND MARAIS, 1974).
The remaining amounts of nitrate reduced in the second and third phase (AN2s and AN3S
respectively) were described by the rate constants K2 and K3, which were independent on
sludge retention time (SRT), influent COD, sludge concentration and recycle ratios.
Consequently the overall nitrate reduction in pre- and post-denitrification systems (ANS), in
steady-state conditions and under no limitation of organic substrate and nitrate, was expressed
with equation 4.1:
ANS =ANu+AN2s+AN3s =aSbi + K2XaRx + K3XaR3; mgN.f' (4.1)
where:
a proportionality constant (mgN.mg biodegradable COD"1); Ri, R3 actual retention times in pre- and post-anoxic reactor respectively (h or d); Xa active mass concentration (g.f ); K2 and K3 denitrification rate constants in pre- and post-denitrification reactor (mgN.gXa"'.d' ).
The denitrification potential for the pre- and post-denitrification reactor enables to estimate
the nitrate-effluent concentration and was formulated as follows:
D'=Ma+o7^-<*'-''' + * > - ^ ; mgNr' (4'2) where:
YH yield coefficient (mgVSS.mgCOD"1) bnT endogenous respiration rate (d" ) fxi , fx3 fraction of sludge mass in primary and secondary anoxic reactor
Characteristic for this approach was that empirical constant values were recommended, which
are related to the denitrification process (a, K2, K3). Regarding the nitrification process, its
design was based on the minimum sludge age. For estimation, empirical kinetic parameters as
maximum growth- and decay rates of nitrifiers were used, corrected by appropriate functions
for pH and temperature. Also the wastewater fractionation regarding subsequent nitrogen
forms in the influent and the amount of nitrogen used for biomass synthesis were calculated
using empirical factors (EKAMAET AL., 1979, VAN HAANDEL AND MARAIS, 1981).
4.1.3 ADVANCED DYNAMIC MODELS
The most often implemented advanced dynamic activated sludge models (ASM's) are
developed by the IAWQ Task Group on Mathematical Modelling for Design and Operation of
Biological Wastewater Treatment Processes and were the results of a compilation of existing
approaches (e.g. DOLDETAL., 1980, VAN HAANDEL ETAL., 1981, WENTZELETAL., 1988,1992).
86
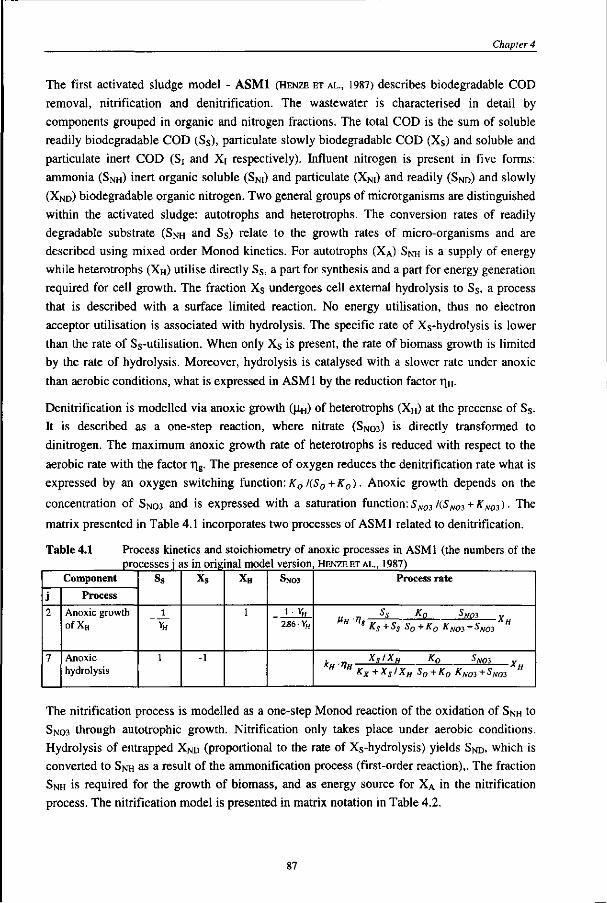
Chapter 4
The first activated sludge model - ASM1 (HENZE ET AL., 1987) describes biodegradable COD
removal, nitrification and denitrification. The wastewater is characterised in detail by
components grouped in organic and nitrogen fractions. The total COD is the sum of soluble
readily biodegradable COD (Ss), particulate slowly biodegradable COD (Xs) and soluble and
particulate inert COD (Si and Xi respectively). Influent nitrogen is present in five forms:
ammonia (SNH) inert organic soluble (SNI) and particulate (XNI) and readily (SND) and slowly
(XND) biodegradable organic nitrogen. Two general groups of microrganisms are distinguished
within the activated sludge: autotrophs and heterotrophs. The conversion rates of readily
degradable substrate (SNH and Ss) relate to the growth rates of micro-organisms and are
described using mixed order Monod kinetics. For autotrophs (XA) SNH is a supply of energy
while heterotrophs (XH) utilise directly Ss, a part for synthesis and a part for energy generation
required for cell growth. The fraction Xs undergoes cell external hydrolysis to Ss, a process
that is described with a surface limited reaction. No energy utilisation, thus no electron
acceptor utilisation is associated with hydrolysis. The specific rate of Xs-hydrolysis is lower
than the rate of Ss-utilisation. When only X s is present, the rate of biomass growth is limited
by the rate of hydrolysis. Moreover, hydrolysis is catalysed with a slower rate under anoxic
than aerobic conditions, what is expressed in ASM1 by the reduction factor r\H.
Denitrification is modelled via anoxic growth ((i.H) of heterotrophs (XH) at the precense of Ss.
It is described as a one-step reaction, where nitrate (SNO3) is directly transformed to
dinitrogen. The maximum anoxic growth rate of heterotrophs is reduced with respect to the
aerobic rate with the factor i"|g. The presence of oxygen reduces the denitrification rate what is
expressed by an oxygen switching function:K0I(S0 + K0). Anoxic growth depends on the
concentration of SNo3 and is expressed with a saturation function: SN03 l(SNOl+KNm). The
matrix presented in Table 4.1 incorporates two processes of ASM 1 related to denitrification.
Table 4.1 Process kinetics and stoichiometry of anoxic processes in ASM1 (the numbers of the processes j as in original model version, HENZE ET AL., 1987)
Component
j
2
7
Process
Anoxic growth ofXH
Anoxic hydrolysis
Ss
1
1
Xs
-1
XH
1
SN03
I-V„ 286 YH
Process rate
Ks +SS S0+ K0 KN01t + SN02
KX + %S ' XH S0 + K0 KN01 + SN03
The nitrification process is modelled as a one-step Monod reaction of the oxidation of SNH to
SNO3 through autotrophic growth. Nitrification only takes place under aerobic conditions.
Hydrolysis of entrapped XND (proportional to the rate of Xs-hydrolysis) yields SND. which is
converted to SNH as a result of the ammonification process (first-order reaction),. The fraction
SNH is required for the growth of biomass, and as energy source for XA in the nitrification
process. The nitrification model is presented in matrix notation in Table 4.2.
87
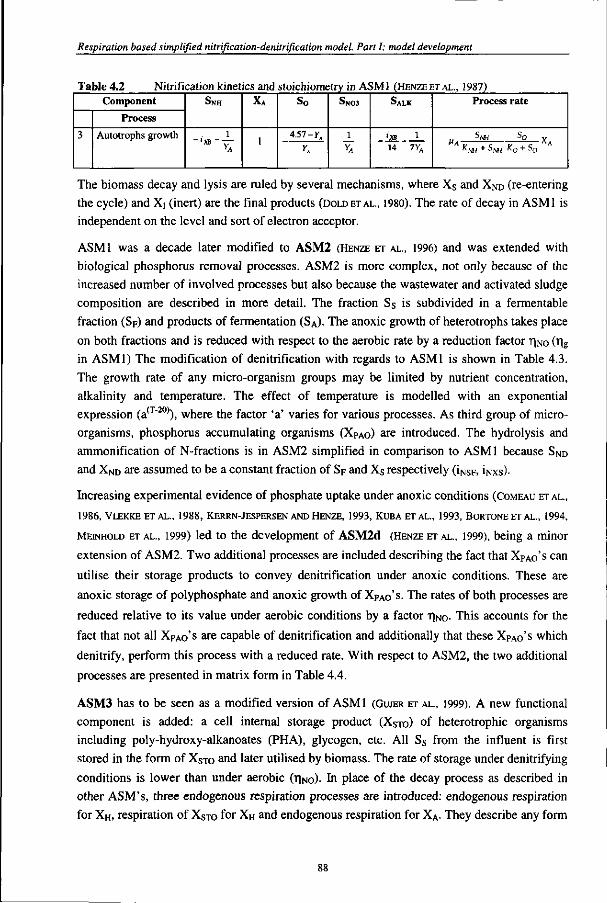
Respiration based simplified nitrification-denitrification model. Part I: model development
Table 4.2 Nitrification kinetics and stoichiometry in ASM 1 (HENZE ET AL„ 1987) Component
3
Process
Autotrophs growth
SNH
1 - ' X B - —
<A
xA
1
So
4 5 7 -y»
YA
S N 0 3
1
YA
S A L K
14 7YA
Process rate
HA SNH S° *A K NH + SNH K0 + S0
The biomass decay and lysis are ruled by several mechanisms, where Xs and XND (re-entering
the cycle) and Xi (inert) are the final products (DOLD ET AL„ 1980). The rate of decay in ASM1 is
independent on the level and sort of electron acceptor.
ASM1 was a decade later modified to ASM2 (HENZE ET AL., 1996) and was extended with
biological phosphorus removal processes. ASM2 is more complex, not only because of the
increased number of involved processes but also because the wastewater and activated sludge
composition are described in more detail. The fraction S s is subdivided in a fermentable
fraction (SF) and products of fermentation (SA). The anoxic growth of heterotrophs takes place
on both fractions and is reduced with respect to the aerobic rate by a reduction factor T)NO (fig
in ASM1) The modification of denitrification with regards to ASM1 is shown in Table 4.3.
The growth rate of any micro-organism groups may be limited by nutrient concentration,
alkalinity and temperature. The effect of temperature is modelled with an exponential
expression (a<T"20)), where the factor 'a' varies for various processes. As third group of micro
organisms, phosphorus accumulating organisms (XPAo) are introduced. The hydrolysis and
ammonification of N-fractions is in ASM2 simplified in comparison to ASM1 because SND
and XND are assumed to be a constant fraction of Sp and Xs respectively (insF, INXS)-
Increasing experimental evidence of phosphate uptake under anoxic conditions (COMEAU ET AL.,
1986, VLEKKE ET AL., 1988, KERRN-JESPERSEN AND HENZE, 1993, KUBA ET AL., 1993, BORTONE ET AL., 1994,
MEINHOLD ET AL., 1999) led to the development of ASM2d (HENZE ET AL., 1999), being a minor
extension of ASM2. Two additional processes are included describing the fact that XPAo's can
utilise their storage products to convey denitrification under anoxic conditions. These are
anoxic storage of polyphosphate and anoxic growth of XPAO'S. The rates of both processes are
reduced relative to its value under aerobic conditions by a factor T|NO- This accounts for the
fact that not all XPAO'S are capable of denitrification and additionally that these XPAo's which
denitrify, perform this process with a reduced rate. With respect to ASM2, the two additional
processes are presented in matrix form in Table 4.4.
ASM3 has to be seen as a modified version of ASM 1 (GUJER ET AL., 1999). A new functional
component is added: a cell internal storage product (XSTO) of heterotrophic organisms
including poly-hydroxy-alkanoates (PHA), glycogen, etc. All Ss from the influent is first
stored in the form of XSTO and later utilised by biomass. The rate of storage under denitrifying
conditions is lower than under aerobic (r|No). In place of the decay process as described in
other ASM's, three endogenous respiration processes are introduced: endogenous respiration
for XH, respiration of XSTO for XH and endogenous respiration for XA. They describe any form
Chapter 4
of biomass loss as well as decay of storage products, both under anoxic and aerobic
conditions. The endogenous rates under denitrifying conditions are lower compared with
aerobic conditions. The differentiation between aerobic and anoxic heterotrophic yield
coefficient is introduced. The expressions describing new process approaches under anoxic
conditions are presented in Table 4.5.
For certain purposes, e.g. control strategies or 'quick' analysis of process potential,
implementation of models with a large state vector (several classes of micro-organisms,
detailed fractionation of wastewater, large number of kinetic and stoichiometric coefficients)
may create a computational problem. Estimation of the parameter values for a particular
situation is complex and a frequent update of sensitive parameters is hardly possible
(analytical problem). The use of 'typical' default values may lead to an erroneous reflection of
reality because of the unique, specific character of wastewater and activated sludge
(depending on location, configuration, etc.). In many cases simplified models constitute an
alternative.
4.1.4 SIMPLIFIED DYNAMIC MODELS
Simplified activated sludge models have been successfully used for control and monitoring
purposes (e.g. VAN HAANDEL ET AL., 1981b, ISAACS ET AL., 1994, ISAACS AND HENZE, 1995, ZHAO ET AL.,
1994a,b, 1995, 1999, BROUWER AND KLAPWUK, 1997, BROUWER ET AL., 1998). One way of model
simplification is to freeze the slow dynamics of the process, so microorganisms are not
explicitly modelled. Simplified models are not suitable for detailed design. When applied in
an adaptive fashion, by which estimated values of the parameters are periodically updated,
simplified models can be applied in control schemes involving a relatively short prediction
window (ISAACS AND HENZE, 1995).
One of the first simplified denitrification approaches was the model of VAN HAANDEL ET AL.
(1982) and EKAMA ET AL., (1983). Accepting the presence of two biodegradable COD-fractions in
municipal wastewater, the denitrification process behaviour could be expressed qualitatively
in terms of the general aerobic model. A quantitative description required the change in the
empirical constant that describes the slower utilisation rate of Xs under anoxic conditions
(Km,xs )• The anoxic degradation of Ss and Xs was independent on each other and described
with substrate limiting Monod equations. The overall utilisation of nitrate is shown in matrix
form in Table 4.6
89
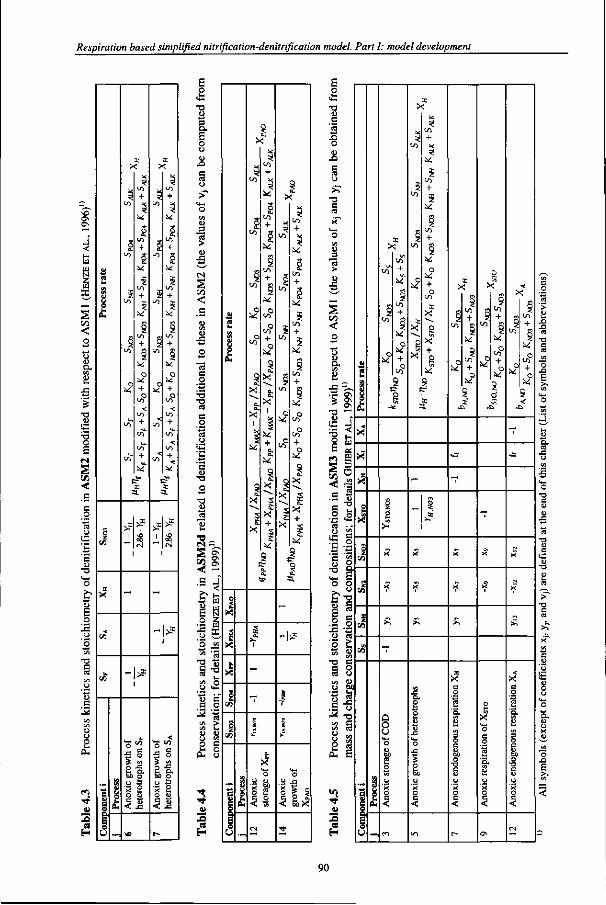
Respiration based simplified nitrification-denitrification model. Part I: model development
4
in
<
5C
<
a*
3 a H
u
w
8 eu
z
X
c/i
c
o
E o u
% 4>
I X
* V)
1 V)
* v j
y v>
^
v}
i i .
5< t o
+ 5!
tO + §.
X
¥ +
+ 2
o
+ o
V) •> :
+ V)
u. s*s
B *
=t
£ >?
a
i
•R« •5 o 4 us o J=
u i3
* a ^ i
v©
i X
* V)
kl V)
* V }
y V)
^
v>
<
* * tO
+ * 3
X
S VI + |
:*: # +
+
o
+ o
v->
+
P* a:
=L
^ 1
>?
s
~\* 1
^ e n
fi £ S •« o -5
•a s
5S
r-
3 a. £ o o u
XI c
-a T3
•n
s § tn >
U U
o c 0- u
• *
• *
V
u
I
o
X
•* E
X
( •
X
2 in
7. \n
B o
E o
u
u a.
9 X
* t o
* V)
s t o
o
I X
a-X 1
«
9 X
? X
^ * ^ + * * « a
t o
+
^ ^ +
o
o t o + o
i 4
X
& X
!* +
9 X
? X +
1 9,
c r
ts-
- . * •
,_
m
X O
1 r? * 8
9 X
X
g t o
? LO
S Vi
o
o
? X
f X
^ + 4 « i + 3
¥ t o + 1
9 t o
+ 9
Sx!
o t o
+ o
X
? X + 1
g a.
- | > ?
! i
rt
O
8 ! ? ^ W J X
o
T3 U c (S
X ) o ID
-O
§ U
T3 C
>T <** o u 3 "3 >
.c
< o
o u a. 2
T3 — 4> r
1 =* ^ e
•2 ^ (3 • -0 jo
r -2
<u 8 -o & - b
o o
85 .2 o J 3 - B O t3
2 ^
S « m V o W
.s -8
•2 -a
2 S ex E
m TT U
«
4)
S3
1 1 <
X
X
X X
S
8 t/3
z
s z
EM
1/1
E S E O U
W X £
*-
X
i t o
*°
+ ^ £ +
i + o
t o
^
o z
>•
X
X
£
'
Q O U
o D
o I/I
o
<
m
1 X
# t o
i t o
y t o
o
a: X
p X
^ VI
+ « 5<
^ ?
+ 5 ; 9 + 1
sx o
+ o
t o 3:
X
X +
3 .
-
- s ^
X
£.
a . g g £
o J=
o
o
2
i n
X
i t o
o
9 t o
+ 9
9 t o
+
9 X
<+*
-
X
>,
3j
X c o
O
W o G
O
2
r-
_ X
g t o
o
9 t o
+ 9
t o
+
9
-CJ
-7
X
o
X
o G o et
a.
o
o
if
ON
*c
^
9 V}
o
s t o
+ 9 o
+
9
T
c
X
>
< X c o
' a -
3 O
00 o c
o
o
J?
CN
90
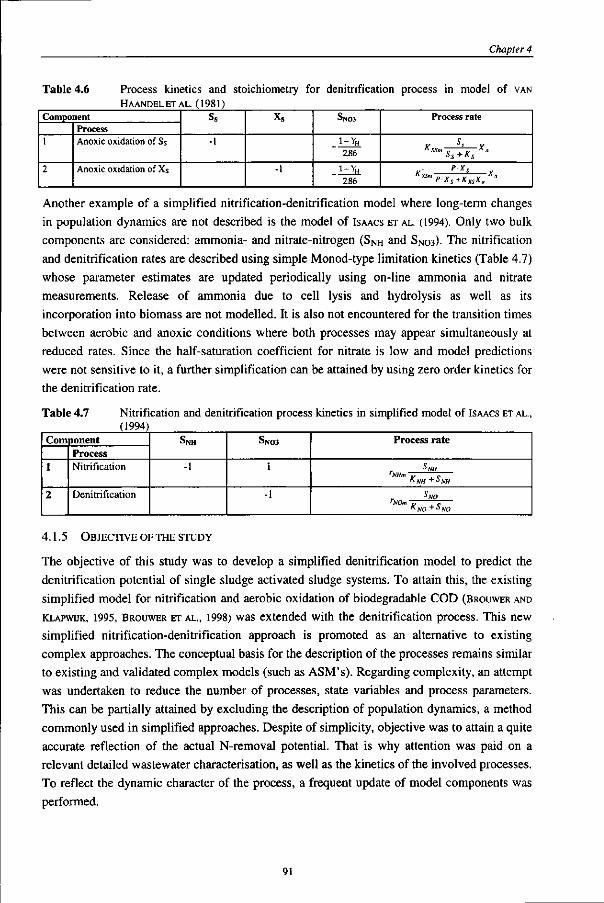
Table 4.6
Chapter 4
Process kinetics and stoichiometry for denitrification process in model of VAN HAANDELETAL. (1981)
Component
1
2
Process Anoxic oxidation of Ss
Anoxic oxidation of Xs
Ss
-1
Xs
-1
SN03
_1-YH
256
256
Process rate
K S« X
PX s + K xsXa
Another example of a simplified nitrification-denitrification model where long-term changes
in population dynamics are not described is the model of ISAACS ET AL. (1994). Only two bulk
components are considered: ammonia- and nitrate-nitrogen (SNH and SNO3)- The nitrification
and denitrification rates are described using simple Monod-type limitation kinetics (Table 4.7)
whose parameter estimates are updated periodically using on-line ammonia and nitrate
measurements. Release of ammonia due to cell lysis and hydrolysis as well as its
incorporation into biomass are not modelled. It is also not encountered for the transition times
between aerobic and anoxic conditions where both processes may appear simultaneously at
reduced rates. Since the half-saturation coefficient for nitrate is low and model predictions
were not sensitive to it, a further simplification can be attained by using zero order kinetics for
the denitrification rate.
Table 4.7 Nitrification and denitrification process kinetics in simplified model of ISAACS ET AL., (1994)
Com
1
2
ponent
Process Nitrification
Denitrification
SNH
-1
SNO3
1
-1
Process rate
$NH rNHm „ _
ANH +:iNH
SliO rHOm „ ?
4.1.5 OBJECTIVE OF THE STUDY
The objective of this study was to develop a simplified denitrification model to predict the
denitrification potential of single sludge activated sludge systems. To attain this, the existing
simplified model for nitrification and aerobic oxidation of biodegradable COD (BROUWER AND
KLAPWUK, 1995, BROUWER ET AL., 1998) was extended with the denitrification process. This new
simplified nitrification-denitrification approach is promoted as an alternative to existing
complex approaches. The conceptual basis for the description of the processes remains similar
to existing and validated complex models (such as ASM's). Regarding complexity, an attempt
was undertaken to reduce the number of processes, state variables and process parameters.
This can be partially attained by excluding the description of population dynamics, a method
commonly used in simplified approaches. Despite of simplicity, objective was to attain a quite
accurate reflection of the actual N-removal potential. That is why attention was paid on a
relevant detailed wastewater characterisation, as well as the kinetics of the involved processes.
To reflect the dynamic character of the process, a frequent update of model components was
performed.
91
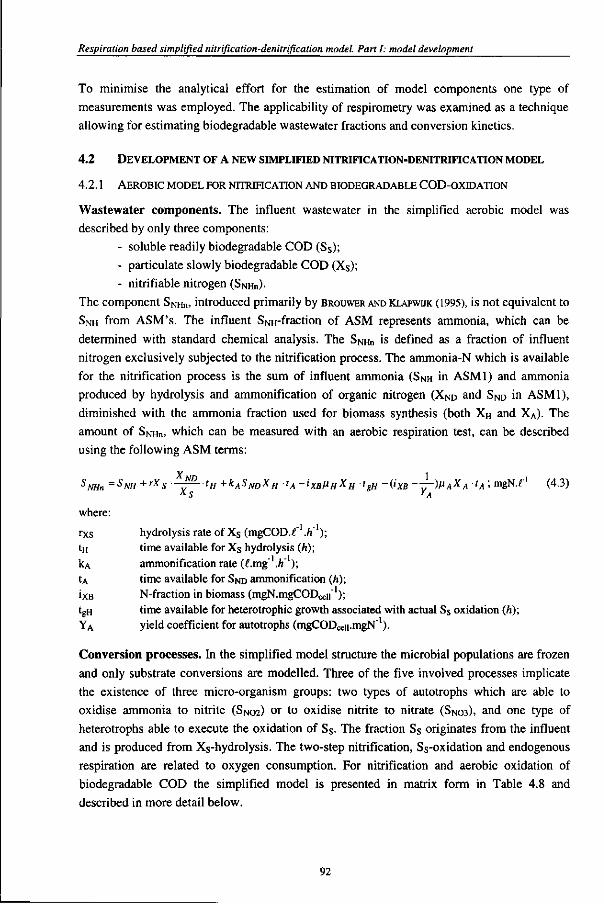
Respiration based simplified nitrification-denitrification model. Part I: model development
To minimise the analytical effort for the estimation of model components one type of measurements was employed. The applicability of respirometry was examined as a technique allowing for estimating biodegradable wastewater fractions and conversion kinetics.
4.2 DEVELOPMENT OF A NEW SIMPLIFIED NITRIFICATION-DENITRIFICATION MODEL
4.2.1 AEROBIC MODEL FOR NITRIFICATION AND BIODEGRADABLE COD-OXIDATTON
Wastewater components. The influent wastewater in the simplified aerobic model was described by only three components:
- soluble readily biodegradable COD (Ss); - particulate slowly biodegradable COD (Xs);
- nitrifiable nitrogen (SnHn)-The component SNHII, introduced primarily by BROUWER AND KLAPWUK (1995), is not equivalent to SNH from ASM's. The influent SNH-fraction of ASM represents ammonia, which can be determined with standard chemical analysis. The SNMI is defined as a fraction of influent nitrogen exclusively subjected to the nitrification process. The ammonia-N which is available for the nitrification process is the sum of influent ammonia (SNH in ASM1) and ammonia produced by hydrolysis and ammonification of organic nitrogen (XND and SND in ASM1), diminished with the ammonia fraction used for biomass synthesis (both XH and XA). The amount of SNHn, which can be measured with an aerobic respiration test, can be described using the following ASM terms:
V i SNHn =SNH +rXS ~ - t H +kASNDXH -tA -IXBUH^H tgH ~HxB ~—)^A^A ->A > mgN.f' (4.3)
XS YA
where:
rxs hydrolysis rate of Xs (mgCOD.r .h~ ) ; tn time available for Xs hydrolysis (h); ICA ammonification rate (^.mg~ .h~ ); tA time available for SND ammonification (h); ixB N-fraction in biomass (mgN.mgCODceif1); tgH time available for heterotrophic growth associated with actual S s oxidation (h); Y A yield coefficient for autotrophs (mgCODceii.mgN" ).
Convers ion processes . In the s implified mode l s tructure the microbial popula t ions are frozen
and only substrate convers ions are model led . Th ree of the five involved processes implicate
the exis tence of three mic ro-organ ism groups: two types of autotrophs which are able to
oxidise ammon i a to nitrite ( SNO2) or to oxidise nitrite to nitrate ( SNO3) . and one type of
heterotrophs able to execu te the oxidat ion of Ss- The fraction Ss originates from the influent
and is p roduced f rom X s -hydro lys i s . The two-s tep nitrification, Ss-oxidat ion and endogenous
respiration are related to oxygen consumpt ion . For nitrification and aerobic oxidat ion of
b iodegradable C O D the s implified mode l is presented in matr ix form in Table 4.8 and
descr ibed in more detail be low.
92
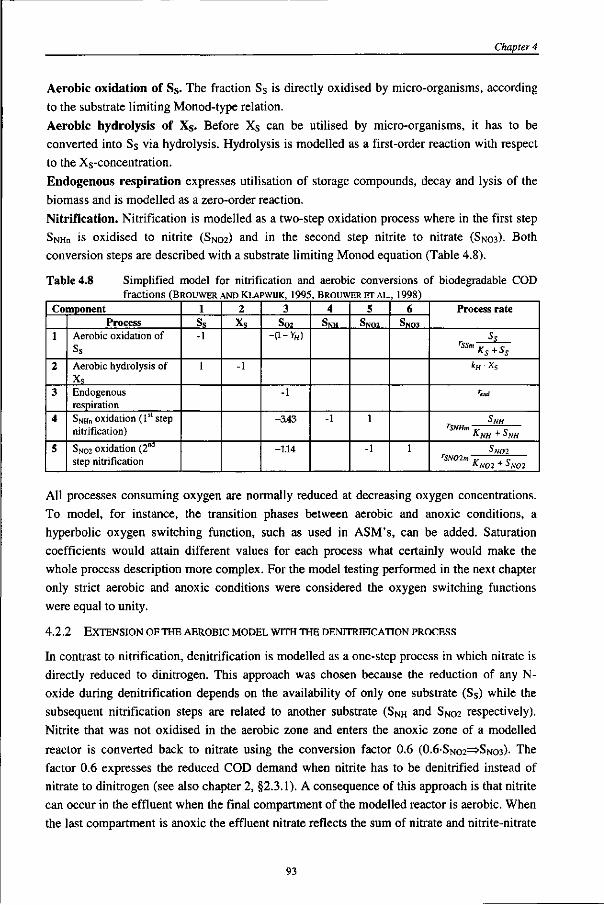
Chapter 4
Aerobic oxidation of Ss. The fraction Ss is directly oxidised by micro-organisms, according
to the substrate limiting Monod-type relation.
Aerobic hydrolysis of Xs. Before Xs can be utilised by micro-organisms, it has to be converted into Ss via hydrolysis. Hydrolysis is modelled as a first-order reaction with respect to the Xs-concentration. Endogenous respiration expresses utilisation of storage compounds, decay and lysis of the biomass and is modelled as a zero-order reaction.
Nitrification. Nitrification is modelled as a two-step oxidation process where in the first step
SNHn is oxidised to nitrite (SN02) and in the second step nitrite to nitrate (SN03). Both conversion steps are described with a substrate limiting Monod equation (Table 4.8).
Table 4.8 Simplified model for nitrification and aerobic conversions of biodegradable COD fractions (BRQUWER AND KLAPWUK, 1995, BRQUWER ET AL., 1998)
Component
1
2
3
4
5
Process Aerobic oxidation of
Aerobic hydrolysis of
xs Endogenous respiration SNH„ oxidation (ls l step nitrification)
SN02 oxidation (2nd
step nitrification
1 Ss -1
1
2
xs
-1
3 So2
-(i-vH)
-1
-3.43
-1.14
4
SNH
-1
5
S N 0 2
1
-1
6
S N 0 3
1
Process rate
h ,MmKs+Ss
kfi %s
reiid
SNH rSNHm „ _
KNH +:>NH SN02
rSN02m „ „ A/TO2 + J y v o 2
All processes consuming oxygen are normally reduced at decreasing oxygen concentrations. To model, for instance, the transition phases between aerobic and anoxic conditions, a hyperbolic oxygen switching function, such as used in ASM's, can be added. Saturation coefficients would attain different values for each process what certainly would make the whole process description more complex. For the model testing performed in the next chapter only strict aerobic and anoxic conditions were considered the oxygen switching functions were equal to unity.
4.2.2 EXTENSION OF THE AEROBIC MODEL WITH THE DENITRIFICATION PROCESS
In contrast to nitrification, denitrification is modelled as a one-step process in which nitrate is directly reduced to dinitrogen. This approach was chosen because the reduction of any N-oxide during denitrification depends on the availability of only one substrate (Ss) while the subsequent nitrification steps are related to another substrate (SNH and SNo2 respectively). Nitrite that was not oxidised in the aerobic zone and enters the anoxic zone of a modelled reactor is converted back to nitrate using the conversion factor 0.6 (0.6SNo2=>SNo3). The factor 0.6 expresses the reduced COD demand when nitrite has to be denitrified instead of nitrate to dinitrogen (see also chapter 2, §2.3.1). A consequence of this approach is that nitrite can occur in the effluent when the final compartment of the modelled reactor is aerobic. When the last compartment is anoxic the effluent nitrate reflects the sum of nitrate and nitrite-nitrate
93
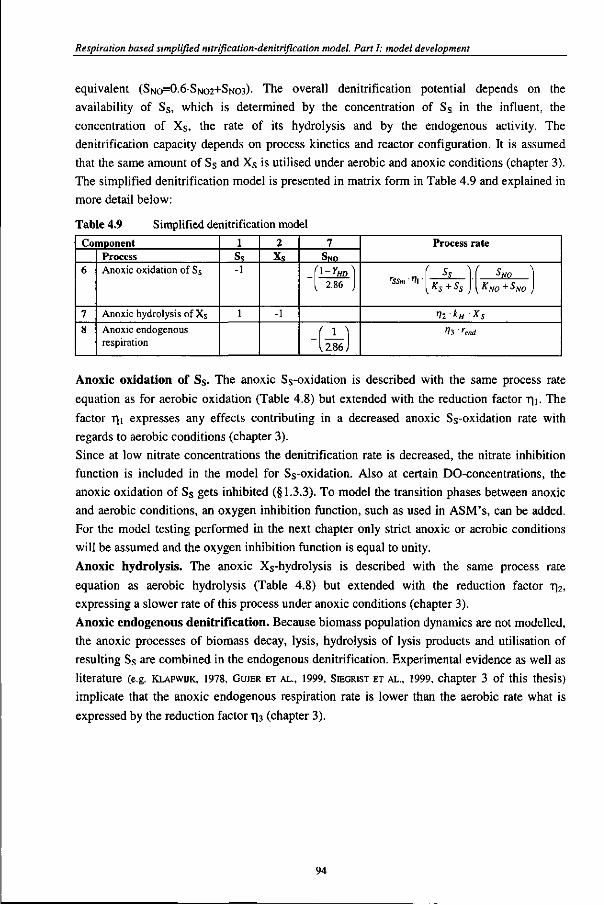
Respiration based simplified nitrification-denitrification model. Part I: model development
equivalent (SNO=0.6SNO2+SNO3)- The overall denitrification potential depends on the availability of Ss, which is determined by the concentration of Ss in the influent, the concentration of Xs, the rate of its hydrolysis and by the endogenous activity. The denitrification capacity depends on process kinetics and reactor configuration. It is assumed that the same amount of Ss and Xs is utilised under aerobic and anoxic conditions (chapter 3). The simplified denitrification model is presented in matrix form in Table 4.9 and explained in more detail below:
Table 4.9 Simplified denitrification model Component
6
7
8
Process Anoxic oxidation of Ss
Anoxic hydrolysis of Xs
Anoxic endogenous respiration
1 Ss -1
1
2 Xs
-1
7 SNO
(1-YHD) { 2.86 J
12.86 J
Process rate
,. , | I . I f SNO ) yKs +SS J y KN0 + SN0 J
1 2 * « -Xs
13 ' rend
Anoxic oxidation of Ss. The anoxic Ss-oxidation is described with the same process rate equation as for aerobic oxidation (Table 4.8) but extended with the reduction factor T|I. The factor rii expresses any effects contributing in a decreased anoxic Ss-oxidation rate with regards to aerobic conditions (chapter 3).
Since at low nitrate concentrations the denitrification rate is decreased, the nitrate inhibition function is included in the model for Ss-oxidation. Also at certain DO-concentrations, the anoxic oxidation of Ss gets inhibited (§1.3.3). To model the transition phases between anoxic and aerobic conditions, an oxygen inhibition function, such as used in ASM's, can be added. For the model testing performed in the next chapter only strict anoxic or aerobic conditions will be assumed and the oxygen inhibition function is equal to unity. Anoxic hydrolysis. The anoxic Xs-hydrolysis is described with the same process rate equation as aerobic hydrolysis (Table 4.8) but extended with the reduction factor r|2, expressing a slower rate of this process under anoxic conditions (chapter 3). Anoxic endogenous denitrification. Because biomass population dynamics are not modelled, the anoxic processes of biomass decay, lysis, hydrolysis of lysis products and utilisation of resulting Ss are combined in the endogenous denitrification. Experimental evidence as well as literature (e.g. KLAPWUK, 1978, GUJER ET AL., 1999, SIEGRIST ET AL., 1999, chapter 3 of this thesis) implicate that the anoxic endogenous respiration rate is lower than the aerobic rate what is expressed by the reduction factor r|3 (chapter 3).
94
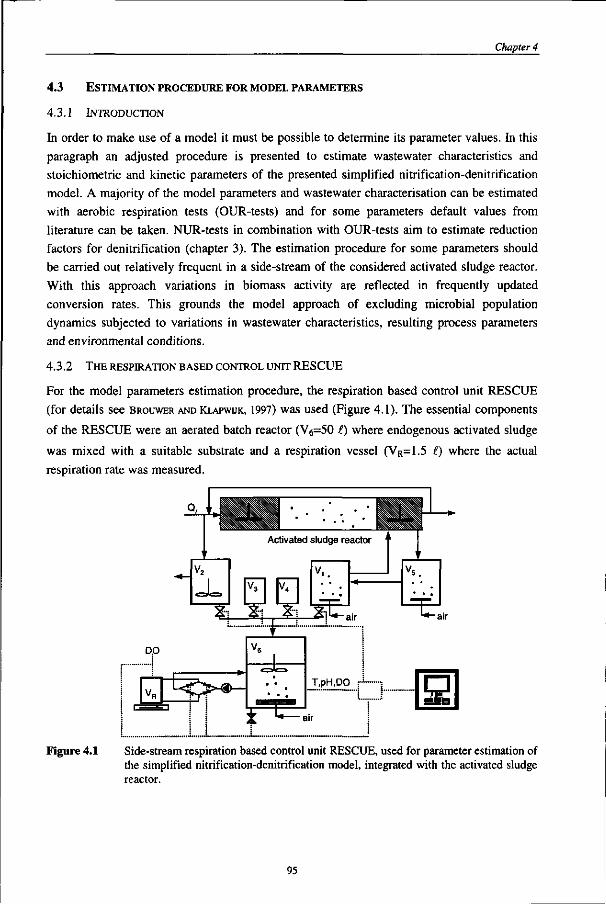
Chapter 4
4.3 ESTIMATION PROCEDURE FOR MODEL PARAMETERS
4.3.1 INTRODUCTION
In order to make use of a model it must be possible to determine its parameter values. In this paragraph an adjusted procedure is presented to estimate wastewater characteristics and stoichiometric and kinetic parameters of the presented simplified nitrification-denitrification model. A majority of the model parameters and wastewater characterisation can be estimated with aerobic respiration tests (OUR-tests) and for some parameters default values from literature can be taken. NUR-tests in combination with OUR-tests aim to estimate reduction factors for denitrification (chapter 3). The estimation procedure for some parameters should be carried out relatively frequent in a side-stream of the considered activated sludge reactor. With this approach variations in biomass activity are reflected in frequently updated conversion rates. This grounds the model approach of excluding microbial population dynamics subjected to variations in wastewater characteristics, resulting process parameters and environmental conditions.
4.3.2 THE RESPIRATION BASED CONTROL UNIT RESCUE
For the model parameters estimation procedure, the respiration based control unit RESCUE
(for details see BROUWER AND KLAPWUK, 1997) was used (Figure 4.1). The essential components
of the RESCUE were an aerated batch reactor (Vg=50 (.) where endogenous activated sludge
was mixed with a suitable substrate and a respiration vessel (VR=1.5 (.) where the actual
respiration rate was measured.
1
Figure 4.1 Side-stream respiration based control unit RESCUE, used for parameter estimation of the simplified nitrification-denitrification model, integrated with the activated sludge reactor.
95
Respiration based simplified nitrification-denitrification model. Part I: model development
Activated sludge was stored, equalised and aerated in an endogenous vessel (Vi=40^ and fed
continuously with sludge from the additional vessel (V5). Vessel V5 was in turn continuously
supplied with fresh sludge from the end of the modelled activated sludge reactor. To ensure
the endogenous stage of examined sludge, the content of V5 was aerated for approximately 2
h. The completely mixed influent storage vessel (V2) was fed continuously with the same
wastewater as for the modelled reactor. Nitrite and ammonium solutions (NaNCh and NH4C1)
of a precisely known concentration were stored in bottles (V3 and V4 respectively). The pH
and temperature in reactor V6 were controlled on chosen set-points with respectively a pH-
controller (Endress&Hauser, Liquisys CPM 240) and a heat exchanger (Julabo, MH, F25).
The respiration unit was connected to a computer via an interface, which provided
communication between the software of the computer and the instrumentation of RESCUE.
The software that controlled the operation of the respiration unit was written in MATLAB.
The measuring frequency of the respiration rate, pH and temperature was once per minute.
4.3.3 AEROBIC RESPIRATION TESTS FOR PARAMETER ESTIMATION
The estimation procedure for model parameters allowed to assess frequently wastewater
components and their conversion kinetics. During one measurement cycle several respiration
tests were performed with different substrates. Each cycle consisted basically of three steps in
the sequence as presented in Figure 4.2 and described below.
STEP 1 Estimation of nitrite-N (SNo2) oxidation kinetics
A known volume of endogenous activated sludge was pumped from Vj to V6 (Figure
4.1). When the respiration vessel (VR) was filled with sludge, the measurement of the
respiration rate started. After the endogenous respiration rate was stabilised (=10
min) a known dose of NaNC>2-solution was added. The respiration rate was measured
until the original endogenous respiration rate was detected again. The optimisation
procedure started to fit the nitrite So2-respirogram with a Monod-type kinetic model
of the SN02-oxidation (Table 4.8, process 5) and two parameters describing the second
step of the nitrification: the maximum volumetric SN02-oxidation rate and its half-
saturation coefficient from the Monod-type relation (rsN02m, KNO2)-
STEP 2 Estimation of ammonia-N (SNH) oxidation kinetics
After the parameter identification procedure of the So2-respirogram with nitrite was
successfully completed, a known dose of NtUCl-solution was spiked into reactor V6.
The same procedure as described in step 1 was repeated, with the difference that the
obtained ammonia So2-respirogram was fitted with the total SNH-oxidation model
(Table 4.8, process 4 and 5). The kinetic parameters of the SiM02-oxidation, obtained
in the first estimation step, allowed to minimise a number of optimised parameters
from the ammonia So2-respirogram. As a result of both experiments, the actual
nitrification parameters (rsN02m> rNHm, KNH. KNO2) were derived. Step 1 and 2 were
repeated each 10-12 ft.
96
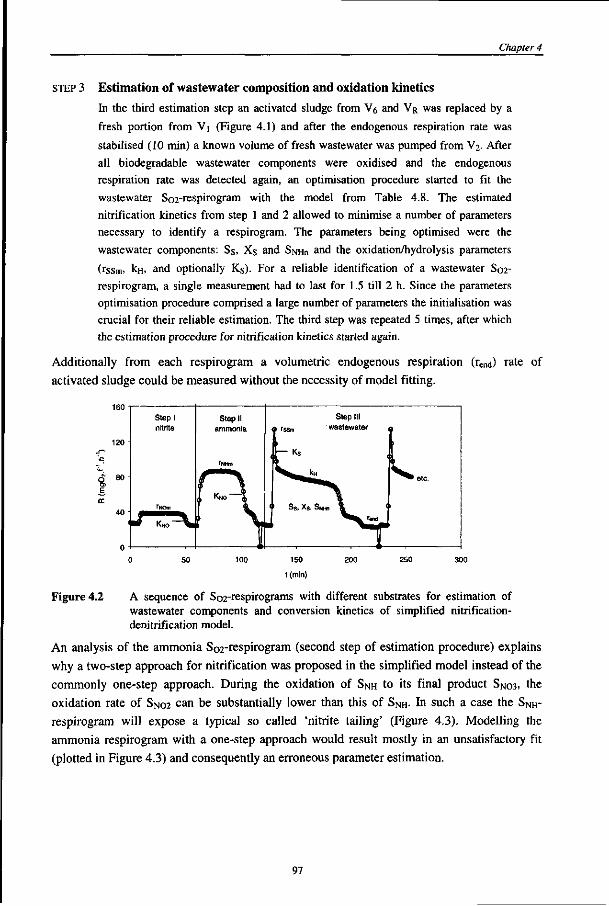
Chapter 4
STEP 3 Estimation of wastewater composition and oxidation kinetics
In the third estimation step an activated sludge from V6 and VR was replaced by a
fresh portion from Vi (Figure 4.1) and after the endogenous respiration rate was
stabilised (10 min) a known volume of fresh wastewater was pumped from V2. After
all biodegradable wastewater components were oxidised and the endogenous
respiration rate was detected again, an optimisation procedure started to fit the
wastewater So2-respirogram with the model from Table 4.8. The estimated
nitrification kinetics from step 1 and 2 allowed to minimise a number of parameters
necessary to identify a respirogram. The parameters being optimised were the
wastewater components: Ss, Xs and SNHII and the oxidation/hydrolysis parameters
(rssm> kH> and optionally Ks). For a reliable identification of a wastewater S02-
respirogram, a single measurement had to last for 1.5 till 2 h. Since the parameters
optimisation procedure comprised a large number of parameters the initialisation was
crucial for their reliable estimation. The third step was repeated 5 times, after which
the estimation procedure for nitrification kinetics started again.
Additionally from each respirogram a volumetric endogenous respiration (rend) rate of
activated sludge could be measured without the necessity of model fitting.
Figure 4.2 A sequence of So2"respirograms with different substrates for estimation of wastewater components and conversion kinetics of simplified nitrification-denitrification model.
An analysis of the ammonia So2-respirogram (second step of estimation procedure) explains
why a two-step approach for nitrification was proposed in the simplified model instead of the
commonly one-step approach. During the oxidation of SNH to its final product SNo3, the
oxidation rate of SNO2 can be substantially lower than this of SNH. In such a case the SNH-
respirogram will expose a typical so called 'nitrite tailing' (Figure 4.3). Modelling the
ammonia respirogram with a one-step approach would result mostly in an unsatisfactory fit
(plotted in Figure 4.3) and consequently an erroneous parameter estimation.
97

Respiration based simplified nitrification-denitrification model. Part I: model development
Figure 4.3 Ammonia So2-respirogram (o) with a common nitrite tailing, fitted with a one-step nitrification model such as e.g. ASM1 (dashed line) and a two-step nitrification model of BROUWER AND KLAPWUK, 1995 (solid line).
4.3.4 ANOXIC RESPIRATION TESTS
To estimate the reduction factors for anoxic Ss-oxidation (r)i), anoxic hydrolysis (T|2) and anoxic endogenous respiration rate (TI3), the OUR- and NUR-test have to be performed in parallel with the considered activated sludge and a representative wastewater sample under well defined, adequate experimental conditions. The experimental procedure of a NUR-test, as well as the estimation procedure of anoxic reduction factors is described in detail in chapter 3. To minimise the experimental efforts, it was primarily assumed that if reduction factors were once estimated, their updating did not need to be carried out intensively. However, care should be taken for 'drastic' changes in plant operation. After a long period of rain weather and changes in the proportion between aerated and anoxic fractions, reduction factors should be updated.
Although many evidences indicate that the anoxic yield for heterotrophs (YHD) exposes a lower value than the aerobic yield (YH), in the presented version of the simplified nitrification-denitrification model YHD is equal to YH.
4.3.5 MODEL PARAMETERS
The list of all components of the simplified nitrification-denitrification model, their definitions, units and estimation methods is presented in Table 4.10.
To take into account the transition phases between an anoxic and aerobic environment in the
activated sludge reactor, would probably contribute in a more precise reflection of reality. For
this purpose the so-called oxygen switching functions (S0/(K0 + S0)) or oxygen inhibition
functions (K0 l(S0 +K0)) can be added to the appropriate processes in the simplified
nitrification-denitrification model. Further improvement of the model can be achieved by
differentiation of the heterotrophic yield coefficient for aerobic and anoxic conditions. These
optional modifications are nevertheless not included in the testing procedures in the course of
this thesis.
98
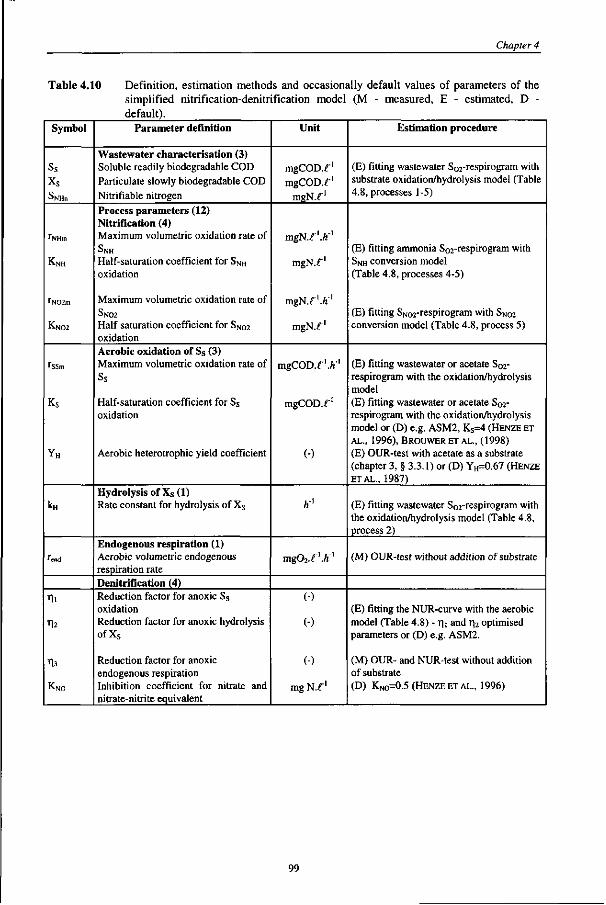
Chapter 4
Table 4.10 Definition, estimation methods and occasionally default values of parameters of the simplified nitrification-denitrification model (M - measured, E - estimated, D -default).
Symbol
SlMHn
rNHm
KNH
rN02m
K.N02
rSSm
Ks
YH
kH
rend
Til
•n.2
%
KNO
Parameter definition
Wastewater characterisation (3) Soluble readily biodegradable COD
Particulate slowly biodegradable COD
Nitrifiable nitrogen
Process parameters (12) Nitrification (4) Maximum volumetric oxidation rate of
SNH
Half-saturation coefficient for SNH
oxidation
Maximum volumetric oxidation rate of
S N 0 2
Half-saturation coefficient for SN02 oxidation
Aerobic oxidation of Ss (3) Maximum volumetric oxidation rate of
Ss
Half-saturation coefficient for Ss oxidation
Aerobic heterotrophic yield coefficient
Hydrolysis of Xs (1) Rate constant for hydrolysis of Xs
Endogenous respiration (1) Aerobic volumetric endogenous respiration rate
Denitrification (4) Reduction factor for anoxic Ss oxidation Reduction factor for anoxic hydrolysis ofXs
Reduction factor for anoxic endogenous respiration Inhibition coefficient for nitrate and nitrate-nitrite equivalent
Unit
mgCOD.f1
mgCOD.f1
mgN.f1
mgN.f'./f1
mgN.f1
mgN.f'.A"1
mgN.f1
mgCOD.f1 .A"1
mgCOD.f1
(-)
hA
mgOi.f1./!'1
(-)
(-)
(-)
mg N . f '
Estimation procedure
(E) fitting wastewater So2-respirogram with substrate oxidation/hydrolysis model (Table 4.8, processes 1-5)
(E) fitting ammonia S02-respirogram with SNH conversion model (Table 4.8, processes 4-5)
(E) fitting SN02-respirogram with SN02
conversion model (Table 4.8, process 5)
(E) fitting wastewater or acetate S02-respirogram with the oxidation/hydrolysis model
(E) fitting wastewater or acetate S02-respirogram with the oxidation/hydrolysis model or (D) e.g. ASM2, K s=4 (HENZE ET AL., 1996), BROUWER ET AL„ (1998) (E) OUR-test with acetate as a substrate (chapter 3, § 3.3.1) or (D) YH=0.67 ( H E N Z E ETAL . , 1987)
(E) fitting wastewater S02-respirogram with the oxidation/hydrolysis model (Table 4.8, process 2)
(M) OUR-test without addition of substrate
(E) fitting the NUR-curve with the aerobic model (Table 4.8) - r|, and T|2 optimised parameters or (D) e.g. ASM2.
(M) OUR- and NUR-test without addition of substrate (D) KNO=0.5 ( H E N Z E E T A L . , 1996)
99
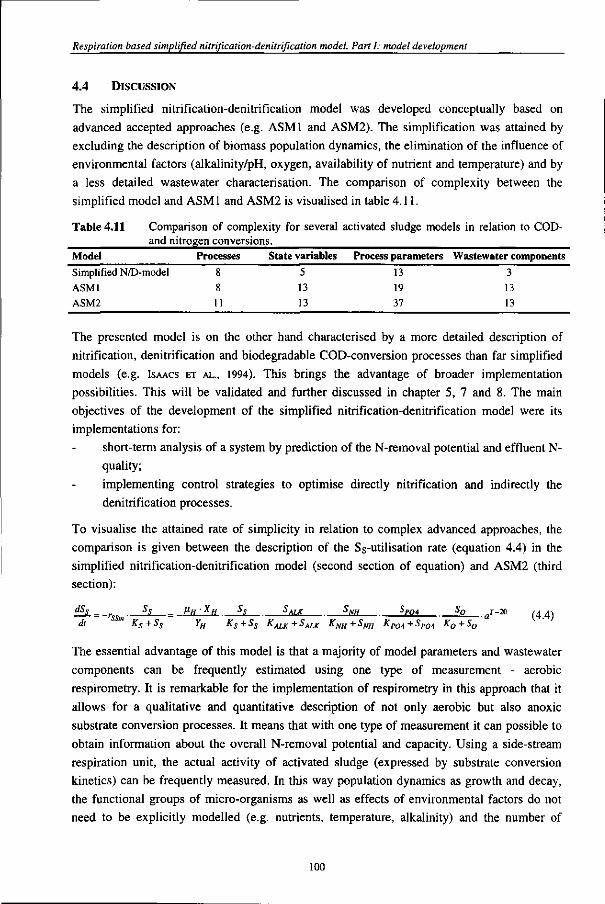
Respiration based simplified nitrification-denitrification model. Part I: model development
4.4 DISCUSSION
The simplified nitrification-denitrification model was developed conceptually based on advanced accepted approaches (e.g. ASMl and ASM2). The simplification was attained by excluding the description of biomass population dynamics, the elimination of the influence of environmental factors (alkalinity/pH, oxygen, availability of nutrient and temperature) and by a less detailed wastewater characterisation. The comparison of complexity between the simplified model and ASMl and ASM2 is visualised in table 4.11.
Table 4.11 Comparison of complexity for several activated sludge models in relation to COD-and nitrogen conversions.
Model Processes State variables
Simplified N/D-model 8 5
ASMl 8 13
ASM2 11 13
Process parameters Wastewater components
13 3 19 13 37 13
The presented model is on the other hand characterised by a more detailed description of nitrification, denitrification and biodegradable COD-conversion processes than far simplified models (e.g. ISAACS ET AL., 1994). This brings the advantage of broader implementation possibilities. This will be validated and further discussed in chapter 5, 7 and 8. The main objectives of the development of the simplified nitrification-denitrification model were its implementations for:
short-term analysis of a system by prediction of the N-removal potential and effluent N-quality;
implementing control strategies to optimise directly nitrification and indirectly the denitrification processes.
To visualise the attained rate of simplicity in relation to complex advanced approaches, the comparison is given between the description of the Ss-utilisation rate (equation 4.4) in the simplified nitrification-denitrification model (second section of equation) and ASM2 (third section):
dSs _ r SS _ ^H ' XH SS SALK iNH S f04 S0 ,7"-20 (A A)
d< Ks + S.s YH Ks + Ss KALK + SALK KNH + SNH KP04 + SP04 K0 + S0
The essential advantage of this model is that a majority of model parameters and wastewater components can be frequently estimated using one type of measurement - aerobic respirometry. It is remarkable for the implementation of respirometry in this approach that it allows for a qualitative and quantitative description of not only aerobic but also anoxic substrate conversion processes. It means that with one type of measurement it can possible to obtain information about the overall N-removal potential and capacity. Using a side-stream respiration unit, the actual activity of activated sludge (expressed by substrate conversion kinetics) can be frequently measured. In this way population dynamics as growth and decay, the functional groups of micro-organisms as well as effects of environmental factors do not need to be explicitly modelled (e.g. nutrients, temperature, alkalinity) and the number of
100
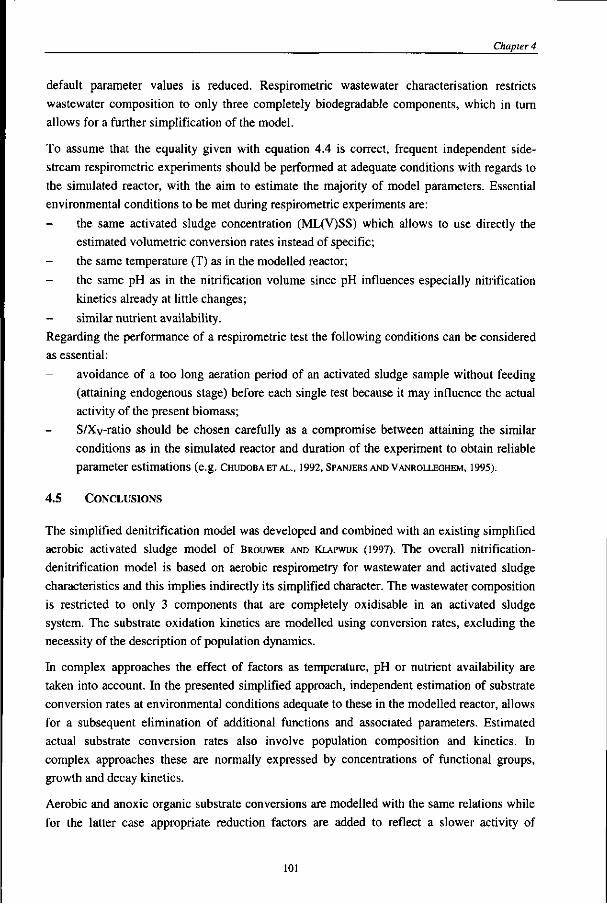
Chapter 4
default parameter values is reduced. Respirometric wastewater characterisation restricts wastewater composition to only three completely biodegradable components, which in turn allows for a further simplification of the model.
To assume that the equality given with equation 4.4 is correct, frequent independent side-stream respirometric experiments should be performed at adequate conditions with regards to the simulated reactor, with the aim to estimate the majority of model parameters. Essential environmental conditions to be met during respirometric experiments are:
- the same activated sludge concentration (ML(V)SS) which allows to use directly the estimated volumetric conversion rates instead of specific;
- the same temperature (T) as in the modelled reactor;
- the same pH as in the nitrification volume since pH influences especially nitrification kinetics already at little changes;
- similar nutrient availability.
Regarding the performance of a respirometric test the following conditions can be considered as essential:
- avoidance of a too long aeration period of an activated sludge sample without feeding (attaining endogenous stage) before each single test because it may influence the actual activity of the present biomass; S/Xy-ratio should be chosen carefully as a compromise between attaining the similar conditions as in the simulated reactor and duration of the experiment to obtain reliable parameter estimations (e.g. CHUDOBAETAL., 1992, SPANJERS AND VANROLLEGHEM, 1995).
4.5 CONCLUSIONS
The simplified denitrification model was developed and combined with an existing simplified aerobic activated sludge model of BROUWER AND KLAPWUK (1997). The overall nitrification-denitrification model is based on aerobic respirometry for wastewater and activated sludge characteristics and this implies indirectly its simplified character. The wastewater composition is restricted to only 3 components that are completely oxidisable in an activated sludge system. The substrate oxidation kinetics are modelled using conversion rates, excluding the necessity of the description of population dynamics.
In complex approaches the effect of factors as temperature, pH or nutrient availability are taken into account. In the presented simplified approach, independent estimation of substrate conversion rates at environmental conditions adequate to these in the modelled reactor, allows for a subsequent elimination of additional functions and associated parameters. Estimated actual substrate conversion rates also involve population composition and kinetics. In complex approaches these are normally expressed by concentrations of functional groups, growth and decay kinetics.
Aerobic and anoxic organic substrate conversions are modelled with the same relations while for the latter case appropriate reduction factors are added to reflect a slower activity of
101
Respiration based simplified nitrification-denitrification model. Part I: model development
activated sludge under denitrifying conditions. The values of reduction factors can be estimated independently using the described methodology from chapter 3 or taken as a calibration parameter in the testing phase of the model.
To obtain maximum benefits from the presented simplified nitrification-denitrification model, the incorporation of an activated sludge system side-stream respiration based control unit for parameters estimation is necessary. To minimise maintenance and operational efforts the respiration set-up should be as far as possible automated regarding the performance of subsequent respiration tests and numerical procedures to obtain model parameters and wastewater characteristics. The validity and applicability of the simplified nitrification-denitrification model will be further tested in chapter 5.
102
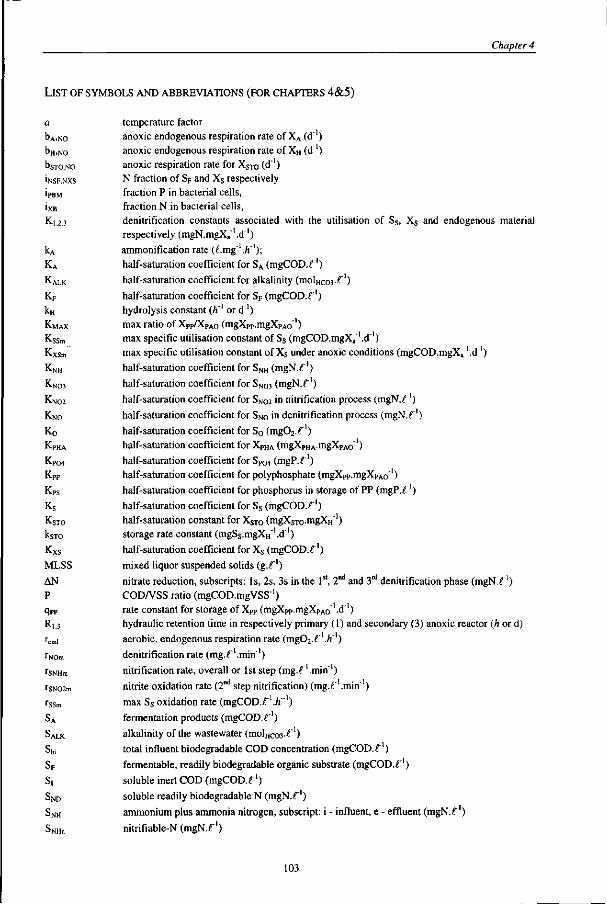
Chapter 4
LIST OF SYMBOLS AND ABBREVIATIONS (FOR CHAPTERS 4&5)
a temperature factor
bA,No anoxic endogenous respiration rate of XA (d"1)
t>H,No anoxic endogenous respiration rate of XH ( d 1 )
bsTO.NO anoxic respiration rate for XSTO (d"')
'NSF.NXS N fraction of Sp and X s respectively
ipBM fraction P in bacterial cells, iXB fraction N in bacterial cells, Ki 2,3 denitrification constants associated with the utilisation of S s , X s and endogenous material
respectively (mgN.mgXa"'.d"') kA ammonification rate (t.mg\h']); KA half-saturation coefficient for SA (mgCOD.f ' )
K ^ K half-saturation coefficient for alkalinity (molHco3- ')
KF half-saturation coefficient for SF (mgCOD.f') kH hydrolysis constant (ft"1 or d"') KMAX max rat io of XPp/XpA 0 (mgXPp.mgXpAo"') Kssm max specific uti l isation constant of S s (mgCOD.mgX a~'.d~') Kxsm max specific uti l isation constant of X s under anoxic condit ions (mgCOD.mgX a" ' .d" ' )
KNH half-saturation coefficient for SNH ( m g N . f ' )
KN 03 half-saturation coefficient for SN03 ( m g N . f ' )
KN 02 half-saturation coefficient for SN02 in nitrification p rocess ( m g N . f ' )
KNo half-saturation coefficient for SNO in denitrification process (mgN . f ' )
Ko half-saturation coefficient for S 0 ( m g 0 2 . f ' ) KPHA half-saturation coefficient for XP H A (mgXpHA.mgXpAo"!)
KP04 half-saturation coefficient for SP04 (mgP . f ' ) Kpp half-saturation coefficient for polyphosphate (mgXpp.mgXpA0"')
KPS half-saturation coefficient for phosphorus in storage of PP (mgP . f ' )
K s half-saturation coefficient for S s (mgCOD. f 1 )
KSTO half-saturation constant for X S TO (mgXSTomgXH~')
ksro storage rate constant (mgSs.mgXH"1.d"')
KXs half-saturation coefficient for X s (mgCOD. f ' )
MLSS mixed liquor suspended solids ( g . f ' )
AN nitrate reduction, subscripts: Is , 2s, 3s in the lsl, 2nd and 3 r d denitrification phase (mgN. f 1 )
P COD/VSS ratio (mgCOD.mgVSS 1 )
qPP rate constant for storage of XPP (mgXpp.mgXpA0~l.d"1)
R] 3 hydraulic retention time in respectively primary (1) and secondary (3) anoxic reactor (ft or d) rend aerobic, endogenous respiration rate (mg0 2 . f ' . f t ' 1 )
rNom denitrification rate ( m g . r .min"')
rsNHm nitrification rate, overall or 1st step (mg.C' .min' ) rSN02m nitrite oxidation rate (2nd step nitrification) (mg.f ' .min ' 1 )
rSSm max S s oxidation rate (mgCOD.f ' . f t" ' )
SA fermentation products (mgCOD.^ 1)
SA L K a lka l in i ty of t he wa s t ewa t e r ( m o l H c o 3 ^ ' )
Sbi total influent biodegradable COD concentration (mgCOD. f ' )
SF fermentable, readily biodegradable organic substrate (mgCOD. r 1 )
S, soluble inert COD (mgCOD. f ' )
SN D soluble readily biodegradable N (mgN . f ' )
SN H ammonium plus ammonia nitrogen, subscript: i - influent, e - effluent (mgN . f ' )
SNH„ nitrifiable-N (mgN.^ 1 )
103
Respiration based simplified nitrification-denitrification model. Pari I: model development
SNi soluble inert organic N (mgN. f ' )
S N 0 sum nitrate and nitrite-nitrate equivalent (mgN.f 1 )
SN 0 2 nitrite (mgN.f 1 )
SN03 nitrate; subscripts: i - influent, e-effluent (mgN.f 1 )
S 0 dissolved oxygen (mg0 2 . f ' )
SP04 inorganic soluble phosphorus, primarily ortho-phosphates (mgP. f ' )
S s soluble readily biodegradable COD (mgCOD.f ' )
T temperature (°C)
V,VD ,VN respectively total, denitrification and nitrification volumes of the activated sludge tank (m3)
Xa concentration of active biomass ( g . f ' )
XA concentration of autotrophic biomass (mgCOD.f ' )
XH concentration of heterotrophic biomass (mgCOD.f 1 )
X[ particulate inert COD (mgCOD.f 1 )
XND particulate slowly biodegradable N (mgN.f 1 )
XN[ particulate inert N (mgN.f 1 )
XP A 0 phosphate accumulating organisms (mgCOD.f 1 )
XPHA cell internal storage products of XpA0 ' s (mgCOD.f 1 )
XPP poly-phosphate (mgP . f ' )
X s particulate slowly biodegradable COD (mgCOD.f 1 )
X S T 0 cell internal storage product of heterotrophic organisms (mgCOD.f 1 )
YA yield coefficient for autotrophic biomass
YH yield coefficient for heterotrophic biomass; subscript: NO3 - anoxic
YSTO,NO3 anoxic yield of stored product per SS ( gX S T ogSs ' )
Greek letters
a proportionality constant (0.028 mgN.mgSbi"')
rig reduction coefficient for heterotrophic growth under anoxic conditions,
r[h reduction coefficient for hydrolysis under anoxic conditions,
r|No reduction coefficients for different anoxic activities in ASM2, ASM2d and ASM3
T| 1 reduction factor for anoxic Ss oxidation, this study
T|2 reduction factor for anoxic hydrolysis, this study
r|3 reduction factor for anoxic endogenous respiration, this study
u.A max growth of XA ( d 1 )
HH max growth of XH ( d 1 )
u.PA0 max growth rate of X P A 0 ( d 1 )
104
LITERATURE
Chapter 4
Andrews, J.F. (edt) (1992) Dynamics and control of the activated sludge process. Water Quality Management Library. Vol.6.
Bortone, G., Malaspina, F., Stante, L. and Tilche, A. (1994) Biological nitrogen and phosphorus removal in an anaerobic/anoxic sequencing batch reactor with separated biofilm nitrification. Wat. Sci. Tech., 30, (6), 303-313.
Brouwer, H. and Klapwijk, B. (1995) A method based on respirometry to calculate nitrification volume of a nitrifying/denitrifying activated sludge plant. Presented at Symposium: „Erfahrungen mit Analysen und ProzeB-meBgeraten in Abwasserreinigungsanlagen" Ostfildern (Germany), 27th November 1995.
Brouwer, H. and Klapwijk, B. (1997) Model-gebaseerde sturing van het aerobe volume in een propstroomaktiefslibinstallatie op basis van respirometrie. Rapport of Departement Agro-milieu- en systeemtechnologie (AMST) Landbouwuniversiteit Wageningen.
Brouwer, H., Bloemen, Klapwijk, B. and Spanjers, H. (1998) Feedforward control of nitrification by manipulating the aerobic volume in activated sludge plants. Wat. Sci. Tech. 38 (3), 245-255.
Chudoba, P., Capdeville, B. and Chudoba, J. (1992) Explanation of biological meaning of the S(/Xo ratio in batch cultivation. Wat. Sci. Tech. 26, (3-4), 743-751.
Comeau, Y., Hall, K.J., Hansock, R.E.W. and Oldham, W. (1986) Biochemical model for enhanced biological phosphorus removal. Wat. Res. 20, 1511-1521.
Dold, P. L., Ekama, G.A. and Marais G.v.R. (1980) A general model for the activated sludge process. Prog. Wat. Technol. 12, 47-77.
Ekama, G, A., v. Haandel, A.C. and Marais, G.v.R. (1979) The present status of research on nitrogen removal : a model for the modifies activated sludge process. Symposium on nutrient removal, SA Branch of IWPC, Pretoria, May. Proc. published by Water Research Commission, PO Box 824, Pretoria, 0001, South Africa
Ekama, G.A., Siebritz, I.P. and Marais, G.v.R. (1983) Consideration in the process design of nutrient removal activated sludge process. Wat. Sci. Tech., IS, (3/4)283-318.
Gujer, W., Henze.M, Mino, T. and van Loosdrecht, M. (1999) Activated sludge model no.3. IAWQ Task Group on Mathematical Modelling for Design and operation of Biological Wastewater Treatment. Wat. Sci. Tech., 39, (1), 183-195.
Henze M., Grady, C.P.L.Jr, Gujer, W., Marais, G.v.R. and Matsuo, T. (1987). Activated sludge model no.l. IAWPRC Scientifical and Technical Report No. 1, IAWPRC, London.
Henze M., Gujer, W., Mino, T., Matsuo, T., Wentzel, M.C., Marais, G.v.R. (1996) Activated Sludge Model No.2.IAWQ Scientifical and Technical Report No.3.
Henze M., Gujer, W., Mino, T., Matsuo, T., Wentzel, M.C., Marais, G.v.R. and van Loosdrecht, M.C.M. (1999) Outline Activated Sludge Model No.2d by IAWQ Task Group on Mathematical Modelling for Design and operation of Biological Wastewater Treatment Processes. Wat. Sci. Tech., 39, (1), 165-183.
Isaacs, S.H., Henze, M. S0eberg, H. and Kiimmel, M. (1994) Modelling the nitrogen dynamics in an alternating activated sludge process. Mathmod Vienna, Feb. 2-4, 1994
Isaacs, S.H. and Henze, M. (1995) Controlled carbon source addition to an alternating nitrification-denitrification wastewater treatment process including biological P removal. Wat. Res., 29, (1), 77-89
Kerrn-Jespersen, J.P. and Henze, M. (1993) Biological phosphorus uptake under anoxic and aerobic conditions. Wat. Res. 27, (4) 617-624.
Klapwijk, A. (1978) Eliminatie van stikstof uit afvalwater door denitrificatie. Dissertation, Agricultural University Wageningen, The Netherlands.
Kuba, T., Smolders, G.J.F., van Loosdrecht, M.C.M. and Heijnen, J.J. (1993) Biological phosphorus removal from wastewater by anaerobic-anoxic sequenching batch reactor. Wat. Sci. Tech. 27,241-252.
Marsden, M.G. and Marais, G.v.R. (1976) The role of the primary anoxic reactor in denitrification and biological phosphorus removal. Research Report No. 19. Dept. Of Civil Engineering. University of Cape Town.
Meinhold, J., Filipe, C.D.M., Daigger, G.T. and Isaacs, S. (1999) Characterisation of the denitrifying fraction of phosphate accumulating organisms in biological phosphate removal. Wat. Sci. Tech., 39, (1), 31-43.
Spanjers, H. and Vanrolleghem, P. (1995) Respirometry as a tool for rapid characterisation of wastewater and activated sludge. Wat. Sci. Tech., 31, (2), 105-114.
Stern, L.B and Marais, G.v.R. (1974) Sewage as an electron donor in biological denitrification. Research Report W7. Dept. of Civil Eng., University of Cape Town, Rondebosch, 7700, South Africa.
Van Haandel, A.C. and Marais, G.v.R. (1981a) Nitrification and denitrification in the activated sludge process. Research Report W42„ Dept. of Civil Engin., Univ. of Cape Town.
105
Respiration based simplified nitrification-denitrification model. Part I: model development
Van Haandel, A.C., Ekama, G.A. and Marais, G.v.R. (1981b) The activated sludge process -Part 3. Single sludge denitrification. Wat. Res., 15, 1135-1152.
Van Haandel, A.C., Dold, P.L., and Marais, G.v.R. (1982) Optimisation of nitrogen removal in the single sludge activated sludge process. Wat. Sci. Tech. 14, (6/7), 443-461.
Van Loosdrecht, M.C.M. (1995) Aspecten van de modellering van actief slibprocessen. NVA symposium "Modelleren van akief slibprocessen: Ervaringen Ontwikkelingen Valkuilen. Utrecht, 1995.
Vlekke, G.J.F.M., Comeau, Y. and Oldham, W.K. (1988) Biological phosphate removal from wastewater with oxygen or nitrate in sequencing batch reactors. Environ. Technol. Lett.9, 791-796.
Wentzel, M.C., Loewenthal, R.E., Ekama, G.A. and Marais, G.v.R. (1988) Enhanced polyphosphate organism cultures in activated sludge system - Part 1: Enhanced culture development. Wat. SA, 14 (2), 81-92.
Wentzel, M.C., Ekama, G.A. and Marais, G.v.R. (1992) Processes and modelling of nitrification denitrification biological excess phosphorus removal systems - a review. Wat. Sci. Tech., 25, (6), 59-82.
Wilson, D.E. and Marais, G.v.R. (1976) Adsorption phase in biological denitrification. Research report No.l 1. Dept. Of Civil Engineering. University of Cape Town.
Zhao, H., Isaacs, S.H., Soeberg, H. and Kummel, H. (1994a). A novel control strategy for improved nitrogen removal in an alternating activated sludge process, Part I: Process analysis. Wat. Res., 28, (3)521-534.
Zhao, H., Isaacs, S.H., Soeberg, H. and Kummel, H. (1994b). A novel control strategy for improved nitrogen removal in an alternating activated sludge process, Part I: Control development, Wat. Res., 28, (3), 535-542.
Zhao, H., Isaacs, S.H., Soeberg, H. and Kummel, H. (1995). An analysis of nitrogen removal and control in an alternating activated sludge process, Wat. Res., 29, 535-544.
Zhao, H., Hao, O.J. and McAvoy, T.J. (1999) Modelling approaches to a SBR: as model no.2, simple model and neural nets. Wat. Sci. Tech., 39, (1), 227-235.
106
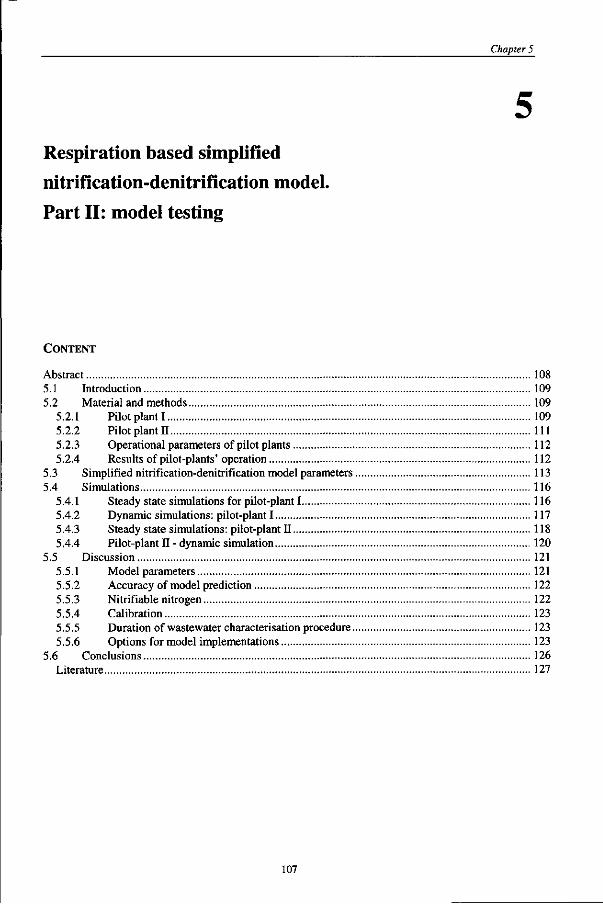
Chapter 5
Respiration based simplified
nitrification-denitrification model.
Part II: model testing
CONTENT
Abstract 108 5.1 Introduction 109 5.2 Material and methods 109
5.2.1 Pilot plant 1 109 5.2.2 Pilot plant II 111 5.2.3 Operational parameters of pilot plants 112 5.2.4 Results of pilot-plants' operation 112
5.3 Simplified nitrification-denitrification model parameters 113 5.4 Simulations 116
5.4.1 Steady state simulations for pilot-plant 1 116 5.4.2 Dynamic simulations: pilot-plant 1 117 5.4.3 Steady state simulations: pilot-plant II 118 5.4.4 Pilot-plant II - dynamic simulation 120
5.5 Discussion 121 5.5.1 Model parameters 121 5.5.2 Accuracy of model prediction 122 5.5.3 Nitrifiable nitrogen 122 5.5.4 Calibration 123 5.5.5 Duration of wastewater characterisation procedure 123 5.5.6 Options for model implementations 123
5.6 Conclusions 126 Literature 127
107
Respiration based simplified nitrification-denitrification model. Part II: model testing
ABSTRACT
The simplified nitrification-denitrification model from chapter 4 was tested using two pilot-plant
configurations, named pilot-plant I and II. The majority of model parameters, like wastewater
characteristics and aerobic conversion kinetics, were obtained using the side-stream automated
respiration based control unit RESCUE (BROUWER AND KLAPWUK, 1997). To describe anoxic substrate
conversions, denitrification reduction factors (T|i..T|3) were estimated for pilot plant II using the
methodology as presented in chapter 3. For pilot-plant I default values for T|i and r|2 were taken while
T|3 was estimated. For parameters having little influence on the quality of model predictions, default
values were used. Steady-state and dynamic simulations were performed with satisfactory results.
Potential implementations of the model for activated sludge systems are discussed, primary for an
analysis of the N-removal potential and control objectives.
108
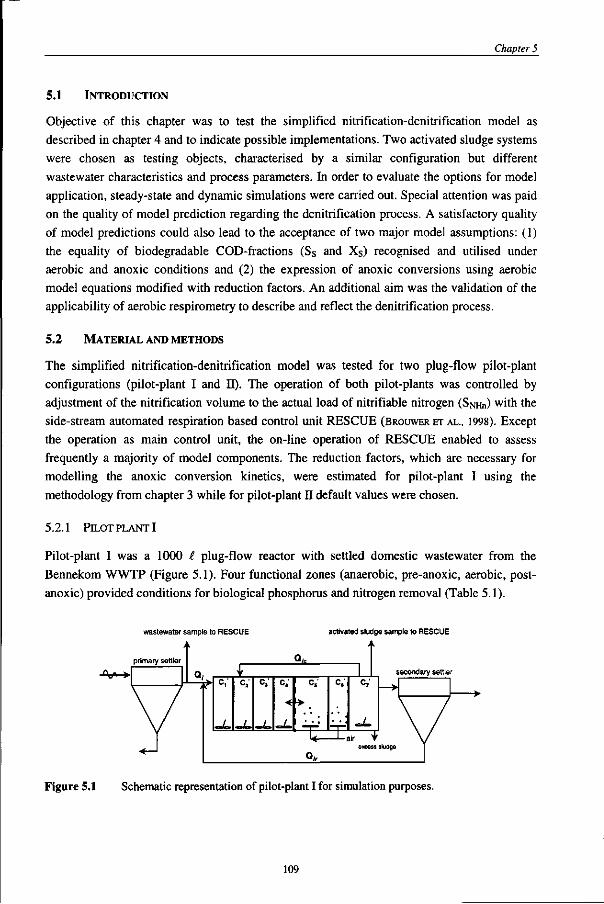
Chapter 5
5.1 INTRODUCTION
Objective of this chapter was to test the simplified nitrification-denitrification model as described in chapter 4 and to indicate possible implementations. Two activated sludge systems were chosen as testing objects, characterised by a similar configuration but different wastewater characteristics and process parameters. In order to evaluate the options for model application, steady-state and dynamic simulations were carried out. Special attention was paid on the quality of model prediction regarding the denitrification process. A satisfactory quality of model predictions could also lead to the acceptance of two major model assumptions: (1) the equality of biodegradable COD-fractions (Ss and Xs) recognised and utilised under aerobic and anoxic conditions and (2) the expression of anoxic conversions using aerobic model equations modified with reduction factors. An additional aim was the validation of the applicability of aerobic respirometry to describe and reflect the denitrification process.
5.2 MATERIAL AND METHODS
The simplified nitrification-denitrification model was tested for two plug-flow pilot-plant configurations (pilot-plant I and II). The operation of both pilot-plants was controlled by adjustment of the nitrification volume to the actual load of nitrifiable nitrogen (SNHn) with the side-stream automated respiration based control unit RESCUE (BROUWER ET AL., 1998). Except the operation as main control unit, the on-line operation of RESCUE enabled to assess frequently a majority of model components. The reduction factors, which are necessary for modelling the anoxic conversion kinetics, were estimated for pilot-plant I using the methodology from chapter 3 while for pilot-plant II default values were chosen.
5.2.1 PILOT PLANT I
Pilot-plant I was a 1000 I plug-flow reactor with settled domestic wastewater from the Bennekom WWTP (Figure 5.1). Four functional zones (anaerobic, pre-anoxic, aerobic, post-anoxic) provided conditions for biological phosphorus and nitrogen removal (Table 5.1).
wastewater sample to RESCUE
primary settler
activated sludge sample to RESCUE
Figure 5.1 Schematic representation of pilot-plant I for simulation purposes.
109
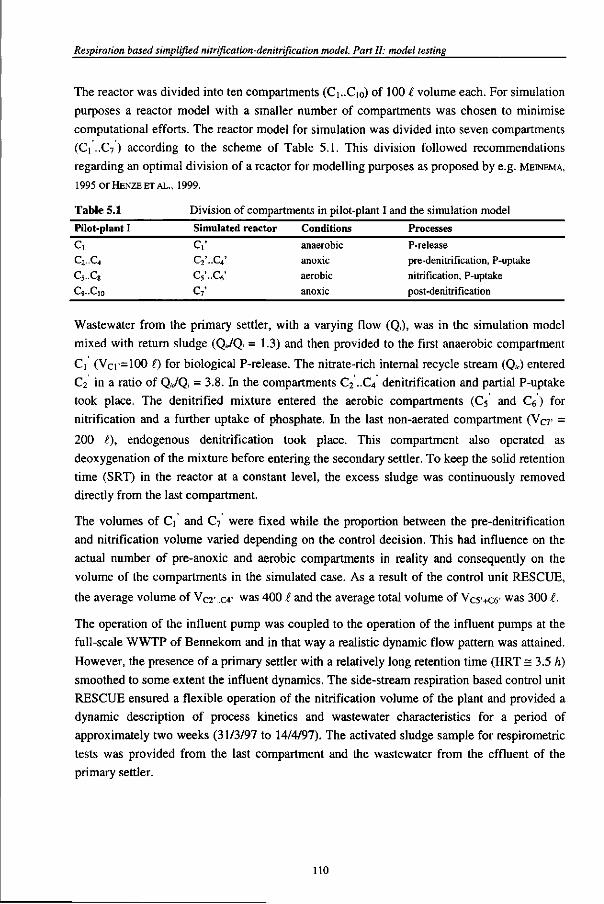
Respiration based simplified nitrification-denitrification model. Part II: model testing
The reactor was divided into ten compartments (C1..C10) of 100 £ volume each. For simulation purposes a reactor model with a smaller number of compartments was chosen to minimise computational efforts. The reactor model for simulation was divided into seven compartments (C) ..C7) according to the scheme of Table 5.1. This division followed recommendations regarding an optimal division of a reactor for modelling purposes as proposed by e.g. MEINEMA,
1995 OrHENZEETAL., 1999.
Table 5.1
Pilot-plant I
c, C2..C4
c5..c8
C9..Q0
Division of compartments in pilot-
Simulated reactor
C,' C2'..C4'
c5\.c6' c7'
Conditions
anaerobic
anoxic
aerobic
anoxic
plant I and the simulation model
Processes
P-release
pre-denitrification, P-uptake
nitrification, P-uptake
post-denitrification
Wastewater from the primary settler, with a varying flow (Q,), was in the simulation model
mixed with return sludge (Q,/Q, = 1.3) and then provided to the first anaerobic compartment
Ci (VCr=100 £) for biological P-release. The nitrate-rich internal recycle stream (Q„) entered
C2 in a ratio of Q,</Q, = 3.8. In the compartments C2 ..C4 denitrification and partial P-uptake
took place. The denitrified mixture entered the aerobic compartments (C5 and Ce) for
nitrification and a further uptake of phosphate. In the last non-aerated compartment (VC7' =
200 £), endogenous denitrification took place. This compartment also operated as
deoxygenation of the mixture before entering the secondary settler. To keep the solid retention
time (SRT) in the reactor at a constant level, the excess sludge was continuously removed
directly from the last compartment.
The volumes of d and C7 were fixed while the proportion between the pre-denitrification
and nitrification volume varied depending on the control decision. This had influence on the
actual number of pre-anoxic and aerobic compartments in reality and consequently on the
volume of the compartments in the simulated case. As a result of the control unit RESCUE,
the average volume of VC2v.c4' was 400 £ and the average total volume of VC5+c6' was 300 £.
The operation of the influent pump was coupled to the operation of the influent pumps at the full-scale WWTP of Bennekom and in that way a realistic dynamic flow pattern was attained. However, the presence of a primary settler with a relatively long retention time (HRT = 3.5 h)
smoothed to some extent the influent dynamics. The side-stream respiration based control unit RESCUE ensured a flexible operation of the nitrification volume of the plant and provided a dynamic description of process kinetics and wastewater characteristics for a period of approximately two weeks (31/3/97 to 14/4/97). The activated sludge sample for respirometric tests was provided from the last compartment and the wastewater from the effluent of the primary settler.
110
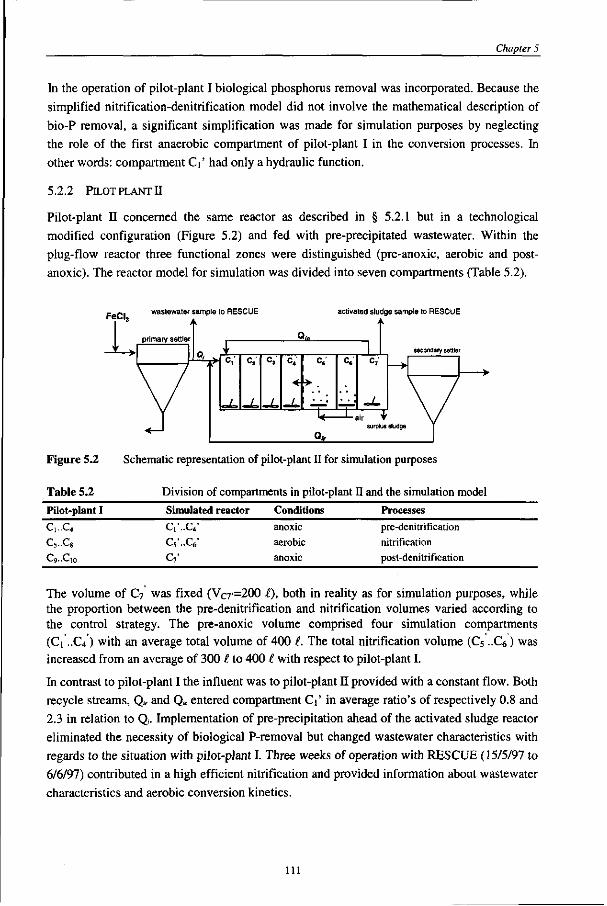
Chapter 5
In the operation of pilot-plant I biological phosphorus removal was incorporated. Because the simplified nitrification-denitrification model did not involve the mathematical description of bio-P removal, a significant simplification was made for simulation purposes by neglecting the role of the first anaerobic compartment of pilot-plant I in the conversion processes. In other words: compartment Cf had only a hydraulic function.
5.2.2 PILOT PLANT n
Pilot-plant II concerned the same reactor as described in § 5.2.1 but in a technological modified configuration (Figure 5.2) and fed with pre-precipitated wastewater. Within the plug-flow reactor three functional zones were distinguished (pre-anoxic, aerobic and post-anoxic). The reactor model for simulation was divided into seven compartments (Table 5.2).
- - . wastewater sample to RESCUE 3 A
primary settler
activated sludge sample to RESCUE
Figure 5.2 Schematic representation of pilot-plant II for simulation purposes
Table 5.2 Division of compartments in pilot-plant II and the simulation model Pilot-plant I Simulated reactor
Cl'..C4'
CV..CV
c7'
Conditions
anoxic
aerobic
anoxic
Processes C1..C4
C5..Q
C9..C10
pre-denitrification nitrification post-denitrification
The volume of C7 was fixed (Vc7'=200 £), both in reality as for simulation purposes, while the proportion between the pre-denitrification and nitrification volumes varied according to the control strategy. The pre-anoxic volume comprised four simulation compartments (Ci ..C4) with an average total volume of 400 £. The total nitrification volume (C5 ..C6) was increased from an average of 300 £ to 400 £ with respect to pilot-plant I.
In contrast to pilot-plant I the influent was to pilot-plant II provided with a constant flow. Both recycle streams, Q„ and Q,c entered compartment CV in average ratio's of respectively 0.8 and 2.3 in relation to Q,. Implementation of pre-precipitation ahead of the activated sludge reactor eliminated the necessity of biological P-removal but changed wastewater characteristics with regards to the situation with pilot-plant I. Three weeks of operation with RESCUE (15/5/97 to 6/6/97) contributed in a high efficient nitrification and provided information about wastewater characteristics and aerobic conversion kinetics.
ill
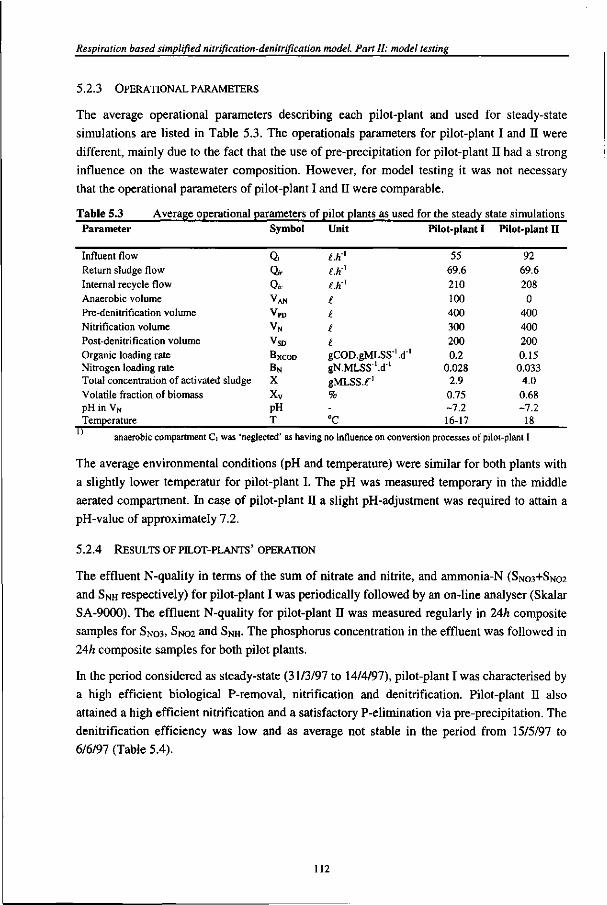
Respiration based simplified nitrification-denitrification model. Part II: model testing
5.2.3 OPERATIONAL PARAMETERS
The average operational parameters describing each pilot-plant and used for steady-state simulations are listed in Table 5.3. The operationals parameters for pilot-plant I and II were different, mainly due to the fact that the use of pre-precipitation for pilot-plant II had a strong influence on the wastewater composition. However, for model testing it was not necessary that the operational parameters of pilot-plant I and n were comparable.
Table 5.3 Average operational parameters of pilot plants as used for the steady state simulations Parameter Symbol Unit Pilot-plant I Pilot-plant II
Influent flow Return sludge flow Internal recycle flow Anaerobic volume Pre-denitrification volume Nitrification volume Post-denitrification volume Organic loading rate Nitrogen loading rate Total concentration of activated sludge Volatile fraction of biomass pH in VN
Temperature
Qi
Qir
Qfc VAN
VPD
VN
VSD
BXCOD
BN
X Xv
PH T
t.Kx
Lhx
LhA
I
e e i gCOD.gMLSS'.d'1
gN.MLSS'.d"1
gMLSS.f1
% -°C
55 69.6 210 100 400 300 200 0.2
0.028 2.9 0.75 -7.2 16-17
92 69.6 208 0
400 400 200 0.15 0.033 4.0 0.68 -7.2 18
anaerobic compartment Ci was 'neglected' as having no influence on conversion processes of pilot-plant I
The average environmental conditions (pH and temperature) were similar for both plants with a slightly lower temperatur for pilot-plant I. The pH was measured temporary in the middle aerated compartment. In case of pilot-plant II a slight pH-adjustment was required to attain a pH-value of approximately 7.2.
5.2.4 RESULTS OF PILOT-PLANTS'OPERATION
The effluent N-quality in terms of the sum of nitrate and nitrite, and ammonia-N (SN03+SN02 and SNH respectively) for pilot-plant I was periodically followed by an on-line analyser (Skalar SA-9000). The effluent N-quality for pilot-plant II was measured regularly in 24h composite samples for SNo3. SNO2 and SNH- The phosphorus concentration in the effluent was followed in 24h composite samples for both pilot plants.
In the period considered as steady-state (31/3/97 to 14/4/97), pilot-plant I was characterised by a high efficient biological P-removal, nitrification and denitrification. Pilot-plant II also attained a high efficient nitrification and a satisfactory P-elimination via pre-precipitation. The denitrification efficiency was low and as average not stable in the period from 15/5/97 to 6/6/97 (Table 5.4).
112
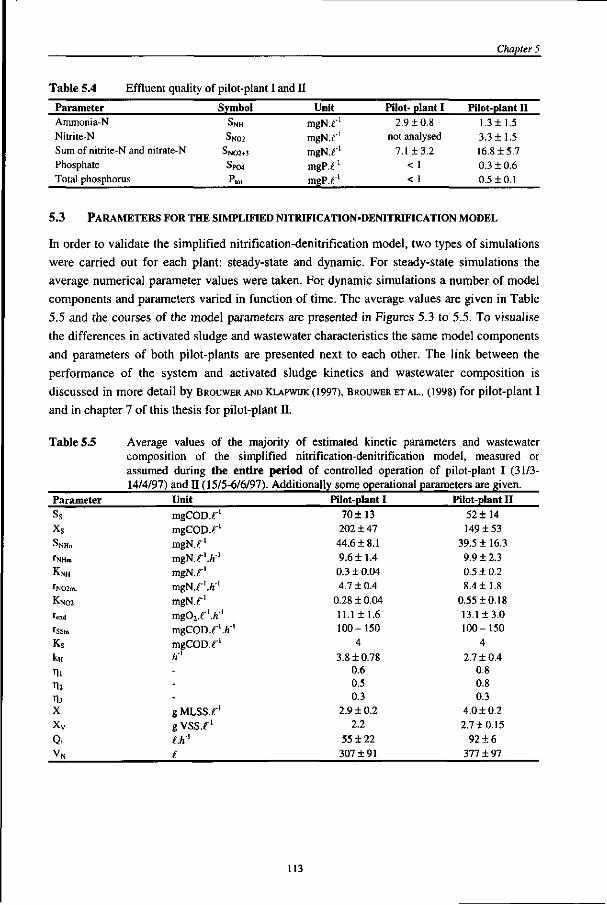
Table 5.4
Parameter
Effluent quality of pilot-plant I and II
Symbol Unit Pilot- plant I
Chapter 5
Pilot-plant II Ammonia-N
Nitrite-N Sum of nitrite-N and nitrate-N
Phosphate Total phosphorus
SNH
S N 0 2
SN02+3
Spo4
"tot
mgN.f1
mgN.f1
mgN.f1
mgP.f1
mgP.f1
2.9 ±0.8 not analysed
7.1+3.2 < 1
<1
1.3 ±1.5 3.3 ±1.5 16.8 + 5.7
0.3 ±0.6
0.5 + 0.1
5.3 PARAMETERS FOR THE SIMPLIFIED NITRIFICATION-DENITRIFICATION MODEL
In order to validate the simplified nitrification-denitrification model, two types of simulations
were carried out for each plant: steady-state and dynamic. For steady-state simulations the
average numerical parameter values were taken. For dynamic simulations a number of model
components and parameters varied in function of time. The average values are given in Table
5.5 and the courses of the model parameters are presented in Figures 5.3 to 5.5. To visualise
the differences in activated sludge and wastewater characteristics the same model components
and parameters of both pilot-plants are presented next to each other. The link between the
performance of the system and activated sludge kinetics and wastewater composition is
discussed in more detail by BROUWER AND KLAPWUK (1997), BROUWER ET AL., (1998) for pilot-plant I
and in chapter 7 of this thesis for pilot-plant II.
Table 5.5 Average values of the majority of estimated kinetic parameters and wastewater composition of the simplified nitrification-denitrification model, measured or assumed during the entire period of controlled operation of pilot-plant I (31/3-14/4/97) and II (15/5-6/6/97). Additionally some operational parameters are given.
Parameter
Ss Xs
SNHn rNHm
KNH rN02m.
K N 0 2
rend rSSm
Ks
kH
Til
Tl2
T|3
X Xv
Q. VN
Unit
mgCOD.f1
mgCOD.f1
mgN.f' mgN.f1 .A"1
mgN.f1
mgN.f1 ./i'1
mgN.f1
mg02.l:\hA
mgCOD.f1./!"1
mgCOD.f1
hl
---g MLSS.f'
g VSS.f'
IJi1
e
Pilot-plant I Pilot-plant II 70 ±13 202 ± 47
44.6 ±8.1
9.6 ±1.4
0.3 + 0.04 4.7 ± 0.4
0.28 ± 0.04
11.1 ± 1.6 100-150
4
3.8 ±0.78 0.6 0.5 0.3
2.9 ± 0.2 2.2
55 + 22
307 + 91
52 ±14 149 ±53
39.5 ±16.3
9.9 ±2.3
0.5 ± 0.2 8.4 ±1.8
0.55 ±0.18
13.1 ±3.0 100-150
4
2.7 ± 0.4 0.8 0.8 0.3
4.0 ±0.2
2.7 + 0.15
92 + 6
377 + 97
113
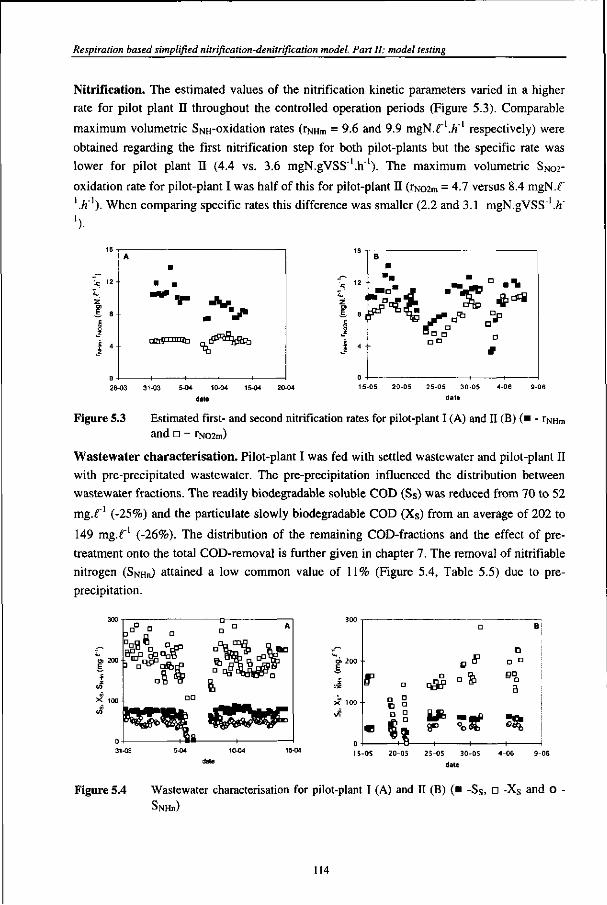
Respiration based simplified nitrification-denitrification model. Part II: model testing
Nitrification. The estimated values of the nitrification kinetic parameters varied in a higher
rate for pilot plant II throughout the controlled operation periods (Figure 5.3). Comparable
maximum volumetric SwH-oxidation rates (rNHm = 9.6 and 9.9 mgN.lA.h'[ respectively) were
obtained regarding the first nitrification step for both pilot-plants but the specific rate was
lower for pilot plant II (4.4 vs. 3.6 mgN.gVSS"'.h"1). The maximum volumetric SNo2-
oxidation rate for pilot-plant I was half of this for pilot-plant II (rN02m = 4.7 versus 8.4 mgN.f
'./i'1). When comparing specific rates this difference was smaller (2.2 and 3.1 mgN.gVSS'.fr"
').
A
-
•
• •
""^ If™
atrinnmiti
J*V . D ^ ^ S f e
12 -
I
8 E
4 -
0 •
B
• • • • ••»• • •
• D " • • _ti"D __
n° ° a n
Figure 5.3 Estimated first- and second nitrification rates for pilot-plant I (A) and II (B) ( • - rNHm and • - rN02m)
Wastewater characterisation. Pilot-plant I was fed with settled wastewater and pilot-plant II
with pre-precipitated wastewater. The pre-precipitation influenced the distribution between
wastewater fractions. The readily biodegradable soluble COD (Ss) was reduced from 70 to 52
mg.r1 (-25%) and the particulate slowly biodegradable COD (Xs) from an average of 202 to
149 mg.r1 (-26%). The distribution of the remaining COD-fractions and the effect of pre-
treatment onto the total COD-removal is further given in chapter 7. The removal of nitrifiable
nitrogen (SNHII) attained a low common value of 11% (Figure 5.4, Table 5.5) due to pre-
precipitation.
o> 200 E
X 100
F u
D ° 1 * 8P
D
C * °fe
"Sf
B
D D D
S D D
a
S
15-05 20-05 25-05 30-05 date
Figure 5.4 Wastewater characterisation for pilot-plant I (A) and II (B) (• -Ss, • -Xs and O
SlMHn)
114
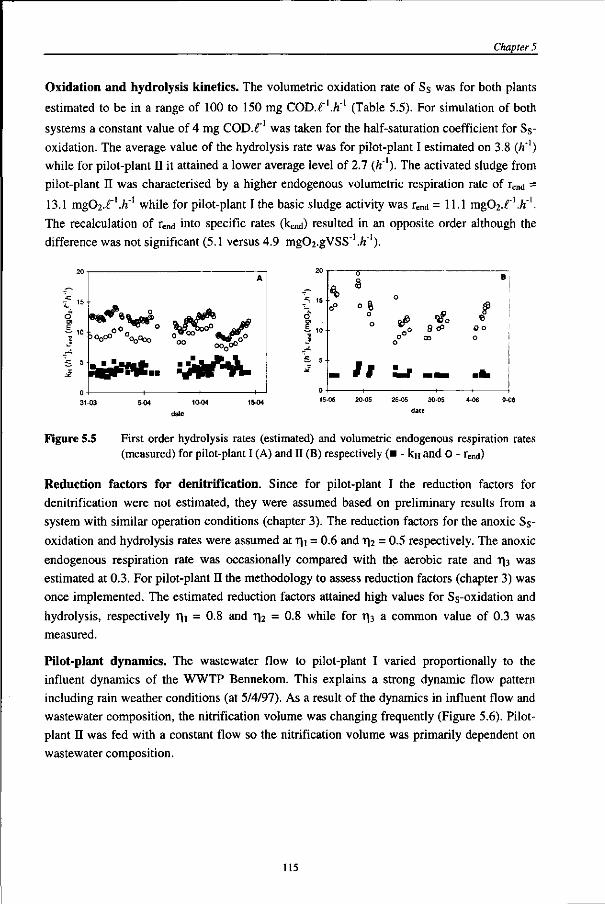
Chapter 5
Oxidation and hydrolysis kinetics. The volumetric oxidation rate of Ss was for both plants
estimated to be in a range of 100 to 150 mg COD.-f'.A'1 (Table 5.5). For simulation of both
systems a constant value of 4 mg COD.r1 was taken for the half-saturation coefficient for Ss-
oxidation. The average value of the hydrolysis rate was for pilot-plant I estimated on 3.8 (A'1)
while for pilot-plant II it attained a lower average level of 2.7 (A"1). The activated sludge from
pilot-plant II was characterised by a higher endogenous volumetric respiration rate of rend =
13.1 mgC^.-f'.A"' while for pilot-plant I the basic sludge activity was Tend =11.1 mgC^.r'.A"1.
The recalculation of rend into specific rates (kend) resulted in an opposite order although the
difference was not significant (5.1 versus 4.9 mg02.gVSS"1.A"').
>o0oo° O0O0QO
A
( 1 —
.5 ,s
o £ 10
c
'-_ £ 5
I J *
0
—
o
o
it I
o
o°
m
.
tfo
8<P CD
m^
.
B
Oo o
• f c
5-04 1004
date
15-05 20-05 25-05 30-05 4-06 9-06
date
Figure 5.5 First order hydrolysis rates (estimated) and volumetric endogenous respiration rates (measured) for pilot-plant I (A) and II (B) respectively (• - kn and O - re„d)
Reduction factors for denitrification. Since for pilot-plant I the reduction factors for denitrification were not estimated, they were assumed based on preliminary results from a system with similar operation conditions (chapter 3). The reduction factors for the anoxic Ss-oxidation and hydrolysis rates were assumed at r\\ = 0.6 and r)2 = 0.5 respectively. The anoxic endogenous respiration rate was occasionally compared with the aerobic rate and r|3 was estimated at 0.3. For pilot-plant II the methodology to assess reduction factors (chapter 3) was once implemented. The estimated reduction factors attained high values for Ss-oxidation and hydrolysis, respectively T)i = 0.8 and r\2 = 0.8 while for T|3 a common value of 0.3 was measured.
Pilot-plant dynamics. The wastewater flow to pilot-plant I varied proportionally to the influent dynamics of the WWTP Bennekom. This explains a strong dynamic flow pattern including rain weather conditions (at 5/4/97). As a result of the dynamics in influent flow and wastewater composition, the nitrification volume was changing frequently (Figure 5.6). Pilot-plant II was fed with a constant flow so the nitrification volume was primarily dependent on wastewater composition.
115
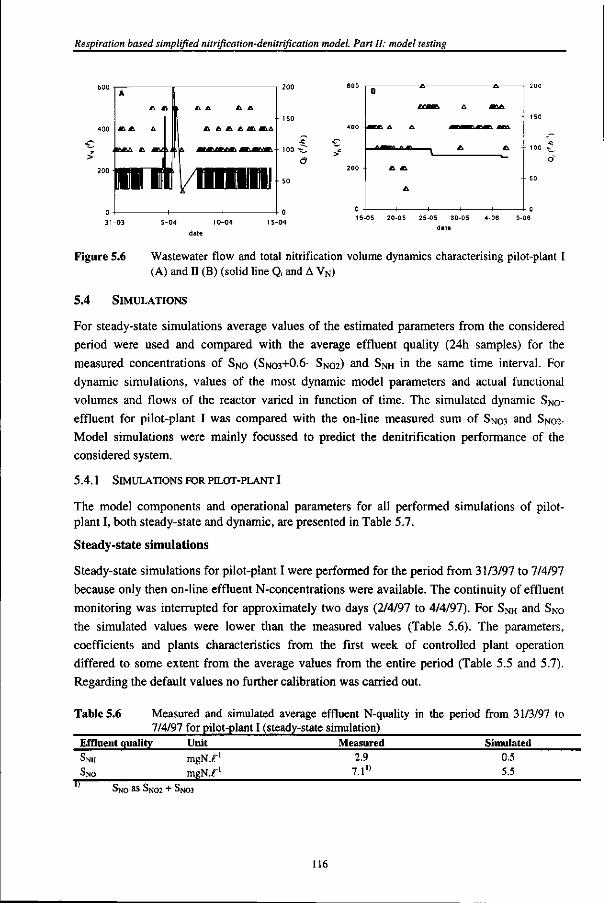
Respiration based simplified nitrification-denitrification model. Part II: model testing
31-03 5-04 10-04 15-04
date
Figure 5.6 Wastewater flow and total nitrification volume dynamics characterising pilot-plant I (A) and II (B) (solid line Q, and A VN)
5.4 SIMULATIONS
For steady-state simulations average values of the estimated parameters from the considered period were used and compared with the average effluent quality (24h samples) for the measured concentrations of SNO (SNO3+0.6- SNO2) and SNH in the same time interval. For dynamic simulations, values of the most dynamic model parameters and actual functional volumes and flows of the reactor varied in function of time. The simulated dynamic SNO-effluent for pilot-plant I was compared with the on-line measured sum of SNo3 and SN02-Model simulations were mainly focussed to predict the denitrification performance of the considered system.
5.4.1 SIMULATIONS FOR PILOT-PLANT I
The model components and operational parameters for all performed simulations of pilot-plant I, both steady-state and dynamic, are presented in Table 5.7.
Steady-state simulations
Steady-state simulations for pilot-plant I were performed for the period from 31/3/97 to 7/4/97 because only then on-line effluent N-concentrations were available. The continuity of effluent monitoring was interrupted for approximately two days (2/4/97 to 4/4/97). For SNH and SNo the simulated values were lower than the measured values (Table 5.6). The parameters, coefficients and plants characteristics from the first week of controlled plant operation differed to some extent from the average values from the entire period (Table 5.5 and 5.7). Regarding the default values no further calibration was carried out.
Table 5.6 Measured and simulated average effluent N-quality 7/4/97 for pilot-plant I (steady-state simulation)
Effluent quality Unit Measured SNH mgN.f1 2.9 SNO mgN.f1 7.1"
in the period from 31/3/97 to
Simulated 0.5 5.5
SNO as SNO? + SN
116
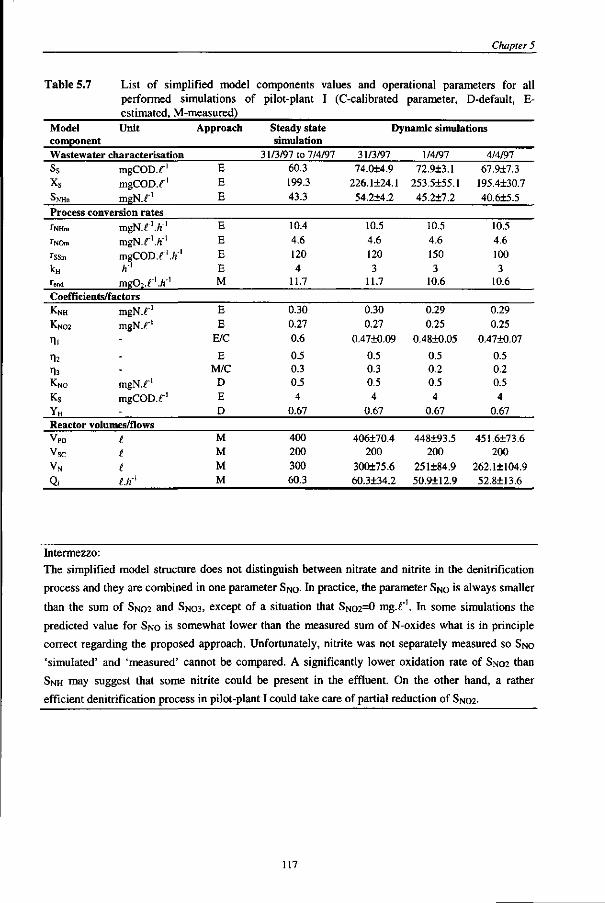
Chapter 5
Table 5.7
Model component
List of simplified model performed simulations of
estimated, M-
Unit
Wastewater characterisation
ss xs SNHn
mgCOD.r'
mgCOD.f'
mgN.f1
measured)
Approach
E E
E
components values and operational parameters for all pilot-plant I
Steady state simulation
31/3/97 to 7/4/9" 60.3
199.3
43.3
(C-calibrated parameter, D-default, E-
Dynamic simulations
31/3/97 74.0+4.9
226.1±24.1
54.2+4.2
1/4/97 72.9±3.1
253.5+55.1
45.2+7.2
4/4/97
67.9±7.3 195.4+30.7
40.6+5.5
Process conversion rates
rNHm
TNOIII
TsSm
kH rend
mgN.f'./i"'
mgN.f'./i"1
mgCOD.f'.fc'1
hA
mgOz.r'./!''
E
E E
E M
10.4
4.6 120
4 11.7
10.5
4.6 120
3 11.7
10.5 4.6
150
3 10.6
10.5
4.6 100
3 10.6
Coefficients/factors
KNH
K N 0 2
Til
% Tl3
KNO
Ks
YH
mgN.f' mgN.r'
---mgN.r1
mgCOD.f' -
E
E
E/C
E M/C
D
E
D
0.30 0.27
0.6
0.5 0.3 0.5
4
0.67
0.30
0.27
0.47+0.09
0.5 0.3 0.5
4
0.67
0.29 0.25
0.48±0.05
0.5 0.2 0.5
4
0.67
0.29
0.25
0.47±0.07
0.5 0.2 0.5
4
0.67 Reactor volumes/flows VPD
V sc
VN
Q,
t I I LHX
M M M M
400 200 300
60.3
406±70.4 200
300+.75.6 60.3±34.2
448+93.5 200
251+84.9 50.9±12.9
451.6±73.6 200
262.1±104.9
52.8±13.6
Intermezzo:
The simplified model structure does not distinguish between nitrate and nitrite in the denitrification
process and they are combined in one parameter SNO- In practice, the parameter SNO is always smaller
than the sum of SNO2 and SNO3> except of a situation that SNO2=0 mg.f'. In some simulations the
predicted value for SNO is somewhat lower than the measured sum of N-oxides what is in principle
correct regarding the proposed approach. Unfortunately, nitrite was not separately measured so SNO
'simulated' and 'measured' cannot be compared. A significantly lower oxidation rate of SNO2 than
SNH may suggest that some nitrite could be present in the effluent. On the other hand, a rather
efficient denitrification process in pilot-plant I could take care of partial reduction of SNO2-
117
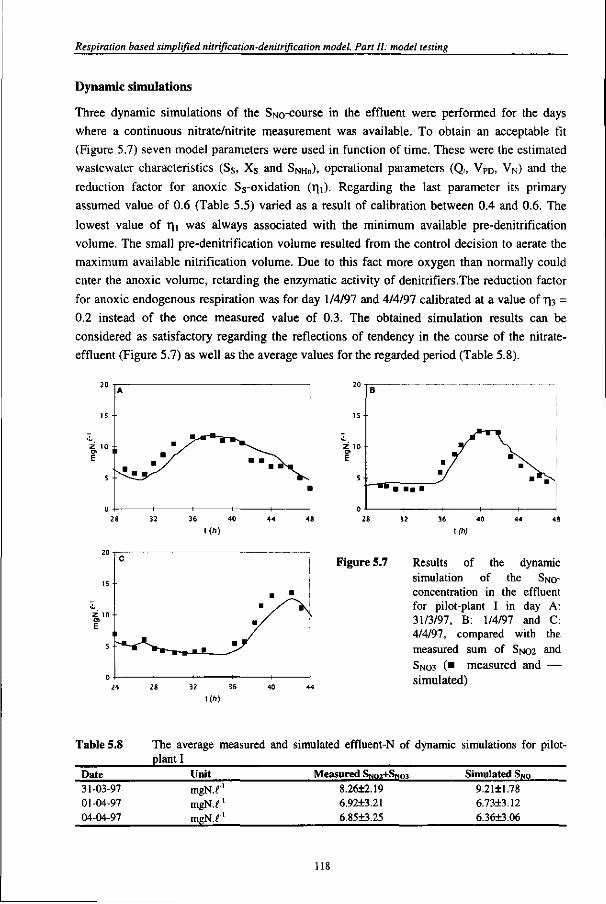
Respiration based simplified nitrification-denitrification model. Part II: model testing
Dynamic simulations
Three dynamic simulations of the Sno-course in the effluent were performed for the days where a continuous nitrate/nitrite measurement was available. To obtain an acceptable fit (Figure 5.7) seven model parameters were used in function of time. These were the estimated wastewater characteristics (Ss, Xs and SNHII). operational parameters (Q(, VPD, VN) and the reduction factor for anoxic Ss-oxidation (r)i). Regarding the last parameter its primary assumed value of 0.6 (Table 5.5) varied as a result of calibration between 0.4 and 0.6. The lowest value of r^ was always associated with the minimum available pre-denitrification volume. The small pre-denitrification volume resulted from the control decision to aerate the maximum available nitrification volume. Due to this fact more oxygen than normally could enter the anoxic volume, retarding the enzymatic activity of denitrifiers.The reduction factor for anoxic endogenous respiration was for day 1/4/97 and 4/4/97 calibrated at a value of r|3 = 0.2 instead of the once measured value of 0.3. The obtained simulation results can be considered as satisfactory regarding the reflections of tendency in the course of the nitrate-effluent (Figure 5.7) as well as the average values for the regarded period (Table 5.8).
24 28
Figure 5.7 Results of the dynamic simulation of the SNO-concentration in the effluent for pilot-plant I in day A: 31/3/97, B: 1/4/97 and C: 4/4/97, compared with the measured sum of SNO2 and SNO3 (• measured and — simulated)
Table 5.8
Date 31-03-97 01-04-97 04-04-97
The average measured and simulated effluent-N of plant I
Unit mgN.f1
mgN.f' mgN.f1
Measured SN02+SN03 8.26±2.19 6.92+3.21 6.85±3.25
dynamic simulations for pilot-
Simulated SNo 9.21+1.78 6.73+3.12 6.36+3.06
118
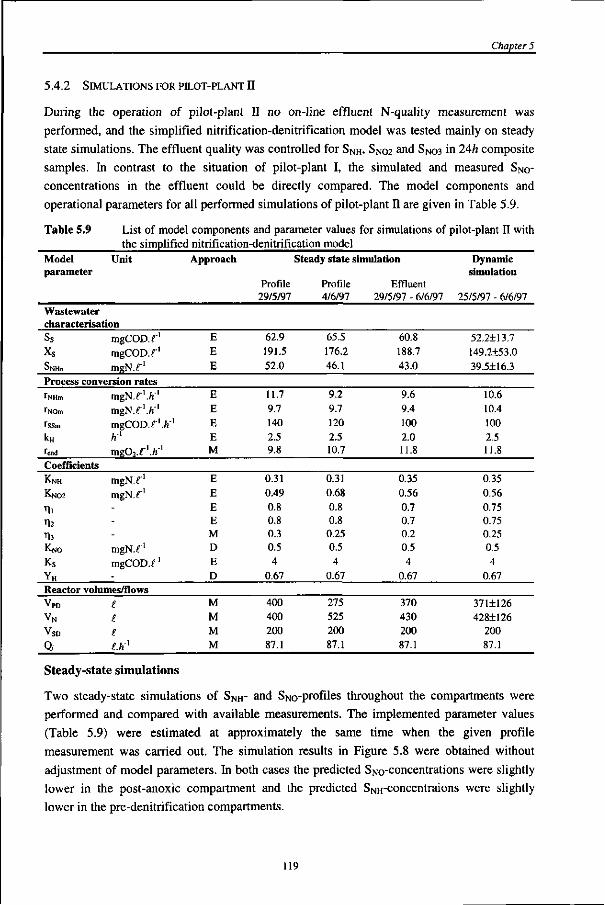
Chapter 5
5.4.2 SIMULATIONS FOR PILOT-PLANT n
During the operation of pilot-plant II no on-line effluent N-quality measurement was performed, and the simplified nitrification-denitrification model was tested mainly on steady state simulations. The effluent quality was controlled for SNH. SNO2 and SNo3 in 24h composite samples. In contrast to the situation of pilot-plant I, the simulated and measured SNo-concentrations in the effluent could be directly compared. The model components and operational parameters for all performed simulations of pilot-plant II are given in Table 5.9.
Table 5.9
Model parameter
Wastewater
List of model the simplified
Unit
characterisation Ss Xs SNHII
mgCOD.f1
mgCOD.f1
mgN.f1
components and parameter values for simulations of nitrification-denitrification model
Approach
E E E
Profile 29/5/97
62.9 191.5 52.0
Steady state simulation
Profile 4/6/97
65.5 176.2 46.1
Effluent 29/5/97 - 6/6/97
60.8 188.7 43.0
pilot-plant II with
Dynamic simulation
25/5/97 - 6/6/97
52.2±13.7 149.2+53.0 39.5+16.3
Process conversion rates fNHm
rNOm
fSSm
kH
Tend
mgN.f'.A"1
mgN.f'.A"1
mgCOD.f'./f1
hA
mgOz.f'.A"1
E E E E M
11.7 9.7 140 2.5 9.8
9.2 9.7 120 2.5 10.7
9.6 9.4 100 2.0 11.8
10.6 10.4 100 2.5 11.8
Coefficients KNH
KN02
1l 12
Tb KNO
Ks
YH
mgN.f1
mgN.f1
---mgN.f1
mgCOD.f1
-
E E E E M D E D
0.31 0.49 0.8 0.8 0.3 0.5 4
0.67
0.31 0.68 0.8 0.8 0.25 0.5 4
0.67
0.35 0.56 0.7 0.7 0.2 0.5 4
0.67
0.35 0.56 0.75 0.75 0.25 0.5 4
0.67 Reactor volumes/flows VPD
VN
VSD
0.
e e i LhA
M M M M
400 400 200 87.1
275 525 200 87.1
370 430 200 87.1
371+126 428±126
200 87.1
Steady-state simulations
Two steady-state simulations of SNH- and SNo-profiles throughout the compartments were performed and compared with available measurements. The implemented parameter values (Table 5.9) were estimated at approximately the same time when the given profile measurement was carried out. The simulation results in Figure 5.8 were obtained without adjustment of model parameters. In both cases the predicted Sno-concentrations were slightly lower in the post-anoxic compartment and the predicted SwH-concentraions were slightly lower in the pre-denitrification compartments.
119
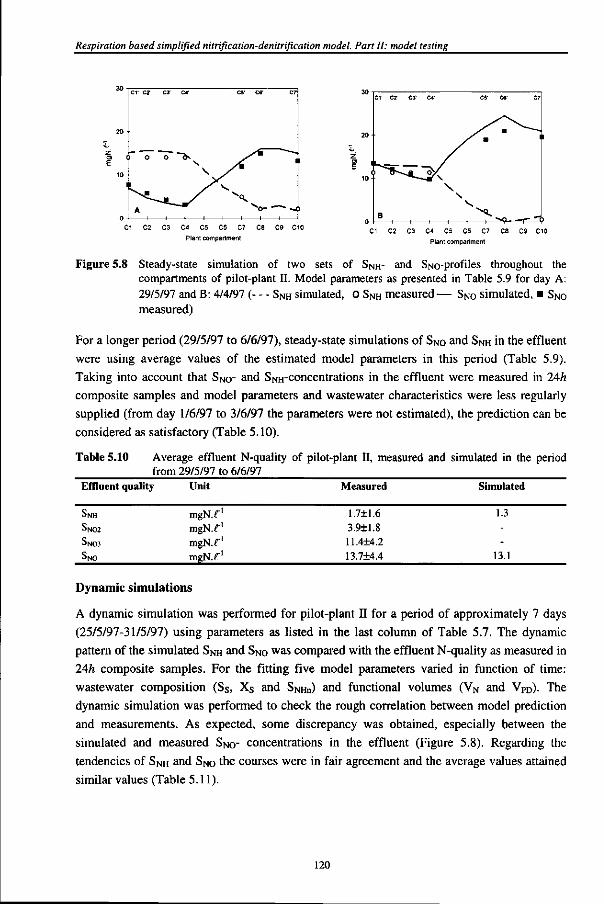
Respiration based simplified nitrification-denitrification model. Part II: model testing
C1 C2 C3 C4 C5 C5 C7 C8 C9 C10
Plant compartment C1 C2 C3 C4 C5 C5 C7 C8 C9 C10
Plant compartment
Figure 5.8 Steady-state simulation of two sets of SNH- and SNO-profiles throughout the compartments of pilot-plant II. Model parameters as presented in Table 5.9 for day A: 29/5/97 and B: 4/4/97 (— SNH simulated, O SNH measured— SNO simulated, • SNO measured)
For a longer period (29/5/97 to 6/6/97), steady-state simulations of SNo and SNH in the effluent were using average values of the estimated model parameters in this period (Table 5.9). Taking into account that SNO- and SNH-concentrations in the effluent were measured in 24h composite samples and model parameters and wastewater characteristics were less regularly supplied (from day 1/6/97 to 3/6/97 the parameters were not estimated), the prediction can be considered as satisfactory (Table 5.10).
Table 5.10 Average effluent N-quality of pilot-plant II, measured and simulated in the period from 29/5/97 to 6/6/97
Effluent quality Unit Measured Simulated
SNH
SN02
SN03
SNO
mgN.^ mgN.^ mgN.^ mgN.^
1.7±1.6 3.9+1.8 11.4±4.2 13.7±4.4
1.3
13.1
Dynamic simulations
A dynamic simulation was performed for pilot-plant II for a period of approximately 7 days (25/5/97-31/5/97) using parameters as listed in the last column of Table 5.7. The dynamic pattern of the simulated SNH and SNO was compared with the effluent N-quality as measured in 24h composite samples. For the fitting five model parameters varied in function of time: wastewater composition (Ss, Xs and SNHII) and functional volumes (VN and VPD). The dynamic simulation was performed to check the rough correlation between model prediction and measurements. As expected, some discrepancy was obtained, especially between the simulated and measured SNO- concentrations in the effluent (Figure 5.8). Regarding the tendencies of SNH and SNO the courses were in fair agreement and the average values attained similar values (Table 5.11).
120
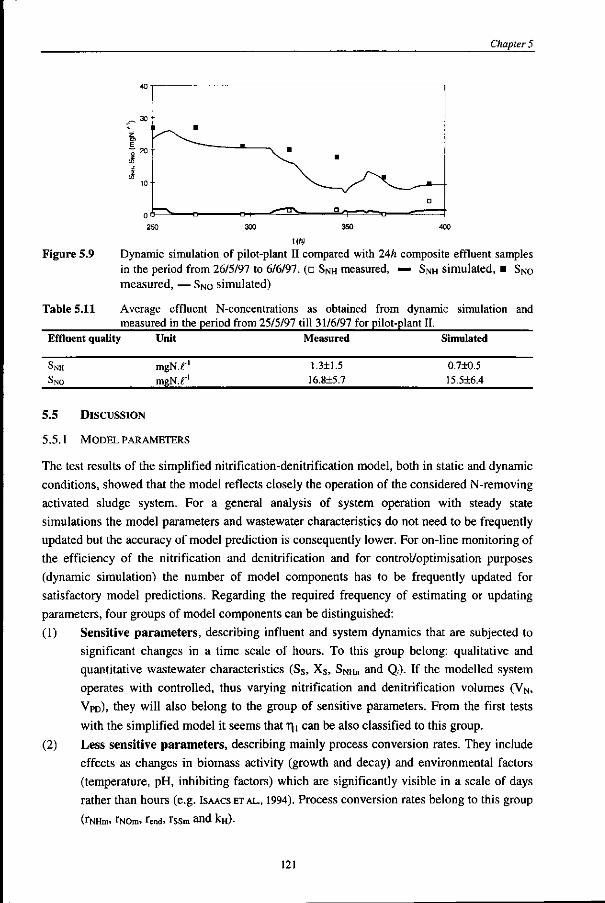
Chapter 5
t(/!>
Figure 5.9 Dynamic simulation of pilot-plant II compared with 24h composite effluent samples in the period from 26/5/97 to 6/6/97. (• SNH measured, — SNH simulated, • SNo measured, — SNO simulated)
Table 5.11 Average effluent N-concentrations as obtained from dynamic simulation and measured in the period from 25/5/97 till 31/6/97 for pilot-plant II,
Effluent quality Unit Measured Simulated
SNH
SNO
mgN.f
mgN.f'
1.3+1.5
16.8±5.7
0.7±0.5 15.5+6.4
5.5 DISCUSSION
5.5.1 MODEL PARAMETERS
The test results of the simplified nitrification-denitrification model, both in static and dynamic
conditions, showed that the model reflects closely the operation of the considered N-removing
activated sludge system. For a general analysis of system operation with steady state
simulations the model parameters and wastewater characteristics do not need to be frequently
updated but the accuracy of model prediction is consequently lower. For on-line monitoring of
the efficiency of the nitrification and denitrification and for control/optimisation purposes
(dynamic simulation) the number of model components has to be frequently updated for
satisfactory model predictions. Regarding the required frequency of estimating or updating
parameters, four groups of model components can be distinguished:
(1) Sensitive parameters, describing influent and system dynamics that are subjected to
significant changes in a time scale of hours. To this group belong: qualitative and
quantitative wastewater characteristics (Ss, Xs, SNHII and Q,). If the modelled system
operates with controlled, thus varying nitrification and denitrification volumes (VN,
VPD), they will also belong to the group of sensitive parameters. From the first tests
with the simplified model it seems that T| I can be also classified to this group.
(2) Less sensitive parameters, describing mainly process conversion rates. They include
effects as changes in biomass activity (growth and decay) and environmental factors
(temperature, pH, inhibiting factors) which are significantly visible in a scale of days
rather than hours (e.g. ISAACS ETAL., 1994). Process conversion rates belong to this group
(rNHm, i"NOm, ren(j, rssm and ICH).
121
Respiration based simplified nitrification-denitrification model. Part II: model testing
(3) Factors and coefficients when once determined are assumed to remain constant for a period of steady-state operation. Their update or verification should be carried out periodically, especially when the operational conditions change significantly. Two reduction factors for anoxic respiration (r)2 and TI3) and half-saturation coefficients K$, KNH and KNO2 belong to this group.
(4) Default parameters, such as e.g. KNo o r YH-
5.5.2 ACCURACY OF MODEL PREDICTION
A discrepancy between model predictions and measurements was noted, especially for some
steady state-simulations (Table 5.6 and 5.10). Possible reasons for a higher measured
concentration of SNH in the effluent than simulated could be:
- smaller actual volume VN due to the existence of dead zones in the aerobic
compartments;
- concentration of estimated SNHII was lower as a result of a different assimilation rate
and/or hydrolysis and ammonification of organic-N in a batch test and in the reactor;
- slight difference in pH between respiration vessel and pilot-plant;
- higher actual wastewater flow due to a spontaneous change of influent pump capacity.
The introduction of the fraction SNHII allows to model precisely the net nitrification process and to predict the SNH-effluent quality. A lower simulated SNH in the pre-anoxic zones (Figure 5.8) seems to be relatively simple to explain using the definition of nitrifiable-N (chapter 4, equation 4.3). Processes such as SwH-assimilation under different electron acceptor conditions, as well as hydrolysis and ammonification of particulate organic nitrogen, are not included in the simplified model.
A lower simulated SNO-concentration in the effluent of pilot-plant I (Table 5.6) might be a result of the negligence of biological P-removal in the model structure. Another reason of some discrepancy between simulated and measured values can be some difference between estimated SNHn under batch conditions and in the modelled reactor.
5.5.3 NlTRIFIABLE NITROGEN
The concentration of SNHII. which is recognised during an aerobic respiration test, may differ to some extent from SNHII in the reactor because of:
- different actual growth rate of biomass affecting the rate of SNH-assimilation (of SNHn). This is caused by different organic loading rates and electron acceptor conditions during a respiration batch test compared with the activated sludge reactor. This effect can be minimised by the choice of a similar S/Xy-ratio as in the simulated reactor;
- different electron acceptor conditions may influence N-hydrolysis and ammonification rates (HENZE AND MLADENOWSKI, 1991, GOELET AL., 1999). The wastewater and sludge in the simulated reactor are subjected to alternating conditions (anaerobic, anoxic, aerobic) while in the respiration test only aerobic conditions are provided.
122
Chapter 5
5.5.4 CALIBRATION
Since the majority of parameters and wastewater characterisation of the simplified model can be measured frequently, an extended calibration of the model is not necessary. The first attempts of model testing proved that estimated parameters could be directly used in a function of time. The model predictions reflected closely the reality. In the initial phase of model testing only the denitrification reduction factor r\\ was calibrated.
5.5.5 DURATION OF WASTEWATER CHARACTERISATION PROCEDURE
The required time of approximately 1.5-2 h to estimate the actual wastewater characterisation can be considered as a limitation of the presented method to estimate parameters of the simplified model. However, the results of dynamic simulations (§ 5.4.2) reveal that this frequency did not effect negatively the quality of the model predictions. For control applications of the simplified model, especially in the system like examined in this chapter (plug-flow and pre-denitrification), the duration of the test for the wastewater characterisation was not a bottleneck for control of the nitrification process. The information about the actual concentration of SNMI in the wastewater volume, directly required for applied control strategy, was obtained before this wastewater reached the nitrification volume. In such a case respiration based control strategy of nitrification had a feed-forward character. Regarding a control strategy for denitrification, which is usually placed as first process in wastewater treatment schemes, it would have a feed-back character.
5.6 OPTIONS FOR MODEL IMPLEMENTATIONS
Development of a 'new' mathematical description of the activated sludge process requires always a justification in its possible implementation. The simplified nitrification-denitrification activated sludge model presented in chapter 4 and tested in this chapter can be used for optimisation of the nitrification and denitrification process. For nitrification one possible control strategy was validated for a plug-flow system and is described elsewhere (BROUWER ET AL., 1997, 1998). Optimisation of the denitrification process with a control strategy will depend on the process configuration. For a plug-flow pre-denitrification system the following state variables can be manipulated to improve the denitrification performance:
- internal nitrate-rich recycle stream, and
- addition of external C-source.
Choice of an optimal internal (nitrate-rich) recycle flow. An optimal recycle flow (Q,c) provides a nitrate load on demand to the pre-denitrification volume (VPD, Figure 5.10), and is therefore preventing nitrate limitation in any point of its volume and its very low concentration in the outflow zone. An optimal recycle ratio allows for the optimal use of denitrification potential in the considered pre-anoxic zone and minimises the oxygen input from the nitrification volume (VN).
123
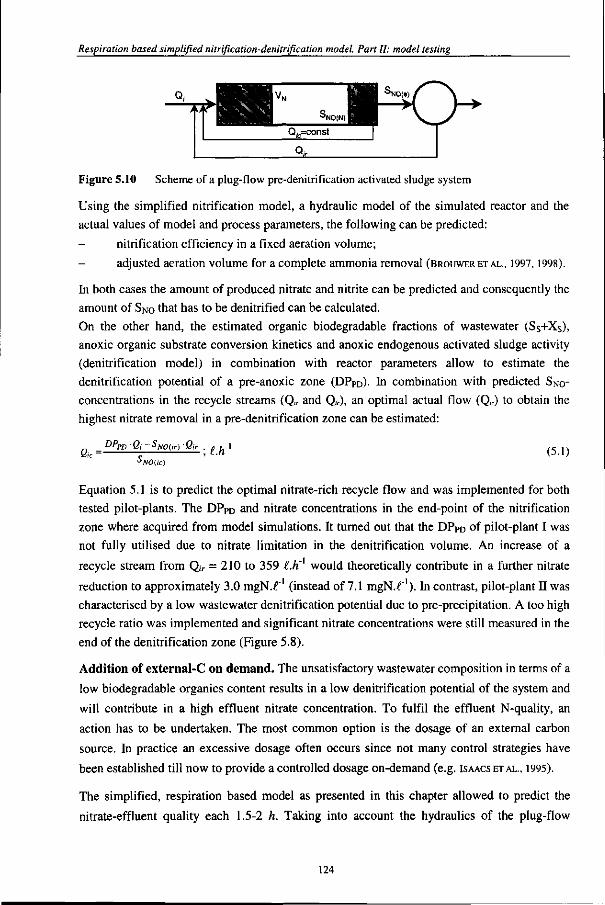
Respiration based simplified nitrification-denitrification model. Part II: model testing
Figure 5.10 Scheme of a plug-flow pre-denitrification activated sludge system
Using the simplified nitrification model, a hydraulic model of the simulated reactor and the
actual values of model and process parameters, the following can be predicted:
- nitrification efficiency in a fixed aeration volume;
- adjusted aeration volume for a complete ammonia removal (BROUWER ET AL., 1997,1998).
In both cases the amount of produced nitrate and nitrite can be predicted and consequently the amount of SNO that has to be denitrified can be calculated.
On the other hand, the estimated organic biodegradable fractions of wastewater (Ss+Xs), anoxic organic substrate conversion kinetics and anoxic endogenous activated sludge activity (denitrification model) in combination with reactor parameters allow to estimate the denitrification potential of a pre-anoxic zone (DPpo). In combination with predicted SNO-concentrations in the recycle streams (Q„ and Q,c), an optimal actual flow (Q,<) to obtain the highest nitrate removal in a pre-denitrification zone can be estimated:
Qj=DPPD - 0 , - W ) ' f e . ^ - i (5.,) ^NO(k)
Equation 5.1 is to predict the optimal nitrate-rich recycle flow and was implemented for both
tested pilot-plants. The DPpo and nitrate concentrations in the end-point of the nitrification
zone where acquired from model simulations. It turned out that the DPPD of pilot-plant I was
not fully utilised due to nitrate limitation in the denitrification volume. An increase of a
recycle stream from Q,> = 210 to 359 £.h~ would theoretically contribute in a further nitrate
reduction to approximately 3.0 mgN.f' (instead of 7.1 mgN.^"1). In contrast, pilot-plant II was
characterised by a low wastewater denitrification potential due to pre-precipitation. A too high
recycle ratio was implemented and significant nitrate concentrations were still measured in the
end of the denitrification zone (Figure 5.8).
Addition of external-C on demand. The unsatisfactory wastewater composition in terms of a
low biodegradable organics content results in a low denitrification potential of the system and
will contribute in a high effluent nitrate concentration. To fulfil the effluent N-quality, an
action has to be undertaken. The most common option is the dosage of an external carbon
source. In practice an excessive dosage often occurs since not many control strategies have
been established till now to provide a controlled dosage on-demand (e.g. ISAACS ETAL., 1995).
The simplified, respiration based model as presented in this chapter allowed to predict the
nitrate-effluent quality each 1.5-2 h. Taking into account the hydraulics of the plug-flow
124
Chapter 5
reactor, the wastewater composition and conversion kinetics were estimated in the wastewater
sample that was almost entering the nitrification volume. In that case, the action to enhance
denitrification efficiency should be undertaken in a post-denitrification volume.
The simplified model allows to predict the nitrate production and consequently the amount of
nitrate that has to be denitrified can be calculated. Using a relational model for an external
carbon source (e.g. § 2.3.5), its dose can be predicted and added to the post-denitrification
volume. A possible procedure leading to the decision of a magnitude of dosage could remind
the following:
(1) estimation of the denitrification potential (ZDP, mgN.f'j and denitrification capacity
(DC, mgN.r1) for the total system (pre- and post-anoxic zone) based on actual
wastewater composition, activated sludge kinetics and reactor characteristics;
(2) estimation of the nitrate concentration to be denitrified (Snod) using the simplified nitrification model and the required effluent quality:
SNOd = (SNHn -SNHe -SNOe); mgN.f ' (5.2)
(3) estimation of the SNo-concentration to be denitrified with an external carbon source
(SNO ):
sNOc=sNOd-DC- mgN.f1 (5.3)
(4) estimation of the required denitrification rate in the post-anoxic zone to obtain a satisfactory SNo-effluent quality (kr/"'):
koreq = SNO ' f t ; mgN.gVSS-'./T' (5.4)
(5) estimation of the required flow of the external carbon source (qc, £.h~l) from a relational model (e.g. chapter 2, Figure 2.9) for a chosen carbon source of known concentration (CODsoiution)- In the following equation qc is hidden in the sludge loading rate (BXCOD):
BXCOD = 9c 2 4 ' C 0 P j° '""°" ; gCOD.gMLSS \h] (5.5) 0 1000- VSD X
Implementation of denitrification control strategies using the simplified nitrification-denitrification model can be implemented in other configurations as well, such as completely mixed systems with simultaneous nitrification/denitrification, alternating systems, SBR's, etc. In any of the mentioned systems the transition phases from anoxic to aerobic conditions and vice-versa appear, and this will influence the actual denitrification and nitrification potential. In such case oxygen switching functions should be added to the appropriate model equations (chapter 4).
125
Respiration based simplified nitrification-denitrification model. Part II: model testing
5.6 CONCLUSIONS
The simplified nitrification-denitrification model was tested for two pilot-plant configurations. In both cases the automated respiration based control unit RESCUE was integrated with the considered pilot-plant. This provided frequently information about the wastewater composition and conversion kinetics as required for the developed model approach.
Acceptable results of steady-state simulations were obtained, implicating benefits that can be attained to predict the overall N-removal potential, based on a very detailed wastewater and activated sludge characterisation. The good prediction of the dynamic behaviour of the nitrate course in the effluent implicates that the model can be implemented for control strategies, e.g. for a feed-back control of the denitrification by a nitrate-rich recycle rate and/or the addition of an external carbon source. Another advantage of the model is its implementation to control the nitrification volume (BROUWER ANDKLAPWUK, 1997, BROUWER ET AL., 1998).
In the presented approach it was proved that activated sludge oxidation kinetics and wastewater composition, which were estimated with one type of respiration measurement, enable to describe very closely the overall N-removal process. The wastewater characterisation as estimated with the aerobic respiration test proved to be adequate to model the denitrification process. The reduction factors for denitrification do not need to be frequently estimated (adjusted) if the activated sludge system operates in steady-state conditions. However, strong dynamics of the system (influent dynamics and a frequent change of the ratio between pre-anoxic and aerobic zones) affects the reduction factor for Ss-oxidation under anoxic conditions (T]I).
Possible implementations of the simplified respiration based nitrification-denitrification model for a control of the denitrification process are considered as alternatives for existing approaches (chapter 1, section 1.7).
126
Chapter 5
LITERATURE
Andrews, J.F. (Edt.) (1992) Dynamics and control of the activated sludge process. Water Quality Management Library. Vol.6, Technomic publication.
Brouwer, H. and Klapwijk, B. (1997) Model-gebaseerde sturing van het aerobe volume in een propstroomaktiefslibinstallatie op basis van respirometrie. Rapport of Departement Agro-milieu- en systeemtechnologie (AMST) Landbouwuniversiteit Wageningen.
Brouwer, H., Bloemen, Klapwijk, B. and Spanjers, H. (1998) Feedforward control by manipulating the aerobic nitrification volume in ASP's. Wat. Sci. Tech. 38 (3), 245-255.
Goel, R., Mino, T., Satoh, H. and Matsuo, T. (1999) Modelling hydrolysis processes considering intracellular storage. Wat. Sci. Tech., 39(1), 97-107.
Henze M., Gujer, W., Mino, T., Matsuo, T., Wentzel, M.C., Marais, G.v.R. and van Loosdrecht, M.C.M. (1999) Outline Activated sludge model No.2d by IAWQ Task Group on Mathematical Modelling for Design and operation of Biological Wastewater Treatment Processes. Wat. Sci. Tech., 39, (1), 165-183.
Henze, M. and Mladenowski, C. (1991) Hydrolysis of particulate substrate by activated sludge under aerobic, anoxic and anaerobic conditions. Wat. Res. 25(1), 61-64
Isaacs, S.H., Henze, M. S0eberg, H. and Kiimmel, M. (1994) Modelling the nitrogen dynamics in an alternating activated sludge process. Mathmod Vienna, Feb. 2-4, 1994
Meinema, K. (1995) Van procesconfiguraties naar modelcomponenten. NVA Symposium, Utrecht, NL.
127
Chapter 6
Effect of pre-precipitation on denitrification potential
CONTENT
Abstract 130 6.1 Introduction 131 6.1.1 Pre-precipitation in wastewater treatment schemes 131 6.1.2 Pre-precipitation - basic aspects 131 6.1.3 Effect of pre-precipitation on wastewater composition and denitrification potential 132 6.1.4 Objective of the study 134 6.2 Materials and methods 135 6.2.1 Experimental set-up 135 6.2.2 Analysis 136 6.2.3 Specific activity tests 137 6.2.4 Operational parameters of SBRs 137 6.3 Results and discussion 138 6.3.1 Phosphorus removal 138 6.3.2 COD and nitrogen removal by pre-precipitation 139 6.3.3 Biological nitrogen removal 142 6.4 Theoretical system optimisation with a simplified model 145 6.5 Conclusions 148 List of symbols and abbreviations 150 Literature 151
Modified version of article presented as: Kujawa, K., Roeleveld, P.J., Klapwijk, A. and Rensink, J.H. (1996) Effect of pre-precipitation on nutrient removal and wastewater composition. VII Symposium Encontro Nacional de Saneamento Basico, 14-16 February 1996, Coimbra, Portugal
129
Effect of pre-precipitation on denitrification potential
ABSTRACT
An integrated biological/chemical nutrient removal process was conducted. Pre-precipitation with
ferric chloride was implemented to attain total phosphorus (Ptot) removal up to 1 mg P.f . Nitrogen
removal was performed in a low-loaded sequencing batch reactor (SBR) with integrated pre-
denitrification and nitrification. Different doses of ferric chloride, used as precipitant, were tested to
find an optimal P-ratio (Fe/P molar ratio) for the required P-removal. With a normal-rate precipitant
dose of P=1.2 Ptot was reduced to 2.4 mg P.f as a result of pre-treatment while in the effluent from
the SBR it reached an average concentration of 1 mg P.f .
Nitrogen removal efficiencies in systems fed with raw and pre-precipitated wastewater were
compared. Special attention was paid on the effect of a change in wastewater composition on the
denitrification potential and effluent quality. With P=1.2 the total COD/N ratio was decreased from
6.5 to 3.1 and consequently the wastewater denitrification potential was reduced with 42% when
compared with a reference system fed with raw wastewater. The activated sludge activity differed
significantly for systems fed with raw and pre-precipitated wastewater. As a result of an elimination
of the majority of organic, particulate and inert material by pre-precipitation, more viable biomass per
MLSS unit was present in SBRs fed with pre-precipitated wastewater. This was confirmed by higher
values of the specific nitrification and denitrification rates.
A simplified nitrification-denitrification model was employed to optimise theoretically the
denitrification in the SBR system with pre-precipitated influent. The results of simulations allowed to
suppose that only little improvement of denitrification efficiency is possible when the denitrification
potential of the wastewater is originally low.
130
Chapter 6
6.1 INTRODUCTION
6.1.1 PRE-PRECIPITATION IN WASTEWATER TREATMENT SCHEMES
Among wastewater pre-treatment technologies, pre-precipitation is a potential method. Pre-
precipitation is usually implemented to reduce phosphorus from wastewater. Secondary
reasons for implementation of pre-precipitation are upgrading or extending the treatment plant
(HENZE, 1992, BUNDEGAARD AND PEDERSEN, 1990) when available land area is limited. For treatment
plants characterised by a high content of particulate material in the influent and high
variations in organic pollution load, pre-precipitation smoothes the dynamics of particulate
organics, organic nitrogen (Norg) and phosphate. This contributes in a better performance of
the activated sludge system (GALIL AND REBHUN, 1990, ANDERSSON ET AL., 1992). Generally, pre-
precipitation represents a low-cost option for enhancing the performance of existing plants
(FIRK, 1990).
Reduction of particulate organic matter contributes in a substantial reduction of the sludge
loading of the system and prolongs the sludge retention time (SRT) (KARLSSON, 1988). This is
beneficial for nitrification (ANDERSSON AND ROSEN, 1990) and decreases the biological sludge
production (HENZE AND HARREMOES, 1990). A significant reduction of the organic load allows for
smaller volumes in case of new plants or will decrease the loading for existing overloaded
plants. Because pre-precipitation is associated with a higher removal of solids than during
conventional settling, a large amount of energy consuming organic matter is eliminated in the
primary settler, resulting in a higher primary sludge production and a higher biogas production
in the digestors (BUNDEGARD, 1990).
6.1.2 PRE-PRECIPITATION - BASIC ASPECTS
Pre-precipitation applied by a municipal wastewater treatment plant can be described as a
process of incorporating phosphate into a particulate form, which can be removed together
with the primary sludge. Using low molecular, positively charged metal salts (mostly Fe+3 and
Al+3) (SDA, 1989) or lime (0DEGAARD, 1992) dissolved P-containing compounds like
orthophosphates are precipitated. The simultaneously occurring process is a destabilisation of
suspended organic matter that cannot be removed by gravity forces in conventional settling.
The smaller sized organic particles of 0.1 to 100 urn (KARLSSON, 1990) are captured by
hydroxide floes of precipitants. Large aggregates are formed with high settling properties.
Expressing above in numbers, the total reduction of COD with high-rate pre-precipitation
varies from 60% (HENZE AND HARREMOES, 1990) up to 75% (KARLSSON, 1990) and for suspended
solids 80 - 90% (KARLSSON, 1990). For comparison, the removal efficiencies for well operating
conventional primary settlers, without addition of chemicals, are 25 to 40% for COD and 50
to 70% for suspended solids (e.g. METCALF&EDDY, 1991, HENZE AND HARREMOES, 1992). The
phosphorus removal efficiency depends on the precipitant dose and may even exceed 90%,
which often means that for municipal wastewater no additional efforts are necessary to fulfil
the P-effluent standards.
131
Effect of pre-precipitation on denitrification potential
The magnitude of dosage will vary, depending on the influent concentration of phosphorus,
the chemical additive, the dosing location, the orthophosphate to total phosphorus ratio (BLISS
ET AL„ 1994) and the desired reduction rate. When the objective is to remove phosphorus up to
1.0 mg P.f\ a normal rate pre-precipitation with a Fe/P or Al/P molar ratio of 1 to 2 can be
used. This molar ratio is also known as (3-ratio (SDA, 1989). When the effluent phosphorus has
to be lower than 1.0 mg P.f\ a high rate pre-precipitation with a much higher (3-ratio has to
be used. Choosing a precipitant dose, one has to keep in mind that a limitation of phosphorus
for the growth of biomass should be avoided.
The choice of a (3-ratio will be never accurate, because of the variability of the P-influent
concentration. In practice this is solved by overdosing the metal salt at an average P-influent
concentration (causing higher sludge production than necessary) or implementing control
strategies based on actual wastewater flow, conductivity, P-influent concentration or turbidity
(OVERATH ET AL., 1981).
The most commonly used precipitants, such as alum or ferric salts will consume alkalinity
what can depress the wastewater pH according to the simplified chemical reaction where iron
salt is a precipitant:
Fe+3 + HnPOi3-" « • FePOi + nH*
If sufficient buffer capacity is not naturally present a supplemental alkalinity has be added to
meet biological treatment requirements.
6.1.3 EFFECT OF PRE-PRECIPITATION ON WASTEWATER COMPOSITION AND DENITRIFICATION
POTENTIAL
The actual wastewater composition determines predominantly the denitrification potential of
an activated sludge system (chapter 2). The more organic matter is removed by pre-treatment,
the less wastewater denitrification potential will be left. Generally, primary precipitation will
remove more COD than nitrogen, lowering the COD/N-ratio (KRISTENSEN AND J0RGENSEN, 1992)
and efficiency of nitrogen removal in the down-stream biological step. Reviewing the mass
balances for nitrogen from pre-precipitated wastewater it can be seen that only 18% (HENZE
AND HARREMOES, 1990) to 30% (HOFFMAN AND KLUTE, 1990) of it ends in primary sludge, while for
COD this can be 60 - 75% (HENZE AND HARREMOES, 1990, KARLSSON, 1990).
The relations between different COD-fractions are changed due to pre-precipitation. The
soluble readily biodegradable and inert fractions (Ss and Si respectively) increase while the
particulate and colloidal slowly biodegradable and inert fractions (Xs and Xi respectively)
significantly decrease in relation to the total amount of organic matter. The major fraction of
influent nitrogen is in the soluble form of ammonia (HENZE ET AL., 1987, 1996), which passes
hardly changed through the pre-precipitation process.
132
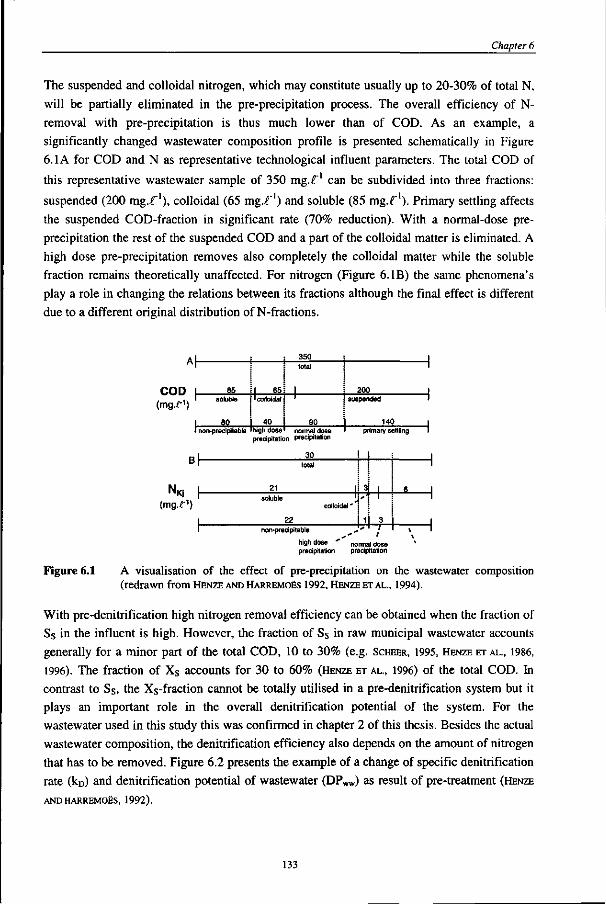
Chapter 6
The suspended and colloidal nitrogen, which may constitute usually up to 20-30% of total N,
will be partially eliminated in the pre-precipitation process. The overall efficiency of N-
removal with pre-precipitation is thus much lower than of COD. As an example, a
significantly changed wastewater composition profile is presented schematically in Figure
6.1 A for COD and N as representative technological influent parameters. The total COD of
this representative wastewater sample of 350 mg.f1 can be subdivided into three fractions:
suspended (200 mgX1), colloidal (65 mg.l'1) and soluble (85 mg.f'). Primary settling affects
the suspended COD-fraction in significant rate (70% reduction). With a normal-dose pre-
precipitation the rest of the suspended COD and a part of the colloidal matter is eliminated. A
high dose pre-precipitation removes also completely the colloidal matter while the soluble
fraction remains theoretically unaffected. For nitrogen (Figure 6.IB) the same phenomena's
play a role in changing the relations between its fractions although the final effect is different
due to a different original distribution of N-fractions.
A
COD (mg.r1)
85 soluble
80 non-precipitable
I 65 1 colloidal
40 high dose
350 total
1 1
90 normal dose
1
1
200 | suspended 1
140 I primary settling I
precipitation precipitation
30
N, (mg.f)
non-precipitable
M-
high dose ' precipitation
normal dose precipitation
Figure 6.1 A visualisation of the effect of pre-precipitation on the wastewater composition (redrawn from HENZE AND HARREMOES 1992, HENZE ET AL., 1994).
With pre-denitrification high nitrogen removal efficiency can be obtained when the fraction of Ss in the influent is high. However, the fraction of Ss in raw municipal wastewater accounts generally for a minor part of the total COD, 10 to 30% (e.g. SCHEER, 1995, HENZE ET AL., 1986, 1996). The fraction of Xs accounts for 30 to 60% (HENZE ET AL., 1996) of the total COD. In contrast to Ss, the Xs-fraction cannot be totally utilised in a pre-denitrification system but it plays an important role in the overall denitrification potential of the system. For the wastewater used in this study this was confirmed in chapter 2 of this thesis. Besides the actual wastewater composition, the denitrification efficiency also depends on the amount of nitrogen that has to be removed. Figure 6.2 presents the example of a change of specific denitrification rate (kD) and denitrification potential of wastewater (DPWW) as result of pre-treatment (HENZE
AND HARREMOES, 1992).
133
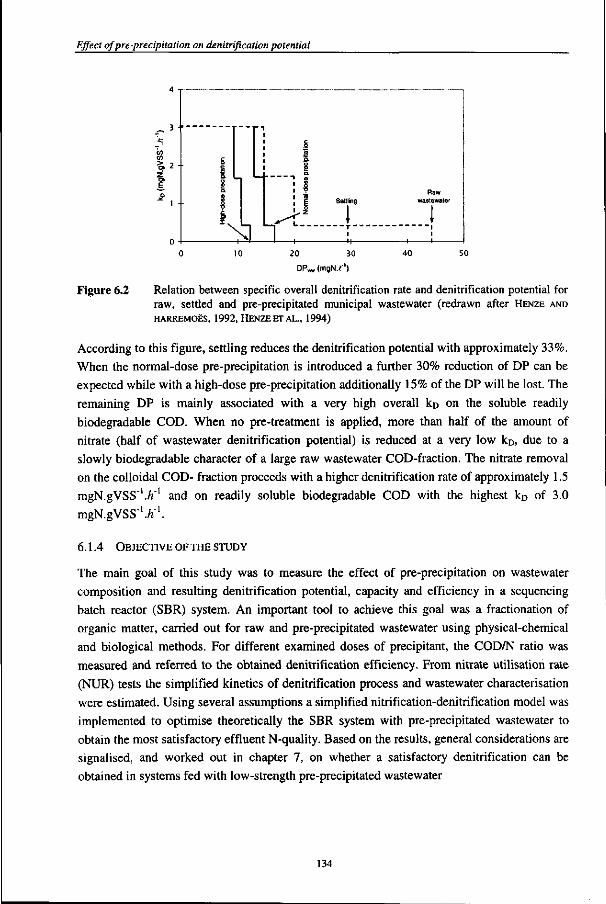
Effect ofpre-precipitation on denitrification potential
DP«» (mgN.f')
Figure 6.2 Relation between specific overall denitrification rate and denitrification potential for raw, settled and pre-precipitated municipal wastewater (redrawn after HENZE AND HARREMOES, 1992, HENZE ET AL., 1994)
According to this figure, settling reduces the denitrification potential with approximately 33%. When the normal-dose pre-precipitation is introduced a further 30% reduction of DP can be expected while with a high-dose pre-precipitation additionally 15% of the DP will be lost. The remaining DP is mainly associated with a very high overall ko on the soluble readily biodegradable COD. When no pre-treatment is applied, more than half of the amount of nitrate (half of wastewater denitrification potential) is reduced at a very low kD, due to a slowly biodegradable character of a large raw wastewater COD-fraction. The nitrate removal on the colloidal COD- fraction proceeds with a higher denitrification rate of approximately 1.5 mgN.gVSS'./i"1 and on readily soluble biodegradable COD with the highest kD of 3.0 mgN.gVSS"1./!"1.
6.1.4 OBJECTIVE OF THE STUDY
The main goal of this study was to measure the effect of pre-precipitation on wastewater composition and resulting denitrification potential, capacity and efficiency in a sequencing batch reactor (SBR) system. An important tool to achieve this goal was a fractionation of organic matter, carried out for raw and pre-precipitated wastewater using physical-chemical and biological methods. For different examined doses of precipitant, the COD/N ratio was measured and referred to the obtained denitrification efficiency. From nitrate utilisation rate (NUR) tests the simplified kinetics of denitrification process and wastewater characterisation were estimated. Using several assumptions a simplified nitrification-denitrification model was implemented to optimise theoretically the SBR system with pre-precipitated wastewater to obtain the most satisfactory effluent N-quality. Based on the results, general considerations are signalised, and worked out in chapter 7, on whether a satisfactory denitrification can be obtained in systems fed with low-strength pre-precipitated wastewater
134
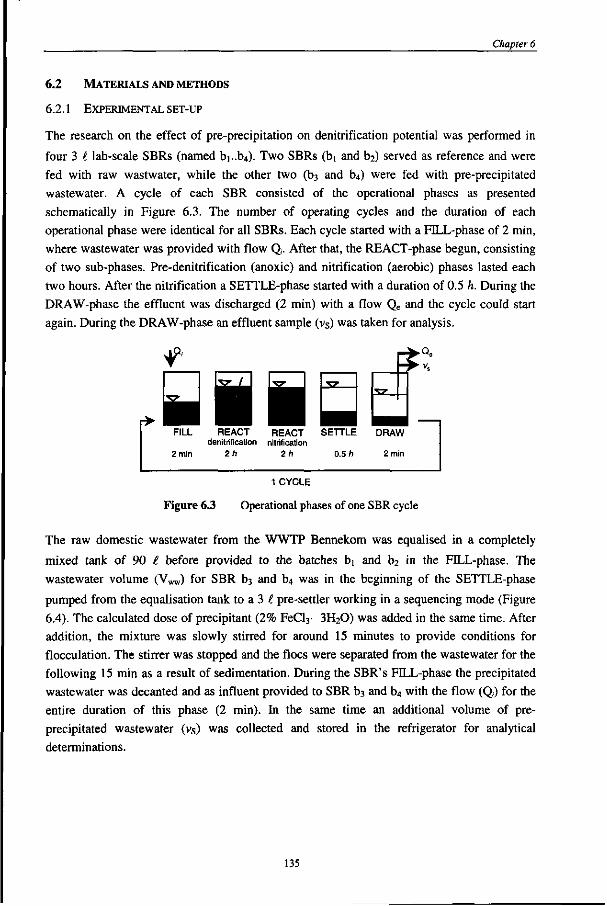
Chapter 6
6.2 MATERIALS AND METHODS
6.2.1 EXPERIMENTAL SET-UP
The research on the effect of pre-precipitation on denitrification potential was performed in four 3 £ lab-scale SBRs (named bi..b4). Two SBRs (bi and b2) served as reference and were fed with raw wastwater, while the other two (b3 and b4) were fed with pre-precipitated wastewater. A cycle of each SBR consisted of the operational phases as presented schematically in Figure 6.3. The number of operating cycles and the duration of each operational phase were identical for all SBRs. Each cycle started with a FILL-phase of 2 min, where wastewater was provided with flow Q,. After that, the REACT-phase begun, consisting of two sub-phases. Pre-denitrification (anoxic) and nitrification (aerobic) phases lasted each two hours. After the nitrification a SETTLE-phase started with a duration of 0.5 h. During the DRAW-phase the effluent was discharged (2 min) with a flow Qe and the cycle could start again. During the DRAW-phase an effluent sample (vs) was taken for analysis.
t E3 1 ^ EH
FILL REACT REACT SETTLE denitrification nitrification
2 min 2/1 2 h 0.5 h 2 min
1 CYCLE
Figure 6.3 Operational phases of one SBR cycle
The raw domestic wastewater from the WWTP Bennekom was equalised in a completely
mixed tank of 90 £ before provided to the batches bj and b2 in the FILL-phase. The
wastewater volume (Vww) for SBR b3 and b4 was in the beginning of the SETTLE-phase
pumped from the equalisation tank to a 3 £ pre-settler working in a sequencing mode (Figure
6.4). The calculated dose of precipitant (2% FeCl3- 3H2O) was added in the same time. After
addition, the mixture was slowly stirred for around 15 minutes to provide conditions for
flocculation. The stirrer was stopped and the floes were separated from the wastewater for the
following 15 min as a result of sedimentation. During the SBR's FILL-phase the precipitated
wastewater was decanted and as influent provided to SBR b3 and b4 with the flow (Q,) for the
entire duration of this phase (2 min). In the same time an additional volume of pre-
precipitated wastewater (vs) was collected and stored in the refrigerator for analytical
determinations.
135
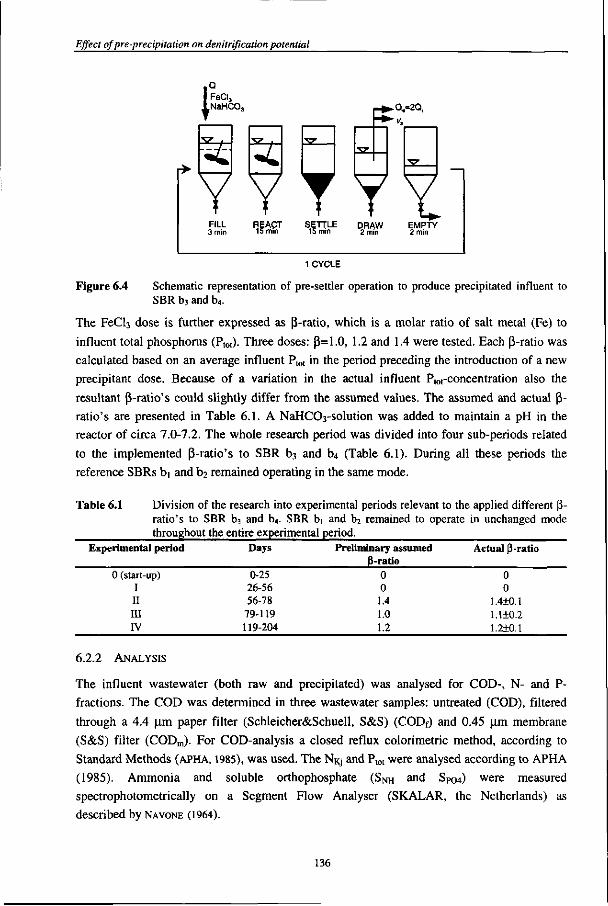
Effect of pre-precipitation on denitrification potential
5Z
-Qe=2Q/
T Y Y FILL REACT SETTLE DRAW EMPTY 3min 15 mm 15 mm 2 min 2 min
1 CYCLE
Figure 6.4 Schematic representation of pre-settler operation to produce precipitated influent to SBR b3 and b4.
The FeCl3 dose is further expressed as P-ratio, which is a molar ratio of salt metal (Fe) to influent total phosphorus (Ptot)- Three doses: (J=1.0, 1.2 and 1.4 were tested. Each P-ratio was calculated based on an average influent Ptot in the period preceding the introduction of a new precipitant dose. Because of a variation in the actual influent P,ot-concentration also the resultant P-ratio's could slightly differ from the assumed values. The assumed and actual P-ratio's are presented in Table 6.1. A NaHCC>3-solution was added to maintain a pH in the reactor of circa 7.0-7.2. The whole research period was divided into four sub-periods related to the implemented P-ratio's to SBR b3 and b4 (Table 6.1). During all these periods the reference SBRs bi and b2 remained operating in the same mode.
Table 6.1 Division of the research into experimental periods relevant to the applied different |3-ratio's to SBR b3 and b4. SBR b| and b2 remained to operate in unchanged mode throughout the entire experimental period.
Experimental period Days Preliminary assumed 3-ratio
0 0 1.4 1.0 1.2
Actual p-ratio
0 0
1.4+0.1 1.1+0.2 1.2+0.1
0 (start-up) I II III IV
0-25 26-56 56-78 79-119 119-204
6.2.2 ANALYSIS
The influent wastewater (both raw and precipitated) was analysed for COD-, N- and P-fractions. The COD was determined in three wastewater samples: untreated (COD), filtered through a 4.4 Lim paper filter (Schleicher&Schuell, S&S) (CODf) and 0.45 Ltm membrane (S&S) filter (CODm). For COD-analysis a closed reflux colorimetric method, according to Standard Methods (APHA, 1985), was used. The NRJ and Ptot were analysed according to APHA (1985). Ammonia and soluble orthophosphate (SNH and SP04) were measured spectrophotometrically on a Segment Flow Analyser (SKALAR, the Netherlands) as described by NAVONE (1964).
136
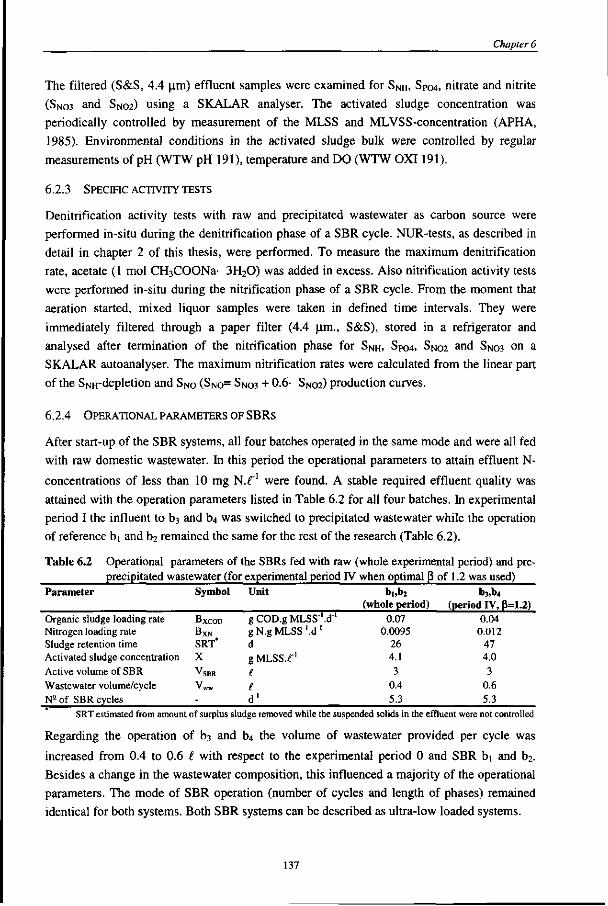
Chapter 6
The filtered (S&S, 4.4 |a.m) effluent samples were examined for SNH, SP04, nitrate and nitrite (SNo3 and SNCG) using a SKALAR analyser. The activated sludge concentration was periodically controlled by measurement of the MLSS and MLVSS-concentration (APHA, 1985). Environmental conditions in the activated sludge bulk were controlled by regular measurements of pH (WTW pH 191), temperature and DO (WTW OXI191).
6.2.3 SPECIFIC ACTIVITY TESTS
Denitrification activity tests with raw and precipitated wastewater as carbon source were performed in-situ during the denitrification phase of a SBR cycle. NUR-tests, as described in detail in chapter 2 of this thesis, were performed. To measure the maximum denitrification rate, acetate (1 mol Cr^COONa- 3H2O) was added in excess. Also nitrification activity tests were performed in-situ during the nitrification phase of a SBR cycle. From the moment that aeration started, mixed liquor samples were taken in defined time intervals. They were immediately filtered through a paper filter (4.4 ixm., S&S), stored in a refrigerator and analysed after termination of the nitrification phase for SNH, Spo4, SNO2 and SNo3 on a SKALAR autoanalyser. The maximum nitrification rates were calculated from the linear part of the SNH-depletion and SNo (SNO= SNO3 + 0.6- SN02) production curves.
6.2.4 OPERATIONAL PARAMETERS OF SBRS
After start-up of the SBR systems, all four batches operated in the same mode and were all fed
with raw domestic wastewater. In this period the operational parameters to attain effluent N-
concentrations of less than 10 mg N.f' were found. A stable required effluent quality was
attained with the operation parameters listed in Table 6.2 for all four batches. In experimental
period I the influent to b3 and b4 was switched to precipitated wastewater while the operation
of reference bi and b2 remained the same for the rest of the research (Table 6.2).
Table 6.2 Operational parameters of the SBRs fed with raw (whole experimental period) and pre-precipitated wastewater (for experimental period IV when optimal ft of 1.2 was used)
Parameter Symbol Unit bi,b2 b3,b( (whole period) (period IV, 3=1.2)
Organic sludge loading rate Nitrogen loading rate Sludge retention time Activated sludge concentration Active volume of SBR Wastewater volume/cycle N2 of SBR cycles
BXCOD
BXN
SRT* X
VsBR V
T WW
-
gCOD.gMLSS'.d"1
gN.gMLSS'.d"1
d g MLSS.f' I I d"1
0.07 0.0095
26 4.1 3
0.4 5.3
0.04 0.012
47 4.0 3
0.6 5.3
SRT estimated from amount of surplus sludge removed while the suspended solids in the effluent were not controlled
Regarding the operation of b3 and b4 the volume of wastewater provided per cycle was
increased from 0.4 to 0.6 I with respect to the experimental period 0 and SBR bi and b2.
Besides a change in the wastewater composition, this influenced a majority of the operational
parameters. The mode of SBR operation (number of cycles and length of phases) remained
identical for both systems. Both SBR systems can be described as ultra-low loaded systems.
137
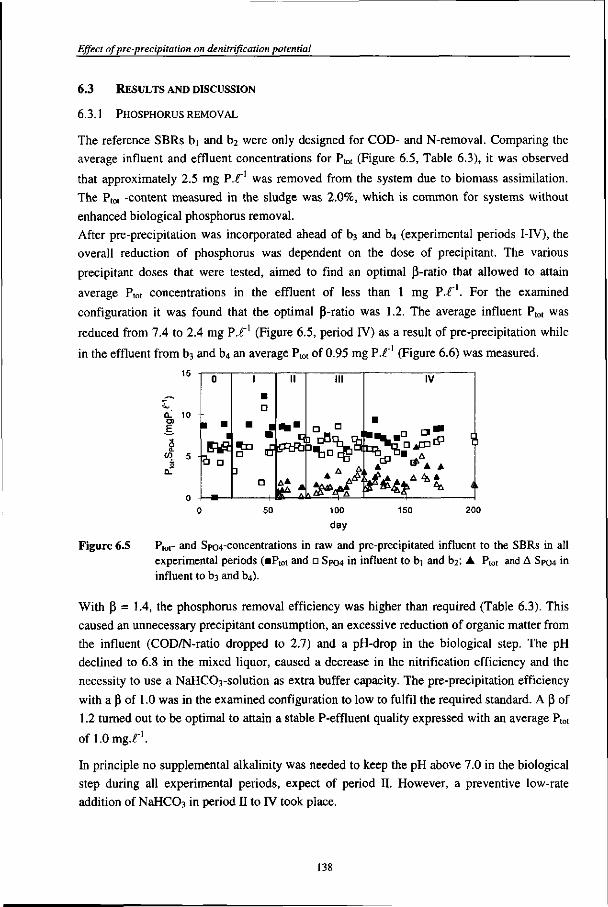
Effect of pre-precipitation on denitrification potential
6.3 RESULTS AND DISCUSSION
6.3.1 PHOSPHORUS REMOVAL
The reference SBRs bi and b2 were only designed for COD- and N-removal. Comparing the
average influent and effluent concentrations for Pt0I (Figure 6.5, Table 6.3), it was observed
that approximately 2.5 mg P.£~l was removed from the system due to biomass assimilation.
The Ptot -content measured in the sludge was 2.0%, which is common for systems without
enhanced biological phosphorus removal.
After pre-precipitation was incorporated ahead of b3 and b4 (experimental periods I-IV), the
overall reduction of phosphorus was dependent on the dose of precipitant. The various
precipitant doses that were tested, aimed to find an optimal P-ratio that allowed to attain
average Ptot concentrations in the effluent of less than 1 mg VI'1. For the examined
configuration it was found that the optimal (3-ratio was 1.2. The average influent Ptot was
reduced from 7.4 to 2.4 mg P. "1 (Figure 6.5, period IV) as a result of pre-precipitation while
in the effluent from b3 and b4 an average Ptot of 0.95 mg P.f' (Figure 6.6) was measured.
15 -r—=-
Q.
3 Q.
CO
III
] • A ** A A
IV
B
50 100
day 150 200
Figure 6.5 Ptot- and Spo4-concentrations in raw and pre-precipitated influent to the SBRs in all experimental periods (•Ptot and • Spo4 in influent to bi and bf, A Plot and A Spo4 in influent to b3 and b4).
With (3 = 1.4, the phosphorus removal efficiency was higher than required (Table 6.3). This
caused an unnecessary precipitant consumption, an excessive reduction of organic matter from
the influent (COD/N-ratio dropped to 2.7) and a pH-drop in the biological step. The pH
declined to 6.8 in the mixed liquor, caused a decrease in the nitrification efficiency and the
necessity to use a NaHCCvsolution as extra buffer capacity. The pre-precipitation efficiency
with a P of 1.0 was in the examined configuration to low to fulfil the required standard. A p of
1.2 turned out to be optimal to attain a stable P-effluent quality expressed with an average Ptot
of l.Omg.f1.
In principle no supplemental alkalinity was needed to keep the pH above 7.0 in the biological step during all experimental periods, expect of period II. However, a preventive low-rate addition of NaHCCh in period II to IV took place.
138
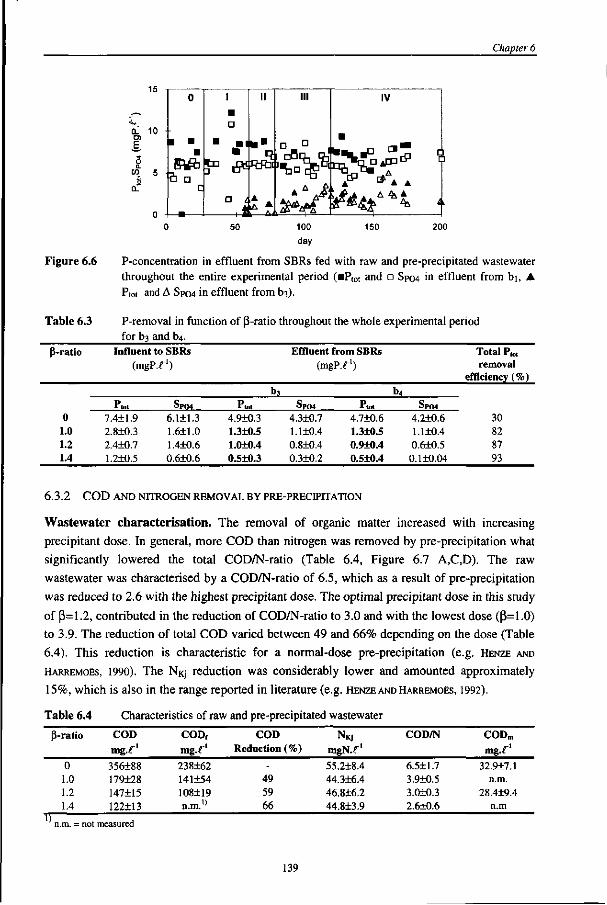
Chapter 6
a. E
15
10
Stfh 3
III
nHch ft
JJ ^ ¥ ^
IV
,nSS*Dj? rP B :P
50 100
day
150 200
Figure 6.6 P-concentration in effluent from SBRs fed with raw and pre-precipitated wastewater throughout the entire experimental period (BPtot and • Spo4 in effluent from bi, A Ptot and A Spo4 in effluent from b3).
Table 6.3 P-removal in function of P-ratio throughout the whole experimental period for b3 and b4.
P-ratio
0 1.0 1.2 1.4
Influent to SBRs (mgP.
"tot
7.4±1.9 2.8±0.3 2.4+0.7 1.2+0.5
f )
Sp04
6.1+1.3 1.6+1.0 1.4±0.6 0.6±0.6
b
"to t
4.9+0.3 1.3±0.5 1.010.4 0.5±0.3
Effluent from SBRs (mgP.f1)
3
Sp04
4.3±0.7 1.1+0.4 0.8±0.4 0.3±0.2
Ptot
4.7+0.6 1.3±0.5 0.9±0.4 0.5±0.4
b4
Sp04
4.2±0.6 1.1+0.4 0.6+0.5 0.1±0.04
Total P,,,, removal
efficiency (%)
30 82 87 93
6.3.2 COD AND NITROGEN REMOVAL BY PRE-PRECIPITATION
Wastewater characterisation. The removal of organic matter increased with increasing precipitant dose. In general, more COD than nitrogen was removed by pre-precipitation what significantly lowered the total COD/N-ratio (Table 6.4, Figure 6.7 A,C,D). The raw wastewater was characterised by a COD/N-ratio of 6.5, which as a result of pre-precipitation was reduced to 2.6 with the highest precipitant dose. The optimal precipitant dose in this study of (5=1.2, contributed in the reduction of COD/N-ratio to 3.0 and with the lowest dose (P=1.0) to 3.9. The reduction of total COD varied between 49 and 66% depending on the dose (Table 6.4). This reduction is characteristic for a normal-dose pre-precipitation (e.g. HENZE AND
HARREMOES, 1990). The NKj reduction was considerably lower and amounted approximately 15%, which is also in the range reported in literature (e.g. HENZE AND HARREMOES, 1992).
Table 6.4 Characteristics of raw and pre-precipitated wastewater
P-ratio
0 1.0 1.2 1.4
COD mg.f1
356+88 179+28 147+15 122±13
CODf
mg.r' 238±62 141+54 108+19 tun."
COD Reduction (%)
-49 59 66
NKJ
mgN.f1
55.2±8.4 44.3+6.4 46.8+6.2 44.8±3.9
COD/N
6.5+1.7 3.9±0.5 3.010.3 2.6±0.6
CODm
mg-f1
32.9+7.1 n.m.
28.419.4 n.m
n.m. = not measured
139
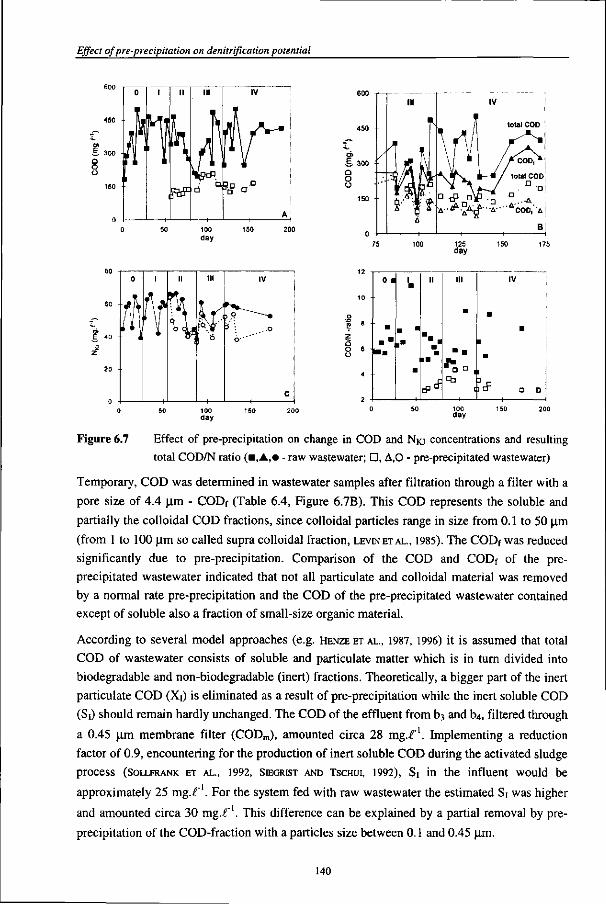
Effect of pre-precipitation on denitrifwation potential
jo o
Z
5 O 6
-a a
cP
0 50 100 150 200 day
Figure 6.7 Effect of pre-precipitation on change in COD and NKJ concentrations and resulting
total COD/N ratio (m,A,» - raw wastewater; • , A,0 - pre-precipitated wastewater)
Temporary, COD was determined in wastewater samples after filtration through a filter with a
pore size of 4.4 |im - CODf (Table 6.4, Figure 6.7B). This COD represents the soluble and
partially the colloidal COD fractions, since colloidal particles range in size from 0.1 to 50 ^m
(from 1 to 100 |j,m so called supra colloidal fraction, LEVIN ETAL., 1985). The CODf was reduced
significantly due to pre-precipitation. Comparison of the COD and CODf of the pre-
precipitated wastewater indicated that not all particulate and colloidal material was removed
by a normal rate pre-precipitation and the COD of the pre-precipitated wastewater contained
except of soluble also a fraction of small-size organic material.
According to several model approaches (e.g. HENZE ET AL., 1987, 1996) it is assumed that total
COD of wastewater consists of soluble and particulate matter which is in turn divided into
biodegradable and non-biodegradable (inert) fractions. Theoretically, a bigger part of the inert
particulate COD (X^ is eliminated as a result of pre-precipitation while the inert soluble COD
(Si) should remain hardly unchanged. The COD of the effluent from b3 and b4, filtered through
a 0.45 |i.m membrane filter (CODm), amounted circa 28 mg..f'. Implementing a reduction
factor of 0.9, encountering for the production of inert soluble COD during the activated sludge
process (SOLLFRANK ET AL„ 1992, SEGRIST AND TSCHUI, 1992), Si in the influent would be
approximately 25 rag.t1. For the system fed with raw wastewater the estimated Si was higher
and amounted circa 30 rng.r . This difference can be explained by a partial removal by pre-
precipitation of the COD-fraction with a particles size between 0.1 and 0.45 |U,m.
140
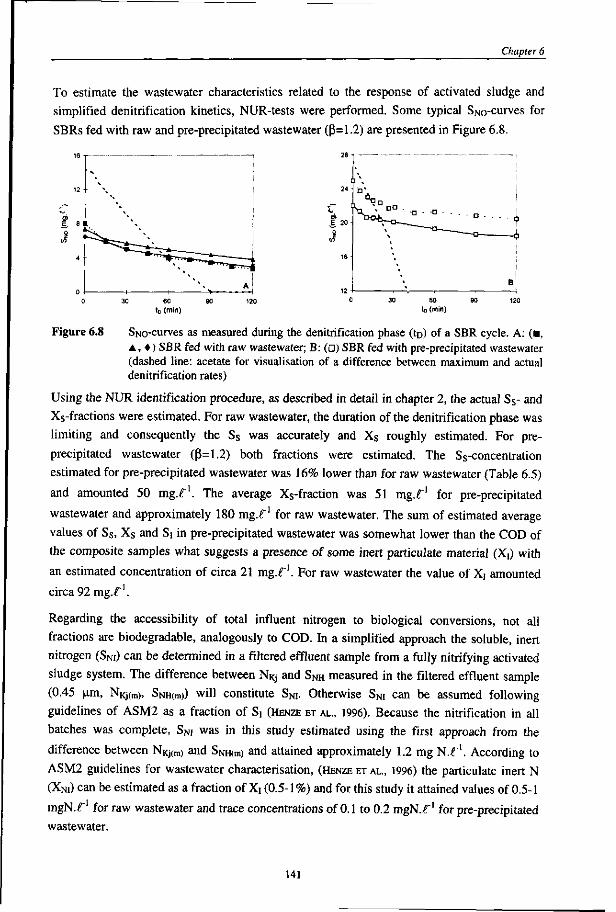
Chapter 6
To estimate the wastewater characteristics related to the response of activated sludge and
simplified denitrification kinetics, NUR-tests were performed. Some typical SNo-curves for
SBRs fed with raw and pre-precipitated wastewater ((3=1.2) are presented in Figure 6.8.
tD (min)
Figure 6.8 SNo-curves as measured during the denitrification phase (to) of a SBR cycle. A: (•, A, • ) SBR fed with raw wastewater; B: (D) SBR fed with pre-precipitated wastewater (dashed line: acetate for visualisation of a difference between maximum and actual denitrification rates)
Using the NUR identification procedure, as described in detail in chapter 2, the actual Ss- and
Xs-fractions were estimated. For raw wastewater, the duration of the denitrification phase was
limiting and consequently the Ss was accurately and Xs roughly estimated. For pre-
precipitated wastewater (p=1.2) both fractions were estimated. The Ss-concentration
estimated for pre-precipitated wastewater was 16% lower than for raw wastewater (Table 6.5)
and amounted 50 mg.f1. The average Xs-fraction was 51 mg.f1 for pre-precipitated
wastewater and approximately 180 mg.f' for raw wastewater. The sum of estimated average
values of Ss, Xs and Si in pre-precipitated wastewater was somewhat lower than the COD of
the composite samples what suggests a presence of some inert particulate material (Xi) with
an estimated concentration of circa 21 mglA. For raw wastewater the value of Xi amounted
circa 92 mg.f1.
Regarding the accessibility of total influent nitrogen to biological conversions, not all fractions are biodegradable, analogously to COD. In a simplified approach the soluble, inert nitrogen (SNL) can be determined in a filtered effluent sample from a fully nitrifying activated sludge system. The difference between NKj and SNH measured in the filtered effluent sample (0.45 urn, NKj(m), SNH(m)) will constitute SNi. Otherwise SNi can be assumed following guidelines of ASM2 as a fraction of Si (HENZE ET AL., 1996). Because the nitrification in all batches was complete, SNi was in this study estimated using the first approach from the difference between NKj(m) and SNH<m) and attained approximately 1.2 mg N.f'. According to ASM2 guidelines for wastewater characterisation, (HENZE ET AL., 1996) the particulate inert N (XN1) can be estimated as a fraction of Xi (0.5-1%) and for this study it attained values of 0.5-1 mgN.f' for raw wastewater and trace concentrations of 0.1 to 0.2 mgN.r1 for pre-precipitated wastewater.
141
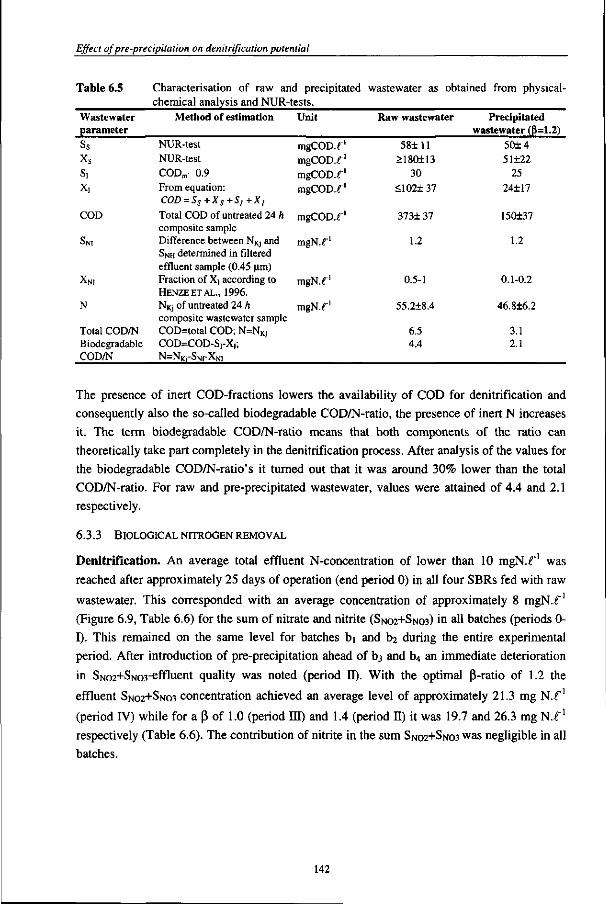
Effect of pre-precipitation on denitrification potential
Table 6.5
Wastewater parameter
ss Xs
s, X,
COD
SNI
XNI
N
Total COD/N Biodegradable COD/N
Characterisation of raw and precipitated chemical analysis and NUR-
Method of estimation
NUR-test NUR-test CODm- 0.9
From equation: COD = Ss+Xs+S,+X,
Total COD of untreated 24 h composite sample Difference between NKj and SNH determined in filtered effluent sample (0.45 urn) Fraction of X\ according to HENZEETAL., 1996.
NKj of untreated 24 h composite wastewater sample COD=total COD; N=NKj
COD=COD-SrX,; N=NKrSNI-XN1
tests.
Unit
mgCOD.f1
mgCOD.f1
mgCOD.f1
mgCOD.f1
mgCOD.f1
mgN.f1
mgN.f1
mgN.f1
wastewater as obtained from physical-
Raw wastewater
58+11 >180±13
30
<102+ 37
373+ 37
1.2
0.5-1
55.2+8.4
6.5 4.4
Precipitated wastewater (P=1.2)
50±4 51±22
25
24±17
150137
1.2
0.1-0.2
46.8+6.2
3.1 2.1
The presence of inert COD-fractions lowers the availability of COD for denitrification and consequently also the so-called biodegradable COD/N-ratio, the presence of inert N increases it. The term biodegradable COD/N-ratio means that both components of the ratio can theoretically take part completely in the denitrification process. After analysis of the values for the biodegradable COD/N-ratio's it turned out that it was around 30% lower than the total COD/N-ratio. For raw and pre-precipitated wastewater, values were attained of 4.4 and 2.1 respectively.
6.3.3 BIOLOGICAL NITROGEN REMOVAL
Denitrification. An average total effluent N-concentration of lower than 10 mgN.f1 was
reached after approximately 25 days of operation (end period 0) in all four SBRs fed with raw
wastewater. This corresponded with an average concentration of approximately 8 mgN.f"1
(Figure 6.9, Table 6.6) for the sum of nitrate and nitrite (SNO2+SNO3) in all batches (periods 0-
I). This remained on the same level for batches bi and \>i during the entire experimental
period. After introduction of pre-precipitation ahead of b3 and b4 an immediate deterioration
in SN02+SiM03-effluent quality was noted (period II). With the optimal |}-ratio of 1.2 the
effluent SNO2+SNO3 concentration achieved an average level of approximately 21.3 mg N.-f'
(period IV) while for a (3 of 1.0 (period HI) and 1.4 (period II) it was 19.7 and 26.3 mg N.f'
respectively (Table 6.6). The contribution of nitrite in the sum SNO2+SNO3 was negligible in all
batches.
142
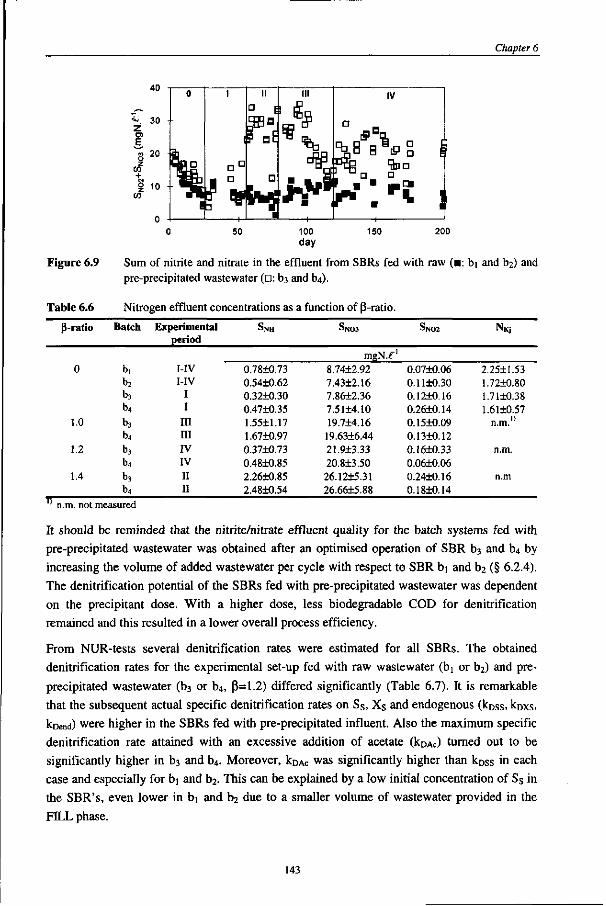
Chapter 6
200
Figure 6.9 Sum of nitrite and nitrate in the effluent from SBRs fed with raw (•: bi and b2) and pre-precipitated wastewater (D: b3 and b4).
Table 6.6 Nitrogen effluent concentrations as a function of P-ratio.
P-ratio
0
1.0
1.2
1.4
Batch
bi b2
b3
b4
b3
b4
b3
b4
b3
b4
Experimental period
I-IV I-IV
I I
III III IV IV II II
SNH
0.78±0.73 0.54+0.62 0.32±0.30 0.47+0.35 1.55±1.17 1.67±0.97 0.37+0.73 0.4810.85 2.26±0.85 2.4810.54
SN03
mgN.f1
8.7412.92 7.4312.16 7.8612.36 7.5114.10 19.714.16 19.6316.44 21.913.33 20.813.50 26.1215.31 26.6615.88
SN02
0.0710.06 0.1110.30 0.12+0.16 0.2610.14 0.1510.09 0.1310.12 0.1610.33 0.0610.06 0.2410.16 0.1810.14
NKJ
2.2511.53 1.7210.80 1.7110.38 1.6110.57
n.m.
n.m.
n.m
n.m. not measured
It should be reminded that the nitrite/nitrate effluent quality for the batch systems fed with pre-precipitated wastewater was obtained after an optimised operation of SBR b3 and b4 by increasing the volume of added wastewater per cycle with respect to SBR bj and b2 (§ 6.2.4). The denitrification potential of the SBRs fed with pre-precipitated wastewater was dependent on the precipitant dose. With a higher dose, less biodegradable COD for denitrification remained and this resulted in a lower overall process efficiency.
From NUR-tests several denitrification rates were estimated for all SBRs. The obtained denitrification rates for the experimental set-up fed with raw wastewater (bi or b2) and pre-precipitated wastewater (b$ or b4, (3=1.2) differed significantly (Table 6.7). It is remarkable that the subsequent actual specific denitrification rates on Ss, Xs and endogenous (kDSs, kDXs, krjend) were higher in the SBRs fed with pre-precipitated influent. Also the maximum specific denitrification rate attained with an excessive addition of acetate (kDAc) turned out to be significantly higher in b3 and b4. Moreover, kDAc was significantly higher than kDSs in each case and especially for bi and b2. This can be explained by a low initial concentration of Ss in the SBR's, even lower in bi and b2 due to a smaller volume of wastewater provided in the FILL phase.
143
Effect of pre-precipitation on denitrification potential
The much higher respective denitrification rates in the batches with pre-precipitated wastewater can result from a relatively low fraction of particulate COD (Xi and Xs) provided to such a system. The fraction Xi adsorbs on activated sludge floes, reducing the viable biomass fraction in the MLSS. The fraction Xs adsorbs also on the sludge floes and is slowly hydrolysed and degraded. When a little amount of Xs and X[ is provided, activated sludge can become more viable and more active than in systems subjected to wastewater with a high Xp and Xs-content.
The specific overall denitrification rate (kD) was determined in relation to the entire duration of the denitrification phase (to) in each SBR. The ko, in contrast to respective denitrification rates, turned out to be 37% higher for batches bi and b2. At first sight the difference does not seem to be significant to contribute in such a deteriorated effluent quality of b3 and b4. However, the effluent quality is not only dependent on the denitrification rate but also on the amount of nitrate that has to be removed. More wastewater was provided to b3 and b4 what resulted in a higher production of nitrate (and nitrite) in the nitrification phase. The smaller overall denitrification rate and higher initial nitrate concentration contributed in insufficient nitrate elimination in b3 and b4, leading finally to its high effluent concentration in steady state conditions.
The significant difference in effluent N-quality of both systems can be the best explained by a
difference in wastewater denitrification potential (DP) that in this case was defined as an
amount of nitrate that could be removed from 1 £ wastewater using the examined activated
sludge (inclusive the basic endogenous denitrification potential of activated sludge). Using the
DP, the difference in denitrification efficiency for SBRs fed with precipitated influent was
calculated to be 42% lower than of the SBRs fed with raw wastewater.
Table 6.7 Specific denitrification rates (koss, koxs. koend, kp and koAc) and wastewater denitrification potential (DP) estimated for SBR systems fed with raw (bi, b2) and pre-precipitated (b3, b4, fl=1.2) wastewater
Denitrification parameter
l^DSS
^DXS
^Dend
kD
kDAc
DP
Unit
mgN.gVSS1.^1
mgN.gVSS1./!"1
mgN.gVSS'./j1
mgN.gVSS'./i"1
mgN.gVSS"1 .A"1
mgN.r1
Raw wastewater (bi,b2)
1.86±0.46 0.69+0.20
0.20 0.88±0.16
4.35 30.20+7.80
Precipitated wastewater 0)3, b4, 3=1.2)
3.33±0.18 0.82+0.13 0.32±0.04 0.64+0.22
6.76 17.44+5.61
Nitrification. Complete nitrification was measured in all batches fed with raw and pre-
precipitated wastewater ((3=1.2). The poorer nitrification efficiency in b3 and b4 when
wastewater was treated with a precipitant dose of P=1.4 was a result of insufficient pH
correction in the SBR.
144
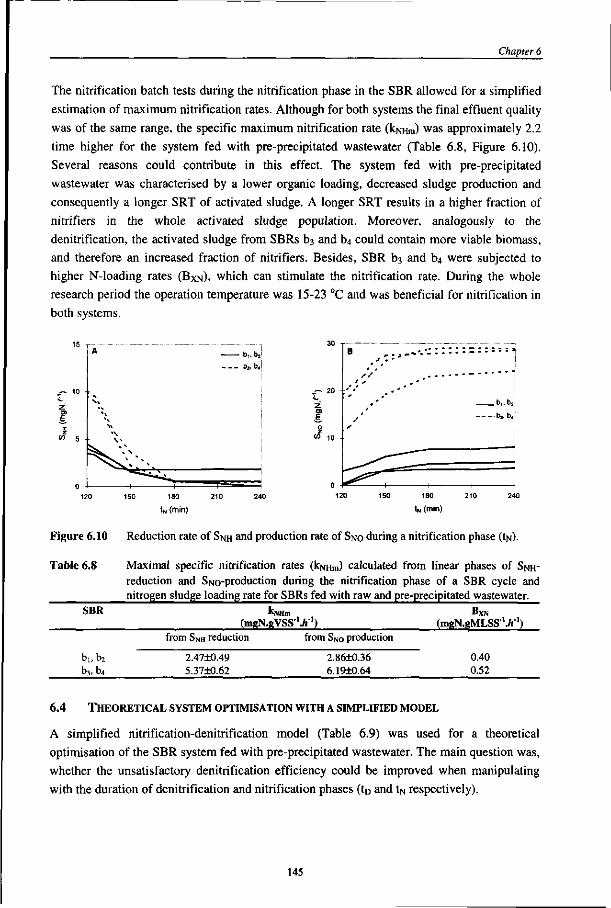
Chapter 6
The nitrification batch tests during the nitrification phase in the SBR allowed for a simplified
estimation of maximum nitrification rates. Although for both systems the final effluent quality
was of the same range, the specific maximum nitrification rate (kNHm) was approximately 2.2
time higher for the system fed with pre-precipitated wastewater (Table 6.8, Figure 6.10).
Several reasons could contribute in this effect. The system fed with pre-precipitated
wastewater was characterised by a lower organic loading, decreased sludge production and
consequently a longer SRT of activated sludge. A longer SRT results in a higher fraction of
nitrifiers in the whole activated sludge population. Moreover, analogously to the
denitrification, the activated sludge from SBRs b3 and b$ could contain more viable biomass,
and therefore an increased fraction of nitrifiers. Besides, SBR b3 and bt, were subjected to
higher N-loading rates (BXNX which can stimulate the nitrification rate. During the whole
research period the operation temperature was 15-23 °C and was beneficial for nitrification in
both systems.
» 10
b„b;
b3. b„
tN (min) tN (min)
Figure 6.10 Reduction rate of SNH and production rate of SNO during a nitrification phase (tn).
Table 6.8 Maximal specific nitrification rates (kNHm) calculated from linear phases of SNH-reduction and SiMO-production during the nitrification phase of a SBR cycle and nitrogen sludge loading rate for SBRs fed with raw and pre-precipitated wastewater.
SBR kNHm (mgN.BVSS-'./r') (msN.gMLSS'./t')
from SNH reduction from SNo production
bi, b2
b3, b4
2.47±0.49 5.37±0.62
2.8610.36 6.19±0.64
0.40 0.52
6.4 THEORETICAL SYSTEM OPTIMISATION WITH A SIMPLIFIED MODEL
A simplified nitrification-denitrification model (Table 6.9) was used for a theoretical
optimisation of the SBR system fed with pre-precipitated wastewater. The main question was,
whether the unsatisfactory denitrification efficiency could be improved when manipulating
with the duration of denitrification and nitrification phases (tn and IN respectively).
145
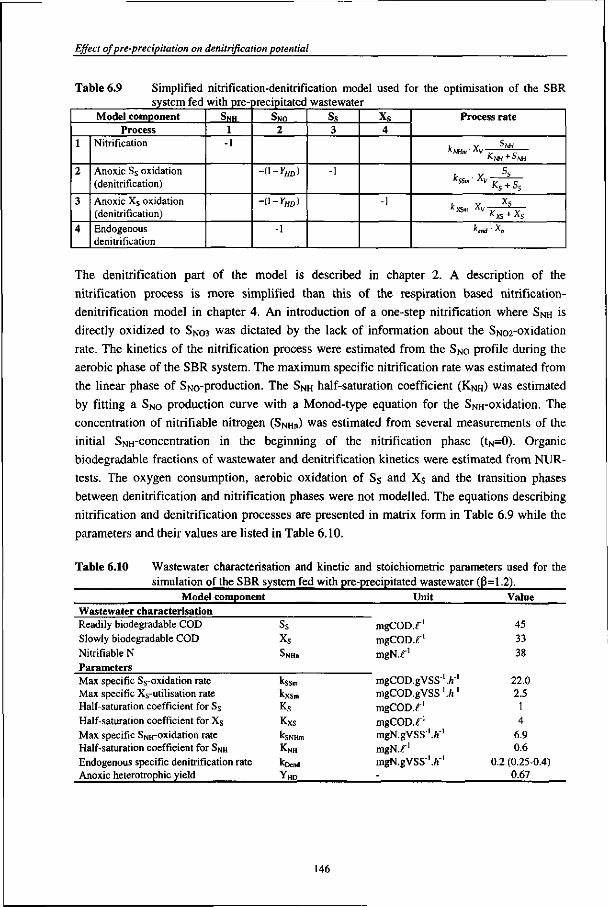
Effect of pre-precipitation on denitrification potential
Table 6.9 Simplified nitrification-denitrification model used for the optimisation of the SBR system fed with pre-precipitated wastewater
Model component Process
1
2
3
4
Nitrification
Anoxic Ss oxidation (denitrification)
Anoxic Xs oxidation (denitrification)
Endogenous denitrification
SNH
1 -1
SNO 2
-0-Y„D)
-o-w -1
Ss 3
-1
Xs
4
-1
Process rate
1. V $NH KNHm A V V c
J. y S s KSSm A V v c
,. v XS KXSm AV r v A XS + A S
kerid %v
The denitrification part of the model is described in chapter 2. A description of the nitrification process is more simplified than this of the respiration based nitrification-denitrification model in chapter 4. An introduction of a one-step nitrification where SNH is directly oxidized to SN03 was dictated by the lack of information about the SN02-oxidation rate. The kinetics of the nitrification process were estimated from the SNo profile during the aerobic phase of the SBR system. The maximum specific nitrification rate was estimated from the linear phase of Sno-production. The SNH half-saturation coefficient (KNH) was estimated by fitting a SNO production curve with a Monod-type equation for the SNH-oxidation. The concentration of nitrifiable nitrogen (SNHn) was estimated from several measurements of the initial SNH-concentration in the beginning of the nitrification phase (tN=0). Organic biodegradable fractions of wastewater and denitrification kinetics were estimated from NUR-tests. The oxygen consumption, aerobic oxidation of Ss and Xs and the transition phases between denitrification and nitrification phases were not modelled. The equations describing nitrification and denitrification processes are presented in matrix form in Table 6.9 while the parameters and their values are listed in Table 6.10.
Table 6.10 Wastewater characterisation and kinetic and stoichiometric parameters used for the simulation of the SBR system fed with pre-precipitated wastewater (3=1.2).
Model component Unit Value Wastewater characterisation Readily biodegradable COD Slowly biodegradable COD Nitrifiable N Parameters Max specific Ss-oxidation rate Max specific Xs-utilisation rate Half-saturation coefficient for Ss Half-saturation coefficient for Xs Max specific SNH-oxidation rate Half-saturation coefficient for SNH Endogenous specific denitrification rate Anoxic heterotrophic yield
Ss Xs
SNHn
kssm kxsm Ks
Kxs ksNHm
KNH
kpend
YHD
mgCOD.r1
mgCOD.r1
mgN.f1
mgCOD.gVSS-'./T1
mgCOD.gVSS-'./f' mgCOD.f1
mgCOD.f1
mgN.gVSS'.ft"1
mgN.f1
mgN.gVSS'./i'1
-
45 33 38
22.0 2.5 1 4
6.9 0.6
0.2 (0.25-0.4) 0.67
146
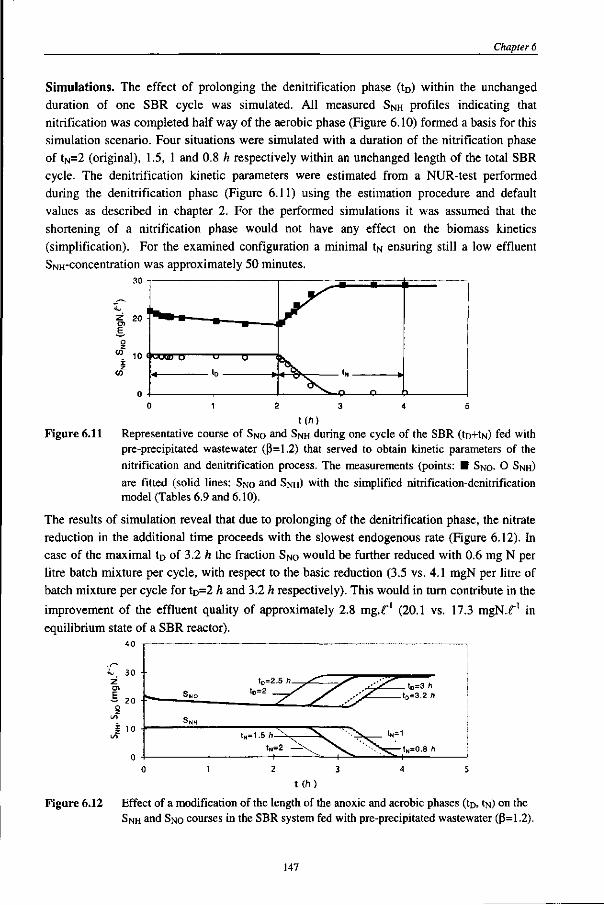
Chapter 6
Simulations. The effect of prolonging the denitrification phase (to) within the unchanged duration of one SBR cycle was simulated. All measured SNH profiles indicating that nitrification was completed half way of the aerobic phase (Figure 6.10) formed a basis for this simulation scenario. Four situations were simulated with a duration of the nitrification phase of tN=2 (original), 1.5, 1 and 0.8 h respectively within an unchanged length of the total SBR cycle. The denitrification kinetic parameters were estimated from a NUR-test performed during the denitrification phase (Figure 6.11) using the estimation procedure and default values as described in chapter 2. For the performed simulations it was assumed that the shortening of a nitrification phase would not have any effect on the biomass kinetics (simplification). For the examined configuration a minimal tn ensuring still a low effluent SNH-concentration was approximately 50 minutes.
30 -
20 -
0 -
MJUB 0
tD
0 ' V "V
tM
v^ „ <-> ' • >
t ( / > )
Figure 6.11 Representative course of SNO and SNH during one cycle of the SBR (to+tisi) fed with pre-precipitated wastewater ((3=1.2) that served to obtain kinetic parameters of the nitrification and denitrification process. The measurements (points: • SNO. O SNH) are fitted (solid lines: SNO and SNH) with the simplified nitrification-denitrification model (Tables 6.9 and 6.10).
The results of simulation reveal that due to prolonging of the denitrification phase, the nitrate reduction in the additional time proceeds with the slowest endogenous rate (Figure 6.12). In case of the maximal to of 3.2 h the fraction SNO would be further reduced with 0.6 mg N per litre batch mixture per cycle, with respect to the basic reduction (3.5 vs. 4.1 mgN per litre of batch mixture per cycle for tD=2 h and 3.2 h respectively). This would in turn contribute in the improvement of the effluent quality of approximately 2.8 mg.-f1 (20.1 vs. 17.3 mgN.-f1 in equilibrium state of a SBR reactor).
10 SNH
1—
t0=2.5 h
tD=2 —f
tN=2 -r
jS—
^ s 4 — ^
S^ ' D " S h
t D - . l •> h
tN=1
S ^ — tN=0.8 h
t (h)
Figure 6.12 Effect of a modification of the length of the anoxic and aerobic phases (to, tn) on the SNH and SNO courses in the SBR system fed with pre-precipitated wastewater (p=1.2).
147
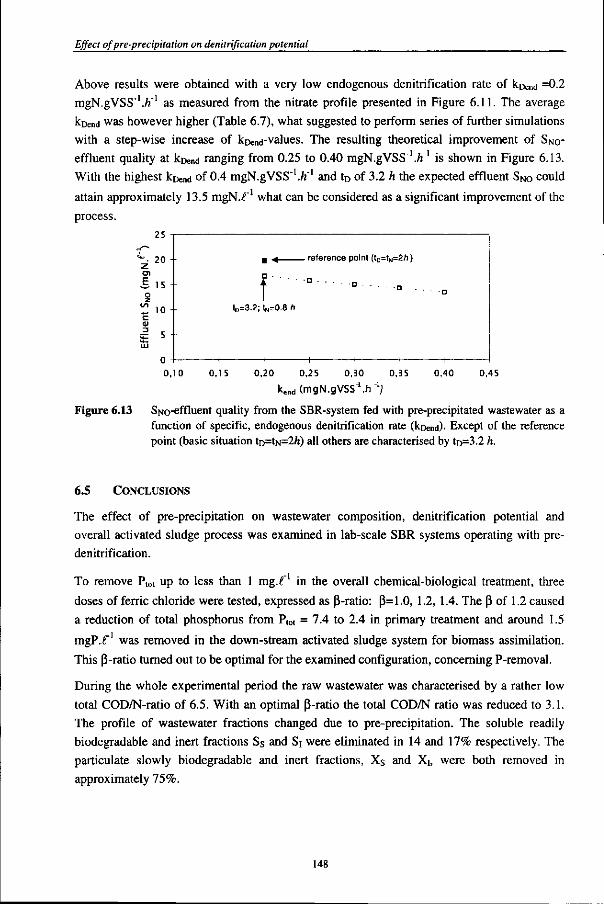
Effect of pre-precipitation on denitrification potential
Above results were obtained with a very low endogenous denitrification rate of kDend =0.2
mgN.gVSS'./f1 as measured from the nitrate profile presented in Figure 6.11. The average
kDend was however higher (Table 6.7), what suggested to perform series of further simulations
with a step-wise increase of k^d-values. The resulting theoretical improvement of SNo-
effluent quality at k^nd ranging from 0.25 to 0.40 mgN.gVSS'.ft"1 is shown in Figure 6.13.
With the highest k^nd of 0.4 mgN.gVSS"1./!-1 and to of 3.2 h the expected effluent SNo could
attain approximately 13.5 mgN.£ what can be considered as a significant improvement of the
process. 25
"~. 20 z
§ 1 5 o
f 10 c
• •*
a -
t tD=3.2; tN=0.8 h
. reference point (t0=tN=2/i)
-+- -+- -+- •+-
0,10 0,15 0,20 0,25 0,30 0,35
kend (mgN.gVSS' . rT1 ]
0,40 0,45
Figure 6.13 SNo-effluent quality from the SBR-system fed with pre-precipitated wastewater as a function of specific, endogenous denitrification rate (koend)- Except of the reference point (basic situation tn=tN=2/!) all others are characterised by to=3.2 h.
6.5 CONCLUSIONS
The effect of pre-precipitation on wastewater composition, denitrification potential and overall activated sludge process was examined in lab-scale SBR systems operating with pre-denitrification.
To remove Ptot up to less than 1 mgl'x in the overall chemical-biological treatment, three
doses of ferric chloride were tested, expressed as P-ratio: P=1.0, 1.2, 1.4. The p of 1.2 caused
a reduction of total phosphorus from Ptoe = 7.4 to 2.4 in primary treatment and around 1.5
mgP.f"1 was removed in the down-stream activated sludge system for biomass assimilation.
This p-ratio turned out to be optimal for the examined configuration, concerning P-removal.
During the whole experimental period the raw wastewater was characterised by a rather low total COD/N-ratio of 6.5. With an optimal P-ratio the total COD/N ratio was reduced to 3.1. The profile of wastewater fractions changed due to pre-precipitation. The soluble readily biodegradable and inert fractions Ss and Si were eliminated in 14 and 17% respectively. The particulate slowly biodegradable and inert fractions, Xs and X], were both removed in approximately 75%.
148
Chapter 6
The denitrification potential of pre-precipitated wastewater was low because its biodegradable
organic content was significantly reduced. This led to high nitrate-effluent concentrations of
approximately 21.3 mg. "1 while in the reference system fed with raw wastewater 8 mg.r1 was
attained throughout the entire experimental period. Pre-precipitation with (3=1.2 caused a 42%
reduction of denitrification potential with respect to the analogous system with raw
wastewater.
The activated sludge from the system fed with pre-precipitated wastewater exposed higher specific denitrification rates for different carbon sources (Ss, Xs, acetate, endogenous) than from the system subjected to raw wastewater. The higher activity of activated sludge was probably caused by the presence of a higher fraction of viable biomass due to a significant reduction of Xs and X] from the wastewater. The overall denitrification rate measured for the whole denitrification phase was however higher for the system fed with raw wastewater.
The denitrification potential of the system depends on wastewater composition and basic respiration activity of the activated sludge. The system denitrification efficiency depends on the denitrification potential and system configuration while the nitrate-effluent quality additionally on the amount of nitrate that has to be denitrified.
The nitrification was complete in both systems, giving a high SiMH-effluent quality. However, the specific nitrification rates were 2.2 times higher for the system fed with pre-precipitated wastewater. The major reason contributing in this effect is an increased nitrifiers fraction in the latter case, caused by a prolonged SRT, a higher fraction of viable biomass in the total activated sludge mass and a lower COD/N-ratio.
The theoretical optimisation of the denitrification process for a system fed with low-strength pre-precipitated wastewater by using a simplified model proved that the SNo-effluent quality is primarily determined by the denitrification potential of the wastewater. The optimisation of such a system is mainly restricted to take maximum advantage of the endogenous denitrification what leads to big anoxic reactors.
149
Effect of pre-precipitation on denitrification potential
LIST OF SYMBOLS AND ABBREVIATIONS
b|. .b4
BXCOD
BXN
COD
COD f
CODm
DP k
KDcnd
^NHm
KNH
K s
Kxs
ML(V)SS
N
N, Kj
NUR
^tot
Q,
Qe
SBR
S,
SNH
SNI
SNO
SNO2
SN03
Sp04 SRT
Ss
tD
tpILL
tN
VsBR
VS
V ¥ WW
x, XNI
X s
X
YHD
subsequent SBR-batches used in the study described in this chapter
organic sludge loading rate (g COD.g M L S S ' . d ' )
N sludge loading rate (g N.g M L S S ' . d ' )
total COD concentration of wastewater (mg. f 1 )
COD measured in wastewater sample filtered through 4.4 urn filter (mg . f ' )
COD measured in wastewater sample filtered through 0.45 | lm membrane filter (mg.f 1 )
denitrification potential (mgN.f 1 )
specific substrate utilisation rate in the anoxic conditions, subscripts: SSm, XSm - maximum of S s
and X s respectively (mg COD.gVSS'./i"1) total specific denitrification rate; additional subscripts: Ac, Ss ,Xs - on acetate, Ss, X s alone; o -overall (mgN.gVSS'./T1) specific endogenous denitrification rate (mgN.gVSS' .A 1) specific maximum nitrification rate (mgN.gVSS'./i"1)
half-saturation coefficient from Monod equation for SNH oxidation (mgN. f ' )
half-saturation coefficient from Monod equation for S s oxidation (mgCOD.f 1 )
half-saturation coefficient from Monod equation for X s (mgCOD.f 1 )
mixed liquor (volatile) suspended solids ( g . f ' )
total nitrogen concentration; in COD/N ratio N=NKj (mgN.f 1 ) total Kjeldahl nitrogen in the influent, regarding influent N K J = N ; subscript: m - NKJ measured in
0.45 iim membrane filtrate (mgN.f 1 )
nitrate utilisation rate
total phosphorus (mgP. f ' )
wastewater flow during FILL phase of SBR cycle ( f / i 1 ) ; Qi*tFm=Vww
wastewater flow during DRAW phase of SBR cycle (l.h~])
sequencing batch reactor
soluble, inert COD (mgCOD.f ' )
soluble ammonia; subscript: (m) - SNH in 0.45 iim membrane filtrate; n - nitrifiable SNH (mgN.f ' )
soluble inert nitrogen (mgN.f 1 )
sum of nitrate and nitrite-nitrate equivalent; SNO=SNO3+0.6«SNO2 (mgN.f )
nitrite (mgN.f 1 )
nitrate (mgN.f 1 )
soluble orthophosphate (mgP. f ' ) solid retention time (d)
soluble readily biodegradable COD (mgCOD.f 1 ) duration of denitrification phase in SBR cycle (h) length of the FILL phase of SBR cycle (h) length of nitrification phase in SBR cycle (h)
active volume of SBR (f)
volume of wastewater sample discharged in DRAW phase of SBR- and presettler cycle for analysis
(mf)
wastewater volume provided in the FILL phase of SBR or pre-settler cycle (f)
particulate inert COD (mgCOD.f 1 )
particulate, inert N (mgN.f 1 )
particulate, slowly biodegradable substrate (mgCOD.f 1 )
concentration of total biomass; subscript: V of volatile biomass (gMLSS.f ] or gVSS. f ' )
heterotrophic yield coefficient (mg CODbiomass.mgCODsubstrate]) molar ratio of precipitant salt to phosphorus in influent wastewater
150
LITERATURE
Chapter 6
APHA-AWA-WPCF (1985) Standard methods for examination of water and wastewater. 16lh
edition, Washington, U.S. Andersson, B. and Rosen, B. (1990) Upgrading for
biological nitrogen removal - some full-scale experiences from Sweden. Wat. Sci. Tech., 22, (7/8), 93-104.
Andersson, B., Aspegren, H., Nyberg, U., Jansen, J.la Cour and 0degaard, H. (1992) Evaluation of pre-precipitation in a wastewater treatment system for extended nutrient removal. In: Hahn and Klute: Chemical Water and Wastewater Treatment. Springer Verlag. Berlin Heidelberg, 341-356.
Bliss, P.J. Ostarcevic, E.R., and Potter, A.A. (1994) Process optimisation for simultaneous biological nitrification and chemical phosphorus removal. Wat. Sci. Tech. 29 (12), 107-115.
Bundegaard, E., Pedersen, J. (1990) Full Scale Experience with Biological and Chemical Phosphorus Removal. In: Hahn and Klute: Chemical Water and Wastewater Treatment. Springer Verlag. Berlin Heidelberg, 443-460.
Firk, W. (1990) Improved phosphorus elimination and nitrogen oxidation through pre-precipitation. Wat. Sci. Tech.,22 (7/8), 277-278.
Galil, N. and Rebhun, M. (1990) Primary chemical treatment minimising dependence on bioprocess in small treatment plants. Wat. Sci. Tech., 22, No. 3/4, 203-210.
Henze M., Grady, C.P.L.Jr, Gujer, W., Marais, G.v.R. and Matsuo, T. (1987) Activated sludge model no.l. IAWPRC Scientifical and Technical Report No. 1, IAWPRC, London.
Henze, M. and Harremoes, P. (1990) Chemical-Biological Nutrient Removal - The HYPRO Concept, Proceedings of the 4th Gothenburg Symposium, 499-510.
Henze, M., Harremoes, P. (1992) Characterization of the Wastewater. The Effect of Chemical Precipitation on the Wastewater Composition and its Consequences for Biological Denitrification, In: Klute and Hahn: Chemical Water and Wastewater Treatment. Springer Verlag. Berlin Heidelberg, 299-311.
Henze, M., Kristensen, G.H. and Strube, R. (1994) Rate capacity characterisation of wastewater for nutrient removal processes. Wat. Sci. Tech. 29 (7), 101-107.
Henze M., Gujer, W., Mino, T., Matsuo, T., Wentzel, M.C., Marais, G.v.R. (1996) Activated Sludge Model No.2. Scientifical and Technical Report No.3.
Hoffman, E., Klute, R. (1990) Improving the Denitrification Potential in Biological Wastewater Treatment by Dosing Carbon From Sludge Hydrolysis. In: Hahn and Klute:
Chemical Water and Wastewater Treatment. Springer Verslag. Berlin Heidelberg, (543-560).
Karlsson, I. (1988) Pre-precipitation for improvement of nitrogen removal in biological wastewater treatment. In: H.H. Hahn and R. Klute (eds.). Springer, 1988.
Karlsson, I. (1990) Carbon Source for Denitirification from Pre-precipitated Sludge. In: Hahn and Klute: Chemical Water and Wastewater Treatment. Springer Verslag. Berlin Heidelberg, 521-529.
Kristensen, G.H. and Jorgensen, P.E. (1992) Pre-precipitation followed by biological denitrification supported by addition of biological or thermal/chemical hydrolysis products. In: Klute and Hahn: Chemical Water and Wastewater Treatment. Springer Verlag. Berlin Heidelberg, 313-328.
Levin, H., Tchobanoglous, G. and Asano, T. (1985) Characterisation of the size distribution of contaminants in wastewater: treatment and reuse implications. Journal WPCF, 57, 805-816.
Navone, R. (1964) Proposed method for nitrate in potable water. Amer. J. Water Works Assoc. 56, 781.
0degaard, H. (1992) Norwegian experiences with chemical treatment of raw wastewater. Wat. Sci. Tech., 25 (12), 255-264.
Overath, H., Trommsdorff, K.U. and Hruschka, H. (1981) Ermittlung geeigneter Parameter zur Steuerung der Chemikalienzugabe bei der chemischen Fallung. In 10 Jahre Oswald Schulze Stiftung, Dokumentation 1971-1981.
SDA The Soap and Detergent Association (1989) Principles and Practice of Phosphorus and Nitrogen Removal From Municipal Wastewater, New York.
Siegrist, H. and Tschui, M. (1992) Interpretation of experimental data with regard to the activated sludge model no. 1 and calibration of the model for municipal wastewater treatment plants, Wat. Sci. Tech., 25 (6), 167-183.
Sollfrank, U. Kappeler, J. and Gujer, W. (1992) Temperature effects on wastewater characterisation and the release of soluble inert organic material, Wat. Sci. Tech., 25 (6), 33-41.
151
Chapter 7
Optimisation of a pre-denitrification system fed with pre-precipitated wastewater with a control strategy
CONTENT
Abstract 154 7.1 Introduction 155 7.2 Materials and methods 156
7.2.1 Pilot-plant 156 7.2.2 Control unit 157 7.2.3 Control procedure 158 7.2.4 Analysis 158 7.2.5 Specific activity tests 159
7.3 Results 159 7.3.1 Phosphorus removal 159 7.3.2 COD&N removal by pre-precipitation 159 7.3.3 Biological nitrogen removal 160
7.4 Discussion 162 7.4 Conclusions 166
List of symbols and abbreviations 167 Literature 168
153
Optimisation of a pre-denitrification system fed with pre-precipitated wastewater with a control strategy
ABSTRACT
To verify the statements on the effect of pre-precipitation on the denitrification potential, as derived
from the research described in chapter 6, and from contradictive evaluations appearing in literature, a
supplementary research was performed. A plug-flow pre-denitrification pilot-plant with pre-
precipitated wastewater was used. Its operation was optimised, by implementing a respiration based
control strategy to adjust the nitrification volume to the actual nitrifiable N load. This control strategy
allowed avoiding over-aeration of the system and a maximum possible denitrification fraction could
be created. Further, relatively high sludge loading rates were employed, while a satisfactory
nitrification efficiency could be still attained.
Pre-precipitation with ferric chloride with P-ratio of 1.0 lowered the total COD/N-ratio of the raw
wastewater from 7.6 to 4.7. Despite of more beneficial wastewater characteristics comparing with the
research described in chapter 6 and implementation of a well operating control strategy the
denitrification efficiency was not significantly improved. Concerning the nitrate effluent quality an
improvement of 5 mgN.r could be obtained for wastewater of the same origin in comparison with the
results from chapter 6 (16.3 vs. 21.3 mg N.£' respectively).
It was concluded that the denitrification potential of the wastewater in question determines
predominantly the denitrification efficiency of a well-dimensioned activated sludge system. Any
optimisation steps contribute only to a small extent in denitrification efficiency improvement.
154
Chapter 7
7.1 INTRODUCTION
Before requirements for nitrogen and phosphorus (N&P) removal from wastewater became
obligatory, all pre-treatment steps reducing the COD-load to the biological reactor were
evaluated positively since they allowed for a reduction of the activated sludge volume and
saving energy for aeration (e.g. 0DEGAARD, 1992, OOTENETAL., 1993). Since strict requirements for
total N&P removal were introduced, the wastewater strength and composition, especially in
terms of biodegradable COD-fractions, became of crucial importance and a high COD-
reduction by any pre-treatment step became counteractive for N&P removal.
Pre-precipitation is an efficient pre-treatment technology for COD- and P-removal. However,
it contributes often in unsatisfactory denitrification efficiency in a down stream activated
sludge treatment. This implies the necessity of additional denitrification volume, addition of
an external carbon source and/or implementation of advanced control strategies.
A significant reduction of organic matter from wastewater by pre-precipitation is evident.
Several opinions exist concerning the influence of a changed organic profile of wastewater on
the denitrification potential. According to HENZE(1994), the denitrification efficiency in systems
with pre-precipitation is 30% lower compared to systems where raw wastewater is supplied.
In research with an ultra-low loaded activated sludge SBR system (described in chapter 6 of
this thesis) the denitrification potential was reduced with 42% after pre-precipitation was
introduced in comparison with a reference system with raw domestic wastewater. Based on
the results from full- and semi-full scale experiments, GIESEN and PETERS (1994) concluded that
pre-precipitation in 100% of the influent stream caused a 21% reduction of the denitrification
efficiency. On the other hand, denitrification was hardly effected when only a part of the
wastewater flow (25%) was exposed to pre-precipitation. In both situations, the P-effluent
requirements were met. KARLSSON and SMITH (1991) found by a comparison of a conventional
system fed with settled wastewater and a system with pre-precipitated wastewater that in both
cases approximately 9 mg N.£~l was removed as a result of denitrification. They stated that a
decreased BOD/N-ratio did not have a negative effect on the denitrification in a system
characterised by an anoxic retention time from 3 to 5 h. UUTERLEMDE and VAN DER ROEST (1994)
presented the results from a system where after introduction of pre-precipitation and with an
optimisation of the oxygen input a sufficiently low total nitrogen effluent quality was
obtained.
The results of the research presented in chapter 6 revealed that the introduction of pre-
precipitation contributed to a high concentration of nitrate in the effluent from the ultra low-
loaded SBR-system with fixed nitrification and denitrification phases. The question arose,
how far the denitrification efficiency can be improved when implementing any optimisation
strategy. With a simplified nitrification-denitrification model the effect of the duration of
anoxic and aerobic phases on the denitrification efficiency was simulated. However, the
simplified character of the model did not allow to predict a change in activated sludge activity,
so a real effluent quality could be only speculated. It was stated, that the denitrification
155
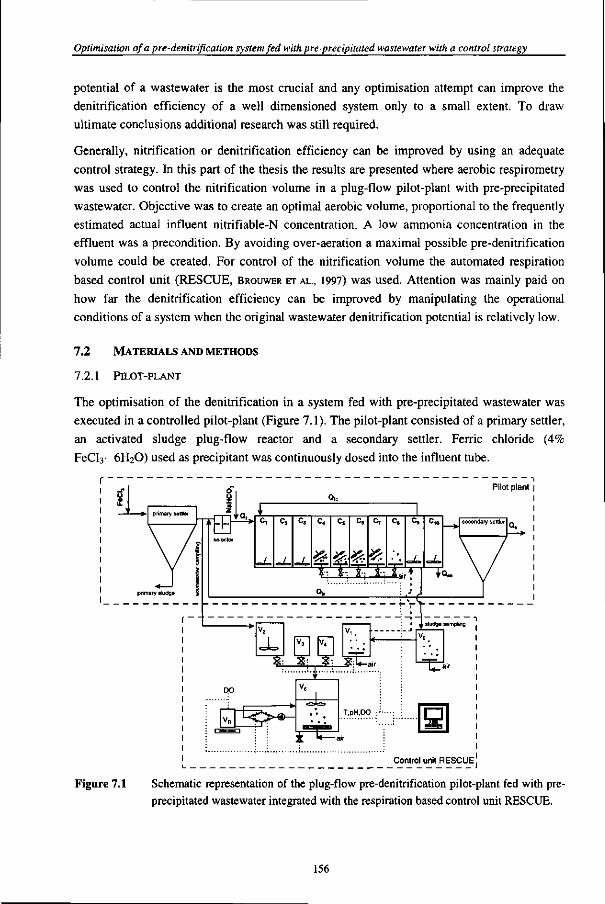
Optimisation of a pre-denitrification system fed with pre-precipitated wastewater with a control strategy
potential of a wastewater is the most crucial and any optimisation attempt can improve the denitrification efficiency of a well dimensioned system only to a small extent. To draw ultimate conclusions additional research was still required.
Generally, nitrification or denitrification efficiency can be improved by using an adequate control strategy. In this part of the thesis the results are presented where aerobic respirometry was used to control the nitrification volume in a plug-flow pilot-plant with pre-precipitated wastewater. Objective was to create an optimal aerobic volume, proportional to the frequently estimated actual influent nitrifiable-N concentration. A low ammonia concentration in the effluent was a precondition. By avoiding over-aeration a maximal possible pre-denitrification volume could be created. For control of the nitrification volume the automated respiration based control unit (RESCUE, BROUWER ET AL., 1997) was used. Attention was mainly paid on how far the denitrification efficiency can be improved by manipulating the operational conditions of a system when the original wastewater denitrification potential is relatively low.
7.2 MATERIALS AND METHODS
7.2.1 PILOT-PLANT
The optimisation of the denitrification in a system fed with pre-precipitated wastewater was executed in a controlled pilot-plant (Figure 7.1). The pilot-plant consisted of a primary settler, an activated sludge plug-flow reactor and a secondary settler. Ferric chloride (4% FeCl3- 6H2O) used as precipitant was continuously dosed into the influent tube.
Figure 7.1 Schematic representation of the plug-flow pre-denitrification pilot-plant fed with pre-precipitated wastewater integrated with the respiration based control unit RESCUE.
156
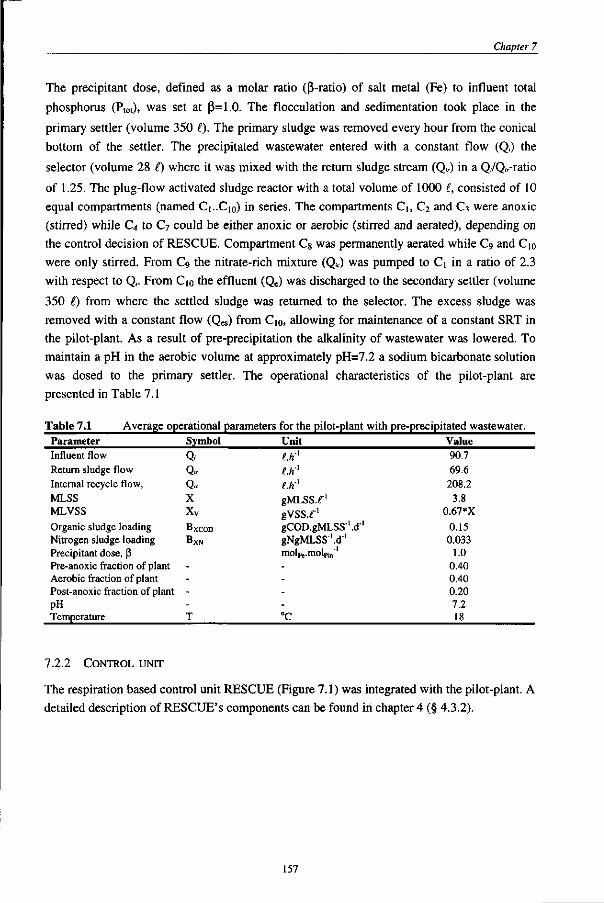
Chapter 7
The precipitant dose, defined as a molar ratio ((3-ratio) of salt metal (Fe) to influent total
phosphorus (Ptot)» was set at (3=1.0. The flocculation and sedimentation took place in the
primary settler (volume 350 (.). The primary sludge was removed every hour from the conical
bottom of the settler. The precipitated wastewater entered with a constant flow (Q,) the
selector (volume 28 I) where it was mixed with the return sludge stream (Q„) in a Q,/Q„-ratio
of 1.25. The plug-flow activated sludge reactor with a total volume of 1000 i, consisted of 10
equal compartments (named C1..C10) in series. The compartments Ci, C2 and C3 were anoxic
(stirred) while C4 to C7 could be either anoxic or aerobic (stirred and aerated), depending on
the control decision of RESCUE. Compartment C& was permanently aerated while C9 and C10
were only stirred. From C9 the nitrate-rich mixture (Q,c) was pumped to Q in a ratio of 2.3
with respect to Q>. From C10 the effluent (Qe) was discharged to the secondary settler (volume
350 () from where the settled sludge was returned to the selector. The excess sludge was
removed with a constant flow (Qes) from C10, allowing for maintenance of a constant SRT in
the pilot-plant. As a result of pre-precipitation the alkalinity of wastewater was lowered. To
maintain a pH in the aerobic volume at approximately pH=7.2 a sodium bicarbonate solution
was dosed to the primary settler. The operational characteristics of the pilot-plant are
presented in Table 7.1
Table 7.1 Average operational parameters for the pilot-plant with pre-precipitated wastewater. Parameter Symbol Unit Value Influent flow Return sludge flow Internal recycle flow, MLSS MLVSS Organic sludge loading Nitrogen sludge loading Precipitant dose, (3 Pre-anoxic fraction of plant Aerobic fraction of plant Post-anoxic fraction of plant pH Temperature
7.2.2 CONTROL UNIT
Q.
0* Q„ X Xv
BXCOD
BXN
----T
/.*"' /.A"1
Lhx
gMLSS.f1
gvss.r1
gCOD.gMLSS'.d-1
gNgMLSS'.d"1
molFe.molpin"'
----°C
90.7 69.6 208.2 3.8
0.67*X
0.15 0.033
1.0 0.40 0.40 0.20 7.2 18
The respiration based control unit RESCUE (Figure 7.1) was integrated with the pilot-plant. A detailed description of RESCUE'S components can be found in chapter 4 (§ 4.3.2).
157
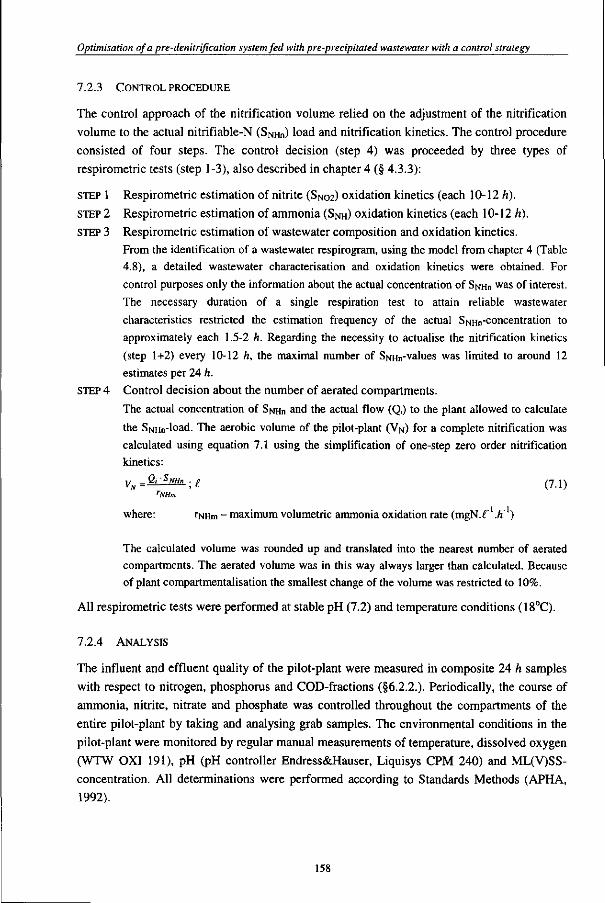
Optimisation of a pre-denitrification system fed with pre-precipitated wastewater with a control strategy
7.2.3 CONTROL PROCEDURE
The control approach of the nitrification volume relied on the adjustment of the nitrification
volume to the actual nitrifiable-N (SNHn) load and nitrification kinetics. The control procedure
consisted of four steps. The control decision (step 4) was proceeded by three types of
respirometric tests (step 1-3), also described in chapter 4 (§ 4.3.3):
STEP 1 Respirometric estimation of nitrite (SN02) oxidation kinetics (each 10-12 h).
STEP 2 Respirometric estimation of ammonia (SNH) oxidation kinetics (each 10-12 h).
STEP 3 Respirometric estimation of wastewater composition and oxidation kinetics.
From the identification of a wastewater respirogram, using the model from chapter 4 (Table
4.8), a detailed wastewater characterisation and oxidation kinetics were obtained. For
control purposes only the information about the actual concentration of SNHn was of interest.
The necessary duration of a single respiration test to attain reliable wastewater
characteristics restricted the estimation frequency of the actual SNHn-concentration to
approximately each 1.5-2 h. Regarding the necessity to actualise the nitrification kinetics
(step 1+2) every 10-12 h, the maximal number of SnHn-values was limited to around 12
estimates per 24 h.
STEP 4 Control decision about the number of aerated compartments.
The actual concentration of SNHII and the actual flow (Q,) to the plant allowed to calculate
the SNHn-load. The aerobic volume of the pilot-plant (VN) for a complete nitrification was
calculated using equation 7.1 using the simplification of one-step zero order nitrification
kinetics:
VN = Q'SNH" ;l (7.1) rNHm
where: rNHm - maximum volumetric ammonia oxidation rate (mgN.r .K )
The calculated volume was rounded up and translated into the nearest number of aerated
compartments. The aerated volume was in this way always larger than calculated. Because
of plant compartmentalisation the smallest change of the volume was restricted to 10%.
All respirometric tests were performed at stable pH (7.2) and temperature conditions (18°C).
7.2.4 ANALYSIS
The influent and effluent quality of the pilot-plant were measured in composite 24 h samples
with respect to nitrogen, phosphorus and COD-fractions (§6.2.2.). Periodically, the course of
ammonia, nitrite, nitrate and phosphate was controlled throughout the compartments of the
entire pilot-plant by taking and analysing grab samples. The environmental conditions in the
pilot-plant were monitored by regular manual measurements of temperature, dissolved oxygen
(WTW OXI 191), pH (pH controller Endress&Hauser, Liquisys CPM 240) and ML(V)SS-
concentration. All determinations were performed according to Standards Methods (APHA,
1992).
158
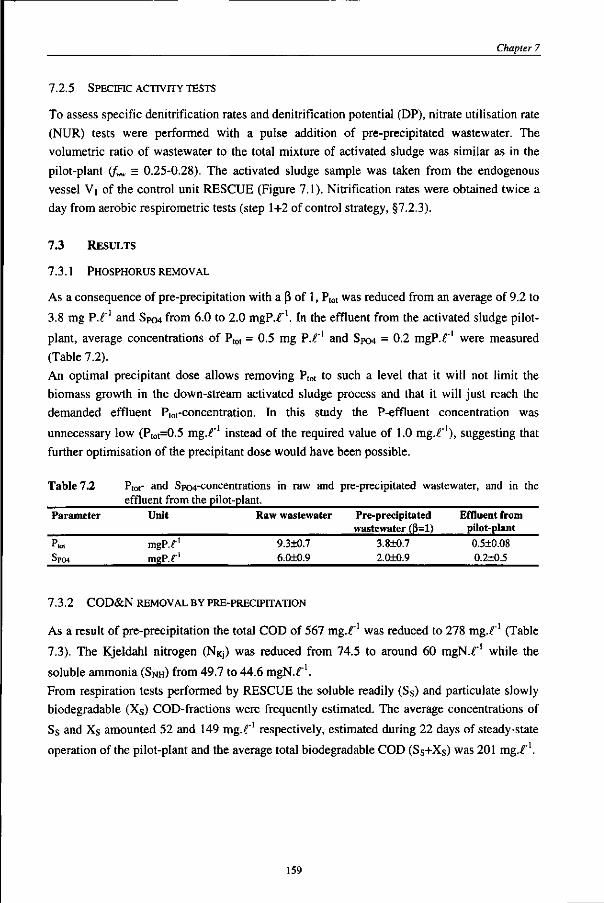
Chapter 7
7.2.5 SPECIFIC ACTIVITY TESTS
To assess specific denitrification rates and denitrification potential (DP), nitrate utilisation rate (NUR) tests were performed with a pulse addition of pre-precipitated wastewater. The volumetric ratio of wastewater to the total mixture of activated sludge was similar as in the pilot-plant (f^ = 0.25-0.28). The activated sludge sample was taken from the endogenous vessel Vi of the control unit RESCUE (Figure 7.1). Nitrification rates were obtained twice a day from aerobic respirometric tests (step 1+2 of control strategy, §7.2.3).
7.3 RESULTS
7.3.1 PHOSPHORUS REMOVAL
As a consequence of pre-precipitation with a P of 1, P,ot was reduced from an average of 9.2 to
3.8 mg P./"1 and SP04 from 6.0 to 2.0 mgP.f1. In the effluent from the activated sludge pilot-
plant, average concentrations of P,ot = 0.5 mg P.£~l and SPo4 = 0.2 mgP. "1 were measured
(Table 7.2).
An optimal precipitant dose allows removing Ptot to such a level that it will not limit the
biomass growth in the down-stream activated sludge process and that it will just reach the
demanded effluent Ptot-concentration. In this study the P-effluent concentration was
unnecessary low (Ptot=0.5 mg. "1 instead of the required value of 1.0 mg..f'), suggesting that
further optimisation of the precipitant dose would have been possible.
Table 7.2
Parameter
"tot
Sp04
Ptot- and Spo4-concentrations in raw and effluent from the pilot-plant.
Unit
mgP.f1
mgP.f'
Raw wastewater
9.310.7 6.010.9
pre-precipitated wastewater, and in the
Pre-precipitated wastewater (3=1)
3.810.7 2.010.9
Effluent from pilot-plant
0.510.08 0.210.5
7.3.2 C O D & N REMOVAL BY PRE-PRECIPITATION
As a result of pre-precipitation the total COD of 567 mg.r1 was reduced to 278 mg.r1 (Table
7.3). The Kjeldahl nitrogen (NRJ) was reduced from 74.5 to around 60 mgN.f"1 while the
soluble ammonia (SNH) from 49.7 to 44.6 mgN.-f'.
From respiration tests performed by RESCUE the soluble readily (Ss) and particulate slowly
biodegradable (Xs) COD-fractions were frequently estimated. The average concentrations of
Ss and Xs amounted 52 and 149 mg.f1 respectively, estimated during 22 days of steady-state
operation of the pilot-plant and the average total biodegradable COD (Ss+Xs) was 201 mg.f'.
159
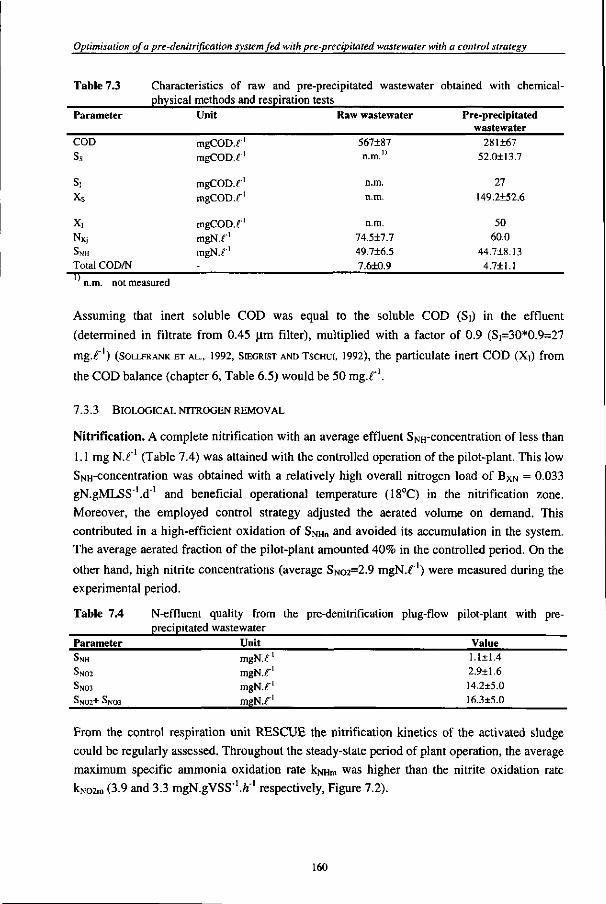
Optimisation of a pre-denitrification system fed with pre-precipitated wastewater with a control strategy
Table 7.3 Characteristics of raw and pre-precipitated wastewater obtained with chemical-physical methods and respiration tests
Parameter Unit Raw wastewater Pre-precipitated wastewater
COD Ss
S, Xs
X, NKj
SNH
Total COD/N
mgCOD.f1
mgCOD.f'
mgCOD.f1
mgCOD.f1
mgCOD.f1
mgN.f1
mgN.f1
567±87 n.m.
n.m.
n.m.
n.m.
74.5+7.7
49.7±6.5
7.6+0.9
281±67
52.0+13.7
27 149.2±52.6
50 60.0
44.7±8.13
4.7+1.1 TT n.m. not measured
Assuming that inert soluble COD was equal to the soluble COD (Si) in the effluent
(determined in filtrate from 0.45 \im filter), multiplied with a factor of 0.9 ( SF30*0 .9=27
mg.i?"1) (SOLLFRANK ET AL., 1992, SEGRIST AND TSCHUI, 1992), the particulate inert COD (Xt) from
the COD balance (chapter 6, Table 6.5) would be 50 mg.f'.
7.3.3 BIOLOGICAL NITROGEN REMOVAL
Nitrification. A complete nitrification with an average effluent SiMH-concentration of less than
1.1 mg N.f' (Table 7.4) was attained with the controlled operation of the pilot-plant. This low
SNH-concentration was obtained with a relatively high overall nitrogen load of BXN = 0.033
gN.gMLSS'.d"1 and beneficial operational temperature (18°C) in the nitrification zone.
Moreover, the employed control strategy adjusted the aerated volume on demand. This
contributed in a high-efficient oxidation of SNHII and avoided its accumulation in the system.
The average aerated fraction of the pilot-plant amounted 40% in the controlled period. On the
other hand, high nitrite concentrations (average SNO2=2.9 mgN..f') were measured during the
experimental period.
Table 7.4 N-effluent quality from the pre-denitrification plug-flow pilot-plant with pre-precipitated wastewater
Parameter Unit Value SNH
SNO2
SN03
SNO2+ SN03
m g N j
m g N j
m g N j
m g N j
1.1±1.4
2.9±1.6
14.2±5.0
16.3±5.0
From the control respiration unit RESCUE the nitrification kinetics of the activated sludge could be regularly assessed. Throughout the steady-state period of plant operation, the average maximum specific ammonia oxidation rate kNHm was higher than the nitrite oxidation rate kN02m (3.9 and 3.3 mgN.gVSS"1./!-1 respectively, Figure 7.2).
160
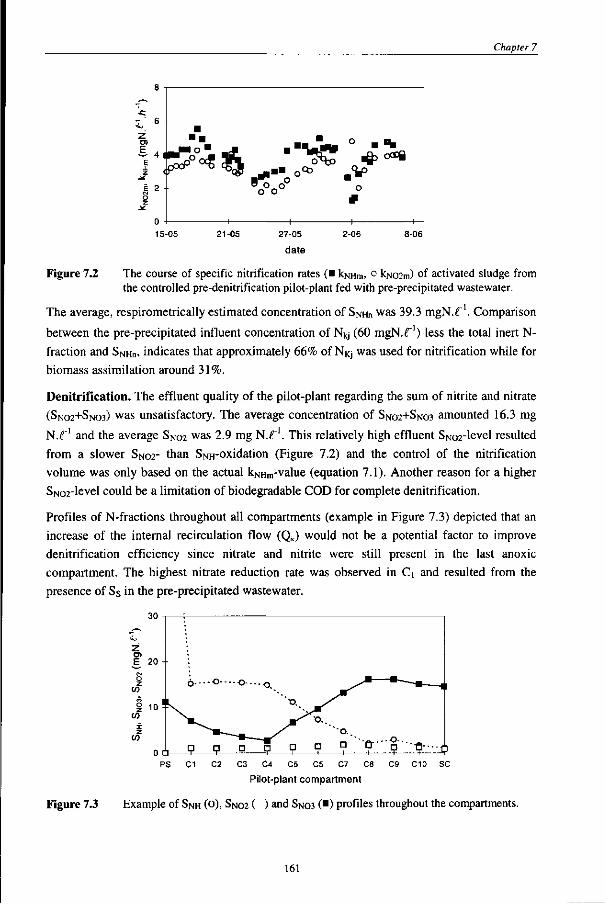
Chapter 7
15-05
Figure 7.2 The course of specific nitrification rates (• kNHm, ° kN02m) of activated sludge from the controlled pre-denitrification pilot-plant fed with pre-precipitated wastewater.
The average, respirometrically estimated concentration of SNHn was 39.3 mgN.r'. Comparison
between the pre-precipitated influent concentration of N j (60 mgN.r1) less the total inert In
fraction and SNHn. indicates that approximately 66% of NKJ was used for nitrification while for
biomass assimilation around 31%.
Denitrification. The effluent quality of the pilot-plant regarding the sum of nitrite and nitrate
(SNO2+SNO3) was unsatisfactory. The average concentration of SNO2+SNO3 amounted 16.3 mg
N.f' and the average SNo2 was 2.9 mg NX1. This relatively high effluent SN02-level resulted
from a slower SNO2- than SNH-oxidation (Figure 7.2) and the control of the nitrification
volume was only based on the actual kNHm-value (equation 7.1). Another reason for a higher
Sivio2-level could be a limitation of biodegradable COD for complete denitrification.
Profiles of N-fractions throughout all compartments (example in Figure 7.3) depicted that an increase of the internal recirculation flow (Q,() would not be a potential factor to improve denitrification efficiency since nitrate and nitrite were still present in the last anoxic compartment. The highest nitrate reduction rate was observed in Ci and resulted from the presence of Ss in the pre-precipitated wastewater.
C3 C4 C5 C5 C7 C8 C9 C10 SC
Pilot-plant compartment
Figure 7.3 Example of SNH (O), SNO2 ( ) and SNO3 (•) profiles throughout the compartments.
161
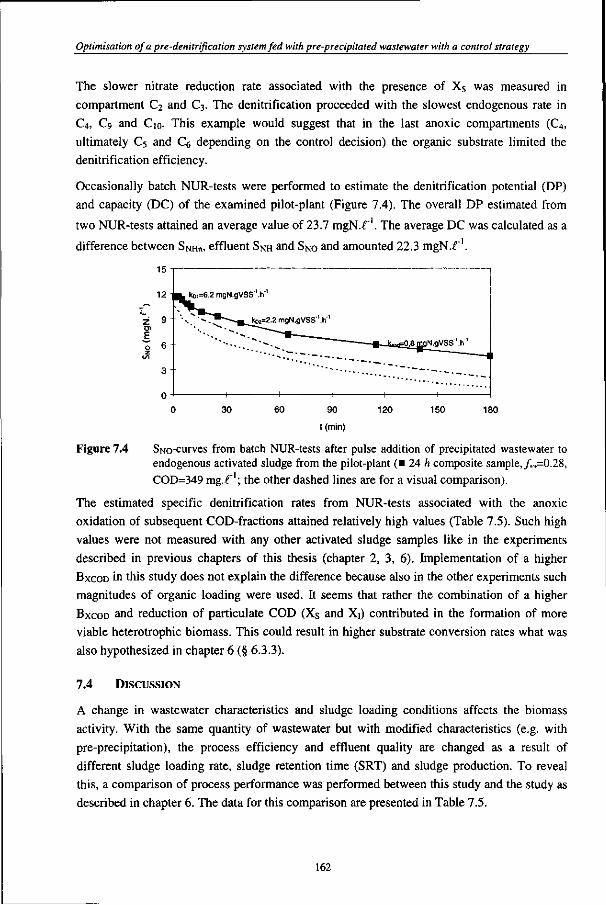
Optimisation of a pre-denitrification system fed with pre-precipitated wastewater with a control strategy
The slower nitrate reduction rate associated with the presence of Xs was measured in compartment C2 and C3. The denitrification proceeded with the slowest endogenous rate in C4, C9 and C10. This example would suggest that in the last anoxic compartments (C4, ultimately C5 and C6 depending on the control decision) the organic substrate limited the denitrification efficiency.
Occasionally batch NUR-tests were performed to estimate the denitrification potential (DP)
and capacity (DC) of the examined pilot-plant (Figure 7.4). The overall DP estimated from
two NUR-tests attained an average value of 23.7 mgN.r1. The average DC was calculated as a
difference between SNHII, effluent SNH and SNO and amounted 22.3 mgN.f .
15
12 ^ k o i = 6 . 2 mgN.gVSS'.h'
* ^ k
' 0 "~^*~~~~B_J<M=2.2 mgN.gVSS'.h'1
' *" • ^ ~ -^B _
~ ' - - , . ~~ • Hmi
•-..
1 1 1 1—
.gOJIn mNflVSS ' . h '
1
30 60 90
t (min)
120 150 180
Figure 7.4 SNo-curves from batch NUR-tests after pulse addition of precipitated wastewater to endogenous activated sludge from the pilot-plant (• 24 h composite sample,/»»=0.28, COD=349 mg..f'; the other dashed lines are for a visual comparison).
The estimated specific denitrification rates from NUR-tests associated with the anoxic oxidation of subsequent COD-fractions attained relatively high values (Table 7.5). Such high values were not measured with any other activated sludge samples like in the experiments described in previous chapters of this thesis (chapter 2, 3, 6). Implementation of a higher BXCOD in this study does not explain the difference because also in the other experiments such magnitudes of organic loading were used. It seems that rather the combination of a higher BXCOD and reduction of particulate COD (Xs and Xi) contributed in the formation of more viable heterotrophic biomass. This could result in higher substrate conversion rates what was also hypothesized in chapter 6 (§ 6.3.3).
7.4 DISCUSSION
A change in wastewater characteristics and sludge loading conditions affects the biomass activity. With the same quantity of wastewater but with modified characteristics (e.g. with pre-precipitation), the process efficiency and effluent quality are changed as a result of different sludge loading rate, sludge retention time (SRT) and sludge production. To reveal this, a comparison of process performance was performed between this study and the study as described in chapter 6. The data for this comparison are presented in Table 7.5.
162
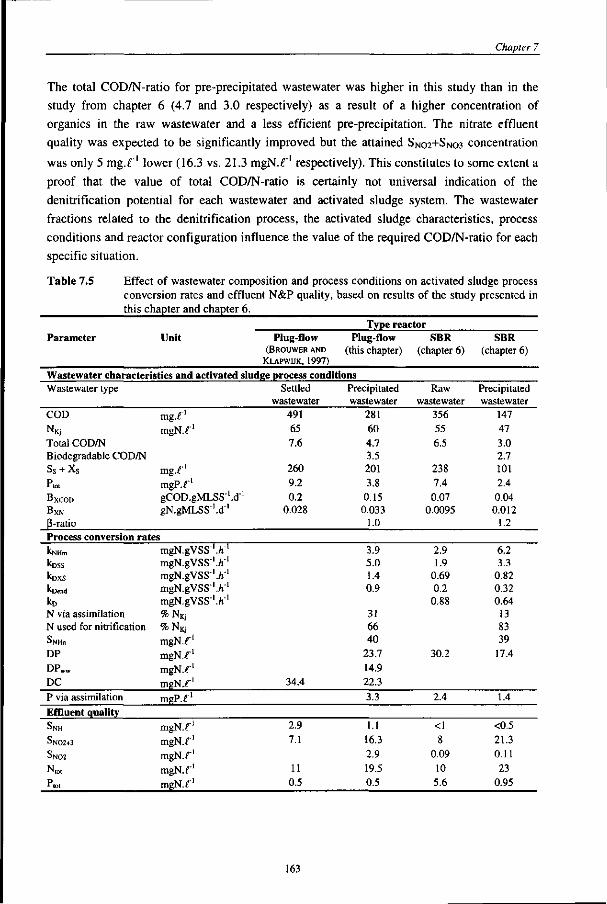
Chapter 7
The total COD/N-ratio for pre-precipitated wastewater was higher in this study than in the study from chapter 6 (4.7 and 3.0 respectively) as a result of a higher concentration of organics in the raw wastewater and a less efficient pre-precipitation. The nitrate effluent quality was expected to be significantly improved but the attained SNO2+SNO3 concentration was only 5 mg.f[ lower (16.3 vs. 21.3 mgN.f"1 respectively). This constitutes to some extent a proof that the value of total COD/N-ratio is certainly not universal indication of the denitrification potential for each wastewater and activated sludge system. The wastewater fractions related to the denitrification process, the activated sludge characteristics, process conditions and reactor configuration influence the value of the required COD/N-ratio for each specific situation.
Table 7.5 Effect of wastewater composition and process conditions conversion rates and effluent N&P quality, this c
Parameter
hapter and chapter 6.
Unit Plug-flow (BROUWER AND
KLAPWUK, 1997)
on activated sludge process based on results of the study presented in
Type reactor Plug-flow
(this chapter) SBR
(chapter 6) SBR
(chapter 6)
Wastewater characteristics and activated sludge process conditions Wastewater type
COD
NKJ
Total COD/N Biodegradable COD/N Ss + Xs
"tot
BXCOD
BXN
3-ratio
mg.f1
mgN.f1
mg.f1
mgP.f1
gCOD.gMLSS'.d-' gN.gMLSS'.d"1
Settled wastewater
491 65 7.6
260 9.2 0.2
0.028
Precipitated wastewater
281 60 4.7 3.5 201 3.8 0.15 0.033
1.0
Raw wastewater
356 55 6.5
238 7.4 0.07
0.0095
Precipitated wastewater
147 47 3.0 2.7 101 2.4 0.04 0.012
1.2 Process conversion rates l^NHm
l^DSS
^DXS
M3end
kD
N via assimilation N used for nitrification S N H H
DP
DPww DC P via assimilation
mgN.gVSS"'./!"1
mgN.gVSS'./i-1
mgN.gVSS'./f1
mgN.gVSS1./!-1
mgN.gVSS1.ft'1
%NKj
%NKj
mgN.f1
mgN.f1
mgN.f1
mgN.f1
mgP.f1
34.4
3.9 5.0 1.4 0.9
31 66 40
23.7 14.9 22.3
3.3
2.9 1.9
0.69 0.2 0.88
30.2
2.4
6.2 3.3
0.82 0.32 0.64 13 83 39
17.4
1.4
Effluent quality SNH
SN02+3
S N 0 2
N,o, "tot
mgN.f1
mgN.f1
mgN.f1
mgN.f1
mgN.f1
2.9 7.1
11 0.5
1.1 16.3 2.9 19.5 0.5
<1 8
0.09 10 5.6
<0.5 21.3 0.11 23
0.95
163
Optimisation of a pre-denitrification system fed with pre-precipitated wastewater with a control strategy
In the research with the same controlled pilot-plant but fed with settled wastewater (BROUWER
AND KLAPWUK, 1997), the effluent SNO2+SNO3 concentration amounted 7.1 mg N.-f' while a rather
satisfactory nitrification was assured. It means that both raw (chapter 6) and settled domestic
wastewater of the same origin was characterised by a denitrification potential allowable to
attain a satisfactory effluent N-quality in an appropriate process configuration. The
introduction of pre-precipitation on the plant with settled wastewater, decreased the COD-
loading with 25% and increased the N-loading with 20%. This contributed in an
unrecoverable deterioration of necessary conditions for a satisfactory denitrification. In other
words, it deteriorated the denitrification potential of the system. A comparison of
denitrification capacities (derivative of the DP) reflects this deterioration (Table 7.5).
The implemented control strategy to optimise the aerobic volume, and consequently the
anoxic volume, seemed to have a negligible effect on the improvement of the denitrification
performance in a system fed with low strength wastewater.
Regarding the comparison of pre-precipitated wastewater characteristics from this study and
the study described in chapter 6, the following aspects can be noted:
the concentrations of Ss and Si were similar;
the particulate COD-fractions (Xs and Xr) in this study were two times higher for X s and
three times for Xi. The reasons might be different initial concentrations of particulate
COD-fractions in the raw wastewater and a lower rate of pre-precipitation.
a relatively high organic sludge loading rate (BXCOD=0.15 vs. 0.04 gCOD.gMLSS'.d"1)
caused in this study an increased biomass production, resulting in an increased demand of
SNH for assimilation with a factor of 2.5.
however, the NKj-concentration in the precipitated wastewater was significantly higher in
this study and the SNHn-concentration was practically identical for both cases. This shows
that SNHII is a resultant of initial wastewater characteristics and process conditions;
a significant difference was measured in specific SiMH-oxidation rates. A much lower
value was obtained in this study (3.9 vs. 6.2 mgN.gVSS'./f '). A high BXCOD, low SRT
and lower reduction of particulate COD-fractions were the most important factors that
reduced the nitrifiers fraction in the total biomass population, and therefore lowered the
nitrification rate;
on the other hand, subsequent specific denitrification rates were approximately two times
higher in this study what can be explained by a higher activity of heterotrophic biomass,
resulting from a higher applied BXCOD and lower SRT. A lower removal efficiency of the
Xs-fraction could have resulted in an increased endogenous denitrifying activity.
Pre-precipitation introduced before a biological nutrient removal system usually causes a
deterioration of nitrate effluent quality. An important reason is a significant reduction of
biodegradable COD, not accompanied by a proportional reduction of biodegradable N-forms.
The denitrification potential on the organic wastewater fractions can be lowered significantly
while the amount of nitrate that has to be denitrified will be affected in a lower rate.
164
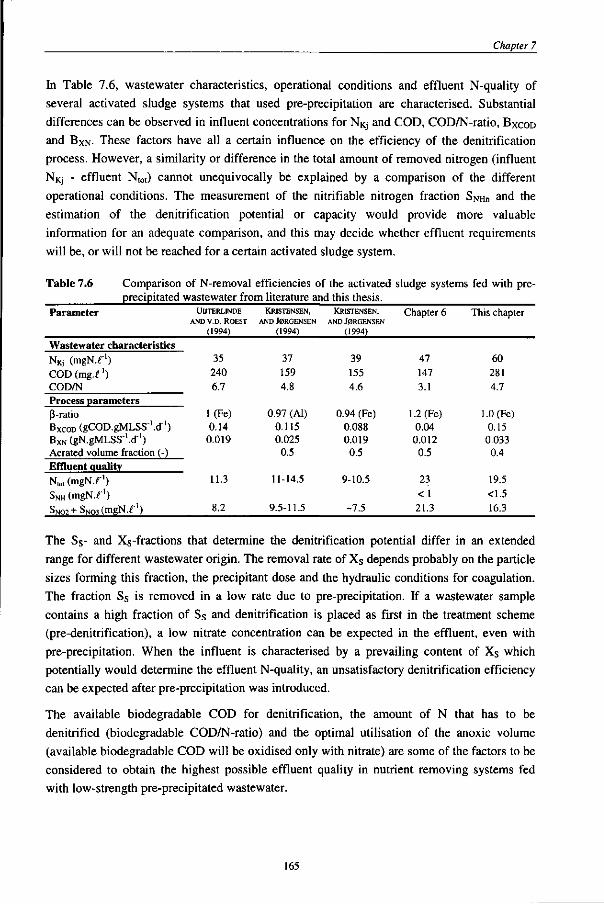
Chapter 7
In Table 7.6, wastewater characteristics, operational conditions and effluent N-quality of several activated sludge systems that used pre-precipitation are characterised. Substantial differences can be observed in influent concentrations for NRJ and COD, COD/N-ratio, BXCOD and BXN- These factors have all a certain influence on the efficiency of the denitrification process. However, a similarity or difference in the total amount of removed nitrogen (influent NKj - effluent Ntot) cannot unequivocally be explained by a comparison of the different operational conditions. The measurement of the nitrifiable nitrogen fraction SNHn and the estimation of the denitrification potential or capacity would provide more valuable information for an adequate comparison, and this may decide whether effluent requirements will be, or will not be reached for a certain activated sludge system.
Table 7.6 Comparison of N-removal efficiencies of the activated sludge systems fed with pre-precipitated wastewater from literature and this thesis.
Parameter UUTERLINDE KRISTENSEN, KRISTENSEN, Chapter 6 This chapter AND V.D. ROEST AND J0RGENSEN AND J0RGENSEN
(1994) (1994) (1994)
Wastewater characteristics NKj (mgN.f1) COD (mg.f') COD/N
Process parameters (5-ratio BXCOD (gCOD.gMLSS-'.d"1)
BXN(gN.gMLSS-1.d-') Aerated volume fraction (-) Effluent quality N,,, (mgN.f1) SNH (mgN.f1) SNO2+SN 03 (mgN.f1)
35 240 6.7
l(Fe) 0.14
0.019
11.3
8.2
37 159 4.8
0.97 (Al) 0.115 0.025 0.5
11-14.5
9.5-11.5
39 155 4.6
0.94 (Fe) 0.088 0.019 0.5
9-10.5
-7.5
47 147 3.1
1.2 (Fe) 0.04
0.012 0.5
23
< 1
21.3
60 281 4.7
1.0 (Fe) 0.15
0.033 0.4
19.5
<1.5
16.3
The Ss- and Xs-fractions that determine the denitrification potential differ in an extended range for different wastewater origin. The removal rate of Xs depends probably on the particle sizes forming this fraction, the precipitant dose and the hydraulic conditions for coagulation. The fraction Ss is removed in a low rate due to pre-precipitation. If a wastewater sample contains a high fraction of Ss and denitrification is placed as first in the treatment scheme (pre-denitrification), a low nitrate concentration can be expected in the effluent, even with pre-precipitation. When the influent is characterised by a prevailing content of Xs which potentially would determine the effluent N-quality, an unsatisfactory denitrification efficiency can be expected after pre-precipitation was introduced.
The available biodegradable COD for denitrification, the amount of N that has to be denitrified (biodegradable COD/N-ratio) and the optimal utilisation of the anoxic volume (available biodegradable COD will be oxidised only with nitrate) are some of the factors to be considered to obtain the highest possible effluent quality in nutrient removing systems fed with low-strength pre-precipitated wastewater.
165
Optimisation of a pre-denitrifwation system fed with pre-precipitated wastewater with a control strategy
7.4 CONCLUSIONS
With a precipitant dose of (3=1.0, the total COD/N-ratio of pre-precipitated wastewater
attained a value of 4.7 and the biodegradable COD/N-ratio a value of 5.1. Especially the last
parameter was more beneficial as in the study of chapter 6 (almost two times higher).
Together with an optimisation of the anoxic and aerobic activated sludge fraction this
contributed only in an improvement for the SN02+SN03-effluent quality of 5 mgN.r1 and the
standard of total N < 10 mgN.r1 was still not fulfilled. This indicates that the required
COD/N-ratio to attain a complete denitrification is not a universal value but is strongly
dependent on wastewater activated sludge characteristics, process conditions and operational
parameters.
A higher BXCOD in this study contributed in higher rate of N- and P-uptake for biomass synthesis. This allowed implementing a lower precipitant dose. Besides, the fraction of nitrifiable-N (StMHn) and nitrate to be denitrified in relation to the total influent N was decreased in comparison with the system examined in chapter 6.
When the denitrification potential of raw and settled wastewater in question allowed just to fulfil the required nitrate standard in the effluent from a down-stream activated sludge system, the reduction of the biodegradable COD by normal rate pre-precipitation caused a significant deterioration. Any optimisation step aiming to improve the denitrification efficiency may improve the nitrate effluent quality only to small extent and is an option in situations where the nitrate effluent level differs slightly from the demanded value.
166
Chapter 7
LIST OF SYMBOLS AND ABBREVIATIONS
BXCOD organic sludge loading rate ( gCOD.gMLSS ' .d 1 ) BX N N sludge loading rate ( gN .gMLSS ' .d 1 ) C] 10 subsequent compartments of the plug-flow pilot-plant
COD total COD of wastewater (mg . f ' )
CODm COD of wastewater filtrate (0.45 urn) (mg . f ' )
COD:N ratio of total influent COD and total influent nitrogen (=NKj)
DO dissolved oxygen concentration (mg02 . f ' )
DP denitrification potential (mgN. f ' )
/„•» fraction of wastewater volume in the total volume of activated sludge mixed liquor (-) kD specific denitrification rate; subscripts: 1 - associated with Ss utilisation including endogenous rate, 2 -
associated with S s utilisation from X s hydrolysis including endogenous rate, 3 or end - endogenous, o -overall (mgN.gVSS' . / i 1 )
kNHm specific rate of ammon ia oxidation (mgN.gVSS ' . /T 1 ) kNOm specific rate of nitrite oxidat ion (mgN.gVSS ' . /T 1 ) N U R nitrate utilisation rate P l o t total phosphorus ( m g P . f ' ) Q e s excess sludge flow (l.fi1) Q, influent wastewater flow to the pilot-plant (l.h,'1) Qic internal nitrate-rich recirculation flow (t.h'*) Q,r recycle sludge flow ((.h'^) fNHm volumetric rate of ammonia oxidation (mgN . f ' . / f ' ) SBR sequencing batch reactor S, soluble inert C O D (mgCOD. f 1 ) SNH concentration of ammonia ( m g N . f ' ) SNH„ concentration of nitrifiable nitrogen ( m g N . f ' ) S N 0 concentration of sum nitrate and nitrite-nitrate equivalent ( m g N . f ' ) SN02 concentration of nitrite ( m g N . f ' ) SN03 concentration of nitrate (mgN . r 1 ) Spew concentration of soluble orthophosphate (mgP . f ' ) SRT solid retention t ime (d) S s soluble, readily biodegradable C O D ( m g C O D . f ' ) T temperature (°C) VN nitrification volume ((.) X total solids concentration in activated sludge reactor ( gMLSS . f ' ) X v volatile suspended solids ( gMLVSS . f ' ) X s particulate, slowly biodegradable COD ( m g C O D . f ' ) X, particulate, inert C O D (mgCOD. f 1 ) P molar ratio: precipitant metal to P,,,, in the influent wastewater (M^Mp^,,"1)
167
Optimisation of a pre-denitrification system fed with pre-precipitated wastewater with a control strategy
LITERATURE
APHA, AWWA, WEF (1992) Standard Methods for examination of water and wastewater. 18th edition. Edts.: Greenberg, A.E., Clesceni, L.S. and Eaton, A.D.
Brouwer, H. and Klapwijk, B. (1997) Model-gebaseerde sturing van het aerobe volume in een propstroomaktiefslibinstallatie op basis van respirometrie. Raport of Departement Agro-milieu- en systeemtechnologie (AMST) leerstoelgroup Milieutechnologie, Landbouwuniversiteit Wageningen.
Brouwer, H., Bloemen, M., Klapwijk, B., Spanjers, H. (1998) Feedforward control by manipulating the aerobic nitrification volume in ASP. Wat. Sci. Tech. 38 (3), 245-255
Giesen, A., Peeters, Th., (1994) Preprecipitatie: nog verder te optimaliseren. H2O (27) 14, 384-388 (in Dutch)
Henze,M., Kristensen, G.H., Strube, R. (1994) Rate-capacity characterisation of wastewater for nutrient removal processes. Wat. Sci. Tech. 29, (7), 101-107.
Karlsson, I., Smith, G. (1991) Pre-precipitation facilities nitrogen removal without tank expansion. Wat. Sci. Tech. 23, 811-817.
Kristensen, G.H. and Jorgensen, P.E. (1994) Pre-precipitation followed by biological
denitrification supported by addition of biological or thermal chemical hydrolysis products. 313-327. Springer Verlag.
0degaard, H. (1992) Norwegian experiences with chemical treatment of raw wastewater. Wat. Sci. Tech., 25, (12), 255-264.
Ooten, R.J., Crosse, J., Shao, Y.J. and Soroushian, F. (1993). Souther California secondary equivalency treatment research and operational projects.
Siegrist, H. and Tschui, M. (1992) Interpretation of experimental data with regard to the activated sludge model no.l and calibration of the model for municipal wastewater treatment plants, Wat. Sci. Tech., 25 (6), 167-183.
Sollfrank, U. Kappeler, J. and Gujer, W. (1992) Temperature effects on wastewater characterisation and the release of soluble inert organic material, Wat. Sci. Tech., 25 (6), 33-41.
Uijterlinde, C.A., v.d. Roest, H.F. (1994) Toch verrast met preprecipitatie op de rwzi Nieuwegein! H20, 27, (17), 518-521.
168
Chapter 8
8 Discussion
CONTENT
8.1 Introduction 170 8.2 Estimation of the denitrification potential 171
8.2.1 General 171 8.2.2 Respiration techniques for the estimation of the denitrification potential 171
NUR-test, direct estimation of the denitrification potential 171 OUR-test, indirect estimation of the denitrification potential 173
8.3 Methodology to estimate theN-removal potential 174 8.4 Implementation and validation of the developed methodologies 176 8.5 Possible applications of the developed methodologies in practice 177
8.5.1 Application for existing systems 177 8.5.2 Assistance in design 178 8.5.3 On-line system monitoring and/or control 180
8.6 Conclusions 182 Literature 183
169
Discussion
8.1 INTRODUCTION
Information which has been published in the last three decades on denitrification in activated
sludge systems (review in chapter 1) would suggest that denitrification is a well recognised
and established process and that there is no special demand for further investigations.
Nevertheless, practical evidences indicate that available information is not efficiently utilised,
although the need to optimise denitrification is often faced. Applied design procedures for
denitrification are still based on empirical relations and general parameters (e.g. BURDICKET AL.,
1982, KAYSER, 1983, HOFFMAN, 1986, US EPA, 1987, SDA, 1988, ECKENFELDER, 1989) and the recent
improvements in the design of the denitrification process are not revolutionary (e.g. KAYSER,
1999), in spite of a continuously improving theoretical understanding of the factors that
influence denitrification.
The knowledge that can be gained from a detailed wastewater characterisation is an example
of information that could better be utilised for studies into design and improvement of the
denitrification process. In treatment plants receiving domestic wastewater, the availability of
biodegradable COD is often considered as the bottleneck. Although many efforts have been
done to establish relations between the type and concentration of organic carbon and the
denitrification parameters, in several obliging design approaches for the denitrification a
general parameter as COD/N- or BODs/N-ratio is used (EKAMA ET AL., 1984, KAYSER, 1999). In
chapter 1 it was stated that the COD/N- or BODs/N-ratio's are not able to estimate the
denitrification potential, capacity or efficiency and no universal default value can be given for
a sufficient performance. This can be confirmed by a large number of estimated values (Table
1.1) of very extended ranges. Other conditions that determine the denitrification potential and
capacity of an activated sludge system are to a big extent recognized and many of them can be
secured by proper design and operation.
Implementation of empirical approaches may lead to an under- or overestimation of the
denitrification volume and for economic and sustainable reasons this should be avoided. For
instance inventory analysis performed for several treatment plants in the Netherlands,
designed with the widely accepted HSA-method, revealed that the difference in volume
between 'reality' and model prediction was as high as -25 till +35 % (STOWA, 1995). A strong
need is being observed in an improved design procedure for wastewater treatment plants,
based on an accurate estimation of the denitrification potential in relation to detailed
wastewater and activated sludge characteristics. The denitrification potential (DP) in this
thesis is defined as the maximal mass of nitrate that can be denitrified in the anoxic volume
per unit of influent flow. The DP depends on the concentration of biodegradable COD in the
influent and the sludge activity.
In this thesis a methodology is presented for the estimation of the denitrification potential in
relation to wastewater and activated sludge characteristics. Two respiration techniques formed
the basis for two different approaches, the anoxic nitrate utilisation rate test (NUR-test) and
the aerobic oxygen utilisation rate test (OUR-test).
170
Chapter 8
The approach that is based on the NUR-test is a direct method for the assessment of the denitrification potential. The approach based on the OUR-test is an indirect method because a simplified model is necessary to transform oxygen utilisation to nitrate utilisation. Both methods were validated with several case studies, characterised by different wastewater composition and activated sludge characteristics. The developed methods offer an advanced possibility for design assistance, optimisation, monitoring and control of wastewater treatment systems with nitrogen removal.
8.2 ESTIMATION OF THE DENITRIFICATION POTENTIAL
8.2.1 GENERAL
For modelling purposes it is generally accepted that biodegradable COD of domestic wastewater is divided into soluble readily biodegradable- (Ss) and particulate slowly biodegradable COD (Xs). The fraction Ss can be directly consumed by denitrifiers and results in high process rates but it forms usually a smaller fraction of the total COD in municipal wastewater. Because of its character it is essential for the process efficiency that Ss is exclusively used for denitrification and not lost by aerobic oxidation. The fraction Xs, forming usually a higher fraction of the total COD, consists of particulate material that has to be hydrolysed before it can be utilised by denitrifiers. Because of a higher concentration and a longer required time for anoxic consumption, more anoxic volume is needed to utilise Xs optimally for denitrification. The amount of nitrate that potentially can be reduced with Ss
(DPss) and Xs (DPxs) is called wastewater denitrification potential (DPWW). Besides the wastewater denitrification potential, each type of activated sludge is characterised by a basic or endogenous denitrification potential (DPend)- The endogenous denitrification in this thesis is defined as the denitrification utilising substrate from storage, adsorption and biomass decay and lysis; this substrate historically originates from the influent. The endogenous denitrification potential, in contrast to wastewater denitrification potential, is more a resultant of process configuration and parameters.
8.2.2 RESPIRATION TECHNIQUES FOR THE ESTIMATION OF THE DENITRIFICATION POTENTIAL
NUR-test, direct estimation of the denitrification potential
In a NUR-test a wastewater sample is mixed with an activated sludge sample and in an anoxic environment the utilisation rate of nitrate/nitrite is measured. The results of a NUR-test (Figure 8.1) allow for a direct estimation of the DPWW and DPe„d, and consequently the estimation of the overall denitrification potential of the examined wastewater treatment plant. Additional information that can be extracted from a NUR-test are the wastewater composition concerning organic biodegradable fractions Ss and Xs, their volumetric rates of utilisation (fssm, rxsm) and the basic volumetric endogenous denitrification rate (ren(j). In combination with reactor characteristics like influent flow, anoxic volumes and activated sludge concentration, the denitrification capacity and the effluent nitrate concentration can be assessed (Figure 8.2, chapter 2 equation 2.20). The amount of nitrate that has to be denitrified
171
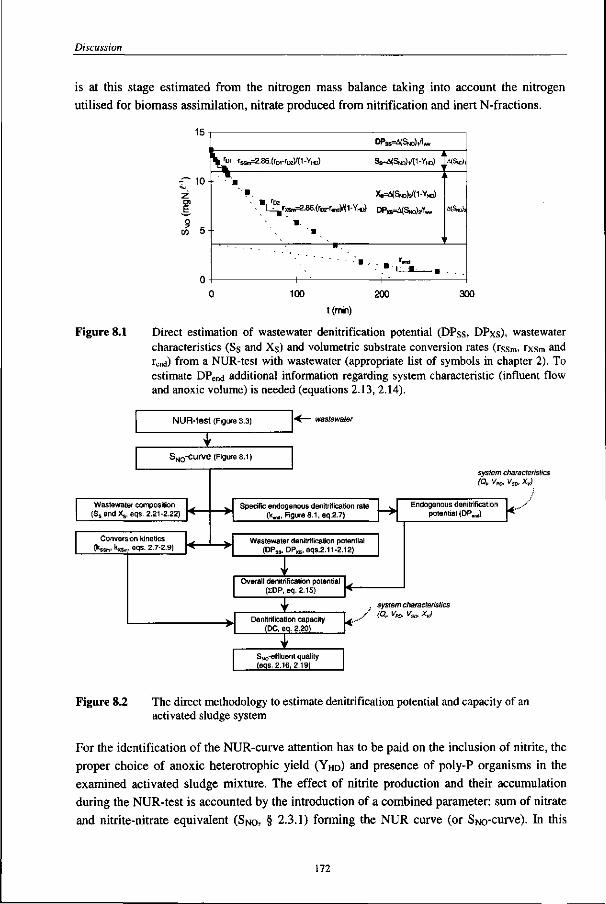
Discussion
is at this stage estimated from the nitrogen mass balance taking into account the nitrogen
utilised for biomass assimilation, nitrate produced from nitrification and inert N-fractions.
Figure 8.1
10-
5
0
DPSS^SNO), / ! , .
V j n rsarf=2.86.(rDl-rD2)/(1-Y«,) S ^ S K M I - Y H D ) , «
A. • •
P. XH^SNOVO-YW)
. L^rxs^2.86.(rD2-rrty(1-Y„D) D P ^ S N C V U 4(S„o)i
m. ' •
" " " " - " • - - • '**
• 1 : K
100 200 300
t(min)
Direct estimation of wastewater denitrification potential (DPss, DPxs), wastewater characteristics (Ss and Xs) and volumetric substrate conversion rates (rssm, rxsm and rend) from a NUR-test with wastewater (appropriate list of symbols in chapter 2). To estimate DPen(j additional information regarding system characteristic (influent flow and anoxic volume) is needed (equations 2.13, 2.14).
NUR-test (Figure 3.3)
SN 0-curve (Figure 8.1)
Wastewater composition (Ss and X,,, eqs. 2.21-2.22)
Conversion kinetics (H.*,. kxs™. eqs. 2.7-2.9)
system characteristics (Q> Vm VSD, Xv)
Specific endogenous denitrification rate (k.M, Figure 8.1, eq.2.7)
Endogenous denitrification potential (DP„J
Wastewater denitrification potential (DPSS, DPXS, eqs.2.11-2.12)
Overall denitrification potential (ZDP, eq. 2.15)
T Denitrification capacity
(DC, eg. 2.20)
±
. system characteristics / (Q, V„, VSD. Xv)
SNO-effluent quality (eqs. 2.16, 2.19)
Figure 8.2 The direct methodology to estimate denitrification potential and capacity of an activated sludge system
For the identification of the NUR-curve attention has to be paid on the inclusion of nitrite, the
proper choice of anoxic heterotrophic yield (Y H D) and presence of poly-P organisms in the
examined activated sludge mixture. The effect of nitrite production and their accumulation
during the NUR-test is accounted by the introduction of a combined parameter: sum of nitrate
and nitrite-nitrate equivalent (SNo> § 2.3.1) forming the NUR curve (or SNo-curve). In this
172
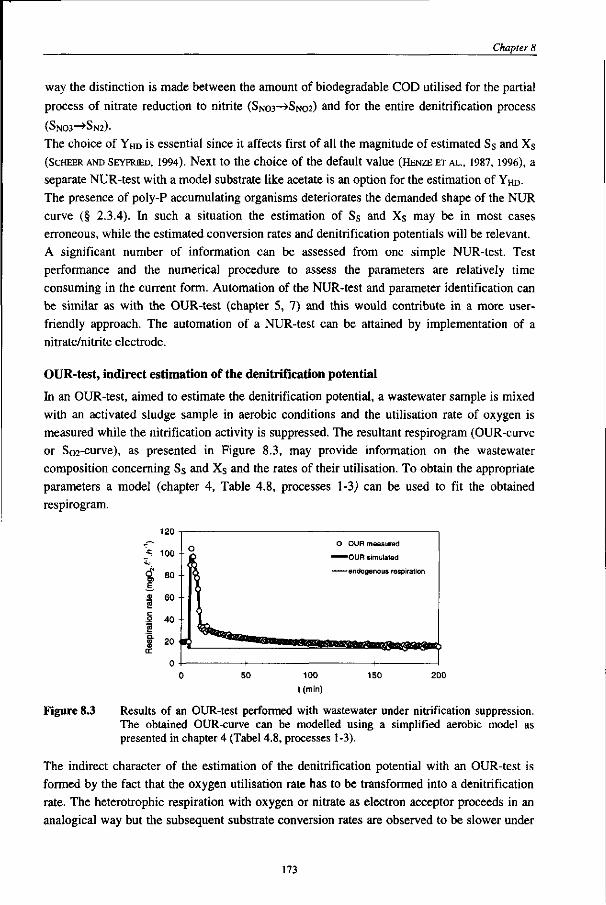
Chapter 8
way the distinction is made between the amount of biodegradable COD utilised for the partial
process of nitrate reduction to nitrite (SNO3-*SNO2) and for the entire denitrification process
(SN03—>Sm)-
The choice of YHD is essential since it affects first of all the magnitude of estimated Ss and Xs (SCHEER AND SEYFRCED, 1994). Next to the choice of the default value (HENZE ET AL., 1987, 1996), a separate NUR-test with a model substrate like acetate is an option for the estimation of YHD-The presence of poly-P accumulating organisms deteriorates the demanded shape of the NUR curve (§ 2.3.4). In such a situation the estimation of Ss and Xs may be in most cases erroneous, while the estimated conversion rates and denitrification potentials will be relevant. A significant number of information can be assessed from one simple NUR-test. Test performance and the numerical procedure to assess the parameters are relatively time consuming in the current form. Automation of the NUR-test and parameter identification can be similar as with the OUR-test (chapter 5, 7) and this would contribute in a more user-friendly approach. The automation of a NUR-test can be attained by implementation of a nitrate/nitrite electrode.
OUR-test, indirect estimation of the denitrification potential
In an OUR-test, aimed to estimate the denitrification potential, a wastewater sample is mixed with an activated sludge sample in aerobic conditions and the utilisation rate of oxygen is measured while the nitrification activity is suppressed. The resultant respirogram (OUR-curve or So2-curve), as presented in Figure 8.3, may provide information on the wastewater composition concerning Ss and Xs and the rates of their utilisation. To obtain the appropriate parameters a model (chapter 4, Table 4.8, processes 1-3) can be used to fit the obtained respirogram.
120
« 100
*£ 80 E S 60 •
.1 40 •
m w 20 •
o
- •
• ^^anaiBBa
O OUR measured
•"•••OUR simulated
endogenous respiration
1 1 1
50 100
t (min)
150 200
Figure 8.3 Results of an OUR-test performed with wastewater under nitrification suppression. The obtained OUR-curve can be modelled using a simplified aerobic model as presented in chapter 4 (Tabel 4.8, processes 1-3).
The indirect character of the estimation of the denitrification potential with an OUR-test is formed by the fact that the oxygen utilisation rate has to be transformed into a denitrification rate. The heterotrophic respiration with oxygen or nitrate as electron acceptor proceeds in an analogical way but the subsequent substrate conversion rates are observed to be slower under
173
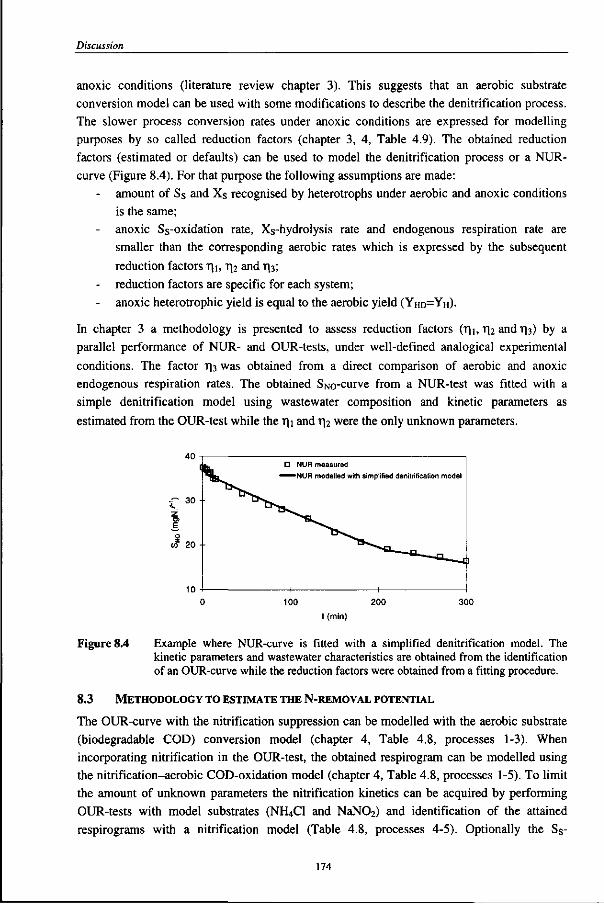
Discussion
anoxic conditions (literature review chapter 3). This suggests that an aerobic substrate conversion model can be used with some modifications to describe the denitrification process. The slower process conversion rates under anoxic conditions are expressed for modelling purposes by so called reduction factors (chapter 3, 4, Table 4.9). The obtained reduction factors (estimated or defaults) can be used to model the denitrification process or a NUR-curve (Figure 8.4). For that purpose the following assumptions are made:
amount of Ss and Xs recognised by heterotrophs under aerobic and anoxic conditions is the same; anoxic Ss-oxidation rate, Xs-hydrolysis rate and endogenous respiration rate are smaller than the corresponding aerobic rates which is expressed by the subsequent
reduction factors T|i, i"|2 and T|3; - reduction factors are specific for each system;
anoxic heterotrophic yield is equal to the aerobic yield (YHD=YH).
In chapter 3 a methodology is presented to assess reduction factors (r\\, T[i andr^) by a parallel performance of NUR- and OUR-tests, under well-defined analogical experimental conditions. The factor T)3 was obtained from a direct comparison of aerobic and anoxic endogenous respiration rates. The obtained SNo-curve from a NUR-test was fitted with a simple denitrification model using wastewater composition and kinetic parameters as estimated from the OUR-test while the r|i and T)2 were the only unknown parameters.
D NUR measured NUR modelled with simplified denitrification model
CO 20
100 200 300
t (min)
Figure 8.4 Example where NUR-curve is fitted with a simplified denitrification model. The kinetic parameters and wastewater characteristics are obtained from the identification of an OUR-curve while the reduction factors were obtained from a fitting procedure.
8.3 METHODOLOGY TO ESTIMATE THE N-REMOVAL POTENTIAL
The OUR-curve with the nitrification suppression can be modelled with the aerobic substrate (biodegradable COD) conversion model (chapter 4, Table 4.8, processes 1-3). When incorporating nitrification in the OUR-test, the obtained respirogram can be modelled using the nitrification-aerobic COD-oxidation model (chapter 4, Table 4.8, processes 1-5). To limit the amount of unknown parameters the nitrification kinetics can be acquired by performing OUR-tests with model substrates (NH4CI and NaN02) and identification of the attained respirograms with a nitrification model (Table 4.8, processes 4-5). Optionally the Ss-
174
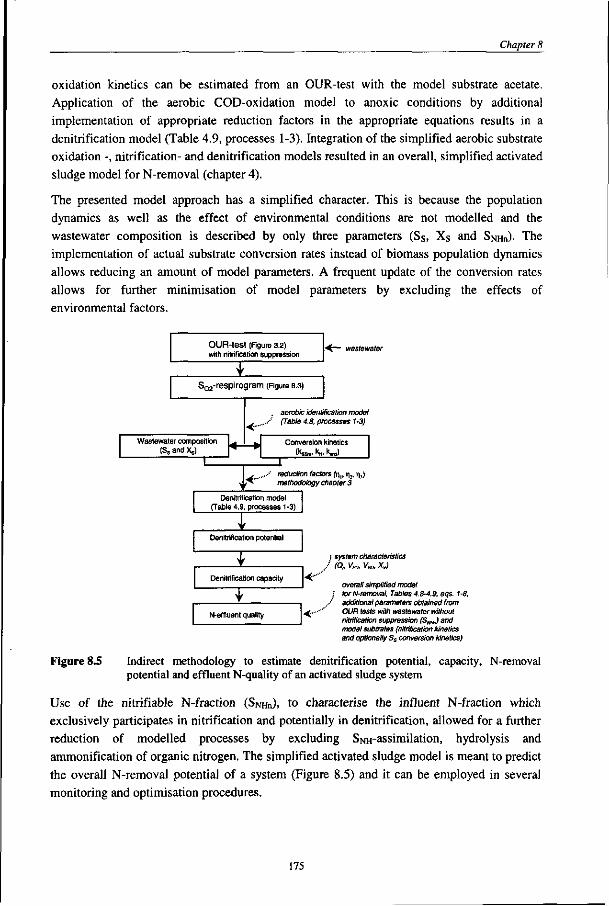
Chapter 8
oxidation kinetics can be estimated from an OUR-test with the model substrate acetate. Application of the aerobic COD-oxidation model to anoxic conditions by additional implementation of appropriate reduction factors in the appropriate equations results in a denitrification model (Table 4.9, processes 1-3). Integration of the simplified aerobic substrate oxidation -, nitrification- and denitrification models resulted in an overall, simplified activated sludge model for N-removal (chapter 4).
The presented model approach has a simplified character. This is because the population dynamics as well as the effect of environmental conditions are not modelled and the wastewater composition is described by only three parameters (Ss, Xs and SNHIO- The implementation of actual substrate conversion rates instead of biomass population dynamics allows reducing an amount of model parameters. A frequent update of the conversion rates allows for further minimisation of model parameters by excluding the effects of environmental factors.
OUR-test (Figure 3.2) with nitrification suppression
S^-respirogram (Figure 8.3)
Wastewater composition (Ss and >g
aerobic identification model (Table 4.8, processes 1-3)
Conversion kinetics
reduction factors fa,, T|2, n,,) methodology chapter 3
Denitrification model (Table 4.9, processes 1-3)
Denitrification potential
Denitrification capacity
N-effluent quality
• system characteristics ' (-Q,. Vm Vso, Xv)
overall simplified model j for N-removal, Tables 4.8-4.9, eqs. 1-8,
•' additional parameters obtained from OUR tests with wastewater without nitrification suppression (SNfJ and model subtrates (nitrification kinetics and optionally Ss conversion kinetics)
Figure 8.5 Indirect methodology to estimate denitrification potential, potential and effluent N-quality of an activated sludge system
capacity, N-removal
Use of the nitrifiable N-fraction (SNHn). to characterise the influent N-fraction which exclusively participates in nitrification and potentially in denitrification, allowed for a further reduction of modelled processes by excluding SNH-assimilation, hydrolysis and ammonification of organic nitrogen. The simplified activated sludge model is meant to predict the overall N-removal potential of a system (Figure 8.5) and it can be employed in several monitoring and optimisation procedures.
175
Discussion
8.4 IMPLEMENTATION AND VALIDATION OF THE DEVELOPED METHODOLOGIES
Testing and validation of the developed methodologies to estimate denitrification- and overall N-removal potential of the activated sludge system were performed using several case studies (batch tests, pilot plants) where the characteristics of activated sludge and wastewater varied. Through these studies it was proved that the methodologies were suitable:
- to assess wastewater characteristics; To model an activated sludge system a relevant wastewater characterisation is essential. Although respiration techniques have served this purpose in the last one and a half decade, it did not obtain sufficient acceptance in practice. Many examples from this thesis prove that both respiration techniques (OUR- and NUR-tests) were a source of reliable information on wastewater composition, allowing for a versatile analysis of the considered activated sludge system. Raw, settled and pre-precipitated domestic wastewater was in this way analysed (chapters 2, 3, 5, 6, 7) for biodegradable COD-fractions but also for the nitrifiable N-concentration. This allowed for example, an evaluation of the effect of pre-treatment on the distribution of the wastewater fractions (chapter 6, 7).
- to estimate the denitrification potential and capacity; Estimation of the denitrification potential allowed for a good definition of process possibilities in relation to wastewater and activated sludge characteristics. Estimation of the denitrification capacity offered an additional tool to optimise a system, both theoretically and in operation (chapter 2, 6, 7).
- to predict N-removal potential of a system: Implementation of the overall simplified activated sludge model for N-removal allowed for a precise estimation of the effluent N-quality in both static and dynamic conditions for two pilot-plants, characterised by significantly different wastewater composition (settled and pre-precipitated) and activated sludge parameters (chapter 5). Implementation of the side-stream aerobic respiration unit allowed for a frequent, reliable estimation of model parameters. Transfer of the respirometrically estimated parameters to describe both, aerobic and anoxic substrate oxidation processes gave satisfactory prediction results.
- to asses reduction factors for denitrification: Implementation of the methodology to assess denitrification reduction factors from OUR- and NUR-tests (chapter 3) allowed to obtain a number of realistic values, in relation to process configuration and parameters. It revealed that each process is characterised by a set of specific values of reduction factors and for that reason individual assessment is required. Moreover, a strongly dynamic character of an activated sludge system affects the reduction factor values. The biggest achievement of this testing was that aerobically obtained model parameters (wastewater characteristics and oxidation kinetics) can be transferred using some modification to describe the denitrification process.
176
Chapter 8
- to control an activated sludge N-removal process; Although not extensively tested, it was signalised that with the presented methodology it is possible to control efficiently the operation of a N-removal activated sludge system. Control of nitrification by aerating the reactor volume on demand, with respect to the SNHn-loading rate and nitrification kinetics, was tested in chapter 7. A stable, low SNH-concentration was attained in the effluent throughout the period of controlled plant operation. Such a control strategy can partly be seen as an optimisation of the denitrification process because over-aeration of a system is avoided, the oxygen content in recycle streams is minimised and a maximal possible denitrification volume is created.
- to optimise theoretically a N-removal system. The presented methodologies to assess the denitrification and N-removal potentials assume the necessity to perform more or less frequently the appropriate batch tests to estimate the actual process capabilities and wastewater characteristics. They are thus especially suitable for analysis of an existing system. Since biomass population dynamics are frozen in the simplified model, the prediction of system capabilities after a significant modification is not correct without specific measurements. However, within certain limits the effect of 'little changes' on the system efficiency can be predicted using the simplified N-removal model (chapter 6).
8.5 POSSIBLE APPLICATIONS OF THE DEVELOPED METHODOLOGIES IN PRACTICE
The developed methodologies for the estimation of the denitrification potential with the NUR-and/or OUR-test suggest some possible implementations, which are discussed in the following paragraphs.
8.5.1 APPLICATION FOR EXISTING SYSTEMS
For estimation of the denitrification potential and capacity of an existing system, the method based on the NUR-test (chapter 2) is recommended. A simple NUR-test allows extracting sufficient and relevant information on the denitrification potential of an existing system without using complex approaches where biomass dynamics are used. When system characteristics as influent flow, volume and sludge concentration are available, the denitrification potential can be translated into denitrification capacity. This approach is especially useful to optimise a system by:
- increasing pre-denitrification volume to increase the magnitude of anoxic Ss- and Xs-utilisation; increasing post-anoxic volume in case when effluent nitrate concentration slightly differs from the required value and biodegradable COD is limiting in pre-denitrification zone;
- minimising oxygen input to the pre-denitrification volume by avoiding too high recirculation rates or minimising the oxygen content in the recycle stream; increasing recirculation rate to provide nitrate load on demand;
177
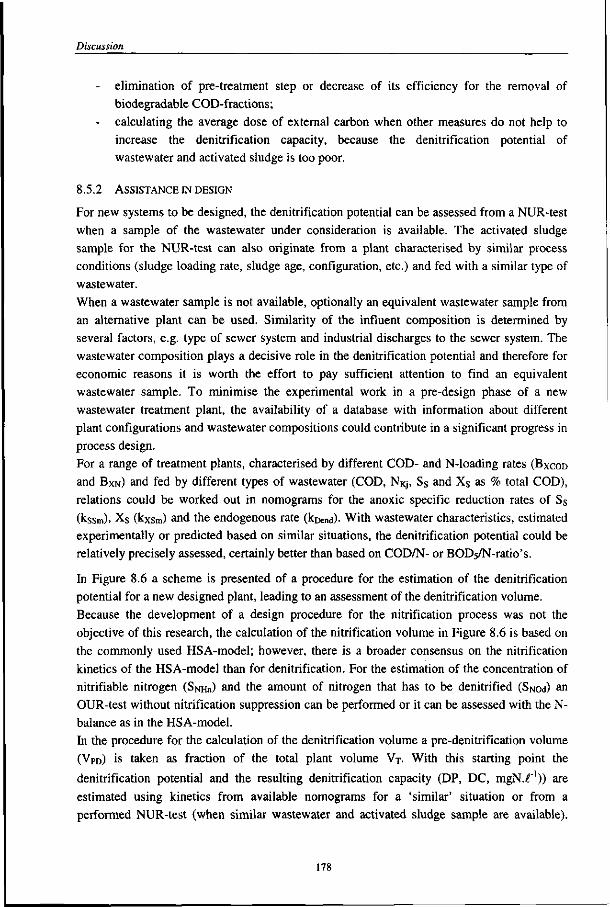
Discussion
elimination of pre-treatment step or decrease of its efficiency for the removal of biodegradable COD-fractions;
- calculating the average dose of external carbon when other measures do not help to increase the denitrification capacity, because the denitrification potential of wastewater and activated sludge is too poor.
8.5.2 ASSISTANCE IN DESIGN
For new systems to be designed, the denitrification potential can be assessed from a NUR-test when a sample of the wastewater under consideration is available. The activated sludge sample for the NUR-test can also originate from a plant characterised by similar process conditions (sludge loading rate, sludge age, configuration, etc.) and fed with a similar type of wastewater. When a wastewater sample is not available, optionally an equivalent wastewater sample from an alternative plant can be used. Similarity of the influent composition is determined by several factors, e.g. type of sewer system and industrial discharges to the sewer system. The wastewater composition plays a decisive role in the denitrification potential and therefore for economic reasons it is worth the effort to pay sufficient attention to find an equivalent wastewater sample. To minimise the experimental work in a pre-design phase of a new wastewater treatment plant, the availability of a database with information about different plant configurations and wastewater compositions could contribute in a significant progress in process design.
For a range of treatment plants, characterised by different COD- and N-loading rates (BXCOD
and BXN) and fed by different types of wastewater (COD, NKj, Ss and Xs as % total COD), relations could be worked out in nomograms for the anoxic specific reduction rates of Ss (kssm), Xs (kxsm) and the endogenous rate (koend)- With wastewater characteristics, estimated experimentally or predicted based on similar situations, the denitrification potential could be relatively precisely assessed, certainly better than based on COD/N- or BOD5/N-ratio's.
In Figure 8.6 a scheme is presented of a procedure for the estimation of the denitrification potential for a new designed plant, leading to an assessment of the denitrification volume. Because the development of a design procedure for the nitrification process was not the objective of this research, the calculation of the nitrification volume in Figure 8.6 is based on the commonly used HSA-model; however, there is a broader consensus on the nitrification kinetics of the HSA-model than for denitrification. For the estimation of the concentration of nitrifiable nitrogen (SNHII) and the amount of nitrogen that has to be denitrified (Snod) an OUR-test without nitrification suppression can be performed or it can be assessed with the rebalance as in the HSA-model. In the procedure for the calculation of the denitrification volume a pre-denitrification volume (VPD) is taken as fraction of the total plant volume VT. With this starting point the denitrification potential and the resulting denitrification capacity (DP, DC, mgN.-f1)) are estimated using kinetics from available nomograms for a 'similar' situation or from a performed NUR-test (when similar wastewater and activated sludge sample are available).
178
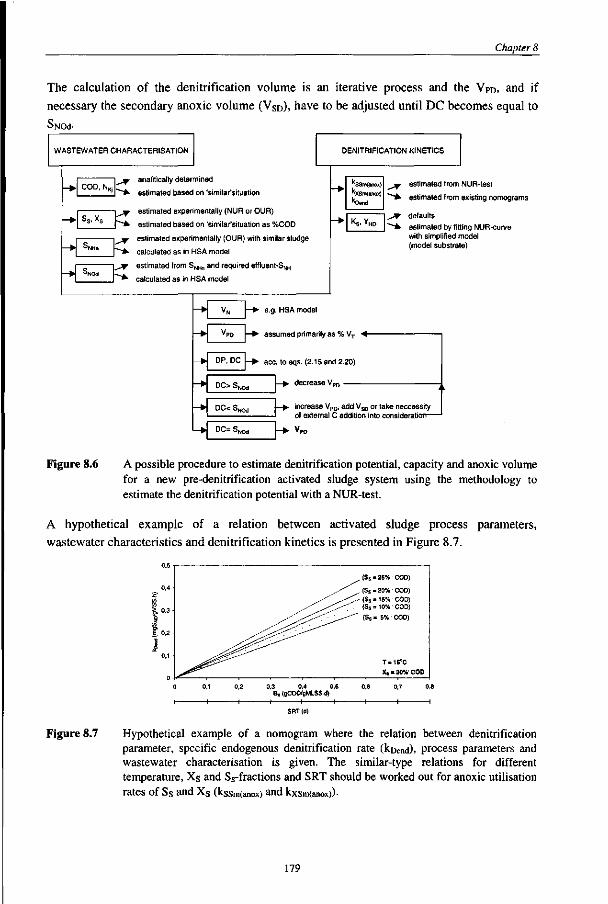
Chapter 8
The calculation of the denitrification volume is an iterative process and the VPD, and if
necessary the secondary anoxic volume (VSD), have to be adjusted until DC becomes equal to
SNOd-
WASTEWATER CHARACTERISATION DENITRIFICATION KINETICS
COD, N^ analiticatly determined
estimated based on 'similar'situation
estimated experimentally (NUR or OUR)
estimated based on 'similar'situation as %COD
estimated experimentally (OUR) with similar sludge
calculated as in HSA model
estimated from SNHn and required effluent-SNH
calculated as in HSA model
K S ' YHI
^jy estimated from NUR-test
"""^ estimated from existing nomograms
^* defaults "-*• estimated by fitting NUR-curve
with simplified model (model substrate)
DP, DC
e.g. HSA model
assumed primarily as % VT <-
acc. to eqs. (2.15 and 2.20)
increase VPD, add VSD or take neccessity of external C addition into consideration—
DC= S ^
Figure 8.6 A possible procedure to estimate denitrification potential, capacity and anoxic volume for a new pre-denitrification activated sludge system using the methodology to estimate the denitrification potential with a NUR-test.
A hypothetical example of a relation between activated sludge process parameters,
wastewater characteristics and denitrification kinetics is presented in Figure 8.7.
0,4
c/j
S.0.3
i £ 0.2
J 0.1 ^0^
,, ,.''"^
../^^'' ^ - ' ^ - ^ < ,~~""~~~
' j^^S-'"'"
, (Ss = 25% COD)
/ ' ' " (Ss = 20% COD) -^ , - < ^ (Ss = 15% COD) , ^ > - - ; (Ss = 10% COD)
- ^ ^ {Ss = 5% COD)
T . 15°C Xs . 30% COD
0,3 0.4 0, Bx (gCOO/gMLSS.d)
Figure 8.7 Hypothetical example of a nomogram where the relation between denitrification parameter, specific endogenous denitrification rate (koend), process parameters and wastewater characterisation is given. The similar-type relations for different temperature, Xs and Ss-fractions and SRT should be worked out for anoxic utilisation rates of Ss and Xs (kssm(anox) and kxsm(anox))-
179
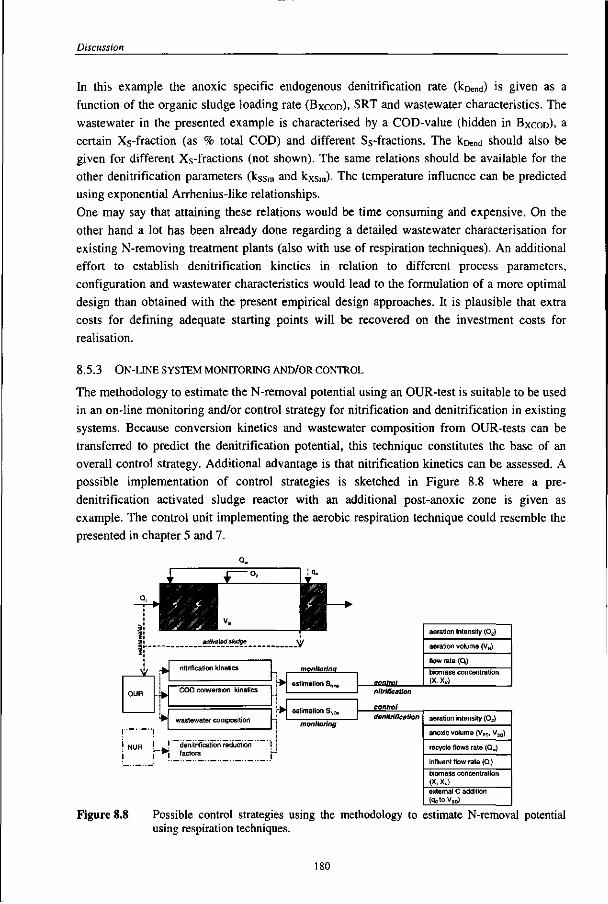
Discussion
In this example the anoxic specific endogenous denitrification rate (koend) is given as a function of the organic sludge loading rate (BXCOD), SRT and wastewater characteristics. The wastewater in the presented example is characterised by a COD-value (hidden in BXCOD)> a certain Xs-fraction (as % total COD) and different Ss-fractions. The kDend should also be given for different Xs-fractions (not shown). The same relations should be available for the other denitrification parameters (kssm and kxsm)- The temperature influence can be predicted using exponential Arrhenius-like relationships. One may say that attaining these relations would be time consuming and expensive. On the other hand a lot has been already done regarding a detailed wastewater characterisation for existing N-removing treatment plants (also with use of respiration techniques). An additional effort to establish denitrification kinetics in relation to different process parameters, configuration and wastewater characteristics would lead to the formulation of a more optimal design than obtained with the present empirical design approaches. It is plausible that extra costs for defining adequate starting points will be recovered on the investment costs for realisation.
8.5.3 ON-LINE SYSTEM MONITORING AND/OR CONTROL
The methodology to estimate the N-removal potential using an OUR-test is suitable to be used in an on-line monitoring and/or control strategy for nitrification and denitrification in existing systems. Because conversion kinetics and wastewater composition from OUR-tests can be transferred to predict the denitrification potential, this technique constitutes the base of an overall control strategy. Additional advantage is that nitrification kinetics can be assessed. A possible implementation of control strategies is sketched in Figure 8.8 where a pre-denitrification activated sludge reactor with an additional post-anoxic zone is given as example. The control unit implementing the aerobic respiration technique could resemble the presented in chapter 5 and 7.
V s^pr
nitrification kinetics
COD conversion kinetics
wastewater composition
! denitrification reduction * j factors
monitorinQ
' ^ estimation SN. control
aeration intensity <02)
aeration volume (VN)
flow rate (QJ
biomass concentration (X, Xv)
• • estimation SN(
monitoring
nitrification
control
aeration intensity (02)
anoxic volume (VPD, VS[
recycle flows rate (Q^)
influent flow rate (Q,)
biomass concentration (X, Xy> external C addition (qc toV5 0)
Figure 8.8 Possible control strategies using the methodology to estimate N-removal potential using respiration techniques.
180
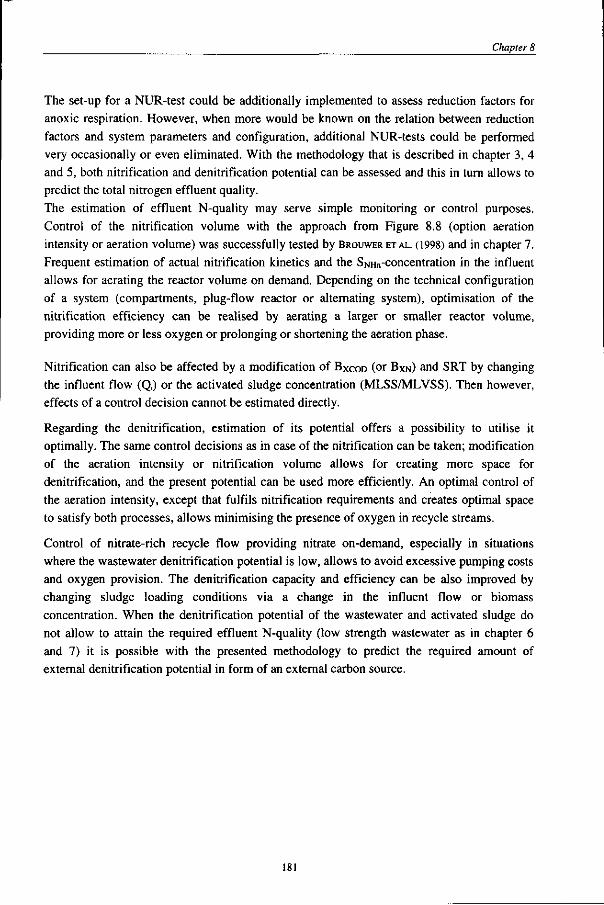
Chapter 8
The set-up for a NUR-test could be additionally implemented to assess reduction factors for anoxic respiration. However, when more would be known on the relation between reduction factors and system parameters and configuration, additional NUR-tests could be performed very occasionally or even eliminated. With the methodology that is described in chapter 3, 4 and 5, both nitrification and denitrification potential can be assessed and this in turn allows to predict the total nitrogen effluent quality. The estimation of effluent N-quality may serve simple monitoring or control purposes. Control of the nitrification volume with the approach from Figure 8.8 (option aeration intensity or aeration volume) was successfully tested by BROUWER ET AL. (1998) and in chapter 7. Frequent estimation of actual nitrification kinetics and the SNHn-concentration in the influent allows for aerating the reactor volume on demand. Depending on the technical configuration of a system (compartments, plug-flow reactor or alternating system), optimisation of the nitrification efficiency can be realised by aerating a larger or smaller reactor volume, providing more or less oxygen or prolonging or shortening the aeration phase.
Nitrification can also be affected by a modification of BXCOD (or BXN) and SRT by changing the influent flow (Q,) or the activated sludge concentration (MLSS/MLVSS). Then however, effects of a control decision cannot be estimated directly.
Regarding the denitrification, estimation of its potential offers a possibility to utilise it optimally. The same control decisions as in case of the nitrification can be taken; modification of the aeration intensity or nitrification volume allows for creating more space for denitrification, and the present potential can be used more efficiently. An optimal control of the aeration intensity, except that fulfils nitrification requirements and creates optimal space to satisfy both processes, allows minimising the presence of oxygen in recycle streams.
Control of nitrate-rich recycle flow providing nitrate on-demand, especially in situations where the wastewater denitrification potential is low, allows to avoid excessive pumping costs and oxygen provision. The denitrification capacity and efficiency can be also improved by changing sludge loading conditions via a change in the influent flow or biomass concentration. When the denitrification potential of the wastewater and activated sludge do not allow to attain the required effluent N-quality (low strength wastewater as in chapter 6 and 7) it is possible with the presented methodology to predict the required amount of external denitrification potential in form of an external carbon source.
181
Discussion
8.6 CONCLUSIONS
The achievement of this thesis can be considered as a step towards a more optimal design and optimisation of the denitrification process. This can be achieved using a relatively simple approach. The proposed approach allows for estimating the denitrification potential of an activated sludge system based on relevant wastewater and activated sludge characteristics. This information can be acquired from two types of respiration tests.
From an anoxic respiration test - nitrate utilisation rate (NUR-) test - with a wastewater sample from the concerned treatment plant, wastewater characteristics, simplified anoxic conversion kinetics and the denitrification potential of wastewater and activated sludge can be assessed directly. For more intensive implementations, an automated NUR-test could be considered as a positive development regarding the experimental and identification procedure.
The aerobic respiration test - oxygen utilisation rate (OUR-) test - with wastewater and nitrification suppression, allows obtaining indirectly the same information as from a NUR-test. To translate the results of an OUR-test to the denitrification potential of a system, a simplified denitrification model was formulated. It resembles practically the aerobic biodegradable COD oxidation model with the only difference that each equation regarding substrate conversion is multiplied with an appropriate denitrification reduction factor. The values of the reduction factors can be assumed based on other widely used approaches or estimated using parallely performed OUR- and NUR-tests.
Both approaches have a simplified character because the population dynamics and influence of any environmental factors are not explicitly modelled. All these effects are however not neglected but, if necessary, hidden in frequently actualised conversion rates.
The presented methodology to estimate the denitrification potential is further extended to the methodology to estimate the overall N-removal potential. This is assesed by extending the simplified aerobic/anoxic substrate oxidation model with a nitrification model (BROUWER AND
KLAPWUK, 1997). The nitrification kinetics is obtained from OUR-tests using a model substrate. The nitrifiable nitrogen from wastewater is obtained by fitting the obtained respirograms with appropriate models from an OUR-test with wastewater and without nitrification suppression.
The developed methodology to estimate the N-removal potential can be implemented for an advanced analysis of existing systems and an objective comparison of a number of optimisation strategies to improve the denitrification and nitrification efficiency. The developed methodology can also be beneficial in design assistance for activated sludge systems with nitrogen removal.
182
LITERATURE
Chapter 8
Brouwer, H. and Klapwijk, B. (1997) Model-gebaseerde sturing van het aerobe volume in een propstroomaktiefslibinstallatie op basis van respirometrie. Rapport of Departement Agro-milieu- en Systeemtechnologie (AMST) Landbouwuniversiteit Wageningen.
Brouwer, H., Bloemen, Klapwijk, B. and Spanjers, H. (1998) Feedforward control of nitrification by manipulating the aerobic volume in activated sludge plants. Wat. Sci. Tech., 38, (3), 245-255.
Burdick, C.R., Refling, D.R. and Stensel, H.D. (1982) Advanced biological treatment to achieve nutrient removal. JWPCF, 54, 1078.
Eckenfelder, W.W. Jr. (1989) Industrial Water Pollution Control, 2nd ed., McGraw-Hill, New York.
Ekama, G.A., Marais, G.v.R., Siebritz, LP., Pitman, A.R., Keay, G.F.P., Keay, G.F.P., Buchnan, L., Gerber, A. and Smollen, M. (1984) Theory, design and operation of nutrient removal activated sludge processes. For Water Research Commission by the University of Cape Town, City Council of Jahannesburg and the National Institute for Water Research of the CSIR, Pretoria.
Henze M., Grady, C.P.L.Jr, Gujer, W., Marais, G.v.R. and Matsuo, T. (1987). Activated sludge model no. 1. IAWPRC Scientifical and Technical Report No. 1, IAWPRC, London.
Henze M., Gujer, W., Mino, T., Matsuo, T., Wentzel, M.C., Marais, G.v.R. (1996) Activated Sludge Model No.2. IAWQ Scientifical and Technical Report No.3.
Hoffman, H. (1986) Konzept und Bemessung der vorgeschalteten Denitrifikation beim Belebungsverfahren. Ber. Wassergiitewirtschaft Gesundheitsing. TU Munchen 72, 1-43.
Kayser,R. (1983) Ein Ansatz zur Bemessung einstufiger Belebungsanlagen fur nitrifikation-Denitrifikation. gwf Wasser/Abwasser, 124, 419-427.
Kayser, R. (1999) New German design guideline for single stage activated sludge plants. Presented on 8* IAWQ conference on Design, Operation and Economics of Large Wastewater Treatment Plants, 6-9 September, 1999, Budapest, Hungary.
Scheer, H. and Seyfried, C.F. (1994) Concepts for determining the readily biodegradable substrate in the sewage and procedures for dimensioning the biological phosphorus removal. Korrespondenz Abwasser, 41, 3/94.
SDA (Soap and Detergents Association) (1988) Principles and practice of nutrient removal from municipal wastewater.
STOWA (1995) Evaluatie van het HSA-model voor toepassing in Nederland, 95-19.
US EPA (1987) Design manual: phosphorus removal. EPA/62-1/1-87/001.
183
Summary
Summary
Denitrification, with its prerequisite process nitrification, is a common practice to remove nitrogen from wastewater in activated sludge systems. From a large number of information published in the last three decades on denitrification it seems to be a well-recognised process. Key factors detrimental to its performance (chapter 1) are well known. The practical evidence indicates however that available information is not always efficiently utilised, although the need to optimise denitrification is often faced in both design and operation.
The relation between the denitrification potential and a detailed wastewater characterisation is an example of prior information that could be better utilised for design and optimisation of the denitrification process. Nowadays, in several obligatory denitrification design approaches a general parameter as COD/N- or BODs/N-ratio is used. With these lumped parameters it is not possible to estimate precisely the denitrification potential, capacity or efficiency. No universal default value can be given due to a unique character of each activated sludge and wastewater. This can be confirmed by a large number of estimated values (Table 1.2) of very extended ranges. Other design approaches use empirical values of the denitrification rate. The analysis of a variety of reported denitrification rate definitions and values (Table 1.1) may lead to the conclusion that this is also not the method for an optimal system design. Implementation of empirical approaches may lead to an under- or overestimation of the denitrification volume, what for economic reasons should be avoided. A strong need is observed for improved design and optimisation procedures for wastewater treatment plants, based on an accurate but relatively simple estimation of the denitrification potential in relation to detailed wastewater and activated sludge characteristics.
In this thesis a methodology is presented for the estimation of the denitrification potential in relation to wastewater and activated sludge characteristics. The denitrification potential (DP) in this thesis is defined as the amount of nitrate that can be reduced with biodegradable COD-fractions present in wastewater and from the endogenous respiration. The derivative of the denitrification potential, denitrification capacity, is defined as the amount of nitrate that is reduced in a given system. A common loss of biodegradable COD for aerobic oxidation (too small anoxic volume, oxygen recycle to anoxic volumes) or biological P-removal are examples that contribute in a lower denitrification capacity than DP.
Two respiration techniques formed the basis for two different approaches, the anoxic nitrate utilisation rate test (NUR-test) and the aerobic oxygen utilisation rate test (OUR-test). The approach that is based on the NUR-test is a direct method for the assessment of the DP. The approach based on the OUR-test is an indirect method because a simplified model is necessary to transform the oxygen utilisation rate to a nitrate utilisation rate. Both methods were validated with several case studies, characterised by different wastewater composition and activated sludge characteristics. The developed methods offer an advanced possibility for design assistance, optimisation, monitoring and control of wastewater treatment systems with nitrogen removal.
In chapter 2 a methodology based on NUR-tests is proposed to estimate the DP of an activated sludge system. Next to the DP, attention is paid to the estimation of the denitrification capacity. Knowledge on the denitrification potential of wastewater allows to calculate the overall denitrification potential of a given treatment plant. In combination with system characteristics and simplified denitrification kinetics it is possible to predict the denitrification capacity and the nitrate effluent quality, probably more accurately than based
185
Summary
on COD/N-ratio or empirical denitrification rates. Using the proposed methodology, also the concentration of readily and slowly biodegradable COD-fractions (Ss and Xs respectively), denitrification rates on Ss, Xs, the endogenous denitrification rate and the anoxic utilisation rates of Ss and Xs can be estimated. With denitrification kinetics and relevant wastewater characteristics several optimisation decisions to improve the denitrification capacity of existing treatment plants can be undertaken with a simplified model.
When the internal DP of a plant is not sufficient to satisfy required effluent N-quality standards, the DP can be increased external in the form of a supplemental carbon source. Using the NUR-based approach, DP and kinetics can be acquired for any external carbon source. With denitrification kinetics from a NUR-test with e.g. acetate, the relation between the obtainable denitrification rate and the acetate sludge loading rate was modelled. Such type of relational model enables to design the rate of an external carbon dosage, the volume of the post-anoxic reactor volume and the development of a control strategy.
To obtain maximum advantage from NUR-tests, a number of experimental conditions have to be followed. For interpretation of the results special attention has to be paid on nitrite inclusion in assessment of the kinetics, presence of enhanced biological phosphorus removal and a proper choice of the anoxic heterotrophic yield factor YHD-
Chapter 3 is the prelude to a simplified activated sludge denitrification model. Activated sludge shows a similar respirometric behaviour pattern under anoxic and aerobic conditions to organic substrate. However, the subsequent respiration rates are usually smaller under anoxic conditions. In activated sludge models, where the denitrification process is mathematically described with aerobic substrate conversion equations, this fact is implemented by appropriate reduction factors (rj)- In chapter 3 a methodology is presented to estimate three reduction factors for three anoxic conversion rates: Ss-utilisation (r)i), Xs-hydrolysis (r|2) and endogenous respiration (r\i), since these processes are assumed to build up the denitrification in the simplified denitrification model (chapter 4 and 5). The methodology consists of two integrated parts: an experimental part and an estimation procedure. The experimental part implements the two respiration based techniques (OUR-test with nitrification suppression and NUR-test), performed under well-defined and analogous experimental conditions. For the estimation procedure two simplified models are used: an aerobic biodegradable COD-oxidation model and a denitrification model. Wastewater characterisation and conversion kinetics can be assessed from an OUR-test by using the estimation procedure with the simplified aerobic COD-oxidation model. The NUR-curve is fitted with the denitrification model, being a modified version of the aerobic model but extended with reduction factors for each process. Since the majority of model parameters are assessed via aerobic respiration tests with wastewater or model substrates, and the factor T|3 can be determined directly, the reduction factors T)i and r|2 are the only optimised parameters from the NUR-curve fitting. Additional attention was paid on the magnitude of difference between the aerobic and anoxic heterotrophic yield and anoxic and aerobic wastewater characterisation.
Some respiration tests were performed with settled domestic wastewater and different activated sludge samples. The results revealed that the values of reduction factors are not uniform but vary in function of activated sludge characteristics, operational conditions and process configuration. From the first validation turned out that the factor T|i is the most sensitive. The reduction factor r\2 exposed less variation and oscillated around values commonly proposed in literature and validated model approaches (0.6-0.7). The reduction factor r|3 exposed much lower values than reported in literature.
186
Summary
From a limited number of respiration tests with acetate as model substrate, the aerobic heterotrophic yield (YH) turned out to be approximately 10% higher than the corresponding anoxic yield (YHD) from nitrifying and nitrifying-denitrifying systems. Estimation of YH and YHD using activated sludge with a high fraction of XPAo is not advised with the proposed methodology because processes of substrate storage and storage product utilisation are not modelled. When YH and YHD are not assessed, the choice of default values from other validated approaches remains an option.
The characterisation of biodegradable wastewater fractions (Ss and Xs) under aerobic and anoxic conditions resulted in similar values for activated sludge originating from nitrifying-denitrifying systems. Non-adapted activated sludge exposed more deviation between the estimated Ss-fractions from OUR- and NUR-tests.
In chapter 4 a simplified respiration based denitrification model is presented and incorporated with the existing simplified model for nitrification and aerobic COD-oxidation (BROUWER AND KLAPWUK (1997) and BROUWER ET AL„ (1998)). A characteristic feature of the resulting simplified nitrification-denitrification model is that substrate conversion is not modelled via the growth of appropriate groups of micro-organisms. Instead, experimentally estimated conversion rates are used, which fact contributes in a reduction of model components with regards to advanced approaches. When the conversion rates are frequently actualised, changes in biomass activity, by varying operational and environmental conditions (temperature, pH, nutrient availability, toxicity), are included. By defining only three biodegradable wastewater fractions, a compromise between complexity and simplicity was obtained. These fractions are the previously introduced S s and Xs and additionally the nitrifiable nitrogen (SNHn)- The fraction SiMHn represents the nitrogen fraction participating exclusively in nitrification. This allows for a reduction of processes and associated parameters in the simplified nitrification-denitrification model. Aerobic and anoxic organic substrate conversions are modelled with the same relations but for anoxic conditions appropriate reduction factors are incorporated in conversion kinetics to reflect a slower activity of activated sludge under denitrifying conditions. The proposed model approach constitutes an alternative for both complex and far-simplified model approaches.
Calibration and implementation of advanced models requires an input of a significant number of parameters. Since the estimation of each parameter is difficult and time consuming, the choice of default values is an option but this can lead to erroneous predictions of reality. Use of complex models is inconvenient for applications like control or monitoring because it creates computational and analytical efforts. The far-simplified models, usually based on online measurement of process state variables (e.g. ammonia, nitrate), are applied to describe a limited number of processes with the simplest kinetics.
To obtain maximum benefits from the presented simplified model, the incorporation of a side-stream respiration based control unit for parameter estimation is necessary. To minimise maintenance and operational efforts the respiration set-up should be as far as possible automated regarding the performance of subsequent respiration tests and numerical procedures to assess model parameters and wastewater characteristics.
The validity and applicability of the simplified model was further tested in chapter 5 with two pilot-plant configurations. The majority of model parameters, like wastewater characteristics and aerobic conversion kinetics, were obtained using the side-stream automated respiration based control unit RESCUE (BROUWER AND KLAPWUK, 1997, BROUWER ETAL., 1998).
187
Summary
Denitrification reduction factors (T|i..T|3), necessary to describe anoxic substrate conversions, were estimated with the methodology as presented in chapter 3 or values from previous research on the examined system were taken. The same heterotrophic yield was used for both aerobic and anoxic conditions. For parameters having little influence on the quality of model predictions, default values were used. Steady-state and dynamic simulations were generally performed with satisfactory results.
Acceptable results of steady-state simulations implicate that the simplified model can be used to predict the overall N-removal potential, based on an actual detailed wastewater and activated sludge characterisation. The good prediction of the dynamic behaviour of the nitrate course in the effluent implicates that the model can be implemented for control strategies, e.g. for a feed-back control of the denitrification by a nitrate-rich recycle rate and/or the addition of an external carbon source. Another advantage of the model is its implementation to control the nitrification volume, tested already by BROUWER AND KLAPWUK, 1997, BROUWER ET AL., 1998 and further in chapter 7 of this thesis.
The validation of the presented approach proved that activated sludge oxidation kinetics and wastewater composition, estimated with one type of respiration measurement, enable to describe very closely the overall N-removal process. In this way the scope of implementation of aerobic respirometry gets extended with the denitrification process. However, the anoxic respiration test to assess reduction factors must sometimes assist to attain better prediction results. When once assessed, the reduction factors for denitrification do not need to be frequently updated if the activated sludge system operates in 'steady-state' conditions. Strong system dynamics (influent dynamics and a frequent change of the ratio between pre-anoxic and aerobic zones) affects especially the reduction factor T|i.
In chapter 6 the effect of pre-precipitation on wastewater composition, DP and overall activated sludge process was examined in lab-scale SBR systems. The operation of a reference system fed with raw wastewater enabled direct comparison. With a coagulant dose of P=1.2 (molar ratio metal to influent phosphorus), the total COD/N-ratio was decreased from 6.5 to 3.0. The soluble COD-fractions were eliminated in significant lower rate than the particulate COD-fractions. The significant reduction of biodegradable wastewater COD (mainly in form of Xs) led to high nitrate-effluent concentrations of approximately 21.3 mg.f' while in the reference system with raw wastewater 8 mg.f' was attained. The wastewater DP was reduced with 42% when compared with a reference system fed with raw wastewater.
The activated sludge from the system fed with pre-precipitated wastewater exposed higher specific denitrification rates for different carbon sources (Ss, Xs, acetate, endogenous) and higher nitrification rates than sludge from the reference system fed with raw wastewater. The higher activity of heterotrophic sludge was probably caused by the presence of a higher fraction of viable biomass due to a significant reduction of Xs and Xi from the wastewater. Longer SRT, lower COD/N-ratio and more viable activated sludge contributed in an increased activity of autotrophic biomass. The DP was however the determining factor for low denitrification efficiency in the system fed with pre-precipitated wastewater. This underlines the risk of using denitrification rates for design of activated sludge systems.
The simplified nitrification-denitrification model was employed to optimise theoretically the denitrification in the SBR system with pre-precipitated influent. The results of simulations allowed to suppose that only little improvement of the denitrification efficiency by manipulating with operational conditions is possible when the DP of the wastewater is
Summary
originally low. The optimisation of such a system is mainly restricted to take maximum advantage of the endogenous denitrification what leads to big anoxic reactors.
To verify the statements on the effect of pre-precipitation on the DP, as derived from the research described in chapter 6, and because of contradictive evaluations appearing in literature, a supplementary research is described in chapter 7. A respiration based control strategy was implemented for optimising a pre-denitrification pilot-plant with pre-precipitated wastewater. This control strategy relies on the adjustment of the nitrification volume to an actual nitrifiable-N load, and this allowed avoiding over-aeration. In this way a maximum possible denitrification fraction could be created. Further, relatively high sludge loading rates were employed while satisfactory nitrification efficiency could still be attained.
Pre-precipitation with ferric chloride ((3=1.0) lowered the total COD/N-ratio of the raw wastewater from 7.6 to 4.7. Despite of more beneficial wastewater characteristics comparing with the research described in chapter 6, and implementation of a well operating control strategy, the denitrification efficiency was not significantly improved. Concerning the nitrate effluent quality, an improvement of 5 mgN.r1 could be obtained for wastewater of the same origin (16.3 vs. 21.3 mg N.r1 respectively) and the standard of total N < 10 mgN.r' was still not fulfilled. The results in chapter 7 confirm that the required COD/N-ratio to attain satisfactory denitrification is not a universal value but is strongly dependent on wastewater and activated sludge characteristics, process conditions and operational parameters.
While the DP of raw and settled wastewater in question allowed to fulfil the nitrate standard in the effluent, the reduction of biodegradable COD by normal rate pre-precipitation caused a significant deterioration. Any optimisation step aiming to improve the denitrification efficiency may improve the nitrate effluent quality only to small extent; in principle it is only an option in situations where the effluent nitrate level differs slightly from the demanded value.
In chapter 8 a comprehensive summary of the presented methodologies to estimate the DP and overall N-removal potential and the interrelation between the subsequent components of the overall methodologies is presented. Examples of validation of different methodologies are given and briefly sketched in this chapter. The discussion on possible application is divided between existing and designed activated sludge systems.
The approach based on a simple NUR-test is especially useful to optimise a system by changing functional zones, internal recycle ratio's, minimising oxygen input to the denitrification volume and evaluating the effect of pre-treatment on the process. When other measures do not help to increase the denitrification capacity, also the average dose of an external carbon source can be estimated. The implementation of a NUR-test for new systems is possible but with the precondition that a comparable wastewater sample and activated sludge sample from a plant with similar process conditions is available. To minimise the experimental effort in a pre-design phase of a new wastewater treatment plant, the availability of a database with information about different plant configurations and wastewater compositions could contribute in a significant progress in process design. For a range of treatment plants, characterised by different loading rates and fed by different types of wastewater, relations could be worked out in nomograms for the anoxic specific reduction rates of Ss, Xs and the endogenous rate. It is expected that the denitrification potential estimated in this way is much more precise than based on COD/N- or BODs/N-ratio's.
Summary
The methodology to estimate the N-removal potential using an OUR-test is suitable to be used in an on-line monitoring and/or control strategy for nitrification and denitrification in existing systems. Because conversion kinetics and wastewater composition from OUR-tests can be transferred to predict the denitrification potential, this technique constitutes the base of an overall control strategy. Additional advantage is that nitrification kinetics can be assessed. The set-up for a NUR-test could be additionally implemented to assess reduction factors for anoxic respiration. However, when more would be known on the relation between reduction factors and system parameters and configuration, additional NUR-tests could be performed occasionally or even eliminated. With the methodologies described in this thesis, both nitrification and denitrification potential can be assessed and this allows for a prediction of the total nitrogen effluent quality.
190
Samenvatting
Samenvatting
Voor de verwijdering van stikstof uit afvalwater is het gecombineerde actiefslibproces van nitrificatie en denitrificatie de gangbare praktijk. De hoeveelheid informatie die in de laatste drie decennia is verschenen over denitrificatie doet vermoeden dat de bepalende factoren voor de uitvoering (hoofdstuk 1) voldoende bekend zijn en dat het proces voldoende wordt doorgrond. De praktijk laat zien dat de beschikbare informatie echter niet altijd doelmatig wordt toegepast, terwijl de noodzaak voor een optimalisatie van het denitrificatieproces regelmatig aan de orde is bij ontwerp en bedrijfsvoering van actiefslibsystemen.
Een voorbeeld van primaire informatie die beter zou kunnen worden benut voor ontwerp en optimalisatie van het denitrificatieproces is de relatie tussen de denitrificatiepotentiaal en een gedetailleerde afvalwaterkarakterisering. In de huidige gangbare ontwerpprocedures wordt doorgaans uitgegaan van algemene parameters als CZV/N- of BZVs/N-verhouding. Met deze somparameters is het daarentegen niet mogelijk de denitrificatiepotentiaal, -capaciteit of het rendement nauwkeurig te bepalen. Voor deze parameters bestaat geen universele waarde vanwege het unieke karakter van elk type afvalwater en actief slib. Dit kan worden bevestigd door de grote gesignaleerde variatie in benodigde CZV/N- of BZVs/N-verhouding voor een vergaande denitrificatie (Tabel 1.2). Alternatieve ontwerpprocedures gebruiken empirische waarden voor de denitrificatiesnelheid. Een analyse van de grote variatie in gerapporteerde definities en waarden voor de denitrificatiesnelheid (Tabel 1.1), geeft aan dat ook dit niet de adequate methode is voor een optimaal ontwerp. Toepassing van bovengenoemde empirische methoden kan resulteren in een onder- of overschatting van het denitrificatievolume en uit kosten-technisch oogpunt moet dit worden vermeden. Om deze reden is er behoefte voor een verbeterde procedure voor het ontwerpen en optimaliseren van actiefslibsystemen, gebaseerd op een accurate en relatief eenvoudige bepaling van de denitrificatiepotentiaal in relatie tot een gedetailleerde karakterisering van het afvalwater en actiefslib. In dit proefschrift zijn methoden gepresenteerd voor de bepaling van de denitrificatiepotentiaal.
De denitrificatiepotentiaal (DP) van een actiefslibsysteem is gedefinieerd als de hoeveelheid nitraat die kan worden gereduceerd met de biodegradeerbare CZV-fracties in het afvalwater en de endogene respiratie van het actief slib. De denitrificatiecapaciteit is een afgeleide van de denitrificatiepotentiaal en is gedefinieerd als de hoeveelheid nitraat die wordt gereduceerd in een bepaald systeem. De aerobe oxidatie van biodegradeerbaar CZV (vanwege beperkt anoxisch volume of recirculatie van zuurstof naar de anoxische zone) en het verbruik van CZV voor de biologische P-verwijdering, zijn processen die verantwoordelijk zijn voor een lagere denitrificatiecapaciteit in vergelijking tot de DP.
Twee respiratietechieken vormen de basis voor twee benaderingen: de anoxische respiratietest voor het meten van de nitraatverbuiksnelheid (in Engels: NUR-test) en de aerobe respiratietest voor het meten van de zuurstofverbruiksnelheid (in Engels: OUR-test). De benadering gebaseerd op de NUR-test is een directe methode voor de schatting van de DP. Omdat een vereenvoudigd model moet worden gebruikt voor het omzetten van de zuurstofverbruiksnelheid naar een nitraatverbruiksnelheid, moet de benadering met de OUR-test worden opgevat als een indirecte methode. Beide methoden zijn getest voor meerdere actiefslibsystemen, met een variatie in afvalwatersamenstelling en slibkarakteristiek. De ontwikkelde procedures bieden een goede mogelijkheid voor ontwerp, optimalisatie en regeling van actiefslibsystemen met stikstofverwijdering.
191
Samenvatting
Hoofdstuk 2 behandelt de procedure om de DP van een actiefslibsysteem te bepalen met een NUR-test. Naast de DP wordt aandacht besteed aan de berekening van de denitrificatie-capaciteit. Kennis over de DP van het afvalwater maakt het mogelijk om de totale DP van een actiefslibsysteem te bepalen. In combinatie met de procesparameters en een vereenvoudigde denitrificatiekinetiek is het mogelijk om de denitrificatiecapaciteit en het nitraatgehalte in het effluent nauwkeuriger te bepalen dan op basis van een CZV/N-verhouding of empirische denitrificatiesnelheden. Met de voorgestelde procedure is het tevens mogelijk om snel en langzaam biodegradeerbare CZV-fracties te bepalen (Ss en Xs) in het afvalwater, de denitrificatiesnelheden op Ss en Xs, de endogene denitrificatiesnelheid en de anoxische omzettingssnelheid van Ss en Xs. Met de denitrificatiekinetiek en relevante afvalwaterkarakterisering kunnen voor bestaande actiefslibsystemen meerdere optimalisatie-mogelijkheden worden beoordeeld met een vereenvoudigd actiefslibmodel.
Wanneer de DP van een actiefslibsysteem niet voldoende is voor het bereiken van de vereiste effluentkwaliteit, kan de DP worden verhoogd in de vorm van een externe koolstofbron. Met de voorgestelde NUR-test kunnen de DP en denitrificatiekinetiek eenvoudig worden vastgesteld van elk type koolstofbron. Voor acetaat was de relatie gemodelleerd tussen de haalbare denitrificatiesnelheid en de acetaatdosering. Met een dusdanige relatie is het mogelijk de doseerhoeveelheid van een externe koolstofbron en het extra benodigde denitrificatievolume te ontwerpen. De relatie kan ook dienen als basis voor het ontwerp van een regelstrategie voor de dosering.
Voor een juiste interpretatie van resultaten dient bij een NUR-test met een aantal experimentele condities rekening te worden gehouden. Speciale aandacht moet onder meer worden besteed aan de vorming van nitriet, de aanwezigheid van biologische P-verwijdering en een adequate keuze van de anoxische heterotrofe yield factor YHD-
Hoofdstuk 3 vormt de inleiding van het in dit proefschrift gepresenteerde vereenvoudigd denitrificatiemodel. Onder anoxische omstandigheden laat actief slib een soortgelijk respirometrisch gedrag zien als onder aerobe omstandigheden. Onder anoxische omstandigheden zijn de opeenvolgende respiratiesnelheden echter lager. In actiefslibmodellen waar het denitrificatieproces wiskundig wordt beschreven via aerobe substraatomzettings-snelheden, wordt daarom gebruik gemaakt van reductiefactoren (r\). In hoofdstuk 3 is een methode gepresenteerd voor de bepaling van de reductiefactoren voor: Ss-omzetting (r|i), Xs-omzetting (r|2) en de endogene respiratie (r\i). Deze processen zijn betrokken bij de opbouw van de denitrificatie in het vereenvoudigde denitrificatiemodel (hoofdstuk 4 en 5). De methode voor de bepaling van de reductiefactoren bestaat uit een experimenteel deel en een numerieke procedure voor parameterschatting. Het experimentele deel omvat de twee respiratietechnieken (OUR-test met remming van nitrificatie en een NUR-test) onder gedefinieerde en identieke experimentele condities. Voor de numerieke procedure worden twee vereenvoudigde modellen gebruikt: een aeroob model voor de oxidatie van biodegradeerbaar CZV en een denitrificatiemodel. De afvalwaterkarakteristiek en kinetiek van de omzetting kunnen worden bepaald via een OUR-test en parameterschatting met het aerobe model. Het verloop van de NUR-test wordt 'gefit' met het denitrificatiemodel, een gemodificeerde versie van het aerobe model met reductiefactoren voor elk proces. Omdat de meerderheid van de modelparameters zijn bepaald via de OUR-test met afvalwater of een modelsubstraat en de factor T|3 direct kan worden bepaald, zijn de reductiefactoren r\\ and T|2 de enige optimalisatieparameters. Bij het uitwerken van de methode is extra aandacht besteed aan de mate van variatie tussen de aerobe en anoxische heterotrofe yieldfactor en de aerobe en anoxische afvalwaterkarakterisering.
192
Samenvatting
Een aantal respiratie-experimenten is uitgevoerd met voorbezonken afvalwater en verschillende soorten actief slib. De resultaten geven aan dat de waarden van de reductiefactoren niet uniform zijn en varieren in functie van slibkarakteristiek, proces-parameters en configuratie. Het bleek dat de factor r)i de meest gevoelige factor is. De reductiefactor T)2 vertoonde minder variatie en lag rond waarden die staan vermeld in de literatuur (0,6-0,7). De bepaalde reductiefactor T|3 was lager dan gerapporteerd in de literatuur.
Van een beperkt aantal respiratie-experimenten met acetaat als modelsubstraat, bleek de aerobe heterotrofe yieldfactor (YH) ongeveer 10% hoger te zijn dan de corresponderende anoxische yieldfactor (YHD) voor slib van een systeem met alleen nitrificatie en van een systeem met nitrificatie en denitrificatie. Voor de bepaling van YH en YHD met slib met een hoge fractie aan XPAO> is de gepresenteerde methode niet geschikt omdat geen rekening is gehouden met opslagproducten. Wanneer YH en YHD niet worden vastgesteld blijft de keuze van standaardwaarden uit de literatuur een mogelijkheid.
De karakterisering van biodegradeerbare fracties (Ss en Xs) onder aerobe en anoxische omstandigheden resulteerde in vergelijkbare waarden bij gebruik van actief slib van een nitrificerend/denitrificerend systeem. Niet-geadapteerd slib vertoonde meer variatie in de bepaalde Ss-fractie via OUR- of NUR-testen.
In hoofdstuk 4 wordt het op respirometrie gebaseerde vereenvoudigde denitrificatiemodel gepresenteerd. Dit model wordt samengevoegd met het bestaande vereenvoudigde model voor nitrificatie en aerobe CZV-oxidatie (BROUWER AND KLAPWUK (1997) and BROUWER ET AL., (1998)). Een karakteristieke eigenschap van het resulterende model is dat de substraatomzetting niet is gemodelleerd via de groei van de betrokken organismen. In plaats daarvan worden experimenteel bepaalde omzettingssnelheden gebruikt. Dit leidt tot een reductie van modelcomponenten in vergelijking tot geavanceerde modellen. Wanneer de omzettings-snelheid regelmatig wordt geactualiseerd, zal hierin de verandering in de activiteit van de biomassa (door variatie in temperatuur, pH of toxiciteit) worden gereflecteerd. Voor de afvalwaterkarakterisering zijn slechts drie biodegradeerbare fracties gedefinieerd; hierdoor is een compromis tussen complexiteit en eenvoud bereikt. Naast de fracties Ss en Xs wordt als extra fractie het nitrificeerbaar stikstof (SNHII) gei'ntroduceerd. De fractie SNHII representeert de stikstoffractie die exclusief deelneemt in het nitrificatieproces. Dit staat een reductie toe van bepaalde processen en betrokken parameters voor een vereenvoudiging van het model. Aerobe en anoxische substraatomzetting zijn gemodelleerd met dezelfde relatie waarbij voor anoxische condities reductiefactoren zijn gebruikt voor de beschrijving van een lagere activiteit onder denitrificerende condities. De voorgestelde modelaanpak vormt een alternatief voor zowel complexe als zeer vereenvoudigde modellen.
Calibratie en implementatie van geavanceerde modellen vereist de invoer van een significant aantal parameters. Omdat de bepaling van elke parameter moeilijk is en tijdrovend, is de keuze van standaardwaarden een optie; dit kan echter leiden tot een zeer afwijkende beschrijving van de praktijk. Het gebruik van complexe modellen voor regeldoeleinden is bovendien lastig vanwege een verhoogde kans op rekenfouten. De zeer vereenvoudigde modellen die meestal zijn gebaseerd op on-line metingen van procesvariabelen (bijv. ammonium en nitraat), worden gebruikt voor een beperkt aantal processen met een niet-complexe kinetiek.
193
Samenvatting
Om maximaal voordeel te halen van het gepresenteerde vereenvoudigde model voor nitrificatie en denitrificatie, is de combinatie met een op respiratie gebaseerde meetopstelling nodig voor parameterschatting. Om bedrijfsvoering en onderhoud te minimaliseren moet de opstelling bij voorkeur zijn geautomatiseerd voor het uitvoeren van respiratiemetingen en het bepalen van de modelparameters en afvalwaterkarakterisering via een numerieke procedure.
De geldigheid en bruikbaarheid van het vereenvoudigde model zijn verder getest in hoofdstuk 5 met twee proefinstallaties. De meerderheid van de modelparameters zijn verkregen met een geautomatiseerde meetopstelling op basis van respirometrie (RESCUE, BROUWER AND KLAPWUK, 1997, BROUWER ET AL., 1998). De reductiefactoren voor denitrificatie (Tii..r|3) zijn bepaald met de methodiek van hoofdstuk 3 of er is gebruik gemaakt van reeds eerder bepaalde factoren voor het onderzochte systeem. Dezelfde heterotrofe yieldfactor werd gebruikt voor aerobe en anoxische condities. Voor parameters met een geringe invloed op de modelresultaten werden standaardwaarden toegepast. Statische en dynamische simulaties werden doorgaans uitgevoerd met goed resultaat.
Acceptabele resultaten met statische simulaties houden in dat het vereenvoudigde model gebruikt kan worden voor een voorspelling van de totale stikstofverwijderingscapaciteit, gebaseerd op een actuele gedetailleerde afvalwater- en slibkarakterisering. De goede beschrijving van het dynamisch karakter van het nitraatverloop in het effluent geeft aan dat het model kan worden ingezet voor regelstrategieen, bijv. voor een regeling van de denitrificatie middels de recirculatie van nitraat en/of de dosering van een externe koolstofbron. Een voordeel van het model is dat het tevens geschikt is voor de regeling van het nitrificatievolume, zoals eerder getest door BROUWER AND KLAPWUK, 1997, BROUWER ET AL., 1998 en beschreven in hoofdstuk 7 van dit proefschrift.
De validatie van de gepresenteerde aanpak geeft aan dat de oxidatiekinetiek en afvalwaterkarakterisering, bepaald met een type respiratiemeting, het mogelijk maakt om het totale proces van stikstofverwijdering goed te beschrijven. Op deze manier wordt het toepassingsgebied voor aerobe respirometrie uitgebreid met het denitrificatieproces. Anoxische respiratietests voor het bepalen van de reductiefactoren zijn desondanks nodig voor een goede beschrijving van het actiefslibsysteem. Eenmaal gemeten hoeven de reductiefactoren voor denitrificatie minder frequent te worden bepaald bij een stabiele bedrijfsvoering van het actiefslibsysteem ('steady-state'-condities). Een sterke dynamiek (influentdynamiek en een frequente verandering in de verhouding tussen het volume van de voordenitrificatie en de aerobe ruimte) heeft vooral invloed op de reductiefactor T) i.
Hoofdstuk 6 behandelt voor een SBR-systeem (Sequencing Batch Reactor) op laboratoriumschaal het effect van voorprecipitatie op de afvalwatersamenstelling, denitrificatiepotentiaal en het totale actiefslibproces. Een identiek SBR-systeem gevoed met onbehandeld afvalwater diende als referentiesysteem. Een dosering met een (3 van 1,2 (molaire verhouding van metaalzout tot fosfaat in het influent) resulteerde in een verlaging van de CZV/N-verhouding van 6,5 tot 3,0. De opgeloste CZV-fracties werden met een significant lagere snelheid verwijderd dan de gesuspendeerde CZV-fracties. De verwijdering van biodegradeerbaar CZV (vooral in de vorm van Xs) leidde tot nitraatconcentraties in het effluent van 21,3 rngX1 terwijl in het referentiesysteem met ruw afvalwater een concentratie van 8 mgX1 kon worden bereikt. De DP van het afvalwater werd door voorprecipitatie met 42% verminderd in vergelijking tot onbehandeld afvalwater.
194
Samenvatting
Het actief slib van het systeem met voorprecipitatie vertoonde hogere specifieke denitrificatiesnelheden voor verschillende koolstofbronnen (Ss, Xs, acetaat en endogeen materiaal) en hogere nitrificatiesnelheden dan voor het referentiesysteem met onbehandeld afvalwater. De hogere activiteit van heterotroof slib werd waarschijnlijk veroorzaakt door de aanwezigheid van een hogere fractie aan actieve biomassa, als resultaat van een vergaande reductie van Xs en X! uit het afvalwater. Een langere slibleeftijd, lagere CZV/N-verhouding en meer actieve biomassa droegen bij aan een grotere fractie van autotrofe biomassa in het actief slib. De verlaagde DP was echter de bepalende factor voor een verminderde denitrificatie in het systeem met voorprecipitatie. Dit deel van het onderzoek onderstreept het gevaar van het gebruik van denitrificatiesnelheden voor ontwerp.
Het vereenvoudigd nitrificatie-denitrificatiemodel was gebruikt voor een theoretische optimalisatie van het het SBR-systeem met voorprecipitatie. Simulatieresultaten geven aan dat bij onvoldoende DP in het afvalwater slechts een beperkte verbetering kan worden gerealiseerd door de procescondities aan te passen. De optimalisatie van een dusdanig systeem kan lopen via een maximale benutting van de endogene denitrificatie; dit leidt echter tot grote anoxische reactoren.
Voor een verificatie van de bevindingen over het effect van voorprecipitatie op de denitrificatiepotentiaal in hoofdstuk 6 en vanwege tegengestelde beweringen in de literatuur, is aanvullend onderzoek uitgevoerd en beschreven in hoofdstuk 7. Een op respirometrie gebaseerde regelstrategie was ingevoerd voor de optimalisatie van een voordenitrificatie-systeem met voorgeprecipiteerd afvalwater. De regelstrategie zorgde voor een aanpassing van het nitrificatievolume op basis van de actuele belasting met nitrificeerbare stikstof. Overmatige beluchting werd via deze regelstrategie voorkomen zodat een maximaal mogelijke anoxische volumefractie voor denitrificatie kon worden gecreeerd.
Voorprecipitatie met ijzerchloride ((3=1,0) verlaagde de totale CZV/N-verhouding van het onbehandelde afvalwater van 7,6 tot 4,7. Ondanks een gunstiger afvalwaterkarateristiek dan in het onderzoek van hoofdstuk 6, en ondanks de implementatie van een adequate regelstrategie, werd het denitrificatierendement niet voldoende verbeterd. Voor afvalwater van dezelfde herkomst kon een verbetering worden gerealiseerd van 5 mgN.r' in het effluent (16,3 versus 21,3 mg N.r1). De effluenteis voor N-totaal < 10 mgN.f' werd dus nog niet bereikt. De resultaten in hoofdstuk 7 bevestigen dat de vereiste CZV/N-verhouding voor voldoende denitrificatie geen universele waarde is en in hoge mate afhankelijk is van afvalwater- en slibkarakteristieken, procescondities en operationele parameters.
Daar waar de DP van ruw en voorbezonken afvalwater voldoende was voor het voldoen aan de gestelde stikstofeis in het effluent, zorgde de reductie van biodegradeerbaar CZV (Xs) door voorprecipitatie voor een significante verslechtering. Elke ingevoerde optimalisatiestap voor het verbeteren van het denitrificatierendement verbeterde de effluentkwaliteit slechts in geringe mate; het is in principe alleen een optie in situaties waar de effluentkwaliteit voor stikstof de vereiste standaard reeds dicht benaderd.
In hoofdstuk 8 is een overzicht gegeven van de gepresenteerde methoden voor het bepalen van de DP en de totale stikstofverwijderingspotentiaal. In dit hoofdstuk worden bovendien voorbeelden omschreven voor een validatie van de verschillende methoden. Voor de discussie over de toepassing is onderscheid gemaakt tussen bestaande en nieuwe actiefslibsystemen.
195
Samenvatting
De methode gebaseerd op de NUR-test is vooral geschikt voor het optimaliseren van de procesconfiguratie, interne recirculatieverhouding, minimalisatie van de zuurstofinbreng in de denitrificatieruimte en de evaluatie van het te verwachten effect van een voorbehandeling van het afvalwater. Wanneer de hiervoor genoemde maatregelen niet resulteren in een verhoging van de denitrificatiecapaciteit is het via een NUR-test mogelijk de benodigde dosering van een externe koolstofbron te bepalen. De implementatie van een NUR-test voor nieuwe systemen is mogelijk; echter met de randvoorwaarde dat een vergelijkbaar monster afvalwater kan worden gebruikt en actiefslib verkrijgbaar is van een actiefslibsysteem met soortgelijke procescondities. Ter vermindering van de experimentele inbreng in een voorontwerp kan de aanwezigheid van een gegevensbestand met informatie over verschillende procesconfiguraties en afvalwatersamenstelling bijdragen aan een significante vooruitgang in procesontwerp. Voor actiefslibsystemen die worden gekarakteriseerd door een verschil in slibbelasting en afvalwaterkarakterisering kunnen relaties worden opgezet in de vorm van nomogrammen voor de denitrificatie op Ss en Xs en de endogene denitrificatie. De verwachting is dat de via deze manier bepaalde denitrificatiepotentiaal meer nauwkeurig is dan gebaseerd op CZV/N of BZV5/N-verhouding.
De methode voor de bepaling van de N-verwijderingspotentiaal met een OUR-test is geschikt voor de monitoring en/of regeling van de nitrificatie en denitrificatie in bestaande systemen. Omdat de omzettingskinetiek en afvalwatersamenstelling van OUR-tests kunnen worden omgezet voor het voorspellen van de denitrificatiepotentiaal, omvat deze techniek de basis voor een totale regelstrategie, mede omdat de nitrificatiekinetiek kan worden vastgesteld. Door NUR-tests uit te voeren kunnen de reductiefactoren voor anoxische respiratie worden vastgesteld. Wanneer echter meer kennis beschikbaar komt over de relatie tussen reductiefactoren en procesparameters en procesconfiguratie, is een incidentele uitvoering van een NUR-test voldoende of in zijn geheel niet meer noodzakelijk. Met de beschreven methoden in dit proefschrift, kunnen zowel de nitrificatie- als denitrificatiepotentiaal worden vastgesteld en dit biedt mogelijkheden voor een voorspelling van de stikstofconcentratie in het effluent.
196
Curriculum vitae
Katarzyna Kujawa-Roeleveld was born the 7th of February 1968 in Zary (Poland). After graduation from the Polish secondary school (gymnasium) she started in 1986 her study at the Poznah University of Technology in Poland, faculty Sanitary Engineering at the Department of Civil Engineering. She obtained her engineer title in 1991 by defending the thesis "Optimisation of nutrient removal in small treatment plants with the UCT activated sludge model". In the beginning of 1992 she started to work as assistant at the Department of Civil Engineering, participating in educational programs for students and in some research projects. Practical experience to transform the knowledge on detailed technological and civil design of comprehensive wastewater treatment plants, she acquired when working for the engineering company AQUA as consulting engineer and for the Water Board as technologist on the Poznan WWTP (both part time). In 1995 she attained a licence of independent design engineer, necessary in Poland to authorise projects. From 1993 she visited within the EU program Tempus a few times the Department of Environmental Technology of the Wageningen University. From March 1995 to the end of 1998 she performed the experimental work as described partially in this thesis. Since July 1999 she works in the Department of Environmental Technology as researcher on the project "Decentralised Sanitation and Reuse".
197