Diffuse light in tomato - University of Arizona
60
Rapport GTB-1158 Diffuse light in tomato Tom Dueck, Jan Janse, Frank Kempkes, Tao Li, Anne Elings & Silke Hemming
Transcript of Diffuse light in tomato - University of Arizona
Rapport GTB-1158
Diffuse light in tomato
Tom Dueck, Jan Janse, Frank Kempkes, Tao Li, Anne Elings & Silke Hemming
ReferaatOnderzoek naar de effecten van diffuus licht op glastuinbouwgewassen wijst uit dat het de groei en vooral de productie bevordert. Voor de tuinder is het van belang het juiste glas te kiezen, met een zo klein mogelijk lichtverlies in de wintermaanden, maar met de maximale voordelen in de voorjaars-, zomer en herfstmaanden. Bij Wageningen UR in Bleiswijk is een teelt met tomaat, Komeett uitgevoerd onder drie typen diffuus glas en standaard tuinbouwglas dat in de zomermaanden voorzien was van een coating van ReduFuse.Vanaf het begin van de oogst was de kiloproductie onder diffuus glas hoger. Deze meerproductie is gerealiseerd vanaf de eerste oogst, als gevolg van de ontwikkeling van de eerste trossen vroeg in het seizoen. Hiermee is het voordeel van een diffuus kasdek in de winter aangetoond. De meerproductie was vooral het gevolg van zwaardere vruchten (gemiddeld 5-8 g zwaarder). Daarnaast vormden zich iets meer trossen (0.5 tros meer) bij diffuus licht en verliep de uitgroeiduur van de trossen vooral in het zonnige voorjaar wat sneller. Daarna heeft de zomer minder zonuren opgeleverd, en ondanks deze natte zomer werd een meerproductie van 8, 9 en 11% gerealiseerd in respectievelijk de Diff45, Diff62 en Diff71 behandelingen. Kennelijk heeft een diffuus kasdek ook bij minder licht een positief effect op het gewas. Ook is er bij de ReduFuse coating, die in mei is opgebracht, uiteindelijk een meerproductie onder de coating gerealiseerd van bijna 5%. Dit biedt perspectieven voor tuinders met een bestaand bedrijf om een meerproductie onder invloed van diffuus licht te verkrijgen. De hogere productie valt dan echter niet samen met de vroege periode met hogere productprijzen. Diffuus licht, of het nu het gewas bereikt via diffuus glas of een coating op het dek, heeft geen invloed op de smaak, refractie of houdbaarheid van tomaat.
AbstractResearch into the effects of diffuse light on horticultural crops shows that it promotes growth and especially the production. For the grower it is important to choose the right glass, with the least amount of light loss in the winter, but with the maximum benefits in the spring, summer and autumn months. An experiment with tomato (cv. Komeett) was performed at Wageningen UR in Bleiswijk under three types of diffuse glass and a standard greenhouse glass coated with ReduFuse in the summer.The first harvest resulted in a higher fruit production under diffuse glass. This increase in production was realised as a result of the development of the first trusses early in the season. This indicates the advantages of a diffuse glass greenhouse in the winter. The increased production was mainly the result of heavier fruits (on average 5-8 g heavier). Also slightly more trusses developed (0.5 truss more) in diffuse light and time from flowering to harvest was faster, especially in spring. During the summer less sunshine was recorded, but despite the wet summer a production increase of 8, 9 and 11% was realised in the Diff45, Diff62 and Diff71 treatments, respectively. It appears that even under lower light conditions, diffuse light has a positive effect on the crop growth and production. The crop production under ReduFuse coating, which was applied in May, was also higher, and reached almost 5% at the end of the growing season. This offers possibilities for growers who cannot build new greenhouses to realize more production under the influence of scattered light. The higher production does not coincide, however, with higher product prices realised earlier in the season. Diffuse light, whether realised under diffuse glass or a coating on the deck, has no influence on the taste or shelf life of tomatoes.
© 2012 Wageningen, Stichting Dienst Landbouwkundig Onderzoek (DLO)
Wageningen UR Glastuinbouw
Adres : Droevendaalsesteeg 1, 6708 PB Wageningen : Postbus 16, 6700 AA WageningenTel. : 0317 - 48 60 01Fax : 0317 - 41 80 94E-mail : [email protected] : www.glastuinbouw.wur.nl
3
Table of contents
1 Dissemination project results 7
2 Summary 9
3 Introduction 11
4 Material and methods 134.1 Plant material and cultivation conditions 13
4.1.1 Plant Material 134.1.2 Growing Conditions 13
4.2 Materials and greenhouse treatments 134.3 Model Simulations 144.4 Measurements 14
4.4.1 Climate registration 144.4.2 Light measurements 144.4.2.1 Global radiation and diffuse light measurements 144.4.2.2 PAR measurements 144.4.2.3 Light distribution in the greenhouse 144.4.2.4 Spectral measurements 154.4.2.5 Light interception 154.4.3 Plant registration, morphology and physiology 154.4.3.1 Plant Registration 154.4.3.2 Plant morphology and destructive harvest 154.4.3.3 Crop Temperature 154.4.3.4 Water uptake 164.4.3.5 Photosynthesis measurements 164.4.3.6 SPAD measurements 164.4.4 Production mesurements 164.4.4.1 Flowering rate and fruit development 164.4.4.2 Production 164.4.4.3 Quality 174.4.5 Energy consumption 17
4.5 Cost-benefit analysis of diffuse glass and coating 17
5 Results and Discussion 195.1 Optimalization of the crop cultivation 195.2 Climate conditions 19
5.2.1 Global radiation and diffuse light 195.2.2 Greenhouse climate 205.2.3 Vertical air temperature distribution in the greenhouse 205.2.4 CO2-concentration, dosage and ventilation 215.2.5 Energy 22
4
5.3 Light measurements 245.3.1 Light transmission 245.3.2 Horizontal light distribution 285.3.3 Light interception 29
5.4 Plant registration 305.5 Physiology 34
5.5.1 Plant temperature in relation to air temperature 345.5.2 Photosynthesis 355.5.3 Photoinhibition 365.5.4 Transpiration of the crop 375.5.5 SPAD measurements 37
5.6 Production 385.6.1 Flowering rate and fruit ripening 385.6.2 Fruit production 40
5.7 Quality 435.8 Model simulations 44
5.8.1 Preliminary investigations 445.8.2 Recalculation of the experimental data 45
5.9 Cost and benefit analysis 47
6 Conclusions 49
7 References 51
Appendix I Fraction of diffuse radiation in global radiation 53
Appendix II Normalisation of spectral measurements 55
Appendix III Development rate of fruit and PAR sum 57
5
ForewordResearch into the influence of diffuse light on plants has shown that more production can be realized provided the light transmission of the glass is not reduced. An important question is the relative importance of light transmission in relation to the degree of light scattering (haze) in the various seasons.
This research was performed within the innovation program Greenhouse as Energy Source commissioned by the Ministry of Economic Affairs, Agriculture and Innovation (EL & I) and the Horticultural Commodity Board. In this study, Wageningen UR Greenhouse Horticulture studied the effects of diffuse light on the greenhouse climate, energy, growth, development and production of tomato. The results of this study are presented in this report.
The project was additionally funded by Guardian BV who also supplied the diffuse glass for the greenhouses, and also by the Province of South Holland in collaboration with Ministry EL & I (Collaborative Skills). Mardenkro BV supplied the coating in one of the treatments and carried out the coating application on the greenhouse roof.
The experiment was intensively monitored by an experimental advisory group (BCO) consisting of Ted Duijvestijn, Joost Barendse, Marco Zuidgeest, Pieter van Staalduinen and Herbert Stolker who regularly visited the experiment.
Barbara Eveleens, Yunim Kan, Esther Meinen, Vida Mohammadkhani, Peter Lagas and Marc Ruijs are thanked for the measurements and analysis of the data. Special thanks go to Bram van Haaster and Kees Scheffers for growing the crop.
Tom Dueck & Jan JanseWageningen UR Greenhouse HorticultureJanuary 2012

6
7
1 Dissemination project results
Publications1. Dueck T & Janse J. 2010. Diffuus glas resulteert in fors hogere productie. Gewasnieuws tomaat 13 (2): 3.2. Dueck TA & Van Telgen HJ. 2010. Tijdelijk licht diffuus maken is een goed idee, mits het lichtverlies beperkt blijft.
Onder Glas 7 (5). p. 56. 3. Van Lier A & Dueck TA. 2010. Diffuus glas moet zich nog bewijzen in sierteeltgewassen (interview met o.a. Tom
Dueck). Vakblad voor de Bloemisterij 65 (6):36-37.4. Van Staalduinen J, Hemming S & Dueck TA. 2010. Onderzoek en praktijk: diffuus glas geeft forse meerproductie
(interview met Silke Hemming en Tom Dueck). Onder Glas 7 (5). p. 5 - 7. 5. Anon. & Dueck T. 2011. Grote proef naar werking diffuus glas. Groenten & Fruit Actueel. 3 jan 2011. 6. Duijvestijn T. 2011. Diffuus: meer verdamping minder Botrytis. Blog 30 maart. http://www.energiek2020.nu/aan-het-
woord/detail/diffuus-meer-verdamping-minder-botrytis/7. Bezemer J & Dueck T. 2011. Voor teler wordt diffuus licht een nieuw stuurinstrument. Onderglas 8 (4): 18-19. April
2011.8. Van Staalduinen, J. & Hemming, S. (2011). Nieuwe soorten glas, anti-reflectie coatings en alternatieve krijtschermen:
Volop keuze om zonlicht diffuus te maken en reflectie te verminderen. Onder Glas 8 (4). p. 21-23. 9. Ammerlaan J. 2011. Drie types diffuus glas in tomatenproef tegelijk. Blog 21 juni. http://www.energiek2020.nu/
aan-het-woord/detail/drie-types-diffuus-glas-in-tomatenproef-gelijk-1/10. Duijvestijn T. 2011. Over langere termijn meer productie onder diffuus glas. Blog 23 augustus. http://www.
energiek2020.nu/aan-het-woord/detail/over-langere-periode-meer-productie-onder-diffuus-glas/11. Janse J & Dueck T. 2011. Nog wekelijks een meerproductie bij diffuus glas. Digitale nieuwsbrief Deligrow, 18 september
2011. http://actua.deligrow.com/members/deligrow-tomaat/dgtom-benelux/tips-onbelicht.php?access=DeliGrow Tomaat&jr=11&wk=37a
12. Dueck T & Janse J. 2011. Nog wekelijks een meerproductie bij diffuus glas. Nieuwsbrief Tomaat LTO -Groeiservice, 24 september 2011, 14(3): 3.
13. Bouwman-van Velden P (interview met TA Dueck en E Poot). 2012. De kracht van samen leren over diffuus licht is groot. Onderglas 1:55.
Presentations6 januari 2011 Diffuus licht voor tomaat. Lezing voor BCO, Bleiswijk. Tom Dueck. 10 januari 2011 Ervaringen met diffuus licht in de kas. Studieclub Groententelers onder glas,Sint-Katelijne-
Waver, België. Silke Hemming. 12 januari 2011 Diffuus licht voor tomaat: kickoff. Lezing WUR Greenhouse Horticulture. Tom Dueck.10 februari 2011 Teeltzaken tomaat diffuus. BCO, Bleiswijk. Jan Janse.16 februari 2011 Licht, belichting en kwaliteit. Voordracht KCB, Bleiswijk. Tom Dueck.28 februari 2011 Diffuus glas en Venlow Energy Kas. Gewasbijeenkomst Komkommer, Maasbree. Jan Janse.17 maart 2011 Natuurlijk licht. Energiek Event 2011, Bleiswijk. Silke Hemming. 21 april 2011 Teeltzaken tomaat diffuus. BCO, Bleiswijk. Jan Janse.16 juni 2011 Diffuse light and tomato: December to June. Lezing voor Noren, Bleiswijk. Tom Dueck.22 juni 2011 Diffuus glas: Hoe en waarom werkt het? INES netwerk Gelderland, Bleiswijk Silke Hemming.23 juni 2011 Diffuus licht en tomaat: December to June. Lezing Tomatentuinders, Bleiswijk. Tom Dueck.26 juni 2011 Productie diffuus t/m week 23. BCO, Bleiswijk. Jan Janse.30 juni 2011 D iffuse light for tomato: effect on leaf and fruit development. Lezing WUR Greenhouse
Horticulture. Yunim Kang.25 aug 2011 Diffuus nog ‘diffuus’? Resultaten t/m week 33. Lezing Tomatentuinders, Bleiswijk. Tom Dueck.1 sept 2011 Diffuus licht en tomaat: overzicht. Lezing Belgisch tuinders en onderzoekers, Bleiswijk. Tom
Dueck.6 sept 2011 Teeltzaken tomaat diffuus. BCO, Bleiswijk. Jan Janse.
8
29 sept 2011 Glas voor de tuinbouw. Klantendag HortiConsult, Deurne. Silke Hemming5 okt 2011 Diffuus licht en tomaat. Lezing TTO, Honselerdijk. Tom Dueck.5 okt 2011 Diffuus licht en tomaat: een overzicht. Tomatencommissie, Den Bosch. Jan Janse.12 okt 2011 Diffuus licht en tomaat: een overzicht. Auberginecommissie, Breda. Jan Janse.13 okt 2011 Diffuus licht en tomaat: een overzicht. BCO, Bleiswijk. Jan Janse.25 okt 2011 Improving LUE in greenhouse crops: The effect of diffuse light on tomato. Lezing WUR
Greenhouse Horticulture. Tao Li26 okt 2011 Diffuus licht en tomaat: een overzicht. Lezing Komkommercommissie, Tricht. Jan Janse.10 nov 2011 Diffuus licht bij tomaat. Àrenasessie Diffuus licht, Bleiswijk. Jan Janse.15 nov 2011 Diffuus licht bij tomaat. Inno Crop Consulting, Bleiswijk. Jan Janse30 nov 2011 Diffuus licht en tomaat. Masterclass Tuinbouw, Jan Janse.14 dec 2011 Diffuus licht bij tomaat. Gewasbijeenkomst tomaat. Futuro, Maasbree. Tom Dueck.
9
2 Summary
Research into the effects of diffuse light on horticultural crops in the past has shown that diffuse light promotes growth and especially the production, even though the properties of the glass were not optimal. Nowadays diffuse glass is available with an anti-reflection (AR) coating, yielding the same or even higher light transmittance than clear glass. This diffuse glass is now available with different degrees of light scattering (haze) and at different costs, but also with differences in expected productivity. It is therefore important to choose the best available glass so that the maximum benefits to the crop in each season can be realized.
This study specifically aimed at the best greenhouse glass characteristics that are currently available. This includes properties such as light transmission, measured both perpendicularly and hemispherically and a high degree of light scattering (haze). Therefore, an experiment was started using different types of glass to investigate the differences in light transmission and light scattering in a year-round cultivation of tomato. The study was conducted within the framework of the program Greenhouse as Energy source commissioned and funded by the Ministry of Economic Affairs, Agriculture and Innovation (EL & I) and the Horticultural Product Board. Additional support was also obtained from a supplier of diffuse glass, Guardian BV, and the project Collaborative Skills from the province of South Holland and the Ministry of EL & I.
In the study, the effects of three types of diffuse glass were examined and compared with those of standard horticultural glass (0% haze and 83% hemispherical light transmission), and standard horticultural glass which in summer, was provided with a coating of ReduFuse (50% haze and 78% light transmission). All three types of diffuse glass were provided with an anti-reflection (AR) coating. Two of the three types of glass used were of the same light transmission (83%) but with a different haze factor, 45% (Diff45) and 71% (Diff71), while the third type with 62% (Diff62) haze had a higher degree of light transmission, namely 85%. In the study, many greenhouse climate parameters were recorded and measurements made, including light transmission, light interception, photosynthesis and photoinhibition, growth, production and fruit quality. There is also an estimate of the cost-benefit of using diffuse glass for tomato cultivation.The production in kilos under diffuse glass was higher right from the start of the harvest and this increase in production was achieved as a result of the development of the first trusses in January. This showed the advantage of a diffuse greenhouse covering in the winter. The increase in production continued throughout the growing season (winter / spring, summer and autumn). The increased production was mainly the result of heavier fruits (on average 5-8 g heavier). Also slightly more trusses were formed (0.5 more trusses) under diffuse glass and the development of the trusses, especially in the sunny spring was faster. Then, the summer of 2011 yielded relatively little sunshine, but despite this wet summer an increased production of 8, 9 and 11% was achieved in the Diff45, Diff62 and Diff71 treatments respectively. Apparently a greenhouse with diffuse glass has a positive effect on the crop, even though with a lower light transmission. Also the ReduFuse coating, which was applied in May, eventually resulted in an extra production of almost 5%. This offers possibilities for growers with existing greenhouses to increase production by increasing the amount of diffuse light. The higher production does not, however, coincide with the early period of higher product prices. Diffuse light achieved by glass or a coating on the glass has no influence on the taste, shelf life or refraction of the tomato fruit.
A number of processes in the cultivation have caused this extra production.
The horizontal distribution of light in a diffuse greenhouse yields a more equal light intensity and the light penetrates deeper into the crop. Condensation may play a role in diffuse glass, because the extra production is more than can be determined just on the basis of the diffuse light alone. Leaves may be differently orientated under diffuse light, with a better light absorption as result. This offers opportunities to increase the light interception by increasing the stem density and thereby increasing the leaf area index (LAI). Under a diffuse greenhouse roof the photosynthetic capacity deeper in the crop is higher as a result of more light and a higher dry matter content in the lower leaves. Because the diffuse light is evenly distributed (less extremes in intensity) little or no photoinhibition occurs during periods with a lot of sunlight above 500 W m-2. This also contributes to the light utilization efficiency. There is a slight difference in the spectral range at the highest haze factor (Diff62 and Diff71) where a slightly higher transmission in the UV range, as well as in the far-red region of the spectrum has been measured.
10
Less Botrytis infection occurred under diffuse glass, especially at the end of the cultivation period and less stems were lost during this period. This is probably due to the more generative growth of the crop, less stress (photoinhibition) during the cultivation and a higher dry matter content of the stems under diffuse glass.
The tomato crops in the study did not generallly use more energy than the reference crop. Although one treatment (Diff45) used more energy, the other two treatments required less energy. Despite comments from growers that the energy use under diffuse glass is higher because because their crop required more heat during the morning hours. this study shows that on average crop under diffuse glass do not require additional energy input. Other types of materials have been used in practice (types of diffuse glass), but this study has concentrated on material with a good light transmission in which a small energy saving was realized. Strikingly, by 3% more light transmission (Diff62) more energy in the greenhouse was realized (more transpiration); while under Diff71 less transpiration was observed. It can be concluded that the glass with the highest light transmission does not always have to be the best.
Assuming the increased production realized in this study, the long-term average prices of vine tomatoes per four week period and an estimated extra cost of the glass, the payback time of diffuse glass is calculated to be 4.2 to 6.3 years. If the extra cost of the diffuse glass can be reduced, or more kilos of produce are realized, the payback time will be shorter. To achieve this, the haze of the glass must be at least 50%, and preferably even higher, provided that the light transmission is similar to or higher than standard greenhouse glass
11
3 Introduction
Previous research on diffuse light has shown that the use of diffuse greenhouse covering materials leads to higher production in cucumber (Dueck et al, 2009) and also in some potted plants (Hemming et al 2007). It has also been shown in peppers that diffuse light contributes to an increase in production (Eveleens et al, 2010) as well as in a field trial with tomato in both an autumn crop and a full season crop (Geuke Meijer et al, 2011).The effects of diffuse light and diffuse greenhouse covering materials are promising. However, from the point of view of the growers some points were considered to be less positive. It appears that in most cases a glass type was chosen with a much lower light transmission which resulted in extra production during the summer, but once the global radiation in August dropped, the relative light loss resulted in reduced production (Geuke Meijer et al, 2011). Another comment was that more energy is required due to a lower light transmission; less heat energy enters the greenhouse. It is therefore important to choose the right glass, so that the light loss in the winter months is as small as possible, but in the spring, summer and autumn months the maximum benefits can be achieved. Research has shown that in cucumber, glass with the highest possible light scattering gives the best result but only if a little loss of light occurs. The field trial with tomato confirms that the materials with a high light scattering which have been studied so far, and are available, usually have a small loss of light. This could negatively affect production in the winter. Nowadays diffuse glass is available with the same or even a higher light transmittance than clear glass, because an anti-reflection (AR) coating is added to the diffuse glass. These types of diffuse glass are now available with different degrees of light scattering, at different costs, but also with different production prognoses.
Previous trials with cucumber have shown that with a low haze (27%) without loss of light increases the yield by 6.5% from mid-February to November. A high haze (74%), with a small loss of light (-3%), gives a yield increase of more than 9%. Experiences in a practical experiment with tomato show that glass with an average haze (60%) and a high loss of light in relation to comparable material does not result in an increased production in the winter months. In this case the growth rate was higher and the number of kilos increased during weeks 45-46, but subsequently the fruit weight dropped sharply in comparison to that in the clear greenhouse. Materials with different percentages of haze are available. In principle the higher the haze the greater the light loss, unless this is offset by additional anti-reflection coatings, which entail higher costs. In the summer there seems to be too much rather than too little light for optimal growth and production. The question is whether a maximum haze in the spring, summer and autumn months without the disadvantages of less light in winter, can lead to a higher year-round production.
The available greenhouse covering materials with a high light scattering which have been used in research, often show small losses of light. This can be very detrimental in the winter months. In the summer, when there is an excess of light (in some crops light is screened away) this problem does not occur. In winter, however, all available light is more than welcome. The reduced amount of light in a greenhouse with diffuse glass can cause a drop in production in the darker months because the growing tip of the plant has a lower temperature, decreased photosynthetic capacity and altered morphology. In addition, it is unknown whether a loss of production may occur under diffuse greenhouse covering materials that do not exhibit loss of light.
In contrast to a (diffuse) coating applied onto the glass, diffuse glass is a permanent property of a greenhouse roof. A diffuse coating can be sprayed onto the greenhouse roof when there is plenty of light in spring and summer and then removed again in the autumn when the light decreases. This coating will reduce a part the light transmittance in the spring and summer and, depending on the coating, this can be estimated as a 5-10% loss of light. The consequences of a rather sudden application of a coating with increasing light and the effect of a few percent less light in the summer on the crop is unknown. To investigate this we have included a treatment where a coating in sprayed onto the greenhouse roof. In this way the effect of a number of types of diffuse greenhouse coverings on the climate and the crop can be determined and compared with a coating and a reference greenhouse. The optimal use of sunlight yields a higher energy efficiency. Application of diffuse light through the covering material can be expected to increase yields up to 10%. The effects of a diffuse coating can be analyzed and compared to those of diffuse glass and an estimate of the costs and benefits of diffuse glass compared to standard glass can be made.

12
13
4 Material and methods
4.1 Plant material and cultivation conditions
4.1.1 Plant Material
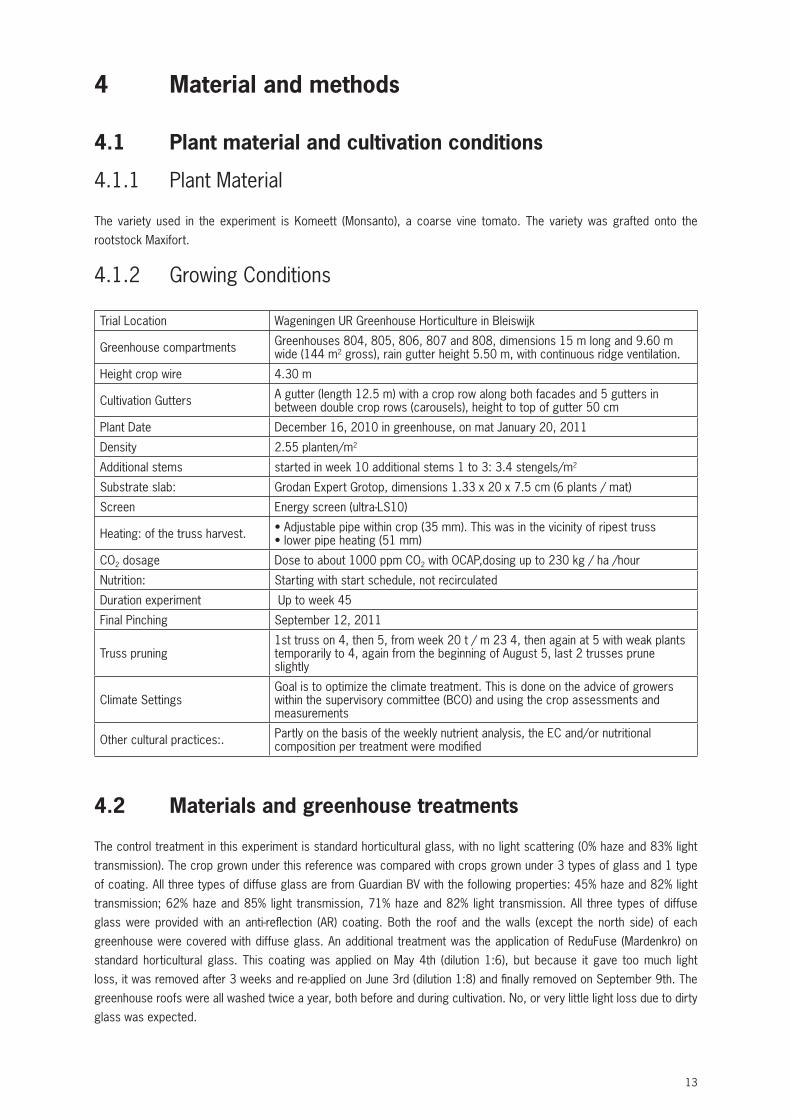
The variety used in the experiment is Komeett (Monsanto), a coarse vine tomato. The variety was grafted onto the rootstock Maxifort.
4.1.2 Growing Conditions
Trial Location Wageningen UR Greenhouse Horticulture in Bleiswijk
Greenhouse compartments Greenhouses 804, 805, 806, 807 and 808, dimensions 15 m long and 9.60 m wide (144 m2 gross), rain gutter height 5.50 m, with continuous ridge ventilation.
Height crop wire 4.30 m
Cultivation Gutters A gutter (length 12.5 m) with a crop row along both facades and 5 gutters in between double crop rows (carousels), height to top of gutter 50 cm
Plant Date December 16, 2010 in greenhouse, on mat January 20, 2011
Density 2.55 planten/m2
Additional stems started in week 10 additional stems 1 to 3: 3.4 stengels/m2
Substrate slab: Grodan Expert Grotop, dimensions 1.33 x 20 x 7.5 cm (6 plants / mat)
Screen Energy screen (ultra-LS10)
Heating: of the truss harvest. • Adjustable pipe within crop (35 mm). This was in the vicinity of ripest truss• lower pipe heating (51 mm)
CO2 dosage Dose to about 1000 ppm CO2 with OCAP,dosing up to 230 kg / ha /hour
Nutrition: Starting with start schedule, not recirculated
Duration experiment Up to week 45
Final Pinching September 12, 2011
Truss pruning1st truss on 4, then 5, from week 20 t / m 23 4, then again at 5 with weak plants temporarily to 4, again from the beginning of August 5, last 2 trusses prune slightly
Climate SettingsGoal is to optimize the climate treatment. This is done on the advice of growers within the supervisory committee (BCO) and using the crop assessments and measurements
Other cultural practices:. Partly on the basis of the weekly nutrient analysis, the EC and/or nutritional composition per treatment were modified
4.2 Materials and greenhouse treatments
The control treatment in this experiment is standard horticultural glass, with no light scattering (0% haze and 83% light transmission). The crop grown under this reference was compared with crops grown under 3 types of glass and 1 type of coating. All three types of diffuse glass are from Guardian BV with the following properties: 45% haze and 82% light transmission; 62% haze and 85% light transmission, 71% haze and 82% light transmission. All three types of diffuse glass were provided with an anti-reflection (AR) coating. Both the roof and the walls (except the north side) of each greenhouse were covered with diffuse glass. An additional treatment was the application of ReduFuse (Mardenkro) on standard horticultural glass. This coating was applied on May 4th (dilution 1:6), but because it gave too much light loss, it was removed after 3 weeks and re-applied on June 3rd (dilution 1:8) and finally removed on September 9th. The greenhouse roofs were all washed twice a year, both before and during cultivation. No, or very little light loss due to dirty glass was expected.
14
4.3 Model Simulations
Using the integrated greenhouse crop growth model Kaspro-INTKAM prior to the experiment, a series of simulations was performed to estimate the relative importance of various haze factors and light transmissions of the covering material. These investigations use the external climate parameters of the "SELjaar" (an average year compiled from different days over a 20 year period). The simulations used climate set points and crop management very similar to those that would be used in the greenhouse experiment. These assessments were performed for Komeett, a tomato variety with a source-limited assimilation.The following primary questions were addressed:• Does every higher haze factor contribute to a higher production, or is there a certain point at which the production
decreases because there is too much light loss?• What is the relative importance of the light transmission in relation to the haze factor?
4.4 Measurements
4.4.1 Climate registration
The set points and actual climate in the greenhouses were recorded every 5 minutes with the climate computer (Hoogendoorn ISii). In addition, the greenhouse air temperature, relative humidity, CO2 concentration, % vent opening, global radiation and PAR light in the greenhouse were measured and stored.From late January to late October the microclimate in the crop was measured by wireless sensors placed between the tomato plants in a row. These were placed at 3 positions within the row and at 2 heights giving a total of 6 sensors per greenhouse compartment. The lowest sensor hung just above the ripening fruit and the highest sensor 0.5 m below the top of the plant. Measured values were recorded every 5 minutes and averaged for each height in the greenhouse.
4.4.2 Light measurements
4.4.2.1 Global radiation and diffuse light measurements
The global radiation was measured with a solarimeter above the greenhouse roof at Wageningen UR Greenhouse Horticulture in Bleiswijk. In addition, there was a second solarimeter with a so-called "shadow ring" which ensures that a distinction could be made between the periods with diffuse radiation and with direct radiation. This gives an idea of the relative amounts of diffuse and direct light.
4.4.2.2 PAR measurements
Measurements of the light intensity (PAR) in the greenhouse were carried out with a Licor quantum line sensor (LI-191) with a length of 100 cm. These light sensors in the greenhouse were hung just above the top of the crop, in the middle of every greenhouse compartment.
4.4.2.3 Light distribution in the greenhouse
Light distribution in the greenhouse was measured with a Licor line quantum sensor (LI-191). The intensity of sunlight at various plant heights was measured in several places in each of the 5 beds (beds along the walls of the greenhouse were not included). Average light intensities were calculated for the whole greenhouse.
15
4.4.2.4 Spectral measurements
The penetration of the different colours of light (light spectrum between 350 nm and 900 nm) through the greenhouse was measured with a spectral meters from Ocean Optics Jaz. The measurements were performed at the top of the crop on both sunny and cloudy days.
4.4.2.5 Light interception
To analyze light distribution within the plant under diffuse glass measurements were done from the top of the crop to different heights above the substrate matting. Measurements were performed on a cloudy day (under diffuse light conditions) with the aid of a Sunscan Canopy analysis system (Delta T-Ltd, United Kingdom). The Sunscan with a length of 75 cm was transversely inserted into the row, every 25 cm. At the same time, a reference measurement was carried out above the plants to determine the relative light intensity, which indicates the degree of light interception.
4.4.3 Plant registration, morphology and physiology
4.4.3.1 Plant Registration
Crop growth was monitored weekly to investigate changes in crop morphology due to the different lighting systems.Every week in each of the 5 compartments on 2 x 8 plants (including extra stems, 2 x 12 stems) the following parameters are recorded:• linear growth (cm)• stem diameter (circa. 25 to 30 cm below the growing point of the plant)• leaf length (first leaf under the flowering truss cm)• flowering vine• number of developing fruit• number of fruits per plant
4.4.3.2 Plant morphology and destructive harvest
A destructive measurement is carried out several times on 5 to 6 plants per treatment. The following parameters were analysed:• Fresh weight of plant leaves and stems separately [g]• Dry weight per plant leaves and stems [g]• Leaf area [m2]• LAI per plant (leaf area index) [m-2 m-2]• SLA per plant (specific leaf area) [cm2 g-1 dry weight]Every time the lowest leaves of the plant are removed these leaves are dried to determine dry matter content.On three dates, namely, June 5th, July 6th and October 4th, the dry matter content of the fruit was calculated.
4.4.3.3 Crop Temperature
The temperature was measured with the plant temperature IR cameras (Brinkman). The cameras were 50-75 cm above the plants and suspended in an angle of about 80 ° (relative to horizontal) to measure the temperature in the upper part (about 1.5 to 3 m2) of the crop. Occasional measurements of leaf temperature were carried out with a hand-held pyrometer thermo-hygrometer/laser (Humiport 05 IR). This was used on 10 to 30 leaves at the top and the bottom of the crop.
16
4.4.3.4 Water uptake
The irrigation for each greenhouse was calculated on the basis of the amount of nutrient solution per minute through the drippers multiplied by the irrigation frequency. The drain of the whole greenhouse compartment was measured and recorded by the climate computer.
4.4.3.5 Photosynthesis measurements
The photosynthetic capacity was measured in 2011 in week 3 and 12 with a photosynthesis meter (Licor 1800-14, USA) with a leaf chamber of 2.0 cm2. By measuring the photosynthesis under defined climatic conditions (700 ppm CO2, 21°C, and about 85% RH in the leaf chamber) with increasing light intensities the photosynthetic capacity can be measured. This is the amount of CO2 which the leaf uses under these specific conditions. This makes it possible to compare all the measurements made during the day in the various greenhouse compartments. Measurements were made on leaves at the top and bottom of the crop. The measurements were performed on a fully grown leaf, which is not shaded by overlying leaves.
4.4.3.6 SPAD measurements
Using a SPAD meter (Minolta SPAD-502), light transmission through a leaf is determined. This gives an impression of the amount of chlorophyll in the leaf. The measurement was carried out on 20 plants per treatment. It is measured on a fully grown leaf at the top of the crop.
4.4.4 Production mesurements
4.4.4.1 Flowering rate and fruit development
The emergence of new flowering trusses was updated weekly. The developing trusses were tagged and registered on the flowering of the second flower. Subsequently, at harvest the harvest date is recorded and the development rate of the truss can be calculated.
4.4.4.2 Production
At the start of the experiment there was a weekly harvest, from week 17 the harvest frequency was 3 times every 2 weeks.The average fruit weight was calculated based on the weight and number of fruits in the experimental fields. The surface area of the 2 experimental fields per compartment was 6.4 m2.Production (kg/m2) is measured from all plants on 3 carousels (double rows). These carousels were, where possible, on the north side of the greenhouse to avoid any influence from the adjacent treatments. Along the wall there was a guard row serving as a buffer.• On the 2 fields per compartment, the following observations made:• Number of trusses• The actual number of the harvested truss per plant• Net weight in kg• Number of good quality fruit• Number of blossom end rot and damaged fruit.
17
4.4.4.3 Quality
Every month from April up to and including October tomatoes were set aside for shelf-life determination, a total of 7 times. For each data usually 8 trusses with a total of 21 to 24 fruits per greenhouse compartment were stored at 20°C and 80% RH. The dates were respectively April 7th, May 9th, June 22nd, July 20th, August 10th, September 19thand October 17th. Using the “taste model” of Wageningen UR Greenhouse Horticulture the flavor is calculated on April 1st, May 12th, June 24th, July 22nd, August 10th, September 21st and October 19th. As part of this flavor determination the % juice, acidity and refraction are measured. The vitamin C content (ascorbic acid) was determined three times on April 1st, July 22nd and September 29th.
4.4.5 Energy consumption
The energy consumption is determined using the heating pipe temperature, pipe diameters, pipe lengths and greenhouse temperature to determine the energy output of the greenhouse. At the compartment level (adjustable heating pipes and the lower (fixed) heating pipes), the differences between the calculated energy was less than 4%.
4.5 Cost-benefit analysis of diffuse glass and coating
To perform a cost benefit analysis of a diffuse greenhouse covering for a tomato crop a number of calculations were carried out. The calculations are based on the three types of glass that were used in the experiment (45%, 62% and 71% haze factor), the realized additional production under each glass type and 2 prices per m2 for extra cost of the glass. Using the KWIN figures for a tomato crop (KWIN code G49) for the cost and product price (price level 2005-2009) the net profit and payback time for the three types of diffuse glass were calculated. The profit is the difference between the additional revenue and additional costs due to diffuse glass and includes the cost of glass. The payback period is determined by dividing the investment by the profit, excluding the cost of glass. The same calculations are performed for the ReduFuse coating.

18
19
5 Results and Discussion
5.1 Optimalization of the crop cultivation
After consultation with the BCO prior to the experiment, no differences in stem density between the various compartments were introduced, but if necessary differences in climate set points and possibly in truss pruning would be used to optimize crop growth.From late March differences between treatments were visible in the crop. In compartments with diffuse glass with a haze of 62% and 71% the crop was the strongest, but not too strong. From mid-April differences in climate set points were made between the 2 compartments with clear glass on the one hand and the other 3 sections with diffused glass. Under both sunny and cloudy conditions the temperature was respectively 1 and 0.5°C lower in the greenhouses with clear glass than in those with diffused glass. The actual differences in daily temperature during this period were less, namely about 0.3 to 0.4°C. By ventilating more or less, these temperature differences were maintained for a long time. In early May the application of a heavy coating of ReduFuse caused a considerable loss of light and the crop in this compartment adopted a more vegetative state with weak growing points. The climate settings in this greenhouse were similar to those in the reference greenhouse. Due to the light loss and even after replacing the coating by a lighter coating, the actual temperature in the coated greenhouse remained usually slightly lower than in the greenhouse with clear glass. The crop in both greenhouses with clear glass often looked more vegetative than the crop in the greenhouses with diffuse glass.
0
500
1000
1500
2000
2500
3000
3500
17-12 17-1 17-2 17-3 17-4 17-5 17-6 17-7 17-8 17-9 17-10
Str
alin
gsom
(J
cm-2
)
G lobale s tralings som
Diffus e stralings som
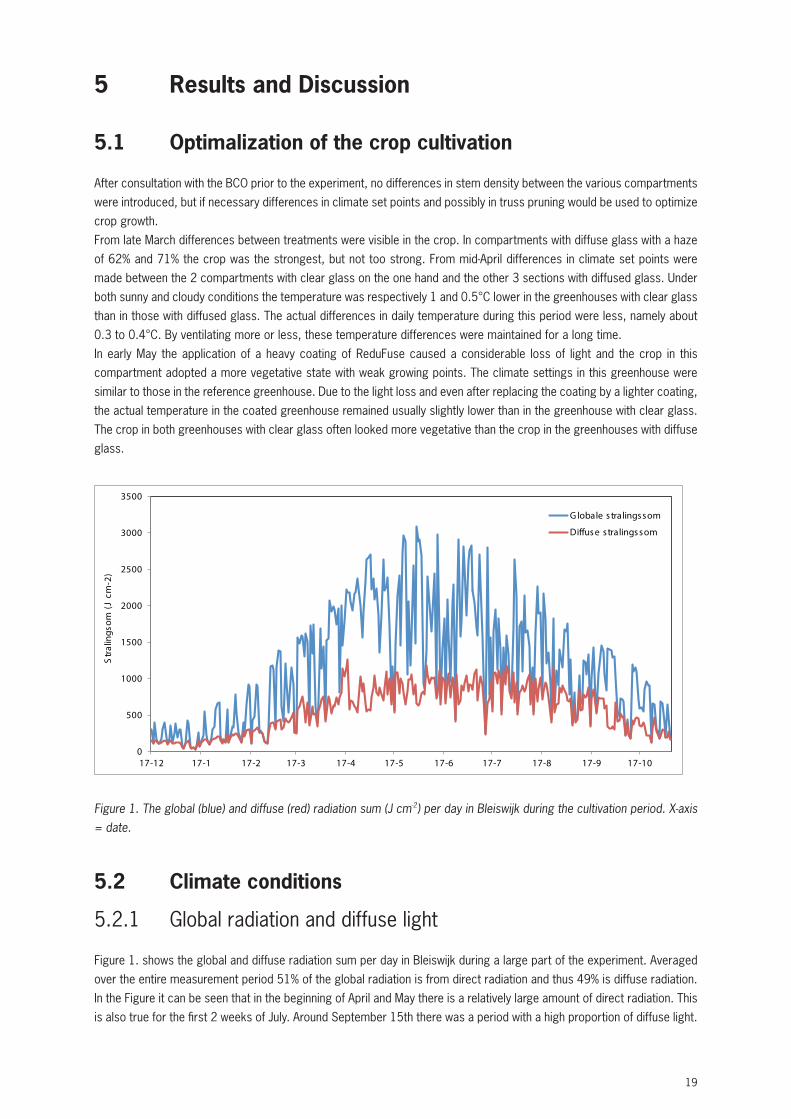
Figure 1. The global (blue) and diffuse (red) radiation sum (J cm-2) per day in Bleiswijk during the cultivation period. X-axis = date.
5.2 Climate conditions
5.2.1 Global radiation and diffuse light
Figure 1. shows the global and diffuse radiation sum per day in Bleiswijk during a large part of the experiment. Averaged over the entire measurement period 51% of the global radiation is from direct radiation and thus 49% is diffuse radiation. In the Figure it can be seen that in the beginning of April and May there is a relatively large amount of direct radiation. This is also true for the first 2 weeks of July. Around September 15th there was a period with a high proportion of diffuse light.
20
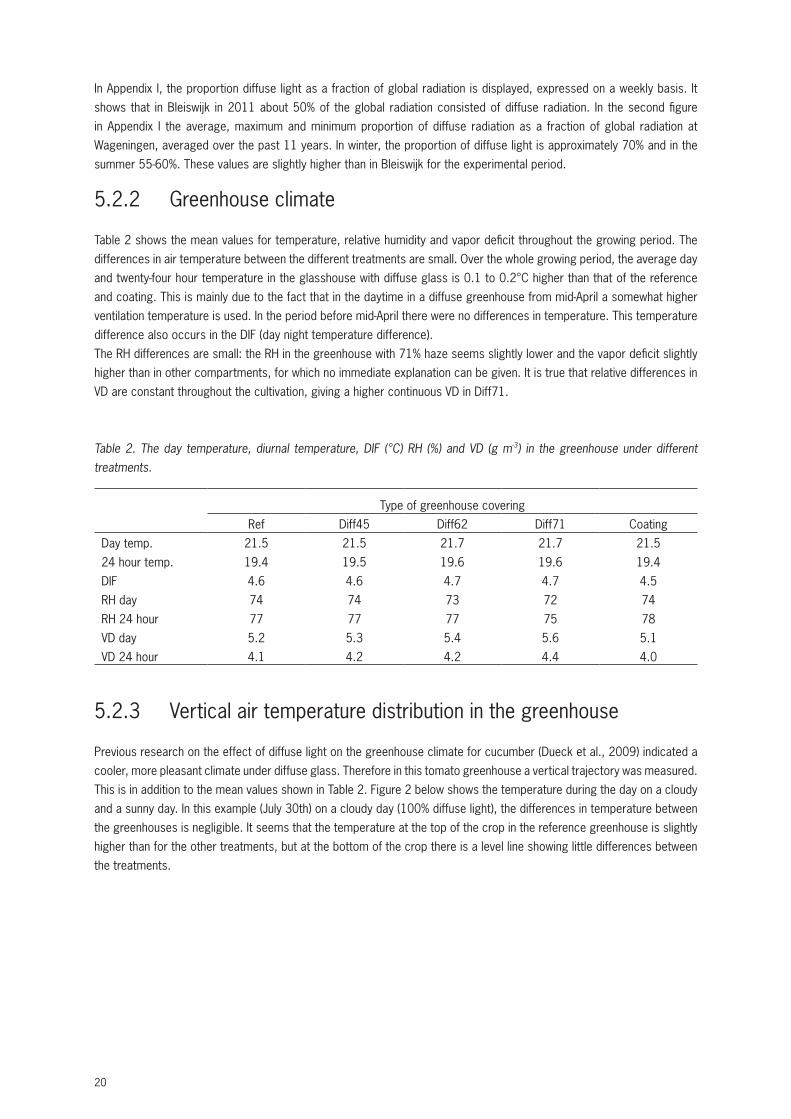
In Appendix I, the proportion diffuse light as a fraction of global radiation is displayed, expressed on a weekly basis. It shows that in Bleiswijk in 2011 about 50% of the global radiation consisted of diffuse radiation. In the second figure in Appendix I the average, maximum and minimum proportion of diffuse radiation as a fraction of global radiation at Wageningen, averaged over the past 11 years. In winter, the proportion of diffuse light is approximately 70% and in the summer 55-60%. These values are slightly higher than in Bleiswijk for the experimental period.
5.2.2 Greenhouse climate
Table 2 shows the mean values for temperature, relative humidity and vapor deficit throughout the growing period. The differences in air temperature between the different treatments are small. Over the whole growing period, the average day and twenty-four hour temperature in the glasshouse with diffuse glass is 0.1 to 0.2°C higher than that of the reference and coating. This is mainly due to the fact that in the daytime in a diffuse greenhouse from mid-April a somewhat higher ventilation temperature is used. In the period before mid-April there were no differences in temperature. This temperature difference also occurs in the DIF (day night temperature difference).The RH differences are small: the RH in the greenhouse with 71% haze seems slightly lower and the vapor deficit slightly higher than in other compartments, for which no immediate explanation can be given. It is true that relative differences in VD are constant throughout the cultivation, giving a higher continuous VD in Diff71.
Table 2. The day temperature, diurnal temperature, DIF (°C) RH (%) and VD (g m-3) in the greenhouse under different treatments.
Type of greenhouse coveringRef Diff45 Diff62 Diff71 Coating
Day temp. 21.5 21.5 21.7 21.7 21.524 hour temp. 19.4 19.5 19.6 19.6 19.4DIF 4.6 4.6 4.7 4.7 4.5RH day 74 74 73 72 74RH 24 hour 77 77 77 75 78VD day 5.2 5.3 5.4 5.6 5.1VD 24 hour 4.1 4.2 4.2 4.4 4.0
5.2.3 Vertical air temperature distribution in the greenhouse
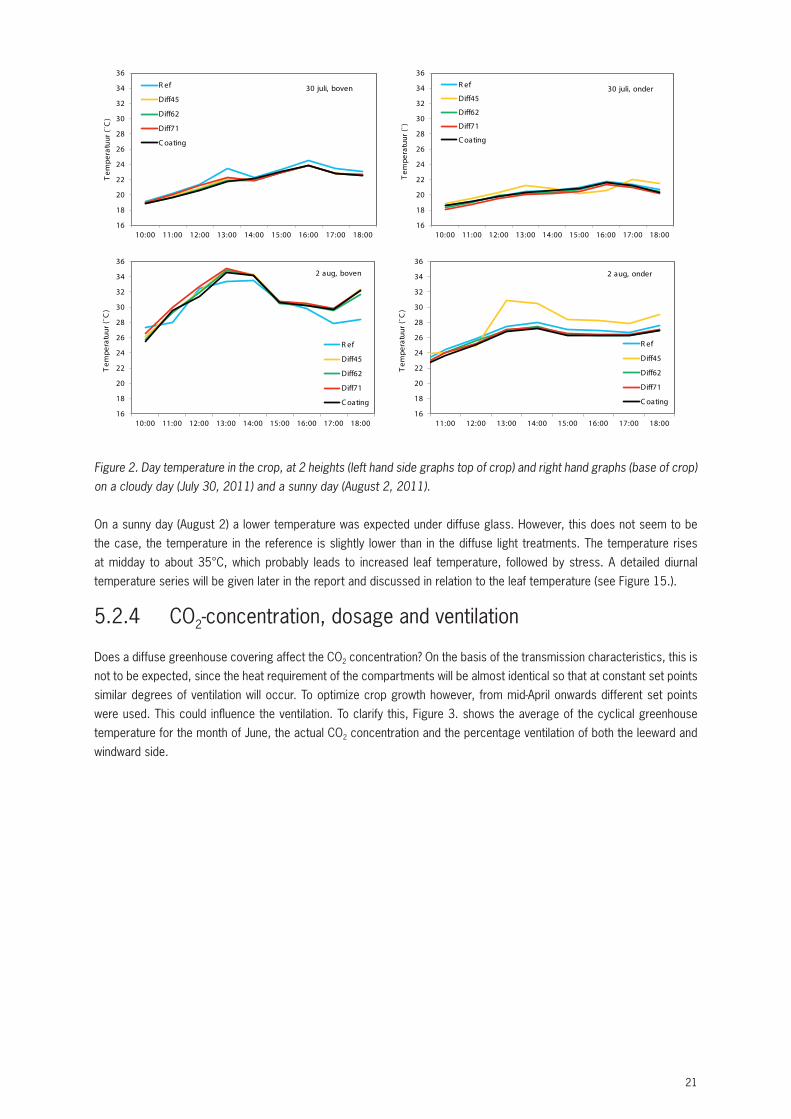
Previous research on the effect of diffuse light on the greenhouse climate for cucumber (Dueck et al., 2009) indicated a cooler, more pleasant climate under diffuse glass. Therefore in this tomato greenhouse a vertical trajectory was measured. This is in addition to the mean values shown in Table 2. Figure 2 below shows the temperature during the day on a cloudy and a sunny day. In this example (July 30th) on a cloudy day (100% diffuse light), the differences in temperature between the greenhouses is negligible. It seems that the temperature at the top of the crop in the reference greenhouse is slightly higher than for the other treatments, but at the bottom of the crop there is a level line showing little differences between the treatments.
21
16
18
20
22
24
26
28
30
32
34
36
10:00 11:00 12:00 13:00 14:00 15:00 16:00 17:00 18:00
Tem
pera
tuur
(¨C
)
R ef
Diff45
Diff62
Diff71
C oating
2 aug, boven
16
18
20
22
24
26
28
30
32
34
36
11:00 12:00 13:00 14:00 15:00 16:00 17:00 18:00
Tem
pera
tuur
(¨C
)
R ef
Diff45
Diff62
Diff71
C oating
2 aug, onder
16
18
20
22
24
26
28
30
32
34
36
10:00 11:00 12:00 13:00 14:00 15:00 16:00 17:00 18:00
Tem
pera
tuur
(¨C
)
R ef
Diff45
Diff62
Diff71
C oating
30 juli, boven
16
18
20
22
24
26
28
30
32
34
36
10:00 11:00 12:00 13:00 14:00 15:00 16:00 17:00 18:00
Tem
pera
tuur
(¨)
R ef
Diff45
Diff62
Diff71
C oating
30 juli, onder
Figure 2. Day temperature in the crop, at 2 heights (left hand side graphs top of crop) and right hand graphs (base of crop) on a cloudy day (July 30, 2011) and a sunny day (August 2, 2011).
On a sunny day (August 2) a lower temperature was expected under diffuse glass. However, this does not seem to be the case, the temperature in the reference is slightly lower than in the diffuse light treatments. The temperature rises at midday to about 35°C, which probably leads to increased leaf temperature, followed by stress. A detailed diurnal temperature series will be given later in the report and discussed in relation to the leaf temperature (see Figure 15.).
5.2.4 CO2-concentration, dosage and ventilation
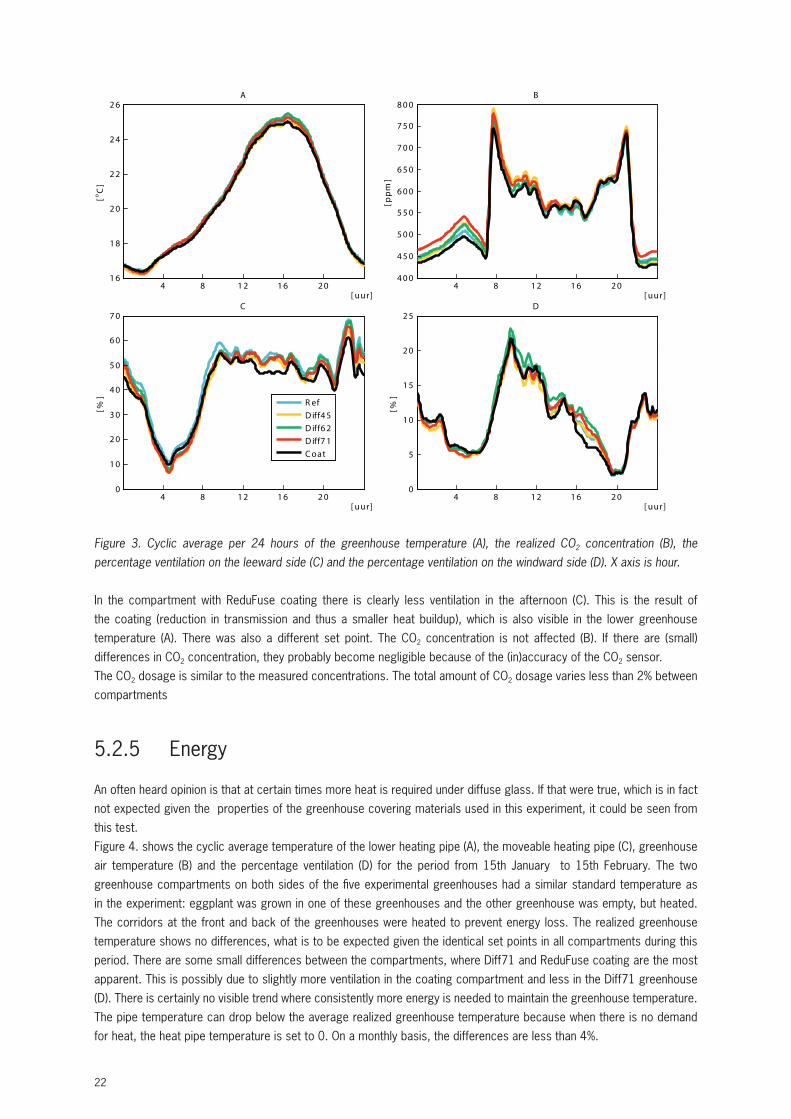
Does a diffuse greenhouse covering affect the CO2 concentration? On the basis of the transmission characteristics, this is not to be expected, since the heat requirement of the compartments will be almost identical so that at constant set points similar degrees of ventilation will occur. To optimize crop growth however, from mid-April onwards different set points were used. This could influence the ventilation. To clarify this, Figure 3. shows the average of the cyclical greenhouse temperature for the month of June, the actual CO2 concentration and the percentage ventilation of both the leeward and windward side.
22
4 8 1 2 1 6 2 01 6
1 8
2 0
2 2
2 4
2 6[o
C]
[ uur ]
A
4 8 1 2 1 6 2 04 0 0
4 5 0
5 0 0
5 5 0
6 0 0
6 5 0
7 0 0
7 5 0
8 0 0
[pp
m]
[ uur ]
B
4 8 1 2 1 6 2 00
1 0
2 0
3 0
4 0
5 0
6 0
7 0
[ uur]
[%]
C
4 8 1 2 1 6 2 00
5
1 0
1 5
2 0
2 5
[%]
[ uur ]
D
R efD iff4 5D iff6 2D iff7 1C oat
Figure 3. Cyclic average per 24 hours of the greenhouse temperature (A), the realized CO2 concentration (B), the percentage ventilation on the leeward side (C) and the percentage ventilation on the windward side (D). X axis is hour.
In the compartment with ReduFuse coating there is clearly less ventilation in the afternoon (C). This is the result of the coating (reduction in transmission and thus a smaller heat buildup), which is also visible in the lower greenhouse temperature (A). There was also a different set point. The CO2 concentration is not affected (B). If there are (small) differences in CO2 concentration, they probably become negligible because of the (in)accuracy of the CO2 sensor.The CO2 dosage is similar to the measured concentrations. The total amount of CO2 dosage varies less than 2% between compartments
5.2.5 Energy
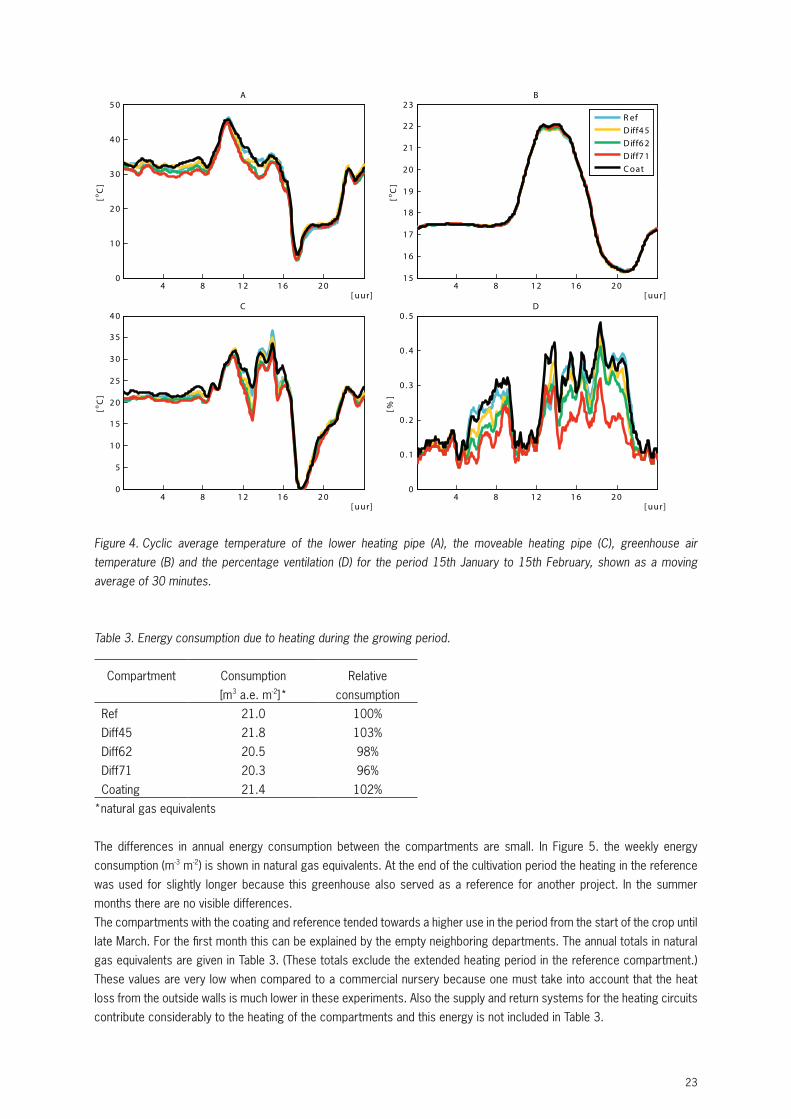
An often heard opinion is that at certain times more heat is required under diffuse glass. If that were true, which is in fact not expected given the properties of the greenhouse covering materials used in this experiment, it could be seen from this test.Figure 4. shows the cyclic average temperature of the lower heating pipe (A), the moveable heating pipe (C), greenhouse air temperature (B) and the percentage ventilation (D) for the period from 15th January to 15th February. The two greenhouse compartments on both sides of the five experimental greenhouses had a similar standard temperature as in the experiment: eggplant was grown in one of these greenhouses and the other greenhouse was empty, but heated. The corridors at the front and back of the greenhouses were heated to prevent energy loss. The realized greenhouse temperature shows no differences, what is to be expected given the identical set points in all compartments during this period. There are some small differences between the compartments, where Diff71 and ReduFuse coating are the most apparent. This is possibly due to slightly more ventilation in the coating compartment and less in the Diff71 greenhouse (D). There is certainly no visible trend where consistently more energy is needed to maintain the greenhouse temperature. The pipe temperature can drop below the average realized greenhouse temperature because when there is no demand for heat, the heat pipe temperature is set to 0. On a monthly basis, the differences are less than 4%.
23
4 8 1 2 1 6 2 00
1 0
2 0
3 0
4 0
5 0[o
C]
[ uur ]
A
4 8 1 2 1 6 2 01 5
1 6
1 7
1 8
1 9
2 0
2 1
2 2
2 3
[ uur]
[oC
]
B
4 8 1 2 1 6 2 00
5
1 0
1 5
2 0
2 5
3 0
3 5
4 0
[oC
]
[ uur ]
C
4 8 1 2 1 6 2 00
0 . 1
0 . 2
0 . 3
0 . 4
0 . 5
[%]
[ uur ]
D
R efD iff4 5D iff6 2D iff7 1C oat
Figure 4. Cyclic average temperature of the lower heating pipe (A), the moveable heating pipe (C), greenhouse air temperature (B) and the percentage ventilation (D) for the period 15th January to 15th February, shown as a moving average of 30 minutes.
Table 3. Energy consumption due to heating during the growing period.
Compartment Consumption[m3 a.e. m-2]*
Relative consumption
Ref 21.0 100%Diff45 21.8 103%Diff62 20.5 98%Diff71 20.3 96%Coating 21.4 102%
*natural gas equivalents
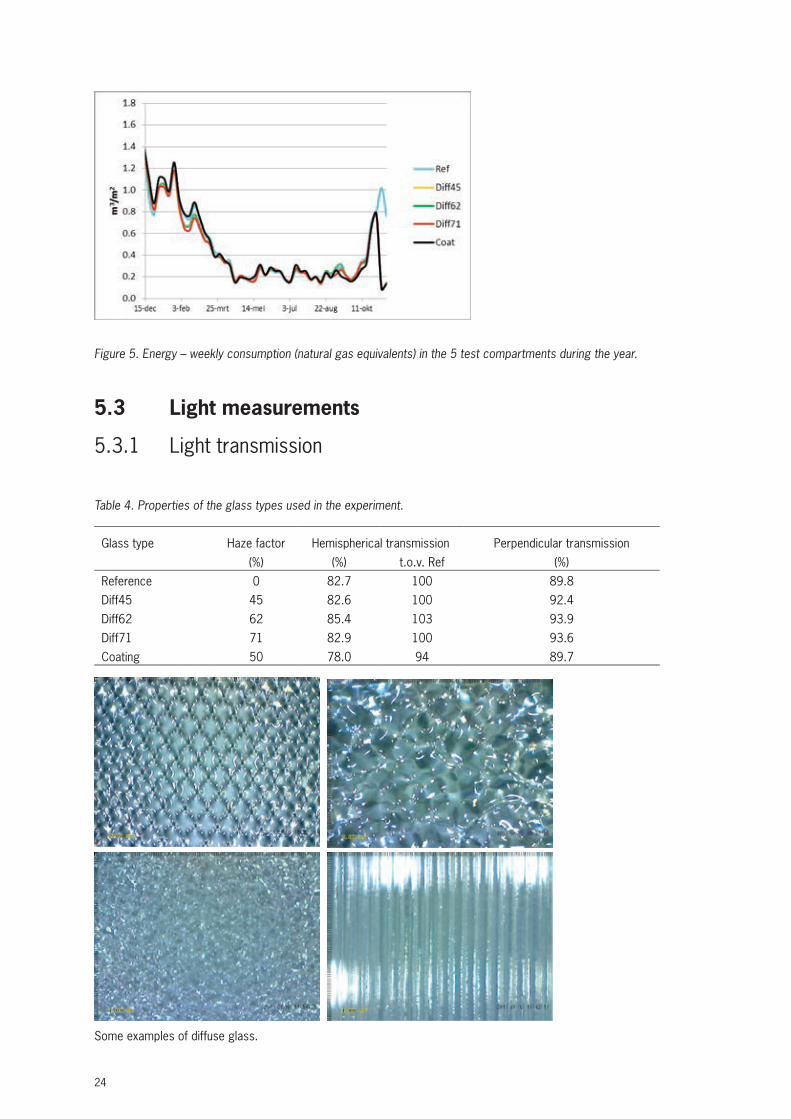
The differences in annual energy consumption between the compartments are small. In Figure 5. the weekly energy consumption (m-3 m-2) is shown in natural gas equivalents. At the end of the cultivation period the heating in the reference was used for slightly longer because this greenhouse also served as a reference for another project. In the summer months there are no visible differences. The compartments with the coating and reference tended towards a higher use in the period from the start of the crop until late March. For the first month this can be explained by the empty neighboring departments. The annual totals in natural gas equivalents are given in Table 3. (These totals exclude the extended heating period in the reference compartment.) These values are very low when compared to a commercial nursery because one must take into account that the heat loss from the outside walls is much lower in these experiments. Also the supply and return systems for the heating circuits contribute considerably to the heating of the compartments and this energy is not included in Table 3.
24
Figure 5. Energy – weekly consumption (natural gas equivalents) in the 5 test compartments during the year.
5.3 Light measurements
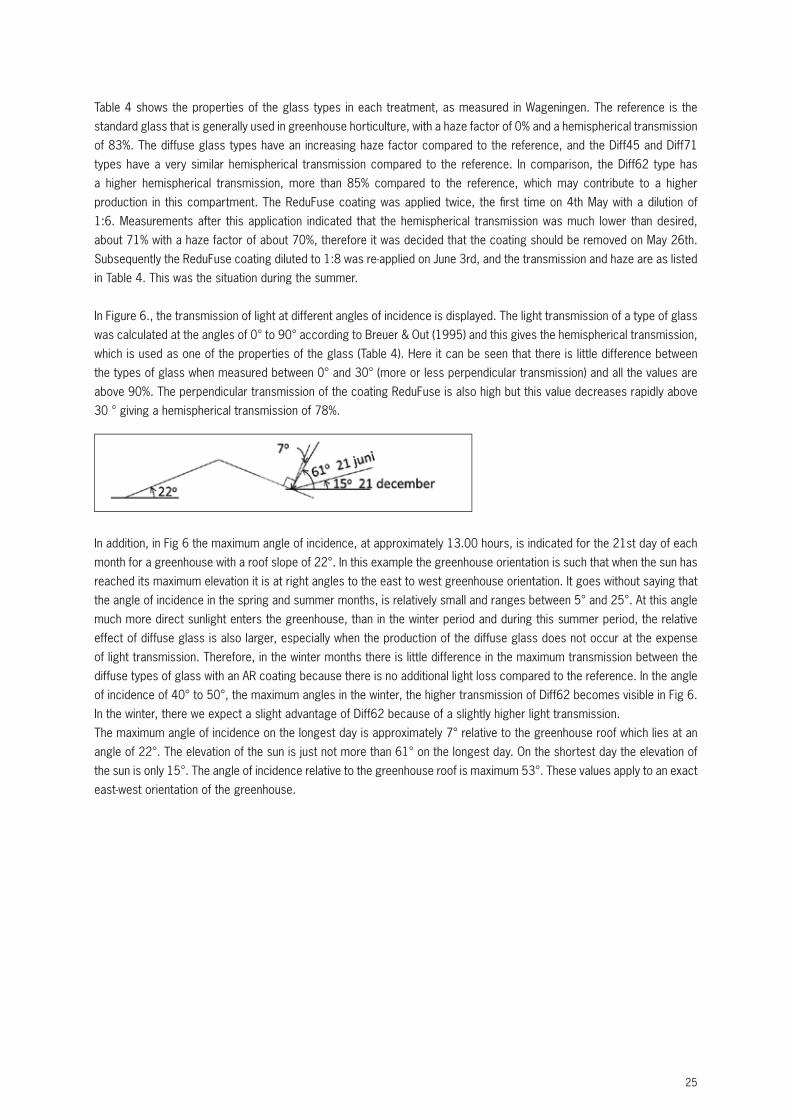
5.3.1 Light transmission
Table 4. Properties of the glass types used in the experiment.
Glass type Haze factor Hemispherical transmission Perpendicular transmission(%) (%) t.o.v. Ref (%)
Reference 0 82.7 100 89.8Diff45 45 82.6 100 92.4Diff62 62 85.4 103 93.9Diff71 71 82.9 100 93.6Coating 50 78.0 94 89.7
Some examples of diffuse glass.
25
Table 4 shows the properties of the glass types in each treatment, as measured in Wageningen. The reference is the standard glass that is generally used in greenhouse horticulture, with a haze factor of 0% and a hemispherical transmission of 83%. The diffuse glass types have an increasing haze factor compared to the reference, and the Diff45 and Diff71 types have a very similar hemispherical transmission compared to the reference. In comparison, the Diff62 type has a higher hemispherical transmission, more than 85% compared to the reference, which may contribute to a higher production in this compartment. The ReduFuse coating was applied twice, the fi rst time on 4th May with a dilution of 1:6. Measurements after this application indicated that the hemispherical transmission was much lower than desired, about 71% with a haze factor of about 70%, therefore it was decided that the coating should be removed on May 26th. Subsequently the ReduFuse coating diluted to 1:8 was re-applied on June 3rd, and the transmission and haze are as listed in Table 4. This was the situation during the summer.
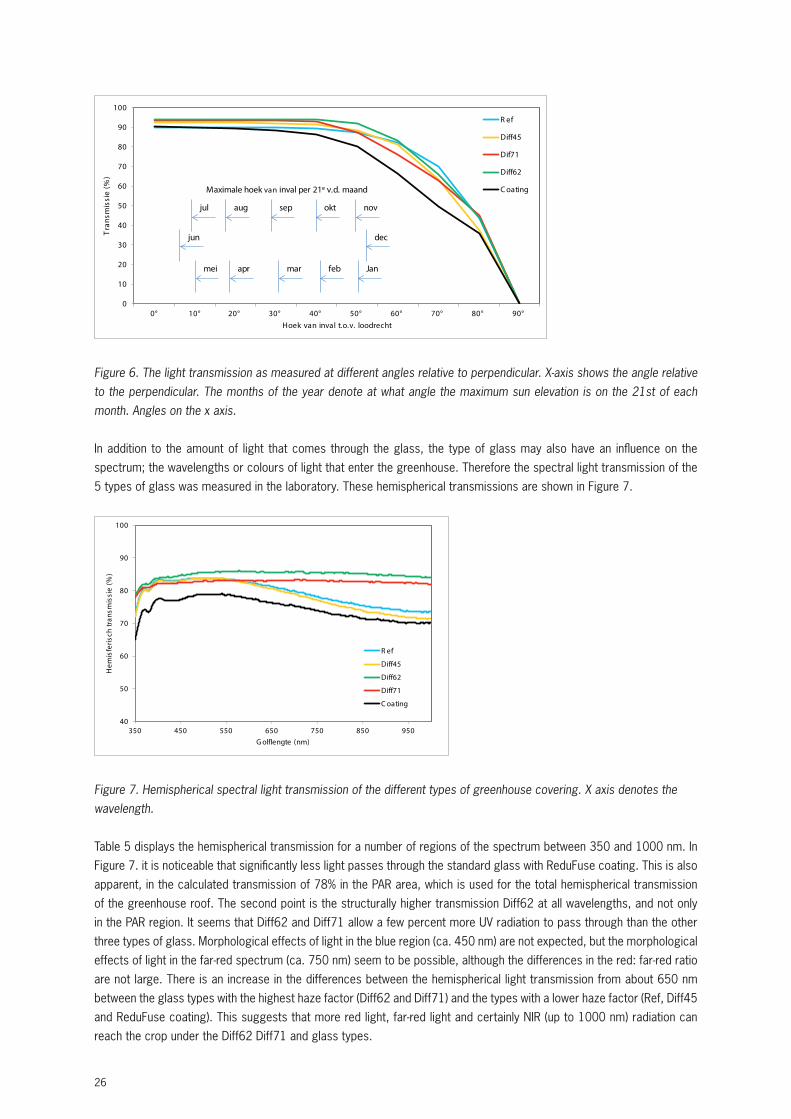
In Figure 6., the transmission of light at different angles of incidence is displayed. The light transmission of a type of glass was calculated at the angles of 0° to 90° according to Breuer & Out (1995) and this gives the hemispherical transmission, which is used as one of the properties of the glass (Table 4). Here it can be seen that there is little difference between the types of glass when measured between 0° and 30° (more or less perpendicular transmission) and all the values are above 90%. The perpendicular transmission of the coating ReduFuse is also high but this value decreases rapidly above 30 ° giving a hemispherical transmission of 78%.
In addition, in Fig 6 the maximum angle of incidence, at approximately 13.00 hours, is indicated for the 21st day of each month for a greenhouse with a roof slope of 22°. In this example the greenhouse orientation is such that when the sun has reached its maximum elevation it is at right angles to the east to west greenhouse orientation. It goes without saying that the angle of incidence in the spring and summer months, is relatively small and ranges between 5° and 25°. At this angle much more direct sunlight enters the greenhouse, than in the winter period and during this summer period, the relative effect of diffuse glass is also larger, especially when the production of the diffuse glass does not occur at the expense of light transmission. Therefore, in the winter months there is little difference in the maximum transmission between the diffuse types of glass with an AR coating because there is no additional light loss compared to the reference. In the angle of incidence of 40° to 50°, the maximum angles in the winter, the higher transmission of Diff62 becomes visible in Fig 6. In the winter, there we expect a slight advantage of Diff62 because of a slightly higher light transmission.The maximum angle of incidence on the longest day is approximately 7° relative to the greenhouse roof which lies at an angle of 22°. The elevation of the sun is just not more than 61° on the longest day. On the shortest day the elevation of the sun is only 15°. The angle of incidence relative to the greenhouse roof is maximum 53°. These values apply to an exact east-west orientation of the greenhouse.
26
0
10
20
30
40
50
60
70
80
90
100
0° 10° 20° 30° 40° 50° 60° 70° 80° 90°
Tra
nsm
issi
e (%
)
Hoek van inval t.o.v. loodrecht
R ef
Diff45
Dif71
Diff62
C oating
Janapr febmei
decjun
mar
novaug oktjul sep
Maximale hoek van inval per 21e v.d. maand
Figure 6. The light transmission as measured at different angles relative to perpendicular. X-axis shows the angle relative to the perpendicular. The months of the year denote at what angle the maximum sun elevation is on the 21st of each month. Angles on the x axis.
In addition to the amount of light that comes through the glass, the type of glass may also have an influence on the spectrum; the wavelengths or colours of light that enter the greenhouse. Therefore the spectral light transmission of the 5 types of glass was measured in the laboratory. These hemispherical transmissions are shown in Figure 7.
40
50
60
70
80
90
100
350 450 550 650 750 850 950
Hem
isfe
risch
tran
smis
sie
(%)
G olflengte (nm)
R ef
Diff45
Diff62
Diff71
C oating
Figure 7. Hemispherical spectral light transmission of the different types of greenhouse covering. X axis denotes the wavelength.
Table 5 displays the hemispherical transmission for a number of regions of the spectrum between 350 and 1000 nm. In Figure 7. it is noticeable that significantly less light passes through the standard glass with ReduFuse coating. This is also apparent, in the calculated transmission of 78% in the PAR area, which is used for the total hemispherical transmission of the greenhouse roof. The second point is the structurally higher transmission Diff62 at all wavelengths, and not only in the PAR region. It seems that Diff62 and Diff71 allow a few percent more UV radiation to pass through than the other three types of glass. Morphological effects of light in the blue region (ca. 450 nm) are not expected, but the morphological effects of light in the far-red spectrum (ca. 750 nm) seem to be possible, although the differences in the red: far-red ratio are not large. There is an increase in the differences between the hemispherical light transmission from about 650 nm between the glass types with the highest haze factor (Diff62 and Diff71) and the types with a lower haze factor (Ref, Diff45 and ReduFuse coating). This suggests that more red light, far-red light and certainly NIR (up to 1000 nm) radiation can reach the crop under the Diff62 Diff71 and glass types.
27
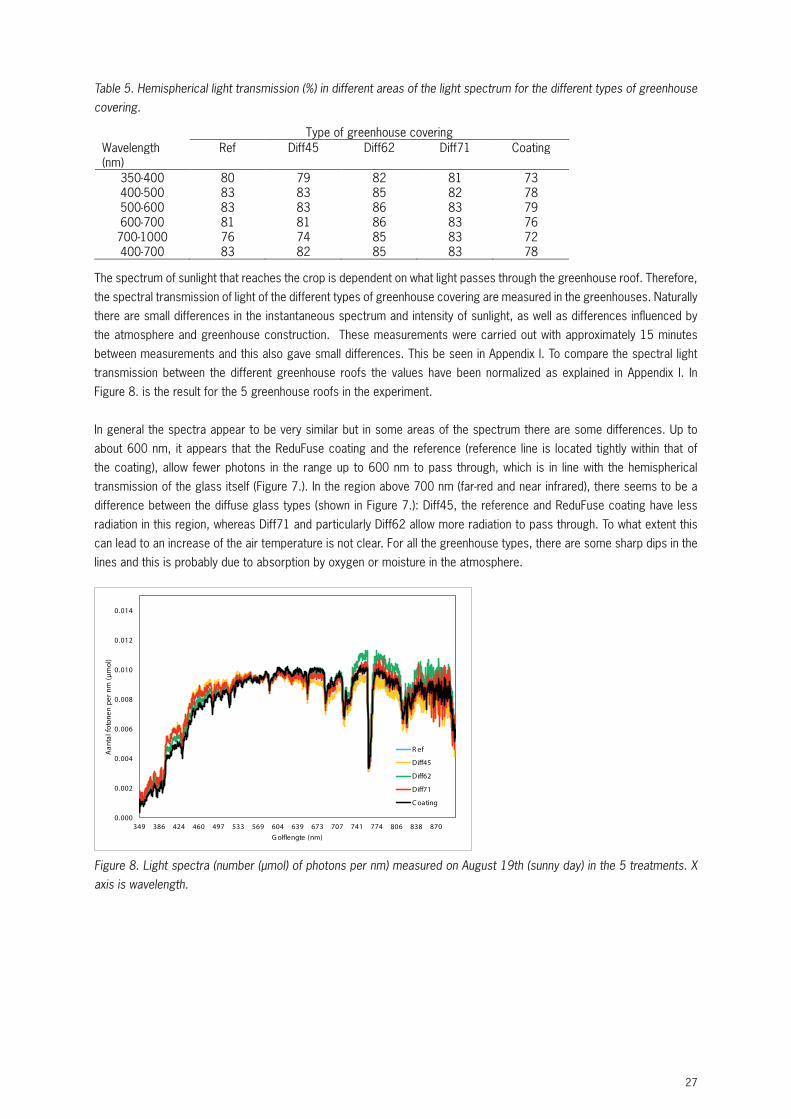
Table 5. Hemispherical light transmission (%) in different areas of the light spectrum for the different types of greenhouse covering.
Table 5: Hemispherical light transmission (%) in different areas of the light spectrum for the different types of greenhouse covering
Type of greenhouse covering Wavelength (nm)
Ref Diff45 Diff62 Diff71 Coating
350400 80 79 82 81 73 400500 83 83 85 82 78 500600 83 83 86 83 79 600700 81 81 86 83 76
7001000 76 74 85 83 72 400700 83 82 85 83 78
The spectrum of sunlight that reaches the crop is dependent on what light passes through the greenhouse roof. Therefore, the spectral transmission of light of the different types of greenhouse covering are measured in the greenhouses. Naturally there are small differences in the instantaneous spectrum and intensity of sunlight, as well as differences influenced by the atmosphere and greenhouse construction. These measurements were carried out with approximately 15 minutes between measurements and this also gave small differences. This be seen in Appendix I. To compare the spectral light transmission between the different greenhouse roofs the values have been normalized as explained in Appendix I. In Fig. 8 is the result for the 5 greenhouse roofs in the experiment. In general the spectra appear to be very similar but in some areas of the spectrum there are some differences. Up to about 600 nm, it appears that the ReduFuse coating and the reference (reference line is located tightly within that of the coating), allow fewer photons in the range up to 600 nm to pass through, which is in line with the hemispherical transmission of the glass itself (Fig. 7). In the region above 700 nm (farred and near infrared), there seems to be a difference between the diffuse glass types (shown in Fig. 7): Diff45, the reference and ReduFuse coating have less radiation in this region, whereas Diff71 and particularly Diff62 allow more radiation to pass through. To what extent this can lead to an increase of the air temperature is not clear. For all the greenhouse types, there are some sharp dips in the lines and this is probably due to absorption by oxygen or moisture in the atmosphere.
Figure 8. Light spectra (number (mol) of photons per nm) measured on August 19th (sunny day) in the 5 treatments. X axis is wavelength.
0.000
0.002
0.004
0.006
0.008
0.010
0.012
0.014
349 386 424 460 497 533 569 604 639 673 707 741 774 806 838 870
Aant
al fo
tone
n pe
r nm
(µm
ol)
Golflengte (nm)
Ref
Diff45
Diff62
Diff71
Coating
The spectrum of sunlight that reaches the crop is dependent on what light passes through the greenhouse roof. Therefore, the spectral transmission of light of the different types of greenhouse covering are measured in the greenhouses. Naturally there are small differences in the instantaneous spectrum and intensity of sunlight, as well as differences influenced by the atmosphere and greenhouse construction. These measurements were carried out with approximately 15 minutes between measurements and this also gave small differences. This be seen in Appendix I. To compare the spectral light transmission between the different greenhouse roofs the values have been normalized as explained in Appendix I. In Figure 8. is the result for the 5 greenhouse roofs in the experiment.
In general the spectra appear to be very similar but in some areas of the spectrum there are some differences. Up to about 600 nm, it appears that the ReduFuse coating and the reference (reference line is located tightly within that of the coating), allow fewer photons in the range up to 600 nm to pass through, which is in line with the hemispherical transmission of the glass itself (Figure 7.). In the region above 700 nm (far-red and near infrared), there seems to be a difference between the diffuse glass types (shown in Figure 7.): Diff45, the reference and ReduFuse coating have less radiation in this region, whereas Diff71 and particularly Diff62 allow more radiation to pass through. To what extent this can lead to an increase of the air temperature is not clear. For all the greenhouse types, there are some sharp dips in the lines and this is probably due to absorption by oxygen or moisture in the atmosphere.
0.000
0.002
0.004
0.006
0.008
0.010
0.012
0.014
349 386 424 460 497 533 569 604 639 673 707 741 774 806 838 870
Aan
tal f
oton
en p
er n
m (
µmol
)
G olflengte (nm)
R ef
Diff45
Diff62
Diff71
C oating
Figure 8. Light spectra (number (µmol) of photons per nm) measured on August 19th (sunny day) in the 5 treatments. X axis is wavelength.
28
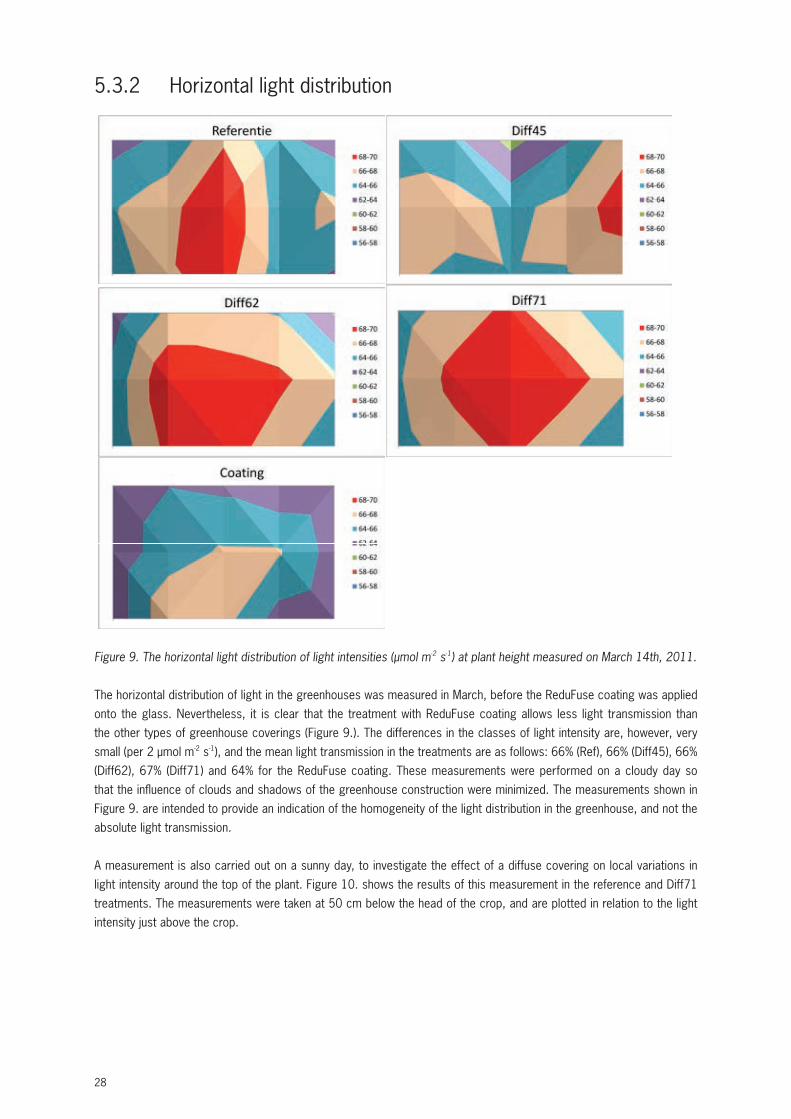
5.3.2 Horizontal light distribution
18
Figuur 8. Licht spectra gemeten op 19 augustus (zonnige dag) in de 5 behandelingen.
5.3.2 Horizontale lichtverdeling
Figuur 9. De horizontale lichtverdeling met lichtintensiteiten (mol m2 s1) op gewashoogte gemeten op 14 maart 2011.
0.000
0.002
0.004
0.006
0.008
0.010
0.012
0.014
349 386 424 460 497 533 569 604 639 673 707 741 774 806 838 870
Aant
al fo
tone
n pe
r nm
(µm
ol)
Golflengte (nm)
Ref
Diff45
Diff62
Diff71
Coating
Figure 9. The horizontal light distribution of light intensities (µmol m-2 s-1) at plant height measured on March 14th, 2011.
The horizontal distribution of light in the greenhouses was measured in March, before the ReduFuse coating was applied onto the glass. Nevertheless, it is clear that the treatment with ReduFuse coating allows less light transmission than the other types of greenhouse coverings (Figure 9.). The differences in the classes of light intensity are, however, very small (per 2 µmol m-2 s-1), and the mean light transmission in the treatments are as follows: 66% (Ref), 66% (Diff45), 66% (Diff62), 67% (Diff71) and 64% for the ReduFuse coating. These measurements were performed on a cloudy day so that the influence of clouds and shadows of the greenhouse construction were minimized. The measurements shown in Figure 9. are intended to provide an indication of the homogeneity of the light distribution in the greenhouse, and not the absolute light transmission.
A measurement is also carried out on a sunny day, to investigate the effect of a diffuse covering on local variations in light intensity around the top of the plant. Figure 10. shows the results of this measurement in the reference and Diff71 treatments. The measurements were taken at 50 cm below the head of the crop, and are plotted in relation to the light intensity just above the crop.
29
19
De horizontale lichtverdeling in de kassen is gemeten in maart, nog voordat de ReduFuse coating opgebracht werd op het dek. De meting is dus uitgevoerd zonder coating op het dek. Desondanks is het duidelijk dat de behandeling met ReduFuse coating minder licht doorlaat dan de overige kasdektypes (Fig. 9). De verschillen in gradaties lichtintensiteit zijn echter zeer klein (per 2 mol m2 s1) en de gemiddelde lichttransmissie in de behandelingen zijn: 66% (Ref), 66% (Diff45), 66% (Diff62), 67% (Diff71) en 64% voor de ReduFuse coating. Deze metingen zijn uitgevoerd op een bewolkte dag om bijvoorbeeld invloeden van bewolking en schaduwen van de kasdekconstructie te minimaliseren. De metingen weergegeven in Fig. 9 zijn bedoeld om een indicatie te krijgen van de homogeniteit van de lichtverdeling in de kas, en niet om de absolute lichttransmissie aan te geven. Er is ook een meting uitgevoerd op een zonnige dag om het effect van een diffuus kasdek op de plaatselijke veranderingen in lichtintensiteit op de kop van het gewas na te gaan. In Fig. 10 worden de resultaten van de metingen in de referentie en Diff71 behandelingen weergegeven. De metingen zijn uitgevoerd 50 cm onder de kop van het gewas en zijn weergegeven in relatie tot de lichtintensiteit net boven het gewas.
Figuur 10. Horizontale lichtverdeling gemeten bovenin het gewas bij de referentie en Diff71 behandeling. In de referentie (standaard glas) zijn er grote plaatselijke verschillen in lichtintensiteit te zien, namelijk een variatie van 4080% van de lichtintensiteit die boven het gewas werd gemeten. Deze lokale verschillen zijn vooral te wijten aan kasconstructies en mogelijk ook apparatuur die in de kas hangt en schaduwwerking geeft. De horizontale lichtverdeling bij Diff71 daarentegen laat veel meer regelmaat en gelijkheid in lichtintensiteit bovenin het gewas zien. Ook vonden Johnson & Smith (2006) dat diffuus licht onderin het gewas homogener is dan direct licht. Hiermee komen er minder verschillen in lichtintensiteit in het gewas voor waardoor in het gewas een gelijkmatiger fotosynthese en meer groei gerealiseerd kan worden, zoals ook door Brodersen et al. (2008) werd gevonden. Het ontwikkelen van bladeren onder diffuus en direct licht kan een grote invloed hebben op de verdeling van licht in het gewas en de mate van lichtonderschepping (Sarlikioti et al. 2011). Bladeren die zich ontwikkelen onder diffuus licht zijn vlakker georiënteerd en staan meer loodrecht op de stengel dan bladeren die ontwikkeld zijn onder direct licht (Muraoka, 1998). Hierdoor wordt de lichtonderschepping onderin het gewas vergroot met als gevolg een grotere lichtbenutting. De Casas et al. (2011) suggereerden dat door deze veranderde oriëntatie, abiotische stress verminderd zou kunnen worden.
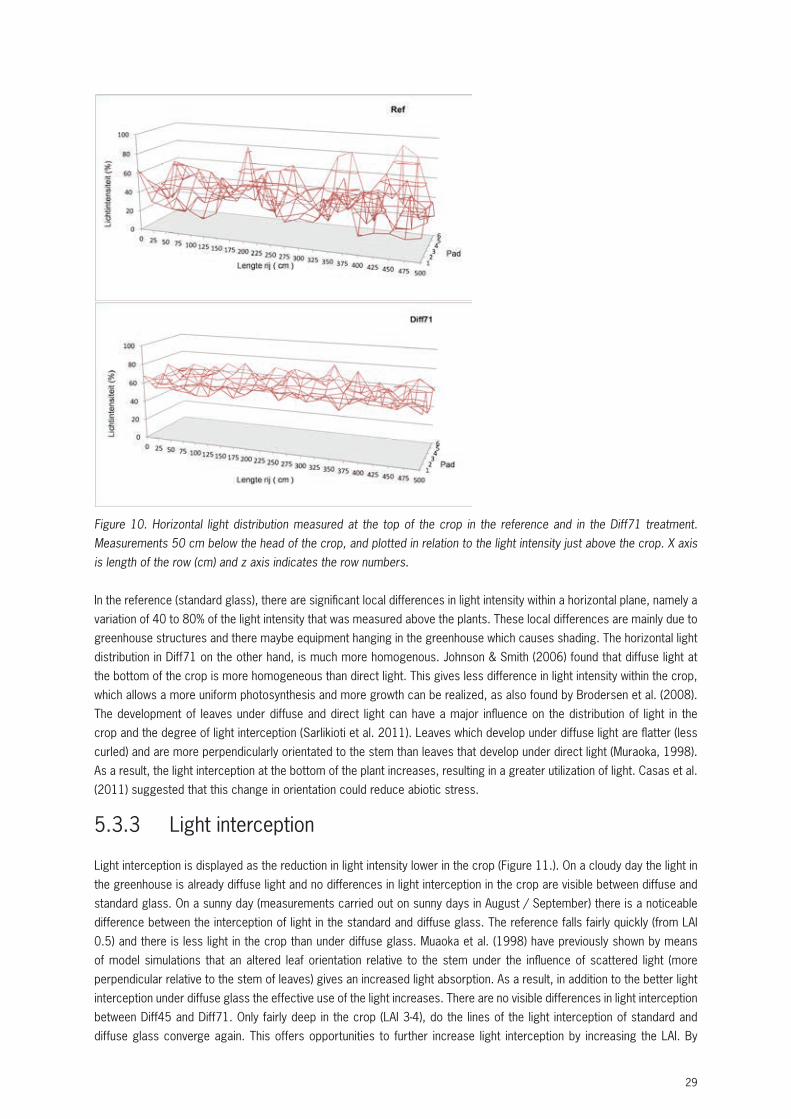
Figure 10. Horizontal light distribution measured at the top of the crop in the reference and in the Diff71 treatment. Measurements 50 cm below the head of the crop, and plotted in relation to the light intensity just above the crop. X axis is length of the row (cm) and z axis indicates the row numbers.
In the reference (standard glass), there are significant local differences in light intensity within a horizontal plane, namely a variation of 40 to 80% of the light intensity that was measured above the plants. These local differences are mainly due to greenhouse structures and there maybe equipment hanging in the greenhouse which causes shading. The horizontal light distribution in Diff71 on the other hand, is much more homogenous. Johnson & Smith (2006) found that diffuse light at the bottom of the crop is more homogeneous than direct light. This gives less difference in light intensity within the crop, which allows a more uniform photosynthesis and more growth can be realized, as also found by Brodersen et al. (2008).The development of leaves under diffuse and direct light can have a major influence on the distribution of light in the crop and the degree of light interception (Sarlikioti et al. 2011). Leaves which develop under diffuse light are flatter (less curled) and are more perpendicularly orientated to the stem than leaves that develop under direct light (Muraoka, 1998). As a result, the light interception at the bottom of the plant increases, resulting in a greater utilization of light. Casas et al. (2011) suggested that this change in orientation could reduce abiotic stress.
5.3.3 Light interception
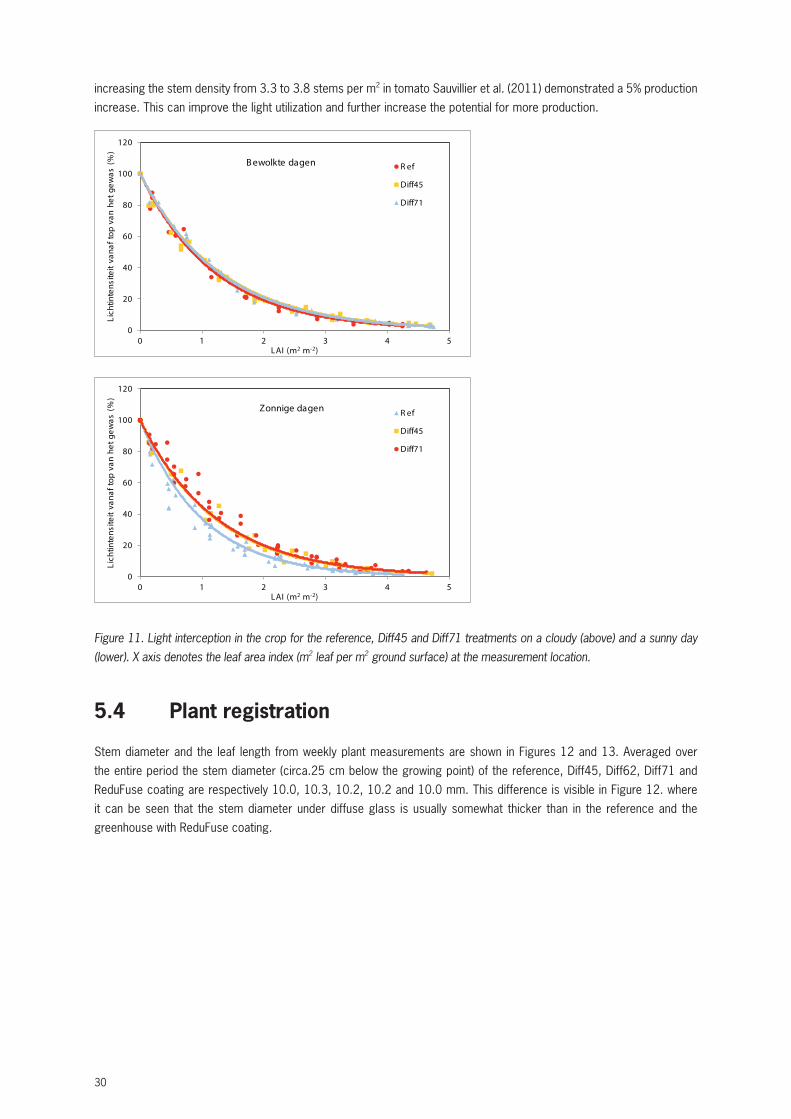
Light interception is displayed as the reduction in light intensity lower in the crop (Figure 11.). On a cloudy day the light in the greenhouse is already diffuse light and no differences in light interception in the crop are visible between diffuse and standard glass. On a sunny day (measurements carried out on sunny days in August / September) there is a noticeable difference between the interception of light in the standard and diffuse glass. The reference falls fairly quickly (from LAI 0.5) and there is less light in the crop than under diffuse glass. Muaoka et al. (1998) have previously shown by means of model simulations that an altered leaf orientation relative to the stem under the influence of scattered light (more perpendicular relative to the stem of leaves) gives an increased light absorption. As a result, in addition to the better light interception under diffuse glass the effective use of the light increases. There are no visible differences in light interception between Diff45 and Diff71. Only fairly deep in the crop (LAI 3-4), do the lines of the light interception of standard and diffuse glass converge again. This offers opportunities to further increase light interception by increasing the LAI. By
30
increasing the stem density from 3.3 to 3.8 stems per m2 in tomato Sauvillier et al. (2011) demonstrated a 5% production increase. This can improve the light utilization and further increase the potential for more production.
0
20
40
60
80
100
120
0 1 2 3 4 5
Lich
tinte
nsite
it va
naf t
op v
an h
et g
ewas
(%
)
LAI (m2 m-2)
R ef
Diff45
Diff71
B ewolkte dagen
0
20
40
60
80
100
120
0 1 2 3 4 5
Lich
tinte
nsite
it va
naf t
op v
an h
et g
ewas
(%
)
LAI (m2 m-2)
R ef
Diff45
Diff71
Zonnige dagen
Figure 11. Light interception in the crop for the reference, Diff45 and Diff71 treatments on a cloudy (above) and a sunny day (lower). X axis denotes the leaf area index (m2 leaf per m2 ground surface) at the measurement location.
5.4 Plant registration
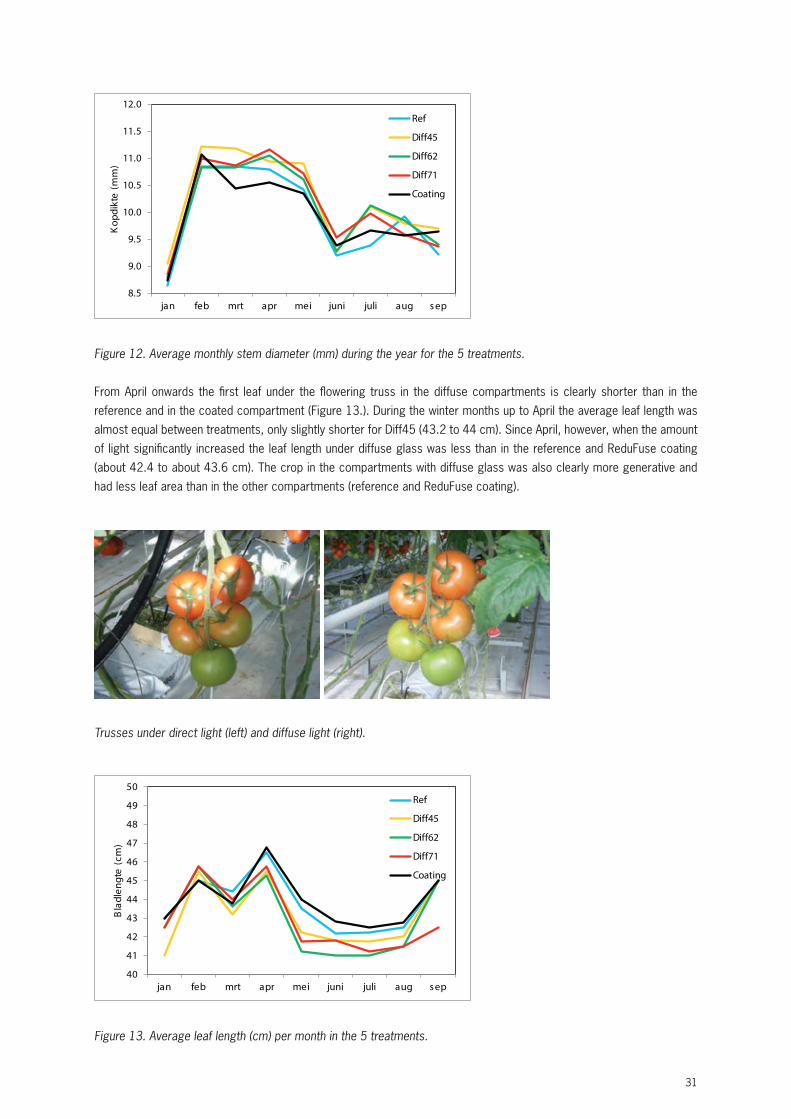
Stem diameter and the leaf length from weekly plant measurements are shown in Figures 12 and 13. Averaged over the entire period the stem diameter (circa.25 cm below the growing point) of the reference, Diff45, Diff62, Diff71 and ReduFuse coating are respectively 10.0, 10.3, 10.2, 10.2 and 10.0 mm. This difference is visible in Figure 12. where it can be seen that the stem diameter under diffuse glass is usually somewhat thicker than in the reference and the greenhouse with ReduFuse coating.
31
8.5
9.0
9.5
10.0
10.5
11.0
11.5
12.0
jan feb mrt apr mei juni juli aug s ep
Kop
dikt
e (m
m)
Ref
Diff45
Diff62
Diff71
Coating
Figure 12. Average monthly stem diameter (mm) during the year for the 5 treatments.
From April onwards the first leaf under the flowering truss in the diffuse compartments is clearly shorter than in the reference and in the coated compartment (Figure 13.). During the winter months up to April the average leaf length was almost equal between treatments, only slightly shorter for Diff45 (43.2 to 44 cm). Since April, however, when the amount of light significantly increased the leaf length under diffuse glass was less than in the reference and ReduFuse coating (about 42.4 to about 43.6 cm). The crop in the compartments with diffuse glass was also clearly more generative and had less leaf area than in the other compartments (reference and ReduFuse coating).
Trusses under direct light (left) and diffuse light (right).
40
41
42
43
44
45
46
47
48
49
50
jan feb mrt apr mei juni juli aug s ep
Bla
dlen
gte
(cm
)
Ref
Diff45
Diff62
Diff71
Coating
Figure 13. Average leaf length (cm) per month in the 5 treatments.
32
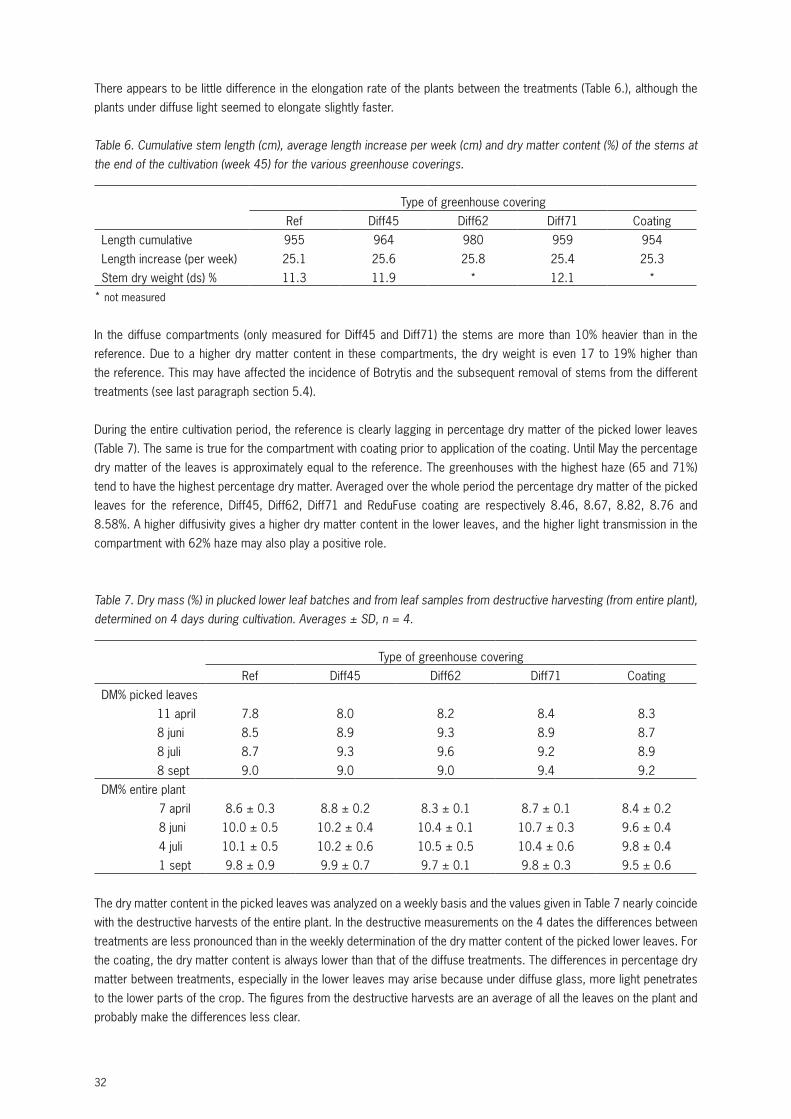
There appears to be little difference in the elongation rate of the plants between the treatments (Table 6.), although the plants under diffuse light seemed to elongate slightly faster.
Table 6. Cumulative stem length (cm), average length increase per week (cm) and dry matter content (%) of the stems at the end of the cultivation (week 45) for the various greenhouse coverings.
Type of greenhouse coveringRef Diff45 Diff62 Diff71 Coating
Length cumulative 955 964 980 959 954Length increase (per week) 25.1 25.6 25.8 25.4 25.3Stem dry weight (ds) % 11.3 11.9 * 12.1 *
* not measured
In the diffuse compartments (only measured for Diff45 and Diff71) the stems are more than 10% heavier than in the reference. Due to a higher dry matter content in these compartments, the dry weight is even 17 to 19% higher than the reference. This may have affected the incidence of Botrytis and the subsequent removal of stems from the different treatments (see last paragraph section 5.4).
During the entire cultivation period, the reference is clearly lagging in percentage dry matter of the picked lower leaves (Table 7). The same is true for the compartment with coating prior to application of the coating. Until May the percentage dry matter of the leaves is approximately equal to the reference. The greenhouses with the highest haze (65 and 71%) tend to have the highest percentage dry matter. Averaged over the whole period the percentage dry matter of the picked leaves for the reference, Diff45, Diff62, Diff71 and ReduFuse coating are respectively 8.46, 8.67, 8.82, 8.76 and 8.58%. A higher diffusivity gives a higher dry matter content in the lower leaves, and the higher light transmission in the compartment with 62% haze may also play a positive role.
Table 7. Dry mass (%) in plucked lower leaf batches and from leaf samples from destructive harvesting (from entire plant), determined on 4 days during cultivation. Averages ± SD, n = 4.
Type of greenhouse coveringRef Diff45 Diff62 Diff71 Coating
DM% picked leaves 11 april 7.8 8.0 8.2 8.4 8.3 8 juni 8.5 8.9 9.3 8.9 8.7 8 juli 8.7 9.3 9.6 9.2 8.9 8 sept 9.0 9.0 9.0 9.4 9.2DM% entire plant 7 april 8.6 ± 0.3 8.8 ± 0.2 8.3 ± 0.1 8.7 ± 0.1 8.4 ± 0.2 8 juni 10.0 ± 0.5 10.2 ± 0.4 10.4 ± 0.1 10.7 ± 0.3 9.6 ± 0.4 4 juli 10.1 ± 0.5 10.2 ± 0.6 10.5 ± 0.5 10.4 ± 0.6 9.8 ± 0.4 1 sept 9.8 ± 0.9 9.9 ± 0.7 9.7 ± 0.1 9.8 ± 0.3 9.5 ± 0.6
The dry matter content in the picked leaves was analyzed on a weekly basis and the values given in Table 7 nearly coincide with the destructive harvests of the entire plant. In the destructive measurements on the 4 dates the differences between treatments are less pronounced than in the weekly determination of the dry matter content of the picked lower leaves. For the coating, the dry matter content is always lower than that of the diffuse treatments. The differences in percentage dry matter between treatments, especially in the lower leaves may arise because under diffuse glass, more light penetrates to the lower parts of the crop. The figures from the destructive harvests are an average of all the leaves on the plant and probably make the differences less clear.
33
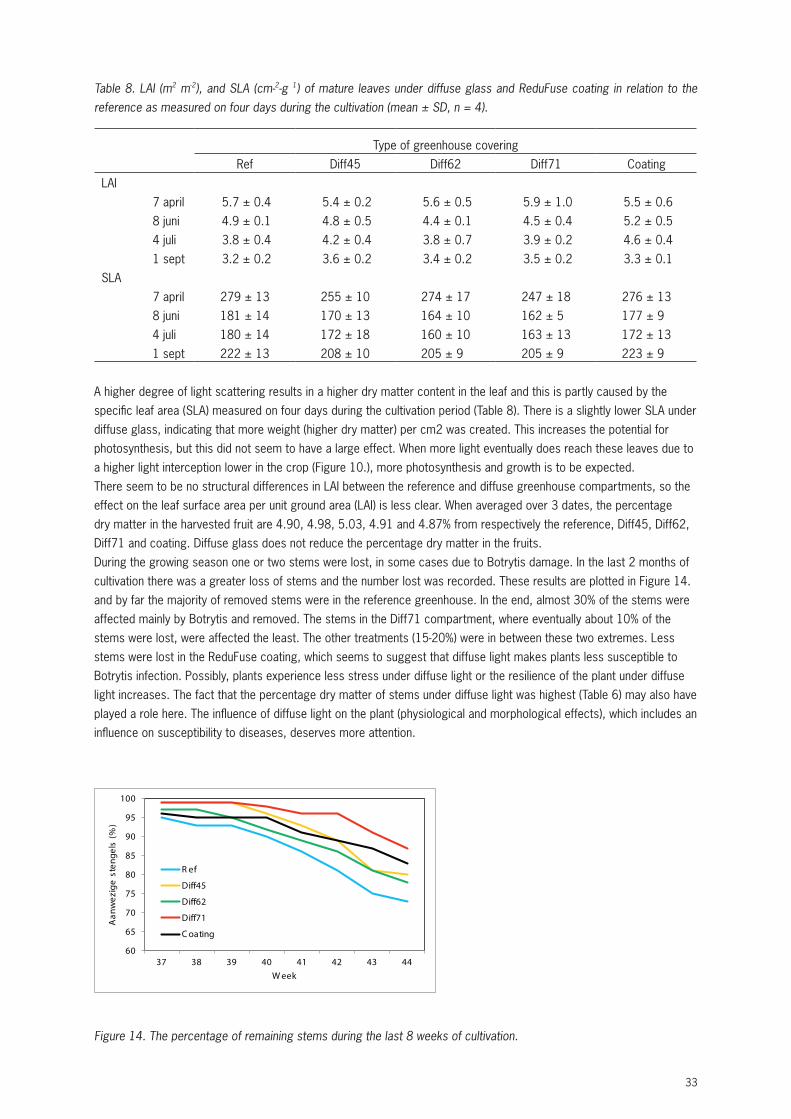
Table 8. LAI (m2 m-2), and SLA (cm-2-g 1) of mature leaves under diffuse glass and ReduFuse coating in relation to the reference as measured on four days during the cultivation (mean ± SD, n = 4).
Type of greenhouse coveringRef Diff45 Diff62 Diff71 Coating
LAI 7 april 5.7 ± 0.4 5.4 ± 0.2 5.6 ± 0.5 5.9 ± 1.0 5.5 ± 0.6 8 juni 4.9 ± 0.1 4.8 ± 0.5 4.4 ± 0.1 4.5 ± 0.4 5.2 ± 0.5 4 juli 3.8 ± 0.4 4.2 ± 0.4 3.8 ± 0.7 3.9 ± 0.2 4.6 ± 0.4 1 sept 3.2 ± 0.2 3.6 ± 0.2 3.4 ± 0.2 3.5 ± 0.2 3.3 ± 0.1SLA 7 april 279 ± 13 255 ± 10 274 ± 17 247 ± 18 276 ± 13 8 juni 181 ± 14 170 ± 13 164 ± 10 162 ± 50 177 ± 90 4 juli 180 ± 14 172 ± 18 160 ± 10 163 ± 13 172 ± 13 1 sept 222 ± 13 208 ± 10 205 ± 90 205 ± 90 223 ± 90
A higher degree of light scattering results in a higher dry matter content in the leaf and this is partly caused by the specific leaf area (SLA) measured on four days during the cultivation period (Table 8). There is a slightly lower SLA under diffuse glass, indicating that more weight (higher dry matter) per cm2 was created. This increases the potential for photosynthesis, but this did not seem to have a large effect. When more light eventually does reach these leaves due to a higher light interception lower in the crop (Figure 10.), more photosynthesis and growth is to be expected.There seem to be no structural differences in LAI between the reference and diffuse greenhouse compartments, so the effect on the leaf surface area per unit ground area (LAI) is less clear. When averaged over 3 dates, the percentage dry matter in the harvested fruit are 4.90, 4.98, 5.03, 4.91 and 4.87% from respectively the reference, Diff45, Diff62, Diff71 and coating. Diffuse glass does not reduce the percentage dry matter in the fruits.During the growing season one or two stems were lost, in some cases due to Botrytis damage. In the last 2 months of cultivation there was a greater loss of stems and the number lost was recorded. These results are plotted in Figure 14. and by far the majority of removed stems were in the reference greenhouse. In the end, almost 30% of the stems were affected mainly by Botrytis and removed. The stems in the Diff71 compartment, where eventually about 10% of the stems were lost, were affected the least. The other treatments (15-20%) were in between these two extremes. Less stems were lost in the ReduFuse coating, which seems to suggest that diffuse light makes plants less susceptible to Botrytis infection. Possibly, plants experience less stress under diffuse light or the resilience of the plant under diffuse light increases. The fact that the percentage dry matter of stems under diffuse light was highest (Table 6) may also have played a role here. The influence of diffuse light on the plant (physiological and morphological effects), which includes an influence on susceptibility to diseases, deserves more attention.
60
65
70
75
80
85
90
95
100
37 38 39 40 41 42 43 44
Aan
wez
ige
sten
gels
(%
)
W eek
R ef
Diff45
Diff62
Diff71
C oating
Figure 14. The percentage of remaining stems during the last 8 weeks of cultivation.
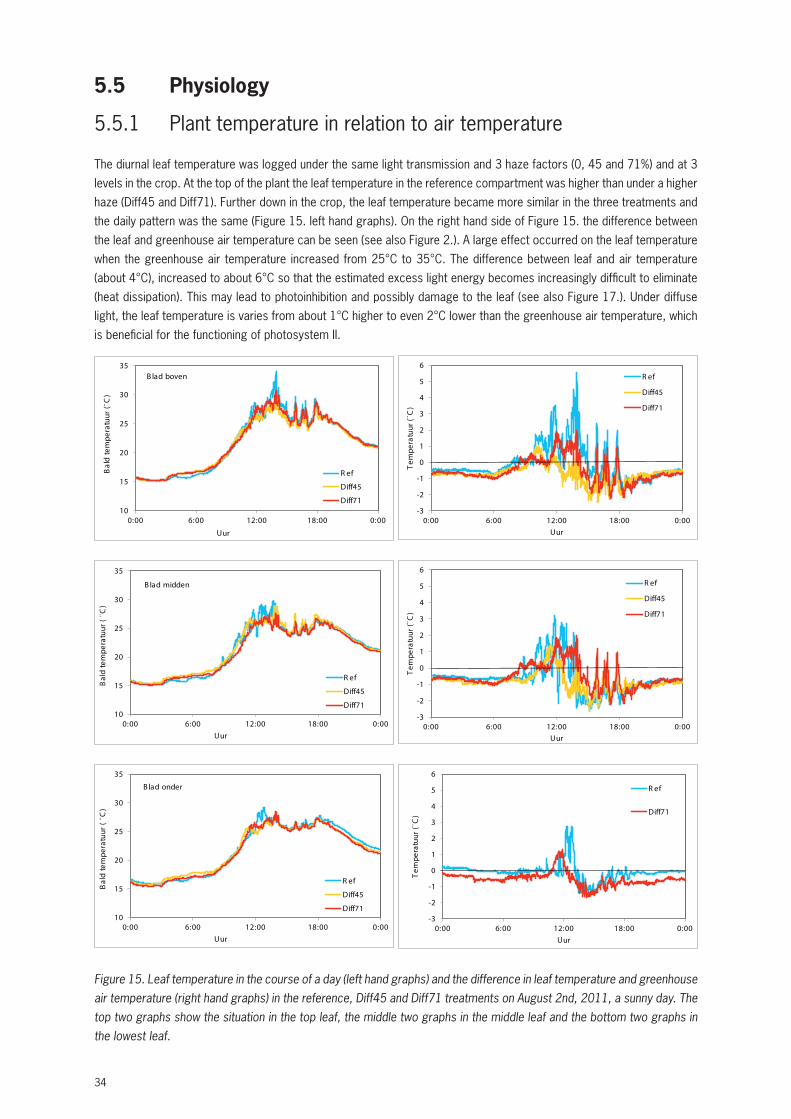
34
5.5 Physiology
5.5.1 Plant temperature in relation to air temperature
The diurnal leaf temperature was logged under the same light transmission and 3 haze factors (0, 45 and 71%) and at 3 levels in the crop. At the top of the plant the leaf temperature in the reference compartment was higher than under a higher haze (Diff45 and Diff71). Further down in the crop, the leaf temperature became more similar in the three treatments and the daily pattern was the same (Figure 15. left hand graphs). On the right hand side of Figure 15. the difference between the leaf and greenhouse air temperature can be seen (see also Figure 2.). A large effect occurred on the leaf temperature when the greenhouse air temperature increased from 25°C to 35°C. The difference between leaf and air temperature (about 4°C), increased to about 6°C so that the estimated excess light energy becomes increasingly difficult to eliminate (heat dissipation). This may lead to photoinhibition and possibly damage to the leaf (see also Figure 17.). Under diffuse light, the leaf temperature is varies from about 1°C higher to even 2°C lower than the greenhouse air temperature, which is beneficial for the functioning of photosystem II.
-3
-2
-1
0
1
2
3
4
5
6
0:00 6:00 12:00 18:00 0:00
Tem
pera
tuur
(¨C
)
Uur
R ef
Diff71
-3
-2
-1
0
1
2
3
4
5
6
0:00 6:00 12:00 18:00 0:00
Tem
pera
tuur
(¨C
)
Uur
R ef
Diff45
Diff71
-3
-2
-1
0
1
2
3
4
5
6
0:00 6:00 12:00 18:00 0:00
Tem
pera
tuur
(¨C
)
Uur
R ef
Diff45
Diff71
10
15
20
25
30
35
0:00 6:00 12:00 18:00 0:00
Bal
d te
mpe
ratu
ur (
¨C
)
Uur
R ef
Diff45
Diff71
B lad onder
10
15
20
25
30
35
0:00 6:00 12:00 18:00 0:00
Bal
d te
mpe
ratu
ur (
¨C
)
Uur
R ef
Diff45
Diff71
B lad midden
10
15
20
25
30
35
0:00 6:00 12:00 18:00 0:00
Bal
d te
mpe
ratu
ur (
¨C)
Uur
R ef
Diff45
Diff71
B lad boven
Figure 15. Leaf temperature in the course of a day (left hand graphs) and the difference in leaf temperature and greenhouse air temperature (right hand graphs) in the reference, Diff45 and Diff71 treatments on August 2nd, 2011, a sunny day. The top two graphs show the situation in the top leaf, the middle two graphs in the middle leaf and the bottom two graphs in the lowest leaf.
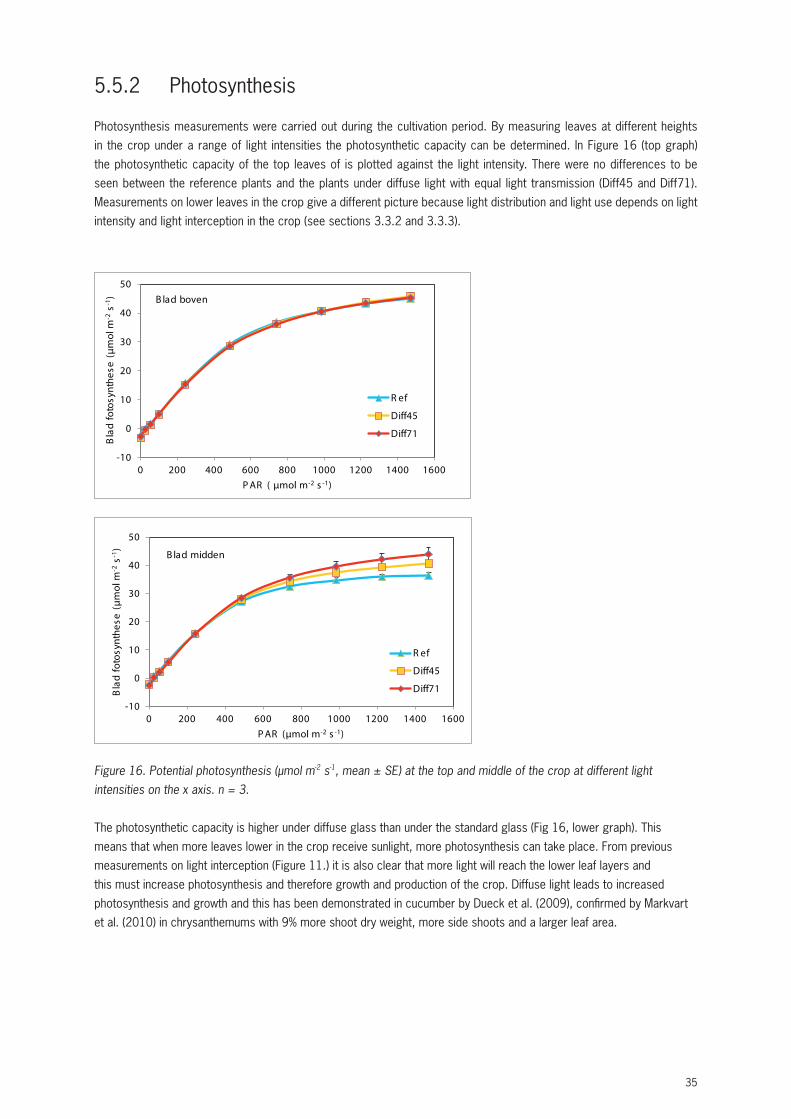
35
5.5.2 Photosynthesis
Photosynthesis measurements were carried out during the cultivation period. By measuring leaves at different heights in the crop under a range of light intensities the photosynthetic capacity can be determined. In Figure 16 (top graph) the photosynthetic capacity of the top leaves of is plotted against the light intensity. There were no differences to be seen between the reference plants and the plants under diffuse light with equal light transmission (Diff45 and Diff71). Measurements on lower leaves in the crop give a different picture because light distribution and light use depends on light intensity and light interception in the crop (see sections 3.3.2 and 3.3.3).
-10
0
10
20
30
40
50
0 200 400 600 800 1000 1200 1400 1600
Bla
d fo
tosy
nthe
se (
μmol
m-2
s-1)
P AR (μmol m-2 s -1)
R ef
Diff45
Diff71
B lad midden
-10
0
10
20
30
40
50
0 200 400 600 800 1000 1200 1400 1600
Bla
d fo
tosy
nthe
se (
μmol
m-2
s-1)
P AR ( μmol m-2 s -1)
R ef
Diff45
Diff71
B lad boven
Figure 16. Potential photosynthesis (µmol m-2 s-1, mean ± SE) at the top and middle of the crop at different light intensities on the x axis. n = 3.
The photosynthetic capacity is higher under diffuse glass than under the standard glass (Fig 16, lower graph). This means that when more leaves lower in the crop receive sunlight, more photosynthesis can take place. From previous measurements on light interception (Figure 11.) it is also clear that more light will reach the lower leaf layers and this must increase photosynthesis and therefore growth and production of the crop. Diffuse light leads to increased photosynthesis and growth and this has been demonstrated in cucumber by Dueck et al. (2009), confirmed by Markvart et al. (2010) in chrysanthemums with 9% more shoot dry weight, more side shoots and a larger leaf area.
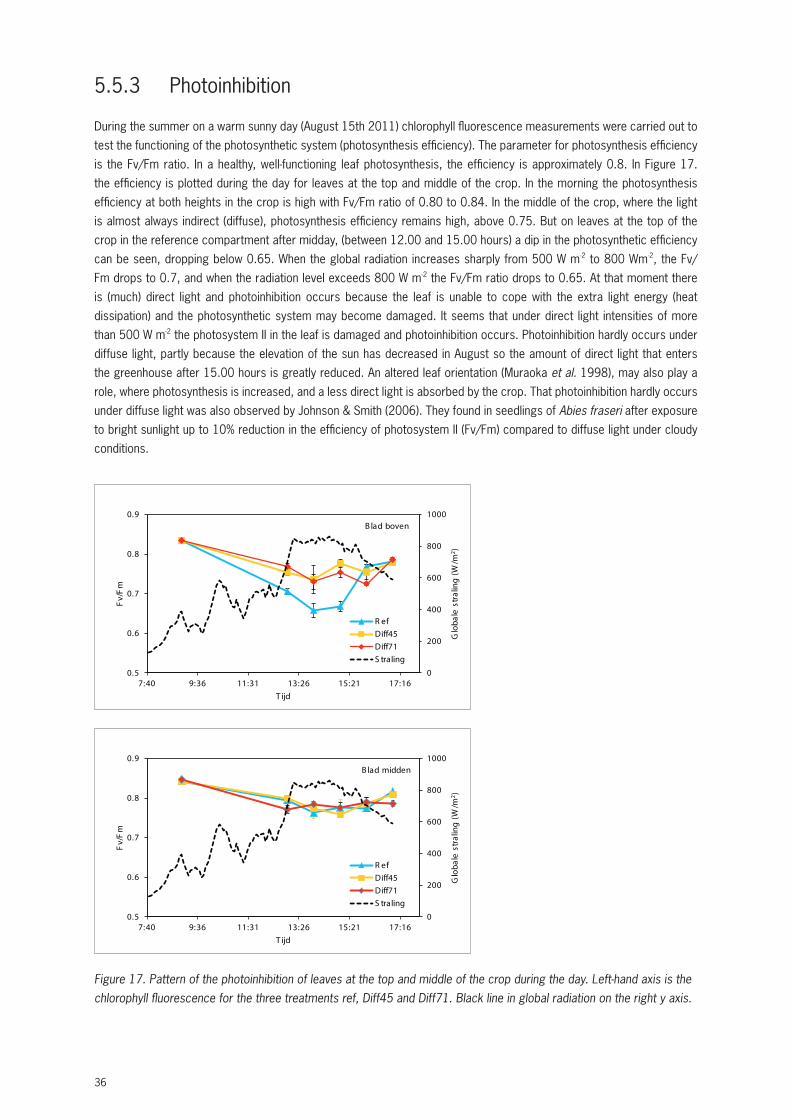
36
5.5.3 Photoinhibition
During the summer on a warm sunny day (August 15th 2011) chlorophyll fluorescence measurements were carried out to test the functioning of the photosynthetic system (photosynthesis efficiency). The parameter for photosynthesis efficiency is the Fv/Fm ratio. In a healthy, well-functioning leaf photosynthesis, the efficiency is approximately 0.8. In Figure 17. the efficiency is plotted during the day for leaves at the top and middle of the crop. In the morning the photosynthesis efficiency at both heights in the crop is high with Fv/Fm ratio of 0.80 to 0.84. In the middle of the crop, where the light is almost always indirect (diffuse), photosynthesis efficiency remains high, above 0.75. But on leaves at the top of the crop in the reference compartment after midday, (between 12.00 and 15.00 hours) a dip in the photosynthetic efficiency can be seen, dropping below 0.65. When the global radiation increases sharply from 500 W m-2 to 800 Wm-2, the Fv/Fm drops to 0.7, and when the radiation level exceeds 800 W m-2 the Fv/Fm ratio drops to 0.65. At that moment there is (much) direct light and photoinhibition occurs because the leaf is unable to cope with the extra light energy (heat dissipation) and the photosynthetic system may become damaged. It seems that under direct light intensities of more than 500 W m-2 the photosystem II in the leaf is damaged and photoinhibition occurs. Photoinhibition hardly occurs under diffuse light, partly because the elevation of the sun has decreased in August so the amount of direct light that enters the greenhouse after 15.00 hours is greatly reduced. An altered leaf orientation (Muraoka et al. 1998), may also play a role, where photosynthesis is increased, and a less direct light is absorbed by the crop. That photoinhibition hardly occurs under diffuse light was also observed by Johnson & Smith (2006). They found in seedlings of Abies fraseri after exposure to bright sunlight up to 10% reduction in the efficiency of photosystem II (Fv/Fm) compared to diffuse light under cloudy conditions.
0
200
400
600
800
1000
0.5
0.6
0.7
0.8
0.9
7:40 9:36 11:31 13:26 15:21 17:16
Glo
bale
str
alin
g (W
/m2 )
Fv/
Fm
T ijd
R efDiff45Diff71S traling
B lad midden
0
200
400
600
800
1000
0.5
0.6
0.7
0.8
0.9
7:40 9:36 11:31 13:26 15:21 17:16
Glo
bale
str
alin
g (W
/m2 )
Fv/
Fm
T ijd
R efDiff45Diff71S traling
B lad boven
Figure 17. Pattern of the photoinhibition of leaves at the top and middle of the crop during the day. Left-hand axis is the chlorophyll fluorescence for the three treatments ref, Diff45 and Diff71. Black line in global radiation on the right y axis.
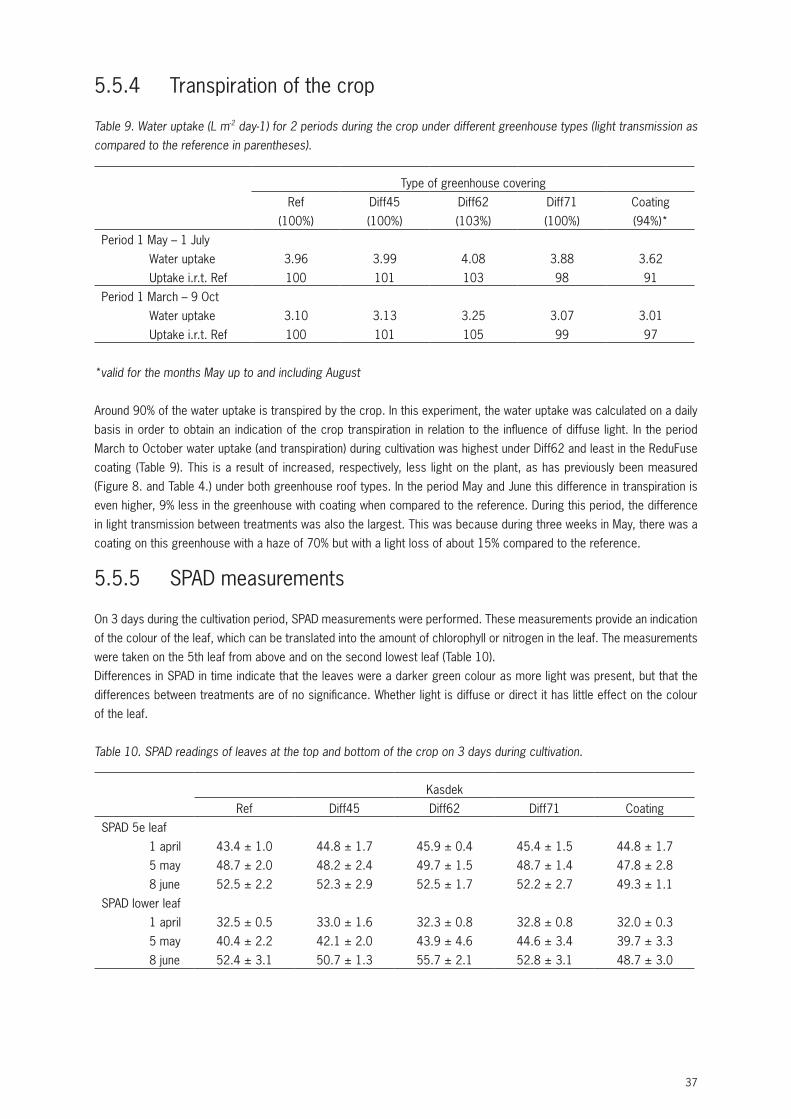
37
5.5.4 Transpiration of the crop
Table 9. Water uptake (L m-2 day-1) for 2 periods during the crop under different greenhouse types (light transmission as compared to the reference in parentheses).
Type of greenhouse coveringRef
(100%)Diff45(100%)
Diff62(103%)
Diff71(100%)
Coating(94%)*
Period 1 May – 1 July Water uptake 3.96 3.99 4.08 3.88 3.62 Uptake i.r.t. Ref 100 101 103 98 91Period 1 March – 9 Oct Water uptake 3.10 3.13 3.25 3.07 3.01 Uptake i.r.t. Ref 100 101 105 99 97
*valid for the months May up to and including August
Around 90% of the water uptake is transpired by the crop. In this experiment, the water uptake was calculated on a daily basis in order to obtain an indication of the crop transpiration in relation to the influence of diffuse light. In the period March to October water uptake (and transpiration) during cultivation was highest under Diff62 and least in the ReduFuse coating (Table 9). This is a result of increased, respectively, less light on the plant, as has previously been measured (Figure 8. and Table 4.) under both greenhouse roof types. In the period May and June this difference in transpiration is even higher, 9% less in the greenhouse with coating when compared to the reference. During this period, the difference in light transmission between treatments was also the largest. This was because during three weeks in May, there was a coating on this greenhouse with a haze of 70% but with a light loss of about 15% compared to the reference.
5.5.5 SPAD measurements
On 3 days during the cultivation period, SPAD measurements were performed. These measurements provide an indication of the colour of the leaf, which can be translated into the amount of chlorophyll or nitrogen in the leaf. The measurements were taken on the 5th leaf from above and on the second lowest leaf (Table 10).Differences in SPAD in time indicate that the leaves were a darker green colour as more light was present, but that the differences between treatments are of no significance. Whether light is diffuse or direct it has little effect on the colour of the leaf.
Table 10. SPAD readings of leaves at the top and bottom of the crop on 3 days during cultivation.
KasdekRef Diff45 Diff62 Diff71 Coating
SPAD 5e leaf 1 april 43.4 ± 1.0 44.8 ± 1.7 45.9 ± 0.4 45.4 ± 1.5 44.8 ± 1.7 5 may 48.7 ± 2.0 48.2 ± 2.4 49.7 ± 1.5 48.7 ± 1.4 47.8 ± 2.8 8 june 52.5 ± 2.2 52.3 ± 2.9 52.5 ± 1.7 52.2 ± 2.7 49.3 ± 1.1SPAD lower leaf 1 april 32.5 ± 0.5 33.0 ± 1.6 32.3 ± 0.8 32.8 ± 0.8 32.0 ± 0.3 5 may 40.4 ± 2.2 42.1 ± 2.0 43.9 ± 4.6 44.6 ± 3.4 39.7 ± 3.3 8 june 52.4 ± 3.1 50.7 ± 1.3 55.7 ± 2.1 52.8 ± 3.1 48.7 ± 3.0
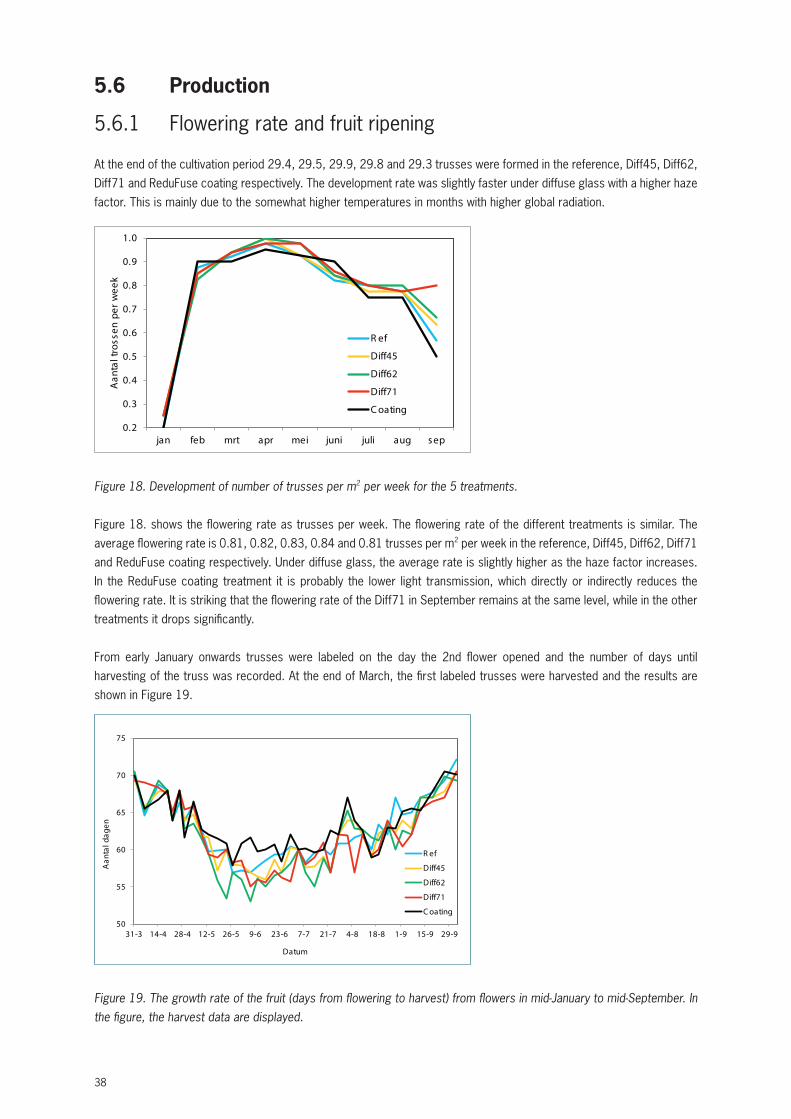
38
5.6 Production
5.6.1 Flowering rate and fruit ripening
At the end of the cultivation period 29.4, 29.5, 29.9, 29.8 and 29.3 trusses were formed in the reference, Diff45, Diff62, Diff71 and ReduFuse coating respectively. The development rate was slightly faster under diffuse glass with a higher haze factor. This is mainly due to the somewhat higher temperatures in months with higher global radiation.
0.2
0.3
0.4
0.5
0.6
0.7
0.8
0.9
1.0
jan feb mrt apr mei juni juli aug s ep
Aan
tal t
ross
en p
er w
eek
R ef
Diff45
Diff62
Diff71
C oating
Figure 18. Development of number of trusses per m2 per week for the 5 treatments.
Figure 18. shows the flowering rate as trusses per week. The flowering rate of the different treatments is similar. The average flowering rate is 0.81, 0.82, 0.83, 0.84 and 0.81 trusses per m2 per week in the reference, Diff45, Diff62, Diff71 and ReduFuse coating respectively. Under diffuse glass, the average rate is slightly higher as the haze factor increases. In the ReduFuse coating treatment it is probably the lower light transmission, which directly or indirectly reduces the flowering rate. It is striking that the flowering rate of the Diff71 in September remains at the same level, while in the other treatments it drops significantly.
From early January onwards trusses were labeled on the day the 2nd flower opened and the number of days until harvesting of the truss was recorded. At the end of March, the first labeled trusses were harvested and the results are shown in Figure 19.
50
55
60
65
70
75
31-3 14-4 28-4 12-5 26-5 9-6 23-6 7-7 21-7 4-8 18-8 1-9 15-9 29-9
Aan
tal d
agen
Datum
R ef
Diff45
Diff62
Diff71
C oating
Figure 19. The growth rate of the fruit (days from flowering to harvest) from flowers in mid-January to mid-September. In the figure, the harvest data are displayed.
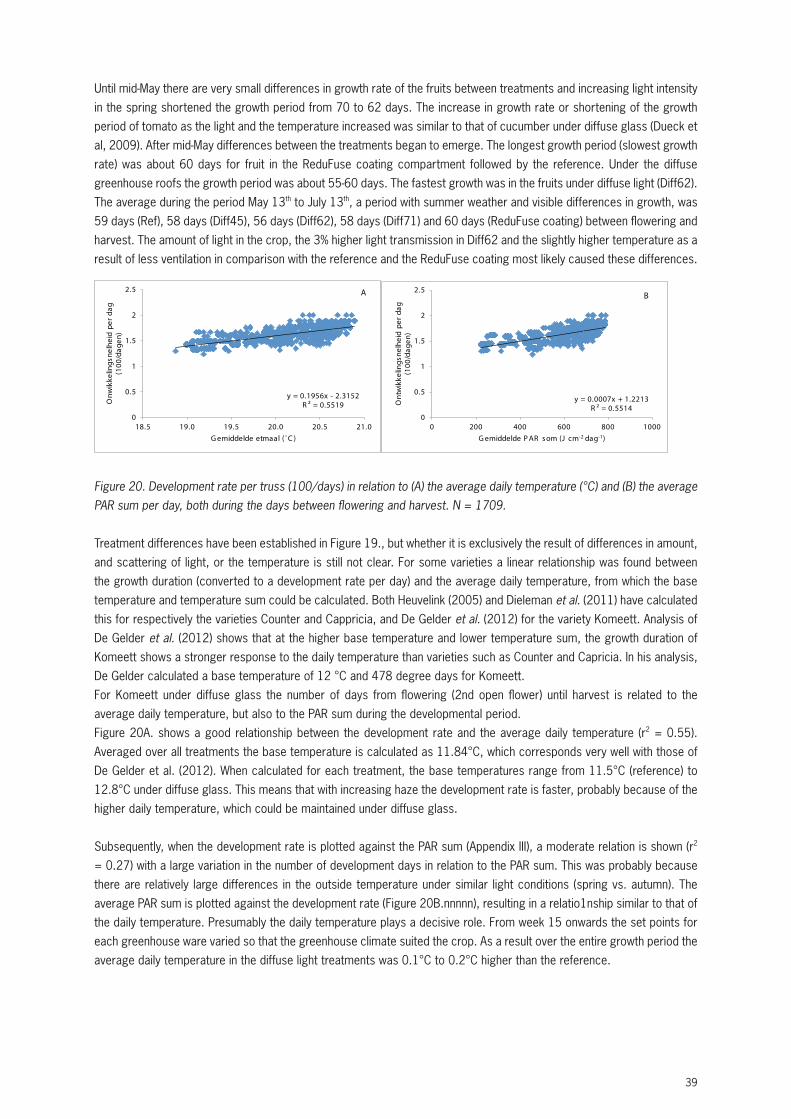
39
Until mid-May there are very small differences in growth rate of the fruits between treatments and increasing light intensity in the spring shortened the growth period from 70 to 62 days. The increase in growth rate or shortening of the growth period of tomato as the light and the temperature increased was similar to that of cucumber under diffuse glass (Dueck et al, 2009). After mid-May differences between the treatments began to emerge. The longest growth period (slowest growth rate) was about 60 days for fruit in the ReduFuse coating compartment followed by the reference. Under the diffuse greenhouse roofs the growth period was about 55-60 days. The fastest growth was in the fruits under diffuse light (Diff62). The average during the period May 13th to July 13th, a period with summer weather and visible differences in growth, was 59 days (Ref), 58 days (Diff45), 56 days (Diff62), 58 days (Diff71) and 60 days (ReduFuse coating) between flowering and harvest. The amount of light in the crop, the 3% higher light transmission in Diff62 and the slightly higher temperature as a result of less ventilation in comparison with the reference and the ReduFuse coating most likely caused these differences.
y = 0.1956x - 2.3152R ² = 0.5519
0
0.5
1
1.5
2
2.5
18.5 19.0 19.5 20.0 20.5 21.0
Onw
ikke
lings
nelh
eid
per
dag
(100
/dag
en)
G emiddelde etmaal (¨C )
A
y = 0.0007x + 1.2213R ² = 0.5514
0
0.5
1
1.5
2
2.5
0 200 400 600 800 1000
Ont
wik
kelin
gsne
lhei
d pe
r da
g (1
00/d
agen
)
G emiddelde P AR s om (J cm-2 dag-1)
B
Figure 20. Development rate per truss (100/days) in relation to (A) the average daily temperature (°C) and (B) the average PAR sum per day, both during the days between flowering and harvest. N = 1709.
Treatment differences have been established in Figure 19., but whether it is exclusively the result of differences in amount, and scattering of light, or the temperature is still not clear. For some varieties a linear relationship was found between the growth duration (converted to a development rate per day) and the average daily temperature, from which the base temperature and temperature sum could be calculated. Both Heuvelink (2005) and Dieleman et al. (2011) have calculated this for respectively the varieties Counter and Cappricia, and De Gelder et al. (2012) for the variety Komeett. Analysis of De Gelder et al. (2012) shows that at the higher base temperature and lower temperature sum, the growth duration of Komeett shows a stronger response to the daily temperature than varieties such as Counter and Capricia. In his analysis, De Gelder calculated a base temperature of 12 °C and 478 degree days for Komeett.For Komeett under diffuse glass the number of days from flowering (2nd open flower) until harvest is related to the average daily temperature, but also to the PAR sum during the developmental period.Figure 20A. shows a good relationship between the development rate and the average daily temperature (r2 = 0.55). Averaged over all treatments the base temperature is calculated as 11.84°C, which corresponds very well with those of De Gelder et al. (2012). When calculated for each treatment, the base temperatures range from 11.5°C (reference) to 12.8°C under diffuse glass. This means that with increasing haze the development rate is faster, probably because of the higher daily temperature, which could be maintained under diffuse glass.
Subsequently, when the development rate is plotted against the PAR sum (Appendix III), a moderate relation is shown (r2 = 0.27) with a large variation in the number of development days in relation to the PAR sum. This was probably because there are relatively large differences in the outside temperature under similar light conditions (spring vs. autumn). The average PAR sum is plotted against the development rate (Figure 20B.nnnnn), resulting in a relatio1nship similar to that of the daily temperature. Presumably the daily temperature plays a decisive role. From week 15 onwards the set points for each greenhouse ware varied so that the greenhouse climate suited the crop. As a result over the entire growth period the average daily temperature in the diffuse light treatments was 0.1°C to 0.2°C higher than the reference.
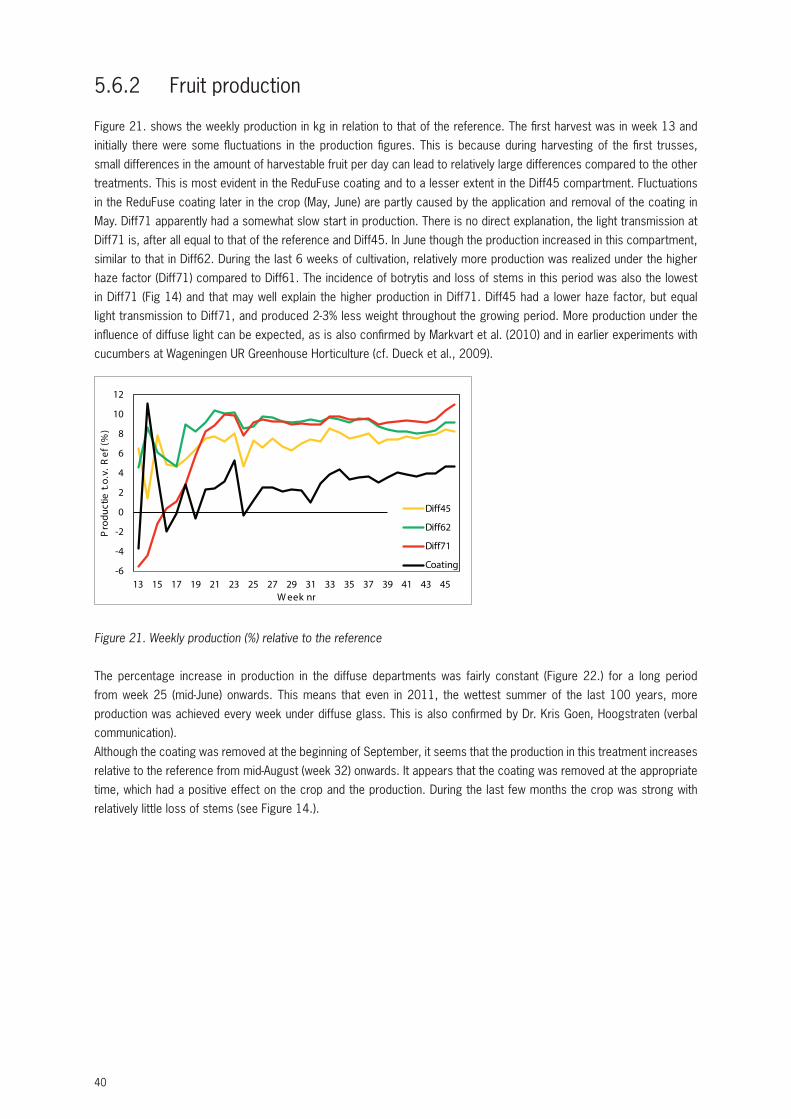
40
5.6.2 Fruit production
Figure 21. shows the weekly production in kg in relation to that of the reference. The first harvest was in week 13 and initially there were some fluctuations in the production figures. This is because during harvesting of the first trusses, small differences in the amount of harvestable fruit per day can lead to relatively large differences compared to the other treatments. This is most evident in the ReduFuse coating and to a lesser extent in the Diff45 compartment. Fluctuations in the ReduFuse coating later in the crop (May, June) are partly caused by the application and removal of the coating in May. Diff71 apparently had a somewhat slow start in production. There is no direct explanation, the light transmission at Diff71 is, after all equal to that of the reference and Diff45. In June though the production increased in this compartment, similar to that in Diff62. During the last 6 weeks of cultivation, relatively more production was realized under the higher haze factor (Diff71) compared to Diff61. The incidence of botrytis and loss of stems in this period was also the lowest in Diff71 (Fig 14) and that may well explain the higher production in Diff71. Diff45 had a lower haze factor, but equal light transmission to Diff71, and produced 2-3% less weight throughout the growing period. More production under the influence of diffuse light can be expected, as is also confirmed by Markvart et al. (2010) and in earlier experiments with cucumbers at Wageningen UR Greenhouse Horticulture (cf. Dueck et al., 2009).
-6
-4
-2
0
2
4
6
8
10
12
13 15 17 19 21 23 25 27 29 31 33 35 37 39 41 43 45
Pro
duct
ie t.
o.v.
Ref
(%
)
W eek nr
Diff45
Diff62
Diff71
Coating
Figure 21. Weekly production (%) relative to the reference
The percentage increase in production in the diffuse departments was fairly constant (Figure 22.) for a long period from week 25 (mid-June) onwards. This means that even in 2011, the wettest summer of the last 100 years, more production was achieved every week under diffuse glass. This is also confirmed by Dr. Kris Goen, Hoogstraten (verbal communication).Although the coating was removed at the beginning of September, it seems that the production in this treatment increases relative to the reference from mid-August (week 32) onwards. It appears that the coating was removed at the appropriate time, which had a positive effect on the crop and the production. During the last few months the crop was strong with relatively little loss of stems (see Figure 14.).
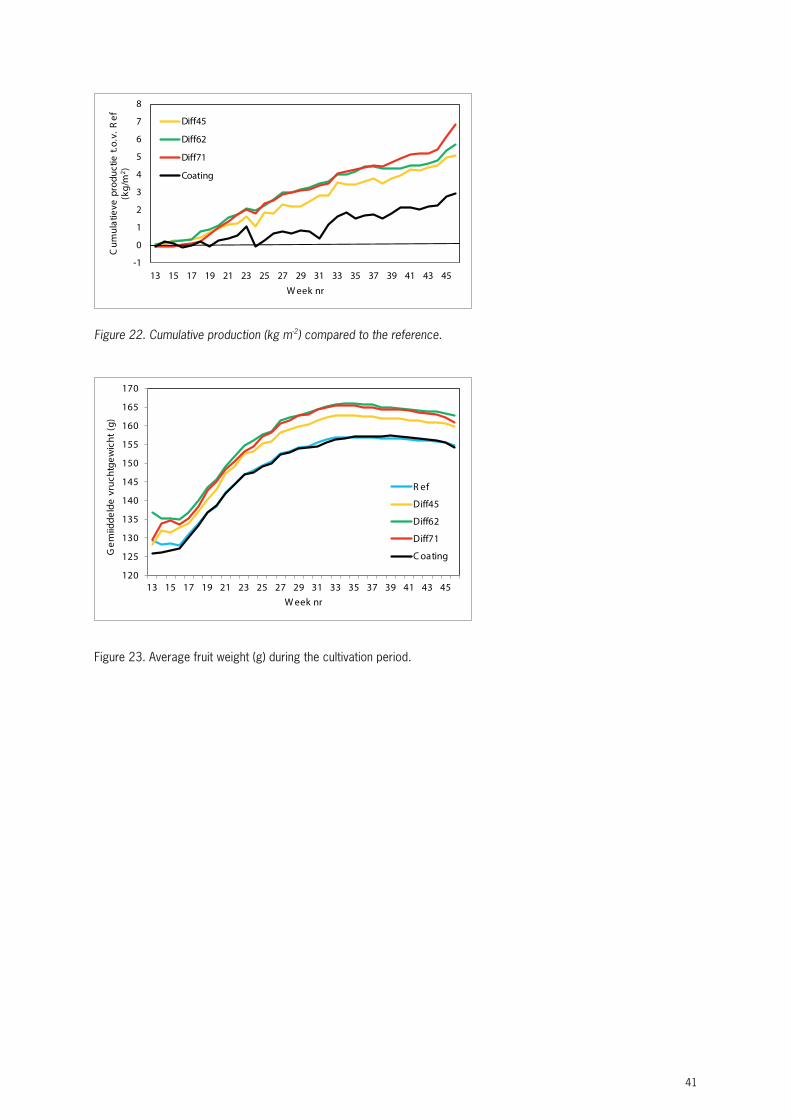
41
-1
0
1
2
3
4
5
6
7
8
13 15 17 19 21 23 25 27 29 31 33 35 37 39 41 43 45
Cum
ulat
ieve
pro
duct
ie t.
o.v.
Ref
(k
g/m
2 )
W eek nr
Diff45
Diff62
Diff71
Coating
Figure 22. Cumulative production (kg m-2) compared to the reference.
120
125
130
135
140
145
150
155
160
165
170
13 15 17 19 21 23 25 27 29 31 33 35 37 39 41 43 45
Gem
iidde
lde
vruc
htge
wic
ht (
g)
W eek nr
R ef
Diff45
Diff62
Diff71
C oating
Figure 23. Average fruit weight (g) during the cultivation period.
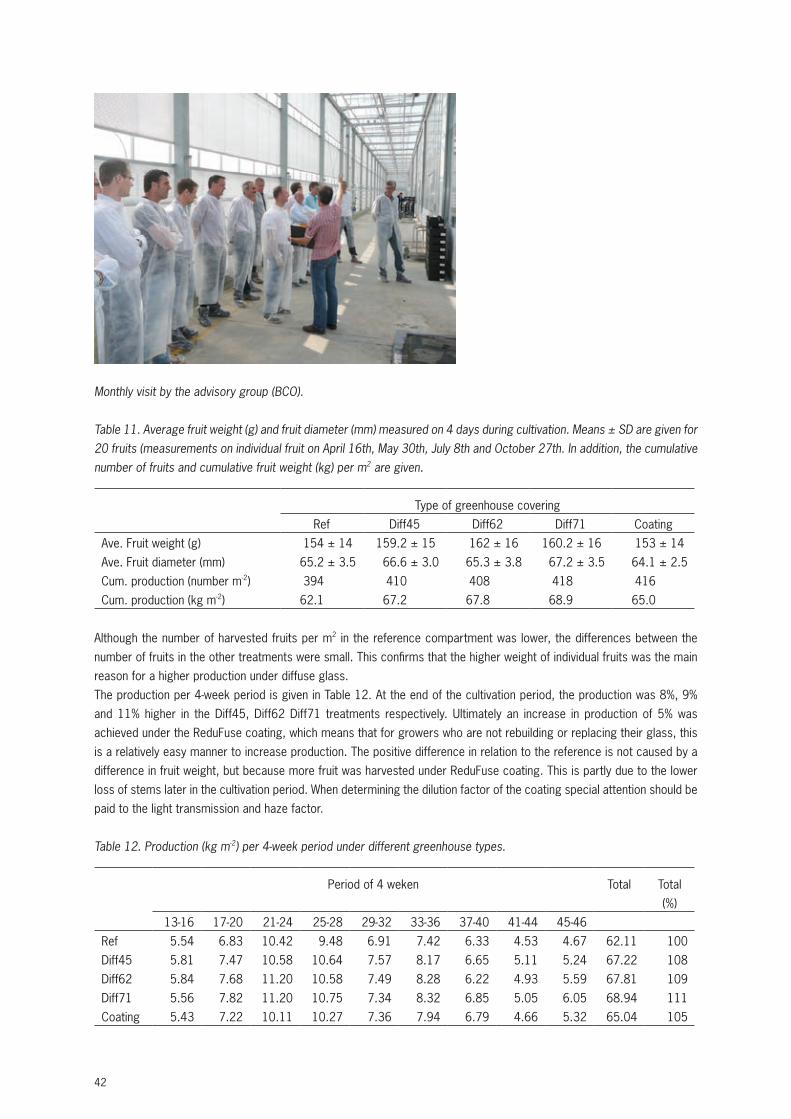
42
Monthly visit by the advisory group (BCO).
Table 11. Average fruit weight (g) and fruit diameter (mm) measured on 4 days during cultivation. Means ± SD are given for 20 fruits (measurements on individual fruit on April 16th, May 30th, July 8th and October 27th. In addition, the cumulative number of fruits and cumulative fruit weight (kg) per m2 are given.
Type of greenhouse coveringRef Diff45 Diff62 Diff71 Coating
Ave. Fruit weight (g) 154 ± 14. 159.2 ± 15. 162 ± 16. 160.2 ± 16. 153 ± 14.Ave. Fruit diameter (mm) 65.2 ± 3.5 66.6 ± 3.0 65.3 ± 3.8 67.2 ± 3.5 64.1 ± 2.5Cum. production (number m-2) 394 ± 0.0 410 ± 0.0 408 ± 0.0 418 ± 0.0 416 ± 0.0Cum. production (kg m-2) 62.1 ± 0.0 67.2 ± 0.0 67.8 ± 0.0 68.9 ± 0.0 65.0 ± 0.0
Although the number of harvested fruits per m2 in the reference compartment was lower, the differences between the number of fruits in the other treatments were small. This confirms that the higher weight of individual fruits was the main reason for a higher production under diffuse glass.The production per 4-week period is given in Table 12. At the end of the cultivation period, the production was 8%, 9% and 11% higher in the Diff45, Diff62 Diff71 treatments respectively. Ultimately an increase in production of 5% was achieved under the ReduFuse coating, which means that for growers who are not rebuilding or replacing their glass, this is a relatively easy manner to increase production. The positive difference in relation to the reference is not caused by a difference in fruit weight, but because more fruit was harvested under ReduFuse coating. This is partly due to the lower loss of stems later in the cultivation period. When determining the dilution factor of the coating special attention should be paid to the light transmission and haze factor.
Table 12. Production (kg m-2) per 4-week period under different greenhouse types.
Period of 4 weken Total Total (%)
13-16 17-20 21-24 25-28 29-32 33-36 37-40 41-44 45-46Ref 5.54 6.83 10.42 9.48 6.91 7.42 6.33 4.53 4.67 62.11 100Diff45 5.81 7.47 10.58 10.64 7.57 8.17 6.65 5.11 5.24 67.22 108Diff62 5.84 7.68 11.20 10.58 7.49 8.28 6.22 4.93 5.59 67.81 109Diff71 5.56 7.82 11.20 10.75 7.34 8.32 6.85 5.05 6.05 68.94 111Coating 5.43 7.22 10.11 10.27 7.36 7.94 6.79 4.66 5.32 65.04 105
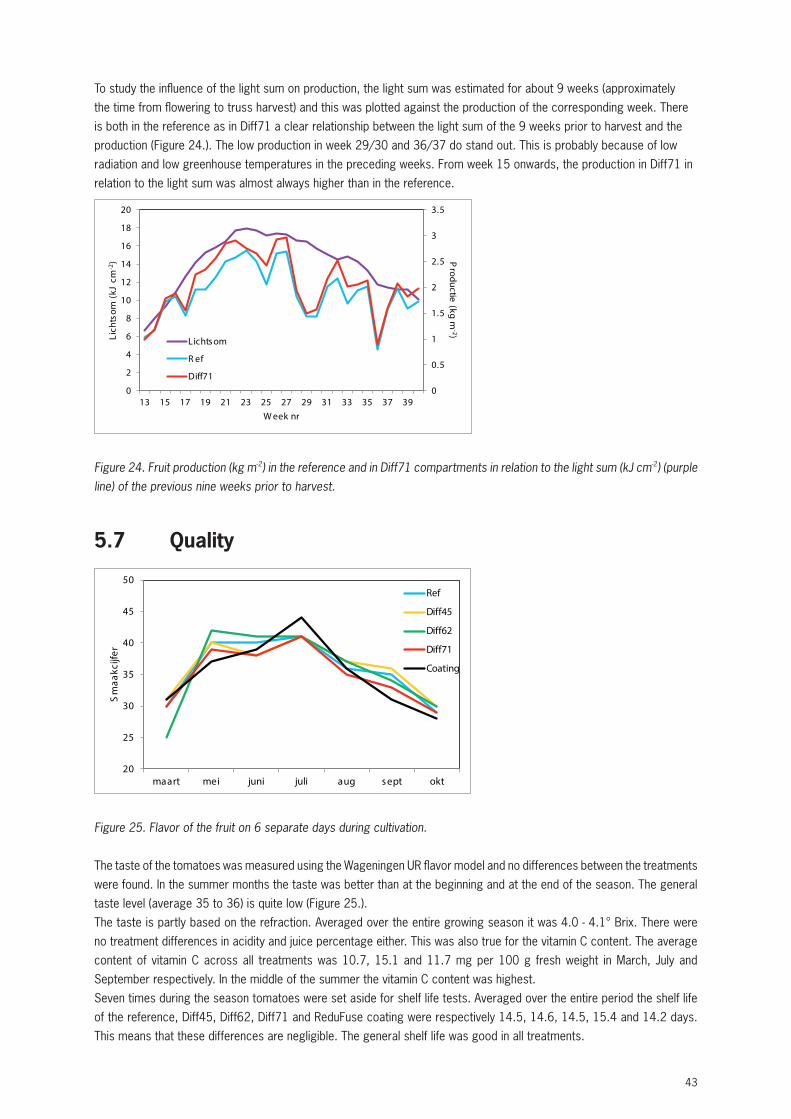
43
To study the influence of the light sum on production, the light sum was estimated for about 9 weeks (approximately the time from flowering to truss harvest) and this was plotted against the production of the corresponding week. There is both in the reference as in Diff71 a clear relationship between the light sum of the 9 weeks prior to harvest and the production (Figure 24.). The low production in week 29/30 and 36/37 do stand out. This is probably because of low radiation and low greenhouse temperatures in the preceding weeks. From week 15 onwards, the production in Diff71 in relation to the light sum was almost always higher than in the reference.
0
0.5
1
1.5
2
2.5
3
3.5
0
2
4
6
8
10
12
14
16
18
20
13 15 17 19 21 23 25 27 29 31 33 35 37 39
Productie (kg m
-2)Lich
tsom
(kJ
cm
-2)
W eek nr
Lichts om
R ef
Diff71
Figure 24. Fruit production (kg m-2) in the reference and in Diff71 compartments in relation to the light sum (kJ cm-2) (purple line) of the previous nine weeks prior to harvest.
5.7 Quality
20
25
30
35
40
45
50
maart mei juni juli aug s ept okt
Sm
aakc
ijfer
Ref
Diff45
Diff62
Diff71
Coating
Figure 25. Flavor of the fruit on 6 separate days during cultivation.
The taste of the tomatoes was measured using the Wageningen UR flavor model and no differences between the treatments were found. In the summer months the taste was better than at the beginning and at the end of the season. The general taste level (average 35 to 36) is quite low (Figure 25.).The taste is partly based on the refraction. Averaged over the entire growing season it was 4.0 - 4.1° Brix. There were no treatment differences in acidity and juice percentage either. This was also true for the vitamin C content. The average content of vitamin C across all treatments was 10.7, 15.1 and 11.7 mg per 100 g fresh weight in March, July and September respectively. In the middle of the summer the vitamin C content was highest.Seven times during the season tomatoes were set aside for shelf life tests. Averaged over the entire period the shelf life of the reference, Diff45, Diff62, Diff71 and ReduFuse coating were respectively 14.5, 14.6, 14.5, 15.4 and 14.2 days. This means that these differences are negligible. The general shelf life was good in all treatments.
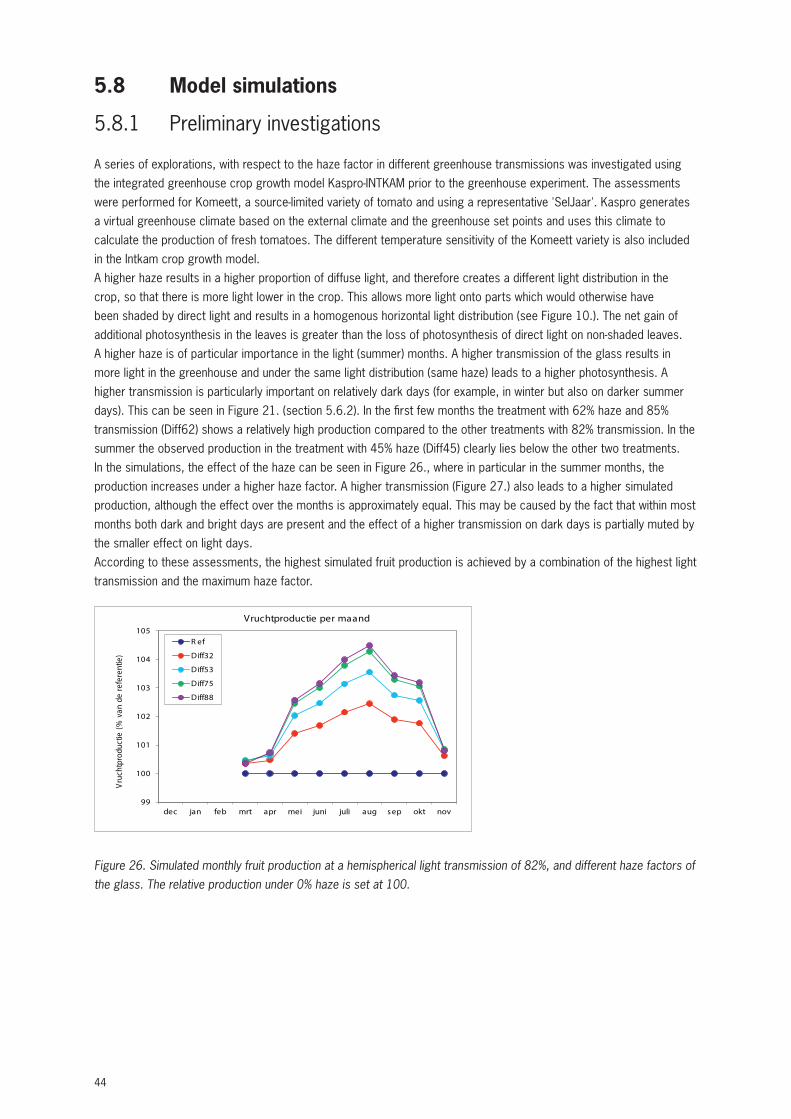
44
5.8 Model simulations
5.8.1 Preliminary investigations
A series of explorations, with respect to the haze factor in different greenhouse transmissions was investigated using the integrated greenhouse crop growth model Kaspro-INTKAM prior to the greenhouse experiment. The assessments were performed for Komeett, a source-limited variety of tomato and using a representative 'SelJaar'. Kaspro generates a virtual greenhouse climate based on the external climate and the greenhouse set points and uses this climate to calculate the production of fresh tomatoes. The different temperature sensitivity of the Komeett variety is also included in the Intkam crop growth model.A higher haze results in a higher proportion of diffuse light, and therefore creates a different light distribution in the crop, so that there is more light lower in the crop. This allows more light onto parts which would otherwise have been shaded by direct light and results in a homogenous horizontal light distribution (see Figure 10.). The net gain of additional photosynthesis in the leaves is greater than the loss of photosynthesis of direct light on non-shaded leaves. A higher haze is of particular importance in the light (summer) months. A higher transmission of the glass results in more light in the greenhouse and under the same light distribution (same haze) leads to a higher photosynthesis. A higher transmission is particularly important on relatively dark days (for example, in winter but also on darker summer days). This can be seen in Figure 21. (section 5.6.2). In the first few months the treatment with 62% haze and 85% transmission (Diff62) shows a relatively high production compared to the other treatments with 82% transmission. In the summer the observed production in the treatment with 45% haze (Diff45) clearly lies below the other two treatments. In the simulations, the effect of the haze can be seen in Figure 26., where in particular in the summer months, the production increases under a higher haze factor. A higher transmission (Figure 27.) also leads to a higher simulated production, although the effect over the months is approximately equal. This may be caused by the fact that within most months both dark and bright days are present and the effect of a higher transmission on dark days is partially muted by the smaller effect on light days.According to these assessments, the highest simulated fruit production is achieved by a combination of the highest light transmission and the maximum haze factor.
99
100
101
102
103
104
105
dec jan feb mrt apr mei juni juli aug s ep okt nov
Vru
chtp
rodu
ctie
(% v
an d
e re
fere
ntie
)
Vruchtproductie per maand
R ef
Diff32
Diff53
Diff75
Diff88
Figure 26. Simulated monthly fruit production at a hemispherical light transmission of 82%, and different haze factors of the glass. The relative production under 0% haze is set at 100.
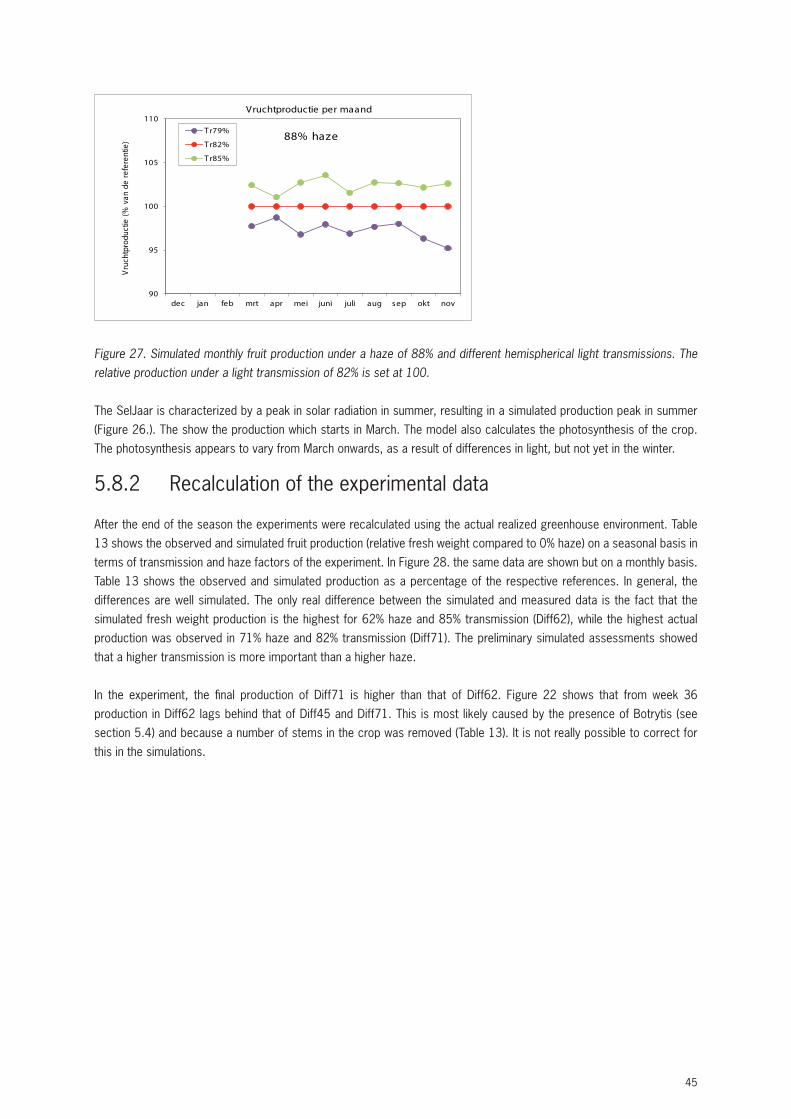
45
90
95
100
105
110
dec jan feb mrt apr mei juni juli aug s ep okt nov
Vru
chtp
rodu
ctie
(% v
an d
e re
fere
ntie
)
Vruchtproductie per maand
T r79%
T r82%
T r85%
88% haze
Figure 27. Simulated monthly fruit production under a haze of 88% and different hemispherical light transmissions. The relative production under a light transmission of 82% is set at 100.
The SelJaar is characterized by a peak in solar radiation in summer, resulting in a simulated production peak in summer (Figure 26.). The show the production which starts in March. The model also calculates the photosynthesis of the crop. The photosynthesis appears to vary from March onwards, as a result of differences in light, but not yet in the winter.
5.8.2 Recalculation of the experimental data
After the end of the season the experiments were recalculated using the actual realized greenhouse environment. Table 13 shows the observed and simulated fruit production (relative fresh weight compared to 0% haze) on a seasonal basis in terms of transmission and haze factors of the experiment. In Figure 28. the same data are shown but on a monthly basis.Table 13 shows the observed and simulated production as a percentage of the respective references. In general, the differences are well simulated. The only real difference between the simulated and measured data is the fact that the simulated fresh weight production is the highest for 62% haze and 85% transmission (Diff62), while the highest actual production was observed in 71% haze and 82% transmission (Diff71). The preliminary simulated assessments showed that a higher transmission is more important than a higher haze.
In the experiment, the final production of Diff71 is higher than that of Diff62. Figure 22 shows that from week 36 production in Diff62 lags behind that of Diff45 and Diff71. This is most likely caused by the presence of Botrytis (see section 5.4) and because a number of stems in the crop was removed (Table 13). It is not really possible to correct for this in the simulations.
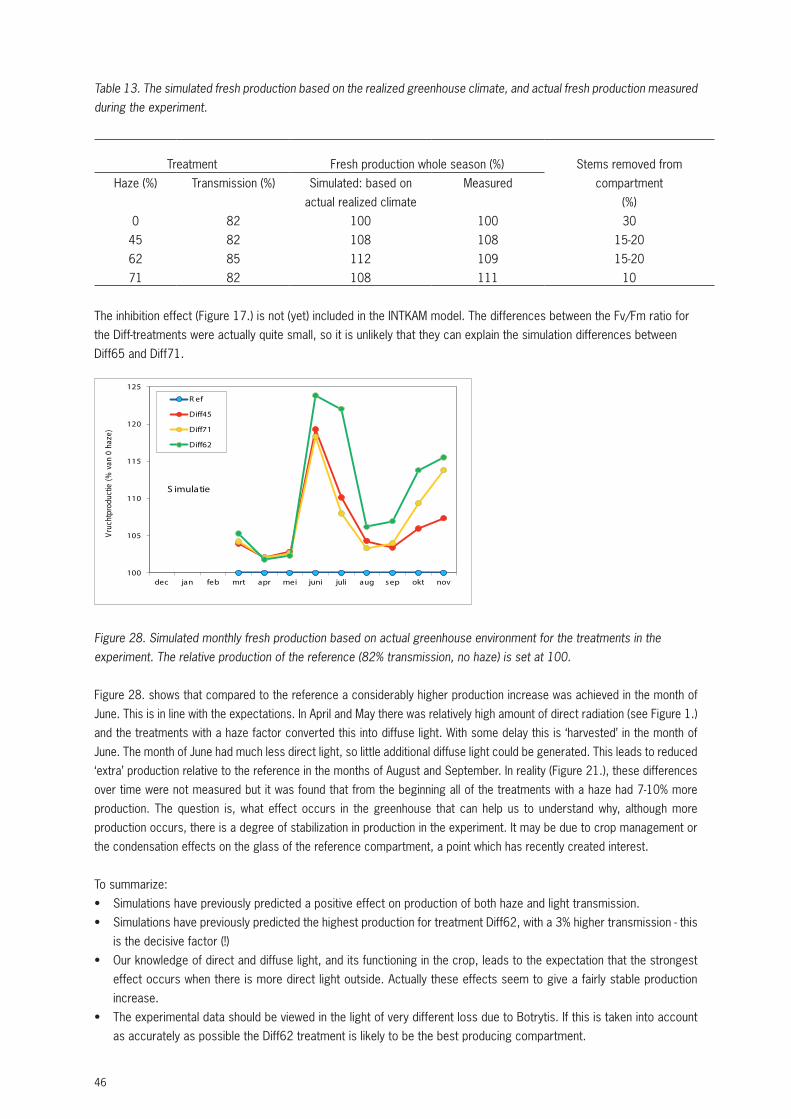
46
Table 13. The simulated fresh production based on the realized greenhouse climate, and actual fresh production measured during the experiment.
Treatment Fresh production whole season (%) Stems removed from compartment
(%)Haze (%) Transmission (%) Simulated: based on
actual realized climateMeasured
0 82 100 100 3045 82 108 108 15-2062 85 112 109 15-2071 82 108 111 10
The inhibition effect (Figure 17.) is not (yet) included in the INTKAM model. The differences between the Fv/Fm ratio for the Diff-treatments were actually quite small, so it is unlikely that they can explain the simulation differences between Diff65 and Diff71.
100
105
110
115
120
125
dec jan feb mrt apr mei juni juli aug s ep okt nov
Vruc
htpr
oduc
tie (%
van
0 h
aze)
S imulatie
R ef
Diff45
Diff71
Diff62
Figure 28. Simulated monthly fresh production based on actual greenhouse environment for the treatments in the experiment. The relative production of the reference (82% transmission, no haze) is set at 100.
Figure 28. shows that compared to the reference a considerably higher production increase was achieved in the month of June. This is in line with the expectations. In April and May there was relatively high amount of direct radiation (see Figure 1.) and the treatments with a haze factor converted this into diffuse light. With some delay this is ‘harvested’ in the month of June. The month of June had much less direct light, so little additional diffuse light could be generated. This leads to reduced ‘extra’ production relative to the reference in the months of August and September. In reality (Figure 21.), these differences over time were not measured but it was found that from the beginning all of the treatments with a haze had 7-10% more production. The question is, what effect occurs in the greenhouse that can help us to understand why, although more production occurs, there is a degree of stabilization in production in the experiment. It may be due to crop management or the condensation effects on the glass of the reference compartment, a point which has recently created interest.
To summarize:• Simulations have previously predicted a positive effect on production of both haze and light transmission.• Simulations have previously predicted the highest production for treatment Diff62, with a 3% higher transmission - this
is the decisive factor (!)• Our knowledge of direct and diffuse light, and its functioning in the crop, leads to the expectation that the strongest
effect occurs when there is more direct light outside. Actually these effects seem to give a fairly stable production increase.
• The experimental data should be viewed in the light of very different loss due to Botrytis. If this is taken into account as accurately as possible the Diff62 treatment is likely to be the best producing compartment.
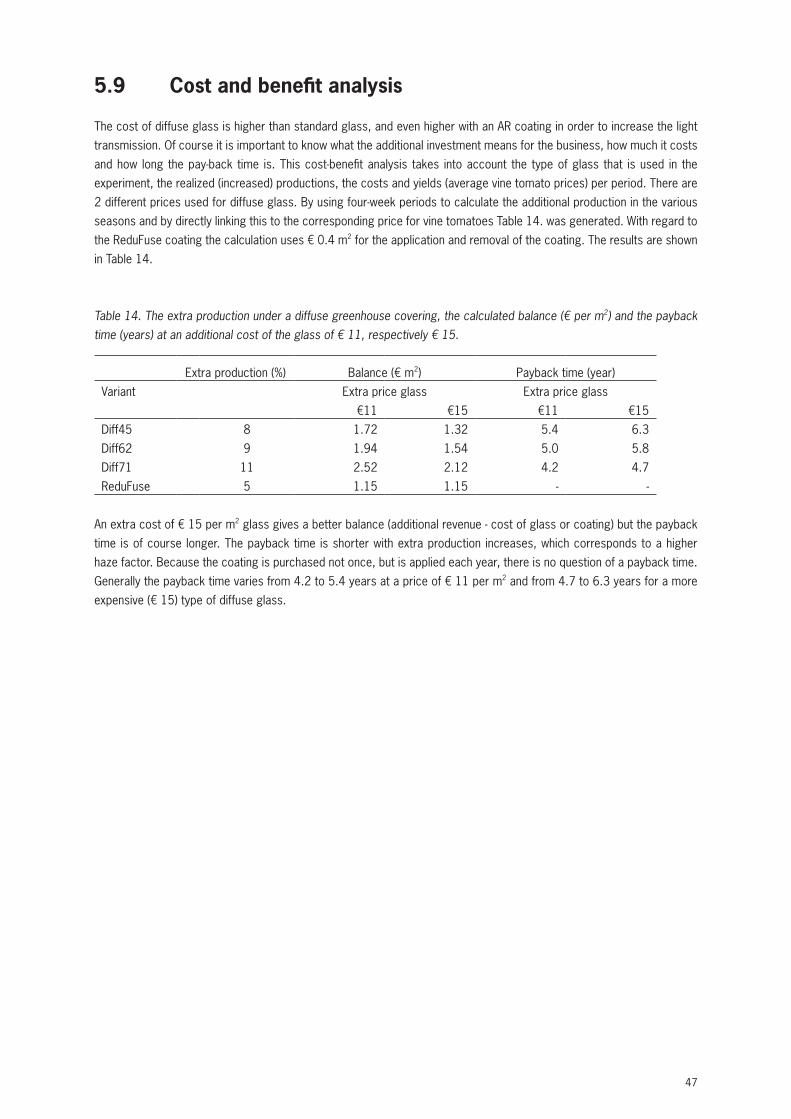
47
5.9 Cost and benefit analysis
The cost of diffuse glass is higher than standard glass, and even higher with an AR coating in order to increase the light transmission. Of course it is important to know what the additional investment means for the business, how much it costs and how long the pay-back time is. This cost-benefit analysis takes into account the type of glass that is used in the experiment, the realized (increased) productions, the costs and yields (average vine tomato prices) per period. There are 2 different prices used for diffuse glass. By using four-week periods to calculate the additional production in the various seasons and by directly linking this to the corresponding price for vine tomatoes Table 14. was generated. With regard to the ReduFuse coating the calculation uses € 0.4 m2 for the application and removal of the coating. The results are shown in Table 14.
Table 14. The extra production under a diffuse greenhouse covering, the calculated balance (€ per m2) and the payback time (years) at an additional cost of the glass of € 11, respectively € 15.
Extra production (%) Balance (€ m2) Payback time (year)Variant Extra price glass Extra price glass
€11 €15 €11 €15Diff45 8 1.72 1.32 5.4 6.3Diff62 9 1.94 1.54 5.0 5.8Diff71 11 2.52 2.12 4.2 4.7ReduFuse 5 1.15 1.15 - -
An extra cost of € 15 per m2 glass gives a better balance (additional revenue - cost of glass or coating) but the payback time is of course longer. The payback time is shorter with extra production increases, which corresponds to a higher haze factor. Because the coating is purchased not once, but is applied each year, there is no question of a payback time. Generally the payback time varies from 4.2 to 5.4 years at a price of € 11 per m2 and from 4.7 to 6.3 years for a more expensive (€ 15) type of diffuse glass.

48
49
6 Conclusions
From the results of this project the following conclusions can be drawn:
1. Extra production can be realized under diffuse glass.
The production of tomatoes was higher under diffuse glass right from the start of the experiment. The glass with the highest haze factor (71%) had a somewhat slower start in comparison to the other diffuse glass types. The increased production was mainly the result of heavier fruits (on average 5-8 g heavier). Also slightly more trusses (0.5 trusses) were formed under diffuse light and these ripened slightly faster as well, especially in May and June (by 1-3 days). Even in a very wet summer, with a high proportion of diffuse light, there was an extra production of 8, 9 and 11% in the greenhouses covered with glass with a diffuse haze factor of respectively 45, 62 and 71% (Diff45, Diff62 and Diff71). Due to the scattering of the light, this light reaches more leaves and within the crop more light can be used for growth and production. Using the current types of glass with up to about 70% haze and up to 3% higher light transmission a production increase of 10-12% seems possible. With an even higher light transmission (up to 7% more light), even more production appears possible.
2. Crop optimization with diffuse glass is possible.
The current knowledge indicates that diffuse glass with a haze factor of 50% or more gives the best results for the production of fruit vegetables. For very light conditions as in the summer months in the Netherlands, a haze factor of 60% is more suitable. However, in all cases, no concessions should be made on the light transmission. This must be at least as high, or preferably higher than the light transmission of standard glass: values from 83% to 88% hemispherical transmission are possible. In addition, it is important that all the leaves of the crop receive optimal light levels, or in other words, all the light the crop intercepts must fall on an optimal (as large as possible), leaf surface. To achieve this, growers can increase the leaf area index (m2 leaf per m2 surface area) by adding new stems to increase light interception and therefore the crop photosynthesis.
3. Despite a reduction in the light transmission ReduFuse coating gives extra production.
The ReduFuse coating was applied in May, when the relative extra production in the diffuse glass compartments was nearly at a maximum. Despite the fact that in the first instance the coating was applied too thickly, removed and then re-applied, an extra production of almost 5% was achieved under the coating. This offers possibilities for growers with existing glass to realize more production under the influence of diffuse light. The higher production does not, however, coincide with the early period with higher prices.
4. No extra energy is required for heating in a greenhouse with diffuse glass.
There are claims that the energy consumption under diffuse glass is higher because more heat is required in the morning hours. During this study no extra energy was used under the diffuse greenhouse covers. Although there was 3% more heat used in the Diff45 treatment, this contrasts with 2% and 4% less energy input in the Diff62 and Diff71 treatments. If the transmission of diffuse glass is equal to or higher than standard glass there will be more light energy entering the greenhouse and this is not expected to increase energy use under diffuse glass.
50
5. Diffuse light penetrates deeper into the crop, has a more uniform horizontal distribution and increases photosynthesis capacity.The horizontal distribution of light in a diffuse greenhouse creates a more even light intensity (homogeneous light distribution) just below the top of the crop. Under a diffuse greenhouse cover more photosynthesis can be realized as a result of more light deeper in the crop layers, which results in a higher dry matter content in the lower leaves and stems. However, it must be said that the measured higher photosynthetic capacity was found under light intensities that do not often occur at the bottom of the crop. By increasing the light intensity more light can shine into the lower crop layers.
6. On days with strong sunlight, there is hardly any photoinhibition under diffuse glass.
Often around noon at light intensities of more than 500 W m-2 a dip in the photosynthetic efficiency occurs because the surplus light energy cannot be processed (heat dissipation). Photoinhibition (inhibition of photosynthesis rate) may occur and damage the photosynthetic system II. Under the influence of diffuse light the light intensity peaks are muted and less photoinhibition occurred.
7. Under a diffuse greenhouse covering less Botrytis infection and less plant loss occurred.
Especially at the end of the cultivation period there was less Botrytis infection and in the last two months fewer plants were lost under diffuse glass. This is probably mainly due to the more generative growth of the crop, less stress (photoinhibition) during the cultivation and a higher dry matter content of the stems under diffuse glass. Botrytis only had a small effect on the production levels in this experiment, because in week 36 (when Botrytis started) the extra production was already visible. If Botrytis had appeared earlier in the cultivation period, it would probably have had an impact on production.
8. Diffuse light has no effect on the taste or shelf life.
No differences in taste were observed between the treatments. Diffuse light also had no effect on refraction, dry matter and vitamin C content and shelf life. The vitamin C content was highest in summer.
9. Diffuse glass has a payback time of 4 to 6 years.
Assuming the increased production realized in this study, the average prices of vine tomatoes per 4-week period and an estimated extra cost of the glass, the payback period of diffuse glass was calculated at 4.2 to 5.4 years when the additional cost of the glass was €11/m2, and 4.7 to 6.3 years at an additional cost of the glass of €15/m2. If the cost of glass production drops or extra fruit production increases, the payback time will be shorter. The haze factor of the glass must not be too low, and the light transmission must be comparable to or higher than standard greenhouse glass.
10. Simulation models suggest that the effect of diffuse glass is more than just more, light.
When the growth and production is simulated using the model (Intkam) both before and after (using the realized greenhouse climate data) the main explanatory factor for the increased production factor was light. However, this does not explain everything. Other factors may also play a role, such as photoinhibition (occasionally at high light) condensation on glass (regularly in warm crops) or Botrytis (long term effects). Photoinhibition and Botrytis have not yet been sufficiently described to be quantitatively included in a model. With regard to the formation of condensation, measurements are currently being carried out to be processed in greenhouse model.
51
7 References
Brodersen, C.R., Vogelmann, T.C., Williams, W.E. and Gorton, H. L. (2008) New paradigm in leaf –level photosynthesis: direct and diffuse lights are not equal. Plant, Cell and Environment, 31, 159-164.
De Casas, R.R., Vargas, P., Pérez-Corona, E., Manrique, E, García-Verdugo, C. & Balaguer, L. 2011. Sun and shade leaves of Olea europaea respond differently to plant size, light availability and genetic variation. Functional Ecology 25: 802-812.
De Gelder G, Warmenhoven M, Kromdijk W, Driever S, De Zwart F, Stolker H & Grootscholten M. 2012. Gelimiteerd CO2 en het nieuwe telen tomaat. Rapport Wageningen UR Glastuinbouw. 39 blz + bijlagen (in druk).
Dieleman, J.A., Gelder, A. de, Janse, J., Eveleens-Clark, B.A., Lagas, P., Elings, A., Qian, T., Steenhuizen, J.W., Biemans, R. 2012. Temperatuurstrategieën in geconditioneerde kassen: Effecten op groei, ontwikkeling en onderliggende processen bij tomaat. Wageningen UR Glastuinbouw, Rapport GTB 1123.
Dueck TA, Poudel D, Janse J & Hemming S. 2009. Diffuus licht – wat is de optimale lichtverstrooiing? Rapport 308 Wageningen UR Glastuinbouw. 34 blz + bijlagen.
Eveleens-Clark BA, Lagas P, Driever SM, Zwinkels J, Bij de Vaate J & Kaarsemaker RC. 2010. 40 kg Paprika. Rapport Wageningen UR Glasbouw.
Geukemeijer P, Rongen B & Van Telgen HJ. 2011. Monitoring gewasgroei tomaat onder diffuus kasdek 2. Praktijkmetingen in een jaarrond teelt van tomaat. Rapport Botany, Horst. 41 blz.
Hemming S, Van Noort F, Hemming J & Dueck T. 2007b. Effecten van diffuus licht op potplanten. Resultaten van een teeltexperiment. Nota 454, PRI, Wageningen. 39 blz. + bijlagen.
Heuvelink E. 2005. Tomatoes. CAB International.Johnson, D.M. & Smith, W.K. 2006. Low clouds and cloud immersion enhance photosynthesis in understory species of
a southern Appalacian spruce-fir forest (USA). American Journal of Botany 93: 1625-1632.Markvart, J., Rosenqvist, E., Aaslyng, J.M. & Ottosen C-O. 2010. How is canopy photosynthesis and growth of
Chrysanthemums affected by diffuse and direct light? European Journal of Horticultural Science 75: 253-258.Muraoka, H., Takenaka, A., Tang, Y, Koizumi, H & Washitani, I. 1998. Flexible leaf orientations of Arisaema heterophyllum
maximize light capture in a forest understorey and avoid excess irradiance at a derforested site. Annals of Botany 82:297-307.
Out, P.G. & Breuer, J.J.G. 1995. The effect of coated glass on light transmission in greenhouses. Report 95-1, IMAG-DLO, Wageningen.
Sarlikioti, V., De Visser, P.H.B. & Marcelis, L.F.M. 2011. Exploring the spatial distribution of light interception and photosynthesis of canopies by means of a functional-structural plant model. Annals of Botany 107:875-883.
Sauviller, C., Goen, K., Van Mechelen, M. & Moerkens, R. 2011. Diffuus licht in paprika en tomaat. ProeftuinNieuws 19:24-25.

52
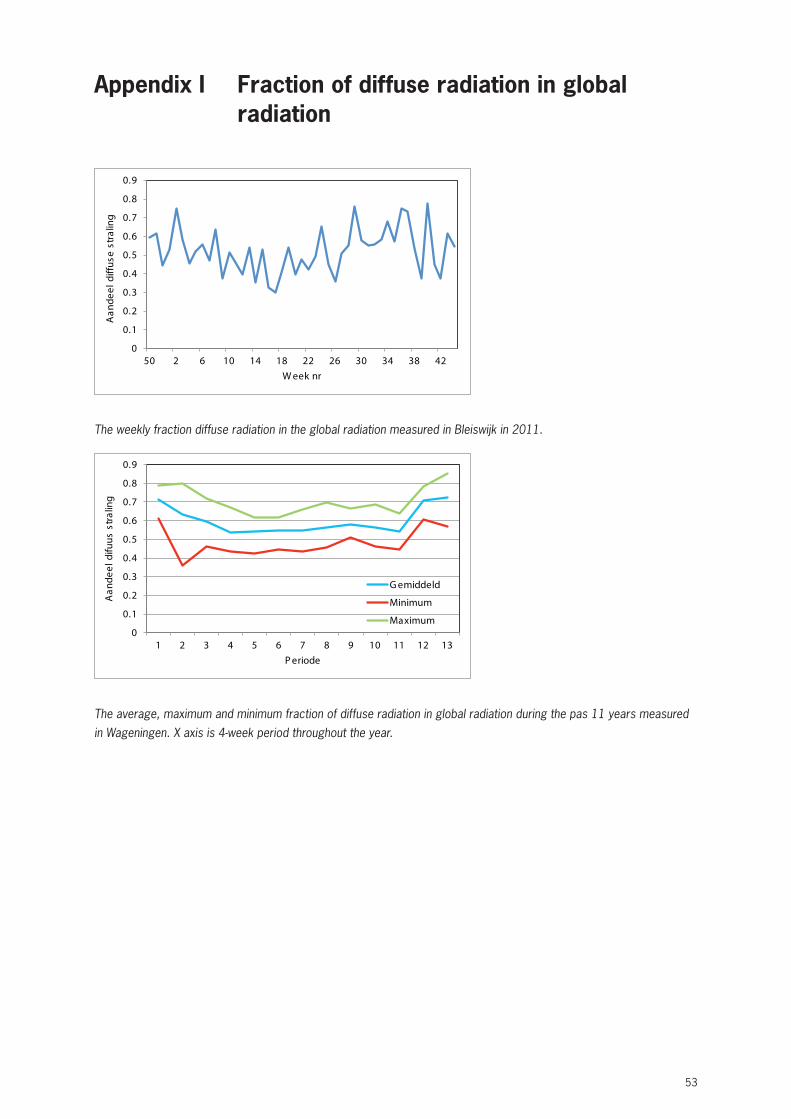
53
Appendix I Fraction of diffuse radiation in global radiation
0
0.1
0.2
0.3
0.4
0.5
0.6
0.7
0.8
0.9
50 2 6 10 14 18 22 26 30 34 38 42
Aan
deel
diff
use
stra
ling
W eek nr
The weekly fraction diffuse radiation in the global radiation measured in Bleiswijk in 2011.
0
0.1
0.2
0.3
0.4
0.5
0.6
0.7
0.8
0.9
1 2 3 4 5 6 7 8 9 10 11 12 13
Aan
deel
difu
us s
tral
ing
P eriode
G emiddeld
Minimum
Maximum
The average, maximum and minimum fraction of diffuse radiation in global radiation during the pas 11 years measured in Wageningen. X axis is 4-week period throughout the year.

54
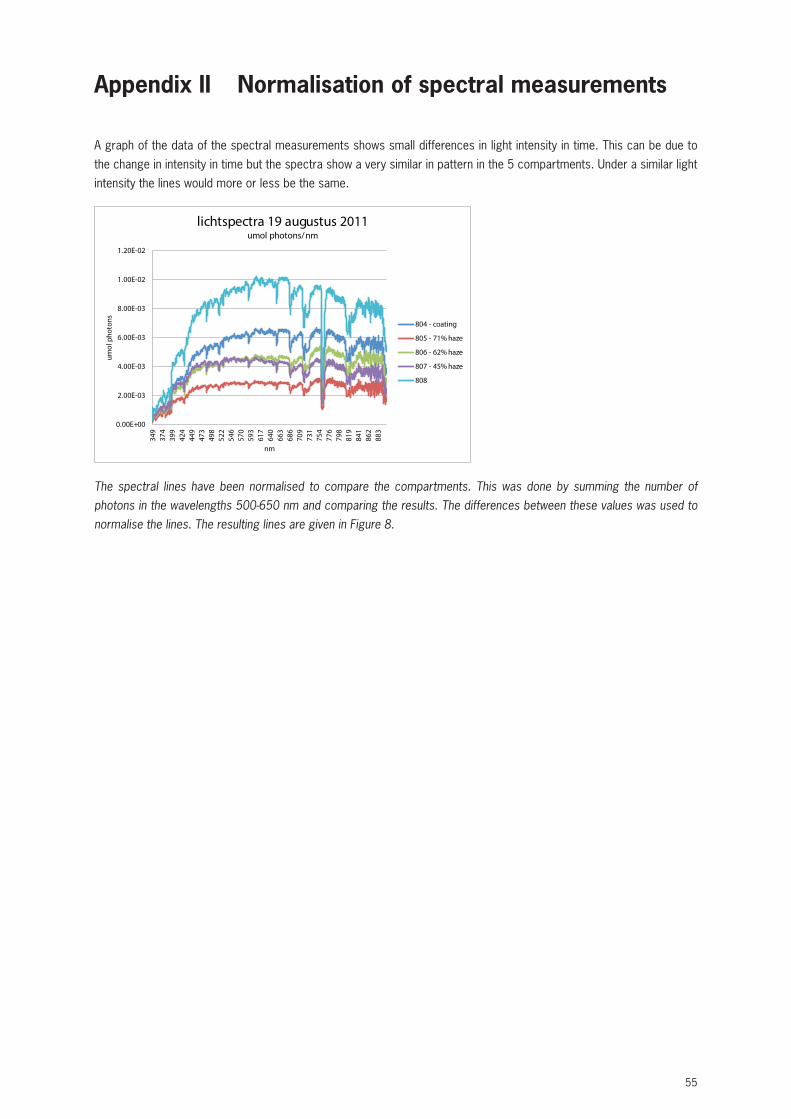
55
Appendix II Normalisation of spectral measurements
A graph of the data of the spectral measurements shows small differences in light intensity in time. This can be due to the change in intensity in time but the spectra show a very similar in pattern in the 5 compartments. Under a similar light intensity the lines would more or less be the same.
0.00E+00
2.00E-03
4.00E-03
6.00E-03
8.00E-03
1.00E-02
1.20E-02
349
374
399
424
449
473
498
522
546
570
593
617
640
663
686
709
731
754
776
798
819
841
862
883
umol
pho
tons
nm
lichtspectra 19 augustus 2011umol photons/nm
804 - coating
805 - 71% haze
806 - 62% haze
807 - 45% haze
808
The spectral lines have been normalised to compare the compartments. This was done by summing the number of photons in the wavelengths 500-650 nm and comparing the results. The differences between these values was used to normalise the lines. The resulting lines are given in Figure 8.

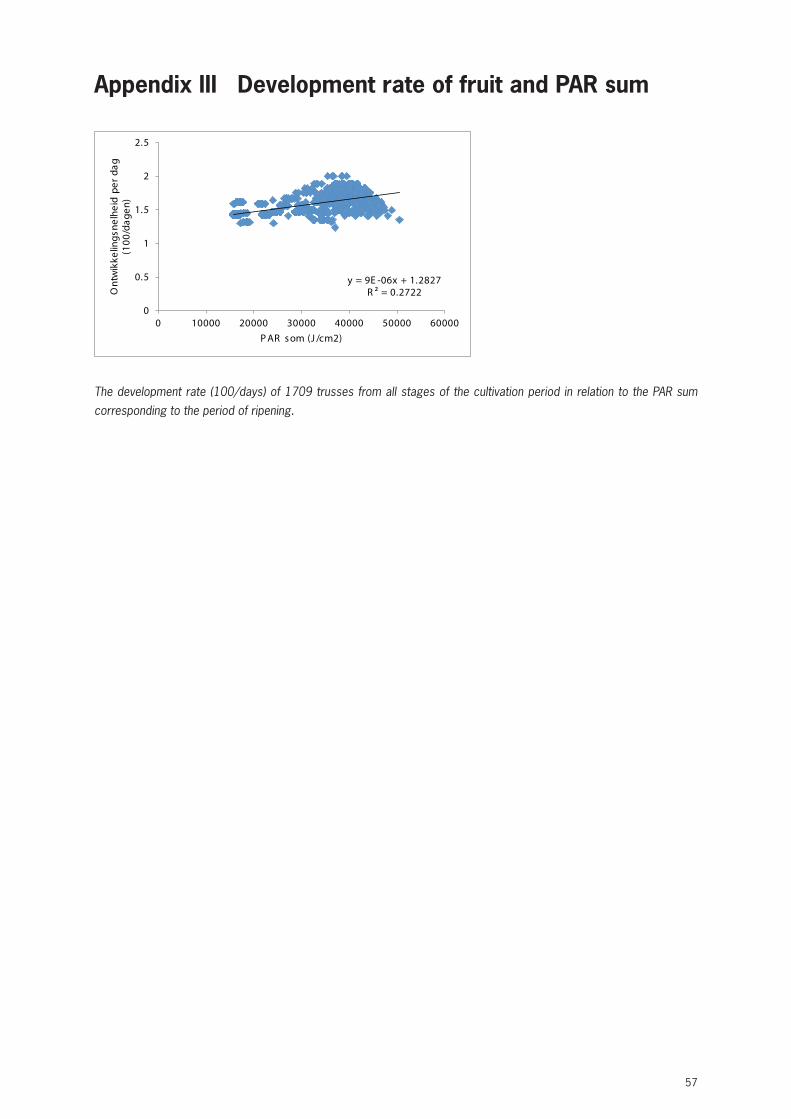
57
Appendix III Development rate of fruit and PAR sum
y = 9E -06x + 1.2827R ² = 0.2722
0
0.5
1
1.5
2
2.5
0 10000 20000 30000 40000 50000 60000
Ont
wik
kelin
gsne
lhei
d pe
r da
g (1
00/d
agen
)
P AR s om (J /cm2)
The development rate (100/days) of 1709 trusses from all stages of the cultivation period in relation to the PAR sum corresponding to the period of ripening.


Projectnummer: 3242104711 | PT nummer: 14231