
Chapman, C. S. , Kern, A., Laguecir, A., & Quentin, W ... · Christopher S. Chapman, Anja Kern,...
25
Chapman, C. S., Kern, A., Laguecir, A., & Quentin, W. (2016). Management accounting and efficiency in health services: the foundational role of cost analysis. In J. Cylus, I. Papanicolas, & P. C. Smith (Eds.), Health system efficiency: How to make measurement matter for policy and management (pp. 75-98). World Health Organization. http://www.euro.who.int/en/about- us/partners/observatory/publications/studies/health-system-efficiency- how-to-make-measurement-matter-for-policy-and-management-2016 Publisher's PDF, also known as Version of record Link to publication record in Explore Bristol Research PDF-document This is the final published version of the article (version of record). It first appeared online via World Health Organisation at http://www.euro.who.int/en/about-us/partners/observatory/publications/studies/health-system- efficiency-how-to-make-measurement-matter-for-policy-and-management-2016. Please refer to any applicable terms of use of the publisher. University of Bristol - Explore Bristol Research General rights This document is made available in accordance with publisher policies. Please cite only the published version using the reference above. Full terms of use are available: http://www.bristol.ac.uk/pure/user-guides/explore-bristol-research/ebr-terms/
Transcript of Chapman, C. S. , Kern, A., Laguecir, A., & Quentin, W ... · Christopher S. Chapman, Anja Kern,...
Chapman, C. S., Kern, A., Laguecir, A., & Quentin, W. (2016).Management accounting and efficiency in health services: thefoundational role of cost analysis. In J. Cylus, I. Papanicolas, & P. C.Smith (Eds.), Health system efficiency: How to make measurementmatter for policy and management (pp. 75-98). World HealthOrganization. http://www.euro.who.int/en/about-us/partners/observatory/publications/studies/health-system-efficiency-how-to-make-measurement-matter-for-policy-and-management-2016
Publisher's PDF, also known as Version of record
Link to publication record in Explore Bristol ResearchPDF-document
This is the final published version of the article (version of record). It first appeared online via World HealthOrganisation at http://www.euro.who.int/en/about-us/partners/observatory/publications/studies/health-system-efficiency-how-to-make-measurement-matter-for-policy-and-management-2016. Please refer to any applicableterms of use of the publisher.
University of Bristol - Explore Bristol ResearchGeneral rights
This document is made available in accordance with publisher policies. Please cite only thepublished version using the reference above. Full terms of use are available:http://www.bristol.ac.uk/pure/user-guides/explore-bristol-research/ebr-terms/
Chapter 4Management accounting and
efficiency in health services: the foundational role of cost analysis
Christopher S. Chapman, Anja Kern, Aziza Laguecir and Wilm Quentin
4.1 Introduction
Efficiency measurement is concerned with measuring and analysing inputs in relation to outputs or vice versa. Management accounting offers a broad set of tools and techniques for measuring and managing many aspects of this challenge. Rising health care costs, driven by population growth, demographic shifts and advances in medical technology, put the focus on cost analysis and management because cost information underpins decisions on resource allocation and effective-ness at system and organizational levels for providers, purchasers and regulators globally. In this chapter, we focus on costing because cost information feeds into many other common management accounting practices, such as tariff setting, targeted cost improvement plans, benchmarking, budgeting, service redesign and performance management.
The peculiarities of the nature of health care as an area of activity have very spe-cific implications for the scope and nature of cost accounting. First, health care in most countries is a heavily regulated sector, and this regulation has a direct impact on definitions of costing, that is, how costing is carried out, including the calculation itself, but also linked concepts such as the kind of cost object that becomes a focus for analysis. For example, regulations on payment of hospitals on the basis of DRGs has made the DRG the major cost object in the acute sector, in turn having an impact on the costing calculation and medical practice (Chapman, Kern & Laguecir, 2014).
A second impact of the nature of health care on costing practice derives from the fact that treatment must often be adjusted for each patient; therefore, patient-level costing should account for differences between patients. However, the share of total cost that can be directly attributed to patients is relatively small. Studies suggest that the direct variable costs that can be directly influenced by physi-cians are around 42% (Taheri, Butz & Greenfield, 2000) with 58% of fixed and
Health system efficiency76
indirect costs1 being out of reach of physicians’ responsibility. Similarly, studies on hospital cost structure have emphasized the high proportion of fixed costs in this setting, reaching 65%, thus making it difficult for front-line staff to actually manage costs (or more precisely, short-run cash flows) at patient level (Roberts et al., 1999). A volume-based allocation of indirect costs is not appropriate for supporting cost management at the patient-level, which instead requires an activity-based approach. An activity-based approach also allows linking costs with health outcomes in a meaningful way (Kaplan & Porter, 2011).
A third impact arises from the fact that there is high pressure to improve the efficiency of health care services while keeping quality at the same level, the aim being the generation of more benefits from the current levels of spending. As a result, the number of users for costing data has increased, now ranging from government and regulators at national or regional level, to health care professions, insurers, health care providers, patients and the general public. This unusually wide range of users makes it difficult to adjust the nature of calculations to the potentially different purposes and interests of these users (Smith et al., 2008).
Perhaps this diversity helps to explain why, despite a growth in the reach and complexity of costing in recent years, progress has been hampered by a tendency towards a lack of conceptual clarity over the costing methodologies appropriate to particular kinds of purposes and decision-making objectives (Chapman, Kern & Laguecir, 2014). Recent developments have shown far greater attention to the detailed task of costing. Costing has been recognized by policymakers as the key for improving the quality of evaluation of health care services. The kind of costing in place does not only directly influence the accuracy of the tariff, but also how health care can be managed (Monitor, 2014a). The rapid development of patient-level information and costing systems also shows the recognition that cost data must sit alongside other patient information (including comorbidities and outcomes). Making this link helps raise the stakes of analysis to include effectiveness beyond efficiency (Kaplan & Porter, 2011).
However, before costing can live up to such expectations, we must first address the widely noted concern over the variability and quality of existing cost infor-mation (Busse, Schreyögg & Smith, 2008; Busse et al., 2011; Chapman et al., 2013; Monitor, 2006, 2013; Northcott & Llewellyn 2004). In fact, many coun-tries find it difficult to produce high-quality costing data (Busse, Schreyögg & Smith, 2008; Busse et al., 2011). Analysis of health care costs across countries has revealed that the cost structure behind a certain procedure or treatment varies significantly from one country to another and between providers within countries.
1 In this article the terms indirect costs and overhead costs are used interchangeably. We argue that it is not the location where costs are incurred (e.g. medical or administrative areas) that is decisive for cost system design, but rather their relation to cost objects. The relation of costs to the cost object determines if costs are direct or indirect costs.

Management accounting and efficiency in health services 77
Table 4.1 shows the analysis of costs for a single procedure (AMI) across countries as analysed by Tiemann and colleagues (2008). Particularly notable variances are ward costs, which vary between 9.76% in Denmark and 74.55% in the Netherlands, with corresponding changes to the level of overheads reported in each of these countries. While variations in medical practices across countries can be at the origin of differences, there are significant differences caused by variations in costing methods and conventions as to what is classed in which category of cost.
Poor-quality cost data – whether in terms of unexplained sources of variance or inappropriate disguising of variance through excessive reliance on averages – are a threat to the delivery of efficient and effective health care. Poor-quality data will not be used in decision-making (or will not be effective if used) while resources will be consumed in producing it. Towards the end of the chapter we offer a detailed discussion of the kinds of efficiency decisions that high-quality cost data might inform. However, given the centrality of cost system design to the production of data that can be used in decision-making, we will address this crucial issue first.
Table 4.1 Costs in different cost categories for AMI
England France Germany Hungary Italy Netherlands Poland Spain Denmarka
Diagnostic procedures
€345.74 €446.79 €296.84 €70.43 €316.97 €349.71 €138.19 €349.52 €349.52
As % of total costs 6.90% 7.55% 10.36% 17.79% 4.25% 6.25% 13.47% 18.78% 7.53%
Normal ward/catheter lab
As % of total costs 31.40% 46.45% 58.63% 35.34% 41.48% 74.66% 48.14% 53.67% 9.76%
Physician €217.20 €614.43 €356.80 €67.95 €406.04 €316.86 €212.46 €167.67 €76.79
Nursing €644.79 €683.56 €782.29 €71.98 €375.10 €2121.49 €210.42 €831.09 €117.67
Others €90.51 €136.77 €50.32 b €22.18 €209.02 €70.92 b €34.54
Materials €621.65 €1313.46 €491.26 b €2286.91 €1533.33 b b €224.17
Drugs €1556.36 €1347.82 €164.97 €89.20 €696.36 €424.28 €189.26 €29.83 €10.78
As % of total costs 31.04% 22.78% 5.76% 22.53% 9.35% 7.58% 18.45% 1.60% 0.23%
Overheads €1537.39 €1373.62 €723.89 €96.40 €3346.66 €644.61 €204.52 €482.91 €3829.73
As % of total costs 30.66% 23.22% 25.25% 24.35% 44.92% 11.51% 19.94% 25.95% 82.48%
Total cost €5013.64 €5916.45 €2866.36 €395.97 €7450.22 €5599.30 €1025.76 €1861.02 €4643.20
Total costs (PPP-adjusted)
€4646.51 €5507.93 €2723.07 €657.14 €7251.03 €5322.83 €1863.61 €2050.18 €3455.00
Reimbursement €4351.00 €5731.06 €3113.96 €808.86 €7574.58 €8722.00 €932.50 c c
Profit -€662.64 -€185.39 €247.60 €412.89 €124.36 €3122.70 -€93.26 c c
Profit margin -13.22% -3.13% 8.64% 104.27% 1.67% 55.77% -9.09% c c
Sources: Table II in Tiemann (2008).Notes: aPartly subsumed in overhead costs. bSubsumed in overhead costs. cNo data available. AMI = acute myocardial infarction; PPP = purchasing power parity.
Health system efficiency78
4.2 Analysing the challenge of cost system design
In thinking about the fundamental steps required in attaching the elements of organizational cost to a particular cost object (such as a patient), there are three basic analytical steps that must be taken:
1. The costing system needs to identify and group together the costs of the various types of resources that the organization has (for example, clinical staff, drugs, premises).
2. Resource costs need to be grouped into cost pools (based around departments or other managerial cost centres, or activities) for which choices are made as to the cost driver for the cost pool.
3. Costs have to be linked (showing more or less variability depending on the choices made) to the chosen cost object (for example, the patient, the service line, and so on).
Choices must be made as to the level of granularity in each of these three steps and there is no single universally best approach to making these choices. Partly this is a result of the many different purposes towards which cost data might be put (for example, price setting, cost management, resource allocation). Partly this is a result of the trade-off to be struck between rising costs as granularity increases set against the possibility of better decisions such granularity may or may not offer. In considering this, it is vital to understand that granularity is not simply a function of the granularity of the cost object (step 3), but also of granularity choices made in the first two steps. Also, while we have separated these steps for the purposes of conceptual clarity, in practice many of these deci-sions are interdependent and taken simultaneously.
4.2.1 Step 1: determining the granularity of costs at resource level
Based on the chart of accounts (that is, a listing of the accounts found in the general ledger of an organization), costs are most typically grouped according to the kind of costs they represent, such as salaries or materials. The way the chart of accounts is constructed significantly influences the detail that is available for costing. For example, instead of simply dealing with salaries as an overarching category, there can be a detailed breakdown of the salaries of nurses, clinicians, technicians, administrative staff, and so on. In addition, the chart of accounts may allow for the separation of salaries for certain grade levels.
The structure of the chart of accounts and its details therefore greatly influence the detail and nature of costs that are readily available for the costing calculation undertaken in steps 2 and 3. Further detail can always be added to that made available through the chart of accounts if detailed ad hoc analysis is undertaken,
Management accounting and efficiency in health services 79
but this is costly to produce and maintain accurately, and so cost system design relies heavily on the structure of the chart of accounts. This is not always to its benefit given that often the chart of accounts is structured with external financial reporting in mind (Johnson & Kaplan, 1987).
With this concern in mind, it is quite common for the chart of accounts to introduce relevant notions of cost behaviour in terms of differentiating between fixed (costs that do not change with the level of output) and variable (costs that change with the level of output) costs in relation to specific resources being mapped. This kind of distinction can feed into ad hoc analysis of marginal cost changes in relation to service redesign decisions and the application of a set of basic management accounting techniques comprising cost–volume–profit analysis. The strength of this framing of cost behaviour is that it quickly and easily allows the modelling of short-run cash flows, something that is both important and intuitively appealing as a matter of concern to a wide range of stakeholders.
The limitations of a fixed and variable framing of cost behaviour are particularly pressing in areas such as health care where a large proportion of cost is fixed. Such a framing can help bring about a relative inattention to fixed costs, even creating a sense that such costs are inevitable. However, even when attention is directed towards fixed costs, under such a framing the approach offers little support for capacity planning and management. Both of these factors can easily lead to a lack of control of fixed costs and inefficient use of them.
Management accounting offers the distinction between direct (costs that can be logically linked to a cost object) and indirect (costs that cannot) costs to address these limitations. In relation to fixed and variable costs, a variable cost is in principle direct. A fixed cost may or may not be. The fixed cash flow cost of a clinician’s salary can still be direct in relation to the time spent with different patients, for example. However, the fixed cash flow cost of premises is indirect.
DRG tariff structures are often based on the full cost of specific treatments. Full cost is made up of the direct costs of the treatment and an appropriate share of indirect costs, such that ultimately if all reported treatment costs are added up, the total is the total cost of the provider organization. The central choice to be made is how to determine what an appropriate share of indirect costs is. There are two main alternatives here: volume-based allocation and an activity-based approach.
Traditional volume-based absorption costing assumes that indirect costs are fixed and can be allocated identically to each service delivered. However, since an indirect cost cannot logically be linked to a cost object, volume-based alloca-tion is inherently arbitrary and in principle incorrect. In terms of monitoring

Health system efficiency80
short-run cash flows, this is not so damaging because the fixed cash flows are assumed to be largely unaffected by different output choices.
The problem with volume-related allocation (which an activity-based approach is designed to remedy) is that while the indirect costs are not related to volume, they are related to something. If the costing system does not reflect these actual relationships, then in the medium term there is a risk of promoting behaviours that will inadvertently increase overheads and short-run fixed cash flows. The central argument of activity-based costing is that traditional volume-based alloca-tions systematically overvalue high-volume simple processes and systematically undervalue low-volume complex ones. As a result, such systems encourage more low-volume complex activities that in turn require greater overhead investments to handle the increased complexity. Thus, the risk with volume-related systems is that indirect costs will rise faster than the volume of services (Kaplan & Cooper, 1998).
While the choice between volume-based and activity-based analysis is most com-monly thought of in relation to the next step (step 2), it is important to bear in mind that the relative ease of analysing activity costs depends on the structure and granularity of the chart of accounts.
4.2.2 Step 2: determining the granularity of cost pools and cost driversThis step involves two related choices. The first choice involves the aggregation of resources identified in the chart of accounts into cost pools that form the basic structure of analysis in cost systems. The second choice involves the selection of a cost driver for the resulting cost pools that allows costs to be linked to the chosen cost object (step 3).
The conceptual challenge in terms of direct costs is not great, although captur-ing the necessary data can be more difficult. The difficulties arise when dealing with indirect costs. In the health care sector, a distinction is often made between indirect costs linked to medical processes (for example, manager of the operating theatre) and overhead costs linked to the indirect costs of the administration (for example, chief executive officer of the hospital or central departments such as accounting, legal department, and so on). When we use the word indirect cost in this chapter, we refer to all non-direct costs because the choices for their treatment are conceptually the same in terms of the visibility of cost behaviour.
Take, for example, a figure for the overall cost of the finance department. This is an indirect cost in the sense that it is a cost whose behaviour we do not easily understand at the patient level and so we are challenged when it comes to choosing an appropriate cost driver. This difficulty arises because the costs of the finance department are an aggregation of many different resource costs (for example,
Management accounting and efficiency in health services 81
payroll costs of accounting staff, office costs to house them, utilities such as electricity, but also consumables such as paper and computers), which rise and fall in relation to many different factors. Such department-based aggregations are often a matter of practical convenience. As a department, there will likely be an annual budget that groups together all of these resource costs. In terms of authorizing spending, this is useful; however, this aggregation is not helpful for understanding cost behaviour.
By virtue of aggregating so many different kinds of costs into a single figure, there is no single cost driver that offers a clear reflection of what accounts for costs in the finance department. The volume of services offers an intuitive but noisy basis for analysis. At an aggregate level, it is plausible that more patients will to some extent lead to more finance department costs. As soon as we consider individual patients, however, it seems likely that individual patient consumption of finance department resources might vary considerably depend-ing on many different factors, some of which will have nothing to do with patient behaviour.
The alternative to a volume-related allocation is an activity-based costing approach. This would reanalyse departmental costs, breaking them down into cost pools reflecting specific activities (for example, running the payroll, credit control). Once analysed in terms of activities, it becomes possible to understand what drives costs. For example, payroll costs likely depend more on the number of clinical staff than the number of patients (because staff/patient ratios might vary considerably across specialities) suggesting the need for a two-stage approach attributing payroll costs to clinicians first and then to patients. Credit control costs may also display significant differences between specialities depending on particular financing arrangements that may again have very little to do with patient numbers.
Credit control is another high-level activity. Depending on the nature of decisions to be taken, it might be appropriate to break it down into subactivities and to map resources yet in more detail. When it comes to the nature of the cost driver, again choices must be made about granularity. For example, we must decide whether it is sufficient to assume that credit control costs are driven by patient numbers in particular specialities, or whether a more granular analysis of hours spent on particular patient cases is appropriate as a cost driver.
As always, these decisions are a trade-off between the cost of collecting and analysing more granular data over the possibilities for making better decisions in light of it. The distinction between direct and indirect costs is not purely linked to the nature of costs, but also depends on this trade-off between the cost of understanding indirect cost behaviours such that they may be considered direct costs and the benefit of having such direct costs inform decision-making. For
Health system efficiency82
example, drugs are in principle a direct cost, in that specific patients consume them. However, depending on the cost of a drug, the cost system may treat it as a direct or indirect cost. If the cost of a drug is relatively high (for example, a high-cost cancer treatment), it may be beneficial to attribute this cost directly to the particular patient. However, if a drug is less expensive (for example, a standard cancer treatment), its cost may be treated effectively as an indirect cost if the cost of analysis outweighs the possibilities of making better decisions on the basis of more refined information. The same choice must be made for staff costs (that is, should they be treated as direct or effectively indirect costs) and at what level of granularity.
In summary, activity-based costing is an approach to attribute resource costs (step 1) to cost objects (step 3), where careful choices are made to link indirect costs to the specific activities that drive them. Activity-based costing is an alternative to volume-related allocation of indirect costs to cost objects (for example, divid-ing costs across patient numbers). Volume-related allocation sacrifices precision for the sake of simplicity and reduced cost of measurement. In deciding how best to account for indirect costs, it is important to always consider the costs and benefits associated with collecting such data. The question to ask is: Does the effort to transform a particular block of overheads into direct costs through an analysis of activity pay back with regard to the decision-making benefits obtained from such efforts?
4.2.3 Step 3: determining the granularity of the chosen cost objectA costing system can always produce an estimate of the cost of a particular cost object (for example, patient episode, patient, service line, trust). However, depending on the approach taken in the previous steps, this estimate may more or less reflect reality. As such, this final step is potentially the least informative in terms of giving a useful indication of the granularity of a costing system, which in practice derives much more from choices made in the preceding two steps. A key matter in terms of granularity at this level arises more from the degree to which a particular cost represents an average across a particular level of cost object, or shows reliable variability between costs at that level.
This issue is often discussed with regard to top-down and bottom-up costing. Dividing total operating theatre costs by the number of patients to identify a cost attributable to an individual patient is a top-down approach. Aggregating the per-theatre minute costs to arrive at a total per-patient cost is a bottom-up approach that allows visibility of cost variation between patients. To rephrase this distinction, with words that make it more obvious how and why these dis-tinctions matter: a top-down approach is a cheap way to produce average costs.
Management accounting and efficiency in health services 83
A bottom-up figure helps to reflect variability of resource consumption across particular cost objects, but it is more expensive to produce.2
The development of time-driven activity-based costing (TDABC) (Kaplan & Anderson, 2004) represents a development that can reduce the costs of more flexible and granular analysis using a bottom-up, activity-based approach. The first step is to work out the total cost of relevant resources required by a cost object and determine the level of practical capacity of the resources to provide services. Time in TDABC reflects the observation that for a surprisingly wide range of resources, this is an appropriate unit of capacity. The second step is to charge cost objects with their consumption of capacity at the per-unit cost of capacity worked out in the first step.
An advantage of TDABC is that it simplifies step 2 as undertaken in earlier activity-based costing systems. So, for example, an early activity-based costing system might have aggregated clinical staff costs as a resource (step 1). This would then be split across inpatient and outpatient activities based on consultant job plans (step 2). These costs would then be driven to patients in the inpatient and outpatient areas (step 3). A TDABC approach avoids the need to make a priori assumptions about the split in step 2. When dealing with the activity of people, this is particularly useful since their split across many activities can significantly and frequently vary. TDABC instead works out a per-minute cost of clinical staff time and then builds costs up from the assignment of that cost to minutes spent with inpatients and outpatients. Granularity at step 3 can then be easily adjusted by doing this using estimates, or standard minute rates per activity, or direct measurement depending on the importance of the information in terms of its capacity to inform useful decisions.
4.3 Demonstrating cost system design choices with two detailed examples
To place the various choices and distinctions discussed in the previous section within a more concrete context, next we analyse how these choices play out using two detailed examples chosen for their impact in terms of clinical and financial importance. First, we discuss how these cost system design choices impact on the analysis of costs in the operating theatre, and second how they have an impact on the analysis of property costs. The examples are based on observations of costing practices and national costing guidelines Germany and the United Kingdom.
2 Here, we use the terms volume-based and activity-based costing to distinguish two different kinds of treatments of indirect costs. In the literature, other distinctions that are often used synonymously can be found, for example, micro costing and bottom-up costing. These are used synonymously for activity-based costing and macro costing, while top-down costing is often used as synonym for the volume-based allocation of costs.
Health system efficiency84
4.3.1 Tracing operating theatre costs to patientsThe operating theatre in an acute care hospital represents a highly significant resource and location of clinical activity. As such, the way in which cost is traced to patients receiving treatment in operating theatres is a matter of considerable importance. As documented in Chapman & Kern (2010) and based on research in the United Kingdom, there is considerable variability to be found in terms of the sophistication of cost system design relating to activity in operating theatres.
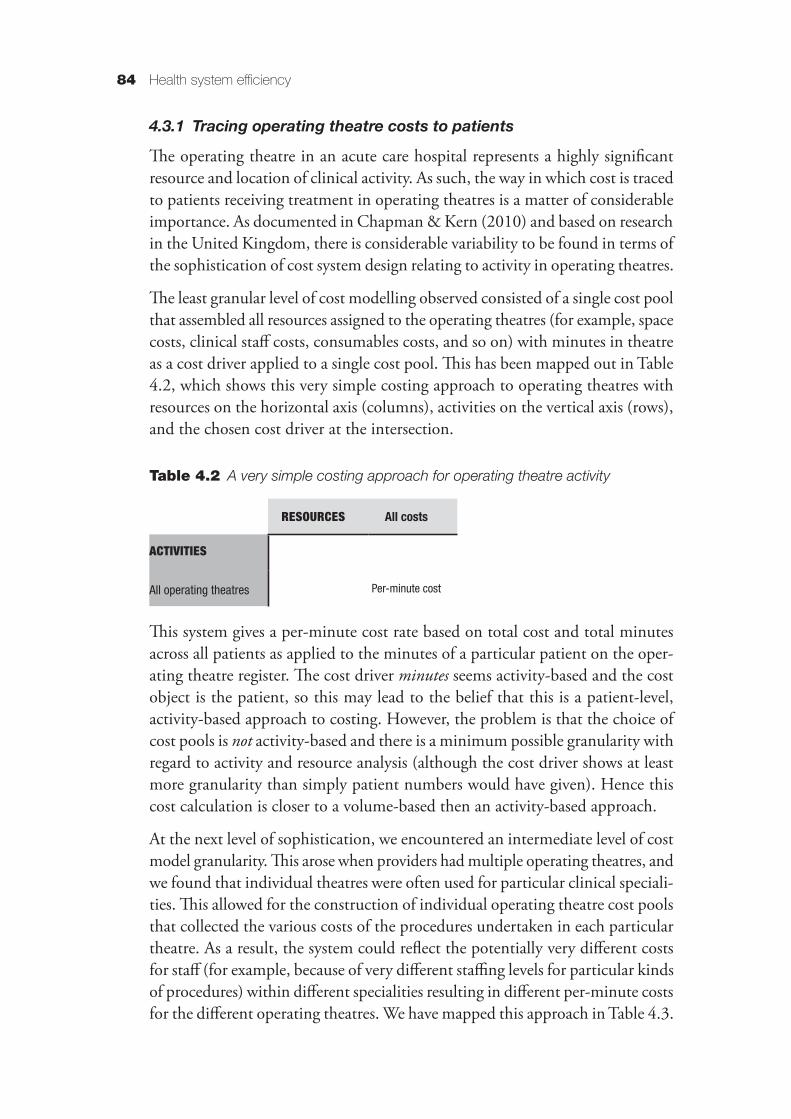
The least granular level of cost modelling observed consisted of a single cost pool that assembled all resources assigned to the operating theatres (for example, space costs, clinical staff costs, consumables costs, and so on) with minutes in theatre as a cost driver applied to a single cost pool. This has been mapped out in Table 4.2, which shows this very simple costing approach to operating theatres with resources on the horizontal axis (columns), activities on the vertical axis (rows), and the chosen cost driver at the intersection.
Table 4.2 A very simple costing approach for operating theatre activity
RESOURCES All costs
ACTIVITIES
All operating theatres Per-minute cost
This system gives a per-minute cost rate based on total cost and total minutes across all patients as applied to the minutes of a particular patient on the oper-ating theatre register. The cost driver minutes seems activity-based and the cost object is the patient, so this may lead to the belief that this is a patient-level, activity-based approach to costing. However, the problem is that the choice of cost pools is not activity-based and there is a minimum possible granularity with regard to activity and resource analysis (although the cost driver shows at least more granularity than simply patient numbers would have given). Hence this cost calculation is closer to a volume-based then an activity-based approach.
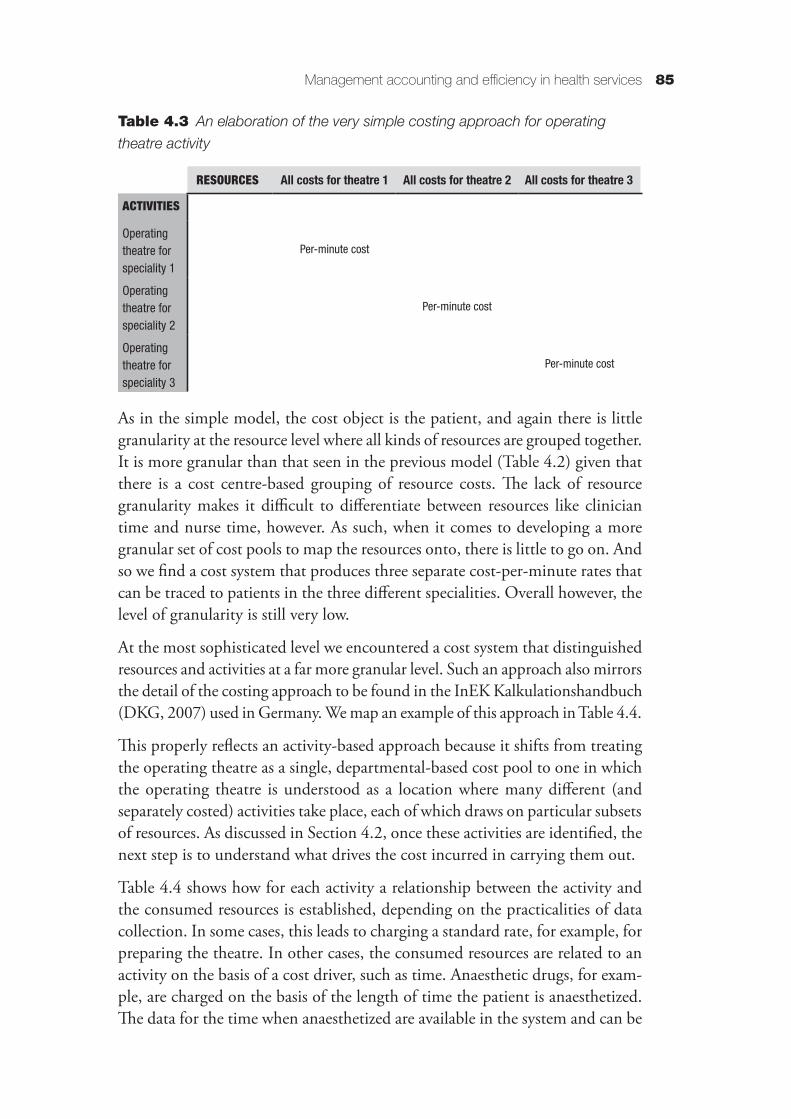
At the next level of sophistication, we encountered an intermediate level of cost model granularity. This arose when providers had multiple operating theatres, and we found that individual theatres were often used for particular clinical speciali-ties. This allowed for the construction of individual operating theatre cost pools that collected the various costs of the procedures undertaken in each particular theatre. As a result, the system could reflect the potentially very different costs for staff (for example, because of very different staffing levels for particular kinds of procedures) within different specialities resulting in different per-minute costs for the different operating theatres. We have mapped this approach in Table 4.3.
Management accounting and efficiency in health services 85
Table 4.3 An elaboration of the very simple costing approach for operating theatre activity
RESOURCES All costs for theatre 1 All costs for theatre 2 All costs for theatre 3
ACTIVITIES
Operating theatre for speciality 1
Per-minute cost
Operating theatre for speciality 2
Per-minute cost
Operating theatre for speciality 3
Per-minute cost
As in the simple model, the cost object is the patient, and again there is little granularity at the resource level where all kinds of resources are grouped together. It is more granular than that seen in the previous model (Table 4.2) given that there is a cost centre-based grouping of resource costs. The lack of resource granularity makes it difficult to differentiate between resources like clinician time and nurse time, however. As such, when it comes to developing a more granular set of cost pools to map the resources onto, there is little to go on. And so we find a cost system that produces three separate cost-per-minute rates that can be traced to patients in the three different specialities. Overall however, the level of granularity is still very low.
At the most sophisticated level we encountered a cost system that distinguished resources and activities at a far more granular level. Such an approach also mirrors the detail of the costing approach to be found in the InEK Kalkulationshandbuch (DKG, 2007) used in Germany. We map an example of this approach in Table 4.4.
This properly reflects an activity-based approach because it shifts from treating the operating theatre as a single, departmental-based cost pool to one in which the operating theatre is understood as a location where many different (and separately costed) activities take place, each of which draws on particular subsets of resources. As discussed in Section 4.2, once these activities are identified, the next step is to understand what drives the cost incurred in carrying them out.
Table 4.4 shows how for each activity a relationship between the activity and the consumed resources is established, depending on the practicalities of data collection. In some cases, this leads to charging a standard rate, for example, for preparing the theatre. In other cases, the consumed resources are related to an activity on the basis of a cost driver, such as time. Anaesthetic drugs, for exam-ple, are charged on the basis of the length of time the patient is anaesthetized. The data for the time when anaesthetized are available in the system and can be
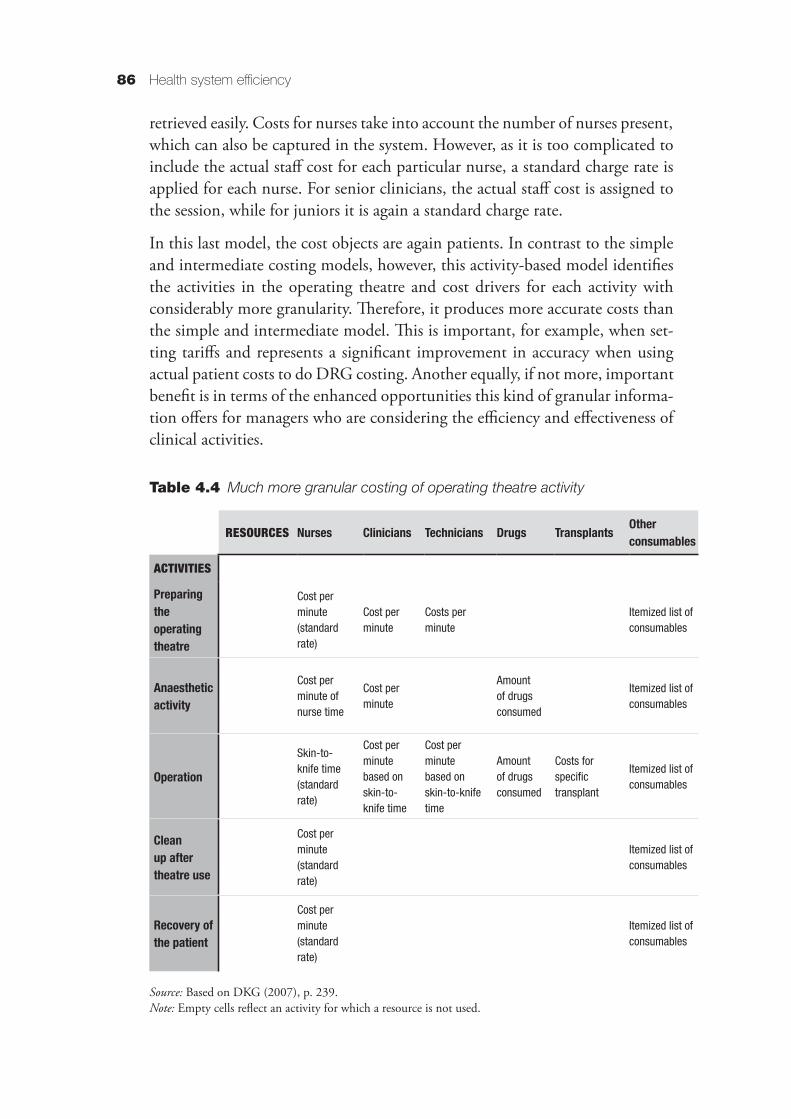
Health system efficiency86
retrieved easily. Costs for nurses take into account the number of nurses present, which can also be captured in the system. However, as it is too complicated to include the actual staff cost for each particular nurse, a standard charge rate is applied for each nurse. For senior clinicians, the actual staff cost is assigned to the session, while for juniors it is again a standard charge rate.
In this last model, the cost objects are again patients. In contrast to the simple and intermediate costing models, however, this activity-based model identifies the activities in the operating theatre and cost drivers for each activity with considerably more granularity. Therefore, it produces more accurate costs than the simple and intermediate model. This is important, for example, when set-ting tariffs and represents a significant improvement in accuracy when using actual patient costs to do DRG costing. Another equally, if not more, important benefit is in terms of the enhanced opportunities this kind of granular informa-tion offers for managers who are considering the efficiency and effectiveness of clinical activities.
Table 4.4 Much more granular costing of operating theatre activity
RESOURCES Nurses Clinicians Technicians Drugs Transplants Other consumables
ACTIVITIES
Preparing the operating theatre
Cost per minute (standard rate)
Cost per minute
Costs per minute
Itemized list of consumables
Anaesthetic activity
Cost per minute of nurse time
Cost per minute
Amount of drugs consumed
Itemized list of consumables
Operation
Skin-to-knife time (standard rate)
Cost per minute based on skin-to-knife time
Cost per minute based on skin-to-knife time
Amount of drugs consumed
Costs for specific transplant
Itemized list of consumables
Clean up after theatre use
Cost per minute (standard rate)
Itemized list of consumables
Recovery of the patient
Cost per minute (standard rate)
Itemized list of consumables
Source: Based on DKG (2007), p. 239.Note: Empty cells reflect an activity for which a resource is not used.
Management accounting and efficiency in health services 87
4.3.2 Tracing estate costs through to patientsIn the preceding discussion, we largely focused on a range of resources and activities that were relatively easily linked to patient activity. A significant por-tion of organizational costs is made up of indirect costs (overheads, support, infrastructure), which are more complicated to link to patients. In this section, we present the additional challenges of dealing with these kinds of costs in terms of granularity of cost system design taking the example of estate or property costs.
Perhaps the simplest way to deal with estate costs would be to adopt a minimum granularity, a top-down, volume-based approach. Such an approach would divide the total estate costs across the number of departments (service lines, points of delivery), and then from there allocate costs onto patients within each of those service lines. This is not likely to be particularly accurate, but the costs of such an approach to costing are low. The most obvious cost driver here, and what is mandated in many jurisdictions in their costing guidance, is to use a space measure, such as square metres of space occupied, as the basis to attribute estate costs to cost centres/service lines.
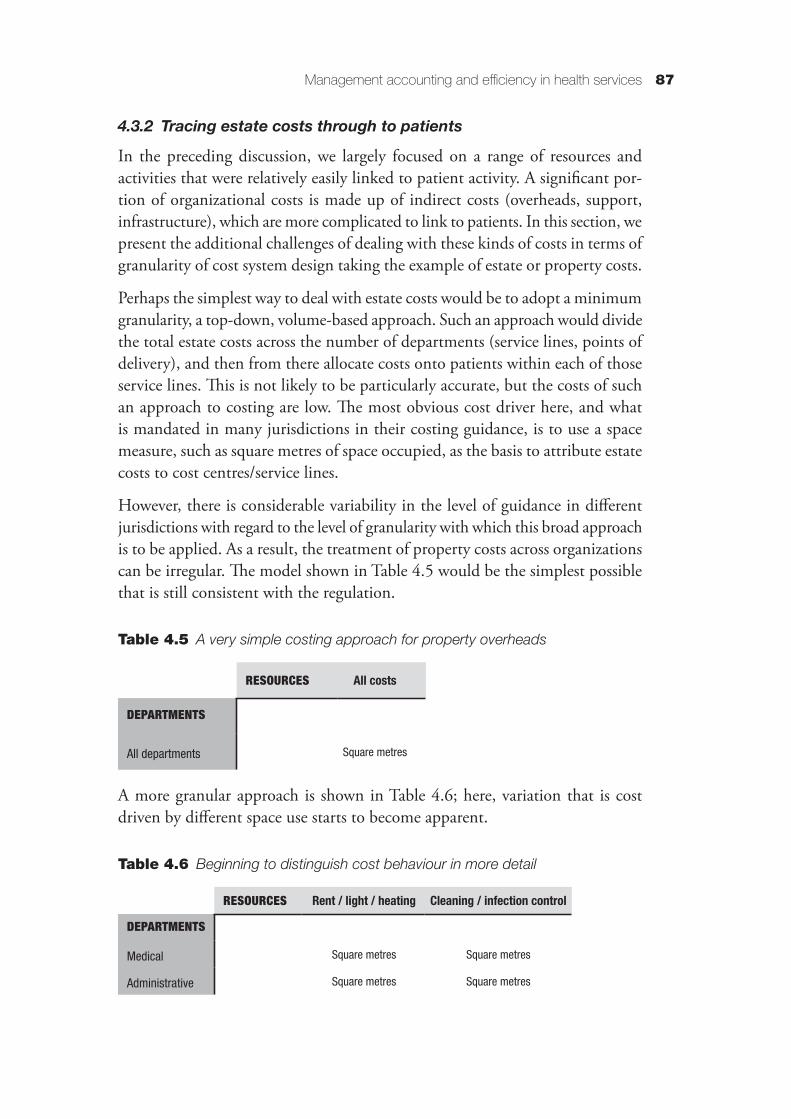
However, there is considerable variability in the level of guidance in different jurisdictions with regard to the level of granularity with which this broad approach is to be applied. As a result, the treatment of property costs across organizations can be irregular. The model shown in Table 4.5 would be the simplest possible that is still consistent with the regulation.
Table 4.5 A very simple costing approach for property overheads
RESOURCES All costs
DEPARTMENTS
All departments Square metres
A more granular approach is shown in Table 4.6; here, variation that is cost driven by different space use starts to become apparent.
Table 4.6 Beginning to distinguish cost behaviour in more detail
RESOURCES Rent / light / heating Cleaning / infection control
DEPARTMENTS
Medical Square metres Square metres
Administrative Square metres Square metres
Health system efficiency88
The question remains, however, of how to link property costs to actual patients. If estate costs at the cost centre or service line level (for example, in the operating theatre) are divided by the number of operations or patients, it will correspond to a top-down, volume-based costing approach. Even if the first step was a bottom-up, activity-based costing approach, through this second step, the calculation turns into a top-down, volume-based calculation. If, however, property costs are attributed to patients based on minutes spent in the operating theatre, it remains a bottom-up, activity-based costing.
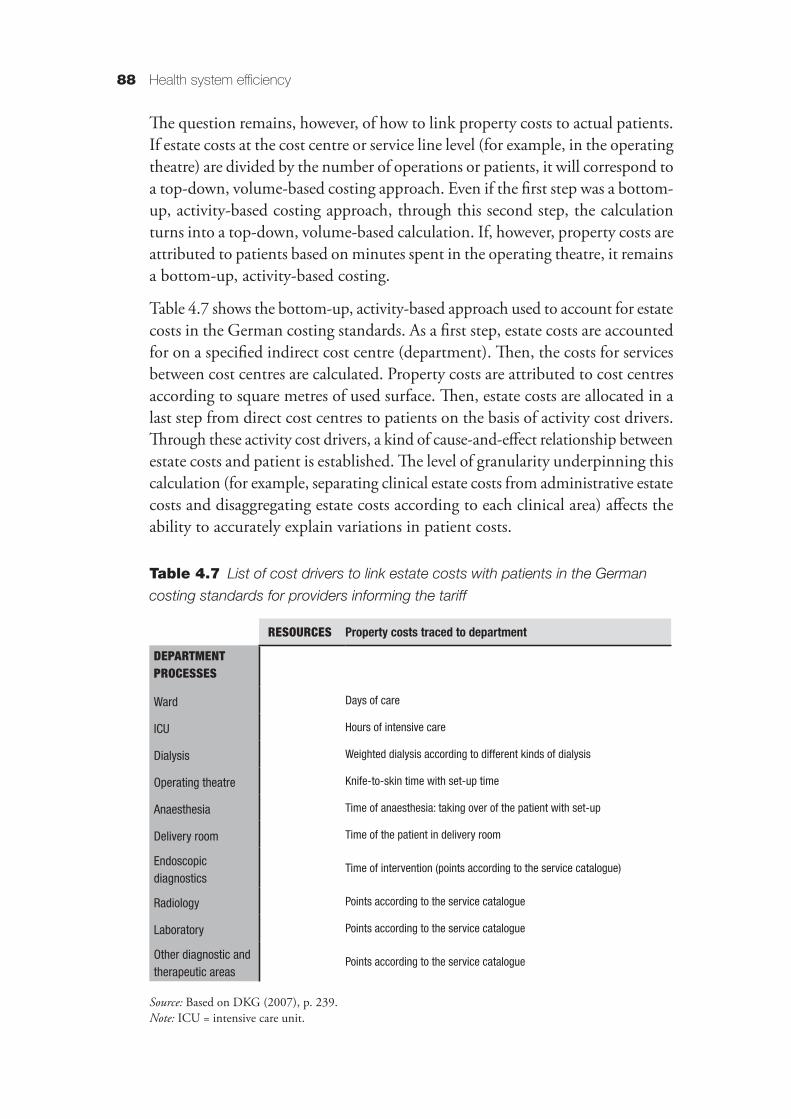
Table 4.7 shows the bottom-up, activity-based approach used to account for estate costs in the German costing standards. As a first step, estate costs are accounted for on a specified indirect cost centre (department). Then, the costs for services between cost centres are calculated. Property costs are attributed to cost centres according to square metres of used surface. Then, estate costs are allocated in a last step from direct cost centres to patients on the basis of activity cost drivers. Through these activity cost drivers, a kind of cause-and-effect relationship between estate costs and patient is established. The level of granularity underpinning this calculation (for example, separating clinical estate costs from administrative estate costs and disaggregating estate costs according to each clinical area) affects the ability to accurately explain variations in patient costs.
Table 4.7 List of cost drivers to link estate costs with patients in the German costing standards for providers informing the tariff
RESOURCES Property costs traced to department
DEPARTMENT PROCESSES
Ward Days of care
ICU Hours of intensive care
Dialysis Weighted dialysis according to different kinds of dialysis
Operating theatre Knife-to-skin time with set-up time
Anaesthesia Time of anaesthesia: taking over of the patient with set-up
Delivery room Time of the patient in delivery room
Endoscopic diagnostics
Time of intervention (points according to the service catalogue)
Radiology Points according to the service catalogue
Laboratory Points according to the service catalogue
Other diagnostic and therapeutic areas
Points according to the service catalogue
Source: Based on DKG (2007), p. 239.Note: ICU = intensive care unit.
Management accounting and efficiency in health services 89
4.3.3 Hybrid cost systems in practiceGiven the variety of costing methods and the wide range of possible levels of granularity discussed, the question arises as to what best practice of costing in health care is. This question can be answered by considering the ultimate objective of clinical costing from a management point of view: to make costs transparent. While in principle this objective can be obtained with all methods, variations in patient costs are more easily and accurately identified using an activity-based costing approach. Further, activity-based, patient-level information allows for more appropriate links between cost and health outcomes, which are essential for evaluating services in health care (Kaplan & Witkowski, 2014). However, the difficulties (and costs) of achieving activity-based costing are greater than for volume-based allocation.
In practice, costing approaches are dominated by regulatory requirements for DRGs as a basis for tariff setting; this is subject to widely varied sophistication, detail and constancy of guidance internationally. However, given the trade-off between the cost of cost analysis and the quality of cost information, it is not surprising that, in practice, costing standards and systems usually consist of a mixture of different methods (that is, activity- and volume-based).
Based on our analysis, we suggest that rather than label a costing system or standards as a whole in terms of being activity-based or volume-based, one could calculate the percentage of costs that follow each costing methods. Costing standards in the United Kingdom recognize that different costing methods exist within costing systems; at the provider level, materiality and quality scores (MAQS) are used to rate the quality of cost information based on the choice of cost drivers. The closer the cost calculation is to actual resource consumption, the higher the score; the choice of cost driver is rated as bronze, silver or gold. This enables providers to better understand how their costing system functions in a more useful way and to evaluate the quality of their cost information.
That said, currently, MAQS primarily focus on the nature of the cost driver, devoting far less attention to the construction of the cost pool to which the cost driver is applied. As discussed in relation to property costs, there are many important choices to be made in this regard, and these significantly affect the ability of costing systems to show actual costs, regardless of which cost driver is chosen. Given this focus on cost drivers, the MAQS score is currently well placed to indicate through a low score that there might be room for improvement in the quality of costing data. At higher scores, however, the approach loses the ability to discriminate between costing systems that have good cost drivers and good cost pools, and those that have good cost drivers but deficiencies in cost pool structure.
Health system efficiency90
4.4 The role of cost data in delivering efficient health care
Much of the emphasis in this chapter has been placed on the importance of the technical characteristics of costing system design. When designing a cost-ing system, it is important to maintain a clear understanding of the decisions and objectives that the system is there to support. In this section, we review in more detail the various ways in which cost data can act as a vital input into efforts to measure and manage efficiency at both provider and health care system levels.
4.4.1 The role of cost data in system-wide resource allocation systemsAt the health care system level, cost data feed into major resource allocation exercises through tariff systems, and also as the basis of negotiations around block contracts and the setting of budget levels between providers and pur-chasers. However, tariff setting within DRG financing systems is often the dominating purpose of costing across countries (Chapman, Kern & Laguecir, 2014).
Countries with DRG-based financing systems use costing data from providers to inform tariff setting, comparisons across providers and efficiency and performance assessment at the system level. In contrast to many other industries, detailed product or service costing is regulated, collected by government and sometimes publicly reported. This raises questions about the process of collecting and using such costing data at the system level. In particular, there are important questions regarding the stewardship responsibilities of governments and regulators in terms of the costing approach (Smith et al., 2008).
Development of a clear conceptual framework and a clear vision of the purpose of the costing approach are needed. Part of such a framework must be the link of costing with practices that are informed by costing, such as DRG development, tariff setting, cost–effectiveness calculations and links with financial accounting and IT. The guidance must specify the design of the cost systems, including, for example, the structure of cost pools and the cost drivers.
Detailed guidance then allows the standardization of cost data across pro-viders, which is a major stewardship responsibility. In fact, standardization is a condition for tariff setting or comparisons across providers. Further, the question of which body or institution designs the guidance and collects the data needs to be addressed, as does the organization of the data collec-tion process. In terms of data collection, we need to consider whether data are collected from all providers or whether a sampling approach should be
Management accounting and efficiency in health services 91
chosen. The question of costs, but also of the representativeness of the cost-ing data, plays a role in this later consideration. Another crucial question that needs to be answered is how to handle information governance (Smith et al., 2008). Costing data need to be audited and data quality needs to be checked. The quality of the information produced using costing data depends on the quality of the raw cost data. Audits and quality checks are therefore essential to ensure public trust in information and to ensure a well-informed public debate.
Cross-country research suggests that considerable variability remains (Chapman et. al., 2013). A growing number of countries that initially opted for a volume-based allocation model for tariff setting are now moving towards activity-based costing. For example, both Ireland and the United Kingdom are currently devel-oping an activity-based approach to costing at the provider level (Chapman et al., 2013). The reason is that while volume-based allocation enables the relatively quick calculation of a tariff, the tariff itself and the underlying costs are not con-sidered relevant or reliable enough (Monitor, 2014b). The perceived inaccuracy of volume-based overheads allocation at clinical unit levels can even lead clini-cians to reject the tariff. Ultimately, volume-based costing is most problematic because it limits the potential for cost data to meaningfully inform clinical and managerial decision-making.
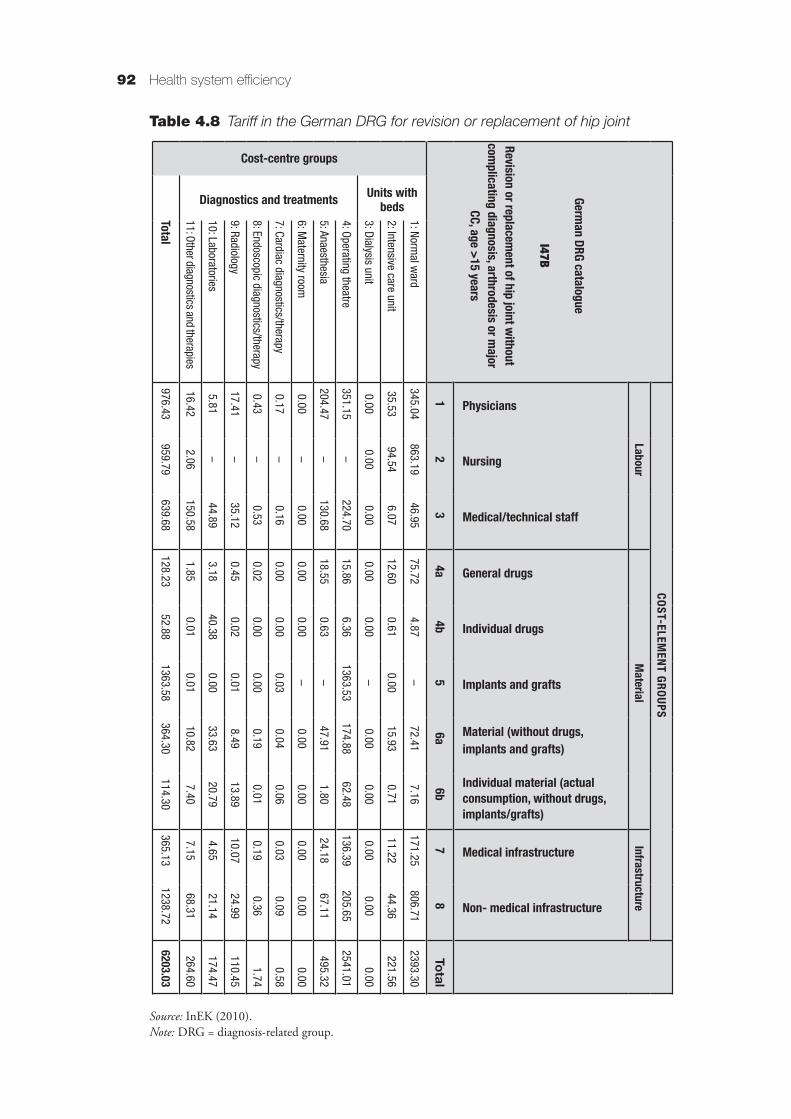
These limitations become apparent once we shift our attention beyond the tariff rates to examine the detail of the various cost elements making up the tariff figures. If calculation of these cost elements is based on a volume-based allocation, the result is the reporting of averages, with no variation in costs across patients. However, if the calculation is based on an activity-based approach, costs across patients will vary. Table 4.8 shows the detailed costs for the German DRG for the revision or replacement of hip joints as an example of the level of detail.
What becomes important as the emphasis shifts from tariff setting to inform-ing clinical and managerial decision-making, however, is the costing approach adopted in arriving at these various cost elements. In the case of volume-based allocations, patients are attributed an average cost for each cost category (for example, physician, nurse, ward and overhead costs). This means that there is very little variation in reported costs at the patient level. The difference in reported patient costs may be explained by just a couple of key drivers, such as variation in length of stay or variation in time in the operating theatre, for example, with many other sources of variation of actual costs left unknown. This becomes problematic when seeking to link costs with health outcomes and using costs to make decisions on service redesign, as discussed further on.
Health system efficiency92
Table 4.8 Tariff in the German DRG for revision or replacement of hip joint
Source: InEK (2010).Note: DRG = diagnosis-related group.
COST-ELEMEN
T GROUPS
LabourM
aterialInfrastructure
German DRG catalogue
I47B
Revision or replacem
ent of hip joint without com
plicating diagnosis, arthrodesis or major
CC, age >15 years
Physicians
Nursing
Medical/technical staff
General drugs
Individual drugs
Implants and grafts
Material (without drugs, implants and grafts)
Individual material (actual consumption, without drugs, implants/grafts)
Medical infrastructure
Non- medical infrastructure
12
34a
4b5
6a6b
78
Total
Cost-centre groups
Units with beds
1: Normal w
ard345.04
863.1946.95
75.724.87
–72.41
7.16171.25
806.712393.30
2: Intensive care unit35.53
94.546.07
12.600.61
0.0015.93
0.7111.22
44.36221.56
3: Dialysis unit0.00
0.000.00
0.000.00
–0.00
0.000.00
0.000.00
Diagnostics and treatments
4: Operating theatre351.15
–224.70
15.866.36
1363.53174.88
62.48136.39
205.652541.01
5: Anaesthesia204.47
–130.68
18.550.63
–47.91
1.8024.18
67.11495.32
6: Maternity room
0.00–
0.000.00
0.00–
0.000.00
0.000.00
0.00
7: Cardiac diagnostics/therapy0.17
–0.16
0.000.00
0.030.04
0.060.03
0.090.58
8: Endoscopic diagnostics/therapy0.43
–0.53
0.020.00
0.000.19
0.010.19
0.361.74
9: Radiology17.41
–35.12
0.450.02
0.018.49
13.8910.07
24.99110.45
10: Laboratories5.81
–44.89
3.1840.38
0.0033.63
20.794.65
21.14174.47
11: Other diagnostics and therapies16.42
2.06150.58
1.850.01
0.0110.82
7.407.15
68.31264.60
Total976.43
959.79639.68
128.2352.88
1363.58364.30
114.30365.13
1238.726203.03
Management accounting and efficiency in health services 93
Activity-based costing of overheads enables reporting of costs at the patient level that take into account a wide range of differences in resource consumption (for example, the specific size of clinical teams for different procedures, rather than an average cost per minute across many procedures). This provides more useful information for clinical and managerial decision-making, as variations between patients can be captured in terms of their actual resource consumption. The resulting tariff may then be a fairer basis for resource allocation. Accurate data are crucial, as these funding mechanisms are used by regulators and purchasers to incentivize reforms in health care practice and delivery at both provider and system levels.
4.5 Cost data and support of local clinical and managerial decision-making
The effectiveness of incentives to enhance the efficiency of health care services depends on the quality of the cost data. This, in turn, is dependent on a con-structive engagement between costing and clinicians. Providers will not make the necessary investments to obtain quality cost data if the data do not play a role in clinicians’ day-to-day decision-making. Furthermore, quality cost information in health care is difficult to achieve without active engagement of clinicians in the design of the cost system, since they are the ones with the granular knowledge of activities that is required to produce robust and reliable cost data in the first place. This then sets up a potentially vicious or virtuous circle. If things go badly, then poor-quality cost data are largely ignored by clinicians to the extent they can manage to do so. If things go well, however, then data on cost variations can become an important tool to identify areas for clinical improvements.
Importantly, the process of developing the quality of cost information can prompt clinical deliberations and decisions over what represents cost-effective health care. The point of costing is not simply to reflect what is going on; more ambitiously, it can play a role in thinking about better ways to do things so that clinicians can play an active role in generating the maximum health benefits for their patients within the resources available to them. Clinicians engage with cost-ing information through a range of common management accounting practices. We discuss the main ones in the following sections.
4.5.1 Targeted cost improvement plansCost reduction targets are often initially formulated at national or political levels. They then cascade downwards through providers with the production of targeted cost improvement plans derived for individual clinical units and depart-ments. The capabilities of clinical units to respond effectively to such targets
Health system efficiency94
depend crucially on the nature and quality of the cost information available. As discussed earlier, volume-based allocations tend to lead to average reported costs, showing variation only in relation to drivers such as length of stay. Based on this, information can relatively easily be produced to highlight some of the variance in actual patient costs, for example, showing average highs and lows. The challenge is that without an activity-based analysis of cost, such variation acts as a largely hypothetical promise that overall costs can be reduced if more patients were as cheap as the cheapest. Unfortunately, a volume-based costing system offers little insight or support in terms of how to effectively and safely achieve this.
An activity-based approach to costing enables cost improvement plans that take into account the impact of indirect costs on activities. Certain types of overheads may be more linked with certain service lines than with others. Rather than advising to cut costs by 10% across all activities, cost manage-ment can better focus on the specific costs and the specific activities that cause excessive costs. Analysed at the patient level, this information can then be compared with the health outcomes achieved to inform analysis of both efficiency and effectiveness.
An important caveat to the ongoing relevance of targeted cost improvement plans is that in the face of continued growth in demand for health care services, it seems likely that more attention will need to be given to generating more health from existing spending rather than hoping to make significant reductions in current spending. This agenda suggests greater attention to the following management accounting practices.
4.5.2 BenchmarkingOnce cost data are activity-based and linked to health outcomes, benchmarking is a powerful way to engage clinicians in exactly the kind of analysis that cost improvement plans require. Effective benchmarking builds from discussions with physicians about the reasons that costs are higher or lower than those of other providers. Discussions between costing experts and clinicians are also essential to ensure that cost data appropriately reflect physicians’ practice and resource consumption decisions.
Such discussions aim to explain the variation in cost between clinicians and patients. In some cases, higher costs are justified by patients requiring more complex care. In other cases, differences in costs are caused by differences in medical practice. A difference could be caused, for example, by the use of differ-ent drugs or other consumables, but also by different surgical techniques. Such differences, once visible, form the basis of discussions among clinicians aimed at
Management accounting and efficiency in health services 95
confirming a shared understanding of when variation is appropriate, and align diverse clinical practice where evidence shows a clinically determined balance of health outcomes and cost.
Discussions around comparisons of costs between the service lines of different hospitals can also reveal differences in resource consumption for indirect costs. If activity-based costing is in place, decision-makers can then spot more easily the origin of such differences and potentially make services more efficient. While activity-based costing has been shown to reduce overall costs (see, for example, Pizzini, 2006), its main advantage may actually lie in using the existing resources more effectively. This is particularly important in a context of coping with rising demand without increasing the available resources.
4.5.3 BudgetingBuilding on these kinds of analyses, activity-based costing data can go on to inform more appropriate budgetary processes as part of the ongoing manage-ment of providers. When there are no costing data at the patient level, the danger is that budgets are set based on past arrangements, power and interests rather than clinical needs, practices and outcomes. Activity-based costs at the patient level allow for more accurate estimates of costs at the service line-level based on the number and type of patients expected. The budget process becomes more objective and fair-based on clearly specified modelling of resource consumption and less on power and local interests.
Activity-based costing has two main advantages here. It enables the construction of the budget in a bottom-up way, enabling the budget holder and operational staff to participate in the budget process while having a better understanding of the impact of their work processes on the costs entailed. This is supported by the use of language that directly speaks to clinical activities as opposed to technical accounting terminology. Staff can understand when constructing the budget how the costs of work processes, for example, are linked to certain overhead costs. Further, it enables a breakdown of the responsibility of budget holders to activity levels (that is, budget holders for the different activities can be defined). In administrative areas, this can allow a more effective definition of responsibilities and cost management.
4.5.4 Service redesignAs has been discussed, activity-based cost information informs a variety of conversations that can inform robust decisions regarding the nature of how health care services might be more effectively arranged. At its bluntest, redesign can take the form of product/service selection decisions, whereby

Health system efficiency96
procedures or clinical areas might be dropped altogether, or more optimisti-cally, improved on.
This kind of decision has become important in many countries at the health care system level also, where providers face a restructuring, as there are too many providers per patient in certain catchment areas, such as central London. Providers are then asked to focus on certain services representing their strengths, while competitors may take over those services that are considered a weakness. A common tool recommended by Monitor in the United Kingdom, for making decisions in such cases, is the portfolio matrix. The portfolio matrix calculates the profit/loss per service line and the relative size of the service line for the provider (Monitor, 2006). A more sophisticated approach over and above such service selection decisions, however, is to use activity-based cost information to inform redesign activities so that services become more clinically and economi-cally beneficial.
4.5.5 Performance managementA popular metric for measuring efficiency is the average length of stay in hospital. This offers a simple way to reduce the potentially vast complexity of individual patient resource consumption patterns to an easily observed driver of overhead costs. However, studies have shown that the length of a hospital stay has limited influence on the total costs of a patient stay (Taheri, Butz & Greenfield, 2000). Taheri, Butz & Greenfield showed that reducing length of stay by 1 day decreases total costs of care by only 3%. They concluded that staff should instead focus on process changes and better use of capacity when seeking to improve efficiency. This requires delving into the complexities of resource consumption and resource spending that measures such as length of stay simplify away from.
More advanced approaches to performance management include the use of costing data, activity data and clinical data from a service line, for example, taking into account the number of patients treated in a service, costs for certain DRGs in that service line and other relevant indicators. Some providers have introduced performance indicators based on the balanced scorecard system (Kaplan & Norton, 1996). For example, Monitor recommends the use of a balanced scorecard at provider and service line levels in the United Kingdom. This system is designed to link strategy and performance indicators, by choosing those performance indicators that are instrumental for achieving strategic goals.
State-of-the-art performance management systems in health care go a step further. They seek to link both economic and clinical performance (Kaplan & Porter, 2011). For example, the Healthcare Costing for Value Institute in the United Kingdom aims to improve the quality of the costing information in
Management accounting and efficiency in health services 97
health care, but also to further develop links between costs and outcomes to measure values. This again is only meaningful at a patient-level of disaggrega-tion, and requires both outcome and cost data to demonstrate value (Kaplan & Witkowski, 2014).
4.6 Conclusions
In this chapter, we have reviewed the technical characteristics that underlie good-quality cost data, and some of the ways in which such data can inform efforts to measure and enhance the efficiency of health care services. We have argued that the main questions for the design of a costing system relate to matters of granularity at each of the three steps in costing system design: granularity of the resources, granularity of cost pools and granularity of cost objects. It is only when resources and cost pools are defined in a sufficiently granular way that an activity-based costing approach can be achieved. Shifting away from volume-based methods is essential if cost information is to accurately reflect resource use and play a more direct role in health care management.
Activity-based costing enables the management of indirect costs by virtue of its reorganization of cost pools away from traditional (often financial reporting-driven) structures towards analysis of activities with defined cost drivers. Realizing the decision-making benefits of these data also requires that cost pools be mapped onto areas of decision-making responsibility. In general, the misalignment of cost analysis and decision-making structures risks inhibiting efforts at service redesign in the first instance. Such misalignment runs the risk that any savings from service redesigns are unlikely to ultimately translate into changes in resource spending. While activity-based costing cannot directly inform reductions in overall spending, particularly in a setting with a high percentage of fixed costs, it can contribute to greater efficiency by indicating where slack exists and thereby contribute to increases in outputs. This seems particularly pertinent in health care settings where there is likely to be increased demand for services and thus expectations of reduced spending seem unrealistic.
Our emphasis in this chapter arises from our sense that cost information is fun-damental to a wide range of efficiency-oriented practices. Past efforts to clearly and consistently conceptualize costing in the health care sector have not been strong enough to bring about widespread production and use of costing data that can support evidence-based decision-making. We argue that regulators should play an essential role in ensuring that resources set aside for the development of costing systems are not spent reinventing the wheel. It is essential that costing guidance be sufficiently detailed so that costing in practice can deliver on the promise to enhance the efficiency of health care provision.

Health system efficiency98
ReferencesBusse R, Schreyögg J, Smith PC (2008). Variability in healthcare treatment costs amongst nine EU countries:
results from the HealthBASKET project. Health Economics, 17(Suppl. S1):S1–S8.Busse R et al., eds. (2011). Diagnosis-related groups in Europe: moving towards transparency, efficiency and quality
in hospitals. European Observatory on Health Systems and Policies Series. Maidenhead, Open University Press (http://www.euro.who.int/__data/assets/pdf_file/0004/162265/e96538.pdf, accessed 24 July 2016).
Chapman CS, Kern A (2010). Costing in the National Health Service: from reporting to managing. London, Chartered Institute of Management Accountants (http://www.cimaglobal.com/Documents/Thought_leadership_docs/R226%20Costing%20in%20the%20National%20UPDATED%20%20(PDF).pdf, accessed 22 July 2016).
Chapman CS, Kern A, Laguecir A (2014). Costing practices in healthcare. Accounting Horizons, 28(2):353–364.Chapman CS et al. (2013). International approaches to clinical costing. Bristol: Healthcare Financial Management
Association.Deutsche Krankenhausgesellschaft (DKG) (2007). Kalkulation von Fallkosten: Handbuch zur Anwendung
in Krankenhäusern. Düsseldorf, DKG (https://www.gkv-spitzenverband.de/media/dokumente/krankenversicherung_1/krankenhaeuser/drg/drg_entwicklung__kalkulation__falldaten/kalkulation/KH_DRG_Kalkulationshandbuch_Version_3_2007_09_18.pdf, accessed 22 July 2016).
Institut für das Entgeltsystem im Krankenhaus (InEK) (2010). G-DRG V2008/2010 HA-Report-Browser. Siegburg, InEK (http://www.g-drg.de/cms/content/view/full/2553, accessed 22 July 2016).
Johnson HT, Kaplan RS (1987). Relevance lost: the rise and fall of management accounting. Boston, MA, Harvard Business School Press.
Kaplan RS, Anderson SR (2004). Time-driven activity-based costing. Harvard Business Review, 82(11):131–138.Kaplan RS, Cooper R (1998). Cost and effect: using integrated cost systems to drive profitability and performance.
Boston, MA, Harvard Business School Press.Kaplan RS, Norton DP (1996). The balanced scorecard: translating strategy into action. Boston, MA, Harvard
Business Review Press.Kaplan RS, Porter ME (2011). How to solve the cost crisis in health care. Harvard Business Review, 89(9):46–52.Kaplan RS, Witkowski ML (2014). Better accounting transforms health care delivery. Accounting Horizons,
28(2):365–383.Monitor (2006). How service-line reporting can improve the productivity and performance of NHS foundation
trusts. London, Monitor.Monitor (2013). Approved costing guidance. London, Monitor.Monitor (2014a). Long-term reform of the NHS payment system. London, Monitor.Monitor (2014b). Improving the costing of NHS services: proposals for 2015–2021. London, Monitor
(https://www.gov.uk/government/uploads/system/uploads/attachment_data/file/381990/Improving_the_costing_of_NHS_services_-_final.pdf, accessed 22 July 2016).
Northcott D, Llewellyn S (2004). Cost variability in health care. London, Chartered Institute of Management Accountants.
Pizzini MJ (2006). The relation between cost-system design, manager’s evaluations of the relevance and usefulness of cost data, and financial performance: an empirical study of US hospitals. Accounting, Organizations and Society, 31(2):179–210.
Roberts RR et al. (1999). Distribution of variable vs fixed costs of hospital care. JAMA, 281(7):644–649.Smith PC et al. (2008). Performance measurement for health system improvement: experiences, challenges, and
prospects. Cambridge, CUP.Taheri PA, Butz DA, Greenfield L J (2000). Length of stay has minimal impact on the cost of hospital
admission. Journal of the American College of Surgeons, 191(2):123–130.Tiemann O (2008). Variations in hospitalisation costs for acute myocardial infarction: a comparison across
Europe. Health Economics, 17(Suppl. S1): S33–S45.