對策與鐘擺 Bob Baur - fundsupermart.com.hk · 對策與鐘擺...
20
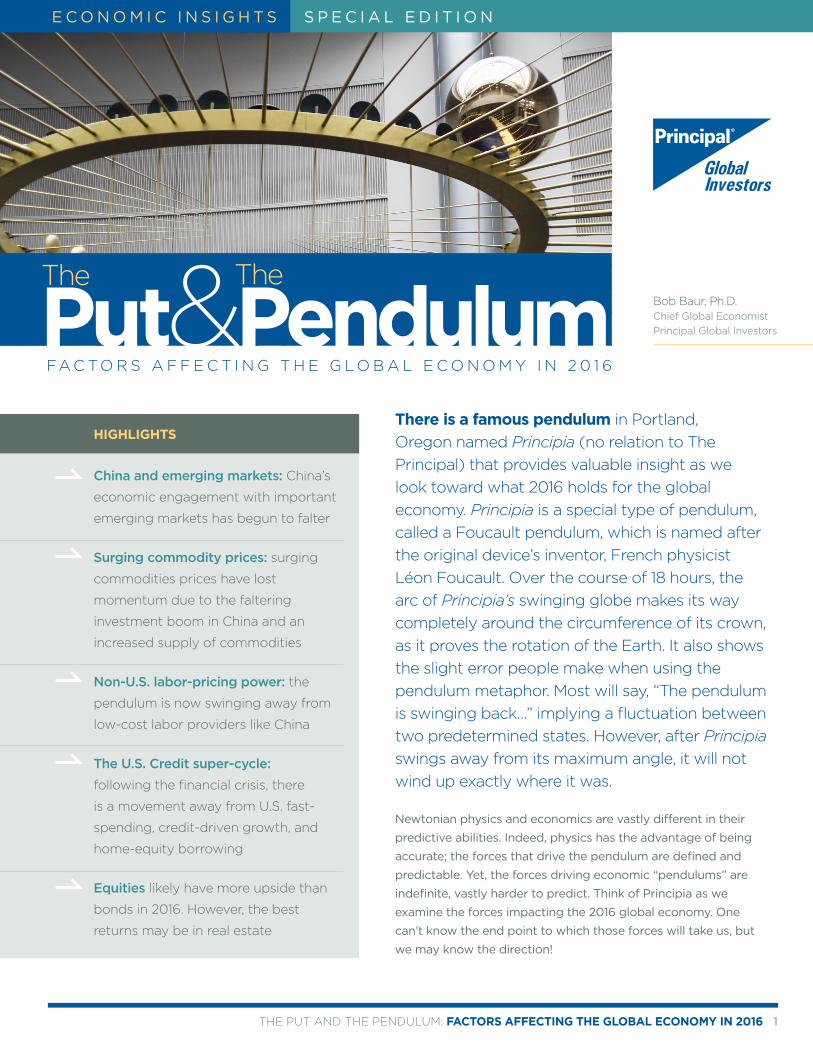
對策與鐘擺 2016年影響環球經濟的因素 1 對策與鐘擺 2016 年影響環球經濟的因素 Bob Baur博士 信安環球投資 首席環球經濟師 美國俄勒岡州布特蘭市有一座著名的Principia鐘擺 (與 The Principal無關),它在我們展望2016年環球 經濟前景的過程中帶來無限啟迪。Principia是一種 名叫傅科擺的特別鐘擺,以原創人法國物理學家傅科 (Léon Foucault)命名。它的鐘擺錘弧形會因應地球 自轉,在18小時循環鐘冠一周。Principia的擺盪方式 讓我們看到人們以鐘擺作比喻的常見謬誤。人們總愛 以「鐘擺回轉了⋯⋯」暗示兩個預定狀態之間的起伏。 然而,Principia擺離最大角度後,永遠也不會準確地 重回那個位置。 牛頓物理定律和經濟學的預測能力有極大的差別。物理的優勢是精 準,鐘擺的驅動力是可界定及預測的,而驅動經濟「鐘擺」的力量卻 是不確定,預測很困難。探討2016年支配環球經濟的各種力量時, 別忘了Principia。這些力量最終會帶我們到何處誰也不知道,但最 少我們可掌握方向! 中國及新興市場:中國與多個重大新興市場 的經濟聯繫開始弱化 商品價格飆升:由於中國投資好景不再, 商品供應量增加,商品價格乏力繼續飆升 非美國勞動力議價能力:鐘擺開始從中國等 廉價勞動力供應國盪向他方 美國信貸超級周期:金融危機過後,美國開 始放棄高速消費、信貸驅動增長及房屋資產 借貸的經濟模式 股市:股市2016年上升空間比債券大,但 最高投資回報應見於地產業 要點概覽 經 濟 透 視 號 外
Transcript of 對策與鐘擺 Bob Baur - fundsupermart.com.hk · 對策與鐘擺...

對策與鐘擺 2016年影響環球經濟的因素 1
對策與鐘擺2 0 1 6年影響環球經濟的因素
Bob Baur博士信安環球投資 首席環球經濟師
美國俄勒岡州布特蘭市有一座著名的Principia鐘擺 (與The Principal無關),它在我們展望2016年環球 經濟前景的過程中帶來無限啟迪。Principia是一種 名叫傅科擺的特別鐘擺,以原創人法國物理學家傅科(Léon Foucault)命名。它的鐘擺錘弧形會因應地球 自轉,在18小時循環鐘冠一周。Principia的擺盪方式 讓我們看到人們以鐘擺作比喻的常見謬誤。人們總愛 以「鐘擺回轉了⋯⋯」暗示兩個預定狀態之間的起伏。 然而,Principia擺離最大角度後,永遠也不會準確地重回那個位置。
牛頓物理定律和經濟學的預測能力有極大的差別。物理的優勢是精準,鐘擺的驅動力是可界定及預測的,而驅動經濟「鐘擺」的力量卻是不確定,預測很困難。探討2016年支配環球經濟的各種力量時,
別忘了Principia。這些力量最終會帶我們到何處誰也不知道,但最
少我們可掌握方向!
中國及新興市場:中國與多個重大新興市場的經濟聯繫開始弱化
商品價格飆升:由於中國投資好景不再,
商品供應量增加,商品價格乏力繼續飆升
非美國勞動力議價能力:鐘擺開始從中國等廉價勞動力供應國盪向他方
美國信貸超級周期:金融危機過後,美國開始放棄高速消費、信貸驅動增長及房屋資產借貸的經濟模式
股市:股市2016年上升空間比債券大,但最高投資回報應見於地產業
要點概覽
經 濟 透 視 號 外
對策與鐘擺 2016年影響環球經濟的因素 2
中國及新興市場 的鐘擺轉向
世界自由貿易談判的烏拉圭回合於1980年代展開,其後於1995年1月達致成立世界貿易組織。中國及其他新興國家開始開放門戶接觸外面的世界。自由貿易和開放政策加上1989年蘇聯解體,創造了龐大的勞動力供應,造成莫大的衝擊。大量就業不足的低工資工人加入勞動大軍,全球勞動人口由15億倍增至30億人。這些國家首次可將產品出口到世界各地,催化了投資熱潮,全數吸納多不勝數的勞工新力軍,世界製造業基地也一次性地由西方移至中國及其他東南亞國家。
中國成為製造業外發訂單的首選目的地。人民幣於1990年代初大幅貶值後,出口井噴式增長,每年輸往發達國家消費市場的廉價貨品數值以萬億美元計。中國的製造業好景亦帶來都市化和巨額基建投資,房屋與物業需求不斷上升。在這股強大力量的支持下,中國本身以至其他發展中國家的經濟衝天騰飛。中國對商品有殷切的需求,商品價格被推至歷史新高,這不但為商品出口商創造豐厚的收益,行業整體也長足增長。
今天,自由貿易帶動的經濟躍進開始停滯,我們第一個經濟鐘擺開始回盪。基於多項原因,中國增長正在放緩:一孩政策下勞動力萎縮、生產力增長減慢、工資大幅上漲、人民幣轉強、運輸成本亦增加。製造商把訂單交給其他國家更划算,加上中國負債率高,實難以透過加大借貸刺激增長。與此同時,年復年的巨額投資令產能嚴重過剩。
自由貿易帶動的經濟躍進 開始停滯,我們第一個經濟 鐘擺開始回盪。基於多項 原因,中國增長正在放緩。
受惠於中國經濟好景的其他發展中國家同樣陷入
低潮。利潤及現金流量雙雙下降,負債過高,生產物價下滑,商品價格狂瀉,各行各業也受供應過剩、產能過剩和高庫存等問題困擾,依靠低廉勞動成本的出口主導增長模式光環不再。全球企業正重新審視應在哪裡製造產品,有些公司選擇在美國生產,皆因當地的生產成本已恢復競爭性。這種現象稱為「製造業回流」。美國製造業目前的單位勞工價格實際上只有1980年的水平或甚至更低。
鐘擺
對策與鐘擺 2016年影響環球經濟的因素 3
中國過去對商品求之若渴,強大的需求曾推動新興市場經濟騰飛,同時也是我們第二個經濟鐘擺的源頭。中國的投資狂潮創造了商品超級周期,導致所有商品出現長達十年的價格升浪。現在,隨着中國增長放緩和投資熱潮降溫,鐘擺便與超高價格的年代說再見。
在金屬、礦物、能源及農業商品價格漲升的勢頭下,商品生產商投放更多資金擴大產能和增加供應,務求滿足殷切的新需求,可是正當新供應開始應市,需求增長便放緩,各類商品價格全線下滑。
大部份商品價格從數年前最高峰急瀉60%至70%,絕不含糊地說明商品超級周期完結,壞消息滿天飛。市場最新的見解是此乃長期趨勢,需求疲弱及供應過剩會持續一段時間⋯⋯可能長達數年。對生產商來說,只要售價仍高於變動生產成本,他們仍會繼續生產,結果便造成持續供過於求。商品周期遲早會正常化,由周期性供求的變化作主導。在可見未來,商品相信不會再創通脹調整的歷史新高,甚至下個十年或更長時間可能也不會。
這樣的情況喻意很廣泛。商品生產國將繼續陷於收益萎縮的苦況。據報沙特阿拉伯向資產管理公司提取700億美元來填補社會開支的缺口;挪威亦動用石油基金應付開支;巴西經濟受多項因素影響陷入低潮,當中油價急跌造成極大的拖累;加拿大的石油供應大增,油價則下挫,難逃技術性衰退的命運;澳洲的礦業不再興旺,增長顯著放緩;俄羅斯步入
經濟衰退大傷元氣;美國北達科他州及德薩斯州的頁岩油地區數以千計工人被裁員。
油價暴跌,石油生產國當然大受打擊,但對其他國家卻是經濟利惠,好像中國、印度及歐元區國家等石油進口大國都如是。智利是另一例子,銅價急挫令該國損失不少出口收益,但幸好石油進口量可觀,此消彼長下貿易條件大致持平。擁有大型多功能旅行車的美國公民現在每次加油約可節省60%
汽油開支,銀行儲蓄就多了50美元,乘以數千萬名車主,金額非常巨大。製造商購入原料的成本也下降,利潤得以提高。商品價格大幅下跌,生產商當然設法縮減成本,因此促進了科技與生產力。以往商品價格高企,早已令消費者改變行為模式,大家使用商品時都注重效率和盡量節約。此外,政府也可放心調低汽油補貼,不怕開罪選民。美國多次經濟衰退期間油價也沒有下跌,從1960年至今情況剛好相反。
商品價格 的鐘擺轉向
對生產商來說,只要售價仍高於變動生產成本,他們仍會繼續生產,結果便造成持續供過於求。
鐘擺
對策與鐘擺 2016年影響環球經濟的因素 4
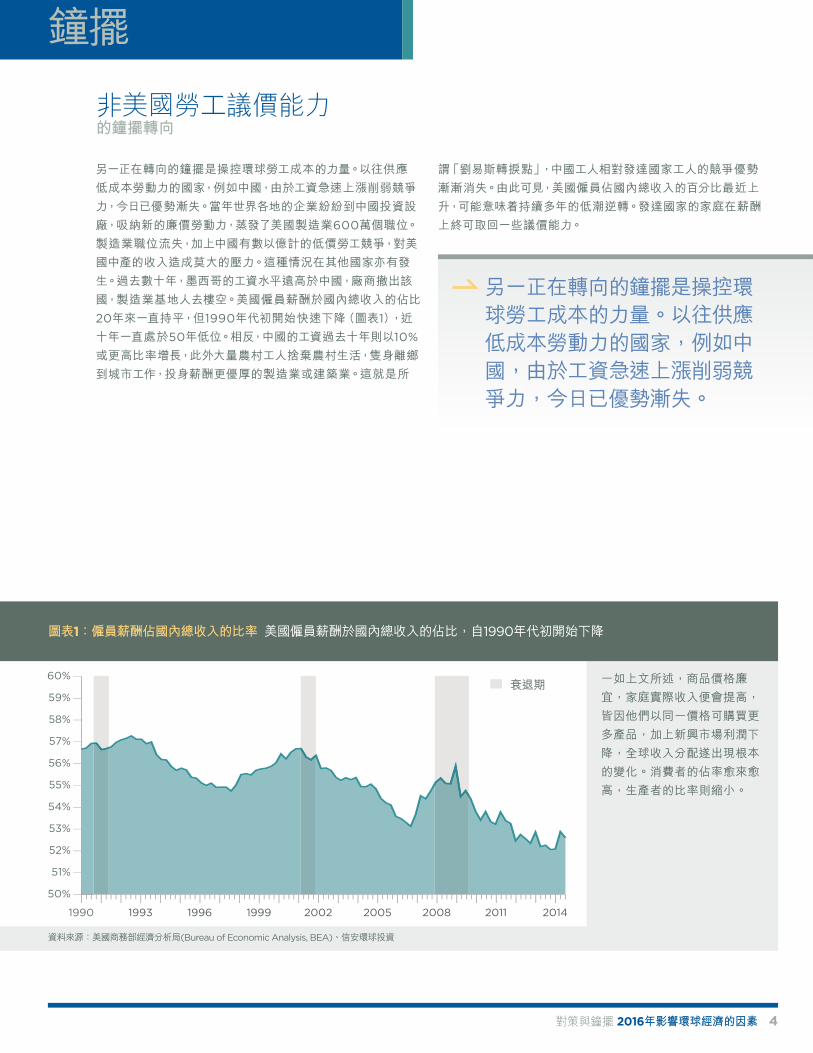
另一正在轉向的鐘擺是操控環球勞工成本的力量。以往供應低成本勞動力的國家,例如中國,由於工資急速上漲削弱競爭力,今日已優勢漸失。當年世界各地的企業紛紛到中國投資設廠,吸納新的廉價勞動力,蒸發了美國製造業600萬個職位。製造業職位流失,加上中國有數以億計的低價勞工競爭,對美國中產的收入造成莫大的壓力。這種情況在其他國家亦有發生。過去數十年,墨西哥的工資水平遠高於中國,廠商撤出該國,製造業基地人去樓空。美國僱員薪酬於國內總收入的佔比20年來一直持平,但1990年代初開始快速下降(圖表1),近十年一直處於50年低位。相反,中國的工資過去十年則以10%
或更高比率增長,此外大量農村工人捨棄農村生活,隻身離鄉到城市工作,投身薪酬更優厚的製造業或建築業。這就是所
謂「劉易斯轉捩點」,中國工人相對發達國家工人的競爭優勢漸漸消失。由此可見,美國僱員佔國內總收入的百分比最近上升,可能意味着持續多年的低潮逆轉。發達國家的家庭在薪酬上終可取回一些議價能力。
一如上文所述,商品價格廉宜,家庭實際收入便會提高,皆因他們以同一價格可購買更多產品,加上新興市場利潤下降,全球收入分配遂出現根本的變化。消費者的佔率愈來愈高,生產者的比率則縮小。
非美國勞工議價能力 的鐘擺轉向
另一正在轉向的鐘擺是操控環球勞工成本的力量。以往供應低成本勞動力的國家,例如中國,由於工資急速上漲削弱競爭力,今日已優勢漸失。
資料來源:美國商務部經濟分析局(Bureau of Economic Analysis, BEA)、信安環球投資
圖表1:僱員薪酬佔國內總收入的比率 美國僱員薪酬於國內總收入的佔比,自1990年代初開始下降
鐘擺
衰退期
對策與鐘擺 2016年影響環球經濟的因素 5
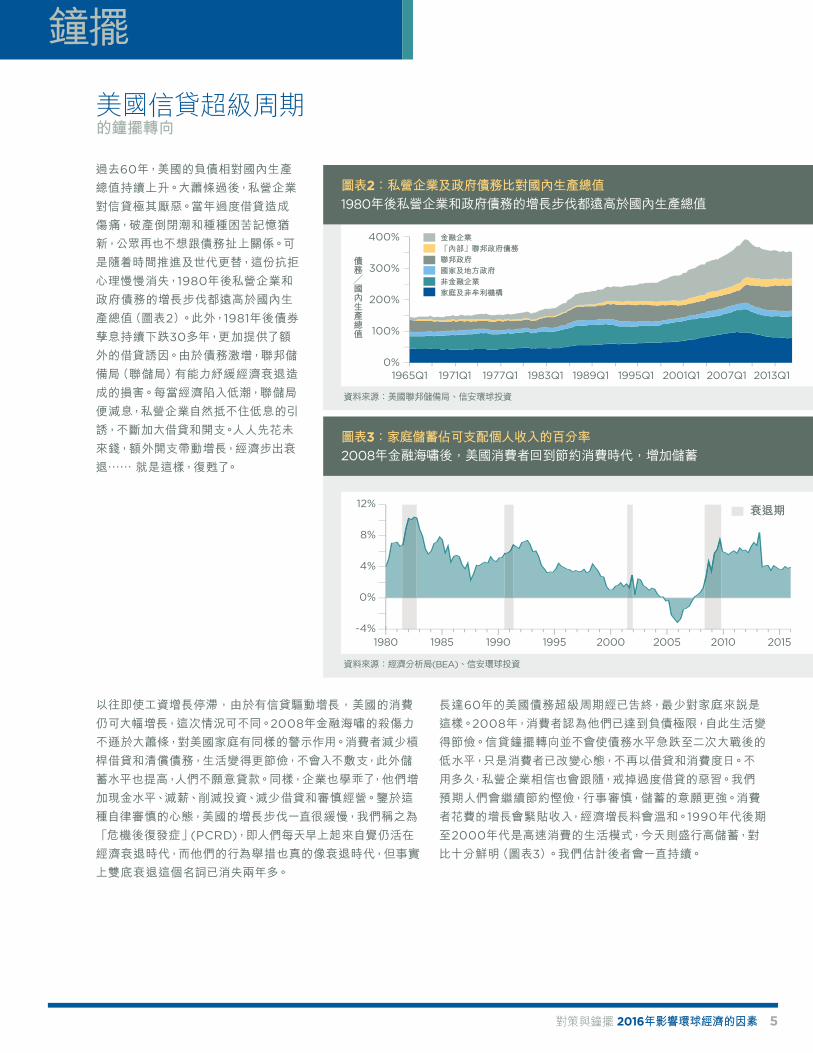
過去60年,美國的負債相對國內生產總值持續上升。大蕭條過後,私營企業對信貸極其厭惡。當年過度借貸造成傷痛,破產倒閉潮和種種困苦記憶猶新,公眾再也不想跟債務扯上關係。可是隨着時間推進及世代更替,這份抗拒心理慢慢消失,1980年後私營企業和政府債務的增長步伐都遠高於國內生產總值(圖表2)。此外,1981年後債券孳息持續下跌30多年,更加提供了額外的借貸誘因。由於債務激增,聯邦儲備局(聯儲局)有能力紓緩經濟衰退造成的損害。每當經濟陷入低潮,聯儲局便減息,私營企業自然抵不住低息的引誘,不斷加大借貸和開支。人人先花未來錢,額外開支帶動增長,經濟步出衰退⋯⋯ 就是這樣,復甦了。
以往即使工資增長停滯,由於有信貸驅動增長,美國的消費仍可大幅增長,這次情況可不同。2008年金融海嘯的殺傷力不遜於大蕭條,對美國家庭有同樣的警示作用。消費者減少槓桿借貸和清償債務,生活變得更節儉,不會入不敷支,此外儲蓄水平也提高,人們不願意貸款。同樣,企業也學乖了,他們增加現金水平、減薪、削減投資、減少借貸和審慎經營。鑒於這種自律審慎的心態,美國的增長步伐一直很緩慢,我們稱之為「危機後復發症」(PCRD),即人們每天早上起來自覺仍活在經濟衰退時代,而他們的行為舉措也真的像衰退時代,但事實上雙底衰退這個名詞已消失兩年多。
長達60年的美國債務超級周期經已告終,最少對家庭來說是這樣。2008年,消費者認為他們已達到負債極限,自此生活變得節儉。信貸鐘擺轉向並不會使債務水平急跌至二次大戰後的低水平,只是消費者已改變心態,不再以借貸和消費度日。不用多久,私營企業相信也會跟隨,戒掉過度借貸的惡習。我們預期人們會繼續節約慳儉,行事審慎,儲蓄的意願更強。消費者花費的增長會緊貼收入,經濟增長料會溫和。1990年代後期至2000年代是高速消費的生活模式,今天則盛行高儲蓄,對比十分鮮明(圖表3)。我們估計後者會一直持續。
資料來源:美國聯邦儲備局、信安環球投資
資料來源:經濟分析局(BEA)、信安環球投資
美國信貸超級周期 的鐘擺轉向
圖表2:私營企業及政府債務比對國內生產總值1980年後私營企業和政府債務的增長步伐都遠高於國內生產總值
圖表3:家庭儲蓄佔可支配個人收入的百分率 2008年金融海嘯後,美國消費者回到節約消費時代,增加儲蓄
鐘擺
金融企業「內部」聯邦政府債務聯邦政府國家及地方政府非金融企業家庭及非牟利機構
債務╱國內生產總值
衰退期
對策與鐘擺 2016年影響環球經濟的因素 6
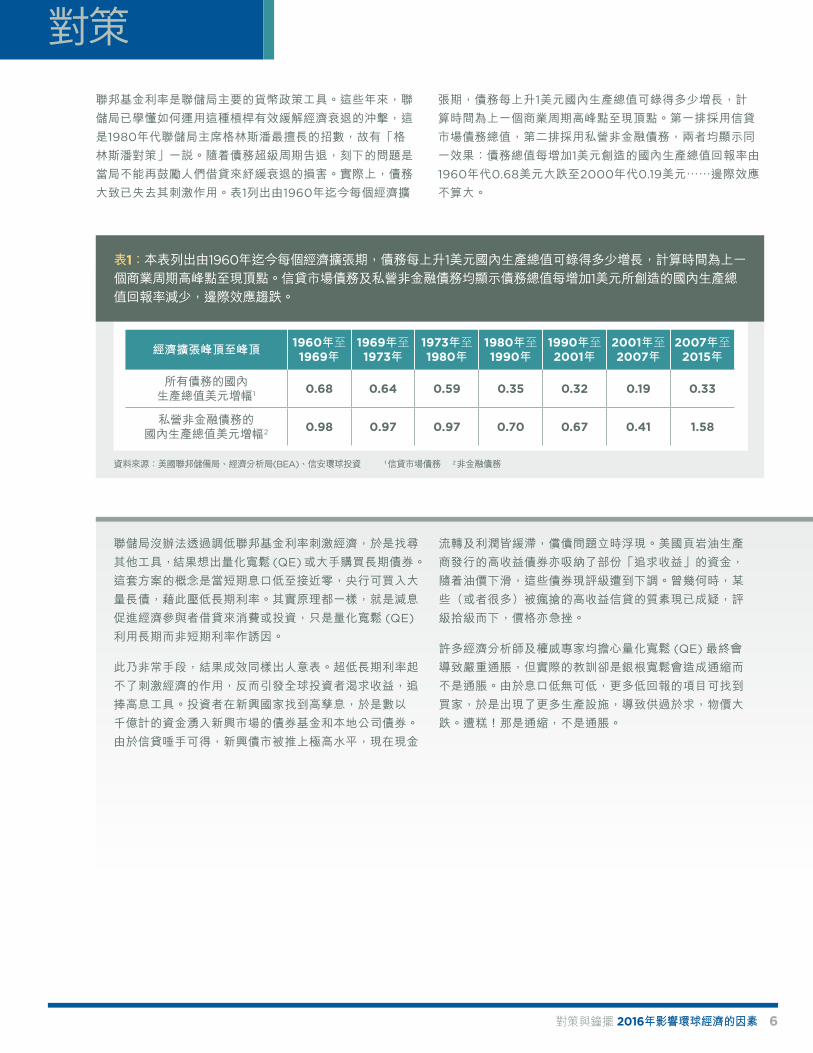
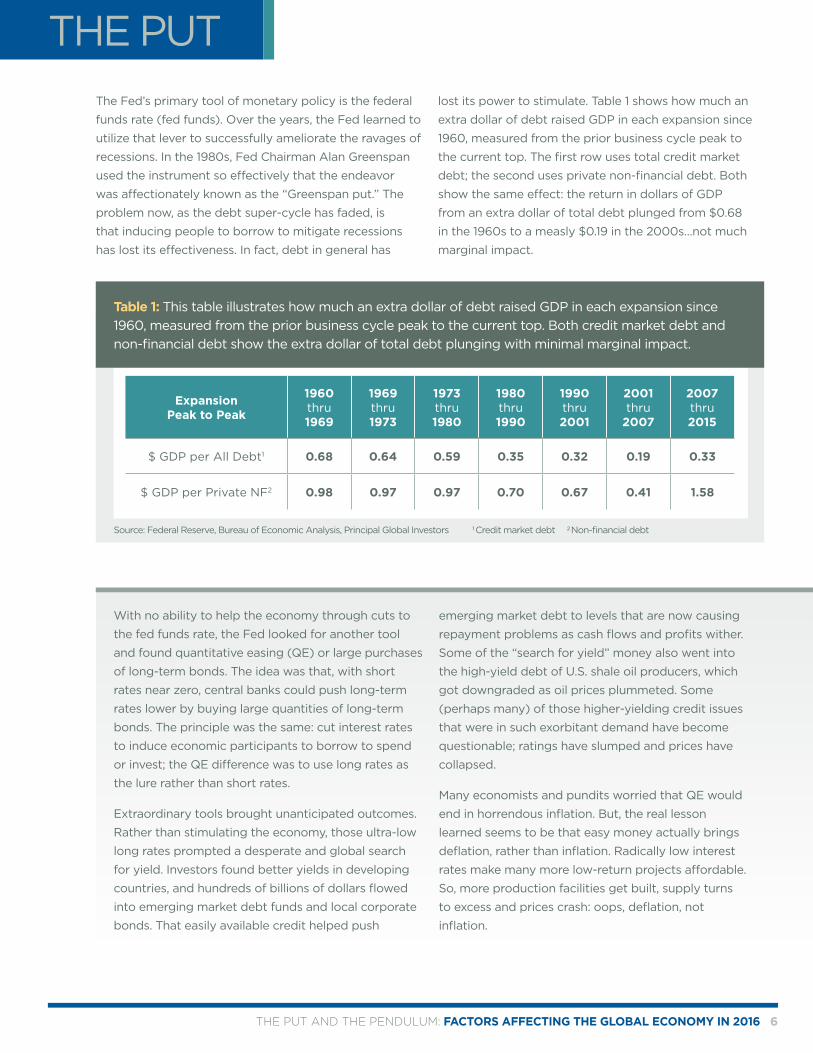
聯邦基金利率是聯儲局主要的貨幣政策工具。這些年來,聯儲局已學懂如何運用這種槓桿有效緩解經濟衰退的沖擊,這是1980年代聯儲局主席格林斯潘最擅長的招數,故有「格林斯潘對策」一說。隨着債務超級周期告退,刻下的問題是當局不能再鼓勵人們借貸來紓緩衰退的損害。實際上,債務大致已失去其刺激作用。表1列出由1960年迄今每個經濟擴
張期,債務每上升1美元國內生產總值可錄得多少增長,計算時間為上一個商業周期高峰點至現頂點。第一排採用信貸市場債務總值,第二排採用私營非金融債務,兩者均顯示同一效果:債務總值每增加1美元創造的國內生產總值回報率由1960年代0.68美元大跌至2000年代0.19美元⋯⋯邊際效應不算大。
聯儲局沒辦法透過調低聯邦基金利率刺激經濟,於是找尋其他工具,結果想出量化寬鬆 (QE)或大手購買長期債券。這套方案的概念是當短期息口低至接近零,央行可買入大量長債,藉此壓低長期利率。其實原理都一樣,就是減息促進經濟參與者借貸來消費或投資,只是量化寬鬆 (QE)
利用長期而非短期利率作誘因。
此乃非常手段,結果成效同樣出人意表。超低長期利率起不了刺激經濟的作用,反而引發全球投資者渴求收益,追捧高息工具。投資者在新興國家找到高孳息,於是數以千億計的資金湧入新興市場的債券基金和本地公司債券。由於信貸唾手可得,新興債市被推上極高水平,現在現金
流轉及利潤皆緩滯,償債問題立時浮現。美國頁岩油生產商發行的高收益債券亦吸納了部份「追求收益」的資金,隨着油價下滑,這些債券現評級遭到下調。曾幾何時,某些(或者很多)被瘋搶的高收益信貸的質素現已成疑,評級拾級而下,價格亦急挫。
許多經濟分析師及權威專家均擔心量化寬鬆 (QE)最終會導致嚴重通脹,但實際的教訓卻是銀根寬鬆會造成通縮而不是通脹。由於息口低無可低,更多低回報的項目可找到買家,於是出現了更多生產設施,導致供過於求,物價大跌。遭糕!那是通縮,不是通脹。
對策
資料來源:美國聯邦儲備局、經濟分析局(BEA)、信安環球投資 1信貸市場債務 2非金融債務
表1:本表列出由1960年迄今每個經濟擴張期,債務每上升1美元國內生產總值可錄得多少增長,計算時間為上一個商業周期高峰點至現頂點。信貸市場債務及私營非金融債務均顯示債務總值每增加1美元所創造的國內生產總值回報率減少,邊際效應趨跌。
經濟擴張峰頂至峰頂 1960年至1969年
1969年至1973年
1973年至1980年
1980年至1990年
1990年至2001年
2001年至2007年
2007年至2015年
所有債務的國內 生產總值美元增幅1 0.68 0.64 0.59 0.35 0.32 0.19 0.33
私營非金融債務的 國內生產總值美元增幅2 0.98 0.97 0.97 0.70 0.67 0.41 1.58
對策與鐘擺 2016年影響環球經濟的因素 7
全球增長重新平衡;不會硬着陸:全球競爭優勢發生變化,意味着世界經濟增長正在重新平衡。例如,早前步伐緩慢的國家開始加快增長,一直高速增長的國家則後繼乏力,以往昂貴的東西現在變得廉宜。發達經濟體系現在更具競爭力,整體環境顯著改善。這正是先入、先出的法則。
2016年經濟增長及投資的影響
美國2008年經歷了金融危機,採取了必需措施以作應對。企業及家庭都縮減開支和變得審慎,銀行業再資本化,迄今一直在復甦。我們預期在消費強勁、工資加快增長、就業大幅增長及實際收入上升等條件支持下,美國經濟2016年可望增長2.5%。衰退結束後,美國私營界持續以3%的速度增長,而把整體增長困在2.2%低水平的阻力因素亦漸漸消除。資本開支的最壞時刻看來已過去,政府採購數字不再收縮。受強厄爾尼諾現象影響,今年冬季的天氣相信會較去年為佳。聯儲局的政策料會保持寬鬆,加息也會循序漸進。嚴重危機得來教訓,局方至今仍趨向審慎,所以增長可能較為緩慢,但假以時日態度應會逐漸開放。不少人關注資本開支疲弱,此外發展中國家商業投資放緩,發達國家則因為內需轉殷而商業投資增長,所以在商業投資或多或少也需要重新平衡。
大歐洲地區數年前也經歷了金融危機,往後料會繼續復甦。我們預期歐元區國家明年增長幅度為1.5%至2%。歐元會繼續偏弱,能源價格亦會持續低廉,兩項因素有助經濟表現。歐洲央行(ECB)
的政策會維持極度寬鬆,利率繼續低企。家庭需求一直以來都保持增長動力,展望明年亦如是。放貸標準現已放寬,貸款需求開始上升。
日本的增長勢頭持續。由於資本開支強勁及家庭需求理想,第三季國內生產總值已向上修訂。就業市場非常緊張,工資正在上漲,企業利潤也漸有起色,然而日圓大幅貶值沖銷了部份增長。
中國及其他發展中國家增長放緩,隨着過去多年好景時積累下來的過剩資金開始消殆,增長步伐會進一步放緩。雖然現在還未到這一天,但目前發展中國家已遇到不少強大阻力:物價通縮、利潤下降、供應過剩、產能過剩。然而,若美國、大歐洲地區和日本的經濟繼續好轉,2016年新興國家應可避免硬着陸。各國匯率變動令全球經濟增長大執位。在強美元支持下,美國的經濟活力向外伸展,而新興國家貨幣偏弱則可刺激本地經濟。中國經濟數據已停止惡化。2016年聯儲局將再次加息,但步伐不會太急,預計年底時聯邦基金利率會調升至0.75%或1%,這樣的節拍應不會對新興國家造成猛烈沖擊。
美國
大歐洲地區及日本
中國
對策與鐘擺 2016年影響環球經濟的因素 8
觀乎市場普遍共識的交易,投資者最想看到商品價格持續疲弱和美元繼續攀升。然而,這些趨勢似乎已接近見頂,12月油價大跌相信是最後投降,跟隨金屬商品的價格也滑至低位。銅價最近靠穩,而由2014年5月開始穩步下滑的CRB工業原材料指數亦已止跌。摩根大通全球製造採購經理指數近期已喘定,數字不再下滑。美元大致上維持強勢,商品價格料可在近期低位靠穩。聯邦基金利率上調後,美元或會再輕微上升,但整體來說升幅已差不多。不錯,聯儲局在其他央行放寬之際加息,但這已不算新聞,市場亦早已消化。即使商品價格成功尋底,除非需求漸漸追上供應,否則反彈的空間非常有限,而現時看來供求平衡的日子仍很遙遠。
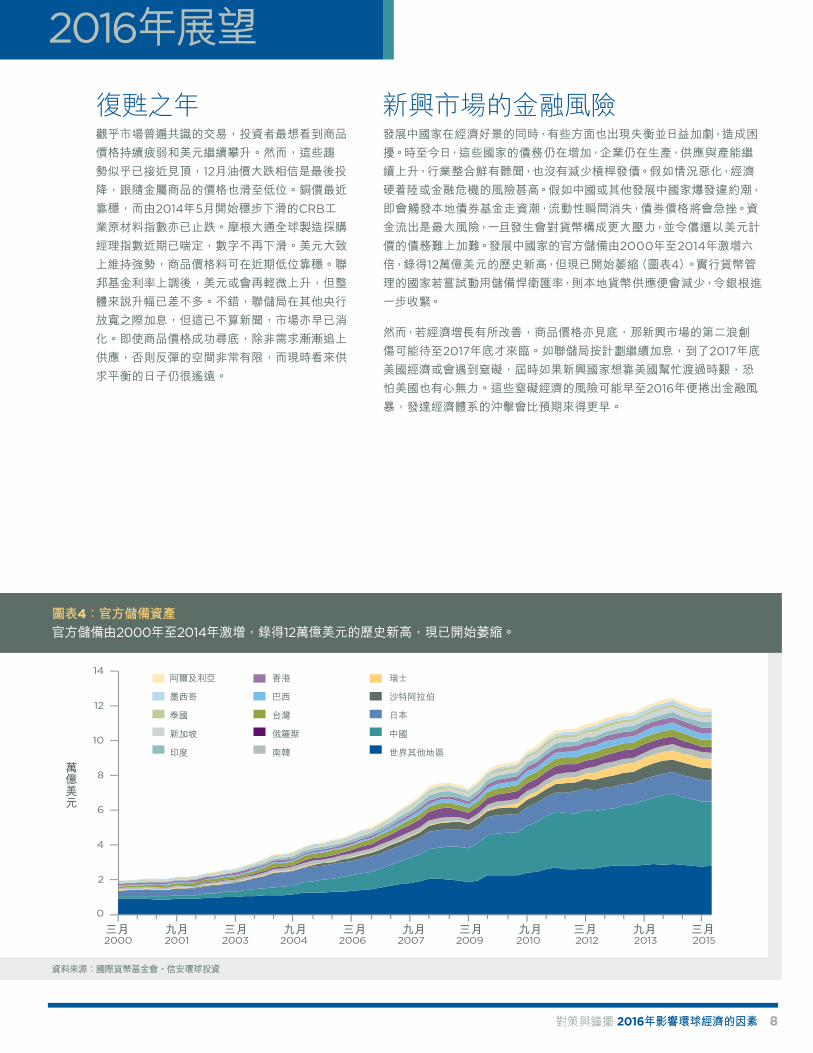
發展中國家在經濟好景的同時,有些方面也出現失衡並日益加劇,造成困擾。時至今日,這些國家的債務仍在增加,企業仍在生產,供應與產能繼續上升,行業整合鮮有聽聞,也沒有減少槓桿發債。假如情況惡化,經濟硬着陸或金融危機的風險甚高。假如中國或其他發展中國家爆發違約潮,即會觸發本地債券基金走資潮,流動性瞬間消失,債券價格將會急挫。資金流出是最大風險,一旦發生會對貨幣構成更大壓力,並令償還以美元計價的債務難上加難。發展中國家的官方儲備由2000年至2014年激增六倍,錄得12萬億美元的歷史新高,但現已開始萎縮(圖表4)。實行貨幣管理的國家若嘗試動用儲備悍衛匯率,則本地貨幣供應便會減少,令銀根進一步收緊。
然而,若經濟增長有所改善,商品價格亦見底,那新興市場的第二浪創傷可能待至2017年底才來臨。如聯儲局按計劃繼續加息,到了2017年底美國經濟或會遇到窒礙,屆時如果新興國家想靠美國幫忙渡過時艱,恐怕美國也有心無力。這些窒礙經濟的風險可能早至2016年便捲出金融風暴,發達經濟體系的沖擊會比預期來得更早。
2016年展望
復甦之年 新興市場的金融風險
資料來源:國際貨幣基金會、信安環球投資
圖表4:官方儲備資產 官方儲備由2000年至2014年激增,錄得12萬億美元的歷史新高,現已開始萎縮。
阿爾及利亞 香港 瑞士
墨西哥 巴西 沙特阿拉伯
泰國 台灣 日本
新加坡 俄羅斯 中國
印度 南韓 世界其他地區
萬億美元
三月 三月 三月 三月 三月 三月九月 九月 九月 九月 九月5
對策與鐘擺 2016年影響環球經濟的因素 9
零利率持續多年,大部份風險類資產的價格已大幅上漲,未來回報根本難有上升的空間。持續多時的發達國家債券牛市肯定已終結,證據之一是儘管8月環球經濟衰退的疑慮因素沸騰,10年期美國國庫券孳息由4月至今一直無力衝破2%水平。同樣,近期市場普遍預期歐洲央行(ECB)採取極端措施,但
10年期德國政府債券孳息跌至0.4%便再次企穩,水平遠高於去年4月錄得的0.07%歷史低位。美國的息口則承受不同壓力:環球儲蓄充裕、低孳息具有競爭力、低通脹、借貸意慾弱、投資機會微,導致利率向下。然而,過剩儲蓄開始減輕,而環球增長亦料會改善,聯儲局政策正在收緊,通脹也不乏
上升動力,只是目前暫時橫行。相互抵銷下,我們認為淨利率會輕微向上。
信貸息差去年4月開始大幅拉闊,主因是市場憂慮對商品價格敏感的企業發生違約。由於過去美國經濟衰退時油價不曾大跌,只有相反的例子,違約風險相信不會太大,顯示收益率較高的信貸仍是可取,最少可作息差交易。然而我們只會與信貸小聚片刻,絕對不會天長地久。
2016年股市上升空間料會大於債券,但增長可能只是來自盈利而市盈率不變。整體來說,目前的市盈率不算嚴重偏高,卻遠高於長期平均值。美國企業的盈利維持中單位數增長,加上幾個點子的股息,令大型股指數的總收益率約可達中至高單位
數。歐元區國家及日本股市因盈利上升的潛力較高,或顯得吸引,經濟增長亦可能有驚喜。然而,美國的投資周期看來已到尾聲,加上受新興市場諸多尚未解決的問題影響,股市未來上升空間有限。
2016年回報最佳的投資領域應是地產。誠然,資本化回報率已下降,但依然遠高於美國國庫券。促進地產投資回報的三大要素中,建築成本和租金兩項目前均已上漲,利率未來亦會輕微上升,由樓價及租金帶來的總體回報可維持於合理水平。美國地產投資信託基金過去價格太高,全年大致無升跌。環球地產投資信託基金或有投資機遇。
2015年,全球經濟增長重新平衡,我們預料2016年發達經濟體將繼續改善,競爭力進一步加強。總括而言,儘管驅動經濟鐘擺的力量不確定和難以預測。跟Principia一樣,環球市場和經濟體系最終何去何從誰也不知道,但最少我們可掌握
方向!
結語
對策與鐘擺 2016年影響環球經濟的因素 10
資料披露本文所載資料乃取自於2015年12月據信為準確無誤的來源。來自信安環球投資或其附屬機構以外其他外界來源的資料亦據信為可靠,但本公司不會另行核實或保證其準確或有效。
本文僅包含關於投資事宜的一般性資訊,不應視為對任何事宜的全面陳述,亦不得作為此類陳述而予倚賴,或視作個別投資的指引、意見或建議。此等一般性資訊並無考慮個別投資者的投資目標、特殊需要或財務狀況,亦不可在任何方面作為預測或保證特定投資或整體市場未來事件的依據。本文所述所有觀點和預測將來或有變更,恕不通知。本文若載及個別投資或證券,概不構成建議買賣或持有該投資或證券。
過去的表現並非日後表現的可靠指標,投資者不應信賴並以此作為任何投資決定的依據。您應考慮個別投資是否符合您的投資目標、特殊需要或財務狀況,方可作出投資決定。
除非適用法律另有相反規定,美國信安金融集團旗下的任何公司或其任何員工或董事均不對可靠性或準確性作出任何保證,亦不會就任何事故引致本文出現的錯漏(包括因疏忽原因引致)承認任何責任。
除非另有說明,本文所示任何數字均以美元為單位。
本文發行範圍:
• 在美國由受美國證券及交易所委員會監管的信安環球投資有限公司發佈。• 由信安環球投資(歐洲)有限公司(地址:Level 1, 1 Wood Street, London EC2V 7JB;在英國註冊,號碼:03819986)在英國發行,其內容已經其核准,該公司並已獲英國金融業操守監管局授權且受其監管。
• 由信安環球投資(新加坡)有限公司(會計與公司管理局註冊編號199603735H)在新加坡發行,該公司受新加坡金融管理局監管。在新加坡,本文僅供機構投資者(以《證券期貨法》(第289章)的定義為準)使用。
• 在香港由證券及期貨事務監察委員會監管並專門為《證券及期貨條例》所釋定專業投資者服務的信安環球投資(香港)有限公司發佈。• 在澳洲由信安環球投資(澳洲)有限公司發行(ABN號碼45 102 488 068,AFC牌照號碼225385),受澳洲證券及投資局監管。• 本文件由在杜拜國際金融中心註冊並獲杜拜金融服務管理局認可為代表辦事處的信安環球投資有限公司發佈,並乃個別提供予收件方,收件方不應傳閱或以其他方式向任何人士或任何其他機構發放。本文只適合資深機構投資者參閱。
• 於日本由Principal Global Investors (Japan) Ltd.發行(日本投資顧問協會,關東財務局(金商)462號;會員號碼011-01627)。• 在英國,本文僅供作為合格對手方的人士或專業投資者(以英國金融業操守監管局規章的定義為準)使用。信安環球投資(歐洲)有限公司在管理客戶投資組合時,可將管理權限委派予並未獲英國金融業操守監管局授權亦不受其監管之聯營方。在此情況下,客戶可能不享有依照「2000年金融服務和市場法」頒佈之規章和條例的保護。
投資涉及風險,包括可能招致本金虧損,國際及環球投資則涉及較大風險,例如貨幣波動、政治╱社會不穩定及會計準則差異等,當中新興市場的風險尤大,這類市場可能缺乏可支持證券市場的健全司法、政治、商業或社會架構。投資於地產投資信託基金亦有特別風險,包括利率波動、信貸風險及流動性風險。
如任何司法管轄區或國家的本地法律或規例禁止派發本文或供人使用,便不應派發本文予該等地區任何人士或實體或供其使用。
保險產品和計劃管理服務由Principal Life Insurance Company提供。Principal Funds, Inc.由Principle Funds Distributor, Inc.分銷。證券乃透過Princor Financial Services Corporation、800-547-7754、Member SIPC及╱或獨立經紀商╱券商發售。由Princor®註冊代表銷售的證券透過Princor發售。Principal Funds Distributor、Princor及Principal Life均為信安金融集團®(愛荷華州得梅因50392)成員。某些投資方案暫未於美國各州或所有美國聯邦地區全面提供。
FA C TO R S A F F E C T I N G T H E G L O B A L E C O N O M Y I N 2 0 1 6
Bob Baur, Ph.D.Chief Global EconomistPrincipal Global Investors
There is a famous pendulum in Portland, Oregon named Principia (no relation to The Principal) that provides valuable insight as we look toward what 2016 holds for the global economy. Principia is a special type of pendulum, called a Foucault pendulum, which is named after the original device’s inventor, French physicist Léon Foucault. Over the course of 18 hours, the arc of Principia’s swinging globe makes its way completely around the circumference of its crown, as it proves the rotation of the Earth. It also shows the slight error people make when using the pendulum metaphor. Most will say, “The pendulum is swinging back…” implying a fluctuation between two predetermined states. However, after Principia swings away from its maximum angle, it will not wind up exactly where it was.
Newtonian physics and economics are vastly different in their
predictive abilities. Indeed, physics has the advantage of being
accurate; the forces that drive the pendulum are defined and
predictable. Yet, the forces driving economic “pendulums” are
indefinite, vastly harder to predict. Think of Principia as we
examine the forces impacting the 2016 global economy. One
can’t know the end point to which those forces will take us, but
we may know the direction!
China and emerging markets: China’s
economic engagement with important
emerging markets has begun to falter
Surging commodity prices: surging
commodities prices have lost
momentum due to the faltering
investment boom in China and an
increased supply of commodities
Non-U.S. labor-pricing power: the
pendulum is now swinging away from
low-cost labor providers like China
The U.S. Credit super-cycle: following the financial crisis, there
is a movement away from U.S. fast-
spending, credit-driven growth, and
home-equity borrowing
Equities likely have more upside than
bonds in 2016. However, the best
returns may be in real estate
HIGHLIGHTS
E C O N O M I C I N S I G H T S S P E C I A L E D I T I O N
THE PUT AND THE PENDULUM: FACTORS AFFECTING THE GLOBAL ECONOMY IN 2016 1
THE PUT AND THE PENDULUM: FACTORS AFFECTING THE GLOBAL ECONOMY IN 2016 2
SWINGING AWAY FROM
CHINA AND EMERGING MARKETS The Uruguay round of world-free trade negotiations
began in the 1980s and culminated with the creation of
the World Trade Organization in January 1995. China
and other emerging countries began to open their
borders to the outside world. Free trade and open
borders, combined with the collapse of the Soviet
Union in 1989, created an immense labor supply shock.
The global workforce doubled, from one and a half
billion to three billion workers, as a vast number of
underemployed and low-wage workers were able to
join. For the first time, their products could be exported
globally. Thus began an immense investment boom to
absorb that huge number of new workers and created
a one-time relocation of manufacturing from the West
to China and other Southeast Asian nations.
China became the destination of choice for outsourced
manufacturing. Its massive currency devaluation of
the early 1990s created an export dynamo, the source
of trillions of dollars of cheap goods for developed-
country consumers. China’s manufacturing boom
also brought urbanization, enormous investment in
infrastructure and demand for housing and property
expansion. This all created skyrocketing economic
growth not only in China, but also in other developing
countries. China’s voracious appetite for commodities
propelled prices to record highs, providing commodity
exporters with huge revenues and super-fast growth.
The economic surge created by free trade is waning,
and our first economic pendulum is reversing. Growth
in China is slowing for several reasons: the one-
child policy has engendered a shrinking labor force;
productivity growth has slowed; as wages have soared,
the currency has strengthened and transportation
costs have risen, manufacturing in other countries has
become more competitive; high debt levels have made
it hard to increase growth through more borrowing;
and years of monumental investment has brought
colossal overcapacity.
THE PENDULUM
The economic surge created by free trade is waning and our first economic pendulum is reversing. Growth in China is slowing for several reasons.
Other developing countries that were pulled
along with the boom are also faltering. Profits
and cash flow are deteriorating; debt is too
high; producer prices are falling; commodity
prices have collapsed; industries are plagued
with over-supply, excess capacity, and heavy
inventories. The export-driven growth model
that relied on competitive labor costs is fading.
Global companies are now re-examining
where their production should take place. In
some cases, the United States is becoming
the choice destination as costs become
competitive once again, a phenomenon
dubbed “reshoring.” Unit labor costs today for
U.S. manufacturing are actually flat to slightly
lower than they were in 1980.
China’s insatiable appetite for commodities drove
the economic surge in emerging markets and is the
source of our second economic pendulum. The gigantic
investment boom in China generated a commodity
super-cycle — an across-the-board, decade-long gale of
surging commodity prices. Now, as China’s growth slows
and its investment rush wanes, this pendulum is swinging
away from the era of ultra-high prices.
Soaring prices for metals, minerals, energy, and
agricultural products drove commodity producers to
invest more and more capital to expand capacity and
increase supply to meet that burgeoning demand.
But, just as the new supply began to come to market,
demand growth faltered and prices collapsed across the
commodity landscape.
The 60% to 70% plummet in most commodity prices
from their peaks of a few years ago makes the end of the
commodity super-cycle unambiguous and mostly old
news. What is new is the view that this is likely a secular
trend and that faltering demand and excess supply will
last for some time…possibly even years. Producers will
keep producing as long as prices are above their variable
cost of production, a recipe for persistent oversupply in
excess of demand. A more normal commodity cycle will
eventually assert itself; one driven by cyclical changes
in supply and demand. Commodities will likely not see
new inflation-adjusted record high prices any time soon,
probably not even in the next decade or longer.
The implications are widespread. Commodity-producing
nations will continue to feel the pinch from dwindling
revenues. Saudi Arabia reportedly withdrew US$70
billion from its asset managers to plug holes in social
spending. Norway had to tap its oil fund to fill its
spending requirements. Brazil’s economy is in tatters
for several reasons, but the plunge in oil prices is not
the least of them. Canada may not avoid a technical
recession as oil supplies surged and prices slumped.
Growth has slowed significantly in Australia as the
mining boom unwinds. Russia is in the midst of a
debilitating recession. In the United States, thousands of
workers have been laid off in the shale oil areas of North
Dakota and Texas.
While the collapse in oil prices is bad for those in the
oil business, it’s an economic benefit to the rest. Chief
among the latter are China, India, and the Eurozone,
all of which are large oil importers. Another example is
Chile, who lost sizable export revenue as copper prices
collapsed, but with large oil imports, its terms of trade
remained about flat. U.S. citizens who own large SUVs
have about 60% less in gasoline expenses each time they
fill the tank, leaving an extra US$50 or so in their bank
account — multiply that by tens of millions of drivers.
Manufacturers also enjoy lower input prices, which
boosts profits. Plunging commodity prices led to gains
in technology and productivity as producers tried to cut
costs. High prices brought behavioral shifts and more
efficient and frugal commodity use. Governments can
reduce gasoline subsidies with less fear of being turned
out of office. There has never been a U.S. recession
associated with falling oil prices; it’s always been the
opposite since 1960.
THE PUT AND THE PENDULUM: FACTORS AFFECTING THE GLOBAL ECONOMY IN 2016 3
SWINGING AWAY FROM
SURGING COMMODITY PRICES
Producers will keep producing as long as prices are above their variable cost of production, a recipe for persistent oversupply in excess of demand.
THE PENDULUM
THE PUT AND THE PENDULUM: FACTORS AFFECTING THE GLOBAL ECONOMY IN 2016 4
Another pendulum that’s reversing involves the forces
that govern global labor costs. The advantage is
moving away from formerly low-cost labor providers
like China, where fast-rising wages have eroded their
competitiveness. As global companies invested in
China to absorb that new supply of cheap workers, U.S.
manufacturing lost six million jobs. This loss and the
competition created by hundreds of millions of low-
cost workers put significant pressure on U.S. middle-
class incomes. It happened in other countries as well.
In past decades, Mexican wages were much higher
than in China, so manufacturing areas in Mexico began
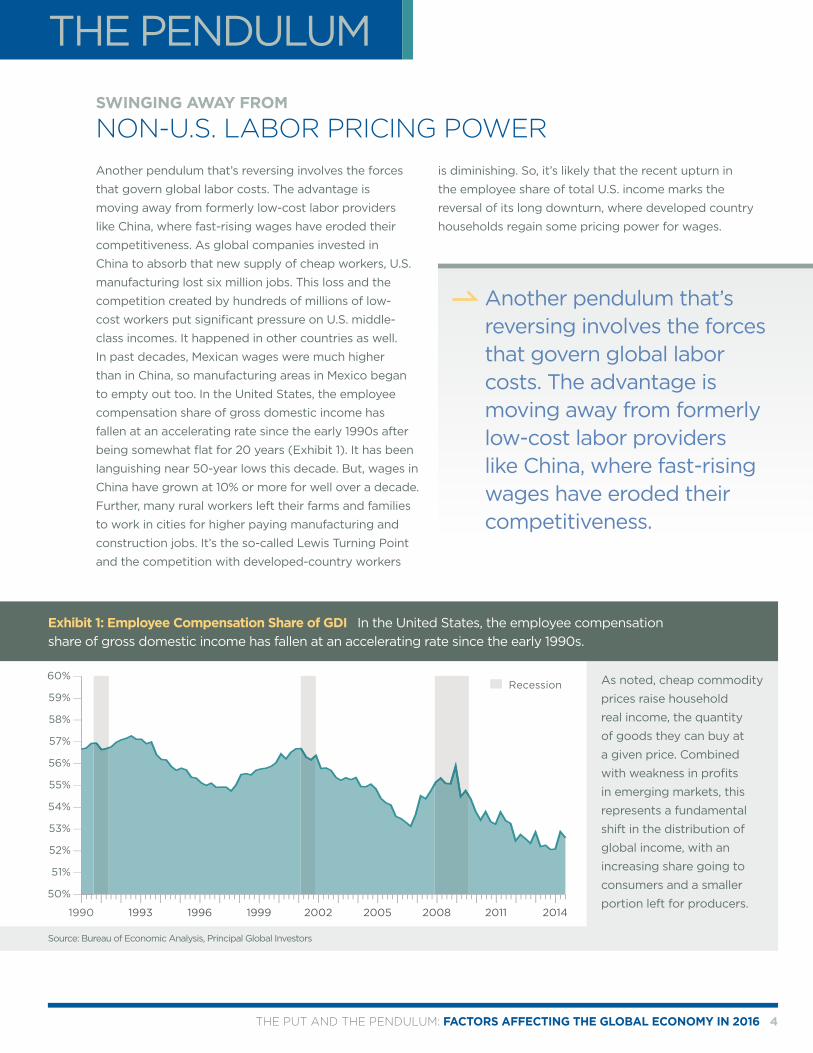
to empty out too. In the United States, the employee
compensation share of gross domestic income has
fallen at an accelerating rate since the early 1990s after
being somewhat flat for 20 years (Exhibit 1). It has been
languishing near 50-year lows this decade. But, wages in
China have grown at 10% or more for well over a decade.
Further, many rural workers left their farms and families
to work in cities for higher paying manufacturing and
construction jobs. It’s the so-called Lewis Turning Point
and the competition with developed-country workers
is diminishing. So, it’s likely that the recent upturn in
the employee share of total U.S. income marks the
reversal of its long downturn, where developed country
households regain some pricing power for wages.
As noted, cheap commodity
prices raise household
real income, the quantity
of goods they can buy at
a given price. Combined
with weakness in profits
in emerging markets, this
represents a fundamental
shift in the distribution of
global income, with an
increasing share going to
consumers and a smaller
portion left for producers.
SWINGING AWAY FROM
NON-U.S. LABOR PRICING POWER
Another pendulum that’s reversing involves the forces that govern global labor costs. The advantage is moving away from formerly low-cost labor providers like China, where fast-rising wages have eroded their competitiveness.
Source: Bureau of Economic Analysis, Principal Global Investors
Exhibit 1: Employee Compensation Share of GDI In the United States, the employee compensation share of gross domestic income has fallen at an accelerating rate since the early 1990s.
THE PENDULUM
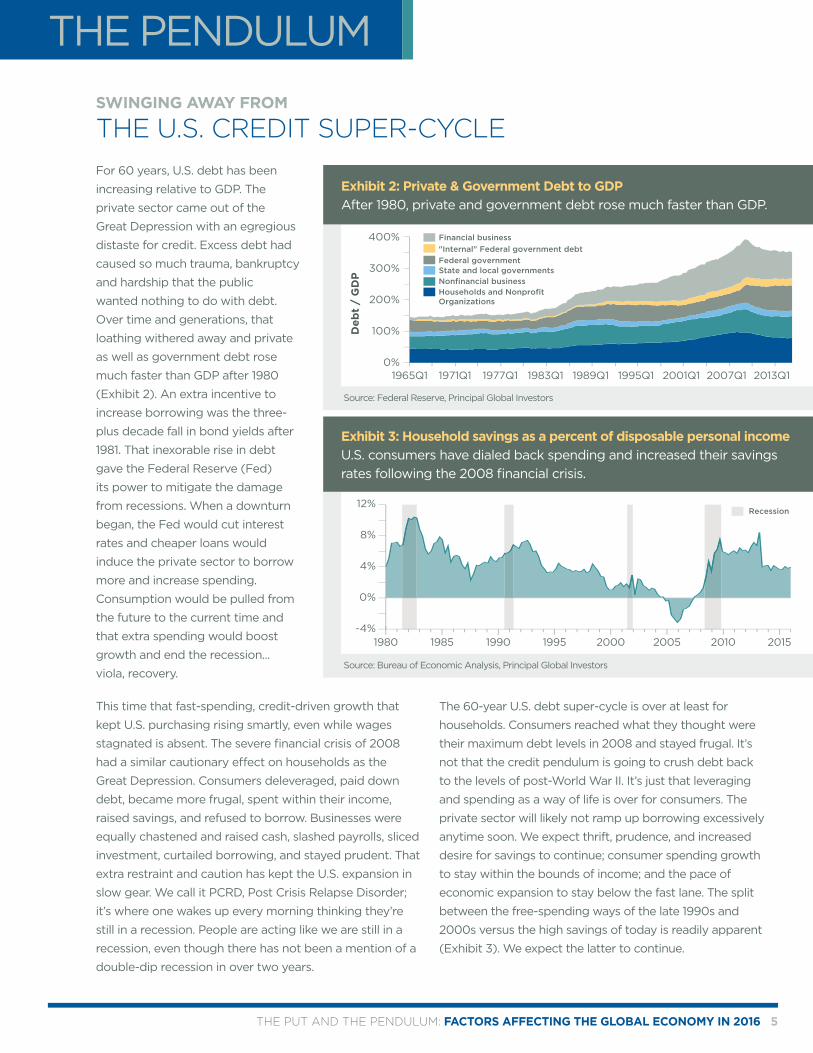
For 60 years, U.S. debt has been
increasing relative to GDP. The
private sector came out of the
Great Depression with an egregious
distaste for credit. Excess debt had
caused so much trauma, bankruptcy
and hardship that the public
wanted nothing to do with debt.
Over time and generations, that
loathing withered away and private
as well as government debt rose
much faster than GDP after 1980
(Exhibit 2). An extra incentive to
increase borrowing was the three-
plus decade fall in bond yields after
1981. That inexorable rise in debt
gave the Federal Reserve (Fed)
its power to mitigate the damage
from recessions. When a downturn
began, the Fed would cut interest
rates and cheaper loans would
induce the private sector to borrow
more and increase spending.
Consumption would be pulled from
the future to the current time and
that extra spending would boost
growth and end the recession...
viola, recovery.
This time that fast-spending, credit-driven growth that
kept U.S. purchasing rising smartly, even while wages
stagnated is absent. The severe financial crisis of 2008
had a similar cautionary effect on households as the
Great Depression. Consumers deleveraged, paid down
debt, became more frugal, spent within their income,
raised savings, and refused to borrow. Businesses were
equally chastened and raised cash, slashed payrolls, sliced
investment, curtailed borrowing, and stayed prudent. That
extra restraint and caution has kept the U.S. expansion in
slow gear. We call it PCRD, Post Crisis Relapse Disorder;
it’s where one wakes up every morning thinking they’re
still in a recession. People are acting like we are still in a
recession, even though there has not been a mention of a
double-dip recession in over two years.
The 60-year U.S. debt super-cycle is over at least for
households. Consumers reached what they thought were
their maximum debt levels in 2008 and stayed frugal. It’s
not that the credit pendulum is going to crush debt back
to the levels of post-World War II. It’s just that leveraging
and spending as a way of life is over for consumers. The
private sector will likely not ramp up borrowing excessively
anytime soon. We expect thrift, prudence, and increased
desire for savings to continue; consumer spending growth
to stay within the bounds of income; and the pace of
economic expansion to stay below the fast lane. The split
between the free-spending ways of the late 1990s and
2000s versus the high savings of today is readily apparent
(Exhibit 3). We expect the latter to continue.
THE PUT AND THE PENDULUM: FACTORS AFFECTING THE GLOBAL ECONOMY IN 2016 5
Source: Federal Reserve, Principal Global Investors
Source: Bureau of Economic Analysis, Principal Global Investors
SWINGING AWAY FROM
THE U.S. CREDIT SUPER-CYCLE
Exhibit 2: Private & Government Debt to GDPAfter 1980, private and government debt rose much faster than GDP.
Exhibit 3: Household savings as a percent of disposable personal income U.S. consumers have dialed back spending and increased their savings rates following the 2008 financial crisis.
THE PENDULUM
THE PUT AND THE PENDULUM: FACTORS AFFECTING THE GLOBAL ECONOMY IN 2016 6
The Fed’s primary tool of monetary policy is the federal
funds rate (fed funds). Over the years, the Fed learned to
utilize that lever to successfully ameliorate the ravages of
recessions. In the 1980s, Fed Chairman Alan Greenspan
used the instrument so effectively that the endeavor
was affectionately known as the “Greenspan put.” The
problem now, as the debt super-cycle has faded, is
that inducing people to borrow to mitigate recessions
has lost its effectiveness. In fact, debt in general has
lost its power to stimulate. Table 1 shows how much an
extra dollar of debt raised GDP in each expansion since
1960, measured from the prior business cycle peak to
the current top. The first row uses total credit market
debt; the second uses private non-financial debt. Both
show the same effect: the return in dollars of GDP
from an extra dollar of total debt plunged from $0.68
in the 1960s to a measly $0.19 in the 2000s…not much
marginal impact.
With no ability to help the economy through cuts to
the fed funds rate, the Fed looked for another tool
and found quantitative easing (QE) or large purchases
of long-term bonds. The idea was that, with short
rates near zero, central banks could push long-term
rates lower by buying large quantities of long-term
bonds. The principle was the same: cut interest rates
to induce economic participants to borrow to spend
or invest; the QE difference was to use long rates as
the lure rather than short rates.
Extraordinary tools brought unanticipated outcomes.
Rather than stimulating the economy, those ultra-low
long rates prompted a desperate and global search
for yield. Investors found better yields in developing
countries, and hundreds of billions of dollars flowed
into emerging market debt funds and local corporate
bonds. That easily available credit helped push
emerging market debt to levels that are now causing
repayment problems as cash flows and profits wither.
Some of the “search for yield” money also went into
the high-yield debt of U.S. shale oil producers, which
got downgraded as oil prices plummeted. Some
(perhaps many) of those higher-yielding credit issues
that were in such exorbitant demand have become
questionable; ratings have slumped and prices have
collapsed.
Many economists and pundits worried that QE would
end in horrendous inflation. But, the real lesson
learned seems to be that easy money actually brings
deflation, rather than inflation. Radically low interest
rates make many more low-return projects affordable.
So, more production facilities get built, supply turns
to excess and prices crash: oops, deflation, not
inflation.
THE PUT
Source: Federal Reserve, Bureau of Economic Analysis, Principal Global Investors 1Credit market debt 2Non-financial debt
Table 1: This table illustrates how much an extra dollar of debt raised GDP in each expansion since 1960, measured from the prior business cycle peak to the current top. Both credit market debt and non-financial debt show the extra dollar of total debt plunging with minimal marginal impact.
ExpansionPeak to Peak
1960thru1969
1969thru1973
1973thru1980
1980thru1990
1990thru2001
2001thru
2007
2007thru2015
$ GDP per All Debt1 0.68 0.64 0.59 0.35 0.32 0.19 0.33
$ GDP per Private NF2 0.98 0.97 0.97 0.70 0.67 0.41 1.58
THE PUT AND THE PENDULUM: FACTORS AFFECTING THE GLOBAL ECONOMY IN 2016 7
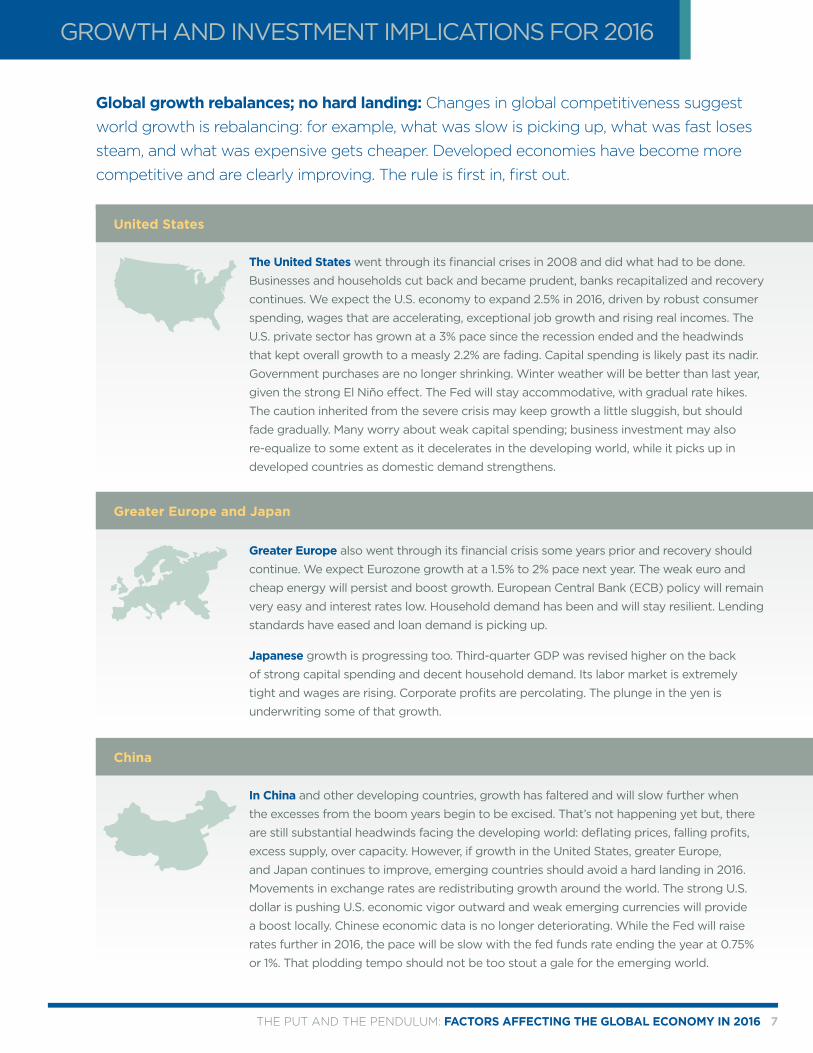
Global growth rebalances; no hard landing: Changes in global competitiveness suggest world growth is rebalancing: for example, what was slow is picking up, what was fast loses steam, and what was expensive gets cheaper. Developed economies have become more competitive and are clearly improving. The rule is first in, first out.
GROWTH AND INVESTMENT IMPLICATIONS FOR 2016
The United States went through its financial crises in 2008 and did what had to be done.
Businesses and households cut back and became prudent, banks recapitalized and recovery
continues. We expect the U.S. economy to expand 2.5% in 2016, driven by robust consumer
spending, wages that are accelerating, exceptional job growth and rising real incomes. The
U.S. private sector has grown at a 3% pace since the recession ended and the headwinds
that kept overall growth to a measly 2.2% are fading. Capital spending is likely past its nadir.
Government purchases are no longer shrinking. Winter weather will be better than last year,
given the strong El Niño effect. The Fed will stay accommodative, with gradual rate hikes.
The caution inherited from the severe crisis may keep growth a little sluggish, but should
fade gradually. Many worry about weak capital spending; business investment may also
re-equalize to some extent as it decelerates in the developing world, while it picks up in
developed countries as domestic demand strengthens.
Greater Europe also went through its financial crisis some years prior and recovery should
continue. We expect Eurozone growth at a 1.5% to 2% pace next year. The weak euro and
cheap energy will persist and boost growth. European Central Bank (ECB) policy will remain
very easy and interest rates low. Household demand has been and will stay resilient. Lending
standards have eased and loan demand is picking up.
Japanese growth is progressing too. Third-quarter GDP was revised higher on the back
of strong capital spending and decent household demand. Its labor market is extremely
tight and wages are rising. Corporate profits are percolating. The plunge in the yen is
underwriting some of that growth.
In China and other developing countries, growth has faltered and will slow further when
the excesses from the boom years begin to be excised. That’s not happening yet but, there
are still substantial headwinds facing the developing world: deflating prices, falling profits,
excess supply, over capacity. However, if growth in the United States, greater Europe,
and Japan continues to improve, emerging countries should avoid a hard landing in 2016.
Movements in exchange rates are redistributing growth around the world. The strong U.S.
dollar is pushing U.S. economic vigor outward and weak emerging currencies will provide
a boost locally. Chinese economic data is no longer deteriorating. While the Fed will raise
rates further in 2016, the pace will be slow with the fed funds rate ending the year at 0.75%
or 1%. That plodding tempo should not be too stout a gale for the emerging world.
United States
Greater Europe and Japan
China
THE PUT AND THE PENDULUM: FACTORS AFFECTING THE GLOBAL ECONOMY IN 2016 8
Consensus trades strongly favor continued
commodity price weakness and an ever-
stronger dollar. Those trends are likely not far
from their zenith. The December plunge in oil
prices is likely a final capitulation and catch-up
to the price action in metals. Copper prices
have stabilized recently and the CRB Raw
Industrial Index is no longer plunging as it had
steadily since May 2014. The JPMorgan Global
Manufacturing PMI has stabilized recently and
quit decelerating. We see the U.S. dollar mostly
just maintaining its strength, which should
allow commodity prices to stabilize around
recent lows. The dollar may rise a bit more
after the fed funds rate hike, but the bulk of
its advance is likely over. Yes, the Fed is hiking
while other central banks stay easy, but that is
old news and markets surely reflect that. Even
after the lows are in, though, commodity prices
have little room to rebound much until demand
growth begins to catch up to that of supply,
which may still be some way off.
The problem for the developing world is that the imbalances
built during the boom years are only getting bigger. Debt is still
rising, companies are still producing, supply and capacity are still
increasing. There has been little consolidation and no deleveraging. If
conditions worsen, there is significant risk of a hard landing or crisis.
A spike in defaults in China or other developing countries would
create a rush for the exits in local-debt funds. Liquidity would vanish
and bond prices would get crushed. Outflows are the biggest risk
and would put even more pressure on currencies, making dollar-
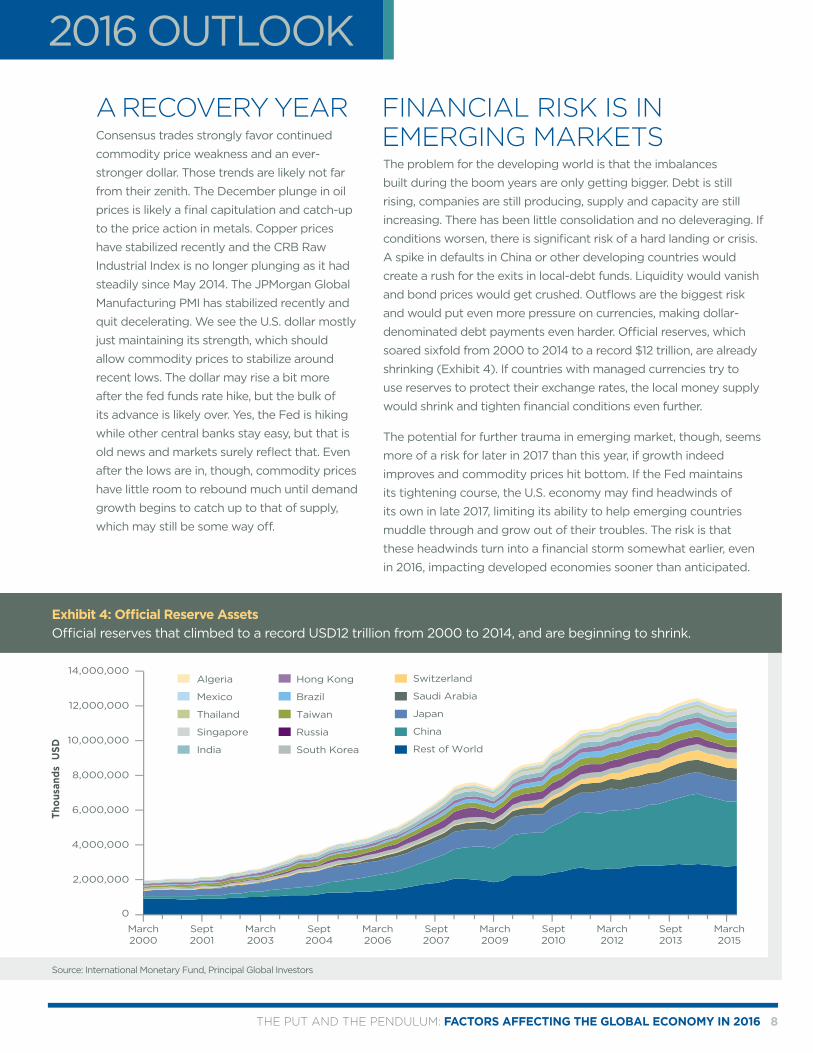
denominated debt payments even harder. Official reserves, which
soared sixfold from 2000 to 2014 to a record $12 trillion, are already
shrinking (Exhibit 4). If countries with managed currencies try to
use reserves to protect their exchange rates, the local money supply
would shrink and tighten financial conditions even further.
The potential for further trauma in emerging market, though, seems
more of a risk for later in 2017 than this year, if growth indeed
improves and commodity prices hit bottom. If the Fed maintains
its tightening course, the U.S. economy may find headwinds of
its own in late 2017, limiting its ability to help emerging countries
muddle through and grow out of their troubles. The risk is that
these headwinds turn into a financial storm somewhat earlier, even
in 2016, impacting developed economies sooner than anticipated.
2016 OUTLOOK
A RECOVERY YEAR FINANCIAL RISK IS IN EMERGING MARKETS
Source: International Monetary Fund, Principal Global Investors
Exhibit 4: Official Reserve Assets Official reserves that climbed to a record USD12 trillion from 2000 to 2014, and are beginning to shrink.
THE PUT AND THE PENDULUM: FACTORS AFFECTING THE GLOBAL ECONOMY IN 2016 9 MM8247 (t151210026y)
The price surge of most risk assets after years of zero
interest rates suggests that future returns will be hard to
find. The long bull market in developed, country bonds
is surely over. Evidence is the inability of yields on 10-
year U.S. Treasurys to breach the 2% level to any degree
since April even as fears of global recession spiked in
August. Similarly, yields on 10-year German Bunds refused
to collapse again below 0.4% even when expectations
for extreme ECB action were at their recent peak; and
that’s well above their record low of 0.07% last April. The
pressure on U.S. interest rates is mixed: ample global
savings, low competitive yields, low inflation, little desire
to borrow or opportunity to invest push rates lower.
But, the savings glut is shrinking, global growth should
improve, the Fed is hiking and inflation is not dead, just
resting. Net, net, we’d say modestly higher.
Credit spreads have widened dramatically since last
April from fear of default by companies sensitive to
commodity prices. Since no U.S. recession has ever been
associated with a plunge in oil prices, only the reverse,
default risk may stay contained, suggesting that those
higher yields in credit may be somewhat enticing, at
least for a trade. We’d only date them for a little while,
though, and not get married.
Equities likely have more upside than bonds in 2016. The
potential, though, may be limited to earnings gains as
price-to-earnings (P/E) multiples will not expand. P/Es are
not grossly extreme, just well above long-term averages.
U.S. earnings growth at mid-single digits plus a couple
of points for dividends would yield total return in the
mid-to upper-single digits for a large-cap index. Eurozone
and Japanese equities may be attractive because there
is greater potential for upside earnings and growth
surprises. However, the U.S. investment cycle is likely in its
later stages and the upside may be limited by contagion
from the problems that have not yet been resolved in
emerging markets.
The best returns may be in real estate. While cap rates
have fallen, they are still wide versus U.S. Treasury bonds.
Building prices are on the way up, as are rents, two of the
three drivers of real estate returns. Interest rates will rise
some, but prices and rents should keep returns decent.
U.S. REITs had been overpriced and just under flat for the
year. Global REITs may have some opportunity.
While 2015 has witnessed a rebalancing of growth,
we can expect that in 2016 developed economies will
continue to improve and become more competitive.
In conclusion, while the forces driving economic
“pendulums” are indefinite and harder to predict, like
Principia we can’t know the end point to which global
markets and economies will ultimately take us, but we
may know the direction.
CONCLUSION
DISCLOSURESThe information in this document has been derived from sources believed to be accurate as of December 2015. Information derived from sources other than Principal Global Investors or its affiliates is believed to be reliable; however we do not independently verify or guarantee its accuracy or validity.
The information in this document contains general information only on investment matters and should not be considered as a comprehensive statement on any matter and should not be relied upon as such nor should it be construed as specific investment advice, an opinion or recommendation. The general information it contains does not take account of any investor’s investment objectives, particular needs or financial situation, nor should it be relied upon in any way as a forecast or guarantee of future events regarding a particular investment or the markets in general. All expressions of opinion and predictions in this document are subject to change without notice. Any reference to a specific investment or security does not constitute a recommendation to buy, sell, or hold such investment or security.
Past performance is not a reliable indicator of future performance and should not be relied upon as a significant basis for an investment decision. You should consider whether an investment fits your investment objectives, particular needs and financial situation before making any investment decision.
Subject to any contrary provisions of applicable law, no company in the Principal Financial Group nor any of their employees or directors gives any warranty of reliability or accuracy nor accepts any responsibility arising in any other way (including by reason of negligence) for errors or omissions in this document.
All figures shown in this document are in U.S. dollars unless otherwise noted.
This document is issued in:• The United States by Principal Global Investors, LLC, which is regulated by the U.S. Securities and Exchange Commission.• The United Kingdom by Principal Global Investors (Europe) Limited, Level 1, 1 Wood Street, London EC2V 7JB, registered in England, No. 03819986, which has approved its contents, and which is authorised and regulated by the Financial Conduct Authority.• Singapore by Principal Global Investors (Singapore) Limited (ACRA Reg. No. 199603735H), which is regulated by the Monetary Authority of Singapore and is directed exclusively at institutional investors as defined by the Securities and Futures Act (Chapter 289).• Hong Kong by Principal Global Investors (Hong Kong) Limited, which is regulated by the Securities and Futures Commission and is directed exclusively at professional investors as defined by the Securities and Futures Ordinance.• Australia by Principal Global Investors (Australia) Limited (ABN 45 102 488 068, AFS License No. 225385), which is regulated by the Australian Securities and Investment Commission.• This document is issued by Principal Global Investors LLC, a branch registered in the Dubai International Financial Centre and authorized by the
Dubai Financial Services Authority as a representative office and is delivered on an individual basis to the recipient and should not be passed on or otherwise distributed by the recipient to any other person or organization. This document is intended for sophisticated institutional and professional investors only.
• Japan by Principal Global Investors (Japan) Ltd. (Kanto Local Finance Bureau (Kinsho) No. 462, Japan Investment Advisers Association; Membership No. 011-01627).
• In the United Kingdom this presentation is directed exclusively at persons who are eligible counterparties or professional investors (as defined by the rules of the Financial Conduct Authority). In connection with its management of client portfolios, Principal Global Investors (Europe) Limited may delegate management authority to affiliates who are not authorised and regulated by the FCA. In any such case, the client may not benefit from all the protections afforded by the rules and regulations enacted under the Financial Services and Markets Act 2000.
Investing involves risk, including possible loss of principal. International and global investing involves greater risks such as currency fluctuations, political/social instability and differing accounting standards. Risk is magnified in emerging markets, which may lack established legal, political, business or social structures to support securities markets. Investing in real estate investment trusts (REITs) involves special risks including interest rate fluctuation, credit risks, and liquidity risks.
This material is not intended for distribution to, or use by any person or entity in any jurisdiction or country where such distribution or use would be contrary to local law or regulation.
Insurance products and plan administrative services are provided by Principal Life Insurance Company. Principal Funds, Inc. is distributed by Principal Funds Distributor, Inc. Securities are offered through Princor Financial Services Corporation, 800-547-7754, Member SIPC and/or independent broker/dealers. Securities sold by a Princor® Registered Representative are offered through Princor. Principal Funds Distributor, Princor and Principal Life are members of the Principal Financial Group®, Des Moines, IA 50392. Certain investment options may not be available in all states or U.S. commonwealths.
THE PUT AND THE PENDULUM: FACTORS AFFECTING THE GLOBAL ECONOMY IN 2016 10 MM8247 (t151210026y)


![21 ] £ b R 22 - LION ROCK DAILY · 情感狂熱的《蝴蝶夫人》的〈花之二重唱〉(李洋與張倩),和接着10多 位歌手登台、氣氛熱鬧的《卡門》多段詠嘆調構成戲劇性的對比。](https://static.fdocuments.nl/doc/165x107/5f0593237e708231d413a3a5/21-b-r-22-lion-rock-fccceeceoeeieiioeoec10.jpg)