BELANGRIK METODE TE BASEER NIE. report 2013_1.pdf · METODE TE BASEER NIE. Produsente word veral...
54
i BELANGRIK Resultate van 'n kultivarproef by 'n enkele lokaliteit in enige jaar, of selfs 'n beperkte aantal lokaliteite in 'n enkele jaar, kan as gevolg van die kenmerkende seisoenale variasie in die RSA hoogs misleidend wees en kan sodoende onregverdiglik teen die beste genotipes vir daardie omgewing diskrimineer. 'n ERNSTIGE BEROEP WORD OP ALLE BETROKKENES GEDOEN OM NIE HUL GENOTIPEADVIES OP SO 'N HOOGS ONBETROUBARE METODE TE BASEER NIE. Produsente word veral versoek om nougeset daar teen te waak dat hulle nie ook foutiewe genotipe uitsprake op dieselfde wyse doen nie, of op hierdie wyse mislei word nie. Hierdie meerjarige resultate van die Nasionale Kultivarproewe, wat deur die LNR-IGG uitgevoer is en gepubliseer word, geskied in belang van produsente, adviesdienste en die teeltbedryf. Die resultate mag derhalwe vryelik gebruik word, mits dit wetenskaplik korrek vertolk word. Vrye gebruik van die resultate word ook met 'n verdere voorwaarde toegelaat, naamlik dat die nodige erkenning aan die bron van die inligting verleen word. LNR - Instituut vir Graangewasse Privaatsak X1251 POTCHEFSTROOM B/I 2520
-
Upload
trinhkhanh -
Category
Documents
-
view
218 -
download
0
Transcript of BELANGRIK METODE TE BASEER NIE. report 2013_1.pdf · METODE TE BASEER NIE. Produsente word veral...
i
BELANGRIK
Resultate van 'n kultivarproef by 'n enkele lokaliteit in enige jaar, of selfs 'n beperkte aantal
lokaliteite in 'n enkele jaar, kan as gevolg van die kenmerkende seisoenale variasie in die RSA
hoogs misleidend wees en kan sodoende onregverdiglik teen die beste genotipes vir daardie
omgewing diskrimineer. 'n ERNSTIGE BEROEP WORD OP ALLE BETROKKENES
GEDOEN OM NIE HUL GENOTIPEADVIES OP SO 'N HOOGS ONBETROUBARE
METODE TE BASEER NIE. Produsente word veral versoek om nougeset daar teen te
waak dat hulle nie ook foutiewe genotipe uitsprake op dieselfde wyse doen nie, of op hierdie
wyse mislei word nie.
Hierdie meerjarige resultate van die Nasionale Kultivarproewe, wat deur die LNR-IGG
uitgevoer is en gepubliseer word, geskied in belang van produsente, adviesdienste en die
teeltbedryf. Die resultate mag derhalwe vryelik gebruik word, mits dit wetenskaplik korrek
vertolk word. Vrye gebruik van die resultate word ook met 'n verdere voorwaarde toegelaat,
naamlik dat die nodige erkenning aan die bron van die inligting verleen word.
LNR - Instituut vir Graangewasse
Privaatsak X1251
POTCHEFSTROOM B/I
2520
ii
DANKBETUIGINGS
Die sukses van hierdie navorsingsprojek is toe te skryf aan die goeie samewerking en medewerking
tussen die private, koöperatiewe en openbare sektore asook boere by wie genotipeproewe geplant is
(Tabel 2 ). Die verantwoordelike navorsers betuig hiermee hul grootste waardering vir die
besondere samewerking en ondersteuning wat hul van al die betrokkenes ontvang het.
Medewerkende instansies en persone
SAADFIRMAS
Agricol (Edms) Bpk
Capstone Seeds South Africa (Edms) BPK
Pannar Saad (Edms) Bpk
LNR – INSTITUUT VIR GRAANGEWASSE
Hierdie verslag se samestelling,voorbereiding en vermeerdering het bydraes deur verskeie
kollegas en beamptes geverg. Spesiale vermelding moet egter gemaak word van die insette
deur Mnr. D J. Muller vir sy beplanning en bestuur van die proewe, Me T. Mathobisa-
Manyokole vir data voorbereiding.
SORGHUM TRUST
Die LNR-IGG wil hiermee ook sy dank uitspreek teenoor die Sorghum Trust vir finansiële
ondersteuning wat die uitvoer van die proewe moontlik gemaak het.

iii
IMPORTANT
Due to typical seasonal variations in the RSA, results of a cultivar trial at a single locality in
any year, or even at a limited number of localities in a single year can be highly misleading
and can discriminate unfairly against genotypes, which may in reality be the best for certain
areas. ALL THOSE INVOLVED ARE STRONGLY URGED NOT TO BASE THEIR
GENOTYPE RECOMMENDATIONS ON A HIGHLY UNRELIABLE METHOD
SUCH AS THIS. Producers, especially, are requested to guard against letting themselves be
misled in this way and against making incorrect genotype judgments.
Results of these National Cultivar Trials, carried out by the ARC-GCI, are published by the
Institute in the interest of producers, advisory services and the breeding industry. These
results may thus be freely used, as long as they are used in a scientifically correct manner,
incorporating the whole spectrum of localities and observations. The source of the
information should also be awarded the necessary recognition when using these results.
ARC – Grain Crops Institute
Private Bag X1251
POTCHEFSTROOM
2520

iv
ACKNOWLEGEMENTS
The success of this research project is due to the good co-operation between the private, co-
operative and public sectors as well as farmers on whose farms genotype trials were planted (Table
2). The researchers wish to express their utmost appreciation for the exceptional co-operation and
support received from all those involved.
Co-working authorities and persons
SEED COMPANIES
Agricol (Pty) Ltd
Capstone Seeds South Africa (Pty) Ltd
Pannar Seed (Pty) Ltd
GRAIN CROPS INSTITUTE
The compilation of this report was made possible by the efforts of many colleagues and
officials. Special thanks go to Mr. D J. Muller for his planning and management of the trials,
Ms. T. Mathobisa-Manyokole for data preparation.
SORGHUM TRUST
The ARC-GCI would like to thank the Sorghum Trust for financial support that made these
trials possible.
v
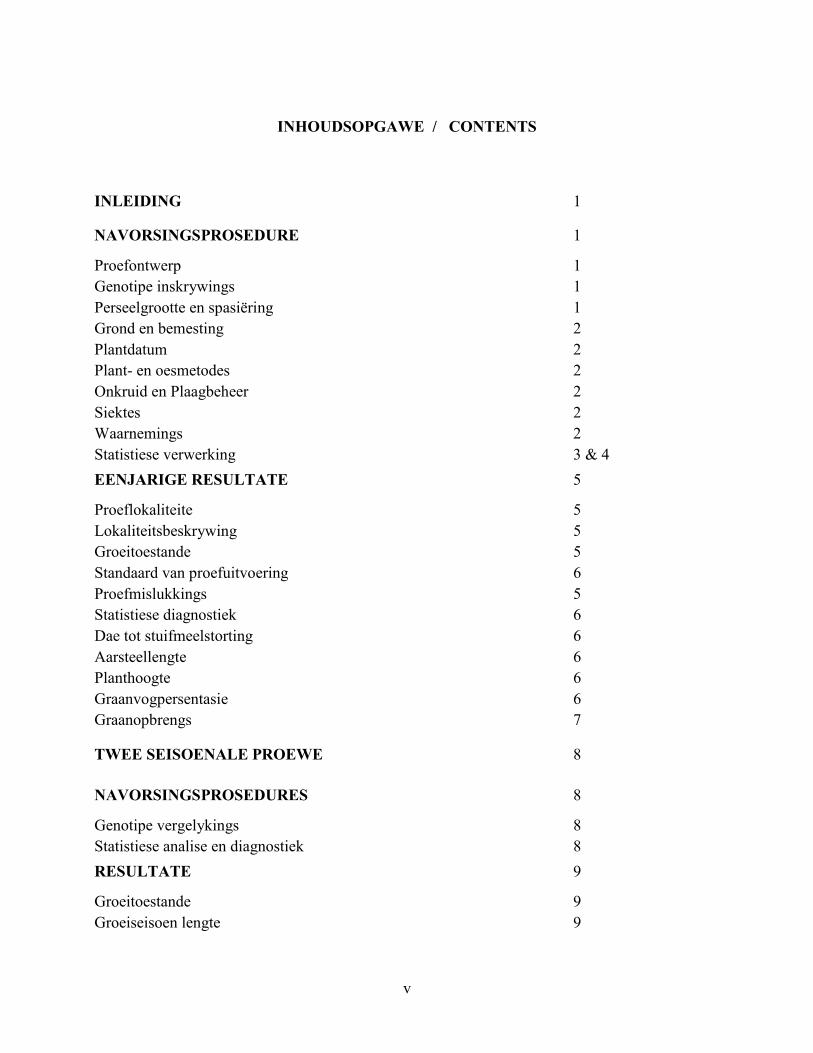
INHOUDSOPGAWE / CONTENTS
INLEIDING 1
NAVORSINGSPROSEDURE 1
Proefontwerp 1 Genotipe inskrywings 1 Perseelgrootte en spasiëring 1 Grond en bemesting 2 Plantdatum 2 Plant- en oesmetodes 2 Onkruid en Plaagbeheer 2 Siektes 2 Waarnemings 2 Statistiese verwerking 3 & 4 EENJARIGE RESULTATE 5
Proeflokaliteite 5 Lokaliteitsbeskrywing 5 Groeitoestande 5 Standaard van proefuitvoering 6 Proefmislukkings 5 Statistiese diagnostiek 6 Dae tot stuifmeelstorting 6 Aarsteellengte 6 Planthoogte 6 Graanvogpersentasie 6 Graanopbrengs 7
TWEE SEISOENALE PROEWE 8
NAVORSINGSPROSEDURES 8
Genotipe vergelykings 8 Statistiese analise en diagnostiek 8 RESULTATE 9
Groeitoestande 9 Groeiseisoen lengte 9

vi
Graanopbrengs 9 AMMI opbrengs stabiliteits waardes 9 Vrywaring 10 INTRODUCTION 11
RESEARCH PROCEDURE 11
Trial design 11 Genotype entries 11 Plot size and spacing 11 Soil and fertilisation 11 Planting date 12 Planting and harvesting methods 12 Pest control 12 Diseases 12 Observations 12 Statistical analysis 13 & 14 SINGLE SEASON RESULTS 15
Trial localities 15 Locality description 15 Growing conditions 15 Standard of trial execution 15 Trial failures 15 Statistical diagnostics 15 Days to pollen shed 15 Peduncle lenght 16 Plant height 16 Grain moisture 16 Grain yield 16 &17 TWO- SEASONAL TRIALS 17
RESEARCH PROCEDURE 17
Genotype comparisons 18 Statistical analysis and diagnostics 18 RESULTS 18
Growing conditions 18 Length of growing season 18 Grain yield 19 AMMI yield stability values 19
vii
Indemnity 20
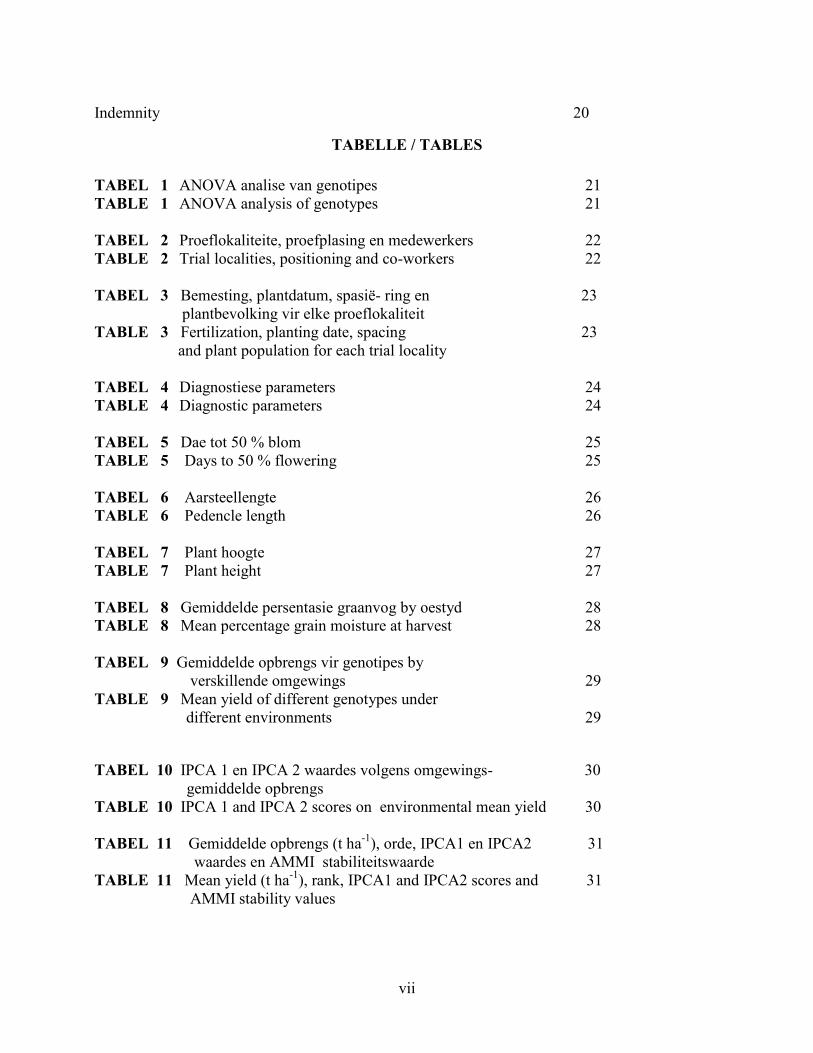
TABELLE / TABLES
TABEL 1 ANOVA analise van genotipes 21 TABLE 1 ANOVA analysis of genotypes 21 TABEL 2 Proeflokaliteite, proefplasing en medewerkers 22 TABLE 2 Trial localities, positioning and co-workers 22 TABEL 3 Bemesting, plantdatum, spasië- ring en 23 plantbevolking vir elke proeflokaliteit TABLE 3 Fertilization, planting date, spacing 23 and plant population for each trial locality TABEL 4 Diagnostiese parameters 24 TABLE 4 Diagnostic parameters 24 TABEL 5 Dae tot 50 % blom 25 TABLE 5 Days to 50 % flowering 25 TABEL 6 Aarsteellengte 26 TABLE 6 Pedencle length 26 TABEL 7 Plant hoogte 27 TABLE 7 Plant height 27 TABEL 8 Gemiddelde persentasie graanvog by oestyd 28 TABLE 8 Mean percentage grain moisture at harvest 28 TABEL 9 Gemiddelde opbrengs vir genotipes by verskillende omgewings 29 TABLE 9 Mean yield of different genotypes under different environments 29
TABEL 10 IPCA 1 en IPCA 2 waardes volgens omgewings- 30 gemiddelde opbrengs
TABLE 10 IPCA 1 and IPCA 2 scores on environmental mean yield 30 TABEL 11 Gemiddelde opbrengs (t ha-1), orde, IPCA1 en IPCA2 31 waardes en AMMI stabiliteitswaarde TABLE 11 Mean yield (t ha-1), rank, IPCA1 and IPCA2 scores and 31 AMMI stability values

viii
TABEL 12 AMMI model seleksie vir beste genotipes volgens 32 gemiddelde opbrengs TABLE 12 AMMI model selection for best genotypes according 32 to mean yield TABEL 13 Groeiseisoen lengte vir spesifieke genotipes 34 TABLE 13 Length of growing season for specific genotypes 34 TABEL 14 Gekombineerde variansie analise 34 TABLE 14 Combined analysis of variance 34 TABEL 15 Gemiddelde graanopbrengs (t ha-1) vir sorghum genotipes 35 &36 TABLE 15 Mean yield (t ha-1) for different sorghum genotypes 35 &36 TABEL 16 IPCA 1 en IPCA 2 waardes vir 23 omgewings gesorteer 37 volgens omgewings-gemiddelde opbrengs TABLE 16 IPCA 1 and IPCA2 scores for 23 environments, sorted on 37 environmental mean yield TABEL 17 Gemiddelde opbrengs (t ha-1), orde, IPCA1 en IPCA2 38 waardes, en AMMI stabiliteitswaarde (ASW) vir die 2012/2013 & 2012/2013 seisoene TABLE 17 Mean yield (t ha-1), rank, IPCA1 And IPCA2 scores 38 and AMMI stability values (ASV) during the 2012/2013 & 2012/2013 seasons TABEL 18 AMMI model seleksie vir beste 12 genotipes volgens 39 gemiddelde opbrengs TABLE 18 AMMI model selection for best 12 genotypes according 39 to mean yield
FIGURE / FIGURES
FIGUUR 1 GGL XY grafiek vir 20 genotipes en 10 omgewings 33 FIGURE 1 GGL bi-plot for 20 genotypes and 10 environments 33 FIGUUR 2 GGL XY grafiek vir 12 genotipes oor 23 omgewings 40 FIGURE 2 GGL bi-plot for 12 genotypes over 23 environments 40 FIGUUR 3a AMMI model dui stabilitieit aan van genotipes by 44 verskillende omgewings FIGURE 3b AMMI model indicate the stability of genotypes at 44 different environments

ix
AANHANGSEL A /APPENDIX A
Interpretasie van AMMI enpbrengsstabiliteit ………………………… 41
Definisies Interaksie Prinsiep Komponent Analise (IPCA) ....... ..... ............... 41 AMMI Stabiliteitswaarde (ASW) ............. ............. .......... 42 Interpretation of AMMI and yield stability...... ..... ............ ............. 42 Definitions Interaction Principle Component Analysis (IPCA) ...... ........... ........ 43 AMMI Stability Value (ASV) ........ ........... ........................ 43

1
INLEIDING
Resultate van die 2012/2013 Nasionale Kultivar Proewe met Sorghum, is in hierdie
verslag saamgevat. Die doelwit van die navorsing is om die stabiliteit van verskillende
genotipes te evalueer ten opsigte van verskillende opbrengspotensiale asook die
agronomiese en industriële waarde van nuwe genotipes. Genotipe inskrywings bestaan uit
die GM, GL en GH graderingsklasse.
NAVORSINGSPROSEDURE
Standaard en wetenskaplik erkende prosedures en waarnemings wat vir die
navorsingsprogram voorgeskryf is, word in die jaarverslae beskryf. Medewerkers is „n
vry hand gegee in die implimentering van mees geskikte produksie praktyke in hulle
spesifieke areas. Dit word gedoen om opbrengste te optimaliseer en om toestande te skep
van varieërende potensiaaltoestande deur plantdatums en/of besproeiingsfrekwensies te
manipuleer.
Proef ontwerp
„n Volledige roosterontwerp met 3 herhalings by elke lokaliteit, is deurgaans gebruik om
die 20 genotipes te akkommodeer. Aan elke lokaliteit is „n spesifieke proefrandomisasie
toegeken, en die uitleg word jaarliks verander.
Genotipe inskrywings
Dieselfde 20 genotipes word gebruik in al die proewe. Saadmaatskappye nomineer al die
genotipes wat ingeskryf word. Saadmaatskappy inskrywings geskied volgens prioriteit.
Indien te veel inskrywings ontvang is, word die finale genotipelys met betrokke
saadmaatskappye beding.
Perseel grootte en spasiëring
A bruto perseel grootte van twee plantrye van 6 m elk en „n netto perseel grootte met
rylengtes van 5m is voorgeskryf vir alle proewe. „n Rywydte van 1.0m en binne-ry
spasiëring van 7.5cm is ook aanbeveel vir proewe. Genoegsame saad is verskaf om „n
goeie stand te verseker.
Sodra saailinge sterk genoeg was, is dit uitgedun om te voldoen aan die aanbevole binne-

2
ry spasiëring.
Grond en bemesting
Gronde wat normaalweg geskik is vir sorghumproduksie, is gebruik waar moontlik.
Keuse van spesifieke grondkondisies en tipes verseker ook verskille in
produksiepotensiaal. Waar moontlik, is proewe geplant onder nette of in kommersiële
aanplantings ten einde voëlskade te minimiseer aan voëlvatbare genotipes.
Bemestingsriglyne is nie voorgeskryf nie, maar is toegedien volgens grondvoedingstatus
en opbrengspotensiaal van die relevante areas.
Plantdatum
Aanvaarbare plantdatums vir suksesvolle sorghum produksie in spesifieke areas is
voorgestel. Dit is verwag dat die plantdatums voor 1 Desember sal wees.
Plant en oesmetodes
Proewe is met die hand of meganies geplant en geoes. Die oesproses het plaasgevind
sodra die graan se vogpersentasie laer was as 22.1%. Na die oesproses is alle sorgum
plante gedors met dieselfde dorsmasjien.
Onkruid en plaagbeheer
Die gebruik van onkruiddoders en plaagbeheermiddels is vrylik toegelaat omdat
effektiewe beheer van onkruid en plae verwag is. Die gebruik van sistemiese
plaagbeheermiddels vir gronde is ook toegelaat. Die gebruik van plaagbeheermiddels
moes gerapporteer word.
Siektes
Medewerkers is gevra om te rapporteer sodra enige siektes waargeneem word sodat
nodige opvolgstappe betyds geneem kan word. Natuurlike infestasie van enige siekte
behoort van so „n aard te wees dat genotipe reaksies waargeneem kan word.
Waarnemings
Die volgende informasie en waarnemings word elke jaar verwag:
... Bemestingformulasie, tyd en metode van toediening
... Siektebeheermiddels, tyd en metode van toediening
3
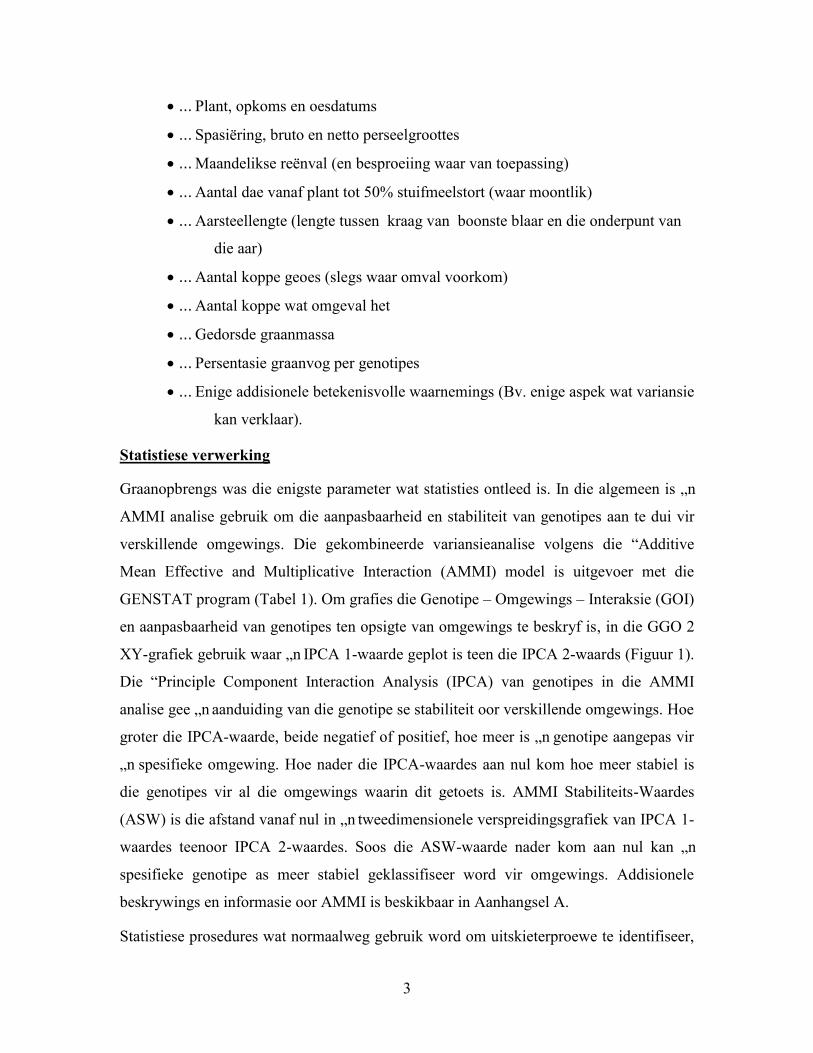
... Plant, opkoms en oesdatums
... Spasiëring, bruto en netto perseelgroottes
... Maandelikse reënval (en besproeiing waar van toepassing)
... Aantal dae vanaf plant tot 50% stuifmeelstort (waar moontlik)
... Aarsteellengte (lengte tussen kraag van boonste blaar en die onderpunt van
die aar)
... Aantal koppe geoes (slegs waar omval voorkom)
... Aantal koppe wat omgeval het
... Gedorsde graanmassa
... Persentasie graanvog per genotipes
... Enige addisionele betekenisvolle waarnemings (Bv. enige aspek wat variansie
kan verklaar).
Statistiese verwerking
Graanopbrengs was die enigste parameter wat statisties ontleed is. In die algemeen is „n
AMMI analise gebruik om die aanpasbaarheid en stabiliteit van genotipes aan te dui vir
verskillende omgewings. Die gekombineerde variansieanalise volgens die “Additive
Mean Effective and Multiplicative Interaction (AMMI) model is uitgevoer met die
GENSTAT program (Tabel 1). Om grafies die Genotipe – Omgewings – Interaksie (GOI)
en aanpasbaarheid van genotipes ten opsigte van omgewings te beskryf is, in die GGO 2
XY-grafiek gebruik waar „n IPCA 1-waarde geplot is teen die IPCA 2-waards (Figuur 1).
Die “Principle Component Interaction Analysis (IPCA) van genotipes in die AMMI
analise gee „n aanduiding van die genotipe se stabiliteit oor verskillende omgewings. Hoe
groter die IPCA-waarde, beide negatief of positief, hoe meer is „n genotipe aangepas vir
„n spesifieke omgewing. Hoe nader die IPCA-waardes aan nul kom hoe meer stabiel is
die genotipes vir al die omgewings waarin dit getoets is. AMMI Stabiliteits-Waardes
(ASW) is die afstand vanaf nul in „n tweedimensionele verspreidingsgrafiek van IPCA 1-
waardes teenoor IPCA 2-waardes. Soos die ASW-waarde nader kom aan nul kan „n
spesifieke genotipe as meer stabiel geklassifiseer word vir omgewings. Addisionele
beskrywings en informasie oor AMMI is beskikbaar in Aanhangsel A.
Statistiese prosedures wat normaalweg gebruik word om uitskieterproewe te identifiseer,

4
is vir doeleindes van hierdie verslag wel toegepas. Sekere statistiese parameters is egter
ook vir diagnostiese doeleindes gebruik aan die hand waarvan besluit is watter proewe
liefs weggelaat moes word.
Diagnostiese parameters:
KV- Die Koëffisient van Variasie verwys na die fout van enkel persele en gee 'n
aanduiding van die grootte van die variasie tussen perseelwaardes wat vanaf
verskeie bronne afkomstig is. Die KV gee dus 'n aanduiding van die akkuraatheid
van die perseelwaardes (grootte van die waarde). Bronne van variasie is
byvoorbeeld grondvariasie (vrugbaarheid, diepte, grondvog, kleipersentasie,
ongelykheid, ens) en plantvariasie (bevolkingsgrootte, oneweredige groei ens).
Stremmingstoestande (vog, temperatuur, siektes, ens) het so dikwels tot gevolg
dat normaalweg aanvaarbare grond- en plantvariasie baie sterker in die proefdata
tot uiting kan kom en die KV vergroot. 'n Relatief hoë KV, wat aan hand van
bekende bronne van variasie verklaar kan word, kan nie as die enigste parameter
gebruik word om onbetroubare proefdata te identifiseer nie.
GKV- Die Genetiese Koëffisient van Variasie verwys na die verskille in kultivar-
opbrengs. Die GKV is dus 'n aanduiding van die variasiegrootte wat aan verskille
in genetiese samestelling tussen kultivarinskrywings toegeskryf kan word. Hoë
waardes kan die gevolg wees van siektevatbaarheid, groot verskille in
rypwordingstadium, temperatuurgevoeligheid en soortgelyke afwykings. Dit word
ook gebruik om uitskieterproewe te identifiseer.
tn- Kultivarherhaalbaarheid verwys na die herhaalbaarheid van kultivargemiddeldes en
kan gedefinieer word as die verwantskap tussen die genotipe variansie en die totale
variansie. Hierdie parameter is eintlik van waarde vir proewe waarvan die aantal
herhalings nie dieselfde is nie.
t- Die Intraklas Korrelasie verwys na die herhaalbaarheid van perseelwaardes oor
herhalings. Hoe groter die ooreenstemming tussen perseelwaardes oor herhalings
vir elke kultivarinskrywing is, hoe nader sal "t" na 1.0 neig.
SF(t)- Die Standaard Fout van die Intraklas Korrelasie (t) gee 'n aanduiding van hoe
akkuraat die skatting van "t" is.

5
t/SF(t)- Hierdie verhouding word as 'n belangrike parameter beskou daar die Intraklas
Korrelasie (t) verkieslik minstens drie keer groter as sy foutterm moet wees. 'n
Verhouding van kleiner as 3.0 dui aan dat die betrokke stel proefdata as minder
betroubaar beskou kan word.
EENJARIGE RESULTATE
Proeflokaliteite
Lokaliteite, proefplasings en medewerker inligting vir die 2012/2013 se proewe word
weergegee in Tabel 2.
Lokaliteitsbeskrywing
Beskikbare inligting oor bemesting en ander relevante genotipe inligting verskyn in Tabel
3. Al 10 genotipe proewe wat aan medewerkers in verskeie lokaliteite versprei is, is terug
ontvang.
Groeitoestande
Groeitoestande het gewissel tussen omgewings en moet dus in aanmerking geneem word
by die interpretasie van resultate. Bo-gemiddelde reënval het voorgekom gedurende
Oktober 2012 oor die oostelike en suidelike gedeeltes van die land. Reënval in die groot
dele van die Noordwes Provinsie, die sentrale- tot die noordwestelike Vrystaat en die
noordelike dele van die Noordkaap was egter ondergemiddeld. Gedurende September en
Oktober is 'n bo-normale plantegroei indeks waargeneem oor die grootste dele van die
Limpopo, Mpumalanga, Gauteng en KwaZulu-Natal – dit word toegeskryf aan relatief
hoë reënval. Plantegroei was onder-normaal oor groot dele van Noordwes Provinsie en
sentraal Vrystaat omdat reënval baie laag was. Die tydperk tussen Desember 2012 tot
Februarie 2013 / Maart 2013, dus ongeveer in die middel van die somerreënvalseisoen,
was die reënval in groot gedeeltes van die somerreënvalgebied onder-normaal. Oor die
grootste gedeelte van die somerreënvalgebied het goeie reënval egter voorgekom
gedurende April 2013, reënval sedert Julie 2012 was byna normaal, maar onder-normale
reënval en selfs droë toestande het ontwikkel in die grootste gedeeltes van Noordwes,
noordoostelike gedeeltes van die Noord-Kaap en die westelike gedeeltes van die Vrystaat
6
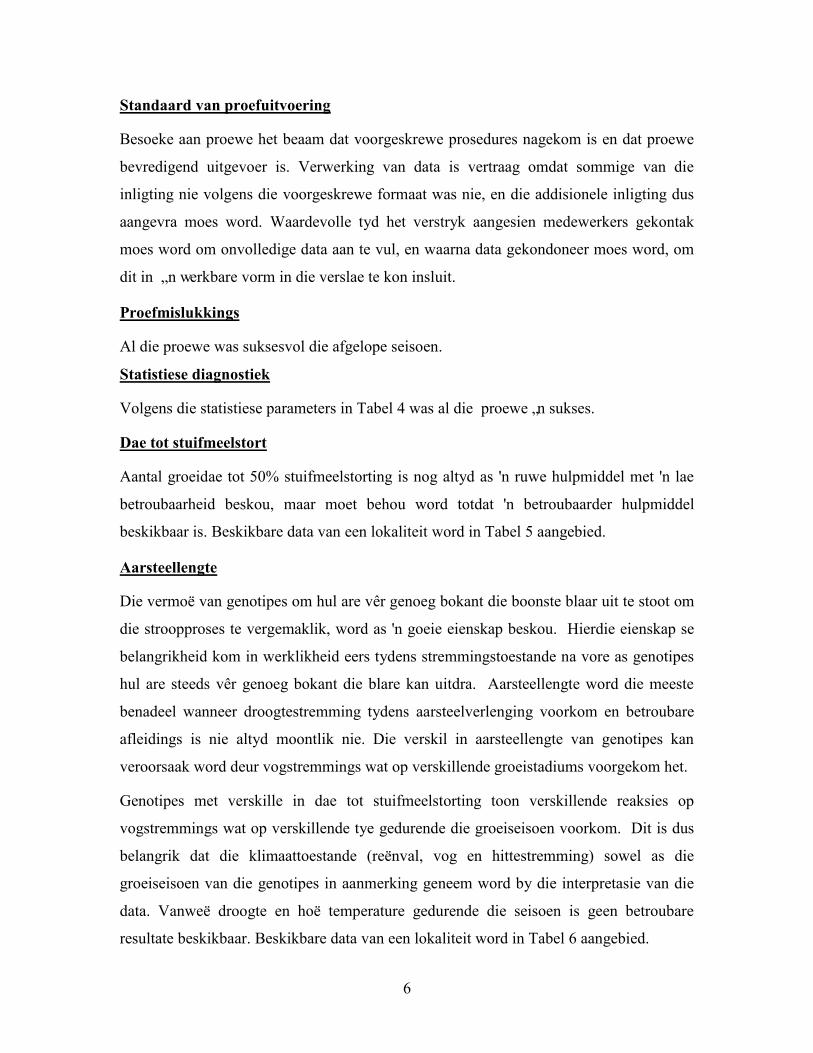
Standaard van proefuitvoering
Besoeke aan proewe het beaam dat voorgeskrewe prosedures nagekom is en dat proewe
bevredigend uitgevoer is. Verwerking van data is vertraag omdat sommige van die
inligting nie volgens die voorgeskrewe formaat was nie, en die addisionele inligting dus
aangevra moes word. Waardevolle tyd het verstryk aangesien medewerkers gekontak
moes word om onvolledige data aan te vul, en waarna data gekondoneer moes word, om
dit in „n werkbare vorm in die verslae te kon insluit.
Proefmislukkings
Al die proewe was suksesvol die afgelope seisoen.
Statistiese diagnostiek
Volgens die statistiese parameters in Tabel 4 was al die proewe „n sukses.
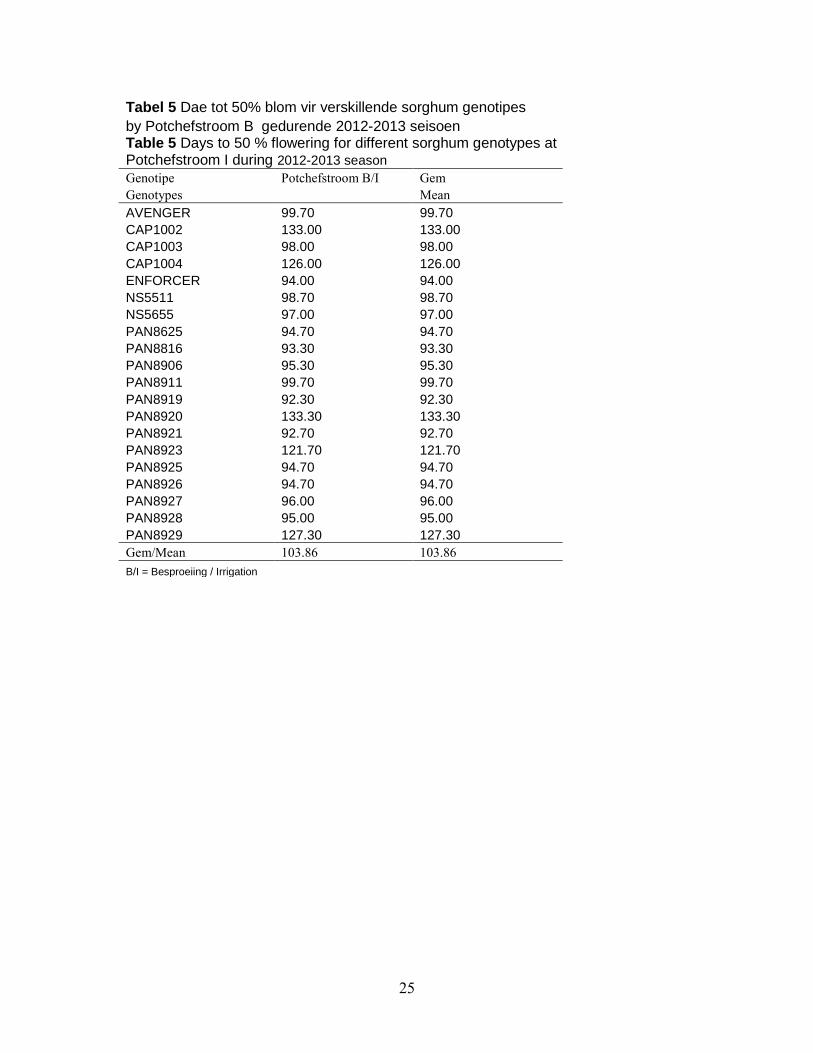
Dae tot stuifmeelstort
Aantal groeidae tot 50% stuifmeelstorting is nog altyd as 'n ruwe hulpmiddel met 'n lae
betroubaarheid beskou, maar moet behou word totdat 'n betroubaarder hulpmiddel
beskikbaar is. Beskikbare data van een lokaliteit word in Tabel 5 aangebied.
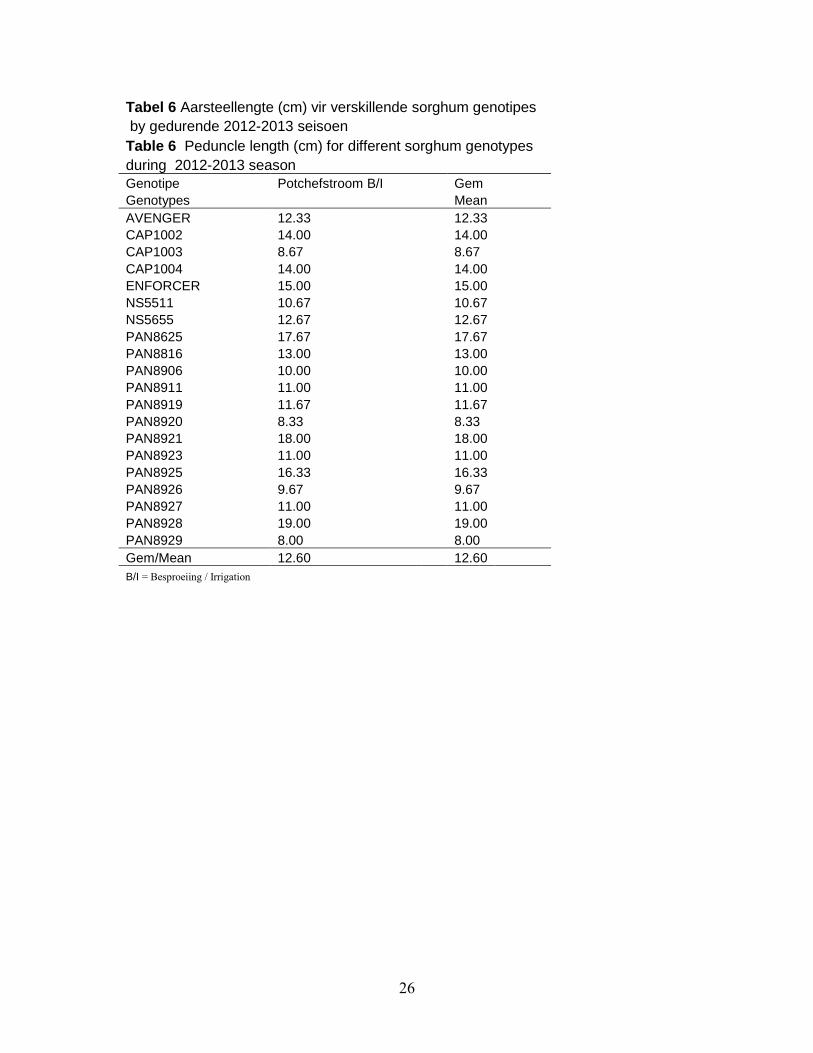
Aarsteellengte
Die vermoë van genotipes om hul are vêr genoeg bokant die boonste blaar uit te stoot om
die stroopproses te vergemaklik, word as 'n goeie eienskap beskou. Hierdie eienskap se
belangrikheid kom in werklikheid eers tydens stremmingstoestande na vore as genotipes
hul are steeds vêr genoeg bokant die blare kan uitdra. Aarsteellengte word die meeste
benadeel wanneer droogtestremming tydens aarsteelverlenging voorkom en betroubare
afleidings is nie altyd moontlik nie. Die verskil in aarsteellengte van genotipes kan
veroorsaak word deur vogstremmings wat op verskillende groeistadiums voorgekom het.
Genotipes met verskille in dae tot stuifmeelstorting toon verskillende reaksies op
vogstremmings wat op verskillende tye gedurende die groeiseisoen voorkom. Dit is dus
belangrik dat die klimaattoestande (reënval, vog en hittestremming) sowel as die
groeiseisoen van die genotipes in aanmerking geneem word by die interpretasie van die
data. Vanweë droogte en hoë temperature gedurende die seisoen is geen betroubare
resultate beskikbaar. Beskikbare data van een lokaliteit word in Tabel 6 aangebied.
7
Planthoogte
Planthoogte was gemeet by twee lokaliteite (Tabel 7) en dui verskille aan tussen
genotipes. Vanweë droogte en onvoldoende water is geen planthoogtes gedurende die
seisoen gemeet. Beskikbaarheid van water gedurende „n seisoen kan planthoogte
betekenisvol beïnvloed.
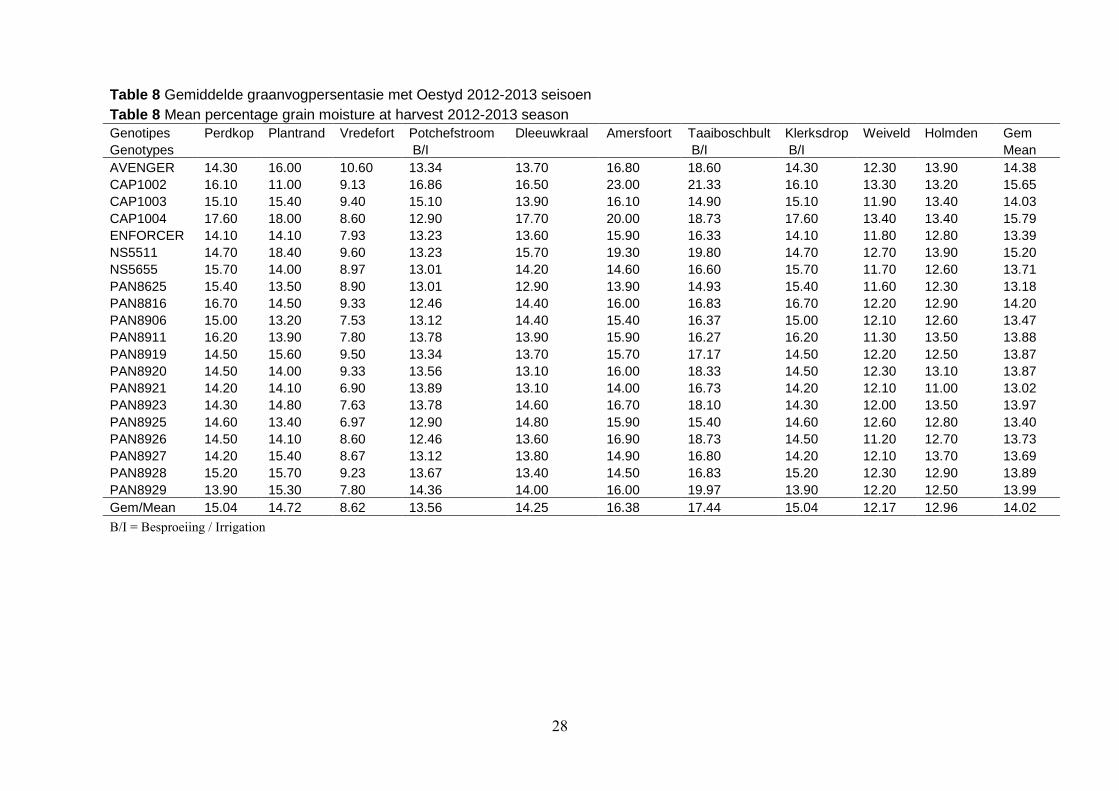
Graanvog
Die gemiddelde persentasie vog van die graan tydens oestyd, word in Tabel 8 weergegee.
Verskille in vogpersentasie tussen lokaliteite en genotipes was gemeet. Die graanvog
saam met die groeiseisoenlengte van 'n genotipe kan 'n aanduiding gee van die
pitvullings- en afdrogingstempo van spesifieke genotipes.
Graanopbrengs
Die opbrengspotensiaal en aanpassingsvermoë van genotipes in spesifieke omgewings
bly die belangrikste maatstaf om genotipeprestasie te vergelyk. Omgewingstoestande
verskil van jaar tot jaar asook van lokaliteit tot lokaliteit, en afleidings van
genotipesprestasie vanaf een jaar se data is nie so betroubaar soos vanaf meerjarige data
nie. Die gekombineerde variansieanalise (ANOVA) van die 20 genotipes oor 10
lokaliteite volgens die AMMI 2 model word weergegee in Tabel 1. Die ANOVA dui op
hoogs betekenisvolle verskille tussen lokaliteite, genotipes en genotipe x
omgewingsinteraksies. Die IPCA 1 en IPCA 2-waardes was ook hoogs betekenisvol.
Tabel 9 verteenwoordig die gemiddelde graanopbrengs van die 20 genotipes soos getoets
oor 10 omgewings (lokaliteite).
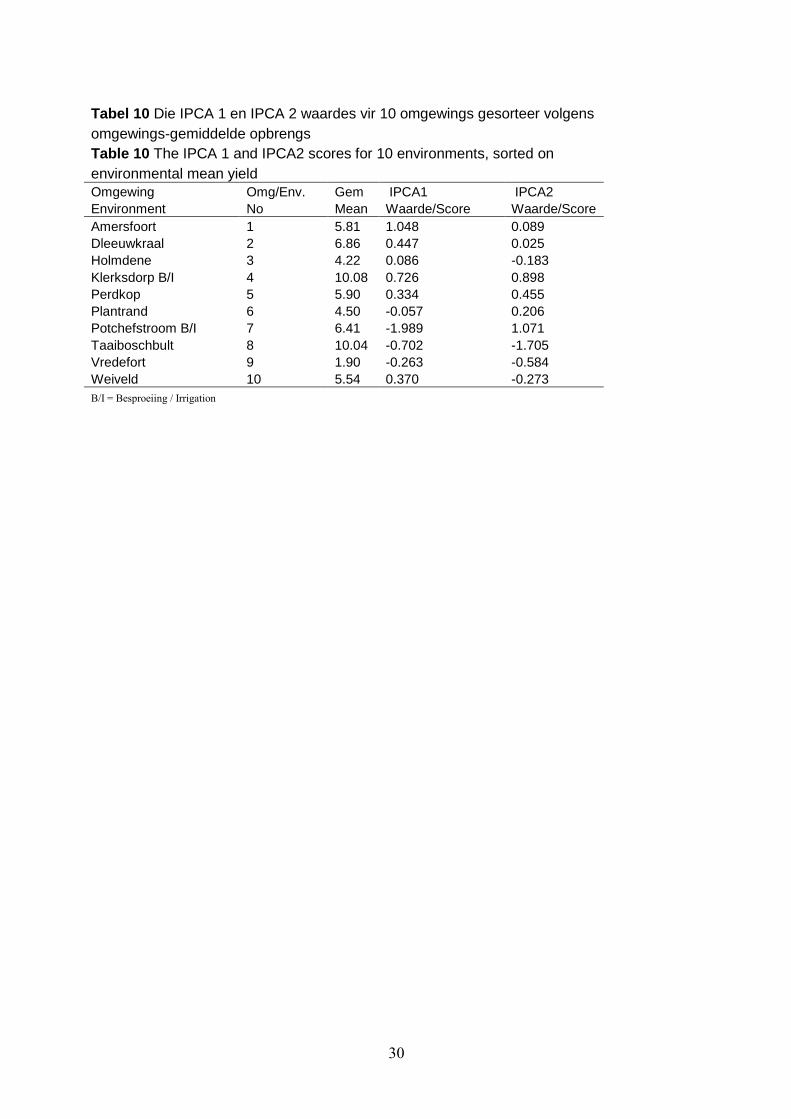
Tabel 10 dui die AMMI analise aan met die IPCA 1 en IPCA 2 waardes vir die
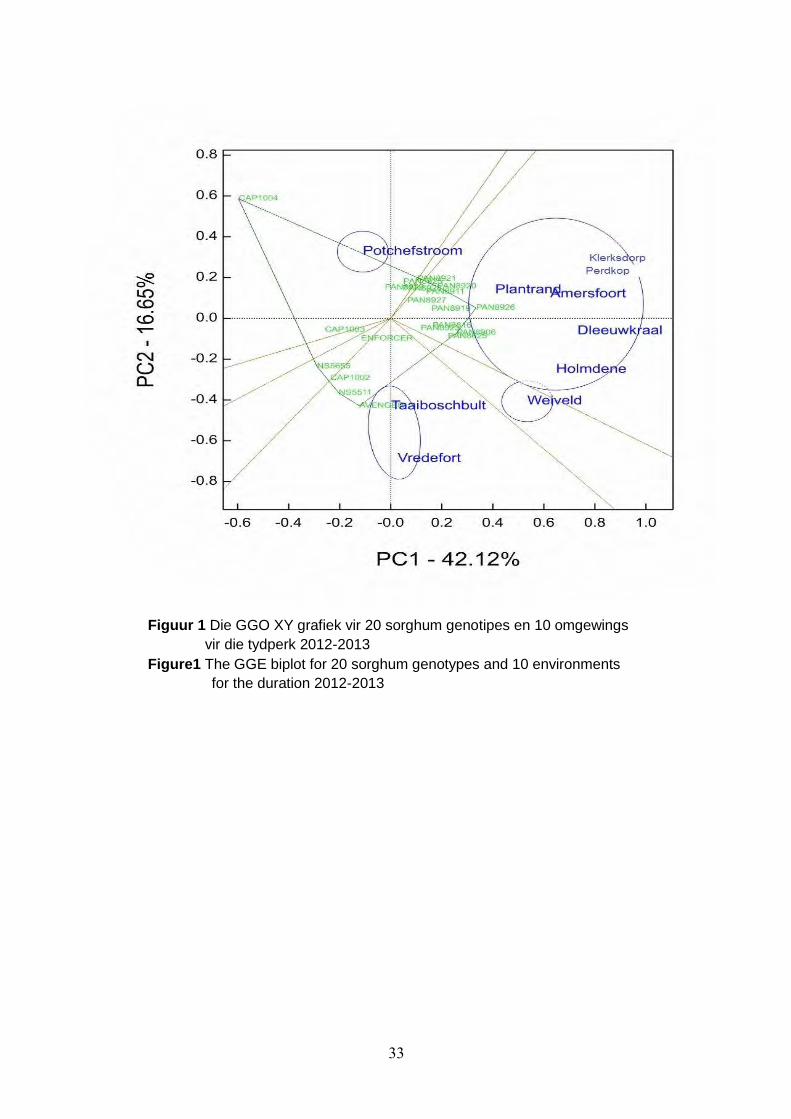
lokaliteite. 'n Genotipe en genotipe x omgewingsinteraksie (GGO) grafiek is gebruik om
die prestasie van verskillende genotipes by 'n omgewing te vergelyk, om die beste
presteerders in verskillende mega-omgewings te identifiseer en om ideale kultivars en
toets lokaliteite te identifiseer. Die grafiek wat weergegee word in die verslag is
gegenereer met die GENSTAT sagteware pakket. Figuur 1 verteenwoordig 'n sorghum
GGO grafiek vir die 2012/2013 seisoen. Toppresterende genotipes wat die beste reageer
kan visueel in die grafiek waargeneem word. Die kultivars is of die beste of swakste

8
genotipes by sommige of al die lokaliteite en kan gebruik word om potensiële mega-
omgewings te identifiseer. Genotipes wat die beste reageer vir 2012/2013 was PAN 8926,
PAN 8625, PAN 8906, AVENGER en CAP. Deur konneksie van die merkers
van genotipes word 'n poligoon gevorm en deur loodregte lyne dan na elke kant van die
poligoon te trek en wat deur die oorsprong gaan word lokaliteite verdeel in verskillende
sektore, elk met 'n verskillende hoek genotipe. Four of the four sectors contained
localities, and these were identified as the four mega-environments.
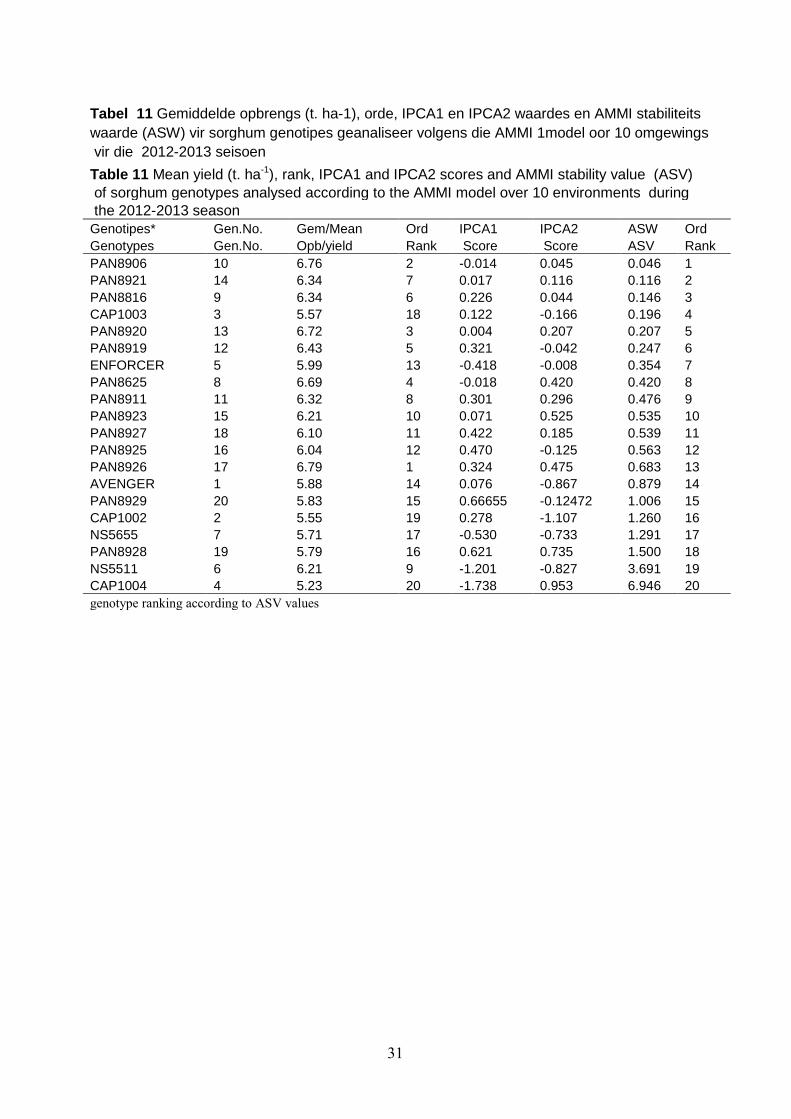
Tabel 11 verteenwoordig die AMMI stabiliteitswaardes vir elke genotipe.
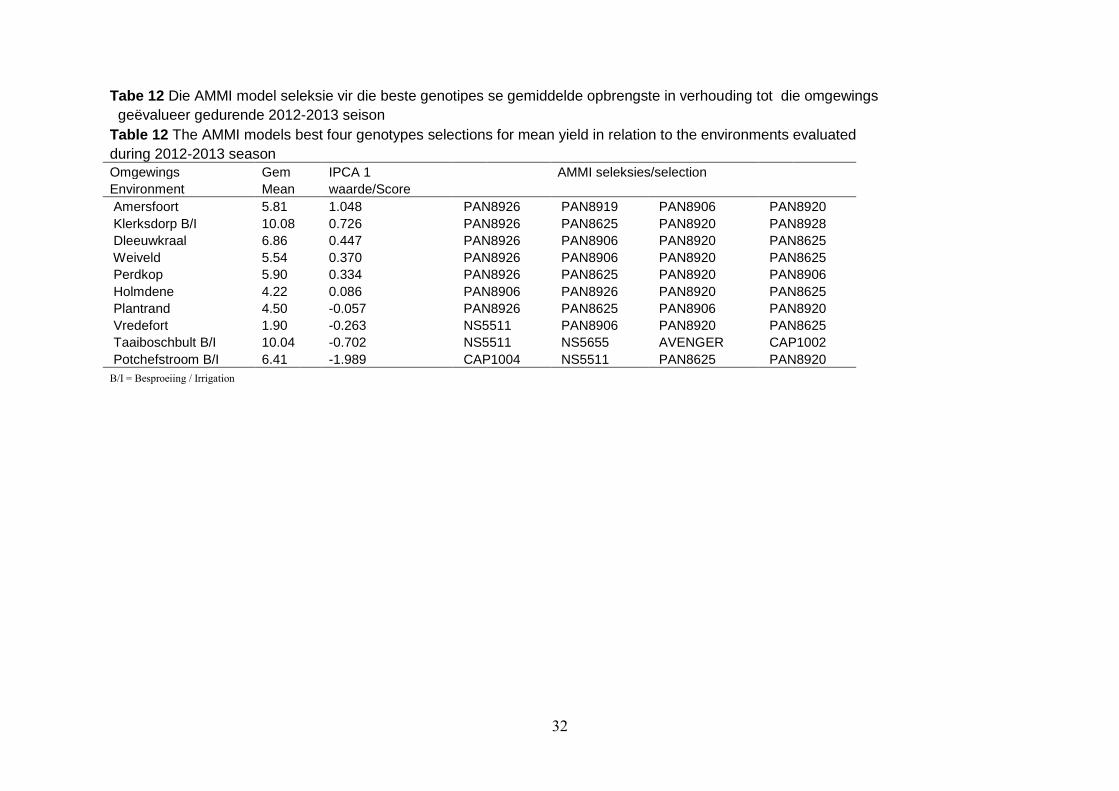
Tabel 12 dui die beste AMMI seleksies van genotipe per omgewing aan.
TWEE SEISOENALE PROEWE
Omdat daar slegs „n paar kultivars getoets is oor die laaste drie jaar is slegs die laaste
twee jaar (2011/2012 en 2012/2013) se resultate in die verslag ingesluit. Die twee
seisoene gee „n aanduiding van kultivar prestasies by spesifieke omgewingstoestande wat
ondervind is gedurende die spesifieke seisoene. Kultivaraanbevelings sal geldig wees vir
ooreenstemmende groeikondisies.
NAVORSINGSPROSEDURES
Standaard en wetenskaplik aanvaarbare prosedures is voorgeskryf vir die
navorsingsprogram en word beskryf in die jaarverslag. Slegs prosedures wat aangeneem
of wat spesifiek van toepassing is op die verslag, word hier bespreek.
Genotipesvergelykings
Om „n onbevooroordeelde vergelyking tussen genotipes te verseker, is slegs genotipes
wat ingeskryf is vir die Nasionale Sorghum Genotipes Proewe vanaf 2011/2012 ingesluit
in die verslag. Nuwe genotipes wat goeie potensiaal toon en ander genotipes wat ingesluit
was vir slegs een of twee seisoene van die drie jaar is nie ingesluit in die verslag nie.
Multiseisoenale resultate van 12 genotipes word weergegee. Die gemiddeld van proewe
is gebruik as standaard vir vergelyking in die AMMI model.
9
Statistiese analise en diagnostiek
Die graanopbrengsdata is statisties verwerk en word aangebied in die vorm van die
AMMI model en AMMI opbrengstabiliteits-waardes. Slegs daardie proewe wat aan die
vereistes van diagnostiese parameters en die uitskieterprogram voldoen het, in die twee
afsonderlike jare, is vir hierdie meerjarige genotipesvergelyking gebruik. Alle ander
proewe is dus ten opsigte van al die genotipe eienskappe as onaanvaarbare proewe
beskou en is dus nie gebruik nie.
RESULTATE
Groeitoestande
Dit is belangrik dat die groeitoestande wat gedurende die 2011/2012 tot 2012/2013
seisoene geheers het, deeglik in ag geneem word by die interpretasie van die resultate.
Dit sal verhoed dat onregverdige genotipe uitsprake gemaak word.
Groeiseisoenlengte
Die groeiseisoenlengte van die betrokke genotipes in die verslag, verskyn in Tabel 13.
Die sleutel wat aangegee word, wys relatiewe verskille uit en daar moet onthou word dat
die presiese aantal dae tot blomstadium deur omgewingstoestande verander kan word.
Die inligting in Tabel 13 is slegs 'n aanduiding van die verwagte groeiseisoenlengte van
genotipes.
Graanopbrengs
Die opbrengspotensiaal en stabiliteit van genotipes in spesifieke omgewings bly die
belangrikste maatstaf om genotipesprestasie te vergelyk. Omgewingstoestande verskil
van jaar tot jaar asook van lokaliteit tot lokaliteit, en afleidings van genotipesprestasie
vanaf een jaar se data is nie so betroubaar soos vanaf meerjarige data nie. Die
gekombineerde variansieanalise (ANOVA) van die 12 genotipes oor 23 lokaliteite en
twee jaar, volgens die AMMI 2 model, word aangedui in Tabel 14 Die ANOVA dui op
hoogs betekenisvolle verskille vir omgewings, genotipes en genotipe x
omgewingsinteraksies; die IPCA 1 en IPCA 2 – waardes was ook hoogs betekenisvol.
Multiseisoenale prestasie van spesifieke genotipes ten opsigte van graan opbrengs word
aangedui in Tabel 15
10
AMMI opbrengs stabiliteits-waardes
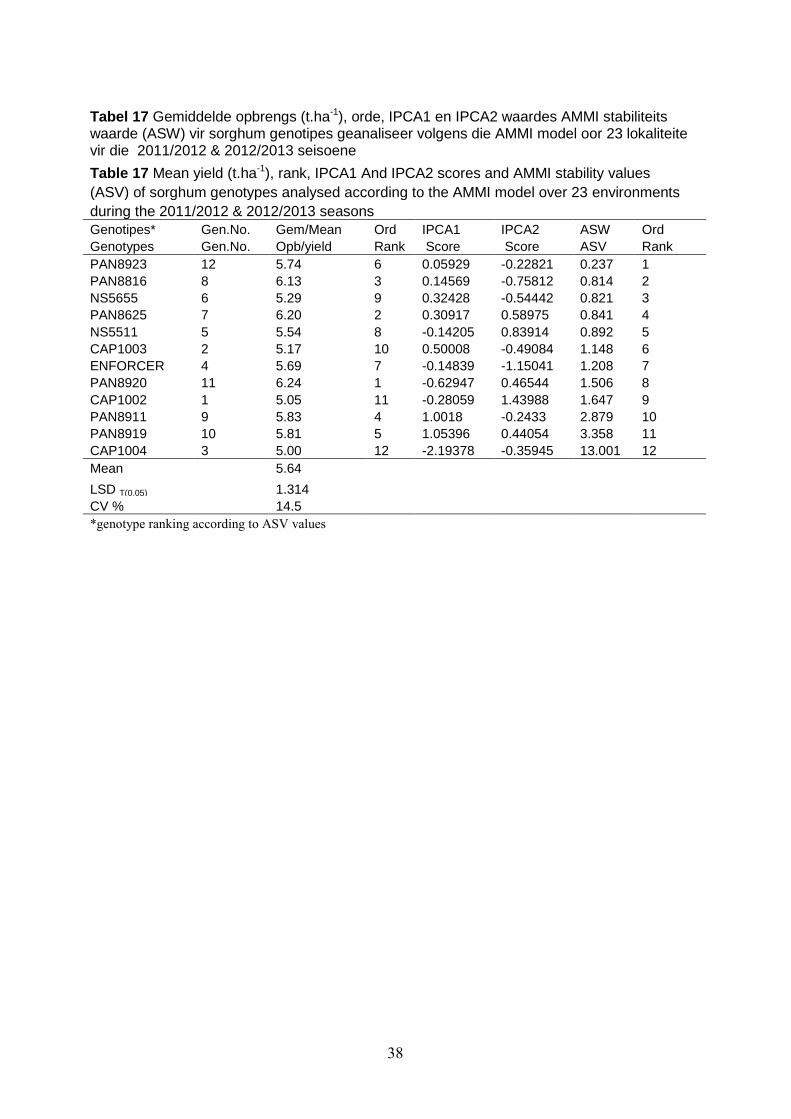
Tabel 16 verteenwoordig die AMMI analise data met die IPCA1 and IPCA2 waardes vir
die omgewings. Om aanvaarbare gevolgtrekkings oor genotipeprestasies te maak is die
AMMI opbrengstabiliteits-waarde bereken. Die waardes word weergegee in Tabel 17
Met die IPCA 1 en IPCA 2 – waardes bekend vir genotipes, kan die beste vier genotipes
vir spesifieke omgewings gekies word (Tabel 18).
In die meerjarige data vanaf 2011/012 - 2012/13 was die toppresteerders PAN 8816 PAN
8625, PAN 8919, NS 5511, CAP 1002 en CAP 1004. Die lokaliteite val in drie. PAN
8816, PAN 8625 en PAN 8919 was die beste presteerder in omgewing een, NS 5511 en
CAP 1002 in omgewing twee , CAP 1004 in drie (Figuur 2). Mega-omgewings wat
gedefinieer word deur verskillende presteerders stel die bestaan van drie mega-
omgewings in die sorghum produksiegebied.
Inligting oor die interpretasie van die resultate vir die doel van genotipes aanbevelings
word verduidelik in Aanhangsel A.
Vrywaring
Die opsteller van die dokument en enige ander bron/instansie/persoon verantwoordelik
vir enige inligting genoem in hierdie dokument is na die beste wete van die opstellers
korrek met druktyd. Die inligting is ontwikkel deur wetenskaplike prosesse en word in
goeder trou aangebied. Enige persoon/instansie wat hierdie inligting gebruik doen dit op
eie risiko en die opstellers of enige ander party sal onder geen omstandighede
verantwoordelik gehou kan word vir enige verliese gelei deur enige persoon/instansie wat
die inligting in hierdie dokument gebruik nie.
11
INTRODUCTION
This report deals with the 2012/2013 National Sorghum Cultivar Trials. The aim of this
research is to evaluate the stability of commercial genotypes to different yield potentials
as well as the agronomic and industrial value of new genotypes. Genotype entries consist
of commercial genotypes in the GM, GL and GH grading classes.
Research procedure
Standard and scientifically acceptable procedures were prescribed for the execution of
this research programme. Co-workers were given a free hand to implement the most
suitable cultivation practices in their areas in order to optimise the yield and to create
condition of varying yield potentials by manipulation date and /or irrigation frequency.
Trial design
A randomized complete block design with three replicates and consisting of 20 genotype
entries were used at all localities. Each locality was allocated its own trial randomization
that differs annually.
Genotype entries
The same 20 genotypes were used in all the trials. Seed companies nominated all the
genotypes entered in the trials. Seed company entries are in order of priority. Where too
many entries were received, the final genotype choice was made through negotiation with
each seed company.
Plot size and spacing
A gross plot size of two plant rows with a row length of 6.0 m and a net plot size with a
row length of 5.0 m were prescribed for all the trials. Row widths of 1.0 m and in-row
spacing of 7.5 cm were recommended for all trials. Sufficient seed was supplied to ensure
a good stand. When seedlings were strong enough, they were thinned out to comply with
the recommended in-row spacing.
Soil and fertilization
Soil types normally used for sorghum production were used where possible. Choosing
12
specific soil conditions and types also incorporated differences in production potentials.
Where possible, trials were planted in wire cages or under commercial conditions in
sorghum fields in order to minimize bird damage to non-bird proof types. Fertilizer
applications were not prescribed, but were applied according to soil fertility and yield
potential of the relevant area.
Planting date
Accepted planting dates for successful sorghum production in the area involved, were
recommended. The planting date was expected to be before 1 December.
Planting and harvesting methods
Trials were planted and harvested by hand or mechanical. Harvesting occurred as soon
as the grain moisture percentage was lower than 22.1 %.
Pest control
The use of suitable herbicides and insecticides were freely allowed, as effective weed and
pest control were required. Use of suitable systemic soil insecticides was also allowed.
The use of pesticides had to be reported.
Diseases
Co-workers were requested to report the incidence of any disease immediately to ensure
that the necessary follow-up action could be done. Natural infection of any disease should
be severe enough to give genotype reaction and differences.
Observations
The following information and observations are requested each year:
Fertilizer quantity, time and method of application.
Pesticide quantity, time and method of application.
Planting, plant emergence and harvesting dates.
Spacing, gross and netto plot size.
Monthly rainfall (and irrigation where applicable).
Number of days from planting to 50 % pollen shed (where possible).
13
Peduncle length (length between the collar of top leaf and bottom of the head).
Number of heads harvested (only where lodging has occurred).
Number of heads that had lodged.
Threshed grain mass.
Percentage grain moisture per genotype.
Any additional meaningful observations (e.g. any aspect denotes variance
differences).
Statistical analysis
Grain yield was the only parameter statistically analysed. In general, an AMMI analysis
was used to indicate the adaptability and stability of genotypes for different
environments. The combined analysis of variance according to the Additive Mean
Effects, and Multiplicative Interaction (AMMI) model was performed using the
GENSTAT Package (Table 1). To graphically explain the Genotype, Environment
Interaction (GEI) and adaptation of the genotypes to the environments, the GGE bi-plot
was used where the IPCA 1 scores were plotted against the IPCA 2 (Figure 1). The
Principle Component Interaction Analysis (IPCA) of genotypes in the AMMI analysis is
an indication of the stability of a genotype over environments.
The greater the IPCA scores, either negative or positive, the more specifically adapted a
genotype is, to a certain environment.
The closer IPCA scores approach zero the more stable the genotype is over all
environments sampled. AMMI Stability Value (ASV) is the distance from zero in a two
dimensional scatter-gram of IPCA 1 scores against IPCA 2 scores. As the ASV nearing
zero the genotype can be considered more stable for the environments. Additional
explanations and information about AMMI are available in Appendix A
Statistical procedures normally used to identify and exclude outlier trials from the
AMMI model were used for the purposes of this report. Certain statistical
parameters (diagnostic parameters) were also used to help in the selection of trials
for presentation.
14
The diagnostic parameters were as follows:
CV- The coefficient of variation - this parameter relates to the error of a single plot, and
as such relates to the variability as induced by soil variation or plant population
i.e. the larger the variation the larger the CV. Stress conditions (moisture,
temperature, diseases, etc.) result in acceptable soil variation to be more
pronounced in trials and a higher CV is recorded. The CV on its own cannot be
used as a parameter to discard trials.
GCV- The genetic coefficient of variation - this parameter relates to the yield differential
between the highest and lowest entry yield, relative to the trial mean i.e. the
greater the difference between the extreme values, the larger the GCV. High
values are indicative of disease sensitivity, differences in maturity stage,
temperature sensitivity and like problems.
tn- Repeatability of genotype mean yield - relates to the repeatability of entry means,
and can be defined as the relationship of genetic variance of observed means. In
genotype trials this parameter is useful only when the number of replications
between trials varies, otherwise the t-value is sufficient.
t- The repeatability of plot yield or intra class correlation coefficient - relates to the
repeatability of plot means over replications, and is interpreted as is the normal
correlation coefficient, i.e. the greater the concurrence of plot values per entry
over replications the closer “t” will strive towards unity. The standard error
calculated for a particular t-value indicates the accuracy of the estimate of “t”
SE(t)- Standard Error of the Intraclass Correlation (t) denotes how accurate the
estimation of "t" is.
t/SE(t)- This relationship is considered an important parameter as the Intraclass
Correlation (t) should be at least three times greater than it's error term. A
relationship of less than 3.0 denotes low reliability.
15
SINGLE SEASONAL RESULTS
Trial localities
Localities, trial placements and co-worker particulars for the 2012/2013 trial series
appear in Table 2.
Locality descriptions
Available information on fertilization and other relevant cultivation information appear in
Table 3. All of 10 genotype trials that have been distributed to co-workers at different
localities in the sorghum production areas were received.
Growing conditions
Growing conditions differed between localities and this must be taken into consideration
when interpreting results. Above-normal rainfall occurred during October 2012 over
much of the eastern and southern parts of the country while most of North West, the
central to northwestern Free State and the northern parts of the Northern Cape received
below-normal rainfall. During September and October above normal vegetation index
was observed over most of Limpopo, Mpumalanga, Gauteng and KwaZuluNatal due to
the relatively high rainfall. Vegetation activity is below normal over much of the North
West and central Free State, where very little precipitation has occurred. During
December 2012 to February 2013, this period constitutes an important part of the summer
rainfall season, clearly showed a large area of below-normal rainfall. Good amount of
rain occurred over much of the summer rainfall region during April 2013, after relatively
dry conditions over much of the region during especially February and March. Most of
the summer rainy region received normal to above-normal rainfall since July 2012.
However, below normal rainfall and even associated with drought conditions developed
over most of the North West, northeastern Northern Cape and western Free State
Standard of trial execution
Visits to the planted trials confirmed that prescribed procedures were followed and that
trials were satisfactorily carried out.

16
Trial failures
All the trials were successful this growing season.
Statistical diagnostics
According to the statistical parameters in Table 4 the grain yields of all tested trials were
successful.
Days to pollen shed
The number of days to 50 % pollen shed is considered a rough aid with low reliability,
but must be retained until a more reliable aid is available. Available data of one locality is
presented in Table 5.
Peduncle length
The ability of genotypes to carry their heads high enough above the top leaf and thus
facilitate harvesting is considered a desirable character. The importance of this character
is realized during conditions of drought stress.
Peduncle length is adversely affected when drought stress occurs during elongation, thus
reliable assumptions are not always possible. The difference in peduncle length of
genotypes can be caused by moisture stress occurring at different times during the
growing season. Genotypes that differ in number of days to pollen shed react differently
to moisture stress occurring at different growth stages. It is thus always important to take
climatic conditions as well as length of growing season into consideration when
interpreting this data. Available data of one locality is presented in Table 6.
Plant height
Plant height was recorded in two localities (Table 7) and indicates differences between
genotypes. The availability of moisture during the season can influence plant height
significantly.
Grain moisture
The mean percentage grain moisture at harvest is presented in Table 8. Differences in
moisture percentage between localities and genotypes were measured. The grain moisture
percentage and length of growing season of a genotype can give an indication of the rate
17
of drying.
Grain yield
The yield potential and adaptability of genotypes in specific environments are the most
important criteria for measuring genotypes performance. Environmental conditions differ
between years and localities, thus reliable and meaningful conclusions cannot be drawn
from a single year‟s yield data alone. Conclusions on genotypes performance made from
the interpretation of multi-seasonal data are more reliable than those drawn from just a
single season. The combined analysis of variance (ANOVA) of the 20 genotypes over 10
environments according to AMMI 2 model are presented in Table 1. The ANOVA
indicated highly significant differences for environments, genotypes and importantly
genotype x environment interaction. The IPCA 1 and IPCA 2 were also highly significant
Table 9 shows the mean grain yield of 20 sorghum genotypes tested at 10 environments.
Table 10 presents the AMMI analysis data with the IPCA1 and IPCA 2 scores for the
environments. Genotype and genotype x environment interaction (GGE) biplots were
used to compare the performance of different genotypes at an environment, identify the
highest yielding genotypes at the different mega environments, and identify ideal
cultivars and test locations. The biplot presented in this report was generated using the
GENSTAT software biplot package. Figure 1 represents GGE biplots for 2012/2013
season of sorghum cultivar trials. In the biplot, vertex genotypes, which are the most
responsive ones, can be visually identified. These are either the best or the poorest
genotypes at some or all locations and can be used to identify possible mega-
environments. The most responsive genotypes were: PAN 8926, PAN 8625, PAN 8906,
AVENGER and CAP 1004. By connecting the markers of the corner genotypes a
polygon is formed. By drawing perpendiculars to each side of the polygon passing
through the origin, the locations are divided among several sectors, each with a different
corner genotype. Four of the four sectors contained localities, and these were identified as
the four mega-environments.
Table 11 represents the AMMI stability values for each genotype
Table 12 indicates the best AMMI selections of genotype per environment.

18
TWO SEASONAL TRIALS
Due to the fact that a few numbers of genotypes had been tested in the last three seasons
only the results for the last two seasons (2011/2012 and 2012/2013) are included in this
report. These two season‟s genotype results are indicative of genotype performance under
specific environmental conditions experienced during the relevant two years. Genotype
recommendations will be valid for similar growing conditions.
RESEARCH PROCEDURE
Standard and scientifically acceptable procedures were prescribed for this research
programme and are described in the annual reports. Only those procedures, which were
adapted or are specifically applicable to this report, are mentioned.
Genotype comparison
To obtain a fair genotype comparison only genotypes, which were entered into the
National Sorghum Genotype Trials since 2011/2012, were included in this report.
Promising new genotypes and other genotypes that were included in one of the two years
could not be included in this report. Multi-seasonal results of 12 genotypes are presented.
The averages of trials were used as standard for comparison in the AMMI model.
Statistical analysis and diagnostics
The grain yield data were statistically analyzed and is presented in the form of the AMMI
model- and AMMI yield stability values. The only trials, which are used for this multi-
seasonal comparison, are those, which fulfilled the requirements of the diagnostic
parameters and the test for outliers during each of the three years. All the other trials are
unacceptable in respect of genotype characteristics and were thus not used.
RESULTS
Growing conditions
It is most important that the growing conditions, which prevailed during the 2011/2012 to
2012/2013 seasons, are taken into consideration with the interpretation of the results.
This will prevent incorrect genotypes comparisons.
19
Length of growing season
The length of growing season for the genotypes has been evaluated for the last two years
and is presented in Table 13. It is most important to note that the specific number of days
from plant to flowering is influenced by environmental conditions. The information in
Table 13 is merely an indication of the expected length of the growing season of
genotypes.
Grain yield
The yield potential and stability of genotypes in specific situations are the most important
criteria for measuring genotype performance. Environmental conditions differ between
years and localities, thus conclusions that are more reliable can be drawn from multi-
seasonal data than from one year's data. The combined analysis of variance (ANOVA) of
the 12 genotypes over 23 environments, and two years, according to the AMMI 2 model,
are presented in Table 14.
The ANOVA indicated highly significant differences for environments, genotypes and
importantly genotype x environment interaction; the IPCA 1 and IPCA 2 scores were also
highly significant. Multi-seasonal performance of specific genotypes in regard to grain
yield is presented in Table 15.
AMMI Yield stability values
Table 16 presents the AMMI analysis data with the IPCA1 and IPCA 2 scores for the
environments. To enable reliable conclusions on genotype performance, AMMI yield
stability values were calculated. These values are presented in Table 17 with the IPCA1
and IPCA 2 scores for the genotypes. Selection for the best four genotypes at specific
environments is presented in Table 18
In the two seasons data from 2011/12-2012/13 the vertex genotypes were PAN 8816
PAN 8625, PAN 8919, NS 5511, CAP 1002 and CAP 1004. The locations fell into three
PAN 8816, PAN 8625 and PAN 8919 was the best performing genotype for environment
one, NS 5511 and CAP 1002 for environment two, CAP 1004 for environment (Fig.2).
Therefore, mega-environments defined by different vertex genotypes suggest the
existence of three mega-environments for the sorghum producing area.

20
Information regarding the interpretation of these results for the purpose of genotype
recommendations is presented in Appendix A.
Indemnity
The composer of this document and any other source/institution/person responsible for
any information contained in this document is to the best knowledge of the composers
correct at printing. The information was developed using sound scientific procedures and
is presented in good faith. Institutions or people use this information at own risk and the
composers or any other parties will under no circumstances be under any legal obligation
regarding any losses occurring by using the information contained in this document.

21
Tabelle/Tables
Tabel 1 ANOVA analise van die sorghum genotipe evaluasie proewe met die
gebruikvan die AMMI 2 model vir die 2012-2013 seisoen. Table 1 ANOVA analysis of the sorghum genotypes evaluation trials, using the
AMMI 2 model for the 2012-2013 season Bron
Source df SS MS F F_prob Totaal/Total 599 4062 6.78 * * Behandeling/Treatment 199 3819 19.19 33.24 0 Genotipe/Genotype 19 109 5.73 9.92 0 Omgewing/Environment 9 3373 374.76 316.71 0 Blok/Block* 20 24 1.18 2.05 0.00523 Interaksie/Interaction 171 337 1.97 3.41 0 IPCA 1 27 131 4.84 8.39 0 IPCA 2 25 93 3.72 6.44 0 Res/Residual 119 113 0.95 1.65 0.00021 Fout/Error 380 219 0.58 * * * Blocks within environments

22
Table 2 Proeflokaliteite en medewerkers 2012/2013 Table 2 Trial localities and co-workers 2012/2013 LOKALITEIT/ ADRES/ADDRESS MEDEWERKER/
LOCALITY CO - WORKER
POTCHEFSTROOM POTCHEFSTROOM AGRICOL
POTCHEFSTROOM B/I ARC-GCI, PRIVATE BAG X1251, POTCHEFSTROOM D. MULLER
VREDEFORT VREDEFORT BARRY STEENKAMP/CAPSTONE SEED
PLATRAND STANDERTON - MPUMALANGA PANNAR RESEARCH SERVICES
PERDEKOP VOLKSRUST - MPUMALANGA PANNAR RESEARCH SERVICES
HOLMDENE STANDERTON - MPUMALANGA PANNAR RESEARCH SERVICES
WEIVELD PARYS - FREE STATE PANNAR RESEARCH SERVICES
KLERKSDORP KLERKSDORP - NORTH WEST PANNAR RESEARCH SERVICES
AMERSFOORT AMERSFOORT - MPUMALANGA PANNAR RESEARCH SERVICES
LEEUWKRAAL STANDERTON - MPUMALANGA PANNAR RESEARCH SERVICES
23
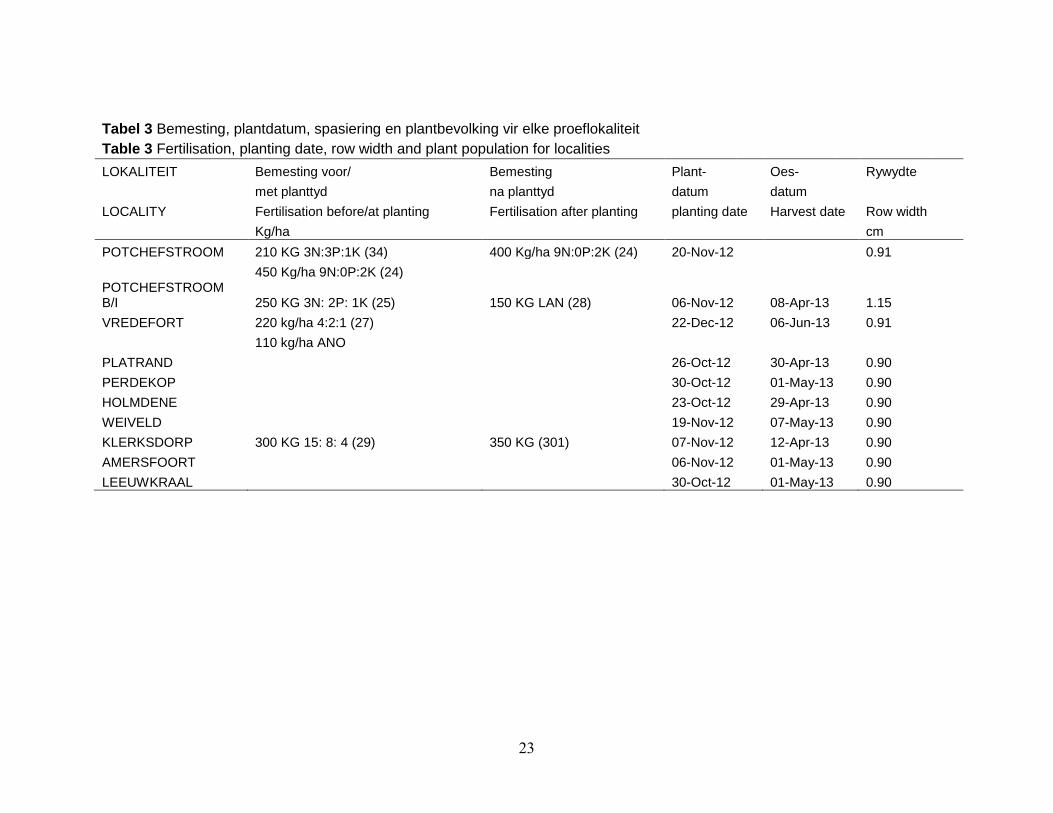
Tabel 3 Bemesting, plantdatum, spasiering en plantbevolking vir elke proeflokaliteit
Table 3 Fertilisation, planting date, row width and plant population for localities
LOKALITEIT Bemesting voor/ Bemesting Plant- Oes- Rywydte
met planttyd na planttyd datum datum
LOCALITY Fertilisation before/at planting Fertilisation after planting planting date Harvest date Row width
Kg/ha cm
POTCHEFSTROOM 210 KG 3N:3P:1K (34) 400 Kg/ha 9N:0P:2K (24) 20-Nov-12
0.91
450 Kg/ha 9N:0P:2K (24)
POTCHEFSTROOM B/I 250 KG 3N: 2P: 1K (25) 150 KG LAN (28) 06-Nov-12 08-Apr-13 1.15
VREDEFORT 220 kg/ha 4:2:1 (27)
22-Dec-12 06-Jun-13 0.91
110 kg/ha ANO
PLATRAND
26-Oct-12 30-Apr-13 0.90
PERDEKOP
30-Oct-12 01-May-13 0.90
HOLMDENE
23-Oct-12 29-Apr-13 0.90
WEIVELD
19-Nov-12 07-May-13 0.90
KLERKSDORP 300 KG 15: 8: 4 (29) 350 KG (301) 07-Nov-12 12-Apr-13 0.90
AMERSFOORT
06-Nov-12 01-May-13 0.90
LEEUWKRAAL 30-Oct-12 01-May-13 0.90
24
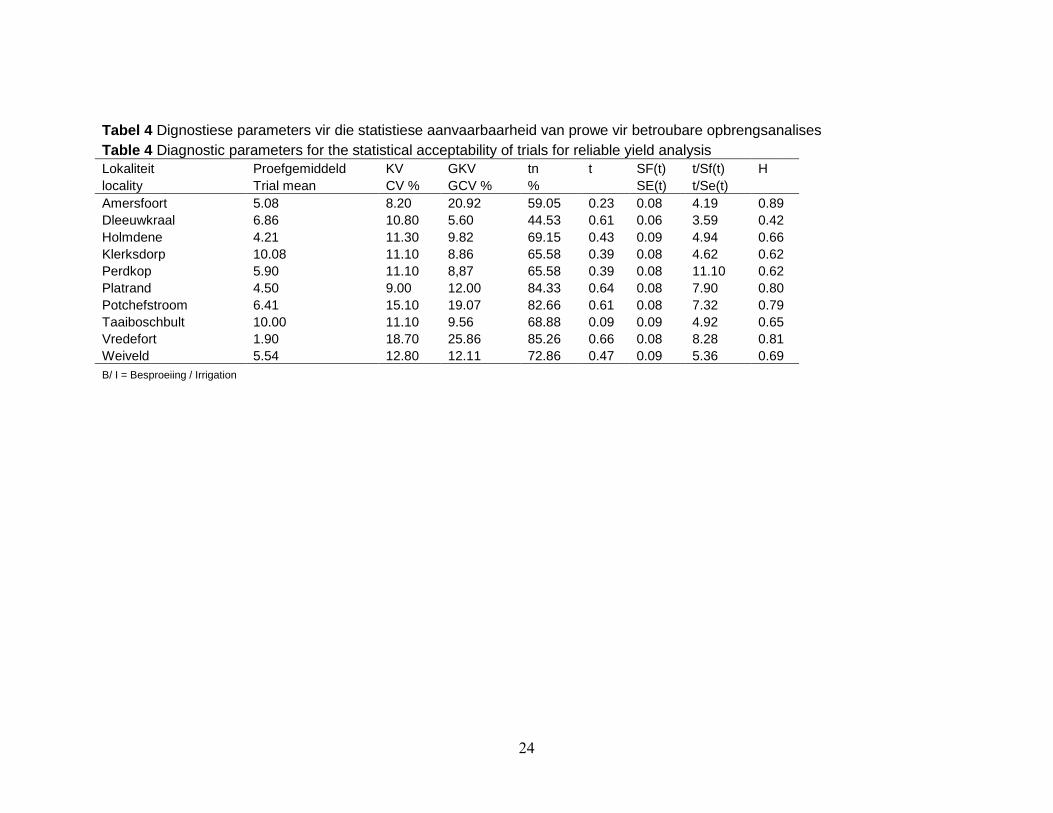
Tabel 4 Dignostiese parameters vir die statistiese aanvaarbaarheid van prowe vir betroubare opbrengsanalises
Table 4 Diagnostic parameters for the statistical acceptability of trials for reliable yield analysis Lokaliteit Proefgemiddeld KV GKV tn t SF(t) t/Sf(t) H
locality Trial mean CV % GCV % %
SE(t) t/Se(t)
Amersfoort 5.08 8.20 20.92 59.05 0.23 0.08 4.19 0.89
Dleeuwkraal 6.86 10.80 5.60 44.53 0.61 0.06 3.59 0.42
Holmdene 4.21 11.30 9.82 69.15 0.43 0.09 4.94 0.66
Klerksdorp 10.08 11.10 8.86 65.58 0.39 0.08 4.62 0.62
Perdkop 5.90 11.10 8,87 65.58 0.39 0.08 11.10 0.62
Platrand 4.50 9.00 12.00 84.33 0.64 0.08 7.90 0.80
Potchefstroom 6.41 15.10 19.07 82.66 0.61 0.08 7.32 0.79
Taaiboschbult 10.00 11.10 9.56 68.88 0.09 0.09 4.92 0.65
Vredefort 1.90 18.70 25.86 85.26 0.66 0.08 8.28 0.81
Weiveld 5.54 12.80 12.11 72.86 0.47 0.09 5.36 0.69
B/ I = Besproeiing / Irrigation
25
Tabel 5 Dae tot 50% blom vir verskillende sorghum genotipes
by Potchefstroom B gedurende 2012-2013 seisoen Table 5 Days to 50 % flowering for different sorghum genotypes at
Potchefstroom I during 2012-2013 season Genotipe Potchefstroom B/I Gem
Genotypes Mean AVENGER 99.70 99.70 CAP1002 133.00 133.00 CAP1003 98.00 98.00 CAP1004 126.00 126.00 ENFORCER 94.00 94.00 NS5511 98.70 98.70 NS5655 97.00 97.00 PAN8625 94.70 94.70 PAN8816 93.30 93.30 PAN8906 95.30 95.30 PAN8911 99.70 99.70 PAN8919 92.30 92.30 PAN8920 133.30 133.30 PAN8921 92.70 92.70 PAN8923 121.70 121.70 PAN8925 94.70 94.70 PAN8926 94.70 94.70 PAN8927 96.00 96.00 PAN8928 95.00 95.00 PAN8929 127.30 127.30 Gem/Mean 103.86 103.86 B/I = Besproeiing / Irrigation
26
Tabel 6 Aarsteellengte (cm) vir verskillende sorghum genotipes
by gedurende 2012-2013 seisoen Table 6 Peduncle length (cm) for different sorghum genotypes
during 2012-2013 season Genotipe Potchefstroom B/I Gem Genotypes Mean AVENGER 12.33 12.33 CAP1002 14.00 14.00 CAP1003 8.67 8.67 CAP1004 14.00 14.00 ENFORCER 15.00 15.00 NS5511 10.67 10.67 NS5655 12.67 12.67 PAN8625 17.67 17.67 PAN8816 13.00 13.00 PAN8906 10.00 10.00 PAN8911 11.00 11.00 PAN8919 11.67 11.67 PAN8920 8.33 8.33 PAN8921 18.00 18.00 PAN8923 11.00 11.00 PAN8925 16.33 16.33 PAN8926 9.67 9.67 PAN8927 11.00 11.00 PAN8928 19.00 19.00 PAN8929 8.00 8.00 Gem/Mean 12.60 12.60 B/I = Besproeiing / Irrigation

27
Tabel 7 Plant hoogte (cm) vir verskillende sorghum genotipes by
gedurende 2012-2013 seisoen Table 7 Plant height (cm) for different sorghum genotypes
during 2012-2013 season Genotipe Potchefstroom Vredefort Gem
Genotypes B/I Mean
AVENGER 153.30 105.00 129.15
CAP1002 201.70 130.00 165.85
CAP1003 158.30 130.00 144.15
CAP1004 198.30 155.00 176.65
ENFORCER 138.30 105.00 121.65
NS5511 163.30 115.00 139.15
NS5655 151.70 80.00 115.85
PAN8625 155.00 95.00 125.00
PAN8816 145.00 105.00 125.00
PAN8906 126.70 95.00 110.85
PAN8911 125.00 105.00 115.00
PAN8919 126.70 80.00 103.35
PAN8920 133.30 100.00 116.65
PAN8921 135.00 90.00 112.50
PAN8923 123.30 80.00 101.65
PAN8925 138.30 115.00 126.65
PAN8926 136.70 80.00 108.35
PAN8927 125.00 85.00 105.00
PAN8928 123.30 80.00 101.65
PAN8929 128.30 80.00 104.15
Gem/Mean 144.33 100.50 122.41
28
Table 8 Gemiddelde graanvogpersentasie met Oestyd 2012-2013 seisoen Table 8 Mean percentage grain moisture at harvest 2012-2013 season
Genotipes Perdkop Plantrand Vredefort Potchefstroom Dleeuwkraal Amersfoort Taaiboschbult Klerksdrop Weiveld Holmden Gem Genotypes B/I B/I B/I Mean AVENGER 14.30 16.00 10.60 13.34 13.70 16.80 18.60 14.30 12.30 13.90 14.38 CAP1002 16.10 11.00 9.13 16.86 16.50 23.00 21.33 16.10 13.30 13.20 15.65 CAP1003 15.10 15.40 9.40 15.10 13.90 16.10 14.90 15.10 11.90 13.40 14.03 CAP1004 17.60 18.00 8.60 12.90 17.70 20.00 18.73 17.60 13.40 13.40 15.79 ENFORCER 14.10 14.10 7.93 13.23 13.60 15.90 16.33 14.10 11.80 12.80 13.39 NS5511 14.70 18.40 9.60 13.23 15.70 19.30 19.80 14.70 12.70 13.90 15.20 NS5655 15.70 14.00 8.97 13.01 14.20 14.60 16.60 15.70 11.70 12.60 13.71 PAN8625 15.40 13.50 8.90 13.01 12.90 13.90 14.93 15.40 11.60 12.30 13.18 PAN8816 16.70 14.50 9.33 12.46 14.40 16.00 16.83 16.70 12.20 12.90 14.20 PAN8906 15.00 13.20 7.53 13.12 14.40 15.40 16.37 15.00 12.10 12.60 13.47 PAN8911 16.20 13.90 7.80 13.78 13.90 15.90 16.27 16.20 11.30 13.50 13.88 PAN8919 14.50 15.60 9.50 13.34 13.70 15.70 17.17 14.50 12.20 12.50 13.87 PAN8920 14.50 14.00 9.33 13.56 13.10 16.00 18.33 14.50 12.30 13.10 13.87 PAN8921 14.20 14.10 6.90 13.89 13.10 14.00 16.73 14.20 12.10 11.00 13.02 PAN8923 14.30 14.80 7.63 13.78 14.60 16.70 18.10 14.30 12.00 13.50 13.97 PAN8925 14.60 13.40 6.97 12.90 14.80 15.90 15.40 14.60 12.60 12.80 13.40 PAN8926 14.50 14.10 8.60 12.46 13.60 16.90 18.73 14.50 11.20 12.70 13.73 PAN8927 14.20 15.40 8.67 13.12 13.80 14.90 16.80 14.20 12.10 13.70 13.69 PAN8928 15.20 15.70 9.23 13.67 13.40 14.50 16.83 15.20 12.30 12.90 13.89 PAN8929 13.90 15.30 7.80 14.36 14.00 16.00 19.97 13.90 12.20 12.50 13.99 Gem/Mean 15.04 14.72 8.62 13.56 14.25 16.38 17.44 15.04 12.17 12.96 14.02 B/I = Besproeiing / Irrigation

29
Tabel 9 Gemiddelde graanopbrengs (t. ha-1 ) vir sorghum genotipes by verskillende omgewings gedurende 2012-2013 seison Table 9 Mean yield (t. ha-1 ) for different sorghum genotypes under different environments during the 2012-2013 season
Genotipes Amersfoort Dleeuwkraal
Holmdene
Klerksdorp Perdkop Plantrand Potchefstroom Taaiboschbult Vredefort Weiveld Gem
Genotypes B/I B/I B/I Mean
AVENGER 4.73 6.58 4.14 9.11 5.34 4.42 4.81 10.75 2.79 6.10 5.88
CAP1002 5.52 6.44 4.25 8.79 5.15 3.07 4.14 11.20 2.07 4.90 5.55
CAP1003 5.71 6.56 2.99 8.72 5.11 4.22 5.52 9.06 2.25 5.59 5.57
CAP1004 3.17 5.25 3.04 8.81 5.16 4.02 9.89 8.85 0.99 3.14 5.23
ENFORCER 4.98 6.35 4.25 9.36 5.48 4.60 7.03 9.78 2.15 5.89 5.99
NS5511 4.71 6.73 4.27 8.50 4.98 4.22 8.15 12.43 2.54 5.60 6.21
NS5655 4.73 6.10 4.10 8.44 4.95 4.25 6.18 11.03 2.29 5.05 5.71
PAN8625 6.40 6.93 4.80 11.31 6.63 4.55 7.55 9.87 2.45 6.44 6.69
PAN8816 5.94 7.27 4.71 10.28 6.02 4.85 6.24 9.87 1.55 6.64 6.34
PAN8906 5.76 7.40 4.55 11.36 6.66 5.87 6.79 10.92 2.44 5.82 6.75
PAN8911 6.43 6.87 4.24 10.60 6.21 5.00 6.41 9.55 1.33 6.57 6.32
PAN8919 7.01 7.07 4.58 10.73 6.28 4.48 6.23 10.61 1.54 5.79 6.43
PAN8920 8.18 7.67 4.13 10.90 6.39 4.06 7.86 11.07 1.59 5.33 6.72
PAN8921 6.53 6.62 4.68 10.28 6.02 5.34 6.78 10.39 1.02 5.69 6.33
PAN8923 4.61 7.26 4.47 10.97 6.43 4.64 6.55 8.69 2.43 6.04 6.21
PAN8925 6.38 7.26 4.06 10.27 6.02 5.03 5.15 10.23 1.35 4.68 6.04
PAN8926 6.71 7.55 4.94 12.40 7.26 4.17 6.94 10.27 2.19 5.42 6.78
PAN8927 6.56 7.25 4.10 10.32 6.04 4.18 5.91 9.37 1.63 5.69 6.10
PAN8928 6.05 7.41 4.16 9.72 5.69 4.97 5.53 6.92 1.89 5.60 5.79
PAN8929 6.04 6.71 3.92 10.67 6.25 4.07 4.52 9.93 1.44 4.78 5.83
Gem/Mean 5.81 6.86 4.22 10.08 5.90 4.50 6.41 10.04 1.90 5.54 6.12
CV% 8.20 10.80 11.30 11.10 11.10 9.00 15.10 11.10 18.20 12.80 12.7
LSD T (0.05) 0.786 1.226 0.790 1.850 1.084 0.665 1.600 1.843 0.584 1.171 1.250
B/ I = Besproeiing / Irrigation
30
Tabel 10 Die IPCA 1 en IPCA 2 waardes vir 10 omgewings gesorteer volgens
omgewings-gemiddelde opbrengs Table 10 The IPCA 1 and IPCA2 scores for 10 environments, sorted on
environmental mean yield Omgewing Omg/Env. Gem IPCA1 IPCA2
Environment No Mean Waarde/Score Waarde/Score Amersfoort 1 5.81 1.048 0.089 Dleeuwkraal 2 6.86 0.447 0.025 Holmdene 3 4.22 0.086 -0.183 Klerksdorp B/I 4 10.08 0.726 0.898 Perdkop 5 5.90 0.334 0.455 Plantrand 6 4.50 -0.057 0.206 Potchefstroom B/I 7 6.41 -1.989 1.071 Taaiboschbult 8 10.04 -0.702 -1.705 Vredefort 9 1.90 -0.263 -0.584 Weiveld 10 5.54 0.370 -0.273 B/I = Besproeiing / Irrigation
31
Tabel 11 Gemiddelde opbrengs (t. ha-1), orde, IPCA1 en IPCA2 waardes en AMMI stabiliteits
waarde (ASW) vir sorghum genotipes geanaliseer volgens die AMMI 1model oor 10 omgewings
vir die 2012-2013 seisoen Table 11 Mean yield (t. ha-1), rank, IPCA1 and IPCA2 scores and AMMI stability value (ASV)
of sorghum genotypes analysed according to the AMMI model over 10 environments during
the 2012-2013 season Genotipes* Gen.No. Gem/Mean Ord IPCA1 IPCA2 ASW Ord
Genotypes Gen.No. Opb/yield Rank Score Score ASV Rank PAN8906 10 6.76 2 -0.014 0.045 0.046 1 PAN8921 14 6.34 7 0.017 0.116 0.116 2 PAN8816 9 6.34 6 0.226 0.044 0.146 3 CAP1003 3 5.57 18 0.122 -0.166 0.196 4 PAN8920 13 6.72 3 0.004 0.207 0.207 5 PAN8919 12 6.43 5 0.321 -0.042 0.247 6 ENFORCER 5 5.99 13 -0.418 -0.008 0.354 7 PAN8625 8 6.69 4 -0.018 0.420 0.420 8 PAN8911 11 6.32 8 0.301 0.296 0.476 9 PAN8923 15 6.21 10 0.071 0.525 0.535 10 PAN8927 18 6.10 11 0.422 0.185 0.539 11 PAN8925 16 6.04 12 0.470 -0.125 0.563 12 PAN8926 17 6.79 1 0.324 0.475 0.683 13 AVENGER 1 5.88 14 0.076 -0.867 0.879 14 PAN8929 20 5.83 15 0.66655 -0.12472 1.006 15 CAP1002 2 5.55 19 0.278 -1.107 1.260 16 NS5655 7 5.71 17 -0.530 -0.733 1.291 17 PAN8928 19 5.79 16 0.621 0.735 1.500 18 NS5511 6 6.21 9 -1.201 -0.827 3.691 19 CAP1004 4 5.23 20 -1.738 0.953 6.946 20 genotype ranking according to ASV values
32
Tabe 12 Die AMMI model seleksie vir die beste genotipes se gemiddelde opbrengste in verhouding tot die omgewings
geëvalueer gedurende 2012-2013 seison Table 12 The AMMI models best four genotypes selections for mean yield in relation to the environments evaluated
during 2012-2013 season Omgewings Gem IPCA 1 AMMI seleksies/selection
Environment Mean waarde/Score
Amersfoort 5.81 1.048 PAN8926 PAN8919 PAN8906 PAN8920
Klerksdorp B/I 10.08 0.726 PAN8926 PAN8625 PAN8920 PAN8928
Dleeuwkraal 6.86 0.447 PAN8926 PAN8906 PAN8920 PAN8625
Weiveld 5.54 0.370 PAN8926 PAN8906 PAN8920 PAN8625
Perdkop 5.90 0.334 PAN8926 PAN8625 PAN8920 PAN8906
Holmdene 4.22 0.086 PAN8906 PAN8926 PAN8920 PAN8625
Plantrand 4.50 -0.057 PAN8926 PAN8625 PAN8906 PAN8920
Vredefort 1.90 -0.263 NS5511 PAN8906 PAN8920 PAN8625
Taaiboschbult B/I 10.04 -0.702 NS5511 NS5655 AVENGER CAP1002
Potchefstroom B/I 6.41 -1.989 CAP1004 NS5511 PAN8625 PAN8920
B/I = Besproeiing / Irrigation
33
Figuur 1 Die GGO XY grafiek vir 20 sorghum genotipes en 10 omgewings
vir die tydperk 2012-2013 Figure1 The GGE biplot for 20 sorghum genotypes and 10 environments
for the duration 2012-2013

34
Tabel 13 Groeiseisoenlengte vir spesifieke genotipes wat getoets is gedurende 2011/2012
& 2012/2013 Table 13 Length of growing season for specific genotype tested during 2011/2012 &
2012/2013 season Genotipes Groeiseisoenlengte
Genotypes Length of growing season
CAP1002 S CAP1003 S CAP1004 M ENFORCER M NS5511 L NS5655 M PAN8625 L PAN8816 M-L PAN8911 S-M PAN8919 M PAN8920 M PAN8923 M Dae tot Blom/ Days to flowering Kort(k)/Short(S) Medium(M) Lank(L)Long
Warm streke/ hot areas 70-75 75-80 80-85
Tabel 14 Die gekombineerde variansie analise (ANOVA) van 12 genotipes oor 23
omgewing Volgens die AMMI 2 model Table 14 The combined analysis of variance (ANOVA) of 12 genotype over 23
environments according to AMMI 2 model Bron / Source df SS MS F F_prob
Totaal/Total 827 5592 6.76 * * Behandeling/Treatment 275 5222 18.99 31.23 0 Genotipe/Genotype 11 145 13.18 21.67 0 Omgewing/Environment 22 4465 202.96 150.02 0 Blok/Block * 46 62 1.35 2.23 0.00002 Interaksie/Interaction 242 612 2.53 4.16 0 IPCA 1 32 188 5.88 9.67 0 IPCA 2 30 116 3.86 6.35 0 Res/Residual 180 308 1.71 2.81 0 Fout/Error 506 308 0.61 * * * Blocks within environments

35
Tabel 15 Gemiddelde graanopbrengs (ton. ha-1) vir sorghum genotipes by verskillende
omgewings gedurende 2011/2012 & 2012/2013 seisoene Table 15 Mean yield (t. ha-1) for different sorghum genotypes under different environments
during the 2011/2012 & 2012/2013 seasons Omgewings CAP1002 CAP1003 CAP1004 ENFORCER NS5511 NS5655
Environment
Taaiboschbult13 11.20 9.06 8.85 9.78 12.43 11.03
Klerksdorp13 8.79 8.72 8.81 9.36 8.50 8.44
Platrand A12 8.47 8.20 6.81 8.57 9.07 8.58
Potchefstroom Early12 7.60 7.39 10.09 9.60 6.49 8.64
Potchefstroom12 9.37 7.18 9.32 8.19 7.52 5.98
Potchefstroom13 4.14 5.52 9.89 7.03 8.15 6.18
Dleeuwkraal13 6.44 6.56 5.25 6.35 6.73 6.10
Potchefstroom Late12 4.01 6.94 5.06 9.26 6.68 6.71
Klerksdorp12 5.15 5.19 5.63 5.58 6.11 5.76
Perdkop13 5.15 5.11 5.16 5.48 4.98 4.95
Amersfoort13 5.52 5.71 3.17 4.98 4.71 4.73
Weiveld13 4.90 5.59 3.14 5.89 5.60 5.05
Weiveld12 4.59 4.60 4.14 4.55 4.81 4.78
Perdkop12 4.55 4.36 4.64 4.46 4.41 4.32
Bethlehem12 2.26 5.58 1.64 5.52 3.96 5.61
Plantrand13 3.07 4.22 4.02 4.60 4.22 4.25
Parys12 4.84 3.63 3.78 4.00 6.63 3.04
Holmdene13 4.25 2.99 3.04 4.25 4.27 4.10
Holmdene12 3.27 2.85 3.34 3.43 3.84 4.06
Platrand E12 2.23 1.94 2.96 3.38 2.64 2.95
Senekal-Steynsrus12 3.05 3.37 2.88 2.18 1.85 2.51
Vredefort13 2.07 2.25 0.99 2.15 2.54 2.29
Villiers12 1.15 1.85 2.44 2.24 1.37 1.69
Mean 5.05 5.17 5.00 5.69 5.54 5.29
LSD T(0.05) CV %

36
Tabel 15 Vervolg Tabel 15 Continued Omgewings PAN8625 PAN8816 PAN8911 PAN8919 PAN8920 PAN8923 Gem
Environment Mean
Taaiboschbult13 9.87 9.87 9.55 10.61 11.08 8.69 10.17
Klerksdorp13 11.31 10.28 10.60 10.73 10.90 10.97 9.78
Platrand A12 11.31 10.44 10.65 10.16 11.50 9.49 9.44
Potchefstroom Early12 9.45 9.87 7.03 6.27 10.83 8.72 8.50
Potchefstroom12 8.35 9.12 6.85 6.96 9.67 7.67 8.01
Potchefstroom13 7.55 6.24 6.41 6.23 7.86 6.55 6.81
Dleeuwkraal13 6.93 7.27 6.87 7.07 7.67 7.26 6.71
Potchefstroom Late12 4.34 8.25 6.64 6.48 7.42 6.31 6.51
Klerksdorp12 7.04 7.28 6.55 7.04 5.85 7.30 6.21
Perdkop13 6.63 6.02 6.21 6.28 6.39 6.43 5.73
Amersfoort13 6.40 5.94 6.43 7.01 8.18 4.61 5.62
Weiveld13 6.44 6.64 6.57 5.79 5.33 6.04 5.58
Weiveld12 5.82 5.24 5.59 5.89 5.67 5.59 5.11
Perdkop12 5.21 5.38 5.14 5.92 5.50 5.99 4.99
Bethlehem12 6.27 5.08 5.62 5.44 2.83 3.80 4.47
Plantrand13 4.55 4.85 5.00 4.48 4.06 4.64 4.33
Parys12 5.47 3.00 3.16 4.41 4.72 3.70 4.20
Holmdene13 4.80 4.71 4.24 4.58 4.13 4.47 4.15
Holmdene12 4.27 4.34 4.19 3.28 3.83 3.04 3.65
Platrand E12 4.10 3.99 4.23 3.67 3.51 3.44 3.25
Senekal-Steynsrus12 2.68 3.10 3.47 2.20 3.09 3.27 2.80
Vredefort13 2.45 1.55 1.33 1.54 1.59 2.43 1.93
Villiers12 1.35 2.53 1.69 1.50 1.89 1.56 1.77
Mean 6.20 6.13 5.83 5.81 6.24 5.74 5.64
LSD T(0.05)
1.314
CV % 14.5
12 & 13 = 2012 & 2013 seisoene, Platrand (A & E) on site with two different localities

37
Tabel 16 Die IPCA 1 en IPCA 2 waardes vir 23 omgewings gesorteer volgens
omgewings-gemiddelde opbrengs. Table 16 The IPCA 1 and IPCA2 scores for 23 environments, sorted on
environmental mean yield. Omgewing Omg/Env. Gem IPCA1 IPCA2
Environment No Mean Waarde/Score Waarde/Score
Taaiboschbult13 19 10.17 -0.0431 0.9065
Klerksdorp13 8 9.78 0.2484 0.1094
Platrand A12 2 9.44 0.6653 0.4370
Potchefstroom Early12 16 8.50 -1.2467 -0.6965
Potchefstroom12 14 8.01 -1.1119 0.4045
Potchefstroom13 15 6.81 -1.2737 -0.2826
Dleeuwkraal13 4 6.71 0.2168 0.1955
Potchefstroom Late12 17 6.51 0.1730 -1.3680
Klerksdorp12 7 6.21 0.1856 -0.0472
Perdkop13 11 5.73 0.0692 0.0706
Amersfoort13 1 5.62 0.6092 0.5307
Weiveld13 23 5.58 0.7174 -0.1174
Weiveld12 22 5.11 0.2273 0.1965
Perdkop12 10 4.99 0.0072 0.0990
Bethlehem12 3 4.47 1.2649 -0.7620
Plantrand13 12 4.33 0.0809 -0.3971
Parys12 9 4.20 -0.3340 1.0807
Holmdene13 6 4.15 0.1488 0.2051
Holmdene12 5 3.65 -0.0804 0.0024
Platrand E12 13 3.25 0.0532 -0.1866
Senekal-Steynsrus12 18 2.80 -0.1780 -0.0758
Vredefort13 21 1.93 0.0081 0.1326
Villiers12 20 1.77 -0.4075 -0.4375
12 & 13 = 2012 & 2013 seisoene 12 & 13 = 2012 & 2013 seasons Platrand (A & E) on site with two different localities
38
Tabel 17 Gemiddelde opbrengs (t.ha-1), orde, IPCA1 en IPCA2 waardes AMMI stabiliteits waarde (ASW) vir sorghum genotipes geanaliseer volgens die AMMI model oor 23 lokaliteite vir die 2011/2012 & 2012/2013 seisoene
Table 17 Mean yield (t.ha-1), rank, IPCA1 And IPCA2 scores and AMMI stability values
(ASV) of sorghum genotypes analysed according to the AMMI model over 23 environments
during the 2011/2012 & 2012/2013 seasons Genotipes* Gen.No. Gem/Mean Ord IPCA1 IPCA2 ASW Ord
Genotypes Gen.No. Opb/yield Rank Score Score ASV Rank
PAN8923 12 5.74 6 0.05929 -0.22821 0.237 1
PAN8816 8 6.13 3 0.14569 -0.75812 0.814 2
NS5655 6 5.29 9 0.32428 -0.54442 0.821 3
PAN8625 7 6.20 2 0.30917 0.58975 0.841 4
NS5511 5 5.54 8 -0.14205 0.83914 0.892 5
CAP1003 2 5.17 10 0.50008 -0.49084 1.148 6
ENFORCER 4 5.69 7 -0.14839 -1.15041 1.208 7
PAN8920 11 6.24 1 -0.62947 0.46544 1.506 8
CAP1002 1 5.05 11 -0.28059 1.43988 1.647 9
PAN8911 9 5.83 4 1.0018 -0.2433 2.879 10
PAN8919 10 5.81 5 1.05396 0.44054 3.358 11
CAP1004 3 5.00 12 -2.19378 -0.35945 13.001 12
Mean 5.64
LSD T(0.05)
1.314 CV % 14.5
*genotype ranking according to ASV values

39
Tabel 18 Die AMMI model seleksie vir die beste genotipes se gemiddelde opbrengste in verhouding tot die 23
omgewings geëvalueer gedurende 2011/2012 & 2012/2013 seisoene Table 18 The AMMI models best genotypes selections for mean yield in relation to the 23 environments
evaluated during 2011/2012 & 2012/2013 seasons Omgewings Gem IPCA 1 AMMI seleksies/selection
Environment Mean Waarde/Score
Taaiboschbult13 10.17 -0.043 PAN8625 PAN8920 CAP1002 NS5511
Klerksdorp13 9.78 0.248 PAN8625 PAN8920 PAN8919 PAN8816
Platrand A12 9.44 0.665 PAN8919 PAN8625 PAN8911 PAN8920
Potchefstroom Early12 8.50 -1.247 CAP1004 PAN8920 ENFORCER PAN8816
Potchefstroom12 8.01 -1.112 CAP1004 PAN8920 PAN8625 NS5511
Potchefstroom13 6.81 -1.274 CAP1004 PAN8920 ENFORCER PAN8816
Dleeuwkraal13 6.71 0.217 PAN8625 PAN8920 PAN8919 PAN8816
Potchefstroom Late12 6.51 0.173 ENFORCER PAN8816 PAN8911 NS5655
Klerksdorp12 6.21 0.186 PAN8625 PAN8816 PAN8920 PAN8911
Perdkop13 5.73 0.069 PAN8625 PAN8920 PAN8816 PAN8919
Amersfoort13 5.62 0.609 PAN8625 PAN8919 PAN8911 PAN8920
Weiveld13 5.58 0.717 PAN8911 PAN8919 PAN8625 PAN8816
Weiveld12 5.11 0.227 PAN8625 PAN8920 PAN8919 PAN8816
Perdkop12 4.99 0.007 PAN8920 PAN8625 PAN8816 PAN8919
Bethlehem12 4.47 1.265 PAN8911 PAN8816 PAN8919 ENFORCER
Plantrand13 4.33 0.081 PAN8816 ENFORCER PAN8911 PAN8920
Parys12 4.20 -0.334 PAN8920 PAN8625 CAP1002 NS5511
Holmdene13 4.15 0.149 PAN8625 PAN8920 PAN8919 PAN8816
Holmdene12 3.65 -0.080 PAN8920 PAN8625 PAN8816 PAN8911
Platrand E12 3.25 0.053 PAN8816 PAN8920 PAN8625 PAN8911
Senekal-Steynsrus12 2.80 -0.178 PAN8920 PAN8816 PAN8625 ENFORCER
Vredefort13 1.93 0.008 PAN8920 PAN8625 PAN8816 PAN8919
Villiers12 1.77 -0.408 PAN8816 PAN8920 ENFORCER CAP1004
12 & 13 = 2012 & 2013 seisoene 12 & 13 = 2012 & 2013 seasons Platrand (A & E) on site with two different
localities

40
Figuur 2 Die GGO XY grafiek vir 12 sorghum genotipes en 23 omgewings
vir die tydperk 2010-2012
Figure 2 The GGE biplot for 12 sorghum genotypes and 23 environments
for the duration 2010-2012
Die nommers verteenwoording omgewing/ The number represent environments in Table 16

41
AANHANGSEL A / APPENDIX A
Die interpretasie van die “ Additive Main Effects and Multiplicative Interactions
(AMMI)” model en opbrengstabiliteit.
Die effek van genotipe en omgewing (G x O) interaksies in die interpretasie van resultate van
opbrengste is welbekend. „n Gekombineerde variansie-analise kan die interaksie kwantifiseer
maar beskryf slegs die hoof effekte. Die klassieke ANOVA help nie veel om die interaksies te
verstaan of te interpreteer nie. Dit is dan ook die rede hoekom stabiliteits-analises, verskeie
vorme van liniêre regressies en afgeleide G x O prosedures tekort skiet in definiëring van
hoofeffekte, betekenisvolle interaksies of te min verklaar van interaksievariasies. AMMI bied „n
baie beter alternatiewe statistiese benadering vir veldproewe waar „n G x O interaksie relevant
kan wees. Multivariasie-analises het drie hoof doelwitte:
a) Om die akkuraatheid van analises en datapatrone te verbeter b) Om die data op te som. c) Om die genotipe – omgewingsinteraksie te kwalifiseer.
Met behulp van multivariansie-analise kan genotipes met ooreenstemmende reaksies
gekombineer word waardeur analises makliker uitgevoer kan word. Die doel van verskillende
multivariansie metodes is om genotipes in te deel in kwalitatiewe homogene en stabiele
subgroepe. Binne sulke subgroepe bestaan daar geen betekenisvolle G x O interaksies nie, terwyl
daar wel verskille tussen subgroepe bestaan. „n XY- grafiek help baie vir modellering of om
genotipes, omgewing of die interaksie te verstaan. Die basiese prinsiep van so „n AMMI XY –
grafiek is dat die punte op die X-as die hoof effekte aandui terwyl die Y-as die interaksie aandui.
„n Genotipe en omgewingskombinasie met beide negatiewe of positiewe waardes het „n
positiewe interaksie en andersins „n negatiewe interaksie. Genotipes naby die bopunt van „n XY
– grafiek presteer goed in dienooreenkomstige omgewings en dieselfde geld vir genotipes aan die
onderkant. Genotipes of omgewings naby die nul lyn op die Y – as het klein interaksies en is dus
relatief stabiel. Genotipes met hoë opbrengspotensiale lê aan die regterkant van so „n grafiek.
DEFINISIES
Interaksie Prinsiep Komponent Analise (IPCA)
IPCA van genotipes in die AMMI analise gee „n aanduiding van die stabiliteit daarvan oor
omgewings. Hoe groter die waarde, beide positief en negatief, hoe meer is „n genotipe aangepas
42
vir „n spesifieke omgewing. Hoe nader die IPCA-waarde aan nul kom hoe meer stabiel is „n
genotipe oor alle gemete omgewings.
AMMI Stabiliteits Waarde (ASW)
Figuur 3a is „n voorbeeld van die AMMI model se klassifikasie vir genotipes se aanpasbaarheid
en stabiliteitskarakteristieke. Indien die letters A tot E verskillende genotipes verteenwoordig kan
die volgende afleidings gemaak word. Genotipe A is baie goed aangepas vir hoë potensiaal
toestande maar is nie baie stabiel nie. Onder swak heersende toestande kan die genotipe swak
presteer. Genotipes B en C is stabiel vir die meeste omgewings alhoewel hulle opbrengste laer
kan wees as A onder hoë potensiaal kondisies. Genotipe C is meer stabiel as Genotipe B omdat
dit nader aan die nul waarde van IPCA lê. Genotipe D word ook as relatief stabiel geklassifiseer,
maar slegs vir lae potensiaal omgewings. Genotipe E is onstabiel en slegs aangepas vir lae
potensiaal omgewings. In die algemeen word genotipes wat geleë is tussen IPCA-waardes van 1
en –1 gereken as stabiel maar hulle aanpasbaarheids-karakteristieke kan wissel tussen hoë en lae
potensiaal omgewings.
The interpretation of the Additive Main Effects And Multiplicative Interactions
(AMMI) model and yield stability
The effect of genotype and environment (GxE) interactions in the interpretation of results of
yield trials, are well known. A combined analysis of variance can quantify the interactions, but
as an additive statistical model describes only the main effects. The classical ANOVA does little
to help understand or interpret the interactions. That is why stability analysis, various forms of
joint linear regression, and related GxE statistical procedures can be deficient in defining main
effects, incorrectly declaring interactions insignificantly, or explaining too little of the interaction
variance. AMMI offers a more appropriate first statistical analysis of yield trials that may have a
GxE interaction.
Multivariate analysis has three main purposes:
a) To increase the accuracy of data patterns and analysis b) To summarize the data c) To clarify the genotype–environment interactions. Through multivariate analysis, genotypes with similar responses can be clustered, and the data
can be summarized and analysed more easily. The aim of various multivariate classification
methods are therefore to allocate genotypes to qualitatively homogeneous stability subsets.
Within subsets, no significant GxE interactions occur, while differences among subsets are due
43
to GxE interactions. A bi-plot is helpful for modelling or understanding the genotypes, the
environments, and the interaction. The basic interpretive principle for such bi-plots is that bi-
plots points displaced along the X-axis differ in main effects, whereas points displaced along the
Y-axis differ in interaction. The joint structure of genotype and environment points in a bi-plot
show the interaction. A genotype and environment combination with both negative scores or
both positive scores, has a positive interaction, and otherwise a negative interaction. Hence
genotypes near the top of a bi-plot do especially well in environments near the top, and likewise
for the bottom genotypes and environments. Genotypes or environments near zero on the Y-axis
have small interactions – they are relatively stable. Genotypes with high yield over the growing
region of the trial are located to the right.
DEFINITIONS
Interaction Principle Component analysis (IPCA)
The Principle Component Interaction Analysis (IPCA) of genotypes in the AMMI analysis is an
indication of the stability of a genotype over environments. The greater the IPCA scores, either
negative or positive, the more specifically adapted a genotype is to a certain environment. The
closer IPCA scores approach zero the more stable the genotype is over all environments sampled.
AMMI Stability Value (ASV)
AMMI Stability Value (ASV) is the distance from zero in a two dimensional scatter gram of
IPCA 1 scores against IPCA 2 scores. As the ASV nearing zero the genotype can be considered
more stable for most of the environments.
Figure 3b is an example of the AMMI model‟s classification of genotypes adaptability and
stability characteristics. If the letters A to E represent genotypes the following conclusions could
be made. Genotype A is very good adapted towards high potential conditions but is not stable.
Therefore, under poor prevailing conditions this genotype may yield poorly. Genotypes B and C
are stable for most environmental potential conditions although their yields will be lower
compared to genotype A under high potential conditions. Genotype C is more stable than
genotype B because it is lying closer to the IPCA value of zero. Genotype D is also considered
stable, but only for low potential environments. Genotype E is unstable and only adapted to low
potential environments. In general, genotypes that are falling between IPCA values of 1 and –1
are considered stable, but their adaptabilities can range between low and high potential
environments.
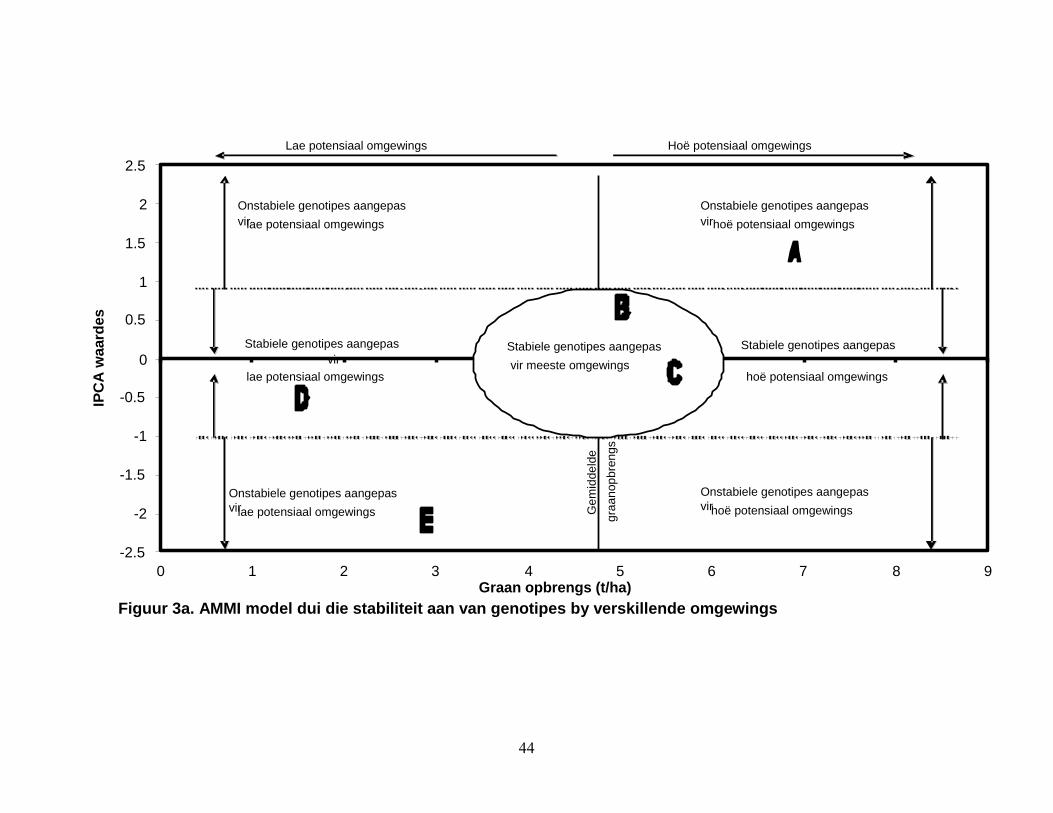
44
-2.5
-2
-1.5
-1
-0.5
0
0.5
1
1.5
2
2.5
0 1 2 3 4 5 6 7 8 9 Graan opbrengs (t/ha)
IPC
A w
aard
es
Onstabiele genotipes aangepas vir lae potensiaal omgewings
Stabiele genotipes aangepas vir
lae potensiaal omgewings
Onstabiele genotipes aangepas vir hoë potensiaal omgewings
Stabiele genotipes aangepas
hoë potensiaal omgewings
Stabiele genotipes aangepas vir meeste omgewings
Lae potensiaal omgewings Hoë potensiaal omgewings
Ge
mid
de
lde
gra
an
op
bre
ng
s
Figuur 3a. AMMI model dui die stabiliteit aan van genotipes by verskillende omgewings
Onstabiele genotipes aangepas vir lae potensiaal omgewings
Onstabiele genotipes aangepas vir hoë potensiaal omgewings
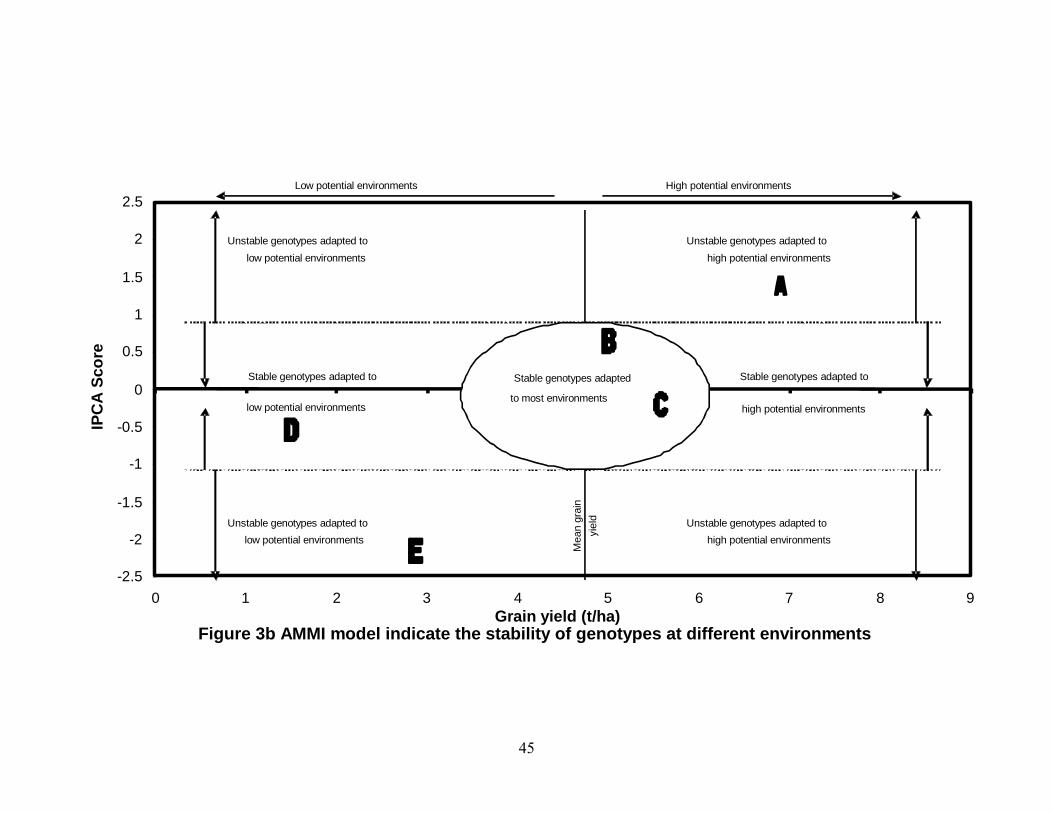
45
-2.5
-2
-1.5
-1
-0.5
0
0.5
1
1.5
2
2.5
0 1 2 3 4 5 6 7 8 9 Grain yield (t/ha)
IPC
A S
co
re
Unstable genotypes adapted to low potential environments
Unstable genotypes adapted to low potential environments
Stable genotypes adapted to
low potential environments
Unstable genotypes adapted to high potential environments
Unstable genotypes adapted to high potential environments
Stable genotypes adapted to
high potential environments
Stable genotypes adapted to most environments
Low potential environments High potential environments
Mean g
rain
yie
ld
Figure 3b AMMI model indicate the stability of genotypes at different environments