Wettelijke Onderzoekstaken Natuur & Milieu
166
WOt-technical report 53 Methodology for estimating emissions from agriculture in the Netherlands Calculations of CH 4 , NH 3 , N 2 O, NO x , PM 10 , PM 2.5 and CO 2 with the National Emission Model for Agriculture (NEMA) J. Vonk, A. Bannink, C. van Bruggen, C.M. Groenestein, J.F.M. Huijsmans, J.W.H. van der Kolk, H.H. Luesink, S.V. Oude Voshaar, S.M. van der Sluis & G.L. Velthof Wettelijke Onderzoekstaken Natuur & Milieu
Transcript of Wettelijke Onderzoekstaken Natuur & Milieu

WOt-technical report 53
Methodology for estimating emissions from agriculture in the NetherlandsCalculations of CH4, NH3, N2O, NOx, PM10, PM2.5 and CO2 with the National Emission Model for Agriculture (NEMA)
J. Vonk, A. Bannink, C. van Bruggen, C.M. Groenestein, J.F.M. Huijsmans, J.W.H. van der Kolk, H.H. Luesink, S.V. Oude Voshaar, S.M. van der Sluis & G.L. Velthof
Wettelijke Onderzoekstaken Natuur & Milieu


Methodology for estimating emissions from agriculture in the Netherlands

This WOt-technical report was produced in accordance with the Quality Manual of the Statutory Research Tasks Unit for Nature & the Environment. The ‘WOt-technical reports’ series presents the findings of research projects implemented for the Statutory Research Tasks Unit for Nature & the Environment by various centres of expertise. WOt-technical report 53 presents the findings of a research project commissioned and funded by the Dutch Ministry of Economic Affairs (EZ).
Methodology for estimating emissions from agriculture in the Netherlands
Calculations of CH4, NH3, N2O, NOx, PM10, PM2.5 and CO2 with the National Emission Model for Agriculture (NEMA)
J. Vonk, A. Bannink, C. van Bruggen, C.M. Groenestein, J.F.M. Huijsmans, J.W.H. van der Kolk, H.H. Luesink, S.V. Oude Voshaar, S.M. van der Sluis & G.L. Velthof
Statutory Research Tasks Unit for Nature & the Environment Wageningen, May 2016
WOt-technical report 53
ISSN 2352-2739
http://dx.doi.org/10.18174/383679
Abstract Vonk, J., A. Bannink, C. van Bruggen, C.M. Groenestein, J.F.M. Huijsmans, J.W.H. van der Kolk, H.H. Luesink, S.V. Oude Voshaar, S.M. van der Sluis & G.L. Velthof (2016). Methodology for estimating emissions from agriculture in the Netherlands. Calculations of CH4, NH3, N2O, NOx, PM10, PM2.5 and CO2 with the National Emission Model for Agriculture (NEMA). Wageningen, The Statutory Research Tasks Unit for Nature and the Environment (WOT Natuur & Milieu). WOt-technical report 53. 164 p; 21 Tab.; 1 Fig.; 108 Ref.; 12 Annexes. The National Emission Model for Agriculture (NEMA) is used to calculate emissions to air from agricultural activities in the Netherlands on a national scale. Emissions of ammonia (NH3) and other N-compounds (NOx and N2O) from animal housing, manure storage, manure application and grazing are assessed using a Total Ammoniacal Nitrogen (TAN) flow model. Furthermore, emissions from application of inorganic N-fertilizer, compost and sewage sludge, cultivation of organic soils, crop residues, and ripening of crops are calculated. NEMA is also used to estimate emissions of methane (CH4) from enteric fermentation and manure management, particulate matter (PM) from manure management and agricultural soils, and carbon dioxide (CO2) from liming. Emissions are calculated in accordance with international guidance criteria and reported in an annual Informative Inventory Report (IIR; for air pollutants) and National Inventory Report (NIR; for greenhouse gases). This methodology report describes the outline and backgrounds of the emission calculations with NEMA. Keywords: air pollutants, greenhouse gases, livestock, crops, animal housing, manure storage, manure application, inorganic fertilizer, enteric fermentation, manure management, agricultural soils, liming, NIR, CRF, IIR, NFR J. Vonka, A. Banninkb, C. van Bruggenc, C.M. Groenesteinb, J.F.M. Huijsmansd, J.W.H. van der Kolke, H.H. Luesinkf, S.V. Oude
Voshaara, S.M. van der Sluisg & G.L. Velthofe
a National Institute for Public Health and the Environment (RIVM) / b Wageningen UR Livestock Research / c Statistics
Netherlands (CBS) / d Wageningen UR Plant Sciences Group / e Wageningen UR Alterra / f Wageningen UR LEI/ g PBL
Netherlands Environmental Assessment Agency
© 2016 Alterra Wageningen UR LEI Wageningen UR PO Box 47, 6700 AA Wageningen PO Box 29703, 2502 LS Den Haag Phone: (0317) 48 07 00; e-mail:[email protected] Phone: (070) 335 83 30; e-mail:
[email protected] Rijksinstituut voor Volksgezondheid en Milieu (RIVM) Wageningen UR Livestock Research PO Box 1, 3720 BA Bilthoven PO Box 338, 6700 AH Wageningen Tel: (030) 274 91 11; e-mail: [email protected] Tel: (0317) 48 39 53; e-mail:
[email protected] Plant Research International Wageningen UR PO Box 16, 6700 AA Wageningen Phone: (0317) 48 60 01; e-mail: [email protected] Centraal Bureau voor de Statistiek Planbureau voor de Leefomgeving PO Box 24500, 2490 HA Den Haag PO Box 303, 3720 AH Bilthoven Tel: (070) 337 38 00; e-mail: [email protected] Tel: (030) 274 274 5; e-mail: [email protected] The WOt-technical reports series is published by the Statutory Research Tasks Unit for Nature & the Environment (WOT
Natuur & Milieu), part of Wageningen UR. This document is available from the secretary’s office, and can be downloaded
from www.wageningenUR.nl/wotnatuurenmilieu Statutory Research Tasks Unit for Nature & the Environment, P.O. Box 47, NL-6700 AA Wageningen, The Netherlands.
Phone: +31 317 48 54 71; e-mail: [email protected]; Internet: www.wageningenUR.nl/wotnatuurenmilieu All rights reserved. No part of this publication may be reproduced and/or republished by printing, photocopying, microfilm or
any other means without the publisher’s prior permission in writing. The publisher accepts no responsibility for any damage
ensuing from the use of the results of this study or from the implementation of the recommendations contained in this
report. F-0031 UK vs 1.2 (2016) Project WOT-04-008-025 WOt-technical report 53 – May 2016

Preface
This report describes the methodologies for estimating emissions to air from agricultural activities in the Netherlands over the 1990-2013 period, as reported in the Informative Inventory Report (IIR; air pollutants) and National Inventory Report (NIR; greenhouse gases) of 2015. An overview of basic principles and results, is also available in the Dutch language (Van Bruggen et al., 2015). The underlying report is an update of the methodology for ammonia emissions from Velthof et al. (2009), and replaces the protocols that previously accompanied the annual greenhouse gas reporting. Calculations are performed with the National Emission Model for Agriculture (NEMA). Various institutes contribute to the annual calculations and maintenance of the model. The authors wish to thank the many colleagues at Statistics Netherlands, the Wageningen UR groups involved (Alterra, LEI, Livestock Research and Plant Sciences Group), PBL Netherlands Environmental Assessment Agency and RIVM for their contributions and support. Peter Zijlema and Harry Vreuls from the Netherlands Enterprise Agency (RVO.nl) provided useful comments on draft versions of the report. Jan Vonk André Bannink Cor van Bruggen Karin Groenestein Jan Huijsmans Jennie van der Kolk Harry Luesink Stephanie Oude Voshaar Sietske van der Sluis Gerard Velthof


Inhoud
Preface 5
Summary 11
1 Introduction 15
1.1 Reporting requirements and institutional arrangements 15 1.2 Outline of the report 16
2 CH4 emissions from enteric fermentation (CRF sector 3A) 19
2.1 Scope and definition 19 2.2 Calculation method 20 2.3 Emission factors 20 2.4 Activity data 23 2.5 Uncertainty and quality 24
3 CH4 emissions from manure management (CRF sector 3B) 27
3.1 Scope and definition 27 3.2 Calculation method 28 3.3 Emission factors 28 3.4 Activity data 30 3.5 Uncertainty and quality 31
4 NH3 emissions from manure management (NFR category 3B) 33
4.1 Scope and definition 33 4.2 Calculation method 34
4.2.1 Ammonia emission from animal houses 35 4.2.2 Ammonia emission from manure storages 35
4.3 Emission factors 36 4.3.1 Emission factors for animal housing 36 4.3.2 Emission factors for outside manure storages 37
4.4 Activity data 37 4.4.1 Emissions from animal houses 37 4.4.2 Emissions from manure storages 39
4.5 Uncertainty and quality 39
5 NOx emissions from manure management (NFR category 3B) 41
5.1 Scope and definition 41 5.2 Calculation method 41 5.3 Emission factors 42 5.4 Activity data 42 5.5 Uncertainty and quality 42
6 N2O emissions from manure management (CRF sector 3B) 43
6.1 Scope and definition 43 6.2 Calculation method 43
6.2.1 Direct N2O emissions from manure management 44 6.2.2 Indirect N2O emissions from manure management 44
6.3 Emission factors 45

6.3.1 Direct N2O emissions from manure management 45 6.3.2 Indirect N2O emissions from manure management 45
6.4 Activity data 45 6.5 Uncertainty and quality 46
7 PM10/2.5 emissions from animal housing (NFR category 3B) 47
7.1 Scope and definition 47 7.2 Calculation method 47 7.3 Emission factors 47 7.4 Activity data 49 7.5 Uncertainty and quality 50
8 NH3 emissions from crop production and agricultural soils (NFR category 3D) 51
8.1 Scope and definition 51 8.2 Calculation method 51
8.2.1 Ammonia emission from inorganic N-fertilizer application 52 8.2.2 Ammonia emission from manure application 52 8.2.3 Ammonia emission from sewage sludge application 53 8.2.4 Ammonia emission from other organic fertilizers (compost) 54 8.2.5 Ammonia emission from grazing 54 8.2.6 Ammonia emission from crop residues 55 8.2.7 Ammonia emission during crop cultivation 55
8.3 Emission factors 55 8.3.1 Emission factors for inorganic N-fertilizer application 55 8.3.2 Emission factors for manure application 57 8.3.3 Emission factors for sewage sludge application 58 8.3.4 Emission factors for other organic fertilizers (compost) 58 8.3.5 Emission factors for grazing 59 8.3.6 Emission factors for crop residues 60 8.3.7 Emission factors for crop cultivation 60
8.4 Activity data 60 8.4.1 Data needed for calculation of emission from fertilizer application 61 8.4.2 Data needed for calculation of emission from manure application 61 8.4.3 Data needed for calculation of emission from sewage sludge application 61 8.4.4 Data needed for calculation of emission from other organic fertilizers (compost) 61 8.4.5 Data needed for calculation of emission from grazing 61 8.4.6 Data needed for calculation of emission from crop residues 62 8.4.7 Data needed for calculation of emission from crop cultivation 62
8.5 Uncertainty and quality 62
9 NOx emissions from crop production and agricultural soils (NFR category 3D) 63
9.1 Scope and definition 63 9.2 Calculation method 63 9.3 Emission factors 63 9.4 Activity data 63 9.5 Uncertainty and quality 64
10 N2O emissions from crop production and agricultural soils (CRF sector 3D) 65
10.1 Scope and definition 65 10.1.1 Direct N2O emissions from managed soils 65 10.1.2 Indirect N2O emissions from managed soils 65
10.2 Calculation method 66 10.2.1 Direct N2O emissions from managed soils 66 10.2.2 Indirect N2O emissions from managed soils 67
10.3 Emission factors 67

10.3.1 Direct N2O emissions from managed soils 67 10.3.2 Indirect N2O emissions from managed soils 69
10.4 Activity data 70 10.4.1 Direct N2O emissions from managed soils 70 10.4.2 Indirect N2O emissions from managed soils 71
10.5 Uncertainty and quality 71
11 PM10/2.5 emissions from crop production and agricultural soils (NFR category 3D) 73
11.1 Scope and definition 73 11.2 Calculation method 73 11.3 Emission factors 74 11.4 Activity data 74 11.5 Uncertainty and quality 74
12 CO2 emissions from liming (CRF category 3G) 75
12.1 Scope and definition 75 12.2 Calculation method 75 12.3 Emission factors 75 12.4 Activity data 75 12.5 Uncertainty and quality 75
References 77
Justification 83
Animal categories 85 Annex 1
Calculation of TAN excretion for dairy cattle and young stock 87 Annex 2
Calculation of TAN excretion for pigs 93 Annex 3
Calculation of TAN excretion for poultry 105 Annex 4
Mineralization and immobilization of nitrogen in manure 121 Annex 5
Emission factors for ammonia from animal housing of cattle 123 Annex 6
Emission factors for ammonia from animal housing of pigs 129 Annex 7
Emission factors for ammonia from animal housing of poultry 137 Annex 8
Animal house occupancy fractions 145 Annex 9
Manure storage outside the animal house 147 Annex 10
Emission factors for calculation direct nitrous oxide emissions from agricultural soils Annex 11(including grazing) 149
Uncertainty, quality assurance and verification 159 Annex 12


Methodology for estimating emissions from agriculture in the Netherlands | 11
Summary
The National Emission Model for Agriculture (NEMA) is used to estimate emissions to air from agricultural activities in the Netherlands. Calculations include the emission of ammonia (NH3), nitrogen oxides (NOx), nitrous oxide (N2O), methane (CH4), particulate matter (PM10, PM2.5) and carbon dioxide (CO2). These emissions originate from various processes within the agricultural production chain, grouped in the Common Reporting Format (CRF; greenhouse gases) and Nomenclature For Reporting (NFR; air pollutants) main categories 3A Enteric fermentation, 3B Manure management, 3D Agricultural soils and 3G Liming.
Enteric fermentation During the digestion of feed, ruminal and/or intestinal fermentation processes take place. Especially in cattle, considerable amounts of CH4 are formed. In accordance to the key source analysis, a country-specific (IPCC Tier 3) method is used for dairy cattle which models the enteric fermentation processes. For other cattle categories, emissions are calculated from the feed rations on a yearly basis, using an IPCC Tier 2 approach. The emissions from smaller ruminants and intestinal fermentation by monogastric animals, are calculated with IPCC 2006 default emission factors per head (Tier 1).
Manure management This category includes emissions from manure stored inside animal houses, and in outside manure storage facilities. CH4 emission results from fermentation of organic matter in stored livestock manure. The rate of emission depends on the chemical composition of the manure and on environmental factors like temperature and the availability of oxygen. Cattle, pigs and poultry are considered key sources, and are therefore assessed using an IPPC Tier 2 approach. The excretion of volatile solids is calculated from rations fed, and multiplied by the maximum methane production potential (Bo) and methane conversion factor (MCF). A distinction is made between liquid and solid manure, and manure excreted on pasture land. Emissions from other animal categories, are calculated using the IPCC 2006 defaults (Tier 1). NH3 is produced from urinary nitrogen (N) and mineralized organic N in the faeces, the sum of which is called TAN (Total Ammoniacal Nitrogen). After bacterial conversion to ammonium gaseous NH3 emits to the air, depending on physical and chemical conditions. TAN in manure is derived from the feed composition on a yearly basis. The NH3 emission is calculated using NH3-N emission factors expressed as % of TAN. These emission factors are directly or indirectly derived from measurements of NH3 emissions from animal houses, and expressed relative to the respective TAN-excretions. Separate calculations are performed for NH3 emissions from manure storages outside the animal housing. Because N-emissions are calculated using the TAN-flow principle, the amount of TAN in storage is corrected for all N losses taking place in the housing system. Emissions of N as NOx and N2O are also part of the TAN flow and originate from (de-)nitrification in manure during storage in animal housings and in outside storage facilities. The NOx and N2O emissions are considered to be of equal size in terms of amounts N lost, and based on the IPCC default emission factors for N2O. These emissions are converted into % of TAN for use in the TAN flow model. Particulate matter (PM10 and PM2.5) emissions from manure management mainly depend on the housing systems. Information on housing systems used in practice is derived from the Agricultural Census, and elaborated further by provincial records on environmental permits. Emission factors have been established by, or are deduced from measurements.

12 | WOt-technical report 53
Agricultural soils As part of the TAN flow, manure N available for application is calculated by subtracting N losses from animal houses and outside manure storages from the total N excretion by livestock. Besides emissions as NH3-N, N2O-N and NOx-N, these losses include N2-N (dinitrogen-N), the use of manure N outside agriculture and (net) export of manure N. The resulting application of livestock manure N is then divided over grassland and cropland (cropped and uncropped), with a differentiation between manure application techniques and their respective NH3 emission factors. For grazed grasslands, NH3 emission is calculated based on TAN excretion on pasture land and an emission factor depending on the N content of the ration. The NH3 emissions from application of inorganic N-fertilizer, sewage sludge, compost, and crop residues left on the field are calculated using country-specific emission factors for these sources. For crop ripening a fixed estimate is used, given the large uncertainty associated with this emission source. Emissions of NOx and N2O occur when N is applied to agricultural soils. For N2O a distinction is made between above-ground and low-ammonia emission application, as incorporation of livestock manure into the soil increases N2O emission. The emission factors are country-specific (Tier 2), as well as those for inorganic N-fertilizer, sewage sludge, compost, pasture manure, crop residues and the cultivation of organic soils. Emissions of NOx are calculated using the EMEP default emission factor for N supply to soil. Particulate matter (PM) is emitted during the storage, handling and transport of agricultural products, the cultivation of agricultural soils and crop harvesting. A Tier 2 approach is used for PM10 and PM2.5 emissions from the tillage of crops. Other sources of PM emissions (concentrates, inorganic fertilizers and pesticide use) have fixed estimates.
Liming Application of lime to reduce soil acidity results in CO2 emissions, because of decomposition of carbonate. Emissions of CO2 from lime are calculated from yearly statistics and the IPCC default emission factors (Tier 1).
Overview of methods and emission factors used For the reporting of air pollutants within the NFR format, the level of methods and emission factors used by NEMA are summarized in Table S.1.
Table S.1 Methods and emission factors (EF) used in NEMA for air pollutants, towards level as distinguished by the 2013 EMEP Guidebook
NFR source categories NOx NH3 PM10/PM2.5
Method EF Method EF Method EF
3. Agriculture
B. Manure management T3 CS T3 CS T2 CS
D. Agricultural soils T3 D T3 CS T2 CS,D
F. Field burning of
agricultural residues
NO NO NO NO NO NO
I. Other NO NO NO NO NO NO
Legend: T2 = EMEP Tier 2; T3 = EMEP Tier 3; D = EMEP default; CS = country specific; NO = not occurring
The methods and EFs used, fully comply with the requirements as set by the 2013 EMEP Guidebook. For the reporting of greenhouse gases within the CRF, the level of methods and emission factors used by NEMA are summarized in Table S.2.
Methodology for estimating emissions from agriculture in the Netherlands | 13
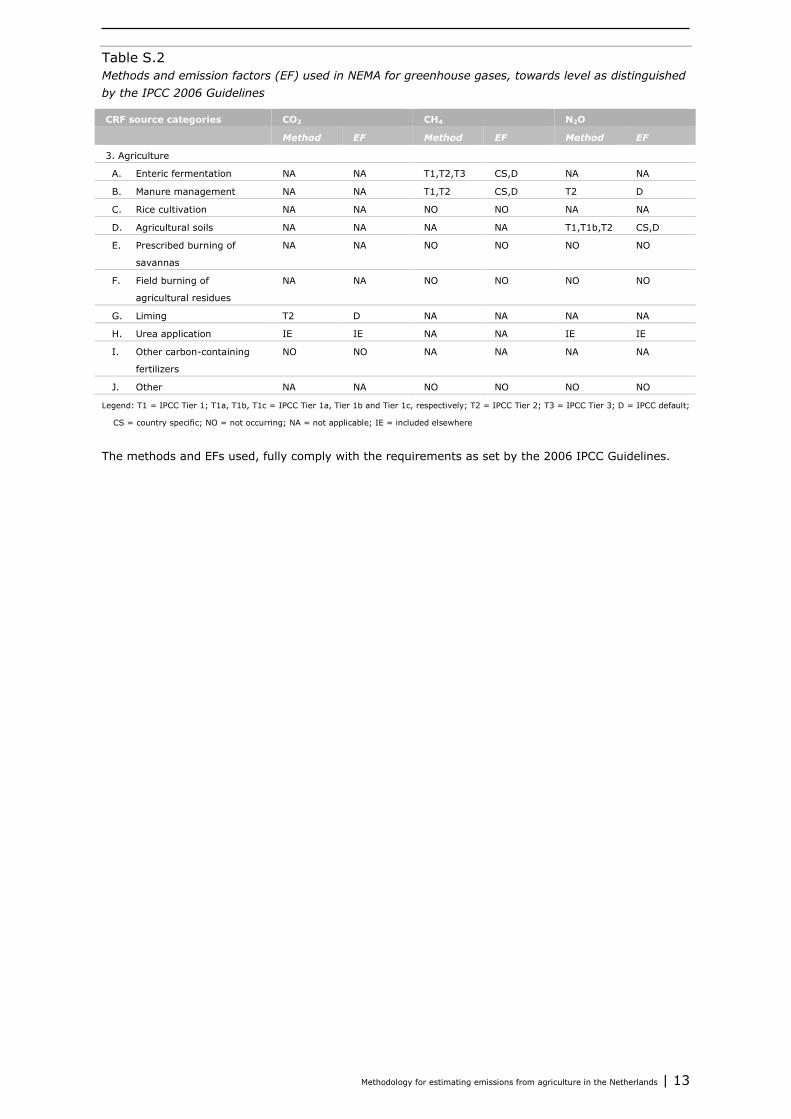
Table S.2 Methods and emission factors (EF) used in NEMA for greenhouse gases, towards level as distinguished by the IPCC 2006 Guidelines
CRF source categories CO2 CH4 N2O
Method EF Method EF Method EF
3. Agriculture
A. Enteric fermentation NA NA T1,T2,T3 CS,D NA NA
B. Manure management NA NA T1,T2 CS,D T2 D
C. Rice cultivation NA NA NO NO NA NA
D. Agricultural soils NA NA NA NA T1,T1b,T2 CS,D
E. Prescribed burning of
savannas
NA NA NO NO NO NO
F. Field burning of
agricultural residues
NA NA NO NO NO NO
G. Liming T2 D NA NA NA NA
H. Urea application IE IE NA NA IE IE
I. Other carbon-containing
fertilizers
NO NO NA NA NA NA
J. Other NA NA NO NO NO NO
Legend: T1 = IPCC Tier 1; T1a, T1b, T1c = IPCC Tier 1a, Tier 1b and Tier 1c, respectively; T2 = IPCC Tier 2; T3 = IPCC Tier 3; D = IPCC default;
CS = country specific; NO = not occurring; NA = not applicable; IE = included elsewhere
The methods and EFs used, fully comply with the requirements as set by the 2006 IPCC Guidelines.

Methodology for estimating emissions from agriculture in the Netherlands | 15
1 Introduction
In 2013, the agricultural sector was responsible for more than 85% of total ammonia (NH3) emissions in the Netherlands. Agriculture also is a significant contributor towards the emissions of nitrogen oxides (NOx). Deposition of NH3 and NOx can lead to adverse effects, in the form of eutrophication and acidification. For emissions of particulate matter agricultural activities form a considerable source as well, especially in the coarse fraction of up to 10 µm in size (PM10). Particulate matter can cause detrimental health effects, and forms an uncertain factor in climate change. With regards to the greenhouse gasses methane (CH4) and nitrous oxide (N2O), agriculture is the largest contributing source towards national total emissions. Combined and expressed as carbon dioxide equivalents (CO2-eq), they amount to about 10% of Dutch greenhouse gas emissions. Stationary combustion (mainly by heating in horticulture) and use of mobile equipment are not included, because these are accounted for in the Energy sector. The only CO2 emissions reported in the sector of Agriculture originate from calcareous fertilizers (liming).
1.1 Reporting requirements and institutional arrangements
Under the Kyoto Protocol, the Netherlands is required to set up and maintain a national system to monitor its greenhouse gas emissions. One of the elements of this system is a transparent and verifiable description of the methods and processes used in this monitoring system. These methods must meet international guideline criteria, which are defined by the United Nations (UN) and the European Union (EU). The Netherlands also reports emissions of other air pollutants. These are used to check if the Netherlands meets the National Emission Ceilings (NEC) and, as a party to the Convention on Long Range Transboundary Air Pollution (CLRTAP), the Gothenburg Protocol. Here too the methods must meet international guideline criteria, which are defined by the European Monitoring and Evaluation Programme (EMEP) of the European Environment Agency (EEA). The Pollutant Release and Transfer Register (PRTR, or ‘EmissieRegistratie’ (ER) in Dutch) collects and formally establishes the yearly emissions of pollutants to air, water and soil. The PRTR is a collaborative group that includes amongst others the institutions: Statistics Netherlands (CBS), Wageningen University & Research Centre (Wageningen UR), the National Institute for Public Health and the Environment (RIVM) and Netherlands Environmental Assessment Agency (PBL). It is coordinated by RIVM under supervision of Netherlands Enterprise Agency (RVO), acting as the National Inventory Entity (NIE) for greenhouse gas reporting. The Ministry of Economic Affairs (EZ) and the Ministry of Infrastructure and Environment (IenM) commission the PRTR. Within the PRTR several teams work on respective sectors as defined by the guideline criteria, including the task force Agriculture and Land Use. Emissions from Land Use, Land Use Change and Forestry (LULUCF) form a separate sector and therefore are not discussed here. This report deals with emissions to air originating from agricultural activities, for which the National Emission Model for Agriculture (NEMA) of the independent Dutch Scientific Committee of the Manure Act (CDM) is used. The model NEMA was developed in 2009 for NH3 (Velthof et al., 2009), and since then calculations for emissions of other compounds have been included (Van Bruggen et al., 2014). The current report gives an overview of the methods applied in NEMA to estimate emissions of CH4, NH3, N2O, NOx, PM10, PM2.5 and CO2 from the agricultural sector. Emission data are available through the website www.emissieregistratie.nl and in yearly reports on greenhouse gas emissions (National Inventory Report, NIR) and other pollutants (Informative Inventory Report, IIR). Data from the PRTR are also used for the evaluation of national environmental
16 | WOt-technical report 53
policy and in many other environmental reports. For this reason, also yearly reports in Dutch are being published, with updated NEMA results.
1.2 Outline of the report
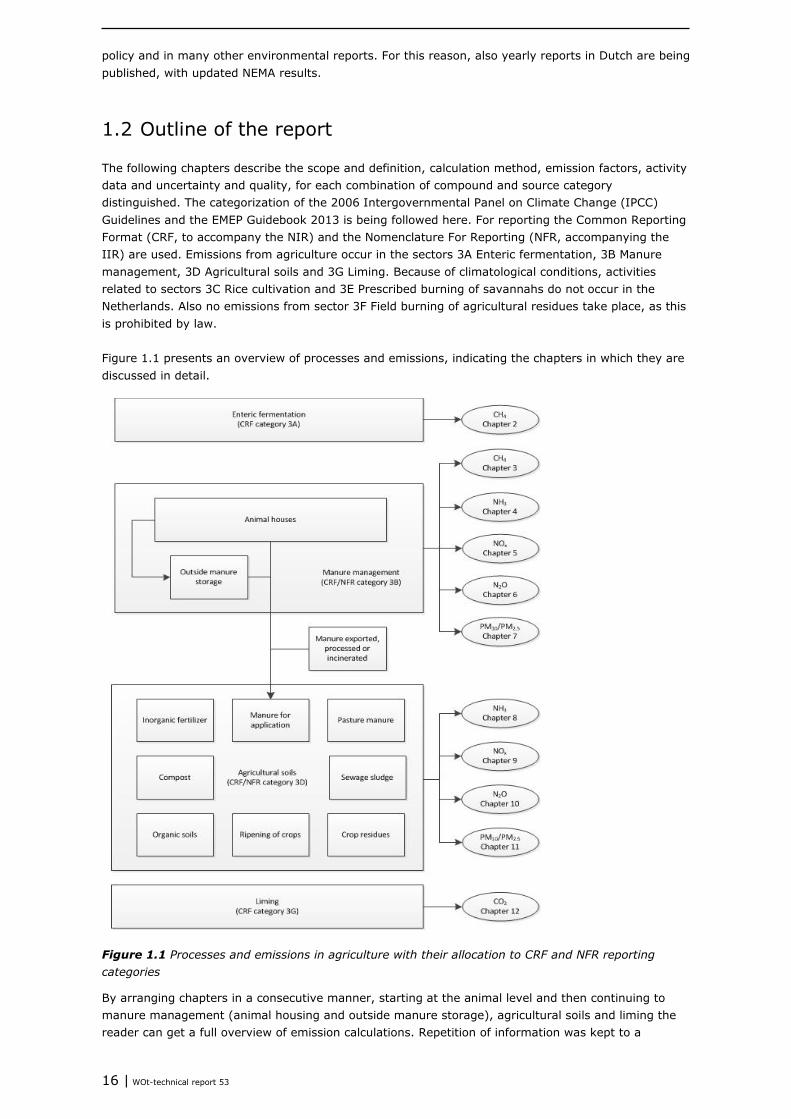
The following chapters describe the scope and definition, calculation method, emission factors, activity data and uncertainty and quality, for each combination of compound and source category distinguished. The categorization of the 2006 Intergovernmental Panel on Climate Change (IPCC) Guidelines and the EMEP Guidebook 2013 is being followed here. For reporting the Common Reporting Format (CRF, to accompany the NIR) and the Nomenclature For Reporting (NFR, accompanying the IIR) are used. Emissions from agriculture occur in the sectors 3A Enteric fermentation, 3B Manure management, 3D Agricultural soils and 3G Liming. Because of climatological conditions, activities related to sectors 3C Rice cultivation and 3E Prescribed burning of savannahs do not occur in the Netherlands. Also no emissions from sector 3F Field burning of agricultural residues take place, as this is prohibited by law. Figure 1.1 presents an overview of processes and emissions, indicating the chapters in which they are discussed in detail.
Figure 1.1 Processes and emissions in agriculture with their allocation to CRF and NFR reporting categories
By arranging chapters in a consecutive manner, starting at the animal level and then continuing to manure management (animal housing and outside manure storage), agricultural soils and liming the reader can get a full overview of emission calculations. Repetition of information was kept to a
Methodology for estimating emissions from agriculture in the Netherlands | 17
minimum, but as chapters are also intended to be read independently, some repetition could not be avoided. This also means that readers interested in given compound(s) should be able to skip the other chapters. This report only briefly addresses the factors that influence the processes underlying the emissions. For a thorough description, reference is made to reports (Oenema et al., 2000; Velthof et al., 2009) and other publications or theses (Aarnink, 1997; Bannink, 2007; Bussink, 1996; Groenestein, 2006; Groot Koerkamp, 1998; Huijsmans, 2003; Monteny, 2001; Oenema et al., 2008; Tamminga et al., 2007 and Velthof, 1997).


Methodology for estimating emissions from agriculture in the Netherlands | 19
2 CH4 emissions from enteric fermentation (CRF sector 3A)
2.1 Scope and definition
This chapter describes the methods and working processes used to determine the emission of methane (CH4) from ruminal and intestinal (enteric) fermentation. In the Common Reporting Format (CRF) the following source categories are distinguished: • 3A1a Mature dairy cattle (ruminal and intestinal fermentation) • 3A1b Other mature cattle (ruminal and intestinal fermentation) • 3A1c Growing cattle (ruminal and intestinal fermentation) • 3A2 Sheep (ruminal and intestinal fermentation) • 3A3 Swine (intestinal fermentation only) • 3A4 Other livestock
d) Goats (ruminal and intestinal fermentation) e) Horses (intestinal fermentation only) f) Mules and asses (intestinal fermentation only) h) Other (intestinal fermentation only)
The categories 3A4a Buffalo, 3A4b Camels and 3A4c Deer are reported in the CRF as Not Occurring (NO), since these are not kept commercially in the Netherlands. In category 3A4g Poultry emissions are reported as Not Estimated (NE), since the anatomy of the gastro-intestinal tract of poultry (i.e. high passage rate of feed) and the composition of poultry feed (relatively high energy value) result in a negligible contribution of fermentation processes to feed digestion. The 2006 IPCC Guidelines do not provide a default emission factor for poultry either. Under category 3A4h Other, emissions of rabbits and fur-bearing animals are being reported. The feed consumed by an animal is digested in the gastro-intestinal tract, to provide the energy and nutrients needed for maintenance and production. Part of the (nearly anaerobic) gastro-intestinal tract accommodates a particularly large microbial population, fermenting the feed in which methane is formed as a by-product. In monogastric animals (pigs, horses and mules and asses) this only involves the large intestine and therefore CH4 production remains relatively low. The gastro-intestinal tract of polygastric animals (cattle, sheep and goats) is specialized to digest fibrous material, especially in the rumen. With intensive microbial fermentation taking place, the rumen gives rise to a considerably larger CH4 production in ruminants than in monogastric animals. In addition to the microbial matter synthesized through fermentation of organic matter, volatile fatty acids and hydrogen gas are produced. Just a small fraction of the hydrogen gas is utilized with microbial growth, or with the production of propionic acid and branched chain volatile fatty acids. The surplus of hydrogen is released into the rumen environment, either in rumen fluid or in the gaseous head space. Together with carbon dioxide, which is available in excess in the rumen, the released hydrogen gas is almost completely converted into CH4 and water by methanogens. Under Dutch feeding conditions of cattle less than 0.5% of hydrogen production was observed to be exhaled, with the remainder exhaled as CH4 (Van Zijderveld et al., 2011). This fairly complete conversion of hydrogen into CH4 keeps the partial gas pressure of hydrogen in the rumen environment very low. As a relatively small increase of the partial gas pressure could have a detrimental effect on the fermentative degradation of feed in the rumen as a result of the inhibition of microbial activity (fibre degradation in particular), this is highly functional. Almost all CH4 (99%) leaves the ruminant via the mouth, via respiration (via blood to the lungs) and by frequent eructations of rumen gases and rumination. The amount of CH4 produced by ruminants depends on the amount of feed consumed by the animal and the characteristics and composition of this feed (Veen, 2000; Smink et al., 2003; Tamminga et al., 2007). The amount of feed ingested strongly determines the amount of organic matter fermented,
20 | WOt-technical report 53
and with this, the amount of hydrogen gas converted into CH4. The feed characteristics (degradability, rate of degradation, outflow to the intestine) determine which fraction of individual feed components ferments in the rumen and which fraction escapes rumen fermentation and flows out to the small intestine (Dijkstra et al., 1992). The chemical composition of the fermented part of the feed determines the amount and type of volatile fatty acids produced (Bannink et al., 2008; Kebreab et al., 2009), and is thereby an important determinant of the surplus of hydrogen in the rumen that becomes converted into CH4 (Mills et al., 2001; Ellis et al., 2008; Bannink et al., 2011). In conclusion, the amount and type of ingested feed determines the emission factor (EF) for CH4 (i.e. the amount of CH4 in kg CH4/year that is produced by an animal), partly through its effect on the so-called methane conversion factor (Ym, i.e. the fraction of gross energy in ingested feed that is converted into CH4).
2.2 Calculation method
The emission of CH4 as a result of ruminal and intestinal fermentation in cattle is calculated by multiplying the number of animals per livestock category by a country-specific emission factor for that livestock category. For the other livestock categories, default EFs are used according to the IPCC 2006 Guidelines. The total emission of CH4 of all animals is calculated by summing the emissions per livestock category. CH4 emissions 3A = ∑i [ number of animals in livestock category (i) ] x EF CH4 3Ai (2.1) In which CH4 emissions 3A : Methane emission (kg CH4/year) for all defined livestock categories (i)
within the CFR source category 3A enteric fermentation EF CH4 3Ai : Emission factor (kg CH4/animal/year) for enteric fermentation of livestock
category (i)
Comparison to IPCC methodology For all livestock categories, excluding cattle, Tier 1 default IPCC emission factors are applied. For cattle, excluding mature dairy cattle, the Tier 2 approach is applied, with intake of gross energy being calculated according to a country-specific method. In this method the EF is calculated using the Ym and the gross energy (GE; MJ/kg dry matter) intake from feed (GEi; MJ/animal/day). The default IPCC value of 0.065 is used as Ym, except for white veal calves since these are fed milk products and therefore do not show full rumen development (Gerrits et al., 2014). For mature dairy cattle, a country-specific Tier 3 approach is applied by using a dynamic simulation model which describes the mechanisms of the fermentation processes in the gastrointestinal tract (Bannink et al., 2011). The model predicts the consequences of nutrition on microbial fermentation and the accompanying production of CH4 in the rumen and the large intestine. The simulation model predicts GEi and the production of CH4 in the rumen and large intestine from feed intake and dietary characteristics (dry matter intake, chemical composition, rumen degradation characteristics). Subsequently, the model calculates the Ym from predicted CH4 emission and GEi. Therefore, the model predicts Ym instead of assuming a constant Ym value as a model input, as is the case with the Tier 2 approach.
2.3 Emission factors
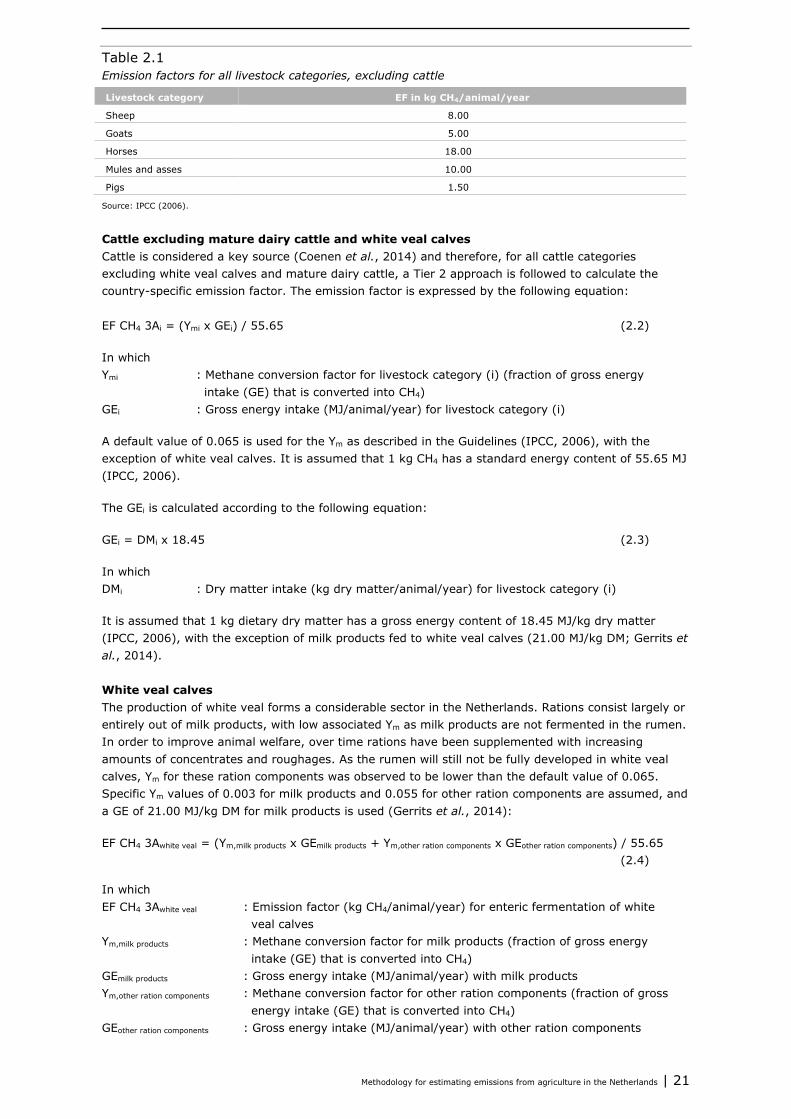
For all livestock categories excluding cattle, a Tier 1 approach is applied with default emission factors as described in the IPCC Guidelines (2006; p. 10.28). Table 2.1 gives an overview of the EFs used.
Methodology for estimating emissions from agriculture in the Netherlands | 21
Table 2.1 Emission factors for all livestock categories, excluding cattle
Livestock category EF in kg CH4/animal/year
Sheep 8.00
Goats 5.00
Horses 18.00
Mules and asses 10.00
Pigs 1.50
Source: IPCC (2006).
Cattle excluding mature dairy cattle and white veal calves Cattle is considered a key source (Coenen et al., 2014) and therefore, for all cattle categories excluding white veal calves and mature dairy cattle, a Tier 2 approach is followed to calculate the country-specific emission factor. The emission factor is expressed by the following equation: EF CH4 3Ai = (Ymi x GEi) / 55.65 (2.2) In which Ymi : Methane conversion factor for livestock category (i) (fraction of gross energy
intake (GE) that is converted into CH4) GEi : Gross energy intake (MJ/animal/year) for livestock category (i) A default value of 0.065 is used for the Ym as described in the Guidelines (IPCC, 2006), with the exception of white veal calves. It is assumed that 1 kg CH4 has a standard energy content of 55.65 MJ (IPCC, 2006). The GEi is calculated according to the following equation: GEi = DMi x 18.45 (2.3) In which DMi : Dry matter intake (kg dry matter/animal/year) for livestock category (i) It is assumed that 1 kg dietary dry matter has a gross energy content of 18.45 MJ/kg dry matter (IPCC, 2006), with the exception of milk products fed to white veal calves (21.00 MJ/kg DM; Gerrits et al., 2014).
White veal calves The production of white veal forms a considerable sector in the Netherlands. Rations consist largely or entirely out of milk products, with low associated Ym as milk products are not fermented in the rumen. In order to improve animal welfare, over time rations have been supplemented with increasing amounts of concentrates and roughages. As the rumen will still not be fully developed in white veal calves, Ym for these ration components was observed to be lower than the default value of 0.065. Specific Ym values of 0.003 for milk products and 0.055 for other ration components are assumed, and a GE of 21.00 MJ/kg DM for milk products is used (Gerrits et al., 2014): EF CH4 3Awhite veal = (Ym,milk products x GEmilk products + Ym,other ration components x GEother ration components) / 55.65 (2.4) In which EF CH4 3Awhite veal : Emission factor (kg CH4/animal/year) for enteric fermentation of white
veal calves Ym,milk products : Methane conversion factor for milk products (fraction of gross energy
intake (GE) that is converted into CH4) GEmilk products : Gross energy intake (MJ/animal/year) with milk products Ym,other ration components : Methane conversion factor for other ration components (fraction of gross
energy intake (GE) that is converted into CH4) GEother ration components : Gross energy intake (MJ/animal/year) with other ration components
22 | WOt-technical report 53
Mature dairy cattle For mature dairy cattle a Tier 3 approach is applied to calculate country-specific emission factors, split in the regions North-West and South-East of the Netherlands. Because both regions have different ration compositions, emissions are also different. The most important difference with the Tier 2 approach is that the simulation model predicts the EF from feed intake and dietary characteristics as model inputs, without using the values of GEi or Ym. Another important difference with the Tier 2 approach is that the simulation model takes into account several dietary characteristics to predict the fermentation processes in the rumen and large intestine, instead of using only the net energy value for milk production and maintenance as a dietary characteristic. A final difference with the Tier 2 approach is that the simulation model calculates GEi from dry matter intake and dietary composition instead of adopting a GE value for feed DM. The EF, GEi and Ym of mature dairy cattle are calculated yearly (Bannink, 2011). The simulation model describes CH4 production as a result of microbial fermentation processes in the gastrointestinal tract of mature dairy cattle. The simulation model is developed by Dijkstra et al. (1992), Mills et al. (2001), and Bannink et al. (2005, 2008, 2011) and is described in scientific (peer-reviewed) journals. Mills et al. (2001) added a representation of CH4 production to the model of rumen fermentation processes developed by Dijkstra et al. (1992), including a representation of the fermentation processes in the large intestine. This model extension calculates the production of volatile fatty acids and hydrogen (the latter converted into CH4) according to Bannink et al. (2006). More recently, an improved representation was included of the production of volatile fatty acids and hydrogen by making this dependent on the acidity of rumen contents (Bannink et al., 2005, 2008, 2011). This version of the simulation model is applied since 2005 as a Tier 3 approach to calculate CH4 emissions in mature dairy cattle. Although the model can also be used for other cattle categories, it is currently not applied for this purpose because of budget constraints and lack of model evaluation results for other categories. Based on predicted values of EF and GEi the simulation model calculates an Ym value. The Ym is hence not part of the assumptions made in the model representation but is a predicted outcome of the model in the same unit as used for Ym with other categories. From the predicted values of the emission factor (EF) and the Gross Energy intake (GEi) per year, the Ym is calculated as follows: Ym = EF × 55.65 / (GE x 365) (2.5) In which Ym : Methane conversion factor (fraction of gross energy intake converted into CH4) EF : Emission factor (kg CH4/animal/year) calculated with the simulation model GE : Gross energy intake (MJ/animal/day) calculated with the simulation model It is assumed that 1 kg CH4 has a standard energy content of 55.65 MJ (IPCC, 2006), and the factor 365 was used to calculate GEi on a yearly basis. Should the results from the simulation model not be available in a particular year, a secondary (simplified) approach is used to calculate the emission factor, where the Ym and GEi/DMi from the three preceding years will be used (as a back-up option). The following equation is then used to calculate the emission factor: EF = (DMi × 365 × GE / DMi (gross energy content in dry matter; average of year n-1 to year n-3) × Ym (average year n-1 to year n-3) ) / 55.65 (2.6) In which EF : Emission factor (kg CH4/animal/year) DMi : Dry matter intake (kg dry matter/animal/day) GE : Gross energy intake (MJ/animal/day) Ym : Methane conversion factor (fraction of gross energy intake (GE) converted into CH4)
Methodology for estimating emissions from agriculture in the Netherlands | 23
It is assumed that 1 kg CH4 has a standard energy content of 55.65 MJ (IPCC, 2006), and the factor 365 is used to calculate DMi on a yearly basis. The emission factor is calculated more accurately with equation 2.6 since estimates are based on dietary characteristics of three consecutive previous years instead of using characteristics of only one single year. The Ym depends on all input data to the simulation model: 1) the level of feed intake, 2) the chemical composition of ingested feed, and 3) the degradation characteristics in the rumen. The origin of this data is described in the next section.
2.4 Activity data
This section provides a more detailed description of the data required as well as the origin of these data.
Animal numbers Annex 1 presents an overview of the animal (sub-)categories being distinguished in the Agricultural Census. This categorization is also used within the NEMA calculations, and results are then grouped towards reporting categories as indicated. Since the IPCC Tier 1 EFs are averages for both sexes and over all age groups, they are to be multiplied by the total number of animals (i.e. including young and male animals) within each livestock category. Different than in emissions of N containing compounds, where excretion by young and male animals is accounted for in the excretion of mother animals, for CH4 from enteric fermentation total number of sheep, goats and pigs are used in the calculations. PVE (2005) estimated the number of privately owned horses and ponies in the Netherlands to be 300,000. In contrast to large-scale pollutants, the Netherlands has chosen not to report greenhouse gas emissions under the ‘Other’ category, therefore privately owned horses and ponies are added to the horses and ponies in the Agricultural Census.
Feed intake and ration of cattle, excluding mature dairy cattle Dry matter intake (DMi; kg dry matter/animal/day) is derived from calculations by the Dutch Working group on Uniformity of calculations of Manure and mineral data (WUM). The intake of various components in the ration (grass silage, maize silage, standard concentrates, protein-rich concentrates and wet by-products) is calculated yearly per cattle category based on national statistics on the amounts of these products that have been traded or produced. These statistics on dietary components cover part of the total energy requirement that is calculated yearly according to a country-specific method for the various cattle categories. Subsequently, it is assumed that the remainder of the energy requirement for the recorded production level is covered by the intake of grass from grazing. From 1990 onwards, the WUM calculates the DM intake and ration yearly, which is also input for the method used to calculate manure production and mineral excretion by farm animals (Van Bruggen, 2003 through 2014). The first release appeared in 1994 (WUM, 1994) and a revised calculation of the rations (from 1990 to 2008) appeared in 2009 (CBS, 2009). The DM intake of cattle, excluding mature dairy cattle, is given in the report written by Smink (2005) and in Van Bruggen et al. (2015).
Feed intake of mature dairy cattle Important input data for the simulation model are: 1. Feed intake levels, DMi, as calculated by WUM (CBS, 2009) for the regions North-West and South-
East, according to the same method as described above for cattle, excluding mature dairy cattle. 2. The chemical composition of DM in the various dietary components (grass herbage, grass silage,
maize silage, standard concentrates, protein-rich concentrates and wet by-products). A distinction is made between soluble carbohydrates (including sugars), starch, cell walls (hemi-cellulose, cellulose, lignin), crude protein (including a distinction of the ammonia fraction), crude fat and crude ash. Data on the composition is derived from information from the laboratory Blgg in Wageningen (www.blgg.agroxpertus.nl), which analyses roughages, and from producers of compound feed. The data used have been previously described by Smink et al. (2005). With a
24 | WOt-technical report 53
recent revision of the WUM rations from 1990 to 2008 by CBS (CBS, 2009) new calculations have been conducted and data of chemical composition is attached to the report of Bannink (2011). Part of the ensiled roughage is not fed to dairy cattle in the same year as the roughage analysis was performed. Therefore, in the annual ration calculations a correction on ensiled roughage is made (CBS, 2009).
3. Rumen intrinsic degradation characteristics of starch, crude protein and fibre. The report by Bannink (2011) also gives the assumptions on these degradation characteristics (soluble/washable fraction, fraction that is potentially degradable, undegradable fraction and the fractional degradation rate of the fraction that is potentially degradable).
Data varies with annual changes in the proportion of individual dietary components (grass herbage, grass silage, maize silage, standard concentrates, protein-rich concentrates, wet by-products) and with changes in chemical composition and intrinsic degradation characteristics of these chemical fractions. The fractional passage rate of fermentable matter and acidity of contents in the rumen and the large intestine are also important model parameters that have a considerable influence on predicted CH4 production. However, this concerns internal model parameters which do not need to be given as an input to the model. Within the current method the simulation model predicts the fractional passage rate as a function of DMi, and acidity as a function of predicted concentration of volatile fatty acids according to Mills et al. (2001). Sensitivity of model predictions for the parameter values and the effect on uncertainty have been described (Bannink, 2011).
2.5 Uncertainty and quality
A Tier 1 uncertainty analysis is implemented every year before the NIR is submitted by the ER, based on the greenhouse gas inventory and in compliance with IPCC Guidelines. The assumptions used and the results thereof are described in an annex to the NIR. In addition to this, where included in the QA/QC-programme for the relevant period, extra analyses are implemented regularly in specific situations, which include any updating of the Tier 2 uncertainty analyses. The Tier 2 uncertainty assessment was last updated in 2009. This assessment showed that a Tier 1 uncertainty assessment is sufficiently reliable and that Tier 2 uncertainty assessments need only be implemented at periodic intervals of around 5 years, unless a major change in an important source is sufficient to require earlier reassessment.
Source specific uncertainty The uncertainty estimatetotal concerns the root of the sum of uncertainty in the data sources used (ADunc) in the square and the uncertainty of the emission factor (EFunc) in the square. The extent of the total uncertainty is here primarily determined by the greatest AD or EF uncertainty. Uncertainty estimatetotal = √ (EFunc
2 + ADunc2) (2.7)
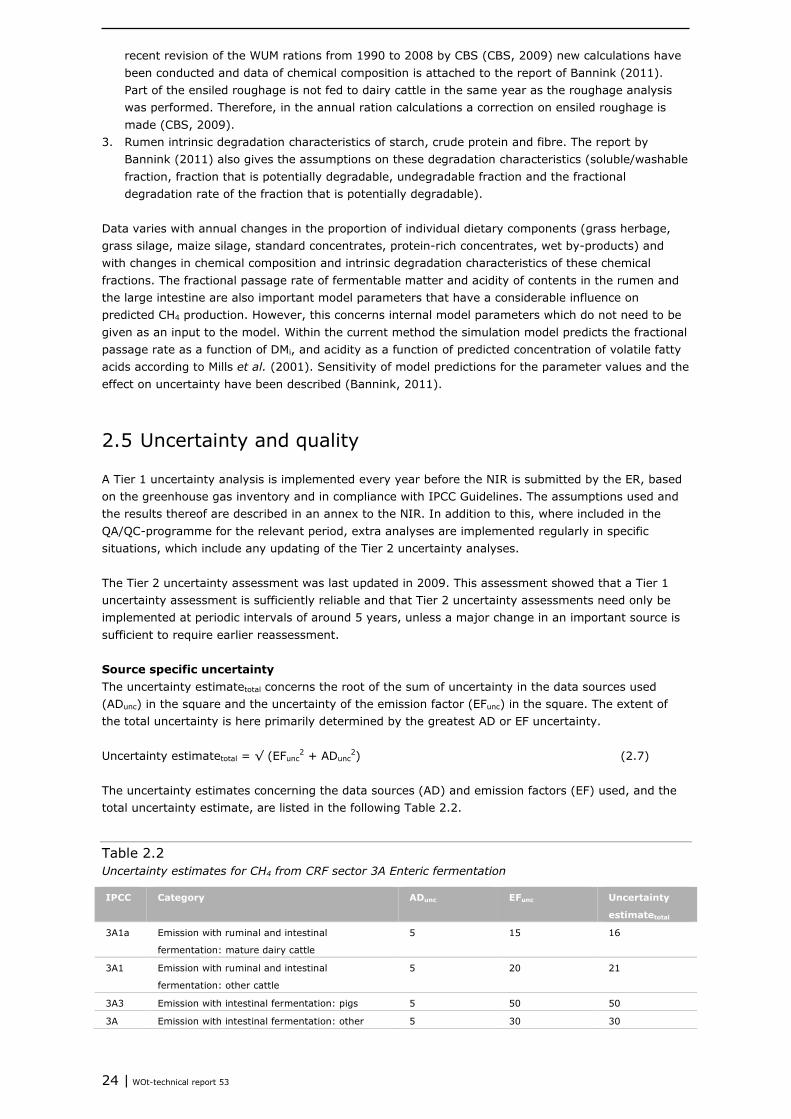
The uncertainty estimates concerning the data sources (AD) and emission factors (EF) used, and the total uncertainty estimate, are listed in the following Table 2.2.
Table 2.2 Uncertainty estimates for CH4 from CRF sector 3A Enteric fermentation
IPCC Category ADunc EFunc Uncertainty
estimatetotal
3A1a Emission with ruminal and intestinal
fermentation: mature dairy cattle
5 15 16
3A1 Emission with ruminal and intestinal
fermentation: other cattle
5 20 21
3A3 Emission with intestinal fermentation: pigs 5 50 50
3A Emission with intestinal fermentation: other 5 30 30
Methodology for estimating emissions from agriculture in the Netherlands | 25
The uncertainty of CH4 emissions as a result of ruminal and intestinal fermentation is based on expert judgement. Uncertainty in activity data (= animal numbers) is about 5% and uncertainty in the CH4 EF for other cattle (excluding mature dairy cattle), pigs and other livestock (horses, mules and asses, sheep, goats) is respectively 20, 50 and 30% (Olivier et al., 2009). Uncertainty of the CH4 EF for ruminal and intestinal fermentation in mature dairy cattle is based on an analysis of the effect of uncertainty of input data for a simulation model, used as a Tier 3 approach, on predicted EF and Ym (Bannink, 2011). Because the model is not applied with other cattle, the lower estimate of uncertainty for mature cattle is not applicable to this category of cattle. A detailed overview of quality assurance and quality control is given in Annex 12. In this annex also some outlines on the verification of data are presented.


Methodology for estimating emissions from agriculture in the Netherlands | 27
3 CH4 emissions from manure management (CRF sector 3B)
3.1 Scope and definition
This chapter describes the methodology and working processes for determining CH4 emissions from manure in animal housings and outside storages, or produced on pasture land during grazing. In the Common Reporting Format (CRF) the following source categories are distinguished: • 3B1a Mature dairy cattle • 3B1b Other mature cattle • 3B1c Growing cattle • 3B2 Sheep • 3B3 Swine • 3B4 Other livestock
d) Goats e) Horses f) Mules and asses g) Poultry h) Other
The source categories 3B4a Buffalo, 3B4b Camels and 3B4c Deer are reported as Not Occurring (NO), because these are not kept commercially in the Netherlands. Under category 3B4h Other, rabbits and fur-bearing animals are being reported. Methane emissions from livestock manure are caused by fermentation of organic matter in an anaerobic environment. It takes some time for methanogenic bacteria to develop and produce methane. This implies that when manure is stored for shorter than a month methane production will remain very low. To what extent organic matter is converted in methane also depends on the (chemical) composition of the manure and environmental factors like temperature. Webb et al. (2012) present an overview of key factors affecting methane emission. Livestock manure can be liquid or solid, depending on the animal category and manure management system (like the use of straw). It is called liquid when it is flowing under gravity and pumpable, solid manure is stackable and can be packed in heaps (RAMIRAN Glossary, 2011). Liquid manure is anaerobic, solid manure, when not packed or compressed, is more aerated, resulting in lower CH4 emissions. • Cattle manure can be liquid (slurry) or solid, possibly with a share of urine and faeces excreted
during grazing. In general female young stock, dairy and suckling cows are kept on pasture land during the summer months. All dairy cows spend part of the day inside the animal house depending on the applied grazing system, particularly at night and during milking times. With an increase of the number of animals per farm, more animals are kept inside the animal house the whole year round. This implies that also during the summer months all of the manure (and methane) is produced in the animal house.
• Pig manure in the Netherlands is mainly liquid. A minor part is solid, produced by pigs for breeding (sows and boars for service) when bedding material is used (for instance straw).
• Poultry includes laying hens, broilers, ducks and turkeys. Because of the high dry matter content of poultry faeces and the management systems used, currently all poultry manure is considered solid. In earlier years of the time series, battery cage systems producing liquid manure are also taken into consideration.
• Goats in the Netherlands are milking goats, which are kept inside the animal house throughout the year and produce solid manure.
• Sheep are grazing animals and only spend time inside the animal house during the lambing season, where they produce solid manure.

28 | WOt-technical report 53
• Horses, mules and asses produce manure in the animal house and during grazing. Solid manure is produced in the period inside the animal house.
• Rabbits and fur-bearing animals (minks, foxes) are kept indoors year-round, and can produce either solid or liquid manure depending on the housing system.
Liquid manure of pigs and cattle is often stored underneath the slatted floors of animal houses in slurry pits, and manure storage facilities outside the animal house. Solid manure is stored in the animal house and stacked outdoors, in most cases with a roof to avoid rainwater. In both cases anaerobic conditions can occur, resulting in the production and emission of CH4. The slurry pit is a so-called accumulation system: there is a constant input of manure and the volume increases until it is removed. The methane emission in such a system increases as the manure temperature rises and the manure is stored for longer periods (Zeeman, 1994). Additionally, when older manure with high methanogenic activity is already present (inoculation) methane emission also increases. Methane emission from manure excreted during grazing is low, because of the aerobic conditions and fast drying of manure.
3.2 Calculation method
The total CH4 emissions from manure management are calculated by summing the CH4 emissions for all livestock categories: CH4 emissions 3B = ∑ CH4 emissions from manure excreted by livestock category (i) (3.1) In which CH4 emissions 3B : Methane emission (kg CH4/year) from manure for all defined livestock
categories (i) within CRF category 3B manure management Cattle, pigs and poultry are considered to be key-sources (Coenen et al., 2014) and therefore EFs are calculated with a Tier 2 approach. In this approach, distinction is made between liquid manure management systems, solid manure management systems and pasture manure. CH4 emissions in livestock category (i) = ∑ [ number of animals in livestock category (i) ] x [ fraction manure management system (j) ] x EF CH4 3Bij (3.2) In which EF CH4 3Bij : Emission factor (kg CH4/animal) for the manure management of livestock
category (i) and manure management system (j) With respect to the other livestock categories, default Tier 1 EFs are used (IPCC, 2006). CH4 emissions in livestock category (i) = [number of animals in livestock category (i) ] x EF CH4 3Bi
(3.3) In which EF CH4 3Bi : Emission factor (kg CH4/animal) for the manure management of livestock
category (i)
3.3 Emission factors
For the key livestock categories cattle, pigs and poultry a country-specific emission factor is calculated for each manure management system using the following formula:

Methodology for estimating emissions from agriculture in the Netherlands | 29
EF CH4 3Bij = VSi x Boi x MCFij x methane density (3.4) In which VSi : Volatile solids (kg VS/year) produced by livestock category (i) Boi : Maximum methane production potential (m3 CH4/kg VS) for the manure
produced by livestock category (i) MCFij : Methane conversion factor for livestock category (i) and manure
management system (j) Methane density : 0.67 kg/m3 CH4
Volatile solids (VS) The amount of volatile solids (VS) excreted is calculated for the key categories cattle, pigs and poultry (Zom and Groenestein, 2015). The amount of volatile solids excreted by livestock depends on the digestibility of the organic matter and protein of the feed components. VS excretion in urine is calculated as the amount of urea (CH4N2O) or uric acid (C5H4O3N4) from the digestibility of crude protein, which is also used in the calculation of TAN. In faeces VS depends on DM uptake, ash content therein and digestibility of the VS (Zom and Groenestein, 2015). Maximum methane production potential (Bo) The Bo depends on the degradability of the organic components in the manure. Bo is expressed in m3 CH4/kg VS and are 0.25 for cattle manure, and 0.34 for pig and poultry manure (Zeeman, 1994; Zeeman and Gerbens, 2002). Methane Conversion Factor (MCF) The MCF indicates which part of Bo will actually be converted into methane depending on degradability and environmental conditions. Zeeman and Gerbens (2002) found an MCF of 0.39 for liquid pig and poultry manure stored for six months at a manure temperature of 15 °C, during three months at 20 °C, or for cattle manure stored for 5-6 months at 20 °C. Information concerning total pig manure storage capacity and the proportion of inside and outside manure storage capacity are taken from studies from Van der Hoek (1994) and CBS (1997 and 2006). Temperatures of manure in inside and outside storage are based on data of De Mol and Hilhorst (2003 and 2004). For cattle, it is assumed that the proportion of inside and outside manure storage capacity (from the early 1990s onwards) is also applicable in following years. The Netherlands uses a country-specific value for cattle manure (MCF = 0.284), based on a manure storage time of six months at a manure temperature of 15 °C (Zeeman, 1994). For cattle, the Netherlands also uses a lower manure temperature for outside storage facilities, and a lower manure temperature during the winter for slurry pits under animal houses. It is assumed that the total storage capacity for pig manure is six months: four months in the slurry pit and two months in outside storage facilities. Because it is not allowed to apply manure during the winter in the Netherlands, it is assumed that all manure storage facilities are empty on September 1st and that the slurry pit inside the animal house is fully filled, before manure is transferred to the outside storage facilities. Another assumption is that both the slurry pit and the outside storage facilities are empty on March 1st (Van der Hoek and Van Schijndel, 2006). From 1997 onwards, the total storage capacity (under the animal house) for pig manure is six months (obligation related to implementation of Nitrates Directive). For solid manure and manure on pasture land, the default IPCC MCF values of respectively 0.02 and 0.01 are used. Table 3.1 presents an overview of the MCF values used. For all other livestock categories, the Tier 1 default emission factors from Table 3.2 are used (IPCC, 2006).

30 | WOt-technical report 53
Table 3.1 MCF values used per animal category
1990-1992 1993-1996 From 1997 on
Liquid manure
Cattle, excluding veal calves 0.17 0.17 0.17
Veal calves 0.14 0.14 0.14
Pigs 0.34 0.36 0.39
Laying hens 0.39 0.39 0.39
Solid manure
Cattle 0.02 0.02 0.02
Pigs 0.02 0.02 0.02
Poultry 0.015 0.015 0.015
Pasture manure
Cattle 0.01 0.01 0.01
Table 3.2 Emission factors for all livestock categories (excluding cattle, pigs and poultry)
Animal category EF in kg CH4/animal/year
Sheep 0.19
Goats 0.13
Horses 1.56
Mules and asses 0.76
Rabbits 0.08
Fur-bearing animals (minks and foxes) 0.68
Source: IPCC (2006).
3.4 Activity data
Animal numbers Annex 1 presents an overview of the animal (sub-)categories being distinguished in the Agricultural Census. This categorization is also used within the NEMA calculations, and results are then grouped towards reporting categories as indicated. Since the IPCC Tier 1 EFs are averages for both sexes and over all age groups, they are to be multiplied by the total number of animals (i.e. including young and male animals) within each livestock category. Different than in emissions of N containing compounds, where excretion by young and male animals is accounted for in the excretion of mother animals, for CH4 from manure management total number of sheep, goats and rabbits are therefore used in the calculations. PVE (2005) estimated the Netherlands has 300,000 privately owned horses. This number is added to the result of the Agricultural Census, and resulting emissions are attributed to agriculture. In contrast to large-scale pollutants, the Netherlands has chosen not to report greenhouse gas emissions under the ‘Other’ category.
Distribution between the manure management systems The proportion of liquid and solid manure depends on how manure is managed in the housing systems. Data on these are derived from the Agricultural Census, supplemented by information on environmental permits issued by local authorities. The length of the grazing period in days per year and hours per day indicate the fraction of manure excreted on pasture land. This is indicated by the Dutch Working group on Uniformity of calculations of Manure and mineral data (WUM). According to the IPCC method, liquid manure is divided into two groups: storage in slurry pits lasting less than one month, and storage lasting longer than one month.

Methodology for estimating emissions from agriculture in the Netherlands | 31
3.5 Uncertainty and quality
A Tier 1 uncertainty analysis is implemented every year before the NIR is submitted by the ER, based on the greenhouse gas inventory and in compliance with IPCC Guidelines. The assumptions used and the results thereof are described in an annex to the NIR. In addition to this, where included in the QA/QC-programme for the relevant period, extra analyses are implemented regularly in specific situations, which include any updating of the Tier 2 uncertainty analyses. The Tier 2 uncertainty assessment was last updated in 2009. This assessment showed that a Tier 1 uncertainty assessment is sufficiently reliable and that Tier 2 uncertainty assessments need only be implemented at periodic intervals of around 5 years, unless a major change in an important source is sufficient to require earlier reassessment.
Source specific uncertainty The uncertainty estimatetotal concerns the root of the sum of uncertainty in the data sources used (ADunc) in the square and the uncertainty of the emission factors (EFunc) in the square. The extent of the total uncertainty is here primarily determined by the greatest AD or EF uncertainty. Uncertainty estimatetotal = √ (ADunc
2 + EFunc2) (3.5)
The uncertainty estimates concerning the data sources (AD) and emission factors (EF) used, and the total uncertainty estimate, are listed in the following Table 3.3.
Table 3.3 Uncertainty estimates for CH4 from CRF sector 3B manure management
IPCC Category ADunc EFunc Uncertainty
estimatetotal
3B1 Emissions from manure management: cattle 10 100 100
3B3 Emissions from manure management: pigs 10 100 100
3B4g Emissions from manure management: poultry 10 100 100
3B Emissions from manure management: other 10 100 100
The uncertainty in the CH4 emissions from the management of manure from cattle and pigs was estimated to be approximately 100%, annually. The uncertainty in the amount of animal manure (10%) was based on a 5% uncertainty in animal numbers and a 5 to 10% uncertainty in excretion per animal (RIVM, 1999). The resulting uncertainty of 7 to 11% was rounded off to 10%. The uncertainty in the CH4 emission factors for manure management, based on expert judgements, was estimated to be 100% (Olivier et al., 2009). A detailed overview of quality assurance and quality control is given in Annex 12. In this annex also some outlines on the verification of data are presented.

Methodology for estimating emissions from agriculture in the Netherlands | 33
4 NH3 emissions from manure management (NFR category 3B)
4.1 Scope and definition
This chapter describes the methods and working processes for determining NH3 emissions from manure management, using the following Nomenclature For Reporting (NFR) categories: • 3B1a Dairy cattle • 3B1b Non-dairy cattle • 3B2 Sheep • 3B3 Swine • 3B4d Goats • 3B4e Horses • 3B4f Mules and asses • 3B4gi Laying hens • 3B4gii Broilers • 3B4h Other animals Buffalo (3B4a) are reported as Not Occurring (NO), because these are not kept commercially in the Netherlands. Turkeys (3B4giii) and Other poultry (3B4giv; concerns ducks) are included within the category Broilers, and therefore reported as Included Elsewhere (IE). NH3 emissions from animal housing and outside manure storage originate mainly from nitrogen excreted in the urine and to a small extent from mineralized organically bound N in faeces. In mammals this nitrogen is excreted as urea (CH4N2O) and in birds as uric acid (C5H4O3N4). Both urea and uric acid are converted by bacterial enzymes (urease and uricase) into ammonium (NH4
+). For urea this process generally takes less than 24 hours (Elzing and Monteny, 1997), while uric acid breaks down less quickly (Groot Koerkamp, 1998). At high pH, NH4
+ is converted to NH3 which emits in a process affected by physical (air speed, area, temperature) and chemical (NH4
+ concentration, pH, ion strength) factors. The sum of the amount of ammonia (NH3) and ammonium (NH4
+) is called total ammoniacal N (TAN). The N-flow method described in Velthof et al. (2009) and in this methodology report calculates the gaseous N emissions based on TAN. This is a change with respect to methodologies used earlier in the Netherlands, which used emission factors based on total N excretion (Oenema et al., 2000; Van der Hoek, 2002). The excretion of TAN is calculated as the sum of excretion of urine N and net mineralized organically bound N in faeces. The net mineralized organically bound N is used since TAN can also be immobilized and become organic N. There is international consensus about the advantages of a methodology to calculate NH3 emissions on the basis of TAN instead of total N: • Gaseous N components are formed from NH4
+ in the manure and research under controlled conditions shows that the NH3 emission is better related to the NH4
+ content than the content of total N in manure (e.g. Velthof et al., 2005).
• A measure that does not change the total amount of N in the manure, but does change the amount of TAN, does affect NH3 emission as well. With an emission factor based on total N this effect cannot be calculated. Rations do not only have an effect on total N excretion, but also on the share TAN of the excretion (Annexes 2, 3 and 4). The effects of ration composition on NH3 emission can be quantified better with a methodology based on TAN.
• The emission factor for application of manure is based on TAN (Section 8.3.2). In the former methodology the emission after application is calculated based on standard TAN contents in the manure from literature. These data are not influenced by changes in rations or housing systems. If the NH3 emission after application of manure can be based on the calculated TAN contents in the
34 | WOt-technical report 53
manure, effects of rations and housing systems on TAN also become visible in the emissions after application.
• Connection is made to internationally accepted concepts of NH3 calculation methods (Reidy et al., 2008), and also to the Emission Inventory Guidebook of EMEP/CORINAIR that is being used in the European and UNECE context (www.eea.europa.eu/publications/emep-eea-guidebook-2013).
In the methodology it is assumed that the relation between the TAN contents and the NH3 emission progresses linearly, so that a linear emission factor is applied as percentage of the excreted TAN in manure. This assumption was also made in the former methodology based on total N (Oenema et al., 2000) and has been found in experimental research (Velthof et al., 2005). The calculation method based on TAN takes into account the net mineralization of organic N that occurs in the manure (Annex 5). Methods to calculate the TAN excretion based on ration data have been drafted (Annexes 2, 3 and 4). This calculation is now done yearly in the WUM calculations, so that effects of changes in TAN (like for instance changes in roughage production and ration composition) on NH3 emission can be well quantified. The actual ration compositions and N digestibility of the separate components are taken as the starting point for the TAN calculations instead of fixed TAN values or empirically averaged digestion values (Velthof et al., 2012). In poultry TAN is mainly uric acid. This is also called TAN in this report. It is however known that part of the uric acid in the animal house and outside manure storage may not have been converted to NH4
+. The amount of uric acid in the applied manure is uncertain, and as a result no correction is made for it. In subsequent sections uniform calculation rules are given based on TAN for all livestock categories. Over time part of the TAN in manure is lost as gaseous N compounds. It is assumed that mineralization takes place directly after excretion. The calculations are performed as follows: 1. The TAN excretion by the animal is calculated as the excretion of N in urine. 2. The amount of TAN produced by net mineralization is calculated from the excretion of organic N in
faeces. 3. The total amount of TAN in manure equals the sum of TAN excretion from step 1 and 2. 4. The emissions of NH3 and other N compounds (N2, N2O, NOx) is calculated relative to the total
amount of N in the manure, expressed as TAN to allow for a consistent calculation method. 5. After reduction of N losses in the animal house from the total TAN in manure, part of the manure
is stored in outside storages and here too N losses occur. 6. The amount of TAN remaining after reduction of N losses in the animal house and/or outside
storage, is applied to land (Chapters 8, 9 and 10). In the next section the calculation steps are described in detail. Section 4.3 describes the conversion of the emission factors for gaseous NH3 losses from animal housing and outside manure storages based on total N to emission factors based on TAN. Which data are needed for all this is explained further in Section 4.4.
4.2 Calculation method
Ammonia emissions from manure management are the sum of emissions from animal housing and outside manure storages. NH3 emissions 3B = ∑ NH3 animal housesi + NH3 manure storagei (4.1) In which NH3 emissions 3B : Ammonia emission (kg NH3/year) for all defined livestock categories (i)
within NFR category 3B manure management NH3 animal housesi : Ammonia emission (kg NH3/year) from animal housing for
livestock category (i) NH3 manure storagei : Ammonia emission (kg NH3/year) from outside manure storages for
livestock category (i)

Methodology for estimating emissions from agriculture in the Netherlands | 35
4.2.1 Ammonia emission from animal houses
The total NH3 emission from animal houses is calculated from: • Number of animals per livestock category; • Total N excretion in the animal house per livestock category and manure management system
(liquid or solid); • Share of TAN in the excretion per livestock category (liquid or solid); • Mineralization of organically bound N in manure stored in the animal house (liquid or solid); • Average emission factors for NH3 from animal housing per livestock category. This emission factor
is weighted for the share of the different housing systems. The NH3 emission from animal houses for livestock category (i) is calculated as: NH3 animal housesi = ∑ TAN inputij x EF NH3-N animal houseij x 17/14 (4.2) In which NH3 animal housesi : Ammonia emission (kg NH3/year) from animal housing for livestock
category (i) TAN inputij : Sum of urine excretion and net N mineralization in the animal house
(TAN; kg N/year) for livestock category (i) and manure management system (j)
EF NH3-N animal houseij : Ammonia emission factor (% of TAN) for animal housings of livestock category (i) and manure management system (j)
17/14 : Conversion factor from NH3-N to NH3 based on molecular weight The TAN input for a given livestock category (i) and manure management system (j) is calculated as follows: TAN inputij = [ number of animals in livestock category (i) ] x [ fraction manure management system (j) ] x (N excretioni x TAN fractioni + N excretioni x (1 - TAN fractioni) x N mineralizationj) (4.3) In which N excretioni : N excretion (kg N/animal) in the animal house for livestock
category (i) TAN fractioni : Fraction urine N in the total N excretion in the animal house for
livestock category (i) N mineralizationj : net N mineralization in % of the organic N excretion for manure
management system (j)
4.2.2 Ammonia emission from manure storages
Part of the manure is stored in outside manure storages. From the initial TAN excreted by livestock (including mineralization), total gaseous nitrogen losses in the animal house are subtracted. These losses occur as NH3, NOx, N2O and N2. After multiplication by the fraction of manure stored, the TAN input into outside storages is established. The total NH3 emission from outside manure storages in a given year is calculated from: • TAN input (urine N excretion and N mineralization in the animal house, minus total N losses in the
animal house); • Emission factors for NH3 for outside manure storages per livestock category and manure
management system (liquid or solid), expressed in percentage of the TAN input. In this emission factor the transfer of manure from the animal house to the outside storage is accounted for.
The NH3 emission from outside manure storages for livestock category (i) is calculated as: NH3 manure storagei = ∑ (TAN inputij - N losses animal houseij) x fraction storageij x EF NH3-N storageij x 17/14 (4.4)

36 | WOt-technical report 53
In which NH3 manure storagei : Ammonia emission (kg NH3/year) from outside manure storages
for livestock category (i) N losses animal houseij : Sum of NH3-N, N2O-N, NOx-N and N2-N losses (kg N/year) from
animal houses for livestock category (i) and manure management system (j)
fraction storageij : Fraction of manure stored outside for livestock category (i) and manure management system (j)
EF NH3-N storageij : Ammonia emission factor (% of TAN) for outside storages of livestock category (i) and manure management system (j)
17/14 : Conversion factor from NH3-N to NH3 based on molecular weight Total N losses from animal houses for livestock category (i) and manure management system (j) are calculated as: N losses animal houseij = TAN inputij x (EF NH3-N animal houseij + EF N2O-N animal houseij + EF NOx-N animal houseij + EF N2-N animal houseij) (4.5) In which EF N2O-N/NOx-N/N2-N animal houseij : Nitrous oxide/nitrogen oxides/nitrogen gas emission
factor (% of TAN) for animal housing of animal category (i) and manure management system (j)
Emission factors for N2O, NOx and N2 from animal housing are usually expressed as percentage of the N excretion (Oenema et al., 2000). Nitrogen emissions as NOx and N2O from manure management are described in Chapters 5 and 6. For NH3 the emission factors are based on TAN. In line with the TAN-flow, the emission factors for N2O, NOx and N2 have to be converted to percentages of TAN in order to determine the amount of TAN entering outside manure storages. Section 4.3.1 describes this conversion along with the emission factors for NH3 from animal housing. Losses as N2 are not reported, but only calculated for calculation of the TAN flow.
4.3 Emission factors
4.3.1 Emission factors for animal housing
NH3 emission factors in the Netherlands are often derived from measurements, resulting from the measurement protocol for emission factors within the 'Regeling ammoniak en veehouderij' (Regulation ammonia and animal husbandry, Rav). The NH3 emission factors derived from the measurements are expressed per animal place. For the TAN-flow, these are converted into an emission factor as a % of TAN present taking into account the vacancy in housing. For all animal housing systems (k) per livestock category (i) the following calculation is performed. EF NH3-N animal houseij = Σ (EF NH3 animal houseik x (14/17) / (1 - fraction vacik)) / TAN inputik x 100 (4.6) In which EF NH3–N animal houseik : Ammonia emission factor (% of TAN excretion) for livestock
category (i) and housing system (k) EF NH3 animal houseik : Ammonia emission factor (kg NH3/animal place/year) for livestock
category (i) and housing system (k) fraction vacik : Fraction of vacancy per animal place for livestock category (i) and
housing system (k), during the housing period TAN inputik : TAN input (kg N/animal/year) for livestock category (i) and
housing system (k) 14/17 : Conversion factor from NH3 to NH3-N based on molecular weight
Methodology for estimating emissions from agriculture in the Netherlands | 37
In order to follow a consistent calculation methodology, the emission factors for N2O, NOx and N2 from animal housing also need to be expressed as percentages of TAN. For all defined livestock categories (i) and manure management systems (j) the following calculations are performed: EF N2O-N/NOx-N/N2-N animal houseij = EF N2O/NOx/N2 animal houseij x N excretioni / TAN inputij
(4.7) In which EF N2O-N/NOx-N/N2-N animal houseij : Emission factors (% of TAN excretion in the animal house)
for N2O/NOx/N2 from livestock category (i) and manure management system (j)
EF N2O/NOx/N2 animal houseij : Emission factors (% of total N excretion in the animal house) for N2O/NOx/N2 from livestock category (i) and manure management system (j)
4.3.2 Emission factors for outside manure storages
The emission factor as percentage of the amount of TAN present at the start of the storage period is calculated from the proportion of the total amount of TAN that is excreted and mineralized in the animal house. For all livestock categories (i) and manure management systems (j), following calculations are performed: EF NH3-N storageij = EF NH3 storageij x ((N excretioni – N losses animal housingij) / (TAN inputij - N losses animal housingij)) (4.8) In which EF NH3-N storageij : Ammonia emission factor (% of TAN) for outside storages of
livestock category (i) and manure management system (j) EF NH3 storageij : Ammonia emission factor (% of N stored) for outside manure storage of
livestock category (i) and manure management system (j) N losses animal housingij: Sum of NH3-N, N2O-N, NOx-N and N2-N losses (kg N/year) from animal
houses for livestock category (i) and manure management system (j) Also in manure storages emissions of N2, N2O and NOx occur, but as emission factors for these include both animal housing and manure storage according to the IPCC guidelines, these are not calculated separately. Emissions from manure storages are therefore included in the EFs described in Section 4.3.1 (equation 4.7).
4.4 Activity data
Besides the animal numbers per livestock category, technical parameters on animal production (N excretion, TAN fraction) and information on management (housing systems, fraction storage) are needed to calculate emissions. An explanation on data needed for calculations on both the emissions from animal houses and emissions from manure storage is given in the next sections.
4.4.1 Emissions from animal houses
Animal numbers Annex 1 presents an overview of the animal (sub-)categories being distinguished in the Agricultural Census. This categorization is also used within the NEMA calculations. Results are then aggregated towards the reporting categories as indicated in Section 4.1. PVE (2005) estimated the Netherlands has 300,000 privately owned horses. This number is added to the result of the Agricultural Census, and resulting emissions are attributed to the ‘Other’ category.
38 | WOt-technical report 53
N excretion per livestock category in the considered year For the N excretion in the animal house (taking into account the excretion on pasture land during grazing) the data of the Working group on Uniformity of calculations of Manure and mineral data (WUM) are used. These data have been published for the 1990-2008 time-series by WUM (2010) and for consecutive years in the publication series Animal manure and minerals (in Dutch; Van Bruggen, 2009 to 2014) available on the Statistics Netherlands (CBS) website, www.cbs.nl.
Fraction of TAN of the total N excretion The excretion of urine N (TAN) is calculated yearly based on data on ration composition and nitrogen digestibilities of the feed components in the ration and production parameters (Tamminga et al., 2000, 2004). In Annexes 2, 3 and 4 the calculation method of urine N excretion for cattle, pigs and poultry is described for historic years (before 2009). For other grazing animals (horses, ponies, sheep and goats) the same methodology is used as for cattle. For rabbits and fur-bearing animals no data were available to calculate the TAN fraction in the N excretion. The share of these animals in the total NH3 emission is limited and data on ration composition are difficult to obtain. To calculate TAN input would take a disproportionate amount of time. The TAN fractions for these animal categories are therefore assumed to be 70% of the excreted N (Velthof et al., 2009). A more detailed explanation of TAN is given in Annexes 2, 3 and 4.
Mineralization/immobilization of organic N It is assumed that the N mineralization during storage of liquid manure in the animal house amounts to 10% of the organic N, based on research of Beline et al. (1998), see also Annex 5. For solid manure, a N immobilization of 25% is assumed. In poultry and fur-bearing animals no mineralization/immobilization is assumed.
NH3 emission factor per livestock category and housing system The data of the most recent NH3 emission factors in the Rav (‘Regeling ammoniak en veehouderij’; Regulation ammonia and animal husbandry) are used where possible. If new information about a certain livestock category or housing system is available, the emission factor can however prelude the one in the Rav. In calculations of historic series the Rav values (or the previous UAV values) have to be used for the year concerned.
The shares of housing systems per livestock category The shares of housing systems per livestock category is based on the Agricultural Census. If for certain categories not enough information is available, other sources can be used like permit files of local authorities. Based on research by Handhavingsamenwerking Noord-Brabant (2010, 2013) showing many of the air scrubbers required in environmental permits not being in use, implementation grades are corrected. In the years up and including 2009 it is assumed 40% was not functioning, decreasing by 8% a year to 16% in 2012. From then on an extrapolation is made, with a decrease of 4% per year to reach 0 in 2016 when all air scrubbers are to be equipped with electronic monitoring.
Lack of occupancy The lack of occupancy is given in Annex 9, based on Van Bruggen et al. (2015). With lack of occupancy the period in which the animal house is unoccupied between production rounds is meant. Vacancy through loss of animals, earlier selection of animals or other reasons for vacancies during a period of growth and rearing as described in Stichting Groen Label (1996) and Ogink et al. (2008) are not considered.
Emission factors for N2O, NOx and N2 The emission factors for N2O, NOx and N2 for animal houses and outside manure storages are based on the IPCC 2006 defaults for N2O and Oenema et al. (2000), setting the EF for NOx equal to N2O and for N2 tenfold (liquid manure) or fivefold (solid manure). This results in the EFs, relative to N excreted by the animals as presented in Table 4.1. Additional information is presented in Chapters 5 (NOx) and 6 (N2O).

Methodology for estimating emissions from agriculture in the Netherlands | 39
Table 4.1 Emission factors for N2O and NOx and N2 used to calculate other N losses from animal houses, expressed as percentage of N excretion
Manure type EF N2O-N (%) EF NOx-N (%) EF N2-N (%)
Liquid manure (cattle/pigs/other) 0.2 0.2 2.0
Solid manure (cattle/pigs/sheep/horses/other) 0.5 0.5 2.5
Liquid manure (poultry) 0.1 0.1 1.0
Solid manure (poultry) 0.1 0.1 0.5
Deep bedding (goats) 1.0 1.0 5.0
Sources: IPCC (2006) and Oenema et al. (2000).
It has been examined whether better emission factors are available in the Netherlands. Based on this study it is concluded that only few data is available on emissions of N2O, NOx and N2 from animal houses and outside manure storages, and that as a result the uncertainties on emission factors for N2O and NOx and N2 are large. Because of the large uncertainties, it was decided to maintain the current methodology based on the IPCC guidelines and Oenema et al. (2000), however the measurements indicated that for the Dutch situation (largely without litter) the IPCC 2006 default values were rather high.
4.4.2 Emissions from manure storages
Fraction of the manure stored outside Information on the fractions of manure stored outside the animal house, are taken from the Agricultural Census complemented with data taken from literature. Annex 10 gives an overview of the percentages and sources.
4.5 Uncertainty and quality
The uncertainty estimatetotal concerns the root of the sum of uncertainty in the data sources used (ADunc) in the square and the uncertainty of the emission factors (EFunc) in the square. The extent of the total uncertainty is here primarily determined by the greatest AD or EF uncertainty. Uncertainty estimatetotal = √ (ADunc
2 + EFunc2) (4.9)
The uncertainty estimates concerning the data sources (AD) and emission factors (EF) used, and the total uncertainty estimate, are listed in the following Table 4.2.
Table 4.2 Uncertainty estimates for NH3 from NFR category 3B manure management
EMEP Category ADunc EFunc Uncertainty
estimatetotal
3B1a Manure management of dairy cattle 2 24 24
3B1b Manure management of non-dairy cattle 2 22-26 23-26
3B3 Manure management of pigs 5-10 26-27 26-29
3B4gi Manure management of laying hens 5-10 66 66
The uncertainty of NH3 emissions as a result of manure management is based on expert judgement. Uncertainty in activity data (= animal numbers) is 2-10% depending on animal category (CBS, 2012) and uncertainty in the NH3 EF for manure management, based on expert judgements, was estimated to be 22-66%. A detailed overview of quality assurance and quality control is given in Annex 12. In this annex also some outlines on the verification of data are presented.

Methodology for estimating emissions from agriculture in the Netherlands | 41
5 NOx emissions from manure management (NFR category 3B)
5.1 Scope and definition
This chapter describes the method and working processes for determining NOx emissions from manure management, using the following Nomenclature For Reporting (NFR) categories: • 3B1a Dairy cattle • 3B1b Non-dairy cattle • 3B2 Sheep • 3B3 Swine • 3B4d Goats • 3B4e Horses • 3B4f Mules and asses • 3B4gi Laying hens • 3B4gii Broilers • 3B4h Other animals The category 3B4a (Buffalo) is reported as Not Occurring (NO), because these are not kept commercially in the Netherlands. Turkeys (3B4giii) and Other poultry (3B4giv; concerns ducks) are included within the category Broilers, and therefore reported as Included Elsewhere (IE). Emissions reported under category 3B concern only the NOx emissions from manure produced in animal houses, and then stored temporarily and/or processed before being transported elsewhere. The nitrogen oxides resulting from manure production on pasture land are reported under category 3D (NOx emissions from soil). Although emissions are reported as nitrogen monoxide by NEMA, it is referred to as NOx in this report to prevent confusion with the notation key NO.
5.2 Calculation method
The amount of nitrogen in manure refers to the gross amount of N excreted, i.e. no reductions for ammonia and nitrous oxide emissions from animal houses and outside manure storages. NOx emissions from livestock manure are calculated as follows: NOx emissions 3B = ∑ [ number of animals in livestock category (i) ] x [ fraction manure management system (j) ] x N excretioni x EF NOx 3Bij x 30/14 (5.1) In which NOx emissions 3B : NOx emissions (kg NOx, expressed as nitrogen monoxide) for all livestock
categories (i) within NFR category 3B manure management N excretioni : N excretion (kg N/animal) for livestock category (i) EF NOx 3Bij : Emission factor (kg NOx-N/kg N excreted in the animal house) for
livestock category (i) and manure management system (j) 30/14 : Conversion factor from kg NOx-N to kg NOx, expressed as nitrogen
monoxide
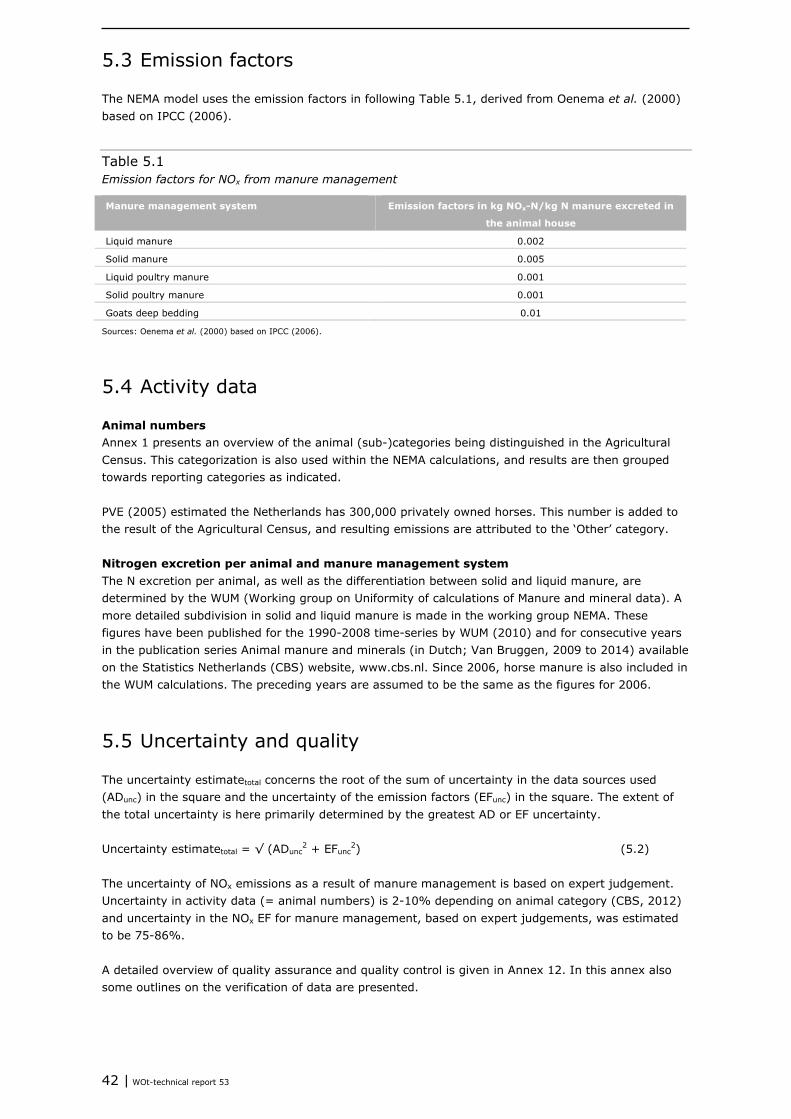
42 | WOt-technical report 53
5.3 Emission factors
The NEMA model uses the emission factors in following Table 5.1, derived from Oenema et al. (2000) based on IPCC (2006).
Table 5.1 Emission factors for NOx from manure management
Manure management system Emission factors in kg NOx-N/kg N manure excreted in
the animal house
Liquid manure 0.002
Solid manure 0.005
Liquid poultry manure 0.001
Solid poultry manure 0.001
Goats deep bedding 0.01
Sources: Oenema et al. (2000) based on IPCC (2006).
5.4 Activity data
Animal numbers Annex 1 presents an overview of the animal (sub-)categories being distinguished in the Agricultural Census. This categorization is also used within the NEMA calculations, and results are then grouped towards reporting categories as indicated. PVE (2005) estimated the Netherlands has 300,000 privately owned horses. This number is added to the result of the Agricultural Census, and resulting emissions are attributed to the ‘Other’ category.
Nitrogen excretion per animal and manure management system The N excretion per animal, as well as the differentiation between solid and liquid manure, are determined by the WUM (Working group on Uniformity of calculations of Manure and mineral data). A more detailed subdivision in solid and liquid manure is made in the working group NEMA. These figures have been published for the 1990-2008 time-series by WUM (2010) and for consecutive years in the publication series Animal manure and minerals (in Dutch; Van Bruggen, 2009 to 2014) available on the Statistics Netherlands (CBS) website, www.cbs.nl. Since 2006, horse manure is also included in the WUM calculations. The preceding years are assumed to be the same as the figures for 2006.
5.5 Uncertainty and quality
The uncertainty estimatetotal concerns the root of the sum of uncertainty in the data sources used (ADunc) in the square and the uncertainty of the emission factors (EFunc) in the square. The extent of the total uncertainty is here primarily determined by the greatest AD or EF uncertainty. Uncertainty estimatetotal = √ (ADunc
2 + EFunc2) (5.2)
The uncertainty of NOx emissions as a result of manure management is based on expert judgement. Uncertainty in activity data (= animal numbers) is 2-10% depending on animal category (CBS, 2012) and uncertainty in the NOx EF for manure management, based on expert judgements, was estimated to be 75-86%. A detailed overview of quality assurance and quality control is given in Annex 12. In this annex also some outlines on the verification of data are presented.

Methodology for estimating emissions from agriculture in the Netherlands | 43
6 N2O emissions from manure management (CRF sector 3B)
6.1 Scope and definition
This chapter describes the method and working processes for determining N2O emissions from manure management. In the Common Reporting Format (CRF) the following source categories are distinguished: • 3B1a Mature dairy cattle • 3B1b Other mature cattle • 3B1c Growing cattle • 3B2 Sheep • 3B3 Swine • 3B4d Goats • 3B4e Horses • 3B4f Mules and asses • 3B4g Poultry • 3B4h Other livestock (rabbits and fur-bearing animals) • 3B5 Indirect N2O emissions The source categories 3B4a Buffalo, 3B4b Camels and 3B4c Deer are reported as Not Occurring (NO), because these are not kept commercially in the Netherlands. Emissions reported under category 3B concern only the N2O emissions from manure produced in animal houses, and then stored temporarily and/or processed before being transported elsewhere. The nitrous oxide resulting from manure production on pasture land is reported under category 3D (Chapter 10; N2O emissions from crop production and agricultural soils). Nitrous oxide emissions from livestock manure management depend on the nitrogen and carbon content of the manure, the amount of time the manure is stored and the treatment method used. During storage the manure often becomes low-oxygen, which slows the nitrification process and therefore denitrification remains low. Nitrification is the process whereby, under high-oxygen circumstances, ammonia (NH4
+) is converted by bacteria into nitrate. Nitrous oxide can be formed as a by-product, particularly if the nitrification is limited through lack of oxygen. Nitrification does not require any organic substances (volatile solids) to be present. Straw-rich solid manure and poultry manure can possess a relatively open and loose structure, where O2 can diffuse far more easily than in liquid manure, enabling nitrification. Denitrification is the process whereby, under low-oxygen circumstances, bacteria can convert nitrate (NO3
-) into the gaseous nitrogen compound N2, with N2O as a by-product. Organic substances (volatile solids) are used as an energy source. Denitrification in animal houses and manure storages is fully depending on the nitrification process, which has to supply the oxidized nitrogen compounds. N2O emissions from solid manure are higher than those from liquid manure, because there is very little nitrification in the latter due to the lack of oxygen.
6.2 Calculation method
Nitrous oxide emissions from manure management are calculated as: N2O emissions 3B = (N2O-N emission direct + N2O-N emission indirect) x 44/28 (6.1)
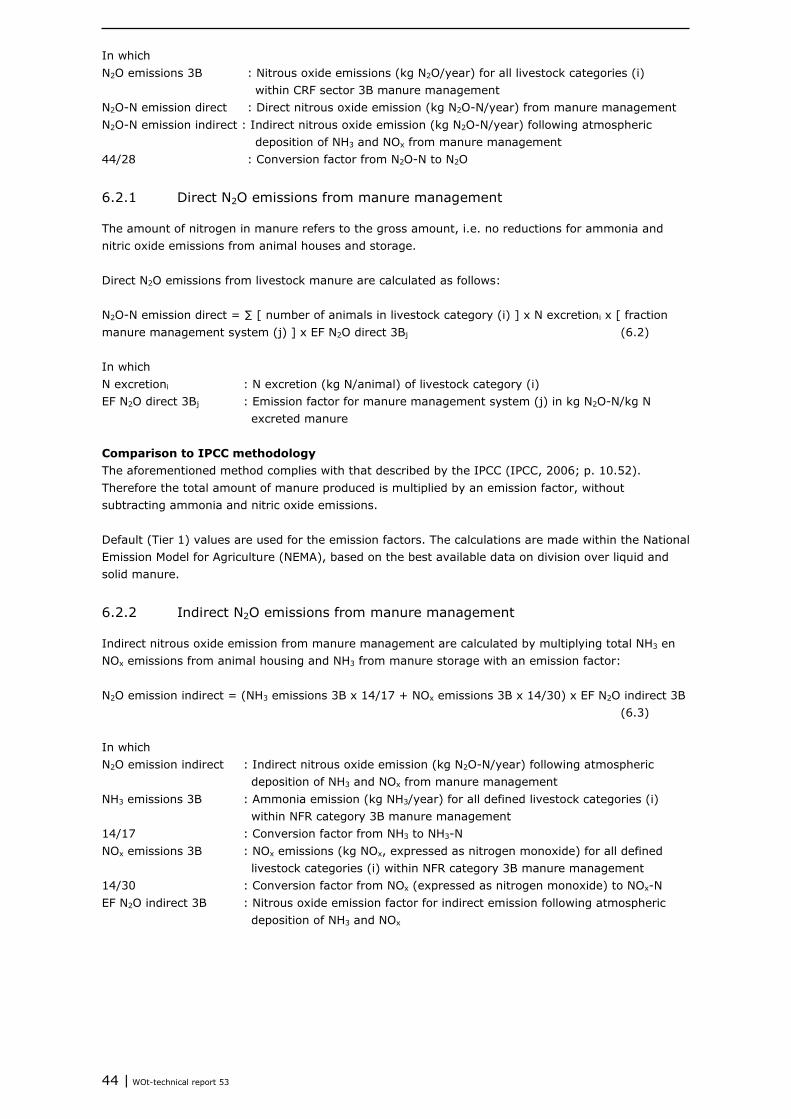
44 | WOt-technical report 53
In which N2O emissions 3B : Nitrous oxide emissions (kg N2O/year) for all livestock categories (i)
within CRF sector 3B manure management N2O-N emission direct : Direct nitrous oxide emission (kg N2O-N/year) from manure management N2O-N emission indirect : Indirect nitrous oxide emission (kg N2O-N/year) following atmospheric
deposition of NH3 and NOx from manure management 44/28 : Conversion factor from N2O-N to N2O
6.2.1 Direct N2O emissions from manure management
The amount of nitrogen in manure refers to the gross amount, i.e. no reductions for ammonia and nitric oxide emissions from animal houses and storage. Direct N2O emissions from livestock manure are calculated as follows: N2O-N emission direct = ∑ [ number of animals in livestock category (i) ] x N excretioni x [ fraction manure management system (j) ] x EF N2O direct 3Bj (6.2) In which N excretioni : N excretion (kg N/animal) of livestock category (i) EF N2O direct 3Bj : Emission factor for manure management system (j) in kg N2O-N/kg N
excreted manure
Comparison to IPCC methodology The aforementioned method complies with that described by the IPCC (IPCC, 2006; p. 10.52). Therefore the total amount of manure produced is multiplied by an emission factor, without subtracting ammonia and nitric oxide emissions. Default (Tier 1) values are used for the emission factors. The calculations are made within the National Emission Model for Agriculture (NEMA), based on the best available data on division over liquid and solid manure.
6.2.2 Indirect N2O emissions from manure management
Indirect nitrous oxide emission from manure management are calculated by multiplying total NH3 en NOx emissions from animal housing and NH3 from manure storage with an emission factor: N2O emission indirect = (NH3 emissions 3B x 14/17 + NOx emissions 3B x 14/30) x EF N2O indirect 3B (6.3) In which N2O emission indirect : Indirect nitrous oxide emission (kg N2O-N/year) following atmospheric
deposition of NH3 and NOx from manure management NH3 emissions 3B : Ammonia emission (kg NH3/year) for all defined livestock categories (i)
within NFR category 3B manure management 14/17 : Conversion factor from NH3 to NH3-N NOx emissions 3B : NOx emissions (kg NOx, expressed as nitrogen monoxide) for all defined
livestock categories (i) within NFR category 3B manure management 14/30 : Conversion factor from NOx (expressed as nitrogen monoxide) to NOx-N EF N2O indirect 3B : Nitrous oxide emission factor for indirect emission following atmospheric
deposition of NH3 and NOx

Methodology for estimating emissions from agriculture in the Netherlands | 45
6.3 Emission factors
6.3.1 Direct N2O emissions from manure management
The NEMA model uses the default IPCC 2006 emission factors, in following Table 6.1.
Table 6.1 Emission factors for N2O from manure management
Manure management system Emission factors in kg N2O-N/kg N manure excreted in
the animal house
Liquid manure 0.002
Solid manure 0.005
Liquid poultry manure 0.001
Solid poultry manure 0.001
Goats deep bedding 0.01
Source: IPCC (2006).
6.3.2 Indirect N2O emissions from manure management
The IPCC 2006 default EF of 0.01 kg N2O-N/kg N emitted as NH3 and NOx from animal houses and outside manure storages is used.
6.4 Activity data
Animal numbers Annex 1 presents an overview of the animal (sub-)categories being distinguished in the Agricultural Census. This categorization is also used within the NEMA calculations, and results are then grouped towards reporting categories as indicated. In sheep, goats, rabbits and fur-bearing animals, both young and male animals are being accounted for in the N excretion of the mother animal. For pigs, the excretion of piglets is included within the excretion of sows. Therefore the number of female animals is used in the calculations for N2O emissions from manure management. PVE (2005) estimated the Netherlands has 300,000 privately owned horses. This number is added to the result of the Agricultural Census, and resulting emissions are attributed to agriculture. In contrast to large-scale pollutants, the Netherlands has chosen not to report greenhouse gas emissions under the ‘Other’ category.
Nitrogen excretion per animal and manure management system The N excretion per animal, as well as the differentiation between solid and liquid manure, are determined by the WUM (Working group on Uniformity of calculations of Manure and mineral data). A more detailed subdivision in solid and liquid manure is made in the working group NEMA. These figures have been published for the 1990-2008 time-series by WUM (2010) and for consecutive years in the publication series Animal manure and minerals (in Dutch; Van Bruggen, 2009 to 2014) available on the Statistics Netherlands (CBS) website, www.cbs.nl. Since 2006, horse manure is also included in the WUM calculations. The preceding years are assumed to be the same as the figures for 2006.
46 | WOt-technical report 53
6.5 Uncertainty and quality
A Tier 1 uncertainty analysis is implemented every year before the NIR is submitted by the ER, based on the greenhouse gas inventory and in compliance with IPCC Guidelines. The assumptions used and the results thereof are described in an annex to the NIR. In addition to this, where included in the QA/QC-programme for the relevant period, extra analyses are implemented regularly in specific situations, which include any updating of the Tier 2 uncertainty analyses. The Tier 2 uncertainty assessment was last updated in 2009. This assessment showed that a Tier 1 uncertainty assessment is sufficiently reliable and that Tier 2 uncertainty assessments need only be implemented at periodic intervals of around 5 years, unless a major change in an important source is sufficient to require earlier reassessment.
Source specific uncertainty The uncertainty estimatetotal concerns the root of the sum of uncertainty in the data sources used (ADunc) in the square and the uncertainty of the emission factor (EFunc) in the square. The extent of the total uncertainty is here primarily determined by the greatest AD or EF uncertainty. Uncertainty estimatetotal = √ (ADunc
2 + EFunc2) (6.4)
The uncertainty estimates concerning the data sources (AD) and emission factors (EF) used, and the total uncertainty estimate, are listed in the following Table 6.2.
Table 6.2 Uncertainty estimates for N2O from CRF sector 3B manure management
IPCC Category ADunc EFunc Uncertainty
estimatetotal
3B Emissions from manure management 10 100 100
The uncertainty in the N2O emission from the management of manure from cattle and pigs was estimated to be approximately 100%, annually. The uncertainty in the amount of animal manure (10%) was based on a 5% uncertainty in animal numbers and a 5 to 10% uncertainty in excretion per animal (RIVM, 1999). The resulting uncertainty of 7 to 11% was rounded off to 10%. The uncertainty in the N2O emission factors for manure management, based on expert judgements, was estimated to be 100% (Olivier et al., 2009). A detailed overview of quality assurance and quality control is given in Annex 12. In this annex also some outlines on the verification of data are presented.
Methodology for estimating emissions from agriculture in the Netherlands | 47
7 PM10/2.5 emissions from animal housing (NFR category 3B)
7.1 Scope and definition
This chapter describes the method and working processes for determining PM10 and PM2.5 emissions from animal housing, using the following Nomenclature For Reporting (NFR) categories: • 3B1a Dairy cattle • 3B1b Non-dairy cattle • 3B2 Sheep • 3B3 Swine • 3B4d Goats • 3B4e Horses • 3B4f Mules and asses • 3B4gi Laying hens • 3B4gii Broilers • 3B4h Other animals The category 3B4a (Buffalo) is reported as Not Occurring (NO), because these are not kept commercially in the Netherlands. Categories 3B4giii (Turkeys) and 3B4giv (Other poultry) are included within the category Broilers (Included Elsewhere, IE). Particulate matter emissions from agriculture mainly originate from animal houses, and consist of skin, manure, feed and bedding particles. Poultry is the main source category of PM10 and PM2.5 in agriculture. Housing systems for laying hens that produced liquid manure were replaced by systems that produce solid manure, which leads to a higher emission of particulate matter. Pigs and cattle also contribute to the particulate matter production but to a much smaller extent. Since more housing systems for pigs use air scrubbers the emission of particulate matter decreases.
7.2 Calculation method
Shares of used housing systems are derived from the Agricultural Census, and the emissions are calculated by multiplying the number of animals per housing system with emission factors for PM10 and PM2.5 in grams/animal/year. PM emissions 3B = ∑ [ number of animals per livestock category (i) ] x [ fraction animal housing system (k) ] x EF PM 3Bik / 1,000 (7.1) In which PM emissions 3B : PM emissions (kg PM10 or PM2.5/year) for all livestock categories (i) and
housing systems (k) within NFR category 3B manure management EF PM 3Bik : Emission factor (g PM10 or PM2.5/year) for livestock category (i) and animal
housing system (k) 1,000 : Conversion factor from grams to kilograms
7.3 Emission factors
The emission factors are based on a measurement program conducted by Wageningen UR Livestock Research between 2007 and 2009 (publication series ‘Particulate matter emission from animal houses’, in Dutch; Mosquera et al., 2009a, 2009b, 2009c, 2010a, 2010b, 2010c and Winkel et al., 2009a, 2009b, 2010).
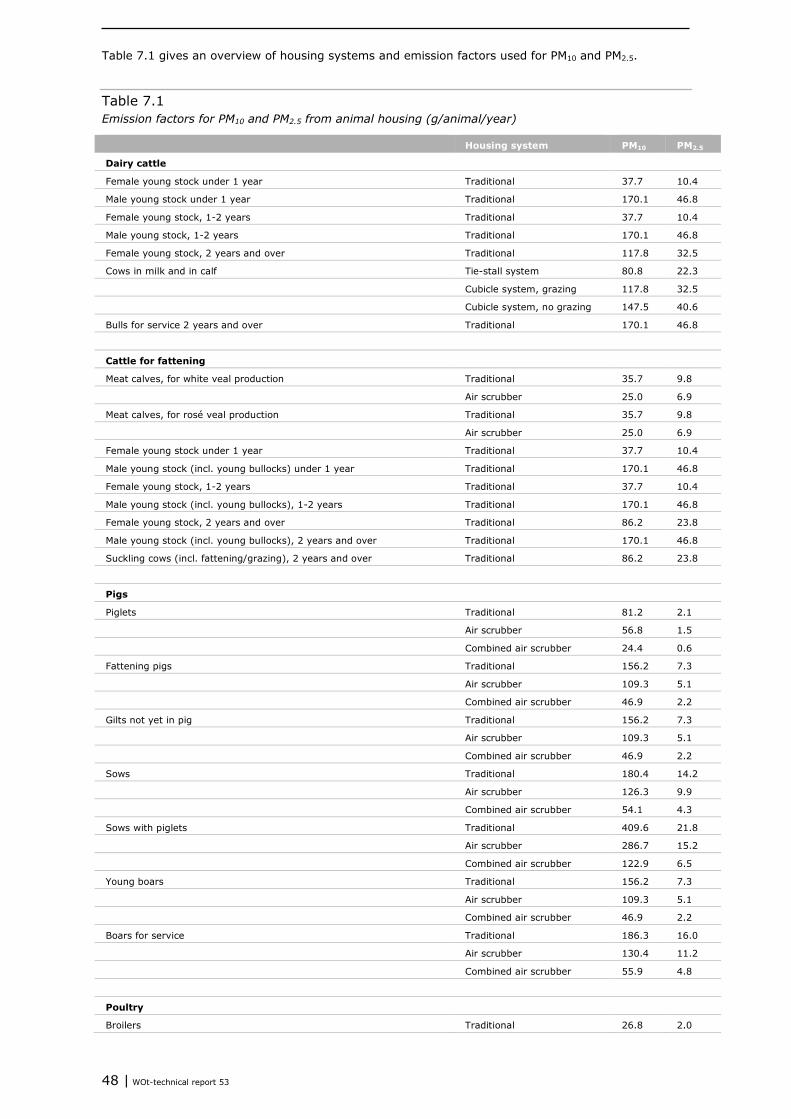
48 | WOt-technical report 53
Table 7.1 gives an overview of housing systems and emission factors used for PM10 and PM2.5.
Table 7.1 Emission factors for PM10 and PM2.5 from animal housing (g/animal/year)
Housing system PM10 PM2.5
Dairy cattle
Female young stock under 1 year Traditional 37.7 10.4
Male young stock under 1 year Traditional 170.1 46.8
Female young stock, 1-2 years Traditional 37.7 10.4
Male young stock, 1-2 years Traditional 170.1 46.8
Female young stock, 2 years and over Traditional 117.8 32.5
Cows in milk and in calf Tie-stall system 80.8 22.3
Cubicle system, grazing 117.8 32.5
Cubicle system, no grazing 147.5 40.6
Bulls for service 2 years and over Traditional 170.1 46.8
Cattle for fattening
Meat calves, for white veal production Traditional 35.7 9.8
Air scrubber 25.0 6.9
Meat calves, for rosé veal production Traditional 35.7 9.8
Air scrubber 25.0 6.9
Female young stock under 1 year Traditional 37.7 10.4
Male young stock (incl. young bullocks) under 1 year Traditional 170.1 46.8
Female young stock, 1-2 years Traditional 37.7 10.4
Male young stock (incl. young bullocks), 1-2 years Traditional 170.1 46.8
Female young stock, 2 years and over Traditional 86.2 23.8
Male young stock (incl. young bullocks), 2 years and over Traditional 170.1 46.8
Suckling cows (incl. fattening/grazing), 2 years and over Traditional 86.2 23.8
Pigs
Piglets Traditional 81.2 2.1
Air scrubber 56.8 1.5
Combined air scrubber 24.4 0.6
Fattening pigs Traditional 156.2 7.3
Air scrubber 109.3 5.1
Combined air scrubber 46.9 2.2
Gilts not yet in pig Traditional 156.2 7.3
Air scrubber 109.3 5.1
Combined air scrubber 46.9 2.2
Sows Traditional 180.4 14.2
Air scrubber 126.3 9.9
Combined air scrubber 54.1 4.3
Sows with piglets Traditional 409.6 21.8
Air scrubber 286.7 15.2
Combined air scrubber 122.9 6.5
Young boars Traditional 156.2 7.3
Air scrubber 109.3 5.1
Combined air scrubber 46.9 2.2
Boars for service Traditional 186.3 16.0
Air scrubber 130.4 11.2
Combined air scrubber 55.9 4.8
Poultry
Broilers Traditional 26.8 2.0
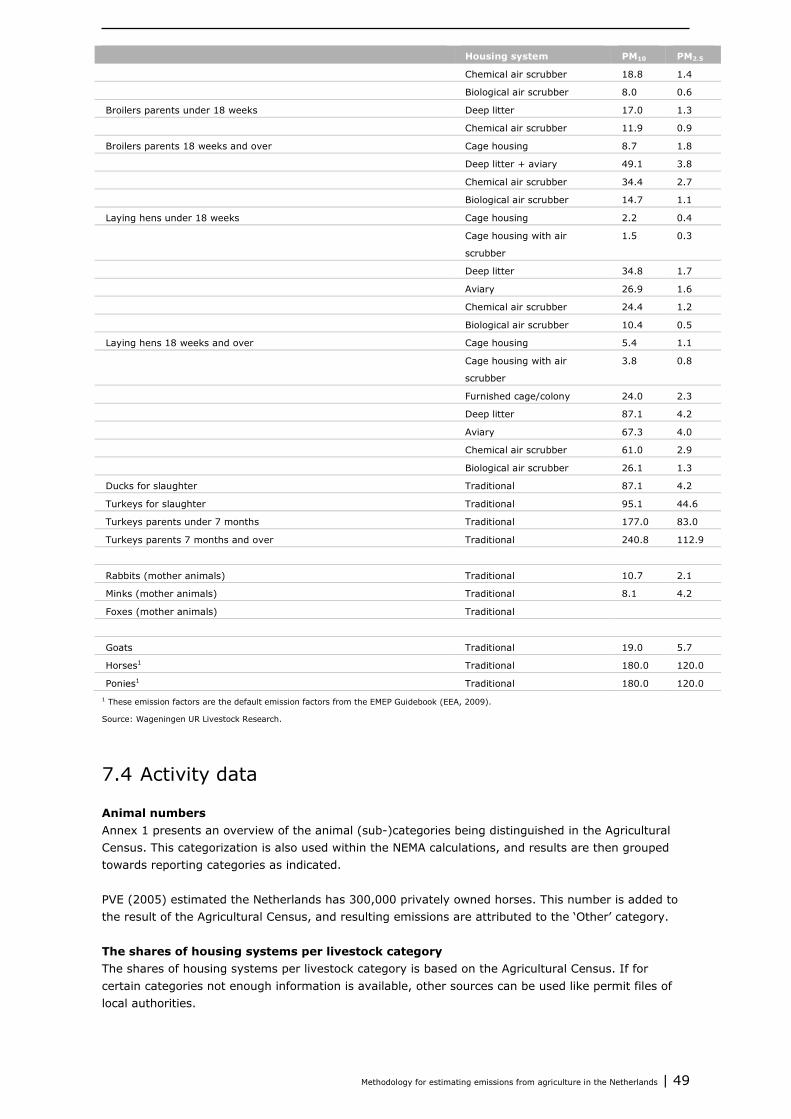
Methodology for estimating emissions from agriculture in the Netherlands | 49
Housing system PM10 PM2.5
Chemical air scrubber 18.8 1.4
Biological air scrubber 8.0 0.6
Broilers parents under 18 weeks Deep litter 17.0 1.3
Chemical air scrubber 11.9 0.9
Broilers parents 18 weeks and over Cage housing 8.7 1.8
Deep litter + aviary 49.1 3.8
Chemical air scrubber 34.4 2.7
Biological air scrubber 14.7 1.1
Laying hens under 18 weeks Cage housing 2.2 0.4
Cage housing with air
scrubber
1.5 0.3
Deep litter 34.8 1.7
Aviary 26.9 1.6
Chemical air scrubber 24.4 1.2
Biological air scrubber 10.4 0.5
Laying hens 18 weeks and over Cage housing 5.4 1.1
Cage housing with air
scrubber
3.8 0.8
Furnished cage/colony 24.0 2.3
Deep litter 87.1 4.2
Aviary 67.3 4.0
Chemical air scrubber 61.0 2.9
Biological air scrubber 26.1 1.3
Ducks for slaughter Traditional 87.1 4.2
Turkeys for slaughter Traditional 95.1 44.6
Turkeys parents under 7 months Traditional 177.0 83.0
Turkeys parents 7 months and over Traditional 240.8 112.9
Rabbits (mother animals) Traditional 10.7 2.1
Minks (mother animals) Traditional 8.1 4.2
Foxes (mother animals) Traditional
Goats Traditional 19.0 5.7
Horses1 Traditional 180.0 120.0
Ponies1 Traditional 180.0 120.0 1 These emission factors are the default emission factors from the EMEP Guidebook (EEA, 2009).
Source: Wageningen UR Livestock Research.
7.4 Activity data
Animal numbers Annex 1 presents an overview of the animal (sub-)categories being distinguished in the Agricultural Census. This categorization is also used within the NEMA calculations, and results are then grouped towards reporting categories as indicated. PVE (2005) estimated the Netherlands has 300,000 privately owned horses. This number is added to the result of the Agricultural Census, and resulting emissions are attributed to the ‘Other’ category.
The shares of housing systems per livestock category The shares of housing systems per livestock category is based on the Agricultural Census. If for certain categories not enough information is available, other sources can be used like permit files of local authorities.
50 | WOt-technical report 53
Based on research by Handhavingsamenwerking Noord-Brabant (2010, 2013) showing many of the air scrubbers required in environmental permits not being in use, implementation grades are corrected. In the years up and including 2009 it is assumed 40% was not functioning, decreasing by 8% a year to 16% in 2012. From then on an extrapolation is made, with a decrease of 4% per year to reach 0 in 2016 when all air scrubbers are to be equipped with electronic monitoring.
7.5 Uncertainty and quality
The uncertainty estimatetotal concerns the root of the sum of uncertainty in the data sources used (ADunc) in the square and the uncertainty of the emission factors (EFunc) in the square. The extent of the total uncertainty is here primarily determined by the greatest AD or EF uncertainty. Uncertainty estimatetotal = √ (ADunc
2 + EFunc2) (7.2)
The uncertainty of PM10/2.5 emissions as a result of manure management is based on expert judgement and measurement variation. Uncertainty in activity data (= animal numbers) is 2-10% depending on animal category (CBS, 2012) and uncertainty in the PM10/2.5 EF for manure management, based on measurement variation, was estimated to be 2-55%. A detailed overview of quality assurance and quality control is given in Annex 12. In this annex also some outlines on the verification of data are presented.
Methodology for estimating emissions from agriculture in the Netherlands | 51
8 NH3 emissions from crop production and agricultural soils (NFR category 3D)
8.1 Scope and definition
This chapter describes the method and working processes for determining NH3 emissions from crop production and agricultural soils, using the following Nomenclature For Reporting (NFR) categories: • 3Da1 Inorganic N-fertilizers (includes also urea application) • 3Da2a Livestock manure applied to soils • 3Da2b Sewage sludge applied to soils • 3Da2c Other organic fertilizers applied to soils (including compost) • 3Da3 Urine and dung deposited by grazing animals • 3Da4 Crop residues applied to soils • 3De Cultivated crops Ammonia emissions occur in all subcategories describing N inputs to the soil (i.e. 3Da1 up to 3Da4), and during crop cultivation (3De). Subcategory 3F Field burning of agricultural residues is reported as Not Occurring (NO) since field burning is prohibited in the Netherlands. In the categories 3Df Use of pesticides and 3I Agriculture other, no ammonia emissions occur either. The amount of TAN and organic N that remains in manure after outside storage, is applied to the soil. It is assumed that manure stocks in storage remain equal, so no correction is made for manure stored longer than 1 year. The amount of TAN in manure applied to soil is calculated from: • Total N (urine N and faecal N) excretion in the animal house; • Mineralization of organic N in storage; • Losses of NH3, N2O, NOx and N2 inside the animal house and during outside storage; • Amount of manure that is incinerated, exported or processed and subsequently used outside
agriculture; • Manure used outside agriculture (hobby farming and application on nature areas). Manure can also be applied to soils directly via grazing animals. Emissions during grazing are calculated directly from TAN. Besides manure application and grazing, the application of inorganic N-fertilizer (including rinsing liquid of air scrubbers) to agricultural soils is a source of emission of NH3. NH3 emission from fertilizer occurs only if the fertilizer contains urea, or when ammonium (NH4
+) is applied to calcareous soils.
8.2 Calculation method
Total ammonia emissions from crop production and agricultural soils are the sum of: NH3 emissions 3D = NH3 fertilizer + NH3 manure application + NH3 sewage sludge + NH3 compost + NH3 grazing + NH3 crop residues + NH3 ripening crops (8.1) In which NH3 emissions 3D : Ammonia emission (kg NH3/year) from CRF sector 3D crop production
and agricultural soils For all distinguished source categories, a calculation method is available within the National Emission Model for Agriculture (NEMA). The amount of TAN in livestock manure available for application, follows from the TAN excretion minus N emissions in animal houses and during manure storage, using a
52 | WOt-technical report 53
balance method to model N flows in agriculture. Also TAN excreted on pasture land during grazing is part of this scheme. The other N supply sources (e.g. inorganic N-fertilizer, sewage sludge, compost and crop residues) are in the flow model as well.
8.2.1 Ammonia emission from inorganic N-fertilizer application
The ammonia emission from inorganic N-fertilizer is calculated from: • Amount of N applied per type of inorganic N-fertilizer; • Emission factor per type of inorganic N-fertilizer (Section 8.3.1). NH3 emissions from inorganic N-fertilizer application are calculated as follows. NH3 fertilizer = ∑ EF NH3 fertilizerl x N fertilizerl x 17/14 (8.2) In which NH3 fertilizer : Ammonia emission (kg NH3/year) from inorganic N-fertilizers EF NH3 fertilizerl : NH3 emission factor of inorganic N-fertilizer (l) in % of the applied N N fertilizerl : Total amount applied inorganic N-fertilizer (l) in kg N 17/14 : Conversion factor from NH3-N to NH3
8.2.2 Ammonia emission from manure application
The amount of TAN that is applied with manure is calculated from: • TAN input in the animal house (the sum of the urine N excretion and the TAN released through
mineralization during storage); • Losses in NH3 and other N compounds in animal houses and manure storages; • Amount N in the manure that is processed and marketed outside agriculture (assumption is that in
this no NH3 emission occurs); • Amount N that is exported or imported through manure (net export); • It is assumed that the yearly stock of N stored in manure does not change. The NH3 emission from manure application is calculated as: NH3 manure application = ∑ (TAN applied on grasslandij x fraction application technique on grasslandj x EF application technique on grasslandj + TAN applied on croplandij x fraction application technique on croplandj x EF application technique on croplandj) x 17/14 (8.3) In which NH3 manure application : Ammonia emission from manure applied to agricultural soils (kg
NH3/year) TAN applied on grasslandij : Amount of TAN in manure (kg N/year) of livestock category (i)
and manure management system (j) applied to grassland fraction application technique on grasslandj : Fractions of manure application techniques for
manure management system (j) used on grassland EF application technique on grasslandj : Ammonia emission factor (% of TAN) for manure
application techniques for manure management system (j) used on grassland
TAN applied on croplandij : Amount of TAN in manure (kg N/year) of livestock category (i) and manure management system (j) applied to cropland
fraction application technique on croplandj : Fractions of manure application techniques for manure management system (j) used on cropland
EF application technique on croplandj : Ammonia emission factor (% of TAN) for manure application techniques for manure management system (j) used on cropland
17/14 : Conversion factor from NH3-N to NH3
Methodology for estimating emissions from agriculture in the Netherlands | 53
The NH3 emission is calculated for different manure application techniques. For grassland the following application techniques are distinguished (Section 8.3.2): surface spreading, shallow injection, trailing hose and slit coulter application. For cropland surface spreading, injection/full coverage, incorporation in 1 track and incorporation in 2 tracks are distinguished. The amount of TAN available per livestock category/manure type, is calculated by subtracting N emissions in animal houses and during manure storage from the TAN excretion in the animal house. Part of the manure is used outside agriculture, processed or exported. The amount of manure per livestock category (i) and manure management system (j) that is available for application, is found by subtracting these amounts from the initial TAN excretion: TAN for applicationij = TAN inputi x [ fraction manure management system (j) ] – N losses animal housingij – NH3 storageij – N processedij – N exportij (8.4) In which TAN for applicationij : Amount of manure (kg N) that per livestock category (i) and manure
management system (j) is applied to agricultural soils TAN inputi : TAN excretion (kg N) in the animal house for livestock category (i) N losses animal housingij : Sum of NH3, N2O, NOx and N2 losses (kg N) from animal houses for
livestock category (i) and manure management system (j) NH3 storageij : NH3 emission from outside manure storages for livestock category (i) and manure management system (j) in kg N N processedij : Amount of manure that per livestock category (i) and manure management system (j) is processed in kg N N exportij : Amount of manure that per livestock category (i) and manure management system (j) is exported in kg N, with import denoted as negative export It is assumed that the imported manure has the same TAN fraction in total N as the manure coming from the animal house and storage. The total amounts of liquid and solid manure are then divided over grassland and cropland, see Section 8.4.2. The NH3 emission from application of manure to grassland and cropland is calculated from i) the amount of TAN that is applied to grassland and cropland through manure and ii) the emission factors for NH3 emission for application by different techniques on cropland and grassland (Section 8.3.2).
8.2.3 Ammonia emission from sewage sludge application
In the calculation of NH3 emission from sewage sludge application a distinction is made between liquid and solid sludge, with different TAN fractions. All sewage sludge, both liquid and solid is assumed to be surface applied on cropland: NH3 sewage sludge = (N sewage sludge x liquid fraction x TAN liquid x EF NH3 liquid + N sewage sludge x solid fraction x TAN solid x EF NH3 solid) x 17/14 (8.5) In which NH3 sewage sludge : Ammonia emission (kg NH3/year) from sewage sludge N sewage sludge : Amount of sewage sludge (kg N) applied to agricultural soils liquid fraction : Fraction sewage sludge in liquid form TAN liquid : Fraction TAN in liquid sewage sludge EF NH3 liquid : Ammonia emission factor (kg NH3-N/kg N applied) for liquid sewage
sludge solid fraction : Fraction sewage sludge in solid form TAN solid : Fraction TAN in solid sewage sludge EF NH3 solid : Ammonia emission factor (kg NH3-N/kg N applied) for solid sewage sludge 17/14 : Conversion factor from NH3-N to NH3

54 | WOt-technical report 53
8.2.4 Ammonia emission from other organic fertilizers (compost)
Two sources of compost are considered (from organic waste or green refuse), however it is assumed that the fraction of TAN in both is equal. All compost is surface applied on cropland: NH3 compost = (N organic waste compost + N green refuse compost) x TAN compost x EF NH3 compost x 17/14 (8.6) In which NH3 compost : Ammonia emission (kg NH3/year) from compost N organic waste compost : Amount of organic waste compost (kg N) applied to agricultural
soils N green refuse compost : Amount of green refuse compost (kg N) applied to agricultural soils
in kg N TAN compost : Fraction TAN in compost EF NH3 compost : Ammonia emission factor (kg NH3-N/kg N applied) for compost 17/14 : Conversion factor from NH3-N to NH3 NEMA also calculates the NH3 emissions for compost use outside agriculture, but these are allocated to NFR sector 6A Other.
8.2.5 Ammonia emission from grazing
The ammonia emission from grazing is calculated from: • N excretion on pasture land per grazing animal category, in kg N calculated on a yearly basis by
the WUM; • Share TAN in the N excretion during grazing, % of total N excretion (Annex 2); • Emission factors for grazing, in % of TAN on pasture land (Section 8.3.5). The total NH3 emission from grazing for all livestock categories (i) is calculated as: NH3 pasture = Σ [ number of animals in livestock category (i) ] x TAN pasturei x EF NH3 grazing x 17/14 (8.7) In which NH3 pasture : Ammonia emissions (kg NH3/year) from grazing TAN pasturei : TAN excretion on pasture land (kg N/year) for livestock category (i) EF NH3 grazing : Emission factor for grazing in % of TAN excretion 17/14 : Conversion factor from NH3-N to NH3 The TAN excretion on pasture land is calculated as: TAN excretion pasturei = N excretion pasturei x TAN fraction pasturei (8.8) In which TAN excretion pasturei : TAN excretion (kg N/animal/year) on pasture land for livestock category (i) N excretion pasturei : Total N excretion (kg N/animal/year) on pasture land for livestock category
(i) TAN fraction pasturei : Fraction TAN in the total N excretion on pasture land for livestock category
(i) The emission factor for grazing is calculated yearly, based on grass composition (year specific emission factor).
Methodology for estimating emissions from agriculture in the Netherlands | 55
8.2.6 Ammonia emission from crop residues
For the calculation of the emission from crop residues the methodology and calculations of De Ruijter et al. (2013) are taken as the starting point: NH3 crop residues = ∑ area grown x N in residue x EF NH3 crop residue x contributing fraction x 17/14 (8.9) In which NH3 crop residues : Ammonia emission (kg NH3/year) from crop residues area grown : Area per crop cultivated in ha N in residue : N contained within the crop residues per crop in kg N/ha EF NH3 crop residue : Emission factor for crop residues in % of the N content contributing fraction : Fraction of the residues that contributes to ammonia emission (i.e. is not
being incorporated into the soil in the first days after harvest) 17/14 : Conversion factor from NH3-N to NH3 The percentage volatilization is based on N content of the residues and assumes full exposure of the crop residues to air, both in the amounts and over time (see Section 8.3.6). With the contributing residue fraction the part of the residues that are incorporated into the soils is being accounted for.
8.2.7 Ammonia emission during crop cultivation
Emissions from standing crops in the Netherlands have been calculated using the DEPAC resistance model (Van Zanten et al., 2010). In this the exchange of ammonia between stomata of the plants, air layer directly above the crop and finally the atmosphere are modeled. Depending on ambient ammonia concentration and type of crop, emission or deposition will take place. These were determined on an hourly basis and aggregated over the growing season. For the Netherlands a total emission of 1.5 Gg NH3-N was found using this method. This estimate has been adopted for the whole time-series, instead of calculating the emissions for each year separately. Reason is the high associated uncertainty, mainly originating from the stomatal compensations points needed for the calculation. It was deemed that using a calculation rule in which cultivated areas are taken into account, would represent a level of accuracy that cannot be attained at this point.
8.3 Emission factors
8.3.1 Emission factors for inorganic N-fertilizer application
Ammonia emission factors for inorganic N-fertilizer are based on Bouwman et al. (2002). In this review paper the results of 148 studies (1,667 ammonia measurements) from all over the world are used to quantify the effect of fertilizer type, crop, N addition, application method, temperature, soil characteristics (cation exchange capacity (CEC), pH, organic matter content) and location on ammonia emission. A regression analysis has been performed (R2 = 28%) and based on this analysis a calculation model has been developed. For the Netherlands the following data are being used.
Crop In the calculation model a distinction is made between ‘grassland’ and ‘upland crops’. The areas of grassland, cropland and maize have been taken from soil use maps. Grassland has a factor class value of -0.045 and cropland and maize are considered to be ‘upland crops’ (factor class value -0.158).
Fertilizer type Calculation has been performed for the fertilizer types in Bouwman et al. (2002), but not all inorganic N-fertilizer types used are mentioned. The emission factors have been calculated as follows:
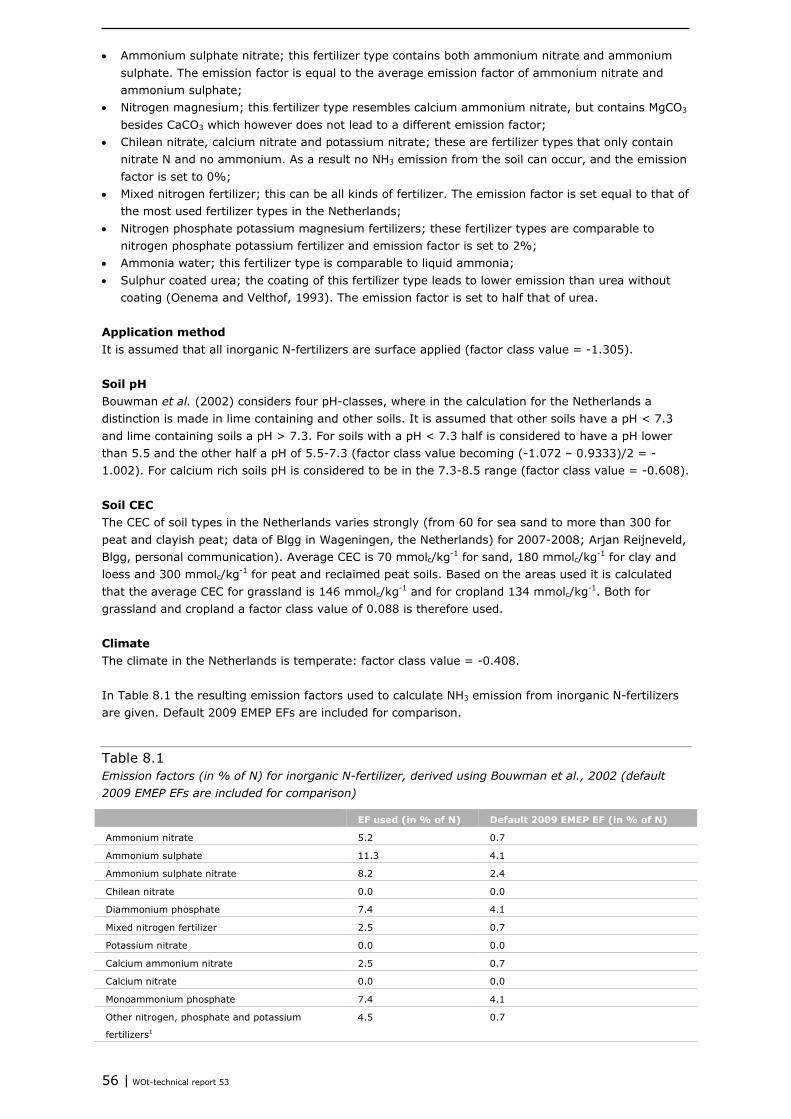
56 | WOt-technical report 53
• Ammonium sulphate nitrate; this fertilizer type contains both ammonium nitrate and ammonium sulphate. The emission factor is equal to the average emission factor of ammonium nitrate and ammonium sulphate;
• Nitrogen magnesium; this fertilizer type resembles calcium ammonium nitrate, but contains MgCO3 besides CaCO3 which however does not lead to a different emission factor;
• Chilean nitrate, calcium nitrate and potassium nitrate; these are fertilizer types that only contain nitrate N and no ammonium. As a result no NH3 emission from the soil can occur, and the emission factor is set to 0%;
• Mixed nitrogen fertilizer; this can be all kinds of fertilizer. The emission factor is set equal to that of the most used fertilizer types in the Netherlands;
• Nitrogen phosphate potassium magnesium fertilizers; these fertilizer types are comparable to nitrogen phosphate potassium fertilizer and emission factor is set to 2%;
• Ammonia water; this fertilizer type is comparable to liquid ammonia; • Sulphur coated urea; the coating of this fertilizer type leads to lower emission than urea without
coating (Oenema and Velthof, 1993). The emission factor is set to half that of urea.
Application method It is assumed that all inorganic N-fertilizers are surface applied (factor class value = -1.305).
Soil pH Bouwman et al. (2002) considers four pH-classes, where in the calculation for the Netherlands a distinction is made in lime containing and other soils. It is assumed that other soils have a pH < 7.3 and lime containing soils a pH > 7.3. For soils with a pH < 7.3 half is considered to have a pH lower than 5.5 and the other half a pH of 5.5-7.3 (factor class value becoming (-1.072 – 0.9333)/2 = -1.002). For calcium rich soils pH is considered to be in the 7.3-8.5 range (factor class value = -0.608).
Soil CEC The CEC of soil types in the Netherlands varies strongly (from 60 for sea sand to more than 300 for peat and clayish peat; data of Blgg in Wageningen, the Netherlands) for 2007-2008; Arjan Reijneveld, Blgg, personal communication). Average CEC is 70 mmolc/kg-1 for sand, 180 mmolc/kg-1 for clay and loess and 300 mmolc/kg-1 for peat and reclaimed peat soils. Based on the areas used it is calculated that the average CEC for grassland is 146 mmolc/kg-1 and for cropland 134 mmolc/kg-1. Both for grassland and cropland a factor class value of 0.088 is therefore used.
Climate The climate in the Netherlands is temperate: factor class value = -0.408. In Table 8.1 the resulting emission factors used to calculate NH3 emission from inorganic N-fertilizers are given. Default 2009 EMEP EFs are included for comparison.
Table 8.1 Emission factors (in % of N) for inorganic N-fertilizer, derived using Bouwman et al., 2002 (default 2009 EMEP EFs are included for comparison)
EF used (in % of N) Default 2009 EMEP EF (in % of N)
Ammonium nitrate 5.2 0.7
Ammonium sulphate 11.3 4.1
Ammonium sulphate nitrate 8.2 2.4
Chilean nitrate 0.0 0.0
Diammonium phosphate 7.4 4.1
Mixed nitrogen fertilizer 2.5 0.7
Potassium nitrate 0.0 0.0
Calcium ammonium nitrate 2.5 0.7
Calcium nitrate 0.0 0.0
Monoammonium phosphate 7.4 4.1
Other nitrogen, phosphate and potassium
fertilizers1
4.5 0.7
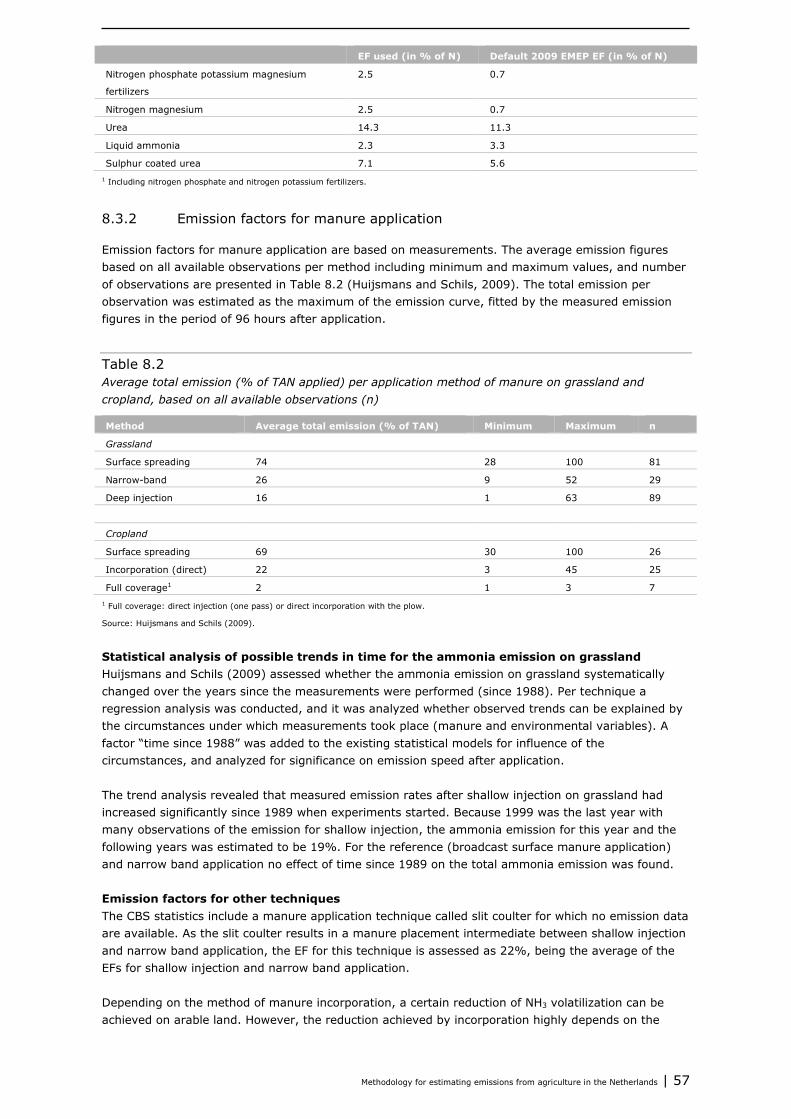
Methodology for estimating emissions from agriculture in the Netherlands | 57
EF used (in % of N) Default 2009 EMEP EF (in % of N)
Nitrogen phosphate potassium magnesium
fertilizers
2.5 0.7
Nitrogen magnesium 2.5 0.7
Urea 14.3 11.3
Liquid ammonia 2.3 3.3
Sulphur coated urea 7.1 5.6 1 Including nitrogen phosphate and nitrogen potassium fertilizers.
8.3.2 Emission factors for manure application
Emission factors for manure application are based on measurements. The average emission figures based on all available observations per method including minimum and maximum values, and number of observations are presented in Table 8.2 (Huijsmans and Schils, 2009). The total emission per observation was estimated as the maximum of the emission curve, fitted by the measured emission figures in the period of 96 hours after application.
Table 8.2 Average total emission (% of TAN applied) per application method of manure on grassland and cropland, based on all available observations (n)
Method Average total emission (% of TAN) Minimum Maximum n
Grassland
Surface spreading 74 28 100 81
Narrow-band 26 9 52 29
Deep injection 16 1 63 89
Cropland
Surface spreading 69 30 100 26
Incorporation (direct) 22 3 45 25
Full coverage1 2 1 3 7 1 Full coverage: direct injection (one pass) or direct incorporation with the plow.
Source: Huijsmans and Schils (2009).
Statistical analysis of possible trends in time for the ammonia emission on grassland Huijsmans and Schils (2009) assessed whether the ammonia emission on grassland systematically changed over the years since the measurements were performed (since 1988). Per technique a regression analysis was conducted, and it was analyzed whether observed trends can be explained by the circumstances under which measurements took place (manure and environmental variables). A factor “time since 1988” was added to the existing statistical models for influence of the circumstances, and analyzed for significance on emission speed after application. The trend analysis revealed that measured emission rates after shallow injection on grassland had increased significantly since 1989 when experiments started. Because 1999 was the last year with many observations of the emission for shallow injection, the ammonia emission for this year and the following years was estimated to be 19%. For the reference (broadcast surface manure application) and narrow band application no effect of time since 1989 on the total ammonia emission was found.
Emission factors for other techniques The CBS statistics include a manure application technique called slit coulter for which no emission data are available. As the slit coulter results in a manure placement intermediate between shallow injection and narrow band application, the EF for this technique is assessed as 22%, being the average of the EFs for shallow injection and narrow band application. Depending on the method of manure incorporation, a certain reduction of NH3 volatilization can be achieved on arable land. However, the reduction achieved by incorporation highly depends on the
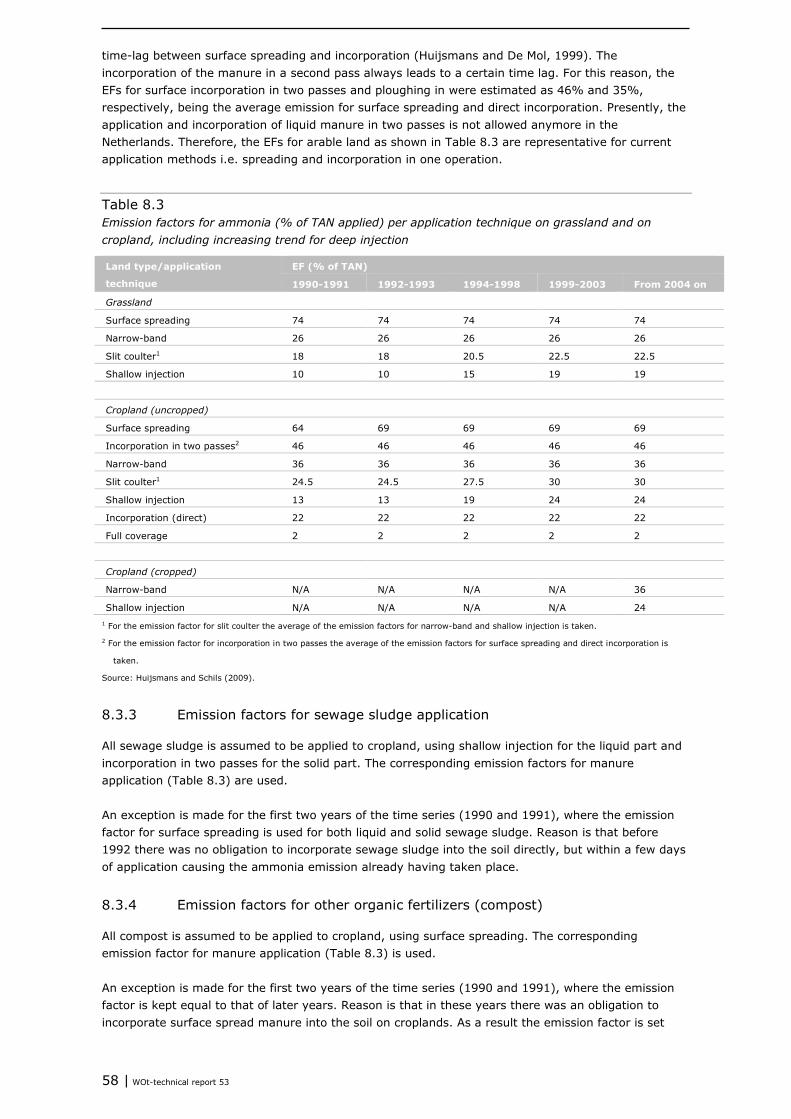
58 | WOt-technical report 53
time-lag between surface spreading and incorporation (Huijsmans and De Mol, 1999). The incorporation of the manure in a second pass always leads to a certain time lag. For this reason, the EFs for surface incorporation in two passes and ploughing in were estimated as 46% and 35%, respectively, being the average emission for surface spreading and direct incorporation. Presently, the application and incorporation of liquid manure in two passes is not allowed anymore in the Netherlands. Therefore, the EFs for arable land as shown in Table 8.3 are representative for current application methods i.e. spreading and incorporation in one operation.
Table 8.3 Emission factors for ammonia (% of TAN applied) per application technique on grassland and on cropland, including increasing trend for deep injection
Land type/application
technique
EF (% of TAN)
1990-1991 1992-1993 1994-1998 1999-2003 From 2004 on
Grassland
Surface spreading 74 74 74 74 74
Narrow-band 26 26 26 26 26
Slit coulter1 18 18 20.5 22.5 22.5
Shallow injection 10 10 15 19 19
Cropland (uncropped)
Surface spreading 64 69 69 69 69
Incorporation in two passes2 46 46 46 46 46
Narrow-band 36 36 36 36 36
Slit coulter1 24.5 24.5 27.5 30 30
Shallow injection 13 13 19 24 24
Incorporation (direct) 22 22 22 22 22
Full coverage 2 2 2 2 2
Cropland (cropped)
Narrow-band N/A N/A N/A N/A 36
Shallow injection N/A N/A N/A N/A 24 1 For the emission factor for slit coulter the average of the emission factors for narrow-band and shallow injection is taken.
2 For the emission factor for incorporation in two passes the average of the emission factors for surface spreading and direct incorporation is
taken.
Source: Huijsmans and Schils (2009).
8.3.3 Emission factors for sewage sludge application
All sewage sludge is assumed to be applied to cropland, using shallow injection for the liquid part and incorporation in two passes for the solid part. The corresponding emission factors for manure application (Table 8.3) are used. An exception is made for the first two years of the time series (1990 and 1991), where the emission factor for surface spreading is used for both liquid and solid sewage sludge. Reason is that before 1992 there was no obligation to incorporate sewage sludge into the soil directly, but within a few days of application causing the ammonia emission already having taken place.
8.3.4 Emission factors for other organic fertilizers (compost)
All compost is assumed to be applied to cropland, using surface spreading. The corresponding emission factor for manure application (Table 8.3) is used. An exception is made for the first two years of the time series (1990 and 1991), where the emission factor is kept equal to that of later years. Reason is that in these years there was an obligation to incorporate surface spread manure into the soil on croplands. As a result the emission factor is set
Methodology for estimating emissions from agriculture in the Netherlands | 59
lower for 1990 and 1991, but this requirement did not apply to compost. From 1992 onwards it is no longer allowed to surface spread liquid manure, and the obligation was lifted for other (solid) manures.
8.3.5 Emission factors for grazing
There are no recent measurements for NH3 emission during grazing. From research of Bussink (1992, 1994) an emission factor in % of total N excretion was derived. From this work also an emission factor based on TAN can be derived since urine N excretion is reported next to total N excretion. Several adjustments to the dataset of Bussink (1992, 1994) were made and the emission factor for grazing (EFgrazN) was corrected for: • Inorganic N-fertilizer applied during the research of Bussink (1992, 1994); • Changes over time in grazing systems used; • Soil type. Following each of these corrections is discussed briefly.
Inorganic N-fertilizer application The emission factor for the inorganic N-fertilizer in the study of Bussink was 2% (calcium ammonium saltpeter on calcium rich clay). However there are reasons to assume that emissions at this specific study site would normally be lower: • NH3 emission from inorganic N-fertilizer is inhibited by the higher NH3 concentration in the air from
grazing (application took place around three days after grazing; • Emission factors for inorganic N-fertilizers are derived from experiments where grass height was
low compared to the research of Bussink (1992, 1994); • Emission from inorganic N-fertilizer is slow and only a part of total NH3 emission will have occurred
during the measuring days; • Measured NH3 emission from calcium ammonium saltpeter at the same location in another year
was 0.1% at 50 kg N/ha and 1% at 400 kg N/ha (Bussink, Wageningen UR, personal communication).
Also application of inorganic N-fertilizer took place in periods without grazing or NH3 measurements. It is estimated that around 75% was applied when measurements were performed (Bussink, Wageningen UR, personal communication). The correction for inorganic N-fertilizer based on that amount, and an emission factor of 1% yields a corrected NH3 emission for grazing between 6 and 38 kg N/ha.
Grazing system The grazing systems in the Netherlands have shifted strongly towards systems with limited grazing in recent years (Aarts et al., 2008; Van Bruggen and Faqiri, 2015). Bussink derived an emission factor in a situation with unlimited (day and night) grazing. Higher temperature, wind speed and global radiation during the day can lead to on average higher NH3 emission from fresh urine patches. Furthermore during the night the grass is wet from dew and background concentrations of NH3 are relatively high (little dilution). This effect is also clearly seen in the measurements of Bussink. The average NH3-N flux over 24 hours was 38 g NH3-N per hour and 46 g NH3-N per hour in the period between 07:00 and 21:30h in case of restricted grazing (Bussink, 1992). Emission during the day is therefore a factor 1.20 higher, and this factor is used to derive the emission factor for systems with limited grazing from the emissions of Bussink (1992, 1994).
Soil type The NH3 emission also depends on the cation exchange capacity (CEC) of the soil (Bussink, 1994; Whitehead and Raistrick, 1993). With higher CEC, the soil can bind NH4
+ more strongly and the risk of NH3 emission reduces. The CEC correction calculated by Bussink (1996) is used: CEC correction = (7.71 – 0.02793 x (CEC – 280))/7.71 (8.10)
60 | WOt-technical report 53
Based on data of Blgg (Wageningen, the Netherlands) for 2007-2008 (Arjan Reijneveld, Blgg personal communication) the average CEC per soil type has been estimated. These are 70 mmolc kg-1 for sand, 180 mmolc kg-1 for clay and loess and 300 mmolc kg-1 for peat and peat moss/cover-sand soils. Resulting correction factors for these soil types are 1.8, 1.4 and 0.9 respectively. After correction for inorganic N-fertilizer use and grazing system, emission factors based on TAN vary between 4.0 and 11.7 depending on soil type. Using the national soil use map of the Netherlands (LGN) it shows that 15% of the grassland is on peat, 47% on sand and 39% on clay and loess. Based on these areas and the CEC correction, a weighted emission factor in % of TAN is calculated (Bussink, 1996): EF NH3 grazing = 2.6%, with NrationWUM < 25 g N per kg DM EF NH3 grazing = 1.98 x 10⁻⁵ * (NrationWUM)3.664, with NrationWUM ≥ 25 g N per kg DM (8.11) In which EF NH3 grazing : Emission factor (% of TAN) for grazing NrationWUM : Average N content of the ration during the grazing season according to the WUM
(g N per kg dry matter). High N rates in feed result in high N excretion and high TAN values, which lead to high NH3 emission. In the Netherlands no measurement data are available for NH3 emission from grazing by other grazing animal species (other cattle, horses, ponies and sheep). It is assumed that these will be equal to dairy cows. As a result, the formula for dairy cattle is also used for other grazing animals.
8.3.6 Emission factors for crop residues
To calculate the percentage of N that is emitted as NH3 from crop residues, a regression model has been derived from literature describing the relationship between ammonia emission and the N content of residues (De Ruijter and Huijsmans, 2012): EF NH3 crop residue = 0.40 x N content – 5.08 (8.12) In which N content : N contained in above-ground crop residues (g/kg dry matter) per crop Based on the regression equation, no emission occurs if the N content is below 12.7 g/kg. The model assumes complete exposure to air of all residues, for a prolonged period of time.
8.3.7 Emission factors for crop cultivation
For ammonia emissions from standing crops, a fixed estimate is reported based on De Ruijter et al. (2013). Therefore no emission factors are needed for the calculations.
8.4 Activity data
Annex 1 presents an overview of the animal (sub-)categories being distinguished in the Agricultural Census. This categorization is also used within the NEMA calculations, and results are then grouped towards reporting categories as indicated. PVE (2005) estimated the Netherlands has 300,000 privately owned horses. This number is added to the result of the Agricultural Census, and resulting emissions are attributed to the ‘Other’ category.
Methodology for estimating emissions from agriculture in the Netherlands | 61
8.4.1 Data needed for calculation of emission from fertilizer application
The usage of the different types of inorganic N-fertilizers is taken from the synthetic fertilizer statistics of LEI Wageningen UR. Amount of rinsing liquid produced by air scrubbers, as calculated by NEMA, is also taken into consideration.
8.4.2 Data needed for calculation of emission from manure application
The amount of TAN in manure that is applied to the soil is calculated from the urine N excretion and mineralization of organic N in animal houses and the gaseous N losses occurring in animal houses and during manure storage. Based on Statistics Netherlands (CBS) statistics, data from the Ministry of Economic Affairs (Netherlands Enterprise Agency) and calculations of the manure market these amounts are corrected for manure processing, export of manure and import of manure. The amounts of manure applied to grassland and cropland are based on the results of the calculations performed in the perspective of monitoring the manure market (Luesink et al., 2008 and De Koeijer et al., 2012; based on the Farm Accountancy Data Network (FADN; or BIN in Dutch) of LEI Wageningen UR and on the data about manure transport of the Netherlands Enterprise Agency). If there are no data on the division of manure over grassland and cropland, then based on loss- or usage norms an estimation is made on the division of manure on grassland and cropland based on acceptation grade in various regions (filling in usage norms). For the implementation grade of application techniques the results of the Agricultural Census are used. In the Agricultural Census of 2010 the kind of manure application techniques on grassland and on cropland were questioned for the last time. For grassland there was the choice of injection, shallow injection, slit coulter, narrow-band application and other. It is assumed that a part of the manure is surface spread (Van Bruggen et al., 2015). For cropland there was the choice of injection, narrow-band application, incorporation in 1 pass, incorporation in 2 passes and other. It is assumed that a part of the manure is surface spread (Van Bruggen et al., 2015). It deserves recommendation to gather closer information on the implementation of the different techniques used in practice (Table 8.3). More detailed information on the calculation of emissions from manure application can be found in Kruseman et al. (2012).
8.4.3 Data needed for calculation of emission from sewage sludge application
Amounts of sewage sludge applied to agricultural soils are available from Statistics Netherlands (CBS). The percentage TAN in the sludge is calculated from German data on N and TAN contents of liquid and solid sewage sludge (Landwirtschaftliches Wochenblatt, 2007).
8.4.4 Data needed for calculation of emission from other organic fertilizers (compost)
Amounts of organic (household) waste and green refuse compost are available from Statistics Netherlands (CBS). The percentage TAN is taken from the Arable fertilization advice (De Haan and Van Geel, 2013; Bemestingsadvies akkerbouw, www.kennisakker.nl).
8.4.5 Data needed for calculation of emission from grazing
Animal numbers Annex 1 presents an overview of the animal (sub-)categories being distinguished in the Agricultural Census. This categorization is also used within the NEMA calculations, and results are then grouped towards reporting categories as indicated. PVE (2005) estimated the Netherlands has 300,000 privately owned horses. This number is added to the result of the Agricultural Census, and resulting emissions are attributed to the ‘Other’ category.
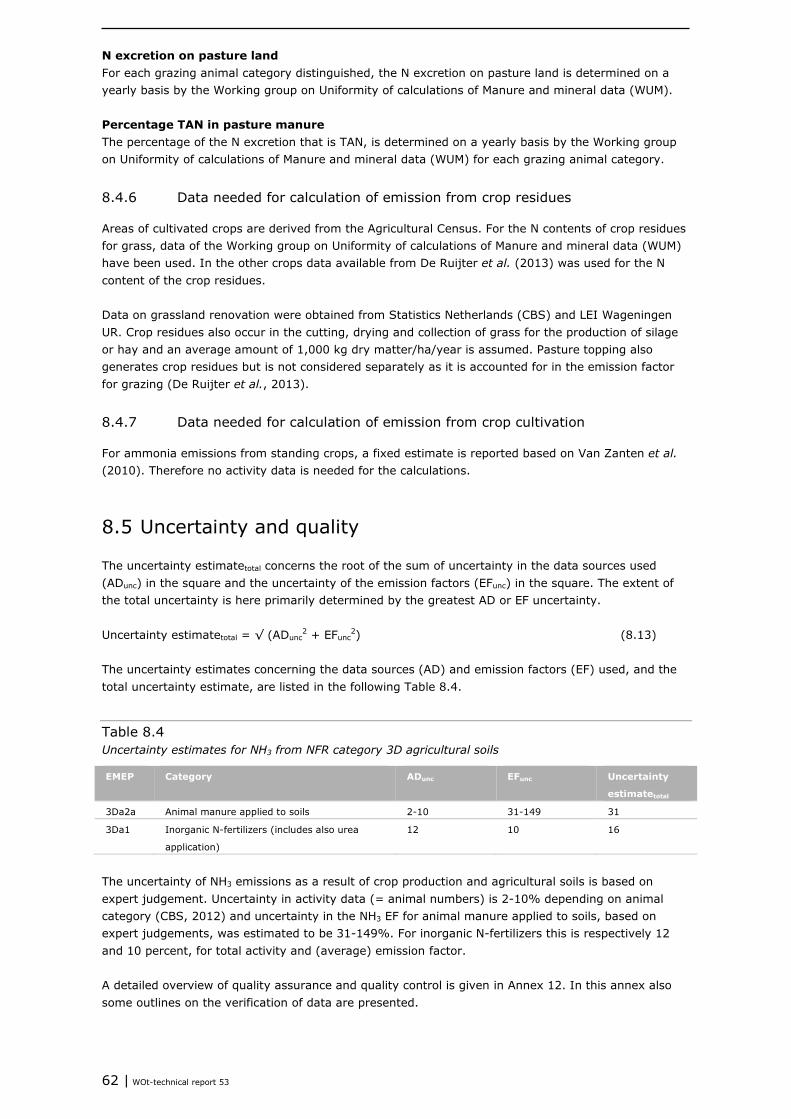
62 | WOt-technical report 53
N excretion on pasture land For each grazing animal category distinguished, the N excretion on pasture land is determined on a yearly basis by the Working group on Uniformity of calculations of Manure and mineral data (WUM).
Percentage TAN in pasture manure The percentage of the N excretion that is TAN, is determined on a yearly basis by the Working group on Uniformity of calculations of Manure and mineral data (WUM) for each grazing animal category.
8.4.6 Data needed for calculation of emission from crop residues
Areas of cultivated crops are derived from the Agricultural Census. For the N contents of crop residues for grass, data of the Working group on Uniformity of calculations of Manure and mineral data (WUM) have been used. In the other crops data available from De Ruijter et al. (2013) was used for the N content of the crop residues. Data on grassland renovation were obtained from Statistics Netherlands (CBS) and LEI Wageningen UR. Crop residues also occur in the cutting, drying and collection of grass for the production of silage or hay and an average amount of 1,000 kg dry matter/ha/year is assumed. Pasture topping also generates crop residues but is not considered separately as it is accounted for in the emission factor for grazing (De Ruijter et al., 2013).
8.4.7 Data needed for calculation of emission from crop cultivation
For ammonia emissions from standing crops, a fixed estimate is reported based on Van Zanten et al. (2010). Therefore no activity data is needed for the calculations.
8.5 Uncertainty and quality
The uncertainty estimatetotal concerns the root of the sum of uncertainty in the data sources used (ADunc) in the square and the uncertainty of the emission factors (EFunc) in the square. The extent of the total uncertainty is here primarily determined by the greatest AD or EF uncertainty. Uncertainty estimatetotal = √ (ADunc
2 + EFunc2) (8.13)
The uncertainty estimates concerning the data sources (AD) and emission factors (EF) used, and the total uncertainty estimate, are listed in the following Table 8.4.
Table 8.4 Uncertainty estimates for NH3 from NFR category 3D agricultural soils
EMEP Category ADunc EFunc Uncertainty
estimatetotal
3Da2a Animal manure applied to soils 2-10 31-149 31
3Da1 Inorganic N-fertilizers (includes also urea
application)
12 10 16
The uncertainty of NH3 emissions as a result of crop production and agricultural soils is based on expert judgement. Uncertainty in activity data (= animal numbers) is 2-10% depending on animal category (CBS, 2012) and uncertainty in the NH3 EF for animal manure applied to soils, based on expert judgements, was estimated to be 31-149%. For inorganic N-fertilizers this is respectively 12 and 10 percent, for total activity and (average) emission factor. A detailed overview of quality assurance and quality control is given in Annex 12. In this annex also some outlines on the verification of data are presented.
Methodology for estimating emissions from agriculture in the Netherlands | 63
9 NOx emissions from crop production and agricultural soils (NFR category 3D)
9.1 Scope and definition
The NFR source category 3D Crop production and agricultural soils consists of: • 3Da1 Inorganic N-fertilizers (includes also urea application) • 3Da2a Livestock manure applied to soils • 3Da2b Sewage sludge applied to soils • 3Da2c Other organic fertilizers applied to soils (including compost) • 3Da3 Urine and dung deposited by grazing animals • 3Da4 Crop residues applied to soils No emissions of NOx occur in the source categories 3Db Indirect emissions from managed soils, 3Dc Farm-level agricultural operations including storage, handling and transport of agricultural products, 3Dd Off-farm storage, handling and transport of bulk agricultural products, 3De Cultivated crops and 3Df Use of pesticides. Since field burning is prohibited by law in the Netherlands, also no emissions occur in category 3F Field burning of agricultural residues. Lastly it was chosen not to report emissions under the 3I Agriculture other category. Although emissions are reported as nitrogen monoxide by NEMA, it is referred to as NOx in this report to prevent confusion with the notation key NO.
9.2 Calculation method
Total NOx emissions from crop production and agricultural soils are calculated as: NOx emission 3D = Σ EF x supply sourcem x 30/14 (9.1) NOx emission 3D : Nitrogen oxides emission (kg NOx/year, expressed as nitrogen monoxide)
for all defined supply sources (m) supply sourcem : Amount of N (kg N/year) for supply source (m) 30/14 : Conversion factor from NOx-N to NOx, expressed as nitrogen monoxide
9.3 Emission factors
NOx emissions from N input to the soil are calculated using the default EMEP emission factor of 0.012 kg NOx-N/kg N input.
9.4 Activity data
Inorganic N-fertilizers The usage of the different types of inorganic N-fertilizers is taken from the synthetic fertilizer statistics of the Agricultural Economics Institute of Wageningen UR (LEI Wageningen UR).
64 | WOt-technical report 53
Livestock manure applied to soils The amount of N that is applied with manure to the soil is calculated from the urine N excretion and mineralization of organic N in animal houses and the gaseous N losses occurring in animal houses and manure storages. Based on Statistics Netherlands (CBS) statistics, data from the Ministry of Economic Affairs-Netherlands Enterprise Agency and calculations of the manure market these amounts are corrected for manure processing, export of manure and import of manure.
Sewage sludge applied to soils The amount of sewage sludge applied to agricultural soils is calculated by CBS and published via Statline.
Other organic fertilizers applied to soils (including compost) The amount of compost applied to agricultural soils is calculated by CBS and published via Statline.
Urine and dung deposited by grazing animals Part of the livestock manure is produced on pasture land during grazing. The amount of nitrogen per animal is calculated by the WUM (Working group on Uniformity of calculations of Manure and mineral data) and is available from the CBS website, www.cbs.nl. Statistics concerning the animal populations are also available on the CBS site.
Crop residues applied to soils Conform the IPCC calculation rules this includes all arable and outdoor horticultural crops (e.g. not from greenhouse farming). All crops that fall under both these two categories are included in the Agricultural Census, available via www.cbs.nl, and are included in the calculations for nitrogen monoxide emissions. In addition, a fixed country-specific value in kg N per hectare is used for the nitrogen content of the above-ground crop residues. Finally, the calculations take account of the fact that sometimes part of the above-ground crop residues are removed from the field and thus do not contribute to laughing gas emissions. Country-specific values are used for these removals, as reported in Van der Hoek et al. (2007). The areas used for these crops are taken from the annual Agricultural Census.
9.5 Uncertainty and quality
The uncertainty estimatetotal concerns the root of the sum of uncertainty in the data sources used (ADunc) in the square and the uncertainty of the emission factors (EFunc) in the square. The extent of the total uncertainty is here primarily determined by the greatest AD or EF uncertainty. Uncertainty estimatetotal = √ (ADunc
2 + EFunc2) (9.2)
The uncertainty of NOx emissions as a result of crop production and agricultural soils is based on expert judgement. Uncertainty in activity data is 5-12% depending on supply source and uncertainty in the NOx EF for agricultural soils is taken from the EMEP Guidebook (EEA, 2009). A detailed overview of quality assurance and quality control is given in Annex 12. In this annex also some outlines on the verification of data are presented.

Methodology for estimating emissions from agriculture in the Netherlands | 65
10 N2O emissions from crop production and agricultural soils (CRF sector 3D)
10.1 Scope and definition
Nitrous oxide (N2O) can be emitted from agricultural soils either directly or indirectly. Direct emissions occur after the application of inorganic N-fertilizer or manure, and during grazing following (de-) nitrification. These activities also lead to emissions of ammonia (NH3) and nitrogen monoxide (NOx), as described in Chapters 8 and 9 respectively. Deposition of nitrogen (from emitted NH3 and NOx) and leaching or run-off from agricultural soils provide nitrogen compounds to land and aquatic systems, from which N2O emissions again take place. Together called indirect emissions, they are attributed to agriculture whether or not emission occurs on agricultural land or even within the country, as agricultural activities form the initial source.
10.1.1 Direct N2O emissions from managed soils
This chapter describes the methodology and working processes for determining direct emissions of N2O from the soil as a result of agricultural activities in the Netherlands. This concerns the Common Reporting Format (CRF) source category 3Da Direct N2O emissions from managed soils, subdivided into: • 3Da1 Inorganic N fertilizers • 3Da2 Organic N fertilizers (with further subdivision into animal manure, sewage sludge and other
organic fertilizers applied to soils) • 3Da3 Urine and dung deposited by grazing animals • 3Da4 Crop residues • 3Da6 Cultivation of organic soils (i.e. histosols) In source category 3Da5 Mineralization/immobilization associated with loss/gain of soil organic matter, only emissions from cropland remaining cropland are to be reported. According to the methodology used for the Land Use, Land Use Change and Forestry (LULUCF) sector in the Netherlands, no emissions occur in this case (Arets et al., 2015). Also the Netherlands has not allocated emissions to source category 3Da7 Other. Nitrous oxide is formed in the soil during the microbiological processes of nitrification and denitrification. Nitrification concerns the process whereby ammonia (NH4
+) under aerobic (oxygen-rich) conditions is converted into nitrate by bacteria. In liquid manure oxygen is the limiting factor for nitrification. Nitrous oxide can be formed as a by-product, particularly when the nitrification process is delayed through lack of oxygen. No organic substances are required for nitrification. Denitrification is the microbiological transformation of NO3
- under anaerobic (low-oxygen) conditions into the gaseous nitrogen compound N2, with N2O as a by-product. Organic substances are used as energy source. Organic soils have higher emissions of nitrous oxide than mineral soils.
10.1.2 Indirect N2O emissions from managed soils
This chapter also describes the methodology and working processes for determining the indirect N2O emissions from the soil, as a result of agricultural activities in the Netherlands. This concerns CRF source category: 3Db Indirect N2O emissions from managed soils. The IPCC Guidelines (2006) give separate estimates of the direct and indirect emissions of nitrous oxide from the agricultural sector. Direct emissions occur in the agricultural system, primarily as a result of the application of inorganic N-fertilizers and livestock manure. Indirect emissions of nitrous oxide concern the formation of N2O in soils and aquatic systems as a result of nitrogen losses from the soil to air and water.
66 | WOt-technical report 53
The IPCC differentiates between two sources of indirect nitrous oxide emissions. • Indirect nitrous oxide emissions after atmospheric depositions of nitrogen compounds that have
evaporated in the form of ammonia and nitrogen oxides from animal houses and manure storage (attributed to manure management, see Chapter 6); from inorganic N-fertilizer, livestock manure application, grazing, sewage sludge and compost (attributed to agricultural soils, this chapter).
• Indirect nitrous oxide emissions from aquatic systems through nitrogen (especially nitrate) leaching and runoff from agricultural soils. Nitrate undergoes denitrification in groundwater or surface water, which creates nitrous oxide.
10.2 Calculation method
Total nitrous oxide emissions from managed soils are calculated as: N2O emissions 3D = N2O emission direct + N2O emission indirect (10.1) In which N2O emissions 3D : Nitrous oxide emissions (kg N2O/year) from CRF source category 3D
agricultural soils and crop production N2O emission direct : Direct N2O emissions from agricultural soils and crop production N2O emission indirect : Indirect N2O emissions from agricultural soils and crop production
10.2.1 Direct N2O emissions from managed soils
Direct nitrous oxide emissions from agricultural soils are calculated by multiplying the amount of nitrogen per supply source by country-specific emission factors. Because the ratio between mineral and organic soils is relatively constant, the emission factors are a weighted mean of all soil types. The total N2O emissions from all supply sources are then calculated by adding up the N2O emissions per supply source. For detailed information, please refer to the background document (Van der Hoek et al., 2007). N2O emission direct = ∑ supply sourcem x EFm x 44/28 (10.2) In which supply sourcem : Amount of N for the defined supply source (m) (kg N) EFm : Emission factor for the defined supply source (m) in kg N2O-N/kg N in supply source 44/28 : Conversion factor from N2O-N to N2O The aforementioned formula differentiates between the following N supply sources (m): 1. Gross application of N from inorganic N-fertilizer, i.e. not reduced by the NH3 and NOx emission
when applying inorganic N-fertilizer. 2. Gross application of N from livestock manure, i.e. not reduced by the NH3 and NOx emission when
applying livestock manure, but minus emissions from animal houses and manure storages together with net export (export - import).
3. Gross N to the soil through grazing domestic agricultural animals, i.e. not reduced by the NH3 and NOx emission when grazing.
4. Remaining crop residues. 5. Agricultural use of organic soils. 6. Sewage sludge. 7. Compost. These emissions are being reported under their respective Common Reporting Format (CRF) categories, with 3Da2 Organic N fertilizers consisting of the sub-sources livestock manure, sewage sludge and compost. The NEMA model is used to determine soil load (in kg N) caused by the application of inorganic N-fertilizer, livestock manure and grazing (Velthof et al., 2012).

Methodology for estimating emissions from agriculture in the Netherlands | 67
Comparison to IPCC methodology The methodology described above conforms to the IPCC method, as described in the IPCC Guidelines (IPCC, 2006). Determining the extent of the NH3 and NOx emissions from animal houses and storage is carried out using country-specific data at Tier 2 or 3 level. Determining the N2O emissions is carried out using a Tier 1b/2 analysis. The use of artificial fertilizers and livestock manure is split into two types of manure application techniques, each has its own country-specific emission factor (see Annex 11 and Velthof and Mosquera, 2011).
10.2.2 Indirect N2O emissions from managed soils
Indirect nitrous oxide emissions from agricultural soils are calculated by multiplying the amount of nitrogen per supply source by the default 2006 IPCC emission factors. The total N2O emission of all supply sources is then calculated by adding up the N2O emissions per supply source. Detailed information can be found in the background document (Van der Hoek et al., 2007). N2O emission indirect = ∑ supply sourcem x EFm x 44/28 (10.3) In which supply sourcem : Amount of N for supply source (m) EFm : Emission factor (kg N2O-N/kg N supply) for supply source (m) 44/28 : Conversion factor from N2O-N to N2O The aforementioned formula differentiates between the following supply sources for agricultural soils: 1. Deposition of ammonia and nitric oxide released during grazing and application of inorganic N-
fertilizer, livestock manure, sewage sludge and compost to agricultural soil. 2. Leaching and runoff of nitrogen added to agricultural soil, in which N mineralization through the
cultivation of organic soils and crop residues are also considered to be supply sources.
Comparison to IPCC methodology The aforementioned method is similar to the IPCC method as described in the IPCC Guidelines (IPCC, 2006). The IPCC also differentiates between two other supply sources. • N2O formation in the atmosphere from ammonia emissions. The IPCC gives no calculation method
for this source, therefore the nitrous oxide emissions created by ammonia in the atmosphere are not included here.
• Discharging effluent from sewage treatment plants into surface water. The nitrous oxide emissions created from discharging effluent into surface water are not included in the agricultural sector, but in the CRF (Common Reporting Format) Category 6B.
Determining the extent of the various supply sources is carried out using country-specific data at Tier 2 or 3 level. The N2O emissions are determined via a Tier 1 analysis. Default IPCC emission factors are used. Additional information on the emission factors is included in Section 10.3.2.
10.3 Emission factors
10.3.1 Direct N2O emissions from managed soils
The total direct emissions of nitrous oxide from agricultural soils are calculated by multiplying the amount of nitrogen per supply source by a fixed country-specific emission factor, and then aggregate this over all supply sources (Van der Hoek et al., 2007). Table 10.1 provides an overview of the emission factors used.

68 | WOt-technical report 53
Table 10.1 Emission factors for direct nitrous oxide emission from agricultural soils
Supply source EF (kg N2O–N per kg N supply ) Reference
Default IPCC EF used
Inorganic N-fertilizer application 0.01 0.013 1
Manure application 0.01
- above ground (surface spreading) 0.004 1
- low ammonia emission application 0.009 1
Sewage sludge 0.01 2
- above ground (surface spreading) 0.004
- low ammonia emission application 0.009
Compost 0.01 0.004
Pasture manure livestock 0.033 1
- cattle, pigs and poultry 0.02
- sheep and other animals 0.01
Crop residues 0.01 0.01 2
Cultivation of organic soils - 0.02 2, 3
References: 1 = Velthof et al. (2010); Velthof and Mosquera (2011); Van Schijndel and Van der Sluis (2011), see Annex 11; 2 = Van der Hoek et
al. (2007); 3 = Kuikman et al. (2005).
In general, organic soils have a higher emission factor than mineral soils. Because the ratio between the two is relatively constant weighted means are used. Furthermore, the emission factor for low emission manure application is twice that of the emission factor for above-ground manure application. The following section provides further information, per supply source, on the emission factors used.
Inorganic N-fertilizer application An emission factor of 0.013 is used for inorganic N-fertilizer application. This is the weighted mean of various inorganic N-fertilizer and soil types.
Livestock manure application An emission factor of 0.004 kg N2O-N per kg net applied N is applied for above-ground application of livestock manure. This factor is 0.009 for low emission manure application. Both figures are weighted means for mineral and organic soils. The higher emission factor for low emission manure application methods is caused by the larger amount of N available for nitrification/denitrification using this method.
Grazing of livestock For grazing, an emission factor of 0.033 kg N2O-N per kg net produced N is used. This is a weighted mean over soil types.
Remaining crop residues For crop residues an emission factor of 0.01 kg N2O-N per kg N is used for the crop residues remaining on mineral soils. This value is estimated from Dutch research studies carried out in the first half of the 1990s (Kroeze, 1994). Arable farming and outdoor horticulture hardly ever occur in organic soils.
Agricultural use of organic soils Average mineralization is 233.5 kg N per hectare peat soil and 204.5 kg N per hectare other organic soil (Kuikman et al., 2005). Using an emission factor of 0.02 (largely taken from Dutch research projects conducted in the first half of the 1990s and reported in Kroeze, 1994), the nitrous oxide emission of histosols amounts to 4.67 kg N2O–N per hectare peat soil and 4.09 kg N2O-N per hectare other organic soils.

Methodology for estimating emissions from agriculture in the Netherlands | 69
Sewage sludge For sewage sludge the emission factors of manure application are used. These are 0.004 kg N2O-N per kg N for surface application and 0.009 kg N2O-N for low ammonia emission application.
Compost All compost is assumed to be surface applied, and has an emission factor of 0.004 kg N2O-N per kg N applied.
10.3.2 Indirect N2O emissions from managed soils
With respect to leaching and runoff of the nitrogen added to soil, the emission factor concerns that part of the nitrogen that is leached and runoff, the so-called FRACleach. A country-specific value is applied because of the relatively high groundwater tables in the Netherlands (Velthof and Mosquera, 2011). The total indirect nitrous oxide emissions from agricultural soils is calculated by multiplying the amount of nitrogen per supply source by the following emission factors of Table 10.2 and then aggregating this over all supply sources (Van der Hoek et al., 2007).
Table 10.2 FRACleach and nitrous oxide emission factors for indirect nitrous oxide emissions from agricultural soil.
Supply source Factor
Depositions of NOx and ammonia emissions from
agricultural soil
- nitrous oxide emission factor 0.01 kg N2O–N per kg N supply
Leaching and runoff from agricultural soil
- FRACleach 0.15 kg N per kg N to soil (1990-1991)
0.14 kg N per kg N to soil (1992-1997)
0.13 kg N per kg N to soil (1998-present)
- nitrous oxide emission factor 0.0075 kg N2O–N per kg N leached/runoff
Source: Van der Hoek et al., 2007; Velthof and Mosquera, 2011.
The following section provides additional information on the emission factors used.
Depositions of ammonia and NOx on the soil The lack of measurement data in the Netherlands means that IPCC default emission factors were chosen when calculating the indirect emissions of nitrous oxide (Denier van der Gon et al., 2004; Van der Hoek et al., 2007).
Leaching and runoff of nitrogen added to the soil The following calculation rule is used to calculate the nitrous oxide emissions for this supply source. N2O leaching and runoff = ∑ supply source x FRACleach x EF x 44/28 (10.4) In which supply source : Amount of N in the supply source (kg) FRACleach : Fraction of the nitrogen that is leaching and running off EF : Emission factor in kg N2O-N/kg N supply 44/28 : Conversion factor from N2O-N to N2O The amount of nitrogen refers to the total amount of inorganic N-fertilizer and the total amount of livestock manure, minus the net export of manure to other countries. The emission factor used is the IPCC default and the FRACleach is country-specific. Further background information on the FRACleach values can be found in Velthof and Mosquera, 2011. Further information concerning the nitrous oxide emission factor of 0.0075 can be found in the 2006 IPCC Guidelines (footnote on p. 11.24).

70 | WOt-technical report 53
10.4 Activity data
10.4.1 Direct N2O emissions from managed soils
The following information is required in order to carry out the calculation using the method described in section 10.1.1. Furthermore, the necessary emission factors are discussed in Section 10.2.1 of this chapter.
Mineral and organic soils As the ratio between mineral and organic soils is relatively constant, weighted emission factors are used for the calculations (Van Schijndel and Van der Sluis, 2011; Annex 11).
Gross amount of nitrogen in inorganic N-fertilizer applied to soil Figures relating to the total gross amount of nitrogen in fertilizer are gathered annually by the LEI (Dutch Agricultural Economic Institute, see also www.lei.wur.nl). The NEMA model calculates emissions of NH3, N2O and NOx from these fertilizers, taking the diversity of inorganic N-fertilizer types into account.
Gross amount of nitrogen in livestock manure applied to soil The gross amount of nitrogen in livestock manure from animal houses and outside manure storages is calculated using the method described in Section 4.2. This is also the gross amount of nitrogen in livestock manure used on agricultural soils, after subtracting emissions from animal housing and outside storage plus the N in net exported manure (i.e. export - import). Emissions of NH3, N2O and NOx resulting from the application of livestock manure on agricultural soils are calculated with the NEMA model. The calculations of the N2O emissions distinguish between above-ground and low-emission application techniques.
Gross amount of nitrogen in manure produced on pasture land Part of the livestock manure is produced on pasture land. The amount of nitrogen per animal is calculated by the WUM (Working group on Uniformity of calculations of Manure and mineral data) and is available from www.cbs.nl. Statistics concerning the animal populations are also available on the CBS site.
Amount of nitrogen in crop residues Conform the IPCC calculation rules this includes all arable and outdoor horticultural crops (e.g. not from greenhouse farming). All crops that fall under both these two categories are included in the Agricultural Census, available via www.cbs.nl, and are included in the calculations for nitrous oxide emissions. In addition, a fixed country-specific value in kg N per hectare is used for the nitrogen content of the above- and below ground crop residues. Finally, the calculations take account of the fact that sometimes part of the above-ground crop residues are removed from the field and thus do not contribute to nitrous oxide emissions. Country-specific values are used for these removals, as reported in Van der Hoek et al. (2007). The areas used for these crops are taken from the annual Agricultural Census, which includes all agricultural companies with their headquarters in the Netherlands and which are larger than, or equal to, three Netherlands size units (nge, until 2009) or 3,000 Standard Output (SO, from 2010).
Cultivation of organic soils Nitrous oxide emissions are determined by multiplying the area of peat and other organic soils by specific Netherlands emission factors. The extent of the areas cultivated is estimated from the land use maps of the Land Use, Land Use Change and Forestry (LULUCF) sector. Maps are available for the base year 1990, 2004, 2009 and 2013. Between these years interpolation takes place. An overview of the resulting areas can be found in Annex 18 to Van Bruggen et al. (2015).

Methodology for estimating emissions from agriculture in the Netherlands | 71
Sewage sludge The amount of sewage sludge applied to agricultural soils is calculated by the CBS and published via Statline.
Compost The amounts of organic waste and green refuse compost applied to agricultural soils or used outside agriculture, is calculated by the CBS and published via Statline.
10.4.2 Indirect N2O emissions from managed soils
To carry out the calculation following the method described in Section 10.1.2 of this chapter, below mentioned data sources are needed. In addition, the emission factors discussed in Section 10.2.2 are used.
Depositions of ammonia and nitric oxide on the soil Although the term ‘deposition’ is used here, it follows from the IPCC Guidelines that this refers not to ammonia depositions, but to the total ammonia and nitric oxide emissions by the agricultural sector in the Netherlands. This primarily concerns the total depositions of all NH3 and NOx emitted by the Netherlands agricultural sector, whatever the geographical location of these depositions (thus also outside the country’s borders). The extent of the NH3 emissions from inorganic N-fertilizer and livestock manure application and during grazing, are calculated within the National Emissions Model for Agriculture (NEMA) using country specific emission factors. For NOx emissions EMEP default emission factors for the application of inorganic N-fertilizer, application of livestock manure and grazing are applied.
Leaching and runoff of nitrogen added to the soil The IPCC Guidelines clearly indicate that the gross supply refers to nitrogen in inorganic N-fertilizer and livestock manure, thus without deducting NH3 and NOx evaporation from animal houses, manure storage, grazing and use of manure. The reason for this is that the leaching and runoff is then the result of (subsequent) depositions of NH3 and NOx which are included immediately and do not need to be determined separately. Any manure that is net exported (export – import) to other countries is deducted from the above. The annual figures showing the amount of nitrogen produced in livestock manure are yearly calculated by the Working group on Uniformity of calculations of Manure and mineral data (WUM) and published via www.cbs.nl. This applies to both animal house and pasture manure. The nitrogen in exported manure is also determined annually by CBS. A country-specific value of 15 to 13% is applied for the part of nitrogen introduced to the soil that is leached (the FRACleach in IPCC definitions) and subsequently forms a source of indirect N2O emission (see Table 10.2).
10.5 Uncertainty and quality
A Tier 1 uncertainty analysis is implemented every year before the NIR is submitted by the ER, based on the greenhouse gas inventory and in compliance with IPCC Guidelines. The assumptions used and the results thereof are described in an annex to the NIR. In addition to this, where included in the QA/QC-programme for the relevant period, extra analyses are implemented regularly in specific situations, which include any updating of the Tier 2 uncertainty analyses. The Tier 2 uncertainty assessment was last updated in 2009. This assessment showed that a Tier 1 uncertainty assessment is sufficiently reliable and that Tier 2 uncertainty assessments need only be implemented at periodic intervals of around 5 years, unless a major change in an important source is sufficient to require earlier reassessment.
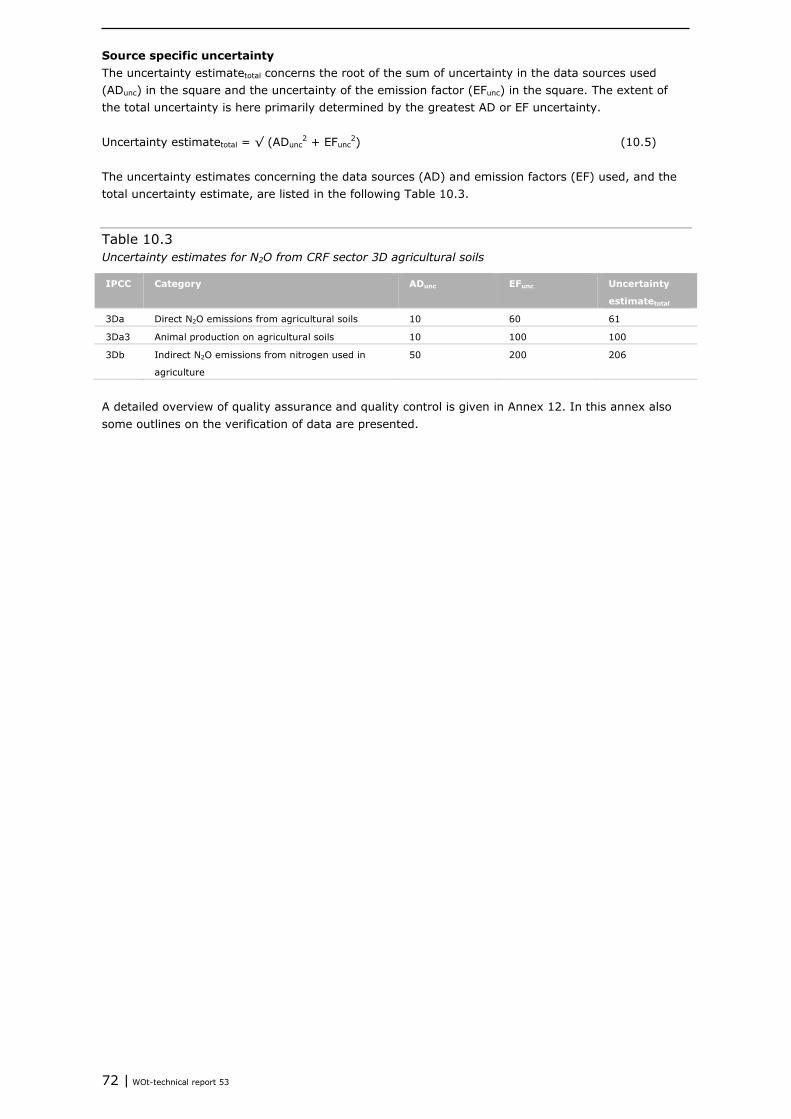
72 | WOt-technical report 53
Source specific uncertainty The uncertainty estimatetotal concerns the root of the sum of uncertainty in the data sources used (ADunc) in the square and the uncertainty of the emission factor (EFunc) in the square. The extent of the total uncertainty is here primarily determined by the greatest AD or EF uncertainty. Uncertainty estimatetotal = √ (ADunc
2 + EFunc2) (10.5)
The uncertainty estimates concerning the data sources (AD) and emission factors (EF) used, and the total uncertainty estimate, are listed in the following Table 10.3.
Table 10.3 Uncertainty estimates for N2O from CRF sector 3D agricultural soils
IPCC Category ADunc EFunc Uncertainty
estimatetotal
3Da Direct N2O emissions from agricultural soils 10 60 61
3Da3 Animal production on agricultural soils 10 100 100
3Db Indirect N2O emissions from nitrogen used in
agriculture
50 200 206
A detailed overview of quality assurance and quality control is given in Annex 12. In this annex also some outlines on the verification of data are presented.
Methodology for estimating emissions from agriculture in the Netherlands | 73
11 PM10/2.5 emissions from crop production and agricultural soils (NFR category 3D)
11.1 Scope and definition
The Nomenclature For Reporting (NFR) source category 3D Crop production and agricultural soils consists of: • 3Dc Farm-level agricultural operations including storage, handling and transport of agricultural
products • 3De Cultivated crops PM emissions occurring during the use of inorganic N-fertilizers, take place during the loading of the applicator. Therefore these are not reported under category 3Da1 Inorganic N-fertilizers (includes also urea application) but 3Dc Farm-level agricultural operations including storage, handling and transport of agricultural products. No emissions of PM occur in the source categories 3Da2a Livestock manure applied to soils, 3Da2a Sewage sludge applied to soils, 3Da2c Other organic fertilizers applied to soils (including compost), 3Da3 Urine and dung deposited by grazing animals, 3Da4 Crop residues applied to soils and 3Db Indirect emissions from managed soils. Activities under 3Dd Off-farm storage, handling and transport of bulk agricultural products are covered by other sectors, and emissions in category 3Df Use of pesticides are included within 3Dc Farm-level agricultural operations including storage, handling and transport of agricultural products. Since field burning is prohibited by law no emissions take place in category 3F Field burning of agricultural residues. Lastly the Netherlands chose not to report emissions under category 3I Agriculture other. Particulate matter emissions from crop production occur during soil cultivation or crop harvesting, and depend on crop sort, soil type, methods used and the weather. Also during other agricultural activities particulate matter is being emitted (e.g. during haymaking and in the use of concentrates, inorganic N-fertilizers and pesticides). These emissions are allocated towards categories 3De and 3Dc, respectively.
11.2 Calculation method
PM emissions from crop production and agricultural soils consist of PM10 and PM2.5 for crop cultivation and the use of concentrates, fertilizer and pesticides. PM emissions from crop cultivation are calculated using a Tier 2 method. The area of each crop is multiplied by emission factors for soil cultivation, harvesting, cleaning and drying in wet climate conditions. PM emissions during transport and handling of concentrates, fertilizer and pesticide have been calculated once using a country specific method (Chardon and Van der Hoek, 2002) and kept constant for the whole time series. The total PM emissions from all supply sources are then calculated by adding up the PM emissions per supply source. Crop cultivation is calculated using formula 11.1: PM emission (kg PM) = ∑ areaq x EFq x n (11.1) In which areaq : Cropped area for the defined crop (q) (ha) EFq : Emission factor for the defined crop (q) in kg per ha n : Number of times the operation is performed on the crop The emission factor in aforementioned formula takes into account the following operations:
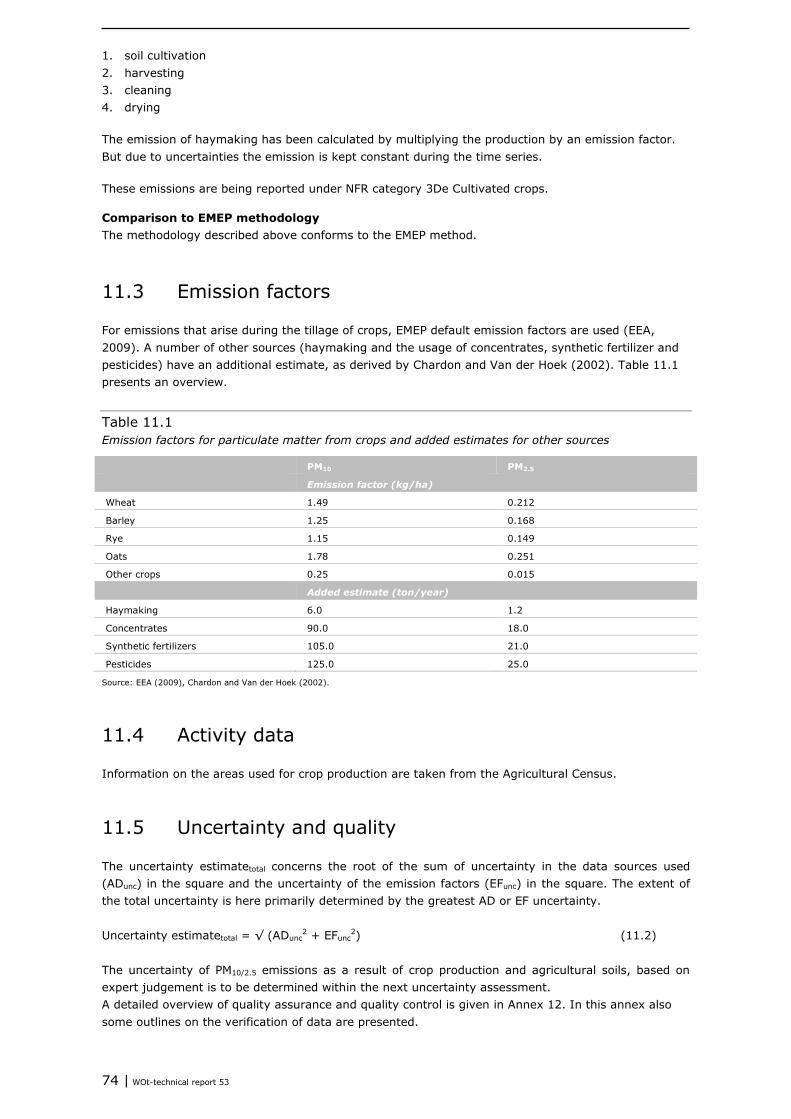
74 | WOt-technical report 53
1. soil cultivation 2. harvesting 3. cleaning 4. drying The emission of haymaking has been calculated by multiplying the production by an emission factor. But due to uncertainties the emission is kept constant during the time series. These emissions are being reported under NFR category 3De Cultivated crops.
Comparison to EMEP methodology The methodology described above conforms to the EMEP method.
11.3 Emission factors
For emissions that arise during the tillage of crops, EMEP default emission factors are used (EEA, 2009). A number of other sources (haymaking and the usage of concentrates, synthetic fertilizer and pesticides) have an additional estimate, as derived by Chardon and Van der Hoek (2002). Table 11.1 presents an overview.
Table 11.1 Emission factors for particulate matter from crops and added estimates for other sources
PM10 PM2.5
Emission factor (kg/ha)
Wheat 1.49 0.212
Barley 1.25 0.168
Rye 1.15 0.149
Oats 1.78 0.251
Other crops 0.25 0.015
Added estimate (ton/year)
Haymaking 6.0 1.2
Concentrates 90.0 18.0
Synthetic fertilizers 105.0 21.0
Pesticides 125.0 25.0
Source: EEA (2009), Chardon and Van der Hoek (2002).
11.4 Activity data
Information on the areas used for crop production are taken from the Agricultural Census.
11.5 Uncertainty and quality
The uncertainty estimatetotal concerns the root of the sum of uncertainty in the data sources used (ADunc) in the square and the uncertainty of the emission factors (EFunc) in the square. The extent of the total uncertainty is here primarily determined by the greatest AD or EF uncertainty. Uncertainty estimatetotal = √ (ADunc
2 + EFunc2) (11.2)
The uncertainty of PM10/2.5 emissions as a result of crop production and agricultural soils, based on expert judgement is to be determined within the next uncertainty assessment. A detailed overview of quality assurance and quality control is given in Annex 12. In this annex also some outlines on the verification of data are presented.
Methodology for estimating emissions from agriculture in the Netherlands | 75
12 CO2 emissions from liming (CRF category 3G)
12.1 Scope and definition
Calcareous fertilizers (calcic limestone (CaCO3) and dolomite (CaMg(CO3)2)) are used to reduce soil acidity. CO2 emissions occur as the carbonate lime dissolves and releases bicarbonate. Bicarbonate (2HCO3
-) evolves into H2O and CO2.
12.2 Calculation method
CO2 emissions as a result of using lime on agricultural soils are determined for reporting in Table 3G of the Common Reporting Format (CRF). The amounts used are reported in the Agricultural Statistics for the total of lime fertilizer products (LEI/CBS, for various years). The available figures are totals and do not specify the application on grassland and cropland separately. Since these figures are reported in CO2-eq there is no need to correct for inaccuracy and the CO2 emissions can be calculated with a Tier 1 method as follows: CO2 emissions 3G = (limestone use x EFlimestone + dolomite use x EFdolomite) x 44/12 (12.1) In which CO2 emissions 3G : Carbon dioxide emissions (kg CO2/year) from CRF source category 3G
Liming EFlimestone : Emission factor (kg CO2-C/kg applied) for limestone EFdolomite : Emission factor (kg CO2-C/kg applied) for dolomite 44/12 : Conversion factor from CO2-C to CO2
12.3 Emission factors
IPCC 2006 Tier 1 default values are used for lime use in agricultural soils, i.e. 0.12 kg CO2-C/kg limestone and 0.13 kg CO2-C/kg dolomite. These translate to 440 kg CO2/ton pure limestone and 477 kg CO2/ton pure dolomite.
12.4 Activity data
Information on the amount of carbonate applied to soil originate from LEI Wageningen UR. Input on carbonate use comes from the Agricultural Census described in Section 1.2 and from industrial processing records and import/export data from retailers of lime fertilizers.
12.5 Uncertainty and quality
The uncertainty estimatetotal concerns the root of the sum of uncertainty in the data sources used (ADunc) in the square and the uncertainty of the emission factors (EFunc) in the square. The extent of the total uncertainty is here primarily determined by the greatest AD or EF uncertainty. Uncertainty estimatetotal = √ (ADunc
2 + EFunc2) (12.2)

76 | WOt-technical report 53
The uncertainty of CO2 emissions as a result of liming is based on expert judgement. Uncertainty is estimated to be 25% in total, with the uncertainty in activity data being 25% and for the emission factor 1%. A detailed overview of quality assurance and quality control is given in Annex 12. In this annex also some outlines on the verification of data are presented.
Methodology for estimating emissions from agriculture in the Netherlands | 77
References
Aarnink, A.J.A., 1997. Ammonia Emission from Houses for Growing Pigs as Affected by Pen Design, Indoor Climate and Behaviour. PhD thesis, 175 pp. Wageningen University, Wageningen, the Netherlands.
Aarts, H.F.M., C.H.G. Daatselaar & G. Holshof, 2008. Bemesting, meststofbenutting en opbrengst van productiegrasland en snijmaïs op melkveebedrijven (in Dutch). Report 208. Plant Research International Wageningen UR, Wageningen, the Netherlands.
Arets, E.J.M.M., J.W.H. van der Kolk, G.M. Hengeveld, J.P. Lesschen, H. Kramer, P.J. Kuikman & M.J. Schelhaas, 2015. Greenhouse gas reporting of the LULUCF sector in the Netherlands. Methodological background. WOt Technical report 52. Statutory Research Tasks Unit for Nature & the Environment. Wageningen UR, Wageningen, the Netherlands.
Bannink, A., J. Dijkstra, J.A.N. Mills, E. Kebreab & J. France, 2005. Nutritional strategies to reduce enteric methane formation in dairy cows. p. 367-376. In: T. Kuczyński, U. Dämmgen, J. Webb & A. Myczko (Eds.), Emissions from European Agriculture. Wageningen Academic Publishers, Wageningen, the Netherlands.
Bannink, A., J. Kogut, J. Dijkstra, E. Kebreab, J. France, A.M. van Vuuren & S. Tamminga, 2006. Estimation of the stoichiometry of volatile fatty acid production in the rumen of lactating cows. Journal of Theoretical Biology 238, p. 36–51.
Bannink, A., 2007. Modelling volatile fatty acid dynamics and rumen function in lactating cows. PhD thesis, 251 pp. Wageningen University, Wageningen, the Netherlands.
Bannink, A., J. France, S. Lopez, W.J.J. Gerrits, E. Kebreab, S. Tamminga & J. Dijkstra, 2008. Modelling the implications of feeding strategy on rumen fermentation and functioning of the rumen wall. Animal Feed Science and Technology 143, p. 3-26.
Bannink, A., 2011. Methane emissions from enteric fermentation by dairy cows, 1990-2008. Background document on the calculation method and uncertainty analysis for the Dutch National Inventory Report on Greenhouse Gas emissions. WOt-Working Document 265. WOT Natuur & Milieu, Wageningen UR, Wageningen, the Netherlands.
Bannink, A., M.W. van Schijndel & J. Dijkstra, 2011. A model of enteric fermentation in dairy cows to estimate methane emission for the Dutch National Inventory Report using the IPCC Tier 3 approach. Animal Feed Science and Technology 166-167, p. 603-618.
Beline, F., J. Martinez, C. Marol & G. Guiraud, 1998. Nitrogen transformations during anaerobically stored 15N-labeled pig slurry. Bioresource Technology 64, p. 83-88.
Bouwman A.F., L.J.M. Bouman & N.H. Batjes, 2002. Estimation of global NH3 volatilization loss from synthetic fertilizers and animal manure applied to arable lands and grasslands. Global Biogeochemical Cycles 16 (2), p. 1024.
Bruggen, C. van, 2003 t/m 2014. Dierlijke mest en mineralen 2001 t/m 2013 (in Dutch). www.cbs.nl. Statistics Netherlands, Den Haag/Heerlen, the Netherlands.
Bruggen, C. van & F. Faqiri, 2015. Trends in beweiden en opstallen van melkkoeien en het effect op emissies naar lucht (in Dutch). CBS Web article 2015-2. Statistics Netherlands, Den Haag/Heerlen, the Netherlands.
Bruggen, C. van, A. Bannink, C.M. Groenestein, B.J. de Haan, J.F.M. Huijsmans, H.H. Luesink, S.M. van der Sluis, G.L. Velthof & J. Vonk, 2014. Emissies naar lucht uit de landbouw in 2012. Berekeningen van ammoniak, stikstofoxide, lachgas, methaan en fijn stof met het model NEMA (in Dutch). WOt-technical report 3. WOT Natuur & Milieu, Wageningen UR, Wageningen, the Netherlands.
Bruggen, C. van, A. Bannink, C.M. Groenestein, J.F.M. Huijsmans, H.H. Luesink, S.M. van der Sluis, G.L. Velthof & J. Vonk, 2015. Emissies naar lucht uit de landbouw 1990-2013. Berekeningen van ammoniak, stikstofoxide, lachgas, methaan en fijn stof met het model NEMA (in Dutch). WOt-technical report 46. WOT Natuur & Milieu, Wageningen UR, Wageningen, the Netherlands.
Bruggen, C. van, C.M. Groenestein, B.J. de Haan, M.W. Hoogeveen, J.F.M. Huijsmans, S.M. van der Sluis & G.L. Velthof, 2011a. Ammoniakemissie uit dierlijke mest en kunstmest, 1990-2008. Berekeningen met het Nationaal Emissiemodel voor Ammoniak (NEMA) (in Dutch). WOt-werkdocument 250. Wageningen, the Netherlands.
78 | WOt-technical report 53
Bruggen, C. van, C.M. Groenestein, B.J. de Haan, M.W. Hoogeveen, J.F.M. Huijsmans. S.M. van der Sluis & G.L. Velthof, 2011b. Ammoniakemissie uit dierlijke mest en kunstmest in 2009. Berekeningen met het Nationaal Emissiemodel voor Ammoniak (NEMA) (in Dutch). WOt-werkdocument 251. WOT Natuur & Milieu, Wageningen UR, Wageningen, the Netherlands.
Bruggen, C. van, C.M. Groenestein, B.J. de Haan, M.W. Hoogeveen, J.F.M. Huijsmans. S.M. van der Sluis & G.L. Velthof, 2012. Ammoniakemissie uit dierlijke mest en kunstmest in 2010. Berekeningen met het Nationaal Emissiemodel voor Ammoniak (NEMA) (in Dutch). WOt-werkdocument 294. WOT Natuur & Milieu, Wageningen UR, Wageningen, the Netherlands.
Bruggen, C. van, C.M. Groenestein, B.J. de Haan, M.W. Hoogeveen, J.F.M. Huijsmans. S.M. van der Sluis & G.L. Velthof, 2013. Ammoniakemissie uit dierlijke mest en kunstmest in 2011. Berekeningen met het Nationaal Emissiemodel voor Ammoniak (NEMA) (in Dutch). WOt-werkdocument 330. WOT Natuur & Milieu, Wageningen UR, Wageningen, the Netherlands.
Bussink, D.W., 1992. Ammonia volatilisation from grassland receiving nitrogen fertiliser and rotationally grazed by dairy cattle. Fertiliser Research 33, 257–265.
Bussink, D.W., 1994. Relationship between ammonia volatilisation and nitrogen fertiliser application rate, intake and excretion of herbage N by cattle on grazed swards. Fertiliser Research 38, 111–121.
Bussink, D.W., 1996. Ammonia volatilization from intensively managed dairy pastures. PhD thesis, 177 pp. Wageningen University, Wageningen, the Netherlands.
CBS, 1997. Boeren in een veranderend milieu (in Dutch). CBS, Voorburg/Heerlen, the Netherlands.
CBS, 2009. Dierlijke mest en mineralen 1990–2008* (in Dutch). Centraal Bureau voor de Statistiek, Den Haag/Heerlen, the Netherlands.
CBS, 2012. Uncertainty analysis of mineral excretion and manure production. CBS, Den Haag, the Netherlands.
CBS, 2015. www.cbs.nl - Statline, Landbouwtellingen. CBS, Voorburg/Heerlen, the Netherlands.
CBS/LEI, Landbouwstatistiek voor totaal kalkmeststoffen 1990-2013 (diverse jaren). (Agricultural statistics for total lime fertilizers 1990-2013) (various years). www.agrimatie.nl (in development).
Chardon W.J. & K.W. van der Hoek, 2002. Berekeningsmethode voor de emissie van fijn stof vanuit de landbouw (in Dutch). Alterra-report 682/RIVM-report 773004014. Alterra Wageningen UR/National Institute for Public Health and the Environment, Wageningen/Bilthoven, the Netherlands.
Coenen, P.W.H.G., C.W.M. van der Maas, P.J. Zijlema, E.J.M.M. Arets, K. Baas, A.C.W.M. van den Berghe, J.D. te Biesebeek, M.M. Nijkamp, E.P. van Huis, G. Geilenkirchen, C.W. Versluijs, R. te Molder, R. Dröge, J.A. Montfoort, C.J. Peek & J. Vonk, 2014. Greenhouse gas emissions in The Netherlands 1990-2012. National Inventory Report 2014. RIVM report 680355016/2014. National Institute for Public Health and the Environment, Bilthoven, the Netherlands.
Denier van der Gon, H.A.C., A. Bleeker, T. Ligthart, J.H. Duijzer, P.J. Kuikman, J.W. van Groenigen, W. Hamminga, C. Kroeze, H.P.J. de Wilde & A. Hensen, 2004. Indirect nitrous oxide emissions from the Netherlands: source strength, methodologies, uncertainties and potential for mitigation. Report R 2004/275, 43 pp. TNO, Apeldoorn, the Netherlands.
Dijkstra, J., H.D.St.C. Neal, D.E. Beever & J. France, 1992. Simulation of nutrient digestion, absorption and outflow in the rumen: model description. Journal of Nutrition 122, p. 2239-2256.
EEA, 2009. EMEP/EEA air pollutant emission inventory guidebook 2009. Technical guidance to prepare national emission inventories. EEA Technical report No. 9/2009. European Environment Agency, Copenhagen.
Ellis, J.L., J. Dijkstra, E. Kebreab, A. Bannink, N.E. Odongo, B.W. McBride & J. France, 2008. Aspects of rumen microbiology central to mechanistic modelling of methane production in cattle. Journal of Agricultural Science 146, p. 213–233.
Elzing, A. & G.J. Monteny, 1997. Modeling and experimental determination of ammonia emission rates from a scale model dairy-cow house. Transactions of the American Society of Agricultural Engineers (ASAE) 40, p. 721-726.
Gerrits, W.J.J., J. Dijkstra & A. Bannink, 2014. Methaanproductie bij witvleeskalveren (in Dutch). Report 813. Wageningen UR Livestock Research, Wageningen, the Netherlands.
Groenestein, C.M., 2006. Environmental Aspects of Improving Sow Welfare with Group Housing and Straw Bedding. PhD thesis, 146 pp. Wageningen University, Wageningen, the Netherlands.

Methodology for estimating emissions from agriculture in the Netherlands | 79
Groot Koerkamp, P.W.G., 1998. Ammonia Emission from Aviary Housing Systems for Laying Hens: Inventory, Characteristics and Solutions. PhD thesis, 161 pp. Wageningen University, Wageningen, the Netherlands.
Haan, J.J. de & W. van Geel (Eds.), 2013. www.kennisakker.nl. Adviesbasis voor de bemesting van akkerbouw- en vollegrondsgroentengewassen (in Dutch). Praktijkonderzoek Plant & Omgeving, Lelystad, the Netherlands.
Handhavingsamenwerking Noord-Brabant, 2010. Evaluatie Project luchtwassers 2009 (in Dutch). www.handhaveninbrabant.nl
Handhavingsamenwerking Noord-Brabant, 2013. Rapport: resultaten Brabantbrede toezichtsaanpak luchtwassers 2011-2012 (in Dutch). www.handhaveninbrabant.nl
Hoek, K.W. van der, 1994. Berekeningsmethodiek ammoniakemissie in Nederland voor de jaren 1990, 1991 en 1992 (in Dutch). RIVM report 773004003. National Institute for Public Health and the Environment, Bilthoven, the Netherlands.
Hoek, K.W. van der, 2002. Uitgangspunten voor de mest- en ammoniakberekeningen 1999 tot en met 2001 zoals gebruikt in de Milieubalans 2001 en 2002, inclusief dataset landbouwemissies 1980-2001 (in Dutch). RIVM report 773004013. National Institute for Public Health and the Environment, Bilthoven, the Netherlands.
Hoek, K.W. van der & M.W. van Schijndel, 2006. Methane and nitrous oxide emissions from animal manure management, 1990 - 2003. Background document on the calculation method for the Dutch National Inventory Report. RIVM report 680.125.002, MNP report 500080002. National Institute for Public Health and the Environment/Netherlands Environmental Assessment Agency, Bilthoven, the Netherlands.
Hoek, K.W. van der, M.W. van Schijndel & P.J. Kuikman, 2007. Direct and indirect nitrous oxide emissions from agricultural soils, 1990-2003. Background document on the calculation method for the Dutch National Inventory Report. RIVM report 680125003/2007; MNP report 500080003/2007. National Institute for Public Health and the Environment/Netherlands Environmental Assessment Agency, Bilthoven, the Netherlands.
Huijsmans, J.F.M., 2003. Manure application and ammonia volatilization. PhD thesis, pp. 160. Wageningen University, Wageningen, the Netherlands, ISBN 90-5808-937-1.
Huijsmans, J.F.M. & R.M. de Mol, 1999. A model for ammonia volatilization after surface application and subsequent incorporation of manure on arable land. Journal of Agricultural Engineering Research 74, p. 73-82.
Huijsmans, J.F.M. & R.L.M. Schils, 2009. Ammonia and nitrous oxide emissions following field-application of manure: state of the art measurements in the Netherlands. In: Proceedings/International Fertiliser Society 655, York, p. 36.
IPCC, 1997. Revised 1996 IPCC Guidelines for National Greenhouse Gas Emission Inventories, Three volumes: Reference Manual, Reporting Guidelines and Workbook. IPCC/OECD/IEA. IPCC WG1 Technical Support Unit, Hadley Centre, Meteorological Office, Bracknell, United Kingdom.
IPCC, 2001. Good Practice Guidance and Uncertainty Management in National Greenhouse Gas Inventories, IPCC-TSU NGGIP, Japan.
IPCC, 2006. 2006 IPCC Guidelines for National Greenhouse Gas Inventories, Prepared by the National Greenhouse Gas Inventories Programme. H.S. Eggleston, L. Buendia, K. Miwa, T. Ngara & K. Tanabe (Eds.). Published: IGES, Japan.
Kebreab, E., J. Dijkstra, A. Bannink & J. France, 2009. Recent advances in modeling nutrient utilization in ruminants. Journal of Animal Science 87, p. E111-E122.
Koeijer, T.J. de, H.H. Luesink & C. Daatselaar, 2012. Synthese monitoring mestmarkt 2006-2011 (in Dutch). WOt-report 119. WOT Natuur & Milieu, Wageningen UR, Wageningen, the Netherlands.
Kroeze, C., 1994. Nitrous oxide. Emission inventory and options for control in the Netherlands. RIVM report 773001004. National Institute for Public Health and the Environment, Bilthoven, the Netherlands.
Kruseman, G., H.H. Luesink, P.W. Blokland, M.W. Hoogeveen & T.J. de Koeijer, 2012. MAMBO 2.x Design principles, model structure and data use. WOt Working Document 307. WOT Natuur & Milieu, Wageningen, the Netherlands.
Kuikman, P.J., J.J.H. van den Akker & F. de Vries, 2005. Lachgasemissie uit organische landbouwbodems (in Dutch). Report 1035-2. Alterra Wageningen UR, Wageningen, the Netherlands.
80 | WOt-technical report 53
Landwirtschaftliches Wochenblatt, 2007. Hühnertrockenkot entlastet Düngerkonto (in German). Landwirtschaftliches Wochenblatt Westfalen-Lippe 28, p. 24 – 27.
Luesink, H.H., P.W. Blokland & J.N. Bosma, 2011. Monitoring mestmarkt 2010. Achtergronddocumentatie (in Dutch). Report 2011-048. LEI-Wageningen UR, Den Haag, the Netherlands.
Luesink, H.H., P.W. Blokland & C. van Bruggen, 2013. Monitoring mestmarkt 2011. Achtergronddocumentatie (in Dutch). www.monitoringmestmarkt.nl
Mills, J.A.N., J. Dijkstra, A. Bannink, S.B. Cammell, E. Kebreab & J. France, 2001. A mechanistic model of whole-tract digestion and methanogenesis in the lactating dairy cow: Model development, evaluation and application. Journal of Animal Science 79, p. 1584-1597.
Mol, R.M. de & M.A. Hilhorst, 2003. Methaan-, lachgas- en ammoniakemissies bij productie, opslag en transport van mest (in Dutch). Report 2003-03. IMAG, Wageningen, the Netherlands.
Mol, R.M. de & M.A. Hilhorst, 2004. Emissiereductieopties voor methaan uit mestopslagen (in Dutch). Report 165. Agrotechnology & Food Innovations B.V., Wageningen, the Netherlands.
Monteny, G.J., J.W.H. Huis in ’t Veld, G. van Duinkerken, G. André & F.C. van der Schans, 2001. Naar een jaarrond-emissie van ammoniak uit melkveestallen (in Dutch). Report. IMAG, Wageningen, the Netherlands.
Mosquera, J., R.A. van Emous, A. Winkel, F. Dousma, E. Lovink, N.W.M. Ogink & A.J.A. Aarnink, 2009a. Fijnstofemissie uit stallen: (groot)ouderdieren van vleeskuikens (in Dutch). Report 276. Wageningen UR Livestock Research, Lelystad, the Netherlands.
Mosquera, J., A. Winkel, R.K. Kwikkel, F.A. Gerrits, N.W.M. Ogink & A.J.A. Aarnink, 2009b. Fijnstofemissie uit stallen: vleeskalkoenen (in Dutch). Report 277. Wageningen UR Livestock Research, Lelystad, the Netherlands.
Mosquera, J., A. Winkel, F. Dousma, E. Lovink, N.W.M. Ogink & A.J.A. Aarnink, 2009c. Fijnstofemissie uit stallen: leghennen in scharrelhuisvesting (in Dutch). Report 279. Wageningen UR Livestock Research, Lelystad, the Netherlands.
Mosquera, J., J.M.G. Hol, A. Winkel, E. Lovink, N.W.M. Ogink & A.J.A. Aarnink, 2010a. Fijnstofemissie uit stallen: vleesvarkens (in Dutch). Report 292. Wageningen UR Livestock Research, Lelystad, the Netherlands.
Mosquera, J., J.M.G. Hol, A. Winkel, G.M. Nijeboer, N.W.M. Ogink & A.J.A. Aarnink, 2010b. Fijnstofemissie uit stallen: dragende zeugen (in Dutch). Report 294. Wageningen UR Livestock Research, Lelystad, the Netherlands.
Mosquera, J., J.M.G. Hol, A. Winkel, J.W.H. Huis in ‘t Veld, F.A. Gerrits, N.W.M. Ogink & A.J.A. Aarnink, 2010c. Fijnstofemissie uit stallen: melkvee (in Dutch). Report 296. Wageningen UR Livestock Research, Lelystad, the Netherlands.
Oenema, O. & G.L. Velthof, 1993. Ammonia volatilization from compound nitrogen-sulfur fertilizers. In: M.A.C. Fragoso & M.L. van Beusichem (Eds.), Optimization of plant nutrition. Kluwer, Dordrecht (1993) 341-349.
Oenema, O., G.L. Velthof, N. Verdoes, P.W.G. Groot Koerkamp, G.J. Monteny, A. Bannink, H.G. van der Meer & K.W. van der Hoek, 2000. Forfaitaire waarden voor gasvormige stikstofverliezen uit stallen en mestopslagen (in Dutch). Report 107, revised edition. Alterra Wageningen UR, Wageningen, the Netherlands.
Oenema, O., A. Bannink, S.G. Sommer, J.W. van Groeningen & G.L. Velthof, 2008. Gaseous Nitrogen Emissions from Livestock Farming Systems. In: J.L. Hatfield & R.F. Follett (Eds.), Nitrogen in the Environment: Sources, Problems and Management. Academic Press/Elsevier, Amsterdam, the Netherlands.
Ogink, N.W.M., J. Mosquera & R.W. Melse, 2008. Standardized testing procedures for assessing ammonia and odor emissions from animal housing systems in the Netherlands. In: Proceedings from the National Conference on Mitigating Air Emissions from Animal Feeding Operations Conference, May 19-21, 2008. Des Moines, Iowa State University, Iowa, USA.
Ogink, N.W.M., C.M. Groenestein & J. Mosquera, 2014. Actualisering ammoniak-emissiefactoren rundvee: advies voor aanpassing in de Regeling ammoniak en veehouderij (in Dutch). Report 744. Wageningen UR Livestock Research, Lelystad, the Netherlands.
Methodology for estimating emissions from agriculture in the Netherlands | 81
Olivier, J.G.J., L.J. Brandes & R.A.B. te Molder, 2009. Uncertainty in the Netherlands’ greenhouse gas emissions inventory: Estimate of annual and trend uncertainty for Dutch sources of greenhouse gas emissions using the IPCC Tier 1 approach. PBL-report 500080013. Netherlands Environmental Assessment Agency, Bilthoven, the Netherlands.
PVE, 2005. Productie en afvoer van paardenmest in Nederland (in Dutch). Memorandum Product Boards for Livestock, Meat and Eggs.
RAMIRAN, 2011. Glossary of terms on livestock and manure management 2011. Second Edition. B. Pain & H. Menzi (Eds.).
Reidy, B., U. Dämmgen, H. Döhler, B. Eurich-Menden, F.K. van Evert, N.J. Hutchings, H.H. Luesink, H. Menzi, T.H. Misselbrook, G.J. Monteny & J. Webb, 2008. Comparison of models used for national agricultural ammonia emission inventories in Europe: liquid manure systems. Atmospheric Environment 42 (14), p. 3452-3464.
RIVM, 1999. Meten, rekenen en onzekerheden. De werkwijze van het RIVM Milieuonderzoek (in Dutch). RIVM report 408129 005 (main report and addendum). National Institute for Public Health and the Environment, Bilthoven, the Netherlands.
Ruijter, F.J. de & J.F.M. Huijsmans, 2012. Ammonia emission from crop residues. Quantification of ammonia volatilization based on crop residue properties. Report 470. Plant Research International Wageningen UR, Wageningen, the Netherlands.
Ruijter, F.J. de, J.F.M. Huijsmans, M.C. van Zanten, W.A.H. Asman & W.A.J. van Pul, 2013. Ammonia emission from standing crops and crop residues. Contribution to total ammonia emission in the Netherlands. Report 535. Plant Research International Wageningen UR, Wageningen, the Netherlands.
Smink, W., 2005. Calculation of methane production from enteric fermentation in cattle excluding dairy cows. Report commissioned by SenterNovem, project number 0377-05-02-02-007. Feed Innovation Services (FIS), Wageningen, the Netherlands.
Smink, W., K.D. Bos, A.F. Fitié, L.J. van der Kolk, W.K.J. Rijm, G. Roelofs & G.A.M. van den Broek, 2003. Methaanreductie melkvee. Een onderzoeksproject naar de inschatting van de methaanproductie vanuit de voeding en naar de reductiemogelijkheden via de voeding van melkkoeien (in Dutch). Report commissioned by Novem, project number 375102/0030. Feed Innovation Services (FIS), Aarle-Rixtel, the Netherlands.
Smink, W., K.W. van der Hoek, A. Bannink & J. Dijkstra, 2005. Calculation of methane production from enteric fermentation in dairy cows. Report commissioned by SenterNovem, project number 0377-05-02-02-003. Feed Innovation Services (FIS)/RIVM/Wageningen University and Research Centre, Wageningen/Bilthoven/Lelystad, the Netherlands.
Stehfest, E. & L. Bouwman, 2006. N2O and NO emission from agricultural fields and soils under natural vegetation: summarizing available measurement data and modeling of global annual emissions. Nutrient Cycling in Agroecosystems 74, p. 207-228.
Stichting Groen Label, 1996. Beoordelingsrichtlijn emissie-arme stalsystemen (in Dutch). Issue March 1996.
Tamminga, S., A.W. Jongbloed, M.M. Van Eerdt, H.F.M. Aarts, F. Mandersloot, N.J.P. Hoogervorst & H. Westhoek, 2000. De forfaitaire excretie van stikstof door landbouwhuisdieren (in Dutch). Report 00-2040R, 71 pp. ID-Lelystad, Lelystad, the Netherlands.
Tamminga, S., F. Aarts, A. Bannink, O. Oenema, G.J. Monteny, 2004. Actualisering van geschatte N en P excreties door rundvee (in Dutch). Milieu en Landelijk gebied 25. Wageningen UR, Wageningen, the Netherlands.
Tamminga, S., A. Bannink, J. Dijkstra & R. Zom, 2007. Feeding strategies to reduce methane loss in cattle. ASG report 34. Animal Sciences Group, Wageningen UR, Lelystad, the Netherlands.
Veen, W.A.G., 2000. Veevoedermaatregelen ter vermindering van methaanproductie door herkauwers. Een deskstudie (in Dutch). Report. Instituut voor de Veevoeding De Schothorst, Lelystad, the Netherlands.
Velthof, G.L., 1997. Nitrous oxide emission from intensively managed grasslands. PhD thesis, 195 pp. Wageningen University, Wageningen, the Netherlands.
Velthof, G.L. & J. Mosquera, 2011. Calculation of nitrous oxide emission from agriculture in the Netherlands. Update of emission factors and leaching fraction. Alterra report 2151. Alterra Wageningen UR, Wageningen, the Netherlands.

82 | WOt-technical report 53
Velthof, G.L., C. van Bruggen, C.M. Groenestein, B.J. de Haan, M.W. Hoogeveen & J.F.M. Huijsmans, 2009. Methodiek voor berekening van ammoniakemissie uit de landbouw in Nederland (in Dutch). WOt-rapport 70. WOT Natuur & Milieu, Wageningen UR, Wageningen, the Netherlands.
Velthof, G.L., C. van Bruggen, C.M. Groenestein, B.J. de Haan, M.W. Hoogeveen & J.F.M. Huijsmans, 2012. A model for inventory of ammonia emissions from agriculture in the Netherlands. Atmospheric Environment 46, p. 248-255.
Velthof, G.L., J. Mosquera, J. Huis in ‘t Veld & E. Hummelink, 2010. Effect of manure application technique on nitrous oxide emission from agricultural soils. Alterra report 1992. Alterra Wageningen UR, Wageningen, the Netherlands.
Velthof, G.L., J.A. Nelemans, O. Oenema & P.J. Kuikman, 2005. Gaseous nitrogen and carbon losses from pig manure derived from different diets. Journal of Environmental Quality 34, p. 698-706.
Velthof, G.L., O. Oenema, R. Postma & M.L. van Beusichem, 1997. Effects of type and amount of applied nitrogen fertilizer on nitrous fluxes from intensively managed grassland. Nutrient Cycling in Agroecosystems 46, p. 257-267.
Webb, J., S.G. Sommer, T. Kupper, K. Groenestein, N.J. Hutchings, B. Eurich-Menden, L. Rodhe, T.H. Misselbrook & B. Amon, 2012. Emissions of Ammonia, Nitrous Oxide and Methane During the Management of Solid Manures. In: E. Lichtfouse (Ed.), Agroecology and Strategies for Climate Change, Sustainable Agriculture Reviews 8, p. 67-107.
Whitehead, D.C. & N. Raistrick, 1993. The volatilization of ammonia from cattle urine applied to soils as influenced by soils properties. Plant Soil 148, p. 43–51.
Winkel, A., J. Mosquera, R.K. Kwikkel, F.A. Gerrits, N.W.M. Ogink & A.J.A. Aarnink, 2009a. Fijnstofemissie uit stallen: vleeskuikens (in Dutch). Report 275. Wageningen UR Livestock Research, Lelystad, the Netherlands.
Winkel, A., J. Mosquera, J.M.G. Hol, G.M. Nijeboer, N.W.M. Ogink & A.J.A. Aarnink, 2009b. Fijnstofemissie uit stallen: leghennen in volièrehuisvesting (in Dutch). Report 278. Wageningen UR Livestock Research, Lelystad, the Netherlands.
Winkel, A., J. Mosquera, J.M.G. Hol, T.G. van Hattum, E. Lovink, N.W.M. Ogink & A.J.A. Aarnink, 2010. Fijnstofemissie uit stallen: biggen (in Dutch). Report 293. Wageningen UR Livestock Research, Lelystad, the Netherlands.
WUM, 1994. Uniformering berekening mest en mineralen. Standaardcijfers rundvee, schapen en geiten, 1990 t/m 1992 (in Dutch). Werkgroep Uniformering berekening Mest- en mineralencijfers, M.M. van Eerdt (Ed.). CBS/IKC-Veehouderij/LAMI/LEI-DLO/RIVM/SLM, the Netherlands.
WUM, 2010. Gestandaardiseerde berekeningsmethode voor dierlijke mest en mineralen. Standaardcijfers 1990-2008 (in Dutch). Werkgroep Uniformering berekening Mest- en mineralencijfers, C. van Bruggen (Ed.). CBS/PBL/LEI-Wageningen UR/Wageningen UR-Livestock Research/Ministerie van LNV/RIVM. CBS, Den Haag, the Netherlands.
Zanten, M.C. van, F.J. Sauter, R.J. Wichink Kruit, J.A. van Jaarsveld & W.A.J. van Pul, 2010. Description of the DEPAC module. Dry deposition modelling with DEPAC_GCN2010. RIVM report 680180001. National Institute for Public Health and the Environment, Bilthoven, the Netherlands.
Zeeman, G., 1994. Methane production and emission in storages for animal manure. Fertilizer Research 37, p. 207-211.
Zeeman, G., & S. Gerbens, 2002. CH4 emissions from animal manure. In: Background Papers IPCC Expert Meetings on Good Practice Guidance and Uncertainty Management in National Greenhouse Gas Inventories. IPCC.
Zijderveld, S.M. van, W.J.J. Gerrits, J. Dijkstra, J.R. Newbold, R.B. Hulshof & H.B. Perdok, 2011. Persistency of methane mitigation by dietary nitrate supplementation in dairy cows. Journal of Dairy Science 94, p. 4028-4038.
Zom, R.L.G. & C.M. Groenestein, 2015. Excretion of volatile solids by livestock to calculate methane production from manure. RAMIRAN 2015 16th International Conference Rural-Urban Symbiosis, 8th-10th September 2015, Hamburg, Germany.

Methodology for estimating emissions from agriculture in the Netherlands | 83
Justification
Emissions are assessed with the National Emission Model for Agriculture (NEMA), approved by the independent Dutch Scientific Committee of the Manure Act (CDM) and administrated by Statistics Netherlands (CBS). The work is guided by the task force Agriculture and Land Use (TgL) of the Pollutant Release and Transfer Register (PRTR, or ‘EmissieRegistratie’ (ER) in Dutch). For greenhouse gas reporting, the Netherlands Enterprise Agency (RVO.nl) reviews the proceedings acting as the National Inventory Entity (NIE). The methodologies follow or comply with the 2006 IPCC Guidelines (greenhouse gases) and the 2013 EMEP Guidebook (air pollutants). The draft report was reviewed and approved by Peter Zijlema and Harry Vreuls (RVO.nl).

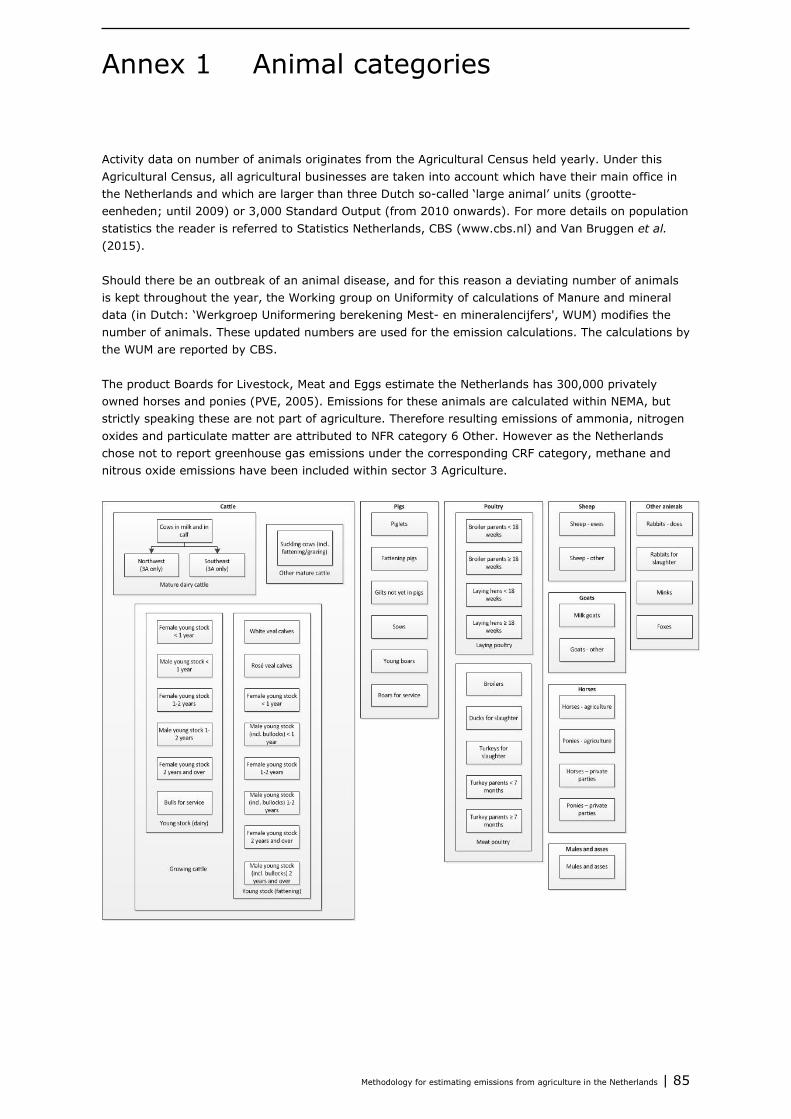
Methodology for estimating emissions from agriculture in the Netherlands | 85
Animal categories Annex 1
Activity data on number of animals originates from the Agricultural Census held yearly. Under this Agricultural Census, all agricultural businesses are taken into account which have their main office in the Netherlands and which are larger than three Dutch so-called ‘large animal’ units (grootte-eenheden; until 2009) or 3,000 Standard Output (from 2010 onwards). For more details on population statistics the reader is referred to Statistics Netherlands, CBS (www.cbs.nl) and Van Bruggen et al. (2015). Should there be an outbreak of an animal disease, and for this reason a deviating number of animals is kept throughout the year, the Working group on Uniformity of calculations of Manure and mineral data (in Dutch: ‘Werkgroep Uniformering berekening Mest- en mineralencijfers', WUM) modifies the number of animals. These updated numbers are used for the emission calculations. The calculations by the WUM are reported by CBS. The product Boards for Livestock, Meat and Eggs estimate the Netherlands has 300,000 privately owned horses and ponies (PVE, 2005). Emissions for these animals are calculated within NEMA, but strictly speaking these are not part of agriculture. Therefore resulting emissions of ammonia, nitrogen oxides and particulate matter are attributed to NFR category 6 Other. However as the Netherlands chose not to report greenhouse gas emissions under the corresponding CRF category, methane and nitrous oxide emissions have been included within sector 3 Agriculture.

Methodology for estimating emissions from agriculture in the Netherlands | 87
Calculation of TAN excretion for Annex 2dairy cattle and young stock
Translation with adaptation of the annex from L. Šebek & A. Bannink (Division Animal Husbandry, Animal Sciences Group (ASG), Wageningen UR) in Velthof et al., 2009.
Introduction Until now the ammonia emission is estimated by means of an emission percentage applied on total N excretion. It is however mainly the excretion of urine N that is responsible for the ammonia emission. Therefore, the current aim is to estimate ammonia emission based on excreted urine N. Excretion of urine N is comparable to that of total ammoniacal N (TAN). This document describes the calculation of TAN as the first step in the adaptation of the calculation methodology for ammonia emission. For dairy cattle, the year 2001 is chosen as target year since the WUM-Rav excretions are based on data for this year. For this same reason, for young cattle the data of the year 1990 was used. A description of the calculation method of TAN is given here and results are presented for dairy cattle, young stock younger than 1 year and young stock with an age between 1 and 2 years, suckling and fattening cows, bulls for service, veal calves for white meat production between 0-6 months, veal calves for rosé meat production between 0-8 months, beef steers younger than 1 year, and beef steers older than 1 year.
Method Calculation method The total N excretion is calculated in accordance with the method used by the WUM, also used by Tamminga et al. (2000, 2004) to derive the fixed excretion figures for various animal categories. In this method the uptake of N with the separate ration components is calculated, and total N excretion as the difference between N uptake and N retained in animal products (milk, growth, offspring). For the results reported in the present document, the same method was used but it was extended with an estimation of the digestion coefficient (DC) for crude protein (CP). Introduction of DC-CP is required to be able to calculate TAN. The calculation is performed for each feedstuff in the ration separately. With the DC-CP per feedstuff the percentage of crude protein uptake can be calculated that is absorbed by the intestine (= digested). The remainder (100% - DC-CP) of crude protein uptake leaves the body with the faeces. Protein absorbed by the intestine is either used for production (milk, growth, offspring) or excreted as urine N by the kidneys. By setting the TAN equal to the excretion of urine N, TAN is calculated by the following steps: • summation of the amount crude protein uptake that is absorbed in the intestine for all feedstuffs in
the ration, • conversion of absorbed protein to absorbed N, • calculation of N retained with animal production, • calculation of excreted urine N as the difference between absorbed N and N retained with animal
production. Calculation of the DC-CP The CVB animal feed table (CVB, 2005a) lists DC-CP values (as a % of crude protein content) for all common products. For roughages this is dependent on the quality of the roughage. Regression equations have been published to calculate the DC-CP based on chemical composition (crude protein content, crude ash content and crude crude fibre content; CVB, 2005b). In Table A2.1 the DC-CP is given for the various ration components fed to dairy cattle or young stock.
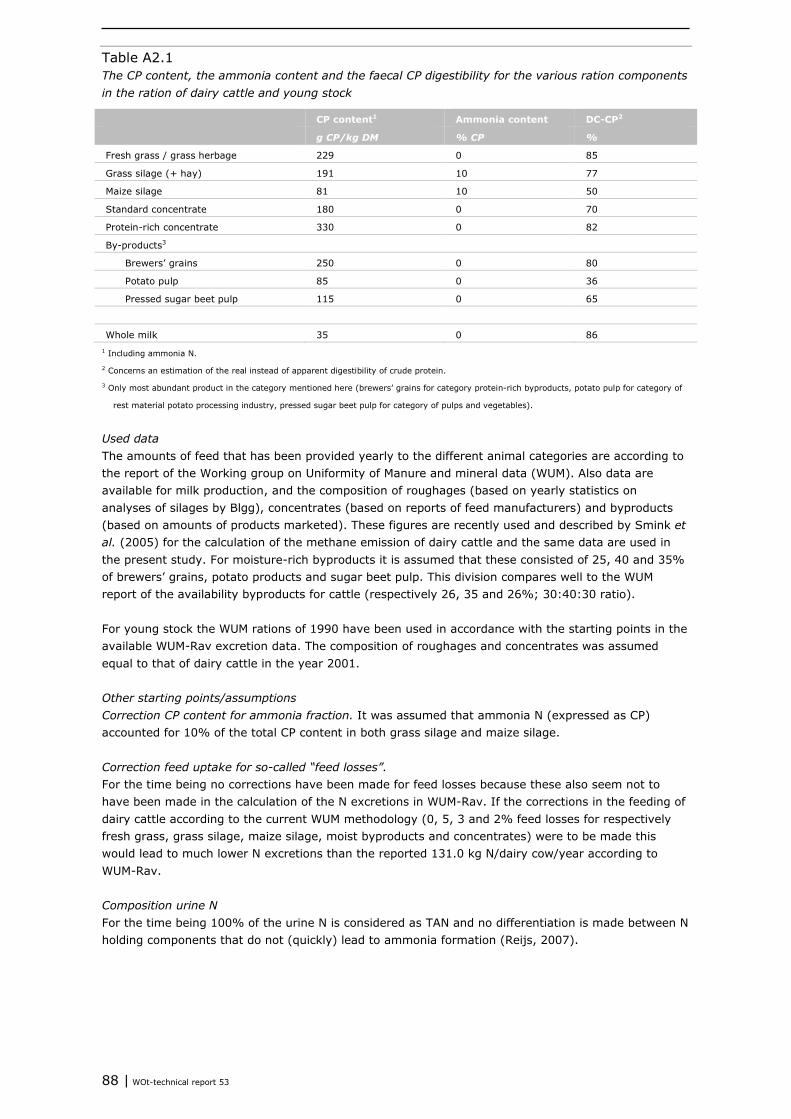
88 | WOt-technical report 53
Table A2.1 The CP content, the ammonia content and the faecal CP digestibility for the various ration components in the ration of dairy cattle and young stock
CP content1 Ammonia content DC-CP2
g CP/kg DM % CP %
Fresh grass / grass herbage 229 0 85
Grass silage (+ hay) 191 10 77
Maize silage 81 10 50
Standard concentrate 180 0 70
Protein-rich concentrate 330 0 82
By-products3
Brewers’ grains 250 0 80
Potato pulp 85 0 36
Pressed sugar beet pulp 115 0 65
Whole milk 35 0 86 1 Including ammonia N.
2 Concerns an estimation of the real instead of apparent digestibility of crude protein.
3 Only most abundant product in the category mentioned here (brewers’ grains for category protein-rich byproducts, potato pulp for category of
rest material potato processing industry, pressed sugar beet pulp for category of pulps and vegetables).
Used data The amounts of feed that has been provided yearly to the different animal categories are according to the report of the Working group on Uniformity of Manure and mineral data (WUM). Also data are available for milk production, and the composition of roughages (based on yearly statistics on analyses of silages by Blgg), concentrates (based on reports of feed manufacturers) and byproducts (based on amounts of products marketed). These figures are recently used and described by Smink et al. (2005) for the calculation of the methane emission of dairy cattle and the same data are used in the present study. For moisture-rich byproducts it is assumed that these consisted of 25, 40 and 35% of brewers’ grains, potato products and sugar beet pulp. This division compares well to the WUM report of the availability byproducts for cattle (respectively 26, 35 and 26%; 30:40:30 ratio). For young stock the WUM rations of 1990 have been used in accordance with the starting points in the available WUM-Rav excretion data. The composition of roughages and concentrates was assumed equal to that of dairy cattle in the year 2001. Other starting points/assumptions Correction CP content for ammonia fraction. It was assumed that ammonia N (expressed as CP) accounted for 10% of the total CP content in both grass silage and maize silage. Correction feed uptake for so-called “feed losses”. For the time being no corrections have been made for feed losses because these also seem not to have been made in the calculation of the N excretions in WUM-Rav. If the corrections in the feeding of dairy cattle according to the current WUM methodology (0, 5, 3 and 2% feed losses for respectively fresh grass, grass silage, maize silage, moist byproducts and concentrates) were to be made this would lead to much lower N excretions than the reported 131.0 kg N/dairy cow/year according to WUM-Rav. Composition urine N For the time being 100% of the urine N is considered as TAN and no differentiation is made between N holding components that do not (quickly) lead to ammonia formation (Reijs, 2007).
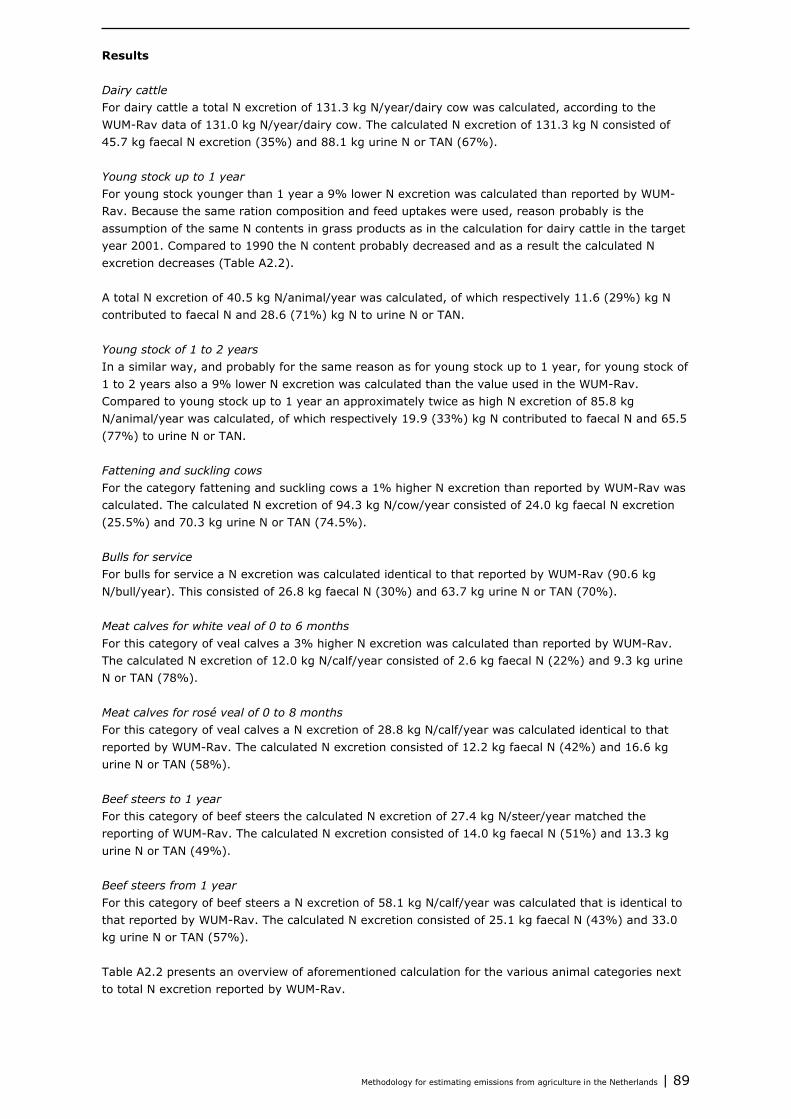
Methodology for estimating emissions from agriculture in the Netherlands | 89
Results Dairy cattle For dairy cattle a total N excretion of 131.3 kg N/year/dairy cow was calculated, according to the WUM-Rav data of 131.0 kg N/year/dairy cow. The calculated N excretion of 131.3 kg N consisted of 45.7 kg faecal N excretion (35%) and 88.1 kg urine N or TAN (67%). Young stock up to 1 year For young stock younger than 1 year a 9% lower N excretion was calculated than reported by WUM-Rav. Because the same ration composition and feed uptakes were used, reason probably is the assumption of the same N contents in grass products as in the calculation for dairy cattle in the target year 2001. Compared to 1990 the N content probably decreased and as a result the calculated N excretion decreases (Table A2.2). A total N excretion of 40.5 kg N/animal/year was calculated, of which respectively 11.6 (29%) kg N contributed to faecal N and 28.6 (71%) kg N to urine N or TAN. Young stock of 1 to 2 years In a similar way, and probably for the same reason as for young stock up to 1 year, for young stock of 1 to 2 years also a 9% lower N excretion was calculated than the value used in the WUM-Rav. Compared to young stock up to 1 year an approximately twice as high N excretion of 85.8 kg N/animal/year was calculated, of which respectively 19.9 (33%) kg N contributed to faecal N and 65.5 (77%) to urine N or TAN. Fattening and suckling cows For the category fattening and suckling cows a 1% higher N excretion than reported by WUM-Rav was calculated. The calculated N excretion of 94.3 kg N/cow/year consisted of 24.0 kg faecal N excretion (25.5%) and 70.3 kg urine N or TAN (74.5%). Bulls for service For bulls for service a N excretion was calculated identical to that reported by WUM-Rav (90.6 kg N/bull/year). This consisted of 26.8 kg faecal N (30%) and 63.7 kg urine N or TAN (70%). Meat calves for white veal of 0 to 6 months For this category of veal calves a 3% higher N excretion was calculated than reported by WUM-Rav. The calculated N excretion of 12.0 kg N/calf/year consisted of 2.6 kg faecal N (22%) and 9.3 kg urine N or TAN (78%). Meat calves for rosé veal of 0 to 8 months For this category of veal calves a N excretion of 28.8 kg N/calf/year was calculated identical to that reported by WUM-Rav. The calculated N excretion consisted of 12.2 kg faecal N (42%) and 16.6 kg urine N or TAN (58%). Beef steers to 1 year For this category of beef steers the calculated N excretion of 27.4 kg N/steer/year matched the reporting of WUM-Rav. The calculated N excretion consisted of 14.0 kg faecal N (51%) and 13.3 kg urine N or TAN (49%). Beef steers from 1 year For this category of beef steers a N excretion of 58.1 kg N/calf/year was calculated that is identical to that reported by WUM-Rav. The calculated N excretion consisted of 25.1 kg faecal N (43%) and 33.0 kg urine N or TAN (57%). Table A2.2 presents an overview of aforementioned calculation for the various animal categories next to total N excretion reported by WUM-Rav.
90 | WOt-technical report 53
Table A2.2 Overview of results for dairy cattle and young stock
Total N excretion
kg N/animal/year
Faecal N TAN TAN
% N excretion kg N/animal/year
WUM-Rav This study This study This study This study
Dairy cattle 131.0 131.3 43.3 88.1 67.1
Young stock up to 1 year 44.4 40.5 11.6 28.9 71.4
Young stock of 1 to 2 years 94.3 85.8 19.9 65.9 76.8
Fattening/suckling cows 93.6 94.3 24.0 70.3 74.5
Bulls for service 90.6 90.6 26.8 63.7 70.3
Meat calves (white) 0-6 months 11.6 12.0 2.6 9.3 77.5
Meat calves (rosé) 0-8 months 28.7 28.8 12.2 16.6 57.6
Beef steers up to 1 year 27.3 27.4 14.0 13.3 48.5
Beef steers from 1 year 58.0 58.1 25.1 33.0 56.8
Discussion An evaluation of the division between the excretion of faecal N and urine N (TAN) is difficult for most of the animal categories because suitable measurement data are lacking. Most measurements have been performed on dairy cattle, for which in various experiments the N excretion with faeces and urine has been collected separately and urine N was directly measured or estimated by a N balance approach. These observations do not involve a fully year cycle, as is the starting point in this study, but momentary observations of the effect of adjustments of dairy cow nutrition on excretion. A selection of these dairy cow observations is compared with the results of this study in Table A2.3. The comparison shows that there is a large range present in the share TAN in the manure of dairy cattle. On average the % TAN in observed N excretion was lower because of a relatively lower N digestibility than calculated in this study (measured values were scaled up to a yearly excretion by multiplication of daily N excretion by 365). This is caused by feed intake and ration composition not being representative of the average ration being fed yearly to dairy cattle. The calculated % TAN however still lies within the range of measured values. On a fully grass-based ration a % TAN of 75% or more has to be expected, which is higher than the calculation for the yearly average in the current study. When replacing over half of the grass silage by maize silage (Valk, 1994) the % TAN can decrease to less than 50%, which is much lower than the calculation in this study.
Table A2.3 Comparison between calculated and measured excretions
Total N excretion Faecal N TAN TAN
% N excretion kg N/animal/year
Dairy cattle
N balance with high variation in
nutritional conditions (Bannink
and Hindle, 2003)
142.4 (± 35.3) 61.3 (± 12.7) 79.6 (± 36.8) 52.9 (± 11.1)
Valk, 1994 144.2 (± 43.4) 59.9 (± 3.8) 84.3 (± 45.3) 55.5 (± 12.8)
This study 131.3 45.7 88.1 67.1
Meat calves (white) TAN as % N
excretion
Observations N balance (Van
den Borne, 2006)
85.1 (± 3.7)
This study 77.5
Methodology for estimating emissions from agriculture in the Netherlands | 91
A recent study of Van den Borne (2006) on white veal calves indicated that TAN on average made up 85.1% (± 3.7%) of total N excretion. This research involved young animals with a starting weight of 150 kg that were fed experimental rations with a separate protein-rich and a lactose-rich meal. A lower N retention in the veal calves may have caused the higher N excretion with urine. The N retention observed was 43.1% (± 3.5%) which is lower than the 48.6% calculated in the present study. A difference in ration composition and the amount of N uptake hence is the cause of the about 10% higher % TAN compared to the calculations in the present study. Nevertheless, the observed data confirm the highest % TAN value for this animal category (Table A2.2). For other animal categories no independent observations of excretion data is available. The balance method to separate calculated N excretion with urine and faeces is also used in other studies (Berentsen et al., 1993; Jonker et al., 1998; but also a general method applied in experimental research such as that of Valk et al., 1994). Details of the calculation method may differ per study. In the current report, however, a simple method was chosen by using faecal CP digestibilities and observed milk N production. In other studies other approaches may have been chosen such as that of intestinal digestible protein values, a variable protein balance, or relationships with milk urea. It is expected, however, that although such calculations adopt different concepts and include detailed aspects of animal N metabolism, they generally lead to comparable outcomes on TAN. Use in the WUM methodology The methodology on TAN calculation and the basal assumptions used in the present document comply with those from the WUM. The results based on WUM differ to a small extent from those in the present document. The WUM calculates the TAN excretion in the animal house to be 60% of total N excretion, and 68% during the pasture period, in contrast to 67% calculated here.
References Bannink A., & V.A. Hindle, 2003. Voorspelling van de opname en excretie van N door melkvee op basis van
melkgegevens (in Dutch). Nutrition and Food, confidential report 03/0008567. Animal Sciences Group, Lelystad, the Netherlands.
Berentsen, P.B.M., G.W.J. Giesen & R.F. Speelman, 1993. Economic and Environmental Effects of a New Protein Evaluation System in Dairy Farming. Journal of Dairy Science 76, p. 2332-2343.
Boer, I.J.M. de, M.C.J. Smits, H. Mollenhorst, G. van Duinkerken & G.J. Monteny, 2002. Prediction of Ammonia Emission from Dairy Barns Using Feed Characteristics Part I: Relation Between Feed Characteristics and Urinary Urea Concentration. Journal of Dairy Science 85, p. 3382.
Borne, J. van den, 2006. Nutrient Synchrony in Preruminant Calves. PhD thesis, 197 pp. Wageningen University, Wageningen, the Netherlands.
Centraal Veevoederbureau, 2005a. Veevoedertabel (in Dutch). CVB, Lelystad, the Netherlands.
Centraal Veevoederbureau, 2005b. Ruwvoedertabel (in Dutch). CVB, Lelystad, the Netherlands.
Jonker, J.S., R.A. Kohn & R.A. Erdman, 1998. Using Milk Urea Nitrogen to Predict Nitrogen Excretion and Utilization Efficiency in Lactating Dairy Cows. Journal of Dairy Science 81, p. 2681.
Reijs, J.W., 2007. Improving slurry by diet adjustments: A novelty to reduce N losses from grassland-based dairy farms. PhD thesis, 203 pp. Wageningen University, Wageningen, the Netherlands.
Smink, W., K.W. van der Hoek, A. Bannink & J. Dijkstra, 2005. Calculation of methane production from enteric fermentation in dairy cows. Report commissioned by SenterNovem, project number 0377-05-02-02-003. Feed Innovation Services (FIS)/RIVM/Wageningen University and Research Centre, Wageningen/Bilthoven/Lelystad, the Netherlands.
Tamminga, S., A.W. Jongbloed, M.M. van Eerdt, H.F.M. Aarts, F. Mandersloot, N.J.P. Hoogervorst & H. Westhoek, 2000. De forfaitaire excretie van stikstof door landbouwhuisdieren (in Dutch). Report 00-2040R. ID-Lelystad, Lelystad, the Netherlands.
Tamminga, S., F. Aarts, A. Bannink, O. Oenema & G.J. Monteny, 2004. Actualisering van geschatte N en P excreties door rundvee (in Dutch). Milieu en Landelijk gebied 25. Wageningen, the Netherlands.
Valk, H., 1994. Effects of partial replacement of herbage by maize silage on N-utilization and milk production of dairy cows. Livestock Production Science 40, p. 241-250.


Methodology for estimating emissions from agriculture in the Netherlands | 93
Calculation of TAN excretion for Annex 3pigs
Translation with adaptation of the annex from Age Jongbloed (Animal Sciences Group (ASG), Wageningen UR, Lelystad) in Velthof et al., 2009.
A3.1 The excretion of nitrogen in pig farming
A3.1.1 Nitrogen content in pigs
In Table A3.1 is indicated what the N contents (g per kg live weight) are in the animal categories distinguished. Also the sources are indicated.
Table A3.1 N contents in animal categories distinguished (Ref. = reference year)
Animal
category
Physiological
status
Ref. Weight
Ref. (kg)
N content
Ref.
Weight
2005
(kg)
N content
2005 (g/kg)
Source
contents
Ref.
Stillborn piglet 0 days 1994 1.3 19.2 1.3 18.73 1
Lost piglet 1-28 days 1994 2.8 19.2 2.8 23.1 1
Lost piglet 29-42 days 1994 9.0 24.0 9.0 24.3 1
Weaned piglet 6 weeks 1994 11.0 24.0 11.0 24.4 1
Lost piglet 7 weeks 1994 12.0 24.0 12.0 24.5 1
Starter piglet Ca. 10 weeks 1991 25.7 24.0 25.6 24.8 1
Fattening pig Ca. 26 weeks 1991 109 23.0 115.7 25.0 1
Gilts 7 months 2001 125 24.9 125 24.9 2
Gilts First mating 2001 140 24.9 140 24.9 2
Young boar 7 months 2001 135 24.9 135 24.9 2
Boar 7 months 1991 130 23.3 - - 1
Boar 2 years 1991 300 24.6 325 25.0 1
Sow At weaning 1994 205 24.9 220 25.0 1
Slaughter sow 1 week after
weaning
piglets
1994 205 24.9 220 25.0 1
1 = WUM, 1994; 2 = Jongbloed and Kemme, 2002.
A3.1.2 The N content and the N digestibility of pig feeds
In Table A3.2 an overview is given of the N contents in the various pig feeds with which calculations have been made.
The N content in the various feeds in the reference year is for an important part derived from WUM (1994) for the year concerned and for the reference year 2001 from Jongbloed and Kemme (2005). The N content in the feeds for 2005 is for most feeds derived from Jongbloed and Van Bruggen (2008).
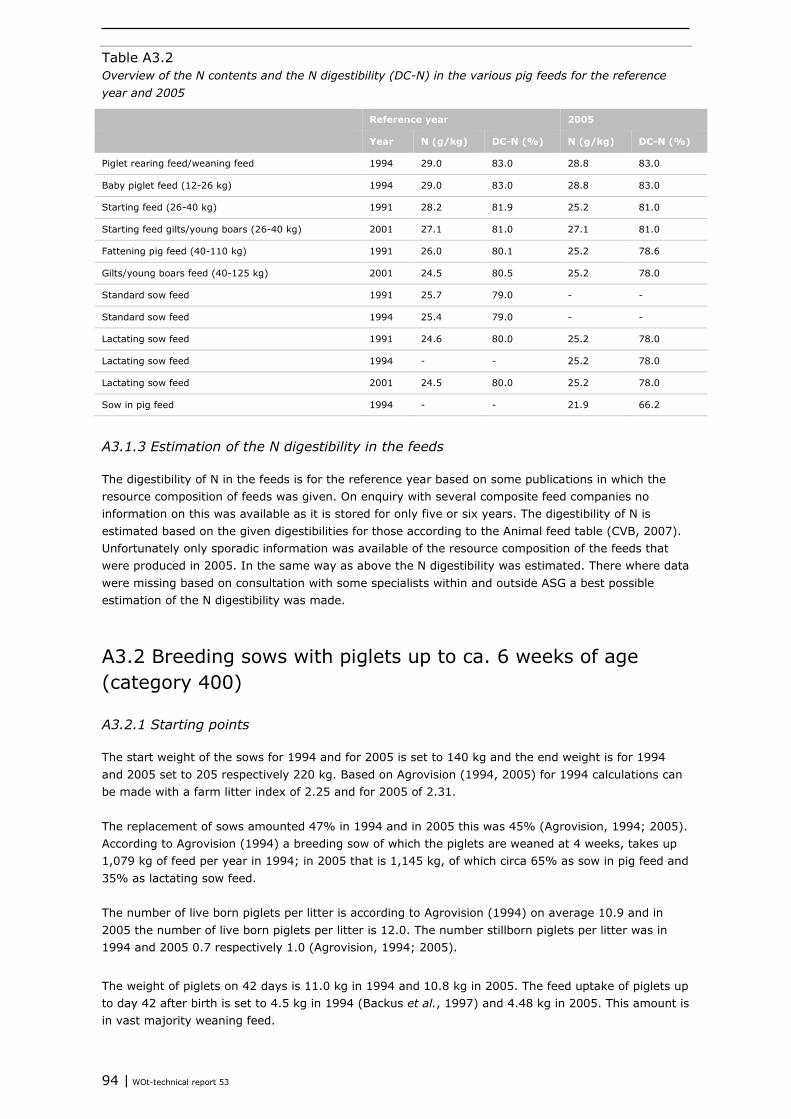
94 | WOt-technical report 53
Table A3.2 Overview of the N contents and the N digestibility (DC-N) in the various pig feeds for the reference year and 2005
Reference year 2005
Year N (g/kg) DC-N (%) N (g/kg) DC-N (%)
Piglet rearing feed/weaning feed 1994 29.0 83.0 28.8 83.0
Baby piglet feed (12-26 kg) 1994 29.0 83.0 28.8 83.0
Starting feed (26-40 kg) 1991 28.2 81.9 25.2 81.0
Starting feed gilts/young boars (26-40 kg) 2001 27.1 81.0 27.1 81.0
Fattening pig feed (40-110 kg) 1991 26.0 80.1 25.2 78.6
Gilts/young boars feed (40-125 kg) 2001 24.5 80.5 25.2 78.0
Standard sow feed 1991 25.7 79.0 - -
Standard sow feed 1994 25.4 79.0 - -
Lactating sow feed 1991 24.6 80.0 25.2 78.0
Lactating sow feed 1994 - - 25.2 78.0
Lactating sow feed 2001 24.5 80.0 25.2 78.0
Sow in pig feed 1994 - - 21.9 66.2
A3.1.3 Estimation of the N digestibility in the feeds
The digestibility of N in the feeds is for the reference year based on some publications in which the resource composition of feeds was given. On enquiry with several composite feed companies no information on this was available as it is stored for only five or six years. The digestibility of N is estimated based on the given digestibilities for those according to the Animal feed table (CVB, 2007). Unfortunately only sporadic information was available of the resource composition of the feeds that were produced in 2005. In the same way as above the N digestibility was estimated. There where data were missing based on consultation with some specialists within and outside ASG a best possible estimation of the N digestibility was made.
A3.2 Breeding sows with piglets up to ca. 6 weeks of age (category 400)
A3.2.1 Starting points
The start weight of the sows for 1994 and for 2005 is set to 140 kg and the end weight is for 1994 and 2005 set to 205 respectively 220 kg. Based on Agrovision (1994, 2005) for 1994 calculations can be made with a farm litter index of 2.25 and for 2005 of 2.31. The replacement of sows amounted 47% in 1994 and in 2005 this was 45% (Agrovision, 1994; 2005). According to Agrovision (1994) a breeding sow of which the piglets are weaned at 4 weeks, takes up 1,079 kg of feed per year in 1994; in 2005 that is 1,145 kg, of which circa 65% as sow in pig feed and 35% as lactating sow feed. The number of live born piglets per litter is according to Agrovision (1994) on average 10.9 and in 2005 the number of live born piglets per litter is 12.0. The number stillborn piglets per litter was in 1994 and 2005 0.7 respectively 1.0 (Agrovision, 1994; 2005).
The weight of piglets on 42 days is 11.0 kg in 1994 and 10.8 kg in 2005. The feed uptake of piglets up to day 42 after birth is set to 4.5 kg in 1994 (Backus et al., 1997) and 4.48 kg in 2005. This amount is in vast majority weaning feed.

Methodology for estimating emissions from agriculture in the Netherlands | 95
The N content of the weaning feed in 1994 was 29.0 g/kg and in 2005 28.8 g/kg. The N digestibility in the weaning pellet is derived from the feed composition according to Kloosterman and Huiskes (1992) and was 83.3%; for 2005 83.0% is taken. The sow feed in 1994 contained 25.4 g N/kg (WUM, 1994), while in 2005 the sow in pig feed and lactating sow feed contained 21.9 respectively 25.2 g N/kg (Jongbloed and Van Bruggen, 2008). The N digestibility of the sow feed in 1994 is estimated based on the feed composition according to Everts et al. (1991) and was 79.0%. The N digestibility of the sow in pig feed is derived from the feed composition of a composite feed manufacturer during the first half of 2006 and was 66.2%. According to another composite feed manufacturer in 2005 the N digestibility of lactating sow feed was 78.0%.
A3.2.2 Results breeding sows with piglets up to ca. 6 weeks of age
In Table A3.3 is based on above mentioned starting points for breeding sows with piglets up to ca. 6 weeks of age an overview given of the N housekeeping if a sow place would be occupied the whole year (no days lost).
Table A3.3 N housekeeping (kg) by breeding sows with piglets up to ca. 6 weeks of age on yearly basis (category 400)
Category 400 1994 2005
g N/kg DC-N N uptake (kg) g N/kg DC-N N uptake (kg)
Weaning feed 29.0 83.3 2.71 28.8 83.0 3.15
Sow in pig feed 25.4 78.9 17.81 21.9 66.2 16.15
Lactating sow feed 25.4 78.9 9.59 25.2 78.0 10.27
Total uptake 30.12 29.57
Fixation 7.13 7.71
Excretion 22.98 21.86
In faeces 6.2 8.3
In urine 16.8 13.6
In urine (%) 72.9 62.2
Table A3.3 shows that the N excretion per sow per year compared to 1994, in 2005 has decreased by over 1.0 kg and that there has been a large shift towards much more N in the faeces and much less in the urine. The percentage of the N excretion in the urine decreased from 72.9 to 62.2. This shift is mostly due to the introduction of a sow in pig feed that has to contain much raw fibre in the framework of the Pig decree (1994).
A3.3 Breeding sows with piglets up to ca. 25 kg (category 401)
A3.3.1 Starting points
For data of the breeding sows is referred to the previous section (the description for category 400). The weight of piglets by the start of fattening is according to Agrovision (1994; 2005) 25.7 kg in 1994 and 25.6 kg in 2005. The age at the start of fattening is on average 80 days. The amount of weaning feed taken up per piglet is 4.5 kg. Based on a feed conversion of 1.65 a piglet takes up 30.0 kg of feed before start of fattening in 1994 and in 2005 feed conversion is 1.59 so that per piglet 28.7 kg of feed is taken up (Agrovision, 1994; 2004).
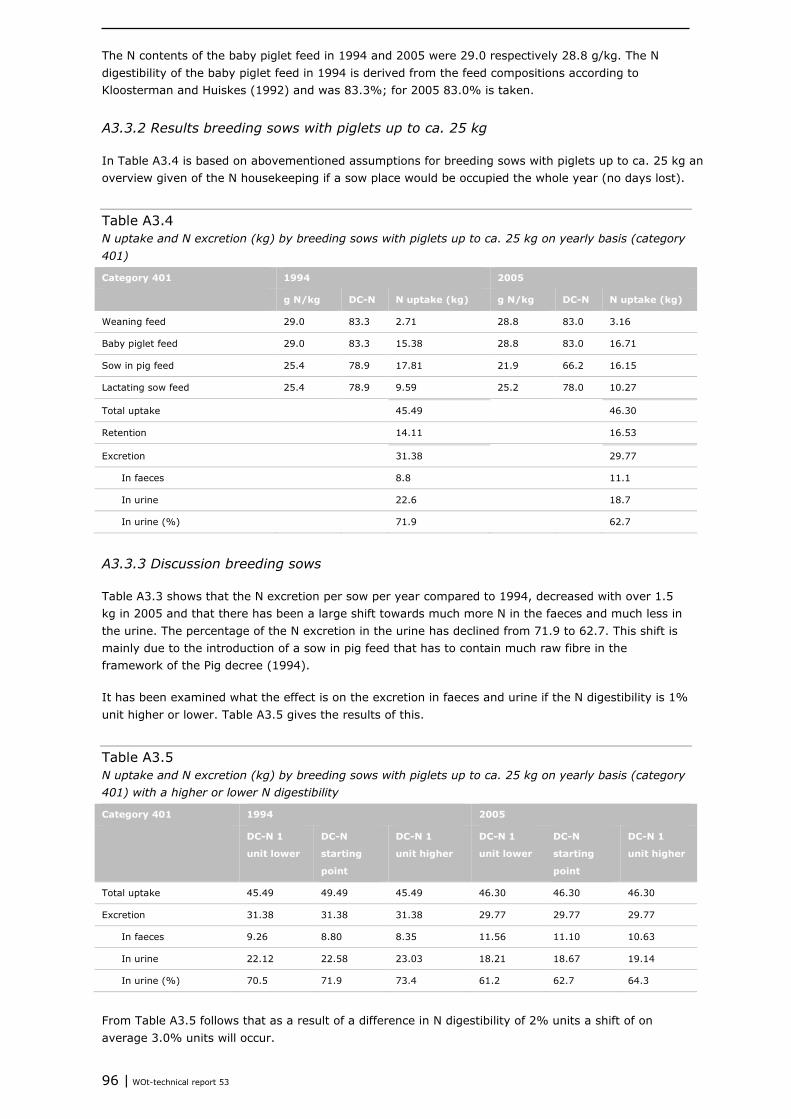
96 | WOt-technical report 53
The N contents of the baby piglet feed in 1994 and 2005 were 29.0 respectively 28.8 g/kg. The N digestibility of the baby piglet feed in 1994 is derived from the feed compositions according to Kloosterman and Huiskes (1992) and was 83.3%; for 2005 83.0% is taken.
A3.3.2 Results breeding sows with piglets up to ca. 25 kg
In Table A3.4 is based on abovementioned assumptions for breeding sows with piglets up to ca. 25 kg an overview given of the N housekeeping if a sow place would be occupied the whole year (no days lost).
Table A3.4 N uptake and N excretion (kg) by breeding sows with piglets up to ca. 25 kg on yearly basis (category 401)
Category 401 1994 2005
g N/kg DC-N N uptake (kg) g N/kg DC-N N uptake (kg)
Weaning feed 29.0 83.3 2.71 28.8 83.0 3.16
Baby piglet feed 29.0 83.3 15.38 28.8 83.0 16.71
Sow in pig feed 25.4 78.9 17.81 21.9 66.2 16.15
Lactating sow feed 25.4 78.9 9.59 25.2 78.0 10.27
Total uptake 45.49 46.30
Retention 14.11 16.53
Excretion 31.38 29.77
In faeces 8.8 11.1
In urine 22.6 18.7
In urine (%) 71.9 62.7
A3.3.3 Discussion breeding sows
Table A3.3 shows that the N excretion per sow per year compared to 1994, decreased with over 1.5 kg in 2005 and that there has been a large shift towards much more N in the faeces and much less in the urine. The percentage of the N excretion in the urine has declined from 71.9 to 62.7. This shift is mainly due to the introduction of a sow in pig feed that has to contain much raw fibre in the framework of the Pig decree (1994). It has been examined what the effect is on the excretion in faeces and urine if the N digestibility is 1% unit higher or lower. Table A3.5 gives the results of this.
Table A3.5 N uptake and N excretion (kg) by breeding sows with piglets up to ca. 25 kg on yearly basis (category 401) with a higher or lower N digestibility
Category 401 1994 2005
DC-N 1
unit lower
DC-N
starting
point
DC-N 1
unit higher
DC-N 1
unit lower
DC-N
starting
point
DC-N 1
unit higher
Total uptake 45.49 49.49 45.49 46.30 46.30 46.30
Excretion 31.38 31.38 31.38 29.77 29.77 29.77
In faeces 9.26 8.80 8.35 11.56 11.10 10.63
In urine 22.12 22.58 23.03 18.21 18.67 19.14
In urine (%) 70.5 71.9 73.4 61.2 62.7 64.3
From Table A3.5 follows that as a result of a difference in N digestibility of 2% units a shift of on average 3.0% units will occur.

Methodology for estimating emissions from agriculture in the Netherlands | 97
A3.4 Gilts not yet in pig of ca. 25 kg to ca. 7 months (category 402)
A3.4.1 Starting points
The start and end weight of the gilts not yet in pig for both 2002 is set to 26 respectively 125 kg. This end weight is derived from Jongbloed and Kemme (2005). The average length of the period is calculated to be 133 days, such that the average growth is 744 g/day. In 2002 the ratio between the starting feed and rearing feed for gilts not yet in pig is set to 15:85 (Jongbloed and Kemme, 2005). The total amount of feed during the lay on period for this category of gilts not yet in pig is 287 kg for 2002. For 2005 the same starting points as for 2002 are taken. The N contents of the starting feed and rearing feed in 2002 were 27.1 respectively 24.5 g/kg. For 2005 these contents are 27.1 respectively 25.2 g/kg. The N digestibility of the starting feed is set to 81.0 and of the rearing feed to 78.0 which is equal to the N digestibility of the lactating sow feed.
A3.4.2 Results gilts not yet in pig of 25 kg to ca. 7 months
In Table A3.6 is based on abovementioned starting points for gilts not yet in pig to ca. 7 months an overview given of the N housekeeping if a pig place would be occupied the whole year (no lost days).
Table A3.6 N uptake and excretion (kg) by gilts not yet in pig of 25 kg to ca. 7 months on yearly basis (category 402)
Category 402 2001 2005
g N/kg DC-N N uptake (kg) g N/kg DC-N N uptake (kg)
Starting feed 27.1 81.0 4.27 27.1 81.0 4.27
Lactating sow feed 24.5 80.0 15.44 25.2 78.0 15.88
Total uptake 19.71 20.15
Retention 6.77 6.77
Excretion 12.93 13.38
In faeces 3.9 4.3
In urine 9.0 9.1
In urine (%) 69.9 67.8
Table A3.6 shows that the N excretion per gilt not yet in pig compared to 2001 decreased somewhat in 2005 and that there has been a shift to more N in the faeces. The percentage of the N excretion in the urine has decreased from 69.9 to 67.8.
A3.5 Gilts not yet in pig of ca. 7 months to first mating (category 403)
A3.5.1 Starting points
The start and end weight of these gilts not yet in pig for both 2002 and 2006 is set to 125 respectively 140 kg (Topigs, 2004). According to this reference it follows that the age at first insemination on average is 243 days, thus the average length of the period can be set to 30 days in 2001 and 2005. The average growth is 500 g/day. The total amount of the lactating sow feed during the lay on period for this category gilts not yet in pig, is calculated to 72 kg for 2001 and 2005.
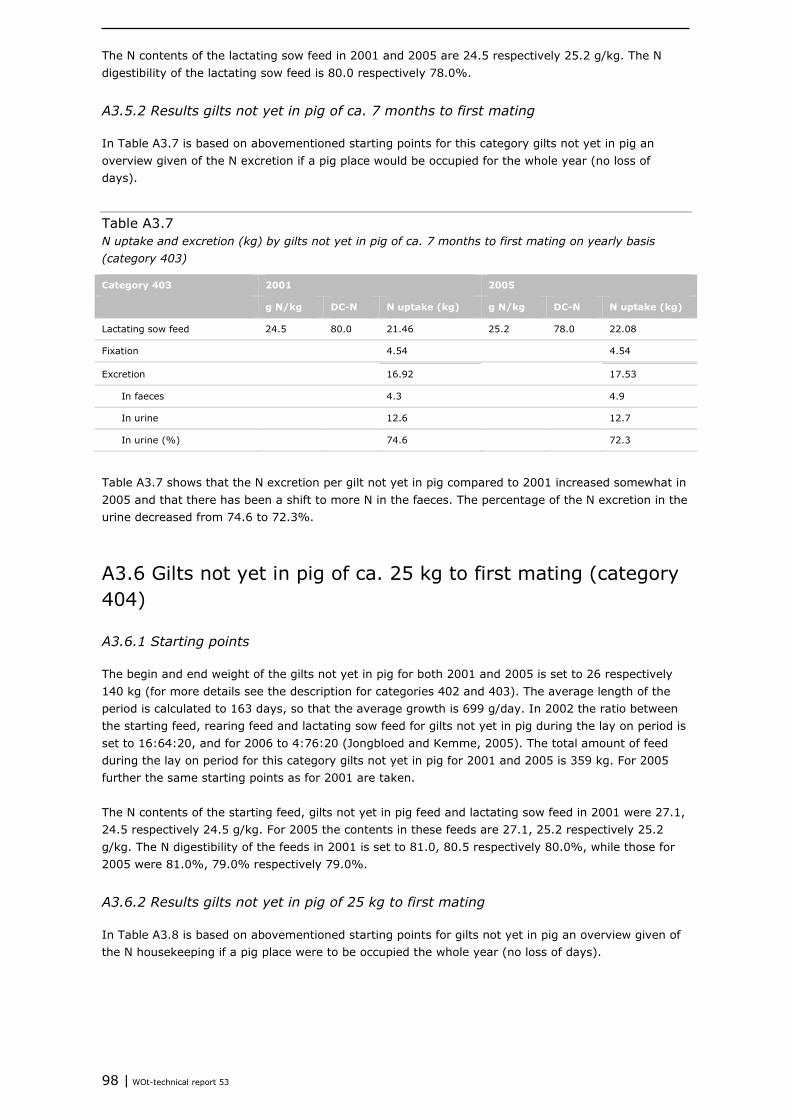
98 | WOt-technical report 53
The N contents of the lactating sow feed in 2001 and 2005 are 24.5 respectively 25.2 g/kg. The N digestibility of the lactating sow feed is 80.0 respectively 78.0%.
A3.5.2 Results gilts not yet in pig of ca. 7 months to first mating
In Table A3.7 is based on abovementioned starting points for this category gilts not yet in pig an overview given of the N excretion if a pig place would be occupied for the whole year (no loss of days).
Table A3.7 N uptake and excretion (kg) by gilts not yet in pig of ca. 7 months to first mating on yearly basis (category 403)
Category 403 2001 2005
g N/kg DC-N N uptake (kg) g N/kg DC-N N uptake (kg)
Lactating sow feed 24.5 80.0 21.46 25.2 78.0 22.08
Fixation 4.54 4.54
Excretion 16.92 17.53
In faeces 4.3 4.9
In urine 12.6 12.7
In urine (%) 74.6 72.3
Table A3.7 shows that the N excretion per gilt not yet in pig compared to 2001 increased somewhat in 2005 and that there has been a shift to more N in the faeces. The percentage of the N excretion in the urine decreased from 74.6 to 72.3%.
A3.6 Gilts not yet in pig of ca. 25 kg to first mating (category 404)
A3.6.1 Starting points
The begin and end weight of the gilts not yet in pig for both 2001 and 2005 is set to 26 respectively 140 kg (for more details see the description for categories 402 and 403). The average length of the period is calculated to 163 days, so that the average growth is 699 g/day. In 2002 the ratio between the starting feed, rearing feed and lactating sow feed for gilts not yet in pig during the lay on period is set to 16:64:20, and for 2006 to 4:76:20 (Jongbloed and Kemme, 2005). The total amount of feed during the lay on period for this category gilts not yet in pig for 2001 and 2005 is 359 kg. For 2005 further the same starting points as for 2001 are taken. The N contents of the starting feed, gilts not yet in pig feed and lactating sow feed in 2001 were 27.1, 24.5 respectively 24.5 g/kg. For 2005 the contents in these feeds are 27.1, 25.2 respectively 25.2 g/kg. The N digestibility of the feeds in 2001 is set to 81.0, 80.5 respectively 80.0%, while those for 2005 were 81.0%, 79.0% respectively 79.0%.
A3.6.2 Results gilts not yet in pig of 25 kg to first mating
In Table A3.8 is based on abovementioned starting points for gilts not yet in pig an overview given of the N housekeeping if a pig place were to be occupied the whole year (no loss of days).

Methodology for estimating emissions from agriculture in the Netherlands | 99
Table A3.8 N uptake and excretion (kg) by gilts not yet in pig of 25 kg to first mating on yearly basis (category 404)
Category 404 2001 2005
g N/kg DC-N N uptake (kg) g N/kg DC-N N uptake (kg)
Starting feed 27.1 81.0 3.49 27.1 81.0 3.49
Gilts not yet in pig feed 24.5 80.5 12.61 25.2 78.0 15.40
Lactating sow feed 24.5 80.0 3.94 25.2 78.0 1.62
Total uptake 20.03 20.50
Fixation 6.36 6.36
Excretion 13.67 14.14
In faeces 3.9 4.4
In urine 9.8 9.7
In urine (%) 71.4 68.8
Table A3.8 shows that the N excretion per gilt not yet in pig per year compared to 2001 increased somewhat in 2005 and that a shift occurred to more N in the faeces. The percentage of the N excretion in the urine has decreased from 71.4 to 68.8%.
A3.7 Young boars of ca. 25 kg to ca. 7 months (category 405)
A3.7.1 Starting points
The start and end weight of the young boars for both 2001 as 2005 is set to 26 respectively 135 kg. The average length of the period is 133 days in 2001 and 2005, so that the average growth per animal per day is 820 grams. In 2001 and 2005 the feed conversion of this category pigs is 2.66. In 2001 and also 2005 during the lay on period a ratio between starting feed, growth feed and finishing feed of 15:20:65 is taken (Jongbloed and Kemme, 2005). This ratio is applied on the total amount of feed (290 kg). The N contents of the starting feed, growth feed and finishing feed in 2001 were 27.1, 24.5 respectively 25.7 g/kg. These contents in 2005 were 27.1, 25.2 respectively 25.2 g/kg. The N digestibility of the feeds was in 2001 81.0%, 80.5% respectively 80.5% and in 2005 81.0%, 78.0% respectively 81.0%.
A3.7.2 Results young boars
In Table A3.9 is based on abovementioned starting points for young boars an overview given of the N housekeeping if a pig place were to be occupied the whole year (no loss of days).
Table A3.9 N uptake and excretion (kg) by young boars to ca. 7 months on yearly basis (category 405)
Category 405 1991 2005
g N/kg DC-N N uptake (kg) g N/kg DC-N N uptake (kg)
Starting feed 27.1 81.0 3.24 27.1 81.0 3.24
Lactating sow feed 24.5 80.5 16.57 25.2 78.0 17.05
Total uptake 19.81 20.28
Fixation 7.46 7.45
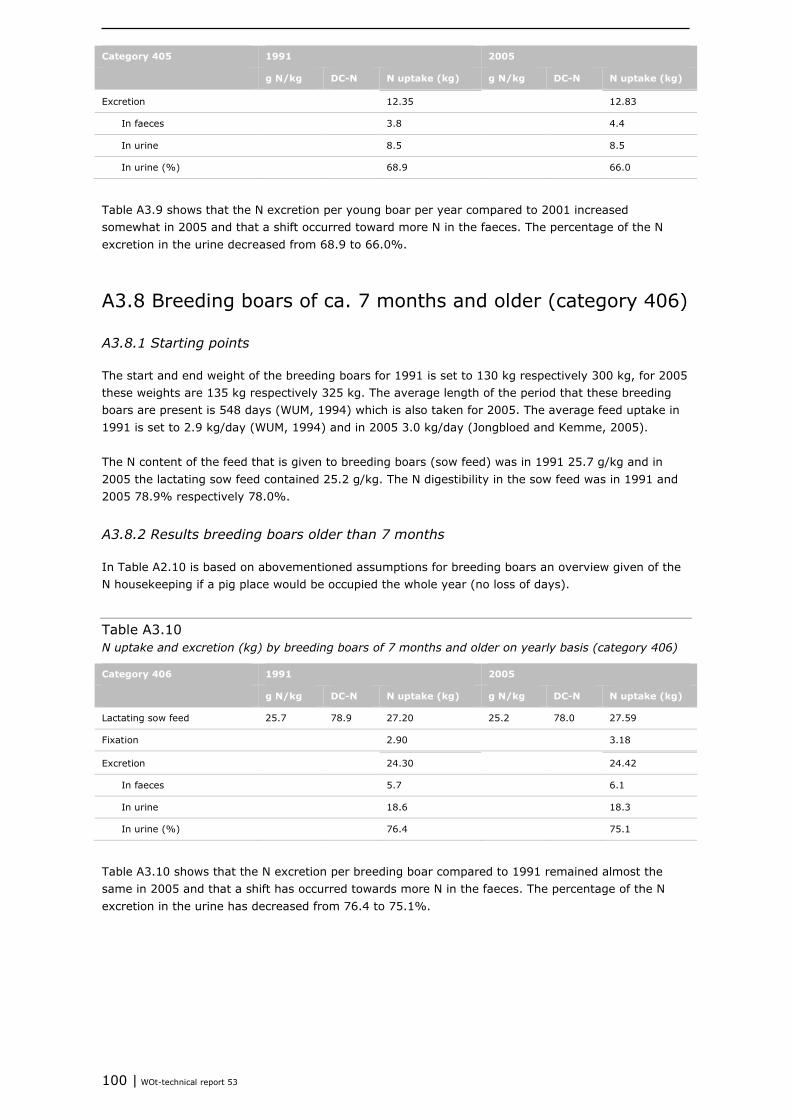
100 | WOt-technical report 53
Category 405 1991 2005
g N/kg DC-N N uptake (kg) g N/kg DC-N N uptake (kg)
Excretion 12.35 12.83
In faeces 3.8 4.4
In urine 8.5 8.5
In urine (%) 68.9 66.0
Table A3.9 shows that the N excretion per young boar per year compared to 2001 increased somewhat in 2005 and that a shift occurred toward more N in the faeces. The percentage of the N excretion in the urine decreased from 68.9 to 66.0%.
A3.8 Breeding boars of ca. 7 months and older (category 406)
A3.8.1 Starting points
The start and end weight of the breeding boars for 1991 is set to 130 kg respectively 300 kg, for 2005 these weights are 135 kg respectively 325 kg. The average length of the period that these breeding boars are present is 548 days (WUM, 1994) which is also taken for 2005. The average feed uptake in 1991 is set to 2.9 kg/day (WUM, 1994) and in 2005 3.0 kg/day (Jongbloed and Kemme, 2005). The N content of the feed that is given to breeding boars (sow feed) was in 1991 25.7 g/kg and in 2005 the lactating sow feed contained 25.2 g/kg. The N digestibility in the sow feed was in 1991 and 2005 78.9% respectively 78.0%.
A3.8.2 Results breeding boars older than 7 months
In Table A2.10 is based on abovementioned assumptions for breeding boars an overview given of the N housekeeping if a pig place would be occupied the whole year (no loss of days).
Table A3.10 N uptake and excretion (kg) by breeding boars of 7 months and older on yearly basis (category 406)
Category 406 1991 2005
g N/kg DC-N N uptake (kg) g N/kg DC-N N uptake (kg)
Lactating sow feed 25.7 78.9 27.20 25.2 78.0 27.59
Fixation 2.90 3.18
Excretion 24.30 24.42
In faeces 5.7 6.1
In urine 18.6 18.3
In urine (%) 76.4 75.1
Table A3.10 shows that the N excretion per breeding boar compared to 1991 remained almost the same in 2005 and that a shift has occurred towards more N in the faeces. The percentage of the N excretion in the urine has decreased from 76.4 to 75.1%.
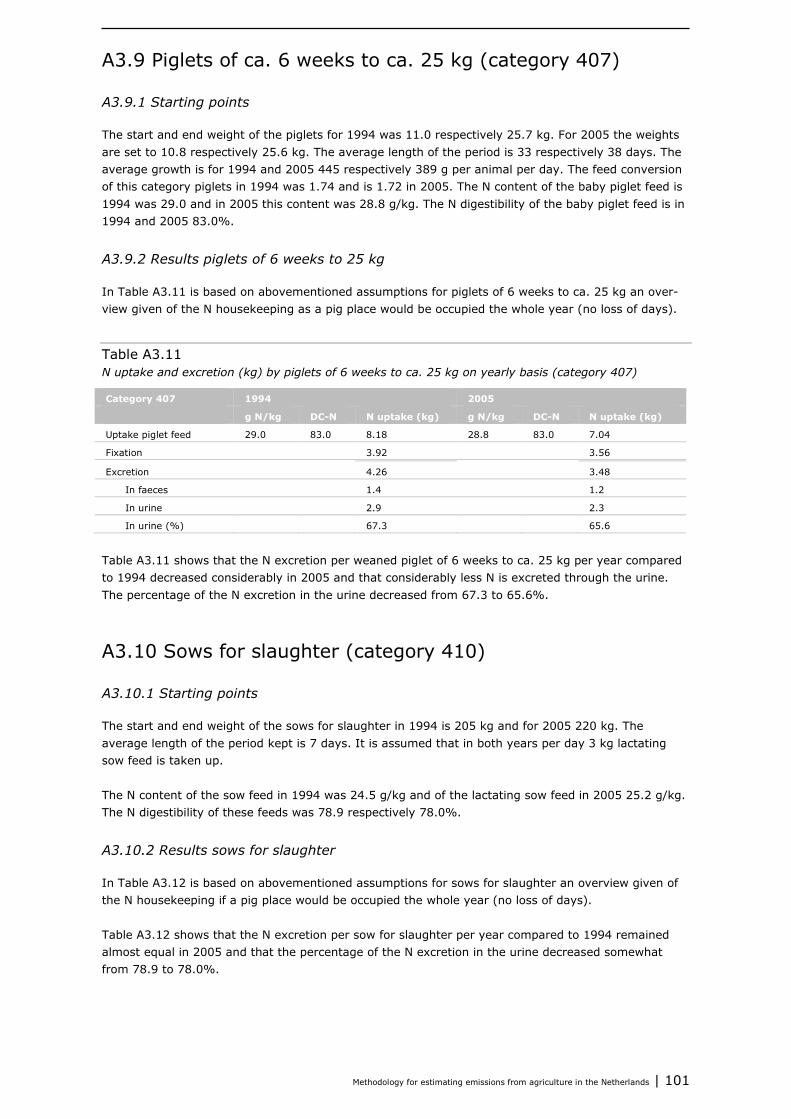
Methodology for estimating emissions from agriculture in the Netherlands | 101
A3.9 Piglets of ca. 6 weeks to ca. 25 kg (category 407)
A3.9.1 Starting points
The start and end weight of the piglets for 1994 was 11.0 respectively 25.7 kg. For 2005 the weights are set to 10.8 respectively 25.6 kg. The average length of the period is 33 respectively 38 days. The average growth is for 1994 and 2005 445 respectively 389 g per animal per day. The feed conversion of this category piglets in 1994 was 1.74 and is 1.72 in 2005. The N content of the baby piglet feed is 1994 was 29.0 and in 2005 this content was 28.8 g/kg. The N digestibility of the baby piglet feed is in 1994 and 2005 83.0%.
A3.9.2 Results piglets of 6 weeks to 25 kg
In Table A3.11 is based on abovementioned assumptions for piglets of 6 weeks to ca. 25 kg an over-view given of the N housekeeping as a pig place would be occupied the whole year (no loss of days).
Table A3.11 N uptake and excretion (kg) by piglets of 6 weeks to ca. 25 kg on yearly basis (category 407)
Category 407 1994 2005
g N/kg DC-N N uptake (kg) g N/kg DC-N N uptake (kg)
Uptake piglet feed 29.0 83.0 8.18 28.8 83.0 7.04
Fixation 3.92 3.56
Excretion 4.26 3.48
In faeces 1.4 1.2
In urine 2.9 2.3
In urine (%) 67.3 65.6
Table A3.11 shows that the N excretion per weaned piglet of 6 weeks to ca. 25 kg per year compared to 1994 decreased considerably in 2005 and that considerably less N is excreted through the urine. The percentage of the N excretion in the urine decreased from 67.3 to 65.6%.
A3.10 Sows for slaughter (category 410)
A3.10.1 Starting points
The start and end weight of the sows for slaughter in 1994 is 205 kg and for 2005 220 kg. The average length of the period kept is 7 days. It is assumed that in both years per day 3 kg lactating sow feed is taken up. The N content of the sow feed in 1994 was 24.5 g/kg and of the lactating sow feed in 2005 25.2 g/kg. The N digestibility of these feeds was 78.9 respectively 78.0%.
A3.10.2 Results sows for slaughter
In Table A3.12 is based on abovementioned assumptions for sows for slaughter an overview given of the N housekeeping if a pig place would be occupied the whole year (no loss of days). Table A3.12 shows that the N excretion per sow for slaughter per year compared to 1994 remained almost equal in 2005 and that the percentage of the N excretion in the urine decreased somewhat from 78.9 to 78.0%.
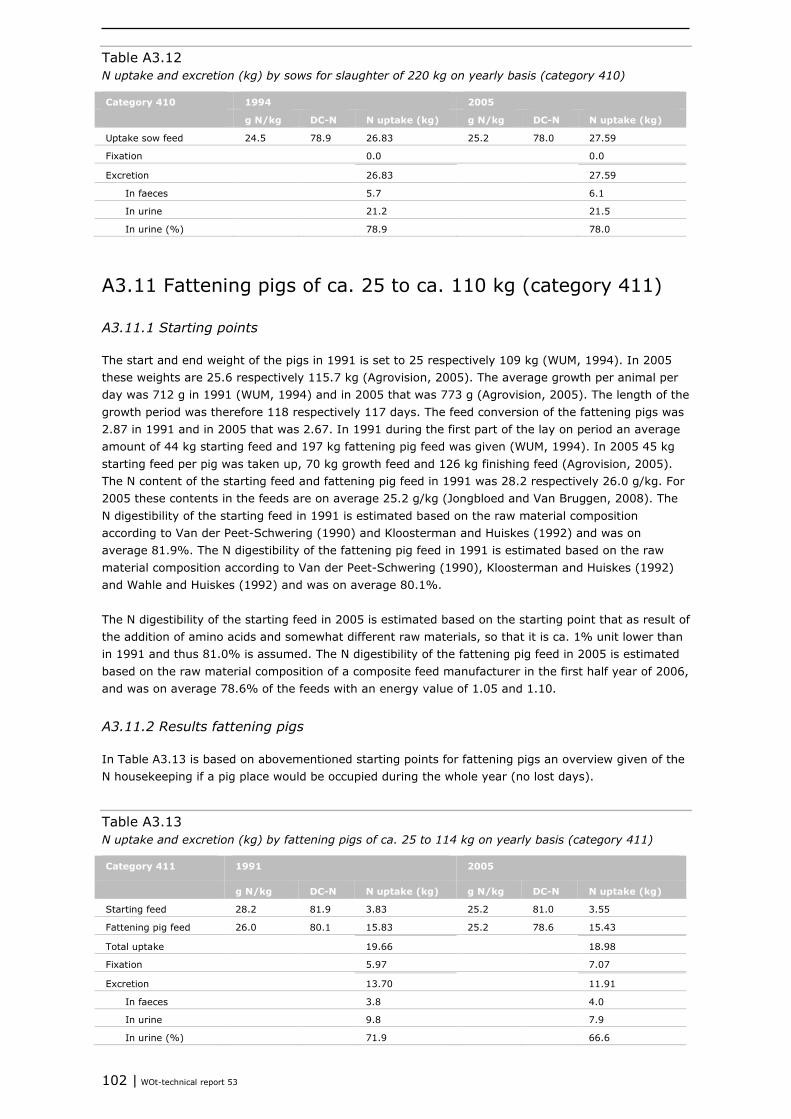
102 | WOt-technical report 53
Table A3.12 N uptake and excretion (kg) by sows for slaughter of 220 kg on yearly basis (category 410)
Category 410 1994 2005
g N/kg DC-N N uptake (kg) g N/kg DC-N N uptake (kg)
Uptake sow feed 24.5 78.9 26.83 25.2 78.0 27.59
Fixation 0.0 0.0
Excretion 26.83 27.59
In faeces 5.7 6.1
In urine 21.2 21.5
In urine (%) 78.9 78.0
A3.11 Fattening pigs of ca. 25 to ca. 110 kg (category 411)
A3.11.1 Starting points
The start and end weight of the pigs in 1991 is set to 25 respectively 109 kg (WUM, 1994). In 2005 these weights are 25.6 respectively 115.7 kg (Agrovision, 2005). The average growth per animal per day was 712 g in 1991 (WUM, 1994) and in 2005 that was 773 g (Agrovision, 2005). The length of the growth period was therefore 118 respectively 117 days. The feed conversion of the fattening pigs was 2.87 in 1991 and in 2005 that was 2.67. In 1991 during the first part of the lay on period an average amount of 44 kg starting feed and 197 kg fattening pig feed was given (WUM, 1994). In 2005 45 kg starting feed per pig was taken up, 70 kg growth feed and 126 kg finishing feed (Agrovision, 2005). The N content of the starting feed and fattening pig feed in 1991 was 28.2 respectively 26.0 g/kg. For 2005 these contents in the feeds are on average 25.2 g/kg (Jongbloed and Van Bruggen, 2008). The N digestibility of the starting feed in 1991 is estimated based on the raw material composition according to Van der Peet-Schwering (1990) and Kloosterman and Huiskes (1992) and was on average 81.9%. The N digestibility of the fattening pig feed in 1991 is estimated based on the raw material composition according to Van der Peet-Schwering (1990), Kloosterman and Huiskes (1992) and Wahle and Huiskes (1992) and was on average 80.1%. The N digestibility of the starting feed in 2005 is estimated based on the starting point that as result of the addition of amino acids and somewhat different raw materials, so that it is ca. 1% unit lower than in 1991 and thus 81.0% is assumed. The N digestibility of the fattening pig feed in 2005 is estimated based on the raw material composition of a composite feed manufacturer in the first half year of 2006, and was on average 78.6% of the feeds with an energy value of 1.05 and 1.10.
A3.11.2 Results fattening pigs
In Table A3.13 is based on abovementioned starting points for fattening pigs an overview given of the N housekeeping if a pig place would be occupied during the whole year (no lost days).
Table A3.13 N uptake and excretion (kg) by fattening pigs of ca. 25 to 114 kg on yearly basis (category 411)
Category 411 1991 2005
g N/kg DC-N N uptake (kg) g N/kg DC-N N uptake (kg)
Starting feed 28.2 81.9 3.83 25.2 81.0 3.55
Fattening pig feed 26.0 80.1 15.83 25.2 78.6 15.43
Total uptake 19.66 18.98
Fixation 5.97 7.07
Excretion 13.70 11.91
In faeces 3.8 4.0
In urine 9.8 7.9
In urine (%) 71.9 66.6

Methodology for estimating emissions from agriculture in the Netherlands | 103
A3.11.3 Discussion fattening pigs
Table A3.13 shows that the N excretion per fattening pig per year compared to 1991 decreased considerably in 2005. As result of the higher N retention the percentage of the N excretion in the urine decreased considerably from 71.9 to 66.6%. For fattening pigs is examined what the effect is on the excretion in faeces and urine if the digestibility of N in the feeds for fattening pigs is 1% unit lower or higher than in the starting situation (Table A3.14).
Table A3.14 N uptake and excretion (kg) by fattening pigs of ca. 25 to 114 kg on yearly basis (category 411) at a higher or lower N digestibility
Category 411 1991 2005
DC-N 1 unit
lower
DC-N
starting
point
DC-N 1 unit
higher
DC-N 1
unit
lower
DC-N
starting
point
DC-N 1
unit
higher
Total uptake 19.66 19.66 19.66 18.98 18.98 18.98
Excretion 13.70 13.70 13.70 11.91 11.91 11.91
In faeces 4.04 3.84 3.65 4.17 3.98 3.79
In urine 9.65 9.85 10.05 7.75 7.94 8.13
In urine (%) 70.5 71.9 73.4 65.0 66.6 68.2
From Table A3.14 it can be seen that in the dependability of the digestibility of N with a deviation of 2% units, no large shifts occur in the division of N over faeces and urine; this is a difference of 2.9% units in 1991 and 3.2% units in 2005.
A3.12 General discussion
An important attention point is a good insight in the N contents of the various feeds. Also because the use of a whole range of feeds for various categories pigs it is sometimes difficult to know how long those feeds are given. However by means of data from Levies Office (Bureau Heffingen) that insight can be obtained for some important feeds but are lacking for small animal categories. This needs to receive more attention. Another point is the N digestibility. Also because of a storage period of five to six years, data on this are lacking in the compound feed industry particularly for the reference years (1991 to 2002). The N digestibility also is not of interest in the formation of the feeds: for protein this is based on ileal or faecal digestible amino acids. Also for the year 2005 it was not possible to gain a reliable insight in the N digestibility. Besides there is such a large array of feeds that it is difficult to classify these correctly. It is hard for the compound feed industry to calculate these data, and possibly competition is a reason not to make these available after all. Ways should be found to obtain more reliable data on the N digestibility in the feeds.
A3.13 Summary pigs
In Table A3.15 a summary is given of the excretion of N and % TAN by various categories of pigs in the reference year and in 2005 in g/year.
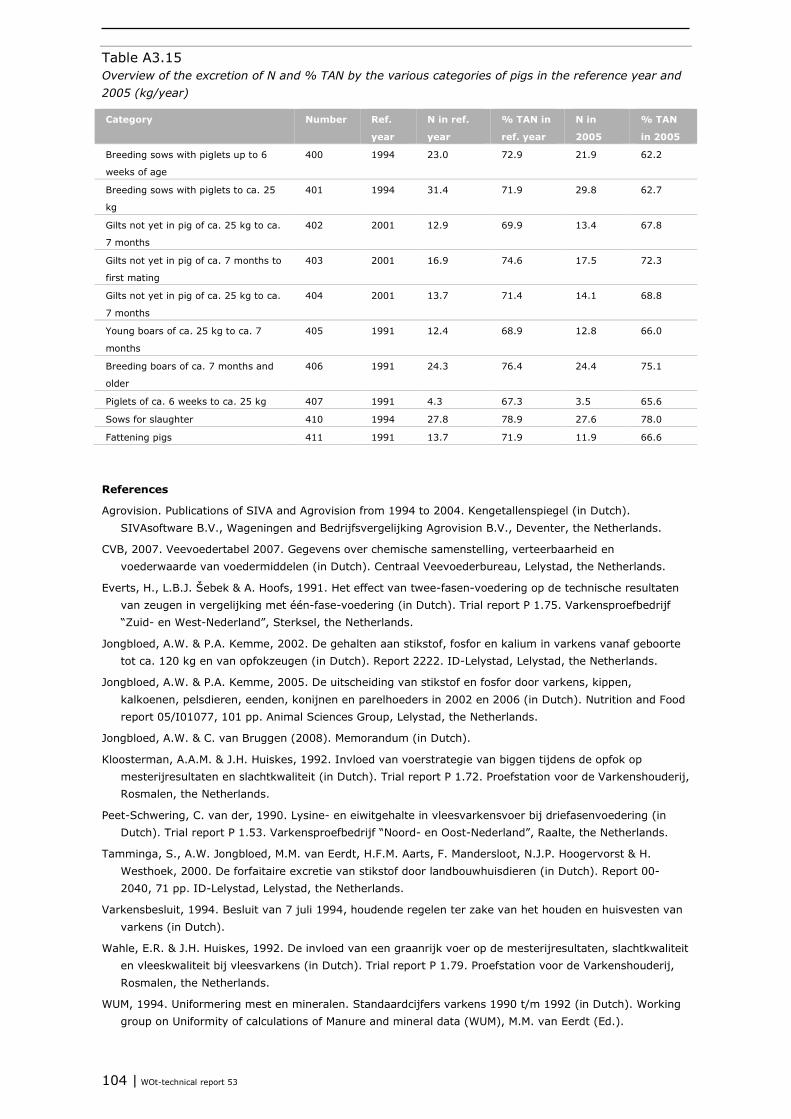
104 | WOt-technical report 53
Table A3.15 Overview of the excretion of N and % TAN by the various categories of pigs in the reference year and 2005 (kg/year)
Category Number Ref.
year
N in ref.
year
% TAN in
ref. year
N in
2005
% TAN
in 2005
Breeding sows with piglets up to 6
weeks of age
400 1994 23.0 72.9 21.9 62.2
Breeding sows with piglets to ca. 25
kg
401 1994 31.4 71.9 29.8 62.7
Gilts not yet in pig of ca. 25 kg to ca.
7 months
402 2001 12.9 69.9 13.4 67.8
Gilts not yet in pig of ca. 7 months to
first mating
403 2001 16.9 74.6 17.5 72.3
Gilts not yet in pig of ca. 25 kg to ca.
7 months
404 2001 13.7 71.4 14.1 68.8
Young boars of ca. 25 kg to ca. 7
months
405 1991 12.4 68.9 12.8 66.0
Breeding boars of ca. 7 months and
older
406 1991 24.3 76.4 24.4 75.1
Piglets of ca. 6 weeks to ca. 25 kg 407 1991 4.3 67.3 3.5 65.6
Sows for slaughter 410 1994 27.8 78.9 27.6 78.0
Fattening pigs 411 1991 13.7 71.9 11.9 66.6
References
Agrovision. Publications of SIVA and Agrovision from 1994 to 2004. Kengetallenspiegel (in Dutch). SIVAsoftware B.V., Wageningen and Bedrijfsvergelijking Agrovision B.V., Deventer, the Netherlands.
CVB, 2007. Veevoedertabel 2007. Gegevens over chemische samenstelling, verteerbaarheid en voederwaarde van voedermiddelen (in Dutch). Centraal Veevoederbureau, Lelystad, the Netherlands.
Everts, H., L.B.J. Šebek & A. Hoofs, 1991. Het effect van twee-fasen-voedering op de technische resultaten van zeugen in vergelijking met één-fase-voedering (in Dutch). Trial report P 1.75. Varkensproefbedrijf “Zuid- en West-Nederland”, Sterksel, the Netherlands.
Jongbloed, A.W. & P.A. Kemme, 2002. De gehalten aan stikstof, fosfor en kalium in varkens vanaf geboorte tot ca. 120 kg en van opfokzeugen (in Dutch). Report 2222. ID-Lelystad, Lelystad, the Netherlands.
Jongbloed, A.W. & P.A. Kemme, 2005. De uitscheiding van stikstof en fosfor door varkens, kippen, kalkoenen, pelsdieren, eenden, konijnen en parelhoeders in 2002 en 2006 (in Dutch). Nutrition and Food report 05/I01077, 101 pp. Animal Sciences Group, Lelystad, the Netherlands.
Jongbloed, A.W. & C. van Bruggen (2008). Memorandum (in Dutch).
Kloosterman, A.A.M. & J.H. Huiskes, 1992. Invloed van voerstrategie van biggen tijdens de opfok op mesterijresultaten en slachtkwaliteit (in Dutch). Trial report P 1.72. Proefstation voor de Varkenshouderij, Rosmalen, the Netherlands.
Peet-Schwering, C. van der, 1990. Lysine- en eiwitgehalte in vleesvarkensvoer bij driefasenvoedering (in Dutch). Trial report P 1.53. Varkensproefbedrijf “Noord- en Oost-Nederland”, Raalte, the Netherlands.
Tamminga, S., A.W. Jongbloed, M.M. van Eerdt, H.F.M. Aarts, F. Mandersloot, N.J.P. Hoogervorst & H. Westhoek, 2000. De forfaitaire excretie van stikstof door landbouwhuisdieren (in Dutch). Report 00-2040, 71 pp. ID-Lelystad, Lelystad, the Netherlands.
Varkensbesluit, 1994. Besluit van 7 juli 1994, houdende regelen ter zake van het houden en huisvesten van varkens (in Dutch).
Wahle, E.R. & J.H. Huiskes, 1992. De invloed van een graanrijk voer op de mesterijresultaten, slachtkwaliteit en vleeskwaliteit bij vleesvarkens (in Dutch). Trial report P 1.79. Proefstation voor de Varkenshouderij, Rosmalen, the Netherlands.
WUM, 1994. Uniformering mest en mineralen. Standaardcijfers varkens 1990 t/m 1992 (in Dutch). Working group on Uniformity of calculations of Manure and mineral data (WUM), M.M. van Eerdt (Ed.).
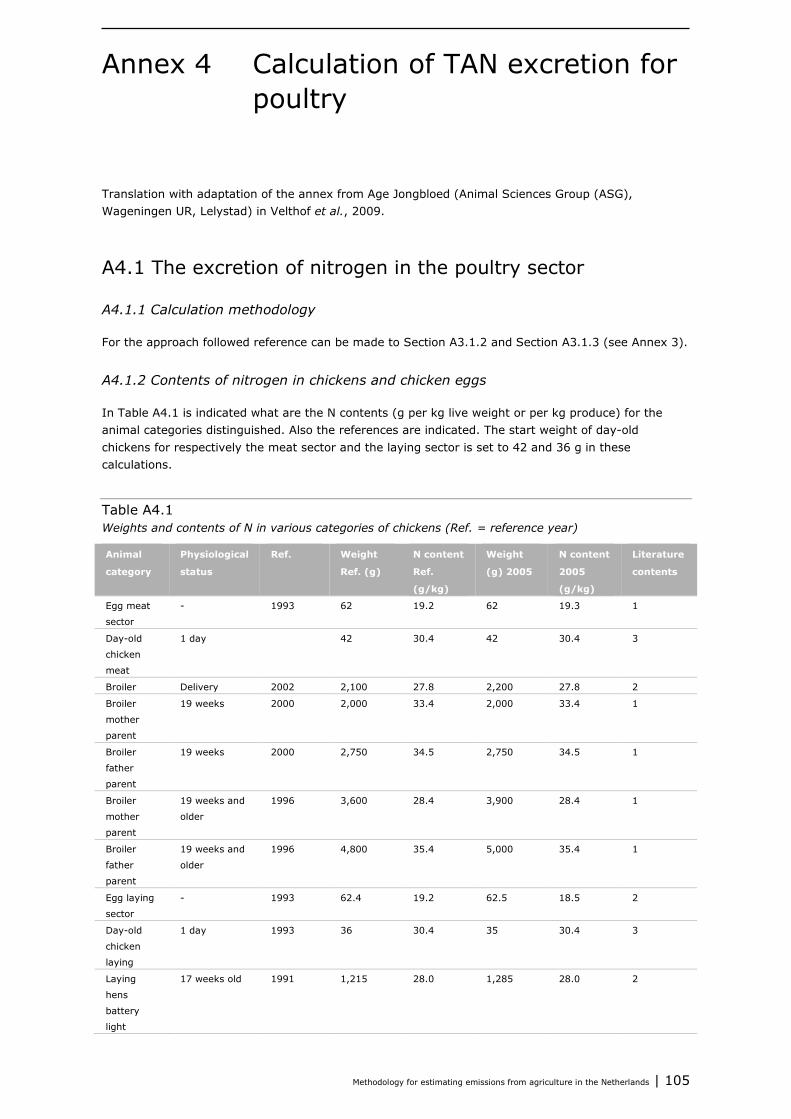
Methodology for estimating emissions from agriculture in the Netherlands | 105
Calculation of TAN excretion for Annex 4poultry
Translation with adaptation of the annex from Age Jongbloed (Animal Sciences Group (ASG), Wageningen UR, Lelystad) in Velthof et al., 2009.
A4.1 The excretion of nitrogen in the poultry sector
A4.1.1 Calculation methodology
For the approach followed reference can be made to Section A3.1.2 and Section A3.1.3 (see Annex 3).
A4.1.2 Contents of nitrogen in chickens and chicken eggs
In Table A4.1 is indicated what are the N contents (g per kg live weight or per kg produce) for the animal categories distinguished. Also the references are indicated. The start weight of day-old chickens for respectively the meat sector and the laying sector is set to 42 and 36 g in these calculations.
Table A4.1 Weights and contents of N in various categories of chickens (Ref. = reference year)
Animal
category
Physiological
status
Ref. Weight
Ref. (g)
N content
Ref.
(g/kg)
Weight
(g) 2005
N content
2005
(g/kg)
Literature
contents
Egg meat
sector
- 1993 62 19.2 62 19.3 1
Day-old
chicken
meat
1 day 42 30.4 42 30.4 3
Broiler Delivery 2002 2,100 27.8 2,200 27.8 2
Broiler
mother
parent
19 weeks 2000 2,000 33.4 2,000 33.4 1
Broiler
father
parent
19 weeks 2000 2,750 34.5 2,750 34.5 1
Broiler
mother
parent
19 weeks and
older
1996 3,600 28.4 3,900 28.4 1
Broiler
father
parent
19 weeks and
older
1996 4,800 35.4 5,000 35.4 1
Egg laying
sector
- 1993 62.4 19.2 62.5 18.5 2
Day-old
chicken
laying
1 day 1993 36 30.4 35 30.4 3
Laying
hens
battery
light
17 weeks old 1991 1,215 28.0 1,285 28.0 2
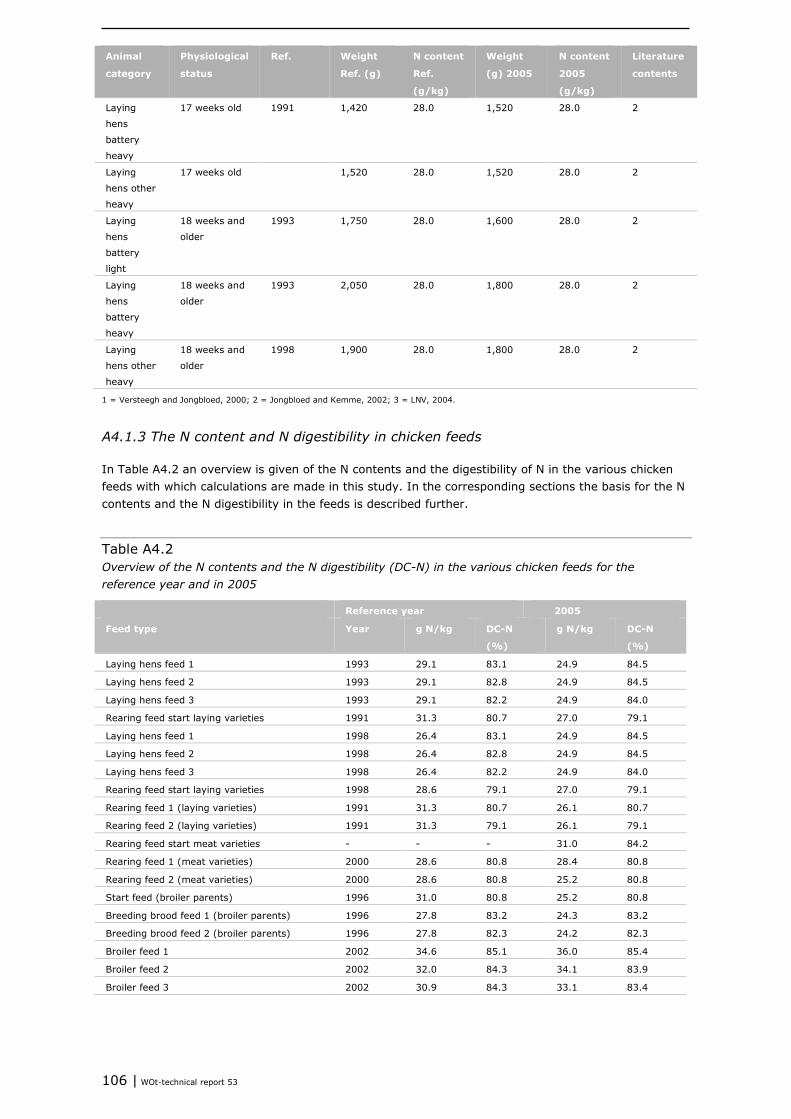
106 | WOt-technical report 53
Animal
category
Physiological
status
Ref. Weight
Ref. (g)
N content
Ref.
(g/kg)
Weight
(g) 2005
N content
2005
(g/kg)
Literature
contents
Laying
hens
battery
heavy
17 weeks old 1991 1,420 28.0 1,520 28.0 2
Laying
hens other
heavy
17 weeks old 1,520 28.0 1,520 28.0 2
Laying
hens
battery
light
18 weeks and
older
1993 1,750 28.0 1,600 28.0 2
Laying
hens
battery
heavy
18 weeks and
older
1993 2,050 28.0 1,800 28.0 2
Laying
hens other
heavy
18 weeks and
older
1998 1,900 28.0 1,800 28.0 2
1 = Versteegh and Jongbloed, 2000; 2 = Jongbloed and Kemme, 2002; 3 = LNV, 2004.
A4.1.3 The N content and N digestibility in chicken feeds
In Table A4.2 an overview is given of the N contents and the digestibility of N in the various chicken feeds with which calculations are made in this study. In the corresponding sections the basis for the N contents and the N digestibility in the feeds is described further.
Table A4.2 Overview of the N contents and the N digestibility (DC-N) in the various chicken feeds for the reference year and in 2005
Reference year 2005
Feed type Year g N/kg DC-N
(%)
g N/kg DC-N
(%)
Laying hens feed 1 1993 29.1 83.1 24.9 84.5
Laying hens feed 2 1993 29.1 82.8 24.9 84.5
Laying hens feed 3 1993 29.1 82.2 24.9 84.0
Rearing feed start laying varieties 1991 31.3 80.7 27.0 79.1
Laying hens feed 1 1998 26.4 83.1 24.9 84.5
Laying hens feed 2 1998 26.4 82.8 24.9 84.5
Laying hens feed 3 1998 26.4 82.2 24.9 84.0
Rearing feed start laying varieties 1998 28.6 79.1 27.0 79.1
Rearing feed 1 (laying varieties) 1991 31.3 80.7 26.1 80.7
Rearing feed 2 (laying varieties) 1991 31.3 79.1 26.1 79.1
Rearing feed start meat varieties - - - 31.0 84.2
Rearing feed 1 (meat varieties) 2000 28.6 80.8 28.4 80.8
Rearing feed 2 (meat varieties) 2000 28.6 80.8 25.2 80.8
Start feed (broiler parents) 1996 31.0 80.8 25.2 80.8
Breeding brood feed 1 (broiler parents) 1996 27.8 83.2 24.3 83.2
Breeding brood feed 2 (broiler parents) 1996 27.8 82.3 24.2 82.3
Broiler feed 1 2002 34.6 85.1 36.0 85.4
Broiler feed 2 2002 32.0 84.3 34.1 83.9
Broiler feed 3 2002 30.9 84.3 33.1 83.4
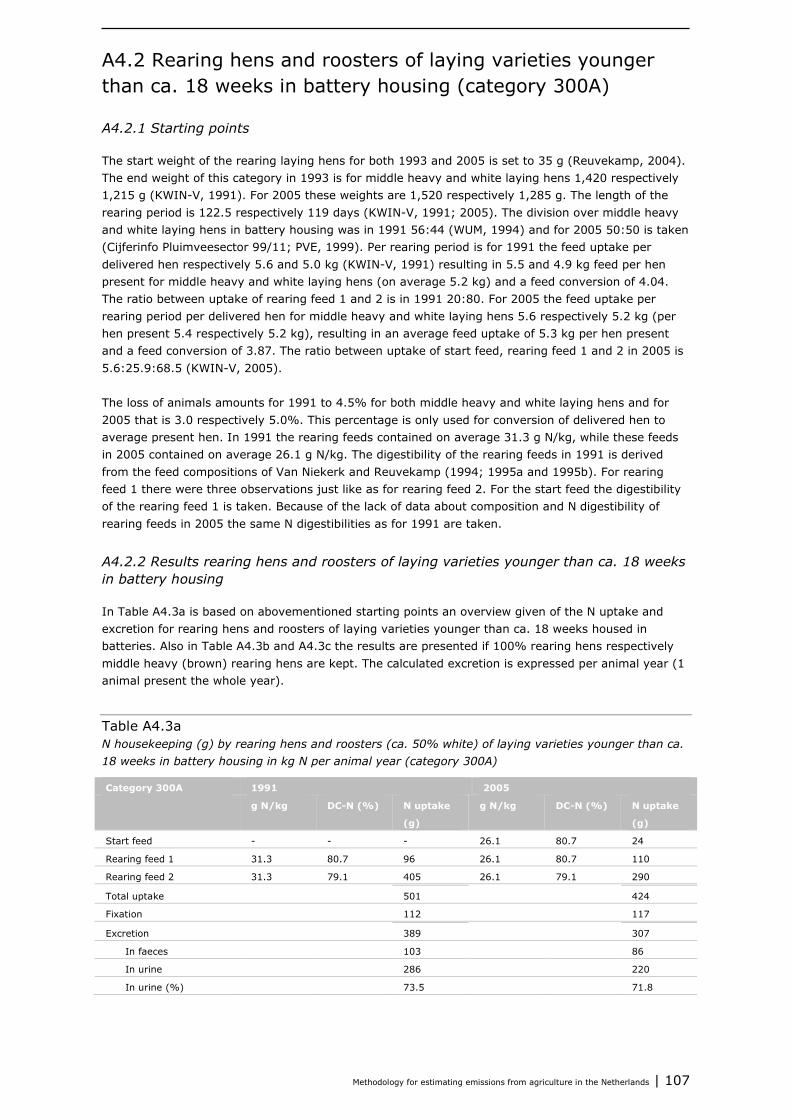
Methodology for estimating emissions from agriculture in the Netherlands | 107
A4.2 Rearing hens and roosters of laying varieties younger than ca. 18 weeks in battery housing (category 300A)
A4.2.1 Starting points
The start weight of the rearing laying hens for both 1993 and 2005 is set to 35 g (Reuvekamp, 2004). The end weight of this category in 1993 is for middle heavy and white laying hens 1,420 respectively 1,215 g (KWIN-V, 1991). For 2005 these weights are 1,520 respectively 1,285 g. The length of the rearing period is 122.5 respectively 119 days (KWIN-V, 1991; 2005). The division over middle heavy and white laying hens in battery housing was in 1991 56:44 (WUM, 1994) and for 2005 50:50 is taken (Cijferinfo Pluimveesector 99/11; PVE, 1999). Per rearing period is for 1991 the feed uptake per delivered hen respectively 5.6 and 5.0 kg (KWIN-V, 1991) resulting in 5.5 and 4.9 kg feed per hen present for middle heavy and white laying hens (on average 5.2 kg) and a feed conversion of 4.04. The ratio between uptake of rearing feed 1 and 2 is in 1991 20:80. For 2005 the feed uptake per rearing period per delivered hen for middle heavy and white laying hens 5.6 respectively 5.2 kg (per hen present 5.4 respectively 5.2 kg), resulting in an average feed uptake of 5.3 kg per hen present and a feed conversion of 3.87. The ratio between uptake of start feed, rearing feed 1 and 2 in 2005 is 5.6:25.9:68.5 (KWIN-V, 2005). The loss of animals amounts for 1991 to 4.5% for both middle heavy and white laying hens and for 2005 that is 3.0 respectively 5.0%. This percentage is only used for conversion of delivered hen to average present hen. In 1991 the rearing feeds contained on average 31.3 g N/kg, while these feeds in 2005 contained on average 26.1 g N/kg. The digestibility of the rearing feeds in 1991 is derived from the feed compositions of Van Niekerk and Reuvekamp (1994; 1995a and 1995b). For rearing feed 1 there were three observations just like as for rearing feed 2. For the start feed the digestibility of the rearing feed 1 is taken. Because of the lack of data about composition and N digestibility of rearing feeds in 2005 the same N digestibilities as for 1991 are taken.
A4.2.2 Results rearing hens and roosters of laying varieties younger than ca. 18 weeks in battery housing
In Table A4.3a is based on abovementioned starting points an overview given of the N uptake and excretion for rearing hens and roosters of laying varieties younger than ca. 18 weeks housed in batteries. Also in Table A4.3b and A4.3c the results are presented if 100% rearing hens respectively middle heavy (brown) rearing hens are kept. The calculated excretion is expressed per animal year (1 animal present the whole year).
Table A4.3a N housekeeping (g) by rearing hens and roosters (ca. 50% white) of laying varieties younger than ca. 18 weeks in battery housing in kg N per animal year (category 300A)
Category 300A 1991 2005
g N/kg DC-N (%) N uptake
(g)
g N/kg DC-N (%) N uptake
(g)
Start feed - - - 26.1 80.7 24
Rearing feed 1 31.3 80.7 96 26.1 80.7 110
Rearing feed 2 31.3 79.1 405 26.1 79.1 290
Total uptake 501 424
Fixation 112 117
Excretion 389 307
In faeces 103 86
In urine 286 220
In urine (%) 73.5 71.8
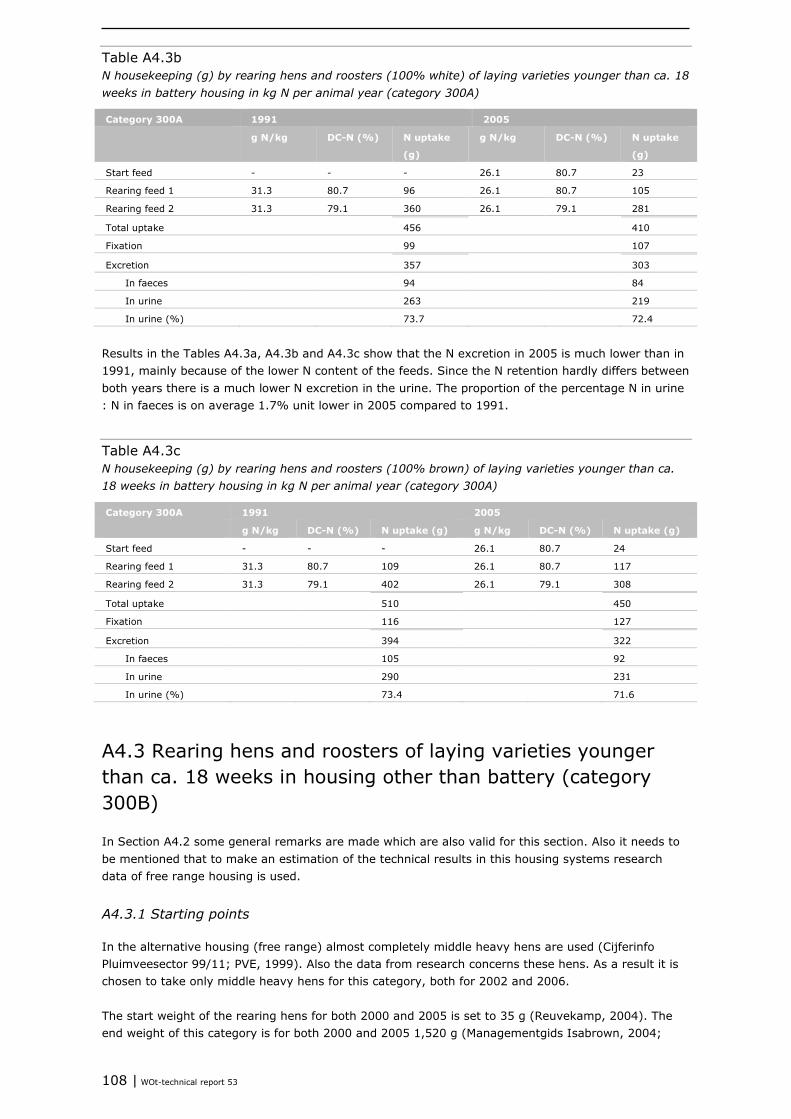
108 | WOt-technical report 53
Table A4.3b N housekeeping (g) by rearing hens and roosters (100% white) of laying varieties younger than ca. 18 weeks in battery housing in kg N per animal year (category 300A)
Category 300A 1991 2005
g N/kg DC-N (%) N uptake
(g)
g N/kg DC-N (%) N uptake
(g)
Start feed - - - 26.1 80.7 23
Rearing feed 1 31.3 80.7 96 26.1 80.7 105
Rearing feed 2 31.3 79.1 360 26.1 79.1 281
Total uptake 456 410
Fixation 99 107
Excretion 357 303
In faeces 94 84
In urine 263 219
In urine (%) 73.7 72.4
Results in the Tables A4.3a, A4.3b and A4.3c show that the N excretion in 2005 is much lower than in 1991, mainly because of the lower N content of the feeds. Since the N retention hardly differs between both years there is a much lower N excretion in the urine. The proportion of the percentage N in urine : N in faeces is on average 1.7% unit lower in 2005 compared to 1991.
Table A4.3c N housekeeping (g) by rearing hens and roosters (100% brown) of laying varieties younger than ca. 18 weeks in battery housing in kg N per animal year (category 300A)
Category 300A 1991 2005
g N/kg DC-N (%) N uptake (g) g N/kg DC-N (%) N uptake (g)
Start feed - - - 26.1 80.7 24
Rearing feed 1 31.3 80.7 109 26.1 80.7 117
Rearing feed 2 31.3 79.1 402 26.1 79.1 308
Total uptake 510 450
Fixation 116 127
Excretion 394 322
In faeces 105 92
In urine 290 231
In urine (%) 73.4 71.6
A4.3 Rearing hens and roosters of laying varieties younger than ca. 18 weeks in housing other than battery (category 300B)
In Section A4.2 some general remarks are made which are also valid for this section. Also it needs to be mentioned that to make an estimation of the technical results in this housing systems research data of free range housing is used.
A4.3.1 Starting points
In the alternative housing (free range) almost completely middle heavy hens are used (Cijferinfo Pluimveesector 99/11; PVE, 1999). Also the data from research concerns these hens. As a result it is chosen to take only middle heavy hens for this category, both for 2002 and 2006. The start weight of the rearing hens for both 2000 and 2005 is set to 35 g (Reuvekamp, 2004). The end weight of this category is for both 2000 and 2005 1,520 g (Managementgids Isabrown, 2004;
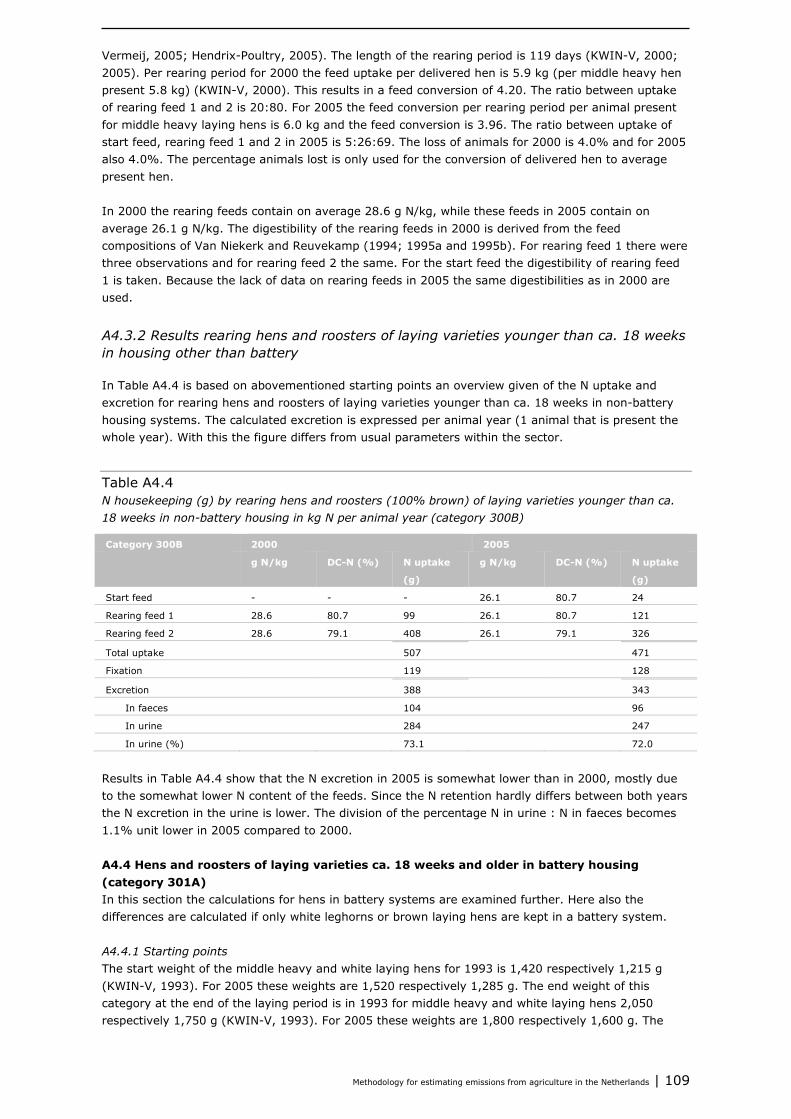
Methodology for estimating emissions from agriculture in the Netherlands | 109
Vermeij, 2005; Hendrix-Poultry, 2005). The length of the rearing period is 119 days (KWIN-V, 2000; 2005). Per rearing period for 2000 the feed uptake per delivered hen is 5.9 kg (per middle heavy hen present 5.8 kg) (KWIN-V, 2000). This results in a feed conversion of 4.20. The ratio between uptake of rearing feed 1 and 2 is 20:80. For 2005 the feed conversion per rearing period per animal present for middle heavy laying hens is 6.0 kg and the feed conversion is 3.96. The ratio between uptake of start feed, rearing feed 1 and 2 in 2005 is 5:26:69. The loss of animals for 2000 is 4.0% and for 2005 also 4.0%. The percentage animals lost is only used for the conversion of delivered hen to average present hen. In 2000 the rearing feeds contain on average 28.6 g N/kg, while these feeds in 2005 contain on average 26.1 g N/kg. The digestibility of the rearing feeds in 2000 is derived from the feed compositions of Van Niekerk and Reuvekamp (1994; 1995a and 1995b). For rearing feed 1 there were three observations and for rearing feed 2 the same. For the start feed the digestibility of rearing feed 1 is taken. Because the lack of data on rearing feeds in 2005 the same digestibilities as in 2000 are used.
A4.3.2 Results rearing hens and roosters of laying varieties younger than ca. 18 weeks in housing other than battery
In Table A4.4 is based on abovementioned starting points an overview given of the N uptake and excretion for rearing hens and roosters of laying varieties younger than ca. 18 weeks in non-battery housing systems. The calculated excretion is expressed per animal year (1 animal that is present the whole year). With this the figure differs from usual parameters within the sector.
Table A4.4 N housekeeping (g) by rearing hens and roosters (100% brown) of laying varieties younger than ca. 18 weeks in non-battery housing in kg N per animal year (category 300B)
Category 300B 2000 2005
g N/kg DC-N (%) N uptake
(g)
g N/kg DC-N (%) N uptake
(g)
Start feed - - - 26.1 80.7 24
Rearing feed 1 28.6 80.7 99 26.1 80.7 121
Rearing feed 2 28.6 79.1 408 26.1 79.1 326
Total uptake 507 471
Fixation 119 128
Excretion 388 343
In faeces 104 96
In urine 284 247
In urine (%) 73.1 72.0
Results in Table A4.4 show that the N excretion in 2005 is somewhat lower than in 2000, mostly due to the somewhat lower N content of the feeds. Since the N retention hardly differs between both years the N excretion in the urine is lower. The division of the percentage N in urine : N in faeces becomes 1.1% unit lower in 2005 compared to 2000. A4.4 Hens and roosters of laying varieties ca. 18 weeks and older in battery housing (category 301A) In this section the calculations for hens in battery systems are examined further. Here also the differences are calculated if only white leghorns or brown laying hens are kept in a battery system. A4.4.1 Starting points The start weight of the middle heavy and white laying hens for 1993 is 1,420 respectively 1,215 g (KWIN-V, 1993). For 2005 these weights are 1,520 respectively 1,285 g. The end weight of this category at the end of the laying period is in 1993 for middle heavy and white laying hens 2,050 respectively 1,750 g (KWIN-V, 1993). For 2005 these weights are 1,800 respectively 1,600 g. The
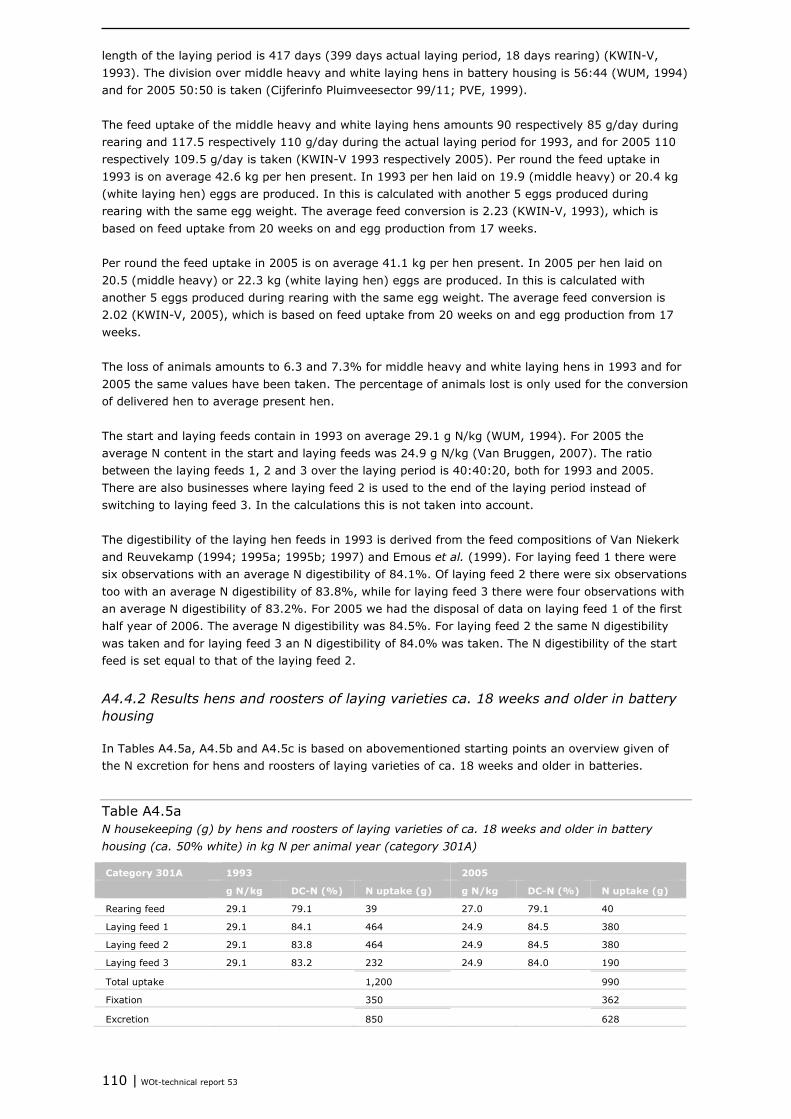
110 | WOt-technical report 53
length of the laying period is 417 days (399 days actual laying period, 18 days rearing) (KWIN-V, 1993). The division over middle heavy and white laying hens in battery housing is 56:44 (WUM, 1994) and for 2005 50:50 is taken (Cijferinfo Pluimveesector 99/11; PVE, 1999). The feed uptake of the middle heavy and white laying hens amounts 90 respectively 85 g/day during rearing and 117.5 respectively 110 g/day during the actual laying period for 1993, and for 2005 110 respectively 109.5 g/day is taken (KWIN-V 1993 respectively 2005). Per round the feed uptake in 1993 is on average 42.6 kg per hen present. In 1993 per hen laid on 19.9 (middle heavy) or 20.4 kg (white laying hen) eggs are produced. In this is calculated with another 5 eggs produced during rearing with the same egg weight. The average feed conversion is 2.23 (KWIN-V, 1993), which is based on feed uptake from 20 weeks on and egg production from 17 weeks. Per round the feed uptake in 2005 is on average 41.1 kg per hen present. In 2005 per hen laid on 20.5 (middle heavy) or 22.3 kg (white laying hen) eggs are produced. In this is calculated with another 5 eggs produced during rearing with the same egg weight. The average feed conversion is 2.02 (KWIN-V, 2005), which is based on feed uptake from 20 weeks on and egg production from 17 weeks. The loss of animals amounts to 6.3 and 7.3% for middle heavy and white laying hens in 1993 and for 2005 the same values have been taken. The percentage of animals lost is only used for the conversion of delivered hen to average present hen. The start and laying feeds contain in 1993 on average 29.1 g N/kg (WUM, 1994). For 2005 the average N content in the start and laying feeds was 24.9 g N/kg (Van Bruggen, 2007). The ratio between the laying feeds 1, 2 and 3 over the laying period is 40:40:20, both for 1993 and 2005. There are also businesses where laying feed 2 is used to the end of the laying period instead of switching to laying feed 3. In the calculations this is not taken into account. The digestibility of the laying hen feeds in 1993 is derived from the feed compositions of Van Niekerk and Reuvekamp (1994; 1995a; 1995b; 1997) and Emous et al. (1999). For laying feed 1 there were six observations with an average N digestibility of 84.1%. Of laying feed 2 there were six observations too with an average N digestibility of 83.8%, while for laying feed 3 there were four observations with an average N digestibility of 83.2%. For 2005 we had the disposal of data on laying feed 1 of the first half year of 2006. The average N digestibility was 84.5%. For laying feed 2 the same N digestibility was taken and for laying feed 3 an N digestibility of 84.0% was taken. The N digestibility of the start feed is set equal to that of the laying feed 2.
A4.4.2 Results hens and roosters of laying varieties ca. 18 weeks and older in battery housing
In Tables A4.5a, A4.5b and A4.5c is based on abovementioned starting points an overview given of the N excretion for hens and roosters of laying varieties of ca. 18 weeks and older in batteries.
Table A4.5a N housekeeping (g) by hens and roosters of laying varieties of ca. 18 weeks and older in battery housing (ca. 50% white) in kg N per animal year (category 301A)
Category 301A 1993 2005
g N/kg DC-N (%) N uptake (g) g N/kg DC-N (%) N uptake (g)
Rearing feed 29.1 79.1 39 27.0 79.1 40
Laying feed 1 29.1 84.1 464 24.9 84.5 380
Laying feed 2 29.1 83.8 464 24.9 84.5 380
Laying feed 3 29.1 83.2 232 24.9 84.0 190
Total uptake 1,200 990
Fixation 350 362
Excretion 850 628
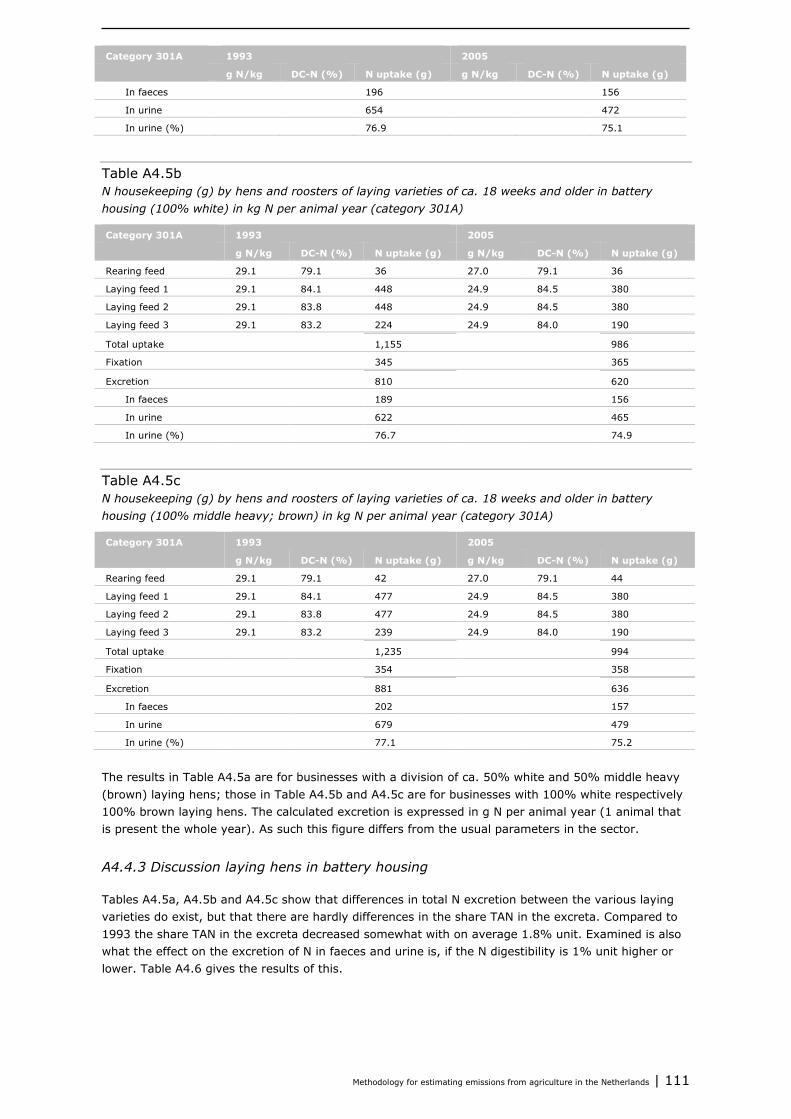
Methodology for estimating emissions from agriculture in the Netherlands | 111
Category 301A 1993 2005
g N/kg DC-N (%) N uptake (g) g N/kg DC-N (%) N uptake (g)
In faeces 196 156
In urine 654 472
In urine (%) 76.9 75.1
Table A4.5b N housekeeping (g) by hens and roosters of laying varieties of ca. 18 weeks and older in battery housing (100% white) in kg N per animal year (category 301A)
Category 301A 1993 2005
g N/kg DC-N (%) N uptake (g) g N/kg DC-N (%) N uptake (g)
Rearing feed 29.1 79.1 36 27.0 79.1 36
Laying feed 1 29.1 84.1 448 24.9 84.5 380
Laying feed 2 29.1 83.8 448 24.9 84.5 380
Laying feed 3 29.1 83.2 224 24.9 84.0 190
Total uptake 1,155 986
Fixation 345 365
Excretion 810 620
In faeces 189 156
In urine 622 465
In urine (%) 76.7 74.9
Table A4.5c N housekeeping (g) by hens and roosters of laying varieties of ca. 18 weeks and older in battery housing (100% middle heavy; brown) in kg N per animal year (category 301A)
Category 301A 1993 2005
g N/kg DC-N (%) N uptake (g) g N/kg DC-N (%) N uptake (g)
Rearing feed 29.1 79.1 42 27.0 79.1 44
Laying feed 1 29.1 84.1 477 24.9 84.5 380
Laying feed 2 29.1 83.8 477 24.9 84.5 380
Laying feed 3 29.1 83.2 239 24.9 84.0 190
Total uptake 1,235 994
Fixation 354 358
Excretion 881 636
In faeces 202 157
In urine 679 479
In urine (%) 77.1 75.2
The results in Table A4.5a are for businesses with a division of ca. 50% white and 50% middle heavy (brown) laying hens; those in Table A4.5b and A4.5c are for businesses with 100% white respectively 100% brown laying hens. The calculated excretion is expressed in g N per animal year (1 animal that is present the whole year). As such this figure differs from the usual parameters in the sector.
A4.4.3 Discussion laying hens in battery housing
Tables A4.5a, A4.5b and A4.5c show that differences in total N excretion between the various laying varieties do exist, but that there are hardly differences in the share TAN in the excreta. Compared to 1993 the share TAN in the excreta decreased somewhat with on average 1.8% unit. Examined is also what the effect on the excretion of N in faeces and urine is, if the N digestibility is 1% unit higher or lower. Table A4.6 gives the results of this.
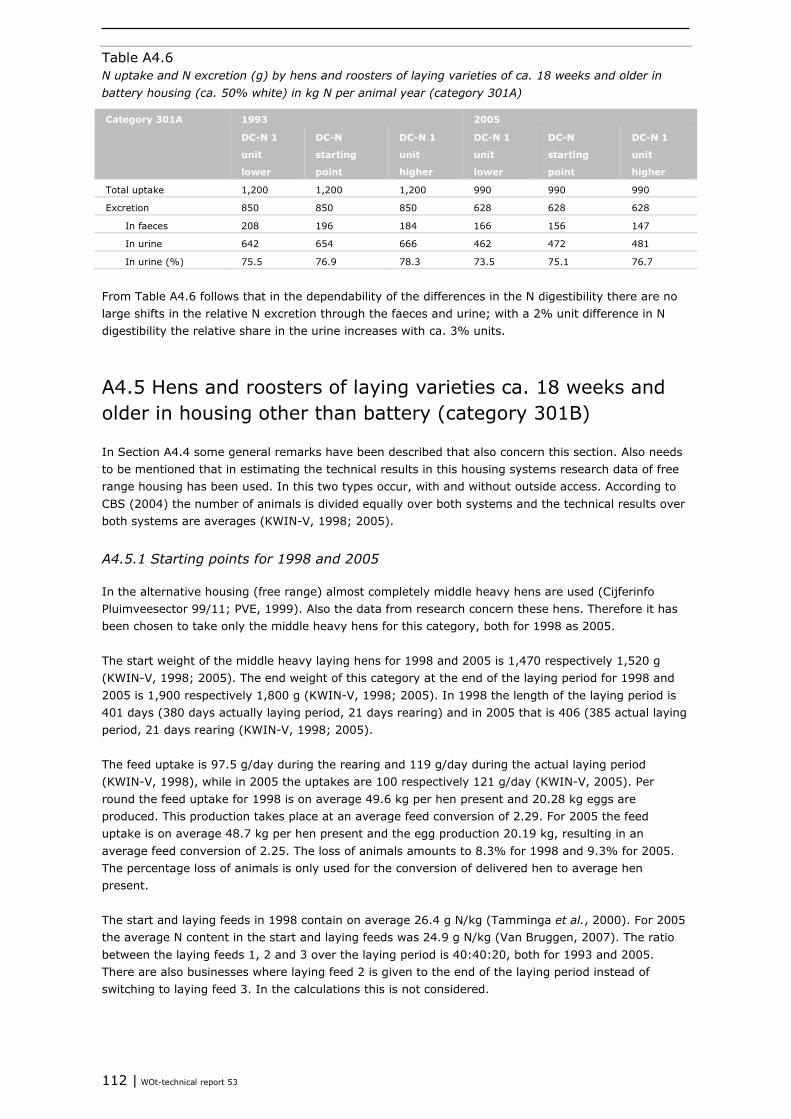
112 | WOt-technical report 53
Table A4.6 N uptake and N excretion (g) by hens and roosters of laying varieties of ca. 18 weeks and older in battery housing (ca. 50% white) in kg N per animal year (category 301A)
Category 301A 1993 2005
DC-N 1
unit
lower
DC-N
starting
point
DC-N 1
unit
higher
DC-N 1
unit
lower
DC-N
starting
point
DC-N 1
unit
higher
Total uptake 1,200 1,200 1,200 990 990 990
Excretion 850 850 850 628 628 628
In faeces 208 196 184 166 156 147
In urine 642 654 666 462 472 481
In urine (%) 75.5 76.9 78.3 73.5 75.1 76.7
From Table A4.6 follows that in the dependability of the differences in the N digestibility there are no large shifts in the relative N excretion through the faeces and urine; with a 2% unit difference in N digestibility the relative share in the urine increases with ca. 3% units.
A4.5 Hens and roosters of laying varieties ca. 18 weeks and older in housing other than battery (category 301B)
In Section A4.4 some general remarks have been described that also concern this section. Also needs to be mentioned that in estimating the technical results in this housing systems research data of free range housing has been used. In this two types occur, with and without outside access. According to CBS (2004) the number of animals is divided equally over both systems and the technical results over both systems are averages (KWIN-V, 1998; 2005).
A4.5.1 Starting points for 1998 and 2005
In the alternative housing (free range) almost completely middle heavy hens are used (Cijferinfo Pluimveesector 99/11; PVE, 1999). Also the data from research concern these hens. Therefore it has been chosen to take only the middle heavy hens for this category, both for 1998 as 2005. The start weight of the middle heavy laying hens for 1998 and 2005 is 1,470 respectively 1,520 g (KWIN-V, 1998; 2005). The end weight of this category at the end of the laying period for 1998 and 2005 is 1,900 respectively 1,800 g (KWIN-V, 1998; 2005). In 1998 the length of the laying period is 401 days (380 days actually laying period, 21 days rearing) and in 2005 that is 406 (385 actual laying period, 21 days rearing (KWIN-V, 1998; 2005). The feed uptake is 97.5 g/day during the rearing and 119 g/day during the actual laying period (KWIN-V, 1998), while in 2005 the uptakes are 100 respectively 121 g/day (KWIN-V, 2005). Per round the feed uptake for 1998 is on average 49.6 kg per hen present and 20.28 kg eggs are produced. This production takes place at an average feed conversion of 2.29. For 2005 the feed uptake is on average 48.7 kg per hen present and the egg production 20.19 kg, resulting in an average feed conversion of 2.25. The loss of animals amounts to 8.3% for 1998 and 9.3% for 2005. The percentage loss of animals is only used for the conversion of delivered hen to average hen present. The start and laying feeds in 1998 contain on average 26.4 g N/kg (Tamminga et al., 2000). For 2005 the average N content in the start and laying feeds was 24.9 g N/kg (Van Bruggen, 2007). The ratio between the laying feeds 1, 2 and 3 over the laying period is 40:40:20, both for 1993 and 2005. There are also businesses where laying feed 2 is given to the end of the laying period instead of switching to laying feed 3. In the calculations this is not considered.
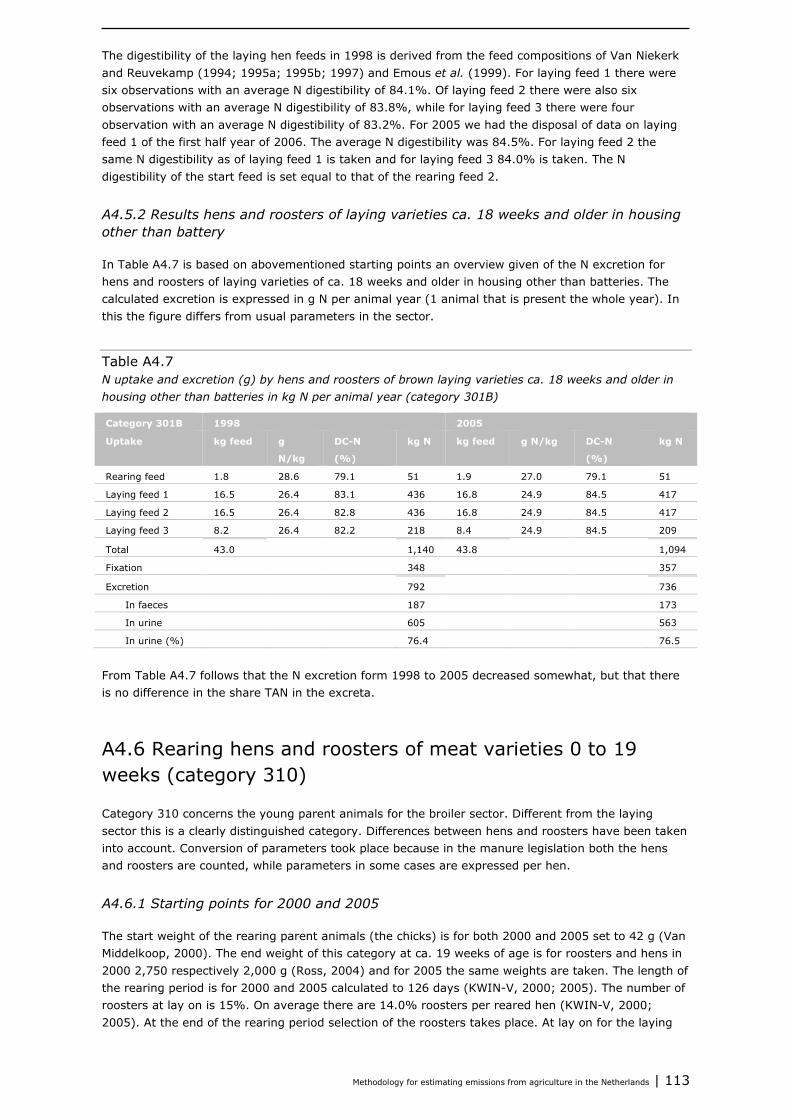
Methodology for estimating emissions from agriculture in the Netherlands | 113
The digestibility of the laying hen feeds in 1998 is derived from the feed compositions of Van Niekerk and Reuvekamp (1994; 1995a; 1995b; 1997) and Emous et al. (1999). For laying feed 1 there were six observations with an average N digestibility of 84.1%. Of laying feed 2 there were also six observations with an average N digestibility of 83.8%, while for laying feed 3 there were four observation with an average N digestibility of 83.2%. For 2005 we had the disposal of data on laying feed 1 of the first half year of 2006. The average N digestibility was 84.5%. For laying feed 2 the same N digestibility as of laying feed 1 is taken and for laying feed 3 84.0% is taken. The N digestibility of the start feed is set equal to that of the rearing feed 2.
A4.5.2 Results hens and roosters of laying varieties ca. 18 weeks and older in housing other than battery
In Table A4.7 is based on abovementioned starting points an overview given of the N excretion for hens and roosters of laying varieties of ca. 18 weeks and older in housing other than batteries. The calculated excretion is expressed in g N per animal year (1 animal that is present the whole year). In this the figure differs from usual parameters in the sector.
Table A4.7 N uptake and excretion (g) by hens and roosters of brown laying varieties ca. 18 weeks and older in housing other than batteries in kg N per animal year (category 301B)
Category 301B 1998 2005
Uptake kg feed g
N/kg
DC-N
(%)
kg N kg feed g N/kg DC-N
(%)
kg N
Rearing feed 1.8 28.6 79.1 51 1.9 27.0 79.1 51
Laying feed 1 16.5 26.4 83.1 436 16.8 24.9 84.5 417
Laying feed 2 16.5 26.4 82.8 436 16.8 24.9 84.5 417
Laying feed 3 8.2 26.4 82.2 218 8.4 24.9 84.5 209
Total 43.0 1,140 43.8 1,094
Fixation 348 357
Excretion 792 736
In faeces 187 173
In urine 605 563
In urine (%) 76.4 76.5
From Table A4.7 follows that the N excretion form 1998 to 2005 decreased somewhat, but that there is no difference in the share TAN in the excreta.
A4.6 Rearing hens and roosters of meat varieties 0 to 19 weeks (category 310)
Category 310 concerns the young parent animals for the broiler sector. Different from the laying sector this is a clearly distinguished category. Differences between hens and roosters have been taken into account. Conversion of parameters took place because in the manure legislation both the hens and roosters are counted, while parameters in some cases are expressed per hen.
A4.6.1 Starting points for 2000 and 2005
The start weight of the rearing parent animals (the chicks) is for both 2000 and 2005 set to 42 g (Van Middelkoop, 2000). The end weight of this category at ca. 19 weeks of age is for roosters and hens in 2000 2,750 respectively 2,000 g (Ross, 2004) and for 2005 the same weights are taken. The length of the rearing period is for 2000 and 2005 calculated to 126 days (KWIN-V, 2000; 2005). The number of roosters at lay on is 15%. On average there are 14.0% roosters per reared hen (KWIN-V, 2000; 2005). At the end of the rearing period selection of the roosters takes place. At lay on for the laying
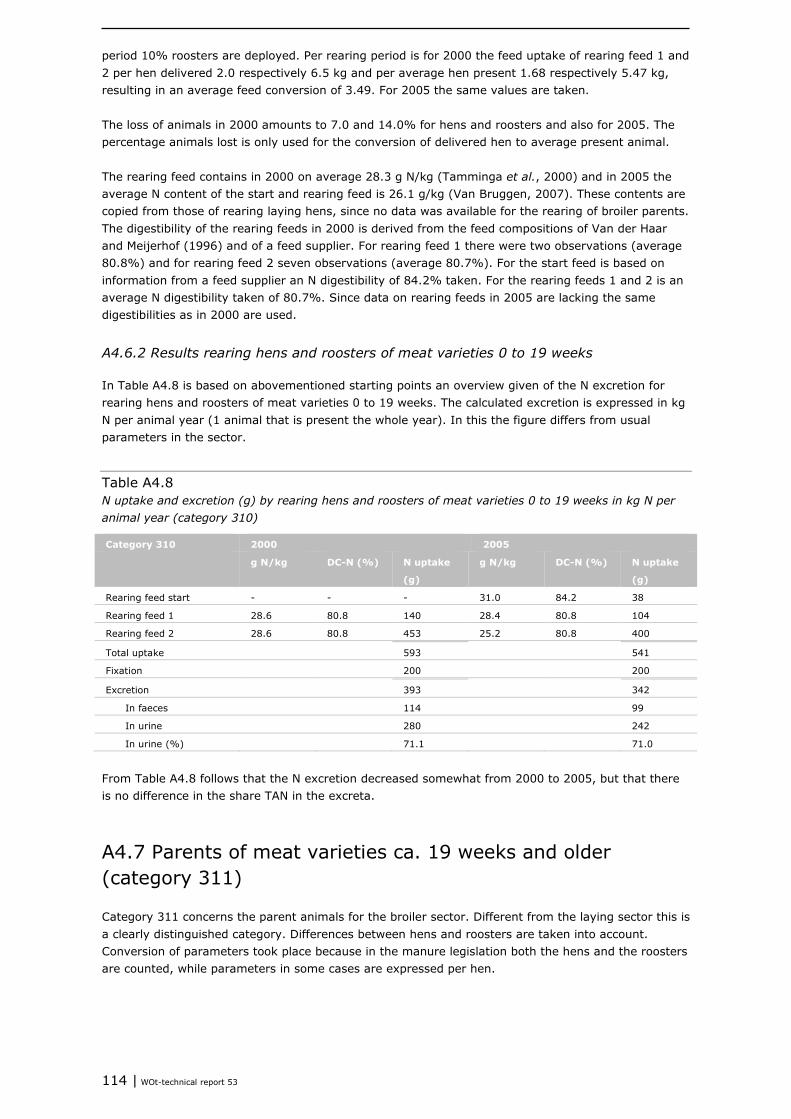
114 | WOt-technical report 53
period 10% roosters are deployed. Per rearing period is for 2000 the feed uptake of rearing feed 1 and 2 per hen delivered 2.0 respectively 6.5 kg and per average hen present 1.68 respectively 5.47 kg, resulting in an average feed conversion of 3.49. For 2005 the same values are taken. The loss of animals in 2000 amounts to 7.0 and 14.0% for hens and roosters and also for 2005. The percentage animals lost is only used for the conversion of delivered hen to average present animal. The rearing feed contains in 2000 on average 28.3 g N/kg (Tamminga et al., 2000) and in 2005 the average N content of the start and rearing feed is 26.1 g/kg (Van Bruggen, 2007). These contents are copied from those of rearing laying hens, since no data was available for the rearing of broiler parents. The digestibility of the rearing feeds in 2000 is derived from the feed compositions of Van der Haar and Meijerhof (1996) and of a feed supplier. For rearing feed 1 there were two observations (average 80.8%) and for rearing feed 2 seven observations (average 80.7%). For the start feed is based on information from a feed supplier an N digestibility of 84.2% taken. For the rearing feeds 1 and 2 is an average N digestibility taken of 80.7%. Since data on rearing feeds in 2005 are lacking the same digestibilities as in 2000 are used.
A4.6.2 Results rearing hens and roosters of meat varieties 0 to 19 weeks
In Table A4.8 is based on abovementioned starting points an overview given of the N excretion for rearing hens and roosters of meat varieties 0 to 19 weeks. The calculated excretion is expressed in kg N per animal year (1 animal that is present the whole year). In this the figure differs from usual parameters in the sector.
Table A4.8 N uptake and excretion (g) by rearing hens and roosters of meat varieties 0 to 19 weeks in kg N per animal year (category 310)
Category 310 2000 2005
g N/kg DC-N (%) N uptake
(g)
g N/kg DC-N (%) N uptake
(g)
Rearing feed start - - - 31.0 84.2 38
Rearing feed 1 28.6 80.8 140 28.4 80.8 104
Rearing feed 2 28.6 80.8 453 25.2 80.8 400
Total uptake 593 541
Fixation 200 200
Excretion 393 342
In faeces 114 99
In urine 280 242
In urine (%) 71.1 71.0
From Table A4.8 follows that the N excretion decreased somewhat from 2000 to 2005, but that there is no difference in the share TAN in the excreta.
A4.7 Parents of meat varieties ca. 19 weeks and older (category 311)
Category 311 concerns the parent animals for the broiler sector. Different from the laying sector this is a clearly distinguished category. Differences between hens and roosters are taken into account. Conversion of parameters took place because in the manure legislation both the hens and the roosters are counted, while parameters in some cases are expressed per hen.

Methodology for estimating emissions from agriculture in the Netherlands | 115
A4.7.1 Starting points
The start weight of the hens respectively roosters for 1996 is 1,900 respectively 2,600 g and for 2005 2,000 respectively 2,750 g (Ross, 2004). The end weight of this category at the end of the production period is for hens and roosters for 1996 3,600 respectively 4,800 g and for 2005 3,700 respectively 4,800 g (KWIN-V, 1996; 2005). The length of the production cycle is for 1998 and 2006 calculated to 346 respectively 343 days (KWIN-V, 1996; 2005). Goal for both 1996 as for 2005 is to have 10% roosters at the start of the laying period. Over the whole period on average 95.51 hens and 8.44 roosters are present. Per laying round is for 1996 the feed uptake on average 3.0 kg pre laying feed and 45.0 kg breeding brood feed per laid on hen (2.9 kg respectively 43.3 kg per average animal present) and 148 brood eggs and 10 consumption eggs of on average 62 grams apiece are produced. This results in 9.27 kg eggs per average present animal. For 2005 the feed uptake per round is on average 3.30 kg pre laying feed and 44.7 kg breeding brood feed per laid on hen (3.20 kg respectively 43.0 kg per average animal present) and 150 brood eggs and 10 consumption eggs of on average 62 grams are produced. This results in 9.54 kg eggs per average animal present. The loss of animals amounts for 1996 to 1.0 respectively 3.5% for hens and roosters during rearing and 10.0 respectively 35.0% during the laying period. For 2005 the percentages loss of animals during rearing are 1.0 respectively 3.6 and 10.0 respectively 35.0% during the laying period. The percentage animals lost is only used for the conversion of delivered hen to average present animal. The N content in the pre laying feed and the breeding brood feed for 1996 is calculated by taking the average content of 1992 (WUM, 1994) and that of Tamminga et al. (2000). The pre laying feed then contains 31.0 g N/kg and the breeding brood feed 27.8 g N/kg. In 2005 the pre laying feed, breeding brood feed 1 and 2 contained respectively 25.2, 24.3 and 24.2 g N/kg (Van Bruggen, 2007). Of the N digestibility of the feeds in 1996 no data are available. For 2005 for the pre laying feed the N digestibility of the rearing feed 2 (80.8%) was taken. Based on data of a composite feed manufacturer beginning 2008 an N digestibility of the breeding brood feed 1 and 2 of 83.2 respectively 82.3% was calculated. These digestibilities are also taken for the feeds of 1996.
A4.7.2 Results hens and roosters of meat varieties from ca. 19 weeks and older
In Table A4.9 is based on abovementioned starting points an overview given of the N uptake and excretion for hens and roosters of meat varieties from ca. 19 weeks and older. The calculated excretion is expressed in kg N per animal year (1 animal that is present the whole year). In this the figure differs from usual parameters in the sector.
Table A4.9 N housekeeping (g) by hens and roosters of meat varieties ca. 19 weeks and older in kg N per animal year (category 311)
Category 311 1996 2005
g N/kg DC-N (%) N uptake
(g)
g N/kg DC-N (%) N uptake
(g)
Start feed 31.0 80.8 103 25.2 80.8 92
Breeding brood feed 1 27.8 83.2 614 24.3 83.2 538
Breeding brood feed 2 27.8 82.3 768 24.2 82.3 662
Total uptake 1,484 1,293
Fixation 258 262
Excretion 1,227 1,030
In faeces 259 225
In urine 968 805
In urine (%) 78.9 78.1
From Table A4.9 follows that the N excretion clearly decreases from 1998 to 2005 but that there is hardly difference in the share TAN in the excreta.
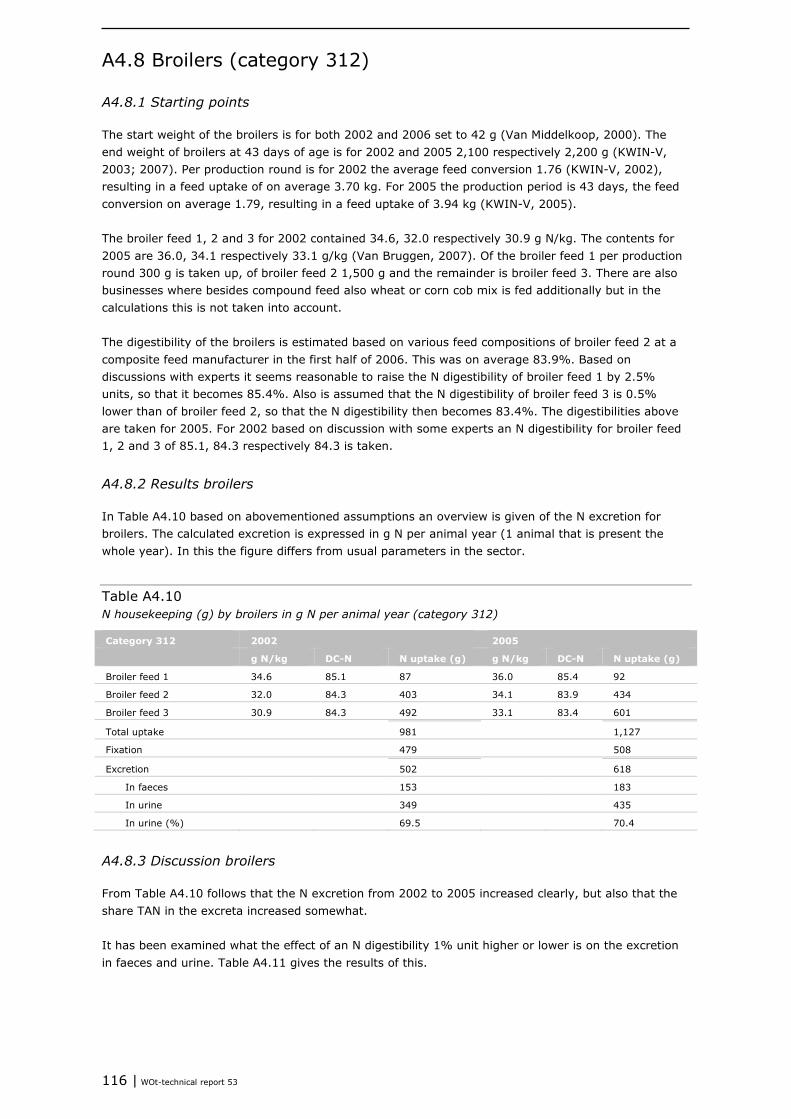
116 | WOt-technical report 53
A4.8 Broilers (category 312)
A4.8.1 Starting points
The start weight of the broilers is for both 2002 and 2006 set to 42 g (Van Middelkoop, 2000). The end weight of broilers at 43 days of age is for 2002 and 2005 2,100 respectively 2,200 g (KWIN-V, 2003; 2007). Per production round is for 2002 the average feed conversion 1.76 (KWIN-V, 2002), resulting in a feed uptake of on average 3.70 kg. For 2005 the production period is 43 days, the feed conversion on average 1.79, resulting in a feed uptake of 3.94 kg (KWIN-V, 2005). The broiler feed 1, 2 and 3 for 2002 contained 34.6, 32.0 respectively 30.9 g N/kg. The contents for 2005 are 36.0, 34.1 respectively 33.1 g/kg (Van Bruggen, 2007). Of the broiler feed 1 per production round 300 g is taken up, of broiler feed 2 1,500 g and the remainder is broiler feed 3. There are also businesses where besides compound feed also wheat or corn cob mix is fed additionally but in the calculations this is not taken into account. The digestibility of the broilers is estimated based on various feed compositions of broiler feed 2 at a composite feed manufacturer in the first half of 2006. This was on average 83.9%. Based on discussions with experts it seems reasonable to raise the N digestibility of broiler feed 1 by 2.5% units, so that it becomes 85.4%. Also is assumed that the N digestibility of broiler feed 3 is 0.5% lower than of broiler feed 2, so that the N digestibility then becomes 83.4%. The digestibilities above are taken for 2005. For 2002 based on discussion with some experts an N digestibility for broiler feed 1, 2 and 3 of 85.1, 84.3 respectively 84.3 is taken.
A4.8.2 Results broilers
In Table A4.10 based on abovementioned assumptions an overview is given of the N excretion for broilers. The calculated excretion is expressed in g N per animal year (1 animal that is present the whole year). In this the figure differs from usual parameters in the sector.
Table A4.10 N housekeeping (g) by broilers in g N per animal year (category 312)
Category 312 2002 2005
g N/kg DC-N N uptake (g) g N/kg DC-N N uptake (g)
Broiler feed 1 34.6 85.1 87 36.0 85.4 92
Broiler feed 2 32.0 84.3 403 34.1 83.9 434
Broiler feed 3 30.9 84.3 492 33.1 83.4 601
Total uptake 981 1,127
Fixation 479 508
Excretion 502 618
In faeces 153 183
In urine 349 435
In urine (%) 69.5 70.4
A4.8.3 Discussion broilers
From Table A4.10 follows that the N excretion from 2002 to 2005 increased clearly, but also that the share TAN in the excreta increased somewhat. It has been examined what the effect of an N digestibility 1% unit higher or lower is on the excretion in faeces and urine. Table A4.11 gives the results of this.
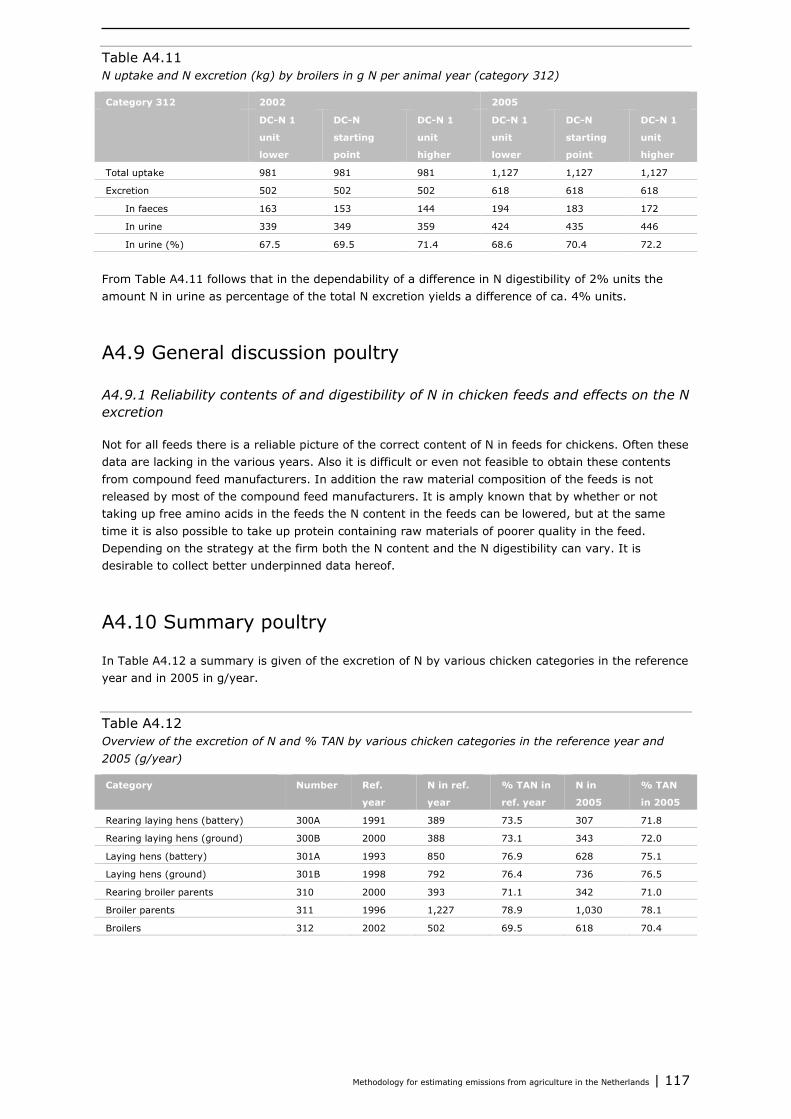
Methodology for estimating emissions from agriculture in the Netherlands | 117
Table A4.11 N uptake and N excretion (kg) by broilers in g N per animal year (category 312)
Category 312 2002 2005
DC-N 1
unit
lower
DC-N
starting
point
DC-N 1
unit
higher
DC-N 1
unit
lower
DC-N
starting
point
DC-N 1
unit
higher
Total uptake 981 981 981 1,127 1,127 1,127
Excretion 502 502 502 618 618 618
In faeces 163 153 144 194 183 172
In urine 339 349 359 424 435 446
In urine (%) 67.5 69.5 71.4 68.6 70.4 72.2
From Table A4.11 follows that in the dependability of a difference in N digestibility of 2% units the amount N in urine as percentage of the total N excretion yields a difference of ca. 4% units.
A4.9 General discussion poultry
A4.9.1 Reliability contents of and digestibility of N in chicken feeds and effects on the N excretion
Not for all feeds there is a reliable picture of the correct content of N in feeds for chickens. Often these data are lacking in the various years. Also it is difficult or even not feasible to obtain these contents from compound feed manufacturers. In addition the raw material composition of the feeds is not released by most of the compound feed manufacturers. It is amply known that by whether or not taking up free amino acids in the feeds the N content in the feeds can be lowered, but at the same time it is also possible to take up protein containing raw materials of poorer quality in the feed. Depending on the strategy at the firm both the N content and the N digestibility can vary. It is desirable to collect better underpinned data hereof.
A4.10 Summary poultry
In Table A4.12 a summary is given of the excretion of N by various chicken categories in the reference year and in 2005 in g/year.
Table A4.12 Overview of the excretion of N and % TAN by various chicken categories in the reference year and 2005 (g/year)
Category Number Ref.
year
N in ref.
year
% TAN in
ref. year
N in
2005
% TAN
in 2005
Rearing laying hens (battery) 300A 1991 389 73.5 307 71.8
Rearing laying hens (ground) 300B 2000 388 73.1 343 72.0
Laying hens (battery) 301A 1993 850 76.9 628 75.1
Laying hens (ground) 301B 1998 792 76.4 736 76.5
Rearing broiler parents 310 2000 393 71.1 342 71.0
Broiler parents 311 1996 1,227 78.9 1,030 78.1
Broilers 312 2002 502 69.5 618 70.4
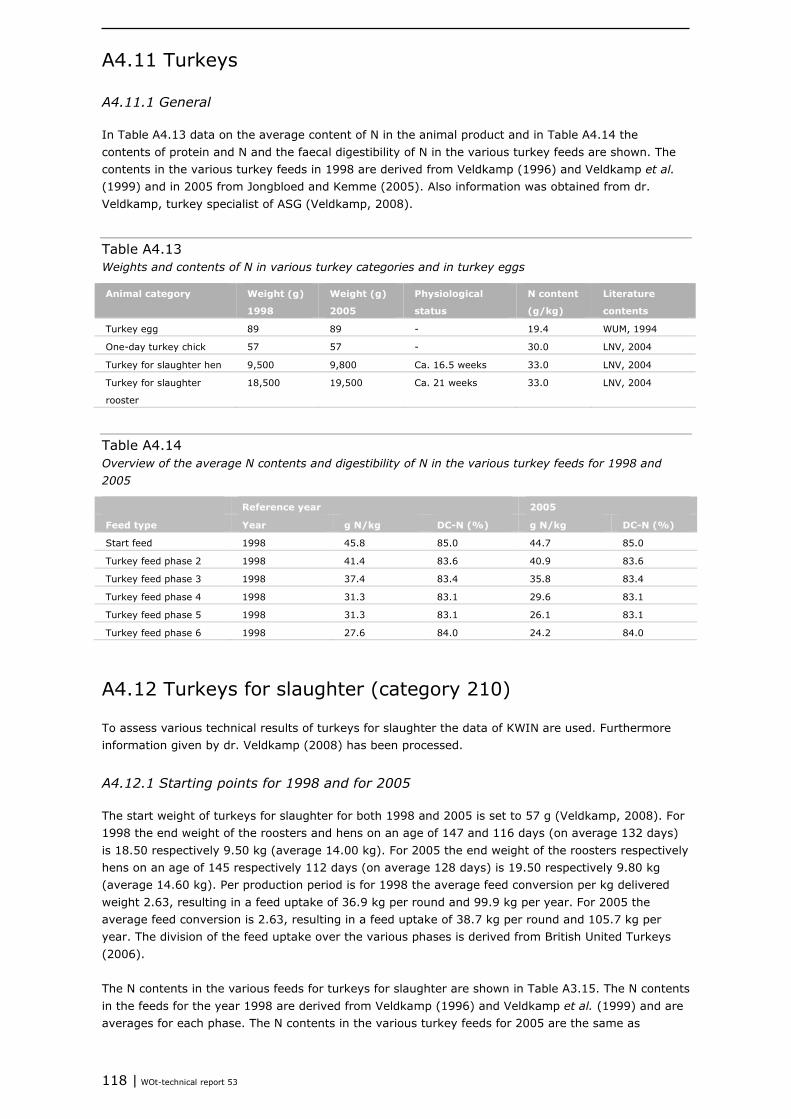
118 | WOt-technical report 53
A4.11 Turkeys
A4.11.1 General
In Table A4.13 data on the average content of N in the animal product and in Table A4.14 the contents of protein and N and the faecal digestibility of N in the various turkey feeds are shown. The contents in the various turkey feeds in 1998 are derived from Veldkamp (1996) and Veldkamp et al. (1999) and in 2005 from Jongbloed and Kemme (2005). Also information was obtained from dr. Veldkamp, turkey specialist of ASG (Veldkamp, 2008).
Table A4.13 Weights and contents of N in various turkey categories and in turkey eggs
Animal category Weight (g)
1998
Weight (g)
2005
Physiological
status
N content
(g/kg)
Literature
contents
Turkey egg 89 89 - 19.4 WUM, 1994
One-day turkey chick 57 57 - 30.0 LNV, 2004
Turkey for slaughter hen 9,500 9,800 Ca. 16.5 weeks 33.0 LNV, 2004
Turkey for slaughter
rooster
18,500 19,500 Ca. 21 weeks 33.0 LNV, 2004
Table A4.14 Overview of the average N contents and digestibility of N in the various turkey feeds for 1998 and 2005
Reference year 2005
Feed type Year g N/kg DC-N (%) g N/kg DC-N (%)
Start feed 1998 45.8 85.0 44.7 85.0
Turkey feed phase 2 1998 41.4 83.6 40.9 83.6
Turkey feed phase 3 1998 37.4 83.4 35.8 83.4
Turkey feed phase 4 1998 31.3 83.1 29.6 83.1
Turkey feed phase 5 1998 31.3 83.1 26.1 83.1
Turkey feed phase 6 1998 27.6 84.0 24.2 84.0
A4.12 Turkeys for slaughter (category 210)
To assess various technical results of turkeys for slaughter the data of KWIN are used. Furthermore information given by dr. Veldkamp (2008) has been processed.
A4.12.1 Starting points for 1998 and for 2005
The start weight of turkeys for slaughter for both 1998 and 2005 is set to 57 g (Veldkamp, 2008). For 1998 the end weight of the roosters and hens on an age of 147 and 116 days (on average 132 days) is 18.50 respectively 9.50 kg (average 14.00 kg). For 2005 the end weight of the roosters respectively hens on an age of 145 respectively 112 days (on average 128 days) is 19.50 respectively 9.80 kg (average 14.60 kg). Per production period is for 1998 the average feed conversion per kg delivered weight 2.63, resulting in a feed uptake of 36.9 kg per round and 99.9 kg per year. For 2005 the average feed conversion is 2.63, resulting in a feed uptake of 38.7 kg per round and 105.7 kg per year. The division of the feed uptake over the various phases is derived from British United Turkeys (2006). The N contents in the various feeds for turkeys for slaughter are shown in Table A3.15. The N contents in the feeds for the year 1998 are derived from Veldkamp (1996) and Veldkamp et al. (1999) and are averages for each phase. The N contents in the various turkey feeds for 2005 are the same as
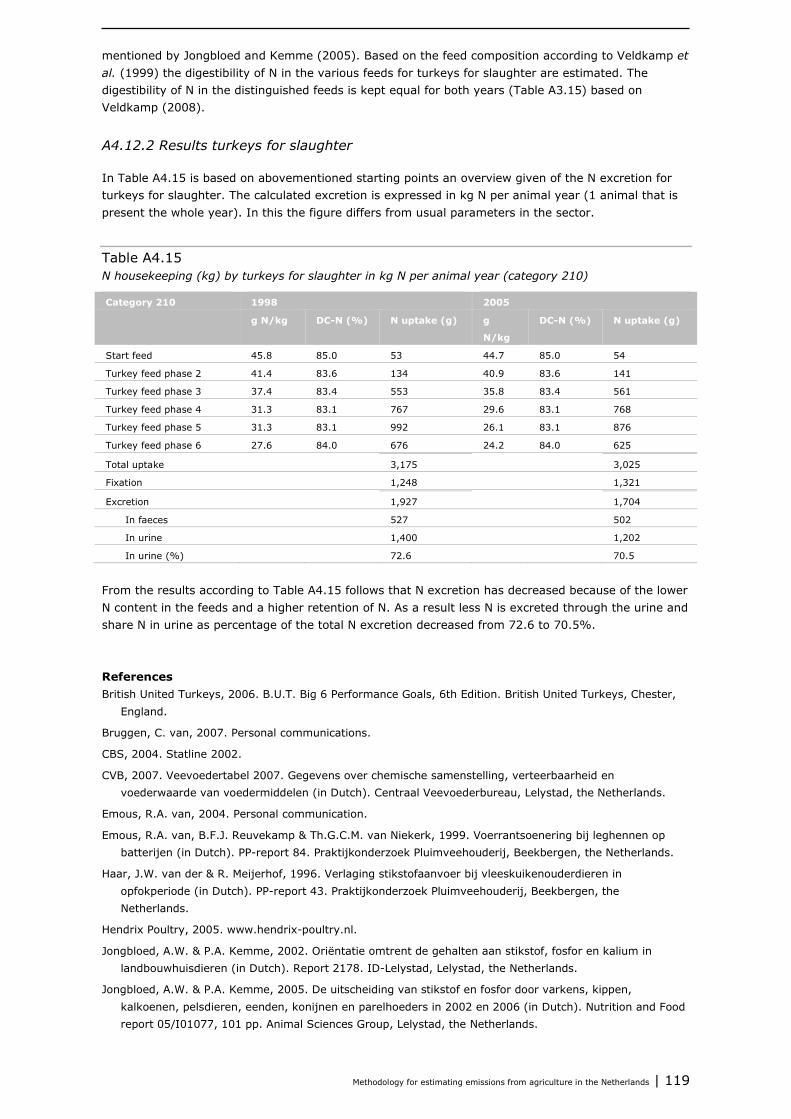
Methodology for estimating emissions from agriculture in the Netherlands | 119
mentioned by Jongbloed and Kemme (2005). Based on the feed composition according to Veldkamp et al. (1999) the digestibility of N in the various feeds for turkeys for slaughter are estimated. The digestibility of N in the distinguished feeds is kept equal for both years (Table A3.15) based on Veldkamp (2008).
A4.12.2 Results turkeys for slaughter
In Table A4.15 is based on abovementioned starting points an overview given of the N excretion for turkeys for slaughter. The calculated excretion is expressed in kg N per animal year (1 animal that is present the whole year). In this the figure differs from usual parameters in the sector.
Table A4.15 N housekeeping (kg) by turkeys for slaughter in kg N per animal year (category 210)
Category 210 1998 2005
g N/kg DC-N (%) N uptake (g) g
N/kg
DC-N (%) N uptake (g)
Start feed 45.8 85.0 53 44.7 85.0 54
Turkey feed phase 2 41.4 83.6 134 40.9 83.6 141
Turkey feed phase 3 37.4 83.4 553 35.8 83.4 561
Turkey feed phase 4 31.3 83.1 767 29.6 83.1 768
Turkey feed phase 5 31.3 83.1 992 26.1 83.1 876
Turkey feed phase 6 27.6 84.0 676 24.2 84.0 625
Total uptake 3,175 3,025
Fixation 1,248 1,321
Excretion 1,927 1,704
In faeces 527 502
In urine 1,400 1,202
In urine (%) 72.6 70.5
From the results according to Table A4.15 follows that N excretion has decreased because of the lower N content in the feeds and a higher retention of N. As a result less N is excreted through the urine and share N in urine as percentage of the total N excretion decreased from 72.6 to 70.5%.
References British United Turkeys, 2006. B.U.T. Big 6 Performance Goals, 6th Edition. British United Turkeys, Chester,
England.
Bruggen, C. van, 2007. Personal communications.
CBS, 2004. Statline 2002.
CVB, 2007. Veevoedertabel 2007. Gegevens over chemische samenstelling, verteerbaarheid en voederwaarde van voedermiddelen (in Dutch). Centraal Veevoederbureau, Lelystad, the Netherlands.
Emous, R.A. van, 2004. Personal communication.
Emous, R.A. van, B.F.J. Reuvekamp & Th.G.C.M. van Niekerk, 1999. Voerrantsoenering bij leghennen op batterijen (in Dutch). PP-report 84. Praktijkonderzoek Pluimveehouderij, Beekbergen, the Netherlands.
Haar, J.W. van der & R. Meijerhof, 1996. Verlaging stikstofaanvoer bij vleeskuikenouderdieren in opfokperiode (in Dutch). PP-report 43. Praktijkonderzoek Pluimveehouderij, Beekbergen, the Netherlands.
Hendrix Poultry, 2005. www.hendrix-poultry.nl.
Jongbloed, A.W. & P.A. Kemme, 2002. Oriëntatie omtrent de gehalten aan stikstof, fosfor en kalium in landbouwhuisdieren (in Dutch). Report 2178. ID-Lelystad, Lelystad, the Netherlands.
Jongbloed, A.W. & P.A. Kemme, 2005. De uitscheiding van stikstof en fosfor door varkens, kippen, kalkoenen, pelsdieren, eenden, konijnen en parelhoeders in 2002 en 2006 (in Dutch). Nutrition and Food report 05/I01077, 101 pp. Animal Sciences Group, Lelystad, the Netherlands.
120 | WOt-technical report 53
KWIN-V, 1994-2005. Kwantitatieve Informatie Veehouderij 1994-2005 (in Dutch). Praktijkonderzoek Rundvee, Schapen en Paarden (PR), Lelystad, the Netherlands.
LNV, 2004. www.hetlnvloket.nl/pls/portal30/docs/FOLDER/LNV_LOKET_US/LNV_FRONTEND_PUBLIEK/BHF/MINAS/DEF.%20TABELLENBROCHURE%202004.PDF.
Managementgids Isabrown, 2004. Isacom B.V., Boekel, the Netherlands.
Middelkoop, J.H. van, 2000. Personal communication.
Niekerk, Th.G.C.M. van & B.F.J. Reuvekamp, 1994. Mestdroging en NH3-emissie (opfok)leghennen (in Dutch). PP-report 22. Praktijkonderzoek Pluimveehouderij, Beekbergen, the Netherlands.
Niekerk, Th.G.C.M. van & B.F.J. Reuvekamp, 1995a. Toepassing van fytase bij (opfok)leghennen (in Dutch). PP-report 37. Praktijkonderzoek Pluimveehouderij, Beekbergen, the Netherlands.
Niekerk, Th.G.C.M. van & B.F.J. Reuvekamp, 1995b. Expanderen van voer bij (opfok)leghennen op batterijen (in Dutch). PP-report 38. Praktijkonderzoek Pluimveehouderij, Beekbergen, the Netherlands.
Niekerk, Th.G.C.M. van & B.F.J. Reuvekamp, 1997. Alternatieve huisvesting leghennen (in Dutch). PP-report 57. Praktijkonderzoek Pluimveehouderij, Beekbergen, the Netherlands.
Productschap Pluimvee en Eieren, 1999. Cijferinfo Pluimveesector, Publicatie 99/11 (in Dutch).
Reuvekamp, B., 2004. Personal communications.
Ross, 2004. Vleeskuikenouderdieren Management Gids 1999 (in Dutch).
Tamminga, S., A.W. Jongbloed, M.M. van Eerdt, H.F.M. Aarts, F. Mandersloot, N.J.P. Hoogervorst & H. Westhoek, 2000. De forfaitaire excretie van stikstof door landbouwhuisdieren (in Dutch). Report 00-2040, 71 pp. ID-DLO, Lelystad, the Netherlands.
Veldkamp, T., 1996. Ammoniakemissie bij het traditionele houderijsysteem voor vleeskalkoenen (volledig strooiselvloer) (in Dutch). PP-report 50. Praktijkonderzoek Pluimveehouderij, Beekbergen, the Netherlands.
Veldkamp, T., A.L.J. Gielkens, J.G.M.J. Bosch & J. van Rooijen, 1999. Oriënterend onderzoek naar de relatie tussen dunne mest en locomotiestoornissen bij vleeskalkoenen (in Dutch). PP-report 85. Praktijkonderzoek Pluimveehouderij, Beekbergen, the Netherlands.
Veldkamp, T., 2008. Personal communication.
Vermeij, I., 2005. Personal communication.
Versteegh, H.A.J. & A.W. Jongbloed, 2000. De hoeveelheid droge stof, as, stikstof, calcium, magnesium, fosfor, natrium, kalium, koper, zink en ijzer in eieren en in vleeskuikenouderdieren op twee leeftijden (in Dutch). Report 99.059. ID-DLO, Lelystad, the Netherlands.
WUM, 1994. Uniformering berekening mest- en mineralencijfers; standaardcijfers pluimvee, 1990-1992 (in Dutch). Working group on Uniformity of calculations of Manure and mineral data (WUM).
WUM, 2002. Dierlijke mest en mineralen 2002 (in Dutch). www.cbs.nl/nl/publicaties/artikelen/milieu-enbodemgebruik/milieu/mest/2002/dierlijke-mest-mineralen-2002-03.htm (author C. van Bruggen).
Methodology for estimating emissions from agriculture in the Netherlands | 121
Mineralization and Annex 5immobilization of nitrogen in manure
Gerard Velthof (Alterra Wageningen UR) Part of the organic matter in manure is easily degradable and will already be broken down in the animal house or storage. During this process, CH4 and CO2 and depending on the composition of the manure, also NH4
+ are formed (mineralization). In manure containing straw (high C/N ratio) part of the NH4
+ will be fixed (immobilized) as organic N. The method to calculate NH3 emission described in this report is based on TAN. As a result, changes in TAN during the storage of manure have to be taken into account. In the literature, only little data is available on mineralization and immobilization of ammonium in manure storages. This is mainly because these processes are hard to determine through a balance method in manure from which also NH3 is emitted. Another possibility to determine mineralization is the use of 15N labeled N, that is added to the ration of the animal or the manure. In an incubation study of Sommer et al. (2007) the N mineralization was low at 10 °C, for both liquid cattle manure as liquid pig manure. The manure has been collected fresh and was stored frozen, until the start of the incubation study. The mineralization increased strongly at increasing temperature. About 80% of the organic N was mineralized at 15-20 °C for 100-200 days. Mineralization was higher in pig manure than in cattle manure. In an incubation study of Sørensen et al. (2003), mineralization of 9-50% of the organic N in liquid cattle manure was found. The fresh manure was incubated at 8 °C for 16 weeks first, and then for 4 weeks at 15 °C. Processing of data from an incubation study of Velthof et al. (2005) shows that the N mineralization of organic N of liquid pig manure at high temperature (90 days at 35 °C) was on average 15%, with a variation of -11 to +30% (depending of the ration). The manure was collected fresh and stored frozen, until the start of the incubation study. In an incubation study with pig manure to which 15N labeled urea was added (Beline et al., 1998) the N mineralization was 19% of the organic N during 84 days at 20 °C. The manure was collected from a farm and thus been stored for a while (it is not clear how long the storage period was). In models used in England and Germany for calculation of ammonia emissions on the national scale the N mineralization is set to 10% of the organic N (with reference to the research of Beline et al., 1998). In the models used by Denmark and Switzerland, mineralization is not (yet) taken into account. In the methodology described in this report, it is assumed that 10% of the organic N in liquid manure stored in the animal house mineralizes. This might be a conservative assumption. Given the uncertainties only mineralization in the animal houses is calculated and not in the outside storage. Also in the outside storage mineralization can occur, but this is possibly lower since the easily degradable organic N will mineralize quickly after excretion in the animal house. For solid manure it is assumed that there is no net mineralization and immobilization. It is recommended to conduct further research into (net) mineralization in liquid cattle and pig manure, since this has an effect on calculated NH3 emissions from the animal house, manure storage and manure application.
122 | WOt-technical report 53
References Beline, F., J. Martinez, C. Marol & G. Guiraud, 1998. Nitrogen transformations during anaerobically stored
15N-labeled pig slurry. Bioresource Technology 64, p. 83-88.
Sommer, S.G., S.O. Petersen, P. Sørensen, H.D. Poulsen & H.B. Møller, 2007. Methane and carbon dioxide emissions and nitrogen turnover during liquid manure storage. Nutrient Cycling in Agroecosystems 78, p. 27–36.
Sørensen, P., M. R. Weisbjerg & P. Lund, 2003. Dietary effects on the composition and plant utilization of nitrogen in dairy cattle manure. Journal of Agricultural Science 141, p. 79–91.
Velthof, G.L., J.A. Nelemans, O. Oenema & P.J. Kuikman, 2005. Gaseous nitrogen and carbon losses from pig manure derived from different diets. Journal of Environmental Quality 34, p. 698 – 706.
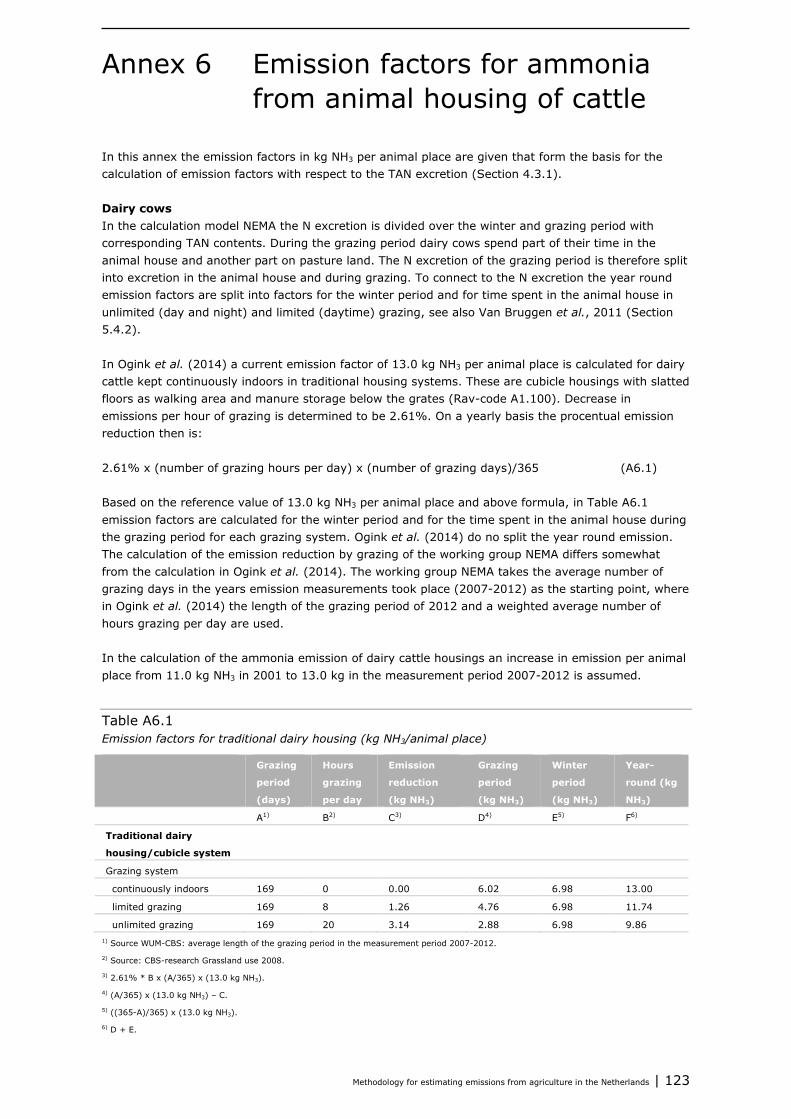
Methodology for estimating emissions from agriculture in the Netherlands | 123
Emission factors for ammonia Annex 6from animal housing of cattle
In this annex the emission factors in kg NH3 per animal place are given that form the basis for the calculation of emission factors with respect to the TAN excretion (Section 4.3.1).
Dairy cows In the calculation model NEMA the N excretion is divided over the winter and grazing period with corresponding TAN contents. During the grazing period dairy cows spend part of their time in the animal house and another part on pasture land. The N excretion of the grazing period is therefore split into excretion in the animal house and during grazing. To connect to the N excretion the year round emission factors are split into factors for the winter period and for time spent in the animal house in unlimited (day and night) and limited (daytime) grazing, see also Van Bruggen et al., 2011 (Section 5.4.2). In Ogink et al. (2014) a current emission factor of 13.0 kg NH3 per animal place is calculated for dairy cattle kept continuously indoors in traditional housing systems. These are cubicle housings with slatted floors as walking area and manure storage below the grates (Rav-code A1.100). Decrease in emissions per hour of grazing is determined to be 2.61%. On a yearly basis the procentual emission reduction then is: 2.61% x (number of grazing hours per day) x (number of grazing days)/365 (A6.1) Based on the reference value of 13.0 kg NH3 per animal place and above formula, in Table A6.1 emission factors are calculated for the winter period and for the time spent in the animal house during the grazing period for each grazing system. Ogink et al. (2014) do no split the year round emission. The calculation of the emission reduction by grazing of the working group NEMA differs somewhat from the calculation in Ogink et al. (2014). The working group NEMA takes the average number of grazing days in the years emission measurements took place (2007-2012) as the starting point, where in Ogink et al. (2014) the length of the grazing period of 2012 and a weighted average number of hours grazing per day are used. In the calculation of the ammonia emission of dairy cattle housings an increase in emission per animal place from 11.0 kg NH3 in 2001 to 13.0 kg in the measurement period 2007-2012 is assumed.
Table A6.1 Emission factors for traditional dairy housing (kg NH3/animal place)
Grazing
period
(days)
Hours
grazing
per day
Emission
reduction
(kg NH3)
Grazing
period
(kg NH3)
Winter
period
(kg NH3)
Year-
round (kg
NH3)
A1) B2) C3) D4) E5) F6)
Traditional dairy
housing/cubicle system
Grazing system
continuously indoors 169 0 0.00 6.02 6.98 13.00
limited grazing 169 8 1.26 4.76 6.98 11.74
unlimited grazing 169 20 3.14 2.88 6.98 9.86 1) Source WUM-CBS: average length of the grazing period in the measurement period 2007-2012.
2) Source: CBS-research Grassland use 2008.
3) 2.61% * B x (A/365) x (13.0 kg NH3).
4) (A/365) x (13.0 kg NH3) – C.
5) ((365-A)/365) x (13.0 kg NH3).
6) D + E.
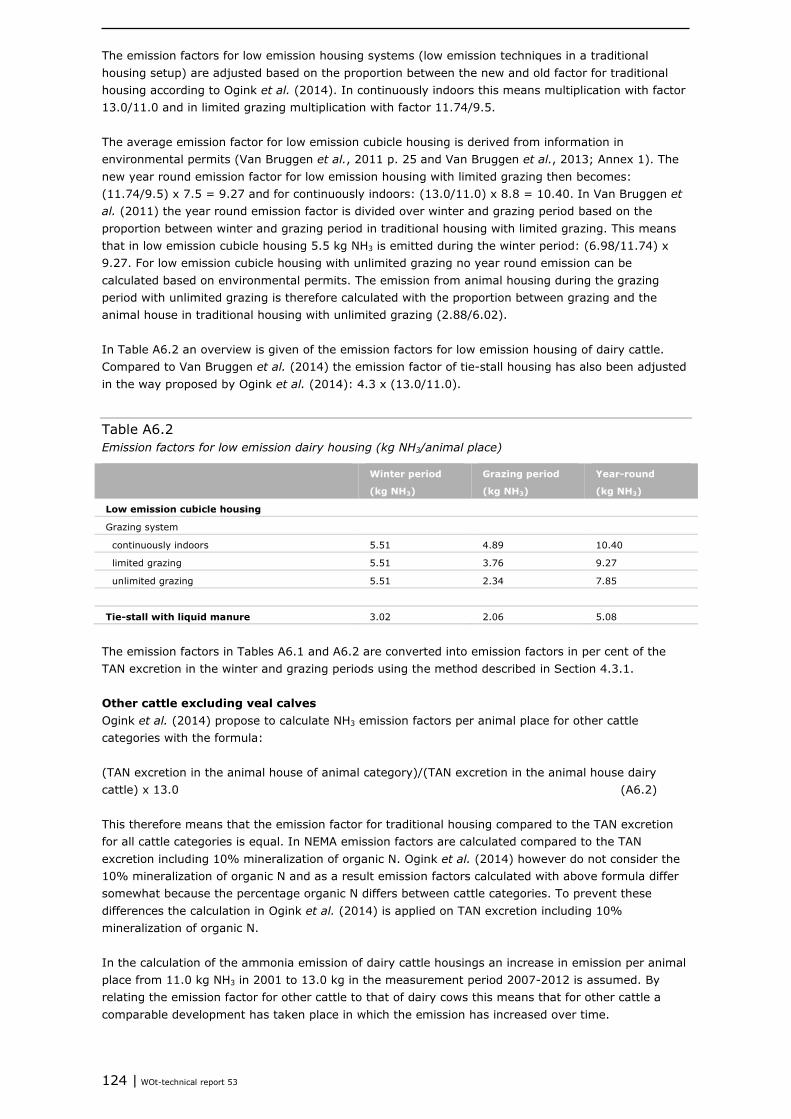
124 | WOt-technical report 53
The emission factors for low emission housing systems (low emission techniques in a traditional housing setup) are adjusted based on the proportion between the new and old factor for traditional housing according to Ogink et al. (2014). In continuously indoors this means multiplication with factor 13.0/11.0 and in limited grazing multiplication with factor 11.74/9.5. The average emission factor for low emission cubicle housing is derived from information in environmental permits (Van Bruggen et al., 2011 p. 25 and Van Bruggen et al., 2013; Annex 1). The new year round emission factor for low emission housing with limited grazing then becomes: (11.74/9.5) x 7.5 = 9.27 and for continuously indoors: (13.0/11.0) x 8.8 = 10.40. In Van Bruggen et al. (2011) the year round emission factor is divided over winter and grazing period based on the proportion between winter and grazing period in traditional housing with limited grazing. This means that in low emission cubicle housing 5.5 kg NH3 is emitted during the winter period: (6.98/11.74) x 9.27. For low emission cubicle housing with unlimited grazing no year round emission can be calculated based on environmental permits. The emission from animal housing during the grazing period with unlimited grazing is therefore calculated with the proportion between grazing and the animal house in traditional housing with unlimited grazing (2.88/6.02). In Table A6.2 an overview is given of the emission factors for low emission housing of dairy cattle. Compared to Van Bruggen et al. (2014) the emission factor of tie-stall housing has also been adjusted in the way proposed by Ogink et al. (2014): 4.3 x (13.0/11.0).
Table A6.2 Emission factors for low emission dairy housing (kg NH3/animal place)
Winter period
(kg NH3)
Grazing period
(kg NH3)
Year-round
(kg NH3)
Low emission cubicle housing
Grazing system
continuously indoors 5.51 4.89 10.40
limited grazing 5.51 3.76 9.27
unlimited grazing 5.51 2.34 7.85
Tie-stall with liquid manure 3.02 2.06 5.08
The emission factors in Tables A6.1 and A6.2 are converted into emission factors in per cent of the TAN excretion in the winter and grazing periods using the method described in Section 4.3.1.
Other cattle excluding veal calves Ogink et al. (2014) propose to calculate NH3 emission factors per animal place for other cattle categories with the formula: (TAN excretion in the animal house of animal category)/(TAN excretion in the animal house dairy cattle) x 13.0 (A6.2) This therefore means that the emission factor for traditional housing compared to the TAN excretion for all cattle categories is equal. In NEMA emission factors are calculated compared to the TAN excretion including 10% mineralization of organic N. Ogink et al. (2014) however do not consider the 10% mineralization of organic N and as a result emission factors calculated with above formula differ somewhat because the percentage organic N differs between cattle categories. To prevent these differences the calculation in Ogink et al. (2014) is applied on TAN excretion including 10% mineralization of organic N. In the calculation of the ammonia emission of dairy cattle housings an increase in emission per animal place from 11.0 kg NH3 in 2001 to 13.0 kg in the measurement period 2007-2012 is assumed. By relating the emission factor for other cattle to that of dairy cows this means that for other cattle a comparable development has taken place in which the emission has increased over time.
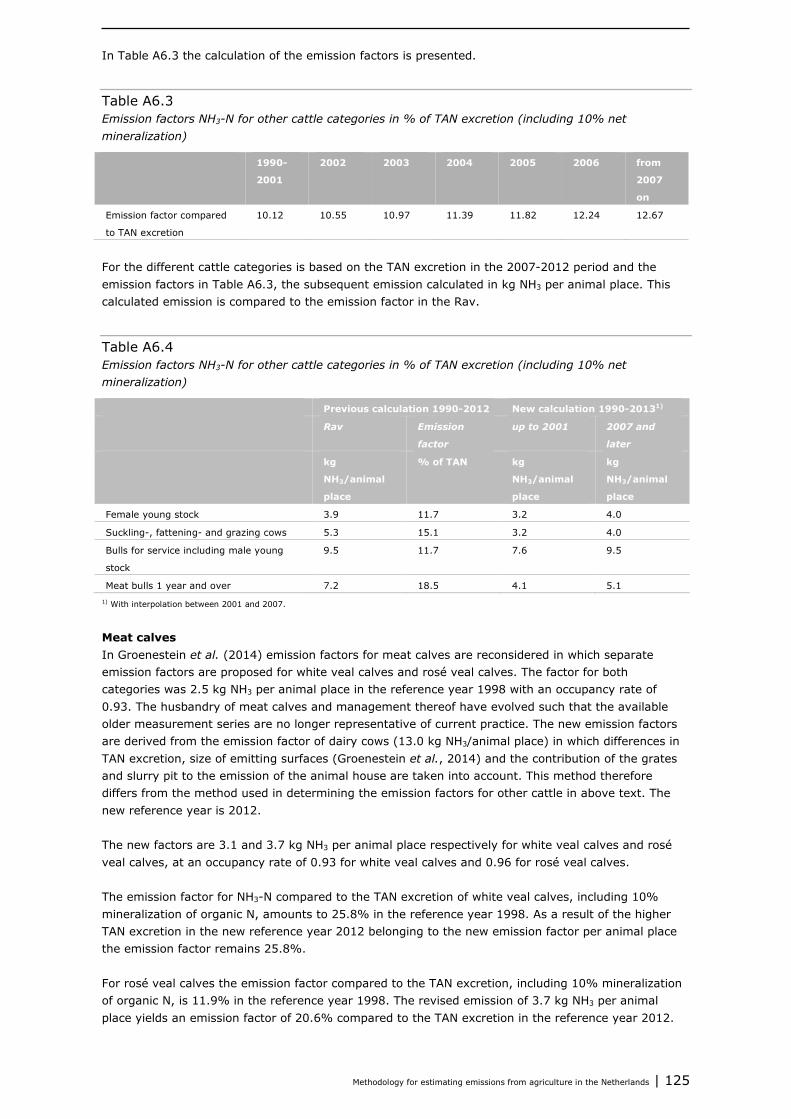
Methodology for estimating emissions from agriculture in the Netherlands | 125
In Table A6.3 the calculation of the emission factors is presented.
Table A6.3 Emission factors NH3-N for other cattle categories in % of TAN excretion (including 10% net mineralization)
1990-
2001
2002 2003 2004 2005 2006 from
2007
on
Emission factor compared
to TAN excretion
10.12 10.55 10.97 11.39 11.82 12.24 12.67
For the different cattle categories is based on the TAN excretion in the 2007-2012 period and the emission factors in Table A6.3, the subsequent emission calculated in kg NH3 per animal place. This calculated emission is compared to the emission factor in the Rav.
Table A6.4 Emission factors NH3-N for other cattle categories in % of TAN excretion (including 10% net mineralization)
Previous calculation 1990-2012 New calculation 1990-20131)
Rav Emission
factor
up to 2001 2007 and
later
kg
NH3/animal
place
% of TAN kg
NH3/animal
place
kg
NH3/animal
place
Female young stock 3.9 11.7 3.2 4.0
Suckling-, fattening- and grazing cows 5.3 15.1 3.2 4.0
Bulls for service including male young
stock
9.5 11.7 7.6 9.5
Meat bulls 1 year and over 7.2 18.5 4.1 5.1 1) With interpolation between 2001 and 2007.
Meat calves In Groenestein et al. (2014) emission factors for meat calves are reconsidered in which separate emission factors are proposed for white veal calves and rosé veal calves. The factor for both categories was 2.5 kg NH3 per animal place in the reference year 1998 with an occupancy rate of 0.93. The husbandry of meat calves and management thereof have evolved such that the available older measurement series are no longer representative of current practice. The new emission factors are derived from the emission factor of dairy cows (13.0 kg NH3/animal place) in which differences in TAN excretion, size of emitting surfaces (Groenestein et al., 2014) and the contribution of the grates and slurry pit to the emission of the animal house are taken into account. This method therefore differs from the method used in determining the emission factors for other cattle in above text. The new reference year is 2012. The new factors are 3.1 and 3.7 kg NH3 per animal place respectively for white veal calves and rosé veal calves, at an occupancy rate of 0.93 for white veal calves and 0.96 for rosé veal calves. The emission factor for NH3-N compared to the TAN excretion of white veal calves, including 10% mineralization of organic N, amounts to 25.8% in the reference year 1998. As a result of the higher TAN excretion in the new reference year 2012 belonging to the new emission factor per animal place the emission factor remains 25.8%. For rosé veal calves the emission factor compared to the TAN excretion, including 10% mineralization of organic N, is 11.9% in the reference year 1998. The revised emission of 3.7 kg NH3 per animal place yields an emission factor of 20.6% compared to the TAN excretion in the reference year 2012.
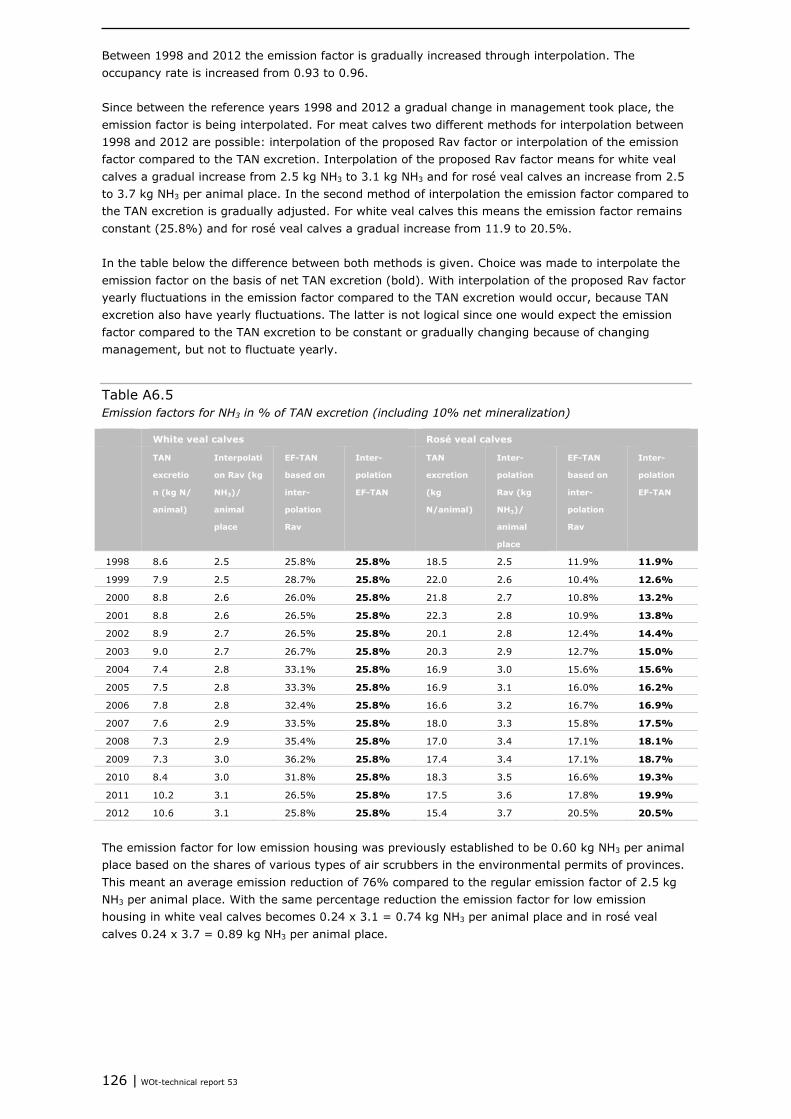
126 | WOt-technical report 53
Between 1998 and 2012 the emission factor is gradually increased through interpolation. The occupancy rate is increased from 0.93 to 0.96. Since between the reference years 1998 and 2012 a gradual change in management took place, the emission factor is being interpolated. For meat calves two different methods for interpolation between 1998 and 2012 are possible: interpolation of the proposed Rav factor or interpolation of the emission factor compared to the TAN excretion. Interpolation of the proposed Rav factor means for white veal calves a gradual increase from 2.5 kg NH3 to 3.1 kg NH3 and for rosé veal calves an increase from 2.5 to 3.7 kg NH3 per animal place. In the second method of interpolation the emission factor compared to the TAN excretion is gradually adjusted. For white veal calves this means the emission factor remains constant (25.8%) and for rosé veal calves a gradual increase from 11.9 to 20.5%. In the table below the difference between both methods is given. Choice was made to interpolate the emission factor on the basis of net TAN excretion (bold). With interpolation of the proposed Rav factor yearly fluctuations in the emission factor compared to the TAN excretion would occur, because TAN excretion also have yearly fluctuations. The latter is not logical since one would expect the emission factor compared to the TAN excretion to be constant or gradually changing because of changing management, but not to fluctuate yearly.
Table A6.5 Emission factors for NH3 in % of TAN excretion (including 10% net mineralization)
White veal calves Rosé veal calves
TAN
excretio
n (kg N/
animal)
Interpolati
on Rav (kg
NH3)/
animal
place
EF-TAN
based on
inter-
polation
Rav
Inter-
polation
EF-TAN
TAN
excretion
(kg
N/animal)
Inter-
polation
Rav (kg
NH3)/
animal
place
EF-TAN
based on
inter-
polation
Rav
Inter-
polation
EF-TAN
1998 8.6 2.5 25.8% 25.8% 18.5 2.5 11.9% 11.9%
1999 7.9 2.5 28.7% 25.8% 22.0 2.6 10.4% 12.6%
2000 8.8 2.6 26.0% 25.8% 21.8 2.7 10.8% 13.2%
2001 8.8 2.6 26.5% 25.8% 22.3 2.8 10.9% 13.8%
2002 8.9 2.7 26.5% 25.8% 20.1 2.8 12.4% 14.4%
2003 9.0 2.7 26.7% 25.8% 20.3 2.9 12.7% 15.0%
2004 7.4 2.8 33.1% 25.8% 16.9 3.0 15.6% 15.6%
2005 7.5 2.8 33.3% 25.8% 16.9 3.1 16.0% 16.2%
2006 7.8 2.8 32.4% 25.8% 16.6 3.2 16.7% 16.9%
2007 7.6 2.9 33.5% 25.8% 18.0 3.3 15.8% 17.5%
2008 7.3 2.9 35.4% 25.8% 17.0 3.4 17.1% 18.1%
2009 7.3 3.0 36.2% 25.8% 17.4 3.4 17.1% 18.7%
2010 8.4 3.0 31.8% 25.8% 18.3 3.5 16.6% 19.3%
2011 10.2 3.1 26.5% 25.8% 17.5 3.6 17.8% 19.9%
2012 10.6 3.1 25.8% 25.8% 15.4 3.7 20.5% 20.5%
The emission factor for low emission housing was previously established to be 0.60 kg NH3 per animal place based on the shares of various types of air scrubbers in the environmental permits of provinces. This meant an average emission reduction of 76% compared to the regular emission factor of 2.5 kg NH3 per animal place. With the same percentage reduction the emission factor for low emission housing in white veal calves becomes 0.24 x 3.1 = 0.74 kg NH3 per animal place and in rosé veal calves 0.24 x 3.7 = 0.89 kg NH3 per animal place.

Methodology for estimating emissions from agriculture in the Netherlands | 127
References Bruggen, C. van, C.M. Groenestein, B.J. de Haan, M.W. Hoogeveen, J.F.M. Huijsmans. S.M. van der Sluis &
G.L. Velthof, 2011. Ammoniakemissie uit dierlijke mest en kunstmest, 1990-2008. Berekeningen met het Nationaal Emissiemodel voor Ammoniak (NEMA) (in Dutch). WOt-werkdocument 250. WOT Natuur & Milieu, Wageningen UR, Wageningen, the Netherlands.
Bruggen, C. van, C.M. Groenestein, B.J. de Haan, M.W. Hoogeveen, J.F.M. Huijsmans. S.M. van der Sluis & G.L. Velthof, 2013. Ammoniakemissie uit dierlijke mest en kunstmest in 2011. Berekeningen met het Nationaal Emissiemodel voor Ammoniak (NEMA) (in Dutch). WOt-werkdocument 330. WOT Natuur & Milieu, Wageningen UR, Wageningen, the Netherlands.
Bruggen, C. van, A. Bannink, C.M. Groenestein, B.J. de Haan, J.F.M. Huijsmans, H.H. Luesink, S.M. van der Sluis, G.L. Velthof & J. Vonk, 2014. Emissies naar lucht uit de landbouw in 2012. Berekeningen van ammoniak, stikstofoxide, lachgas, methaan en fijn stof met het model NEMA (in Dutch). WOt-technical report 3. WOT Natuur & Milieu, Wageningen UR, Wageningen, the Netherlands.
Groenestein, C.M., S. Bokma & N.W.M. Ogink, 2014. Actualisering ammoniakemissiefactoren vleeskalveren tot circa 8 maanden. Advies voor aanpassing in de Regeling ammoniak en veehouderij (in Dutch). Report 778. Wageningen UR Livestock Research, Lelystad, the Netherlands.
Ogink, N.W.M., C.M. Groenestein & J. Mosquera, 2014. Actualisering ammoniakemissiefactoren rundvee: advies voor aanpassing in de Regeling ammoniak en veehouderij (in Dutch). Report 744. Wageningen UR Livestock Research, Lelystad, the Netherlands.


Methodology for estimating emissions from agriculture in the Netherlands | 129
Emission factors for ammonia Annex 7from animal housing of pigs
In this annex the emission factors in kg NH3 per animal place are given that form the basis for the calculation of emission factors relative to the TAN excretion (Section 4.3.1).
Table A7.1 Emission factors for traditional pig housing (kg NH3 per animal place)
kg NH3 / animal place
Sows with piglets 8.3
Open and sows in pig 4.2
Weaned piglets 0.60
Fattening and rearing pigs
Slurry pit under complete animal place, pen surface 0.8 m2/animal place 5.0
Slurry pit under complete animal place, pen surface 1.0 m2/animal place 6.1
Slurry pit under part of the animal place, pen surface 0.8 m2/animal place 3.4
Slurry pit under part of the animal place, pen surface 1.0 m2/animal place 4.0
Boars for service 5.5
Table A7.2 Emission factors for reduced emission housing of sows with piglets (kg NH3 per animal place)
EF 1990-
20041)
2005-
20062)
2007-
20103)
2011-
20124)
20135)
kg NH3/
animal
place
fraction fraction fraction fraction fraction
Air scrubbers
biological air scrubber system 70% emission
reduction
2.5 0.25 0.16 0.11 0.09
chemical air scrubber system 70% emission
reduction
2.5 0.37 0.42 0.28 0.20
chemical air scrubber system 95% emission
reduction
0.42 0.38 0.33 0.30 0.26
combined air scrubber system 85% emission
reduction chemical and water washer
1.3 - 0.06 0.18 0.17
combined air scrubber system 70% emission
reduction chemical and water washer, biofilter
2.5 - 0.00 0.01 0.01
combined air scrubber system 85% emission
reduction chemical and water washer, biofilter
1.3 - 0.02 0.03 0.03
combined air scrubber system 85% emission
reduction with water curtain and biological washer
1.3 - - 0.10 0.24
Average emission factor (kg NH3/animal
place)
N/A 1.7 1.7 1.5 1.4
Floor/slurry pit adjustment
rinsing gully system, rinsing with liquid manure 3.3 0.06 0.05 0.05 0.05
level coated pit floor with rack and pinion shove
system
4.0 0.03 0.01 0.01 0.00
manure shove with coated sloping pit floor and 3.1 0.03 0.02 0.01 0.01

130 | WOt-technical report 53
EF 1990-
20041)
2005-
20062)
2007-
20103)
2011-
20124)
20135)
kg NH3/
animal
place
fraction fraction fraction fraction fraction
urine gully
manure gully with manure discharge system 3.2 0.06 0.05 0.04 0.03
shallow slurry pits with manure and water canal 4.0 0.35 0.24 0.22 0.22
shovels in manure gully 2.5 0.05 0.04 0.02 0.02
cool deck system 2.4 0.12 0.10 0.09 0.08
manure pan/- box under farrowing pen 2.9 0.06 0.06 0.08 0.08
manure pan with water and manure canal under
farrowing pen
2.9 0.16 0.19 0.18 0.16
water canal combined with separate manure canal
or manure box
2.9 0.08 0.22 0.30 0.33
average emission factor (kg NH3/animal
place)
4.15 3.3 3.2 3.1 3.1
1) The emission reduction in this period is set to 50% compared to traditional housing (Van der Hoek, 2002).
2) Source: environmental permits in the province Noord-Brabant on 1-1-2005.
3) Source: environmental permits in the province Noord-Brabant on 1-1-2009.
4) Source: environmental permits in provinces: Overijssel, Gelderland, Utrecht, Noord-Brabant and Limburg on 1-1-2012.
5) Source: environmental permits in provinces: Overijssel, Gelderland, Utrecht, Noord-Brabant and Limburg on 1-1-2014.
Table A7.3 Emission factors for reduced emission housing of open and sows in pig (kg NH3 per animal place)
EF 1990-
20041)
2005-
20062)
2007-
20103)
2011-
20124)
20135)
kg
NH3/animal
place
fraction fraction fraction fraction fraction
Air scrubbers
biological air scrubber system 70%
emission reduction
1.3 0.22 0.15 0.11 0.09
chemical air scrubber system 70%
emission reduction
1.3 0.42 0.45 0.29 0.22
chemical air scrubber system 95%
emission reduction
0.21 0.38 0.33 0.31 0.29
combined air scrubber system 85%
emission reduction chemical and water
washer
0.63 - 0.05 0.13 0.12
combined air scrubber system 70%
emission reduction with water washer,
chemical washer and biofilter
1.3 - - 0.01 0.01
combined air scrubber system 85%
emission reduction chemical and water
washer, biofilter
0.63 - 0.01 0.03 0.03
combined air scrubber system 85%
emission reduction water curtain and
biological washer
0.63 - 0.00 0.11 0.23
average emission factor (kg
NH3/animal place)
N/A 0.90 0.90 0.77 0.72
Floor/slurry pit adjustment
narrow shallow manure canals with metal
three sided grates and sewerage
2.4 0.28 0.24 0.25 -
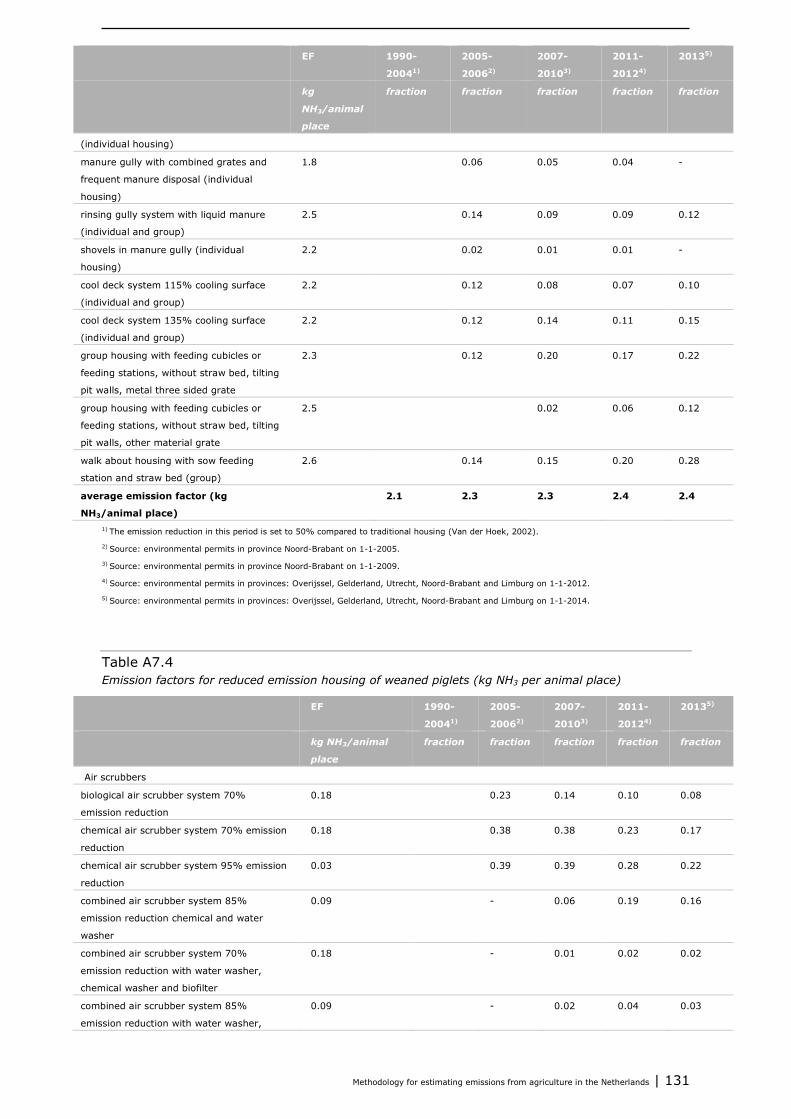
Methodology for estimating emissions from agriculture in the Netherlands | 131
EF 1990-
20041)
2005-
20062)
2007-
20103)
2011-
20124)
20135)
kg
NH3/animal
place
fraction fraction fraction fraction fraction
(individual housing)
manure gully with combined grates and
frequent manure disposal (individual
housing)
1.8 0.06 0.05 0.04 -
rinsing gully system with liquid manure
(individual and group)
2.5 0.14 0.09 0.09 0.12
shovels in manure gully (individual
housing)
2.2 0.02 0.01 0.01 -
cool deck system 115% cooling surface
(individual and group)
2.2 0.12 0.08 0.07 0.10
cool deck system 135% cooling surface
(individual and group)
2.2 0.12 0.14 0.11 0.15
group housing with feeding cubicles or
feeding stations, without straw bed, tilting
pit walls, metal three sided grate
2.3 0.12 0.20 0.17 0.22
group housing with feeding cubicles or
feeding stations, without straw bed, tilting
pit walls, other material grate
2.5 0.02 0.06 0.12
walk about housing with sow feeding
station and straw bed (group)
2.6 0.14 0.15 0.20 0.28
average emission factor (kg
NH3/animal place)
2.1 2.3 2.3 2.4 2.4
1) The emission reduction in this period is set to 50% compared to traditional housing (Van der Hoek, 2002).
2) Source: environmental permits in province Noord-Brabant on 1-1-2005.
3) Source: environmental permits in province Noord-Brabant on 1-1-2009.
4) Source: environmental permits in provinces: Overijssel, Gelderland, Utrecht, Noord-Brabant and Limburg on 1-1-2012.
5) Source: environmental permits in provinces: Overijssel, Gelderland, Utrecht, Noord-Brabant and Limburg on 1-1-2014.
Table A7.4 Emission factors for reduced emission housing of weaned piglets (kg NH3 per animal place)
EF 1990-
20041)
2005-
20062)
2007-
20103)
2011-
20124)
20135)
kg NH3/animal
place
fraction fraction fraction fraction fraction
Air scrubbers
biological air scrubber system 70%
emission reduction
0.18 0.23 0.14 0.10 0.08
chemical air scrubber system 70% emission
reduction
0.18 0.38 0.38 0.23 0.17
chemical air scrubber system 95% emission
reduction
0.03 0.39 0.39 0.28 0.22
combined air scrubber system 85%
emission reduction chemical and water
washer
0.09 - 0.06 0.19 0.16
combined air scrubber system 70%
emission reduction with water washer,
chemical washer and biofilter
0.18 - 0.01 0.02 0.02
combined air scrubber system 85%
emission reduction with water washer,
0.09 - 0.02 0.04 0.03
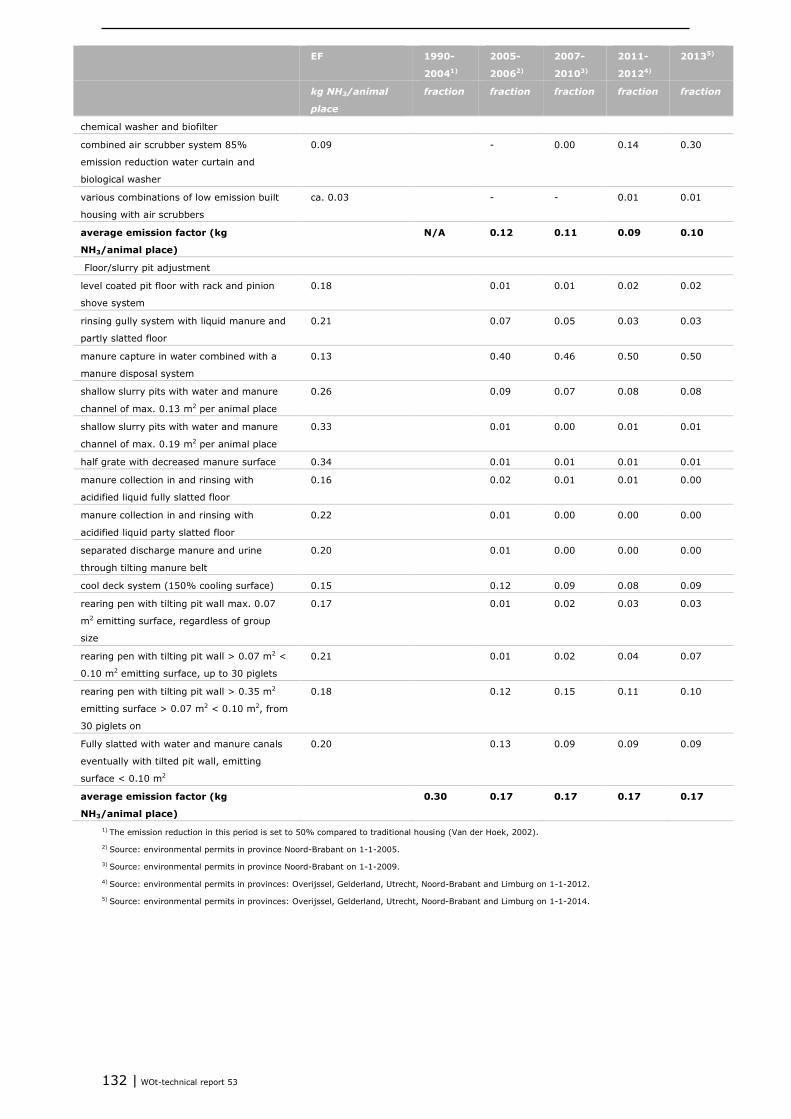
132 | WOt-technical report 53
EF 1990-
20041)
2005-
20062)
2007-
20103)
2011-
20124)
20135)
kg NH3/animal
place
fraction fraction fraction fraction fraction
chemical washer and biofilter
combined air scrubber system 85%
emission reduction water curtain and
biological washer
0.09 - 0.00 0.14 0.30
various combinations of low emission built
housing with air scrubbers
ca. 0.03 - - 0.01 0.01
average emission factor (kg
NH3/animal place)
N/A 0.12 0.11 0.09 0.10
Floor/slurry pit adjustment
level coated pit floor with rack and pinion
shove system
0.18 0.01 0.01 0.02 0.02
rinsing gully system with liquid manure and
partly slatted floor
0.21 0.07 0.05 0.03 0.03
manure capture in water combined with a
manure disposal system
0.13 0.40 0.46 0.50 0.50
shallow slurry pits with water and manure
channel of max. 0.13 m2 per animal place
0.26 0.09 0.07 0.08 0.08
shallow slurry pits with water and manure
channel of max. 0.19 m2 per animal place
0.33 0.01 0.00 0.01 0.01
half grate with decreased manure surface 0.34 0.01 0.01 0.01 0.01
manure collection in and rinsing with
acidified liquid fully slatted floor
0.16 0.02 0.01 0.01 0.00
manure collection in and rinsing with
acidified liquid party slatted floor
0.22 0.01 0.00 0.00 0.00
separated discharge manure and urine
through tilting manure belt
0.20 0.01 0.00 0.00 0.00
cool deck system (150% cooling surface) 0.15 0.12 0.09 0.08 0.09
rearing pen with tilting pit wall max. 0.07
m2 emitting surface, regardless of group
size
0.17 0.01 0.02 0.03 0.03
rearing pen with tilting pit wall > 0.07 m2 <
0.10 m2 emitting surface, up to 30 piglets
0.21 0.01 0.02 0.04 0.07
rearing pen with tilting pit wall > 0.35 m2
emitting surface > 0.07 m2 < 0.10 m2, from
30 piglets on
0.18 0.12 0.15 0.11 0.10
Fully slatted with water and manure canals
eventually with tilted pit wall, emitting
surface < 0.10 m2
0.20 0.13 0.09 0.09 0.09
average emission factor (kg
NH3/animal place)
0.30 0.17 0.17 0.17 0.17
1) The emission reduction in this period is set to 50% compared to traditional housing (Van der Hoek, 2002).
2) Source: environmental permits in province Noord-Brabant on 1-1-2005.
3) Source: environmental permits in province Noord-Brabant on 1-1-2009.
4) Source: environmental permits in provinces: Overijssel, Gelderland, Utrecht, Noord-Brabant and Limburg on 1-1-2012.
5) Source: environmental permits in provinces: Overijssel, Gelderland, Utrecht, Noord-Brabant and Limburg on 1-1-2014.
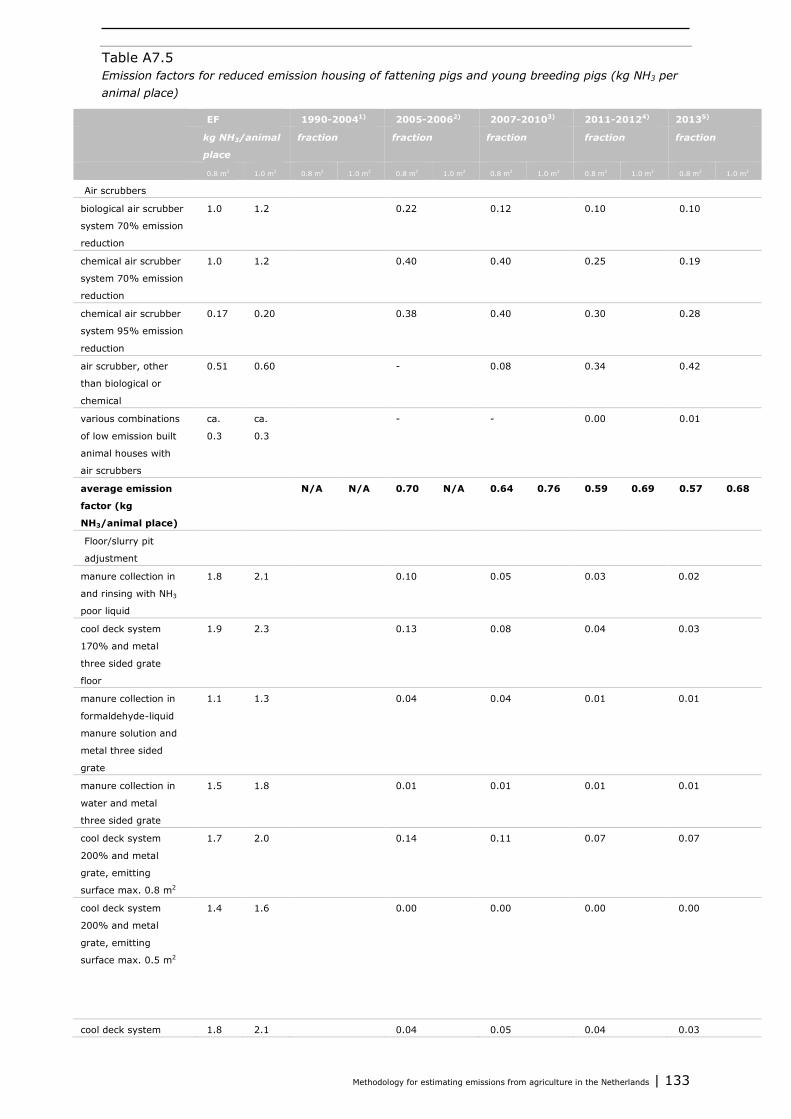
Methodology for estimating emissions from agriculture in the Netherlands | 133
Table A7.5 Emission factors for reduced emission housing of fattening pigs and young breeding pigs (kg NH3 per animal place)
EF 1990-20041) 2005-20062) 2007-20103) 2011-20124) 20135)
kg NH3/animal
place
fraction fraction fraction fraction fraction
0.8 m2 1.0 m2 0.8 m2 1.0 m2 0.8 m2 1.0 m2 0.8 m2 1.0 m2 0.8 m2 1.0 m2 0.8 m2 1.0 m2
Air scrubbers
biological air scrubber
system 70% emission
reduction
1.0 1.2 0.22 0.12 0.10 0.10
chemical air scrubber
system 70% emission
reduction
1.0 1.2 0.40 0.40 0.25 0.19
chemical air scrubber
system 95% emission
reduction
0.17 0.20 0.38 0.40 0.30 0.28
air scrubber, other
than biological or
chemical
0.51 0.60 - 0.08 0.34 0.42
various combinations
of low emission built
animal houses with
air scrubbers
ca.
0.3
ca.
0.3
- - 0.00 0.01
average emission
factor (kg
NH3/animal place)
N/A N/A 0.70 N/A 0.64 0.76 0.59 0.69 0.57 0.68
Floor/slurry pit
adjustment
manure collection in
and rinsing with NH3
poor liquid
1.8 2.1 0.10 0.05 0.03 0.02
cool deck system
170% and metal
three sided grate
floor
1.9 2.3 0.13 0.08 0.04 0.03
manure collection in
formaldehyde-liquid
manure solution and
metal three sided
grate
1.1 1.3 0.04 0.04 0.01 0.01
manure collection in
water and metal
three sided grate
1.5 1.8 0.01 0.01 0.01 0.01
cool deck system
200% and metal
grate, emitting
surface max. 0.8 m2
1.7 2.0 0.14 0.11 0.07 0.07
cool deck system
200% and metal
grate, emitting
surface max. 0.5 m2
1.4 1.6 0.00 0.00 0.00 0.00
cool deck system 1.8 2.1 0.04 0.05 0.04 0.03
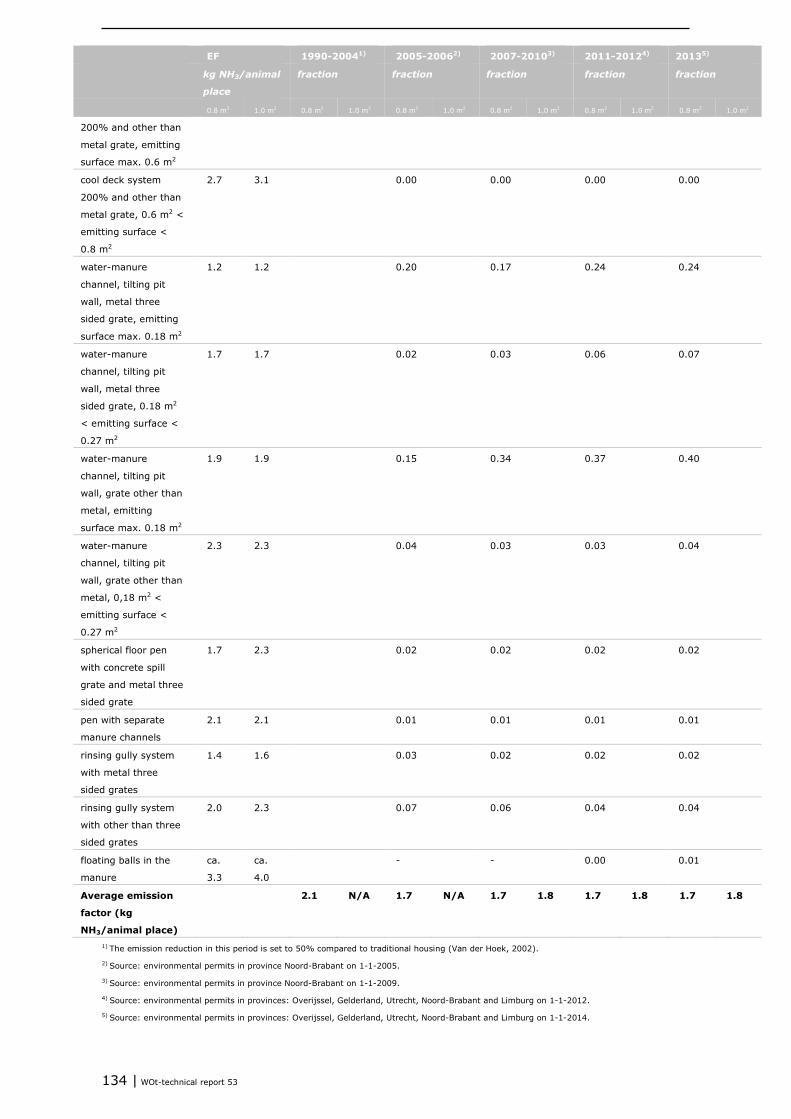
134 | WOt-technical report 53
EF 1990-20041) 2005-20062) 2007-20103) 2011-20124) 20135)
kg NH3/animal
place
fraction fraction fraction fraction fraction
0.8 m2 1.0 m2 0.8 m2 1.0 m2 0.8 m2 1.0 m2 0.8 m2 1.0 m2 0.8 m2 1.0 m2 0.8 m2 1.0 m2
200% and other than
metal grate, emitting
surface max. 0.6 m2
cool deck system
200% and other than
metal grate, 0.6 m2 <
emitting surface <
0.8 m2
2.7 3.1 0.00 0.00 0.00 0.00
water-manure
channel, tilting pit
wall, metal three
sided grate, emitting
surface max. 0.18 m2
1.2 1.2 0.20 0.17 0.24 0.24
water-manure
channel, tilting pit
wall, metal three
sided grate, 0.18 m2
< emitting surface <
0.27 m2
1.7 1.7 0.02 0.03 0.06 0.07
water-manure
channel, tilting pit
wall, grate other than
metal, emitting
surface max. 0.18 m2
1.9 1.9 0.15 0.34 0.37 0.40
water-manure
channel, tilting pit
wall, grate other than
metal, 0,18 m2 <
emitting surface <
0.27 m2
2.3 2.3 0.04 0.03 0.03 0.04
spherical floor pen
with concrete spill
grate and metal three
sided grate
1.7 2.3 0.02 0.02 0.02 0.02
pen with separate
manure channels
2.1 2.1 0.01 0.01 0.01 0.01
rinsing gully system
with metal three
sided grates
1.4 1.6 0.03 0.02 0.02 0.02
rinsing gully system
with other than three
sided grates
2.0 2.3 0.07 0.06 0.04 0.04
floating balls in the
manure
ca.
3.3
ca.
4.0
- - 0.00 0.01
Average emission
factor (kg
NH3/animal place)
2.1 N/A 1.7 N/A 1.7 1.8 1.7 1.8 1.7 1.8
1) The emission reduction in this period is set to 50% compared to traditional housing (Van der Hoek, 2002).
2) Source: environmental permits in province Noord-Brabant on 1-1-2005.
3) Source: environmental permits in province Noord-Brabant on 1-1-2009.
4) Source: environmental permits in provinces: Overijssel, Gelderland, Utrecht, Noord-Brabant and Limburg on 1-1-2012.
5) Source: environmental permits in provinces: Overijssel, Gelderland, Utrecht, Noord-Brabant and Limburg on 1-1-2014.
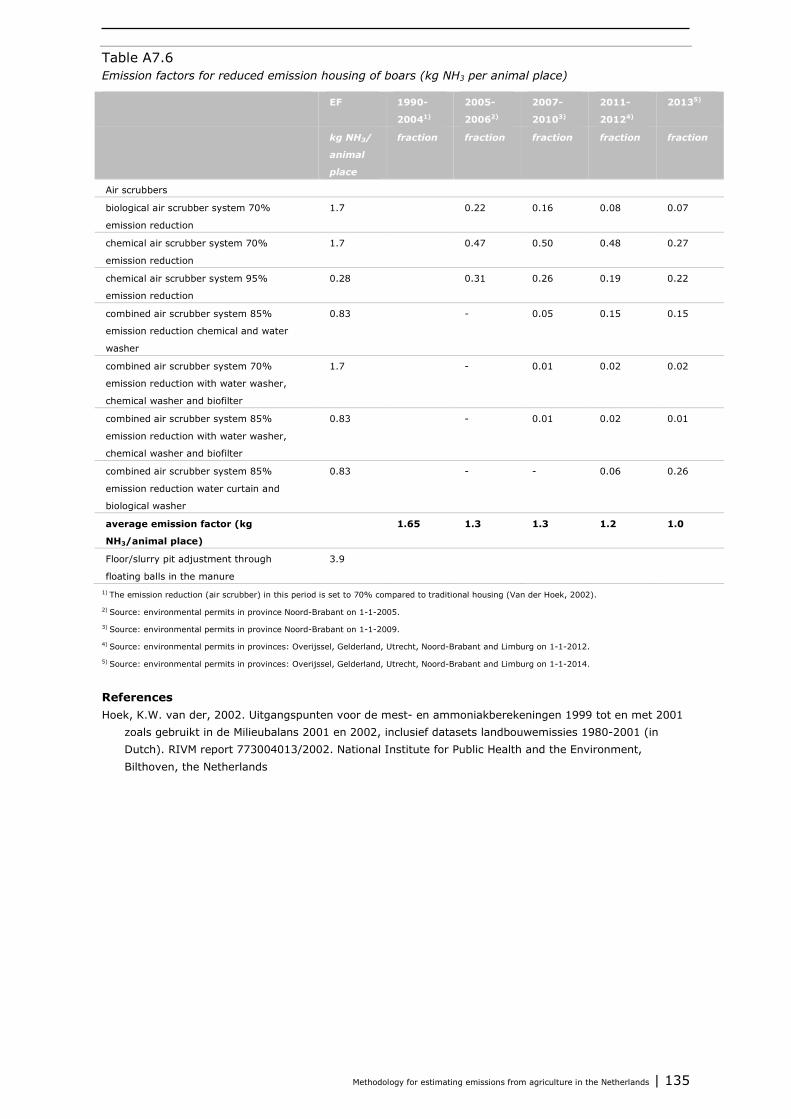
Methodology for estimating emissions from agriculture in the Netherlands | 135
Table A7.6 Emission factors for reduced emission housing of boars (kg NH3 per animal place)
EF 1990-
20041)
2005-
20062)
2007-
20103)
2011-
20124)
20135)
kg NH3/
animal
place
fraction fraction fraction fraction fraction
Air scrubbers
biological air scrubber system 70%
emission reduction
1.7 0.22 0.16 0.08 0.07
chemical air scrubber system 70%
emission reduction
1.7 0.47 0.50 0.48 0.27
chemical air scrubber system 95%
emission reduction
0.28 0.31 0.26 0.19 0.22
combined air scrubber system 85%
emission reduction chemical and water
washer
0.83 - 0.05 0.15 0.15
combined air scrubber system 70%
emission reduction with water washer,
chemical washer and biofilter
1.7 - 0.01 0.02 0.02
combined air scrubber system 85%
emission reduction with water washer,
chemical washer and biofilter
0.83 - 0.01 0.02 0.01
combined air scrubber system 85%
emission reduction water curtain and
biological washer
0.83 - - 0.06 0.26
average emission factor (kg
NH3/animal place)
1.65 1.3 1.3 1.2 1.0
Floor/slurry pit adjustment through
floating balls in the manure
3.9
1) The emission reduction (air scrubber) in this period is set to 70% compared to traditional housing (Van der Hoek, 2002).
2) Source: environmental permits in province Noord-Brabant on 1-1-2005.
3) Source: environmental permits in province Noord-Brabant on 1-1-2009.
4) Source: environmental permits in provinces: Overijssel, Gelderland, Utrecht, Noord-Brabant and Limburg on 1-1-2012.
5) Source: environmental permits in provinces: Overijssel, Gelderland, Utrecht, Noord-Brabant and Limburg on 1-1-2014.
References Hoek, K.W. van der, 2002. Uitgangspunten voor de mest- en ammoniakberekeningen 1999 tot en met 2001
zoals gebruikt in de Milieubalans 2001 en 2002, inclusief datasets landbouwemissies 1980-2001 (in Dutch). RIVM report 773004013/2002. National Institute for Public Health and the Environment, Bilthoven, the Netherlands

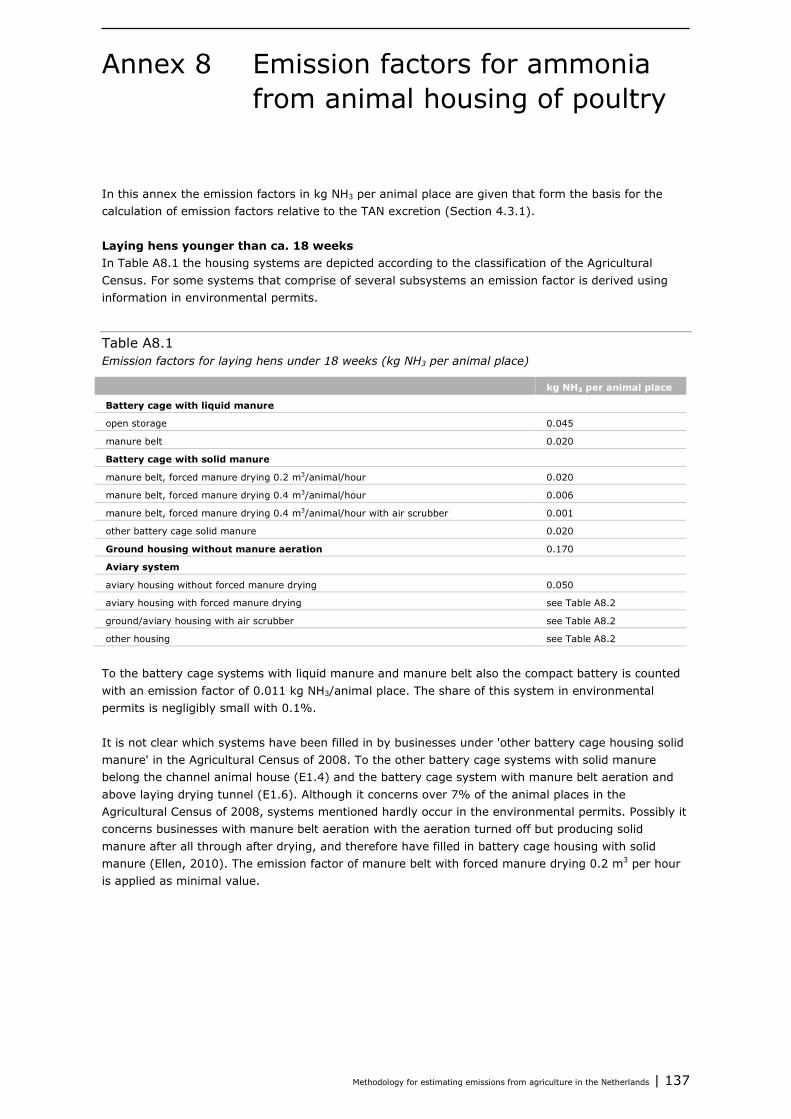
Methodology for estimating emissions from agriculture in the Netherlands | 137
Emission factors for ammonia Annex 8from animal housing of poultry
In this annex the emission factors in kg NH3 per animal place are given that form the basis for the calculation of emission factors relative to the TAN excretion (Section 4.3.1).
Laying hens younger than ca. 18 weeks In Table A8.1 the housing systems are depicted according to the classification of the Agricultural Census. For some systems that comprise of several subsystems an emission factor is derived using information in environmental permits.
Table A8.1 Emission factors for laying hens under 18 weeks (kg NH3 per animal place)
kg NH3 per animal place
Battery cage with liquid manure
open storage 0.045
manure belt 0.020
Battery cage with solid manure
manure belt, forced manure drying 0.2 m3/animal/hour 0.020
manure belt, forced manure drying 0.4 m3/animal/hour 0.006
manure belt, forced manure drying 0.4 m3/animal/hour with air scrubber 0.001
other battery cage solid manure 0.020
Ground housing without manure aeration 0.170
Aviary system
aviary housing without forced manure drying 0.050
aviary housing with forced manure drying see Table A8.2
ground/aviary housing with air scrubber see Table A8.2
other housing see Table A8.2
To the battery cage systems with liquid manure and manure belt also the compact battery is counted with an emission factor of 0.011 kg NH3/animal place. The share of this system in environmental permits is negligibly small with 0.1%. It is not clear which systems have been filled in by businesses under 'other battery cage housing solid manure' in the Agricultural Census of 2008. To the other battery cage systems with solid manure belong the channel animal house (E1.4) and the battery cage system with manure belt aeration and above laying drying tunnel (E1.6). Although it concerns over 7% of the animal places in the Agricultural Census of 2008, systems mentioned hardly occur in the environmental permits. Possibly it concerns businesses with manure belt aeration with the aeration turned off but producing solid manure after all through after drying, and therefore have filled in battery cage housing with solid manure (Ellen, 2010). The emission factor of manure belt with forced manure drying 0.2 m3 per hour is applied as minimal value.

138 | WOt-technical report 53
Table A8.2 Derived emission factors for laying hens under 18 weeks (kg NH3 per animal place)
EF 1990-
20101)
2011-
20122)
20133)
kg
NH3/animal
place
fraction fraction fraction
Aviary housing with forced manure drying
65-70% of the living place is grate, manure belt
aeration 0.3 m3/hour. Manure belts reeled off
minimally once a week
0.030 1.00 0.70 0.54
45-55% of the living space is grate, manure belts
reeled off minimally twice a week, aeration 0.1
m3/hour
0.030 - 0.16 0.28
45-55% of the living space is grate, manure belts
reeled off minimally twice a week, aeration 0.3
m3/hour
0.023 - - 0.02
55-60% of the living space is grate, manure belt
reeled off minimally once a week, aeration 0.4
m³/hour
0.020 - 0.14 0.15
average emission factor (kg NH3/animal place) 0.030 0.029 0.028
Aviary housing with air scrubber
aviary housing and chemical air scrubber system
70% emission reduction4)
0.017 1.00 - -
aviary housing and chemical air scrubber system
90% emission reduction
0.005 - 0.56 0.57
aviary housing and biological air scrubber system
70% emission reduction
0.015 - 0.44 0.43
average emission factor (kg NH3/animal place) 0.017 0.009 0.011
Other housing5)
other housing systems non-battery cage 0.170 0.75 0.57 0.42
other housing systems battery cage 0.045 0.25 0.03 0.31
warmth heaters and fans 0.150 - 0.40 0.03
colony housing 0.016 - - 0.24
average emission factor (kg NH3/animal place) 0.139 0.157 0.094 1) Source: environmental permits in province Noord-Brabant on 1-1-2009.
2) Source: environmental permits in provinces: Overijssel, Gelderland, Utrecht, Noord-Brabant and Limburg on 1-1-2012.
3) Source: environmental permits in provinces: Overijssel, Gelderland, Utrecht, Noord-Brabant and Limburg on 1-1-2014.
4) Air scrubber systems are rarely used. Although the emission factor in the Rav applies to ground housing, in the Agricultural Census only aviary
housing with air scrubber is counted. In the period after 2010 the calculated emission factor for aviary with air scrubber is applied.
5) The composition of this group can vary, depending on the differentiation in animal housing system in the Agricultural Census.
The emission factor in the Rav applies to situations in which the manure is disposed of from the business immediately or stored for a maximum of two weeks in a covered container. In other cases an additional emission factor for post-processing techniques like after drying or other storage applies. The emission factor for the post-processing technique is to be added to the emission factor of the animal housing type. For rearing hens from the environmental permits an average additional emission factor for after drying of 0.005 kg NH3 is derived. Although in animals with ground housing in the Agricultural Census in some cases a post-processing technique is applied, this is not accounted for. The Rav does not provide an additional emission factor for post-processing techniques in ground housing.
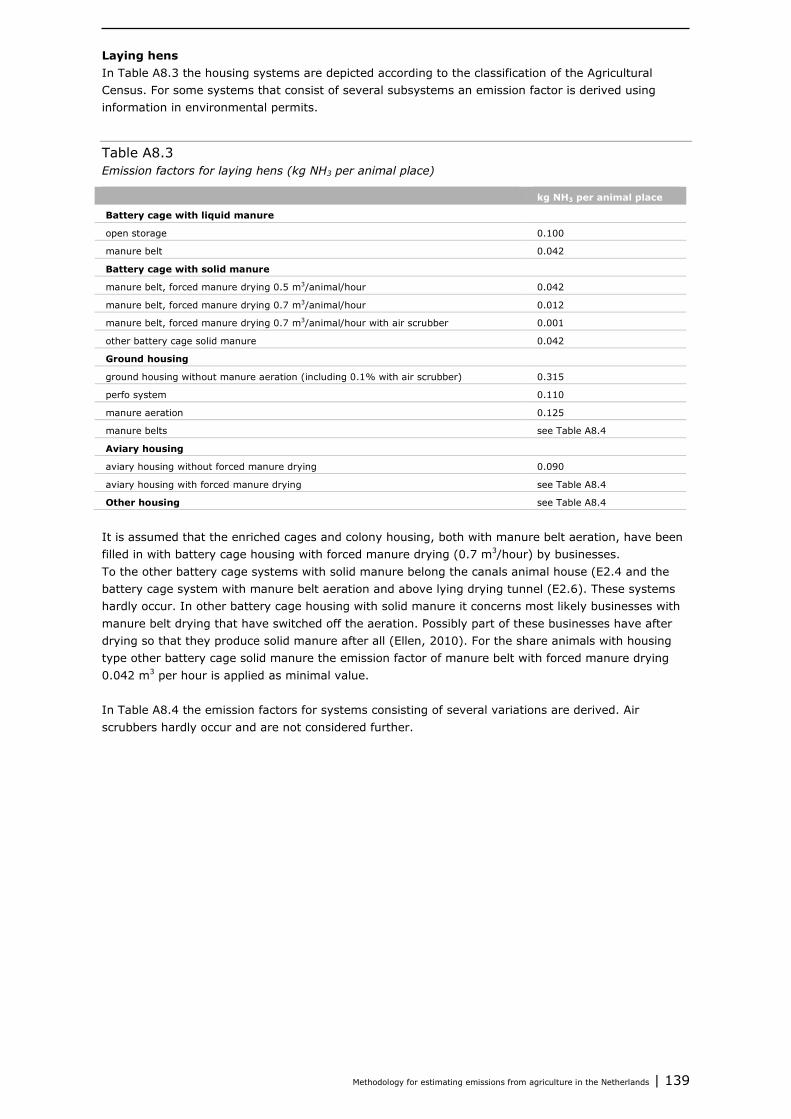
Methodology for estimating emissions from agriculture in the Netherlands | 139
Laying hens In Table A8.3 the housing systems are depicted according to the classification of the Agricultural Census. For some systems that consist of several subsystems an emission factor is derived using information in environmental permits.
Table A8.3 Emission factors for laying hens (kg NH3 per animal place)
kg NH3 per animal place
Battery cage with liquid manure
open storage 0.100
manure belt 0.042
Battery cage with solid manure
manure belt, forced manure drying 0.5 m3/animal/hour 0.042
manure belt, forced manure drying 0.7 m3/animal/hour 0.012
manure belt, forced manure drying 0.7 m3/animal/hour with air scrubber 0.001
other battery cage solid manure 0.042
Ground housing
ground housing without manure aeration (including 0.1% with air scrubber) 0.315
perfo system 0.110
manure aeration 0.125
manure belts see Table A8.4
Aviary housing
aviary housing without forced manure drying 0.090
aviary housing with forced manure drying see Table A8.4
Other housing see Table A8.4
It is assumed that the enriched cages and colony housing, both with manure belt aeration, have been filled in with battery cage housing with forced manure drying (0.7 m3/hour) by businesses. To the other battery cage systems with solid manure belong the canals animal house (E2.4 and the battery cage system with manure belt aeration and above lying drying tunnel (E2.6). These systems hardly occur. In other battery cage housing with solid manure it concerns most likely businesses with manure belt drying that have switched off the aeration. Possibly part of these businesses have after drying so that they produce solid manure after all (Ellen, 2010). For the share animals with housing type other battery cage solid manure the emission factor of manure belt with forced manure drying 0.042 m3 per hour is applied as minimal value. In Table A8.4 the emission factors for systems consisting of several variations are derived. Air scrubbers hardly occur and are not considered further.

140 | WOt-technical report 53
Table A8.4 Derived emission factors for laying hens (kg NH3 per animal place)
EF 1990-
20101)
2011-
20122)
20133)
kg NH3/
animal
place
fraction fraction fraction
Ground housing with manure belts
free-range housing on two floors with manure belts
under the grates (reeled off twice a week),
occupancy 9 animals per m2
0.068 1.00 0.91 0.91
free-range housing with frequent manure and litter
removal
0.106 - 0.09 0.09
average emission factor (kg NH3/animal place) 0.068 0.071 0.072
Aviary housing with forced manure drying
45-55% of the living space is grate, manure belt
aeration 0.2 m3/hour. Manure belts reeled off
minimally twice a week
0.055 0.88 0.79 0.76
45-55% of the living space is grate, manure belt
aeration 0.5 m3/hour. Manure belts reeled off
minimally twice a week
0.042 - - 0.03
30–35% of the living space is grate, manure belt
aeration 0.7 m3/hour. Manure belts reeled off
minimally once a week
0.025 0.08 0.09 0.11
55–60% of the living space is grate, manure belt
aeration 0.7 m3/hour. Manure belts reeled off
minimally once a week
0.037 0.04 0.11 0.10
average emission factor (kg NH3/animal place) 0.052 0.050 0.050
Other housing4)
other housing systems non-battery cage 0.315 0.88 0.68 0.43
other housing systems battery cage 0.100 0.12 0.09 0.08
aviary housing with air scrubber 0.0265) 0.20 -
ground housing with air scrubber 0.0495) 0.02 -
enriched cage/colony housing 0.030 - - 0.49
average emission factor (kg NH3/animal place) 0.290 0.231 0.085 1) Source: environmental permits in province Noord-Brabant on 1-1-2009.
2) Source: environmental permits in provinces: Overijssel, Gelderland, Utrecht, Noord-Brabant and Limburg on 1-1-2012.
3) Source: environmental permits in provinces: Overijssel, Gelderland, Utrecht, Noord-Brabant and Limburg on 1-1-2014.
4) The composition of this group can vary, depending on the differentiation in animal housing systems in the Agricultural Census.
5) Factor put together from several types of air scrubbers.
The emission factor in the Rav applies to situations in which the manure is disposed of immediately from the business or is stored for a period of at most two weeks in a covered container. In other cases an additional emission factor for post-processing techniques like after drying or other storage applies. The emission factor of the post-processing technique is to be added to the emission factor of the animal housing type. Based on information in environmental permits the average additional emission factor for after drying is 0.010 kg NH3 up to 2010 and for the years after 0.008 kg NH3 per animal place.
Broiler parents to ca. 19 weeks In Table A8.5 the animal housing systems are depicted according to the classification in the Agricultural Census. For some systems that consist of several subsystems an emission factor is derived using information in environmental permits.

Methodology for estimating emissions from agriculture in the Netherlands | 141
Table A8.5 Emission factors for broiler parents under 19 weeks (kg NH3 per animal place)
kg NH3 per animal place
traditional housing 0.250
air scrubber/biofilter 0.025
other low emission housing see Table A8.6
In Table A8.6 emission factors for other low emission housing are presented.
Table A8.6 Emission factors for broiler parents under 19 weeks (kg NH3 per animal place)
EF 1990-2010 2011-
20121)
20132)
kg
NH3/animal
place
fraction fraction fraction
Other low emission housing
animal house with mixed air ventilation 0.183 - 1.00 0.91
animal house with heating system with warmth
heaters and fans
0.180 - - 0.10
animal house with air blending system for drying
litter layer in combination with a warmth exchanger
0.158 - - 0.19
average emission factor (kg NH3/animal place) N/A 0.183 0.178 1) Source: environmental permits in provinces: Overijssel, Gelderland, Utrecht, Noord-Brabant and Limburg on 1-1-2012.
2) Source: environmental permits in provinces: Overijssel, Gelderland, Utrecht, Noord-Brabant and Limburg on 1-1-2014.
Broiler parents In Table A8.7 the housing systems are depicted according to the classification of the Agricultural Census. For some systems consisting of several subsystems an emission factor is derived using information in environmental permits.
Table A8.7 Emission factors for broiler parents (kg NH3 per animal place)
kg NH3 per animal place
traditional housing 0.580
enriched cage/group cage 0.080
aviary housing with forced manure drying see Table A8.8
ground housing with manure aeration from above 0.250
ground housing with vertical hoses in the manure or through tubes underneath the bin 0.435
perfo system 0.230
air scrubber systems see Table A8.8
ground housing with manure belts 0.245
In Table A8.8 emission factors for systems consisting of several variations are derived.

142 | WOt-technical report 53
Table A8.8 Derived emission factors for broiler parents (kg NH3 per animal place)
EF 1990-
20101)
2011-
20122)
20133)
kg
NH3/animal
place
fraction fraction fraction
Aviary housing with forced manure drying
aviary housing with forced manure drying 0.170 1.00 0.91 0.79
aviary housing with forced manure and litter drying 0.130 - 0.09 0.21
average emission factor (kg NH3/animal place) 0.170 0.166 0.161
Air scrubber systems
chemical air scrubber system 90% emission
reduction
0.058 0.81 0.26 0.29
biological air scrubber system 70% emission
reduction
0.174 0.19 0.74 0.71
average emission factor (kg NH3/animal place) 0.080 0.144 0.141 1) Source: environmental permits in province Noord-Brabant on 1-1-2009.
2) Source: environmental permits in provinces: Overijssel, Gelderland, Utrecht, Noord-Brabant and Limburg on 1-1-2012.
3) Source: environmental permits in provinces: Overijssel, Gelderland, Utrecht, Noord-Brabant and Limburg on 1-1-2014.
The emission factor in the Rav applies to situations in which the manure is removed from the farm directly or stored for a period of no more than two weeks in a covered container. In the remaining cases an additional emission factor for post-processing techniques like after drying or other storage applies. The emission factor of the post-processing technique has to be added to the emission factor of the housing type. Based on the information in environmental permits the average additional emission factor for after drying amounts to 0.010 kg NH3 up to 2010 and in the years after 0.008 kg NH3 per animal place.
Broilers In Table A8.9 the housing systems are depicted according to the classification of the Agricultural Census. For some systems consisting of several subsystems an emission factor is derived using information in environmental permits.
Table A8.9 Emission factors for broilers (kg NH3 per animal place)
kg NH3 per animal place
traditional housing 0.080
floor with litter drying see Table A8.10
storey systems see Table A8.10
air scrubber systems see Table A8.10
ground housing with floor heating and cooling 0.045
mixed air ventilation, warmth heaters and fans, air blending see Table A8.10
In Table A8.10 emission factors for systems consisting of several variations are derived.

Methodology for estimating emissions from agriculture in the Netherlands | 143
Table A8.10 Derived emission factors for broilers (kg NH3 per animal place)
EF 1990-
20101)
2011-
20122)
20133)
kg NH3/
animal
place
fraction fraction fraction
Floor with litter drying
floating floor with litter drying 0.005 0.48 0.36 0.37
perforated floor with litter drying 0.014 0.52 0.64 0.63
average emission factor (kg NH3/animal place) 0.010 0.011 0.011
Storey systems
storey system with fully slatted floor and manure belt
aeration
0.005 0.49 0.40 0.44
storey system with manure belt and litter drying 0.020 0.51 0.60 0.56
average emission factor (kg NH3/animal place) 0.013 0.014 0.013
Air scrubber systems
chemical air scrubber system 90% emission
reduction
0.008 0.90 0.74 0.69
biological air scrubber system 70% emission
reduction
0.024 0.10 0.25 0.25
ground housing with floor heating and floor cooling +
chemical air scrubber system 90% emission
reduction
0.005 - - 0.06
animal house with heating system and fans +
biological air scrubber system 70% emission
reduction
0.011 - 0.01 -
average emission factor (kg NH3/animal place) 0.010 0.012 0.012 1) Source: environmental permits in province Noord-Brabant on 1-1-2009.
2) Source: environmental permits in provinces: Overijssel, Gelderland, Utrecht, Noord-Brabant and Limburg on 1-1-2012.
3) Source: environmental permits in provinces: Overijssel, Gelderland, Utrecht, Noord-Brabant and Limburg on 1-1-2014.
Ducks for slaughter In ducks for slaughter only traditional housing occurs with an emission factor of 0.210 kg NH3 per animal place.
Turkeys for slaughter In Table A8.11 the housing systems are presented according to the classification of the Agricultural Census. For some systems consisting of several subsystems an emission factor is derived using information of environmental permits.
Table A8.11 Emission factors for turkeys (kg NH3 per animal place)
kg NH3 per animal place
traditional housing 0.68
low emission housing see Table A8.12
In Table A8.12 emission factors for systems consisting of several variations are derived.

144 | WOt-technical report 53
Table A8.12 Derived emission factors for turkeys (kg NH3 per animal place)
EF 1990-
20101)
2011-
20122)
20133)
kg NH3/
animal
place
fraction fraction fraction
Low emission housing
partly elevated litter floor 0.36 1.00 0.45 0.36
chemical air scrubber system 90% emission
reduction
0.07 - 0.01 0.01
mechanically ventilated animal house with frequent
litter removal
0.26 - 0.49 0.43
biological air scrubber system 70% emission
reduction
0.20 - 0.06 0.06
animal house with heating system with warmth
heaters and fans
0.49 - - 0.13
average emission factor (kg NH3/animal place) 0.36 0.30 0.32 1) Source: environmental permits in province Noord-Brabant on 1-1-2009.
2) Source: environmental permits in provinces: Overijssel, Gelderland, Utrecht, Noord-Brabant and Limburg on 1-1-2012.
3) Source: environmental permits in provinces: Overijssel, Gelderland, Utrecht, Noord-Brabant and Limburg on 1-1-2014.
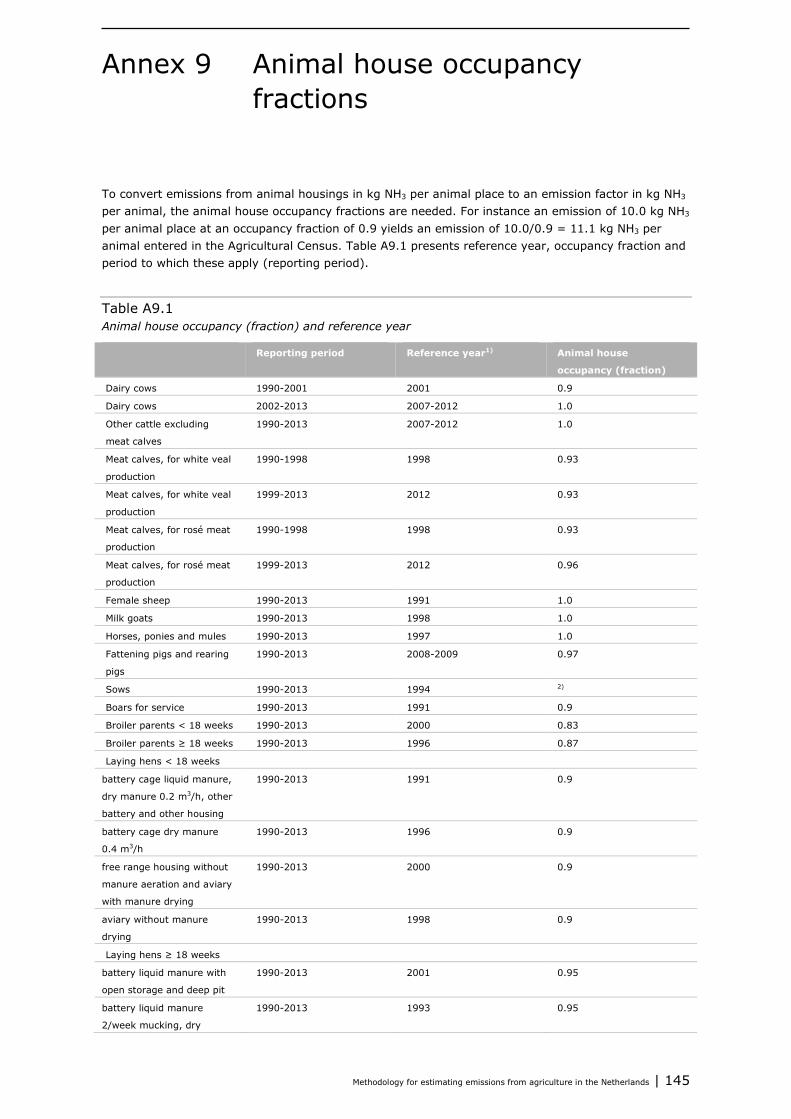
Methodology for estimating emissions from agriculture in the Netherlands | 145
Animal house occupancy Annex 9fractions
To convert emissions from animal housings in kg NH3 per animal place to an emission factor in kg NH3 per animal, the animal house occupancy fractions are needed. For instance an emission of 10.0 kg NH3 per animal place at an occupancy fraction of 0.9 yields an emission of 10.0/0.9 = 11.1 kg NH3 per animal entered in the Agricultural Census. Table A9.1 presents reference year, occupancy fraction and period to which these apply (reporting period).
Table A9.1 Animal house occupancy (fraction) and reference year
Reporting period Reference year1) Animal house
occupancy (fraction)
Dairy cows 1990-2001 2001 0.9
Dairy cows 2002-2013 2007-2012 1.0
Other cattle excluding
meat calves
1990-2013 2007-2012 1.0
Meat calves, for white veal
production
1990-1998 1998 0.93
Meat calves, for white veal
production
1999-2013 2012 0.93
Meat calves, for rosé meat
production
1990-1998 1998 0.93
Meat calves, for rosé meat
production
1999-2013 2012 0.96
Female sheep 1990-2013 1991 1.0
Milk goats 1990-2013 1998 1.0
Horses, ponies and mules 1990-2013 1997 1.0
Fattening pigs and rearing
pigs
1990-2013 2008-2009 0.97
Sows 1990-2013 1994 2)
Boars for service 1990-2013 1991 0.9
Broiler parents < 18 weeks 1990-2013 2000 0.83
Broiler parents ≥ 18 weeks 1990-2013 1996 0.87
Laying hens < 18 weeks
battery cage liquid manure,
dry manure 0.2 m3/h, other
battery and other housing
1990-2013 1991 0.9
battery cage dry manure
0.4 m3/h
1990-2013 1996 0.9
free range housing without
manure aeration and aviary
with manure drying
1990-2013 2000 0.9
aviary without manure
drying
1990-2013 1998 0.9
Laying hens ≥ 18 weeks
battery liquid manure with
open storage and deep pit
1990-2013 2001 0.95
battery liquid manure
2/week mucking, dry
1990-2013 1993 0.95

146 | WOt-technical report 53
Reporting period Reference year1) Animal house
occupancy (fraction)
manure 0.5 m3/h, other
battery
battery dry manure 0.7
m3/h
1990-2013 1996 0.95
free range housing and
aviary without manure
drying
1990-2013 1998 0.95
aviary manure drying 1990-2013 2001 0.95
Broilers
traditional, litter drying,
storey system with slatted
floor and aeration, air
scrubber
1990-2013 2002 0.81
ground housing with floor
heating and - cooling
1990-2013 1997-1998 0.81
mixed air ventilation 1990-2013 2005 0.81
Ducks 1990-2013 2000 0.84
Turkeys 1990-2013 1998 0.95
Rabbits (mother animals) 1990-2013 1998 1.0
Fur-bearing animals
(mother animals)
1990-2013 1991 0.9
1) The reference year is the year or period that corresponds with the year or the period in which the emission factor in kg NH3 per animal place is
taken up in the Rav respectively is measured.
2) Per breeding sow present: 0.25 sow with piglets; 0.83 open and sows in pig and 2.8 weaned piglet per breeding sow.

Methodology for estimating emissions from agriculture in the Netherlands | 147
Manure storage outside the Annex 10animal house
Table A10.1 Manure storage outside animal housing (% of produced manure)
1990-
20041)
20052) 20062) 20072) 20082) 20092) 2010-
20113)
20123) 20134)
Liquid cattle manure 25 27 27 27 27 27 24 24 23
Liquid pig manure 10 15 15 15 15 15 21 21 19
Liquid poultry manure 15 88 88 88 88 88 100 100 100
Liquid manure of fur-bearing
animals
50 50 50 50 50 50 50 50 50
Solid manure of grazing
animals, pigs and rabbits
100 100 100 100 100 100 100 100 100
Solid poultry manure
deep pit housing 100 100 100 100 N/A N/A N/A N/A N/A
pre-dried belt manure
(battery cage and aviary)
100 100 100 100 100 100 100 100 100
post-dried manure 100 90 60 40 0 0 0 40 40
laying poultry – litter manure 100 85 65 70 40 35 25 25 30
broiler manure 100 100 100 100 85 90 95 95 100
duck manure 100 75 5 95 0 0 0 0 0
turkey manure 25 27 27 27 27 27 24 24 23 1) Agricultural Census 1993.
2) Agricultural Census 2007 and transportation documents animal manure.
3) Agricultural Census 2010 and transportation documents animal manure.
4) Agricultural Census 2014 and transportation documents animal manure.
Table A10.2 Covered manure storages (% of stored manure outside animal housing)
19901) 19911) 1992-
19962)
1997-
20043)
2005-
20134)
Liquid cattle manure 25 25 67 97 100
Liquid pig manure 70 75 82 100 100
Liquid poultry manure
open storage 60 70 78 100 100
manure belt disposal 0 17 78 100 100 1) Van der Hoek (1994).
2) Agricultural Census 1993.
3) Van der Hoek (2002).
4) Hoogeveen et al. (2010).
N.B. Other manure storages are not covered.
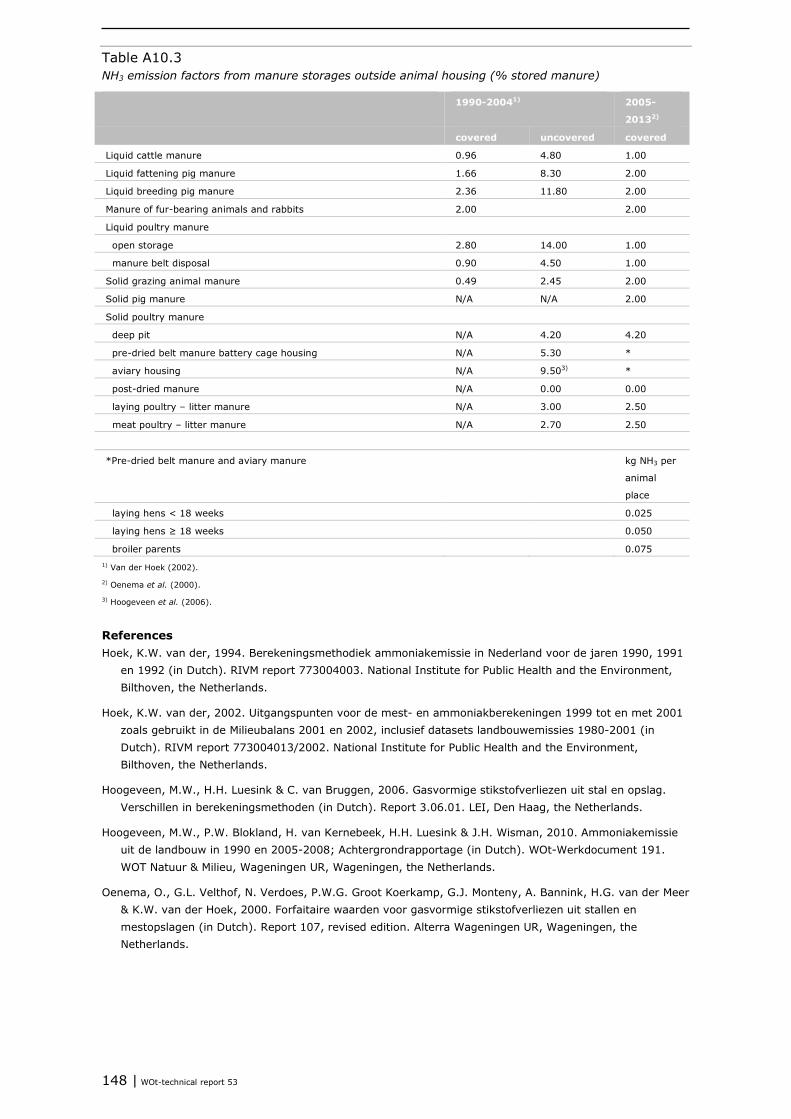
148 | WOt-technical report 53
Table A10.3 NH3 emission factors from manure storages outside animal housing (% stored manure)
1990-20041) 2005-
20132)
covered uncovered covered
Liquid cattle manure 0.96 4.80 1.00
Liquid fattening pig manure 1.66 8.30 2.00
Liquid breeding pig manure 2.36 11.80 2.00
Manure of fur-bearing animals and rabbits 2.00 2.00
Liquid poultry manure
open storage 2.80 14.00 1.00
manure belt disposal 0.90 4.50 1.00
Solid grazing animal manure 0.49 2.45 2.00
Solid pig manure N/A N/A 2.00
Solid poultry manure
deep pit N/A 4.20 4.20
pre-dried belt manure battery cage housing N/A 5.30 *
aviary housing N/A 9.503) *
post-dried manure N/A 0.00 0.00
laying poultry – litter manure N/A 3.00 2.50
meat poultry – litter manure N/A 2.70 2.50
*Pre-dried belt manure and aviary manure kg NH3 per
animal
place
laying hens < 18 weeks 0.025
laying hens ≥ 18 weeks 0.050
broiler parents 0.075 1) Van der Hoek (2002).
2) Oenema et al. (2000).
3) Hoogeveen et al. (2006).
References Hoek, K.W. van der, 1994. Berekeningsmethodiek ammoniakemissie in Nederland voor de jaren 1990, 1991
en 1992 (in Dutch). RIVM report 773004003. National Institute for Public Health and the Environment, Bilthoven, the Netherlands.
Hoek, K.W. van der, 2002. Uitgangspunten voor de mest- en ammoniakberekeningen 1999 tot en met 2001 zoals gebruikt in de Milieubalans 2001 en 2002, inclusief datasets landbouwemissies 1980-2001 (in Dutch). RIVM report 773004013/2002. National Institute for Public Health and the Environment, Bilthoven, the Netherlands.
Hoogeveen, M.W., H.H. Luesink & C. van Bruggen, 2006. Gasvormige stikstofverliezen uit stal en opslag. Verschillen in berekeningsmethoden (in Dutch). Report 3.06.01. LEI, Den Haag, the Netherlands.
Hoogeveen, M.W., P.W. Blokland, H. van Kernebeek, H.H. Luesink & J.H. Wisman, 2010. Ammoniakemissie uit de landbouw in 1990 en 2005-2008; Achtergrondrapportage (in Dutch). WOt-Werkdocument 191. WOT Natuur & Milieu, Wageningen UR, Wageningen, the Netherlands.
Oenema, O., G.L. Velthof, N. Verdoes, P.W.G. Groot Koerkamp, G.J. Monteny, A. Bannink, H.G. van der Meer & K.W. van der Hoek, 2000. Forfaitaire waarden voor gasvormige stikstofverliezen uit stallen en mestopslagen (in Dutch). Report 107, revised edition. Alterra Wageningen UR, Wageningen, the Netherlands.
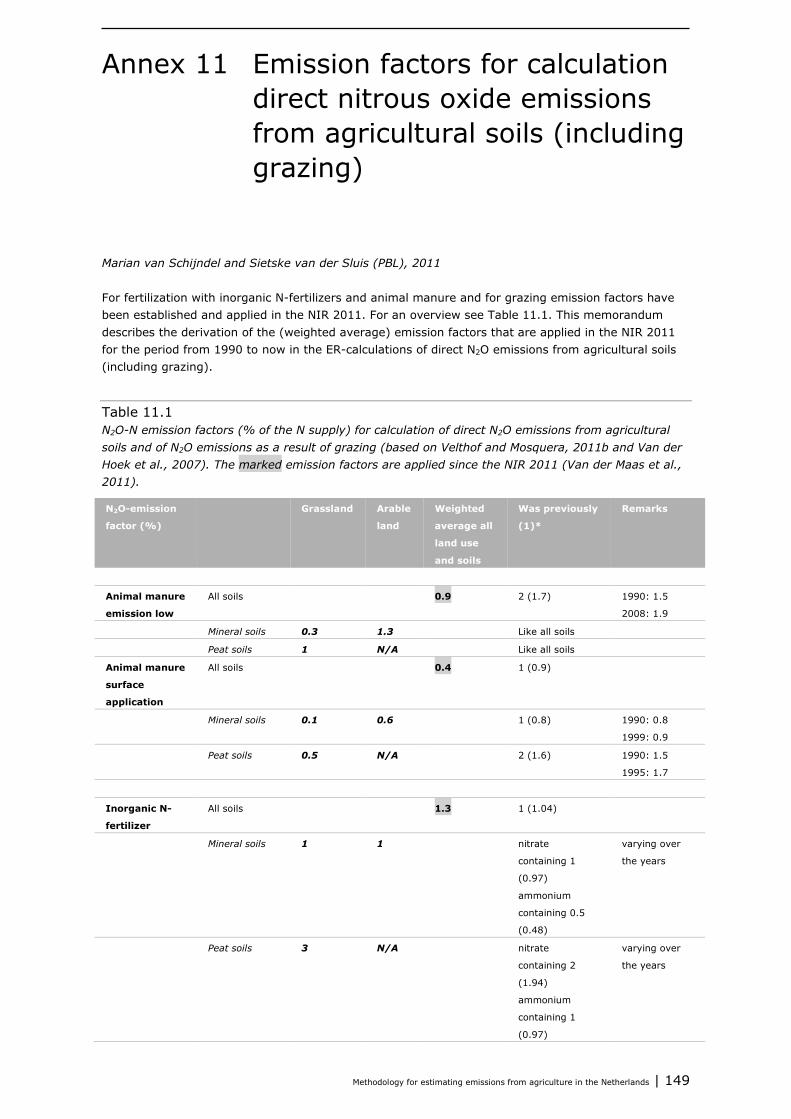
Methodology for estimating emissions from agriculture in the Netherlands | 149
Emission factors for calculation Annex 11direct nitrous oxide emissions from agricultural soils (including grazing)
Marian van Schijndel and Sietske van der Sluis (PBL), 2011 For fertilization with inorganic N-fertilizers and animal manure and for grazing emission factors have been established and applied in the NIR 2011. For an overview see Table 11.1. This memorandum describes the derivation of the (weighted average) emission factors that are applied in the NIR 2011 for the period from 1990 to now in the ER-calculations of direct N2O emissions from agricultural soils (including grazing).
Table 11.1 N2O-N emission factors (% of the N supply) for calculation of direct N2O emissions from agricultural soils and of N2O emissions as a result of grazing (based on Velthof and Mosquera, 2011b and Van der Hoek et al., 2007). The marked emission factors are applied since the NIR 2011 (Van der Maas et al., 2011).
N2O-emission
factor (%)
Grassland Arable
land
Weighted
average all
land use
and soils
Was previously
(1)*
Remarks
Animal manure
emission low
All soils 0.9 2 (1.7) 1990: 1.5
2008: 1.9
Mineral soils 0.3 1.3 Like all soils
Peat soils 1 N/A Like all soils
Animal manure
surface
application
All soils 0.4 1 (0.9)
Mineral soils 0.1 0.6 1 (0.8) 1990: 0.8
1999: 0.9
Peat soils 0.5 N/A 2 (1.6) 1990: 1.5
1995: 1.7
Inorganic N-
fertilizer
All soils 1.3 1 (1.04)
Mineral soils 1 1 nitrate
containing 1
(0.97)
ammonium
containing 0.5
(0.48)
varying over
the years
Peat soils 3 N/A nitrate
containing 2
(1.94)
ammonium
containing 1
(0.97)
varying over
the years
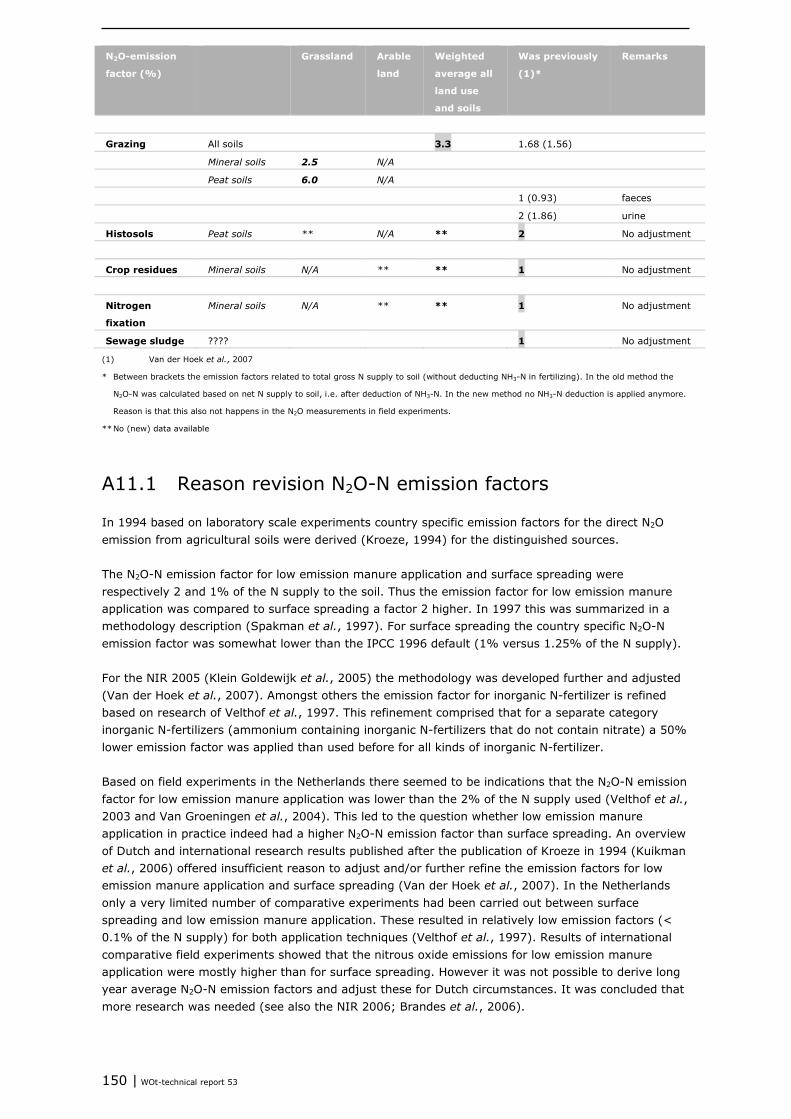
150 | WOt-technical report 53
N2O-emission
factor (%)
Grassland Arable
land
Weighted
average all
land use
and soils
Was previously
(1)*
Remarks
Grazing All soils 3.3 1.68 (1.56)
Mineral soils 2.5 N/A
Peat soils 6.0 N/A
1 (0.93) faeces
2 (1.86) urine
Histosols Peat soils ** N/A ** 2 No adjustment
Crop residues Mineral soils N/A ** ** 1 No adjustment
Nitrogen
fixation
Mineral soils N/A ** ** 1 No adjustment
Sewage sludge ???? 1 No adjustment
(1) Van der Hoek et al., 2007
* Between brackets the emission factors related to total gross N supply to soil (without deducting NH3-N in fertilizing). In the old method the
N2O-N was calculated based on net N supply to soil, i.e. after deduction of NH3-N. In the new method no NH3-N deduction is applied anymore.
Reason is that this also not happens in the N2O measurements in field experiments.
** No (new) data available
A11.1 Reason revision N2O-N emission factors
In 1994 based on laboratory scale experiments country specific emission factors for the direct N2O emission from agricultural soils were derived (Kroeze, 1994) for the distinguished sources. The N2O-N emission factor for low emission manure application and surface spreading were respectively 2 and 1% of the N supply to the soil. Thus the emission factor for low emission manure application was compared to surface spreading a factor 2 higher. In 1997 this was summarized in a methodology description (Spakman et al., 1997). For surface spreading the country specific N2O-N emission factor was somewhat lower than the IPCC 1996 default (1% versus 1.25% of the N supply). For the NIR 2005 (Klein Goldewijk et al., 2005) the methodology was developed further and adjusted (Van der Hoek et al., 2007). Amongst others the emission factor for inorganic N-fertilizer is refined based on research of Velthof et al., 1997. This refinement comprised that for a separate category inorganic N-fertilizers (ammonium containing inorganic N-fertilizers that do not contain nitrate) a 50% lower emission factor was applied than used before for all kinds of inorganic N-fertilizer. Based on field experiments in the Netherlands there seemed to be indications that the N2O-N emission factor for low emission manure application was lower than the 2% of the N supply used (Velthof et al., 2003 and Van Groeningen et al., 2004). This led to the question whether low emission manure application in practice indeed had a higher N2O-N emission factor than surface spreading. An overview of Dutch and international research results published after the publication of Kroeze in 1994 (Kuikman et al., 2006) offered insufficient reason to adjust and/or further refine the emission factors for low emission manure application and surface spreading (Van der Hoek et al., 2007). In the Netherlands only a very limited number of comparative experiments had been carried out between surface spreading and low emission manure application. These resulted in relatively low emission factors (< 0.1% of the N supply) for both application techniques (Velthof et al., 1997). Results of international comparative field experiments showed that the nitrous oxide emissions for low emission manure application were mostly higher than for surface spreading. However it was not possible to derive long year average N2O-N emission factors and adjust these for Dutch circumstances. It was concluded that more research was needed (see also the NIR 2006; Brandes et al., 2006).
Methodology for estimating emissions from agriculture in the Netherlands | 151
Between 2007 and 2010 in the Netherlands 2 to 3 year lasting comparative field experiments have been conducted to map the N2O emissions for surface spreading and low emission manure application, in which for comparison also the fertilization with inorganic N-fertilizer was researched (Velthof et al., 2010 and Velthof and Mosquera, 2011a). It was found that low emission manure application has higher N2O-N emission factors than surface spreading. The emission factors derived based were lower than the emission factors used for both fertilization techniques, and there were differences in the N2O-N emission factors between grassland and arable land and between animal manure and inorganic N-fertilizer. These findings were the incentive to follow-up research. Based on all available Dutch and other NW European measurements of N2O emission factors starting from the beginning of the nineties it was recommended to adjust the emission factors for manure application and inorganic N-fertilizer use (Velthof and Mosquera, 2011b). PBL Netherlands Environmental Assessment Agency has reviewed the statistical analysis performed by Velthof and Mosquera on behalf of the Emission Registration (see Annex 2).
A11.2 Motivation for calculating weighted average emission factors
Table 11.1 distinguishes for animal manure low emission manure application and surface fertilization. Further for animal manure, inorganic N-fertilizer and grazing there are separate emission factors for mineral soils, peat soils, grassland and arable land (see data in italics) as determined by Velthof and Mosquera, 2011b.
A11.2.1 Data series N supply to soil
Based on the historical data for N supply to grassland and arable land (part of the manure and ammonia calculation for the Emission Registration, see for instance Hoogeveen et al., 2010) for four soil types a yearly and multiannual weighted average emission factor can be calculated (Table A11.2 up to Table A11.4, at the end of this Annex). For this the data series of 1990-2005 is used, because the data 2006-2008 show a trend break with the data of 1990-2005. Especially there is a factor 8 to 15 increase in the supply of respectively inorganic N-fertilizer and animal manure to arable land on peat soil. Also there is almost a bisection in the supply of N in manure (through fertilization and grazing) to grassland on peat. This correlates to specific data becoming available on the cultivation of crops on several soil types through the Agricultural Census since 2006. Up to 2006 this information was not available and crops were allocated to soil types. Grassland was situated on peat soil as much as possible and only in case of too little grassland also arable land was situated on peat soil. The supply of manure to arable land on peat soil was as a result of this limited to << 1% and deemed negligible. In the assumption that the supply of manure to arable land is negligible, use of the whole data series (1990-2008) leads to a weighted average emission factor that is circa 0.1% lower than in using the data series 1990-2005. For the current emission calculations the data series of 1990-2005 is used to prevent underestimation of the emissions. From the new information that is available over the period 2006-2008 it turns out that the supply of manure on arable land on peat soil is circa 1 to 2% higher. At this moment it is unknown whether including the supply of manure to arable land on peat leads to significant higher N2O emission factors. There is no N2O emission factor available for fertilization of arable land on peat with animal manure or inorganic N-fertilizer. A sensitivity analysis shows that including the supply of manure to arable land on peat does not lead to a higher weighted average emission factor.
152 | WOt-technical report 53
Only with an emission factor that is a factor 6 to 8 higher for supply of animal manure to arable land on peat the weighted average emission factor becomes 0.1% point higher. For inorganic N-fertilizer this is only the case when the emission factor is a factor 40 higher. Experiments on grassland show that the emission factor for peat soils is often a factor 3 to 5 higher than the emission factor for mineral soils. Assuming this increase also applies to arable land it is assumed that the weighted average emission factor is correct.
A11.2.2 Variation in N supply to soil
The share of the N supply to arable land coming from animal manure is for the whole period of 1990 until now on average circa 48%, this share varies between 36 and 57%. Deviation of the average is therefore at maximum around 25%. For grassland the average N supply from animal manure is circa 52%, this varies between 43 and 64%. Deviation of the average is therefore at maximum around 20%. For grassland on peat soils an average N supply of circa 11% (9-14%) applies. The share of the N supply to arable land coming from inorganic N-fertilizer is for 1990 until now on average 27%, in which this share varies between circa 23 to circa 41%. Deviation of the average is therefore at maximum around 50%. For grassland the average N supply coming from inorganic N-fertilizer is circa 73%, in which this share varies between circa 59 to 77%. Deviation from the average is therefore at maximum around 20%. The variation in the shares of the N supply to arable land versus grassland therefore is tens of per cents. Also for the emission factors derived for the various sources the uncertainty is tens of per cents (see standard deviations in Velthof and Mosquera, 2011b). The uncertainties in the emission factors and in the yearly N supply to mineral versus organic soils with grassland and arable land do not make it necessary to conduct yearly calculation for the distinguished sources. Also for the supply of N2O emission figures in international reports disaggregated emission factors are not necessary. From 2011 on the disaggregated data on N supply possibly will not become available yearly1. For these reasons multiannual weighted average emission factors are derived for surface spreading, for low emission manure application, for application of inorganic N-fertilizers and for grazing.
A11.2.3 Weighted average emission factors
Animal manure For animal manure the (multiannual weighted average) N2O emission factor for surface spreading and low emission manure application is respectively 0.4% and 0.9% of the N supply to soil. That is circa a factor 2 lower than the value applied up to now. This applies to surface spreading (decrease from circa 1 to 0.4% of the N supply) as well as low emission manure application (decrease from circa 2 to 0.9% of the N supply). There is a significant difference in emission factors for low emission manure application and surface spreading. For low emission manure application the N2O-N emission factor is a factor 2 higher than for surface spreading, namely 0.9% versus 0.4% of the N supply (Velthof et al., 2010). The share of N in surface spreading decreases strongly between 1990 and 1995 (from 100 to 5%). This makes it necessary to calculate these sources separately in the yearly emission calculations and thus to differentiate separate emission factors for surface spreading and low emission manure application.
1 This as result of the transition to a new calculation methodology for the yearly national ammonia calculations (Velthof et
al., 2009 and Van Bruggen et al., 2011). The previously yearly used MAMBO model for the ammonia calculations will be applied by the ER possibly only for the purpose of regionalization. This will likely be less frequent than yearly, for instance 3 yearly.

Methodology for estimating emissions from agriculture in the Netherlands | 153
Inorganic N-fertilizer For inorganic N-fertilizer the (multiannual weighted average) N2O-N emission factor is circa 30% higher than the value applied up until now (from circa 1 to 1.3% of the N supply). Reason is that especially for grassland on peat soils the emission factor based on measurement turns out to be higher than assumed (3% instead of 2%). Also no longer a lower emission factor for ammonium containing (nitrate free) inorganic N-fertilizer is applied, because the available measurements do not provide sufficient basis for different factors. In the Netherlands very few measurement were done; only 3 comparative experiments with a duration of more than 8 months. In 1 of the 3 experiments there seems to be a lower emission factor for the ammonium containing (nitrate fee) inorganic N-fertilizer. In the other 2 experiments there is no difference or the emission factor is even higher. Also literature research into international measurements does not provide a definite answer (Velthof and Mosquera, 2011b).
Grazing For grazing the (multiannual weighted average) emission factor is circa a factor 2 higher based on measurements (urine/dung data in Appendix 1 of Velthof and Mosquera, 2011b); it increases from circa 1.7 to 3.3% N2O-N of the N supply.
Other sources For the emission factor of the smaller sources crop residues, N fixation, histosols and sewage sludge the ‘old’ values still apply because no new data is available. For histosols the emission factor is 2%. This is consistent with the average of the new emission factors that apply for grassland on peat soils for inorganic N-fertilizer and low emission manure application (respectively 3 and 1%). For crop residues and nitrogen fixation the emission factor is 1%. This is consistent with the average of the emission factors that apply for arable land on mineral soils for inorganic N-fertilizers and low emission manure application (respectively 1 and 1.3%).
Comparison to IPCC defaults The new emission factor for low emission manure application of 0.9% is lower than the IPCC 1996 default of 1.25%, but is approximately around the new IPCC 2006 default of 1%. For surface spreading the emission factor is a factor 2 lower than the IPCC 2006 default. The new emission factor for inorganic N-fertilizer is somewhat higher than the IPCC 1996 default (1.3 versus 1.25%). In comparison to the new IPCC 2006 default of 1% of the N supply the country specific value is circa 30% higher. The new emission factor for grazing is 3.3% of the N supply and with that circa 65% higher than the IPCC 1996 and IPCC 2006 defaults of 2%.
References Brandes, L.J., G.E.M. Alkemade, P.G. Ruyssenaars, H.H.J. Vreuls & P.W.H.G. Coenen, 2006. Greenhouse Gas
Emissions in the Netherlands 1990-2004. National Inventory Report 2006. MNP report 500080001/2006. Netherlands Environmental Assessment Agency, Bilthoven, the Netherlands.
Hoek, K.W. van der, M.W. van Schijndel & P.J. Kuikman, 2007. Direct and indirect nitrous oxide emissions from agricultural soils, 1990-2003. Background document on the calculation method for the Dutch NIR. MNP report 500080003, RIVM report 680125003. Netherlands Environmental Assessment Agency/National Institute for Public Health and the Environment, Bilthoven, the Netherlands.
Hoogeveen, M.W., P.W. Blokland, H. van Kernebeek, H.H. Luesink & J.H. Wisman, 2010. Ammoniakemissie uit de landbouw in 1990 en 2005-2008. Achtergrondrapportage (in Dutch). WOt-Working Document 191, WOT Natuur & Milieu, Wageningen UR, Wageningen, the Netherlands.
Klein Goldewijk, K., J.G.J. Olivier, J.A.H.W. Peters, P.W.H.G. Coenen & H.H.J. Vreuls, 2005. Greenhouse Gas Emissions in the Netherlands 1990-2003. National Inventory Report 2005.
RIVM report 773201009/2005. National Institute for Public Health and the Environment, Bilthoven, the Netherlands.
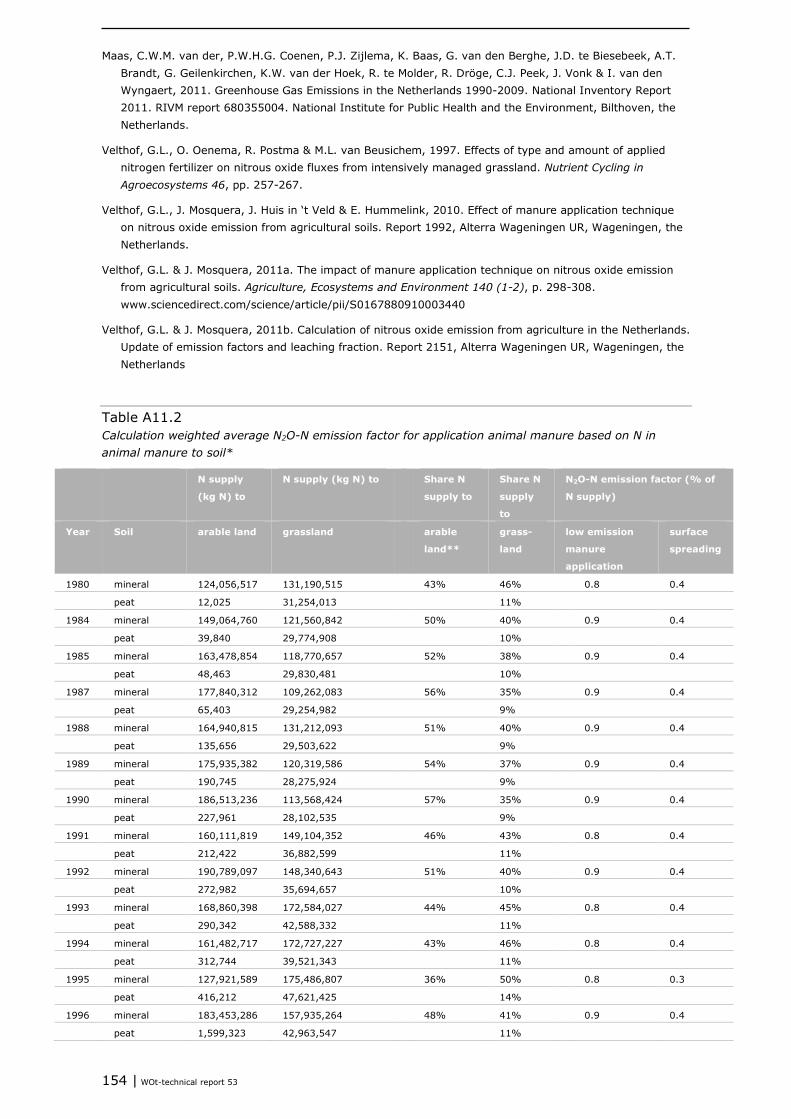
154 | WOt-technical report 53
Maas, C.W.M. van der, P.W.H.G. Coenen, P.J. Zijlema, K. Baas, G. van den Berghe, J.D. te Biesebeek, A.T. Brandt, G. Geilenkirchen, K.W. van der Hoek, R. te Molder, R. Dröge, C.J. Peek, J. Vonk & I. van den Wyngaert, 2011. Greenhouse Gas Emissions in the Netherlands 1990-2009. National Inventory Report 2011. RIVM report 680355004. National Institute for Public Health and the Environment, Bilthoven, the Netherlands.
Velthof, G.L., O. Oenema, R. Postma & M.L. van Beusichem, 1997. Effects of type and amount of applied nitrogen fertilizer on nitrous oxide fluxes from intensively managed grassland. Nutrient Cycling in Agroecosystems 46, pp. 257-267.
Velthof, G.L., J. Mosquera, J. Huis in ‘t Veld & E. Hummelink, 2010. Effect of manure application technique on nitrous oxide emission from agricultural soils. Report 1992, Alterra Wageningen UR, Wageningen, the Netherlands.
Velthof, G.L. & J. Mosquera, 2011a. The impact of manure application technique on nitrous oxide emission from agricultural soils. Agriculture, Ecosystems and Environment 140 (1-2), p. 298-308. www.sciencedirect.com/science/article/pii/S0167880910003440
Velthof, G.L. & J. Mosquera, 2011b. Calculation of nitrous oxide emission from agriculture in the Netherlands. Update of emission factors and leaching fraction. Report 2151, Alterra Wageningen UR, Wageningen, the Netherlands
Table A11.2 Calculation weighted average N2O-N emission factor for application animal manure based on N in animal manure to soil*
N supply
(kg N) to
N supply (kg N) to Share N
supply to
Share N
supply
to
N2O-N emission factor (% of
N supply)
Year Soil arable land grassland arable
land**
grass-
land
low emission
manure
application
surface
spreading
1980 mineral 124,056,517 131,190,515 43% 46% 0.8 0.4
peat 12,025 31,254,013 11%
1984 mineral 149,064,760 121,560,842 50% 40% 0.9 0.4
peat 39,840 29,774,908 10%
1985 mineral 163,478,854 118,770,657 52% 38% 0.9 0.4
peat 48,463 29,830,481 10%
1987 mineral 177,840,312 109,262,083 56% 35% 0.9 0.4
peat 65,403 29,254,982 9%
1988 mineral 164,940,815 131,212,093 51% 40% 0.9 0.4
peat 135,656 29,503,622 9%
1989 mineral 175,935,382 120,319,586 54% 37% 0.9 0.4
peat 190,745 28,275,924 9%
1990 mineral 186,513,236 113,568,424 57% 35% 0.9 0.4
peat 227,961 28,102,535 9%
1991 mineral 160,111,819 149,104,352 46% 43% 0.8 0.4
peat 212,422 36,882,599 11%
1992 mineral 190,789,097 148,340,643 51% 40% 0.9 0.4
peat 272,982 35,694,657 10%
1993 mineral 168,860,398 172,584,027 44% 45% 0.8 0.4
peat 290,342 42,588,332 11%
1994 mineral 161,482,717 172,727,227 43% 46% 0.8 0.4
peat 312,744 39,521,343 11%
1995 mineral 127,921,589 175,486,807 36% 50% 0.8 0.3
peat 416,212 47,621,425 14%
1996 mineral 183,453,286 157,935,264 48% 41% 0.9 0.4
peat 1,599,323 42,963,547 11%
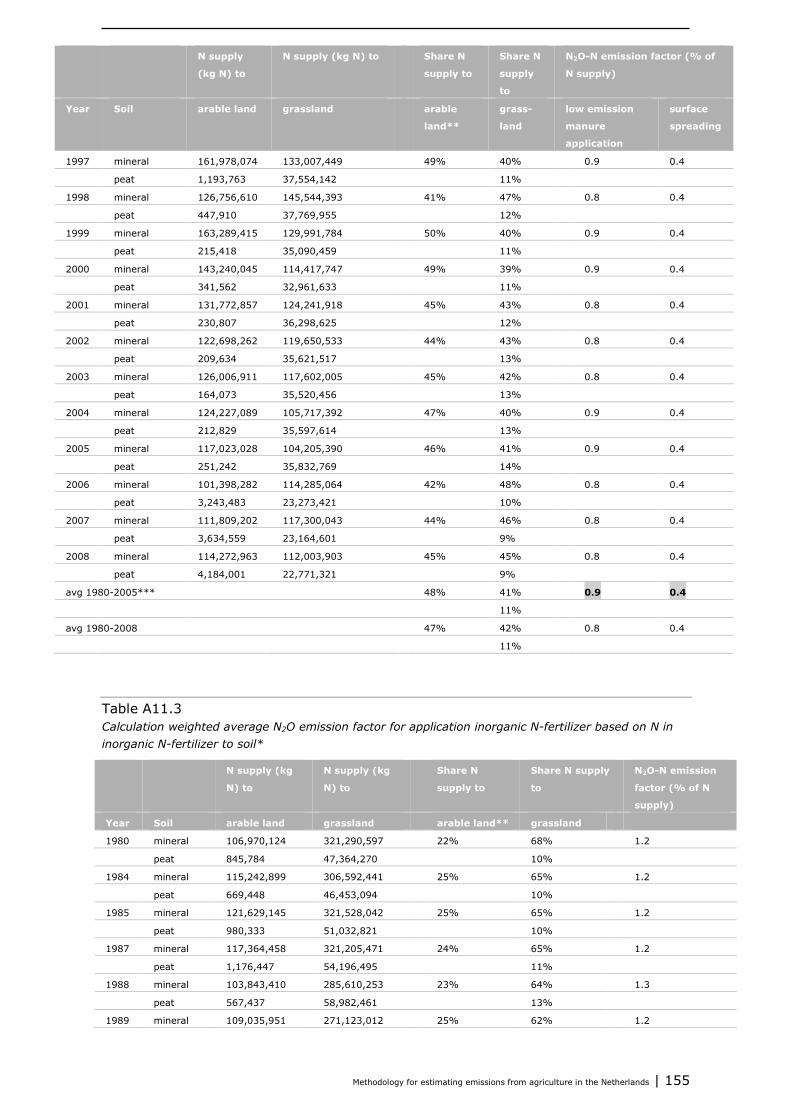
Methodology for estimating emissions from agriculture in the Netherlands | 155
N supply
(kg N) to
N supply (kg N) to Share N
supply to
Share N
supply
to
N2O-N emission factor (% of
N supply)
Year Soil arable land grassland arable
land**
grass-
land
low emission
manure
application
surface
spreading
1997 mineral 161,978,074 133,007,449 49% 40% 0.9 0.4
peat 1,193,763 37,554,142 11%
1998 mineral 126,756,610 145,544,393 41% 47% 0.8 0.4
peat 447,910 37,769,955 12%
1999 mineral 163,289,415 129,991,784 50% 40% 0.9 0.4
peat 215,418 35,090,459 11%
2000 mineral 143,240,045 114,417,747 49% 39% 0.9 0.4
peat 341,562 32,961,633 11%
2001 mineral 131,772,857 124,241,918 45% 43% 0.8 0.4
peat 230,807 36,298,625 12%
2002 mineral 122,698,262 119,650,533 44% 43% 0.8 0.4
peat 209,634 35,621,517 13%
2003 mineral 126,006,911 117,602,005 45% 42% 0.8 0.4
peat 164,073 35,520,456 13%
2004 mineral 124,227,089 105,717,392 47% 40% 0.9 0.4
peat 212,829 35,597,614 13%
2005 mineral 117,023,028 104,205,390 46% 41% 0.9 0.4
peat 251,242 35,832,769 14%
2006 mineral 101,398,282 114,285,064 42% 48% 0.8 0.4
peat 3,243,483 23,273,421 10%
2007 mineral 111,809,202 117,300,043 44% 46% 0.8 0.4
peat 3,634,559 23,164,601 9%
2008 mineral 114,272,963 112,003,903 45% 45% 0.8 0.4
peat 4,184,001 22,771,321 9%
avg 1980-2005*** 48% 41% 0.9 0.4
11%
avg 1980-2008 47% 42% 0.8 0.4
11%
Table A11.3 Calculation weighted average N2O emission factor for application inorganic N-fertilizer based on N in inorganic N-fertilizer to soil*
N supply (kg
N) to
N supply (kg
N) to
Share N
supply to
Share N supply
to
N2O-N emission
factor (% of N
supply)
Year Soil arable land grassland arable land** grassland
1980 mineral 106,970,124 321,290,597 22% 68% 1.2
peat 845,784 47,364,270 10%
1984 mineral 115,242,899 306,592,441 25% 65% 1.2
peat 669,448 46,453,094 10%
1985 mineral 121,629,145 321,528,042 25% 65% 1.2
peat 980,333 51,032,821 10%
1987 mineral 117,364,458 321,205,471 24% 65% 1.2
peat 1,176,447 54,196,495 11%
1988 mineral 103,843,410 285,610,253 23% 64% 1.3
peat 567,437 58,982,461 13%
1989 mineral 109,035,951 271,123,012 25% 62% 1.2
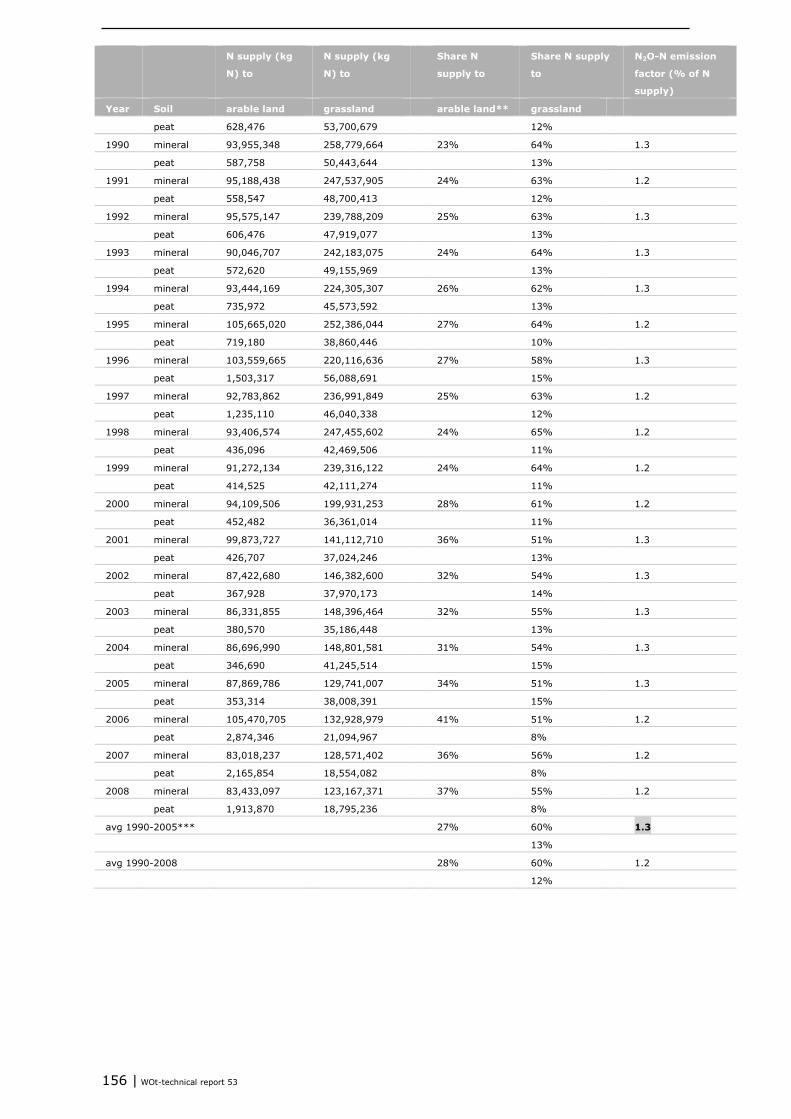
156 | WOt-technical report 53
N supply (kg
N) to
N supply (kg
N) to
Share N
supply to
Share N supply
to
N2O-N emission
factor (% of N
supply)
Year Soil arable land grassland arable land** grassland
peat 628,476 53,700,679 12%
1990 mineral 93,955,348 258,779,664 23% 64% 1.3
peat 587,758 50,443,644 13%
1991 mineral 95,188,438 247,537,905 24% 63% 1.2
peat 558,547 48,700,413 12%
1992 mineral 95,575,147 239,788,209 25% 63% 1.3
peat 606,476 47,919,077 13%
1993 mineral 90,046,707 242,183,075 24% 64% 1.3
peat 572,620 49,155,969 13%
1994 mineral 93,444,169 224,305,307 26% 62% 1.3
peat 735,972 45,573,592 13%
1995 mineral 105,665,020 252,386,044 27% 64% 1.2
peat 719,180 38,860,446 10%
1996 mineral 103,559,665 220,116,636 27% 58% 1.3
peat 1,503,317 56,088,691 15%
1997 mineral 92,783,862 236,991,849 25% 63% 1.2
peat 1,235,110 46,040,338 12%
1998 mineral 93,406,574 247,455,602 24% 65% 1.2
peat 436,096 42,469,506 11%
1999 mineral 91,272,134 239,316,122 24% 64% 1.2
peat 414,525 42,111,274 11%
2000 mineral 94,109,506 199,931,253 28% 61% 1.2
peat 452,482 36,361,014 11%
2001 mineral 99,873,727 141,112,710 36% 51% 1.3
peat 426,707 37,024,246 13%
2002 mineral 87,422,680 146,382,600 32% 54% 1.3
peat 367,928 37,970,173 14%
2003 mineral 86,331,855 148,396,464 32% 55% 1.3
peat 380,570 35,186,448 13%
2004 mineral 86,696,990 148,801,581 31% 54% 1.3
peat 346,690 41,245,514 15%
2005 mineral 87,869,786 129,741,007 34% 51% 1.3
peat 353,314 38,008,391 15%
2006 mineral 105,470,705 132,928,979 41% 51% 1.2
peat 2,874,346 21,094,967 8%
2007 mineral 83,018,237 128,571,402 36% 56% 1.2
peat 2,165,854 18,554,082 8%
2008 mineral 83,433,097 123,167,371 37% 55% 1.2
peat 1,913,870 18,795,236 8%
avg 1990-2005*** 27% 60% 1.3
13%
avg 1990-2008 28% 60% 1.2
12%

Methodology for estimating emissions from agriculture in the Netherlands | 157
Table A11.4 Calculation weighted average N2O emission factor for grazing based on N in pasture manure to soil*
N supply (kg N) to N supply (kg N) to
year mineral peat N2O-N emission factor (%
of N supply)
1980 107,508,357 24,674,512 3.2
1984 119,347,758 27,232,572 3.2
1985 121,731,826 28,144,527 3.2
1987 123,537,968 28,990,668 3.2
1988 115,887,919 27,259,575 3.2
1989 115,780,711 27,211,678 3.2
1990 121,894,046 28,534,860 3.2
1991 124,259,557 29,059,000 3.2
1992 119,230,167 28,189,410 3.2
1993 119,802,693 28,642,606 3.2
1994 110,172,205 26,420,847 3.2
1995 110,190,780 26,542,838 3.2
1996 112,515,810 30,676,162 3.2
1997 105,550,182 32,090,792 3.3
1998 94,709,103 28,909,070 3.3
1999 81,121,551 25,597,115 3.3
2000 74,318,394 23,178,293 3.3
2001 75,716,792 23,705,551 3.3
2002 60,076,981 19,368,654 3.4
2003 61,799,968 19,573,558 3.3
2004 60,023,293 21,370,347 3.4
2005 59,810,261 21,389,229 3.4
2006 66,689,712 12,502,196 3.1
2007 60,286,513 11,358,872 3.1
2008 64,312,534 11,955,203 3.0
avg 1990-2005*** 3.3
avg 1990-2008 3.2
* N to soil after subtraction of NH3-N during application because data without subtraction of NH3-N for N to peat respectively mineral soils are not available; in the emission calculations the weighted average emission factors however are related to the total gross N supply to soil (without subtraction of NH3-N during application). Assumption is that the differences in evaporation of NH3 in arable land and grassland are so small that these will not influence the division of the gross N supply over grassland and arable land. 1980-1997: MestAmm data LEI 1997-2005: MAM data LEI 2006-2008: MAMBO data LEI ** In calculation of the shares N to arable land and grassland the N supply to arable land on peat is neglected. The share is relatively small (< 0.2%) and for this source no emission factors are available. *** The data 2006-2008 show a break in the trend with the data 1980-2005. Especially there is a factor 8 to 15 increase in the supply of respectively inorganic N-fertilizer and animal manure to arable land on peat. Also there is almost a halving in the supply of N in manure (through fertilization and grazing) to grassland on peat. This correlates to specific data becoming available on the cultivation of crops on several soil types through the Agricultural Census from 2006 on.
158 | WOt-technical report 53
In the assumption that the supply of manure to arable land is negligible, use of the whole data series (1990-2008) leads to a weighted average emission factor that is circa 0.1% point lower than in use of the data series 1990-2005. For the emission calculation the weighted average emission factor based on the data series 1990-2005 is used to prevent underestimation of the emissions. From a sensitivity analysis follows that there is a reasonable chance that weighing in the supply of manure to arable land on peat does not lead to an even higher weighted average emission factor.
Methodology for estimating emissions from agriculture in the Netherlands | 159
Uncertainty, quality assurance Annex 12and verification
A12.1 Estimating uncertainties
For the PRTR dataset of 2013 uncertainties are calculated with the propagation of error method based on literature and expert judgements. Since calculation methods of activity data and emission factors do not change often, this dataset of uncertainties can be used for multiple years. When a calculation method is changed also the uncertainty of the considered activity data or emission factor is adjusted based on literature and expert judgements, to keep the data set of uncertainties up to date. For each emission source reported in the National Inventory Report (NIR) and the Informative Inventory Report (IIR) an uncertainty is stated. The total uncertainty concerns the square root of the sum of squared uncertainties of the activity data (ADunc) and the emission factor (EFunc), see formula A12.1. The extent of the total uncertainty is primarily determined by the largest uncertainty. Uncertainty estimatetotal = √ (ADunc
2 + EFunc2) (A12.1)
When a Tier 1 method is applied to calculate emissions also the default uncertainty is used from the IPCC 2006 Guidelines or EMEP 2009 Guidebook. When a range of uncertainties is being given, the highest uncertainty is used to prevent underestimation. When Tier 2 and Tier 3 methods are used the uncertainties are preferably calculated with use of literature and expert judgements. However, when there is not sufficient information available on the uncertainty of an emission source, the default uncertainty from the IPCC Guidelines or EMEP Guidebook is used.
A12.2 Quality assurance and quality control (QA/QC)
The PRTR task force leader on Agriculture is responsible for: 1. well documented and adopted data; 2. calculations having been implemented correctly; 3. assumptions are consistent, specific parameters (e.g. activity data) are used consistently; 4. complete and consistent data sets have been supplied. A yearly check on the above mentioned responsibilities is performed. Any actions that result from these checks are noted on an ‘action list’ by the ER secretary. The task force leader is responsible for improvements and communicates by e-mail regarding these QC checks, actions and results with the ER secretary. While adding a new emission year the task force leader performs a trend analysis, in which data from the new year are compared with data from the previous years. The task force leader provides an explanation if the increase or decrease of emissions exceeds the minimum level of 5% at target group level or 0.5% at national level. These explanations are also sent by e-mail to the ER secretary by the task force leader. The ER secretary keeps a logbook of all these QC checks and trend explanations and archives all concerned e-mails on the ER network. This shows explicitly that the required checks and corrections have been carried out. Based on the results of the trend analysis and the feedback on the control and correction process (‘action list’) the Working Group on Emissions Monitoring (WEM) gives advice to the institute representatives (Deltares on behalf of Rijkswaterstaat, Statistics Netherlands (CBS) and Netherlands Environmental Assessment Agency (PBL)) to approve the dataset. The ER project leader

160 | WOt-technical report 53
at RIVM defines the dataset, on receipt of an e-mail by the institute representatives, in which they give their approval. Furthermore, all changes of emissions in the whole time series as a result of recalculations are documented in CRF table 8(b).
A12.3 Verification
To check the quality of the calculated emissions for the sources named in this report, general QA/QC-procedures have been followed that are in line with the IPCC Guidelines. These are described further in the QA/QC-programme used by the National System, and the annual working plans published by the PRTR.
Sector specific QC No additional specific verification procedures are implemented for the sources defined in this sector.
Methodology for estimating emissions from agriculture in the Netherlands | 161
Published documents in the Technical reports series of the Statutory Research Tasks Unit for Nature & the Environment. WOt-technical reports are available from the secretary’s office, T 0317 – 48 54 71; E [email protected] Reports can also be downloaded from www.wageningenUR.nl/wotnatuurenmilieu 1 Arets, E.J.M.M., K.W. van der Hoek, H. Kramer, P.J. Kuikman & J.-P. Lesschen (2013). Greenhouse gas reporting of the
LULUCF sector for the UNFCCC and Kyoto Protocol. Background to the Dutch NIR 2013.
2 Kleunen, A. van, M. van Roomen, L. van den Bremer, A.J.J. Lemaire, J-W. Vergeer & E. van Winden (2014). Ecologische
gegevens van vogels voor Standaard Gegevensformulieren Vogelrichtlijngebieden.
3 Bruggen, C. van, A. Bannink, C.M. Groenestein, B.J. de Haan, J.F.M. Huijsmans, H.H. Luesink, S.M. van der Sluis, G.L.
Velthof & J. Vonk (2014). Emissies naar lucht uit de landbouw in 2012. Berekeningen van ammoniak, stikstofoxide,
lachgas, methaan en fijn stof met het model NEMA
4 Verburg, R.W., T. Selnes & M.J. Bogaardt (2014). Van denken naar doen; ecosysteemdiensten in de praktijk. Case
studies uit Nederland, Vlaanderen en het Verenigd Koninkrijk.
5 Velthof, G.L. & O. Oenema (2014). Commissie van Deskundigen Meststoffenwet. Taken en werkwijze; versie 2014
6 Berg, J. van den, V.J. Ingram, L.O. Judge & E.J.M.M. Arets (2014). Integrating ecosystem services into tropical
commodity chains- cocoa, soy and palm oil; Dutch policy options from an innovation system approach
7 Knegt de, B., T. van der Meij, S. Hennekens, J.A.M. Janssen & W. Wamelink (2014). Status en trend van structuur- en
functiekenmerken van Natura 2000- habitattypen op basis van het Landelijke Meetnet Flora (LMF) en de Landelijke
Vegetatie Databank (LVD). Achtergronddocument voor de Artikel 17-rapportage.
8 Janssen, J.A.M., E.J. Weeda, P.C. Schipper, R.J. Bijlsma, J.H.J. Schaminée, G.H.P. Arts, C.M. Deerenberg, O.G. Bos &
R.G. Jak (2014). Habitattypen in Natura 2000-gebieden. Beoordeling van oppervlakte representativiteit en
behoudsstatus in de Standard Data Forms (SDFs).
9 Ottburg, F.G.W.A., J.A.M. Janssen (2014).Habitatrichtlijnsoorten in Natura 2000-gebieden. Beoordeling van populatie,
leefgebied en isolatie in de Standard Data Forms (SDFs)
10 Arets, E.J.M.M. & F.R. Veeneklaas (2014). Costs and benefits of a more sustainable production of tropical timber.
11 Vader, J. & M.J. Bogaardt (2014). Natuurverkenning 2 jaar later; Over gebruik en doorwerking van Natuurverkenning
2010-2040.
12 Smits, M.J.W. & C.M. van der Heide (2014). Hoe en waarom bedrijven bijdragen aan behoud van ecosysteemdiensten;
en hoe de overheid dergelijke bijdragen kan stimuleren.
13 Knegt, B. de (ed.) (2014). Graadmeter Diensten van Natuur; Vraag, aanbod, gebruik en trend van goederen en
diensten uit ecosystemen in Nederland.
14 Beltman, W.H.J., M.M.S. Ter Horst, P.I. Adriaanse, A. de Jong & J. Deneer (2014). FOCUS_TOXSWA manual 4.4.2;
User’s Guide version 4.
15 Adriaanse, P.I., W.H.J. Beltman & F. Van den Berg (2014). Metabolite formation in water and in sediment in the
TOXSWA model. Theory and procedure for the upstream catchment of FOCUS streams.
16 Groenestein, K., C. van Bruggen en H. Luesink (2014). Harmonisatie diercategorieën
17 Kistenkas, F.H. (2014). Juridische aspecten van gebiedsgericht natuurbeleid (Natura 2000)
18 Koeijer, T.J. de, H.H. Luesink & C.H.G. Daatselaar (2014). Synthese monitoring mestmarkt 2006 – 2012.
19 Schmidt, A.M., A. van Kleunen, L. Soldaat & R. Bink (2014). Rapportages op grond van de Europese Vogelrichtlijn en
Habitatrichtlijn. Evaluatie rapportageperiode 2007-2012 en aanbevelingen voor de periode 2013-2018
20 Fey F.E., N.M.A.J. Dankers, A. Meijboom, P.W. van Leeuwen, M. de Jong, E.M. Dijkman & J.S.M. Cremer (2014).
Ontwikkeling van enkele mosselbanken in de Nederlandse Waddenzee, situatie 2013.
21 Hendriks, C.M.A., D.A. Kamphorst en R.A.M. Schrijver (2014). Motieven van actoren voor verdere verduurzaming in de
houtketen.
22 Selnes, T.A. and D.A. Kamphorst (2014). International governance of biodiversity; searching for renewal
23 Dirkx, G.H.P, E. den Belder, I.M. Bouwma, A.L. Gerritsen, C.M.A. Hendriks, D.J. van der Hoek, M. van Oorschot & B.I.
de Vos (2014). Achtergrondrapport bij beleidsstudie Natuurlijk kapitaal: toestand, trends en perspectief;
Verantwoording casestudies
24 Wamelink, G.W.W., M. Van Adrichem, R. Jochem & R.M.A. Wegman (2014). Aanpassing van het Model for Nature Policy

162 | WOt-technical report 53
(MNP) aan de typologie van het Subsidiestelsel Natuur en Landschap (SNL); Fase 1
25 Vos, C.C., C.J. Grashof-Bokdam & P.F.M. Opdam (2014). Biodiversity and ecosystem services: does species diversity
enhance effectiveness and reliability? A systematic literature review.
26 Arets, E.J.M.M., G.M. Hengeveld, J.P. Lesschen, H. Kramer, P.J. Kuikman & J.W.H. van der Kolk (2014). Greenhouse gas
reporting of the LULUCF sector for the UNFCCC and Kyoto Protocol. Background to the Dutch NIR 2014.
27 Roller, te J.A., F. van den Berg, P.I. Adriaanse, A. de Jong & W.H.J. Beltman (2014). Surface WAter Scenario Help
(SWASH) version 5.3. technical description
28 Schuiling, C., A.M. Schmidt & M. Boss (2014). Beschermde gebiedenregister; Technische documentatie
29 Goossen, C.M., M.A. Kiers (2015). Mass mapping; State of the art en nieuwe ideeën om bezoekersaantallen in
natuurgebieden te meten
30 Hennekens, S.M, M. Boss en A.M. Schmidt (2014). Landelijke Vegetatie Databank; Technische documentatie
31 Bijlsma, R.J., A. van Kleunen & R. Pouwels (2014). Structuur- en functiekenmerken van leefgebieden van Vogelrichtlijn-
en Habitatrichtlijnsoorten; Een concept en bouwstenen om leefgebieden op landelijk niveau en gebiedsniveau te
beoordelen
32 Commissie Deskundigen Meststoffenwet (2015). Nut en risico’s van covergisting. Syntheserapport.
33 Bijlsma, R.J. & J.A.M. Janssen (2014). Structuur en functie van habitattypen; Onderdeel van de documentatie van de
Habitatrichtlijn artikel 17-rapportage 2013
34 Fey F.E., N.M.J.A. Dankers, A. Meijboom, P.W. van Leeuwen, J. Cuperus, B.E. van der Weide, M. de Jong, E.M. Dijkman
& J.S.M. Cremer (2014). Ecologische ontwikkeling binnen een voor menselijke activiteiten gesloten gebied in de
Nederlandse Waddenzee; Tussenrapportage achtste jaar na sluiting (najaar 2013).
35 Kuindersma, W., F.G. Boonstra, R.A. Arnouts, R. Folkert, R.J. Fontein, A. van Hinsberg & D.A. Kamphorst (2015).
Vernieuwingen in het provinciaal natuurbeleid; Vooronderzoek voor de evaluatie van het Natuurpact.
36 Berg van den, F., W.H.J. Beltman, P.I. Adriaanse, A. de Jong & J.A. te Roller (2015). SWASH Manual 5.3. User’s Guide
version 5
37 Brouwer, F.M., A.B. Smit & R.W. Verburg (2015). Economische prikkels voor vergroening in de landbouw
38 Verburg, R.W., R. Michels, L.F. Puister (2015). Aanpassing Instrumentarium Kosten Natuurbeleid (IKN) aan de typologie
van het Subsidiestelsel Natuur en Landschap (SNL)
39 Commissie Deskundigen Meststoffenwet (2015). Actualisering methodiek en protocol om de fosfaattoestand van de
bodem vast te stellen
40 Gies, T.J.A., J. van Os, R.A. Smidt, H.S.D. Naeff & E.C. Vos (2015). Geografisch Informatiesysteem Agrarische Bedrijven
(GIAB); Gebruikershandleiding 2010.
41 Kramer, H., J. Clement (2015). Basiskaart Natuur 2013. Een landsdekkend basisbestand voor de terrestrische natuur in
Nederland
42 Kamphorst, D.A., T.A. Selnes, W. Nieuwenhuizen (2015). Vermaatschappelijking van natuurbeleid. Een verkennend
onderzoek bij drie provincies
43 Commissie Deskundige Meststoffenwet (2015). Advies ‘Mestverwerkingspercentages 2016’
44 Meeuwsen, H.A.M. & R. Jochem (2015). Openheid van het landschap; Berekeningen met het model ViewScape
45 Groenestein, C.M., J. de Wit, C. van Bruggen & O. Oenema (2015). Stikstof- en fosfaatexcretie van gangbaar en
biologisch gehouden landbouwhuisdieren. Herziening excretieforfaits Meststoffenwet 2015
46 Bruggen, C. van, A. Bannink, C.M. Groenestein, J.F.M. Huijsmans, H.H. Luesink, S.M. van der Sluis, G.L. Velthof & J.
Vonk (2015). Emissies naar lucht uit de landbouw, 1990-2013. Berekeningen van ammoniak, stikstofoxide, lachgas,
methaan en fijn stof met het model NEMA.
47 Boonstra, F.G. & A.L. Gerritsen (2015). Systeemverantwoordelijkheid in het natuurbeleid; Input voor agendavorming
van de Balans van de Leefomgeving 2014
48 Overbeek, M.M.M., M-J. Bogaardt & J.C. Dagevos (2015). Intermediairs die bijdragen van burgers en bedrijven aan
natuur en landschap mobiliseren.
49 Os, J. van, R.A.M. Schrijver & M.E.A. Broekmeyer (2015). Kan het Natuurbeleid tegen een stootje? Enkele botsproeven
van de herijkte Ecologische Hoofdstructuur.
50 Hennekens, S.M., J.M. Hendriks, W.A. Ozinga, J.H.J. Schaminée & L. Santini (2015). BioScore 2 – Plants & Mammals.
Background and pre-processing of distribution data

Methodology for estimating emissions from agriculture in the Netherlands | 163
51 Koffijberg K., P. de Boer, F. Hustings, A. van Kleunen, K. Oosterbeek & J.S.M. Cremer (2015). Broedsucces van
kustbroedvogels in de Waddenzee in 2011-2013.
52 Arets, E.J.M.M., J.W.H van der Kolk, G.M. Hengeveld, J.P. Lesschen, H. Kramer, P.J. Kuikman & M.J. Schelhaas (2015).
Greenhouse gas reporting of the LULUCF sector in the Netherlands. Methodological background.
53 Vonk, J., A. Bannink, C. van Bruggen, C.M. Groenestein, J.F.M. Huijsmans, J.W.H. van der Kolk, H.H. Luesink, S.V.
Oude Voshaar, S.M. van der Sluis & G.L. Velthof (2016). Methodology for estimating emissions from agriculture in the
Netherlands. Calculations of CH4, NH3, N2O, NOx, PM10, PM2.5 and CO2 with the National Emission Model for Agriculture
(NEMA)
54 Groenestein, K. & J. Mosquera (2015). Evaluatie van methaanemissieberekeningen en -metingen in de veehouderij.
55 Schmidt, A.M. & A.S. Adams (2015). Documentatie Habitatrichtlijn-rapportage artikel 17, 2007-2012
56 Schippers, P., A.M. Schmidt, A.L. van Kleunen & L. van den Bremer (2015). Standard Data Form Natura 2000; bepaling
van de belangrijkste drukfactoren in Natura 2000-gebieden.
57 Fey F.E., N.M.A.J. Dankers, A. Meijboom, C. Sonneveld, J.P. Verdaat, A.G. Bakker, E.M. Dijkman & J.S.M. Cremer
(2015). Ontwikkeling van enkele mosselbanken in de Nederlandse Waddenzee, situatie 2014.
58 Blaeij, A.T. de, R. Michels, R.W. Verburg & W.H.G.J. Hennen (2015). Recreatiemodule in Instrumentarium Kosten
Natuurbeleid (IKN); Bepaling van de recreatiekosten
59 Bakker, E. de, H. Dagevos, R.J. Fontein & H.J. Agricola (2015). De potentie van co-creatie voor natuurbeleid. Een
conceptuele en empirische verkenning.
60 Bouwma, I.M., A.L. Gerritsen, D.A. Kamphorst & F.H. Kistenkas (2015). Policy instruments and modes of governance in
environmental policies of the European Union; Past, present and future
61 F. van den Berg, A. Tiktak, J.J.T.I. Boesten & A.M.A. van der Linden (2016). PEARL model for pesticide behaviour and
emissions in soil-plant systems; Description of processes
62 Kuiters, A.T., G.A. de Groot, D.R. Lammertsma, H.A.H. Jansman & J. Bovenschen (2016). Genetische monitoring van de
Nederlandse otterpopulatie; Ontwikkeling van populatieomvang en genetische status 2014/2015
63 Smits, M.J.W., C.M. van der Heide, H. Dagevos, T. Selnes & C.M. Goossen (2016). Natuurinclusief ondernemen: van
koplopers naar mainstreaming?
64 Pouwels, P. , M. van Eupen, M.H.C. van Adrichem, B. de Knegt & J.G.M. van der Greft (2016). MetaNatuurplanner v2.0.
Status A
65 Broekmeyer, M.E.A. & M.E. Sanders (2016). Natuurwetgeving en het omgevingsrecht. Achtergronddocument bij Balans
van de Leefomgeving, 2014

The mission of WOT Natuur & Milieu is to carry out statutory research tasks on issues relating to nature and the environment. These tasks are implemented in order to support the Dutch Minister of Economic Affairs, who is responsible for these issues. The Statutory Research Tasks Unit for Nature and the Environment (WOT Natuur & Milieu) works on products of the Netherlands Environmental Assessment Agency (PBL), such as the Assessment of the Human Environment reports and the Nature Outlook reports. In addition, the unit advises the Ministry of Economic Affairs about fertilisers and pesticides and their authorisation, and provides data required to compile biodiversity reports to the European Union.
WOT Natuur & Milieu is part of the international expertise organisation Wageningen UR (University & Research centre). Its mission is ‘To explore the potential of nature to improve the quality of life’. Within Wageningen UR, nine specialised research institutes of the DLO Foundation have joined forces with Wageningen University to help answer the most important questions in the domain of healthy food and living environment. With approximately 30 locations, 6,000 members of staff and 9,000 students, Wageningen UR is one of the leading organisations in its domain worldwide. The integral approach to problems and the cooperation between the various disciplines are at the heart of the unique Wageningen Approach.
Theme Agri-EnviromentWettelijke OnderzoekstakenNatuur & MilieuPO Box 47NL-6700 AA WageningenT +31 (0) 317 48 54 71E [email protected]
ISSN 2352-2739
www.wageningenUR.nl/wotnatuurenmilieu