
WELFARE, THE EARNED INCOME TAX CREDIT, AND …scholz/Teaching_742/Meyer...WELFARE, THE EARNED INCOME...
52
WELFARE, THE EARNED INCOME TAX CREDIT, AND THE LABOR SUPPLY OF SINGLE MOTHERS* BRUCE D. MEYER AND DAN T. ROSENBAUM During 1984 –1996, welfare and tax policy were changed to encourage work by single mothers. The Earned Income Tax Credit was expanded, welfare bene ts were cut, welfare time limits were added, and welfare cases were terminated. Medicaid for the working poor was expanded, as were training programs and child care. During this same time period there were unprecedented increases in the employment and hours of single mothers. We show that a large share of the increase in work by single mothers can be attributed to the EITC and other tax changes, with smaller shares for welfare bene t cuts, welfare waivers, training programs and child care programs. I. INTRODUCTION Between 1984 and 1996, changes in tax and transfer pro- grams sharply increased the incentive for single mothers to work. During this same period, single mothers began to work more as their weekly employment increased by about six percentage points and their annual employment increased by nearly nine percentage points. Other groups, such as single women without children, married mothers, and black men, did not experience similar gains in employment over this period (see Meyer and Rosenbaum [2000a]). These facts lead us to examine whether the changes in tax and transfer programs were responsible for single mothers working more and what changes were the most important. * We thank Joseph Altonji, Timothy Bartik, Rebecca Blank, Janet Currie, Steven Davis, Jeffrey Liebman, Thomas MaCurdy, Leslie Moscow, Derek Neal, Julie Rosenbaum, Christopher Ruhm, John Karl Scholz, seminar participants at the Association for Public Policy Analysis and Management Annual Meetings, University of California at San Diego, the Federal Reserve Board, the Institute for Research on Poverty, the Manpower Demonstration Research Corporation, the University of Maryland, the National Association for Welfare Research and Sta- tistics Annual Meetings, the National Bureau of Economic Research, the National Tax Association annual meetings, Northwestern University, Syracuse University, Texas A & M University, the Urban Institute, and the University of Wisconsin and many others for comments. We have been greatly aided by help with data and program details by Daniel Feenberg, Linda Giannarelli, Laura Guy, Phillip Le- vine, Robert McIntire, Steve Savner, Jill Schield, and Aaron Yelowitz. Brian Jenn and Christopher Jepsen provided excellent research assistance. This research has been partly supported by the Northwestern University/University of Chicago Joint Poverty Center, the Household International, Inc. Chair in Economics and the National Science Foundation (Meyer), and a Research Training Fellowship in Urban Poverty funded by the National Science Foundation and Northwestern University (Rosenbaum). © 2001 by the President and Fellows of Harvard College and the Massachusetts Institute of Technology. The Quarterly Journal of Economics, August 2001 1063
Transcript of WELFARE, THE EARNED INCOME TAX CREDIT, AND …scholz/Teaching_742/Meyer...WELFARE, THE EARNED INCOME...
WELFARE THE EARNED INCOME TAX CREDIT ANDTHE LABOR SUPPLY OF SINGLE MOTHERS
BRUCE D MEYER AND DAN T ROSENBAUM
During 1984ndash1996 welfare and tax policy were changed to encourage work bysingle mothers The Earned Income Tax Credit was expanded welfare benetswere cut welfare time limits were added and welfare cases were terminatedMedicaid for the working poor was expanded as were training programs and childcare During this same time period there were unprecedented increases in theemployment and hours of single mothers We show that a large share of theincrease in work by single mothers can be attributed to the EITC and other taxchanges with smaller shares for welfare benet cuts welfare waivers trainingprograms and child care programs
I INTRODUCTION
Between 1984 and 1996 changes in tax and transfer pro-grams sharply increased the incentive for single mothers to workDuring this same period single mothers began to work more astheir weekly employment increased by about six percentagepoints and their annual employment increased by nearly ninepercentage points Other groups such as single women withoutchildren married mothers and black men did not experiencesimilar gains in employment over this period (see Meyer andRosenbaum [2000a]) These facts lead us to examine whether thechanges in tax and transfer programs were responsible for singlemothers working more and what changes were the mostimportant
We thank Joseph Altonji Timothy Bartik Rebecca Blank Janet CurrieSteven Davis Jeffrey Liebman Thomas MaCurdy Leslie Moscow Derek NealJulie Rosenbaum Christopher Ruhm John Karl Scholz seminar participants atthe Association for Public Policy Analysis and Management Annual MeetingsUniversity of California at San Diego the Federal Reserve Board the Institute forResearch on Poverty the Manpower Demonstration Research Corporation theUniversity of Maryland the National Association for Welfare Research and Sta-tistics Annual Meetings the National Bureau of Economic Research the NationalTax Association annual meetings Northwestern University Syracuse UniversityTexas A amp M University the Urban Institute and the University of Wisconsinand many others for comments We have been greatly aided by help with data andprogram details by Daniel Feenberg Linda Giannarelli Laura Guy Phillip Le-vine Robert McIntire Steve Savner Jill Schield and Aaron Yelowitz Brian Jennand Christopher Jepsen provided excellent research assistance This research hasbeen partly supported by the Northwestern UniversityUniversity of ChicagoJoint Poverty Center the Household International Inc Chair in Economics andthe National Science Foundation (Meyer) and a Research Training Fellowship inUrban Poverty funded by the National Science Foundation and NorthwesternUniversity (Rosenbaum)
copy 2001 by the President and Fellows of Harvard College and the Massachusetts Institute ofTechnologyThe Quarterly Journal of Economics August 2001
1063
The largest change in the work incentives of single mothersbetween 1984 and 1996 was a tenfold increase in credits throughthe Earned Income Tax Credit (EITC) Only working families(primarily those with children) receive the EITC so its expansionincreased the incentive for single mothers to work We analyzenot only the federal EITC but other federal income tax changesstate income taxes and state EITCs as well The Medicaid pro-gram also greatly expanded during this period Between 1984 and1994 the number of children receiving health coverage throughMedicaid increased 77 percent while the number of coveredadults with dependent children increased 35 percent The expan-sions increased coverage for nonwelfare families with incomesnear the poverty line thus making work more attractive forlow-income single mothers Cash assistance to single parentsthrough Aid to Families with Dependent Children (AFDC) alsochanged quite dramatically over this period Nearly every stateexperimented with changes often under federal waivers of theexisting AFDC rules These changes typically imposed work re-quirements time limits or other measures to encourage singlemothers to work We also investigate the effects of other changesto the AFDC and Food Stamp programs including changes inbenet levels earnings disregards and benet reduction ratesFinally we examine the effects of changes in child care andtraining programs during this period
Our main research strategy identies the effects of thesepolicies on single mothersrsquo labor supply through the differentialtreatment of single mothers and single women without childrenunder welfare and tax laws However the richness of these policychanges allows us to consider additional specications that focuson narrower sources of variation including differences amongsingle mothers in their numbers and ages of children and differ-ences across states in their taxes benets and living costs Thesesources of variation are likely to be unrelated to underlyingdifferences across individuals in their desire to work and thusare likely to be exogenous to labor supply decisions We alsodevelop a new methodology for summarizing the key features ofthe complex nonlinear budget sets created by policies such as theEITC Medicaid and AFDC
Understanding the relationship between the changes in gov-ernment policies and the increases in the labor supply of singlemothers during this period is important for several reasons Firstthese changes in policies provide a plausible source of exogenous
1064 QUARTERLY JOURNAL OF ECONOMICS
variation with which to identify the effects of tax and welfareparameters on labor supply The magnitudes of these effects arekey determinants of the gains or losses from changes in incomeredistribution and social insurance policies
Second understanding the effects of government policiesduring the 1984 ndash1996 period has taken on more importance dueto the passage of the Personal Responsibility and Work Opportu-nity Reconciliation Act of 1996 (PRWORA) In 1997 PRWORAreplaced the main cash assistance program for single mothersAFDC with Temporary Assistance for Needy Families (TANF)The increased state discretion under the new law combined withpolitical changes has led to welfare reform which discourageswelfare receipt and often diverts potential welfare recipients fromtraditional programs These reforms are difcult if not impossibleto characterize using a few variables It is likely that many of thepolicies examined in this paper will be harder and more problem-atic to analyze using post-PRWORA data1
Third there is surprisingly little previous work that esti-mates the effects of the EITC Medicaid or welfare changes onwhether single mothers work The only paper that directly exam-ines how the EITC affects single mothersrsquo labor supply is Eissaand Liebman [1996] which examines the effect of the Tax ReformAct of 19862 In his discussion of the labor supply effects ofMedicaid Moftt [1992] argues that there has been too little workto draw reliable conclusions3 Moftt describes the labor supplyeffect of AFDC as being subject to considerable uncertainty andnotes that the broader labor supply literature has examinedsingle mothers ldquoonly rarelyrdquo4 Dickert Houser and Scholz [1995]argue that this literature provides little guidance as to how theEITC will affect labor market participation and that this omis-sion is especially important because past work suggests that most
1 See Ellwood [2000] National Research Council [1999] and Jencks andSwingle [2000] for related arguments
2 Several papers use labor supply parameters estimated from the negativeincome tax experiments and other sources to simulate the effects of the EITCincluding Hoffman and Seidman [1990] Holtzblatt McCubbin and Gillette[1994] Browning [1995] and Dickert Houser and Scholz [1995] Dickert Houserand Scholz estimate the effect of the after-tax wage and welfare programs onparticipation using a cross section of data from the 1990 panel of the Survey ofIncome and Program Participation (SIPP) They then apply these results tosimulate the effects of the EITC on participation Eissa and Hoynes [1998]examine the effects of the EITC on the labor supply of married couples
3 See Blank [1989] Winkler [1991] and Moftt and Wolfe [1992] in particu-lar The more recent work of Yelowitz [1995] examines the 1988 to 1991 period
4 See Danziger Haveman and Plotnick [1981] and Moftt [1992]
1065THE LABOR SUPPLY OF SINGLE MOTHERS
of the labor supply response is in the work decision rather thanthe hours decision Furthermore there is no work that we areaware of that assesses the overall effect of recent changes intraining and child care programs5 The work on the effects ofwelfare waivers has examined program caseloads rather thanemployment and has reached conicting results6
We examine the major policies affecting the labor supply ofsingle mothers during the 1984 to 1996 period using two datasets the Current Population Survey (CPS) Outgoing RotationGroup Files and the March CPS Files By investigating severalprograms at once using thirteen years of individual data weaccount for their separate effects and we can directly comparethe programs using the same sample time period and methodsOur approach improves on the common past research strategy ofexamining changes in one of these policies in isolation over ashort time period or with a single cross section of data
The estimates from our main specications suggest that theEITC and other tax changes account for over 60 percent of the1984 ndash1996 increase in the weekly and annual employment ofsingle mothers (relative to single women without children) Wel-fare waivers and other changes in AFDC account for smaller butstill large shares of the increase for both employment measuresChanges in Medicaid training and child care programs play asmaller role Our estimated effects of tax and EITC changes arefairly robust across time periods and specications We ndlarger effects for less educated women and smaller but stillsubstantial effects when we compare changes for single motherswith different numbers of children Some of these identicationstrategies result in much weaker AFDC effects The effects ofother policies on employment tend not to vary much by specica-tion Additionally we nd that the effects of the policies on totalhours worked are very similar to the employment results
The structure of the paper is as follows Section II provides atheory of the decision to work and states our main modelingchoices We describe the two data sets used in the empirical workin Section III Section IV describes the main program changes
5 See Gueron and Pauly [1991] for a review of training programs for welfarerecipients and Council of Economic Advisers [1997] for a review of work on theeffects of child care
6 See Levine and Whitmore [1998] Martini and Wiseman [1997] Blank[1997] and Ziliak et al [1997] for differing views of the relative importance ofwelfare waivers economic conditions and benet cuts in the recent decline inwelfare receipt
1066 QUARTERLY JOURNAL OF ECONOMICS
over the 1984 to 1996 period that affected the labor supply ofsingle mothers We also provide summary statistics on programchanges discuss their theoretical impacts on labor supply andintroduce variables that measure particular policies Section Vcompares the employment rates and other characteristics of sin-gle mothers and single women without children Section VI in-vestigates how the employment of single mothers was affected bythe policies we study We also examine alternative explanationsfor our results and briey examine hours worked Section VIIprovides an accounting of the contribution of different policychanges to the overall increase in employment of single mothersin recent years We then offer conclusions in Section VIII
II MODELING THE WORK DECISION
Our modeling approach combines some of the best aspects ofstructural methods and quasi-experimental or natural experi-ment type approaches Beginning from a structural approachclaries which variables should enter the work decision and theform in which they should enter Our simple structural modelalso allows us to test some fundamental economic predictions andmore convincingly simulate policy changes7 The quasi-experi-mental methods make transparent the assumptions that allowthe identication of our key coefcients By the appropriate use ofcontrol variables and simplifying assumptions we identify ourkey parameters using only the sources of variation in our ex-planatory variables that we believe are exogenous
We focus on employment because previous work has foundthat women are more responsive to wages and income in thedecision to work than in the hours decision (see Heckman [1993])The probability that a single woman works is just the probabilitythat the expected utility when working Uw exceeds the expectedutility when not working Un w ie Pr[Uw gt Unw ] We takeutility to be a function of income Y nonmarket time L an indi-cator for welfare participation P (which captures transactioncosts or stigma) other demographic and other control variablesX and an additive stochastic term e Thus the probability ofwork is just
7 Because of the simplications we make to improve the modelrsquos tractabilityone may not want to consider our approach fully structural As with any struc-tural model simulations that rely heavily on simplifying assumptions may givemisleading results
1067THE LABOR SUPPLY OF SINGLE MOTHERS
(1) Pr[U(Yw Lw Pw X) U(Ynw Lnw Pnw X)]where the randomness in this event comes from the stochasticterm e
Income when working is pretax earnings minus taxes plusAFDC and Food Stamps plus Medicaid benets Income whennot working is the maximum AFDCFood Stamp benet andMedicaid benets In each case we calculate the earnings taxesand benets for a given individual incorporating family composi-tion (number and ages of children) and characteristics of stateand federal policies at the time We calculate real income andbenets across states using a cost of living index that depends onstate housing costs The decision to work should depend on thereal return to work not the nominal return8
A key issue in implementing this approach is the form of theuncertainty about a womanrsquos wage and hours should she work Inthe estimates reported here we take a woman to have no moreknowledge of her potential wage and hours than we do as re-searchers9 Thus we take her wage to be a random draw from adistribution (to be specied below) and her hours worked to be arandom draw from a distribution (also to be specied below) thatis conditional on the wage realization Then the probability ofworking is just
(2) PrE[Uw] Unwwhere the expectation here is over the joint wage and hoursdistribution
To estimate equation (2) we take the distribution of e to benormal and take U to be linear in income and nonmarket time (wehave relaxed this latter assumption in other work) In the linearcase (2) has a very simple form
(3) Pra (E[Yw] 2 Ynw) 1 b (E[Lw] 2 Lnw)
2 r (E[Pw] 2 Pnw) 1 X 9 g e nw 2 e wwhere X is other variables that may affect the work decision such
8 Our base specication includes a state cost of living adjustment followingthe approach of National Research Council [1995] One can argue that housingcosts largely reect local amenities However to the extent that these amenitiesare largely xed benets of an area one would still want to account for statedifferences in housing costs when calculating the value of additional income
9 We have also considered two alternatives 1) a woman knows her wage andhours before choosing to work and 2) a woman knows her wage but not her hoursbefore choosing to work Our experiments with these alternatives yielded resultsqualitatively similar to our main results
1068 QUARTERLY JOURNAL OF ECONOMICS
as demographic variables and characteristics of state welfarewaivers training programs and child care programs This speci-cation also allows xed costs of work which vary across demo-graphic groups Under the normality assumption (3) can be re-written as
(4) F a (E[Yw] 2 Ynw) 1 b (E[Lw] 2 Lnw) 2 r (E[Pw] 2 Pnw) 1 X 9 g We make the simplifying assumption that nonworking singlemothers participate in welfare and that working single mothersparticipate if their earnings are low enough to qualify them foraid This assumption is clearly a simplication as some womenwho qualify for aid will not participate because of the transactioncosts or stigma of doing so Past work on program takeup sug-gests that about 75 percent of those eligible for AFDC and about50 percent of those eligible for Food Stamps participate (for arecent review of past work see Blank and Ruggles [1996]) How-ever AFDC takeup rates between 80 and 90 percent are probablycloser to the truth given the underreporting of welfare receipt instandard data sets (see Bavier [1999]) We also assume that allsingle women without children do not participate in welfare pro-grams10
We generalize (4) by allowing the coefcients on the differentcomponents of income to differ since income from differentsources may be valued differently For example we allow theeffect of welfare income (AFDC plus Food Stamps) to differ fromthat of labor income taxes paid and Medicaid coverage Welfareincome may be valued less than labor income because of a vari-able component to the transaction costs or stigma of welfareparticipation (see Moftt [1983]) Medicaid may be valued at lessthan our calculated cost because it is an in-kind transfer or morethan cost because of its insurance component These separatecoefcients on different income terms allow for additional tests ofthe hypothesis that increases in the return to work make workmore likely and they allow an approach that is less restrictiveie less likely to yield biased estimates
We assume that all single mothers face the same pretax wage
10 The primary program for which single women without children would beeligible is Food Stamps Single adults with children are more than ten times aslikely to receive Food Stamps as single adults without children (authorsrsquo calcula-tions and U S Department of Agriculture [1995]) Furthermore since the FoodStamp program has not changed much over time and does not differ much by stateexcept for interactions with AFDC our control variables below (particularly yearand number of children dummies) should account for most of these differences
1069THE LABOR SUPPLY OF SINGLE MOTHERS
and hours distribution and we make the same assumption forsingle childless women We estimated some specications thatused a wagehours distribution that varied with demographicsalthough these results are not reported here (see Meyer andRosenbaum [1999]) Thus expected earnings if working only varywith the controls and are absorbed by X which includes variablesfor the presence and number of children age education stateyear and other variables described fully below Similarly non-market time when working and not working E[Lw ] and Lnw respectively are taken to be constant or to vary with X and thusare absorbed by X Pn w which identically equals 1 is absorbedinto the constant We then obtain the employment probability
(5) F a 1E[taxes] 1 a 2E[AFDC and Food Stamp benefits if work]
1 a 3E[Medicaid coverage if work valued at cost]
2 a 4maximum AFDCFood Stamp benefit
2 a 5Medicaid coverage if do not work valued at cost
1 r E[Pw] 1 X 9 g
We allow the tax and welfare variables in (5) to vary withyear state and the number and ages of children To implementthis approach we discretize the wage and hours distribution andperform the numerical integration required in (5) allowing thehours distribution to vary with the wage level because of thepronounced dependence between the two distributions To calcu-late the wage and hours distribution we pool 1984 ndash1996 MarchCPS data and estimate one distribution that we use for all yearsWe do this separately for single mothers and single childlesswomen We approximate these distributions using cells denedby 50 intervals of the joint wage and hours distribution (seeAppendix 1 for details) Our approach is both tractable and yetable to capture the fairly complex and highly nonlinear budgetconstraints of low income single mothers These complexities aredescribed in detail in Section IV
III DATA
The data used in this paper come from the Current Popula-tion Survey (CPS) a nationally representative monthly survey ofapproximately 60000 households We use two types of the CPSdata the March CPS Files and the merged Outgoing Rotation
1070 QUARTERLY JOURNAL OF ECONOMICS
Group (ORG) data During each interview household membersare asked whether they worked last week and their hoursworked as well as many other questions In the March inter-views individuals are asked to provide detailed retrospectiveinformation including hours earnings and weeks worked duringthe previous year The ORG les come from all twelve months ofthe year but only include the same person once in a given yearThe March CPS data are from the 1985ndash1997 interviews andtherefore provide information on the years 1984 ndash1996 The ORGdata are from 1984 ndash1996 We limit the sample to single women(widowed divorced and never married) who are between 19 and44 years old and not in school In the March CPS women whowere ill or disabled during the previous year or who had positiveearned income but zero hours of work are also excluded Theresulting samples sizes are 373662 for the ORG and 119019 forthe March CPS
IV THE POLICY CHANGES AND LABOR SUPPLY
In this section we describe the major policy changes between1984 and 1996 that affected the labor supply of single mothersFor each policy or program we rst provide some brief back-ground information and outline the major changes between 1984and 1996 (see Figure I for a time line depicting these changes)Next we describe the policy variables used in the empirical workto summarize the incentive effects of these programs Finally weanalyze the theoretical effects of these changes on labor supplyespecially on the choice of whether or not to work An in-depthdiscussion of the policy changes is in Meyer and Rosenbaum[2000a]
A The EITC and Federal and State Income Taxes
In our period the most important changes in work incentivesfor single mothers probably came from the Earned Income TaxCredit11 EITC credits increased fteenfold from $16 billion in1984 to a projected $251 billion in 1996 Single parents receivedabout two-thirds of these EITC dollars (see U S House of Rep-resentatives Green Book [1996] U S Department of the Trea-sury SOI [1999]) In 1996 a single woman with two children who
11 See Liebman [1998] for a history of the EITC and a survey of many of thekey economic issues
1071THE LABOR SUPPLY OF SINGLE MOTHERS
earned less than $8890 (the phase-in range) received a 40 percentcredit on dollars earned up to a maximum of $3556 Because thecredit is refundable and a mother of two with those earnings wasnot subject to any federal income tax (due to the standard deduc-tion and personal exemptions) she would have received a check
FIGURE IMajor Tax and Welfare Policy Changes Affecting Low Income Women
1984ndash1997
1072 QUARTERLY JOURNAL OF ECONOMICS
from the IRS for the credit amount With additional earnings upto $11610 the credit amount did not change Additional earningsbeyond $11610 and up to $28495 (the phase-out range) resultedin a reduction in the credit by 2106 percent of the additionalearnings until the credit was reduced to zero This credit sched-ule meant that a woman with two children earning between$5000 and just under $19000 received at least a $2000 credit
The current EITC is the result of several legislative changes(summarized in Figure I) which greatly expanded the EITC after1984 Between its beginning in 1975 and the passage of the TaxReform Act of 1986 (TRA86) the EITC was small and the creditamounts did not keep up with ination Beginning with theTRA86 the EITC was expanded in a number of dimensions Firstcredit rates phase-in ranges and phase-out ranges were in-creased considerably Second in 1991 the credit was expanded toprovide a larger credit for families with two or more children12
The increment to the maximum credit for a second child wassmall through 1993 but beginning in 1994 the difference began torise sharply it rose to $490 in 1994 $1016 in 1995 and $1404 in1996 Third in 1991 the requirements for qualifying childrenwere changed in a way that tended to increase eligibility
The after-tax incomes of single women were affected by otherchanges in federal income taxes during this period such as the1987 increase in the personal exemption and the 1988 increase inthe standard deduction for household heads To illustrate theoverall changes in after-tax incomes we plot in Figure II thedifference in after-tax income (earnings minus federal incometaxes plus the EITC) between a woman with two children and awoman with no children for various pretax earnings levels in1984 1988 1992 and 199613
Figure II illustrates several important aspects of the EITCexpansions First between 1984 and 1988 single mothers of twowith earnings between $10000 and $20000 experienced in-creases in take-home pay (relative to single women without chil-
12 There were other small program changes From 1991 through 1993 therewere small refundable credits for child health insurance premiums and for chil-dren under one Beginning in January 1991 the EITC was not counted as incomein most means-tested programs increasing its value for very low income women
13 Changes over time in this difference were almost entirely due to changesin the taxes paid (or credits received) by single mothers as can be seen in panel 1of Table I The taxes paid by single women without children hardly changedbetween 1984 and 1996 especially for earnings levels between $10000 and$20000
1073THE LABOR SUPPLY OF SINGLE MOTHERS
dren) that ranged from $500 to $1500 (unless noted all dollaramounts are in 1996 PCE deated dollars) Most of this increasewas due to large increases in both the maximum credit and theearnings level before the credit phase-out began The most strik-ing feature of Figure II is the large 1994 ndash1996 expansions whichdisproportionately affected women with two or more children Forexample the take-home pay difference for women with $7500 ofearnings increased only about $600 between 1984 and 1993 butincreased over $1500 between 1993 and 1996 Unlike the earlierexpansions those since 1993 dramatically increased the take-home-pay difference for very low income women (earnings under$10000) due to large increases in the credit rate and maximumcredit
As well as federal income tax changes we incorporate in thisstudy the effects of state income taxes including state EITCs By1994 seven states had their own EITCs The largest ve of thesestates began their credit during the period we examine All of thestate EITCs were set as a fraction of the federal EITC and thusincreased when it did There were other state income tax changesduring our sample period that reduced taxes for single mothersMore than a dozen states increased their personal exemptionincreased their child credit added a higher standard deductionor added a separate tax schedule for household heads
To summarize these changes in federal and states taxes we
FIGURE IIAfter-Tax Income of a Single Mother with Two Children Minus a Single
Woman without Children 1984 1988 1992 1996All numbers are in 1996 dollars deated with the Personal Consumption Ex-
penditures Deator All women are assumed to have only earned income and totake the standard deduction Single women with children and without childrenare assumed to le as head of household and single respectively After-tax incomeis income after federal taxes or credits
1074 QUARTERLY JOURNAL OF ECONOMICS
calculate a variable called Income Taxes if Work This variable isthe expected taxes a woman would pay in a given state and yearwith a given family composition and ages of children The expec-tation is calculated by integrating over the wage and hours dis-tribution of single women as described in Section II Appendix 2reports the mean of this variable for single mothers and singlewomen without children for various years Over the years 1984 ndash1996 taxes paid by single mothers relative to single women with-out children fell by $1607 Thirty-nine percent of the relative fallin taxes (increase in credits) occurred in the last three years(1993ndash1996) About 43 percent occurred in 1987 and 1988 with18 percent occurring between 1991 and 1993 Almost all of the fallin relative taxes was due to federal tax changes Only $37 wasdue to state taxes with all but $7 of this due to state EITCsHowever in the seven states with state EITCs the role of statetaxes was much greater In these jurisdictions state EITCs ac-counted for a $215 drop in the taxes of single mothers relative tosingle women without children
The theoretical effect of the EITC expansions on the annualparticipation decision of single parents is unambiguously posi-tive Since the EITC expansions have increased the after-taxreturn to work at all earnings levels work is unambiguouslymore attractive The effect of the EITC and its expansions on thehours of work among those working is much less clear and de-pends on where a person would choose to work on the pre- andpostcredit budget sets Overall the income effect of the creditcombined with the negative substitution effect that people face onthe phase-out portion of the credit is expected to reduce the hoursof those who work14
B AFDC Food Stamps and Waivers
The two programs that have been most commonly thought ofas welfare are Aid to Families with Dependent Children (AFDC)and Food Stamps We discuss Food Stamps along with AFDC
14 One might wonder whether households are aware of these tax incentivesand bother to le tax returns Awareness appears to be high [Romich and Weisner2000 Smeeding et al 2000] and EITC takeup appears to be high and risingScholz [1990 1994] estimates takeup to be 75 percent in 1988 and between 80 and86 percent in 1990 With the increases in the EITC after 1990 that raised thevalue of ling and disproportionately made eligible moderate income people whoare likely to le one might expect that the participation rate rose further Inaddition EITC awareness and outreach has increased in recent years On theother hand recent compliance efforts may have discouraged some potential lers
1075THE LABOR SUPPLY OF SINGLE MOTHERS
because nearly 90 percent of AFDC recipients also received FoodStamps [U S House of Representatives 1996] The AFDC pro-gram provided cash payments to families with children who havebeen deprived of support due to the absence or unemployment ofa parent The Food Stamp program provides low-income house-holds with coupons to purchase food AFDC program parameterswere set by the states while most Food Stamp parameters are thesame in all states Nevertheless because of the interaction of theeligibility and benet calculations of the two programs there areinterstate differences in the Food Stamps received for people insimilar situations Both of these programs are large relative toother means-tested programs with 1996 AFDC and Food Stampexpenditures totaling $237 billion and $255 billion respectivelyBoth had growing expenditures and caseloads in the late 1980sand early 1990s with peaks in scal year 1994
While much past work has summarized the AFDC and FoodStamp programs using the combined maximum benet this mea-sure ignores the large interstate differences and changes overtime in earnings exemptions and implicit tax rates By 1996fteen states had exemptions and tax rates that differed from thestandard $120 earnings exemption and the two-thirds implicittax rate We summarize AFDC and Food Stamps with threevariables implied by our theoretical model the maximum com-bined benet expected benets if a person works and the prob-ability of AFDC receipt (which captures transaction costs orstigma) Due to cuts in AFDC the mean maximum combinedAFDC and Food Stamp benet fell about 7 percent over thesample period Over the same period mean benets for a workingsingle mother remained roughly constant as implicit tax rateswere reduced
Theory predicts that the AFDC and Food Stamp programsdecrease labor supply for two reasons First the income effect ofthe guarantee amount (maximum benet) should make employ-ment less likely and reduce hours worked if a woman worksSecond the implicit tax rate resulting from reductions in benetsas earnings increase (captured by reductions in the benets ifwork variable) also reduces the incentive to work Thus AFDCshould decrease both the likelihood of working and hours condi-tional on working However in interpreting our estimates belowone should bear in mind that substantial research indicates thatactual exemptions and implicit tax rates differ from the statutory
1076 QUARTERLY JOURNAL OF ECONOMICS
ones15 Consequently our calculations of AFDC benets for thosewho work may be fairly rough We will return to this issue inSection VI
Under AFDC the Secretary of Health and Human Services(HHS) was authorized to waive specied program requirementsto allow states to experiment This waiver authority was rarelyused prior to the late 1980s but its use accelerated under Presi-dents Bush and Clinton Between January 1993 and August1996 HHS approved welfare waivers in 43 states While statesexperimented with changes in nearly every aspect of AFDCmany provisions applied to small parts of states or would not beexpected to have a substantial effect on the employment of singlemothers We focus on a few types of waiver provisions that weretried in many states Our main welfare waiver variables are AnyTime Limit which equals one for single mothers in states thatimposed work requirements or benet reductions on those whoreached time limits and Any Terminations which equals one forany single mother in a state in which a welfare case had beenterminated under a welfare waiver Some common types of pro-visions such as expanded income disregards have been incorpo-rated in our coding of the AFDC program Others such as familycaps (which limited the benets for additional children) or in-creased resource limits (which loosened the asset restrictions forAFDC eligibility) likely have small or ambiguous effects on em-ployment and are therefore not included
In this paper we focus on implementation dates and actualbeginning dates of terminations instead of application or ap-proval dates We also examine a dummy variable for states thatapplied for a major statewide waiver in case this indicates atightening of administrative requirements in a state These vari-ables are interacted with an indicator for whether a woman haschildren In Table I we report the fraction of single women livingin states that have applied for or implemented various types ofwaivers Very few women were in states that had implementedsignicant waivers through at least 1994 The fraction of womenin states that had made a major waiver application was muchhigher 022 in 1992 and 085 in 1996
15 See Fraker Moftt and Wolf [1985] and Levine [1997] Other researchindicates that few AFDC recipients report their income to welfare ofces [Edinand Lein 1997 Hill et al 1999]
1077THE LABOR SUPPLY OF SINGLE MOTHERS
C Medicaid
Medicaid is the biggest and most costly program that aidssingle mothers and their children In 1994 $309 billion wasspent on 248 million nonaged nondisabled Medicaid recipients agroup that was predominantly single mothers and their children[U S House of Representatives Green Book 1996 pp 897ndash902]Unlike the Food Stamp program and especially AFDC Medicaideligibility has expanded dramatically since 1984 resulting in amore than threefold increase between 1984 and 1994 in Medicaidexpenditures on families with dependent children (and a 60 per-cent increase in the caseload) Prior to 1987 Medicaid eligibilityfor single mothers and their children generally required receipt ofAFDC In a series of expansions Medicaid coverage was extendedto low-income pregnant women and children (again see Figure I)The differences across states in the extent to which they tookadvantage of the permitted coverage options generated largedifferences in who was covered in different years in differentstates Moreover state AFDC income limits interacted with theMedicaid expansions to determine the additional families covered(see Meyer and Rosenbaum [2000b] for more details)
We measure Medicaid benets by rst calculating the num-ber of adults and children in the family that would be covered ifa woman works We then convert these numbers to dollar valuesusing Medicaid expenditures per child and adult averaged overall states and years16 As can be seen in Table I there was a fairlysteady increase over our sample period in the number of familymembers covered under Medicaid if a single mother works
The theoretical effect of Medicaid expansions on the decisionto work is positive since those newly covered are those withearnings that would make them ineligible for AFDC The Med-icaid expansions also could result in some working women in-creasing their hours if pre-expansion earnings limits resulted inthem reducing their hours of work in order to qualify for Medicaidcoverage Overall the effect on hours conditional on working isambiguous since the expansions also could result in hours de-creases for women who choose to reduce their hours in order toqualify for Medicaid coverage for their children
16 Note that in our specications Medicaid coverage for the nonworking iscollinear with family size and number of children controls so a 5 is not estimated
1078 QUARTERLY JOURNAL OF ECONOMICS
D Training and Child Care Programs
To capture the effect of training programs on the probabilityof work by single mothers we focus on the programs specicallyfor AFDC applicants and recipients rst the Work Incentives(WIN) program and then the Job Opportunities and Basic Skills(JOBS) program Total expenditures as well as the emphasis ofthese programs changed sharply over our period (see Table I) Weconstruct two variables that measure the character and extent ofthe JOBS and WIN programs in a state and year Because edu-cational spending is likely to have a different effect than otherspending we split expenditures into education and job searchother We scale state expenditures by the size of the AFDCmandatory population These variables are interacted with anindicator for whether a woman would be required to participate inJOBS or WIN (based on the age of her youngest child these rulesdiffered across states and over time) so that these variables equalzero for single women without children or with children under theage cutoff
The effects of these training programs on labor supply likelydepends on the mix of services provided and the stringency of theparticipation requirements Job search assistance job place-ments and improving job skills and readiness should lower jobsearch costs thereby increasing the level of work for womentrainees On the other hand even with a benecial long-termeffect on wages or employment secondary or postsecondary edu-cation may delay entry into the workforce while women takeclasses leading to a short-term negative employment effect Inany case there is much stronger evidence of employment effectsfrom job search assistance than from education at least in theshort run17
The cost and quality of child care is likely to have an impor-tant effect on whether a woman works The federal role in childcare for low-income women expanded greatly following the Fam-ily Support Act of 1988 and the Omnibus Budget ReconciliationAct of 1990 Four large programs started during this periodAFDC Child Care Transitional Child Care At-Risk Child Careand Child Care and Development Block Grants We focus onthese programs because they are particularly important for singlemothers and they were the main changes over our period Total
17 See Gueron and Pauly [1991] and U S Department of Health andHuman Services [1997b]
1079THE LABOR SUPPLY OF SINGLE MOTHERS
TA
BL
EI
SU
MM
AR
YC
HA
RA
CT
ER
IST
ICS
OF
PO
LIC
IES
AF
FE
CT
ING
SIN
GL
EM
OT
HE
RS
AN
DS
ING
LE
WO
ME
NW
ITH
OU
TC
HIL
DR
EN
19
841
988
1992
A
ND
1996
Var
iabl
e
1984
1988
1992
1996
Ch
ildr
enN
och
ildr
enC
hil
dren
No
chil
dren
Ch
ildr
enN
och
ildr
enC
hil
dren
No
chil
dren
An
nu
alfe
dera
lst
ate
inco
me
taxe
sE
ITC
an
d1
2O
AS
DH
IA
t$5
000
earn
ings
216
935
22
338
376
253
340
82
1478
194
At
$10
000
earn
ings
118
954
234
713
562
673
1427
220
1214
32A
t$1
500
0ea
rnin
gs15
9920
7578
425
8950
226
872
476
2706
At
$20
000
earn
ings
2721
3325
2477
3844
2374
3980
1686
4009
At
$30
000
earn
ings
5466
6326
5398
6538
5527
6666
5585
6668
An
nu
alA
FD
Can
dfo
odst
amp
bene
ts
At
$0ea
rnin
gs75
830
7406
073
910
7056
0A
t$5
000
earn
ings
4719
047
340
4791
045
640
At
$10
000
earn
ings
1871
018
850
2029
019
750
At
$15
000
earn
ings
491
048
50
640
062
10
At
$20
000
earn
ings
800
890
116
013
20
Med
icai
dn
um
ber
offa
mil
ym
embe
rsel
igib
leA
t$0
earn
ings
265
000
262
000
266
000
268
000
At
$500
0ea
rnin
gs2
510
002
530
002
560
002
520
00A
t$1
000
0ea
rnin
gs1
100
001
410
001
620
001
920
00A
t$1
500
0ea
rnin
gs0
270
000
350
000
760
001
010
00A
t$2
000
0ea
rnin
gs0
030
000
050
000
310
000
490
00A
t$2
500
0ea
rnin
gs0
000
000
010
000
090
000
190
00
1080 QUARTERLY JOURNAL OF ECONOMICS
TA
BL
EI
(CO
NT
INU
ED
)
Var
iabl
e
1984
1988
1992
1996
Ch
ildr
enN
och
ildr
enC
hil
dren
No
chil
dren
Ch
ildr
enN
och
ildr
enC
hil
dren
No
chil
dren
Wai
vers
An
yti
me
lim
it0
000
000
00
010
039
0A
ny
term
inat
ions
000
00
000
000
00
210
Maj
orw
aive
rap
plic
atio
n0
000
002
00
220
085
0A
nn
ual
trai
nin
gch
ild
care
doll
ars
per
elig
ible
reci
pien
tT
rain
ingmdash
edu
cati
on0
00
010
00
126
0T
rain
ingmdash
job
sear
cho
ther
126
039
016
60
272
0C
hil
dca
re0
00
024
60
302
0N
um
ber
ofob
serv
atio
ns
9391
189
1492
1118
612
103
3319
311
8788
158
46
Sou
rce
The
data
are
from
the
1984
ndash199
6C
urre
ntP
opu
lati
onS
urve
yO
utg
oing
Rot
atio
nG
roup
File
(OR
G)
Res
tric
tion
sT
hesa
mpl
ein
clud
es19
ndash44
year
-old
sing
lew
omen
(div
orce
dw
idow
ed
orne
ver
mar
ried
)w
hoar
eno
tin
scho
ol
Not
esT
hese
mea
nsar
eca
lcu
late
du
sing
the
char
acte
rist
ics
ofth
eO
RG
sam
ple
for
the
give
nye
aran
dar
ew
eigh
ted
Wom
enar
eas
sum
edto
bein
thei
rr
stfo
urm
onth
sof
wor
kto
hav
eno
une
arn
edin
com
ean
dto
clai
mn
och
ildca
reex
pen
ses
Als
osi
ngle
wom
enw
ith
and
wit
hout
chil
dren
are
assu
med
tol
eas
head
ofh
ouse
hol
dan
dsi
ngle
res
pect
ivel
yan
dto
clai
mth
est
anda
rdde
duct
ion
Tax
esan
dw
elfa
rear
ead
just
edfo
rst
ate
cost
ofli
vin
gdi
ffer
ence
san
dal
ldol
lar
amou
nts
are
expr
esse
din
1996
dolla
rsS
eeA
ppen
dix
1fo
rsp
eci
cin
dice
sus
edan
dot
her
deta
ils
1081THE LABOR SUPPLY OF SINGLE MOTHERS
state and federal expenditures on these four new federal pro-grams by state and year are scaled by the number of singlemothers with children under six These numbers can be seen inTable I which shows a steep rise in child care expendituresbetween 1988 and 1992 followed by a slower rise in later yearsFor more detail on training and child care programs see Meyerand Rosenbaum [1999]
V THE DETERMINANTS OF EMPLOYMENT
We use several different econometric methods to identify theimpact of the recent policy changes on the employment of singlemothers We begin with the familiar difference in differencesestimator This approach compares employment rates over timefor single mothers with those for single women without childrenThis approach is the one taken by Eissa and Liebman [1996] intheir study of the EITC over the 1984 to 1990 period We waituntil Section VI to discuss the estimates from our simple struc-tural model
A Employment Rates of Single Mothers and Single ChildlessWomen
The top panel of Table II reports the employment rates ofsingle mothers and single women without children along withthe difference in employment rates between these two groups ofsingle women We report this difference because many determi-nants of employment that change over time especially wages andmacroeconomic conditions might be expected to affect all singlewomen similarly Other determinants of employment particu-larly the tax and transfer programs that we examine specicallyaffect single mothers The bottom panel of Table II focuses on thesubsample of single mothers with children under six (again rela-tive to single women without children) a group we expect to bemore responsive to changes in the rewards to work Also employ-ment changes are likely to have greater effects on children forbetter or worse when they are young and their mother likelyplays a larger role in their care and education
We report two different measures of employment whether awoman worked last week (from the ORG data) and whether awoman worked at all last year (from the March data) Eachmeasure has its advantages Whether a woman worked last weekis probably a better measure of labor supply to use as an input to
1082 QUARTERLY JOURNAL OF ECONOMICS
policy decisions since its average captures the fraction of womenworking in a given week This variable will be especially useful ifthose who move in or out of the workforce on the margin workonly a few weeks during the year On the other hand as discussedearlier the EITC unequivocally increases the probability of work-
TABLE IIEMPLOYMENT RATES FOR SINGLE MOTHERS SINGLE MOTHERS WITH CHILDREN
UNDER SIX AND SINGLE WOMEN WITHOUT CHILDREN 1984ndash1996
Year
CPS Outgoing Rotation Groupworked last week = 1 March CPS worked last year = 1
ChildrenNo
children DifferenceStandard
error ChildrenNo
children DifferenceStandard
error
1984 05854 08014 2 02160 00059 07322 09399 2 02077 000831985 05861 08048 2 02187 00058 07302 09439 2 02137 000831986 05891 08131 2 02240 00057 07310 09450 2 02141 000821987 05941 08179 2 02238 00056 07382 09473 2 02091 000811988 06027 08215 2 02188 00058 07482 09485 2 02003 000841989 06136 08150 2 02015 00058 07577 09409 2 01831 000801990 06007 08155 2 02148 00056 07591 09424 2 01832 000791991 05790 08031 2 02242 00056 07428 09418 2 01990 000791992 05790 07957 2 02167 00057 07387 09299 2 01913 000811993 05875 07918 2 02044 00057 07511 09356 2 01845 000801994 06053 07921 2 01868 00057 07907 09312 2 01405 000781995 06265 07971 2 01707 00058 08072 09340 2 01268 000801996 06450 07938 2 01488 00060 08191 09290 2 01098 00079
Childrenunder 6
Nochildren Difference
Standarderror
Childrenunder 6
Nochildren Difference
Standarderror
1984 04382 08014 2 03632 00083 06122 09399 2 03277 001311985 04328 08048 2 03720 00082 05966 09439 2 03474 001331986 04362 08131 2 03770 00081 06227 09450 2 03223 001281987 04437 08179 2 03742 00082 06096 09473 2 03377 001291988 04634 08215 2 03581 00084 06277 09485 2 03207 001321989 04790 08150 2 03360 00083 06282 09409 2 03127 001271990 04569 08155 2 03586 00079 06369 09424 2 03055 001241991 04289 08031 2 03743 00078 06092 09418 2 03326 001241992 04330 07957 2 03627 00078 06273 09299 2 03027 001241993 04557 07918 2 03362 00078 06428 09356 2 02929 001221994 04796 07921 2 03125 00079 06934 09312 2 02378 001211995 05147 07971 2 02825 00081 07221 09340 2 02119 001231996 05396 07938 2 02543 00085 07476 09290 2 01813 00119
Sources The data are from the 1984ndash1996 Current Population Survey Outgoing Rotation Group File(ORG) and the 1985ndash1997 March Current Population Survey (March CPS) and are weighted
Restrictions Both samples include 19ndash44 year-old single women (divorced widowed or never married)who are not in school The March CPS sample excludes disabled or ill women and those with positive earnedincome but zero hours of work In the second panel single mothers without a child under six are excludedSee text for details
1083THE LABOR SUPPLY OF SINGLE MOTHERS
ing at all in a given tax year but for some could decrease weeksworked If our goal is to provide a sharp test of theoretical pre-dictions whether a woman worked last year is a better outcomemeasure We report both measures with the expectation that theeffects of many of the recent policy changes on weekly employ-ment will be smaller than on annual employment
The employment rates reported in Table II exhibit a strikingtime pattern For single mothers weekly employment increasedby almost 6 percentage points between 1984 and 1996 whileannual employment increased over 85 percentage points Most ofthis increase occurred between 1991 and 199618 Focusing on thesubsample of single mothers with young children the employ-ment increases were even larger 10 percentage points for weeklyemployment and 135 percentage points for annual employmentIn contrast the declines in both weekly and annual employmentof about one percentage point for single women without childrensuggest that the rising employment of single mothers was not aresult of better work opportunities for all single women More-over the timing of the employment increases suggest that policychanges in the 1990s are likely to have played a large role
B Comparing Single Mothers and Single Women withoutChildren
Appendix 2 reports descriptive statistics for single womenwith and without children for the years 1984 1988 1992 and1996 The table indicates that single mothers tend to be older andless educated and are more likely to be nonwhite than singlewomen without children The age of single women without chil-dren rises appreciably over the sample period as does the edu-cation level of single mothers The fraction of single mothersliving with parents is stable while the rate for single womenwithout children falls The rates of cohabitation rise for bothsingle women with and without children
A potential criticism of the Table II results (and our main
18 One concern in interpreting changes in employment for single mothersduring the years 1992 to 1994 is that beginning in January 1994 the CPS used aredesigned questionnaire For a description of this CPS redesign see CohanyPolivka and Rothgeb [1994] and Polivka and Miller [1998] In Meyer and Rosen-baum [1999] we assess the extent of any bias due to the redesign using the parallelsurvey which provides contemporaneous responses using the new and old surveysWe also employ ORGMarch comparisons using the fact that redesign affected thetwo data sets at a different point in time Overall these comparisons indicate thatthe CPS redesign had a small effect that if it leads to any bias suggests that weslightly understate the recent employment increases of single mothers
1084 QUARTERLY JOURNAL OF ECONOMICS
regression results below) is that single women without childrenare not a good comparison group for single mothers The means inAppendix 2 suggest the possibility that changes in the character-istics of single mothers versus single women without childrencould explain the two groupsrsquo differing employment rate trendsIn our regression results we condition on observable characteris-tics such as race and education in order to make the two groupsmore comparable It is also interesting to note that single womenwith and without children are quite similar in an importantdimension hourly earnings The mean hourly earnings of womenwith and without children are fairly similar (and they are muchcloser if one controls for education)
Perhaps more importantly one might argue that employ-ment rates are so high for single women without children that itis unreasonable to expect this group to respond to changes ineconomic conditions in the same way that single mothers do Yetemployment rates are not particularly high for low-educated sin-gle women particularly when examining employment last weekOnly 33 percent of high school dropout single mothers workedand 48 percent of high school dropout single women withoutchildren worked last week Nevertheless in our later regressionsderivative estimates for our key policy variables tend to be thelargest and most statistically signicant for high school dropouts
One might also wonder whether the large increases in em-ployment that we nd for single mothers but not for singlewomen without children also occur for other demographicgroups In Meyer and Rosenbaum [2000a] we examine whetherthere are similar employment increases for two other groups withhistorically low employment rates black males 19ndash44 and mar-ried mothers 19ndash44 We nd that the large increases in employ-ment of single mothers over 1984 ndash1996 and particularly since1991ndash1996 are not mirrored by other demographic groups
Another potential criticism of our approach is that usingvariation across women in their marital status number of chil-dren and state of residence implicitly assumes that marriagefertility and migration decisions are exogenous to the policychanges that we examine The evidence on the effects of policychanges on these decisions is mixed making the exogeneity as-sumption more plausible For example in her recent reviewHoynes [1997] concludes ldquoTogether this evidence suggests thatmarriage decisions are not sensitive to nancial incentivesrdquo Shealso argues that ldquoOverall [the effects of welfare on out-of-wedlock
1085THE LABOR SUPPLY OF SINGLE MOTHERS
births] are often insignicant and when they are not they aresmall [pp 129ndash130]rdquo On the other hand another recent reviewMoftt [1997] suggests that the weight of the evidence impliessome effect of welfare benets on marriage and fertility As tolocation Meyer [1999] concludes that there is a signicant butsmall effect of welfare on migration Overall it is likely thatendogenous single motherhood and location exert a small bias onour results
C Accounting for Individual and State Characteristics
As mentioned above the results in Table II could be partlyexplained by differential changes over time in characteristicssuch as age and education for single women with and withoutchildren Moreover business cycles may differentially affect sin-gle women with and without children thereby leading to employ-ment shifts unrelated to policy changes Consequently Table IIIpresents probit employment estimates for single women control-ling for demographic and business cycle changes We include alarge number of controls for differences between the two groupsand we include the unemployment rate as well as its interactionwith whether or not a woman has children The specication thatwe estimate is
(6) Pr(Eit 5 1) 5 F a Xit 1 b tYEARt
1 g t(YEARt p ANYCHILDRENi)
where Eit equals one if woman i from year t reports positive hoursworked in the reference week for the ORG (or the previous yearfor the March CPS) Xit is a vector that includes demographic andbusiness cycle variables YEARt is an indicator variable for yeart and ANYCHILDRENi equals one for a woman with childrenThe year dummies control for labor market trends in overallfemale employment and the X vector controls for demographicand business cycle effect differences between the groups espe-cially compositional shifts over time Thus differences between g t
coefcients give difference-in-differences estimates controlling forthese other factors These differences can be interpreted as esti-mates of the combined effect of changes in all factors affecting theemployment of single mothers relative to single women withoutchildren
The demographic and business cycle variables accounted forin Table III include controls for state race ethnicity age educa-
1086 QUARTERLY JOURNAL OF ECONOMICS
TABLE IIIPROBIT EMPLOYMENT PROBABILITY ESTIMATES FOR SINGLE WOMEN 1984ndash1996
Explanatory variable
ORG worked lastweek = 1
March CPS workedlast year = 1
(1) (2)
Averagederivative
Standarderror
Averagederivative
Standarderror
Any children p 1984 2 00797 00107 2 01087 00160Any children p 1985 2 00856 00105 2 01199 00156Any children p 1986 2 00857 00103 2 01144 00153Any children p 1987 2 00880 00099 2 01056 00144Any children p 1988 2 00837 00096 2 00918 00140Any children p 1989 2 00663 00094 2 00745 00131Any children p 1990 2 00788 00095 2 00832 00136Any children p 1991 2 00823 00102 2 00916 00151Any children p 1992 2 00747 00106 2 00706 00159Any children p 1993 2 00601 00101 2 00830 00153Any children p 1994 2 00538 00098 2 00388 00145Any children p 1995 2 00405 00096 2 00154 00143Any children p 1996 2 00121 00097 00042 00140Nonwhite 2 00902 00019 2 00727 00033Hispanic 2 00405 00030 2 00608 00033Age 19ndash24 2 00210 00024 2 00077 00055Age 25ndash29 00070 00024 2 00107 00095Age 35ndash39 2 00049 00026 00008 00052Age 40ndash44 2 00108 00028 00107 00116High school dropout 2 02161 00022 2 01512 00032Some college 00870 00019 00989 00055Bachelors 01441 00025 01755 00055Masters 01295 00040 01927 00095Divorced 2 00068 00028 00062 00052Widowed 2 01201 00080 2 01218 00116Any children p divorced 01154 00038 00720 00063Any children p widowed 00978 00097 01148 00137[ of children under 18 2 00404 00014 2 00325 00020[ of children under 6 2 00955 00020 2 00699 00027Pregnant z z 2 01333 00063Unearned income ($1000s) z z 2 00035 00003Central city z z 2 00230 00030State unemployment rate () 2 00113 00008 2 00101 00015Any children p state unemployment
rate () 00017 00010 00032 00017Number of observations 373662 119019
Sources The data are from the 1984ndash1996 Current Population Survey Outgoing Rotation Group File(ORG) and the 1985ndash1997 March Current Population Survey (March CPS)
Restrictions See Table II for sample restrictionsControls Additional controls include indicators for state year calendar month and calendar month
interacted with any children (ORG)Notes Unearned income includes interest dividend Social Security veteransrsquo benets and retirement
income The omitted group is white non-Hispanic age 30ndash34 never married and not pregnant (March CPS)She does not live in a central city (March CPS) and has only a high school education See text for details
1087THE LABOR SUPPLY OF SINGLE MOTHERS
tion marital status marital status interacted with a childrenindicator the number of children under six and eighteen thestate unemployment rate the state unemployment rate inter-acted with a children indicator (for the March CPS only) controlsfor pregnancy central city and unearned income and (for theORG only) controls for month and month interacted with a chil-dren indicator Note that the difference-in-differences calculatedby subtracting one YEAR p ANYCHILDREN coefcient fromanother are hardly affected by including the controls19 For ex-ample between 1984 and 1996 the weekly employment of singlemothers relative to single women without children rises 71 per-centage points without controls and 68 percentage points withcontrols20 For annual employment the difference-in-differencesestimator for 1984 to 1996 suggests an 117 percentage pointincrease in the relative annual employment of single motherswithout controls and an 113 percentage point increase withcontrols Again most of the increase occurs between 1991 and1996 Therefore these difference-in-difference estimates suggesta potential role for policy changes especially since 1991
VI POLICY VARIABLES AND EMPLOYMENT USING OUR SIMPLE
STRUCTURAL MODEL
We now move on to our main approach that uses our simplestructural model to distinguish between the different policies andto provide estimates that have a clearer interpretation Whilesome of the estimates rely on comparisons of single mothers andsingle women with children over time other estimates use avariety of other sources of identifying variation in our key explana-tory variables In some specications the identifying variationcomes from differences in taxes and benets for families of dif-ferent sizes and in different states as well as changes in thesetaxes and benets over time and differences in state living costs
Table IV reports estimates of our structural model of the
19 Due to the difculty in gauging the magnitude of probit coefcient esti-mates instead we report derivatives of the probability of working with respect toeach of the explanatory variables averaged over the single mothers in the sampleThus differences in the average derivatives for the YEAR p ANYCHILDRENvariables give changes over time in the difference in employment between singlewomen with and without children analogous to the changes that can be calculatedfrom Table II
20 The ldquowithout controlsrdquo results come from a weighted probit including onlythe year dummies and YEAR p ANYCHILDREN interactions
1088 QUARTERLY JOURNAL OF ECONOMICS
effects of tax and welfare policy on the probability that a womanworks These specications provide estimates of the parametersin expression (5) of Section II and can be used to obtain estimatesof the effects of the different policy changes during the 1984 ndash1996period These specications also provide coefcients that can beused to summarize the effects of a wide range of policies and thatcan be used to simulate other policies In addition to the variablesshown in Table IV each of these probits include the controlvariables reported in Table III (except for the YEAR p ANY-CHILDREN interactions) along with a large number of familycomposition variables listed in the table notes These controlvariables imply that we are not using simple differences acrossfamily types to identify our coefcients We are using changesover time or differences across states in how different families aretreated We focus rst on the full sample specications in columns(1) and (5)
All of the coefcients on the income variables have the signsthat are implied by our simple structural model and are signi-cantly different from zero21 Lower taxes and maximum welfarebenets increase employment while higher welfare benets if awoman works (due to lower implicit taxes on earnings) increaseemployment Rather than restricting the income variables toenter the worknonwork decision as a single expected incomevariable we have allowed the coefcients on the different compo-nents of income to differ It is thus encouraging that the coef-cients on the income tax and welfare variables have roughly thesame magnitude as expected The one exception to this rule isthat the coefcient on Welfare Benets if Work in the weeklyemployment equation is substantially larger than the other in-come coefcients
A Taxes
The Income Taxes if Work coefcient implies that a onethousand dollar reduction in income taxes if a woman worksincreases employment last week by 27 percentage points andincreases employment last year by 45 percentage points Both ofthese effects are strongly signicant These coefcients indicateelasticities of the participation rate with respect to the return to
21 We examined the importance of allowing for correlation among the errorterms at the level of state p year p ANYCHILDREN using STATA These standarderrors are very close to those without this correction for clustering
1089THE LABOR SUPPLY OF SINGLE MOTHERS
TA
BL
EIV
PR
OB
ITE
ST
IMA
TE
SO
FT
HE
EF
FE
CT
OF
PO
LIC
YV
AR
IAB
LE
SO
NT
HE
EM
PL
OY
ME
NT
OF
SIN
GL
EW
OM
EN
AV
ER
AG
ED
ER
IVA
TIV
E(S
TA
ND
AR
DE
RR
OR)
Exp
lan
ator
yva
riab
le
OR
Gw
orke
dla
stw
eek
=1
Mar
chC
PS
wor
ked
last
year
=1
Yea
rsof
edu
cati
onY
ears
ofed
ucat
ion
All
lt12
12gt
12A
lllt
1212
gt12
(1)
(2)
(3)
(4)
(5)
(6)
(7)
(8)
Inco
me
taxe
sif
wor
k2
002
732
004
172
003
342
001
822
004
492
008
792
005
262
002
07in
$100
0sy
ear
(00
034)
(00
080)
(00
057)
(00
051)
(00
053)
(00
150)
(00
090)
(00
063)
Wel
fare
max
imu
mbe
net
20
0340
20
0425
20
0357
20
0218
20
0295
20
0579
20
0349
20
0068
in$1
000s
yea
r(0
002
4)(0
005
6)(0
004
0)(0
003
6)(0
003
8)(0
010
6)(0
006
3)(0
004
5)W
elfa
rebe
ne
tif
wor
k0
0772
006
540
0916
005
390
0571
011
770
0626
002
33in
$100
0sy
ear
(00
073)
(00
171)
(00
121)
(00
109)
(00
107)
(00
299)
(00
177)
(00
125)
Pro
babi
lity
ofA
FD
Cre
ceip
t2
019
852
029
262
025
472
010
872
017
422
026
942
020
192
011
94if
wor
k(0
023
9)(0
052
2)(0
039
8)(0
036
3)(0
034
8)(0
094
4)(0
058
6)(0
041
7)M
edic
aid
ifw
ork
20
0096
20
0040
000
132
001
672
000
452
001
190
0007
20
0072
in$1
000s
yea
r(0
003
3)(0
006
6)(0
005
6)(0
005
5)(0
004
4)(0
010
9)(0
007
6)(0
005
9)W
aive
rmdashan
yti
me
lim
it0
0136
004
080
0192
20
0065
001
910
0256
000
720
0169
(Ind
icat
orva
riab
le)
(00
071)
(00
160)
(00
119)
(00
102)
(00
125)
(00
329)
(00
209)
(00
149)
Wai
vermdash
any
term
inat
ions
002
220
0355
003
540
0124
004
820
1174
005
320
0148
(Ind
icat
orva
riab
le)
(00
110)
(00
260)
(00
181)
(00
158)
(00
223)
(00
607)
(00
375)
(00
250)
Tra
inin
gmdashed
uca
tion
20
0805
20
0824
20
0715
20
0563
20
0759
20
0708
20
1222
20
0257
in$1
000s
yea
r(0
019
0)(0
043
0)(0
031
1)(0
028
3)(0
031
0)(0
084
9)(0
050
7)(0
037
6)
1090 QUARTERLY JOURNAL OF ECONOMICS
TA
BL
EIV
(CO
NT
INU
ED
)
Exp
lana
tory
vari
able
OR
Gw
orke
dla
stw
eek
=1
Mar
chC
PS
wor
ked
last
year
=1
Yea
rsof
edu
cati
onY
ears
ofed
uca
tion
All
lt12
12gt
12A
lllt
1212
gt12
(1)
(2)
(3)
(4)
(5)
(6)
(7)
(8)
Tra
inin
gmdashjo
bse
arch
oth
er0
0446
004
720
0607
002
600
0526
006
690
0643
002
84in
$100
0sy
ear
(00
117)
(00
272)
(00
190)
(00
175)
(00
192)
(00
528)
(00
317)
(00
236)
Chi
ldca
re0
0227
002
720
0190
002
260
0229
004
380
0175
001
94in
$100
0sy
ear
(00
065)
(00
148)
(00
104)
(00
104)
(00
100)
(00
287)
(00
164)
(00
119)
Sta
teu
nem
ploy
men
tra
te2
001
002
000
982
001
012
001
052
000
832
001
332
000
902
000
53in
perc
enta
gepo
ints
(00
007)
(00
020)
(00
013)
(00
010)
(00
014)
(00
044)
(00
024)
(00
016)
Any
chil
dren
pst
ate
unem
pra
te2
000
010
0009
20
0010
000
080
0011
000
422
000
090
0022
inpe
rcen
tage
poin
ts(0
000
9)(0
002
1)(0
001
4)(0
001
3)(0
001
4)(0
004
2)(0
002
4)(0
001
7)N
um
ber
ofob
serv
atio
ns37
366
251
146
134
432
188
084
119
019
159
9441
060
619
65
Sou
rces
The
data
are
from
the
1984
ndash199
6C
urre
ntP
opul
atio
nSu
rvey
Out
goin
gR
otat
ion
Gro
up
Fil
e(O
RG
)an
dth
e19
85ndash1
997
Mar
chC
urre
ntP
opul
atio
nS
urve
y(M
arch
CP
S)
Res
tric
tion
sS
eeT
able
IIfo
rsa
mpl
ere
stri
ctio
ns
Spec
ica
tion
s(2
)an
d(6
)ar
ere
stri
cted
tohi
ghsc
hoo
ldr
opou
ts(
3)an
d(7
)to
high
sch
ool
grad
uate
san
d(4
)an
d(8
)to
thos
ew
ith
aned
ucat
ion
beyo
nd
hig
hsc
hool
C
ontr
ols
Inad
diti
onto
the
vari
able
sin
Tab
leII
I(e
xcep
tfo
rth
ein
tera
ctio
nsbe
twee
nye
aran
dan
ych
ildr
en)
the
foll
owin
gco
ntro
lsar
ein
clud
ed
indi
cato
rsfo
rst
ate
year
ca
len
dar
mon
tha
nd
cale
ndar
mon
thin
tera
cted
wit
han
ych
ildr
en(O
RG
)w
heth
erat
leas
ton
etw
oth
ree
and
four
orm
ore
child
ren
are
pote
ntia
llyA
FD
Cel
igib
lew
heth
erat
leas
ton
ean
dat
leas
ttw
och
ildr
enar
eE
ITC
elig
ible
and
wh
ethe
rat
leas
ton
ech
ild
isu
nder
six
unde
rth
ree
unde
rtw
oan
dun
der
one
Las
tco
ntin
uou
sva
riab
les
for
the
num
ber
ofch
ildr
enun
der
each
age
betw
een
one
and
nin
etee
nar
ein
clud
ed
Not
esI
nal
lspe
cic
atio
ns
the
tax
wel
fare
and
Med
icai
dva
riab
les
are
calc
ula
ted
usin
ga
join
tho
urs
wag
edi
stri
buti
one
stim
ated
sepa
rate
lyfo
rsi
ngl
ew
omen
wit
han
dw
itho
utch
ildr
enT
axes
and
wel
fare
are
adju
sted
for
stat
eco
stof
livi
ngdi
ffer
ence
san
dal
ldo
llar
amou
nts
are
expr
esse
din
1996
doll
ars
See
App
endi
x1
for
spec
ic
indi
ces
used
and
othe
rde
tail
s
1091THE LABOR SUPPLY OF SINGLE MOTHERS
work of 107 for any employment during the year and 083 forwork in an average week We also estimated specications withseparate coefcients on state and federal income taxes althoughfor brevity these full estimates are not reported here The resultsfor federal taxes were similar to all taxes while the derivative(standard error) for state income taxes was a large and signicant2 00336 (00083) in the ORG sample and a smaller and insigni-cant 2 00165 (00139) in the March sample Thus while the statetax estimates are much less precise and differ in the two samplesthey give the same message as the other tax coefcients ie thatthe labor supply of single mothers responds to taxes
B Welfare
The full sample specications of columns (1) and (5) alsoindicate substantial effects of welfare on employment A onethousand dollar reduction in the annual Welfare Maximum Bene-t (the AFDC plus Food Stamp benet a women receives if shedoes not work) increases employment last week by 34 percentagepoints and increases employment last year by 30 percentagepoints This calculation holds constant the other welfare vari-ables Welfare Benets if Work and Probability of AFDC Receiptif Work that generally change with the maximum benet TheWelfare Benets if Work effect is sizable implying that a onethousand dollar increase in benets when one works increasesemployment last week by 72 percentage points and last year by57 percentage points These estimates suggest substantial posi-tive employment effects of reductions in implicit tax rates andincreases in earnings disregards
The transaction costs or stigma of welfare receipt as mea-sured by the Probability of AFDC Receipt if Work variable isnegative and signicantly different from zero as expected (seeequation (5)) The magnitude of this coefcient can be gauged bycomparing it with the coefcients on the variables denominatedin thousands of dollars Such comparisons suggest a transactioncost of several thousand dollars with the exact number depend-ing on the employment measure and the income variable usedFor example using the Welfare Benets if Work coefcient in theORG sample yields a transaction cost estimate of $2571 whilethe March sample implies an estimate of $3051 This resultagrees with past studies as well as ethnographies that havetended to nd substantial transaction costs or stigma of welfarereceipt
1092 QUARTERLY JOURNAL OF ECONOMICS
To assess the effect of cutting the AFDC benet one needs toincorporate the effects of all three of the welfare variables and theMedicaid if Work variable When the AFDC maximum benetand payment standard are cut they not only reduce benets ifone does not work but also reduce benets if one does work Theyalso decrease the likelihood that a working mother will be onwelfare at all thereby reducing both her Medicaid eligibility andher AFDC transaction and stigma costs When we do the fullcalculations we nd that a 10 percent cut in the maximumbenet ($324 annually) increases both the annual and weeklyemployment rate by about 10 percentage points
Despite a more detailed calculation of welfare incentivesthan most past work and the use of panel data techniques wethink there are important potential sources of bias in these esti-mates We should also note that by dividing the effect of welfareinto income when working and when not and by estimating aseparate term for transaction costsstigma we are putting thetheoretical predictions to a more severe test than most work Asdiscussed in Section IV the Welfare Benets if Work variable andthe Probability of AFDC Receipt if Work variable are more dif-cult to calculate precisely than our other variables The largercoefcient on the Welfare Benets if Work variable could also bedue to the scale of this variable being inappropriately low Theearnings distribution used to calculate expected benets putsmost of the weight on earnings levels where welfare benetswould be low or zero It is very likely that we should use anearnings distribution that puts greater weight in the left tailsince women who work while on welfare rarely report all of theirearnings to the welfare ofce [Edin and Lein 1997] The reasonsfor possible bias in the Probability of AFDC Receipt if Workvariable are similar The coefcients on these two variables tendto both be large in the same specications with their oppositesigns canceling each other out
C Medicaid
We nd little effect of Medicaid on the employment decisionsof single mothers Theory predicts that the Medicaid if Workvariable will have a positive effect on employment The variablehas the opposite effect from this prediction in both samplesalthough the coefcient estimates are small and usually are notsignicantly different from zero This result is not completelyunexpected given the weak and conicting ndings in past work
1093THE LABOR SUPPLY OF SINGLE MOTHERS
Part of the difculty is the uncertainty about individual knowledgeof Medicaid rules and their valuation of the benets We havetried a large number of alternative specications none of whichindicates a large effect of Medicaid A full accounting of theseresults can be found in Meyer and Rosenbaum [2000b]
D Welfare Waivers and Time Limits
The AFDC waiver variables have the expected effect on em-ployment and their coefcients are signicantly different fromzero Both the implementation of a time limit on welfare receiptand the actual termination of benets under a work requirementor time limit waiver are predicted to increase employment bybetween 14 and 48 percentage points However until the lastyears of our sample the overall importance of such waivers issmall Even by 1994 only 5 percent of single mothers lived instates with a time limit and less than half of 1 percent lived instates that had begun to terminate benets
One should be cautious in interpreting the waiver coef-cients especially in attributing effects to the implementation ofparticular provisions of recent waivers or the termination of casesper se The perception of welfare changes by potential welfarerecipients the attitudes of case workers and differences in stateimplementation of policies likely play a large role in inuencingthe welfare caseload and consequently employment It is alsoeconometrically difcult to disentangle which provisions of awaiver are the most important since states typically imple-mented several changes to their AFDC programs under waiversat the same time The reported coefcients are partly the effect ofthe particular actions coded and partly a proxy for other changesgoing on in the states
Recognizing these limitations the strength of the evidencehere for a causal interpretation of the waiver results is muchgreater than in the studies of welfare caseloads First we useimplementation dates rather than application or approval dateswhich are at best loosely related to when provisions are enforcedSecond when we account for state intentions to reform welfare asindicated by whether or not a state has made a major waiverapplication this variable has little effect Third one or two yearleads of our time limit and termination variables have small andinsignicant coefcients suggesting that the provisions per serather than publicity or administrator attitudes lead to the em-ployment increases This result contrasts with those of Blank
1094 QUARTERLY JOURNAL OF ECONOMICS
[1997] and Levine and Whitmore [1998] who found strong effectsof leads of waiver variables on caseloads
E Training and Child Care
The last three coefcient estimates in Table IV measure theemployment effects of expenditures on training and child careHigher expenditures on job search and other training and onchild care are associated with a higher employment rate for singlemothers Training expenditures on education have a negativeeffect that is signicant in both samples The job search coef-cients imply that an increase in expenditures of one thousanddollars (about two-thirds of average expenditures) would increasethe employment rate for single mothers without young childrenby over four percentage points Since single mothers withoutchildren young enough to exempt them from training programsmake up about half of all single mothers the overall effect wouldbe over two percentage points An increase in federal and statechild care expenditures of ve hundred dollars per single motherwith a child under six (slightly less than the mean in 1996) isassociated with about a one percentage point increase in bothweekly and annual employment These effects are quite substan-tial per dollar expended The training result on education is notsurprising given the weaker results in the literature on classroomtraining and the possible short-term effect on employment aswomen are in classrooms rather than jobs
F Results by Education Group
Table IV also reports separate estimates for the effects of thepolicy variables for three education groups less than high schoolhigh school and some college We would expect a priori that thepolicy variables which mostly capture taxes and benets receivedby low-income women would have the greatest effect on highschool dropouts less of an effect on those with a high schooldegree and even less of an effect on those with some college22
Overall the results by level of education are consistent with thehypothesized larger effects on the less educated The derivativestend to be much larger in absolute value for high school dropoutsthan they are in the full sample and much smaller for those with
22 The estimates use a xed wagehours distribution (that does not vary byeducation) to calculate the income and benet variables so that the explanatoryvariables are comparable across the columns
1095THE LABOR SUPPLY OF SINGLE MOTHERS
some college than in the full sample For example a one thousanddollar cut in taxes (or increase in tax credits) for high schooldropout single women is predicted to increase their employmentby 42 percentage points in a typical week and increase work atall during the year by 88 percentage points The correspondingnumbers for those with some college education are 18 percentagepoints and 21 percentage points Many of the other policy vari-able derivatives also fall with increased education23
G Unemployment and Macroeconomic Conditions
Table IV also reports the coefcients on the state unemploy-ment rate and its interaction with a dummy variable for a singlewoman having children The unemployment rate is strongly sig-nicant and implies that for single women without children a onepercentage point increase in the unemployment rate is associatedwith a 10 percentage point decrease in employment in a typicalweek and a 08 percentage point decrease in work anytime duringthe year On the other hand the interaction of the unemploymentrate with being a single mother is small and not signicantlydifferent from zero The point estimates imply that a one percent-age point increase in the unemployment rate is associated withonly a 001 percentage point decrease in a typical week and 01percentage point increase any time during the year in theemployment of single mothers relative to single women withoutchildren These coefcients indicate a strong and similarresponsiveness of both groups of single women to the state of themacroeconomy This result is favorable for the use of singlewomen without children as a comparison group for single mothers
H Alternative Specications
Since many of the changes in policy notably welfare reformtook place in recent years and a well-publicized decline in thewelfare rolls began in 1994 we reestimate the full sample speci-cations of Table IV dropping the years 1994 ndash1996 along withthe waiver variables (which are nearly always zero through1993) The estimates from this shorter sample which are re-ported in columns (1) and (5) of Table V are very close to those
23 The derivatives might be lower for groups with higher levels of educationbecause their employment rates are higher leaving less room for increases inemployment However the drop in the magnitude of the policy variable deriva-tives with more education is greater than it is for other control variables such asthe unemployment rate
1096 QUARTERLY JOURNAL OF ECONOMICS
TA
BL
EV
PR
OB
ITE
STIM
AT
ES
OF
TH
EE
FF
EC
TO
FP
OL
ICY
VA
RIA
BL
ES
ON
TH
EE
MP
LO
YM
EN
TO
FS
ING
LE
WO
ME
NA
LT
ER
NA
TIV
ES
PE
CIF
ICA
TIO
NS
AV
ER
AG
ED
ER
IVA
TIV
E(S
TA
ND
AR
DE
RR
OR)
Exp
lana
tory
vari
able
OR
G
wor
ked
last
wee
k=
1M
arch
CP
Sw
orke
dla
stye
ar=
1
(1)
(2)
(3)
(4)
(5)
(6)
(7)
(8)
Inco
me
taxe
sif
wor
k2
002
892
001
352
005
012
000
552
004
302
002
532
005
582
003
05in
$100
0sy
ear
(00
045)
(00
087)
(00
051)
(00
084)
(00
074)
(00
129)
(00
087)
(00
133)
Lag
ged
inco
me
taxe
sif
wor
kz
zz
20
0263
zz
z2
001
75in
$100
0sy
ear
zz
z(0
009
2)z
zz
(00
148)
Wel
fare
max
imu
mbe
net
20
0375
20
0107
20
0464
20
0340
20
0291
20
0011
20
0445
20
0296
in$1
000s
yea
r(0
002
9)(0
006
5)(0
003
3)(0
002
4)(0
004
7)(0
009
2)(0
005
6)(0
003
8)W
elfa
rebe
ne
tif
wor
k0
0911
001
070
1027
007
660
0644
20
0080
20
0882
005
67in
$100
0sy
ear
(00
089)
(00
106)
(00
099)
(00
073)
(00
132)
(00
144)
(00
157)
(00
107)
Pro
babi
lity
ofA
FD
Cre
ceip
t2
021
042
010
442
024
102
019
502
020
562
008
372
026
652
017
17if
wor
k(0
029
7)(0
033
6)(0
032
7)(0
023
9)(0
043
3)(0
050
1)(0
051
8)(0
034
8)M
edic
aid
ifw
ork
20
0133
000
292
002
092
000
952
000
790
0055
20
0107
20
0045
in$1
000s
yea
r(0
004
6)(0
003
7)(0
004
5)(0
003
3)(0
005
9)(0
004
9)(0
006
6)(0
004
4)W
aive
rmdashan
yti
me
lim
itz
001
710
0204
001
28z
002
470
0350
001
84(I
ndic
ator
vari
able
)z
(00
080)
(00
104)
(00
071)
z(0
014
1)(0
019
7)(0
012
5)W
aive
rmdashan
yte
rmin
atio
nsz
001
600
0456
002
15z
003
550
0703
004
79(I
ndic
ator
vari
able
)z
(00
116)
(00
163)
(00
110)
z(0
023
8)(0
034
7)(0
022
3)
1097THE LABOR SUPPLY OF SINGLE MOTHERS
TA
BL
EV
(CO
NT
INU
ED
)
Exp
lana
tory
vari
able
OR
Gw
orke
dla
stw
eek
=1
Mar
chC
PS
w
orke
dla
stye
ar=
1
(1)
(2)
(3)
(4)
(5)
(6)
(7)
(8)
Tra
inin
gmdashed
uca
tion
20
0755
20
0764
20
0728
20
0841
20
0804
20
0656
20
1396
20
0780
in$1
000s
yea
r(0
023
7)(0
022
3)(0
039
2)(0
019
0)(0
040
1)(0
036
5)(0
060
7)(0
031
0)T
rain
ingmdash
job
sear
cho
ther
007
620
0441
001
060
0428
007
150
0571
008
490
0517
in$1
000s
yea
r(0
014
0)(0
013
3)(0
023
7)(0
011
7)(0
023
7)(0
021
3)(0
038
2)(0
019
3)C
hild
care
000
110
0190
000
710
0215
20
0033
001
710
0286
002
22in
$100
0sy
ear
(00
092)
(00
073)
(00
088)
(00
066)
(00
140)
(00
114)
(00
161)
(00
101)
1994
ndash199
6ex
clud
edY
esN
oN
oN
oY
esN
oN
oN
oS
ingl
em
oth
ers
only
No
Yes
No
No
No
Yes
No
No
Mot
her
sw
och
ildr
enlt
6ex
cl
No
No
Yes
No
No
No
Yes
No
Nu
mbe
rof
obse
rvat
ions
292
731
122
966
303
396
373
662
938
1640
818
957
8611
901
9
Sou
rces
The
data
are
from
the
1984
ndash199
6C
urre
ntP
opul
atio
nSu
rvey
Out
goin
gR
otat
ion
Gro
up
Fil
e(O
RG
)an
dth
e19
85ndash1
997
Mar
chC
urre
ntP
opul
atio
nS
urve
y(M
arch
CP
S)
Res
tric
tion
sS
eeT
able
IIfo
rsa
mpl
ere
stri
ctio
ns
Spe
cic
atio
ns(1
)an
d(5
)ex
clu
de19
94ndash1
996
Spe
cic
atio
ns
(2)
and
(6)
incl
ude
only
sin
gle
mot
hers
Spe
cic
atio
ns
(3)
and
(7)
incl
ude
sing
lew
omen
wit
hout
chil
dren
and
sing
lem
othe
rsw
hose
youn
gest
chil
dis
less
than
six
Con
trol
sS
eeT
able
IVfo
rco
ntr
ols
Indi
cato
rsfo
rin
tera
ctio
nsbe
twee
nst
ate
and
any
AF
DC
elig
ible
chil
dren
and
betw
een
year
and
both
any
AF
DC
elig
ible
child
ren
and
any
EIT
Cel
igib
lech
ildre
nar
ein
clud
edin
spec
ica
tion
s(2
)an
d(6
)N
otes
In
alls
peci
cat
ions
the
tax
wel
fare
and
Med
icai
dva
riab
les
are
calc
ula
ted
usin
ga
join
tho
urs
wag
edi
stri
buti
ones
tim
ated
sepa
rate
lyfo
rsi
ngle
wom
enw
ith
and
wit
hout
chil
dren
Tax
esan
dw
elfa
rear
ead
just
edfo
rst
ate
cost
ofli
vin
gdi
ffer
ence
sA
lso
alld
olla
ram
ount
sar
eex
pres
sed
in19
96do
llar
sS
eeA
ppen
dix
1fo
rsp
eci
cin
dice
sus
edan
dot
her
deta
ils
1098 QUARTERLY JOURNAL OF ECONOMICS
over the full sample period The only exception to this generali-zation is that the job searchother training coefcient is largerand the child care coefcient is smaller and statistically insigni-cant over the shorter time span These results are among themost important in this paper because they indicate that (1) theurry of welfare reform measures after 1993 has not falsely led toour main results and (2) the extended recovery of the 1990s is notan alternative explanation for our main results
Next we examine a sample of only single mothers Thisspecication identies the effects of the income variables throughchanges across states and for different family sizes In the case ofthe Income Taxes if Work variable we are largely using thevariation from the last few years when the EITC for women withone child was nearly unchanged but the EITC for women with twoor more children rose in large steps Thus identication comesfrom using women with one child as a control group and chang-ing the treatment that women with two or more children receiveWith single mothers only the year indicators remove the timetrend in welfare receipt and benets and the state indicatorsremove time-constant differences in state welfare benets andmuch of these state cost of living differences in the income vari-ables Thus the variation in welfare benets used to identify thecoefcients is now changes in state-level benets This identi-cation approach examines the employment response to fairlysubtle or short-run features of the welfare and tax laws Thesepolicy changes may be overwhelmed by other factors in thesespecications Despite these potential difculties much of theincome tax effect remains although the estimates are muchsmaller While the effect of taxes is still signicant in the MarchCPS data the drop in the coefcient and larger standard errorleads the ORG coefcient to be insignicantly different from zeroThe welfare benet coefcients are now no longer signicant TheAFDC transaction cost coefcient however remains signicantin the ORG data while the Medicaid coefcient has the expectedsign but remains small and insignicant in both samples
In the third set of specications of Table V we only includesingle mothers with a child under six (and single women withoutchildren) The derivative estimates for the tax and welfare vari-ables including waivers are often substantially larger in magni-tude for these single mothers with young children especially forthe tax variable in the ORG sample These specications are ofparticular interest because the effects of increased employment
1099THE LABOR SUPPLY OF SINGLE MOTHERS
on parental care is likely to be largest on these families withyoung children who are not likely to be in school The last speci-cation of Table V examines whether women learn about taxchanges with a delay after they are implemented This specica-tion includes both the contemporaneous and one year lagged taxvariables The results are somewhat supportive of a lagged effectof taxes In the ORG data the contemporaneous tax variable issmall and insignicant while the lagged variable is large andsignicant In the March CPS it is the contemporaneous variablethat is large and signicant while the lagged variable is smallerand signicant although still substantial in size
I Additional Specications and Hours Worked
We examine several other specications that are not reportedhere in order to determine the benets of studying many pro-grams at the same time to check the sensitivity of our results toalternative specications and to see whether there are particu-larly large effects for certain subgroups of the population We ndthat ignoring some of the policy changes that we study has asubstantial effect on the estimates for the remaining programsWhen we include the tax variable but leave out the other policyvariables its coefcient is about 50 percent larger in both sam-ples When the only policy variables that we include are Medicaidif Work and the Welfare Maximum Benet the Medicaid coef-cient is positive and signicant in the March CPS sample Whenthe other policy variables are not included the waiver variablesare much larger On the other hand the tax coefcient is hardlychanged when the training and child care variables are excludedThese results suggest that the common research strategy of in-vestigating one program in isolation has the potential to givemisleading results
We have examined the sensitivity of our results to alterna-tive samples and variable denitions In particular the resultsare little changed by using more stringent denitions of employ-ment by including separated women or women in school We alsotry several subgroup analyses In particular we examine differ-ences between whites and nonwhites and family heads and sub-family heads Nonwhites appear to be more affected by welfarewaivers than whites while subfamily heads are more sensitive totaxes than family heads
To obtain a broader picture of the effects of welfare and taxpolicy on labor supply we also examined hours worked (see
1100 QUARTERLY JOURNAL OF ECONOMICS
Meyer and Rosenbaum [1999] for more details) Difference-in-differences estimates for hours analogous to those in Table IIshow large relative increases in work for single mothers over thesample period with almost all of the change occurring after 1991We also estimated a series of Tobit and OLS regressions todetermine the effects of tax and welfare policy on hours controllingfor demographics economic conditions state and year We in-clude the same variables as we did in Tables IV and V althoughwe should emphasize that these variables were constructed forour structural model of employment and so are less suitable foran analysis of hours The effects of the policy variables in theTobit estimates for all women whether or not they work tend to besimilar to the effects on employment seen in the earlier tablesThese results hold for the sample of single mothers as well as forall single women The results are very similar for hours per yearin the March CPS and hours in a typical week in the ORG Forhours worked conditioning on positive hours the policy variablestend to have much the same signs but smaller and less signi-cant coefcients Overall the results tend to conrm the resultsfor the main policy variables that we found in the employmentprobits
VII WHICH POLICIES ACCOUNTED FOR THE EMPLOYMENT CHANGES
Our simultaneous examination of many government policiesmakes it straightforward to estimate the relative contribution ofthese policies to the recent increase in employment of singlemothers In Table VI we decompose the employment increases forsingle mothers relative to single women without children for boththe entire period (1984 ndash1996) and the recent period of rapidemployment growth (1992ndash1996) Overall these decompositionsindicate a large role for the EITC and other tax changes modestroles for AFDC benet cuts and waivers and smaller roles forMedicaid training and child care increases
Using the parameter estimates from our main specications(specications (1) and (5) of Table IV) the EITC explains 62percent of the increase in weekly employment over the full 1984to 1996 period yet only 27 percent of the increase between 1992and 1996 For annual employment the EITC plays a very similarrole explaining 61 percent of the 1984 to 1996 increase and 35percent of the 1992 to 1996 increase The corresponding changesin employment attributed to the EITC over the full 1984 to 1996
1101THE LABOR SUPPLY OF SINGLE MOTHERS
TA
BL
EV
IC
ON
TR
IBU
TIO
NO
FP
OL
ICY
CH
AN
GE
ST
OT
HE
CH
AN
GE
SIN
TH
ER
EL
AT
IVE
EM
PL
OY
ME
NT
OF
SIN
GL
EM
OT
HE
RS
VE
RSU
SS
ING
LE
WO
ME
NW
ITH
OU
TC
HIL
DR
EN
19
84ndash1
996
AN
D19
92ndash1
996
Exp
lan
ator
yva
riab
le
1984
ndash199
619
92ndash1
996
OR
GM
arch
CP
SO
RG
Mar
chC
PS
Din
emp
of
tota
lD
inem
p
ofto
tal
Din
emp
of
tota
lD
inem
p
ofto
tal
Inco
me
taxe
sif
wor
k0
0438
622
0
0720
614
0
0186
268
0
0305
351
W
elfa
rem
axim
um
ben
et
001
7925
4
001
5613
3
001
1416
5
000
9911
4
Wel
fare
ben
et
ifw
ork
000
050
70
0003
03
20
0045
26
52
000
332
38
Pro
babi
lity
ofA
FD
Cre
ceip
tif
wor
k2
000
022
03
20
0002
20
10
0020
29
000
172
0M
edic
aid
ifw
ork
20
0070
29
92
000
322
28
20
0023
23
32
000
112
12
Tot
alw
elfa
rebe
ne
tsamp
Med
icai
d0
0112
159
0
0125
106
0
0066
96
000
738
4W
aive
rmdashan
yti
me
lim
it0
0054
76
000
756
40
0052
76
000
738
5W
aive
rmdashan
yte
rmin
atio
ns
000
466
50
0099
84
000
466
60
0099
114
T
otal
wel
fare
wai
vers
000
9914
1
001
7414
8
000
9814
2
001
7219
8
Tra
inin
gmdashed
uca
tion
20
0101
214
4
20
0096
28
22
000
212
30
20
0020
22
3T
rain
ingmdash
job
sear
cho
ther
000
659
20
0077
65
000
476
80
0056
64
Ch
ild
care
000
689
70
0069
59
000
111
80
0013
15
Tot
altr
ain
ing
ampch
ild
care
000
324
60
0050
43
000
395
70
0039
56
Dem
ogra
phic
s2
000
732
104
2
000
682
58
001
0715
5
001
1212
9
Oth
er0
0096
137
0
0172
147
0
0196
283
0
0158
182
T
otal
007
0510
00
011
7410
00
006
9110
00
008
6910
00
Sou
rces
The
data
are
from
the
1984
ndash199
6C
urre
ntP
opul
atio
nSu
rvey
Out
goin
gR
otat
ion
Gro
up
Fil
e(O
RG
)an
dth
e19
85ndash1
997
Mar
chC
urre
ntP
opul
atio
nS
urve
y(M
arch
CP
S)
Not
es
Din
emp
give
sth
ech
ange
inth
eem
ploy
men
tof
sing
lem
othe
rs(r
elat
ive
tosi
ngle
wom
enw
itho
ut
chil
dren
)ov
erth
esp
eci
edti
me
peri
odth
atis
due
toth
egi
ven
expl
anat
ory
vari
able
(s)
of
tota
lgiv
esth
epe
rcen
tage
ofth
eem
ploy
men
tin
crea
sefo
rsi
ngle
mot
hers
(rel
ativ
eto
sing
lew
omen
wit
hout
chil
dren
)exp
lain
edby
the
give
nex
plan
ator
yva
riab
le(s
)T
he
rela
tive
empl
oym
ent
incr
ease
sar
eth
eav
erag
ede
riva
tive
esti
mat
esof
the
inte
ract
ions
ina
wei
ghte
dpr
obit
mod
elin
clu
ding
year
indi
cato
rsan
dth
eir
inte
ract
ions
wit
han
any
chil
dren
indi
cato
rT
he
para
met
eres
tim
ates
used
toes
tim
ate
the
chan
gein
empl
oym
ent
com
efr
omsp
eci
cati
ons
(1)
and
(5)o
fTab
leIV
wh
ileth
ech
ange
over
tim
ein
the
polic
yva
riab
les
com
esfr
omA
ppen
dix
2
1102 QUARTERLY JOURNAL OF ECONOMICS
period and the 1992 to 1996 period are also reported in Table VIWe estimate that the EITC and other tax changes increasedweekly employment 44 percentage points and annual employ-ment 72 percentage points over the full period with about 40percent of this change occurring over the 1992 to 1996 subperiodWhile these estimates are substantial they bracket the EITCeffects found by Eissa and Liebman [1996] and are smaller thanthose predicted by Dickert Houser and Scholz [1995] and Keane[1995]24
Changes in the maximum welfare benet and implicit taxrates and the Medicaid expansions account for between 10 and 16percent of the increase in weekly employment and between 8 and11 percent of the increase in annual employment over eitherperiod The effect of the Medicaid expansions themselves is usu-ally small or negative Conversely the effects of welfare waiversappear to be substantial with the estimates suggesting thatpolicies instituted under waivers account for about 14 to 15 per-cent of the increase in employment over the full sample periodand about 14 to 20 percent of the increase between 1992 and 1996for both weekly and annual employment In general both jobtraining and child care explain small parts of the employmentincrease although in the case of weekly employment over the fullperiod child care can account for about 10 percent of the increase
Improved macroeconomic conditions increased employmentfor both single mothers and single women without children overthe 1984 ndash1996 period Because the above calculations are forsingle mothers compared with single women without childrenunemployment is not given a share in the decomposition In all ofthe employment probits the interaction of unemployment andbeing a single mother had an economically small and statisticallyinsignicant effect Changes in state unemployment rates areestimated to have increased the absolute level of employment ofsingle mothers by 20 percentage points during a typical week
24 Eissa and Liebman [1996] found up to a 28 percentage point increase inparticipation due to TRA86 (which as we indicate in Section IV accounted for 43percent of the 1984ndash1996 change in taxes) Keane [1995] predicted that the1984ndash1996 changes will result in a 107 percentage point increase in participa-tion while Dickert Houser and Scholz [1995] predicted that the 1993ndash1996changes (39 percent of the full 1984ndash1996 change in taxes) would increase em-ployment of single parents by 33 percentage points Experimental ndings suchas those reported in Blank Card and Robins [2000] suggest substantial respon-siveness of welfare recipients and other low-income people to nancial incentivesThese experimental results would need to be extrapolated to all single mothersand the EITC to provide comparisons
1103THE LABOR SUPPLY OF SINGLE MOTHERS
and 14 percentage points during the year over the 1984 ndash1996period These numbers are equivalent to 284 percent of therelative increase in weekly employment and 122 percent of therelative increase in annual employment of single mothers overthe period
In results not shown we recalculate the shares of the em-ployment increase due to various policies using the parameterestimates from specications with only single mothers (specica-tions (2) and (6) of Table V) These results suggest a much smallerrole for the EITC and other tax changes in explaining the changesin employment ranging from 49 to 56 percent as large as those inTable VI Changes in the maximum welfare benet are lessimportant while the results for welfare waivers job training andchild care are largely unchanged
VIII CONCLUSIONS
Between 1984 and 1996 tax and transfer policy were reori-ented to encourage work by single mothers Single mothers haveresponded to these incentives by working more especially after1991 and especially those with children under six To assesswhich policy changes have led to the employment increases weexamine the incentives of federal and state income taxes AFDCMedicaid Food Stamps and their implicit tax rates and earningsdisregards as well as AFDC waivers instituting time limits orwork requirements Our detailed examination of these policychanges using two large micro data sets indicates that EITC andother tax changes account for over 60 percent of the 1984 to 1996increase in the weekly and annual employment of single mothersrelative to single women without children Changes to welfareprograms were less important but still account for a substantialshare of the employment increases Changes in Medicaid train-ing and child care programs play a considerably smaller roleThese ndings are conrmed in an analysis of hours worked
This paper makes several methodological improvements overpast research including the estimation of a simple structuralmodel of employment which provides several independent tests ofthe hypothesis that single mothers respond to economic incen-tives Our results indicate that nancial incentives have powerfuleffects on single mothersrsquo employment decisions and that thedifferent sources of these incentives have effects of plausiblemagnitudes We also nd a sizable transaction cost or stigma to
1104 QUARTERLY JOURNAL OF ECONOMICS
welfare We rely on less subjective measures of welfare waiverssuch as implementation dates and the beginning of case termi-nations and provide the rst evidence on the effects of waivers onemployment Unlike most past work we examine the major pro-grams affecting single mothers together nding that examiningone or two programs in isolation can lead to biases in estimatedbehavioral effects
In most of our specications identication comes from thedifferences in incentives faced by single women with and withoutchildren While we argue that single women without children area plausible comparison group we also provide estimates that donot rely on this comparison Instead these estimates rely onchanges in the treatment of family size state cost of living dif-ferences changes in state income taxes differences in earningsdisregards and implicit tax rates across states and changes inthese parameters and welfare benets within a state over timeOur nding of large tax and welfare effects on employment arerobust although tax effects and especially welfare effects aresometimes smaller using alternative identication strategies
Our result that the EITC played a dominant role in theemployment increases of single mothers between 1984 and 1996suggests that policies that ldquomake work payrdquo are effective in in-creasing work by single mothers This lesson is important in lightof the emphasis on punitive measures such as time limits andwork requirements in the most recent welfare reforms
APPENDIX 1 DESCRIPTION OF POLICY VARIABLES
This section describes the construction of our policy variablesand lists our information sources First we begin with the as-sumptions that we use to determine taxes program participationand benet levels
1 The determination of whether a woman has children andhow many she has is based on the CPS family and sub-family denitions Children in primary families (both re-lated and unrelated) are assigned to the family headwhile children in subfamilies are assigned to the subfam-ily head rather than to the primary family head Childrenare dened as any member of the given family (primary orsubfamily) under age 19 (or under 24 and a full-timestudent) for EITC purposes and under age 18 for all otherprograms
1105THE LABOR SUPPLY OF SINGLE MOTHERS
2 In the March CPS sample the age for tax purposes is theage at the time of the March interview We subtract onefor AFDC and Medicaid purposes In the ORG sample weuse the age at the time of the interview for AFDC andMedicaid but for tax purposes we add one for interviewsoccurring between January and June
3 Women have no unearned income (including child sup-port) or assets and their children have no earned incomeunearned income or assets hence earnings determinetheir program eligibility
4 Single mothers are assumed to le as head of householdand claim their children as dependents while singlewomen without children le as single Also all womentake the standard deduction
5 Women receiving AFDC are in their rst four months ofwork and do not claim child care expenses25
6 Single women without children do not receive FoodStamps
7 Shelter costs (an input in Food Stamp calculations) varyonly by state and over time
A Tax Welfare and Medicaid Variables
First for each woman we calculate ve quantities income taxliabilities (federal and state income taxes incorporating federaland state EITCs) welfare benets (AFDC plus Food Stamps)AFDC receipt (indicator for AFDC eligibility) and Medicaidadults covered and Medicaid children covered Under the assump-tions above these calculations are made at 50 annual earningslevels generated from the cells of a joint wagehours distributionThe 50 cells come from a combination of ve annual hours levels(500 1000 1500 2000 and 2500) and ten hourly wage levels (45 6 7 8 10 12 15 20 and 25)
Second we use the wagehours distributions described in thetext to weight the above quantities We calculate the distributionsusing only women with more than $500 of annual earnings Wethen construct the following variables
25 These assumptions are roughly consistent with the facts In scal year1995 over two-thirds of AFDC families with earnings were in their rst fourmonths of work and only about 16 percent of AFDC families with earningsclaimed child care expenses [U S Department of Health and Human ServicesCharacteristics of AFDC Recipients 1996]
1106 QUARTERLY JOURNAL OF ECONOMICS
c Income Taxes if Work is the weighted sum of income taxliabilities at the various annual earnings points using thewagehours distributions described above as weights
c Welfare Benets if Work is the weighted sum of welfarebenets at the various annual earnings points using thewagehours distributions described above as weights
c Probability of AFDC if Work is the weighted sum of AFDCreceipt at the various annual earnings points using thewagehours distributions described above as weights
c Medicaid if Work is calculated in two steps First wecalculate the weighted sum of Medicaid adults covered andMedicaid children covered at the various annual earningspoints using the wagehours distributions described aboveas weights Second we then multiply these sums by dollarexpenditures separately for adults and children In themain specications we use average expenditures over allstates and years
c Welfare Maximum Benet is the welfare benet assumingzero earnings
We calculate AFDC monthly benets (AFDC) as follows (settingquantities in parentheses to zero if negative)
(A1) AFDC 5 min MAXBEN RR p [PS 2 BRR p (EI 2 DIS)]
wheremdash MAXBEN is the maximum benetmdash RR is the ratable reductionmdash PS is the payment standard (the dollar amount when
benets end not counting disregards)mdash BRR is the benet reduction ratemdash EI is earned income andmdash DIS is the earnings disregard
We calculate Food Stamp benets in two steps (setting quantitiesin parentheses to zero if negative) First we calculate themonthly shelter cost expense deduction (SED) and second wecalculate the monthly Food Stamp benet (FS)
(A2) SED 5 (min SEDC SE 2 05
p ((1 2 EIDP) p EI 1 AFDC 2 SD))
(A3) FS 5 (MB 2 03 p ((1 2 EIDP)
p EI 1 AFDC 2 SD 2 SED))
1107THE LABOR SUPPLY OF SINGLE MOTHERS
wheremdash EIDP is the earned income deduction percentage (018
prior to 1986 020 starting in 1986)mdash MB is the maximum Food Stamp benetmdash SD is the standard deductionmdash SE is shelter expensesmdash SEDC is the shelter expense deduction ceilingTax and welfare variables (and earned and unearned income
variables) are adjusted for state cost of living differences usingthe poverty threshold index for 1990 from National ResearchCouncil [1995] which is adjusted annually using the PCE dea-tor The poverty threshold index accounts for housing cost differ-ences between states using Census housing cost data
Sources for Taxes Welfare and Medicaid
We obtain the federal income tax schedules from the U SDepartment of the Treasury [various years] The state tax infor-mation was obtained from four sources the Advisory Committeeon Intergovernmental Relations [various years] the CommerceClearing House [various years] unpublished data from the Cen-ter on Budget Policy and Priorities and Feenberg and Coutts[1993] The AFDC program parameters are obtained from theU S Department of Health and Human Services (Characteristicsof State Plans [various years]) and unpublished data from theUrban Institute The Food Stamp parameters come from the U SHouse of Representatives (Green Book [various years]) and theU S Department of Agriculture [various years] The Medicaidprogram information is obtained from three sources the NationalGovernorrsquos Association [various dates] the IntergovernmentalHealth Policy Project [various years] and the U S House ofRepresentatives [Medicaid Source Book 1988 1993] Medicaiddollar values (separately for adults and children) come from un-published tables from the Health Care Financing Administration(HCFA)
B Welfare Waiver Variables
c Any Time Limit is one starting with the implementationmonth of a waiver that imposes mandatory work require-ments on families that reach time limits or results in thereduction or total loss of AFDC payments after a certaintime limit has been reached (usually two years)
1108 QUARTERLY JOURNAL OF ECONOMICS
c Any Terminations is one beginning with the month inwhich a case is rst terminated under a welfare waiver
c Major Waiver Application is one beginning with the monthin which a state rst applies for a major statewide waiver
Note that these variables are always zero for women withoutAFDC children
Sources for Welfare Waiver Variables
The waiver variables we used are based on our reading of thewaiver summaries in General Accounting Ofce [1997] the U SDepartment of Health and Human Services [1997c] and Savnerand Greenberg [1997] These sources generally have the imple-mentation dates of waivers We also consulted American PublicWelfare Association [1996] Levine and Whitmore [1998] andU S Department of Health and Human Services [1997a] Ourclassication scheme follows most closely the classicationschemes in General Accounting Ofce [1997] and the U S De-partment of Health and Human Services [1997c]
C Training Program Variables
These variables measure variation across states and overtime in federal and state spending on welfare-to-work programsand on eligibility criteria These numbers are based on the statelevel scal year WIN (Work Incentive) program expenditures andstate level scal year JOBS (Job Opportunities and Basic Skills)program expenditures by component (job search education etc)We calculate spending per female AFDC adult who is not exemptfrom participation based on the age of her youngest child Thedollars are then divided by the state average wage to obtain anamount of services provided26
We calculate the distribution of the age of the youngest childand we apportion total JOBS spending to women using the frac-tion of participants who are female adults We divide spendinginto two categories education which includes education postsec-ondary education and self-initiated education and other whichincludes job search job development and placement on-the-jobtraining work supplementation community work experienceself-initiated training job skills job readiness and assessmentand employability plan For scal year 1990 it is necessary to
26 The state average wage is average hourly wage for manufacturing in thestate It is normalized so that the 1996 value = 100
1109THE LABOR SUPPLY OF SINGLE MOTHERS
extrapolate WIN expenditures forward and JOBS expendituresbackward to the date when the JOBS program began in a givenstate We also extrapolate 1985 WIN data back to 1984 and scalyear 1996 forward to the rst three months of scal year 1997
Note that the training variables are zero for women withoutAFDC children and women with children young enough to ex-empt the mother from participation in WIN or JOBS
Sources for Training Variables
JOBSWIN expenditure data come from unpublished U SDepartment of Health and Human Services and U S Depart-ment of Labor tabulations and the U S House of Representa-tives (Green Book [various years]) To calculate the distribution ofthe age of youngest child for single mothers we use data from theU S Department of Health and Human Services (Characteristicsof AFDC Recipients [various years]) and authorsrsquo calculationsfrom the March CPS Wage data come from the Bureau of LaborStatistics web site
D Child Care Variable
Child Care expenditures are actual federal and state expen-ditures by state on the following four programs AFDC ChildCare Transitional Child Care At-Risk Child Care and ChildCare and Development Block Grants Expenditures are put on aper-person basis by dividing through by the number of unmarriedwomen with children less than six This denominator is calcu-lated using annual data on the number of women by state (fromthe Census Bureau) and the fraction of women in a state who areunmarried with children less than six which is calculated fromthe ORG over the entire 1984 ndash1996 period Like training dollarsthe resulting dollar value is then divided by the state averagewage to obtain an amount of services provided
Note that the child care variable is always zero for womenwithout children less than six
Sources for Child Care Variable
Child Care expenditures come from unpublished U S De-partment of Health and Human Service tabulations Annual dataon the number of women by state come from the U S CensusBureau The fraction of women in a state who are unmarried withchildren less than six is calculated from the ORG by the authorsWage data come from the Bureau of Labor Statistics web site
1110 QUARTERLY JOURNAL OF ECONOMICS
AP
PE
ND
IX2
VA
RIA
BL
EM
EA
NS
FO
RS
ING
LE
MO
TH
ER
SA
ND
SIN
GL
EW
OM
EN
WIT
HO
UT
CH
ILD
RE
N1
984
1988
199
219
96
Var
iabl
e
1984
1988
1992
1996
Ch
ildr
enN
och
ildr
enC
hil
dren
No
chil
dren
Ch
ildr
enN
och
ildr
enC
hil
dren
No
chil
dren
Age
314
426
86
319
727
79
319
628
83
321
929
22
Non
wh
ite
037
10
155
036
30
162
038
40
178
037
70
207
His
pan
ic0
086
005
30
103
007
20
111
007
90
136
009
3H
igh
sch
ool
drop
out
026
20
094
024
60
091
024
10
094
021
10
092
Som
eco
lleg
e0
211
029
70
234
030
50
256
031
70
311
031
7B
ach
elor
s0
063
019
20
064
020
40
061
021
00
072
023
3M
aste
rs0
022
005
90
025
006
10
023
006
60
021
006
4D
ivor
ced
056
40
151
053
30
161
047
70
165
046
00
162
Wid
owed
006
60
010
005
50
010
004
70
012
003
80
012
Liv
ing
wit
hpa
ren
ts0
156
041
80
151
037
50
154
034
70
154
033
9L
ivin
gw
ith
un
rela
ted
adu
ltm
ale
009
70
135
012
50
167
014
80
198
016
50
218
[of
chil
dren
un
der
181
681
z1
664
z1
707
z1
707
z[
ofch
ildr
enu
nde
r6
056
0z
057
1z
062
4z
061
3z
Ear
ned
inco
me
(Mar
ch)
128
1018
331
134
6220
183
132
3218
993
147
6019
912
Ear
ned
inco
me
ifw
ork
(Mar
ch)
172
5019
536
180
1321
293
179
3020
453
180
2321
479
An
nu
alho
urs
ifw
ork
(Mar
ch)
1718
1837
1724
1894
1712
1862
1740
1881
Hou
rly
earn
ings
(Mar
ch)
985
103
89
9110
86
987
105
910
03
109
8In
com
eta
xes
ifw
ork
1521
2751
1030
2958
811
2967
7929
14W
elfa
rem
axim
um
ben
et
7583
z74
06z
7391
z70
56z
Wel
fare
ben
et
ifw
ork
1482
z14
78z
1546
z14
88z
Pro
babi
lity
ofA
FD
Cre
ceip
tif
wor
k0
255
z0
287
z0
266
z0
256
zM
edic
aid
ifw
ork
1215
013
590
1704
219
424
Nu
mbe
rof
obse
rvat
ion
s93
9118
914
9211
186
1210
333
193
1187
8815
846
Sou
rces
The
data
are
prim
arily
from
the
1984
ndash199
6C
urre
ntP
opul
atio
nSu
rvey
Out
goin
gR
otat
ion
Gro
upF
ile(O
RG
)and
from
the
1985
ndash199
7M
arch
Cur
rent
Pop
ulat
ion
Surv
ey(M
arch
)R
estr
icti
ons
See
Tab
leII
for
sam
ple
rest
rict
ion
sN
otes
Mea
ns
com
efr
omth
eO
RG
unle
ssth
eyar
ela
bele
d(M
arch
)T
hese
mea
nsar
eca
lcul
ated
usi
ngth
ech
arac
teri
stic
sof
the
give
nsa
mpl
efo
rth
egi
ven
year
and
are
wei
ghte
dW
omen
are
assu
med
tobe
inth
eir
rst
four
mon
ths
ofw
ork
toha
ven
ou
near
ned
inco
me
and
tocl
aim
noch
ildca
reex
pens
esA
lso
sin
gle
wom
enw
ith
and
wit
hou
tch
ildr
enar
eas
sum
edto
le
ashe
adof
hous
ehol
dan
dsi
ngl
ere
spec
tive
ly
and
tocl
aim
the
stan
dard
dedu
ctio
nT
axes
and
wel
fare
are
adju
sted
for
stat
eco
stof
livi
ng
diff
eren
ces
All
doll
aram
ount
sar
eex
pres
sed
in19
96do
llar
spe
rye
arS
eeA
ppen
dix
1fo
rsp
eci
cin
dice
sus
edan
dot
her
deta
ils
1111THE LABOR SUPPLY OF SINGLE MOTHERS
DEPARTMENT OF ECONOMICS AND INSTITUTE FOR POLICY RESEARCH NORTHWESTERN
UNIVERSITY AND NATIONAL BUREAU OF ECONOMIC RESEARCH
DEPARTMENT OF ECONOMICS UNIVERSITY OF NORTH CAROLINA GREENSBORO
REFERENCES
American Public Welfare Association ldquoSummary of Approved AFDC WaiverActionsrdquo (Washington DC May 1993 and August 1 1996)
Advisory Committee on Intergovernmental Relations Signicant Features ofFiscal Federalism (Washington DC various years)
Bavier Richard ldquoAn Early Look at the Effects of Welfare Reformrdquo unpublishedpaper March 1999
Blank Rebecca M ldquoWhat Causes Public Assistance Caseloads to Growrdquo unpub-lished paper May 1997
mdashmdash ldquoThe Effect of Medical Need and Medicaid on AFDC Participationrdquo Journalof Human Resources XXIV (1989) 54ndash87
Blank Rebecca M and Patricia Ruggles ldquoWhen Do Women Use Aid to Familieswith Dependent Children and Food Stampsrdquo Journal of Human ResourcesXXXI (1996) 57ndash89
Blank Rebecca M David E Card and Philip K Robins ldquoFinancial Incentives forIncreasing Work and Income among Low-Income Familiesrdquo in Finding JobsWork and Welfare Reform David Card and Rebecca M Blank eds (NewYork Russell Sage Foundation 2000) pp 373ndash419
Browning Edgar K ldquoEffects of the Earned Income Tax Credit on Income andWelfarerdquo National Tax Journal XLVIII (1995) 23ndash43
Cohany Sharon Anne Polivka and Jennifer Rothgeb ldquoRevisions in the CurrentPopulation Survey Effective January 1994rdquo Employment and Earnings XLI(1994) 13ndash37
Commerce Clearing House State Tax Handbook (Chicago IL various years)Council of Economic Advisers ldquoThe Economics of Child Carerdquo (Washington DC
December 1997)Danziger Sheldon Robert Haveman and Robert Plotnick ldquoHow Income Trans-
fers Affect Work Savings and the Income Distribution A Critical ReviewrdquoJournal of Economic Literature XIX (1981) 975ndash1028
Dickert Stacy Scott Houser and John Karl Scholz ldquoThe Earned Income TaxCredit and Transfer Programs A Study of Labor Market and Program Par-ticipationrdquo in Tax Policy and the Economy 9 James M Poterba ed (Cam-bridge MA MIT Press 1995) pp 1ndash50
Edin Kathryn and Laura Lein Making Ends Meet How Single Mothers SurviveWelfare and Low-Wage Work (New York Russell Sage Foundation 1997)
Eissa Nada and Jeffrey B Liebman ldquoLabor Supply Response to the EarnedIncome Tax Creditrdquo Quarterly Journal of Economics CXII (1996) 605ndash637
Eissa Nada and Hilary Williamson Hoynes ldquoThe Earned Income Tax Credit andLabor Supply Married Couplesrdquo NBER Working Paper No 6856 December1998
Ellwood David T ldquoThe Impact of the Earned Income Tax Credit and Social PolicyReforms on Work Marriage and Living Arrangementsrdquo National Tax JournalLIII (2000) 1063ndash1106
Feenberg Daniel and Elisabeth Coutts ldquoAn Introduction to the TAXSIM ModelrdquoJournal of Policy Analysis and Management XII (1993) 189ndash194
Fraker Thomas Robert Moftt and Douglas Wolf ldquoEffective Tax Rates andGuarantees in the AFDC Program 1967ndash1982rdquo Journal of Human Re-sources XX (1985) 252ndash263
General Accounting Ofce ldquoWelfare Reform Statesrsquo Early Experiences withBenet Terminationrdquo (Washington DC GAO S-97-74 May 1997)
Gueron Judith M and Edward Pauly From Welfare to Work (New York RussellSage Foundation 1991)
Heckman James J ldquoWhat Has Been Learned about Labor Supply in the PastTwenty Yearsrdquo American Economic Review LXXXIII (1993) 116ndash121
Hill Carolyn V Joseph Hotz Charles H Mullin and John Karl Scholz ldquoEITC
1112 QUARTERLY JOURNAL OF ECONOMICS
Eligibility Participation and Compliance Rates for AFDC Households Evi-dence from the California Caseloadrdquo unpublished paper March 1999
Hoffman Saul D and Laurence S Seidman The Earned Income Tax CreditAntipoverty Effectiveness and Labor Market Effects (Kalamazoo MI UpjohnInstitute for Employment Research 1990)
Holtzblatt Janet Janet McCubbin and Robert Gillette ldquoPromoting Workthrough the EITCrdquo National Tax Journal XLVII (1994) 591ndash608
Hoynes Hilary Williamson ldquoWork and Marriage Incentives in Welfare ProgramsWhat Have We Learnedrdquo in Fiscal Policy Lessons from Economic ResearchAlan J Auerbach ed (Cambridge MA MIT Press 1997)
Intergovernmental Health Policy Project Major Changes in State Medicaid andIndigent Care Programs (Washington DC various years)
Jencks Christopher and Joseph Swingle ldquoHas Welfare Reform Helped or HurtSingle Momsrdquo unpublished paper February 2000
Keane Michael ldquoA New Idea for Welfare Reformrdquo Federal Reserve Bank ofMinneapolis Quarterly Review XXXVIII (1995) 2ndash28
Levine Judith A ldquoPolicy Incentives Confront Everyday Realities IntegratingEconomic and Sociological Perspectives on the Welfare-to-Work Transitionrdquounpublished paper March 1997
Levine Phillip B and Diane M Whitmore ldquoThe Impact of Welfare Reform on theAFDC Caseloadrdquo National Tax Association Proceedings Ninetieth AnnualConference (1998) 24ndash33
Liebman Jeffrey B ldquoThe Impact of the Earned Income Tax Credit on Incentivesand Income Distributionrdquo in Tax Policy and the Economy 12 James MPoterba ed (Cambridge MA MIT Press 1998) pp 83ndash120
Martini Alberto and Michael Wiseman ldquoExplaining the Recent Decline in Wel-fare Caseloads Is the Council of Economic Advisers Rightrdquo Challenge XL(1997) 6 ndash20
Meyer Bruce D ldquoDo the Poor Move to Receive Higher Welfare Benetsrdquo unpub-lished paper April 1999
Meyer Bruce D and Dan T Rosenbaum ldquoWelfare the Earned Income Tax Creditand the Labor Supply of Single Mothersrdquo NBER Working Paper No 7363September 1999
Meyer Bruce D and Dan T Rosenbaum ldquoMaking Single Mothers Work RecentChanges in Tax and Welfare Policy and their Effectsrdquo National Tax JournalLIII (2000a) 1027ndash1062
Meyer Bruce D and Dan T Rosenbaum ldquoMedicaid Private Health Insuranceand the Labor Supply of Single Mothersrdquo unpublished paper November2000b
Moftt Robert ldquoAn Economic Model of Welfare Stigmardquo American EconomicReview LXXIII (1983) 1023ndash1035
mdashmdash ldquoIncentive Effects of the U S Welfare Systemrdquo Journal of Economic Litera-ture XXX (1992) 1ndash61
mdashmdash ldquoThe Effect of Welfare on Marriage and Fertility What Do We Know andWhat Do We Need to Knowrdquo unpublished paper December 1997
Moftt Robert and Barbara Wolfe ldquoThe Effect of the Medicaid Program onWelfare Participation and Labor Supplyrdquo Review of Economics and StatisticsLXXIV (1992) 615ndash626
National Governorrsquos Association MCH (Maternal and Child Health) Update(Washington DC various dates)
National Research Council Measuring Poverty A New Approach Constance FCitro and Robert T Michael eds (Washington DC National Academy Press1995)
mdashmdash Evaluating Welfare Reform A Framework and Review of Current WorkRobert Moftt and Michele Ver Ploeg eds (Washington DC National Acad-emy Press 1999)
Polivka Anne E and Stephen M Miller ldquoThe CPS After the Redesign Refocus-ing the Economic Lensrdquo in Labor Statistics Measurement Issues John Halti-wanger Marilyn E Manser and Robert Topel eds (Chicago University ofChicago Press 1998) pp 249ndash286
Romich Jennifer L and Thomas Weisner ldquoHow Families View and Use the
1113THE LABOR SUPPLY OF SINGLE MOTHERS
EITC The Case for Lump-sum Deliveryrdquo National Tax Journal LIII (2000)1245ndash1265
Savner Steve and Mark Greenberg ldquoThe CLASP Guide to Welfare Waivers1997rdquo (Washington DC Center for Law and Social Policy 1997)
Scholz John Karl ldquoThe Participation Rate of the Earned Income Tax CreditrdquoInstitute for Research on Poverty Madison WI Discussion Paper 928-90October 1990
mdashmdash ldquoThe Earned Income Tax Credit Participation Compliance and AntipovertyEffectivenessrdquo National Tax Journal XLVII (1994) 59ndash81
Smeeding Timothy M Katherine E Ross Michael OrsquoConnor and Michael SimonldquoThe EITC Expectation Knowledge Use and Economic and Social MobilityrdquoNational Tax Journal LIII (2000) 1187ndash1210
U S Department of Agriculture Characteristics of Food Stamp Households(Alexandria VA U S Department of Agriculture Food and Consumer Ser-vice Ofce of Analysis and Evaluation various years)
U S Department of Health and Human Services Characteristics and FinancialCircumstances of AFDC Recipients (Washington DC U S Department ofHealth and Human Services Administration for Children and FamiliesOfce of Family Assistance Division of Performance Measurement variousyears)
mdashmdash Characteristics of State Plans for Aid to Families with Dependent Children(Washington DC U S Department of Health and Human Services Admin-istration for Children and Families Ofce of Family Assistance variousyears)
mdashmdash HHS Fact Sheet State Welfare Demonstrations (Washington DC U SDepartment of Health and Human Services March 17 1997a)
mdashmdash National Evaluation of Welfare-to-Work Strategies (Washington DC Ad-ministration for Children and Families Ofce of the Assistant Secretary forPlanning and Evaluation December 1997b)
mdashmdash Setting the Baseline A Report on State Welfare Waivers (Washington DCU S Department of Health and Human Services Ofce of the AssistantSecretary for Planning and Evaluation 1997c)
U S Department of the Treasury Statistics of Income Individual Income TaxReturns (Washington DC U S Department of the Treasury Internal Reve-nue Service various years)
U S Department of the Treasury Your Federal Income Tax Tax Guide forIndividuals (Washington DC U S Department of the Treasury InternalRevenue Service various years)
U S House of Representatives Committee on Energy and Commerce MedicaidSource Book Background Data and Analysis (Washington DC GovernmentPrinting Ofce November 1988 and January 1993)
U S House of Representatives Committee on Ways and Means Green BookBackground Material and Data on Programs within the Jurisdiction of theCommittee on Ways and Means (Washington DC Government Printing Of-ce various years)
Winkler Anne ldquoThe Incentive Effects of Medicaid on Womenrsquos Labor SupplyrdquoJournal of Human Resources XXVI (1991) 308ndash337
Yelowitz Aaron S ldquoThe Medicaid Notch Labor Supply and Welfare Participa-tionrdquo Quarterly Journal of Economics CX (1995) 909ndash940
Ziliak James P David N Figlio Elizabeth E Davis and Laura S ConnollyldquoAccounting for the Decline in AFDC Caseloads Welfare Reform or EconomicGrowthrdquo unpublished paper July 1997
1114 QUARTERLY JOURNAL OF ECONOMICS
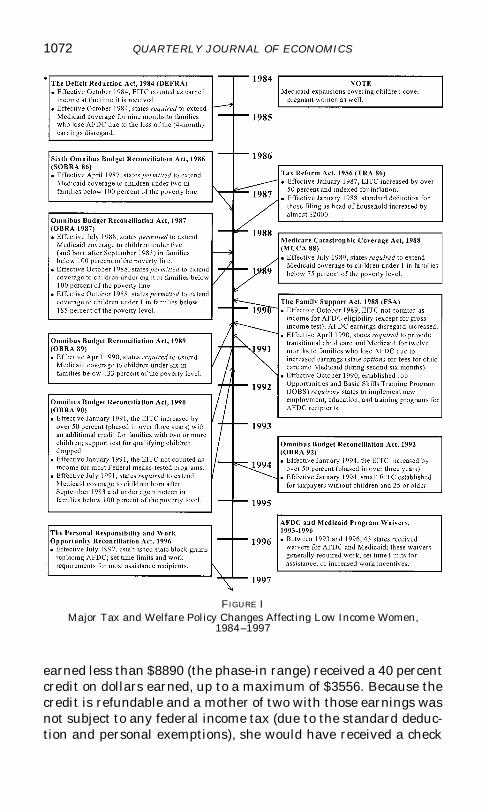
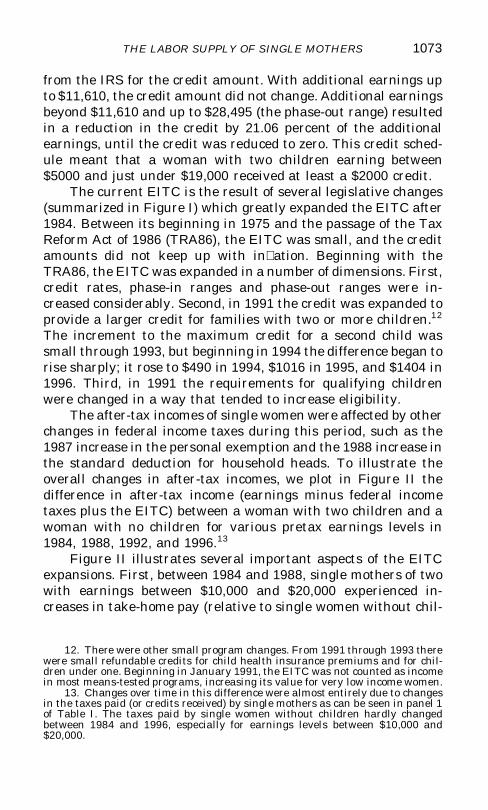
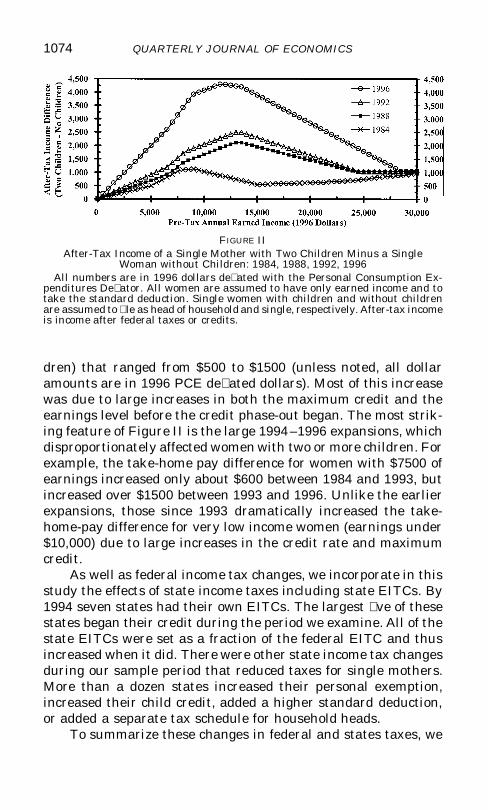

C Medicaid
Medicaid is the biggest and most costly program that aidssingle mothers and their children In 1994 $309 billion wasspent on 248 million nonaged nondisabled Medicaid recipients agroup that was predominantly single mothers and their children[U S House of Representatives Green Book 1996 pp 897ndash902]Unlike the Food Stamp program and especially AFDC Medicaideligibility has expanded dramatically since 1984 resulting in amore than threefold increase between 1984 and 1994 in Medicaidexpenditures on families with dependent children (and a 60 per-cent increase in the caseload) Prior to 1987 Medicaid eligibilityfor single mothers and their children generally required receipt ofAFDC In a series of expansions Medicaid coverage was extendedto low-income pregnant women and children (again see Figure I)The differences across states in the extent to which they tookadvantage of the permitted coverage options generated largedifferences in who was covered in different years in differentstates Moreover state AFDC income limits interacted with theMedicaid expansions to determine the additional families covered(see Meyer and Rosenbaum [2000b] for more details)
We measure Medicaid benets by rst calculating the num-ber of adults and children in the family that would be covered ifa woman works We then convert these numbers to dollar valuesusing Medicaid expenditures per child and adult averaged overall states and years16 As can be seen in Table I there was a fairlysteady increase over our sample period in the number of familymembers covered under Medicaid if a single mother works
The theoretical effect of Medicaid expansions on the decisionto work is positive since those newly covered are those withearnings that would make them ineligible for AFDC The Med-icaid expansions also could result in some working women in-creasing their hours if pre-expansion earnings limits resulted inthem reducing their hours of work in order to qualify for Medicaidcoverage Overall the effect on hours conditional on working isambiguous since the expansions also could result in hours de-creases for women who choose to reduce their hours in order toqualify for Medicaid coverage for their children
16 Note that in our specications Medicaid coverage for the nonworking iscollinear with family size and number of children controls so a 5 is not estimated
1078 QUARTERLY JOURNAL OF ECONOMICS
D Training and Child Care Programs
To capture the effect of training programs on the probabilityof work by single mothers we focus on the programs specicallyfor AFDC applicants and recipients rst the Work Incentives(WIN) program and then the Job Opportunities and Basic Skills(JOBS) program Total expenditures as well as the emphasis ofthese programs changed sharply over our period (see Table I) Weconstruct two variables that measure the character and extent ofthe JOBS and WIN programs in a state and year Because edu-cational spending is likely to have a different effect than otherspending we split expenditures into education and job searchother We scale state expenditures by the size of the AFDCmandatory population These variables are interacted with anindicator for whether a woman would be required to participate inJOBS or WIN (based on the age of her youngest child these rulesdiffered across states and over time) so that these variables equalzero for single women without children or with children under theage cutoff
The effects of these training programs on labor supply likelydepends on the mix of services provided and the stringency of theparticipation requirements Job search assistance job place-ments and improving job skills and readiness should lower jobsearch costs thereby increasing the level of work for womentrainees On the other hand even with a benecial long-termeffect on wages or employment secondary or postsecondary edu-cation may delay entry into the workforce while women takeclasses leading to a short-term negative employment effect Inany case there is much stronger evidence of employment effectsfrom job search assistance than from education at least in theshort run17
The cost and quality of child care is likely to have an impor-tant effect on whether a woman works The federal role in childcare for low-income women expanded greatly following the Fam-ily Support Act of 1988 and the Omnibus Budget ReconciliationAct of 1990 Four large programs started during this periodAFDC Child Care Transitional Child Care At-Risk Child Careand Child Care and Development Block Grants We focus onthese programs because they are particularly important for singlemothers and they were the main changes over our period Total
17 See Gueron and Pauly [1991] and U S Department of Health andHuman Services [1997b]
1079THE LABOR SUPPLY OF SINGLE MOTHERS
TA
BL
EI
SU
MM
AR
YC
HA
RA
CT
ER
IST
ICS
OF
PO
LIC
IES
AF
FE
CT
ING
SIN
GL
EM
OT
HE
RS
AN
DS
ING
LE
WO
ME
NW
ITH
OU
TC
HIL
DR
EN
19
841
988
1992
A
ND
1996
Var
iabl
e
1984
1988
1992
1996
Ch
ildr
enN
och
ildr
enC
hil
dren
No
chil
dren
Ch
ildr
enN
och
ildr
enC
hil
dren
No
chil
dren
An
nu
alfe
dera
lst
ate
inco
me
taxe
sE
ITC
an
d1
2O
AS
DH
IA
t$5
000
earn
ings
216
935
22
338
376
253
340
82
1478
194
At
$10
000
earn
ings
118
954
234
713
562
673
1427
220
1214
32A
t$1
500
0ea
rnin
gs15
9920
7578
425
8950
226
872
476
2706
At
$20
000
earn
ings
2721
3325
2477
3844
2374
3980
1686
4009
At
$30
000
earn
ings
5466
6326
5398
6538
5527
6666
5585
6668
An
nu
alA
FD
Can
dfo
odst
amp
bene
ts
At
$0ea
rnin
gs75
830
7406
073
910
7056
0A
t$5
000
earn
ings
4719
047
340
4791
045
640
At
$10
000
earn
ings
1871
018
850
2029
019
750
At
$15
000
earn
ings
491
048
50
640
062
10
At
$20
000
earn
ings
800
890
116
013
20
Med
icai
dn
um
ber
offa
mil
ym
embe
rsel
igib
leA
t$0
earn
ings
265
000
262
000
266
000
268
000
At
$500
0ea
rnin
gs2
510
002
530
002
560
002
520
00A
t$1
000
0ea
rnin
gs1
100
001
410
001
620
001
920
00A
t$1
500
0ea
rnin
gs0
270
000
350
000
760
001
010
00A
t$2
000
0ea
rnin
gs0
030
000
050
000
310
000
490
00A
t$2
500
0ea
rnin
gs0
000
000
010
000
090
000
190
00
1080 QUARTERLY JOURNAL OF ECONOMICS
TA
BL
EI
(CO
NT
INU
ED
)
Var
iabl
e
1984
1988
1992
1996
Ch
ildr
enN
och
ildr
enC
hil
dren
No
chil
dren
Ch
ildr
enN
och
ildr
enC
hil
dren
No
chil
dren
Wai
vers
An
yti
me
lim
it0
000
000
00
010
039
0A
ny
term
inat
ions
000
00
000
000
00
210
Maj
orw
aive
rap
plic
atio
n0
000
002
00
220
085
0A
nn
ual
trai
nin
gch
ild
care
doll
ars
per
elig
ible
reci
pien
tT
rain
ingmdash
edu
cati
on0
00
010
00
126
0T
rain
ingmdash
job
sear
cho
ther
126
039
016
60
272
0C
hil
dca
re0
00
024
60
302
0N
um
ber
ofob
serv
atio
ns
9391
189
1492
1118
612
103
3319
311
8788
158
46
Sou
rce
The
data
are
from
the
1984
ndash199
6C
urre
ntP
opu
lati
onS
urve
yO
utg
oing
Rot
atio
nG
roup
File
(OR
G)
Res
tric
tion
sT
hesa
mpl
ein
clud
es19
ndash44
year
-old
sing
lew
omen
(div
orce
dw
idow
ed
orne
ver
mar
ried
)w
hoar
eno
tin
scho
ol
Not
esT
hese
mea
nsar
eca
lcu
late
du
sing
the
char
acte
rist
ics
ofth
eO
RG
sam
ple
for
the
give
nye
aran
dar
ew
eigh
ted
Wom
enar
eas
sum
edto
bein
thei
rr
stfo
urm
onth
sof
wor
kto
hav
eno
une
arn
edin
com
ean
dto
clai
mn
och
ildca
reex
pen
ses
Als
osi
ngle
wom
enw
ith
and
wit
hout
chil
dren
are
assu
med
tol
eas
head
ofh
ouse
hol
dan
dsi
ngle
res
pect
ivel
yan
dto
clai
mth
est
anda
rdde
duct
ion
Tax
esan
dw
elfa
rear
ead
just
edfo
rst
ate
cost
ofli
vin
gdi
ffer
ence
san
dal
ldol
lar
amou
nts
are
expr
esse
din
1996
dolla
rsS
eeA
ppen
dix
1fo
rsp
eci
cin
dice
sus
edan
dot
her
deta
ils
1081THE LABOR SUPPLY OF SINGLE MOTHERS
state and federal expenditures on these four new federal pro-grams by state and year are scaled by the number of singlemothers with children under six These numbers can be seen inTable I which shows a steep rise in child care expendituresbetween 1988 and 1992 followed by a slower rise in later yearsFor more detail on training and child care programs see Meyerand Rosenbaum [1999]
V THE DETERMINANTS OF EMPLOYMENT
We use several different econometric methods to identify theimpact of the recent policy changes on the employment of singlemothers We begin with the familiar difference in differencesestimator This approach compares employment rates over timefor single mothers with those for single women without childrenThis approach is the one taken by Eissa and Liebman [1996] intheir study of the EITC over the 1984 to 1990 period We waituntil Section VI to discuss the estimates from our simple struc-tural model
A Employment Rates of Single Mothers and Single ChildlessWomen
The top panel of Table II reports the employment rates ofsingle mothers and single women without children along withthe difference in employment rates between these two groups ofsingle women We report this difference because many determi-nants of employment that change over time especially wages andmacroeconomic conditions might be expected to affect all singlewomen similarly Other determinants of employment particu-larly the tax and transfer programs that we examine specicallyaffect single mothers The bottom panel of Table II focuses on thesubsample of single mothers with children under six (again rela-tive to single women without children) a group we expect to bemore responsive to changes in the rewards to work Also employ-ment changes are likely to have greater effects on children forbetter or worse when they are young and their mother likelyplays a larger role in their care and education
We report two different measures of employment whether awoman worked last week (from the ORG data) and whether awoman worked at all last year (from the March data) Eachmeasure has its advantages Whether a woman worked last weekis probably a better measure of labor supply to use as an input to
1082 QUARTERLY JOURNAL OF ECONOMICS
policy decisions since its average captures the fraction of womenworking in a given week This variable will be especially useful ifthose who move in or out of the workforce on the margin workonly a few weeks during the year On the other hand as discussedearlier the EITC unequivocally increases the probability of work-
TABLE IIEMPLOYMENT RATES FOR SINGLE MOTHERS SINGLE MOTHERS WITH CHILDREN
UNDER SIX AND SINGLE WOMEN WITHOUT CHILDREN 1984ndash1996
Year
CPS Outgoing Rotation Groupworked last week = 1 March CPS worked last year = 1
ChildrenNo
children DifferenceStandard
error ChildrenNo
children DifferenceStandard
error
1984 05854 08014 2 02160 00059 07322 09399 2 02077 000831985 05861 08048 2 02187 00058 07302 09439 2 02137 000831986 05891 08131 2 02240 00057 07310 09450 2 02141 000821987 05941 08179 2 02238 00056 07382 09473 2 02091 000811988 06027 08215 2 02188 00058 07482 09485 2 02003 000841989 06136 08150 2 02015 00058 07577 09409 2 01831 000801990 06007 08155 2 02148 00056 07591 09424 2 01832 000791991 05790 08031 2 02242 00056 07428 09418 2 01990 000791992 05790 07957 2 02167 00057 07387 09299 2 01913 000811993 05875 07918 2 02044 00057 07511 09356 2 01845 000801994 06053 07921 2 01868 00057 07907 09312 2 01405 000781995 06265 07971 2 01707 00058 08072 09340 2 01268 000801996 06450 07938 2 01488 00060 08191 09290 2 01098 00079
Childrenunder 6
Nochildren Difference
Standarderror
Childrenunder 6
Nochildren Difference
Standarderror
1984 04382 08014 2 03632 00083 06122 09399 2 03277 001311985 04328 08048 2 03720 00082 05966 09439 2 03474 001331986 04362 08131 2 03770 00081 06227 09450 2 03223 001281987 04437 08179 2 03742 00082 06096 09473 2 03377 001291988 04634 08215 2 03581 00084 06277 09485 2 03207 001321989 04790 08150 2 03360 00083 06282 09409 2 03127 001271990 04569 08155 2 03586 00079 06369 09424 2 03055 001241991 04289 08031 2 03743 00078 06092 09418 2 03326 001241992 04330 07957 2 03627 00078 06273 09299 2 03027 001241993 04557 07918 2 03362 00078 06428 09356 2 02929 001221994 04796 07921 2 03125 00079 06934 09312 2 02378 001211995 05147 07971 2 02825 00081 07221 09340 2 02119 001231996 05396 07938 2 02543 00085 07476 09290 2 01813 00119
Sources The data are from the 1984ndash1996 Current Population Survey Outgoing Rotation Group File(ORG) and the 1985ndash1997 March Current Population Survey (March CPS) and are weighted
Restrictions Both samples include 19ndash44 year-old single women (divorced widowed or never married)who are not in school The March CPS sample excludes disabled or ill women and those with positive earnedincome but zero hours of work In the second panel single mothers without a child under six are excludedSee text for details
1083THE LABOR SUPPLY OF SINGLE MOTHERS
ing at all in a given tax year but for some could decrease weeksworked If our goal is to provide a sharp test of theoretical pre-dictions whether a woman worked last year is a better outcomemeasure We report both measures with the expectation that theeffects of many of the recent policy changes on weekly employ-ment will be smaller than on annual employment
The employment rates reported in Table II exhibit a strikingtime pattern For single mothers weekly employment increasedby almost 6 percentage points between 1984 and 1996 whileannual employment increased over 85 percentage points Most ofthis increase occurred between 1991 and 199618 Focusing on thesubsample of single mothers with young children the employ-ment increases were even larger 10 percentage points for weeklyemployment and 135 percentage points for annual employmentIn contrast the declines in both weekly and annual employmentof about one percentage point for single women without childrensuggest that the rising employment of single mothers was not aresult of better work opportunities for all single women More-over the timing of the employment increases suggest that policychanges in the 1990s are likely to have played a large role
B Comparing Single Mothers and Single Women withoutChildren
Appendix 2 reports descriptive statistics for single womenwith and without children for the years 1984 1988 1992 and1996 The table indicates that single mothers tend to be older andless educated and are more likely to be nonwhite than singlewomen without children The age of single women without chil-dren rises appreciably over the sample period as does the edu-cation level of single mothers The fraction of single mothersliving with parents is stable while the rate for single womenwithout children falls The rates of cohabitation rise for bothsingle women with and without children
A potential criticism of the Table II results (and our main
18 One concern in interpreting changes in employment for single mothersduring the years 1992 to 1994 is that beginning in January 1994 the CPS used aredesigned questionnaire For a description of this CPS redesign see CohanyPolivka and Rothgeb [1994] and Polivka and Miller [1998] In Meyer and Rosen-baum [1999] we assess the extent of any bias due to the redesign using the parallelsurvey which provides contemporaneous responses using the new and old surveysWe also employ ORGMarch comparisons using the fact that redesign affected thetwo data sets at a different point in time Overall these comparisons indicate thatthe CPS redesign had a small effect that if it leads to any bias suggests that weslightly understate the recent employment increases of single mothers
1084 QUARTERLY JOURNAL OF ECONOMICS
regression results below) is that single women without childrenare not a good comparison group for single mothers The means inAppendix 2 suggest the possibility that changes in the character-istics of single mothers versus single women without childrencould explain the two groupsrsquo differing employment rate trendsIn our regression results we condition on observable characteris-tics such as race and education in order to make the two groupsmore comparable It is also interesting to note that single womenwith and without children are quite similar in an importantdimension hourly earnings The mean hourly earnings of womenwith and without children are fairly similar (and they are muchcloser if one controls for education)
Perhaps more importantly one might argue that employ-ment rates are so high for single women without children that itis unreasonable to expect this group to respond to changes ineconomic conditions in the same way that single mothers do Yetemployment rates are not particularly high for low-educated sin-gle women particularly when examining employment last weekOnly 33 percent of high school dropout single mothers workedand 48 percent of high school dropout single women withoutchildren worked last week Nevertheless in our later regressionsderivative estimates for our key policy variables tend to be thelargest and most statistically signicant for high school dropouts
One might also wonder whether the large increases in em-ployment that we nd for single mothers but not for singlewomen without children also occur for other demographicgroups In Meyer and Rosenbaum [2000a] we examine whetherthere are similar employment increases for two other groups withhistorically low employment rates black males 19ndash44 and mar-ried mothers 19ndash44 We nd that the large increases in employ-ment of single mothers over 1984 ndash1996 and particularly since1991ndash1996 are not mirrored by other demographic groups
Another potential criticism of our approach is that usingvariation across women in their marital status number of chil-dren and state of residence implicitly assumes that marriagefertility and migration decisions are exogenous to the policychanges that we examine The evidence on the effects of policychanges on these decisions is mixed making the exogeneity as-sumption more plausible For example in her recent reviewHoynes [1997] concludes ldquoTogether this evidence suggests thatmarriage decisions are not sensitive to nancial incentivesrdquo Shealso argues that ldquoOverall [the effects of welfare on out-of-wedlock
1085THE LABOR SUPPLY OF SINGLE MOTHERS
births] are often insignicant and when they are not they aresmall [pp 129ndash130]rdquo On the other hand another recent reviewMoftt [1997] suggests that the weight of the evidence impliessome effect of welfare benets on marriage and fertility As tolocation Meyer [1999] concludes that there is a signicant butsmall effect of welfare on migration Overall it is likely thatendogenous single motherhood and location exert a small bias onour results
C Accounting for Individual and State Characteristics
As mentioned above the results in Table II could be partlyexplained by differential changes over time in characteristicssuch as age and education for single women with and withoutchildren Moreover business cycles may differentially affect sin-gle women with and without children thereby leading to employ-ment shifts unrelated to policy changes Consequently Table IIIpresents probit employment estimates for single women control-ling for demographic and business cycle changes We include alarge number of controls for differences between the two groupsand we include the unemployment rate as well as its interactionwith whether or not a woman has children The specication thatwe estimate is
(6) Pr(Eit 5 1) 5 F a Xit 1 b tYEARt
1 g t(YEARt p ANYCHILDRENi)
where Eit equals one if woman i from year t reports positive hoursworked in the reference week for the ORG (or the previous yearfor the March CPS) Xit is a vector that includes demographic andbusiness cycle variables YEARt is an indicator variable for yeart and ANYCHILDRENi equals one for a woman with childrenThe year dummies control for labor market trends in overallfemale employment and the X vector controls for demographicand business cycle effect differences between the groups espe-cially compositional shifts over time Thus differences between g t
coefcients give difference-in-differences estimates controlling forthese other factors These differences can be interpreted as esti-mates of the combined effect of changes in all factors affecting theemployment of single mothers relative to single women withoutchildren
The demographic and business cycle variables accounted forin Table III include controls for state race ethnicity age educa-
1086 QUARTERLY JOURNAL OF ECONOMICS
TABLE IIIPROBIT EMPLOYMENT PROBABILITY ESTIMATES FOR SINGLE WOMEN 1984ndash1996
Explanatory variable
ORG worked lastweek = 1
March CPS workedlast year = 1
(1) (2)
Averagederivative
Standarderror
Averagederivative
Standarderror
Any children p 1984 2 00797 00107 2 01087 00160Any children p 1985 2 00856 00105 2 01199 00156Any children p 1986 2 00857 00103 2 01144 00153Any children p 1987 2 00880 00099 2 01056 00144Any children p 1988 2 00837 00096 2 00918 00140Any children p 1989 2 00663 00094 2 00745 00131Any children p 1990 2 00788 00095 2 00832 00136Any children p 1991 2 00823 00102 2 00916 00151Any children p 1992 2 00747 00106 2 00706 00159Any children p 1993 2 00601 00101 2 00830 00153Any children p 1994 2 00538 00098 2 00388 00145Any children p 1995 2 00405 00096 2 00154 00143Any children p 1996 2 00121 00097 00042 00140Nonwhite 2 00902 00019 2 00727 00033Hispanic 2 00405 00030 2 00608 00033Age 19ndash24 2 00210 00024 2 00077 00055Age 25ndash29 00070 00024 2 00107 00095Age 35ndash39 2 00049 00026 00008 00052Age 40ndash44 2 00108 00028 00107 00116High school dropout 2 02161 00022 2 01512 00032Some college 00870 00019 00989 00055Bachelors 01441 00025 01755 00055Masters 01295 00040 01927 00095Divorced 2 00068 00028 00062 00052Widowed 2 01201 00080 2 01218 00116Any children p divorced 01154 00038 00720 00063Any children p widowed 00978 00097 01148 00137[ of children under 18 2 00404 00014 2 00325 00020[ of children under 6 2 00955 00020 2 00699 00027Pregnant z z 2 01333 00063Unearned income ($1000s) z z 2 00035 00003Central city z z 2 00230 00030State unemployment rate () 2 00113 00008 2 00101 00015Any children p state unemployment
rate () 00017 00010 00032 00017Number of observations 373662 119019
Sources The data are from the 1984ndash1996 Current Population Survey Outgoing Rotation Group File(ORG) and the 1985ndash1997 March Current Population Survey (March CPS)
Restrictions See Table II for sample restrictionsControls Additional controls include indicators for state year calendar month and calendar month
interacted with any children (ORG)Notes Unearned income includes interest dividend Social Security veteransrsquo benets and retirement
income The omitted group is white non-Hispanic age 30ndash34 never married and not pregnant (March CPS)She does not live in a central city (March CPS) and has only a high school education See text for details
1087THE LABOR SUPPLY OF SINGLE MOTHERS
tion marital status marital status interacted with a childrenindicator the number of children under six and eighteen thestate unemployment rate the state unemployment rate inter-acted with a children indicator (for the March CPS only) controlsfor pregnancy central city and unearned income and (for theORG only) controls for month and month interacted with a chil-dren indicator Note that the difference-in-differences calculatedby subtracting one YEAR p ANYCHILDREN coefcient fromanother are hardly affected by including the controls19 For ex-ample between 1984 and 1996 the weekly employment of singlemothers relative to single women without children rises 71 per-centage points without controls and 68 percentage points withcontrols20 For annual employment the difference-in-differencesestimator for 1984 to 1996 suggests an 117 percentage pointincrease in the relative annual employment of single motherswithout controls and an 113 percentage point increase withcontrols Again most of the increase occurs between 1991 and1996 Therefore these difference-in-difference estimates suggesta potential role for policy changes especially since 1991
VI POLICY VARIABLES AND EMPLOYMENT USING OUR SIMPLE
STRUCTURAL MODEL
We now move on to our main approach that uses our simplestructural model to distinguish between the different policies andto provide estimates that have a clearer interpretation Whilesome of the estimates rely on comparisons of single mothers andsingle women with children over time other estimates use avariety of other sources of identifying variation in our key explana-tory variables In some specications the identifying variationcomes from differences in taxes and benets for families of dif-ferent sizes and in different states as well as changes in thesetaxes and benets over time and differences in state living costs
Table IV reports estimates of our structural model of the
19 Due to the difculty in gauging the magnitude of probit coefcient esti-mates instead we report derivatives of the probability of working with respect toeach of the explanatory variables averaged over the single mothers in the sampleThus differences in the average derivatives for the YEAR p ANYCHILDRENvariables give changes over time in the difference in employment between singlewomen with and without children analogous to the changes that can be calculatedfrom Table II
20 The ldquowithout controlsrdquo results come from a weighted probit including onlythe year dummies and YEAR p ANYCHILDREN interactions
1088 QUARTERLY JOURNAL OF ECONOMICS
effects of tax and welfare policy on the probability that a womanworks These specications provide estimates of the parametersin expression (5) of Section II and can be used to obtain estimatesof the effects of the different policy changes during the 1984 ndash1996period These specications also provide coefcients that can beused to summarize the effects of a wide range of policies and thatcan be used to simulate other policies In addition to the variablesshown in Table IV each of these probits include the controlvariables reported in Table III (except for the YEAR p ANY-CHILDREN interactions) along with a large number of familycomposition variables listed in the table notes These controlvariables imply that we are not using simple differences acrossfamily types to identify our coefcients We are using changesover time or differences across states in how different families aretreated We focus rst on the full sample specications in columns(1) and (5)
All of the coefcients on the income variables have the signsthat are implied by our simple structural model and are signi-cantly different from zero21 Lower taxes and maximum welfarebenets increase employment while higher welfare benets if awoman works (due to lower implicit taxes on earnings) increaseemployment Rather than restricting the income variables toenter the worknonwork decision as a single expected incomevariable we have allowed the coefcients on the different compo-nents of income to differ It is thus encouraging that the coef-cients on the income tax and welfare variables have roughly thesame magnitude as expected The one exception to this rule isthat the coefcient on Welfare Benets if Work in the weeklyemployment equation is substantially larger than the other in-come coefcients
A Taxes
The Income Taxes if Work coefcient implies that a onethousand dollar reduction in income taxes if a woman worksincreases employment last week by 27 percentage points andincreases employment last year by 45 percentage points Both ofthese effects are strongly signicant These coefcients indicateelasticities of the participation rate with respect to the return to
21 We examined the importance of allowing for correlation among the errorterms at the level of state p year p ANYCHILDREN using STATA These standarderrors are very close to those without this correction for clustering
1089THE LABOR SUPPLY OF SINGLE MOTHERS
TA
BL
EIV
PR
OB
ITE
ST
IMA
TE
SO
FT
HE
EF
FE
CT
OF
PO
LIC
YV
AR
IAB
LE
SO
NT
HE
EM
PL
OY
ME
NT
OF
SIN
GL
EW
OM
EN
AV
ER
AG
ED
ER
IVA
TIV
E(S
TA
ND
AR
DE
RR
OR)
Exp
lan
ator
yva
riab
le
OR
Gw
orke
dla
stw
eek
=1
Mar
chC
PS
wor
ked
last
year
=1
Yea
rsof
edu
cati
onY
ears
ofed
ucat
ion
All
lt12
12gt
12A
lllt
1212
gt12
(1)
(2)
(3)
(4)
(5)
(6)
(7)
(8)
Inco
me
taxe
sif
wor
k2
002
732
004
172
003
342
001
822
004
492
008
792
005
262
002
07in
$100
0sy
ear
(00
034)
(00
080)
(00
057)
(00
051)
(00
053)
(00
150)
(00
090)
(00
063)
Wel
fare
max
imu
mbe
net
20
0340
20
0425
20
0357
20
0218
20
0295
20
0579
20
0349
20
0068
in$1
000s
yea
r(0
002
4)(0
005
6)(0
004
0)(0
003
6)(0
003
8)(0
010
6)(0
006
3)(0
004
5)W
elfa
rebe
ne
tif
wor
k0
0772
006
540
0916
005
390
0571
011
770
0626
002
33in
$100
0sy
ear
(00
073)
(00
171)
(00
121)
(00
109)
(00
107)
(00
299)
(00
177)
(00
125)
Pro
babi
lity
ofA
FD
Cre
ceip
t2
019
852
029
262
025
472
010
872
017
422
026
942
020
192
011
94if
wor
k(0
023
9)(0
052
2)(0
039
8)(0
036
3)(0
034
8)(0
094
4)(0
058
6)(0
041
7)M
edic
aid
ifw
ork
20
0096
20
0040
000
132
001
672
000
452
001
190
0007
20
0072
in$1
000s
yea
r(0
003
3)(0
006
6)(0
005
6)(0
005
5)(0
004
4)(0
010
9)(0
007
6)(0
005
9)W
aive
rmdashan
yti
me
lim
it0
0136
004
080
0192
20
0065
001
910
0256
000
720
0169
(Ind
icat
orva
riab
le)
(00
071)
(00
160)
(00
119)
(00
102)
(00
125)
(00
329)
(00
209)
(00
149)
Wai
vermdash
any
term
inat
ions
002
220
0355
003
540
0124
004
820
1174
005
320
0148
(Ind
icat
orva
riab
le)
(00
110)
(00
260)
(00
181)
(00
158)
(00
223)
(00
607)
(00
375)
(00
250)
Tra
inin
gmdashed
uca
tion
20
0805
20
0824
20
0715
20
0563
20
0759
20
0708
20
1222
20
0257
in$1
000s
yea
r(0
019
0)(0
043
0)(0
031
1)(0
028
3)(0
031
0)(0
084
9)(0
050
7)(0
037
6)
1090 QUARTERLY JOURNAL OF ECONOMICS
TA
BL
EIV
(CO
NT
INU
ED
)
Exp
lana
tory
vari
able
OR
Gw
orke
dla
stw
eek
=1
Mar
chC
PS
wor
ked
last
year
=1
Yea
rsof
edu
cati
onY
ears
ofed
uca
tion
All
lt12
12gt
12A
lllt
1212
gt12
(1)
(2)
(3)
(4)
(5)
(6)
(7)
(8)
Tra
inin
gmdashjo
bse
arch
oth
er0
0446
004
720
0607
002
600
0526
006
690
0643
002
84in
$100
0sy
ear
(00
117)
(00
272)
(00
190)
(00
175)
(00
192)
(00
528)
(00
317)
(00
236)
Chi
ldca
re0
0227
002
720
0190
002
260
0229
004
380
0175
001
94in
$100
0sy
ear
(00
065)
(00
148)
(00
104)
(00
104)
(00
100)
(00
287)
(00
164)
(00
119)
Sta
teu
nem
ploy
men
tra
te2
001
002
000
982
001
012
001
052
000
832
001
332
000
902
000
53in
perc
enta
gepo
ints
(00
007)
(00
020)
(00
013)
(00
010)
(00
014)
(00
044)
(00
024)
(00
016)
Any
chil
dren
pst
ate
unem
pra
te2
000
010
0009
20
0010
000
080
0011
000
422
000
090
0022
inpe
rcen
tage
poin
ts(0
000
9)(0
002
1)(0
001
4)(0
001
3)(0
001
4)(0
004
2)(0
002
4)(0
001
7)N
um
ber
ofob
serv
atio
ns37
366
251
146
134
432
188
084
119
019
159
9441
060
619
65
Sou
rces
The
data
are
from
the
1984
ndash199
6C
urre
ntP
opul
atio
nSu
rvey
Out
goin
gR
otat
ion
Gro
up
Fil
e(O
RG
)an
dth
e19
85ndash1
997
Mar
chC
urre
ntP
opul
atio
nS
urve
y(M
arch
CP
S)
Res
tric
tion
sS
eeT
able
IIfo
rsa
mpl
ere
stri
ctio
ns
Spec
ica
tion
s(2
)an
d(6
)ar
ere
stri
cted
tohi
ghsc
hoo
ldr
opou
ts(
3)an
d(7
)to
high
sch
ool
grad
uate
san
d(4
)an
d(8
)to
thos
ew
ith
aned
ucat
ion
beyo
nd
hig
hsc
hool
C
ontr
ols
Inad
diti
onto
the
vari
able
sin
Tab
leII
I(e
xcep
tfo
rth
ein
tera
ctio
nsbe
twee
nye
aran
dan
ych
ildr
en)
the
foll
owin
gco
ntro
lsar
ein
clud
ed
indi
cato
rsfo
rst
ate
year
ca
len
dar
mon
tha
nd
cale
ndar
mon
thin
tera
cted
wit
han
ych
ildr
en(O
RG
)w
heth
erat
leas
ton
etw
oth
ree
and
four
orm
ore
child
ren
are
pote
ntia
llyA
FD
Cel
igib
lew
heth
erat
leas
ton
ean
dat
leas
ttw
och
ildr
enar
eE
ITC
elig
ible
and
wh
ethe
rat
leas
ton
ech
ild
isu
nder
six
unde
rth
ree
unde
rtw
oan
dun
der
one
Las
tco
ntin
uou
sva
riab
les
for
the
num
ber
ofch
ildr
enun
der
each
age
betw
een
one
and
nin
etee
nar
ein
clud
ed
Not
esI
nal
lspe
cic
atio
ns
the
tax
wel
fare
and
Med
icai
dva
riab
les
are
calc
ula
ted
usin
ga
join
tho
urs
wag
edi
stri
buti
one
stim
ated
sepa
rate
lyfo
rsi
ngl
ew
omen
wit
han
dw
itho
utch
ildr
enT
axes
and
wel
fare
are
adju
sted
for
stat
eco
stof
livi
ngdi
ffer
ence
san
dal
ldo
llar
amou
nts
are
expr
esse
din
1996
doll
ars
See
App
endi
x1
for
spec
ic
indi
ces
used
and
othe
rde
tail
s
1091THE LABOR SUPPLY OF SINGLE MOTHERS
work of 107 for any employment during the year and 083 forwork in an average week We also estimated specications withseparate coefcients on state and federal income taxes althoughfor brevity these full estimates are not reported here The resultsfor federal taxes were similar to all taxes while the derivative(standard error) for state income taxes was a large and signicant2 00336 (00083) in the ORG sample and a smaller and insigni-cant 2 00165 (00139) in the March sample Thus while the statetax estimates are much less precise and differ in the two samplesthey give the same message as the other tax coefcients ie thatthe labor supply of single mothers responds to taxes
B Welfare
The full sample specications of columns (1) and (5) alsoindicate substantial effects of welfare on employment A onethousand dollar reduction in the annual Welfare Maximum Bene-t (the AFDC plus Food Stamp benet a women receives if shedoes not work) increases employment last week by 34 percentagepoints and increases employment last year by 30 percentagepoints This calculation holds constant the other welfare vari-ables Welfare Benets if Work and Probability of AFDC Receiptif Work that generally change with the maximum benet TheWelfare Benets if Work effect is sizable implying that a onethousand dollar increase in benets when one works increasesemployment last week by 72 percentage points and last year by57 percentage points These estimates suggest substantial posi-tive employment effects of reductions in implicit tax rates andincreases in earnings disregards
The transaction costs or stigma of welfare receipt as mea-sured by the Probability of AFDC Receipt if Work variable isnegative and signicantly different from zero as expected (seeequation (5)) The magnitude of this coefcient can be gauged bycomparing it with the coefcients on the variables denominatedin thousands of dollars Such comparisons suggest a transactioncost of several thousand dollars with the exact number depend-ing on the employment measure and the income variable usedFor example using the Welfare Benets if Work coefcient in theORG sample yields a transaction cost estimate of $2571 whilethe March sample implies an estimate of $3051 This resultagrees with past studies as well as ethnographies that havetended to nd substantial transaction costs or stigma of welfarereceipt
1092 QUARTERLY JOURNAL OF ECONOMICS
To assess the effect of cutting the AFDC benet one needs toincorporate the effects of all three of the welfare variables and theMedicaid if Work variable When the AFDC maximum benetand payment standard are cut they not only reduce benets ifone does not work but also reduce benets if one does work Theyalso decrease the likelihood that a working mother will be onwelfare at all thereby reducing both her Medicaid eligibility andher AFDC transaction and stigma costs When we do the fullcalculations we nd that a 10 percent cut in the maximumbenet ($324 annually) increases both the annual and weeklyemployment rate by about 10 percentage points
Despite a more detailed calculation of welfare incentivesthan most past work and the use of panel data techniques wethink there are important potential sources of bias in these esti-mates We should also note that by dividing the effect of welfareinto income when working and when not and by estimating aseparate term for transaction costsstigma we are putting thetheoretical predictions to a more severe test than most work Asdiscussed in Section IV the Welfare Benets if Work variable andthe Probability of AFDC Receipt if Work variable are more dif-cult to calculate precisely than our other variables The largercoefcient on the Welfare Benets if Work variable could also bedue to the scale of this variable being inappropriately low Theearnings distribution used to calculate expected benets putsmost of the weight on earnings levels where welfare benetswould be low or zero It is very likely that we should use anearnings distribution that puts greater weight in the left tailsince women who work while on welfare rarely report all of theirearnings to the welfare ofce [Edin and Lein 1997] The reasonsfor possible bias in the Probability of AFDC Receipt if Workvariable are similar The coefcients on these two variables tendto both be large in the same specications with their oppositesigns canceling each other out
C Medicaid
We nd little effect of Medicaid on the employment decisionsof single mothers Theory predicts that the Medicaid if Workvariable will have a positive effect on employment The variablehas the opposite effect from this prediction in both samplesalthough the coefcient estimates are small and usually are notsignicantly different from zero This result is not completelyunexpected given the weak and conicting ndings in past work
1093THE LABOR SUPPLY OF SINGLE MOTHERS
Part of the difculty is the uncertainty about individual knowledgeof Medicaid rules and their valuation of the benets We havetried a large number of alternative specications none of whichindicates a large effect of Medicaid A full accounting of theseresults can be found in Meyer and Rosenbaum [2000b]
D Welfare Waivers and Time Limits
The AFDC waiver variables have the expected effect on em-ployment and their coefcients are signicantly different fromzero Both the implementation of a time limit on welfare receiptand the actual termination of benets under a work requirementor time limit waiver are predicted to increase employment bybetween 14 and 48 percentage points However until the lastyears of our sample the overall importance of such waivers issmall Even by 1994 only 5 percent of single mothers lived instates with a time limit and less than half of 1 percent lived instates that had begun to terminate benets
One should be cautious in interpreting the waiver coef-cients especially in attributing effects to the implementation ofparticular provisions of recent waivers or the termination of casesper se The perception of welfare changes by potential welfarerecipients the attitudes of case workers and differences in stateimplementation of policies likely play a large role in inuencingthe welfare caseload and consequently employment It is alsoeconometrically difcult to disentangle which provisions of awaiver are the most important since states typically imple-mented several changes to their AFDC programs under waiversat the same time The reported coefcients are partly the effect ofthe particular actions coded and partly a proxy for other changesgoing on in the states
Recognizing these limitations the strength of the evidencehere for a causal interpretation of the waiver results is muchgreater than in the studies of welfare caseloads First we useimplementation dates rather than application or approval dateswhich are at best loosely related to when provisions are enforcedSecond when we account for state intentions to reform welfare asindicated by whether or not a state has made a major waiverapplication this variable has little effect Third one or two yearleads of our time limit and termination variables have small andinsignicant coefcients suggesting that the provisions per serather than publicity or administrator attitudes lead to the em-ployment increases This result contrasts with those of Blank
1094 QUARTERLY JOURNAL OF ECONOMICS
[1997] and Levine and Whitmore [1998] who found strong effectsof leads of waiver variables on caseloads
E Training and Child Care
The last three coefcient estimates in Table IV measure theemployment effects of expenditures on training and child careHigher expenditures on job search and other training and onchild care are associated with a higher employment rate for singlemothers Training expenditures on education have a negativeeffect that is signicant in both samples The job search coef-cients imply that an increase in expenditures of one thousanddollars (about two-thirds of average expenditures) would increasethe employment rate for single mothers without young childrenby over four percentage points Since single mothers withoutchildren young enough to exempt them from training programsmake up about half of all single mothers the overall effect wouldbe over two percentage points An increase in federal and statechild care expenditures of ve hundred dollars per single motherwith a child under six (slightly less than the mean in 1996) isassociated with about a one percentage point increase in bothweekly and annual employment These effects are quite substan-tial per dollar expended The training result on education is notsurprising given the weaker results in the literature on classroomtraining and the possible short-term effect on employment aswomen are in classrooms rather than jobs
F Results by Education Group
Table IV also reports separate estimates for the effects of thepolicy variables for three education groups less than high schoolhigh school and some college We would expect a priori that thepolicy variables which mostly capture taxes and benets receivedby low-income women would have the greatest effect on highschool dropouts less of an effect on those with a high schooldegree and even less of an effect on those with some college22
Overall the results by level of education are consistent with thehypothesized larger effects on the less educated The derivativestend to be much larger in absolute value for high school dropoutsthan they are in the full sample and much smaller for those with
22 The estimates use a xed wagehours distribution (that does not vary byeducation) to calculate the income and benet variables so that the explanatoryvariables are comparable across the columns
1095THE LABOR SUPPLY OF SINGLE MOTHERS
some college than in the full sample For example a one thousanddollar cut in taxes (or increase in tax credits) for high schooldropout single women is predicted to increase their employmentby 42 percentage points in a typical week and increase work atall during the year by 88 percentage points The correspondingnumbers for those with some college education are 18 percentagepoints and 21 percentage points Many of the other policy vari-able derivatives also fall with increased education23
G Unemployment and Macroeconomic Conditions
Table IV also reports the coefcients on the state unemploy-ment rate and its interaction with a dummy variable for a singlewoman having children The unemployment rate is strongly sig-nicant and implies that for single women without children a onepercentage point increase in the unemployment rate is associatedwith a 10 percentage point decrease in employment in a typicalweek and a 08 percentage point decrease in work anytime duringthe year On the other hand the interaction of the unemploymentrate with being a single mother is small and not signicantlydifferent from zero The point estimates imply that a one percent-age point increase in the unemployment rate is associated withonly a 001 percentage point decrease in a typical week and 01percentage point increase any time during the year in theemployment of single mothers relative to single women withoutchildren These coefcients indicate a strong and similarresponsiveness of both groups of single women to the state of themacroeconomy This result is favorable for the use of singlewomen without children as a comparison group for single mothers
H Alternative Specications
Since many of the changes in policy notably welfare reformtook place in recent years and a well-publicized decline in thewelfare rolls began in 1994 we reestimate the full sample speci-cations of Table IV dropping the years 1994 ndash1996 along withthe waiver variables (which are nearly always zero through1993) The estimates from this shorter sample which are re-ported in columns (1) and (5) of Table V are very close to those
23 The derivatives might be lower for groups with higher levels of educationbecause their employment rates are higher leaving less room for increases inemployment However the drop in the magnitude of the policy variable deriva-tives with more education is greater than it is for other control variables such asthe unemployment rate
1096 QUARTERLY JOURNAL OF ECONOMICS
TA
BL
EV
PR
OB
ITE
STIM
AT
ES
OF
TH
EE
FF
EC
TO
FP
OL
ICY
VA
RIA
BL
ES
ON
TH
EE
MP
LO
YM
EN
TO
FS
ING
LE
WO
ME
NA
LT
ER
NA
TIV
ES
PE
CIF
ICA
TIO
NS
AV
ER
AG
ED
ER
IVA
TIV
E(S
TA
ND
AR
DE
RR
OR)
Exp
lana
tory
vari
able
OR
G
wor
ked
last
wee
k=
1M
arch
CP
Sw
orke
dla
stye
ar=
1
(1)
(2)
(3)
(4)
(5)
(6)
(7)
(8)
Inco
me
taxe
sif
wor
k2
002
892
001
352
005
012
000
552
004
302
002
532
005
582
003
05in
$100
0sy
ear
(00
045)
(00
087)
(00
051)
(00
084)
(00
074)
(00
129)
(00
087)
(00
133)
Lag
ged
inco
me
taxe
sif
wor
kz
zz
20
0263
zz
z2
001
75in
$100
0sy
ear
zz
z(0
009
2)z
zz
(00
148)
Wel
fare
max
imu
mbe
net
20
0375
20
0107
20
0464
20
0340
20
0291
20
0011
20
0445
20
0296
in$1
000s
yea
r(0
002
9)(0
006
5)(0
003
3)(0
002
4)(0
004
7)(0
009
2)(0
005
6)(0
003
8)W
elfa
rebe
ne
tif
wor
k0
0911
001
070
1027
007
660
0644
20
0080
20
0882
005
67in
$100
0sy
ear
(00
089)
(00
106)
(00
099)
(00
073)
(00
132)
(00
144)
(00
157)
(00
107)
Pro
babi
lity
ofA
FD
Cre
ceip
t2
021
042
010
442
024
102
019
502
020
562
008
372
026
652
017
17if
wor
k(0
029
7)(0
033
6)(0
032
7)(0
023
9)(0
043
3)(0
050
1)(0
051
8)(0
034
8)M
edic
aid
ifw
ork
20
0133
000
292
002
092
000
952
000
790
0055
20
0107
20
0045
in$1
000s
yea
r(0
004
6)(0
003
7)(0
004
5)(0
003
3)(0
005
9)(0
004
9)(0
006
6)(0
004
4)W
aive
rmdashan
yti
me
lim
itz
001
710
0204
001
28z
002
470
0350
001
84(I
ndic
ator
vari
able
)z
(00
080)
(00
104)
(00
071)
z(0
014
1)(0
019
7)(0
012
5)W
aive
rmdashan
yte
rmin
atio
nsz
001
600
0456
002
15z
003
550
0703
004
79(I
ndic
ator
vari
able
)z
(00
116)
(00
163)
(00
110)
z(0
023
8)(0
034
7)(0
022
3)
1097THE LABOR SUPPLY OF SINGLE MOTHERS
TA
BL
EV
(CO
NT
INU
ED
)
Exp
lana
tory
vari
able
OR
Gw
orke
dla
stw
eek
=1
Mar
chC
PS
w
orke
dla
stye
ar=
1
(1)
(2)
(3)
(4)
(5)
(6)
(7)
(8)
Tra
inin
gmdashed
uca
tion
20
0755
20
0764
20
0728
20
0841
20
0804
20
0656
20
1396
20
0780
in$1
000s
yea
r(0
023
7)(0
022
3)(0
039
2)(0
019
0)(0
040
1)(0
036
5)(0
060
7)(0
031
0)T
rain
ingmdash
job
sear
cho
ther
007
620
0441
001
060
0428
007
150
0571
008
490
0517
in$1
000s
yea
r(0
014
0)(0
013
3)(0
023
7)(0
011
7)(0
023
7)(0
021
3)(0
038
2)(0
019
3)C
hild
care
000
110
0190
000
710
0215
20
0033
001
710
0286
002
22in
$100
0sy
ear
(00
092)
(00
073)
(00
088)
(00
066)
(00
140)
(00
114)
(00
161)
(00
101)
1994
ndash199
6ex
clud
edY
esN
oN
oN
oY
esN
oN
oN
oS
ingl
em
oth
ers
only
No
Yes
No
No
No
Yes
No
No
Mot
her
sw
och
ildr
enlt
6ex
cl
No
No
Yes
No
No
No
Yes
No
Nu
mbe
rof
obse
rvat
ions
292
731
122
966
303
396
373
662
938
1640
818
957
8611
901
9
Sou
rces
The
data
are
from
the
1984
ndash199
6C
urre
ntP
opul
atio
nSu
rvey
Out
goin
gR
otat
ion
Gro
up
Fil
e(O
RG
)an
dth
e19
85ndash1
997
Mar
chC
urre
ntP
opul
atio
nS
urve
y(M
arch
CP
S)
Res
tric
tion
sS
eeT
able
IIfo
rsa
mpl
ere
stri
ctio
ns
Spe
cic
atio
ns(1
)an
d(5
)ex
clu
de19
94ndash1
996
Spe
cic
atio
ns
(2)
and
(6)
incl
ude
only
sin
gle
mot
hers
Spe
cic
atio
ns
(3)
and
(7)
incl
ude
sing
lew
omen
wit
hout
chil
dren
and
sing
lem
othe
rsw
hose
youn
gest
chil
dis
less
than
six
Con
trol
sS
eeT
able
IVfo
rco
ntr
ols
Indi
cato
rsfo
rin
tera
ctio
nsbe
twee
nst
ate
and
any
AF
DC
elig
ible
chil
dren
and
betw
een
year
and
both
any
AF
DC
elig
ible
child
ren
and
any
EIT
Cel
igib
lech
ildre
nar
ein
clud
edin
spec
ica
tion
s(2
)an
d(6
)N
otes
In
alls
peci
cat
ions
the
tax
wel
fare
and
Med
icai
dva
riab
les
are
calc
ula
ted
usin
ga
join
tho
urs
wag
edi
stri
buti
ones
tim
ated
sepa
rate
lyfo
rsi
ngle
wom
enw
ith
and
wit
hout
chil
dren
Tax
esan
dw
elfa
rear
ead
just
edfo
rst
ate
cost
ofli
vin
gdi
ffer
ence
sA
lso
alld
olla
ram
ount
sar
eex
pres
sed
in19
96do
llar
sS
eeA
ppen
dix
1fo
rsp
eci
cin
dice
sus
edan
dot
her
deta
ils
1098 QUARTERLY JOURNAL OF ECONOMICS
over the full sample period The only exception to this generali-zation is that the job searchother training coefcient is largerand the child care coefcient is smaller and statistically insigni-cant over the shorter time span These results are among themost important in this paper because they indicate that (1) theurry of welfare reform measures after 1993 has not falsely led toour main results and (2) the extended recovery of the 1990s is notan alternative explanation for our main results
Next we examine a sample of only single mothers Thisspecication identies the effects of the income variables throughchanges across states and for different family sizes In the case ofthe Income Taxes if Work variable we are largely using thevariation from the last few years when the EITC for women withone child was nearly unchanged but the EITC for women with twoor more children rose in large steps Thus identication comesfrom using women with one child as a control group and chang-ing the treatment that women with two or more children receiveWith single mothers only the year indicators remove the timetrend in welfare receipt and benets and the state indicatorsremove time-constant differences in state welfare benets andmuch of these state cost of living differences in the income vari-ables Thus the variation in welfare benets used to identify thecoefcients is now changes in state-level benets This identi-cation approach examines the employment response to fairlysubtle or short-run features of the welfare and tax laws Thesepolicy changes may be overwhelmed by other factors in thesespecications Despite these potential difculties much of theincome tax effect remains although the estimates are muchsmaller While the effect of taxes is still signicant in the MarchCPS data the drop in the coefcient and larger standard errorleads the ORG coefcient to be insignicantly different from zeroThe welfare benet coefcients are now no longer signicant TheAFDC transaction cost coefcient however remains signicantin the ORG data while the Medicaid coefcient has the expectedsign but remains small and insignicant in both samples
In the third set of specications of Table V we only includesingle mothers with a child under six (and single women withoutchildren) The derivative estimates for the tax and welfare vari-ables including waivers are often substantially larger in magni-tude for these single mothers with young children especially forthe tax variable in the ORG sample These specications are ofparticular interest because the effects of increased employment
1099THE LABOR SUPPLY OF SINGLE MOTHERS
on parental care is likely to be largest on these families withyoung children who are not likely to be in school The last speci-cation of Table V examines whether women learn about taxchanges with a delay after they are implemented This specica-tion includes both the contemporaneous and one year lagged taxvariables The results are somewhat supportive of a lagged effectof taxes In the ORG data the contemporaneous tax variable issmall and insignicant while the lagged variable is large andsignicant In the March CPS it is the contemporaneous variablethat is large and signicant while the lagged variable is smallerand signicant although still substantial in size
I Additional Specications and Hours Worked
We examine several other specications that are not reportedhere in order to determine the benets of studying many pro-grams at the same time to check the sensitivity of our results toalternative specications and to see whether there are particu-larly large effects for certain subgroups of the population We ndthat ignoring some of the policy changes that we study has asubstantial effect on the estimates for the remaining programsWhen we include the tax variable but leave out the other policyvariables its coefcient is about 50 percent larger in both sam-ples When the only policy variables that we include are Medicaidif Work and the Welfare Maximum Benet the Medicaid coef-cient is positive and signicant in the March CPS sample Whenthe other policy variables are not included the waiver variablesare much larger On the other hand the tax coefcient is hardlychanged when the training and child care variables are excludedThese results suggest that the common research strategy of in-vestigating one program in isolation has the potential to givemisleading results
We have examined the sensitivity of our results to alterna-tive samples and variable denitions In particular the resultsare little changed by using more stringent denitions of employ-ment by including separated women or women in school We alsotry several subgroup analyses In particular we examine differ-ences between whites and nonwhites and family heads and sub-family heads Nonwhites appear to be more affected by welfarewaivers than whites while subfamily heads are more sensitive totaxes than family heads
To obtain a broader picture of the effects of welfare and taxpolicy on labor supply we also examined hours worked (see
1100 QUARTERLY JOURNAL OF ECONOMICS
Meyer and Rosenbaum [1999] for more details) Difference-in-differences estimates for hours analogous to those in Table IIshow large relative increases in work for single mothers over thesample period with almost all of the change occurring after 1991We also estimated a series of Tobit and OLS regressions todetermine the effects of tax and welfare policy on hours controllingfor demographics economic conditions state and year We in-clude the same variables as we did in Tables IV and V althoughwe should emphasize that these variables were constructed forour structural model of employment and so are less suitable foran analysis of hours The effects of the policy variables in theTobit estimates for all women whether or not they work tend to besimilar to the effects on employment seen in the earlier tablesThese results hold for the sample of single mothers as well as forall single women The results are very similar for hours per yearin the March CPS and hours in a typical week in the ORG Forhours worked conditioning on positive hours the policy variablestend to have much the same signs but smaller and less signi-cant coefcients Overall the results tend to conrm the resultsfor the main policy variables that we found in the employmentprobits
VII WHICH POLICIES ACCOUNTED FOR THE EMPLOYMENT CHANGES
Our simultaneous examination of many government policiesmakes it straightforward to estimate the relative contribution ofthese policies to the recent increase in employment of singlemothers In Table VI we decompose the employment increases forsingle mothers relative to single women without children for boththe entire period (1984 ndash1996) and the recent period of rapidemployment growth (1992ndash1996) Overall these decompositionsindicate a large role for the EITC and other tax changes modestroles for AFDC benet cuts and waivers and smaller roles forMedicaid training and child care increases
Using the parameter estimates from our main specications(specications (1) and (5) of Table IV) the EITC explains 62percent of the increase in weekly employment over the full 1984to 1996 period yet only 27 percent of the increase between 1992and 1996 For annual employment the EITC plays a very similarrole explaining 61 percent of the 1984 to 1996 increase and 35percent of the 1992 to 1996 increase The corresponding changesin employment attributed to the EITC over the full 1984 to 1996
1101THE LABOR SUPPLY OF SINGLE MOTHERS
TA
BL
EV
IC
ON
TR
IBU
TIO
NO
FP
OL
ICY
CH
AN
GE
ST
OT
HE
CH
AN
GE
SIN
TH
ER
EL
AT
IVE
EM
PL
OY
ME
NT
OF
SIN
GL
EM
OT
HE
RS
VE
RSU
SS
ING
LE
WO
ME
NW
ITH
OU
TC
HIL
DR
EN
19
84ndash1
996
AN
D19
92ndash1
996
Exp
lan
ator
yva
riab
le
1984
ndash199
619
92ndash1
996
OR
GM
arch
CP
SO
RG
Mar
chC
PS
Din
emp
of
tota
lD
inem
p
ofto
tal
Din
emp
of
tota
lD
inem
p
ofto
tal
Inco
me
taxe
sif
wor
k0
0438
622
0
0720
614
0
0186
268
0
0305
351
W
elfa
rem
axim
um
ben
et
001
7925
4
001
5613
3
001
1416
5
000
9911
4
Wel
fare
ben
et
ifw
ork
000
050
70
0003
03
20
0045
26
52
000
332
38
Pro
babi
lity
ofA
FD
Cre
ceip
tif
wor
k2
000
022
03
20
0002
20
10
0020
29
000
172
0M
edic
aid
ifw
ork
20
0070
29
92
000
322
28
20
0023
23
32
000
112
12
Tot
alw
elfa
rebe
ne
tsamp
Med
icai
d0
0112
159
0
0125
106
0
0066
96
000
738
4W
aive
rmdashan
yti
me
lim
it0
0054
76
000
756
40
0052
76
000
738
5W
aive
rmdashan
yte
rmin
atio
ns
000
466
50
0099
84
000
466
60
0099
114
T
otal
wel
fare
wai
vers
000
9914
1
001
7414
8
000
9814
2
001
7219
8
Tra
inin
gmdashed
uca
tion
20
0101
214
4
20
0096
28
22
000
212
30
20
0020
22
3T
rain
ingmdash
job
sear
cho
ther
000
659
20
0077
65
000
476
80
0056
64
Ch
ild
care
000
689
70
0069
59
000
111
80
0013
15
Tot
altr
ain
ing
ampch
ild
care
000
324
60
0050
43
000
395
70
0039
56
Dem
ogra
phic
s2
000
732
104
2
000
682
58
001
0715
5
001
1212
9
Oth
er0
0096
137
0
0172
147
0
0196
283
0
0158
182
T
otal
007
0510
00
011
7410
00
006
9110
00
008
6910
00
Sou
rces
The
data
are
from
the
1984
ndash199
6C
urre
ntP
opul
atio
nSu
rvey
Out
goin
gR
otat
ion
Gro
up
Fil
e(O
RG
)an
dth
e19
85ndash1
997
Mar
chC
urre
ntP
opul
atio
nS
urve
y(M
arch
CP
S)
Not
es
Din
emp
give
sth
ech
ange
inth
eem
ploy
men
tof
sing
lem
othe
rs(r
elat
ive
tosi
ngle
wom
enw
itho
ut
chil
dren
)ov
erth
esp
eci
edti
me
peri
odth
atis
due
toth
egi
ven
expl
anat
ory
vari
able
(s)
of
tota
lgiv
esth
epe
rcen
tage
ofth
eem
ploy
men
tin
crea
sefo
rsi
ngle
mot
hers
(rel
ativ
eto
sing
lew
omen
wit
hout
chil
dren
)exp
lain
edby
the
give
nex
plan
ator
yva
riab
le(s
)T
he
rela
tive
empl
oym
ent
incr
ease
sar
eth
eav
erag
ede
riva
tive
esti
mat
esof
the
inte
ract
ions
ina
wei
ghte
dpr
obit
mod
elin
clu
ding
year
indi
cato
rsan
dth
eir
inte
ract
ions
wit
han
any
chil
dren
indi
cato
rT
he
para
met
eres
tim
ates
used
toes
tim
ate
the
chan
gein
empl
oym
ent
com
efr
omsp
eci
cati
ons
(1)
and
(5)o
fTab
leIV
wh
ileth
ech
ange
over
tim
ein
the
polic
yva
riab
les
com
esfr
omA
ppen
dix
2
1102 QUARTERLY JOURNAL OF ECONOMICS
period and the 1992 to 1996 period are also reported in Table VIWe estimate that the EITC and other tax changes increasedweekly employment 44 percentage points and annual employ-ment 72 percentage points over the full period with about 40percent of this change occurring over the 1992 to 1996 subperiodWhile these estimates are substantial they bracket the EITCeffects found by Eissa and Liebman [1996] and are smaller thanthose predicted by Dickert Houser and Scholz [1995] and Keane[1995]24
Changes in the maximum welfare benet and implicit taxrates and the Medicaid expansions account for between 10 and 16percent of the increase in weekly employment and between 8 and11 percent of the increase in annual employment over eitherperiod The effect of the Medicaid expansions themselves is usu-ally small or negative Conversely the effects of welfare waiversappear to be substantial with the estimates suggesting thatpolicies instituted under waivers account for about 14 to 15 per-cent of the increase in employment over the full sample periodand about 14 to 20 percent of the increase between 1992 and 1996for both weekly and annual employment In general both jobtraining and child care explain small parts of the employmentincrease although in the case of weekly employment over the fullperiod child care can account for about 10 percent of the increase
Improved macroeconomic conditions increased employmentfor both single mothers and single women without children overthe 1984 ndash1996 period Because the above calculations are forsingle mothers compared with single women without childrenunemployment is not given a share in the decomposition In all ofthe employment probits the interaction of unemployment andbeing a single mother had an economically small and statisticallyinsignicant effect Changes in state unemployment rates areestimated to have increased the absolute level of employment ofsingle mothers by 20 percentage points during a typical week
24 Eissa and Liebman [1996] found up to a 28 percentage point increase inparticipation due to TRA86 (which as we indicate in Section IV accounted for 43percent of the 1984ndash1996 change in taxes) Keane [1995] predicted that the1984ndash1996 changes will result in a 107 percentage point increase in participa-tion while Dickert Houser and Scholz [1995] predicted that the 1993ndash1996changes (39 percent of the full 1984ndash1996 change in taxes) would increase em-ployment of single parents by 33 percentage points Experimental ndings suchas those reported in Blank Card and Robins [2000] suggest substantial respon-siveness of welfare recipients and other low-income people to nancial incentivesThese experimental results would need to be extrapolated to all single mothersand the EITC to provide comparisons
1103THE LABOR SUPPLY OF SINGLE MOTHERS
and 14 percentage points during the year over the 1984 ndash1996period These numbers are equivalent to 284 percent of therelative increase in weekly employment and 122 percent of therelative increase in annual employment of single mothers overthe period
In results not shown we recalculate the shares of the em-ployment increase due to various policies using the parameterestimates from specications with only single mothers (specica-tions (2) and (6) of Table V) These results suggest a much smallerrole for the EITC and other tax changes in explaining the changesin employment ranging from 49 to 56 percent as large as those inTable VI Changes in the maximum welfare benet are lessimportant while the results for welfare waivers job training andchild care are largely unchanged
VIII CONCLUSIONS
Between 1984 and 1996 tax and transfer policy were reori-ented to encourage work by single mothers Single mothers haveresponded to these incentives by working more especially after1991 and especially those with children under six To assesswhich policy changes have led to the employment increases weexamine the incentives of federal and state income taxes AFDCMedicaid Food Stamps and their implicit tax rates and earningsdisregards as well as AFDC waivers instituting time limits orwork requirements Our detailed examination of these policychanges using two large micro data sets indicates that EITC andother tax changes account for over 60 percent of the 1984 to 1996increase in the weekly and annual employment of single mothersrelative to single women without children Changes to welfareprograms were less important but still account for a substantialshare of the employment increases Changes in Medicaid train-ing and child care programs play a considerably smaller roleThese ndings are conrmed in an analysis of hours worked
This paper makes several methodological improvements overpast research including the estimation of a simple structuralmodel of employment which provides several independent tests ofthe hypothesis that single mothers respond to economic incen-tives Our results indicate that nancial incentives have powerfuleffects on single mothersrsquo employment decisions and that thedifferent sources of these incentives have effects of plausiblemagnitudes We also nd a sizable transaction cost or stigma to
1104 QUARTERLY JOURNAL OF ECONOMICS
welfare We rely on less subjective measures of welfare waiverssuch as implementation dates and the beginning of case termi-nations and provide the rst evidence on the effects of waivers onemployment Unlike most past work we examine the major pro-grams affecting single mothers together nding that examiningone or two programs in isolation can lead to biases in estimatedbehavioral effects
In most of our specications identication comes from thedifferences in incentives faced by single women with and withoutchildren While we argue that single women without children area plausible comparison group we also provide estimates that donot rely on this comparison Instead these estimates rely onchanges in the treatment of family size state cost of living dif-ferences changes in state income taxes differences in earningsdisregards and implicit tax rates across states and changes inthese parameters and welfare benets within a state over timeOur nding of large tax and welfare effects on employment arerobust although tax effects and especially welfare effects aresometimes smaller using alternative identication strategies
Our result that the EITC played a dominant role in theemployment increases of single mothers between 1984 and 1996suggests that policies that ldquomake work payrdquo are effective in in-creasing work by single mothers This lesson is important in lightof the emphasis on punitive measures such as time limits andwork requirements in the most recent welfare reforms
APPENDIX 1 DESCRIPTION OF POLICY VARIABLES
This section describes the construction of our policy variablesand lists our information sources First we begin with the as-sumptions that we use to determine taxes program participationand benet levels
1 The determination of whether a woman has children andhow many she has is based on the CPS family and sub-family denitions Children in primary families (both re-lated and unrelated) are assigned to the family headwhile children in subfamilies are assigned to the subfam-ily head rather than to the primary family head Childrenare dened as any member of the given family (primary orsubfamily) under age 19 (or under 24 and a full-timestudent) for EITC purposes and under age 18 for all otherprograms
1105THE LABOR SUPPLY OF SINGLE MOTHERS
2 In the March CPS sample the age for tax purposes is theage at the time of the March interview We subtract onefor AFDC and Medicaid purposes In the ORG sample weuse the age at the time of the interview for AFDC andMedicaid but for tax purposes we add one for interviewsoccurring between January and June
3 Women have no unearned income (including child sup-port) or assets and their children have no earned incomeunearned income or assets hence earnings determinetheir program eligibility
4 Single mothers are assumed to le as head of householdand claim their children as dependents while singlewomen without children le as single Also all womentake the standard deduction
5 Women receiving AFDC are in their rst four months ofwork and do not claim child care expenses25
6 Single women without children do not receive FoodStamps
7 Shelter costs (an input in Food Stamp calculations) varyonly by state and over time
A Tax Welfare and Medicaid Variables
First for each woman we calculate ve quantities income taxliabilities (federal and state income taxes incorporating federaland state EITCs) welfare benets (AFDC plus Food Stamps)AFDC receipt (indicator for AFDC eligibility) and Medicaidadults covered and Medicaid children covered Under the assump-tions above these calculations are made at 50 annual earningslevels generated from the cells of a joint wagehours distributionThe 50 cells come from a combination of ve annual hours levels(500 1000 1500 2000 and 2500) and ten hourly wage levels (45 6 7 8 10 12 15 20 and 25)
Second we use the wagehours distributions described in thetext to weight the above quantities We calculate the distributionsusing only women with more than $500 of annual earnings Wethen construct the following variables
25 These assumptions are roughly consistent with the facts In scal year1995 over two-thirds of AFDC families with earnings were in their rst fourmonths of work and only about 16 percent of AFDC families with earningsclaimed child care expenses [U S Department of Health and Human ServicesCharacteristics of AFDC Recipients 1996]
1106 QUARTERLY JOURNAL OF ECONOMICS
c Income Taxes if Work is the weighted sum of income taxliabilities at the various annual earnings points using thewagehours distributions described above as weights
c Welfare Benets if Work is the weighted sum of welfarebenets at the various annual earnings points using thewagehours distributions described above as weights
c Probability of AFDC if Work is the weighted sum of AFDCreceipt at the various annual earnings points using thewagehours distributions described above as weights
c Medicaid if Work is calculated in two steps First wecalculate the weighted sum of Medicaid adults covered andMedicaid children covered at the various annual earningspoints using the wagehours distributions described aboveas weights Second we then multiply these sums by dollarexpenditures separately for adults and children In themain specications we use average expenditures over allstates and years
c Welfare Maximum Benet is the welfare benet assumingzero earnings
We calculate AFDC monthly benets (AFDC) as follows (settingquantities in parentheses to zero if negative)
(A1) AFDC 5 min MAXBEN RR p [PS 2 BRR p (EI 2 DIS)]
wheremdash MAXBEN is the maximum benetmdash RR is the ratable reductionmdash PS is the payment standard (the dollar amount when
benets end not counting disregards)mdash BRR is the benet reduction ratemdash EI is earned income andmdash DIS is the earnings disregard
We calculate Food Stamp benets in two steps (setting quantitiesin parentheses to zero if negative) First we calculate themonthly shelter cost expense deduction (SED) and second wecalculate the monthly Food Stamp benet (FS)
(A2) SED 5 (min SEDC SE 2 05
p ((1 2 EIDP) p EI 1 AFDC 2 SD))
(A3) FS 5 (MB 2 03 p ((1 2 EIDP)
p EI 1 AFDC 2 SD 2 SED))
1107THE LABOR SUPPLY OF SINGLE MOTHERS
wheremdash EIDP is the earned income deduction percentage (018
prior to 1986 020 starting in 1986)mdash MB is the maximum Food Stamp benetmdash SD is the standard deductionmdash SE is shelter expensesmdash SEDC is the shelter expense deduction ceilingTax and welfare variables (and earned and unearned income
variables) are adjusted for state cost of living differences usingthe poverty threshold index for 1990 from National ResearchCouncil [1995] which is adjusted annually using the PCE dea-tor The poverty threshold index accounts for housing cost differ-ences between states using Census housing cost data
Sources for Taxes Welfare and Medicaid
We obtain the federal income tax schedules from the U SDepartment of the Treasury [various years] The state tax infor-mation was obtained from four sources the Advisory Committeeon Intergovernmental Relations [various years] the CommerceClearing House [various years] unpublished data from the Cen-ter on Budget Policy and Priorities and Feenberg and Coutts[1993] The AFDC program parameters are obtained from theU S Department of Health and Human Services (Characteristicsof State Plans [various years]) and unpublished data from theUrban Institute The Food Stamp parameters come from the U SHouse of Representatives (Green Book [various years]) and theU S Department of Agriculture [various years] The Medicaidprogram information is obtained from three sources the NationalGovernorrsquos Association [various dates] the IntergovernmentalHealth Policy Project [various years] and the U S House ofRepresentatives [Medicaid Source Book 1988 1993] Medicaiddollar values (separately for adults and children) come from un-published tables from the Health Care Financing Administration(HCFA)
B Welfare Waiver Variables
c Any Time Limit is one starting with the implementationmonth of a waiver that imposes mandatory work require-ments on families that reach time limits or results in thereduction or total loss of AFDC payments after a certaintime limit has been reached (usually two years)
1108 QUARTERLY JOURNAL OF ECONOMICS
c Any Terminations is one beginning with the month inwhich a case is rst terminated under a welfare waiver
c Major Waiver Application is one beginning with the monthin which a state rst applies for a major statewide waiver
Note that these variables are always zero for women withoutAFDC children
Sources for Welfare Waiver Variables
The waiver variables we used are based on our reading of thewaiver summaries in General Accounting Ofce [1997] the U SDepartment of Health and Human Services [1997c] and Savnerand Greenberg [1997] These sources generally have the imple-mentation dates of waivers We also consulted American PublicWelfare Association [1996] Levine and Whitmore [1998] andU S Department of Health and Human Services [1997a] Ourclassication scheme follows most closely the classicationschemes in General Accounting Ofce [1997] and the U S De-partment of Health and Human Services [1997c]
C Training Program Variables
These variables measure variation across states and overtime in federal and state spending on welfare-to-work programsand on eligibility criteria These numbers are based on the statelevel scal year WIN (Work Incentive) program expenditures andstate level scal year JOBS (Job Opportunities and Basic Skills)program expenditures by component (job search education etc)We calculate spending per female AFDC adult who is not exemptfrom participation based on the age of her youngest child Thedollars are then divided by the state average wage to obtain anamount of services provided26
We calculate the distribution of the age of the youngest childand we apportion total JOBS spending to women using the frac-tion of participants who are female adults We divide spendinginto two categories education which includes education postsec-ondary education and self-initiated education and other whichincludes job search job development and placement on-the-jobtraining work supplementation community work experienceself-initiated training job skills job readiness and assessmentand employability plan For scal year 1990 it is necessary to
26 The state average wage is average hourly wage for manufacturing in thestate It is normalized so that the 1996 value = 100
1109THE LABOR SUPPLY OF SINGLE MOTHERS
extrapolate WIN expenditures forward and JOBS expendituresbackward to the date when the JOBS program began in a givenstate We also extrapolate 1985 WIN data back to 1984 and scalyear 1996 forward to the rst three months of scal year 1997
Note that the training variables are zero for women withoutAFDC children and women with children young enough to ex-empt the mother from participation in WIN or JOBS
Sources for Training Variables
JOBSWIN expenditure data come from unpublished U SDepartment of Health and Human Services and U S Depart-ment of Labor tabulations and the U S House of Representa-tives (Green Book [various years]) To calculate the distribution ofthe age of youngest child for single mothers we use data from theU S Department of Health and Human Services (Characteristicsof AFDC Recipients [various years]) and authorsrsquo calculationsfrom the March CPS Wage data come from the Bureau of LaborStatistics web site
D Child Care Variable
Child Care expenditures are actual federal and state expen-ditures by state on the following four programs AFDC ChildCare Transitional Child Care At-Risk Child Care and ChildCare and Development Block Grants Expenditures are put on aper-person basis by dividing through by the number of unmarriedwomen with children less than six This denominator is calcu-lated using annual data on the number of women by state (fromthe Census Bureau) and the fraction of women in a state who areunmarried with children less than six which is calculated fromthe ORG over the entire 1984 ndash1996 period Like training dollarsthe resulting dollar value is then divided by the state averagewage to obtain an amount of services provided
Note that the child care variable is always zero for womenwithout children less than six
Sources for Child Care Variable
Child Care expenditures come from unpublished U S De-partment of Health and Human Service tabulations Annual dataon the number of women by state come from the U S CensusBureau The fraction of women in a state who are unmarried withchildren less than six is calculated from the ORG by the authorsWage data come from the Bureau of Labor Statistics web site
1110 QUARTERLY JOURNAL OF ECONOMICS
AP
PE
ND
IX2
VA
RIA
BL
EM
EA
NS
FO
RS
ING
LE
MO
TH
ER
SA
ND
SIN
GL
EW
OM
EN
WIT
HO
UT
CH
ILD
RE
N1
984
1988
199
219
96
Var
iabl
e
1984
1988
1992
1996
Ch
ildr
enN
och
ildr
enC
hil
dren
No
chil
dren
Ch
ildr
enN
och
ildr
enC
hil
dren
No
chil
dren
Age
314
426
86
319
727
79
319
628
83
321
929
22
Non
wh
ite
037
10
155
036
30
162
038
40
178
037
70
207
His
pan
ic0
086
005
30
103
007
20
111
007
90
136
009
3H
igh
sch
ool
drop
out
026
20
094
024
60
091
024
10
094
021
10
092
Som
eco
lleg
e0
211
029
70
234
030
50
256
031
70
311
031
7B
ach
elor
s0
063
019
20
064
020
40
061
021
00
072
023
3M
aste
rs0
022
005
90
025
006
10
023
006
60
021
006
4D
ivor
ced
056
40
151
053
30
161
047
70
165
046
00
162
Wid
owed
006
60
010
005
50
010
004
70
012
003
80
012
Liv
ing
wit
hpa
ren
ts0
156
041
80
151
037
50
154
034
70
154
033
9L
ivin
gw
ith
un
rela
ted
adu
ltm
ale
009
70
135
012
50
167
014
80
198
016
50
218
[of
chil
dren
un
der
181
681
z1
664
z1
707
z1
707
z[
ofch
ildr
enu
nde
r6
056
0z
057
1z
062
4z
061
3z
Ear
ned
inco
me
(Mar
ch)
128
1018
331
134
6220
183
132
3218
993
147
6019
912
Ear
ned
inco
me
ifw
ork
(Mar
ch)
172
5019
536
180
1321
293
179
3020
453
180
2321
479
An
nu
alho
urs
ifw
ork
(Mar
ch)
1718
1837
1724
1894
1712
1862
1740
1881
Hou
rly
earn
ings
(Mar
ch)
985
103
89
9110
86
987
105
910
03
109
8In
com
eta
xes
ifw
ork
1521
2751
1030
2958
811
2967
7929
14W
elfa
rem
axim
um
ben
et
7583
z74
06z
7391
z70
56z
Wel
fare
ben
et
ifw
ork
1482
z14
78z
1546
z14
88z
Pro
babi
lity
ofA
FD
Cre
ceip
tif
wor
k0
255
z0
287
z0
266
z0
256
zM
edic
aid
ifw
ork
1215
013
590
1704
219
424
Nu
mbe
rof
obse
rvat
ion
s93
9118
914
9211
186
1210
333
193
1187
8815
846
Sou
rces
The
data
are
prim
arily
from
the
1984
ndash199
6C
urre
ntP
opul
atio
nSu
rvey
Out
goin
gR
otat
ion
Gro
upF
ile(O
RG
)and
from
the
1985
ndash199
7M
arch
Cur
rent
Pop
ulat
ion
Surv
ey(M
arch
)R
estr
icti
ons
See
Tab
leII
for
sam
ple
rest
rict
ion
sN
otes
Mea
ns
com
efr
omth
eO
RG
unle
ssth
eyar
ela
bele
d(M
arch
)T
hese
mea
nsar
eca
lcul
ated
usi
ngth
ech
arac
teri
stic
sof
the
give
nsa
mpl
efo
rth
egi
ven
year
and
are
wei
ghte
dW
omen
are
assu
med
tobe
inth
eir
rst
four
mon
ths
ofw
ork
toha
ven
ou
near
ned
inco
me
and
tocl
aim
noch
ildca
reex
pens
esA
lso
sin
gle
wom
enw
ith
and
wit
hou
tch
ildr
enar
eas
sum
edto
le
ashe
adof
hous
ehol
dan
dsi
ngl
ere
spec
tive
ly
and
tocl
aim
the
stan
dard
dedu
ctio
nT
axes
and
wel
fare
are
adju
sted
for
stat
eco
stof
livi
ng
diff
eren
ces
All
doll
aram
ount
sar
eex
pres
sed
in19
96do
llar
spe
rye
arS
eeA
ppen
dix
1fo
rsp
eci
cin
dice
sus
edan
dot
her
deta
ils
1111THE LABOR SUPPLY OF SINGLE MOTHERS
DEPARTMENT OF ECONOMICS AND INSTITUTE FOR POLICY RESEARCH NORTHWESTERN
UNIVERSITY AND NATIONAL BUREAU OF ECONOMIC RESEARCH
DEPARTMENT OF ECONOMICS UNIVERSITY OF NORTH CAROLINA GREENSBORO
REFERENCES
American Public Welfare Association ldquoSummary of Approved AFDC WaiverActionsrdquo (Washington DC May 1993 and August 1 1996)
Advisory Committee on Intergovernmental Relations Signicant Features ofFiscal Federalism (Washington DC various years)
Bavier Richard ldquoAn Early Look at the Effects of Welfare Reformrdquo unpublishedpaper March 1999
Blank Rebecca M ldquoWhat Causes Public Assistance Caseloads to Growrdquo unpub-lished paper May 1997
mdashmdash ldquoThe Effect of Medical Need and Medicaid on AFDC Participationrdquo Journalof Human Resources XXIV (1989) 54ndash87
Blank Rebecca M and Patricia Ruggles ldquoWhen Do Women Use Aid to Familieswith Dependent Children and Food Stampsrdquo Journal of Human ResourcesXXXI (1996) 57ndash89
Blank Rebecca M David E Card and Philip K Robins ldquoFinancial Incentives forIncreasing Work and Income among Low-Income Familiesrdquo in Finding JobsWork and Welfare Reform David Card and Rebecca M Blank eds (NewYork Russell Sage Foundation 2000) pp 373ndash419
Browning Edgar K ldquoEffects of the Earned Income Tax Credit on Income andWelfarerdquo National Tax Journal XLVIII (1995) 23ndash43
Cohany Sharon Anne Polivka and Jennifer Rothgeb ldquoRevisions in the CurrentPopulation Survey Effective January 1994rdquo Employment and Earnings XLI(1994) 13ndash37
Commerce Clearing House State Tax Handbook (Chicago IL various years)Council of Economic Advisers ldquoThe Economics of Child Carerdquo (Washington DC
December 1997)Danziger Sheldon Robert Haveman and Robert Plotnick ldquoHow Income Trans-
fers Affect Work Savings and the Income Distribution A Critical ReviewrdquoJournal of Economic Literature XIX (1981) 975ndash1028
Dickert Stacy Scott Houser and John Karl Scholz ldquoThe Earned Income TaxCredit and Transfer Programs A Study of Labor Market and Program Par-ticipationrdquo in Tax Policy and the Economy 9 James M Poterba ed (Cam-bridge MA MIT Press 1995) pp 1ndash50
Edin Kathryn and Laura Lein Making Ends Meet How Single Mothers SurviveWelfare and Low-Wage Work (New York Russell Sage Foundation 1997)
Eissa Nada and Jeffrey B Liebman ldquoLabor Supply Response to the EarnedIncome Tax Creditrdquo Quarterly Journal of Economics CXII (1996) 605ndash637
Eissa Nada and Hilary Williamson Hoynes ldquoThe Earned Income Tax Credit andLabor Supply Married Couplesrdquo NBER Working Paper No 6856 December1998
Ellwood David T ldquoThe Impact of the Earned Income Tax Credit and Social PolicyReforms on Work Marriage and Living Arrangementsrdquo National Tax JournalLIII (2000) 1063ndash1106
Feenberg Daniel and Elisabeth Coutts ldquoAn Introduction to the TAXSIM ModelrdquoJournal of Policy Analysis and Management XII (1993) 189ndash194
Fraker Thomas Robert Moftt and Douglas Wolf ldquoEffective Tax Rates andGuarantees in the AFDC Program 1967ndash1982rdquo Journal of Human Re-sources XX (1985) 252ndash263
General Accounting Ofce ldquoWelfare Reform Statesrsquo Early Experiences withBenet Terminationrdquo (Washington DC GAO S-97-74 May 1997)
Gueron Judith M and Edward Pauly From Welfare to Work (New York RussellSage Foundation 1991)
Heckman James J ldquoWhat Has Been Learned about Labor Supply in the PastTwenty Yearsrdquo American Economic Review LXXXIII (1993) 116ndash121
Hill Carolyn V Joseph Hotz Charles H Mullin and John Karl Scholz ldquoEITC
1112 QUARTERLY JOURNAL OF ECONOMICS
Eligibility Participation and Compliance Rates for AFDC Households Evi-dence from the California Caseloadrdquo unpublished paper March 1999
Hoffman Saul D and Laurence S Seidman The Earned Income Tax CreditAntipoverty Effectiveness and Labor Market Effects (Kalamazoo MI UpjohnInstitute for Employment Research 1990)
Holtzblatt Janet Janet McCubbin and Robert Gillette ldquoPromoting Workthrough the EITCrdquo National Tax Journal XLVII (1994) 591ndash608
Hoynes Hilary Williamson ldquoWork and Marriage Incentives in Welfare ProgramsWhat Have We Learnedrdquo in Fiscal Policy Lessons from Economic ResearchAlan J Auerbach ed (Cambridge MA MIT Press 1997)
Intergovernmental Health Policy Project Major Changes in State Medicaid andIndigent Care Programs (Washington DC various years)
Jencks Christopher and Joseph Swingle ldquoHas Welfare Reform Helped or HurtSingle Momsrdquo unpublished paper February 2000
Keane Michael ldquoA New Idea for Welfare Reformrdquo Federal Reserve Bank ofMinneapolis Quarterly Review XXXVIII (1995) 2ndash28
Levine Judith A ldquoPolicy Incentives Confront Everyday Realities IntegratingEconomic and Sociological Perspectives on the Welfare-to-Work Transitionrdquounpublished paper March 1997
Levine Phillip B and Diane M Whitmore ldquoThe Impact of Welfare Reform on theAFDC Caseloadrdquo National Tax Association Proceedings Ninetieth AnnualConference (1998) 24ndash33
Liebman Jeffrey B ldquoThe Impact of the Earned Income Tax Credit on Incentivesand Income Distributionrdquo in Tax Policy and the Economy 12 James MPoterba ed (Cambridge MA MIT Press 1998) pp 83ndash120
Martini Alberto and Michael Wiseman ldquoExplaining the Recent Decline in Wel-fare Caseloads Is the Council of Economic Advisers Rightrdquo Challenge XL(1997) 6 ndash20
Meyer Bruce D ldquoDo the Poor Move to Receive Higher Welfare Benetsrdquo unpub-lished paper April 1999
Meyer Bruce D and Dan T Rosenbaum ldquoWelfare the Earned Income Tax Creditand the Labor Supply of Single Mothersrdquo NBER Working Paper No 7363September 1999
Meyer Bruce D and Dan T Rosenbaum ldquoMaking Single Mothers Work RecentChanges in Tax and Welfare Policy and their Effectsrdquo National Tax JournalLIII (2000a) 1027ndash1062
Meyer Bruce D and Dan T Rosenbaum ldquoMedicaid Private Health Insuranceand the Labor Supply of Single Mothersrdquo unpublished paper November2000b
Moftt Robert ldquoAn Economic Model of Welfare Stigmardquo American EconomicReview LXXIII (1983) 1023ndash1035
mdashmdash ldquoIncentive Effects of the U S Welfare Systemrdquo Journal of Economic Litera-ture XXX (1992) 1ndash61
mdashmdash ldquoThe Effect of Welfare on Marriage and Fertility What Do We Know andWhat Do We Need to Knowrdquo unpublished paper December 1997
Moftt Robert and Barbara Wolfe ldquoThe Effect of the Medicaid Program onWelfare Participation and Labor Supplyrdquo Review of Economics and StatisticsLXXIV (1992) 615ndash626
National Governorrsquos Association MCH (Maternal and Child Health) Update(Washington DC various dates)
National Research Council Measuring Poverty A New Approach Constance FCitro and Robert T Michael eds (Washington DC National Academy Press1995)
mdashmdash Evaluating Welfare Reform A Framework and Review of Current WorkRobert Moftt and Michele Ver Ploeg eds (Washington DC National Acad-emy Press 1999)
Polivka Anne E and Stephen M Miller ldquoThe CPS After the Redesign Refocus-ing the Economic Lensrdquo in Labor Statistics Measurement Issues John Halti-wanger Marilyn E Manser and Robert Topel eds (Chicago University ofChicago Press 1998) pp 249ndash286
Romich Jennifer L and Thomas Weisner ldquoHow Families View and Use the
1113THE LABOR SUPPLY OF SINGLE MOTHERS
EITC The Case for Lump-sum Deliveryrdquo National Tax Journal LIII (2000)1245ndash1265
Savner Steve and Mark Greenberg ldquoThe CLASP Guide to Welfare Waivers1997rdquo (Washington DC Center for Law and Social Policy 1997)
Scholz John Karl ldquoThe Participation Rate of the Earned Income Tax CreditrdquoInstitute for Research on Poverty Madison WI Discussion Paper 928-90October 1990
mdashmdash ldquoThe Earned Income Tax Credit Participation Compliance and AntipovertyEffectivenessrdquo National Tax Journal XLVII (1994) 59ndash81
Smeeding Timothy M Katherine E Ross Michael OrsquoConnor and Michael SimonldquoThe EITC Expectation Knowledge Use and Economic and Social MobilityrdquoNational Tax Journal LIII (2000) 1187ndash1210
U S Department of Agriculture Characteristics of Food Stamp Households(Alexandria VA U S Department of Agriculture Food and Consumer Ser-vice Ofce of Analysis and Evaluation various years)
U S Department of Health and Human Services Characteristics and FinancialCircumstances of AFDC Recipients (Washington DC U S Department ofHealth and Human Services Administration for Children and FamiliesOfce of Family Assistance Division of Performance Measurement variousyears)
mdashmdash Characteristics of State Plans for Aid to Families with Dependent Children(Washington DC U S Department of Health and Human Services Admin-istration for Children and Families Ofce of Family Assistance variousyears)
mdashmdash HHS Fact Sheet State Welfare Demonstrations (Washington DC U SDepartment of Health and Human Services March 17 1997a)
mdashmdash National Evaluation of Welfare-to-Work Strategies (Washington DC Ad-ministration for Children and Families Ofce of the Assistant Secretary forPlanning and Evaluation December 1997b)
mdashmdash Setting the Baseline A Report on State Welfare Waivers (Washington DCU S Department of Health and Human Services Ofce of the AssistantSecretary for Planning and Evaluation 1997c)
U S Department of the Treasury Statistics of Income Individual Income TaxReturns (Washington DC U S Department of the Treasury Internal Reve-nue Service various years)
U S Department of the Treasury Your Federal Income Tax Tax Guide forIndividuals (Washington DC U S Department of the Treasury InternalRevenue Service various years)
U S House of Representatives Committee on Energy and Commerce MedicaidSource Book Background Data and Analysis (Washington DC GovernmentPrinting Ofce November 1988 and January 1993)
U S House of Representatives Committee on Ways and Means Green BookBackground Material and Data on Programs within the Jurisdiction of theCommittee on Ways and Means (Washington DC Government Printing Of-ce various years)
Winkler Anne ldquoThe Incentive Effects of Medicaid on Womenrsquos Labor SupplyrdquoJournal of Human Resources XXVI (1991) 308ndash337
Yelowitz Aaron S ldquoThe Medicaid Notch Labor Supply and Welfare Participa-tionrdquo Quarterly Journal of Economics CX (1995) 909ndash940
Ziliak James P David N Figlio Elizabeth E Davis and Laura S ConnollyldquoAccounting for the Decline in AFDC Caseloads Welfare Reform or EconomicGrowthrdquo unpublished paper July 1997
1114 QUARTERLY JOURNAL OF ECONOMICS
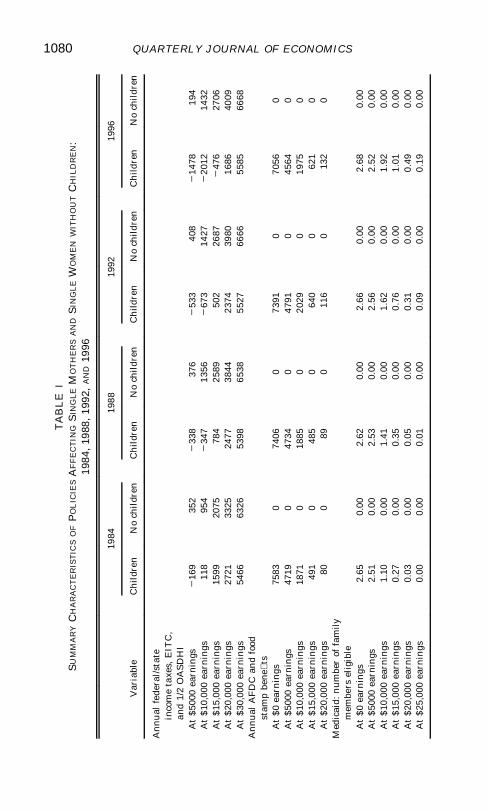
TA
BL
EI
SU
MM
AR
YC
HA
RA
CT
ER
IST
ICS
OF
PO
LIC
IES
AF
FE
CT
ING
SIN
GL
EM
OT
HE
RS
AN
DS
ING
LE
WO
ME
NW
ITH
OU
TC
HIL
DR
EN
19
841
988
1992
A
ND
1996
Var
iabl
e
1984
1988
1992
1996
Ch
ildr
enN
och
ildr
enC
hil
dren
No
chil
dren
Ch
ildr
enN
och
ildr
enC
hil
dren
No
chil
dren
An
nu
alfe
dera
lst
ate
inco
me
taxe
sE
ITC
an
d1
2O
AS
DH
IA
t$5
000
earn
ings
216
935
22
338
376
253
340
82
1478
194
At
$10
000
earn
ings
118
954
234
713
562
673
1427
220
1214
32A
t$1
500
0ea
rnin
gs15
9920
7578
425
8950
226
872
476
2706
At
$20
000
earn
ings
2721
3325
2477
3844
2374
3980
1686
4009
At
$30
000
earn
ings
5466
6326
5398
6538
5527
6666
5585
6668
An
nu
alA
FD
Can
dfo
odst
amp
bene
ts
At
$0ea
rnin
gs75
830
7406
073
910
7056
0A
t$5
000
earn
ings
4719
047
340
4791
045
640
At
$10
000
earn
ings
1871
018
850
2029
019
750
At
$15
000
earn
ings
491
048
50
640
062
10
At
$20
000
earn
ings
800
890
116
013
20
Med
icai
dn
um
ber
offa
mil
ym
embe
rsel
igib
leA
t$0
earn
ings
265
000
262
000
266
000
268
000
At
$500
0ea
rnin
gs2
510
002
530
002
560
002
520
00A
t$1
000
0ea
rnin
gs1
100
001
410
001
620
001
920
00A
t$1
500
0ea
rnin
gs0
270
000
350
000
760
001
010
00A
t$2
000
0ea
rnin
gs0
030
000
050
000
310
000
490
00A
t$2
500
0ea
rnin
gs0
000
000
010
000
090
000
190
00
1080 QUARTERLY JOURNAL OF ECONOMICS
TA
BL
EI
(CO
NT
INU
ED
)
Var
iabl
e
1984
1988
1992
1996
Ch
ildr
enN
och
ildr
enC
hil
dren
No
chil
dren
Ch
ildr
enN
och
ildr
enC
hil
dren
No
chil
dren
Wai
vers
An
yti
me
lim
it0
000
000
00
010
039
0A
ny
term
inat
ions
000
00
000
000
00
210
Maj
orw
aive
rap
plic
atio
n0
000
002
00
220
085
0A
nn
ual
trai
nin
gch
ild
care
doll
ars
per
elig
ible
reci
pien
tT
rain
ingmdash
edu
cati
on0
00
010
00
126
0T
rain
ingmdash
job
sear
cho
ther
126
039
016
60
272
0C
hil
dca
re0
00
024
60
302
0N
um
ber
ofob
serv
atio
ns
9391
189
1492
1118
612
103
3319
311
8788
158
46
Sou
rce
The
data
are
from
the
1984
ndash199
6C
urre
ntP
opu
lati
onS
urve
yO
utg
oing
Rot
atio
nG
roup
File
(OR
G)
Res
tric
tion
sT
hesa
mpl
ein
clud
es19
ndash44
year
-old
sing
lew
omen
(div
orce
dw
idow
ed
orne
ver
mar
ried
)w
hoar
eno
tin
scho
ol
Not
esT
hese
mea
nsar
eca
lcu
late
du
sing
the
char
acte
rist
ics
ofth
eO
RG
sam
ple
for
the
give
nye
aran
dar
ew
eigh
ted
Wom
enar
eas
sum
edto
bein
thei
rr
stfo
urm
onth
sof
wor
kto
hav
eno
une
arn
edin
com
ean
dto
clai
mn
och
ildca
reex
pen
ses
Als
osi
ngle
wom
enw
ith
and
wit
hout
chil
dren
are
assu
med
tol
eas
head
ofh
ouse
hol
dan
dsi
ngle
res
pect
ivel
yan
dto
clai
mth
est
anda
rdde
duct
ion
Tax
esan
dw
elfa
rear
ead
just
edfo
rst
ate
cost
ofli
vin
gdi
ffer
ence
san
dal
ldol
lar
amou
nts
are
expr
esse
din
1996
dolla
rsS
eeA
ppen
dix
1fo
rsp
eci
cin
dice
sus
edan
dot
her
deta
ils
1081THE LABOR SUPPLY OF SINGLE MOTHERS
state and federal expenditures on these four new federal pro-grams by state and year are scaled by the number of singlemothers with children under six These numbers can be seen inTable I which shows a steep rise in child care expendituresbetween 1988 and 1992 followed by a slower rise in later yearsFor more detail on training and child care programs see Meyerand Rosenbaum [1999]
V THE DETERMINANTS OF EMPLOYMENT
We use several different econometric methods to identify theimpact of the recent policy changes on the employment of singlemothers We begin with the familiar difference in differencesestimator This approach compares employment rates over timefor single mothers with those for single women without childrenThis approach is the one taken by Eissa and Liebman [1996] intheir study of the EITC over the 1984 to 1990 period We waituntil Section VI to discuss the estimates from our simple struc-tural model
A Employment Rates of Single Mothers and Single ChildlessWomen
The top panel of Table II reports the employment rates ofsingle mothers and single women without children along withthe difference in employment rates between these two groups ofsingle women We report this difference because many determi-nants of employment that change over time especially wages andmacroeconomic conditions might be expected to affect all singlewomen similarly Other determinants of employment particu-larly the tax and transfer programs that we examine specicallyaffect single mothers The bottom panel of Table II focuses on thesubsample of single mothers with children under six (again rela-tive to single women without children) a group we expect to bemore responsive to changes in the rewards to work Also employ-ment changes are likely to have greater effects on children forbetter or worse when they are young and their mother likelyplays a larger role in their care and education
We report two different measures of employment whether awoman worked last week (from the ORG data) and whether awoman worked at all last year (from the March data) Eachmeasure has its advantages Whether a woman worked last weekis probably a better measure of labor supply to use as an input to
1082 QUARTERLY JOURNAL OF ECONOMICS
policy decisions since its average captures the fraction of womenworking in a given week This variable will be especially useful ifthose who move in or out of the workforce on the margin workonly a few weeks during the year On the other hand as discussedearlier the EITC unequivocally increases the probability of work-
TABLE IIEMPLOYMENT RATES FOR SINGLE MOTHERS SINGLE MOTHERS WITH CHILDREN
UNDER SIX AND SINGLE WOMEN WITHOUT CHILDREN 1984ndash1996
Year
CPS Outgoing Rotation Groupworked last week = 1 March CPS worked last year = 1
ChildrenNo
children DifferenceStandard
error ChildrenNo
children DifferenceStandard
error
1984 05854 08014 2 02160 00059 07322 09399 2 02077 000831985 05861 08048 2 02187 00058 07302 09439 2 02137 000831986 05891 08131 2 02240 00057 07310 09450 2 02141 000821987 05941 08179 2 02238 00056 07382 09473 2 02091 000811988 06027 08215 2 02188 00058 07482 09485 2 02003 000841989 06136 08150 2 02015 00058 07577 09409 2 01831 000801990 06007 08155 2 02148 00056 07591 09424 2 01832 000791991 05790 08031 2 02242 00056 07428 09418 2 01990 000791992 05790 07957 2 02167 00057 07387 09299 2 01913 000811993 05875 07918 2 02044 00057 07511 09356 2 01845 000801994 06053 07921 2 01868 00057 07907 09312 2 01405 000781995 06265 07971 2 01707 00058 08072 09340 2 01268 000801996 06450 07938 2 01488 00060 08191 09290 2 01098 00079
Childrenunder 6
Nochildren Difference
Standarderror
Childrenunder 6
Nochildren Difference
Standarderror
1984 04382 08014 2 03632 00083 06122 09399 2 03277 001311985 04328 08048 2 03720 00082 05966 09439 2 03474 001331986 04362 08131 2 03770 00081 06227 09450 2 03223 001281987 04437 08179 2 03742 00082 06096 09473 2 03377 001291988 04634 08215 2 03581 00084 06277 09485 2 03207 001321989 04790 08150 2 03360 00083 06282 09409 2 03127 001271990 04569 08155 2 03586 00079 06369 09424 2 03055 001241991 04289 08031 2 03743 00078 06092 09418 2 03326 001241992 04330 07957 2 03627 00078 06273 09299 2 03027 001241993 04557 07918 2 03362 00078 06428 09356 2 02929 001221994 04796 07921 2 03125 00079 06934 09312 2 02378 001211995 05147 07971 2 02825 00081 07221 09340 2 02119 001231996 05396 07938 2 02543 00085 07476 09290 2 01813 00119
Sources The data are from the 1984ndash1996 Current Population Survey Outgoing Rotation Group File(ORG) and the 1985ndash1997 March Current Population Survey (March CPS) and are weighted
Restrictions Both samples include 19ndash44 year-old single women (divorced widowed or never married)who are not in school The March CPS sample excludes disabled or ill women and those with positive earnedincome but zero hours of work In the second panel single mothers without a child under six are excludedSee text for details
1083THE LABOR SUPPLY OF SINGLE MOTHERS
ing at all in a given tax year but for some could decrease weeksworked If our goal is to provide a sharp test of theoretical pre-dictions whether a woman worked last year is a better outcomemeasure We report both measures with the expectation that theeffects of many of the recent policy changes on weekly employ-ment will be smaller than on annual employment
The employment rates reported in Table II exhibit a strikingtime pattern For single mothers weekly employment increasedby almost 6 percentage points between 1984 and 1996 whileannual employment increased over 85 percentage points Most ofthis increase occurred between 1991 and 199618 Focusing on thesubsample of single mothers with young children the employ-ment increases were even larger 10 percentage points for weeklyemployment and 135 percentage points for annual employmentIn contrast the declines in both weekly and annual employmentof about one percentage point for single women without childrensuggest that the rising employment of single mothers was not aresult of better work opportunities for all single women More-over the timing of the employment increases suggest that policychanges in the 1990s are likely to have played a large role
B Comparing Single Mothers and Single Women withoutChildren
Appendix 2 reports descriptive statistics for single womenwith and without children for the years 1984 1988 1992 and1996 The table indicates that single mothers tend to be older andless educated and are more likely to be nonwhite than singlewomen without children The age of single women without chil-dren rises appreciably over the sample period as does the edu-cation level of single mothers The fraction of single mothersliving with parents is stable while the rate for single womenwithout children falls The rates of cohabitation rise for bothsingle women with and without children
A potential criticism of the Table II results (and our main
18 One concern in interpreting changes in employment for single mothersduring the years 1992 to 1994 is that beginning in January 1994 the CPS used aredesigned questionnaire For a description of this CPS redesign see CohanyPolivka and Rothgeb [1994] and Polivka and Miller [1998] In Meyer and Rosen-baum [1999] we assess the extent of any bias due to the redesign using the parallelsurvey which provides contemporaneous responses using the new and old surveysWe also employ ORGMarch comparisons using the fact that redesign affected thetwo data sets at a different point in time Overall these comparisons indicate thatthe CPS redesign had a small effect that if it leads to any bias suggests that weslightly understate the recent employment increases of single mothers
1084 QUARTERLY JOURNAL OF ECONOMICS
regression results below) is that single women without childrenare not a good comparison group for single mothers The means inAppendix 2 suggest the possibility that changes in the character-istics of single mothers versus single women without childrencould explain the two groupsrsquo differing employment rate trendsIn our regression results we condition on observable characteris-tics such as race and education in order to make the two groupsmore comparable It is also interesting to note that single womenwith and without children are quite similar in an importantdimension hourly earnings The mean hourly earnings of womenwith and without children are fairly similar (and they are muchcloser if one controls for education)
Perhaps more importantly one might argue that employ-ment rates are so high for single women without children that itis unreasonable to expect this group to respond to changes ineconomic conditions in the same way that single mothers do Yetemployment rates are not particularly high for low-educated sin-gle women particularly when examining employment last weekOnly 33 percent of high school dropout single mothers workedand 48 percent of high school dropout single women withoutchildren worked last week Nevertheless in our later regressionsderivative estimates for our key policy variables tend to be thelargest and most statistically signicant for high school dropouts
One might also wonder whether the large increases in em-ployment that we nd for single mothers but not for singlewomen without children also occur for other demographicgroups In Meyer and Rosenbaum [2000a] we examine whetherthere are similar employment increases for two other groups withhistorically low employment rates black males 19ndash44 and mar-ried mothers 19ndash44 We nd that the large increases in employ-ment of single mothers over 1984 ndash1996 and particularly since1991ndash1996 are not mirrored by other demographic groups
Another potential criticism of our approach is that usingvariation across women in their marital status number of chil-dren and state of residence implicitly assumes that marriagefertility and migration decisions are exogenous to the policychanges that we examine The evidence on the effects of policychanges on these decisions is mixed making the exogeneity as-sumption more plausible For example in her recent reviewHoynes [1997] concludes ldquoTogether this evidence suggests thatmarriage decisions are not sensitive to nancial incentivesrdquo Shealso argues that ldquoOverall [the effects of welfare on out-of-wedlock
1085THE LABOR SUPPLY OF SINGLE MOTHERS
births] are often insignicant and when they are not they aresmall [pp 129ndash130]rdquo On the other hand another recent reviewMoftt [1997] suggests that the weight of the evidence impliessome effect of welfare benets on marriage and fertility As tolocation Meyer [1999] concludes that there is a signicant butsmall effect of welfare on migration Overall it is likely thatendogenous single motherhood and location exert a small bias onour results
C Accounting for Individual and State Characteristics
As mentioned above the results in Table II could be partlyexplained by differential changes over time in characteristicssuch as age and education for single women with and withoutchildren Moreover business cycles may differentially affect sin-gle women with and without children thereby leading to employ-ment shifts unrelated to policy changes Consequently Table IIIpresents probit employment estimates for single women control-ling for demographic and business cycle changes We include alarge number of controls for differences between the two groupsand we include the unemployment rate as well as its interactionwith whether or not a woman has children The specication thatwe estimate is
(6) Pr(Eit 5 1) 5 F a Xit 1 b tYEARt
1 g t(YEARt p ANYCHILDRENi)
where Eit equals one if woman i from year t reports positive hoursworked in the reference week for the ORG (or the previous yearfor the March CPS) Xit is a vector that includes demographic andbusiness cycle variables YEARt is an indicator variable for yeart and ANYCHILDRENi equals one for a woman with childrenThe year dummies control for labor market trends in overallfemale employment and the X vector controls for demographicand business cycle effect differences between the groups espe-cially compositional shifts over time Thus differences between g t
coefcients give difference-in-differences estimates controlling forthese other factors These differences can be interpreted as esti-mates of the combined effect of changes in all factors affecting theemployment of single mothers relative to single women withoutchildren
The demographic and business cycle variables accounted forin Table III include controls for state race ethnicity age educa-
1086 QUARTERLY JOURNAL OF ECONOMICS
TABLE IIIPROBIT EMPLOYMENT PROBABILITY ESTIMATES FOR SINGLE WOMEN 1984ndash1996
Explanatory variable
ORG worked lastweek = 1
March CPS workedlast year = 1
(1) (2)
Averagederivative
Standarderror
Averagederivative
Standarderror
Any children p 1984 2 00797 00107 2 01087 00160Any children p 1985 2 00856 00105 2 01199 00156Any children p 1986 2 00857 00103 2 01144 00153Any children p 1987 2 00880 00099 2 01056 00144Any children p 1988 2 00837 00096 2 00918 00140Any children p 1989 2 00663 00094 2 00745 00131Any children p 1990 2 00788 00095 2 00832 00136Any children p 1991 2 00823 00102 2 00916 00151Any children p 1992 2 00747 00106 2 00706 00159Any children p 1993 2 00601 00101 2 00830 00153Any children p 1994 2 00538 00098 2 00388 00145Any children p 1995 2 00405 00096 2 00154 00143Any children p 1996 2 00121 00097 00042 00140Nonwhite 2 00902 00019 2 00727 00033Hispanic 2 00405 00030 2 00608 00033Age 19ndash24 2 00210 00024 2 00077 00055Age 25ndash29 00070 00024 2 00107 00095Age 35ndash39 2 00049 00026 00008 00052Age 40ndash44 2 00108 00028 00107 00116High school dropout 2 02161 00022 2 01512 00032Some college 00870 00019 00989 00055Bachelors 01441 00025 01755 00055Masters 01295 00040 01927 00095Divorced 2 00068 00028 00062 00052Widowed 2 01201 00080 2 01218 00116Any children p divorced 01154 00038 00720 00063Any children p widowed 00978 00097 01148 00137[ of children under 18 2 00404 00014 2 00325 00020[ of children under 6 2 00955 00020 2 00699 00027Pregnant z z 2 01333 00063Unearned income ($1000s) z z 2 00035 00003Central city z z 2 00230 00030State unemployment rate () 2 00113 00008 2 00101 00015Any children p state unemployment
rate () 00017 00010 00032 00017Number of observations 373662 119019
Sources The data are from the 1984ndash1996 Current Population Survey Outgoing Rotation Group File(ORG) and the 1985ndash1997 March Current Population Survey (March CPS)
Restrictions See Table II for sample restrictionsControls Additional controls include indicators for state year calendar month and calendar month
interacted with any children (ORG)Notes Unearned income includes interest dividend Social Security veteransrsquo benets and retirement
income The omitted group is white non-Hispanic age 30ndash34 never married and not pregnant (March CPS)She does not live in a central city (March CPS) and has only a high school education See text for details
1087THE LABOR SUPPLY OF SINGLE MOTHERS
tion marital status marital status interacted with a childrenindicator the number of children under six and eighteen thestate unemployment rate the state unemployment rate inter-acted with a children indicator (for the March CPS only) controlsfor pregnancy central city and unearned income and (for theORG only) controls for month and month interacted with a chil-dren indicator Note that the difference-in-differences calculatedby subtracting one YEAR p ANYCHILDREN coefcient fromanother are hardly affected by including the controls19 For ex-ample between 1984 and 1996 the weekly employment of singlemothers relative to single women without children rises 71 per-centage points without controls and 68 percentage points withcontrols20 For annual employment the difference-in-differencesestimator for 1984 to 1996 suggests an 117 percentage pointincrease in the relative annual employment of single motherswithout controls and an 113 percentage point increase withcontrols Again most of the increase occurs between 1991 and1996 Therefore these difference-in-difference estimates suggesta potential role for policy changes especially since 1991
VI POLICY VARIABLES AND EMPLOYMENT USING OUR SIMPLE
STRUCTURAL MODEL
We now move on to our main approach that uses our simplestructural model to distinguish between the different policies andto provide estimates that have a clearer interpretation Whilesome of the estimates rely on comparisons of single mothers andsingle women with children over time other estimates use avariety of other sources of identifying variation in our key explana-tory variables In some specications the identifying variationcomes from differences in taxes and benets for families of dif-ferent sizes and in different states as well as changes in thesetaxes and benets over time and differences in state living costs
Table IV reports estimates of our structural model of the
19 Due to the difculty in gauging the magnitude of probit coefcient esti-mates instead we report derivatives of the probability of working with respect toeach of the explanatory variables averaged over the single mothers in the sampleThus differences in the average derivatives for the YEAR p ANYCHILDRENvariables give changes over time in the difference in employment between singlewomen with and without children analogous to the changes that can be calculatedfrom Table II
20 The ldquowithout controlsrdquo results come from a weighted probit including onlythe year dummies and YEAR p ANYCHILDREN interactions
1088 QUARTERLY JOURNAL OF ECONOMICS
effects of tax and welfare policy on the probability that a womanworks These specications provide estimates of the parametersin expression (5) of Section II and can be used to obtain estimatesof the effects of the different policy changes during the 1984 ndash1996period These specications also provide coefcients that can beused to summarize the effects of a wide range of policies and thatcan be used to simulate other policies In addition to the variablesshown in Table IV each of these probits include the controlvariables reported in Table III (except for the YEAR p ANY-CHILDREN interactions) along with a large number of familycomposition variables listed in the table notes These controlvariables imply that we are not using simple differences acrossfamily types to identify our coefcients We are using changesover time or differences across states in how different families aretreated We focus rst on the full sample specications in columns(1) and (5)
All of the coefcients on the income variables have the signsthat are implied by our simple structural model and are signi-cantly different from zero21 Lower taxes and maximum welfarebenets increase employment while higher welfare benets if awoman works (due to lower implicit taxes on earnings) increaseemployment Rather than restricting the income variables toenter the worknonwork decision as a single expected incomevariable we have allowed the coefcients on the different compo-nents of income to differ It is thus encouraging that the coef-cients on the income tax and welfare variables have roughly thesame magnitude as expected The one exception to this rule isthat the coefcient on Welfare Benets if Work in the weeklyemployment equation is substantially larger than the other in-come coefcients
A Taxes
The Income Taxes if Work coefcient implies that a onethousand dollar reduction in income taxes if a woman worksincreases employment last week by 27 percentage points andincreases employment last year by 45 percentage points Both ofthese effects are strongly signicant These coefcients indicateelasticities of the participation rate with respect to the return to
21 We examined the importance of allowing for correlation among the errorterms at the level of state p year p ANYCHILDREN using STATA These standarderrors are very close to those without this correction for clustering
1089THE LABOR SUPPLY OF SINGLE MOTHERS
TA
BL
EIV
PR
OB
ITE
ST
IMA
TE
SO
FT
HE
EF
FE
CT
OF
PO
LIC
YV
AR
IAB
LE
SO
NT
HE
EM
PL
OY
ME
NT
OF
SIN
GL
EW
OM
EN
AV
ER
AG
ED
ER
IVA
TIV
E(S
TA
ND
AR
DE
RR
OR)
Exp
lan
ator
yva
riab
le
OR
Gw
orke
dla
stw
eek
=1
Mar
chC
PS
wor
ked
last
year
=1
Yea
rsof
edu
cati
onY
ears
ofed
ucat
ion
All
lt12
12gt
12A
lllt
1212
gt12
(1)
(2)
(3)
(4)
(5)
(6)
(7)
(8)
Inco
me
taxe
sif
wor
k2
002
732
004
172
003
342
001
822
004
492
008
792
005
262
002
07in
$100
0sy
ear
(00
034)
(00
080)
(00
057)
(00
051)
(00
053)
(00
150)
(00
090)
(00
063)
Wel
fare
max
imu
mbe
net
20
0340
20
0425
20
0357
20
0218
20
0295
20
0579
20
0349
20
0068
in$1
000s
yea
r(0
002
4)(0
005
6)(0
004
0)(0
003
6)(0
003
8)(0
010
6)(0
006
3)(0
004
5)W
elfa
rebe
ne
tif
wor
k0
0772
006
540
0916
005
390
0571
011
770
0626
002
33in
$100
0sy
ear
(00
073)
(00
171)
(00
121)
(00
109)
(00
107)
(00
299)
(00
177)
(00
125)
Pro
babi
lity
ofA
FD
Cre
ceip
t2
019
852
029
262
025
472
010
872
017
422
026
942
020
192
011
94if
wor
k(0
023
9)(0
052
2)(0
039
8)(0
036
3)(0
034
8)(0
094
4)(0
058
6)(0
041
7)M
edic
aid
ifw
ork
20
0096
20
0040
000
132
001
672
000
452
001
190
0007
20
0072
in$1
000s
yea
r(0
003
3)(0
006
6)(0
005
6)(0
005
5)(0
004
4)(0
010
9)(0
007
6)(0
005
9)W
aive
rmdashan
yti
me
lim
it0
0136
004
080
0192
20
0065
001
910
0256
000
720
0169
(Ind
icat
orva
riab
le)
(00
071)
(00
160)
(00
119)
(00
102)
(00
125)
(00
329)
(00
209)
(00
149)
Wai
vermdash
any
term
inat
ions
002
220
0355
003
540
0124
004
820
1174
005
320
0148
(Ind
icat
orva
riab
le)
(00
110)
(00
260)
(00
181)
(00
158)
(00
223)
(00
607)
(00
375)
(00
250)
Tra
inin
gmdashed
uca
tion
20
0805
20
0824
20
0715
20
0563
20
0759
20
0708
20
1222
20
0257
in$1
000s
yea
r(0
019
0)(0
043
0)(0
031
1)(0
028
3)(0
031
0)(0
084
9)(0
050
7)(0
037
6)
1090 QUARTERLY JOURNAL OF ECONOMICS
TA
BL
EIV
(CO
NT
INU
ED
)
Exp
lana
tory
vari
able
OR
Gw
orke
dla
stw
eek
=1
Mar
chC
PS
wor
ked
last
year
=1
Yea
rsof
edu
cati
onY
ears
ofed
uca
tion
All
lt12
12gt
12A
lllt
1212
gt12
(1)
(2)
(3)
(4)
(5)
(6)
(7)
(8)
Tra
inin
gmdashjo
bse
arch
oth
er0
0446
004
720
0607
002
600
0526
006
690
0643
002
84in
$100
0sy
ear
(00
117)
(00
272)
(00
190)
(00
175)
(00
192)
(00
528)
(00
317)
(00
236)
Chi
ldca
re0
0227
002
720
0190
002
260
0229
004
380
0175
001
94in
$100
0sy
ear
(00
065)
(00
148)
(00
104)
(00
104)
(00
100)
(00
287)
(00
164)
(00
119)
Sta
teu
nem
ploy
men
tra
te2
001
002
000
982
001
012
001
052
000
832
001
332
000
902
000
53in
perc
enta
gepo
ints
(00
007)
(00
020)
(00
013)
(00
010)
(00
014)
(00
044)
(00
024)
(00
016)
Any
chil
dren
pst
ate
unem
pra
te2
000
010
0009
20
0010
000
080
0011
000
422
000
090
0022
inpe
rcen
tage
poin
ts(0
000
9)(0
002
1)(0
001
4)(0
001
3)(0
001
4)(0
004
2)(0
002
4)(0
001
7)N
um
ber
ofob
serv
atio
ns37
366
251
146
134
432
188
084
119
019
159
9441
060
619
65
Sou
rces
The
data
are
from
the
1984
ndash199
6C
urre
ntP
opul
atio
nSu
rvey
Out
goin
gR
otat
ion
Gro
up
Fil
e(O
RG
)an
dth
e19
85ndash1
997
Mar
chC
urre
ntP
opul
atio
nS
urve
y(M
arch
CP
S)
Res
tric
tion
sS
eeT
able
IIfo
rsa
mpl
ere
stri
ctio
ns
Spec
ica
tion
s(2
)an
d(6
)ar
ere
stri
cted
tohi
ghsc
hoo
ldr
opou
ts(
3)an
d(7
)to
high
sch
ool
grad
uate
san
d(4
)an
d(8
)to
thos
ew
ith
aned
ucat
ion
beyo
nd
hig
hsc
hool
C
ontr
ols
Inad
diti
onto
the
vari
able
sin
Tab
leII
I(e
xcep
tfo
rth
ein
tera
ctio
nsbe
twee
nye
aran
dan
ych
ildr
en)
the
foll
owin
gco
ntro
lsar
ein
clud
ed
indi
cato
rsfo
rst
ate
year
ca
len
dar
mon
tha
nd
cale
ndar
mon
thin
tera
cted
wit
han
ych
ildr
en(O
RG
)w
heth
erat
leas
ton
etw
oth
ree
and
four
orm
ore
child
ren
are
pote
ntia
llyA
FD
Cel
igib
lew
heth
erat
leas
ton
ean
dat
leas
ttw
och
ildr
enar
eE
ITC
elig
ible
and
wh
ethe
rat
leas
ton
ech
ild
isu
nder
six
unde
rth
ree
unde
rtw
oan
dun
der
one
Las
tco
ntin
uou
sva
riab
les
for
the
num
ber
ofch
ildr
enun
der
each
age
betw
een
one
and
nin
etee
nar
ein
clud
ed
Not
esI
nal
lspe
cic
atio
ns
the
tax
wel
fare
and
Med
icai
dva
riab
les
are
calc
ula
ted
usin
ga
join
tho
urs
wag
edi
stri
buti
one
stim
ated
sepa
rate
lyfo
rsi
ngl
ew
omen
wit
han
dw
itho
utch
ildr
enT
axes
and
wel
fare
are
adju
sted
for
stat
eco
stof
livi
ngdi
ffer
ence
san
dal
ldo
llar
amou
nts
are
expr
esse
din
1996
doll
ars
See
App
endi
x1
for
spec
ic
indi
ces
used
and
othe
rde
tail
s
1091THE LABOR SUPPLY OF SINGLE MOTHERS
work of 107 for any employment during the year and 083 forwork in an average week We also estimated specications withseparate coefcients on state and federal income taxes althoughfor brevity these full estimates are not reported here The resultsfor federal taxes were similar to all taxes while the derivative(standard error) for state income taxes was a large and signicant2 00336 (00083) in the ORG sample and a smaller and insigni-cant 2 00165 (00139) in the March sample Thus while the statetax estimates are much less precise and differ in the two samplesthey give the same message as the other tax coefcients ie thatthe labor supply of single mothers responds to taxes
B Welfare
The full sample specications of columns (1) and (5) alsoindicate substantial effects of welfare on employment A onethousand dollar reduction in the annual Welfare Maximum Bene-t (the AFDC plus Food Stamp benet a women receives if shedoes not work) increases employment last week by 34 percentagepoints and increases employment last year by 30 percentagepoints This calculation holds constant the other welfare vari-ables Welfare Benets if Work and Probability of AFDC Receiptif Work that generally change with the maximum benet TheWelfare Benets if Work effect is sizable implying that a onethousand dollar increase in benets when one works increasesemployment last week by 72 percentage points and last year by57 percentage points These estimates suggest substantial posi-tive employment effects of reductions in implicit tax rates andincreases in earnings disregards
The transaction costs or stigma of welfare receipt as mea-sured by the Probability of AFDC Receipt if Work variable isnegative and signicantly different from zero as expected (seeequation (5)) The magnitude of this coefcient can be gauged bycomparing it with the coefcients on the variables denominatedin thousands of dollars Such comparisons suggest a transactioncost of several thousand dollars with the exact number depend-ing on the employment measure and the income variable usedFor example using the Welfare Benets if Work coefcient in theORG sample yields a transaction cost estimate of $2571 whilethe March sample implies an estimate of $3051 This resultagrees with past studies as well as ethnographies that havetended to nd substantial transaction costs or stigma of welfarereceipt
1092 QUARTERLY JOURNAL OF ECONOMICS
To assess the effect of cutting the AFDC benet one needs toincorporate the effects of all three of the welfare variables and theMedicaid if Work variable When the AFDC maximum benetand payment standard are cut they not only reduce benets ifone does not work but also reduce benets if one does work Theyalso decrease the likelihood that a working mother will be onwelfare at all thereby reducing both her Medicaid eligibility andher AFDC transaction and stigma costs When we do the fullcalculations we nd that a 10 percent cut in the maximumbenet ($324 annually) increases both the annual and weeklyemployment rate by about 10 percentage points
Despite a more detailed calculation of welfare incentivesthan most past work and the use of panel data techniques wethink there are important potential sources of bias in these esti-mates We should also note that by dividing the effect of welfareinto income when working and when not and by estimating aseparate term for transaction costsstigma we are putting thetheoretical predictions to a more severe test than most work Asdiscussed in Section IV the Welfare Benets if Work variable andthe Probability of AFDC Receipt if Work variable are more dif-cult to calculate precisely than our other variables The largercoefcient on the Welfare Benets if Work variable could also bedue to the scale of this variable being inappropriately low Theearnings distribution used to calculate expected benets putsmost of the weight on earnings levels where welfare benetswould be low or zero It is very likely that we should use anearnings distribution that puts greater weight in the left tailsince women who work while on welfare rarely report all of theirearnings to the welfare ofce [Edin and Lein 1997] The reasonsfor possible bias in the Probability of AFDC Receipt if Workvariable are similar The coefcients on these two variables tendto both be large in the same specications with their oppositesigns canceling each other out
C Medicaid
We nd little effect of Medicaid on the employment decisionsof single mothers Theory predicts that the Medicaid if Workvariable will have a positive effect on employment The variablehas the opposite effect from this prediction in both samplesalthough the coefcient estimates are small and usually are notsignicantly different from zero This result is not completelyunexpected given the weak and conicting ndings in past work
1093THE LABOR SUPPLY OF SINGLE MOTHERS
Part of the difculty is the uncertainty about individual knowledgeof Medicaid rules and their valuation of the benets We havetried a large number of alternative specications none of whichindicates a large effect of Medicaid A full accounting of theseresults can be found in Meyer and Rosenbaum [2000b]
D Welfare Waivers and Time Limits
The AFDC waiver variables have the expected effect on em-ployment and their coefcients are signicantly different fromzero Both the implementation of a time limit on welfare receiptand the actual termination of benets under a work requirementor time limit waiver are predicted to increase employment bybetween 14 and 48 percentage points However until the lastyears of our sample the overall importance of such waivers issmall Even by 1994 only 5 percent of single mothers lived instates with a time limit and less than half of 1 percent lived instates that had begun to terminate benets
One should be cautious in interpreting the waiver coef-cients especially in attributing effects to the implementation ofparticular provisions of recent waivers or the termination of casesper se The perception of welfare changes by potential welfarerecipients the attitudes of case workers and differences in stateimplementation of policies likely play a large role in inuencingthe welfare caseload and consequently employment It is alsoeconometrically difcult to disentangle which provisions of awaiver are the most important since states typically imple-mented several changes to their AFDC programs under waiversat the same time The reported coefcients are partly the effect ofthe particular actions coded and partly a proxy for other changesgoing on in the states
Recognizing these limitations the strength of the evidencehere for a causal interpretation of the waiver results is muchgreater than in the studies of welfare caseloads First we useimplementation dates rather than application or approval dateswhich are at best loosely related to when provisions are enforcedSecond when we account for state intentions to reform welfare asindicated by whether or not a state has made a major waiverapplication this variable has little effect Third one or two yearleads of our time limit and termination variables have small andinsignicant coefcients suggesting that the provisions per serather than publicity or administrator attitudes lead to the em-ployment increases This result contrasts with those of Blank
1094 QUARTERLY JOURNAL OF ECONOMICS
[1997] and Levine and Whitmore [1998] who found strong effectsof leads of waiver variables on caseloads
E Training and Child Care
The last three coefcient estimates in Table IV measure theemployment effects of expenditures on training and child careHigher expenditures on job search and other training and onchild care are associated with a higher employment rate for singlemothers Training expenditures on education have a negativeeffect that is signicant in both samples The job search coef-cients imply that an increase in expenditures of one thousanddollars (about two-thirds of average expenditures) would increasethe employment rate for single mothers without young childrenby over four percentage points Since single mothers withoutchildren young enough to exempt them from training programsmake up about half of all single mothers the overall effect wouldbe over two percentage points An increase in federal and statechild care expenditures of ve hundred dollars per single motherwith a child under six (slightly less than the mean in 1996) isassociated with about a one percentage point increase in bothweekly and annual employment These effects are quite substan-tial per dollar expended The training result on education is notsurprising given the weaker results in the literature on classroomtraining and the possible short-term effect on employment aswomen are in classrooms rather than jobs
F Results by Education Group
Table IV also reports separate estimates for the effects of thepolicy variables for three education groups less than high schoolhigh school and some college We would expect a priori that thepolicy variables which mostly capture taxes and benets receivedby low-income women would have the greatest effect on highschool dropouts less of an effect on those with a high schooldegree and even less of an effect on those with some college22
Overall the results by level of education are consistent with thehypothesized larger effects on the less educated The derivativestend to be much larger in absolute value for high school dropoutsthan they are in the full sample and much smaller for those with
22 The estimates use a xed wagehours distribution (that does not vary byeducation) to calculate the income and benet variables so that the explanatoryvariables are comparable across the columns
1095THE LABOR SUPPLY OF SINGLE MOTHERS
some college than in the full sample For example a one thousanddollar cut in taxes (or increase in tax credits) for high schooldropout single women is predicted to increase their employmentby 42 percentage points in a typical week and increase work atall during the year by 88 percentage points The correspondingnumbers for those with some college education are 18 percentagepoints and 21 percentage points Many of the other policy vari-able derivatives also fall with increased education23
G Unemployment and Macroeconomic Conditions
Table IV also reports the coefcients on the state unemploy-ment rate and its interaction with a dummy variable for a singlewoman having children The unemployment rate is strongly sig-nicant and implies that for single women without children a onepercentage point increase in the unemployment rate is associatedwith a 10 percentage point decrease in employment in a typicalweek and a 08 percentage point decrease in work anytime duringthe year On the other hand the interaction of the unemploymentrate with being a single mother is small and not signicantlydifferent from zero The point estimates imply that a one percent-age point increase in the unemployment rate is associated withonly a 001 percentage point decrease in a typical week and 01percentage point increase any time during the year in theemployment of single mothers relative to single women withoutchildren These coefcients indicate a strong and similarresponsiveness of both groups of single women to the state of themacroeconomy This result is favorable for the use of singlewomen without children as a comparison group for single mothers
H Alternative Specications
Since many of the changes in policy notably welfare reformtook place in recent years and a well-publicized decline in thewelfare rolls began in 1994 we reestimate the full sample speci-cations of Table IV dropping the years 1994 ndash1996 along withthe waiver variables (which are nearly always zero through1993) The estimates from this shorter sample which are re-ported in columns (1) and (5) of Table V are very close to those
23 The derivatives might be lower for groups with higher levels of educationbecause their employment rates are higher leaving less room for increases inemployment However the drop in the magnitude of the policy variable deriva-tives with more education is greater than it is for other control variables such asthe unemployment rate
1096 QUARTERLY JOURNAL OF ECONOMICS
TA
BL
EV
PR
OB
ITE
STIM
AT
ES
OF
TH
EE
FF
EC
TO
FP
OL
ICY
VA
RIA
BL
ES
ON
TH
EE
MP
LO
YM
EN
TO
FS
ING
LE
WO
ME
NA
LT
ER
NA
TIV
ES
PE
CIF
ICA
TIO
NS
AV
ER
AG
ED
ER
IVA
TIV
E(S
TA
ND
AR
DE
RR
OR)
Exp
lana
tory
vari
able
OR
G
wor
ked
last
wee
k=
1M
arch
CP
Sw
orke
dla
stye
ar=
1
(1)
(2)
(3)
(4)
(5)
(6)
(7)
(8)
Inco
me
taxe
sif
wor
k2
002
892
001
352
005
012
000
552
004
302
002
532
005
582
003
05in
$100
0sy
ear
(00
045)
(00
087)
(00
051)
(00
084)
(00
074)
(00
129)
(00
087)
(00
133)
Lag
ged
inco
me
taxe
sif
wor
kz
zz
20
0263
zz
z2
001
75in
$100
0sy
ear
zz
z(0
009
2)z
zz
(00
148)
Wel
fare
max
imu
mbe
net
20
0375
20
0107
20
0464
20
0340
20
0291
20
0011
20
0445
20
0296
in$1
000s
yea
r(0
002
9)(0
006
5)(0
003
3)(0
002
4)(0
004
7)(0
009
2)(0
005
6)(0
003
8)W
elfa
rebe
ne
tif
wor
k0
0911
001
070
1027
007
660
0644
20
0080
20
0882
005
67in
$100
0sy
ear
(00
089)
(00
106)
(00
099)
(00
073)
(00
132)
(00
144)
(00
157)
(00
107)
Pro
babi
lity
ofA
FD
Cre
ceip
t2
021
042
010
442
024
102
019
502
020
562
008
372
026
652
017
17if
wor
k(0
029
7)(0
033
6)(0
032
7)(0
023
9)(0
043
3)(0
050
1)(0
051
8)(0
034
8)M
edic
aid
ifw
ork
20
0133
000
292
002
092
000
952
000
790
0055
20
0107
20
0045
in$1
000s
yea
r(0
004
6)(0
003
7)(0
004
5)(0
003
3)(0
005
9)(0
004
9)(0
006
6)(0
004
4)W
aive
rmdashan
yti
me
lim
itz
001
710
0204
001
28z
002
470
0350
001
84(I
ndic
ator
vari
able
)z
(00
080)
(00
104)
(00
071)
z(0
014
1)(0
019
7)(0
012
5)W
aive
rmdashan
yte
rmin
atio
nsz
001
600
0456
002
15z
003
550
0703
004
79(I
ndic
ator
vari
able
)z
(00
116)
(00
163)
(00
110)
z(0
023
8)(0
034
7)(0
022
3)
1097THE LABOR SUPPLY OF SINGLE MOTHERS
TA
BL
EV
(CO
NT
INU
ED
)
Exp
lana
tory
vari
able
OR
Gw
orke
dla
stw
eek
=1
Mar
chC
PS
w
orke
dla
stye
ar=
1
(1)
(2)
(3)
(4)
(5)
(6)
(7)
(8)
Tra
inin
gmdashed
uca
tion
20
0755
20
0764
20
0728
20
0841
20
0804
20
0656
20
1396
20
0780
in$1
000s
yea
r(0
023
7)(0
022
3)(0
039
2)(0
019
0)(0
040
1)(0
036
5)(0
060
7)(0
031
0)T
rain
ingmdash
job
sear
cho
ther
007
620
0441
001
060
0428
007
150
0571
008
490
0517
in$1
000s
yea
r(0
014
0)(0
013
3)(0
023
7)(0
011
7)(0
023
7)(0
021
3)(0
038
2)(0
019
3)C
hild
care
000
110
0190
000
710
0215
20
0033
001
710
0286
002
22in
$100
0sy
ear
(00
092)
(00
073)
(00
088)
(00
066)
(00
140)
(00
114)
(00
161)
(00
101)
1994
ndash199
6ex
clud
edY
esN
oN
oN
oY
esN
oN
oN
oS
ingl
em
oth
ers
only
No
Yes
No
No
No
Yes
No
No
Mot
her
sw
och
ildr
enlt
6ex
cl
No
No
Yes
No
No
No
Yes
No
Nu
mbe
rof
obse
rvat
ions
292
731
122
966
303
396
373
662
938
1640
818
957
8611
901
9
Sou
rces
The
data
are
from
the
1984
ndash199
6C
urre
ntP
opul
atio
nSu
rvey
Out
goin
gR
otat
ion
Gro
up
Fil
e(O
RG
)an
dth
e19
85ndash1
997
Mar
chC
urre
ntP
opul
atio
nS
urve
y(M
arch
CP
S)
Res
tric
tion
sS
eeT
able
IIfo
rsa
mpl
ere
stri
ctio
ns
Spe
cic
atio
ns(1
)an
d(5
)ex
clu
de19
94ndash1
996
Spe
cic
atio
ns
(2)
and
(6)
incl
ude
only
sin
gle
mot
hers
Spe
cic
atio
ns
(3)
and
(7)
incl
ude
sing
lew
omen
wit
hout
chil
dren
and
sing
lem
othe
rsw
hose
youn
gest
chil
dis
less
than
six
Con
trol
sS
eeT
able
IVfo
rco
ntr
ols
Indi
cato
rsfo
rin
tera
ctio
nsbe
twee
nst
ate
and
any
AF
DC
elig
ible
chil
dren
and
betw
een
year
and
both
any
AF
DC
elig
ible
child
ren
and
any
EIT
Cel
igib
lech
ildre
nar
ein
clud
edin
spec
ica
tion
s(2
)an
d(6
)N
otes
In
alls
peci
cat
ions
the
tax
wel
fare
and
Med
icai
dva
riab
les
are
calc
ula
ted
usin
ga
join
tho
urs
wag
edi
stri
buti
ones
tim
ated
sepa
rate
lyfo
rsi
ngle
wom
enw
ith
and
wit
hout
chil
dren
Tax
esan
dw
elfa
rear
ead
just
edfo
rst
ate
cost
ofli
vin
gdi
ffer
ence
sA
lso
alld
olla
ram
ount
sar
eex
pres
sed
in19
96do
llar
sS
eeA
ppen
dix
1fo
rsp
eci
cin
dice
sus
edan
dot
her
deta
ils
1098 QUARTERLY JOURNAL OF ECONOMICS
over the full sample period The only exception to this generali-zation is that the job searchother training coefcient is largerand the child care coefcient is smaller and statistically insigni-cant over the shorter time span These results are among themost important in this paper because they indicate that (1) theurry of welfare reform measures after 1993 has not falsely led toour main results and (2) the extended recovery of the 1990s is notan alternative explanation for our main results
Next we examine a sample of only single mothers Thisspecication identies the effects of the income variables throughchanges across states and for different family sizes In the case ofthe Income Taxes if Work variable we are largely using thevariation from the last few years when the EITC for women withone child was nearly unchanged but the EITC for women with twoor more children rose in large steps Thus identication comesfrom using women with one child as a control group and chang-ing the treatment that women with two or more children receiveWith single mothers only the year indicators remove the timetrend in welfare receipt and benets and the state indicatorsremove time-constant differences in state welfare benets andmuch of these state cost of living differences in the income vari-ables Thus the variation in welfare benets used to identify thecoefcients is now changes in state-level benets This identi-cation approach examines the employment response to fairlysubtle or short-run features of the welfare and tax laws Thesepolicy changes may be overwhelmed by other factors in thesespecications Despite these potential difculties much of theincome tax effect remains although the estimates are muchsmaller While the effect of taxes is still signicant in the MarchCPS data the drop in the coefcient and larger standard errorleads the ORG coefcient to be insignicantly different from zeroThe welfare benet coefcients are now no longer signicant TheAFDC transaction cost coefcient however remains signicantin the ORG data while the Medicaid coefcient has the expectedsign but remains small and insignicant in both samples
In the third set of specications of Table V we only includesingle mothers with a child under six (and single women withoutchildren) The derivative estimates for the tax and welfare vari-ables including waivers are often substantially larger in magni-tude for these single mothers with young children especially forthe tax variable in the ORG sample These specications are ofparticular interest because the effects of increased employment
1099THE LABOR SUPPLY OF SINGLE MOTHERS
on parental care is likely to be largest on these families withyoung children who are not likely to be in school The last speci-cation of Table V examines whether women learn about taxchanges with a delay after they are implemented This specica-tion includes both the contemporaneous and one year lagged taxvariables The results are somewhat supportive of a lagged effectof taxes In the ORG data the contemporaneous tax variable issmall and insignicant while the lagged variable is large andsignicant In the March CPS it is the contemporaneous variablethat is large and signicant while the lagged variable is smallerand signicant although still substantial in size
I Additional Specications and Hours Worked
We examine several other specications that are not reportedhere in order to determine the benets of studying many pro-grams at the same time to check the sensitivity of our results toalternative specications and to see whether there are particu-larly large effects for certain subgroups of the population We ndthat ignoring some of the policy changes that we study has asubstantial effect on the estimates for the remaining programsWhen we include the tax variable but leave out the other policyvariables its coefcient is about 50 percent larger in both sam-ples When the only policy variables that we include are Medicaidif Work and the Welfare Maximum Benet the Medicaid coef-cient is positive and signicant in the March CPS sample Whenthe other policy variables are not included the waiver variablesare much larger On the other hand the tax coefcient is hardlychanged when the training and child care variables are excludedThese results suggest that the common research strategy of in-vestigating one program in isolation has the potential to givemisleading results
We have examined the sensitivity of our results to alterna-tive samples and variable denitions In particular the resultsare little changed by using more stringent denitions of employ-ment by including separated women or women in school We alsotry several subgroup analyses In particular we examine differ-ences between whites and nonwhites and family heads and sub-family heads Nonwhites appear to be more affected by welfarewaivers than whites while subfamily heads are more sensitive totaxes than family heads
To obtain a broader picture of the effects of welfare and taxpolicy on labor supply we also examined hours worked (see
1100 QUARTERLY JOURNAL OF ECONOMICS
Meyer and Rosenbaum [1999] for more details) Difference-in-differences estimates for hours analogous to those in Table IIshow large relative increases in work for single mothers over thesample period with almost all of the change occurring after 1991We also estimated a series of Tobit and OLS regressions todetermine the effects of tax and welfare policy on hours controllingfor demographics economic conditions state and year We in-clude the same variables as we did in Tables IV and V althoughwe should emphasize that these variables were constructed forour structural model of employment and so are less suitable foran analysis of hours The effects of the policy variables in theTobit estimates for all women whether or not they work tend to besimilar to the effects on employment seen in the earlier tablesThese results hold for the sample of single mothers as well as forall single women The results are very similar for hours per yearin the March CPS and hours in a typical week in the ORG Forhours worked conditioning on positive hours the policy variablestend to have much the same signs but smaller and less signi-cant coefcients Overall the results tend to conrm the resultsfor the main policy variables that we found in the employmentprobits
VII WHICH POLICIES ACCOUNTED FOR THE EMPLOYMENT CHANGES
Our simultaneous examination of many government policiesmakes it straightforward to estimate the relative contribution ofthese policies to the recent increase in employment of singlemothers In Table VI we decompose the employment increases forsingle mothers relative to single women without children for boththe entire period (1984 ndash1996) and the recent period of rapidemployment growth (1992ndash1996) Overall these decompositionsindicate a large role for the EITC and other tax changes modestroles for AFDC benet cuts and waivers and smaller roles forMedicaid training and child care increases
Using the parameter estimates from our main specications(specications (1) and (5) of Table IV) the EITC explains 62percent of the increase in weekly employment over the full 1984to 1996 period yet only 27 percent of the increase between 1992and 1996 For annual employment the EITC plays a very similarrole explaining 61 percent of the 1984 to 1996 increase and 35percent of the 1992 to 1996 increase The corresponding changesin employment attributed to the EITC over the full 1984 to 1996
1101THE LABOR SUPPLY OF SINGLE MOTHERS
TA
BL
EV
IC
ON
TR
IBU
TIO
NO
FP
OL
ICY
CH
AN
GE
ST
OT
HE
CH
AN
GE
SIN
TH
ER
EL
AT
IVE
EM
PL
OY
ME
NT
OF
SIN
GL
EM
OT
HE
RS
VE
RSU
SS
ING
LE
WO
ME
NW
ITH
OU
TC
HIL
DR
EN
19
84ndash1
996
AN
D19
92ndash1
996
Exp
lan
ator
yva
riab
le
1984
ndash199
619
92ndash1
996
OR
GM
arch
CP
SO
RG
Mar
chC
PS
Din
emp
of
tota
lD
inem
p
ofto
tal
Din
emp
of
tota
lD
inem
p
ofto
tal
Inco
me
taxe
sif
wor
k0
0438
622
0
0720
614
0
0186
268
0
0305
351
W
elfa
rem
axim
um
ben
et
001
7925
4
001
5613
3
001
1416
5
000
9911
4
Wel
fare
ben
et
ifw
ork
000
050
70
0003
03
20
0045
26
52
000
332
38
Pro
babi
lity
ofA
FD
Cre
ceip
tif
wor
k2
000
022
03
20
0002
20
10
0020
29
000
172
0M
edic
aid
ifw
ork
20
0070
29
92
000
322
28
20
0023
23
32
000
112
12
Tot
alw
elfa
rebe
ne
tsamp
Med
icai
d0
0112
159
0
0125
106
0
0066
96
000
738
4W
aive
rmdashan
yti
me
lim
it0
0054
76
000
756
40
0052
76
000
738
5W
aive
rmdashan
yte
rmin
atio
ns
000
466
50
0099
84
000
466
60
0099
114
T
otal
wel
fare
wai
vers
000
9914
1
001
7414
8
000
9814
2
001
7219
8
Tra
inin
gmdashed
uca
tion
20
0101
214
4
20
0096
28
22
000
212
30
20
0020
22
3T
rain
ingmdash
job
sear
cho
ther
000
659
20
0077
65
000
476
80
0056
64
Ch
ild
care
000
689
70
0069
59
000
111
80
0013
15
Tot
altr
ain
ing
ampch
ild
care
000
324
60
0050
43
000
395
70
0039
56
Dem
ogra
phic
s2
000
732
104
2
000
682
58
001
0715
5
001
1212
9
Oth
er0
0096
137
0
0172
147
0
0196
283
0
0158
182
T
otal
007
0510
00
011
7410
00
006
9110
00
008
6910
00
Sou
rces
The
data
are
from
the
1984
ndash199
6C
urre
ntP
opul
atio
nSu
rvey
Out
goin
gR
otat
ion
Gro
up
Fil
e(O
RG
)an
dth
e19
85ndash1
997
Mar
chC
urre
ntP
opul
atio
nS
urve
y(M
arch
CP
S)
Not
es
Din
emp
give
sth
ech
ange
inth
eem
ploy
men
tof
sing
lem
othe
rs(r
elat
ive
tosi
ngle
wom
enw
itho
ut
chil
dren
)ov
erth
esp
eci
edti
me
peri
odth
atis
due
toth
egi
ven
expl
anat
ory
vari
able
(s)
of
tota
lgiv
esth
epe
rcen
tage
ofth
eem
ploy
men
tin
crea
sefo
rsi
ngle
mot
hers
(rel
ativ
eto
sing
lew
omen
wit
hout
chil
dren
)exp
lain
edby
the
give
nex
plan
ator
yva
riab
le(s
)T
he
rela
tive
empl
oym
ent
incr
ease
sar
eth
eav
erag
ede
riva
tive
esti
mat
esof
the
inte
ract
ions
ina
wei
ghte
dpr
obit
mod
elin
clu
ding
year
indi
cato
rsan
dth
eir
inte
ract
ions
wit
han
any
chil
dren
indi
cato
rT
he
para
met
eres
tim
ates
used
toes
tim
ate
the
chan
gein
empl
oym
ent
com
efr
omsp
eci
cati
ons
(1)
and
(5)o
fTab
leIV
wh
ileth
ech
ange
over
tim
ein
the
polic
yva
riab
les
com
esfr
omA
ppen
dix
2
1102 QUARTERLY JOURNAL OF ECONOMICS
period and the 1992 to 1996 period are also reported in Table VIWe estimate that the EITC and other tax changes increasedweekly employment 44 percentage points and annual employ-ment 72 percentage points over the full period with about 40percent of this change occurring over the 1992 to 1996 subperiodWhile these estimates are substantial they bracket the EITCeffects found by Eissa and Liebman [1996] and are smaller thanthose predicted by Dickert Houser and Scholz [1995] and Keane[1995]24
Changes in the maximum welfare benet and implicit taxrates and the Medicaid expansions account for between 10 and 16percent of the increase in weekly employment and between 8 and11 percent of the increase in annual employment over eitherperiod The effect of the Medicaid expansions themselves is usu-ally small or negative Conversely the effects of welfare waiversappear to be substantial with the estimates suggesting thatpolicies instituted under waivers account for about 14 to 15 per-cent of the increase in employment over the full sample periodand about 14 to 20 percent of the increase between 1992 and 1996for both weekly and annual employment In general both jobtraining and child care explain small parts of the employmentincrease although in the case of weekly employment over the fullperiod child care can account for about 10 percent of the increase
Improved macroeconomic conditions increased employmentfor both single mothers and single women without children overthe 1984 ndash1996 period Because the above calculations are forsingle mothers compared with single women without childrenunemployment is not given a share in the decomposition In all ofthe employment probits the interaction of unemployment andbeing a single mother had an economically small and statisticallyinsignicant effect Changes in state unemployment rates areestimated to have increased the absolute level of employment ofsingle mothers by 20 percentage points during a typical week
24 Eissa and Liebman [1996] found up to a 28 percentage point increase inparticipation due to TRA86 (which as we indicate in Section IV accounted for 43percent of the 1984ndash1996 change in taxes) Keane [1995] predicted that the1984ndash1996 changes will result in a 107 percentage point increase in participa-tion while Dickert Houser and Scholz [1995] predicted that the 1993ndash1996changes (39 percent of the full 1984ndash1996 change in taxes) would increase em-ployment of single parents by 33 percentage points Experimental ndings suchas those reported in Blank Card and Robins [2000] suggest substantial respon-siveness of welfare recipients and other low-income people to nancial incentivesThese experimental results would need to be extrapolated to all single mothersand the EITC to provide comparisons
1103THE LABOR SUPPLY OF SINGLE MOTHERS
and 14 percentage points during the year over the 1984 ndash1996period These numbers are equivalent to 284 percent of therelative increase in weekly employment and 122 percent of therelative increase in annual employment of single mothers overthe period
In results not shown we recalculate the shares of the em-ployment increase due to various policies using the parameterestimates from specications with only single mothers (specica-tions (2) and (6) of Table V) These results suggest a much smallerrole for the EITC and other tax changes in explaining the changesin employment ranging from 49 to 56 percent as large as those inTable VI Changes in the maximum welfare benet are lessimportant while the results for welfare waivers job training andchild care are largely unchanged
VIII CONCLUSIONS
Between 1984 and 1996 tax and transfer policy were reori-ented to encourage work by single mothers Single mothers haveresponded to these incentives by working more especially after1991 and especially those with children under six To assesswhich policy changes have led to the employment increases weexamine the incentives of federal and state income taxes AFDCMedicaid Food Stamps and their implicit tax rates and earningsdisregards as well as AFDC waivers instituting time limits orwork requirements Our detailed examination of these policychanges using two large micro data sets indicates that EITC andother tax changes account for over 60 percent of the 1984 to 1996increase in the weekly and annual employment of single mothersrelative to single women without children Changes to welfareprograms were less important but still account for a substantialshare of the employment increases Changes in Medicaid train-ing and child care programs play a considerably smaller roleThese ndings are conrmed in an analysis of hours worked
This paper makes several methodological improvements overpast research including the estimation of a simple structuralmodel of employment which provides several independent tests ofthe hypothesis that single mothers respond to economic incen-tives Our results indicate that nancial incentives have powerfuleffects on single mothersrsquo employment decisions and that thedifferent sources of these incentives have effects of plausiblemagnitudes We also nd a sizable transaction cost or stigma to
1104 QUARTERLY JOURNAL OF ECONOMICS
welfare We rely on less subjective measures of welfare waiverssuch as implementation dates and the beginning of case termi-nations and provide the rst evidence on the effects of waivers onemployment Unlike most past work we examine the major pro-grams affecting single mothers together nding that examiningone or two programs in isolation can lead to biases in estimatedbehavioral effects
In most of our specications identication comes from thedifferences in incentives faced by single women with and withoutchildren While we argue that single women without children area plausible comparison group we also provide estimates that donot rely on this comparison Instead these estimates rely onchanges in the treatment of family size state cost of living dif-ferences changes in state income taxes differences in earningsdisregards and implicit tax rates across states and changes inthese parameters and welfare benets within a state over timeOur nding of large tax and welfare effects on employment arerobust although tax effects and especially welfare effects aresometimes smaller using alternative identication strategies
Our result that the EITC played a dominant role in theemployment increases of single mothers between 1984 and 1996suggests that policies that ldquomake work payrdquo are effective in in-creasing work by single mothers This lesson is important in lightof the emphasis on punitive measures such as time limits andwork requirements in the most recent welfare reforms
APPENDIX 1 DESCRIPTION OF POLICY VARIABLES
This section describes the construction of our policy variablesand lists our information sources First we begin with the as-sumptions that we use to determine taxes program participationand benet levels
1 The determination of whether a woman has children andhow many she has is based on the CPS family and sub-family denitions Children in primary families (both re-lated and unrelated) are assigned to the family headwhile children in subfamilies are assigned to the subfam-ily head rather than to the primary family head Childrenare dened as any member of the given family (primary orsubfamily) under age 19 (or under 24 and a full-timestudent) for EITC purposes and under age 18 for all otherprograms
1105THE LABOR SUPPLY OF SINGLE MOTHERS
2 In the March CPS sample the age for tax purposes is theage at the time of the March interview We subtract onefor AFDC and Medicaid purposes In the ORG sample weuse the age at the time of the interview for AFDC andMedicaid but for tax purposes we add one for interviewsoccurring between January and June
3 Women have no unearned income (including child sup-port) or assets and their children have no earned incomeunearned income or assets hence earnings determinetheir program eligibility
4 Single mothers are assumed to le as head of householdand claim their children as dependents while singlewomen without children le as single Also all womentake the standard deduction
5 Women receiving AFDC are in their rst four months ofwork and do not claim child care expenses25
6 Single women without children do not receive FoodStamps
7 Shelter costs (an input in Food Stamp calculations) varyonly by state and over time
A Tax Welfare and Medicaid Variables
First for each woman we calculate ve quantities income taxliabilities (federal and state income taxes incorporating federaland state EITCs) welfare benets (AFDC plus Food Stamps)AFDC receipt (indicator for AFDC eligibility) and Medicaidadults covered and Medicaid children covered Under the assump-tions above these calculations are made at 50 annual earningslevels generated from the cells of a joint wagehours distributionThe 50 cells come from a combination of ve annual hours levels(500 1000 1500 2000 and 2500) and ten hourly wage levels (45 6 7 8 10 12 15 20 and 25)
Second we use the wagehours distributions described in thetext to weight the above quantities We calculate the distributionsusing only women with more than $500 of annual earnings Wethen construct the following variables
25 These assumptions are roughly consistent with the facts In scal year1995 over two-thirds of AFDC families with earnings were in their rst fourmonths of work and only about 16 percent of AFDC families with earningsclaimed child care expenses [U S Department of Health and Human ServicesCharacteristics of AFDC Recipients 1996]
1106 QUARTERLY JOURNAL OF ECONOMICS
c Income Taxes if Work is the weighted sum of income taxliabilities at the various annual earnings points using thewagehours distributions described above as weights
c Welfare Benets if Work is the weighted sum of welfarebenets at the various annual earnings points using thewagehours distributions described above as weights
c Probability of AFDC if Work is the weighted sum of AFDCreceipt at the various annual earnings points using thewagehours distributions described above as weights
c Medicaid if Work is calculated in two steps First wecalculate the weighted sum of Medicaid adults covered andMedicaid children covered at the various annual earningspoints using the wagehours distributions described aboveas weights Second we then multiply these sums by dollarexpenditures separately for adults and children In themain specications we use average expenditures over allstates and years
c Welfare Maximum Benet is the welfare benet assumingzero earnings
We calculate AFDC monthly benets (AFDC) as follows (settingquantities in parentheses to zero if negative)
(A1) AFDC 5 min MAXBEN RR p [PS 2 BRR p (EI 2 DIS)]
wheremdash MAXBEN is the maximum benetmdash RR is the ratable reductionmdash PS is the payment standard (the dollar amount when
benets end not counting disregards)mdash BRR is the benet reduction ratemdash EI is earned income andmdash DIS is the earnings disregard
We calculate Food Stamp benets in two steps (setting quantitiesin parentheses to zero if negative) First we calculate themonthly shelter cost expense deduction (SED) and second wecalculate the monthly Food Stamp benet (FS)
(A2) SED 5 (min SEDC SE 2 05
p ((1 2 EIDP) p EI 1 AFDC 2 SD))
(A3) FS 5 (MB 2 03 p ((1 2 EIDP)
p EI 1 AFDC 2 SD 2 SED))
1107THE LABOR SUPPLY OF SINGLE MOTHERS
wheremdash EIDP is the earned income deduction percentage (018
prior to 1986 020 starting in 1986)mdash MB is the maximum Food Stamp benetmdash SD is the standard deductionmdash SE is shelter expensesmdash SEDC is the shelter expense deduction ceilingTax and welfare variables (and earned and unearned income
variables) are adjusted for state cost of living differences usingthe poverty threshold index for 1990 from National ResearchCouncil [1995] which is adjusted annually using the PCE dea-tor The poverty threshold index accounts for housing cost differ-ences between states using Census housing cost data
Sources for Taxes Welfare and Medicaid
We obtain the federal income tax schedules from the U SDepartment of the Treasury [various years] The state tax infor-mation was obtained from four sources the Advisory Committeeon Intergovernmental Relations [various years] the CommerceClearing House [various years] unpublished data from the Cen-ter on Budget Policy and Priorities and Feenberg and Coutts[1993] The AFDC program parameters are obtained from theU S Department of Health and Human Services (Characteristicsof State Plans [various years]) and unpublished data from theUrban Institute The Food Stamp parameters come from the U SHouse of Representatives (Green Book [various years]) and theU S Department of Agriculture [various years] The Medicaidprogram information is obtained from three sources the NationalGovernorrsquos Association [various dates] the IntergovernmentalHealth Policy Project [various years] and the U S House ofRepresentatives [Medicaid Source Book 1988 1993] Medicaiddollar values (separately for adults and children) come from un-published tables from the Health Care Financing Administration(HCFA)
B Welfare Waiver Variables
c Any Time Limit is one starting with the implementationmonth of a waiver that imposes mandatory work require-ments on families that reach time limits or results in thereduction or total loss of AFDC payments after a certaintime limit has been reached (usually two years)
1108 QUARTERLY JOURNAL OF ECONOMICS
c Any Terminations is one beginning with the month inwhich a case is rst terminated under a welfare waiver
c Major Waiver Application is one beginning with the monthin which a state rst applies for a major statewide waiver
Note that these variables are always zero for women withoutAFDC children
Sources for Welfare Waiver Variables
The waiver variables we used are based on our reading of thewaiver summaries in General Accounting Ofce [1997] the U SDepartment of Health and Human Services [1997c] and Savnerand Greenberg [1997] These sources generally have the imple-mentation dates of waivers We also consulted American PublicWelfare Association [1996] Levine and Whitmore [1998] andU S Department of Health and Human Services [1997a] Ourclassication scheme follows most closely the classicationschemes in General Accounting Ofce [1997] and the U S De-partment of Health and Human Services [1997c]
C Training Program Variables
These variables measure variation across states and overtime in federal and state spending on welfare-to-work programsand on eligibility criteria These numbers are based on the statelevel scal year WIN (Work Incentive) program expenditures andstate level scal year JOBS (Job Opportunities and Basic Skills)program expenditures by component (job search education etc)We calculate spending per female AFDC adult who is not exemptfrom participation based on the age of her youngest child Thedollars are then divided by the state average wage to obtain anamount of services provided26
We calculate the distribution of the age of the youngest childand we apportion total JOBS spending to women using the frac-tion of participants who are female adults We divide spendinginto two categories education which includes education postsec-ondary education and self-initiated education and other whichincludes job search job development and placement on-the-jobtraining work supplementation community work experienceself-initiated training job skills job readiness and assessmentand employability plan For scal year 1990 it is necessary to
26 The state average wage is average hourly wage for manufacturing in thestate It is normalized so that the 1996 value = 100
1109THE LABOR SUPPLY OF SINGLE MOTHERS
extrapolate WIN expenditures forward and JOBS expendituresbackward to the date when the JOBS program began in a givenstate We also extrapolate 1985 WIN data back to 1984 and scalyear 1996 forward to the rst three months of scal year 1997
Note that the training variables are zero for women withoutAFDC children and women with children young enough to ex-empt the mother from participation in WIN or JOBS
Sources for Training Variables
JOBSWIN expenditure data come from unpublished U SDepartment of Health and Human Services and U S Depart-ment of Labor tabulations and the U S House of Representa-tives (Green Book [various years]) To calculate the distribution ofthe age of youngest child for single mothers we use data from theU S Department of Health and Human Services (Characteristicsof AFDC Recipients [various years]) and authorsrsquo calculationsfrom the March CPS Wage data come from the Bureau of LaborStatistics web site
D Child Care Variable
Child Care expenditures are actual federal and state expen-ditures by state on the following four programs AFDC ChildCare Transitional Child Care At-Risk Child Care and ChildCare and Development Block Grants Expenditures are put on aper-person basis by dividing through by the number of unmarriedwomen with children less than six This denominator is calcu-lated using annual data on the number of women by state (fromthe Census Bureau) and the fraction of women in a state who areunmarried with children less than six which is calculated fromthe ORG over the entire 1984 ndash1996 period Like training dollarsthe resulting dollar value is then divided by the state averagewage to obtain an amount of services provided
Note that the child care variable is always zero for womenwithout children less than six
Sources for Child Care Variable
Child Care expenditures come from unpublished U S De-partment of Health and Human Service tabulations Annual dataon the number of women by state come from the U S CensusBureau The fraction of women in a state who are unmarried withchildren less than six is calculated from the ORG by the authorsWage data come from the Bureau of Labor Statistics web site
1110 QUARTERLY JOURNAL OF ECONOMICS
AP
PE
ND
IX2
VA
RIA
BL
EM
EA
NS
FO
RS
ING
LE
MO
TH
ER
SA
ND
SIN
GL
EW
OM
EN
WIT
HO
UT
CH
ILD
RE
N1
984
1988
199
219
96
Var
iabl
e
1984
1988
1992
1996
Ch
ildr
enN
och
ildr
enC
hil
dren
No
chil
dren
Ch
ildr
enN
och
ildr
enC
hil
dren
No
chil
dren
Age
314
426
86
319
727
79
319
628
83
321
929
22
Non
wh
ite
037
10
155
036
30
162
038
40
178
037
70
207
His
pan
ic0
086
005
30
103
007
20
111
007
90
136
009
3H
igh
sch
ool
drop
out
026
20
094
024
60
091
024
10
094
021
10
092
Som
eco
lleg
e0
211
029
70
234
030
50
256
031
70
311
031
7B
ach
elor
s0
063
019
20
064
020
40
061
021
00
072
023
3M
aste
rs0
022
005
90
025
006
10
023
006
60
021
006
4D
ivor
ced
056
40
151
053
30
161
047
70
165
046
00
162
Wid
owed
006
60
010
005
50
010
004
70
012
003
80
012
Liv
ing
wit
hpa
ren
ts0
156
041
80
151
037
50
154
034
70
154
033
9L
ivin
gw
ith
un
rela
ted
adu
ltm
ale
009
70
135
012
50
167
014
80
198
016
50
218
[of
chil
dren
un
der
181
681
z1
664
z1
707
z1
707
z[
ofch
ildr
enu
nde
r6
056
0z
057
1z
062
4z
061
3z
Ear
ned
inco
me
(Mar
ch)
128
1018
331
134
6220
183
132
3218
993
147
6019
912
Ear
ned
inco
me
ifw
ork
(Mar
ch)
172
5019
536
180
1321
293
179
3020
453
180
2321
479
An
nu
alho
urs
ifw
ork
(Mar
ch)
1718
1837
1724
1894
1712
1862
1740
1881
Hou
rly
earn
ings
(Mar
ch)
985
103
89
9110
86
987
105
910
03
109
8In
com
eta
xes
ifw
ork
1521
2751
1030
2958
811
2967
7929
14W
elfa
rem
axim
um
ben
et
7583
z74
06z
7391
z70
56z
Wel
fare
ben
et
ifw
ork
1482
z14
78z
1546
z14
88z
Pro
babi
lity
ofA
FD
Cre
ceip
tif
wor
k0
255
z0
287
z0
266
z0
256
zM
edic
aid
ifw
ork
1215
013
590
1704
219
424
Nu
mbe
rof
obse
rvat
ion
s93
9118
914
9211
186
1210
333
193
1187
8815
846
Sou
rces
The
data
are
prim
arily
from
the
1984
ndash199
6C
urre
ntP
opul
atio
nSu
rvey
Out
goin
gR
otat
ion
Gro
upF
ile(O
RG
)and
from
the
1985
ndash199
7M
arch
Cur
rent
Pop
ulat
ion
Surv
ey(M
arch
)R
estr
icti
ons
See
Tab
leII
for
sam
ple
rest
rict
ion
sN
otes
Mea
ns
com
efr
omth
eO
RG
unle
ssth
eyar
ela
bele
d(M
arch
)T
hese
mea
nsar
eca
lcul
ated
usi
ngth
ech
arac
teri
stic
sof
the
give
nsa
mpl
efo
rth
egi
ven
year
and
are
wei
ghte
dW
omen
are
assu
med
tobe
inth
eir
rst
four
mon
ths
ofw
ork
toha
ven
ou
near
ned
inco
me
and
tocl
aim
noch
ildca
reex
pens
esA
lso
sin
gle
wom
enw
ith
and
wit
hou
tch
ildr
enar
eas
sum
edto
le
ashe
adof
hous
ehol
dan
dsi
ngl
ere
spec
tive
ly
and
tocl
aim
the
stan
dard
dedu
ctio
nT
axes
and
wel
fare
are
adju
sted
for
stat
eco
stof
livi
ng
diff
eren
ces
All
doll
aram
ount
sar
eex
pres
sed
in19
96do
llar
spe
rye
arS
eeA
ppen
dix
1fo
rsp
eci
cin
dice
sus
edan
dot
her
deta
ils
1111THE LABOR SUPPLY OF SINGLE MOTHERS
DEPARTMENT OF ECONOMICS AND INSTITUTE FOR POLICY RESEARCH NORTHWESTERN
UNIVERSITY AND NATIONAL BUREAU OF ECONOMIC RESEARCH
DEPARTMENT OF ECONOMICS UNIVERSITY OF NORTH CAROLINA GREENSBORO
REFERENCES
American Public Welfare Association ldquoSummary of Approved AFDC WaiverActionsrdquo (Washington DC May 1993 and August 1 1996)
Advisory Committee on Intergovernmental Relations Signicant Features ofFiscal Federalism (Washington DC various years)
Bavier Richard ldquoAn Early Look at the Effects of Welfare Reformrdquo unpublishedpaper March 1999
Blank Rebecca M ldquoWhat Causes Public Assistance Caseloads to Growrdquo unpub-lished paper May 1997
mdashmdash ldquoThe Effect of Medical Need and Medicaid on AFDC Participationrdquo Journalof Human Resources XXIV (1989) 54ndash87
Blank Rebecca M and Patricia Ruggles ldquoWhen Do Women Use Aid to Familieswith Dependent Children and Food Stampsrdquo Journal of Human ResourcesXXXI (1996) 57ndash89
Blank Rebecca M David E Card and Philip K Robins ldquoFinancial Incentives forIncreasing Work and Income among Low-Income Familiesrdquo in Finding JobsWork and Welfare Reform David Card and Rebecca M Blank eds (NewYork Russell Sage Foundation 2000) pp 373ndash419
Browning Edgar K ldquoEffects of the Earned Income Tax Credit on Income andWelfarerdquo National Tax Journal XLVIII (1995) 23ndash43
Cohany Sharon Anne Polivka and Jennifer Rothgeb ldquoRevisions in the CurrentPopulation Survey Effective January 1994rdquo Employment and Earnings XLI(1994) 13ndash37
Commerce Clearing House State Tax Handbook (Chicago IL various years)Council of Economic Advisers ldquoThe Economics of Child Carerdquo (Washington DC
December 1997)Danziger Sheldon Robert Haveman and Robert Plotnick ldquoHow Income Trans-
fers Affect Work Savings and the Income Distribution A Critical ReviewrdquoJournal of Economic Literature XIX (1981) 975ndash1028
Dickert Stacy Scott Houser and John Karl Scholz ldquoThe Earned Income TaxCredit and Transfer Programs A Study of Labor Market and Program Par-ticipationrdquo in Tax Policy and the Economy 9 James M Poterba ed (Cam-bridge MA MIT Press 1995) pp 1ndash50
Edin Kathryn and Laura Lein Making Ends Meet How Single Mothers SurviveWelfare and Low-Wage Work (New York Russell Sage Foundation 1997)
Eissa Nada and Jeffrey B Liebman ldquoLabor Supply Response to the EarnedIncome Tax Creditrdquo Quarterly Journal of Economics CXII (1996) 605ndash637
Eissa Nada and Hilary Williamson Hoynes ldquoThe Earned Income Tax Credit andLabor Supply Married Couplesrdquo NBER Working Paper No 6856 December1998
Ellwood David T ldquoThe Impact of the Earned Income Tax Credit and Social PolicyReforms on Work Marriage and Living Arrangementsrdquo National Tax JournalLIII (2000) 1063ndash1106
Feenberg Daniel and Elisabeth Coutts ldquoAn Introduction to the TAXSIM ModelrdquoJournal of Policy Analysis and Management XII (1993) 189ndash194
Fraker Thomas Robert Moftt and Douglas Wolf ldquoEffective Tax Rates andGuarantees in the AFDC Program 1967ndash1982rdquo Journal of Human Re-sources XX (1985) 252ndash263
General Accounting Ofce ldquoWelfare Reform Statesrsquo Early Experiences withBenet Terminationrdquo (Washington DC GAO S-97-74 May 1997)
Gueron Judith M and Edward Pauly From Welfare to Work (New York RussellSage Foundation 1991)
Heckman James J ldquoWhat Has Been Learned about Labor Supply in the PastTwenty Yearsrdquo American Economic Review LXXXIII (1993) 116ndash121
Hill Carolyn V Joseph Hotz Charles H Mullin and John Karl Scholz ldquoEITC
1112 QUARTERLY JOURNAL OF ECONOMICS
Eligibility Participation and Compliance Rates for AFDC Households Evi-dence from the California Caseloadrdquo unpublished paper March 1999
Hoffman Saul D and Laurence S Seidman The Earned Income Tax CreditAntipoverty Effectiveness and Labor Market Effects (Kalamazoo MI UpjohnInstitute for Employment Research 1990)
Holtzblatt Janet Janet McCubbin and Robert Gillette ldquoPromoting Workthrough the EITCrdquo National Tax Journal XLVII (1994) 591ndash608
Hoynes Hilary Williamson ldquoWork and Marriage Incentives in Welfare ProgramsWhat Have We Learnedrdquo in Fiscal Policy Lessons from Economic ResearchAlan J Auerbach ed (Cambridge MA MIT Press 1997)
Intergovernmental Health Policy Project Major Changes in State Medicaid andIndigent Care Programs (Washington DC various years)
Jencks Christopher and Joseph Swingle ldquoHas Welfare Reform Helped or HurtSingle Momsrdquo unpublished paper February 2000
Keane Michael ldquoA New Idea for Welfare Reformrdquo Federal Reserve Bank ofMinneapolis Quarterly Review XXXVIII (1995) 2ndash28
Levine Judith A ldquoPolicy Incentives Confront Everyday Realities IntegratingEconomic and Sociological Perspectives on the Welfare-to-Work Transitionrdquounpublished paper March 1997
Levine Phillip B and Diane M Whitmore ldquoThe Impact of Welfare Reform on theAFDC Caseloadrdquo National Tax Association Proceedings Ninetieth AnnualConference (1998) 24ndash33
Liebman Jeffrey B ldquoThe Impact of the Earned Income Tax Credit on Incentivesand Income Distributionrdquo in Tax Policy and the Economy 12 James MPoterba ed (Cambridge MA MIT Press 1998) pp 83ndash120
Martini Alberto and Michael Wiseman ldquoExplaining the Recent Decline in Wel-fare Caseloads Is the Council of Economic Advisers Rightrdquo Challenge XL(1997) 6 ndash20
Meyer Bruce D ldquoDo the Poor Move to Receive Higher Welfare Benetsrdquo unpub-lished paper April 1999
Meyer Bruce D and Dan T Rosenbaum ldquoWelfare the Earned Income Tax Creditand the Labor Supply of Single Mothersrdquo NBER Working Paper No 7363September 1999
Meyer Bruce D and Dan T Rosenbaum ldquoMaking Single Mothers Work RecentChanges in Tax and Welfare Policy and their Effectsrdquo National Tax JournalLIII (2000a) 1027ndash1062
Meyer Bruce D and Dan T Rosenbaum ldquoMedicaid Private Health Insuranceand the Labor Supply of Single Mothersrdquo unpublished paper November2000b
Moftt Robert ldquoAn Economic Model of Welfare Stigmardquo American EconomicReview LXXIII (1983) 1023ndash1035
mdashmdash ldquoIncentive Effects of the U S Welfare Systemrdquo Journal of Economic Litera-ture XXX (1992) 1ndash61
mdashmdash ldquoThe Effect of Welfare on Marriage and Fertility What Do We Know andWhat Do We Need to Knowrdquo unpublished paper December 1997
Moftt Robert and Barbara Wolfe ldquoThe Effect of the Medicaid Program onWelfare Participation and Labor Supplyrdquo Review of Economics and StatisticsLXXIV (1992) 615ndash626
National Governorrsquos Association MCH (Maternal and Child Health) Update(Washington DC various dates)
National Research Council Measuring Poverty A New Approach Constance FCitro and Robert T Michael eds (Washington DC National Academy Press1995)
mdashmdash Evaluating Welfare Reform A Framework and Review of Current WorkRobert Moftt and Michele Ver Ploeg eds (Washington DC National Acad-emy Press 1999)
Polivka Anne E and Stephen M Miller ldquoThe CPS After the Redesign Refocus-ing the Economic Lensrdquo in Labor Statistics Measurement Issues John Halti-wanger Marilyn E Manser and Robert Topel eds (Chicago University ofChicago Press 1998) pp 249ndash286
Romich Jennifer L and Thomas Weisner ldquoHow Families View and Use the
1113THE LABOR SUPPLY OF SINGLE MOTHERS
EITC The Case for Lump-sum Deliveryrdquo National Tax Journal LIII (2000)1245ndash1265
Savner Steve and Mark Greenberg ldquoThe CLASP Guide to Welfare Waivers1997rdquo (Washington DC Center for Law and Social Policy 1997)
Scholz John Karl ldquoThe Participation Rate of the Earned Income Tax CreditrdquoInstitute for Research on Poverty Madison WI Discussion Paper 928-90October 1990
mdashmdash ldquoThe Earned Income Tax Credit Participation Compliance and AntipovertyEffectivenessrdquo National Tax Journal XLVII (1994) 59ndash81
Smeeding Timothy M Katherine E Ross Michael OrsquoConnor and Michael SimonldquoThe EITC Expectation Knowledge Use and Economic and Social MobilityrdquoNational Tax Journal LIII (2000) 1187ndash1210
U S Department of Agriculture Characteristics of Food Stamp Households(Alexandria VA U S Department of Agriculture Food and Consumer Ser-vice Ofce of Analysis and Evaluation various years)
U S Department of Health and Human Services Characteristics and FinancialCircumstances of AFDC Recipients (Washington DC U S Department ofHealth and Human Services Administration for Children and FamiliesOfce of Family Assistance Division of Performance Measurement variousyears)
mdashmdash Characteristics of State Plans for Aid to Families with Dependent Children(Washington DC U S Department of Health and Human Services Admin-istration for Children and Families Ofce of Family Assistance variousyears)
mdashmdash HHS Fact Sheet State Welfare Demonstrations (Washington DC U SDepartment of Health and Human Services March 17 1997a)
mdashmdash National Evaluation of Welfare-to-Work Strategies (Washington DC Ad-ministration for Children and Families Ofce of the Assistant Secretary forPlanning and Evaluation December 1997b)
mdashmdash Setting the Baseline A Report on State Welfare Waivers (Washington DCU S Department of Health and Human Services Ofce of the AssistantSecretary for Planning and Evaluation 1997c)
U S Department of the Treasury Statistics of Income Individual Income TaxReturns (Washington DC U S Department of the Treasury Internal Reve-nue Service various years)
U S Department of the Treasury Your Federal Income Tax Tax Guide forIndividuals (Washington DC U S Department of the Treasury InternalRevenue Service various years)
U S House of Representatives Committee on Energy and Commerce MedicaidSource Book Background Data and Analysis (Washington DC GovernmentPrinting Ofce November 1988 and January 1993)
U S House of Representatives Committee on Ways and Means Green BookBackground Material and Data on Programs within the Jurisdiction of theCommittee on Ways and Means (Washington DC Government Printing Of-ce various years)
Winkler Anne ldquoThe Incentive Effects of Medicaid on Womenrsquos Labor SupplyrdquoJournal of Human Resources XXVI (1991) 308ndash337
Yelowitz Aaron S ldquoThe Medicaid Notch Labor Supply and Welfare Participa-tionrdquo Quarterly Journal of Economics CX (1995) 909ndash940
Ziliak James P David N Figlio Elizabeth E Davis and Laura S ConnollyldquoAccounting for the Decline in AFDC Caseloads Welfare Reform or EconomicGrowthrdquo unpublished paper July 1997
1114 QUARTERLY JOURNAL OF ECONOMICS
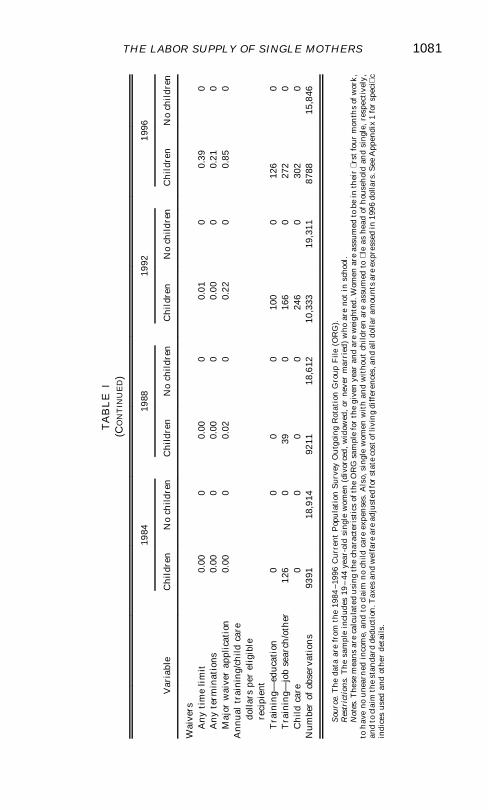
TA
BL
EI
(CO
NT
INU
ED
)
Var
iabl
e
1984
1988
1992
1996
Ch
ildr
enN
och
ildr
enC
hil
dren
No
chil
dren
Ch
ildr
enN
och
ildr
enC
hil
dren
No
chil
dren
Wai
vers
An
yti
me
lim
it0
000
000
00
010
039
0A
ny
term
inat
ions
000
00
000
000
00
210
Maj
orw
aive
rap
plic
atio
n0
000
002
00
220
085
0A
nn
ual
trai
nin
gch
ild
care
doll
ars
per
elig
ible
reci
pien
tT
rain
ingmdash
edu
cati
on0
00
010
00
126
0T
rain
ingmdash
job
sear
cho
ther
126
039
016
60
272
0C
hil
dca
re0
00
024
60
302
0N
um
ber
ofob
serv
atio
ns
9391
189
1492
1118
612
103
3319
311
8788
158
46
Sou
rce
The
data
are
from
the
1984
ndash199
6C
urre
ntP
opu
lati
onS
urve
yO
utg
oing
Rot
atio
nG
roup
File
(OR
G)
Res
tric
tion
sT
hesa
mpl
ein
clud
es19
ndash44
year
-old
sing
lew
omen
(div
orce
dw
idow
ed
orne
ver
mar
ried
)w
hoar
eno
tin
scho
ol
Not
esT
hese
mea
nsar
eca
lcu
late
du
sing
the
char
acte
rist
ics
ofth
eO
RG
sam
ple
for
the
give
nye
aran
dar
ew
eigh
ted
Wom
enar
eas
sum
edto
bein
thei
rr
stfo
urm
onth
sof
wor
kto
hav
eno
une
arn
edin
com
ean
dto
clai
mn
och
ildca
reex
pen
ses
Als
osi
ngle
wom
enw
ith
and
wit
hout
chil
dren
are
assu
med
tol
eas
head
ofh
ouse
hol
dan
dsi
ngle
res
pect
ivel
yan
dto
clai
mth
est
anda
rdde
duct
ion
Tax
esan
dw
elfa
rear
ead
just
edfo
rst
ate
cost
ofli
vin
gdi
ffer
ence
san
dal
ldol
lar
amou
nts
are
expr
esse
din
1996
dolla
rsS
eeA
ppen
dix
1fo
rsp
eci
cin
dice
sus
edan
dot
her
deta
ils
1081THE LABOR SUPPLY OF SINGLE MOTHERS
state and federal expenditures on these four new federal pro-grams by state and year are scaled by the number of singlemothers with children under six These numbers can be seen inTable I which shows a steep rise in child care expendituresbetween 1988 and 1992 followed by a slower rise in later yearsFor more detail on training and child care programs see Meyerand Rosenbaum [1999]
V THE DETERMINANTS OF EMPLOYMENT
We use several different econometric methods to identify theimpact of the recent policy changes on the employment of singlemothers We begin with the familiar difference in differencesestimator This approach compares employment rates over timefor single mothers with those for single women without childrenThis approach is the one taken by Eissa and Liebman [1996] intheir study of the EITC over the 1984 to 1990 period We waituntil Section VI to discuss the estimates from our simple struc-tural model
A Employment Rates of Single Mothers and Single ChildlessWomen
The top panel of Table II reports the employment rates ofsingle mothers and single women without children along withthe difference in employment rates between these two groups ofsingle women We report this difference because many determi-nants of employment that change over time especially wages andmacroeconomic conditions might be expected to affect all singlewomen similarly Other determinants of employment particu-larly the tax and transfer programs that we examine specicallyaffect single mothers The bottom panel of Table II focuses on thesubsample of single mothers with children under six (again rela-tive to single women without children) a group we expect to bemore responsive to changes in the rewards to work Also employ-ment changes are likely to have greater effects on children forbetter or worse when they are young and their mother likelyplays a larger role in their care and education
We report two different measures of employment whether awoman worked last week (from the ORG data) and whether awoman worked at all last year (from the March data) Eachmeasure has its advantages Whether a woman worked last weekis probably a better measure of labor supply to use as an input to
1082 QUARTERLY JOURNAL OF ECONOMICS
policy decisions since its average captures the fraction of womenworking in a given week This variable will be especially useful ifthose who move in or out of the workforce on the margin workonly a few weeks during the year On the other hand as discussedearlier the EITC unequivocally increases the probability of work-
TABLE IIEMPLOYMENT RATES FOR SINGLE MOTHERS SINGLE MOTHERS WITH CHILDREN
UNDER SIX AND SINGLE WOMEN WITHOUT CHILDREN 1984ndash1996
Year
CPS Outgoing Rotation Groupworked last week = 1 March CPS worked last year = 1
ChildrenNo
children DifferenceStandard
error ChildrenNo
children DifferenceStandard
error
1984 05854 08014 2 02160 00059 07322 09399 2 02077 000831985 05861 08048 2 02187 00058 07302 09439 2 02137 000831986 05891 08131 2 02240 00057 07310 09450 2 02141 000821987 05941 08179 2 02238 00056 07382 09473 2 02091 000811988 06027 08215 2 02188 00058 07482 09485 2 02003 000841989 06136 08150 2 02015 00058 07577 09409 2 01831 000801990 06007 08155 2 02148 00056 07591 09424 2 01832 000791991 05790 08031 2 02242 00056 07428 09418 2 01990 000791992 05790 07957 2 02167 00057 07387 09299 2 01913 000811993 05875 07918 2 02044 00057 07511 09356 2 01845 000801994 06053 07921 2 01868 00057 07907 09312 2 01405 000781995 06265 07971 2 01707 00058 08072 09340 2 01268 000801996 06450 07938 2 01488 00060 08191 09290 2 01098 00079
Childrenunder 6
Nochildren Difference
Standarderror
Childrenunder 6
Nochildren Difference
Standarderror
1984 04382 08014 2 03632 00083 06122 09399 2 03277 001311985 04328 08048 2 03720 00082 05966 09439 2 03474 001331986 04362 08131 2 03770 00081 06227 09450 2 03223 001281987 04437 08179 2 03742 00082 06096 09473 2 03377 001291988 04634 08215 2 03581 00084 06277 09485 2 03207 001321989 04790 08150 2 03360 00083 06282 09409 2 03127 001271990 04569 08155 2 03586 00079 06369 09424 2 03055 001241991 04289 08031 2 03743 00078 06092 09418 2 03326 001241992 04330 07957 2 03627 00078 06273 09299 2 03027 001241993 04557 07918 2 03362 00078 06428 09356 2 02929 001221994 04796 07921 2 03125 00079 06934 09312 2 02378 001211995 05147 07971 2 02825 00081 07221 09340 2 02119 001231996 05396 07938 2 02543 00085 07476 09290 2 01813 00119
Sources The data are from the 1984ndash1996 Current Population Survey Outgoing Rotation Group File(ORG) and the 1985ndash1997 March Current Population Survey (March CPS) and are weighted
Restrictions Both samples include 19ndash44 year-old single women (divorced widowed or never married)who are not in school The March CPS sample excludes disabled or ill women and those with positive earnedincome but zero hours of work In the second panel single mothers without a child under six are excludedSee text for details
1083THE LABOR SUPPLY OF SINGLE MOTHERS
ing at all in a given tax year but for some could decrease weeksworked If our goal is to provide a sharp test of theoretical pre-dictions whether a woman worked last year is a better outcomemeasure We report both measures with the expectation that theeffects of many of the recent policy changes on weekly employ-ment will be smaller than on annual employment
The employment rates reported in Table II exhibit a strikingtime pattern For single mothers weekly employment increasedby almost 6 percentage points between 1984 and 1996 whileannual employment increased over 85 percentage points Most ofthis increase occurred between 1991 and 199618 Focusing on thesubsample of single mothers with young children the employ-ment increases were even larger 10 percentage points for weeklyemployment and 135 percentage points for annual employmentIn contrast the declines in both weekly and annual employmentof about one percentage point for single women without childrensuggest that the rising employment of single mothers was not aresult of better work opportunities for all single women More-over the timing of the employment increases suggest that policychanges in the 1990s are likely to have played a large role
B Comparing Single Mothers and Single Women withoutChildren
Appendix 2 reports descriptive statistics for single womenwith and without children for the years 1984 1988 1992 and1996 The table indicates that single mothers tend to be older andless educated and are more likely to be nonwhite than singlewomen without children The age of single women without chil-dren rises appreciably over the sample period as does the edu-cation level of single mothers The fraction of single mothersliving with parents is stable while the rate for single womenwithout children falls The rates of cohabitation rise for bothsingle women with and without children
A potential criticism of the Table II results (and our main
18 One concern in interpreting changes in employment for single mothersduring the years 1992 to 1994 is that beginning in January 1994 the CPS used aredesigned questionnaire For a description of this CPS redesign see CohanyPolivka and Rothgeb [1994] and Polivka and Miller [1998] In Meyer and Rosen-baum [1999] we assess the extent of any bias due to the redesign using the parallelsurvey which provides contemporaneous responses using the new and old surveysWe also employ ORGMarch comparisons using the fact that redesign affected thetwo data sets at a different point in time Overall these comparisons indicate thatthe CPS redesign had a small effect that if it leads to any bias suggests that weslightly understate the recent employment increases of single mothers
1084 QUARTERLY JOURNAL OF ECONOMICS
regression results below) is that single women without childrenare not a good comparison group for single mothers The means inAppendix 2 suggest the possibility that changes in the character-istics of single mothers versus single women without childrencould explain the two groupsrsquo differing employment rate trendsIn our regression results we condition on observable characteris-tics such as race and education in order to make the two groupsmore comparable It is also interesting to note that single womenwith and without children are quite similar in an importantdimension hourly earnings The mean hourly earnings of womenwith and without children are fairly similar (and they are muchcloser if one controls for education)
Perhaps more importantly one might argue that employ-ment rates are so high for single women without children that itis unreasonable to expect this group to respond to changes ineconomic conditions in the same way that single mothers do Yetemployment rates are not particularly high for low-educated sin-gle women particularly when examining employment last weekOnly 33 percent of high school dropout single mothers workedand 48 percent of high school dropout single women withoutchildren worked last week Nevertheless in our later regressionsderivative estimates for our key policy variables tend to be thelargest and most statistically signicant for high school dropouts
One might also wonder whether the large increases in em-ployment that we nd for single mothers but not for singlewomen without children also occur for other demographicgroups In Meyer and Rosenbaum [2000a] we examine whetherthere are similar employment increases for two other groups withhistorically low employment rates black males 19ndash44 and mar-ried mothers 19ndash44 We nd that the large increases in employ-ment of single mothers over 1984 ndash1996 and particularly since1991ndash1996 are not mirrored by other demographic groups
Another potential criticism of our approach is that usingvariation across women in their marital status number of chil-dren and state of residence implicitly assumes that marriagefertility and migration decisions are exogenous to the policychanges that we examine The evidence on the effects of policychanges on these decisions is mixed making the exogeneity as-sumption more plausible For example in her recent reviewHoynes [1997] concludes ldquoTogether this evidence suggests thatmarriage decisions are not sensitive to nancial incentivesrdquo Shealso argues that ldquoOverall [the effects of welfare on out-of-wedlock
1085THE LABOR SUPPLY OF SINGLE MOTHERS
births] are often insignicant and when they are not they aresmall [pp 129ndash130]rdquo On the other hand another recent reviewMoftt [1997] suggests that the weight of the evidence impliessome effect of welfare benets on marriage and fertility As tolocation Meyer [1999] concludes that there is a signicant butsmall effect of welfare on migration Overall it is likely thatendogenous single motherhood and location exert a small bias onour results
C Accounting for Individual and State Characteristics
As mentioned above the results in Table II could be partlyexplained by differential changes over time in characteristicssuch as age and education for single women with and withoutchildren Moreover business cycles may differentially affect sin-gle women with and without children thereby leading to employ-ment shifts unrelated to policy changes Consequently Table IIIpresents probit employment estimates for single women control-ling for demographic and business cycle changes We include alarge number of controls for differences between the two groupsand we include the unemployment rate as well as its interactionwith whether or not a woman has children The specication thatwe estimate is
(6) Pr(Eit 5 1) 5 F a Xit 1 b tYEARt
1 g t(YEARt p ANYCHILDRENi)
where Eit equals one if woman i from year t reports positive hoursworked in the reference week for the ORG (or the previous yearfor the March CPS) Xit is a vector that includes demographic andbusiness cycle variables YEARt is an indicator variable for yeart and ANYCHILDRENi equals one for a woman with childrenThe year dummies control for labor market trends in overallfemale employment and the X vector controls for demographicand business cycle effect differences between the groups espe-cially compositional shifts over time Thus differences between g t
coefcients give difference-in-differences estimates controlling forthese other factors These differences can be interpreted as esti-mates of the combined effect of changes in all factors affecting theemployment of single mothers relative to single women withoutchildren
The demographic and business cycle variables accounted forin Table III include controls for state race ethnicity age educa-
1086 QUARTERLY JOURNAL OF ECONOMICS
TABLE IIIPROBIT EMPLOYMENT PROBABILITY ESTIMATES FOR SINGLE WOMEN 1984ndash1996
Explanatory variable
ORG worked lastweek = 1
March CPS workedlast year = 1
(1) (2)
Averagederivative
Standarderror
Averagederivative
Standarderror
Any children p 1984 2 00797 00107 2 01087 00160Any children p 1985 2 00856 00105 2 01199 00156Any children p 1986 2 00857 00103 2 01144 00153Any children p 1987 2 00880 00099 2 01056 00144Any children p 1988 2 00837 00096 2 00918 00140Any children p 1989 2 00663 00094 2 00745 00131Any children p 1990 2 00788 00095 2 00832 00136Any children p 1991 2 00823 00102 2 00916 00151Any children p 1992 2 00747 00106 2 00706 00159Any children p 1993 2 00601 00101 2 00830 00153Any children p 1994 2 00538 00098 2 00388 00145Any children p 1995 2 00405 00096 2 00154 00143Any children p 1996 2 00121 00097 00042 00140Nonwhite 2 00902 00019 2 00727 00033Hispanic 2 00405 00030 2 00608 00033Age 19ndash24 2 00210 00024 2 00077 00055Age 25ndash29 00070 00024 2 00107 00095Age 35ndash39 2 00049 00026 00008 00052Age 40ndash44 2 00108 00028 00107 00116High school dropout 2 02161 00022 2 01512 00032Some college 00870 00019 00989 00055Bachelors 01441 00025 01755 00055Masters 01295 00040 01927 00095Divorced 2 00068 00028 00062 00052Widowed 2 01201 00080 2 01218 00116Any children p divorced 01154 00038 00720 00063Any children p widowed 00978 00097 01148 00137[ of children under 18 2 00404 00014 2 00325 00020[ of children under 6 2 00955 00020 2 00699 00027Pregnant z z 2 01333 00063Unearned income ($1000s) z z 2 00035 00003Central city z z 2 00230 00030State unemployment rate () 2 00113 00008 2 00101 00015Any children p state unemployment
rate () 00017 00010 00032 00017Number of observations 373662 119019
Sources The data are from the 1984ndash1996 Current Population Survey Outgoing Rotation Group File(ORG) and the 1985ndash1997 March Current Population Survey (March CPS)
Restrictions See Table II for sample restrictionsControls Additional controls include indicators for state year calendar month and calendar month
interacted with any children (ORG)Notes Unearned income includes interest dividend Social Security veteransrsquo benets and retirement
income The omitted group is white non-Hispanic age 30ndash34 never married and not pregnant (March CPS)She does not live in a central city (March CPS) and has only a high school education See text for details
1087THE LABOR SUPPLY OF SINGLE MOTHERS
tion marital status marital status interacted with a childrenindicator the number of children under six and eighteen thestate unemployment rate the state unemployment rate inter-acted with a children indicator (for the March CPS only) controlsfor pregnancy central city and unearned income and (for theORG only) controls for month and month interacted with a chil-dren indicator Note that the difference-in-differences calculatedby subtracting one YEAR p ANYCHILDREN coefcient fromanother are hardly affected by including the controls19 For ex-ample between 1984 and 1996 the weekly employment of singlemothers relative to single women without children rises 71 per-centage points without controls and 68 percentage points withcontrols20 For annual employment the difference-in-differencesestimator for 1984 to 1996 suggests an 117 percentage pointincrease in the relative annual employment of single motherswithout controls and an 113 percentage point increase withcontrols Again most of the increase occurs between 1991 and1996 Therefore these difference-in-difference estimates suggesta potential role for policy changes especially since 1991
VI POLICY VARIABLES AND EMPLOYMENT USING OUR SIMPLE
STRUCTURAL MODEL
We now move on to our main approach that uses our simplestructural model to distinguish between the different policies andto provide estimates that have a clearer interpretation Whilesome of the estimates rely on comparisons of single mothers andsingle women with children over time other estimates use avariety of other sources of identifying variation in our key explana-tory variables In some specications the identifying variationcomes from differences in taxes and benets for families of dif-ferent sizes and in different states as well as changes in thesetaxes and benets over time and differences in state living costs
Table IV reports estimates of our structural model of the
19 Due to the difculty in gauging the magnitude of probit coefcient esti-mates instead we report derivatives of the probability of working with respect toeach of the explanatory variables averaged over the single mothers in the sampleThus differences in the average derivatives for the YEAR p ANYCHILDRENvariables give changes over time in the difference in employment between singlewomen with and without children analogous to the changes that can be calculatedfrom Table II
20 The ldquowithout controlsrdquo results come from a weighted probit including onlythe year dummies and YEAR p ANYCHILDREN interactions
1088 QUARTERLY JOURNAL OF ECONOMICS
effects of tax and welfare policy on the probability that a womanworks These specications provide estimates of the parametersin expression (5) of Section II and can be used to obtain estimatesof the effects of the different policy changes during the 1984 ndash1996period These specications also provide coefcients that can beused to summarize the effects of a wide range of policies and thatcan be used to simulate other policies In addition to the variablesshown in Table IV each of these probits include the controlvariables reported in Table III (except for the YEAR p ANY-CHILDREN interactions) along with a large number of familycomposition variables listed in the table notes These controlvariables imply that we are not using simple differences acrossfamily types to identify our coefcients We are using changesover time or differences across states in how different families aretreated We focus rst on the full sample specications in columns(1) and (5)
All of the coefcients on the income variables have the signsthat are implied by our simple structural model and are signi-cantly different from zero21 Lower taxes and maximum welfarebenets increase employment while higher welfare benets if awoman works (due to lower implicit taxes on earnings) increaseemployment Rather than restricting the income variables toenter the worknonwork decision as a single expected incomevariable we have allowed the coefcients on the different compo-nents of income to differ It is thus encouraging that the coef-cients on the income tax and welfare variables have roughly thesame magnitude as expected The one exception to this rule isthat the coefcient on Welfare Benets if Work in the weeklyemployment equation is substantially larger than the other in-come coefcients
A Taxes
The Income Taxes if Work coefcient implies that a onethousand dollar reduction in income taxes if a woman worksincreases employment last week by 27 percentage points andincreases employment last year by 45 percentage points Both ofthese effects are strongly signicant These coefcients indicateelasticities of the participation rate with respect to the return to
21 We examined the importance of allowing for correlation among the errorterms at the level of state p year p ANYCHILDREN using STATA These standarderrors are very close to those without this correction for clustering
1089THE LABOR SUPPLY OF SINGLE MOTHERS
TA
BL
EIV
PR
OB
ITE
ST
IMA
TE
SO
FT
HE
EF
FE
CT
OF
PO
LIC
YV
AR
IAB
LE
SO
NT
HE
EM
PL
OY
ME
NT
OF
SIN
GL
EW
OM
EN
AV
ER
AG
ED
ER
IVA
TIV
E(S
TA
ND
AR
DE
RR
OR)
Exp
lan
ator
yva
riab
le
OR
Gw
orke
dla
stw
eek
=1
Mar
chC
PS
wor
ked
last
year
=1
Yea
rsof
edu
cati
onY
ears
ofed
ucat
ion
All
lt12
12gt
12A
lllt
1212
gt12
(1)
(2)
(3)
(4)
(5)
(6)
(7)
(8)
Inco
me
taxe
sif
wor
k2
002
732
004
172
003
342
001
822
004
492
008
792
005
262
002
07in
$100
0sy
ear
(00
034)
(00
080)
(00
057)
(00
051)
(00
053)
(00
150)
(00
090)
(00
063)
Wel
fare
max
imu
mbe
net
20
0340
20
0425
20
0357
20
0218
20
0295
20
0579
20
0349
20
0068
in$1
000s
yea
r(0
002
4)(0
005
6)(0
004
0)(0
003
6)(0
003
8)(0
010
6)(0
006
3)(0
004
5)W
elfa
rebe
ne
tif
wor
k0
0772
006
540
0916
005
390
0571
011
770
0626
002
33in
$100
0sy
ear
(00
073)
(00
171)
(00
121)
(00
109)
(00
107)
(00
299)
(00
177)
(00
125)
Pro
babi
lity
ofA
FD
Cre
ceip
t2
019
852
029
262
025
472
010
872
017
422
026
942
020
192
011
94if
wor
k(0
023
9)(0
052
2)(0
039
8)(0
036
3)(0
034
8)(0
094
4)(0
058
6)(0
041
7)M
edic
aid
ifw
ork
20
0096
20
0040
000
132
001
672
000
452
001
190
0007
20
0072
in$1
000s
yea
r(0
003
3)(0
006
6)(0
005
6)(0
005
5)(0
004
4)(0
010
9)(0
007
6)(0
005
9)W
aive
rmdashan
yti
me
lim
it0
0136
004
080
0192
20
0065
001
910
0256
000
720
0169
(Ind
icat
orva
riab
le)
(00
071)
(00
160)
(00
119)
(00
102)
(00
125)
(00
329)
(00
209)
(00
149)
Wai
vermdash
any
term
inat
ions
002
220
0355
003
540
0124
004
820
1174
005
320
0148
(Ind
icat
orva
riab
le)
(00
110)
(00
260)
(00
181)
(00
158)
(00
223)
(00
607)
(00
375)
(00
250)
Tra
inin
gmdashed
uca
tion
20
0805
20
0824
20
0715
20
0563
20
0759
20
0708
20
1222
20
0257
in$1
000s
yea
r(0
019
0)(0
043
0)(0
031
1)(0
028
3)(0
031
0)(0
084
9)(0
050
7)(0
037
6)
1090 QUARTERLY JOURNAL OF ECONOMICS
TA
BL
EIV
(CO
NT
INU
ED
)
Exp
lana
tory
vari
able
OR
Gw
orke
dla
stw
eek
=1
Mar
chC
PS
wor
ked
last
year
=1
Yea
rsof
edu
cati
onY
ears
ofed
uca
tion
All
lt12
12gt
12A
lllt
1212
gt12
(1)
(2)
(3)
(4)
(5)
(6)
(7)
(8)
Tra
inin
gmdashjo
bse
arch
oth
er0
0446
004
720
0607
002
600
0526
006
690
0643
002
84in
$100
0sy
ear
(00
117)
(00
272)
(00
190)
(00
175)
(00
192)
(00
528)
(00
317)
(00
236)
Chi
ldca
re0
0227
002
720
0190
002
260
0229
004
380
0175
001
94in
$100
0sy
ear
(00
065)
(00
148)
(00
104)
(00
104)
(00
100)
(00
287)
(00
164)
(00
119)
Sta
teu
nem
ploy
men
tra
te2
001
002
000
982
001
012
001
052
000
832
001
332
000
902
000
53in
perc
enta
gepo
ints
(00
007)
(00
020)
(00
013)
(00
010)
(00
014)
(00
044)
(00
024)
(00
016)
Any
chil
dren
pst
ate
unem
pra
te2
000
010
0009
20
0010
000
080
0011
000
422
000
090
0022
inpe
rcen
tage
poin
ts(0
000
9)(0
002
1)(0
001
4)(0
001
3)(0
001
4)(0
004
2)(0
002
4)(0
001
7)N
um
ber
ofob
serv
atio
ns37
366
251
146
134
432
188
084
119
019
159
9441
060
619
65
Sou
rces
The
data
are
from
the
1984
ndash199
6C
urre
ntP
opul
atio
nSu
rvey
Out
goin
gR
otat
ion
Gro
up
Fil
e(O
RG
)an
dth
e19
85ndash1
997
Mar
chC
urre
ntP
opul
atio
nS
urve
y(M
arch
CP
S)
Res
tric
tion
sS
eeT
able
IIfo
rsa
mpl
ere
stri
ctio
ns
Spec
ica
tion
s(2
)an
d(6
)ar
ere
stri
cted
tohi
ghsc
hoo
ldr
opou
ts(
3)an
d(7
)to
high
sch
ool
grad
uate
san
d(4
)an
d(8
)to
thos
ew
ith
aned
ucat
ion
beyo
nd
hig
hsc
hool
C
ontr
ols
Inad
diti
onto
the
vari
able
sin
Tab
leII
I(e
xcep
tfo
rth
ein
tera
ctio
nsbe
twee
nye
aran
dan
ych
ildr
en)
the
foll
owin
gco
ntro
lsar
ein
clud
ed
indi
cato
rsfo
rst
ate
year
ca
len
dar
mon
tha
nd
cale
ndar
mon
thin
tera
cted
wit
han
ych
ildr
en(O
RG
)w
heth
erat
leas
ton
etw
oth
ree
and
four
orm
ore
child
ren
are
pote
ntia
llyA
FD
Cel
igib
lew
heth
erat
leas
ton
ean
dat
leas
ttw
och
ildr
enar
eE
ITC
elig
ible
and
wh
ethe
rat
leas
ton
ech
ild
isu
nder
six
unde
rth
ree
unde
rtw
oan
dun
der
one
Las
tco
ntin
uou
sva
riab
les
for
the
num
ber
ofch
ildr
enun
der
each
age
betw
een
one
and
nin
etee
nar
ein
clud
ed
Not
esI
nal
lspe
cic
atio
ns
the
tax
wel
fare
and
Med
icai
dva
riab
les
are
calc
ula
ted
usin
ga
join
tho
urs
wag
edi
stri
buti
one
stim
ated
sepa
rate
lyfo
rsi
ngl
ew
omen
wit
han
dw
itho
utch
ildr
enT
axes
and
wel
fare
are
adju
sted
for
stat
eco
stof
livi
ngdi
ffer
ence
san
dal
ldo
llar
amou
nts
are
expr
esse
din
1996
doll
ars
See
App
endi
x1
for
spec
ic
indi
ces
used
and
othe
rde
tail
s
1091THE LABOR SUPPLY OF SINGLE MOTHERS
work of 107 for any employment during the year and 083 forwork in an average week We also estimated specications withseparate coefcients on state and federal income taxes althoughfor brevity these full estimates are not reported here The resultsfor federal taxes were similar to all taxes while the derivative(standard error) for state income taxes was a large and signicant2 00336 (00083) in the ORG sample and a smaller and insigni-cant 2 00165 (00139) in the March sample Thus while the statetax estimates are much less precise and differ in the two samplesthey give the same message as the other tax coefcients ie thatthe labor supply of single mothers responds to taxes
B Welfare
The full sample specications of columns (1) and (5) alsoindicate substantial effects of welfare on employment A onethousand dollar reduction in the annual Welfare Maximum Bene-t (the AFDC plus Food Stamp benet a women receives if shedoes not work) increases employment last week by 34 percentagepoints and increases employment last year by 30 percentagepoints This calculation holds constant the other welfare vari-ables Welfare Benets if Work and Probability of AFDC Receiptif Work that generally change with the maximum benet TheWelfare Benets if Work effect is sizable implying that a onethousand dollar increase in benets when one works increasesemployment last week by 72 percentage points and last year by57 percentage points These estimates suggest substantial posi-tive employment effects of reductions in implicit tax rates andincreases in earnings disregards
The transaction costs or stigma of welfare receipt as mea-sured by the Probability of AFDC Receipt if Work variable isnegative and signicantly different from zero as expected (seeequation (5)) The magnitude of this coefcient can be gauged bycomparing it with the coefcients on the variables denominatedin thousands of dollars Such comparisons suggest a transactioncost of several thousand dollars with the exact number depend-ing on the employment measure and the income variable usedFor example using the Welfare Benets if Work coefcient in theORG sample yields a transaction cost estimate of $2571 whilethe March sample implies an estimate of $3051 This resultagrees with past studies as well as ethnographies that havetended to nd substantial transaction costs or stigma of welfarereceipt
1092 QUARTERLY JOURNAL OF ECONOMICS
To assess the effect of cutting the AFDC benet one needs toincorporate the effects of all three of the welfare variables and theMedicaid if Work variable When the AFDC maximum benetand payment standard are cut they not only reduce benets ifone does not work but also reduce benets if one does work Theyalso decrease the likelihood that a working mother will be onwelfare at all thereby reducing both her Medicaid eligibility andher AFDC transaction and stigma costs When we do the fullcalculations we nd that a 10 percent cut in the maximumbenet ($324 annually) increases both the annual and weeklyemployment rate by about 10 percentage points
Despite a more detailed calculation of welfare incentivesthan most past work and the use of panel data techniques wethink there are important potential sources of bias in these esti-mates We should also note that by dividing the effect of welfareinto income when working and when not and by estimating aseparate term for transaction costsstigma we are putting thetheoretical predictions to a more severe test than most work Asdiscussed in Section IV the Welfare Benets if Work variable andthe Probability of AFDC Receipt if Work variable are more dif-cult to calculate precisely than our other variables The largercoefcient on the Welfare Benets if Work variable could also bedue to the scale of this variable being inappropriately low Theearnings distribution used to calculate expected benets putsmost of the weight on earnings levels where welfare benetswould be low or zero It is very likely that we should use anearnings distribution that puts greater weight in the left tailsince women who work while on welfare rarely report all of theirearnings to the welfare ofce [Edin and Lein 1997] The reasonsfor possible bias in the Probability of AFDC Receipt if Workvariable are similar The coefcients on these two variables tendto both be large in the same specications with their oppositesigns canceling each other out
C Medicaid
We nd little effect of Medicaid on the employment decisionsof single mothers Theory predicts that the Medicaid if Workvariable will have a positive effect on employment The variablehas the opposite effect from this prediction in both samplesalthough the coefcient estimates are small and usually are notsignicantly different from zero This result is not completelyunexpected given the weak and conicting ndings in past work
1093THE LABOR SUPPLY OF SINGLE MOTHERS
Part of the difculty is the uncertainty about individual knowledgeof Medicaid rules and their valuation of the benets We havetried a large number of alternative specications none of whichindicates a large effect of Medicaid A full accounting of theseresults can be found in Meyer and Rosenbaum [2000b]
D Welfare Waivers and Time Limits
The AFDC waiver variables have the expected effect on em-ployment and their coefcients are signicantly different fromzero Both the implementation of a time limit on welfare receiptand the actual termination of benets under a work requirementor time limit waiver are predicted to increase employment bybetween 14 and 48 percentage points However until the lastyears of our sample the overall importance of such waivers issmall Even by 1994 only 5 percent of single mothers lived instates with a time limit and less than half of 1 percent lived instates that had begun to terminate benets
One should be cautious in interpreting the waiver coef-cients especially in attributing effects to the implementation ofparticular provisions of recent waivers or the termination of casesper se The perception of welfare changes by potential welfarerecipients the attitudes of case workers and differences in stateimplementation of policies likely play a large role in inuencingthe welfare caseload and consequently employment It is alsoeconometrically difcult to disentangle which provisions of awaiver are the most important since states typically imple-mented several changes to their AFDC programs under waiversat the same time The reported coefcients are partly the effect ofthe particular actions coded and partly a proxy for other changesgoing on in the states
Recognizing these limitations the strength of the evidencehere for a causal interpretation of the waiver results is muchgreater than in the studies of welfare caseloads First we useimplementation dates rather than application or approval dateswhich are at best loosely related to when provisions are enforcedSecond when we account for state intentions to reform welfare asindicated by whether or not a state has made a major waiverapplication this variable has little effect Third one or two yearleads of our time limit and termination variables have small andinsignicant coefcients suggesting that the provisions per serather than publicity or administrator attitudes lead to the em-ployment increases This result contrasts with those of Blank
1094 QUARTERLY JOURNAL OF ECONOMICS
[1997] and Levine and Whitmore [1998] who found strong effectsof leads of waiver variables on caseloads
E Training and Child Care
The last three coefcient estimates in Table IV measure theemployment effects of expenditures on training and child careHigher expenditures on job search and other training and onchild care are associated with a higher employment rate for singlemothers Training expenditures on education have a negativeeffect that is signicant in both samples The job search coef-cients imply that an increase in expenditures of one thousanddollars (about two-thirds of average expenditures) would increasethe employment rate for single mothers without young childrenby over four percentage points Since single mothers withoutchildren young enough to exempt them from training programsmake up about half of all single mothers the overall effect wouldbe over two percentage points An increase in federal and statechild care expenditures of ve hundred dollars per single motherwith a child under six (slightly less than the mean in 1996) isassociated with about a one percentage point increase in bothweekly and annual employment These effects are quite substan-tial per dollar expended The training result on education is notsurprising given the weaker results in the literature on classroomtraining and the possible short-term effect on employment aswomen are in classrooms rather than jobs
F Results by Education Group
Table IV also reports separate estimates for the effects of thepolicy variables for three education groups less than high schoolhigh school and some college We would expect a priori that thepolicy variables which mostly capture taxes and benets receivedby low-income women would have the greatest effect on highschool dropouts less of an effect on those with a high schooldegree and even less of an effect on those with some college22
Overall the results by level of education are consistent with thehypothesized larger effects on the less educated The derivativestend to be much larger in absolute value for high school dropoutsthan they are in the full sample and much smaller for those with
22 The estimates use a xed wagehours distribution (that does not vary byeducation) to calculate the income and benet variables so that the explanatoryvariables are comparable across the columns
1095THE LABOR SUPPLY OF SINGLE MOTHERS
some college than in the full sample For example a one thousanddollar cut in taxes (or increase in tax credits) for high schooldropout single women is predicted to increase their employmentby 42 percentage points in a typical week and increase work atall during the year by 88 percentage points The correspondingnumbers for those with some college education are 18 percentagepoints and 21 percentage points Many of the other policy vari-able derivatives also fall with increased education23
G Unemployment and Macroeconomic Conditions
Table IV also reports the coefcients on the state unemploy-ment rate and its interaction with a dummy variable for a singlewoman having children The unemployment rate is strongly sig-nicant and implies that for single women without children a onepercentage point increase in the unemployment rate is associatedwith a 10 percentage point decrease in employment in a typicalweek and a 08 percentage point decrease in work anytime duringthe year On the other hand the interaction of the unemploymentrate with being a single mother is small and not signicantlydifferent from zero The point estimates imply that a one percent-age point increase in the unemployment rate is associated withonly a 001 percentage point decrease in a typical week and 01percentage point increase any time during the year in theemployment of single mothers relative to single women withoutchildren These coefcients indicate a strong and similarresponsiveness of both groups of single women to the state of themacroeconomy This result is favorable for the use of singlewomen without children as a comparison group for single mothers
H Alternative Specications
Since many of the changes in policy notably welfare reformtook place in recent years and a well-publicized decline in thewelfare rolls began in 1994 we reestimate the full sample speci-cations of Table IV dropping the years 1994 ndash1996 along withthe waiver variables (which are nearly always zero through1993) The estimates from this shorter sample which are re-ported in columns (1) and (5) of Table V are very close to those
23 The derivatives might be lower for groups with higher levels of educationbecause their employment rates are higher leaving less room for increases inemployment However the drop in the magnitude of the policy variable deriva-tives with more education is greater than it is for other control variables such asthe unemployment rate
1096 QUARTERLY JOURNAL OF ECONOMICS
TA
BL
EV
PR
OB
ITE
STIM
AT
ES
OF
TH
EE
FF
EC
TO
FP
OL
ICY
VA
RIA
BL
ES
ON
TH
EE
MP
LO
YM
EN
TO
FS
ING
LE
WO
ME
NA
LT
ER
NA
TIV
ES
PE
CIF
ICA
TIO
NS
AV
ER
AG
ED
ER
IVA
TIV
E(S
TA
ND
AR
DE
RR
OR)
Exp
lana
tory
vari
able
OR
G
wor
ked
last
wee
k=
1M
arch
CP
Sw
orke
dla
stye
ar=
1
(1)
(2)
(3)
(4)
(5)
(6)
(7)
(8)
Inco
me
taxe
sif
wor
k2
002
892
001
352
005
012
000
552
004
302
002
532
005
582
003
05in
$100
0sy
ear
(00
045)
(00
087)
(00
051)
(00
084)
(00
074)
(00
129)
(00
087)
(00
133)
Lag
ged
inco
me
taxe
sif
wor
kz
zz
20
0263
zz
z2
001
75in
$100
0sy
ear
zz
z(0
009
2)z
zz
(00
148)
Wel
fare
max
imu
mbe
net
20
0375
20
0107
20
0464
20
0340
20
0291
20
0011
20
0445
20
0296
in$1
000s
yea
r(0
002
9)(0
006
5)(0
003
3)(0
002
4)(0
004
7)(0
009
2)(0
005
6)(0
003
8)W
elfa
rebe
ne
tif
wor
k0
0911
001
070
1027
007
660
0644
20
0080
20
0882
005
67in
$100
0sy
ear
(00
089)
(00
106)
(00
099)
(00
073)
(00
132)
(00
144)
(00
157)
(00
107)
Pro
babi
lity
ofA
FD
Cre
ceip
t2
021
042
010
442
024
102
019
502
020
562
008
372
026
652
017
17if
wor
k(0
029
7)(0
033
6)(0
032
7)(0
023
9)(0
043
3)(0
050
1)(0
051
8)(0
034
8)M
edic
aid
ifw
ork
20
0133
000
292
002
092
000
952
000
790
0055
20
0107
20
0045
in$1
000s
yea
r(0
004
6)(0
003
7)(0
004
5)(0
003
3)(0
005
9)(0
004
9)(0
006
6)(0
004
4)W
aive
rmdashan
yti
me
lim
itz
001
710
0204
001
28z
002
470
0350
001
84(I
ndic
ator
vari
able
)z
(00
080)
(00
104)
(00
071)
z(0
014
1)(0
019
7)(0
012
5)W
aive
rmdashan
yte
rmin
atio
nsz
001
600
0456
002
15z
003
550
0703
004
79(I
ndic
ator
vari
able
)z
(00
116)
(00
163)
(00
110)
z(0
023
8)(0
034
7)(0
022
3)
1097THE LABOR SUPPLY OF SINGLE MOTHERS
TA
BL
EV
(CO
NT
INU
ED
)
Exp
lana
tory
vari
able
OR
Gw
orke
dla
stw
eek
=1
Mar
chC
PS
w
orke
dla
stye
ar=
1
(1)
(2)
(3)
(4)
(5)
(6)
(7)
(8)
Tra
inin
gmdashed
uca
tion
20
0755
20
0764
20
0728
20
0841
20
0804
20
0656
20
1396
20
0780
in$1
000s
yea
r(0
023
7)(0
022
3)(0
039
2)(0
019
0)(0
040
1)(0
036
5)(0
060
7)(0
031
0)T
rain
ingmdash
job
sear
cho
ther
007
620
0441
001
060
0428
007
150
0571
008
490
0517
in$1
000s
yea
r(0
014
0)(0
013
3)(0
023
7)(0
011
7)(0
023
7)(0
021
3)(0
038
2)(0
019
3)C
hild
care
000
110
0190
000
710
0215
20
0033
001
710
0286
002
22in
$100
0sy
ear
(00
092)
(00
073)
(00
088)
(00
066)
(00
140)
(00
114)
(00
161)
(00
101)
1994
ndash199
6ex
clud
edY
esN
oN
oN
oY
esN
oN
oN
oS
ingl
em
oth
ers
only
No
Yes
No
No
No
Yes
No
No
Mot
her
sw
och
ildr
enlt
6ex
cl
No
No
Yes
No
No
No
Yes
No
Nu
mbe
rof
obse
rvat
ions
292
731
122
966
303
396
373
662
938
1640
818
957
8611
901
9
Sou
rces
The
data
are
from
the
1984
ndash199
6C
urre
ntP
opul
atio
nSu
rvey
Out
goin
gR
otat
ion
Gro
up
Fil
e(O
RG
)an
dth
e19
85ndash1
997
Mar
chC
urre
ntP
opul
atio
nS
urve
y(M
arch
CP
S)
Res
tric
tion
sS
eeT
able
IIfo
rsa
mpl
ere
stri
ctio
ns
Spe
cic
atio
ns(1
)an
d(5
)ex
clu
de19
94ndash1
996
Spe
cic
atio
ns
(2)
and
(6)
incl
ude
only
sin
gle
mot
hers
Spe
cic
atio
ns
(3)
and
(7)
incl
ude
sing
lew
omen
wit
hout
chil
dren
and
sing
lem
othe
rsw
hose
youn
gest
chil
dis
less
than
six
Con
trol
sS
eeT
able
IVfo
rco
ntr
ols
Indi
cato
rsfo
rin
tera
ctio
nsbe
twee
nst
ate
and
any
AF
DC
elig
ible
chil
dren
and
betw
een
year
and
both
any
AF
DC
elig
ible
child
ren
and
any
EIT
Cel
igib
lech
ildre
nar
ein
clud
edin
spec
ica
tion
s(2
)an
d(6
)N
otes
In
alls
peci
cat
ions
the
tax
wel
fare
and
Med
icai
dva
riab
les
are
calc
ula
ted
usin
ga
join
tho
urs
wag
edi
stri
buti
ones
tim
ated
sepa
rate
lyfo
rsi
ngle
wom
enw
ith
and
wit
hout
chil
dren
Tax
esan
dw
elfa
rear
ead
just
edfo
rst
ate
cost
ofli
vin
gdi
ffer
ence
sA
lso
alld
olla
ram
ount
sar
eex
pres
sed
in19
96do
llar
sS
eeA
ppen
dix
1fo
rsp
eci
cin
dice
sus
edan
dot
her
deta
ils
1098 QUARTERLY JOURNAL OF ECONOMICS
over the full sample period The only exception to this generali-zation is that the job searchother training coefcient is largerand the child care coefcient is smaller and statistically insigni-cant over the shorter time span These results are among themost important in this paper because they indicate that (1) theurry of welfare reform measures after 1993 has not falsely led toour main results and (2) the extended recovery of the 1990s is notan alternative explanation for our main results
Next we examine a sample of only single mothers Thisspecication identies the effects of the income variables throughchanges across states and for different family sizes In the case ofthe Income Taxes if Work variable we are largely using thevariation from the last few years when the EITC for women withone child was nearly unchanged but the EITC for women with twoor more children rose in large steps Thus identication comesfrom using women with one child as a control group and chang-ing the treatment that women with two or more children receiveWith single mothers only the year indicators remove the timetrend in welfare receipt and benets and the state indicatorsremove time-constant differences in state welfare benets andmuch of these state cost of living differences in the income vari-ables Thus the variation in welfare benets used to identify thecoefcients is now changes in state-level benets This identi-cation approach examines the employment response to fairlysubtle or short-run features of the welfare and tax laws Thesepolicy changes may be overwhelmed by other factors in thesespecications Despite these potential difculties much of theincome tax effect remains although the estimates are muchsmaller While the effect of taxes is still signicant in the MarchCPS data the drop in the coefcient and larger standard errorleads the ORG coefcient to be insignicantly different from zeroThe welfare benet coefcients are now no longer signicant TheAFDC transaction cost coefcient however remains signicantin the ORG data while the Medicaid coefcient has the expectedsign but remains small and insignicant in both samples
In the third set of specications of Table V we only includesingle mothers with a child under six (and single women withoutchildren) The derivative estimates for the tax and welfare vari-ables including waivers are often substantially larger in magni-tude for these single mothers with young children especially forthe tax variable in the ORG sample These specications are ofparticular interest because the effects of increased employment
1099THE LABOR SUPPLY OF SINGLE MOTHERS
on parental care is likely to be largest on these families withyoung children who are not likely to be in school The last speci-cation of Table V examines whether women learn about taxchanges with a delay after they are implemented This specica-tion includes both the contemporaneous and one year lagged taxvariables The results are somewhat supportive of a lagged effectof taxes In the ORG data the contemporaneous tax variable issmall and insignicant while the lagged variable is large andsignicant In the March CPS it is the contemporaneous variablethat is large and signicant while the lagged variable is smallerand signicant although still substantial in size
I Additional Specications and Hours Worked
We examine several other specications that are not reportedhere in order to determine the benets of studying many pro-grams at the same time to check the sensitivity of our results toalternative specications and to see whether there are particu-larly large effects for certain subgroups of the population We ndthat ignoring some of the policy changes that we study has asubstantial effect on the estimates for the remaining programsWhen we include the tax variable but leave out the other policyvariables its coefcient is about 50 percent larger in both sam-ples When the only policy variables that we include are Medicaidif Work and the Welfare Maximum Benet the Medicaid coef-cient is positive and signicant in the March CPS sample Whenthe other policy variables are not included the waiver variablesare much larger On the other hand the tax coefcient is hardlychanged when the training and child care variables are excludedThese results suggest that the common research strategy of in-vestigating one program in isolation has the potential to givemisleading results
We have examined the sensitivity of our results to alterna-tive samples and variable denitions In particular the resultsare little changed by using more stringent denitions of employ-ment by including separated women or women in school We alsotry several subgroup analyses In particular we examine differ-ences between whites and nonwhites and family heads and sub-family heads Nonwhites appear to be more affected by welfarewaivers than whites while subfamily heads are more sensitive totaxes than family heads
To obtain a broader picture of the effects of welfare and taxpolicy on labor supply we also examined hours worked (see
1100 QUARTERLY JOURNAL OF ECONOMICS
Meyer and Rosenbaum [1999] for more details) Difference-in-differences estimates for hours analogous to those in Table IIshow large relative increases in work for single mothers over thesample period with almost all of the change occurring after 1991We also estimated a series of Tobit and OLS regressions todetermine the effects of tax and welfare policy on hours controllingfor demographics economic conditions state and year We in-clude the same variables as we did in Tables IV and V althoughwe should emphasize that these variables were constructed forour structural model of employment and so are less suitable foran analysis of hours The effects of the policy variables in theTobit estimates for all women whether or not they work tend to besimilar to the effects on employment seen in the earlier tablesThese results hold for the sample of single mothers as well as forall single women The results are very similar for hours per yearin the March CPS and hours in a typical week in the ORG Forhours worked conditioning on positive hours the policy variablestend to have much the same signs but smaller and less signi-cant coefcients Overall the results tend to conrm the resultsfor the main policy variables that we found in the employmentprobits
VII WHICH POLICIES ACCOUNTED FOR THE EMPLOYMENT CHANGES
Our simultaneous examination of many government policiesmakes it straightforward to estimate the relative contribution ofthese policies to the recent increase in employment of singlemothers In Table VI we decompose the employment increases forsingle mothers relative to single women without children for boththe entire period (1984 ndash1996) and the recent period of rapidemployment growth (1992ndash1996) Overall these decompositionsindicate a large role for the EITC and other tax changes modestroles for AFDC benet cuts and waivers and smaller roles forMedicaid training and child care increases
Using the parameter estimates from our main specications(specications (1) and (5) of Table IV) the EITC explains 62percent of the increase in weekly employment over the full 1984to 1996 period yet only 27 percent of the increase between 1992and 1996 For annual employment the EITC plays a very similarrole explaining 61 percent of the 1984 to 1996 increase and 35percent of the 1992 to 1996 increase The corresponding changesin employment attributed to the EITC over the full 1984 to 1996
1101THE LABOR SUPPLY OF SINGLE MOTHERS
TA
BL
EV
IC
ON
TR
IBU
TIO
NO
FP
OL
ICY
CH
AN
GE
ST
OT
HE
CH
AN
GE
SIN
TH
ER
EL
AT
IVE
EM
PL
OY
ME
NT
OF
SIN
GL
EM
OT
HE
RS
VE
RSU
SS
ING
LE
WO
ME
NW
ITH
OU
TC
HIL
DR
EN
19
84ndash1
996
AN
D19
92ndash1
996
Exp
lan
ator
yva
riab
le
1984
ndash199
619
92ndash1
996
OR
GM
arch
CP
SO
RG
Mar
chC
PS
Din
emp
of
tota
lD
inem
p
ofto
tal
Din
emp
of
tota
lD
inem
p
ofto
tal
Inco
me
taxe
sif
wor
k0
0438
622
0
0720
614
0
0186
268
0
0305
351
W
elfa
rem
axim
um
ben
et
001
7925
4
001
5613
3
001
1416
5
000
9911
4
Wel
fare
ben
et
ifw
ork
000
050
70
0003
03
20
0045
26
52
000
332
38
Pro
babi
lity
ofA
FD
Cre
ceip
tif
wor
k2
000
022
03
20
0002
20
10
0020
29
000
172
0M
edic
aid
ifw
ork
20
0070
29
92
000
322
28
20
0023
23
32
000
112
12
Tot
alw
elfa
rebe
ne
tsamp
Med
icai
d0
0112
159
0
0125
106
0
0066
96
000
738
4W
aive
rmdashan
yti
me
lim
it0
0054
76
000
756
40
0052
76
000
738
5W
aive
rmdashan
yte
rmin
atio
ns
000
466
50
0099
84
000
466
60
0099
114
T
otal
wel
fare
wai
vers
000
9914
1
001
7414
8
000
9814
2
001
7219
8
Tra
inin
gmdashed
uca
tion
20
0101
214
4
20
0096
28
22
000
212
30
20
0020
22
3T
rain
ingmdash
job
sear
cho
ther
000
659
20
0077
65
000
476
80
0056
64
Ch
ild
care
000
689
70
0069
59
000
111
80
0013
15
Tot
altr
ain
ing
ampch
ild
care
000
324
60
0050
43
000
395
70
0039
56
Dem
ogra
phic
s2
000
732
104
2
000
682
58
001
0715
5
001
1212
9
Oth
er0
0096
137
0
0172
147
0
0196
283
0
0158
182
T
otal
007
0510
00
011
7410
00
006
9110
00
008
6910
00
Sou
rces
The
data
are
from
the
1984
ndash199
6C
urre
ntP
opul
atio
nSu
rvey
Out
goin
gR
otat
ion
Gro
up
Fil
e(O
RG
)an
dth
e19
85ndash1
997
Mar
chC
urre
ntP
opul
atio
nS
urve
y(M
arch
CP
S)
Not
es
Din
emp
give
sth
ech
ange
inth
eem
ploy
men
tof
sing
lem
othe
rs(r
elat
ive
tosi
ngle
wom
enw
itho
ut
chil
dren
)ov
erth
esp
eci
edti
me
peri
odth
atis
due
toth
egi
ven
expl
anat
ory
vari
able
(s)
of
tota
lgiv
esth
epe
rcen
tage
ofth
eem
ploy
men
tin
crea
sefo
rsi
ngle
mot
hers
(rel
ativ
eto
sing
lew
omen
wit
hout
chil
dren
)exp
lain
edby
the
give
nex
plan
ator
yva
riab
le(s
)T
he
rela
tive
empl
oym
ent
incr
ease
sar
eth
eav
erag
ede
riva
tive
esti
mat
esof
the
inte
ract
ions
ina
wei
ghte
dpr
obit
mod
elin
clu
ding
year
indi
cato
rsan
dth
eir
inte
ract
ions
wit
han
any
chil
dren
indi
cato
rT
he
para
met
eres
tim
ates
used
toes
tim
ate
the
chan
gein
empl
oym
ent
com
efr
omsp
eci
cati
ons
(1)
and
(5)o
fTab
leIV
wh
ileth
ech
ange
over
tim
ein
the
polic
yva
riab
les
com
esfr
omA
ppen
dix
2
1102 QUARTERLY JOURNAL OF ECONOMICS
period and the 1992 to 1996 period are also reported in Table VIWe estimate that the EITC and other tax changes increasedweekly employment 44 percentage points and annual employ-ment 72 percentage points over the full period with about 40percent of this change occurring over the 1992 to 1996 subperiodWhile these estimates are substantial they bracket the EITCeffects found by Eissa and Liebman [1996] and are smaller thanthose predicted by Dickert Houser and Scholz [1995] and Keane[1995]24
Changes in the maximum welfare benet and implicit taxrates and the Medicaid expansions account for between 10 and 16percent of the increase in weekly employment and between 8 and11 percent of the increase in annual employment over eitherperiod The effect of the Medicaid expansions themselves is usu-ally small or negative Conversely the effects of welfare waiversappear to be substantial with the estimates suggesting thatpolicies instituted under waivers account for about 14 to 15 per-cent of the increase in employment over the full sample periodand about 14 to 20 percent of the increase between 1992 and 1996for both weekly and annual employment In general both jobtraining and child care explain small parts of the employmentincrease although in the case of weekly employment over the fullperiod child care can account for about 10 percent of the increase
Improved macroeconomic conditions increased employmentfor both single mothers and single women without children overthe 1984 ndash1996 period Because the above calculations are forsingle mothers compared with single women without childrenunemployment is not given a share in the decomposition In all ofthe employment probits the interaction of unemployment andbeing a single mother had an economically small and statisticallyinsignicant effect Changes in state unemployment rates areestimated to have increased the absolute level of employment ofsingle mothers by 20 percentage points during a typical week
24 Eissa and Liebman [1996] found up to a 28 percentage point increase inparticipation due to TRA86 (which as we indicate in Section IV accounted for 43percent of the 1984ndash1996 change in taxes) Keane [1995] predicted that the1984ndash1996 changes will result in a 107 percentage point increase in participa-tion while Dickert Houser and Scholz [1995] predicted that the 1993ndash1996changes (39 percent of the full 1984ndash1996 change in taxes) would increase em-ployment of single parents by 33 percentage points Experimental ndings suchas those reported in Blank Card and Robins [2000] suggest substantial respon-siveness of welfare recipients and other low-income people to nancial incentivesThese experimental results would need to be extrapolated to all single mothersand the EITC to provide comparisons
1103THE LABOR SUPPLY OF SINGLE MOTHERS
and 14 percentage points during the year over the 1984 ndash1996period These numbers are equivalent to 284 percent of therelative increase in weekly employment and 122 percent of therelative increase in annual employment of single mothers overthe period
In results not shown we recalculate the shares of the em-ployment increase due to various policies using the parameterestimates from specications with only single mothers (specica-tions (2) and (6) of Table V) These results suggest a much smallerrole for the EITC and other tax changes in explaining the changesin employment ranging from 49 to 56 percent as large as those inTable VI Changes in the maximum welfare benet are lessimportant while the results for welfare waivers job training andchild care are largely unchanged
VIII CONCLUSIONS
Between 1984 and 1996 tax and transfer policy were reori-ented to encourage work by single mothers Single mothers haveresponded to these incentives by working more especially after1991 and especially those with children under six To assesswhich policy changes have led to the employment increases weexamine the incentives of federal and state income taxes AFDCMedicaid Food Stamps and their implicit tax rates and earningsdisregards as well as AFDC waivers instituting time limits orwork requirements Our detailed examination of these policychanges using two large micro data sets indicates that EITC andother tax changes account for over 60 percent of the 1984 to 1996increase in the weekly and annual employment of single mothersrelative to single women without children Changes to welfareprograms were less important but still account for a substantialshare of the employment increases Changes in Medicaid train-ing and child care programs play a considerably smaller roleThese ndings are conrmed in an analysis of hours worked
This paper makes several methodological improvements overpast research including the estimation of a simple structuralmodel of employment which provides several independent tests ofthe hypothesis that single mothers respond to economic incen-tives Our results indicate that nancial incentives have powerfuleffects on single mothersrsquo employment decisions and that thedifferent sources of these incentives have effects of plausiblemagnitudes We also nd a sizable transaction cost or stigma to
1104 QUARTERLY JOURNAL OF ECONOMICS
welfare We rely on less subjective measures of welfare waiverssuch as implementation dates and the beginning of case termi-nations and provide the rst evidence on the effects of waivers onemployment Unlike most past work we examine the major pro-grams affecting single mothers together nding that examiningone or two programs in isolation can lead to biases in estimatedbehavioral effects
In most of our specications identication comes from thedifferences in incentives faced by single women with and withoutchildren While we argue that single women without children area plausible comparison group we also provide estimates that donot rely on this comparison Instead these estimates rely onchanges in the treatment of family size state cost of living dif-ferences changes in state income taxes differences in earningsdisregards and implicit tax rates across states and changes inthese parameters and welfare benets within a state over timeOur nding of large tax and welfare effects on employment arerobust although tax effects and especially welfare effects aresometimes smaller using alternative identication strategies
Our result that the EITC played a dominant role in theemployment increases of single mothers between 1984 and 1996suggests that policies that ldquomake work payrdquo are effective in in-creasing work by single mothers This lesson is important in lightof the emphasis on punitive measures such as time limits andwork requirements in the most recent welfare reforms
APPENDIX 1 DESCRIPTION OF POLICY VARIABLES
This section describes the construction of our policy variablesand lists our information sources First we begin with the as-sumptions that we use to determine taxes program participationand benet levels
1 The determination of whether a woman has children andhow many she has is based on the CPS family and sub-family denitions Children in primary families (both re-lated and unrelated) are assigned to the family headwhile children in subfamilies are assigned to the subfam-ily head rather than to the primary family head Childrenare dened as any member of the given family (primary orsubfamily) under age 19 (or under 24 and a full-timestudent) for EITC purposes and under age 18 for all otherprograms
1105THE LABOR SUPPLY OF SINGLE MOTHERS
2 In the March CPS sample the age for tax purposes is theage at the time of the March interview We subtract onefor AFDC and Medicaid purposes In the ORG sample weuse the age at the time of the interview for AFDC andMedicaid but for tax purposes we add one for interviewsoccurring between January and June
3 Women have no unearned income (including child sup-port) or assets and their children have no earned incomeunearned income or assets hence earnings determinetheir program eligibility
4 Single mothers are assumed to le as head of householdand claim their children as dependents while singlewomen without children le as single Also all womentake the standard deduction
5 Women receiving AFDC are in their rst four months ofwork and do not claim child care expenses25
6 Single women without children do not receive FoodStamps
7 Shelter costs (an input in Food Stamp calculations) varyonly by state and over time
A Tax Welfare and Medicaid Variables
First for each woman we calculate ve quantities income taxliabilities (federal and state income taxes incorporating federaland state EITCs) welfare benets (AFDC plus Food Stamps)AFDC receipt (indicator for AFDC eligibility) and Medicaidadults covered and Medicaid children covered Under the assump-tions above these calculations are made at 50 annual earningslevels generated from the cells of a joint wagehours distributionThe 50 cells come from a combination of ve annual hours levels(500 1000 1500 2000 and 2500) and ten hourly wage levels (45 6 7 8 10 12 15 20 and 25)
Second we use the wagehours distributions described in thetext to weight the above quantities We calculate the distributionsusing only women with more than $500 of annual earnings Wethen construct the following variables
25 These assumptions are roughly consistent with the facts In scal year1995 over two-thirds of AFDC families with earnings were in their rst fourmonths of work and only about 16 percent of AFDC families with earningsclaimed child care expenses [U S Department of Health and Human ServicesCharacteristics of AFDC Recipients 1996]
1106 QUARTERLY JOURNAL OF ECONOMICS
c Income Taxes if Work is the weighted sum of income taxliabilities at the various annual earnings points using thewagehours distributions described above as weights
c Welfare Benets if Work is the weighted sum of welfarebenets at the various annual earnings points using thewagehours distributions described above as weights
c Probability of AFDC if Work is the weighted sum of AFDCreceipt at the various annual earnings points using thewagehours distributions described above as weights
c Medicaid if Work is calculated in two steps First wecalculate the weighted sum of Medicaid adults covered andMedicaid children covered at the various annual earningspoints using the wagehours distributions described aboveas weights Second we then multiply these sums by dollarexpenditures separately for adults and children In themain specications we use average expenditures over allstates and years
c Welfare Maximum Benet is the welfare benet assumingzero earnings
We calculate AFDC monthly benets (AFDC) as follows (settingquantities in parentheses to zero if negative)
(A1) AFDC 5 min MAXBEN RR p [PS 2 BRR p (EI 2 DIS)]
wheremdash MAXBEN is the maximum benetmdash RR is the ratable reductionmdash PS is the payment standard (the dollar amount when
benets end not counting disregards)mdash BRR is the benet reduction ratemdash EI is earned income andmdash DIS is the earnings disregard
We calculate Food Stamp benets in two steps (setting quantitiesin parentheses to zero if negative) First we calculate themonthly shelter cost expense deduction (SED) and second wecalculate the monthly Food Stamp benet (FS)
(A2) SED 5 (min SEDC SE 2 05
p ((1 2 EIDP) p EI 1 AFDC 2 SD))
(A3) FS 5 (MB 2 03 p ((1 2 EIDP)
p EI 1 AFDC 2 SD 2 SED))
1107THE LABOR SUPPLY OF SINGLE MOTHERS
wheremdash EIDP is the earned income deduction percentage (018
prior to 1986 020 starting in 1986)mdash MB is the maximum Food Stamp benetmdash SD is the standard deductionmdash SE is shelter expensesmdash SEDC is the shelter expense deduction ceilingTax and welfare variables (and earned and unearned income
variables) are adjusted for state cost of living differences usingthe poverty threshold index for 1990 from National ResearchCouncil [1995] which is adjusted annually using the PCE dea-tor The poverty threshold index accounts for housing cost differ-ences between states using Census housing cost data
Sources for Taxes Welfare and Medicaid
We obtain the federal income tax schedules from the U SDepartment of the Treasury [various years] The state tax infor-mation was obtained from four sources the Advisory Committeeon Intergovernmental Relations [various years] the CommerceClearing House [various years] unpublished data from the Cen-ter on Budget Policy and Priorities and Feenberg and Coutts[1993] The AFDC program parameters are obtained from theU S Department of Health and Human Services (Characteristicsof State Plans [various years]) and unpublished data from theUrban Institute The Food Stamp parameters come from the U SHouse of Representatives (Green Book [various years]) and theU S Department of Agriculture [various years] The Medicaidprogram information is obtained from three sources the NationalGovernorrsquos Association [various dates] the IntergovernmentalHealth Policy Project [various years] and the U S House ofRepresentatives [Medicaid Source Book 1988 1993] Medicaiddollar values (separately for adults and children) come from un-published tables from the Health Care Financing Administration(HCFA)
B Welfare Waiver Variables
c Any Time Limit is one starting with the implementationmonth of a waiver that imposes mandatory work require-ments on families that reach time limits or results in thereduction or total loss of AFDC payments after a certaintime limit has been reached (usually two years)
1108 QUARTERLY JOURNAL OF ECONOMICS
c Any Terminations is one beginning with the month inwhich a case is rst terminated under a welfare waiver
c Major Waiver Application is one beginning with the monthin which a state rst applies for a major statewide waiver
Note that these variables are always zero for women withoutAFDC children
Sources for Welfare Waiver Variables
The waiver variables we used are based on our reading of thewaiver summaries in General Accounting Ofce [1997] the U SDepartment of Health and Human Services [1997c] and Savnerand Greenberg [1997] These sources generally have the imple-mentation dates of waivers We also consulted American PublicWelfare Association [1996] Levine and Whitmore [1998] andU S Department of Health and Human Services [1997a] Ourclassication scheme follows most closely the classicationschemes in General Accounting Ofce [1997] and the U S De-partment of Health and Human Services [1997c]
C Training Program Variables
These variables measure variation across states and overtime in federal and state spending on welfare-to-work programsand on eligibility criteria These numbers are based on the statelevel scal year WIN (Work Incentive) program expenditures andstate level scal year JOBS (Job Opportunities and Basic Skills)program expenditures by component (job search education etc)We calculate spending per female AFDC adult who is not exemptfrom participation based on the age of her youngest child Thedollars are then divided by the state average wage to obtain anamount of services provided26
We calculate the distribution of the age of the youngest childand we apportion total JOBS spending to women using the frac-tion of participants who are female adults We divide spendinginto two categories education which includes education postsec-ondary education and self-initiated education and other whichincludes job search job development and placement on-the-jobtraining work supplementation community work experienceself-initiated training job skills job readiness and assessmentand employability plan For scal year 1990 it is necessary to
26 The state average wage is average hourly wage for manufacturing in thestate It is normalized so that the 1996 value = 100
1109THE LABOR SUPPLY OF SINGLE MOTHERS
extrapolate WIN expenditures forward and JOBS expendituresbackward to the date when the JOBS program began in a givenstate We also extrapolate 1985 WIN data back to 1984 and scalyear 1996 forward to the rst three months of scal year 1997
Note that the training variables are zero for women withoutAFDC children and women with children young enough to ex-empt the mother from participation in WIN or JOBS
Sources for Training Variables
JOBSWIN expenditure data come from unpublished U SDepartment of Health and Human Services and U S Depart-ment of Labor tabulations and the U S House of Representa-tives (Green Book [various years]) To calculate the distribution ofthe age of youngest child for single mothers we use data from theU S Department of Health and Human Services (Characteristicsof AFDC Recipients [various years]) and authorsrsquo calculationsfrom the March CPS Wage data come from the Bureau of LaborStatistics web site
D Child Care Variable
Child Care expenditures are actual federal and state expen-ditures by state on the following four programs AFDC ChildCare Transitional Child Care At-Risk Child Care and ChildCare and Development Block Grants Expenditures are put on aper-person basis by dividing through by the number of unmarriedwomen with children less than six This denominator is calcu-lated using annual data on the number of women by state (fromthe Census Bureau) and the fraction of women in a state who areunmarried with children less than six which is calculated fromthe ORG over the entire 1984 ndash1996 period Like training dollarsthe resulting dollar value is then divided by the state averagewage to obtain an amount of services provided
Note that the child care variable is always zero for womenwithout children less than six
Sources for Child Care Variable
Child Care expenditures come from unpublished U S De-partment of Health and Human Service tabulations Annual dataon the number of women by state come from the U S CensusBureau The fraction of women in a state who are unmarried withchildren less than six is calculated from the ORG by the authorsWage data come from the Bureau of Labor Statistics web site
1110 QUARTERLY JOURNAL OF ECONOMICS
AP
PE
ND
IX2
VA
RIA
BL
EM
EA
NS
FO
RS
ING
LE
MO
TH
ER
SA
ND
SIN
GL
EW
OM
EN
WIT
HO
UT
CH
ILD
RE
N1
984
1988
199
219
96
Var
iabl
e
1984
1988
1992
1996
Ch
ildr
enN
och
ildr
enC
hil
dren
No
chil
dren
Ch
ildr
enN
och
ildr
enC
hil
dren
No
chil
dren
Age
314
426
86
319
727
79
319
628
83
321
929
22
Non
wh
ite
037
10
155
036
30
162
038
40
178
037
70
207
His
pan
ic0
086
005
30
103
007
20
111
007
90
136
009
3H
igh
sch
ool
drop
out
026
20
094
024
60
091
024
10
094
021
10
092
Som
eco
lleg
e0
211
029
70
234
030
50
256
031
70
311
031
7B
ach
elor
s0
063
019
20
064
020
40
061
021
00
072
023
3M
aste
rs0
022
005
90
025
006
10
023
006
60
021
006
4D
ivor
ced
056
40
151
053
30
161
047
70
165
046
00
162
Wid
owed
006
60
010
005
50
010
004
70
012
003
80
012
Liv
ing
wit
hpa
ren
ts0
156
041
80
151
037
50
154
034
70
154
033
9L
ivin
gw
ith
un
rela
ted
adu
ltm
ale
009
70
135
012
50
167
014
80
198
016
50
218
[of
chil
dren
un
der
181
681
z1
664
z1
707
z1
707
z[
ofch
ildr
enu
nde
r6
056
0z
057
1z
062
4z
061
3z
Ear
ned
inco
me
(Mar
ch)
128
1018
331
134
6220
183
132
3218
993
147
6019
912
Ear
ned
inco
me
ifw
ork
(Mar
ch)
172
5019
536
180
1321
293
179
3020
453
180
2321
479
An
nu
alho
urs
ifw
ork
(Mar
ch)
1718
1837
1724
1894
1712
1862
1740
1881
Hou
rly
earn
ings
(Mar
ch)
985
103
89
9110
86
987
105
910
03
109
8In
com
eta
xes
ifw
ork
1521
2751
1030
2958
811
2967
7929
14W
elfa
rem
axim
um
ben
et
7583
z74
06z
7391
z70
56z
Wel
fare
ben
et
ifw
ork
1482
z14
78z
1546
z14
88z
Pro
babi
lity
ofA
FD
Cre
ceip
tif
wor
k0
255
z0
287
z0
266
z0
256
zM
edic
aid
ifw
ork
1215
013
590
1704
219
424
Nu
mbe
rof
obse
rvat
ion
s93
9118
914
9211
186
1210
333
193
1187
8815
846
Sou
rces
The
data
are
prim
arily
from
the
1984
ndash199
6C
urre
ntP
opul
atio
nSu
rvey
Out
goin
gR
otat
ion
Gro
upF
ile(O
RG
)and
from
the
1985
ndash199
7M
arch
Cur
rent
Pop
ulat
ion
Surv
ey(M
arch
)R
estr
icti
ons
See
Tab
leII
for
sam
ple
rest
rict
ion
sN
otes
Mea
ns
com
efr
omth
eO
RG
unle
ssth
eyar
ela
bele
d(M
arch
)T
hese
mea
nsar
eca
lcul
ated
usi
ngth
ech
arac
teri
stic
sof
the
give
nsa
mpl
efo
rth
egi
ven
year
and
are
wei
ghte
dW
omen
are
assu
med
tobe
inth
eir
rst
four
mon
ths
ofw
ork
toha
ven
ou
near
ned
inco
me
and
tocl
aim
noch
ildca
reex
pens
esA
lso
sin
gle
wom
enw
ith
and
wit
hou
tch
ildr
enar
eas
sum
edto
le
ashe
adof
hous
ehol
dan
dsi
ngl
ere
spec
tive
ly
and
tocl
aim
the
stan
dard
dedu
ctio
nT
axes
and
wel
fare
are
adju
sted
for
stat
eco
stof
livi
ng
diff
eren
ces
All
doll
aram
ount
sar
eex
pres
sed
in19
96do
llar
spe
rye
arS
eeA
ppen
dix
1fo
rsp
eci
cin
dice
sus
edan
dot
her
deta
ils
1111THE LABOR SUPPLY OF SINGLE MOTHERS
DEPARTMENT OF ECONOMICS AND INSTITUTE FOR POLICY RESEARCH NORTHWESTERN
UNIVERSITY AND NATIONAL BUREAU OF ECONOMIC RESEARCH
DEPARTMENT OF ECONOMICS UNIVERSITY OF NORTH CAROLINA GREENSBORO
REFERENCES
American Public Welfare Association ldquoSummary of Approved AFDC WaiverActionsrdquo (Washington DC May 1993 and August 1 1996)
Advisory Committee on Intergovernmental Relations Signicant Features ofFiscal Federalism (Washington DC various years)
Bavier Richard ldquoAn Early Look at the Effects of Welfare Reformrdquo unpublishedpaper March 1999
Blank Rebecca M ldquoWhat Causes Public Assistance Caseloads to Growrdquo unpub-lished paper May 1997
mdashmdash ldquoThe Effect of Medical Need and Medicaid on AFDC Participationrdquo Journalof Human Resources XXIV (1989) 54ndash87
Blank Rebecca M and Patricia Ruggles ldquoWhen Do Women Use Aid to Familieswith Dependent Children and Food Stampsrdquo Journal of Human ResourcesXXXI (1996) 57ndash89
Blank Rebecca M David E Card and Philip K Robins ldquoFinancial Incentives forIncreasing Work and Income among Low-Income Familiesrdquo in Finding JobsWork and Welfare Reform David Card and Rebecca M Blank eds (NewYork Russell Sage Foundation 2000) pp 373ndash419
Browning Edgar K ldquoEffects of the Earned Income Tax Credit on Income andWelfarerdquo National Tax Journal XLVIII (1995) 23ndash43
Cohany Sharon Anne Polivka and Jennifer Rothgeb ldquoRevisions in the CurrentPopulation Survey Effective January 1994rdquo Employment and Earnings XLI(1994) 13ndash37
Commerce Clearing House State Tax Handbook (Chicago IL various years)Council of Economic Advisers ldquoThe Economics of Child Carerdquo (Washington DC
December 1997)Danziger Sheldon Robert Haveman and Robert Plotnick ldquoHow Income Trans-
fers Affect Work Savings and the Income Distribution A Critical ReviewrdquoJournal of Economic Literature XIX (1981) 975ndash1028
Dickert Stacy Scott Houser and John Karl Scholz ldquoThe Earned Income TaxCredit and Transfer Programs A Study of Labor Market and Program Par-ticipationrdquo in Tax Policy and the Economy 9 James M Poterba ed (Cam-bridge MA MIT Press 1995) pp 1ndash50
Edin Kathryn and Laura Lein Making Ends Meet How Single Mothers SurviveWelfare and Low-Wage Work (New York Russell Sage Foundation 1997)
Eissa Nada and Jeffrey B Liebman ldquoLabor Supply Response to the EarnedIncome Tax Creditrdquo Quarterly Journal of Economics CXII (1996) 605ndash637
Eissa Nada and Hilary Williamson Hoynes ldquoThe Earned Income Tax Credit andLabor Supply Married Couplesrdquo NBER Working Paper No 6856 December1998
Ellwood David T ldquoThe Impact of the Earned Income Tax Credit and Social PolicyReforms on Work Marriage and Living Arrangementsrdquo National Tax JournalLIII (2000) 1063ndash1106
Feenberg Daniel and Elisabeth Coutts ldquoAn Introduction to the TAXSIM ModelrdquoJournal of Policy Analysis and Management XII (1993) 189ndash194
Fraker Thomas Robert Moftt and Douglas Wolf ldquoEffective Tax Rates andGuarantees in the AFDC Program 1967ndash1982rdquo Journal of Human Re-sources XX (1985) 252ndash263
General Accounting Ofce ldquoWelfare Reform Statesrsquo Early Experiences withBenet Terminationrdquo (Washington DC GAO S-97-74 May 1997)
Gueron Judith M and Edward Pauly From Welfare to Work (New York RussellSage Foundation 1991)
Heckman James J ldquoWhat Has Been Learned about Labor Supply in the PastTwenty Yearsrdquo American Economic Review LXXXIII (1993) 116ndash121
Hill Carolyn V Joseph Hotz Charles H Mullin and John Karl Scholz ldquoEITC
1112 QUARTERLY JOURNAL OF ECONOMICS
Eligibility Participation and Compliance Rates for AFDC Households Evi-dence from the California Caseloadrdquo unpublished paper March 1999
Hoffman Saul D and Laurence S Seidman The Earned Income Tax CreditAntipoverty Effectiveness and Labor Market Effects (Kalamazoo MI UpjohnInstitute for Employment Research 1990)
Holtzblatt Janet Janet McCubbin and Robert Gillette ldquoPromoting Workthrough the EITCrdquo National Tax Journal XLVII (1994) 591ndash608
Hoynes Hilary Williamson ldquoWork and Marriage Incentives in Welfare ProgramsWhat Have We Learnedrdquo in Fiscal Policy Lessons from Economic ResearchAlan J Auerbach ed (Cambridge MA MIT Press 1997)
Intergovernmental Health Policy Project Major Changes in State Medicaid andIndigent Care Programs (Washington DC various years)
Jencks Christopher and Joseph Swingle ldquoHas Welfare Reform Helped or HurtSingle Momsrdquo unpublished paper February 2000
Keane Michael ldquoA New Idea for Welfare Reformrdquo Federal Reserve Bank ofMinneapolis Quarterly Review XXXVIII (1995) 2ndash28
Levine Judith A ldquoPolicy Incentives Confront Everyday Realities IntegratingEconomic and Sociological Perspectives on the Welfare-to-Work Transitionrdquounpublished paper March 1997
Levine Phillip B and Diane M Whitmore ldquoThe Impact of Welfare Reform on theAFDC Caseloadrdquo National Tax Association Proceedings Ninetieth AnnualConference (1998) 24ndash33
Liebman Jeffrey B ldquoThe Impact of the Earned Income Tax Credit on Incentivesand Income Distributionrdquo in Tax Policy and the Economy 12 James MPoterba ed (Cambridge MA MIT Press 1998) pp 83ndash120
Martini Alberto and Michael Wiseman ldquoExplaining the Recent Decline in Wel-fare Caseloads Is the Council of Economic Advisers Rightrdquo Challenge XL(1997) 6 ndash20
Meyer Bruce D ldquoDo the Poor Move to Receive Higher Welfare Benetsrdquo unpub-lished paper April 1999
Meyer Bruce D and Dan T Rosenbaum ldquoWelfare the Earned Income Tax Creditand the Labor Supply of Single Mothersrdquo NBER Working Paper No 7363September 1999
Meyer Bruce D and Dan T Rosenbaum ldquoMaking Single Mothers Work RecentChanges in Tax and Welfare Policy and their Effectsrdquo National Tax JournalLIII (2000a) 1027ndash1062
Meyer Bruce D and Dan T Rosenbaum ldquoMedicaid Private Health Insuranceand the Labor Supply of Single Mothersrdquo unpublished paper November2000b
Moftt Robert ldquoAn Economic Model of Welfare Stigmardquo American EconomicReview LXXIII (1983) 1023ndash1035
mdashmdash ldquoIncentive Effects of the U S Welfare Systemrdquo Journal of Economic Litera-ture XXX (1992) 1ndash61
mdashmdash ldquoThe Effect of Welfare on Marriage and Fertility What Do We Know andWhat Do We Need to Knowrdquo unpublished paper December 1997
Moftt Robert and Barbara Wolfe ldquoThe Effect of the Medicaid Program onWelfare Participation and Labor Supplyrdquo Review of Economics and StatisticsLXXIV (1992) 615ndash626
National Governorrsquos Association MCH (Maternal and Child Health) Update(Washington DC various dates)
National Research Council Measuring Poverty A New Approach Constance FCitro and Robert T Michael eds (Washington DC National Academy Press1995)
mdashmdash Evaluating Welfare Reform A Framework and Review of Current WorkRobert Moftt and Michele Ver Ploeg eds (Washington DC National Acad-emy Press 1999)
Polivka Anne E and Stephen M Miller ldquoThe CPS After the Redesign Refocus-ing the Economic Lensrdquo in Labor Statistics Measurement Issues John Halti-wanger Marilyn E Manser and Robert Topel eds (Chicago University ofChicago Press 1998) pp 249ndash286
Romich Jennifer L and Thomas Weisner ldquoHow Families View and Use the
1113THE LABOR SUPPLY OF SINGLE MOTHERS
EITC The Case for Lump-sum Deliveryrdquo National Tax Journal LIII (2000)1245ndash1265
Savner Steve and Mark Greenberg ldquoThe CLASP Guide to Welfare Waivers1997rdquo (Washington DC Center for Law and Social Policy 1997)
Scholz John Karl ldquoThe Participation Rate of the Earned Income Tax CreditrdquoInstitute for Research on Poverty Madison WI Discussion Paper 928-90October 1990
mdashmdash ldquoThe Earned Income Tax Credit Participation Compliance and AntipovertyEffectivenessrdquo National Tax Journal XLVII (1994) 59ndash81
Smeeding Timothy M Katherine E Ross Michael OrsquoConnor and Michael SimonldquoThe EITC Expectation Knowledge Use and Economic and Social MobilityrdquoNational Tax Journal LIII (2000) 1187ndash1210
U S Department of Agriculture Characteristics of Food Stamp Households(Alexandria VA U S Department of Agriculture Food and Consumer Ser-vice Ofce of Analysis and Evaluation various years)
U S Department of Health and Human Services Characteristics and FinancialCircumstances of AFDC Recipients (Washington DC U S Department ofHealth and Human Services Administration for Children and FamiliesOfce of Family Assistance Division of Performance Measurement variousyears)
mdashmdash Characteristics of State Plans for Aid to Families with Dependent Children(Washington DC U S Department of Health and Human Services Admin-istration for Children and Families Ofce of Family Assistance variousyears)
mdashmdash HHS Fact Sheet State Welfare Demonstrations (Washington DC U SDepartment of Health and Human Services March 17 1997a)
mdashmdash National Evaluation of Welfare-to-Work Strategies (Washington DC Ad-ministration for Children and Families Ofce of the Assistant Secretary forPlanning and Evaluation December 1997b)
mdashmdash Setting the Baseline A Report on State Welfare Waivers (Washington DCU S Department of Health and Human Services Ofce of the AssistantSecretary for Planning and Evaluation 1997c)
U S Department of the Treasury Statistics of Income Individual Income TaxReturns (Washington DC U S Department of the Treasury Internal Reve-nue Service various years)
U S Department of the Treasury Your Federal Income Tax Tax Guide forIndividuals (Washington DC U S Department of the Treasury InternalRevenue Service various years)
U S House of Representatives Committee on Energy and Commerce MedicaidSource Book Background Data and Analysis (Washington DC GovernmentPrinting Ofce November 1988 and January 1993)
U S House of Representatives Committee on Ways and Means Green BookBackground Material and Data on Programs within the Jurisdiction of theCommittee on Ways and Means (Washington DC Government Printing Of-ce various years)
Winkler Anne ldquoThe Incentive Effects of Medicaid on Womenrsquos Labor SupplyrdquoJournal of Human Resources XXVI (1991) 308ndash337
Yelowitz Aaron S ldquoThe Medicaid Notch Labor Supply and Welfare Participa-tionrdquo Quarterly Journal of Economics CX (1995) 909ndash940
Ziliak James P David N Figlio Elizabeth E Davis and Laura S ConnollyldquoAccounting for the Decline in AFDC Caseloads Welfare Reform or EconomicGrowthrdquo unpublished paper July 1997
1114 QUARTERLY JOURNAL OF ECONOMICS
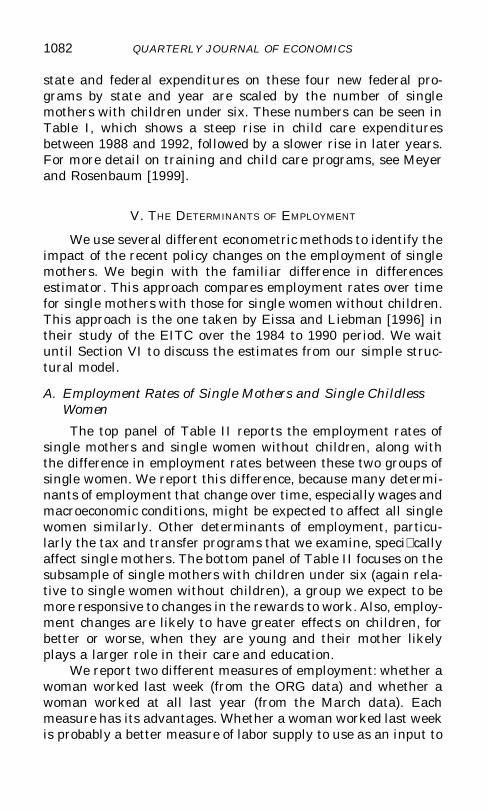
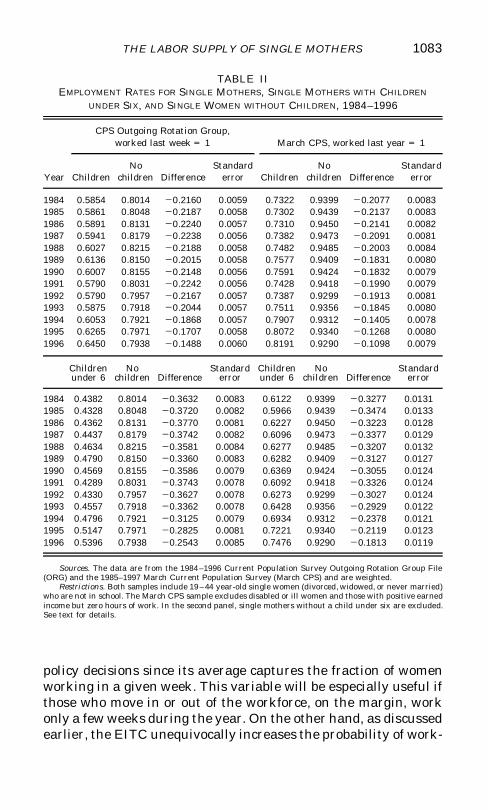
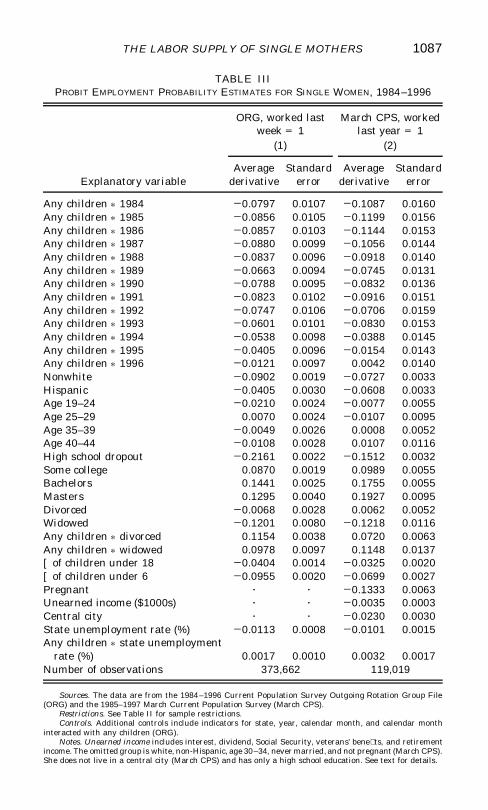
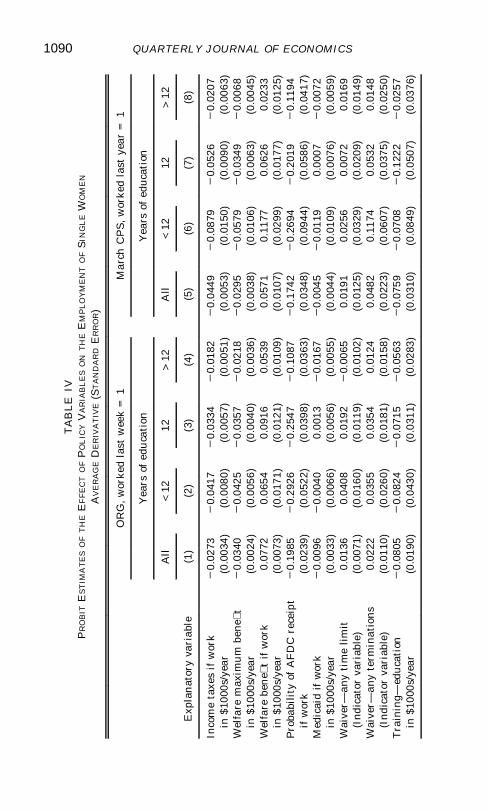
TA
BL
EIV
PR
OB
ITE
ST
IMA
TE
SO
FT
HE
EF
FE
CT
OF
PO
LIC
YV
AR
IAB
LE
SO
NT
HE
EM
PL
OY
ME
NT
OF
SIN
GL
EW
OM
EN
AV
ER
AG
ED
ER
IVA
TIV
E(S
TA
ND
AR
DE
RR
OR)
Exp
lan
ator
yva
riab
le
OR
Gw
orke
dla
stw
eek
=1
Mar
chC
PS
wor
ked
last
year
=1
Yea
rsof
edu
cati
onY
ears
ofed
ucat
ion
All
lt12
12gt
12A
lllt
1212
gt12
(1)
(2)
(3)
(4)
(5)
(6)
(7)
(8)
Inco
me
taxe
sif
wor
k2
002
732
004
172
003
342
001
822
004
492
008
792
005
262
002
07in
$100
0sy
ear
(00
034)
(00
080)
(00
057)
(00
051)
(00
053)
(00
150)
(00
090)
(00
063)
Wel
fare
max
imu
mbe
net
20
0340
20
0425
20
0357
20
0218
20
0295
20
0579
20
0349
20
0068
in$1
000s
yea
r(0
002
4)(0
005
6)(0
004
0)(0
003
6)(0
003
8)(0
010
6)(0
006
3)(0
004
5)W
elfa
rebe
ne
tif
wor
k0
0772
006
540
0916
005
390
0571
011
770
0626
002
33in
$100
0sy
ear
(00
073)
(00
171)
(00
121)
(00
109)
(00
107)
(00
299)
(00
177)
(00
125)
Pro
babi
lity
ofA
FD
Cre
ceip
t2
019
852
029
262
025
472
010
872
017
422
026
942
020
192
011
94if
wor
k(0
023
9)(0
052
2)(0
039
8)(0
036
3)(0
034
8)(0
094
4)(0
058
6)(0
041
7)M
edic
aid
ifw
ork
20
0096
20
0040
000
132
001
672
000
452
001
190
0007
20
0072
in$1
000s
yea
r(0
003
3)(0
006
6)(0
005
6)(0
005
5)(0
004
4)(0
010
9)(0
007
6)(0
005
9)W
aive
rmdashan
yti
me
lim
it0
0136
004
080
0192
20
0065
001
910
0256
000
720
0169
(Ind
icat
orva
riab
le)
(00
071)
(00
160)
(00
119)
(00
102)
(00
125)
(00
329)
(00
209)
(00
149)
Wai
vermdash
any
term
inat
ions
002
220
0355
003
540
0124
004
820
1174
005
320
0148
(Ind
icat
orva
riab
le)
(00
110)
(00
260)
(00
181)
(00
158)
(00
223)
(00
607)
(00
375)
(00
250)
Tra
inin
gmdashed
uca
tion
20
0805
20
0824
20
0715
20
0563
20
0759
20
0708
20
1222
20
0257
in$1
000s
yea
r(0
019
0)(0
043
0)(0
031
1)(0
028
3)(0
031
0)(0
084
9)(0
050
7)(0
037
6)
1090 QUARTERLY JOURNAL OF ECONOMICS
TA
BL
EIV
(CO
NT
INU
ED
)
Exp
lana
tory
vari
able
OR
Gw
orke
dla
stw
eek
=1
Mar
chC
PS
wor
ked
last
year
=1
Yea
rsof
edu
cati
onY
ears
ofed
uca
tion
All
lt12
12gt
12A
lllt
1212
gt12
(1)
(2)
(3)
(4)
(5)
(6)
(7)
(8)
Tra
inin
gmdashjo
bse
arch
oth
er0
0446
004
720
0607
002
600
0526
006
690
0643
002
84in
$100
0sy
ear
(00
117)
(00
272)
(00
190)
(00
175)
(00
192)
(00
528)
(00
317)
(00
236)
Chi
ldca
re0
0227
002
720
0190
002
260
0229
004
380
0175
001
94in
$100
0sy
ear
(00
065)
(00
148)
(00
104)
(00
104)
(00
100)
(00
287)
(00
164)
(00
119)
Sta
teu
nem
ploy
men
tra
te2
001
002
000
982
001
012
001
052
000
832
001
332
000
902
000
53in
perc
enta
gepo
ints
(00
007)
(00
020)
(00
013)
(00
010)
(00
014)
(00
044)
(00
024)
(00
016)
Any
chil
dren
pst
ate
unem
pra
te2
000
010
0009
20
0010
000
080
0011
000
422
000
090
0022
inpe
rcen
tage
poin
ts(0
000
9)(0
002
1)(0
001
4)(0
001
3)(0
001
4)(0
004
2)(0
002
4)(0
001
7)N
um
ber
ofob
serv
atio
ns37
366
251
146
134
432
188
084
119
019
159
9441
060
619
65
Sou
rces
The
data
are
from
the
1984
ndash199
6C
urre
ntP
opul
atio
nSu
rvey
Out
goin
gR
otat
ion
Gro
up
Fil
e(O
RG
)an
dth
e19
85ndash1
997
Mar
chC
urre
ntP
opul
atio
nS
urve
y(M
arch
CP
S)
Res
tric
tion
sS
eeT
able
IIfo
rsa
mpl
ere
stri
ctio
ns
Spec
ica
tion
s(2
)an
d(6
)ar
ere
stri
cted
tohi
ghsc
hoo
ldr
opou
ts(
3)an
d(7
)to
high
sch
ool
grad
uate
san
d(4
)an
d(8
)to
thos
ew
ith
aned
ucat
ion
beyo
nd
hig
hsc
hool
C
ontr
ols
Inad
diti
onto
the
vari
able
sin
Tab
leII
I(e
xcep
tfo
rth
ein
tera
ctio
nsbe
twee
nye
aran
dan
ych
ildr
en)
the
foll
owin
gco
ntro
lsar
ein
clud
ed
indi
cato
rsfo
rst
ate
year
ca
len
dar
mon
tha
nd
cale
ndar
mon
thin
tera
cted
wit
han
ych
ildr
en(O
RG
)w
heth
erat
leas
ton
etw
oth
ree
and
four
orm
ore
child
ren
are
pote
ntia
llyA
FD
Cel
igib
lew
heth
erat
leas
ton
ean
dat
leas
ttw
och
ildr
enar
eE
ITC
elig
ible
and
wh
ethe
rat
leas
ton
ech
ild
isu
nder
six
unde
rth
ree
unde
rtw
oan
dun
der
one
Las
tco
ntin
uou
sva
riab
les
for
the
num
ber
ofch
ildr
enun
der
each
age
betw
een
one
and
nin
etee
nar
ein
clud
ed
Not
esI
nal
lspe
cic
atio
ns
the
tax
wel
fare
and
Med
icai
dva
riab
les
are
calc
ula
ted
usin
ga
join
tho
urs
wag
edi
stri
buti
one
stim
ated
sepa
rate
lyfo
rsi
ngl
ew
omen
wit
han
dw
itho
utch
ildr
enT
axes
and
wel
fare
are
adju
sted
for
stat
eco
stof
livi
ngdi
ffer
ence
san
dal
ldo
llar
amou
nts
are
expr
esse
din
1996
doll
ars
See
App
endi
x1
for
spec
ic
indi
ces
used
and
othe
rde
tail
s
1091THE LABOR SUPPLY OF SINGLE MOTHERS
work of 107 for any employment during the year and 083 forwork in an average week We also estimated specications withseparate coefcients on state and federal income taxes althoughfor brevity these full estimates are not reported here The resultsfor federal taxes were similar to all taxes while the derivative(standard error) for state income taxes was a large and signicant2 00336 (00083) in the ORG sample and a smaller and insigni-cant 2 00165 (00139) in the March sample Thus while the statetax estimates are much less precise and differ in the two samplesthey give the same message as the other tax coefcients ie thatthe labor supply of single mothers responds to taxes
B Welfare
The full sample specications of columns (1) and (5) alsoindicate substantial effects of welfare on employment A onethousand dollar reduction in the annual Welfare Maximum Bene-t (the AFDC plus Food Stamp benet a women receives if shedoes not work) increases employment last week by 34 percentagepoints and increases employment last year by 30 percentagepoints This calculation holds constant the other welfare vari-ables Welfare Benets if Work and Probability of AFDC Receiptif Work that generally change with the maximum benet TheWelfare Benets if Work effect is sizable implying that a onethousand dollar increase in benets when one works increasesemployment last week by 72 percentage points and last year by57 percentage points These estimates suggest substantial posi-tive employment effects of reductions in implicit tax rates andincreases in earnings disregards
The transaction costs or stigma of welfare receipt as mea-sured by the Probability of AFDC Receipt if Work variable isnegative and signicantly different from zero as expected (seeequation (5)) The magnitude of this coefcient can be gauged bycomparing it with the coefcients on the variables denominatedin thousands of dollars Such comparisons suggest a transactioncost of several thousand dollars with the exact number depend-ing on the employment measure and the income variable usedFor example using the Welfare Benets if Work coefcient in theORG sample yields a transaction cost estimate of $2571 whilethe March sample implies an estimate of $3051 This resultagrees with past studies as well as ethnographies that havetended to nd substantial transaction costs or stigma of welfarereceipt
1092 QUARTERLY JOURNAL OF ECONOMICS
To assess the effect of cutting the AFDC benet one needs toincorporate the effects of all three of the welfare variables and theMedicaid if Work variable When the AFDC maximum benetand payment standard are cut they not only reduce benets ifone does not work but also reduce benets if one does work Theyalso decrease the likelihood that a working mother will be onwelfare at all thereby reducing both her Medicaid eligibility andher AFDC transaction and stigma costs When we do the fullcalculations we nd that a 10 percent cut in the maximumbenet ($324 annually) increases both the annual and weeklyemployment rate by about 10 percentage points
Despite a more detailed calculation of welfare incentivesthan most past work and the use of panel data techniques wethink there are important potential sources of bias in these esti-mates We should also note that by dividing the effect of welfareinto income when working and when not and by estimating aseparate term for transaction costsstigma we are putting thetheoretical predictions to a more severe test than most work Asdiscussed in Section IV the Welfare Benets if Work variable andthe Probability of AFDC Receipt if Work variable are more dif-cult to calculate precisely than our other variables The largercoefcient on the Welfare Benets if Work variable could also bedue to the scale of this variable being inappropriately low Theearnings distribution used to calculate expected benets putsmost of the weight on earnings levels where welfare benetswould be low or zero It is very likely that we should use anearnings distribution that puts greater weight in the left tailsince women who work while on welfare rarely report all of theirearnings to the welfare ofce [Edin and Lein 1997] The reasonsfor possible bias in the Probability of AFDC Receipt if Workvariable are similar The coefcients on these two variables tendto both be large in the same specications with their oppositesigns canceling each other out
C Medicaid
We nd little effect of Medicaid on the employment decisionsof single mothers Theory predicts that the Medicaid if Workvariable will have a positive effect on employment The variablehas the opposite effect from this prediction in both samplesalthough the coefcient estimates are small and usually are notsignicantly different from zero This result is not completelyunexpected given the weak and conicting ndings in past work
1093THE LABOR SUPPLY OF SINGLE MOTHERS
Part of the difculty is the uncertainty about individual knowledgeof Medicaid rules and their valuation of the benets We havetried a large number of alternative specications none of whichindicates a large effect of Medicaid A full accounting of theseresults can be found in Meyer and Rosenbaum [2000b]
D Welfare Waivers and Time Limits
The AFDC waiver variables have the expected effect on em-ployment and their coefcients are signicantly different fromzero Both the implementation of a time limit on welfare receiptand the actual termination of benets under a work requirementor time limit waiver are predicted to increase employment bybetween 14 and 48 percentage points However until the lastyears of our sample the overall importance of such waivers issmall Even by 1994 only 5 percent of single mothers lived instates with a time limit and less than half of 1 percent lived instates that had begun to terminate benets
One should be cautious in interpreting the waiver coef-cients especially in attributing effects to the implementation ofparticular provisions of recent waivers or the termination of casesper se The perception of welfare changes by potential welfarerecipients the attitudes of case workers and differences in stateimplementation of policies likely play a large role in inuencingthe welfare caseload and consequently employment It is alsoeconometrically difcult to disentangle which provisions of awaiver are the most important since states typically imple-mented several changes to their AFDC programs under waiversat the same time The reported coefcients are partly the effect ofthe particular actions coded and partly a proxy for other changesgoing on in the states
Recognizing these limitations the strength of the evidencehere for a causal interpretation of the waiver results is muchgreater than in the studies of welfare caseloads First we useimplementation dates rather than application or approval dateswhich are at best loosely related to when provisions are enforcedSecond when we account for state intentions to reform welfare asindicated by whether or not a state has made a major waiverapplication this variable has little effect Third one or two yearleads of our time limit and termination variables have small andinsignicant coefcients suggesting that the provisions per serather than publicity or administrator attitudes lead to the em-ployment increases This result contrasts with those of Blank
1094 QUARTERLY JOURNAL OF ECONOMICS
[1997] and Levine and Whitmore [1998] who found strong effectsof leads of waiver variables on caseloads
E Training and Child Care
The last three coefcient estimates in Table IV measure theemployment effects of expenditures on training and child careHigher expenditures on job search and other training and onchild care are associated with a higher employment rate for singlemothers Training expenditures on education have a negativeeffect that is signicant in both samples The job search coef-cients imply that an increase in expenditures of one thousanddollars (about two-thirds of average expenditures) would increasethe employment rate for single mothers without young childrenby over four percentage points Since single mothers withoutchildren young enough to exempt them from training programsmake up about half of all single mothers the overall effect wouldbe over two percentage points An increase in federal and statechild care expenditures of ve hundred dollars per single motherwith a child under six (slightly less than the mean in 1996) isassociated with about a one percentage point increase in bothweekly and annual employment These effects are quite substan-tial per dollar expended The training result on education is notsurprising given the weaker results in the literature on classroomtraining and the possible short-term effect on employment aswomen are in classrooms rather than jobs
F Results by Education Group
Table IV also reports separate estimates for the effects of thepolicy variables for three education groups less than high schoolhigh school and some college We would expect a priori that thepolicy variables which mostly capture taxes and benets receivedby low-income women would have the greatest effect on highschool dropouts less of an effect on those with a high schooldegree and even less of an effect on those with some college22
Overall the results by level of education are consistent with thehypothesized larger effects on the less educated The derivativestend to be much larger in absolute value for high school dropoutsthan they are in the full sample and much smaller for those with
22 The estimates use a xed wagehours distribution (that does not vary byeducation) to calculate the income and benet variables so that the explanatoryvariables are comparable across the columns
1095THE LABOR SUPPLY OF SINGLE MOTHERS
some college than in the full sample For example a one thousanddollar cut in taxes (or increase in tax credits) for high schooldropout single women is predicted to increase their employmentby 42 percentage points in a typical week and increase work atall during the year by 88 percentage points The correspondingnumbers for those with some college education are 18 percentagepoints and 21 percentage points Many of the other policy vari-able derivatives also fall with increased education23
G Unemployment and Macroeconomic Conditions
Table IV also reports the coefcients on the state unemploy-ment rate and its interaction with a dummy variable for a singlewoman having children The unemployment rate is strongly sig-nicant and implies that for single women without children a onepercentage point increase in the unemployment rate is associatedwith a 10 percentage point decrease in employment in a typicalweek and a 08 percentage point decrease in work anytime duringthe year On the other hand the interaction of the unemploymentrate with being a single mother is small and not signicantlydifferent from zero The point estimates imply that a one percent-age point increase in the unemployment rate is associated withonly a 001 percentage point decrease in a typical week and 01percentage point increase any time during the year in theemployment of single mothers relative to single women withoutchildren These coefcients indicate a strong and similarresponsiveness of both groups of single women to the state of themacroeconomy This result is favorable for the use of singlewomen without children as a comparison group for single mothers
H Alternative Specications
Since many of the changes in policy notably welfare reformtook place in recent years and a well-publicized decline in thewelfare rolls began in 1994 we reestimate the full sample speci-cations of Table IV dropping the years 1994 ndash1996 along withthe waiver variables (which are nearly always zero through1993) The estimates from this shorter sample which are re-ported in columns (1) and (5) of Table V are very close to those
23 The derivatives might be lower for groups with higher levels of educationbecause their employment rates are higher leaving less room for increases inemployment However the drop in the magnitude of the policy variable deriva-tives with more education is greater than it is for other control variables such asthe unemployment rate
1096 QUARTERLY JOURNAL OF ECONOMICS
TA
BL
EV
PR
OB
ITE
STIM
AT
ES
OF
TH
EE
FF
EC
TO
FP
OL
ICY
VA
RIA
BL
ES
ON
TH
EE
MP
LO
YM
EN
TO
FS
ING
LE
WO
ME
NA
LT
ER
NA
TIV
ES
PE
CIF
ICA
TIO
NS
AV
ER
AG
ED
ER
IVA
TIV
E(S
TA
ND
AR
DE
RR
OR)
Exp
lana
tory
vari
able
OR
G
wor
ked
last
wee
k=
1M
arch
CP
Sw
orke
dla
stye
ar=
1
(1)
(2)
(3)
(4)
(5)
(6)
(7)
(8)
Inco
me
taxe
sif
wor
k2
002
892
001
352
005
012
000
552
004
302
002
532
005
582
003
05in
$100
0sy
ear
(00
045)
(00
087)
(00
051)
(00
084)
(00
074)
(00
129)
(00
087)
(00
133)
Lag
ged
inco
me
taxe
sif
wor
kz
zz
20
0263
zz
z2
001
75in
$100
0sy
ear
zz
z(0
009
2)z
zz
(00
148)
Wel
fare
max
imu
mbe
net
20
0375
20
0107
20
0464
20
0340
20
0291
20
0011
20
0445
20
0296
in$1
000s
yea
r(0
002
9)(0
006
5)(0
003
3)(0
002
4)(0
004
7)(0
009
2)(0
005
6)(0
003
8)W
elfa
rebe
ne
tif
wor
k0
0911
001
070
1027
007
660
0644
20
0080
20
0882
005
67in
$100
0sy
ear
(00
089)
(00
106)
(00
099)
(00
073)
(00
132)
(00
144)
(00
157)
(00
107)
Pro
babi
lity
ofA
FD
Cre
ceip
t2
021
042
010
442
024
102
019
502
020
562
008
372
026
652
017
17if
wor
k(0
029
7)(0
033
6)(0
032
7)(0
023
9)(0
043
3)(0
050
1)(0
051
8)(0
034
8)M
edic
aid
ifw
ork
20
0133
000
292
002
092
000
952
000
790
0055
20
0107
20
0045
in$1
000s
yea
r(0
004
6)(0
003
7)(0
004
5)(0
003
3)(0
005
9)(0
004
9)(0
006
6)(0
004
4)W
aive
rmdashan
yti
me
lim
itz
001
710
0204
001
28z
002
470
0350
001
84(I
ndic
ator
vari
able
)z
(00
080)
(00
104)
(00
071)
z(0
014
1)(0
019
7)(0
012
5)W
aive
rmdashan
yte
rmin
atio
nsz
001
600
0456
002
15z
003
550
0703
004
79(I
ndic
ator
vari
able
)z
(00
116)
(00
163)
(00
110)
z(0
023
8)(0
034
7)(0
022
3)
1097THE LABOR SUPPLY OF SINGLE MOTHERS
TA
BL
EV
(CO
NT
INU
ED
)
Exp
lana
tory
vari
able
OR
Gw
orke
dla
stw
eek
=1
Mar
chC
PS
w
orke
dla
stye
ar=
1
(1)
(2)
(3)
(4)
(5)
(6)
(7)
(8)
Tra
inin
gmdashed
uca
tion
20
0755
20
0764
20
0728
20
0841
20
0804
20
0656
20
1396
20
0780
in$1
000s
yea
r(0
023
7)(0
022
3)(0
039
2)(0
019
0)(0
040
1)(0
036
5)(0
060
7)(0
031
0)T
rain
ingmdash
job
sear
cho
ther
007
620
0441
001
060
0428
007
150
0571
008
490
0517
in$1
000s
yea
r(0
014
0)(0
013
3)(0
023
7)(0
011
7)(0
023
7)(0
021
3)(0
038
2)(0
019
3)C
hild
care
000
110
0190
000
710
0215
20
0033
001
710
0286
002
22in
$100
0sy
ear
(00
092)
(00
073)
(00
088)
(00
066)
(00
140)
(00
114)
(00
161)
(00
101)
1994
ndash199
6ex
clud
edY
esN
oN
oN
oY
esN
oN
oN
oS
ingl
em
oth
ers
only
No
Yes
No
No
No
Yes
No
No
Mot
her
sw
och
ildr
enlt
6ex
cl
No
No
Yes
No
No
No
Yes
No
Nu
mbe
rof
obse
rvat
ions
292
731
122
966
303
396
373
662
938
1640
818
957
8611
901
9
Sou
rces
The
data
are
from
the
1984
ndash199
6C
urre
ntP
opul
atio
nSu
rvey
Out
goin
gR
otat
ion
Gro
up
Fil
e(O
RG
)an
dth
e19
85ndash1
997
Mar
chC
urre
ntP
opul
atio
nS
urve
y(M
arch
CP
S)
Res
tric
tion
sS
eeT
able
IIfo
rsa
mpl
ere
stri
ctio
ns
Spe
cic
atio
ns(1
)an
d(5
)ex
clu
de19
94ndash1
996
Spe
cic
atio
ns
(2)
and
(6)
incl
ude
only
sin
gle
mot
hers
Spe
cic
atio
ns
(3)
and
(7)
incl
ude
sing
lew
omen
wit
hout
chil
dren
and
sing
lem
othe
rsw
hose
youn
gest
chil
dis
less
than
six
Con
trol
sS
eeT
able
IVfo
rco
ntr
ols
Indi
cato
rsfo
rin
tera
ctio
nsbe
twee
nst
ate
and
any
AF
DC
elig
ible
chil
dren
and
betw
een
year
and
both
any
AF
DC
elig
ible
child
ren
and
any
EIT
Cel
igib
lech
ildre
nar
ein
clud
edin
spec
ica
tion
s(2
)an
d(6
)N
otes
In
alls
peci
cat
ions
the
tax
wel
fare
and
Med
icai
dva
riab
les
are
calc
ula
ted
usin
ga
join
tho
urs
wag
edi
stri
buti
ones
tim
ated
sepa
rate
lyfo
rsi
ngle
wom
enw
ith
and
wit
hout
chil
dren
Tax
esan
dw
elfa
rear
ead
just
edfo
rst
ate
cost
ofli
vin
gdi
ffer
ence
sA
lso
alld
olla
ram
ount
sar
eex
pres
sed
in19
96do
llar
sS
eeA
ppen
dix
1fo
rsp
eci
cin
dice
sus
edan
dot
her
deta
ils
1098 QUARTERLY JOURNAL OF ECONOMICS
over the full sample period The only exception to this generali-zation is that the job searchother training coefcient is largerand the child care coefcient is smaller and statistically insigni-cant over the shorter time span These results are among themost important in this paper because they indicate that (1) theurry of welfare reform measures after 1993 has not falsely led toour main results and (2) the extended recovery of the 1990s is notan alternative explanation for our main results
Next we examine a sample of only single mothers Thisspecication identies the effects of the income variables throughchanges across states and for different family sizes In the case ofthe Income Taxes if Work variable we are largely using thevariation from the last few years when the EITC for women withone child was nearly unchanged but the EITC for women with twoor more children rose in large steps Thus identication comesfrom using women with one child as a control group and chang-ing the treatment that women with two or more children receiveWith single mothers only the year indicators remove the timetrend in welfare receipt and benets and the state indicatorsremove time-constant differences in state welfare benets andmuch of these state cost of living differences in the income vari-ables Thus the variation in welfare benets used to identify thecoefcients is now changes in state-level benets This identi-cation approach examines the employment response to fairlysubtle or short-run features of the welfare and tax laws Thesepolicy changes may be overwhelmed by other factors in thesespecications Despite these potential difculties much of theincome tax effect remains although the estimates are muchsmaller While the effect of taxes is still signicant in the MarchCPS data the drop in the coefcient and larger standard errorleads the ORG coefcient to be insignicantly different from zeroThe welfare benet coefcients are now no longer signicant TheAFDC transaction cost coefcient however remains signicantin the ORG data while the Medicaid coefcient has the expectedsign but remains small and insignicant in both samples
In the third set of specications of Table V we only includesingle mothers with a child under six (and single women withoutchildren) The derivative estimates for the tax and welfare vari-ables including waivers are often substantially larger in magni-tude for these single mothers with young children especially forthe tax variable in the ORG sample These specications are ofparticular interest because the effects of increased employment
1099THE LABOR SUPPLY OF SINGLE MOTHERS
on parental care is likely to be largest on these families withyoung children who are not likely to be in school The last speci-cation of Table V examines whether women learn about taxchanges with a delay after they are implemented This specica-tion includes both the contemporaneous and one year lagged taxvariables The results are somewhat supportive of a lagged effectof taxes In the ORG data the contemporaneous tax variable issmall and insignicant while the lagged variable is large andsignicant In the March CPS it is the contemporaneous variablethat is large and signicant while the lagged variable is smallerand signicant although still substantial in size
I Additional Specications and Hours Worked
We examine several other specications that are not reportedhere in order to determine the benets of studying many pro-grams at the same time to check the sensitivity of our results toalternative specications and to see whether there are particu-larly large effects for certain subgroups of the population We ndthat ignoring some of the policy changes that we study has asubstantial effect on the estimates for the remaining programsWhen we include the tax variable but leave out the other policyvariables its coefcient is about 50 percent larger in both sam-ples When the only policy variables that we include are Medicaidif Work and the Welfare Maximum Benet the Medicaid coef-cient is positive and signicant in the March CPS sample Whenthe other policy variables are not included the waiver variablesare much larger On the other hand the tax coefcient is hardlychanged when the training and child care variables are excludedThese results suggest that the common research strategy of in-vestigating one program in isolation has the potential to givemisleading results
We have examined the sensitivity of our results to alterna-tive samples and variable denitions In particular the resultsare little changed by using more stringent denitions of employ-ment by including separated women or women in school We alsotry several subgroup analyses In particular we examine differ-ences between whites and nonwhites and family heads and sub-family heads Nonwhites appear to be more affected by welfarewaivers than whites while subfamily heads are more sensitive totaxes than family heads
To obtain a broader picture of the effects of welfare and taxpolicy on labor supply we also examined hours worked (see
1100 QUARTERLY JOURNAL OF ECONOMICS
Meyer and Rosenbaum [1999] for more details) Difference-in-differences estimates for hours analogous to those in Table IIshow large relative increases in work for single mothers over thesample period with almost all of the change occurring after 1991We also estimated a series of Tobit and OLS regressions todetermine the effects of tax and welfare policy on hours controllingfor demographics economic conditions state and year We in-clude the same variables as we did in Tables IV and V althoughwe should emphasize that these variables were constructed forour structural model of employment and so are less suitable foran analysis of hours The effects of the policy variables in theTobit estimates for all women whether or not they work tend to besimilar to the effects on employment seen in the earlier tablesThese results hold for the sample of single mothers as well as forall single women The results are very similar for hours per yearin the March CPS and hours in a typical week in the ORG Forhours worked conditioning on positive hours the policy variablestend to have much the same signs but smaller and less signi-cant coefcients Overall the results tend to conrm the resultsfor the main policy variables that we found in the employmentprobits
VII WHICH POLICIES ACCOUNTED FOR THE EMPLOYMENT CHANGES
Our simultaneous examination of many government policiesmakes it straightforward to estimate the relative contribution ofthese policies to the recent increase in employment of singlemothers In Table VI we decompose the employment increases forsingle mothers relative to single women without children for boththe entire period (1984 ndash1996) and the recent period of rapidemployment growth (1992ndash1996) Overall these decompositionsindicate a large role for the EITC and other tax changes modestroles for AFDC benet cuts and waivers and smaller roles forMedicaid training and child care increases
Using the parameter estimates from our main specications(specications (1) and (5) of Table IV) the EITC explains 62percent of the increase in weekly employment over the full 1984to 1996 period yet only 27 percent of the increase between 1992and 1996 For annual employment the EITC plays a very similarrole explaining 61 percent of the 1984 to 1996 increase and 35percent of the 1992 to 1996 increase The corresponding changesin employment attributed to the EITC over the full 1984 to 1996
1101THE LABOR SUPPLY OF SINGLE MOTHERS
TA
BL
EV
IC
ON
TR
IBU
TIO
NO
FP
OL
ICY
CH
AN
GE
ST
OT
HE
CH
AN
GE
SIN
TH
ER
EL
AT
IVE
EM
PL
OY
ME
NT
OF
SIN
GL
EM
OT
HE
RS
VE
RSU
SS
ING
LE
WO
ME
NW
ITH
OU
TC
HIL
DR
EN
19
84ndash1
996
AN
D19
92ndash1
996
Exp
lan
ator
yva
riab
le
1984
ndash199
619
92ndash1
996
OR
GM
arch
CP
SO
RG
Mar
chC
PS
Din
emp
of
tota
lD
inem
p
ofto
tal
Din
emp
of
tota
lD
inem
p
ofto
tal
Inco
me
taxe
sif
wor
k0
0438
622
0
0720
614
0
0186
268
0
0305
351
W
elfa
rem
axim
um
ben
et
001
7925
4
001
5613
3
001
1416
5
000
9911
4
Wel
fare
ben
et
ifw
ork
000
050
70
0003
03
20
0045
26
52
000
332
38
Pro
babi
lity
ofA
FD
Cre
ceip
tif
wor
k2
000
022
03
20
0002
20
10
0020
29
000
172
0M
edic
aid
ifw
ork
20
0070
29
92
000
322
28
20
0023
23
32
000
112
12
Tot
alw
elfa
rebe
ne
tsamp
Med
icai
d0
0112
159
0
0125
106
0
0066
96
000
738
4W
aive
rmdashan
yti
me
lim
it0
0054
76
000
756
40
0052
76
000
738
5W
aive
rmdashan
yte
rmin
atio
ns
000
466
50
0099
84
000
466
60
0099
114
T
otal
wel
fare
wai
vers
000
9914
1
001
7414
8
000
9814
2
001
7219
8
Tra
inin
gmdashed
uca
tion
20
0101
214
4
20
0096
28
22
000
212
30
20
0020
22
3T
rain
ingmdash
job
sear
cho
ther
000
659
20
0077
65
000
476
80
0056
64
Ch
ild
care
000
689
70
0069
59
000
111
80
0013
15
Tot
altr
ain
ing
ampch
ild
care
000
324
60
0050
43
000
395
70
0039
56
Dem
ogra
phic
s2
000
732
104
2
000
682
58
001
0715
5
001
1212
9
Oth
er0
0096
137
0
0172
147
0
0196
283
0
0158
182
T
otal
007
0510
00
011
7410
00
006
9110
00
008
6910
00
Sou
rces
The
data
are
from
the
1984
ndash199
6C
urre
ntP
opul
atio
nSu
rvey
Out
goin
gR
otat
ion
Gro
up
Fil
e(O
RG
)an
dth
e19
85ndash1
997
Mar
chC
urre
ntP
opul
atio
nS
urve
y(M
arch
CP
S)
Not
es
Din
emp
give
sth
ech
ange
inth
eem
ploy
men
tof
sing
lem
othe
rs(r
elat
ive
tosi
ngle
wom
enw
itho
ut
chil
dren
)ov
erth
esp
eci
edti
me
peri
odth
atis
due
toth
egi
ven
expl
anat
ory
vari
able
(s)
of
tota
lgiv
esth
epe
rcen
tage
ofth
eem
ploy
men
tin
crea
sefo
rsi
ngle
mot
hers
(rel
ativ
eto
sing
lew
omen
wit
hout
chil
dren
)exp
lain
edby
the
give
nex
plan
ator
yva
riab
le(s
)T
he
rela
tive
empl
oym
ent
incr
ease
sar
eth
eav
erag
ede
riva
tive
esti
mat
esof
the
inte
ract
ions
ina
wei
ghte
dpr
obit
mod
elin
clu
ding
year
indi
cato
rsan
dth
eir
inte
ract
ions
wit
han
any
chil
dren
indi
cato
rT
he
para
met
eres
tim
ates
used
toes
tim
ate
the
chan
gein
empl
oym
ent
com
efr
omsp
eci
cati
ons
(1)
and
(5)o
fTab
leIV
wh
ileth
ech
ange
over
tim
ein
the
polic
yva
riab
les
com
esfr
omA
ppen
dix
2
1102 QUARTERLY JOURNAL OF ECONOMICS
period and the 1992 to 1996 period are also reported in Table VIWe estimate that the EITC and other tax changes increasedweekly employment 44 percentage points and annual employ-ment 72 percentage points over the full period with about 40percent of this change occurring over the 1992 to 1996 subperiodWhile these estimates are substantial they bracket the EITCeffects found by Eissa and Liebman [1996] and are smaller thanthose predicted by Dickert Houser and Scholz [1995] and Keane[1995]24
Changes in the maximum welfare benet and implicit taxrates and the Medicaid expansions account for between 10 and 16percent of the increase in weekly employment and between 8 and11 percent of the increase in annual employment over eitherperiod The effect of the Medicaid expansions themselves is usu-ally small or negative Conversely the effects of welfare waiversappear to be substantial with the estimates suggesting thatpolicies instituted under waivers account for about 14 to 15 per-cent of the increase in employment over the full sample periodand about 14 to 20 percent of the increase between 1992 and 1996for both weekly and annual employment In general both jobtraining and child care explain small parts of the employmentincrease although in the case of weekly employment over the fullperiod child care can account for about 10 percent of the increase
Improved macroeconomic conditions increased employmentfor both single mothers and single women without children overthe 1984 ndash1996 period Because the above calculations are forsingle mothers compared with single women without childrenunemployment is not given a share in the decomposition In all ofthe employment probits the interaction of unemployment andbeing a single mother had an economically small and statisticallyinsignicant effect Changes in state unemployment rates areestimated to have increased the absolute level of employment ofsingle mothers by 20 percentage points during a typical week
24 Eissa and Liebman [1996] found up to a 28 percentage point increase inparticipation due to TRA86 (which as we indicate in Section IV accounted for 43percent of the 1984ndash1996 change in taxes) Keane [1995] predicted that the1984ndash1996 changes will result in a 107 percentage point increase in participa-tion while Dickert Houser and Scholz [1995] predicted that the 1993ndash1996changes (39 percent of the full 1984ndash1996 change in taxes) would increase em-ployment of single parents by 33 percentage points Experimental ndings suchas those reported in Blank Card and Robins [2000] suggest substantial respon-siveness of welfare recipients and other low-income people to nancial incentivesThese experimental results would need to be extrapolated to all single mothersand the EITC to provide comparisons
1103THE LABOR SUPPLY OF SINGLE MOTHERS
and 14 percentage points during the year over the 1984 ndash1996period These numbers are equivalent to 284 percent of therelative increase in weekly employment and 122 percent of therelative increase in annual employment of single mothers overthe period
In results not shown we recalculate the shares of the em-ployment increase due to various policies using the parameterestimates from specications with only single mothers (specica-tions (2) and (6) of Table V) These results suggest a much smallerrole for the EITC and other tax changes in explaining the changesin employment ranging from 49 to 56 percent as large as those inTable VI Changes in the maximum welfare benet are lessimportant while the results for welfare waivers job training andchild care are largely unchanged
VIII CONCLUSIONS
Between 1984 and 1996 tax and transfer policy were reori-ented to encourage work by single mothers Single mothers haveresponded to these incentives by working more especially after1991 and especially those with children under six To assesswhich policy changes have led to the employment increases weexamine the incentives of federal and state income taxes AFDCMedicaid Food Stamps and their implicit tax rates and earningsdisregards as well as AFDC waivers instituting time limits orwork requirements Our detailed examination of these policychanges using two large micro data sets indicates that EITC andother tax changes account for over 60 percent of the 1984 to 1996increase in the weekly and annual employment of single mothersrelative to single women without children Changes to welfareprograms were less important but still account for a substantialshare of the employment increases Changes in Medicaid train-ing and child care programs play a considerably smaller roleThese ndings are conrmed in an analysis of hours worked
This paper makes several methodological improvements overpast research including the estimation of a simple structuralmodel of employment which provides several independent tests ofthe hypothesis that single mothers respond to economic incen-tives Our results indicate that nancial incentives have powerfuleffects on single mothersrsquo employment decisions and that thedifferent sources of these incentives have effects of plausiblemagnitudes We also nd a sizable transaction cost or stigma to
1104 QUARTERLY JOURNAL OF ECONOMICS
welfare We rely on less subjective measures of welfare waiverssuch as implementation dates and the beginning of case termi-nations and provide the rst evidence on the effects of waivers onemployment Unlike most past work we examine the major pro-grams affecting single mothers together nding that examiningone or two programs in isolation can lead to biases in estimatedbehavioral effects
In most of our specications identication comes from thedifferences in incentives faced by single women with and withoutchildren While we argue that single women without children area plausible comparison group we also provide estimates that donot rely on this comparison Instead these estimates rely onchanges in the treatment of family size state cost of living dif-ferences changes in state income taxes differences in earningsdisregards and implicit tax rates across states and changes inthese parameters and welfare benets within a state over timeOur nding of large tax and welfare effects on employment arerobust although tax effects and especially welfare effects aresometimes smaller using alternative identication strategies
Our result that the EITC played a dominant role in theemployment increases of single mothers between 1984 and 1996suggests that policies that ldquomake work payrdquo are effective in in-creasing work by single mothers This lesson is important in lightof the emphasis on punitive measures such as time limits andwork requirements in the most recent welfare reforms
APPENDIX 1 DESCRIPTION OF POLICY VARIABLES
This section describes the construction of our policy variablesand lists our information sources First we begin with the as-sumptions that we use to determine taxes program participationand benet levels
1 The determination of whether a woman has children andhow many she has is based on the CPS family and sub-family denitions Children in primary families (both re-lated and unrelated) are assigned to the family headwhile children in subfamilies are assigned to the subfam-ily head rather than to the primary family head Childrenare dened as any member of the given family (primary orsubfamily) under age 19 (or under 24 and a full-timestudent) for EITC purposes and under age 18 for all otherprograms
1105THE LABOR SUPPLY OF SINGLE MOTHERS
2 In the March CPS sample the age for tax purposes is theage at the time of the March interview We subtract onefor AFDC and Medicaid purposes In the ORG sample weuse the age at the time of the interview for AFDC andMedicaid but for tax purposes we add one for interviewsoccurring between January and June
3 Women have no unearned income (including child sup-port) or assets and their children have no earned incomeunearned income or assets hence earnings determinetheir program eligibility
4 Single mothers are assumed to le as head of householdand claim their children as dependents while singlewomen without children le as single Also all womentake the standard deduction
5 Women receiving AFDC are in their rst four months ofwork and do not claim child care expenses25
6 Single women without children do not receive FoodStamps
7 Shelter costs (an input in Food Stamp calculations) varyonly by state and over time
A Tax Welfare and Medicaid Variables
First for each woman we calculate ve quantities income taxliabilities (federal and state income taxes incorporating federaland state EITCs) welfare benets (AFDC plus Food Stamps)AFDC receipt (indicator for AFDC eligibility) and Medicaidadults covered and Medicaid children covered Under the assump-tions above these calculations are made at 50 annual earningslevels generated from the cells of a joint wagehours distributionThe 50 cells come from a combination of ve annual hours levels(500 1000 1500 2000 and 2500) and ten hourly wage levels (45 6 7 8 10 12 15 20 and 25)
Second we use the wagehours distributions described in thetext to weight the above quantities We calculate the distributionsusing only women with more than $500 of annual earnings Wethen construct the following variables
25 These assumptions are roughly consistent with the facts In scal year1995 over two-thirds of AFDC families with earnings were in their rst fourmonths of work and only about 16 percent of AFDC families with earningsclaimed child care expenses [U S Department of Health and Human ServicesCharacteristics of AFDC Recipients 1996]
1106 QUARTERLY JOURNAL OF ECONOMICS
c Income Taxes if Work is the weighted sum of income taxliabilities at the various annual earnings points using thewagehours distributions described above as weights
c Welfare Benets if Work is the weighted sum of welfarebenets at the various annual earnings points using thewagehours distributions described above as weights
c Probability of AFDC if Work is the weighted sum of AFDCreceipt at the various annual earnings points using thewagehours distributions described above as weights
c Medicaid if Work is calculated in two steps First wecalculate the weighted sum of Medicaid adults covered andMedicaid children covered at the various annual earningspoints using the wagehours distributions described aboveas weights Second we then multiply these sums by dollarexpenditures separately for adults and children In themain specications we use average expenditures over allstates and years
c Welfare Maximum Benet is the welfare benet assumingzero earnings
We calculate AFDC monthly benets (AFDC) as follows (settingquantities in parentheses to zero if negative)
(A1) AFDC 5 min MAXBEN RR p [PS 2 BRR p (EI 2 DIS)]
wheremdash MAXBEN is the maximum benetmdash RR is the ratable reductionmdash PS is the payment standard (the dollar amount when
benets end not counting disregards)mdash BRR is the benet reduction ratemdash EI is earned income andmdash DIS is the earnings disregard
We calculate Food Stamp benets in two steps (setting quantitiesin parentheses to zero if negative) First we calculate themonthly shelter cost expense deduction (SED) and second wecalculate the monthly Food Stamp benet (FS)
(A2) SED 5 (min SEDC SE 2 05
p ((1 2 EIDP) p EI 1 AFDC 2 SD))
(A3) FS 5 (MB 2 03 p ((1 2 EIDP)
p EI 1 AFDC 2 SD 2 SED))
1107THE LABOR SUPPLY OF SINGLE MOTHERS
wheremdash EIDP is the earned income deduction percentage (018
prior to 1986 020 starting in 1986)mdash MB is the maximum Food Stamp benetmdash SD is the standard deductionmdash SE is shelter expensesmdash SEDC is the shelter expense deduction ceilingTax and welfare variables (and earned and unearned income
variables) are adjusted for state cost of living differences usingthe poverty threshold index for 1990 from National ResearchCouncil [1995] which is adjusted annually using the PCE dea-tor The poverty threshold index accounts for housing cost differ-ences between states using Census housing cost data
Sources for Taxes Welfare and Medicaid
We obtain the federal income tax schedules from the U SDepartment of the Treasury [various years] The state tax infor-mation was obtained from four sources the Advisory Committeeon Intergovernmental Relations [various years] the CommerceClearing House [various years] unpublished data from the Cen-ter on Budget Policy and Priorities and Feenberg and Coutts[1993] The AFDC program parameters are obtained from theU S Department of Health and Human Services (Characteristicsof State Plans [various years]) and unpublished data from theUrban Institute The Food Stamp parameters come from the U SHouse of Representatives (Green Book [various years]) and theU S Department of Agriculture [various years] The Medicaidprogram information is obtained from three sources the NationalGovernorrsquos Association [various dates] the IntergovernmentalHealth Policy Project [various years] and the U S House ofRepresentatives [Medicaid Source Book 1988 1993] Medicaiddollar values (separately for adults and children) come from un-published tables from the Health Care Financing Administration(HCFA)
B Welfare Waiver Variables
c Any Time Limit is one starting with the implementationmonth of a waiver that imposes mandatory work require-ments on families that reach time limits or results in thereduction or total loss of AFDC payments after a certaintime limit has been reached (usually two years)
1108 QUARTERLY JOURNAL OF ECONOMICS
c Any Terminations is one beginning with the month inwhich a case is rst terminated under a welfare waiver
c Major Waiver Application is one beginning with the monthin which a state rst applies for a major statewide waiver
Note that these variables are always zero for women withoutAFDC children
Sources for Welfare Waiver Variables
The waiver variables we used are based on our reading of thewaiver summaries in General Accounting Ofce [1997] the U SDepartment of Health and Human Services [1997c] and Savnerand Greenberg [1997] These sources generally have the imple-mentation dates of waivers We also consulted American PublicWelfare Association [1996] Levine and Whitmore [1998] andU S Department of Health and Human Services [1997a] Ourclassication scheme follows most closely the classicationschemes in General Accounting Ofce [1997] and the U S De-partment of Health and Human Services [1997c]
C Training Program Variables
These variables measure variation across states and overtime in federal and state spending on welfare-to-work programsand on eligibility criteria These numbers are based on the statelevel scal year WIN (Work Incentive) program expenditures andstate level scal year JOBS (Job Opportunities and Basic Skills)program expenditures by component (job search education etc)We calculate spending per female AFDC adult who is not exemptfrom participation based on the age of her youngest child Thedollars are then divided by the state average wage to obtain anamount of services provided26
We calculate the distribution of the age of the youngest childand we apportion total JOBS spending to women using the frac-tion of participants who are female adults We divide spendinginto two categories education which includes education postsec-ondary education and self-initiated education and other whichincludes job search job development and placement on-the-jobtraining work supplementation community work experienceself-initiated training job skills job readiness and assessmentand employability plan For scal year 1990 it is necessary to
26 The state average wage is average hourly wage for manufacturing in thestate It is normalized so that the 1996 value = 100
1109THE LABOR SUPPLY OF SINGLE MOTHERS
extrapolate WIN expenditures forward and JOBS expendituresbackward to the date when the JOBS program began in a givenstate We also extrapolate 1985 WIN data back to 1984 and scalyear 1996 forward to the rst three months of scal year 1997
Note that the training variables are zero for women withoutAFDC children and women with children young enough to ex-empt the mother from participation in WIN or JOBS
Sources for Training Variables
JOBSWIN expenditure data come from unpublished U SDepartment of Health and Human Services and U S Depart-ment of Labor tabulations and the U S House of Representa-tives (Green Book [various years]) To calculate the distribution ofthe age of youngest child for single mothers we use data from theU S Department of Health and Human Services (Characteristicsof AFDC Recipients [various years]) and authorsrsquo calculationsfrom the March CPS Wage data come from the Bureau of LaborStatistics web site
D Child Care Variable
Child Care expenditures are actual federal and state expen-ditures by state on the following four programs AFDC ChildCare Transitional Child Care At-Risk Child Care and ChildCare and Development Block Grants Expenditures are put on aper-person basis by dividing through by the number of unmarriedwomen with children less than six This denominator is calcu-lated using annual data on the number of women by state (fromthe Census Bureau) and the fraction of women in a state who areunmarried with children less than six which is calculated fromthe ORG over the entire 1984 ndash1996 period Like training dollarsthe resulting dollar value is then divided by the state averagewage to obtain an amount of services provided
Note that the child care variable is always zero for womenwithout children less than six
Sources for Child Care Variable
Child Care expenditures come from unpublished U S De-partment of Health and Human Service tabulations Annual dataon the number of women by state come from the U S CensusBureau The fraction of women in a state who are unmarried withchildren less than six is calculated from the ORG by the authorsWage data come from the Bureau of Labor Statistics web site
1110 QUARTERLY JOURNAL OF ECONOMICS
AP
PE
ND
IX2
VA
RIA
BL
EM
EA
NS
FO
RS
ING
LE
MO
TH
ER
SA
ND
SIN
GL
EW
OM
EN
WIT
HO
UT
CH
ILD
RE
N1
984
1988
199
219
96
Var
iabl
e
1984
1988
1992
1996
Ch
ildr
enN
och
ildr
enC
hil
dren
No
chil
dren
Ch
ildr
enN
och
ildr
enC
hil
dren
No
chil
dren
Age
314
426
86
319
727
79
319
628
83
321
929
22
Non
wh
ite
037
10
155
036
30
162
038
40
178
037
70
207
His
pan
ic0
086
005
30
103
007
20
111
007
90
136
009
3H
igh
sch
ool
drop
out
026
20
094
024
60
091
024
10
094
021
10
092
Som
eco
lleg
e0
211
029
70
234
030
50
256
031
70
311
031
7B
ach
elor
s0
063
019
20
064
020
40
061
021
00
072
023
3M
aste
rs0
022
005
90
025
006
10
023
006
60
021
006
4D
ivor
ced
056
40
151
053
30
161
047
70
165
046
00
162
Wid
owed
006
60
010
005
50
010
004
70
012
003
80
012
Liv
ing
wit
hpa
ren
ts0
156
041
80
151
037
50
154
034
70
154
033
9L
ivin
gw
ith
un
rela
ted
adu
ltm
ale
009
70
135
012
50
167
014
80
198
016
50
218
[of
chil
dren
un
der
181
681
z1
664
z1
707
z1
707
z[
ofch
ildr
enu
nde
r6
056
0z
057
1z
062
4z
061
3z
Ear
ned
inco
me
(Mar
ch)
128
1018
331
134
6220
183
132
3218
993
147
6019
912
Ear
ned
inco
me
ifw
ork
(Mar
ch)
172
5019
536
180
1321
293
179
3020
453
180
2321
479
An
nu
alho
urs
ifw
ork
(Mar
ch)
1718
1837
1724
1894
1712
1862
1740
1881
Hou
rly
earn
ings
(Mar
ch)
985
103
89
9110
86
987
105
910
03
109
8In
com
eta
xes
ifw
ork
1521
2751
1030
2958
811
2967
7929
14W
elfa
rem
axim
um
ben
et
7583
z74
06z
7391
z70
56z
Wel
fare
ben
et
ifw
ork
1482
z14
78z
1546
z14
88z
Pro
babi
lity
ofA
FD
Cre
ceip
tif
wor
k0
255
z0
287
z0
266
z0
256
zM
edic
aid
ifw
ork
1215
013
590
1704
219
424
Nu
mbe
rof
obse
rvat
ion
s93
9118
914
9211
186
1210
333
193
1187
8815
846
Sou
rces
The
data
are
prim
arily
from
the
1984
ndash199
6C
urre
ntP
opul
atio
nSu
rvey
Out
goin
gR
otat
ion
Gro
upF
ile(O
RG
)and
from
the
1985
ndash199
7M
arch
Cur
rent
Pop
ulat
ion
Surv
ey(M
arch
)R
estr
icti
ons
See
Tab
leII
for
sam
ple
rest
rict
ion
sN
otes
Mea
ns
com
efr
omth
eO
RG
unle
ssth
eyar
ela
bele
d(M
arch
)T
hese
mea
nsar
eca
lcul
ated
usi
ngth
ech
arac
teri
stic
sof
the
give
nsa
mpl
efo
rth
egi
ven
year
and
are
wei
ghte
dW
omen
are
assu
med
tobe
inth
eir
rst
four
mon
ths
ofw
ork
toha
ven
ou
near
ned
inco
me
and
tocl
aim
noch
ildca
reex
pens
esA
lso
sin
gle
wom
enw
ith
and
wit
hou
tch
ildr
enar
eas
sum
edto
le
ashe
adof
hous
ehol
dan
dsi
ngl
ere
spec
tive
ly
and
tocl
aim
the
stan
dard
dedu
ctio
nT
axes
and
wel
fare
are
adju
sted
for
stat
eco
stof
livi
ng
diff
eren
ces
All
doll
aram
ount
sar
eex
pres
sed
in19
96do
llar
spe
rye
arS
eeA
ppen
dix
1fo
rsp
eci
cin
dice
sus
edan
dot
her
deta
ils
1111THE LABOR SUPPLY OF SINGLE MOTHERS
DEPARTMENT OF ECONOMICS AND INSTITUTE FOR POLICY RESEARCH NORTHWESTERN
UNIVERSITY AND NATIONAL BUREAU OF ECONOMIC RESEARCH
DEPARTMENT OF ECONOMICS UNIVERSITY OF NORTH CAROLINA GREENSBORO
REFERENCES
American Public Welfare Association ldquoSummary of Approved AFDC WaiverActionsrdquo (Washington DC May 1993 and August 1 1996)
Advisory Committee on Intergovernmental Relations Signicant Features ofFiscal Federalism (Washington DC various years)
Bavier Richard ldquoAn Early Look at the Effects of Welfare Reformrdquo unpublishedpaper March 1999
Blank Rebecca M ldquoWhat Causes Public Assistance Caseloads to Growrdquo unpub-lished paper May 1997
mdashmdash ldquoThe Effect of Medical Need and Medicaid on AFDC Participationrdquo Journalof Human Resources XXIV (1989) 54ndash87
Blank Rebecca M and Patricia Ruggles ldquoWhen Do Women Use Aid to Familieswith Dependent Children and Food Stampsrdquo Journal of Human ResourcesXXXI (1996) 57ndash89
Blank Rebecca M David E Card and Philip K Robins ldquoFinancial Incentives forIncreasing Work and Income among Low-Income Familiesrdquo in Finding JobsWork and Welfare Reform David Card and Rebecca M Blank eds (NewYork Russell Sage Foundation 2000) pp 373ndash419
Browning Edgar K ldquoEffects of the Earned Income Tax Credit on Income andWelfarerdquo National Tax Journal XLVIII (1995) 23ndash43
Cohany Sharon Anne Polivka and Jennifer Rothgeb ldquoRevisions in the CurrentPopulation Survey Effective January 1994rdquo Employment and Earnings XLI(1994) 13ndash37
Commerce Clearing House State Tax Handbook (Chicago IL various years)Council of Economic Advisers ldquoThe Economics of Child Carerdquo (Washington DC
December 1997)Danziger Sheldon Robert Haveman and Robert Plotnick ldquoHow Income Trans-
fers Affect Work Savings and the Income Distribution A Critical ReviewrdquoJournal of Economic Literature XIX (1981) 975ndash1028
Dickert Stacy Scott Houser and John Karl Scholz ldquoThe Earned Income TaxCredit and Transfer Programs A Study of Labor Market and Program Par-ticipationrdquo in Tax Policy and the Economy 9 James M Poterba ed (Cam-bridge MA MIT Press 1995) pp 1ndash50
Edin Kathryn and Laura Lein Making Ends Meet How Single Mothers SurviveWelfare and Low-Wage Work (New York Russell Sage Foundation 1997)
Eissa Nada and Jeffrey B Liebman ldquoLabor Supply Response to the EarnedIncome Tax Creditrdquo Quarterly Journal of Economics CXII (1996) 605ndash637
Eissa Nada and Hilary Williamson Hoynes ldquoThe Earned Income Tax Credit andLabor Supply Married Couplesrdquo NBER Working Paper No 6856 December1998
Ellwood David T ldquoThe Impact of the Earned Income Tax Credit and Social PolicyReforms on Work Marriage and Living Arrangementsrdquo National Tax JournalLIII (2000) 1063ndash1106
Feenberg Daniel and Elisabeth Coutts ldquoAn Introduction to the TAXSIM ModelrdquoJournal of Policy Analysis and Management XII (1993) 189ndash194
Fraker Thomas Robert Moftt and Douglas Wolf ldquoEffective Tax Rates andGuarantees in the AFDC Program 1967ndash1982rdquo Journal of Human Re-sources XX (1985) 252ndash263
General Accounting Ofce ldquoWelfare Reform Statesrsquo Early Experiences withBenet Terminationrdquo (Washington DC GAO S-97-74 May 1997)
Gueron Judith M and Edward Pauly From Welfare to Work (New York RussellSage Foundation 1991)
Heckman James J ldquoWhat Has Been Learned about Labor Supply in the PastTwenty Yearsrdquo American Economic Review LXXXIII (1993) 116ndash121
Hill Carolyn V Joseph Hotz Charles H Mullin and John Karl Scholz ldquoEITC
1112 QUARTERLY JOURNAL OF ECONOMICS
Eligibility Participation and Compliance Rates for AFDC Households Evi-dence from the California Caseloadrdquo unpublished paper March 1999
Hoffman Saul D and Laurence S Seidman The Earned Income Tax CreditAntipoverty Effectiveness and Labor Market Effects (Kalamazoo MI UpjohnInstitute for Employment Research 1990)
Holtzblatt Janet Janet McCubbin and Robert Gillette ldquoPromoting Workthrough the EITCrdquo National Tax Journal XLVII (1994) 591ndash608
Hoynes Hilary Williamson ldquoWork and Marriage Incentives in Welfare ProgramsWhat Have We Learnedrdquo in Fiscal Policy Lessons from Economic ResearchAlan J Auerbach ed (Cambridge MA MIT Press 1997)
Intergovernmental Health Policy Project Major Changes in State Medicaid andIndigent Care Programs (Washington DC various years)
Jencks Christopher and Joseph Swingle ldquoHas Welfare Reform Helped or HurtSingle Momsrdquo unpublished paper February 2000
Keane Michael ldquoA New Idea for Welfare Reformrdquo Federal Reserve Bank ofMinneapolis Quarterly Review XXXVIII (1995) 2ndash28
Levine Judith A ldquoPolicy Incentives Confront Everyday Realities IntegratingEconomic and Sociological Perspectives on the Welfare-to-Work Transitionrdquounpublished paper March 1997
Levine Phillip B and Diane M Whitmore ldquoThe Impact of Welfare Reform on theAFDC Caseloadrdquo National Tax Association Proceedings Ninetieth AnnualConference (1998) 24ndash33
Liebman Jeffrey B ldquoThe Impact of the Earned Income Tax Credit on Incentivesand Income Distributionrdquo in Tax Policy and the Economy 12 James MPoterba ed (Cambridge MA MIT Press 1998) pp 83ndash120
Martini Alberto and Michael Wiseman ldquoExplaining the Recent Decline in Wel-fare Caseloads Is the Council of Economic Advisers Rightrdquo Challenge XL(1997) 6 ndash20
Meyer Bruce D ldquoDo the Poor Move to Receive Higher Welfare Benetsrdquo unpub-lished paper April 1999
Meyer Bruce D and Dan T Rosenbaum ldquoWelfare the Earned Income Tax Creditand the Labor Supply of Single Mothersrdquo NBER Working Paper No 7363September 1999
Meyer Bruce D and Dan T Rosenbaum ldquoMaking Single Mothers Work RecentChanges in Tax and Welfare Policy and their Effectsrdquo National Tax JournalLIII (2000a) 1027ndash1062
Meyer Bruce D and Dan T Rosenbaum ldquoMedicaid Private Health Insuranceand the Labor Supply of Single Mothersrdquo unpublished paper November2000b
Moftt Robert ldquoAn Economic Model of Welfare Stigmardquo American EconomicReview LXXIII (1983) 1023ndash1035
mdashmdash ldquoIncentive Effects of the U S Welfare Systemrdquo Journal of Economic Litera-ture XXX (1992) 1ndash61
mdashmdash ldquoThe Effect of Welfare on Marriage and Fertility What Do We Know andWhat Do We Need to Knowrdquo unpublished paper December 1997
Moftt Robert and Barbara Wolfe ldquoThe Effect of the Medicaid Program onWelfare Participation and Labor Supplyrdquo Review of Economics and StatisticsLXXIV (1992) 615ndash626
National Governorrsquos Association MCH (Maternal and Child Health) Update(Washington DC various dates)
National Research Council Measuring Poverty A New Approach Constance FCitro and Robert T Michael eds (Washington DC National Academy Press1995)
mdashmdash Evaluating Welfare Reform A Framework and Review of Current WorkRobert Moftt and Michele Ver Ploeg eds (Washington DC National Acad-emy Press 1999)
Polivka Anne E and Stephen M Miller ldquoThe CPS After the Redesign Refocus-ing the Economic Lensrdquo in Labor Statistics Measurement Issues John Halti-wanger Marilyn E Manser and Robert Topel eds (Chicago University ofChicago Press 1998) pp 249ndash286
Romich Jennifer L and Thomas Weisner ldquoHow Families View and Use the
1113THE LABOR SUPPLY OF SINGLE MOTHERS
EITC The Case for Lump-sum Deliveryrdquo National Tax Journal LIII (2000)1245ndash1265
Savner Steve and Mark Greenberg ldquoThe CLASP Guide to Welfare Waivers1997rdquo (Washington DC Center for Law and Social Policy 1997)
Scholz John Karl ldquoThe Participation Rate of the Earned Income Tax CreditrdquoInstitute for Research on Poverty Madison WI Discussion Paper 928-90October 1990
mdashmdash ldquoThe Earned Income Tax Credit Participation Compliance and AntipovertyEffectivenessrdquo National Tax Journal XLVII (1994) 59ndash81
Smeeding Timothy M Katherine E Ross Michael OrsquoConnor and Michael SimonldquoThe EITC Expectation Knowledge Use and Economic and Social MobilityrdquoNational Tax Journal LIII (2000) 1187ndash1210
U S Department of Agriculture Characteristics of Food Stamp Households(Alexandria VA U S Department of Agriculture Food and Consumer Ser-vice Ofce of Analysis and Evaluation various years)
U S Department of Health and Human Services Characteristics and FinancialCircumstances of AFDC Recipients (Washington DC U S Department ofHealth and Human Services Administration for Children and FamiliesOfce of Family Assistance Division of Performance Measurement variousyears)
mdashmdash Characteristics of State Plans for Aid to Families with Dependent Children(Washington DC U S Department of Health and Human Services Admin-istration for Children and Families Ofce of Family Assistance variousyears)
mdashmdash HHS Fact Sheet State Welfare Demonstrations (Washington DC U SDepartment of Health and Human Services March 17 1997a)
mdashmdash National Evaluation of Welfare-to-Work Strategies (Washington DC Ad-ministration for Children and Families Ofce of the Assistant Secretary forPlanning and Evaluation December 1997b)
mdashmdash Setting the Baseline A Report on State Welfare Waivers (Washington DCU S Department of Health and Human Services Ofce of the AssistantSecretary for Planning and Evaluation 1997c)
U S Department of the Treasury Statistics of Income Individual Income TaxReturns (Washington DC U S Department of the Treasury Internal Reve-nue Service various years)
U S Department of the Treasury Your Federal Income Tax Tax Guide forIndividuals (Washington DC U S Department of the Treasury InternalRevenue Service various years)
U S House of Representatives Committee on Energy and Commerce MedicaidSource Book Background Data and Analysis (Washington DC GovernmentPrinting Ofce November 1988 and January 1993)
U S House of Representatives Committee on Ways and Means Green BookBackground Material and Data on Programs within the Jurisdiction of theCommittee on Ways and Means (Washington DC Government Printing Of-ce various years)
Winkler Anne ldquoThe Incentive Effects of Medicaid on Womenrsquos Labor SupplyrdquoJournal of Human Resources XXVI (1991) 308ndash337
Yelowitz Aaron S ldquoThe Medicaid Notch Labor Supply and Welfare Participa-tionrdquo Quarterly Journal of Economics CX (1995) 909ndash940
Ziliak James P David N Figlio Elizabeth E Davis and Laura S ConnollyldquoAccounting for the Decline in AFDC Caseloads Welfare Reform or EconomicGrowthrdquo unpublished paper July 1997
1114 QUARTERLY JOURNAL OF ECONOMICS
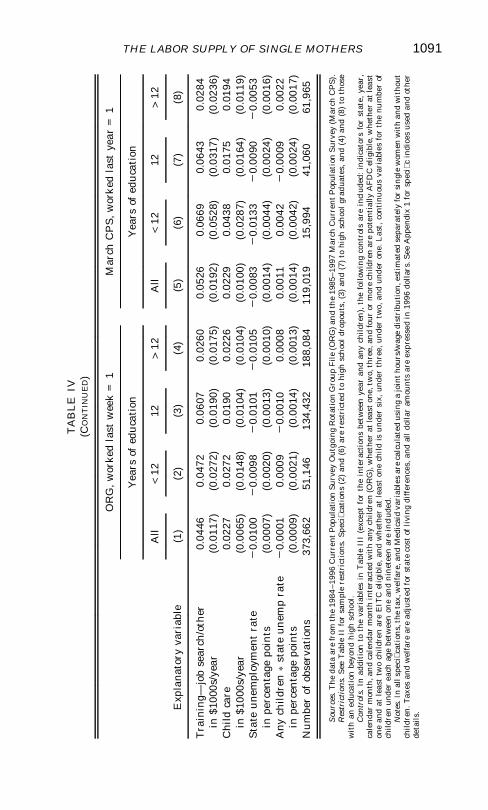
TA
BL
EIV
(CO
NT
INU
ED
)
Exp
lana
tory
vari
able
OR
Gw
orke
dla
stw
eek
=1
Mar
chC
PS
wor
ked
last
year
=1
Yea
rsof
edu
cati
onY
ears
ofed
uca
tion
All
lt12
12gt
12A
lllt
1212
gt12
(1)
(2)
(3)
(4)
(5)
(6)
(7)
(8)
Tra
inin
gmdashjo
bse
arch
oth
er0
0446
004
720
0607
002
600
0526
006
690
0643
002
84in
$100
0sy
ear
(00
117)
(00
272)
(00
190)
(00
175)
(00
192)
(00
528)
(00
317)
(00
236)
Chi
ldca
re0
0227
002
720
0190
002
260
0229
004
380
0175
001
94in
$100
0sy
ear
(00
065)
(00
148)
(00
104)
(00
104)
(00
100)
(00
287)
(00
164)
(00
119)
Sta
teu
nem
ploy
men
tra
te2
001
002
000
982
001
012
001
052
000
832
001
332
000
902
000
53in
perc
enta
gepo
ints
(00
007)
(00
020)
(00
013)
(00
010)
(00
014)
(00
044)
(00
024)
(00
016)
Any
chil
dren
pst
ate
unem
pra
te2
000
010
0009
20
0010
000
080
0011
000
422
000
090
0022
inpe
rcen
tage
poin
ts(0
000
9)(0
002
1)(0
001
4)(0
001
3)(0
001
4)(0
004
2)(0
002
4)(0
001
7)N
um
ber
ofob
serv
atio
ns37
366
251
146
134
432
188
084
119
019
159
9441
060
619
65
Sou
rces
The
data
are
from
the
1984
ndash199
6C
urre
ntP
opul
atio
nSu
rvey
Out
goin
gR
otat
ion
Gro
up
Fil
e(O
RG
)an
dth
e19
85ndash1
997
Mar
chC
urre
ntP
opul
atio
nS
urve
y(M
arch
CP
S)
Res
tric
tion
sS
eeT
able
IIfo
rsa
mpl
ere
stri
ctio
ns
Spec
ica
tion
s(2
)an
d(6
)ar
ere
stri
cted
tohi
ghsc
hoo
ldr
opou
ts(
3)an
d(7
)to
high
sch
ool
grad
uate
san
d(4
)an
d(8
)to
thos
ew
ith
aned
ucat
ion
beyo
nd
hig
hsc
hool
C
ontr
ols
Inad
diti
onto
the
vari
able
sin
Tab
leII
I(e
xcep
tfo
rth
ein
tera
ctio
nsbe
twee
nye
aran
dan
ych
ildr
en)
the
foll
owin
gco
ntro
lsar
ein
clud
ed
indi
cato
rsfo
rst
ate
year
ca
len
dar
mon
tha
nd
cale
ndar
mon
thin
tera
cted
wit
han
ych
ildr
en(O
RG
)w
heth
erat
leas
ton
etw
oth
ree
and
four
orm
ore
child
ren
are
pote
ntia
llyA
FD
Cel
igib
lew
heth
erat
leas
ton
ean
dat
leas
ttw
och
ildr
enar
eE
ITC
elig
ible
and
wh
ethe
rat
leas
ton
ech
ild
isu
nder
six
unde
rth
ree
unde
rtw
oan
dun
der
one
Las
tco
ntin
uou
sva
riab
les
for
the
num
ber
ofch
ildr
enun
der
each
age
betw
een
one
and
nin
etee
nar
ein
clud
ed
Not
esI
nal
lspe
cic
atio
ns
the
tax
wel
fare
and
Med
icai
dva
riab
les
are
calc
ula
ted
usin
ga
join
tho
urs
wag
edi
stri
buti
one
stim
ated
sepa
rate
lyfo
rsi
ngl
ew
omen
wit
han
dw
itho
utch
ildr
enT
axes
and
wel
fare
are
adju
sted
for
stat
eco
stof
livi
ngdi
ffer
ence
san
dal
ldo
llar
amou
nts
are
expr
esse
din
1996
doll
ars
See
App
endi
x1
for
spec
ic
indi
ces
used
and
othe
rde
tail
s
1091THE LABOR SUPPLY OF SINGLE MOTHERS
work of 107 for any employment during the year and 083 forwork in an average week We also estimated specications withseparate coefcients on state and federal income taxes althoughfor brevity these full estimates are not reported here The resultsfor federal taxes were similar to all taxes while the derivative(standard error) for state income taxes was a large and signicant2 00336 (00083) in the ORG sample and a smaller and insigni-cant 2 00165 (00139) in the March sample Thus while the statetax estimates are much less precise and differ in the two samplesthey give the same message as the other tax coefcients ie thatthe labor supply of single mothers responds to taxes
B Welfare
The full sample specications of columns (1) and (5) alsoindicate substantial effects of welfare on employment A onethousand dollar reduction in the annual Welfare Maximum Bene-t (the AFDC plus Food Stamp benet a women receives if shedoes not work) increases employment last week by 34 percentagepoints and increases employment last year by 30 percentagepoints This calculation holds constant the other welfare vari-ables Welfare Benets if Work and Probability of AFDC Receiptif Work that generally change with the maximum benet TheWelfare Benets if Work effect is sizable implying that a onethousand dollar increase in benets when one works increasesemployment last week by 72 percentage points and last year by57 percentage points These estimates suggest substantial posi-tive employment effects of reductions in implicit tax rates andincreases in earnings disregards
The transaction costs or stigma of welfare receipt as mea-sured by the Probability of AFDC Receipt if Work variable isnegative and signicantly different from zero as expected (seeequation (5)) The magnitude of this coefcient can be gauged bycomparing it with the coefcients on the variables denominatedin thousands of dollars Such comparisons suggest a transactioncost of several thousand dollars with the exact number depend-ing on the employment measure and the income variable usedFor example using the Welfare Benets if Work coefcient in theORG sample yields a transaction cost estimate of $2571 whilethe March sample implies an estimate of $3051 This resultagrees with past studies as well as ethnographies that havetended to nd substantial transaction costs or stigma of welfarereceipt
1092 QUARTERLY JOURNAL OF ECONOMICS
To assess the effect of cutting the AFDC benet one needs toincorporate the effects of all three of the welfare variables and theMedicaid if Work variable When the AFDC maximum benetand payment standard are cut they not only reduce benets ifone does not work but also reduce benets if one does work Theyalso decrease the likelihood that a working mother will be onwelfare at all thereby reducing both her Medicaid eligibility andher AFDC transaction and stigma costs When we do the fullcalculations we nd that a 10 percent cut in the maximumbenet ($324 annually) increases both the annual and weeklyemployment rate by about 10 percentage points
Despite a more detailed calculation of welfare incentivesthan most past work and the use of panel data techniques wethink there are important potential sources of bias in these esti-mates We should also note that by dividing the effect of welfareinto income when working and when not and by estimating aseparate term for transaction costsstigma we are putting thetheoretical predictions to a more severe test than most work Asdiscussed in Section IV the Welfare Benets if Work variable andthe Probability of AFDC Receipt if Work variable are more dif-cult to calculate precisely than our other variables The largercoefcient on the Welfare Benets if Work variable could also bedue to the scale of this variable being inappropriately low Theearnings distribution used to calculate expected benets putsmost of the weight on earnings levels where welfare benetswould be low or zero It is very likely that we should use anearnings distribution that puts greater weight in the left tailsince women who work while on welfare rarely report all of theirearnings to the welfare ofce [Edin and Lein 1997] The reasonsfor possible bias in the Probability of AFDC Receipt if Workvariable are similar The coefcients on these two variables tendto both be large in the same specications with their oppositesigns canceling each other out
C Medicaid
We nd little effect of Medicaid on the employment decisionsof single mothers Theory predicts that the Medicaid if Workvariable will have a positive effect on employment The variablehas the opposite effect from this prediction in both samplesalthough the coefcient estimates are small and usually are notsignicantly different from zero This result is not completelyunexpected given the weak and conicting ndings in past work
1093THE LABOR SUPPLY OF SINGLE MOTHERS
Part of the difculty is the uncertainty about individual knowledgeof Medicaid rules and their valuation of the benets We havetried a large number of alternative specications none of whichindicates a large effect of Medicaid A full accounting of theseresults can be found in Meyer and Rosenbaum [2000b]
D Welfare Waivers and Time Limits
The AFDC waiver variables have the expected effect on em-ployment and their coefcients are signicantly different fromzero Both the implementation of a time limit on welfare receiptand the actual termination of benets under a work requirementor time limit waiver are predicted to increase employment bybetween 14 and 48 percentage points However until the lastyears of our sample the overall importance of such waivers issmall Even by 1994 only 5 percent of single mothers lived instates with a time limit and less than half of 1 percent lived instates that had begun to terminate benets
One should be cautious in interpreting the waiver coef-cients especially in attributing effects to the implementation ofparticular provisions of recent waivers or the termination of casesper se The perception of welfare changes by potential welfarerecipients the attitudes of case workers and differences in stateimplementation of policies likely play a large role in inuencingthe welfare caseload and consequently employment It is alsoeconometrically difcult to disentangle which provisions of awaiver are the most important since states typically imple-mented several changes to their AFDC programs under waiversat the same time The reported coefcients are partly the effect ofthe particular actions coded and partly a proxy for other changesgoing on in the states
Recognizing these limitations the strength of the evidencehere for a causal interpretation of the waiver results is muchgreater than in the studies of welfare caseloads First we useimplementation dates rather than application or approval dateswhich are at best loosely related to when provisions are enforcedSecond when we account for state intentions to reform welfare asindicated by whether or not a state has made a major waiverapplication this variable has little effect Third one or two yearleads of our time limit and termination variables have small andinsignicant coefcients suggesting that the provisions per serather than publicity or administrator attitudes lead to the em-ployment increases This result contrasts with those of Blank
1094 QUARTERLY JOURNAL OF ECONOMICS
[1997] and Levine and Whitmore [1998] who found strong effectsof leads of waiver variables on caseloads
E Training and Child Care
The last three coefcient estimates in Table IV measure theemployment effects of expenditures on training and child careHigher expenditures on job search and other training and onchild care are associated with a higher employment rate for singlemothers Training expenditures on education have a negativeeffect that is signicant in both samples The job search coef-cients imply that an increase in expenditures of one thousanddollars (about two-thirds of average expenditures) would increasethe employment rate for single mothers without young childrenby over four percentage points Since single mothers withoutchildren young enough to exempt them from training programsmake up about half of all single mothers the overall effect wouldbe over two percentage points An increase in federal and statechild care expenditures of ve hundred dollars per single motherwith a child under six (slightly less than the mean in 1996) isassociated with about a one percentage point increase in bothweekly and annual employment These effects are quite substan-tial per dollar expended The training result on education is notsurprising given the weaker results in the literature on classroomtraining and the possible short-term effect on employment aswomen are in classrooms rather than jobs
F Results by Education Group
Table IV also reports separate estimates for the effects of thepolicy variables for three education groups less than high schoolhigh school and some college We would expect a priori that thepolicy variables which mostly capture taxes and benets receivedby low-income women would have the greatest effect on highschool dropouts less of an effect on those with a high schooldegree and even less of an effect on those with some college22
Overall the results by level of education are consistent with thehypothesized larger effects on the less educated The derivativestend to be much larger in absolute value for high school dropoutsthan they are in the full sample and much smaller for those with
22 The estimates use a xed wagehours distribution (that does not vary byeducation) to calculate the income and benet variables so that the explanatoryvariables are comparable across the columns
1095THE LABOR SUPPLY OF SINGLE MOTHERS
some college than in the full sample For example a one thousanddollar cut in taxes (or increase in tax credits) for high schooldropout single women is predicted to increase their employmentby 42 percentage points in a typical week and increase work atall during the year by 88 percentage points The correspondingnumbers for those with some college education are 18 percentagepoints and 21 percentage points Many of the other policy vari-able derivatives also fall with increased education23
G Unemployment and Macroeconomic Conditions
Table IV also reports the coefcients on the state unemploy-ment rate and its interaction with a dummy variable for a singlewoman having children The unemployment rate is strongly sig-nicant and implies that for single women without children a onepercentage point increase in the unemployment rate is associatedwith a 10 percentage point decrease in employment in a typicalweek and a 08 percentage point decrease in work anytime duringthe year On the other hand the interaction of the unemploymentrate with being a single mother is small and not signicantlydifferent from zero The point estimates imply that a one percent-age point increase in the unemployment rate is associated withonly a 001 percentage point decrease in a typical week and 01percentage point increase any time during the year in theemployment of single mothers relative to single women withoutchildren These coefcients indicate a strong and similarresponsiveness of both groups of single women to the state of themacroeconomy This result is favorable for the use of singlewomen without children as a comparison group for single mothers
H Alternative Specications
Since many of the changes in policy notably welfare reformtook place in recent years and a well-publicized decline in thewelfare rolls began in 1994 we reestimate the full sample speci-cations of Table IV dropping the years 1994 ndash1996 along withthe waiver variables (which are nearly always zero through1993) The estimates from this shorter sample which are re-ported in columns (1) and (5) of Table V are very close to those
23 The derivatives might be lower for groups with higher levels of educationbecause their employment rates are higher leaving less room for increases inemployment However the drop in the magnitude of the policy variable deriva-tives with more education is greater than it is for other control variables such asthe unemployment rate
1096 QUARTERLY JOURNAL OF ECONOMICS
TA
BL
EV
PR
OB
ITE
STIM
AT
ES
OF
TH
EE
FF
EC
TO
FP
OL
ICY
VA
RIA
BL
ES
ON
TH
EE
MP
LO
YM
EN
TO
FS
ING
LE
WO
ME
NA
LT
ER
NA
TIV
ES
PE
CIF
ICA
TIO
NS
AV
ER
AG
ED
ER
IVA
TIV
E(S
TA
ND
AR
DE
RR
OR)
Exp
lana
tory
vari
able
OR
G
wor
ked
last
wee
k=
1M
arch
CP
Sw
orke
dla
stye
ar=
1
(1)
(2)
(3)
(4)
(5)
(6)
(7)
(8)
Inco
me
taxe
sif
wor
k2
002
892
001
352
005
012
000
552
004
302
002
532
005
582
003
05in
$100
0sy
ear
(00
045)
(00
087)
(00
051)
(00
084)
(00
074)
(00
129)
(00
087)
(00
133)
Lag
ged
inco
me
taxe
sif
wor
kz
zz
20
0263
zz
z2
001
75in
$100
0sy
ear
zz
z(0
009
2)z
zz
(00
148)
Wel
fare
max
imu
mbe
net
20
0375
20
0107
20
0464
20
0340
20
0291
20
0011
20
0445
20
0296
in$1
000s
yea
r(0
002
9)(0
006
5)(0
003
3)(0
002
4)(0
004
7)(0
009
2)(0
005
6)(0
003
8)W
elfa
rebe
ne
tif
wor
k0
0911
001
070
1027
007
660
0644
20
0080
20
0882
005
67in
$100
0sy
ear
(00
089)
(00
106)
(00
099)
(00
073)
(00
132)
(00
144)
(00
157)
(00
107)
Pro
babi
lity
ofA
FD
Cre
ceip
t2
021
042
010
442
024
102
019
502
020
562
008
372
026
652
017
17if
wor
k(0
029
7)(0
033
6)(0
032
7)(0
023
9)(0
043
3)(0
050
1)(0
051
8)(0
034
8)M
edic
aid
ifw
ork
20
0133
000
292
002
092
000
952
000
790
0055
20
0107
20
0045
in$1
000s
yea
r(0
004
6)(0
003
7)(0
004
5)(0
003
3)(0
005
9)(0
004
9)(0
006
6)(0
004
4)W
aive
rmdashan
yti
me
lim
itz
001
710
0204
001
28z
002
470
0350
001
84(I
ndic
ator
vari
able
)z
(00
080)
(00
104)
(00
071)
z(0
014
1)(0
019
7)(0
012
5)W
aive
rmdashan
yte
rmin
atio
nsz
001
600
0456
002
15z
003
550
0703
004
79(I
ndic
ator
vari
able
)z
(00
116)
(00
163)
(00
110)
z(0
023
8)(0
034
7)(0
022
3)
1097THE LABOR SUPPLY OF SINGLE MOTHERS
TA
BL
EV
(CO
NT
INU
ED
)
Exp
lana
tory
vari
able
OR
Gw
orke
dla
stw
eek
=1
Mar
chC
PS
w
orke
dla
stye
ar=
1
(1)
(2)
(3)
(4)
(5)
(6)
(7)
(8)
Tra
inin
gmdashed
uca
tion
20
0755
20
0764
20
0728
20
0841
20
0804
20
0656
20
1396
20
0780
in$1
000s
yea
r(0
023
7)(0
022
3)(0
039
2)(0
019
0)(0
040
1)(0
036
5)(0
060
7)(0
031
0)T
rain
ingmdash
job
sear
cho
ther
007
620
0441
001
060
0428
007
150
0571
008
490
0517
in$1
000s
yea
r(0
014
0)(0
013
3)(0
023
7)(0
011
7)(0
023
7)(0
021
3)(0
038
2)(0
019
3)C
hild
care
000
110
0190
000
710
0215
20
0033
001
710
0286
002
22in
$100
0sy
ear
(00
092)
(00
073)
(00
088)
(00
066)
(00
140)
(00
114)
(00
161)
(00
101)
1994
ndash199
6ex
clud
edY
esN
oN
oN
oY
esN
oN
oN
oS
ingl
em
oth
ers
only
No
Yes
No
No
No
Yes
No
No
Mot
her
sw
och
ildr
enlt
6ex
cl
No
No
Yes
No
No
No
Yes
No
Nu
mbe
rof
obse
rvat
ions
292
731
122
966
303
396
373
662
938
1640
818
957
8611
901
9
Sou
rces
The
data
are
from
the
1984
ndash199
6C
urre
ntP
opul
atio
nSu
rvey
Out
goin
gR
otat
ion
Gro
up
Fil
e(O
RG
)an
dth
e19
85ndash1
997
Mar
chC
urre
ntP
opul
atio
nS
urve
y(M
arch
CP
S)
Res
tric
tion
sS
eeT
able
IIfo
rsa
mpl
ere
stri
ctio
ns
Spe
cic
atio
ns(1
)an
d(5
)ex
clu
de19
94ndash1
996
Spe
cic
atio
ns
(2)
and
(6)
incl
ude
only
sin
gle
mot
hers
Spe
cic
atio
ns
(3)
and
(7)
incl
ude
sing
lew
omen
wit
hout
chil
dren
and
sing
lem
othe
rsw
hose
youn
gest
chil
dis
less
than
six
Con
trol
sS
eeT
able
IVfo
rco
ntr
ols
Indi
cato
rsfo
rin
tera
ctio
nsbe
twee
nst
ate
and
any
AF
DC
elig
ible
chil
dren
and
betw
een
year
and
both
any
AF
DC
elig
ible
child
ren
and
any
EIT
Cel
igib
lech
ildre
nar
ein
clud
edin
spec
ica
tion
s(2
)an
d(6
)N
otes
In
alls
peci
cat
ions
the
tax
wel
fare
and
Med
icai
dva
riab
les
are
calc
ula
ted
usin
ga
join
tho
urs
wag
edi
stri
buti
ones
tim
ated
sepa
rate
lyfo
rsi
ngle
wom
enw
ith
and
wit
hout
chil
dren
Tax
esan
dw
elfa
rear
ead
just
edfo
rst
ate
cost
ofli
vin
gdi
ffer
ence
sA
lso
alld
olla
ram
ount
sar
eex
pres
sed
in19
96do
llar
sS
eeA
ppen
dix
1fo
rsp
eci
cin
dice
sus
edan
dot
her
deta
ils
1098 QUARTERLY JOURNAL OF ECONOMICS
over the full sample period The only exception to this generali-zation is that the job searchother training coefcient is largerand the child care coefcient is smaller and statistically insigni-cant over the shorter time span These results are among themost important in this paper because they indicate that (1) theurry of welfare reform measures after 1993 has not falsely led toour main results and (2) the extended recovery of the 1990s is notan alternative explanation for our main results
Next we examine a sample of only single mothers Thisspecication identies the effects of the income variables throughchanges across states and for different family sizes In the case ofthe Income Taxes if Work variable we are largely using thevariation from the last few years when the EITC for women withone child was nearly unchanged but the EITC for women with twoor more children rose in large steps Thus identication comesfrom using women with one child as a control group and chang-ing the treatment that women with two or more children receiveWith single mothers only the year indicators remove the timetrend in welfare receipt and benets and the state indicatorsremove time-constant differences in state welfare benets andmuch of these state cost of living differences in the income vari-ables Thus the variation in welfare benets used to identify thecoefcients is now changes in state-level benets This identi-cation approach examines the employment response to fairlysubtle or short-run features of the welfare and tax laws Thesepolicy changes may be overwhelmed by other factors in thesespecications Despite these potential difculties much of theincome tax effect remains although the estimates are muchsmaller While the effect of taxes is still signicant in the MarchCPS data the drop in the coefcient and larger standard errorleads the ORG coefcient to be insignicantly different from zeroThe welfare benet coefcients are now no longer signicant TheAFDC transaction cost coefcient however remains signicantin the ORG data while the Medicaid coefcient has the expectedsign but remains small and insignicant in both samples
In the third set of specications of Table V we only includesingle mothers with a child under six (and single women withoutchildren) The derivative estimates for the tax and welfare vari-ables including waivers are often substantially larger in magni-tude for these single mothers with young children especially forthe tax variable in the ORG sample These specications are ofparticular interest because the effects of increased employment
1099THE LABOR SUPPLY OF SINGLE MOTHERS
on parental care is likely to be largest on these families withyoung children who are not likely to be in school The last speci-cation of Table V examines whether women learn about taxchanges with a delay after they are implemented This specica-tion includes both the contemporaneous and one year lagged taxvariables The results are somewhat supportive of a lagged effectof taxes In the ORG data the contemporaneous tax variable issmall and insignicant while the lagged variable is large andsignicant In the March CPS it is the contemporaneous variablethat is large and signicant while the lagged variable is smallerand signicant although still substantial in size
I Additional Specications and Hours Worked
We examine several other specications that are not reportedhere in order to determine the benets of studying many pro-grams at the same time to check the sensitivity of our results toalternative specications and to see whether there are particu-larly large effects for certain subgroups of the population We ndthat ignoring some of the policy changes that we study has asubstantial effect on the estimates for the remaining programsWhen we include the tax variable but leave out the other policyvariables its coefcient is about 50 percent larger in both sam-ples When the only policy variables that we include are Medicaidif Work and the Welfare Maximum Benet the Medicaid coef-cient is positive and signicant in the March CPS sample Whenthe other policy variables are not included the waiver variablesare much larger On the other hand the tax coefcient is hardlychanged when the training and child care variables are excludedThese results suggest that the common research strategy of in-vestigating one program in isolation has the potential to givemisleading results
We have examined the sensitivity of our results to alterna-tive samples and variable denitions In particular the resultsare little changed by using more stringent denitions of employ-ment by including separated women or women in school We alsotry several subgroup analyses In particular we examine differ-ences between whites and nonwhites and family heads and sub-family heads Nonwhites appear to be more affected by welfarewaivers than whites while subfamily heads are more sensitive totaxes than family heads
To obtain a broader picture of the effects of welfare and taxpolicy on labor supply we also examined hours worked (see
1100 QUARTERLY JOURNAL OF ECONOMICS
Meyer and Rosenbaum [1999] for more details) Difference-in-differences estimates for hours analogous to those in Table IIshow large relative increases in work for single mothers over thesample period with almost all of the change occurring after 1991We also estimated a series of Tobit and OLS regressions todetermine the effects of tax and welfare policy on hours controllingfor demographics economic conditions state and year We in-clude the same variables as we did in Tables IV and V althoughwe should emphasize that these variables were constructed forour structural model of employment and so are less suitable foran analysis of hours The effects of the policy variables in theTobit estimates for all women whether or not they work tend to besimilar to the effects on employment seen in the earlier tablesThese results hold for the sample of single mothers as well as forall single women The results are very similar for hours per yearin the March CPS and hours in a typical week in the ORG Forhours worked conditioning on positive hours the policy variablestend to have much the same signs but smaller and less signi-cant coefcients Overall the results tend to conrm the resultsfor the main policy variables that we found in the employmentprobits
VII WHICH POLICIES ACCOUNTED FOR THE EMPLOYMENT CHANGES
Our simultaneous examination of many government policiesmakes it straightforward to estimate the relative contribution ofthese policies to the recent increase in employment of singlemothers In Table VI we decompose the employment increases forsingle mothers relative to single women without children for boththe entire period (1984 ndash1996) and the recent period of rapidemployment growth (1992ndash1996) Overall these decompositionsindicate a large role for the EITC and other tax changes modestroles for AFDC benet cuts and waivers and smaller roles forMedicaid training and child care increases
Using the parameter estimates from our main specications(specications (1) and (5) of Table IV) the EITC explains 62percent of the increase in weekly employment over the full 1984to 1996 period yet only 27 percent of the increase between 1992and 1996 For annual employment the EITC plays a very similarrole explaining 61 percent of the 1984 to 1996 increase and 35percent of the 1992 to 1996 increase The corresponding changesin employment attributed to the EITC over the full 1984 to 1996
1101THE LABOR SUPPLY OF SINGLE MOTHERS
TA
BL
EV
IC
ON
TR
IBU
TIO
NO
FP
OL
ICY
CH
AN
GE
ST
OT
HE
CH
AN
GE
SIN
TH
ER
EL
AT
IVE
EM
PL
OY
ME
NT
OF
SIN
GL
EM
OT
HE
RS
VE
RSU
SS
ING
LE
WO
ME
NW
ITH
OU
TC
HIL
DR
EN
19
84ndash1
996
AN
D19
92ndash1
996
Exp
lan
ator
yva
riab
le
1984
ndash199
619
92ndash1
996
OR
GM
arch
CP
SO
RG
Mar
chC
PS
Din
emp
of
tota
lD
inem
p
ofto
tal
Din
emp
of
tota
lD
inem
p
ofto
tal
Inco
me
taxe
sif
wor
k0
0438
622
0
0720
614
0
0186
268
0
0305
351
W
elfa
rem
axim
um
ben
et
001
7925
4
001
5613
3
001
1416
5
000
9911
4
Wel
fare
ben
et
ifw
ork
000
050
70
0003
03
20
0045
26
52
000
332
38
Pro
babi
lity
ofA
FD
Cre
ceip
tif
wor
k2
000
022
03
20
0002
20
10
0020
29
000
172
0M
edic
aid
ifw
ork
20
0070
29
92
000
322
28
20
0023
23
32
000
112
12
Tot
alw
elfa
rebe
ne
tsamp
Med
icai
d0
0112
159
0
0125
106
0
0066
96
000
738
4W
aive
rmdashan
yti
me
lim
it0
0054
76
000
756
40
0052
76
000
738
5W
aive
rmdashan
yte
rmin
atio
ns
000
466
50
0099
84
000
466
60
0099
114
T
otal
wel
fare
wai
vers
000
9914
1
001
7414
8
000
9814
2
001
7219
8
Tra
inin
gmdashed
uca
tion
20
0101
214
4
20
0096
28
22
000
212
30
20
0020
22
3T
rain
ingmdash
job
sear
cho
ther
000
659
20
0077
65
000
476
80
0056
64
Ch
ild
care
000
689
70
0069
59
000
111
80
0013
15
Tot
altr
ain
ing
ampch
ild
care
000
324
60
0050
43
000
395
70
0039
56
Dem
ogra
phic
s2
000
732
104
2
000
682
58
001
0715
5
001
1212
9
Oth
er0
0096
137
0
0172
147
0
0196
283
0
0158
182
T
otal
007
0510
00
011
7410
00
006
9110
00
008
6910
00
Sou
rces
The
data
are
from
the
1984
ndash199
6C
urre
ntP
opul
atio
nSu
rvey
Out
goin
gR
otat
ion
Gro
up
Fil
e(O
RG
)an
dth
e19
85ndash1
997
Mar
chC
urre
ntP
opul
atio
nS
urve
y(M
arch
CP
S)
Not
es
Din
emp
give
sth
ech
ange
inth
eem
ploy
men
tof
sing
lem
othe
rs(r
elat
ive
tosi
ngle
wom
enw
itho
ut
chil
dren
)ov
erth
esp
eci
edti
me
peri
odth
atis
due
toth
egi
ven
expl
anat
ory
vari
able
(s)
of
tota
lgiv
esth
epe
rcen
tage
ofth
eem
ploy
men
tin
crea
sefo
rsi
ngle
mot
hers
(rel
ativ
eto
sing
lew
omen
wit
hout
chil
dren
)exp
lain
edby
the
give
nex
plan
ator
yva
riab
le(s
)T
he
rela
tive
empl
oym
ent
incr
ease
sar
eth
eav
erag
ede
riva
tive
esti
mat
esof
the
inte
ract
ions
ina
wei
ghte
dpr
obit
mod
elin
clu
ding
year
indi
cato
rsan
dth
eir
inte
ract
ions
wit
han
any
chil
dren
indi
cato
rT
he
para
met
eres
tim
ates
used
toes
tim
ate
the
chan
gein
empl
oym
ent
com
efr
omsp
eci
cati
ons
(1)
and
(5)o
fTab
leIV
wh
ileth
ech
ange
over
tim
ein
the
polic
yva
riab
les
com
esfr
omA
ppen
dix
2
1102 QUARTERLY JOURNAL OF ECONOMICS
period and the 1992 to 1996 period are also reported in Table VIWe estimate that the EITC and other tax changes increasedweekly employment 44 percentage points and annual employ-ment 72 percentage points over the full period with about 40percent of this change occurring over the 1992 to 1996 subperiodWhile these estimates are substantial they bracket the EITCeffects found by Eissa and Liebman [1996] and are smaller thanthose predicted by Dickert Houser and Scholz [1995] and Keane[1995]24
Changes in the maximum welfare benet and implicit taxrates and the Medicaid expansions account for between 10 and 16percent of the increase in weekly employment and between 8 and11 percent of the increase in annual employment over eitherperiod The effect of the Medicaid expansions themselves is usu-ally small or negative Conversely the effects of welfare waiversappear to be substantial with the estimates suggesting thatpolicies instituted under waivers account for about 14 to 15 per-cent of the increase in employment over the full sample periodand about 14 to 20 percent of the increase between 1992 and 1996for both weekly and annual employment In general both jobtraining and child care explain small parts of the employmentincrease although in the case of weekly employment over the fullperiod child care can account for about 10 percent of the increase
Improved macroeconomic conditions increased employmentfor both single mothers and single women without children overthe 1984 ndash1996 period Because the above calculations are forsingle mothers compared with single women without childrenunemployment is not given a share in the decomposition In all ofthe employment probits the interaction of unemployment andbeing a single mother had an economically small and statisticallyinsignicant effect Changes in state unemployment rates areestimated to have increased the absolute level of employment ofsingle mothers by 20 percentage points during a typical week
24 Eissa and Liebman [1996] found up to a 28 percentage point increase inparticipation due to TRA86 (which as we indicate in Section IV accounted for 43percent of the 1984ndash1996 change in taxes) Keane [1995] predicted that the1984ndash1996 changes will result in a 107 percentage point increase in participa-tion while Dickert Houser and Scholz [1995] predicted that the 1993ndash1996changes (39 percent of the full 1984ndash1996 change in taxes) would increase em-ployment of single parents by 33 percentage points Experimental ndings suchas those reported in Blank Card and Robins [2000] suggest substantial respon-siveness of welfare recipients and other low-income people to nancial incentivesThese experimental results would need to be extrapolated to all single mothersand the EITC to provide comparisons
1103THE LABOR SUPPLY OF SINGLE MOTHERS
and 14 percentage points during the year over the 1984 ndash1996period These numbers are equivalent to 284 percent of therelative increase in weekly employment and 122 percent of therelative increase in annual employment of single mothers overthe period
In results not shown we recalculate the shares of the em-ployment increase due to various policies using the parameterestimates from specications with only single mothers (specica-tions (2) and (6) of Table V) These results suggest a much smallerrole for the EITC and other tax changes in explaining the changesin employment ranging from 49 to 56 percent as large as those inTable VI Changes in the maximum welfare benet are lessimportant while the results for welfare waivers job training andchild care are largely unchanged
VIII CONCLUSIONS
Between 1984 and 1996 tax and transfer policy were reori-ented to encourage work by single mothers Single mothers haveresponded to these incentives by working more especially after1991 and especially those with children under six To assesswhich policy changes have led to the employment increases weexamine the incentives of federal and state income taxes AFDCMedicaid Food Stamps and their implicit tax rates and earningsdisregards as well as AFDC waivers instituting time limits orwork requirements Our detailed examination of these policychanges using two large micro data sets indicates that EITC andother tax changes account for over 60 percent of the 1984 to 1996increase in the weekly and annual employment of single mothersrelative to single women without children Changes to welfareprograms were less important but still account for a substantialshare of the employment increases Changes in Medicaid train-ing and child care programs play a considerably smaller roleThese ndings are conrmed in an analysis of hours worked
This paper makes several methodological improvements overpast research including the estimation of a simple structuralmodel of employment which provides several independent tests ofthe hypothesis that single mothers respond to economic incen-tives Our results indicate that nancial incentives have powerfuleffects on single mothersrsquo employment decisions and that thedifferent sources of these incentives have effects of plausiblemagnitudes We also nd a sizable transaction cost or stigma to
1104 QUARTERLY JOURNAL OF ECONOMICS
welfare We rely on less subjective measures of welfare waiverssuch as implementation dates and the beginning of case termi-nations and provide the rst evidence on the effects of waivers onemployment Unlike most past work we examine the major pro-grams affecting single mothers together nding that examiningone or two programs in isolation can lead to biases in estimatedbehavioral effects
In most of our specications identication comes from thedifferences in incentives faced by single women with and withoutchildren While we argue that single women without children area plausible comparison group we also provide estimates that donot rely on this comparison Instead these estimates rely onchanges in the treatment of family size state cost of living dif-ferences changes in state income taxes differences in earningsdisregards and implicit tax rates across states and changes inthese parameters and welfare benets within a state over timeOur nding of large tax and welfare effects on employment arerobust although tax effects and especially welfare effects aresometimes smaller using alternative identication strategies
Our result that the EITC played a dominant role in theemployment increases of single mothers between 1984 and 1996suggests that policies that ldquomake work payrdquo are effective in in-creasing work by single mothers This lesson is important in lightof the emphasis on punitive measures such as time limits andwork requirements in the most recent welfare reforms
APPENDIX 1 DESCRIPTION OF POLICY VARIABLES
This section describes the construction of our policy variablesand lists our information sources First we begin with the as-sumptions that we use to determine taxes program participationand benet levels
1 The determination of whether a woman has children andhow many she has is based on the CPS family and sub-family denitions Children in primary families (both re-lated and unrelated) are assigned to the family headwhile children in subfamilies are assigned to the subfam-ily head rather than to the primary family head Childrenare dened as any member of the given family (primary orsubfamily) under age 19 (or under 24 and a full-timestudent) for EITC purposes and under age 18 for all otherprograms
1105THE LABOR SUPPLY OF SINGLE MOTHERS
2 In the March CPS sample the age for tax purposes is theage at the time of the March interview We subtract onefor AFDC and Medicaid purposes In the ORG sample weuse the age at the time of the interview for AFDC andMedicaid but for tax purposes we add one for interviewsoccurring between January and June
3 Women have no unearned income (including child sup-port) or assets and their children have no earned incomeunearned income or assets hence earnings determinetheir program eligibility
4 Single mothers are assumed to le as head of householdand claim their children as dependents while singlewomen without children le as single Also all womentake the standard deduction
5 Women receiving AFDC are in their rst four months ofwork and do not claim child care expenses25
6 Single women without children do not receive FoodStamps
7 Shelter costs (an input in Food Stamp calculations) varyonly by state and over time
A Tax Welfare and Medicaid Variables
First for each woman we calculate ve quantities income taxliabilities (federal and state income taxes incorporating federaland state EITCs) welfare benets (AFDC plus Food Stamps)AFDC receipt (indicator for AFDC eligibility) and Medicaidadults covered and Medicaid children covered Under the assump-tions above these calculations are made at 50 annual earningslevels generated from the cells of a joint wagehours distributionThe 50 cells come from a combination of ve annual hours levels(500 1000 1500 2000 and 2500) and ten hourly wage levels (45 6 7 8 10 12 15 20 and 25)
Second we use the wagehours distributions described in thetext to weight the above quantities We calculate the distributionsusing only women with more than $500 of annual earnings Wethen construct the following variables
25 These assumptions are roughly consistent with the facts In scal year1995 over two-thirds of AFDC families with earnings were in their rst fourmonths of work and only about 16 percent of AFDC families with earningsclaimed child care expenses [U S Department of Health and Human ServicesCharacteristics of AFDC Recipients 1996]
1106 QUARTERLY JOURNAL OF ECONOMICS
c Income Taxes if Work is the weighted sum of income taxliabilities at the various annual earnings points using thewagehours distributions described above as weights
c Welfare Benets if Work is the weighted sum of welfarebenets at the various annual earnings points using thewagehours distributions described above as weights
c Probability of AFDC if Work is the weighted sum of AFDCreceipt at the various annual earnings points using thewagehours distributions described above as weights
c Medicaid if Work is calculated in two steps First wecalculate the weighted sum of Medicaid adults covered andMedicaid children covered at the various annual earningspoints using the wagehours distributions described aboveas weights Second we then multiply these sums by dollarexpenditures separately for adults and children In themain specications we use average expenditures over allstates and years
c Welfare Maximum Benet is the welfare benet assumingzero earnings
We calculate AFDC monthly benets (AFDC) as follows (settingquantities in parentheses to zero if negative)
(A1) AFDC 5 min MAXBEN RR p [PS 2 BRR p (EI 2 DIS)]
wheremdash MAXBEN is the maximum benetmdash RR is the ratable reductionmdash PS is the payment standard (the dollar amount when
benets end not counting disregards)mdash BRR is the benet reduction ratemdash EI is earned income andmdash DIS is the earnings disregard
We calculate Food Stamp benets in two steps (setting quantitiesin parentheses to zero if negative) First we calculate themonthly shelter cost expense deduction (SED) and second wecalculate the monthly Food Stamp benet (FS)
(A2) SED 5 (min SEDC SE 2 05
p ((1 2 EIDP) p EI 1 AFDC 2 SD))
(A3) FS 5 (MB 2 03 p ((1 2 EIDP)
p EI 1 AFDC 2 SD 2 SED))
1107THE LABOR SUPPLY OF SINGLE MOTHERS
wheremdash EIDP is the earned income deduction percentage (018
prior to 1986 020 starting in 1986)mdash MB is the maximum Food Stamp benetmdash SD is the standard deductionmdash SE is shelter expensesmdash SEDC is the shelter expense deduction ceilingTax and welfare variables (and earned and unearned income
variables) are adjusted for state cost of living differences usingthe poverty threshold index for 1990 from National ResearchCouncil [1995] which is adjusted annually using the PCE dea-tor The poverty threshold index accounts for housing cost differ-ences between states using Census housing cost data
Sources for Taxes Welfare and Medicaid
We obtain the federal income tax schedules from the U SDepartment of the Treasury [various years] The state tax infor-mation was obtained from four sources the Advisory Committeeon Intergovernmental Relations [various years] the CommerceClearing House [various years] unpublished data from the Cen-ter on Budget Policy and Priorities and Feenberg and Coutts[1993] The AFDC program parameters are obtained from theU S Department of Health and Human Services (Characteristicsof State Plans [various years]) and unpublished data from theUrban Institute The Food Stamp parameters come from the U SHouse of Representatives (Green Book [various years]) and theU S Department of Agriculture [various years] The Medicaidprogram information is obtained from three sources the NationalGovernorrsquos Association [various dates] the IntergovernmentalHealth Policy Project [various years] and the U S House ofRepresentatives [Medicaid Source Book 1988 1993] Medicaiddollar values (separately for adults and children) come from un-published tables from the Health Care Financing Administration(HCFA)
B Welfare Waiver Variables
c Any Time Limit is one starting with the implementationmonth of a waiver that imposes mandatory work require-ments on families that reach time limits or results in thereduction or total loss of AFDC payments after a certaintime limit has been reached (usually two years)
1108 QUARTERLY JOURNAL OF ECONOMICS
c Any Terminations is one beginning with the month inwhich a case is rst terminated under a welfare waiver
c Major Waiver Application is one beginning with the monthin which a state rst applies for a major statewide waiver
Note that these variables are always zero for women withoutAFDC children
Sources for Welfare Waiver Variables
The waiver variables we used are based on our reading of thewaiver summaries in General Accounting Ofce [1997] the U SDepartment of Health and Human Services [1997c] and Savnerand Greenberg [1997] These sources generally have the imple-mentation dates of waivers We also consulted American PublicWelfare Association [1996] Levine and Whitmore [1998] andU S Department of Health and Human Services [1997a] Ourclassication scheme follows most closely the classicationschemes in General Accounting Ofce [1997] and the U S De-partment of Health and Human Services [1997c]
C Training Program Variables
These variables measure variation across states and overtime in federal and state spending on welfare-to-work programsand on eligibility criteria These numbers are based on the statelevel scal year WIN (Work Incentive) program expenditures andstate level scal year JOBS (Job Opportunities and Basic Skills)program expenditures by component (job search education etc)We calculate spending per female AFDC adult who is not exemptfrom participation based on the age of her youngest child Thedollars are then divided by the state average wage to obtain anamount of services provided26
We calculate the distribution of the age of the youngest childand we apportion total JOBS spending to women using the frac-tion of participants who are female adults We divide spendinginto two categories education which includes education postsec-ondary education and self-initiated education and other whichincludes job search job development and placement on-the-jobtraining work supplementation community work experienceself-initiated training job skills job readiness and assessmentand employability plan For scal year 1990 it is necessary to
26 The state average wage is average hourly wage for manufacturing in thestate It is normalized so that the 1996 value = 100
1109THE LABOR SUPPLY OF SINGLE MOTHERS
extrapolate WIN expenditures forward and JOBS expendituresbackward to the date when the JOBS program began in a givenstate We also extrapolate 1985 WIN data back to 1984 and scalyear 1996 forward to the rst three months of scal year 1997
Note that the training variables are zero for women withoutAFDC children and women with children young enough to ex-empt the mother from participation in WIN or JOBS
Sources for Training Variables
JOBSWIN expenditure data come from unpublished U SDepartment of Health and Human Services and U S Depart-ment of Labor tabulations and the U S House of Representa-tives (Green Book [various years]) To calculate the distribution ofthe age of youngest child for single mothers we use data from theU S Department of Health and Human Services (Characteristicsof AFDC Recipients [various years]) and authorsrsquo calculationsfrom the March CPS Wage data come from the Bureau of LaborStatistics web site
D Child Care Variable
Child Care expenditures are actual federal and state expen-ditures by state on the following four programs AFDC ChildCare Transitional Child Care At-Risk Child Care and ChildCare and Development Block Grants Expenditures are put on aper-person basis by dividing through by the number of unmarriedwomen with children less than six This denominator is calcu-lated using annual data on the number of women by state (fromthe Census Bureau) and the fraction of women in a state who areunmarried with children less than six which is calculated fromthe ORG over the entire 1984 ndash1996 period Like training dollarsthe resulting dollar value is then divided by the state averagewage to obtain an amount of services provided
Note that the child care variable is always zero for womenwithout children less than six
Sources for Child Care Variable
Child Care expenditures come from unpublished U S De-partment of Health and Human Service tabulations Annual dataon the number of women by state come from the U S CensusBureau The fraction of women in a state who are unmarried withchildren less than six is calculated from the ORG by the authorsWage data come from the Bureau of Labor Statistics web site
1110 QUARTERLY JOURNAL OF ECONOMICS
AP
PE
ND
IX2
VA
RIA
BL
EM
EA
NS
FO
RS
ING
LE
MO
TH
ER
SA
ND
SIN
GL
EW
OM
EN
WIT
HO
UT
CH
ILD
RE
N1
984
1988
199
219
96
Var
iabl
e
1984
1988
1992
1996
Ch
ildr
enN
och
ildr
enC
hil
dren
No
chil
dren
Ch
ildr
enN
och
ildr
enC
hil
dren
No
chil
dren
Age
314
426
86
319
727
79
319
628
83
321
929
22
Non
wh
ite
037
10
155
036
30
162
038
40
178
037
70
207
His
pan
ic0
086
005
30
103
007
20
111
007
90
136
009
3H
igh
sch
ool
drop
out
026
20
094
024
60
091
024
10
094
021
10
092
Som
eco
lleg
e0
211
029
70
234
030
50
256
031
70
311
031
7B
ach
elor
s0
063
019
20
064
020
40
061
021
00
072
023
3M
aste
rs0
022
005
90
025
006
10
023
006
60
021
006
4D
ivor
ced
056
40
151
053
30
161
047
70
165
046
00
162
Wid
owed
006
60
010
005
50
010
004
70
012
003
80
012
Liv
ing
wit
hpa
ren
ts0
156
041
80
151
037
50
154
034
70
154
033
9L
ivin
gw
ith
un
rela
ted
adu
ltm
ale
009
70
135
012
50
167
014
80
198
016
50
218
[of
chil
dren
un
der
181
681
z1
664
z1
707
z1
707
z[
ofch
ildr
enu
nde
r6
056
0z
057
1z
062
4z
061
3z
Ear
ned
inco
me
(Mar
ch)
128
1018
331
134
6220
183
132
3218
993
147
6019
912
Ear
ned
inco
me
ifw
ork
(Mar
ch)
172
5019
536
180
1321
293
179
3020
453
180
2321
479
An
nu
alho
urs
ifw
ork
(Mar
ch)
1718
1837
1724
1894
1712
1862
1740
1881
Hou
rly
earn
ings
(Mar
ch)
985
103
89
9110
86
987
105
910
03
109
8In
com
eta
xes
ifw
ork
1521
2751
1030
2958
811
2967
7929
14W
elfa
rem
axim
um
ben
et
7583
z74
06z
7391
z70
56z
Wel
fare
ben
et
ifw
ork
1482
z14
78z
1546
z14
88z
Pro
babi
lity
ofA
FD
Cre
ceip
tif
wor
k0
255
z0
287
z0
266
z0
256
zM
edic
aid
ifw
ork
1215
013
590
1704
219
424
Nu
mbe
rof
obse
rvat
ion
s93
9118
914
9211
186
1210
333
193
1187
8815
846
Sou
rces
The
data
are
prim
arily
from
the
1984
ndash199
6C
urre
ntP
opul
atio
nSu
rvey
Out
goin
gR
otat
ion
Gro
upF
ile(O
RG
)and
from
the
1985
ndash199
7M
arch
Cur
rent
Pop
ulat
ion
Surv
ey(M
arch
)R
estr
icti
ons
See
Tab
leII
for
sam
ple
rest
rict
ion
sN
otes
Mea
ns
com
efr
omth
eO
RG
unle
ssth
eyar
ela
bele
d(M
arch
)T
hese
mea
nsar
eca
lcul
ated
usi
ngth
ech
arac
teri
stic
sof
the
give
nsa
mpl
efo
rth
egi
ven
year
and
are
wei
ghte
dW
omen
are
assu
med
tobe
inth
eir
rst
four
mon
ths
ofw
ork
toha
ven
ou
near
ned
inco
me
and
tocl
aim
noch
ildca
reex
pens
esA
lso
sin
gle
wom
enw
ith
and
wit
hou
tch
ildr
enar
eas
sum
edto
le
ashe
adof
hous
ehol
dan
dsi
ngl
ere
spec
tive
ly
and
tocl
aim
the
stan
dard
dedu
ctio
nT
axes
and
wel
fare
are
adju
sted
for
stat
eco
stof
livi
ng
diff
eren
ces
All
doll
aram
ount
sar
eex
pres
sed
in19
96do
llar
spe
rye
arS
eeA
ppen
dix
1fo
rsp
eci
cin
dice
sus
edan
dot
her
deta
ils
1111THE LABOR SUPPLY OF SINGLE MOTHERS
DEPARTMENT OF ECONOMICS AND INSTITUTE FOR POLICY RESEARCH NORTHWESTERN
UNIVERSITY AND NATIONAL BUREAU OF ECONOMIC RESEARCH
DEPARTMENT OF ECONOMICS UNIVERSITY OF NORTH CAROLINA GREENSBORO
REFERENCES
American Public Welfare Association ldquoSummary of Approved AFDC WaiverActionsrdquo (Washington DC May 1993 and August 1 1996)
Advisory Committee on Intergovernmental Relations Signicant Features ofFiscal Federalism (Washington DC various years)
Bavier Richard ldquoAn Early Look at the Effects of Welfare Reformrdquo unpublishedpaper March 1999
Blank Rebecca M ldquoWhat Causes Public Assistance Caseloads to Growrdquo unpub-lished paper May 1997
mdashmdash ldquoThe Effect of Medical Need and Medicaid on AFDC Participationrdquo Journalof Human Resources XXIV (1989) 54ndash87
Blank Rebecca M and Patricia Ruggles ldquoWhen Do Women Use Aid to Familieswith Dependent Children and Food Stampsrdquo Journal of Human ResourcesXXXI (1996) 57ndash89
Blank Rebecca M David E Card and Philip K Robins ldquoFinancial Incentives forIncreasing Work and Income among Low-Income Familiesrdquo in Finding JobsWork and Welfare Reform David Card and Rebecca M Blank eds (NewYork Russell Sage Foundation 2000) pp 373ndash419
Browning Edgar K ldquoEffects of the Earned Income Tax Credit on Income andWelfarerdquo National Tax Journal XLVIII (1995) 23ndash43
Cohany Sharon Anne Polivka and Jennifer Rothgeb ldquoRevisions in the CurrentPopulation Survey Effective January 1994rdquo Employment and Earnings XLI(1994) 13ndash37
Commerce Clearing House State Tax Handbook (Chicago IL various years)Council of Economic Advisers ldquoThe Economics of Child Carerdquo (Washington DC
December 1997)Danziger Sheldon Robert Haveman and Robert Plotnick ldquoHow Income Trans-
fers Affect Work Savings and the Income Distribution A Critical ReviewrdquoJournal of Economic Literature XIX (1981) 975ndash1028
Dickert Stacy Scott Houser and John Karl Scholz ldquoThe Earned Income TaxCredit and Transfer Programs A Study of Labor Market and Program Par-ticipationrdquo in Tax Policy and the Economy 9 James M Poterba ed (Cam-bridge MA MIT Press 1995) pp 1ndash50
Edin Kathryn and Laura Lein Making Ends Meet How Single Mothers SurviveWelfare and Low-Wage Work (New York Russell Sage Foundation 1997)
Eissa Nada and Jeffrey B Liebman ldquoLabor Supply Response to the EarnedIncome Tax Creditrdquo Quarterly Journal of Economics CXII (1996) 605ndash637
Eissa Nada and Hilary Williamson Hoynes ldquoThe Earned Income Tax Credit andLabor Supply Married Couplesrdquo NBER Working Paper No 6856 December1998
Ellwood David T ldquoThe Impact of the Earned Income Tax Credit and Social PolicyReforms on Work Marriage and Living Arrangementsrdquo National Tax JournalLIII (2000) 1063ndash1106
Feenberg Daniel and Elisabeth Coutts ldquoAn Introduction to the TAXSIM ModelrdquoJournal of Policy Analysis and Management XII (1993) 189ndash194
Fraker Thomas Robert Moftt and Douglas Wolf ldquoEffective Tax Rates andGuarantees in the AFDC Program 1967ndash1982rdquo Journal of Human Re-sources XX (1985) 252ndash263
General Accounting Ofce ldquoWelfare Reform Statesrsquo Early Experiences withBenet Terminationrdquo (Washington DC GAO S-97-74 May 1997)
Gueron Judith M and Edward Pauly From Welfare to Work (New York RussellSage Foundation 1991)
Heckman James J ldquoWhat Has Been Learned about Labor Supply in the PastTwenty Yearsrdquo American Economic Review LXXXIII (1993) 116ndash121
Hill Carolyn V Joseph Hotz Charles H Mullin and John Karl Scholz ldquoEITC
1112 QUARTERLY JOURNAL OF ECONOMICS
Eligibility Participation and Compliance Rates for AFDC Households Evi-dence from the California Caseloadrdquo unpublished paper March 1999
Hoffman Saul D and Laurence S Seidman The Earned Income Tax CreditAntipoverty Effectiveness and Labor Market Effects (Kalamazoo MI UpjohnInstitute for Employment Research 1990)
Holtzblatt Janet Janet McCubbin and Robert Gillette ldquoPromoting Workthrough the EITCrdquo National Tax Journal XLVII (1994) 591ndash608
Hoynes Hilary Williamson ldquoWork and Marriage Incentives in Welfare ProgramsWhat Have We Learnedrdquo in Fiscal Policy Lessons from Economic ResearchAlan J Auerbach ed (Cambridge MA MIT Press 1997)
Intergovernmental Health Policy Project Major Changes in State Medicaid andIndigent Care Programs (Washington DC various years)
Jencks Christopher and Joseph Swingle ldquoHas Welfare Reform Helped or HurtSingle Momsrdquo unpublished paper February 2000
Keane Michael ldquoA New Idea for Welfare Reformrdquo Federal Reserve Bank ofMinneapolis Quarterly Review XXXVIII (1995) 2ndash28
Levine Judith A ldquoPolicy Incentives Confront Everyday Realities IntegratingEconomic and Sociological Perspectives on the Welfare-to-Work Transitionrdquounpublished paper March 1997
Levine Phillip B and Diane M Whitmore ldquoThe Impact of Welfare Reform on theAFDC Caseloadrdquo National Tax Association Proceedings Ninetieth AnnualConference (1998) 24ndash33
Liebman Jeffrey B ldquoThe Impact of the Earned Income Tax Credit on Incentivesand Income Distributionrdquo in Tax Policy and the Economy 12 James MPoterba ed (Cambridge MA MIT Press 1998) pp 83ndash120
Martini Alberto and Michael Wiseman ldquoExplaining the Recent Decline in Wel-fare Caseloads Is the Council of Economic Advisers Rightrdquo Challenge XL(1997) 6 ndash20
Meyer Bruce D ldquoDo the Poor Move to Receive Higher Welfare Benetsrdquo unpub-lished paper April 1999
Meyer Bruce D and Dan T Rosenbaum ldquoWelfare the Earned Income Tax Creditand the Labor Supply of Single Mothersrdquo NBER Working Paper No 7363September 1999
Meyer Bruce D and Dan T Rosenbaum ldquoMaking Single Mothers Work RecentChanges in Tax and Welfare Policy and their Effectsrdquo National Tax JournalLIII (2000a) 1027ndash1062
Meyer Bruce D and Dan T Rosenbaum ldquoMedicaid Private Health Insuranceand the Labor Supply of Single Mothersrdquo unpublished paper November2000b
Moftt Robert ldquoAn Economic Model of Welfare Stigmardquo American EconomicReview LXXIII (1983) 1023ndash1035
mdashmdash ldquoIncentive Effects of the U S Welfare Systemrdquo Journal of Economic Litera-ture XXX (1992) 1ndash61
mdashmdash ldquoThe Effect of Welfare on Marriage and Fertility What Do We Know andWhat Do We Need to Knowrdquo unpublished paper December 1997
Moftt Robert and Barbara Wolfe ldquoThe Effect of the Medicaid Program onWelfare Participation and Labor Supplyrdquo Review of Economics and StatisticsLXXIV (1992) 615ndash626
National Governorrsquos Association MCH (Maternal and Child Health) Update(Washington DC various dates)
National Research Council Measuring Poverty A New Approach Constance FCitro and Robert T Michael eds (Washington DC National Academy Press1995)
mdashmdash Evaluating Welfare Reform A Framework and Review of Current WorkRobert Moftt and Michele Ver Ploeg eds (Washington DC National Acad-emy Press 1999)
Polivka Anne E and Stephen M Miller ldquoThe CPS After the Redesign Refocus-ing the Economic Lensrdquo in Labor Statistics Measurement Issues John Halti-wanger Marilyn E Manser and Robert Topel eds (Chicago University ofChicago Press 1998) pp 249ndash286
Romich Jennifer L and Thomas Weisner ldquoHow Families View and Use the
1113THE LABOR SUPPLY OF SINGLE MOTHERS
EITC The Case for Lump-sum Deliveryrdquo National Tax Journal LIII (2000)1245ndash1265
Savner Steve and Mark Greenberg ldquoThe CLASP Guide to Welfare Waivers1997rdquo (Washington DC Center for Law and Social Policy 1997)
Scholz John Karl ldquoThe Participation Rate of the Earned Income Tax CreditrdquoInstitute for Research on Poverty Madison WI Discussion Paper 928-90October 1990
mdashmdash ldquoThe Earned Income Tax Credit Participation Compliance and AntipovertyEffectivenessrdquo National Tax Journal XLVII (1994) 59ndash81
Smeeding Timothy M Katherine E Ross Michael OrsquoConnor and Michael SimonldquoThe EITC Expectation Knowledge Use and Economic and Social MobilityrdquoNational Tax Journal LIII (2000) 1187ndash1210
U S Department of Agriculture Characteristics of Food Stamp Households(Alexandria VA U S Department of Agriculture Food and Consumer Ser-vice Ofce of Analysis and Evaluation various years)
U S Department of Health and Human Services Characteristics and FinancialCircumstances of AFDC Recipients (Washington DC U S Department ofHealth and Human Services Administration for Children and FamiliesOfce of Family Assistance Division of Performance Measurement variousyears)
mdashmdash Characteristics of State Plans for Aid to Families with Dependent Children(Washington DC U S Department of Health and Human Services Admin-istration for Children and Families Ofce of Family Assistance variousyears)
mdashmdash HHS Fact Sheet State Welfare Demonstrations (Washington DC U SDepartment of Health and Human Services March 17 1997a)
mdashmdash National Evaluation of Welfare-to-Work Strategies (Washington DC Ad-ministration for Children and Families Ofce of the Assistant Secretary forPlanning and Evaluation December 1997b)
mdashmdash Setting the Baseline A Report on State Welfare Waivers (Washington DCU S Department of Health and Human Services Ofce of the AssistantSecretary for Planning and Evaluation 1997c)
U S Department of the Treasury Statistics of Income Individual Income TaxReturns (Washington DC U S Department of the Treasury Internal Reve-nue Service various years)
U S Department of the Treasury Your Federal Income Tax Tax Guide forIndividuals (Washington DC U S Department of the Treasury InternalRevenue Service various years)
U S House of Representatives Committee on Energy and Commerce MedicaidSource Book Background Data and Analysis (Washington DC GovernmentPrinting Ofce November 1988 and January 1993)
U S House of Representatives Committee on Ways and Means Green BookBackground Material and Data on Programs within the Jurisdiction of theCommittee on Ways and Means (Washington DC Government Printing Of-ce various years)
Winkler Anne ldquoThe Incentive Effects of Medicaid on Womenrsquos Labor SupplyrdquoJournal of Human Resources XXVI (1991) 308ndash337
Yelowitz Aaron S ldquoThe Medicaid Notch Labor Supply and Welfare Participa-tionrdquo Quarterly Journal of Economics CX (1995) 909ndash940
Ziliak James P David N Figlio Elizabeth E Davis and Laura S ConnollyldquoAccounting for the Decline in AFDC Caseloads Welfare Reform or EconomicGrowthrdquo unpublished paper July 1997
1114 QUARTERLY JOURNAL OF ECONOMICS
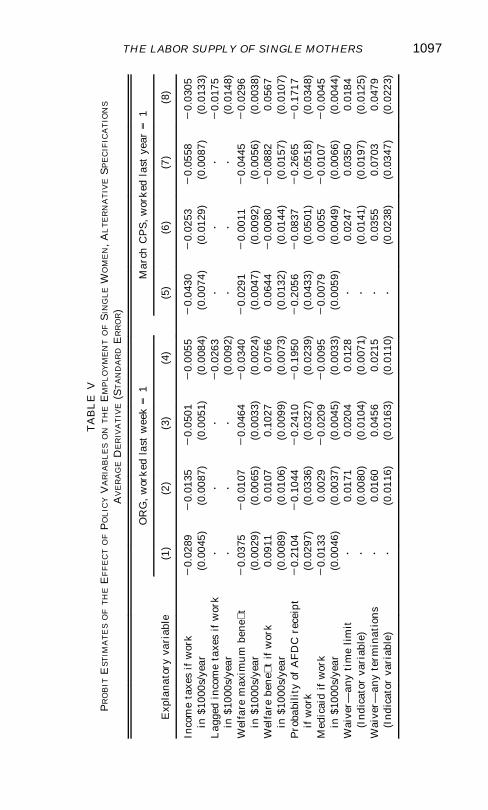
TA
BL
EV
PR
OB
ITE
STIM
AT
ES
OF
TH
EE
FF
EC
TO
FP
OL
ICY
VA
RIA
BL
ES
ON
TH
EE
MP
LO
YM
EN
TO
FS
ING
LE
WO
ME
NA
LT
ER
NA
TIV
ES
PE
CIF
ICA
TIO
NS
AV
ER
AG
ED
ER
IVA
TIV
E(S
TA
ND
AR
DE
RR
OR)
Exp
lana
tory
vari
able
OR
G
wor
ked
last
wee
k=
1M
arch
CP
Sw
orke
dla
stye
ar=
1
(1)
(2)
(3)
(4)
(5)
(6)
(7)
(8)
Inco
me
taxe
sif
wor
k2
002
892
001
352
005
012
000
552
004
302
002
532
005
582
003
05in
$100
0sy
ear
(00
045)
(00
087)
(00
051)
(00
084)
(00
074)
(00
129)
(00
087)
(00
133)
Lag
ged
inco
me
taxe
sif
wor
kz
zz
20
0263
zz
z2
001
75in
$100
0sy
ear
zz
z(0
009
2)z
zz
(00
148)
Wel
fare
max
imu
mbe
net
20
0375
20
0107
20
0464
20
0340
20
0291
20
0011
20
0445
20
0296
in$1
000s
yea
r(0
002
9)(0
006
5)(0
003
3)(0
002
4)(0
004
7)(0
009
2)(0
005
6)(0
003
8)W
elfa
rebe
ne
tif
wor
k0
0911
001
070
1027
007
660
0644
20
0080
20
0882
005
67in
$100
0sy
ear
(00
089)
(00
106)
(00
099)
(00
073)
(00
132)
(00
144)
(00
157)
(00
107)
Pro
babi
lity
ofA
FD
Cre
ceip
t2
021
042
010
442
024
102
019
502
020
562
008
372
026
652
017
17if
wor
k(0
029
7)(0
033
6)(0
032
7)(0
023
9)(0
043
3)(0
050
1)(0
051
8)(0
034
8)M
edic
aid
ifw
ork
20
0133
000
292
002
092
000
952
000
790
0055
20
0107
20
0045
in$1
000s
yea
r(0
004
6)(0
003
7)(0
004
5)(0
003
3)(0
005
9)(0
004
9)(0
006
6)(0
004
4)W
aive
rmdashan
yti
me
lim
itz
001
710
0204
001
28z
002
470
0350
001
84(I
ndic
ator
vari
able
)z
(00
080)
(00
104)
(00
071)
z(0
014
1)(0
019
7)(0
012
5)W
aive
rmdashan
yte
rmin
atio
nsz
001
600
0456
002
15z
003
550
0703
004
79(I
ndic
ator
vari
able
)z
(00
116)
(00
163)
(00
110)
z(0
023
8)(0
034
7)(0
022
3)
1097THE LABOR SUPPLY OF SINGLE MOTHERS
TA
BL
EV
(CO
NT
INU
ED
)
Exp
lana
tory
vari
able
OR
Gw
orke
dla
stw
eek
=1
Mar
chC
PS
w
orke
dla
stye
ar=
1
(1)
(2)
(3)
(4)
(5)
(6)
(7)
(8)
Tra
inin
gmdashed
uca
tion
20
0755
20
0764
20
0728
20
0841
20
0804
20
0656
20
1396
20
0780
in$1
000s
yea
r(0
023
7)(0
022
3)(0
039
2)(0
019
0)(0
040
1)(0
036
5)(0
060
7)(0
031
0)T
rain
ingmdash
job
sear
cho
ther
007
620
0441
001
060
0428
007
150
0571
008
490
0517
in$1
000s
yea
r(0
014
0)(0
013
3)(0
023
7)(0
011
7)(0
023
7)(0
021
3)(0
038
2)(0
019
3)C
hild
care
000
110
0190
000
710
0215
20
0033
001
710
0286
002
22in
$100
0sy
ear
(00
092)
(00
073)
(00
088)
(00
066)
(00
140)
(00
114)
(00
161)
(00
101)
1994
ndash199
6ex
clud
edY
esN
oN
oN
oY
esN
oN
oN
oS
ingl
em
oth
ers
only
No
Yes
No
No
No
Yes
No
No
Mot
her
sw
och
ildr
enlt
6ex
cl
No
No
Yes
No
No
No
Yes
No
Nu
mbe
rof
obse
rvat
ions
292
731
122
966
303
396
373
662
938
1640
818
957
8611
901
9
Sou
rces
The
data
are
from
the
1984
ndash199
6C
urre
ntP
opul
atio
nSu
rvey
Out
goin
gR
otat
ion
Gro
up
Fil
e(O
RG
)an
dth
e19
85ndash1
997
Mar
chC
urre
ntP
opul
atio
nS
urve
y(M
arch
CP
S)
Res
tric
tion
sS
eeT
able
IIfo
rsa
mpl
ere
stri
ctio
ns
Spe
cic
atio
ns(1
)an
d(5
)ex
clu
de19
94ndash1
996
Spe
cic
atio
ns
(2)
and
(6)
incl
ude
only
sin
gle
mot
hers
Spe
cic
atio
ns
(3)
and
(7)
incl
ude
sing
lew
omen
wit
hout
chil
dren
and
sing
lem
othe
rsw
hose
youn
gest
chil
dis
less
than
six
Con
trol
sS
eeT
able
IVfo
rco
ntr
ols
Indi
cato
rsfo
rin
tera
ctio
nsbe
twee
nst
ate
and
any
AF
DC
elig
ible
chil
dren
and
betw
een
year
and
both
any
AF
DC
elig
ible
child
ren
and
any
EIT
Cel
igib
lech
ildre
nar
ein
clud
edin
spec
ica
tion
s(2
)an
d(6
)N
otes
In
alls
peci
cat
ions
the
tax
wel
fare
and
Med
icai
dva
riab
les
are
calc
ula
ted
usin
ga
join
tho
urs
wag
edi
stri
buti
ones
tim
ated
sepa
rate
lyfo
rsi
ngle
wom
enw
ith
and
wit
hout
chil
dren
Tax
esan
dw
elfa
rear
ead
just
edfo
rst
ate
cost
ofli
vin
gdi
ffer
ence
sA
lso
alld
olla
ram
ount
sar
eex
pres
sed
in19
96do
llar
sS
eeA
ppen
dix
1fo
rsp
eci
cin
dice
sus
edan
dot
her
deta
ils
1098 QUARTERLY JOURNAL OF ECONOMICS
over the full sample period The only exception to this generali-zation is that the job searchother training coefcient is largerand the child care coefcient is smaller and statistically insigni-cant over the shorter time span These results are among themost important in this paper because they indicate that (1) theurry of welfare reform measures after 1993 has not falsely led toour main results and (2) the extended recovery of the 1990s is notan alternative explanation for our main results
Next we examine a sample of only single mothers Thisspecication identies the effects of the income variables throughchanges across states and for different family sizes In the case ofthe Income Taxes if Work variable we are largely using thevariation from the last few years when the EITC for women withone child was nearly unchanged but the EITC for women with twoor more children rose in large steps Thus identication comesfrom using women with one child as a control group and chang-ing the treatment that women with two or more children receiveWith single mothers only the year indicators remove the timetrend in welfare receipt and benets and the state indicatorsremove time-constant differences in state welfare benets andmuch of these state cost of living differences in the income vari-ables Thus the variation in welfare benets used to identify thecoefcients is now changes in state-level benets This identi-cation approach examines the employment response to fairlysubtle or short-run features of the welfare and tax laws Thesepolicy changes may be overwhelmed by other factors in thesespecications Despite these potential difculties much of theincome tax effect remains although the estimates are muchsmaller While the effect of taxes is still signicant in the MarchCPS data the drop in the coefcient and larger standard errorleads the ORG coefcient to be insignicantly different from zeroThe welfare benet coefcients are now no longer signicant TheAFDC transaction cost coefcient however remains signicantin the ORG data while the Medicaid coefcient has the expectedsign but remains small and insignicant in both samples
In the third set of specications of Table V we only includesingle mothers with a child under six (and single women withoutchildren) The derivative estimates for the tax and welfare vari-ables including waivers are often substantially larger in magni-tude for these single mothers with young children especially forthe tax variable in the ORG sample These specications are ofparticular interest because the effects of increased employment
1099THE LABOR SUPPLY OF SINGLE MOTHERS
on parental care is likely to be largest on these families withyoung children who are not likely to be in school The last speci-cation of Table V examines whether women learn about taxchanges with a delay after they are implemented This specica-tion includes both the contemporaneous and one year lagged taxvariables The results are somewhat supportive of a lagged effectof taxes In the ORG data the contemporaneous tax variable issmall and insignicant while the lagged variable is large andsignicant In the March CPS it is the contemporaneous variablethat is large and signicant while the lagged variable is smallerand signicant although still substantial in size
I Additional Specications and Hours Worked
We examine several other specications that are not reportedhere in order to determine the benets of studying many pro-grams at the same time to check the sensitivity of our results toalternative specications and to see whether there are particu-larly large effects for certain subgroups of the population We ndthat ignoring some of the policy changes that we study has asubstantial effect on the estimates for the remaining programsWhen we include the tax variable but leave out the other policyvariables its coefcient is about 50 percent larger in both sam-ples When the only policy variables that we include are Medicaidif Work and the Welfare Maximum Benet the Medicaid coef-cient is positive and signicant in the March CPS sample Whenthe other policy variables are not included the waiver variablesare much larger On the other hand the tax coefcient is hardlychanged when the training and child care variables are excludedThese results suggest that the common research strategy of in-vestigating one program in isolation has the potential to givemisleading results
We have examined the sensitivity of our results to alterna-tive samples and variable denitions In particular the resultsare little changed by using more stringent denitions of employ-ment by including separated women or women in school We alsotry several subgroup analyses In particular we examine differ-ences between whites and nonwhites and family heads and sub-family heads Nonwhites appear to be more affected by welfarewaivers than whites while subfamily heads are more sensitive totaxes than family heads
To obtain a broader picture of the effects of welfare and taxpolicy on labor supply we also examined hours worked (see
1100 QUARTERLY JOURNAL OF ECONOMICS
Meyer and Rosenbaum [1999] for more details) Difference-in-differences estimates for hours analogous to those in Table IIshow large relative increases in work for single mothers over thesample period with almost all of the change occurring after 1991We also estimated a series of Tobit and OLS regressions todetermine the effects of tax and welfare policy on hours controllingfor demographics economic conditions state and year We in-clude the same variables as we did in Tables IV and V althoughwe should emphasize that these variables were constructed forour structural model of employment and so are less suitable foran analysis of hours The effects of the policy variables in theTobit estimates for all women whether or not they work tend to besimilar to the effects on employment seen in the earlier tablesThese results hold for the sample of single mothers as well as forall single women The results are very similar for hours per yearin the March CPS and hours in a typical week in the ORG Forhours worked conditioning on positive hours the policy variablestend to have much the same signs but smaller and less signi-cant coefcients Overall the results tend to conrm the resultsfor the main policy variables that we found in the employmentprobits
VII WHICH POLICIES ACCOUNTED FOR THE EMPLOYMENT CHANGES
Our simultaneous examination of many government policiesmakes it straightforward to estimate the relative contribution ofthese policies to the recent increase in employment of singlemothers In Table VI we decompose the employment increases forsingle mothers relative to single women without children for boththe entire period (1984 ndash1996) and the recent period of rapidemployment growth (1992ndash1996) Overall these decompositionsindicate a large role for the EITC and other tax changes modestroles for AFDC benet cuts and waivers and smaller roles forMedicaid training and child care increases
Using the parameter estimates from our main specications(specications (1) and (5) of Table IV) the EITC explains 62percent of the increase in weekly employment over the full 1984to 1996 period yet only 27 percent of the increase between 1992and 1996 For annual employment the EITC plays a very similarrole explaining 61 percent of the 1984 to 1996 increase and 35percent of the 1992 to 1996 increase The corresponding changesin employment attributed to the EITC over the full 1984 to 1996
1101THE LABOR SUPPLY OF SINGLE MOTHERS
TA
BL
EV
IC
ON
TR
IBU
TIO
NO
FP
OL
ICY
CH
AN
GE
ST
OT
HE
CH
AN
GE
SIN
TH
ER
EL
AT
IVE
EM
PL
OY
ME
NT
OF
SIN
GL
EM
OT
HE
RS
VE
RSU
SS
ING
LE
WO
ME
NW
ITH
OU
TC
HIL
DR
EN
19
84ndash1
996
AN
D19
92ndash1
996
Exp
lan
ator
yva
riab
le
1984
ndash199
619
92ndash1
996
OR
GM
arch
CP
SO
RG
Mar
chC
PS
Din
emp
of
tota
lD
inem
p
ofto
tal
Din
emp
of
tota
lD
inem
p
ofto
tal
Inco
me
taxe
sif
wor
k0
0438
622
0
0720
614
0
0186
268
0
0305
351
W
elfa
rem
axim
um
ben
et
001
7925
4
001
5613
3
001
1416
5
000
9911
4
Wel
fare
ben
et
ifw
ork
000
050
70
0003
03
20
0045
26
52
000
332
38
Pro
babi
lity
ofA
FD
Cre
ceip
tif
wor
k2
000
022
03
20
0002
20
10
0020
29
000
172
0M
edic
aid
ifw
ork
20
0070
29
92
000
322
28
20
0023
23
32
000
112
12
Tot
alw
elfa
rebe
ne
tsamp
Med
icai
d0
0112
159
0
0125
106
0
0066
96
000
738
4W
aive
rmdashan
yti
me
lim
it0
0054
76
000
756
40
0052
76
000
738
5W
aive
rmdashan
yte
rmin
atio
ns
000
466
50
0099
84
000
466
60
0099
114
T
otal
wel
fare
wai
vers
000
9914
1
001
7414
8
000
9814
2
001
7219
8
Tra
inin
gmdashed
uca
tion
20
0101
214
4
20
0096
28
22
000
212
30
20
0020
22
3T
rain
ingmdash
job
sear
cho
ther
000
659
20
0077
65
000
476
80
0056
64
Ch
ild
care
000
689
70
0069
59
000
111
80
0013
15
Tot
altr
ain
ing
ampch
ild
care
000
324
60
0050
43
000
395
70
0039
56
Dem
ogra
phic
s2
000
732
104
2
000
682
58
001
0715
5
001
1212
9
Oth
er0
0096
137
0
0172
147
0
0196
283
0
0158
182
T
otal
007
0510
00
011
7410
00
006
9110
00
008
6910
00
Sou
rces
The
data
are
from
the
1984
ndash199
6C
urre
ntP
opul
atio
nSu
rvey
Out
goin
gR
otat
ion
Gro
up
Fil
e(O
RG
)an
dth
e19
85ndash1
997
Mar
chC
urre
ntP
opul
atio
nS
urve
y(M
arch
CP
S)
Not
es
Din
emp
give
sth
ech
ange
inth
eem
ploy
men
tof
sing
lem
othe
rs(r
elat
ive
tosi
ngle
wom
enw
itho
ut
chil
dren
)ov
erth
esp
eci
edti
me
peri
odth
atis
due
toth
egi
ven
expl
anat
ory
vari
able
(s)
of
tota
lgiv
esth
epe
rcen
tage
ofth
eem
ploy
men
tin
crea
sefo
rsi
ngle
mot
hers
(rel
ativ
eto
sing
lew
omen
wit
hout
chil
dren
)exp
lain
edby
the
give
nex
plan
ator
yva
riab
le(s
)T
he
rela
tive
empl
oym
ent
incr
ease
sar
eth
eav
erag
ede
riva
tive
esti
mat
esof
the
inte
ract
ions
ina
wei
ghte
dpr
obit
mod
elin
clu
ding
year
indi
cato
rsan
dth
eir
inte
ract
ions
wit
han
any
chil
dren
indi
cato
rT
he
para
met
eres
tim
ates
used
toes
tim
ate
the
chan
gein
empl
oym
ent
com
efr
omsp
eci
cati
ons
(1)
and
(5)o
fTab
leIV
wh
ileth
ech
ange
over
tim
ein
the
polic
yva
riab
les
com
esfr
omA
ppen
dix
2
1102 QUARTERLY JOURNAL OF ECONOMICS
period and the 1992 to 1996 period are also reported in Table VIWe estimate that the EITC and other tax changes increasedweekly employment 44 percentage points and annual employ-ment 72 percentage points over the full period with about 40percent of this change occurring over the 1992 to 1996 subperiodWhile these estimates are substantial they bracket the EITCeffects found by Eissa and Liebman [1996] and are smaller thanthose predicted by Dickert Houser and Scholz [1995] and Keane[1995]24
Changes in the maximum welfare benet and implicit taxrates and the Medicaid expansions account for between 10 and 16percent of the increase in weekly employment and between 8 and11 percent of the increase in annual employment over eitherperiod The effect of the Medicaid expansions themselves is usu-ally small or negative Conversely the effects of welfare waiversappear to be substantial with the estimates suggesting thatpolicies instituted under waivers account for about 14 to 15 per-cent of the increase in employment over the full sample periodand about 14 to 20 percent of the increase between 1992 and 1996for both weekly and annual employment In general both jobtraining and child care explain small parts of the employmentincrease although in the case of weekly employment over the fullperiod child care can account for about 10 percent of the increase
Improved macroeconomic conditions increased employmentfor both single mothers and single women without children overthe 1984 ndash1996 period Because the above calculations are forsingle mothers compared with single women without childrenunemployment is not given a share in the decomposition In all ofthe employment probits the interaction of unemployment andbeing a single mother had an economically small and statisticallyinsignicant effect Changes in state unemployment rates areestimated to have increased the absolute level of employment ofsingle mothers by 20 percentage points during a typical week
24 Eissa and Liebman [1996] found up to a 28 percentage point increase inparticipation due to TRA86 (which as we indicate in Section IV accounted for 43percent of the 1984ndash1996 change in taxes) Keane [1995] predicted that the1984ndash1996 changes will result in a 107 percentage point increase in participa-tion while Dickert Houser and Scholz [1995] predicted that the 1993ndash1996changes (39 percent of the full 1984ndash1996 change in taxes) would increase em-ployment of single parents by 33 percentage points Experimental ndings suchas those reported in Blank Card and Robins [2000] suggest substantial respon-siveness of welfare recipients and other low-income people to nancial incentivesThese experimental results would need to be extrapolated to all single mothersand the EITC to provide comparisons
1103THE LABOR SUPPLY OF SINGLE MOTHERS
and 14 percentage points during the year over the 1984 ndash1996period These numbers are equivalent to 284 percent of therelative increase in weekly employment and 122 percent of therelative increase in annual employment of single mothers overthe period
In results not shown we recalculate the shares of the em-ployment increase due to various policies using the parameterestimates from specications with only single mothers (specica-tions (2) and (6) of Table V) These results suggest a much smallerrole for the EITC and other tax changes in explaining the changesin employment ranging from 49 to 56 percent as large as those inTable VI Changes in the maximum welfare benet are lessimportant while the results for welfare waivers job training andchild care are largely unchanged
VIII CONCLUSIONS
Between 1984 and 1996 tax and transfer policy were reori-ented to encourage work by single mothers Single mothers haveresponded to these incentives by working more especially after1991 and especially those with children under six To assesswhich policy changes have led to the employment increases weexamine the incentives of federal and state income taxes AFDCMedicaid Food Stamps and their implicit tax rates and earningsdisregards as well as AFDC waivers instituting time limits orwork requirements Our detailed examination of these policychanges using two large micro data sets indicates that EITC andother tax changes account for over 60 percent of the 1984 to 1996increase in the weekly and annual employment of single mothersrelative to single women without children Changes to welfareprograms were less important but still account for a substantialshare of the employment increases Changes in Medicaid train-ing and child care programs play a considerably smaller roleThese ndings are conrmed in an analysis of hours worked
This paper makes several methodological improvements overpast research including the estimation of a simple structuralmodel of employment which provides several independent tests ofthe hypothesis that single mothers respond to economic incen-tives Our results indicate that nancial incentives have powerfuleffects on single mothersrsquo employment decisions and that thedifferent sources of these incentives have effects of plausiblemagnitudes We also nd a sizable transaction cost or stigma to
1104 QUARTERLY JOURNAL OF ECONOMICS
welfare We rely on less subjective measures of welfare waiverssuch as implementation dates and the beginning of case termi-nations and provide the rst evidence on the effects of waivers onemployment Unlike most past work we examine the major pro-grams affecting single mothers together nding that examiningone or two programs in isolation can lead to biases in estimatedbehavioral effects
In most of our specications identication comes from thedifferences in incentives faced by single women with and withoutchildren While we argue that single women without children area plausible comparison group we also provide estimates that donot rely on this comparison Instead these estimates rely onchanges in the treatment of family size state cost of living dif-ferences changes in state income taxes differences in earningsdisregards and implicit tax rates across states and changes inthese parameters and welfare benets within a state over timeOur nding of large tax and welfare effects on employment arerobust although tax effects and especially welfare effects aresometimes smaller using alternative identication strategies
Our result that the EITC played a dominant role in theemployment increases of single mothers between 1984 and 1996suggests that policies that ldquomake work payrdquo are effective in in-creasing work by single mothers This lesson is important in lightof the emphasis on punitive measures such as time limits andwork requirements in the most recent welfare reforms
APPENDIX 1 DESCRIPTION OF POLICY VARIABLES
This section describes the construction of our policy variablesand lists our information sources First we begin with the as-sumptions that we use to determine taxes program participationand benet levels
1 The determination of whether a woman has children andhow many she has is based on the CPS family and sub-family denitions Children in primary families (both re-lated and unrelated) are assigned to the family headwhile children in subfamilies are assigned to the subfam-ily head rather than to the primary family head Childrenare dened as any member of the given family (primary orsubfamily) under age 19 (or under 24 and a full-timestudent) for EITC purposes and under age 18 for all otherprograms
1105THE LABOR SUPPLY OF SINGLE MOTHERS
2 In the March CPS sample the age for tax purposes is theage at the time of the March interview We subtract onefor AFDC and Medicaid purposes In the ORG sample weuse the age at the time of the interview for AFDC andMedicaid but for tax purposes we add one for interviewsoccurring between January and June
3 Women have no unearned income (including child sup-port) or assets and their children have no earned incomeunearned income or assets hence earnings determinetheir program eligibility
4 Single mothers are assumed to le as head of householdand claim their children as dependents while singlewomen without children le as single Also all womentake the standard deduction
5 Women receiving AFDC are in their rst four months ofwork and do not claim child care expenses25
6 Single women without children do not receive FoodStamps
7 Shelter costs (an input in Food Stamp calculations) varyonly by state and over time
A Tax Welfare and Medicaid Variables
First for each woman we calculate ve quantities income taxliabilities (federal and state income taxes incorporating federaland state EITCs) welfare benets (AFDC plus Food Stamps)AFDC receipt (indicator for AFDC eligibility) and Medicaidadults covered and Medicaid children covered Under the assump-tions above these calculations are made at 50 annual earningslevels generated from the cells of a joint wagehours distributionThe 50 cells come from a combination of ve annual hours levels(500 1000 1500 2000 and 2500) and ten hourly wage levels (45 6 7 8 10 12 15 20 and 25)
Second we use the wagehours distributions described in thetext to weight the above quantities We calculate the distributionsusing only women with more than $500 of annual earnings Wethen construct the following variables
25 These assumptions are roughly consistent with the facts In scal year1995 over two-thirds of AFDC families with earnings were in their rst fourmonths of work and only about 16 percent of AFDC families with earningsclaimed child care expenses [U S Department of Health and Human ServicesCharacteristics of AFDC Recipients 1996]
1106 QUARTERLY JOURNAL OF ECONOMICS
c Income Taxes if Work is the weighted sum of income taxliabilities at the various annual earnings points using thewagehours distributions described above as weights
c Welfare Benets if Work is the weighted sum of welfarebenets at the various annual earnings points using thewagehours distributions described above as weights
c Probability of AFDC if Work is the weighted sum of AFDCreceipt at the various annual earnings points using thewagehours distributions described above as weights
c Medicaid if Work is calculated in two steps First wecalculate the weighted sum of Medicaid adults covered andMedicaid children covered at the various annual earningspoints using the wagehours distributions described aboveas weights Second we then multiply these sums by dollarexpenditures separately for adults and children In themain specications we use average expenditures over allstates and years
c Welfare Maximum Benet is the welfare benet assumingzero earnings
We calculate AFDC monthly benets (AFDC) as follows (settingquantities in parentheses to zero if negative)
(A1) AFDC 5 min MAXBEN RR p [PS 2 BRR p (EI 2 DIS)]
wheremdash MAXBEN is the maximum benetmdash RR is the ratable reductionmdash PS is the payment standard (the dollar amount when
benets end not counting disregards)mdash BRR is the benet reduction ratemdash EI is earned income andmdash DIS is the earnings disregard
We calculate Food Stamp benets in two steps (setting quantitiesin parentheses to zero if negative) First we calculate themonthly shelter cost expense deduction (SED) and second wecalculate the monthly Food Stamp benet (FS)
(A2) SED 5 (min SEDC SE 2 05
p ((1 2 EIDP) p EI 1 AFDC 2 SD))
(A3) FS 5 (MB 2 03 p ((1 2 EIDP)
p EI 1 AFDC 2 SD 2 SED))
1107THE LABOR SUPPLY OF SINGLE MOTHERS
wheremdash EIDP is the earned income deduction percentage (018
prior to 1986 020 starting in 1986)mdash MB is the maximum Food Stamp benetmdash SD is the standard deductionmdash SE is shelter expensesmdash SEDC is the shelter expense deduction ceilingTax and welfare variables (and earned and unearned income
variables) are adjusted for state cost of living differences usingthe poverty threshold index for 1990 from National ResearchCouncil [1995] which is adjusted annually using the PCE dea-tor The poverty threshold index accounts for housing cost differ-ences between states using Census housing cost data
Sources for Taxes Welfare and Medicaid
We obtain the federal income tax schedules from the U SDepartment of the Treasury [various years] The state tax infor-mation was obtained from four sources the Advisory Committeeon Intergovernmental Relations [various years] the CommerceClearing House [various years] unpublished data from the Cen-ter on Budget Policy and Priorities and Feenberg and Coutts[1993] The AFDC program parameters are obtained from theU S Department of Health and Human Services (Characteristicsof State Plans [various years]) and unpublished data from theUrban Institute The Food Stamp parameters come from the U SHouse of Representatives (Green Book [various years]) and theU S Department of Agriculture [various years] The Medicaidprogram information is obtained from three sources the NationalGovernorrsquos Association [various dates] the IntergovernmentalHealth Policy Project [various years] and the U S House ofRepresentatives [Medicaid Source Book 1988 1993] Medicaiddollar values (separately for adults and children) come from un-published tables from the Health Care Financing Administration(HCFA)
B Welfare Waiver Variables
c Any Time Limit is one starting with the implementationmonth of a waiver that imposes mandatory work require-ments on families that reach time limits or results in thereduction or total loss of AFDC payments after a certaintime limit has been reached (usually two years)
1108 QUARTERLY JOURNAL OF ECONOMICS
c Any Terminations is one beginning with the month inwhich a case is rst terminated under a welfare waiver
c Major Waiver Application is one beginning with the monthin which a state rst applies for a major statewide waiver
Note that these variables are always zero for women withoutAFDC children
Sources for Welfare Waiver Variables
The waiver variables we used are based on our reading of thewaiver summaries in General Accounting Ofce [1997] the U SDepartment of Health and Human Services [1997c] and Savnerand Greenberg [1997] These sources generally have the imple-mentation dates of waivers We also consulted American PublicWelfare Association [1996] Levine and Whitmore [1998] andU S Department of Health and Human Services [1997a] Ourclassication scheme follows most closely the classicationschemes in General Accounting Ofce [1997] and the U S De-partment of Health and Human Services [1997c]
C Training Program Variables
These variables measure variation across states and overtime in federal and state spending on welfare-to-work programsand on eligibility criteria These numbers are based on the statelevel scal year WIN (Work Incentive) program expenditures andstate level scal year JOBS (Job Opportunities and Basic Skills)program expenditures by component (job search education etc)We calculate spending per female AFDC adult who is not exemptfrom participation based on the age of her youngest child Thedollars are then divided by the state average wage to obtain anamount of services provided26
We calculate the distribution of the age of the youngest childand we apportion total JOBS spending to women using the frac-tion of participants who are female adults We divide spendinginto two categories education which includes education postsec-ondary education and self-initiated education and other whichincludes job search job development and placement on-the-jobtraining work supplementation community work experienceself-initiated training job skills job readiness and assessmentand employability plan For scal year 1990 it is necessary to
26 The state average wage is average hourly wage for manufacturing in thestate It is normalized so that the 1996 value = 100
1109THE LABOR SUPPLY OF SINGLE MOTHERS
extrapolate WIN expenditures forward and JOBS expendituresbackward to the date when the JOBS program began in a givenstate We also extrapolate 1985 WIN data back to 1984 and scalyear 1996 forward to the rst three months of scal year 1997
Note that the training variables are zero for women withoutAFDC children and women with children young enough to ex-empt the mother from participation in WIN or JOBS
Sources for Training Variables
JOBSWIN expenditure data come from unpublished U SDepartment of Health and Human Services and U S Depart-ment of Labor tabulations and the U S House of Representa-tives (Green Book [various years]) To calculate the distribution ofthe age of youngest child for single mothers we use data from theU S Department of Health and Human Services (Characteristicsof AFDC Recipients [various years]) and authorsrsquo calculationsfrom the March CPS Wage data come from the Bureau of LaborStatistics web site
D Child Care Variable
Child Care expenditures are actual federal and state expen-ditures by state on the following four programs AFDC ChildCare Transitional Child Care At-Risk Child Care and ChildCare and Development Block Grants Expenditures are put on aper-person basis by dividing through by the number of unmarriedwomen with children less than six This denominator is calcu-lated using annual data on the number of women by state (fromthe Census Bureau) and the fraction of women in a state who areunmarried with children less than six which is calculated fromthe ORG over the entire 1984 ndash1996 period Like training dollarsthe resulting dollar value is then divided by the state averagewage to obtain an amount of services provided
Note that the child care variable is always zero for womenwithout children less than six
Sources for Child Care Variable
Child Care expenditures come from unpublished U S De-partment of Health and Human Service tabulations Annual dataon the number of women by state come from the U S CensusBureau The fraction of women in a state who are unmarried withchildren less than six is calculated from the ORG by the authorsWage data come from the Bureau of Labor Statistics web site
1110 QUARTERLY JOURNAL OF ECONOMICS
AP
PE
ND
IX2
VA
RIA
BL
EM
EA
NS
FO
RS
ING
LE
MO
TH
ER
SA
ND
SIN
GL
EW
OM
EN
WIT
HO
UT
CH
ILD
RE
N1
984
1988
199
219
96
Var
iabl
e
1984
1988
1992
1996
Ch
ildr
enN
och
ildr
enC
hil
dren
No
chil
dren
Ch
ildr
enN
och
ildr
enC
hil
dren
No
chil
dren
Age
314
426
86
319
727
79
319
628
83
321
929
22
Non
wh
ite
037
10
155
036
30
162
038
40
178
037
70
207
His
pan
ic0
086
005
30
103
007
20
111
007
90
136
009
3H
igh
sch
ool
drop
out
026
20
094
024
60
091
024
10
094
021
10
092
Som
eco
lleg
e0
211
029
70
234
030
50
256
031
70
311
031
7B
ach
elor
s0
063
019
20
064
020
40
061
021
00
072
023
3M
aste
rs0
022
005
90
025
006
10
023
006
60
021
006
4D
ivor
ced
056
40
151
053
30
161
047
70
165
046
00
162
Wid
owed
006
60
010
005
50
010
004
70
012
003
80
012
Liv
ing
wit
hpa
ren
ts0
156
041
80
151
037
50
154
034
70
154
033
9L
ivin
gw
ith
un
rela
ted
adu
ltm
ale
009
70
135
012
50
167
014
80
198
016
50
218
[of
chil
dren
un
der
181
681
z1
664
z1
707
z1
707
z[
ofch
ildr
enu
nde
r6
056
0z
057
1z
062
4z
061
3z
Ear
ned
inco
me
(Mar
ch)
128
1018
331
134
6220
183
132
3218
993
147
6019
912
Ear
ned
inco
me
ifw
ork
(Mar
ch)
172
5019
536
180
1321
293
179
3020
453
180
2321
479
An
nu
alho
urs
ifw
ork
(Mar
ch)
1718
1837
1724
1894
1712
1862
1740
1881
Hou
rly
earn
ings
(Mar
ch)
985
103
89
9110
86
987
105
910
03
109
8In
com
eta
xes
ifw
ork
1521
2751
1030
2958
811
2967
7929
14W
elfa
rem
axim
um
ben
et
7583
z74
06z
7391
z70
56z
Wel
fare
ben
et
ifw
ork
1482
z14
78z
1546
z14
88z
Pro
babi
lity
ofA
FD
Cre
ceip
tif
wor
k0
255
z0
287
z0
266
z0
256
zM
edic
aid
ifw
ork
1215
013
590
1704
219
424
Nu
mbe
rof
obse
rvat
ion
s93
9118
914
9211
186
1210
333
193
1187
8815
846
Sou
rces
The
data
are
prim
arily
from
the
1984
ndash199
6C
urre
ntP
opul
atio
nSu
rvey
Out
goin
gR
otat
ion
Gro
upF
ile(O
RG
)and
from
the
1985
ndash199
7M
arch
Cur
rent
Pop
ulat
ion
Surv
ey(M
arch
)R
estr
icti
ons
See
Tab
leII
for
sam
ple
rest
rict
ion
sN
otes
Mea
ns
com
efr
omth
eO
RG
unle
ssth
eyar
ela
bele
d(M
arch
)T
hese
mea
nsar
eca
lcul
ated
usi
ngth
ech
arac
teri
stic
sof
the
give
nsa
mpl
efo
rth
egi
ven
year
and
are
wei
ghte
dW
omen
are
assu
med
tobe
inth
eir
rst
four
mon
ths
ofw
ork
toha
ven
ou
near
ned
inco
me
and
tocl
aim
noch
ildca
reex
pens
esA
lso
sin
gle
wom
enw
ith
and
wit
hou
tch
ildr
enar
eas
sum
edto
le
ashe
adof
hous
ehol
dan
dsi
ngl
ere
spec
tive
ly
and
tocl
aim
the
stan
dard
dedu
ctio
nT
axes
and
wel
fare
are
adju
sted
for
stat
eco
stof
livi
ng
diff
eren
ces
All
doll
aram
ount
sar
eex
pres
sed
in19
96do
llar
spe
rye
arS
eeA
ppen
dix
1fo
rsp
eci
cin
dice
sus
edan
dot
her
deta
ils
1111THE LABOR SUPPLY OF SINGLE MOTHERS
DEPARTMENT OF ECONOMICS AND INSTITUTE FOR POLICY RESEARCH NORTHWESTERN
UNIVERSITY AND NATIONAL BUREAU OF ECONOMIC RESEARCH
DEPARTMENT OF ECONOMICS UNIVERSITY OF NORTH CAROLINA GREENSBORO
REFERENCES
American Public Welfare Association ldquoSummary of Approved AFDC WaiverActionsrdquo (Washington DC May 1993 and August 1 1996)
Advisory Committee on Intergovernmental Relations Signicant Features ofFiscal Federalism (Washington DC various years)
Bavier Richard ldquoAn Early Look at the Effects of Welfare Reformrdquo unpublishedpaper March 1999
Blank Rebecca M ldquoWhat Causes Public Assistance Caseloads to Growrdquo unpub-lished paper May 1997
mdashmdash ldquoThe Effect of Medical Need and Medicaid on AFDC Participationrdquo Journalof Human Resources XXIV (1989) 54ndash87
Blank Rebecca M and Patricia Ruggles ldquoWhen Do Women Use Aid to Familieswith Dependent Children and Food Stampsrdquo Journal of Human ResourcesXXXI (1996) 57ndash89
Blank Rebecca M David E Card and Philip K Robins ldquoFinancial Incentives forIncreasing Work and Income among Low-Income Familiesrdquo in Finding JobsWork and Welfare Reform David Card and Rebecca M Blank eds (NewYork Russell Sage Foundation 2000) pp 373ndash419
Browning Edgar K ldquoEffects of the Earned Income Tax Credit on Income andWelfarerdquo National Tax Journal XLVIII (1995) 23ndash43
Cohany Sharon Anne Polivka and Jennifer Rothgeb ldquoRevisions in the CurrentPopulation Survey Effective January 1994rdquo Employment and Earnings XLI(1994) 13ndash37
Commerce Clearing House State Tax Handbook (Chicago IL various years)Council of Economic Advisers ldquoThe Economics of Child Carerdquo (Washington DC
December 1997)Danziger Sheldon Robert Haveman and Robert Plotnick ldquoHow Income Trans-
fers Affect Work Savings and the Income Distribution A Critical ReviewrdquoJournal of Economic Literature XIX (1981) 975ndash1028
Dickert Stacy Scott Houser and John Karl Scholz ldquoThe Earned Income TaxCredit and Transfer Programs A Study of Labor Market and Program Par-ticipationrdquo in Tax Policy and the Economy 9 James M Poterba ed (Cam-bridge MA MIT Press 1995) pp 1ndash50
Edin Kathryn and Laura Lein Making Ends Meet How Single Mothers SurviveWelfare and Low-Wage Work (New York Russell Sage Foundation 1997)
Eissa Nada and Jeffrey B Liebman ldquoLabor Supply Response to the EarnedIncome Tax Creditrdquo Quarterly Journal of Economics CXII (1996) 605ndash637
Eissa Nada and Hilary Williamson Hoynes ldquoThe Earned Income Tax Credit andLabor Supply Married Couplesrdquo NBER Working Paper No 6856 December1998
Ellwood David T ldquoThe Impact of the Earned Income Tax Credit and Social PolicyReforms on Work Marriage and Living Arrangementsrdquo National Tax JournalLIII (2000) 1063ndash1106
Feenberg Daniel and Elisabeth Coutts ldquoAn Introduction to the TAXSIM ModelrdquoJournal of Policy Analysis and Management XII (1993) 189ndash194
Fraker Thomas Robert Moftt and Douglas Wolf ldquoEffective Tax Rates andGuarantees in the AFDC Program 1967ndash1982rdquo Journal of Human Re-sources XX (1985) 252ndash263
General Accounting Ofce ldquoWelfare Reform Statesrsquo Early Experiences withBenet Terminationrdquo (Washington DC GAO S-97-74 May 1997)
Gueron Judith M and Edward Pauly From Welfare to Work (New York RussellSage Foundation 1991)
Heckman James J ldquoWhat Has Been Learned about Labor Supply in the PastTwenty Yearsrdquo American Economic Review LXXXIII (1993) 116ndash121
Hill Carolyn V Joseph Hotz Charles H Mullin and John Karl Scholz ldquoEITC
1112 QUARTERLY JOURNAL OF ECONOMICS
Eligibility Participation and Compliance Rates for AFDC Households Evi-dence from the California Caseloadrdquo unpublished paper March 1999
Hoffman Saul D and Laurence S Seidman The Earned Income Tax CreditAntipoverty Effectiveness and Labor Market Effects (Kalamazoo MI UpjohnInstitute for Employment Research 1990)
Holtzblatt Janet Janet McCubbin and Robert Gillette ldquoPromoting Workthrough the EITCrdquo National Tax Journal XLVII (1994) 591ndash608
Hoynes Hilary Williamson ldquoWork and Marriage Incentives in Welfare ProgramsWhat Have We Learnedrdquo in Fiscal Policy Lessons from Economic ResearchAlan J Auerbach ed (Cambridge MA MIT Press 1997)
Intergovernmental Health Policy Project Major Changes in State Medicaid andIndigent Care Programs (Washington DC various years)
Jencks Christopher and Joseph Swingle ldquoHas Welfare Reform Helped or HurtSingle Momsrdquo unpublished paper February 2000
Keane Michael ldquoA New Idea for Welfare Reformrdquo Federal Reserve Bank ofMinneapolis Quarterly Review XXXVIII (1995) 2ndash28
Levine Judith A ldquoPolicy Incentives Confront Everyday Realities IntegratingEconomic and Sociological Perspectives on the Welfare-to-Work Transitionrdquounpublished paper March 1997
Levine Phillip B and Diane M Whitmore ldquoThe Impact of Welfare Reform on theAFDC Caseloadrdquo National Tax Association Proceedings Ninetieth AnnualConference (1998) 24ndash33
Liebman Jeffrey B ldquoThe Impact of the Earned Income Tax Credit on Incentivesand Income Distributionrdquo in Tax Policy and the Economy 12 James MPoterba ed (Cambridge MA MIT Press 1998) pp 83ndash120
Martini Alberto and Michael Wiseman ldquoExplaining the Recent Decline in Wel-fare Caseloads Is the Council of Economic Advisers Rightrdquo Challenge XL(1997) 6 ndash20
Meyer Bruce D ldquoDo the Poor Move to Receive Higher Welfare Benetsrdquo unpub-lished paper April 1999
Meyer Bruce D and Dan T Rosenbaum ldquoWelfare the Earned Income Tax Creditand the Labor Supply of Single Mothersrdquo NBER Working Paper No 7363September 1999
Meyer Bruce D and Dan T Rosenbaum ldquoMaking Single Mothers Work RecentChanges in Tax and Welfare Policy and their Effectsrdquo National Tax JournalLIII (2000a) 1027ndash1062
Meyer Bruce D and Dan T Rosenbaum ldquoMedicaid Private Health Insuranceand the Labor Supply of Single Mothersrdquo unpublished paper November2000b
Moftt Robert ldquoAn Economic Model of Welfare Stigmardquo American EconomicReview LXXIII (1983) 1023ndash1035
mdashmdash ldquoIncentive Effects of the U S Welfare Systemrdquo Journal of Economic Litera-ture XXX (1992) 1ndash61
mdashmdash ldquoThe Effect of Welfare on Marriage and Fertility What Do We Know andWhat Do We Need to Knowrdquo unpublished paper December 1997
Moftt Robert and Barbara Wolfe ldquoThe Effect of the Medicaid Program onWelfare Participation and Labor Supplyrdquo Review of Economics and StatisticsLXXIV (1992) 615ndash626
National Governorrsquos Association MCH (Maternal and Child Health) Update(Washington DC various dates)
National Research Council Measuring Poverty A New Approach Constance FCitro and Robert T Michael eds (Washington DC National Academy Press1995)
mdashmdash Evaluating Welfare Reform A Framework and Review of Current WorkRobert Moftt and Michele Ver Ploeg eds (Washington DC National Acad-emy Press 1999)
Polivka Anne E and Stephen M Miller ldquoThe CPS After the Redesign Refocus-ing the Economic Lensrdquo in Labor Statistics Measurement Issues John Halti-wanger Marilyn E Manser and Robert Topel eds (Chicago University ofChicago Press 1998) pp 249ndash286
Romich Jennifer L and Thomas Weisner ldquoHow Families View and Use the
1113THE LABOR SUPPLY OF SINGLE MOTHERS
EITC The Case for Lump-sum Deliveryrdquo National Tax Journal LIII (2000)1245ndash1265
Savner Steve and Mark Greenberg ldquoThe CLASP Guide to Welfare Waivers1997rdquo (Washington DC Center for Law and Social Policy 1997)
Scholz John Karl ldquoThe Participation Rate of the Earned Income Tax CreditrdquoInstitute for Research on Poverty Madison WI Discussion Paper 928-90October 1990
mdashmdash ldquoThe Earned Income Tax Credit Participation Compliance and AntipovertyEffectivenessrdquo National Tax Journal XLVII (1994) 59ndash81
Smeeding Timothy M Katherine E Ross Michael OrsquoConnor and Michael SimonldquoThe EITC Expectation Knowledge Use and Economic and Social MobilityrdquoNational Tax Journal LIII (2000) 1187ndash1210
U S Department of Agriculture Characteristics of Food Stamp Households(Alexandria VA U S Department of Agriculture Food and Consumer Ser-vice Ofce of Analysis and Evaluation various years)
U S Department of Health and Human Services Characteristics and FinancialCircumstances of AFDC Recipients (Washington DC U S Department ofHealth and Human Services Administration for Children and FamiliesOfce of Family Assistance Division of Performance Measurement variousyears)
mdashmdash Characteristics of State Plans for Aid to Families with Dependent Children(Washington DC U S Department of Health and Human Services Admin-istration for Children and Families Ofce of Family Assistance variousyears)
mdashmdash HHS Fact Sheet State Welfare Demonstrations (Washington DC U SDepartment of Health and Human Services March 17 1997a)
mdashmdash National Evaluation of Welfare-to-Work Strategies (Washington DC Ad-ministration for Children and Families Ofce of the Assistant Secretary forPlanning and Evaluation December 1997b)
mdashmdash Setting the Baseline A Report on State Welfare Waivers (Washington DCU S Department of Health and Human Services Ofce of the AssistantSecretary for Planning and Evaluation 1997c)
U S Department of the Treasury Statistics of Income Individual Income TaxReturns (Washington DC U S Department of the Treasury Internal Reve-nue Service various years)
U S Department of the Treasury Your Federal Income Tax Tax Guide forIndividuals (Washington DC U S Department of the Treasury InternalRevenue Service various years)
U S House of Representatives Committee on Energy and Commerce MedicaidSource Book Background Data and Analysis (Washington DC GovernmentPrinting Ofce November 1988 and January 1993)
U S House of Representatives Committee on Ways and Means Green BookBackground Material and Data on Programs within the Jurisdiction of theCommittee on Ways and Means (Washington DC Government Printing Of-ce various years)
Winkler Anne ldquoThe Incentive Effects of Medicaid on Womenrsquos Labor SupplyrdquoJournal of Human Resources XXVI (1991) 308ndash337
Yelowitz Aaron S ldquoThe Medicaid Notch Labor Supply and Welfare Participa-tionrdquo Quarterly Journal of Economics CX (1995) 909ndash940
Ziliak James P David N Figlio Elizabeth E Davis and Laura S ConnollyldquoAccounting for the Decline in AFDC Caseloads Welfare Reform or EconomicGrowthrdquo unpublished paper July 1997
1114 QUARTERLY JOURNAL OF ECONOMICS
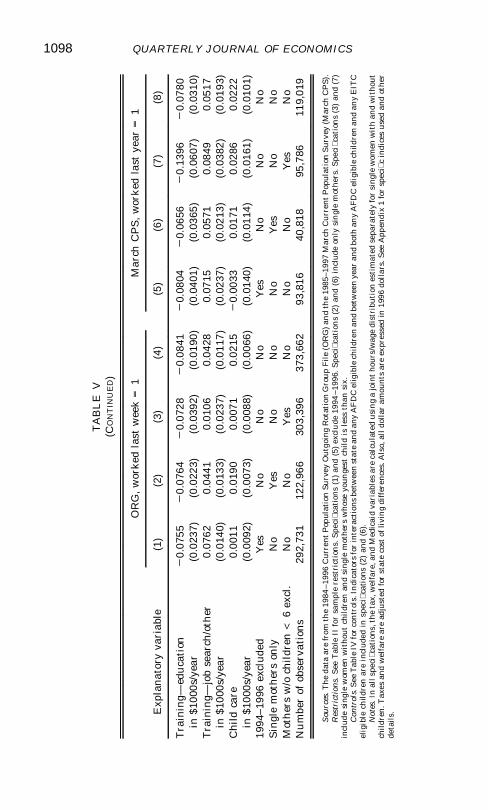
TA
BL
EV
(CO
NT
INU
ED
)
Exp
lana
tory
vari
able
OR
Gw
orke
dla
stw
eek
=1
Mar
chC
PS
w
orke
dla
stye
ar=
1
(1)
(2)
(3)
(4)
(5)
(6)
(7)
(8)
Tra
inin
gmdashed
uca
tion
20
0755
20
0764
20
0728
20
0841
20
0804
20
0656
20
1396
20
0780
in$1
000s
yea
r(0
023
7)(0
022
3)(0
039
2)(0
019
0)(0
040
1)(0
036
5)(0
060
7)(0
031
0)T
rain
ingmdash
job
sear
cho
ther
007
620
0441
001
060
0428
007
150
0571
008
490
0517
in$1
000s
yea
r(0
014
0)(0
013
3)(0
023
7)(0
011
7)(0
023
7)(0
021
3)(0
038
2)(0
019
3)C
hild
care
000
110
0190
000
710
0215
20
0033
001
710
0286
002
22in
$100
0sy
ear
(00
092)
(00
073)
(00
088)
(00
066)
(00
140)
(00
114)
(00
161)
(00
101)
1994
ndash199
6ex
clud
edY
esN
oN
oN
oY
esN
oN
oN
oS
ingl
em
oth
ers
only
No
Yes
No
No
No
Yes
No
No
Mot
her
sw
och
ildr
enlt
6ex
cl
No
No
Yes
No
No
No
Yes
No
Nu
mbe
rof
obse
rvat
ions
292
731
122
966
303
396
373
662
938
1640
818
957
8611
901
9
Sou
rces
The
data
are
from
the
1984
ndash199
6C
urre
ntP
opul
atio
nSu
rvey
Out
goin
gR
otat
ion
Gro
up
Fil
e(O
RG
)an
dth
e19
85ndash1
997
Mar
chC
urre
ntP
opul
atio
nS
urve
y(M
arch
CP
S)
Res
tric
tion
sS
eeT
able
IIfo
rsa
mpl
ere
stri
ctio
ns
Spe
cic
atio
ns(1
)an
d(5
)ex
clu
de19
94ndash1
996
Spe
cic
atio
ns
(2)
and
(6)
incl
ude
only
sin
gle
mot
hers
Spe
cic
atio
ns
(3)
and
(7)
incl
ude
sing
lew
omen
wit
hout
chil
dren
and
sing
lem
othe
rsw
hose
youn
gest
chil
dis
less
than
six
Con
trol
sS
eeT
able
IVfo
rco
ntr
ols
Indi
cato
rsfo
rin
tera
ctio
nsbe
twee
nst
ate
and
any
AF
DC
elig
ible
chil
dren
and
betw
een
year
and
both
any
AF
DC
elig
ible
child
ren
and
any
EIT
Cel
igib
lech
ildre
nar
ein
clud
edin
spec
ica
tion
s(2
)an
d(6
)N
otes
In
alls
peci
cat
ions
the
tax
wel
fare
and
Med
icai
dva
riab
les
are
calc
ula
ted
usin
ga
join
tho
urs
wag
edi
stri
buti
ones
tim
ated
sepa
rate
lyfo
rsi
ngle
wom
enw
ith
and
wit
hout
chil
dren
Tax
esan
dw
elfa
rear
ead
just
edfo
rst
ate
cost
ofli
vin
gdi
ffer
ence
sA
lso
alld
olla
ram
ount
sar
eex
pres
sed
in19
96do
llar
sS
eeA
ppen
dix
1fo
rsp
eci
cin
dice
sus
edan
dot
her
deta
ils
1098 QUARTERLY JOURNAL OF ECONOMICS
over the full sample period The only exception to this generali-zation is that the job searchother training coefcient is largerand the child care coefcient is smaller and statistically insigni-cant over the shorter time span These results are among themost important in this paper because they indicate that (1) theurry of welfare reform measures after 1993 has not falsely led toour main results and (2) the extended recovery of the 1990s is notan alternative explanation for our main results
Next we examine a sample of only single mothers Thisspecication identies the effects of the income variables throughchanges across states and for different family sizes In the case ofthe Income Taxes if Work variable we are largely using thevariation from the last few years when the EITC for women withone child was nearly unchanged but the EITC for women with twoor more children rose in large steps Thus identication comesfrom using women with one child as a control group and chang-ing the treatment that women with two or more children receiveWith single mothers only the year indicators remove the timetrend in welfare receipt and benets and the state indicatorsremove time-constant differences in state welfare benets andmuch of these state cost of living differences in the income vari-ables Thus the variation in welfare benets used to identify thecoefcients is now changes in state-level benets This identi-cation approach examines the employment response to fairlysubtle or short-run features of the welfare and tax laws Thesepolicy changes may be overwhelmed by other factors in thesespecications Despite these potential difculties much of theincome tax effect remains although the estimates are muchsmaller While the effect of taxes is still signicant in the MarchCPS data the drop in the coefcient and larger standard errorleads the ORG coefcient to be insignicantly different from zeroThe welfare benet coefcients are now no longer signicant TheAFDC transaction cost coefcient however remains signicantin the ORG data while the Medicaid coefcient has the expectedsign but remains small and insignicant in both samples
In the third set of specications of Table V we only includesingle mothers with a child under six (and single women withoutchildren) The derivative estimates for the tax and welfare vari-ables including waivers are often substantially larger in magni-tude for these single mothers with young children especially forthe tax variable in the ORG sample These specications are ofparticular interest because the effects of increased employment
1099THE LABOR SUPPLY OF SINGLE MOTHERS
on parental care is likely to be largest on these families withyoung children who are not likely to be in school The last speci-cation of Table V examines whether women learn about taxchanges with a delay after they are implemented This specica-tion includes both the contemporaneous and one year lagged taxvariables The results are somewhat supportive of a lagged effectof taxes In the ORG data the contemporaneous tax variable issmall and insignicant while the lagged variable is large andsignicant In the March CPS it is the contemporaneous variablethat is large and signicant while the lagged variable is smallerand signicant although still substantial in size
I Additional Specications and Hours Worked
We examine several other specications that are not reportedhere in order to determine the benets of studying many pro-grams at the same time to check the sensitivity of our results toalternative specications and to see whether there are particu-larly large effects for certain subgroups of the population We ndthat ignoring some of the policy changes that we study has asubstantial effect on the estimates for the remaining programsWhen we include the tax variable but leave out the other policyvariables its coefcient is about 50 percent larger in both sam-ples When the only policy variables that we include are Medicaidif Work and the Welfare Maximum Benet the Medicaid coef-cient is positive and signicant in the March CPS sample Whenthe other policy variables are not included the waiver variablesare much larger On the other hand the tax coefcient is hardlychanged when the training and child care variables are excludedThese results suggest that the common research strategy of in-vestigating one program in isolation has the potential to givemisleading results
We have examined the sensitivity of our results to alterna-tive samples and variable denitions In particular the resultsare little changed by using more stringent denitions of employ-ment by including separated women or women in school We alsotry several subgroup analyses In particular we examine differ-ences between whites and nonwhites and family heads and sub-family heads Nonwhites appear to be more affected by welfarewaivers than whites while subfamily heads are more sensitive totaxes than family heads
To obtain a broader picture of the effects of welfare and taxpolicy on labor supply we also examined hours worked (see
1100 QUARTERLY JOURNAL OF ECONOMICS
Meyer and Rosenbaum [1999] for more details) Difference-in-differences estimates for hours analogous to those in Table IIshow large relative increases in work for single mothers over thesample period with almost all of the change occurring after 1991We also estimated a series of Tobit and OLS regressions todetermine the effects of tax and welfare policy on hours controllingfor demographics economic conditions state and year We in-clude the same variables as we did in Tables IV and V althoughwe should emphasize that these variables were constructed forour structural model of employment and so are less suitable foran analysis of hours The effects of the policy variables in theTobit estimates for all women whether or not they work tend to besimilar to the effects on employment seen in the earlier tablesThese results hold for the sample of single mothers as well as forall single women The results are very similar for hours per yearin the March CPS and hours in a typical week in the ORG Forhours worked conditioning on positive hours the policy variablestend to have much the same signs but smaller and less signi-cant coefcients Overall the results tend to conrm the resultsfor the main policy variables that we found in the employmentprobits
VII WHICH POLICIES ACCOUNTED FOR THE EMPLOYMENT CHANGES
Our simultaneous examination of many government policiesmakes it straightforward to estimate the relative contribution ofthese policies to the recent increase in employment of singlemothers In Table VI we decompose the employment increases forsingle mothers relative to single women without children for boththe entire period (1984 ndash1996) and the recent period of rapidemployment growth (1992ndash1996) Overall these decompositionsindicate a large role for the EITC and other tax changes modestroles for AFDC benet cuts and waivers and smaller roles forMedicaid training and child care increases
Using the parameter estimates from our main specications(specications (1) and (5) of Table IV) the EITC explains 62percent of the increase in weekly employment over the full 1984to 1996 period yet only 27 percent of the increase between 1992and 1996 For annual employment the EITC plays a very similarrole explaining 61 percent of the 1984 to 1996 increase and 35percent of the 1992 to 1996 increase The corresponding changesin employment attributed to the EITC over the full 1984 to 1996
1101THE LABOR SUPPLY OF SINGLE MOTHERS
TA
BL
EV
IC
ON
TR
IBU
TIO
NO
FP
OL
ICY
CH
AN
GE
ST
OT
HE
CH
AN
GE
SIN
TH
ER
EL
AT
IVE
EM
PL
OY
ME
NT
OF
SIN
GL
EM
OT
HE
RS
VE
RSU
SS
ING
LE
WO
ME
NW
ITH
OU
TC
HIL
DR
EN
19
84ndash1
996
AN
D19
92ndash1
996
Exp
lan
ator
yva
riab
le
1984
ndash199
619
92ndash1
996
OR
GM
arch
CP
SO
RG
Mar
chC
PS
Din
emp
of
tota
lD
inem
p
ofto
tal
Din
emp
of
tota
lD
inem
p
ofto
tal
Inco
me
taxe
sif
wor
k0
0438
622
0
0720
614
0
0186
268
0
0305
351
W
elfa
rem
axim
um
ben
et
001
7925
4
001
5613
3
001
1416
5
000
9911
4
Wel
fare
ben
et
ifw
ork
000
050
70
0003
03
20
0045
26
52
000
332
38
Pro
babi
lity
ofA
FD
Cre
ceip
tif
wor
k2
000
022
03
20
0002
20
10
0020
29
000
172
0M
edic
aid
ifw
ork
20
0070
29
92
000
322
28
20
0023
23
32
000
112
12
Tot
alw
elfa
rebe
ne
tsamp
Med
icai
d0
0112
159
0
0125
106
0
0066
96
000
738
4W
aive
rmdashan
yti
me
lim
it0
0054
76
000
756
40
0052
76
000
738
5W
aive
rmdashan
yte
rmin
atio
ns
000
466
50
0099
84
000
466
60
0099
114
T
otal
wel
fare
wai
vers
000
9914
1
001
7414
8
000
9814
2
001
7219
8
Tra
inin
gmdashed
uca
tion
20
0101
214
4
20
0096
28
22
000
212
30
20
0020
22
3T
rain
ingmdash
job
sear
cho
ther
000
659
20
0077
65
000
476
80
0056
64
Ch
ild
care
000
689
70
0069
59
000
111
80
0013
15
Tot
altr
ain
ing
ampch
ild
care
000
324
60
0050
43
000
395
70
0039
56
Dem
ogra
phic
s2
000
732
104
2
000
682
58
001
0715
5
001
1212
9
Oth
er0
0096
137
0
0172
147
0
0196
283
0
0158
182
T
otal
007
0510
00
011
7410
00
006
9110
00
008
6910
00
Sou
rces
The
data
are
from
the
1984
ndash199
6C
urre
ntP
opul
atio
nSu
rvey
Out
goin
gR
otat
ion
Gro
up
Fil
e(O
RG
)an
dth
e19
85ndash1
997
Mar
chC
urre
ntP
opul
atio
nS
urve
y(M
arch
CP
S)
Not
es
Din
emp
give
sth
ech
ange
inth
eem
ploy
men
tof
sing
lem
othe
rs(r
elat
ive
tosi
ngle
wom
enw
itho
ut
chil
dren
)ov
erth
esp
eci
edti
me
peri
odth
atis
due
toth
egi
ven
expl
anat
ory
vari
able
(s)
of
tota
lgiv
esth
epe
rcen
tage
ofth
eem
ploy
men
tin
crea
sefo
rsi
ngle
mot
hers
(rel
ativ
eto
sing
lew
omen
wit
hout
chil
dren
)exp
lain
edby
the
give
nex
plan
ator
yva
riab
le(s
)T
he
rela
tive
empl
oym
ent
incr
ease
sar
eth
eav
erag
ede
riva
tive
esti
mat
esof
the
inte
ract
ions
ina
wei
ghte
dpr
obit
mod
elin
clu
ding
year
indi
cato
rsan
dth
eir
inte
ract
ions
wit
han
any
chil
dren
indi
cato
rT
he
para
met
eres
tim
ates
used
toes
tim
ate
the
chan
gein
empl
oym
ent
com
efr
omsp
eci
cati
ons
(1)
and
(5)o
fTab
leIV
wh
ileth
ech
ange
over
tim
ein
the
polic
yva
riab
les
com
esfr
omA
ppen
dix
2
1102 QUARTERLY JOURNAL OF ECONOMICS
period and the 1992 to 1996 period are also reported in Table VIWe estimate that the EITC and other tax changes increasedweekly employment 44 percentage points and annual employ-ment 72 percentage points over the full period with about 40percent of this change occurring over the 1992 to 1996 subperiodWhile these estimates are substantial they bracket the EITCeffects found by Eissa and Liebman [1996] and are smaller thanthose predicted by Dickert Houser and Scholz [1995] and Keane[1995]24
Changes in the maximum welfare benet and implicit taxrates and the Medicaid expansions account for between 10 and 16percent of the increase in weekly employment and between 8 and11 percent of the increase in annual employment over eitherperiod The effect of the Medicaid expansions themselves is usu-ally small or negative Conversely the effects of welfare waiversappear to be substantial with the estimates suggesting thatpolicies instituted under waivers account for about 14 to 15 per-cent of the increase in employment over the full sample periodand about 14 to 20 percent of the increase between 1992 and 1996for both weekly and annual employment In general both jobtraining and child care explain small parts of the employmentincrease although in the case of weekly employment over the fullperiod child care can account for about 10 percent of the increase
Improved macroeconomic conditions increased employmentfor both single mothers and single women without children overthe 1984 ndash1996 period Because the above calculations are forsingle mothers compared with single women without childrenunemployment is not given a share in the decomposition In all ofthe employment probits the interaction of unemployment andbeing a single mother had an economically small and statisticallyinsignicant effect Changes in state unemployment rates areestimated to have increased the absolute level of employment ofsingle mothers by 20 percentage points during a typical week
24 Eissa and Liebman [1996] found up to a 28 percentage point increase inparticipation due to TRA86 (which as we indicate in Section IV accounted for 43percent of the 1984ndash1996 change in taxes) Keane [1995] predicted that the1984ndash1996 changes will result in a 107 percentage point increase in participa-tion while Dickert Houser and Scholz [1995] predicted that the 1993ndash1996changes (39 percent of the full 1984ndash1996 change in taxes) would increase em-ployment of single parents by 33 percentage points Experimental ndings suchas those reported in Blank Card and Robins [2000] suggest substantial respon-siveness of welfare recipients and other low-income people to nancial incentivesThese experimental results would need to be extrapolated to all single mothersand the EITC to provide comparisons
1103THE LABOR SUPPLY OF SINGLE MOTHERS
and 14 percentage points during the year over the 1984 ndash1996period These numbers are equivalent to 284 percent of therelative increase in weekly employment and 122 percent of therelative increase in annual employment of single mothers overthe period
In results not shown we recalculate the shares of the em-ployment increase due to various policies using the parameterestimates from specications with only single mothers (specica-tions (2) and (6) of Table V) These results suggest a much smallerrole for the EITC and other tax changes in explaining the changesin employment ranging from 49 to 56 percent as large as those inTable VI Changes in the maximum welfare benet are lessimportant while the results for welfare waivers job training andchild care are largely unchanged
VIII CONCLUSIONS
Between 1984 and 1996 tax and transfer policy were reori-ented to encourage work by single mothers Single mothers haveresponded to these incentives by working more especially after1991 and especially those with children under six To assesswhich policy changes have led to the employment increases weexamine the incentives of federal and state income taxes AFDCMedicaid Food Stamps and their implicit tax rates and earningsdisregards as well as AFDC waivers instituting time limits orwork requirements Our detailed examination of these policychanges using two large micro data sets indicates that EITC andother tax changes account for over 60 percent of the 1984 to 1996increase in the weekly and annual employment of single mothersrelative to single women without children Changes to welfareprograms were less important but still account for a substantialshare of the employment increases Changes in Medicaid train-ing and child care programs play a considerably smaller roleThese ndings are conrmed in an analysis of hours worked
This paper makes several methodological improvements overpast research including the estimation of a simple structuralmodel of employment which provides several independent tests ofthe hypothesis that single mothers respond to economic incen-tives Our results indicate that nancial incentives have powerfuleffects on single mothersrsquo employment decisions and that thedifferent sources of these incentives have effects of plausiblemagnitudes We also nd a sizable transaction cost or stigma to
1104 QUARTERLY JOURNAL OF ECONOMICS
welfare We rely on less subjective measures of welfare waiverssuch as implementation dates and the beginning of case termi-nations and provide the rst evidence on the effects of waivers onemployment Unlike most past work we examine the major pro-grams affecting single mothers together nding that examiningone or two programs in isolation can lead to biases in estimatedbehavioral effects
In most of our specications identication comes from thedifferences in incentives faced by single women with and withoutchildren While we argue that single women without children area plausible comparison group we also provide estimates that donot rely on this comparison Instead these estimates rely onchanges in the treatment of family size state cost of living dif-ferences changes in state income taxes differences in earningsdisregards and implicit tax rates across states and changes inthese parameters and welfare benets within a state over timeOur nding of large tax and welfare effects on employment arerobust although tax effects and especially welfare effects aresometimes smaller using alternative identication strategies
Our result that the EITC played a dominant role in theemployment increases of single mothers between 1984 and 1996suggests that policies that ldquomake work payrdquo are effective in in-creasing work by single mothers This lesson is important in lightof the emphasis on punitive measures such as time limits andwork requirements in the most recent welfare reforms
APPENDIX 1 DESCRIPTION OF POLICY VARIABLES
This section describes the construction of our policy variablesand lists our information sources First we begin with the as-sumptions that we use to determine taxes program participationand benet levels
1 The determination of whether a woman has children andhow many she has is based on the CPS family and sub-family denitions Children in primary families (both re-lated and unrelated) are assigned to the family headwhile children in subfamilies are assigned to the subfam-ily head rather than to the primary family head Childrenare dened as any member of the given family (primary orsubfamily) under age 19 (or under 24 and a full-timestudent) for EITC purposes and under age 18 for all otherprograms
1105THE LABOR SUPPLY OF SINGLE MOTHERS
2 In the March CPS sample the age for tax purposes is theage at the time of the March interview We subtract onefor AFDC and Medicaid purposes In the ORG sample weuse the age at the time of the interview for AFDC andMedicaid but for tax purposes we add one for interviewsoccurring between January and June
3 Women have no unearned income (including child sup-port) or assets and their children have no earned incomeunearned income or assets hence earnings determinetheir program eligibility
4 Single mothers are assumed to le as head of householdand claim their children as dependents while singlewomen without children le as single Also all womentake the standard deduction
5 Women receiving AFDC are in their rst four months ofwork and do not claim child care expenses25
6 Single women without children do not receive FoodStamps
7 Shelter costs (an input in Food Stamp calculations) varyonly by state and over time
A Tax Welfare and Medicaid Variables
First for each woman we calculate ve quantities income taxliabilities (federal and state income taxes incorporating federaland state EITCs) welfare benets (AFDC plus Food Stamps)AFDC receipt (indicator for AFDC eligibility) and Medicaidadults covered and Medicaid children covered Under the assump-tions above these calculations are made at 50 annual earningslevels generated from the cells of a joint wagehours distributionThe 50 cells come from a combination of ve annual hours levels(500 1000 1500 2000 and 2500) and ten hourly wage levels (45 6 7 8 10 12 15 20 and 25)
Second we use the wagehours distributions described in thetext to weight the above quantities We calculate the distributionsusing only women with more than $500 of annual earnings Wethen construct the following variables
25 These assumptions are roughly consistent with the facts In scal year1995 over two-thirds of AFDC families with earnings were in their rst fourmonths of work and only about 16 percent of AFDC families with earningsclaimed child care expenses [U S Department of Health and Human ServicesCharacteristics of AFDC Recipients 1996]
1106 QUARTERLY JOURNAL OF ECONOMICS
c Income Taxes if Work is the weighted sum of income taxliabilities at the various annual earnings points using thewagehours distributions described above as weights
c Welfare Benets if Work is the weighted sum of welfarebenets at the various annual earnings points using thewagehours distributions described above as weights
c Probability of AFDC if Work is the weighted sum of AFDCreceipt at the various annual earnings points using thewagehours distributions described above as weights
c Medicaid if Work is calculated in two steps First wecalculate the weighted sum of Medicaid adults covered andMedicaid children covered at the various annual earningspoints using the wagehours distributions described aboveas weights Second we then multiply these sums by dollarexpenditures separately for adults and children In themain specications we use average expenditures over allstates and years
c Welfare Maximum Benet is the welfare benet assumingzero earnings
We calculate AFDC monthly benets (AFDC) as follows (settingquantities in parentheses to zero if negative)
(A1) AFDC 5 min MAXBEN RR p [PS 2 BRR p (EI 2 DIS)]
wheremdash MAXBEN is the maximum benetmdash RR is the ratable reductionmdash PS is the payment standard (the dollar amount when
benets end not counting disregards)mdash BRR is the benet reduction ratemdash EI is earned income andmdash DIS is the earnings disregard
We calculate Food Stamp benets in two steps (setting quantitiesin parentheses to zero if negative) First we calculate themonthly shelter cost expense deduction (SED) and second wecalculate the monthly Food Stamp benet (FS)
(A2) SED 5 (min SEDC SE 2 05
p ((1 2 EIDP) p EI 1 AFDC 2 SD))
(A3) FS 5 (MB 2 03 p ((1 2 EIDP)
p EI 1 AFDC 2 SD 2 SED))
1107THE LABOR SUPPLY OF SINGLE MOTHERS
wheremdash EIDP is the earned income deduction percentage (018
prior to 1986 020 starting in 1986)mdash MB is the maximum Food Stamp benetmdash SD is the standard deductionmdash SE is shelter expensesmdash SEDC is the shelter expense deduction ceilingTax and welfare variables (and earned and unearned income
variables) are adjusted for state cost of living differences usingthe poverty threshold index for 1990 from National ResearchCouncil [1995] which is adjusted annually using the PCE dea-tor The poverty threshold index accounts for housing cost differ-ences between states using Census housing cost data
Sources for Taxes Welfare and Medicaid
We obtain the federal income tax schedules from the U SDepartment of the Treasury [various years] The state tax infor-mation was obtained from four sources the Advisory Committeeon Intergovernmental Relations [various years] the CommerceClearing House [various years] unpublished data from the Cen-ter on Budget Policy and Priorities and Feenberg and Coutts[1993] The AFDC program parameters are obtained from theU S Department of Health and Human Services (Characteristicsof State Plans [various years]) and unpublished data from theUrban Institute The Food Stamp parameters come from the U SHouse of Representatives (Green Book [various years]) and theU S Department of Agriculture [various years] The Medicaidprogram information is obtained from three sources the NationalGovernorrsquos Association [various dates] the IntergovernmentalHealth Policy Project [various years] and the U S House ofRepresentatives [Medicaid Source Book 1988 1993] Medicaiddollar values (separately for adults and children) come from un-published tables from the Health Care Financing Administration(HCFA)
B Welfare Waiver Variables
c Any Time Limit is one starting with the implementationmonth of a waiver that imposes mandatory work require-ments on families that reach time limits or results in thereduction or total loss of AFDC payments after a certaintime limit has been reached (usually two years)
1108 QUARTERLY JOURNAL OF ECONOMICS
c Any Terminations is one beginning with the month inwhich a case is rst terminated under a welfare waiver
c Major Waiver Application is one beginning with the monthin which a state rst applies for a major statewide waiver
Note that these variables are always zero for women withoutAFDC children
Sources for Welfare Waiver Variables
The waiver variables we used are based on our reading of thewaiver summaries in General Accounting Ofce [1997] the U SDepartment of Health and Human Services [1997c] and Savnerand Greenberg [1997] These sources generally have the imple-mentation dates of waivers We also consulted American PublicWelfare Association [1996] Levine and Whitmore [1998] andU S Department of Health and Human Services [1997a] Ourclassication scheme follows most closely the classicationschemes in General Accounting Ofce [1997] and the U S De-partment of Health and Human Services [1997c]
C Training Program Variables
These variables measure variation across states and overtime in federal and state spending on welfare-to-work programsand on eligibility criteria These numbers are based on the statelevel scal year WIN (Work Incentive) program expenditures andstate level scal year JOBS (Job Opportunities and Basic Skills)program expenditures by component (job search education etc)We calculate spending per female AFDC adult who is not exemptfrom participation based on the age of her youngest child Thedollars are then divided by the state average wage to obtain anamount of services provided26
We calculate the distribution of the age of the youngest childand we apportion total JOBS spending to women using the frac-tion of participants who are female adults We divide spendinginto two categories education which includes education postsec-ondary education and self-initiated education and other whichincludes job search job development and placement on-the-jobtraining work supplementation community work experienceself-initiated training job skills job readiness and assessmentand employability plan For scal year 1990 it is necessary to
26 The state average wage is average hourly wage for manufacturing in thestate It is normalized so that the 1996 value = 100
1109THE LABOR SUPPLY OF SINGLE MOTHERS
extrapolate WIN expenditures forward and JOBS expendituresbackward to the date when the JOBS program began in a givenstate We also extrapolate 1985 WIN data back to 1984 and scalyear 1996 forward to the rst three months of scal year 1997
Note that the training variables are zero for women withoutAFDC children and women with children young enough to ex-empt the mother from participation in WIN or JOBS
Sources for Training Variables
JOBSWIN expenditure data come from unpublished U SDepartment of Health and Human Services and U S Depart-ment of Labor tabulations and the U S House of Representa-tives (Green Book [various years]) To calculate the distribution ofthe age of youngest child for single mothers we use data from theU S Department of Health and Human Services (Characteristicsof AFDC Recipients [various years]) and authorsrsquo calculationsfrom the March CPS Wage data come from the Bureau of LaborStatistics web site
D Child Care Variable
Child Care expenditures are actual federal and state expen-ditures by state on the following four programs AFDC ChildCare Transitional Child Care At-Risk Child Care and ChildCare and Development Block Grants Expenditures are put on aper-person basis by dividing through by the number of unmarriedwomen with children less than six This denominator is calcu-lated using annual data on the number of women by state (fromthe Census Bureau) and the fraction of women in a state who areunmarried with children less than six which is calculated fromthe ORG over the entire 1984 ndash1996 period Like training dollarsthe resulting dollar value is then divided by the state averagewage to obtain an amount of services provided
Note that the child care variable is always zero for womenwithout children less than six
Sources for Child Care Variable
Child Care expenditures come from unpublished U S De-partment of Health and Human Service tabulations Annual dataon the number of women by state come from the U S CensusBureau The fraction of women in a state who are unmarried withchildren less than six is calculated from the ORG by the authorsWage data come from the Bureau of Labor Statistics web site
1110 QUARTERLY JOURNAL OF ECONOMICS
AP
PE
ND
IX2
VA
RIA
BL
EM
EA
NS
FO
RS
ING
LE
MO
TH
ER
SA
ND
SIN
GL
EW
OM
EN
WIT
HO
UT
CH
ILD
RE
N1
984
1988
199
219
96
Var
iabl
e
1984
1988
1992
1996
Ch
ildr
enN
och
ildr
enC
hil
dren
No
chil
dren
Ch
ildr
enN
och
ildr
enC
hil
dren
No
chil
dren
Age
314
426
86
319
727
79
319
628
83
321
929
22
Non
wh
ite
037
10
155
036
30
162
038
40
178
037
70
207
His
pan
ic0
086
005
30
103
007
20
111
007
90
136
009
3H
igh
sch
ool
drop
out
026
20
094
024
60
091
024
10
094
021
10
092
Som
eco
lleg
e0
211
029
70
234
030
50
256
031
70
311
031
7B
ach
elor
s0
063
019
20
064
020
40
061
021
00
072
023
3M
aste
rs0
022
005
90
025
006
10
023
006
60
021
006
4D
ivor
ced
056
40
151
053
30
161
047
70
165
046
00
162
Wid
owed
006
60
010
005
50
010
004
70
012
003
80
012
Liv
ing
wit
hpa
ren
ts0
156
041
80
151
037
50
154
034
70
154
033
9L
ivin
gw
ith
un
rela
ted
adu
ltm
ale
009
70
135
012
50
167
014
80
198
016
50
218
[of
chil
dren
un
der
181
681
z1
664
z1
707
z1
707
z[
ofch
ildr
enu
nde
r6
056
0z
057
1z
062
4z
061
3z
Ear
ned
inco
me
(Mar
ch)
128
1018
331
134
6220
183
132
3218
993
147
6019
912
Ear
ned
inco
me
ifw
ork
(Mar
ch)
172
5019
536
180
1321
293
179
3020
453
180
2321
479
An
nu
alho
urs
ifw
ork
(Mar
ch)
1718
1837
1724
1894
1712
1862
1740
1881
Hou
rly
earn
ings
(Mar
ch)
985
103
89
9110
86
987
105
910
03
109
8In
com
eta
xes
ifw
ork
1521
2751
1030
2958
811
2967
7929
14W
elfa
rem
axim
um
ben
et
7583
z74
06z
7391
z70
56z
Wel
fare
ben
et
ifw
ork
1482
z14
78z
1546
z14
88z
Pro
babi
lity
ofA
FD
Cre
ceip
tif
wor
k0
255
z0
287
z0
266
z0
256
zM
edic
aid
ifw
ork
1215
013
590
1704
219
424
Nu
mbe
rof
obse
rvat
ion
s93
9118
914
9211
186
1210
333
193
1187
8815
846
Sou
rces
The
data
are
prim
arily
from
the
1984
ndash199
6C
urre
ntP
opul
atio
nSu
rvey
Out
goin
gR
otat
ion
Gro
upF
ile(O
RG
)and
from
the
1985
ndash199
7M
arch
Cur
rent
Pop
ulat
ion
Surv
ey(M
arch
)R
estr
icti
ons
See
Tab
leII
for
sam
ple
rest
rict
ion
sN
otes
Mea
ns
com
efr
omth
eO
RG
unle
ssth
eyar
ela
bele
d(M
arch
)T
hese
mea
nsar
eca
lcul
ated
usi
ngth
ech
arac
teri
stic
sof
the
give
nsa
mpl
efo
rth
egi
ven
year
and
are
wei
ghte
dW
omen
are
assu
med
tobe
inth
eir
rst
four
mon
ths
ofw
ork
toha
ven
ou
near
ned
inco
me
and
tocl
aim
noch
ildca
reex
pens
esA
lso
sin
gle
wom
enw
ith
and
wit
hou
tch
ildr
enar
eas
sum
edto
le
ashe
adof
hous
ehol
dan
dsi
ngl
ere
spec
tive
ly
and
tocl
aim
the
stan
dard
dedu
ctio
nT
axes
and
wel
fare
are
adju
sted
for
stat
eco
stof
livi
ng
diff
eren
ces
All
doll
aram
ount
sar
eex
pres
sed
in19
96do
llar
spe
rye
arS
eeA
ppen
dix
1fo
rsp
eci
cin
dice
sus
edan
dot
her
deta
ils
1111THE LABOR SUPPLY OF SINGLE MOTHERS
DEPARTMENT OF ECONOMICS AND INSTITUTE FOR POLICY RESEARCH NORTHWESTERN
UNIVERSITY AND NATIONAL BUREAU OF ECONOMIC RESEARCH
DEPARTMENT OF ECONOMICS UNIVERSITY OF NORTH CAROLINA GREENSBORO
REFERENCES
American Public Welfare Association ldquoSummary of Approved AFDC WaiverActionsrdquo (Washington DC May 1993 and August 1 1996)
Advisory Committee on Intergovernmental Relations Signicant Features ofFiscal Federalism (Washington DC various years)
Bavier Richard ldquoAn Early Look at the Effects of Welfare Reformrdquo unpublishedpaper March 1999
Blank Rebecca M ldquoWhat Causes Public Assistance Caseloads to Growrdquo unpub-lished paper May 1997
mdashmdash ldquoThe Effect of Medical Need and Medicaid on AFDC Participationrdquo Journalof Human Resources XXIV (1989) 54ndash87
Blank Rebecca M and Patricia Ruggles ldquoWhen Do Women Use Aid to Familieswith Dependent Children and Food Stampsrdquo Journal of Human ResourcesXXXI (1996) 57ndash89
Blank Rebecca M David E Card and Philip K Robins ldquoFinancial Incentives forIncreasing Work and Income among Low-Income Familiesrdquo in Finding JobsWork and Welfare Reform David Card and Rebecca M Blank eds (NewYork Russell Sage Foundation 2000) pp 373ndash419
Browning Edgar K ldquoEffects of the Earned Income Tax Credit on Income andWelfarerdquo National Tax Journal XLVIII (1995) 23ndash43
Cohany Sharon Anne Polivka and Jennifer Rothgeb ldquoRevisions in the CurrentPopulation Survey Effective January 1994rdquo Employment and Earnings XLI(1994) 13ndash37
Commerce Clearing House State Tax Handbook (Chicago IL various years)Council of Economic Advisers ldquoThe Economics of Child Carerdquo (Washington DC
December 1997)Danziger Sheldon Robert Haveman and Robert Plotnick ldquoHow Income Trans-
fers Affect Work Savings and the Income Distribution A Critical ReviewrdquoJournal of Economic Literature XIX (1981) 975ndash1028
Dickert Stacy Scott Houser and John Karl Scholz ldquoThe Earned Income TaxCredit and Transfer Programs A Study of Labor Market and Program Par-ticipationrdquo in Tax Policy and the Economy 9 James M Poterba ed (Cam-bridge MA MIT Press 1995) pp 1ndash50
Edin Kathryn and Laura Lein Making Ends Meet How Single Mothers SurviveWelfare and Low-Wage Work (New York Russell Sage Foundation 1997)
Eissa Nada and Jeffrey B Liebman ldquoLabor Supply Response to the EarnedIncome Tax Creditrdquo Quarterly Journal of Economics CXII (1996) 605ndash637
Eissa Nada and Hilary Williamson Hoynes ldquoThe Earned Income Tax Credit andLabor Supply Married Couplesrdquo NBER Working Paper No 6856 December1998
Ellwood David T ldquoThe Impact of the Earned Income Tax Credit and Social PolicyReforms on Work Marriage and Living Arrangementsrdquo National Tax JournalLIII (2000) 1063ndash1106
Feenberg Daniel and Elisabeth Coutts ldquoAn Introduction to the TAXSIM ModelrdquoJournal of Policy Analysis and Management XII (1993) 189ndash194
Fraker Thomas Robert Moftt and Douglas Wolf ldquoEffective Tax Rates andGuarantees in the AFDC Program 1967ndash1982rdquo Journal of Human Re-sources XX (1985) 252ndash263
General Accounting Ofce ldquoWelfare Reform Statesrsquo Early Experiences withBenet Terminationrdquo (Washington DC GAO S-97-74 May 1997)
Gueron Judith M and Edward Pauly From Welfare to Work (New York RussellSage Foundation 1991)
Heckman James J ldquoWhat Has Been Learned about Labor Supply in the PastTwenty Yearsrdquo American Economic Review LXXXIII (1993) 116ndash121
Hill Carolyn V Joseph Hotz Charles H Mullin and John Karl Scholz ldquoEITC
1112 QUARTERLY JOURNAL OF ECONOMICS
Eligibility Participation and Compliance Rates for AFDC Households Evi-dence from the California Caseloadrdquo unpublished paper March 1999
Hoffman Saul D and Laurence S Seidman The Earned Income Tax CreditAntipoverty Effectiveness and Labor Market Effects (Kalamazoo MI UpjohnInstitute for Employment Research 1990)
Holtzblatt Janet Janet McCubbin and Robert Gillette ldquoPromoting Workthrough the EITCrdquo National Tax Journal XLVII (1994) 591ndash608
Hoynes Hilary Williamson ldquoWork and Marriage Incentives in Welfare ProgramsWhat Have We Learnedrdquo in Fiscal Policy Lessons from Economic ResearchAlan J Auerbach ed (Cambridge MA MIT Press 1997)
Intergovernmental Health Policy Project Major Changes in State Medicaid andIndigent Care Programs (Washington DC various years)
Jencks Christopher and Joseph Swingle ldquoHas Welfare Reform Helped or HurtSingle Momsrdquo unpublished paper February 2000
Keane Michael ldquoA New Idea for Welfare Reformrdquo Federal Reserve Bank ofMinneapolis Quarterly Review XXXVIII (1995) 2ndash28
Levine Judith A ldquoPolicy Incentives Confront Everyday Realities IntegratingEconomic and Sociological Perspectives on the Welfare-to-Work Transitionrdquounpublished paper March 1997
Levine Phillip B and Diane M Whitmore ldquoThe Impact of Welfare Reform on theAFDC Caseloadrdquo National Tax Association Proceedings Ninetieth AnnualConference (1998) 24ndash33
Liebman Jeffrey B ldquoThe Impact of the Earned Income Tax Credit on Incentivesand Income Distributionrdquo in Tax Policy and the Economy 12 James MPoterba ed (Cambridge MA MIT Press 1998) pp 83ndash120
Martini Alberto and Michael Wiseman ldquoExplaining the Recent Decline in Wel-fare Caseloads Is the Council of Economic Advisers Rightrdquo Challenge XL(1997) 6 ndash20
Meyer Bruce D ldquoDo the Poor Move to Receive Higher Welfare Benetsrdquo unpub-lished paper April 1999
Meyer Bruce D and Dan T Rosenbaum ldquoWelfare the Earned Income Tax Creditand the Labor Supply of Single Mothersrdquo NBER Working Paper No 7363September 1999
Meyer Bruce D and Dan T Rosenbaum ldquoMaking Single Mothers Work RecentChanges in Tax and Welfare Policy and their Effectsrdquo National Tax JournalLIII (2000a) 1027ndash1062
Meyer Bruce D and Dan T Rosenbaum ldquoMedicaid Private Health Insuranceand the Labor Supply of Single Mothersrdquo unpublished paper November2000b
Moftt Robert ldquoAn Economic Model of Welfare Stigmardquo American EconomicReview LXXIII (1983) 1023ndash1035
mdashmdash ldquoIncentive Effects of the U S Welfare Systemrdquo Journal of Economic Litera-ture XXX (1992) 1ndash61
mdashmdash ldquoThe Effect of Welfare on Marriage and Fertility What Do We Know andWhat Do We Need to Knowrdquo unpublished paper December 1997
Moftt Robert and Barbara Wolfe ldquoThe Effect of the Medicaid Program onWelfare Participation and Labor Supplyrdquo Review of Economics and StatisticsLXXIV (1992) 615ndash626
National Governorrsquos Association MCH (Maternal and Child Health) Update(Washington DC various dates)
National Research Council Measuring Poverty A New Approach Constance FCitro and Robert T Michael eds (Washington DC National Academy Press1995)
mdashmdash Evaluating Welfare Reform A Framework and Review of Current WorkRobert Moftt and Michele Ver Ploeg eds (Washington DC National Acad-emy Press 1999)
Polivka Anne E and Stephen M Miller ldquoThe CPS After the Redesign Refocus-ing the Economic Lensrdquo in Labor Statistics Measurement Issues John Halti-wanger Marilyn E Manser and Robert Topel eds (Chicago University ofChicago Press 1998) pp 249ndash286
Romich Jennifer L and Thomas Weisner ldquoHow Families View and Use the
1113THE LABOR SUPPLY OF SINGLE MOTHERS
EITC The Case for Lump-sum Deliveryrdquo National Tax Journal LIII (2000)1245ndash1265
Savner Steve and Mark Greenberg ldquoThe CLASP Guide to Welfare Waivers1997rdquo (Washington DC Center for Law and Social Policy 1997)
Scholz John Karl ldquoThe Participation Rate of the Earned Income Tax CreditrdquoInstitute for Research on Poverty Madison WI Discussion Paper 928-90October 1990
mdashmdash ldquoThe Earned Income Tax Credit Participation Compliance and AntipovertyEffectivenessrdquo National Tax Journal XLVII (1994) 59ndash81
Smeeding Timothy M Katherine E Ross Michael OrsquoConnor and Michael SimonldquoThe EITC Expectation Knowledge Use and Economic and Social MobilityrdquoNational Tax Journal LIII (2000) 1187ndash1210
U S Department of Agriculture Characteristics of Food Stamp Households(Alexandria VA U S Department of Agriculture Food and Consumer Ser-vice Ofce of Analysis and Evaluation various years)
U S Department of Health and Human Services Characteristics and FinancialCircumstances of AFDC Recipients (Washington DC U S Department ofHealth and Human Services Administration for Children and FamiliesOfce of Family Assistance Division of Performance Measurement variousyears)
mdashmdash Characteristics of State Plans for Aid to Families with Dependent Children(Washington DC U S Department of Health and Human Services Admin-istration for Children and Families Ofce of Family Assistance variousyears)
mdashmdash HHS Fact Sheet State Welfare Demonstrations (Washington DC U SDepartment of Health and Human Services March 17 1997a)
mdashmdash National Evaluation of Welfare-to-Work Strategies (Washington DC Ad-ministration for Children and Families Ofce of the Assistant Secretary forPlanning and Evaluation December 1997b)
mdashmdash Setting the Baseline A Report on State Welfare Waivers (Washington DCU S Department of Health and Human Services Ofce of the AssistantSecretary for Planning and Evaluation 1997c)
U S Department of the Treasury Statistics of Income Individual Income TaxReturns (Washington DC U S Department of the Treasury Internal Reve-nue Service various years)
U S Department of the Treasury Your Federal Income Tax Tax Guide forIndividuals (Washington DC U S Department of the Treasury InternalRevenue Service various years)
U S House of Representatives Committee on Energy and Commerce MedicaidSource Book Background Data and Analysis (Washington DC GovernmentPrinting Ofce November 1988 and January 1993)
U S House of Representatives Committee on Ways and Means Green BookBackground Material and Data on Programs within the Jurisdiction of theCommittee on Ways and Means (Washington DC Government Printing Of-ce various years)
Winkler Anne ldquoThe Incentive Effects of Medicaid on Womenrsquos Labor SupplyrdquoJournal of Human Resources XXVI (1991) 308ndash337
Yelowitz Aaron S ldquoThe Medicaid Notch Labor Supply and Welfare Participa-tionrdquo Quarterly Journal of Economics CX (1995) 909ndash940
Ziliak James P David N Figlio Elizabeth E Davis and Laura S ConnollyldquoAccounting for the Decline in AFDC Caseloads Welfare Reform or EconomicGrowthrdquo unpublished paper July 1997
1114 QUARTERLY JOURNAL OF ECONOMICS
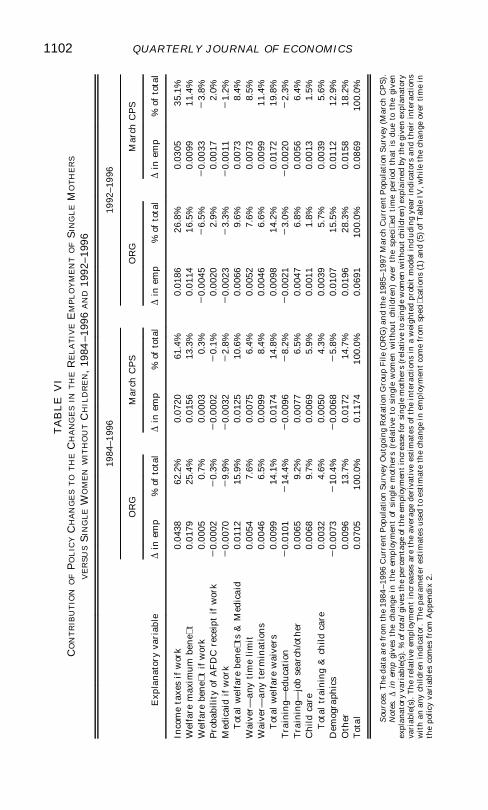
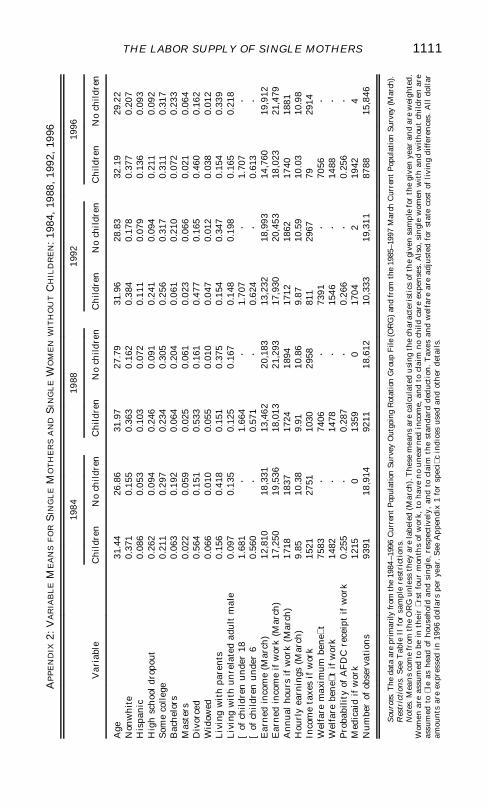
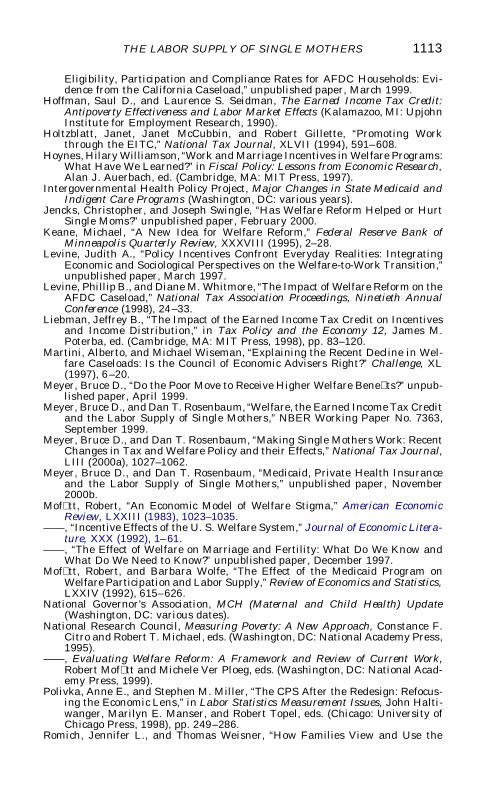