Verzorgingsgebied - Home | De Watergroep
98
2012 Water. Today and tomorrow. AnnuAL rEporT
Transcript of Verzorgingsgebied - Home | De Watergroep

Vlaamse Maatschappij voor Watervoorziening cvba
Maatschappelijke zetelVooruitgangstraat 189 - 1030 Brussel
T. 02 238 94 11 - F. 02 230 97 [email protected] • www.dewatergroep.be
BTW BE 0224 771 467
Colofon
Verantwoordelijke uitgever: Jan HammeneckerRedactie en coördinatie: De Watergroep – Afdeling communicatie
Concept & vormgeving: ArtexDruk: Sparks Printing
Fotografie: Marc Wauters, Fotostudio Leemans, Dieter De Lathauwer, Artur Eranosian, Frank De Luyck, Fotomix, Vlaanderen vanuit de Lucht, medewerkers De Watergroep
Wettelijk depot: D/2013/7180/1
Verzorgingsgebied
2012
Water. Today and tomorrow.
AnnuAL rEporT


1
Foreword
While this annual report not only marks the closure of another financial year, it also comes at a time when we are taking an important step in our company’s history. As you probably already know, the ‘Vlaamse Maatschappij voor Watervoorziening’ (Flemish Water Supply Company) has a new name since January 1, 2013: De Watergroep (The Water Group). This new name is the logical consequence of an evolution that we have made in recent years and which means that the old name no longer conveys what we stand for now. Today we offer a lot more than ‘just drinking water’.
De Watergroep will of course continue to be a supplier of drinking water first and foremost, which means, for instance, that we will continue to invest in the protection of our water resources and efficient and advanced treatment technology.
We are more than happy to let other companies that are looking for sustainable solutions to optimise their water cycle benefit from the technology that we developed for our own drinking water production and distribution system. We design, build and operate industrial water systems that benefit both environment and company.
Finally, we want to help our communities and partners return the water that we supply back to our streams and rivers, in purified form. To this end, we founded our new business unit RioPACT in 2012, in which we combine our sewage services along with our knowledge partner Aquafin.
Based on our activity report you will notice that in De Watergroep everything revolves around sustainability
and customised services to our customers. ‘Customers’ should be seen very broadly. These could include anything from private individuals and companies to municipal authorities.
This theme is reflected in our new vision: ‘We supply a range of customised water solutions. Today, for tomorrow’s generation.’
We go into the future with confidence, strengthened by the knowledge and expertise that we have built up over the last century. We want to provide you and your (grand)children with clean water for years to come, while never losing sight of the importance of environmental sustainability.
Luc AsselmanChairman of the Board of Directors
C o n T e n T S
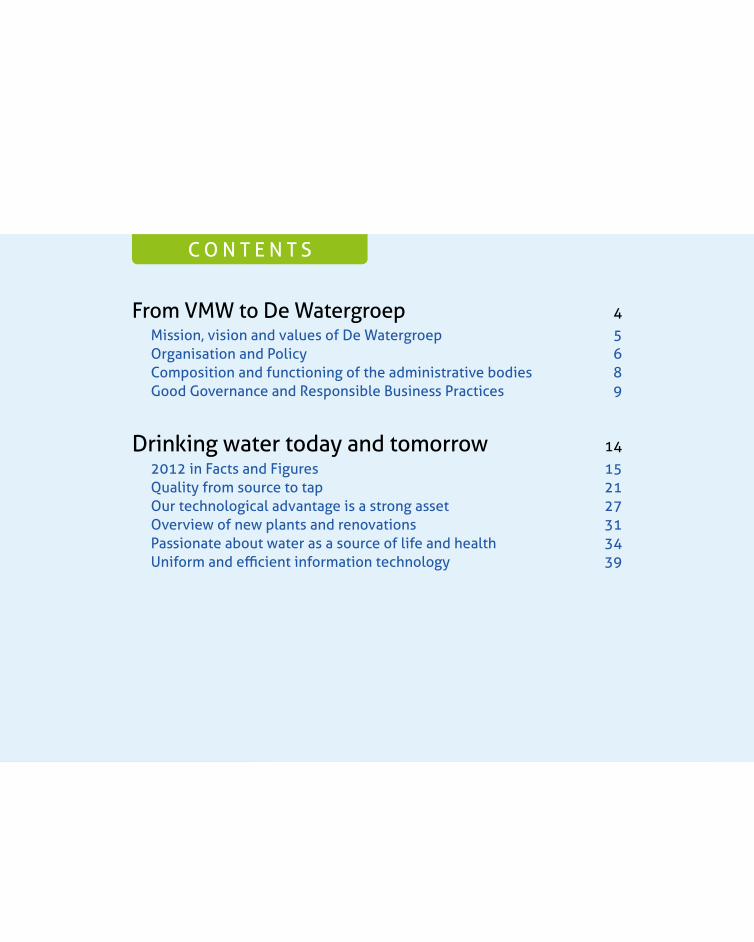
From VMW to De Watergroep 4
Mission, vision and values of De Watergroep 5organisation and Policy 6Composition and functioning of the administrative bodies 8Good Governance and Responsible Business Practices 9
Drinking water today and tomorrow 14
2012 in Facts and Figures 15Quality from source to tap 21Our technological advantage is a strong asset 27Overview of new plants and renovations 31Passionate about water as a source of life and health 34Uniform and efficient information technology 39

Sustainable industrial water projects 42
We are a leading partner in Flanders and abroad 43
Wastewater management for the future 46
Aquafin and De Watergroep join forces in RioPACT 47RioP and RioAct 48I-View for managing pumping stations 48An overview of the sewerage projects 49
Connected by water 50
We treat people and resources in a sustainable manner 51De Watergroep in dialogue 56
Annual Report from the Board of Directors concerning the 2012 annual accounts 60

From VMW to De Watergroep
5
our missionWe supply a range of customised water solutions. Today, for tomorrow’s generation.
our vision De Watergroep is passionate about water as a source of life and health.
our technological advantage is a strong asset that we constantly develop and exploit.
We treat people and resources in a sustainable manner. We are a leading partner in Flanders and abroad.
our values Team spirit
Collegiality is our first priority and transcends individual interests.
Reliability Promises should be kept. You can count on us – we do
business in a fair and proper manner. Commitment
Our employees act with the utmost care and attention, as if De Watergroep were their own company.
We stand for commitment, responsibility and ownership.
We work with passion and enthusiasm. Care
We take care of our customers, our colleagues and the resources we use.
We pay attention to our environment, health and safety.
We operate in a cost conscious manner. Initiative
our employees are given space to develop their skills. We are willing to change and are open to new ideas,
new techniques and methods. We give creativity every opportunity to succeed.
Mission, vision and values of De Watergroep
As from January 1 2013, the Vlaamse Maatschappij voor Watervoorziening has a new name: De Watergroep. Our mission, vision and values give proof of care and sustainability in many respects. De Watergroep is an open and transparent organisation attaching a lot of importance to an efficient operation and corporate governance.
We have become accustomed to having access to quality drinking water from the tap 24 hours a day, 7 days a week. We take it for granted. But 100 years ago things were quite different. That is when the Nationale Maatschappij der Waterleidingen (National Water Company) was founded, which later became the Vlaamse Maatschappij voor Watervoorziening (VMW or Flemish Water Supply Company).
We are now a century further and both our company and our services have strongly evolved. We have grown from a classic drinking water company into a comprehensive water supplier providing services throughout the entire water chain.
The name ‘Vlaamse Maatschappij voor Watervoorziening’ (Flemish Water Supply Company) therefore no longer covers it. Starting from 2013 we will be continuing under a new name: De Watergroep. Strengthened by 100 years of experience, we move forward with a future-oriented mission and vision.
6
organisation and Policy
Board of DirectorsChAIR OF The BOARDLuc Asselman
DIReCTORS-VICe ChAIRPeRSONSAlbert VandezandeKristel GevaertTania Janssens
GOVeRNMeNT COMMISSIONeRSSammy WuytsPaul Thomas (until January 25, 2013)Pieter De Cuyper (as of January 25, 2013)
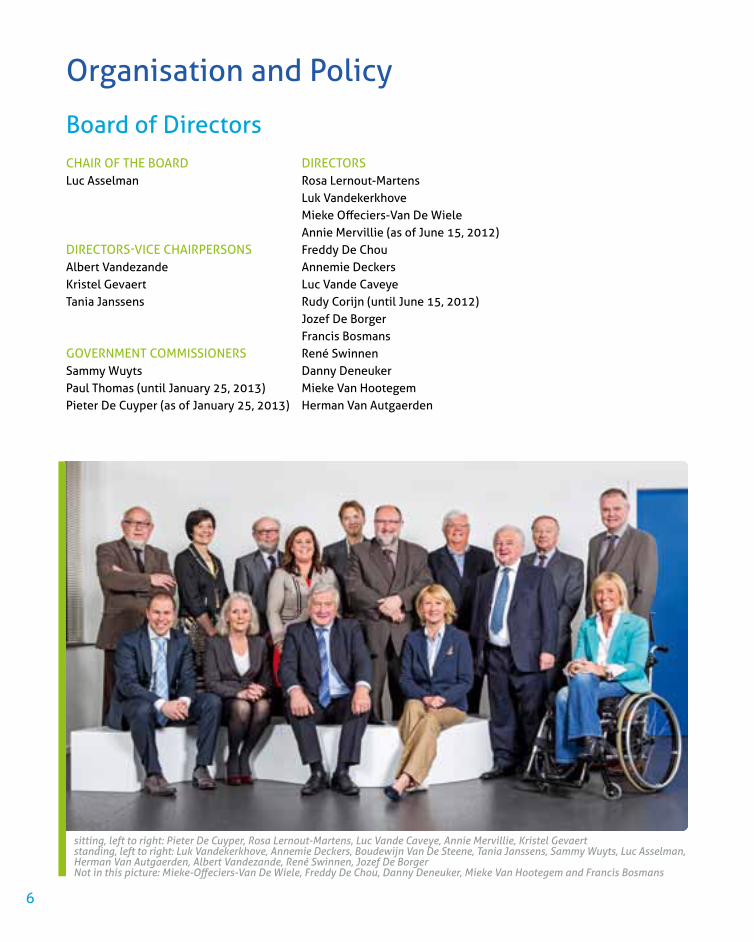
sitting, left to right: Pieter De Cuyper, Rosa Lernout-Martens, Luc Vande Caveye, Annie Mervillie, Kristel Gevaertstanding, left to right: Luk Vandekerkhove, Annemie Deckers, Boudewijn Van De Steene, Tania Janssens, Sammy Wuyts, Luc Asselman, Herman Van Autgaerden, Albert Vandezande, René Swinnen, Jozef De BorgerNot in this picture: Mieke-Offeciers-Van De Wiele, Freddy De Chou, Danny Deneuker, Mieke Van Hootegem and Francis Bosmans
DIReCTORSRosa Lernout-MartensLuk VandekerkhoveMieke Offeciers-Van De WieleAnnie Mervillie (as of June 15, 2012)Freddy De ChouAnnemie DeckersLuc Vande CaveyeRudy Corijn (until June 15, 2012)Jozef De BorgerFrancis BosmansRené SwinnenDanny Deneuker Mieke Van hootegemherman Van Autgaerden

7
Management CommitteeBernard Breda, Director General (until March 31, 2012)Boudewijn Van De Steene, Director General (as of May 1, 2012)Luc Keustermans, Technical DirectorJan hammenecker, Commercial DirectorFrederik Looten, Director of Government Relationsevelyn Becu, Director of Personnel and OrganisationSteven Mullens, Director of Finance and ControllingFrank De Poortere, Director Business Unit Industry & ServicesPaul Suenens, Provincial Director of West FlandersAlfred Bauwens, Provincial Director of east Flanders (until October 31, 2012)Karin Stemgée, Provincial Director of east Flanders (as of November 1, 2012)eddy Troosters, Provincial Director of Flemish BrabantMichel Vanroy, Provincial Director Limburg
From left to right: Frederik Looten, Eddy Troosters, Luc Keustermans, Evelyn Becu, Michel Vanroy, Boudewijn Van De Steene, Steven Mullens, Frank De Poortere, Paul Suenens, Karin Stemgée, Jan Hammenecker

8
Composition and functioning of the administrative bodiesThe Board of Directors is composed of sixteen members, including the Chairperson of the Board. The Chairperson of the Board is appointed by the Flemish Government. eight of the sixteen members were also appointed by the Flemish Government, four of which on the recommendation of the members united in a Provincial Committee. The other eight members are appointed by the General Assembly, on the recommendation of the Provincial Committees.
The Board of Directors appoints the Chairpersons of the Provincial Committees from among its members. The members of the provincial water services of West Flanders, east Flanders, Flemish Brabant and Limburg are united in the Provincial Committees. The members of the Board of Directors each have a six-year renewable mandate.
The mandate of Mr Rudy Corijn ended in 2012. Ms Annie Mervillie was appointed by the General Assembly as a director with effect from 15 June 2012. The offices of Mr Luc Vande Caveye and Mr herman Van Autgaerden were renewed, by the General Assembly and by the Flemish Government, respectively.
The Board of Directors met thirteen times in 2012. The average attendance rate was 91%.
The following committees are active within the Board of Directors: the Committee of the Chairperson and Deputy Chairpersons, the Audit Committee, the Property and Investment Committee and the Board of Directors and Industry and Services Business Unit. The Board of Directors is represented in the employer delegation within the Consultative Committee on Pensions composed with equal representation. The committees provide advice on their assigned files. The average attendance rate was 86% for the committees.
The members of the Board of Directors shall be reimbursed according to the remuneration scheme adopted by the General Assembly on 8 June 2007 and amended by order of the General Assembly
of 6 June 2008. More information about this compensation scheme is published on the website of De Watergroep. In 2012, the members of the Board of Directors were paid out €203,962 in attendance fees, including the fixed fee.
The members of the Board of Directors who live in a municipality that is a member of a provincial water service, are ipso jure a member of the Provincial Committee, the Sectoral Committees and the office of the Provincial Committee of that water service.The Provincial Offices are responsible for the day-to-day administration of the provincial water services. The table below summarises the operating procedures of the Provincial Offices in 2012:
ProvinceNumber of
meetingsAttendance
rateWest Flanders 10 84%east Flanders 11 89%Flemish Brabant 11 88%Limburg 13 89%
In 2010, the RioP water services for the provinces of West and east Flanders entered into force. The members of the Board of Directors who live in a municipality of the corresponding RioP water service are a member of the Provincial Committee and of the office of the Provincial Committee of that RioP water service. The table below summarises the operating procedures of the RioP Provincial Offices in 2012:
ProvinceNumber of
meetingsAttendance
rateWest Flanders 6 68%east Flanders 5 88%
The day-to-day management of De Watergroep is in the hands of the Management Team. The Management Team is responsible for a correct translation of the policies laid down by the Board of Directors. The gross wages of the 10 members of the Management Team amounted to a total of €851,978 in 2012.

9
An Audit Committee has been active within the Board of Directors since 2006. The members of the Audit Committee are appointed by the Board of Directors, which also appoints the Chairperson of the Audit Committee.
The main task of the Audit Committee is to assist the Board of Directors in its supervisory function, particularly in the following areas:
the functioning of the internal risk management and control systems, including monitoring compliance with and operation of the relevant laws and regulations and internal company rules;
monitoring the implementation of recommendations and comments of the Internal Audit Department and the external auditor;
the role and performance of the Internal Audit Department;
to make recommendations to the Board of Directors regarding the appointment or reappointment of members of the joint auditors, as well as their fees;
the relationship with the external auditor, in particular his independence, and any non-auditing activities he performs for the company;
preparation of meetings of the joint auditors with the Board of Directors at which the annual accounts and the annual report of the company are discussed. The same applies to any financial information provided by the company to various supervisory bodies.
The Audit Committee has unrestricted access to all information and personnel of the company and may dispose of all resources it deems necessary to perform
its task. The Audit Committee meets at least twice a year or more frequently if required by circumstances.
In 2012, the Audit Committee met six times and discussed the following main topics:
review of the long-term internal audit plan; the functioning of the internal risk management and control systems in the sectoral service centres and in the fields of water purchasing and sales of other water companies, logistics and materials distribution management, registration and invoicing of customer orders;
recommendations regarding points for improvement in the functioning of committees and administrative bodies, and optimisation of the processes controlling the self-financing capacity;
administrative investigations further to reports and specific assignments at the request of the Board of Directors;
the validation of compliance with internal and external regulations regarding leave administration, cumulation of professional activities, commuting, attendance fees and allowances to directors;
monitoring the implementation of recommendations and actions of the management with regard to previously performed audits.
The Internal Audit Department operates autonomously and independently. The Head of Internal Audit (the ‘internal auditor’) reports directly to the Chairperson of the Audit Committee and is appointed by the Board of Directors, following the recommendation of the Audit Committee.
Over the past year, De Watergroep has again taken a number of important steps in the area of transparency and responsible business practices. A thorough review of the administrative bodies has led, among other things, to a significant reduction in the number of offices and a halving of the number of Policy Preparation Committees of the Board of Directors. The Integrity Policy and the principles of good governance were further integrated into daily operations. Finally, there were new projects that put our social commitment into practice at home and abroad.
Good Governance and Responsible Business Practices
Audit Committee and Internal Audit

10
The internal auditor is responsible for: developing the audit plan based on a risk analysis; performance of the audit activities; discussing findings and formulating recommendations to those responsible and, after being supplemented with management responses, reporting in an audit report;
monitoring the performance of proposed recommen-dations so as to provide relative certainty that they are actually performed;
compliance with the standards of the Institute of Internal Auditors (IIA Belgium) and an internal quality control programme.
Following an invitation to tender, ernst & Young was appointed to assist the Internal Audit Department of De Watergroep on 26 September 2008. This contract was renewed on September 30, 2011, for a period of 3 years.
The internal auditor identifies key business risks and examines whether there are sufficient internal control mechanisms in place to minimise those risks. The internal auditor then checks whether the controls are in fact performed effectively and formulates the necessary advice about this matter.
Toward leaner and more efficient administrative bodiesDe Watergroep prepared a drastic downsizing of its administrative bodies in 2012. This eliminates 436 offices by June 2013, which represents more than two thirds of the existing offices.
A first step took place at the start of the new legislature in 2013: from now on each municipality can only delegate one representative in the Sectoral Committee, who simultaneously also serves on the Provincial Committee. Until now, there were two different representatives, possibly supplemented with one or two additional representatives depending on the number of inhabitants of the municipality. This measure will cause 250 offices to disappear. This reduction is the result of an adaptation of the internal rules of procedure.
By mid 2013, De Watergroep even wants to go a step further and completely eliminate the Sectoral Committees. Since this requires an amendment to the articles of association, this abolition will be submitted to the General Assembly on June 14, 2013.
De Watergroep aims to increase its efficiency by means of this intervention. Because De Watergroep continues to attach great importance to having strong local roots, it will consult more directly with municipal policy makers and technical services. The administrative bodies will also be supported with more specific training in the future.
De Watergroep also reviewed the functioning of its Board of Directors, while specifically halving the number of Policy Preparation Committees from eight to four.

11
Integrity on the railsIn 2012, the Integrity Policy of De Watergroep was given a definitive form with the designation of an Integrity Management Coordinator and the launch of the first Annual Action Plan. The Integrity Policy was started in 2009 with the elaboration of a Code of ethics that provides clear practical examples of how our organisation understands acting with integrity. This Code provides guidance for our staff to take decisions responsibly and ethically.
The roles and responsibilities were delineated in order to embed the Integrity Policy in De Watergroep structurally. each employee gets to know the Code of
De Watergroep has been working together with Guberna, the Institute for Directors, since 2009 to examine how to integrate regulations concerning good governance better into our daily operations. This led to a series of recommendations, which were systematically converted into decisions and internal procedures. With this, De Watergroep anticipates the principles of good governance in the Flemish public sector, in relation to which the Flemish Government has approved the draft decree on February 1, 2013.
A detailed comparison of the new regulations with the current situation in De Watergroep shows that there
is an almost complete compliance with all applicable regulations. For example, De Watergroep has an Integrity Policy for its employees. In 2012 a custom Code of ethics was also developed for the members of the Board of Directors. The remuneration of the Directors is transparent and meets the regulations.
There is also full transparency on remuneration of top managers since the wage scales and staff regulations – and any adjustments thereto – are published in the Belgian Official Journal. The remuneration and attendance fees awarded to directors at all levels are published on the website of De Watergroep.
ethics and the different roles within the Integrity Policy through an interactive dilemma training.
The Integrity Management Coordinator, who was appointed in January 2012 and who launched her first annual action plan three months later, plays a key role in the Integrity Policy. From now on all employees will be introduced to the Code of ethics through a dilemma training and learn how they can put the vision, mission and values of De Watergroep into practice.
Principles of good governance anchored in its method of operation
12
As a public water company De Watergroep attaches great importance to social commitment. Thus we have been actively supporting projects in the developing world for several years while also not losing sight of the underprivileged in Flanders.
WATeR AND POVeRTY IN FLANDeRS
In connection with the International Day for the eradication of Poverty on 17 October 2012, De Watergroep, together with VVSG (the Association of Flemish Cities and Municipalities) and the local Public Centres for Social Welfare (OCMW), launched a new initiative in aid of the underprivileged in Flanders.
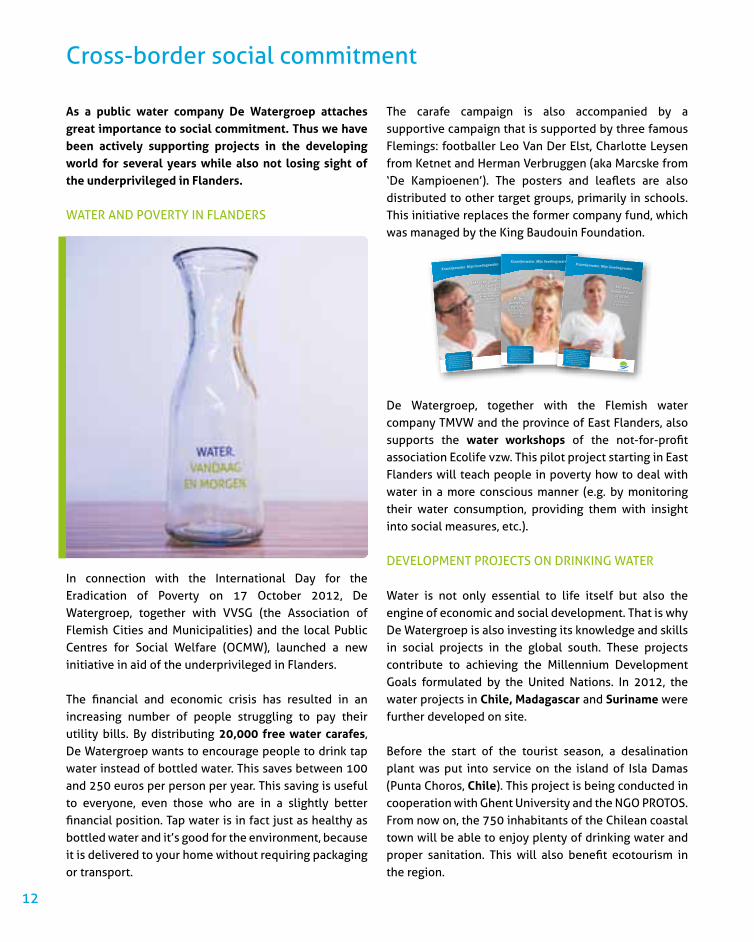
The financial and economic crisis has resulted in an increasing number of people struggling to pay their utility bills. By distributing 20,000 free water carafes, De Watergroep wants to encourage people to drink tap water instead of bottled water. This saves between 100 and 250 euros per person per year. This saving is useful to everyone, even those who are in a slightly better financial position. Tap water is in fact just as healthy as bottled water and it’s good for the environment, because it is delivered to your home without requiring packaging or transport.
Cross-border social commitment
The carafe campaign is also accompanied by a supportive campaign that is supported by three famous Flemings: footballer Leo Van Der elst, Charlotte Leysen from Ketnet and herman Verbruggen (aka Marcske from ‘De Kampioenen’). The posters and leaflets are also distributed to other target groups, primarily in schools. This initiative replaces the former company fund, which was managed by the King Baudouin Foundation.
De Watergroep, together with the Flemish water company TMVW and the province of east Flanders, also supports the water workshops of the not-for-profit association ecolife vzw. This pilot project starting in east Flanders will teach people in poverty how to deal with water in a more conscious manner (e.g. by monitoring their water consumption, providing them with insight into social measures, etc.).
DeVeLOPMeNT PROJeCTS ON DRINKING WATeR
Water is not only essential to life itself but also the engine of economic and social development. That is why De Watergroep is also investing its knowledge and skills in social projects in the global south. These projects contribute to achieving the Millennium Development Goals formulated by the United Nations. In 2012, the water projects in Chile, Madagascar and Suriname were further developed on site.
Before the start of the tourist season, a desalination plant was put into service on the island of Isla Damas (Punta Choros, Chile). This project is being conducted in cooperation with Ghent University and the nGo PRoToS. From now on, the 750 inhabitants of the Chilean coastal town will be able to enjoy plenty of drinking water and proper sanitation. This will also benefit ecotourism in the region.
Lekker én goedkoop.
Een echte
kampioenendrank.
Herman Verbruggen
Alias ‘Markske’ van
F.C. De Kampioenen
Kraantjeswater. Mijn lievelingswater.
‘Verwonderd dat kraantjeswater
m’n lievelingsdrank is? Ik vind water
uit de kraan ook echt een wonder.
24 uur per dag krijg je het goedkoopste
en lekkerste water thuis geleverd.
Zo’n kampioenendrank, daar kan
zelfs m’n chocomelk niet tegen op!’
Water zonder dop.
Da’s top.Charlotte LeysenKetnetwrapster
Kraantjeswater. Mijn lievelingswater.
‘Als wrapster beweeg ik veel. En daar krijg je dorst van. Gelukkig is
m’n lievelingsdrank wel altijd ergens in de buurt. Welk merk dat is?
Kraantjeswater met de grote K. Want water zonder dop, da’s top. Voor jou, voor mij én het milieu.’
Met purekwaliteit scoor
je altijd.Leo Van der Elst
Ex-profvoetballer
Kraantjeswater. Mijn lievelingswater.
‘Ik ga voor kwaliteit. In alles wat ik doe.Daarom kies ik voluit voorkraantjeswater. Wist je dat water uit je kraan de strengst gecontroleerdedrank is? En dat zuivere drankje kan je zomaar bij je thuis tappen. Zeg nu zelf, met zo’n pure kwaliteit scoor je toch altijd.’

13
Together with PROTOS, the drinking water supply and waste water purification system was also further developed in a number of deprived areas of Toamasina. Toamasima is the largest port city of Madagascar, located on the east coast. The collaboration with PRoToS for this
project was extended until 2015. In this context, De Watergroep also signed a cooperation agreement with The Syndicat des eaux d’Île de France (SEDIF), the largest public water authority in France on March 14, 2012. This partnership expands the scope of the existing
project in Madagascar and makes it possible for infrastructural work to be accelerated. The agreement has an initial term of three years but may be renewed. De Watergroep contributes 25,000 euros a year to this project and SeDIF 50,000 euros each time.
In May 2012, a number of employees travelled to Suriname. Together with the local authorities, they built a water supply system in the village of Galibi, located in the Maroni district. De Watergroep has been participating in this project for several years in the context of the twinning between Koksijde and Maroni.
Closer to home, on 18 October, 12 young people went to work in various positions at De Watergroep on the occasion of the ‘Zuiddag’ (a Belgian initiative in aid of people in the global south): administrative assistant, sampler, tester and even Chairman of the Board of Directors. ‘Zuiddag’ is a solidarity campaign by, with and for young people. Under the slogan ‘Work for Change’, school children from Flanders and Brussels worked for one day during school hours. They donated their wages to a youth project in the global south.
Working for people in the global south
Construction of a drinking water installation in Suriname
14
Drinking water today and tomorrow
15
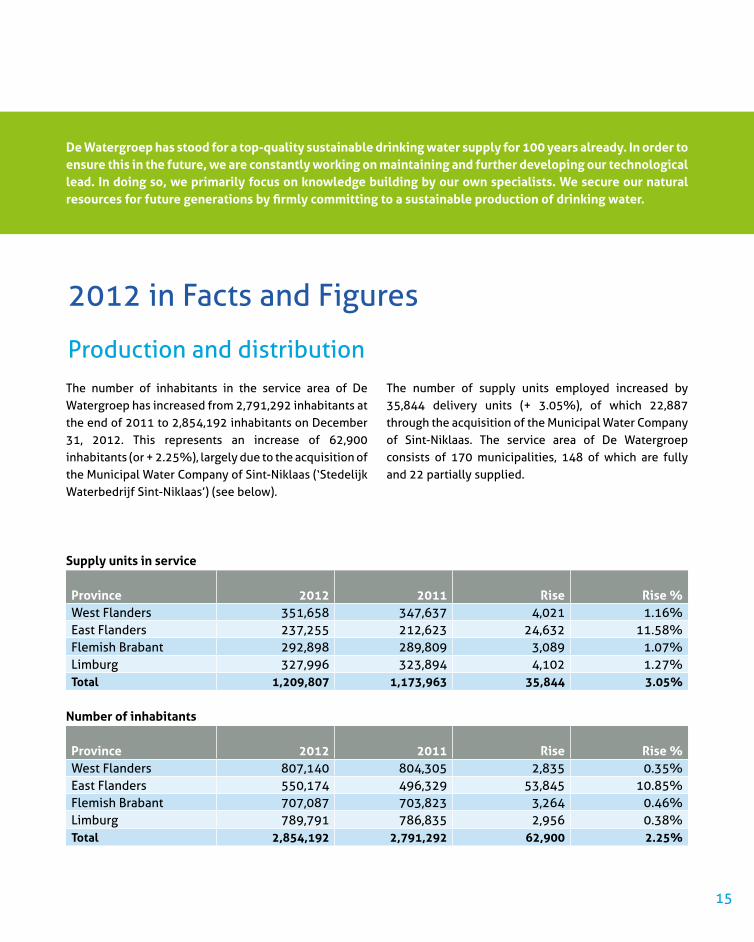
The number of inhabitants in the service area of De Watergroep has increased from 2,791,292 inhabitants at the end of 2011 to 2,854,192 inhabitants on December 31, 2012. This represents an increase of 62,900 inhabitants (or + 2.25%), largely due to the acquisition of the Municipal Water Company of Sint-Niklaas (‘Stedelijk Waterbedrijf Sint-Niklaas’) (see below).
The number of supply units employed increased by 35,844 delivery units (+ 3.05%), of which 22,887 through the acquisition of the Municipal Water Company of Sint-Niklaas. The service area of De Watergroep consists of 170 municipalities, 148 of which are fully and 22 partially supplied.
De Watergroep has stood for a top-quality sustainable drinking water supply for 100 years already. In order to ensure this in the future, we are constantly working on maintaining and further developing our technological lead. In doing so, we primarily focus on knowledge building by our own specialists. We secure our natural resources for future generations by firmly committing to a sustainable production of drinking water.
Supply units in service
Province 2012 2011 Rise Rise %West Flanders 351,658 347,637 4,021 1.16%east Flanders 237,255 212,623 24,632 11.58%Flemish Brabant 292,898 289,809 3,089 1.07%Limburg 327,996 323,894 4,102 1.27%Total 1,209,807 1,173,963 35,844 3.05%
Number of inhabitants
Province 2012 2011 Rise Rise %West Flanders 807,140 804,305 2,835 0.35%east Flanders 550,174 496,329 53,845 10.85%Flemish Brabant 707,087 703,823 3,264 0.46%Limburg 789,791 786,835 2,956 0.38%Total 2,854,192 2,791,292 62,900 2.25%
2012 in Facts and Figures
Production and distribution
16
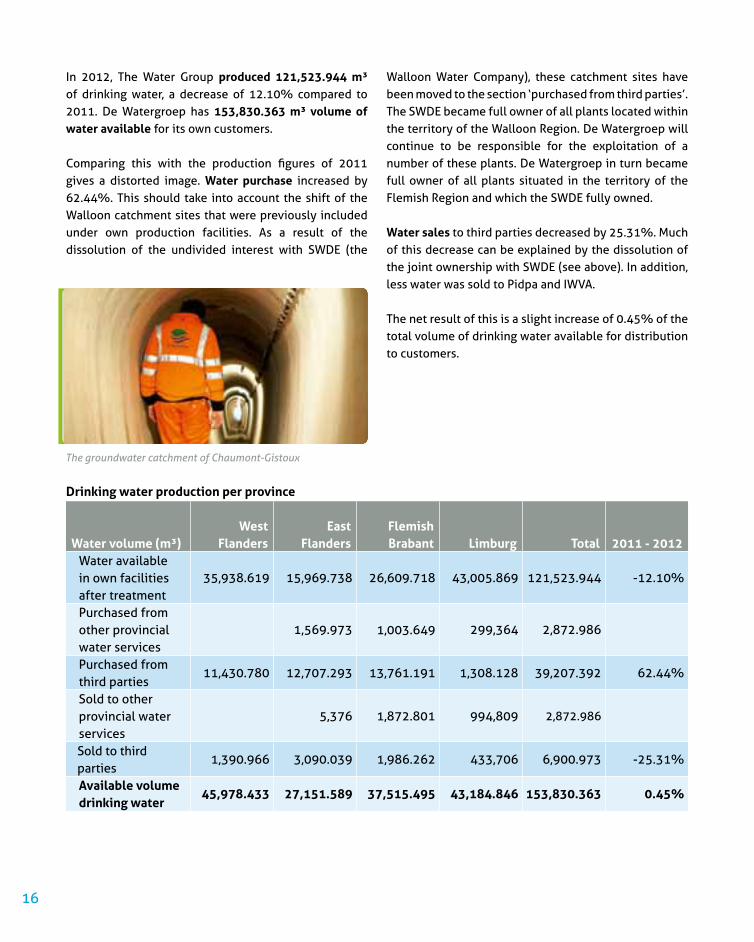
In 2012, The Water Group produced 121,523.944 m³ of drinking water, a decrease of 12.10% compared to 2011. De Watergroep has 153,830.363 m³ volume of water available for its own customers.
Comparing this with the production figures of 2011 gives a distorted image. Water purchase increased by 62.44%. This should take into account the shift of the Walloon catchment sites that were previously included under own production facilities. As a result of the dissolution of the undivided interest with SWDe (the
Walloon Water Company), these catchment sites have been moved to the section ‘purchased from third parties’. The SWDe became full owner of all plants located within the territory of the Walloon Region. De Watergroep will continue to be responsible for the exploitation of a number of these plants. De Watergroep in turn became full owner of all plants situated in the territory of the Flemish Region and which the SWDe fully owned.
Water sales to third parties decreased by 25.31%. Much of this decrease can be explained by the dissolution of the joint ownership with SWDe (see above). In addition, less water was sold to Pidpa and IWVA.
The net result of this is a slight increase of 0.45% of the total volume of drinking water available for distribution to customers.
Drinking water production per province
Water volume (m³)West
FlandersEast
FlandersFlemish Brabant Limburg Total 2011 - 2012
Water available in own facilities after treatment
35,938.619 15,969.738 26,609.718 43,005.869 121,523.944 -12.10%
Purchased from other provincial water services
1,569.973 1,003.649 299,364 2,872.986
Purchased from third parties
11,430.780 12,707.293 13,761.191 1,308.128 39,207.392 62.44%
Sold to other provincial water services
5,376 1,872.801 994,809 2,872.986
Sold to third parties
1,390.966 3,090.039 1,986.262 433,706 6,900.973 -25.31%
Available volume drinking water
45,978.433 27,151.589 37,515.495 43,184.846 153,830.363 0.45%
The groundwater catchment of Chaumont-Gistoux

17
Customers are supplied through an extensive mains system, which had a length of 30,987 km in late 2012 (growth of 1%). The largest share of this concerns distribution pipelines (approximately 84%). The remaining pipelines are supply or raw water pipelines. This total includes 211 km of pipes of the former Municipal Water Company of Sint-Niklaas.
The graphical representation of water types looks as follows:
In 2012 the natural growth of the network was 176 km. The acquisition of Sint-niklaas and transfer of lines to SWDe under the joint ownership were not included in the growth figures but they were included in the total number of kilometres of pipes.
Growth of mains system in 2012
Mains system length (km)West
FlandersEast
FlandersFlemish Brabant Limburg Total 2011 Total 2012
New in 2012 (a) 118 54 85 94 294 351Out of service in 2012 (b) 53 27 51 44 142 175Growth in 2012 (a)-(b) 66 27 34 50 151 176Total network in service 10,165 4,982 7,225 8,615 30,662 30,987on 31-12-2012
The average age of the mains system is 34 years. The pipes that were taken out of service in 2012 had an average age of 45 years.
Groundwater
Surface water
Purchase
Sales
Water balance sheet 2012
52%21%
23%
4%

18
Sint-Niklaas now completely supplied by De Watergroep
Production and storage infrastructure
West
FlandersEast
FlandersFlemish Brabant Limburg Total
Water production centres Surface water 4 1 5 Groundwater 6 4 27 20 57Total number of water production centres
10 5 27 20 62
Booster pumping stations 18 5 28 9 60Pressure water installations 3 4 24 9 40Water towers 16 19 23 24 82 Storage capacity (m³) 17,000 20,100 18,450 26,800 82,350Reservoirs 18 11 24 20 73Storage capacity (m³) 113,925 48,000 100,300 49,953 312,178Total storage capacity (m³) 130,925 68,100 118,750 76,753 394,528
For some time already De Watergroep was responsible for the water supply in the submunicipalities Sinaai, Belsele and Nieuwkerken. From January 1, 2012, we supply the entire territory of Sint-niklaas. This represents an increase of 22,887 supply units (take-off points), 51,400 inhabitants and 211 km of pipes.
De Watergroep has taken over the distribution activities of the Municipal Water Company of Sint-Niklaas, including all moveable and immovable property, plant and equipment (pipes, take-off points, etc.), the business assets and stocks. A regional support centre will remain established in Sint-Niklaas until the end of 2014 as technical and administrative support for the Waasland sectoral service centre in Lokeren.
Water tower at Sint-Niklaas

19
Key figures 2012 2011
Production (million m³) - Groundwater 86.76 104.73- Surface water 34.76 33.52Total 121.52 138.25Purchase from third parties (million m³) - SWDe 24.89 16.67- AWW 5.49 5.30- TMVW 7.49 0.90- other 1.33 1.27Total 39.21 24.14Sales to third parties (million m³) - SWDe 3.12 4.57- TMVW 3.13 3.39- IWM 0.43 0.28- other 0.21 0.99Total 6.90 9.23Supply units - In service 1,209,807 1,173,963 - existing 1,217,929 1,180,891 Member municipalities - Fully 148 147- Partially 22 23Population 2,854,192 2,791,292 Capital- Registered capital 868,498,250 861,337,075 - number of shares 38,139,930 37,853,483 Staff (at December 31) - Statutory 1,311 1,320 - Under contract 112 87- other 52 70Total 1,475 1,477
20
fixed fee
price for usage per m³
contribution for treatment
contribution for transport
TAV
telephone
transfer
card
phone
website
estimation
on site
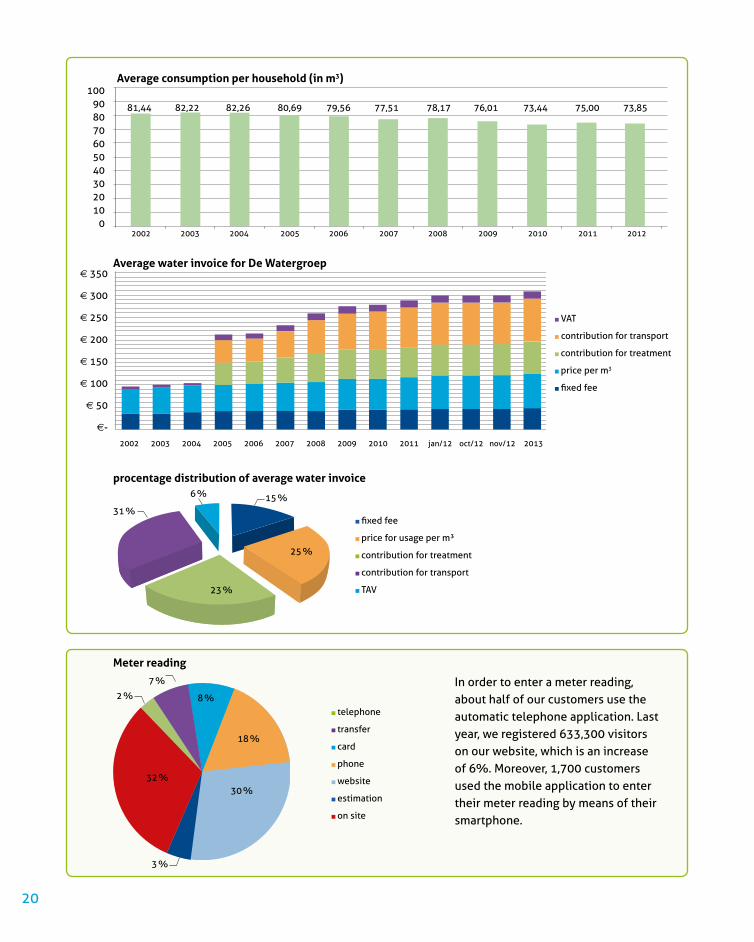
Average consumption per household (in m3)
Average water invoice for De Watergroep
procentage distribution of average water invoice
100908070605040302010
0
e 350
e 300
e 250
e 200
e 150
e 100
e 50
e-
81,44
2002
2002
In order to enter a meter reading, about half of our customers use the automatic telephone application. Last year, we registered 633,300 visitors on our website, which is an increase of 6%. Moreover, 1,700 customers used the mobile application to enter their meter reading by means of their smartphone.
2003 2004 2005 2006 2007 2008 2009 2010 2011 jan/12 oct/12 nov/12 2013
2003 2004 2005 2006 2007 2008 2009 2010 2011 2012
82,22 82,26 80,69 79,56 77,51 78,17 76,01 73,44 75,00 73,85
VAT
contribution for transport
contribution for treatment
price per m3
fixed fee
31 %
6 %
2 %
7 %
8 %
18 %
30 %
3 %
32 %
15 %
25 %
23 %
Meter reading

21
Quality from source to tap
Control of production and distribution
De Watergroep has a renowned laboratory recognised by the Flemish Government in accordance with ‘VLAReL’ legislation for performing a large number of analysis packages for drinking water, groundwater and surface water. ‘VLAReL’ stands for ‘Vlaams reglement inzake erkenningen met betrekking tot het leefmilieu’ (order of the Flemish Government of 19 November 2010 establishing the Flemish regulation on recognitions relating to the environment). In addition, our laboratory is BELAC accredited (Belgian Accreditation Council). Performing analyses as recognised and accredited laboratory requires the continuous application of the strict ISO 17025 quality standard for laboratories.
In the context of recognition and accreditation, the laboratory
participated in more than 85 international ringtests for
microbiological, inorganic and organic parameters in 2012.
The high scores achieved in these ringtests confirm the high
quality standard of the measurements performed daily.
De Watergroep monitors the quality of its drinking water from source to tap. Quality control includes both statutory audits of the drinking water supplied as well
STATUTORY AUDIT
In the context of statutory audits, analyses are conducted on samples taken at the kitchen tap of the customer. Monitoring-type analyses encompass a large number of bacteriological and chemical parameters (including nitro compounds and metals), which enable us to monitor the daily quality of the drinking water distributed.
as the additional audit of internal processes during the process of extraction, production and distribution.
Audit-type analyses encompass all the parameters of the monitoring package, complemented by a wide range of heavy metals and organic compounds such as polycyclic hydrocarbons, pesticides and chlorine disinfection byproducts.
22
ADDITIONAL COMPANY AUDITS
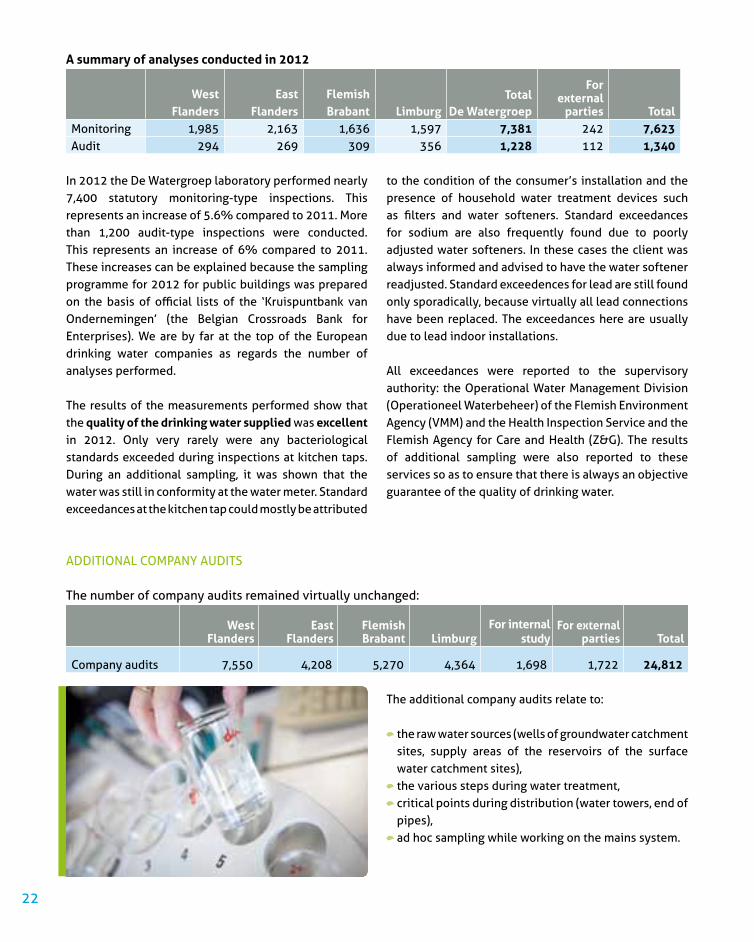
In 2012 the De Watergroep laboratory performed nearly 7,400 statutory monitoring-type inspections. This represents an increase of 5.6% compared to 2011. More than 1,200 audit-type inspections were conducted. This represents an increase of 6% compared to 2011. These increases can be explained because the sampling programme for 2012 for public buildings was prepared on the basis of official lists of the ‘Kruispuntbank van ondernemingen’ (the Belgian Crossroads Bank for enterprises). We are by far at the top of the european drinking water companies as regards the number of analyses performed.
The results of the measurements performed show that the quality of the drinking water supplied was excellent in 2012. Only very rarely were any bacteriological standards exceeded during inspections at kitchen taps. During an additional sampling, it was shown that the water was still in conformity at the water meter. Standard exceedances at the kitchen tap could mostly be attributed
The additional company audits relate to:
the raw water sources (wells of groundwater catchment sites, supply areas of the reservoirs of the surface water catchment sites), the various steps during water treatment, critical points during distribution (water towers, end of pipes), ad hoc sampling while working on the mains system.
to the condition of the consumer’s installation and the presence of household water treatment devices such as filters and water softeners. Standard exceedances for sodium are also frequently found due to poorly adjusted water softeners. In these cases the client was always informed and advised to have the water softener readjusted. Standard exceedences for lead are still found only sporadically, because virtually all lead connections have been replaced. The exceedances here are usually due to lead indoor installations. All exceedances were reported to the supervisory authority: the Operational Water Management Division (operationeel Waterbeheer) of the Flemish environment Agency (VMM) and the health Inspection Service and the Flemish Agency for Care and health (Z&G). The results of additional sampling were also reported to these services so as to ensure that there is always an objective guarantee of the quality of drinking water.
A summary of analyses conducted in 2012
WestFlanders
EastFlanders
FlemishBrabant Limburg
Total De Watergroep
For external
parties Total Monitoring 1,985 2,163 1,636 1,597 7,381 242 7,623Audit 294 269 309 356 1,228 112 1,340
The number of company audits remained virtually unchanged:
WestFlanders
EastFlanders
Flemish Brabant Limburg
For internal study
For external parties Total
Company audits 7,550 4,208 5,270 4,364 1,698 1,722 24,812
23
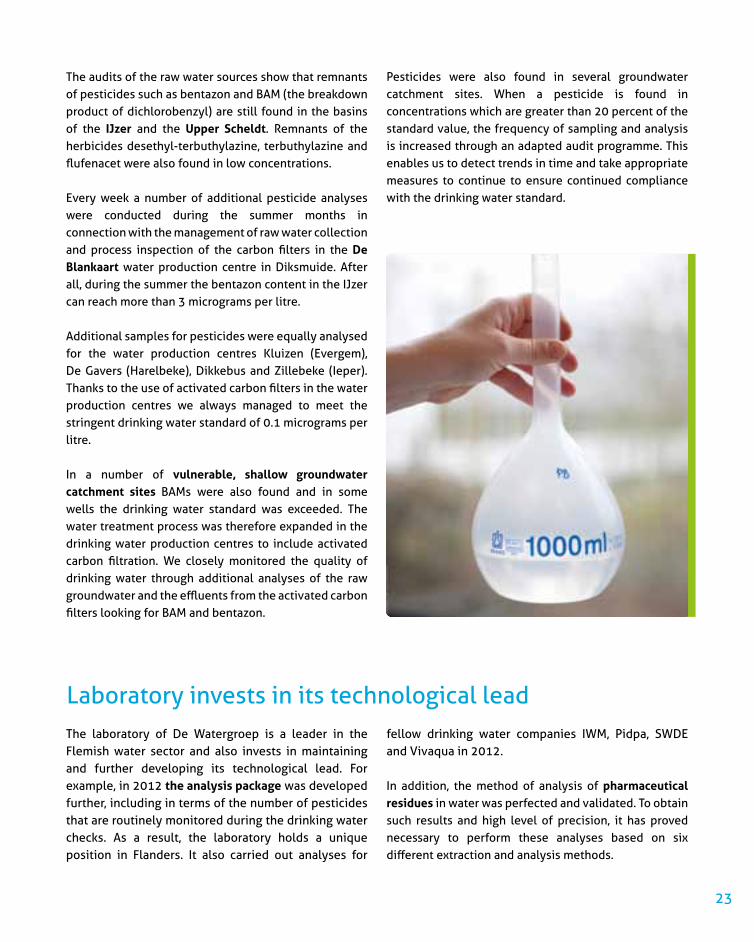
Laboratory invests in its technological leadThe laboratory of De Watergroep is a leader in the Flemish water sector and also invests in maintaining and further developing its technological lead. For example, in 2012 the analysis package was developed further, including in terms of the number of pesticides that are routinely monitored during the drinking water checks. As a result, the laboratory holds a unique position in Flanders. It also carried out analyses for
fellow drinking water companies IWM, Pidpa, SWDe and Vivaqua in 2012.
In addition, the method of analysis of pharmaceutical residues in water was perfected and validated. To obtain such results and high level of precision, it has proved necessary to perform these analyses based on six different extraction and analysis methods.
The audits of the raw water sources show that remnants of pesticides such as bentazon and BAM (the breakdown product of dichlorobenzyl) are still found in the basins of the IJzer and the Upper Scheldt. Remnants of the herbicides desethyl-terbuthylazine, terbuthylazine and flufenacet were also found in low concentrations.
every week a number of additional pesticide analyses were conducted during the summer months in connection with the management of raw water collection and process inspection of the carbon filters in the De Blankaart water production centre in Diksmuide. After all, during the summer the bentazon content in the IJzer can reach more than 3 micrograms per litre.
Additional samples for pesticides were equally analysed for the water production centres Kluizen (evergem), De Gavers (harelbeke), Dikkebus and Zillebeke (Ieper). Thanks to the use of activated carbon filters in the water production centres we always managed to meet the stringent drinking water standard of 0.1 micrograms per litre.
In a number of vulnerable, shallow groundwater catchment sites BAMs were also found and in some wells the drinking water standard was exceeded. The water treatment process was therefore expanded in the drinking water production centres to include activated carbon filtration. We closely monitored the quality of drinking water through additional analyses of the raw groundwater and the effluents from the activated carbon filters looking for BAM and bentazon.
Pesticides were also found in several groundwater catchment sites. When a pesticide is found in concentrations which are greater than 20 percent of the standard value, the frequency of sampling and analysis is increased through an adapted audit programme. This enables us to detect trends in time and take appropriate measures to continue to ensure continued compliance with the drinking water standard.

24
The sampling programme was initiated in the last quarter of 2012 and also includes numerous vulnerable groundwater catchment sites, in addition to the main surface water catchment sites. The analysis programme will continue to be monitored and expanded in 2013.
A market study was performed on the purchase of a high resolution mass spectrometer, coupled with liquid chromatography. This will allow De Watergroep to detect new pollutants in water. The conversion of these substances to unknown substances by the oxidative treatment applied in water treatment processes can thus also be studied. The purchase of this equipment is scheduled for the first quarter of 2013. Because of this investment, which makes it possible to detect non-volatile components, the laboratory will be able to identify and quantify virtually all substances which can lead to odour and taste problems.
The method of analysis of polycyclic aromatic hydrocarbons with the aid of gas chromatography was perfected and validated. Until 2012, this analysis was performed using liquid chromatography. The switch to gas chromatography was necessary in order to be able to meet the demands of the VLAReL legislation on analysis methods.
Due to the development of a new, combined extraction method for polycyclic hydrocarbons and pesticides, the performance of the Organic Chemistry Department was increased.
The samplers were equipped with a hand terminal (PDA, or personal data assistant). The results of the measurements can therefore be sent on to the LIMS (the laboratory database) on site, resulting in administrative simplification. Changes in the daily programme can be also applied immediately.
In the Inorganic Chemistry Department a screening method was perfected for measuring bromide with inductively coupled plasma mass spectrometry (ICP-MS). This analysis is performed on samples taken from the river catchments of De Blankaart, De Gavers and Kluizen. Indeed, when ozone is used bromide can be converted into the carcinogenic bromate, which cannot be removed by conventional treatment techniques.
When employing regenerated activated carbon, the leaching behaviour of iodide was monitored at different times during the rinsing and filtration process. In this way, we can guarantee that the iodine concentration after activated carbon filtration is sufficiently low so that no odour problems occur as a result of the formation of iodoform. Iodoform causes a very characteristic odour (similar to disinfectant) with a very low odour threshold. To enable a rapid screening, this analysis was performed with ICP-MS every time.

25
The number of heavy metals that can be measured by ICP-MS was also expanded.
The number of bacteriological controls remained virtually constant. For the analysis of coliforms and enterococci more samples were taken in 2012 with the quicker enzymatic method, so the result is known within 24 hours. In 2013, this method will be extended to all bacteriological controls.
In the Bacteriology Department the purchasing dossier was completed for a device that will enable the laboratory to identify pathogenic organisms quickly and unequivocally through molecular genetic engineering. In this method, the part of the genetic material (the gene) that is characteristic of the bacteria that is being looked for is released and detected using specific chemical reactions. This technique will be operational in 2013. As a result, the laboratory has a selective identification method and the result can be reported several hours after receipt of the sample. This will allow us to respond quickly to emergencies.
Screenings were conducted for the presence of the parasites Cryptosporidium and Giardia in collaboration with Ghent University. These parasites can enter surface water through the faeces of cattle. The results obtained from the raw surface water of De Blankaart, Kluizen, De Gavers, Dikkebus and Zillebeke showed that the parasites mentioned were present only in negligible quantities. They were absent in the clean water. In addition, the Bacteriology Department also worked together with KWR (Watercycle Research Institute) to determine the presence of opportunistic pathogens. The study will be completed in 2013.
The expertise of the laboratory could be further commercialised in 2012 by performing analyses for IWM, Pidpa, Vivaqua and SWDe. In addition, the laboratory carried out analyses carried out at the request of other laboratories, such as de Bodemkundige Dienst van België (The Belgian Soil Service).
Finally, the laboratory actively collaborates with European research programmes:
the BIOTReAT project (research on the removal of pesticides using bacteria), the TAPeS project (research programme for the detection and removal of emerging pollutants), the NANO TRACe project (development of the ‘ lab-on-a-chip (LoC)’).

26
More than 4,000 lead take-off points replacedAt the end of 2013 the drinking water standards will become more stringent in the area of lead: the maximum limit for the presence of lead in drinking water is being reduced from 25 to 10 micrograms per litre. De Watergroep has already invested a lot to remove the lead take-off points from its water mains over the last 10 years.
The high number of take-off points that still need to be replaced is due to the acquisition of de Stedelijke Waterregie van Ieper (the Urban Water Management Agency of Ypres) (nearly 3,000 lead take-off points) and the acquisition of the Municipal Water Company of Sint-Niklaas (6,000 lead take-off points). De Watergroep is doing everything possible to implement the appropriate substitutions within the proposed timeframe.
In spite of this extensive lead replacement programme there can still be lead in the consumer’s installation. Since elevated lead concentrations may pose a health risk, De Watergroep is paying extra attention to this is-sue, especially in category 1 public institutions, such as schools, nursing homes and hospitals.
In addition, De Watergroep examines all monitoring samples for the presence of lead, which is not explicitly imposed by the law.
Replaced in 2010
Replaced in 2011
Replaced in 2012
To be replaced in 2013
West Flanders 902 978 956 3,433east Flanders 412 543 1,866 5,857Flemish Brabant 629 1,167 882 1,880Limburg 166 345 391 634Total De Watergroep 2,109 3,033 4,095 11,804

27
Proprietary technology for the removal of natural organic matterThe removal of natural organic matter (in technical terms ‘NOM’) is an important treatment step in the production of drinking water from surface water. These organic compounds can give rise to the formation of harmful byproducts of the disinfection and to the regrowth of micro-organisms in the distribution network.
natural organic matter can be removed in various ways. The most commonly used technology is that of coagulation. By adding a chemical substance the suspended particles coagulate and may then be removed. This technology is also still used in the surface water catchment sites of De Watergroep. however, in addition to a high concentration of NOM, the water of Kluizen and De Blankaart also contains many bicarbonates. As a result, the coagulation step requires a lot of chemicals, which leads to the formation of large amounts of residual materials. Partial or complete removal of NOM before coagulation can reduce production costs.
Ion exchange has been tested in water supply systems worldwide for this purpose. This technology cannot simply be copied from known applications such as softening of drinking water. The classically used filtering installations would immediately clog if applied to raw surface water. That is why the Australian firm Orica Water Care developed a method involving ion exchange in suspension during the last century, and started selling MIeX® resin for this purpose. De Watergroep tested this technology from 2005 to 2007 in Kluizen in a pilot plant, combined with ultrafiltration, ozonation and activated carbon filtration. however, on the basis of the cost and reliability of the processes it was decided to use flotation in any further extensions of the production capacity instead of ultrafiltration.
The pilot plant was rebuilt and since 2010 tests have been carried out with ion exchange – now in a fluidised bed – followed by flotation.
In 2012, several improvements were made to the pilot plant, which make it possible to test other, cheaper resins. The pilot plant achieves lower NOM levels than industrial flotation installations and consumes only a quarter of the amount of chemicals. De Watergroep now has proprietary technology developed by the experts of the Water Technology Department. Testing in the pilot plant will be continued in 2013. We are thus acquiring sufficient knowledge to implement this technology on a large scale starting from 2018 in the further expansion of the production capacity of Kluizen in the context of the Aqua.Duct project, within which De Watergroep, TMVW and AWW will be collaborating towards an increased supply security.
our technological advantage is a strong asset
Pilot plant for the removal of organic matter in Kluizen

28
The water production centre of Waarmaarde is located in the south-east of West Flanders. It provides 3.7 million m³ of drinking water annually to the region from Avelgem to Tielt and is therefore essential for the drinking water supply. The raw water is pumped up out of deep wells in the carboniferous limestone and from 3 shallow batteries in Avelgem, Waarmaarde and Kerkhove. The electromechanical equipment of the existing station and the batteries were due for replacement. The investments were spread over several years. After renovating the battery in Waarmaarde, water treatment is next.
In spring of 2012 the Water Technology Department conducted pilot tests for the design of an optimised water treatment system. Because the water of the water production centre in Waarmaarde is harder than in the neighbouring water production centre in Kooigem, a water-softening step was also tested. At present, the raw water contains no pesticides or micro-pollutants, but because the batteries are vulnerable, the operation of a double-layer filter with activated carbon was tested.
The positive results of the pilot plant were used as a basis for the design of the industrial plant. The preliminary design for the production centre of Waarmaarde was developed In 2012. In order to reduce the investment cost, the softening will be calculated for the nominal production capacity, so that the client will receive soft water in normal situations.
To increase the security of supply in the region, the renovated water production centre will be able to deliver a higher peak volume of partially softened water in the event of emergencies in neighbouring water production centres. Thus, the installation costs for the softening are minimised.
The design was completed and the hydraulic line was set up late 2012. The search was also started for ways to improve the efficiency of the reactors so as to reduce chemical consumption. This research will continue in 2013.
De Watergroep is working on a master plan to completely renovate the De Blankaart water production centre in the short to medium term. Within this master plan, a treatment concept was established in 2012 for the new post-treatment process: ozonation, two-stage activated carbon filtration, ultraviolet disinfection and residual disinfection with sodium hypochlorite. The placement of the new treatment steps on the grounds was outlined and the investment and operating costs were estimated.The main innovation is the introduction of ozonation in
the treatment process, which creates an additional barrier for organic micro-pollutants. These include pesticides, and medicines, but also components which are naturally present in the water (toxins & odourants and flavourings derived from algae). The ozonation will also make the chlorine dosage for the sand filters unnecessary and provide an increased disinfection capacity and increased bio-stability of the water produced.
The combination of the current pretreatment with ozonation, two-stage activated carbon filtration and residual disinfection with chlorine in the new post-treatment process guarantees sufficient disinfection capacity against viruses and bacteria. The introduction of a UV disinfection step will ensure the inactivation of pathogens with a high resistance to chemical disinfection.
Study on optimal water treatment for Waarmaarde
Next step in the master plan De Blankaart

29
The Water Technology Department has performed vari-ous tests in the water production centre of Saint-Léger to optimise the removal of manganese in recent years, through the use of various types fine-grained sand and dose of sodium hydroxide. only a permanent dose of so-dium hydroxide gave satisfactory results, after which we went looking for a chemical-free method to remove the manganese.
Late 2011 it was decided to make the clearwell chlorine-free so that the rinsing water of the filters would contain
no chlorine. This benefited the nitrification of the filters, to the extent that four of the six filters were able to remo-ve the manganese completely in the spring of 2012. The last 2 filters were further improved by the installation of a second cascade stage, where more CO2 and hydrogen sulphide was removed. As a result of this the acidity in-creased slightly without the need for any chemicals – just enough to allow the filters to remove all the manganese. By the end of 2012, all filters were fully operational.
De Watergroep further modelled its mains system in 2012. The south-west of West Flanders was modelled with Infoworks WS. As a result, our network model covers a total of more than 75% of the supply area. The objective is to have a mains system model of the entire supply area of De Watergroep by the end of 2013. To increase the transparency and efficiency, the working method in Infoworks was uniformised and a new IT structure developed.
Meanwhile the existing mains system models of east Flanders, Flemish Brabant and Limburg prove their usefulness to support an effective, cost-efficient and sustainable investment policy on a daily basis. Mains system modelling is an important tool to detect bottlenecks and potential supply security problems and develop effective solutions.
For example, a new cost-efficient method of operation was developed with particular attention to the security of supply for the water production centre and the water-softening plant in Velm, among other things. In the framework of the Aqua.Duct project all scenarios of De Watergroep relative to each were weighed in terms of supply security and investment required. The water production centre had to be completely shut down for the connection of the solar panels in Kluizen. This was only possible on the basis of operating advice supplied by network simulations. Without this support expensive emergency groups would have been essential.
All supply line projects are also always tested using simulations in Infoworks. An effective investment policy is also safeguarded using this system.
Mains system modelling is also an indispensable tool for the reduction of non revenue water (water that is not charged for). By combining multiple data sources (GIS, Arcado, operating knowledge) we get a better understanding of water management. In 2012 modelling offered, among other things, support for the definition of registration zones in the provincial water service of Limburg, an essential foundation to reduce non revenue water. This knowledge was also exchanged with other water companies during a workshop organised by Royal haskoningDhV.
Better manganese removal and fewer chemicals in Saint-Léger
Water supply plans have reached maturity
Registration zones Riemst

30
The information from the mains system models is also very useful for the relicensing of catchment sites. The great social importance of the catchment sites in Lommel and Winksele was, for example, demonstrated in this way.
In addition to quantitative analyses, network modelling can also be used for quality aspects. Thus, a start was made to make a detailed calculation of the distribution zone of softened water for the new water production centre in Haasrode.
Finally, the accumulated expertise in network modelling was also used in projects with external partners:
A study was launched for vegetable-processing company Ardo on the reuse of effluent water for the irrigation of fields via a local mains system.
The Water Technology Department built a network model of the water supply infrastructure in the city of Toamasina in Madagascar for the NGO Protos, with the aim of providing the local water company Jirama with more insight in the operation of their infrastructure. The first part of the project consisted of the division of the mains system into registration zones.
Further cooperation with IWM was developed in the municipality of Leopoldsburg. From now on water will be supplied from the mains system of De Watergroep, rather than through the catchment area of IWM in Leopoldsburg.
new technology determines condition of pipesWhen managing a water mains it is important to deter-mine the ideal time to invest. The pipes need to be re-placed in order to avoid fractures, but this shouldn’t be done too early or too late. De Watergroep has developed a method for this purpose for pipes in asbestos cement and grey cast iron. A risk matrix was prepared based on condition assessments which can be used in support of mains system management and asset management.
The condition assessments include, among other things: a phenolphthalein test, ultrasonic testing, hardness mea-surements, other non-destructive techniques, laboratory testing, etc. The condition of the pipes in asbestos ce-ment and grey cast iron is currently being mapped per Sectoral Service Centre for the provincial water service of Limburg. This takes into account the measured mecha-
nical parameters of the pipe and the type of soil (aggres-sive, prone to settlement, etc.).
In 2012, we also investigated a non-destructive method of investigation of the external company echologics. This method works on the basis of a sound that is sent through the pipe with a certain frequency. At two con-secutive fire hydrants you measure the sound intensity ‘in’ and ‘out’. The difference is a measure of the average stiffness of the pipe between the two fire hydrants, since the water and the soil are not very compressible. Based on this one can calculate the average wall thickness and thus check whether there is wall thickness loss between any two hydrants. This method is promising for providing a fairly accurate and fast analysis of existing pipes with-out damaging them.
Phenolphtalein test

31
Through the Production and Supply Investment Programme, De Watergroep invests about 30 million euros each year in the expansion or renovation of water production centres, water towers, reservoirs, supply lines and pressurisation units. In addition, 1 million euros goes to smaller repairs and renovations in the more than 300 sites operated by De Watergroep. In order to adequately manage the company’s property, the Buildings Unit is currently developing a handy tool to create condition assessments, where the condition of the building in terms of building physics is fully inventoried. These measurements are repeated periodically, so we always have access to a current inventory. In time, this allows for optimal budgeting, planning, and coordination of the maintenance work on the buildings. Below is a list of the most outstanding projects in 2012.
overview of new plants and renovations
Water tower Koolskamp
West FlandersPRoJeCTS
The new Menen-Geluveld supply line replaces the existing line between the Menen pumping station and Geluveld reservoir. From this reservoir De Watergroep supplies drinking water to the following municipalities: heuvelland, Zonnebeke, Poperinge and Ieper.
The current cast-iron pipe is outdated and causing a significant nuisance on the busy Menin-Ypres road in the event of leaks.
The new line follows a different route and will also offer more capacity during peak consumption. A preliminary investigation has confirmed that a large number of explosives will be unearthed during the work. To ensure that the work is conducted safely, both for employees on site and local residents, De Watergroep has obliged the contractor to call in the support of an explosives expert. The works started in the autumn.
east FlandersPRoJeCTS
In the water production centre of Kluizen works were carried out on the water intake towers. Because of the increased pumping capacity to 60,000 m³ of raw water per day, the pump shafts in the water intake tower of Reservoir 1 were enlarged and the concrete suspension frame of the pumps was thoroughly reinforced. All electrical control cabinets and sluice gate controls of the water intake towers were housed in a new technical room that was built on top of the water outlet tower. A new shaft pump was also installed.
In Geraardsbergen (onkerzele) a new reservoir was built and put into use in May 2012. This allows us to better absorb peak demands in the Dender area and we have a larger buffer capacity for maintenance and modification work on the TMVW supply line. The reservoir with a capacity of 5,000 m³ is fully embedded in the Molenberg, in harmony with its environment.

32
DeSIGNS
In the Dender area a new supply line will be built between Erembodegem (Aalst) and Iddergem (Denderleeuw). The line ensures greater security of supply during peak consumption. It runs over a length of 6.5 km, a third of which will be built without digging a trench by means of directed drilling.
In the water production centre of Kluizen, the low pressure pumps of Reservoir 2 will be replaced by more robust, dry-mounted pumps. This also includes a number of adjustments to the corresponding electrical installation.
A new service centre will also be built at the entrance of the site. It will include offices, changing rooms and washrooms for employees, but also a laboratory and a visitors’ room.
A new water production centre will be built equipped with the latest treatment techniques in Zele. The process steps are: cascade aeration, coagulation, flocculation, decantation, open sand filters, closed activated carbon filters and grey water recovery. In 2012, the construction works were tendered, the electromechanical equipment is scheduled for 2013
Flemish BrabantPRoJeCTS
Water intake tower in Kluizen
Water production centre HAC Haasrode
Reservoir Geraardsbergen
The Leuven area is supplied from the water production centres huiskens, Abdij and Cadol. The construction was started in 2009 of the new water production centre in Haasrode in order to achieve a more effective treatment of groundwater, while also being able to offer customers softer water. The groundwater of the three different catchment sites will be treated in this centre. The water production centre and a number of supply lines were completed in 2012. Commissioning will take place in the autumn of 2013, once the final infrastructural works are finished within the entire project.
The hageland region has insufficient water production capacity to meet its own demand. To expand the supply capacity from the Demervallei a new supply line over a length of 5 km was constructed from Assent to the water tower of Bekkevoort.

33
LimburgPRoJeCTS
In the water production centre of Bovelingen (Heers) groundwater is processed into soft drinking water. The first water-softening plant of De Watergroep operates through a pellet reactor with sodium hydroxide. The entire treatment process (from the wells via the pellet reactor to the closed iron removal filter) was operated under pressure. To disconnect the various treatment steps hydraulically and to avoid fine-grained sand from the reactor ending up in the downstream filters, an intermediate reservoir of 150 m³ was built with a separate pump room.
DeSIGNS
Due to the vulnerability to pesticides and the high degree of hardness of the drinking water in the Sint-Truiden region, a new plant will be built on the site of the current water production centre in Velm (Sint-Truiden). The new treatment and production process consists of: pellet reactors for central partial softening, open double-layer filters to keep the drinking water free of pesticides, two clearwells and a pump room.
Water production centre Den Dijk Haacht
Water production centre HAC Haasrode
Water production centre Den Dijk in Haacht treats groundwater from 6 deep wells and consists of several treatment steps, including filters for the removal of iron and manganese. In order to improve the reliability and the efficiency of the system for grey water recovery and to increase the operating time of the closed filters, a number of modifications were made in 2012 to the electromechanical equipment.
DeSIGNS
The battery wells of the southern alluvium of water production centre Het Broek (Bertem) were taken out of service in the past because they caused seepage on the filters. Because of the good quality of the raw water they will be put back into service, provided the water in the well pavilion area is subjected to an additional treatment. In 2012 a preliminary design was prepared for this.
Three new low pressure pavilions will be built for the existing groundwater catchment sites huiskens, Abbey and Cadol, for the new water production centre in Haasrode. These will guarantee the supply of untreated groundwater to the water production centre in haasrode, where the raw water will be centrally treated.
Two new production wells will be drilled at the Vinkenberg (Diest) catchment area, which will be responsible for an increase in capacity of the Zichem water production centre

34
De Watergroep has long had an eye for sustainable water production and operates from a forward-looking vision. Only in this way can we easily provide our customers with sufficient high-quality drinking water in the future. This approach focuses on both the natural environment and cost-effective management.
A sophisticated strategy for managing groundwater wellsDe Watergroep operates nearly 950 groundwater extraction wells. In order to have the maximum well capacity at all times we employ a ‘well management strategy’ that focuses on two aspects: preventing well blockage and optimal regeneration techniques.
This approach ensures a longer life of the production wells and therefore also a cost-effective drinking water supply. Due to the strict implementation of the maintenance plan the extraction infrastructure is in excellent condition at the end of 2012. There were no capacity problems over the past year.
In carrying out the maintenance plan, quite a lot of drilling, regeneration and/or filling work was performed in 2012 by the specialised drilling crew of De Watergroep in the catchment sites of Waarmaarde, Menebeek, Overlaar, herent and Zichem.
In addition, work was performed for fellow drinking water company Pidpa, and for eOC and Marine harvest Pieters in the context of industrial water projects. We were contracted to perform work on the catchment sites of Pecq, Aarschot Schoonhoven and eisden. A total of 850,000 euros was spent on well management, excluding costs for research and development.
Thus, the extraction and Natural environment Department – in cooperation with KWR (Watercycle Research Institute) – performed studies on the occurrence and the different types of blockages of filter slots.
own indicator interprets groundwater levelsNearly three-quarters of the water De Watergroep produces comes from underground water supplies. To monitor the status of groundwater, every month we measure the levels in around 1,700 measuring or production wells. Meanwhile our level database contains more than 1.2 million entries. To analyse all this quickly and efficiently, the extraction & Natural environment Department developed a proprietary indicator. Recent results indicate that none of our catchment sites suffer from low water levels or overload of a water layer.
each groundwater well is assigned a class that describes the condition of: ‘minimum level’ and ‘very low level’ to ‘very high level’ and ‘maximum level’. The results of the indicator can be interpreted at different levels: all wells together, in Flanders, per extraction site and per individual measuring well.The groundwater level indicator is based on drought indicators that are used worldwide and performs the analysis with a statistical program. The results are also mapped out in the GIS program Geomedia.
Passionate about water as a source of life and health

35
The level indicator gives a clear picture of the fluctuations of the water level per season or spread over several years. As it turns out, 2012 was a slightly wetter
year than average. Furthermore, the state of the water levels is spatially depicted at the level of Flanders and per extraction site.
Division number of wells per class 1995-2012
For wells with a ‘very low level’ and a ‘minimum level’ we automatically create a graph of the evolution of the water level. Thus we are able to quickly interpret the level sets for any extreme values and/or possible erroneous measurements. Apart from monitoring the overall condition of the water levels, a low level in a
production well can also indicate a well blockage. In this way De Watergroep can quickly identify potential problems and, quite literally, get to the source of the problem.
Hydrogeological expertiseIn 2012, the hydrogeological study of the extraction potential in Meerheuvel, in the Meuse valley, came to an end. The study concluded that this site offers very good opportunities to extract large amounts of water without disturbing the balance of the groundwater table. Furthermore, the groundwater is naturally soft here.
In addition, the study went on to look at the relationship between the level increases and quality changes in our groundwater catchment sites in the limestone water layer in Pecq and Spiere. Since 2011 we have been
extracting at as constant a rate as possible in order to more gradually raise the level without a continuous increase and decrease. This method of operation should limit the chemical reactions between water and rock. The results are clearly positive. This study is being continued in 2013. The objective is a sustainable recovery of the water layer of the carboniferous limestone, in accordance with the eU Water Framework Directive.
jan/
95
jan/
96
jan/
97
jan/
98
jan/
99
jan/
00
jan/
01
jan/
02
jan/
03
jan/
04
jan/
05
jan/
06
jan/
07
jan/
08
jan/
09
jan/
10
jan/
11
jan/
12
jan/
13
Y
X
100%90%80%70%60%50%40%30%20%10%
0%
Maximum level
Very high level
High level
Average level
Low level
Very low level
Minimum level

36
environment and water extraction in harmony
The extraction and Natural environment Department submitted 18 environmental permit applications. Three applications for exemption from the eIA requirements were submitted and obtained: one for a new chalk extraction site in Aarschot, one for the expansion of the extraction site in Groot-overlaar and the new authorisation for the water production centre De Blankaart. Most of the environmental dossiers relate to the renewal of the environmental permit for water production centres, with or without extraction. De Watergroep also uses its expertise to prepare environmental dossiers for industrial customers. We also provided advice in many third party projects within the protection zones around our groundwater
catchment sites. Special attention is paid to the potential impact on our sources. We try to preserve our groundwater reserves as best as possible.
nature conservation and water extraction often go hand in hand. however, the effects of a groundwater extraction site on nature cannot always be prevented or eliminated. In view of the operational reliability of the drinking water supply, De Watergroep advocates that existing infrastructure be taken into account when establishing conservation goals. This is for example the case in the interpretation of the ‘habitats’ Community Directive in the european Natura 2000 areas.
An active contribution to environmental legislationWe are also actively working on new developments in the field of environmental legislation. For example, in 2012 a vision was developed on the re-infiltration of industrial waste water in water production centres, within the context of an integrated water policy. This principle will be applied in Zele.
Together with our umbrella organisation AquaFlanders we have been advocating for years for the introduction of the permanent environmental permit and integration of environmental permit and planning permission into a single integrated physical environment permit, which
was effectively introduced by the Flemish Government in 2011 and eventually should lead to administrative simplification. In 2012, work continued on two concept papers, among other things on the transitional measures for the conversion of existing licenses that are valid for a limited term to permanent environmental permits. The unique integrated physical environment permit is also being given form. De Watergroep recommends that water extraction activities in the context of public water supply and the transport of water to the public distribution network should from now be assessed at Flemish rather than at the provincial level.

37
Water safety plans protect our sourcesDe Watergroep is working on water safety plans for mapping out the risks for the drinking water supply, linked to the associated control measures. In preparation, source dossiers for all vulnerable groundwater catchment sites and all surface water catchment sites were compiled in 2012. These dossiers include, among other things, the delineation of the supply zones. These are areas in which the groundwater will reach the wells after a certain time. In addition, the evolution of the groundwater quantity and quality was described for the catchment sites in the Dijlevallei and the Voervallei, the catchment sites in eisden and Meeswijk and the
catchment sites in the Molenbeekvallei (Leuven). The OVAM (Public Waste Agency of Flanders) is currently also making an inventory of the installations that are at risk in the vicinity of our drinking water catchment sites. To protect the groundwater catchment sites even better, De Watergroep is developing additional expertise by conducting tracer tests on groundwater catchment sites. This scientific instrument allows us to simulate the transport of pollutants in the subsoil. The extraction site of eisden/Meeswijk is being used as a pilot project. effective testing will follow in 2013.
De Watergroep also participated in the preparation of a new groundwater decree. The existing decree dates from 1985 and is therefore no longer in line with current scientific insights and new threats. We hereby call for an effective protection and enforcement policy, coupled with a campaign to raise awareness that draws attention to the importance of a well-protected subsoil. In the event of acute risk, a swift and efficient set of contingency
arrangements are needed. We also advocate the creation of a specific fund for the protection of groundwater resources and to carry out the necessary scientific studies for the delineation of the protection zones. The operating resources may come from the existing levies on water extraction, which are thus deployed transparently.
38
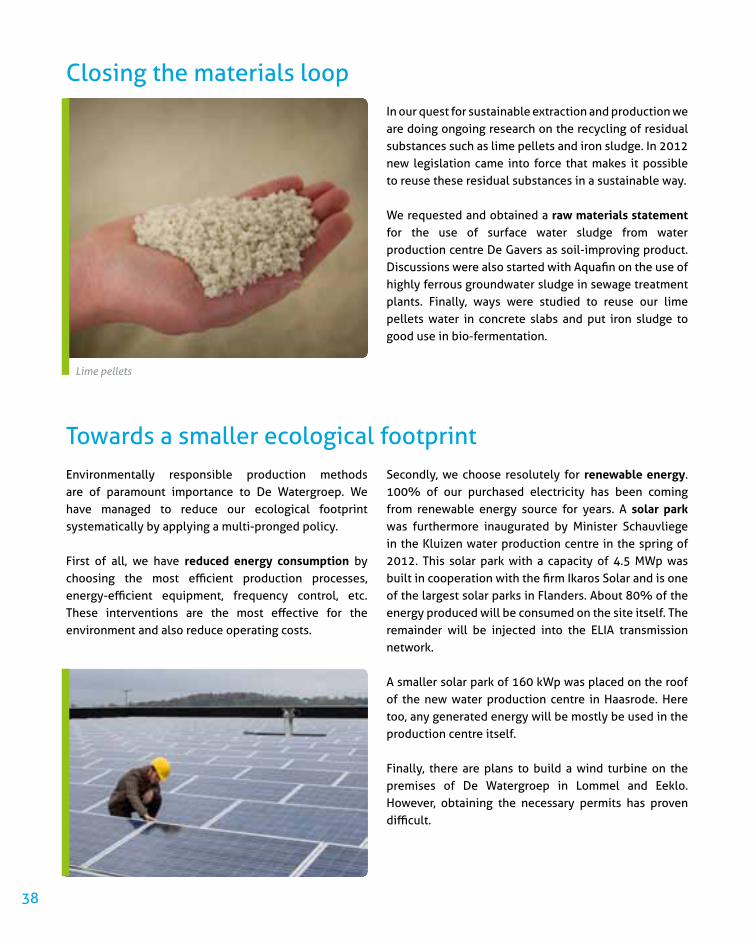
Closing the materials loopIn our quest for sustainable extraction and production we are doing ongoing research on the recycling of residual substances such as lime pellets and iron sludge. In 2012 new legislation came into force that makes it possible to reuse these residual substances in a sustainable way.
We requested and obtained a raw materials statement for the use of surface water sludge from water production centre De Gavers as soil-improving product. Discussions were also started with Aquafin on the use of highly ferrous groundwater sludge in sewage treatment plants. Finally, ways were studied to reuse our lime pellets water in concrete slabs and put iron sludge to good use in bio-fermentation.
Towards a smaller ecological footprintenvironmentally responsible production methods are of paramount importance to De Watergroep. We have managed to reduce our ecological footprint systematically by applying a multi-pronged policy.
First of all, we have reduced energy consumption by choosing the most efficient production processes, energy-efficient equipment, frequency control, etc. These interventions are the most effective for the environment and also reduce operating costs.
Secondly, we choose resolutely for renewable energy. 100% of our purchased electricity has been coming from renewable energy source for years. A solar park was furthermore inaugurated by Minister Schauvliege in the Kluizen water production centre in the spring of 2012. This solar park with a capacity of 4.5 MWp was built in cooperation with the firm Ikaros Solar and is one of the largest solar parks in Flanders. About 80% of the energy produced will be consumed on the site itself. The remainder will be injected into the eLIA transmission network.
A smaller solar park of 160 kWp was placed on the roof of the new water production centre in Haasrode. Here too, any generated energy will be mostly be used in the production centre itself.
Finally, there are plans to build a wind turbine on the premises of De Watergroep in Lommel and eeklo. however, obtaining the necessary permits has proven difficult.
Lime pellets

39
A uniform and efficient information technology
De Watergroep is participating in the pilot project on smart water and energy meters in Kessel-Lo. Around 200 water meters, set up at our domestic customers, are electronically linked with the smart energy meter of eandis. every day the readings per fifteen minutes, along with a number of alarms, are sent to a database of De Watergroep.
With this pilot project, we want to evaluate what benefits this data can provide, how detailed the data should be, and what smart, meaningful services can possibly be offered to customers.
Smart water meters on trial
De Watergroep is always up-to-date with the latest developments in the area of information technology in order to optimally manage its infrastructure and operation. Achieving synergy and increasing efficiency is central to this.
Towards a single platform for central dispatchingUntil now, each provincial water service of De Watergroep has had its own private dispatching system to monitor production and distribution via telemetry. Instead of investing in the renewal of the four dispatching systems, a single central platform will be developed that integrates the four systems. The dispatching system of Flemish Brabant is already operational on the central platform. In 2012, the central system was fully duplicated on two sites and studies were completed for the migration of the dispatching system of Limburg. Roll-out will follow in 2013. The migration of the dispatching systems of West and east Flanders was ordered and will be launched in 2013.
The evolution to one platform offers numerous advantages: lower operating costs, greater reliability, more efficient use of staff, etc. The core of the central dispatching system is a common database where all information about processes are stored in a uniform and standardised way. This data will be used for monitoring
of procedures and processes, process control and as a basis for the data warehouse and management reporting.
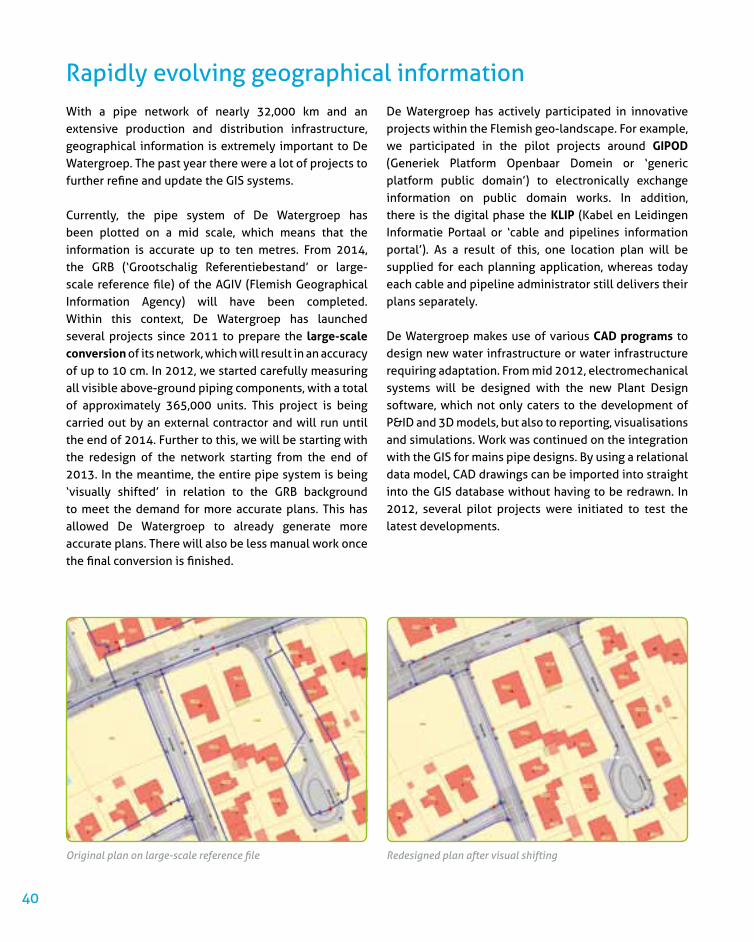
40
Rapidly evolving geographical informationWith a pipe network of nearly 32,000 km and an extensive production and distribution infrastructure, geographical information is extremely important to De Watergroep. The past year there were a lot of projects to further refine and update the GIS systems.
Currently, the pipe system of De Watergroep has been plotted on a mid scale, which means that the information is accurate up to ten metres. From 2014, the GRB (‘Grootschalig Referentiebestand’ or large-scale reference file) of the AGIV (Flemish Geographical Information Agency) will have been completed. Within this context, De Watergroep has launched several projects since 2011 to prepare the large-scale conversion of its network, which will result in an accuracy of up to 10 cm. In 2012, we started carefully measuring all visible above-ground piping components, with a total of approximately 365,000 units. This project is being carried out by an external contractor and will run until the end of 2014. Further to this, we will be starting with the redesign of the network starting from the end of 2013. In the meantime, the entire pipe system is being ‘visually shifted’ in relation to the GRB background to meet the demand for more accurate plans. This has allowed De Watergroep to already generate more accurate plans. There will also be less manual work once the final conversion is finished.
De Watergroep has actively participated in innovative projects within the Flemish geo-landscape. For example, we participated in the pilot projects around GIPOD (Generiek Platform Openbaar Domein or ‘generic platform public domain’) to electronically exchange information on public domain works. In addition, there is the digital phase the KLIP (Kabel en Leidingen Informatie Portaal or ‘cable and pipelines information portal’). As a result of this, one location plan will be supplied for each planning application, whereas today each cable and pipeline administrator still delivers their plans separately.
De Watergroep makes use of various CAD programs to design new water infrastructure or water infrastructure requiring adaptation. From mid 2012, electromechanical systems will be designed with the new Plant Design software, which not only caters to the development of P&ID and 3D models, but also to reporting, visualisations and simulations. Work was continued on the integration with the GIS for mains pipe designs. By using a relational data model, CAD drawings can be imported into straight into the GIS database without having to be redrawn. In 2012, several pilot projects were initiated to test the latest developments.
Original plan on large-scale reference file Redesigned plan after visual shifting
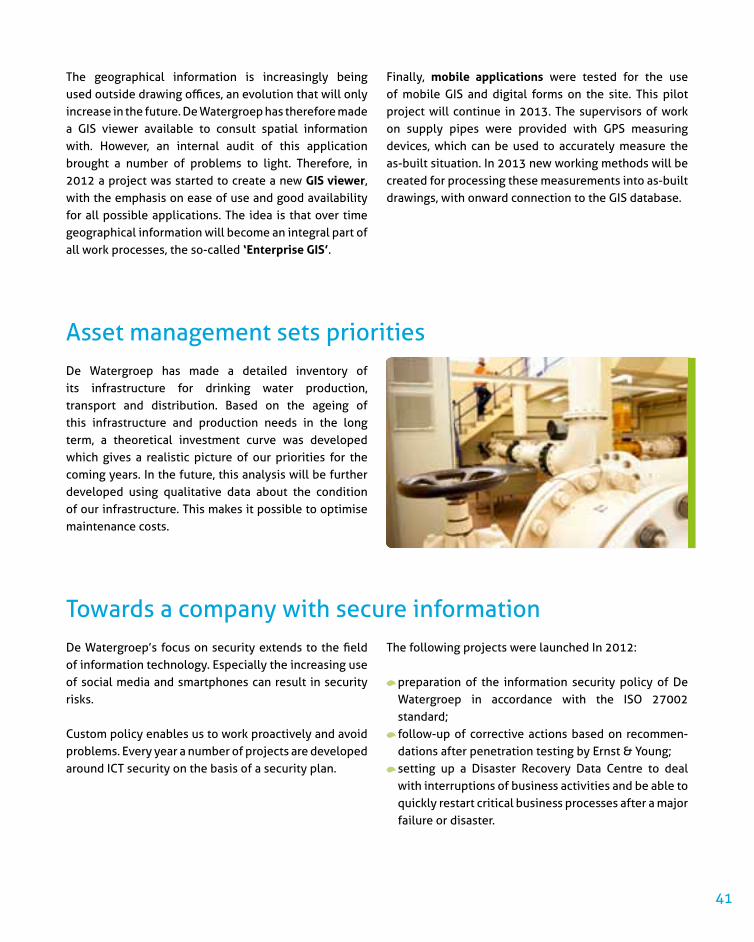
41
The geographical information is increasingly being used outside drawing offices, an evolution that will only increase in the future. De Watergroep has therefore made a GIS viewer available to consult spatial information with. however, an internal audit of this application brought a number of problems to light. Therefore, in 2012 a project was started to create a new GIS viewer, with the emphasis on ease of use and good availability for all possible applications. The idea is that over time geographical information will become an integral part of all work processes, the so-called ‘Enterprise GIS’.
Finally, mobile applications were tested for the use of mobile GIS and digital forms on the site. This pilot project will continue in 2013. The supervisors of work on supply pipes were provided with GPS measuring devices, which can be used to accurately measure the as-built situation. In 2013 new working methods will be created for processing these measurements into as-built drawings, with onward connection to the GIS database.
Asset management sets prioritiesDe Watergroep has made a detailed inventory of its infrastructure for drinking water production, transport and distribution. Based on the ageing of this infrastructure and production needs in the long term, a theoretical investment curve was developed which gives a realistic picture of our priorities for the coming years. In the future, this analysis will be further developed using qualitative data about the condition of our infrastructure. This makes it possible to optimise maintenance costs.
Towards a company with secure informationDe Watergroep’s focus on security extends to the field of information technology. especially the increasing use of social media and smartphones can result in security risks.
Custom policy enables us to work proactively and avoid problems. every year a number of projects are developed around ICT security on the basis of a security plan.
The following projects were launched In 2012:
preparation of the information security policy of De Watergroep in accordance with the ISO 27002 standard; follow-up of corrective actions based on recommen-dations after penetration testing by ernst & Young; setting up a Disaster Recovery Data Centre to deal with interruptions of business activities and be able to quickly restart critical business processes after a major failure or disaster.
42
Sustainable industrial water projects
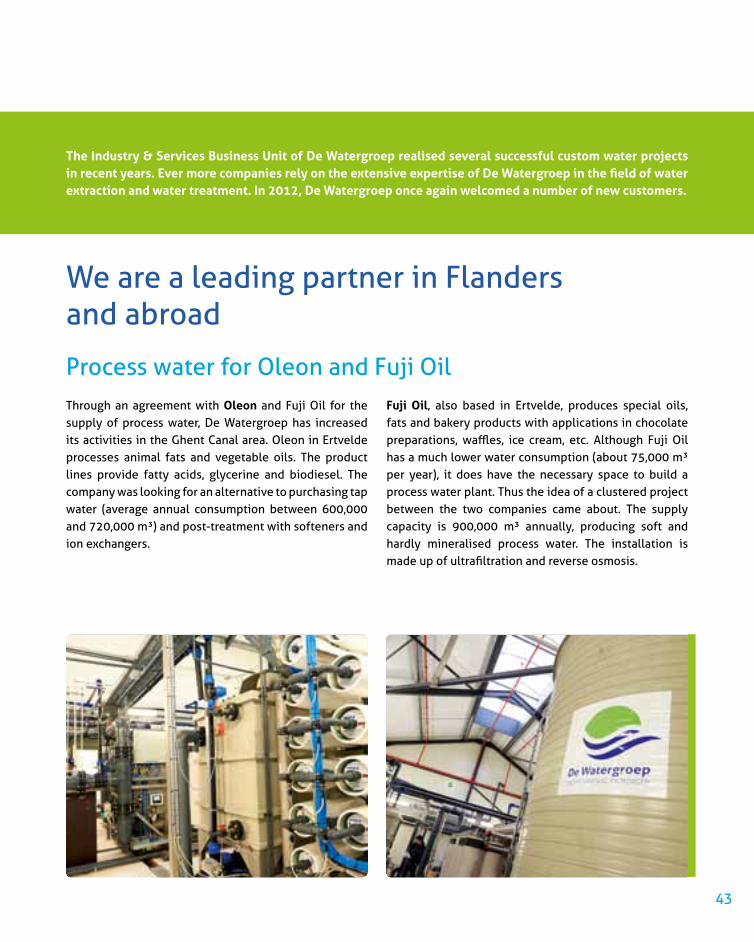
43
Through an agreement with Oleon and Fuji Oil for the supply of process water, De Watergroep has increased its activities in the Ghent Canal area. oleon in ertvelde processes animal fats and vegetable oils. The product lines provide fatty acids, glycerine and biodiesel. The company was looking for an alternative to purchasing tap water (average annual consumption between 600,000 and 720,000 m³) and post-treatment with softeners and ion exchangers.
Fuji Oil, also based in ertvelde, produces special oils, fats and bakery products with applications in chocolate preparations, waffles, ice cream, etc. Although Fuji Oil has a much lower water consumption (about 75,000 m³ per year), it does have the necessary space to build a process water plant. Thus the idea of a clustered project between the two companies came about. The supply capacity is 900,000 m³ annually, producing soft and hardly mineralised process water. The installation is made up of ultrafiltration and reverse osmosis.
Process water for Oleon and Fuji Oil
We are a leading partner in Flanders and abroad
The Industry & Services Business Unit of De Watergroep realised several successful custom water projects in recent years. Ever more companies rely on the extensive expertise of De Watergroep in the field of water extraction and water treatment. In 2012, De Watergroep once again welcomed a number of new customers.

44
De Watergroep has been supplying EOC in oudenaarde and Rousselot in Ghent with process water for some time now. Both companies were so pleased with how well the system worked they decided to extend the contract with De Watergroep for the supply of demineralised water.
Incopack from Dilsen-Stokkem operates in the food industry. The company manufactures cream and desserts and consumes approximately 100,000 m³ of drinking water per year in this process. To meet the demand of this large industrial customer, the water from the ‘eisden mine site’ pumping station was made available to Incopack. For this, De Watergroep constructed a conduit between the pumping station and the company. A measurement and control system on-site facilitates follow-up and reporting. In November 2012, Incopack started using its custom water installation.
New projects with existing customers
For the first time in Flanders, two drinking water companies, IWVA (Intercommunale Waterleidingsmaat-schappij van Veurne-Ambacht) and De Watergroep have worked together to create a custom water project for a company, namely PepsiCo. PepsiCo produces chips and snacks for the european market in Veurne. The company made great efforts in recent years to reduce its electricity and gas consumption. In spite of the fact that the water consumption was reduced by 40% per kilogram of product produced, PepsiCo still consumed 300,000 m³
of drinking water annually. To further reduce water consumption, PepsiCo signed a contract with IWVA and De Watergroep for a water filtration plant with which about 60% of its water can be reused. In this way the company can save at least 180,000 m³ per year. The total annual supply capacity of the plant is 215,000 m³ of process water of drinking water quality.
Industrial water project helps to protect groundwater resources
Installation Incopack

45
Company Water source Delivered quality Capacity (m³/year)
Taminco Ghent-Terneuzen canal demineralised water 700,000 Farm Frites effluent drinking water 350,000
Citrique Belge Gete cooling water 1,700,000
Spano Roeselare canal process water 100,000
Rousselot Ghent-Terneuzen canal drinking water 650,000
Incopack groundwater from mining area drinking water 100,000
Grey water (32 West Flemish companies)
surface water different qualities (drinking water, softened, demineralised, etc.)
1,800,000
Taminco Ghent-Terneuzen canal demineralised water 700,000
eoC shallow groundwater process water 175,000
Marine harvest Pieters groundwater drinking water 80,000
Bravi effluent drinking water 100,000 Veurne Snack Foods (PepsiCo) effluent drinking water 250,000
Oleon & Fuji Oil Ghent-Terneuzen canal soft process water 900,000
Two pilot containers flexible custom
46
Wastewater management for the future

47
On September 1, 2012, a new business unit was launched in De Watergroep, which was named RioPACT. All existing sewerage activities are bundled into one whole within this business unit in collaboration with Aquafin. RioPACT has a wide range of services for municipalities wishing to be supported by a partner with knowledge and expertise of sewage management.
RioPACT works across companies and provides great financial transparency as the finances of sewerage activities are completely separate from drinking water activities. employees of both De Watergroep and Aquafin work in RioPACT.
Aquafin and De Watergroep join forces in RioPACT
De Watergroep has developed a strong position in the field of wastewater management in recent years along with its knowledge partner Aquafin. With RioP, we offer municipalities a total solution that coordinates all sewerage tasks. There is also the modular concept RioAct and other forms of structural cooperation are also possible. Recently, all sewerage activities have been bundled in the RioPACT business unit.

48
The RioPACT business unit combines all sewerage activities of De Watergroep. First there is the total package RioP, a formula that was set up to enable municipalities to meet the Flemish wastewater objectives on time. These objectives, in turn, derive from the eU Water Framework Directive. When a municipality joins, RioP takes over all municipal sewerage tasks. RioP is also responsible for the financing of investment projects and asks for the necessary subsidies. RioP works with individual accounts per municipality: all means that a municipality receives or makes available for sewerage works, are to be used only for that municipality. As consideration for the contribution of their sewerage system, the municipalities are given the option of receiving 25% of the economic value of their sewerage in cash and the rest is paid in shares.
In 2010, RioP water services were established within De Watergroep in West and east Flanders and the corresponding governing bodies were installed.
As a major player in the field of waste management we want to have an efficient tool to manage sewage pumping stations, pumping stations and small purification facilities, always and anywhere. We use I-View for this purpose in RioAct and RioP. The system collects, processes and displays all relevant data and ensures that the management of the plants runs efficiently and
In the other provinces within the service area of De Watergroep a similar RioP service can be set up at the request of the members.
By the end of 2012, 13 municipalities had joined RioP: 4 in West Flanders and 9 in east Flanders. There are two possible entry times a year: on January 1 and July 1.
In addition to the total package RioP, there is also RioAct: a modular concept for sewage management in the short term, with an annually renewable contract. By the end of 2012, 40 municipalities had joined RioAct.
Besides RioP and RioAct, municipalities can also enter into a contract with De Watergroep for specific tasks in the field of waste management. It may involve connecting houses to the sewer system or maintenance of municipal pumping stations and sewage treatment plants.
economically. The system is securely accessible via the internet, including for municipal partners who wish to monitor their own facilities Thus, over 400 pumps and more than 200 sewage pumping stations were monitored by I-View in east Flanders at the end of 2012.
RioP and RioAct
I-View for managing pumping stations

49
West FlandersRioPAnzegem, Tielt, Vleteren and Zedelgem
RioActArdooie, Bredene, Deerlijk, heuvelland, Kuurne, Lo-Reninge, Mesen, Meulebeke, Oostrozebeke, Roeselare, Waregem, Wervik, Wingene, Zonnebeke and Zwevegem
Connecting houses to the sewer systemDentergem, Spiere-helkijn, Wielsbeke
east FlandersRioPeeklo, Kaprijke, Kruibeke, Laarne, Moerbeke, Ninove, Temse, Waasmunster and Wachtebeke
RioActAssenede, Berlare, Beveren, Denderleeuw, evergem, Geraardsbergen, haaltert, herzele, Lochristi, Lokeren, Maldegem, Sint-Gillis-Waas, Sint-Laureins, Sint-Niklaas, Stekene, Waarschoot and Zele
As a subcontractor for AquafinWetteren
Flemish BrabantRioActAarschot, Bierbeek, Roosdaal
Connecting houses to the sewer systemHerent and Lennik
Connecting houses to the sewer system in cooperation with AquafinDiest, haacht, Kampenhout, Kortenberg and Vilvoorde
Management and maintenance of municipal sewage pumping stations and sewage purification plants Roosdaal and Rotselaar
LimburgRioActAs, Bilzen, hamont-Achtel, Tessenderlo, Wellen
An overview of the sewerage projectsOn December 31, 2012, De Watergroep had a contract for the provision of services with the following municipalities in the area of waste management:

50
Connected by water

51
The Management of the Personnel & Organisation Department has optimised its services in order to evolve from an administrative organisation into a modern, flexible, customer-oriented personnel policy. This process consist of five interrelated building blocks: structure, employees, climate, systems and organisation.
The personnel policy translates the company’s vision out of three dimensions:
recognise that our people make the difference, understand how they can make that difference, make sure they make the difference.
Within a future oriented policy, investing in people is extremely important. In practice, this happens in several areas:
focusing on development; guiding change (new vision, mission, values, culture, etc.);
determining and developing leadership; developing talent management; doing work on performance management and succession planning.
We treat people and resources in a sustainable manner
The employees of De Watergroep are constantly busy supplying high-quality water to domestic and industrial customers. They are supported in this by a contemporary personnel policy. De Watergroep believes in offering efficient and customer-friendly service. We keep our finger on the pulse through training, comparative studies and a professional complaints management system.
In recent years the need for a new, transparent personnel policy with a focus on development and growth arose. The job classification and measurement project was started project in consultation with the trade unions.All existing positions are mapped out in an objective and structured way. A new job classification system will be prepared based on the results.
The custom personnel policy of De Watergroep
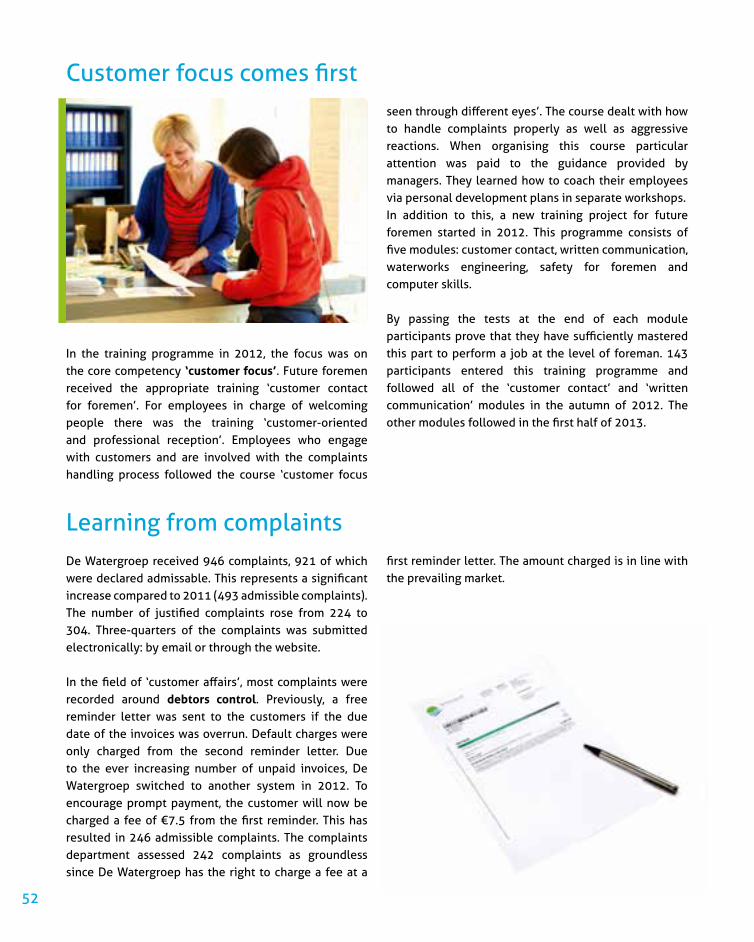
52
In the training programme in 2012, the focus was on the core competency ‘customer focus’. Future foremen received the appropriate training ‘customer contact for foremen’. For employees in charge of welcoming people there was the training ‘customer-oriented and professional reception’. employees who engage with customers and are involved with the complaints handling process followed the course ‘customer focus
De Watergroep received 946 complaints, 921 of which were declared admissable. This represents a significant increase compared to 2011 (493 admissible complaints). The number of justified complaints rose from 224 to 304. Three-quarters of the complaints was submitted electronically: by email or through the website.
In the field of ‘customer affairs’, most complaints were recorded around debtors control. Previously, a free reminder letter was sent to the customers if the due date of the invoices was overrun. Default charges were only charged from the second reminder letter. Due to the ever increasing number of unpaid invoices, De Watergroep switched to another system in 2012. To encourage prompt payment, the customer will now be charged a fee of €7.5 from the first reminder. This has resulted in 246 admissible complaints. The complaints department assessed 242 complaints as groundless since De Watergroep has the right to charge a fee at a
seen through different eyes’. The course dealt with how to handle complaints properly as well as aggressive reactions. When organising this course particular attention was paid to the guidance provided by managers. They learned how to coach their employees via personal development plans in separate workshops.In addition to this, a new training project for future foremen started in 2012. This programme consists of five modules: customer contact, written communication, waterworks engineering, safety for foremen and computer skills.
By passing the tests at the end of each module participants prove that they have sufficiently mastered this part to perform a job at the level of foreman. 143 participants entered this training programme and followed all of the ‘customer contact’ and ‘written communication’ modules in the autumn of 2012. The other modules followed in the first half of 2013.
first reminder letter. The amount charged is in line with the prevailing market.
Customer focus comes first
Learning from complaints

53
53 admissible complaints were recorded concerning incorrect invoicing. These involve erroneous personal data, too high rates, overestimation of consumption volume, charging of interest and legal expenses, incorrect meter readings, incorrect settlement of riser rental, charging of a frozen water meter, social exemption, etc. In 13 cases the complaints department was of the opinion that an error could indeed have been made or that data might have been incorrectly processed, etc.
Customers who continue to receive invoices for consumption at a previous address often believe that this is the fault of De Watergroep. however, most of the 30 complaints on this subject were unfounded. Very often customers move without providing De Watergroep with the necessary data, making it impossible to prepare an appropriate final settlement. When the new customer also fails to inform De Watergroep, the departing customer stays registered at the old address, with all related consequences.
64 customers filed a complaint after receiving an increased consumption invoice as a result of a significant increase in consumption. Of these 55 complaints were evaluated as groundless since the increased consumption was due to non-hidden leaks, which under the provisions of the general regulations on water sales do not entitle the customer to have their consumption invoice recalculated. 2 complaints were upheld because it involved underground leakage loss that was initially not recognised as such. In 7 cases, De Watergroep, for reasons of fairness and taking into account the very specific circumstances of the case, worked out an amicable arrangement with the customer.
Finally, quite a few complaints can be reduced to a correct communication with the customer. These involve substantively correct and clear information, which is transmitted in a customer-friendly way. efforts in this area are continuing.
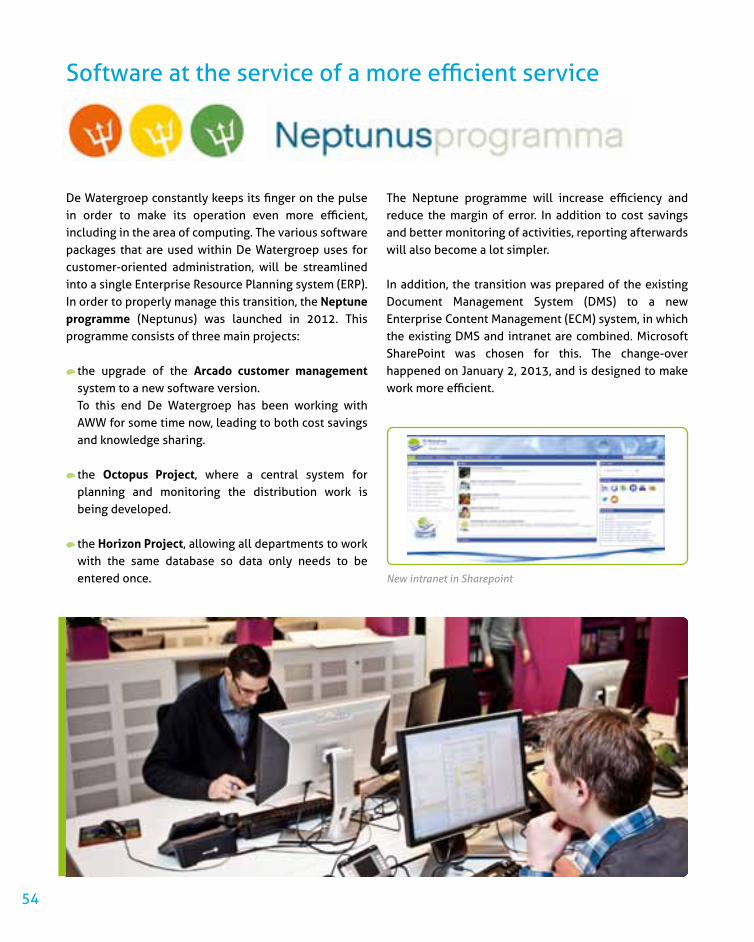
54
De Watergroep constantly keeps its finger on the pulse in order to make its operation even more efficient, including in the area of computing. The various software packages that are used within De Watergroep uses for customer-oriented administration, will be streamlined into a single enterprise Resource Planning system (eRP). In order to properly manage this transition, the Neptune programme (Neptunus) was launched in 2012. This programme consists of three main projects:
the upgrade of the Arcado customer management system to a new software version.
To this end De Watergroep has been working with AWW for some time now, leading to both cost savings and knowledge sharing.
the Octopus Project, where a central system for planning and monitoring the distribution work is being developed.
the Horizon Project, allowing all departments to work with the same database so data only needs to be entered once.
The Neptune programme will increase efficiency and reduce the margin of error. In addition to cost savings and better monitoring of activities, reporting afterwards will also become a lot simpler.
In addition, the transition was prepared of the existing Document Management System (DMS) to a new enterprise Content Management (eCM) system, in which the existing DMS and intranet are combined. Microsoft SharePoint was chosen for this. The change-over happened on January 2, 2013, and is designed to make work more efficient.
Software at the service of a more efficient service
New intranet in Sharepoint
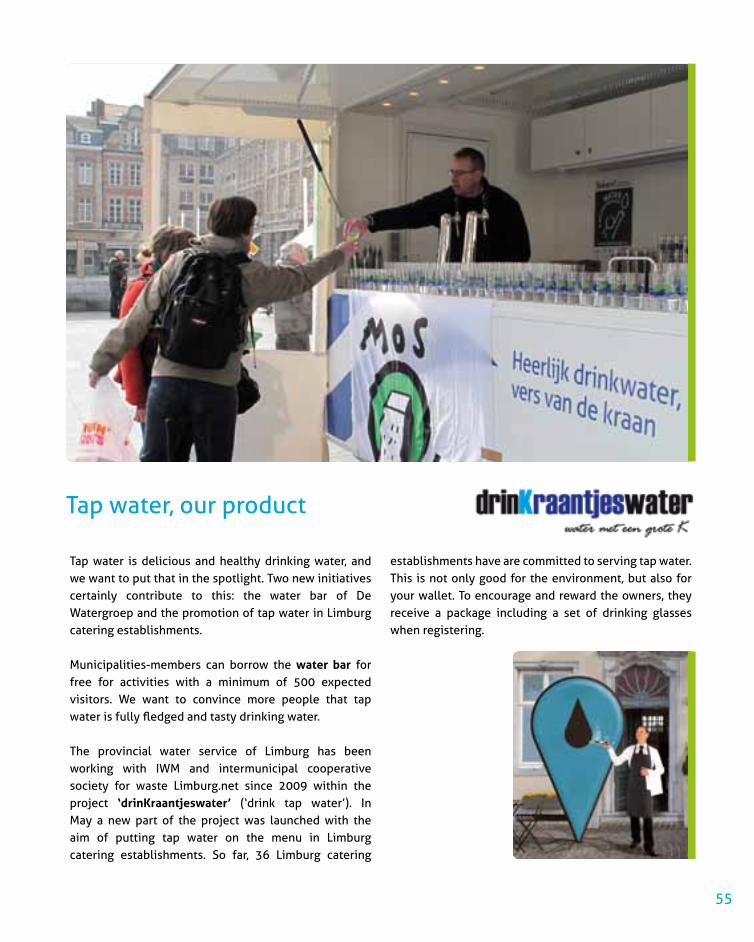
55
Tap water is delicious and healthy drinking water, and we want to put that in the spotlight. Two new initiatives certainly contribute to this: the water bar of De Watergroep and the promotion of tap water in Limburg catering establishments.
Municipalities-members can borrow the water bar for free for activities with a minimum of 500 expected visitors. We want to convince more people that tap water is fully fledged and tasty drinking water.
The provincial water service of Limburg has been working with IWM and intermunicipal cooperative society for waste Limburg.net since 2009 within the project ‘drinKraantjeswater’ (‘drink tap water’). In May a new part of the project was launched with the aim of putting tap water on the menu in Limburg catering establishments. So far, 36 Limburg catering
establishments have are committed to serving tap water. This is not only good for the environment, but also for your wallet. To encourage and reward the owners, they receive a package including a set of drinking glasses when registering.
Tap water, our product

56
Biotreat: European project for the development and evaluation of
microbiological treatment techniques for the removal of low concentrations of pesticides in groundwater TAPES:
European project on emerging contaminants NANOTRACE:
European project for the development of the ‘lab-on-a-chip’ BTO working group on microbiological analysis methods of the KWR (Watercycle Research Institute) BTO working group geo-information of the KWR Cooperation with Ghent University for the detection of Cryptosporidium in surface and drinking water Hydrocheck working group of Belgaqua:
testing of materials that come into contact with drinking water Various specialised working groups for the implementation of new analysis methods in the context of the recognition of the laboratory (drafting method regulations in the Water Compendium of VITO) International Scheldt Commission
• AquaFlanders working and steering groups Water Resources, Infrastructure and Environment, WSP
(Water Safety Planning), Communication, Integrated Water Invoice, Rates Structures and Sewerage Policy CIW working groups
Operation of the Basin (Bekkenwerking), Ecological Water Management, Groundwater and Water Test (Watertoets) KWR: contact group on wells, PBC risk management sources, BTO Surface-covering time series analysis and BTO TES (thermal energy storage system) systems Technical Working Group Transhennuyère Cooperation with universities
Ghent University, University of Leuven, University of Liège Belgian Committee for Hydrogeologists International Association of Hydrogeologists
Belgian chapter of the International Association of Hydrogeologists (BCH) Industry Association of Flemish Environmental Coordinators (VMC) User Group ‘Intergraph Benelux’ Customer and Market Platform of the KWR
knowledge exchange about European regulations, SEPA, business process management, debt collection and the implementation of a customer monitor Flanders International Technical Agency (Fita) On April 2 to 3, Katleen De Leu and Ann Bijnens (marketing) participated in the conference ‘Water Utility Management and Pricing Policy’ of IWA in Cyprus, where they also presented the first draft of the leaflet ‘International Statistics for Water Services’ in the Working Group Statistics. On 25 June (Milan) and 30 November (Lisbon) De Watergroep was represented on the Board of Directors of Aqua Publica Europea, the association founded to protect the public nature of the drinking water sector in Europe In June, a representative of De Watergroep actively participated in the seminar that the Environment, Nature and Energy Department (LNE) of the Flemish Government organised in Seoul (South Korea) with the theme ‘Biodiversity and water issues’. Jan Hammenecker gave a presentation on ‘The goals of smart tarification of water’ September 16 to 21: IWA World Water Congress in Busan, South Korea. Presentation by Nico Vanhove on ‘Sustainable management of the groundwater infrastructure at De Watergroep’, presentation ‘International Statistics for Water Services’ by Jan Hammenecker (info on water production, rates, consumption, market regulation in 47 countries and 180 cities). The database also formed the basis for the presentation ‘Tariffs, the state of the art. Smart tarification and cost recovery.’ Luc Keustermans held talks with the Dutch knowledge institute KWR on future cooperation on water technology research
Symposia, conferences and collaboration
De Watergroep is working on knowledge exchange within various platforms:
De Watergroep in dialogue

57
October 29 to November 1: The 6th International IWA Conference on Flotation for Water and Wastewater Systems, New York; participants Jan Cromphout and Liesbeth Verdickt; presentations by Jan Cromphout: ‘Kluizen water production centre: choice of flotation as most appropriate treatment technology’ and ‘Kluizen water production centre: pneumatically adjustable flotation nozzle, a proprietary design of De Watergroep’ November 14: Workshop Royal HaskoningDHV on ‘Non Revenue Water’, Amersfoort; participants Gisèle Peleman, Maarten Torbeyns; presentation by Gisèle Peleman: ‘NRW Approach within the De Watergroep’ 20 to 21 November: KWR workshop ‘Visions of water companies on water treatment’, Antwerp; participants Jan Cromphout, Liesbeth Verdickt, Gisèle Peleman; presentation by Jan Cromphout: ‘De Watergroep’s vision on water treatment’; visit to Kluizen water production centre on 21 November 26 to 29 November: IWA Disinfection 2012 Conference, Mexico; participants Jan Cromphout, Liesbeth Verdickt; presentation by Jan Cromphout: ‘Optimisation of ozonation in Kluizen water production centre’, where the ozone dose was adjusted to obtain sufficient inactivation of pathogens in combination with minimal bromate formation December 6: laboratory staff participated in KVCV seminar ‘Potable water: threatened more than ever?’ (Malle)

58
On 5 March, Joke Schauvliege, Flemish Minister for environment, Nature and Culture, officially opened the solar park in Kluizen. With its 14,600 panels, this is the largest solar park in east Flanders.
On 3 March and 12 May, people living near the groundwater extraction site in Biez were able to visit the underground extraction site, an initiative in collaboration with the municipality of Grez-Doiceau. In total, more than 600 visitors were shown around.
On March 12, De Watergroep signed a cooperation agreement in Paris with SEDIF (Syndicat des eaux d’Ile de France) for a development project in Madagascar.
Mid-May, a Vietnamese delegation from the province of Dihn Bihn visited our water production centre in Kluizen, in the context of a comprehensive programme on ‘water supply and sanitation’.
On 28 June, the Molenberg reservoir was officially put into operation in Geraardsbergen (onkerzele).
The brand new water bar of De Watergroep was brought out at the following events:
- old-Limburgish Festival of the archers Meeuwen-Gruitrode (end of June)
- ‘Vierdaagse van de IJzer’ (end of Augustus) - ‘De Gordel in Overijse’ (2 September) - Schools cross-country run in Opwijk (21 September) - Open Company Day (Open Bedrijvendag)
in Kluizen (October 7) - ‘Kerstcorrida’ in Deerlijk (23 December)
Official opening of new reservoir in Geraardsbergen
A Vietnamese delegation visits the water production centre in Kluizen
Official opening of solar park in Kluizen
Open Days, visits and events
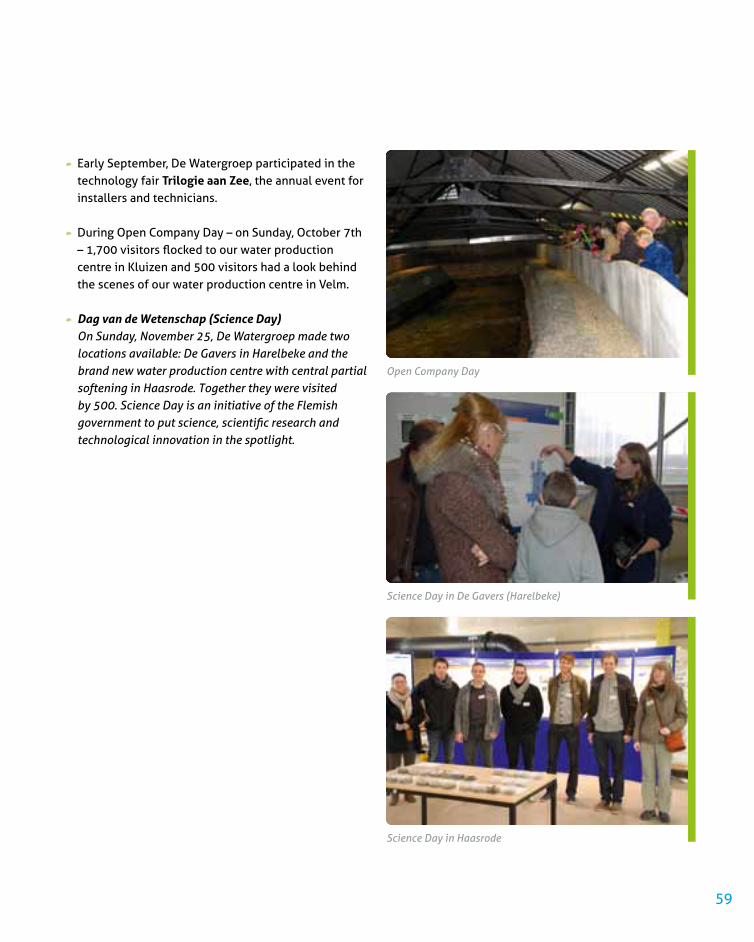
59
early September, De Watergroep participated in the technology fair Trilogie aan Zee, the annual event for installers and technicians.
During Open Company Day – on Sunday, October 7th – 1,700 visitors flocked to our water production centre in Kluizen and 500 visitors had a look behind the scenes of our water production centre in Velm.
Dag van de Wetenschap (Science Day) On Sunday, November 25, De Watergroep made two
locations available: De Gavers in Harelbeke and the brand new water production centre with central partial softening in Haasrode. Together they were visited by 500. Science Day is an initiative of the Flemish government to put science, scientific research and technological innovation in the spotlight.
Science Day in De Gavers (Harelbeke)
Science Day in Haasrode
Open Company Day

Annual Report from the Board of Directors concerning
the 2012 annual accounts

61
Introduction
The present report provides an explanation of the 2012 annual accounts and the various movements in the balance sheet and the income statement, so that they can be placed in their proper context.
To improve readability, the amounts are shown in millions of euros.
In 2012, a number of important events occurred with a visible impact on the accounts and their presentation.
On January 1, 2012, the Municipal Water Company of Sint-Niklaas was acquired.
RioP was launched on January 1, 2010. With RioP, De Watergroep offers its partners a total solution for the remediation of their wastewater. In 2010 and 2011, 14 municipalities in West and East Flanders joined RioP. On January 1, 2012, one RioP-partner decided to leave and continue to work with us on the basis of a RioAct agreement.
On March 28, 2012, a framework agreement was concluded between the SWDE (Eaux or Walloon Water Company) and De Watergroep in connection with the dissolution of joint ownership of the facilities from the NMDW (National Water Company).
The purpose of this agreement is to ensure the sustainability of the mutual water supplies between SWDE and De Watergroep.
The transfer of immovable property between the SWDE and De Watergroep, entailed by the joint ownership, was settled. Agreements were also made about the mutual sale of water and the technical management of the plants of the SWDE delegated to De Watergroep.
To paint a clearer picture of the capital of the company, the Board of Directors decided to inventory the drinking water take-off points and represent their economic value in the books.
The valuation rules have been adapted and from financial year 2012, the costs of design, study, monitoring of the performance of the work and contribution to the completion (in short ‘engineering costs’) will form a part of the acquisition value of the assets under construction.
Under the Act of 27 October 2006 on the supervision of institutions for occupational retirement provision (IORP), the Board of Directors set up a provision of 245 million euros in financial year 2007. This provision has since been adjusted annually based on updated calculations.
These and other issues will be discussed in the remainder of the annual report in extenso.
The annual accounts of De Watergroep on the financial year ending December 31, 2012, closed with a balance sheet total of 1,900.4 million and the income statement shows a profit of 6.3 million euros.
Cash flow rose by 25.32 million. This figure gives a good indication of the self-financing capacity of De Watergroep. It shows how many liquid assets were freed to fund investments. If more is invested than the cash flow, it will have to be done with additional loans.
Unlike the classical cash flow calculation, De Watergroep also takes into account the capitalised internal production and amortisation of capital subsidies. The correction for this non-cash income does not weigh so heavily in most other companies, but in De Watergroep they form an integral part of the proceeds.
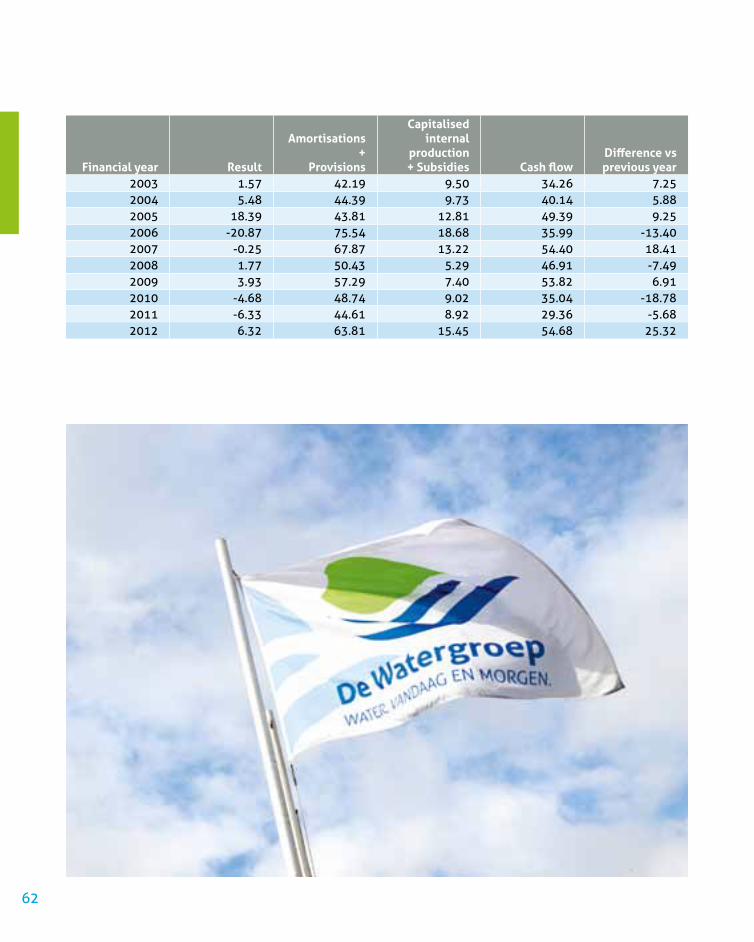
62
Financial year Result
Amortisations+
Provisions
Capitalised internal
production + Subsidies Cash flow
Difference vs previous year
2003 1.57 42.19 9.50 34.26 7.252004 5.48 44.39 9.73 40.14 5.882005 18.39 43.81 12.81 49.39 9.252006 -20.87 75.54 18.68 35.99 -13.402007 -0.25 67.87 13.22 54.40 18.412008 1.77 50.43 5.29 46.91 -7.492009 3.93 57.29 7.40 53.82 6.912010 -4.68 48.74 9.02 35.04 -18.782011 -6.33 44.61 8.92 29.36 -5.682012 6.32 63.81 15.45 54.68 25.32
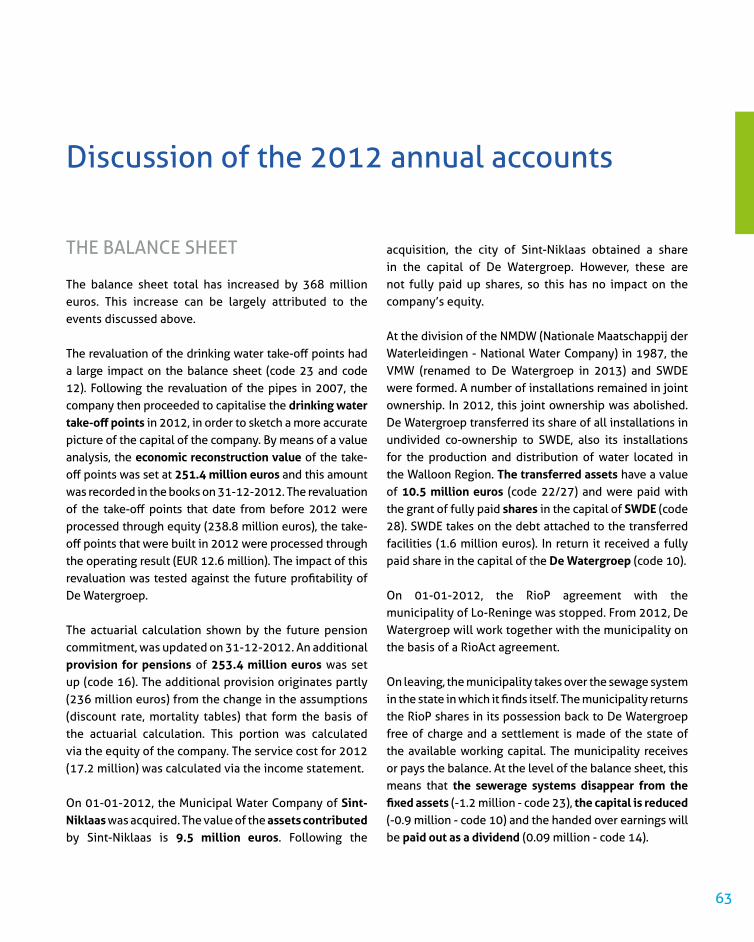
63
ThE BAlANCE ShEET
The balance sheet total has increased by 368 million euros. This increase can be largely attributed to the events discussed above.
The revaluation of the drinking water take-off points had a large impact on the balance sheet (code 23 and code 12). Following the revaluation of the pipes in 2007, the company then proceeded to capitalise the drinking water take-off points in 2012, in order to sketch a more accurate picture of the capital of the company. By means of a value analysis, the economic reconstruction value of the take-off points was set at 251.4 million euros and this amount was recorded in the books on 31-12-2012. The revaluation of the take-off points that date from before 2012 were processed through equity (238.8 million euros), the take-off points that were built in 2012 were processed through the operating result (EUR 12.6 million). The impact of this revaluation was tested against the future profitability of De Watergroep.
The actuarial calculation shown by the future pension commitment, was updated on 31-12-2012. An additional provision for pensions of 253.4 million euros was set up (code 16). The additional provision originates partly (236 million euros) from the change in the assumptions (discount rate, mortality tables) that form the basis of the actuarial calculation. This portion was calculated via the equity of the company. The service cost for 2012 (17.2 million) was calculated via the income statement.
On 01-01-2012, the Municipal Water Company of Sint-Niklaas was acquired. The value of the assets contributed by Sint-Niklaas is 9.5 million euros. Following the
acquisition, the city of Sint-Niklaas obtained a share in the capital of De Watergroep. however, these are not fully paid up shares, so this has no impact on the company’s equity.
At the division of the NMDW (Nationale Maatschappij der Waterleidingen - National Water Company) in 1987, the VMW (renamed to De Watergroep in 2013) and SWDE were formed. A number of installations remained in joint ownership. In 2012, this joint ownership was abolished. De Watergroep transferred its share of all installations in undivided co-ownership to SWDE, also its installations for the production and distribution of water located in the Walloon Region. The transferred assets have a value of 10.5 million euros (code 22/27) and were paid with the grant of fully paid shares in the capital of SWDE (code 28). SWDE takes on the debt attached to the transferred facilities (1.6 million euros). In return it received a fully paid share in the capital of the De Watergroep (code 10).
On 01-01-2012, the RioP agreement with the municipality of lo-Reninge was stopped. From 2012, De Watergroep will work together with the municipality on the basis of a RioAct agreement.
On leaving, the municipality takes over the sewage system in the state in which it finds itself. The municipality returns the RioP shares in its possession back to De Watergroep free of charge and a settlement is made of the state of the available working capital. The municipality receives or pays the balance. At the level of the balance sheet, this means that the sewerage systems disappear from the fixed assets (-1.2 million - code 23), the capital is reduced (-0.9 million - code 10) and the handed over earnings will be paid out as a dividend (0.09 million - code 14).
Discussion of the 2012 annual accounts

64
To meet their supramunicipal obligations with regard to sewage treatment, the water companies signed a contract with Aquafin. The charged costs of Aquafin are included in the operating expenses. Since the contributions of the subscribers are insufficient to meet the costs of the treatment, a contribution of the MINA fund was provided. This contribution is calculated via the operating income.In December 2012 an invoice was already received from Aquafin with respect to the first quarter of 2013 of 29.3 million euros (code 440). These costs were allocated to the financial year 2013 via the accruals and deferred income ‘deferred charges’ (code 490).An advance payment was also received from the MINA Fund for its compensation for the first quarter of 2013 amounting to 29.4 million euros. This amount was received in the bank (code 55) and also affects the other amounts payable (code 48).
ThE INCOME STATEMENT
De Watergroep closes its income statement for the financial year 2012 with a profit of 6.3 million euros.
Operating result
Unlike last year (-2.7 million euros) De Watergroep realized a trading profit of 8 million euros. The better results of De Watergroep cannot be attributed to a single event as several parameters played a part in this.
Despite a slight decrease in water consumption, we see an increase in turnover (code 70). The acquisition of the Municipal Water Company of Sint-Niklaas caused a rise in the number of supply units and thus more turnover. In combination with a number of rate increases granted to De Watergroep based on submitted rates dossiers, this resulted in a positive balance.
The cost to purchase water (under code 61) from other water companies increased by 9 million euros. As mentioned above, the framework agreement concluded
between the SWDE and De Watergroep for the dissolution of the joint-ownership regulated the mutual selling of water between the water companies. The increase in water costs is largely due to the new terms of this agreement.
As discussed above, the economic reconstruction value of the take-off points was determined on 31-12-2012 by means of a value analysis. The revaluation of the take-off points built in 2012 was calculated through the operating result (code 61: -24.6 million euros, code 70: - 11.9 million euros).
Starting from this financial year, the ‘engineering costs’ are included in the acquisition value of the assets under construction. Practically speaking, this means that a surcharge percentage was determined to be applied to projects for which the employees of De Watergroep are themselves responsible for the design, the study, the monitoring of the performance of the work and the contribution to the delivery. This surcharge percentage was checked against the actual engineering costs. It should also be ensured that after capitalisation of this surcharge rate the acquisition value of the related asset does not exceed its market value. This year 5.9 million euros (code 72) was added to the assets under construction via own construction booked as fixed assets. Two consecutive wage indexations (06-2011 and 03-2012) and an increase in the employee contribution to pensions (from 33% in 2011 to 35% in 2012) meant that labour costs rose significantly. Nevertheless, the personnel expenses were 6.4 million euros lower in 2012 than in 2011.
In 2011 an amount of 10.3 million euros was paid into the pension reserve. The office of the central administration in Brussels was leased out under a long lease at the end of 2009. The capital gain realised on the building, minus the investment cost of the new building, was paid into the pension fund by the end of 2011.

65
We see an increase of 22 million euros in the section for provisions for risks and expenses (code 635/7). As mentioned above, the increase in these costs are almost entirely due to an additional provision for pensions. A service cost of 17.2 million euros was registered. The fact that people will be working 1 year longer in the future creates an additional cost of 10 million euros and the wage indexation of 2% in March 2012 ensures that an additional 7.2 million euros will be needed.
Financial results
The financial result was -2.6 million euros.This is in line with the results of the previous year (-2.9 million euros). In 2012, De Watergroep decided to try to stabilise its debt, except for special projects (acquisitions, expansion RioP activity).
Exeptional results
The exceptional result amounts to 1 million euros.This positive result is due to the gain realised on a number of tangible assets. This capital gain will be paid into the pension reserve in 2013 in accordance with the decision of the Board of Directors of 28-03-2008.
INCOME STATEMENT PER WATER SERVICE
The specific analytical income statements at December 31, 2012 have been prepared on the basis of an allocation model that was validated by the Board of Directors and the Provincial Offices of the Provincial water services and RioP services. The allocation model uses a number of allocation formulas and completes a number of phases in order to arrive at an income statement per water service. The RioP-accounts are not interdependent. This means that the result is attributable to the individual municipality and can therefore not be used to balance out any negative results of other water services.
Figures in million euros
Results P and G services
Allocation of result
G service
Results P Service after
allocation G Service
West Flanders 12.81 -13.09 -0.28
East Flanders 9.04 -6.90 2.14
Flemish Brabant 10.79 -10.74 0.05
limburg 13.80 -12.38 1.42
General water service
-43.11 43.11 0.00
RioP West Flanders
0.58 0,00 0.58
RioP East Flanders
2.40 0,00 2.40
6.31 0,00 6.31
P service: Provincial water servicesG service: General water service
APPROPRIATION OF PROFITS
As regards the appropriation of profit of the financial year ending 2012, amounting to 757,757 euros, the Board of Directors proposes to the General Assembly that De Watergroep transfer 665,954 euros to the next financial year.
As stated above, the RioP accounts are not interdependent. By withdrawing from De Watergroep, lo-Reninge terminates the partnership contract and the municipality is entitled to payment of an exit value. The Board of Directors therefore proposes to the General Assembly that the profit carried forward of 91,803 euros be transferred to the individual account of lo-Reninge.
DISChARGE
The Board also proposes to grant discharge to the Directors and the Statutory Auditor regarding the mandate exercised during the financial year 2012.
66
ANY IMPORTANT EVENTS ThAT hAVE OCCURRED SINCE ThE END OF ThE FINANCIAl YEAR
Not applicable.
DESCRIPTION OF RISKS AND UNCERTAINTIESTo better identify and control potential risks and uncertainties, an Internal Audit Department was already established in the past that, managed by the Audit Committee, performs the necessary audits and controls. From 2013, an Enterprise Risk Manager will also be appointed to formulate a pragmatic and coordinated policy to identify, evaluate and manage the relevant risks in a systematic way.
Operational risks
Security of supply Ground and surface water catchment sites are under
constant pressure, both in terms of the quality of these sources and the amount that can be extracted from them. These are continuously monitored.
To increase the security of supply, our own resources are supplemented by external supplies and agreements on transit.
In this context, reference can be made to the Aqua.Duct project, a partnership between De Watergroep, AWW and TMVW with an estimated investment of 170 million euros, and a contract of delivery in the long term (30 years), which was concluded in 2012 with SWDE.
Supply interruptions These may occur as a result of major breaks in
the supply or distribution system, or as a result of
calamities in production centres. Such problems can never be entirely forseen. It
is of paramount importance that customers of De Watergroep are minimally affected in the event of supply interruptions.
Environmental risks As a water company we are totally dependent on a
natural product. The protection of water catchment areas is therefore one of our top priorities. De Watergroep proactively contacts the legislature to bring attention to this problem and try to help come up with solutions.
IT risks A failure of the IT network or the supporting IT systems
could cause problems affecting the entire company. De Watergroep takes the necessary measures to ensure that the IT network and the associated IT systems are improved and that an emergency copy is available at all times, as far as is permitted by the company’s technical and financial capabilities. De Watergroep has drawn up recovery plans for the most critical IT systems and regularly tests these.
Financial risks - Credit risk Credit risk is the risk that a counterparty will default
on its contractual obligations or fail to pay its debts. Exposure to this risk has increased significantly in recent years due to the integration of sewage treatment costs in the water invoice, which has caused the amounts to almost double. To mitigate this risk as much as possible, a new procedure for debtors control was implemented in 2012. The aim of this new procedure is to reduce the accounts receivable cycle, which should lead to an accelerated and more
Additional elements

67
complete recovery of the outstanding amounts. Additionally, a follow-up step was added where customers are proactively contacted in case of arrears. In this way, potential problems related to invoicing or payment are quickly detected and remedied.
- Rates De Watergroep operates in a mature market with little
potential for growth and characterised by a continuing decline in consumption per person. The latter has had a strong effect on sales as a result of the free delivery of the first 15 m³ per person, making the share of consumption that is paid for more susceptible to fluctuations. In this regulated market, rates are subject to the approval of the Minister of Economy, meaning that uncertainties in amount and timing of price adjustments are built in to the system.
ACTIVITIES IN ThE FIElD OF RESEARCh AND DEVElOPMENT
In order to research certain topics within each discipline on a more fundamental level, a comprehensive programme for research and development has been set up that is geared towards developing new production processes and improving existing ones.
INTERNAl RESEARCh
Flotation: Optimisation of flotation-filtration plant in Kluizen.
IEX: Further research on the removal of natural organic matter (NOM) with ion exchange with the aid of the SI system (Saturation Index).
SI and corrosion: A literature study shows that an SI value of > 0 to protect the pipes makes little makes sense. It is recommended to strive for an SI of 0 or even less in the future.
Condition assessment of existing piping in fibre ce-ment and grey cast iron: A method was developed to create a risk matrix based on condition assessments performed on tube sections of existing pipes in fibre cement and grey cast iron that can be used as support
for mains system management and asset manage-ment.
Removal of microorganisms: Modern techniques (such as flow cytometry) will be examined in order to evaluate the different production processes in the area of the removal of microorganisms.
Optimisation of disinfection: In Kluizen, ozonation was optimised so that the concentration of byproducts is now even further below the standard value.
Quality evolution Bossuit-Kortrijk canal: screening of organic micropollutants via GC-MS.
Protection zones: The protection zones around the groundwater catchment sites are redefined through new technologies, developed for optimal protection of the extraction sites.
Research on chemical phenomena in water-bearing groundwater layers of carboniferous limestone.
New pipe materials and methodologies: being researched. Research & Development with external partners.
RESEARCh AND DEVElOPMENT
Research on flocculation as pretreatment for ultrafiltration: This thesis research was started in collaboration with the University of leuven.
Nanofiltration: Estab and Cerawater: De Watergroep is also involved in the development of nanofiltration membranes in cooperation with several domestic and foreign research institutions.
The Blue Circle: The Blue Circle is a research project on the sustainable reuse of water and the exploitation of waste streams.
EU project Biotreat (together with Ghent University and the University of leuven) on the biological removal of organic pollutants.
TAPES: European cooperation project in which the ge-neral group of emerging substances in drinking water and wastewater will be studied.
KWR: De Watergroep actively participated in the BTO study (Bedrijfstakonderzoek or Company Branch Study) of the KWR on the development of opportunistic pathogens in the distribution network: the final report is expected in 2013.

68
ThE EXISTENCE OF BRANCh OFFICES
Not applicable.
MAJOR lOSSES
Not applicable.
USE OF FINANCIAlINSTRUMENTS
De Watergroep’s main method of controlling the financial risk of the outstanding debt is to spread it – across different providers, different durations and expiration dates. Regarding the latter, due to circumstances there will be a peak of debts requiring refinancing in 2015 amounting to 67.6 million euros, while De Watergroep aims to achieve an average of 35 million euros. That is why the interest rate on a loan from BNP Paribas Fortis for 22.5 million euros was fixed at 3.265%, provided there is an Interest Rate Swap (IRS). This reduces the interest rate risk, while at the same time contributing to a larger spread in maturities.The annual repayment is retained, the five-year reviewable rate based on ISDAFIX 5 years + 48 base points, is converted into a fixed rate of 3.265% per annum. This interest rate swap will take effect from the first revision in 2015. In 2015, 22.5 million euros of the loan will still be owed. The annual repayments amount to 1.5 million euros.
CIRCUMSTANCES ThAT MIGhTSIGNIFICANTlY INFlUENCE ThEDEVElOPMENT OF ThE COMPANY
Not applicable.
AUDITCOMITTEE
At least one member of the Audit Committee shall be an independent director who possesses the necessary expertise in the field of accounting and auditing.
ADDITIONAl INFORMATION
Capital subsidies (Art. 100, 5°C of the Belgian Company Code):In 2012, capital subsidies for 6,972,617.81 euros were awarded by the Flemish Region in the context of sewerage projects. An amount was paid of 3,690,250 euros relating to subsidies previously awarded.

69

70
Codes 2012 2011ASSETSFIXED ASSETS 20/28 1,673,182,286.27 1,383,516,053.40Formation expenses 20 0.00 0.00Intangible fixed assets 21 6,581,817.79 8,060,491.77Tangible fixed assets 22/27 1,656,072,040.18 1,375,403,938.33 land and buildings 22 271,864,489.14 283,090,603.78 Machinery and equipment 23 1,294,246,625.02 1,026,013,061.45 Furniture and rolling stock 24 6,020,817.30 6,606,437.62 leasing and similar rights 25 0.00 0.00 Other tangible fixed assets 26 0.00 0.00 Assets under construction and prepayments 27 83,940,108.72 59,693,835.48Financial fixed assets 28 10,528,428.30 51,623.30 Affiliated companies 280/1 0.00 0.00 Participating intrests 280 0.00 0.00 Receivables 281 0.00 0.00 Companies in which a participating interest is held 282/3 0.00 0.00 Participating interests 282 0.00 0.00 Receivables 283 0.00 0.00 Other financial fixed assets 284/8 10,528,428.30 51,623.30 Shares 284 10,483,002.50 6,197.50 Receivables and guarantees (cash) 285/8 45,425.80 45,425.80CURRENT ASSETS 227,178,903.59 149,074,298.38Receivables at more than one year 29 0.00 0.00 Trade receivables 290 0.00 0.00 Other receivables 291 0.00 0.00Stocks and orders in progress 3 3,950,040.48 3,638,348.40 Stocks 30/36 3,950,040.48 3,638,348.40 Raw materials and supplies 30/1 3,831,198.10 3,488,398.54 Work in progress 32 118,842.38 149,949.86 Finished products 33 0.00 0.00 Goods for resale 34 0.00 0.00 Property earmarked for sale 35 0.00 0.00 Advance payments 36 0.00 0.00 Orders in progress 37 0.00 0.00Receivables due within one year 40/1 115,709,001.58 98,037,385.36 Trade receivables 40 79,952,194.10 73,214,859.64 Other receivables 41 35,756,807.48 24,822,525.72Investments 50/53 30,000,000.00 30,000,000.71 Own shares 50 0.00 0.00 Other investments 51/53 30,000,000.00 30,000,000.71Cash and cash equivalents 54/58 45,144,437.54 14,272,438.76Prepayments and accrued income 490/1 32,375,423.99 3,126,125.15TOTAl ASSETS 1,900,361,189.86 1,532,590,351.78
DE WATERGROEP BAlANCE ShEET - ASSETS

71
DE WATERgROEP bAlANCE ShEET - lIAbIlITIES
lIABIlITIESShAREhOlDERS' EQUITY 10/15 812,021,106.68 799,437,521.23Capital 10 630,482,049.57 629,025,049.46 Subscribed capital 100 868,498,250.00 861,311,725.00 Uncalled capital 101 -238,016,200.43 -232,286,675.54Issue premiums 11 0.00 0.00Revaluation gains 12 2,531,221.29 0.00Reserves 13 83,900,161.30 83,900,161.30 Statutory reserve 130 83,900,161.30 83,900,161.30 Non-distributable reserves 131 0.00 0.00 For own shares 1310 0.00 0.00 Other 1311 0.00 0.00 Tax-free reserves 132 0.00 0.00 Distributable reserves 133 0.00 0.00Transferred profit/loss 14 665,954.03 -5,561,597.11Capital subsidies 15 94,441,720.49 92,073,907.58PROVISIONS AND DEFERRED TAXES 16 561,746,930.46 310,153,977.54Provisions for risks and expenses 160/5 561,746,930.46 310,153,977.54 Pensions and similar obligations 160 539,037,369.54 286,123,883.62 Taxes 161 0.00 0.00 Major maintenance and repair work 162 16,522,511.35 16,526,423.85 Other risks and expenses 163/5 6,187,049.57 7,503,670.07Deferred taxes 168 0.00 0.00lIABIlITIES 17/49 526,593,152.72 422,998,853.01liabilities due at more than one year 17 222,466,600.19 222,357,257.49 Financial liabilities 170/174 218,845,072.99 211,719,993.69 Subordinated loans 170 0.00 0.00 Non-subordinated bond loans 171 0.00 1,518,347.83 leases and similar liabilities 172 0.00 0.00 Banks 173 218,845,072.99 210,201,645.86 Other loans 174 0.00 0.00 Trade accounts payable 175 0.00 0.00 Suppliers 1750 0.00 0.00 Bills of exchange payable 1751 0.00 0.00 Payments on account of orders 176 3,614,692.86 3,614,025.10 Other liabilities 178/9 6,834.34 7,023,238.70liabilities due within one year 42/48 237,646,592.03 146,711,953.95 liabilities due at more than one year, falling due within the year 42 13,984,258.22 12,132,888.14 Financial liabilities 43 0.00 0.00 Banks 430/8 0.00 0.00 Other loans 439 0.00 0.00 Trade accounts payable 44 118,901,922.46 64,900,738.21 Suppliers 440/5 118,901,922.46 64,900,738.21 Bills of exchange payable 441 0.00 0.00 Advance payments received 46 26,778,145.26 26,670,543.90 liabilities relating to taxes, remuneration and social security 45 8,007,977.45 8,121,097.18 Taxes 450/3 2,642,344.05 2,715,185.52 Remuneration and social security 454/9 5,365,633.40 5,405,911.66 Other liabilities 47/48 69,974,288.64 34,886,686.52Accruals and deferred income 492/3 66,479,960.51 53,929,641.58TOTAl lIABIlITIES 1,900,361,189.86 1,532,590,351.78
Codes 2012 2011

72
Codes 2012 2011INCOME STATEMENT OPERATING INCOME 70/74 532,754,849.87 503,333,127.45Turnover 70 439,509,830.29 425,455,131.33Stocks of work in progress and finished products and orders in progress: increase (decrease -) 71 -31,107.48 -193,837.09
Produced fixed assets 72 10,846,383.14 4,640,002.98Other operating income 74 82,429,743.92 73,431,830.23OPERATING EXPENSES 60/64 -524,875,636.16 -506,049,119.26Goods for resale, raw materials and supplies 60 -8,128,921.46 -8,085,147.70 Purchases 600/8 -8,471,721.74 -7,795,118.04 Stocks: decrease (increase) 609 342,800.28 -290,029.66Services and miscellaneous goods 61 -336,349,283.53 -327,772,314.20Remuneration, social security and pensions 62 -95,856,121.90 -102,287,355.14Depreciation and impairment of formation expenses, intangible and tangible fixed assets 630 -47,714,197.44 -47,532,229.96
Impairments of stocks, orders in progress and trade receivables: transfers (reversals) 631/4 -695,581.05 -3,682,222.07
Provisions for risks and expenses: transfers (additions and reversals) 635/7 -15,402,119.00 6,608,207.42Other operating expenses 640/8 -20,729,411.78 -23,298,057.61Operating profit (loss -) 74/64 7,879,213.71 -2,715,991.81 FINANCIAl INCOME 75 5,364,337.31 4,810,827.57Income from financial fixed assets 750 0.00 0.00Income from current assets 751 756,988.94 528,718.24Other financial income 752/9 4,607,348.37 4,282,109.33FINANCIAl EXPENSES 65 -7,923,964.95 -7,745,110.83Costs of debt 650 -7,809,458.44 -7,508,434.16Impairments of current assets other than stocks, orders in progress and trade receivables: transfers (reversal) 651 0.00 0.00
Other financial expenses 652/9 -114,506.51 -236,676.67Profit (loss-) on ordinary activities 70/65 5,319,586.07 -5,650,275.07 EXTRAORDINARY EXPENSES 76 1,064,483.05 845,453.71Reversal of depreciation and impairment of intangible and tangible fixed assets 760 5,523.68 17,972.38
Reversal of impairments on financial fixed assets 761 0.00 0.00Reversal of provisions for extraordinary risks and expenses 762 0.00 0.00gains on disposal of fixed assets 763 829,350.29 572,703.81Other extraordinary expenses 764/9 229,609.08 254,777.52EXTRAORDINARY EXPENSES 66 -64,714.75 -1,527,662.59Extraordinary depreciation and impairment of formation expenses, intangible and tangible fixed assets 660 0.00 0.00
Impairment of financial fixed assets 661 0.00 0.00Provisions for extraordinary risks and expenses - Additions (transfers) 662 0.00 0.00losses on disposal of fixed assets 663 -36,835.75 -1,473,124.59Other extraordinary expenses 664/8 -27,879.00 -54,538.00Profit (loss-) for the year before taxation 70/66 6,319,354.37 -6,332,483.95
PROFIT (lOSS-) FOR APPROPRIATION 70/68 6,319,354.37 -6,332,483.95PROFIT (lOSS-) bROUghT FORWARD FROM PREVIOUS YEAR 14P -5,561,597.11 770,886.84PROFIT (lOSS-) TO bE CARRIED FORWARD (14) 665,954.03 -5,561,597.11DISTRIBUTABlE PROFIT 694/6 91,803.23 0.00
DE WATERGROEP INCOME STATEMENT

73
CENTRAl OFFICECodes 2012 2011
INDIVIDUAl INCOME STATEMENTOPERATING INCOME 70/74 298,960.07 222,449.55Turnover 70 0.00 0.00 Fixed charge 7000 0.00 0.00 Additional consumption 7010 0.00 0.00 Sewage treatment contribution 7011 0.00 0.00 Sewerage contribution 7012 0.00 0.00 Sewerage contribution – customers with own extraction 7013 0.00 0.00 Other turnover 702/9 0.00 0.00Stocks of work in progress and finished products and orders in progress: increase (decrease -) 71 0.00 0.00
Produced fixed assets 72 0.00 0.00Other operating income 74 297,645.38 221,199.55 MINA fund operating subsidy 74000 0.00 0.00 Operating subsidies 74001 0.00 0.00 RioP municipalities operating subsidy 74002 0.00 0.00 Other operating income 741/9 297,645.38 221,199.55Internal allocation of income 799 1,314.69 1,250.00OPERATING EXPENSES 60/64 -298,960.07 -222,449.55Goods for resale, raw materials and supplies 60 0.00 0.00 Purchases 600/8 -8,471,113.09 -7,795,118.04 Stocks: decrease (increase) 609 8,471,113.09 7,795,118.04Services and miscellaneous goods 61 -12,006,092.39 -10,537,159.73 Sewage treatment contribution 61202 0.00 0.00 Sewerage contribution 61203 0.00 0.00 Sewerage contribution - customers with own extraction 61204 0.00 0.00 Other services and miscellaneous goods 610/8 -12,006,092.39 -10,537,159.73Remuneration, social security and pensions 62 -13,711,934.91 -23,000,211.75Depreciation and impairment of formation expenses, intangible and tangible fixed assets 630 -2,883,631.97 -2,927,253.58
Impairments of stocks, orders in progress and trade receivables: transfers (reversals) 631/4 2,243.16 2,384.82
Provisions for risks and expenses: transfers (additions and reversals) 635/7 -25,783,785.98 2,553,527.16Other operating expenses 640/8 -2,468,767.57 -1,360,463.22Allocation of operating expenses 6499 56,735,491.26 35,213,300.09 Allocation 1: internal C (premises, post & insurance) 64997 966,870.96 1,042,699.51 Allocation 2: C -> P&G 64998 55,768,620.30 34,170,600.58 Allocation 3: G -> P 64999 0.00 0.00 Allocation 4: P -> RioP 64995 0.00 0.00 Allocation RioP -> Municipality 64996 0.00 0.00Internal allocation of costs 69 -182,481.67 -166,573.34Operating profit (loss -) 74/64 0.00 0.00
See reverse side >

74
Codes 2012 2011FINANCIAl INCOME 75 522,227.08 278,586.00Income from financial fixed assets 750 0.00 0.00Income from current assets 751 519,683.93 278,062.78Other financial income 752/9 2,543.15 523.22FINANCIAl EXPENSES 65 -522,227.08 -278,586.00Costs of debt 650 -7,376,098.55 -7,236,433.82Impairments of current assets other than stocks, orders in progress and trade receivables: transfers (reversal) 651 0.00 0.00
Other financial expenses 652/9 -4,397.90 -23,246.39Allocation of financial expenses 6599 6,858,269.37 6,981,094.21 Allocation 1: internal C (premises, post & insurance) 65997 0.00 0.00 Allocation 2: C -> P&G 65998 6,858,269.37 6,981,094.21 Allocation 3: G -> P 65999 0.00 0.00Profit (loss-) on ordinary activities 70/65 0.00 0.00
EXTRAORDINARY EXPENSES 76 930,347.86 145,518.36Reversal of depreciation and impairment of intangible and tangible fixed assets 760 4,850.63 75.87
Reversal of impairments on financial fixed assets 761 0.00 0.00Reversal of provisions for extraordinary risks and expenses 762 0.00 0.00gains on disposal of fixed assets 763 735,290.25 4,459.27Other extraordinary expenses 764/9 190,206.98 140,983.22EXTRAORDINARY EXPENSES 66 -930,347.86 -145,518.36Extraordinary depreciation and impairment of formation expenses, intangible and tangible fixed assets 660 0.00 0.00
Impairment of financial fixed assets 661 0.00 0.00Provisions for extraordinary risks and expenses - Additions (transfers) 662 0.00 0.00losses on disposal of fixed assets 663 0.00 -1,023,21Other extraordinary expenses 664/8 -5,521.83 -25,291.17Allocation of extraordinary expenses 669 -924,826.03 -119,203.98 Allocation 1: internal C (premises, post & insurance) 66997 0.00 0.00 Allocation 2: C -> P&G 66998 -924,826.03 -119,203.98 Allocation 3: G -> P 66999 0.00 0.00 Allocation 4: P -> RioP 66995 0.00 0.00 Allocation RioP -> Municipality 66996 0.00 0.00Profit (loss-) for the year before taxation 70/66 0.00 0.00 PROFIT (lOSS-) FOR APPROPRIATION 70/68 0.00 0.00PROFIT (lOSS-) bROUghT FORWARD FROM PREVIOUS YEAR 14P 0.00 0.00PROFIT (lOSS-) TO bE CARRIED FORWARD (14) 0.00 0.00DISTRIBUTABlE PROFIT 694/6 0.00 0.00
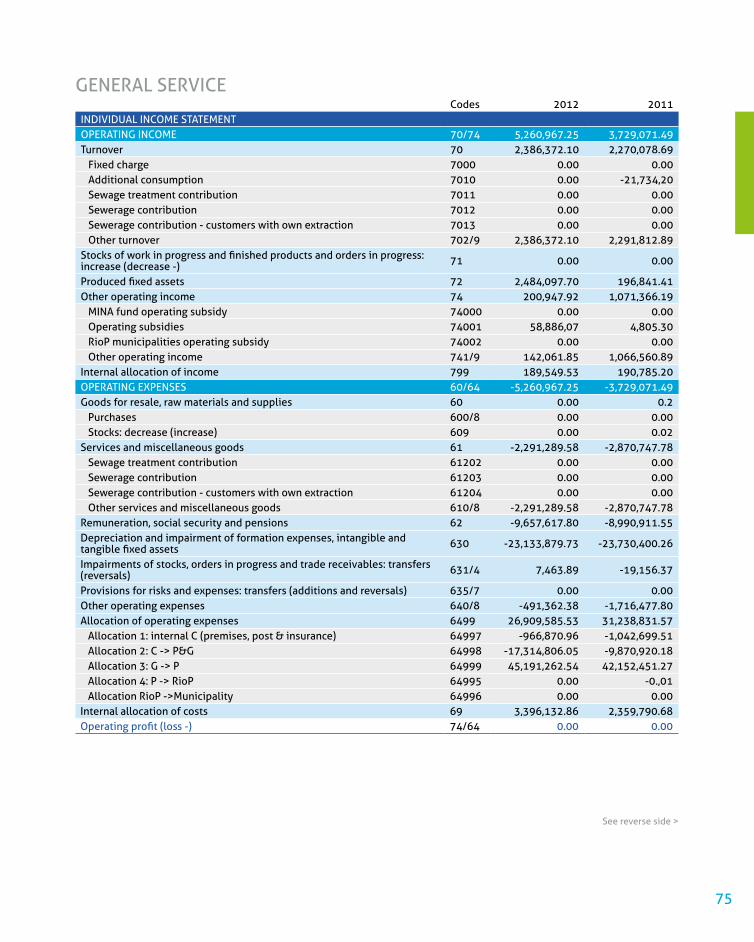
75
GENERAl SERVICECodes 2012 2011
INDIVIDUAl INCOME STATEMENTOPERATING INCOME 70/74 5,260,967.25 3,729,071.49Turnover 70 2,386,372.10 2,270,078.69 Fixed charge 7000 0.00 0.00 Additional consumption 7010 0.00 -21,734,20 Sewage treatment contribution 7011 0.00 0.00 Sewerage contribution 7012 0.00 0.00 Sewerage contribution - customers with own extraction 7013 0.00 0.00 Other turnover 702/9 2,386,372.10 2,291,812.89Stocks of work in progress and finished products and orders in progress: increase (decrease -) 71 0.00 0.00
Produced fixed assets 72 2,484,097.70 196,841.41Other operating income 74 200,947.92 1,071,366.19 MINA fund operating subsidy 74000 0.00 0.00 Operating subsidies 74001 58,886,07 4,805.30 RioP municipalities operating subsidy 74002 0.00 0.00 Other operating income 741/9 142,061.85 1,066,560.89Internal allocation of income 799 189,549.53 190,785.20OPERATING EXPENSES 60/64 -5,260,967.25 -3,729,071.49Goods for resale, raw materials and supplies 60 0.00 0.2 Purchases 600/8 0.00 0.00 Stocks: decrease (increase) 609 0.00 0.02Services and miscellaneous goods 61 -2,291,289.58 -2,870,747.78 Sewage treatment contribution 61202 0.00 0.00 Sewerage contribution 61203 0.00 0.00 Sewerage contribution - customers with own extraction 61204 0.00 0.00 Other services and miscellaneous goods 610/8 -2,291,289.58 -2,870,747.78Remuneration, social security and pensions 62 -9,657,617.80 -8,990,911.55Depreciation and impairment of formation expenses, intangible and tangible fixed assets 630 -23,133,879.73 -23,730,400.26
Impairments of stocks, orders in progress and trade receivables: transfers (reversals) 631/4 7,463.89 -19,156.37
Provisions for risks and expenses: transfers (additions and reversals) 635/7 0.00 0.00Other operating expenses 640/8 -491,362.38 -1,716,477.80Allocation of operating expenses 6499 26,909,585.53 31,238,831.57 Allocation 1: internal C (premises, post & insurance) 64997 -966,870.96 -1,042,699.51 Allocation 2: C -> P&G 64998 -17,314,806.05 -9,870,920.18 Allocation 3: G -> P 64999 45,191,262.54 42,152,451.27 Allocation 4: P -> RioP 64995 0.00 -0.,01 Allocation RioP ->Municipality 64996 0.00 0.00Internal allocation of costs 69 3,396,132.86 2,359,790.68Operating profit (loss -) 74/64 0.00 0.00
See reverse side >

76
Codes 2012 2011FINANCIAl INCOME 75 4,552,501.99 4,224,177.63Income from financial fixed assets 750 0.00 0.00Income from current assets 751 0.00 0.00Other financial income 752/9 4,552,501.99 4,224,177.63FINANCIAl EXPENSES 65 -4,552,501.99 -4,224,177.63Costs of debt 650 -94,164.21 -106,276.51Impairments of current assets other than stocks, orders in progress and trade receivables: transfers (reversal) 651 0.00 0.00
Other financial expenses 652/9 -0.02 0.00Allocation of financial expenses 6599 -4,458,337.76 -4,117,901.12 Allocation 1: internal C (premises, post & insurance) 65997 0.00 0.00 Allocation 2: C -> P&G 65998 -2,685,646.82 -2,816,629.48 Allocation 3: G -> P 65999 -1,772,690.94 -1,301,271.64Profit (loss-) on ordinary activities 70/65 0.00 0.00 EXTRAORDINARY EXPENSES 76 2,714.92 403,700.70Reversal of depreciation and impairment of intangible and tangible fixed assets 760 614.92 17,711.71
Reversal of impairments on financial fixed assets 761 0.00 0.00Reversal of provisions for extraordinary risks and expenses 762 0.00 0.00gains on disposal of fixed assets 763 2,100.00 369,940.61Other extraordinary expenses 764/9 0.00 16,048.38EXTRAORDINARY EXPENSES 66 -2,714.92 -403,700.70Extraordinary depreciation and impairment of formation expenses, intangible and tangible fixed assets 660 0.00 0.00
Impairment of financial fixed assets 661 0.00 0.00Provisions for extraordinary risks and expenses - Additions (transfers) 662 0.00 0.00losses on disposal of fixed assets 663 -36,386.74 -576,292.72Other extraordinary expenses 664/8 0.00 0.00Allocation of extraordinary expenses 669 33,671.82 172,592.02 Allocation 1: internal C (premises, post & insurance) 66997 0.00 0.00 Allocation 2: C -> P&G 66998 344,556.09 47,847.68 Allocation 3: M -> G 66999 -310,884.27 124,744.34 Allocation 4: P -> RioP 66995 0.00 0.00 Allocation RioP -> Municipality 66996 0.00 0.00Profit (loss-) for the year before taxation 70/66 0.00 0.00 PROFIT (lOSS-) FOR APPROPRIATION 70/68 0.00 0.00PROFIT (lOSS-) bROUghT FORWARD FROM PREVIOUS YEAR 14P 0.00 0.00PROFIT (lOSS-) TO bE CARRIED FORWARD (14) 0.00 0.00DISTRIBUTABlE PROFIT 694/6 0.00 0.00
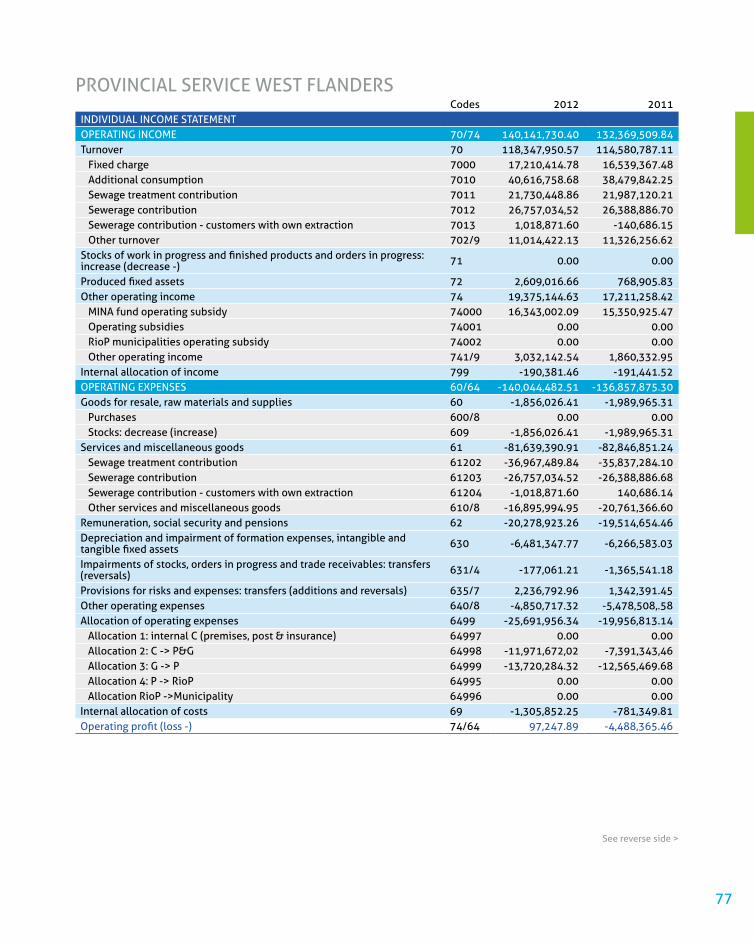
77
Codes 2012 2011INDIVIDUAl INCOME STATEMENTOPERATING INCOME 70/74 140,141,730.40 132,369,509.84Turnover 70 118,347,950.57 114,580,787.11 Fixed charge 7000 17,210,414.78 16,539,367.48 Additional consumption 7010 40,616,758.68 38,479,842.25 Sewage treatment contribution 7011 21,730,448.86 21,987,120.21 Sewerage contribution 7012 26,757,034,52 26,388,886.70 Sewerage contribution - customers with own extraction 7013 1,018,871.60 -140,686.15 Other turnover 702/9 11,014,422.13 11,326,256.62Stocks of work in progress and finished products and orders in progress: increase (decrease -) 71 0.00 0.00
Produced fixed assets 72 2,609,016.66 768,905.83Other operating income 74 19,375,144.63 17,211,258.42 MINA fund operating subsidy 74000 16,343,002.09 15,350,925.47 Operating subsidies 74001 0.00 0.00 RioP municipalities operating subsidy 74002 0.00 0.00 Other operating income 741/9 3,032,142.54 1,860,332.95Internal allocation of income 799 -190,381.46 -191,441.52OPERATING EXPENSES 60/64 -140,044,482.51 -136,857,875.30Goods for resale, raw materials and supplies 60 -1,856,026.41 -1,989,965.31 Purchases 600/8 0.00 0.00 Stocks: decrease (increase) 609 -1,856,026.41 -1,989,965.31Services and miscellaneous goods 61 -81,639,390.91 -82,846,851.24 Sewage treatment contribution 61202 -36,967,489.84 -35,837,284.10 Sewerage contribution 61203 -26,757,034.52 -26,388,886.68 Sewerage contribution - customers with own extraction 61204 -1,018,871.60 140,686.14 Other services and miscellaneous goods 610/8 -16,895,994.95 -20,761,366.60Remuneration, social security and pensions 62 -20,278,923.26 -19,514,654.46Depreciation and impairment of formation expenses, intangible and tangible fixed assets 630 -6,481,347.77 -6,266,583.03
Impairments of stocks, orders in progress and trade receivables: transfers (reversals) 631/4 -177,061.21 -1,365,541.18
Provisions for risks and expenses: transfers (additions and reversals) 635/7 2,236,792.96 1,342,391.45Other operating expenses 640/8 -4,850,717.32 -5,478,508,.58Allocation of operating expenses 6499 -25,691,956.34 -19,956,813.14 Allocation 1: internal C (premises, post & insurance) 64997 0.00 0.00 Allocation 2: C -> P&G 64998 -11,971,672,02 -7,391,343,46 Allocation 3: G -> P 64999 -13,720,284.32 -12,565,469.68 Allocation 4: P -> RioP 64995 0.00 0.00 Allocation RioP ->Municipality 64996 0.00 0.00Internal allocation of costs 69 -1,305,852.25 -781,349.81Operating profit (loss -) 74/64 97,247.89 -4,488,365.46
PROVINCIAl SERVICE WEST FlANDERS
See reverse side >

78
Codes 2012 2011FINANCIAl INCOME 75 146,570.83 142,029.96Income from financial fixed assets 750 0.00 0.00Income from current assets 751 94,330.10 84,621.48Other financial income 752/9 52,240.73 57,408.48FINANCIAl EXPENSES 65 -857,440.54 -1,015,023.46Costs of debt 650 0.00 0.00Impairments of current assets other than stocks, orders in progress and trade receivables: transfers (reversal) 651 0.00 0.00
Other financial expenses 652/9 -2,663.26 -1,788.96Allocation of financial expenses 6599 -854,777.28 -1,013,234.50 Allocation 1: internal C (premises, post & insurance) 65997 0.00 0.00 Allocation 2: C -> P&G 65998 -1,390,783.57 -1,392,411.75 Allocation 3: G -> P 65999 536,006.29 379,177.25Profit (loss-) on ordinary activities 70/65 -613,621.82 -5,361,358.96
EXTRAORDINARY EXPENSES 76 70,468.90 146,762.78Reversal of depreciation and impairment of intangible and tangible fixed assets 760 0.00 0.00
Reversal of impairments on financial fixed assets 761 0.00 0.00Reversal of provisions for extraordinary risks and expenses 762 0.00 0.00gains on disposal of fixed assets 763 43,560.04 73,625.00Other extraordinary expenses 764/9 26,908.86 73,137.78EXTRAORDINARY EXPENSES 66 267,287.75 -89,916.28Extraordinary depreciation and impairment of formation expenses, intangible and tangible fixed assets 660 0.00 0.00
Impairment of financial fixed assets 661 0.00 0.00Provisions for extraordinary risks and expenses - Additions (transfers) 662 0.00 0.00losses on disposal of fixed assets 663 -174.95 -75,679.77Other extraordinary expenses 664/8 -5,612.87 -44.61Allocation of extraordinary expenses 669 273,075.57 -14,191.90 Allocation 1: internal C (premises, post & insurance) 66997 0.00 0.00 Allocation 2: C -> P&G 66998 179,073.89 22,157.33 Allocation 3: G -> P 66999 94,001.68 -36,349.23 Allocation 4: P -> RioP 66995 0.00 0.00 Allocation RioP -> Municipality 66996 0.00 0.00Profit (loss-) for the year before taxation 70/66 -275,865.17 -5,304,512.46 PROFIT (lOSS-) FOR APPROPRIATION 70/68 -275,865.17 -5,304,512.46PROFIT (lOSS-) bROUghT FORWARD FROM PREVIOUS YEAR 14P -14,645,785.06 -9,341,272.60PROFIT (lOSS-) TO bE CARRIED FORWARD (14) -14,921,650.23 -14,645,785.06DISTRIBUTABlE PROFIT 694/6 0.00 0.00
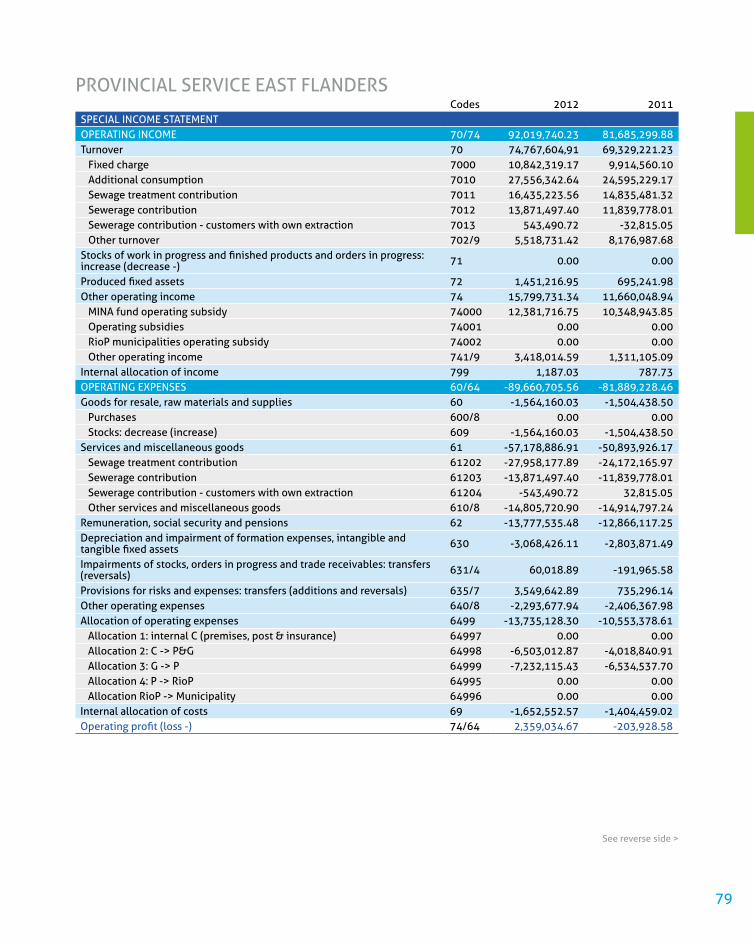
79
Codes 2012 2011SPECIAl INCOME STATEMENTOPERATING INCOME 70/74 92,019,740.23 81,685,299.88Turnover 70 74,767,604,91 69,329,221.23 Fixed charge 7000 10,842,319.17 9,914,560.10 Additional consumption 7010 27,556,342.64 24,595,229.17 Sewage treatment contribution 7011 16,435,223.56 14,835,481.32 Sewerage contribution 7012 13,871,497.40 11,839,778.01 Sewerage contribution - customers with own extraction 7013 543,490.72 -32,815.05 Other turnover 702/9 5,518,731.42 8,176,987.68Stocks of work in progress and finished products and orders in progress: increase (decrease -) 71 0.00 0.00
Produced fixed assets 72 1,451,216.95 695,241.98Other operating income 74 15,799,731.34 11,660,048.94 MINA fund operating subsidy 74000 12,381,716.75 10,348,943.85 Operating subsidies 74001 0.00 0.00 RioP municipalities operating subsidy 74002 0.00 0.00 Other operating income 741/9 3,418,014.59 1,311,105.09Internal allocation of income 799 1,187.03 787.73OPERATING EXPENSES 60/64 -89,660,705.56 -81,889,228.46Goods for resale, raw materials and supplies 60 -1,564,160.03 -1,504,438.50 Purchases 600/8 0.00 0.00 Stocks: decrease (increase) 609 -1,564,160.03 -1,504,438.50Services and miscellaneous goods 61 -57,178,886.91 -50,893,926.17 Sewage treatment contribution 61202 -27,958,177.89 -24,172,165.97 Sewerage contribution 61203 -13,871,497.40 -11,839,778.01 Sewerage contribution - customers with own extraction 61204 -543,490.72 32,815.05 Other services and miscellaneous goods 610/8 -14,805,720.90 -14,914,797.24Remuneration, social security and pensions 62 -13,777,535.48 -12,866,117.25Depreciation and impairment of formation expenses, intangible and tangible fixed assets 630 -3,068,426.11 -2,803,871.49
Impairments of stocks, orders in progress and trade receivables: transfers (reversals) 631/4 60,018.89 -191,965.58
Provisions for risks and expenses: transfers (additions and reversals) 635/7 3,549,642.89 735,296.14Other operating expenses 640/8 -2,293,677.94 -2,406,367.98Allocation of operating expenses 6499 -13,735,128.30 -10,553,378.61 Allocation 1: internal C (premises, post & insurance) 64997 0.00 0.00 Allocation 2: C -> P&G 64998 -6,503,012.87 -4,018,840.91 Allocation 3: G -> P 64999 -7,232,115.43 -6,534,537.70 Allocation 4: P -> RioP 64995 0.00 0.00 Allocation RioP -> Municipality 64996 0.00 0.00Internal allocation of costs 69 -1,652,552.57 -1,404,459.02Operating profit (loss -) 74/64 2,359,034.67 -203,928.58
PROVINCIAl SERVICE EAST FlANDERS
See reverse side >
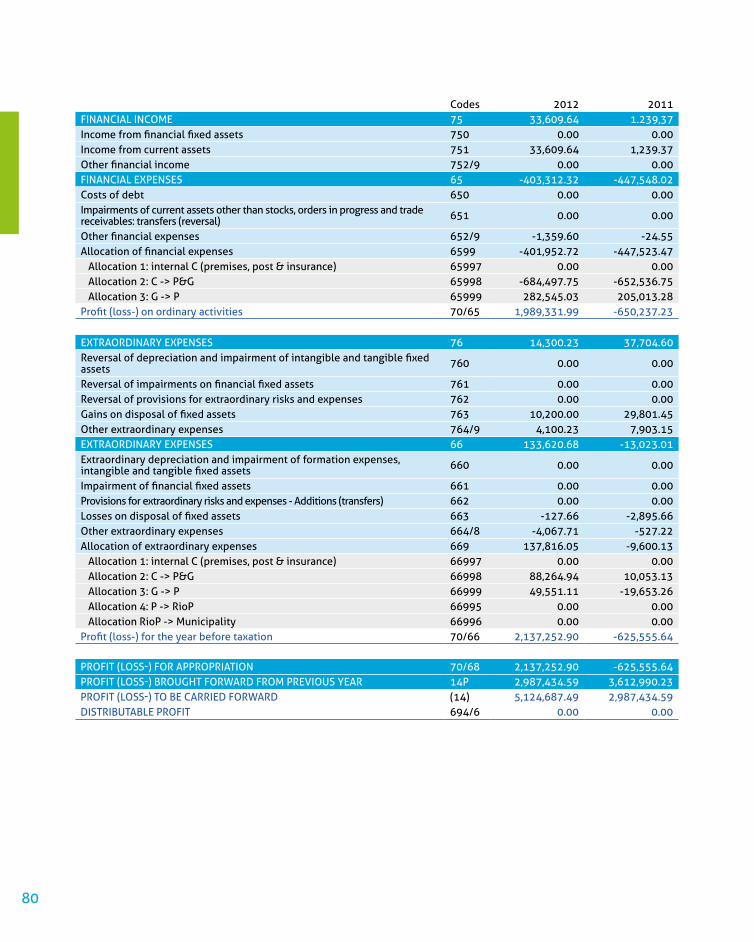
80
Codes 2012 2011FINANCIAl INCOME 75 33,609.64 1.239,37Income from financial fixed assets 750 0.00 0.00Income from current assets 751 33,609.64 1,239.37Other financial income 752/9 0.00 0.00FINANCIAl EXPENSES 65 -403,312.32 -447,548.02Costs of debt 650 0.00 0.00Impairments of current assets other than stocks, orders in progress and trade receivables: transfers (reversal) 651 0.00 0.00
Other financial expenses 652/9 -1,359.60 -24.55Allocation of financial expenses 6599 -401,952.72 -447,523.47 Allocation 1: internal C (premises, post & insurance) 65997 0.00 0.00 Allocation 2: C -> P&G 65998 -684,497.75 -652,536.75 Allocation 3: G -> P 65999 282,545.03 205,013.28Profit (loss-) on ordinary activities 70/65 1,989,331.99 -650,237.23
EXTRAORDINARY EXPENSES 76 14,300.23 37,704.60Reversal of depreciation and impairment of intangible and tangible fixed assets 760 0.00 0.00
Reversal of impairments on financial fixed assets 761 0.00 0.00Reversal of provisions for extraordinary risks and expenses 762 0.00 0.00gains on disposal of fixed assets 763 10,200.00 29,801.45Other extraordinary expenses 764/9 4,100.23 7,903.15EXTRAORDINARY EXPENSES 66 133,620.68 -13,023.01Extraordinary depreciation and impairment of formation expenses, intangible and tangible fixed assets 660 0.00 0.00
Impairment of financial fixed assets 661 0.00 0.00Provisions for extraordinary risks and expenses - Additions (transfers) 662 0.00 0.00losses on disposal of fixed assets 663 -127.66 -2,895.66Other extraordinary expenses 664/8 -4,067.71 -527.22Allocation of extraordinary expenses 669 137,816.05 -9,600.13 Allocation 1: internal C (premises, post & insurance) 66997 0.00 0.00 Allocation 2: C -> P&G 66998 88,264.94 10,053.13 Allocation 3: G -> P 66999 49,551.11 -19,653.26 Allocation 4: P -> RioP 66995 0.00 0.00 Allocation RioP -> Municipality 66996 0.00 0.00Profit (loss-) for the year before taxation 70/66 2,137,252.90 -625,555.64 PROFIT (lOSS-) FOR APPROPRIATION 70/68 2,137,252.90 -625,555.64PROFIT (lOSS-) bROUghT FORWARD FROM PREVIOUS YEAR 14P 2,987,434.59 3,612,990.23PROFIT (lOSS-) TO bE CARRIED FORWARD (14) 5,124,687.49 2,987,434.59DISTRIBUTABlE PROFIT 694/6 0.00 0.00
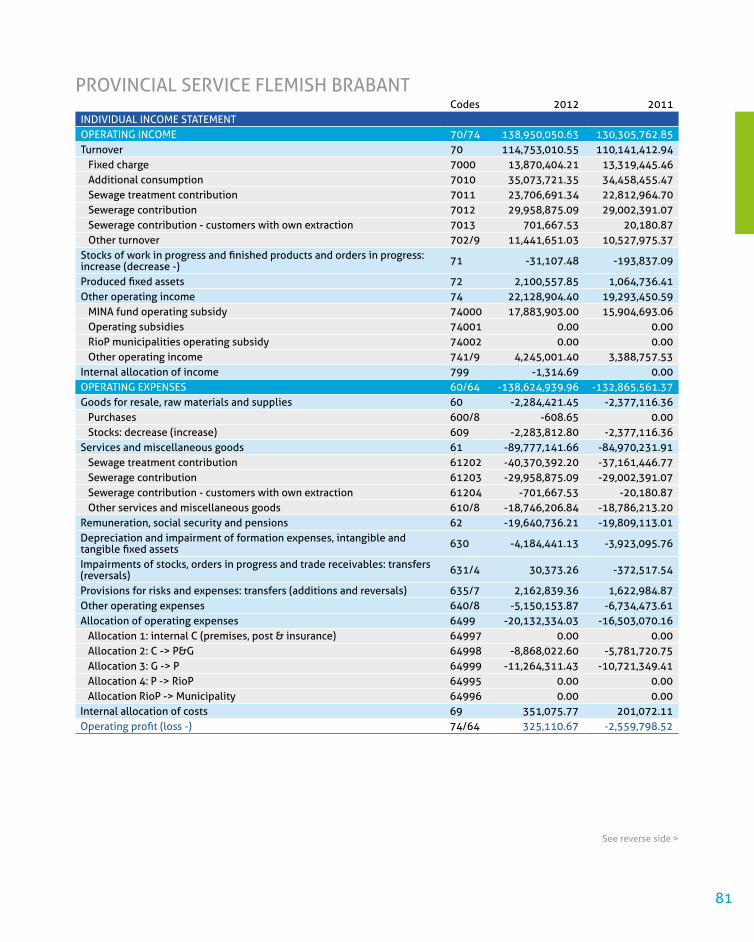
81
Codes 2012 2011INDIVIDUAl INCOME STATEMENTOPERATING INCOME 70/74 138,950,050.63 130,305,762.85Turnover 70 114,753,010.55 110,141,412.94 Fixed charge 7000 13,870,404.21 13,319,445.46 Additional consumption 7010 35,073,721.35 34,458,455.47 Sewage treatment contribution 7011 23,706,691.34 22,812,964.70 Sewerage contribution 7012 29,958,875.09 29,002,391.07 Sewerage contribution - customers with own extraction 7013 701,667.53 20,180.87 Other turnover 702/9 11,441,651.03 10,527,975.37Stocks of work in progress and finished products and orders in progress: increase (decrease -) 71 -31,107.48 -193,837.09
Produced fixed assets 72 2,100,557.85 1,064,736.41Other operating income 74 22,128,904.40 19,293,450.59 MINA fund operating subsidy 74000 17,883,903.00 15,904,693.06 Operating subsidies 74001 0.00 0.00 RioP municipalities operating subsidy 74002 0.00 0.00 Other operating income 741/9 4,245,001.40 3,388,757.53Internal allocation of income 799 -1,314.69 0.00OPERATING EXPENSES 60/64 -138,624,939.96 -132,865,561.37Goods for resale, raw materials and supplies 60 -2,284,421.45 -2,377,116.36 Purchases 600/8 -608.65 0.00 Stocks: decrease (increase) 609 -2,283,812.80 -2,377,116.36Services and miscellaneous goods 61 -89,777,141.66 -84,970,231.91 Sewage treatment contribution 61202 -40,370,392.20 -37,161,446.77 Sewerage contribution 61203 -29,958,875.09 -29,002,391.07 Sewerage contribution - customers with own extraction 61204 -701,667.53 -20,180.87 Other services and miscellaneous goods 610/8 -18,746,206.84 -18,786,213.20Remuneration, social security and pensions 62 -19,640,736.21 -19,809,113.01Depreciation and impairment of formation expenses, intangible and tangible fixed assets 630 -4,184,441.13 -3,923,095.76
Impairments of stocks, orders in progress and trade receivables: transfers (reversals) 631/4 30,373.26 -372,517.54
Provisions for risks and expenses: transfers (additions and reversals) 635/7 2,162,839.36 1,622,984.87Other operating expenses 640/8 -5,150,153.87 -6,734,473.61Allocation of operating expenses 6499 -20,132,334.03 -16,503,070.16 Allocation 1: internal C (premises, post & insurance) 64997 0.00 0.00 Allocation 2: C -> P&G 64998 -8,868,022.60 -5,781,720.75 Allocation 3: G -> P 64999 -11,264,311.43 -10,721,349.41 Allocation 4: P -> RioP 64995 0.00 0.00 Allocation RioP -> Municipality 64996 0.00 0.00Internal allocation of costs 69 351,075.77 201,072.11Operating profit (loss -) 74/64 325,110.67 -2,559,798.52
PROVINCIAl SERVICE FlEMISh BRABANT
See reverse side >

82
Codes 2012 2011FINANCIAl INCOME 75 56,838.30 96,164.73Income from financial fixed assets 750 0.00 0.00Income from current assets 751 56,838.30 96,164.73Other financial income 752/9 0.00 0.00FINANCIAl EXPENSES 65 -551,819.32 -774,683.43Costs of debt 650 0.00 0.00Impairments of current assets other than stocks, orders in progress and trade receivables: transfers (reversal) 651 0.00 0.00
Other financial expenses 652/9 -105,676.30 -210,820.69Allocation of financial expenses 6599 -446,143.02 -563,862.74 Allocation 1: internal C (premises, post & insurance) 65997 0.00 0.00 Allocation 2: C -> P&G 65998 -890,761.97 -895,066.72 Allocation 3: G -> P 65999 444,618.95 331,203.98Profit (loss-) on ordinary activities 70/65 -169,870.35 -3,238,317.22
EXTRAORDINARY EXPENSES 76 32,618.51 52,293.57Reversal of depreciation and impairment of intangible and tangible fixed assets 760 58.13 184.80
Reversal of impairments on financial fixed assets 761 0.00 0.00Reversal of provisions for extraordinary risks and expenses 762 0.00 0.00gains on disposal of fixed assets 763 25,950.00 39,600.00Other extraordinary expenses 764/9 6,610.38 12,508.77EXTRAORDINARY EXPENSES 66 186,844.40 -622,428.90Extraordinary depreciation and impairment of formation expenses, intangible and tangible fixed assets 660 0.00 0.00
Impairment of financial fixed assets 661 0.00 0.00Provisions for extraordinary risks and expenses - Additions (transfers) 662 0.00 0.00losses on disposal of fixed assets 663 -146.40 -575,648.45Other extraordinary expenses 664/8 -5,933.01 -28,659.33Allocation of extraordinary expenses 669 192,923.81 -18,121.12 Allocation 1: internal C (premises, post & insurance) 66997 0.00 0.00 Allocation 2: C -> P&G 66998 114,949.11 13,629.22 Allocation 3: G -> P 66999 77,974.70 -31,750.34 Allocation 4: P -> RioP 66995 0.00 0.00 Allocation RioP -> Municipality 66996 0.00 0.00Profit (loss-) for the year before taxation 70/66 49,592.56 -3,808,452,.55 PROFIT (lOSS-) FOR APPROPRIATION 70/68 49,592.56 -3,808,452.55PROFIT (lOSS-) bROUghT FORWARD FROM PREVIOUS YEAR 14P -6,363,074.73 -2,554,622.18PROFIT (lOSS-) TO bE CARRIED FORWARD (14) -6,313,482.17 -6,363,074.73DISTRIBUTABlE PROFIT 694/6 0.00 0.00
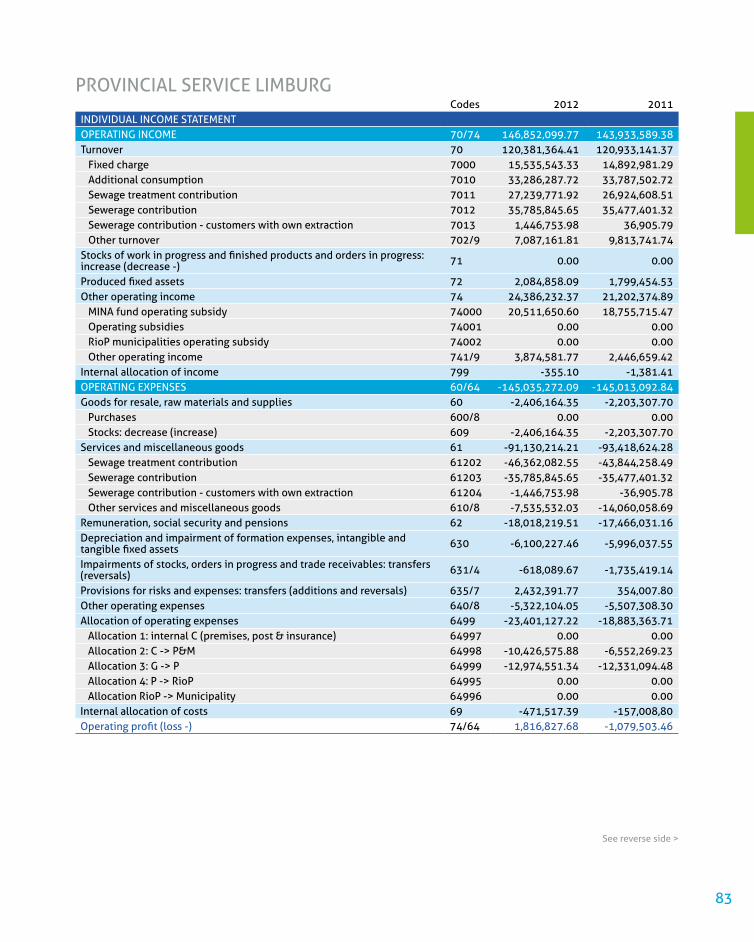
83
Codes 2012 2011INDIVIDUAl INCOME STATEMENTOPERATING INCOME 70/74 146,852,099.77 143,933,589.38Turnover 70 120,381,364.41 120,933,141.37 Fixed charge 7000 15,535,543.33 14,892,981.29 Additional consumption 7010 33,286,287.72 33,787,502.72 Sewage treatment contribution 7011 27,239,771.92 26,924,608.51 Sewerage contribution 7012 35,785,845.65 35,477,401.32 Sewerage contribution - customers with own extraction 7013 1,446,753.98 36,905.79 Other turnover 702/9 7,087,161.81 9,813,741.74Stocks of work in progress and finished products and orders in progress: increase (decrease -) 71 0.00 0.00
Produced fixed assets 72 2,084,858.09 1,799,454.53Other operating income 74 24,386,232.37 21,202,374.89 MINA fund operating subsidy 74000 20,511,650.60 18,755,715.47 Operating subsidies 74001 0.00 0.00 RioP municipalities operating subsidy 74002 0.00 0.00 Other operating income 741/9 3,874,581.77 2,446,659.42Internal allocation of income 799 -355.10 -1,381.41OPERATING EXPENSES 60/64 -145,035,272.09 -145,013,092.84Goods for resale, raw materials and supplies 60 -2,406,164.35 -2,203,307.70 Purchases 600/8 0.00 0.00 Stocks: decrease (increase) 609 -2,406,164.35 -2,203,307.70Services and miscellaneous goods 61 -91,130,214.21 -93,418,624.28 Sewage treatment contribution 61202 -46,362,082.55 -43,844,258.49 Sewerage contribution 61203 -35,785,845.65 -35,477,401.32 Sewerage contribution - customers with own extraction 61204 -1,446,753.98 -36,905.78 Other services and miscellaneous goods 610/8 -7,535,532.03 -14,060,058.69Remuneration, social security and pensions 62 -18,018,219.51 -17,466,031.16Depreciation and impairment of formation expenses, intangible and tangible fixed assets 630 -6,100,227.46 -5,996,037.55
Impairments of stocks, orders in progress and trade receivables: transfers (reversals) 631/4 -618,089.67 -1,735,419.14
Provisions for risks and expenses: transfers (additions and reversals) 635/7 2,432,391.77 354,007.80Other operating expenses 640/8 -5,322,104.05 -5,507,308.30Allocation of operating expenses 6499 -23,401,127.22 -18,883,363.71 Allocation 1: internal C (premises, post & insurance) 64997 0.00 0.00 Allocation 2: C -> P&M 64998 -10,426,575.88 -6,552,269.23 Allocation 3: G -> P 64999 -12,974,551.34 -12,331,094.48 Allocation 4: P -> RioP 64995 0.00 0.00 Allocation RioP -> Municipality 64996 0.00 0.00Internal allocation of costs 69 -471,517.39 -157,008,80Operating profit (loss -) 74/64 1,816,827.68 -1,079,503.46
PROVINCIAl SERVICE lIMBURG
See reverse side >
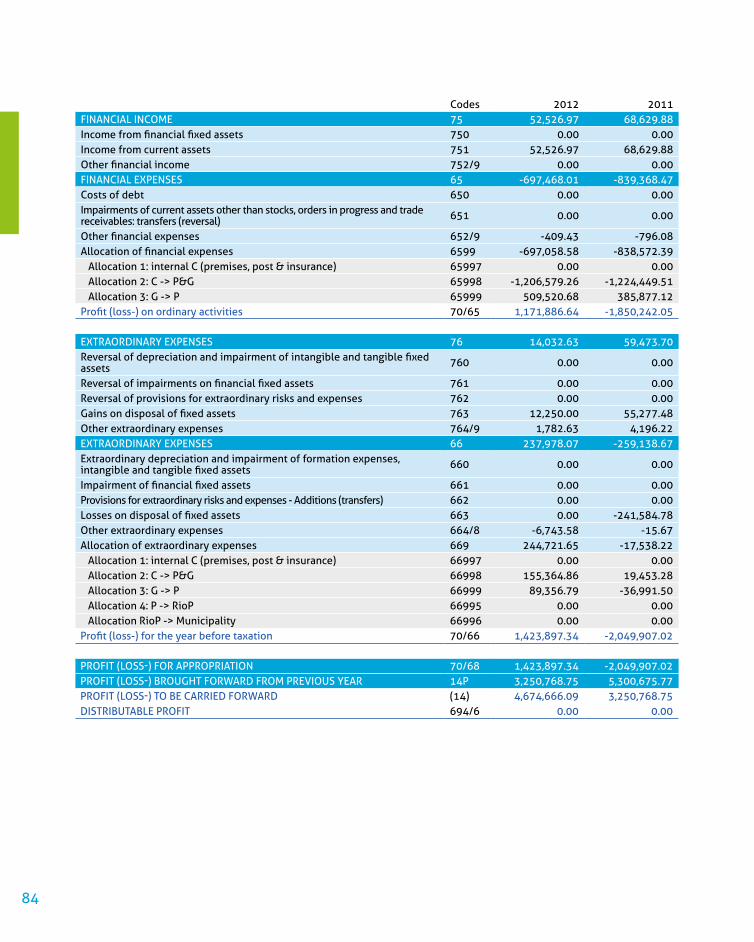
84
Codes 2012 2011FINANCIAl INCOME 75 52,526.97 68,629.88Income from financial fixed assets 750 0.00 0.00Income from current assets 751 52,526.97 68,629.88Other financial income 752/9 0.00 0.00FINANCIAl EXPENSES 65 -697,468.01 -839,368.47Costs of debt 650 0.00 0.00Impairments of current assets other than stocks, orders in progress and trade receivables: transfers (reversal) 651 0.00 0.00
Other financial expenses 652/9 -409.43 -796.08Allocation of financial expenses 6599 -697,058.58 -838,572.39 Allocation 1: internal C (premises, post & insurance) 65997 0.00 0.00 Allocation 2: C -> P&G 65998 -1,206,579.26 -1,224,449.51 Allocation 3: G -> P 65999 509,520.68 385,877.12Profit (loss-) on ordinary activities 70/65 1,171,886.64 -1,850,242.05 EXTRAORDINARY EXPENSES 76 14,032.63 59,473.70Reversal of depreciation and impairment of intangible and tangible fixed assets 760 0.00 0.00
Reversal of impairments on financial fixed assets 761 0.00 0.00Reversal of provisions for extraordinary risks and expenses 762 0.00 0.00gains on disposal of fixed assets 763 12,250.00 55,277.48Other extraordinary expenses 764/9 1,782.63 4,196.22EXTRAORDINARY EXPENSES 66 237,978.07 -259,138.67Extraordinary depreciation and impairment of formation expenses, intangible and tangible fixed assets 660 0.00 0.00
Impairment of financial fixed assets 661 0.00 0.00Provisions for extraordinary risks and expenses - Additions (transfers) 662 0.00 0.00losses on disposal of fixed assets 663 0.00 -241,584.78Other extraordinary expenses 664/8 -6,743.58 -15.67Allocation of extraordinary expenses 669 244,721.65 -17,538.22 Allocation 1: internal C (premises, post & insurance) 66997 0.00 0.00 Allocation 2: C -> P&G 66998 155,364.86 19,453.28 Allocation 3: G -> P 66999 89,356.79 -36,991.50 Allocation 4: P -> RioP 66995 0.00 0.00 Allocation RioP -> Municipality 66996 0.00 0.00Profit (loss-) for the year before taxation 70/66 1,423,897.34 -2,049,907.02 PROFIT (lOSS-) FOR APPROPRIATION 70/68 1,423,897.34 -2,049,907.02PROFIT (lOSS-) bROUghT FORWARD FROM PREVIOUS YEAR 14P 3,250,768.75 5,300,675.77PROFIT (lOSS-) TO bE CARRIED FORWARD (14) 4,674,666.09 3,250,768.75DISTRIBUTABlE PROFIT 694/6 0.00 0.00

85
Codes 2012 2011INDIVIDUAl INCOME STATEMENTOPERATING INCOME 70/74 2,260,303.66 2,696,959.73Turnover 70 2,080,004.95 1,928,298.93 Fixed charge 7000 0.00 0.00 Additional consumption 7010 0.00 0.00 Sewage treatment contribution 7011 0.00 0.00 Sewerage contribution 7012 1,894,373.15 2,005,143.04 Sewerage contribution - customers with own extraction 7013 85,097,52 -165,483.75 Other turnover 702/9 100,534.28 88,639.64Stocks of work in progress and finished products and orders in progress: increase (decrease -) 71 0.00 0.00
Produced fixed assets 72 1,439.42 18,516.06Other operating income 74 178,859.29 750,144.74 MINA fund operating subsidy 74000 0.00 0.00 Operating subsidies 74001 0.00 0.00 RioP municipalities operating subsidy 74002 177,021.34 750,114.74 Other operating income 741/9 1,837.95 30.00Internal allocation of income 799 0.00 0.00OPERATING EXPENSES 60/64 -1,628,888.94 -1,672,772.90Goods for resale, raw materials and supplies 60 -660.97 48.95 Purchases 600/8 0.00 0.00 Stocks: decrease (increase) 609 -660.97 48.95Services and miscellaneous goods 61 -515,481.13 -669,185.21 Sewage treatment contribution 61202 0.00 0.00 Sewerage contribution 61203 0.00 0.00 Sewerage contribution - customers with own extraction 61204 0.00 0.00 Other services and miscellaneous goods 610/8 -515,481.13 -669,185.21Remuneration, social security and pensions 62 -286,902.92 -293,122.69Depreciation and impairment of formation expenses, intangible and tangible fixed assets 630 -523,351.81 -541,725.73
Impairments of stocks, orders in progress and trade receivables: transfers (reversals) 631/4 -3.54 -3.54
Provisions for risks and expenses: transfers (additions and reversals) 635/7 0.00 0.00Other operating expenses 640/8 -38,469.05 -3,614.20Allocation of operating expenses 6499 -189,709.58 -165,137.15 Allocation 1: internal C (premises, post & insurance) 64997 0.00 0.00 Allocation 2: C -> P&G 64998 -189,709.58 -165,137.14 Allocation 3: G -> P 64999 0.00 0.00 Allocation 4: P -> RioP 64995 0.00 0.00 Allocation RioP -> Municipality 64996 0.00 -0.01Internal allocation of costs 69 -74,309.94 -33.33Operating profit (loss -) 74/64 631,414.72 1,024,186.83
See reverse side >
RioP West Flanders

86
Codes 2012 2011FINANCIAl INCOME 75 0.00 0.00Income from financial fixed assets 750 0.00 0.00Income from current assets 751 0.00 0.00Other financial income 752/9 0.00 0.00FINANCIAl EXPENSES 65 -60,226.59 -28,624.40Costs of debt 650 -60,226.59 -28,624.40Impairments of current assets other than stocks, orders in progress and trade receivables: transfers (reversal) 651 0.00 0.00
Other financial expenses 652/9 0.00 0.00Allocation of financial expenses 6599 0.00 0.00 Allocation 1: internal C (premises, post & insurance) 65997 0.00 0.00 Allocation 2: C -> P&G 65998 0.00 0.00 Allocation 3: G -> P 65999 0.00 0.00Profit (loss-) on ordinary activities 70/65 571,188.13 995,562.43 EXTRAORDINARY EXPENSES 76 0.00 0.00Reversal of depreciation and impairment of intangible and tangible fixed assets 760 0.00 0.00
Reversal of impairments on financial fixed assets 761 0.00 0.00Reversal of provisions for extraordinary risks and expenses 762 0.00 0.00gains on disposal of fixed assets 763 0.00 0.00Other extraordinary expenses 764/9 0.00 0.00EXTRAORDINARY EXPENSES 66 11,186.69 1,716.66Extraordinary depreciation and impairment of formation expenses, intangible and tangible fixed assets 660 0.00 0.00
Impairment of financial fixed assets 661 0.00 0.00Provisions for extraordinary risks and expenses - Additions (transfers) 662 0.00 0.00losses on disposal of fixed assets 663 0.00 0.00Other extraordinary expenses 664/8 0.00 0.00Allocation of extraordinary expenses 669 11,186.69 1,716.66 Allocation 1: internal C (premises, post & insurance) 66997 0.00 0.00 Allocation 2: C -> P&G 66998 11,186.69 1,716.68 Allocation 3: G -> P 66999 0.00 0.00 Allocation 4: P -> RioP 66995 0.00 0.00 Allocation RioP -> Municipality 66996 0.00 -0,02Profit (loss-) for the year before taxation 70/66 582,374.82 997,279.09 PROFIT (lOSS-) FOR APPROPRIATION 70/68 582,374.82 997,279.09PROFIT (lOSS-) bROUghT FORWARD FROM PREVIOUS YEAR 14P 2,093,404.72 1,096,125.63PROFIT (lOSS-) TO bE CARRIED FORWARD (14) 2,583,976.31 2,093,404.72DISTRIBUTABlE PROFIT 694/6 91,803.23 0.00

87
Codes 2012 2011INDIVIDUAl INCOME STATEMENTOPERATING INCOME 70/74 6,970,997.86 8,390,484.73Turnover 70 6,793,522.80 6,272,191.06 Fixed charge 7000 0.00 0.00 Additional consumption 7010 0.00 0.00 Sewage treatment contribution 7011 0.00 0.00 Sewerage contribution 7012 6,191,571.34 5,901,776.02 Sewerage contribution - customers with own extraction 7013 170,395.35 -72,295.84 Other turnover 702/9 431,556.11 442,710.88Stocks of work in progress and finished products and orders in progress: increase (decrease -) 71 0.00 0.00
Produced fixed assets 72 115,196.47 96,306.76Other operating income 74 62,278.59 2,021,986.91 MINA fund operating subsidy 74000 0.00 0.00 Operating subsidies 74001 0.00 0.00 RioP municipalities operating subsidy 74002 61,397.62 2,021,709.41 Other operating income 741/9 880.97 277.50Internal allocation of income 799 0.00 0.00OPERATING EXPENSES 60/64 -4,321,419.80 -3,799,067.35Goods for resale, raw materials and supplies 60 -17,488.25 -10,368.80 Purchases 600/8 0.00 0.00 Stocks: decrease (increase) 609 -17,488.25 -10,368.80Services and miscellaneous goods 61 -1,810,786.74 -1,565,587.88 Sewage treatment contribution 61202 0.00 0.00 Sewerage contribution 61203 0.00 0.00 Sewerage contribution - customers with own extraction 61204 0.00 0.00 Other services and miscellaneous goods 610/8 -1,810,786.74 -1,565,587.88Remuneration, social security and pensions 62 -484,251.81 -347,193.27Depreciation and impairment of formation expenses, intangible and tangible fixed assets 630 -1,338,891.46 -1,343,262.56
Impairments of stocks, orders in progress and trade receivables: transfers (reversals) 631/4 -525.83 -3.54
Provisions for risks and expenses: transfers (additions and reversals) 635/7 0.00 0.00Other operating expenses 640/8 -114,159.60 -90,843.92Allocation of operating expenses 6499 -494,821.30 -390,368.89 Allocation 1: internal C (premises, post & insurance) 64997 0.00 0.00 Allocation 2: C -> P&G 64998 -494,821.30 -390,368.90 Allocation 3: G -> P 64999 0.00 0.00 Allocation 4: P -> RioP 64995 0.00 0.00 Allocation RioP -> Municipality 64996 0.00 0.01Internal allocation of costs 69 -60,494.81 -51,438.49Operating profit (loss -) 74/64 2,649,578.06 4,591,417.38
See reverse side >
RioP East Flanders

88
Codes 2012 2011FINANCIAl INCOME 75 62.50 0.00Income from financial fixed assets 750 0.00 0.00Income from current assets 751 0.00 0.00Other financial income 752/9 62.50 0.00FINANCIAl EXPENSES 65 -278,969.09 -137,099.43Costs of debt 650 -278,969.09 -137,099.43Impairments of current assets other than stocks, orders in progress and trade receivables: transfers (reversal) 651 0.00 0.00
Other financial expenses 652/9 0.00 0.00Allocation of financial expenses 6599 0.00 0.00 Allocation 1: internal C (premises, post & insurance) 65997 0.00 0.00 Allocation 2: C -> P&G 65998 0.00 0.00 Allocation 3: G -> P 65999 0.00 0.00Profit (loss-) on ordinary activities 70/65 2,370,671.47 4,454,317.95 EXTRAORDINARY EXPENSES 76 0.00 0.00Reversal of depreciation and impairment of intangible and tangible fixed assets 760 0.00 0.00
Reversal of impairments on financial fixed assets 761 0.00 0.00Reversal of provisions for extraordinary risks and expenses 762 0.00 0.00gains on disposal of fixed assets 763 0.00 0.00Other extraordinary expenses 764/9 0.00 0.00EXTRAORDINARY EXPENSES 66 31,430.45 4,346.68Extraordinary depreciation and impairment of formation expenses, intangible and tangible fixed assets 660 0.00 0.00
Impairment of financial fixed assets 661 0.00 0.00Provisions for extraordinary risks and expenses - Additions (transfers) 662 0.00 0.00losses on disposal of fixed assets 663 0.00 0.00Other extraordinary expenses 664/8 0.00 0.00Allocation of extraordinary expenses 669 31,430.45 4,346.68 Allocation 1: internal C (premises, post & insurance) 66997 0.00 0.00 Allocation 2: C -> P&G 66998 31,430.45 4,346.66 Allocation 3: G -> P 66999 0.00 0.00 Allocation 4: P -> RioP 66995 0.00 0.00 Allocation RioP -> Municipality 66996 0.00 0.02Profit (loss-) for the year before taxation 70/66 2,402,101.92 4,458,664.63 PROFIT (lOSS-) FOR APPROPRIATION 70/68 2,402,101.92 4,458,664.63PROFIT (lOSS-) bROUghT FORWARD FROM PREVIOUS YEAR 14P 7,115,654.61 2,656,989.98PROFIT (lOSS-) TO bE CARRIED FORWARD (14) 9,517,756.53 7,115,654.61DISTRIBUTABlE PROFIT 694/6 0.00 0.00
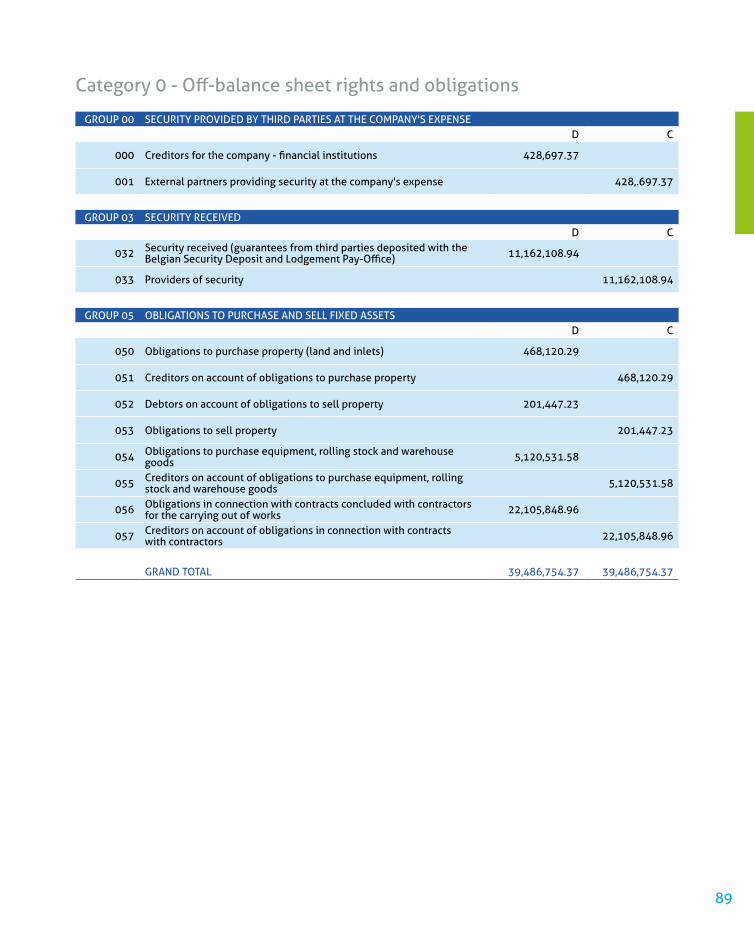
89
Category 0 - Off-balance sheet rights and obligations
GROUP 00 SECURITY PROVIDED BY ThIRD PARTIES AT ThE COMPANY'S EXPENSED C
000 Creditors for the company - financial institutions 428,697.37
001 External partners providing security at the company's expense 428,.697.37
GROUP 03 SECURITY RECEIVEDD C
032 Security received (guarantees from third parties deposited with the belgian Security Deposit and lodgement Pay-Office) 11,162,108.94
033 Providers of security 11,162,108.94
GROUP 05 OBlIGATIONS TO PURChASE AND SEll FIXED ASSETSD C
050 Obligations to purchase property (land and inlets) 468,120.29
051 Creditors on account of obligations to purchase property 468,120.29
052 Debtors on account of obligations to sell property 201,447.23
053 Obligations to sell property 201,447.23
054 Obligations to purchase equipment, rolling stock and warehouse goods 5,120,531.58
055 Creditors on account of obligations to purchase equipment, rolling stock and warehouse goods 5,120,531.58
056 Obligations in connection with contracts concluded with contractors for the carrying out of works 22,105,848.96
057 Creditors on account of obligations in connection with contracts with contractors 22,105,848.96
GRAND TOTAl 39,486,754.37 39,486,754.37
90
A. DEPRECIATION
As of 1 January 1998, all assets are depreciated on a pro rata basis.
Formation expenses (20XXX)
The formation expenses are charged directly to the income statement.
Intangible fixed assets (21XXX)
Computer software (21100): amortised by the straight line method over 36 months (33%).
Knowhow (21120): amortised by the straight line method over a 5-year period (20%).
Business assets (21400): amortised over a 5-year period (20%).
Tangible fixed assets (22XXX/25XXX)
1. Land (22000 + 22200) (including surface inlets)
land is not depreciated, even if a building is subsequently erected on it.
land that forms part of developed property purchased and for which no separate valuation could be obtained for the land and the building (applies only to purchases up to and including 1990) is depreciated as an integral component of the total value of the purchased property.
2. Buildings (221XX + 22200)2.1. Offices and buildings for operational purposes (22100 + 22200)
Realised up to and including 31-12-1995: straight line depreciation over 50 years (2%).
Realised from 01-01-1996: straight line depreciation over 30 years (3.33%).
2.2. Production and supply installations (22100 + 22200) in the drinking water infrastructure (water towers, reservoirs, pressure installations, pumping stations and treatment plants)
Realised up to and including 31-12-1990: From 01-01-1991 to 31-12-1995 these were
depreciated by the straight line method over 60 years (1.67%). From 01-01-1996, they are depreciated on their net book value at 31-12-1995 over 25 years in equal, annual instalments (4%), bringing the total depreciation period to 30 years.
Realised with effect from 01-01-1991 up to 31-12-1995: straight line depreciation over 50 years (2%).
Verwezenlijkt vanaf 01-01-1996: lineair af te schrijven over 30 jaar (3,33%).
Realised with effect from 01-01-1996: straight line depreciation over 30 years (3.33%).
Investments in electromechanical equipment (22110) at these production and supply installations in the drinking water infrastructure (pumps, measuring and control equipment, pipelines, switchboards etc. - in short, fixtures) are depreciated by the straight line method over 20 years (5%).
Coordinated accounting policies
(Royal Decree of 08.10.1976 – art. 15 para.2)
(approved by the Board of Directors at its meeting on 29 March 2013)

91
For adaptation and renovation works (22120) which are regarded as investments (their value exceeds 125,000 euros in the case of buildings):
If these works to buildings total between 125,000 euros and 750,000 euros, they are capitalised and depreciated by the straight line method over 10 years (10%).
Works in excess of 750,000 euros are depreciated by the straight line method over 20 years (5%).
2.3 Sewage pumping stations (22150)The investment in the structural part of sewage pumping stations is depreciated by the straight line method over 30 years (3.33%).Investments in electromechanical equipment (22160) at these sewage pumping stations (pumps, measuring and control equipment, pipelines, switchboards etc. - in short, fixtures) are depreciated by the straight line method over 15 years (6.67%).
3. Assets acquired under the leasehold system or any other right in rem (22300)
These assets are depreciated by the straight line method over the duration of the lease or right in rem.
4. Contractual water-related installations (22400)These are depreciated by the straight line method over the duration of the contract.
5. Reservoirs (22500)The De Blankaart and Kluizen reservoirs are depreciated by the straight line method over 20 years (5%).
6. Distribution pipes (23010), supply pipes (23000) and sewers (23030)
Supply pipes (23000) and distribution pipes (23010) are distinguished by the pipe’s nominal diameter: pipes up to a nominal diameter of 150 mm are distribution pipes.
The depreciation period for drinking water pipes depends on the nature of the material. Depreciation is performed until a residual value of 20% of the initial purchase value is reached:
Sort of material Average lifePVC before 1973 45 yearsPVC after 1973 75 yearsPolyethyleen 75 yearsAsbestos cement 75 yearsGrey cast iron 75 yearsDuctile cast iron 75 yearsSteel 75 yearsReinforced concrete 75 yearsOther 60 years
Sewers (23030) are depreciated by the straight line method over 75 years, until a residual value of 20% of the initial purchase value is reached.
Sewers that are taken over when a partner joins the company and for which no detailed inventory is yet available are assumed to have an average life of 75 years. Their average age is estimated at 30 years. Consequently, these sewers are depreciated over 45 years.
Any change to the pipelines and sewers (both new investments and replacement investments and decommissioning) is reconciled on the basis of standard, coordinated data recording procedures between the technical equipment and accounting records before being recognised in the financial statements.
7. Chambers (on pipelines or in sewers) (23020)Chambers are depreciated by the straight line method over a 20 year period, until a residual value of 20% of the initial purchase value is reached.
8. Individual treatment systems for waste water (23040)
These are depreciated by the straight line method over 15 years (6.67%).
9. Drinking water branch pipes (23060)Branch pipes are depreciated by the straight line method over 30 years, until a residual value of 20% of the initial purchase value is reached.
92
In 2012, an analysis was performed in order to ascertain the replacement value of the existing drinking water branch pipes. On 31-12-2012 the branch pipes were recognised on the balance sheet at a value of 251.4 million euros.
10. Excavators (23100)These are depreciated by the straight line method over 5 years (20%).
11. Large equipment (compressors, damming equipment, construction pumps etc.) (23200)
This equipment is depreciated by the straight line method over 5 years (20%).
12. IT equipment (hardware and system software) (23300)
IT equipment is depreciated by the straight line method over 36 months (33%).
13. Precision instruments (23400)These include devices used for surveying and are depreciated by the straight line method over 5 years (20%).
14. Telecommunications equipment (radio equipment, modems, telephone switchboards and telephones, fax machines, data transmission lines etc.) (23500)
All new equipment is subjected to straight line depreciation over 5 years (20%).
15. Furniture (chairs, cupboards, desks etc.) (24000, 24010)
Furniture is depreciated by the straight line method over 10 years (10%).
16. Laboratory equipment (24020)This equipment is depreciated by the straight line method over 5 years (20%).
17. Vehicles (HGVs and vans, cars and dual-purpose vehicles) (24100 + 24110)
Vehicles are depreciated by the straight line method over 5 years (20%).
18. Leasing (25XXX)leases are amortised over the term of the contract.
B. CAPITALISATION OF TANGIBLE FIXED ASSETS
Purchased tangible fixed assetsThese assets are capitalised on the basis of purchase price, plus the notary’s fees, registration costs and, if applicable, the costs of compulsory purchase. Other costs, such as loss of crops, surveys, provisional commissioning etc. are recognised in the results.
Self-produced fixed assets (depreciated in the same manner as purchased tangible fixed assets)These assets are valued at their cost of manufacture. In addition to the purchase costs of raw materials, consumables and supplies, this also includes the production costs directly attributable to the individual product or product group.As of 2012, the costs of design, studies, supervision of the progress of work and cooperation with delivery (in short, the “engineering costs”) are also capitalised. The impact of this new accounting policy is elucidated in the annual report.Until such time as they are fully complete, these assets are recognised under “fixed assets under construction”.

93
C. STOCKS
1. Warehouse stocks (30XXX)The stocks are valued when the annual inventories are drawn up.With effect from 1 January 2000, stock is valued according to the FIFO method. An impairment of 100% is recognised on stocks older than three years.
2. Work in progress (32XXX)This is valued at the cost of manufacture and only contains direct costs.
D. INVESTMENTS AND CASH AND CASH EQUIVALENTS
Credit balances at banks are carried at nominal value. An impairment is recognised if their realisable value on the reporting date is lower than their book value.
Payments in foreign currency Payments are converted from euro to foreign currency at the official exchange rates on the date of the transaction. As the volume of transactions with parties abroad is small, no provisions are formed for exchange rate fluctuations.
E. PROVISIONS FOR RISKS AND EXPENSES
A provision for risks an expenses is formed for the risks and potential losses that are known on the reporting date and which have arisen during the financial year or previous financial years.
F. RECEIVABLES DUE WITHIN ONE YEAR
If there are no historic impairment rates available, the general provision for bad debts is calculated as follows:(total trade receivables older than one year at 50%) + (total trade receivables older than two years at 100%).
G. RESEARCH AND DEVELOPMENT
The costs associated with research and development are charged to the income statement in the financial year in which they are incurred.
H. TURNOVER FROM WATER SALES
Due to the billing system and frequency in the sales process, the billing date is taken as the basis for determining the cut-off dates for turnover.

94
In accordance with the provisions of law and the Articles of Association, we present to you our report in connection with our remit as auditor. This report con-tains our opinion on the annual financial statements for the financial year ended 31 December 2012, as de-fined below, and our opinion on other requirements of the relevant laws and regulations.
Report on the annual financial statements - Unqualified opinion
We have audited the annual financial statements of VlAAMSE MAATSChAPPIJ VOOR WATERVOORZIENING CVbA (“the company”) for the financial year which ended on 31 December 2012, which have been drawn up in accordance with the accounting reference system applicable in Belgium. These financial statements comprise the balance sheet at 31 December 2012, the income statement for the financial year ended on that date, and the notes. Total assets are EUR 1,900,361,190 and the income statement records profit for the year of EUR 6,319,354.
Responsibility of the Board of Directors for preparing the financial statementsThe Board of Directors is responsible for preparing the financial statements, which present a true and fair picture in accordance with the accounting reference system applicable in Belgium, and for implementing an internal control system which the Board deems necessary in order to prepare financial statements which are free from material misstatement, whether due to fraud or error.
Responsibility of the auditorIt is our responsibility to express an opinion on these financial statements, based on our audit. We performed our audit in accordance with international auditing standards (ISA). These standards require that we comply with the ethical requirements applicable to us and plan and perform our audit to obtain reasonable assurance about whether the financial statements are free from material misstatement.
An audit involves performing procedures to obtain audit evidence about the amounts and disclosures in the financial statements. The procedures selected depend on the auditor’s judgment, including the assessment of the risks of material misstatement of the financial statements, whether due to fraud or error. In making those risk assessments, the auditor considers the company’s internal control relevant to the preparation and fair presentation of the financial statements by the company, in order to design audit procedures that are appropriate in the circumstances, but not for the purpose of expressing an opinion on the effectiveness of the company’s internal control. An audit also includes evaluating the appropriateness of accounting policies used and the reasonableness of accounting estimates made by the Board of Directors, as well as evaluating the overall presentation of the financial statements we obtained the clarifications and evidence necessary for our audit from the persons responsible and from the company’s Board of Directors. We believe that the audit evidence we have obtained is sufficient and appropriate to provide a basis for our unqualified audit opinion.
Report of the Auditor to the Annual General Meeting of DE WATERGROEP (Vlaamse Maatschappij voor Watervoorziening cvba) on the financial year ending on 31 December 2012

95
Unqualified opinionIn our opinion, the financial statements give a true and fair view of the financial position of the company as at 31 December 2012 and of its results for the financial year ending on that date, in accordance with the accounting reference system applicable in Belgium.
Opinion on other requirements set by the relevant laws and regulations
The Board of Directors is responsible for the prepa-ration and content of the annual report, compliance with the statutory and administrative requirements applicable to the accounting system, and for compli-ance with the Belgian Companies Code and the com-pany’s Articles of Association.
As part of our mandate, it is our responsibility to verify compliance with certain statutory and admi-nistrative requirements in all material respects. We therefore add the following, additional comments, which do not alter the scope of our opinion on the financial statements:
The annual report comprises the information required by law, is consistent in all material respects with the financial statements and does not contain any information that is evidently inconsistent with the information at our disposal in connection with our mandate.
Notwithstanding formal aspects of secondary importance, the accounts were kept in accordance with the statutory and administrative requirements applicable in Belgium.
The appropriation of profit which is now proposed to the Annual General Meeting is in accordance with the provisions of law and the Articles of Association.
As regards the appropriation of the profit proposed to the Annual General Meeting, we refer to the Board of Directors’ annual report which, in accordance with Article 41 of the Articles of Association, discloses the result for the financial year as evidenced by the individual income statement to 31 December 2012 for each water service established by the Vlaamse Maatschappij voor Watervoorziening.
There are no transactions effected or decisions made of which we must inform you that are in contravention of the Articles of Association or the Belgian Companies Code.
Brussels, 30 May 2013
KPMG & PartnersAuditors
represented by
luc Vleck Wim heyndrickxAuditor Auditor

Provincial office West FlandersRoggelaan 2, 8500 KortrijkTel. 056 23 17 11 - Fax 056 23 17 [email protected]
Sectoral service centresNoord Zedelgemsesteenweg 2 8480 Eernegem Tel. 059 29 99 83 Fax 059 29 81 44
Oost Roterijstraat 131 8790 Waregem Tel. 056 60 41 73 Fax 056 61 00 86
Zuid Westlaan 9 8560 Wevelgem Tel. 056 24 04 60 Fax 056 51 89 81
Westhoek Frankrijklaan 12 8970 Poperinge Tel. 057 34 69 30 Fax 057 33 85 11
Centrum Wagenmakersstraat 54 8500 Kortrijk Tel. 056 21 09 56 Fax 056 22 42 97
Provincial office East FlandersKoning Boudewijnstraat 46, 9000 GentTel. 09 240 91 11 - Fax 09 222 89 [email protected]
Sectoral service centresMeetjesland Ringlaan 13 9900 Eeklo Tel. 09 377 27 91 Fax 09 377 05 44
Waasland K. Boudewijnlaan 42 9160 Lokeren Tel. 09 348 39 11 Fax 09 348 90 46
Denderstreek Nederwijk 263 9400 Ninove Tel. 054 32 38 11 Fax 054 32 52 45
Provincial office Flemish BrabantHerbert Hooverplein 23, 3000 LeuvenTel. 016 24 09 11 - Fax 016 23 93 [email protected]
Sectoral service centresNoord Wingepark 57 3110 Rotselaar Tel. 016 44 27 40 Fax 016 44 27 59
Oost Grijpenlaan 1 3300 Tienen Tel. 016 80 49 10 Fax 016 80 49 39
Zuid Waversebaan 22 3050 Oud-Heverlee Tel. 016 38 74 10 Fax 016 38 74 29
West Assesteenweg 116 1750 Lennik Tel. 02 454 00 60 Fax 02 454 56 27
noordwest Twee Leeuwenweg 21 1800 Vilvoorde Tel. 02 254 71 60 Fax 02 254 71 80
Provincial office LimburgRunkstersteenweg 208, 3500 HasseltTel. 011 28 06 11 - Fax 011 27 57 [email protected]
Sectoral service centresNoord De Roosen 15 3910 Neerpelt Tel. 011 80 89 50 Fax 011 66 43 37
Oost Kantonnale Baan 3 3635 As Tel. 089 86 94 70 Fax 089 65 97 18
Zuidoost Hasseltsestraat 34 3740 Bilzen Tel. 089 41 08 40 Fax 089 41 33 79
Zuidwest Bedrijvenstraat 4513 3800 Sint-Truiden Tel. 011 69 74 80 Fax 011 69 18 47
West Korspelsesteenweg 75 3581 Beringen Tel. 011 34 02 70 Fax 011 34 87 77
Provincial office Limburg
Provincial office West Flanders
Provincial office East Flanders
Provincial office Flemish Brabant
Mesen
Staden
Hooglede
Oudenburg
Pittem
Ardooie
Middelkerke
Jabbeke
ZedelgemGistel
KoekelareIchtegem
Torhout
Oostkamp
Wingene
Kortemark
Diksmuide
Houthulst
Lichtervelde
Bredene
Oostende
Tielt
Langemark-Poelkapelle
Roeselare
IzegemIngelmunster
Meulebeke
Dentergem
Oostrozebeke
Wielsbeke
Waregem
Harelbeke
LendeledeLedegem
Moorslede
ZonnebekeIeper
Wervik Menen
Wevelgem Kortrijk
Zwevegem
KuurneDeerlijk
Anzegem
Avelgem
Spiere-Helkijn
Heuvelland
Poperinge
Vleteren
Lo-Reninge
BRUGGE
GENT
Sint-Niklaas
Maldegem
Sint-Laureins
Eeklo
KaprijkeAssenede
Wachtebeke
Evergem
Waarschoot
Lochristi
Laarne
Stekene
Moerbeke
Lokeren
Berlare
Zele
Waasmunster
Sint-Gillis-Waas Beveren
Kruibeke
Temse
Herzele
Haaltert Denderleeuw
Ninove
Lierde
Geraardsbergen
Herne
Galmaarden
Bever
Pepingen
Gooik
Lennik
Roosdaal
Opwijk
Merchtem
Meise
Londerzeel Kapelle-opden-Bos
BRUSSEL
Ternat
Halle
Grimbergen
Zemst
Steenokkerzeel
Vilvoorde
Zaventem
Tervuren
Kortenberg
Bertem
Huldenberg
Overijse
Oud-Heverlee
Herent
Kampenhout
LEUVEN
BoortmeerbeekHaacht
Rotselaar
KeerbergenTremelo
Begijnendijk
Aarschot
Holsbeek
Lubbeek
Bierbeek
Boutersem
Hoegaarden
Tienen
Glabbeek
Tielt-Winge
Bekkevoort
Scherpenheuvel-Zichem
Diest
Landen
As
Meeuwen-Gruitrode
Kortessem
Hoeselt
Tessenderlo
Lummen
Geetbets
Sint-Truiden
GingelomHeers
Borgloon
Wellen
Heusden-Zolder
Zonhoven
HASSELT
Diepenbeek
Tongeren
Herstappe
Ham
Houthalen-Helchteren
Genk
Zutendaal
Bilzen
Riemst
Lanaken
Maasmechelen
Opglabbeek
Voeren
Dilsen-Stokkem
Maaseik
Lommel
Overpelt
Neerpelt
Hamont-Achel
Bocholt
PeerHechtel-Eksel Bree
Kinrooi
Liedekerke
Halen Herk-de-Stad
Nieuwerkerken
Beringen
Alken
water tower
storage basin
provincial offices
sectoral service centres