UGent: Pieter Spanoghe, Sofie Vergucht & Walter Steurbaut · Naam presentatie – Pieter Spanoghe...
44
Naam presentatie – Pieter Spanoghe – 04/11/2008 pag.1 Faculteit Bio-Ingenieurswetenschappen – Labo Fytofarmacie UGent: Pieter Spanoghe, Sofie Vergucht & Walter Steurbaut Pribel historiek Study financed by the Federal Public Service, Health, Food Chain Safety and Environment
Transcript of UGent: Pieter Spanoghe, Sofie Vergucht & Walter Steurbaut · Naam presentatie – Pieter Spanoghe...
Naam presentatie – Pieter Spanoghe – 04/11/2008 pag.1Faculteit Bio-Ingenieurswetenschappen – Labo Fytofarmacie
UGent: Pieter Spanoghe, Sofie Vergucht & Walter Steurbaut
Pribel historiek
Study financed by the Federal Public Service, Health, Food Chain Safety and Environment
Naam presentatie – Pieter Spanoghe – 04/11/2008 pag.2Faculteit Bio-Ingenieurswetenschappen – Labo Fytofarmacie
1. Introduction & history Indicators Belgium
� Introduction
� WP1: Why indicators
� WP2: Principle indicators
� WP3: Overview indicators Belgium
� WP4: Pribel indicator concept
2. Case Study – Pribel 1991-1996
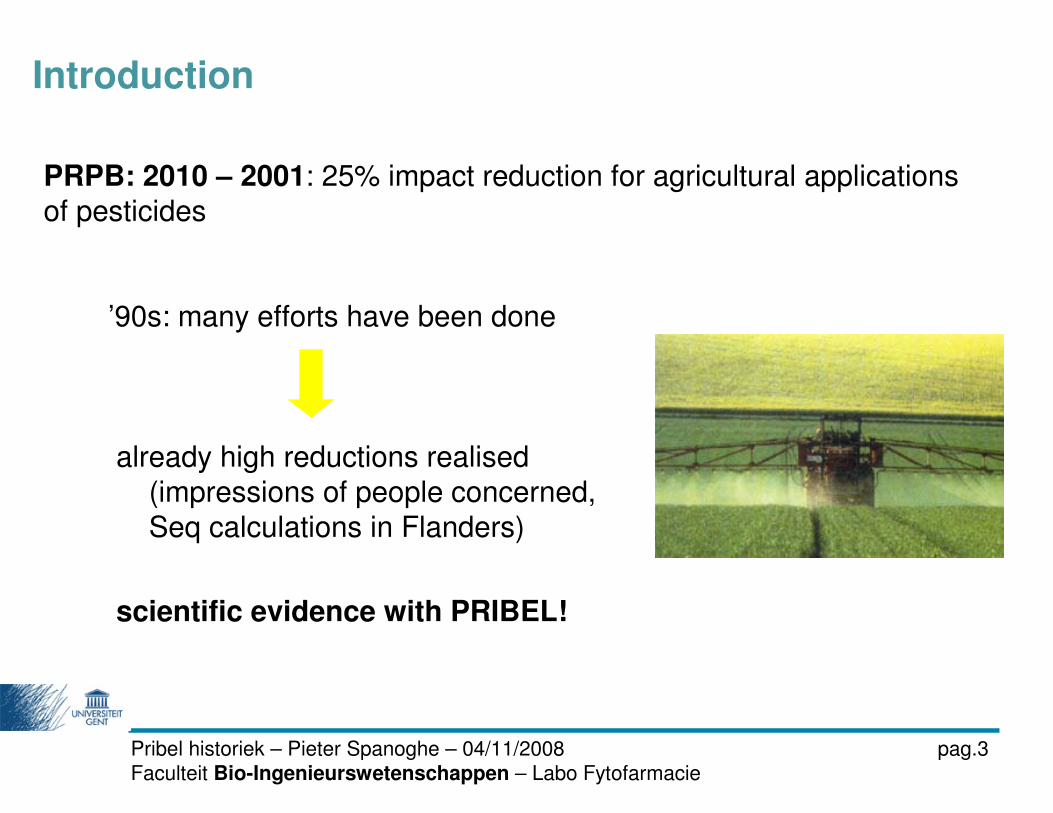
PRPB: 2010 – 2001: 25% impact reduction for agricultural applications
of pesticides
’90s: many efforts have been done
already high reductions realised
(impressions of people concerned,
Seq calculations in Flanders)
scientific evidence with PRIBEL!
Pribel historiek – Pieter Spanoghe – 04/11/2008 pag.3Faculteit Bio-Ingenieurswetenschappen – Labo Fytofarmacie
Introduction
� Indicators
– Use: kg, dosis/ha, Frequentie of Application,…
– Single-impact: Seq, GUS,…
– Multi-impact: POCER
� Models
– SEPTWA, PESTLA, Europoem, Hydrus…
1. Why Indicators?
Pribel historiek – Pieter Spanoghe – 04/11/2008 pag.4Faculteit Bio-Ingenieurswetenschappen – Labo Fytofarmacie
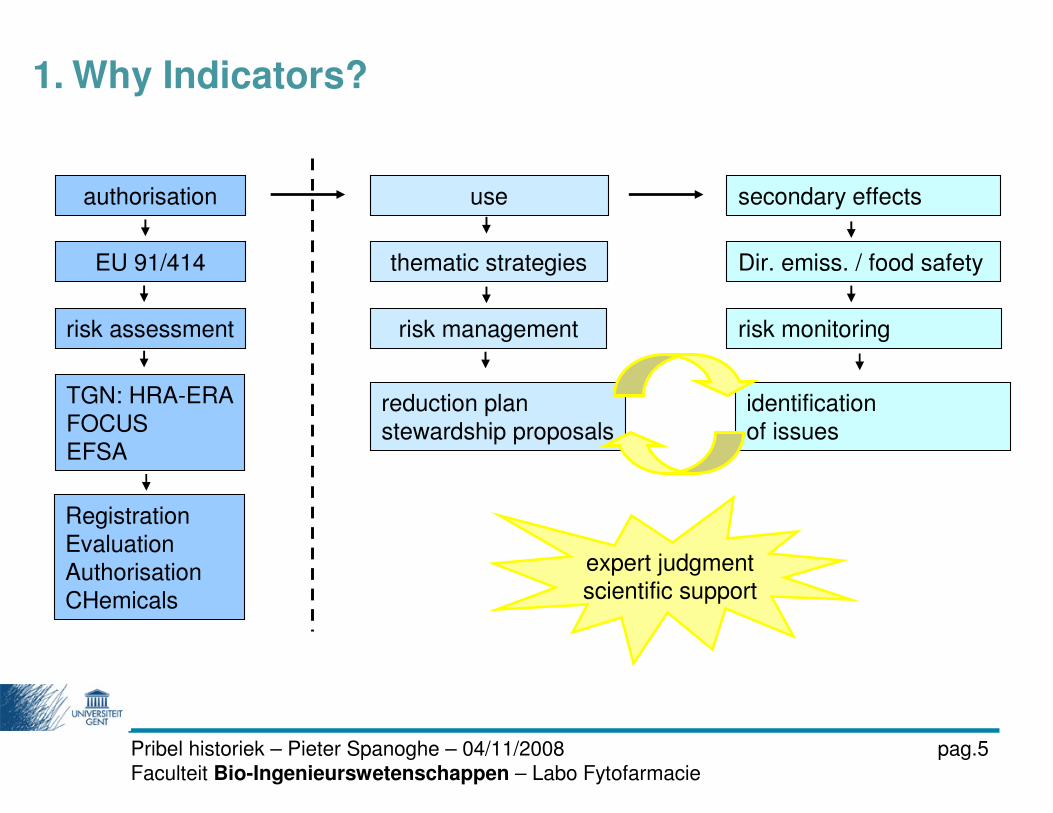
authorisation
EU 91/414
risk assessment
TGN: HRA-ERA
FOCUSEFSA
Registration
EvaluationAuthorisation
CHemicals
1. Why Indicators?
use
thematic strategies
risk management
secondary effects
Dir. emiss. / food safety
risk monitoring
reduction plan
stewardship proposals
identification
of issues
expert judgmentscientific support
Pribel historiek – Pieter Spanoghe – 04/11/2008 pag.5Faculteit Bio-Ingenieurswetenschappen – Labo Fytofarmacie
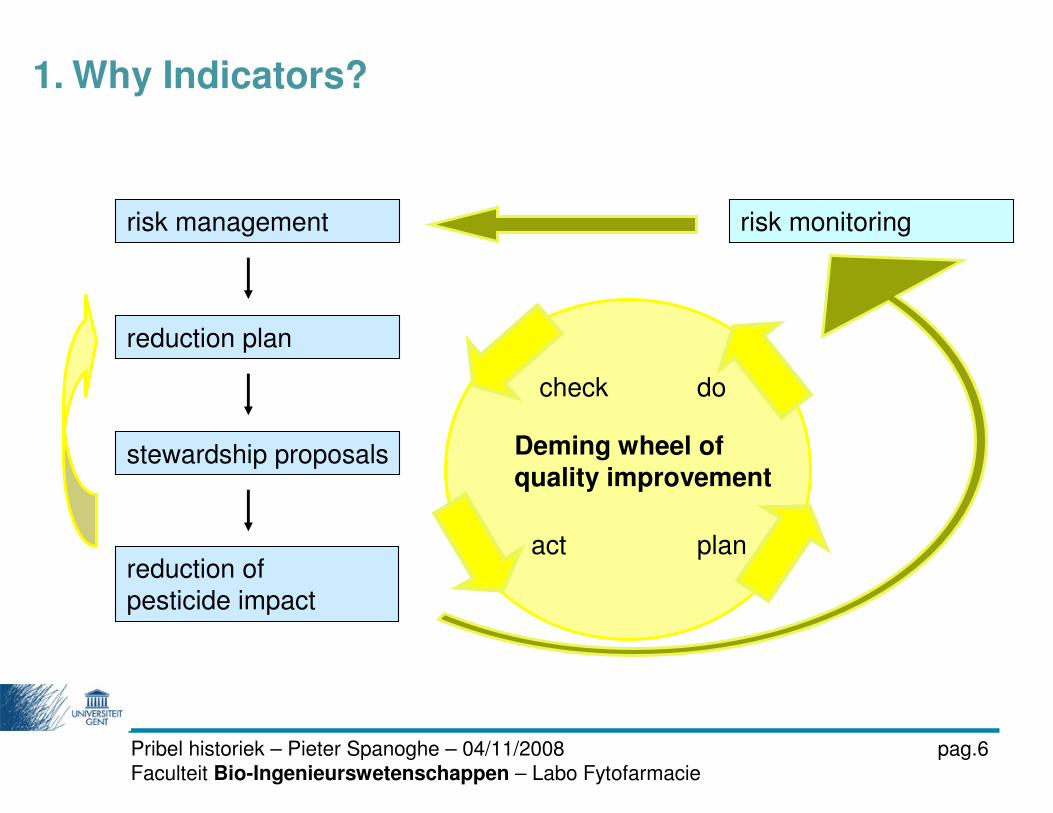
risk management
reduction plan
stewardship proposals
risk monitoring
reduction of
pesticide impact
plan
docheck
act
Deming wheel ofquality improvement
1. Why Indicators?
Pribel historiek – Pieter Spanoghe – 04/11/2008 pag.6Faculteit Bio-Ingenieurswetenschappen – Labo Fytofarmacie
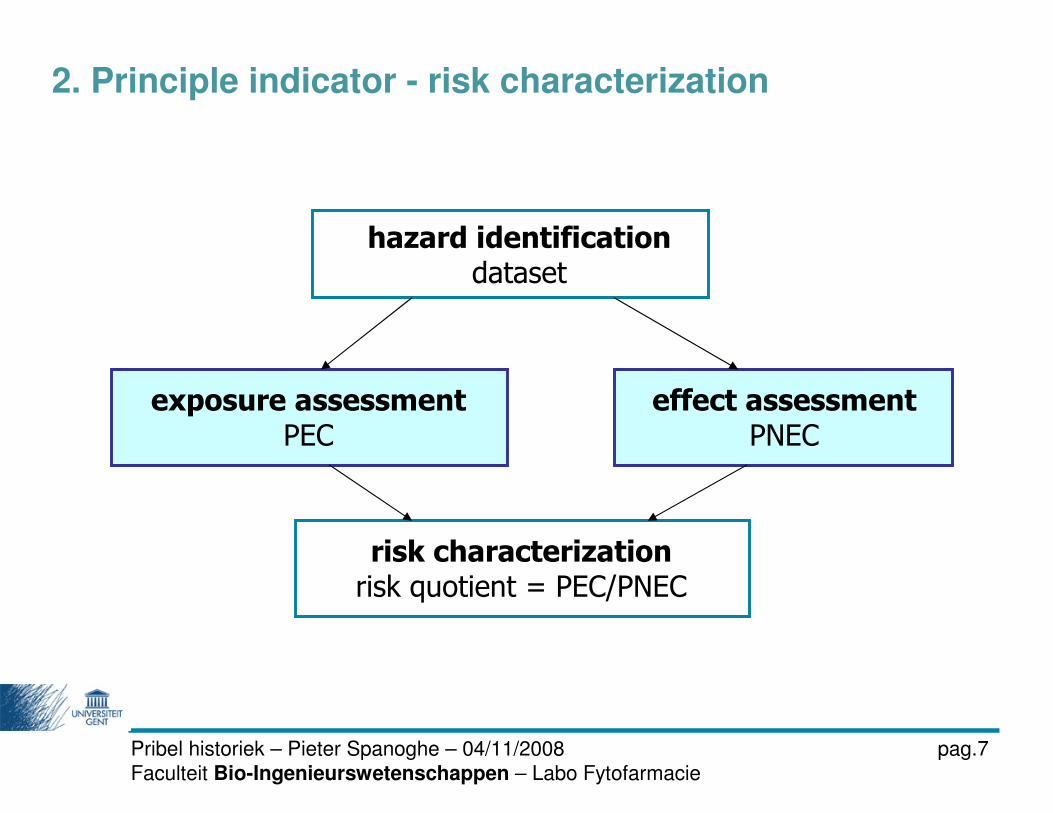
2. Principle indicator - risk characterization
hazard identification dataset
exposure assessment PEC
effect assessment PNEC
risk characterization risk quotient = PEC/PNEC
Pribel historiek – Pieter Spanoghe – 04/11/2008 pag.7Faculteit Bio-Ingenieurswetenschappen – Labo Fytofarmacie
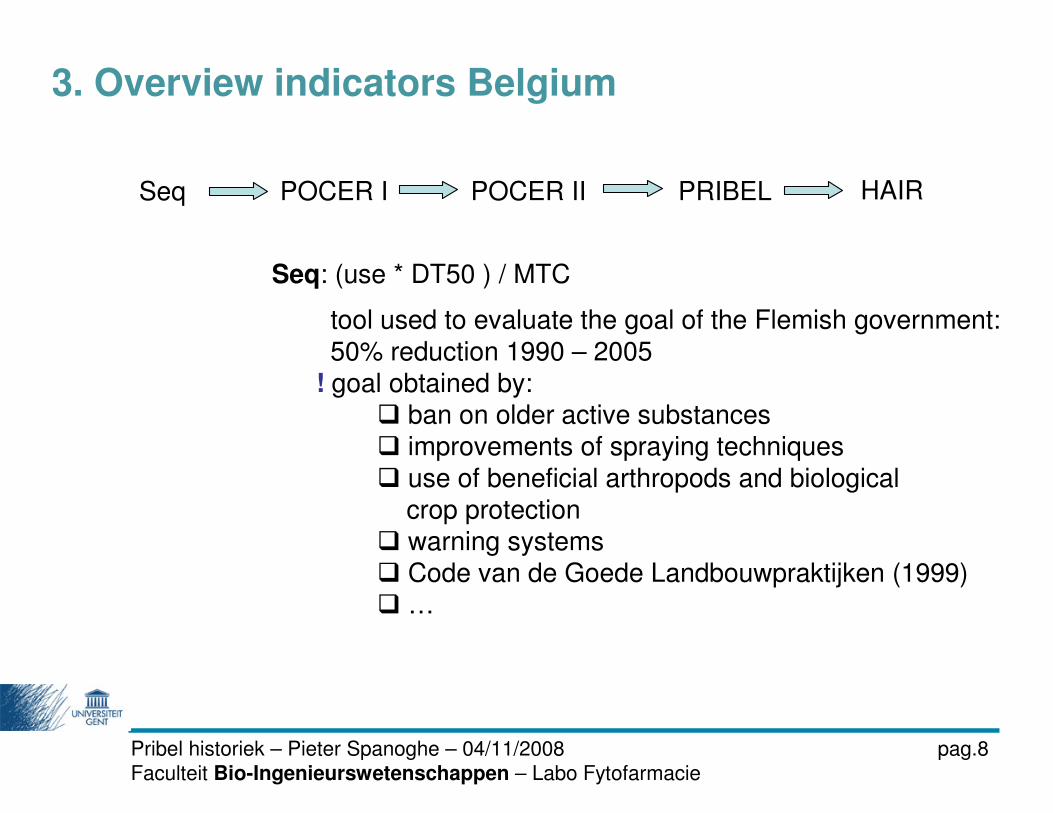
3. Overview indicators Belgium
Seq: (use * DT50 ) / MTC
tool used to evaluate the goal of the Flemish government:
50% reduction 1990 – 2005
! goal obtained by:
� ban on older active substances
� improvements of spraying techniques
� use of beneficial arthropods and biological
crop protection
� warning systems
� Code van de Goede Landbouwpraktijken (1999)
� …
Seq POCER I POCER II PRIBEL HAIR
Pribel historiek – Pieter Spanoghe – 04/11/2008 pag.8Faculteit Bio-Ingenieurswetenschappen – Labo Fytofarmacie
Pribel historiek – Pieter Spanoghe – 04/11/2008 pag.9Faculteit Bio-Ingenieurswetenschappen – Labo Fytofarmacie
Naam presentatie – Pieter Spanoghe – 04/11/2008 pag.10Faculteit Bio-Ingenieurswetenschappen – Labo Fytofarmacie
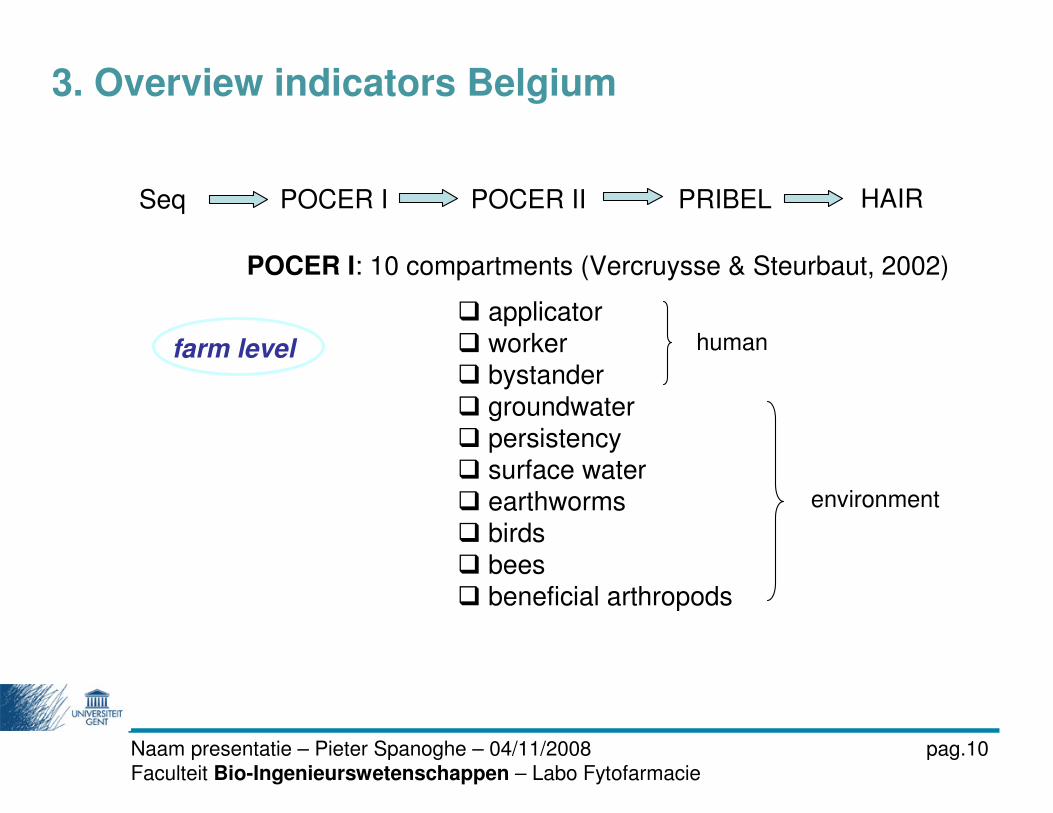
POCER I: 10 compartments (Vercruysse & Steurbaut, 2002)
� applicator
� worker
� bystander
� groundwater
� persistency
� surface water
� earthworms
� birds
� bees
� beneficial arthropods
human
environment
farm level
Seq POCER I POCER II PRIBEL HAIR
3. Overview indicators Belgium
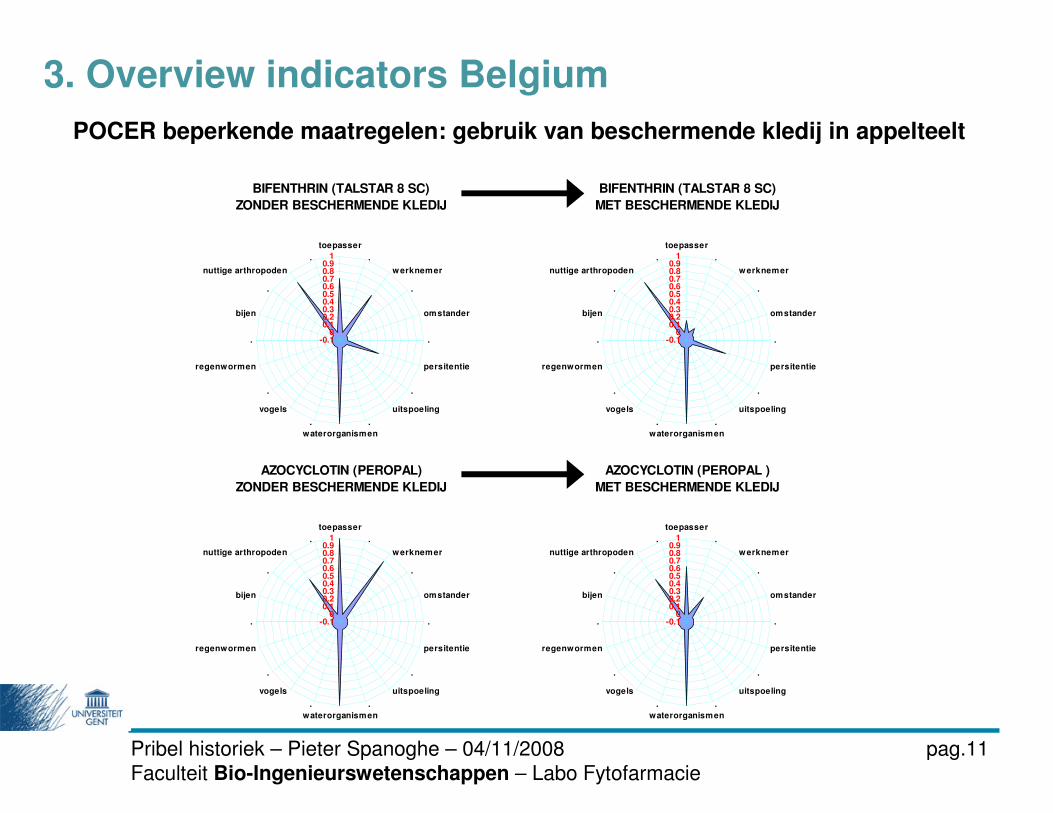
POCER beperkende maatregelen: gebruik van beschermende kledij in appelteelt
BIFENTHRIN (TALSTAR 8 SC)
ZONDER BESCHERMENDE KLEDIJ
-0.10
0.10.20.30.40.50.60.70.80.9
1
toepasser
.
werknemer
.
omstander
.
persitentie
.
uitspoeling
.
waterorganismen
.
vogels
.
regenwormen
.
bijen
.
nuttige arthropoden
.
BIFENTHRIN (TALSTAR 8 SC)
MET BESCHERMENDE KLEDIJ
-0.10
0.10.20.30.40.50.60.70.80.9
1
toepasser
.
werknemer
.
omstander
.
persitentie
.
uitspoeling
.
waterorganismen
.
vogels
.
regenwormen
.
bijen
.
nuttige arthropoden
.
AZOCYCLOTIN (PEROPAL)
ZONDER BESCHERMENDE KLEDIJ
-0.10
0.10.20.30.40.50.60.70.80.9
1
toepasser
.
werknemer
.
omstander
.
persitentie
.
uitspoeling
.
waterorganismen
.
vogels
.
regenwormen
.
bijen
.
nuttige arthropoden
.
AZOCYCLOTIN (PEROPAL )
MET BESCHERMENDE KLEDIJ
-0.10
0.10.20.30.40.50.60.70.80.9
1
toepasser
.
werknemer
.
omstander
.
persitentie
.
uitspoeling
.
waterorganismen
.
vogels
.
regenwormen
.
bijen
.
nuttige arthropoden
.
3. Overview indicators Belgium
Pribel historiek – Pieter Spanoghe – 04/11/2008 pag.11Faculteit Bio-Ingenieurswetenschappen – Labo Fytofarmacie
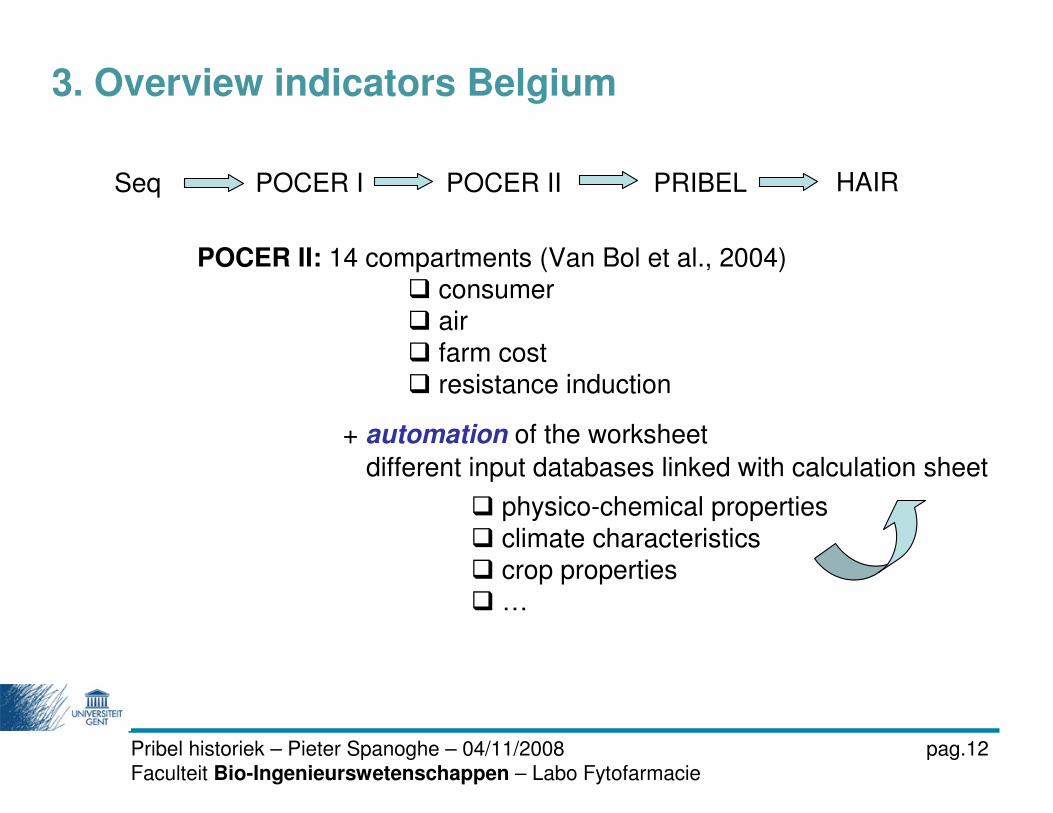
POCER II: 14 compartments (Van Bol et al., 2004)
� consumer
� air
� farm cost
� resistance induction
+ automation of the worksheet
different input databases linked with calculation sheet
� physico-chemical properties
� climate characteristics
� crop properties
� …
Seq POCER I POCER II PRIBEL HAIR
3. Overview indicators Belgium
Pribel historiek – Pieter Spanoghe – 04/11/2008 pag.12Faculteit Bio-Ingenieurswetenschappen – Labo Fytofarmacie
Seq POCER I POCER II PRIBEL HAIR
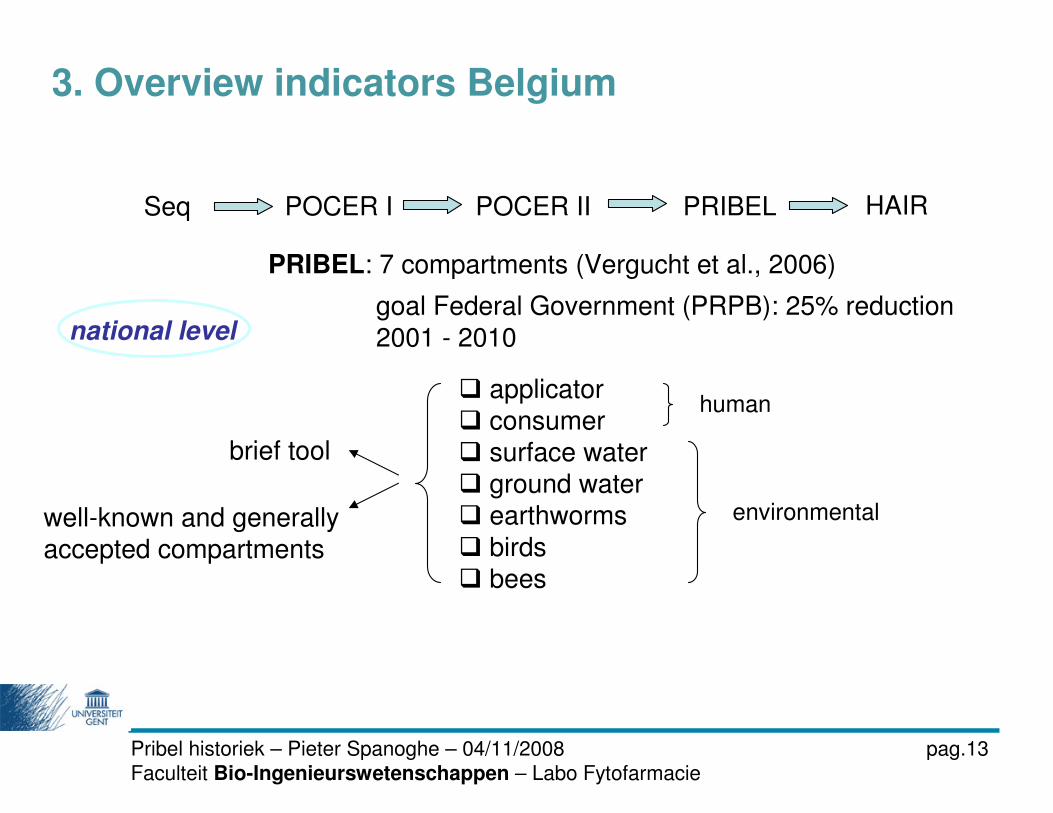
PRIBEL: 7 compartments (Vergucht et al., 2006)
national level
human
environmental
brief tool
well-known and generally
accepted compartments
� applicator
� consumer
� surface water
� ground water
� earthworms
� birds
� bees
goal Federal Government (PRPB): 25% reduction
2001 - 2010
3. Overview indicators Belgium
Pribel historiek – Pieter Spanoghe – 04/11/2008 pag.13Faculteit Bio-Ingenieurswetenschappen – Labo Fytofarmacie
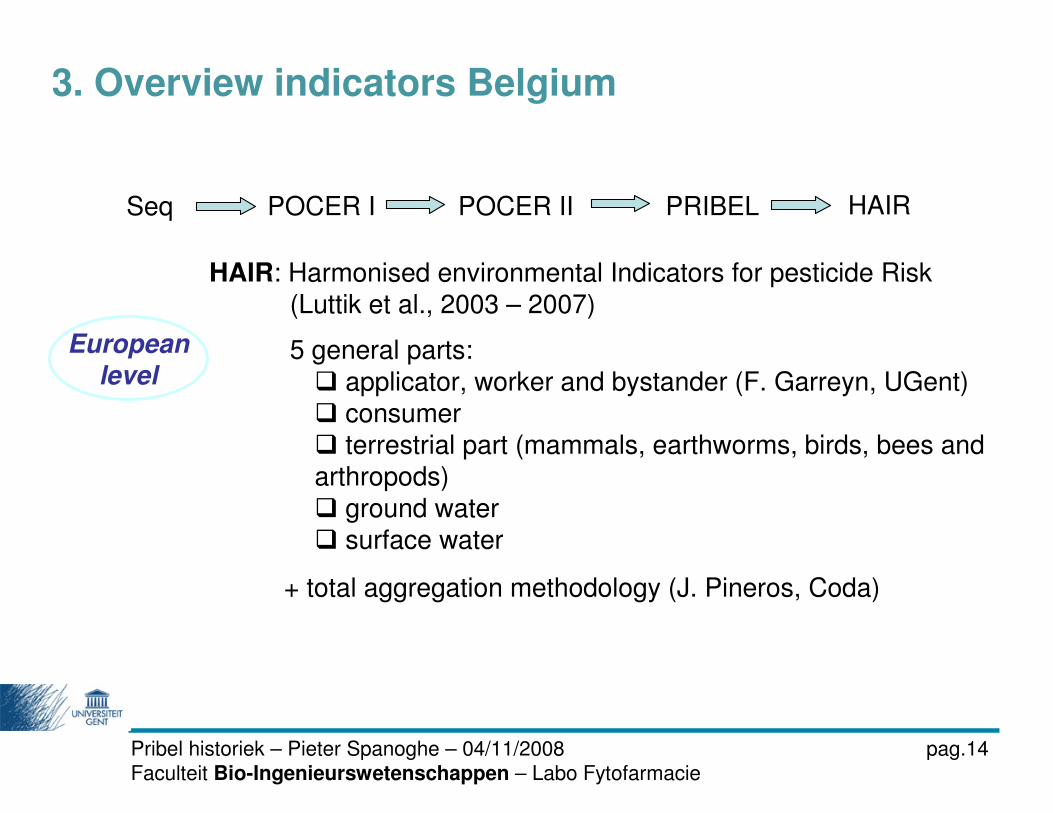
Seq POCER I POCER II PRIBEL HAIR
HAIR: Harmonised environmental Indicators for pesticide Risk
(Luttik et al., 2003 – 2007)
5 general parts:
� applicator, worker and bystander (F. Garreyn, UGent)
� consumer
� terrestrial part (mammals, earthworms, birds, bees and
arthropods)
� ground water
� surface water
+ total aggregation methodology (J. Pineros, Coda)
European
level
3. Overview indicators Belgium
Pribel historiek – Pieter Spanoghe – 04/11/2008 pag.14Faculteit Bio-Ingenieurswetenschappen – Labo Fytofarmacie
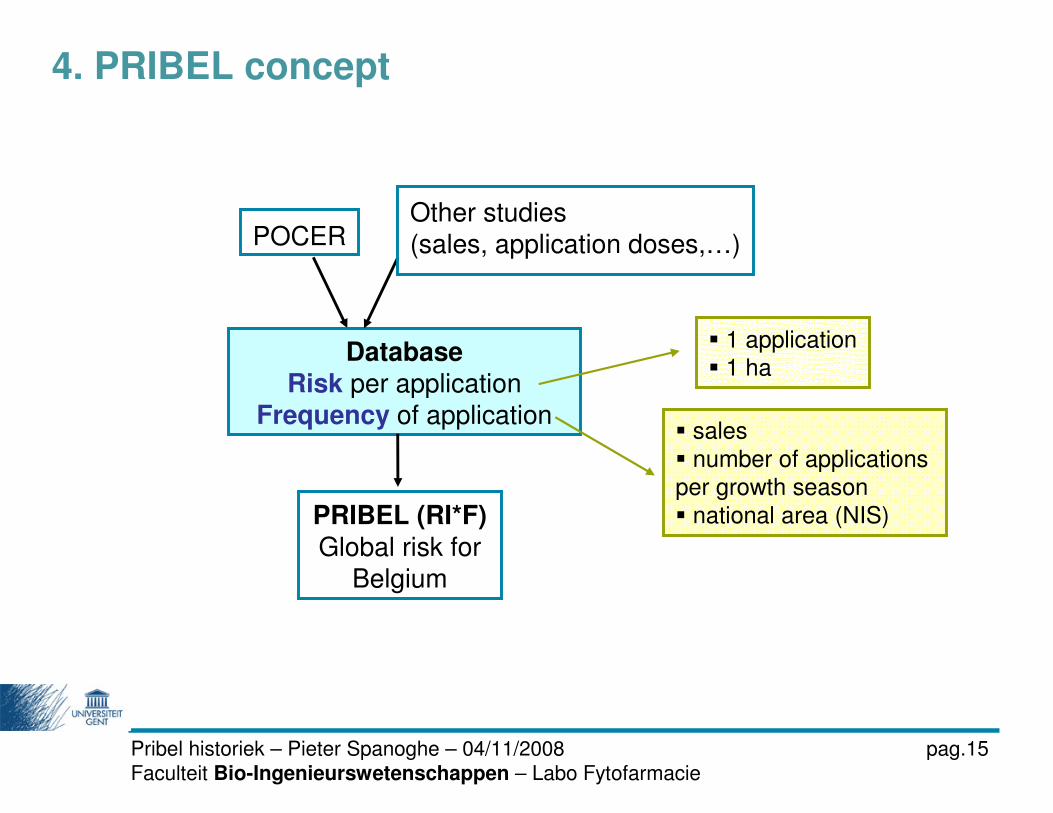
POCER
PRIBEL (RI*F)
Global risk for
Belgium
DatabaseRisk per application
Frequency of application
Other studies
(sales, application doses,…)
� 1 application� 1 ha
� sales
� number of applications per growth season
� national area (NIS)
Pribel historiek – Pieter Spanoghe – 04/11/2008 pag.15Faculteit Bio-Ingenieurswetenschappen – Labo Fytofarmacie
4. PRIBEL concept
4. PRIBEL concept
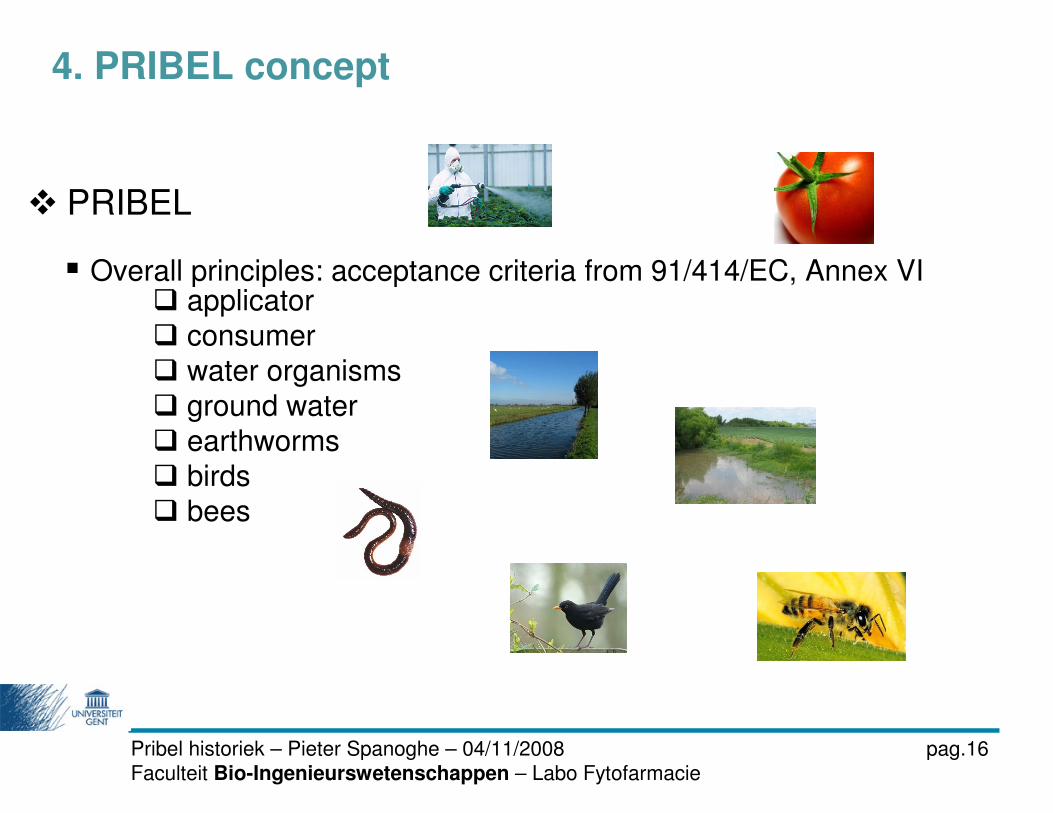
� PRIBEL
� applicator
� consumer
� water organisms
� ground water
� earthworms
� birds
� bees
� Overall principles: acceptance criteria from 91/414/EC, Annex VI
Pribel historiek – Pieter Spanoghe – 04/11/2008 pag.16Faculteit Bio-Ingenieurswetenschappen – Labo Fytofarmacie
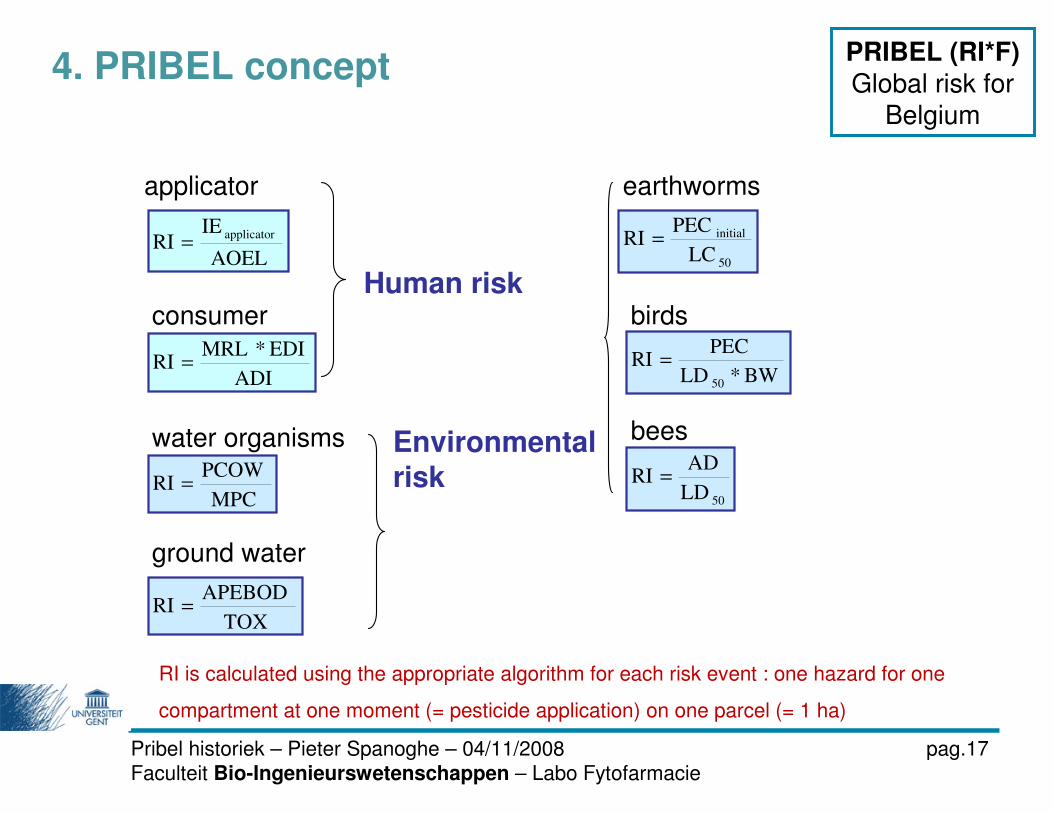
AOEL
IERI
applicator=
ADI
EDI*MRLRI =
TOX
APEBODRI =
MPC
PCOWRI =
BW*LD
PECRI
50
=
50LD
ADRI =
50
initial
LC
PECRI =
consumer
water organisms
ground water
birds
bees
earthwormsapplicator
Human risk
Environmental risk
Pribel historiek – Pieter Spanoghe – 04/11/2008 pag.17Faculteit Bio-Ingenieurswetenschappen – Labo Fytofarmacie
RI is calculated using the appropriate algorithm for each risk event : one hazard for one
compartment at one moment (= pesticide application) on one parcel (= 1 ha)
4. PRIBEL concept PRIBEL (RI*F)Global risk for
Belgium
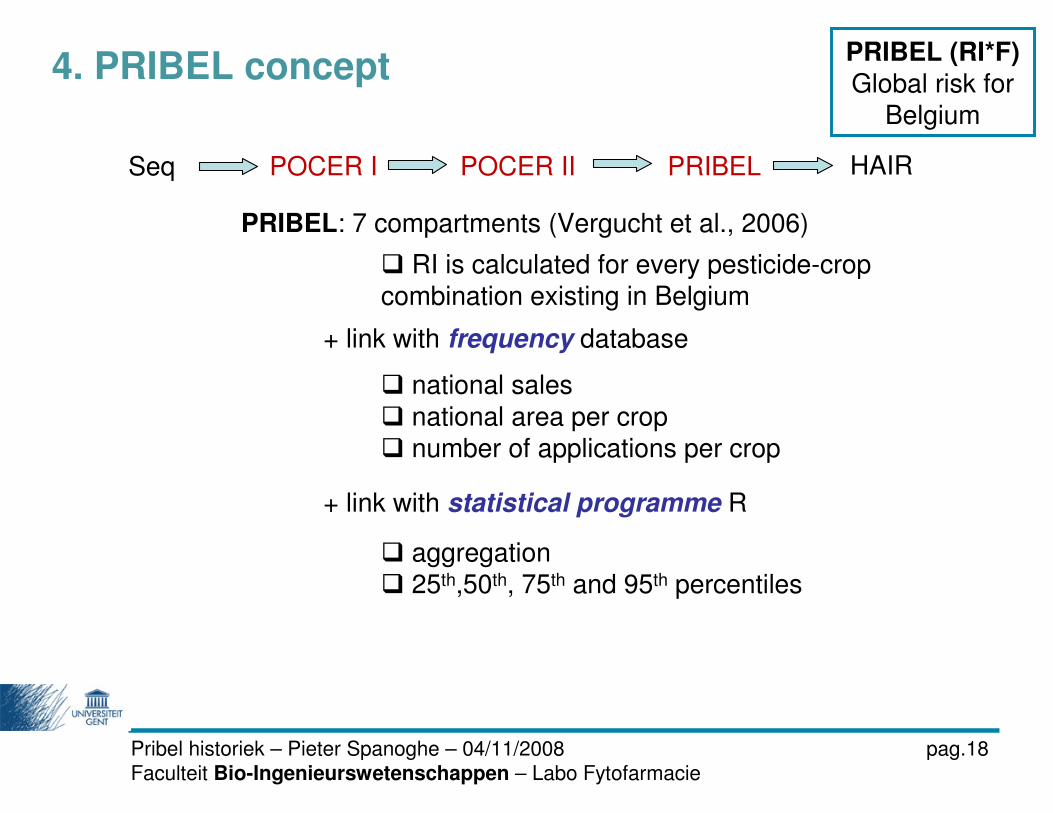
Seq POCER I POCER II PRIBEL HAIR
+ link with frequency database
� national sales
� national area per crop
� number of applications per crop
PRIBEL: 7 compartments (Vergucht et al., 2006)
+ link with statistical programme R
� aggregation
� 25th,50th, 75th and 95th percentiles
Pribel historiek – Pieter Spanoghe – 04/11/2008 pag.18Faculteit Bio-Ingenieurswetenschappen – Labo Fytofarmacie
4. PRIBEL concept
� RI is calculated for every pesticide-crop
combination existing in Belgium
PRIBEL (RI*F)Global risk for
Belgium
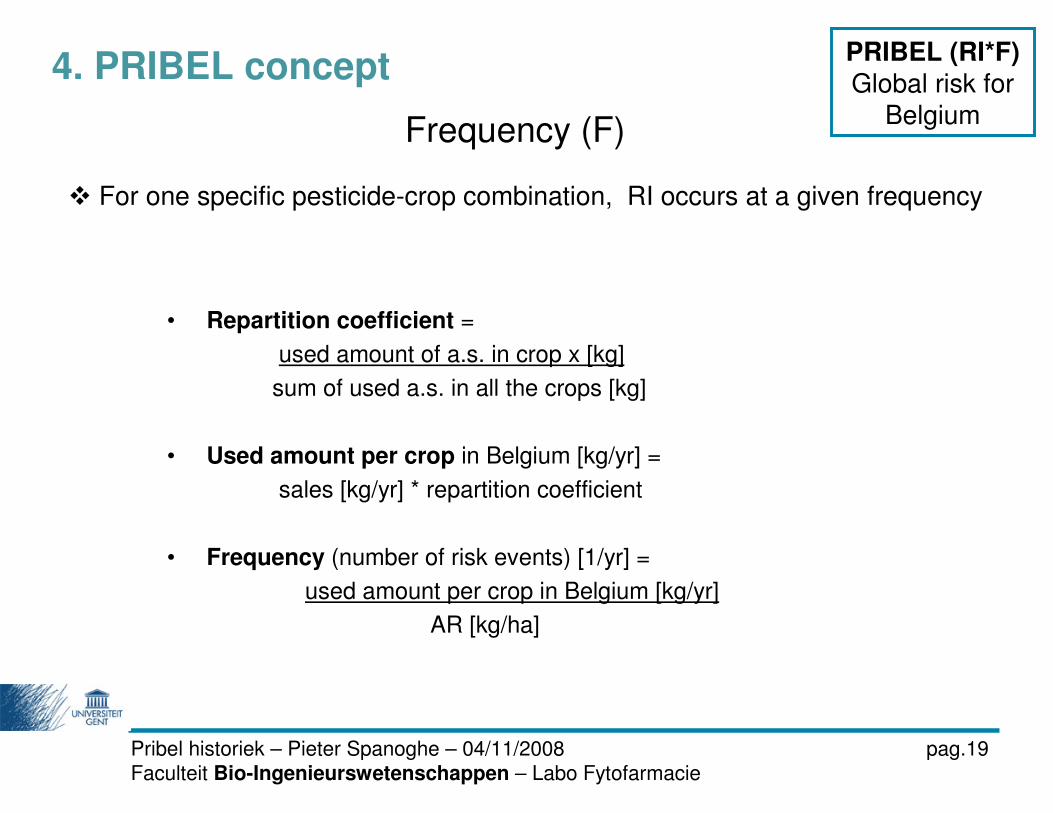
Frequency (F)
• Repartition coefficient =
used amount of a.s. in crop x [kg]
sum of used a.s. in all the crops [kg]
• Used amount per crop in Belgium [kg/yr] =
sales [kg/yr] * repartition coefficient
• Frequency (number of risk events) [1/yr] =
used amount per crop in Belgium [kg/yr]
AR [kg/ha]
Pribel historiek – Pieter Spanoghe – 04/11/2008 pag.19Faculteit Bio-Ingenieurswetenschappen – Labo Fytofarmacie
4. PRIBEL concept
� For one specific pesticide-crop combination, RI occurs at a given frequency
PRIBEL (RI*F)Global risk for
Belgium
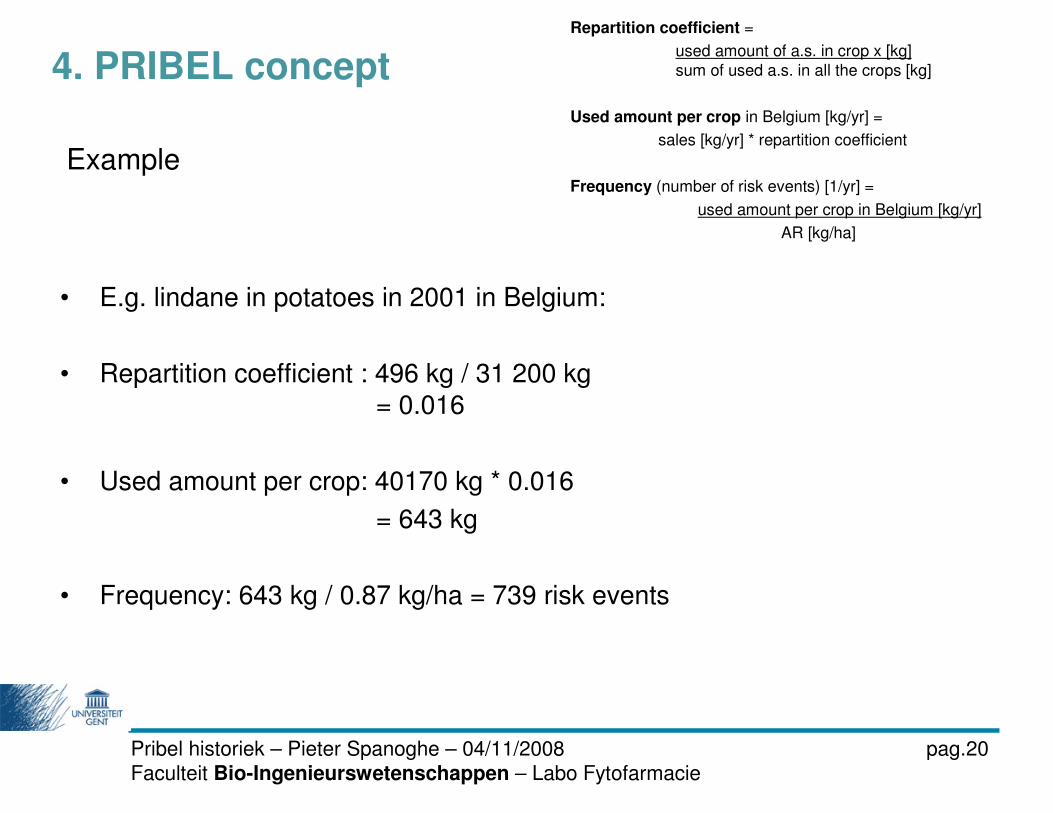
Example
• E.g. lindane in potatoes in 2001 in Belgium:
• Repartition coefficient : 496 kg / 31 200 kg
= 0.016
• Used amount per crop: 40170 kg * 0.016
= 643 kg
• Frequency: 643 kg / 0.87 kg/ha = 739 risk events
Pribel historiek – Pieter Spanoghe – 04/11/2008 pag.20Faculteit Bio-Ingenieurswetenschappen – Labo Fytofarmacie
4. PRIBEL concept
Repartition coefficient =
used amount of a.s. in crop x [kg]
sum of used a.s. in all the crops [kg]
Used amount per crop in Belgium [kg/yr] =
sales [kg/yr] * repartition coefficient
Frequency (number of risk events) [1/yr] =
used amount per crop in Belgium [kg/yr]
AR [kg/ha]
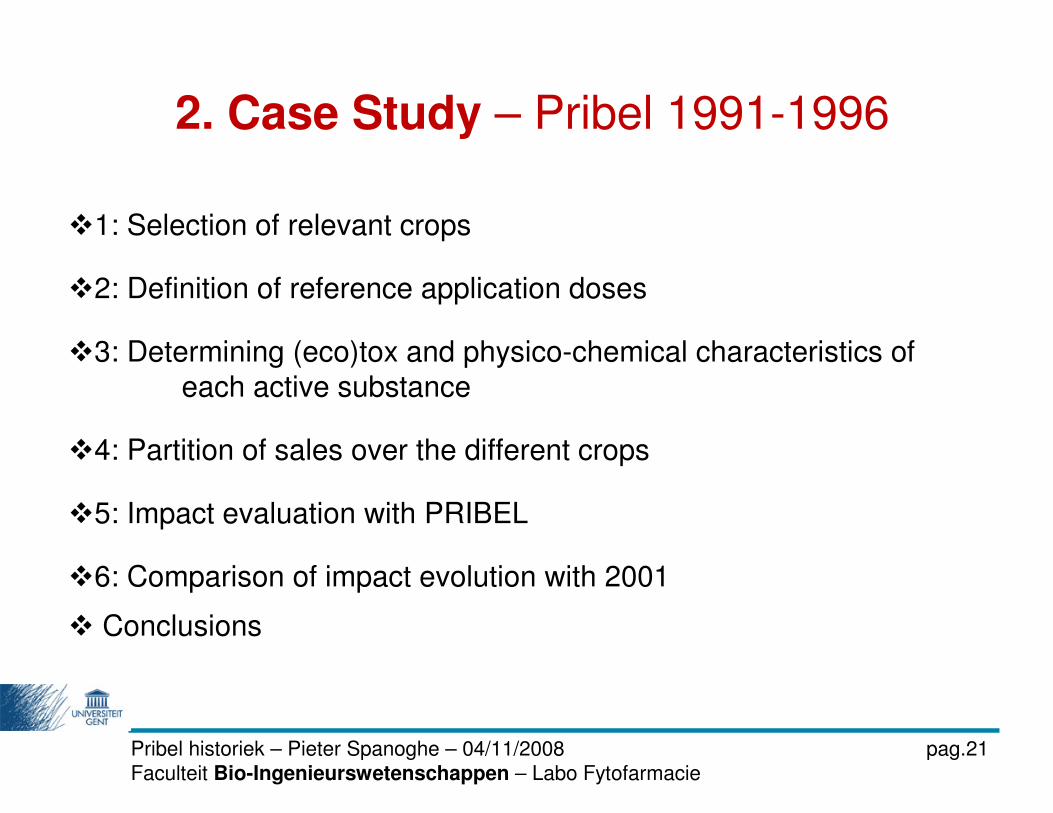
2. Case Study – Pribel 1991-1996
�1: Selection of relevant crops
�2: Definition of reference application doses
�3: Determining (eco)tox and physico-chemical characteristics of
each active substance
�4: Partition of sales over the different crops
�5: Impact evaluation with PRIBEL
�6: Comparison of impact evolution with 2001
� Conclusions
Pribel historiek – Pieter Spanoghe – 04/11/2008 pag.21Faculteit Bio-Ingenieurswetenschappen – Labo Fytofarmacie
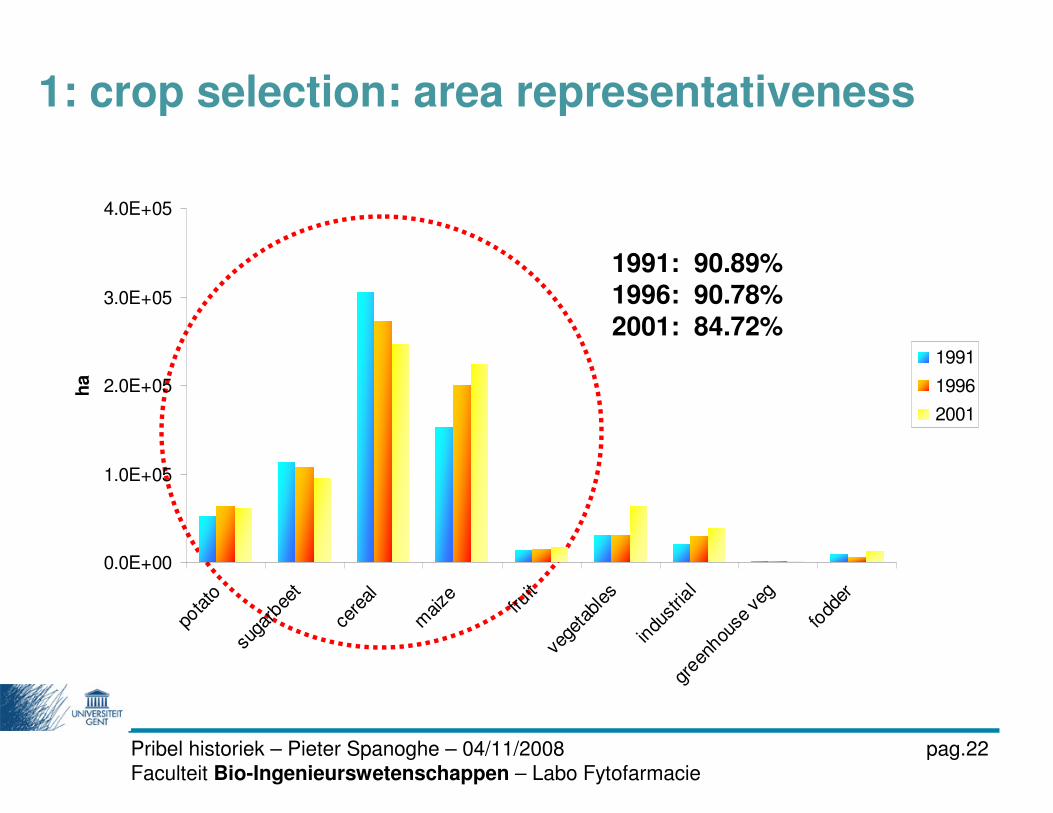
1: crop selection: area representativeness
1991: 90.89%1996: 90.78%
2001: 84.72%
0.0E+00
1.0E+05
2.0E+05
3.0E+05
4.0E+05
pota
to
suga
rbee
t
cere
al
mai
ze fruit
vege
tabl
es
indu
stria
lgr
eenhou
se v
eg
fodd
er
ha
1991
1996
2001
Pribel historiek – Pieter Spanoghe – 04/11/2008 pag.22Faculteit Bio-Ingenieurswetenschappen – Labo Fytofarmacie
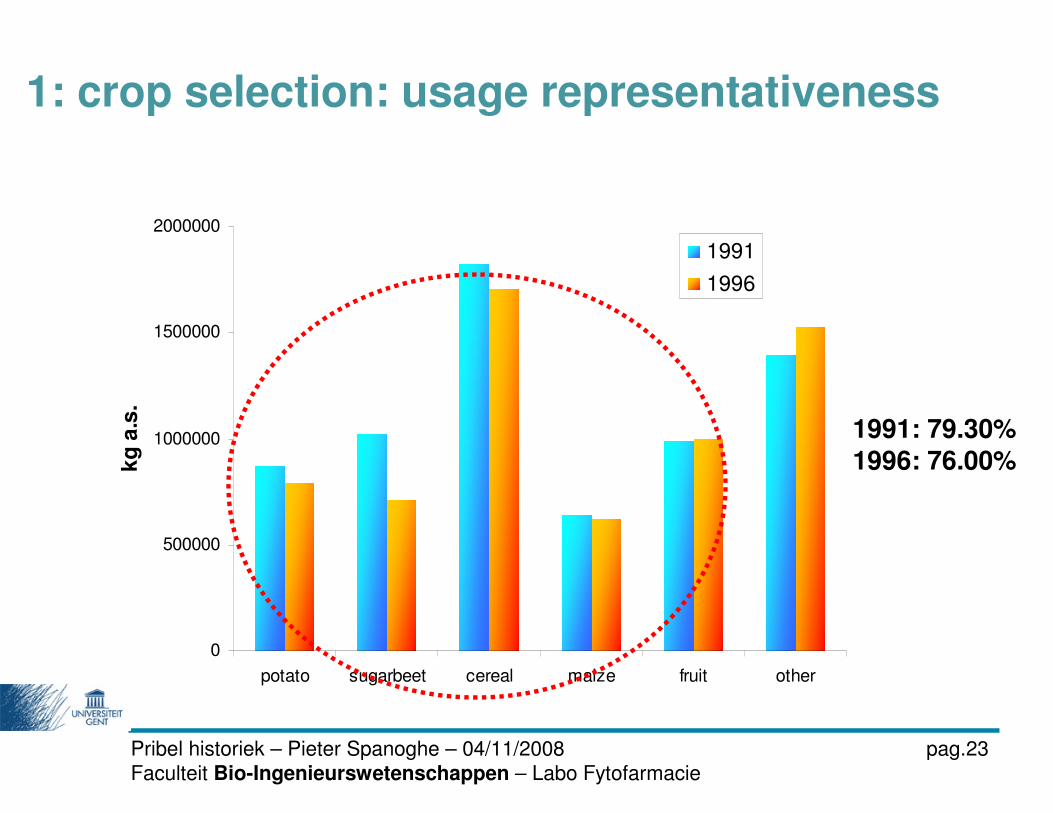
1: crop selection: usage representativeness
1991: 77.38%1996: 80.01%2001: 75.63%
0
500000
1000000
1500000
2000000
potato sugarbeet cereal maize fruit other
kg
a.s
.
1991
1996
1991: 79.30%
1996: 76.00%
Pribel historiek – Pieter Spanoghe – 04/11/2008 pag.23Faculteit Bio-Ingenieurswetenschappen – Labo Fytofarmacie
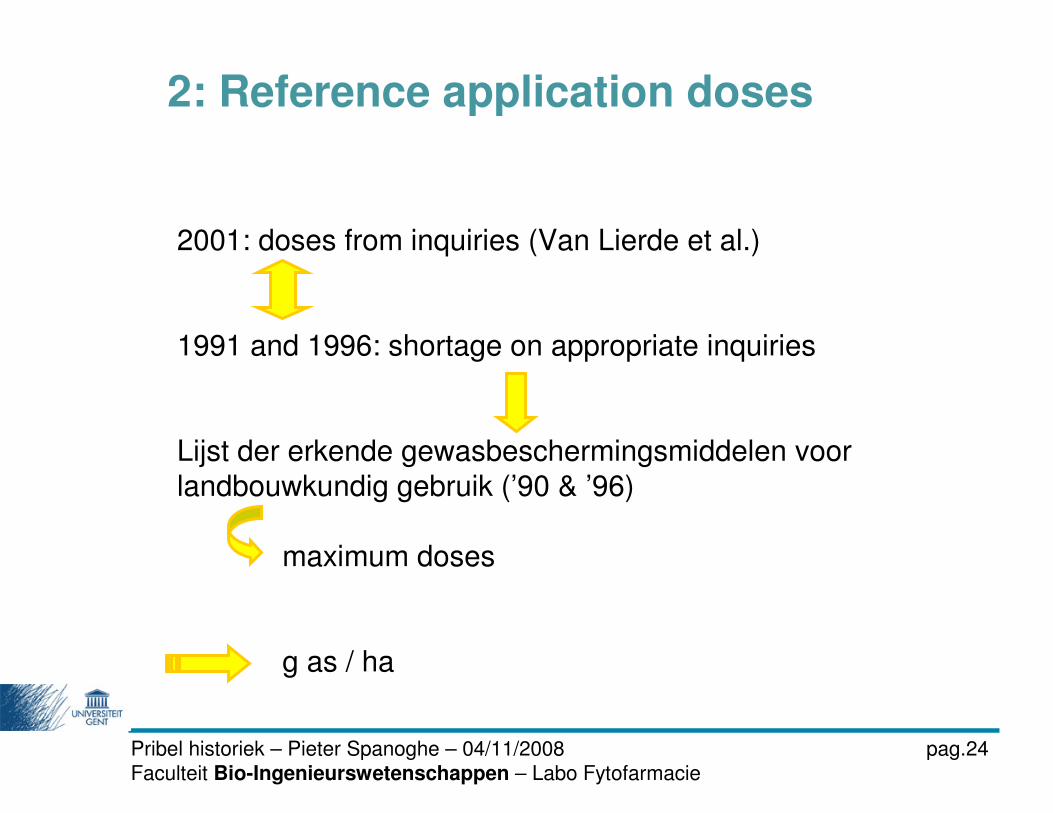
2: Reference application doses
2001: doses from inquiries (Van Lierde et al.)
1991 and 1996: shortage on appropriate inquiries
Lijst der erkende gewasbeschermingsmiddelen voor
landbouwkundig gebruik (’90 & ’96)
maximum doses
g as / ha
Pribel historiek – Pieter Spanoghe – 04/11/2008 pag.24Faculteit Bio-Ingenieurswetenschappen – Labo Fytofarmacie
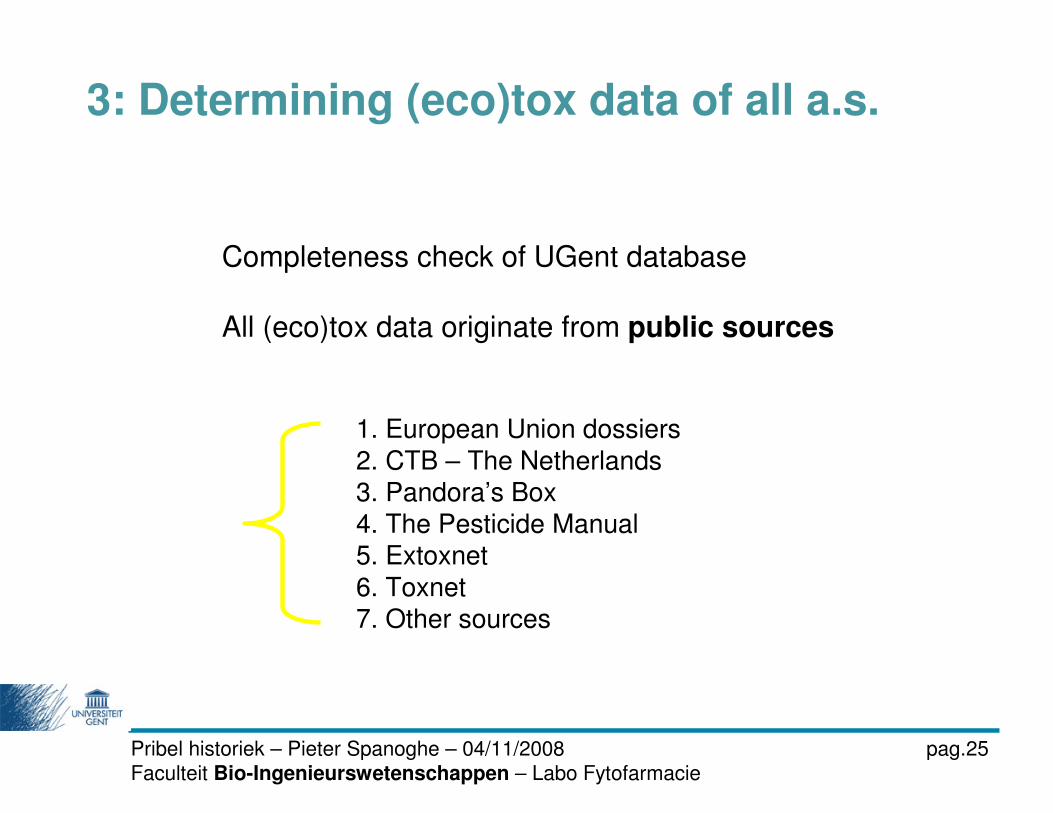
3: Determining (eco)tox data of all a.s.
Completeness check of UGent database
All (eco)tox data originate from public sources
1. European Union dossiers
2. CTB – The Netherlands
3. Pandora’s Box
4. The Pesticide Manual
5. Extoxnet
6. Toxnet
7. Other sources
Pribel historiek – Pieter Spanoghe – 04/11/2008 pag.25Faculteit Bio-Ingenieurswetenschappen – Labo Fytofarmacie
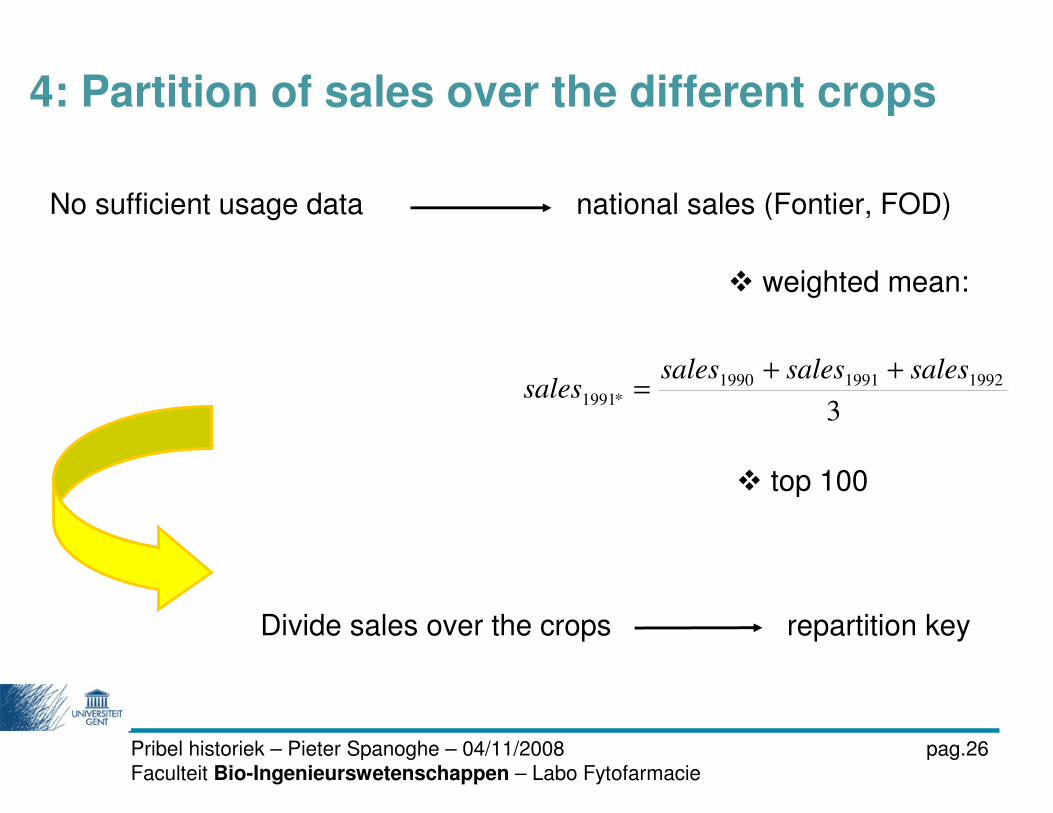
4: Partition of sales over the different crops
No sufficient usage data national sales (Fontier, FOD)
Divide sales over the crops repartition key
� weighted mean:
3
199219911990
*1991
salessalessalessales
++=
� top 100
Pribel historiek – Pieter Spanoghe – 04/11/2008 pag.26Faculteit Bio-Ingenieurswetenschappen – Labo Fytofarmacie
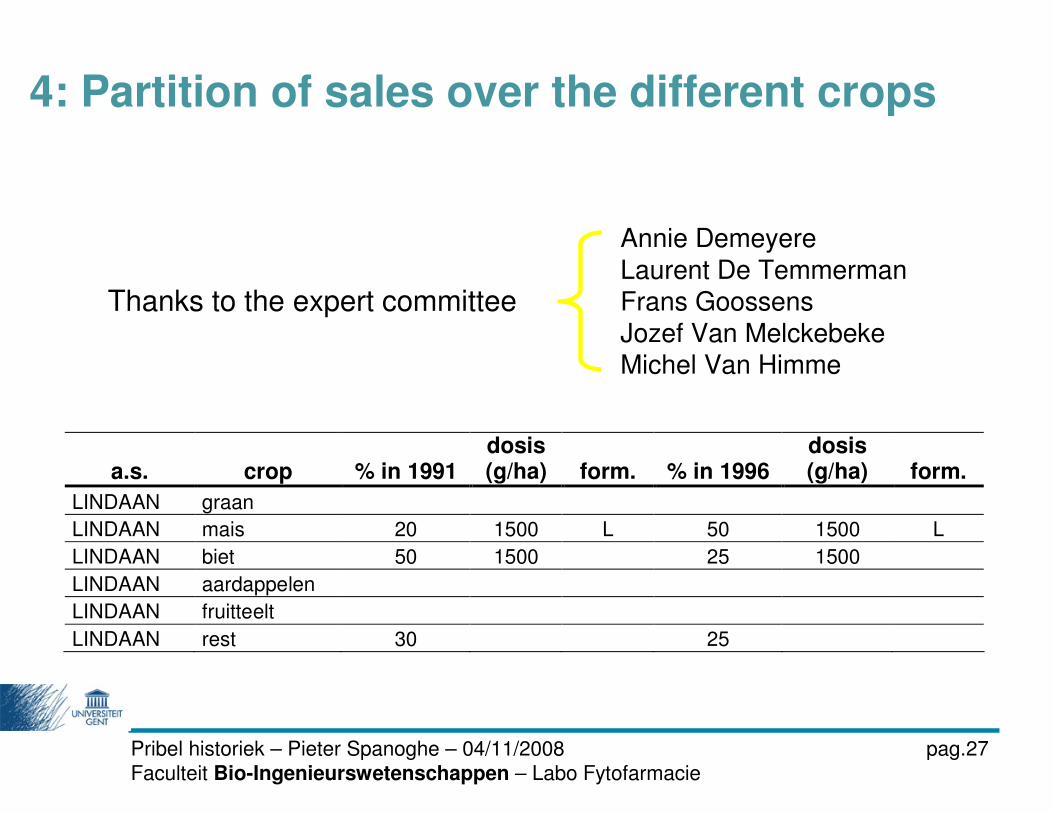
a.s. crop % in 1991 dosis (g/ha) form. % in 1996
dosis (g/ha) form.
LINDAAN graan
LINDAAN mais 20 1500 L 50 1500 L
LINDAAN biet 50 1500 25 1500
LINDAAN aardappelen
LINDAAN fruitteelt
LINDAAN rest 30 25
Annie Demeyere
Laurent De Temmerman
Frans Goossens
Jozef Van Melckebeke
Michel Van Himme
Thanks to the expert committee
4: Partition of sales over the different crops
Pribel historiek – Pieter Spanoghe – 04/11/2008 pag.27Faculteit Bio-Ingenieurswetenschappen – Labo Fytofarmacie
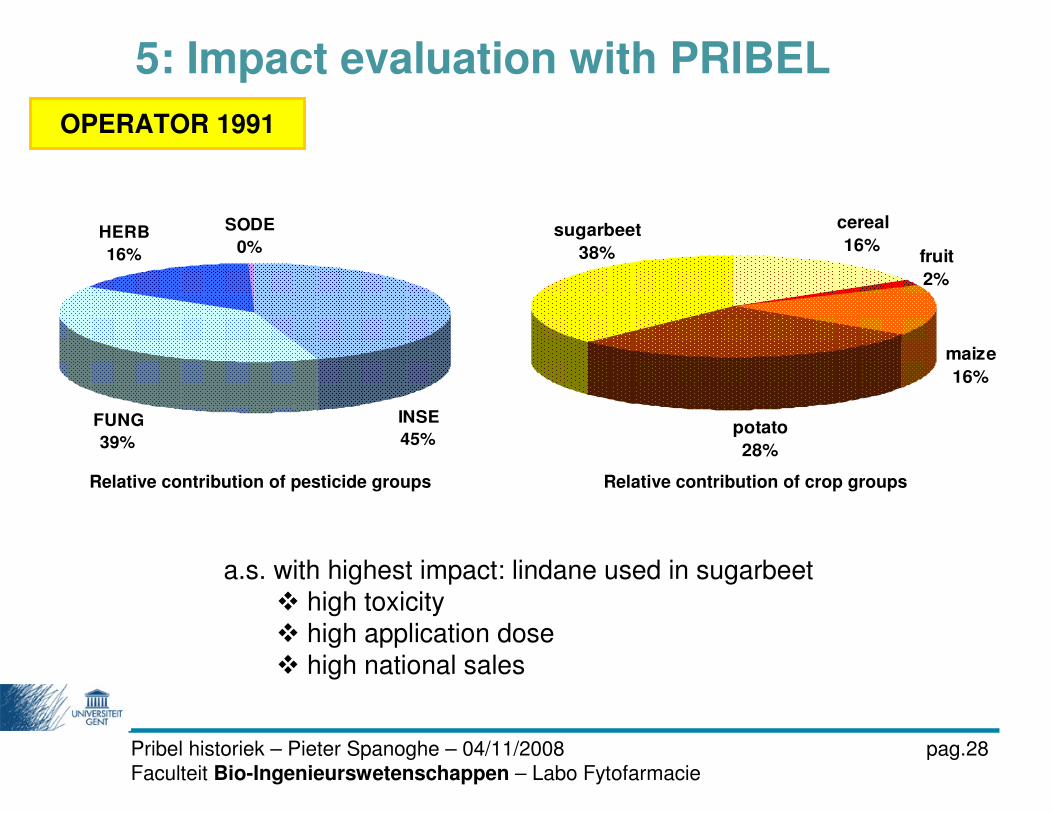
HERB
16%
SODE
0%
FUNG
39%
INSE
45%
cereal
16%fruit
2%
maize
16%
potato
28%
sugarbeet
38%
5: Impact evaluation with PRIBEL
OPERATOR 1991
Relative contribution of pesticide groups Relative contribution of crop groups
a.s. with highest impact: lindane used in sugarbeet
� high toxicity
� high application dose
� high national sales
Pribel historiek – Pieter Spanoghe – 04/11/2008 pag.28Faculteit Bio-Ingenieurswetenschappen – Labo Fytofarmacie
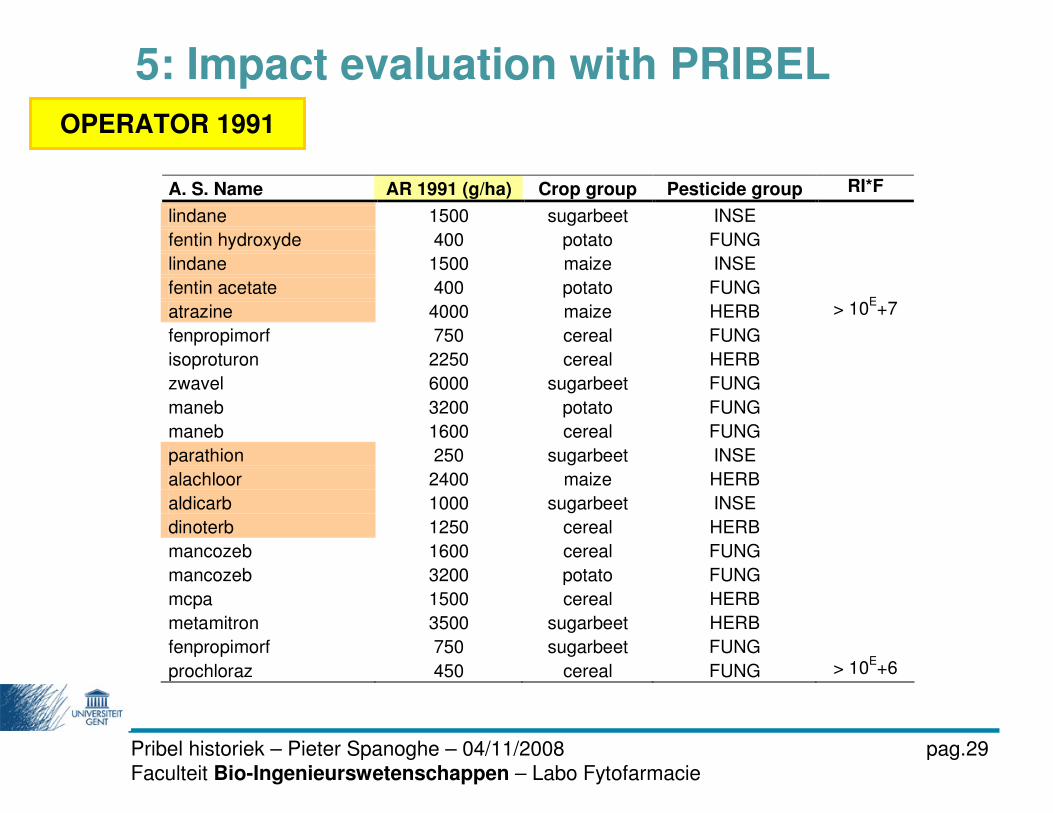
A. S. Name AR 1991 (g/ha) Crop group Pesticide group RI*F
lindane 1500 sugarbeet INSE
fentin hydroxyde 400 potato FUNG
lindane 1500 maize INSE
fentin acetate 400 potato FUNG
atrazine 4000 maize HERB > 10E+7
fenpropimorf 750 cereal FUNG
isoproturon 2250 cereal HERB
zwavel 6000 sugarbeet FUNG
maneb 3200 potato FUNG
maneb 1600 cereal FUNG
parathion 250 sugarbeet INSE
alachloor 2400 maize HERB
aldicarb 1000 sugarbeet INSE
dinoterb 1250 cereal HERB
mancozeb 1600 cereal FUNG
mancozeb 3200 potato FUNG
mcpa 1500 cereal HERB
metamitron 3500 sugarbeet HERB
fenpropimorf 750 sugarbeet FUNG
prochloraz 450 cereal FUNG > 10E+6
5: Impact evaluation with PRIBEL
OPERATOR 1991
Pribel historiek – Pieter Spanoghe – 04/11/2008 pag.29Faculteit Bio-Ingenieurswetenschappen – Labo Fytofarmacie
INSE
41%
FUNG
40%
HERB
18%
SODE
1%cereal
17%fruit
2%
sugarbeet
17%
maize
31%potato
33%
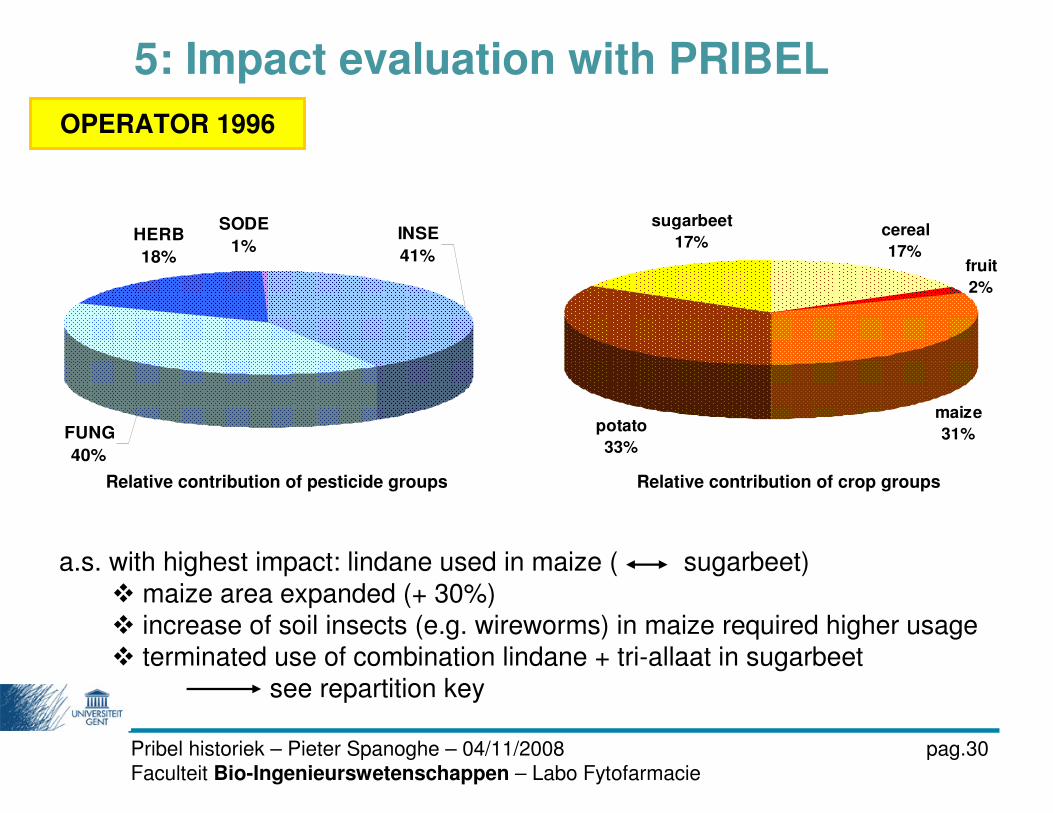
5: Impact evaluation with PRIBEL
OPERATOR 1996
Relative contribution of pesticide groups Relative contribution of crop groups
a.s. with highest impact: lindane used in maize ( sugarbeet)
� maize area expanded (+ 30%)
� increase of soil insects (e.g. wireworms) in maize required higher usage
� terminated use of combination lindane + tri-allaat in sugarbeet
see repartition key
Pribel historiek – Pieter Spanoghe – 04/11/2008 pag.30Faculteit Bio-Ingenieurswetenschappen – Labo Fytofarmacie
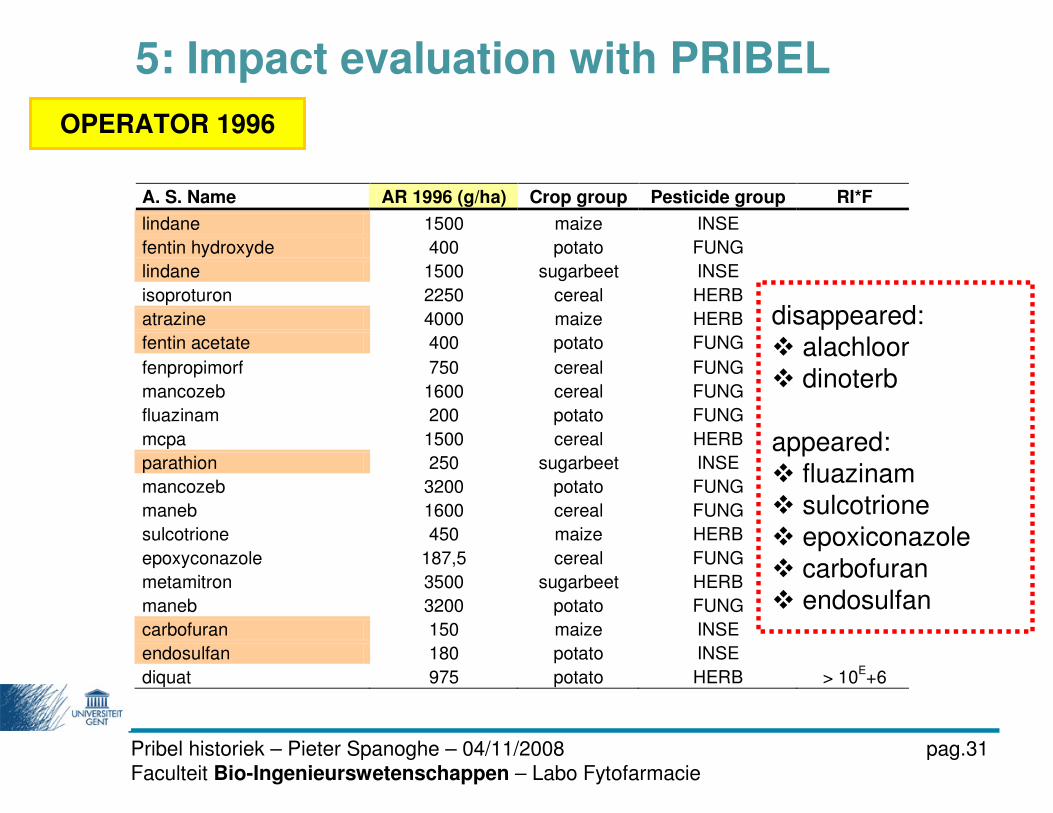
A. S. Name AR 1996 (g/ha) Crop group Pesticide group RI*F
lindane 1500 maize INSE
fentin hydroxyde 400 potato FUNG
lindane 1500 sugarbeet INSE
isoproturon 2250 cereal HERB > 10E+7
atrazine 4000 maize HERB
fentin acetate 400 potato FUNG
fenpropimorf 750 cereal FUNG
mancozeb 1600 cereal FUNG
fluazinam 200 potato FUNG
mcpa 1500 cereal HERB
parathion 250 sugarbeet INSE
mancozeb 3200 potato FUNG
maneb 1600 cereal FUNG
sulcotrione 450 maize HERB
epoxyconazole 187,5 cereal FUNG
metamitron 3500 sugarbeet HERB
maneb 3200 potato FUNG
carbofuran 150 maize INSE
endosulfan 180 potato INSE
diquat 975 potato HERB > 10E+6
5: Impact evaluation with PRIBEL
OPERATOR 1996
disappeared:
� alachloor
� dinoterb
appeared:
� fluazinam
� sulcotrione
� epoxiconazole
� carbofuran
� endosulfan
Pribel historiek – Pieter Spanoghe – 04/11/2008 pag.31Faculteit Bio-Ingenieurswetenschappen – Labo Fytofarmacie
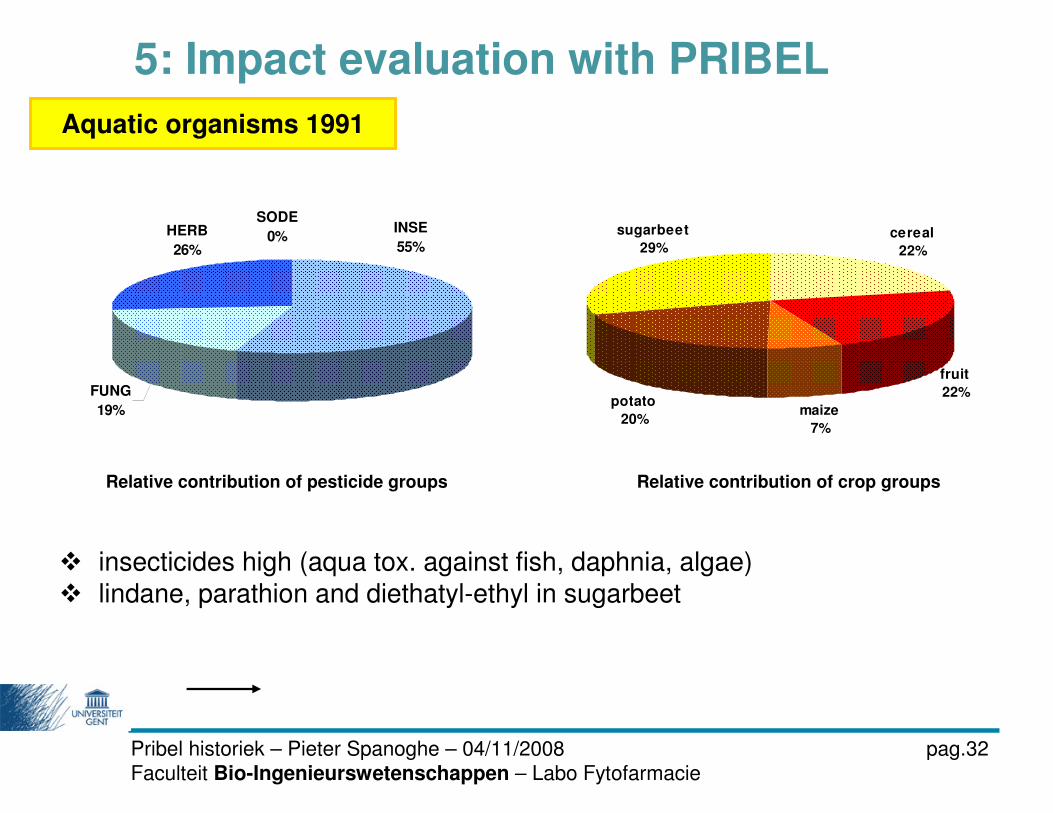
5: Impact evaluation with PRIBEL
Aquatic organisms 1991
Relative contribution of pesticide groups Relative contribution of crop groups
� insecticides high (aqua tox. against fish, daphnia, algae)
� lindane, parathion and diethatyl-ethyl in sugarbeet
SODE
0%HERB
26%
FUNG
19%
INSE
55%cereal
22%
fruit
22%
maize
7%
potato
20%
sugarbeet
29%
Pribel historiek – Pieter Spanoghe – 04/11/2008 pag.32Faculteit Bio-Ingenieurswetenschappen – Labo Fytofarmacie
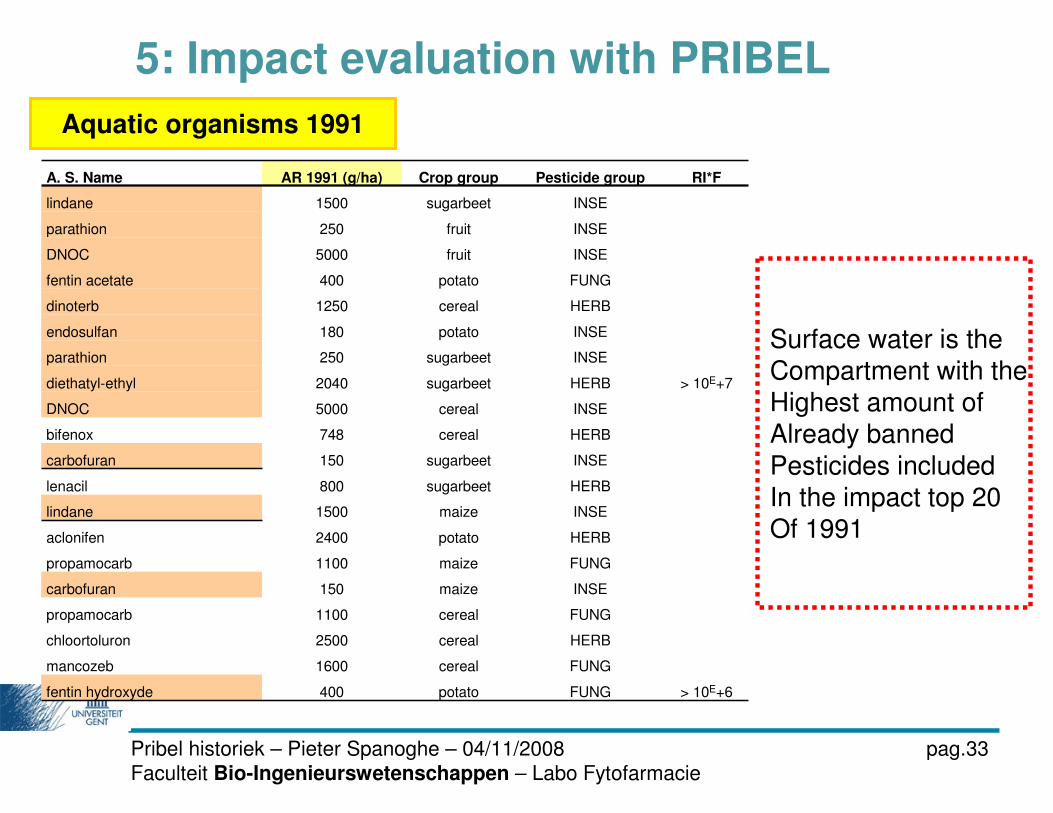
5: Impact evaluation with PRIBEL
Surface water is the
Compartment with the
Highest amount of
Already banned
Pesticides included
In the impact top 20
Of 1991
Aquatic organisms 1991
A. S. Name AR 1991 (g/ha) Crop group Pesticide group RI*F
lindane 1500 sugarbeet INSE
parathion 250 fruit INSE
DNOC 5000 fruit INSE
fentin acetate 400 potato FUNG
dinoterb 1250 cereal HERB
endosulfan 180 potato INSE
parathion 250 sugarbeet INSE
diethatyl-ethyl 2040 sugarbeet HERB > 10E+7
DNOC 5000 cereal INSE
bifenox 748 cereal HERB
carbofuran 150 sugarbeet INSE
lenacil 800 sugarbeet HERB
lindane 1500 maize INSE
aclonifen 2400 potato HERB
propamocarb 1100 maize FUNG
carbofuran 150 maize INSE
propamocarb 1100 cereal FUNG
chloortoluron 2500 cereal HERB
mancozeb 1600 cereal FUNG
fentin hydroxyde 400 potato FUNG > 10E+6
Pribel historiek – Pieter Spanoghe – 04/11/2008 pag.33Faculteit Bio-Ingenieurswetenschappen – Labo Fytofarmacie
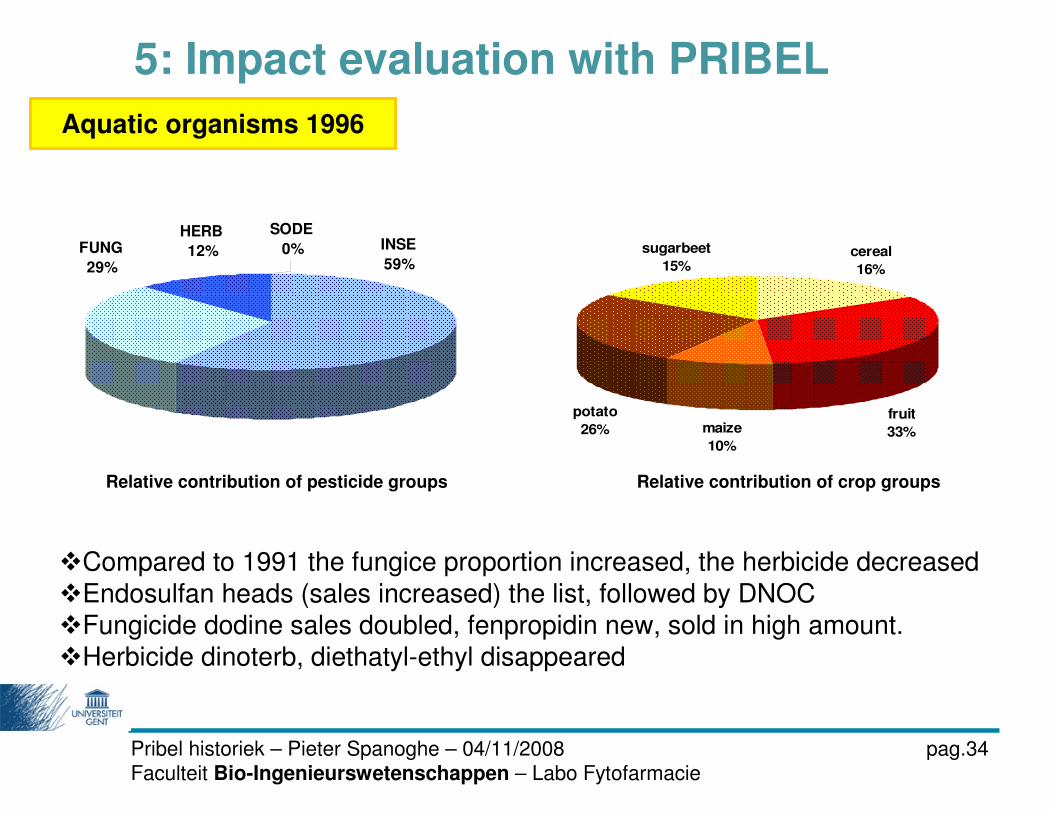
5: Impact evaluation with PRIBEL
Aquatic organisms 1996
Relative contribution of pesticide groups Relative contribution of crop groups
�Compared to 1991 the fungice proportion increased, the herbicide decreased
�Endosulfan heads (sales increased) the list, followed by DNOC
�Fungicide dodine sales doubled, fenpropidin new, sold in high amount.
�Herbicide dinoterb, diethatyl-ethyl disappeared
SODE
0%HERB
12%FUNG
29%
INSE
59%cereal
16%
maize
10%
potato
26%fruit
33%
sugarbeet
15%
Pribel historiek – Pieter Spanoghe – 04/11/2008 pag.34Faculteit Bio-Ingenieurswetenschappen – Labo Fytofarmacie
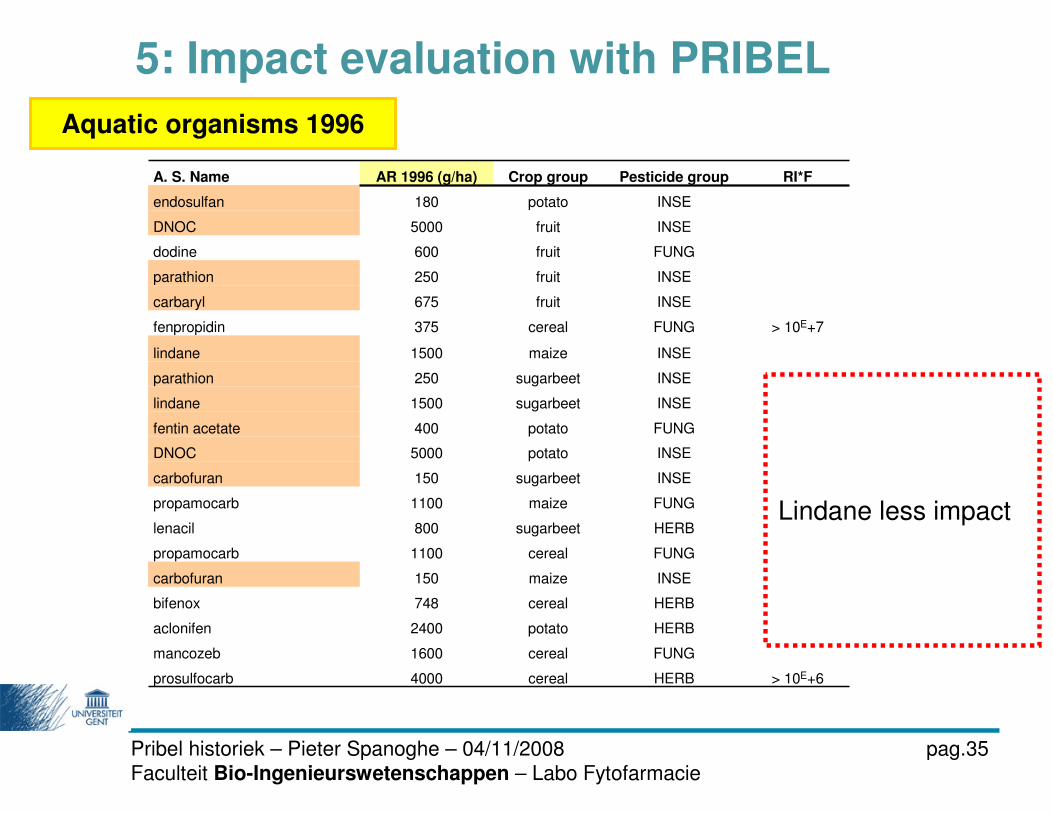
5: Impact evaluation with PRIBEL
Aquatic organisms 1996
A. S. Name AR 1996 (g/ha) Crop group Pesticide group RI*F
endosulfan 180 potato INSE
DNOC 5000 fruit INSE
dodine 600 fruit FUNG
parathion 250 fruit INSE
carbaryl 675 fruit INSE
fenpropidin 375 cereal FUNG > 10E+7
lindane 1500 maize INSE
parathion 250 sugarbeet INSE
lindane 1500 sugarbeet INSE
fentin acetate 400 potato FUNG
DNOC 5000 potato INSE
carbofuran 150 sugarbeet INSE
propamocarb 1100 maize FUNG
lenacil 800 sugarbeet HERB
propamocarb 1100 cereal FUNG
carbofuran 150 maize INSE
bifenox 748 cereal HERB
aclonifen 2400 potato HERB
mancozeb 1600 cereal FUNG
prosulfocarb 4000 cereal HERB > 10E+6
Lindane less impact
Pribel historiek – Pieter Spanoghe – 04/11/2008 pag.35Faculteit Bio-Ingenieurswetenschappen – Labo Fytofarmacie
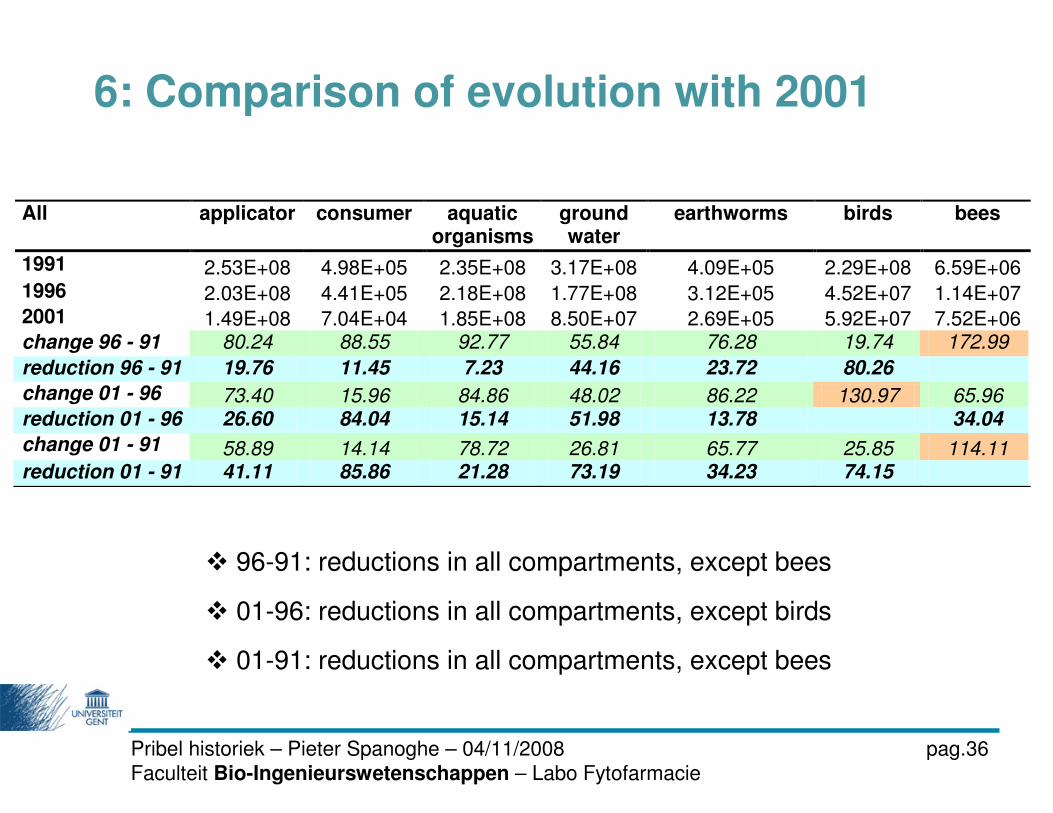
All applicator consumer aquatic organisms
ground water
earthworms birds bees
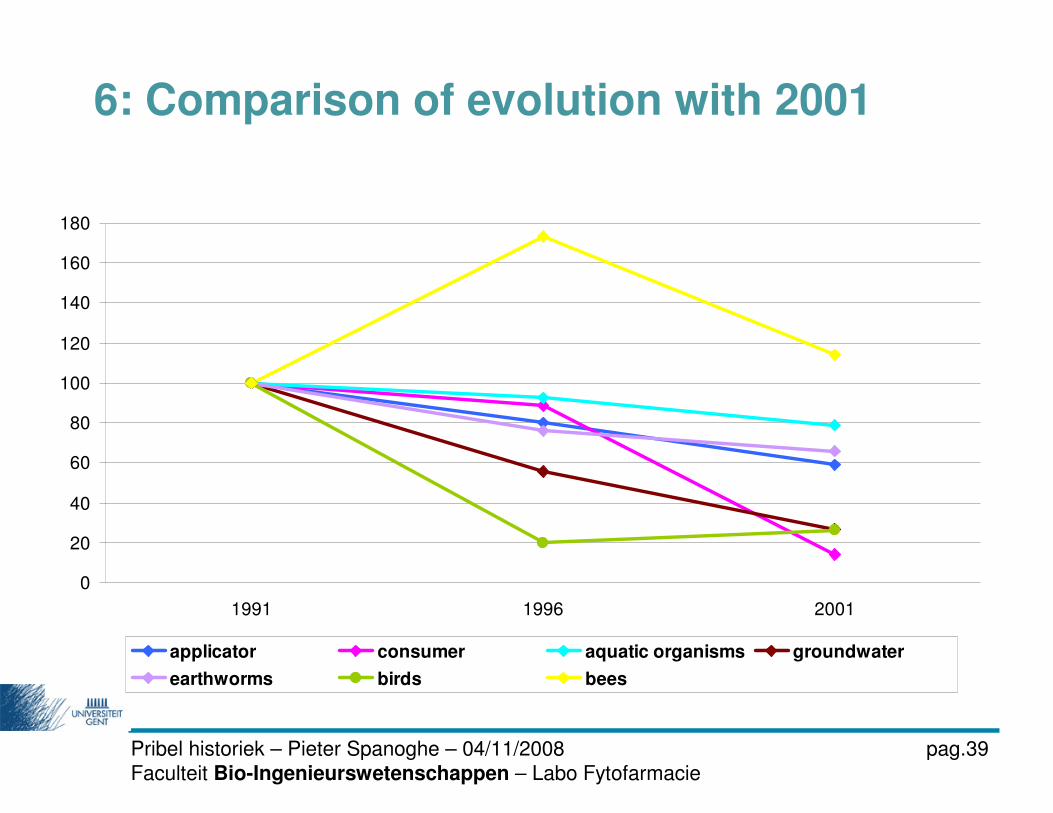
1991 2.53E+08 4.98E+05 2.35E+08 3.17E+08 4.09E+05 2.29E+08 6.59E+06 1996 2.03E+08 4.41E+05 2.18E+08 1.77E+08 3.12E+05 4.52E+07 1.14E+07 2001 1.49E+08 7.04E+04 1.85E+08 8.50E+07 2.69E+05 5.92E+07 7.52E+06 change 96 - 91 80.24 88.55 92.77 55.84 76.28 19.74 172.99
reduction 96 - 91 19.76 11.45 7.23 44.16 23.72 80.26
change 01 - 96 73.40 15.96 84.86 48.02 86.22 130.97 65.96
reduction 01 - 96 26.60 84.04 15.14 51.98 13.78 34.04
change 01 - 91 58.89 14.14 78.72 26.81 65.77 25.85 114.11
reduction 01 - 91 41.11 85.86 21.28 73.19 34.23 74.15
6: Comparison of evolution with 2001
� 96-91: reductions in all compartments, except bees
� 01-96: reductions in all compartments, except birds
� 01-91: reductions in all compartments, except bees
Pribel historiek – Pieter Spanoghe – 04/11/2008 pag.36Faculteit Bio-Ingenieurswetenschappen – Labo Fytofarmacie
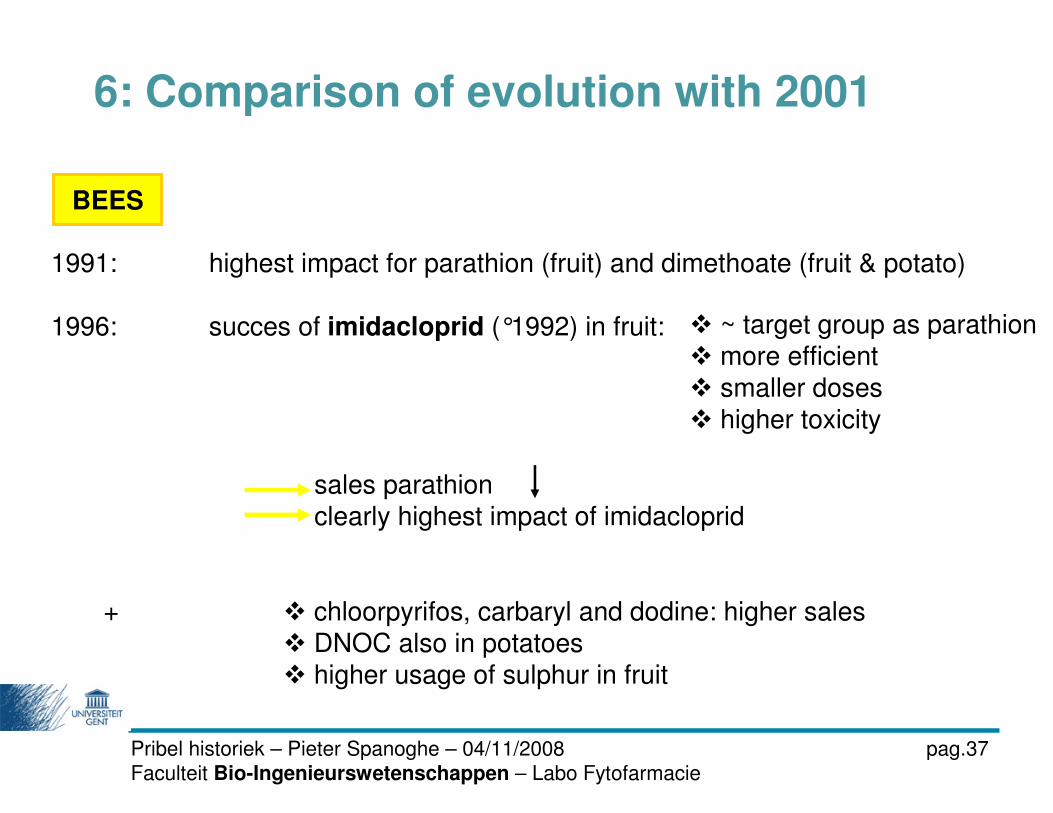
1991: highest impact for parathion (fruit) and dimethoate (fruit & potato)
1996: succes of imidacloprid (°1992) in fruit:
sales parathion
clearly highest impact of imidacloprid
+
6: Comparison of evolution with 2001
BEES
� ~ target group as parathion
� more efficient
� smaller doses
� higher toxicity
� chloorpyrifos, carbaryl and dodine: higher sales
� DNOC also in potatoes
� higher usage of sulphur in fruit
Pribel historiek – Pieter Spanoghe – 04/11/2008 pag.37Faculteit Bio-Ingenieurswetenschappen – Labo Fytofarmacie
� aldicarb (GR) in sugarbeet
� carbofuran (ZB) in maize and sugarbeet
� methiocarb (GR) in different crops
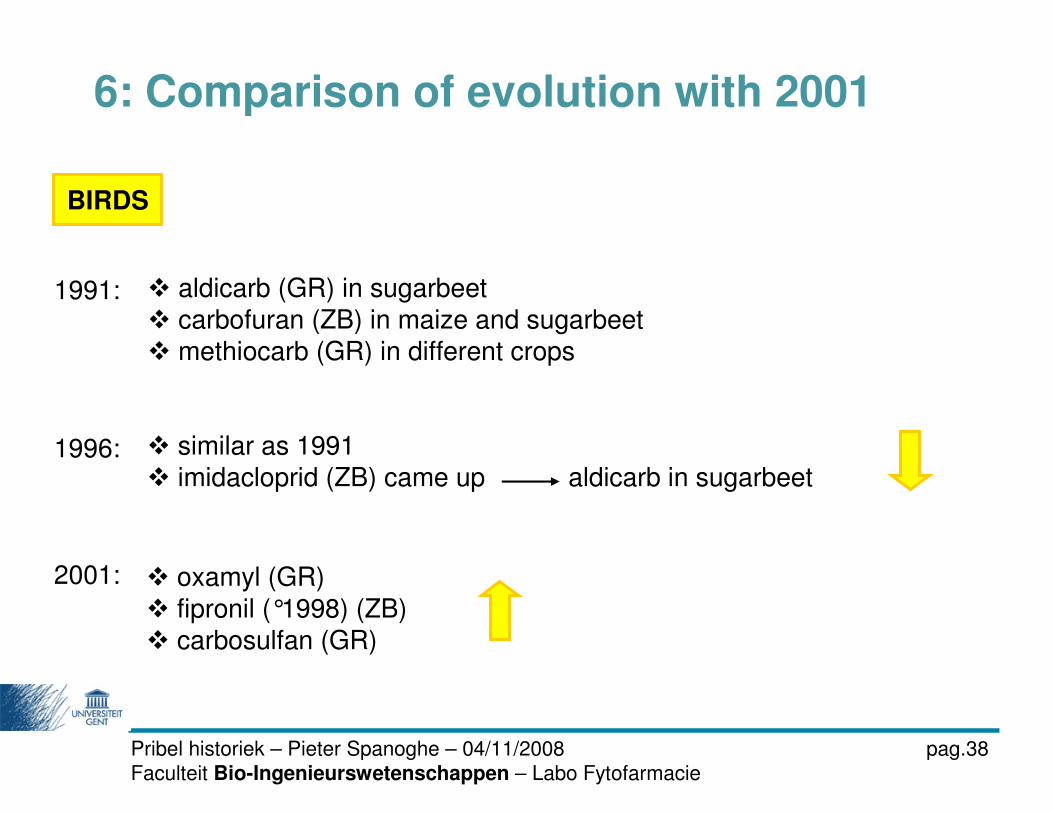
BIRDS
6: Comparison of evolution with 2001
1991:
1996:
2001:
� similar as 1991
� imidacloprid (ZB) came up aldicarb in sugarbeet
� oxamyl (GR)
� fipronil (°1998) (ZB)
� carbosulfan (GR)
Pribel historiek – Pieter Spanoghe – 04/11/2008 pag.38Faculteit Bio-Ingenieurswetenschappen – Labo Fytofarmacie
0
20
40
60
80
100
120
140
160
180
1991 1996 2001
applicator consumer aquatic organisms groundwater
earthworms birds bees
6: Comparison of evolution with 2001
Pribel historiek – Pieter Spanoghe – 04/11/2008 pag.39Faculteit Bio-Ingenieurswetenschappen – Labo Fytofarmacie
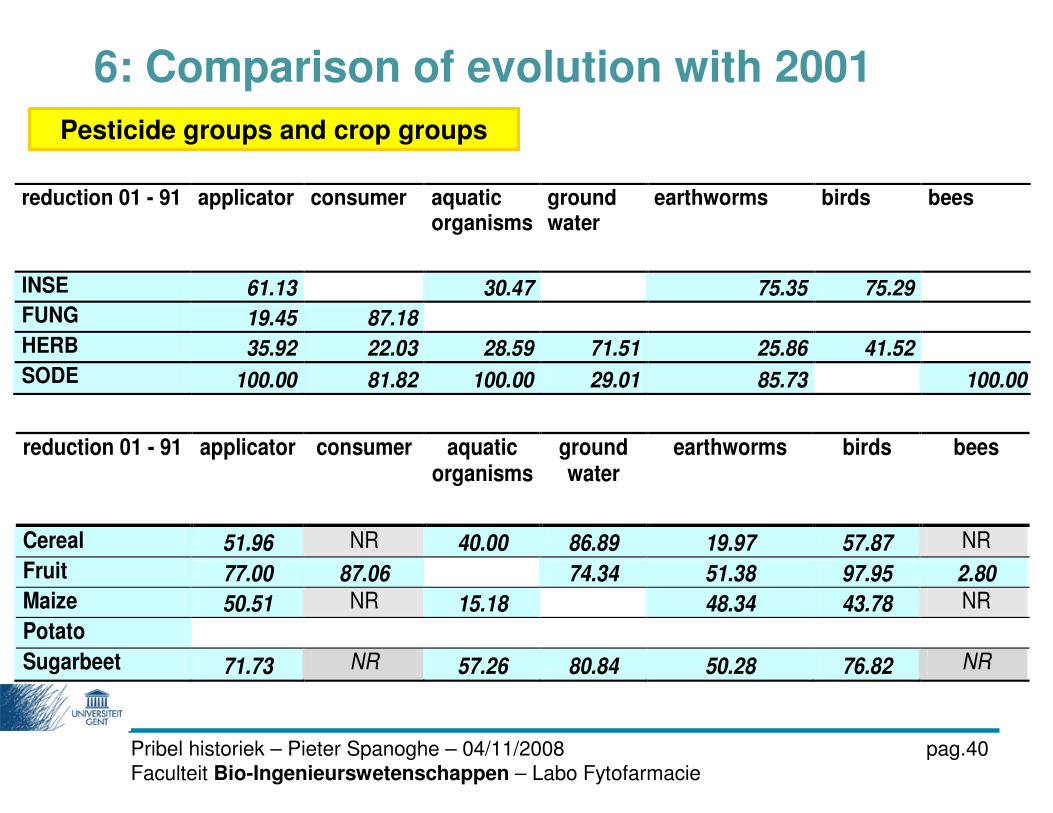
reduction 01 - 91 applicator consumer aquatic organisms
ground water
earthworms birds bees
INSE 61.13 30.47 75.35 75.29
FUNG 19.45 87.18
HERB 35.92 22.03 28.59 71.51 25.86 41.52
SODE 100.00 81.82 100.00 29.01 85.73 100.00
reduction 01 - 91 applicator consumer aquatic organisms
ground water
earthworms birds bees
Cereal 51.96 NR 40.00 86.89 19.97 57.87 NR
Fruit 77.00 87.06 74.34 51.38 97.95 2.80
Maize 50.51 NR 15.18 48.34 43.78 NR
Potato
Sugarbeet 71.73 NR 57.26 80.84 50.28 76.82 NR
6: Comparison of evolution with 2001
Pesticide groups and crop groups
Pribel historiek – Pieter Spanoghe – 04/11/2008 pag.40Faculteit Bio-Ingenieurswetenschappen – Labo Fytofarmacie
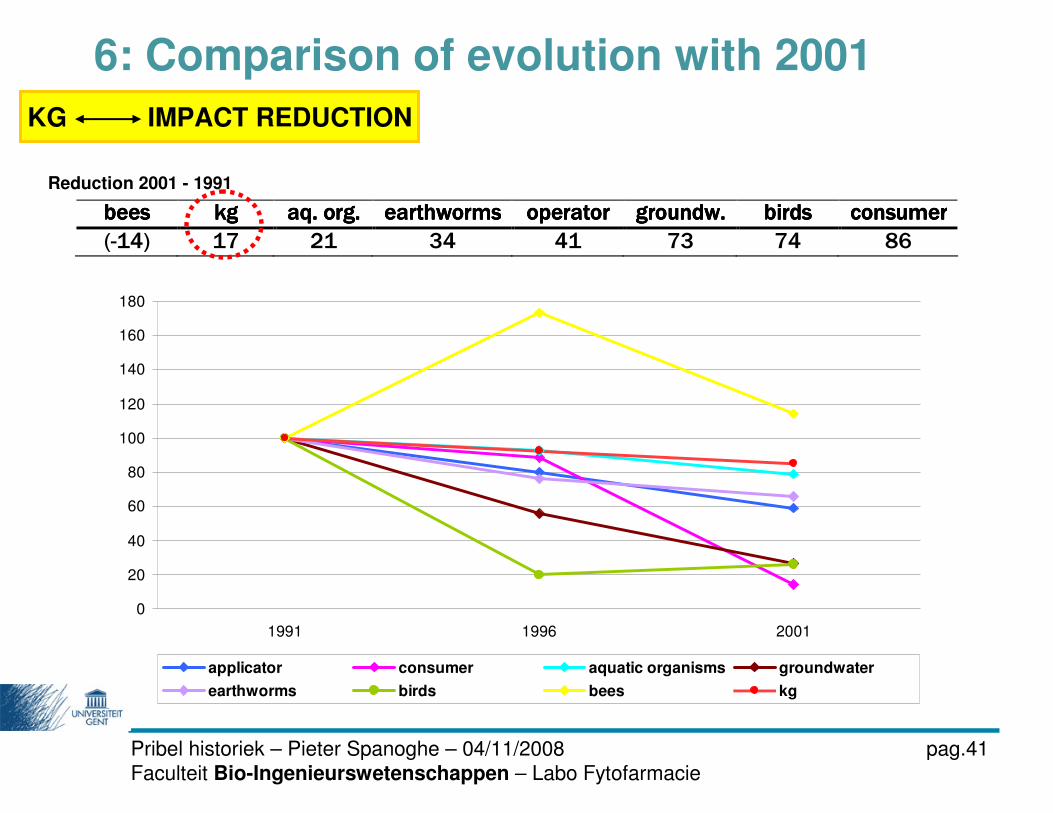
beesbeesbeesbees kgkgkgkg aq. org.aq. org.aq. org.aq. org. earthwormsearthwormsearthwormsearthworms operatoroperatoroperatoroperator groundw.groundw.groundw.groundw. birdsbirdsbirdsbirds consumerconsumerconsumerconsumer
(-14) 17 21 34 41 73 74 86
0
20
40
60
80
100
120
140
160
180
1991 1996 2001
applicator consumer aquatic organisms groundwater
earthworms birds bees kg
6: Comparison of evolution with 2001
KG IMPACT REDUCTION
Reduction 2001 - 1991
Pribel historiek – Pieter Spanoghe – 04/11/2008 pag.41Faculteit Bio-Ingenieurswetenschappen – Labo Fytofarmacie
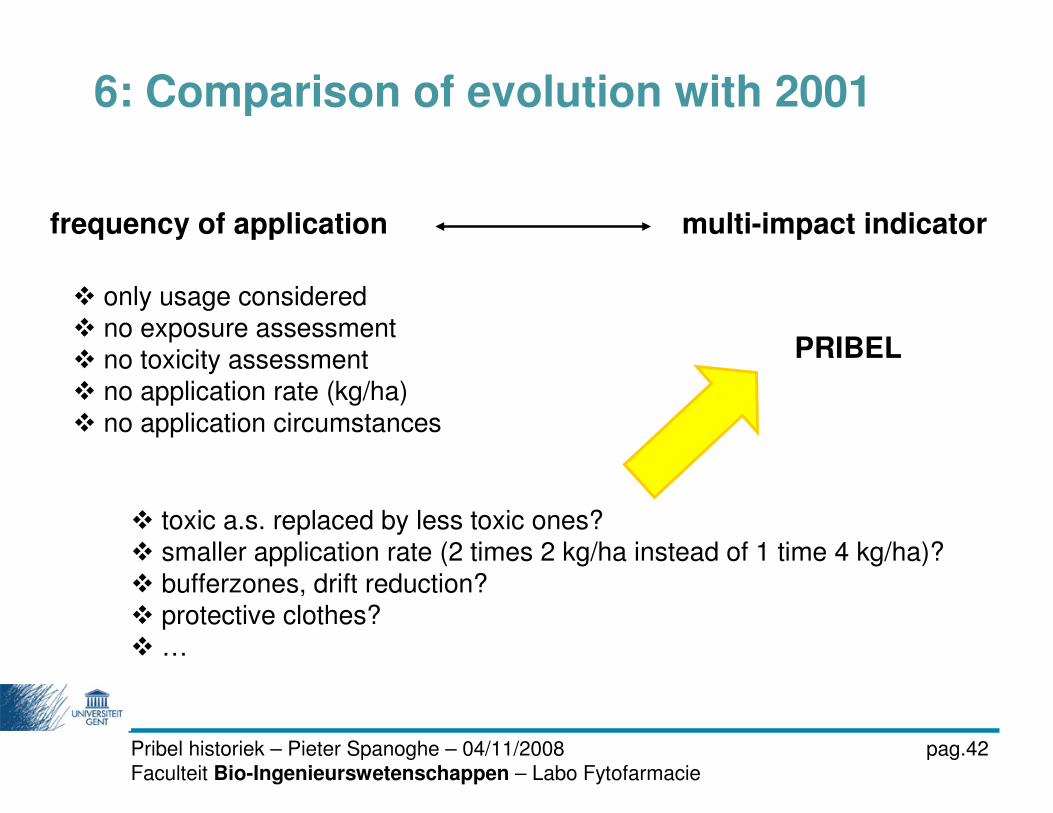
6: Comparison of evolution with 2001
frequency of application multi-impact indicator
� only usage considered
� no exposure assessment
� no toxicity assessment
� no application rate (kg/ha)
� no application circumstances
PRIBEL
� toxic a.s. replaced by less toxic ones?
� smaller application rate (2 times 2 kg/ha instead of 1 time 4 kg/ha)?
� bufferzones, drift reduction?
� protective clothes?
� …
Pribel historiek – Pieter Spanoghe – 04/11/2008 pag.42Faculteit Bio-Ingenieurswetenschappen – Labo Fytofarmacie
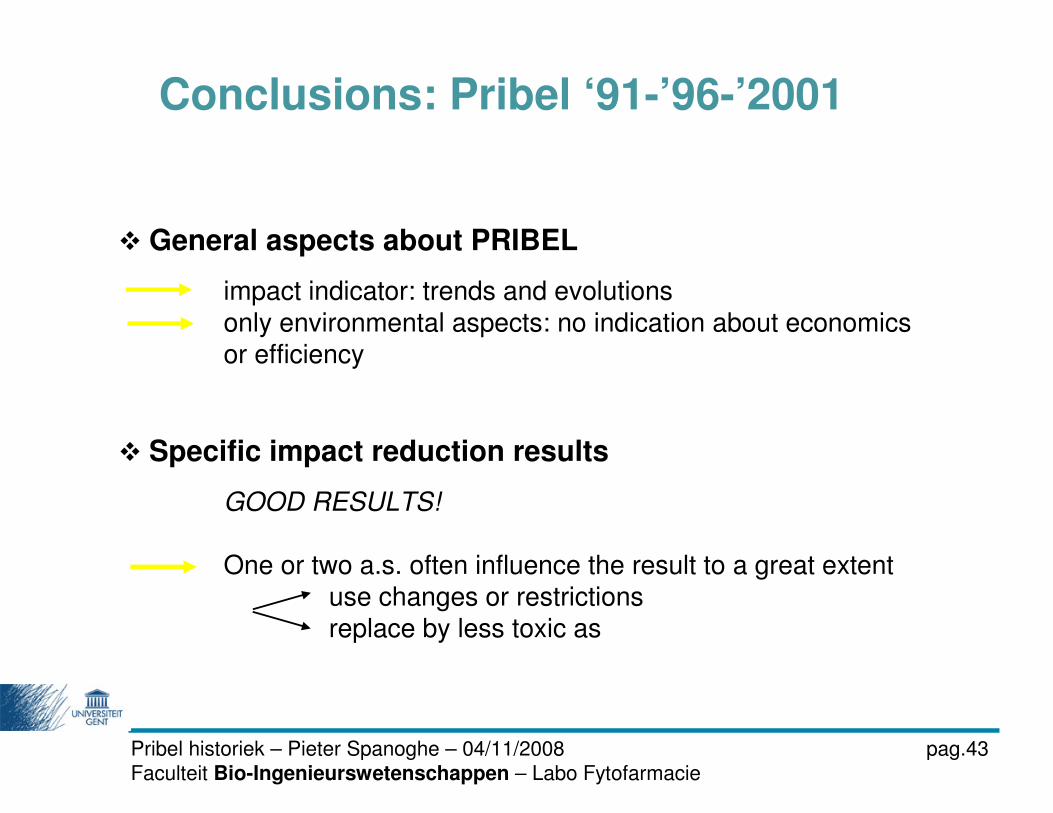
� General aspects about PRIBEL
impact indicator: trends and evolutions
only environmental aspects: no indication about economics
or efficiency
� Specific impact reduction results
GOOD RESULTS!
One or two a.s. often influence the result to a great extent
use changes or restrictions
replace by less toxic as
Pribel historiek – Pieter Spanoghe – 04/11/2008 pag.43Faculteit Bio-Ingenieurswetenschappen – Labo Fytofarmacie
Conclusions: Pribel ‘91-’96-’2001
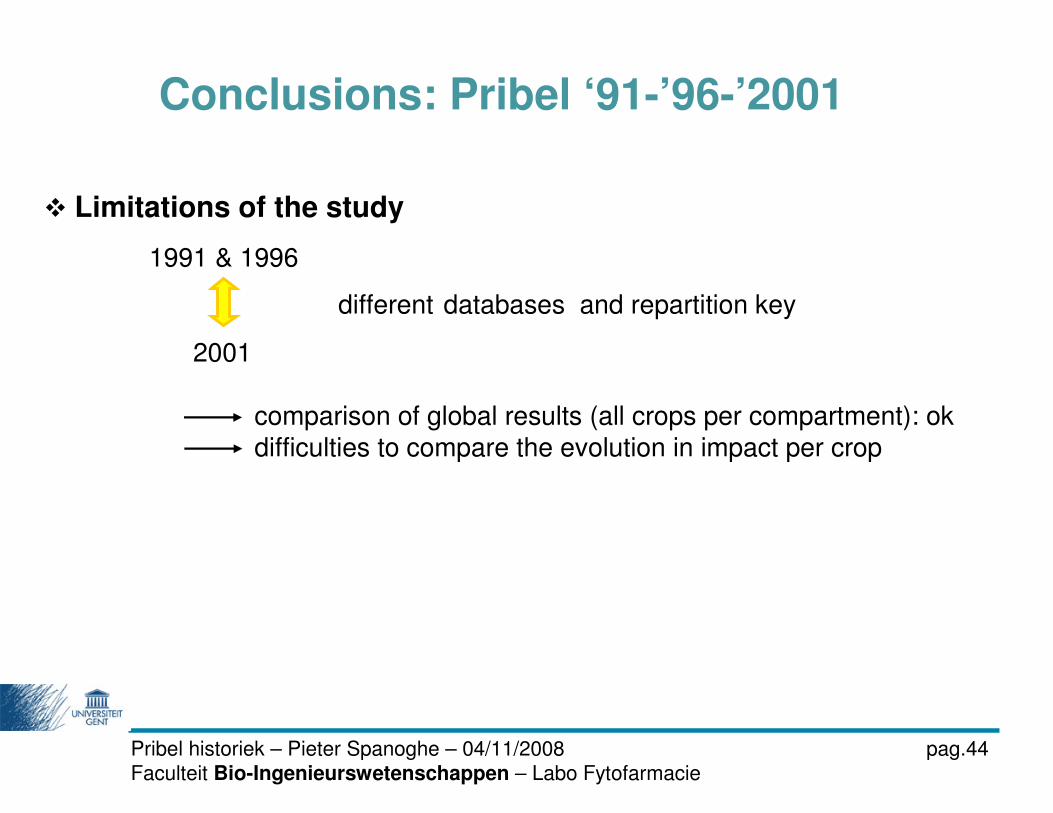
� Limitations of the study
1991 & 1996
2001
comparison of global results (all crops per compartment): ok
difficulties to compare the evolution in impact per crop
different databases and repartition key
Pribel historiek – Pieter Spanoghe – 04/11/2008 pag.44Faculteit Bio-Ingenieurswetenschappen – Labo Fytofarmacie
Conclusions: Pribel ‘91-’96-’2001