
S(veht3e2jij4dq4e55aotiu45... · too. As the medium term fiscal policy statement notes “Major...
76
Transcript of S(veht3e2jij4dq4e55aotiu45... · too. As the medium term fiscal policy statement notes “Major...

YOJANA March 2013 1
Our Representatives : Ahmedabad: Amita Maru, Bangalore: B.S. Meenakshi, Chennai: A. Elangovan, Guwahati: Anupoma Das, Hyderabad: S. Dharmapuri, Kolkata: Antara Ghosh, Mumbai: Dipali Durge, Thiruvananthapuram: R.K. Pillai.
YOJANA seeks to carry the message of the Plan to all sections of the people and promote a more earnest discussion on problems of social and economic development. Although published by the Ministry of Information and Broadcasting, Yojana is not restricted to expressing the official point of view. Yojana is published in Assamese, Bengali, English, Gujarati, Hindi, Kannada, Malayalam, Marathi, Oriya, Punjabi, Tamil, Telugu and Urdu.
For new subscriptions, renewals, enquiries please contact : Business Manager (Circulation & Advt.), Publications Division, Min. of I&B, East Block-IV, Level-VII,R.K. Puram, New Delhi-110066, Tel.: 26100207, Telegram : Soochprakasan and Sales Emporia : Publications Division: *Soochna Bhavan, CGO Complex, Lodhi Road, New Delhi -110003 (Ph 24365610) *Hall No.196, Old Secretariat, Delhi 110054(Ph 23890205) * 701, B Wing, 7th Floor, Kendriya Sadan, Belapur, Navi Mumbai 400614 (Ph 27570686)*8, Esplanade East, Kolkata-700069 (Ph 22488030) *’A’ Wing, Rajaji Bhawan, Basant Nagar, Chennai-600090 (Ph 24917673) *Press road, Near Govt. Press, Thiruvananthapuram-695001 (Ph 2330650) *Block No.4, 1st Floor, Gruhakalpa Complex, M G Road, Nampally, Hyderabad-500001 (Ph 24605383) *1st Floor, ‘F’ Wing, Kendriya Sadan, Koramangala, Bangalore-560034 (Ph 25537244) *Bihar State Co-operative Bank Building, Ashoka Rajpath, Patna-800004 (Ph 2683407) *Hall No 1, 2nd floor, Kendriya Bhawan, Sector-H, Aliganj, Lucknow-226024(Ph 2225455) *Ambica Complex, 1st Floor, above UCO Bank, Paldi, Ahmedabad-380007 (Ph 26588669) *KKB Road, New Colony, House No.7, Chenikuthi, Guwahati 781003 (Ph 2665090)
SUBSCRIPTION : 1 year Rs. 100, 2 years Rs. 180, 3 years Rs. 250. For SAARC countries by Air Mail Rs. 530 yearly; for European and other countries Rs. 730 yearly.No. of Pages : 76
Disclaimer : l The views expressed in various articles are those of the authors’ and not necessarily of the government. l The readers are requested to verify the claims made in the advertisements regarding career guidance books/institutions. Yojana does not own responsibility
regarding the contents of the advertisements.
EDITORIAL OFFICE : Yojana Bhavan, Sansad Marg, New Delhi-110001 Tel.: 23096738, 23042511. Tlgm.: Yojana. Business Manager (Hqs.) : Ph :24367260, 24365609, 24365610
March 2013 Vol 57
Chief Editor : Rajesh K. JhaSenior Editor : Shyamala M. IyerEditor : Manogyan R. Pal
Joint Director (Production) : V.K. MeenaCover Design : Gajanan P. DhopeE-mail (Editorial) : [email protected]
Website : www.yojana.gov.in
Let noble thoughts come to us from all sidesRig Veda
(Circulation) : pdjucir_ [email protected]
YOJANA March 2013 1
C O N T E N T S
BUDGET PROPOSALS-AN OvERvIEW ........................................ 4
HOW IS THE UNION BUDGET FORMULATED? Happy Pant ........................................................................................8
BUDGET 2013-14 : TAxATION PROPOSALS T N Ashok .......................................................................................11
DO YOu KNOw? .......................................................................17
BUDGET 2013-14 AND BEYOND: WHAT IT MEANS FOR FISCAL CONSOLIDATION? Pinaki Chakraborty .........................................................................18
SOCIAL SECTOR OUTLAYS-AN ASSESSMENT Urmi Goswami ...............................................................................21
BUDGET : CONCEPTS AND TERMINOLOGIES ....................... 26
SHODHYATRA
FLAMELESS SEAL MAKER AND OTHERS .............................29
INDIA’S DEFENCE BUDGET Jayanta Roy Chowdhury .................................................................31
A POWER SECTOR REvIEW OF BUDGET Hiranmoy Roy, Anil Kumar ............................................................35
AGRICULTURE AND BUDGET Sandip Das ......................................................................................38
NORTHEAST INDIA B Singh ...........................................................................................43
GENDER ISSUES: BUDGET PROPOSALS Shahin Razi .....................................................................................47
RAIL BUDGET 2013-14 - AN ANALYSIS G Srinivasan ....................................................................................50
ECONOMIC SURvEY - AN OvERvIEW R C Rajamani .................................................................................54
BEST PRACTICESTHE TRIBAL CULTURE Purshottam Lal ................................................................................58
ExAMINING THE PRIORITIES FOR DIFFERENT SECTORS IN THE UNION BUDGET Saumya Shrivastava, Kanika Kaul ..................................................59
PUBLIC PRIvATE PARTNERSHIPS (PPPS): ANALYSING THE FACTORS BEHIND THEIR GROWTH Manisha verma ..............................................................................61
vOCATIONAL EDUCATION & SKILL DEvELOPMENT IN SECONDARY EDUCATION IN THE xII PLAN Raman P Singh ................................................................................67
2 YOJANA March 2013
Jana
ni -
Shi
shu
Sur
aksh
a K
arya
kram
Ove
r 1
cro
re
pre
gn
an
t w
om
en
b
en
efit
ted
Un
iver
sal
Imm
un
isat
ion
2.5
cro
re c
hild
ren
va
ccin
ate
d
ú
Sar
va S
hik
sha
Ab
hiy
an
28
,00
0 p
rim
ary
sc
ho
ols
an
d 6
00
0
up
pe
r p
rim
ary
sc
ho
ols
op
en
ed
ú
Mid
Da
y M
ea
l S
ch
em
e
Ove
r 1
0.5
4 c
rore
ch
ildre
n b
ein
g
pro
vid
ed
ho
t co
oke
d
me
als
in s
cho
ols
Sch
ola
rsh
ips
to
ab
ou
t 6
3 la
kh
min
ority
stu
de
nts
an
d 4
8 la
kh S
C
stu
de
nts
in 2
011
-12
Sc
ho
lars
hip
S
ch
em
es
Ove
r 4
6,0
00
h
ab
itatio
ns
con
ne
cte
d t
hro
ug
h
all-
we
ath
er
roa
ds
Bet
ter
Co
nn
ecti
vity
Realisin
g
Dre
am
sB
uild
ing
Fu
ture
s
Min
istr
y o
f In
form
ati
on
an
d B
roa
dc
as
tin
g
Go
ve
rnm
en
t o
f In
dia
Dr.
Ma
nm
oh
an
Sin
gh
Prim
e M
inis
ter
Sm
t. S
on
ia G
an
dh
iC
ha
irp
ers
on
, U
PA
Ê´ÉEò
ÉºÉ E
òÒ Eò
½þÉxÉ
Ò ¦É
É®úiÉ
Êxɨ
ÉÉÇhÉ E
òÒ VÉ
Ö¤ÉÉxÉ
Ò
davp 22111/13/0101/1213
YE-
272/
2013
YOJANA March 2013 3YOJANA March 2013 3
The presentation of the Union Budget is always preceded by a lot of speculation and excitement. This year too it was no different. Analysts and watchers of the Indian economy wondered how the Union Budget would tackle the complex challenges facing the Indian
economy. How would the Finance Minister address the issue of spurring growth while keeping the inflation under control? What would be the strategy to reduce fiscal deficit without compromising on the flagship programmes of the government? In view of the general elections in 2014, what would be the political constraints on the budget? After all, budget is not simply an exercise in working out the revenue and expenditure of the government. Fundamentally, budget is an exercise in political- economy since the economic issues are inextricably intertwined with the political imperatives. The challenge was indeed daunting and the Finance Minister chose the Majjhima Patipada- the middle way.
A general slow down in the world economy had its impact on the Indian economy. The GDP growth rate declined from 9.3 percent in 2007-08 to 5.00 percent in 2012-13. Though, inflation measured in terms of Wholesale Price Index (WPI) stayed around 7-8 percent in the current financial year, the food inflation remained high affecting the Consumer Price Index (CPI) adversely. Fiscal Deficit and Current Account Deficit (CAD) have also been areas of concern. It is in the context of these tough economic realities that the budget has tried to strike a balance between demands of growth and containing inflation and continued expenditure on social sectors like health, employment generation while reducing the subsidy bill to keep the fiscal deficit within the limits of the Financial Responsibility and Budget Management (FRBM) rules.
In the current financial year, the fiscal deficit is 5.2 percent and it is projected to come down to 4.8 percent in the FY 2013-14. Indeed the cut down in the plan expenditure of the government by approximately 18 percent has been an important factor in the reduction in fiscal deficit in the FY 2012-13, but in the coming financial year an increased tax revenue collection by 19 percent, reduction in subsidies from 2.6 percent of GDP to 2 percent and increased capital receipts from disinvestment, sale of spectrum etc. to the tune of ` 55814 crore would help the government keep the fiscal deficit under tight control.
However, the social commitment of the government has not been allowed to be diluted against the imperatives of financial consolidation. The budget has tried to keep the allocation to the flagship programmes like MGNREGA (` 33,000 crore against the actual expenditure of ` 29387 crore in 2012-13), food-subsidy (` 90000 crore against ` 85000 crore in FY 2012-13) with allocation of ` 10000 crore tentatively set aside for the food-security scheme which is likely to come in the FY 2013-14, at a sustained level. The outlay for education has been increased by 17 percent to ` 65867 crore and the health sector has been allocated ` 37,330 crore which marks an increase of 23 percent over the last year. The plan expenditure has also been enhanced by 29 percent compared to the BE 2012-13.
A number of innovative schemes have been announced in the Budget. The Women’s Bank with an allocation of ` 1000 crore is a new concept which would be watched keenly for its impact in future. Special attention has been paid to ensure safety of women for which an allocation of ̀ 1000 crore has been made under the Nirbhaya fund. A surcharge of 10 percent has been levied on the ‘super-rich’ category whose annual income exceeds ` 1 crore. This surcharge is expected to garner more than `1500 crore for the government.
It may not be an easy task to achieve the targets set out in the budget. Commentators have pointed out that the budget projections for increased revenue collection, reduced subsidies on petroleum products, Current Account Deficit and exchange rate may be difficult to achieve. But there is no room for complacency. Only a strong and financially stable economic system can give the government space and capability to implement the agenda of inclusive growth.
Majjhima Patipada
4 YOJANA March 2013
NION BUDGET e n d e d o u t creditably on the main task for fiscal 2012-13. It kept the fiscal deficit under
control at 5.2 percent of GDP instead of the often feared 6 percent estimate, as late as September 2012. Though superficially the dip in the fiscal deficit is just a marginal improvement from the revised target of 5.3 percent, it is the first time since 2008-09 that the fiscal deficit calculated by the finance ministry will dip close to 5 percent. This is significant considering that the current account deficit will also close out this fiscal almost at 5 percent. Further, the revenue deficit has been contained at 3.9 percent in the current fiscal and would be brought down to 3.3 percent in 2013-14.
Budget 2013-14 has staved off the downgrade from international rating agencies, plumped for i n v e s t m e n t a t t h e c o s t o f consumption and tried to make India a better place to invest in. In the process it has been harsh on expenditure. The Finance Minister
Budget Proposals-An Overview
BuDGET 2013-14
Budget 2013-14 has staved off the downgrade from
international rating agencies, plumped
for investment at the cost of
consumption and tried to make India
a better place to invest in
has used the scalpel on the subsidies too. As the medium term fiscal policy statement notes “Major subsidies in the Revised Estimates for 2012-13 have increased to Rs 2,47,854 crore as compared to the Budget Estimates for 2012-13 of Rs 1,79,554 crore. The major part of increase has come from petroleum subsidies that went up from Rs 43,580 crore in BE 2012-13 to Rs 96,880 crore in RE 2012-13”. This is a 122 percent rise that the minister has clawed back in 2013-14.
So what is the scene with major subsidies? They are budgeted at Rs 2,20,972 crore in BE 2013-14. Total subsidies are at 2.6 percent of GDP in RE 2012-13 and are budgeted to be at 2 percent of GDP in 2013-14, the commitment the finance minister has taken on from the vijay Kelkar committee. The subsidy bill is pegged lower by 11 percent in 2013-14. The Budget hopes to cap the total expenditure on major subsidies including fuel, food and fertiliser at Rs 2,20,971.50 crore for the 2013-14 fiscal as against Rs 2,47,854 crore in the revised estimates for this fiscal.
Compiled by Yojana Editorial team.
uUnion
Budge
t
YOJANA March 2013 5
Interestingly, the revised estimates for this fiscal are higher by 38 percent compared to the budget estimate of Rs 1,79,554 crore.
While the oil subsidy is pegged at Rs 65,000 crore for next fiscal against the revised estimate (RE) of Rs 96,880 crore in 2012-13 fiscal, the food subsidy is estimated to rise to Rs 90,000 crore next fiscal from the RE of Rs 85,000 crore in 2012-13. The fertiliser subsidy is also pegged slightly lower at Rs 65,971.50 crore in the next fiscal, as against the RE of Rs 65,974 crore in 2012-13 fiscal.
To balance these giveaways the budget has built in an aggressive tax mobilisation target. It includes Rs 18,000 crore of additional revenue mobilisation measures. The same document says “With these measures tax revenues in 2013-14 are expected to grow at 19.1 percent. The tax to GDP ratio estimated in the Budget for 2013-14 is 10.9 percent. Budget Estimates for 2013-14 assumes a normal tax growth of 17 percent over RE 2012-13 and remaining tax growth emanating from additional resource mobilization measures.
The bleak economic outlook gives the minister space to keep tax giveaways to almost nil this year. Once economic growth returns next year there will be demands for tax breaks. The fiscal policy statement points out “As the tax to GDP ratio increases, further improvements would be more gradual and difficult to achieve. The outlook for tax revenues for the years 2014-15 and 2015-16 has been designed keeping this in mind”. In a hope to reach a tax to GDP ratio of 11.9
percent, the Budget has estimated a 19 percent rise in revenue receipts to Rs 10,56,331 crore in 2013-14 as compared to a revised estimate of Rs 8,71,828 crore for the fiscal.
So far as the market borrowings are concerned, the gross market borrowings have been pegged at a record Rs 6,29,009 crore in 2013-14, the net borrowings are expected to rise to Rs 4,84,000 crore. This is just a 3.5 percent rise over the revised estimate of Rs 4,67384 crore in the current fiscal. The difference is due to the record redemption of bonds estimated at Rs 1,45,009 crore in 2013-14.
It is betting heavily on proceeds from disinvestment in state owned firms to help finance the ambitious fiscal deficit target. The Budget has doubled the disinvestment target for next fiscal to Rs 40,000 crore, as against a revised estimate of Rs 24,000 crore in the current fiscal. In addition, the government is also betting on raising Rs 14,000 crore from selling off its residual stake in Hindustan Zinc, Balco and SUUTI.
Though finance minister P Chidambaram did not announce the disinvestment target in his speech, the total estimate of Rs 55,814 crore works out to the highest target from stake sale proceeds in over a decade.
Among the sectoral initiatives the finance minister announced that independent regulator will be expected to provide solutions to revive among other the road sector, which has seen a slowdown in award and implementation of projects.
To be eligible to claim the benefits the home buyers will have to buy their first home whose value should not exceed Rs 40 lakh and the home loan should be restricted to Rs 25 lakh. While the loan needs to be taken between April 1, 2013 and March 31, 2014, the buyer can claim the available benefit of deduction Rs 1 lakh over a period of two years.
In case the loan is taken in the middle of 2013-14, the buyer can claim the applicable benefit in the assessment year beginning April 2014 and the remaining amount can be claimed in the next assessment year.
For the capital markets in an effort to bring the derivative trading in commodities and the securities market at par, the finance minister announced the commodities transaction tax (CTT) of 0.01 percent of the price of the trade on all commodities except agricultural commodities.
The finance minister also announced reduction of the securities transaction tax on equity futures from existing 0.17 percent to 0.01 percent bringing both CTT and STT at par.
"There is no distinction between derivative trading in the securities market and derivative trading in the commodities market, only the underlying asset is different. I propose to levy CTT on non-agricultural commodities futures contracts at the same rate as on equity futures, which is at 0.01 percent of the price of the trade," said the Finance Minister in his speech.
6 YOJANA March 2013
To rev ive the weakened investment climate in the country and to quicken the implementation of projects, the budget 2013-14 proposed to offer incentives to companies that step in to make investments. The finance minister has also announced an investment allowance of 15 percent for all new high value investments of more than Rs 100 crore over the next two financial years. The benefit will be in addition to the current rates of depreciation. It has however
taken couple of measures to plug the loopholes for tax avoidance by companies.
But, what about inflation management? The Reserve Bank of India would soon launch inflation-indexed bonds to make people move away from gold as the instrument of effective hedge against inflation. "This will be done next fiscal. We will have our cash and debt management meeting towards the end of this financial year and
hopefully, from the first or second month of the next fiscal, we will launch inflation-indexed bonds," RBI Deputy Governor HR Khan told reporters. The central bank has been planning to introduce IIBs to keep investors away from gold as a hedge against inflation.
The final surmise—a tough set of decisions in a difficult year, that is what Budget 2013-14 will be known as. q
(E-mail:[email protected])
12th Plan Projects Investment of Rs 55,00,000 Crore in Infrastructure
While presenting the Budget for 2013-14, the Finance Minister P. Chidambaram said that the growth rate of an economy is correlated with the investment rate. The key to restart the growth engine is to attract more investment, both from domestic investors and foreign investors. He said that efforts will be made to
improve communication of the country’s policies to remove any apprehension or distrust in the minds of investors, including fears about undue regulatory burden or application of tax laws. ‘Doing business in India’ must be seen as easy, friendly and mutually beneficial.
While every sector can absorb new investment, it is the infrastructure sector that needs large volumes of investment. The 12th Plan projects an investments of USD 1 trillion or Rs. 55,00,000 crore in infrastructure. The Plan envisages that the private sector will share 47 percent of the investment. Besides, India needs new and innovative instruments to mobilize funds for this order of investment. Government has taken or will take the following measures to increase investment in infrastructure:
Infrastructure Debt Funds (IDF) will be encouraged. These funds will raise resources and, through take-out finance, credit enhancement and other innovative means, provide long-term low-cost debt for infrastructure projects. Four IDFs have been registered with SEBI so far and two of them were launched in the month of February, 2013.
India Infrastructure Finance Corporation Ltd (IICL), in partnership with the Asian Development Bank, will offer credit enhancement to infrastructure companies that wish to access the bond market to tap long term funds.
In the last two years, a number of institutions were allowed to issue tax free bonds. They raised Rs. 30,000 crore in 2011-12 and are expected to raise about Rs. 25,000 crore in 2012-13. It is proposed to allow some institutions to issue tax free bonds in 2013-14, strictly based on need and capacity to raise money in the market, upto a total sum of Rs. 50,000 crore.
Multilateral Development Banks are keen to assist in efforts to promote regional connectivity. Combining the ‘Look East’ policy and the interests of the North Eastern States, it is proposed to seek the assistance of the World Bank and the Asian Development Bank to build roads in the North Eastern States and connect them to Myanmar.
NABARD operates the Rural Infrastructure Development Fund (RIDF). RIDF has successfully utilized 18 tranches so far. It is proposed to raise the corpus of RIDF-xIx in 2013-14 to Rs.20,000 crore. Pursuant to the announcement made last year, a sum of Rs. 5000 crore will be made available to NABARD to finance construction of warehouses, godowns, silos and cold storage units designed to store units designed to store agricultural produce, both in the public and the private sectors. This window will also finance, through the State Governments, construction of godowns by panchayats to enable farmers to store their produce, the Finance Minister announced.
YOJANA March 2013 7
3State of the Economy and Prospects
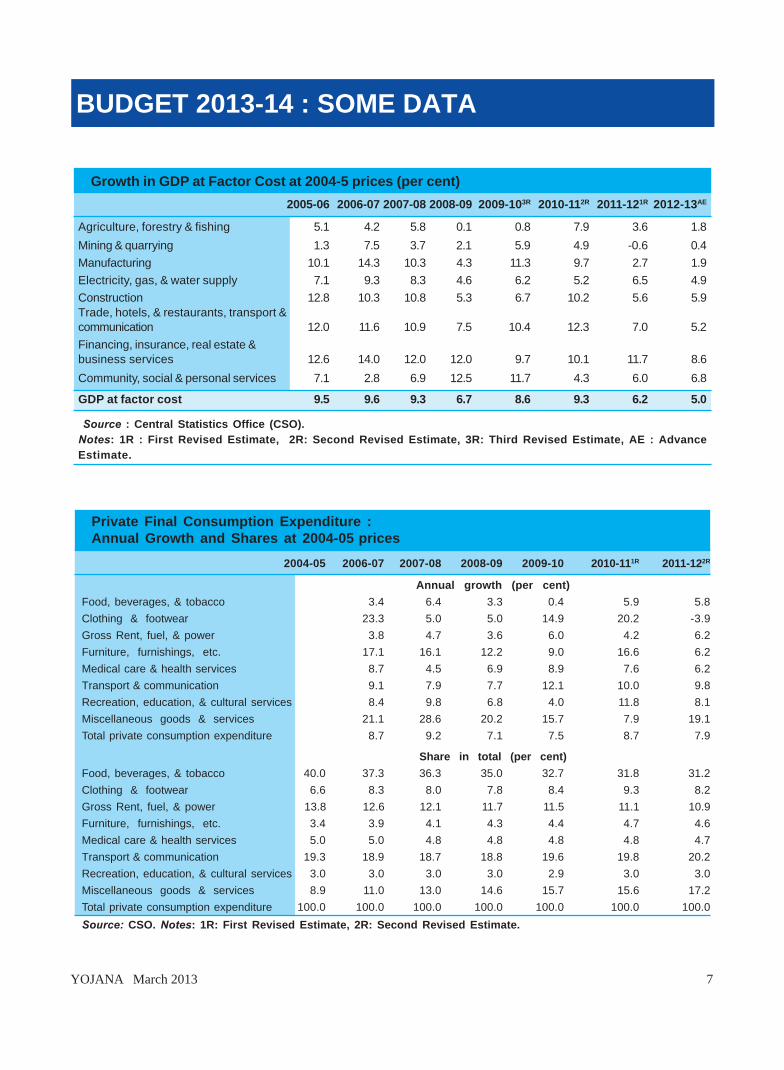
Growth in GDP at Factor Cost at 2004-5 prices (per cent)2005-06 2006-07 2007-08 2008-09 2009-103R 2010-112R 2011-121R 2012-13AE
Agriculture, forestry & fishing 5.1 4.2 5.8 0.1 0.8 7.9 3.6 1.8Mining & quarrying 1.3 7.5 3.7 2.1 5.9 4.9 -0.6 0.4Manufacturing 10.1 14.3 10.3 4.3 11.3 9.7 2.7 1.9Electricity, gas, & water supply 7.1 9.3 8.3 4.6 6.2 5.2 6.5 4.9Construction 12.8 10.3 10.8 5.3 6.7 10.2 5.6 5.9Trade, hotels, & restaurants, transport &communication 12.0 11.6 10.9 7.5 10.4 12.3 7.0 5.2Financing, insurance, real estate &business services 12.6 14.0 12.0 12.0 9.7 10.1 11.7 8.6Community, social & personal services 7.1 2.8 6.9 12.5 11.7 4.3 6.0 6.8
GDP at factor cost 9.5 9.6 9.3 6.7 8.6 9.3 6.2 5.0
Source : Central Statistics Office (CSO).Notes: 1R : First Revised Estimate, 2R: Second Revised Estimate, 3R: Third Revised Estimate, AE : AdvanceEstimate.
which registered a growth rate of only 3.5 per centand 3.1 per cent in 2011-12 and 2012-13 respectively.The rate of growth of the manufacturing sector waseven lower at 2.7 per cent and 1.9 per cent for thesetwo years respectively. Growth in agriculture has alsobeen weak in 2012-13, following lower-than-normalrainfall, especially in the initial phases (months ofJune and July) of the south-west monsoon.
1.4 After achieving double-digit growth continuouslyfor five years and narrowly missing double digits inthe sixth (between 2005-06 and 2010-11), the growthrate of the services sector also declined to 8.2 percent in 2011-12 and 6.6 per cent in 2012-13. In 2011-12 the sector that particularly slowed within theservices sector was Trade, Hotels, and Restaurants,Transport and Communications, and its growth furtherdeclined in 2012-13. Activities in this sector, beingforms of derived demand, tend to grow at a slowerrate with the slowdown of economic activity in theindustry and agriculture sectors.
1.5 Why has the economy slowed down so rapidlydespite recovering strongly from the global financialcrisis? A number of factors are responsible. First,the boost to demand given by monetary and fiscalstimulus following the crisis was large. Finalconsumption grew at an average of over 8 per centannually between 2009-10 and 2011-12. The resultwas strong inflation and a powerful monetaryresponse that also slowed consumption demand.Second, starting in 2011-12, corporate andinfrastructure investment started slowing both as aresult of investment bottlenecks as well as the tightermonetary policy. Thirdly, even as the economyslowed, it was hit by two additional shocks: a slowing
global economy, weighed down by the crisis in theEuro area and uncertainties about fiscal policy inthe United States, and a weak monsoon, at least inits initial phase.
1.6 As growth slowed and government revenuesdid not keep pace with spending, the fiscal deficitthreatened to breach the target. With governmentsavings falling, and private savings also shrinking,the CAD--which is the investment that cannot befinanced by domestic savings and has to be financedfrom abroad--also widened. In the rest of this chapter,the statistical underpinnings of the macroeconomyare analysed followed by the rationale behind thegovernment's policy for macroeconomic stabilizationand restoring growth, in addition to themacroeconomic outlook and possible risks to theoutlook.
1.7 The Economic Survey does not just analysethe economy; it is also a detailed record of majordevelopments in the economy. So themacroeconomic analysis will be followed by asummary tour of the other chapters in the Survey.
ASPECTS OF GROWTH
1.8 In the last decade, growth has increasinglycome from the services sector, whose contributionto overall growth of the economy has been 65 percent, while that of the industry and agriculture sectorshas been 27 per cent and 8 per cent respectively.Figure 1.1 shows the contributions of these sectorsto the overall growth of the economy from 2003-04to 2012-13.
http://indiabudget.nic.in
6 Economic Survey 2012-13
1.14 Quarterly GDP growth rate in India declinedin each of the successive quarters between the fourthquarter of 2010-11 and the fourth quarter of 2011-12.Growth in H1 of the current year works out to 5.4 percent, while the CSO's Advance Estimate for growthfor 2012-13 is 5.0 per cent. Let us now analyse someof the key elements of aggregate demand to seewhy the economy has slowed.
PRIVATE FINAL CONSUMPTIONEXPENDITURE
1.15 Private final consumption expenditureaccounts for about three-fifths of GDP at marketprices. An increase in people's disposable incometends to reduce the share of food in total consumption(the National Sample Survey Organization's [NSSO]Survey on Consumption Expenditure provides clearevidence of the downward trend in share of food intotal consumption). Expectedly, therefore, the growthrate of expenditure on the food, beverages, andtobacco group is lower than that of total private finalconsumption expenditure, resulting in a reduction inits share from 40 per cent in 2004-05 to 31.2 percent in 2011-12 (Table 1.4).
1.16 In the current year, private final consumptionexpenditure has slowed considerably, from 8 per centin 2011-12 to 4.1 per cent in 2012-13 (Table 1.2).The rate of growth of production of a large number ofconsumer durables declined significantly, e.g. privatevehicles from 23.2 per cent in April-November 2011to - 5.6 per cent in April-November 2012. Similarly,the growth rate of production of consumer durablesfor mass consumption declined from 12.2 per centin April-November 2011 to 3.3 per cent in April-November 2012.
1.17 Part of the reason for the general slowdownin consumption could be that higher inflation tendsto reduce real disposable incomes of households.Growth of durable goods consumption (under theassumption that growth of consumption for theseitems would not be significantly different from thegrowth in production) may have slowed even furtherrecently, because high interest rates and resultinghigh monthly instalments restrained purchases. Atthe same time, the seasonally adjusted consumernon-durable index of industrial production (IIP),which is typically a smoother series than durablegoods production, has been picking up since August2012.
Private Final Consumption Expenditure : Annual Growth and Shares at 2004-05 prices
2004-05 2006-07 2007-08 2008-09 2009-10 2010-111R 2011-122R
Annual growth (per cent)Food, beverages, & tobacco 3.4 6.4 3.3 0.4 5.9 5.8Clothing & footwear 23.3 5.0 5.0 14.9 20.2 -3.9Gross Rent, fuel, & power 3.8 4.7 3.6 6.0 4.2 6.2Furniture, furnishings, etc. 17.1 16.1 12.2 9.0 16.6 6.2Medical care & health services 8.7 4.5 6.9 8.9 7.6 6.2Transport & communication 9.1 7.9 7.7 12.1 10.0 9.8Recreation, education, & cultural services 8.4 9.8 6.8 4.0 11.8 8.1Miscellaneous goods & services 21.1 28.6 20.2 15.7 7.9 19.1Total private consumption expenditure 8.7 9.2 7.1 7.5 8.7 7.9
Share in total (per cent)Food, beverages, & tobacco 40.0 37.3 36.3 35.0 32.7 31.8 31.2Clothing & footwear 6.6 8.3 8.0 7.8 8.4 9.3 8.2Gross Rent, fuel, & power 13.8 12.6 12.1 11.7 11.5 11.1 10.9Furniture, furnishings, etc. 3.4 3.9 4.1 4.3 4.4 4.7 4.6Medical care & health services 5.0 5.0 4.8 4.8 4.8 4.8 4.7Transport & communication 19.3 18.9 18.7 18.8 19.6 19.8 20.2Recreation, education, & cultural services 3.0 3.0 3.0 3.0 2.9 3.0 3.0Miscellaneous goods & services 8.9 11.0 13.0 14.6 15.7 15.6 17.2Total private consumption expenditure 100.0 100.0 100.0 100.0 100.0 100.0 100.0Source: CSO. Notes: 1R: First Revised Estimate, 2R: Second Revised Estimate.
http://indiabudget.nic.in
BuDGET 2013-14 : SOME DaTa
8 YOJANA March 2013
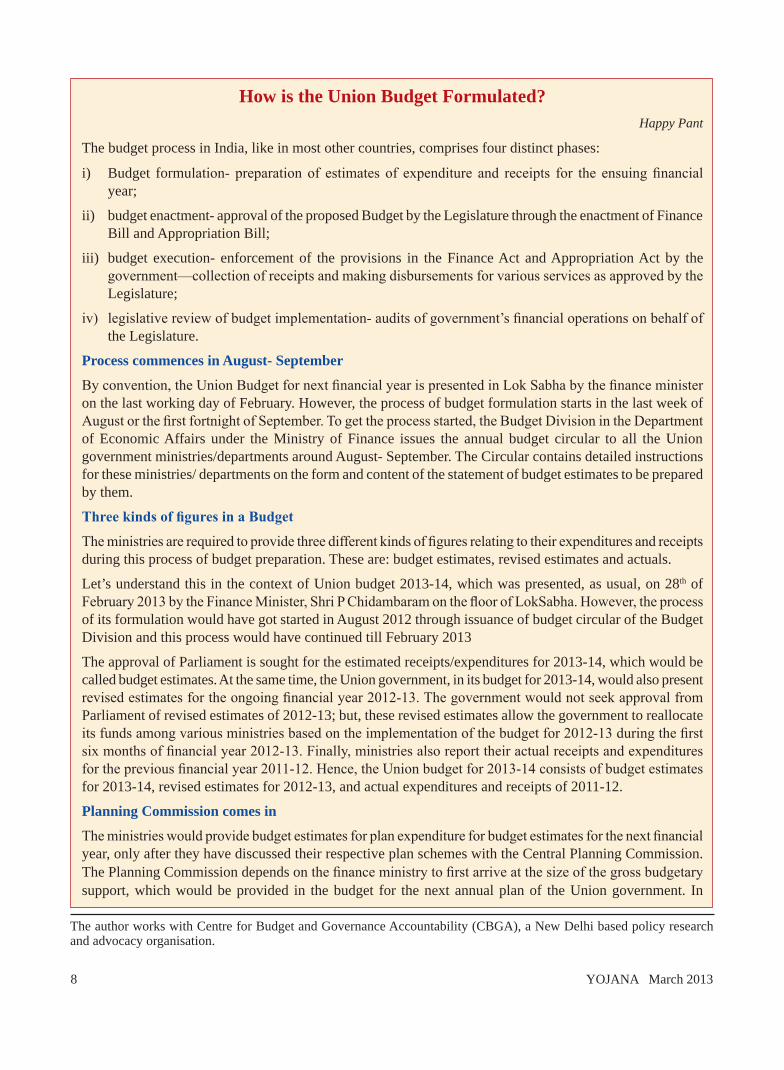
How is the union Budget Formulated?Happy Pant
The budget process in India, like in most other countries, comprises four distinct phases:
i) Budget formulation- preparation of estimates of expenditure and receipts for the ensuing financial year;
ii) budget enactment- approval of the proposed Budget by the Legislature through the enactment of Finance Bill and Appropriation Bill;
iii) budget execution- enforcement of the provisions in the Finance Act and Appropriation Act by the government—collection of receipts and making disbursements for various services as approved by the Legislature;
iv) legislative review of budget implementation- audits of government’s financial operations on behalf of the Legislature.
Process commences in August- September
By convention, the Union Budget for next financial year is presented in Lok Sabha by the finance minister on the last working day of February. However, the process of budget formulation starts in the last week of August or the first fortnight of September. To get the process started, the Budget Division in the Department of Economic Affairs under the Ministry of Finance issues the annual budget circular to all the Union government ministries/departments around August- September. The Circular contains detailed instructions for these ministries/ departments on the form and content of the statement of budget estimates to be prepared by them.
Three kinds of figures in a Budget
The ministries are required to provide three different kinds of figures relating to their expenditures and receipts during this process of budget preparation. These are: budget estimates, revised estimates and actuals.
Let’s understand this in the context of Union budget 2013-14, which was presented, as usual, on 28th of February 2013 by the Finance Minister, Shri P Chidambaram on the floor of LokSabha. However, the process of its formulation would have got started in August 2012 through issuance of budget circular of the Budget Division and this process would have continued till February 2013
The approval of Parliament is sought for the estimated receipts/expenditures for 2013-14, which would be called budget estimates. At the same time, the Union government, in its budget for 2013-14, would also present revised estimates for the ongoing financial year 2012-13. The government would not seek approval from Parliament of revised estimates of 2012-13; but, these revised estimates allow the government to reallocate its funds among various ministries based on the implementation of the budget for 2012-13 during the first six months of financial year 2012-13. Finally, ministries also report their actual receipts and expenditures for the previous financial year 2011-12. Hence, the Union budget for 2013-14 consists of budget estimates for 2013-14, revised estimates for 2012-13, and actual expenditures and receipts of 2011-12.
Planning Commission comes in
The ministries would provide budget estimates for plan expenditure for budget estimates for the next financial year, only after they have discussed their respective plan schemes with the Central Planning Commission. The Planning Commission depends on the finance ministry to first arrive at the size of the gross budgetary support, which would be provided in the budget for the next annual plan of the Union government. In
The author works with Centre for Budget and Governance Accountability (CBGA), a New Delhi based policy research and advocacy organisation.
YOJANA March 2013 9
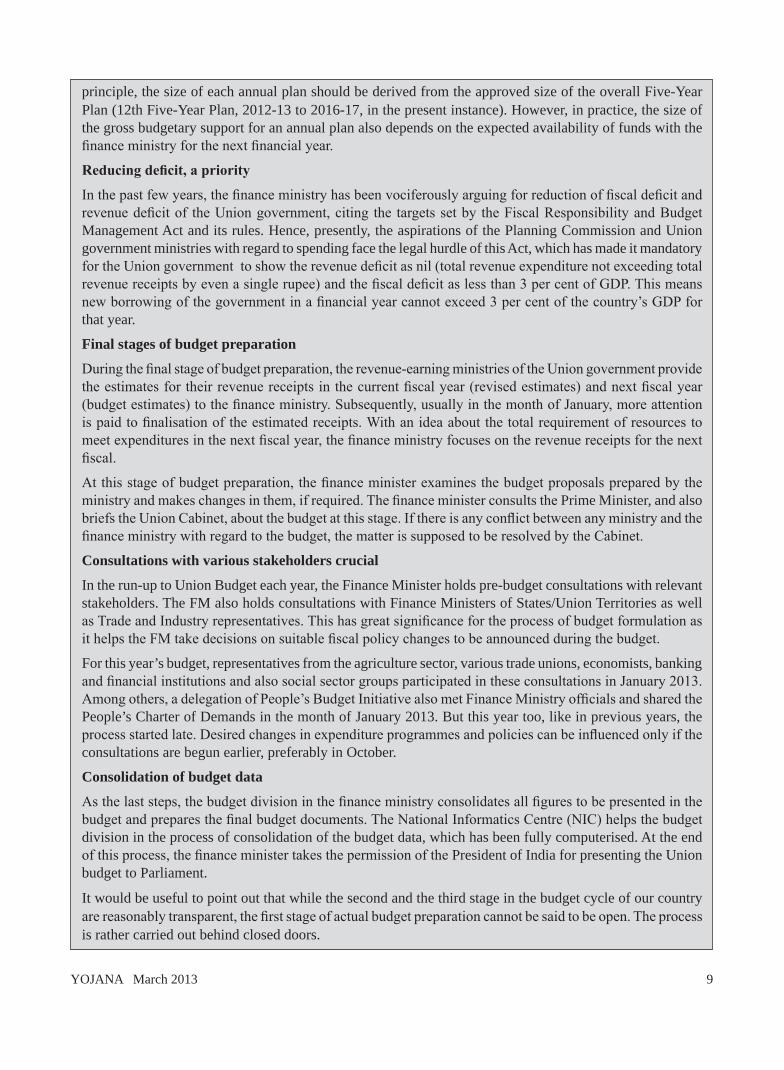
principle, the size of each annual plan should be derived from the approved size of the overall Five-Year Plan (12th Five-Year Plan, 2012-13 to 2016-17, in the present instance). However, in practice, the size of the gross budgetary support for an annual plan also depends on the expected availability of funds with the finance ministry for the next financial year.
Reducing deficit, a priority
In the past few years, the finance ministry has been vociferously arguing for reduction of fiscal deficit and revenue deficit of the Union government, citing the targets set by the Fiscal Responsibility and Budget Management Act and its rules. Hence, presently, the aspirations of the Planning Commission and Union government ministries with regard to spending face the legal hurdle of this Act, which has made it mandatory for the Union government to show the revenue deficit as nil (total revenue expenditure not exceeding total revenue receipts by even a single rupee) and the fiscal deficit as less than 3 per cent of GDP. This means new borrowing of the government in a financial year cannot exceed 3 per cent of the country’s GDP for that year.
Final stages of budget preparation
During the final stage of budget preparation, the revenue-earning ministries of the Union government provide the estimates for their revenue receipts in the current fiscal year (revised estimates) and next fiscal year (budget estimates) to the finance ministry. Subsequently, usually in the month of January, more attention is paid to finalisation of the estimated receipts. With an idea about the total requirement of resources to meet expenditures in the next fiscal year, the finance ministry focuses on the revenue receipts for the next fiscal.
At this stage of budget preparation, the finance minister examines the budget proposals prepared by the ministry and makes changes in them, if required. The finance minister consults the Prime Minister, and also briefs the Union Cabinet, about the budget at this stage. If there is any conflict between any ministry and the finance ministry with regard to the budget, the matter is supposed to be resolved by the Cabinet.
Consultations with various stakeholders crucial
In the run-up to Union Budget each year, the Finance Minister holds pre-budget consultations with relevant stakeholders. The FM also holds consultations with Finance Ministers of States/Union Territories as well as Trade and Industry representatives. This has great significance for the process of budget formulation as it helps the FM take decisions on suitable fiscal policy changes to be announced during the budget.
For this year’s budget, representatives from the agriculture sector, various trade unions, economists, banking and financial institutions and also social sector groups participated in these consultations in January 2013. Among others, a delegation of People’s Budget Initiative also met Finance Ministry officials and shared the People’s Charter of Demands in the month of January 2013. But this year too, like in previous years, the process started late. Desired changes in expenditure programmes and policies can be influenced only if the consultations are begun earlier, preferably in October.
Consolidation of budget data
As the last steps, the budget division in the finance ministry consolidates all figures to be presented in the budget and prepares the final budget documents. The National Informatics Centre (NIC) helps the budget division in the process of consolidation of the budget data, which has been fully computerised. At the end of this process, the finance minister takes the permission of the President of India for presenting the Union budget to Parliament.
It would be useful to point out that while the second and the third stage in the budget cycle of our country are reasonably transparent, the first stage of actual budget preparation cannot be said to be open. The process is rather carried out behind closed doors.
10 YOJANA March 2013
YE-
287/
2013
YOJANA March 2013 11
H E E L E C T I O N eve 2013-14 Union Budget was the most challenging financial exercise for the Finance Minister P
Chidambaram, who once presented the “Dream Budget “in a previous avatar as financial minister when he pushed India’s growth trajectory to over 8 percent . But this time around the call was not for another “Dream Budget” or a “Nightmare Budget” as the economic matrix altered dramatically with the rapid change in the global economic scenario of raging oil prices and economic meltdown, ravaging particularly the EU community and USA, both of whom are India’s major trading partners.
Hard core economics took precedence over any populist measures in the fifth and final budget of the government steered by Chidambaram that resisted any temptation for any largesse or major concessions either for the corporate sector or the individual as it sought to kick-start the economy saddled with a rising fiscal and alarming current account deficits, galloping inflation particularly of food, slowdown in foreign investments
Budget 2013-14 : Taxation Proposals
BuDGET 2013-14
T N Ashok
aNalySIS
A good stop gap budget that takes
into account current economic
matrix and taxation measures that align
with the larger macro- economic
picture and to support DTC and GST are also on
the way
and tough trade deficit and a tough balance of payments position.
With general elections just 14 months away in May 2014, expectations were high among vote bank politics managers for largesse, another hike in exemption limits for personal rates of taxation at the entry level (between Rs 2 lakhs and Rs 5 lakhs), restructuring in the other higher taxation slabs, tax breaks for the corporate sector and major incentives for foreign investors and for capital markets such as stock exchanges to boost sentiments.
But the Finance Minister simply could not afford any of these as fiscal prudence was the call of the hour and that was the message that had to go out to foreign investors and credit rating agencies that India was truly aware and on top of the tough economic scenario by taking measures for consolidation . And that’s exactly what the finance minister did with his taxation measures and other schemes that sought to revive confidence of industry and foreign investors in an economy that was once predicted to cross the 9 percent GDP growth but lost its
The author is former Economics Editor, PTI.
T
12 YOJANA March 2013
way in between to remain stagnant at just about 5 percent .
Both the Economic Survey and the Union Budget now pegs GDP growth rate at 6.1 to 6.7 percent for the 2013-14 fiscal and even 7 percent for the 2014-15 fiscal year. Even the Planning Commission shares this hope but expects it go beyond 7 percent given the fiscal consolidation and prudent monetary management.
So Chidambaram restricted himself to taxation measures that would just about give him the revenues for development and help provide resurgence in the economy. None can complain that taxation measures are harsh as they are meagre for the onerous task before the finance managers to bring the economy back on the rails. It was also unrealistic to expect any largesse or tax breaks at a time when the finance minister had to operate in a restricted economic space.
Reiterating the fact, the Finance Minister said, "The message we are giving to the world today is that India is following a fiscally prudent path."
The new taxation measures or revised ones under direct and indirect category aim to raise modest revenue of Rs 18,000 crore, with Rs 13,300 crore coming from direct taxes and Rs 4,700 crore from indirect taxes. The googly in the taxation measures is the 10 percent surcharge on super rich category of persons, HUFs, firms and entities with similar tax status with an income exceeding Rs one crore, albeit for one year. Effectively some 42,800 registered people in the highest tax bracket of 30 to 40
percent and above eventually will end up surrendering 40 percent of their income by way of taxes to the government.
Mr Chidambaram told a post budget press conference that bulk of his direct tax measures of Rs 13,000 crore plus would actually accrue from this Surcharge on the one crore income earners. He hoped the industry would imbibe the spirit of the affluent and bear the burden for a year cheerfully.
The industry was cautious in reacting to the taxation measures as FICCI President Naina Lal Kidwai (HSBC) said one had to read the fine print before rejoicing (industry expected huge super rich taxes) but felt the overall objective was to contain fiscal deficit and revive growth. CII President Adi Godrej was more vocal in saying the budget was realistic and would certainly revive growth and the burden was a small price to pay. Other industry bodies such as ASSOCHAM and PHDCCI also welcomed the taxation and other measures in the budget as growth oriented.
But the stock markets tanked with indices dipping by close to 300 points as they felt there were no major measures to boost sentiments and the confusing provisions on tax residency certificate frightened foreign investors who bring in funds to India through low tax countries such as Mauritius, Singapore and Cyprus, introduction of a commodity transaction tax and the provisions on dividend distribution tax and such other measures did not encourage them.
As the finance minister or some economists have opined the
stock markets are not the actual barometer of an economy because it’s mostly constituted by Foreign Institutional Investors (FIIs) who are different from those making Foreign Direct Investments (FDIs) – the FIIs are in for short term gains and are migratory birds that fly from one exchange to another to book profits but FDI is long term investment. Investors who bring in FDI are more committed and serious players who help to boost India’s foreign currency reserves.
The Finance Minister also brought in greater clarity in definition of foreign investments by distinguishing the FIIs from FDIs. Those who held a stake higher than 10 percent were classified as FDIs and those with less than that figure as FIIs. The clarification on tax resident certificate and actual beneficiary also helps tax authorities but “spooked” foreign investors initially prompting a statement from the ministry saying the FM would allay their fears and reservation while replying to the discussion on the budget.
To allay fears and provide comfort to foreign investors, Chidambaram has sought to provide a road map for attracting investors in the long run. SEBI will simplify procedures and prescribe uniform registration and other norms for entry of foreign portfolio investors. SEBI will converge the different KYC norms and adopt a risk based approach to KYC to make it easier for foreign investors such as central banks, sovereign wealth funds, university funds, pension funds to invest in India.
Some other measures include: FIIs to participate in exchange trade currency derivative segment to the
YOJANA March 2013 13
extent of their Rupee exposure in India, FIIs to use investment in corporate bonds and govt. securities as collateral to meet margin requirements. Stock exchanges are allowed to introduce a dedicated debt segment to develop the debt market.
Turning to the personal rates of taxation, the Finance Minister however resisted from raising the exemption limits in the entry level that is between Rs 2 lakhs to Rs 5 lakhs, but gave credits of upto Rs 2000 per tax payer in this bracket that would benefit over 1.80 crore tax payers to the tune of Rs 3,600 crore. Chidambaram said that if he had raised the exemption limit further, it would have meant a substantial loss of revenue as a huge population would have gone out of the tax net at a time when government was trying to bring more people into the tax net to buoy up the tax revenues for development. The government could simply not afford any further raising the ceilings on exemption limits or restructuring the slabs as that would again lead to significant loss of revenues.
A major relief the finance minister provided to the middle class was for the first home buyer taking a loan of upto Rs 25 lakhs where additional deduction of interest of Rs 100,000 has been provided that can be claimed in accounting year 2014/15. Eventually it means he can claim Rs 200,000 deduction in taxes as there is already a provision for a like amount.
Chidambaram justified his taxation measures and wanted the people to be patient as the economy was challenged and the wheels had to turn. He was
clear that the economy had to turn around and growth had to get back above 6 percent level so that any concessions or tax breaks could be considered. The budget is not the end but one of a series of measures in the financial exercise and that the government could announce more measures to rein in the economy both during the discussion on the budget and the finance bill.
Industry was eagerly awaiting a firm statement on Direct Taxes Code (DTC) and the Goods and Services Tax (GST). They are both progressive measures that would provide a road map for the country in future to align itself with global trends and best practices in tax management eventually to leapfrog growth. While the FM made a commitment to bring the much delayed DTC bill before the end of the current budget session of Parliament, he could not make any commitment on the GST. For the GST constitutional amendments were needed and state governments had to come to a unanimous agreement for its implementation pan India.
The Finance Minister has however as a measure of caution provided some Rs 9,000 crore as compensation to be paid to the states for any losses they might suffer in collections when sales taxes and other state levies are phased out.
India’s tax system is under pressure as tax revenues are not that buoyant though greater compliance had been achieved under the direct taxes category and more people have been brought under the tax system which has also been made effective with central registry at Bangalore with enhanced computerisation that
tells authorities clearly who pays taxes regularly and who does not. It’s now easy to go after those who don’t pay taxes.
The government’s main aim now is to widen the tax base and bring more people in to the tax net rather than increase taxes to increase revenues. The classic example is the Service Tax category where some 17 lakhs have been identified and brought into the net. As this tax is still in its nascent stage, it’s not that effective as its illustrious brother the personal income tax. Only 10 lakh people have been paying service tax and some seven lakhs have been irregular entering and exiting erratically. Government has taken a soft handed approach to this category as 50 percent of the GDP in the country today is contributed by the services tax sector (IT sector and service providers including software specialists and companies, lawyers, finance consultants, doctors, lawyers, public affairs practitioners etc.) .
As Chidambaram asked, when this category is contributing so much, why should it not contribute to the tax kitty and that’s why the government has come up with a voluntary compliance scheme to enable those seven lakhs that have not paid taxes to pay a onetime tax retrospectively for five years from 2007 and get the benefit of waiver of penalties or surcharges.
In an economy severe ly challenged by global recessionary trends as export revenues shrink and imports rise leading to an imbalance that severely affects the Current Account Deficit (CAD) , it was imperative to understand the philosophy of taxation rather than go into details of taxation.
14 YOJANA March 2013
CAD rises because export revenues shrink and import costs go up. Chidambaram’s argument is that the country’s exports have to rise substantially so as to pay for the imports. Only then CAD can come down.
India has to import crude oil and oil seeds in the short run because the country needs it. But does India
require so much gold for jewellery for the people which is adding up to import costs because of the unprecedented price of gold is the question. Nevertheless government has brought down the taxes on jewellery drastically from 6 percent to 2 percent and relaxed restrictions on baggage allowance to allow women passengers to bring gold or gold jewellery valued up to Rs one
lakh and male passengers up to Rs 50,000. Chidambaram however said he proposed to bring in alternatives to gold which was being bought essentially as a social custom or as a hedge against inflation.
The Finance Minister feels that CAD can be best managed by increasing crude oil production in the country and so also oil seeds
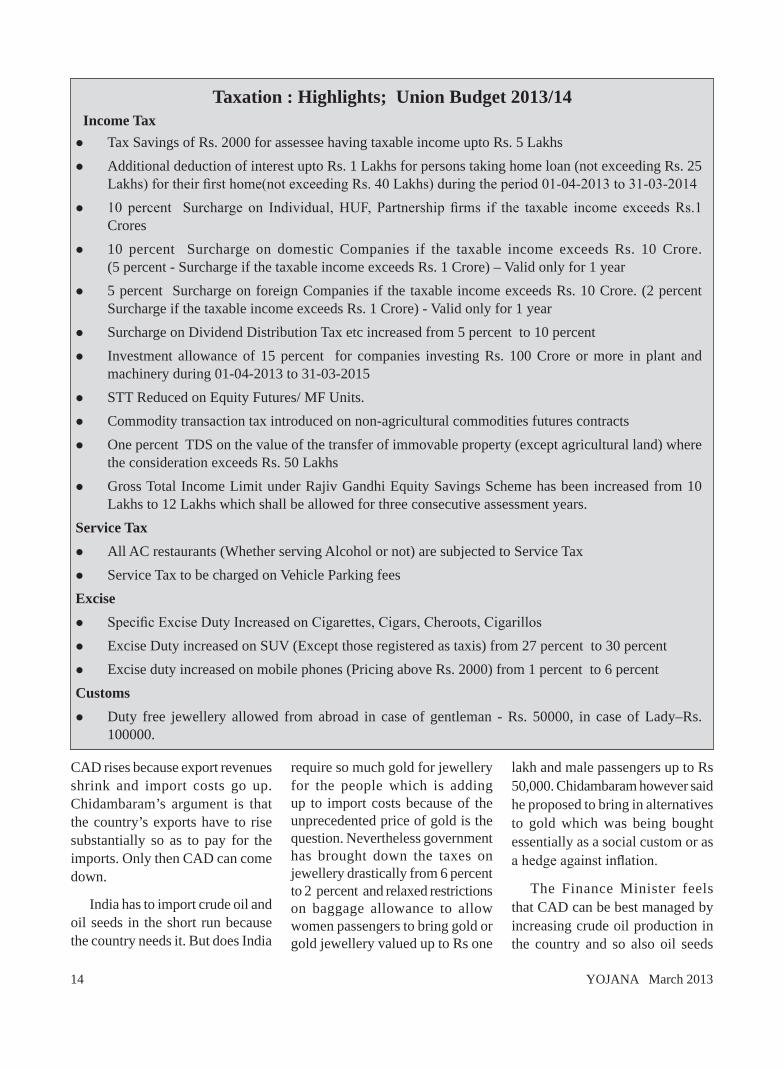
Income Taxl Tax Savings of Rs. 2000 for assessee having taxable income upto Rs. 5 Lakhsl Additional deduction of interest upto Rs. 1 Lakhs for persons taking home loan (not exceeding Rs. 25
Lakhs) for their first home(not exceeding Rs. 40 Lakhs) during the period 01-04-2013 to 31-03-2014l 10 percent Surcharge on Individual, HUF, Partnership firms if the taxable income exceeds Rs.1
Croresl 10 percent Surcharge on domestic Companies if the taxable income exceeds Rs. 10 Crore.
(5 percent - Surcharge if the taxable income exceeds Rs. 1 Crore) – valid only for 1 yearl 5 percent Surcharge on foreign Companies if the taxable income exceeds Rs. 10 Crore. (2 percent
Surcharge if the taxable income exceeds Rs. 1 Crore) - valid only for 1 yearl Surcharge on Dividend Distribution Tax etc increased from 5 percent to 10 percent l Investment allowance of 15 percent for companies investing Rs. 100 Crore or more in plant and
machinery during 01-04-2013 to 31-03-2015l STT Reduced on Equity Futures/ MF Units.l Commodity transaction tax introduced on non-agricultural commodities futures contractsl One percent TDS on the value of the transfer of immovable property (except agricultural land) where
the consideration exceeds Rs. 50 Lakhsl Gross Total Income Limit under Rajiv Gandhi Equity Savings Scheme has been increased from 10
Lakhs to 12 Lakhs which shall be allowed for three consecutive assessment years.Service Tax l All AC restaurants (Whether serving Alcohol or not) are subjected to Service Taxl Service Tax to be charged on vehicle Parking feesExcise l Specific Excise Duty Increased on Cigarettes, Cigars, Cheroots, Cigarillosl Excise Duty increased on SUv (Except those registered as taxis) from 27 percent to 30 percent l Excise duty increased on mobile phones (Pricing above Rs. 2000) from 1 percent to 6 percent Customs l Duty free jewellery allowed from abroad in case of gentleman - Rs. 50000, in case of Lady–Rs.
100000.
Taxation : Highlights; union Budget 2013/14
YOJANA March 2013 15
production so that imports come down and valuable foreign exchange is saved. India now has foreign currency reserves of near US $ 300 billion enough to pay for its crude oil or imports for another six months. But the foreign exchange accretion has to be continuous so that what is spent is replenished.
Accordingly the FM has made a lot of relaxations in portfolio investments that are where FIIs bring in quick money, so that SEBI can incentivise them to bring in more and also hold onto them in India for a reasonable time.
An emerging economy must have a tax system that reflects best global practices. A Tax Administration Reform Commission is on the anvil to review tax policies and tax laws and submit period reports that can be implemented to strengthen the capacity of our tax system. Concurrently the DTC bill will also come up for consideration in the current budget session, so that it becomes a law in the near future bringing in greater confidence of foreign investors in India.
The Tax GDP ratio in India in 2011- 12 was just 5.5 percent for direct taxes and 4.4 percent for indirect taxes, way too low for any large developing country like India. This would not garner adequate resources for inclusive and sustainable development. In 2007-08, the ratio peaked 11.9 percent and current tax reforms or measures hope to reclaim that peak at least in the short run.
The indirect taxes seek to raise about Rs 5,000 crore through some adjustments, levies in excise and customs which is not a very high amount for an economy of India’s size where expenditure is sought to be capped at Rs 16 lakh crore. Some of the key provisions will raise the cost of cigarettes, cigars and cigarillos in keeping with the No Smoking campaign, marbles used in construction, Sports Utility vehicles (SUvs) , Cell Phones over the value of Rs 2,000 to mention a few.
Crux of the realistic budget is No Major Taxes or Tax breaks for either the individual or the corporate sector but government priotirised measures to contain fiscal deficit and cap current account deficit, tackle inflation, reduce impediments for growth, attract foreign investments, and mobilise funds for development works. A good stop gap budget that takes into account current economic matrix and taxation measures that align with the larger macro- economic picture and to support DTC and GST are also on the way. q
(E-mail:[email protected]) YE-
276/
2013
16 YOJANA March 2013
YE-
273/
2013
YOJANA March 2013 17
DO yOu KNOW?what is Fiscal Responsibility and Budget Management Act ?
The Fiscal Responsibility and Budget Management (FRBM) Act was enacted by the Parliament in 2003. Its objective is to institutionalise fiscal discipline, reduce fiscal deficit and improve macro economic management. This law aims at promoting fiscal stability for the country on a long-term basis. It emphasises a transparent fiscal management system and a more equitable distribution of debts over the years. This law also gives flexibility to the Reserve Bank of India to undertake monetary policy to control inflation.
Government needs resources for funding various kinds of developmental schemes and routine expenditures. Resources are raised through taxes and borrowing. The government can raise funds by borrowing from the Reserve Bank of India, financial institutions or from the public by floating bonds. Fiscal deficit is the total expenditure minus the revenue receipt, loan recoveries and receipts from disinvestment etc. It is a measure of the government borrowing in a year.
However, uncontrolled fiscal deficit is considered harmful for the health of economy. FRBM Act was notified in 2004 in response to the need felt to curb large fiscal deficit. The FRBM rules specify annual reduction targets for fiscal indicators. Originally, the act envisaged revenue deficit to be reduced to nil in five years beginning 2004-05. Fiscal deficit was required to be reduced to 3 percent of GDP by 2008-09. The Act also provides exception to the government in case of natural calamity and for national security.
The implantation of the act was put on hold in 2007-08 due to global financial crisis and the need for fiscal stimulus. There was a need for increased government expenditure to create demand to fight off the financial downturn and hence the government moved away from the path of fiscal consolidation for this period. This law also prohibits borrowing by government from the Reserve Bank of India and purchase of primary issues of central government securities after 2006. The act asked the Central government to lay in Parliament three statements in one financial year about the fiscal policy. To enforce fiscal discipline at the state level, the Twelfth finance commission provided for incentives to states through conditional debt restructuring and interest rate relief.
In 2012, the FRBM was amended and it was decided that the FRBM would target effective revenue deficit in place of revenue deficit. Effective revenue deficit excludes capital expenditure from revenue deficit and thus gives space to the government to spend on creation of capital assets.
The critics of this law feel, it would curb the government’s social sector spending but there is no denying the fact that the need for fiscal sustainability cannot be ignored. The original document of FRBM Act can be seen on: http://finmin.nic.in/law/frbmact2003.pdf.
what is GST?The Goods & Services Tax
(GST) is an indirect tax reform measure which will replace all other indirect taxes such as Central Sales Tax, Octroi, excise duty, Service Tax and value Added Tax (vAT) at the central and state levels. India will have a 'dual GST' system where states and the centre both would have power to levy taxes on goods
and services. Exports would be an exception and GST will not be imposed on them. Under the GST, no distinction is made between goods and services for purpose of levying tax. GST is a value added tax where the person paying tax on his output is also entitled to get input tax credit on the tax paid on its inputs.
The idea of GST was first proposed in the budget speech of 2006-07 which had set out the deadline of 2010 for its introduction in the country. To implement such a tax regime a constitutional amendment would be needed as the Centre as well the States are involved in this issue. The government expects that the legislative process for the enactment of the GST would be started in the next few months. The Finance Minister has expressed the hope that the two tax reforms – the GST and Direct Tax Code (DTC) will be implemented soon.
The objective of GST is to make the taxation simple and to broaden the tax base. It will also help create a common market throughout the length and breadth of the country. The GST has the advantage of redistributing the burden of taxation equitably between manufacturing and services. The rate of taxation is also likely to come down with the introduction of GST. Goods of basic importance will have lower tax rates. Better compliance and increased tax collection will boost the tax to GDP ratio. Economic growth is also likely to get an impetus through GST. A report of National Council of Applied Economic Research has estimated an increase of 0.9 percent to 1.7 percent in the economic growth with the implementation of GST. Exports will also increase according to this study. q
(Compiled by Hasan Zia, Editor, Yojana, Urdu)
18 YOJANA March 2013
T MAY not be an exaggeration to say that Budget 2013-14 has been crafted in most challenging m a c r o e c o n o m i c
circumstances reflected in high fiscal imbalance, declining GDP growth, high inflation, increasing current account deficit (CAD) and an uncertain global economic environment. Rising crude prices in the in ternat ional market and increasing gold import as an instrument of asset holding increased the CAD and thereby external sector imbalance. These external shocks further compounded the problem of macroinstability in presence of high fiscal deficit and stubbornly high inflation. There is no doubt that the budget 2013-14, squarely focused on fiscal consolidation. The idea is that fiscal consolidation would revive growth and if growth picks up that would help correct other macro imbalances and challenges of development through higher growth of public revenues. Thus, the question is would growth pick up in the short run due to measures
Budget 2013-14 and Beyond:What it means for Fiscal Consolidation?
BuDGET 2013-14
Pinaki Chakraborty
DISCuSSION
In fact, the story of fiscal consolidation remains incomplete without proposed
GST reform. It has been discussed in literature that a
non-distortionary and neutral tax like
GST would give stimulus to growth
and revenues
of fiscal consolidation proposed in the budget? Lot would depend upon host of macroeconomic factors; both on the fiscal and monetary side, including critical reforms like GST.
High fiscal deficit of the central government is not a new phenomenon. It remained at an uncomfortably high level since 2008-09. Alternative estimates before the budget suggested that the fiscal deficit will be close to 6 per cent of GDP in 2012-13 (RE). However, the budget 2013-14 (BE) pegged the fiscal deficit at 4.8 per cent of GDP and as per the 2012-13 (RE), it is expected to be 5.2 per cent of GDP. The biggest challenge would be to maintain these targets as the fiscal year progresses. Although, achieving these targets assume priority, we need to recognise the fact that path of fiscal adjustment is equally important as the target.
Before we comment on the path of fiscal adjustment, it may be worthwhile to see the nature of fiscal imbalance of the central government. As evident from
The author is Professor, National Institute of Public Finance and Policy, New Delhi.
I
YOJANA March 2013 19
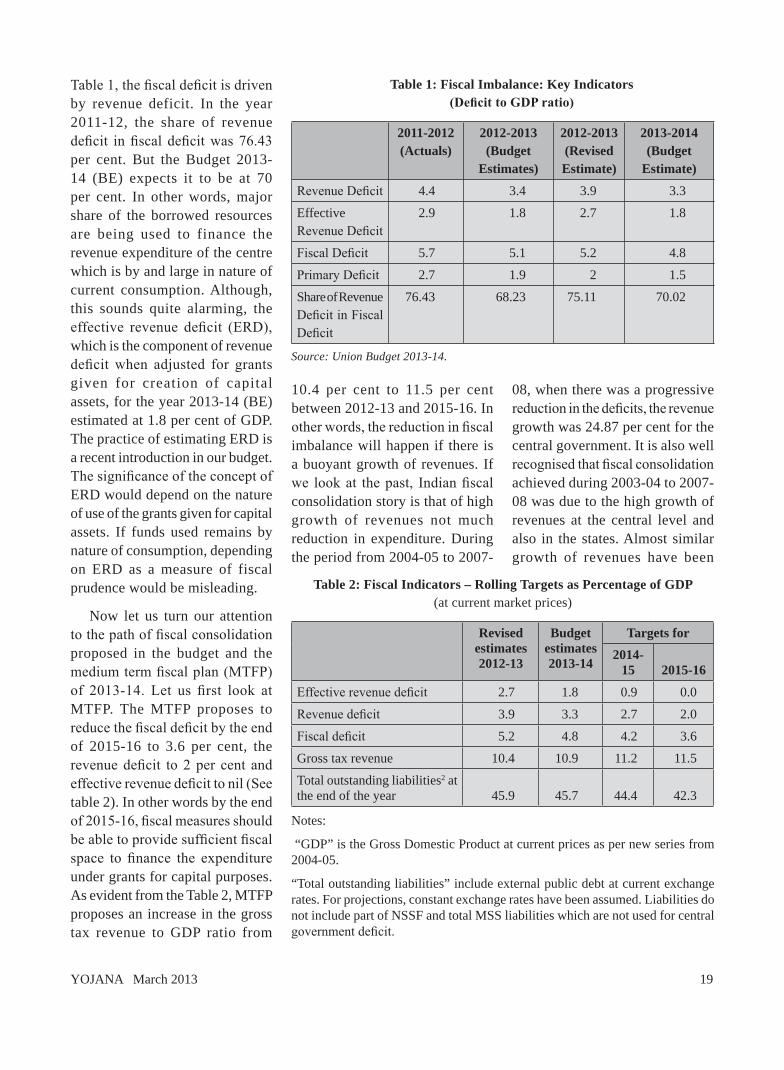
Table 1, the fiscal deficit is driven by revenue deficit. In the year 2011-12, the share of revenue deficit in fiscal deficit was 76.43 per cent. But the Budget 2013-14 (BE) expects it to be at 70 per cent. In other words, major share of the borrowed resources are being used to finance the revenue expenditure of the centre which is by and large in nature of current consumption. Although, this sounds quite alarming, the effective revenue deficit (ERD), which is the component of revenue deficit when adjusted for grants given for creation of capital assets, for the year 2013-14 (BE) estimated at 1.8 per cent of GDP. The practice of estimating ERD is a recent introduction in our budget. The significance of the concept of ERD would depend on the nature of use of the grants given for capital assets. If funds used remains by nature of consumption, depending on ERD as a measure of fiscal prudence would be misleading.
Now let us turn our attention to the path of fiscal consolidation proposed in the budget and the medium term fiscal plan (MTFP) of 2013-14. Let us first look at MTFP. The MTFP proposes to reduce the fiscal deficit by the end of 2015-16 to 3.6 per cent, the revenue deficit to 2 per cent and effective revenue deficit to nil (See table 2). In other words by the end of 2015-16, fiscal measures should be able to provide sufficient fiscal space to finance the expenditure under grants for capital purposes. As evident from the Table 2, MTFP proposes an increase in the gross tax revenue to GDP ratio from
10.4 per cent to 11.5 per cent between 2012-13 and 2015-16. In other words, the reduction in fiscal imbalance will happen if there is a buoyant growth of revenues. If we look at the past, Indian fiscal consolidation story is that of high growth of revenues not much reduction in expenditure. During the period from 2004-05 to 2007-
08, when there was a progressive reduction in the deficits, the revenue growth was 24.87 per cent for the central government. It is also well recognised that fiscal consolidation achieved during 2003-04 to 2007-08 was due to the high growth of revenues at the central level and also in the states. Almost similar growth of revenues have been
Table 1: Fiscal Imbalance: Key Indicators(Deficit to GDP ratio)
2011-2012 (Actuals)
2012-2013 (Budget
Estimates)
2012-2013 (Revised Estimate)
2013-2014 (Budget
Estimate)Revenue Deficit 4.4 3.4 3.9 3.3
Effective Revenue Deficit
2.9 1.8 2.7 1.8
Fiscal Deficit 5.7 5.1 5.2 4.8
Primary Deficit 2.7 1.9 2 1.5
Share of Revenue Deficit in Fiscal Deficit
76.43 68.23 75.11 70.02
Source: Union Budget 2013-14.
Table 2: Fiscal Indicators – Rolling Targets as Percentage of GDP(at current market prices)
Revised estimates 2012-13
Budget estimates 2013-14
Targets for2014-
15 2015-16Effective revenue deficit 2.7 1.8 0.9 0.0
Revenue deficit 3.9 3.3 2.7 2.0
Fiscal deficit 5.2 4.8 4.2 3.6
Gross tax revenue 10.4 10.9 11.2 11.5
Total outstanding liabilities2 at the end of the year 45.9 45.7 44.4 42.3
Notes:
“GDP” is the Gross Domestic Product at current prices as per new series from 2004-05.
“Total outstanding liabilities” include external public debt at current exchange rates. For projections, constant exchange rates have been assumed. Liabilities do not include part of NSSF and total MSS liabilities which are not used for central government deficit.
20 YOJANA March 2013
proposed in the present MTFP for the period from 2012-13 to 2015-16 to achieve fiscal consolidation. But there is a fundamental difference between the earlier phase of fiscal consolidation and the one proposed in this budget. During the earlier phase, the GDP growth was 8.03 per cent. However, the current years GDP growth estimated by Central Statistical Organisation is 5 per cent and the Economic Survey predicted a growth rate for the year 2013-14 within a range of 6.1 to 6.7 per cent. So, much of the targets of fiscal consolidation would depend on what happens to the economic
growth in the medium term at least upto 2015-16. If growth falters, then probably the proposed fiscal consolidation will go off the track. It needs to be recognised that due to global economic uncertainty and prevailing depressed investors’ sentiment, the country may not immediately see a quantum jump in growth. But key reform like GST can push growth and expand tax base and contribute significantly to higher revenues. In fact, the story of fiscal consolidation remains incomplete without proposed GST reform. It has been discussed in literature that a
non-distortionary and neutral tax like GST would give stimulus to growth and revenues. Even though the global economic environment is uncertain, investment is not picking up, such a crucial tax reform can really push growth. Though, it is a federal issue, and central government cannot do things unilaterally, it is critical to overcome hurdles so that Indian common market develops which in turn pushes demand and growth and thereby fiscal consolidation without compromising much needed development spending. q
(E-mail:[email protected])
New Measures for welfare of SC/ST, women and Minorities
Sharing the concerns of the Members of the House for the welfare of the scheduled castes and the scheduled tribes, the Finance Minister P. Chidambaram announced that the Budget has sub plans for them and reiterated that the funds allocated to the sub plans cannot be diverted
and must be spent for the purpose of the sub plans. He made an allocation of Rs. 41, 561 crore to the scheduled castes sub plan and Rs. 24,598 crore to the tribal sub plan. Similarly, sufficient allocations have been made to programmes relating to women and children. The Minister informed the Members that the gender budget has Rs. 97,134 crore and the child budget Rs. 77, 236 crore in 2013-14.
He said, women belonging to the most vulnerable groups, including single women and widows, must be able to live with self-esteem and dignity and added that young women face gender discrimination everywhere, especially at the work place. Ministry of Women and Child Development has been asked to design schemes that will address these concerns and a sum of Rs. 200 crore has been provided to begin work in this regard.
The Finance Minister allocated Rs. 3,511 crore to the Ministry of Minority Affairs, which is an increase of 12 percent over the BE and 60 percent over the RE of 2012-13. The Maulana Azad Education Foundation is the main vehicle to implement education schemes and channelized funds to non-government organisations for the minorities. Its corpus stands at Rs. 750 crore. With the objective of raising it to Rs. 1500 crore during the 12th Plan period, the Minister proposed to allocate Rs. 160 crore to the corpus fund. The foundation wishes to add medical aid to its objectives and the same has been accepted that a beginning can be made by providing medical facilities such as a resident doctor in the educational institutions run or funded by the Foundation. Rs. 100 crore is being allocated to launch this initiative. He said, government is committed to provide support to persons with disabilities and announced a sum of Rs. 110 crore to the Department of Disability Affairs for the ADIP Scheme in 2013-14.
YOJANA March 2013 21
COUNTRY’S most important resource a r e i t s p e o p l e ” , Finance Minister P Chidambaram said quoting Joseph Stiglitz,
and through his Budget speech the finance minister spoke of the need to pay “special attention” to the sections that had been left behind. Yet when it came to making good on the talk, the government fell short. Social sector—education, health, sanitation, welfare, rural development—allocations in Budget 2013-14 fails to convince anyone that the government is seized of the importance and urgent need to invest in the people.
This year, the total budget outlay for the social sector, excluding the non-Plan spending, saw a modest increase in its share of the GDP—from 1.7% in 2012-13 revised estimates to 1.9% in 2013-14 budget estimates. Going by past records, it is likely that total social sector spending will see a downward revision by the time the 2013-14 revised estimates are worked out.
Many will argue that social sector ’s demand for higher allocations is something of a fetish.
Social Sector Outlays-An Assessment
BuDGET 2013-14
Urmi Goswami
DEBaTE
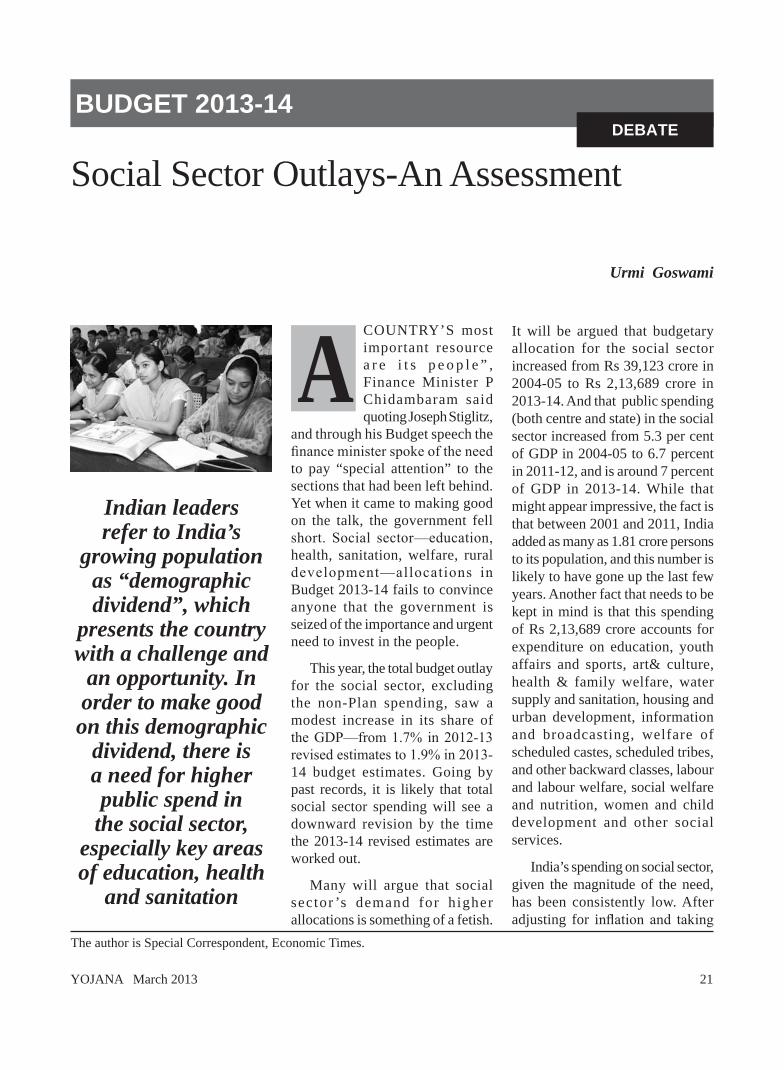
Indian leaders refer to India’s
growing population as “demographic dividend”, which
presents the country with a challenge and
an opportunity. In order to make good on this demographic
dividend, there is a need for higher public spend in
the social sector, especially key areas of education, health
and sanitation
It will be argued that budgetary allocation for the social sector increased from Rs 39,123 crore in 2004-05 to Rs 2,13,689 crore in 2013-14. And that public spending (both centre and state) in the social sector increased from 5.3 per cent of GDP in 2004-05 to 6.7 percent in 2011-12, and is around 7 percent of GDP in 2013-14. While that might appear impressive, the fact is that between 2001 and 2011, India added as many as 1.81 crore persons to its population, and this number is likely to have gone up the last few years. Another fact that needs to be kept in mind is that this spending of Rs 2,13,689 crore accounts for expenditure on education, youth affairs and sports, art& culture, health & family welfare, water supply and sanitation, housing and urban development, information and broadcasting, welfare of scheduled castes, scheduled tribes, and other backward classes, labour and labour welfare, social welfare and nutrition, women and child development and other social services.
India’s spending on social sector, given the magnitude of the need, has been consistently low. After adjusting for inflation and taking
The author is Special Correspondent, Economic Times.
A
22 YOJANA March 2013
into account existing deficiencies in the social sector, it becomes clear that budgetary allocations for key areas such as education, health, sanitation, nutrition, rural development has not gone up over the last few years. The average social sector spending in developed countries is to the tune of 14% of GDP.
In budget 2013-14, the two key development indicators—education and health—did not fare too well. Total central government allocation for education is at 0.70 percent of the GDP, marginally up from 0.67 percent in 2012-13 (revised estimates) and down from 0.74 percent in last year’s budget. The spend on health is a cause for concern—this year the health budget increased by only Rs 2,842 crore over last year’s b u d g e t e s t i m a t e s . C e n t r a l government spend on health is at 0.33 percent of GDP compared to 0.29 percent in 2012-13 revised estimates and down from 0.34 percent in the budget estimate for 2012-13. The marginal increase in allocation is far too small to address the large need in the two crucial sectors.
An important issue with direct feedback effect on health—drinking water and sanitation— saw a modest hike of Rs 2,260 crore in budgetary allocations over the 2012-13 revised estimate of Rs 13,005.3 crore. The increased allocation is nowhere what is required—only 43.5 percent of the population gets tap water supply and 53.1 percent of households have no access to toilets and defecate in the open. The health hazard—both in the short and long-term—that this situation presents is far from being addressed. Given the state of healthcare, with its
overdependence on private out of pocket expenditure by households, the lack of basic sanitation presents a serious problem. Not only does it contribute to rural indebtedness, but affects the productivity of human capital so central for sustained economic growth.
There has been no move towards the promised 6 percent of GDP for education; total public spending is yet to cross the 3.7 percent mark. According to the Economic Survey, outlays on education was at 3.31 percent of GDP in the 2012-13 budget estimates. Given the downward revision, the outlay is about 3.2 percent of GDP. Finance minister P Chidambaram provided for Rs 27,258 crore for implementing the Right to Education through the Sarva Shiksha Abhiyan. Allocation is up by 6.6 percent over 25,555 crore provided last year, which had been revised to Rs 23,645 crore. This year’s budgetary allocation is nowhere near the Rs 39,115 crore that ministry for human resource development had sought.
The Right to Education makes it compulsory for the government to provide educat ion to al l children between 6 and 14 years. Key standards—classrooms, provisioning of drinking water and toilets, teachers in accordance to the pupil-teacher ratio—set out in the Act have to met by March 31 this year. The drastic cut in outlay for the Sarva Shiksha Abhiyan for 2012-13, and the failure to step up allocation in 2013-14 will present a problem. Meeting and sustaining these requirements will entail a higher outlay of funds. Failure to provide adequate funds in the early years of implementation is likely to endanger the effectiveness of the
quality interventions that the Right to Education proposes. With more than 70 percent of the population dependent on government-funded schooling, it is essential to ensure that adequate funds areimplement the Right to Education this year. These two factors would push up the demand for funds. Not providing the required financial support could stunt the goal of universalizing elementary education and affecting the quality of human capital which would have deleterious effect on growth.
There has been an increased dependence of this elementary education programme on the 2 percent cess levied in 2004-05. The share of cess in financing the Sarva Shiksha Abhiyan has been going up.. For 2013-14, the budget estimates set the share of the education cess at 60.35 percent or Rs 16,453 crore, of the total allocation of Rs 27,258 crore. The increased share of the cess in financing elementary education presents a concern, as it is not accompanied by a commensurate increase in budgetary support, which has been steadily declining. With the expenditure on elementary education not showing signs of stabilizing, the dependence on the levy to ensure that the government can meet i t s cons t i tu t ional commitment should raise concerns. This over reliance on the education cess along with an increased push for private participation through the public-private participation raises an important question. This could be argued as signs of withdrawal by the government from provisioning for a key development indicator. This needs to checked. Outsourcing the provision of education will not help; public funding of education needs to be
YOJANA March 2013 23
sustained. Inclusive and sustained growth that the government is pushing on paper can only be actualized if spending in education, a key development indicator, is increased substantially.
Another key area, which requires further investment, especially in light of the Right to Education Act, is teacher training. The Act mandates all teachers need to complete and meet training requirements within five years of the legislation being force. However, budgetary allocation for strengthening teacher-training institutes is constant at Rs 450 crore. It needs to be said though in the current year, the ministry was able to utilize only Rs 249 crore of the allocated Rs 450. The low level of spend could explain the finance minister allocation in Budget 2013-14. On the other hand, in the higher education segment, there has been a substantial increase in allocation for National Mission on Teachers and Teaching—from Rs5.27 crore in 2012-13 to Rs 217 crore in 2013-14. This is a welcome step. Though teachers are a weak and crucial link in the elementary education segment, it would heartening to see a higher allocation and a roadmap for improving both quality and quantity of teachers in the Budget.
Equally worrying is the fact that allocations for several schemes that sought to address exclusion have not risen, effectively meaning lower allocation. Schemes like inclusive education for the disabled, appointment of language teachers, women’s hostels in polytechnics and vocationalisation of education have been affected.
The small but determined beginning has been made in the
higher education sector--Rs 400 crore has been allocated for the Rashtriya Uccha Shiksha Abhiyan, a scheme geared at strengthening the state universities and colleges. There has been a significant scaling up of the funding for the Rashtriya Madhyamik Shiksha abhiyan or the universalisation of secondary schooling—Rs 3,983 crore have been provided, a 25.6 percent hike over the revised estimates for 2012-13.
What makes Budget 2013-14 unsettling for the education sector is that it fails to address critical concerns of inadequate outlays in the elementary school segment, unclear prioritization of sectors, under utilization of funds in certain cases, and the apparent withdrawal of the government. These are issues that the government needs to address and provide some clarity.
The picture is dismal when it comes to provisioning for the health sector. The combined, centre and states, public spend remained at around 1 percent of GDP in 2012-13. India’s public provisioning for health falls far behind that of other countries in the neighbourhood like China and Sri Lanka. In China, healthcare accounted for 10.3 percent of total public spending in 2009, and spend on health was at 2.3 percent of GDP.
The country’s total expenditure on health amounts to about 5 per cent of GDP, which would be comparable with other developing countries at the same level of per capita income. The lion share of the spending on health is borne by private households’ out of pocket expenditure, roughly between 70 to 80 per cent of total expenditure on health care. The low level of
public spending means that a large part of the expenditure on health is borne by households from their private resources—income and savings. This is affects the poor most adversely.
The low spend on health has serious repercussions. A study in Indian poverty by Anirudh Krishna of Duke University found that rural expenditure on health is the primary reason for families decline into poverty. The inability to spend on health and the debts incurred for it are factors that push families into poverty.
In its Twelfth Plan document, the government has stated its intention to raise public expenditure to 2.5 per cent of GDP by 2017, when the plan period comes to a close. Budget 2013-14 appears to do little to achieve this goal. Spend on health accounts for 2.24 percent of the Budget. Extreme under provisioning for health has somewhat become a standard. Centre’s total expenditure on health as a proportion of GDP has only marginally increased from 0.25 percent in 2003-04 to 0.33 percent in 2013-14. For a country with a vast population, and a high level of people who can be adjudged as poor, such paltry spending on health is a cause of serious concern.
In 2012-13, then finance minister Pranab Mukherjee announced the launch of the National Urban Health Mission to encompass the primary healthcare needs of people in the urban areas, but no allocation was made. This year the government has moved towards universalisation of healthcare--P Chidambaram has allocated Rs 21,239 crore for the new health
24 YOJANA March 2013
mission, which merges the existing National Rural Health Mission with the National Urban Health Mission. Despite the expansion in beneficiaries, the share of the mission in the total budget shows a decline; the National Rural Health Mission had an allocation of Rs 20,822 crore in 2012-13.
The budget has allocated Rs 4,727 crore for medical education, training and research and Rs 150 crore for the National Programme for the Health Care of Elderly and eight geriatric centres for the development in the area of geriatric medicine. It has also set aside Rs 1,650 crore for six AIIMS like institutions
The gap in health personnel and inequity in health infrastructure continues to be critical. vacancies and shortfall plague the system. vacancies of doctors at the primary healthcare system rose from 17.5 percent in 2005 to 24.1 percent in 2011, while shortfall of specialists rose from 45.7 percent in 2005 to 63.9 percent in 2011. An allocation of Rs 1023 crore has been made for human resources in healthcare, but the contours of the spending are not clear.
The low level of funds for public health is an indicator for another pillar of the government’s “sustainable and sustained” growth aim. Environment is a key public health concern. The lack of investment in public heal th rol lout whether i t is through key programmes or health infrastructure will also hinder the need for greater environmental accountability from the people. Unlike last year there has been no windfall for sanitation, this would further hamper efforts to improve public health.
The inadequate provisioning for the social sector, particularly education and health, needs to be seen in the context of concerns about the resource mobilization efforts of the government. In real terms, it means that public provisioning for the social sector, which is key for ensuring inclusive and sustainable development, are likely to come under pressure. Unfortunately, the Budget fails to provide any concrete proposals for the addressing revenues foregone due to tax exemptions. In h i s Budge t Speech , the finance minister acknowledged that India has a low tax to GDP ratio. That acknowledgement not withstanding, there appears to be little in the Budget by way of substantive proposals to increase the tax-GDP ratio. The ratio of government’s gross tax receipts is projected to increase from 10.4 percent of GDP in the 2012-13 revised estimates to 10.9 percent of GDP in 2013-14. The proposed income tax surcharge on the super rich works out to a increase of 3 percent on the peak tax rate, and doesn’t do much to fill the gap.
Projections are that in 2025, over 70 percent of the country’s population will be of working age. More often than not, Indian leaders refer to India’s growing population as “demographic dividend”, which presents the country with a challenge and an opportunity. In order to make good on this demographic dividend, there is a need for higher public spend in the social sector, especially key areas of education, health and sanitation.
If the government is really interested in leveraging this demographic dividend it needs
to move beyond rhetoric. A higher spend in the social sector, particularly on both education and health, is absolutely essential if the government is serious about inclusive and sustained growth. Improving the quality of the two key development indicators will create the requisite pressure to ensure that the high economic growth is both inclusive and sustainable. A better-educated and healthy populace will mean improved productivity. There is a tendency to view social sector spending as an outflow of resources—especially when it comes to providing education or healthcare. A part of this push for limiting public spend in these sectors comes from those who call for greater privatization of health and education. It would be a big mistake if the government retreats any further from these sectors. Investing in social sector segments like health and education is key to growth.
Nearly 170 years ago, Russian thinker Alexander Herzen asked “If progress is the end, for whom are we working? … Do you truly wish to condemn all human beings alive to-day to the sad role of caryatids supporting a floor for others some day to dance on. . . or of wretched galley slaves, up to their knees in mud, dragging a barge filled with some mysterious treasure and with the humble words “progress in the future” inscribed on its bows?” Herzen’s query is relevant after all these years, and if the government really wants to ensure that growth should be “faster, sustainable and more inclusive” becomes more than just a pretty slogan, it will do well to invest in its people by focusing on the social sector. q
(E-mail:[email protected])

YOJANA March 2013 25
www.visionias.in������������www.visionias.wordpress.com
Under�the�Guidance�of Ajay�Kumar�Singh (B.Tech.�IIT Roorkee)
VISION�IASTM
09650617807,�09968029039,�09717162595
103,�1 Floor�B/1-2, Ansal�Building,�Behind�UCO�Bank,�Dr.�Mukherjee�Nagar,�Delhi-09st
To�download�topper’s�answer�booklets,�interview�transcripts�and�complete�list�of�selectionsvisit:�www.visionias.wordpress.com�&�www.visionias.in
Nikhil�PavanRank�-�60
Gitanjali�Brandon,�Rank�-�6(Topper�in�Sociology)
Harshika�Singh,�Rank�-�8 Amrutesh�Kalidas,�Rank�-�10(Topper�in�Philosophy)
General�Studies,�Philosophy,��Sociology,�Public Admn.,Psychology,�Geography,�Essay
ALL INDIA IAS�TEST�SERIES�2013/2014
Personality�Development�Program�for�IAS�Interview
All�India�Rank,�Micro�&�Macro:�Performance Analysis,�Cyclic,�Flexible�&�Expert�Discussion
DISTANCE�LEARNING����������������������CLASSROOM����������������������ONLINE
INNOVATIVE ASSESSMENT�SYSTEMTM
CSAT�(G.S.�Pre.�+ Aptitude�Test)
Practice�Mock�Test�Time�Slot:�Each�day�of�the�week 10 AM�&�2�PM
PHILOSOPHYby
Anoop�Kumar�Singh
JAIPUR�CENTRE9001949244,�9799974032
G.S.by
Team�Vision�IAS
ADMISSION�OPEN
YE-
263/
2013
26 YOJANA March 2013
U D G E T O F a government is a c o m p r e h e n s i v e s t a t e m e n t o f g o v e r n m e n t finances relating
to a particular year. Every Budget broadly consists of two parts- (i) Expenditure Budget and (ii) Receipts Budget.
The amounts of intended expenditure by the Government in the next financial year are expressed in the Expenditure Budget.
The entire Expenditure Budget can be divided into two distinct categories, viz.
i) C a p i t a l E x p e n d i t u r e -those expenditures by the government that lead to an increase in the assets or a reduction in the liabilities of the government. It is however not necessary that the assets created should be productive or they should even be revenue generating. Only the charges towards the construction of the asset are counted as Capital expenditure, while the subsequent charges for its
Budget : Concepts and Terminologies
uNDERSTaNDING ThE BuDGET
Happy Pant
maintenance are considered as Revenue expenditure. Most capital expenditure is non-recurring.
- E x a m p l e s o f C a p i t a l Expenditure causing ‘increase in assets’: construction of a new Flyover, Union Govt. giving a Loan to a State Govt.
- E x a m p l e s o f C a p i t a l Expenditure causing ‘reduction of a liability’: Union Govt. repays the principal amount of a loan it had taken in the past.
ii) R e v e n u e E x p e n d i t u r e -those expenditures by the government that do not affect its asset-liability position. Mos t k inds o f r evenue expenditures are seen as recurring expenditures. The entire amount of Grants given by the Union Government to States is reported in the Union Budget as Revenue Expenditure, even though a part of those Grants get utilized by States for building Schools, Hospitals etc. This is so because the ownership of the schools or hospitals
Bbuilt from the Central grants would not be with the Union Government.
- E x a m p l e s o f R e v e n u e Expenditure are: expenditure on Food Subsidy, Salary of staff, procurement of medicines , procurement of text books, payment of interest, etc
Total government expenditure can also be divided into another set of categories, viz. i) Plan Expenditure Plan expenditure refers to
government expenditure, which is meant for financing the programmes/schemes formulated under the ongoing/ previous Five Year Plan
ii) Non-Plan Expenditure E x p e n d i t u r e s o f t h e
government, which are not included under the Plan Expenditure are called Non Plan Expenditure. It includes some of the important types of government expenditure, eg: interest payments, pension, defence expenditure, spending on law and order, spending on legislature, subsidies,
YOJANA March 2013 27
and salary of regular cadre teachers, doctors and other government officials.
The Receipts Budget presents the information on how much the Government intends to collect as its financial resources for meeting its expenditure requirements and from which sources, in the next fiscal year. This can also be divided into two categories:
i) Capital Receipts- those receipts that lead to a reduction in the assets or an increase in the liabilities of the government.
- Capital Receipts that lead to a ‘reduction in assets’: Recoveries of Loans given by the government and Earnings from Disinvestment;
- Capital Receipts that lead to an ‘increase in liabilities’: Debt.
ii) Revenue Receipts- those receipts that don’t affect the asset-liability position of the government. Revenue Receipts comprise proceeds of Taxes (like, Income Tax, Corporation Tax, Customs, Excise, Service Tax, etc.) and Non-tax revenue of the government (like, Interest receipts, Fees/ User Charges, and Dividend & Profits from PSUs).
Government revenue through taxation can be divided into Direct Taxes and Indirect Taxes.
Direct Taxes: Those taxes for which the tax-burden cannot be shifted are called Direct Taxes. Examples of Direct Taxes are:i) Corporation Tax This is a
tax levied on the income of registered companies in the country, whether national or foreign, under the Income Tax Act, 1961.
ii) Personal Income tax- This is a tax on the income of individuals, firms etc. other than Companies, under the Income Tax Act, 1961. This head also includes other Taxes, mainly the ‘Securities Transaction Tax’, which is levied on transaction in listed securities undertaken on stock exchanges and in units of mutual funds.
iii) Wealth Tax- This is a tax levied on the benefits derived from the ownership of property, under the Wealth Tax Act, 1957. Wealth tax has virtually been abolished in India.
Indirect Taxes: Those taxes for which the tax-burden can be shifted are called Indirect Taxes. Any person, who directly pays this kind of a tax to the Government, need not bear the burden of that particular tax; he/she can ultimately shift the tax-burden to other persons later through business transactions of goods/ services. Indirect tax on any good or service affects the rich and the poor alike! Unlike indirect taxes, direct taxes are linked to the tax-payee’s ability to pay and hence are considered to be progressive. Examples of Indirect Taxes are:i) Customs Duties-In this ,
the taxable component is import into or export from the country.
ii) Excise Duties: It is a type of tax levied on those goods, which are manufactured in the country and are meant for domestic consumption. It is a tax on manufacturing, which is paid by the manufacturer, but he passes this burden on to the consumers.
iii) Sales Tax: It is levied on the sale of a commodity, which is produced/imported and being sold for the first time. If the product is sold subsequently without being processed further, it is exempt from sales tax. Before the introduction of vAT, sales tax used to be levied under the authority of both Central Legislation (Central Sales Tax) and State Government’s Legislation (Sales Tax)
iv) Service Tax: It is a tax levied on services provided by a person and the responsibility of payment of the tax is cast on the service provider. However this tax can be recovered by the service provider from the service receiver in course of his/her business transactions.
v) Value Added Tax (VAT): vAT is a multi-stage tax, intended to tax every stage of sale of a good where some value has been added to the raw materials; but taxpayers do receive credit for tax already paid on the raw materials in earlier stages.
Debt and Deficit
A Debt is a kind of receipt that necessarily leads to an increase
28 YOJANA March 2013
of the government’s liabilities. The government incurs a Debt only for meeting the gap created by excess of its expenditure over its receipts for that year, which is called Deficit.
Fiscal Deficit
It is the gap between the government’s total Expenditure (including loans net of repayments) and its Total Receipts (excluding new debt to be taken). Thus Fiscal Deficit for a year indicates the borrowing to be made by the government that year.
Revenue Deficit
The gap between Total Revenue Expenditure of the Government and its Total Revenue Receipts is called the Revenue Deficit
D i s t r i b u t i o n o f f i n a n c i a l resources between the Centre and the States
A Finance Commission is set up every five years to recommend measures for sharing o resources between the Centre and the States, mainly pertaining to the Tax Revenue collected by the Central Government. Presently the recommendations made by the 13th Finance Commission are in effect (from 2010-11 to 2014-15), whereby 32 percent o f the sha reab le /d iv i s ib le pool of Central tax revenue is transferred to States every year and the Centre retains the remaining amount for the Union Budget.
Tax-GDP Ratio
Gross Domestic Product (GDP) is an indicator of the size of a country’s economy. In order to
assess the extent of government’s pol icy in tervent ions in the economy, some of the important fiscal parameters, like, total expenditure by the government, tax revenue, deficit etc. are expressed as a proportion of the GDP. Accordingly, a country’s tax-GDP ratio helps us understand how much tax revenue is being
collected by the government as compared to the overall size of the economy. A higher tax to GDP ratio in a country is a positive sign meaning that the government is collecting a decent amount of tax revenue as compared to the size of its economy. q
(E-mail:[email protected])
■
YE-
277/
2013
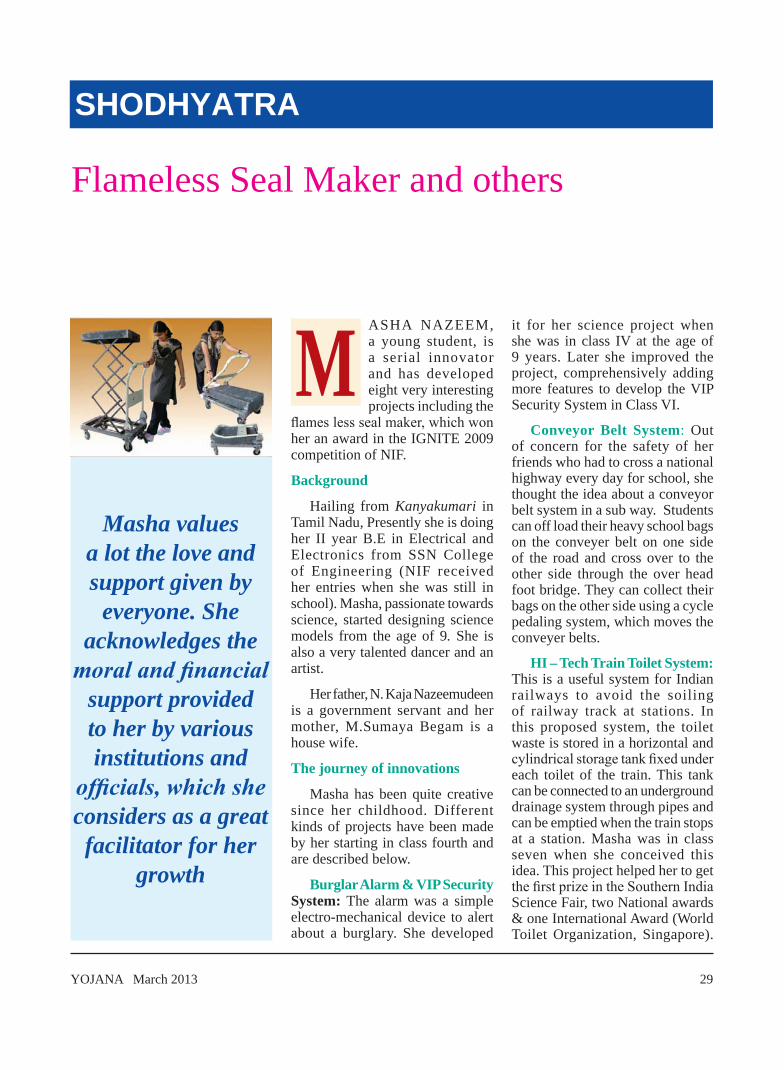
YOJANA March 2013 29
ASHA NAZEEM, a young student, is a serial innovator and has developed eight very interesting projects including the
flames less seal maker, which won her an award in the IGNITE 2009 competition of NIF.
Background
Hailing from Kanyakumari in Tamil Nadu, Presently she is doing her II year B.E in Electrical and Electronics from SSN College of Engineering (NIF received her entries when she was still in school). Masha, passionate towards science, started designing science models from the age of 9. She is also a very talented dancer and an artist.
Her father, N. Kaja Nazeemudeen is a government servant and her mother, M.Sumaya Begam is a house wife.
The journey of innovations
Masha has been quite creative since her childhood. Different kinds of projects have been made by her starting in class fourth and are described below.
Burglar Alarm & VIP Security System: The alarm was a simple electro-mechanical device to alert about a burglary. She developed
Flameless Seal Maker and others
ShODhyaTRa
Masha values a lot the love and support given by
everyone. She acknowledges the
moral and financial support provided to her by various institutions and
officials, which she considers as a great facilitator for her
growth
it for her science project when she was in class Iv at the age of 9 years. Later she improved the project, comprehensively adding more features to develop the vIP Security System in Class vI.
Conveyor Belt System: Out of concern for the safety of her friends who had to cross a national highway every day for school, she thought the idea about a conveyor belt system in a sub way. Students can off load their heavy school bags on the conveyer belt on one side of the road and cross over to the other side through the over head foot bridge. They can collect their bags on the other side using a cycle pedaling system, which moves the conveyer belts.
HI – Tech Train Toilet System: This is a useful system for Indian railways to avoid the soiling of railway track at stations. In this proposed system, the toilet waste is stored in a horizontal and cylindrical storage tank fixed under each toilet of the train. This tank can be connected to an underground drainage system through pipes and can be emptied when the train stops at a station. Masha was in class seven when she conceived this idea. This project helped her to get the first prize in the Southern India Science Fair, two National awards & one International Award (World Toilet Organization, Singapore).
M
30 YOJANA March 2013
She was also invited by the then President of India at Rashtrapati Bhawan. She also demonstrated the project before the Railway Boarding Meeting at Rail Bhawan, Delhi in the presence of the then Railway Minister.
Modified Fuel Dispenser: It is a very simple system to prevent accidental spill over of petrol/diesel while dispensing at the fuel station. A small roller ball has been inserted between the grip and the dispensing lever in the hand held dispenser. Thus only when the fuel nozzle is inside the tank of the vehicle, the ball will roll forward and downwards enabling the lever to be pressed. As soon the position changes to upright, the ball rolls back, and thus the dispensing lever cannot be pressed as the ball comes in between the lever and the grip.
Flameless Seal Maker: Sealing different confidential or legal documents of the government is a mandatory requirement. While returning from her school, Masha often used to visit her father’s office (sub treasury) where she noticed him sealing official documents. Sometimes, he also used to get burned from the candle while sealing. She wondered if there was an alternative way to do this and questioned her father who jokingly asked her to find a way. Taking this as a challenge, after a lot of hits and trials with different materials, she was finally able to develop the flameless seal maker.
Masha’s electricity operated flameless seal maker is made in hylam and polypropylene material, which is very light and handy. The user can load the lac pieces from the upper top. Using a small piston, the flow of the molten lac can be regulated. Temperature also can be controlled by thermostat control fitted inside the device. Using this seal maker, about 100 seals can be applied safely within 10
minutes. This seal maker is simple, handy, hassle free and device. Masha herself filed a patent for this device.
The possibility of using it by different government departments and by the Election Commission is being explored. This seal maker has been tested in two election booths in Kanya Kumari during the recent elections. This was the first time in India that an authoritative seal as affixed for government purpose without using naked flames was used. Otherwise this practice has been going on since the regime of Mughal emperor Jahangir. She won an award at the hands of Dr APJ Abdul Kalam in the Ignite 2009 award function organised by NIF.
Mechanical porter: Masha observed the problems women and old face while moving luggage or any other heavy object at home from one place to the other. Hence she developed this small mechanical porter where luggage can be loaded and it can be then raised to the required height using a jack like mechanism by hand or foot. Masha also got an award for this porter in Ignite 2010 competition of NIF.
Recognitions
Masha has been rewarded by the various international and prestigious institutions. So far she received 2 international awards, (World Toilet Organization, Singapore and Anna University, Chennai) and 5 national awards which includes the awards at 97th Indian Science Congress, National Innovation Foundation and National Council for Education Research and Training. Besides this, viswesariaya Industrial and Technological Museum Bangalore awarded her the Southern India Award where as the Science City Chennai has given the state award for Tamil Nadu. Masha was also short listed for the prestigious TR35 young innovator award by the
Technology Review Magazine, the world’s oldest science magazine of the MIT, USA.
Masha has made presentations of her innovations in several institutes including Indian Institute of Space Science and Technology, Trivandrum and Indian Institute of Science, Bangalore where she received National Science Research Fellowship. She was also awarded KvPY research fellowship. She claims to have travelled more than 62000 kilometers across the length and breadth of the country and met over 11 lakh people for the cause of promotion of science. She has also visited Japan as a guest invitee of the Government of Japan (deputed by the ministry of HRD/ Government of India) and UAE as an invitee of the Indian residents in Dubai.
Masha values a lot the love and support given by everyone. She acknowledges the moral and financial support provided to her by various institutions and officials, which she considers as a great facilitator for her growth. She specially remembers the encouraging words of the Chief Election Commissioner Dr. Quraishi during the one hour presentation on the flameless seal maker at the Election Commission, “You take up the task of manufacturing and supply of seal Maker to Election Commission of your own and become the youngest inventor cum entrepreneur of India. The Election Commission will provide all help including arranging loans from Banks.”
Young Masha aspires for a research career in engineering. Besides, she aims to continue the development of useful and unique products and wishes to become an entrepreneur one day. q
(E-mail : [email protected], www.nifindia.org)
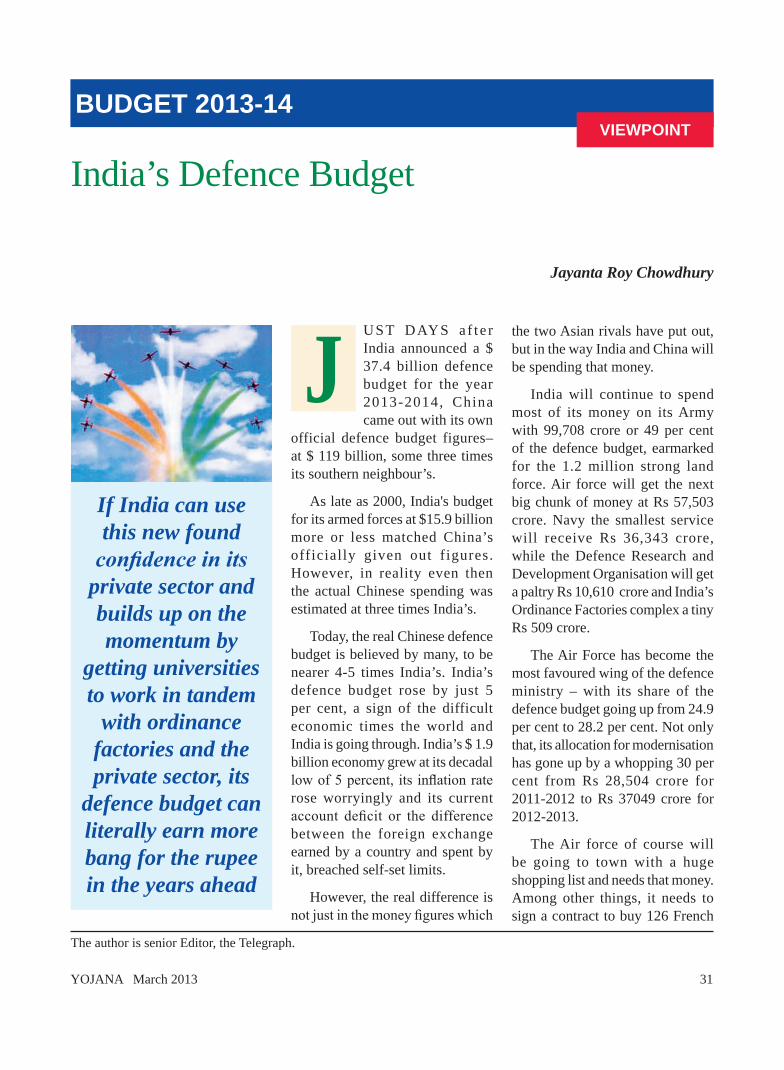
YOJANA March 2013 31
UST DAYS a f t e r India announced a $ 37.4 billion defence budget for the year 2013-2014, China came out with its own
official defence budget figures– at $ 119 billion, some three times its southern neighbour’s.
As late as 2000, India's budget for its armed forces at $15.9 billion more or less matched China’s officially given out figures. However, in reality even then the actual Chinese spending was estimated at three times India’s.
Today, the real Chinese defence budget is believed by many, to be nearer 4-5 times India’s. India’s defence budget rose by just 5 per cent, a sign of the difficult economic times the world and India is going through. India’s $ 1.9 billion economy grew at its decadal low of 5 percent, its inflation rate rose worryingly and its current account deficit or the difference between the foreign exchange earned by a country and spent by it, breached self-set limits.
However, the real difference is not just in the money figures which
India’s Defence Budget
BuDGET 2013-14
Jayanta Roy Chowdhury
VIEWPOINT
If India can use this new found
confidence in its private sector and builds up on the momentum by
getting universities to work in tandem
with ordinance factories and the private sector, its
defence budget can literally earn more bang for the rupee in the years ahead
the two Asian rivals have put out, but in the way India and China will be spending that money.
India will continue to spend most of its money on its Army with 99,708 crore or 49 per cent of the defence budget, earmarked for the 1.2 million strong land force. Air force will get the next big chunk of money at Rs 57,503 crore. Navy the smallest service will receive Rs 36,343 crore, while the Defence Research and Development Organisation will get a paltry Rs 10,610 crore and India’s Ordinance Factories complex a tiny Rs 509 crore.
The Air Force has become the most favoured wing of the defence ministry – with its share of the defence budget going up from 24.9 per cent to 28.2 per cent. Not only that, its allocation for modernisation has gone up by a whopping 30 per cent from Rs 28,504 crore for 2011-2012 to Rs 37049 crore for 2012-2013.
The Air force of course will be going to town with a huge shopping list and needs that money. Among other things, it needs to sign a contract to buy 126 French
The author is senior Editor, the Telegraph.
J
32 YOJANA March 2013
Rafale fighters, sometime later this calendar year. It also plans to sign deals to buy heavy lift CH-47F Chinook heavy lift helicopters, Boeing Apache longbow attack helicopters and Airbus tanker transporters.
T h e N a v y a n d A r m y ’s modernisation plans have received cuts by 2.8 per cent and 3.5 per cent respectively. Last year, some 31 per cent of the Rs 79,198 crore capital budget for the defence forces had been earmarked for Indian Navy, as part of a strategy to build up India’s outreach to partly protect sea lanes used by its merchantmen, especially energy tankers which feed India’s growing appetite for crude oil and partly to counter China’s growing naval presence.
However, the real problem with Indian defence spending is that it relies heavily on foreign weapon purchases – compared to the Chinese who depend more on domestic manufacture. This means India gets a) fewer aircraft or tanks or weapons for the money both countries spend. b) Their spares have to be continuously bought and c) there is always a fear of disruption of supplies because of the vagaries of foreign relations.
While India has been busy buying the C 130J Hercules heavy lift aircraft, China has been busy producing its Y-20 heavy lift aircraft, with a maximum payload of 66 tonnes and capable of flying 4,400 km. The aircraft is based on Russia’s workhorse – the Ilyushin series and still uses old Russian engines and is certainly not as sophisticated as the US built Hercules.
Similarly, while India hankers for Chinook helicopters, the Chinese have come out with the 13.8-ton AC313 heavy lift helicopter. Unveiled last year, this aircraft is a larger and modified version of the 7-ton Zhi-8 medium transport helicopter that is a close copy of the French SA 321 Super Frelon. China had bought 13 of the French helicopters in the 1970s and at least one was reportedly disassembled for study and reverse-engineering.
India, despite its head-start in aircraft manufacturing, having started making aircraft in the 1940s and jet engines in the 1950s, has proved itself incapable of even reverse engineering the many makes of aircraft it has bought and makes under license.
T h e s t o r y w i t h t a n k s is no different. Despite grand announcements, the Arjun main battle tank has proven to be a flop story. Just under 50 of them have been built and no regiment equipped with these home-made tanks. India still depends on old Russian T-72s and the slightly `newer’ T-90s.
Despite having bought the 155 mm Bofors howitzer guns in the late 1980s along with the technology, domestic politics, saw projects to build them locally shelved for decades. This year, at long last the Indian army has placed orders with Ordinance Factory Board to build 114 of them with slight modifications.
Contrast this with the Chinese model. Besides, the heavy lift aircraft, Beijing has succesfully reverse engineered Russia’s Sukhoi aircraft and America’s stealth technology. Its J-20 and J-31
aircraft may be doubted by western analysts, but like most Chinese take-aways these advanced fighter jets are likely to be value for money products, though not as advanced as their western counterparts.
Just one and half decade back, China, like India was a major importer of weapons. However, in the last decade and a half, it very consciously worked to ̀ catch up’. It reverse engineered British missiles, worked on Soviet era fighter jet platforms to work in improvements. It used students and scientists sent abroad on exchange programmes to spy on rival systems, a few of which were openly available, some commercially buyable. It hired out-of-work Soviet weapons scientists and specialists and restructured its own defence research and production labyrinths.
The Middle Kingdom has also strategised by coming up with innovative ideas to take on its arch rival – the US – whose military size, strength and spending - dwarfs everyone else. Beijing is believed experimenting with ̀ bugs’ in telecom and power equipment which could cause power and communication systems in client countries to collapse. It has again reportedly trained armies of hackers who can play havoc with computer based command and control systems in a wide range of areas and is perfecting satellite warfare capabilities to take out the communication lines of the enemy. It has also reportedly strategised on using low cost, small yet very fast strike craft to disable enemy fleets including aircraft carrier groups.
Despite this defence-industrial complex model next door, India’s focus on indigenisation is more than
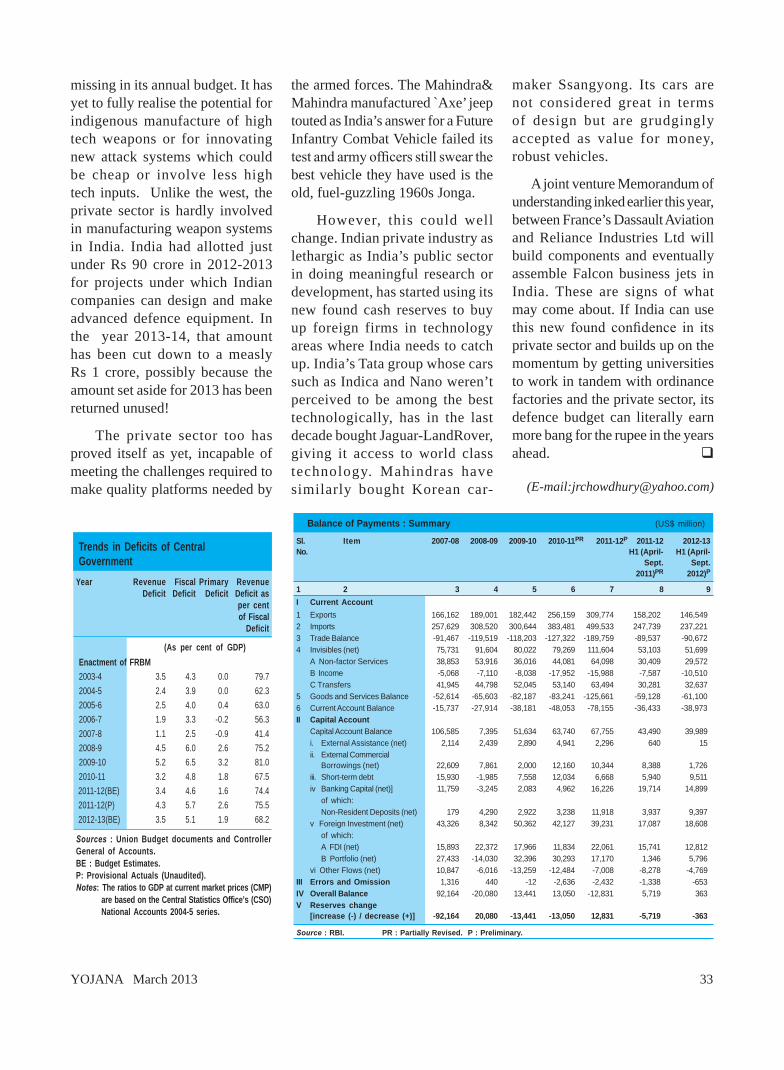
YOJANA March 2013 33
missing in its annual budget. It has yet to fully realise the potential for indigenous manufacture of high tech weapons or for innovating new attack systems which could be cheap or involve less high tech inputs. Unlike the west, the private sector is hardly involved in manufacturing weapon systems in India. India had allotted just under Rs 90 crore in 2012-2013 for projects under which Indian companies can design and make advanced defence equipment. In the year 2013-14, that amount has been cut down to a measly Rs 1 crore, possibly because the amount set aside for 2013 has been returned unused!
The private sector too has proved itself as yet, incapable of meeting the challenges required to make quality platforms needed by
the armed forces. The Mahindra& Mahindra manufactured ̀ Axe’ jeep touted as India’s answer for a Future Infantry Combat vehicle failed its test and army officers still swear the best vehicle they have used is the old, fuel-guzzling 1960s Jonga.
However, this could well change. Indian private industry as lethargic as India’s public sector in doing meaningful research or development, has started using its new found cash reserves to buy up foreign firms in technology areas where India needs to catch up. India’s Tata group whose cars such as Indica and Nano weren’t perceived to be among the best technologically, has in the last decade bought Jaguar-LandRover, giving it access to world class technology. Mahindras have similarly bought Korean car-
maker Ssangyong. Its cars are not considered great in terms of design but are grudgingly accepted as value for money, robust vehicles.
A joint venture Memorandum of understanding inked earlier this year, between France’s Dassault Aviation and Reliance Industries Ltd will build components and eventually assemble Falcon business jets in India. These are signs of what may come about. If India can use this new found confidence in its private sector and builds up on the momentum by getting universities to work in tandem with ordinance factories and the private sector, its defence budget can literally earn more bang for the rupee in the years ahead. q
(E-mail:[email protected])132 Economic Survey 2012-13
(4.2 per cent of GDP) as compared with US$ 48.1billion (2.8 per cent of GDP) in 2010-11. Net capitalinflows were higher at US$ 67.8 billion (3.6 per centof GDP) in 2011-12 as compared to US$ 63.7 billion(3.7 per cent of GDP) in 2010-11, mainly due to higherFDI inflows and NRI deposits. As the capital accountsurplus fell short of financing current account deficit,there was a drawdown of reserves (on BoP basis) tothe extent of US$ 12.8 billion during 2011-12 asagainst an accretion of US$ 13.1 billion in 2010-11.
6.8 As per the latest available data for the first half(H1- April-September 2012) of 2012-13, India’sbalance of payments continued to be under stress.
This is reflected in the higher current account deficitin H1 (April-September) of 2012-13 than thecorresponding period of the previous year, mainlydue to worsening of trade deficit reflected in sharperdecline in exports than the imports and lowerinvisibles surplus. The net capital flows in absoluteterm, were also lower during H1 of 2012-13 vis-a-visthe corresponding period of 2011-12 (Table 6.2).
Current Account1 during 2011-126.9 During 2011-12, exports crossed the US$ 300billion mark for the first time. The rate of growthhowever, declined to 20.9 per cent to US$ 309.8
Balance of Payments : Summary (US$ million)
Sl. Item 2007-08 2008-09 2009-10 2010-11PR 2011-12P 2011-12 2012-13No. H1 (April- H1 (April-
Sept. Sept.2011)PR 2012)P
1 2 3 4 5 6 7 8 9I Current Account1 Exports 166,162 189,001 182,442 256,159 309,774 158,202 146,5492 Imports 257,629 308,520 300,644 383,481 499,533 247,739 237,2213 Trade Balance -91,467 -119,519 -118,203 -127,322 -189,759 -89,537 -90,6724 Invisibles (net) 75,731 91,604 80,022 79,269 111,604 53,103 51,699
A Non-factor Services 38,853 53,916 36,016 44,081 64,098 30,409 29,572B Income -5,068 -7,110 -8,038 -17,952 -15,988 -7,587 -10,510C Transfers 41,945 44,798 52,045 53,140 63,494 30,281 32,637
5 Goods and Services Balance -52,614 -65,603 -82,187 -83,241 -125,661 -59,128 -61,1006 Current Account Balance -15,737 -27,914 -38,181 -48,053 -78,155 -36,433 -38,973II Capital Account
Capital Account Balance 106,585 7,395 51,634 63,740 67,755 43,490 39,989i. External Assistance (net) 2,114 2,439 2,890 4,941 2,296 640 15ii. External Commercial
Borrowings (net) 22,609 7,861 2,000 12,160 10,344 8,388 1,726iii. Short-term debt 15,930 -1,985 7,558 12,034 6,668 5,940 9,511iv Banking Capital (net)] 11,759 -3,245 2,083 4,962 16,226 19,714 14,899
of which:Non-Resident Deposits (net) 179 4,290 2,922 3,238 11,918 3,937 9,397
v Foreign Investment (net) 43,326 8,342 50,362 42,127 39,231 17,087 18,608of which:A FDI (net) 15,893 22,372 17,966 11,834 22,061 15,741 12,812B Portfolio (net) 27,433 -14,030 32,396 30,293 17,170 1,346 5,796
vi Other Flows (net) 10,847 -6,016 -13,259 -12,484 -7,008 -8,278 -4,769III Errors and Omission 1,316 440 -12 -2,636 -2,432 -1,338 -653IV Overall Balance 92,164 -20,080 13,441 13,050 -12,831 5,719 363V Reserves change
[increase (-) / decrease (+)] -92,164 20,080 -13,441 -13,050 12,831 -5,719 -363
Source : RBI. PR : Partially Revised. P : Preliminary.
1 As per the sixth edition of Balance of Payments Manual (BPM 6, 2009) of the IMF, the current account of the BoPincludes all the transaction (other than those in financial items) involving exchange of economic value which takesplace between resident and non-resident entities.
http://indiabudget.nic.in
57Public Finance
to lower realization in direct tax revenues and underprovisioning of subsidies. Recognizing the need forfunding the higher levels of outgo on subsidies onaccount of elevated levels of global crude oil prices,higher provision was made for the same in Budget2012-13. However, as part of the fiscal consolidationprocess, the Budget also announced the intent torestrict expenditure on central subsidies to under2 per cent of GDP.
3.4 The Budget for 2012-13 introducedamendments to the FRBM Act as part of the FinanceBill. These amendments contained two importantfeatures of expenditure reforms. First is theintroduction of the concept of effective revenuedeficit, which excludes from the conventional revenuedeficit, grants for the creation of capital assets. Thisis an important development for the reason that whilethe revenue deficit of the consolidated generalgovernment fully reflects total capital expenditureincurred, in the accounts of the centre, thesetransfers are shown as revenue expenditure.Therefore the mandate of eliminating the conventionalrevenue deficit of the centre becomes problematic.With this amendment, the endeavour of thegovernment under the FRBM Act would be toeliminate the effective revenue deficit. Similarly, atstate level also, some of the capital transfers tolocal bodies or parastatals could get reflected asrevenue expenditure. By understating capitalexpenditure, this might lead to a divergence betweenthe national accounts data on capital formation onthe government accounts and the conventional publicfinance data that is gleaned from the Budgets.
3.5 The second important feature is theintroduction of the provision for 'Medium TermExpenditure Framework Statement’ in the FRBMAct. This medium-term framework provides for rollingtargets for expenditure, imparting greater certainty,and encourages prioritization of expenditure.Together with the measures proposed to raise thetax-GDP ratio, the expenditure reforms are expectedto yield better fiscal marksmanship, therebymitigating key fiscal risks.
FISCAL MARKSMANSHIP
3.6 Post the FRBM Act but prior to global financialcrisis, significant fiscal consolidation was achievedwith the fiscal deficit of the centre declining rapidlyto 2.5 per cent of GDP in 2007-8, which was muchbelow the threshold target of 3 per cent set in the
FRBM Act (Table 3.1). However, the government’sfiscal policy is evaluated not only on overall fiscalmarksmanship in terms of fiscal and revenue deficitswhich are in effect-derived indicators, but also onmarksmanship in terms of key revenue andexpenditure targets.
3.7 It is useful to note that in the immediate post-FRBM period, fiscal marksmanship of the centralgovernment had a series of overperformances to itscredit except in 2008-9 and in 2011-12(Figure 3.1). While the overshooting of the deficittargets in 2008-9 was a conscious decision toobviate the adverse impact of the global financialcrisis, the large slippage in 2011-12 owed to aconfluence of adverse economic outcomes arisingfrom global and domestic factors. It was on accountof lower receipts (which explains about 58 per centof total slippage) due to a sharp deceleration in realGDP growth, particularly in the industry sector,elevated levels of inflation, subdued financial marketconditions for generating the required disinvestmentreceipts, and overshooting of expenditure(accounting for the remaining 42 per cent of slippage)mainly on account of persistently high levels of globalcrude oil and fertilizer prices which were not passedthrough to the domestic price setting. Thus the risks
Trends in Deficits of CentralGovernment
Year Revenue Fiscal Primary RevenueDeficit Deficit Deficit Deficit as
per centof Fiscal
Deficit
(As per cent of GDP) Enactment of FRBM 2003-4 3.5 4.3 0.0 79.7 2004-5 2.4 3.9 0.0 62.3 2005-6 2.5 4.0 0.4 63.0 2006-7 1.9 3.3 -0.2 56.3 2007-8 1.1 2.5 -0.9 41.4 2008-9 4.5 6.0 2.6 75.2 2009-10 5.2 6.5 3.2 81.0 2010-11 3.2 4.8 1.8 67.5 2011-12(BE) 3.4 4.6 1.6 74.4 2011-12(P) 4.3 5.7 2.6 75.5 2012-13(BE) 3.5 5.1 1.9 68.2
Sources : Union Budget documents and ControllerGeneral of Accounts.BE : Budget Estimates.P: Provisional Actuals (Unaudited).Notes: The ratios to GDP at current market prices (CMP)
are based on the Central Statistics Office’s (CSO)National Accounts 2004-5 series.
http://indiabudget.nic.in

34 YOJANA March 2013
YE-
264/
2013
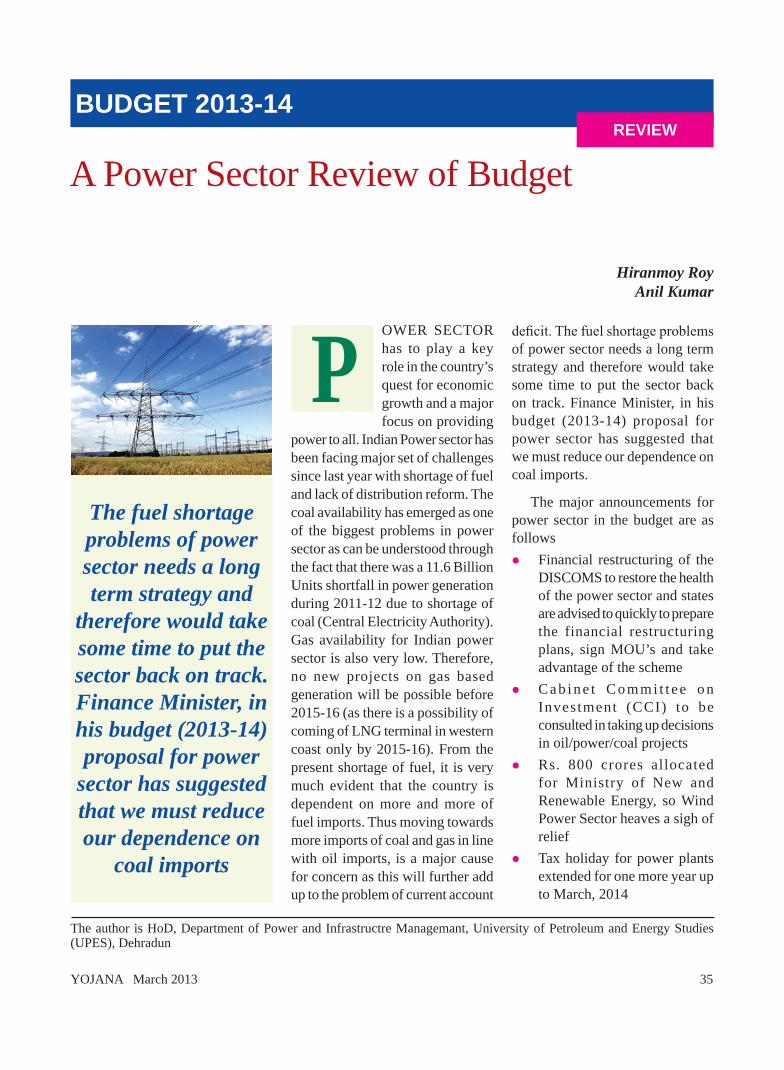
YOJANA March 2013 35
OWER SECTOR has to play a key role in the country’s quest for economic growth and a major focus on providing
power to all. Indian Power sector has been facing major set of challenges since last year with shortage of fuel and lack of distribution reform. The coal availability has emerged as one of the biggest problems in power sector as can be understood through the fact that there was a 11.6 Billion Units shortfall in power generation during 2011-12 due to shortage of coal (Central Electricity Authority). Gas availability for Indian power sector is also very low. Therefore, no new projects on gas based generation will be possible before 2015-16 (as there is a possibility of coming of LNG terminal in western coast only by 2015-16). From the present shortage of fuel, it is very much evident that the country is dependent on more and more of fuel imports. Thus moving towards more imports of coal and gas in line with oil imports, is a major cause for concern as this will further add up to the problem of current account
A Power Sector Review of Budget
BuDGET 2013-14
Hiranmoy Roy Anil Kumar
REVIEW
The fuel shortage problems of power sector needs a long term strategy and
therefore would take some time to put the sector back on track. Finance Minister, in his budget (2013-14) proposal for power
sector has suggested that we must reduce our dependence on
coal imports
deficit. The fuel shortage problems of power sector needs a long term strategy and therefore would take some time to put the sector back on track. Finance Minister, in his budget (2013-14) proposal for power sector has suggested that we must reduce our dependence on coal imports.
The major announcements for power sector in the budget are as followsl Financial restructuring of the
DISCOMS to restore the health of the power sector and states are advised to quickly to prepare the financial restructuring plans, sign MOU’s and take advantage of the scheme
l C a b i n e t C o m m i t t e e o n Investment (CCI) to be consulted in taking up decisions in oil/power/coal projects
l Rs. 800 crores allocated for Ministry of New and Renewable Energy, so Wind Power Sector heaves a sigh of relief
l Tax holiday for power plants extended for one more year up to March, 2014
The author is HoD, Department of Power and Infrastructre Managemant, University of Petroleum and Energy Studies (UPES), Dehradun
P
36 YOJANA March 2013
l Wind energy sector to get generation based incentives
l To encourage states to take up waste to energy (WTE) projects via PPP mode
l Rs.5280 crores allocated to Department of Energy
l Current Account Deficit still high – one of the main reasons is high import of coal
l Coal import in April-December, 2012 at 100 million tonnes, to rise to 185 million tonnes in 2013-14
l For increasing coal supply, PPP projects along with Coal India has been announced
l Oil and Gas policy to be announced
l The recent buzz word in USA is Shale Gas for future energy needs. So it is a welcome move that Govt. of India will announce Shale Gas policy soon
l Oil and Gas blocks under National Exploration Licensing Policy (NELP) to be cleared this year
l Natural Gas Pricing Policy to be reviewed – to benefit the gas companies
l Five LNG te rmina ls in Dabhol in Ratnagiri district of Maharastra will be operational in 2013-14
l Rate of Withholding tax on interest payments on ECB is proposed to be reduced from 20 to 5 percent which will benefit power sector also
l Duties have been equalized on steam and bituminous coal used for generation. Now both would attract 2 percent customs and 2 percent countervailing duty (CvD).
This customs duty and CvD will push up the coal prices and generation costs and widen the price differential with domestic coal fired power.
Extension of the sunset clause for availing ten year tax holiday for a year would benefit approximately 20 Giga Watts of capacities to be commissioned in 2013-14. The extension would drive promoters to complete ongoing projects quickly and this may attract fresh investment. Funding will also improve with the issuance of tax-free bonds of Rs. 50,000 crores and credit enhancement through IIFCL.
The proposal to adopt a PPP framework for coal production will improve domestic supply of coal in the long term. Custom duty on imported coal, which was previously exempt, has been increased to two percent while countervailing duty has also been raised to two percent. Further the Railway budget hiked freight rates by 5.8 percent. Consequently, generation costs will increase per unit for coal- based projects.
Introduction of 2 percent customs duty and 2 percent CvD will have an impact on the price of imported coal and on the cost of power generation and is expected to increase the tariff. The upshot is that around 60 to 70 percent coal imported earlier for thermal power plants was exempt from any customs duty. Now this category of coal will see a rise in costs of imports and resulting rise in cost of generation.
Changes in duties on coal, railway tariffs and other costs will raise generation cost by 20
paise per unit and much higher in states where power utilities are making losses. The hike would be steepest where utilities are reeling under losses. Moreover the states which will be adopting financial restructuring package burdened with heavy losses, have to announce tariff hike as one of the conditions for restructuring.
For the first time budget has made provision for waste- to- energy (WTE) projects via PPP mode. This will be supported through different instruments like viability gap funding (vGF), repayable grant and low cost capital. A debate has started on the suitability of such projects as environmentalists are of the opinion that these projects and technologies are not suitable for India. Though Municipal bodies say it is the most effective way to manage waste and this may encourage private players as there is provision for vGF. Delhi has such plant of 16 MW capacity at Okhla and other two projects will be operational at Gazipur and Narela –Bawana by this year end. WTE projects are the only way to dispose waste in the metro cities.
As per the budget estimate, coal imports during the period April- December, 2012 have crossed 100 million tones. It is estimated that import will rise to 185 million tonnes in 2016-17. If the coal requirements of the existing power plants and the power plants that will come into operation by 31.03.2015 are taken into account, there is no
CORRIGENDUMIn the Do You Know Column of February 2013 issue (Pg. 50) of Yojana, the word 'unemployment' in col. 1 line 32 should read as 'employment'.
Editor
YOJANA March 2013 37
alternative except to import coal and adopt a policy of blending and pooled pricing. Finance Minister has suggested that in the medium and long term, we must reduce our dependence on coal imports. This can be achieved through devising a PPP policy framework with Coal India Limited (CIL) in order to increase the production of coal for supply to power producers. These matters are under active consideration and Minister of Coal will announce Government’s policies in due course.
There was a mis- classification between steam and bituminous coal
as both are used in thermal power plants. The steam coal was exempt from customs duty but attracts a CvD of one percent. Bituminous coal attracted a duty of 5 percent and a CvD of 6 percent. The budget proposed to equalize the duties on both kinds of coal and levy 2 percent customs duty and 2 percent CvD to avoid these mis - classification.
Since there is change in coal pricing policies of different countries mainly Indonesia and Australia, the Indian import price of coal has increased. All the power producing companies who
have signed a long term power purchase agreements with various utilities, now want revision of price due to this change in imported coal price. But no clear policy has been declared as yet by Central or State Govt. in this regard. So power plants based on imported coal are operating at under capacity. Now Indian power producers are looking for imported coal from politically stabilsed south East African countries like Mozambique and Botswana other than South Africa as new source. q
(E-mail:[email protected])
FORM IV(Statement about ownership and other particulars about newspaper Yojana (English) published in the
first issue of every year after the last of day of February) 1. Place of Publication : New Delhi2. Periodicity of its Publication : Monthly3. Printer’s Name & Nationality : Ira Joshi, Indian, Soochna Bhavan, Publications Division, New Delhi-110 003.4. Publisher’s Name , Nationality : Ira Joshi, & Address Indian, Soochna Bhavan, Publications Division, New Delhi-110 003.5. Editor’s Name , Nationality : Mrs. Shyamala Mani Iyer & Address Indian, Yojana, Publications Division Room No. 542, Yojana Bhavan, New Delhi - 110 0016. Names and addresses of individuals : Wholly owned by Ministry of I&B
who own the newspaper and partners Govt. of India, New Delhi-100 001. of shareholders holding more than one percent of the total capital
I, Ira Joshi hereby declare that the particulars given above are true to the best of my knowledge and belief.
Date: 01.03.2013Sd/-
(Ira Joshi) Publisher
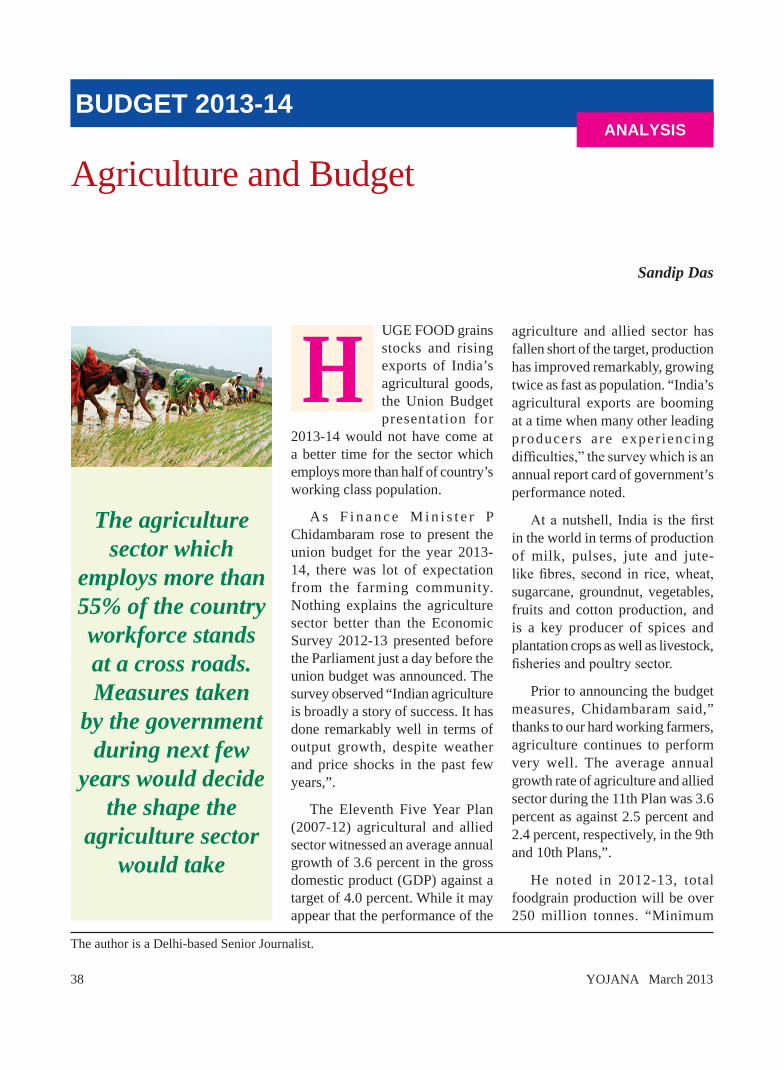
38 YOJANA March 2013
UGE FOOD grains stocks and rising exports of India’s agricultural goods, the Union Budget presentation for
2013-14 would not have come at a better time for the sector which employs more than half of country’s working class population.
A s F i n a n c e M i n i s t e r P Chidambaram rose to present the union budget for the year 2013-14, there was lot of expectation from the farming community. Nothing explains the agriculture sector better than the Economic Survey 2012-13 presented before the Parliament just a day before the union budget was announced. The survey observed “Indian agriculture is broadly a story of success. It has done remarkably well in terms of output growth, despite weather and price shocks in the past few years,”.
The Eleventh Five Year Plan (2007-12) agricultural and allied sector witnessed an average annual growth of 3.6 percent in the gross domestic product (GDP) against a target of 4.0 percent. While it may appear that the performance of the
Agriculture and Budget
BuDGET 2013-14
Sandip Das
aNalySIS
The agriculture sector which
employs more than 55% of the country workforce stands at a cross roads. Measures taken
by the government during next few
years would decide the shape the
agriculture sector would take
agriculture and allied sector has fallen short of the target, production has improved remarkably, growing twice as fast as population. “India’s agricultural exports are booming at a time when many other leading producers are exper iencing difficulties,” the survey which is an annual report card of government’s performance noted.
At a nutshell, India is the first in the world in terms of production of milk, pulses, jute and jute-like fibres, second in rice, wheat, sugarcane, groundnut, vegetables, fruits and cotton production, and is a key producer of spices and plantation crops as well as livestock, fisheries and poultry sector.
Prior to announcing the budget measures, Chidambaram said,” thanks to our hard working farmers, agriculture continues to perform very well. The average annual growth rate of agriculture and allied sector during the 11th Plan was 3.6 percent as against 2.5 percent and 2.4 percent, respectively, in the 9th and 10th Plans,”.
He noted in 2012-13, total foodgrain production will be over 250 million tonnes. “Minimum
The author is a Delhi-based Senior Journalist.
H
YOJANA March 2013 39
support price of every agricultural produce under the procurement programme has been increased s ignif icant ly. Farmers have responded to the price signals and produced more. Agricultural exports from April to December, 2012 have crossed Rs 138,403 crore,” Chidambaram noted.
Though government constantly focuses on increasing exports of manufactured goods and services, according to a recent paper written by the Commission for Agricultural Costs and Prices (CACP) chief Ashok Gulati and others, its off-on policy on agricultural exports is preventing the country for achieving its potential.
“If the government is proactive, FY’12 exports can cross $42– 43 billion”, Gulati says. In 2011-12, according to Gulati, agricultural exports by India were more than $37 billion against an import of commodities worth around $17 billion.
India has emerged as the world’s largest exporter of rice, replacing Thailand and vietnam and the country has also the biggest exporter of buffalo meat beating traditionally strong countries such as Brazil, Australia and the US.
CACP research paper titled ‘Farm trade: Tapping the hidden potential’ has stated that agricultural exports have increased more than 10 fold from $3.5 billion in 1990-91 to $37.1 billion in 2011-12. “This share is more than the share that India has in global merchandise exports,” the paper has noted.
The agriculture sector which employs more than 55% of the country workforce stands at a cross roads. Measures taken by
the government during next few years would decide the shape the agriculture sector would take.
As the latest Economic survey points out that “India is at a juncture where further reforms are urgently required to achieve greater efficiency and productivity in agriculture for sustaining growth. There is need to have stable and consistent policies where markets play a deserving role and private investment in infrastructure is stepped up. An efficient supply chain that firmly establishes the linkage between retail demand and the farmer will be important,”.
The survey also points out that rationalization of agricultural incentives and strengthening of food price management will also help, together with a predictable trade policy for agriculture. These initiatives need to be coupled with skill development and better research and development in this sector along with improved delivery of credit, seeds, risk management tools, and other inputs ensuring sustainable and climate-resilient agricultural practices.
One of the key proposal announced by Finance Minister P Chidambaram in his budget speech includes close to 22% jump in the agriculture credit target for the next fiscal besides granting similar hike in allocation for the agriculture ministry.
“Agricultural credit is a driver of agricultural production. We will exceed the target of Rs 5,75,000 crore fixed for 2012-13. For 2013-14, I propose to increase the target to Rs 7,00,000 crore,” Chidambaram said while presenting the Budget for the 2013-14.
The finance minister also announced continuance of the interest-subvention for short-term crop loan. Farmers who repay loan on time will be able to get credit at 4% interest per annum. He also announced extension of crop loan scheme to private sector banks along with the loan extended by public sector banks, Regional Rural Banks and cooperative banks.
“So far, the scheme has been applied to loans extended by public sector banks, Regional Rural Banks and cooperative banks, I propose to extend the scheme to crop loans borrowed from private sector banks and scheduled commercial banks in respect to loans given within the service area of the branch concerned,” Chidambaram announced.
Similarly, another thrust of the finance minister’s budget proposal was 22% increase in financial grant for the agriculture ministry to Rs 27,049 crore for the next fiscal in comparison to last year. The hike in allocation also includes Rs 3,415 crore earmarked for agricultural research.
Another key proposal announced by the finance minister include a Rs 1000 crore allocation under the Bringing Green Revolution in the Eastern India (BGREI) for the next fiscal. For augmenting rice production in states including Assam, Odisha, Jharkhand and West Bengal, the government had allocated Rs 400 crore in 2011-12 and Rs 1000 crore during the current fiscal.
“The original Green Revolution States face the problem of stagnating yields and over-exploitation of water resources. The answer lies in crop
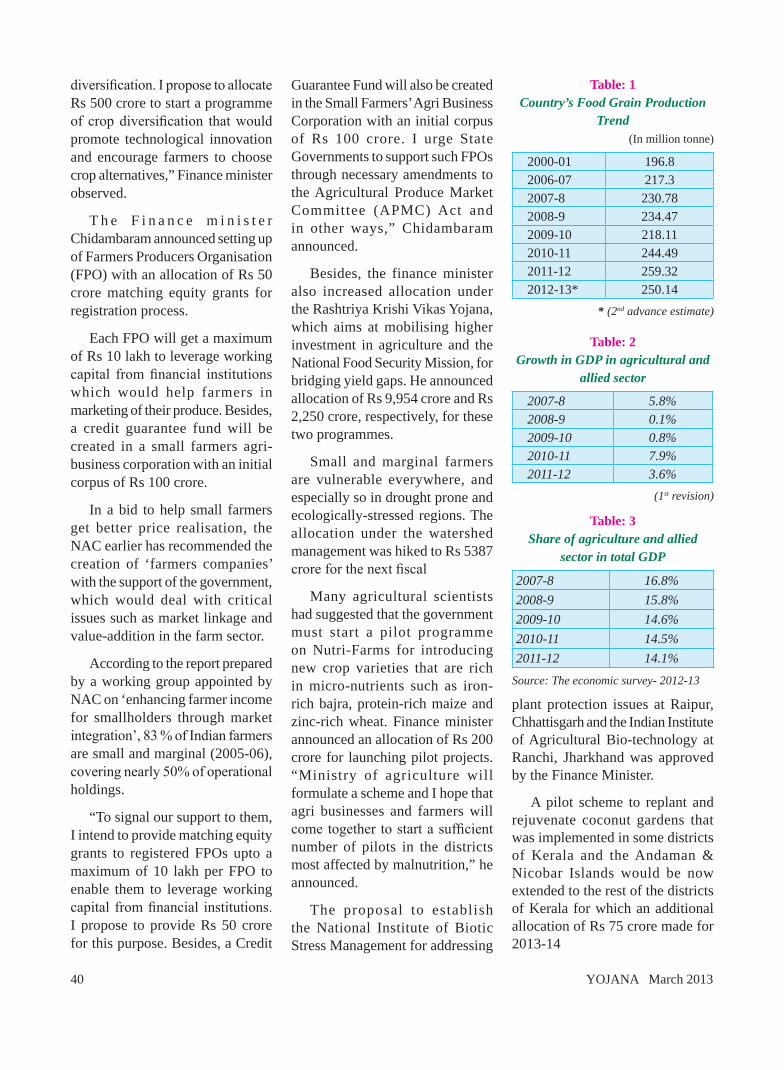
40 YOJANA March 2013
diversification. I propose to allocate Rs 500 crore to start a programme of crop diversification that would promote technological innovation and encourage farmers to choose crop alternatives,” Finance minister observed.
T h e F i n a n c e m i n i s t e r Chidambaram announced setting up of Farmers Producers Organisation (FPO) with an allocation of Rs 50 crore matching equity grants for registration process.
Each FPO will get a maximum of Rs 10 lakh to leverage working capital from financial institutions which would help farmers in marketing of their produce. Besides, a credit guarantee fund will be created in a small farmers agri-business corporation with an initial corpus of Rs 100 crore.
In a bid to help small farmers get better price realisation, the NAC earlier has recommended the creation of ‘farmers companies’ with the support of the government, which would deal with critical issues such as market linkage and value-addition in the farm sector.
According to the report prepared by a working group appointed by NAC on ‘enhancing farmer income for smallholders through market integration’, 83 % of Indian farmers are small and marginal (2005-06), covering nearly 50% of operational holdings.
“To signal our support to them, I intend to provide matching equity grants to registered FPOs upto a maximum of 10 lakh per FPO to enable them to leverage working capital from financial institutions. I propose to provide Rs 50 crore for this purpose. Besides, a Credit
Guarantee Fund will also be created in the Small Farmers’ Agri Business Corporation with an initial corpus of Rs 100 crore. I urge State Governments to support such FPOs through necessary amendments to the Agricultural Produce Market Committee (APMC) Act and in other ways,” Chidambaram announced.
Besides, the finance minister also increased allocation under the Rashtriya Krishi vikas Yojana, which aims at mobilising higher investment in agriculture and the National Food Security Mission, for bridging yield gaps. He announced allocation of Rs 9,954 crore and Rs 2,250 crore, respectively, for these two programmes.
Small and marginal farmers are vulnerable everywhere, and especially so in drought prone and ecologically-stressed regions. The allocation under the watershed management was hiked to Rs 5387 crore for the next fiscal
Many agricultural scientists had suggested that the government must start a pilot programme on Nutri-Farms for introducing new crop varieties that are rich in micro-nutrients such as iron-rich bajra, protein-rich maize and zinc-rich wheat. Finance minister announced an allocation of Rs 200 crore for launching pilot projects. “Ministry of agriculture will formulate a scheme and I hope that agri businesses and farmers will come together to start a sufficient number of pilots in the districts most affected by malnutrition,” he announced.
The proposal to establish the National Institute of Biotic Stress Management for addressing
plant protection issues at Raipur, Chhattisgarh and the Indian Institute of Agricultural Bio-technology at Ranchi, Jharkhand was approved by the Finance Minister.
A pilot scheme to replant and rejuvenate coconut gardens that was implemented in some districts of Kerala and the Andaman & Nicobar Islands would be now extended to the rest of the districts of Kerala for which an additional allocation of Rs 75 crore made for 2013-14
Table: 1Country’s Food Grain Production
Trend(In million tonne)
2000-01 196.82006-07 217.32007-8 230.782008-9 234.472009-10 218.112010-11 244.492011-12 259.322012-13* 250.14
* (2nd advance estimate)
Table: 2Growth in GDP in agricultural and
allied sector
2007-8 5.8%2008-9 0.1%2009-10 0.8%2010-11 7.9%2011-12 3.6%
(1st revision)
Table: 3Share of agriculture and allied
sector in total GDP
2007-8 16.8%2008-9 15.8%2009-10 14.6%2010-11 14.5%2011-12 14.1%
Source: The economic survey- 2012-13
YOJANA March 2013 41
“We are certain many of the new initiatives of the Government shall go a long way in empowering farmers by increasing their incomes and ensuring sustainable livelihoods.
We strongly believe as we sharpen our focus on sustainable food production and its supply, technology shall play a pivotal role,” Ram Kaundinya, Chairman, ABLE-AG (Association of Biotech Led Enterprises-Agriculture Group) observed.
For giving boost to livestock sector, the National Livestock Mission will be launched in 2013-14 to attract investment and to enhance productivity taking into account local agro-climatic conditions. Finance minister announced allocation of Rs 307 crore for the mission. Besides this there would be a sub Mission for increasing the availability of feed and fodder.
With the proposed National Food Security Bill, which is expected to be passed during next few months, finance minister set aside Rs 10,000 crore for proposed food security legislation which expected to bring in more than 67% population for distribution of subsidized food grains distribution.
The finance minister also announced inclusion of all the other agricultural development activities including National Food Security Mission, National Mission on Sustainable Agriculture including Micro Irrigation, National Mission on Oilseeds and Oil Palm, National Mission on Agricultural Extension and Technology and National Horticulture Mission.
All the measures are expected
to give boost to the critical sector of the economy. However the economic survey points out two critical areas which needs urgent attention of the government.
In case of oil seeds, India is one of the largest producers of oilseeds in the world. However, 50 percent of its domestic requirements are met through imports, out of which crude palm oil and RBD palmolein constitute about 77 percent and soyabean oil constitutes about 12 percent. Import dependence was only about 3 percent during 1992-3. With rising purchasing power, the edible oil consumption is increasing steadily during last many years.
The production of oilseeds, though it has increased in recent years (from 18.44 million tonne in 2000-1 to 29.79 mt in 2011-12), has not kept pace with the demand for edible oils in the country. Imports have helped raise the per capita availability of edible oils which has increased from 5.8 kg in 1992-3 increased to 14.5kg in 2010-11.
“Considering the situation, it is time to frame a price band for edible oils in a manner that harmonizes the interests of domestic farmers, processors, and consumers through imposition of import duty at an appropriate rate. The import duty would also generate revenue, which could also be utilized for an oilseeds development programme,” the economic survey has noted.
On sugar sector, it is well known that India is the largest consumer and second largest producer of sugar after Brazil. Sugar and sugarcane are notified as essential commodities under the Essential Commodities Act 1955.
The production of sugarcane during 2012-13 is estimated at 334.54 million tonnes. However the Indian sugar sector suffers from policy inconsistency and unpredictability. The sugar industry in India is over-regulated and prone to cyclicality due to price interventions.
“Deregulation of the sugar industry has been widely debated for a long time. From a purely economic point of view, greater play of market forces would provide better prices and serve the interests of all stakeholders. The government should come into the picture only in situations where absolutely necessary. Export bans and controls could be replaced with small variable external tariffs to stabilize prices,” the survey noted.
In conclusion, the economic survey aptly sums up the key challenges faced by the critical sector of the economy. While stating that the farmers’ access to markets is hampered by poor roads, rudimentary market infrastructure, and excessive regulation, the survey suggested private sector involvement in creat ion of efficient market in order to provide farmers an alternative competitive marketing channel for transaction of their agricultural produce at remunerative prices. For most of these challenges, budget had some measures announced which is an encouraging signs for giving boost to the sector in the long run.
Ajay vir Jakhar, Chairman, Bharat Krishak Samaj said ,”now the government job is pursue state governments to improve marketing infrastructure so that farmers income rise steadily,” q
(E-mail:[email protected])
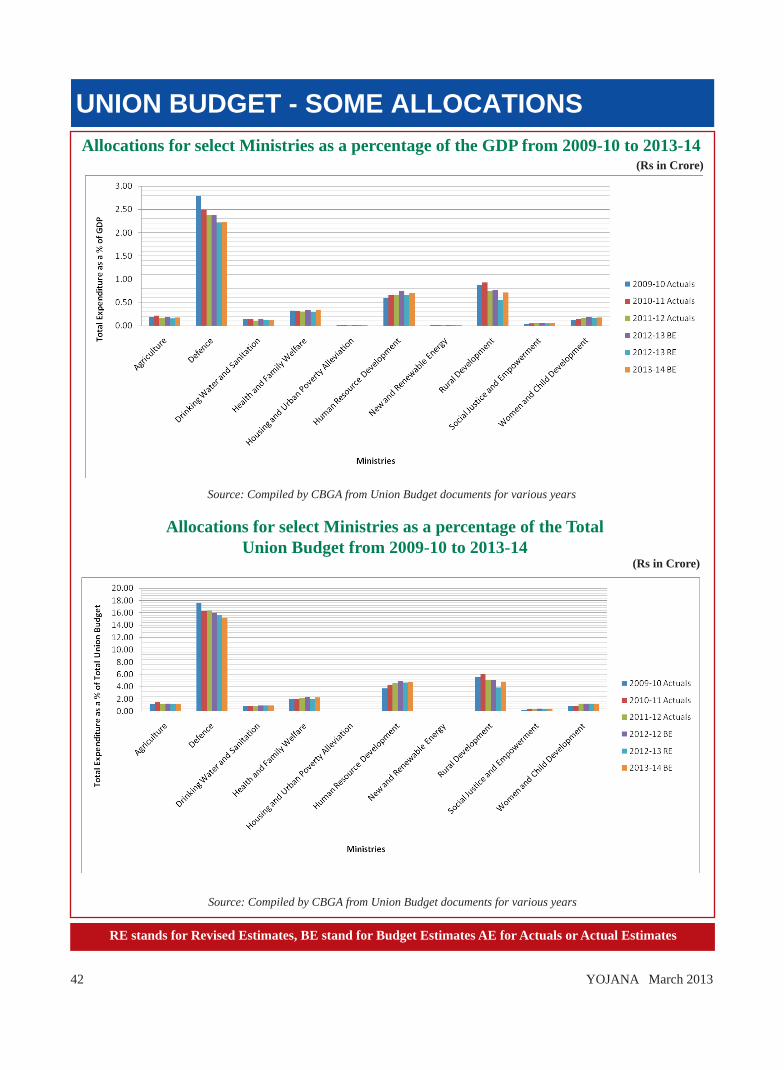
42 YOJANA March 2013
Allocations for select Ministries as a percentage of the GDP from 2009-10 to 2013-14 (Rs in Crore)
Allocations for select Ministries as a percentage of the Total union Budget from 2009-10 to 2013-14
(Rs in Crore)
Source: Compiled by CBGA from Union Budget documents for various years
Source: Compiled by CBGA from Union Budget documents for various years
RE stands for Revised Estimates, BE stand for Budget Estimates AE for Actuals or Actual Estimates
uNION BuDGET - SOME allOCaTIONS
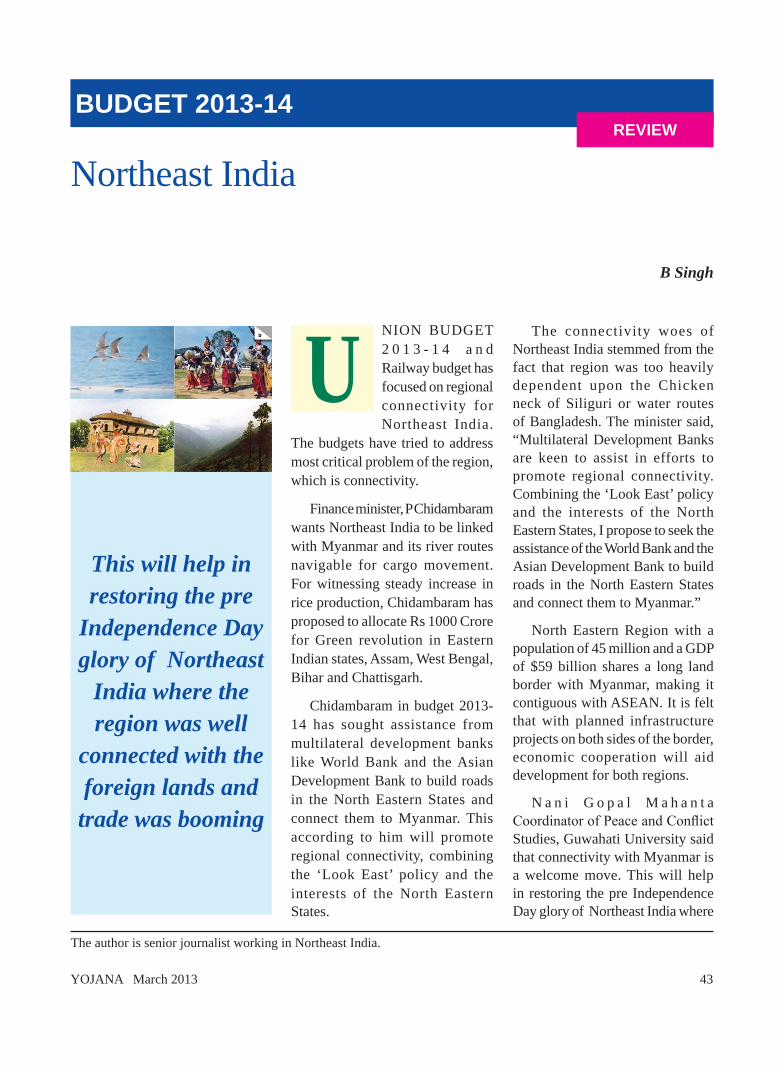
YOJANA March 2013 43
NION BUDGET 2 0 1 3 - 1 4 a n d Railway budget has focused on regional connectivity for Northeast India.
The budgets have tried to address most critical problem of the region, which is connectivity.
Finance minister, P Chidambaram wants Northeast India to be linked with Myanmar and its river routes navigable for cargo movement. For witnessing steady increase in rice production, Chidambaram has proposed to allocate Rs 1000 Crore for Green revolution in Eastern Indian states, Assam, West Bengal, Bihar and Chattisgarh.
Chidambaram in budget 2013-14 has sought assistance from multilateral development banks like World Bank and the Asian Development Bank to build roads in the North Eastern States and connect them to Myanmar. This according to him will promote regional connectivity, combining the ‘Look East’ policy and the interests of the North Eastern States.
Northeast India
BuDGET 2013-14
B Singh
REVIEW
This will help in restoring the pre
Independence Day glory of Northeast
India where the region was well
connected with the foreign lands and
trade was booming
The connectivity woes of Northeast India stemmed from the fact that region was too heavily dependent upon the Chicken neck of Siliguri or water routes of Bangladesh. The minister said, “Multilateral Development Banks are keen to assist in efforts to promote regional connectivity. Combining the ‘Look East’ policy and the interests of the North Eastern States, I propose to seek the assistance of the World Bank and the Asian Development Bank to build roads in the North Eastern States and connect them to Myanmar.”
North Eastern Region with a population of 45 million and a GDP of $59 billion shares a long land border with Myanmar, making it contiguous with ASEAN. It is felt that with planned infrastructure projects on both sides of the border, economic cooperation will aid development for both regions.
N a n i G o p a l M a h a n t a Coordinator of Peace and Conflict Studies, Guwahati University said that connectivity with Myanmar is a welcome move. This will help in restoring the pre Independence Day glory of Northeast India where
The author is senior journalist working in Northeast India.
u
44 YOJANA March 2013
the region was well connected with the foreign lands and trade was booming.”
Chidambaram has announced the Lakhipur – Bhanga stretch of river Barak in Assam will soon be accorded the status of the sixth national waterway. This is expected to provide fillip to cargo movement. Several mega infrastructure projects are implemented in Northeast and this facilitatees movement of huge consignments.
The cabinet recently has given its approval for preparation of projects/schemes for development of infrastructure facilities on Lakhipur-Bhanga stretch (121km) of the Barak river at an estimated cost of Rs 123 crore with implementation in two phases.
Inland Waterways Authority of India (IWAI) will be the implementing agency for this project. Abhijit Barooah, Co Chairman, CII North East Council said, “This is first concert step towards putting in practice the Look East policy".
The finance minister said, “Five inland waterways have been declared as national waterways. I am happy to announce that the Minister of Water Resources will move a Bill in Parliament to declare the Lakhipur – Bhanga stretch of river Barak in Assam as the sixth national waterway. Preparatory work is underway to build a grid connecting waterways, roads and ports. The 12th Plan has an adequate outlay for capital works, including dredging, on the national waterways.”
He elaborated that the objective is to choose barge operators,
through competitive bidding, to transport bulk cargo on the national waterways. The first transport contract has been awarded in West Bengal from Haldia to Farakka.
India's greater engagement in Myanmar has resulted in New Delhi doing Kaladan multimodal transport project to upgrade the Sittwe Port connecting Paletwa in Myanmar’s Chin State to Mizoram and the trilateral highway project connecting Myanmar-Thailand and India through Moreh border is targeted for completion by 2016.
The Budgetary allocation for the Ministry of DoNER has been hiked to Rs 2030.97 crore from Rs 1,750 crore allocated last year. Similarly, allocation for the North Eastern Council (NEC) has also been hiked to Rs 713 crore. The grant from the Central Pool of Resources for the NER has increased to Rs 948 crore from Rs 775 crore allotted in 2012-2013.
Allocation for the Bodoland Territorial Council under the special package has been increased to Rs 60 crore. The BTC was allocated Rs 35 crore during the last fiscal.
Union budget 2013-14 has proposed to provide Rs 100 Crore Tata Institute of Social Sciences (TISS) , Guwaha t i campus . Minister, DoNER, Paban Singh Ghatowar described it as forward looking. The fruits of higher share in Central taxes would benefit the North Eastern States as their own resources would increase and ultimately benefit the people.
As the allocation for the Central ministries have also been increased, the earmarked funds for the North-east as per the 10 percent mandatory
allocation for the Region would also consequently increase. “The North Eastern States would definitely benefit from this Budget”.
He added that the proposal to approach multilateral financial institutions to fund regional connectivity would deliver a big boost to the Look East Policy.
Similarly Northeast Frontier Railway’s (NFR) plan outlay for 2013-14 is pegged at Rs 2783, 80 Crore. Union Railway minister, Pawan Kumar Bansal has announced Manipur will be rail linked while the gauge conversion of Lumding-Silchar-Jiribam is under progress (national project). The minister sought national project status for Rangia-Murkongselek gauge conversion.
New railway track between Dimapur to Tizit is proposed besides doubling of Bongaigaon-Kamakhya railway track via Rangia. Bansal has set his eyes on Arunachal Pradesh, the frontier state. The minister in his speech announced that railway link to Arunachal Pradesh will be provided this year as the work of Harmuti-Naharlagun railway track is progressing well. The track was scheduled to be completed by 2011-12.
The minister has also sought national project status for the proposed Rupai-Pasuramkund railway track. Pasuramkund is a Hindu pilgrimage site in Arunachal and attracts lakhs of devotees annually.
Ministry of Railways would impart skills to the youth in railway related trades in 25 locations including Agartala, Dimapur, Imphal, Katihar, Lumding and Naharlagun.
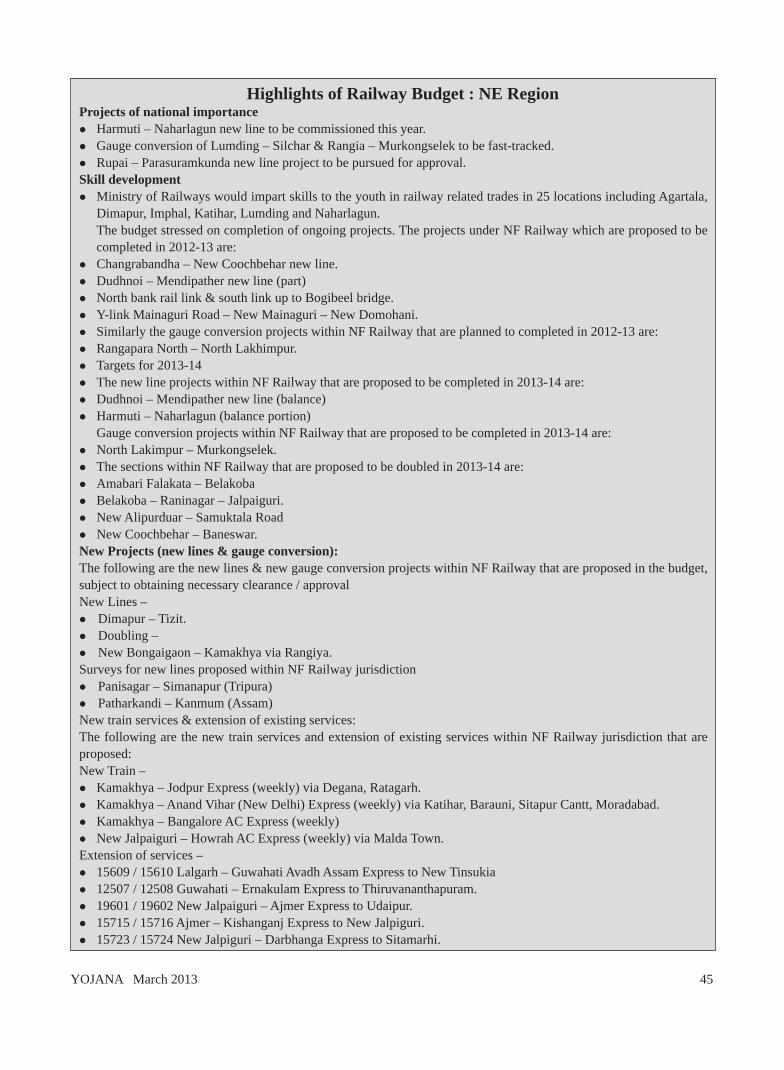
YOJANA March 2013 45
Highlights of Railway Budget : NE RegionProjects of national importancel Harmuti – Naharlagun new line to be commissioned this year.l Gauge conversion of Lumding – Silchar & Rangia – Murkongselek to be fast-tracked.lRupai – Parasuramkunda new line project to be pursued for approval.Skill developmentl Ministry of Railways would impart skills to the youth in railway related trades in 25 locations including Agartala,
Dimapur, Imphal, Katihar, Lumding and Naharlagun. The budget stressed on completion of ongoing projects. The projects under NF Railway which are proposed to be
completed in 2012-13 are:l Changrabandha – New Coochbehar new line.l Dudhnoi – Mendipather new line (part)lNorth bank rail link & south link up to Bogibeel bridge.lY-link Mainaguri Road – New Mainaguri – New Domohani.l Similarly the gauge conversion projects within NF Railway that are planned to completed in 2012-13 are:lRangapara North – North Lakhimpur.l Targets for 2013-14l The new line projects within NF Railway that are proposed to be completed in 2013-14 are:lDudhnoi – Mendipather new line (balance)l Harmuti – Naharlagun (balance portion) Gauge conversion projects within NF Railway that are proposed to be completed in 2013-14 are:l North Lakimpur – Murkongselek.l The sections within NF Railway that are proposed to be doubled in 2013-14 are:l Amabari Falakata – BelakobalBelakoba – Raninagar – Jalpaiguri.lNew Alipurduar – Samuktala RoadlNew Coochbehar – Baneswar.New Projects (new lines & gauge conversion):The following are the new lines & new gauge conversion projects within NF Railway that are proposed in the budget, subject to obtaining necessary clearance / approvalNew Lines – l Dimapur – Tizit.lDoubling – l New Bongaigaon – Kamakhya via Rangiya.Surveys for new lines proposed within NF Railway jurisdictionl Panisagar – Simanapur (Tripura)l Patharkandi – Kanmum (Assam)New train services & extension of existing services:The following are the new train services and extension of existing services within NF Railway jurisdiction that are proposed:New Train – l Kamakhya – Jodpur Express (weekly) via Degana, Ratagarh.l Kamakhya – Anand vihar (New Delhi) Express (weekly) via Katihar, Barauni, Sitapur Cantt, Moradabad.l Kamakhya – Bangalore AC Express (weekly)l New Jalpaiguri – Howrah AC Express (weekly) via Malda Town.Extension of services – l 15609 / 15610 Lalgarh – Guwahati Avadh Assam Express to New Tinsukial 12507 / 12508 Guwahati – Ernakulam Express to Thiruvananthapuram.l 19601 / 19602 New Jalpaiguri – Ajmer Express to Udaipur.l 15715 / 15716 Ajmer – Kishanganj Express to New Jalpiguri.l 15723 / 15724 New Jalpiguri – Darbhanga Express to Sitamarhi.
46 YOJANA March 2013
Welcoming the budget CII stated that increase in Budget outlay in social sectors, viz Rural Development, Education and Health-more than Rs 1,80,000 crore has been earmarked on these three sectors-will definitely benefit the weaker segments of society, particularly those in rural areas.
The p roposa l t o ex t end Agricultural credit of Rs 7 lakh crores is a step in right direction, which together with the budget of 1,000 crore to the eastern states for Agricultural sector should benefit the farmers of Assam, provided sufficient number of Kisan Credit Cards are issued in time.
The announcement of building roads to Myanmar with World Bank / Asian Development Bank assistance under the Look East Policy is a demand that has been raised by CII for a long time. There is great emphasis on Skill development which will benefit the North East youth.
Despite slowing economy, the finance minister has resisted any major increase in Tax rates. However it was generally felt
by industry circles that more concrete steps were announced for implementation of Goods & Service Tax (GST) and Direct Tax Code (DTC) . Ano the r disappointent us is the lack of focus on infrastructure. For the North Eastern region CII believed that Infrastructure creation should be a priority for the government and earmarking of funds should have been announced.
Local industry body, Federation of Industries for Northeast Region (FINER) stated that union budget is reasonably good one in national perspective because i t very cautiously and in a calibrated manner addresses the challenges before the Indian economy to control fiscal deficit inflation and improve GDP growth . Notwithstanding the still weak global cues, Indian economy appears to be back on growth trajectory with index of business confidence again picking up.
The body added that increase in allocation for infrastructure and other social sectors spending does augur well and notwithstanding the
fact that Northeast Region has not been frequently mentioned in the Budget Speech, the region would certainly benefit from the increased outflow of Budget allocation provided we are smart enough to garner our due share and put the resources meant for development to a logical use.
“As member of the Prime Minister’s High Power Task Force on MSME, we at FINER are extremely happy that Finance minister has acknowledged the importance of MSME sector and provided incentives for 3 more years in case the sector graduates to next level from micro to small, and small to medium.”
R.S. Joshi, Finer Chairman said, “We are disappointed that FM has not heeded to the request of FINER and all Chief Ministers of North East Region to restore the spiri t of NEIIPP (North East Industrial and Investment Promotion Policy) 2007 by doing away with unilateral and arbitrary dilutions made in the implementation of the policy. q
(E-mail:[email protected])
YOJANAForthcoming
IssuesApril
Disability-Policy, Challenges & Initiatives
May Social Media
April 2013&
May 2013
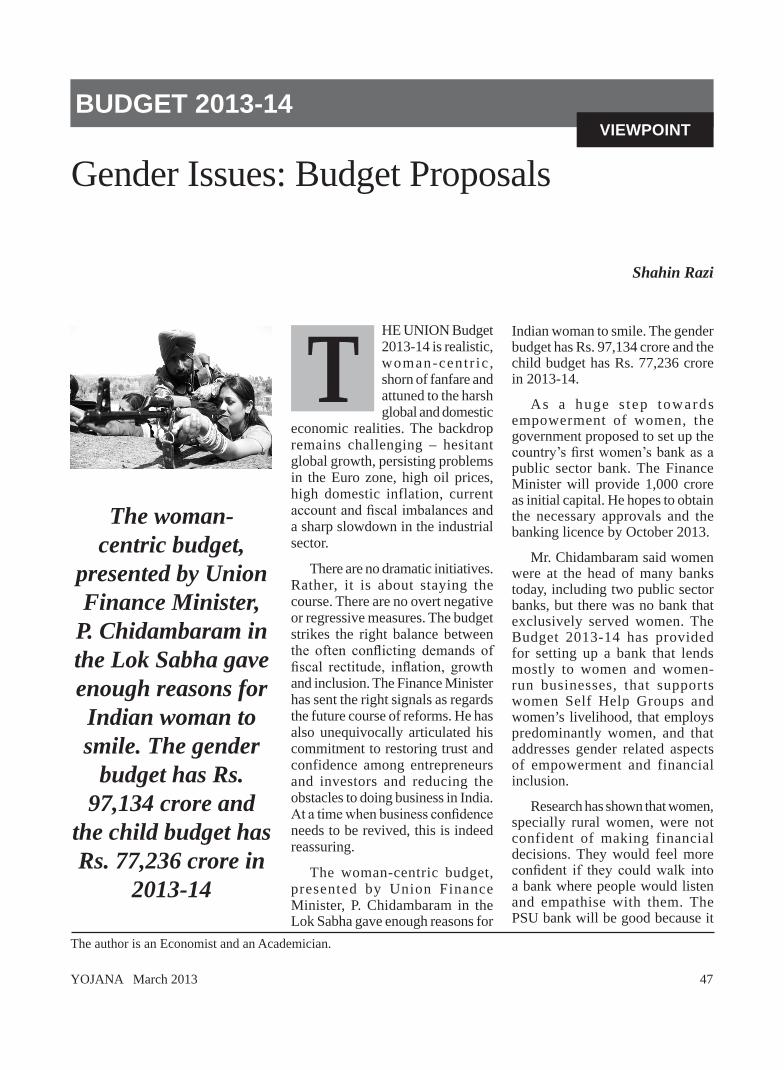
YOJANA March 2013 47
HE UNION Budget 2013-14 is realistic, woman-centr ic , shorn of fanfare and attuned to the harsh global and domestic
economic realities. The backdrop remains challenging – hesitant global growth, persisting problems in the Euro zone, high oil prices, high domestic inflation, current account and fiscal imbalances and a sharp slowdown in the industrial sector.
There are no dramatic initiatives. Rather, it is about staying the course. There are no overt negative or regressive measures. The budget strikes the right balance between the often conflicting demands of fiscal rectitude, inflation, growth and inclusion. The Finance Minister has sent the right signals as regards the future course of reforms. He has also unequivocally articulated his commitment to restoring trust and confidence among entrepreneurs and investors and reducing the obstacles to doing business in India. At a time when business confidence needs to be revived, this is indeed reassuring.
The woman-centric budget, presented by Union Finance Minister, P. Chidambaram in the Lok Sabha gave enough reasons for
Gender Issues: Budget Proposals
BuDGET 2013-14
Shahin Razi
VIEWPOINT
The woman-centric budget,
presented by Union Finance Minister,
P. Chidambaram in the Lok Sabha gave enough reasons for Indian woman to smile. The gender
budget has Rs. 97,134 crore and
the child budget has Rs. 77,236 crore in
2013-14
Indian woman to smile. The gender budget has Rs. 97,134 crore and the child budget has Rs. 77,236 crore in 2013-14.
As a huge s tep towards empowerment of women, the government proposed to set up the country’s first women’s bank as a public sector bank. The Finance Minister will provide 1,000 crore as initial capital. He hopes to obtain the necessary approvals and the banking licence by October 2013.
Mr. Chidambaram said women were at the head of many banks today, including two public sector banks, but there was no bank that exclusively served women. The Budget 2013-14 has provided for setting up a bank that lends mostly to women and women-run businesses, that supports women Self Help Groups and women’s livelihood, that employs predominantly women, and that addresses gender related aspects of empowerment and financial inclusion.
Research has shown that women, specially rural women, were not confident of making financial decisions. They would feel more confident if they could walk into a bank where people would listen and empathise with them. The PSU bank will be good because it
The author is an Economist and an Academician.
T
48 YOJANA March 2013
will help women make their own decisions. Research says women are more comfortable with women managers or advisors. Also, a bank run by women means they can go there without a male member of the family.
Of the three big promises made by Mr. Chidambaram in his budget proposals for 2013-14, the first was the “collective responsibility to ensure the safety and dignity of women.” Towards this end, the government announced a proposal to set up a NIRBHAYA FUND with an allocation of Rs. 1,000 crore. Union Women and Child Development Minister and other Ministers concerned will work out the details of all structure, scope and application of the Fund.
Referring to the horrific case of gang rape and murder of a young woman in the National Capital in December, Mr. Chidambaram said recent incidents had cast a long dark shadow on our liberal and progressive credentials.
“As more women enter public spaces – for education or work or access to services or leisure –
there are more reports of violence against them. We stand in solidarity with our girl children and women. And we pledge to do everything possible to empower them and to keep them safe and secure,” the Finance Minister said, adding that a number of initiatives were under way and many more would be taken by government as well as non-government organisations.
S a y i n g t h e s e d e s e r v e d g o v e r n m e n t s u p p o r t , M r. Chidambaram announced the NIRBHAYA FUND, named after the gang rape victim.
Pointing out that women belonging to the most vulnerable groups, including single women and widows, must be able to live with self-esteem and dignity, the Minister said young women faced gender discrimination everywhere, especially at the work place. The Ministry of Women and Child Development has been asked to design schemes that will address these concerns. “I propose to provide an additional sum of Rs. 200 crore to the Ministry to begin work in this regard,” he said.
Another small proposal in the gender budget is that it has raised the maximum amount of jewellery that may be brought home by Indian women who have lived abroad for more than a year or who are changing residence from Rs. 20,000 to Rs. 1,00,000
A scheme for maternal and child malnutrition for the 100 poorest districts with an allocation of Rs. 300 crores is also envisaged. The budget has substantially increased allocations to schemes that allow for direct cash transfers to women and young Indians. The Indira Gandhi Matritva Sahyog Yojana (IGMSY) that envisages providing cash assistance directly to pregnant and lactating women has seen its budget allocation for the coming year going up to almost five times the Revised Estimate for the current year.
The 2013-14 budget is, in fact, a good one, aiming to improve the economy with strong focus on infrastructure and rural development and with stress on women, youth and the poor, who constitute a majority of the population. q
(E-mail:[email protected])
Procedures for Foreign Portfolio Investors Simplified
Terming the Indian markets as amongst the best regulated the Finance Minister announced several measures to strengthen the capital market regulator SEBI on the eve of its Silver Jubilee. The Depository Participants authorized by SEBI will now register different classes of portfolio investors subject to compliance with KYC
guidelines doing away with different procedures and avenues for many categories. SEBI will simplify the procedure for the Foreign Portfolio Investors and prescribe uniform registration and other norms by converging the different KYC norms. In order to remove the ambiguity between FDI and FII in accordance with international practices, an investor with a stake of 10% or less will be treated as FII whereas the one with more than 10% stake will be treated as FDI. The FIIs will also be permitted to participate in exchange tradedCurrency Derivatives segments to the extent of their Indian rupee exposure in India. FIIs will also be permitted to use their investments in Corporate Bonds and Government Securities as collateral to meet their margin requirements.
Angel investors provide both experience and capital to new ventures. SEBI will prescribe requirements for angel investor pools by which they can be recognized as category I venture funds. With the objective of developing the debt market, stock exchanges will be allowed to introduce a debt segment on the exchange wherein banks and primary dealers will be trading members alongwith insurance companies, provident funds and pension funds. The list of eligible securities in which Pension Funds and Provident Funds may invest will be enlarged to include exchange traded funds, debt mutual funds and asset backed securities.

YOJANA March 2013 49
YE-
274/
2013
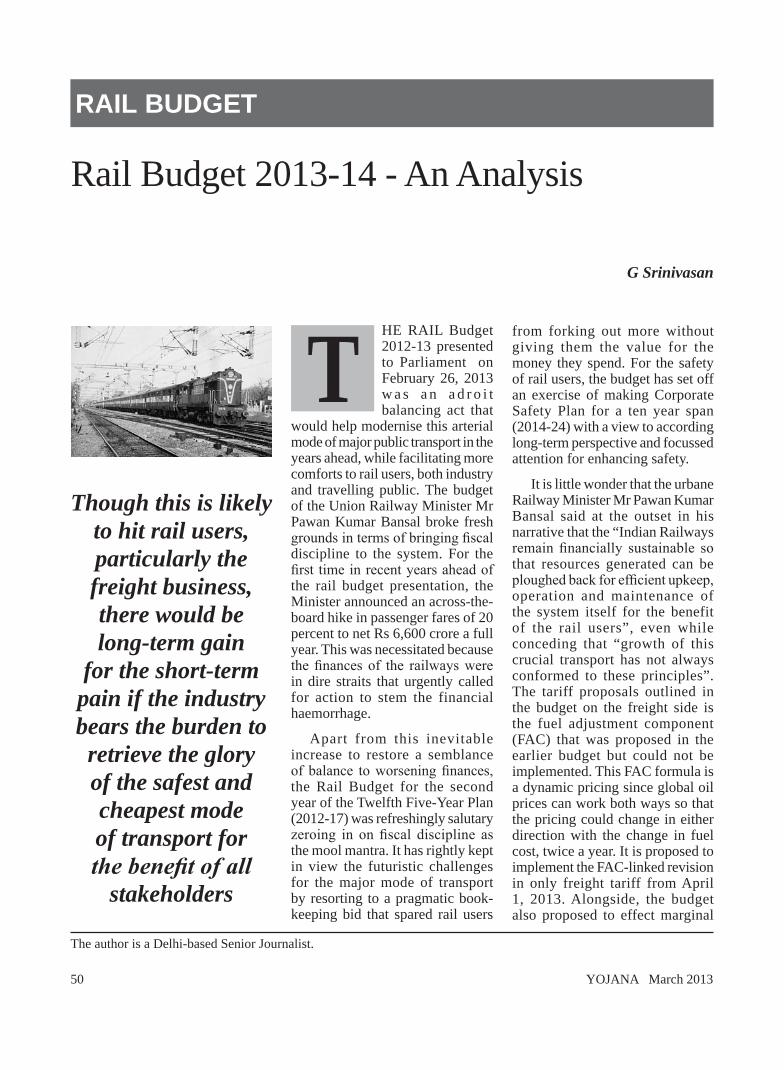
50 YOJANA March 2013
HE RAIL Budget 2012-13 presented to Parliament on February 26, 2013 w a s a n a d r o i t balancing act that
would help modernise this arterial mode of major public transport in the years ahead, while facilitating more comforts to rail users, both industry and travelling public. The budget of the Union Railway Minister Mr Pawan Kumar Bansal broke fresh grounds in terms of bringing fiscal discipline to the system. For the first time in recent years ahead of the rail budget presentation, the Minister announced an across-the-board hike in passenger fares of 20 percent to net Rs 6,600 crore a full year. This was necessitated because the finances of the railways were in dire straits that urgently called for action to stem the financial haemorrhage.
Apart from this inevitable increase to restore a semblance of balance to worsening finances, the Rail Budget for the second year of the Twelfth Five-Year Plan (2012-17) was refreshingly salutary zeroing in on fiscal discipline as the mool mantra. It has rightly kept in view the futuristic challenges for the major mode of transport by resorting to a pragmatic book-keeping bid that spared rail users
Rail Budget 2013-14 - An Analysis
RaIl BuDGET
G Srinivasan
Though this is likely to hit rail users, particularly the freight business, there would be long-term gain
for the short-term pain if the industry bears the burden to retrieve the glory of the safest and cheapest mode of transport for the benefit of all
stakeholders
from forking out more without giving them the value for the money they spend. For the safety of rail users, the budget has set off an exercise of making Corporate Safety Plan for a ten year span (2014-24) with a view to according long-term perspective and focussed attention for enhancing safety.
It is little wonder that the urbane Railway Minister Mr Pawan Kumar Bansal said at the outset in his narrative that the “Indian Railways remain financially sustainable so that resources generated can be ploughed back for efficient upkeep, operation and maintenance of the system itself for the benefit of the rail users”, even while conceding that “growth of this crucial transport has not always conformed to these principles”. The tariff proposals outlined in the budget on the freight side is the fuel adjustment component (FAC) that was proposed in the earlier budget but could not be implemented. This FAC formula is a dynamic pricing since global oil prices can work both ways so that the pricing could change in either direction with the change in fuel cost, twice a year. It is proposed to implement the FAC-linked revision in only freight tariff from April 1, 2013. Alongside, the budget also proposed to effect marginal
The author is a Delhi-based Senior Journalist.
T
YOJANA March 2013 51
increase in supplementary charge for superfast rains, reservation fee, clerkage charge, cancellation charge and tatkal charge to net Rs 881 crore a full year.
As the freight traffic remains the lifeline of the system, the proposed rationalisation on the basic freight rates of major commodities, though in the range of 5.8 to 6 per cent, is bound to have a cascading effect on overall prices of commodities affecting the common-man, trade and industry said in their instant reaction. But given the escalating cost of major fuels such as high speed diesel oil and electricity which exacts substantial percentage in freight operations, it is time that the railways explored other non-tariff business such as the vast railway lands vested with them for commercial exploitation in innovative ways. In this context, the budget has taken some modest moves by setting a target of Rs 1000 crore each for Rail Land Development Authority and IR Station Development Corporation in 2013-14 for commercial exploitation, after several years of manifest inaction on this key front. It is also encouraging to know that the Indian Railways is set to achieve the milestone of entering the one billion tonne Select Club, joining Chinese Russian and US Railways. In fiscal 2012-13, the originating freight loading is estimated to be 1007 million tonnes, about 38 million tonnes over 2011-12. For the fiscal 2013-14, the target has been set at 1025 million tonnes
With the Planning Commission having tentatively pegged the Railways’ 12th Plan size at Rs 5.19 lakh crore with a gross budgetary support of R 1.94 lakh crore, internal resources of Rs 1.05 lakh crore and market borrowing of Rs 1.20 lakh crore, with another Rs 1 lakh crore expected to be raised through public private partnership
route, the tasks ahead are really stupendous. That the railways have put huge faith in PPP route against ‘limited success’ so far and have now zeroed in on a slew of projects such as elevated rail corridor in Mumbai, parts of the dedicated freight corridor, redevelopment of stations, power generation/energy saving projects, freight terminals show that commercial considerations seem to be swaying the IR now than seldom in the past. The moot point is how the mandarins in the Rail Bhawan would come out with lucrative policy support to prospective private partners. A major millstone is the absence of neutral umpire to oversee PPP projects so that onsite disputes or sticking points once the schemes go on stream are resolved without undue harassment to the private investors.
A related issue is the need for setting up of an independent Rail Tariff Authority which had been flagged off in the last budget. Though Mr Bansal said a proposal in this regard was formulated and is at inter-ministerial consultation stage, there is an urgent need to establish such an authority particularly when the system had to move with dynamic pricing pattern to reflect the escalating cost of inputs so that all rail users do not protest in return for a decent standard of service.
Yet another laudable lineament in the rail budget this time is that as many as 347 ongoing projects had been identified as priority projects and provided committed funding. It is gratifying that the Rail Minister said that he would ensure funding of these projects at required level during the 12th Plan so as to complete them in a time bound manner for early harvest of benefits to all the stakeholders in the economy. A plan outlay of Rs 63,363 crore is proposed for 2013-
14 with the thrust being on doubling of tracks, safety of passenger and staff welfare for which the allocation has been augmented from about Rs 11,410 crore in 2012-13 to Rs 13,220 crore, an increase of 16 percent.
For improving passengers’ travel, it has been proposed to identify 104 stations, serving a population of more than one million or those serving places of religious/ tourist importance, progressive extension of bio-toilets on trains, setting up of six more Rail Neer bottling plants at vijayawada, Nagpur, Lalitpur, Bilaspur, Jaipur and Ahmedabad and upgrading another 60 stations as Adarsh stations in addition to the extant 980 already selected. With the growing popularity of Shatabdi and Rajdhani trains, IR proposes to introduce one such coach in select trains which will provide an excellent milieu and latest modern facilities and services. Such coaches would be named “Anubhuti” with matching fare structure. The announcement of a revamp of the E-ticketing system to handle 7200 tickets per minute from the existing 2000 tickets per minute and to handle 1.20 lakh users at a time instead of the present 40,000 should be of immense comfort to prospective passengers. This also casts the onus on them as the seats/berths in popular trains do get filled up much faster. Alongside, the Rail Minister also unveiled 67 new express trains and 27 new passenger trains, besides extending the services of 57 trains and increasing the frequency of 24 trains.
On the financial performance, it undoubtedly reflects on the credit of the system that an operating ratio (percentage of working expenses to traffic earnings) of 88.8 percent is being compassed this fiscal, even after fully discharging the loan of Rs 3000 crore along with interest that was taken from the Ministry
52 YOJANA March 2013
of Finance and after setting apart Rs 9500 crore for Depreciation Reserve Fund (DRF), which is important for financing rolling stocks to keep the system spic and span. Against this, the budget estimate for 2013-14 projects an Operating Ratio (OR) of 87.8 percent with a DRF appropriation of only Rs 7500 crore. Critics said this once again highlights the dire need for a more dependable index of financial performance rather
than the present OR, which can be tweaked by appropriately adjusting the DRF allocation. They hoped that the proposed revamping of the accounting system would look into this aspect more seriously.
Considering how the railways had given place to road transport over the years from their commanding share in the movement of goods and services across the country, it is laudable that a sensible budget
designed to confer long-term benefits to the system has been presented. Though this is likely to hit rail users, particularly the freight business, there would be long-term gain for the short-term pain if the industry bears the burden to retrieve the glory of the safest and cheapest mode of transport for the benefit of all stakeholders, both present ones and the posterity. q
(E-mail:[email protected])
HIGHLIGHTS OF RAILWAY BUDGET 2013-14
• 67 new Express trains to be introduced• 26 new passenger services, 8 DEMU services and 5 MEMU services to be introduced• Run of 57 trains to be extended• Frequency of 24 trains to be increased• First AC EMU rake to be introduced on Mumbai suburban network in 2013-14• 72 additional services to be introduced in Mumbai and 18 in Kolkata• Rake length increased from 9 cars to 12 cars for 80 services in Kolkata and 30 services in
Chennai• 500 km new lines, 750 km doubling, 450 km gauge conversion targeted in 2013-14• First ever rail link to connect Arunachal Pradesh• Some Railway related activities to come under MGNREGA• For the first time 347 ongoing projects identified as priority projects with the committed
funding• Highest ever plan outlay of Rs. 63,363 crore• Loan of Rs. 3000 crore repaid fully.• A new fund-Debt Service Fund set up to meet committed liabilities.• Freight loading of 1047 MT, 40 MT more than 2012-13• Passenger growth 5.2% in 2013-14• Gross Traffic Receipts–Rs. 1,43,742 crore i.e. an increase of 18,062 crore over RE, 2012-13• Dividend payment estimated at Rs. 6,249 crore• Operating Ratio to be 87.8% in 2013-14• Supplementary charges for super fast trains, reservation fee, clerkage charge, cancellation
charge and tatkal charge marginally increased• Fuel Adjustment Component linked revision for freight tariff to be implemented from 1st
April 2013• Enhanced reservation fee abolished• Elimination of 10797 Level Crossings (LC) during the 12th Plan and no addition of new LCs
henceforth• Introduction of 160/200 kmph Self Propelled Accident Relief Trains• ‘Aadhar’ to be used for various passenger and staff related services• Internet ticketing from 0030 hours to 2330 hours• E-ticketing through mobile phones

YOJANA March 2013 53
YE-
278/
2013
54 YOJANA March 2013
ENERALLY SEEN as anticipating the Union Budget, the Economic Survey for 2012-13 tabled in Parliament on
February 27 on the eve of the central budget 2013-14, expectedly pitched for further reforms, cut in subsidies, definitive action on eliminating barriers to investment and employment generation.
Not surprisingly, the budget proposals the following day largely reflected the mood seen in in the survey.
Against the backdrop of a steady decline in growth rate over the years, the survey has however gone optimistic to forecast a GDP growth of 6.1 to 6.7 percent for fiscal 2013-14. It is also hopeful of controlling inflation, projecting a decline to stay between 6.2 and 6.6 percent.
Injecting Hope
The survey clearly sought to inject hope amid a bleak scenario that saw a plunge in growth to around 5 percent and 6.2 percent in the previous two fiscals (2012-
Economic Survey - An Overview
BuDGET 2013-14
R C Rajamani
The Survey calls for staying on the path of indicated fiscal
consolidation. This, it says, is critical to sustaining the desirable macro-
economic outcomes not only in terms
of higher growth in real GDP and lower inflation, but also in
easing the financing of the widening current
account deficit (CAD), for which India’s
sovereign credit rating is important
13, 2011-12) from 9.3 percent and 8.6 percent in the two fiscals before that (2010-11, 2009-10) , triggered in the main by the global slowdown since September 2008.
“The slowdown is a wake-up call for increasing the pace of actions and reforms,” the survey declared, giving, however, credit to the economic managers for being able to steer to reasonable safety from rough waters. Attributing this feat to “good policies and strong reforms programme”, the survey expressed optimism that the economy will return stronger.
The survey also pushed for fast action on the ground after the opening up of the retail trade to foreign direct investment and said this will not just pave the way for flow of investment in new technology, but also for marketing of farm produce in India. “Fast agricultural growth remains vital for jobs, incomes and food security.”
Introducing a special chapter on employment, the survey says the future holds promise for India if it seizes the demographic dividend, with nearly half of the additions to
The author is Editorial Consultant, The Statesman, New Delhi.
G
YOJANA March 2013 55
the labour force till 2030 expected in the 30-49 age group. “Because good jobs are both the pathway to growth as well as the best form of inclusion, India has to think of ways of enabling their creation,” says the survey, adding new jobs are currently being added mainly in informal and low productivity sectors.
Containing subsidies
The Survey emphasises that efforts will have to be made to contain subsidies through better targeting and for reducing leakages involved in their delivery. One such initiative is direct benefit transfer (DBT) scheme. Government has been calibrating pricing policies to addressing the issue of burgeoning fertiliser subsidy and underlined the need for according priority to food subsidy in view of the under consumption of basic food by the poor and the extant of malnutrition.
Another consequence of slowdown has been lower than targeted tax and non-tax revenues. With the subsidies bill, particularly that of petroleum products, increasing, and the danger that fiscal targets would be breached substantially became very real in the current year, the Survey said. “The situation warranted urgent steps to reduce government spending so as to contain inflation. Also required were steps to facilitate corporate and infrastructure investment so as to ease supply.
CAD Concern
The survey expresses concern over the high current account deficit due to a higher share of imports vis a vis exports and says this in
the short run must be corrected by cutting oil and gold imports with market-determined prices.
This, the survey argues, is all the more necessary, since the flow of invisibles - such as money in the form of remittances by Indians abroad and software earnings - are not particularly sufficient to cut current account deficit, now at 4 percent of the GDP.
On the controversial issue of land acquisition, the survey seeks a balance between the need for economic growth and the costs imposed on the displaced with proper mapping of land, easier means to facilitate leasing and transparent compensation policy.
On foreign direct investment, the survey notes that India, with a rank of four in the global restrictiveness index, fares better than China, ranked first. Yet, there is scope to reverse the moderation seen last year in inflows of overseas capital.Accordingly, it calls for a review in increasing the foreign investment cap in a host of areas, notably public sector banks, insurance and defence production as they promise new technology and practices and such capital are better than portfolio investment.
Farm growth
With agriculture growth rate falling short of the 4 percent target in last five years, the sector needs urgent reforms to boost crop yields and private investment in infrastructure so as to motivate farmers and feed the growing population, the survey said. The farm sector achieved 3.6 percent growth during the 11th Five year Plan (2007-12), falling short of the
4 percent growth target, although it was much higher than growth of 2.5 and 2.4 percent during 9th and 10th Plans, it added.
The agriculture sector is broadly a story of success in the past few years. “Yet, India is at a juncture where further reforms are urgently required to achieve greater efficiency and productivity in agriculture for sustaining growth.”
Fighting Inflation
The survey points out that the priority for the Government will be to fight high inflation by reducing the fiscal impetus to demand as well as by focusing on incentivising food production through measures other than price supports. But unlike the previous year, when food inflation was mainly driven by higher protein food prices, this year the pressure has been coming mainly from cereals.
On the Balance of Payments and External Position, the survey highlights that with net exports declining, India’s balance of payments has come under pressure. Moreover, in the current fiscal, foreign exchange reserves have fluctuated between US$ 286 billion and US$ 295.6 billion, while the rupee remained volatile in the range of Rs 53.02 to Rs 54.78 per US dollar during October 2012 to January 2013.
Focus on Jobs, Development
The survey has a special chapter focusing on jobs. The future holds promise for India provided we can seize the “demographic dividend” as nearly half the additions to the Indian labour force over the period 2011-30 will be in the age group 30-
56 YOJANA March 2013
49. India is creating jobs in industry but mainly in low productivity construction and not enough formal jobs in manufacturing, which typically are higher productivity. The high productivity service sector is also not creating enough jobs. As the number of people looking for jobs rises, both because of the population dividend and because share of agriculture shrinks, these vulnerabilities will become important.
Ind ia wi th i t s focus on inclusive development and timely interventions has been able to ward off the ills of global economic and financial crisis better than many other countries. The global recession and the slow down have squeezed the fiscal space for most countries. However, India’s social sector spending has seen a continuous increase. According to Survey, the country continues to work on xIIth Plan initiative for “Faster, More Inclusive and More Sustainable Growth” and strives for targeted policy for the poor with minimal leakages. To achieve greater inclusive development, the share of Central Govt. expenditure (Plan and Non-Plan) on Social Service and Rural Development increased from 14.8 percent in 2007-08 to 17.4 percent in 2012-13(BE) 2007-08 to 25.1 percent in 2012-13.
uIAI, Bharat Nirman, Growth Indicators
Survey says that under Phase 2 of Unique Identification Authority of India (UIAI), 40 crore residents are to be enrolled before end 2014. As of December 2012, 25 crores Aadhaars had been generated and approximately 20.00 crore aadhaars
letters has been dispatched. Pilots on Direct benefit transfers (DBT) have also been successfully conducted in the States of Jharkhand, Tripura and Maharashra to transfer monetary benefits related to social welfare schemes. Survey says that about 10.5 crore children benefitted under the mid-day meals programme during 2011-12.
According to Survey, through Bharat Nirman Programme, the country strives to achieve a higher degree of rural- urban integration and an even pattern of growth and opportunities for the poor and disadvantaged. During 2012-13 as against physical target of 30.10 lakhs houses, 25.35 lakhs houses were sanctioned and 13.88 lakhs had been constructed as on 31st December, 2012. The Unit assistance provided under the Indira Awas Yojana (IAY) is being revised w.e.f 1st April, 2013 from Rs.45,000 to Rs.70,000/ in plain areas and from Rs.48,500/ to Rs.75,000/ in hilly/ difficult areas/integrated action plan districts. 82 left wing extremisms affected districts have been made eligible for this higher rate of unit assistance. Under the Pradhan Mantri Gram Sarak Yojna (PMGSY), a sum of Rs.l02658 crore to have been released to the States and about Rs. 96939 crore spent by December, 2012. A total of 3,63,652 Km. road length connecting nearly 90,000 habitations has been completed. About 74 percent of rural habitations are fully covered under the provision of the safe drinking water.
The Survey finds that while some states have performed well in terms of growth indicators, they
have performed poorly in terms of poverty, rural-urban disparity, unemployment, education, health and financial inclusion. According to Survey, Bihar has the highest decadal (2001-11) growth rate of population(25 percent ) while Kerala has the lowest rate (4.9 percent ). In 2011, Kerala has the highest sex ratio ( 1084), while Haryana is at the bottom (877). In terms of growth Bihar is the best performer (16.7 percent), Rajasthan is the worst (5.4 percent ). Highest Poverty Head Count Ratio (HCR) exists in Bihar (53.5) while lowest is in Himachal Pradesh (9.5 percent). The unemployment rate is the lowest in Gujarat (18) and highest in Kerala and Bihar (73) in Urban areas and the lowest in Rajasthan (4) and again highest in Kerala (75) in rural areas. Kerala is the best performer in terms of life expectancy at birth whereas Assam is the worst performer in both males and females. Based on above findings, the Surveys calls for a rethink on the criteria used for devolution of funds to states.
Highest rise in Share of Services
A comparison of the services performance of the top 15 countries for the 11 year period from 2001 to 2011 shows that the increase in share of services in GDP is the highest for India with 8.1 percentage points. These 15 top countries include major developed countries along with Brazil, Russia, India and China. While China’s highest services compound annual growth rate (CAGR) stood at 11.1 percent, India’s very high CAGR of 9.2 percent was second highest and also accompanied by highest change in its share. This is
YOJANA March 2013 57
a reflection of the fact that India’s growth has been powered mainly by the services sector.
Benefits of Market Diversification
There has been significant market diversification in India’s trade. Region wise, India’s exports to Europe and America have declined to 18.7 percent and 19.5 percent respectively in 2012-13 from 25.9 percent and 24.7 percent in 2000-01. On the other hand export to Asia and Africa rose to 50.4 percent and 9.6 percent respectively from 37.4 percent and 5.3 percent respectively during the same period. There was a noticeable rise in the share of West Asia–GCC (Gulf Cooperation Council) countries from 14.9 percent in 2011-12 to 17.7 percent
in 2012-13 (April- November) said the Survey. However, the Survey noted that “in terms of product diversification a lot more needs to be done.”
More than 3.7 Lakh Villages Electrified
The Survey notes that more than 3.79 lakh villages across the country have been provided electricity through the Rajiv Gandhi Grameen vidyutikaran Yojana (RGGvY). The rural electrification scheme launched in April, 2005 has provided electricity to 1,06,116 unelectrified villages and intensive electrification in 2,73,328 partially electrified villages. It has also provided free electricity connections to 202.6 lakh below poverty line (BPL) households as on 30th November,
2012. In addition, capital subsidy of Rs. 26,664 crore has been utilised under the scheme so far.
Fisca l Outcome Indicates Improvement in 2012-13
The Survey emphasises that the fiscal outcome of Central Government in 2012-13 so far indicates a significant improvement over 2011-12. The fiscal position of the States has continued to progress with fiscal deficit budgeted at 2.1 percent of gross domestic product (GDP).
The fiscal outcome of 2011-12 was affected by macro economic developments of slow down in growth, higher global crude oil prices and sluggish financial market conditions for effecting the budgeted disinvestments programme.
The Survey calls for staying on the path of indicated fiscal consolidation. This, it says, is critical to sustaining the desirable macro-economic outcomes not only in terms of higher growth in real GDP and lower inflation, but also in easing the financing of the widening current account deficit (CAD), for which India’s sovereign credit rating is important.
In sum, the survey has displayed cautious optimism about India’s overall growth, stressing that any growth is meaningless if it is not inclusive. Hence it lays emphasis on social spending to benefit the poor and socially disadvantaged sections, while advocating restraint on general consumption by the more fortunate. It’s a good recipe for inclusive growth and its success, no doubt, depends on honest implementation. q
(E-mail:[email protected])
Highlights of the Economic Survey 2012-13
l Economic growth pegged at 6.1-6.7 percent in 2013-14l March 2013 inflation estimated at 6.2-6.6 per centl Priority will be to rein in high inflationl FDI in retail to pave the way for investment in new technology and
marketing of agriculture producel Survey calls for widening of tax base and prioritising expenditure
to bridge fiscal deficitl Calls for curbing gold imports to contain current account deficitl Aadhaar-based direct cash transfer scheme can help plug leakages
in subsidiesl With subsidies bill increasing, danger of missing fiscal targets is
real in FY13l Survey pitches for hike in prices of diesel and LPG to cut subsidy
burden.l Foreign Exchange reserves remains steady at $295.6 billion at
December, 2012-endl At present, overall energy deficit is about 8.6 percent and peak
shortage of power is about 9 per cent.l Infrastructure bottlenecks affecting industrial sector performancel Prospects for world trade as well as of India are still uncertain.l Pitches for further opening of sectors for FDI
58 YOJANA March 2013
HIv SINGH Anchla, a retired teacher and one of the most respected villagers of Damkasa Gram Panchayat, Block Durgkondal in Kanker
District in Chhattisgarh has donated five acres of land to his community of fellow Gond tribals. Together, they nurture rare herbs, plants and trees on this land which otherwise are likely to become extinct with few even recognizing the loss. Tribal communities, which constitute one third of the state’s population, share a unique relationship with their natural as well as cultural heritage which unfortunately is dying a slow death in this modern era.
It is not only Shiv Singh Anchla’s efforts but their symbiotic relationship with their heritage that has motivated them to conserve and sustain their legacy. Testimony to their success is the dense forest cover of the region spread over a vast expanse and enriched with immense mineral wealth. Being inhabited by the tribals is the sole reason why, despite close proximity to the main road, the forests stand unharmed. And in return, the forests help these indigenous communities sustain their socioeconomic and cultural lives.
Since time immemorial, tribal communities have spent a life in relative isolation under these thick canopies with harmony, protection and belief developing a mutual association. The deep rooted tribal
The Tribal Culture
BEST PRaCTICES
Purshottam Lal
conditions and sentiments are fulfilled by the revered forests environment. Jungles help them lead a simple life. Most of their requirements like wood for building purposes, resins, gums, dyes, firewood, herbal medicines, fodder for cattle, mahua flowers, sal seeds, sal and Tendu leaves, edible roots, tubers, bamboo and wild fruits are met by the forests. For the rest, the Gond tribe, settled agriculturists now, depend on farming. Besides their prime cultivation of paddy, they grow corn, tilhan, madiya, among other crops. Since they ventured late into agriculture, Gonds lack knowledge of irrigation and other other productive techniques.
“At present, every member of the tribal community is allowed to cut as much wood for commercial purpose as one can carry easily on his or her shoulder in one go. This wood, along with other things from the extra stock, is sold at the weekly haat (market) organized in the nearby villages. At these haats, one can still witness the existence of the old barter system where villagers barter rice for spices and other essentials.
If someone tries to violate the laws and harm the forests, especially in view of the threat from Wood Mafias, the Forest Committees constituted by villagers themselves brings these instances to the notice of Forests Officials. They now have the support of the forest department, which in yesteryears was not the case.
S The advent of development measures in these in te r io r villages has started taking the tribal communities in a positive direction. Tribal communities are now well aware of Panchayat systems and avail benefits from the state schemes. Anganbadi Kendras, Primary and Medium Schools, are providing education to the young tribal children leading them on the path of progress. Communication facilities have also reached these difficult to reach areas and today, one can find tribals taking benefit from mobile phones. The birth rate has also improved and smaller families are now well accepted in the region. “Chhota Parivar, Sukhi Parivar - We have started realizing the benefits of having two or three children,” said Sahdev Gaud, one of the villagers.
Issues like health, transport and safe drinking water have not been sorted out as yet but people have faith that they will soon be.
“Today Industrialization and Urbanization has spread its roots. In such a scenario, protecting our natural wealth like forests, minerals, fresh air, water and land becomes critical. Along with society and culture, it is imperative that we save our environment. Tribal culture teaches us to be disciplined as that is the only way to lead a life that is in harmony with our nature,” said Shiv Singh Anchla.
Charkha Features
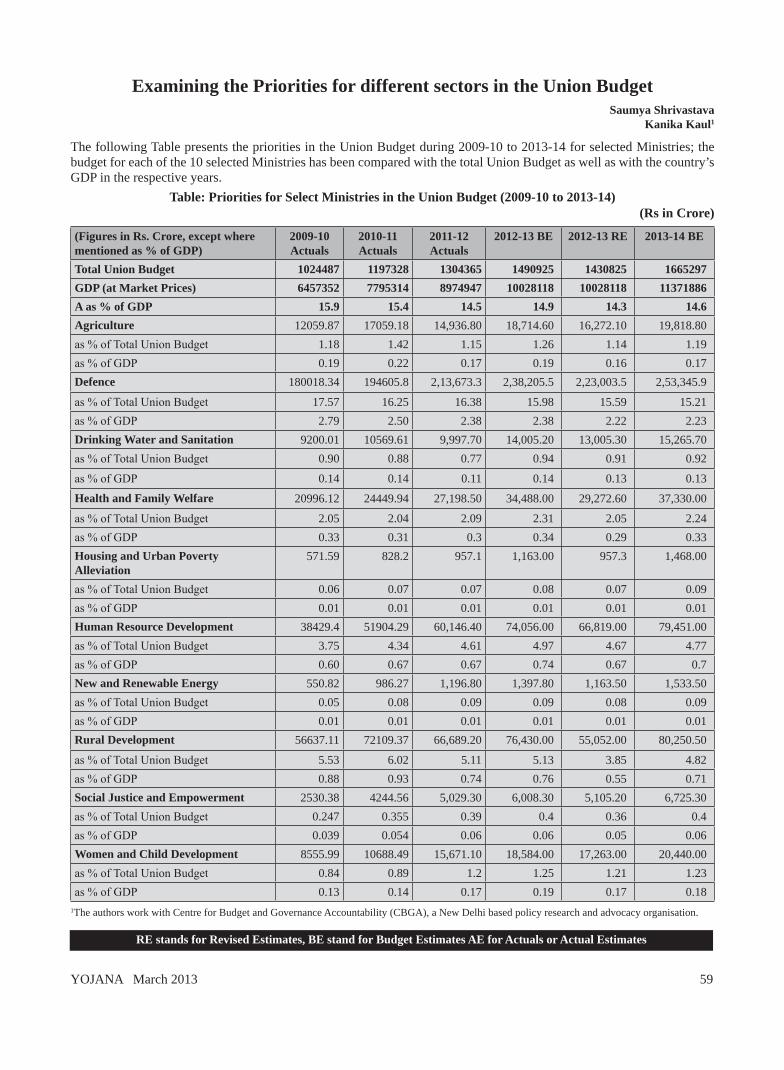
YOJANA March 2013 59
Examining the Priorities for different sectors in the union BudgetSaumya Shrivastava
Kanika Kaul1
The following Table presents the priorities in the Union Budget during 2009-10 to 2013-14 for selected Ministries; the budget for each of the 10 selected Ministries has been compared with the total Union Budget as well as with the country’s GDP in the respective years.
Table: Priorities for Select Ministries in the union Budget (2009-10 to 2013-14)(Rs in Crore)
(Figures in Rs. Crore, except where mentioned as % of GDP)
2009-10 Actuals
2010-11 Actuals
2011-12 Actuals
2012-13 BE 2012-13 RE 2013-14 BE
Total union Budget 1024487 1197328 1304365 1490925 1430825 1665297GDP (at Market Prices) 6457352 7795314 8974947 10028118 10028118 11371886A as % of GDP 15.9 15.4 14.5 14.9 14.3 14.6Agriculture 12059.87 17059.18 14,936.80 18,714.60 16,272.10 19,818.80as % of Total Union Budget 1.18 1.42 1.15 1.26 1.14 1.19as % of GDP 0.19 0.22 0.17 0.19 0.16 0.17Defence 180018.34 194605.8 2,13,673.3 2,38,205.5 2,23,003.5 2,53,345.9
as % of Total Union Budget 17.57 16.25 16.38 15.98 15.59 15.21as % of GDP 2.79 2.50 2.38 2.38 2.22 2.23Drinking water and Sanitation 9200.01 10569.61 9,997.70 14,005.20 13,005.30 15,265.70as % of Total Union Budget 0.90 0.88 0.77 0.94 0.91 0.92
as % of GDP 0.14 0.14 0.11 0.14 0.13 0.13
Health and Family welfare 20996.12 24449.94 27,198.50 34,488.00 29,272.60 37,330.00
as % of Total Union Budget 2.05 2.04 2.09 2.31 2.05 2.24as % of GDP 0.33 0.31 0.3 0.34 0.29 0.33Housing and urban Poverty Alleviation
571.59 828.2 957.1 1,163.00 957.3 1,468.00
as % of Total Union Budget 0.06 0.07 0.07 0.08 0.07 0.09as % of GDP 0.01 0.01 0.01 0.01 0.01 0.01Human Resource Development 38429.4 51904.29 60,146.40 74,056.00 66,819.00 79,451.00as % of Total Union Budget 3.75 4.34 4.61 4.97 4.67 4.77as % of GDP 0.60 0.67 0.67 0.74 0.67 0.7New and Renewable Energy 550.82 986.27 1,196.80 1,397.80 1,163.50 1,533.50as % of Total Union Budget 0.05 0.08 0.09 0.09 0.08 0.09as % of GDP 0.01 0.01 0.01 0.01 0.01 0.01Rural Development 56637.11 72109.37 66,689.20 76,430.00 55,052.00 80,250.50
as % of Total Union Budget 5.53 6.02 5.11 5.13 3.85 4.82as % of GDP 0.88 0.93 0.74 0.76 0.55 0.71Social Justice and Empowerment 2530.38 4244.56 5,029.30 6,008.30 5,105.20 6,725.30as % of Total Union Budget 0.247 0.355 0.39 0.4 0.36 0.4as % of GDP 0.039 0.054 0.06 0.06 0.05 0.06women and Child Development 8555.99 10688.49 15,671.10 18,584.00 17,263.00 20,440.00as % of Total Union Budget 0.84 0.89 1.2 1.25 1.21 1.23as % of GDP 0.13 0.14 0.17 0.19 0.17 0.18
1The authors work with Centre for Budget and Governance Accountability (CBGA), a New Delhi based policy research and advocacy organisation.
RE stands for Revised Estimates, BE stand for Budget Estimates AE for Actuals or Actual Estimates

60 YOJANA March 2013
2010 UPSC Final Result, includes 5th Rank and in Top 50 5th, 11th, 13th, 14th, 18th, 23rd, 24th, 30th, 40th, 44th, 50th,Total Selection 69 Highest Marks in Geography past years 2008 (411) 2009(397) 2010 (369)2011 (423)
2011 UPSC Final Ranks 23, 29, 30, 35, 44, 53, 97 and Other
Ultimate Learning Experience (P) Ltd.
YE-
275/
2013
YOJANA March 2013 61
H E T E R M ‘Publ ic Pr ivate Par tnersh ip’ or ‘PPP’ has become a buzzword o f late in the policy
circles, and is being increasingly resorted to as a preferred medium for provisioning of public services both within the industrialised and low-income countries. While the PPPs are more commonly found in the transport infrastructure sector, such as roads, airports, and ports (primarily due to the commercial pricing models), they are also invoked in water supply and sanitation, tourism, education, health, and other social sector programmes, albeit to a lesser degree. A significant difference is however observed in the nature of PPPs across these sectors. In many cases they appear to be glorified forms of service level agreements rather than ‘partnerships’ as are defined in the normative literature on PPPs.
Engagement with the private sec to r fo r p rov i s ion ing o f infrastructure facilities has become increasingly popular in the past few
Public Private Partnerships (PPPs): Analysing the factors behind their growth
aNalySIS
Manisha Verma
The economic perspective in
favour of PPP is that they present an attractive alternative
to the market and contractualised
relationships and are viewed to be broader in scope than privatisation and a qualitative
leap from traditional contracting
decades. India too has joined the bandwagon of countries adopting PPPs for delivery of services under various infrastructure sectors. It is claimed that India has the maximum number of projects within PPP in the transport sector. Its experience in highways and expressways has been substantial. All national highways in the present phase of NHDP (National Highways Development Programme) are being implemented within PPP mode. Recently, the empowered Group of Ministers on infrastructure has decided that 95% of road projects in the current year will be through PPP. Several airports are being built with private sector participation, while some metro-rail projects, such as the Hyderabad metro, are also opting for this approach rather than the traditional way of public sector delivery. According to the Economic Survey 2010-2011, against a target of 30% of private sector participation in infrastructure sector, the achieved figure was 34%. An investment of USD 1 trillion has been envisaged for infrastructure during the 12th Plan; of this USD 500 billion is
The author is Civil Servant, working in the Government of India. She has a PhD from the Institute for Development Policy and Management (IDPM) at the University of Manchester, UK.
T
62 YOJANA March 2013
expected to be contributed by the private sector. These figures demonstrate the primacy given to private sector participation at the policy level.
Against this background, this article attempts to provide theoretical insights into the concept of PPP, and analyses the reasons for its growth and acceptance as a mode of service delivery in many countries.
Growth of PPPs
There have been instances of the State engaging with the private sector towards provisioning of public services throughout the known history- the case of Mathew, private tax-collector from the Bible; public street lamps in 18th century England were cleaned by private contractors; the rail companies of 19th century England and the US were privately owned; 82% of Sir Frances Drakes fleet of 197 vessels, which conquered the Spanish armada, were owned by contractors. Toll roads and toll bridges, privately owned and operated, has been around since antiquity. Toll roads carry mention in writings of the Greek historian and philosopher Strabo (63 BC-AD 21) in Geographia during the time of Caesar Augustus, where he records existence of tolls on the Little Saint Barnard Pass. Historical development of PPPs in infrastructure had its beginning in Europe in the demand for mass travel and long distance commerce in second half of 17th century. France pioneered the concession type model in 17th century which was extensively used in the 19th century to finance and develop public infrastructure.
However, Publ ic Pr iva te Partnerships as are known in their current form started in the Organisation for Economic Co-operation and Development (OECD) coun t r i e s and the USA. These gradually spread to the low-income countries. Reliance on PPPs as a preferred mode of service delivery rose to significant proportions during the 1990s, peaking around 1997. Governments under Presidents Carter and Reagan in the USA and Margaret Thatcher in UK promoted wide range of partnerships at all levels of the State. Among all the countries adopting PPPs, UK has had the maximum number of projects implemented under the Public Finance Initiative (PFI) initiated in 1992. PPPs have been now included in legislation in many countries such as the urban policy legislation of UK and USA, industrial policies of France, and economic development policies of Italy, Netherlands and UK. While Netherlands, Australia, Hungary, Italy, Japan, Korea, Spain and France have had substantial experience in implementing infrastructure projects under PPP, countries like Chile, Brazil, Singapore, India, and Canada are actively exploring this mode of delivery of public services. PPPs form the core of European Union (EU) initiatives for economic competitiveness and are the preferred framework fo r deve lopmen t o f t r ans -European transportation. Recently the European Commission has advocated greater use of PPPs for provisioning of infrastructural services and bringing in innovation in service delivery.
understanding the context of PPPs
Different defini t ions and i n t e r p r e t a t i o n s h a v e b e e n associated with the term Public-Private Partnerships. These depend upon the context within which they are initiated and operated. Simply put, the term PPP traditionally implies engaging with the private sector for provisioning of public services and infrastructure such as roads, airports, ports, health services, garbage and waste management. Such services have been historically provided by the government through public works agencies . According to some, PPP is a framework for describing all cooperative ventures between the State and the non-State agencies, both for profit and not-for-profit. Within the limited context of transport infrastructure sector, PPP is defined as a long term collaborative effort between the government and private agencies, wherein both pool in their differentiated and specialised resources for planning, design, construction, operation and maintenance of infrastructure services. They also share investments, risks, benefits and responsibilities. This feature of the PPP has been argued to form the crux of the partnership. The facility thus developed eventually reverts back to the government after expiry of the concession period. In India this period ranges from 20 to 30 years.
A common misconception about PPPs is that they involve the private sector merely for financial partnering. However, PPPs are more about a service
YOJANA March 2013 63
procurement policy rather than a capital asset management policy; they do not do away with public investment but merely supplement it. Within a PPP the private partner is involved in a broader ambit of ‘infrastructure investment’ where neither the private sector nor the government is the only owner.
PPPs are perceived to provide public services more efficiently than what the government could accomplish on its own. In the classical literature on public administration, there is a distinct divide between the roles and responsibilities between the State and the private sector, often termed as ‘the market’. While some works were to be taken up by the government agencies due to their social and economic mandate, some services were delivered by the agencies. However, the traditional conceptualisation of the state being the sole provider of services and goods for public welfare came under severe strain in the decades since 1970s. In the 1970s and 1980s, as the demand for public infrastructure grew and governments became increasingly fund starved, due to deficit financing and populist pressures to hold prices below costs, their capacity to provide sufficient and quality infrastructure was found to be inadequate. The public utilities were therefore largely neglected. In most of the developing low-income countries it was found that public finance for infrastructure was generally inadequate and full cost recovery of infrastructure charges was becoming more of an exception than a rule. In addition to poor allocation of funds for development of infrastructure,
maintenance got even little, which was assumed to be funded by future budgets which were typically insufficient. Traditional methods also left a number of risks with the public sector, regarding the asset ownership. This is attributed to its monopoly position with no incentive for competition, poor fiscal discipline and limited fiscal autonomy to public bodies and managerial inefficiency which increases production cost. Many governments attempted to improve performance through corporatisation and performance contracts which were largely unsuccessful.
Furthermore, the government in its controlling and regulating mode was found to be outdated, path dependent and inflicted with the pathology of politicized bureaucracy. This was attributed to bounded rationality of decision makers, predisposition toward rigidity, extreme focus on rule rather than the outcome, and growing rent seeking behaviour of policy makers. The government agencies came to be widely perceived to be inefficient and inadequate because of their hierarchical and vertical structures of management and incapable of delivery of quality public services which could be sustained over a long period of time.
The private sector, on the other hand, was seen as a better allocator of services, more efficient in delivery and management of services, and innovative, flexible and agile to respond to market changes. In the USA, the early enthusiasm towards PPPs grew in the background of
‘privatism’, which dominated American thinking since early 19th century. This presumed the private sector to be intrinsically superior for delivery of public services. This new philosophy was moored in neo-classical and new institutional economics. A market focus coupled with ‘supply and demand’ and ‘user pays’ ethos tried to infuse entrepreneurial management techniques from the private sector to increase public sector efficiency through contracts and competition within the public agencies and with private sector. It stressed on disaggregation of public services, measured performance, output control and growth of markets, and hence, price signals. What initially started as infusing features of the private sector in management of public organisations, in late 1970s, slowly transformed (in 1990s) into a much larger role of private sector in providing finances, manpower and technological resources during the construction of the assets, and management of the services subsequently.
In the more recent discourses on PPPs, these have been viewed as new forms of governance. They are being analysed as ‘governance networks’ between the State and non-State actors aimed towards collaboration, co-production, co-management and communicative governance. They are being viewed as an alternative way of provisioning of public services that combines the features of both the State and the market, and as a response to limitations to markets and hierarchies with regard to allocation of resources
64 YOJANA March 2013
and provisioning of services. As a hybrid mix of the two forms, they typically mix virtues of state, like accountability, probity, legitimacy and transparency, and efficiency and quality attributes of the market.
Moreover, they are argued to represent a relational dimension of the State where the State extends itself beyond its theoretically determined boundaries , and partners with various agencies in order to achieve its social and economic goals. PPPs also reflect the welfare state being replaced by the ‘competition state’ which behaves more like a market player and takes the lead in spearheading the structural transformation of markets and brings about policy changes involving the private sector. This shift is being attributed the changing meaning of what constitutes the ‘public’ and the ‘private’ sectors. The traditional divides between the two domains are being blurred, and new forms of governance models are providing frameworks for delivery of public services.
Categorising PPPs
PPPs are often classified into ‘economic’ and ‘social’ blocks and are further distinguished as ‘hard’ and ‘soft’. While roads, railways, telecommunication and airports fall under the ‘hard economic’ category, areas like vocational training, technology t r ans fe r and Resea rch and Development (R&D) facilitation are termed as ‘soft economic’. Water treatment, housing and prisons and childcare are labelled as ‘hard social’ whereas social
security, environment services and community services are included in ‘soft social’ category.
PPPs are also distinguished on the basis of stages in which partnership is entered into. It can be either in the ‘planning and design’ stage or at the ‘realisation’ stage. As financial arrangements, PPPs have been observed to take different forms. There are various terms for them, such as BOT (Build Operate Transfer), BOO (Build Own Operate), Build Own Operate Transfer (BOOT), and Design Build Finance Operate (DBFO). The DBFO model appears to be most preferred PPP model across the world.
Analysis of factors contributing to growth of PPPs
Many fac tors have been identified for the growth of PPPs. These have been varied across sectors and countries, depending on the context of the prevalent structures within which PPPs operate. As mentioned earlier, on a larger canvas, growth of PPPs is widely credited to the implicit assumption that the market stands for better efficiencies in production and delivery of services, and partnering with the market infuses reform, competition, discipline and entrepreneurial spirit in the government. PPPs reflect larger ideological changes in debates of governance and the transformation of the State-market relationship where partnerships may not only be the result, but also the cause of these changing equations.
PPPs have become the preferred alterative of many ‘third way’
governments which provides them an option to tread the middle path between outright privatisation and na t iona l i s a t i o n . M a n y governments attempt to fill the ‘capability gap’ in areas where they lack technical expertise through these alliances.
But the most significant reason for opting for a partnership is the resource dependency between the two partners. The new theory of resource- interdependence is based on the argument that to be effective, governments must blend their capacities with those of the various non-governmental actors. PPPs enable pooling of specialised complementary resources of the two partners. They provide easy access to private finance, managerial knowledge and entrepreneurial skills of the manpower in design, construction and management of assets and facilities created. Specialisation of the private partner helps to reduce the final total cost. This enhances the efficiency gains due to improved resource allocation, effective organisation and innovative solutions for meeting demands of specific segments of users. Furthermore, engag ing w i th t he p r iva t e sector at the stage of problem definition ushers in specialised knowledge in the decision making and policy process. Working on design and execution of a joint project ostensibly results in rapid dissemination of skills and information, reduced development time and fewer errors.
P P P s a l s o e n a b l e r i s k -sharing with the private sector.
YOJANA March 2013 65
Infrastructure projects often involve r isks which though unvalued, are purported to carry a cost. These are all the more in a PPP- the multitude of actors, highly technical tendering, contract evaluation and closure processes make PPPs a complex procurement and investment process. Some of these risks can be transferred to the private sector, which is perceived to be in a better position to identify, evaluate and mitigate it at the lowest cost, thus lowering total project cost and resulting in cost-effective services. Also, due to their more flexible and adaptable forms of management, the private sector can respond more nimbly to threats and opportunities as compared to the public sector.
Analys ing th i s f rom the perspective of collaborative governance, it is claimed that that no single actor has the resources, knowledge or sufficient action potential to handle issues or dominate unilaterally. All governments today face a vast array of interests, and aggregation is seen as a functional requirement and reality. The new meaning of governance does not point to state actors as the only entities in policy making and allocation of resources. In this milieu, amorphous non-state agencies possessing differentiated expertise inform the collective policy process. In this mode, the government collaborates with other actors for both formulating and implementing policies. As new forms of governance, collaboration and not competition is the central theme of partnerships; as joint
ventures they s tab i l i se the volatilities in the market, and mitigate competitive pressures instead of exploiting them.
PPPs enable governments of the low-income countries to tide over huge public debt and introduce innovation in design and delivery of public service thereby ensuring its long term sustainability. The economic perspective in favour of PPP is that they present an attractive alternative to the market and contractualised relationships and are viewed to be broader in scope than privatisation and a qualitative leap from traditional contracting. Fiscal pressures have often led governments to look for innovative solutions to maximise effectiveness in reallocating resources. Due to the ‘buy-now, pay-later’ attribute, PPPs are ‘off the balance sheet’. This means that PPP finances do not appear as large capital expenditures in the year that they occur, but as series of smaller revenue expenses over the life of the project. Evidence suggests that this helps increase value for Money (vFM) of the investment; keeps public sector budgets, and especially budget deficiencies, in control; allows the public sector to avoid up-front capital costs thereby, reducing expenditure on large capital intensive projects. Moreover, the fiscal space created helps boost medium-term growth and generate fiscal revenue in the future. Governments can allocate resources to other policy priorities as PPPs are financed off the balance sheet. According to few scholars, the partnership
model has been precipitated by economic globalisation which has structurally altered the nature of the welfare State. Governments are forced to reduce capital spending while still having social goals.
According to some authors, as a public policy representing the government’s wider approach towards infrastructure delivery, PPPs carry a significant political undercurrent. Promise of faster delivery of infrastructure projects and an immediate cut in capital expenditure has potential to generate significant political incentives, especially in the short run. PPPs enable politicians to deliver more projects in a short time, demonstrating policy achievement and acting as a tool for harnessing short term political gains. Furthermore, politicians have a tendency to argue their cases based on the successful cases rather than the failures. Politicians are also seen to be gaining from the improved relations with the construction business houses.
Conclusion
The article provided a brief description of the growth of PPPs, and explained its basic features. The reasons behind the acceptance and growth of PPPs as a new mode for delivery of public services were explored and analysed. The perspectives of resource-dependency, economic efficiency, political imperatives and new mode of governance were also examined. q
(E-mail: [email protected])
Readers may send in their views/suggestions on the articles published in Yojana at the e-mail:[email protected]
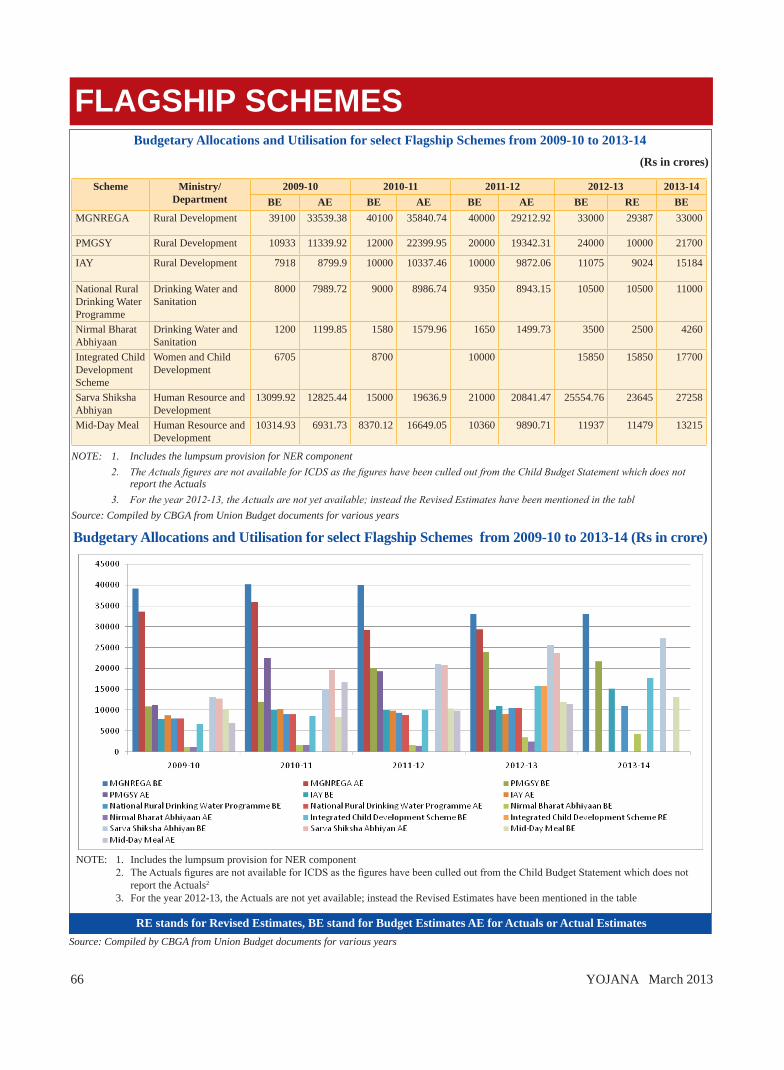
66 YOJANA March 2013
Budgetary Allocations and utilisation for select Flagship Schemes from 2009-10 to 2013-14(Rs in crores)
Scheme Ministry/ Department
2009-10 2010-11 2011-12 2012-13 2013-14BE AE BE AE BE AE BE RE BE
MGNREGA Rural Development 39100 33539.38 40100 35840.74 40000 29212.92 33000 29387 33000
PMGSY Rural Development 10933 11339.92 12000 22399.95 20000 19342.31 24000 10000 21700
IAY Rural Development 7918 8799.9 10000 10337.46 10000 9872.06 11075 9024 15184
National Rural Drinking Water Programme
Drinking Water and Sanitation
8000 7989.72 9000 8986.74 9350 8943.15 10500 10500 11000
Nirmal Bharat Abhiyaan
Drinking Water and Sanitation
1200 1199.85 1580 1579.96 1650 1499.73 3500 2500 4260
Integrated Child Development Scheme
Women and Child Development
6705 8700 10000 15850 15850 17700
Sarva Shiksha Abhiyan
Human Resource and Development
13099.92 12825.44 15000 19636.9 21000 20841.47 25554.76 23645 27258
Mid-Day Meal Human Resource and Development
10314.93 6931.73 8370.12 16649.05 10360 9890.71 11937 11479 13215
NOTE: 1. Includes the lumpsum provision for NER component 2. The Actuals figures are not available for ICDS as the figures have been culled out from the Child Budget Statement which does not
report the Actuals 3. For the year 2012-13, the Actuals are not yet available; instead the Revised Estimates have been mentioned in the tablSource: Compiled by CBGA from Union Budget documents for various years
NOTE: 1. Includes the lumpsum provision for NER component 2. The Actuals figures are not available for ICDS as the figures have been culled out from the Child Budget Statement which does not
report the Actuals2
3. For the year 2012-13, the Actuals are not yet available; instead the Revised Estimates have been mentioned in the table
Budgetary Allocations and utilisation for select Flagship Schemes from 2009-10 to 2013-14 (Rs in crore)
RE stands for Revised Estimates, BE stand for Budget Estimates AE for Actuals or Actual Estimates
FlaGShIP SChEMES
Source: Compiled by CBGA from Union Budget documents for various years
YOJANA March 2013 67
ITH A dramatic g r o w t h i n e l e m e n t a r y e d u c a t i o n enrolments and improvements in
retention and transition rates in recent years, particularly after the enforcement of RTE Act, the demand for secondary schooling is growing rapidly. Meeting this demand is critical for three reasons. First, secondary education fulfils large manpower needs of the semi-organized and the organized sectors of the economy. Second, it is the supply chain for higher education. Finally, it caters to the needs of teachers for primary schooling.
P u b l i c e x p e n d i t u r e o n secondary education has increased from Rs.35,806 crore in 2007–08 to Rs.94,183 crore in 2011–12, leading to an increase in its share as a percentage of GDP from 0.78 percent to 1.05 per cent. Per capita expenditure on secondary education has gone up from Rs.315 to Rs.784 during this period. The Central Government’s expenditure has gone up from Rs.2,578 crore in 2007–08 to Rs.13,278 crore
vocational Education & Skill Development in Secondary Education in the xII Plan
XII PlaN
Raman P Singh
REVIEW
The aim is to increase the
percentage of the workforce which
has received formal skills through
vocational education and training from
12.0 percent at present to 25.0 percent by the
end of the Twelfth Plan. This would
mean that about 70 million more people have to be imparted formal skills in the
next five years
in 2011–12, a five-fold increase. There is s ignif icant private expenditure as well. The average private expenditure on secondary education in private schools is as high as Rs.893 per month as compared to only Rs.275 per month in government schools. This difference is primarily due to high tuition fees in private schools.
The current GER for the secondary stage (Classes Ix–x) in 2010-11 at about 65 percent is inadequate, while the dropout rate at 49 percent is also very high. Thus, the country needs to move towards universalization of opportunity to attend secondary schooling of adequate quality. With enrolment in elementary education reaching near universal levels, there would be an opportunity to move towards universal access to secondary education under RMSA.
There are both social and economic benefits of secondary school ing . Alongs ide c lear improvements in health, gender equality and living conditions with secondary education, investments in secondary schooling have
The author is a Dy Adviser (HRD), Planning Commission.
w
68 YOJANA March 2013
high marginal rates of return, it being the supply chain for the labour force in the semi-organized and the organized sectors of the economy. This aspect of secondary schooling brings in sharp focus the importance of vocational education at secondary stage.
The Level of Education of the Labour Force: As per the 66th round of NSS the general education level of over 50 percent of India’s labour force in the age group 15–59 remains extremely low. Of the total labour force of 431 million about 29 percent are illiterate, another 24 percent has education up to primary level. Of the balance, about 29 percent had education level up to secondary which included 17.6 percent with middle level education. Only about 17 percent have higher levels of education (including higher secondary, d iploma/certificate, graduates, and higher than graduation).
The Share of Vocationally Trained in the Labour Force: As per the 66th Round of NSS (2009–10), the vocationally trained in the age group 15–59 in the labour force are around 10 percent of the Labour Force in that age group. The absolute number of those who are receiving formal vocational training is 1.9 million in 2009–10. An additional 9 million in the labour force have already received vocational training formally. Finally, an additional 32.7 million have received non-formal vocational training. Thus, the total number of those received or receiving vocational training in the labour force (15–59) was 43 million in 2009–10.
Approach to the XII Plan: The Approach to the Twelfth Five Year Plan (Faster, Sustainable and More Inclusive Growth) recognizes the role of vocational education in social and economic transformation: (i) “It is a common knowledge
that children acquire skills faster if taught earlier. It may, therefore, be important to offer pre-vocational courses in classes Ix and x, either as an add-on or as an alternative to work education or third language, and skills training of elementary nature, for example, manipulating simple instruments at the elementary level.”
(ii) “Students opting for such p r e - v o c a t i o n a l c o u r s e s should be encouraged and facilitated to take up advanced vocational subjects at the higher secondary level. In addition, vertical mobility options for students taking vocational courses should be available at the undergraduate and postgraduate level, failing which vocational courses at the school-level may not pick up.”
(iii) “For a high quality vocational education at school level to evolve and grow in the country, there is a need to train and equip our teachers on a continuous basis with latest skills and the vocational pedagogy itself. There is a need for special focus on training of trainers/teachers in skill impartation possibly using a PPP model.”
(iv) “The vocational curriculum
needs to be integrated and closely aligned with academic c u r r i c u l u m c o n t a i n i n g modules on various generic and specific vocational skills and that the same need to be evolved in consultation with and active involvement of industry. There should be an emphasis on development of multiple skills so that trainees/students may respond to changes in technology and market demands.”
(v) “The revised scheme of vocationalisation of secondary education should be revisited based on the pilots that have been undertaken to test and to ensure that it is aligned with the new National vocational Education Qualifications Framework (NvEQF) and industry-led Sector Skill Councils (SSC), so that vocationalisation does not become an expensive dead end for students. Given the different economic contexts across the country, system of monitoring and evaluation of the scheme must be strengthened.”
The mean years of schooling of the working age population (over 15 years) has increased from 4.2 years in 2000 to 5.12 years in 2010. However, this remains well below the level in other emerging market countries such as China (8.17 years), and Brazil (7.54 years). Fortunately, the efforts made in expanding access to education in the past 10 years will show up in the form of younger, more educated population entering the
YOJANA March 2013 69
labour force replacing the retiring/superannuating older and less-educated individuals. There is a good chance that we can reach an average of 8 years by the end of the Thirteenth Plan.
“A well educated population, a d e q u a t e l y e q u i p p e d w i t h knowledge and skill is not only essential to support economic growth, but is also a precondition for growth to be inclusive since it is the educated and skilled person who can stand to benefit most from the employment opportunities which growth will provide.”
Skill Development: It is critical for the country to make secondary education much more job-relevant through skills training within the schools. For this, higher investments will need to be made to equip secondary schools with teachers/trainers who have technical skills, and equipment (such as workshops, machines, computer equipment) that can be used to impart technical and vocational skills. In countries such as South Korea and Australia, 25–40 percent of high school students opt for vocational courses, making them job-ready once they finish Grade 12. The vocational credits they earn in secondary schools are recognized by the general education system and a high proportion of these students return to universities to pursue a college degree at a later stage.
In India, only 5 percent of the population of 19–24 age group has acquired some skills through vocational education, while the corresponding figure for Korea is as high as 96 percent. National
Knowledge Commission (NKC) has recommended expansion and re-designing of vocational education and improvement of its quality. National Skill Development Mission (NSDM) has also recognized the demand for employment-oriented vocational education programmes with provision for hands-on training. In order to reap the benefits of the demographic dividend, it is critical to align vocational education within the composite framework of secondary schooling.
T h e c u r r i c u l u m s h o u l d have modu les on l i t e r acy, numeracy, communication skills, en t repreneurship and o ther skills relevant to work place requirements. There should be emphasis on development of generic and multiple skills so that persons may respond to changes in technology and market demands. Generic skills that cut across a number of occupations would enable an individual to transfer from one field to another during his/her working life. Other features must include compulsory partnership with employers who could provide trainers and arrange for internships, give advice on curricula, and participate in assessment and certification.
Improved training and skill development is critical for providing decent employment opportunities to the growing youth population and necessary to sustain the high growth momentum. Although institutional structure has been put in place, there is still a long way to go. While skill formation has to be mainstreamed in the formal education system right from class x
onwards, skill creation outside the formal education needs coordinated action and innovative approach. National Skill Development Mission launched in the Eleventh Plan has brought about a paradigm shift in handling skill development programmes, has clearly defined core principles and put in place a Coordinated Action Plan for Skill Development.
A three- t ier ins t i tu t ional structure is already in place for the purpose. This lays down a solid foundation for a skills ecosystem in the country. During the Twelfth Plan, gaps in skills ecosystem have to be identified and plugged, while building on the foundation that has been laid. An important tier of the Coordinated Action Plan for Skill Development, National Skil l Development Corporation (NSDC) has already made significant progress and bulk of such skill formation targeted particularly at the large unorganized sector will come through NSDC interventions and initiatives at the State level. For this, support to NSDC would have to be significantly enhanced and State Skill Development Missions in all States would have to be fully operational and effective during the Twelfth Plan.
There is a need for concerted action in several key areas in order to ensure that skill formation takes place in a demand driven manner. Curriculum for skill development has to be reoriented on a continuing basis to meet the demands of the employers/industry and align it with the available self-employment opportunities. Accreditation and certification
70 YOJANA March 2013
system has to be improved. There is a need to establish an institutional mechanism for providing access to information on skill inventory and skill maps on a real time basis. A sectoral approach is required for the purpose with special emphasis on those sectors that have high employment potential. Standards may be set by the industry-led sector skill councils which must be made effective during the Twelfth Plan, while the accreditation of certification processes should be done by independent, specialized agencies with certification left to the institutions. Skill Development Centres can be established in existing education and training institutions. This would ensure huge saving in cost and time. A system of funding poor people for skill development through direct financial aid or loan also needs to be put in place. Apprenticeship training as another mode for on-job training has to be remodelled to make it more effective and up-scaled significantly.
Finally, vocational education at the school level and vocational t ra in ing through Indus t r ia l Training Institutes (ITIs) and Industrial Training Centres (ITCs) need significant expansion and overhaul. There is an urgent need to revisit the scheme for upgradat ion of government ITIs as Centres of Excellence through the PPP to implement it more effectively during the Twelfth Plan. There is a need for establishing flexible learning pathways integrated to schooling on one end and higher education on the other through National
Vocational Education Qualification Framework (NvEQF). Public-Private Partnerships in financing, service delivery, and provision of workspaces and training of trainers should be promoted. Employment exchanges can be repositioned as outreach points. There is a need for removal of entry-barriers to private participation, while putting in place an effective regulatory framework for coordinating the network of Private players, as also for monitoring, evaluating and analyzing outcomes of various programmes. All these issues have received thoughtful consideration during the Eleventh Plan; now operational details have to be worked out and specific initiatives launched during the Twelfth Plan.
vocational education at the secondary level would be aligned with skills training under the Ministry of Labour through Industrial Training Centres and modular training programmes as well as short-term training p rov ided th rough Nat iona l Skills Development Corporation (NSDC). Skills training under the JSS and NGO schemes of Adult Education programmes would be aligned with the framework for vocational education at the secondary level. In order to roll out these skills programmes, a massive effort would be needed for professional development of school leadership, master faculty trainers, inspectors, test evaluators and counsellors. Appropriate institutional arrangements with linkage to NSDC for capacity development for professional
certification and accreditation systems for institutions should also be put in place.
Improved training and skill development i s cr i t ica l for providing decent employment opportunities to the growing youth population and necessary to sustain the high growth momentum. Although institutional structure has been put in place, there is still a long way to go. There is a need for concerted action in several key areas in order to ensure that skill formation takes place in a demand driven manner. Curriculum for skill development has to be reoriented on a continuing basis to meet the demands of the employers/industry and align it with the available self-employment opportunities.
R e n e w e d F o c u s o n Vocational Education - Policy Directions in the Twelfth Plan: vocational education at the secondary stage provides for diversification of educational opportunities so as to enhance individual employability, reduce the mismatch between demand and supply of skilled manpower and provide an alternative for those pursuing higher education. Hence, it is important and would be implemented from class Ix onwards, unlike the present provision for its implementation from class xI, and would be s u b s u m e d u n d e r R M S A . vocational Education courses will be based on National Occupation Standards (NOS) brought out by the Sector Skill Councils (SSCs) that determine the minimum levels of competencies for various vocations. Academic qualifications would be assessed and certified by
YOJANA March 2013 71
educational bodies and vocational skills would be assessed and certified by respective SSCs.
I n t h e Tw e l f t h P l a n , a mechanism would be created for convergence of vocational courses offered by various ministries, private initiatives and vocational education institutions, and use schools as the outlet for vocational education of young people. A comprehensive repertoire of vocational courses, duration of each course, equipment and facilities, costs and agencies will be developed. Like Germany and many other industrialized countries, the repertoire should have modular courses, which allow exit and entry into the job market and further.
Salient Components of the Revised Scheme of Vocational Education at Higher Secondary Stage: The scheme of vocational stream at the +2 stage, launched in 1988 and revised in 1992–93, was continued after further revision in 2011. Despite massive infrastructure of 21000 Sections in over 10000 schools with vocational streams catering to over 1 million students, only about 4.8 percent of all students are enrolled in the vocational streams, as per an evaluation study carried out in 1995-96, against a target of covering 25 percent of such students. About 28 percent of vocational pass outs were employed/self-employed and 38.3 percent vocational pass outs were pursuing higher studies. The process for revamping of the scheme of vocational education at the secondary and higher secondary stage has already been initiated.
This is primarily meant for offering vE in Classes xI-xII. The changes in the revised scheme have incorporated the nuances of NvEQF. The revised scheme will assist vE from Class Ix (level 1 of NvEQF) across the country. Suitable test of competencies in literacy & numeracy will have to be undertaken by all students at the end of 8th grade, which would be used as a selection criterion for further education. The processes would be in compliance with RTE Act, 2009 for s tudents desirous of entering level 1 of NvEQF. The introduction of vE from Class Ix and the preparation of syllabi will have to be developed in consonance with the endorsement by CABE on 7.6.2011 for extending RTE to Class x.
Objectives:
l To impart training in simple marketable skills to students in Class Ix & x.
l To develop vocational interests and aptitudes.
l To facilitate students in making choice of vocational courses in Classes xI-xII.
l To prepare s tudents for p a r t i c i p a t i o n i n w o r k as a desired dimension of education.
l To inculcate healthy values related to work culture.
l To provide linkage to higher education after completion of Class xII.
The revised scheme is now aligned with NvEQF to create clear educational pathways from school to higher education level and
provide more options to students to choose vocational modules depending on their aptitude and economic requirements. The revised scheme has been designed to address the weaknesses identified in the current system of vocational education. The salient components of the revised scheme include
l Strengthening of existing schools imparting vocational education;
l Establishing new schools through State Governments;
l In-service teacher training of seven days for existing vE teachers;
l 30-day induction course for new vE teachers;
l Development of competency based modules for each individual vocational course;
l Provision of assistance to run vocational schools under PPP mode and support to reputed NGOs for carrying out short duration innovative vocational education programmes;
l M a n d a t o r y r e v i s i o n i n curriculum once in three years to ensure that the curriculum is guided by needs of the industry;
l Establishment of a separate vocational cell within Central Board of Secondary Education; and
l All the components and activities would be guided by t he Na t iona l Sk i l l s Qualifications Framework (NSQF).
A separate pilot programme within the NvEQF has been launched in Haryana, Assam,
72 YOJANA March 2013
West Bengal and Karnataka are also in the process of launching a pilot. Based on the learning from the pilot, this would be scaled up in the Twelfth Plan. An MIS and web portal on vocational education will be set up to share best practices and experiences. Haryana has launched a pilot for introducing vocational education under NvEQF in 40 pilot schools in eight districts. The salient features of the pilot project on vocational Education under NvEQF are as under:l Each of the pilot schools offer
two vocational subjects out of IT/ITES, Retail, Automobile and Security. These would be started from Class 9 and Class xI.
l The Curriculum has been designed by the respective Sector Skills Councils (SSCs) under NSDC. The content has been created by PSSCIvE, C B S E a n d Wa d h w a n i foundation.
l Teachers have been recruited on a contract basis, and have undergone training in pedagogy and domain skills. Principals of schools have undergone orientation.
l Each school has a vocational coordinator to create and nurture linkages of local industry and business with the school and its students. They will also facilitate guest lectures, industry visits and placements.
l Assessment will be done by Board of School Education Haryana and assessors of respective SSC.
Based on the learning from the pilot(s), a possible road map could be to expand the coverage of vocational education from 2013–14 to about 400 schools in Haryana. The number of courses offered could be increased from 8 to 10 and pilots will be started during 2013–14 in all States which show interest. States which manage the pilot successfully could expand the coverage in year 2014–15 to about ten times the number of schools covered under pilot. A nodal resource centre could be created at the national level to support the State Governments.
The approach so far has been to create stand-alone vocational education facilities. The need of the hour is that secondary schools in every panchayat can be used for vocational training outside the school hours. A formal system of vocational education certification needs to be evolved to certify students and youths to acquire skills through this method. This would require adequate and suitable infrastructure to impart the vocational training.
Students pursuing vocational courses at +2 level would be provided facil i t ies for apprenticeship training under the Apprenticeship Act. While skill formation has to be mainstreamed in the formal education system right from class Ix onwards, skill creation outside the formal education system needs coordinated action and innovative approaches. A vE cell has been established within the CBSE. The States would also be encouraged and supported to set up similar cells
in the State Boards and encourage students to take vocational courses along with academic courses either as combination subjects or additional subjects, and allow credit accumulation and transfer on the pattern of CBSE-NIOS collaboration. The National and State Boards would draw up a detailed scheme of evaluation with respective SSCs to enable competency-based assessment of students. As the course design and TLM deve lopment ge t decentralized, PSSCIvE, the expert central institution, should be elevated for quality assurance in vocational education.
Pandi t Sunderlal Sharma Central Institute of vocational E d u c a t i o n ( P S S C I v E ) i n collaboration and partnership with State Boards/CBSE/Experts will develop exemplar competency-based curricula with inputs from industry, business organisation, ag r icu l tu ra l in i t i a t ives fo r contextualization and localization of content by States. Competency-based curricula will be adopted/adapted by Central/State Boards of Education. Each curriculum will have to meet national standards for competencies and other applicable norms set by SSCs.
The aim is to increase the percentage of the workforce which has received formal skills through vocational education and training from 12.0 percent at present to 25.0 percent by the end of the Twelfth Plan. This would mean that about 70 million more people have to be imparted formal skills in the next five years. q
(E-mail:[email protected])