
Strategies for optimisation of paediatric cardiopulmonary ... · emboli during open heart surgery....
321
RIJKSUNIVERSITEIT GRONINGEN Strategies for optimisation of paediatric cardiopulmonary bypass PROEFSCHRIFT ter verkrijging van het doctoraat in de Medische Wetenschappen aan de Rijksuniversiteit Groningen op gezag van de Rector Magnificus, dr. F. Zwarts, in het openbaar te verdedigen op woensdag 12 februari 2003 om 16.00 uur door Filip Maria Jan Jozef De Somer geboren op 10 mei 1960 te Aalst (België)
Transcript of Strategies for optimisation of paediatric cardiopulmonary ... · emboli during open heart surgery....

RIJKSUNIVERSITEIT GRONINGEN
Strategies for optimisation of paediatric cardiopulmonary
bypass
PROEFSCHRIFT
ter verkrijging van het doctoraat in deMedische Wetenschappen
aan de Rijksuniversiteit Groningenop gezag van de
Rector Magnificus, dr. F. Zwarts,in het openbaar te verdedigen op
woensdag 12 februari 2003om 16.00 uur
door
Filip Maria Jan Jozef De Somergeboren op 10 mei 1960
te Aalst (België)
Promotores: Prof. dr. T. Ebels
Prof. dr. G. Van Nooten
Co-promotor: Prof. dr. P. Verdonck
Beoordelingscommissie: Prof. dr. R.Berger
Prof. dr. H.J.Busscher
Prof. dr. M. Hazekamp
ISBN 90-423-0210-0

Voor Caroline en Casper
Voor mijn ouders

© Copyright Shaker Publishing 2002All rights reserved. No part of this publication may be reproduced, stored in aretrieval system, or transmitted, in any form or by any means, electronic,mechanical, photocopying, recording or otherwise, without the priorpermission of the publishers.
Printed in The Netherlands.
ISBN 90-423-0210-0Shaker Publishing BVSt. Maartenslaan 266221 AX MaastrichtTel.: 043-3500424Fax: 043-3255090http:// www.shaker.nl
Contents
1
Contents
Chapter 1: Introduction 3
Chapter 2: Vascular access for total body perfusion 9
Chapter 3: Circuit design 21
Chapter 4: Oxygenation by artificial lung systems 33
Chapter 5: Systemic inflammatory response 43
Chapter 6: Summary and new prospectives 59
Appendix 1 Evaluation of different paediatric venous cannulas using
gravity drainage and VAVD: an in vitro study
Perfusion, 2002; 17(5): 321 – 326
63
Appendix 2 Hydrodynamical Comparison of Aortic Arch Cannulae
Int. J. Art. Organs, 1998; 21(11): 705 – 713
83
Appendix 3 Comparison of two dissimilar designs of paediatric aortic
cannulae
Int. J. Art. Organs, 2002, 25(9): 867 – 874
115
Appendix 4 D-901 Neonatal oxygenator: a new perspective
Perfusion 1994; 9: 349 – 355
141
Appendix 5 Low extracorporeal priming volumes for infants: a benefit?
Perfusion 1996; 11: 455 – 460
159
Appendix 6 Hydrodynamic characteristics of artificial lungs
ASAIO, 2000; 46(5): 532 – 535
175
Contents
2
Appendix 7 Impact of oxygenator design on hemolysis, shear stress,
white blood cell and platelet count
J. Cardiothor.Vasc. Anesth. 1996; 10: 884 - 889
195
Appendix 8 Can an oxygenator design potentially contribute to air
embolism in CPB. A novel method for the determination of
the air removal capabilities of neonatal oxygenators
Perfusion, 1998; 13: 157 – 163
219
Appendix 9 In vivo evaluation of a phosphorylcholine coated
cardiopulmonary bypass
Journal of Extra-corporeal technology, 1999; 31 (2): 62-67
241
Appendix 10 Phosphorylcholine coating of extracorporeal circuits
provides natural protection against blood activation by the
material surface
European Journal of Cardio-Thoracic Surgery, 2000;
18(5): 602 – 606
261
Appendix 11 Tissue factor as main activator of the coagulation system
during cardiopulmonary bypass
The Journal of Thoracic and Cardiovascular Surgery,
2002; 123: 951 – 958
283
Nederlandse samenvatting 309
Dankwoord 315
Curriculum vitae 317

Chapter 1
3
Chapter 1 Introduction and aim of the thesis
The mortality associated with the repair of congenital heart defects in early life
has decreased considerably over the years. However improved survival has
unmasked a whole spectrum of morbidity associated with the practice of
cardiopulmonary bypass [1].
As a general concept, cardiopulmonary bypass will temporarily bypass heart
and lungs. This is achieved by introducing one or two venous cannulas in the
venae cavae that direct venous return of the patient, by means of plastic
tubing, into a reservoir. This reservoir replaces the compliance of the veins.
From the reservoir blood is pumped through an artificial lung or oxygenator.
The oxygenator heats or cools the blood and maintains physiologic blood
gases. Subsequently the oxygenated blood is guided through an arterial filter
and re-infused by means of an arterial cannula into the aorta. All these
components need to be primed before cardiopulmonary bypass can be
started. Apart of this life support, the circuit is designed to meet specific
surgical needs. Most systems have one or more aspiration lines for the
recuperation of blood losses in the surgical field, the unloading of the left
ventricle and aspiration of blood from additional blood vessels such as a left
superior vena cava or collateral blood vessels. In many institutions the
cardioplegia delivery is also integrated into the cardiopulmonary bypass
circuit.
During conduct of paediatric cardiopulmonary bypass quite drastic changes
occur. Due to haemodilution by priming solutions and cardioplegia, the
haematocrit varies between 20 – 35%. Most operations require a certain
Chapter 1
4
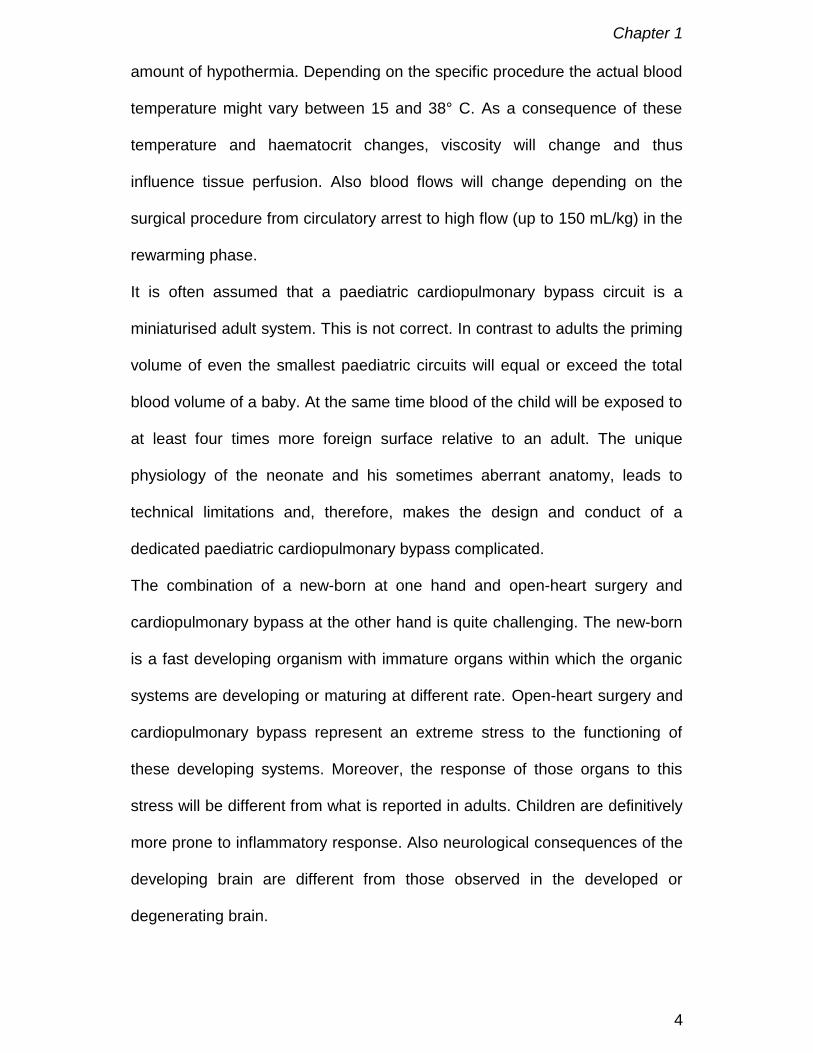
amount of hypothermia. Depending on the specific procedure the actual blood
temperature might vary between 15 and 38° C. As a consequence of these
temperature and haematocrit changes, viscosity will change and thus
influence tissue perfusion. Also blood flows will change depending on the
surgical procedure from circulatory arrest to high flow (up to 150 mL/kg) in the
rewarming phase.
It is often assumed that a paediatric cardiopulmonary bypass circuit is a
miniaturised adult system. This is not correct. In contrast to adults the priming
volume of even the smallest paediatric circuits will equal or exceed the total
blood volume of a baby. At the same time blood of the child will be exposed to
at least four times more foreign surface relative to an adult. The unique
physiology of the neonate and his sometimes aberrant anatomy, leads to
technical limitations and, therefore, makes the design and conduct of a
dedicated paediatric cardiopulmonary bypass complicated.
The combination of a new-born at one hand and open-heart surgery and
cardiopulmonary bypass at the other hand is quite challenging. The new-born
is a fast developing organism with immature organs within which the organic
systems are developing or maturing at different rate. Open-heart surgery and
cardiopulmonary bypass represent an extreme stress to the functioning of
these developing systems. Moreover, the response of those organs to this
stress will be different from what is reported in adults. Children are definitively
more prone to inflammatory response. Also neurological consequences of the
developing brain are different from those observed in the developed or
degenerating brain.
Chapter 1
5
The small size of vascular and cardiac structures not only challenges surgical
skills but also limit the possibilities for obtaining an optimal vascular access
and a bloodless surgical field.
Due to this unique anatomical and physiological environment specially
designed components have been developed. This research and development
is expensive and will often reach the end spectrum of technical know how.
Unfortunately, most of the time some industries are reluctant to invest in the
paediatric domain because of the small numbers compared to the huge
amount of adult cardiac procedures performed yearly.
Further research is also required to investigate the long and short-term
influence of different surgical strategies and techniques for conducting
cardiopulmonary on the different organ systems. Recent research clearly
demonstrates a correlation between conduct of cardiopulmonary bypass and
morbidity [2-6].
However, as pointed out by Jonas and Elliott [1], the consequences of a badly
conducted paediatric cardiopulmonary bypass should not be underestimated
as it may impact several decades. The child’s quality of life is likely to be
markedly diminished. Yet that is only part of the potential disaster. Children
have parents and relatives. Each will be affected by the poor outcome of
cardiopulmonary bypass. One bypass disaster can ruin many lives.

Chapter 1
6
Aim of the thesis
The aim of this thesis is to address different aspects of paediatric
cardiopulmonary bypass in detail and to propose modifications in order to
reduce cardiopulmonary bypass related morbidity and by doing so, improve
patient outcome. We will focus on four major items: (1) vascular access, (2)
mass transfer and fluid dynamics of oxygenators, (3) circuits and (4) whole
body inflammatory reaction.
• The small vascular structures of the new-born demand a better design
description of the geometry and fluid dynamic characteristics of cannulas.
There is not only a need for a better validation of today’s cannulas but also
for research into the relation between the hemodynamic characteristics of
these cannulas and possible damage to blood elements.
• The oxygenator is prone to less optimal flow, due to its tortuous flow path,
its large foreign surface area and the rapid changes in blood velocity
resulting in non-optimal mass transfer and activation of the whole body
inflammatory response. Additionally, most oxygenators have a priming
volume that is too high compared to the total blood volume of a new-born.
There is an urgent need for smaller, more blood compatible oxygenators,
with optimisation of their fluid mechanics and gas exchange in order to fit
the paediatric needs. These needs will include the capability for achieving
subnormal arterial oxygen tensions in cyanotic children without
compromising the high oxygen consumption of children during rewarming.
• Most circuits today have been designed based on empirically derived data.
This results in large volumes in the arterial and venous lines as well as in

Chapter 1
7
the aspiration lines. The use of an arterial line filter is highly recommended
although it is not used in an appropriate way in most institutions.
• Finally, the use and conduct of a paediatric cardiopulmonary bypass will
end in a mild or more pronounced whole body inflammatory reaction. The
strength of this reaction will vary from child to child, the equipment used,
and the conduct of the bypass.
We will propose techniques and strategies to overcome or to reduce these
problems and by doing so to ameliorate the cardiopulmonary bypass related
morbidity.
References
1. RA Jonas, MJ Elliott. Cardiopulmonary bypass in neonates, infants and
young children. Butterworth-Heinemann, Oxford 1994.
2. S Daniel. Review of the multifactorial aspects of BioInCompatibility in CPB.
Perfusion, 1996; 11: 246-255.
3. DT Pearson, RF Carter, MB Hammo, PS Waterhouse. Gaseous micro-
emboli during open heart surgery. In: Towards safer cardiac surgery. Ed.
DB Longmore. Lancaster, MTP Press, 1981: 325-354.
4. JM Pearl, DW Thomas, G Grist, JY Duffy, PB Manning. Hyperoxia for
management of acid-base status during deep hypothermia with circulatory
arrest. Ann Thorac Surg 2000; 70: 751-755.
5. RA Jonas, DC Bellinger, LA Rappaport et al. Relation of pH strategy and
development outcome after hypothermic circulatory arrest. J Thorac
Cardiovasc Surg. 1993; 106: 362-368.

Chapter 1
8
6. T Shin’oka, D Shum-Tim, PC Laussen et al. Effects of oncotic pressure
and haematocrit on outcome after hypothermic circulatory arrest. Ann
Thorac Surg 1998; 65: 155-164.

Chapter 2
9
Chapter 2 Vascular access for total body perfusion
2.1. Introduction
This chapter introduces the limitations and boundary conditions of vascular
access in paediatric cardiopulmonary bypass. The different requirements for
venous and arterial access are reviewed. Finally, the hydrodynamic
characteristics and different evaluation methods are presented and discussed.
Recommendations for an optimal communication between manufacturer and
clinician are given.
2.1.1. Problems related to vascular access
Unsuccessful cannulation may lead to cerebral complications [1-3] A
malpositioned aortic cannula may obstruct cerebral blood flow, or it may
cause a preferential flow into the descending aorta and “steal” blood from the
brain’s circulation [3]. Alternatively, obstruction by the superior vena caval
cannula may decrease cerebral venous drainage and potentially lead to brain
dysfunction [3]. A direct correlation between age and cerebral alterations (low
cerebral blood flow velocity and EEG slowing) caused by malpositioning of the
cannulas has been reported [3].
2.2. Venous access
Cannulation of the venous side of the circulation aims at draining the venous
blood from the central veins or right heart cavities in a laminar flow without
inducing any marked change of the pressure within the large veins. Only then
an adequate forward flow can be established. The entire venous return to the
Chapter 2
10
heart should be able to pass through the chosen cannulas without obstruction
and without damaging the blood vessel [4].
An essential problem of venous drainage is a compliance and geometric
mismatch. Wide, low-resistance, collapsible vessels are connected to smaller,
less compliant, artificial conduits. When suction is applied to the venous
reservoir, flow starts to increase linearly, but once the vessel starts to
collapse, the flow will stagnate. Increase in suction force beyond a critical
level, therefore, cannot increase the amount of venous drainage. Additionally,
high resistance in the drainage tube necessitates higher degrees of suction
than is needed with short, wide tubing. Maintenance of a positive pressure at
the tip of the cannula broadens the range of flow regulation because it
prevents venous collapse [5]. Reduced venous drainage may be due to
reduced venous pressure, inadequate height of the patient above the venous
reservoir, malposition of the venous cannulas or obstruction or excess
resistance of the lines and cannulas. Venodilation or hypovolaemia may
cause inadequate venous pressure.
2.3. Arterial access
Cannulation of the arterial side of the circulation must provide an adequate
forward flow of blood to the patient. The cannula and its placement must not
be non-obstructive and flow must be directed to the distal aorta in order to
perfuse all areas of the body.
The ideal cannula will generate sufficient flow without obstructing or damaging
the blood vessel.
Chapter 2
11
2.4. Cannula characteristics
2.4.1. Design related problems
The choice of the best cannula for a given procedure is not simple. In general,
manufacturers do not mention in their information brochures the internal
diameter of a cannula but only the outer diameter. Depending on the
production process, the wall thickness of comparable cannulas can be quite
different although their respective manufacturers measured identical outer
diameters [6]. Additionally, production tolerances result in important
differences in internal diameter even between cannulas of identical size and
manufactured by the same company. Since the pressure-flow relation highly
depends on the inner diameter and cannulas standard used in paediatric
cardiopulmonary bypass have small diameters, this results in significant
deviations of the mean values given by the manufacturer.
Another difficulty is related to the fact that the pressure-flow characteristic of a
cannula is always measured for water (low viscosity and Newtonian fluid).
Unfortunately, it is difficult to extrapolate water values towards blood (higher
viscosity and non Newtonian fluid) flow conditions.
2.4.2. Available data for clinicians
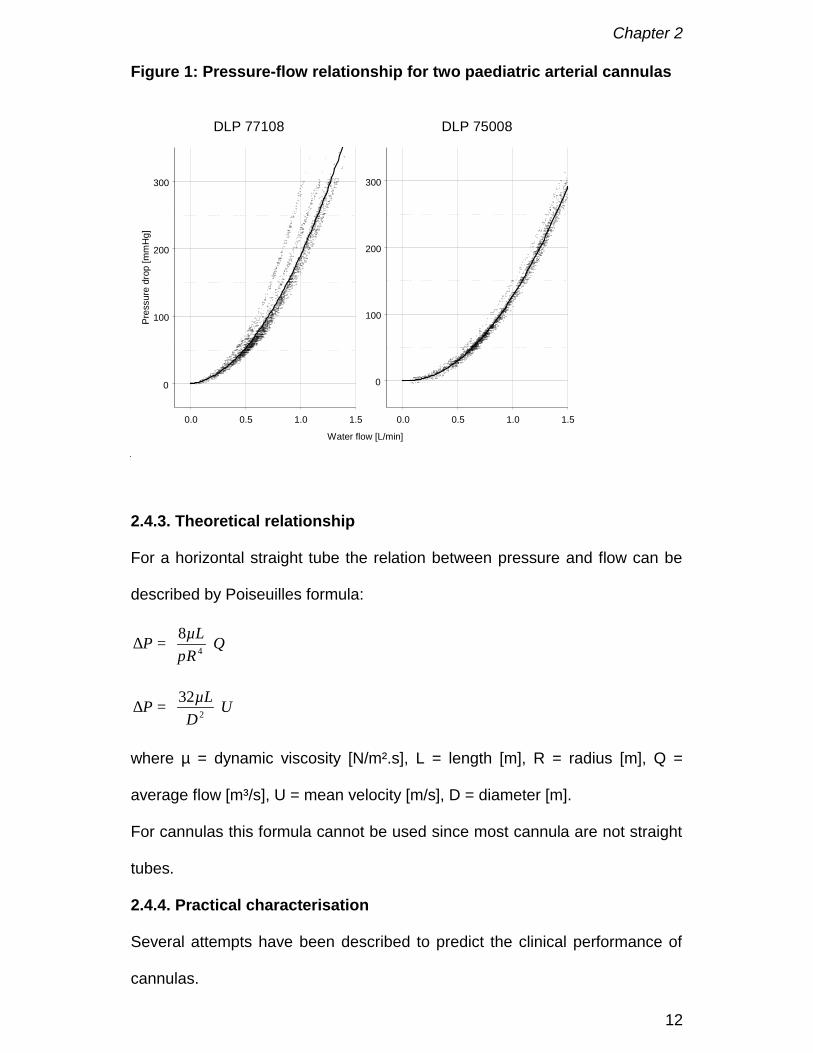
Manufacturers only report the polynomial regression of the water data of a
certain number of cannulas (Figure 1). Thus, the user has no information
about of the possible variability range. This is demonstrated in Figure 1 where
both the polynomial regression (full line) as given by the manufacturer and the
measured data of ten cannulas (dots) are depicted.
Chapter 2
12
Figure 1: Pressure-flow relationship for two paediatric arterial cannulas
0.0 0.5 1.0 1.5
0
100
200
300
Pres
sure
dro
p [m
mH
g]
DLP 77108
Water flow [L/min]
0.0 0.5 1.0 1.5
0
100
200
300
DLP 75008
2.4.3. Theoretical relationship
For a horizontal straight tube the relation between pressure and flow can be
described by Poiseuilles formula:
QRµLP
=∆ 4
8π
UD
µLP
=∆ 2
32
where µ = dynamic viscosity [N/m².s], L = length [m], R = radius [m], Q =
average flow [m³/s], U = mean velocity [m/s], D = diameter [m].
For cannulas this formula cannot be used since most cannula are not straight
tubes.
2.4.4. Practical characterisation
Several attempts have been described to predict the clinical performance of
cannulas.
Chapter 2
13
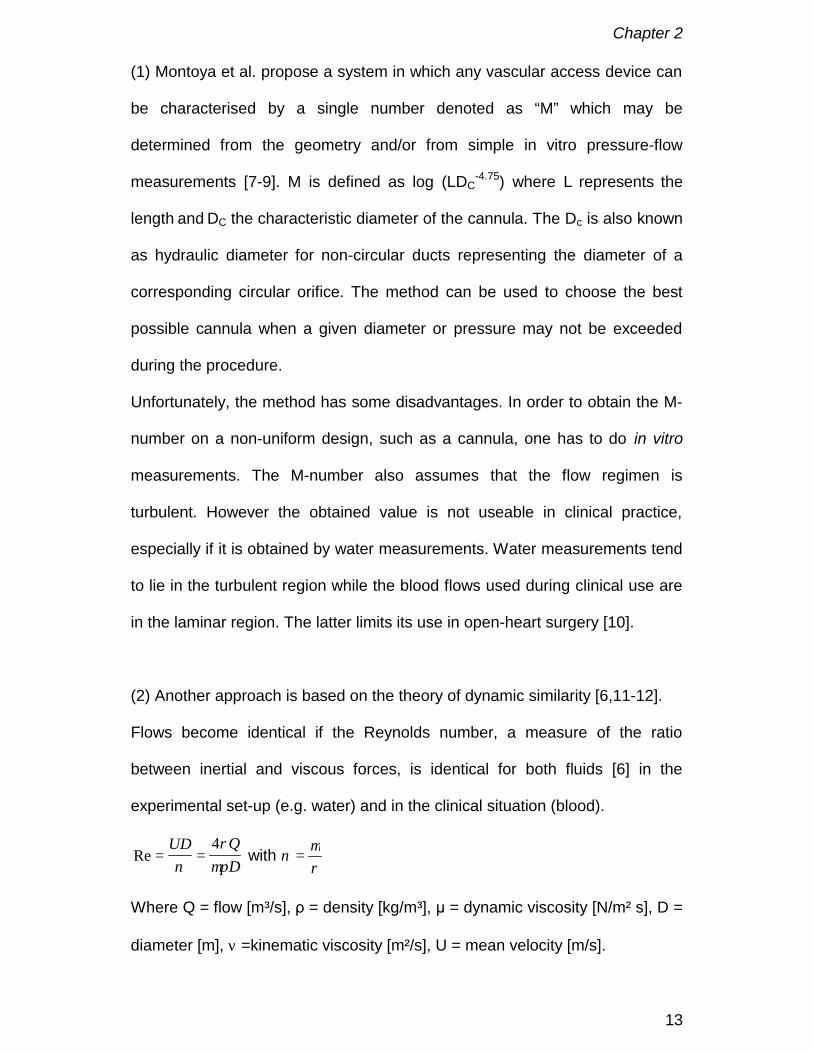
(1) Montoya et al. propose a system in which any vascular access device can
be characterised by a single number denoted as “M” which may be
determined from the geometry and/or from simple in vitro pressure-flow
measurements [7-9]. M is defined as log (LDC-4.75) where L represents the
length and DC the characteristic diameter of the cannula. The Dc is also known
as hydraulic diameter for non-circular ducts representing the diameter of a
corresponding circular orifice. The method can be used to choose the best
possible cannula when a given diameter or pressure may not be exceeded
during the procedure.
Unfortunately, the method has some disadvantages. In order to obtain the M-
number on a non-uniform design, such as a cannula, one has to do in vitro
measurements. The M-number also assumes that the flow regimen is
turbulent. However the obtained value is not useable in clinical practice,
especially if it is obtained by water measurements. Water measurements tend
to lie in the turbulent region while the blood flows used during clinical use are
in the laminar region. The latter limits its use in open-heart surgery [10].
(2) Another approach is based on the theory of dynamic similarity [6,11-12].
Flows become identical if the Reynolds number, a measure of the ratio
between inertial and viscous forces, is identical for both fluids [6] in the
experimental set-up (e.g. water) and in the clinical situation (blood).
Re = =UD Q
Dνρ
µπ4
with ρµ
ν =
Where Q = flow [m³/s], ρ = density [kg/m³], μ = dynamic viscosity [N/m² s], D =
diameter [m], ν =kinematic viscosity [m²/s], U = mean velocity [m/s].
Chapter 2
14
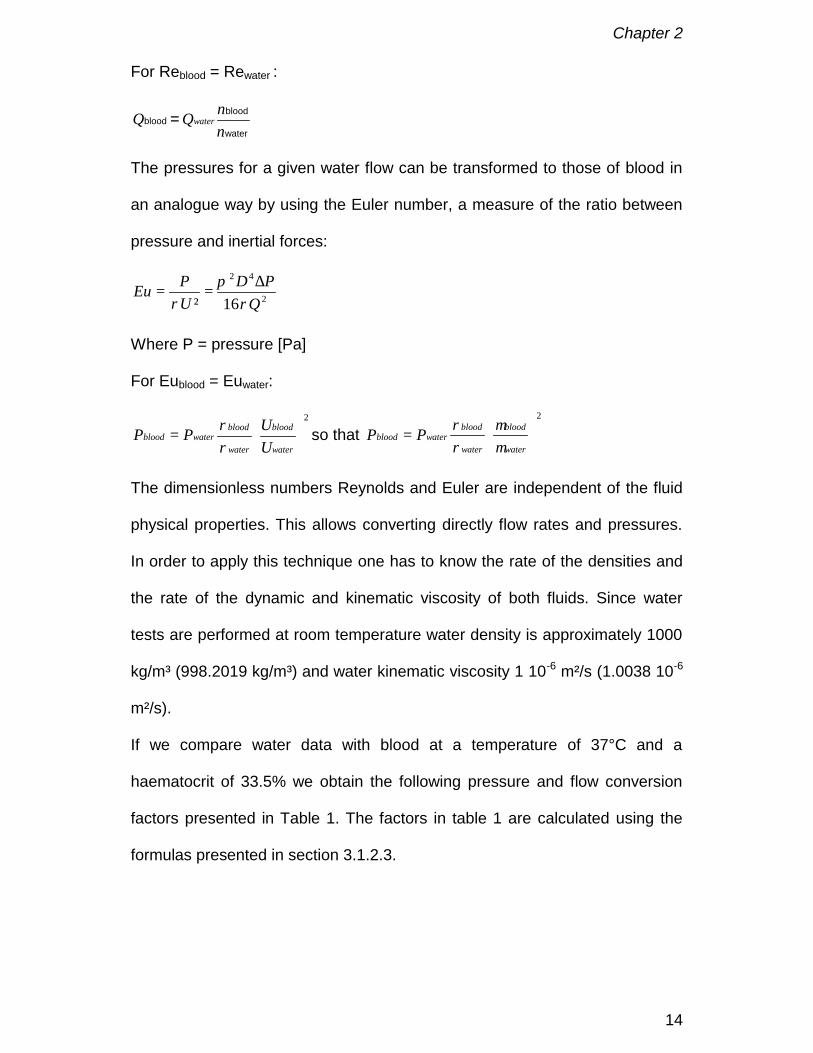
For Reblood = Rewater :
water
bloodblood =
νν
waterQQ
The pressures for a given water flow can be transformed to those of blood in
an analogue way by using the Euler number, a measure of the ratio between
pressure and inertial forces:
2
42
16² QPD
UPEu
ρπ
ρ∆
==
Where P = pressure [Pa]
For Eublood = Euwater:
2
=
water
blood
water
bloodwaterblood
UUPP
ρρ so that
2
=
water
blood
water
bloodwaterblood PP
µµ
ρρ
The dimensionless numbers Reynolds and Euler are independent of the fluid
physical properties. This allows converting directly flow rates and pressures.
In order to apply this technique one has to know the rate of the densities and
the rate of the dynamic and kinematic viscosity of both fluids. Since water
tests are performed at room temperature water density is approximately 1000
kg/m³ (998.2019 kg/m³) and water kinematic viscosity 1 10-6 m²/s (1.0038 10-6
m²/s).
If we compare water data with blood at a temperature of 37°C and a
haematocrit of 33.5% we obtain the following pressure and flow conversion
factors presented in Table 1. The factors in table 1 are calculated using the
formulas presented in section 3.1.2.3.

Chapter 2
15
Table 1. Pressure and flow conversion factors
Qblood/Qwater Pblood/Pwater
T = 37°C 2.43 6.21
T = 20°C 3.40 12.19
Flows and pressures measured during water tests are multiplied with these
factors to obtain corresponding blood flows and pressures.
(3) A third method rescales the coefficients of the fitted parabolic equation
between pressure drop (∆P) and flow rate (Q)
waterwaterwaterwaterwater QbQaP +=∆ 2
to blood
bloodbloodbloodbloodblood QbQaP +=∆ 2
For a given awater, bwater and the relationship between pressure and flow one
can determine ablood and bblood as:
waterwater
bloodblood aa
ρρ
=
waterwater
bloodblood b
µµb =
Table 2. Conversion factors for coefficients a and b
ablood/awater bblood/bwater
T = 37°C 1.055 2.56
T = 20°C 1.055 3.59
The factors in Table 2 are derived from Table 1 taking into account awater
blood
ρρ

Chapter 2
16
ratio of 1.03.
In Figure 3 a comparison of both methods (calculation based on dynamic
similarity and the parabolic method) is presented. There is still a deviation
from the measured data but it gives an estimate of what can be expected
under given conditions. The deviation is due to the low accuracy of water
measurements caused by the error range on pressure transducers and flow
meters. These errors are subsequently multiplied with the conversion factors
resulting in even larger deviations. This also explains why the deviation of the
calculated data is smaller at 37°C than at 20°C. Use of water-glycerin
solutions by manufacturers for validation of their cannulas instead of water will
reduce the error.
0.0 0.2 0.4 0.6 0.8 1.0Blood flow [L/min]
0
75
150
225
300
Pres
sure
dro
p [m
mH
g]
Dynamic similarityMeasuredParabolic method
DLP 7700820°C - Hct 33.5%
0.0 0.2 0.4 0.6 0.8 1.00
50
100
150
200
250
300Dynamic similarityMeasuredParabolic method
37°C - Hct 33.5%

Chapter 2
17
2.4.5. Quantification of blood damage
Pressure-flow relationships do not give direct information regarding the
possible damage of blood elements when a given cannula is used. It is not
necessarily the cannula with the highest pressure drop that will generate most
damage. The exerted shear rate and specifically shear stress in combination
with the duration of these forces (residence time) are far more important
factors for blood cell damage [13]. Shear stress equals fluid dynamic viscosity
multiplied by shear rate.
ru
δδµτ = with u the axial velocity component and r the radial variable
or
LRPw2
∆=τ
where τw = shear stress [N/m²], R = radius [m], L = length [m]
As tube length is usually several orders of magnitude greater than radius,
pressure is generally orders of magnitude greater than shear stress [14].
Physiological values of shear stress range from 1 – 50 dynes/cm² 1[14].
Most actual cannulas will easily generate shear stresses of several hundred
dynes/cm² [15], which is far above the trigger values of 75 and 100 dynes/cm²
[14,16] needed to activate white blood cells and platelets, respectively.
1 ²
1²
10mN
cmdyne
=
Chapter 2
18
2.5. Conclusions
Vascular access in neonates and small infants remains a major challenge for
adequate paediatric cardiopulmonary bypass. Small vascular structures,
congenital malformations and technical limitations in the manufacturing of
cannulas give rise to specific problems. A better documentation of the
pressure-flow relationship of a cannula in combination with its shear stress
data will help the clinician in choosing the best cannula for a given procedure.
Thus manufacturers should provide more adequate information regarding the
pressure-flow characteristics and both the inner and outer diameter of their
products.
References
1. FH Kern, PR Hickey. The effects of cardiopulmonary bypass on the brain.
In: Cardiopulmonary bypass in neonates, infants and young children. Eds:
RA Jonas, MJ Elliott. Butterworth-Heinemann, Oxford 1994: 263-281
2. RA Rodriguez, G Cornel, L Semelhago, WM Splinter, NA Weerasena.
Cerebral effects in superior vena caval cannula obstruction: the role of
brain monitoring. Ann Thorac Surg 1997; 64: 1820-1822.
3. RA Rodriguez, G Cornel, WM Splinter, NA Weerasena, CW Reid. Cerebral
vascular effects of aortovenous cannulations for pediatric cardiopulmonary
bypass. Ann Throac Surg 2000; 69: 1229-1235.
4. M Elliott. Canulation for cardiopulmonary bypass for repair of congenital
heart disease. In: Cardiopulmonary bypass in neonates, infants and young
children. Eds: RA Jonas, MJ Elliott. Butterworth-Heinemann, Oxford 1994:
128-140.
Chapter 2
19
5. PM Galletti, GA Brecher. Connection of the vascular system with an
extracorporeal circuit. In: Heart lung bypass; principles and techniques of
extracorporeal circulation. New York: Grune and Stratton; 1962: 171-193.
6. JF Douglas, JM Gaiorek, JA Swaffield, Part III Dimensional Analysis and
Similarity in Fluid Mechanics, 3rd ed., Longman Scientific & Technical,
Harlow, UK; 1985.
7. Delius RE, Montoya JP, Merz SI, McKenzie J, Snedecor S, Bove EL,
Bartlett RH. New method for describing the performance of cardiac
surgery cannulas. Ann Thorac Surg. 1992 Feb;53(2):278-81.
8. Sinard JM, Merz SI, Hatcher MD, Montoya JP, Bartlett RH. Evaluation of
extracorporeal perfusion catheters using a standardized measurement
technique--the M-number. ASAIO Trans. 1991 Apr-Jun;37(2):60-4.
9. Montoya JP, Merz SI, Bartlett RH. A standardized system for describing
flow/pressure relationships in vascular access devices. ASAIO Trans.
1991; 37(1):4-8
10. Kim WG, Park SS. Clinical application of the M-numbers of aortic cannulas
during hypothermic cardiopulmonary bypass in pediatric patients. Artif
Organs. 1999 Apr;23(4):369-72.
11. Uyttersprot N. “Stromingseigenschappen en bloedcompatibiliteit van
kindercanules.” Master of Science in Engineering, Thesis in Dutch, Ghent
University, 1999.
12. Verdonck P, Siller U, De Wachter D, De Somer F. Hydrodynamical
comparison of aortic arch cannulae. Int J Artif Organs, 1998; 21:705-713.

Chapter 2
20
13. LJ Wurzinger, R Opitz, P Blasberg, H Schmid-Schönbein. Platelet and
coagulation parameters following millisecond exposure to laminar shear
stress. Thrombosis and Haemostasis. 1985; 54: 381-386.
14. SM Slack, VT Turitto. Fluid dynamic and hemorheologic considerations.
Cardiovasc Pathol 1993; 2(3): 11S-21S.
15. F De Somer, L Foubert, M Vanackere, D Dujardin, J Delanghe, G Van
Nooten. Impact of oxygenator design on hemolysis, shear stress, white
blood cell and platelet count. J. Cardiothor.Vasc. Anesth. 1996; 10: 884-
889
16. LV McIntire, RR Martin. Mechanical trauma induced PMN leukocyte
dysfunction. In The Rheology of Blood Vessels and Associated Tissues
Eds Gross DR, Hwang NHC.. Alphen aan den Rijn: NATO Advanced
Study Institute Series - E, No 41, Sijthoff & Noordhoff, 1981

Chapter 3
21
Chapter 3 Circuit design
The cardiopulmonary bypass circuit consists basically of venous and arterial
(often including an arterial filter) tubing lines and an oxygenator with
integrated heat exchanger. This chapter deals with the hydrodynamic design
of the tubing and arterial filter. The artificial lung or oxygenator is discussed in
chapter 4.
3.1. Tubing
3.1.1. Priming volume
Once cardiopulmonary bypass is started, the volume in the arterial and
venous line as well as the priming volume of the oxygenator enlarges the total
circulating blood volume of the baby. Additionally, suction and vent lines that
are empty before starting cardiopulmonary bypass, remove an important
amount of blood out of the circulation once in use. Subsequently this blood is
returned into the circulation just before weaning cardiopulmonary bypass. As
a result important and rapid changes in circulating blood volume occur during
cardiopulmonary bypass. Because of this it is important to keep volumes in
the complete extracorporeal circulation as small as possible without
jeopardising flow requirements of the given lines. Its length and diameter
(Table 1) determine the volume of a line

Chapter 3
22
Table 1: Priming volumes for different tubing diameters
Tubing diameter 1
Inch mm
Priming volume per 10 cm of
length (mL)
1/8 3.17 0.792
3/16 4.76 1.781
1/4 6.35 3.167
3/8 9.53 7.126
1/2 12.70 12.668
3.1.2. Dimensions of the tubing
3.1.2.1. Introduction
The dimensions of the venous and arterial lines depend on the desired blood
flow rate and the height difference between table and oxygenator. When
gravity drainage is used a height difference between 30 and 40 cm is
generally accepted [1]. In many institutions sizing of tubing is established in
an empirical way. A more objective way is to decide based on fluid dynamic
parameters [2], thus limiting the dead volume in the aspiration lines to an
absolute minimum. The resulting reduction in priming volume results in less
homologous blood product utilisation [3,4].
3.1.2.2. Laminar or turbulent flow
Two types of steady flow of real fluids exist: laminar flow and turbulent flow
with a transition zone in between. Different fluid dynamic laws govern the two
types of flow.
1 1 inch = 25.4 mm

Chapter 3
23
In laminar flow, fluid particles move along straight, parallel paths in layers.
Magnitudes of velocities of adjacent layers are not the same. The viscosity of
the fluid is dominant and thus suppresses any tendency for turbulent
conditions due to the inertia of the fluid.
In turbulent flow, fluid particles move in a haphazard fashion in all directions.
The critical velocity is the velocity below which all turbulence is damped out by
the viscosity of the fluid. It is found that a Reynolds number of about 2000
represents the upper limit of laminar steady flow of practical interest. The
Reynolds number is a dimensionless number, representing the ratio of inertia
forces to viscous forces, in circular pipes [2].
νUD Re =
U = mean velocity [m/s], D = diameter [m], ν =kinematic viscosity [m²/s]
with
ρν
µ=
where ρ = density [kg/m³], µ = absolute blood viscosity [N/m² .s]
3.1.2.3. Blood viscosity
Dynamic viscosity of a fluid (µ) is either determined from literature data or
measured in a viscosity meter. Blood viscosity can be described by
exponential formula with:
100)273(
180064.5exp
+
+−=
Tplasmaµ
)31.2exp( Hctµµ plasma=
[ ])1(035.109.1 HctHct −+=ρ
Chapter 3
24
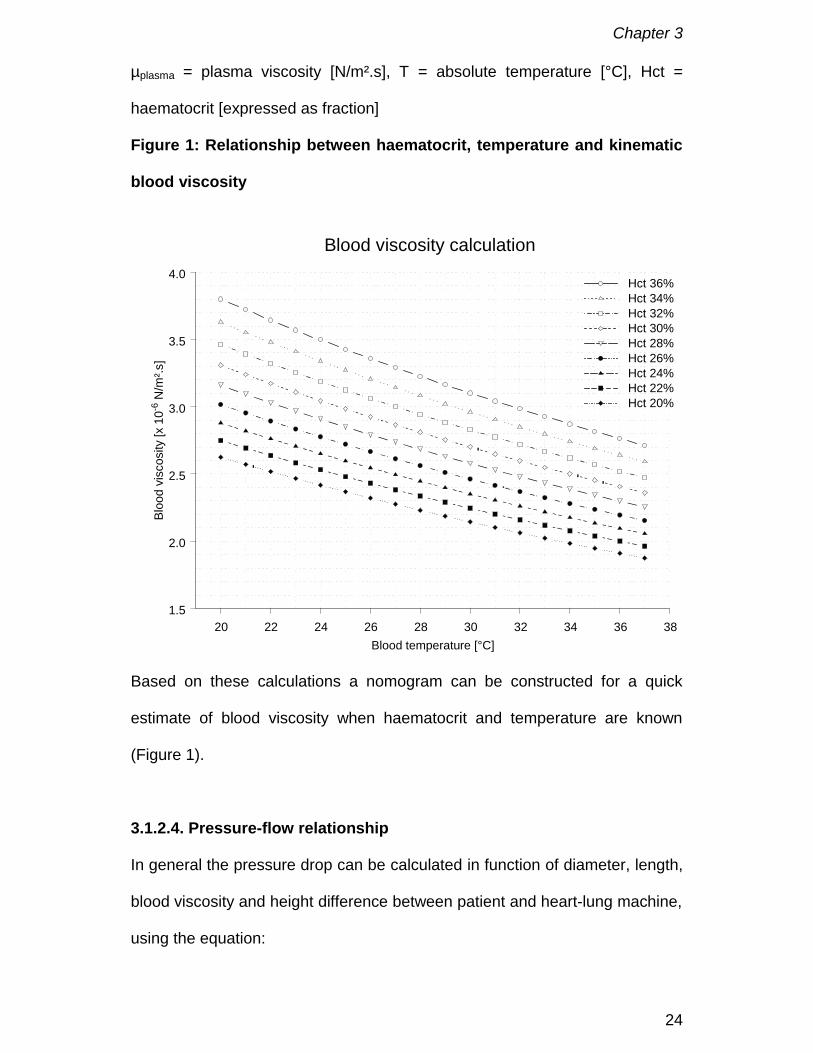
µplasma = plasma viscosity [N/m².s], T = absolute temperature [°C], Hct =
haematocrit [expressed as fraction]
Figure 1: Relationship between haematocrit, temperature and kinematic
blood viscosity
20 22 24 26 28 30 32 34 36 38Blood temperature [°C]
1.5
2.0
2.5
3.0
3.5
4.0
Bloo
d vi
scos
ity [x
10-6
N/m
².s]
Hct 36%Hct 34%Hct 32%Hct 30%Hct 28%Hct 26%Hct 24%Hct 22%Hct 20%
Blood viscosity calculation
Based on these calculations a nomogram can be constructed for a quick
estimate of blood viscosity when haematocrit and temperature are known
(Figure 1).
3.1.2.4. Pressure-flow relationship
In general the pressure drop can be calculated in function of diameter, length,
blood viscosity and height difference between patient and heart-lung machine,
using the equation:
Chapter 3
25
gU
DLfP
2
2
=∆
where f = friction factor, g = gravitational acceleration [m/s²] and
Re64
=f when flow is laminar.
However when the flow regimen is turbulent f is calculated using the
Colebrook equation:
+−=
fDf Re51.2
7.3log21 ε
with ε the roughness parameter.
Besides the Colebrook equation the Blasius formula is valid for smooth pipes
and low Reynold numbers. The friction factor becomes independent of the
roughness of the tube
41
Re316.0−
=f
By using these equations flow diagrams can be calculated for venous and
arterial lines in function of length, diameter, required blood flow, viscosity and
desired pressure drop.
3.1.2.5. Case study
If a baby needs cardiopulmonary bypass support one can calculate what
should be the appropriate diameter for both arterial and venous line. In our
example, the cardiopulmonary bypass circuit has an arterial and venous line
of 150 cm. The surgeon wants for this specific case a haematocrit of 30% and
no hypothermia during cardiopulmonary bypass. The maximum blood flow to
ensure adequate tissue perfusion is 700 mL/min.

Chapter 3
26
From Figure 2 we learn that both 3/16 and 1/4 inch arterial lines generate
laminar flow (shaded zone) for the given conditions. However, the pressure
loss over the arterial line will be approximately 20 mmHg higher if a 3/16 inch
diameter is chosen. This difference is acceptable so a 3/16 inch line gives the
best compromise between priming volume and pressure-flow characteristics.
Figure 2. Flow regimen in paediatric arterial lines
0.1 0.3 0.5 0.7 0.9 1.1 1.3 1.5 1.7 1.9Blood flow [L/min]
0
50
100
150
Pres
sure
dro
p [m
mHg
]
Characteristics of 3/16" and 1/4" arterial lines.
Reynolds < 20003/16 3/16 3/16 3/16
3/163/16
3/163/16
3/163/16
3/16
3/16
3/16
3/16
3/16
3/16
3/16
3/16
3/16
3/16
3/16
1/4 1/4 1/4 1/4 1/4 1/4 1/4 1/4 1/4 1/4 1/4 1/4 1/4 1/4 1/4 1/4 1/4 1/41/4
1/41/4
Length: 150 cmTemperature: 37° CelsiusHaematocrit: 30%
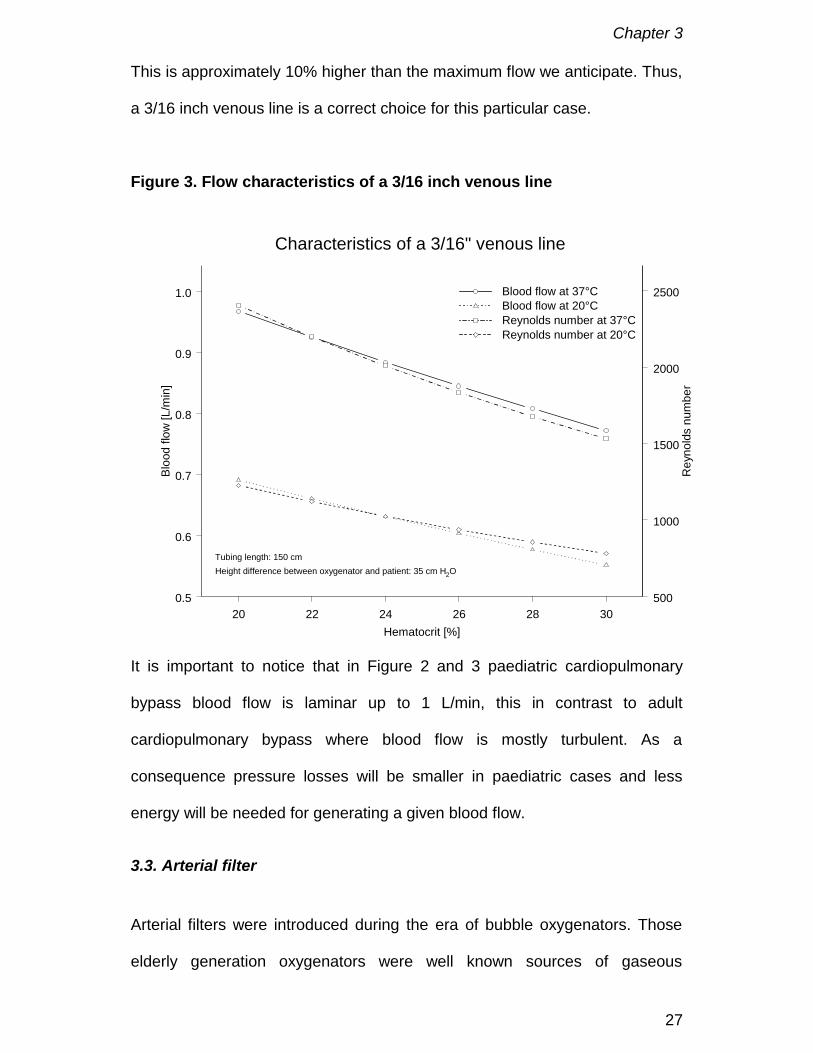
Suppose it is decided to use a 3/16 inch venous line in the above described
case and the height difference between the operating table and the
oxygenator is 35 cm H20. We can determine the limitations of this choice by
using Figure 3. On the right Y-axis we notice that the Reynolds number
(squares), when using a haematocrit of 30% (X-axis) and a blood temperature
of 37°C, is below 2000 for a blood flow of 700 mL/min. The maximum blood
flow we can drain for these conditions (circles) is 770 mL/min (left Y-axis).
Chapter 3
27
This is approximately 10% higher than the maximum flow we anticipate. Thus,
a 3/16 inch venous line is a correct choice for this particular case.
Figure 3. Flow characteristics of a 3/16 inch venous line
20 22 24 26 28 30Hematocrit [%]
0.5
0.6
0.7
0.8
0.9
1.0
Bloo
d flo
w [L
/min
]
Blood flow at 37°CBlood flow at 20°CReynolds number at 37°CReynolds number at 20°C
500
1000
1500
2000
2500
Rey
nold
s nu
mbe
r
Characteristics of a 3/16" venous line
Tubing length: 150 cmHeight difference between oxygenator and patient: 35 cm H2O
It is important to notice that in Figure 2 and 3 paediatric cardiopulmonary
bypass blood flow is laminar up to 1 L/min, this in contrast to adult
cardiopulmonary bypass where blood flow is mostly turbulent. As a
consequence pressure losses will be smaller in paediatric cases and less
energy will be needed for generating a given blood flow.
3.3. Arterial filter
Arterial filters were introduced during the era of bubble oxygenators. Those
elderly generation oxygenators were well known sources of gaseous
Chapter 3
28
microemboli. At the end of the eighties membrane oxygenators became the
standard resulting in almost no gaseous microemboli. The removal of
gaseous microemboli by arterial filters is based on the concept of the bubble
trap and the bubble barrier. The bubble trap concept exploits the tendency of
bubbles to rise in a liquid if given the opportunity. This can be accomplished
by reducing the velocity of the incoming blood so that the natural buoyancy of
the bubbles becomes the dominant force. If an escape path is provided these
bubbles can be eliminated. This technique can remove bubbles of 300 µm or
more in diameter. Gas separation based on the surface tension phenomena
at a wetted screen is employed for the removal of bubbles less than 300 µm.
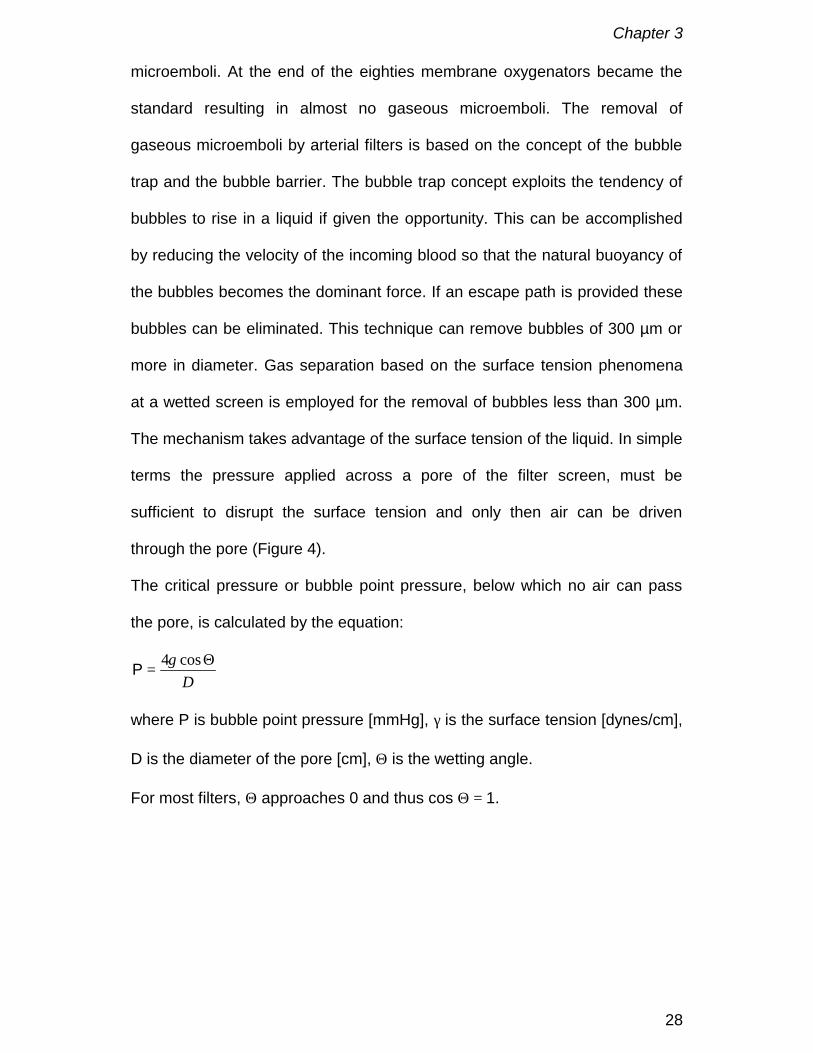
The mechanism takes advantage of the surface tension of the liquid. In simple
terms the pressure applied across a pore of the filter screen, must be
sufficient to disrupt the surface tension and only then air can be driven
through the pore (Figure 4).
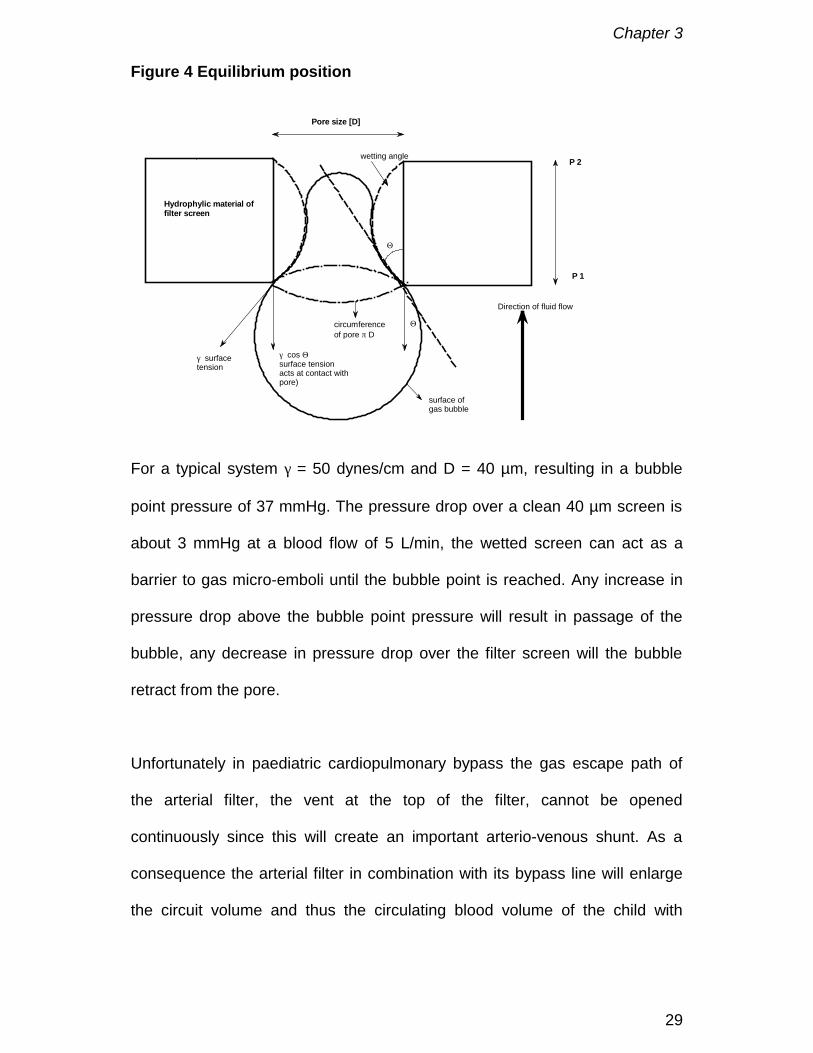
The critical pressure or bubble point pressure, below which no air can pass
the pore, is calculated by the equation:
DΘ
=cos4γP
where P is bubble point pressure [mmHg], γ is the surface tension [dynes/cm],
D is the diameter of the pore [cm], Θ is the wetting angle.
For most filters, Θ approaches 0 and thus cos Θ = 1.
Chapter 3
29
Figure 4 Equilibrium position
P 1
P 2
Pore size [D]
Hydrophylic material offilter screen
Direction of fluid flow
γ surfacetension
circumferenceof pore π D
γ cos Θsurface tensionacts at contact withpore)
Θ
surface ofgas bubble
Θ
wetting angle
For a typical system γ = 50 dynes/cm and D = 40 µm, resulting in a bubble
point pressure of 37 mmHg. The pressure drop over a clean 40 µm screen is
about 3 mmHg at a blood flow of 5 L/min, the wetted screen can act as a
barrier to gas micro-emboli until the bubble point is reached. Any increase in
pressure drop above the bubble point pressure will result in passage of the
bubble, any decrease in pressure drop over the filter screen will the bubble
retract from the pore.
Unfortunately in paediatric cardiopulmonary bypass the gas escape path of
the arterial filter, the vent at the top of the filter, cannot be opened
continuously since this will create an important arterio-venous shunt. As a
consequence the arterial filter in combination with its bypass line will enlarge
the circuit volume and thus the circulating blood volume of the child with
Chapter 3
30
approximately 50 mL. This volume increase represents approximately 25% of
the total circuit volume.
However, the microporous fibres of the membrane can actively remove
gaseous microemboli. When blood enters the oxygenator its velocity will be
reduced, in the same manner as in an arterial filter, due to the larger open
area for blood flow. When gas comes into contact with the microporous fibres
it will be transported through the micropores due to the pressure difference
between the blood and gas side. This process is in function of pressure drop,
contact area and the availability of gas exchange fibres at the entrance of the
oxygenator.
3.4. Conclusions
The use of hydrodynamic formulas for the calculation of tubing length and
diameter allows the surgical team to define the best possible solution for a
given clinical situation based on desired pressure drop and flow pattern.
The use of an arterial line filter is debatable since it is a passive device that
cannot operate with open vent line during paediatric cardiopulmonary bypass.
The exclusion of the arterial filter in combination with an adequate choice of
tubing will result in an important reduction of dead volume and less
haemodilution, leading to a reduced use of homologous blood products.
Chapter 3
31
References
1. JE Brodie, RB Johnson. In The manual of clinical perfusion. Augusta,
Glendale Medical Corporation, 1994, 9-14.
2. P Dierickx, D De Wachter, P Verdonck. Fluid mechanical approach of
extracorporeal circulation. Course notes Institute Biomedical Technology,
Hydraulics laboratory Ghent University, 1998.
3. Elliot M. Minimizing the bypass circuit: a rational step in the development
of pediatric perfusion. Perfusion 1993; 8: 81-86
4. Tyndal M, Berryessa RG, Campbell DN, Clarke DR. Micro-Prime Circuit
Facilitating Minimal Blood use during Infant Perfusion. J. Extra-Corpor.
Technol. 1987, 19: 352-357

Chapter 3
32
Chapter 4
33
Chapter 4 Oxygenation by artificial lung systems
The artificial lung or oxygenator is the most technical part of the
cardiopulmonary bypass circuit. The design objectives of the “ideal”
oxygenator are still the same as in 1962 when Galletti and Brecher [1]
described, the “ideal” oxygenator as one that provided: oxygenation of venous
blood, carbon dioxide elimination, minimum blood trauma, small priming
volume and safety.
Today almost 100% of the oxygenators used are membrane oxygenators [2].
Meaning that a membrane separates the gas and the blood phase. The
majority of devices use a microporous hydrophobic membrane. Beside the
function of gas exchanger most devices incorporate a heat exchanger and a
reservoir. Thus the oxygenator performs all major functions of the natural
lungs except for their endocrine function, which can be suspended for a short
time without major ill effects.
4.1. The venous reservoir
There are two basic types of venous reservoirs: closed and open. The closed
system consists of a PVC bag with an in and outlet and one or more venting
ports for the evacuation of air. Advantages of the closed system are almost no
blood-air interface, small foreign surface area; collapse of the outlet when the
reservoir is suddenly emptied; quick indication of fluid changes and the ability
of volume controlled weaning from cardiopulmonary bypass. Disadvantages
are a more difficult air removal, when air accidentally enters the system, and
the need for an additional cardiotomy reservoir.
Chapter 4
34
The open system is in essence a reservoir open to the atmosphere with
incorporated cardiotomy reservoir. This system is somewhat easier to set-up
than a closed system and avoids the use of an additional cardiotomy
reservoir. When accidentally large amounts of air enter the reservoir, this can
be faster removed than in a closed system. The major disadvantages are the
large foreign surface area, the hold-up of volume in filter and defoamer and
the risk of inadvertently pumping air.
4.2. The heat-exchanger
The working principle of a heat exchanger is based on the principles of
conduction and forced convection. Water is used to control the temperature of
the blood. A common misconception is that the blood side is the determining
factor for performance. The water side is as important because it is desirable
to have high flows and turbulent flow to promote conductance. On the blood
side it is important to maintain laminar flow to minimise blood component
damage, but also to keep the total cross sectional area for blood flow as small
as possible to increase conductance [3].
The material used for the separation between the blood and water flows
should be as thin as possible for the highest conductance, with a very high
thermal conductivity, yet still have the integrity to withstand the expected
water and blood side pressures without failure.
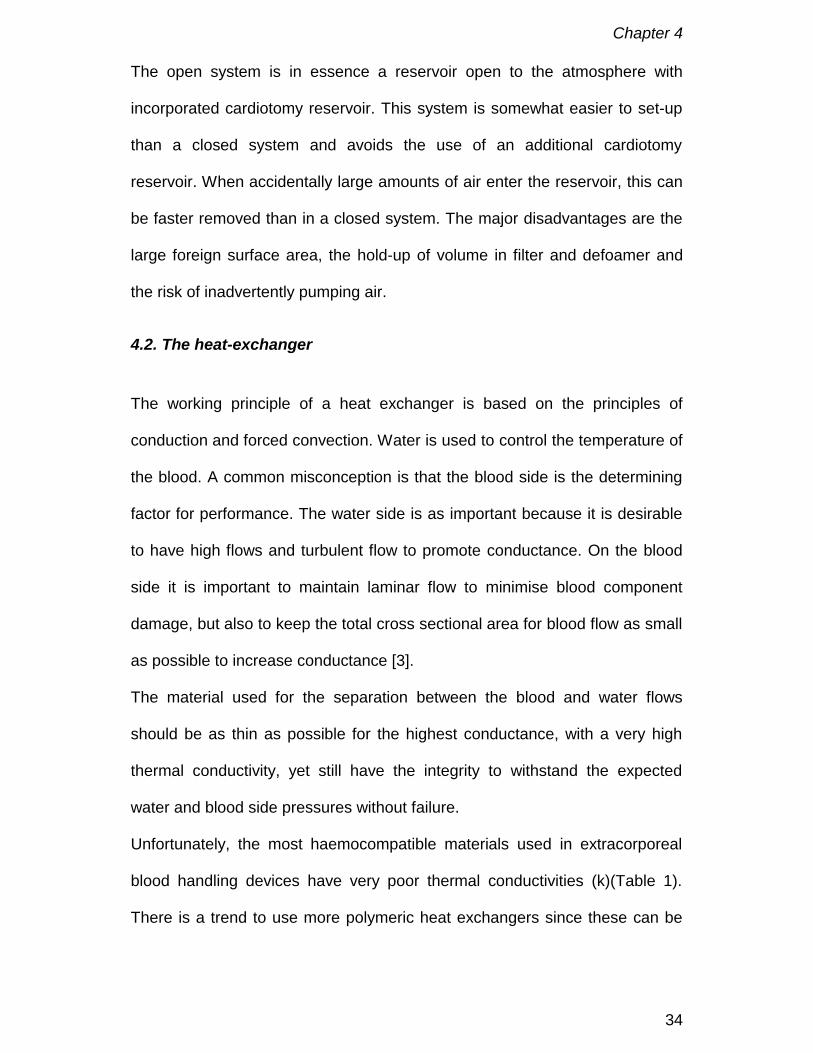
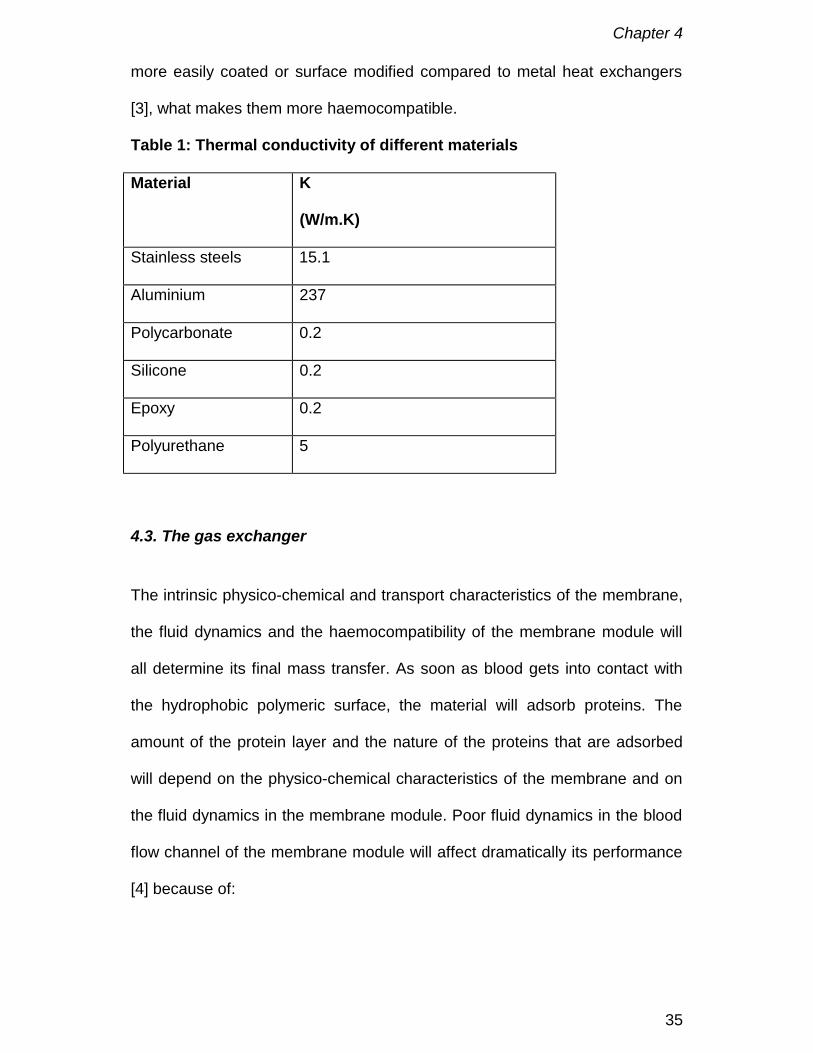
Unfortunately, the most haemocompatible materials used in extracorporeal
blood handling devices have very poor thermal conductivities (k)(Table 1).
There is a trend to use more polymeric heat exchangers since these can be
Chapter 4
35
more easily coated or surface modified compared to metal heat exchangers
[3], what makes them more haemocompatible.
Table 1: Thermal conductivity of different materials
Material K
(W/m.K)
Stainless steels 15.1
Aluminium 237
Polycarbonate 0.2
Silicone 0.2
Epoxy 0.2
Polyurethane 5
4.3. The gas exchanger
The intrinsic physico-chemical and transport characteristics of the membrane,
the fluid dynamics and the haemocompatibility of the membrane module will
all determine its final mass transfer. As soon as blood gets into contact with
the hydrophobic polymeric surface, the material will adsorb proteins. The
amount of the protein layer and the nature of the proteins that are adsorbed
will depend on the physico-chemical characteristics of the membrane and on
the fluid dynamics in the membrane module. Poor fluid dynamics in the blood
flow channel of the membrane module will affect dramatically its performance
[4] because of:
Chapter 4
36
1. High blood boundary layer resistance to mass transport. This remains
extremely important since the resistance to mass transfer in a microporous
membrane oxygenator is fluid bound.
2. Poor haemocompatibility. High shear rates, eddy formation and stagnation
will favour the occurrence of clotting [5]
3. Large membrane surface. This will is needed for obtaining enough mass
transfer but will on the other hand cause activation of the complement
system [6,7]
In order to obtain the best possible fluid dynamics, most manufacturers use
today extra luminal flow (ELF) designs. In this design blood is flowing outside
regularly spaced hollow fibres. The hollow fibres are delivered knitted together
in a double layer mat. The membrane module is manufactured by wrapping a
double layer hollow fibre mat around a solid core, which is then inserted into a
cylindrical shell. In these modules blood flows through the membrane mesh
while gas flow is fed counter-currently into the hollow fibres. Since flow
through the membrane mesh will be forced to flow partly along and partly
around each hollow fibre secondary flows will be generated. This particular
membrane arrangement induces mixing in every section of the membrane
module to an extent that will depend on the membrane angle with respect to
the main direction of blood flow [4]. The efficient destruction of boundary
layers by this “static mixer” configuration leads to reduced resistance to mass
transfer [8] and yields high transfer rates across the membrane. Aside of the
better mass transfer this design has also lower pressure drops at the blood
side and no sharp edges in the blood flow path resulting in a better
haemocompatibility.
Chapter 4
37
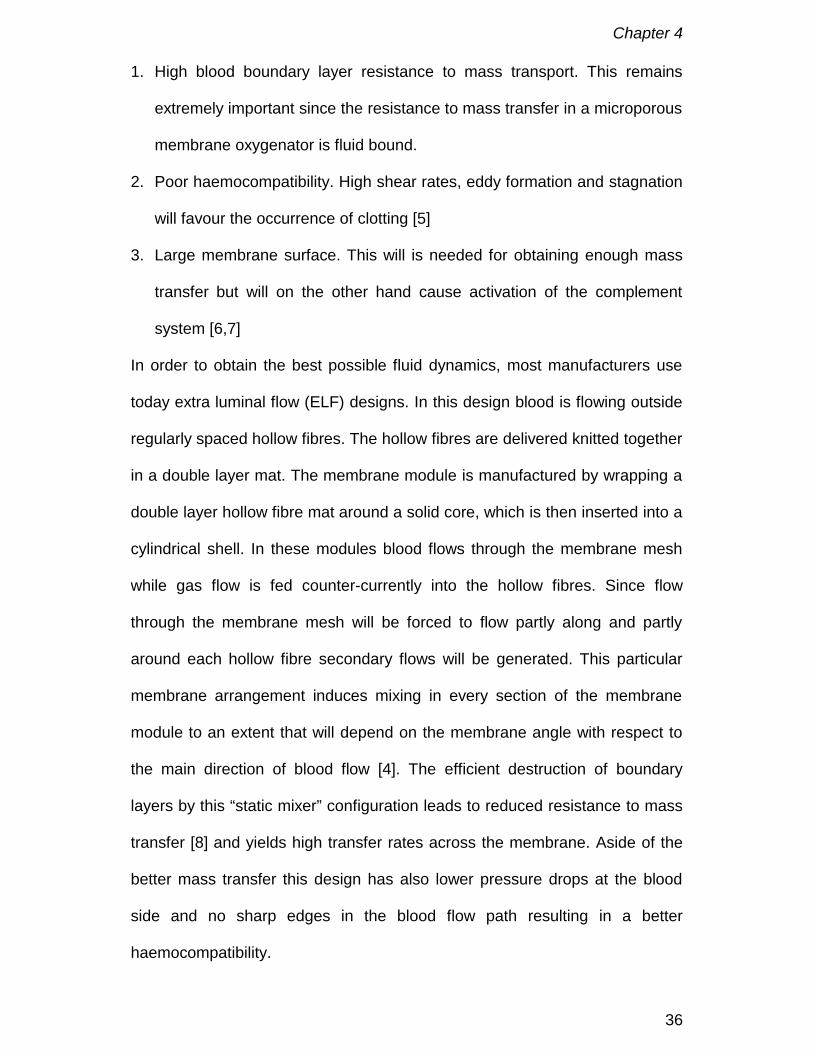
The introduction of this ELF design in paediatric oxygenators has resulted in
an important reduction of the total priming volume of the paediatric
cardiopulmonary bypass (Figure 1).
Figure 1. Evolution of priming volume in the University Hospital in Gent
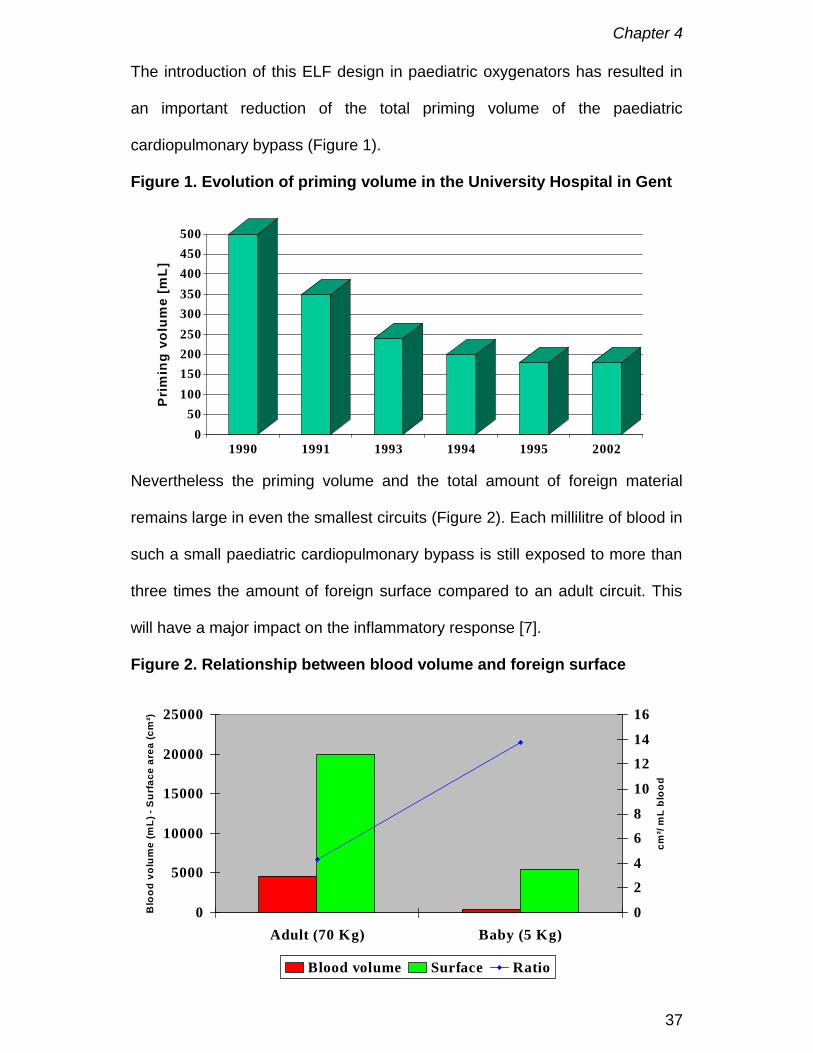
Nevertheless the priming volume and the total amount of foreign material
remains large in even the smallest circuits (Figure 2). Each millilitre of blood in
such a small paediatric cardiopulmonary bypass is still exposed to more than
three times the amount of foreign surface compared to an adult circuit. This
will have a major impact on the inflammatory response [7].
Figure 2. Relationship between blood volume and foreign surface
0
5000
10000
15000
20000
25000
Adult (70 Kg) Baby (5 Kg)
Blo
od v
olum
e (m
L) -
Sur
face
are
a (c
m²)
0
24
68
10
1214
16
cm²/
mL
bloo
d
Blood volume Surface Ratio
050
100150200250300350400450500
Pri
min
g vo
lum
e [m
L]
1990 1991 1993 1994 1995 2002

Chapter 4
38
4.4. Fluid dynamics and shear stress
As pointed out when describing the gas exchanger module, fluid dynamics is
an important item for obtaining optimal mass transfer. However an oxygenator
does consist of different components which must be connected. At the same
time, blood has to be evenly distributed over the heat exchanger and through
the membrane mesh by manifolds. As a result blood velocity will change when
blood passes through the oxygenator and this may result in zones of stasis,
eddy formation and or high shear. The average shear stress at the wall in a
membrane oxygenator can be calculated by starting with the general
macroscopic force balance for flow in a tube [9]. However, tube flow does not
accurately represent the complex flow in an ELF oxygenator. Flow through an
oxygenator can be considered as flow through a porous medium. According to
Bird [10] the shear stress in each oxygenator was calculated by considering
the flow equivalent to the flow in a packed column governed by:
LPRh∆
=τ
where: ∆P = pressure drop [N/m²], L= blood path length [cm], Rh = hydraulic
radius [cm]
)()(
)6/25(AeP
LQRhε
µ∆
=
where: ε = porosity of membrane area that fills that cross section
Q = volumetric pump flow [L/min]
µ = dynamic fluid viscosity [N/m².s]
Ae = cross sectional area for flow [m²]
25/6 = experimental derived factor.

Chapter 4
39
Mockros proposed a different formula for calculating shear in an oxygenator
[11,12].
21
∆
=VPQµ
τ
where: V = volume oxygenator [L]
The average shear for two different neonatal oxygenators calculated by both
formulas are given in table 2.
Table 2: Characteristics of two neonatal oxygenators
Parameter DidecoD901
PolystanSafe Micro
Membrane Surface area, m² 0.34 0.33Heat Exchanger Area, m² 0.02 0.05Void volume 0.58 0.48Total priming volume, cm³ 60 52Blood Pressure Drop @ 0.8 lpm (mmHg) 95 51Blood Pressure Drop @ 0.6 lpm (mmHg) 65 35Blood Pressure Drop @ 0.4 lpm (mmHg) 40 21Blood Pressure Drop @ 0.2 lpm (mmHg) 20 9Blood Path Length oxygenator, cm 30 15.3Average Cross sectional area for flow, cm² 12 7.62τ oxygenator (Ben Brian) [dynes/cm²]1 18 17τ oxygenator (Mockros) [dynes/cm²]1 25 20τ membrane compartment (Ben Brian)[dynes/cm²]1
31 19
τ membrane compartment (Mockros)[dynes/cm²]1
7 5
Although the calculated values are comparable with those in blood vessels
(see chapter 2), these values are average values and do not exclude that at
certain points in the design shear stress is above the critical level of 75 – 100
dynes/cm² needed to activate white blood cells and platelets.
1 ²
1²
10mN
cmdyne
=
Chapter 4
40
Every extracorporeal device will have a flow window with “ideal shear”. If
shear is to high platelets and blood elements will be damaged but when shear
is too low platelets will be more easily adsorbed by the material. As explained
earlier not only the magnitude of shear stress is important but also the
exposure time to this absolute value. It is well known that high shear for a
short time period is better tolerated than average shear during a long
exposure time [13]. In order to define spots with high or very low shear stress
in a design computational fluid dynamics are used [14-16].
4.5. Conclusions
Major improvements in oxygenator design has led to a large reduction in
foreign surface area, better haemocompatibility and enhanced mass transfer.
Although fluid dynamics have improved more work should be done to locate
risk zones at micro level. Computational fluid dynamics might offer the tool for
obtaining this goal. Finally this may lead to the ideal paediatric oxygenator
that will combine optimal fluid dynamics and thus mass transfer with a small
priming volume and foreign surface area.
References
1. PM Galletti, GA Brecher. Bubble oxygenation and membrane oxygenation.
In: Heart lung bypass; principles and techniques of extracorporeal
circulation. New York: Grune and Stratton; 1962: 108-120.

Chapter 4
41
2. Giovanni Cecere, Robert Groom, Richard Forest, Reed Quinn, Jeremy
Morton. A 10-year review of pediatric perfusion practice in North America.
Perfusion 2002; 17: 83-89.
3. RL Rigatti, R Stewart. Heat exchange in extracorporeal systems. In:
Cardiopulmonary bypass Principles and techniques of extracorporeal
circulation. Ed. CT Mora. New York: Springer Verlag; 1995: 247-256.
4. G Catapano, A Wodetzki, U Baurmeister. Blood flow outside regularly
spaced hollow fibers: the future concept of membrane devices. The Int J
Artif Organs 1992; 15: 327-330.
5. HL Goldsmith. The effects of flow and fluid mechanical stress on red cells
and platelets. Trans ASAIO 1974; 20: 21-26.
6. A Mahiout, H Meinhold, M Kessel, H Schulze, U Baurmeister. Dialyzer
membranes: effects of surface area and chemical modification of cellulose
on complement and platelet activation. Artif Organs 1987: 11: 149-154.
7. J Sonntag, I Dähnert, B Stiller, R Hetzer, PE Lange. Complement and
contact activation during cardiovascular operations in infants. Ann Thorac
Surg 1998; 65: 525-531.
8. WJ Dorson, KG Larsen. Secondary flows in membrane oxygenators. In
Mechanical devices for cardiopulmonary assistance. Eds. RH Bartlett, PA
Drinker, PM Galletti Adv. Cardiol., vol 6, pp 17-39 Karger, Basel 1971.
9. BF Brian. Comparative analysis of shear stress and pressure drop in
membrane oxygenators. White paper. Cobe Laboratories, Inc. 1995.
10. RB Bird, WE Stewart, EN Lightfoot. In: Transport phenomena. John Wiley
& Sons, NY, 1960.
Chapter 4
42
11. JM Ramstack, L Zuckerman, LF Mockros. Shear induced activation of
platelets. J Biomech 1979; 12: 113-125.
12. M Bluestein, LF Mockros. Hemolytic effects of energy dissipation in flowing
blood. Med Biol Eng 1969; 7: 1-6.
13. VT Turitto, CL Hall. Mechanical factors affecting hemostasis and
thrombosis. Thromb Res 1998; 15: S25-31.
14. MS Goodin, EJ Thor, WS Haworth. Use of computational fluid dynamics in
the design of the Avecor Affinity oxygenator. Perfusion 1994; 9: 217-222.
15. PW Dierickx, F De Somer, DS De Wachter, G Van Nooten, PR Verdonck.
Hydrodynamic characteristics of artificial lungs. ASAIO Journal, 2000;
46(5): 532-535.
16. Peter W Dierickx, Dirk S De Wachter, Filip De Somer, Guido Van Nooten,
Pascal R Verdonck. Mass Transfer Characteristics of Artificial Lungs.
ASAIO Journal, 2001; 47(6): 628-633.
Chapter 5
43
Chapter 5 Systemic inflammatory response
At the moment cardiac surgery starts; the baby is aggressed by many factors.
This agression by both surgery and cardiopulmonary bypass results in an
inflammatory response. There is little doubt that this inflammatory response is
responsible for a proportion of the mortality and morbidity associated with
cardiac surgery. Certain organs and tissues are at higher risk of developing
deranged function after the perfusion and in the postoperative period. At the
greatest risk are the formed elements in the blood, the platelet and white cell,
resulting in clotting problems and abnormal organ and tissue functions. In
particular the pulmonary system, heart and myocardium, kidney and
splanchnic bed, and the brain and cerebral circulation are specifically affected
and thus contribute to early postoperative morbidity and mortality [1]. Small
babies are even more at risk due to the larger volume and foreign surface
area of the extracorporeal circuit in combination with the immaturity of many
organs systems and the large amount of blood that after contact with tissue is
returned into the systemic circulation.
The bio-incompatibility of cardiopulmonary bypass is multifactorial (Figure 1)
and can be divided in two major groups: material independent and material
dependent [2].

Chapter 5
44
Figure 1.Bioincompatibility of paediatric cardiopulmonary bypass is
multifactorial
MaterialsMaterialsrelatedrelated
CircuitCircuitrelatedrelatedSurgerySurgery
relatedrelated
PatientPatientGeneticGeneticrelatedrelated
TempTemp..
CardioCardio--plegiaplegia
TissueTissueFactorFactor
DrugsDrugs
ShedShedandand/or/or
SuctionedSuctionedBloodBlood. Air. Air
SterilitySterility
OpenOpenvsvs
ClosedClosed
RollerRollervsvs
CentrifCentrif..
PulsePulsevsvs
NonNon
StasisStasisPointsPoints
EmboliEmboliShearShearStressStress
DebrisDebrisSurfaceSurfaceAreaArea(s)(s)
CanuCanu
--lationlation
CoagCoag
Pathophysiology and bioincompatibility of CPB
5.1. Material dependent
Under normal conditions, when blood is in a blood vessel with intact
endothelium, no activation of blood proteins or elements will occur. However,
the moment blood leaves this protected environment and comes into contact
with damaged endothelium, other tissue or artificial surfaces several cascades
of reactions will start. At the same time the shear stresses that work beneficial
when applied on endothelium by releasing mediators such as nitric oxide, will
now in absence of the endothelium activate blood elements. Aspects that
contribute to this activation cascade are the surface characteristics [3], the
sterilisation method and the chemical composition of the surface of the
polymer. It is important to notice that there can be major chemical differences
between the bulk material and the surface.
Chapter 5
45
5.2. Blood interactions with polymers
5.2.1. Protein adsorption and complement activation
As soon as blood comes in contact with the hydrophobic polymer surfaces of
the cardiopulmonary bypass the latter will be almost immediately covered with
proteins. The formation of this protein layer is followed by the adherence of
platelets. In addition to fibrinogen, γ-globulin preadsorbed to artificial surfaces
enhances the platelet release reaction in vitro. In contrast, serum albumin
passivates the surface towards platelet adhesion [4]. Glycosyl transferase
reactions involving incomplete terminal oligosaccharide units were postulated
as mediators for these platelet-protein interactions. These groups are present
in fibrinogen, γ-globulin and many other glycoproteins in plasma, but are
absent in albumin [5]. The highest concentration of fibrinogen on the material
is realised after 15 minutes [5]. Fibrinogen adsorption has been used as a
measure of thrombogenicity of materials. Aside from its role in the fibrin
formation it will bind blood platelets via their surface glycoproteins IIb/IIIa and
Gib [6]. However the platelets do not seem to interact with the material directly
but through the adsorbed protein layer.
In high flow rate conditions it seems that the platelet response is a major
determinant of blood incompatibility with artificial surfaces [2]. At this point it is
important to put in perspective the effects of shear stresses near the wall of
the hydrophobic polymers since this will contribute to leukocyte and platelet
activation and in exceptional situations red blood cell lysis.
Although complement is activated to a large degree via the alternative
pathway, it is only to a minimal extent, in adult surgery, linked to the foreign
Chapter 5
46
materials. Other pathways must be playing a role in the complement
activation such as factor XIIa, kallikrein and tissue factor [7]. Likewise, C3a
and C5a anaphylatoxins may appear to be reduced in plasma where in reality
they are adsorbed by the protein layers and thus are measured in lower
amounts [8].
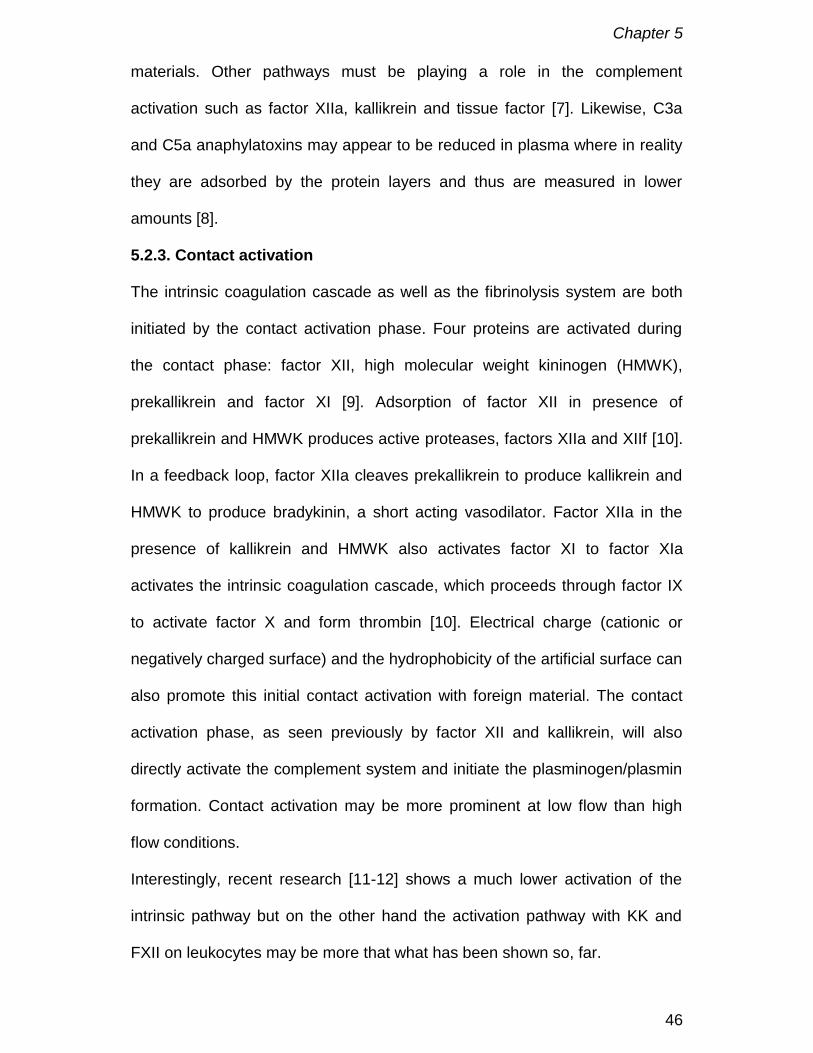
5.2.3. Contact activation
The intrinsic coagulation cascade as well as the fibrinolysis system are both
initiated by the contact activation phase. Four proteins are activated during
the contact phase: factor XII, high molecular weight kininogen (HMWK),
prekallikrein and factor XI [9]. Adsorption of factor XII in presence of
prekallikrein and HMWK produces active proteases, factors XIIa and XIIf [10].
In a feedback loop, factor XIIa cleaves prekallikrein to produce kallikrein and
HMWK to produce bradykinin, a short acting vasodilator. Factor XIIa in the
presence of kallikrein and HMWK also activates factor XI to factor XIa
activates the intrinsic coagulation cascade, which proceeds through factor IX
to activate factor X and form thrombin [10]. Electrical charge (cationic or
negatively charged surface) and the hydrophobicity of the artificial surface can
also promote this initial contact activation with foreign material. The contact
activation phase, as seen previously by factor XII and kallikrein, will also
directly activate the complement system and initiate the plasminogen/plasmin
formation. Contact activation may be more prominent at low flow than high
flow conditions.
Interestingly, recent research [11-12] shows a much lower activation of the
intrinsic pathway but on the other hand the activation pathway with KK and
FXII on leukocytes may be more that what has been shown so, far.

Chapter 5
47
5.3. Material independent
Other factors that influence the degree of inflammatory response do not
depend on the material but are equally or more important for the initiation of
an inflammatory response. A very aggressive activator is the cardiotomy
suction. Especially in paediatric surgery the amount of blood recuperated by
the cardiotomy reservoir can be quite large due to additional blood vessels
(e.g. left vena cava superior), flow through collateral vessels etc. This
aspirated blood is contaminated with tissue factor, tissue and fat fragments,
free plasma haemoglobin, thrombin, tissue plasminogen activator and fibrin
degradation products. All these elements in combination with the turbulent
flow and the blood-air mixing in the aspiration lines will activate, through blood
platelets and leukocytes, both coagulation and complement cascades. At the
same time the aspirated fat emboli are an important source of cerebral
embolisation [13] which, unfortunately cannot be prevented by the use of
venous or arterial filters [14-15]. Important is also the presence of high
amounts of S100BB in aspirated blood originating from fat, muscle and
marrow in the mediastinal blood [16]. Since it had always been postulated that
S100BB was a specific marker for brain damage and that the elevated plasma
levels found after cardiopulmonary bypass were caused by damage of the
brain.
A second factor is flow dynamics and fluid mechanical stresses (See also
chapters 2 & 4). Especially stasis and eddy formation has an important impact
on protein adsorption and thus on the formation of thrombi. Also shear stress
is an important activator of primarily platelets and leukocytes. The magnitude
and duration of shear stress will dependent from component to component
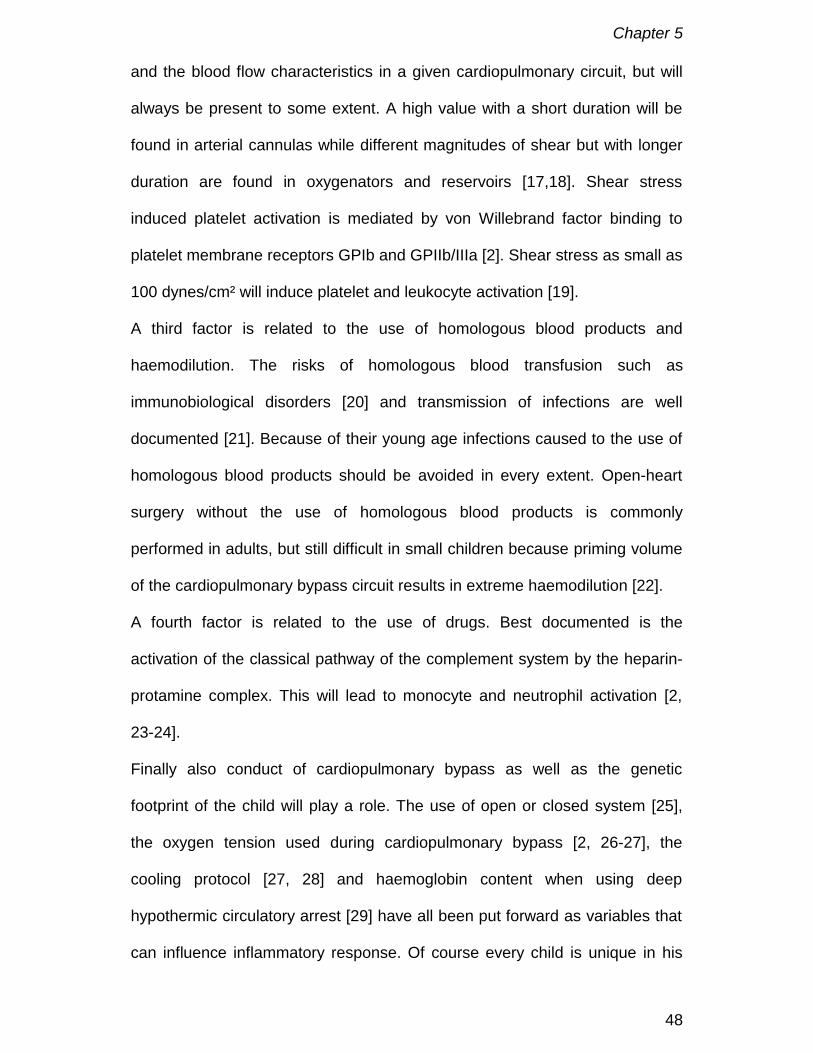
Chapter 5
48
and the blood flow characteristics in a given cardiopulmonary circuit, but will
always be present to some extent. A high value with a short duration will be
found in arterial cannulas while different magnitudes of shear but with longer
duration are found in oxygenators and reservoirs [17,18]. Shear stress
induced platelet activation is mediated by von Willebrand factor binding to
platelet membrane receptors GPIb and GPIIb/IIIa [2]. Shear stress as small as
100 dynes/cm² will induce platelet and leukocyte activation [19].
A third factor is related to the use of homologous blood products and
haemodilution. The risks of homologous blood transfusion such as
immunobiological disorders [20] and transmission of infections are well
documented [21]. Because of their young age infections caused to the use of
homologous blood products should be avoided in every extent. Open-heart
surgery without the use of homologous blood products is commonly
performed in adults, but still difficult in small children because priming volume
of the cardiopulmonary bypass circuit results in extreme haemodilution [22].
A fourth factor is related to the use of drugs. Best documented is the
activation of the classical pathway of the complement system by the heparin-
protamine complex. This will lead to monocyte and neutrophil activation [2,
23-24].
Finally also conduct of cardiopulmonary bypass as well as the genetic
footprint of the child will play a role. The use of open or closed system [25],
the oxygen tension used during cardiopulmonary bypass [2, 26-27], the
cooling protocol [27, 28] and haemoglobin content when using deep
hypothermic circulatory arrest [29] have all been put forward as variables that
can influence inflammatory response. Of course every child is unique in his

Chapter 5
49
genetic footprint and this can interact in the way they biologically will react on
the damage caused by the surgery and cardiopulmonary bypass. The
haptoglobin phenotype for example will determine the capacity for binding free
plasma haemoglobin [30] and might have an impact on the immune response
[31]. While the different platelet PLA allelic frequency have been associated
with a predisposition for increased thrombogenicity [32], increased release of
IL8 and TNF after cardiopulmonary bypass [33] and more pronounced
neurocognitive decline after cardiopulmonary bypass [34]. Beside these
genetic factors also the pathology might influence the activation of the
different cascade. The higher incidence of fibrinolysis in cyanotic children is a
perfect example of the latter.
Inflammatory response to cardiopulmonary bypass is considerably more
complex than it seemed a decade ago. In children the analysis of
inflammatory response is even more complex due to different response of
neonates and children to cardiopulmonary bypass [35]. Nevertheless, it is
possible, based on our present knowledge to attenuate inflammatory
response. The large foreign surface area of the paediatric cardiopulmonary
bypass circuit, almost 4 times more than an adult circuit, remains an important
issue [5]. Changing this surface into a more blood compatible surface looks
promising. The aims of such a re-engineering should be elimination or
reduction of [2]:
1. Plasma protein adsorption in order to reduce cellular activation
2. Coagulation activation
3. Complement activation
4. Leukocyte activation
Chapter 5
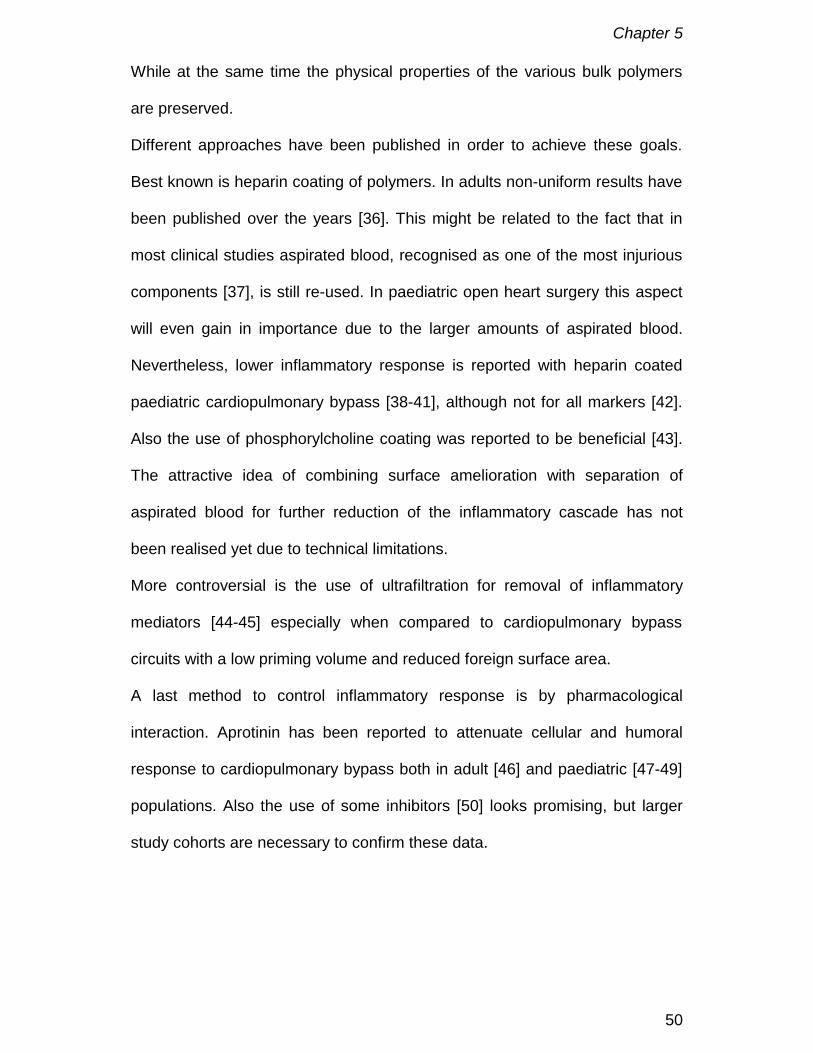
50
While at the same time the physical properties of the various bulk polymers
are preserved.
Different approaches have been published in order to achieve these goals.
Best known is heparin coating of polymers. In adults non-uniform results have
been published over the years [36]. This might be related to the fact that in
most clinical studies aspirated blood, recognised as one of the most injurious
components [37], is still re-used. In paediatric open heart surgery this aspect
will even gain in importance due to the larger amounts of aspirated blood.
Nevertheless, lower inflammatory response is reported with heparin coated
paediatric cardiopulmonary bypass [38-41], although not for all markers [42].
Also the use of phosphorylcholine coating was reported to be beneficial [43].
The attractive idea of combining surface amelioration with separation of
aspirated blood for further reduction of the inflammatory cascade has not
been realised yet due to technical limitations.
More controversial is the use of ultrafiltration for removal of inflammatory
mediators [44-45] especially when compared to cardiopulmonary bypass
circuits with a low priming volume and reduced foreign surface area.
A last method to control inflammatory response is by pharmacological
interaction. Aprotinin has been reported to attenuate cellular and humoral
response to cardiopulmonary bypass both in adult [46] and paediatric [47-49]
populations. Also the use of some inhibitors [50] looks promising, but larger
study cohorts are necessary to confirm these data.

Chapter 5
51
5.4. Conclusion
The inflammatory response to cardiopulmonary bypass is considerably more
complex than it seemed a decade ago. The acute phase response to trauma
may be an integral part of this process. Our expanding knowledge of
inflammatory mediators will allow a better understanding of cardiopulmonary
related morbidity and may hopefully lead to improvement of biocompatibility of
cardiopulmonary bypass resulting in less injurious systemic responses and
diminished organ and tissue damage.
References
1. D Royston. Systemic inflammatory responses to surgery with
cardiopulmonary bypass. Perfusion, 1996; 11: 177-189.
2. S Daniel. Review of the multifactorial aspects of BioInCompatibility in CPB.
Perfusion, 1996; 11: 246-255.
3. NP Ziats, DA Pankowsky, BP Tierney et al. Absorption of Hagemann
factor and other human plasma proteins to biomedical polymers. J Lab
Clin Med 1990; 116: 687-696.
4. V Videm, E Fosse, JL Svennig. Platelet preservation during coronary
bypass surgery with bubble and membrane oxygenators: effect of albumin
priming. Perfusion 1993;8: 409-415.
5. BR Young, LK Lambrecht, SL Cooper. Plasma Proteins: Their Role in
Initiating Platelet and Fibrin Deposition on Biomaterials. In Cooper SL,
Peppas NA, eds. Biomaterials: Interfacial Phenomena and Applications..
Washington DC: Advances in Chemistry Series 199, American Chemical
Society, 1982; 317-350
Chapter 5
52
6. BR Young, LK Lambrecht, RM Albrecht et al. Platelet protein interactions
at blood-polymer interfaces in the canine test model. Trans ASAIO, 1983;
29: 442-446.
7. YJ Gu, MA Mariani, PW Boonstra, JG Grandjean, W van Oeveren.
Complement activation in coronary bypass grafting patients without
cardiopulmonary bypass. The role of tissue injury by surgical incision.
Chest 1999; 116: 892-898.
8. H Nishida, S Aomi, Y Tomizawa et al. Comparative study of
biocompatibility between the open and closed circuit in cardiopulmonary
bypass. Artificial Organs 1999; 23: 547-551.
9. RW Colman. Surface mediated defense reactions. The plasma contact
activation system. J Clin Invest 1984; 73: 1249.
10. LH Edmunds, N Stenach. Blood-surface interface. In: GP Gravlee, RF
Davis, M Kurusz, JR Utley eds. Cardiopulmonary bypass. Principles and
practice Philadelphia: Lippincott Williams & Wilkins, 2000: 150-166.
11. W Gil. Inflammo-coagulatory response, extrinsic pathway thrombin
generation and a new theory of activated clotting time interpretation.
Perfusion 2001;16(1):27-35.
12. C Baufreton, JL de Brux. Les traitements de surface en circulation
extracorporelle. RBM 1999;21 suppl 1: 20-25.
13. RF Brooker, WR Brown, DM Moody, et al. Cardiotomy Suction: A Major
Source of Brain Lipid Emboli During Cardiopulmonary Bypass. Ann Thorac
Surg 1998;65:1651-55.
14. DA Stump. Emboli: Their source and significance in neurological outcome.
25th Anniversary NeSECC Journal 2001; 26: 15-19

Chapter 5
53
15. EH Kincaid, TJ Jones, DA Stump et al. Processing scavenged blood with a
cell saver reduces cerebral lipid microembolization. In: Annual meeting of
the Southern Thoracic Association; Puerto Rico, 1999.
16. RE Anderson, LO Hansson, O Nilsson, J Liska, G Settergren, J Vaage.
Increase in serum S100A-1B and S100BB during cardiac surgery arises
from extracerebral sources. Ann Thorac Surg 2001; 71: 1512-1517.
17. F De Somer, L Foubert, M Vanackere, D Dujardin, J Delanghe, G Van
Nooten. Impact of oxygenator design on hemolysis, shear stress, white
blood cell and platelet count. J. Cardiothor.Vasc. Anesth. 1996; 10: 884-
889
18. YJ Gu, PW Boonstra, R Graaff, AA Rijnsburger, H Mungroop, W van
Oeveren. Pressure drop, shear stress, and activation of leucocytes during
cardiopulmonary bypass: A comparison between hollow fiber and flat
sheet membrane oxygenators. Artificial Organs 2000; 24: 43-48.
19. JD Hellums, RA Hardwick. Response of Platelets to Shear Stress - a
Review. In The Rheology of Blood Vessels and Associated Tissues Eds
Gross DR, Hwang NHC.. Alphen aan den Rijn: NATO Advanced Study
Institute Series - E, No 41, Sijthoff & Noordhoff, 1981
20. A Salama, EC Mueller. Delayed hemolytic transfusion reactions. Evidence
for complement activation involving allogeneic and autologous red cells.
Transfusion 1984; 24: 188-193.
21. JW Rasenack, HJ Schlayer, F Hettler, T Peters, AS Preisler, W Gerok.
Hepatitis B virus infection without immunological markers after open-heart
surgery. Lancet 1995; 345: 355-357.
Chapter 5
54
22. LA Chambers, DM Cohen, JT Davis. Transfusion patterns in pediatric
open heart surgery. Transfusion 1996; 36: 150-154.
23. NC Cavarocchi, HV Schaff, TA Orszulak, HA Homburger, WA Schnell, JR
Pluth. Evidence for complement activation by protamine-heparin
interaction after cardiopulmonary bypass. Surgery 1985; 98(3): 525-531
24. S Ashraf, Y Tian, D Cowan et al. “Low-dose” aprotinin modifies
hemostasis but not pro-inflammatory cytokine release. Ann Thorac Surg
1997; 63: 68-73.
25. H Nishida, S Aomi, Y Tomizawa et al. Comparative study of
biocompatibility between the open and closed circuit in cardiopulmonary
bypass. Artificial Organs 1999; 23: 547-551.
26. DT Pearson, RF Carter, MB Hammo, PS Waterhouse. Gaseous micro-
emboli during open heart surgery. In: Towards safer cardiac surgery. Ed.
DB Longmore. Lancaster, MTP Press, 1981: 325-354.
27. JM Pearl, DW Thomas, G Grist, JY Duffy, PB Manning. Hyperoxia for
management of acid-base status during deep hypothermia with circulatory
arrest. Ann Thorac Surg 2000; 70: 751-755.
28. RA Jonas, DC Bellinger, LA Rappaport et al. Relation of pH strategy and
development outcome after hypothermic circulatory arrest. J Thorac
Cardiovasc Surg. 1993; 106: 362-368.
29. T Shin’oka, D Shum-Tim, PC Laussen et al. Effects of oncotic pressure
and haematocrit on outcome after hypothermic circulatory arrest. Ann
Thorac Surg 1998; 65: 155-164.
30. J Delanghe, K Allcock, M Langlois, L Claeys, M De Buyzere. Fast
determination of haptoglobin phenotype and calculation of hemoglobin

Chapter 5
55
binding capacity using high pressure gel permeation chromatography. Clin
Chim Acta 2000; 291: 43-51.
31. M Langlois, JR Delanghe. Biological and clinical significance of
haptoglobin polymorphism in humans. Clin Chem 1996; 42: 1589-1600.
32. EJ Weiss, PF Bray, M Tayback et al. A polumorphism of a platelet
glycoprotein receptor as an inherited risk factor for coronary thrombosis. N
Eng J Med 1996; 334: 1090-1094.
33. N Drabe, G Zünd, J Grünenfelder et al. Genetic predisposition in patients
undergoing cardiopulmonary bypass surgery is associated with an
increase of inflammatory cytokines. Eur J Cardiothorac Surg 2001; 20:
609-613.
34. JP Mathew, CS Rinder, JG Howe et al. Platelet PlA2 polymorphism
enhances risk of neurocognitive decline after cardiopulmonary bypass.
Ann Thorac Surg 2001; 71: 663-666
35. SS Ashraf, Y Tian, S Zacharrias, D Cowan, P Martin, K Watterson. Effects
of cardiopulmonary bypass on neonatal and paediatric inflammatory
profiles. Eur J Cardiothorac Surg 1997; 12: 862-868.
36. HP Wendel, G Ziemer. Coating-techniques to improve the
hemocompatibility of artificial devices used for extracorporeal circulation.
Eur J of Cardiothoracic Surg 1999;16:342-50.
37. de Haan J, Boonstra PW, Monnink SHJ, Ebels T, van Oeveren W.
Retransfusion of Suctioned Blood During Cardiopulmonary Bypass Impairs
Hemostasis. Ann Thorac Surg 1995;59: 901-7.
Chapter 5
56
38. HH Schreurs, MJ Wijers, J Gu et al. Heparin-coated bypass circuits:
effects on inflammatory response in paediatric cardiac operations. Ann
Thorac Surg 1998; 66: 166-171.
39. EA Grossi, K Kallenbach, S Chau et al. Impact of heparin bonding on
pediatric cardiopulmonary bypass: a prospective randomized study. Ann
Thorac Surg 2000; 70: 191-196.
40. T Ozawa, K Yoshihara, N Koyama, Y Watanabe, N Shiono, Y Takanashi.
Clinical efficacy of heparin-bonded bypass circuits related to cytokine
responses in children. Ann Thorac Surg 2000; 69: 584-590.
41. K Miyaji, RL Hannan, J Ojito, JP Jacobs, JA White, RP Burke. Heparin-
coated cardiopulmonary bypass circuit: clinical effects in pediatric cardiac
surgery. J Card Surg 2000; 15: 194-198.
42. SB Horton, WW Butt, RJ Mullaly et al. IL-6 and IL-8 levels after
cardiopulmonary bypass are not affected by surface coating. Ann Thorac
Surg 1999; 68: 1751-1755.
43. F. De Somer, K. François, W. van Oeveren et al. Phosphorylcholine
coating of extracorporeal circuits provides natural protection against blood
activation by the material surface. Eur J Cardiothorac Surg 2000; 18(5):
602-606.
44. RM Ungerleiter. Effects of cardiopulmonary bypass and use of modified
ultrafiltration. Ann Thorac Surg 1998; 65: S35-39.
45. MS Chew, I Brandslund, V Brix-Christensen et al. Tissue injury and the
inflammatory response to pediatric cardiac surgery with cardiopulmonary
bypass. Anesthesiology 2001; 94: 745-753.
Chapter 5
57
46. D Royston. Preventing the inflammatory response to open-heart surgery:
the role of aprotinin and other protease inhibitors. Int J Cardiol 1996; 53:
S11-S37.
47. H Mössinger, W Dietrich. Activation of hemostasis during cardiopulmonary
bypass and pediatric aprotinin dosage. Ann Thorac Surg 1998; 65: S45-
51.
48. J Boldt. Endothelial related coagulation in pediatric surgery. Ann Thorac
Surg 1998; 65: S56-59.
49. CF Wippermann, FX Schmid, B Eberle et al. Reduced inotropic support
after aprotinin therapy during pediatric cardiac operations. Ann Thorac
Surg 1999; 67: 173-176.
50. B Stiller, J Sonntag, I Dähnert et al. Capillary leak syndrome in children
who undergo cardiopulmonary bypass: clinical outcome in comparison
with complement activation and C1 inhibitor. Intensive Care Med 2001; 27:
193-200

Chapter 5
58
.

Chapter 6
59
Chapter 6 Summary and new prospectives
Since the first use of a heart-lung machine for total cardiopulmonary bypass
on April 5, 1951 major changes took place. While the first two patients did not
survive, today cardiopulmonary bypass related mortality is almost nihil. The
huge circuits with a bubble or film oxygenator requiring several litres of prime
have been replaced with small membrane oxygenators and circuits that only
require a few hundred millilitres of prime.
As more procedures were done the knowledge and long term follow-up of
patients with congenital heart disease increased. Based on these new
insights, more and more children are operated in the first days or weeks of
their life since this seems to have a major impact on long term survival.
However, this approach confronts the clinician with a lot of technical
limitations when he has to place a neonate of 2 Kg on cardiopulmonary
bypass. The often still immature organs demand for further research in order
to keep bypass related damage to an absolute minimum.
A first major problem is that of vascular access. The small blood vessels of
the child need to be cannulated without obstructing blood flow or damaging
the vessel wall. What is the best design for obtaining this goal? How can one
be sure that all organs are perfused, that the native heart will not be
challenged by an additional afterload and that total venous return is directed
towards the cardiopulmonary bypass? Appendix 1 focuses on the limitations
and advantages of vacuum assisted venous return (VAVD) in small babies.
VAVD makes it possible to enhanced venous return with approximately 10%
mainly due to a larger pressure difference. Additionally, VAVD also allows to
Chapter 6
60
use smaller cannulas resulting in less obstruction of the blood vessel and less
damage to the blood vessel wall. The combination of smaller cannulas with
VAVD might result in a larger operating field for the surgeon with less back
flow.
For arterial re-infusion the design of a cannula is of main importance.
Appendix 2 explains how arterial cannula design will affect jet formation while
Appendix 3 points to the limitations of existing paediatric arterial cannulas.
Large differences for their pressure flow characteristics were found based on
deviations in internal diameter and design.
In paediatric cardiopulmonary bypass the oxygenator remains a problem
because of his priming volume, large foreign surface area and not always
optimal fluid dynamics. These problems are partly due to the fact that most if
not all paediatric oxygenators are “downscaled” adult oxygenators and not
specifically adapted for neonatal procedures. Appendix 4 represents the
clinical benefits of an oxygenator specially designed for neonatal
cardiopulmonary bypass. The use of such a neonatal oxygenator makes it
possible to construct much smaller circuits resulting in less haemodilution.
Appendix 5 gives the clinical impact on blood products when using a neonatal
oxygenator in combination with a small circuit. The fluid dynamics in an
oxygenator are important for achieving optimal mass transfer and
haemocompatibility. Appendix 6 presents a new technique for the comparison
of the pressure flow relationship in oxygenators with a different design. This
approach makes it possible to make more objective decisions when
Chapter 6
61
comparing different products. The impact of the new ELF membrane
oxygenators on blood elements was studied in appendix 7.
One can question the use of an arterial filter in a paediatric circuit as it will
enlarge total priming volume without adding any additional safety. Appendix 8
suggests that the hollow fibre stack of the membrane compartment might be
an acceptable alternative since it will act as a depth filter and it is able to
remove gaseous emboli. This alternative will reduce priming volume without
jeopardising safety.
Control of the inflammatory response is a major goal for the paediatric team.
One approach coating all artificial surfaces with a coating that biomimicks the
outer layer of the cell membrane leads to a reduction in complement
activation and a better platelet preservation. This is reported in a dog model in
appendix 9 and confirmed in the clinical setting in appendix 10.
Unfortunately this coating does inhibit the inflammatory response completely
and this might be explained by the findings of appendix 11 that blood coming
from structures not covered with endothelium such as the pericardium and
pleural cavities does activate the coagulation system. By doing so it will also
activate the complement system and promote capillary leak.
Clinical implications and possible future directions
More and more new-borns with congenital heart disease are operated within
the first days or weeks of life. As a result body weight can be very low and the
anatomical structures will be small. Institution of cardiopulmonary bypass
Chapter 6
62
under such conditions asks for dedicated cannulas with minimal deviation of
the inner diameter. In order to achieve optimal venous drainage and arterial
re-infusion under all circumstances, more designs and diameters should be
developed. Pressure-flow diagrams based on viscous solutions such as
water-glycerine should accompany these new designs as well as existing
designs.
Vacuum assisted venous return in combination with dedicated venous
cannulas will further reduce the total priming volume of the cardiopulmonary
circuit and more importantly also reduce the “dead volume” in aspiration lines.
As a result blood will be exposed to a lower amount of foreign material and
less haemodilution of coagulation proteins and blood elements will occur. Due
to the lower haemodilution less homologous products are needed and
exposure to multiple blood donors can be avoided.
The treatment of all foreign material with a biocompatible coating will reduce
inflammatory response.
Future developments should focus on
1. Membrane technology: microporous versus diffusive
2. Surface treatment of all foreign surface
3. Integration of components and miniaturisation of the cardiopulmonary
bypass for further reduction of priming volume and foreign surface
4. Fluid mechanics of the complete cardiopulmonary bypass circuit combined
with extensive modelling of the fluid mechanics in each component
5. Cannulas in combination with the physical and biological aspects of
vascular access in general
6. Selective blood treatment for activated blood

Appendix 1
63
Evaluation of different paediatric venous cannulas usinggravity drainage and VAVD: an in vitro study
F. De Somer, D. De Wachter, PR Verdonck, G. Van Nooten, T. Ebels
Perfusion, 2002; 17(5): 321-326
Appendix 1
64
Abstract
Six different commercially available paediatric venous cannulas together with
a special constructed cannula were tested in vitro for their pressure-flow
relationship. With the cannulas placed in an open reservoir, flow increased
with larger diameters and higher pressures. At a pressure of 30 cm H2O flows
were 219 ± 20 mL/min, 285 ± 13 mL/min, 422 ± 11 mL/min, 728 ± 4 mL/min,
for the 12 Fr, 13.2, 14 Fr and 16 Fr, respectively. No differences were founds
between angled and straight cannulas.
When the cannulas were tested in a latex model simulating the right atrium
and venae cavae, the highest flow obtained by gravity was 164 mL/min using
an angled 14 Fr cannula. When vacuum was applied to augment venous
return a maximum flow of 179 mL/min was measured using an angled 14 Fr
cannula.
Collapse can occur when the pressure difference becomes too high in the test
system. This is important since most children are selectively cannulated in
both major veins. Monitoring of the intravascular pressure might help to
prevent collapse. A larger diameter venous cannula does not always produce
the highest flow when placed in a vein. This is most obvious when
augmenting venous return. The design of the cannula tip in combination with
VAVD can affect the venous return.
Appendix 1
65
Introduction
Vascular access remains an important aspect of cardiopulmonary bypass
(CPB) in paediatric cardiac surgery. Bi-caval cannulation with straight or
angled cannulas, using gravity siphon drainage, is most often used. In the last
decade major improvements have been made to decrease the extracorporeal
blood volume [1], as a result of which the volume of the tubing becomes more
important. Once the diameter required for a calculated flow be chosen, the
only way further to decrease this volume is to shorten the length of the lines.
This can be achieved by using active vacuum augmentation of the venous
return, which allows the user to place the oxygenator closer to the patient [2].
Vacuum assisted venous drainage gained renewed interest since the start of
minimally invasive cardiac procedures [3,4], and for reduction of priming
volume in paediatric circuits [5-8]. Veins are compliance vessels and will
collapse at negative pressures between minus 5 – 10 mmHg [2]. When using
gravity drainage, the pressure in the vein(s) will be more or less constant
during the procedure. However, when vacuum is applied as driving pressure
much lower pressures can be achieved. As a result the veins can collapse
and instead of an increase a reduction in flow, due to partial obstruction of the
open area for flow by the vein, will result.
In this study we investigate the influence of vein collapse, cannula diameter
and exerted negative pressure on the venous return in vitro.
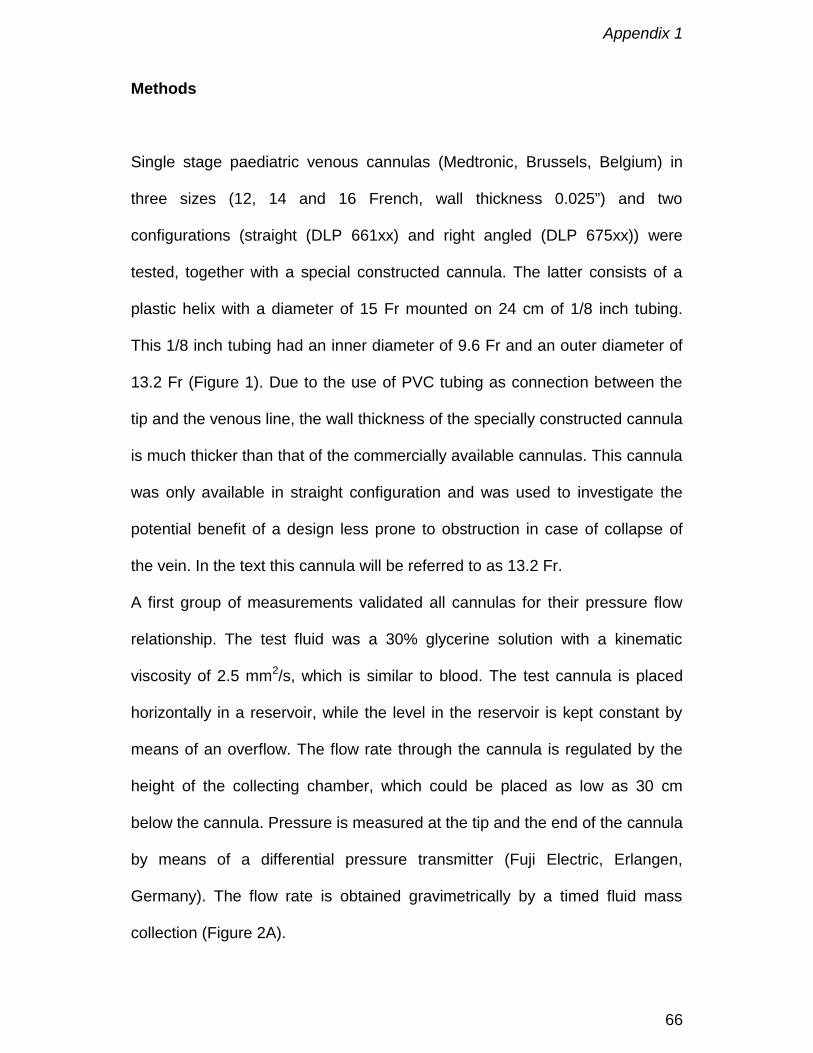
Appendix 1
66
Methods
Single stage paediatric venous cannulas (Medtronic, Brussels, Belgium) in
three sizes (12, 14 and 16 French, wall thickness 0.025”) and two
configurations (straight (DLP 661xx) and right angled (DLP 675xx)) were
tested, together with a special constructed cannula. The latter consists of a
plastic helix with a diameter of 15 Fr mounted on 24 cm of 1/8 inch tubing.
This 1/8 inch tubing had an inner diameter of 9.6 Fr and an outer diameter of
13.2 Fr (Figure 1). Due to the use of PVC tubing as connection between the
tip and the venous line, the wall thickness of the specially constructed cannula
is much thicker than that of the commercially available cannulas. This cannula
was only available in straight configuration and was used to investigate the
potential benefit of a design less prone to obstruction in case of collapse of
the vein. In the text this cannula will be referred to as 13.2 Fr.
A first group of measurements validated all cannulas for their pressure flow
relationship. The test fluid was a 30% glycerine solution with a kinematic
viscosity of 2.5 mm2/s, which is similar to blood. The test cannula is placed
horizontally in a reservoir, while the level in the reservoir is kept constant by
means of an overflow. The flow rate through the cannula is regulated by the
height of the collecting chamber, which could be placed as low as 30 cm
below the cannula. Pressure is measured at the tip and the end of the cannula
by means of a differential pressure transmitter (Fuji Electric, Erlangen,
Germany). The flow rate is obtained gravimetrically by a timed fluid mass
collection (Figure 2A).

Appendix 1
67
For a second experiment a model of the right atrium including both caval
veins was constructed in latex. The dimensions of the model were based on
the echocardiographic measurements of the right atrium and caval veins in 10
babies. The average weight of the 10 children was 5.5 ± 0.7 kg. The average
diameter of the superior and inferior caval vein was 4.9 ± 0.4 mm and 5.3 ±
0.4 mm, respectively. For ease of construction both veins in the model had a
diameter of 5 mm. This results in a cannula-vein diameter ratio of 0.79 for the
12 Fr, 0.87 for the 13.2 Fr, 0.92 for the 14 Fr and 1.05 for the 16 Fr cannula.
For the measurements only the inferior caval vein was cannulated and a
purse string was used to prevent back flow into the right atrium. If both caval
veins had been cannulated, validation of the exact flow in each of the two
cannulae would have been difficult. The compliance of both vessels was
designed in such a way that they could collapse at a pressure of
approximately minus 10 - 15 mmHg. Pressures were recorded at the tip and
the end of the cannula. Flow was measured by a Transonic flow meter
(Transonic®, Ithaka,NY, USA). In a first approach gravity drainage was
applied with a height difference of 30 cm H2O. In a second approach a VAVD
controller (Polystan AS, Vaerlose, Denmark) was used to assist venous return
(Figure 2B), with the reservoir fluid level situated 18 cm below the model.

Appendix 1
68
Results (Table 1)
Pressure – flow relationship
The maximum flow obtained at 30 cm H2O with the straight cannulas was 219
± 20 mL/min, 285 ± 13 mL/min, 422 ± 11 mL/min, 728 ± 4 mL/min, for the 12
Fr, 13.2, 14 Fr and 16 Fr, respectively (Figure 3). For the angled canulae
flows of 216 ± 13 mL/min, 454 ± 7 mL/min and 727 ± 35 mL/min were
obtained at 30 cm H2O for the 12 Fr, 14 Fr and 16 Fr cannulas (Figure 3).
First experiment: gravity drainage
With the straight cannulas, the maximum flow before collapse occurred was
136 mL/min, 142 mL/min, 142 mL/min and 149 mL/min for the 12 Fr, 13.2 Fr,
14 Fr, and 16 Fr, respectively. With the angled cannulas flows of 131 mL/min,
164 mL/min and 151 mL/min were obtained with the 12 Fr, 14 Fr and 16 Fr
cannula (Figure 4). The mean pressure at which collapse of the vessel
occurred was 9.9 ± 1.2 mmHg.
Second experiment: VAVD
With the straight cannulas, the maximum flow before collapse occurred was
155 mL/min, 163 mL/min, 129 mL/min and 143 mL/min for the 12 Fr, 13.2 Fr,
14 Fr and 16 Fr, respectively. With the angled cannulas flows of 156 mL/min,
179 mL/min and 165 mL/min were obtained with the 12 Fr, 14 Fr and 16 Fr
cannula (Figure 5). The mean pressure at which collapse of the vessel
occurred was 12.4 ± 1.1 mmHg.
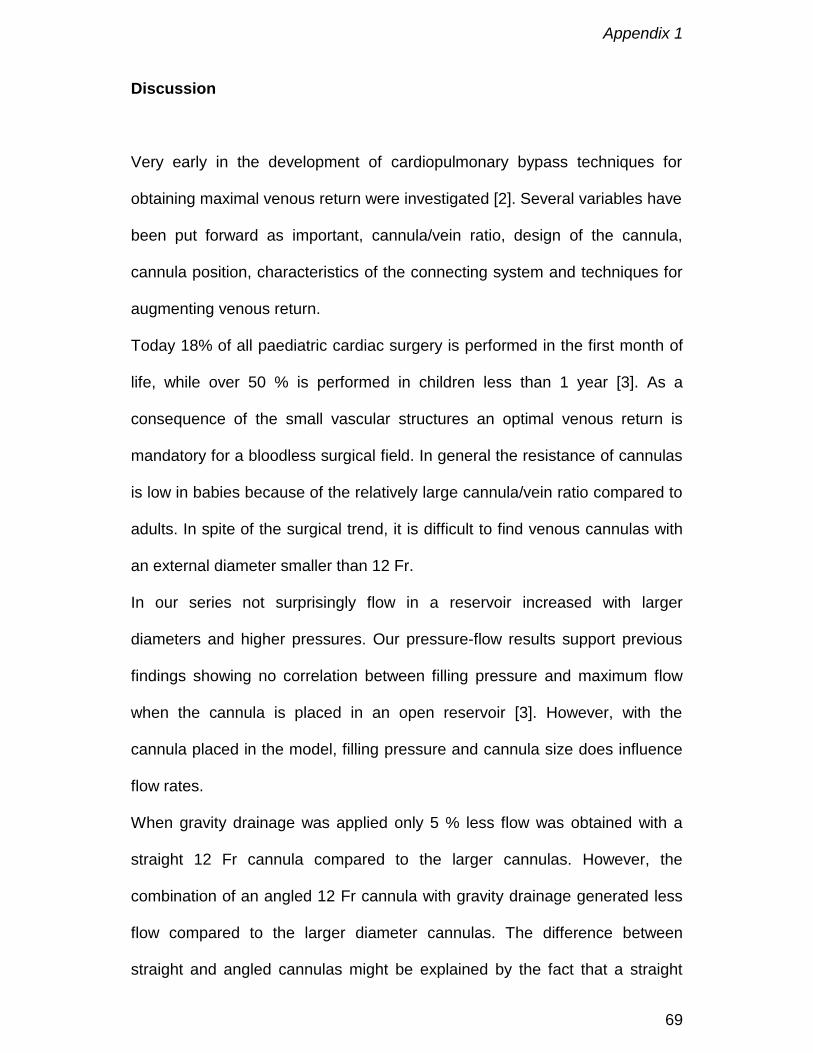
Appendix 1
69
Discussion
Very early in the development of cardiopulmonary bypass techniques for
obtaining maximal venous return were investigated [2]. Several variables have
been put forward as important, cannula/vein ratio, design of the cannula,
cannula position, characteristics of the connecting system and techniques for
augmenting venous return.
Today 18% of all paediatric cardiac surgery is performed in the first month of
life, while over 50 % is performed in children less than 1 year [3]. As a
consequence of the small vascular structures an optimal venous return is
mandatory for a bloodless surgical field. In general the resistance of cannulas
is low in babies because of the relatively large cannula/vein ratio compared to
adults. In spite of the surgical trend, it is difficult to find venous cannulas with
an external diameter smaller than 12 Fr.
In our series not surprisingly flow in a reservoir increased with larger
diameters and higher pressures. Our pressure-flow results support previous
findings showing no correlation between filling pressure and maximum flow
when the cannula is placed in an open reservoir [3]. However, with the
cannula placed in the model, filling pressure and cannula size does influence
flow rates.
When gravity drainage was applied only 5 % less flow was obtained with a
straight 12 Fr cannula compared to the larger cannulas. However, the
combination of an angled 12 Fr cannula with gravity drainage generated less
flow compared to the larger diameter cannulas. The difference between
straight and angled cannulas might be explained by the fact that a straight
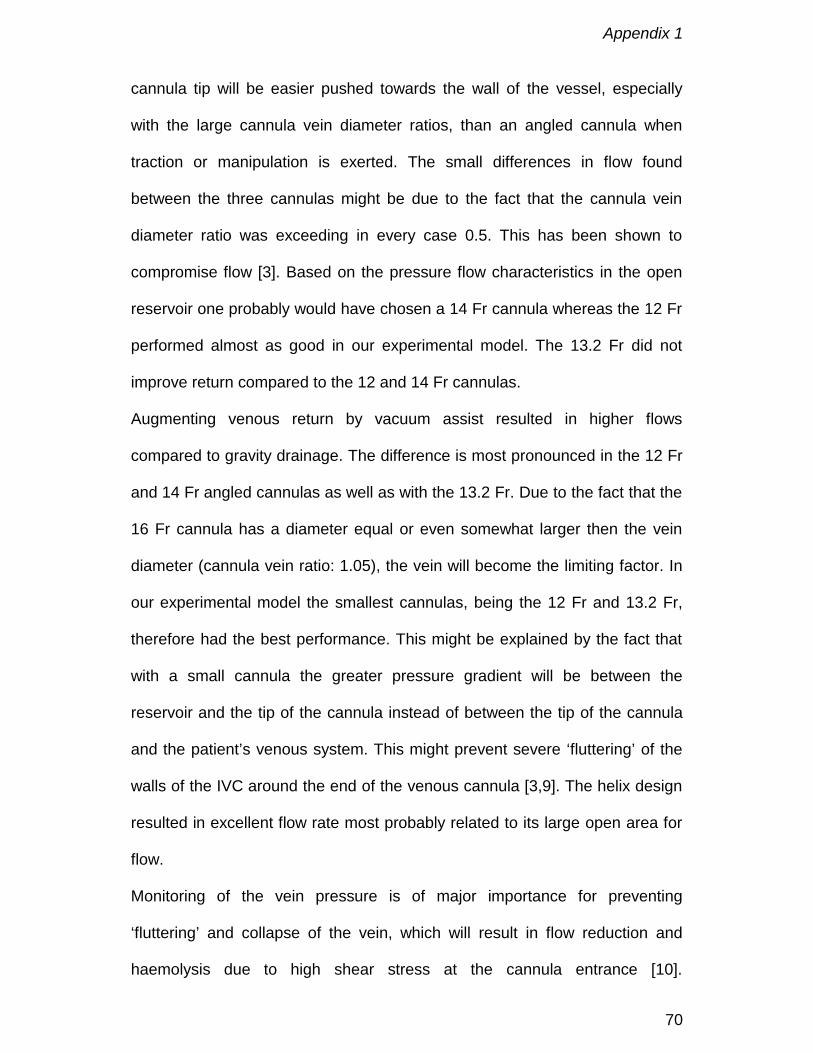
Appendix 1
70
cannula tip will be easier pushed towards the wall of the vessel, especially
with the large cannula vein diameter ratios, than an angled cannula when
traction or manipulation is exerted. The small differences in flow found
between the three cannulas might be due to the fact that the cannula vein
diameter ratio was exceeding in every case 0.5. This has been shown to
compromise flow [3]. Based on the pressure flow characteristics in the open
reservoir one probably would have chosen a 14 Fr cannula whereas the 12 Fr
performed almost as good in our experimental model. The 13.2 Fr did not
improve return compared to the 12 and 14 Fr cannulas.
Augmenting venous return by vacuum assist resulted in higher flows
compared to gravity drainage. The difference is most pronounced in the 12 Fr
and 14 Fr angled cannulas as well as with the 13.2 Fr. Due to the fact that the
16 Fr cannula has a diameter equal or even somewhat larger then the vein
diameter (cannula vein ratio: 1.05), the vein will become the limiting factor. In
our experimental model the smallest cannulas, being the 12 Fr and 13.2 Fr,
therefore had the best performance. This might be explained by the fact that
with a small cannula the greater pressure gradient will be between the
reservoir and the tip of the cannula instead of between the tip of the cannula
and the patient’s venous system. This might prevent severe ‘fluttering’ of the
walls of the IVC around the end of the venous cannula [3,9]. The helix design
resulted in excellent flow rate most probably related to its large open area for
flow.
Monitoring of the vein pressure is of major importance for preventing
‘fluttering’ and collapse of the vein, which will result in flow reduction and
haemolysis due to high shear stress at the cannula entrance [10].

Appendix 1
71
Unfortunately, in most articles the authors only report the pressure measured
on top of the venous reservoir [3-8,10]. However this pressure will be the sum
of the pressure at the tip of the cannula, the hydrostatic pressure and the
pressure loss over the tubing and cannula. The latter makes it very difficult to
compare results of different studies since most authors do not mention tubing
length and hydrostatic pressure. The flow regimen in a piece of 3/16 or ¼ inch
will be laminar with the blood flows, blood temperatures and haematocrit
conditions used during CPB on a baby of 5 kg. Using the Hagen-Poiseuille
equation (See appendix) one can calculate the contribution of the tubing in the
pressure difference measured on top of the venous reservoir. When a baby of
5 kg, with a haematocrit of 25% and a blood temperature of 25°C, is perfused
with a flow of 120 mL/kg, the pressure difference for each meter of 3/16 or ¼
inch tubing will be 15 mmHg and 5 mmHg, respectively. When the oxygenator
is not at the same level of the right atrium we also have to add the hydrostatic
pressure head to the total pressure difference. This is approximately 8 mmHg
for each 10 cm height difference.
In summary, we found that collapse can occur when the venous pressure
becomes too low in the test system. This is important since most children are
selectively cannulated in both major veins. Measuring vacuum at the top of
the venous reservoir is not a good indicator of the pressure in the vein.
Monitoring of the intravenous pressure might help to prevent collapse of the
vein. A larger diameter venous cannula does not always produce the highest
flow when placed in a vein. This is most obvious when augmenting venous
return. The design of the cannula tip in combination with VAVD can affect the
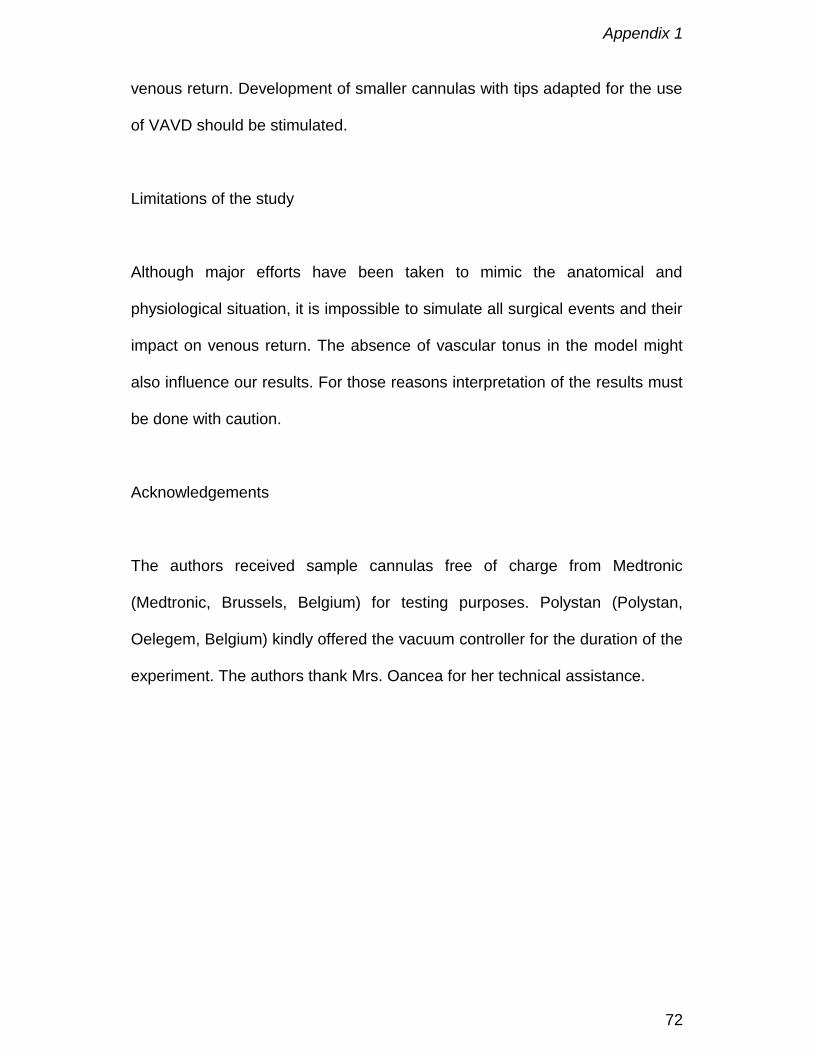
Appendix 1
72
venous return. Development of smaller cannulas with tips adapted for the use
of VAVD should be stimulated.
Limitations of the study
Although major efforts have been taken to mimic the anatomical and
physiological situation, it is impossible to simulate all surgical events and their
impact on venous return. The absence of vascular tonus in the model might
also influence our results. For those reasons interpretation of the results must
be done with caution.
Acknowledgements
The authors received sample cannulas free of charge from Medtronic
(Medtronic, Brussels, Belgium) for testing purposes. Polystan (Polystan,
Oelegem, Belgium) kindly offered the vacuum controller for the duration of the
experiment. The authors thank Mrs. Oancea for her technical assistance.
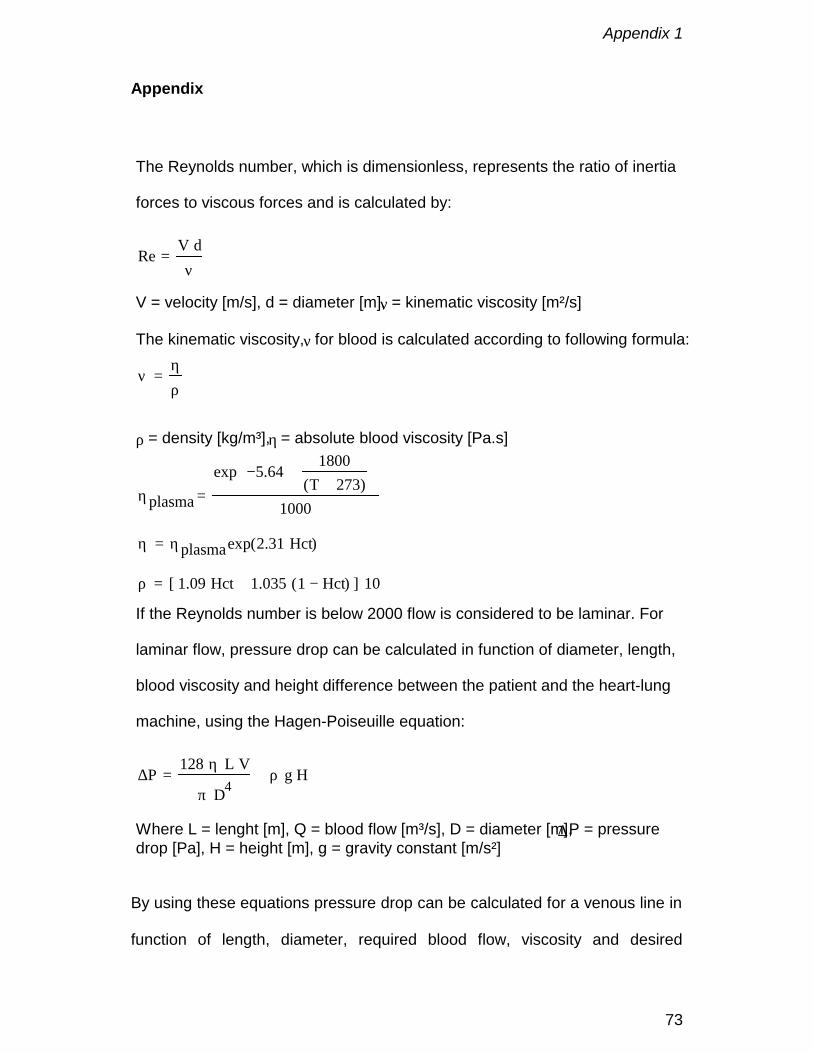
Appendix 1
73
Appendix
By using these equations pressure drop can be calculated for a venous line in
function of length, diameter, required blood flow, viscosity and desired
The Reynolds number, which is dimensionless, represents the ratio of inertia
forces to viscous forces and is calculated by:
ReV d⋅ν
=
V = velocity [m/s], d = diameter [m], ν = kinematic viscosity [m²/s]
The kinematic viscosity, ν for blood is calculated according to following formula:
νη
ρ=
ρ = density [kg/m³], η = absolute blood viscosity [Pa.s]
ηplasma
exp 5.64−1800
T 273+( )+
1000=
η ηplasmaexp 2.31 Hct⋅( )⋅=
ρ 1.09 Hct⋅ 1.035 1 Hct−( )⋅+[ ] 10⋅=
If the Reynolds number is below 2000 flow is considered to be laminar. For
laminar flow, pressure drop can be calculated in function of diameter, length,
blood viscosity and height difference between the patient and the heart-lung
machine, using the Hagen-Poiseuille equation:
∆P128 η⋅ L⋅ V⋅
π D4⋅ρ g⋅ H⋅+=
Where L = lenght [m], Q = blood flow [m³/s], D = diameter [m], ∆P = pressure drop [Pa], H = height [m], g = gravity constant [m/s²]
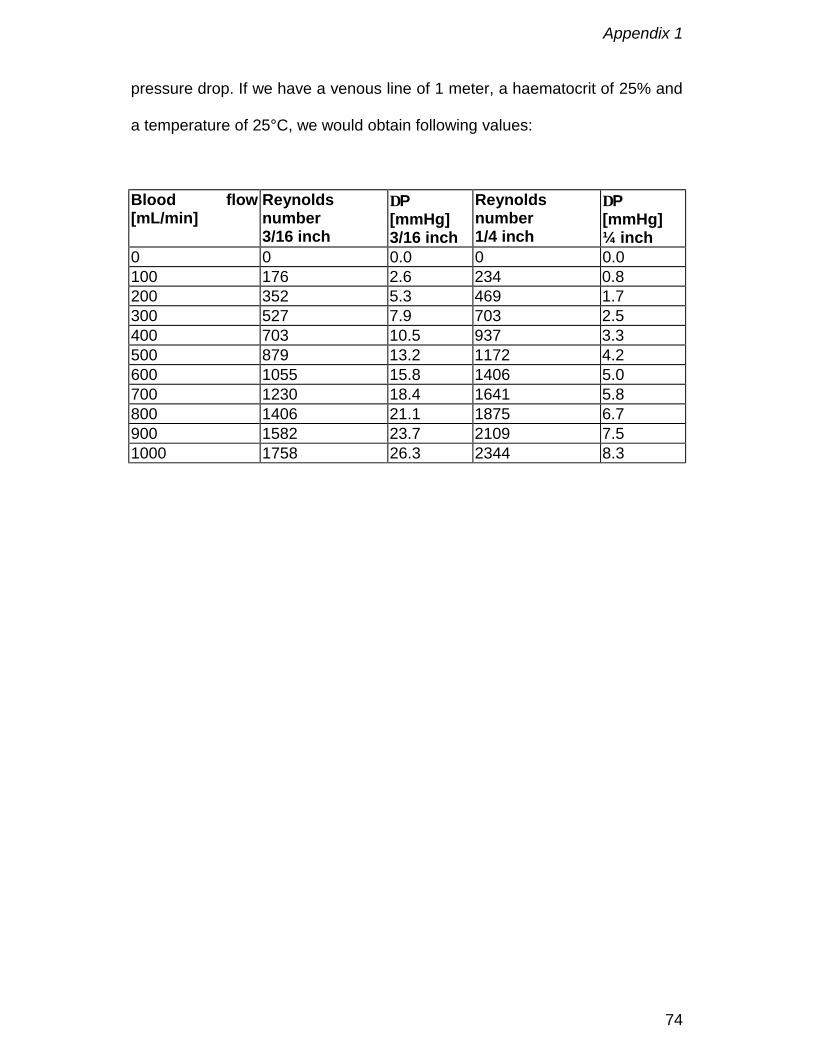
Appendix 1
74
pressure drop. If we have a venous line of 1 meter, a haematocrit of 25% and
a temperature of 25°C, we would obtain following values:
Blood flow[mL/min]
Reynoldsnumber3/16 inch
∆P[mmHg]3/16 inch
Reynoldsnumber1/4 inch
∆P[mmHg]¼ inch
0 0 0.0 0 0.0100 176 2.6 234 0.8200 352 5.3 469 1.7300 527 7.9 703 2.5400 703 10.5 937 3.3500 879 13.2 1172 4.2600 1055 15.8 1406 5.0700 1230 18.4 1641 5.8800 1406 21.1 1875 6.7900 1582 23.7 2109 7.51000 1758 26.3 2344 8.3

Appendix 1
75
References
1. De Somer F, Foubert L, Poelaert J, Dujardin D, Van Nooten G, François K.
Low extracorporeal priming volumes for infants: a benefit? Perfusion 1996;
11: 455-460.
2. Galetti PM, Brecher GA. Connection of the vascular system with an
extracorporeal circuit. Heart-lung bypass, principles and techniques of
extracorporeal circulation. New York: Grune & Stratton, 1962: 171-93.
3. Kurusz M, Deyo DJ, Sholar AD, Tao W, Zwischenberger JB. Laboratory
testing of femoral venous cannulae: effect of size, position and negative
pressure on flow. Perfusion 1999; 14: 379-387.
4. Münster K, Andersen U, Mikkelsen J, Petterson G. Vacuum assisted
venous drainage. Perfusion 1999; 14: 419-423.
5. Lau CL, Posther KE, Stephenson GR et al. Mini-circuit cardiopulmonary
bypass with vacuum assisted venous drainage: feasibility of an
asanguineous prime in the neonate. Perfusion 1999; 14: 389-396.
6. Darling E, Kaemmer D, Lawson S, Smigla G, Collins K, Shearer I, Jaggers
J. Experimental use of an ultra-low prime neonatal cardiopulmonary
bypass circuit utilizing vacuum assisted venous drainage. JECT 1998; 30:
184-189.
7. Ahlberg K, Sistino JJ, Nemoto S. Hematological effects of a low-prime
neonatal cardiopulmonary bypass circuit utilizing vacuum-assisted venous
return in the porcine model. JECT 1999; 31; 195-201.
Appendix 1
76
8. R Berryessa, R Wiencek, J Jacobson, D Hollingshead, K Farmer, G Cahill.
Vacuum-assisted venous return in pediatric cardiopulmonary bypass.
Perfusion 2000; 15: 63-67.
9. Kirklin JW, Barratt-Boyes BG. Hypothermia, circulatory arrest, and
cardiopulmonary bypass. Cardiac Surgery, 2nd edn. New York: Churchill
Livingstone, 1993: 76.
10. Pedersen TH, Videm V, Svennevig JL et al. Extracorporeal membrane
oxygenation using a centrifugal pump and a servo regulator to prevent
negative inlet pressure. Ann Thorac Surg 1997; 63: 1333-39.
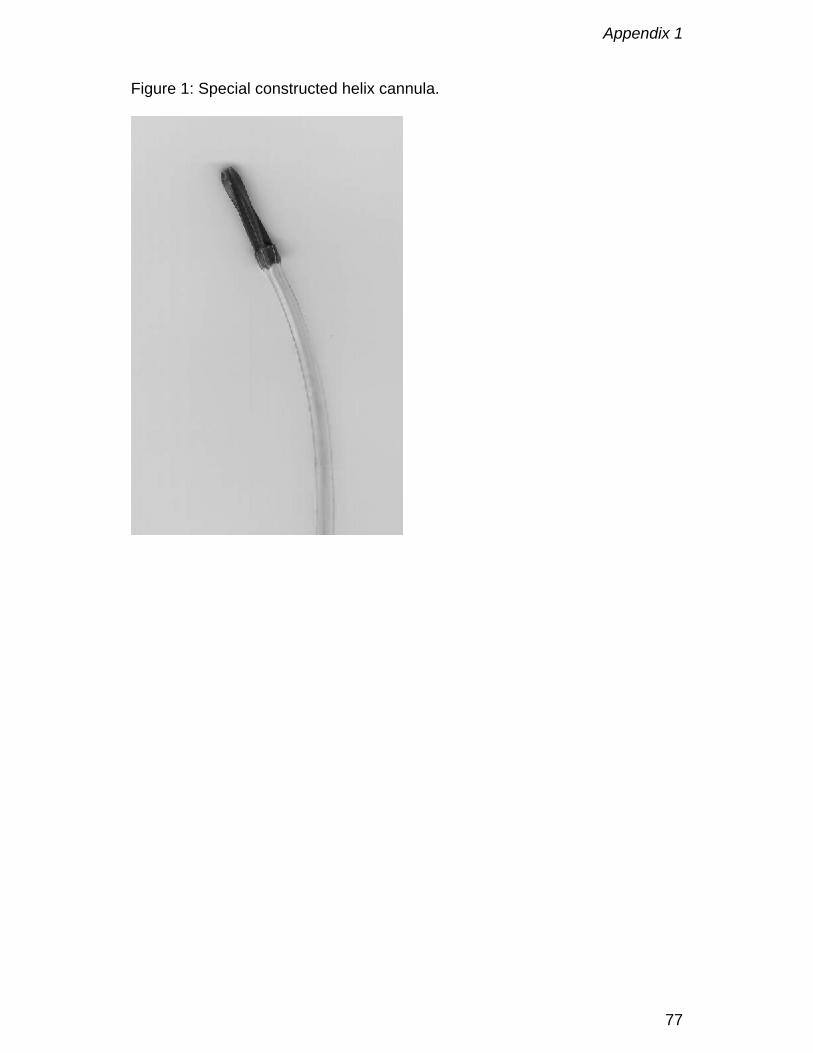
Appendix 1
77
Figure 1: Special constructed helix cannula.
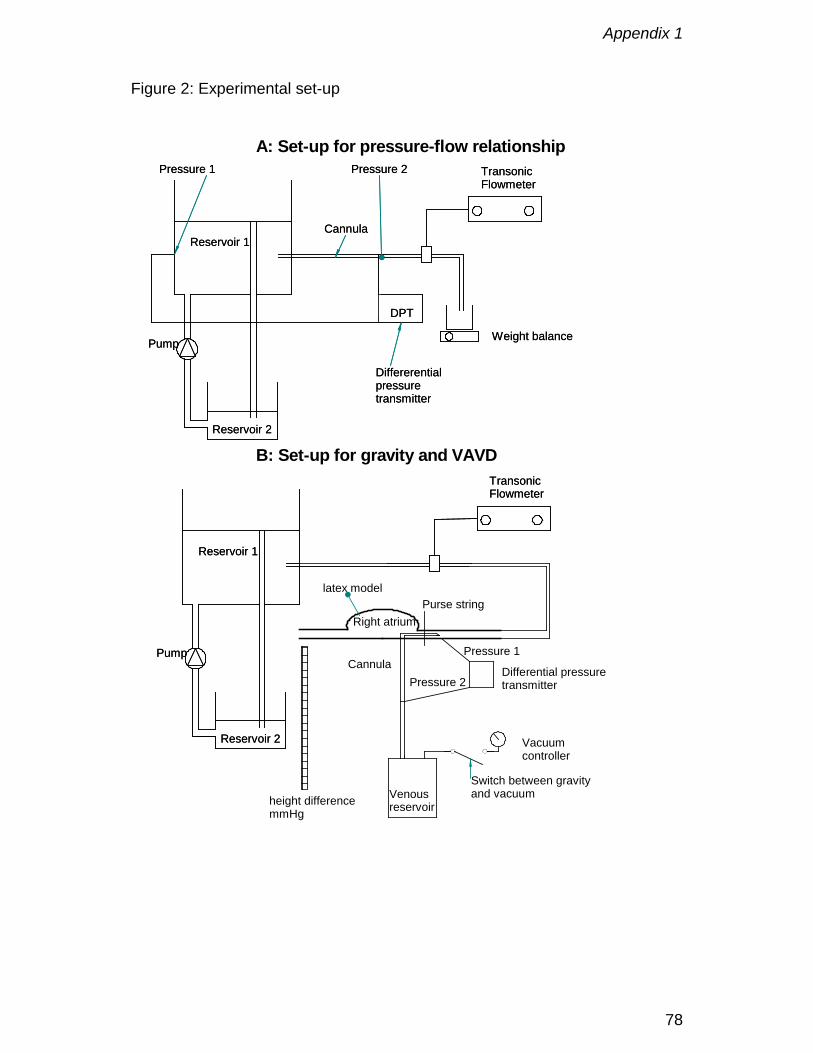
Appendix 1
78
Figure 2: Experimental set-up
A: Set-up for pressure-flow relationship
B: Set-up for gravity and VAVD
Reservoir 1
Reservoir 2
Pump
TransonicFlowmeter
Reservoir 1
Reservoir 2
Pump
TransonicFlowmeter
Purse string
Cannula
Right atrium
Vacuumcontroller
Venousreservoir
Pressure 1
Pressure 2Differential pressuretransmitter
Reservoir 1
Reservoir 2
DPT
Weight balancePump
Cannula
TransonicFlowmeter
Pressure 2Pressure 1
Differerentialpressuretransmitter
Reservoir 1
Reservoir 2
DPT
Weight balancePump
Cannula
TransonicFlowmeter
Pressure 2Pressure 1
Differerentialpressuretransmitter
Switch between gravityand vacuumheight difference
mmHg
latex model
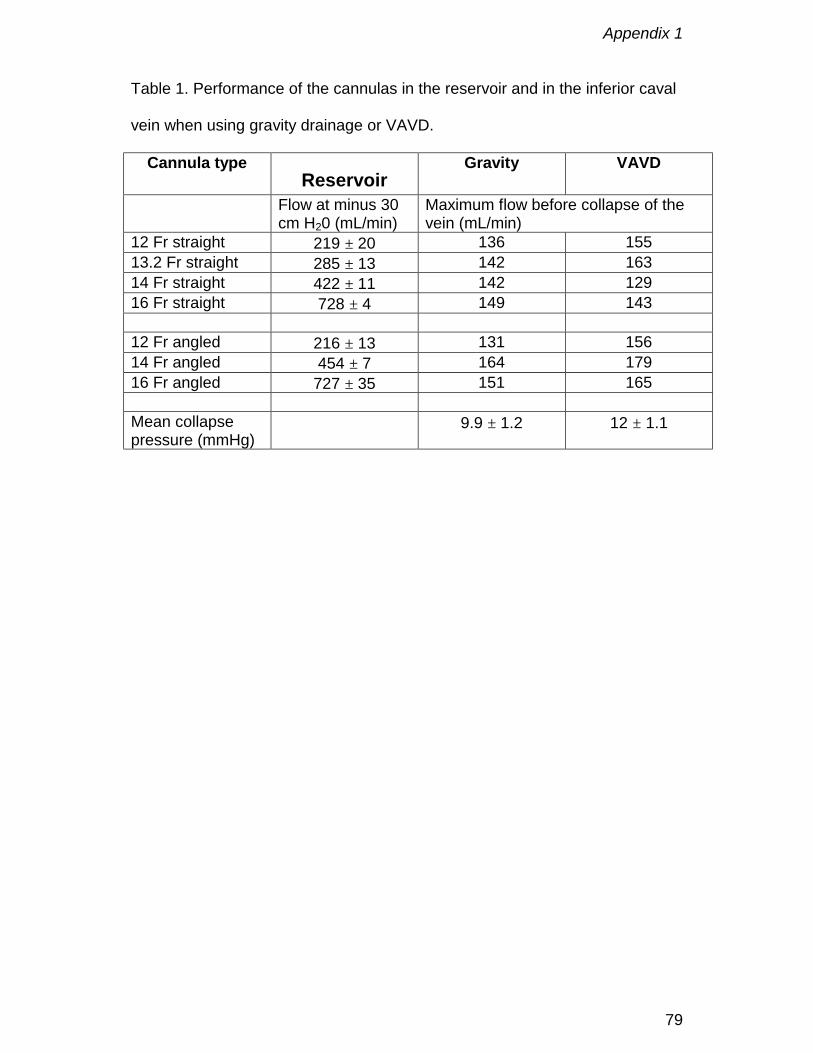
Appendix 1
79
Table 1. Performance of the cannulas in the reservoir and in the inferior caval
vein when using gravity drainage or VAVD.
Cannula typeReservoir
Gravity VAVD
Flow at minus 30cm H20 (mL/min)
Maximum flow before collapse of thevein (mL/min)
12 Fr straight 219 ± 20 136 15513.2 Fr straight 285 ± 13 142 16314 Fr straight 422 ± 11 142 12916 Fr straight 728 ± 4 149 143
12 Fr angled 216 ± 13 131 15614 Fr angled 454 ± 7 164 17916 Fr angled 727 ± 35 151 165
Mean collapsepressure (mmHg)
9.9 ± 1.2 12 ± 1.1

Appendix 1
80
Figure 3: Pressure – flow relationship.
100 300 500 700Flow [mL/min]
0
5
10
15
20
25
30
Pres
sure
at t
ip [m
mH
g]
Straight cannulae
12 French14 French16 French13.2 French
100 300 500 700Flow [mL/min]
0
5
10
15
20
25
30
Pres
sure
at t
ip [m
mH
g]
12 French14 French16 French
Angled cannulae

Appendix 1
81
Figure 4:
25 50 75 100 125 150 175 200Flow [mL/min]
0
5
10
15
Pres
sure
dro
p [m
mH
g]
12 French14 French16 French13.2 French
Gravity straight cannulae
25 50 75 100 125 150 175 200Flow [mL/min]
0
5
10
15
Pres
sure
dro
p [m
mH
g]
12 French14 French16 French
Gravity angled cannulae
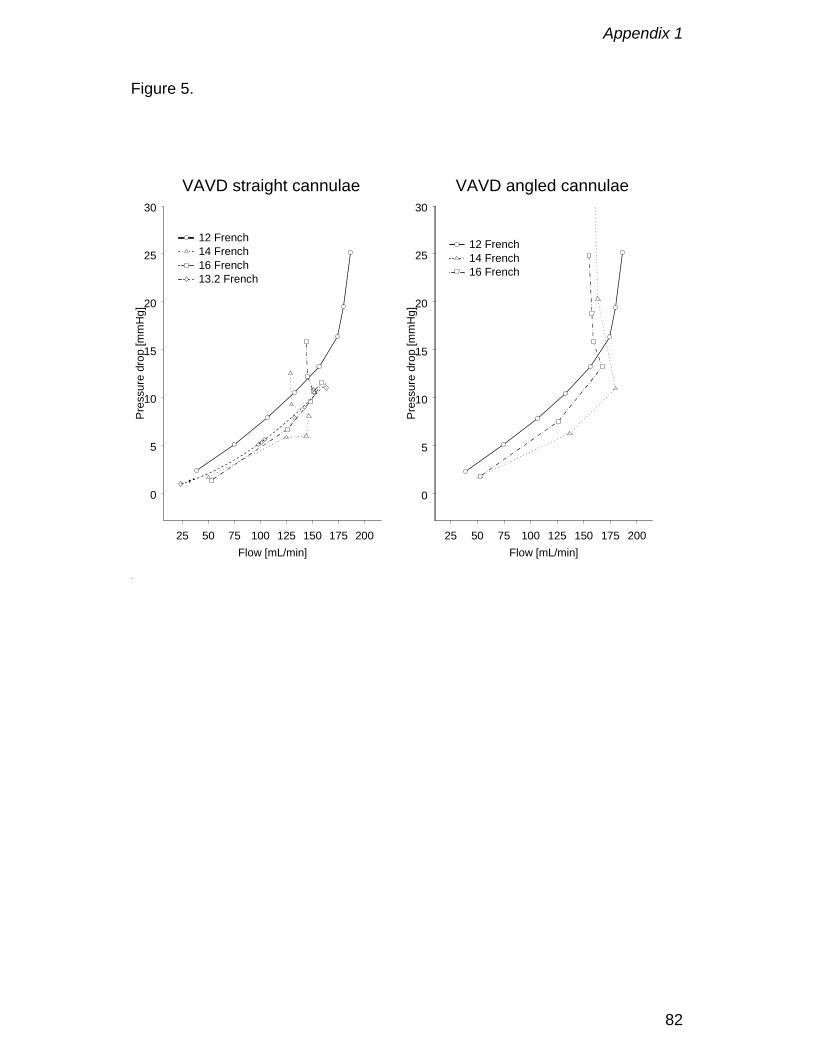
Appendix 1
82
Figure 5.
25 50 75 100 125 150 175 200Flow [mL/min]
0
5
10
15
20
25
30
Pres
sure
dro
p [m
mH
g]
12 French14 French16 French13.2 French
VAVD straight cannulae
25 50 75 100 125 150 175 200Flow [mL/min]
0
5
10
15
20
25
30
Pres
sure
dro
p [m
mH
g]
12 French14 French16 French
VAVD angled cannulae
Appendix 2
83
Hydrodynamical Comparison of Aortic Arch Cannulae
P.R. Verdonck, U. Siller, D. De Wachter, F. De Somer, G. Van Nooten
Int. J. Art. Organs, 1998; 21(11): 705 - 713.
Appendix 2
84
Abstract
The high velocity of blood flow exiting aortic arch cannulae may erode
atherosclerotic material from the aortic intima causing non-cardiac
complications such as stroke, multiple organ failure and death. Five 24 Fr
cannulae from the Sarns product line (straigth open tip, angled open tip with
and without round side holes, straight and angled closed tip with four
rectangular, lateral side holes) and a flexible cannula used at the University
Hospital of Gent (straigth open tip) are compared in an in-vitro steady flow
setup, to study the spatial velocity distribution inside the jet. The setup
consists of an ultrasound Doppler velocimeter, mounted opposite to the
cannula tip in an outflow reservoir. An elevated supply tank supplies steady
flow of 1.3 L/min of water. Exit forces at various distances from the tip are
calculated by integrating the assessed velocity profiles. The pressure drop
across the cannula tip is measured using fluid filled pressure transducers. The
four sidehole design provide the lowest exit velocity (0.85 vs 1.08 m/s) and
forces per jet (0.03 vs 0.15-0.20 N). The round sideholes are useless as less
than 1 % of the flow is directed through them. Furthermore, the use of angled
tip cannulae is suggested because the force exerted on the aortic wall
decreases the more the angle of incidence of the jet deviates from 90°.
Pressure drop is the lowest for the 4 side hole design and highest for the open
tip and increases when an angled tip is used.
Keywords
aortic cannula, in vitro hydrodynamics, sandblasting effect.
Appendix 2
85
Introduction
Atherosclerotic disease of the ascending and transverse aortic arch is an
important risk factor for stroke associated with use of cardiopulmonary bypass
(CPB) [1,2]. Detachment of atherosclerotic material from the aortic intima can
be caused by external manipulation (such as cannulation and clamping) and
internal disruption. Tissue erosion in the aortic arch is caused by the high-
velocity jet emerging from an aortic cannula during CPB termed the
“sandblasting effect” [3]. The high speed jet is caused by the relatively small
cross section of the cannula tip which is around 8 mm in outer diameter for a
cannula used on adults with average blood flows of 4 to 6 l/min.
During the last decade lots of effort have been performed to design better
cannulae. Already in 1986 the use of a long aortic arch cannula with its tip
extending beyond the origins of the arch vessels was suggested because it
could avoid the hazard of stroke by directing the high-velocity blood flow down
the ascending aorta and away from the cerebral arteries [3]. Muehrche et al.
made a different approach by designing a new arterial cannula with four side
holes specifically to reduce the velocity of blood flow and the exit force in
order to decrease the sandblasting effect and to produce a more gentle high-
flow perfusion [4]. Nevertheless because it is difficult to verify the position of
the four jets inside the patient’s aorta one or more jets might still hit calcified
material.
Besides the above mentioned efforts cannula design needs to be improved
both hydro- and hemodynamically to reduce the rate of perioperative
problems. Influencing factors are multiple: pressure drop, flow rate, jet

Appendix 2
86
velocity, geometry of cannula, tip position in the aorta, shear stress, exit force
and operation time. To improve the performance of cannulae on the long term
it is necessary to evaluate the relationship between the hydrodynamic
parameters in an experimental setup.

Appendix 2
87
Materials and Methods
1. Tested cannulae
Five models out of the six cannulae tested in this study are selected from the
3M-Sarns product line and one is a self-made cannula, named “Gent Hospital”
in this paper, used at the University Hospital of Gent. The cannulae
distinguish each other by their geometries, dimensions and materials.
The geometry describes the general shape of a cannula. Most models are a
composition of three components: a connector, a tube and a tip. On one
model of the tested group the distinction between the tube and the tip is not
possible because they consist of the same piece (“Gent Hospital”). The
entrance of the tip is defined as the first deviation from the general tube
design. Figure 1 shows a schematic picture of a cannula. For all models the
connector is a standard 3/8 inch (0.95 mm) Polycarbonate connector
commonly used in the clinical practice.
Tips are straight or angled fitted with or without side holes. The shape of
these side holes is either round or rectangular. All tips except for one (“Gent
Hospital”) of the tested samples are conic to gently decrease the diameter of
the tube towards the end of the tip.
Important dimensions to characterize a cannula are the diameter and length
of the tip and the tube. The outer diameter of the tip is measured in French
(circumference in millimeters). All samples in the test are 24 French (8 mm)
cannulae.
In all cases PVC is used as material for both the tip and the tube. Due to
different additives (softeners) the stiffness of the tested examples at room
Appendix 2
88
temperature varies from soft (easy pliable) to stiff (not flexible at all). An
overview of all tested models is summarized in Table 1 in which GOA
represents the geometric orifice area calculated as π r2, with r the diameter of
the tip, augmented with the area of side holes if present. The flow through a
tube with inelastic walls depends on the velocity of the fluid and the effective
outflow area EOA which does not necessarily equal the GOA. For the side
hole cannulae the EOA will be determined experimentally from velocity flow
measurements.
2. Experimental setup
The setup consists of three parts:
- a system of reservoirs, tubing and a centrifugal pump to provide a constant
flow;
- an ultrasound Doppler velocimeter to measure the velocities of the jet at
various distances away from the tip and to visualize the contour of the jet;
- a data acquisition system to assess the pressure drop over the tube and the
tip as a function of the flow.
Figure 2 gives a schematic overview of the experimental setup.
The water is raised by a centrifugal pump from a tank to the upper reservoir
where it enters a vertical tube of 1250 mm in height. The water column in the
tube provides a constant bottom pressure of 95 mmHg because it is fitted with
an overflow that leads any surplus water back to the tank. An array of two
valves is attached to the outflow at the bottom of the reservoir to allow an
accurate adjustment of the flow. The connection to the cannula is made by the
same 3/8 inch tube that is used on extracorporeal circulation systems in the
Appendix 2
89
clinical practice. It is attached to a luer lockport that permits the introduction of
two fluid lines into the cannula.
The cannula is inserted into the outflow reservoir either through an opening in
the wall (straight tip) or from the top (angled tip). Inside of the container it is
fastened with a horizontally and vertically adjustable clamp. The variable
support is necessary to position the tip of the cannula exactly opposite to the
ultrasound probe. In order to have the option to measure the jet from the side
and from below two extra openings for the ultrasound probe are intended at
the bottom and on the sidewall respectively. The Plexiglas window on one
side of the container makes it possible to see the tip of the cannula.
A cylindrical reservoir is chosen to keep disturbing reflections of the ultrasonic
waves from sharp edges low. The outflow reservoir offers an inner diameter of
200 mm and measures 590 mm in height.
The water level inside of the container must stay constant to apply a positive
back pressure on the tip of the cannula. This is realized by an overflow which
is also connected to the tank by a plastic tube. By pulling the overflow pipe out
of its socket the reservoir can be emptied quickly.
The pressure is measured at two different positions inside the tested cannula
with fluid lines connected to piezoresistive transducers. The pressure in the
reservoir at the level of the tip can be computed by measuring the height of
the water column above the center of the cannula. Knowing the pressure in
three points (reservoir, connector and the beginning of the tip) for a given flow
makes it possible to calculate the pressure drop across the tip ∆ptip, the tube
∆ptube including the connector ∆pconnector and the total length of the cannula:
∆pTube = pConnector - pTip
Appendix 2
90
∆pTip = pTip - pReservoir
∆pCannula = pConnector - pReservoir
The output of the pressure readings takes place numerically and graphically
on the screen of the system with an accuracy of ± 0.5 mmHg within a range of
± 50 mmHg. The data acquisition software is developed at the Hydraulics
Laboratory of the University of Gent.
A clamp-on ultrasound flow probe (Transonic 3/8" Transonic Systems, Ihaca,
New York) attached to the connection tube between the upper reservoir with
the cannula is used to measure the average flow. To ensure that the flow is
fully developed at the position of the flow probe (even for laminar flow
conditions) the sensor is placed at a distance of one meter away from the
origin of the tube.
The velocities inside the jet are measured with (PWD) Pulsed Wave Doppler
echography (Vingmed CFM 800). All measurements are performed in a
detailed way and only high velocities (set arbitrarily above 0.9 m/s for all open
tip and round side hole cannulae, and to 0.6 m/s for all rectangular side hole
cannulae) are studied. The sampling volume is moved along a scan line
running parallel to the symmetry line of the cannula (reference line). The first
measurement is taken at this position which is still inside of the cannula. It is
recorded as picture number one. Picture number two is located one cursor
step to the left at the same distance away from the probe. The angle between
two scan lines is 1°. The cursor is moved further to the left until the detected
velocity is lower than 0.9 m/s or 0.6 m/s respectively. The part of the jet on the
right side of the reference line is scanned in the same manner. The same
procedure is carried out for all other distances from the transducer. The
Appendix 2
91
deepness is changed in intervals of 10 mm. Figure 3 shows the measuring
points that are accessed by using the protocol described above. All
measurements are performed for a constant flow of 1.3 l/min of water with 2
% cornstarch to improve the image quality. Besides PWD measurement also
Color Flow Doppler (CFD) image are studied in two perpendicular planes, a
horizontal and a vertical one.
3. Exit force
The harmfulness of the sandblasting effect depends on the vector of the exit
force of the jet that is perpendicular to the aortic wall (cosine term) (figure 4).
This is in contrast with the shear stress, which is caused by friction force
oriented laterally with respect to the wall. By definition the force is the product
of the pressure p and the area A the pressure works on:
F = pA cosα = ρ u2 A cosα
where u represents the velocity and α the angle between the cannula and the
horizontal plane (the angle of incidence). This can also be written as a
differential equation:
dFdA
= u cos2ρ α
The force is a function of the angle of incidence and the radius and velocity of
the jet. In addition the force depends on the distance from the point of the tip
which makes it a three dimensional problem.
To be able to integrate the formula it is assumed that the jet has a circular
cross section which is a function of the radius (A = πr2 so that dA = 2πrdr).
Furthermore an integration of the equation is only possible if a functional

Appendix 2
92
relationship for the velocity profile is given. For most situations the following
profile is applicable assuming a turbulent velocity profile : u(r) = (1 - r/R)1/n
Umax with R being the maximum radius and Umax the maximum velocity.
Prandtl derived n to 7 from Blasius’ law of friction [5].
Rearranging the equations and inserting the expressions for the assumed
velocity profile leads to:
αρπ cos 1 -
R - 1
2 +/n 2R +
Rr - 1
1 +/n 2R U 2- = F(r)
2 +/n 21 +/n 22max
rr
The force at a certain depth is obtained for r = R (n = 7):
αρπ cos R U 7249 = F 22
max
Appendix 2
93
Results
Figure 5 shows the comparison between the calculated geometric outflow
area (GOA) and the measured effective outflow area (EOA) for all tested
cannulae. These values deviate for cannulae with side holes.
Figure 6 displays the high velocity core of the jet obtained with PWD in the
horizontal plane (left panel) and the vertical plane (right panel) for the Sarns
9484. As mentioned before only a limited range of velocities is measured for
each jet. Plotting these velocities in a chart according to their measuring
position gives a good impression of the spatial distribution of the maximum of
the jet which is referred to as the core of the jet. Distances measured in
respect to the position of the ultrasound probe are drawn on the left hand side
of the diagram (Fig. 6) and distances measured from the point of the tip are
given on the right hand side with the tip being positioned at zero. At the
boundaries of the jet flowing water starts to mix with the resting fluid in the
reservoir. The core decreases in size with increasing distance from the exit of
the cannula. Nevertheless it is observed that even at a distance of 90 mm
away from the tip the maximum of the velocity in the center of the jet remains
constant. This suggests that a velocity drop-off regarding the peak velocity is
not yet present at that distance. These measurements together with the CF
Doppler measurements show an axisymmetric jet indicating that the angled
cut of the point of the tip does not effect basically the profile of the jet. Peak
velocities of all the cannulae vary between 0.85 m/s (“Sarns 5847" and “Sarns
5774") and 1.08 m/s (“Gent Hospital”) for a steady water flow of 1.3 l/min
(blood flow of 4 l/min). Figure 7 summarizes the measured peak velocities.

Appendix 2
94
For all cannulae it is observed that the peak velocities in the vertical plane are
slightly higher compared to the values measured in the horizontal plane
because reflections from the bottom of the reservoir and the water surface are
higher in this case.
An estimation of the maximum exit force of the tested cannulae is obtained
from the average measured values for the velocities and the available cross
section (Tab. 1). Figure 8 shows the variation of the exit force as a function of
the radius.
The peak pressure drop over the cannulae varies between 14.4 (“Sarns
5847") and 31.8 mmHg (“Gent Hospital”) for a water flow of 3 L/min which
corresponds to a pressure drop of 132 - 291 mmHg for a blood flow of 9
L/min.
Figure 9 shows the measured pressure drop for all cannulae. Besides the
pressure versus flow chart (Fig. 10, left panel) the data is also represented in
a dimensionless way where the Euler number is a function of the Reynolds
number (Fig. 10, right panel). The Euler number is defined asup =Eu
2ρ∆ and
the Reynolds number as Re = ρ u D/µ where ρ represents the density, u the
velocity, D the internal diameter and µ the dynamic viscosity. The graphs for
the pressure drop over the tube, the tip and the cannula are drawn separately.
As already can be seen from Figure 9 and 10 the total pressure drop across
the cannulae is mainly influenced by the tip except for the model “Gent
Hospital” where the tube plays the most important part because of its long and
thin origin.
Figure 11 summarizes the measured water flow across the cannulae for a

Appendix 2
95
constant pressure drop of 10.9 mmHg.
Appendix 2
96
Discussion
Sandblasting effect: peak velocities and exit force
Two out of six cannulae (“Sarns 5847" and “Sarns 5774") tested in this study
feature a new tip design where the blood flow exits through four lateral side
holes and not through an open tip like on the other models which is believed
to reduce peak velocities and exit forces [4].
To verify this statement the spatial velocity distribution of all cannulae is
measured with an ultrasound Doppler velocimeter and the exit forces at
certain distances from the tip are calculated out of the peak velocity and the
diameter of the jet by means of an integration.
Although aortic arch cannulae are routinely used during open heart operations
the importance of their hydrodynamics is somewhat overseen. In literature a
few papers are directly dealing with this topic. This is in contrast with the
knowledge that in terms of clinically significant central nervous system
dysfunction the most important embolic hazard of open heart operations in the
current area is atheroembolism from the ascending aorta.
The term “sandblasting effect” is used to describe the erosion process. In fact
this is misleading because it is actually the high pressure exerted on the aortic
wall rather than particles accelerated by a fluid (which would be the technical
meaning of the expression) that causes the dislodge of material. Erythrocytes
are too small and soft as to act like sand corns in the blood jet. Since the
terminology “sandblasting effect” is found in all of the reviewed papers it
seems to be an accepted phrase in the clinical field despite of its actual
meaning.
Appendix 2
97
To quantify the significance of the sandblasting effect Grossi et al. measured
intraoperatively the flow in the aortic arch of 18 patients undergoing CPB by
by epiaortic ultrasonography [3]. All patients were cannulated in the ascending
aorta, 10 with a short (15 mm) and 8 with a long (70 mm) cannula.
The peak forward aortic flow velocities measured on the caudal luminal
surface of the aortic arch were 0.80 m/s (± 0.23 m/s) when the CPB was
turned off and 2.42 m/s (± 0.69 m/s) on CPB for the short cannula. Using the
long cannula velocities of 0.53 m/s (± 0.20 m/s) and 0.18 m/s (± 0.10 m/s)
off/on CPB were measured respectively. For all measurements a handhold
probe was used connected to a Doppler velocimeter set to the continuous
wave mode.
Based on these measurements it was concluded that a long tip cannula
should be used in patients with an atheromatous aortic arch because it
confines the sandblasting effect to the descending aorta beyond the origins of
the cerebral vessels. Grossi’s results are somewhat questionable because
cannulae with different cross sections (long: 22 French versus short: 20
French) were compared. It is not surprising that the cannulae with the larger
cross section (long) provide lower peak velocities. Furthermore the length of
the tip has no influence on the quantity of the exit velocity assuming a
constant flow for all cannulae but only the pressure drop increases with
growing length.
The accuracy of the velocity measurements which is inadequate in one case
and it is peculiar that the long tip cannulae offer velocities that are even lower
than the physiological values in the aortic arch (0.18 versus 0.53 m/s). This
phenomenon is based on the fact that Doppler measurements are very

Appendix 2
98
direction sensitive (handhold probe) and that the continuous wave Doppler
mode (integration of all velocities on one line) rather than the pulsed Doppler
mode (local velocity measurements) had been chosen. Nevertheless our
velocity measurements obtained with PWD deviates also from data published
by Muehrche [4]. They reported very low peak velocities for a water flow of 2
l/min between 0.29 and 0.72 m/s. For example the peak velocity of the model
RMI ARS 024C, which is a straight open tip cannula with an internal diameter
of 6.1 mm, is measured at 0.57 m/s whereas a calculation would suggest a
value of around 1.41 m/s. An explanation for this deviation could be probably
found in an appropriate calibration of the laser Doppler anemometer. It is also
questionable if the measured velocity drop-off obtained with an ultrasound
velocimeter reflects the actual situation. Due to the limited lateral resolution of
ultrasound Doppler velocimeters it is likely to underestimate peak velocities if
the width of the jet is approximately of the same size as the width of the
sampling volume. The calculated velocity drop-off appears too low in this
case.
All open tip cannulae offer equal peak velocities and diameters of the jet
resulting in the same exit forces. The four side hole cannulae provide a larger
EOA which produces lower peak velocities and therefore reduces exit forces.
Pressure drop
The pressure drop across a cannula for a given blood flow is of concern in the
clinical practice because it adds to the total pressure loss of the CPB and
needs to be taken into account to adjust the roller pump of the extracorporeal
system previous to the operation.
Appendix 2
99
Due to this interest pressure versus flow charts are recorded for each of the
tested cannulae. Losses are measured for the tube and the tip of the
cannulae seperately to prove that the tip dominates the total loss. All pressure
versus flow charts are also presented in a dimensionless manner (Euler
versus Reynolds number) to advertise the benefits of dimensionless numbers.
For the flow of interest one has to compute the Reynolds number; look up the
corresponding Euler number in the graph and compute the resulting pressure
drop as ρ u2 * Eu, with u the mean velocity, which is the flow rate divided by
the cross-sectional area. There is also no need to rescale the graphs for blood
although the measurements are performed with water.
This is of great advantage when hemodilution and hypothermia are present,
because they alter the dynamic viscosity and therefore the pressure flow
relationship. However with the dimensionless numbers Re and Eu the graph
is normalized for a Newtonian fluid of any viscosity.
Montoya et al. proposed a standardized system to describe pressure versus
flow relationships in vascular access devices e.g. aortic arch cannulae [7].
Their request is that catheters are usually characterized by the French
number and length only. This description does not provide any information
about the pressure-flow relationship of the catheter nor does it allow for
performance comparisons between catheters.
Their system allows to characterize any vascular access device by a single
number denoted as “M” which may be determinated from the geometry or
from simple in vitro pressure-flow measurements. M is defined as log (LDC-
4.75) where L represents the length and DC the characteristic diameter of the
cannula. The system can be used by surgeons who wish to choose an

Appendix 2
100
appropriate catheter when size or pressure limitations are given or by
manufacturers who may supply M as a specification which will allow for
performance comparisons between catheters.
However the M number does not provide any new information because it
could be replaced by two already existing dimensionless numbers: the Euler
and the Reynolds number. Euler is defined as Eu = ∆p/ρu2 = λL/2DC for a
straight tube with λ a dimensionless friction number. Inserting Blasius’
equation for λ [5] and substituting the velocity by the flow Q, gives the
relationship Eu/Re-0.25 = 0.158 L/DC which is constant for a given geometry. If
all pressure and velocity values were provided in a dimensionless manner in
terms of Reynolds and Euler this approach would be an alternative to the M
number which might have some difficulties to become widely accepted.
Appendix 2
101
Conclusions
In summary the four side hole designs show a superior hydrodynamic
performance in the in vitro study compared to the end hole cannulae.
However the situation might look different in an in vivo setup. E.g. the amount
of the exit force exerted on the aortic wall depends very much upon the angle
of incidence. The jet of the straight open tip cannulae hits the aortic wall
almost perpendicular resulting in a high impact on possibly calcified tissue
whereas the jet of the angled tip cannulae hits the wall at a flatter angle which
results in a lower force on the aortic wall.
The four side hole designs are difficult to judge in this respect because one or
more of the four jets is likely to hit the aorta at a right angle. It must be taken
into account that the exit force is much lower compared to the other cannulae
but since the threshold value to erode calcified plaque is unknown it remains
questionable if the design offers a large advantage compared to the angled
open tip cannulae in an in vivo situation.
It is suggested to determine the threshold value for tissue erosion in an in vitro
setup before starting an in vivo investigation of the flow patterns of the
cannulae to be able to judge the force that needs to be applied to erode
calcified material.
Meanwhile it is advised to use angled tip cannulae to direct the blood flow
away from the aortic wall reducing the impact on the aortic intima.
Appendix 2
102
References
1. Katz E.S., Tunick P.A., Rusinek H., Ribakove G., Spencer F.C., Kronzon I.
Protruding aortic atheromas predict stroke in elderly patients undergoing
cardiopulmonary bypass : experience with intraoperative transesophageal
echocardiography. J. Am. Coll. Cardiol. 20:70-7, 1992.
2. Ribakove G.H., Katz E.S., Galloway A.C. et al. Surgical implications of
transesophageal echocardiography to grade the atheromatous aortic arch.
Ann. Thorac. Surg. 53:758-93; 1992.
3. Grossi E.A., Kanchuger S., Schwartz S., McLoughlin D.E., LeBoutillier M.,
Ribakove G.H., Marschall K.E., Galloway A.C., Colvin S.B. Effect of
cannula length on aortic arch flow : protection of the atheromatous aortic
arch. Ann. Thorac. Surg. 59:710-2, 1995.
4. Muehrche D.D., Cornhill J.F., Thomas J.D., Cosgrove D.M. Flow
characteristics of aortic cannulae. J. Card. Surg. 10:514-519, 1995.
5. Streeter V.L. Handbook of fluid dynamics. Mc Graw-Hill Book Company;
1961.
6. Guiot C. et al. Continous and pulsed Doppler power spectral density in
steady flow : an experimental investigation. Med. & Biol. Eng. & Comput.
35:146-159, 1997.
7. Montoya J.P. et al. A standardized system for describing flow/pressure
relationships in vascular access devices. ASAIO Transactions. 37:4-8,
1991.

Appendix 2
103
Table 1. Geometries, dimensions and materials of the tested 24 French
cannulae

Appendix 2
104
Figure 1. Schematic drawing of a cannula (a connector, a tube and the tip).
Connector Tube Tip
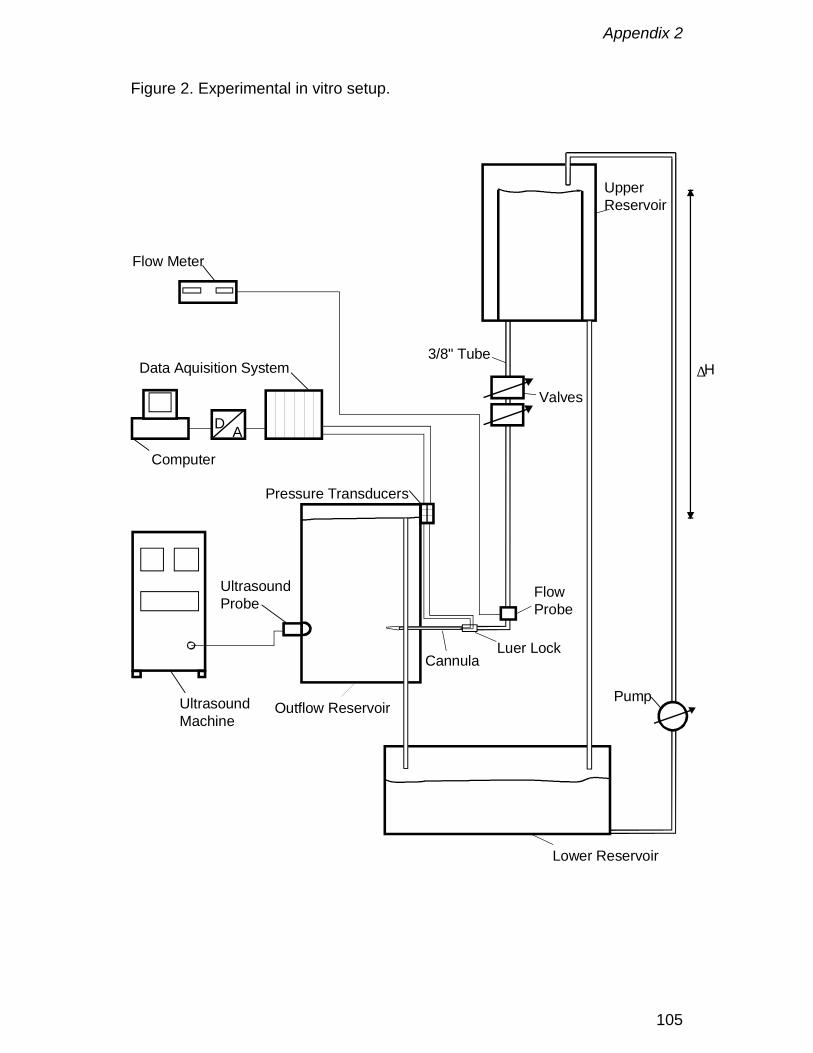
Appendix 2
105
Figure 2. Experimental in vitro setup.
UpperReservoir
Valves
3/8" Tube
FlowProbe
Luer LockCannula
Pressure Transducers
Pump
∆H
Outflow Reservoir
Lower Reservoir
UltrasoundProbe
UltrasoundMachine
Flow Meter
AD
Data Aquisition System
Computer
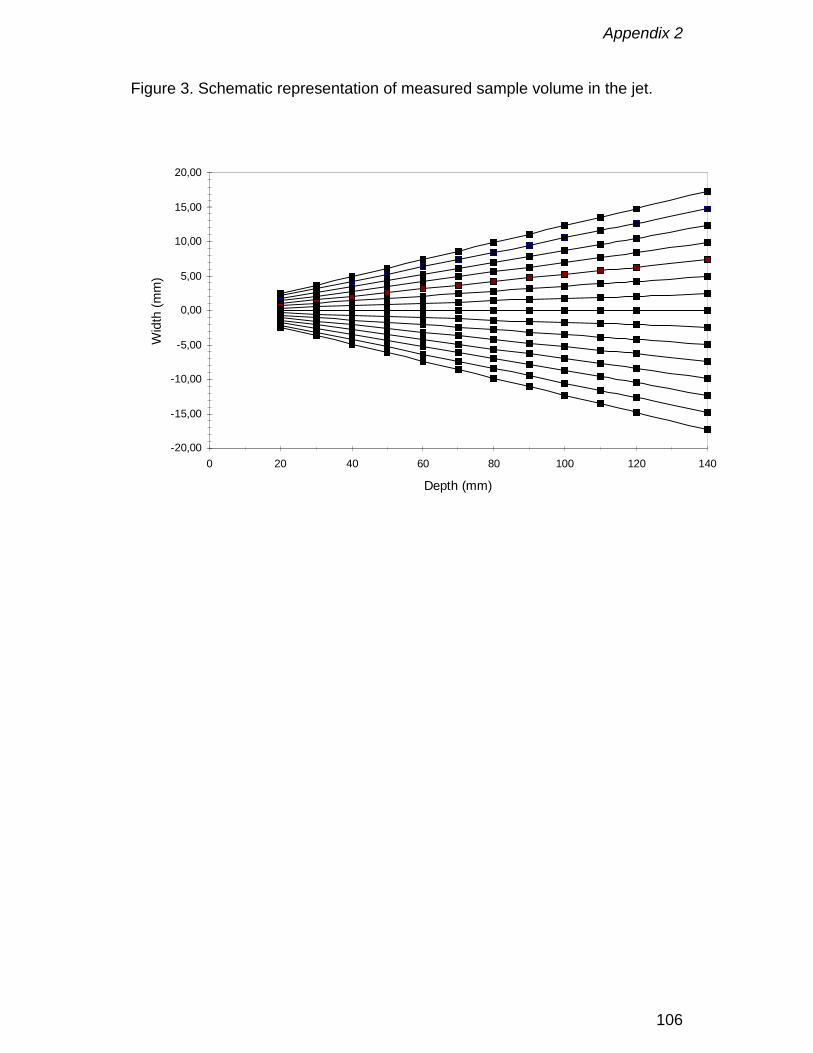
Appendix 2
106
Figure 3. Schematic representation of measured sample volume in the jet.
-20,00
-15,00
-10,00
-5,00
0,00
5,00
10,00
15,00
20,00
0 20 40 60 80 100 120 140
Depth (mm)
Wid
th (m
m)
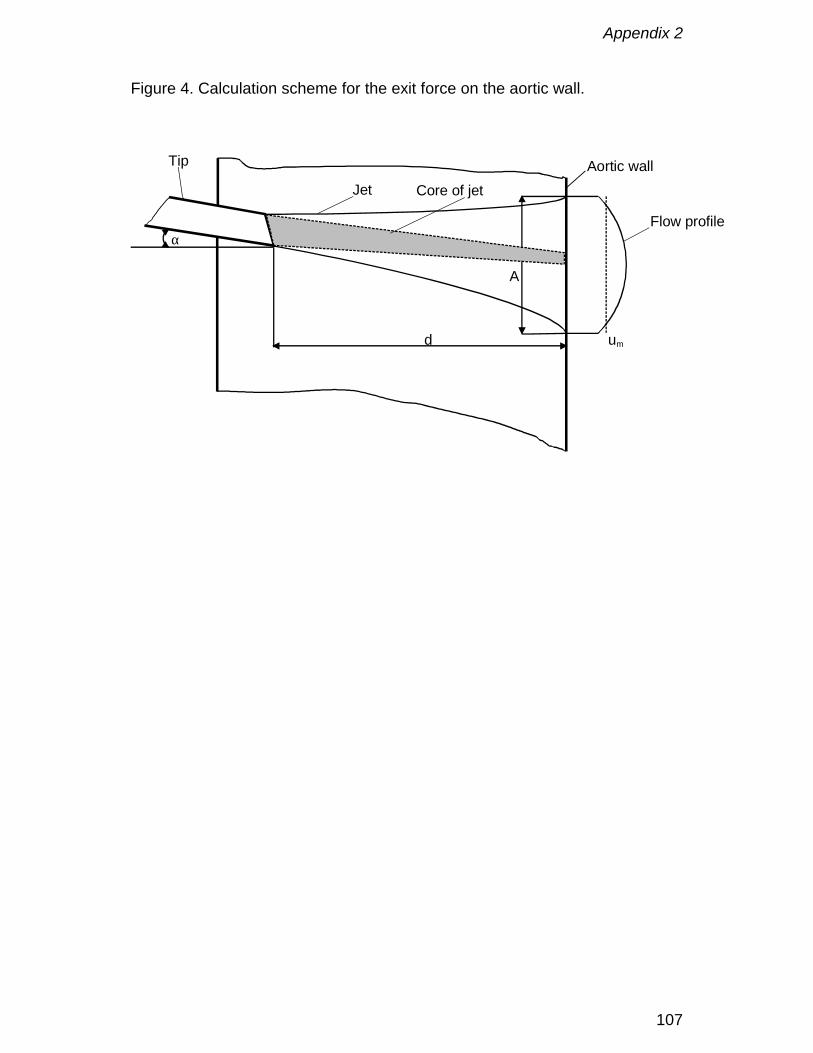
Appendix 2
107
Figure 4. Calculation scheme for the exit force on the aortic wall.
α
d um
Tip
JetAortic wall
Flow profile
Core of jet
A

Appendix 2
108
Figure 5. Comparison between geometric outflow area and effective outflow
area of all tested cannulae.
0
10
20
30
40
50
60
70
80
90G
ent
Hos
pita
l
Sarn
s94
84
Sarn
s16
5264
Sarn
s44
01
Sarn
s58
47
Sarn
s57
74
Out
flow
cro
ss s
ectio
n (m
m2 )
GOA
EOA
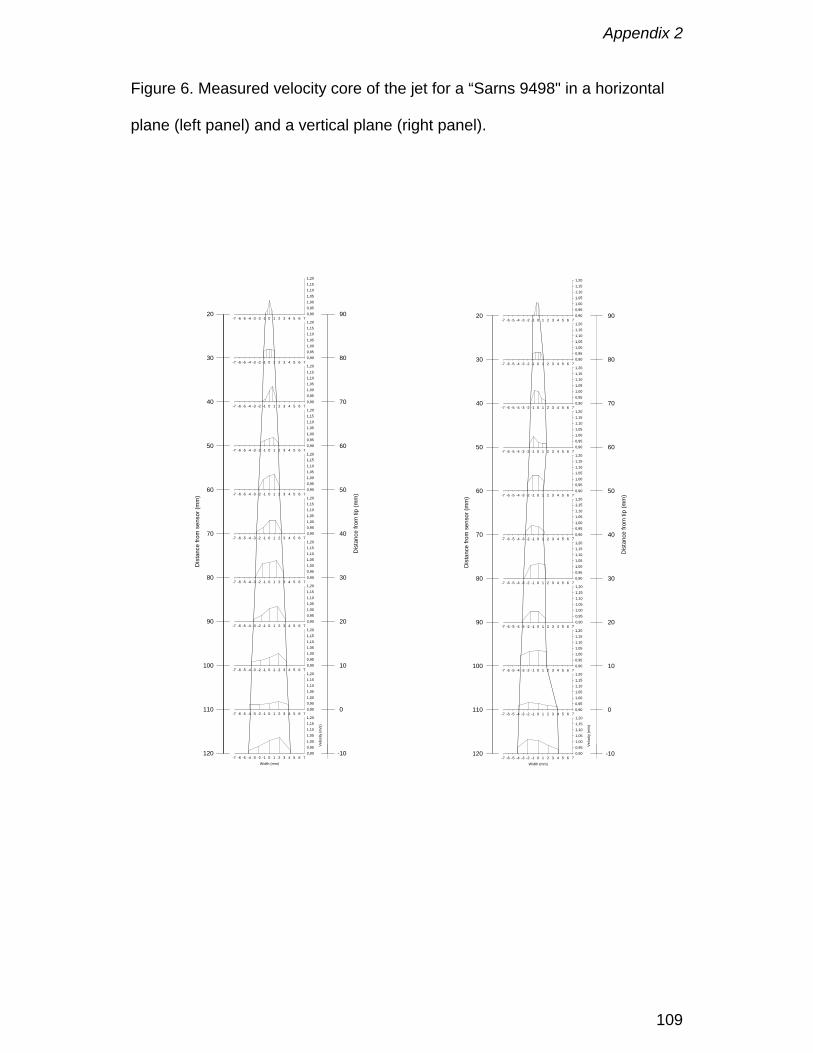
Appendix 2
109
Figure 6. Measured velocity core of the jet for a “Sarns 9498" in a horizontal
plane (left panel) and a vertical plane (right panel).
Width (mm)-7 -6 -5 -4 -3 -2 -1 0 1 2 3 4 5 6 7
Vel
ocity
(m/s
)
0,900,951,001,051,101,151,20
-7 -6 -5 -4 -3 -2 -1 0 1 2 3 4 5 6 70,900,951,001,051,101,151,20
20
30
40
50
60
70
80
90
100
110
120
Dis
tanc
e fro
m s
enso
r (m
m)
-10
0
10
20
30
40
50
60
70
80
90
Dis
tanc
e fro
m ti
p (m
m)
-7 -6 -5 -4 -3 -2 -1 0 1 2 3 4 5 6 70,900,951,001,051,101,151,20
-7 -6 -5 -4 -3 -2 -1 0 1 2 3 4 5 6 70,900,951,001,051,101,151,20
-7 -6 -5 -4 -3 -2 -1 0 1 2 3 4 5 6 70,900,951,001,051,101,151,20
-7 -6 -5 -4 -3 -2 -1 0 1 2 3 4 5 6 70,900,951,001,051,101,151,20
-7 -6 -5 -4 -3 -2 -1 0 1 2 3 4 5 6 70,900,951,001,051,101,151,20
-7 -6 -5 -4 -3 -2 -1 0 1 2 3 4 5 6 70,900,951,001,051,101,151,20
-7 -6 -5 -4 -3 -2 -1 0 1 2 3 4 5 6 70,900,951,001,051,101,151,20
-7 -6 -5 -4 -3 -2 -1 0 1 2 3 4 5 6 70,900,951,001,051,101,151,20
-7 -6 -5 -4 -3 -2 -1 0 1 2 3 4 5 6 70,900,951,001,051,101,151,20
Width (mm)-7 -6 -5 -4 -3 -2 -1 0 1 2 3 4 5 6 7
Velo
city
(m/s
)
0,900,951,001,051,101,151,20
-7 -6 -5 -4 -3 -2 -1 0 1 2 3 4 5 6 70,900,951,001,051,101,151,20
20
30
40
50
60
70
80
90
100
110
120
Dis
tanc
e fro
m s
enso
r (m
m)
-10
0
10
20
30
40
50
60
70
80
90
Dis
tanc
e fro
m ti
p (m
m)
-7 -6 -5 -4 -3 -2 -1 0 1 2 3 4 5 6 70,900,951,001,051,101,151,20
-7 -6 -5 -4 -3 -2 -1 0 1 2 3 4 5 6 70,900,951,001,051,101,151,20
-7 -6 -5 -4 -3 -2 -1 0 1 2 3 4 5 6 70,900,951,001,051,101,151,20
-7 -6 -5 -4 -3 -2 -1 0 1 2 3 4 5 6 70,900,951,001,051,101,151,20
-7 -6 -5 -4 -3 -2 -1 0 1 2 3 4 5 6 70,900,951,001,051,101,151,20
-7 -6 -5 -4 -3 -2 -1 0 1 2 3 4 5 6 70,900,951,001,051,101,151,20
-7 -6 -5 -4 -3 -2 -1 0 1 2 3 4 5 6 70,900,951,001,051,101,151,20
-7 -6 -5 -4 -3 -2 -1 0 1 2 3 4 5 6 70,900,951,001,051,101,151,20
-7 -6 -5 -4 -3 -2 -1 0 1 2 3 4 5 6 70,900,951,001,051,101,151,20

Appendix 2
110
Figure 7. Measured peak velocities.
0,75 0,75
0,97 1,00 1,00
0,85 0,85
1,05 1,07 1,07 1,081,05
0,00
0,20
0,40
0,60
0,80
1,00
1,20
Sarn
s58
47
Sarn
s57
74
Sarn
s94
84
Sarn
s16
5264
Sarn
s44
01
Gen
tH
ospi
tal
Peak
vel
ocity
(m/s
)
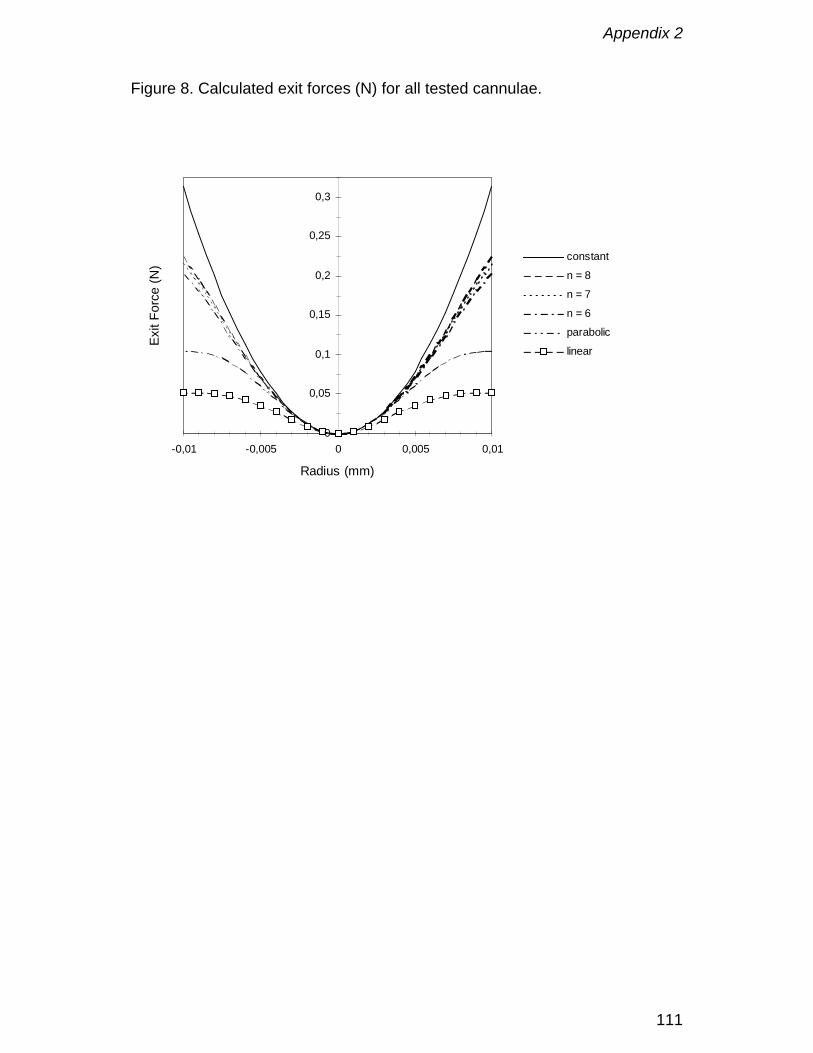
Appendix 2
111
Figure 8. Calculated exit forces (N) for all tested cannulae.
0
0,05
0,1
0,15
0,2
0,25
0,3
-0,01 -0,005 0 0,005 0,01
Radius (mm)
Exit
Forc
e (N
)
constant
n = 8
n = 7
n = 6
parabolic
linear
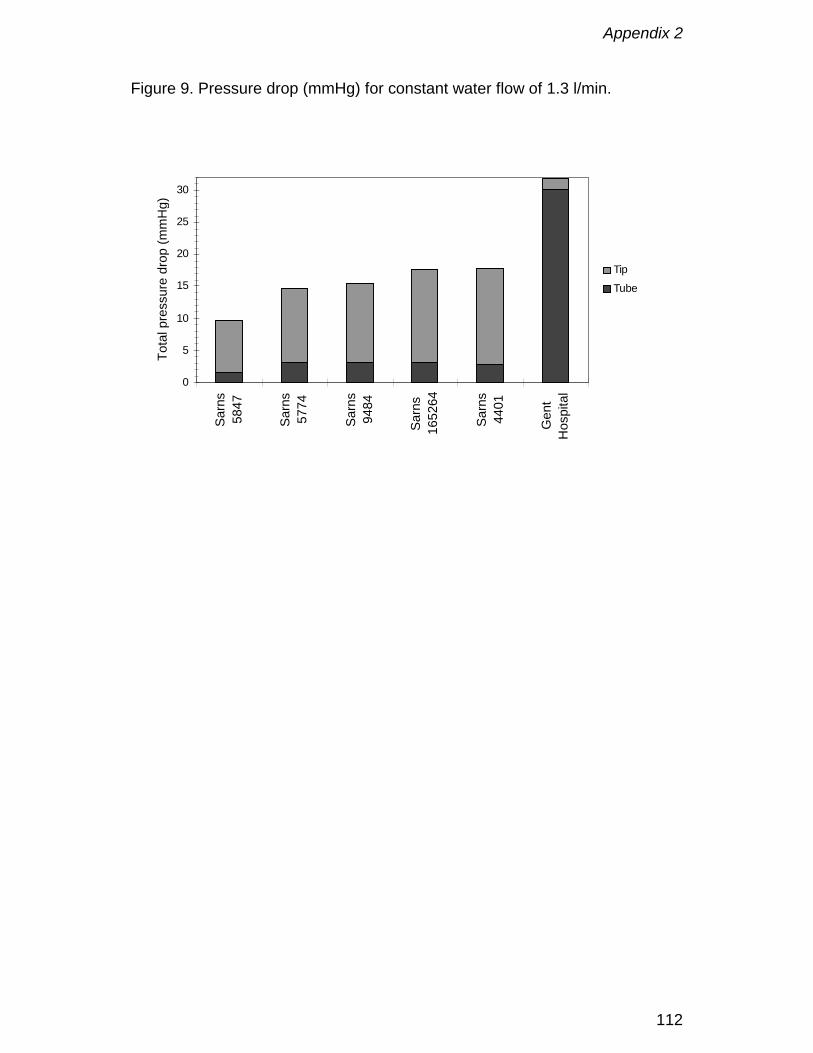
Appendix 2
112
Figure 9. Pressure drop (mmHg) for constant water flow of 1.3 l/min.
0
5
10
15
20
25
30
Sarn
s58
47
Sarn
s57
74
Sarn
s94
84
Sarn
s16
5264
Sarn
s44
01
Gen
tH
ospi
tal
Tota
l pre
ssur
e dr
op (m
mH
g)
Tip
Tube
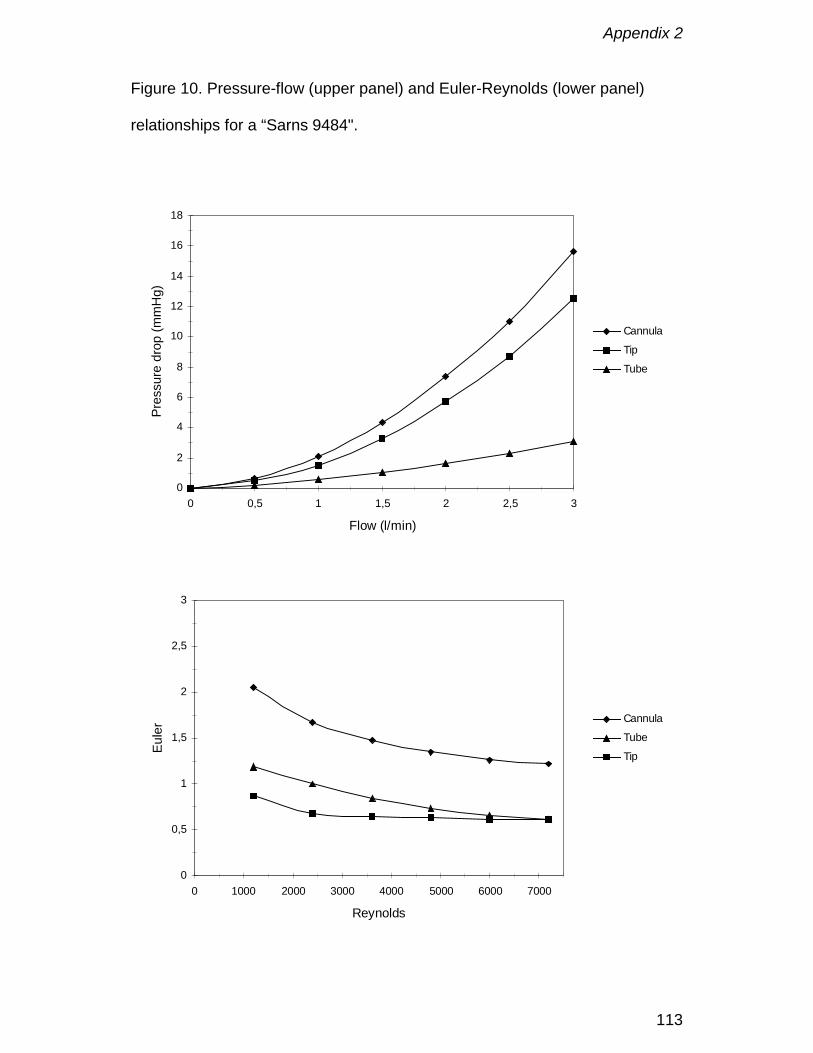
Appendix 2
113
Figure 10. Pressure-flow (upper panel) and Euler-Reynolds (lower panel)
relationships for a “Sarns 9484".
0
2
4
6
8
10
12
14
16
18
0 0,5 1 1,5 2 2,5 3
Flow (l/min)
Pres
sure
dro
p (m
mH
g)
Cannula
Tip
Tube
0
0,5
1
1,5
2
2,5
3
0 1000 2000 3000 4000 5000 6000 7000
Reynolds
Eule
r Cannula
Tube
Tip
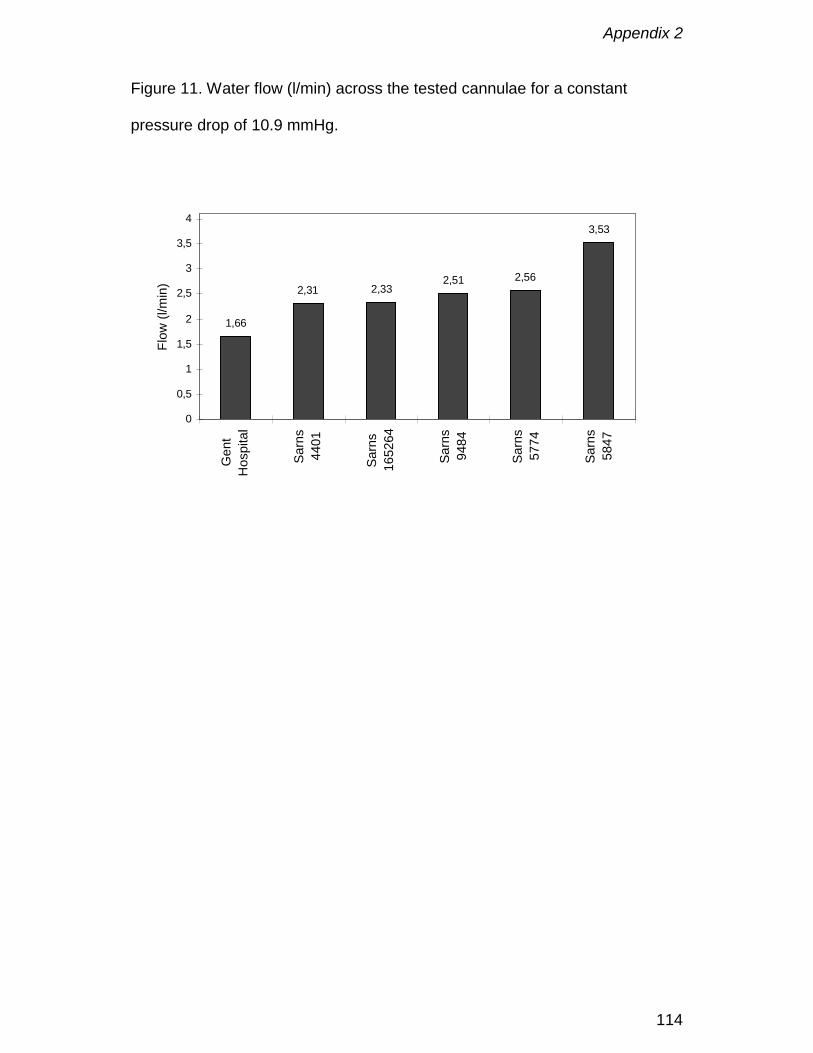
Appendix 2
114
Figure 11. Water flow (l/min) across the tested cannulae for a constant
pressure drop of 10.9 mmHg.
1,66
2,31 2,332,51 2,56
3,53
0
0,5
1
1,5
2
2,5
3
3,5
4G
ent
Hos
pita
l
Sarn
s44
01
Sarn
s16
5264
Sarn
s94
84
Sarn
s57
74
Sarn
s58
47
Flow
(l/m
in)
Appendix 3
115
Comparison of two dissimilar designs of paediatric aorticcannulae
D. De Wachter, F. De Somer, PR Verdonck
Int. J. Art. Organs, 2002; 25(9): 867 - 874

Appendix 3
116
Abstract
Any extracorporeal blood treatment requires an adequate and safe connection
to the circulation. For cardiopulmonary bypass procedures, aortic and venous
cannulas are utilized. However, the performance of these cannulas is not only
dependent on their size (diameter), but merely on their complete geometric
design.
In this paper two aortic cannula designs are evaluated haemodynamically for
two different sizes (8, 10 Fr) with both aqueous fluids as well as with blood.
Using the novel concept of equivalent diameter, a new performance
parameter, and the theory of dynamical similarity the results obtained with
different fluids can be compared. Data points of one cannula can be fitted with
a parabolic equation.
There is a significant performance difference between the two 8 Fr cannulas.
The 10 Fr cannulas differ non-signicantly except when water is used.
Equivalent diameters obtained with water in the turbulent region are
significantly higher than those obtained with fluids that have a higher viscosity
(blood and aqueous glycerine mixture). The latter fluids have comparable
viscosities and render an equal equivalent diameter. The coefficients of their
proper parabolic fit lines can be easily recalculated into each other.
This provides a simple method to quickly determine pressure drops over
cannulas in the operating room.

Appendix 3
117
Introduction
During open heart surgery procedures, the heart is arrested. To cover heart
and lung functions during this period, an extracorporeal shunt is established
over the heart (cardiopulmonary bypass), which includes a blood pump to
pump the blood through the extracorporeal circuit and back into the main
circulation, and an artificial lung for gas exchange. Blood is collected on the
venous side by means of a plastic cannula and drained by gravity into a
collecting reservoir. On the positive pressure side of the pump a plastic aortic
cannula is employed to inject the oxygenated blood into the intracorporal
circulation.
Pediatric aortic cannulas are made from soft plastic and on the one end they
allow a connection to PVC tubing, while at the other end they have a small tip,
suitable for introduction in the aorta of children. This tip is either in hard plastic
or it is a wire-reinforced. The dimensions of a paediatric cannula are a
compromise between technical requirements (blood flow vs. pressure drop)
and practical limitations (aortic diameter, small incision). Tip dimensions are
commonly stated in french (Fr); 1 Fr corresponds to an outer diameter of 0.33
mm. However inner diameters (ID) may differ significantly (Table 1).
The purpose of this study is to characterise the hydraulic resistance of
paediatric aortic cannulas on the one hand with an aqueous solution, similar
as has been done for adult size cannulas [1] and secondly with blood. The
second objective is to test whether these values can be used to determine
actual flow resistance in the operating room where the cannulas are perfused
by blood with different haematocrits and temperatures.
Appendix 3
118
Materials and Methods
4 different cannulas are included in the study (Table 1). All cannulas are from
DLP (Medtronic®). Of each type 2 specimens are studied. These cannulas
can be grouped in two ways: according to size (10Fr or 8Fr) or according to
tip design (series 750xx or 77xxx). The 750xx series cannulas have a short
light blue stiff plastic tip with a sudden diameter reduction (Figure 1). The
inner diameter (ID) of their tip is smaller than the ID of a 77xxx series cannula
of comparable French size. The latter series of cannulas have a long wire-
reinforced flexible tip with a smooth diameter reduction halfway the cannula.
The length of the 750xx series is shorter than the 771xx series, mainly
because the flexible tip of the latter can be introduced downstream into the
aorta. Pressure-flow relationships are assessed using three different fluids:
pure water, an aqueous glycerine solution (35 vol. %), both at room
temperature (20-25°C) and bovine blood with a hematocrit of about 32% (at
20°C and 37°C).
The test set-up consists of a tubing set, a variable speed rollerpump and a
small temperature controlled reservoir (Figure 2). The fluid is pumped from
the reservoir through the cannula and back in the reservoir. The tip of the
cannula is positioned in a long large bore tube (length: 50cm, ID=1/2 inch), to
minimise afterload influence. In fact this tube serves also as a sort of reservoir
in which kinetic energy of the fluid jet, that is propulsed from the cannula’s tip,
can be dissipated. Flow rate is measured with an ultrasonic transit-time
clamp-on flow meter (Transonic®, Ithaca NY, USA), that was previously
calibrated for each fluid by a volumetric method. Pressures are measured with

Appendix 3
119
fluid-filled piezo-electrical transducers (Ohmeda, Gent, Belgium), two-point
calibrated before each test run.
To determine a single data point, flow rate and pressures are recorded during
a finite time, through a computer data-acquisition card (PC74, Eagle
Technology, Cape Town, South Africa) and suitable software, typically at a
sampling rate of 200Hz. Due to roller pump operation, these curves exhibit a
periodical pattern. Actual data points are then determined by averaging these
values over an integral number of periods. All averaged data points are used
to fit a parabolic equation through the origin, stating the pressure drop (∆P)
flow rate (Q) relationship of a cannula. The parabolic equation is obtained by
polynomial regression (Sigmaplot, SPSS Inc., Erkrath, Germany).
Data obtained with different fluids render different parabolic equations.
However using the theory of dynamic similarity [2] (see Appendix), the
coefficients of these parabola can be recalculated and compared. Since
during clinical use, these cannulas are perfused with blood, the most useful
conversions are those to blood. The simplest method is to directly convert
pressures (P) and flow rates (Q) according to these ratios:
2
2
fb
bf
f
b
fb
bf
f
b
PP
µρ
µρ
µρ
µρ== (1)
where subscripts b denote blood and f any other fluid (water, aqueous
glycerine, ..). ρ and µ are respectively the density and the dynamic viscosity.
A second method rescales the coefficients of the fitted parabolic equation. If
the parabola is defined with ∆P the pressure drop and Q the flow rate:
bQaQP +=∆ 2 (2)

Appendix 3
120
Then the new coefficients are determined by rescaling with ratios of density
and dynamic viscosity:
f
bfb
f
bfb bbaa
µµ
ρρ
== (3)
The last method consists of the utilisation of dimensionless numbers, which
are independent of the fluid’s physical properties. The Euler number (Eu) is a
dimensionless measure of the pressure losses and the Reynolds number (Re)
of the flow rate:
µπρ
ρπ
e
e
DQ
QPD 4Re
16Eu 2
42
=∆
= (4)
The equivalent diameter De is determined from the effective diameters. The
effective diameter Deff is defined as the internal diameter that a circular tube
with the same length (L) as the cannula should have to exhibit the same
pressure drop as the cannula under study at a particular flow rate. At fully
developed turbulent flow (Re > 4000; water measurements), it is determined
from the Blasius equation (top of eq. 5). At laminar flow (Re < 2300; blood &
glycerine measurements) it is derived from the well-known Poiseuille equation
(lower part of eq. 5).
4
194
743
128
0541.0
PLQD
PQLD
eff
eff
∆=
∆=
πµ
µρ(5)
Deff should be independent on the fluid’s density (ρ) and dynamic viscosity (µ),
as their effects are cancelled by the flow / pressure drop ratio. However, when
using the Poiseuille equation, Deff depends on the flow rate because of special
pressure losses in the cannula that are not linearly proportional to the flow
Appendix 3
121
rate. As a reasonable approximation, it can be assumed that Deff varies
linearly with Re. Therefore the actual equivalent diameter (De) is obtained as
the Deff at Re=1000 on the linear regression line that is fitted through all Deff in
the laminar range for blood and aqueous glycerine and as the average of the
effective diameters determined from all measurements in the turbulent flow
range (Re> 4000) for water. The Blasius equation is utilized for water since
most water measurements fall in the turbulent flow regimen because of its
much lower viscosity compared with blood.
Dynamic viscosity of the fluids (µ) is either determined from literature data
(water [3], blood [4]), or measured in a viscometer (aqueous glycerine &
blood). Blood viscosity µb can be described by exponential functions, with µp:
plasma viscosity, T: absolute temperature (K) and Hct the fraction of red blood
cell volume [4]:
)35.2exp()180054.5exp(
HctT
pb
p
µµ
µ
=
+−=(6)
Appendix 3
122
Results
Viscosities of the fluids are respectively: 3.66 mPa.s for bovine blood at 37°C;
5.66 mPa.s for blood at 20°C; 3.36 mPa.s for 35%-65% glycerine-water
mixture at 20°C and 1.00 mPa.s for tap water.
In Table 2 the equivalent diameters of the four cannulas are presented. They
range from 2.5 mm for the 75008 8 Fr cannula to 3 mm for the 10 Fr
cannulas. The equivalent diameter obtained with water measurements is 6%
(75xxx series) to 10% (77xxx series) higher than for measurements with
blood.
The coefficients of the parabolic pressure equation (eq. 2) are listed in Table
3. The quadratic coefficients (a) are greater than the linear coefficients (b).
Both coefficients, but especially the linear coefficient (b) are generally greater
for the aqueous glycerine compared to the blood measurements, while for
water they are generally smaller. Also, the ratio of b/a is generally smaller for
water measurements. This ratio is a measure of the flow rate at which the
influence of the special pressure losses in the tip overhaul the pressure losses
in the cannula tube, the latter at these low flow rates being linearly related to
the laminar flow rate of the fluid.
In Figure 3 the pressure-flow relationships of all cannulas as measured with
bovine blood at 37°C are plotted along with their fitted parabolic regression
line proper. If the total pressure drop over each cannula would be limited to
200 mmHg, the maximal blood flow rate through the different cannulas is
respectively 0.78 L/min (77008); 1.05 L/min (77008); 1.60 L/min (77110) and
1.64 L/min (75010).
Appendix 3
123
In Figure 4 the Eu-Re relationship is shown for cannula 77008 on a semi-
logaritmic plot, with their respective transformed parabolic regression lines. As
is observed, the type of fluid does not influence to a great extent the position
of the plots that are in the laminar region (Re<2300, hollow symbols). For the
water measurements, which are mostly recorded in the turbulent flow region,
the curve is shifted up with respect to the laminar case. This indicates that the
dimensionless pressure drop in the turbulent region is larger than for laminar
flow. However, remark that the Euler number is proportional to the equivalent
diameter to the fourth power and that the equivalent diameter for water is
greater than that for the other fluids. Typically the region with Reynolds
numbers between 2000 and 4000 is regarded as a transition region. In this
region the behaviour of the fluid may be either laminar or turbulent or
somewhere in between. The only water measurement point at Re=1400 is
definitely measured with a laminar flow regime and shows a much lower Eu.
In fact this point lies amongst those measured with other fluids.
In Figure 5 the error of the calculated pressure-flow relationships for blood
with respect to the measured pressure-flow relationship is shown in the case
of the 77008 cannula. The coefficients of these calculated pressure-flow
relationships are found in Table 4. These coefficients are found by applying
either equations (3) or using the dimensionless numbers Eu and Re
(equations 4).
Appendix 3
124
Discussion
8 and 10 Fr cannulas are typical sizes used during paediatric surgery of
smaller childeren (up to 10kg). This group of patients constitutes
approximately 50% of the total paediatric population undergoing cardiac
surgery [5]. Size selection today is mainly done on anatomical grounds and on
arbitrary limits. Gates et al. [6] and Hessel [8] propose to limit the pressure
drop to 100 mmHg to avoid turbulent flow. More objective criteria are
necessary to make decent selections.
As is expected from theoretical considerations, cannulas that have a larger
internal diameter and a shorter length will exhibit the lowest pressure drop for
the same flow rate. According to the Poiseuille theory the diameter acts to the
fourth power, while the pressure drop is linearly proportional with the
cannula's length. Therefore, according to Table 1, the cannulas should be
ranked according to the highest pressure drop from 77008 over 75008 and
75010 to 77110. Indeed, this is exactly what is found, using the equivalent
diameter as a measure of performance (Table 2). In the water column this
ranking is indeed apparent, although the differences between the 10Fr
cannulas for blood and glycerine measurements are not significant. This is
also observed in Figure 3, where the two curves of the 10 Fr cannulas do not
differ much in the typical range of blood flow rates (up to 2 L/min). This may
be explained by the fact that the effect of the favorably shorter length of the
75010 is impaired by the much smaller inner diameter (ID) of its tip as
compared with the 77110 cannula (Table 1). For the 8 Fr cannulas the
difference in ID is not so great and therefore their curves do not overlap.
Appendix 3
125
If pressure would be the selection criterium, cannulas with greater equivalent
diameter are to be preferred (e.g. type 75008). If the equivalent diameter is
nearly equal and consequently the pressure gradient over the cannula, the
shortest cannula will produce the lowest pressure drop (e.g. 75010).
The equivalent diameter is shown to be a good predictor of performance as it
ranks the cannulas according to their pressure drop at the same flow rate.
However, the actual value is not useable in clinical practice, especially if it is
obtained by water measurements. In fact this has been tried before [7] and
promoted as the M-number. The reason is easily pointed out, as water
measurements tend to lie in the turbulent region (see Figure 4), whereas
during clinical operation blood is used and the flow is in the laminar region. As
can be observed in Table 2 the values obtained by water measurements are 6
to 10% higher than those obtained with either blood or aqueous glycerine.
However, this difference does not really have much meaning as the
equivalent diameter is arbitrarily determined at a Reynolds number of 1000.
Also, it is stated that the equivalent diameter is non-constant in the laminar
region. Typically it varies by up to 15% from the lower (Re=500) to high
Reynolds numbers (Re=2000). Typical Re values for blood flow through an 8
Fr cannula lie between 500 to 1500 and between 800-2500 for 10 Fr cannula,
depending on blood flow rate and viscosity. This indicates that Re=1000 is a
good compromise for the determination of the equivalent diameter, although it
remains an arbitrarily choosen number. On the other hand, Re=1000 is
considered to be critical for the flow through extracorporeal tubing sets by
Hessel [8]. No significant differences were found between equivalent
diameters of each cannula obtained by either blood or glycerine

Appendix 3
126
measurements. Therefore it can be concluded that the performance that is
assessed with glycerine is well matched by that determined by blood
measurements. Although aqueous glycerine is but a Newtonian fluid that
lacks the non-Newtonian characteristics of blood, it is apparent that the
comparable viscosities of both fluids are sufficient to render equal results.
One way to translate the measured pressure-flow rate relationship is by
utilizing equations (1). The only unknown to perform this conversion is the
blood viscosity which can be approximated by equations (6). However, due to
measurement errors and uncertaincies in the determination of the viscosities,
large deviations are possible, such that generally the error on the calculated
pressure is not less than 20%, except perhaps when using the measurements
obtained with blood at 20°C. These large errors can be expected in part
because of the conversion that has to be done. As is seen in Figure 4, the
water measurements for the 77008 cannula are performed at much higher
Re-numbers (but equal flow rates!) as the blood measurements, due to the
lower water viscosity. Since Re is inverse proportional to the viscosity, it can
be stated from equation (1) that the flow rates are scaled according to the
ratio of the Re numbers. The result is that the translated flow rates range from
0-6 L/min, much higher than the actual range used in clinical settings. Only
the measurements at low water flow rates translate into reasonable blood flow
rate values, but unfortunately these water measurements are made with
limited accuracy.
Therefore a better approach is to use the coefficients of the parabolic
equation (eq. 2) that describe the pressure drop for the cannula as a function
of blood flow rate and scale them according to equations (3). In this
Appendix 3
127
conversion the weight of the viscosity ratio is diminished and acts only on the
small linear coefficients (b). The more general method is with an Eu-Re
dimensionless analysis, which is quite similar, except that also the equivalent
diameters are taken into account (see Appendix). As a case, we have
selected cannula 77008 to test the potential of this conversion. This operation
renders new coefficients (Table 4), that allow to calculate the specific
pressure drop at a given flow rate. The relative errors of this calculation with
the actual blood measurements are plotted in Figure 5. At low flow rates the
errors are generally very high. This effect is caused by the lower relative
accuracy of the measurements in this range. For flow rates in the range from
0.4 to 1.2 L/min, the absolute error remains relatively constant for pressure
drops calculated from water measurements (15-20%) or from blood at 20°C
(10%; no difference between the two methods since the equivalent diameters
are equal). The latter is rather suprising, since it would be expected that the
blood measurement at 20°C is a good predictor of the values for blood at
37°C. However, the same effect as previously explained is active: the limited
accuracy of the blood viscosity measurement yields a new linear coefficient
(b) that is twice as high (see Table 4) as the original for 37°C blood (Table 3).
In Figure 5, the thick black lines show the error between the original blood
measurements at 37°C and the regression line fitted with the coefficients of
Table 3 on the one hand and secondly the lines that delineate the 99%
confidence intervals. This indicates that using the regression line for the
prediction of the pressure, a (maximal) error of up to 10% can be introduced.
So it seems that a 10% error in prediction is not bad at all. The only curves
that yield better results are the glycerine measurements. Since its viscosity is
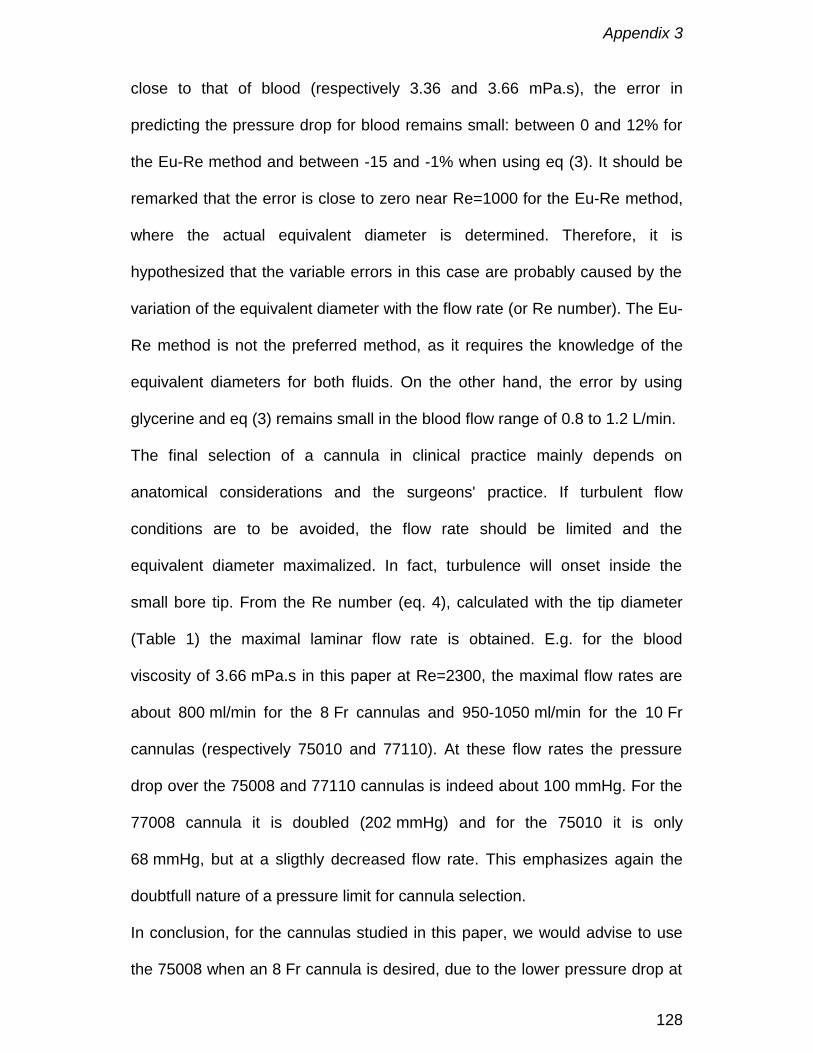
Appendix 3
128
close to that of blood (respectively 3.36 and 3.66 mPa.s), the error in
predicting the pressure drop for blood remains small: between 0 and 12% for
the Eu-Re method and between -15 and -1% when using eq (3). It should be
remarked that the error is close to zero near Re=1000 for the Eu-Re method,
where the actual equivalent diameter is determined. Therefore, it is
hypothesized that the variable errors in this case are probably caused by the
variation of the equivalent diameter with the flow rate (or Re number). The Eu-
Re method is not the preferred method, as it requires the knowledge of the
equivalent diameters for both fluids. On the other hand, the error by using
glycerine and eq (3) remains small in the blood flow range of 0.8 to 1.2 L/min.
The final selection of a cannula in clinical practice mainly depends on
anatomical considerations and the surgeons' practice. If turbulent flow
conditions are to be avoided, the flow rate should be limited and the
equivalent diameter maximalized. In fact, turbulence will onset inside the
small bore tip. From the Re number (eq. 4), calculated with the tip diameter
(Table 1) the maximal laminar flow rate is obtained. E.g. for the blood
viscosity of 3.66 mPa.s in this paper at Re=2300, the maximal flow rates are
about 800 ml/min for the 8 Fr cannulas and 950-1050 ml/min for the 10 Fr
cannulas (respectively 75010 and 77110). At these flow rates the pressure
drop over the 75008 and 77110 cannulas is indeed about 100 mmHg. For the
77008 cannula it is doubled (202 mmHg) and for the 75010 it is only
68 mmHg, but at a sligthly decreased flow rate. This emphasizes again the
doubtfull nature of a pressure limit for cannula selection.
In conclusion, for the cannulas studied in this paper, we would advise to use
the 75008 when an 8 Fr cannula is desired, due to the lower pressure drop at

Appendix 3
129
equal flow rates and the 77110 cannula 10 Fr cannula, as it allows for higher
blood flow rates before turbulent flow occurs, albeit with slightly higher
pressure drops. Maximal clinical blood flow rates for the 8 Fr cannulas lie
around 750 ml/min and around 1 L/min for the 10 Fr cannulas.

Appendix 3
130
Conclusion
In this paper we have shown that the performance of paediatric cannulas for
cardiopulmonary bypass techniques can be readily evaluated by the concept
of equivalent diameter. To determine the actual pressure drop over the
cannula in the clinical setting, it is sufficient to measure the pressure-flow
relationship with a fluid that has a comparable viscosity as blood and translate
with the theory of dynamical similarity the coefficients of the fitted parabolic
regression line to the values for blood . A simple calculation with the resulting
quadratic equation and the desired blood flow rate is then able to render an
accurate estimation of the pressure drop.
Acknowledgement
Dirk De Wachter is a post-doctoral Fellow of the Fund for Scientific Research
- Flanders, Belgium.
The authors like to thank DLP - Medtronic to provide us with samples of the
cannulas. The kind assistance of Neil Uyttensprot and Jürgen Lissens during
the experiments is greatly appreciated.
Appendix 3
131
References
1. Verdonck P, Siller U, De Wachter D, De Somer F, Hydrodynamical
comparison of aortic arch cannulae, Int J Artif Organs, 1998; 21: 705-713.
2. Douglas JF, Gasiorek JM, Swaffield JA, Part III Dimensional Analysis and
Similarity. In: Fluid Mechanics, 3rd ed. Harlow UK: Longman Scientific &
Technical; 1985; ISBN 0-582-23408-5
3. Touloukian YS, Saxena SC, Hestermans P, Thermophysical properties of
matter, Vol 11: Viscosity. New York, USA: IFI Plenum; 1975: 643p.
4. De Wachter D, Modelling of dialysis treatment for renal failure. PhD
dissertation (in Dutch), Ghent University, Belgium; 1998.
5. Cecere G, Groom R, Forest R, Quinn R, Morton J, A 10-year review of
pediatric perfusion practice in North America. Perfusion, 2002; 17: 83-89
6. Gates RN, Cushen CK, Laks H, Cardiopulmonary bypass in infants and
children. In: Cardiopulmonary bypass. Principles and practice. Gravlee
GP, Davis RF, Utley JR (eds). Williams & Wilkins, Baltimore USA, 1993:
619-624
7. Montoya JP, Merz SI, Bartlett RH, A standardized system for describing
flow/pressure relationships in vascular access devices. ASAIO Trans.
1991; 37(1): 4-8
8. Hessel EA, Cardiopulmonary bypass circuitry and cannulation techniques.
In: Cardiopulmonary bypass. Principles and practice. Gravlee GP, Davis
RF, Utley JR (eds). Williams & Wilkins, Baltimore USA, 1993: 55-92

Appendix 3
132
Appendix: dynamic simililarity
A1. Conversion of pressures and flow rates
Dimensionless numbers are independent of the fluid’s physical properties.
Therefore the ratio of the Reynolds number (equation (4)) for any two fluids
should be unity. The same applies to the Euler number (equation(4)). Using
these properties, the ratio of the two flow rates and the ratio of the pressure
drops can be written as:
bf
fb
ff
bb
ff
fe
be
bb
f
b
f
b
bf
fb
ffe
f
b
bbe
f
b
f
b
QD
DQ
PP
DD
ρµρµ
ρρ
ρπ
πρ
ρµρµ
µπρ
ρµπ
2
2
2
2
2
42
42
2
1616
EuEu4
4ReRe
===∆∆
== −
−−
−
(a1)
The subscript f denotes an aqueous fluid and b stands for blood. Since the
equivalent diameter De should also be independent of the fluid’s properties, it
can be eliminated from the coefficient ratios. Equation (a1) is similar to
equation (1) of the main text.
A2. Conversion of the constants of the quadratic pressure drop equation
The parabolic relation between pressure drop en flow rate through the origin
(equation (2)) can be divided by the flow rate to render the flow rate
dependent hydraulic resistance:
baQQPRh +=
∆= (a2)
In dimensionless form this becomes with Eu (equation (4)) as a measure of
pressure drop, Re (equation (4)) as a measure of the flow rate and the Eu.Re
product as a measure of dimensionless hydraulic resistance:

Appendix 3
133
βαµ
πρ
πµ
π+=+=
∆= Re
4Re
164Re.Eu
3423eee DbDa
QPD (a3)
α and β are dimensionless coefficients that are independent of the fluid’s
physical properties. For the cannulas in this study, β ranges from a few
hundred to a few thousand and α lies between 1 and 2. The fluid dependent
coefficients a and b can be deduced from these dimensionless coefficients,
the fluid’s viscosity µ and density ρ and the equivalent diameter De:
342416
ee Db
Da
πµ
βπ
ρα == (a4)
The dimensions of these coefficients are in SI units: a in Pa/(m3/s)2 and b in
Pa/(m3/s), otherwise conversion constants should be added. The ratios of the
coefficients for different fluids are easily determined from equation (a4) and
simplified under the already stated assumption that the equivalent diameter is
independent of the fluid’s properties :
f
b
be
fe
f
b
f
b
f
b
be
fe
f
b
f
b
DD
bb
DD
aa
µµ
µµ
ρρ
ρρ
≈=≈=−
−
−
−3
3
4
4
(a5)
The subscript f denotes an aqueous fluid and b stands for blood. Since the
equivalent diameter De should also be independent of the fluid’s properties, it
can be eliminated from the coefficient ratios. Equation (a5) is equivalent to
equation (3) in the main text.
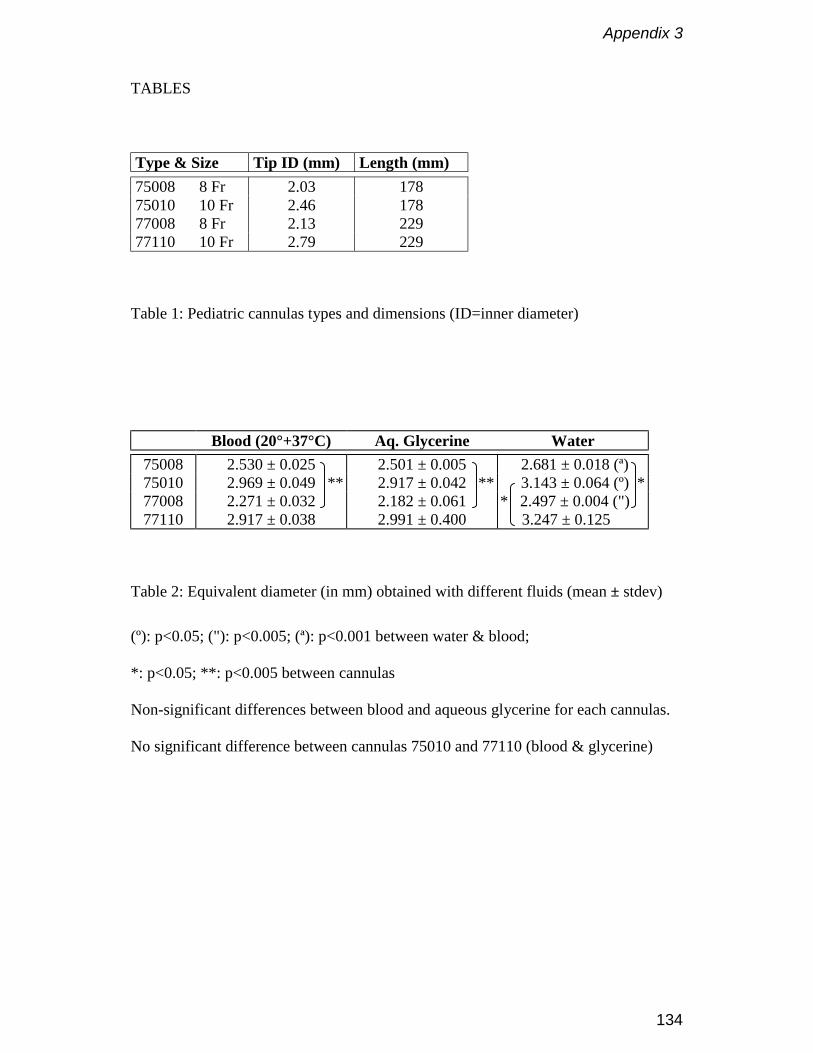
Appendix 3
134
TABLES
Type & Size Tip ID (mm) Length (mm)75008 8 Fr 2.03 17875010 10 Fr 2.46 17877008 8 Fr 2.13 22977110 10 Fr 2.79 229
Table 1: Pediatric cannulas types and dimensions (ID=inner diameter)
Blood (20°+37°C) Aq. Glycerine Water75008 2.530 ± 0.025 2.501 ± 0.005 2.681 ± 0.018 (ª)75010 ** 2.969 ± 0.049 ** ** 2.917 ± 0.042 ** * 3.143 ± 0.064 (º) *77008 2.271 ± 0.032 2.182 ± 0.061 * 2.497 ± 0.004 (") *77110 2.917 ± 0.038 2.991 ± 0.400 3.247 ± 0.125 (')
Table 2: Equivalent diameter (in mm) obtained with different fluids (mean ± stdev)
(º): p<0.05; ("): p<0.005; (ª): p<0.001 between water & blood;
*: p<0.05; **: p<0.005 between cannulas
Non-significant differences between blood and aqueous glycerine for each cannulas.
No significant difference between cannulas 75010 and 77110 (blood & glycerine)
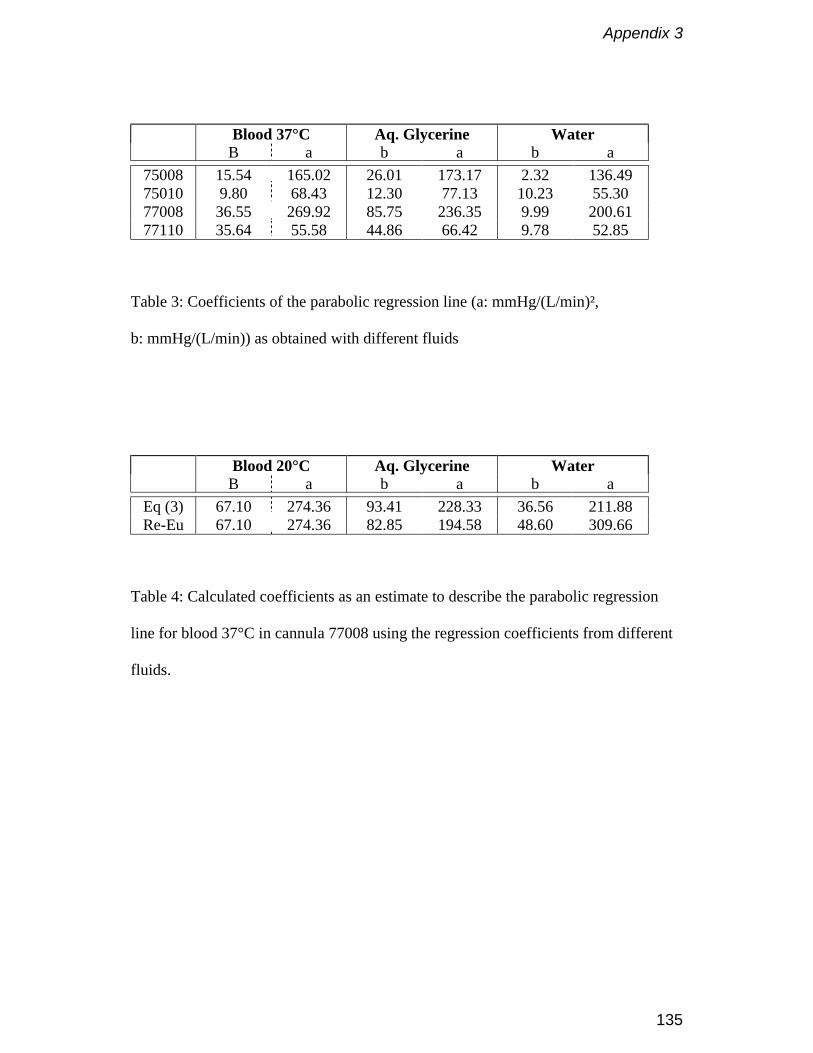
Appendix 3
135
Blood 37°C Aq. Glycerine WaterB a b a b a
75008 15.54 165.02 26.01 173.17 2.32 136.4975010 9.80 68.43 12.30 77.13 10.23 55.3077008 36.55 269.92 85.75 236.35 9.99 200.6177110 35.64 55.58 44.86 66.42 9.78 52.85
Table 3: Coefficients of the parabolic regression line (a: mmHg/(L/min)²,
b: mmHg/(L/min)) as obtained with different fluids
Blood 20°C Aq. Glycerine WaterB a b a b a
Eq (3) 67.10 274.36 93.41 228.33 36.56 211.88Re-Eu 67.10 274.36 82.85 194.58 48.60 309.66
Table 4: Calculated coefficients as an estimate to describe the parabolic regression
line for blood 37°C in cannula 77008 using the regression coefficients from different
fluids.

Appendix 3
136
FIGURES
Figure 1. A picture of the two designs, shown here for the 10Fr cannulas.
The 75xxx series has a small short plastic tip. The 77xxx series has a long
wire-enforced tip.
Figure 2. The test set-up. P: pressure transducers.
Reservoir
Cannula
Rollerpump
Flow
P
P
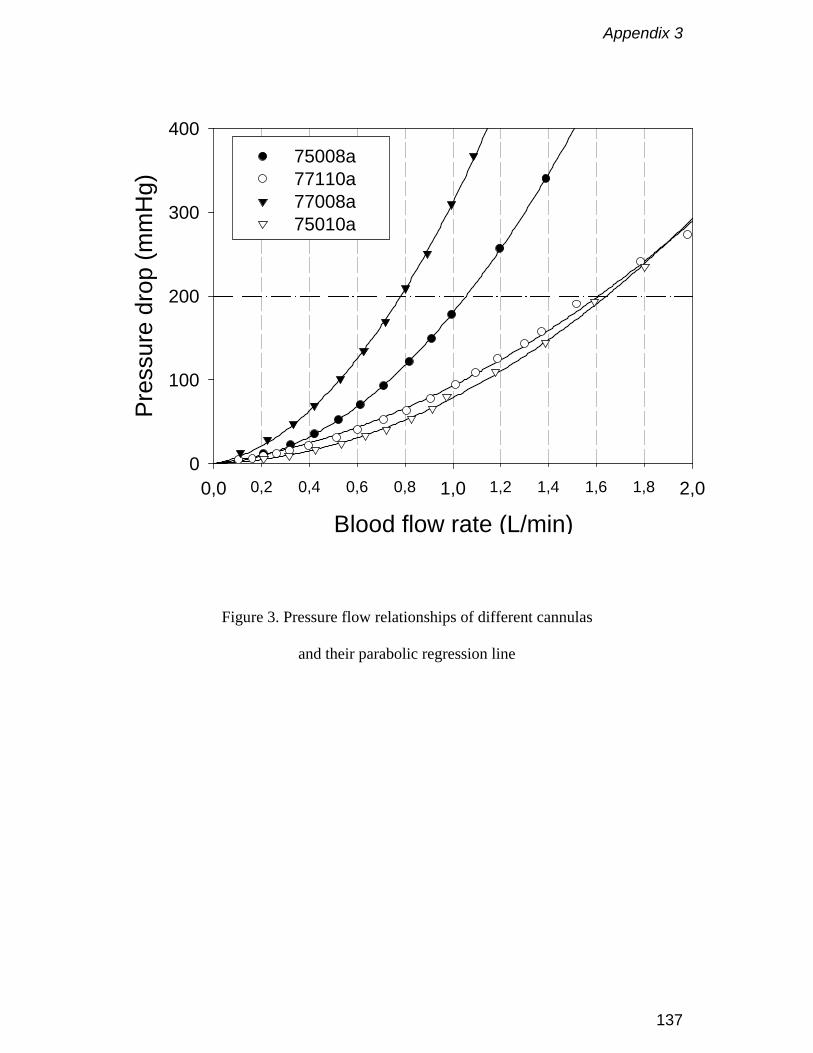
Appendix 3
137
Blood flow rate (L/min)0,2 0,4 0,6 0,8 1,2 1,4 1,6 1,80,0 1,0 2,0
Pres
sure
dro
p (m
mH
g)
0
100
200
300
40075008a 77110a 77008a 75010a
Figure 3. Pressure flow relationships of different cannulas
and their parabolic regression line

Appendix 3
138
Figure 4. Eu-Re plot of 77008 cannula for different fluids and
their transformed regression lines
Re200 300 500 2000 3000 5000 200001000 10000
Eu
2
3
4
5
6
7
Blood 37°CAequous glycerine 25°CBlood 20°CWater 25°C
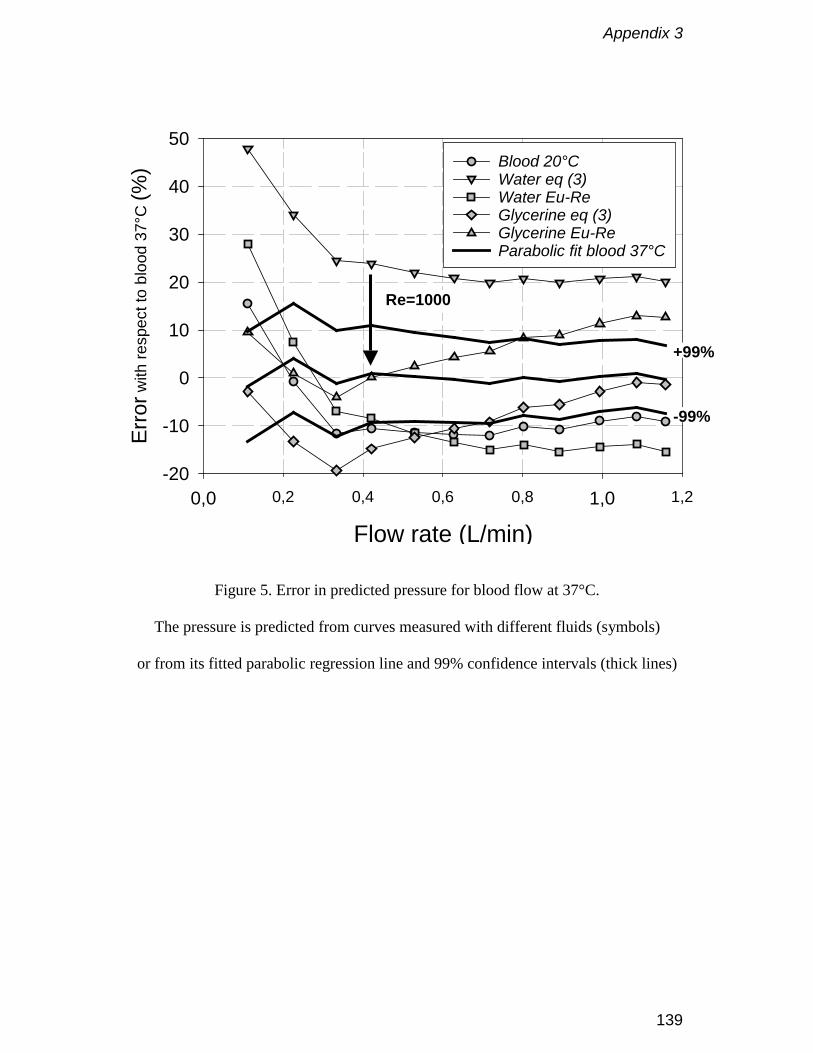
Appendix 3
139
Figure 5. Error in predicted pressure for blood flow at 37°C.
The pressure is predicted from curves measured with different fluids (symbols)
or from its fitted parabolic regression line and 99% confidence intervals (thick lines)
Flow rate (L/min)0,2 0,4 0,6 0,8 1,20,0 1,0
Erro
r with
resp
ect t
o bl
ood
37°C
(%)
-20
-10
0
10
20
30
40
50Blood 20°CWater eq (3)Water Eu-ReGlycerine eq (3)Glycerine Eu-ReParabolic fit blood 37°C
Re=1000
+99%
-99%

Appendix 3
140
Appendix 4
141
D-901 Neonatal oxygenator: a new perspective
F. De Somer, K. François, L. Foubert, Y. Deryck, D. De Smet, M. Vanackere,
G. Van Nooten
Perfusion 1994; 9: 349-355
Appendix 4
142
Abstract
Five infants with congenital heart disease were perfused with the D-901
neonatal oxygenator at the time of their cardiac surgery. The ability to reduce
the prime volume below the bloodvolume as well as the blood handling and
gas transfer characteristics were studied.
In all cases the prime volume was less than or equal to the bloodvolume of
the patient. This resulted in a reduction in the use of homologous blood
products. Due to the concept of the D-901 it was possible to adapt the tubing
in such a way that a complete prime of 220 ml was obtained.
The device had a maximum oxygen transfer of 45 ml/minute. The maximum
carbon dioxide removal was 50 ml/minute at a blood gas ratio of 1.
The mean platelet count post bypass decreased to 91% of the baseline value.
Mean free haemoglobin levels increased to 86 mg/100 ml at 120 minutes of
bypass.
We conclude that the D-901 oxygenator opens new perspectives for perfusion
in small babies in terms of priming volume and use of homologous blood
products while maintaining good gas transfer characteristics. However, larger
series are necessary to expand our experience with this device and its
limitations.
No specific problems related to the device were encountered and all infants
had an uneventful postoperative course.
Appendix 4
143
Introduction
Perfusion techniques in neonates and small infants vary significantly from
those in adults. However, little attention has been paid to the design of
oxygenators for these patients (1), the former being only smaller copies of
their larger brothers currently used in adult cardiac surgery. For this reason it
is very difficult to find oxygenators with a priming volume which is lower than
the total blood volume of the patient.
Recently Dideco (Mirandola, Italy) released a small oxygenator (D 901) which
is especially designed for use in infants up to 7 kilograms.
This device was tested in two ways. First the priming volume of the complete
system was investigated, and secondly the blood handling and gas transfer
characteristics were evaluated.
Appendix 4
144
Materials and methods
The D-901 was used in five babies undergoing elective cardiac surgery for
congenital heart disease (Table 1). The D-901 hollow fiber membrane
oxygenator is built around a central heat exchanger core. The heat exchanger
is made of molded stainless steel and has a surface area of 0.02 m2. The
oxygenator uses a polypropylene microporous hollow fiber mat to separate
blood and gas pathways. Blood flow is channeled around the outside of the
fibers and gas flows through the lumen of the fibers. The priming volume of
the heat exchanger/oxygenator structure is 60 ml. If the small flexible venous
reservoir is included, the minimal priming volume is 90 ml. The device has an
effective membrane surface area of 0.34 m2 and a nominal blood flow of 0.8
l/min. All connectors can be used with both 3/16" and 1/4" tubings.
The extracorporeal system comprised a Cobe heart lung machine (Cobe
Cardiovascular, Arvada, CO, USA), custom tubing packs made of PVC and
silicone (International Medical Products, Brussels, Belgium) and a Dideco
Midicard cardiotomy reservoir (Dideco, Mirandola, Italy). No arterial filter was
used in the system. Since the priming volume of the circuit becomes more
important when the priming volume of the oxygenator module decreases, we
adapted our circuit to this new situation. We used an 3/16" PVC arterial line of
150 cm and a 1/4" silicone venous line of 90 cm. The pump boot was 1/4"
silicone tubing with a wall thickness of 3/32". This setup resulted in a final
priming volume of 220 ml. One must take into account that the use of every
vent or sucker during the procedure will take away a considerable amount of
blood out of the circulation. For this reason one could be obliged to fill the
circuit with extra fluid to compensate for this loss. To anticipate this problem
we reduced the diameter of all venting and sucker lines to 3/16". This resulted
in a reduction of the dead volume in venting and sucker lines by 50%.

Appendix 4
145
Perfusion technique
Each oxygenator was inspected and set up in accordance with the
manufacturer's enclosed instructions. The circuit was flushed with carbon
dioxide prior to gravity priming. Blood flow rates were maintained to ensure
adequate tissue perfusion. An alpha-stat regimen (2) was used in all cases for
acid/base and blood gas management. Gas flow was delivered through
Sechrist air/O2 blenders (Sechrist Industries, Anaheim, CA, USA) with sweep
rates sufficient to maintain uncorrected PaCO2 within a normal range or
subnormal range in patients with pulmonary hypertension. Continous PaO2
measurements were done using the Polystan polytrode (Polystan A/S,
VærlØse, Denmark). Gas analysis (oxygen and carbon dioxide concentration)
was performed on both inlet and outlet of the oxygenator (Ohmeda RGM
5250). Activated coagulation times were kept above 400 seconds during
bypass. St Thomas II solution (20 ml/kg) was used for cardioplegic arrest in all
cases.
The priming consisted of a mixture of 20% human albumin, 15% mannitol (0.5
g/kg) and plasmalyte A. Packed red blood cells were added if necessary to
obtain a haematocrit of 30% during the extracorporeal circulation (ECC).
The lowest temperature during the procedures was 25° Celsius
(oesophageal). The patients were vasodilated to keep the mean arterial
pressure during ECC between 40 and 50 mmHg as described by the Marie-
Lannelongue group in Paris (3).
Data collection
ECG, central venous pressure, arterial pressure, pump flow, core
temperature, pressure drop over the oxygenator, arterial, venous and water
temperature were recorded manually every 15 minutes. Arterial and venous
blood gas samples together with electrolytes (sodium and potassium) were
analysed on a Corning 288 blood gas analyser (Ciba Corning, Medfield,
Appendix 4
146
USA). White blood cell count, red blood cell count, haematocrit, haemoglobin
and platelets were processed using STKS-Coulter counter apparatus. Serum
concentrations of free haemoglobin and haptoglobin (Hp) (as markers of
haemolysis) were determined using immunonephelometry on a BN
nephelometer (Behringwerke, Marburg, Germany). Blood samples were taken
prior to institution of bypass, after mixing (fifteen minutes bypass), every thirty
minutes during bypass, post bypass and daily during the first three
postoperative days. Total protein concentration used to estimate oncotic
pressure, was measured the day before surgery, immediately post bypass
and the first three postoperative days.
Data analysis
Following parameters were calculated: oxygen consumption (VO2/min), shunt
fraction of the oxygenator (Qs/Qt) and the oxygen transfer slope (OTS).
Calculations and techniques to obtain those values have been published
previously (4).
The correction for haemodilution of the platelet values was obtained
considering the baseline platelet count in the prime to be zero. Even when
blood prime was used no platelets were added to the prime as packed red
cells where used instead of whole blood. However one unit of packed red
cells does contain an important amount of free haemoglobin (mean 87
mg/100 ml) and haptoglobin (mean 0,24 g/l), which was added to the ECC in
the four patients where blood priming was used. Therefore haemolysis
markers were also quantified as the increment between measurements.
Appendix 4
147
Results
Priming volume
In cases 1 and 2 a priming volume of 240 ml for the whole system was
obtained. In cases 3 to 5 the priming volume had decreased to 220 ml by the
use of slightly shorter tubing. The latter was a reduction with 37% compared
to our previous system (Cobe VPCML, Pall arterial filter, 3/16” arterial line,
1/4” venous line) (Figure 1). In all cases, except one, it was possible to obtain
a priming volume which was lower than the estimated blood volume of the
patient (Figure 2). Recently the priming volume was reduced to 200 ml by
changing the pump boot tubing from 1/4" to 3/16".
In one case we did not add homologous blood.
No extra fluids were added to the circuit during ECC in two patients. In the
three other cases an average of 80 ml was added. Mean diuresis in all cases
during ECC was 31 ml (Table 2).
Gas transfer analysis
The oxygen transfer slope (change in FiO2/change in VO2/min) for the D-901
is shown in Figure 3. The maximal oxygen transfer was 45 ml/min or 132
ml/min/m2. Maximum carbon dioxide removal was 50 ml/min at a blood to gas
ratio of 1. Mean venous oxygen saturation was 64%.
Haemolysis
Serum free haemoglobin increased from a mean of 7.84 mg/100ml pre
bypass to 86 mg/100ml at 120 minutes of ECC. The increment in free
haemoglobin between the first measurement during ECC (15 minutes) and
120 minutes of ECC was 54 mg/100ml.

Appendix 4
148
Serum Hp level fell from 1.27 g/l prior to institution of bypass to 0.38 g/l at 120
minutes of ECC. The decrease between the first measurement during ECC
and after 120 minutes of ECC was 0.26 g/l.
Haematology and blood chemistry
Mean haematocrit during ECC was 30%. Mean platelet count (Figure 4)
decreased slightly during ECC. A mean of 91% of the baseline value was
obtained post ECC. Mean total protein level decreased from 65.3 g/l on the
preoperative day to 44.4 g/l immediately post ECC. At the end of the study the
total protein level was 54.4 g/l.
In the patient where no blood was added to the prime, haematocrit was
28.8%, platelet count 111% of the baseline value and protein level 51 g/l at
the end of bypass.

Appendix 4
149
Discussion
For many years there is great demand for smaller oxygenators especially
designed for the difficult problems encountered in cardiac surgery for
babies.(1,3,5,6,7) The D-901 is designed to deal with such problems. Due to
the unique design of heat exchanger and connectors a low complete system
prime can be obtained when used with short appropriate tubing. This may
result in a reduction in coagulation disorders and complement activation. The
reduced use of homologous blood products however is important (8). The
device allowed us to avoid the use of homologous blood products in one
patient in whom haematocrit, platelet count and protein levels were preserved
after ECC.
The D-901 gas transfer characteristics meet the requirements set by the
Association for the Advancement of Medical Instrumentation (9) and
compares favourably with other devices. The device is very predictable and
by using the oxygen transfer slope it is easy to anticipate sudden changes in
metabolic needs of the babies. A reliable continous venous oxygen saturation
device operating with an acceptable error at low flows (up to 0.5 l/min) would
make it even easier to steer the oxygenator.
The miniaturisation of tubing and connectors did not result in a higher
haemolysis in the range of blood flows used (3). There was also no
remarkable loss of platelets showing an acceptable biocompatibility of the
device.
We could easily prevent a drop in protein levels, thus reducing the risk for
capillary leak (3). There was no need for ultrafiltration in our series.
Conclusion
We conclude that the D-901 oxygenator opens new perspectives for perfusion
in small babies in terms of priming volume and use of homologous blood

Appendix 4
150
products while maintaining good gas transfer characteristics. However, larger
series are necessary to expand our experience with this device and its
limitations.
Appendix 4
151
References
1. Menghini A. Oxygenation design: a global approach. Perfusion 1993; 8:
87-92
2. Swan H. Acid-base management during hypothermic circulatory arrest for
cardiac surgery. In:Rahn H, Prakash O. eds. Acid-base Regulation and
Body Temperature. Boston: Martinus Nijhoff
3. Nicolas F, Daniel J-P, Bruniaux J et al. Conventional cardiopulmonary
bypass in neonates. A physiological approach - 10 years of experience at
Marie-Lannelongue Hospital. Perfusion 1994, 9: 41-49
4. De Somer F, De Smet D, Vanackere M et al. Clinical evaluation of a new
hollow fibre membrane oxygenator. Perfusion 1994, 9: 57-65
5. Molina G Neonate, Infant and pediatric perfusion: a Review of recent
product selection. Presentation held at the American Academy of
Perfusion Siences meeting on 2/1991 in San Francisco.
6. Elliot M. Minimizing the bypass circuit: a rational step in the development
of paediatric perfusion. Perfusion 1993; 8: 81-86
7. Elliot M, Rao PV, Hampton M. Current paediatric perfusion practice in the
UK. Perfusion 1993; 8: 7-25
8. Tyndal M, Berryessa RG, Campbell DN, Clarke DR. Micro-Prime Circuit
Facilitating Minimal Blood use during Infant Perfusion. J. Extra-Corpor.
Technol. 1987, 19: 352-357
9. Association for the Advancement of Medical Instrumentation. Standard for
blood/gas exchange devices-oxygenators. 1982.
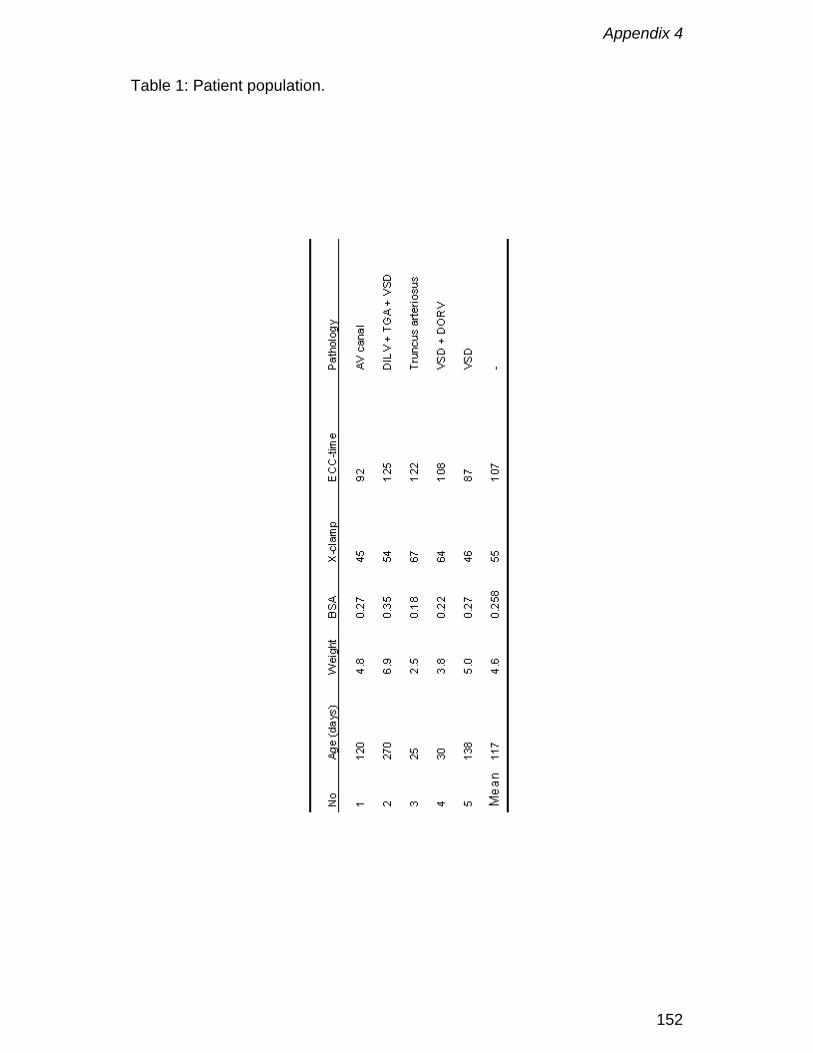
Appendix 4
152
Table 1: Patient population.
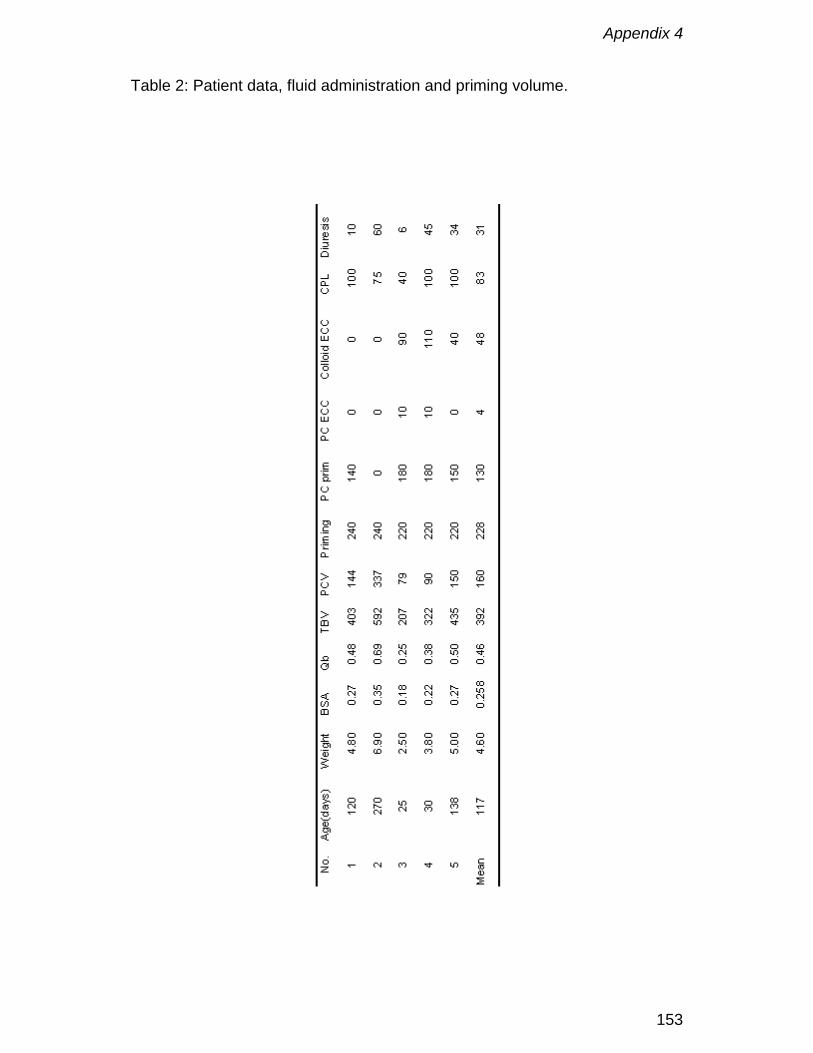
Appendix 4
153
Table 2: Patient data, fluid administration and priming volume.

Appendix 4
154
Figure 1 Evolution of priming volume for babies smaller than 7 kg in UZ Gent.
VPCML = Variable Prime Cobe Membrane Lung; D-901 = Dideco Lilliput 1
oxygenator; AF = Pall 1440 arterial filter; AL = arterial line; VL = venous line;
PB = pump boot.
0
50
100
150
200
250
300
350
400
450
500
1990 1991 1993 1994
ml
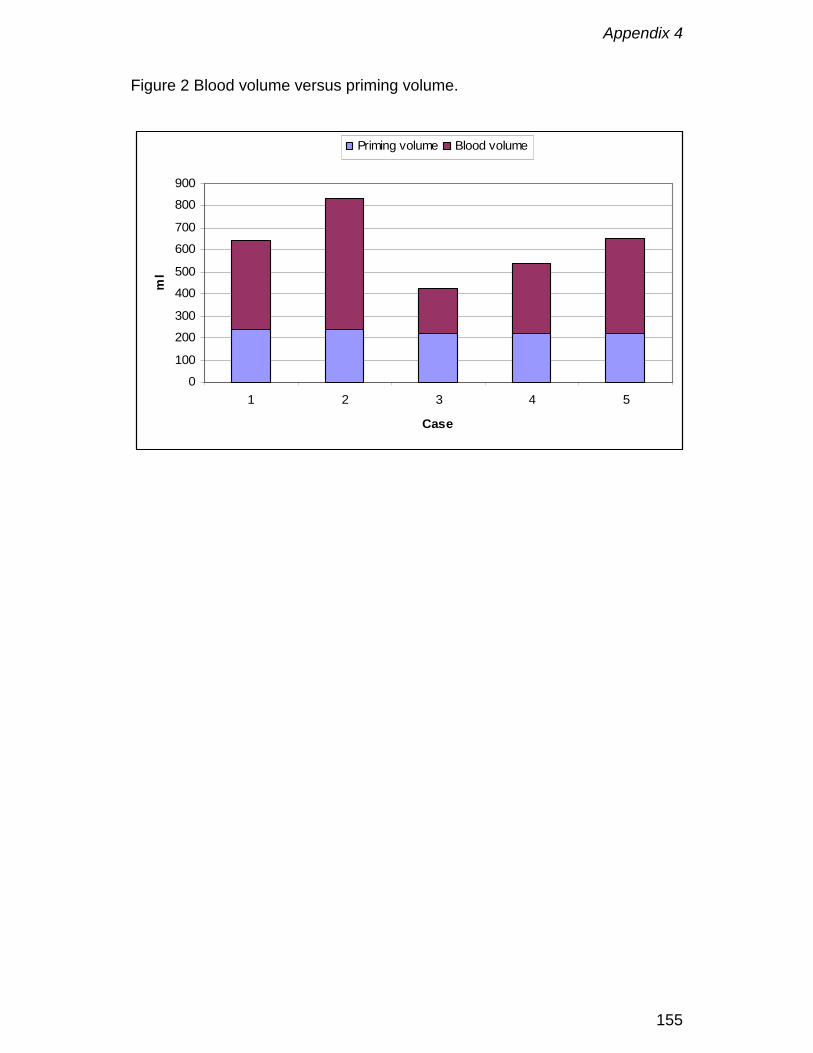
Appendix 4
155
Figure 2 Blood volume versus priming volume.
0
100
200
300
400
500
600
700
800
900
1 2 3 4 5
Case
ml
Priming volume Blood volume

Appendix 4
156
Figure 3 Oxygen transfer slope (OTS)
y = 0.018x + 0.1664
0.2
0.3
0.4
0.5
0.6
0.7
0.8
0.9
1
0 5 10 15 20 25 30 35 40 45
Oxygen transfer (ml/min)
FiO
2 (%
)
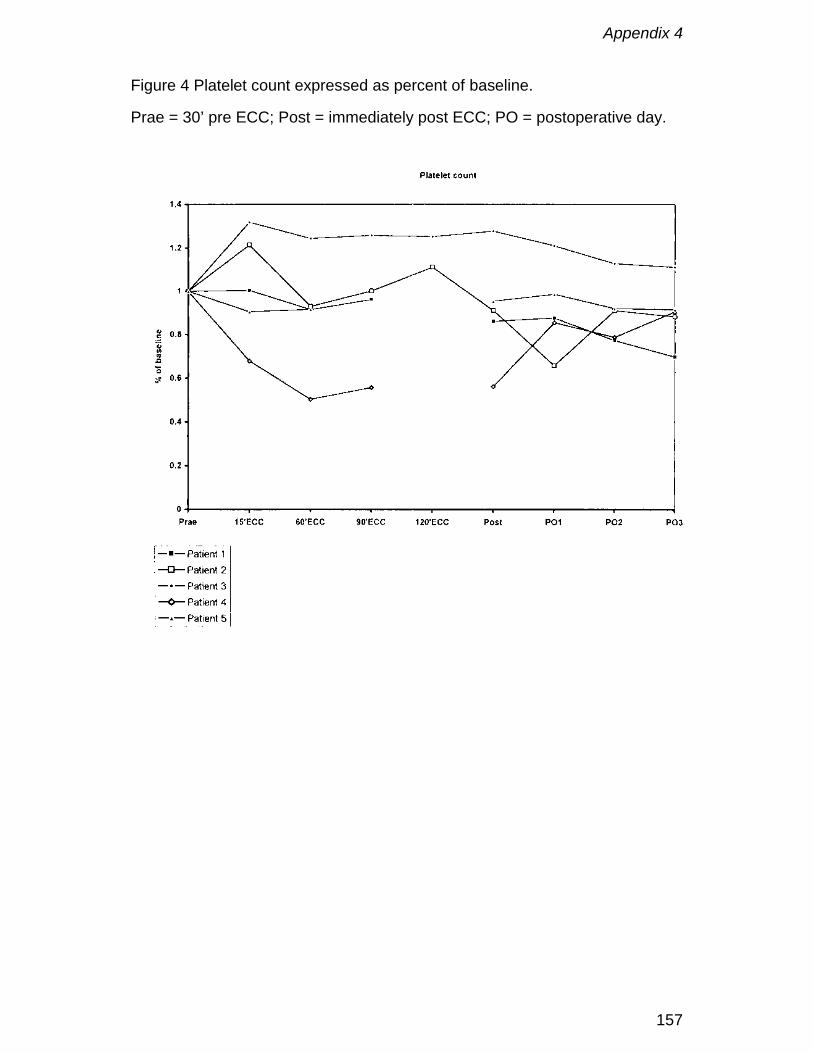
Appendix 4
157
Figure 4 Platelet count expressed as percent of baseline.
Prae = 30’ pre ECC; Post = immediately post ECC; PO = postoperative day.

Appendix 4
158
Appendix 5
159
Low extracorporeal priming volumes for infants: a benefit?
F. De Somer, L. Foubert, J. Poelaert, D. Dujardin, G. Van Nooten, K. François
Perfusion 1996; 11: 455-460

Appendix 5
160
Abstract
An extracorporeal circuit consisting of an oxygenator especially designed for
neonatal use and appropriately sized tubings, with an average total priming
volume of 205 ml, was used on 80 infants undergoing cardiac surgery for
congenital heart disease. The priming volume and foreign surface area of the
circuit were determined. The influence of low priming volumes on the use of
blood products and the management of cardiopulmonary bypass was studied.
No whole blood nor platelets were used in this study. The mean volume of
packed red blood cells used over the hospital stay was 202 ± 67 ml. The
mean volume of fresh frozen plasma (FFP) used until the second
postoperative day was 62 ± 72 ml. The mean total blood loss until the second
postoperative day was 15.8 ± 9.2 ml/kg.
The priming volume of the extracorporeal circuit was 62 % lower than values
commonly reported in the literature. The low priming volume had a strong
influence on the use of platelets and FFP and in a lesser extent on the use of
packed red blood cells.
Appendix 5
161
Introduction
For many years the average priming volume of an extracorporeal circuit for
infants up to 8 kg is approximately 500 ml (1). After the start of
cardiopulmonary bypass (CPB) the cardioplegia volume is almost immediately
added to this priming volume (PV), which results in a massive haemodilution.
The latter may cause serious side effects such as alterations in coagulation
mechanisms and changes in extracellular/interstitial fluid distribution (2).
In an attempt to prevent this extreme haemodilution several techniques have
been described. Reduction of the priming volume by tailoring the circuit (3)
and modified ultrafiltration are well known techniques(4). Until recently the first
technique was not very popular because of the lack of specific neonatal
oxygenators and the fact that perfusion techniques had to be changed
dramatically. The latter removes water from the patient at the end of bypass
and perfuses the pulmonary artery with oxygenated blood at the same time.
However, it may not prevent the onset of the inflammatory response by the
large foreign surface at the beginning of and during CPB.
Recently two new oxygenators especially designed for neonatal use were
released: Dideco D-901 Lilliput (Mirandola, Italy) and Polystan Microsafe
(Polystan, VærlØse Denmark). Both of them can be easily used with priming
volumes as low as 200 ml (5). The aim of this study was to determine the
priming volume and foreign surface area of a low volume system and to
evaluate its influence on the use of blood products and the management of
CPB.
Appendix 5
162
Materials and Methods
The D-901 (n=76) and the Microsafe (n=4) were used in cardiac surgery for
congenital heart disease (Table 1). The D-901 is a closed system and was
used together with a Midicard (Dideco, Mirandola, Italy) cardiotomy reservoir.
This reservoir automatically reduces the filter material depending on the
suction volume. Since suction never exceeded 1000 ml a minute, only one-
third of the filter medium was used in all cases. The Microsafe is an open
system and has a venous reservoir of 400 ml. Since this can be rather small
for larger infants (5-8 kg) it was only used in infants below 5 kg, in contrast to
the D-901 which was used for infants up to 8 kg. Both systems have quite
comparable characteristics (Table 2) and both oxygenators can be used with
3/16 inch or 1/4 inch tubing.
The extracorporeal system consisted of a Cobe heart lung machine (Cobe
Cardiovascular Inc., Arvada, CO, USA), custom tubing packs of
polyvinylchloride (PVC) and silicone (International Medical Products,
Brussels, Belgium) and a Dideco Midicard cardiotomy reservoir (Dideco,
Mirandola, Italy). No arterial filter was used in the system. Since the relative
importance of the circuit increases when the priming volume of the oxygenator
decreases, we adapted our circuit to this new situation. We used an 3/16 inch
PVC arterial line of 150 cm and a 1/4 inch silicone venous line of 90 cm. The
pump boot was 3/16 inch silicone tubing with a wall thickness of 3/32 inch.
This set-up resulted in a final priming volume of 205 ml. One must take into
account that the use of every vent or sucker during the procedure will remove
a considerable amount of blood from the circulation. For this reason one could
Appendix 5
163
be obliged to fill the circuit with extra fluid to compensate for this loss. To
anticipate this problem we reduced the diameter of all venting and suction
lines to 3/16 inch. This resulted in a 44 % reduction of the dead volume in
venting and suction lines.
Perfusion Technique
Each oxygenator was inspected and set up in accordance with the
manufacturer's instructions. The circuit was flushed with carbon dioxide prior
to gravity priming. Since the system was primed with a 50 ml syringe the
exact priming volume was easy to determine. Blood flow rates were
maintained to ensure adequate tissue perfusion. An alpha-stat regimen (6)
was used in all cases for acid/base and blood gas management. Gas flow
was delivered through Sechrist air/oxygen gas blenders (Sechrist Industries,
Anaheim, CA, USA) with sweep rates sufficient to maintain uncorrected
PaCO2 within a normal range or subnormal range in patients with pulmonary
hypertension. Continuous PaO2 measurements were done using the Polystan
Polytrode (Polystan A/S, VærlØse, Denmark). Gas analysis (oxygen and
carbon dioxide concentration) was performed on both inlet and outlet of the
oxygenator (Ohmeda RGM 5250). Activated coagulation times were kept
above 400 seconds during bypass. St Thomas II solution (15-20 ml/kg) was
used for cardioplegic arrest in all cases.
The priming consisted of a mixture of 20% human albumin, 15% mannitol (0.5
g/kg) and Plasma-Lyte-A. Packed red blood cells were added if necessary to
obtain a haematocrit of 30% at the end of CPB.
The lowest oesophageal temperature during the procedures was 15° for deep
hypothermic circulatory arrest (DHCA) and 25° for continuous flow. The
Appendix 5
164
patients were vasodilated to keep the mean arterial pressure during CPB
between 30 and 40 mmHg as described by others (7).
Data Collection.
Haematocrit and platelets were determined the day before the operation, at
the end of the operation and two days postoperatively. The total amount of
blood products (packed red blood cells (PC), fresh frozen plasma (FFP),
platelets (Plts)) used in the priming, in the perioperative and postoperative
period were noted, as was total blood loss. One patient was removed from the
due to a perforation of the right atrium by a central venous catheter in the
postoperative period.
Blood loss was compared between patients who received FFP and those who
did not. Blood loss was expressed as ml/kg.
Haemodilution was calculated by following formulae:
Total blood volume (TBV) = weight x 85 ml
Red cell volume (RCV) = TBV x haematocrit (Hct)
Haemodilution (HD) by the priming volume = RCV/(TBV+PV)
Complete HD = RCV/(TBV+PV+CPL) where CPL = cardioplegia volume
Surface area of the tubing was calculated using following formula,
Surface = Πdh where d = inner diameter in cm and h = height in cm.
Volume in the tubing was calculated using following formula: Volume = Πr2h
where r is radius (cm) and h is height (cm). The values used for the
oxygenators were those mentioned in the brochures of the companies. The
information not available in the brochures was sent to us by the research and
development department of both companies.

Appendix 5
165
Results
Surface area and priming volume.
The surface area of the membrane, heat exchanger and their housing was
3750 cm2 for the Lilliput and 4060 cm2 for the Microsafe. The overall foreign
surface area (including the venous bag) was 3815 cm2 for the Lilliput plus
1725 cm2 for the cardiotomy reservoir resulting in a total of 5540 cm2 .
Including the venous reservoir, defoamer and filters the total foreign surface
area was 4710 cm2 for the Polystan Microsafe.
The surface of the extracorporeal lines (arterial line, venous line, pumphead)
was 554 cm2.
The total surface area of the neonatal systems was 6094 cm2 (D-901) and
5264 cm2 (Microsafe) respectively.
The priming volume for each system varied between 180 and 250 ml.
Use of blood products.
The mean use of packed red cells until the second postoperative day was 202
± 67 ml. The mean use of packed cells in the priming volume was 93.5 ± 60
ml. Three infants (3.7%) did not receive packed red cells in the priming
volume nor in the perioperative period. Twenty infants (25%) did not receive
packed red cells in the priming volume.
The mean use of FFP until the second postoperative day was 62 ± 72 ml. The
mean use of FFP in the priming volume was 2 ± 19 ml. In total 30 infants
(37.5%) of whom 4 below 3 kilogram did not receive FFP during their hospital
stay. Sixty eight infants (85%) did not have FFP in the priming volume.
No homologous platelets nor whole blood was used.

Appendix 5
166
Haematology.
Platelet count the day before the operation was 378 ± 144 x 1000/mm3. It
decreased towards the end of the operation to 156 ± 71 x 1000/mm3. At the
second postoperative day the value was 251 ± 140 x 1000/mm3.
Mean haematocrit the day before the operation was 38 ± 8 %. The mean
lowest value during CPB was 26 ± 4 %. At the end of CPB a mean
haematocrit value of 29 ± 3% was obtained. At the second postoperative day
mean haematocrit was 34.7 ± 4 % .
Blood loss.
The overall mean blood loss was 15.8 ± 9.2 ml/kg. There was no statistical
difference (ANOVA) in blood loss between those patients who received FFP
and those who did not.
Appendix 5
167
Discussion
For many years the use of CPB in cardiac surgery for congenital heart
disease has induced a massive haemodilution up to 300% in infants below 5
kg (7). This causes some adverse effects such as decrease in the
concentration of nutrients as well as in oxygen content of blood, alteration in
coagulation mechanism with potential for increased bleeding,
extracellular/interstitial fluid accumulation, redistribution of coronary blood flow
with myocardial ischaemia and possible contribution to immunosuppression
with increased risk of infection (2). This study demonstrates that reduction of
priming volume and hence, limitation of haemodilution can be performed
safely. Compared with the average priming volume of 500 ml reported in the
literature (1,7-9) our neonatal system offers a reduction of 60% in priming
volume. As a result, the risk for adverse effects may be limited. In infants
below 5 kg the venous line, which was 1/4 inch in our study, can be changed
to 3/16 inch, decreasing the priming volume to 180 ml. Due to the small
priming volume the amount of foreign surface area exposed to blood is less
than half that compared to a conventional system (e.g. the Cobe VPCML used
on its smallest compartment has a foreign surface area of 10975 cm²
(Personal communication with Mark Miller, Cobe Cardiovascular Inc., Arvada,
CO, USA) . This concept of low volume-low foreign surface area might be
beneficial, although still in debate, for reducing complement activation (10,11).
If, from a theoretical point of view a conventional system of 500 ml had been
used in CPB for the infants in our study, and if we had used the same
management of CPB, the calculated mean amount of packed red cells used in
Appendix 5
168
the priming volume would have been 245 ± 50 ml. This is 62 % more than
what was used in our study, and even 8 % more than the total amount of
packed red cells used during the whole hospital stay of the infants in the study
group.
Beside the decreased need for packed red cells, the use of other homologous
blood products is also favourably influenced since neither homologous
platelets neither whole blood were administered. The use of FFP was also
limited to a minority of the patients. Since there is no difference in blood loss
between the group which received FFP and the group which did not, the use
of FFP is probably not justified and was based on the experience we had in
the past with larger priming volumes. For this reason the use of FFP will be
limited in the future to those patients who have a pathologic
thromboelastography or disturbed coagulation tests. Due to the low volume of
blood products used a high number of infants can be operated on with
exposure to only one blood product donor.
No major differences in management with a conventional system were
observed, except for the very small residual volume in the circuit. The
Microsafe however, will be possibly restricted for infants under 5 kilogram due
to its small venous reservoir of 400 ml.
In our study there was no need for modified ultrafiltration, since, due to the
small priming volume, it was much easier to control fluid shifts and hence
extracellular interstitial fluid accumulation, possibly related to it. Due the small
amount of PC used in the priming volume the use of calcium to counteract the
effects of sodium citrate could be avoided, which might reduce reperfusion
injury (12).

Appendix 5
169
This relatively new concept of small neonatal oxygenators used with
appropriately sized tubings, may solve some of the problems caused by
haemodilution in infants below 8 kg. Future studies should examine the
influence of these systems on coagulation and complement activation.
Appendix 5
170
References
1. Elliott M, Rao PV, Hampton M. Current paediatric perfusion practice in the
UK. Perfusion 1993; 8: 7-25
2. Cooper MM, Elliott M. Haemodilution. In: Jonas RA, Elliott M eds.
Cardiopulmonary bypass in neonates, infants and young infants. Oxford:
Butterworth-Heinemann Ltd, 1994: 82-100
3. Tyndall Jr. CM, Berryessa RG, Campbell DN, Clarke DR. Micro-prime
circuit facilitating minimal blood use during infant perfusion. J. Extra-corpor.
Technology 1987; 19: 352-357.
4. Naik SK, Elliott MJ. Ultrafiltration and paediatric cardiopulmonary bypass.
Perfusion 1993; 8: 101-112
5. De Somer F, François K, Foubert L et al. D-901 neonatal oxygenator: a
new perspective. Perfusion 1994; 9: 349-355.
6. Swan H. Acid-base management during hypothermic circulatory arrest for
cardiac surgery. In:Rahn H, Prakash O. eds. Acid-base Regulation and
Body Temperature. Boston: Martinus Nijhoff , 1985: 81-107
7. Nicolas F, Daniel J-P, Bruniaux J et al. Conventional cardiopulmonary
bypass in neonates. A physiological approach - 10 years of experience at
Marie-Lannelongue Hospital. Perfusion 1994, 9: 41-49
8. Hill AG, Groom RC, Akl BF, Lefrak EA, Kurusz M. Current paediatric
perfusion practice in North America. Perfusion 1993; 8: 27-38
9. Groom RC, Hill AG, Kurusz M, Munoz R et al. Paediatric perfusion practice
in North America: an update. Perfusion 1995; 10: 393-401
Appendix 5
171
10. Bonser RS, Vergani D. The role of the complement system during
cardiopulmonary bypass. In: Kay HK, editor. Techniques in Extracorporeal
Circulation. Third Edition. Butterworth-Heinemann, 1992: 156-177
11. Gu YJ, Boonstra PW, Akkerman C, Mungroop H, Tigchelaar I, Van
Oeveren W. Blood compatibility of two different types of membrane
oxygenator during cardiopulmonary bypass in infants. Int.J.Artif.Organs.
1994 Oct; 17: 543-548
12. Vinten-Johansen J, Hammon J. Myocardial protection during cardiac
surgery. In: Gravlee GP, Davis RF, Utley JR, eds. Cardiopulmonary Bypass
Principles and Practice. Baltimore: Williams and Wilkins, 1993: 172-173
Appendix 5
172
Figure 1 Dideco D-901 Lilliput.

Appendix 5
173
Figure 2 Polystan Microsafe
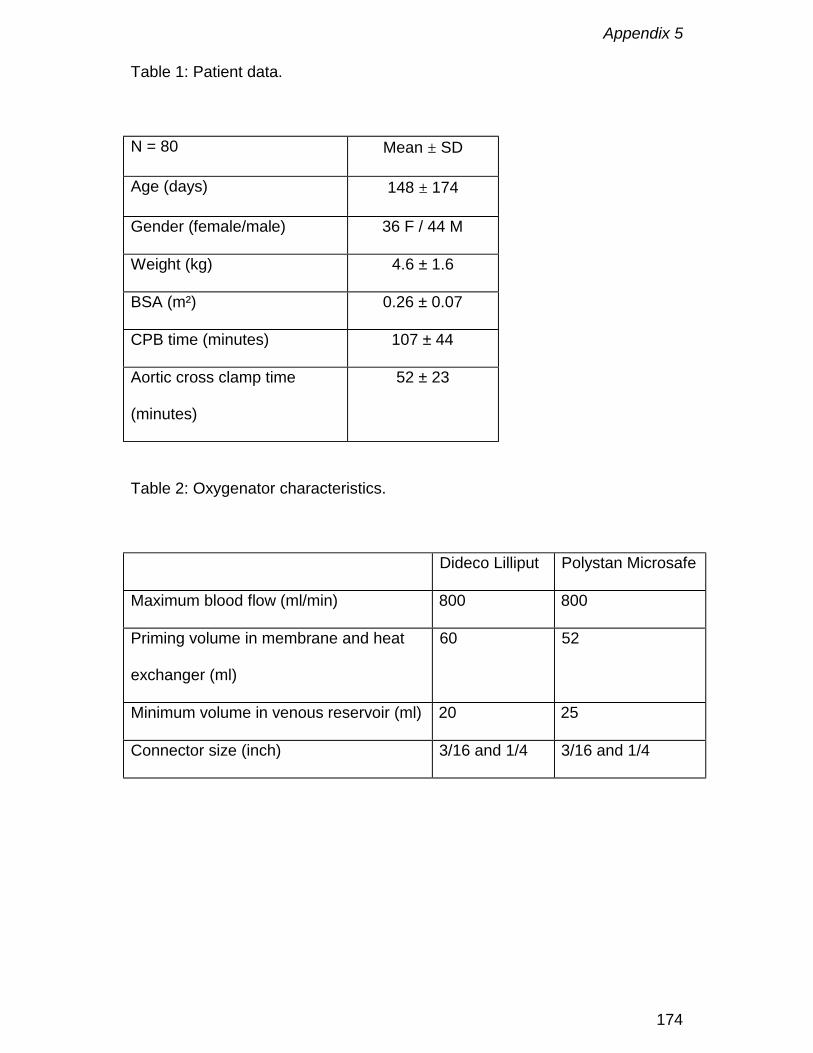
Appendix 5
174
Table 1: Patient data.
N = 80 Mean ± SD
Age (days) 148 ± 174
Gender (female/male) 36 F / 44 M
Weight (kg) 4.6 ± 1.6
BSA (m²) 0.26 ± 0.07
CPB time (minutes) 107 ± 44
Aortic cross clamp time
(minutes)
52 ± 23
Table 2: Oxygenator characteristics.
Dideco Lilliput Polystan Microsafe
Maximum blood flow (ml/min) 800 800
Priming volume in membrane and heat
exchanger (ml)
60 52
Minimum volume in venous reservoir (ml) 20 25
Connector size (inch) 3/16 and 1/4 3/16 and 1/4

Appendix 6
175
Hydrodynamic characteristics of artificial lungs
Peter W. Dierickx, Filip De Somer, Dirk S. De Wachter, Guido Van Nooten,
and Pascal R. Verdonck
ASAIO, 2000; 46(5): 532-535

Appendix 6
176
Abstract
An artificial lung is used during cardiopulmonary bypass to oxygenate blood
and to control blood temperature. The pressure drop-flow rate characteristics
of the membrane compartment in three hollow fiber membrane oxygenators
were determined in vitro to characterize design features. Results are
presented in a unique dimensionless relationship between Euler number, NEu
(ratio of pressure drop to kinetic energy) and Reynolds number, NRe (ratio of
inertial to viscous forces) and are a function of the device porosity, ε, and a
characteristic device length, ξ, defined as the ratio of the mean blood path
and manifold length: ( )ε1εNβα
εξN
Re2Eu −⋅⋅
+=⋅ .
This dimensionless approach allows us (1) to compare oxygenators
independently, and (2) to relate water tests to blood.
Appendix 6
177
Introduction
An artificial lung is used during cardiopulmonary bypass to oxygenate blood
and to control the blood temperature. The blood-material interaction in the
artificial lung induces a complex systemic inflammatory reaction. To control
this reaction, more biocompatible surfaces, in combination with blood outside
the fiber geometry’s (less surface for the same mass transfer) were
introduced. In general, a membrane oxygenator is placed between the pump
and the patient to overcome the resistance exerted by the device. Resistance
can be monitored by measuring blood flow in combination with inlet and outlet
pressure and is related to the geometry of the way the fluid flows (flow
pattern) through the membrane oxygenator. Few attempts have been made to
characterize hydrodynamics, including geometry and flow pattern, of an
artificial lung.1-3 Vaslef et al. proposed a dimensionless flow-friction
relationship that only incorporated the viscous losses, eliminating nonlinear
effects in the pressure-flow rate relationship. Our study investigated the value
of a unique relationship between pressure drop in the membrane
compartment and flow rate as a function of geometry and flow pattern,
incorporating nonlinear effects. Such a relationship may facilitate the design of
new devices.
Appendix 6
178
Materials and Methods
Dimensional Analysis
An artificial lung can be characterized by different geometrical parameters:
membrane surface area, A; diameter of the fiber, d; length of the fiber
compartment, L; inside housing outer diameter, Di; outside housing inner
diameter, Do and gross frontal area of the blood path, Af. The “void fraction” or
device porosity, ε, is defined as the ratio of the volume of voids (volume in the
membrane compartment occupied by blood) to the volume of the bed (total
volume of the membrane compartment). A characteristic length for flow
through porous beds or packed fiber bundles, is hydraulic radius, Rh.
Hydraulic radius is expressed in terms of device porosity, ε, and wetted
surface, a, per unit volume of bed 4,5:
abed of volume
surface wettedbed of volume
voidsof volume
R hε
=
= (1)
Manifold length, Lm, is defined as the length by which the total oxygenator flow
is divided per unit width of fiber stack. Mean blood path length, Lb, is the
average distance blood has to travel through the fiber stack. Consequently, a
dimensionless characteristic device length, ξ, can be defined as the ratio of
mean blood path length, Lb, and average manifold length, Lm. We assume that
blood is uniformly distributed over the fiber stack. In Sarns Turbo 440 (3M,
Michigan) and Optima (Cobe, Arvada) membrane oxygenators, Lm and Lb are
determined as shown in Figure 1 (left panel). Blood enters the membrane

Appendix 6
179
evenly distributed over the length, L, of the manifold, and blood flow is split in
two for left and right sides. Blood flow rate per unit membrane width Q´ is:
LQ
LQQ
m ⋅==′
2 (2)
Mean blood path length is :
+
⋅π
=2
DD2
L oib (3)
In the Dideco D703 (Dideco, Miranda, Italy), blood flow enters the fiber stack
circumferentially (Figure 1 right panel). Manifold length is:
+
⋅π=2
DDL oim (4)
whereas mean blood path length is determined as :
LLb = (5)
The measured pressure drop, ΔP, and flow rate, Q, relationship is presented
as a polynomial of second order:
QbQaP 2 ⋅′+⋅′=∆ (6)
Reynolds number, NRe, is defined as the ratio of inertial and viscous forces.
Characteristic length in the Reynolds number for flow through a fiber stack, is
hydraulic diameter, Rh. Consequently, Reynolds number, NRe, is defined as
µρ⋅⋅
⋅ε⋅
= h
fRe
R4A
QN (7)
in which Af represents the gross frontal area, ρ represents the density, and μ
the dynamic viscosity of the fluid. Euler number, NEu, is defined as the ratio of
pressure drop and kinetic energy:
Appendix 6
180
2
f
Eu
AQ
PN
ε⋅
⋅ρ
∆=
(8)
If eq. (6) is divided by the denominator of eq. (8), one can describe Euler
number, NEu, as a dimensionless function of the reciprocal of Reynolds
number, NRe, under the assumption of laminar flow conditions in the fiber
stack.
Re
Eu NβαN ′
+′=(9)
An analogous approach has already been successfully applied to the flow
characteristics of aortic canulae.6 A similar, but not identical approach is
described by Ergun,5 Bird et al.,4 and by Macdonald et al.7 for flow through
porous media. Our starting point for a dimensionless relationship is a pressure
drop-flow rate relationship, whereas Ergun5 related the pressure gradient to
fluid velocity. α’ and β’ in Eq. 9 are model parameters that characterize the
porous medium and, therefore, must be functions of the medium5,7 rather than
universal constants. It is assumed that the medium can be characterized by
the device porosity, ε, and the dimensionless characteristic device length, ξ,
and that the functional form of α’ and β’, in analogy with Ergun5 and
Macdonald et al.,7 can be represented as a power function of device porosity
and dimensionless characteristic device length:
( ) ( )( ) ( ) 'pε1ξεβξε,β
ε1ξεαξε,αmn
pmn
−⋅⋅⋅=′
−⋅⋅⋅=′′′
(10)
in which α, β, n, m, p, n´, m´, and p’ are constants that may be determined by
nonlinear regression analysis. The relationship between Euler and Reynolds,

Appendix 6
181
therefore, is determined solely by geometry and flow pattern in the artificial
lung.
Materials
Pressure drop-flow rate characteristics of the membrane compartment of
three different hollow fiber membrane oxygenators (Sarns Turbo 440 (n=2),
Optima (n=3), Dideco D703 (n=3)) were measured in vitro and analyzed to
characterize design features.
Experimental Setup
Experiments were performed with water, and steady flow is applied using an
upstream reservoir with a constant head. Pressure was measured between
the heat exchanger and membrane compartment, and at the inlet and outlet of
the artificial lung, using fluid-filled pressure transducers (Ohmeda, Gent,
Belgium). Flow rate was measured with an ultrasonic transit time flow meter
(Transonic, Ithaca, NY). Downstream of the artificial lung, static pressure was
kept constant at 150 mmHg.
Statistical Analysis
Fitting of the parabolic pressure drop and flow rate relationship is performed
using the non-linear regression Marquardt-Levenberg algorithm (Sigmastat
2.0, Jandel Scientific, Germany). The same technique is used to fit
geometrical parameters within the Euler-Reynolds relationship. Results are
presented with upper and lower confidence limits (95%), asymptotic standard
errors of fit parameters and coefficient of determination, R², for non-linear
regression.
Appendix 6
182
Results
Figure 2 presents pressure drop and flow rate characteristics for the
membrane compartments of three different artificial lungs, indicating a
parabolic relationship between ∆P and Q (Eq. 6). The technique to measure
the pressure between the heat exchanger and the membrane compartment
does not influence the pressure drop-flow relationship. Hence, the variance in
pressure drop–flow rate relationship in Figure 2 for the three Dideco D703
artificial lungs may be attributed to difference in construction of the membrane
compartment. The corresponding Euler-Reynolds relationship for the
membrane compartment (Eq. 9) is depicted in Figure 3. The geometric data
and model parameters α’ and β’ are tabulated in Table 1, indicating a similar
trend among the different artificial lungs in NEu-NRe for device porosity ε, and
dimensionless characteristic device length ξ: α’ and β’ increase with ε and
decrease with ξ. Based on this finding, the functions of Eq. (10) are
determined and yield the following dimensionless relationship:
( )ε1εNβα
εξN
Re2Eu −⋅⋅
+=⋅ (11)
The results of the non-linear regression are listed in Table 2 and depicted in
Figure 4. Figure 5 shows that for each oxygenator the original ∆P versus Q
data, along with the predicted ∆P versus Q relationship (with 95% regression
intervals for α and β) obtained by converting the dimensionless fit from figure
4 back to dimensional form.

Appendix 6
183
Discussion
The importance of the effect of a given resistance and flow characteristic in an
artificial lung on blood elements and the degree of inflammatory response
have not yet been established. However, it is well known however that shear
stress plays an important role in the activation of blood platelets and white
blood cells. However, from an engineering point of view, a certain pressure
drop over the device is necessary for an even distribution of blood flow. In the
past, few attempts have been made to characterize hydrodynamics, including
the geometry and flow pattern of an artificial lung. Pressure drop across a
membrane compartment can be studied using a dimensionless relationship
between Euler and Reynolds number as a function of two dimensionless
characteristic geometrical parameters, namely, device porosity ε and the
dimensionless characteristic device length ξ. This relationship indicates that
the (total) pressure across heat exchanger and membrane compartment is
directly related to (1) length of the blood path, (2) length of the manifold and
(3) flow pattern. Figure 4 can be presented as a device specific scaling of
Figure 3, resulting in one curve representing the three artificial lungs.
In Figure 5, the dimensionless Eu-Re equation gives a good prediction of the
∆P-Q relationship for water flow rates up to 3.5 lpm (Re<10). However, at
higher water flow rates (Re>10), the predicted ∆P-Q data deviate from the
measured ∆P-Q data, especially for the Optima.
The dimensionless approach is independent of fluid density and viscosity and
enables one to relate water tests to blood, advertising the benefits of
dimensionless numbers. There is no need to rescale the graphs for blood,
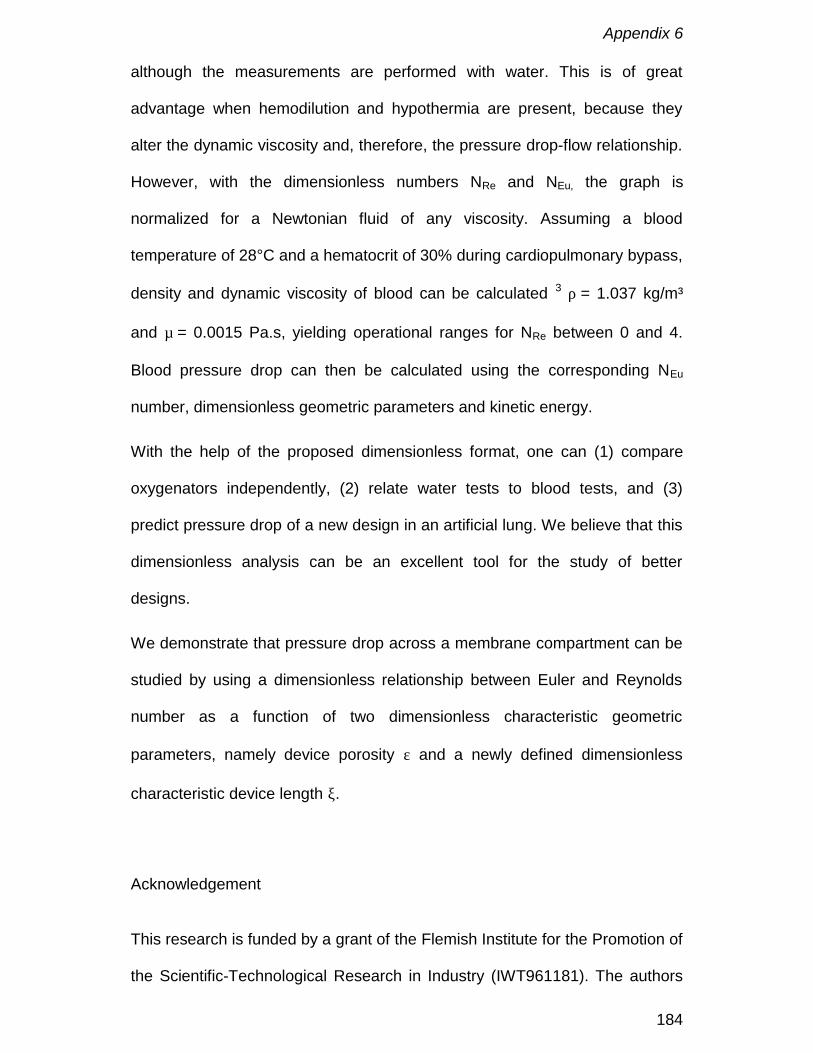
Appendix 6
184
although the measurements are performed with water. This is of great
advantage when hemodilution and hypothermia are present, because they
alter the dynamic viscosity and, therefore, the pressure drop-flow relationship.
However, with the dimensionless numbers NRe and NEu, the graph is
normalized for a Newtonian fluid of any viscosity. Assuming a blood
temperature of 28°C and a hematocrit of 30% during cardiopulmonary bypass,
density and dynamic viscosity of blood can be calculated 3 ρ = 1.037 kg/m³
and µ = 0.0015 Pa.s, yielding operational ranges for NRe between 0 and 4.
Blood pressure drop can then be calculated using the corresponding NEu
number, dimensionless geometric parameters and kinetic energy.
With the help of the proposed dimensionless format, one can (1) compare
oxygenators independently, (2) relate water tests to blood tests, and (3)
predict pressure drop of a new design in an artificial lung. We believe that this
dimensionless analysis can be an excellent tool for the study of better
designs.
We demonstrate that pressure drop across a membrane compartment can be
studied by using a dimensionless relationship between Euler and Reynolds
number as a function of two dimensionless characteristic geometric
parameters, namely device porosity ε and a newly defined dimensionless
characteristic device length ξ.
Acknowledgement
This research is funded by a grant of the Flemish Institute for the Promotion of
the Scientific-Technological Research in Industry (IWT961181). The authors

Appendix 6
185
like to express their gratitude to Nico Vincart for doing most of the
measurements.

Appendix 6
186
References
1. S.N. Vaslef, L.F. Mockros, R.W. Anderson, R. Leonard: Use of a
mathematical model to predict oxygen transfer rates in hollow fiber
membrane oxygenators. ASAIO Trans 40: 990-996, 1994
2. S.N. Vaslef, L.F. Mockros, K.E. Cook, R. Leonard, J. Sung, R.W.
Anderson: Computer-assisted design of an implantable, intrathoracic
artificial lung. Artif Organs 18: 813-817, 1994
3. L.F. Mockros and R. Leonard : Compact Cross-Flow Tubular Oxygenators.
ASAIO Trans 31:628-633, 1985.
4. R.B. Bird, W.E. Stewart, E.N. Lightfoot : Transport Phenomena. New York,
John Wiley & Sons, 1960.
5. S. Ergun: Fluid flow through packed columns. Chem Eng Prog 48: 89-94,
1952
6. P.R. Verdonck, U. Siller, D.S. De Wachter, F. De Somer, G. Van Nooten :
Hydrodynamical comparison of aortic arch cannulae. Int. J. Artif. Organs
21(11): 705-13, 1998.
7. I.F. Macdonald, M.S. El-Sayed, K. Mow, F.A. Dullien: Flow through porous
media: the Ergun equation revisited. Industrial Engineering Chem
Fundament 18: 199-208, 1979.
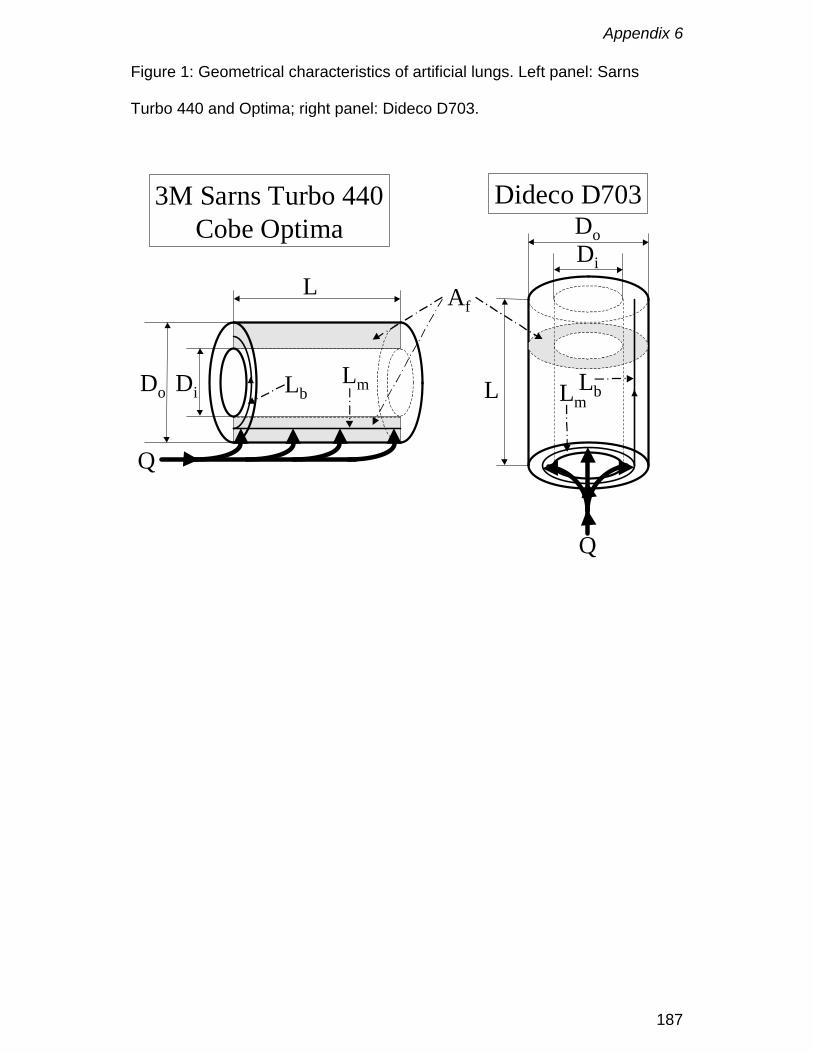
Appendix 6
187
Figure 1: Geometrical characteristics of artificial lungs. Left panel: Sarns
Turbo 440 and Optima; right panel: Dideco D703.
Do Di
L
LbLm
Q
Do
L LmLb
Q
Di
3M Sarns Turbo 440Cobe Optima
Dideco D703
Af
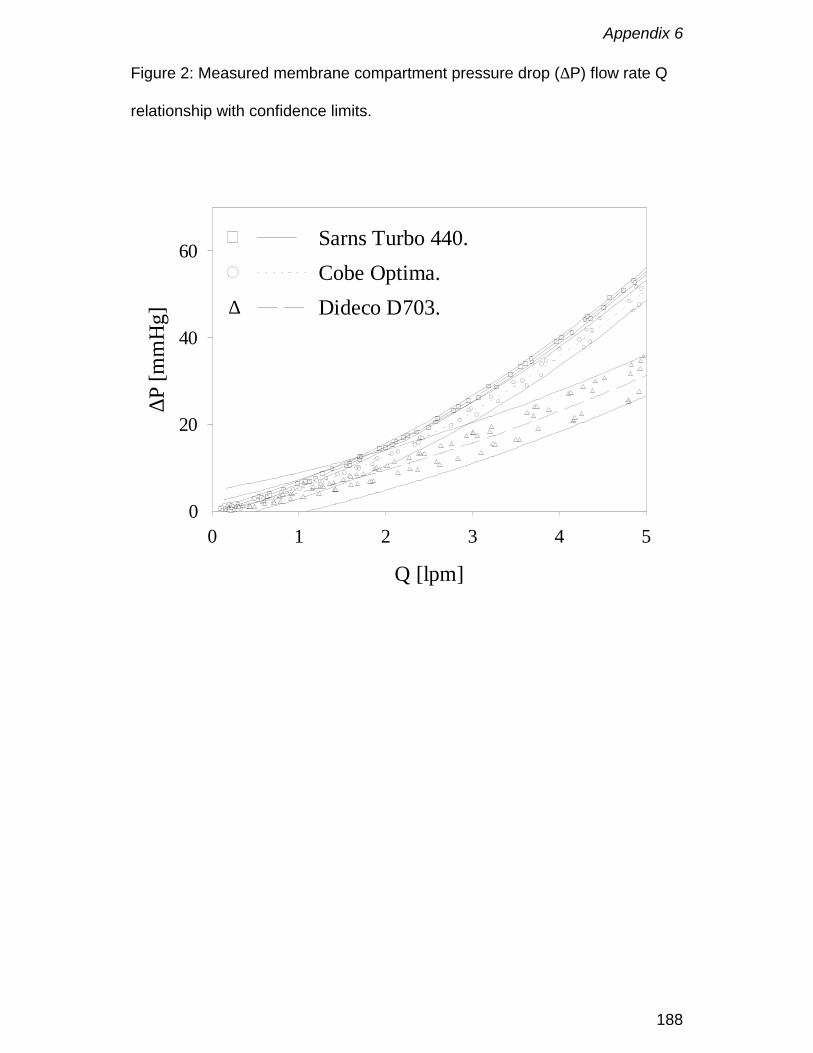
Appendix 6
188
Figure 2: Measured membrane compartment pressure drop (∆P) flow rate Q
relationship with confidence limits.
Q [lpm]
0 1 2 3 4 5
∆P [m
mH
g]
0
20
40
60 Sarns Turbo 440.Cobe Optima.Dideco D703.∆

Appendix 6
189
Figure 3: Euler–Reynolds relationship for the Sarns Turbo 440, Optima and
Dideco D703 on a bilogaritmic plot.
NRe
1 10
NEu
103
104
105
Sarns Turbo 440.Cobe Optima.Dideco D703.
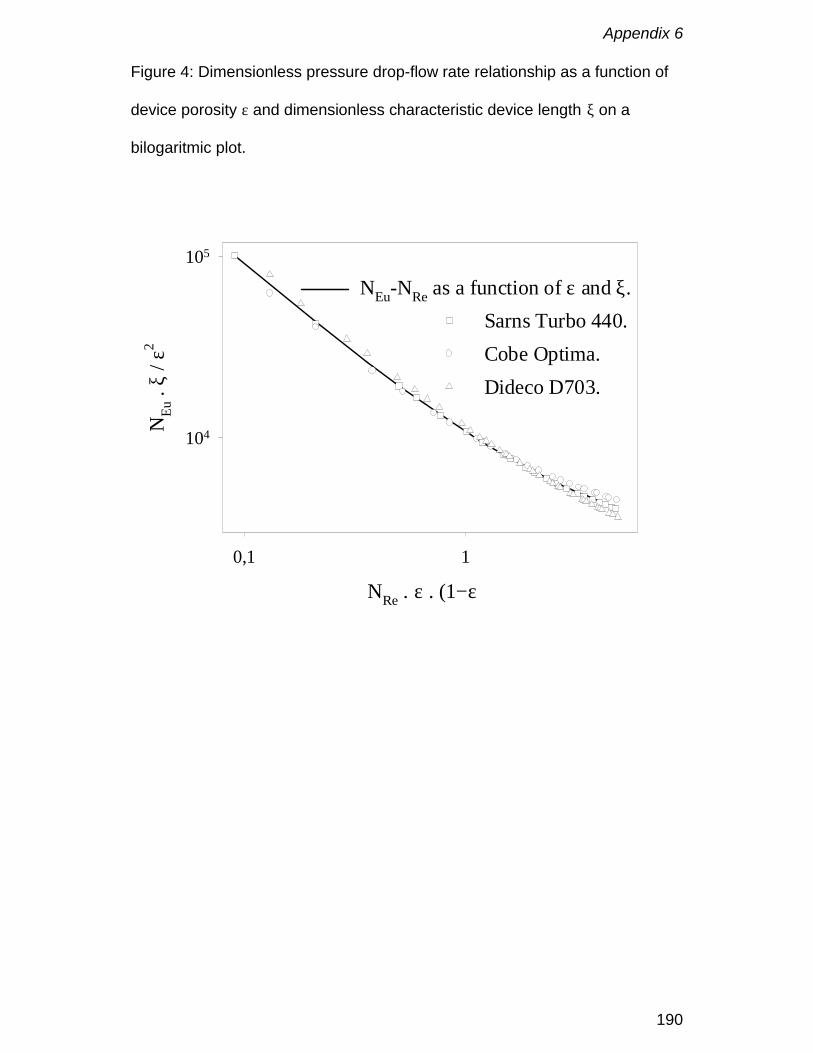
Appendix 6
190
Figure 4: Dimensionless pressure drop-flow rate relationship as a function of
device porosity ε and dimensionless characteristic device length ξ on a
bilogaritmic plot.
NRe . ε . (1−ε)
0,1 1
NEu
. ξ
/ ε2
104
105
NEu-NRe as a function of ε and ξ.Sarns Turbo 440.Cobe Optima.Dideco D703.
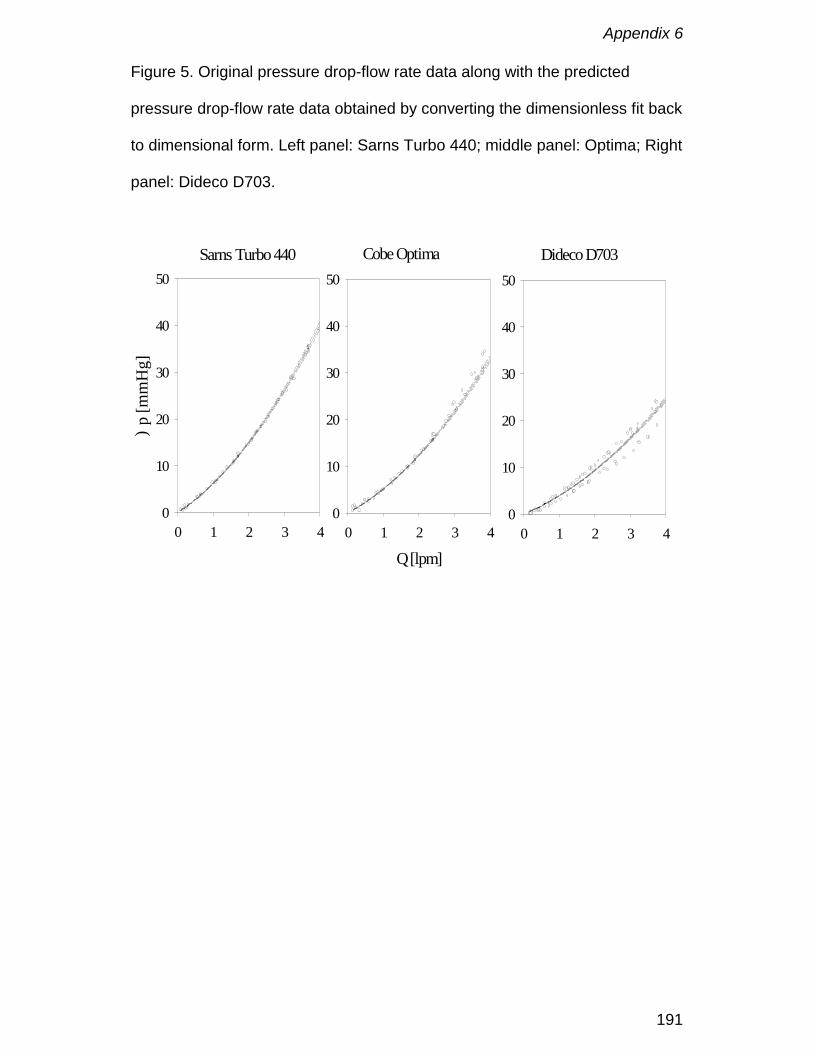
Appendix 6
191
Figure 5. Original pressure drop-flow rate data along with the predicted
pressure drop-flow rate data obtained by converting the dimensionless fit back
to dimensional form. Left panel: Sarns Turbo 440; middle panel: Optima; Right
panel: Dideco D703.
0 1 2 3 4
)p
[mm
Hg]
0
10
20
30
40
50Sarns Turbo 440
Q [lpm]0 1 2 3 4
0
10
20
30
40
50
Cobe Optima
0 1 2 3 40
10
20
30
40
50
Dideco D703
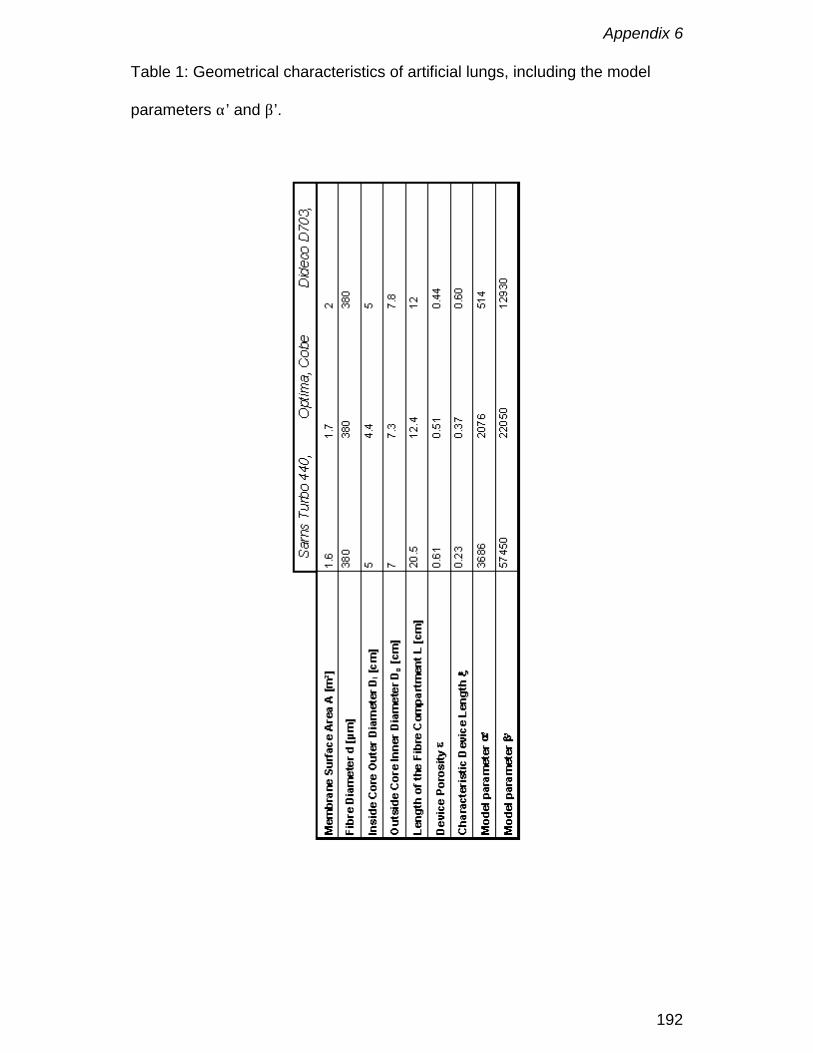
Appendix 6
192
Table 1: Geometrical characteristics of artificial lungs, including the model
parameters α’ and β’.

Appendix 6
193
Table 2: Non-linear regression results.
α ± SD 2365 ± 52
β ± SD 8509 ± 25
R² 0.998

Appendix 6
194

Appendix 7
195
Impact of oxygenator design on hemolysis, shear stress,white blood cell and platelet count
De Somer F, Foubert L, Vanackere M, Dujardin D, Delanghe J.,Van Nooten G
J. Cardiothor.Vasc. Anesth. 1996; 10: 884-889

Appendix 7
196
Abstract
Objective: To determine whether relative pressure drop, shear stress,
hemolysis, white blood cell and platelet count are influenced by different
oxygenator designs. To compare the oxygenator results with the average
shear stress over an arterial cannula.
Design: Prospective; patients enrolled consecutively.
Setting: University Hospital.
Participants: 3 times 12 adult patients, scheduled for routine cardiac surgery.
Interventions: Each group was submitted to a different oxygenator design,
group 1 to a high pressure hollow fibre membrane oxygenator (Sarns Turbo),
group 2 to a medium pressure hollow fibre membrane oxygenator (Cobe
Optima) and group 3 to a flat sheet membrane oxygenator (Cobe Duo).
Measurements and Main results: Although the investigated oxygenators have
important differences in pressure drop and shear stress no statistical
differences were found in hemolysis generation or blood handling between the
different groups. Actually the study shows much higher shear stress levels
over an average arterial cannula than over any of the evaluated oxygenators.
Conclusions: The pressure drop over an oxygenator does not correlate well
with shear stress and hemolysis because the dimensions of the system
(radius and length) must be included in the calculation of shear stress from
pressure drop.
Appendix 7
197
Introduction
During the last years low prime, hollow fibre oxygenators have become first
choice in most cardiac centres. The main rationale is the reduction in total
system prime and blood foreign material interface. However, the effects of
pressure drop over an oxygenator on blood trauma still appear to be a subject
of debate (1,2). According to the literature (1,3,4) it is not the pressure drop as
such that causes hemolysis and cellular activation, but shear stress. Red
blood cells are less sensitive than platelets and white cells to shear, with a
critical shear stress level of 2000 - 3000 dynes/cm², below which hemolysis is
limited (3,4). Platelets and white cells are activated at significantly lower shear
stress levels of 100 and 75 dynes/cm², respectively (5-7)
The aim of this study is to evaluate the relative pressure drop, shear stress,
and ex vivo blood handling characteristics for three different oxygenator
designs.
Appendix 7
198
Materials and methods
The study consisted of three groups of 12 patients (Table 1). In group 1
(Sarns Turbo, 3M, Ann Arbor, MI) a hollow fibre oxygenator with a high
pressure drop, in group 2 (Cobe Optima, Cobe Cardiovascular, Arvada, CO).
a hollow fibre oxygenator with a moderate pressure drop and in group 3 a low
prime flat sheet oxygenator design (Cobe Duo, Cobe Cardiovascular, Arvada,
CO) were used. The Cobe Duo consists of two oxygenators in one device.
This is accomplished by two flat sheet membrane compartments, each 1.3 m2,
placed in parallel. The heatexchanger is the same whether one or two
compartments. Depending on the oxygen consumption of the patient one can
start on one or two compartments are used. If one starts on the first
compartment the second still can be opened when needed during the
extracorporeal circulation. Only one patient in group three had an oxygen
consumption which exceeded the oxygen transfer capacity of one
compartment. This patient was perfused with both oxygenator compartments,
which resulted in a total system prime of 1500 ml. There were no statistical
differences between demografic data of the patients in the three groups.
The specific characteristics of the oxygenators are presented in table 2.
The extracorporeal system comprised in all groups the Cobe heart-lung
machine (Cobe Cardiovascular, Arvada, CO), custom tubing packs made of
polyvinyl chloride (PVC) tubing with exception of the arterial pumphead
(silicone), arterial line filtration (40 micron), cardiotomy reservoir with a 20
micron filter and a collapsible venous reservoir. The arterial line had an
internal diameter of 3/8 inch and was 175 cm long, the venous line was 1/2
Appendix 7
199
inch and had a length of 190 cm. All suction lines were 1/4 inch and had an all
over length of 360 cm (from top to cardiotomy reservoir). Occlusion setting of
the arterial rollerpump was completely occlusive at a back pressure of 330
mmHg. The occlusion setting was verified and eventually adjusted before
every use. The prime solution was a mixture of Plasma-Lyte A, human
albumin 20% and mannitol. The complete system had a priming volume of
1300 ml in every group.
In group 1 one patient, in group 2 five patients and in group 3 two patients
received homologous blood in order to obtain a post bypass hematocrit of
25%.
Each oxygenator configuration was used on 12 consecutive patients
undergoing routine cardiac surgery.
Perfusion technique
All oxygenators were inspected and set up in accordance with the
manufacturer’s enclosed instructions. Blood flow rates were maintained to
ensure adequate tissue perfusion. The arterial pump was a standard
rollerpump (Cobe Cardiovascular, Arvada, CO). An alpha-stat regimen was
used in all cases for acid-base and blood gas management. The detailed
perfusion protocol was published elsewhere (8).
Since suction is an important determinant of hemolysis (9), it was controlled
within strict limits. Suction was only applied when necessary and the
revolutions of the roller pumps were kept as low as possible. The aspiration
on the aortic needle was pressure controlled and automatically stopped at a
negative pressure of minus 100 mmHg.
Appendix 7
200
Activated clotting times were kept above 400 seconds. Cardioplegia was
instituted by using St. Thomas cardioplegia two solution (400-1000 ml).
Data collection
White blood cell count, red blood cell count, hematocrit, hemoglobin and
platelets were processed using STKS-Coulter counter apparatus. Serum
concentrations of free hemoglobin (free Hb), haptoglobin (Hp) and hemopexin
(Hpx) were determined as markers of hemolysis using immunonephelometry
(10) on a BN nephelometer (Behringwerke, Marburg) and expressed
according to IFCC standards (11). Blood samples were taken prior to
institution of bypass, after mixing (five minutes bypass), every 20 minutes
during bypass, five minutes after bypass and 30 minutes after the
administration of protamine.
For correction of the obtained results for hemodilution (due to the priming fluid
and the cardioplegia) a neutral plasma protein IgG was monitored. Correction
was done using the following formula:
corrected concentration = measured concentration x initial IgG
concentration/IgG concentration at time of measurement
Values of platelets (PLT) were expressed as percent of baseline according to:
% of baseline = (prebypass IgG/IgG at time of measurement) x (measured
PLT count/prebypass PLT count) x 100
Shear stress calculations were made for both the cannula and each
oxygenator group at standard blood conditions of 37° Celsius and 35%
hematocrit. These blood characteristics were chosen because the data from
the cannula manufacturer for the determination of pressure drop were
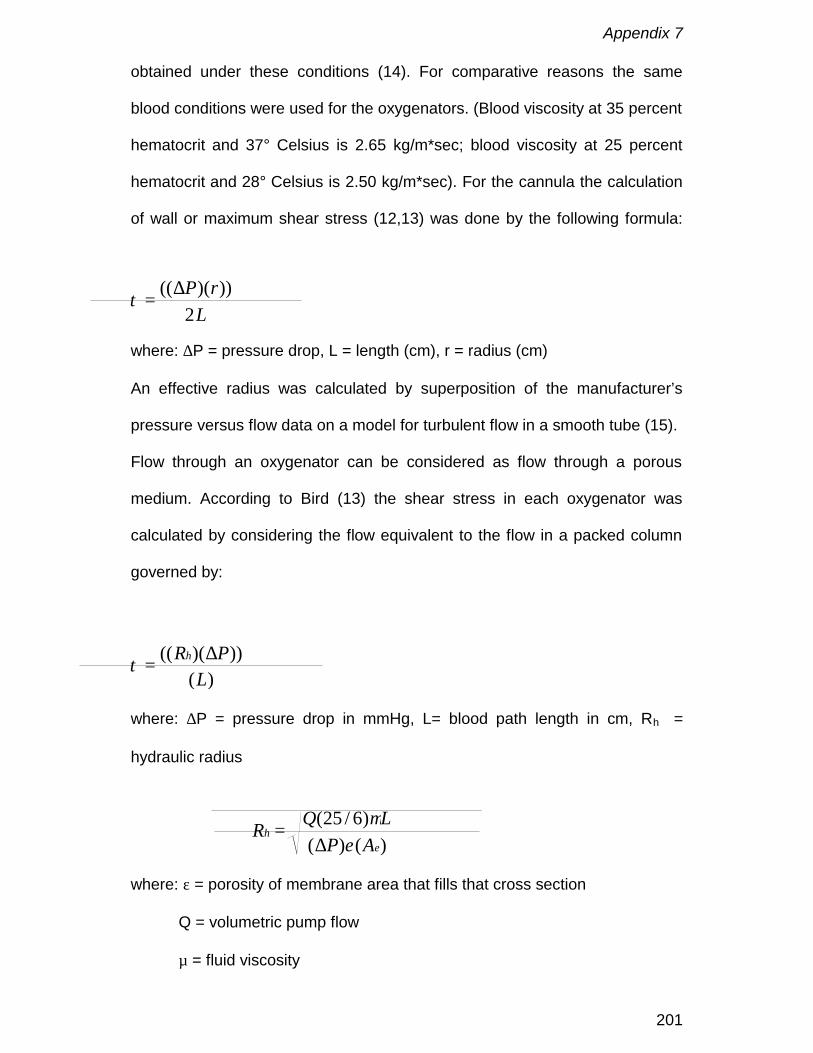
Appendix 7
201
obtained under these conditions (14). For comparative reasons the same
blood conditions were used for the oxygenators. (Blood viscosity at 35 percent
hematocrit and 37° Celsius is 2.65 kg/m*sec; blood viscosity at 25 percent
hematocrit and 28° Celsius is 2.50 kg/m*sec). For the cannula the calculation
of wall or maximum shear stress (12,13) was done by the following formula:
τ =((∆P)(r))
2L
where: ∆P = pressure drop, L = length (cm), r = radius (cm)
An effective radius was calculated by superposition of the manufacturer’s
pressure versus flow data on a model for turbulent flow in a smooth tube (15).
Flow through an oxygenator can be considered as flow through a porous
medium. According to Bird (13) the shear stress in each oxygenator was
calculated by considering the flow equivalent to the flow in a packed column
governed by:
τ =((Rh)(∆P))
(L)
where: ∆P = pressure drop in mmHg, L= blood path length in cm, Rh =
hydraulic radius
Rh =Q(25 / 6)µL(∆P)ε(Ae)
where: ε = porosity of membrane area that fills that cross section
Q = volumetric pump flow
µ = fluid viscosity
Appendix 7
202
Ae = is empty housing cross sectional area for flow in cm²
25/6 = experimental derived factor.
The hydraulic radius for each group was calculated from superposition of
pressure drop data on the packed column flow model (13).
Statistics
Statistical analysis was performed using analysis of variance for repeated
measurements. Statistical analysis of bypass data was performed up to 60
minutes of bypass. There were insufficient data available in all groups for
further analysis beyond 60 minutes. In order to test the control value against
all other values the Dunnett test was used. All values are expressed as mean
± SD where appropriate.
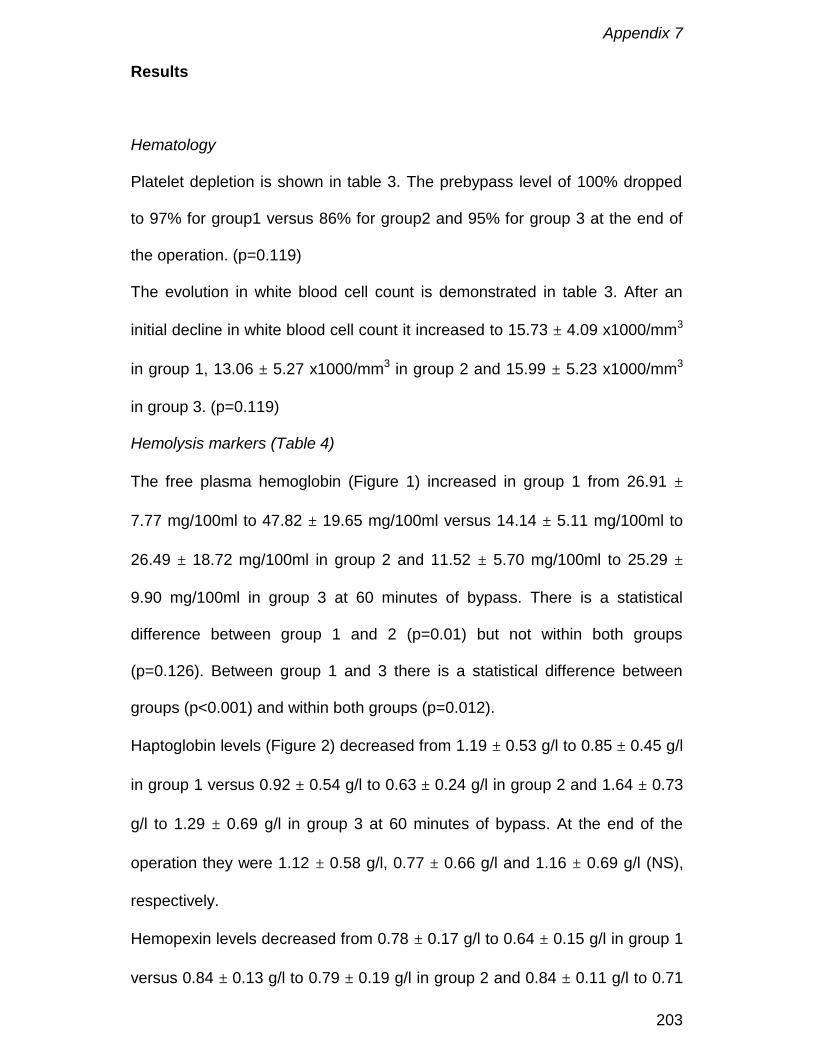
Appendix 7
203
Results
Hematology
Platelet depletion is shown in table 3. The prebypass level of 100% dropped
to 97% for group1 versus 86% for group2 and 95% for group 3 at the end of
the operation. (p=0.119)
The evolution in white blood cell count is demonstrated in table 3. After an
initial decline in white blood cell count it increased to 15.73 ± 4.09 x1000/mm3
in group 1, 13.06 ± 5.27 x1000/mm3 in group 2 and 15.99 ± 5.23 x1000/mm3
in group 3. (p=0.119)
Hemolysis markers (Table 4)
The free plasma hemoglobin (Figure 1) increased in group 1 from 26.91 ±
7.77 mg/100ml to 47.82 ± 19.65 mg/100ml versus 14.14 ± 5.11 mg/100ml to
26.49 ± 18.72 mg/100ml in group 2 and 11.52 ± 5.70 mg/100ml to 25.29 ±
9.90 mg/100ml in group 3 at 60 minutes of bypass. There is a statistical
difference between group 1 and 2 (p=0.01) but not within both groups
(p=0.126). Between group 1 and 3 there is a statistical difference between
groups (p<0.001) and within both groups (p=0.012).
Haptoglobin levels (Figure 2) decreased from 1.19 ± 0.53 g/l to 0.85 ± 0.45 g/l
in group 1 versus 0.92 ± 0.54 g/l to 0.63 ± 0.24 g/l in group 2 and 1.64 ± 0.73
g/l to 1.29 ± 0.69 g/l in group 3 at 60 minutes of bypass. At the end of the
operation they were 1.12 ± 0.58 g/l, 0.77 ± 0.66 g/l and 1.16 ± 0.69 g/l (NS),
respectively.
Hemopexin levels decreased from 0.78 ± 0.17 g/l to 0.64 ± 0.15 g/l in group 1
versus 0.84 ± 0.13 g/l to 0.79 ± 0.19 g/l in group 2 and 0.84 ± 0.11 g/l to 0.71
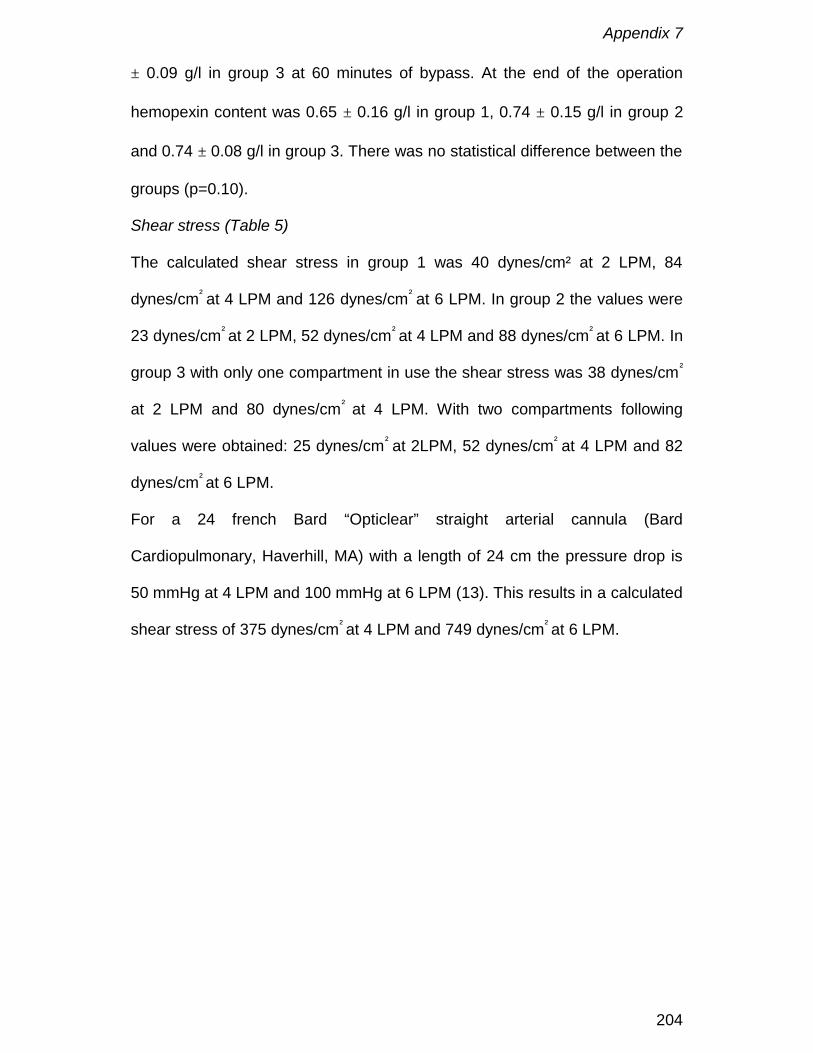
Appendix 7
204
± 0.09 g/l in group 3 at 60 minutes of bypass. At the end of the operation
hemopexin content was 0.65 ± 0.16 g/l in group 1, 0.74 ± 0.15 g/l in group 2
and 0.74 ± 0.08 g/l in group 3. There was no statistical difference between the
groups (p=0.10).
Shear stress (Table 5)
The calculated shear stress in group 1 was 40 dynes/cm² at 2 LPM, 84
dynes/cm² at 4 LPM and 126 dynes/cm² at 6 LPM. In group 2 the values were
23 dynes/cm² at 2 LPM, 52 dynes/cm² at 4 LPM and 88 dynes/cm² at 6 LPM. In
group 3 with only one compartment in use the shear stress was 38 dynes/cm²
at 2 LPM and 80 dynes/cm² at 4 LPM. With two compartments following
values were obtained: 25 dynes/cm² at 2LPM, 52 dynes/cm² at 4 LPM and 82
dynes/cm² at 6 LPM.
For a 24 french Bard “Opticlear” straight arterial cannula (Bard
Cardiopulmonary, Haverhill, MA) with a length of 24 cm the pressure drop is
50 mmHg at 4 LPM and 100 mmHg at 6 LPM (13). This results in a calculated
shear stress of 375 dynes/cm² at 4 LPM and 749 dynes/cm² at 6 LPM.
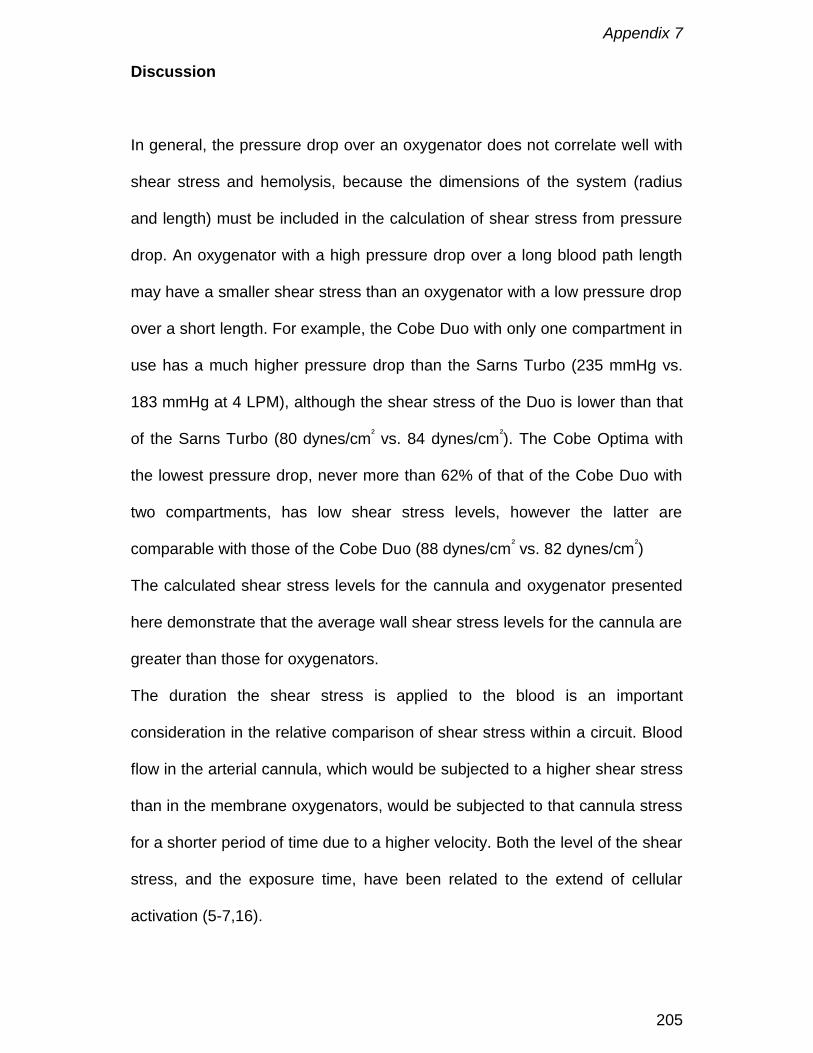
Appendix 7
205
Discussion
In general, the pressure drop over an oxygenator does not correlate well with
shear stress and hemolysis, because the dimensions of the system (radius
and length) must be included in the calculation of shear stress from pressure
drop. An oxygenator with a high pressure drop over a long blood path length
may have a smaller shear stress than an oxygenator with a low pressure drop
over a short length. For example, the Cobe Duo with only one compartment in
use has a much higher pressure drop than the Sarns Turbo (235 mmHg vs.
183 mmHg at 4 LPM), although the shear stress of the Duo is lower than that
of the Sarns Turbo (80 dynes/cm² vs. 84 dynes/cm²). The Cobe Optima with
the lowest pressure drop, never more than 62% of that of the Cobe Duo with
two compartments, has low shear stress levels, however the latter are
comparable with those of the Cobe Duo (88 dynes/cm² vs. 82 dynes/cm²)
The calculated shear stress levels for the cannula and oxygenator presented
here demonstrate that the average wall shear stress levels for the cannula are
greater than those for oxygenators.
The duration the shear stress is applied to the blood is an important
consideration in the relative comparison of shear stress within a circuit. Blood
flow in the arterial cannula, which would be subjected to a higher shear stress
than in the membrane oxygenators, would be subjected to that cannula stress
for a shorter period of time due to a higher velocity. Both the level of the shear
stress, and the exposure time, have been related to the extend of cellular
activation (5-7,16).
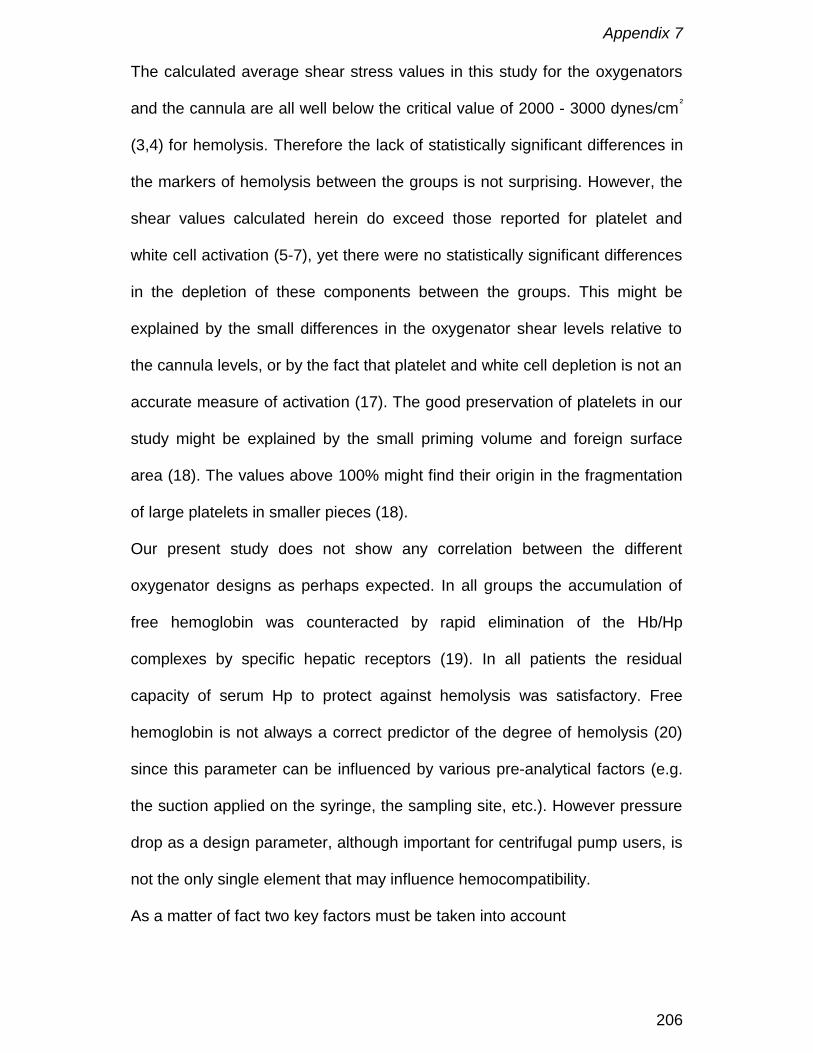
Appendix 7
206
The calculated average shear stress values in this study for the oxygenators
and the cannula are all well below the critical value of 2000 - 3000 dynes/cm²
(3,4) for hemolysis. Therefore the lack of statistically significant differences in
the markers of hemolysis between the groups is not surprising. However, the
shear values calculated herein do exceed those reported for platelet and
white cell activation (5-7), yet there were no statistically significant differences
in the depletion of these components between the groups. This might be
explained by the small differences in the oxygenator shear levels relative to
the cannula levels, or by the fact that platelet and white cell depletion is not an
accurate measure of activation (17). The good preservation of platelets in our
study might be explained by the small priming volume and foreign surface
area (18). The values above 100% might find their origin in the fragmentation
of large platelets in smaller pieces (18).
Our present study does not show any correlation between the different
oxygenator designs as perhaps expected. In all groups the accumulation of
free hemoglobin was counteracted by rapid elimination of the Hb/Hp
complexes by specific hepatic receptors (19). In all patients the residual
capacity of serum Hp to protect against hemolysis was satisfactory. Free
hemoglobin is not always a correct predictor of the degree of hemolysis (20)
since this parameter can be influenced by various pre-analytical factors (e.g.
the suction applied on the syringe, the sampling site, etc.). However pressure
drop as a design parameter, although important for centrifugal pump users, is
not the only single element that may influence hemocompatibility.
As a matter of fact two key factors must be taken into account
Appendix 7
207
1. The total pressure drop of the bypass system (oxygenator, filter,
connectors, cannulae etc...) and not only the oxygenator itself.
2. The instantaneous shear forces or stresses within the entire bypass circuit
as a function of blood flow rate. One should be very carefull not to draw any
hasty decision based on normal average shear stress calculations as they do
not indicate the instantaneous shear stresses that can sometimes exceed
what the red blood cells, the platelets and the leukocytes can withstand before
they are damaged. And again the full circuit has to be analyzed (21,22) and
not only the oxygenator.
On the other hand measuring, monitoring or calculating instantaneous shear
forces during cardiopulmonary bypass is a rather difficult task. Because of the
practical difficulty any total bypass design has to be assessed against
hemocompatibility to assure the best preservation as possible of our patient
formed blood elements. Although the challenge for us remains to agree on
standard markers to best characterize and clinically objectivate
hemocompatibility.
Acknowledgement.
The authors wish to express their gratitude to Mr. Ben F. Brian for his valuable
help in the preparation of this manuscript.

Appendix 7
208
References
1. Bearss MG, The Relationship Between Membrane Oxygenator Blood Path
Pressure Drop and Hemolysis: An In-vitro Evaluation. The Journal of
Extra-Corporeal Technology 25: 87-92, 1993
2. Personnal communication Ned Evans, product specialist 3M
3. Nevaril CG, Lynch EC, Alfrey CP, Hellums JD, Erythrocyte damage and
destruction induced by shearing stress. J.Lab. & Clin. Med. 71: 781-790,
1968
4. Blackshear PL, Dorman FD, Steinbach EJ, et al: Shear, Wall Interaction
and Hemolysis. Trans. Amer. Soc. Artif. Int. Organs 12: 113-120, 1966
5. Hellums JD, Biorheology in Thrombosis Research. Annals of Biomedical
Engineering. 22: 445-455, 1994.
6. Hellums JD, Hardwick RA.: Response of Platelets to Shear Stress - a
Review. In Gross DR, Hwang NHC eds. The Rheology of Blood Vessels
and Associated Tissues. Alphen aan den Rijn: NATO Advanced Study
Institute Series - E, No 41, Sijthoff & Noordhoff, 1981
7. McIntire LV, Martin RR. Mechanical Trauma Induced PMN Leucocyte
Dysfunction. In Gross DR, Hwang NHC eds. The Rheology of Blood
Vessels and Associated Tissues. Alphen aan den Rijn: NATO Advanced
Study Institute Series - E, No 41, Sijthoff & Noordhoff, 1981
8. De Somer F, De Smet D, Vanackere M, et al: Clinical evaluation of a new
hollow fibre membrane oxygenator. Perfusion. 9: 57-64, 1994

Appendix 7
209
9. de Jong JCF, ten Duis HJ, Smit Sibinga C. Th, Wildevuur Ch. R. H.
Hematologic aspects of cardiotomy suction in cardiac operations. J.
Thorac. Cardiovasc. Surg. 79: 227-236, 1980
10. Fink et al. Measurement of proteins with the Behring Nephelometer. J.
Clin. Chem. Clin. Biochem. 27: 261-276, 1989
11. Johnson AMA New international reference for proteins in human serum.
Arch. Pathol. Lab. Med. 117: 29-31, 1993
12. Data provided by Bard Cardiopulmonary, PRMA#93-006 Rep 6/94 1.5M.
13. Giles RV, Fluid Mechanics and Hydraulics 2nd edition, New York:
McGraw-Hill Book Company, 1977, p 101.
14. Bird RB, Stewart WE, Lightfoot EN. Transport Phenomena, New York:
John Wiley and Sons, 1960: p 197.
15. Montoya JP, Merz SI, Bartlett RH. A Standardized System for Describing
Flow/Pressure Relationships in Vascular Access Devices. Trans ASAIO
37: 4-8, 1991.
16. Lambert J. In: Schmid-Schönbein H, Teitel P eds. Basic aspects of blood
trauma The Hague: Martinus Nijhoff Publishers, 300-311, 1979
17. O’Brien JR, Etherington MD, Rebleeding, the reversal of shear activation
of platelets - a possible clue to thrombogenesis. Thromb. Res. 65: 821-
822, 1992;.
18. In: Casthelhy PA, Bregman D. eds. Cardiopulmonary Bypass: Physiology,
Related complications and Pharmacology. New York: Futura Publishing
Company, 71, 196, 1991
19. Kino K et al. Hemoglobin - Haptoglobin receptor in rat liver plasma
membrane. J. Biol. Chem. 255: 9616-9620, 1980.

Appendix 7
210
20. Lammers M, Gressner AM. Immunonephelometric quantification of free
haemoglobin. J. Clin Chem Clin Biochem 25: 363-367, 1987.
21. Craddock PR, Hammerschmidt D, White JG, et al: Complement (C5a) -
induced granulocyte aggregation in vitro. A possible mechanism of
complement mediated leukostasis and leukopenia. J Clin Invest 60: 260-
64, 1977
22. Hammerschmidt DE, Stroncek DF, Bowers TK et al. Complement
activation and neutropenia occuring during cardiopulmonary bypass. J
Thorac Cardiovasc Surg 81: 370-77, 1981
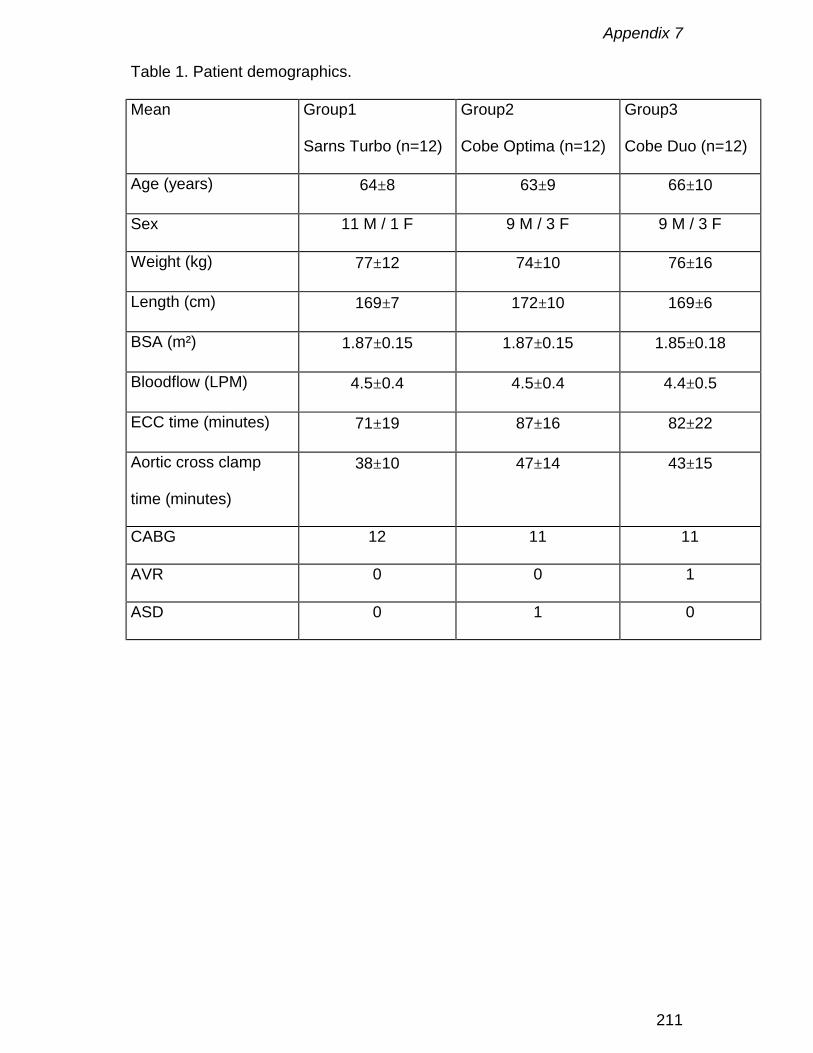
Appendix 7
211
Table 1. Patient demographics.
Mean Group1
Sarns Turbo (n=12)
Group2
Cobe Optima (n=12)
Group3
Cobe Duo (n=12)
Age (years) 64±8 63±9 66±10
Sex 11 M / 1 F 9 M / 3 F 9 M / 3 F
Weight (kg) 77±12 74±10 76±16
Length (cm) 169±7 172±10 169±6
BSA (m²) 1.87±0.15 1.87±0.15 1.85±0.18
Bloodflow (LPM) 4.5±0.4 4.5±0.4 4.4±0.5
ECC time (minutes) 71±19 87±16 82±22
Aortic cross clamp
time (minutes)
38±10 47±14 43±15
CABG 12 11 11
AVR 0 0 1
ASD 0 1 0

Appendix 7
212
Table 2. Oxygenator characteristics.
Sarns Turbo Cobe Optima Cobe Duo
1 compartment
Cobe Duo
2 compartments
Geometry hollow fibre hollow fibre flat sheet flat sheet
Surface Area1, m² 1.9 1.7 1.3 2.6
Priming1, ml 270 260 260 460
Flow Range1,
LPM
1 - 7 0.5 - 8 0.5 - 5 0.5 - 8
Pressure Drop2
2 LPM (mmHg)
88 38 111 73
Pressure Drop2
4 LPM (mmHg)
183 87 235 152
Pressure Drop2
6 LPM (mmHg)
279 148 304
(5LPM)3
241
1 Manufacturer’s Information
2 In vitro measurements with bovine blood at 37° C and 35% haematocrit
3 The maximum bloodflow over one compartment is 5 LPM
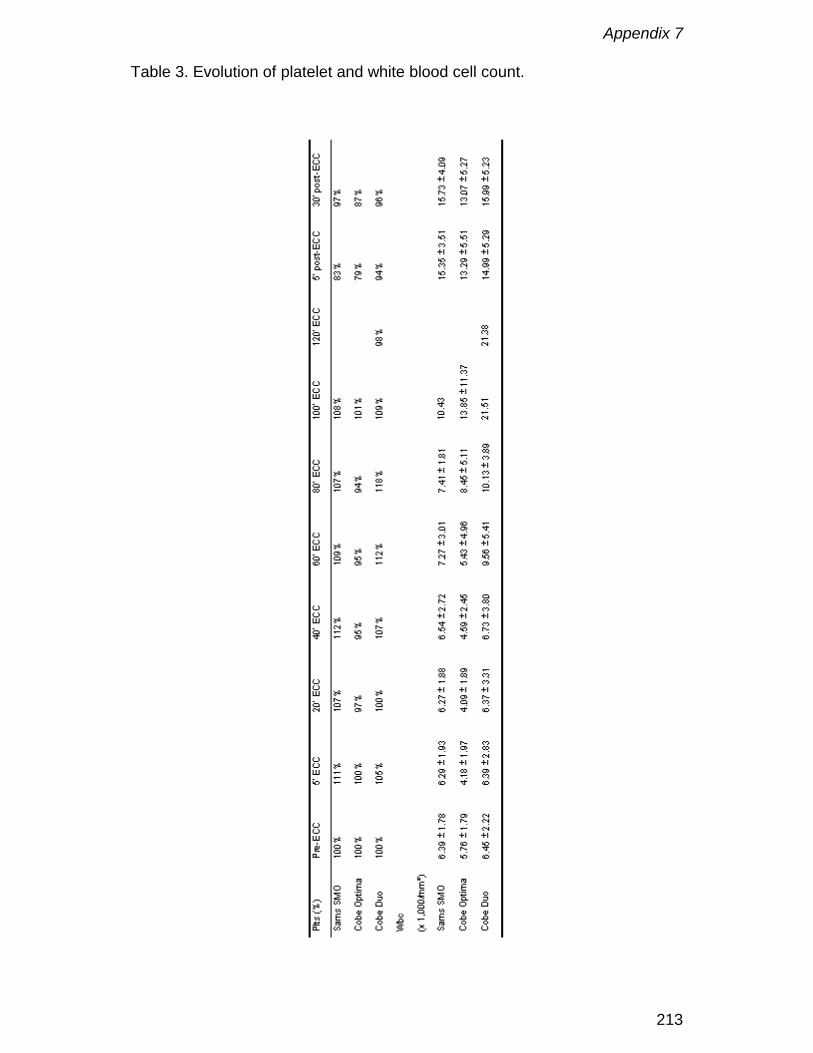
Appendix 7
213
Table 3. Evolution of platelet and white blood cell count.

Appendix 7
214
Table 4. Hemolysis parameters.
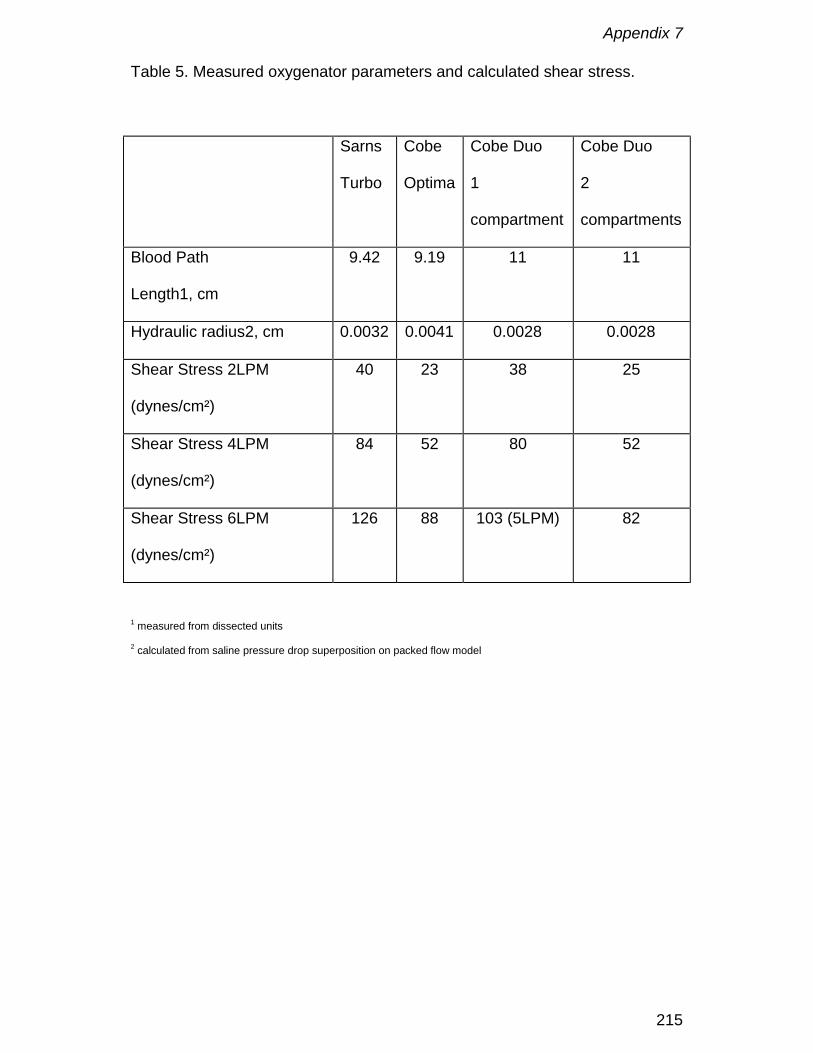
Appendix 7
215
Table 5. Measured oxygenator parameters and calculated shear stress.
Sarns
Turbo
Cobe
Optima
Cobe Duo
1
compartment
Cobe Duo
2
compartments
Blood Path
Length1, cm
9.42 9.19 11 11
Hydraulic radius2, cm 0.0032 0.0041 0.0028 0.0028
Shear Stress 2LPM
(dynes/cm²)
40 23 38 25
Shear Stress 4LPM
(dynes/cm²)
84 52 80 52
Shear Stress 6LPM
(dynes/cm²)
126 88 103 (5LPM) 82
1 measured from dissected units
2 calculated from saline pressure drop superposition on packed flow model
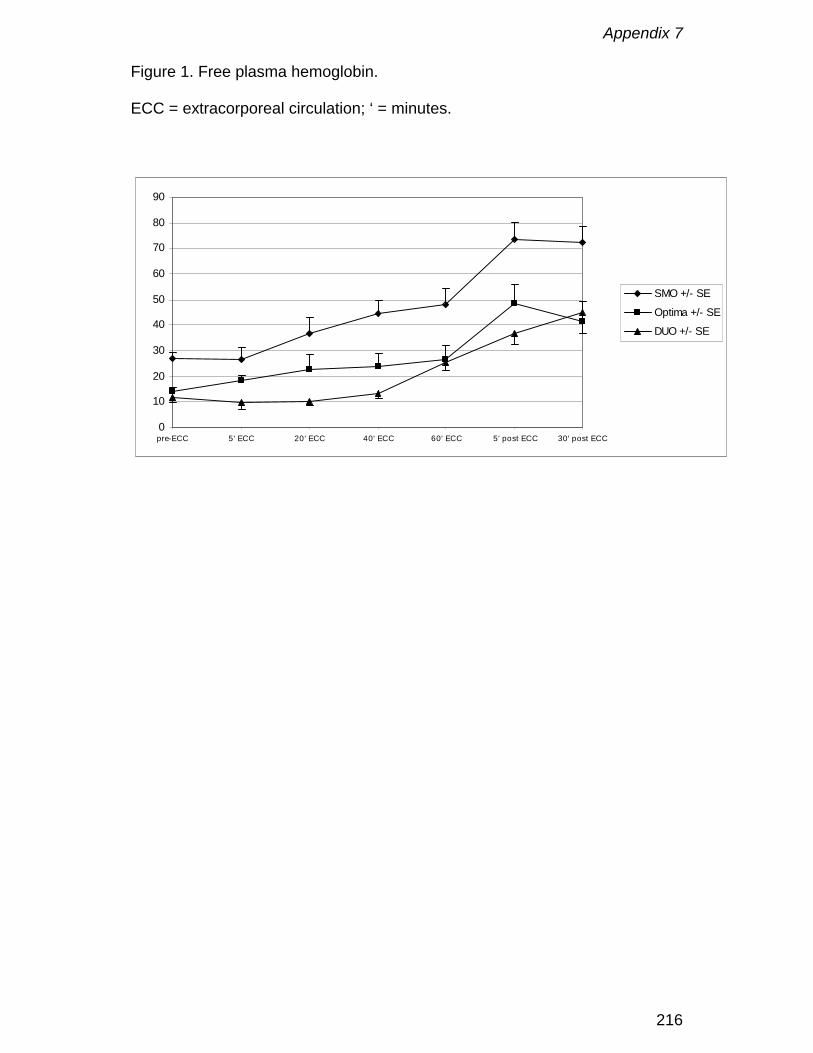
Appendix 7
216
Figure 1. Free plasma hemoglobin.
ECC = extracorporeal circulation; ‘ = minutes.
0
10
20
30
40
50
60
70
80
90
pre-ECC 5' ECC 20' ECC 40' ECC 60' ECC 5' post ECC 30' post ECC
SMO +/- SE
Optima +/- SE
DUO +/- SE

Appendix 7
217
Figure 2. Haptoglobin levels.
0.00
0.20
0.40
0.60
0.80
1.00
1.20
1.40
1.60
1.80
2.00
pre-ECC 5' ECC 20' ECC 40' ECC 60' ECC 5' post ECC 30' post ECC
SMO +/- SE
Optima +/- SE
Duo +/- SE

Appendix 7
218
Appendix 8
219
Can an oxygenator design potentially contribute to airembolism in CPB? A novel method for the determination of
the air removal capabilities of neonatal membraneoxygenators
F. De Somer, P. Dierickx, D. Dujardin, P. Verdonck, G. Van Nooten
Perfusion, 1998; 13: 157-163
Appendix 8
220
Abstract
At the moment air handling of a membrane oxygenator is in general studied
by using an ultrasonic sound bubble counter. However this is not a
quantitative method and it does not give any information where air was
entrapped in the oxygenator and if it eventually was removed through the
membrane for gas exchange.
This study presents a novel technique for determination of the air handling
characteristics of a membrane oxygenator. It is aimed at defining not only the
amount of air released by the oxygenator but also the amount of air trapped
within the oxygenator and or removed through the gas exchange membrane.
Two neonatal membrane oxygenators without the use of an arterial filter are
investigated: Polystan Microsafe and Dideco Lilliput. Although the air trap
function of both oxygenators when challenged with a bolus of air was simular
the Microsafe obtained this effect mainly by capturing the air in the heat
exchanger compartment while the Lilliput did remove a large amount of air
through the membrane. The difference in trap function was most striking
during the continous infusion of air.
Immediate contact with a microporous membrane, avoidance of high
velocities within the oxygenator, pressure drop, transit time and construction
of the fibre mat all contribute to the air handling characteristics of a membrane
oxygenator.
Appendix 8
221
Introduction
With the introduction of neonatal oxygenators total system priming volumes of
180 ml are feasible 1. The use of an arterial filter in these systems is
debatable. The priming volume of a paediatric arterial filter with its bypass is
almost as large as the membrane heat exchanger compartment of a neonatal
oxygenator. Beside this an arterial screen filter is only effective in the removal
of air emboli with an open purge line. However, especially in small babies it is
not desirable to keep this purge line open since one wants to know exactly the
tissue perfusion.
By not using an arterial screen filter there is a risk for pumping gaseous
microemboli (GME) or particles towards the patient. However most of the data
supporting this risk is generated using bubble oxygenators2-4. When using
membrane oxygenators a lower incidence of GME generation is reported.
However, membrane oxygenators can vary in their air handling performance,
as has been frequently reported 4-7.
The assessment of air handling capabilities of an oxygenator includes
generally an ultrasonic bubble counter 8. However the latter is not a sufficient
quantitative method and has a low reproducibility due to the limitations of the
working principle 9-11. This matter of fact is preventing an objective
assessment that could contribute to the air handling improvement of a given
device.
This study investigates the risk for microemboli and macroemboli when using
a neonatal membrane oxygenator without an arterial screen filter. It is aimed
at defining not only the amount of air released by the oxygenator but also the

Appendix 8
222
amount of air trapped within the oxygenator and or removed through the gas
exchange membrane.

Appendix 8
223
Method
Circuit (Figure 1)
To determine the amount of air released by the oxygenator a standpipe is
used as described by Miller5. This standpipe (e) acts as a long cylindrical
bubble trap. A dilato meter (4) measures the amount of gas evacuated
through the gas exchange membrane. This meter consists of a calibrated
glass capillary with a mercury drop inside. After sealing the gas outlet port and
the overpressure relief with silicone the capillary is connected to the gas inlet
port. As gas goes from the blood to the gas compartment the mercury drop
will move due to the volume increase until equilibrium is established with the
atmospheric pressure. The following formula converts the displacement of the
mercury drop into volume:
Where: V=volume in ml, ∆L=displacement of the mercury drop in mm,
d=diameter of the glass capillary in mm
Gross filtered bovine blood (22% haematocrit, 22° Celsius) is sequestered in
a 10-liter reservoir (f). It is pumped by a calibrated roller pump (a)(Cobe
Cardiovascular Inc., Arvada, CO, USA) through a Cobe Excel flat sheet
membrane oxygenator (b), which is known for its good air removal capability.
Blood flow is then directed via 1/4 inch PVC line versus the test device (d) into
the standpipe. Blood returns back to the reservoir via a 3/8 inch PVC line.
Arterial line pressure is maintained at 150 mmHg. The blood flow during the
4000.. 2dLV π∆
=

Appendix 8
224
experiment is set at 600 ml / minute. Pressures were measured before (1) and
after (2) the membrane oxygenator by fluid filled pressure transducers
(Ohmeda - Spectramed, Gent, Belgium)
A connector and stopcock (c) are added in-line to the test device inlet prior to
the test. This gives the possibility to directly inject a bolus of air ((STP) 1, 5
and 20 ml) in order to simulate a gross air embolus, or to attach a syringe
pump and slowly inject air (20 ml at 3 ml/min) to simulate an adverse event
leading to GME. After injecting a bolus a three-minute period is allowed for
equilibration after which the pump is stopped and the data recorded. During
the slow injection the pump flow is maintained during 10 minutes before the
data are recorded.
A “Y” connector is added prior to the entrance of the standpipe, so that a
recirculation line back to the aliquot can be used during priming and
debubbling of the test device. The test device is carbon dioxide flushed and
primed according to the manufacturers’ instructions. A syringe (5) is employed
at the top of the standpipe to volumetrically quantify the amount of air that
passes through the membrane test device. The reservoir is positioned to
minimise head pressure effects.
A Hatteland CMD-10 (Hatteland Instrumentering, Royken, Norway) pulsed
doppler microbubble counter (3) is attached to the tubing 20 cm after the
arterial outlet of the test device. The device is set at a maximum sensitivity
and is utilised to detect micro bubbles not macro bubbles. This device is
connected to a computer with a COMAC computer interface supported by
BUBMON (version 1.6 Hatteland Instrumentering, Royken, Norway). The

Appendix 8
225
addition of the bubble counter in the test circuit is to compare the bubble
counts with the amount of air collected in the standpipe after the test device.
Calibration
The circuit is verified by initially injecting a 0.5-ml, 1 ml, 5 ml and 10 ml bolus
into the circuit with no test oxygenator. The injected air is then collected at the
pipette to verify that the standpipe is effectively collecting all the air injected.
Injecting 0.5 ml, 1 ml, 5 ml and 10 ml before the mercury drop after which the
change in distance is recorded does calibration of the dilato meter.
Test devices
At this time only two neonatal oxygenators have been investigated, Polystan
Microsafe and Dideco Lilliput. Although their performance characteristics are
very comparable (Table 1) their design is not. The Microsafe consists of two
cylinders. The first cylinder forms the heat exchanger made of stainless steel
tubes. The second cylinder holds the gas exchange membrane. A rigid tube
connects both cylinders. Although blood flow will be the same everywhere in
the device the velocity will not. Blood velocity will be high in the inlet
connector, outlet connector and the connecting tube between both cylinders
and much lower in the cylinders itself. In the Lilliput blood flows through the
inner side of a spiral corrugated pipe heat exchanger after which it enters the
fibre stack for gas exchange. This design gives high velocities in inlet and
outlet connectors and lower velocity in the rest of the oxygenator. Both
devices have a top to bottom flow path in order to establish a bubble trap
function in the oxygenator. The fibres in the Microsafe are in an angle of

Appendix 8
226
approximately 15° to the length axis of the membrane module. In the Lilliput
the fibres are in parallel with the length axis of the oxygenator module and the
clearly visible spacing wires are perpendicular to the length axis. The
pressure drop over the oxygenator is lower in the Microsafe design compared
to the Lilliput design.

Appendix 8
227
Results
Calibration
Calibration of the standpipe (R²= 0.99) and the dilato meter (R²=0.99) shows
an excellent correlation (Figure 2).
Bolus injection
The results of the bolus and slow air injections are shown in Table 2.
Injection of 1 ml air in the Microsafe resulted in a visible air collection of 1 ml
at the bottom of the heat exchanger, no air entrapping in the bubble trap and
no removal of air by the membrane. In the Lilliput no air was observed in the
oxygenator module or in the bubble trap. However the oxygenator contained
0.9 ± 0.1 ml air and 0.1 ± 0.1 ml was removed by the membrane.
The 5 ml bolus injection resulted in visible air (4.7 ± 0.1 ml) in the heat
exchanger module of the Microsafe, no air in the bubble trap and a evacuation
of 0.4 ± 0.2 ml by the membrane. In the Lilliput air was found at the top of the
oxygenator (1.8 ± 0.2 ml), in the bubble trap (0.1 ± 0.2 ml ) and 3.1 ± 0.1 ml
was evacuated by the membrane.
With injection of 20 ml of air, air was found in both heat exchanger and
membrane modules of the Microsafe (8.3 ml) as in the bubble trap (4.9 ml)
while 6.8 ml was evacuated by the membrane. In the Lilliput air was found in
the oxygenator (3.2 ml) and in the bubbletrap (4.2 ml). At the end of the three-
minute period for stabilisation there was still some small movement of the
mercury drop. At that time the membrane evacuated 12.6 ml.
Appendix 8
228
Slow injection
When injecting 20 ml of air at 3 ml / minute the Microsafe entrapped air in
both heat exchanger module and membrane module (12.2 ± 1.9 ml). As more
air entered the oxygenator module it was captured in the same plane as the
arterial outlet connector of the oxygenator after which it travelled along the
fibres towards the arterial outlet connector (Photograph 1). This resulted in 2.7
± 0.1 ml of entrapped air in the bubble trap. The membrane evacuated 5.1 ±
1.7 ml.
In the Lilliput air was observed in the membrane compartment where the
membrane easily removed it. Even after the 10 minutes of stabilisation there
was still some evacuation by the membrane as detected by the dilato meter.
The oxygenator entrapped 2.9 ± 0.1 ml of air, no air was found in the bubble
trap and the membrane removed 17.1 ± 0.1 ml.
Pressure measurements
The pressure drop over the oxygenator during the experiment was 30.1 ± 1.4
mmHg for the Microsafe and 53.1 ± 1.5 mmHg for the Lilliput.
During the bolus injection of 5 and 20 ml there was a sudden transient
increase in pre membrane pressure with the Lilliput for a few seconds after
which it returned to normal.
Appendix 8
229
Discussion
Arterial screen filtration has become a standard procedure in the USA for
paediatric and adult perfusion. The rationale is reducing the risk for gaseous
and/or solid microemboli. However the fear for these adverse effects was
mainly based on the large experience with bubble oxygenators 2-4. Membrane
oxygenators in opposition do have a complete different working principle. The
packed fibres in the gas exchange compartment do not only provide a control
of the blood path but will also work as an effective depth filter for solid
particles. This was confirmed by recent research in a pig model showing no
difference in embolisation of vital organs after three hours of extra-corporeal
circulation using an extra-luminal hollow fibre oxygenator with or without
arterial screen filter 12. Several papers have described a much lower or even
non-existent generation of GME with the introduction of membrane
oxygenators 13,14. However there is a lot of contradiction amongst authors
about the GME generation of a given device 6,13. This inconsistency finds
probably its origin in the non-quantitative nature of the data generated by
bubble counters and in the severe limitations to count accurately GME by
ultrasonic techniques 10,14. Indeed problems can occur from the angle and
coupling of the ultrasonic transducer, the frequency and pulse length of the
device, the electrical circuitry employed, bubble diameter and shape, tubing
diameter and curvature, amount of air and speed at which air is introduced,
red cell interference, and the rate of blood flow 5, 11,. Finally the bubbles
themselves may produce the most serious problems. Signal differences can
Appendix 8
230
result from multiple bubbles clumping, bubbles of different sizes blocking
others, the beam missing multiple bubbles etc.
It was the assumption of the authors that theoretically a membrane
oxygenator must be able to evacuate air because of its combination of a
microporous membrane with a depth filter. The results in this study show
clearly that this hypothesis is correct but highly dependent on the oxygenator
design. Both oxygenators had more or less the same bubble trap efficiency
when confronted with an air challenge. However the Microsafe obtained this
effect mainly by capturing the air in the heat exchanger compartment. Since
the heat exchanger is not permeable for gas the risk for a sudden release of
this air by movement of the oxygenator (taking samples, repositioning) or by
changes in temperature is still existing over time. In the Lilliput is almost
immediately contact between the air and the gas exchange membrane as a
result of this a large portion of the air is evacuated. This difference is most
obvious during the slow injection of air where the Lilliput due to the fact that it
is confronted with smaller quantities of air over time is capable to remove
almost 90% of the air via the membrane after 10 minutes. The Microsafe will
in the same circumstance still release emboli versus the patient.
Repositioning of the arterial outlet connector in another plane could probably
reduce this. Nevertheless this design always will keep an amount of gas
accumulated in the heat exchanger module. Also the construction of the
membrane mat and the existence of high velocities within the body of the
oxygenator seems to be an important aspect. In the Microsafe air is actually
pushed by the high velocity generated in the connection tube between the two
cylinders in the plane of the arterial outlet connector, where it is guided by the
Appendix 8
231
fibres towards the arterial outlet. Interesting was also the influence of the
pressure drop. Theoretically a higher-pressure drop should be beneficial in
the removal of air, especially when there is a good contact with the membrane
material. The Lilliput with the higher-pressure drop and the largest immediate
contact with the membrane is the most effective. As a consequence of this
one should not only open the purge line on an oxygenator when air has
entered the unit but also at the same time raise the pressure downstream the
oxygenator.
Removal of air in a neonatal oxygenator seems to be positively influenced by
following aspects: rapid and large contact with the gas exchange membrane,
contact time between the fibres and the gas, avoidance of zones with high
velocity within the oxygenator module, pressure drop (higher seems
favourable) and the construction of the fibre mat. The dilato meter also
showed an important consideration however that the evacuation of air through
the membrane is the most effective in the beginning and will decrease over
time. This is explained by the reduction of the contact area of the bubble
against the fibre over time.
The results of this study show an important influence of oxygenator design on
the air removal capability of a neonatal oxygenator. Although others have tried
to speculate what was happening to gas once it had entered the oxygenator
they had no means to measure or quantify it7. The technique described in this
paper gives the possibility to actually measure and quantify the capability of a
given device to trap, release or evacuate air. Because of the existing lack in
data we believe this test protocol should become a standard procedure in
combination with pulsed Doppler bubble counting for the evaluation and study
Appendix 8
232
of the air removal and air trap capabilities of membrane oxygenators or
artificial lungs.
Acknowledgements
This study was supported by a specialisation grant from the Flemish Institute
for the promotion of the Scientific-Technological Research in Industry (no.
961181).
Appendix 8
233
References
1. F. De Somer, L. Foubert, J. Poelaert, D. Dujardin, G. Van Nooten, K.
François. Low extracorporeal priming volumes for infants: a benefit?
Perfusion 1996, 11: 455 - 460
2. DT Pearson, MP Holden, SJ Poslad, A Murray, PS Waterhouse. A clinical
evaluation of the performance characteristics of one membrane and five
bubble oxygenators: gas transfer and gaseous microemboli production.
Perfusion 1986; 1: 15 - 26
3. PLC Smith Interventions to reduce cerebral injury during cardiac surgery –
introduction and the effect of oxygenator type. Perfusion 1989; 4: 139 -
145
4. M Sellman, T Ivert, P Stensved, M Högberg, BKH Semb. Doppler
ultrasound estimation of microbubbles in the arterial line during
extracorporeal circulation. Perfusion 1990; 5: 23 - 32
5. M J Miller, R R Johnson. Comparative Analysis of Air Handling in
Membrane Oxygenators. Cobe Cardiovascular, 1996.
6. AP Mehra, A Atkins, A Maisuria, BE Glenville. Air handling characteristics
of five membrane oxygenators. Perfusion 1994; 9: 357 - 362
7. PD Beckley, PD Shinko, JP Sites. A comparison of gaseous emboli
release in five membrane oxygenators. Perfusion 1997; 12: 133 - 141
8. B D Butler, M Kurusz. Gaseous microemboli: a review. Perfusion 1990, 5:
81 – 89
9. W Pugsley The use of Doppler ultrasound in the assesment of
microemboli during cardiac surgery. Perfusion 1989; 4: 115 - 122

Appendix 8
234
10. G Wright, A Furness, S Haigh. Integral pulse frequency modulated
ultrasound for the detection and quantification of gas microbubbles in
flowing blood. Perfusion 1987; 2: 131 - 138
11. M Kurusz, B D Butler. Embolic Events and Cardiopulmonary Bypass. In: G
P Gravlee, R F Davis, J R Utley eds. Cardiopulmonary Bypass Principles
and Practice, Baltimore: Williams & Wilkins, 1993: 267 – 290.
12. M K Dewanjee, S M Wu, M Kapadvanjwala et al. Emboli From an
Extraluminal Blood Flow Hollow Fiber Oxygenator With and Without an
arterial Filter During Cardiopulmonary Bypass in a Pig Model. ASAIO
Journal 1996, 42: 1010 – 1018
13. T Gourlay, J Fleming, K M Taylor, M Aslam Evaluation of a range of
extracorporeal membrane oxygenators. Perfusion 1990; 5: 117 – 133
14. B D Butler Biophysical aspects of gas bubbles in blood. Biomedical
Instrumentation 1985, 19: 59 -62
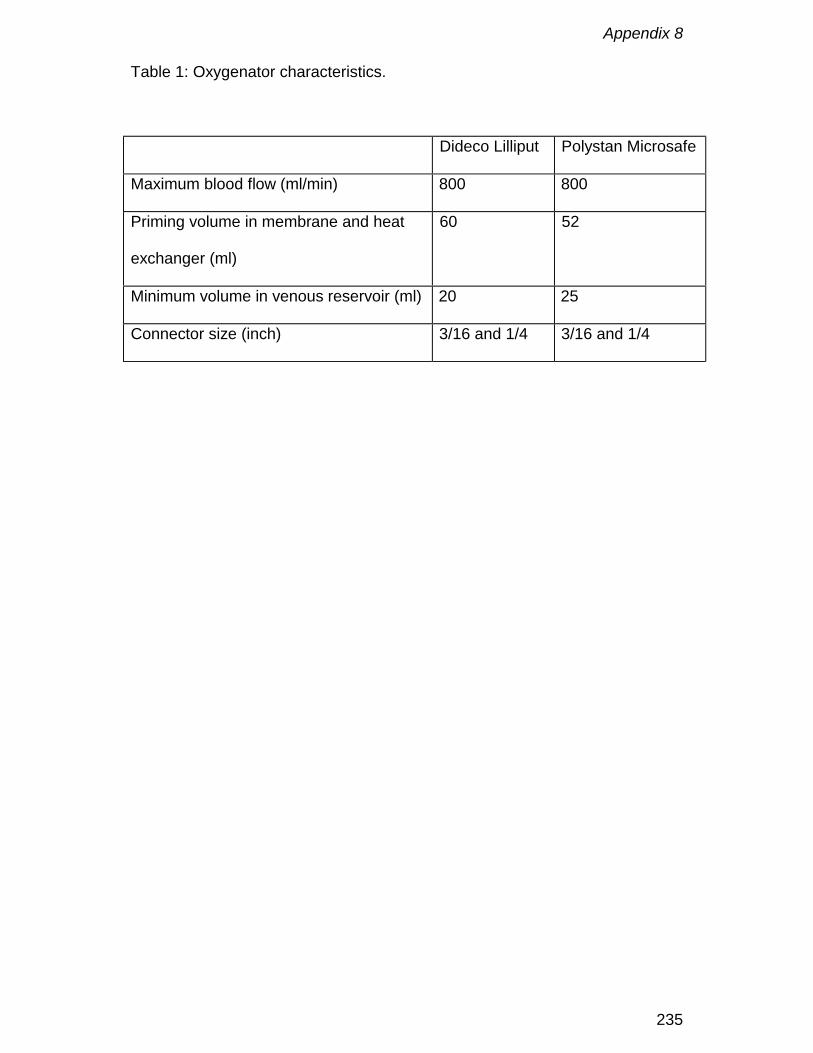
Appendix 8
235
Table 1: Oxygenator characteristics.
Dideco Lilliput Polystan Microsafe
Maximum blood flow (ml/min) 800 800
Priming volume in membrane and heat
exchanger (ml)
60 52
Minimum volume in venous reservoir (ml) 20 25
Connector size (inch) 3/16 and 1/4 3/16 and 1/4
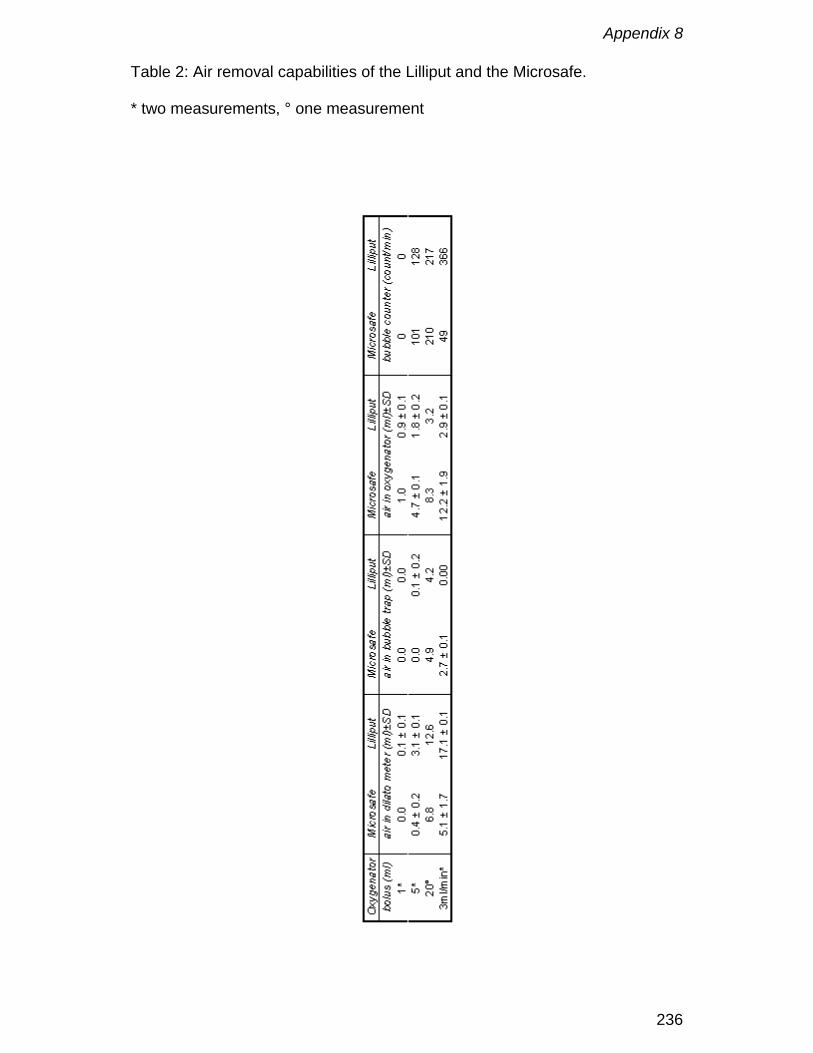
Appendix 8
236
Table 2: Air removal capabilities of the Lilliput and the Microsafe.
* two measurements, ° one measurement

Appendix 8
237
Figure 1: Test circuit.
(a) calibrated roller pump, (b) Cobe Excel, (c) port for air injection, (d) testdevice, (e) standpipe, (f) reservoir, (1) and (2) pressure measurements, (3)Doppler probe, (4) dilatometer, (5) syringe
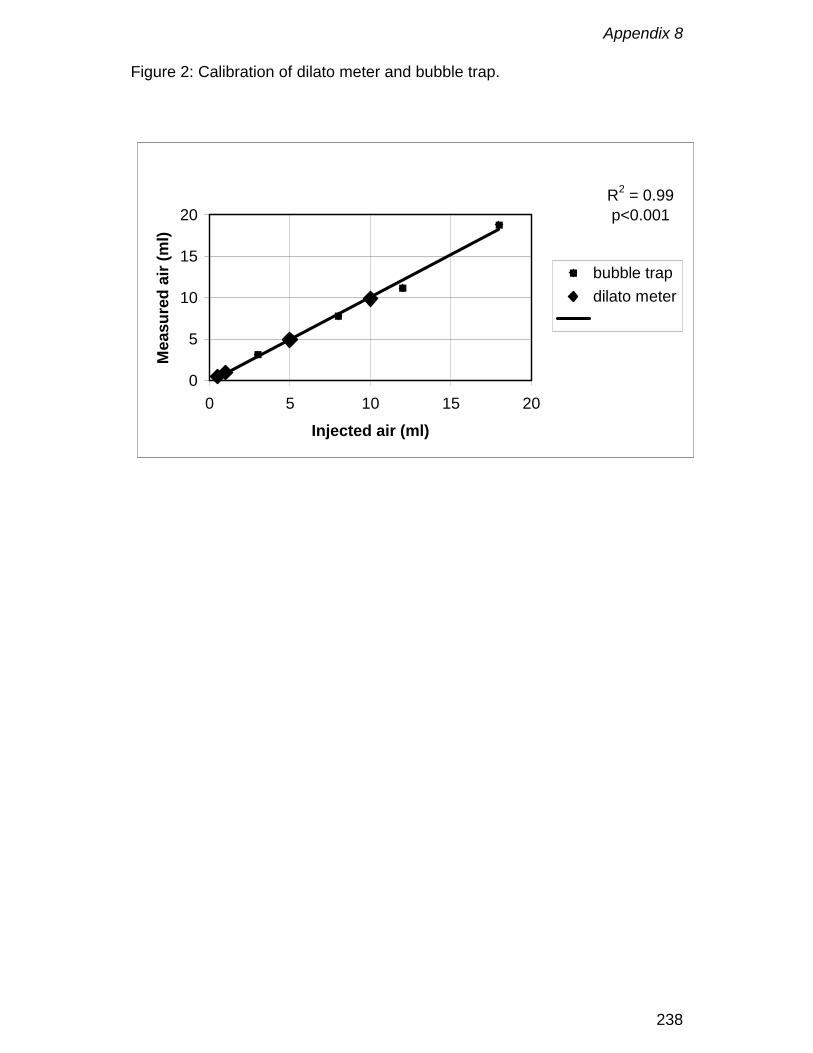
Appendix 8
238
Figure 2: Calibration of dilato meter and bubble trap.
R2 = 0.99p<0.001
0
5
10
15
20
0 5 10 15 20
Injected air (ml)
Mea
sure
d ai
r (m
l)
bubble trapdilato meter
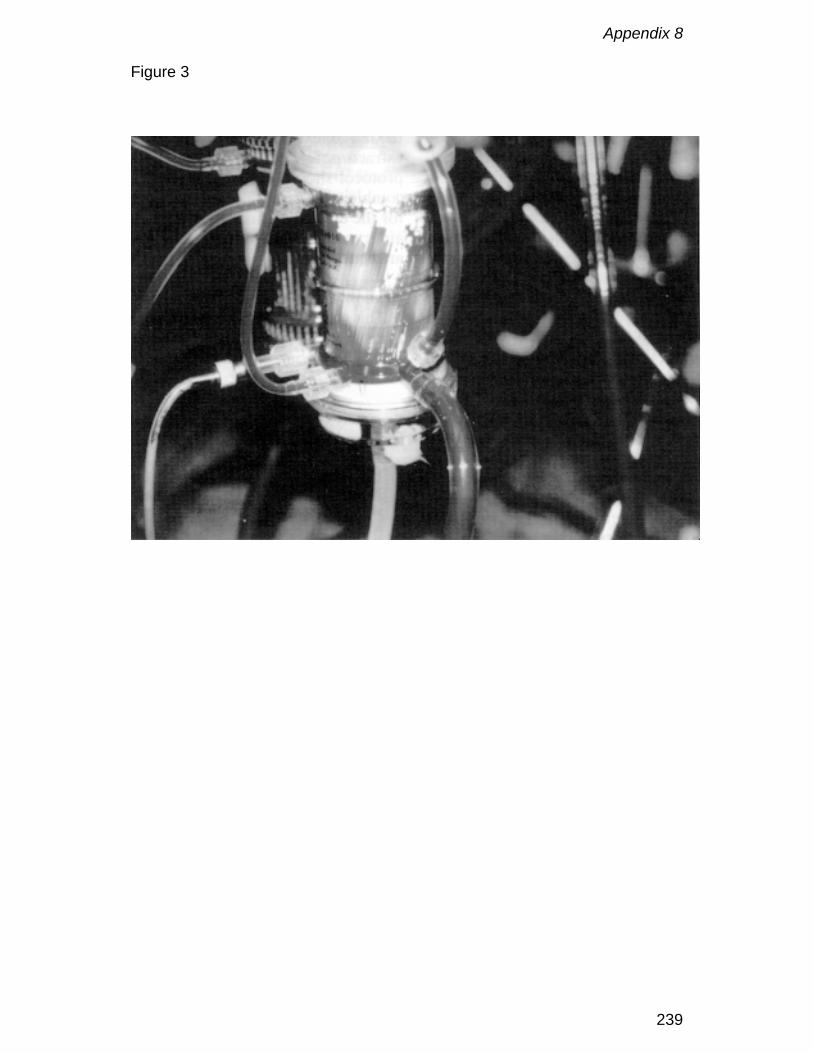
Appendix 8
239
Figure 3

Appendix 8
240
Appendix 9
241
In vivo evaluation of a phosphorylcholine coatedcardiopulmonary bypass
F. De Somer, Y. Van Belleghem, L. Foubert, K. François, F. Dubrulle,
D. De Wolf and G. Van Nooten
Journal of Extra-corporeal technology, 1999; 31 (2): 62-67
Appendix 9
242
Abstract
A complete phosphorylcholine coated cardiopulmonary bypass circuit,
including the Dideco D901 oxygenator, was tested for gas transfer, blood path
resistance and biocompatibility in a standardized setting. Blood compatibility
was tested by measuring complement and platelet activation.
Three dogs (mean body weight : 28 ± 3 kg) were placed on cardiopulmonary
bypass at a flow rate of 600 mL/min during six hours. The animals were
weaned from cardiopulmonary bypass and sacrificed electively after seven
days.
Oxygen and carbon dioxide transfer were 26.6 ± 2.4 mL/min and 33.0 ± 1.9
mL/min, respectively. Mean pressure drop across the oxygenator was 52.6 ±
0.2 mmHg. The respective baseline values for thromboxane B2, prostaglandin
E2 and platelet factor 4 were 1817 ± 283 pg/mL, 12783 ± 2109 pg/mL, 0.35 ±
0.08 IU/mL. Thromboxane B2 and prostaglandin E2 increased slightly to 2881
± 868 pg/mL and 18083 ± 3144 pg/mL at 30 minutes of bypass, whereas
platelet factor 4 values remained stable during the procedure. Concentrations
of tumor necrosis factor α and complement split products C5a were only
mildly increased.
After use scanning electron microscopy was performed on the inner housing,
heat exchanger and outer surface of the hollow fibres. No thrombi nor
organised cellular deposits were found on any of the components.
Phosphorylcholine coating of CPB seems to be very promising regarding
platelet activation and complement activation.

Appendix 9
243
Introduction
Materials used in a cardiopulmonary bypass (CPB) circuit are not originally
developed for this application. In general these materials activate the
coagulation, complement and fibrinolysis cascades. Together with turbulent
flow patterns, zones of blood stasis and the aspiration of shed blood this
contributes to the bio-in-compatibility of CPB. In order to reduce this bio-in-
compatibility several approaches have been proposed : reduction of foreign
surface area, more even distribution of blood flow, avoiding stasis and blood-
air interfaces, use of anticoagulant and antifibrinolytic drugs and surface
modification of the different materials. An alternative approach is the
development of bio-membrane-mimetic surfaces. Such surfaces are designed
to mimic the outer surface of blood cells [1, 2]. This outer surface is
predominantly composed of phosphorylcholine groups, which contribute
largely to the non-thrombogenic properties of blood cells. Recent research
shows that polymers containing phosphorylcholine reduce protein adsorption
and complement activation markedly [3].
This study investigates the impact of a complete phosphorylcholine coated
CPB circuit on the oxygen transfer, blood elements, coagulation and
complement activation.
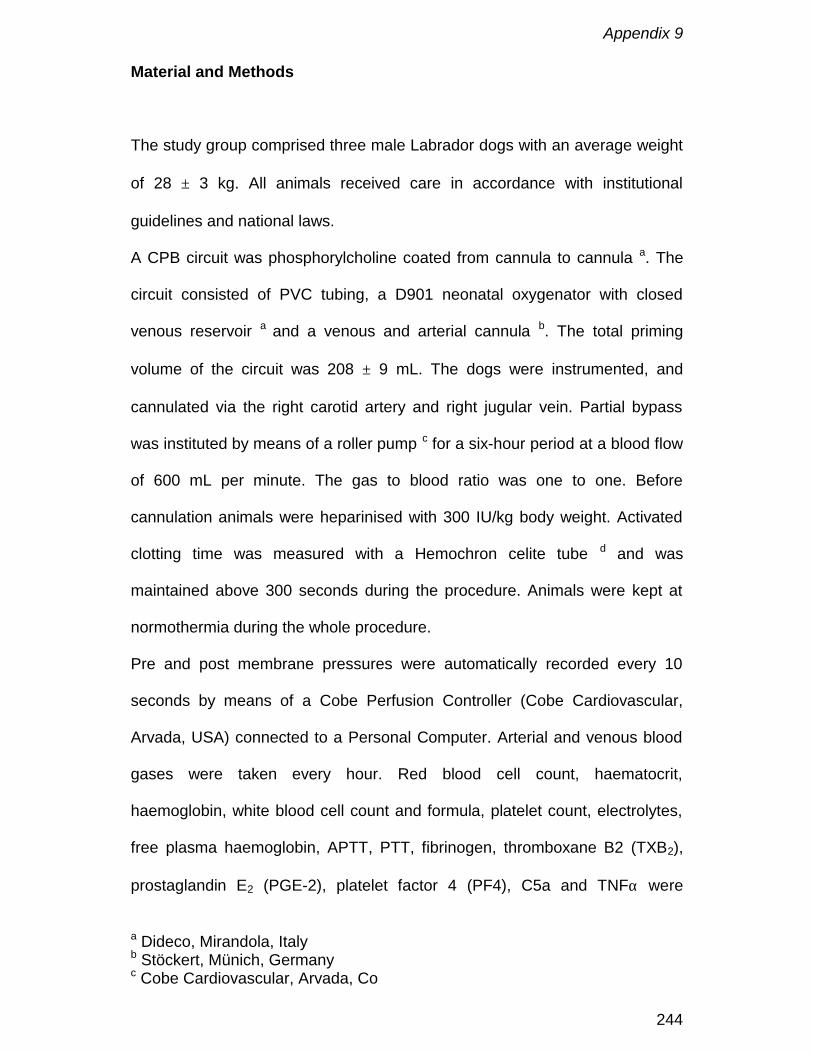
Appendix 9
244
Material and Methods
The study group comprised three male Labrador dogs with an average weight
of 28 ± 3 kg. All animals received care in accordance with institutional
guidelines and national laws.
A CPB circuit was phosphorylcholine coated from cannula to cannula a. The
circuit consisted of PVC tubing, a D901 neonatal oxygenator with closed
venous reservoir a and a venous and arterial cannula b. The total priming
volume of the circuit was 208 ± 9 mL. The dogs were instrumented, and
cannulated via the right carotid artery and right jugular vein. Partial bypass
was instituted by means of a roller pump c for a six-hour period at a blood flow
of 600 mL per minute. The gas to blood ratio was one to one. Before
cannulation animals were heparinised with 300 IU/kg body weight. Activated
clotting time was measured with a Hemochron celite tube d and was
maintained above 300 seconds during the procedure. Animals were kept at
normothermia during the whole procedure.
Pre and post membrane pressures were automatically recorded every 10
seconds by means of a Cobe Perfusion Controller (Cobe Cardiovascular,
Arvada, USA) connected to a Personal Computer. Arterial and venous blood
gases were taken every hour. Red blood cell count, haematocrit,
haemoglobin, white blood cell count and formula, platelet count, electrolytes,
free plasma haemoglobin, APTT, PTT, fibrinogen, thromboxane B2 (TXB2),
prostaglandin E2 (PGE-2), platelet factor 4 (PF4), C5a and TNFα were
a Dideco, Mirandola, Italyb Stöckert, Münich, Germanyc Cobe Cardiovascular, Arvada, Co

Appendix 9
245
analysed before instituting CPB and at 30, 60, 120, 240 and 360 minutes of
CPB. All values were corrected for haemodilution using following formula:
Corrected value = measured value * (start haematocrit/actual haematocrit).
Haemolysis rate (HR) was calculated using following formula:
HR=free plasma haemoglobin (mg/mL)/ haematocrit
Data are expressed as mean value ± standard error of the mean.
At the end of the experiment, the extracorporeal circuit was checked for
visible clots and fibrinogen deposits. Electron microscopy was performed on
the oxygenator inner housing, heat exchanger, fibres and knots of the weft
yarn.
One week after the experiment the animals were sacrificed and autopsy of the
lungs, kidneys and heart was performed.
Analysis techniques
Radioimmunoassay was used for the determination of TXB2 e, PGE-2 f and
C5a e. Platelet factor 4 g and TNFα e were analysed using enzyme-linked
immuno-sorbent assay (ELISA).
Data analysis
All data are presented as mean ± standard error of the mean. Statistical
analysis was done by using the Friedman test corrected for multiple
comparisons. Results were significant when p < 0.05.
d International Technidyne Corporation, Edison, NJe Amersham International, UKf Perseptive Biosystems, USAg Boehringer, Germany

Appendix 9
246
Results
Mass transfer
Mean oxygen transfer was 26.6 ± 2.4 mL/min (Figure 1). Mean carbon dioxide
removal was 33.0 ± 1.9 mL/min.
Inlet and outlet oxygenator pressures
Mean inlet and outlet pressure before and after the oxygenator was 160.9 ±
0.3 mmHg and 108.4 ± 0.2 mmHg, respectively. Mean pressure drop across
the D901 was 52.6 ± 0.2 mmHg.
Haematology and haemolysis (Table 1)
Platelet count started at a mean value of 159 ± 55 /mm³ pre CPB and
decreased to a mean value of 123 ± 34 at 30 minutes of CPB, after which it
normalized to a mean value of 150 ± 22 /mm³ at the end of the experiment (p
= NS).
White blood cell count started at 6700 ± 300 /mm³, decreased to 5300 ±
200/mm³ at 30 minutes and then steadily increased to 12200 ± 1100 /mm³ at
the end of CPB (p = 0.01). Differentiation of the white blood cell count showed
no major changes with exception of the eosinophils, which decreased from a
baseline average value of 6.3 % to 0.3 % at the end of the experiment.
Free plasma haemoglobin levels started at a mean value of 63 ± 15 mg/100
mL pre CPB and stabilized at a mean value of 43 ± 11 mg/100 mL at the end
of CPB (p = NS). Haemolysis rate started at a mean value of 0.26 ± 0.04
Appendix 9
247
mg/mL cells and decreased over time to an average value of 0.10 ± 0.01
mg/mL cells.
Inflammatory response (Figure 2)
C5a levels raised from 14 ± 2.1 IU/mL to 25.9 ± 9.5 IU/mL (p = NS) at 30
minutes of CPB after which they returned to baseline values. TNFα started
from a baseline value of 2.8 ± 0.1 pg/mL, then increased to 3.6 ± 1.5 pg/mL (p
= NS) at 30 minutes, and finally decreased to 2.8 ± 0.9 pg/mL at 360 minutes.
Platelet activation (Figure 3)
Thromboxane B2 and PGE-2 levels increased from a starting value of 1817 ±
283 pg/mL and 12783 ± 2109 pg/mL respectively, to 2881 ± 868 pg/mL (p =
NS) and 18083 ± 3144 pg/mL (p = NS) at 30 minutes, after which the levels
returned to 1595 ± 353 pg/mL and 9897 ± 3175 pg/mL at the end of CPB.
Platelet factor 4 and LDH values remained stable during the experiment.
Autopsy
Autopsy of heart, lungs and kidneys did not reveal any pathologic lesions in
the dogs.
Scanning electron microscopy
Examination of the polycarbonate housing (Figure 4), the stainless steel heat
exchanger (Figure 5), polypropylene fibres (Figure 6) and knots of the weft
yarn (Figure 7) showed almost no deposition of proteins and platelets.
Appendix 9
248
Discussion
Although phosphorylcholine coatings have already been applied with good
results on chest tubes and coronary stents they have never been used in a
complete CPB circuit [4, 5].
Coating of micorporous hollow fibres can cover the micropores with a small
layer of coating what can result in a higher resistance to diffusion. The
application of a small layer of phosphorylcholine on the gas exchange fibres
does not influence the oxygen transfer of the oxygenator (Figure 1). Scanning
electron microscopy photographs of the hollow fibre showing open pores
support this finding (Figure 6). The obtained oxygen transfer data are not only
comparable with the ones provided by the manufacturer but also show a high
reproducibility amongst the different oxygenators.
Whole body inflammatory response to CPB is highly complex, and
complement appears to be just one component. The alternative complement
pathway is activated during CPB and results in the activation of C5 to C5a
and C5b. C5a activates neutrophils and C5b initiates the formation of the
membrane attack complex, which is capable of producing cell lysis and death
[6]. Whereas complement levels up to four times the baseline are observed
during CPB [7, 8], during our experiment only a relatively small increase in
C5a level of 46% is noted at 30 minutes of bypass. During CPB, leukocyte
count first decreases, in response to haemodilution, after which it increases
moderately during the procedure. At the same time monocytes and
neutrophils are activated, while lymphocytes count decreases resulting in a
higher susceptibility to infection postoperatively [6]. Our results show a
Appendix 9
249
comparative evolution in white blood cell count, but no major changes in white
blood cell differentiation with exception of the eosinophil count. Although no
real markers for neutrophil activation, such as Mac-1, were measured, one
could speculate on less activation of neutrophils due to the lower generation
of C5a. This is in line with previous research [9]
In uncoated circuits platelet activation is expressed by an increase of both
thromboxane B2 and PGE-2 up to 4 times the baseline [7, 10]. In our study
only a mild activation of platelets is observed at 30 minutes of bypass, but the
overall activation by the surface is much lower as shown by the constant
values of thromboxane B2, platelet factor 4, PGE-2 and LDH. This suggests
that a phosphorylcholine coated CPB has excellent non-thrombogenic
characteristics.
Free plasma haemoglobin levels and haemolysis rates show values
comparable with those reported for uncoated circuits [7].
When heparinised blood comes into contact with nonendothelial surfaces,
plasma proteins are instantaneously adsorbed onto the surface. All these
nonendothelial surfaces produce a thrombotic stimulus, but the stimulus
seems to vary between surfaces. Heparin-bound surfaces seem to be more
thromboresistant. This study, in agreement with the literature, shows that
phosphorylcholine coated surfaces are at least equal in thromboresistance as
is shown by the SEM analysis of housing, fibres, heat exchanger and weft
yarn. However, in contrast to heparin bound surfaces, which loose their
antithrombotic properties after exposure to protamine, phosphorylcholine
coating can be expected to resist to contamination of the circulating blood with
protamine [11].

Appendix 9
250
Phosphorylcholine coating of CPB seems to be very promising regarding
platelet activation and complement activation, which makes it a full alternative
for heparin bound surfaces. However, these promising results should be
confirmed by expanding the series. Clinical studies should clarify if these
results can be reproduced during cardiac surgery with a certain degree of
organ ischaemia and reperfusion, which are both known to activate
complement and platelets.
Appendix 9
251
References
1. Yianni YP: Biocompatible surfaces based upon biomembrane mimicry. In
Quinn PJ, Cherry RI (eds.). Structural and Dynamic Properties of Lipids
and Membranes. Portland. Press Research Monograph. 1992, pp 187-216
2. Campbell EJ, O’Byrne V, Stratford PW, Quirk J, Vick TA, Wiles MC, Yianni
YP. Biocompatible surfaces using methacryloylphosphorylcholine
laurylmethacrylate copolymer. ASAIO 1994; 40: 853-857.
3. Yu J., Lamba NMK, Courtney JM et al. Polymeric biomaterials: influence of
phosphorylcholine polar groups on protein adsorption and complement
activation. Int. J. Artif. Organs 1994; 17: 499-504.
4. Hunter S, Angelini GD: Phosphorylcholine coated chest tubes improve
drainage after open heart surgery. Ann. Thorac. Surg. 56: 1139-1342,
1993.
5. Nordrehaug JE, Chronos NAF, Sigwart U: A biocompatible coating applied
to metallic stents (abstract). J.Am.Coll.Cardiol. 5A 1994
6. Edmunds LH Jr. Cardiopulmonary bypass and blood. In Pifarré R. (ed.)
Blood conservation with aprotinin. Philadelphia. Hanley & Belfus Inc. 1995,
pp 45 – 67.
7. Hatori N, Yoshizu H, Haga Y, Kusama Y, Takeshima S, Segawa D,
Tanaka S. Biocompatibility of heparin-coated membrane oxygenator
during cardiopulmonary bypass. Artificial Organs 1994; 18: 904-910.
8. Ashraf S, Tian Y, Cowan D, Entress A, Martin PG, Watterson KG. Release
of proinflammatory cytokines during pediatric cardiopulmonary bypass:

Appendix 9
252
Heparin-bonded versus nonbonded oxygenators. Ann Thorac Surg 1997;
64:1790-4.
9. DeFife KM, Yun JK, Azeez A, Stack S, Ishihara K, Nakabayashi N, Colton
E, Anderson JM. Adhesion and cytokine production by monocytes on poly
(2-methacryloyloxyethyl phosphorylcholine-co-alkyl methacrylate)-coated
polymers. J Biomed Mater Res 1995; 29: 431-439.
10. Butterworth JF, Utley JR, Swain JA. Neuroendocrine and electrolyte
responses to cardiopulmonary bypass. In Gravlee GP, Davis RF, Utley JR
(eds). Cardiopulmonary Bypass. Principles and Practice. Baltimore.
Williams and Wilkins. 1993, pp 305-307.
11. von Segesser LK, Gyurech DD, Schilling JJ, Marquardt K, Turina MI. Can
protamine be used during perfusion with heparin surface coated
equipment? ASAIO J. 1993; 39: M190-4
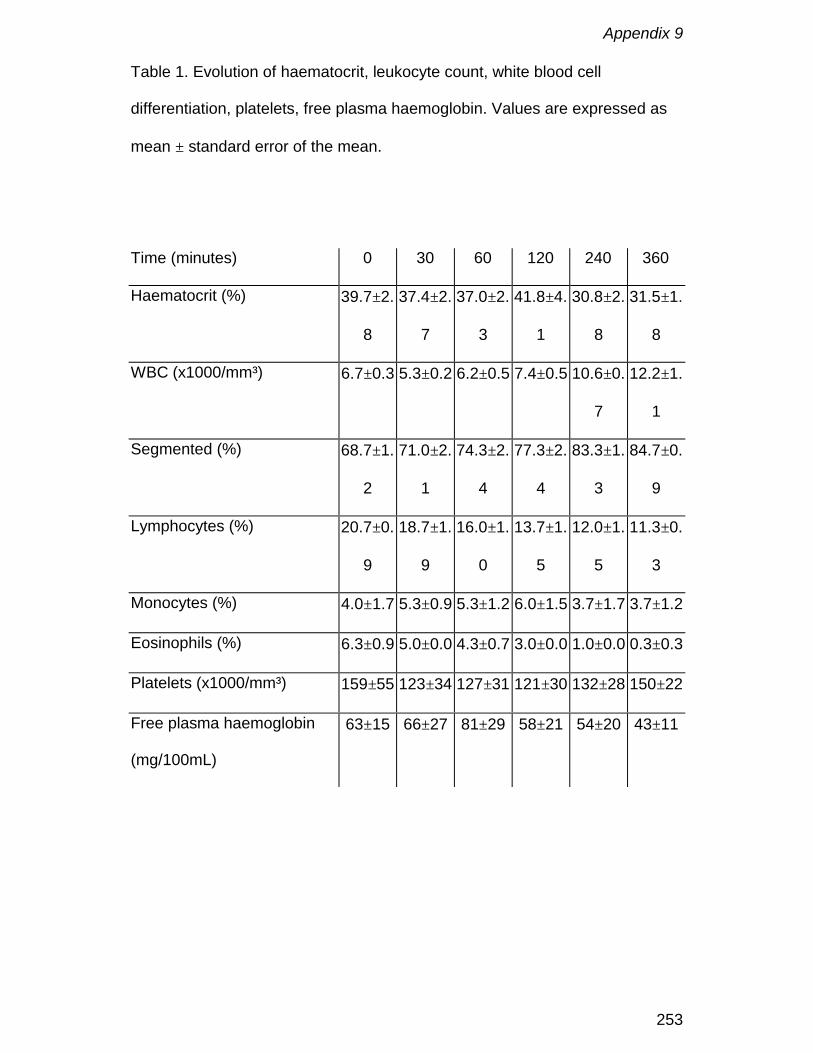
Appendix 9
253
Table 1. Evolution of haematocrit, leukocyte count, white blood cell
differentiation, platelets, free plasma haemoglobin. Values are expressed as
mean ± standard error of the mean.
Time (minutes) 0 30 60 120 240 360
Haematocrit (%) 39.7±2.
8
37.4±2.
7
37.0±2.
3
41.8±4.
1
30.8±2.
8
31.5±1.
8
WBC (x1000/mm³) 6.7±0.3 5.3±0.2 6.2±0.5 7.4±0.5 10.6±0.
7
12.2±1.
1
Segmented (%) 68.7±1.
2
71.0±2.
1
74.3±2.
4
77.3±2.
4
83.3±1.
3
84.7±0.
9
Lymphocytes (%) 20.7±0.
9
18.7±1.
9
16.0±1.
0
13.7±1.
5
12.0±1.
5
11.3±0.
3
Monocytes (%) 4.0±1.7 5.3±0.9 5.3±1.2 6.0±1.5 3.7±1.7 3.7±1.2
Eosinophils (%) 6.3±0.9 5.0±0.0 4.3±0.7 3.0±0.0 1.0±0.0 0.3±0.3
Platelets (x1000/mm³) 159±55 123±34 127±31 121±30 132±28 150±22
Free plasma haemoglobin
(mg/100mL)
63±15 66±27 81±29 58±21 54±20 43±11
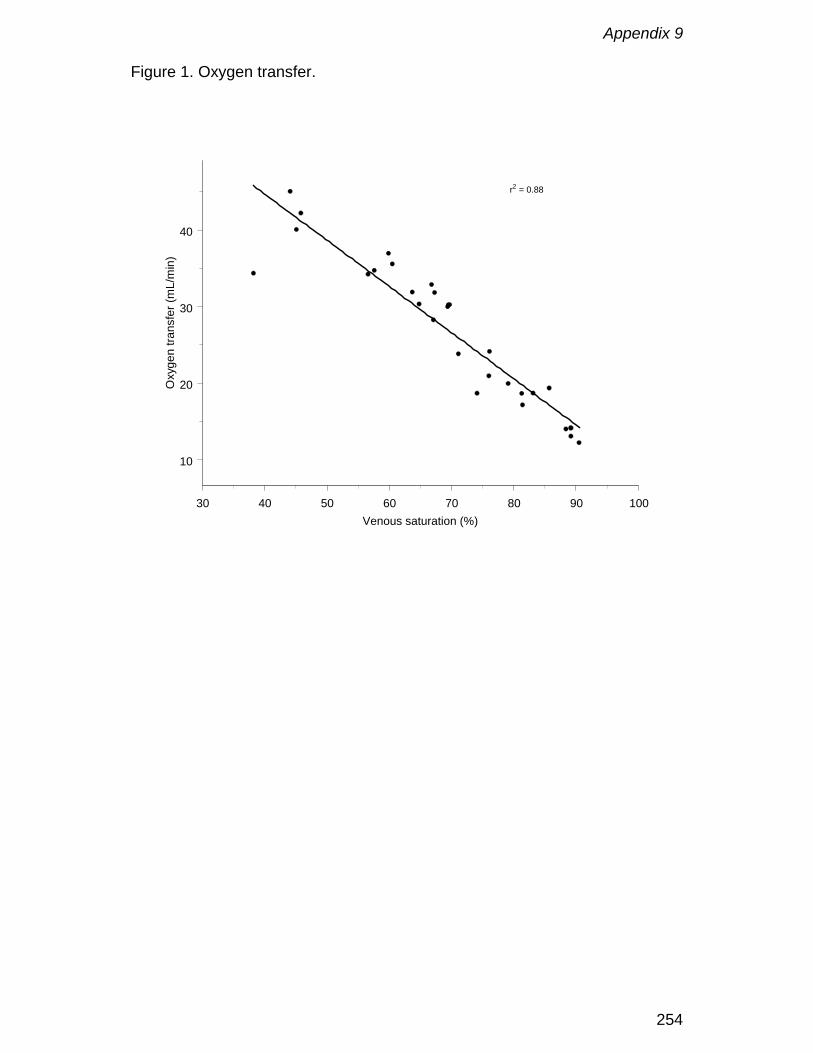
Appendix 9
254
Figure 1. Oxygen transfer.
30 40 50 60 70 80 90 100Venous saturation (%)
10
20
30
40
Oxy
gen
trans
fer (
mL/
min
)r2 = 0.88
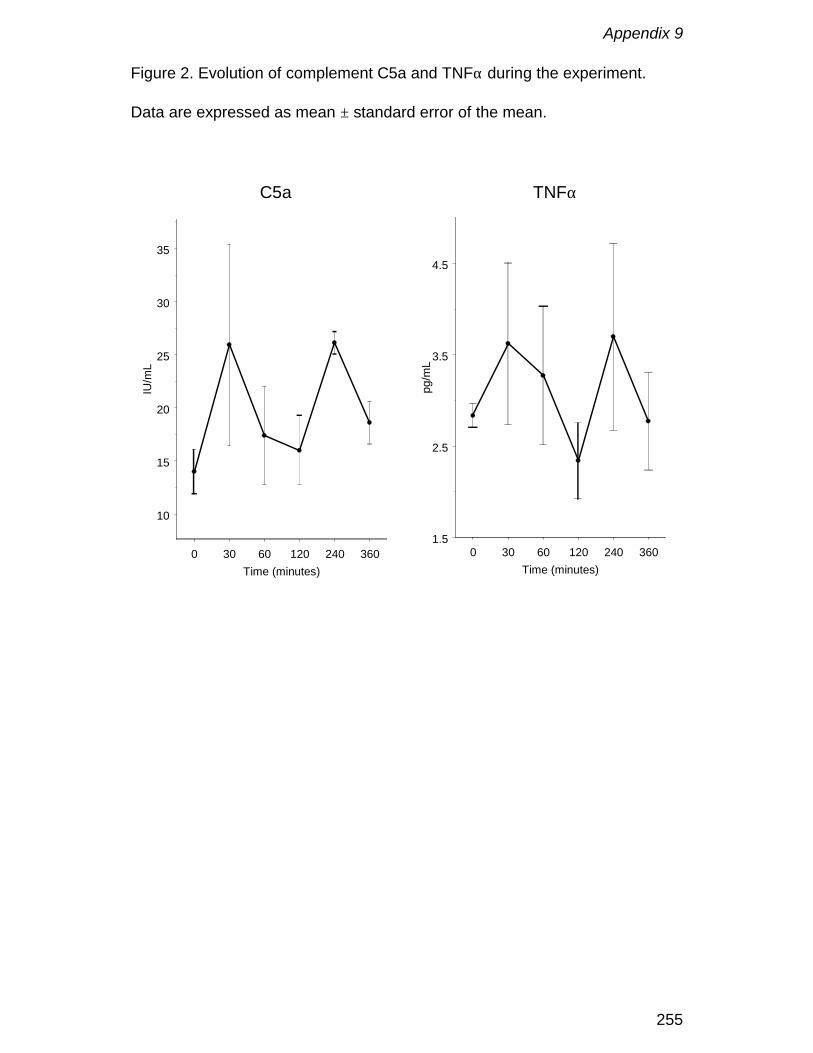
Appendix 9
255
Figure 2. Evolution of complement C5a and TNFα during the experiment.
Data are expressed as mean ± standard error of the mean.
0 30 60 120 240 360Time (minutes)
10
15
20
25
30
35
IU/m
L
C5a
0 30 60 120 240 360Time (minutes)
1.5
2.5
3.5
4.5
pg/m
L
TNFα
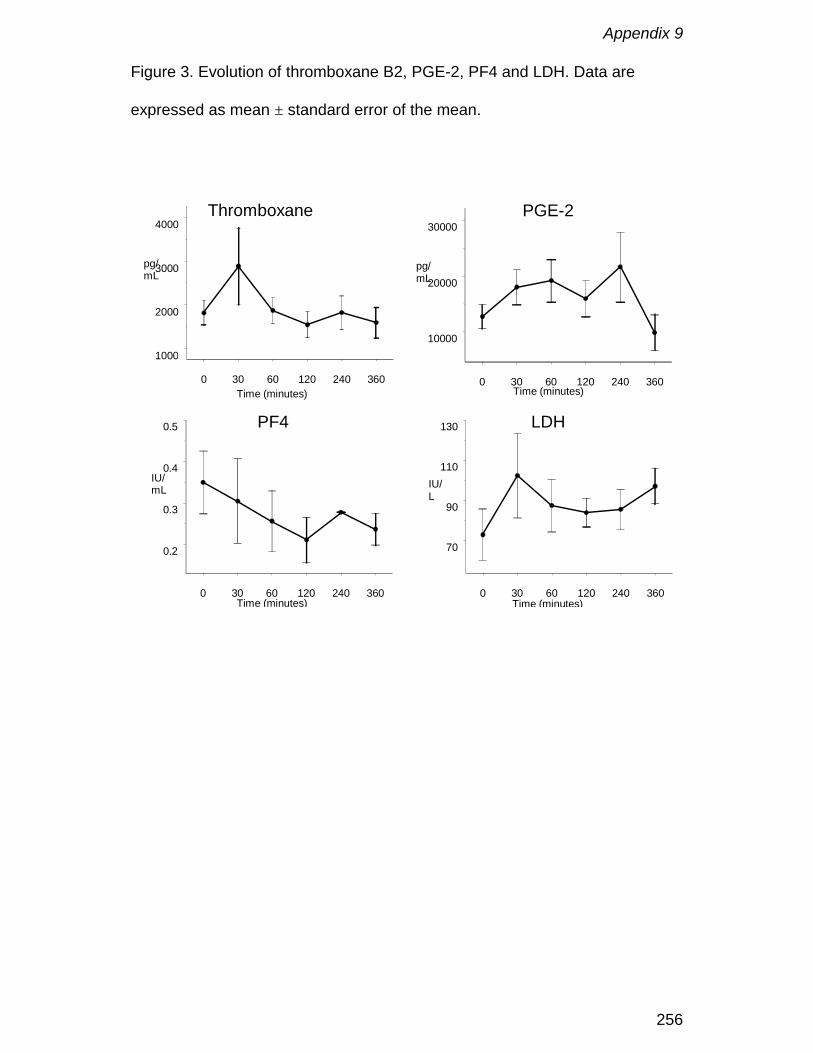
Appendix 9
256
Figure 3. Evolution of thromboxane B2, PGE-2, PF4 and LDH. Data are
expressed as mean ± standard error of the mean.
0 30 60 120 240 360Time (minutes)
1000
2000
3000
4000
pg/mL
ThromboxaneB2
0 30 60 120 240 360Time (minutes)
10000
20000
30000
pg/mL
PGE-2
0 30 60 120 240 360Time (minutes)
0.2
0.3
0.4
0.5
IU/mL
PF4
0 30 60 120 240 360Time (minutes)
70
90
110
130
IU/L
LDH
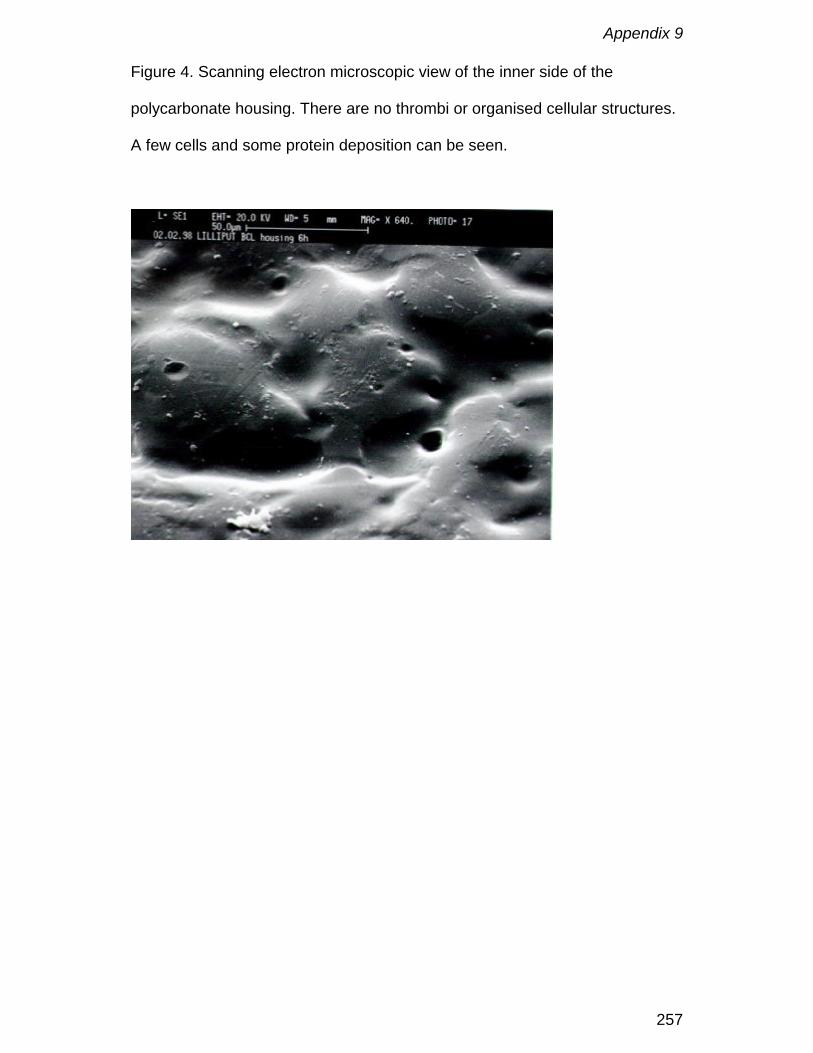
Appendix 9
257
Figure 4. Scanning electron microscopic view of the inner side of the
polycarbonate housing. There are no thrombi or organised cellular structures.
A few cells and some protein deposition can be seen.

Appendix 9
258
Figure 5. Scanning electron microscopic view of the stainless steel heat
exchanger. There is absence of thrombi and cellular structures.

Appendix 9
259
Figure 6. Scanning electron microscopic view of a polypropylene hollow fibre.
The open pores can be clearly seen. There is no evidence of thrombi or
cellular structures.
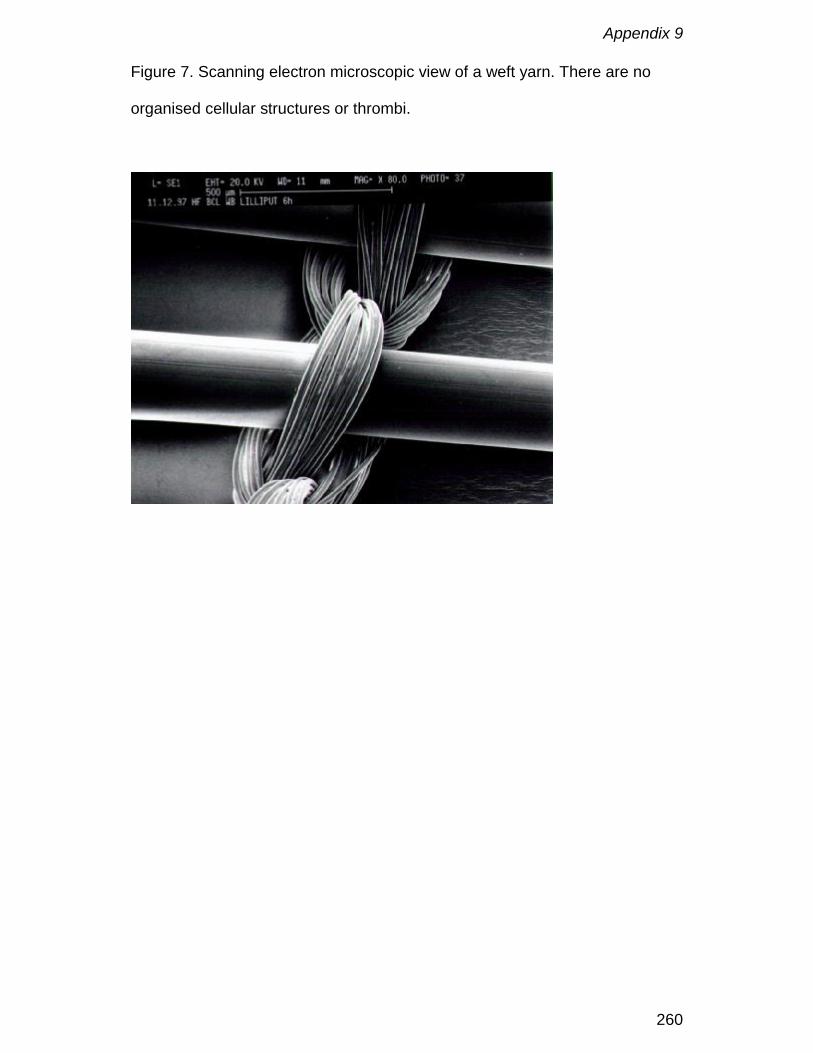
Appendix 9
260
Figure 7. Scanning electron microscopic view of a weft yarn. There are no
organised cellular structures or thrombi.
Appendix 10
261
Phosphorylcholine coating of extracorporeal circuits providesnatural protection against blood activation by the material
surface
F. De Somer, K. François, W. van Oeveren, J. Poelaert, D. De Wolf, T. Ebels,
G. Van Nooten
European Journal of Cardio-Thoracic Surgery, 2000; 18(5): 602-606
Appendix 10
262
Abstract
Objective: The aim of this study is to evaluate the use of a new coating,
mimicking the outer cell membrane, in paediatric cardiac surgery.
Methods: Two groups of ten patients with a body weight below 8 kg,
undergoing elective cardiac operations for different congenital anomalies,
were prospectively enrolled in this study. In one group the whole
extracorporeal circuit, including the cannulas, was coated with
phosphorylcholine (PC). In the second group the same circuit was used
without coating. Platelet activation (Thromboxane B2, β-Thromboglobulin),
activation of the coagulation system (F1+2), leukocyte activation
(CD11b/CD18) and complement activation (TCC) were analysed prae CPB, at
15, 60 minutes of CPB, at the end of CPB, 20 minutes post CPB and at
postoperative day 1 and 6.
Results: No statistical differences were found for F1+2 and CD11b/CD18.
After onset of CPB mean levels of TCC remained stable in the PC group
whereas an increase was observed in the control group. During CPB βTG
values in both groups increased to a maximum at the end of CPB. Within
groups the increase in βTG levels during CPB was statistically significant (p <
0.05) from baseline in the control group starting from 60 minutes of CPB
whereas no statistical difference was observed in the PC group. After the start
of CPB TXB2 mean levels increased to 405 ± 249 pg/mL in the PC group
versus 535 ± 224 pg/mL in the control group. After this initial increase there
was a small decline in the PC group with further increase. This was in contrast
Appendix 10
263
to the control group were TXB2 levels further increased up to a mean of 718 ±
333 pg/mL at the end of CPB (p = 0.016).
Conclusions: Phosphorylcholine coating had a favourable effect on blood
platelets, which is most obvious after studying the changes during
cardiopulmonary bypass. A steady increase of TXB2 and β thromboglobulin
was observed in the control group, whereas plateau formation was observed
in the phosphorylcholine group. Clinically, this effect may contribute to
reduced blood loss and less thromboembolic complications. Complement
activation is lower in the coated group.
Keywords: Phosphorylcholine coating; Paediatric surgery; Cardiopulmonary
bypass; Platelets; Complement.
Appendix 10
264
Introduction
Approximately 56000 paediatric cardiopulmonary bypass operations were
performed in Europe and the United States in 1996. The anticipated continued
growth of paediatric cardiac surgical practice due to improvement of
technology has shown a 10% increase in last years. Although small babies
are much more vulnerable to inflammatory response due to the larger volume
and foreign surface area of the extracorporeal circuit, the smaller neonatal
oxygenators became available only a few years ago. A further improvement of
the extracorporeal circuit is expected to be related to the surface
characteristics. Depending on the treatment of polymer materials, its surface
may be modified to reduce thrombogenic or inflammatory reactions. Heparin
coating, which is known to reduce the inflammatory reactions, was just
recently introduced for use in paediatric bypass [1]. An antithrombogenic
coating is not commonly used as yet, but may be achieved by application of
phosphorylcholine (PC). This coating will produce interfacial characteristics,
which largely mimic the main lipid headgroup component of the outer cell
membrane [2]. In contrast to the negatively charged phospholipids of the inner
membrane, these neutral phospholipids do not activate the clotting system
and are therefore non-thrombogenic, as would be expected for a major
component of the outer surface of an erythrocyte [2,3]. Till today only limited
experience with phosphorylcholine coatings is available [4,5]
Since coagulation in infants is more delicate than in adults, if not only by the
reduced availability of inhibitors, an antithrombogenic coating was anticipated
to be most profitable for paediatric cardiopulmonary bypass.

Appendix 10
265
The use of PC coated circuits as compared to uncoated extracorporeal
circuits in elective paediatric cardiac surgery was evaluated in this study, by
means of clinical and biochemical evaluation.
Appendix 10
266
Materials and Methods
Two groups of ten patients with a body weight below 8 kg, undergoing elective
cardiac operations for different congenital anomalies (Table 1). Patient
selection was consecutive from 9/6/1998 to 20/1/1999 including all patients. In
the PC group the whole extracorporeal circuit, including the cannulas, was
coated with phosphorylcholine (Dideco, Mirandola, Italy). In the control group
the same circuit was used without coating. Informed parental consent was
obtained for all patients, according to the regulations of the hospital medical
ethics committee.
Cardiopulmonary bypass (CPB) consisted of a D901 neonatal oxygenator with
integrated collapsible venous reservoir (Dideco, Mirandola, Italy), cardiotomy
reservoir (Dideco, Mirandola, Italy) and a custom tubing pack made of PVC.
Priming volume was 200 mL. Priming solution consisted of Plasmalyte-A
(Baxter, Lessines, Belgium), human albumin (Red Cross, Brussels, Belgium)
and packed red cells were added in order to obtain a 4% concentration of
human albumin in the priming solution and an intraoperative haematocrit of
30%. Five hundred IU of porcine heparin was added to the prime (Roche,
Brussels, Belgium). Before cannulation patients were heparinised with 300
IU/kg body weight. Activated clotting time was measured with a Medtronic
kaolin cartridge (Medtronic Hemotec, Parker, CO) and was maintained above
400 seconds during the procedure. Patients were systemically cooled to an
eosophageal temperature of 25°C and weaned of CPB when rectal
temperature was above 34°C. Blood flow rates were maintained to ensure
adequate tissue perfusion.

Appendix 10
267
Arterial and venous blood gases were taken at 15 minutes, 30 minutes and
subsequently every 30 minutes of CPB. Blood samples for determination of
complement activation (Terminal Complement Complex), platelet activation
(Thromboxane B2, β-Thromboglobulin), activation of the coagulation
(Fragment 1+2) and white blood cell activation (CD11b/CD18) were taken
after induction, at 15 and 60 minutes of CPB, at the end of CPB, post CPB
and at postoperative day 1 and 6.
Analysis methods
TCC (C5b-9) was determined by means of an Enzyme Linked
ImmunoSorbent Assay (ELISA) (Quidel, San Diego, CA).
Thromboxane represents activation of the arachidonic pathway in platelets,
and was determined by means of ELISA (Biotrak, Amersham, UK).
β-Thromboglobulin was obtained by an ELISA technique (Diagnostica Stago,
Boehringer Mannheim, BRD) and represents the release of α-granules from
platelets.
Fragment 1+2 is released after cleavage of prothrombin to thrombin.
Fragment 1+2 has no biological activity and remains in blood indicating
activation of the clotting system. Fragment 1+2 was determined by ELISA
(Dade Behring, Marburg, BRD).
Fifty µL of whole blood was incubated with 10µL CD18 antibody (clone 130,
Becton Dickinson, USA) conjugated with FITC and 10 µL CD11b antibody
(clone D12, Becton Dickinson, USA) conjugated with phycoerythrin. The cells
were incubated during 20 minutes at room temperature in the dark, then RBC
were lysed and WBC fixed with Uti-Lyse (Dako) and two color flow cytometric
analyses were performed on a FACSort (Becton Dickinson, USA) equipped

Appendix 10
268
with a single argon ion laser. A minimum of 10000 cells was analysed per
sample. Analyses were performed on a lymhogate with CellQuest software.
Statistics
All data are presented as mean ± standard deviation. Statistical analysis was
done using a Friedman test for the within variation, a Wilcoxon test for the
paired comparison and a Kruskal-Wallis test for the between comparison. The
individual p-values were corrected using following formula: αind=1-(1-αjoint)1/m.
Results were considered to be significant when p<0.05.
Appendix 10
269
Results
Terminal Complement Complex (TCC)
Baseline levels of TCC were different for both groups (145 ± 94 ng/mL (PC)
versus 64 ± 32 ng/mL (Control); p = 0.04) (Figure 1). After onset of CPB mean
levels stayed stable in the PC group (130 ± 146 ng/mL) whereas an increase
to 138 ± 110 ng/mL was observed in the control group (not significant). With
progress of CPB an increase in TCC was noticed in both groups. Within
groups the increase in TCC was statistical significant from baseline at end of
bypass (p = 0.012) and after protamine administration (p = 0.005) in the PC
group, while in the control group statistical difference was reached at 60
minutes (p = 0.018), end of CPB (p = 0.005) and after protamine
administration (p = 0.005). On postoperative day 1 levels in both groups were
at baseline again.
β-thromboglobulin (βTG)
Baseline levels of βTG were different in both groups, 427 ± 202 ng/mL in the
PC group versus 233 ± 158 ng/mL in the control group (p = 0.013). During
CPB values in both groups increased to a maximum at the end of CPB
(Figure 2). Within groups the increase in βTG levels during CPB was
statistically significant (p < 0.05) from baseline in the control group starting
from 60 minutes of CPB whereas no statistical difference was observed in the
PC group.
Thromboxane B2 (TXB2)
Baseline levels of TXB2 were similar in both groups. (PC, 117 ± 109 pg/mL
versus control 125 ± 163 pg/mL, not significant). After start of CPB TXB2
Appendix 10
270
mean levels increased to 405 ± 249 pg/mL in the PC group versus 535 ± 224
pg/mL in the control group. After this initial increase there was a small decline
in the PC group with further increase (Figure 2). This in contrast to the control
group were TXB2 levels further increased up to a mean of 718 ± 333 pg/mL at
the end of CPB (p = 0.016).
Fragment 1+2
Fragment 1+2 mean values were low in both groups and did not exceed 4
nmol/L. No statistical differences were observed between and within both
groups.
CD11b/CD18
CD11b/CD18 expression rose progressively in both groups and peaked at a
value of 4 to 5 times the baseline level at 60 minutes of CPB, being in most
cases, the first measurement after release of the aortic crossclamp.
Subsequently the expression declined towards normal values on
postoperative day 1.
Mass transfer
The mean oxygen transfer was 4.0 ± 1.3 mL O2/100 mL blood in the PC group
versus 4.4 ± 1.3 mL O2/100 mL blood (p = NS) in the control group. Mean
CO2 removal was 3.2 ± 1.5 mL C02/100 mL blood in the PC group and 3.1 ±
1.4 mL C02/100 mL blood in the control group (p = NS).
Appendix 10
271
Discussion
We studied the thrombogenic and inflammatory response after the use of
phosphorylcholine coating, by evaluating progression of βTG release and
thromboxane production, both related to platelet activation, and complement
activation. Also the interaction of the phosphorylcholine coating on the gas
transfer properties of the hollow fibre membranes was evaluated.
Although the literature shows an improved biocompatibility in adult surgery
when using coatings [6], the thrombogenic and inflammatory response is
usally mild in routine adult surgery which makes it difficult to demonstrate
differences in postoperative clinical response. Small babies are much more
vulnerable to the adverse effects of cardiopulmonary bypass due to the
relatively high priming volume and relative large blood foreign material surface
in contact with blood. Additionally several organ systems are still immature.
The characteristic feature of biological membranes is their functional and
compositional lipid asymmetry, which has been described in several cell types
and is thought to stem from the requirement of biological membranes to have
asymmetric protein distributions across the bilayer. In all of the cells for which
lipid compositional asymmetry has been described, negatively charged
phospholipids are found predominantly on the inner cytoplasmatic side of the
membrane, while the neutral zwitterionic PC-containing antithrombotic lipids
predominate in the outer membrane leaflet. Negatively charged phospholipids
are thrombogenic and it has been proposed that this membrane asymmetry
may serve the biological purpose in the maintenance of the delicate balance
between haemostasis and thrombosis. In vitro experiments, in which various

Appendix 10
272
phospholipid coatings were applied to surfaces, showed a very high
procoagulant activity of negatively charged phospholipids was shown. This is
in contrast to the PC-containing surfaces that were not active in coagulation
tests [2,3]. We did not observe an inhibition of activation of the clotting
system, which may indicate a merely passive effect of the PC coating towards
the clotting system. Additionally, F1+2, a cleavage product of prothrombin
during thrombin generation, was very low in our study, indicating proper
anticoagulation during CPB and proper sample collection throughout. Since
F1+2 concentrations of 4 nmol/L are even not noteworthy in a clinical sense, a
comparison between the systems cannot be made under the present
conditions. However both markers of platelet activation showed that the PC
coated circuits were activating mildly and for a short period of time, whereas
the uncoated circuits continued to activate platelets. A difficulty is that the
platelet release product β thromboglobulin is sensitive to release during blood
sampling and processing, especially in non-coagulated blood. Typical for this
parameter is a large individual difference. This may have caused an increase
of the “baseline” β-thromboglobulin concentrations, which was determined in
samples collected after thoracotomy.
Concentrations of TXB2 in uncoated systems followed the pattern of previous
observations with a gradual increase towards end of CPB. In contrast, TXB2
concentrations increased in the phosphorylcholine coated group for only a
short period of time and were already reduced at 60 minutes in 5 out of 7
determinations. It indicates a short exposure of platelets to an activating
surface that rapidly became passive. TXB2 formation appeared most of all

Appendix 10
273
restricted to the operating period, since postoperatively a return to baseline
was observed.
Cell adhesion to biomaterials is a surface dependent event, which is
additionally influenced by the dynamic interaction between proteins and the
material surface [7-9]. The low platelet activation may be due to the affinity of
the phosphorylcholine coating for phospholipids, which may immediately
adsorb to the polymer surface because they are smaller and more
concentrated than most proteins [10]. The adsorbed phospholipids may then
assemble by themselves and form an organised layer on the surface just like
real biomembranes [10], which then interacts minimally with proteins and
cells.
Few series have evaluated heparin coating in paediatric CPB [1,9-10].
Reduced complement activation has been observed as in adult CPB
[1,11,12]. To our surprise, also the PC coating appeared to generate less
complement activation than the uncoated systems. Although baseline
concentrations were slightly different between both groups the increase of
TCC was far more pronounced in the uncoated group (6 times baseline)
compared to the coated group (2 times baseline). For the first 60 minutes of
CPB the differences can be mainly attributed to material dependent activation
by the extracorporeal circuit. Thereafter in both groups further TCC generation
was observed. In the coated group a few patients showed very high TCC
generation probably due to longer reperfusion time. It is known that rewarming
and return of suctioned blood markedly contribute to complement activation
during the later period of CPB, which may have caused the large individual
differences. After CPB no further increase of TCC was observed, although
Appendix 10
274
protamine can cause some additional complement activation. The return to
baseline at day 1 shows rapid recovery from the CPB insult.
In vitro experiments showed decreasing complement activation with
increasing surface phoshorylcholine mole fractions [10], suggesting that the
phosporylcholine is responsible for the reduction. The working mechanism is
probably related to lesser activation of the complement protein C5 [13] and
the inhibition of monocyte and macrophage adhesion [14].
Two of the biochemical tests showed a different baseline, namely β-
thromboglobulin and TCC. For both of these tests it is known that particularly
in infants large individual differences exist. Comparison of these variables with
historical data obtained in a similar group of patients showed that β-
thromboglobulin baseline values ranged between 150 and 450 IU/mL [15].
Historical baseline TCC values in infants ranged between 40 and 460 ng/mL
[1]. Obviously, values from most samples in our study fell within those ranges
and must be considered normal baselines.
General conclusion
Phosphorylcholine coating appears to have a favourable effect on blood
platelets, which is most obvious after studying the changes during
cardiopulmonary bypass. A steady increase of TXB2 and β thromboglobulin
was observed in the control group, whereas plateau formation was observed
in the phosphorylcholine group. Clinically, this effect may contribute to
reduced blood loss and less thromboembolic complications. Also complement
Appendix 10
275
activation is lower in the coated group. The limited number of patients in this
study, however, only allows speculations as to the clinical relevance.
Limitations of the study
Due to the fact that our study concerns a biological system with relatively
large standard deviations in a limited number of patients, our data should be
interpreted with caution. Moreover, the relative extensive use of blood suckers
during many cases in this study, will cause an important activation of the
coagulation and complement cascades. For these reasons large randomised
studies are necessary to investigate in depth the efficacy of coated CPB
circuits during paediatric open heart operations.

Appendix 10
276
References
1. Scheurs HH, Wijers MJ, Gu J. van Oeveren W, van Domburg T, de Boer
JH, Bogers AJJC. Heparin-coated bypass circuits: effects on inflammatory
response in pediatric cardiac operations. Ann Thorac Surg 1998;66:166-
71.
2. Zwaal RFA, Hemker HC. Blood Cell Membranes and Haemostasis.
Haemostasis 11: 12 – 39, 1982.
3. Yianni YP. Biocompatible surfaces based upon biomembrane mimicry. In:
Quinn PJ and Cherry RJ, editors Structural and dynamic properties of
lipids and membranes. London: Portland Press Ltd, 1992: 182-217.
4. Hunter S, Angelini GD. Phosphatidylcholine-Coated Chest Tubes Improve
Drainage after Open Heart Operation. Ann Thorac Surg, 1993, 56: 1339-
42.
5. von Segesser LK, Tonz M, Leskosek B, Turina M. Evaluation of
phospholipidic surface coatings ex-vivo. Int J Artif Organs, 1994, 17: 294-
300.
6. Fukutomi M, Kobayashi S, Niwaya K, Hamada Y, Kitamura S. Changes in
platelet, granulocyte and complement activation during cardiopulmonary
bypass using heparin-coated equipment. Artif Organs, 1996; 20: 767-776.
7. Lewis JC, Hantgan RR, Stevenson SC, Thornburg T, Kieffer N, Guichard
J, Breton-Gorius J. Fibrinogen and glycoprotein IIb/IIIa localization during
platelet adhesion. Am J Pathol 136:239-252, 1990
Appendix 10
277
8. Lee JH, Lee HB. Platelet adhesion onto wettability gradient surfaces in the
absence and presence of plasma proteins. J Biomed Mater Res 41:304-
311, 1998
9. Lindon JN, McManama G, Kushner L, Merrill EW, Salzman E. Does the
conformation of adsorbed fibrinogen dictate platelet interactions with
artificial surfaces? Blood, 1986; 68: 355-362.
10. Ishihara K, Nakabayashi N. Hemocompatible Cellulose Dialysis
Membranes Modified with Phospholipid Polymers. Artif Organs 1995;
19(12): 1215-1221.
11. Kagaisaki K, Masai T, Kadoba K, Sawa Y, Nomura F, Fukushima N,
Ichikawa H, Ohata T, Suzuki K, Taketani S, Matsuda H. Biocompatibility of
heparin-coated circuits in pediatric cardiopulmonary bypass. Artif Organs
1997; 21:836-840.
12. Ashraf S, Tian Y, Cowan D, Entress A, Martin PG, Watterson KG. Release
of proinflammatory cytokines during paediatric cardiopulmonary bypass:
Heparin-bonded versus nonbonded oxygenators. Ann Thorac Surg 1997;
64: 1790-4.
13. Yu J, Lamba NMK, Courtney JM, Whateley TL, Gaylor JDS, Lowe GDO,
Ishihara K, Nakabayashi N. Polymeric biomaterials: influence of
phosphorylcholine polar groups on protein adsorption and complement
activation. Int J Artif Organs 1994; 7: 499-504.
14. DeFife KM, Yun JK, Azeez A, Stack S, Ishihara K, Nakabayashi N, Colton
E, Anderson JM. Adhesion and cytokine production by monocytes on
poly(2-methacryloyloxymethyl phosphorylcholine-co-alkyl methacrylate)-

Appendix 10
278
coated polymers. Journal of Biomedical Materials Research, 1995; 29:
431-439.
15. Gu YJ, Boonstra PW, Akkerman C, Mungroop H, Tigchelaar I, van
Oeveren W. Blood compatibility of two types of membrane oxygenator
during cardiopulmonary bypass in infants. Int J Artif Organs, 1994; 17:534-
548
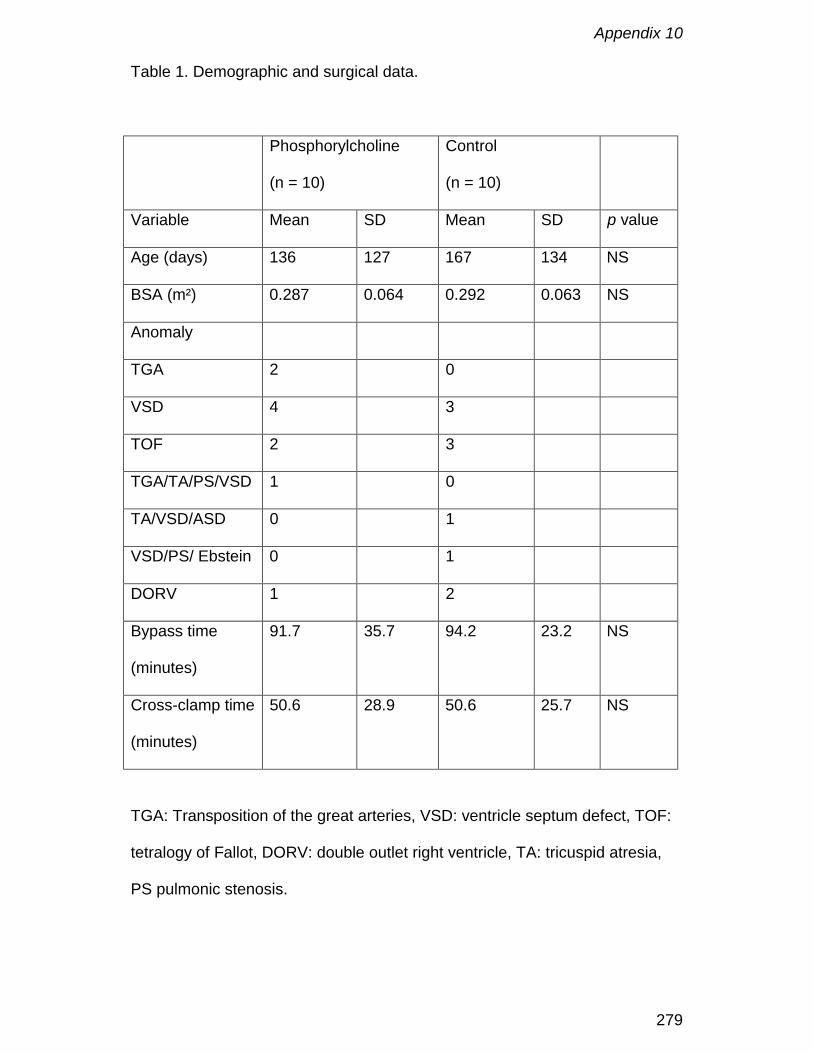
Appendix 10
279
Table 1. Demographic and surgical data.
Phosphorylcholine
(n = 10)
Control
(n = 10)
Variable Mean SD Mean SD p value
Age (days) 136 127 167 134 NS
BSA (m²) 0.287 0.064 0.292 0.063 NS
Anomaly
TGA 2 0
VSD 4 3
TOF 2 3
TGA/TA/PS/VSD 1 0
TA/VSD/ASD 0 1
VSD/PS/ Ebstein 0 1
DORV 1 2
Bypass time
(minutes)
91.7 35.7 94.2 23.2 NS
Cross-clamp time
(minutes)
50.6 28.9 50.6 25.7 NS
TGA: Transposition of the great arteries, VSD: ventricle septum defect, TOF:
tetralogy of Fallot, DORV: double outlet right ventricle, TA: tricuspid atresia,
PS pulmonic stenosis.
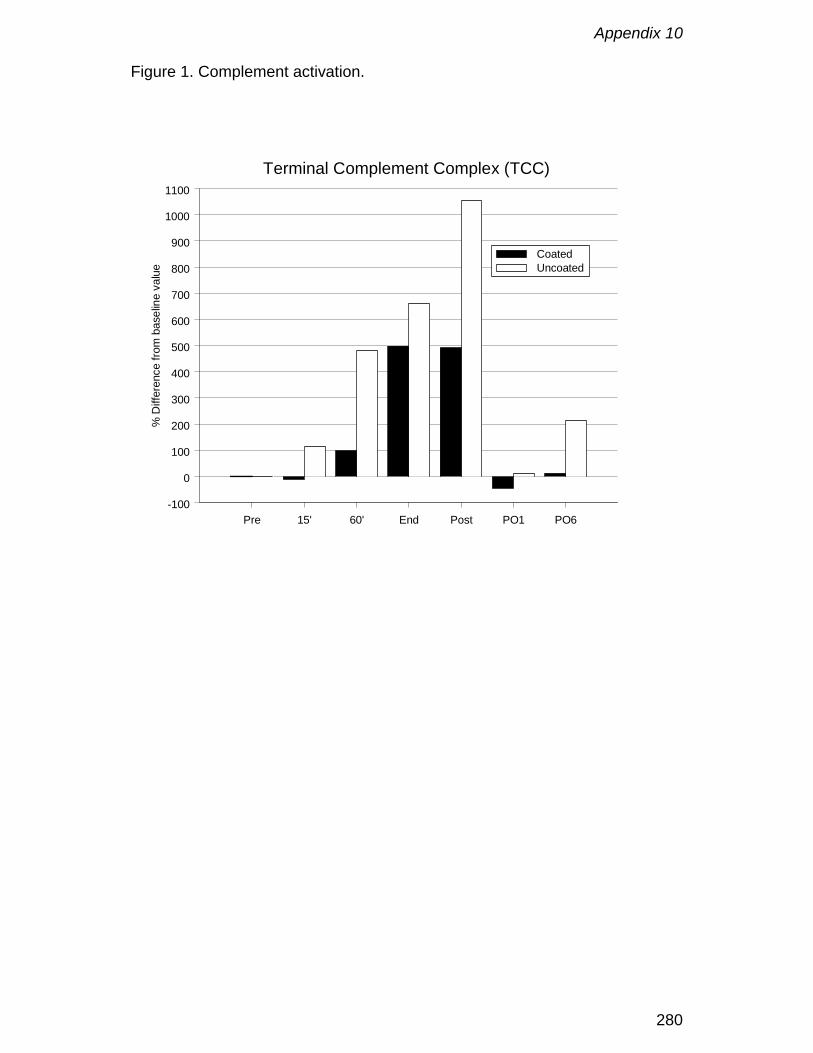
Appendix 10
280
Figure 1. Complement activation.
Pre 15' 60' End Post PO1 PO6-100
0
100
200
300
400
500
600
700
800
900
1000
1100
% D
iffer
ence
from
bas
elin
e va
lue
Terminal Complement Complex (TCC)
CoatedUncoated

Appendix 10
281
Figure 2: Platelet activation.
Pre 15' 60' End Post PO1 PO6-100
0
100
200
300
400
500
% d
iffer
ence
from
bas
elin
e va
lue
Thromboxane B2
CoatedUncoated
Pre 15' 60' End Post PO1 PO6-50
0
50
100
β-Thromboglobulin

Appendix 10
282

Appendix 11
283
Tissue factor as main activator of the coagulation systemduring cardiopulmonary bypass
F. De Somer ECCP, Y. Van Belleghem MD, F. Caes MD, K. François MD, H.
Van Overbeke MD, J. Arnout MD, PhD, Y. Taeymans MD, PhD,
G. Van Nooten MD, PhD
The Journal of Thoracic and Cardiovascular Surgery, 2002; 123: 951-958

Appendix 11
284
Abstract
Objective: This study investigates the influence of foreign material and blood
aspirated from nonvascular structures on activation of coagulation, hemolysis
and blood loss.
Methods: The series comprises three randomized groups (C, S and S+P) of
10 patients undergoing routine coronary artery bypass grafting with
cardiopulmonary bypass. In group C, the control group, all aspirated blood
was returned into the circulation. In group S suction blood was discarded
whereas Group S+P was identical to Group S, with surfaces coated with
phosphorylcholine. Plasma concentrations of β-thromboglobulin, thrombin
generation, haptoglobin and free hemoglobin, as well as blood loss, were
measured.
Results: A steady increase in free plasma hemoglobin, as well as an
increased generation of thrombin, was noticed in group C. Moreover, a close
correlation (r = 0.916) between the generation of thrombin and its inhibition
(thrombin-antithrombin complexes) was observed. Platelets were clearly
activated in group C and, to a lesser extend, in group S. In contrast, platelet
activation in group S+P was negligible, resulting in a 30% decrease in blood
loss (p=0.05).
Conclusions: Aspirated blood contaminated by tissue contact is the most
important activator of the coagulation system and the principal cause of
hemolysis during cardiopulmonary bypass. Contact with foreign surface is not
a main variable in the procoagulant effect of bypass. Mimicking the outer cell
Appendix 11
285
membrane structure resulted in decreased platelet activation and decreased
blood loss.
Ultramini-abstract
This study demonstrates that aspiration of blood from non-vascular structures
is the main activator of coagulation. The influence of foreign surface in
procoagulant activity is small. Mimicking the outer cell membrane on the
foreign surface resulted in decreased platelet activation and a significant
reduction of blood loss.

Appendix 11
286
Introduction
During cardiopulmonary bypass (CPB), blood is diverted into an
extracorporeal circulation. Those foreign surfaces exert a strong procoagulant
effect [1]. Over the years, many improvements have been made to the
components of the CPB circuit. Heparin coating and, more recently,
phosphorylcholine coating definitively reduce inflammatory response [2,3].
The characteristic feature of biological membranes is their functional and
compositional lipid asymmetry, which has been described in several cell
types. It is thought to stem from the requirement of biological membranes to
have asymmetric protein distributions across the bilayer. In all of the cells for
which lipid compositional asymmetry has been described, negatively charged
phospholipids are found predominantly on the inner cytoplasmatic side of the
membrane, whereas the neutral zwitterionic phosphorylcholine containing
antithrombotic lipids predominate in the outer membrane leaflet. Negatively
charged phospholipids are thrombogenic. This membrane asymmetry may
serve the biological purpose in the maintenance of the delicate balance
between hemostasis and thrombosis. However, reduction in activation of the
coagulation cascade and cell trauma is not conclusive [3]. This might be
related to the fact that, in most clinical studies, aspirated blood, which is
recognised as one of the most injurious components [4], is still reused. The
purpose of this study is to investigate the contribution of aspirated blood
versus foreign material in the activation of the coagulation cascade and cell
trauma.
Appendix 11
287
Materials and methods
Patients
Thirty patients were prospectively randomized into 1 of 3 groups. All patients
were subjected to elective coronary artery bypass grafting. The sole exclusion
criterion was an ejection fraction less than 40%. There were no statistical
differences in demographics and operative data between groups (Table 1).
The medical ethical committee of the hospital approved the study, and written
informed consent was obtained from all patients.
In the control group (Group C; n=10) CPB was performed in a standard
fashion, with recuperation of all suction blood into the circulation. In second
group (Group S; n=10) the same circuit was used as in the control group, but
aspirated blood collected from mediastinal cavities, pleural cavities or both
was discarded. The third Group (Group S+P; n=10) was identical to group 2
except for the coating of all foreign material with phosphorylcholine.
Operative techniques
Before cannulation, porcine heparin (300 IU/kg; Roche Pharmaceuticals,
Mannheim, Germany) was injected. Activated coagulation time (kaolin ACT;
Medtronic Hemotec, Inc, Englewood, Colo) was kept above 400 seconds
throughout CPB. CPB consisted of custom tubing pack made of polyvinyl
chloride, an arterial filter, a membrane oxygenator and an open venous
reservoir with separated cardiotomy reservoir (Dideco, Mirandola, Italy).
Circuits were identical in the different groups, with exception of Group S+P in
which all surfaces in contact with blood were coated with phosphorylcholine.
The heart-lung machine (COBE Cardiovascular, Arvada, Colo) was primed
Appendix 11
288
with a mixture of gelatine solution (Pasteur Merieux, Lyon, France), Mannitol
(Baxter Healthcare Corporation, Deerfield, Ill), 2 million KIU of aprotinin
(Bayer AG, Leverkusen, Germany) and 5000 IU of heparin (Roche, Brussels,
Belgium). Total priming volume was 1300 mL. Esophageal temperature was
lowered to 28°C. If possible, autologous blood was removed after induction,
aiming at a hematocrit level of 25% during CPB. During aortic crossclamping,
the aortic root was vented with a pressure-controlled roller pump. Myocardial
preservation during aortic crossclamping was obtained with approximately
800 mL (600 – 900) of crystalloid, antegrade, modified St. Thomas’ Hospital
cardioplegic solution.
Blood sampling
Blood samples were taken after induction, at 15 minutes of CPB, 5 minutes
after release of the aortic cross clamp, at the end of CPB, 20 minutes post
CPB and on postoperative days 1 and 2. Total blood loss was documented at
4, 8 and 12 hours postoperatively.
Laboratory assays
Serum concentrations of free hemoglobin and haptoglobin were determined
as markers of hemolysis by using immunonephelometry [5] on a BN
nephelometer (Behringwerke AG, Marburg, Germany) and expressed
according to Instructional Faculty Consortium Committee standards [6].
The prothrombin fragment (F1+2), split off during conversion of prothrombin to
thrombin, was measured on citrated plasma by using a quantitative enzyme-
linked immunosorbent assay (ELISA; EnzygnostR F1+2 micro, Behring
Diagnostics GmbH, Frankfurt, Germany). The capture antibodies in this

Appendix 11
289
sandwich ELISA are highly specific polyclonal antibodies raised in rabbits
against a synthetic peptide from the negatively charged region of F1+2
fragment. Peroxidase-conjugated rabbit anti-human prothrombin antibodies are
used as the tagging antibody. Normal level, determined in 24 healthy
volunteers, is 1,16 ± 0,39 nmol/L (range 0,5 - 2,6 nmol/L; median, 1,1 nmol/L).
Thrombin-antithrombin complexes (TATs), reflecting thrombin generation
followed by inhibition by antithrombin, were determined on citrated plasma by
means of ELISA ( EnzygnostR TAT micro, Behring Diagnostics GmbH),
according to the manufacturer’s instructions. This ELISA employs a polyclonal
antibody specific for neoantigenic determinants on thrombin as capture
antibody and peroxidase-labelled polyclonal rabbit anti-human antithrombin III
as the tag antibody. Normal TAT level, determined in 24 healthy volunteers
are 4,07 ±2,33 ng/mL (range: 2 - 14,9 ng/mL; median, 3,4 ng/ml).
β-thromboglobulin (β−TG), released from α-granules at platelet activation was
recorded with commercially available ELISA testing (Asserachrom βTG;
Diagnostica Stago, Parsippany, NJ). Normal values determined in 40 healthy
donors ranged from 15 to 42 IU/mL (mean, 24.4 IU/mL).
Statistics
The overall differences among the 3 groups were analyzed with a Kruskal-
Wallis test. The comparison between each individual group was done with a
Mann-Whitney test corrected for repeated comparisons. The sample points
were related to the progress of the operation and differed in each patient.
Comparisons at each sample point were therefore not considered relevant.
Hence, the values were treated individually for each patient, calculating the
surface under the curve representing the total release during CPB.

Appendix 11
290
The correlation between the generation of thrombin (PF 1+2) and its inhibition
(TAT) was calculated with a Spearman R test.
Appendix 11
291
Results
Coagulation
Lactic dehydrogenase
Lactic dehydrogenase (LDH) levels increased in all groups on postoperative
day 1 and 2 compared with baseline values (Figure 1). Mean total LDH
release was 296318 ± 137924 U/L/procedure in group C, 112170 ± 75153
U/L/procedure in group S (p=0.005) and 136212 ± 91602 U/L/procedure in
group S+P (p=0.01).
β-thromboglobulin
The concentration of β-TG remained stable during CPB in group S+P,
whereas an increase over time was observed in groups S and C (Figure 1). In
all groups an increase of baseline values was noted at 20 minutes after CPB.
Mean total release of β-TG during CPB was 3790 ± 4103 IU/mL/CPB in the
S+P group, 18870 ± 20479 IU/mL/CPB in group C (p=0.016) and 8040 ± 3986
IU/mL/CPB in group S (p=0.004).
Prothrombin fragment 1+2
In the control group an important increase in F1+2 levels was noted during
CPB (Figure 2) from a mean baseline value of 1.9 ± 1.8 µg/L to 5.0 ± 3.0 µg/L
at the end of CPB, which further increased to 5.4 ± 2.3 µg/L at 20 minutes
after CPB. In group S and S+P the values remained stable during and after
CPB. Mean total F1+2 during CPB was 20594 ± 21733 µg/L/CPB in group C,
2534 ± 2365 µg/L/CPB in group S (p=0.001) and 2197 ± 2095 µg/L/CPB in
S+P (p=0.001).

Appendix 11
292
Thrombin-antithrombin complex
Mean values of TAT complex decreased slightly in groups S and S+P, from
25.3 ± 42.7 nmol/L and 24.6 ± 21.9 nmol/L to 8.6 ± 8.1 nmol/L and 7.3 ± 2.2
nmol/L at 15 minutes of bypass, respectively (Figure 2). Subsequently, the
values remained stable during CPB and returned to baseline values at 20
minutes after CPB. This in opposition to group C, were the mean baseline
value of 56.9 ± 85.8 nmol/L, after a first decrease to 30.8 ± 22.4 nmol/L,
started to increase to a value of 128.0 ± 96.1 nmol/L at the end of CPB. Mean
total generation of TAT during CPB was 62926 ± 61907 nmol/L/CPB in group
C versus 4009 ± 2958 nmol/L/CPB in group S (p=0.001) and 3925 ± 1593
nmol/L/CPB in group S+P (p=0.001). Moreover, close correlation was
established between levels of TAT and F1+2 (r = 0.916; p<0.001) in group C
(Figure 3).
Hemolysis
Free plasma hemoglobin
Whereas mean free plasma hemoglobin levels remain stable in group S and
S+P, there is a steady increase from 9.9 ± 4.3 mg/dL to 46.6 ± 17.6 mg/dL at
20 minutes after CPB in group C (Figure 4). Mean total generation of plasma
free hemoglobin during the procedure was most pronounced in group C
(353800 ± 193475 mg/dL/procedure) compared with that seen in group S
(70140 ± 56462 mg/dL/procedure; p=0.001) and group S+P (130390 ± 86308
mg/dL/procedure; p=0.001).
Haptoglobin
Mean haptoglobin levels decreased in all groups over time (Figure 4).
Appendix 11
293
Blood loss and tranfusions
In group S an average of 295 ± 136 mL and in group S+P an average of 370 ±
172 mL (p=not significant) of blood was aspirated during CPB and discarded
at the end of the procedure. The hematocrit levels on postoperative day 1
were 30.6 ± 4.1 % in group C, 29.9 ± 3.0 % in group S and 32.8 ± 3.0 % in
group S+P (p=0.196).
The average blood loss during the first 4 hours postoperatively was 210 ± 80
mL (p=0.05) in group S+P, 326 ± 170 mL in group C, and 338 ± 223 mL in
group S. Blood losses between 4 and 8 hours and 8 and 12 hours
postoperatively were not statistical different between groups (Figure 5).
Dividing the total population in patients who lost more or less than 250 mL
during the first 4 postoperative hours revealed duration of CPB (p<0.001),
prolonged cross-clamp time (p=0.002) and number of bypasses (p=0.03) to
be incremental risk factors for bleeding. By using the same division with
regard to the 3 groups, a significant difference in reduced blood loss was
found in favor of group S+P (p=0.05, Table 2).
In none of the groups were blood products given during CPB. In group S no
blood products were given, whereas in group S+P 1 patient and in group C 4
patients received packed red cells postoperatively (p=0.05).
Appendix 11
294
Discussion
Despite anticoagulation with high doses of heparin during CPB, this procedure
is associated with considerable activation of the coagulation system [1]. The
important rise in F1+2 and TAT levels obtained in our control group confirms
the procoagulant effect of CPB. In addition, significant activation of blood
platelets and generation of hemolysis was observed. After unclamping, most
surgeons reinfuse blood aspirated from the mediastinal and pleural cavities.
Recirculation of suction blood is documented to decrease the mean arterial
pressure [7], to activate the coagulation cascade [8,9] and to generate
hemolysis [8,10]. As soon as blood comes into contact with tissue factor, the
coagulation cascade is activated [12,13]. As a result of surgical trauma, tissue
factor can be present in both mediastinal and pleural cavities. Therefore,
blood recuperated from these cavities will be activated, and thrombin will be
generated, leading to elevation of both TAT and F 1+2. In our intervention
groups in which reinfusion of aspirated blood was omitted, almost no rise in
TAT and F1+2 levels was observed, clearly suggesting aspirated blood to be
the main cause of thrombin generation. A discussion is ongoing whether
heparin dosing during CPB based on ACT measurement is optimal or whether
heparin by itself is an adequate anticoagulant in this setting [14-16]. Several
studies have shown a poor correlation between ACT and plasma heparin
levels as measured with an anti-Xa method [14]. However, rapid point-of-care
methods to measure heparin levels are still in the process of validation.
Therefore, in our study heparin dosing was still adjusted on the basis of the
ACT. Despotis and colleagues [15] described that a more effective

Appendix 11
295
suppression of the hemostatic system in CPB may be obtained when heparin
dosing is based on heparin blood concentrations rather than on ACT. In their
study a negative correlation was found between F1+2 and TAT levels on the
one hand and plasma heparin concentrations, as measured with an anti-Xa
method, on the other hand. In contrast to this, the study of Knudsen and
coworkers [16] clearly showed that high levels of F1+2 may be generated
during CPB, despite adequate heparin anticoagulation, as measured with a
plasma anti-Xa method. In this study, suction blood was also reinfused, and
the highest F1+2 levels were similarly to those in our study found shortly after
unclamping. The high degree of comparability of the F1+2 results of our
control group and the results reported by Knudsen and coworkers makes it
unlikely that the low F1+2 values in patients in whom no aspirated blood was
reinfused could be due to higher heparin levels. Differences in amount of
aspirated blood volume may account for the differences found in the literature.
However, blood aspirated from cavities covered with endothelium does not
activate the coagulation [12].
Destruction of red blood cells in contact with the pericardium, pleural cavities,
or both, was recognized in the early days [11]. In our control group, free
plasma hemoglobin started to increase after the release of the aortic
crossclamp, simultaneously with a steady decrease in haptoglobin levels over
time. In a recent study where aspirated blood was kept separated until the
end of CPB, a similar increase in hemolysis was noticed after reinfusion of
this aspirated blood [10]. Major hemolysis is caused by blood aspirated from
nonvascular cavities. This is most likely caused by shear forces, negative
pressure, and the blood-air interaction. The effect of mechanical destruction
Appendix 11
296
(arterial roller pump) is partially neutralized by rapid elimination of the
haptoglobin-hemopexin complexes at specific hepatic receptors. Hemolysis
generation by means of the arterial roller pump remains negligible during
short-term cardiac surgery and was confirmed by low free plasma hemoglobin
values during CPB in both retainment groups.
In addition to high circulating levels of heparin, attempts have been made to
control activation of the coagulation system by coating the foreign surface
area of the CPB. However, generation of TAT and F1+2 in most studies was
not conclusive [3].
Phosphorylcholine coating mimics the characteristic feature of biological
membranes. In vitro experiments, in which various phospholipid coatings were
applied to surfaces, showed a very high procoagulant activity of negatively
charged phospholipids. This in contrast to the absence of activation of
phosphorylcholine-containing surfaces in coagulation tests [17,18]. Blood
platelets are not only essential for the coagulation but also interfere with white
blood cell and complement activation. Platelets were activated predominantly
in group C, by means of reinfusion of damaged and activated platelets with
aspirated blood. However, also in group S, moderate platelet activation is
noticed starting over time, whereas absolutely no increase is observed in
group S+P. Better platelet preservation in group S+P is also reflected by lower
blood loss in the immediate postoperative period. The difference between
group S and group S+P can be seen as the representation of the damage
caused by the contact with untreated foreign material. This finding is in
agreement with previous observations [2].
Appendix 11
297
No statistical differences regarding duration of CPB, crossclamp time and
number of bypasses were observed between groups. Nevertheless, a
significant higher number of patients lost less than 250 mL blood in group
S+P. In the population who lost more than 250 mL during the first 4
postoperative hours, there was a positive correlation with the duration of CPB,
crossclamp time and number of bypasses, which is in agreement with
previous findings [19].
Development of a dedicated venous reservoir makes it possible to separate
aspirated blood coming from different sources. Blood from vascular structures
can be safely returned into the circulation, whereas highly activated blood
caused by contact with tissue factor can be kept separated. Depending on the
amount of blood loss, the latter can be processed with a cell salvage system
or discarded. Moreover, recent in vitro research also points out that
generation of fat emboli is negligible in groups without recuperation of the
mediastinal blood compared with that in a control group [20].
General conclusion
Retainment of blood aspirated out of nonvascular structures will significantly
reduce morbidity of CPB. Blood activated by means of tissue factor should be
discarded or processed with a cell salvage system. Phosphorylcholine coating
is not a main participant for control of the procoagulant effect of CPB but
results in decreased platelet activation and decreased blood loss.

Appendix 11
298
Limitations of the study
Because our study concerns a biological system with relatively large SDs in a
limited number of patients, our data should be interpreted with caution. Large
randomized studies are necessary to investigate the influence of reinfusion of
aspirated blood on morbidity.
Acknowledgement
We thank Sorin-Biomedica, Mirandola, Italy, for providing the
phosphorylcholine coated oxygenators, cannulas and custom packs.
Appendix 11
299
References
1. Tanaka T, Takao M, Yada I, Yuasa H, Kugasawa M, Degushi K.
Alterations in coagulation and fibrinolysis associated with cardiopulmonary
bypass during open heart surgery. J Cardiothorac Anesth 1989;3:181-88
2. De Somer F, François K, van Oeveren W, et al. Phosphorylcholine coating
of extracorporeal circuits provides natural protection against blood
activation by the material surface. Eur. J. of Cardiothoracic Surg (In press).
3. Wendel HP, Ziemer G. Coating-techniques to improve the
hemocompatibility of artificial devices used for extracorporeal circulation.
Eur J of Cardiothoracic Surg 1999;16:342-50.
4. Malinauskas RA, Sade RM, Dearing JP, Spinale FG, Crawford FA, von
Recum AF. Blood damaging effects in cardiotomy suction return. The
Journal of Extra-Corporeal technology 1988;20:41-6.
5. Fink PC, Römer M, Haeckel R, Fateh Moghadam A, et al. Measurement of
proteins with the Behring Nephelometer. A multicentre evaluation. J. Clin.
Chem. Clin. Biochem. 1989;27:261-76
6. Johnson AMA. A new international reference preparation for proteins in
human serum. Arch. Pathol. Lab. Med. 1993;117:29-31.
7. Lavee J, Naveh N, Dinbar I, Shinfield A, Goor DA. Prostacycline and
Prostaglandin E2 mediate reduction of increased mean arterial pressure
during cardiopulmonary bypass by aspiration of shed pulmonary venous
blood. J Thorac Cardiovasc Surg 1990;100:546-51.
Appendix 11
300
8. de Haan J, Boonstra PW, Monnink SHJ, Ebels T, van Oeveren W.
Retransfusion of Suctioned Blood During Cardiopulmonary Bypass Impairs
Hemostasis. Ann Thorac Surg 1995;59: 901-7.
9. Walpoth BH, Eggensperger N, Hauser SP, et al. Effects of unprocessed
and processed cardiopulmonary bypass blood retransfused into patients
after cardiac surgery. Int J Artif Organs 1999;22:210-16.
10. Hansbro SD, Sharpe DAC, Catchpole R, et al. Hemolysis during
cardiopulmonary bypass: an in vivo comparison of standard roller pumps,
nonocclusive roller pumps and centrifugal pumps. Perfusion 1999;14:3-10.
11. Boisclair MD, Lane DA, Philippou H, Sheikh S, Hunt B. Thrombin
production, inactivation and expression during open heart surgery
measured by assays for activation fragments including a new ELISA for
prothrombin fragment F1+2. Thrombosis and Haemostasis
1993;70(2):253-58.
12. Boisclair MD, Lane DA, Philippou H, et al. Mechanisms of thrombin
generation during surgery and cardiopulmonary bypass. Blood
1993;82:3350-57.
13. Morris KN, Kinross FM, Stirling GR. Hemolysis of blood in the pericardium:
the major source of plasma hemoglobin during total body perfusion. J
Thoracic and Cardiovas Surg. 1965;49:250-58
14. Niles SD, Sutton RG, Ploessl J, Pennell B. Correlation of ACT as
measured with three commercially available devices with circulating
heparin level during cardiac surgery. J Extra Corpor Technol.
1995;27:197-200.

Appendix 11
301
15. Despotis GJ, Joist JH, Hogue CW Jr, Alsoufiev A, Joiner-Maier D, Santoro
SA, Spitznagel E, Weitz JI, Goodnough LT. More effective suppression of
hemostatic system activation in patients undergoing cardiac surgery by
heparin dosing based on heparin blood concentrations rather than ACT.
Thromb Haemost. 1996;76:902-8.
16. Knudsen L, Hasenkam JM, Kure HH, Hughes P, Bellaiche L, Ahlburg P,
Djurhuus C. Monitoring thrombin generation with prothrombin fragment 1.2
assay during cardiopulmonary bypass surgery. Thromb Res. 1996; 84: 45-
54.
17. Zwaal RFA, Hemker HC. Blood Cell Membranes and Haemostasis.
Haemostasis 1982;11:12-39.
18. Yianni YP. Biocompatible surfaces based upon biomembrane mimicry. In:
Quinn PJ and Cherry RJ, editors Structural and dynamic properties of
lipids and membranes. London: Portland Press Ltd, 1992: 182-217.
19. Tuman KJ, McCarthy RJ, O’Connor CJ, McCarthy WE, Ivankovitch AD.
Aspirin does not increase allogeneic blood transfusions in reoperative
coronary artery surgery. Anesth Analg 1996;83(6):1178-84
20. Brooker RF, Brown WR, Moody DM, et al. Cardiotomy Suction: A Major
Source of Brain Lipid Emboli During Cardiopulmonary Bypass. Ann Thorac
Surg 1998;65:1651-55.
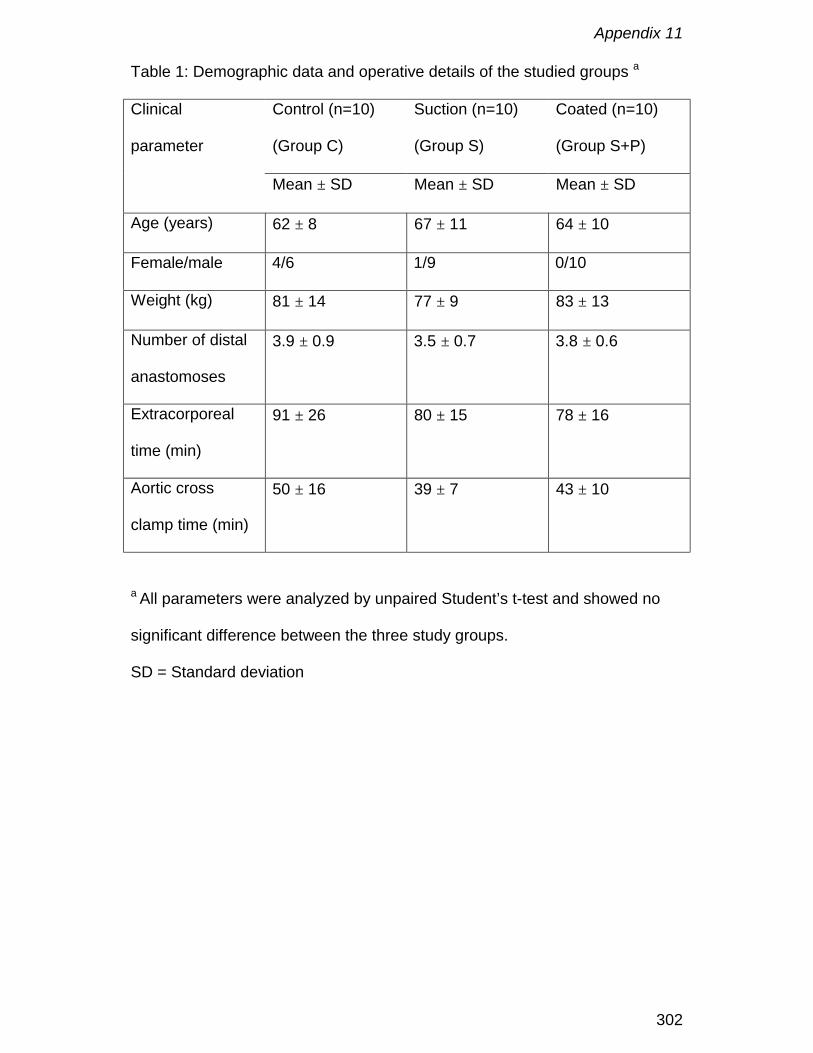
Appendix 11
302
Table 1: Demographic data and operative details of the studied groups a
Control (n=10)
(Group C)
Suction (n=10)
(Group S)
Coated (n=10)
(Group S+P)
Clinical
parameter
Mean ± SD Mean ± SD Mean ± SD
Age (years) 62 ± 8 67 ± 11 64 ± 10
Female/male 4/6 1/9 0/10
Weight (kg) 81 ± 14 77 ± 9 83 ± 13
Number of distal
anastomoses
3.9 ± 0.9 3.5 ± 0.7 3.8 ± 0.6
Extracorporeal
time (min)
91 ± 26 80 ± 15 78 ± 16
Aortic cross
clamp time (min)
50 ± 16 39 ± 7 43 ± 10
a All parameters were analyzed by unpaired Student’s t-test and showed no
significant difference between the three study groups.
SD = Standard deviation
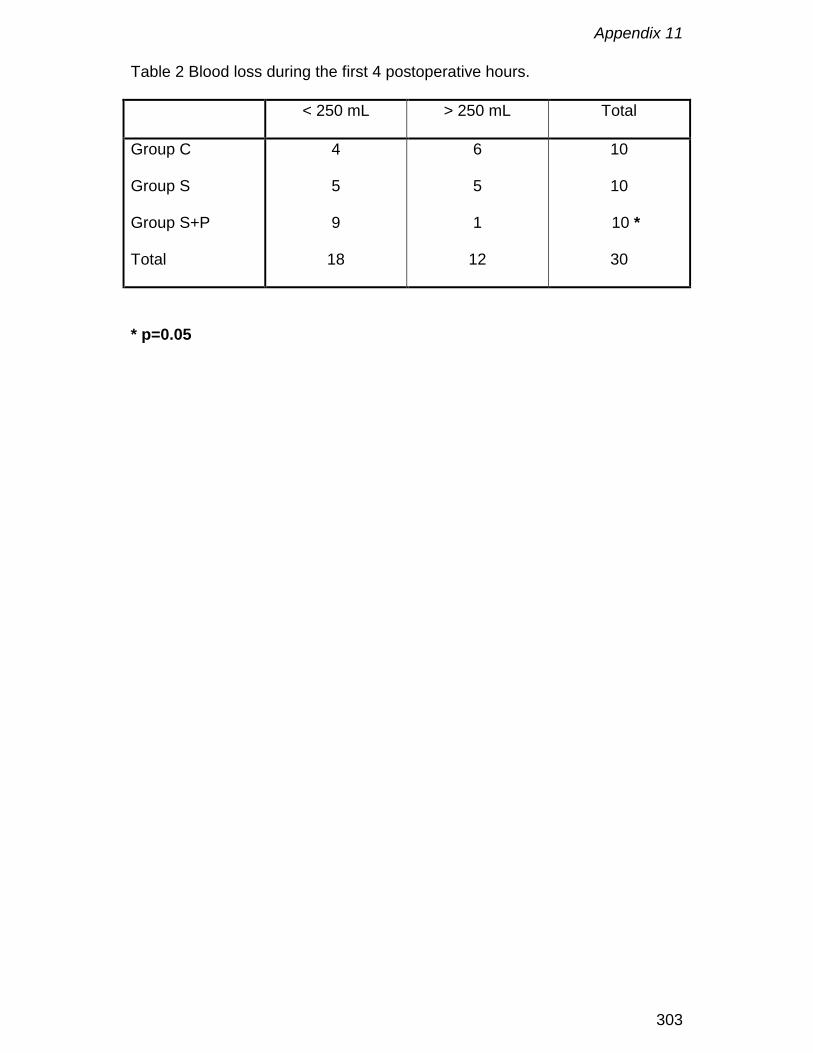
Appendix 11
303
Table 2 Blood loss during the first 4 postoperative hours.
< 250 mL > 250 mL Total
Group C
Group S
Group S+P
Total
4
5
9
18
6
5
1
12
10
10
10 *
30
* p=0.05
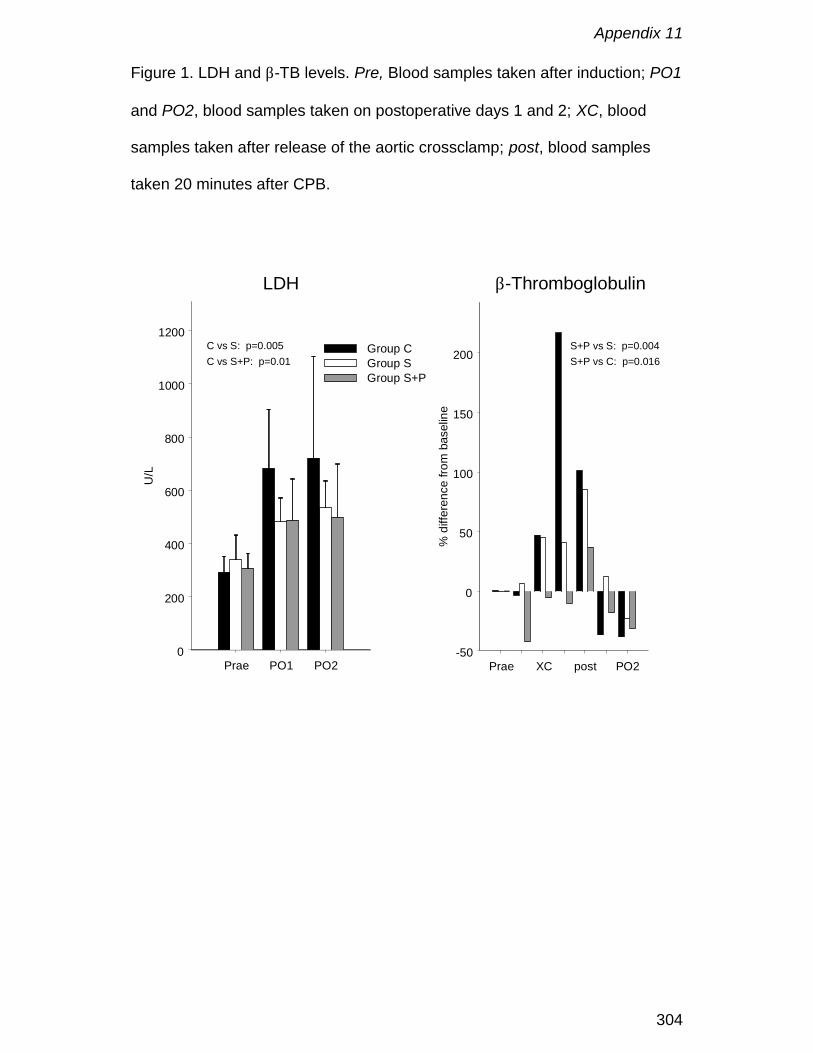
Appendix 11
304
Figure 1. LDH and β-TB levels. Pre, Blood samples taken after induction; PO1
and PO2, blood samples taken on postoperative days 1 and 2; XC, blood
samples taken after release of the aortic crossclamp; post, blood samples
taken 20 minutes after CPB.
Prae PO1 PO20
200
400
600
800
1000
1200
U/L
LDH
Group CGroup SGroup S+P
C vs S: p=0.005C vs S+P: p=0.01
Prae XC post PO2-50
0
50
100
150
200
% d
iffer
ence
from
bas
elin
e
β-Thromboglobulin
S+P vs S: p=0.004S+P vs C: p=0.016
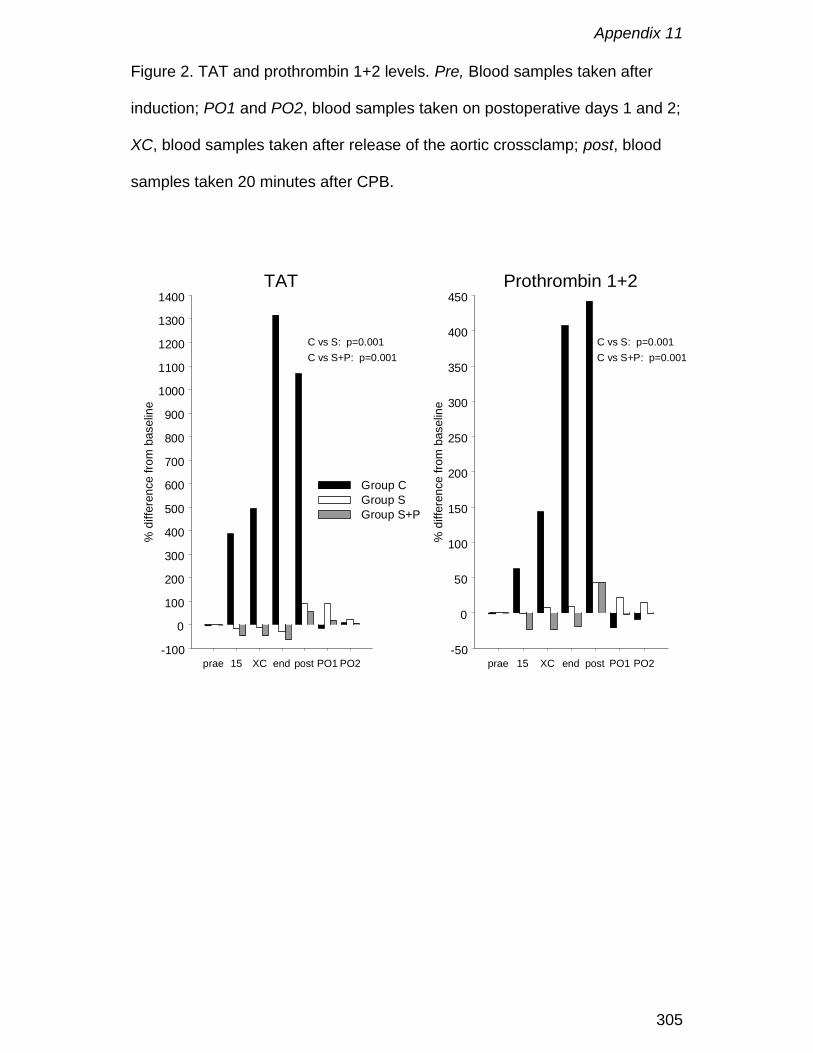
Appendix 11
305
Figure 2. TAT and prothrombin 1+2 levels. Pre, Blood samples taken after
induction; PO1 and PO2, blood samples taken on postoperative days 1 and 2;
XC, blood samples taken after release of the aortic crossclamp; post, blood
samples taken 20 minutes after CPB.
prae 15 XC end post PO1 PO2-100
0
100
200
300
400
500
600
700
800
900
1000
1100
1200
1300
1400
% d
iffer
ence
from
bas
elin
e
TAT
Group CGroup SGroup S+P
C vs S: p=0.001C vs S+P: p=0.001
prae 15 XC end post PO1 PO2-50
0
50
100
150
200
250
300
350
400
450
% d
iffer
ence
from
bas
elin
e
Prothrombin 1+2
C vs S: p=0.001C vs S+P: p=0.001
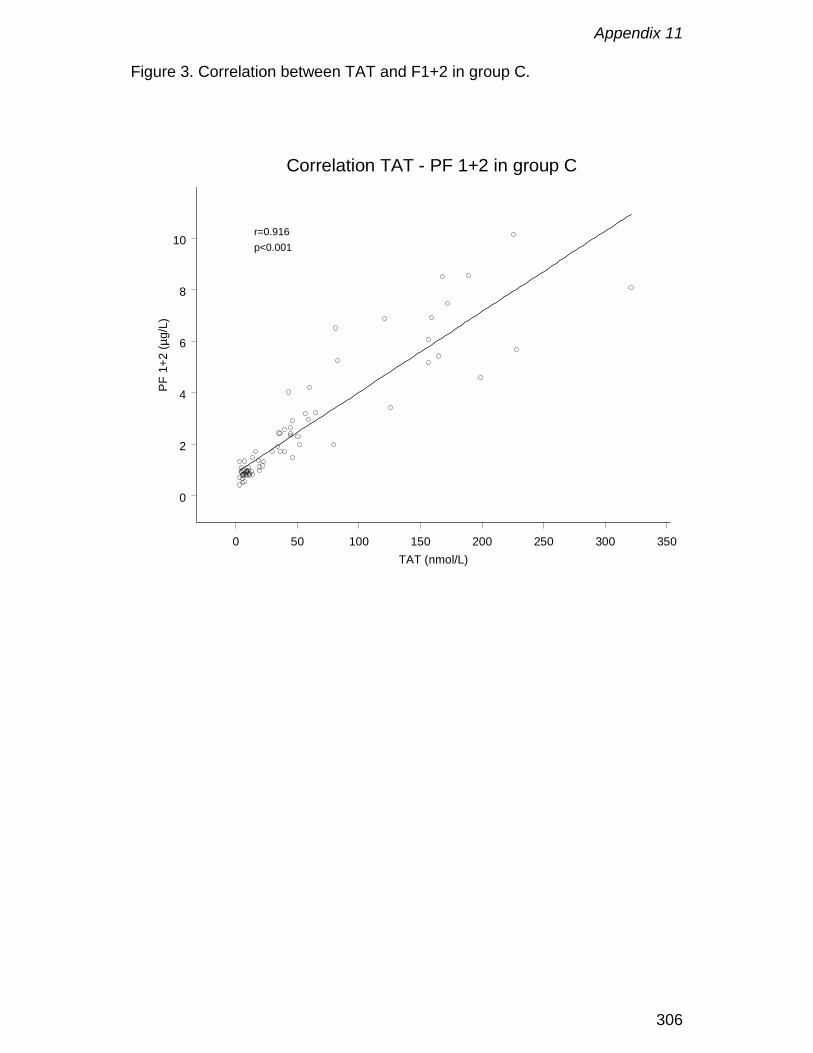
Appendix 11
306
Figure 3. Correlation between TAT and F1+2 in group C.
0 50 100 150 200 250 300 350TAT (nmol/L)
0
2
4
6
8
10
PF 1
+2 (µ
g/L)
Correlation TAT - PF 1+2 in group C
r=0.916p<0.001
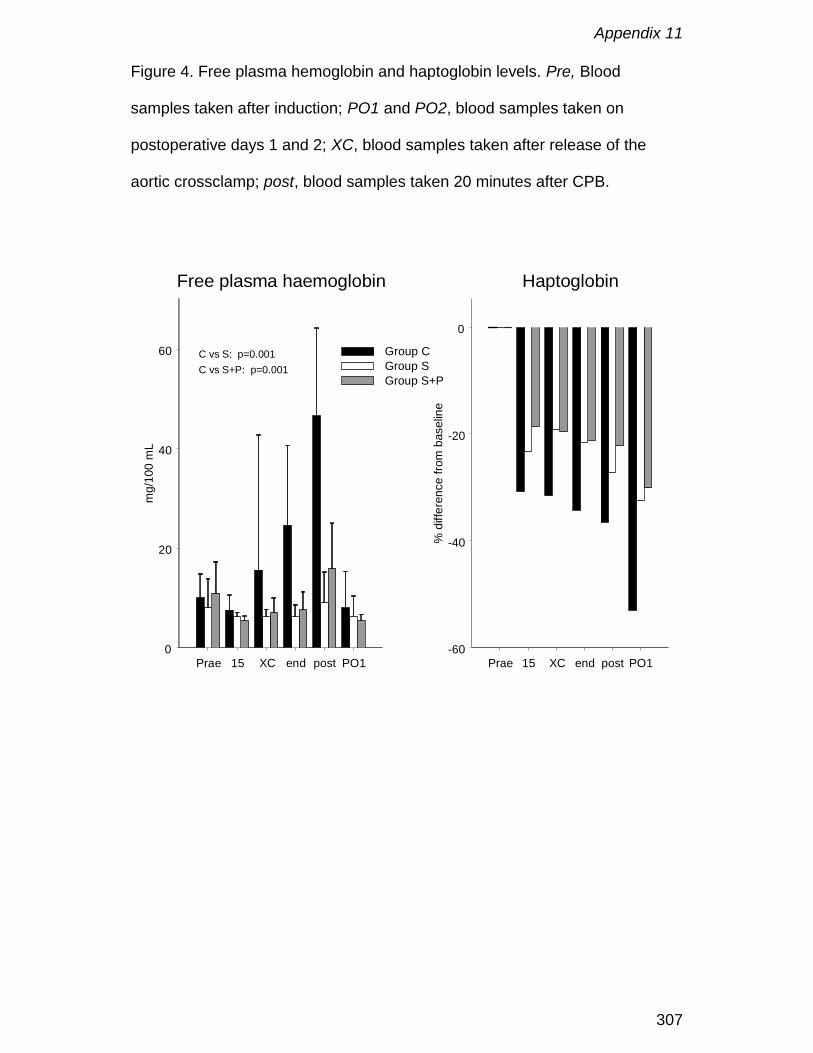
Appendix 11
307
Figure 4. Free plasma hemoglobin and haptoglobin levels. Pre, Blood
samples taken after induction; PO1 and PO2, blood samples taken on
postoperative days 1 and 2; XC, blood samples taken after release of the
aortic crossclamp; post, blood samples taken 20 minutes after CPB.
Prae 15 XC end post PO10
20
40
60
mg/
100
mL
Free plasma haemoglobin
Group CGroup SGroup S+P
Prae 15 XC end post PO1-60
-40
-20
0
% d
iffer
ence
from
bas
elin
e
Haptoglobin
C vs S: p=0.001C vs S+P: p=0.001
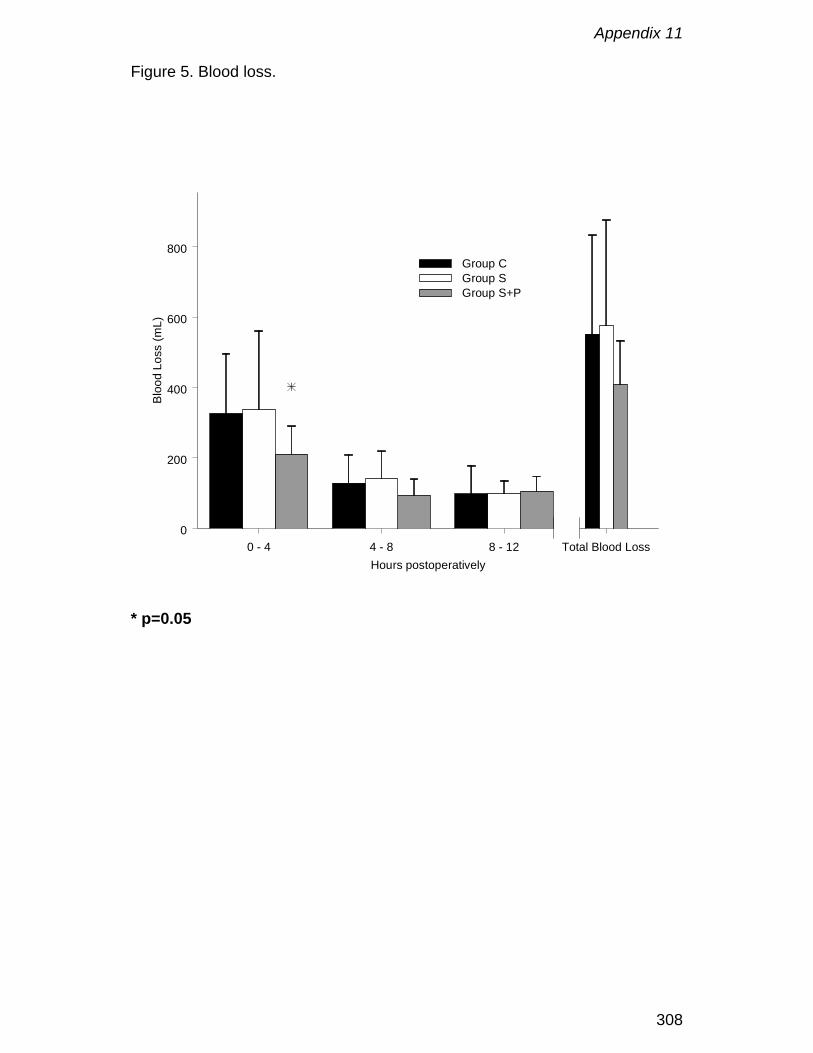
Appendix 11
308
Figure 5. Blood loss.
0 - 4 4 - 8 8 - 12 Total Blood LossHours postoperatively
0
200
400
600
800
Bloo
d Lo
ss (m
L)
Group CGroup SGroup S+P
* p=0.05
Nederlandse samenvatting
309
Nederlandse samenvatting
Sinds het eerste gebruik van de hart-longmachine voor totale
cardiopulmonale bypass op 5 april 1951, is veel veranderd. Waar de eerste
twee patiënten de procedure niet overleefden, is vandaag de mortaliteit
veroorzaakt door de cardiopulmonale bypass zo goed als onbestaande. De
enorme circuits met een bellen- of film-oxygenator, welke verschillende liters
vulvloeistof vereisten, werden vervangen door kleine membraanoxygenatoren
ingebouwd in circuits die slechts gebruik maken van een paar honderd
milliliters vulvloeistof.
Naarmate meer en meer procedures werden uitgevoerd nam de kennis en de
langetermijnopvolging van patiëntjes met congenitale hartgebreken toe.
Gebaseerd op deze nieuwe inzichten worden tegenwoordig meer en meer
kinderen zeer vroeg, met name in de eerste dagen of weken van hun leven,
chirurgisch behandeld daar dit leidt tot een betere langetermijnoverleving.
Nochthans wordt de chirurg geconfronteerd met tal van technische
beperkingen wanneer hij een vroeggeborene van pakweg 2 kilo op
cardiopulmonale bypass dient te plaatsen. Derhalve is verder onderzoek
nodig om schade veroorzaakt door de cardiopulmonale bypass aan de vaak
nog immature organen, tot een absoluut minimum te beperken.
Een eerste probleem is de vasculaire toegang. De anatomisch kleine
bloedvaten van een kind dienen te worden gecanuleerd zonder deze te
obstrueren of de wanden te beschadigen. Wat is het beste ontwerp om dit te
realiseren? Hoe kan men bereiken dat alle organen worden bevloeid, dat het
hart niet wordt blootgesteld aan een bijkomende nabelasting en dat de
Nederlandse samenvatting
310
volledige veneuze terugvloei naar de cardiopulmonale bypass wordt
afgevoerd? Appendix 1 belicht de beperkingen en voordelen van vacuum
geassisteerde veneuze terugvloei (VAVD) wanneer deze wordt gebruikt bij
kinderen. VAVD maakt het mogelijk de veneuze terugvloei met ongeveer 10%
te verhogen door middel van een groter drukverval. Daarnaast laat het
gebruik van VAVD ook toe kleinere canules te gebruiken, waardoor het
bloedvat minder geobstrueerd wordt en de vaatwand minder beschadigd. Een
groter operatieveld en minder terugvloei uit collaterale bloedvaten kan worden
bekomen door de combinatie van kleinere canules en VAVD.
Het ontwerp van de canule is zeer belangrijk voor een optimale re-infusie van
bloed in de aorta. Appendix 2 legt de relatie uit tussen canule-ontwerp en het
onstaan van jets, terwijl appendix 3 de beperkingen van bestaande
pediatrische canules belicht. Zo werden grote verschillen in druk-debiet
relaties aangetoond veroorzaakt door afwijkingen in binnendiameter en het
ontwerp van de canule.
De oxygenator blijft een probleem apart in het pediatrische cardiopulmonale
bypass circuit door zijn vulvolume, het relatief groot oppervlak aan
lichaamsvreemd materiaal en de niet altijd optimale vloeistofdynamica. Deze
problemen worden deels veroorzaakt door het feit dat de meeste, zo niet alle,
pediatrische oxygenatoren in feite verkleinde volwassen oxygenatoren zijn,
die niet aangepast zijn aan de noden van neonatale procedures. Appendix 4
somt de voordelen op van een oxygenator die specifiek voor de neonatale
cardiopulmonale bypass werd ontworpen. Het gebruik van een dergelijke
oxygenator maakt het mogelijk kleinere circuits samen te stellen, waardoor er
minder bloedverdunning optreed. Appendix 5 toont de klinische impact van

Nederlandse samenvatting
311
een dergelijke neonatale oxygenator in combinatie met een klein circuit op het
verbruik van bloedproducten. Om een optimaal massatransport en een goede
hemocompatibiliteit te bekomen is de vloeistofdynamica in een oxygenator
vitaal. Appendix 6 stelt een nieuwe techniek voor om de druk-debiet relatie
van oxygenatoren met een verschillend ontwerp te vergelijken. Deze aanpak
maakt het mogelijk om objectieve beslissingen te nemen, wanneer men
verschillende producten vergelijkt. De impact van de nieuwe ELF
membraanoxygenatoren op bloedelementen werd bestudeerd in appendix 7.
Het gebruik van een arteriële filter in een pediatrisch circuit kan in vraag
gesteld worden, daar dit enkel het vulvolume zal vergroten zonder dat hierbij
de veiligheid wordt verhoogd. Appendix 8 suggereert dat de hollevezelbundel
van het membraancompartiment een aanvaardbaar alternatief zou kunnen
zijn voor een arteriële filter daar deze een dieptefilter is voor partikels en in
staat is gasembolen te verwijderen. Terzelfdertijd, zal dit alternatief het
vulvolume van het totale circuit reduceren zonder impact op de veiligheid.
Het controleren van het inflammatoire antwoord is een van de belangrijkste
doelstellingen van het pediatrische team. Het behandelen van alle
lichaamsvreemde oppervlakken met een coating die het buitenmembraan van
de rode bloedcel nabootst, leidt tot een vermindering van de complement
activatie en een betere bescherming van de bloedplaatjesfunctie. Dit wordt
beschreven in appendix 9 en bevestigd in de kliniek in appendix 10.
Ongelukkigerwijs kan deze coating het inflammatoire antwoord niet volledig
blokkeren en dit kan wellicht verklaard worden door de bevindingen in
Nederlandse samenvatting
312
appendix 11, die aantonen dat bloed afkomstig uit ruimtes die niet niet bedekt
zijn met endotheel, zoals het pericard en de pleuraholtes, de stolling activeert.
Secundair zal dit leiden tot activatie van de complementcascade en tot een
verhoogde permeabiliteit van de vaatwand.
Klinische implicaties en toekomstige ontwikkelingen
Meer en meer pasgeborenen met een congenitaal hartgebrek worden
geopereerd tijdens de eerste dagen of weken van hun leven. Als gevolg
hiervan is het lichaamsgewicht vaak erg laag en zijn de anatomische
structuren klein. Het opstarten van de cardiopulmonale bypass onder
dergelijke omstandigheden vraagt specifieke canules met een minimale
afwijking van de vooropgestelde binnendiameter. Om onder alle
omstandigheden een optimale veneuze terugvloei en arteriële re-infusie te
realiseren dienen meer ontwerpen en kleinere diameters te worden
ontwikkeld. Druk-debiet diagrams vertrekkende van visceuze vloeistoffen
zoals water-glycerine zouden deze nieuwe ontwerpen dienen te vergezellen.
Vacuum geassisteerde veneuze terugvloei in combinatie met specifieke
veneuze canules zal het totale vulvolume van het cardiopulmonale circuit
verder verkleinen, en even belangrijk het “dood volume” in zuigerlijnen
verminderen. Als gevolg hiervan zal het bloed blootgesteld worden aan een
kleinere hoeveelheid lichaamsvreemd materiaal en zal er minder verdunning
optreden van de stollingseiwitten en de bloedelementen. Door deze minder
uitgesproken verdunning zal het gebruik van bloedproducten afnemen
Nederlandse samenvatting
313
waardoor verhinderd wordt dat het patiëntje aan meerdere bloeddonoren
wordt blootgesteld.
De behandeling van alle lichaamsvreemd materiaal met een
hemocompatibele coating zal het inflammatoire antwoord beter controleren.
Nieuwe ontwikkelingen dienen te gebeuren in
1. membraantechnologie: microporeuze versus diffusiemembranen
2. oppervlaktebehandeling van alle lichaamsvreemde materiaal
3. Integratie van de componenten en verdere miniaturisatie van de
cardiopulmonale bypass om het vulvolume en de hoeveelheid
lichaamsvreemdmateriaal verder te verminderen
4. Vloeistofmechanica van het volledige cardiopulmonale bypass circuit
gecombineerd met extensieve modellering van de vloeistofmechanica van
elke afzonderlijke component.
5. Cannules en de fysische en biologische aspecten van vasculaire toegang
in het algemeen.
6. De selectieve behandeling van geactiveerd bloed.

Nederlandse samenvatting
314
Dankwoord
315
Dankwoord
Wanneer ik, met dit werk in de hand, terugblik op de voorbije jaren komen
herinneringen aan enkele griekse sagen in me op. Net als de personages in
deze sagen, kende ik in de periode waarin dit werk tot stand kwam,
momenten van zowel kommer en kwel, als van intens geluk. Op mijn weg
kwam ik vele boeiende mensen tegen, welke allen een stempel op mij hebben
gedrukt. Elk van hun ben ik dan ook bijzonder dankbaar voor hun bijdrage
aan mijn werk. Dit eindresultaat kon immers enkel tot stand komen dankzij
hun hulp, ervaring en wijze raad.
Graag wil ik enkele personen in het bijzonder vernoemen. Mijn heel speciale
dank gaat uit naar mijn beide promotores. Professor doctor T. Ebels leerde ik
waarderen als een heel beminnelijk man, met een open en analytische geest.
Hij was steeds beschikbaar om grote en kleine problemen van de baan te
helpen alsook om advies te geven bij de verschillende ontwikkelingsfases van
mijn thesis. Zowel hijzelf, als de faculteit Medische wetenschappen van de
Rijksuniversiteit Groningen zullen steeds een aparte plaats in mijn hart
bekleden. Professor doctor G. Van Nooten ben ik zeer erkentelijk voor de
mogelijkheden die hij aanbracht. Dank zij hem heb ik dit werk aangevat en
door zijn enthousiasme, wetenschappelijke kennis en kritische bemerkingen
heb ik het kunnen beëindigen. Ik zie hem dan ook als mijn professionele
mentor en hoop nog vele jaren met hem te mogen samenwerken.
Als clinicus ontbrak het mij, zeker in de beginfase, aan inzicht in de
theoretische achtergronden van de biomedische ingenieurstechnieken. Dank
zij mijn co-promotor Professor doctor P. Verdonck en zijn uitzonderlijke groep
Dankwoord
316
werd dit gemis snel verholpen. Peter Dierickx en Dirk De Wachter leerden mij
het nut van mathematische modellering inzien als hulpmiddel voor het
begrijpen van complexe problemen en waren steeds bereid om mij met woord
en daad bij te staan.
Professor doctor Taeymans ben ik erkentelijk voor de originele manier waarop
hij de min- en plus-punten van statische analyses aanbracht.
Mijn collega’s, Dirk, Martin, Daniel, Patrick en Kurt, ben ik dankbaar voor het
klankbord dat zij mij boden gedurende de vele discussies, waardoor mijn
gedachten zich konden ordenen en ik misstappen tot een minimum kon
beperken. Ook hun bereidheid om een deel van mijn klinische taken over te
nemen wanneer ik met experimenten bezig was heb ik ten zeerste weten te
waarderen.
Mijn paranimfen, Dirk en Ton, waren het peper en het zout. Zij zorgden voor
de broodnodige structuur, terwijl hun optimisme en humor de meest efficiënte
medicamenten waren tegen zwartgalligheid.
Naast hen die ik speciaal vernoemd heb, zijn er nog vele anderen wie ik
erkentelijkheid verschuldigd ben en die ik bij deze hartelijk wil danken.
Ondanks al deze hulp denk ik niet dat ik dit werk had kunnen voltooien zonder
de liefde en morele steun van Caroline en Casper. Ik dank hen voor het
begrip en de zelfopoffering die zij zo lange tijd hebben opgebracht en ik wil dit
werk dan ook heel speciaal aan hen opdragen.
Als laatste, maar zeker niet als minste wil ik ook mijn ouders vermelden. Dank
zij hun opvoeding en de mogelijkheden die zij me gegeven hebben ben ik tot
dit punt geraakt.

Curriculum vitae
317
Curriculum vitae
De schrijver van dit proefschrift werd geboren op 10 mei 1960 te Aalst, België.
In 1978 haalde hij het getuigschrift van Hoger Secundair Onderwijs, richting
Latijn-wetenschappen, evenals het bekwaamheidsdiploma dat toegang
verleent tot het Hoger Onderwijs aan het Sint Jozefcollege te Aalst.
Aansluitend, volgde hij de opleiding tot gegradueerde verpleegkundige aan
het Sint Augustinusinstituut, eveneens te Aalst, alwaar hij afstudeerde in
1981. In 1990 beëindigde hij het postgraduaats Opleidingsprogramma voor
perfusionist aan de Universitaire Ziekenhuizen Leuven en bekwam hij het
getuigschrift “Erkend Klinisch Perfusionist” (EKP) van de Belgische
Vereniging voor Extracorporale Technologie (BelSECT). Dit werd aangevuld
met een European Certificate in Cardiovascular Perfusion in 1995, uitgereikt
door de European Board of Cardiovascular Perfusion (ECCP).
Na een kort verblijf als verantwoordelijke voor peritoneaal dialyse in het OLV
ziekenhuis te Aalst, start hij in 1981, in hetzelfde ziekenhuis, zijn loopbaan als
perfusionist. In 1988 wordt hij ad interim hoofdperfusionist in het Academisch
Ziekenhuis van de Vrije Universiteit Brussel (VUB). Sinds 1989 tot heden is hij
hoofdperfusionist in het Universitair Ziekenhuis Gent.
Hiernaast fungeert hij als gastdocent in de Katholieke Hogeschool Sint
Lieven, in de “Postgraduaatsopleiding tot perfusionist” van de Universitaire
Ziekenhuizen Leuven en in het Institute for Biomedical Technology (IBITECH)
van de Universiteit Gent.