Status Paper -Ganga
38
STATUS PAPER ON RIVER State of Environment and Water National River Conservation Director Minis try of Environme nt and Fores xa xk ls ok Hkkjr ls ok xkls ok k kj r l s ok
Transcript of Status Paper -Ganga
8/13/2019 Status Paper -Ganga
http://slidepdf.com/reader/full/status-paper-ganga 1/38
STATUS P
State of
NationaMinist
8/13/2019 Status Paper -Ganga
http://slidepdf.com/reader/full/status-paper-ganga 2/38
STATUS PAPER ON RIVER GANGA
State of Environment and Water Quality
National River Conservation DirectorateMinistry of Environment and Forests
Government of India
August, 2009
Alternate Hydro Energy CentreIndian Institute of Technology Roorkee
lR;eso t;rs eso t r

8/13/2019 Status Paper -Ganga
http://slidepdf.com/reader/full/status-paper-ganga 3/38
Disclaimer
Every possible care has been taken to ensure thatthe data used in this paper are correct, consistentand complete as far as possible. Constraints of available time and resources, however, do not
preclude the possibility of errors, omissions etc. inthe data and consequently in their use in the paper.Contents of this paper can be used freely.
8/13/2019 Status Paper -Ganga
http://slidepdf.com/reader/full/status-paper-ganga 4/38
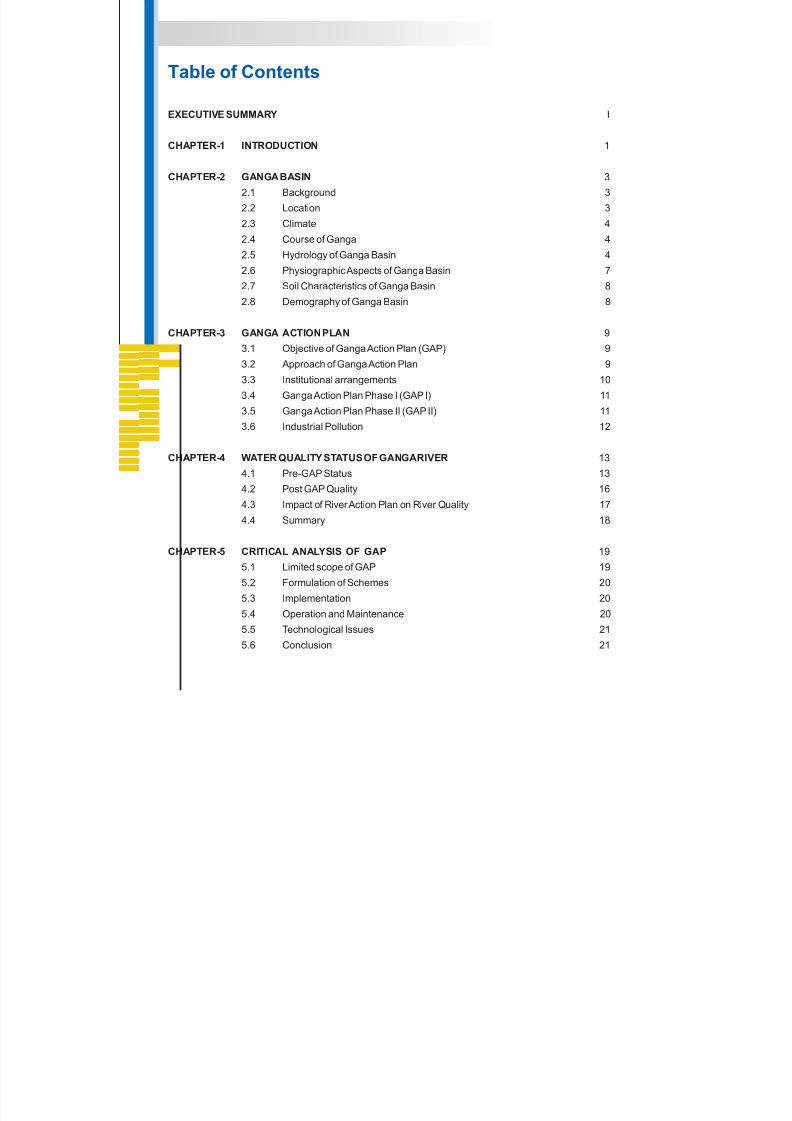
Table of Contents
EXECUTIVE SUMMARY
CHAPTER-1 INTRODUCTION
CHAPTER-2 GANGA BASIN
CHAPTER-3 GANGA ACTION PLAN
CHAPTER-4 WATER QUALITY STATUS OF GANGARIVER
CHAPTER-5 CRITICAL ANALYSIS OF GAP
I
1
3
2.1 Background 3
2.2 Location 3
2.3 Climate 4
2.4 Course of Ganga 4
2.5 Hydrology of Ganga Basin 4
2.6 Physiographic Aspects of Ganga Basin 7
2.7 Soil Characteristics of Ganga Basin 8
2.8 Demography of Ganga Basin 8
9
3.1 Objective of Ganga Action Plan (GAP) 9
3.2 Approach of Ganga Action Plan 9
3.3 Institutional arrangements 10
3.4 Ganga Action Plan Phase I (GAP I) 11
3.5 Ganga Action Plan Phase II (GAP II) 113.6 Industrial Pollution 12
13
4.1 Pre-GAP Status 13
4.2 Post GAP Quality 16
4.3 Impact of River Action Plan on River Quality 17
4.4 Summary 18
195.1 Limited scope of GAP 19
5.2 Formulation of Schemes 20
5.3 Implementation 20
5.4 Operation and Maintenance 20
5.5 Technological Issues 21
5.6 Conclusion 21
8/13/2019 Status Paper -Ganga
http://slidepdf.com/reader/full/status-paper-ganga 5/38
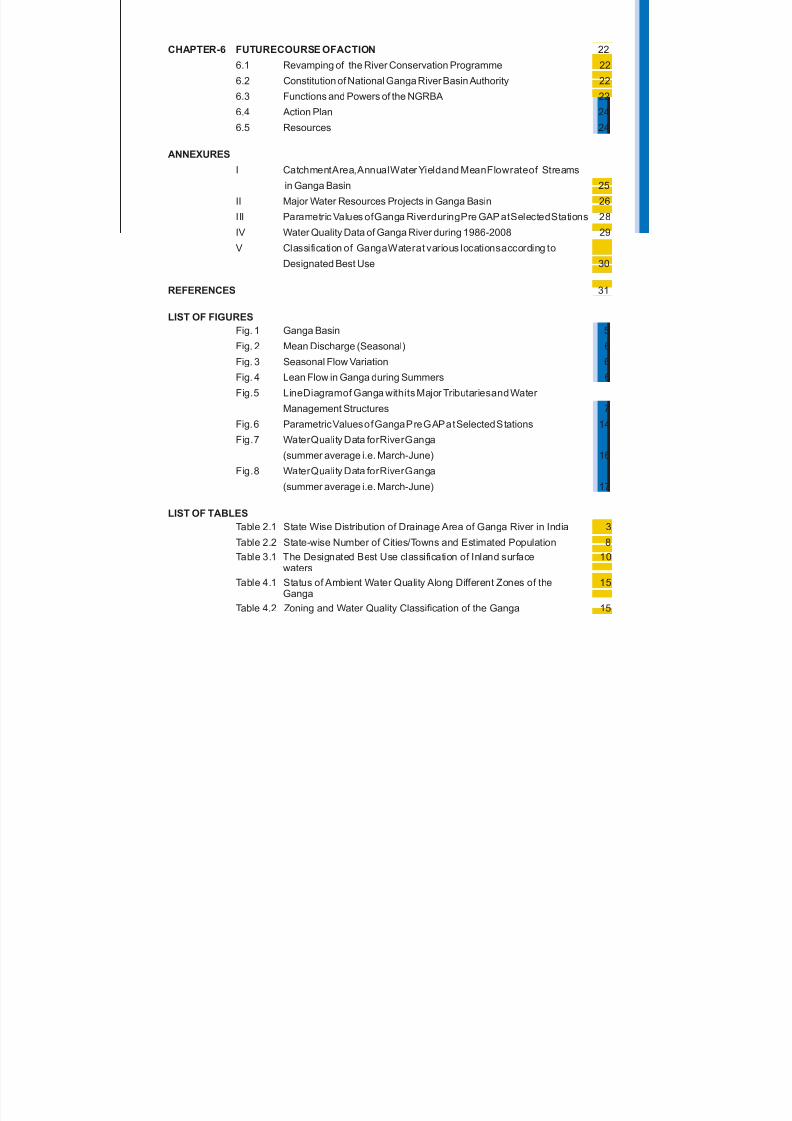
CHAPTER-6 FUTURECOURSE OFACTION
REFERENCES
LIST OF FIGURES
22
6.1 Revamping of the River Conservation Programme 22
6.2 Constitution of National Ganga River Basin Authority 22
6.3 Functions and Powers of the NGRBA 22
6.4 Action Plan 24
6.5 Resources 24
31
Fig. 1 Ganga Basin 5
(summer average i.e. March-June) 16
(summer average i.e. March-June) 17
ANNEXURES
LIST OF TABLES
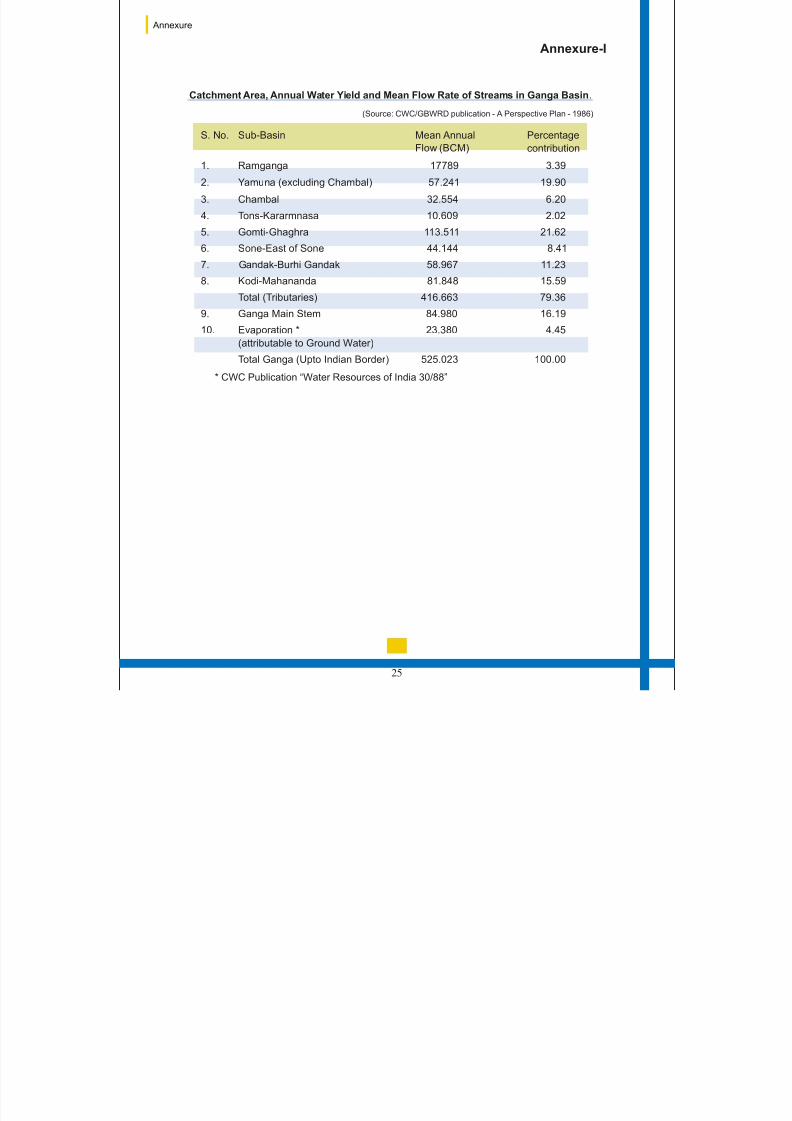
I CatchmentArea,AnnualWater Yieldand MeanFlowrateof Streams
in Ganga Basin 25
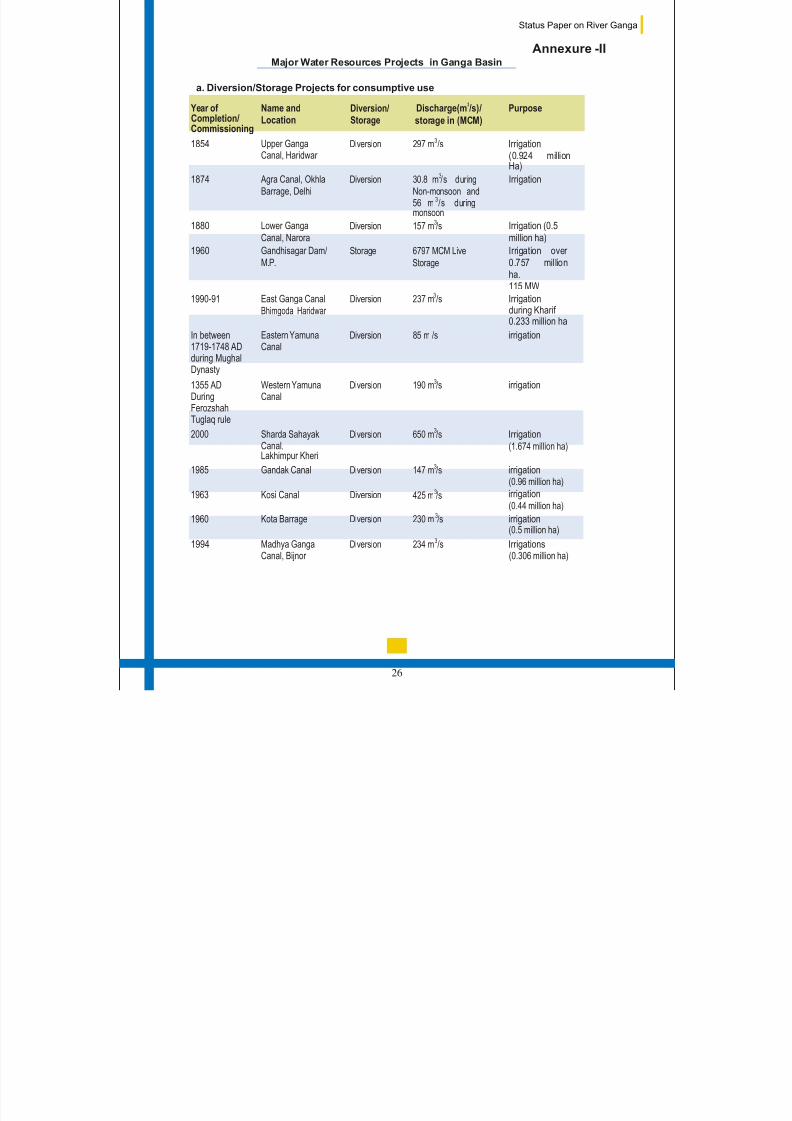
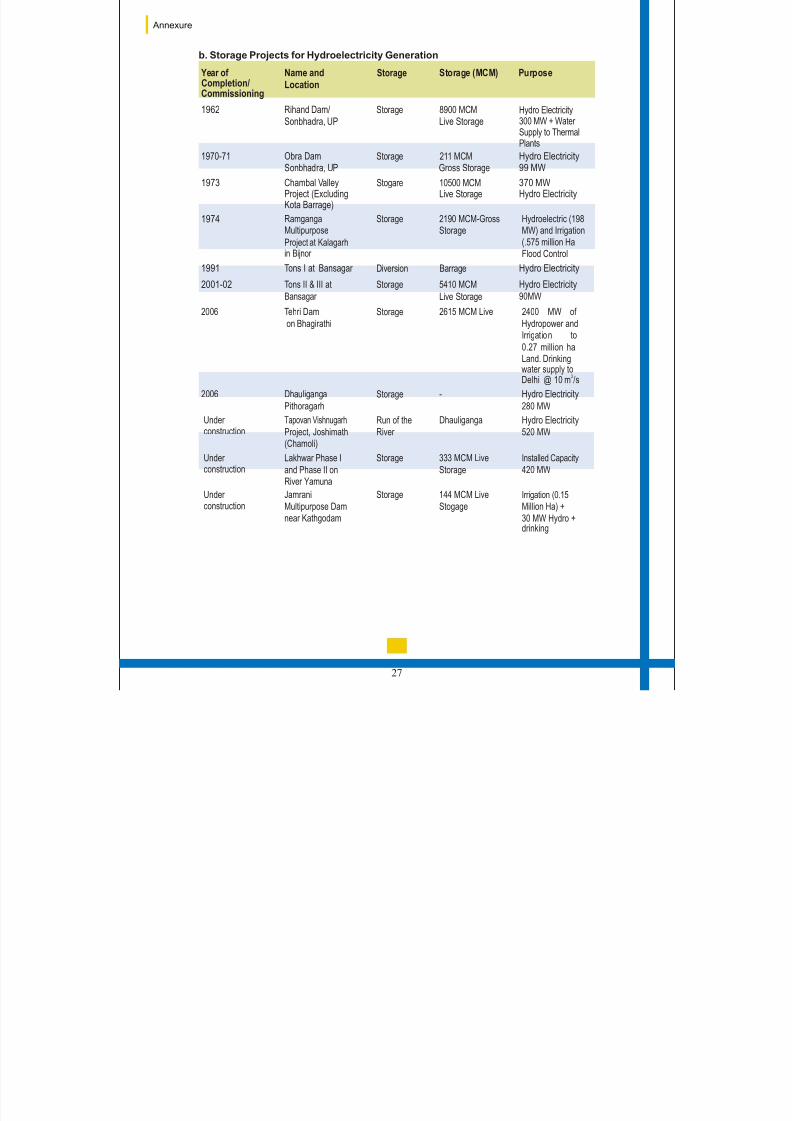
II Major Water Resources Projects in Ganga Basin 26
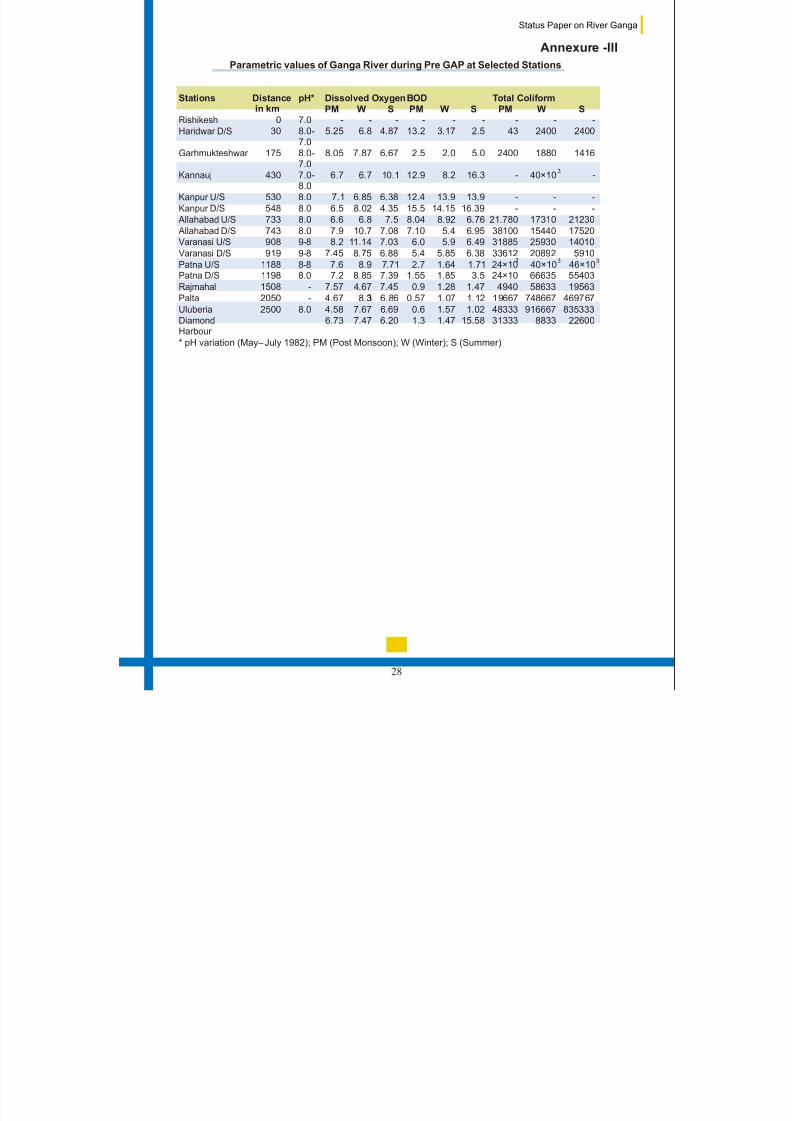
III Parametric Values ofGanga RiverduringPre GAP atSelectedStations 28
IV Water Quality Data of Ganga River during 1986-2008 29
V Classification of GangaWaterat various locationsaccording to
Designated Best Use 30
Fig. 2 Mean Discharge (Seasonal) 6
Fig. 3 Seasonal Flow Variation 6
Fig. 4 Lean Flow in Ganga during Summers 6
Fig.5 LineDiagramof Ganga withits Major Tributariesand Water
Management Structures 7
Fig. 6 Parametric Values o f Ganga P re G AP a t Selected S tations 14
Fig.7 WaterQuality Data forRiverGanga
Fig.8 WaterQuality Data forRiverGanga
Table 2.2 State-wise Number of Cities/Towns and Estimated Population 8
Table 3.1 The Designated Best Use classification of Inland surface 10waters
Table 4.1 Status of Ambient Water Quality Along Different Zones of the 15Ganga
Table 4.2 Zoning and Water Quality Classification of the Ganga 15
Table 2.1 State Wise Distribution of Drainage Area of Ganga River in India 3
8/13/2019 Status Paper -Ganga
http://slidepdf.com/reader/full/status-paper-ganga 6/38
1.0 INTRODUCTION
India is endowed with rich water resources.
Approximately 45,000 km long riverine systems
criss-cross the length and breadth of the country.
major 46 medium river
basins
extending over
the states of Uttarakhand, Uttar Pradesh, Haryana,Himachal Pradesh, Delhi, Bihar, Jharkhand,
Rajasthan, Madhya Pradesh, Chhattisgarh and
West Bengal.
Rapidly increasing population, rising standards of
living and exponential growth of industrialization
and urbanisation have exposed the water
resources, in general, and rivers, in particular, to
various forms of degradation. Many Indian rivers,
including the Ganga in several stretches,particularly during lean flows, have become unfit
even for bathing. Realising that the rivers of the
country were in a serious state of degradation, a
beginning towards their restoration was made with
the launching of the Ganga Action Plan (GAP) in
1985.
Ganga drains a basin of extraordinary variation in
altitude, climate, land use and cropping pattern.
Ganga has been a cradle of human civilization
since time immemorial. It is one of the most sacred
rivers in the world and is deeply revered by the
people of this country.
India has 12 river basins,
and14 minor and desert river basins. Ganga
river basin is the largest of these,
2.0 GANGA BASIN
Executive Summary
i
The Ganga basin lies between East longitudes
73°30 and 89° 0 and North latitudes of 22°30 and
31°30, covering an area of 1,086,000 sq km,
extending over India, Nepal and Bangladesh. It has
a catchment area of 8,61,404 sq. km in India,
constituting 26% of the country's land mass and
supporting about 43% of population (448.3 million
as per 2001 census).
December
e potential of
s
, particularly in the
stretch between Kannauj andAllahbad
Ganga has many tributaries, both in the Himalayan
region before it enters the plains at Haridwar and
further downstream before its confluence with the
Bay of Bengal. -May are the lean flow
months. The surface water resourc
Ganga ha been assessed as 525 billion cubic
meters (BCM). Substantial abstraction of water for
various purposes including irrigation, power
generation and drinking water has impacted the
quantity of flows in the river
.
The Ganga Action Plan was launched in 1985 with
the objective of pollution abatement to improve the
water quality in the river. The programme included
261 schemes spread over 25 Class I towns of U.P.,
Bihar and West Bengal. The main focus of the Planwas on Interception & Diversion and treatment of
sewage generated from these identified towns. 34
Sewage Treatment Plants (STPs) with a treatment
capacity of 869 mld have been set up under the
Plan. GAP I was completed in March 2000 at a cost
of Rs. 452 crores.
3.0 GANGA ACTION PLAN (GAP)
8/13/2019 Status Paper -Ganga
http://slidepdf.com/reader/full/status-paper-ganga 7/38
ii
GAP II was started in 1993. It covers 59 towns
located along the river in the five states of
Uttarakhand, U.P, Jharkhand, Bihar and West
Bengal. 319 schemes have been taken up under
the Plan, out of which 200 have been completed.
An expenditure of Rs. 370.40 crore has been
incurred so far and sewage treatment capacity of 130mld has been created.
GAP II was expanded in 1996 into the National
River Conservation Plan (NRCP), which presently
covers polluted stretches of 36 rivers in 20 States in
the country.
The Ganga river water quality evaluated on the
basis of pollution indicators (DO, BOD and
coliform) indicates that dissolved oxygen levels
have improved in the main stem of Ganga. The
values are mostly above the recommended value
of 5.0 mg/l, except in the stretch between Kannauj
and Kanpur where values below 5.0 mg /l have
been noticed on several occasions. BOD values
are also within stipulated limits in the upper and
lower reaches of the Ganga but tend to be higher than 5.0 mg /l in the middle stretch from Kannauj to
Varanasi. This can be described as the critical
stretch.
The faecal coliform remains the only parameter on
which the observed values exceed the permissible
limits of 2500 MPN/100 ml at most places except in
the upper reaches up to Haridwar.
D es pi te t he p ro bl em s o f o pe ra ti on a nd
maintenance, the river water quality shows
discernible improvement (in terms of DO and BOD)
4.0 STATUS OF WATER QUALITY OFGANGA RIVER
over the pre-GAP period. This should be seen in
the background of a steep increase in population
with concomitant increase in organic pollution load.
The success of GAP has been in preventing further
deterioration of water quality, generally maintaining
it and improving it in some places, even though the
pollution load draining into the river has
substantially increased due to population growth,
rapid industrialization and urbanization. It can be
inferred that if the pollution abatement programme
had not been implemented there would have been
an inevitable deterioration in the quality of river
water posing threat to public health and ecology. A
positive outcome of the programme has been an
increased public awareness of the need to protect
our rivers.
Recognising the need to revamp the river
conservation strategy, the Central Government has
given Ganga the status of a 'National River' and has
set up the National Ganga River Basin Authority
(NGRBA) on 20 February 2009. It is anempowered planning, financing, monitoring and
coordinating Authority for effective abatement of
pollution and conservation of the river. The
Authority would adopt a comprehensive and
holistic approach for conserving the river Ganga
with river basin as the unit of planning. The
Authority would seek to maintain minimum
ecological flows besides implementing pollution
abatement activities.
5.0 CRITICALANALYSISOF GAP
6.0 FUTURECOURSE OFACTION
th
Status Paper on River Ganga
8/13/2019 Status Paper -Ganga
http://slidepdf.com/reader/full/status-paper-ganga 8/38
India is endowed with rich water resources.
Approximately 45,000 km long riverine systems
criss-cross the length and breadth of the country.
These rivers include Himalayan snow fed rivers,
peninsular rain fed rivers and coastal short rapids.
The total geographical area of 3.29 millon square
km of the country has been divided in to 12 major
river basins, 46 medium river basins and 14 minor
and desert river basins. The major river basinsaccount for 78% of total surface area and serve
80% of the population. The Ganga river basin is the
largest of these, extending over the states of
Uttarakhand, Uttar Pradesh, Haryana, Himachal
Pradesh, Delhi, Bihar, Jharkhand, Rajasthan,
Madhya Pradesh, Chhattisgarh and West Bengal.
Rapidly increasing population, rising standards of
living and exponential growth of industrialisation
and urbanisation have exposed the water resources, in general, and rivers, in particular, to
various forms of degradation. The deterioration in
the water quality of the river impacts the people
immediately. Many Indian rivers, including the
Ganga in some stretches, particularly during lean
flows, have become unfit even for bathing.
Realising that the rivers of the country were in a
serious state of degradation, a beginning towards
their restoration was made with the launching of theGanga Action Plan in 1985. It was envisaged as a
comprehensive programme of river conservation
with the objective of improving the water quality. It
was visualised that in due course, the programme
would be enlarged to cover other major rivers of the
country.
Introduction
1
In order to prepare such a major programme, an
exhaustive study
of the Ganga Basin arried by
the Central Pollution Control Board (CPCB). The
study covered all aspects of rivers in the Ganga
basin including water quality. The study pointed
out that besides pollution from municipal and
industrial wastes, non-point sources like run off
from rural settlements, pesticides from agricultural
fields, open defecation, dumping of carcasses
significantly contribute to
pollution of the river and render the water
unsuitable for its intended use.
Equally important is the issue of flow in the River.
Dams and barrages for storing and diverting water
for irrigation, domestic consumption and industry,
affect the flow, particularly during dry months. This
has serious implications for water quality and
aquatic life in the river.
The Ganga Action Plan Phase I (GAP I) was started
in 1985 to improve the water quality of river Ganga
to acceptable standards by preventing the pollution
load reaching the river. The main focus of the Plan
was on interception, diversion and treatment of
municipal sewage draining into the river, which
accounted for about 75% of river pollution.
Treatment capacity of 869 million liters per day
(MLD) was created in 25 Class-I towns in the three
States of Uttar Pradesh, Bihar and West Bengal. In
addition to the core works relating to sewerage and
sewage treatment, certain non-core works like
afforestation, crematoria, low cost sanitation and
river front development, were also taken up.
t itled “Assessment and
Development Study of River Basin Series”
(ADSORBS) was c out
and
disposal of dead bodies
01
8/13/2019 Status Paper -Ganga
http://slidepdf.com/reader/full/status-paper-ganga 9/38
2
Under GAP I, only a part of the pollution load of river
Ganga was addressed. Therefore, the Plan was
extended to GAP II, which was approved in stages
between 1993 and 1996. Besides Ganga, GAP II
included its major tributaries viz. Yamuna, Gomti
and Damodar. Subsequently, Mahananda wasalso added. 59 towns along the main stem of river
Status Paper on River Ganga
Ganga in the 5 States of Uttarakhand, UP, Biha
Jharkhand and West Bengal are covered under GA
II. A sewage treatment capacity of 130 MLD has bee
created under the Plan.
In response to demands from many States, the Gang
Action Plan was expanded in 1996 to the Nation
River Conservation Plan (NRCP) to include oth
rivers in the country. Presently polluted stretches of 3
rivers in 20 States are covered under NRCP.
8/13/2019 Status Paper -Ganga
http://slidepdf.com/reader/full/status-paper-ganga 10/38
2.1 BACKGROUND
The Himalayas are the source of three major Indian
rivers namely the Indus, the Ganga and the
B ra hm ap ut ra . G an ga d ra in s a b as in o f
extraordinary variation in altitude, climate, land
use, flora and fauna, social and cultural life.
Ganga has been a cradle of human civilizationsince time immemorial. Millions depend on this
great river for physical and spiritual sustenance.
People have immense faith in the powers of healing
andregeneration of the Ganga. It is one of the most
sacred rivers in the world and is deeply revered by
the people of this country. The River plays a vital
role in religious ceremonies and rituals. To bathe in
Ganga is a lifelong ambition of many who
congregate in large numbers for several river
Ganga Basin
3
centered festivals such as Kumbh Mela and
numerous Snan (bath) festivals.
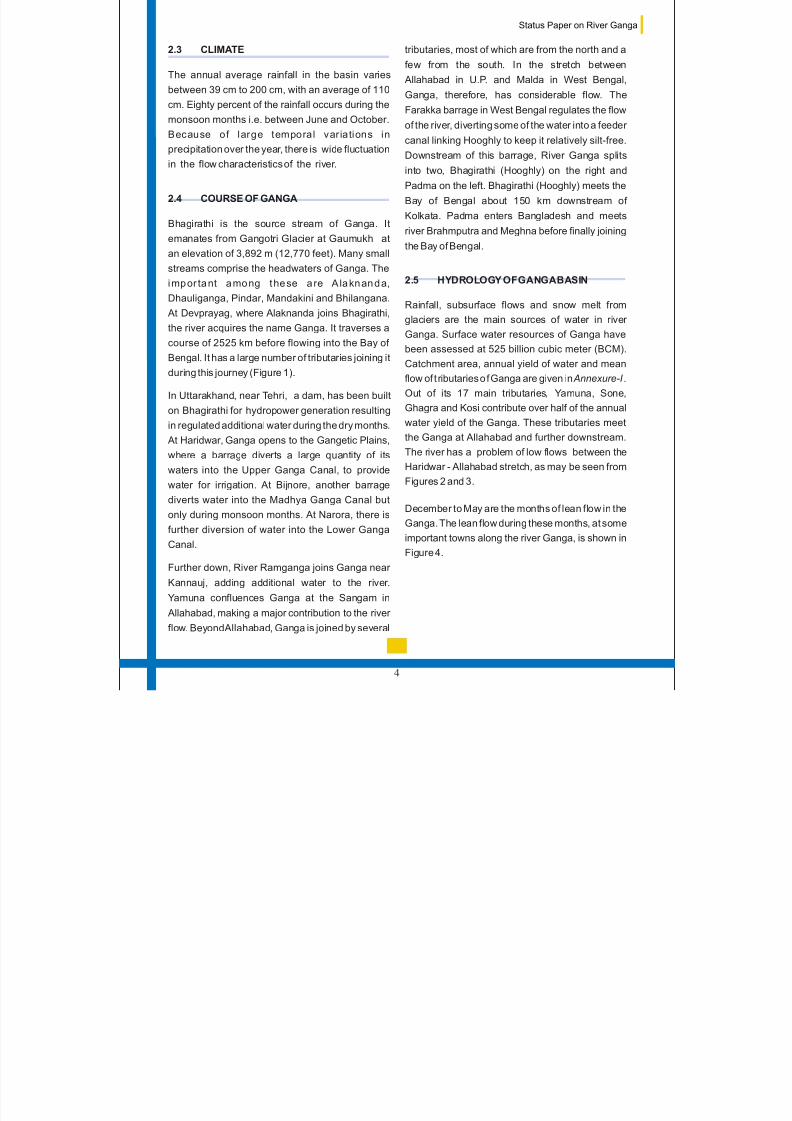
Ganga basin is the largest river basin in India in
terms of catchment area, constituting 26% of the
country's land mass (8,61,404 Sq. km) and
supporting about 43% of its population (448.3
million as per 2001 census). The basin lies
between East longitudes 73°30and 89° 0 and North
latitudes of 22°30 and 31°30, covering an area of
1,086,000 sq km, extending over India, Nepal and
Bangladesh. About 79% area of Ganga basin is in
India. The basin covers 11 states viz., Uttarakhand,
U.P., M.P., Rajasthan, Haryana, Himachal
Pradesh, Chhattisgarh, Jharkhand, Bihar, West
Bengal and Delhi. The drainage area in each state
is given in Table 2.1.
2.2 LOCATION
02
Table 2.1: State Wise Distribution of Drainage Area of the Ganga River in India
State
Total
Uttarakhand and Uttar Pradesh
Madhya Pradesh and Chhattisgarh
Bihar and Jharkhand
Rajasthan
West Bengal
Haryana
Himachal Pradesh
Delhi
Drainage area (km )
861,404
2
294,364
198,962
143,961
112,490
71,485
34,341
4,317
1,484
(Source: CWC publication no. 50/89 “Major River Basins of India - An Overview” - April 1989)
8/13/2019 Status Paper -Ganga
http://slidepdf.com/reader/full/status-paper-ganga 11/38
4
2.3 CLIMATE
2.4 COURSE OF GANGA
The annual average rainfall in the basin varies
between 39 cm to 200 cm, with an average of 110
cm. Eighty percent of the rainfall occurs during the
monsoon months i.e. between June and October.
B ec au se o f l ar g e t em po ra l v ar ia ti on s i nprecipitation over the year, there is wide fluctuation
in the flow characteristics of the river.
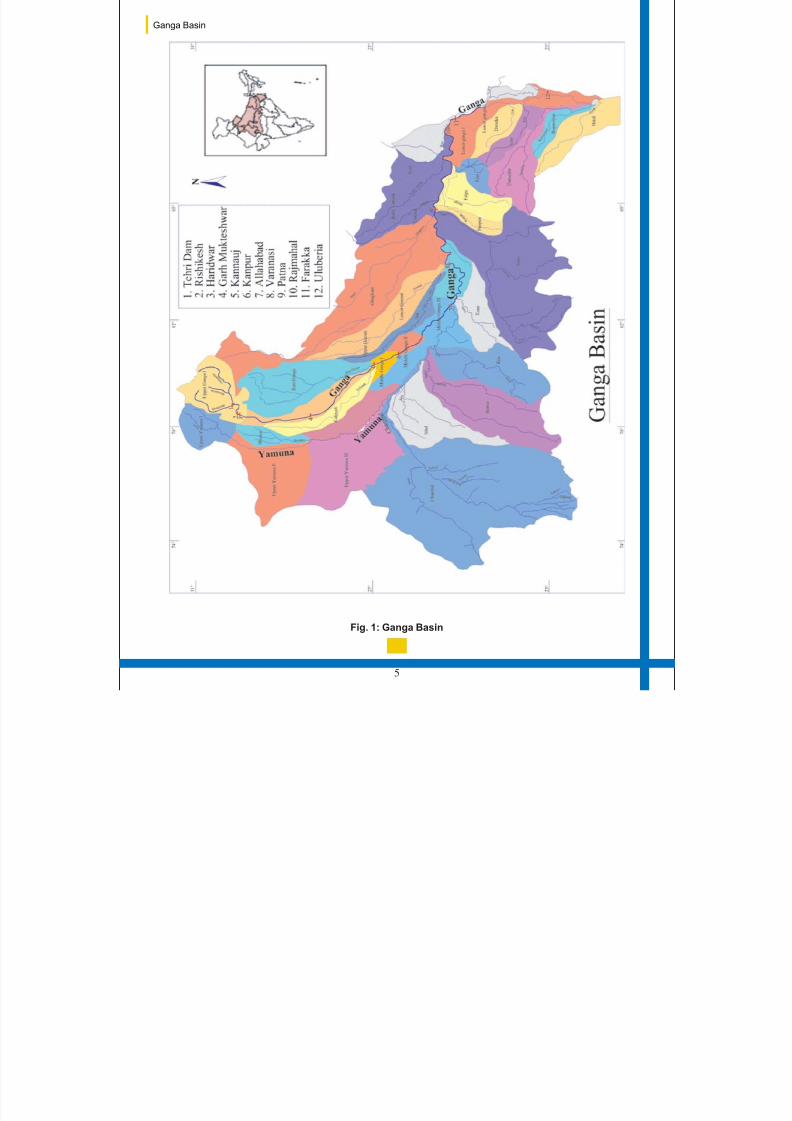
Bhagirathi is the source stream of Ganga. It
emanates from Gangotri Glacier at Gaumukh at
an elevation of 3,892 m (12,770 feet). Many small
streams comprise the headwaters of Ganga. The
i mp or ta nt a mo ng t he se a re A la kn an d a,
Dhauliganga, Pindar, Mandakini and Bhilangana.
At Devprayag, where Alaknanda joins Bhagirathi,
the river acquires the name Ganga. It traverses a
course of 2525 km before flowing into the Bay of
Bengal. It has a large number of tributaries joining it
during this journey (Figure 1).
In Uttarakhand, near Tehri, a dam, has been built
on Bhagirathi for hydropower generation resultingin regulated additional water during the dry months.
At Haridwar, Ganga opens to the Gangetic Plains,
where a barrage diverts a large quantity of its
waters into the Upper Ganga Canal, to provide
water for irrigation. At Bijnore, another barrage
diverts water into the Madhya Ganga Canal but
only during monsoon months. At Narora, there is
further diversion of water into the Lower Ganga
Canal.
Further down, River Ramganga joins Ganga near
Kannauj, adding additional water to the river.
Yamuna confluences Ganga at the Sangam in
Allahabad, making a major contribution to the river
flow. BeyondAllahabad, Ganga is joined by several
tributaries, most of which are from the north and a
few from the south. In the stretch between
Allahabad in U.P. and Malda in West Bengal,
Ganga, therefore, has considerable flow. The
Farakka barrage in West Bengal regulates the flow
of the river, diverting some of the water into a feeder
canal linking Hooghly to keep it relatively silt-free.
Downstream of this barrage, River Ganga splits
into two, Bhagirathi (Hooghly) on the right and
Padma on the left. Bhagirathi (Hooghly) meets the
Bay of Bengal about 150 km downstream of
Kolkata. Padma enters Bangladesh and meets
river Brahmputra and Meghna before finally joining
the Bay of Bengal.
2.5 HYDROLOGY OFGANGABASIN
Rainfall, subsurface flows and snow melt from
glaciers are the main sources of water in river
Ganga. Surface water resources of Ganga have
been assessed at 525 billion cubic meter (BCM).
Catchment area, annual yield of water and mean
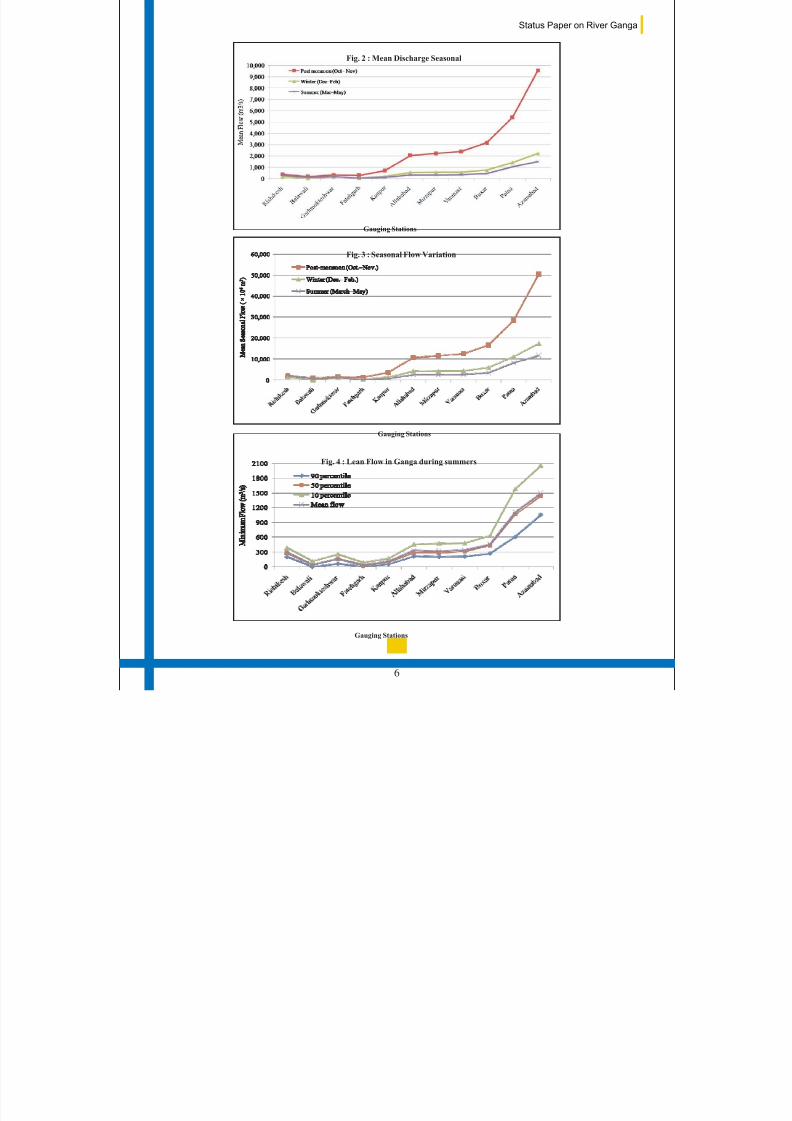
flow of t ributaries o f Ganga are given in .
Out of its 17 main tributaries Yamuna, Sone,
Ghagra and Kosi contribute over half of the annual
water yield of the Ganga. These tributaries meet
the Ganga at Allahabad and further downstream.
The river has a problem of low flows between the
Haridwar - Allahabad stretch, as may be seen from
Figures 2 and 3.
December to May are the months of lean flow in the
Ganga. The lean flow during these months, at some
important towns along the river Ganga, is shown in
Figure 4.
Annexure-I
,
Status Paper on River Ganga
8/13/2019 Status Paper -Ganga
http://slidepdf.com/reader/full/status-paper-ganga 12/38
5
Fig. 1: Ganga Basin
Ganga Basin
8/13/2019 Status Paper -Ganga
http://slidepdf.com/reader/full/status-paper-ganga 13/38
6
Gauging Stations
Gauging Stations
Fig. 2 : Mean Discharge Seasonal
Fig. 3 : Seasonal Flow Variation
Gauging Stations
Fig. 4 : Lean Flow in Ganga during summers
Status Paper on River Ganga
8/13/2019 Status Paper -Ganga
http://slidepdf.com/reader/full/status-paper-ganga 14/38
7
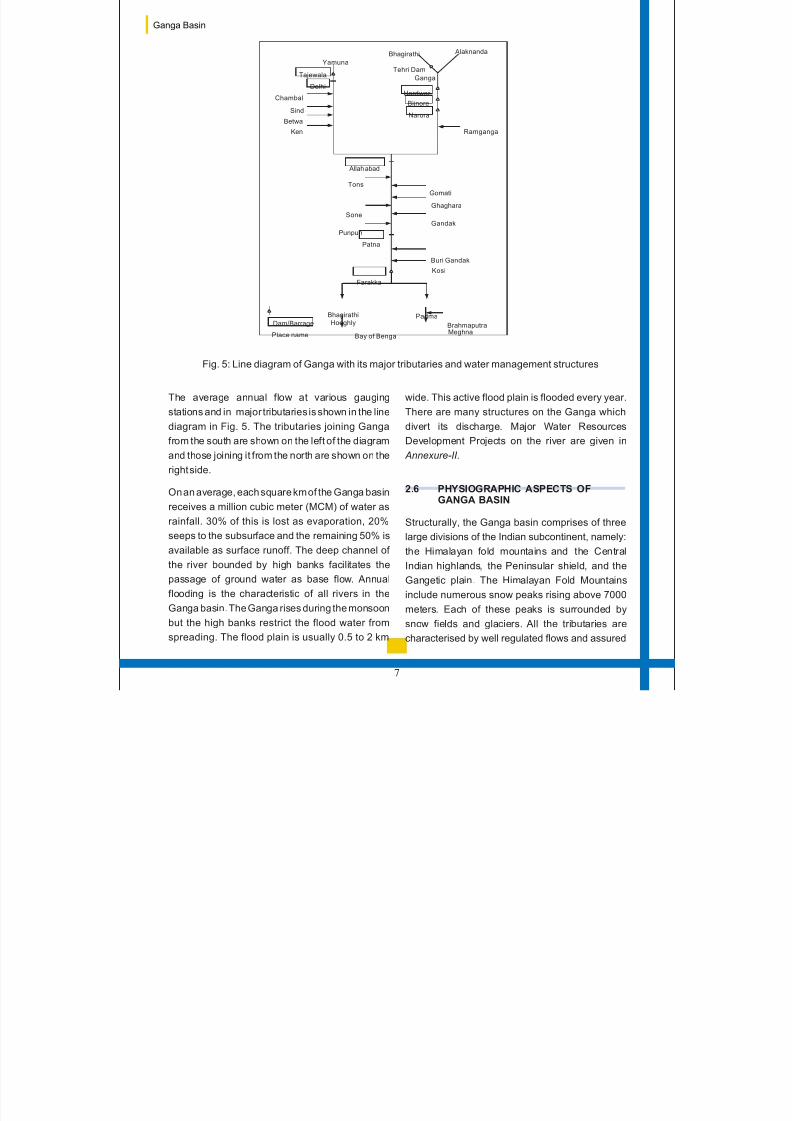
Fig. 5: Line diagram of Ganga with its major tributaries and water management structures
The average annual flow at various gauging
stations and in major tributaries is shown in the linediagram in Fig. 5. The tributaries joining Ganga
from the south are shown on the left of the diagram
and those joining it from the north are shown on the
right side.
On an average, each square km of the Ganga basin
receives a million cubic meter (MCM) of water as
rainfall. 30% of this is lost as evaporation, 20%
seeps to the subsurface and the remaining 50% is
available as surface runoff. The deep channel of the river bounded by high banks facilitates the
passage of ground water as base flow. Annual
flooding is the characteristic of all rivers in the
Ganga basin. The Ganga rises during the monsoon
but the high banks restrict the flood water from
spreading. The flood plain is usually 0.5 to 2 km
wide. This active flood plain is flooded every year.
There are many structures on the Ganga whichdivert its discharge. Major Water Resources
Development Projects on the river are given in
.
Structurally, the Ganga basin comprises of three
large divisions of the Indian subcontinent, namely:
the Himalayan fold mountains the CentralIndian highlands the Peninsular shield, and the
Gangetic plain. The Himalayan Fold Mountains
include numerous snow peaks rising above 7000
meters. Each of these peaks is surrounded by
snow fields and glaciers. All the tributaries are
characterised by well regulated flows and assured
Annexure-II
2.6 PHYSIOGRAPHIC ASPECTS OFGANGA BASIN
and,
Ganga Basin
Ramganga
Tehri DamYamuna
Chambal
Sind
Betwa
Ken
Tons
Sone
Punpun
Gomati
Ghaghara
Gandak
Buri Gandak
Kosi
Bhagirathi
HooghlyPadma
Brahmaputra
Delhi
Tajewala
Hardwar
Narora
Bhagirathi Alaknanda
Allah abad
Patna
Farakka
Ganga
Bijnore
MeghnaBay of BengalPlace name
Dam/Barrage

8/13/2019 Status Paper -Ganga
http://slidepdf.com/reader/full/status-paper-ganga 15/38
8
supply of water throughout the year. The Gangetic
plain, in which the main stem of Ganga lies,
consists of alluvial formation and is a vast flat
depositional surface at an elevation below 300
meters.
The Ganga basin consists of a wide variety of soils.
While soils of the high Himalayas in the north are
subject to continuous erosion, the Gangetic plain
provides a huge receptacle into which thousands of
meters of thick layers of sediments have been
deposited to form a wide valley plain. The Deccan
plateau in the south has a mantle of residual soils of
varying thickness arising out of weathering of ancient rocks of the peninsular shield. Some of the
soils are highly susceptible to erosion. Mountain
soils, submontane soils and alluvial soils, covering
58 % of the basin area, have very high erodibility;
red soils covering 12% of the basin area have high
erodibility, red & yellow soils and mixed red and
black soils covering an area of 8% have moderate
erodibility, and deep black soils and medium black
soils covering an area of 14% have low erodibility.
2.7 SOIL CHARACTERISTICS OFGANGA BASIN
Shallow black soils and lateritic soils covering an
area of 6% have very low erodibility.
Broadly, it can be said that soils in Haryana,
Uttarakhand, Uttar Pradesh, Bihar, Jharkhand and
West Bengal, through which the main stem of
Ganga and all its tributaries flow, have very high
erodibility.
Demography has an important bearing on the state
of the river as it is significantly affected by the
population living within the basin. Average
population density in the Ganga basin is 520
persons per square km as against 312 for the entire
country (2001 census). Major cities of Delhi,Kolkata, Kanpur, Lucknow, Patna, Agra, Meerut,
Varanasi and Allahabad are situated in the basin.
The cities in the basin have large and growing
populations and a rapidly expanding industrial
base. The summary of urban population in the
basin is given in Table 2.2. It can be seen that
between 1991 and 2001, urban population
increased by 32%. This trend is likely to continue.
The pollution load is also expected to increase
correspondingly.
2.8 DEMOGRAPHYOF GANGA BASIN
Table 2.2: State-wise Number of Cities/Towns and Estimated Population
S. No State No of towns/cities
Urban population
1991 20011. Bihar
(including Jharkhand)130 6,715,096 8,681,800
2. Haryana 106 4,054,744 6,115,304
3. Himachal Pradesh 57 449,196 595,581
4. Madhya Pradesh( including Chhattisgarh)
394 12,152,967 15,967,145
5. Rajasthan 222 10,077,371 13,200,000
6. Uttar Pradesh 704 27,544,233 34,539,582
7. Uttarakhand 86 2,179,074
8. West Bengal 373 18,707,601 22,427,251
9. Delhi 1 8,471,625 12,905,780
Total 2073 88,172,833 116,611,517
Status Paper on River Ganga
8/13/2019 Status Paper -Ganga
http://slidepdf.com/reader/full/status-paper-ganga 16/38
To prevent the pollution of river Ganga and to
improve its water quality, an Action Plan known as
Ganga Action Plan was formulated in the year 1984
on the basis of a comprehensive survey of the
Ganga Basin carried out by the Central Pollution
C on tr ol B oa rd u nd er " As se ss me nt a nd
Development Study of River Basin Series
(ADSORB)".
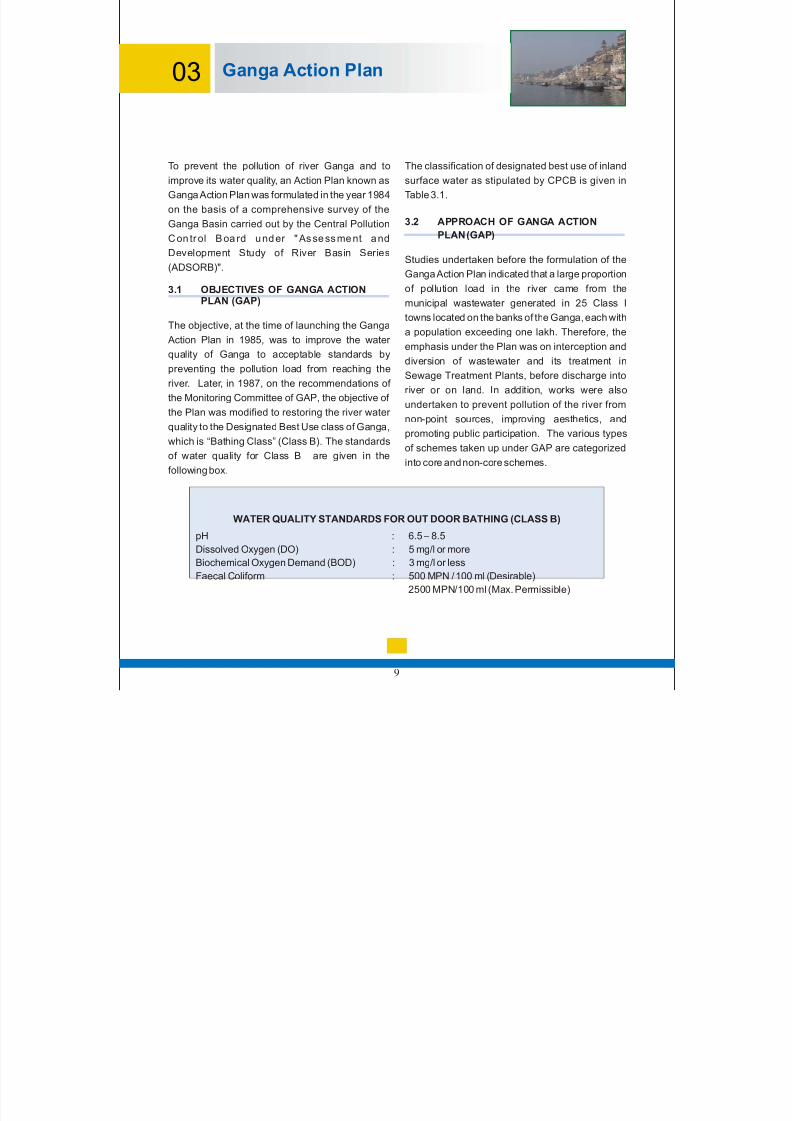
The objective, at the time of launching the Ganga
Action Plan in 1985, was to improve the water
quality of Ganga to acceptable standards by
preventing the pollution load from reaching the
river. Later, in 1987, on the recommendations of
the Monitoring Committee of GAP, the objective of
the Plan was modified to restoring the river water quality to the Designated Best Use class of Ganga,
which is “Bathing Class” (Class B). The standards
of water quality for Class B are given in the
following box.
3.1 OBJECTIVES OF GANGA ACTIONPLAN (GAP)
Ganga Action Plan
9
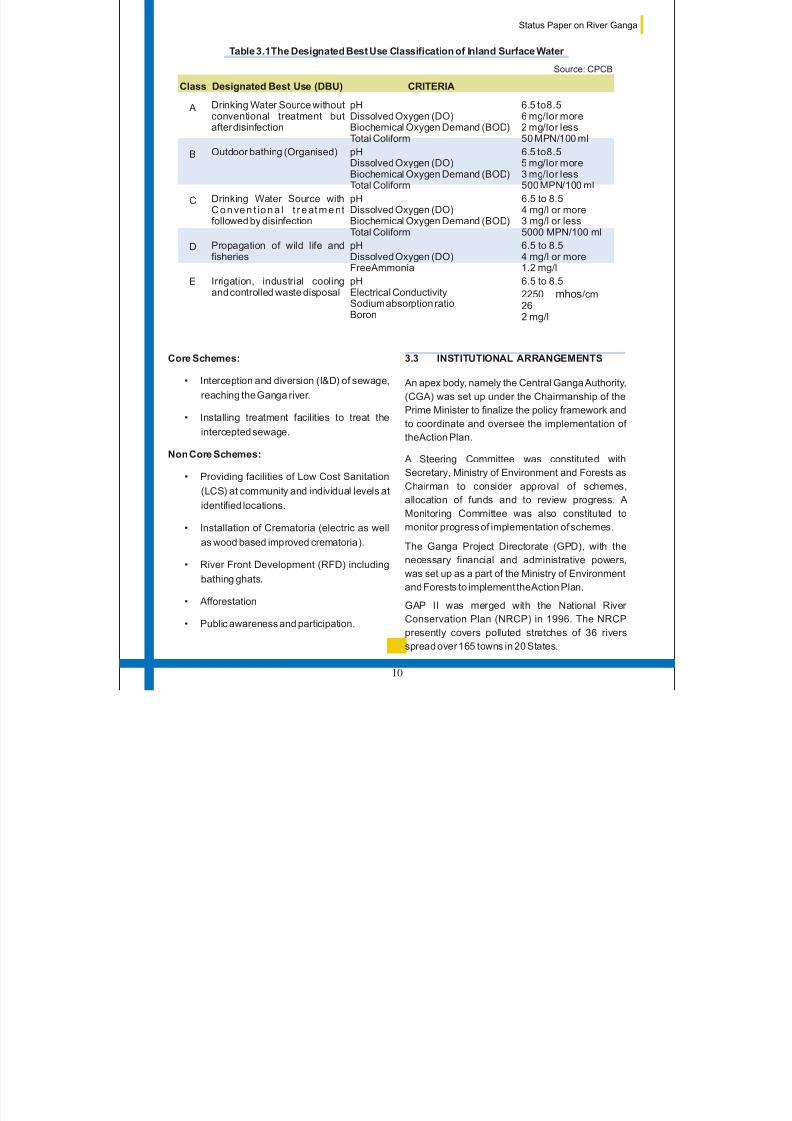
The classification of designated best use of inland
surface water as stipulated by CPCB is given in
Table 3.1.
Studies undertaken before the formulation of the
Ganga Action Plan indicated that a large proportionof pollution load in the river came from the
municipal wastewater generated in 25 Class I
towns located on the banks of the Ganga, each with
a population exceeding one lakh. Therefore, the
emphasis under the Plan was on interception and
diversion of wastewater and its treatment in
Sewage Treatment Plants, before discharge into
river or on land. In addition, works were also
undertaken to prevent pollution of the river from
non-point sources, improving aesthetics, and
promoting public participation. The various types
of schemes taken up under GAP are categorized
into core and non-core schemes.
3.2 APPROACH OF GANGA ACTION
PLAN (GAP)
03
pH : 6.5 – 8.5
Dissolved Oxygen (DO) : 5 mg/l or moreBiochemical Oxygen Demand (BOD) : 3 mg/l or less
Faecal Coliform : 500 MPN / 100 ml (Desirable)
2500 MPN/100 ml (Max. Permissible)
WATER QUALITY STANDARDS FOR OUT DOOR BATHING (CLASS B)
8/13/2019 Status Paper -Ganga
http://slidepdf.com/reader/full/status-paper-ganga 17/38
10
Table 3.1The Designated Best Use lassification of nlandC I Surface Water
Class Designated Best Use (DBU)
Drinking Water Source withoutconventional treatment butafter disinfection
Outdoor bathing (Organised)
Drinking Water Source withC o n ve n t io n a l t r e at m e ntfollowed by disinfection
Propagation of wild life andfisheries
Irrigation, industrial coolingand controlled waste disposal
pHDissolved Oxygen (DO)Biochemical Oxygen Demand (BOD)
Total ColiformpHDissolved Oxygen (DO)Biochemical Oxygen Demand (BOD)Total Coliform
pHDissolved Oxygen (DO)Biochemical Oxygen Demand (BOD)Total Coliform
pHDissolved Oxygen (DO)FreeAmmonia
pHElectrical ConductivitySodium absorption ratioBoron
Source: CPCB
6.5 to8.56 mg/lor more2 mg/lor less
50 MPN/100 ml6.5 to8.55 mg/lor more3 mg/lor less500 MPN/100 ml
6.5 to 8.54 mg/l or more3 mg/l or less5000 MPN/100 ml
6.5 to 8.54 mg/l or more1.2 mg/l
6.5 to 8.5
225262 mg/l
0 /cmmhos
A
B
C
D
E
CRITERIA
Core Schemes:
• Interception and diversion (I&D) of sewage,
reaching the Ganga river.
• Installing treatment facilities to treat the
intercepted sewage.
•
•
atoria
•
•
•
Non Core Schemes:
Providing facilities of Low Cost Sanitation
(LCS) at community and individual levels at
identified locations.
Installation of Crematoria (electric as well
as wood based improved crem ).
River Front Development (RFD) including
bathing ghats.
Afforestation
Public awareness and participation.
3.3 INSTITUTIONAL ARRANGEMENTS
An apex body, namely the Central Ganga Authority,
(CGA) was set up under the Chairmanship of the
Prime Minister to finalize the policy framework and
to coordinate and oversee the implementation of
theAction Plan.
A Steering Committee was constituted with
Secretary, Ministry of Environment and Forests as
Chairman to consider approval of schemes,
allocation of funds and to review progress. A
Monitoring Committee was also constituted to
monitor progress of implementation of schemes.
The Ganga Project Directorate (GPD), with the
necessary financial and administrative powers,
was set up as a part of the Ministry of Environment
and Forests to implement theAction Plan.
GAP II was merged with the National River
Conservation Plan (NRCP) in 1996. The NRCP
presently covers polluted stretches of 36 rivers
spread over 165 towns in 20 States.
Status Paper on River Ganga
8/13/2019 Status Paper -Ganga
http://slidepdf.com/reader/full/status-paper-ganga 18/38
11
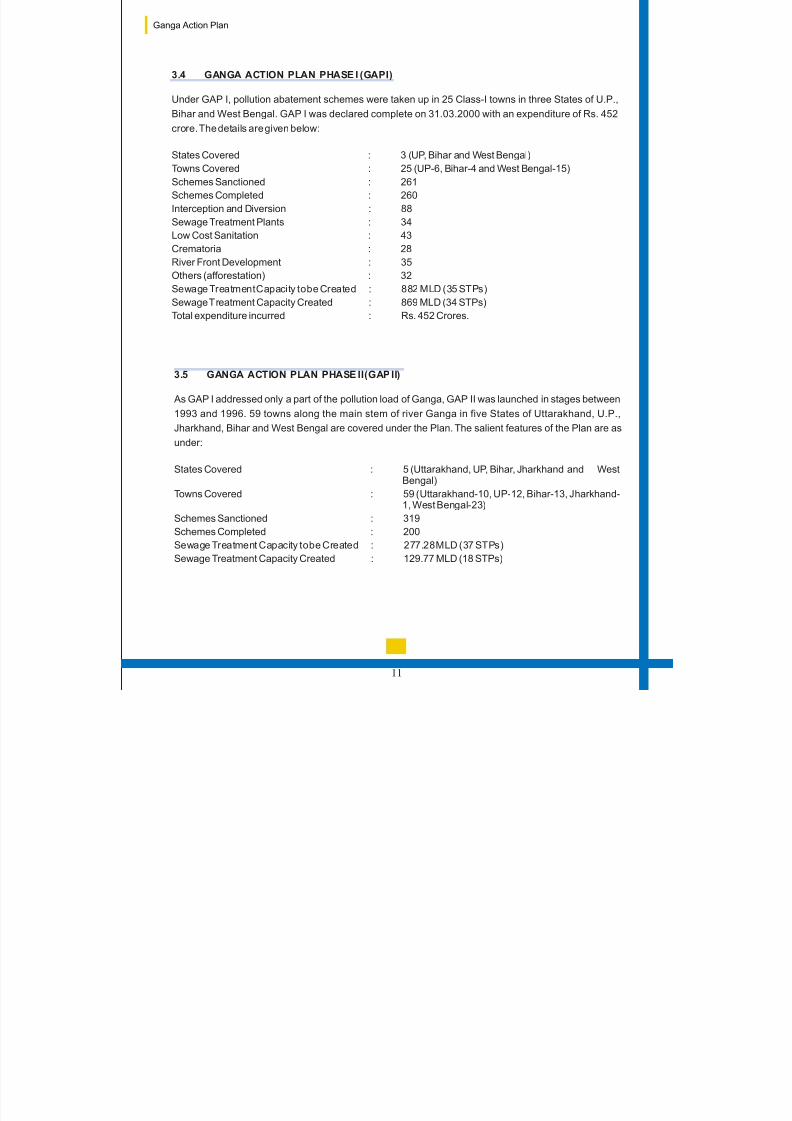
3.4 GANGA ACTION PLAN PHASE I (GAPI)
Under GAP I, pollution abatement schemes were taken up in 25 Class-I towns in three States of U.P.,
Bihar and West Bengal. GAP I was declared complete on 31.03.2000 with an expenditure of Rs. 452
crore. The details are given below:
States Covered : 3 (UP, Bihar and West Bengal)
Towns Covered : 25 (UP-6, Bihar-4 and West Bengal-15)
Schemes Sanctioned : 261
Schemes Completed : 260
Interception and Diversion : 88
Sewage Treatment Plants : 34
Low Cost Sanitation : 43
Crematoria : 28
River Front Development : 35
Others (afforestation) : 32Sewage TreatmentCapacity tobe Created : 882 MLD (35 STPs)
SewageTreatment Capacity Created : 869 MLD (34 STPs)
Total expenditure incurred : Rs. 452 Crores.
3.5 GANGA ACTION PLAN PHASE II(GAP II)
As GAP I addressed only a part of the pollution load of Ganga, GAP II was launched in stages between
1993 and 1996. 59 towns along the main stem of river Ganga in five States of Uttarakhand, U.P.,Jharkhand, Bihar and West Bengal are covered under the Plan. The salient features of the Plan are as
under:
States Covered : 5 (Uttarakhand, UP, Bihar, Jharkhand and WestBengal)
Towns Covered : 59 (Uttarakhand-10, UP-12, Bihar-13, Jharkhand-1, West Bengal-23)
Schemes Sanctioned : 319
Schemes Completed : 200
Sewage Treatment Capacity tobe Created : 277.28MLD (37 STPs)
Sewage Treatment Capacity Created : 129.77 MLD (18 STPs)
Ganga Action Plan
8/13/2019 Status Paper -Ganga
http://slidepdf.com/reader/full/status-paper-ganga 19/38
12
3.6 INDUSTRIALPOLLUTION
Though industrial pollution constitutes around 20%
of the total pollution load by volume, its contribution
to polluting the river Ganga is much greater, due to
the higher concentration of ollutants. This problem
was sought to be addressed by focusing on Grossly
Polluting Industries. Any industrial unit, discharging
into the river effluent having BOD load of 100
kg/day or more and/or is involved in the
p
,
manufacture and use of hazardous substances, is
classified as grossly polluting. Such units were
identified and asked to install Effluent Treatment
Plants.
Presently, 154 grossly polluting industrial units are
identified on the main stem of River Ganga. Of
these, 94 units have Effluent Treatment Plants
(ETPs) operating satisfactorily, 22 have ETPs but
they do not operate satisfactorily and 38 Units have
closed down. The total number of grossly polluting
units along river Ganga and its tributaries is 478. Of
these, 335 units have ETPs operating satisfactorily,
while in 64 units ETPs do not operate satisfactorily
and 79 units have been closed down.
Status Paper on River Ganga
8/13/2019 Status Paper -Ganga
http://slidepdf.com/reader/full/status-paper-ganga 20/38
Water quality monitoring is undertaken with the
objective of defining the status of water quality. It
also provides an idea of the trend in water quality. It
is a long term and standardized assessment. The
primary uses considered for such characterization
relate to drinking water, safety of human contact
and health of ecosystems.
Before the launching of GAP, a comprehensivestudy of water quality in Ganga River Basin was
undertaken by CPCB (at 39 stations between
Rishikesh and Diamond Harbour). Under GAP,
Water Quality Monitoring is a regular activity. This is
being done at 27 Monitoring Stations. Though 21
water quality parameters were identified by NRCD,
the emphasis is on parameters which indicate the
quality criteria for Designated Best Use viz. pH,
Dissolved Oxygen (DO), Biochemical Oxygen
Demand (BOD) and indictor bacteria coliform
(faecal coliform).
This monitoring is being carried out through
reputed scientific institutes/universities situated
along the river and having the necessary
infrastructure and capability to undertake this work.
Nine core parameters and site specific heavy
metals are monitored on a monthly basis.
Performance monitoring of sewage treatment
plants is also undertaken. A 'Protocol for Water
Quality Monitoring' notified by the Water Quality
Assessment Authority is being followed for
achieving uniformity in monitoring of surface &
ground water by all agencies in the country.
Water Quality Statusof Ganga River
13
The authenticity and reliability of water quality data
is ensured through an exercise of Analytical Quality
Control (AQC) with the help of Central Pollution
Control Board. A water quality monitoring bulletin is
published at regular intervals for information and
corrective measures.
During the pre-GAP period, DO values exhibited a
more or less stable pattern in Ganga. The average
values ranged between 6.8-7.2 mg/l. The values
were generally above 4.0 mg/l. Higher values were
recorded in winters at Haridwar, Allahabad,
Varanasi and Patna. There were only minor
fluctuations.
BOD depicts the pollution status of a stream and is
measured as oxygen equivalent of organic matter.
The values exhibited higher pollution level during
post monsoon months than in summers and
winters. The BOD levels were higher at Kannauj
and downstream upto Varanasi. The pattern of
variation, spatial and temporal, was not smooth.
Maximum values were recorded at Kanpur
downstream [15.5 mg/l, 14.15 mg/l, 16.39 mg/l
(post-monsoon, winter and summers)]. Minimum
values of less than 3 mg/l were recorded in the hilly
4.1 PRE-GAP STATUS
4.1.1 Dissolved Oxygen (DO)
4.1.2 Biochemical Oxygen Demand (BOD)
04
8/13/2019 Status Paper -Ganga
http://slidepdf.com/reader/full/status-paper-ganga 21/38
14
stretches and downstream of Patna, except at
Diamond Harbour where value of 15.58 mg/l was
recorded in summer.
The variation in total coliforms was 48333, 916667and 835333 MPN/100 ml (post monsoon, winter
and summer) at Uluberia with minimum levels at
Haridwar (43, 2400, ).As expected, the counts
4.1.3 Coliform
2400
were higher in summers compared to those in post-
monsoon and winter seasons.
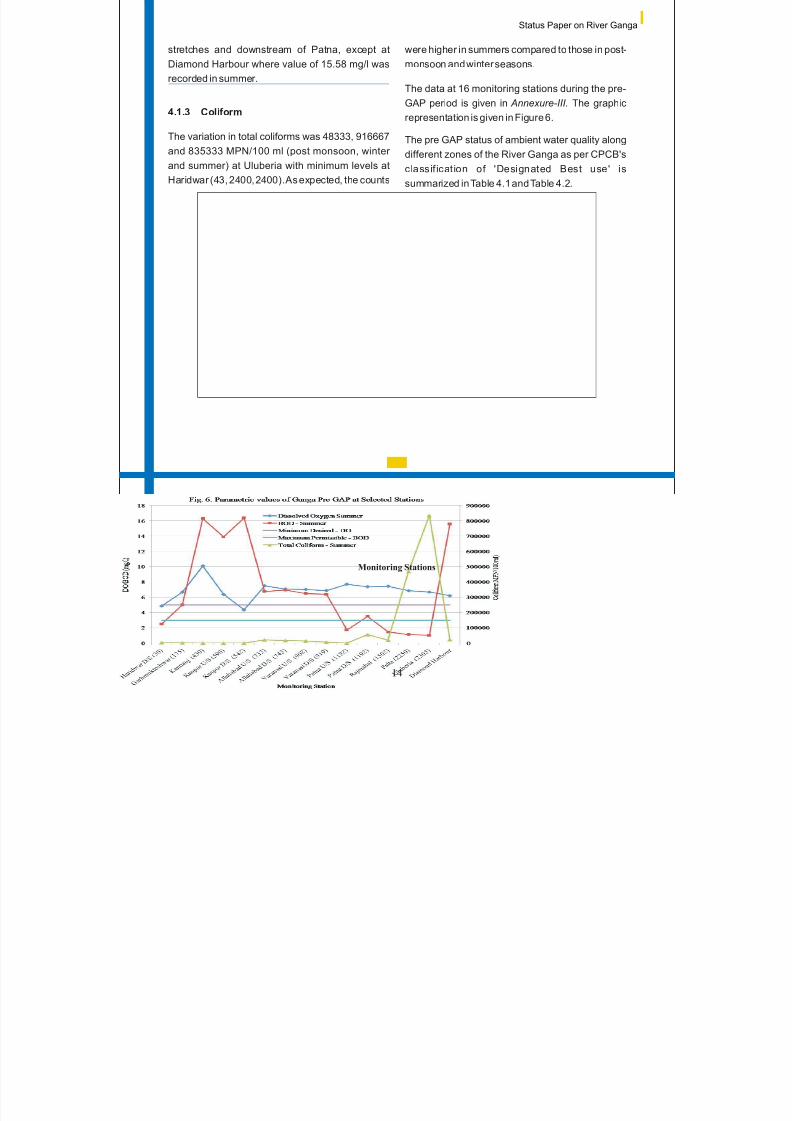
The data at 16 monitoring stations during the pre-
GAP period is given in The graphic
representation is given in Figure 6.
Annexure-III.
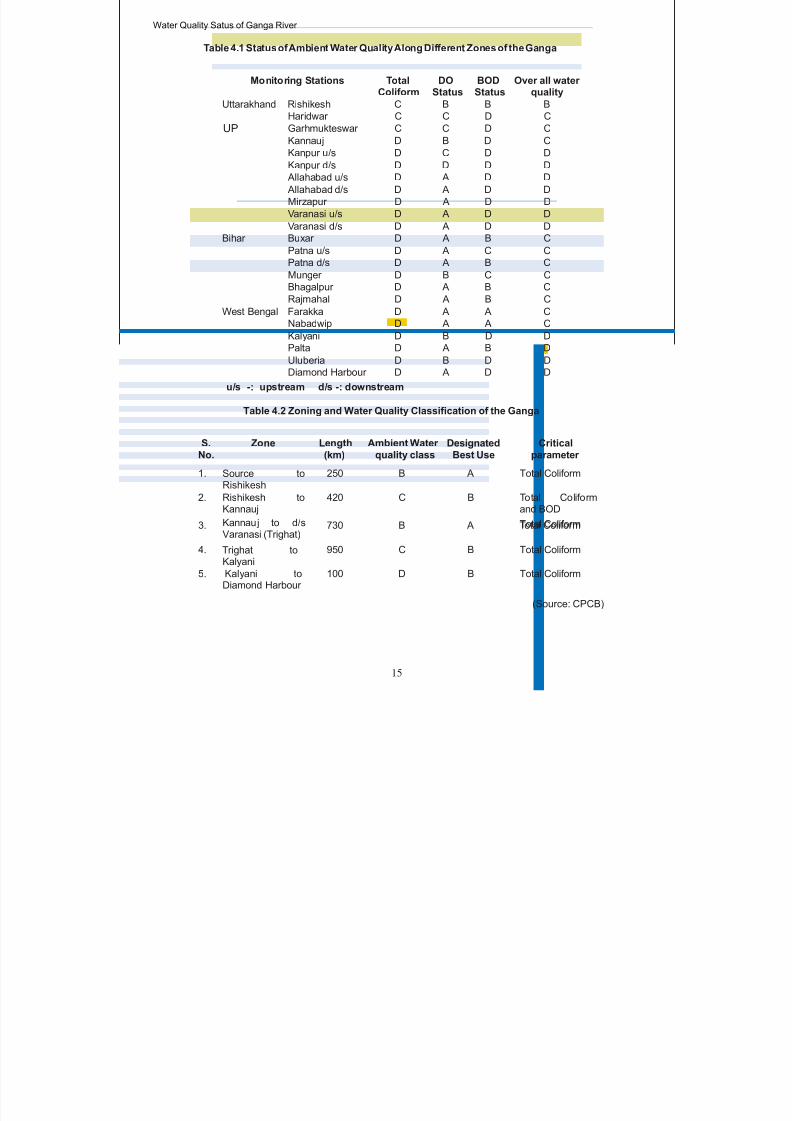
The pre GAP status of ambient water quality along
different zones of the River Ganga as per CPCB's
classif ication of 'Designated Best use' is
summarized in Table 4.1 and Table 4.2.
Monitoring Stations
Status Paper on River Ganga
8/13/2019 Status Paper -Ganga
http://slidepdf.com/reader/full/status-paper-ganga 22/38
15
Uttarakhand Rishikesh C B B B
Diamond Harbour D A D D
Monitoring Stations TotalColiform
DOStatus
BODStatus
Over all water quality
Table 4.2 Zoning and Water Quality Classification of the Ganga
S.No.
Zone Length(km)
Ambient Water quality class
DesignatedBest Use
Criticalparameter
1. Source toRishikesh
250 B A
2. Rishikesh toKannauj
420 C B
4. 950 C B
5. Kalyani toDiamond Harbour
100 D B
Total Coliform
Total Coliformand BOD
Total Coliform
Total Coliform
Total Coliform3. 730 B A Total ColiformKannauj to d/sVaranasi (Trighat)
Trighat toKalyani
Table 4.1 Status of Ambient Water Quality Along Different Zones of the Ganga
u/s -: upstream d/s -: downstream
(Source: CPCB)
Haridwar C C D C
Garhmukteswar C C D C
Kannauj D B D CKanpur u/s D C D D
Kanpur d/s D D D D
Allahabad u/s D A D D
Allahabad d/s D A D D
Mirzapur D A D D
Varanasi u/s D A D D
Varanasi d/s D A D D
Bihar Buxar D A B C
Patna u/s D A C C
Patna d/s D A B C
Munger D B C CBhagalpur D A B C
Rajmahal D A B C
West Bengal Farakka D A A C
Nabadwip D A A C
Kalyani D B D D
Palta D A B D
Uluberia D B D D
UP
Water Quality Satus of Ganga River
8/13/2019 Status Paper -Ganga
http://slidepdf.com/reader/full/status-paper-ganga 23/38
16
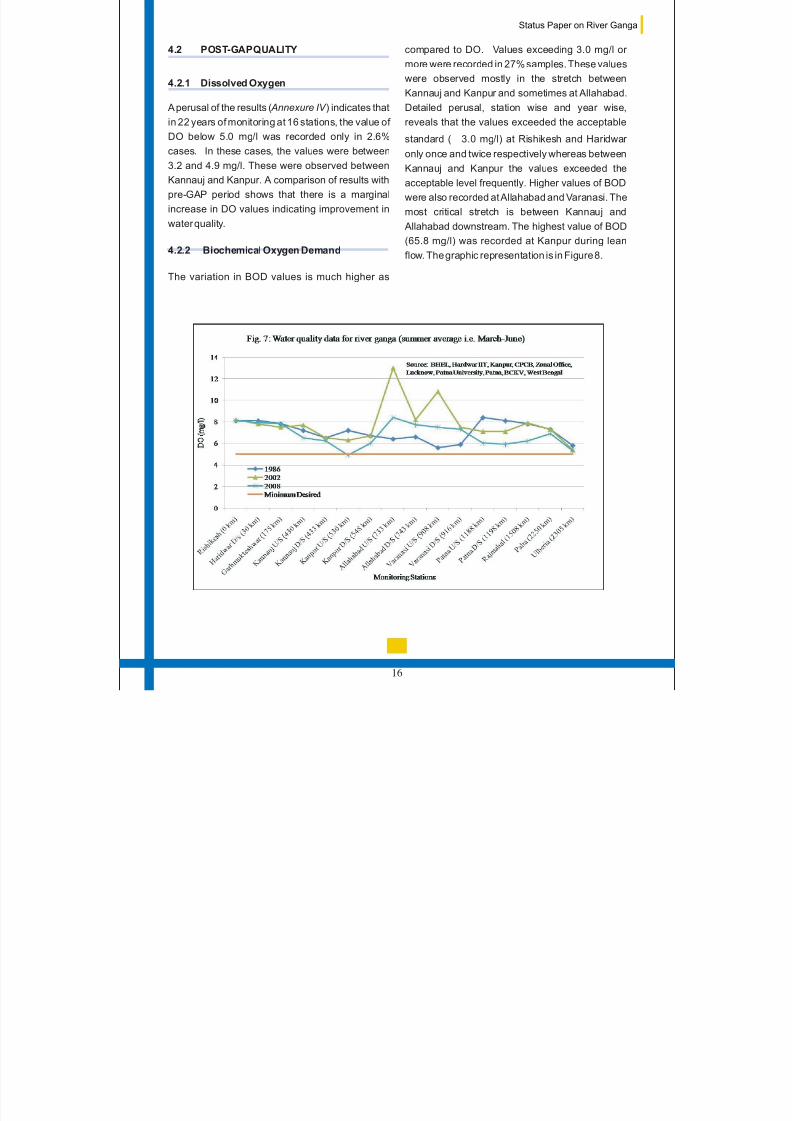
4.2 POST-GAPQUALITY
4.2.1 Dissolved Oxygen
A perusal of the results ( ) indicates that
in 22 years of monitoring at 16 stations, the value of
DO below 5.0 mg/l was recorded only in 2.6%cases. In these cases, the values were between
3.2 and 4.9 mg/l. These were observed between
Kannauj and Kanpur. A comparison of results with
pre-GAP period shows that there is a marginal
increase in DO values indicating improvement in
water quality
Annexure IV
.
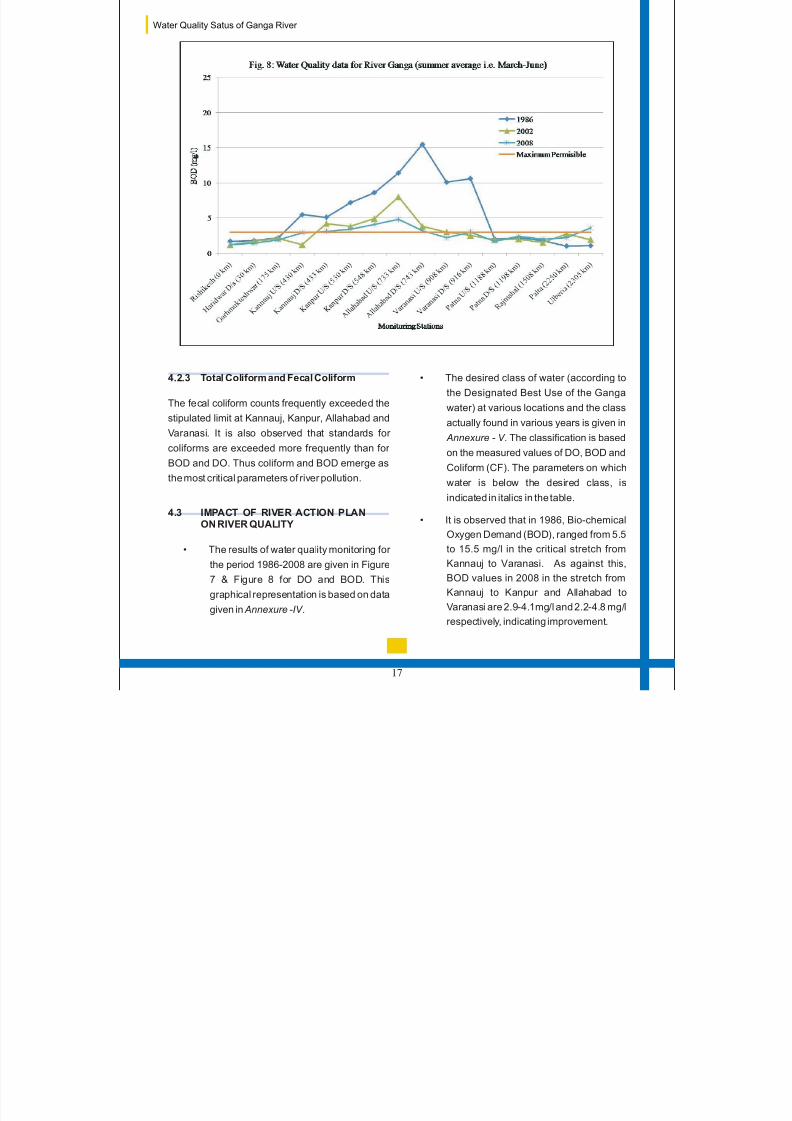
4.2.2 Biochemical Oxygen Demand
The variation in BOD values is much higher as
compared to DO. Values exceeding 3.0 mg/l or
more were recorded in 27% samples. These values
were observed mostly in the stretch between
Kannauj and Kanpur and sometimes at Allahabad.
Detailed perusal, station wise and year wise,
reveals that the values exceeded the acceptable
standard ( 3.0 mg/l) at Rishikesh and Haridwar only once and twice respectively whereas between
Kannauj and Kanpur the values exceeded the
acceptable level frequently. Higher values of BOD
were also recorded at Allahabad and Varanasi. The
most critical stretch is between Kannauj and
Allahabad downstream. The highest value of BOD
(65.8 mg/l) was recorded at Kanpur during lean
flow. The graphic representation is in Figure 8.
Status Paper on River Ganga
8/13/2019 Status Paper -Ganga
http://slidepdf.com/reader/full/status-paper-ganga 24/38
17
4.2.3 Total Coliform and Fecal Coliform
4.3 IMPACT OF RIVER ACTION PLANON RIVER QUALITY
The fecal coliform counts exceeded the
stipulated limit at Kannauj, Kanpur, Allahabad and
Varanasi. It is also observed that standards for
coliforms are exceeded more frequently than for
BOD and DO. Thus coliform and BOD emerge as
the most critical parameters of river pollution.
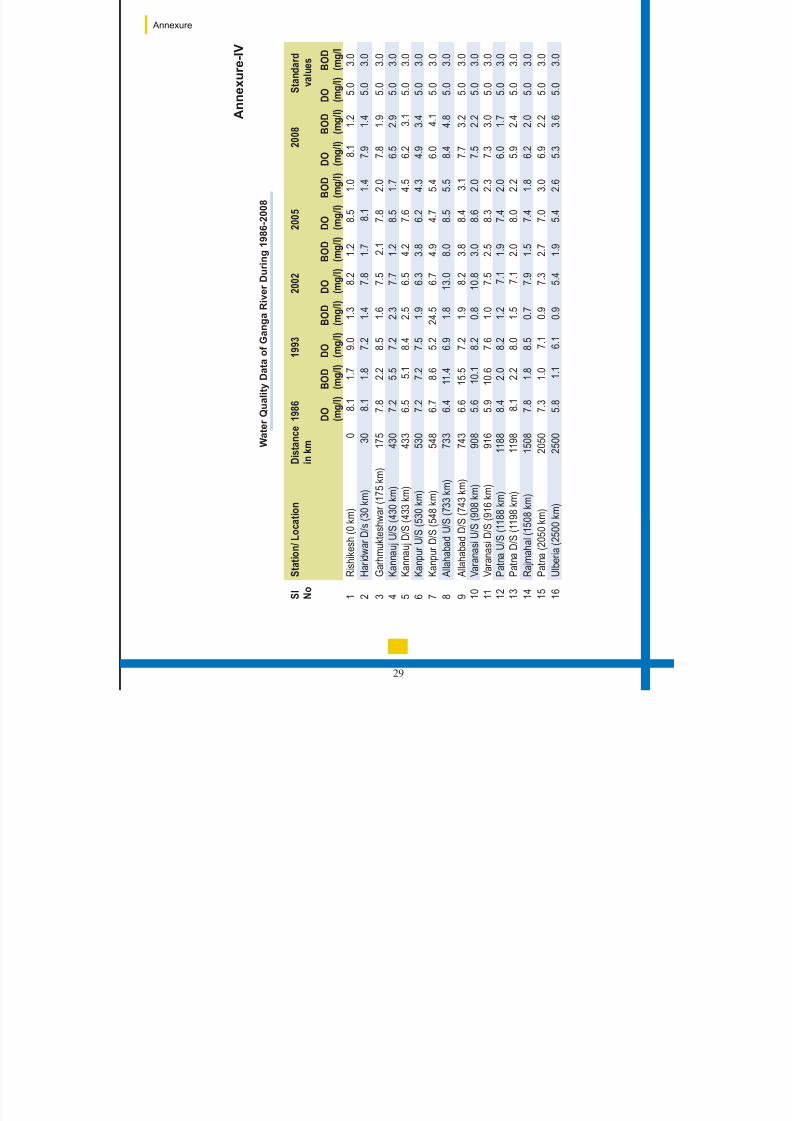
• The results of water quality monitoring for the period 1986-2008 are given in Figure
7 & Figure 8 for DO and BOD. This
graphical representation is based on data
given in .
frequently
Annexure -IV
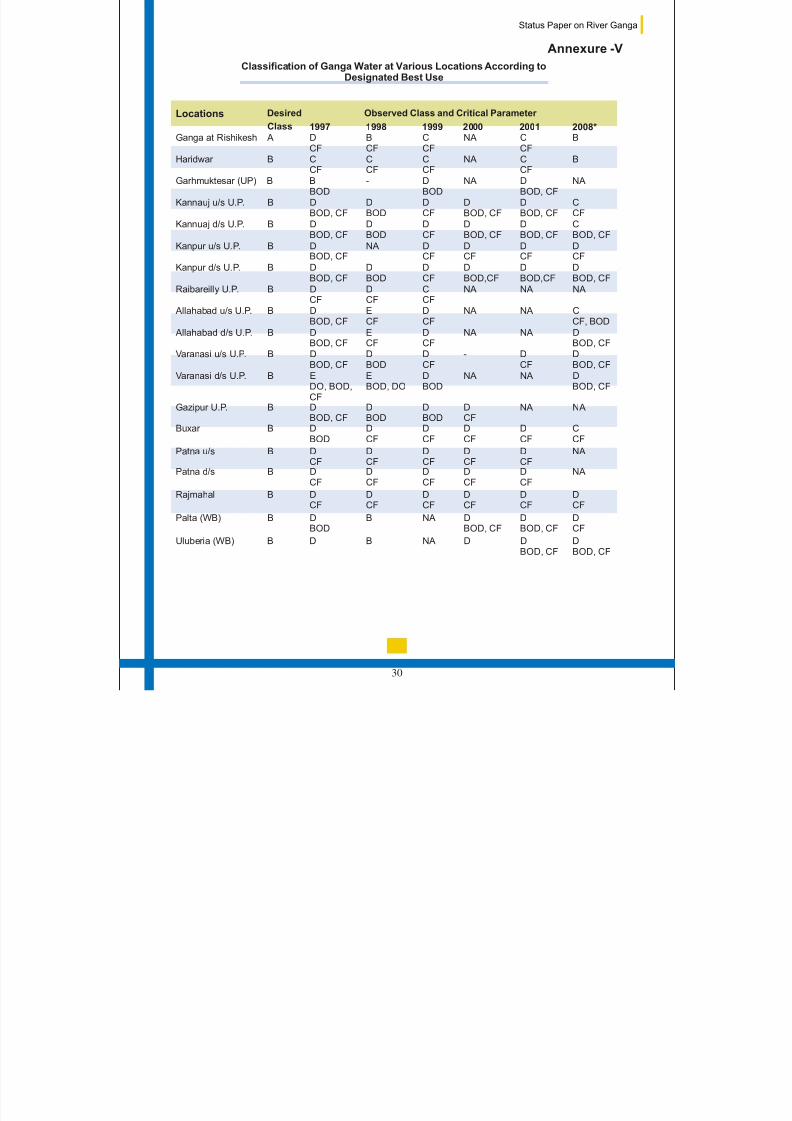
The desired class of water (according to
the Designated Best Use of the Ganga
water) at various locations and the class
actually found in various years is given in
. The classification is based
on the measured values of DO, BOD and
Coliform (CF). The parameters on which
water is below the desired class, is
indicated in italics in the table.
It is observed that in 1986, Bio-chemical
Oxygen Demand (BOD), ranged from 5.5
to 15.5 mg/l in the critical stretch fromKannauj to Varanasi. As against this,
BOD values in 2008 in the stretch
Kannauj to Kanpur and Allahabad to
Varanasi are 2.9-4.1mg/l and 2.2-4.8 mg/l
respectively, indicating improvement.
•
•
from
Annexure - V
Water Quality Satus of Ganga River
8/13/2019 Status Paper -Ganga
http://slidepdf.com/reader/full/status-paper-ganga 25/38
18
Dissolved Oxygen (DO) levels (in the
Allahabad-Varanasi stretch) were in the
range of 5.9 to 6.6 mg/l in 1986. In 2008,
the range had improved to 7.3 to 8.4 mg/l.
These values of BOD and DO are
averages for the critical months of March
to June, when temperatures are high andthe flows in the river arelow.
D es pi te t he p ro bl em s o f o pe ra ti on a nd
maintenance river water quality has shown
discernible improvement (in terms of DO and BOD)
over the pre-GAP period. This has to be seen in the
background of a steep increase in population with
concomitant increase in organic pollution load. In
the absence of Ganga Action Plan, there would
h av e b ee n f ur th er d et er io ra ti on i n t he se
parameters. This conclusion has also been
corroborated by several independent studies
(Markandya & Murthy, 2004).
The high BOD values in some of the towns are
attributed to increased population and partial
interception and diversion under GAP schemes.
The water quality of the river is likely to improve
when all the ongoing works are completed and the
entire waste water being generated is tackled.
A comparison of pre-GAP and post-GAP values of
the three critical parameters, namely DO, BOD and
•
4.4 SUMMARY
,
Coliforms reveals the following:
• Di ss ol ve d Ox yg en i s l ar ge ly w it hi n
acceptable limits.
In the upper Ganga, from origin to Har dwar,
the water quality is more or less of Bathing
Standards (Class B).
Higher levels of coliform are present almost
throughout Ganga. GAP has not been able
to adequately address the issue of
coliforms.
The stretch from Kannauj to Kanpur and
Allahabad to Varanasi remains critical and
needs focused attention. Apart from higher
levels of coliforms, the norms for BOD
indicating organic pollution are also
exceeded in this stretch.
A study on development of scenarios on
comparison of river water quality
without GAP (Markandya & Murthy, 2004)
showed that a stretch of about 740 km (out
of total 1520 km) between Rishikesh and
Rajmahal would have violated the BOD limit
of 3 mg/l without GAP. The study also
indicated that stretch of about 437 km had
a BOD level above the permissible limit of 3
mg/l after GAP I.
• i
•
•
•
with and
a
Status Paper on River Ganga
8/13/2019 Status Paper -Ganga
http://slidepdf.com/reader/full/status-paper-ganga 26/38
The implementation of GAP has been successful in
preventing further deterioration of water quality in
the river Ganga, and in fact improving it in a few
places, even though the pollution load has
increased substantially with time. It would be safe
to infer that if the pollution abatement programme
had not been taken up there would have been an
inevitable and sharp deterioration in the quality of
water, posing a serious threat to public health and
ecology. Another positive impact of the programme
has been an increased public awareness of the
need to protect our rivers and other sources of
surface water from degradation.
In view of the fact that water quality has not yet
reached the prescribed standards for bathing,
especially in the stretch from Kannauj to Varanasi,
there has been criticism of the GAP in the media
and civil society. A very significant factor in this
regard is the inadequate flow in the river due to
abstraction of water for various purposes including
irrigation, drinking water and power generation. A
sizeable proportion of water is diverted into the
Upper and Lower Ganga canals resulting in
reduced flow in the main river.
On the other hand, there have been independent
studies by academic institutions which have
concluded that the programme has produced
positive results. The Cost Benefit Analysis of GAP-I
carried out jointly by the University of Bath and
Metroeconomica, UK in collaboration with several
Indian institutions also endorsed the positive
outcomes of the Plan.
Critical Analysis of GAP
19
Another indicator of the positive impact of GA I is
that several States demanded that the river
conservation programme be extended to other
rivers. As a result, the National River Conservation
Plan (NRCP) was launched in 1995,
presently
covers polluted stretches of 36 rivers in 20 States
GAP suffered from the following limitations;
• Only a part of the pollution load of the river
could be tackled.
GAP concentrated on improving the water
quality of Ganga, in terms of organic
pollution and dissolved oxygen.
Only the wastewater of towns flowingthrough the drains to the river was targeted.
Connections of household toilets to the
sewer system, solid waste management,
and some other vital aspects of municipal
activities, which impinge on the water
quality were not addressed.
The issue of ensuring environmental flows
in the river was not attended to. This has
become increasingly important in view of the competing demands on the Ganga
water for drinking, irrigation and power
generation. Adopting more efficient water
conservation practices could have reduced
the need for abstraction of water from
Ganga.
P
as a country-
wide river conservation programme. It
.
•
mainly
•
•
5.1 LIMITED SCOPE OF GAP
05
8/13/2019 Status Paper -Ganga
http://slidepdf.com/reader/full/status-paper-ganga 27/38
20
Tree cover in the Ganga basin has reduced
considerably and land use pattern has
changed leading to soil erosion. Sediment
yield and its deposit on the river bed were
also not monitored.
Pollution load from non-point sources was
addressed marginally.
No attention was paid to run-off from
agricultural fields, which brings non-
biodegradable pesticides into the river.
Measures necessary for the prevention of
pollution of the river water while planning
new settlements or expansion of the
present ones were not considered.
Watershed development as well as
groundwater and surface water interaction
were not covered.
Only Class-I towns on the banks of rivers
were taken up. Thus a large number of
urban settlements remained outside the
purview of the Plan.
Pollut ion from rural sector was not
addressed.
Several parameters such as heavy metals,
pesticides, nitrogen and phosphorous were
not monitored. These parameters have
b e co me i mp o rt an t w it h i n cr e as ed
industrialisation and urbanisation.
There was little sense of ownership among thestakeholders due to their limited participation in
formulating schemes and in implementation. In
public perception, the Plan continues to be seen as
a Government scheme.
•
,
•
•
•
•
•
•
•
5.2 FORMULATION OF SCHEMES
In the initial stages, schemes of I&D and STP were
implemented with limited knowledge of actual
wastewater generation and treatment technology
options. This was due to lack of indigenous
experience in pollution abatement works. An
a tt emp t h as b ee n m ad e to a dd re ss t hi s
shortcoming in the next stage (GAP II), with varioustechnologies being evaluated to select the most
appropriate option for a particular location.
Initially, no provision was made for supply of stand-
by power. Treatment plants & pumping stations,
t he re fo re , w er e o pe r at ed w it h f re qu e nt
interruptions. Subsequently, dedicated power line
and/or diesel generator sets have been installed to
ensure uninterrupted power supply to these
facilities. However, O&M continues to be a major problem.
there
were delays in preparing sanctioning schemes
Problems of land acquisition, court cases,
contractual issues and inadequate capacities in the
local bodies/implementing agencies came in the
way of speedy implementation.
In some cases, essential components of schemes
were not foreseen and estimates had to be revised.
This caused cost over-runs and delays.
While seeking approval of schemes under the GAP,the State Governments had committed to ensuring
proper O&M of the river conservation assets being
created. However, most of the states could not
provide adequate financial resources for O&M,
In the absence of a fast track mechanism,
and .
5.3 IMPLEMENTATION
5.4 OPERATION ANDMAINTENANCE (O&M)
Status Paper on River Ganga
8/13/2019 Status Paper -Ganga
http://slidepdf.com/reader/full/status-paper-ganga 28/38
21
s t ea d y a n d u n in t er r up t ed e l ec tr i ci t y a n d
e x pe r ie n ce d m a np o we r. T h e M u ni c ip a l
Corporations had problems in raising the required
financial and human resources to ensure proper
operation and maintenance of pollution abatment
infrastructure created under GAP. Consequently,
O&M of these assets suffered resulting incontinued pollution of the river.
Under-utilization of STPs, in some instances due to
non-conveyance of the sewage to the STPs,
particularly in the absence of upstream systems
such as branch sewer and house connections is
also a serious constraint.
Decentralized approach was adopted only in a few
places under the Plan. The schemes generally
relied on centralised systems, which meant that
sewage was transported to the periphery of the
town for treatment before its final disposal. This
resulted in long sewer systems, involving pumping
and treatment, which were capital and energy
intensive.
A variety of treatment technologies have beenadopted under GAP. At places where adequate
land was available, waste stabilization pond
technology was used. In most other places,
technologies like the Activated Sludge Process
(ASP), which is a tried and tested technology, as
well as Upflow Anaerobic Sludge Blanket (UASB),
which is a new technology, were adopted. While
5.5 TECHNOLOGICAL ISSUES
ASP is an energy intensive technology, the UASB is
less energy intensive but its effluent needs to be
polished to meet the prescribed standards before it
can be discharged into the river. The experience of
using various technologies under GAP has been
utilised in selection of appropriate treatment
technologies in r iver pollution abatementprogrammes subsequently taken up under the
NRCP.
The system design for the schemes of interception,
diversion & treatment of sewage catered to the
hydraulic and organic load at the time of designing,
with provision for increased load in future.
However, treatment facilities at many places were
soon found to be inadequate
Large volume of wastewater in
excess of treatment capacity of the STPs, had to be
discharged into the river without treatment.
GAP has been a mixed success. Though the
programme yielded good results in many stretches,
the problem of pollution in river Ganga has not been
fully addressed. The river water quality has
improved at many locations despite significantly
increased demographic and other pressures.
However, the critical parameters of water quality,
which adversely impact human health, exceed the
prescribed standard limits at major locations.
due to phenomenal
growth of population and new residential coloniescoming up without adequate wastewater treatment
infrastructure.
5.6 CONCLUSION
Critical Analysis of GAP
8/13/2019 Status Paper -Ganga
http://slidepdf.com/reader/full/status-paper-ganga 29/38
6.1 REVAMPING OF THE RIVERPROGRAM
6.2 CONSTITUTION OF NATIONALGANGA RIVER BASIN AUTHORITY
CONSERVATION ME
The need for revamping the river conservation
programme was widely recognised in view of the
shortcomings in the approach followed in the
Ganga Action Plan.
Though this approach yielded good
results in many stretches, the problem was not fully
addressed. In the meanwhile, the challenges have
grown. Over the years, the demand for river water is
growing for irrigation, drinking water, industrial use
and power. The increasing pollution load from
expanding cities, diminishing flows due to melting
glaciers, adverse health impacts, ineffective
enforcement of environmental norms and lack of
social mobilization compound the challenge.
It was felt necessary that a new holistic approach
based on river basin as the unit of planning and
institutional redesign may be adopted. Accordingly,
the Government of India has given Ganga the
status of a 'National River' and has constituted the'National Ganga River Basin Authority' (NGRBA)
on 20.02.2009. The NGRBA is an empowered
planning, financing, monitoring and coordinating
authority for the Ganga River set up under Section
The implementation was
piecemeal and focussed more on municipal
sewage.
Future Course of Action
22
3(3) of the Environment (Protection) Act, 1986
The Ministry of Environment and Forests would
provide the necessary administrative and technical
support to theAuthority.
• The Authority has both regulatory and
developmental functions. The Authority will
take measures for effective abatement of
pollution and conservation of the river
Ganga in keeping with sustainable
development needs. These include:-
development of river basin management
plan and regulation of activities aimed at
prevention, control and abatement of
pollution in the river Ganga to maintain its
water quality, and to take measures
relevant to river ecology and management
in the Ganga Basin States;
maintenance of minimum ecological flows
in the river Ganga with the aim of
ensuring water quality and environmentally
sustainable development;
m ea su re s n ec es sa ry f or p l an n in g,financing and execution of programmes for
abatement of pollution in the river Ganga
including augmentation of sewerage
infrastructure, catchment area treatment,
.
6.3 FUNCTIONS AND POWERS OFTHE NGRBA
• a
•
•
06

8/13/2019 Status Paper -Ganga
http://slidepdf.com/reader/full/status-paper-ganga 30/38
23
protection of flood plains, creating public
awareness and such other measures for
promoting environmentally sustainable
river conservation;
collection, analysis and dissemination of
information relating to environmental
pollution in the river Ganga;
investigations and research regarding
problems of environmental pollution and
conservation of the river Ganga;
creation of special purpose vehicles, as
appropriate, for implementation of works
vested with theAuthority;
promotion of water conservation practicesincluding recycling and reuse, rain water
harvesting, and decentralised sewage
treatment systems;
m o n i t o r i n g a n d r e v i e w o f t h e
implementation of various programmes or
activities taken up for prevention, control
and abatement of pollution in the river
Ganga; and
issuance of directions under section 5 of the
Environment (Protection) Act, 1986 for the
purpose of exercising and performing all or
any of the above functions and for
achievement of its objectives.
•
•
•
•
•
•
The NGRBA would thus be responsible for
addressing the problem of pollution in Ganga in a
holistic and comprehensive manner. Theresponsibilities of the Authority would include
integrating activities related to sustainable use of
water, pollution abatement, maintenance of
ecological flows, and river conservation. The
NGRBAwould identify the pollution sources, build a
database using scientific methods, analyse the
data and ensure its sharing. The NGRBA will draw
up a work plan with clear timelines and sources of
funding.
The Authority would coordinate with other
regulatory agencies like the Central Pollution
Control Board (CPCB) and the State Pollution
Control Boards (SPCBs) for access to data, and
expertise and for promoting new technological
options. Since water quality is directly impacted by
abstraction, it may issue directions for taking
appropriate measures with a view to ensuring
minimum flows in the river in the interest of pollution
control and environmental management. The
Authority will also encourage States, ULBs,
industry and farmers to increase water use
efficiency and reuse wastewater after proper
treatment.
The State Governments would set up the State
River Conservation Authorities (SRCAs) for
c o or d in a ti n g a n d i m pl e me n ti n g t h e r i ve r
conservation activities at the State level. These
would function under the chairmanship of the Chief
Ministers. Based on the integrated basin
management plan drawn by the NGRBA, the State
Governments will take steps for comprehensive
management of the river in the States through their
respectiveAuthorities.
It is expected that this new initiative would
rejuvenate the collective efforts of the Centre and
States for cleaning the national river Ganga.
Future Course of Action
8/13/2019 Status Paper -Ganga
http://slidepdf.com/reader/full/status-paper-ganga 31/38
24
6.4 ACTION PLAN
A detailed plan of activities with milestones to be
achieved will be formulated for approval of the
Authority. This would include timelines and
budgetary resources. Essential preliminary
activities in this regard have been initiated. These
are:
•
•
• Preparation of P s
i
• Discussion a ities of
Special P urpose Vehicles ( ) at
appropriate locations as a means of
mobilizing private sector resources and
achieving efficiencies.
•
•
• a
between the
Central Government, ernmen s
l in ki ng f lo w o f f un ds to
achievement of agreed milestones
The allocations for pollution abatement and other
river conservation works in the Ganga Basin under
Preparation of a River Basin Management
Plan for the GangaBasin
Preparation of a Status paper on Ganga
Action lan for the hotspots
like Har dwar, Kanpur, Allahabad, Varanasi,
Patna, etc. in consultation with the State
Governments.
on mod l setting up of
SPVs
Mapping of the Ganga Basin
Preparation of a Compendium of sewage
treatment technologies
Pre para tion o f me mo rand um o f
agreement to be signed
State Gov t
and ULBs
.
6.5 RESOURCES
the existing Central and State schemes are
inadequate, and not commensurate with the
objective of cleaning the river to the desired
standards in a time bound manner. Significant
upscaling of budgetary support for the river
cleaning activities would, therefore, be essential.
For carrying out the mandate of the Authority, andto achieve the objective of cleaning the river Ganga
in a time-bound manner, substantial resources will
be required. These resources could be mobilized
by using a combination of options. These include
•
•
• ing A
•
•
• -
financial institutions.
Dovetailing the existing schemes like
Jawaharlal Nehru National Urban Renewal
Mission (JNNURM), Urban Infrastructure
Development Scheme for Small and
MediumTowns (UIDSSMT), etc.
Encouraging the State Governments and
the Urban Local Bodies to generate
resources through taxes, levies, cess, user
charges etc.
Creat a corpus for the uthority to be
provided by the Central Government.
Approaching the 13 Finance Commission
for a special provision, considering theimpact on a very large population.
Creating SPVs for implementing specific
river conservation activities. This would
help mobilize resources from the private
sector and the financial institutions.
Seeking external assistance from multi
lateral
th
Status Paper on River Ganga
8/13/2019 Status Paper -Ganga
http://slidepdf.com/reader/full/status-paper-ganga 32/38
25
Annexure
S. No. Sub-Basin Mean AnnualFlow (BCM)
Percentagecontribution
2. Yamuna (excluding Chambal) 57.241 19.90
* CWC Publication “Water Resources of India 30/88”
Catchment Area, Annual Water Yield and Mean Flow Rate of Streams in Ganga Basin.
(Source: CWC/GBWRD publication - A Perspective Plan - 1986)
Annexure-I
1. Ramganga 17789 3.39
3. Chambal 32.554 6.20
4. Tons-Kararmnasa 10.609 2.02
5. Gomti-Ghaghra 113.511 21.62
6. Sone-East of Sone 44.144 8.41
7. Gandak-Burhi Gandak 58.967 11.23
8.
9.
10.
Kodi-Mahananda 81.848 15.59
Total (Tributaries) 416.663 79.36
Ganga Main Stem 84.980 16.19
(attributable to Ground Water)
Evaporation * 23.380 4.45
Total Ganga (Upto Indian Border) 525.023 100.00
8/13/2019 Status Paper -Ganga
http://slidepdf.com/reader/full/status-paper-ganga 33/38
26
Status Paper on River Ganga
Name andLocation Storage
Diversion/ Discharge(m /s)
storage in (MCM)
3 / Purpose
1854 Upper GangaCanal, Haridwar
Diversion 297 m3/s Irrigation(0.924 millionHa)
1874 Agra Canal, OkhlaBarrage, Delhi
Diversion 30.8 m3/s during
Non-monsoon and56 m 3/s duringmonsoon
Irrigation
1880 Lower Ganga
Canal, NaroraDiversion 157 m3/s Irrigation (0.5
million ha)
1960 Gandhisagar Dam/M.P.
Storage 6797 MCM Live Irrigation over 0.757 million
ha.115 MW
1990-91 East Ganga Canal DiversionBhimgoda Haridwar
237 m /s Irrigation
0.233 million ha
Western YamunaCanal
Diversion 190 m3/s irrigation
Eastern YamunaCanal
Diversion 85 m
3
/s irrigation
Sharda SahayakCanal,Lakhimpur Kheri
Diversion 650 m3/s Irrigation
(0.44 million ha)
Gandak Canal Diversion 147 m3/s irrigation
Kosi Canal Diversion 425 m3
3
/s irrigation
Kota Barrage Diversion 230 m /s irrigation
1994 Madhya Ganga
Canal, Bijnor
Diversion 234 m3/s Irrigations
(0.306 million ha)
Annexure -IIMajor Water Resources Projects Gangain Basin
during Kharif
(1.674 million ha)
(0.96 million ha)
(0.5 million ha)
a. Diversion/Storage Projects for consumptive use
In between1719-1748 ADduring MughalDynasty
1355 ADDuringFerozshahTuglaq rule
2000
1985
1963
1960
Storage
Year of Completion/Commissioning
8/13/2019 Status Paper -Ganga
http://slidepdf.com/reader/full/status-paper-ganga 34/38
Tons I at Bansagar Diversion Barrage Hydro Electricity
1962 Rihand Dam/Live Storage
Storage 8900 MCM Hydro Electricity300 MW + Water Supply to ThermalPlants
Sonbhadra, UP
27
Annexure
2006 Tehri Dam
on Bhagirathi
2615 MCM Live 2400 MW of
Hydropower andIrrigation to
0.27 million haLand. Drinkingwater supply toDelhi @ 10 m /s
3
2006 Dhauliganga
Pithoragarh
- Hydro Electricity
280 MW
Under construction
Tapovan Vishnugarh
Project, Joshimath
Run of the
River
Dhauliganga
RamgangaMultipurpose
Project at Kalagarhin Bijnor
Storage 2190 MCM-GrossStorage
Hydroelectric (198MW) and Irrigation
(.575 million HaFlood Control
Jamrani
Multipurpose Dam
near Kathgodam
Storage 144 MCM Live
Stogage
Installed Capacity
Million Ha) +
30 MW Hydro +drinking
Lakhwar Phase I
and Phase II onRiver Yamuna
Storage 333 MCM Live
Storage
1973 Chambal Valley Stogare 370 MWProject (ExcludingKota Barrage)
Hydro Electricity
Year of Completion/Commissioning
Name andLocation
Storage Storage (MCM) Purpose
10500 MCMLive Storage
Storage
Storage
(Chamoli)520 MW
Hydro Electricity
Irrigation (0.15
420 MW
b. Storage Projects for Hydroelectricity Generation
1970-71 Obra Dam Storage 211 MCM Hydro Electricity99 MWSonbhadra, UP Gross Storage
1974
Bansagar
Storage 5410 MCM
90MWLive Storage
Hydro Electricity2001-02 Tons II & III at
1991
Under construction
Under construction
8/13/2019 Status Paper -Ganga
http://slidepdf.com/reader/full/status-paper-ganga 35/38
28
Annexure -III
Parametric values of Ganga River during Pre GAP at Selected Stations
Stations Distancein km
pH* Dissolved Oxygen BOD Total Coliform
PM W S PM W S PM W SRishikesh 0 7.0 - - - - - - - - -
Haridwar D/S 30 8.0-
7.0
5.25 6.8 4.87 13.2 3.17 2.5 43 2400 2400
Garhmukteshwar 175 8.0-7.0
8.05 7.87 6.67 2.5 2.0 5.0 2400 1880 1416
Kannauj 430 7.0-8.0
6.7 6.7 10.1 12.9 8.2 16.3 - 40×103
-
Kanpur U/S 530 8.0 7.1 6.85 6.38 12.4 13.9 13.9 - - -
Kanpur D/S 548 8.0 6.5 8.02 4.35 15.5 14.15 16.39 - - -
Allahabad U/S 733 8.0 6.6 6.8 7.5 8.04 8.92 6.76 21.780 17310 21230
Allahabad D/S 743 8.0 7.9 10.7 7.08 7.10 5.4 6.95 38100 15440 17520
Varanasi U/S 908 9-8 8.2 11.14 7.03 6.0 5.9 6.49 31885 25930 14010
Varanasi D/S 919 9-8 7.45 8.75 6.88 5.4 5.85 6.38 33612 20892 5910
Patna U/S 1188 8-8 7.6 8.9 7.71 2.7 1.64 1.71 24×103
40×103
46×103
Patna D/S 1198 8.0 7.2 8.85 7.39 1.55 1.85 3.5 24×10 66635 55403Rajmahal 1508 - 7.57 4.67 7.45 0.9 1.28 1.47 4940 58633 19563
Palta 2050 - 4.67 8.33 6.86 0.57 1.07 1.12 19667 748667 469767
Uluberia 2500 8.0 4.58 7.67 6.69 0.6 1.57 1.02 48333 916667 835333
DiamondHarbour
6.73 7.47 6.20 1.3 1.47 15.58 31333 8833 22600
* pH variation (May– July 1982); PM (Post Monsoon); W (Winter); S (Summer)
Status Paper on River Ganga
8/13/2019 Status Paper -Ganga
http://slidepdf.com/reader/full/status-paper-ganga 36/38
29
S l
N o
S t a t i o
n /
L o c a
t i o n
D i s t a n c e
i n k m
1 9
8 6
1 9 9 3
2 0 0 2
2 0 0 5
2 0 0 8
S t a n
d a r d
v a
l u e s
D O
( m
g / l )
B O D
( m g
/ l )
D O
( m g
/ l )
B O D
( m g
/ l )
D O
( m g /
l )
B O D
( m g
/ l )
D O
( m g
/ l )
B O D
( m g
/ l )
D O
( m g
/ l )
B O D
( m g
/ l )
D O
( m g
/ l )
B O D
( m g
/ l
2
H a r i d w
a r
D / s
( 3 0 k m
)
3 0
8 . 1
1 . 8
7 . 2
1 . 4
7 . 8
1 . 7
8 . 1
1 . 4
7 . 9
1 . 4
3 . 0
3
G a r h m
u k t e s
h w a r
( 1 7 5 k m
)
1 7 5
7 . 8
2 . 2
8 . 5
1 . 6
7 . 5
2 . 1
7 . 8
2 . 0
7 . 8
1 . 9
3 . 0
4
K a n n a
u j
U / S ( 4 3 0 k m
)
4 3 0
7 . 2
5 . 5
7 . 2
2 . 3
7 . 7
1 . 2
8 . 5
1 . 7
6 . 5
2 . 9
3 . 0
5
K a n n a
u j
D / S ( 4 3 3 k m
)
4 3 3
6 . 5
5 . 1
8 . 4
2 . 5
6 . 5
4 . 2
7 . 6
4 . 5
6 . 2
3 . 1
6
K a n p u
r U
/ S ( 5 3 0 k m
)
5 3 0
7 . 2
7 . 2
7 . 5
1 . 9
6 . 3
3 . 8
6 . 2
4 . 3
4 . 9
3 . 4
7
K a n p u
r D
/ S ( 5 4 8 k m
)
5 4 8
6 . 7
8 . 6
5 . 2
2 4
. 5
6 . 7
4 . 9
4 . 7
5 . 4
6 . 0
4 . 1
8
A l l a h a
b a
d U / S ( 7 3 3 k m
)
7 3 3
6 . 4
1 1
. 4
6 . 9
1 . 8
1 3 . 0
8 . 0
8 . 5
5 . 5
8 . 4
4 . 8
9
A l l a h a
b a
d D / S ( 7 4 3 k m
)
7 4 3
6 . 6
1 5
. 5
7 . 2
1 . 9
8 . 2
3 . 8
8 . 4
3 . 1
7 . 7
3 . 2
1 0
V a r a n a s
i U
/ S ( 9 0 8 k m
)
9 0 8
5 . 6
1 0
. 1
8 . 2
0 . 8
1 0 . 8
3 . 0
8 . 6
2 . 0
7 . 5
2 . 2
1 1
V a r a n a s
i D
/ S ( 9 1 6 k m
)
9 1 6
5 . 9
1 0
. 6
7 . 6
1 . 0
7 . 5
2 . 5
8 . 3
2 . 3
7 . 3
3 . 0
1 2
P a
t n a
U / S ( 1 1 8 8 k m
)
1 1 8 8
8 . 4
2 . 0
8 . 2
1 . 2
7 . 1
1 . 9
7 . 4
2 . 0
6 . 0
1 . 7
1 3
P a
t n a
D / S ( 1 1 9 8 k m
)
1 1 9 8
8 . 1
2 . 2
8 . 0
1 . 5
7 . 1
2 . 0
8 . 0
2 . 2
5 . 9
2 . 4
1 4
R a
j m a
h a
l ( 1
5 0 8 k m
)
1 5 0 8
7 . 8
1 . 8
8 . 5
0 . 7
7 . 9
1 . 5
7 . 4
1 . 8
6 . 2
2 . 0
1 5
P a
t n a
( 2 0 5 0 k m
)
2 0 5 0
7 . 3
1 . 0
7 . 1
0 . 9
7 . 3
2 . 7
7 . 0
3 . 0
6 . 9
2 . 2
1 6
U l b e r i a
( 2 5 0 0 k m
)
2 5 0 0
5 . 8
1 . 1
6 . 1
0 . 9
5 . 4
1 . 9
5 . 4
2 . 6
5 . 3
3 . 6
1
R i s h i k
e s
h ( 0 k m
)
0
8 . 1
1 . 7
9 . 0
1 . 3
8 . 2
1 . 2
8 . 5
1 . 0
8 . 1
1 . 2
5 . 0
3 . 0
A n n e x u r e - I V
W a t e r Q
u a l i t y D a t a o f G a n g a
D u r i n g 1 9 8 6 - 2 0 0 8
R i v e r
3 . 0
3 . 0
3 . 0
3 . 0
3 . 0
3 . 0
3 . 0
3 . 0
3 . 0
3 . 0
3 . 0
3 . 0
5 . 0
5 . 0
5 . 0
5 . 0
5 . 0
5 . 0
5 . 0
5 . 0
5 . 0
5 . 0
5 . 0
5 . 0
5 . 0
5 . 0
5 . 0
Annexure
8/13/2019 Status Paper -Ganga
http://slidepdf.com/reader/full/status-paper-ganga 37/38
30
Annexure -V
Classification of Ganga Water at Various Locations According toDesignated Best Use
Locations Desired
Class
Observed Class and Critical Parameter
1997 1998 1999 2000 2001 2008*
Ganga at Rishikesh A DCF
BCF
CCF
NA CCF
B
Haridwar B CCF
CCF
CCF
NA CCF
B
Garhmuktesar (UP) B BBOD
- DBOD
NA DBOD, CF
NA
Kannauj u/s U.P. B DBOD, CF
DBOD
DCF
DBOD, CF
DBOD, CF
CCF
Kannuaj d/s U.P. B DBOD, CF
DBOD
DCF
DBOD, CF
DBOD, CF
CBOD, CF
Kanpur u/s U.P. B DBOD, CF
NA DCF
DCF
DCF
DCF
Kanpur d/s U.P. B D
BOD, CF
D
BOD
D
CF
D
BOD,CF
D
BOD,CF
D
BOD, CFRaibareilly U.P. B D
CFDCF
CCF
NA NA NA
Allahabad u/s U.P. B DBOD, CF
ECF
DCF
NA NA CCF, BOD
Allahabad d/s U.P. B DBOD, CF
ECF
DCF
NA NA DBOD, CF
Varanasi u/s U.P. B DBOD, CF
DBOD
DCF
- DCF
DBOD, CF
Varanasi d/s U.P. B EDO, BOD,CF
EBOD, DO
DBOD
NA NA DBOD, CF
Gazipur U.P. B D
BOD, CF
D
BOD
D
BOD
D
CF
NA NA
Buxar B DBOD
DCF
DCF
DCF
DCF
CCF
Patna u/s B DCF
DCF
DCF
DCF
DCF
NA
Patna d/s B DCF
DCF
DCF
DCF
DCF
NA
Rajmahal B DCF
DCF
DCF
DCF
DCF
DCF
Palta (WB) B DBOD
B NA DBOD, CF
DBOD, CF
DCF
Uluberia (WB) B D B NA D D
BOD, CF
D
BOD, CF
Status Paper on River Ganga
8/13/2019 Status Paper -Ganga
http://slidepdf.com/reader/full/status-paper-ganga 38/38
1. Das Gupta, S.P. “The Ganga Basin, Basin Sub-
Basin Inventory of Water Pollution, Part II
(Excluding the Yamuna Sub-Basin),” Centre for
Study of Man and Environment, 1984.
2. Krishna Murti, C.R., Bilgrami, K.S., Das. T.M. and
Mathur, R.P., “The Ganga A Scientific Study”,
Northern Book Depot, NewDelhi, 1991.
3. Repor t of the Committee Constituted to
Recommend Measures for Improvement in “The
Ganga Action Plan”, Ministry of Environment &
Forests, Govt. of India, NewDelhi, March 1999.
4. B ul le ti n f or Wa te r Q ua li ty M on it or in g,
Performance of Sewage Treatment Plant and
Summer Average, Ministry of Environment &
Forests, Govt. of India, NewDelhi, July-Dec 2002.
5. Markandya, A. & Murty, M.N., "Cost benefit
analysis of cleaning the Ganges: some emerging
e n vi r on m en t a n d d e ve l op m en t i s su e s, "
Environment and Development Economics,
Cambridge University Press, vol. 9(01), pages
61-81, February 2004
6. Bulletin for Water Quality Monitoring, Summer
Averages Performance Monitoring of Sewage
Treatment Plants (STPs), Water Quality Data,
Ministry of Environment & Forests, Govt. of India,
New Delhi, January-June 2004.
7. Lacy Shaw, “Modeling the Efficacy of the Ganga
Action Plan's Restoration of the Ganga River,
I n di a ”, T h es i s, N a tu r al R e so u rc e s a n d
Environment at the University of Michigan, Aug.
2006,
8. Lok Sabha Starred Question No. 70, Ganga
Action Plan, Ministry of Environment and Forests,
Government of India Nov 27 2006
References
9. Report for the Working Group on Rivers Lakes
and Aquifers, For Eleventh Plan, Vol I, National
River Conservation Directorate, Ministry of
Environment & Forests, Govt. of India, New Delhi,
March 2007.
10. Jain S K, et al; “Hydrology and water resources of
India”, Volume 57, Water Science and Technology
Library, Springer 2007, pp 333 469
11. M.I.S. Report of Programmes, National River
Conservation Plan,, Ministry of Environment &
Forests, Govt. of India, NewDelhi, Vol.-I, 2007.
12. Roy Nanigopal and Sinha Rajiv, “Understanding
Confluence Dynamics in the Alluvial Ganga-
Ramganga Valley, India: An Integrated Approach
u s in g G e om o rp h ol o gy a n d H yd r ol o gy ”,
Geomorphology 92, pp. 182 - 197, May 2007.
13. Water Quality Bulletin on River Water Quality
Monitoring and Performance Monitoring of
Sewage Treatment Plants (STPs), National River
C o n se r va t i on D i re c t or a t e, M i n is t r y o f
Environment & Forests, Govt. of India, New Delhi,
January-June 2007.
14. Water Quality Monitoring for Ganga, NRCD,
MOEF, NewDelhi, Jan - June 2008.
15. M.I.S. Report of Programmes, National River
Conservation Plan, Ministry of Environment &
Forests, Govt. of India, Vol-II, Sept. 2008.
16. M.I.S. Report of Programmes Under, NationalRiver Conservation Plan, Ministry of Environment
& Forests, Govt. of India, New Delhi, Vol-III, Sept.
2008.
17. Ganga Action Plan-A Critical Analysis, Eco
Friends, Kanpur (undated)