selecteed works lr print
31
Uldis Vilcins 2010-2016 SELECTED WORKS
-
Upload
uldis-vilcins -
Category
Documents
-
view
84 -
download
0
Transcript of selecteed works lr print
Uldis Vilcins
2010-2016
SELECTED WORKS
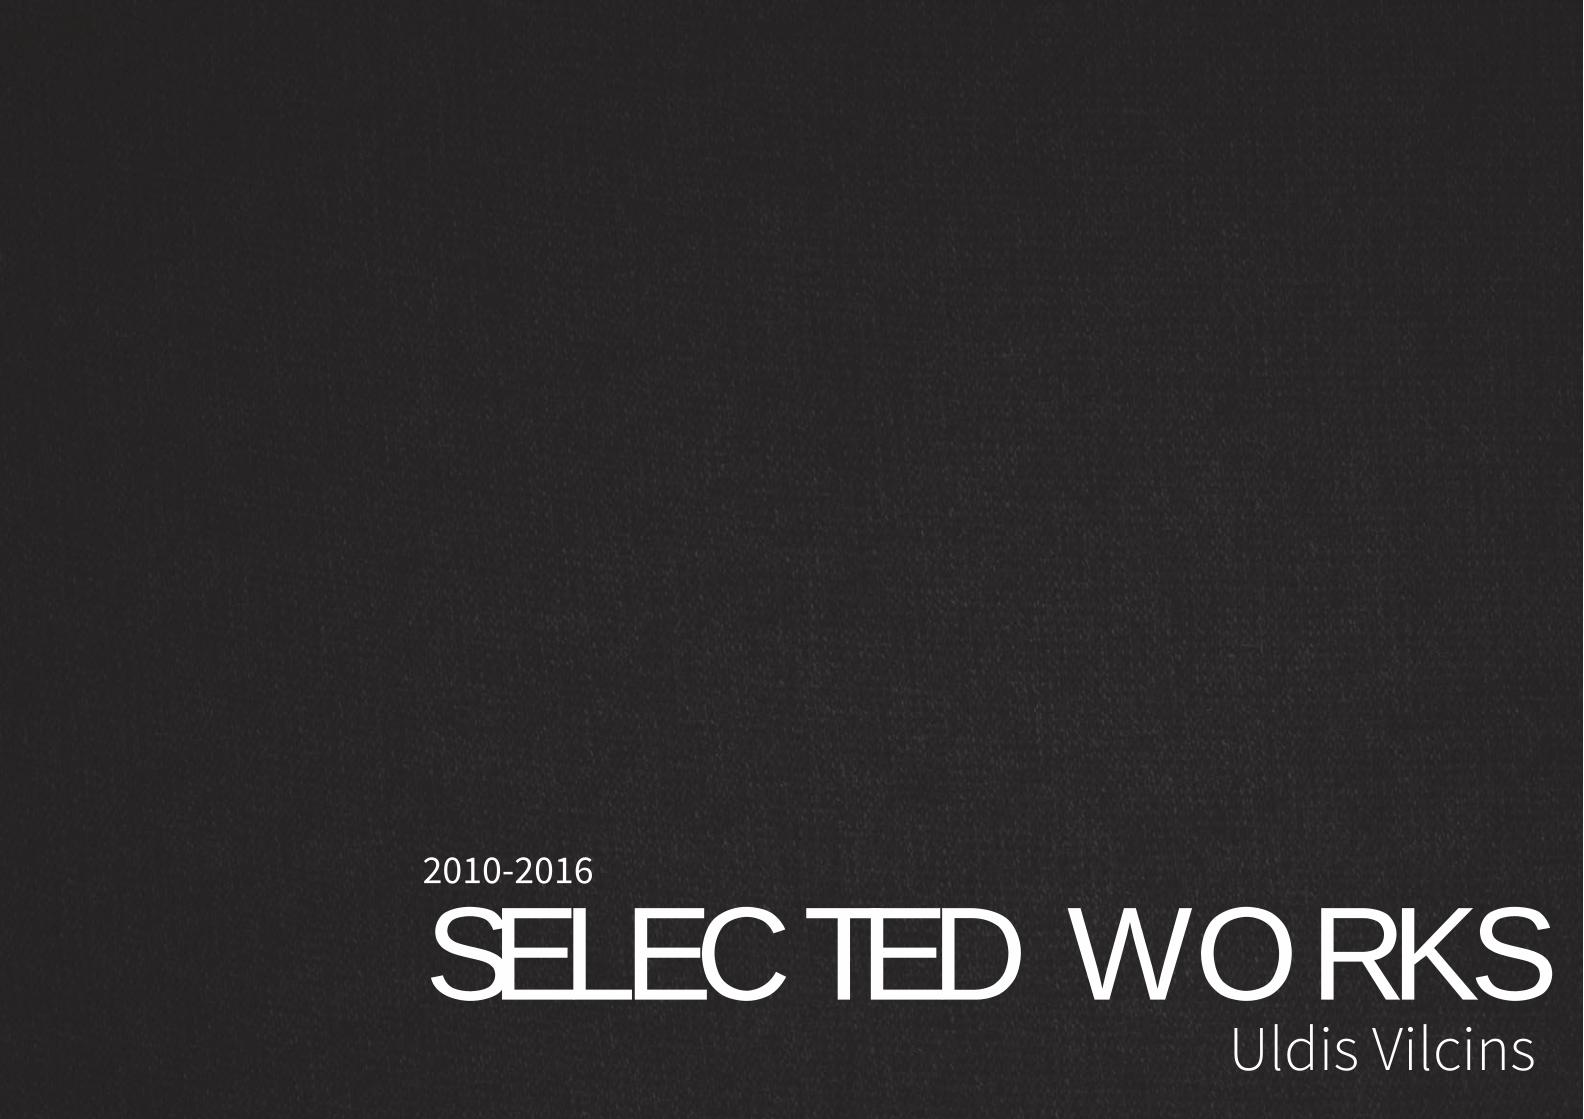
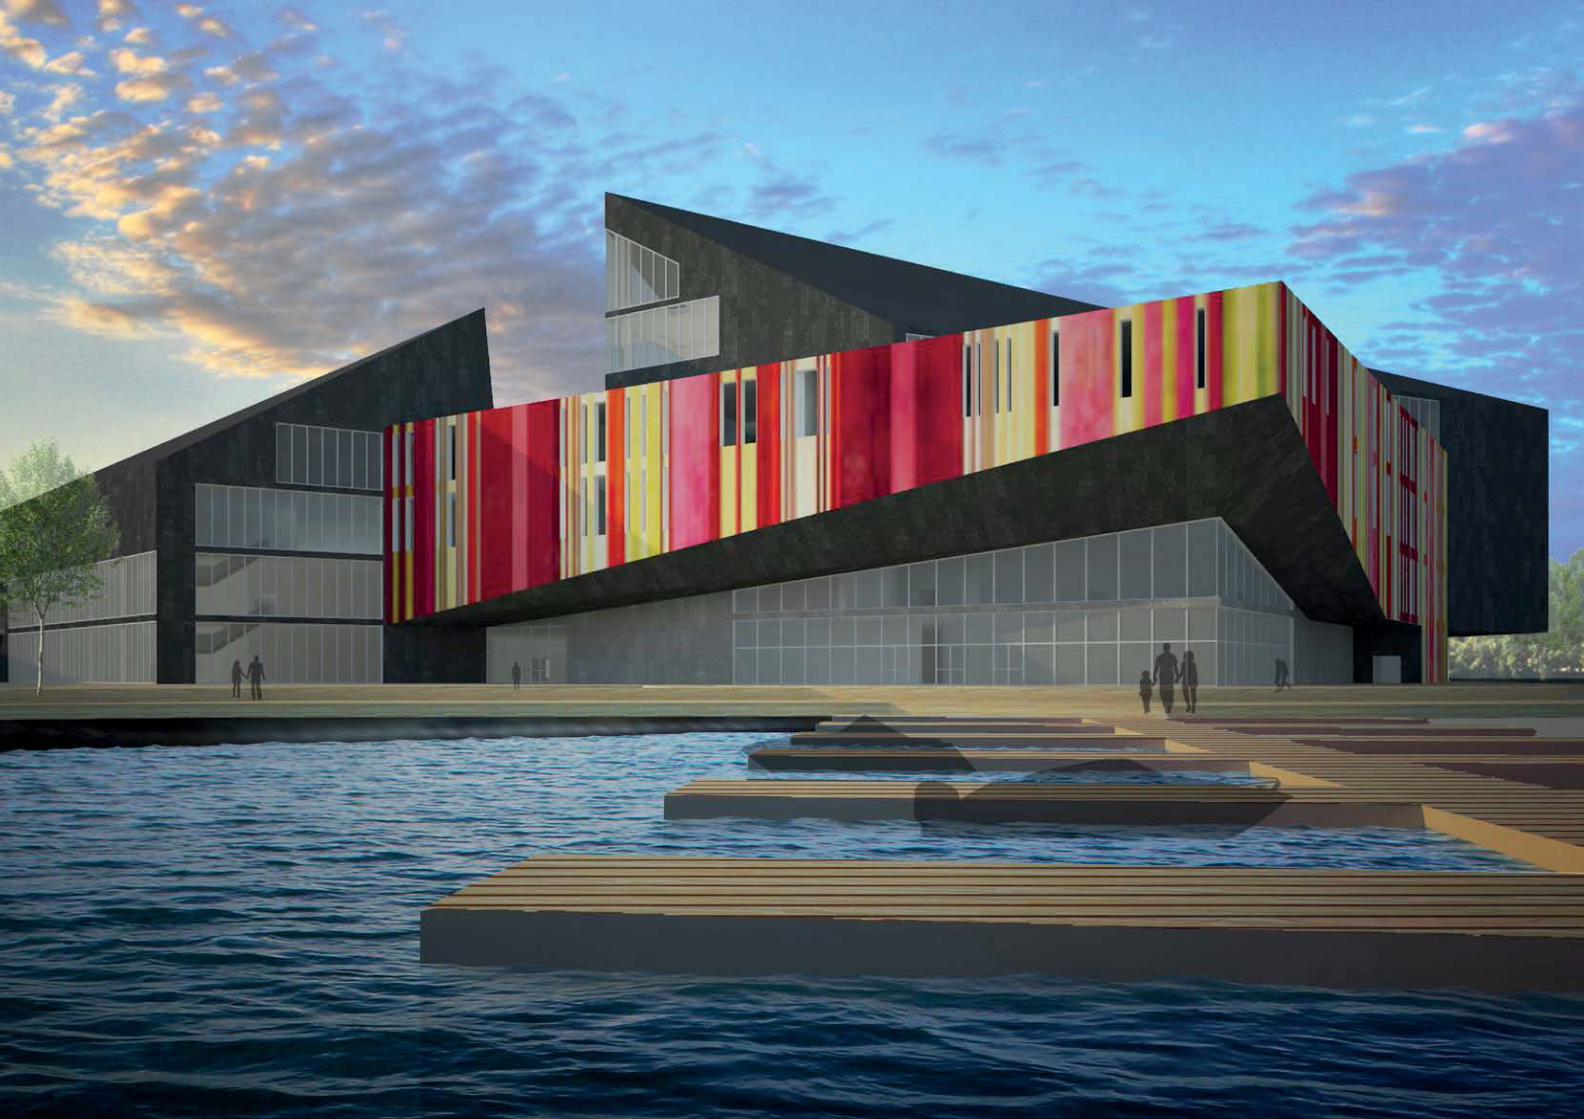
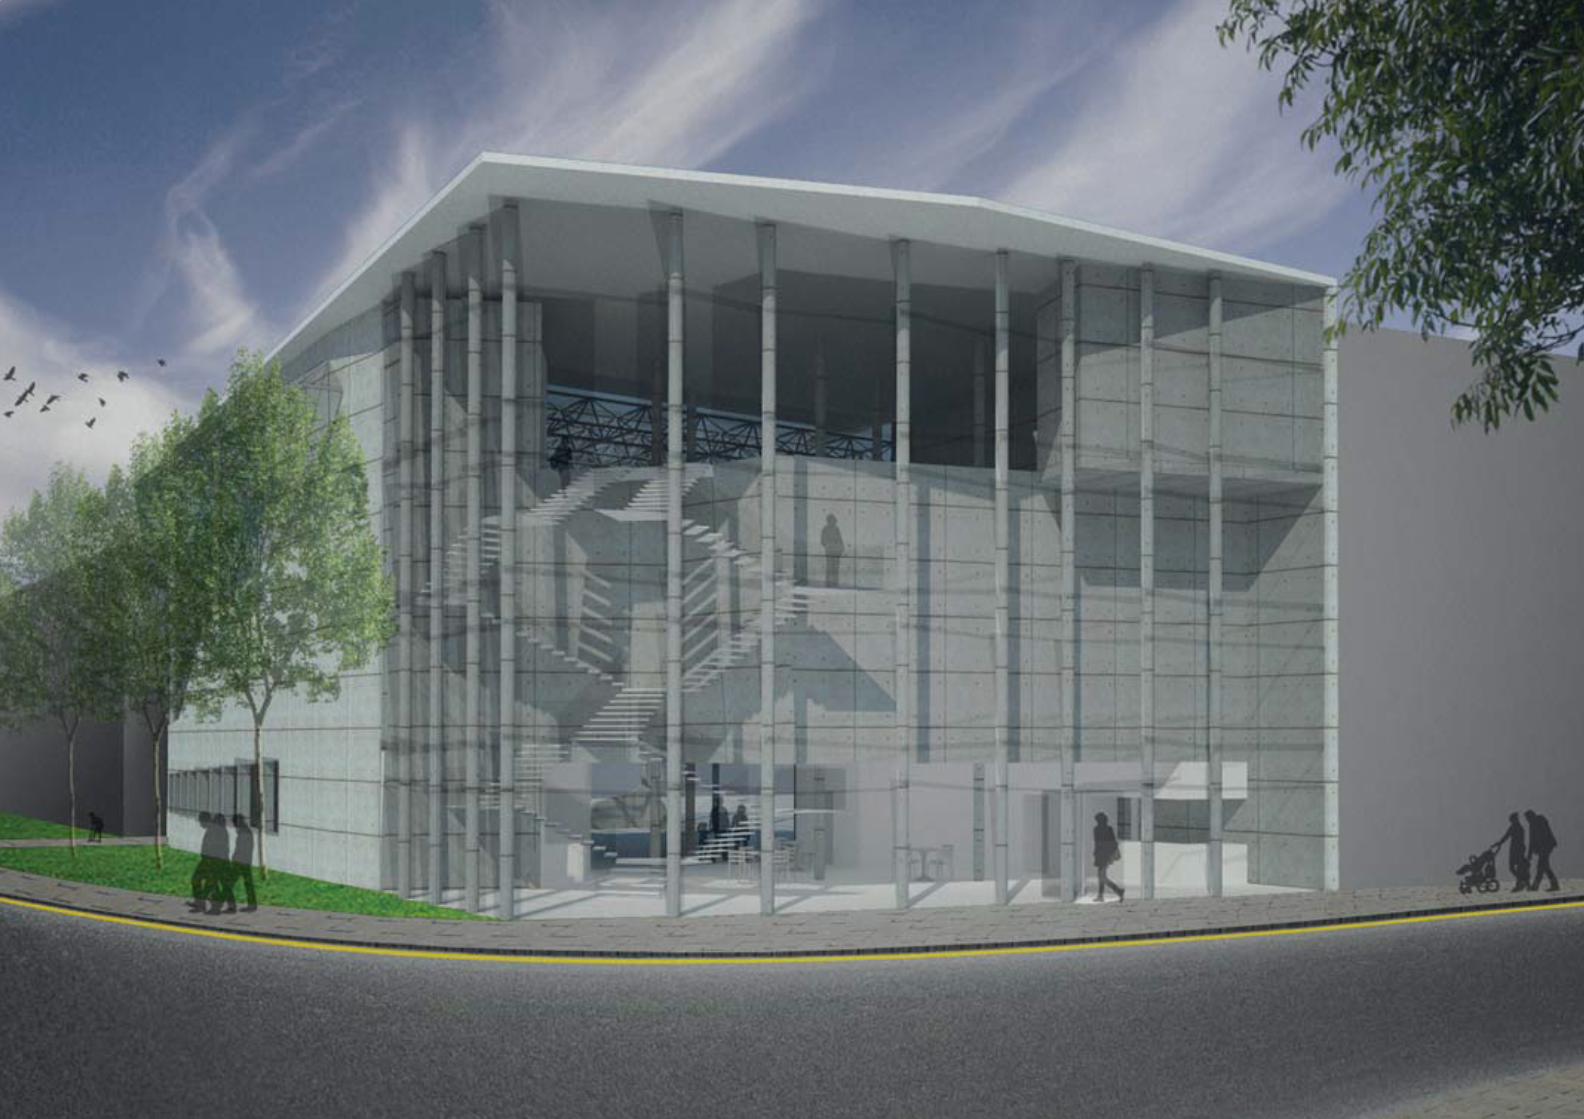
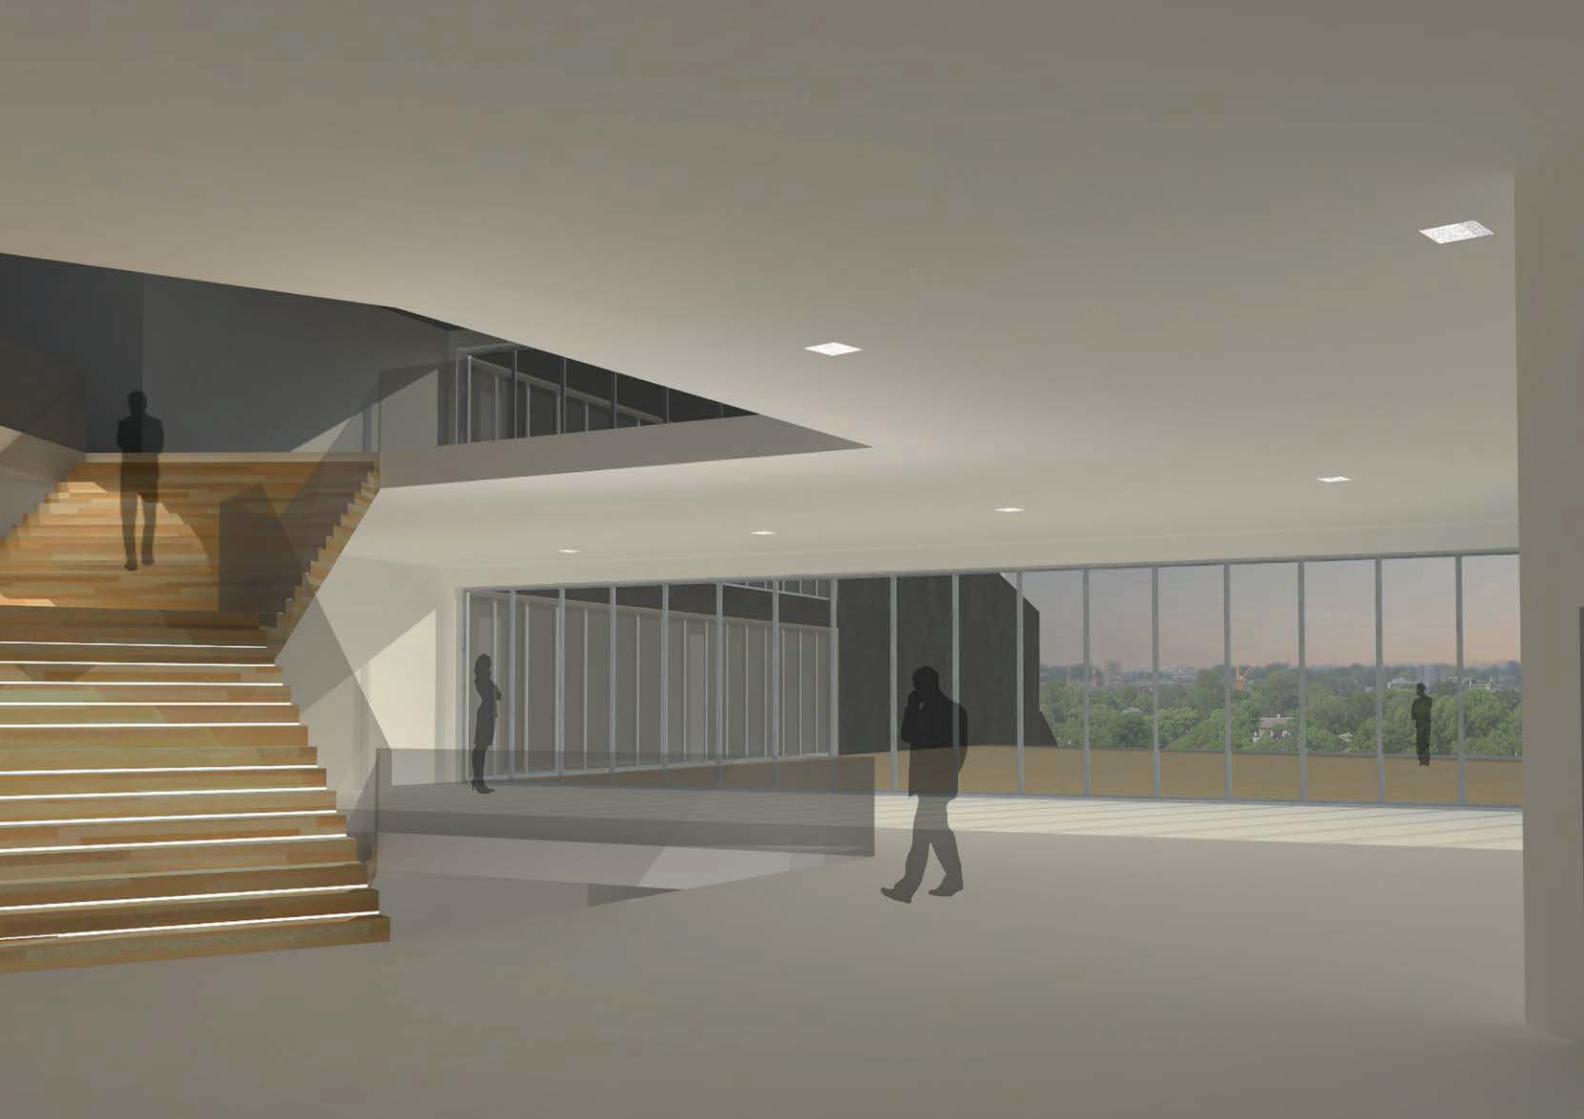
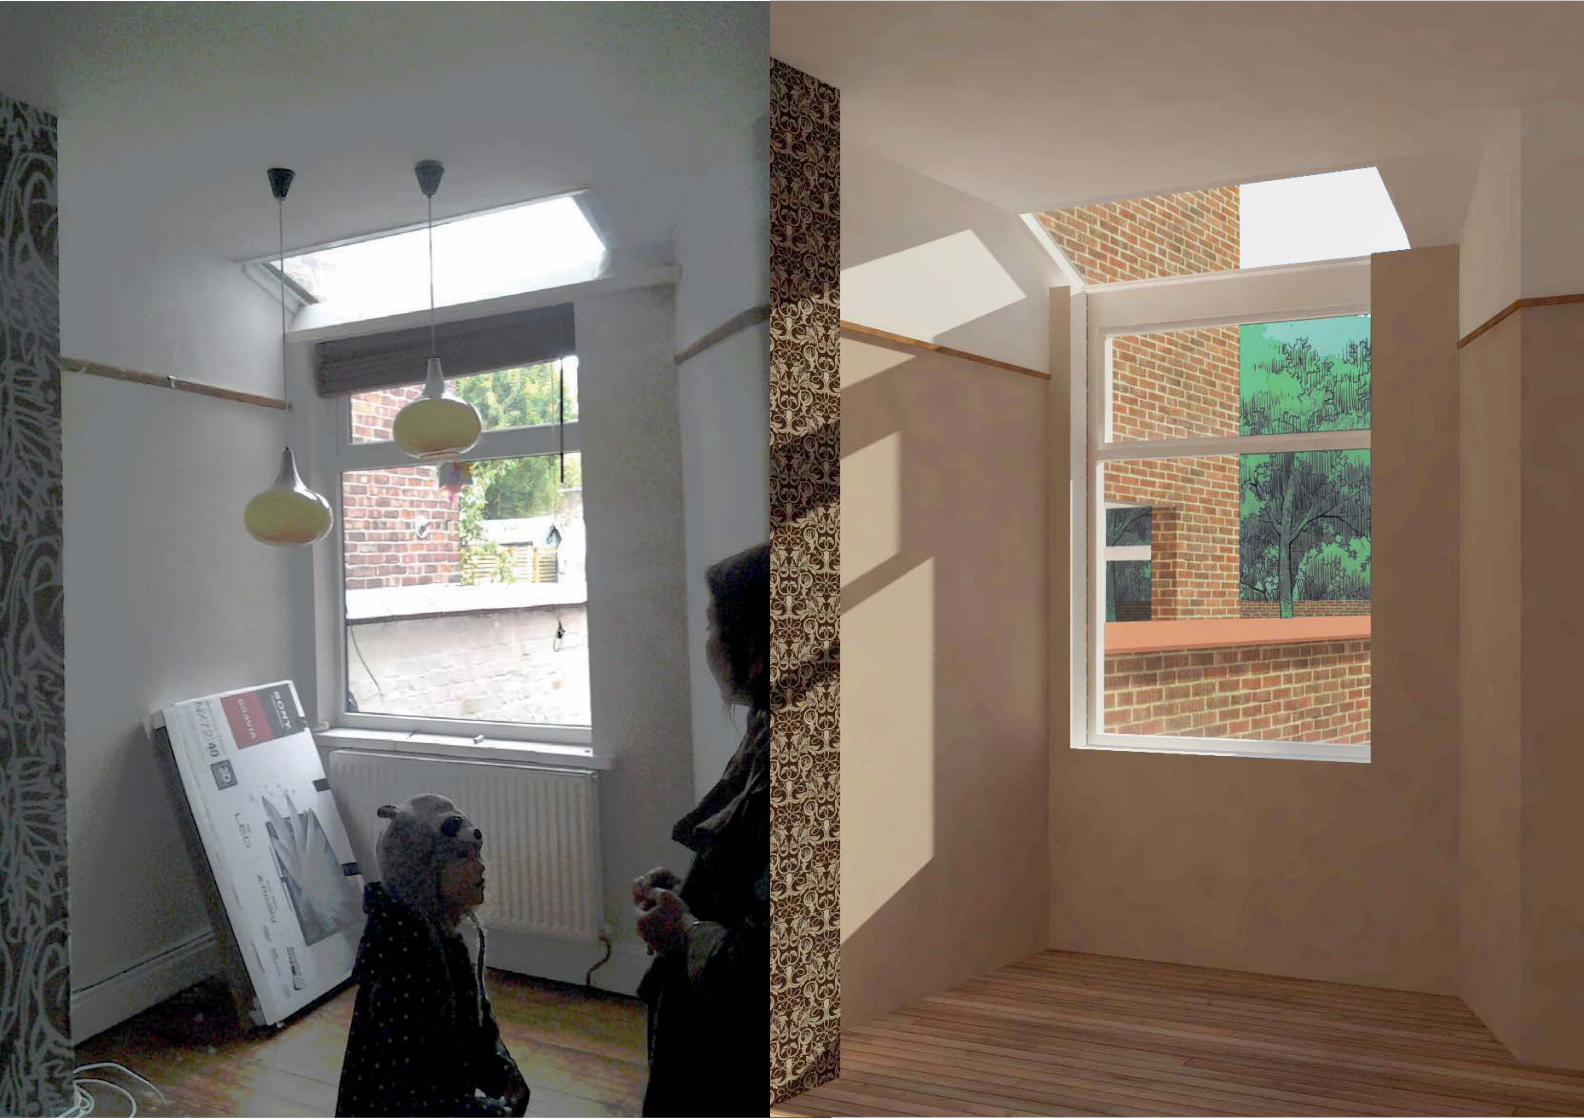
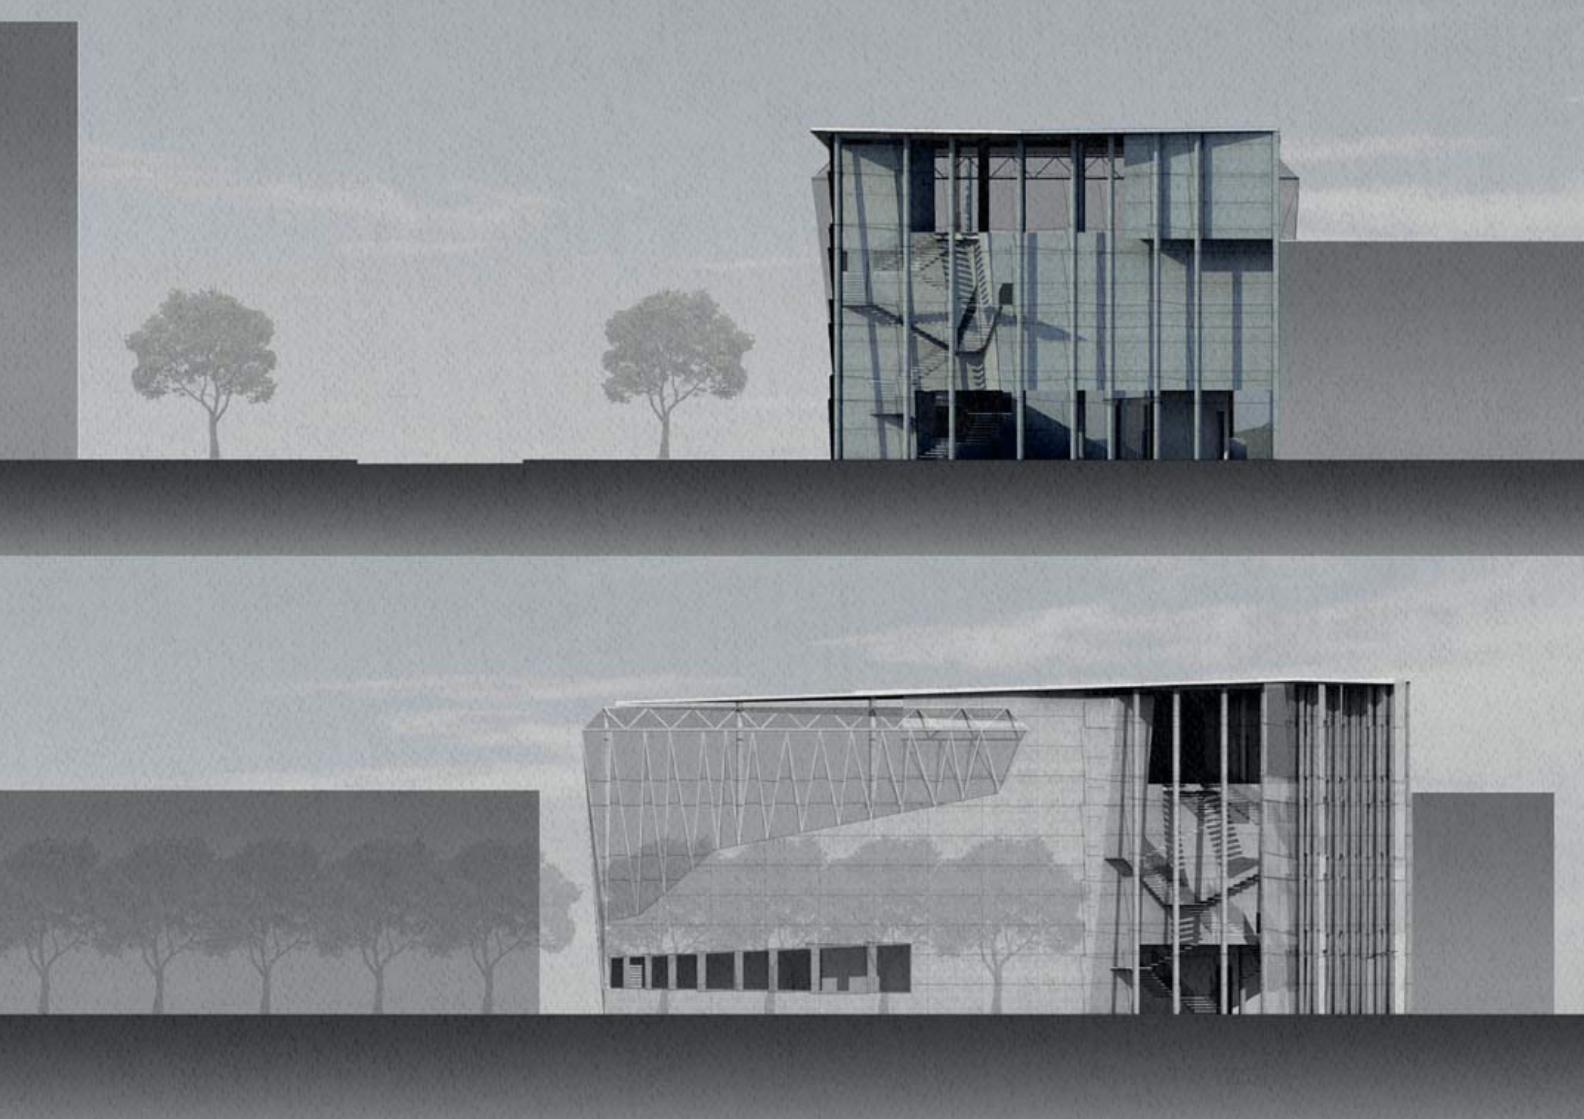
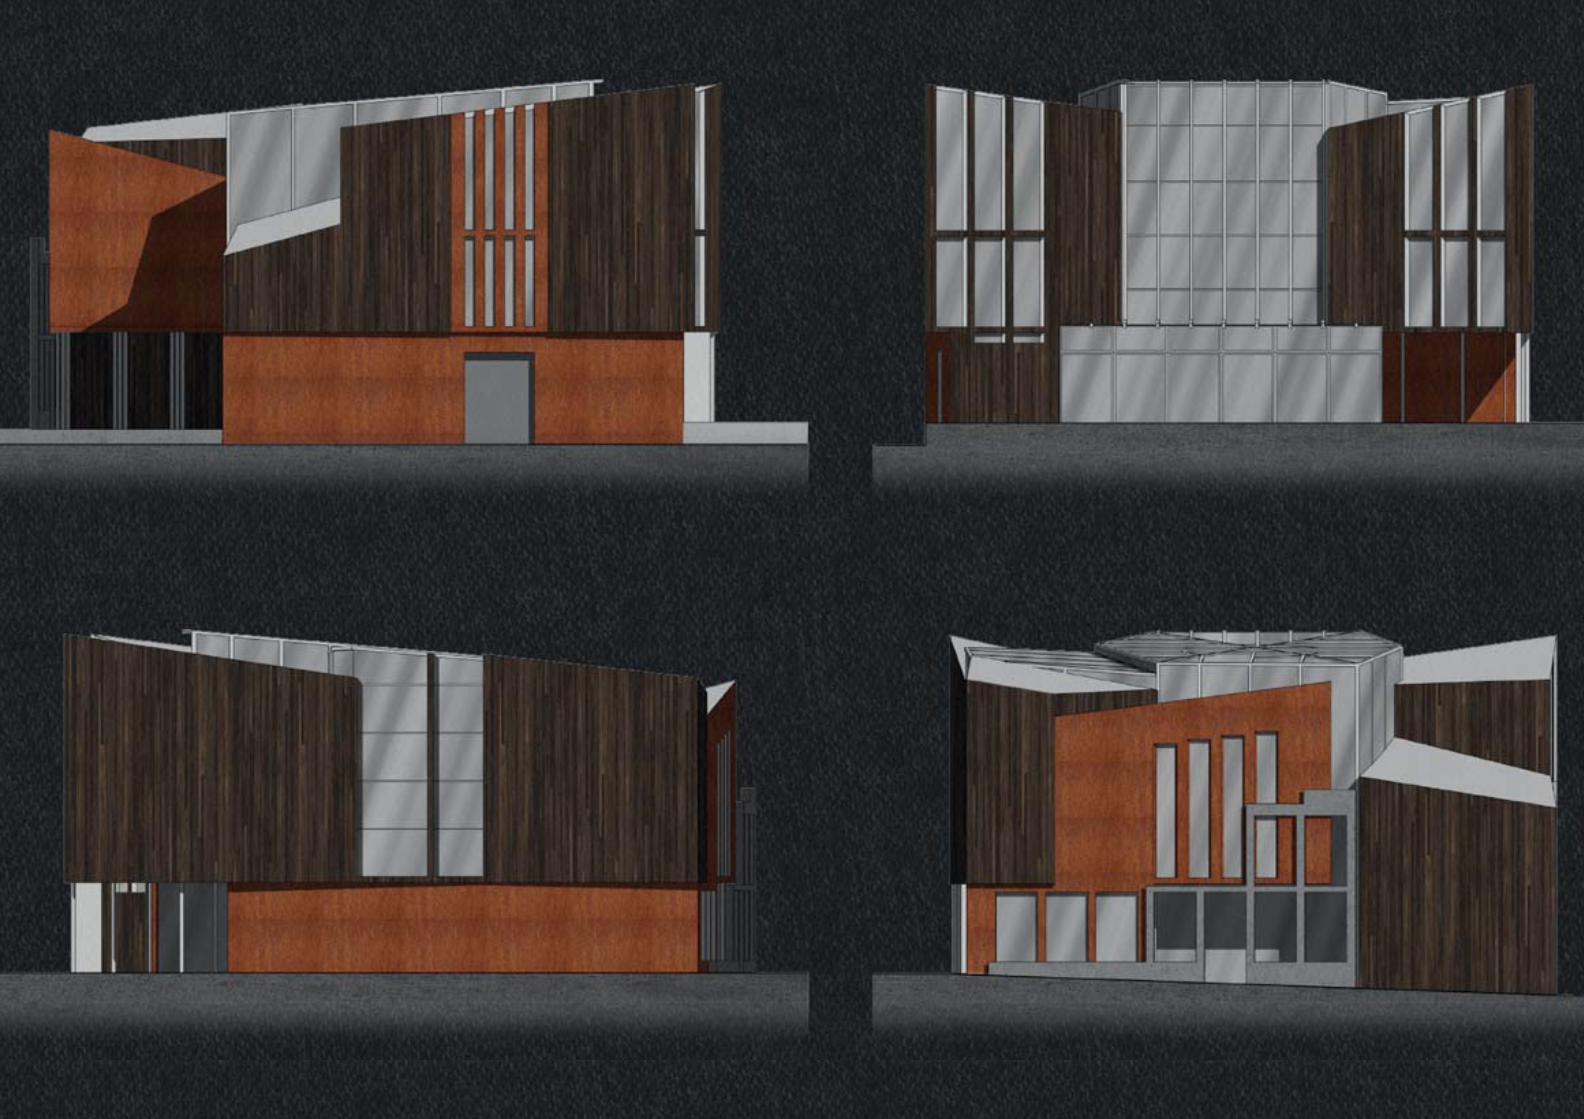
3D Visualisations0102030405
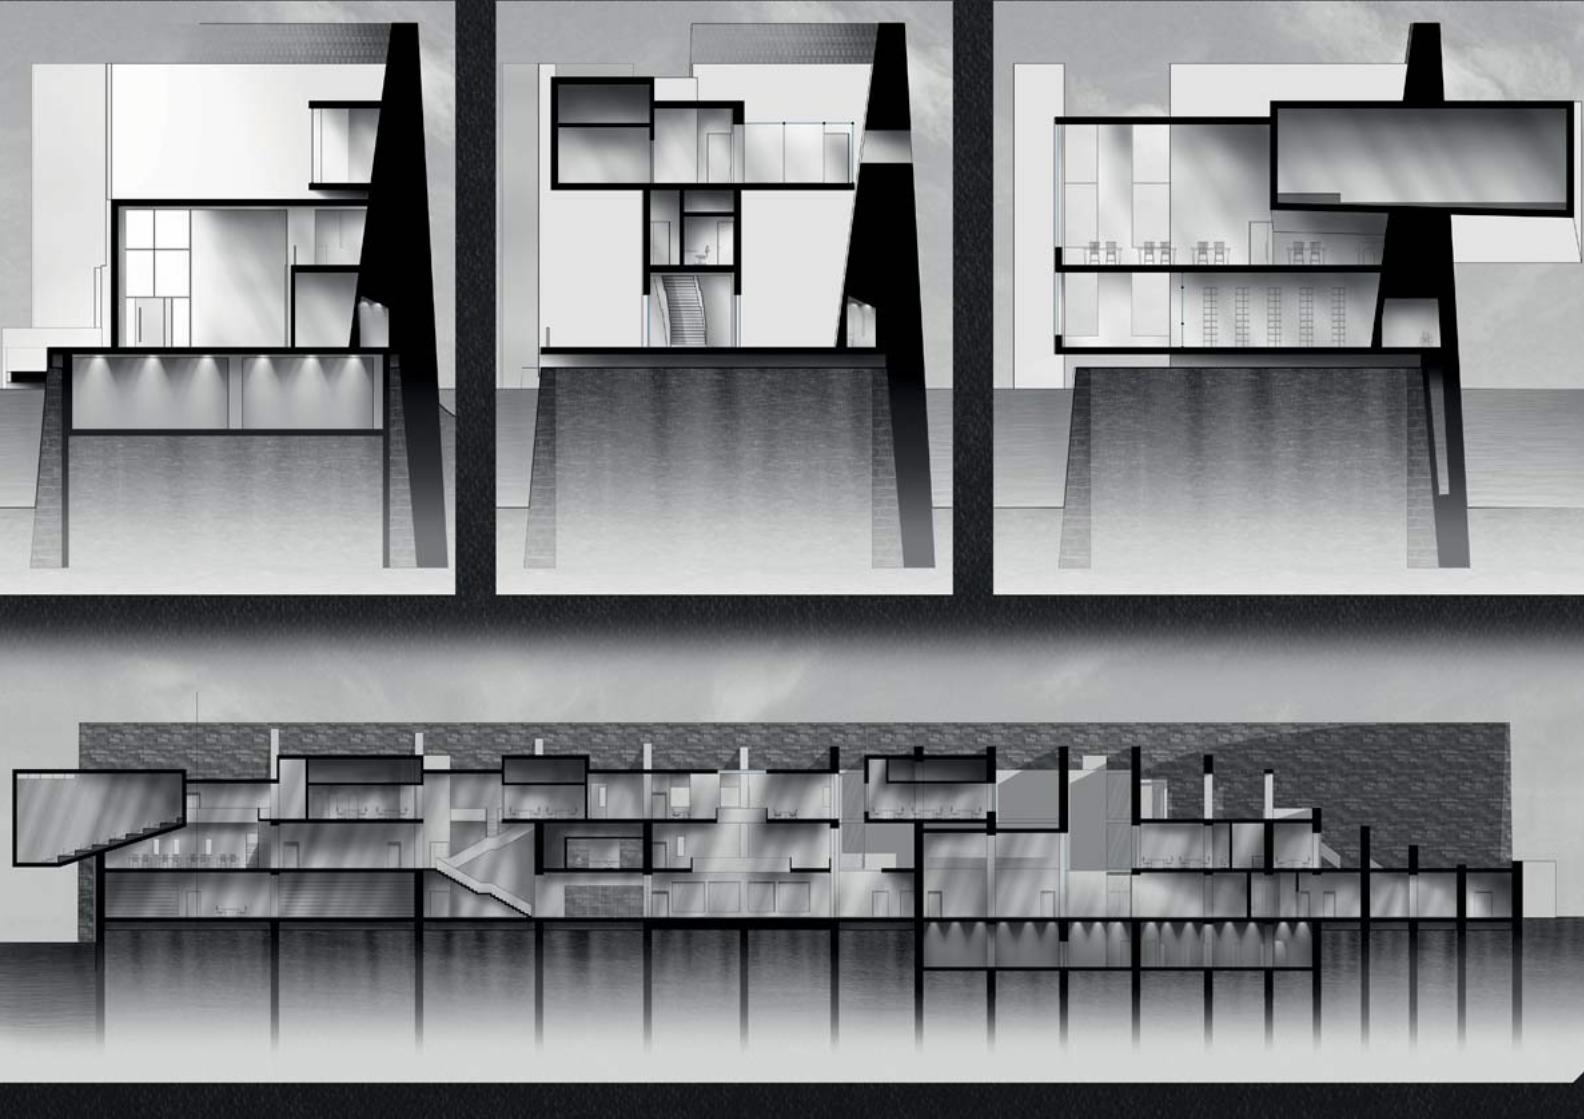
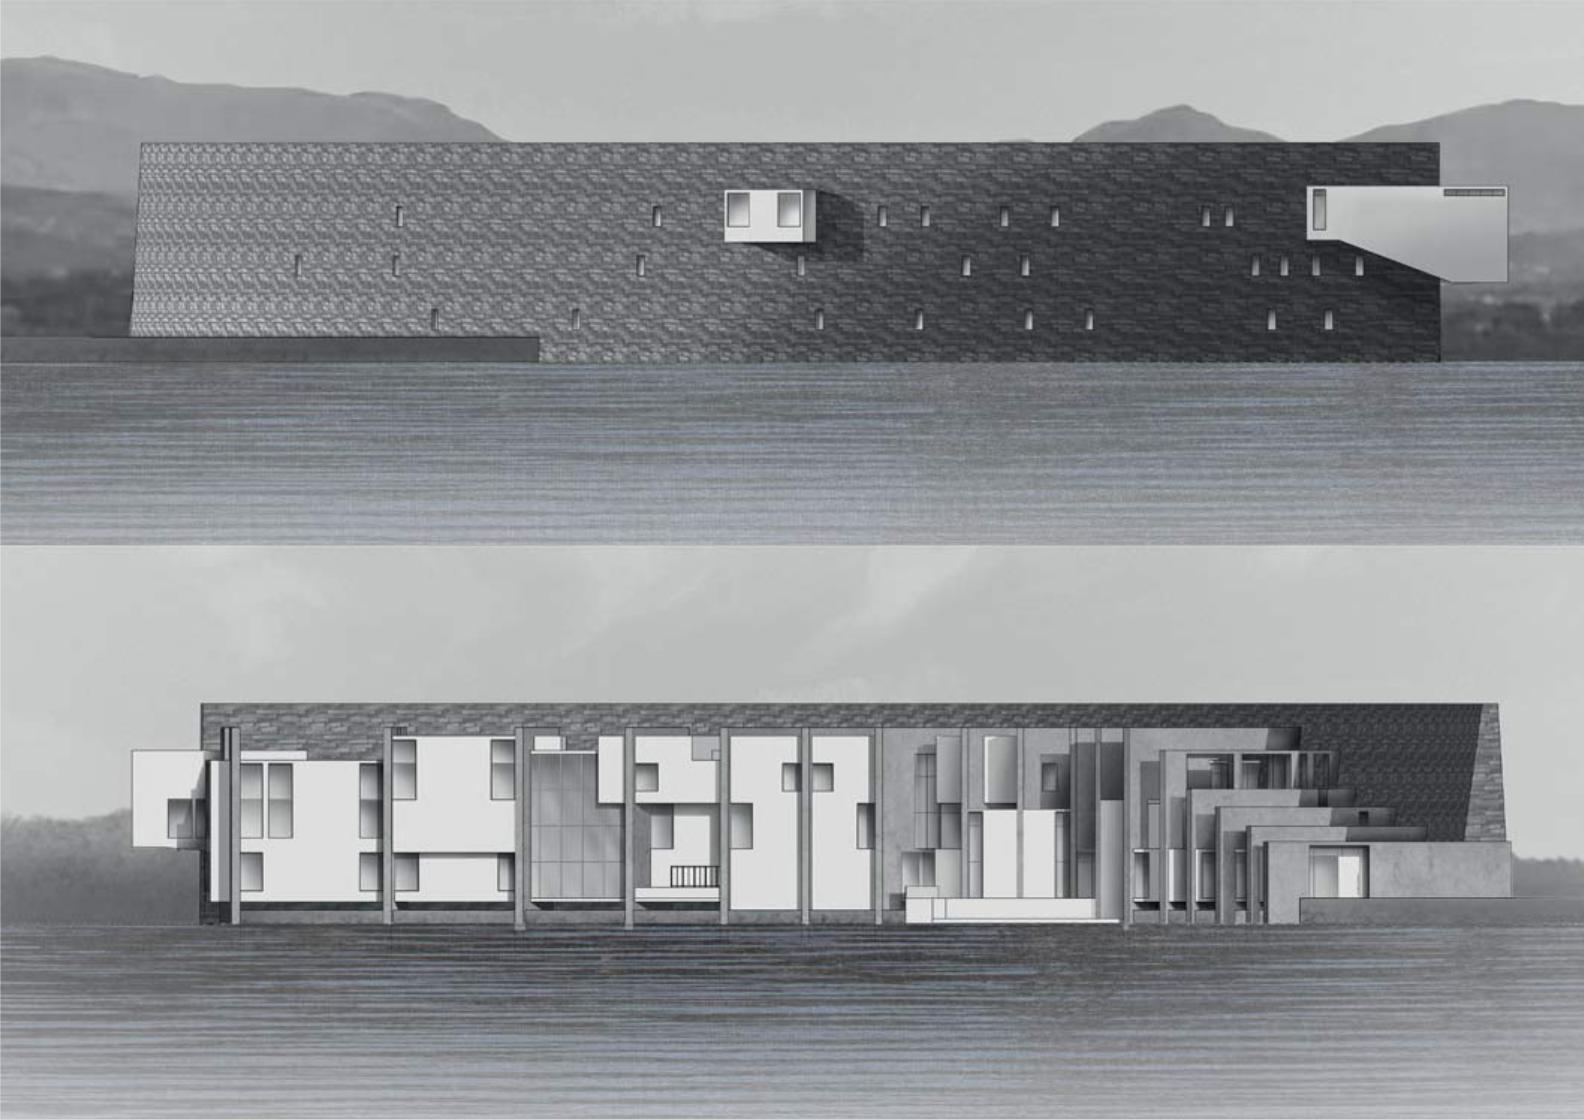
Drawings
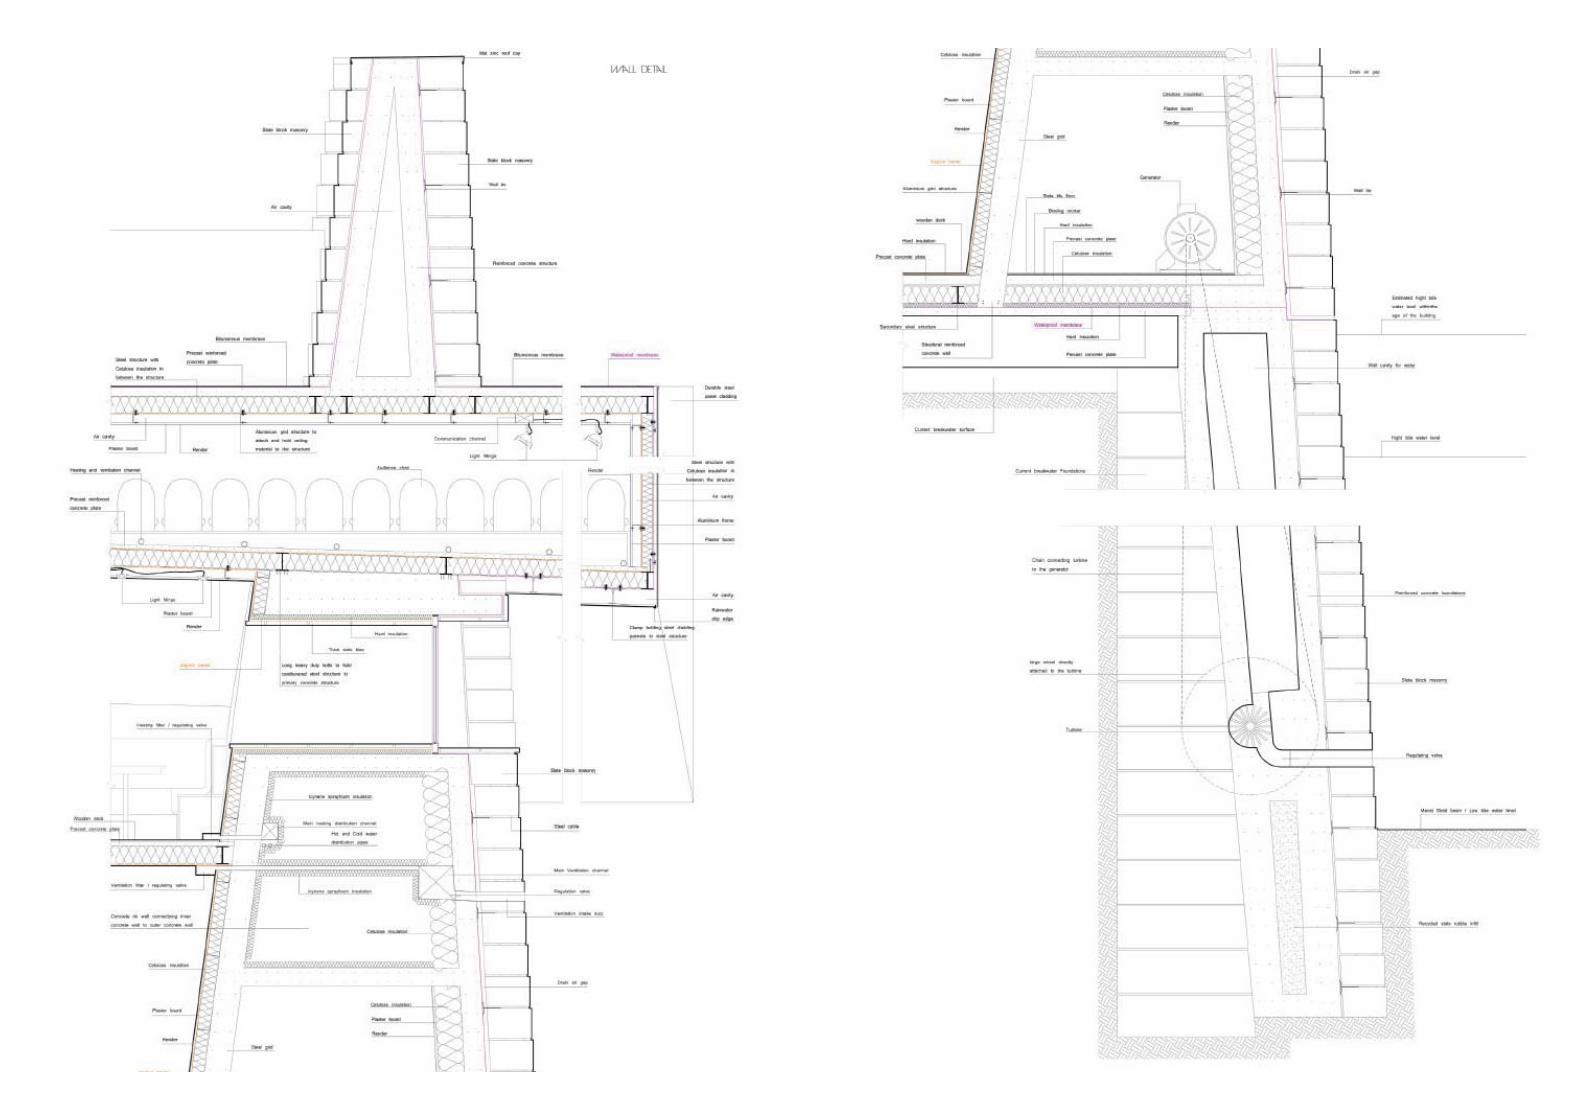
Details
Data Visual Representation
Model Making

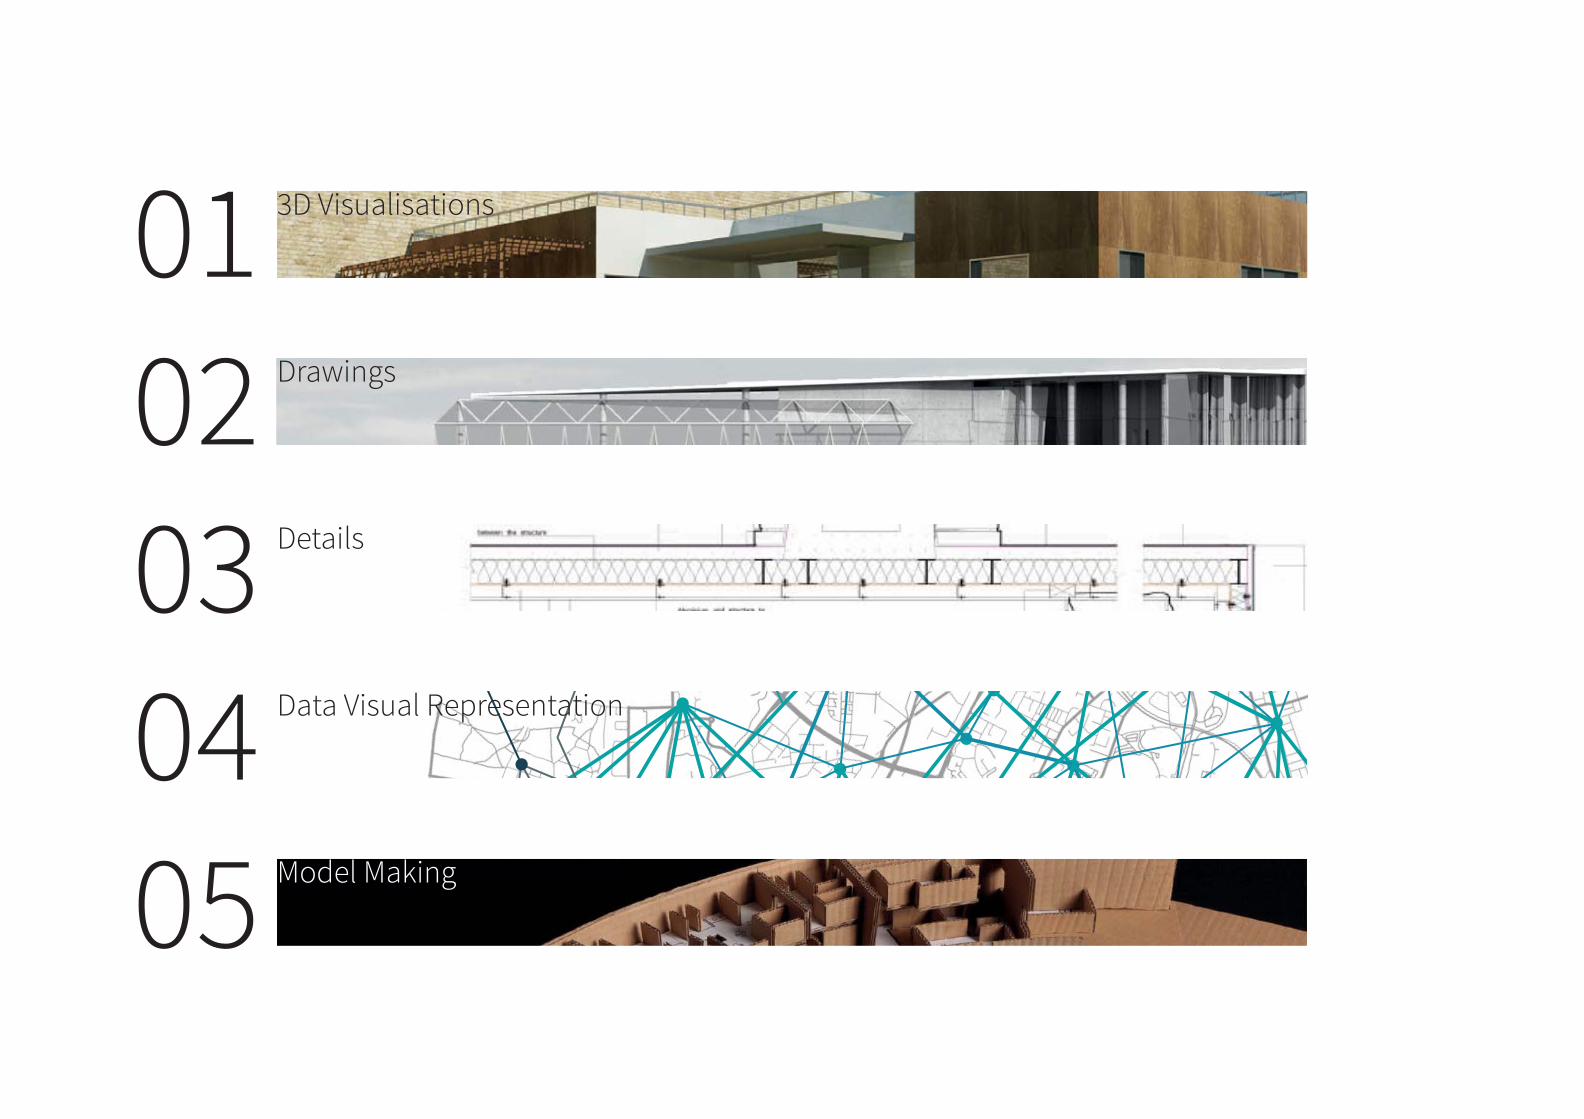
3D Visualisations01


Drawings02


Details03


Data Visual Representation04
80 K
60 K
50 K
40 K
30 K
20 K
10 K
0
100 K
120 K
140 K
160 K
180 K
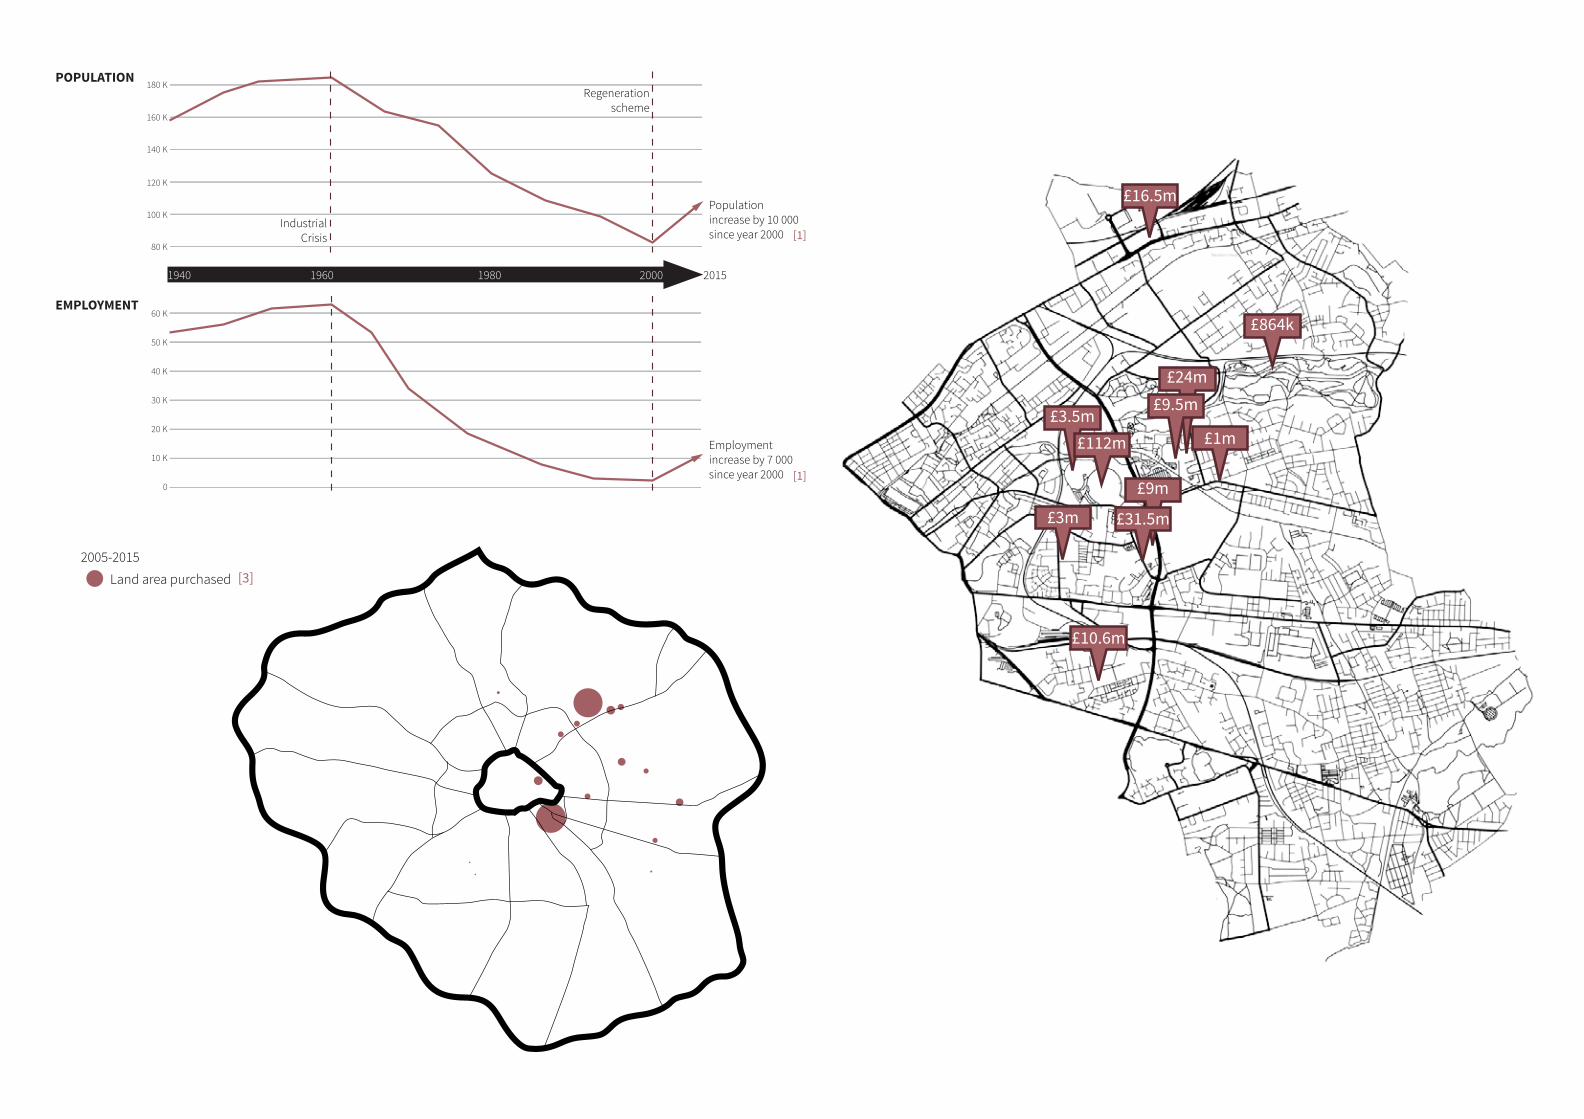
1940 1960 1980 2000 2015
Regeneration scheme
Population increase by 10 000 since year 2000 [1]
[1]
Employment increase by 7 000 since year 2000
Industrial Crisis
POPULATION
EMPLOYMENT
2005-2015
Land area purchased [3]
£24m
£9m
£9.5m
£864k
£3.5m£112m
£31.5m
£1m
£10.6m
£16.5m
£3m
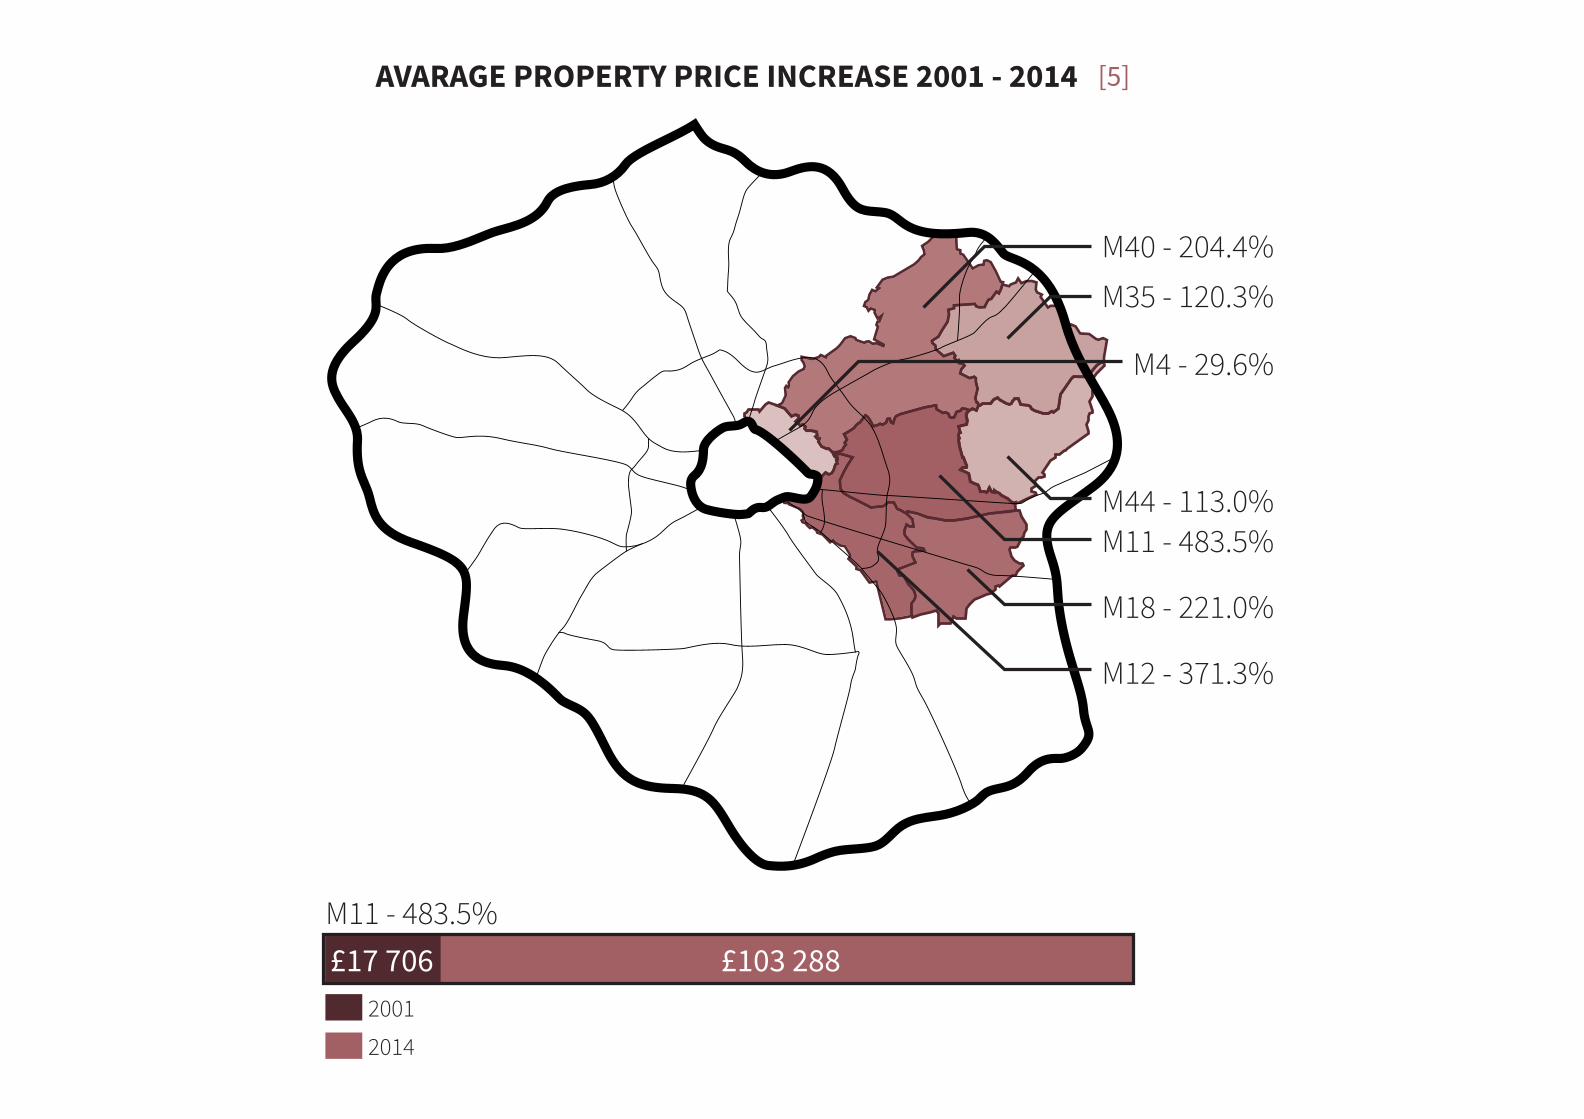
AVARAGE PROPERTY PRICE INCREASE 2001 - 2014
M11 - 483.5%
M11 - 483.5%
M12 - 371.3%
M18 - 221.0%
M44 - 113.0%
M40 - 204.4%
M35 - 120.3%
M4 - 29.6%
2001
2014
£17 706 £103 288
[5]
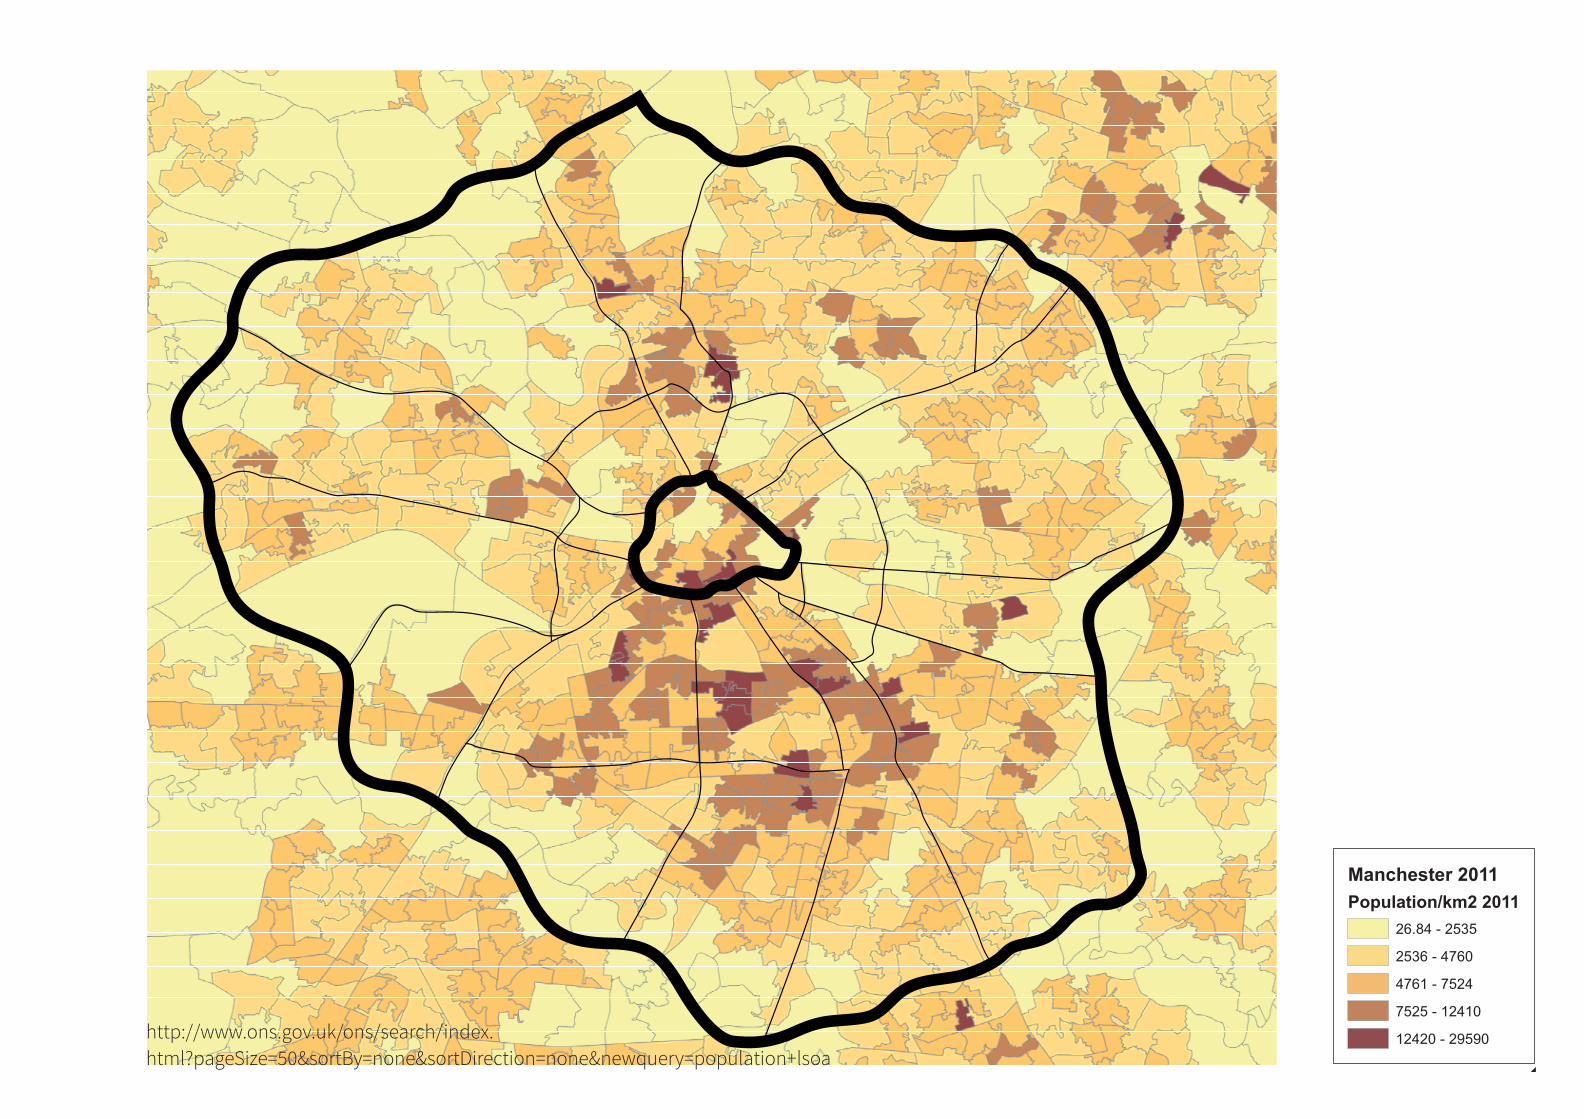
http://www.ons.gov.uk/ons/search/index.html?pageSize=50&sortBy=none&sortDirection=none&newquery=population+lsoa
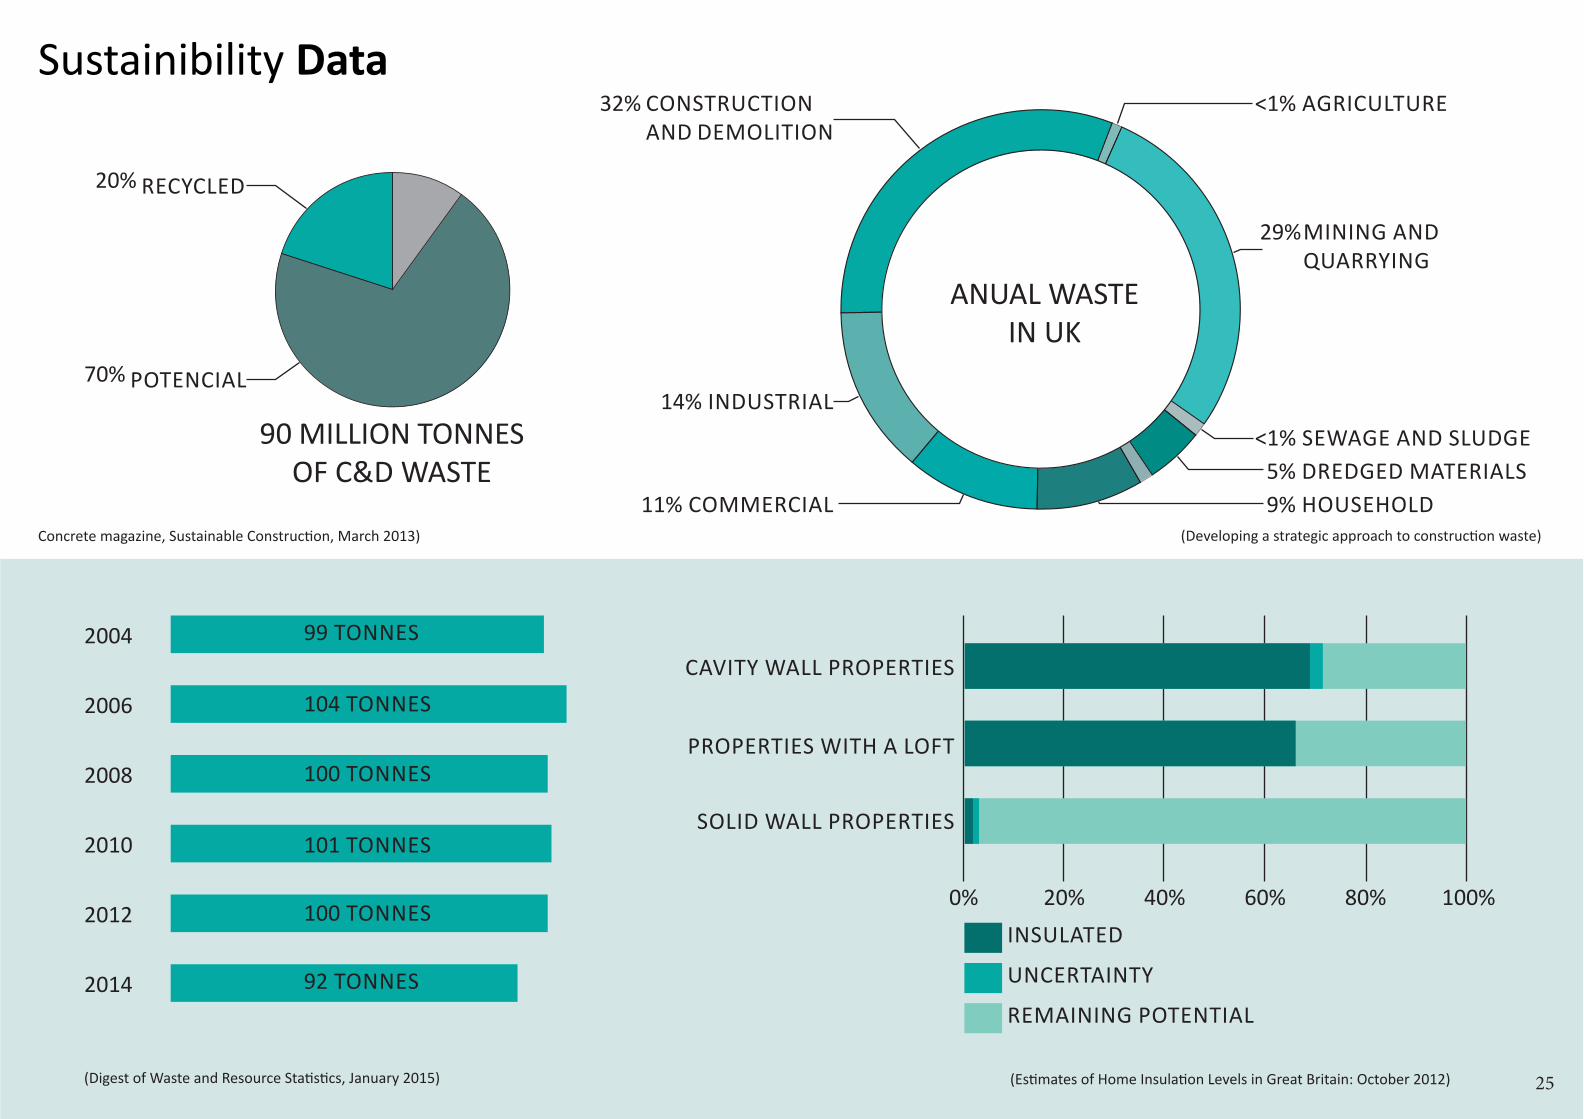
MINING AND QUARRYING
REMAINING POTENTIAL
UNCERTAINTY
INSULATED
CONSTRUCTION AND DEMOLITION
RECYCLED
POTENCIAL
2004 99 TONNES
104 TONNES
100 TONNES
101 TONNES
100 TONNES
92 TONNES
2008
2010
2012
2014
IN UK
90 MILLION TONNES
Sustainibility

Model Making05