Roadmap 2050 en bedrijvigheid in Nederland voor ... · Oil Gas Coal 1860 -… B1 A1T B2 A1B A2 A1FI...
40
Roadmap 2050 en bedrijvigheid in Nederland voor hernieuwbare energie Remko Ybema www.ecn.nl Ambassadeursconferentie - 20 januari 2011
Transcript of Roadmap 2050 en bedrijvigheid in Nederland voor ... · Oil Gas Coal 1860 -… B1 A1T B2 A1B A2 A1FI...
Roadmap 2050 en bedrijvigheid in Nederland voor hernieuwbare energie
Remko Ybema
www.ecn.nl
Ambassadeursconferentie - 20 januari 2011
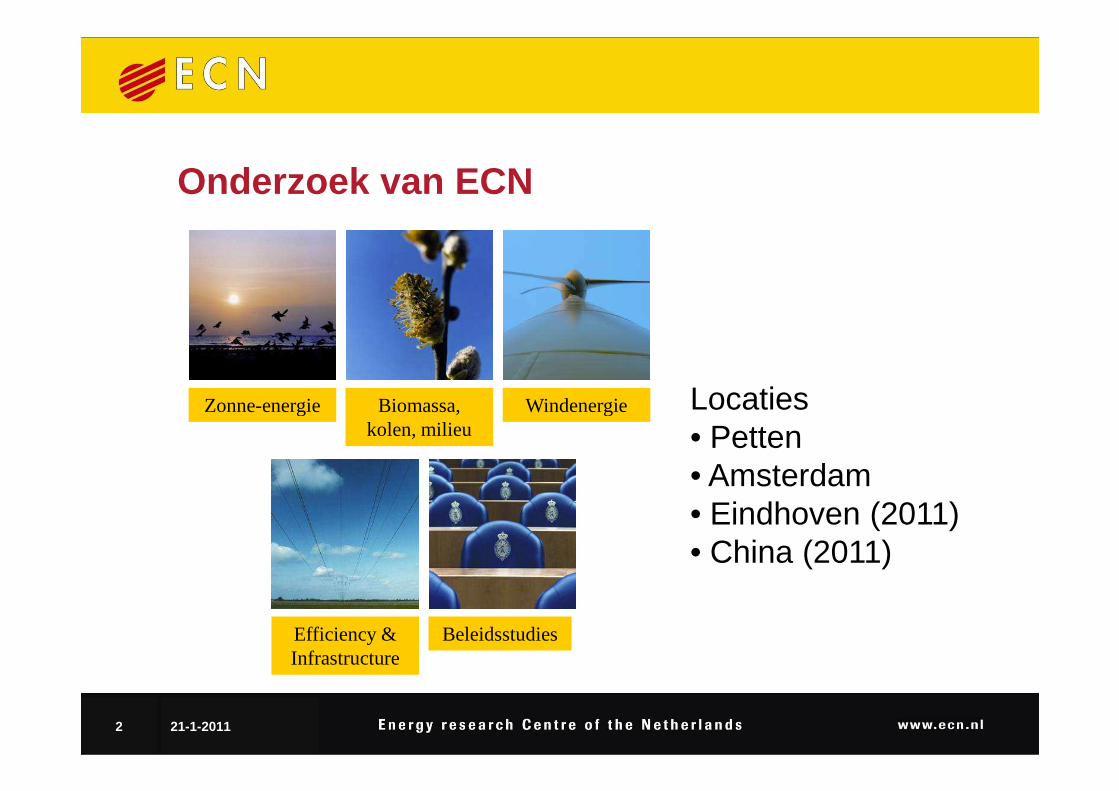
Onderzoek van ECN
Zonne-energie WindenergieBiomassa, Locaties
2 21-1-2011
Zonne-energie Windenergie
BeleidsstudiesEfficiency & Infrastructure
Biomassa, kolen, milieu
Locaties• Petten• Amsterdam• Eindhoven (2011)• China (2011)
Inhoud
• Roadmap 2050• Bedrijvigheid op gebied van hernieuwbare energie
3 21-1-2011
Roadmap 2050
4 21-1-2011
Waarom energievisies (en –scenario’s) voor 2050?
• Voorbereiden op toekomstige uitdagingen• Aansprekend beeld creëren om naar toe te werken
5 21-1-2011
Roadmap 2050
• Initiatief van European Climate Foundation (ECF)• Uitgevoerd door ECF, McKinsey, Kema, Imperial
College London, Oxford Economics, E3G, ECN en OMAOMA
• Bedoeld om geloofwaardige paden te laten zien naar een Europese energievoorziening waar de CO2-uitstoot in 2050 met 80% is verminderd- Inzoomen op de elektriciteitssector- Strategische lessen trekken- Beleidsopties voor de volgende 5 jaar
6 21-1-2011
Wat is echt nieuw aan ECF Roadmap 2050?
• Groot aangepakt met een brede groep van instituten en bedrijven
• Consequenties van elektriciteitsvoorziening met veel hernieuwbare energie goed uitgezochtveel hernieuwbare energie goed uitgezocht
• Eerste analyse van fundamentele beleidsissues• High level presentatie en professioneel
PR-offensief
7 21-1-2011
Hoofdboodschappen Roadmap 2050 (1)
• Het is voor Europa mogelijk om in 2050 de CO2-uitstoot met 80% te verminderen
• Er is een sleutelrol voor besparing en elektriciteit• Elektriciteitsproductie moet ‘zero carbon’ worden • Elektriciteitsproductie moet ‘zero carbon’ worden
en dat is mogelijk met verschillende soorten brandstofmix met hernieuwbare energie, kernenergie en kolen/gas-centrales met CCS
8 21-1-2011
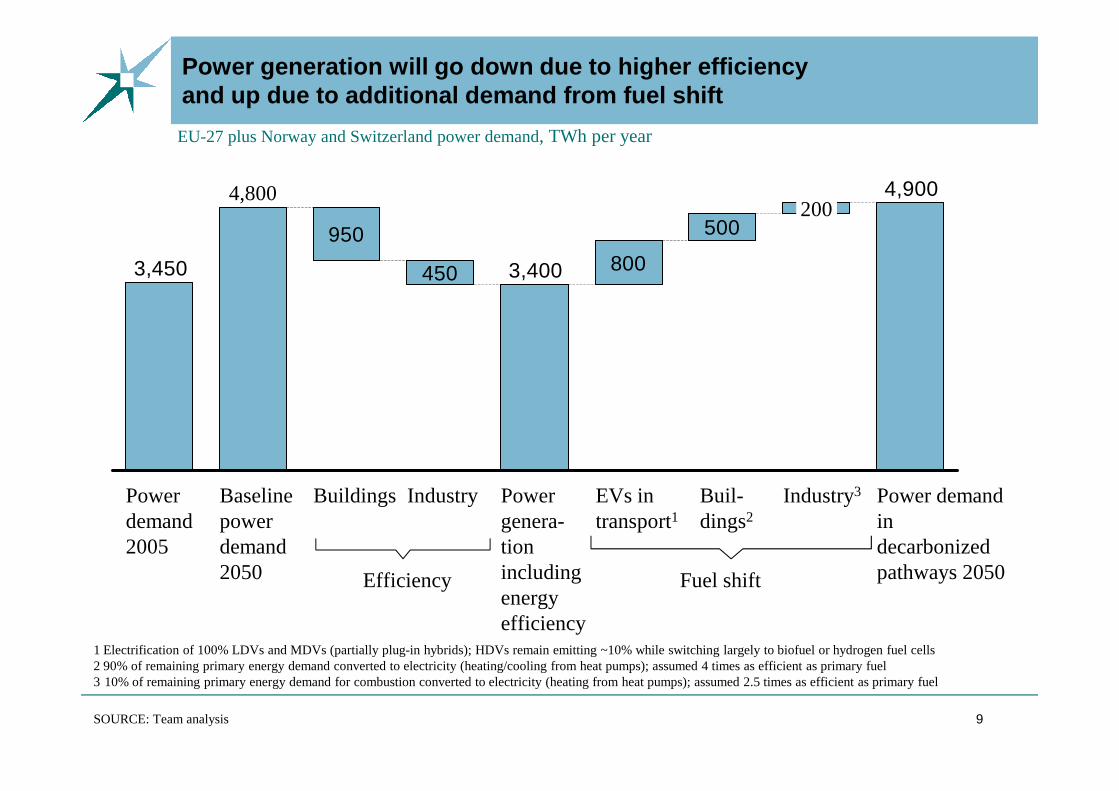
Power generation will go down due to higher efficie ncy and up due to additional demand from fuel shift
EU-27 plus Norway and Switzerland power demand, TWh per year
950
450 800
500
4,900
3,4003,450
4,800200
9
1 Electrification of 100% LDVs and MDVs (partially plug-in hybrids); HDVs remain emitting ~10% while switching largely to biofuel or hydrogen fuel cells2 90% of remaining primary energy demand converted to electricity (heating/cooling from heat pumps); assumed 4 times as efficient as primary fuel3 10% of remaining primary energy demand for combustion converted to electricity (heating from heat pumps); assumed 2.5 times as efficient as primary fuel
SOURCE: Team analysis
Baseline power demand 2050
BuildingsPower demand 2005
Power demand in decarbonized pathways 2050
Industry3Buil-dings2
EVs in transport1
Power genera-tion including energy efficiency
Industry
Efficiency Fuel shift
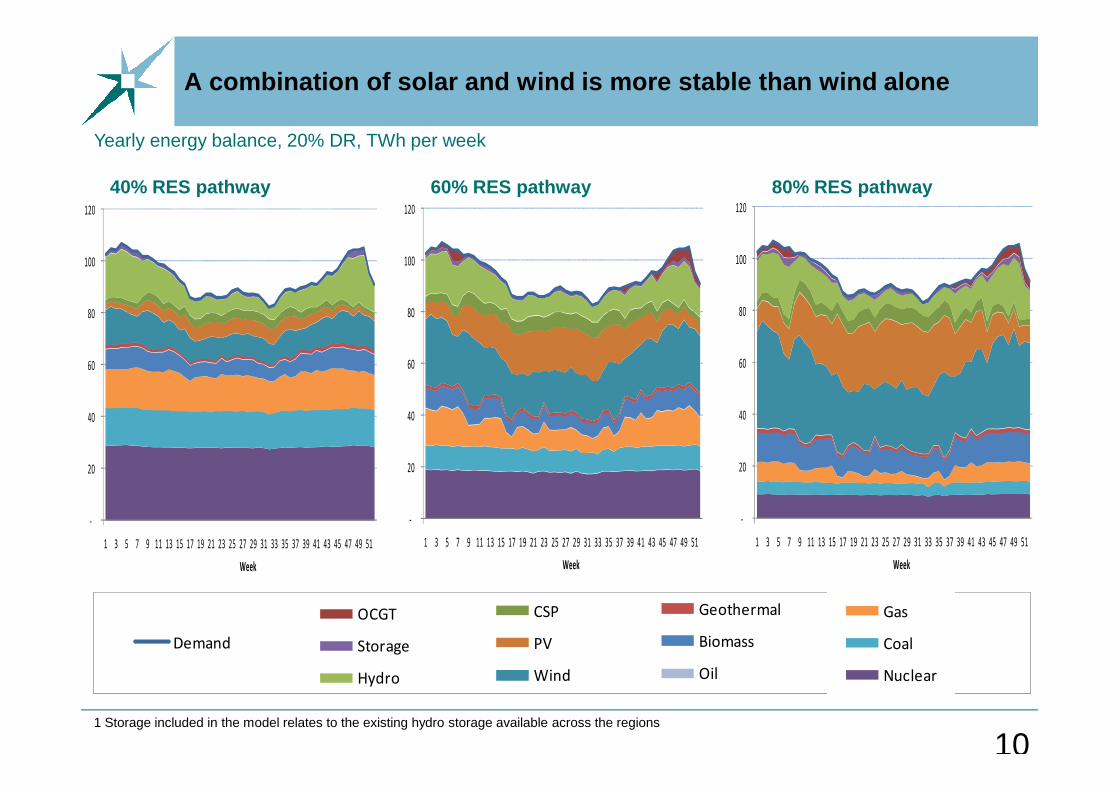
A combination of solar and wind is more stable than wind alone
1
Yearly energy balance, 20% DR, TWh per week
60
80
100
120
60
80
100
120
60
80
100
120
40% RES pathway 60% RES pathway 80% RES pathway
10
Gas
Coal
Nuclear
1 Storage included in the model relates to the existing hydro storage available across the regions
-
20
40
1 3 5 7 9 11 13 15 17 19 21 23 25 27 29 31 33 35 37 39 41 43 45 47 49 51
Week
Geothermal
Biomass
Oil
CSP
PV
Wind
OCGT
Storage
Hydro
Demand
-
20
40
1 3 5 7 9 11 13 15 17 19 21 23 25 27 29 31 33 35 37 39 41 43 45 47 49 51
Week
-
20
40
1 3 5 7 9 11 13 15 17 19 21 23 25 27 29 31 33 35 37 39 41 43 45 47 49 51
Week
Hoofdboodschappen Roadmap 2050 (2)
• Met veel hernieuwbare energie is er een intermittency issue- Veel meer trans-Europese transmissie is nodig
in Europa en vraagsturingin Europa en vraagsturing• De extra kosten vallen mee• De kapitaalskosten van de energiesector zullen
fors toenemen• Nu beginnen, anders hogere kosten
11 21-1-2011
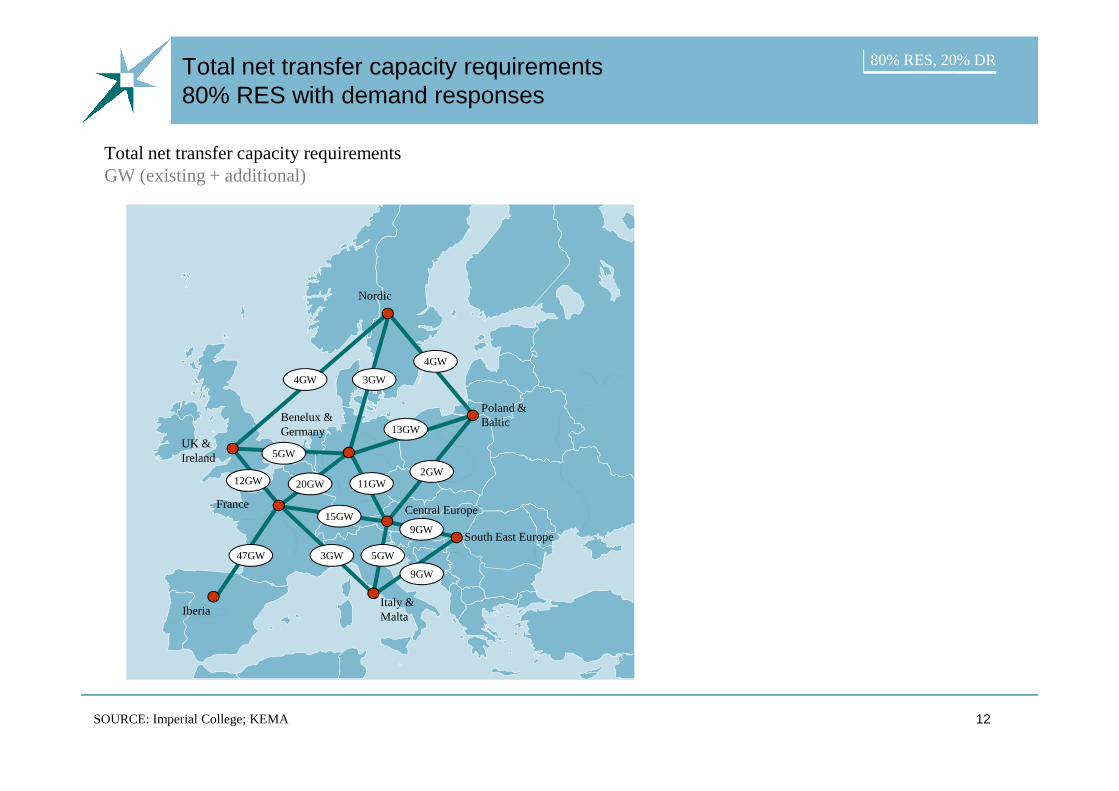
Total net transfer capacity requirements 80% RES with demand responses
80% RES, 20% DR
Nordic
4GW
4GW 3GW
Total net transfer capacity requirements GW (existing + additional)
12SOURCE: Imperial College; KEMA
Iberia
France
UK & Ireland
Benelux & Germany
Italy & Malta
South East Europe
Central Europe
Poland & Baltic
5GW
11GW20GW
47GW
9GW
9GW
12GW
13GW
15GW
3GW 5GW
2GW
60
70
80
90
100
110
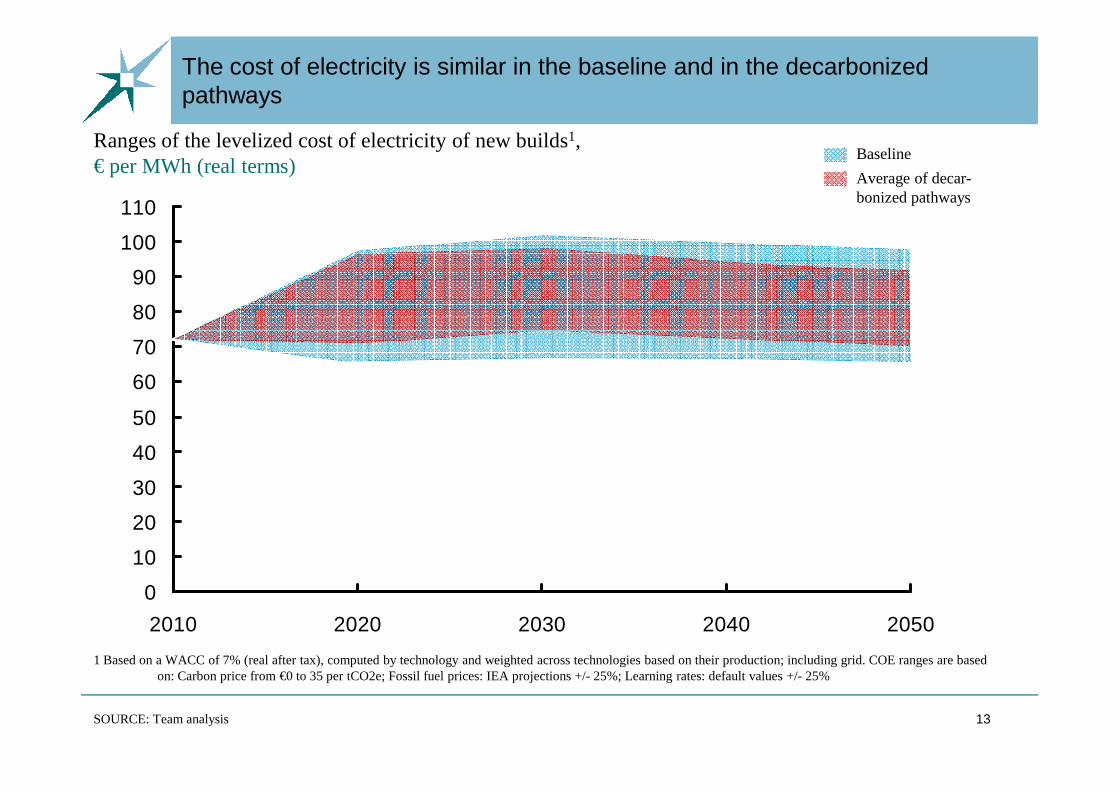
The cost of electricity is similar in the baseline and in the decarbonized pathways
Baseline
Average of decar-bonized pathways
Ranges of the levelized cost of electricity of new builds1, € per MWh (real terms)
13
0
10
20
30
40
50
2010 2020 2030 2040 2050
SOURCE: Team analysis
1 Based on a WACC of 7% (real after tax), computed by technology and weighted across technologies based on their production; including grid. COE ranges are based on: Carbon price from €0 to 35 per tCO2e; Fossil fuel prices: IEA projections +/- 25%; Learning rates: default values +/- 25%
50
60
70
80
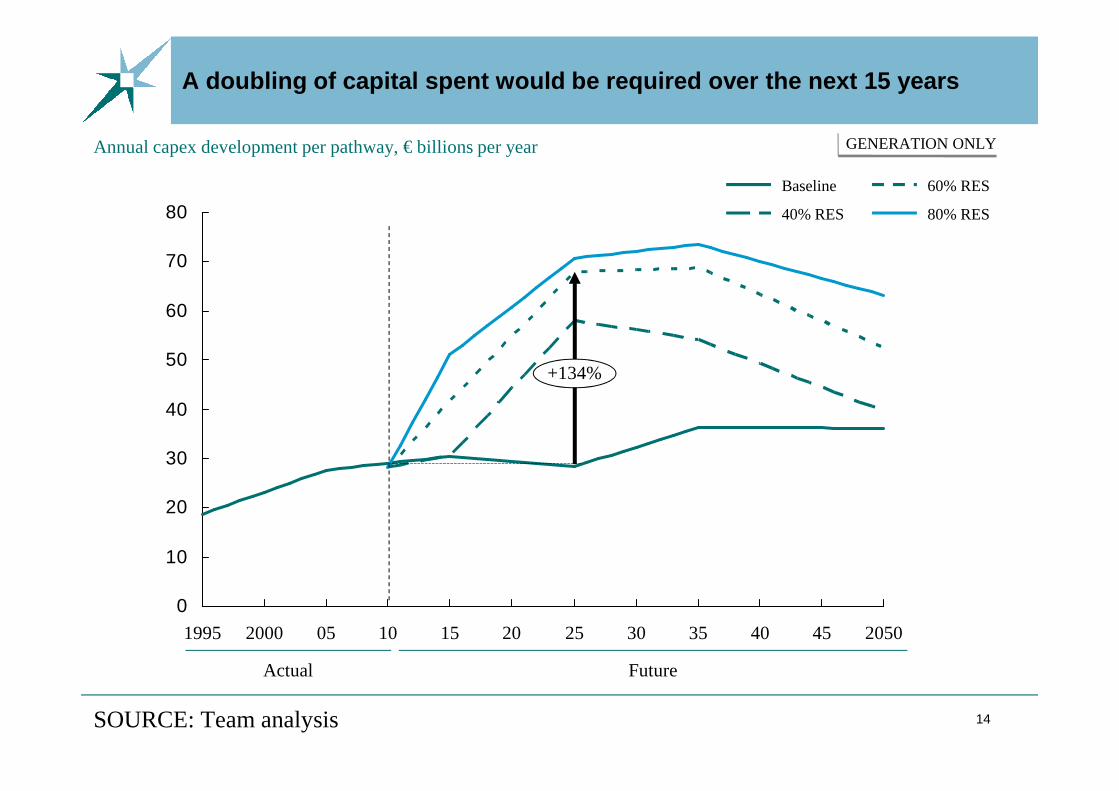
+134%
80% RES
60% RES
40% RES
Baseline
Annual capex development per pathway, € billions per year GENERATION ONLY
A doubling of capital spent would be required over the next 15 years
14
0
10
20
30
40
205045403530252015100520001995
Actual Future
SOURCE: Team analysis
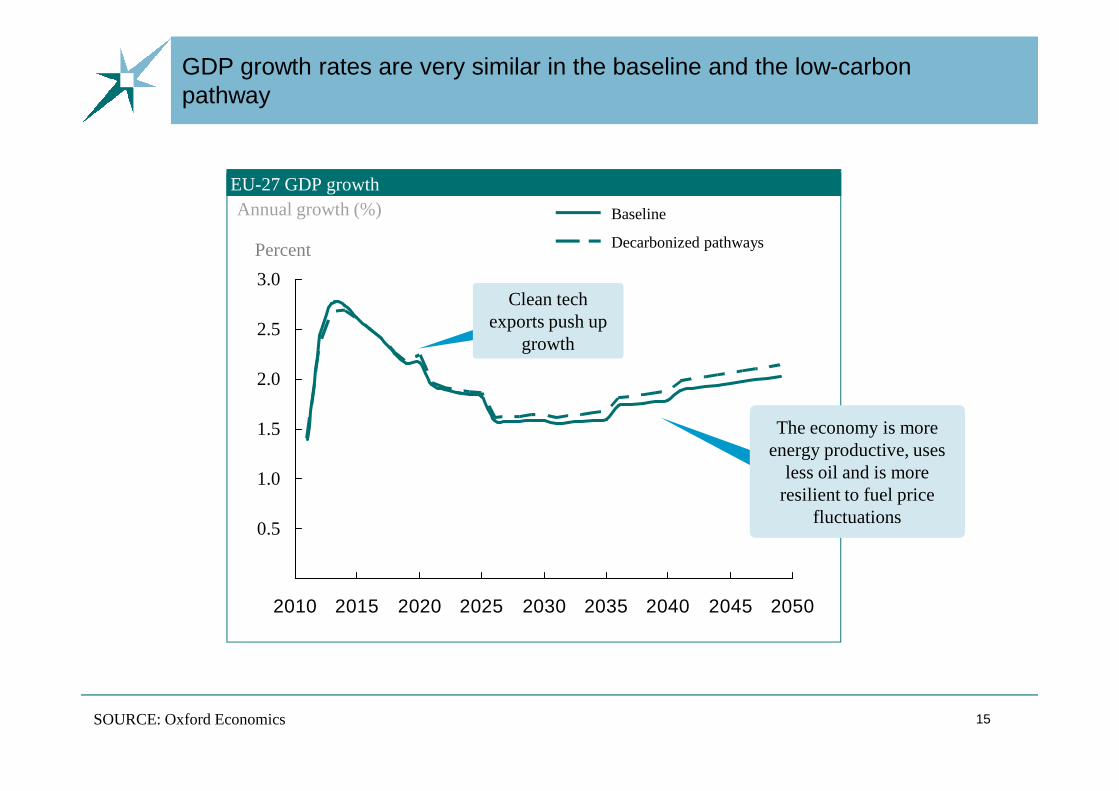
EU-27 GDP growth
Percent
3.0
2.5
2.0
GDP growth rates are very similar in the baseline and the low-carbon pathway
Baseline
Decarbonized pathways
Clean tech exports push up
growth
Annual growth (%)
15SOURCE: Oxford Economics
2010 2015 2020 2025 2030 2035 2040 2045 2050
0.5
1.5
1.0
The economy is more energy productive, uses
less oil and is more resilient to fuel price
fluctuations
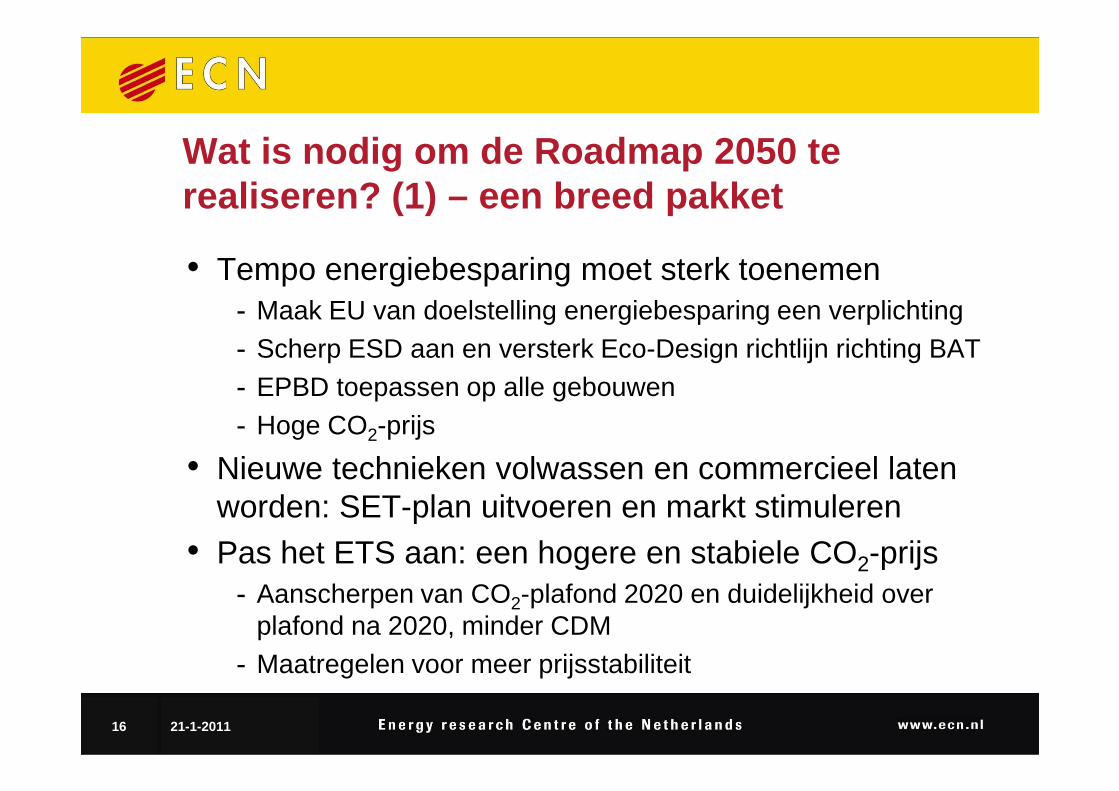
Wat is nodig om de Roadmap 2050 te realiseren? (1) – een breed pakket
• Tempo energiebesparing moet sterk toenemen- Maak EU van doelstelling energiebesparing een verplichting- Scherp ESD aan en versterk Eco-Design richtlijn richting BAT- EPBD toepassen op alle gebouwen- EPBD toepassen op alle gebouwen- Hoge CO2-prijs
• Nieuwe technieken volwassen en commercieel laten worden: SET-plan uitvoeren en markt stimuleren
• Pas het ETS aan: een hogere en stabiele CO2-prijs- Aanscherpen van CO2-plafond 2020 en duidelijkheid over
plafond na 2020, minder CDM- Maatregelen voor meer prijsstabiliteit
16 21-1-2011
Wat is nodig om de Roadmap 2050 te realiseren? (2)
• Duidelijkheid voor de elektriciteitssector bieden- Financiële prikkels voor o.a. CCS- Regulering
• Ontwikkel regionale roadmaps voor de power sector samen •met de belanghebbenden
• Ontwikkel capaciteitsmarkten of andere manieren om elektriciteitsmarkt te verbeteren
• Zorg dat de transitie gefinancierd kan worden• Introduceer een Climate and Resource Directive
17 21-1-2011
Kanttekeningen bij visiedocumenten
• Veronderstellen voorspoedige technische innovaties• Weinig aandacht voor andere belangen, voorkeuren
en weerstand tegen verandering- Kosten gaan voor de baten uit- Kosten gaan voor de baten uit- Prisoners dilemma
• Grote mate van optimaliteit bij de realisatie verondersteld - In de praktijk vaak gebrek aan coördinatie, trage
besluitvorming, etc.• Benodigde nationale beleid nauwelijks uitgewerkt
18 21-1-2011
Bedrijvigheid op gebied van hernieuwbare energie
19 21-1-2011
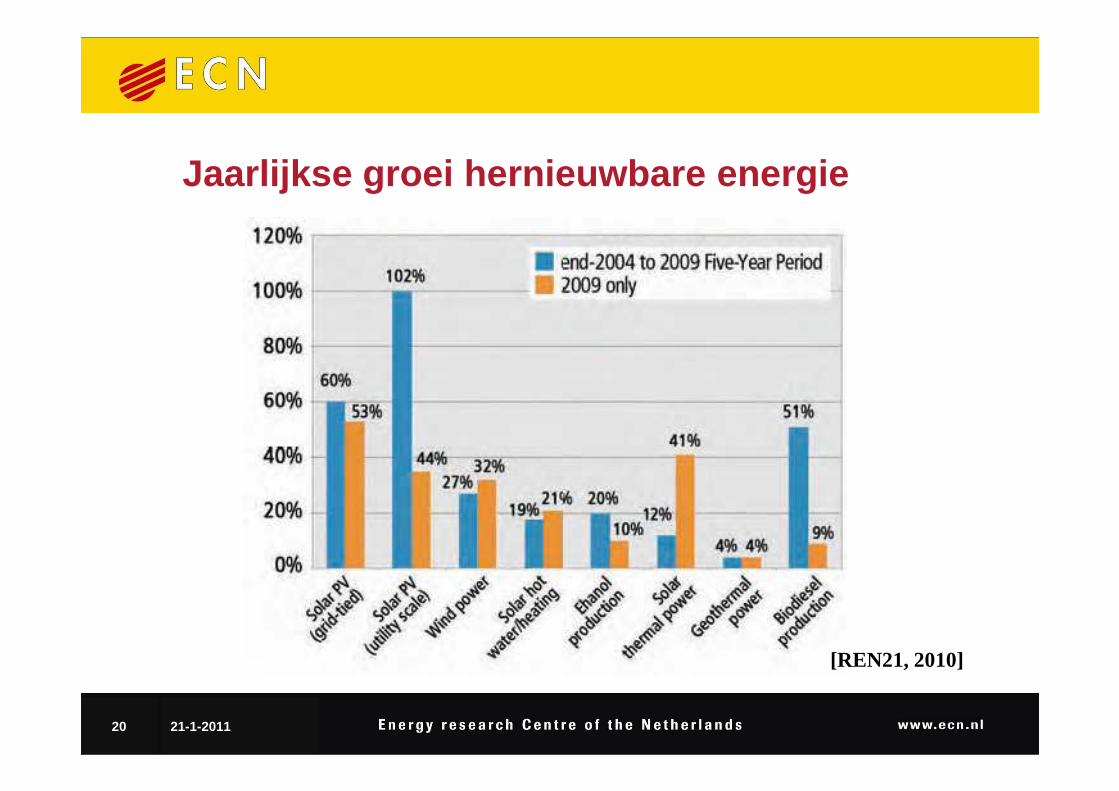
Jaarlijkse groei hernieuwbare energie
20 21-1-2011
[REN21, 2010]
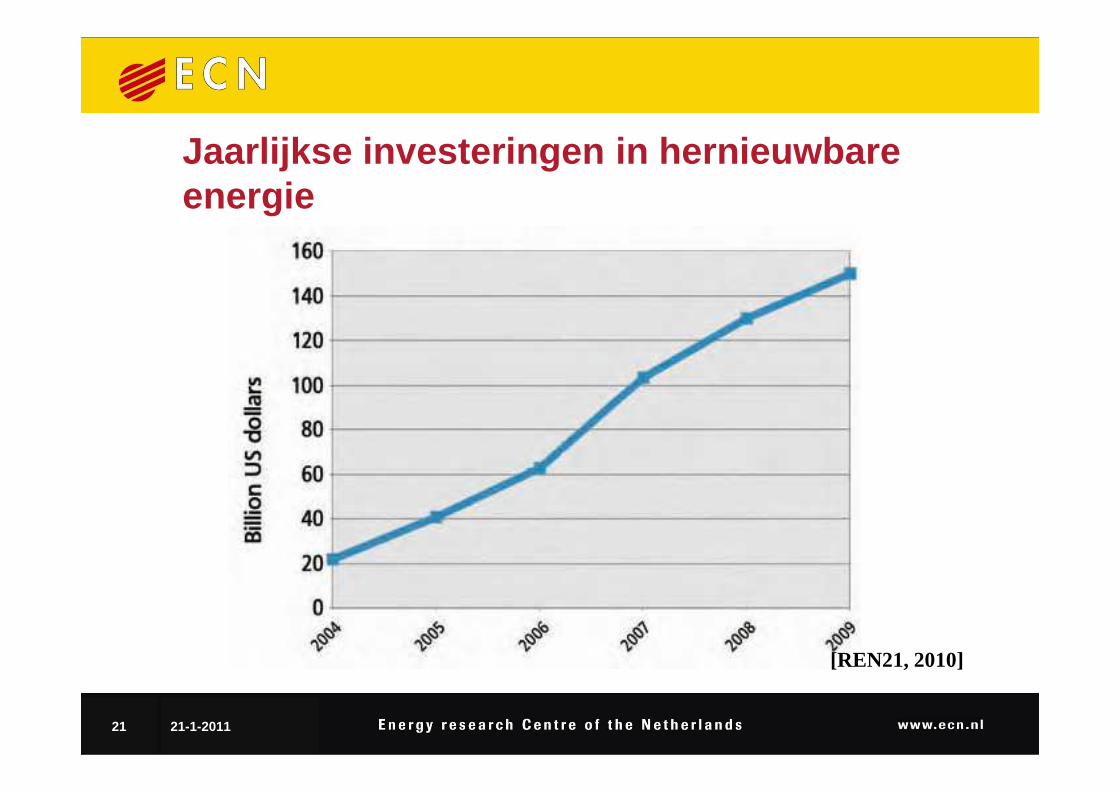
Jaarlijkse investeringen in hernieuwbare energie
21 21-1-2011
[REN21, 2010]
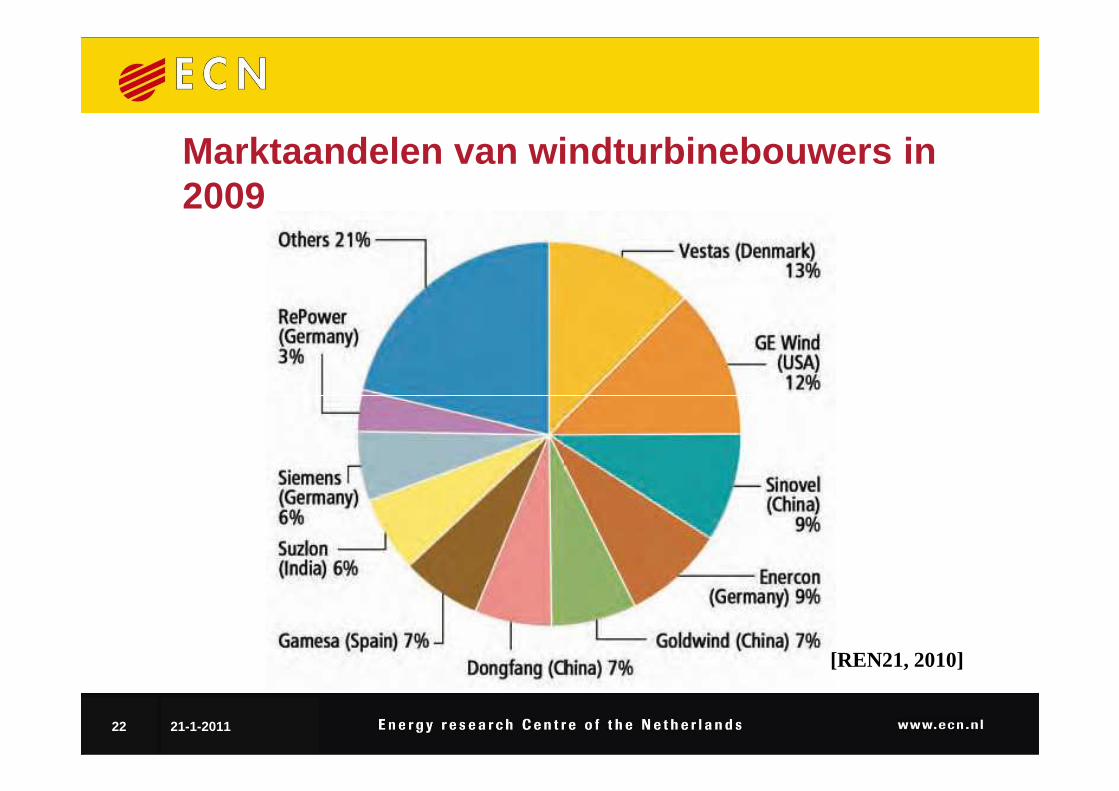
Marktaandelen van windturbinebouwers in 2009
22 21-1-2011
[REN21, 2010]
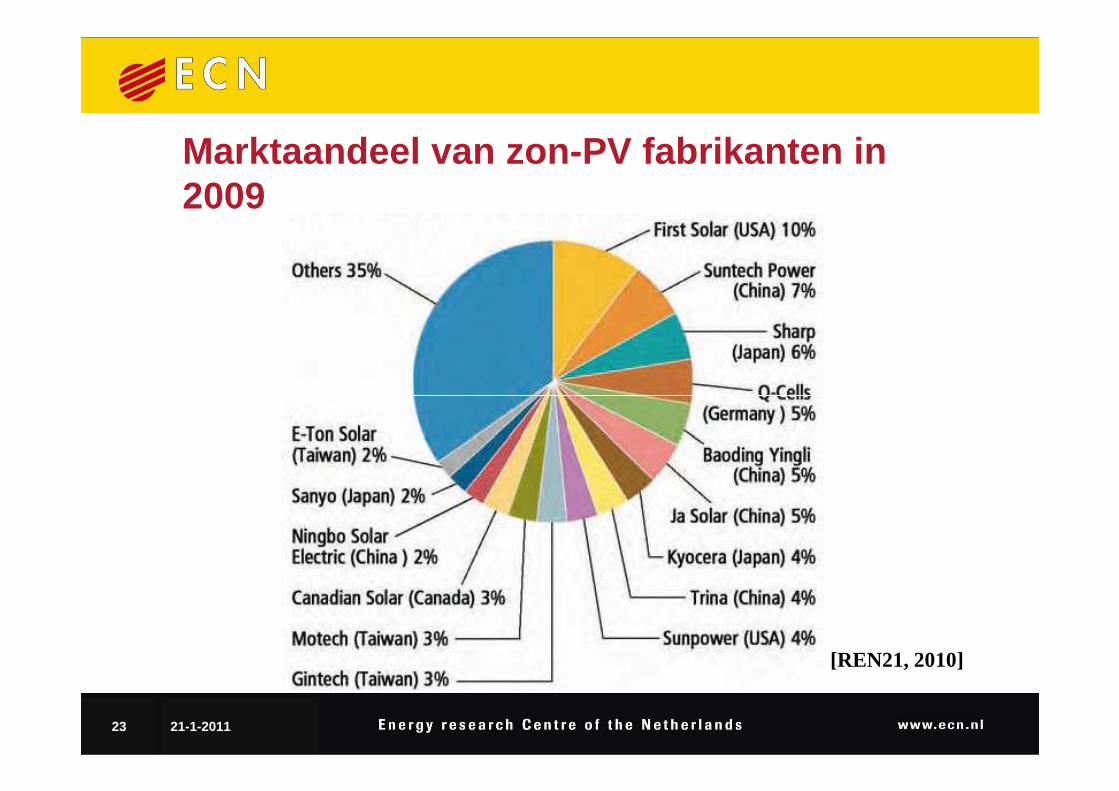
Marktaandeel van zon-PV fabrikanten in 2009
23 21-1-2011
[REN21, 2010]
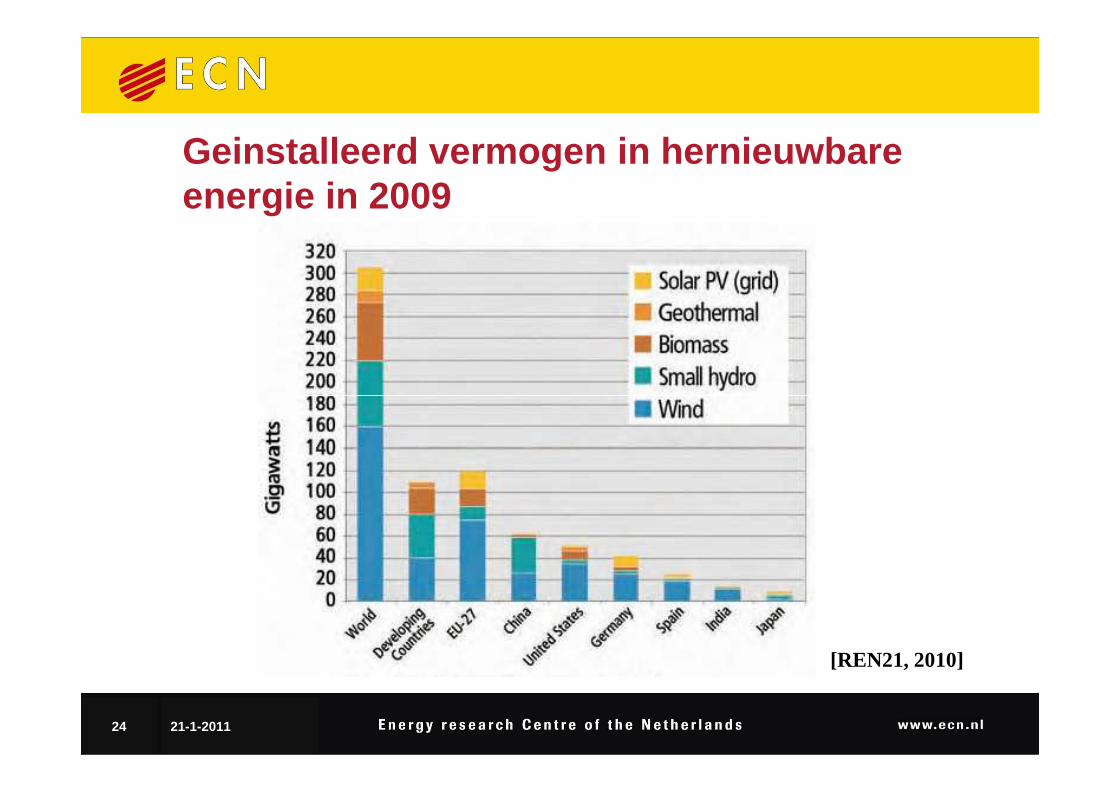
Geinstalleerd vermogen in hernieuwbare energie in 2009
24 21-1-2011
[REN21, 2010]
Bedrijvigheid op gebied van energie in Nederland
• Aardgas: meer dan 10 mrd baten, 11000 banen• Energiebesparing: 20.000 tot 30.000 banen• Hernieuwbare energie: 11.000 banen, omzet van
5,5 mrd5,5 mrd
• En energiebedrijven, raffinaderijen, ….
25 21-1-2011
Nederlandse duurzame energiesector
• Geen grote Nederlandse spelers (kleine thuismarkt)• Vooral R&D en consultancy en toelevering en
assemblage• Veel kleine bedrijven• Veel kleine bedrijven• Vooral afvalketen, zon-PV, zon-thermisch, wind en
biogas• Exportpositie het sterkst bij zon-PV (270 mln), wind
op zee (270 mln) en biobrandstoffen (80 mln)
26 21-1-2011
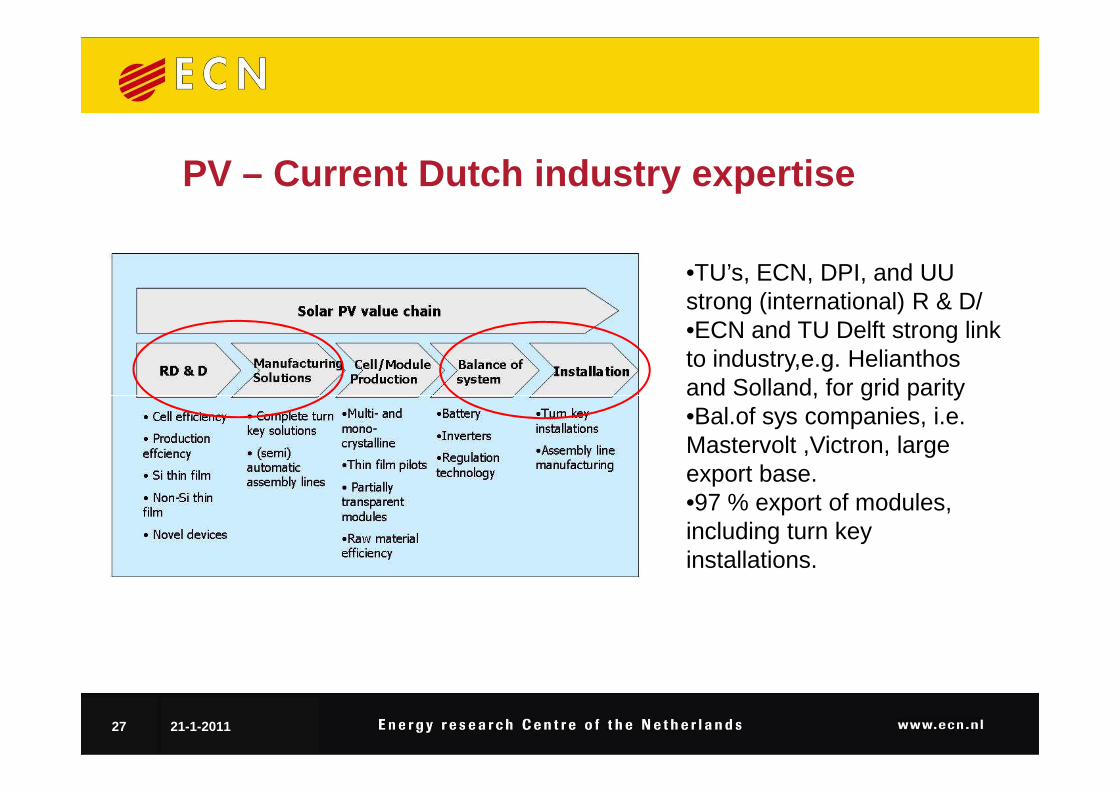
PV – Current Dutch industry expertise
•TU’s, ECN, DPI, and UU strong (international) R & D/•ECN and TU Delft strong link to industry,e.g. Helianthos and Solland, for grid parity
27 21-1-2011
and Solland, for grid parity•Bal.of sys companies, i.e. Mastervolt ,Victron, large export base.•97 % export of modules, including turn key installations.
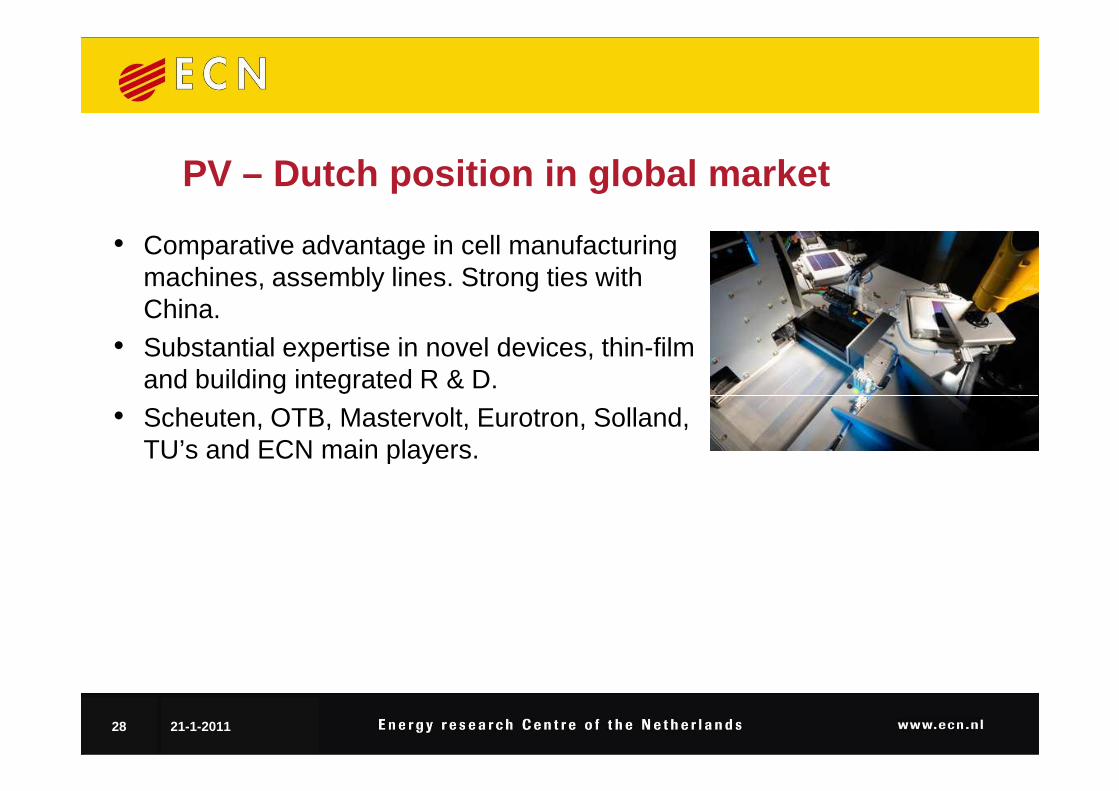
PV – Dutch position in global market
• Comparative advantage in cell manufacturing machines, assembly lines. Strong ties with China.
• Substantial expertise in novel devices, thin-film and building integrated R & D.
•
28 21-1-2011
• Scheuten, OTB, Mastervolt, Eurotron, Solland, TU’s and ECN main players.
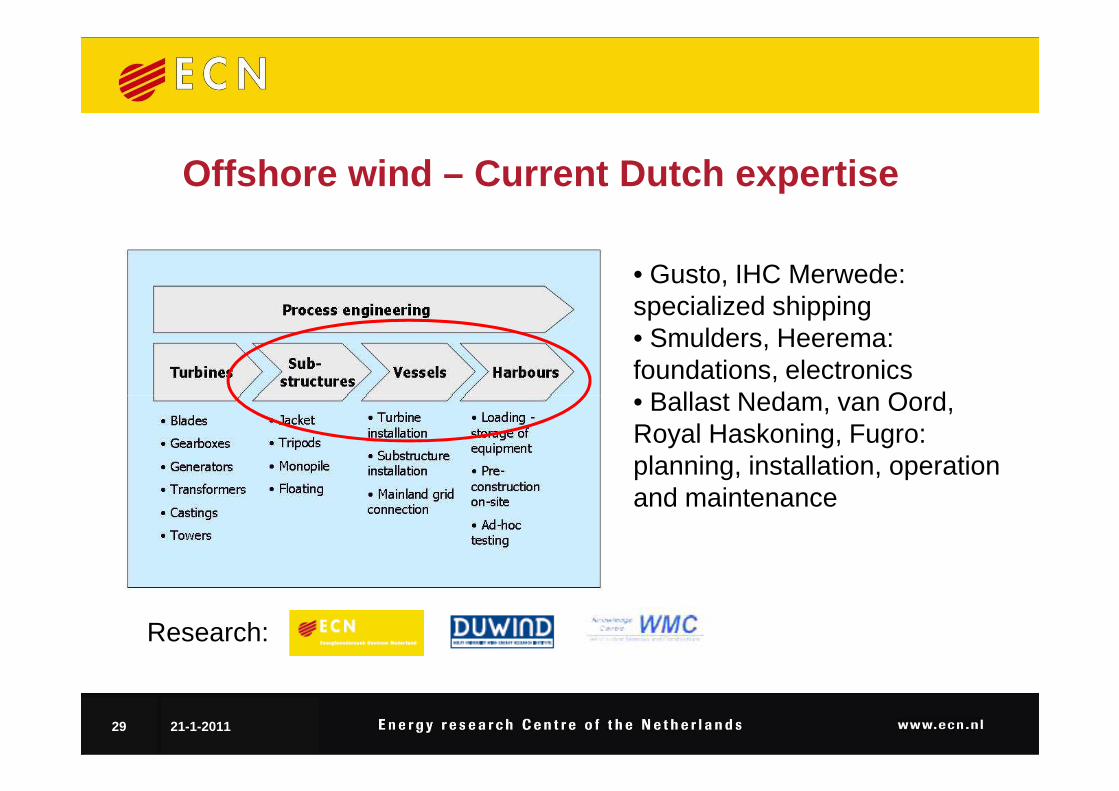
Offshore wind – Current Dutch expertise
• Gusto, IHC Merwede: specialized shipping• Smulders, Heerema: foundations, electronics• Ballast Nedam, van Oord,
29 21-1-2011
• Ballast Nedam, van Oord, Royal Haskoning, Fugro: planning, installation, operation and maintenance
Research:
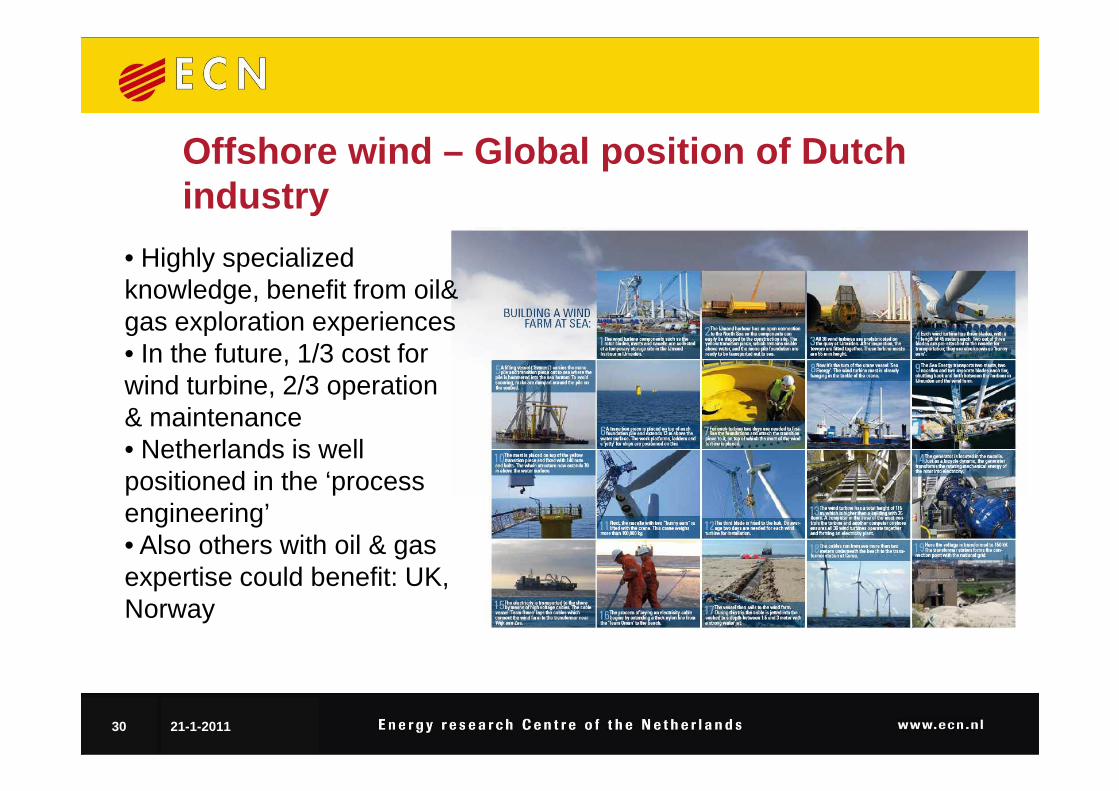
Offshore wind – Global position of Dutch industry
• Highly specialized knowledge, benefit from oil& gas exploration experiences • In the future, 1/3 cost for wind turbine, 2/3 operation
30 21-1-2011
wind turbine, 2/3 operation & maintenance• Netherlands is well positioned in the ‘process engineering’• Also others with oil & gas expertise could benefit: UK, Norway
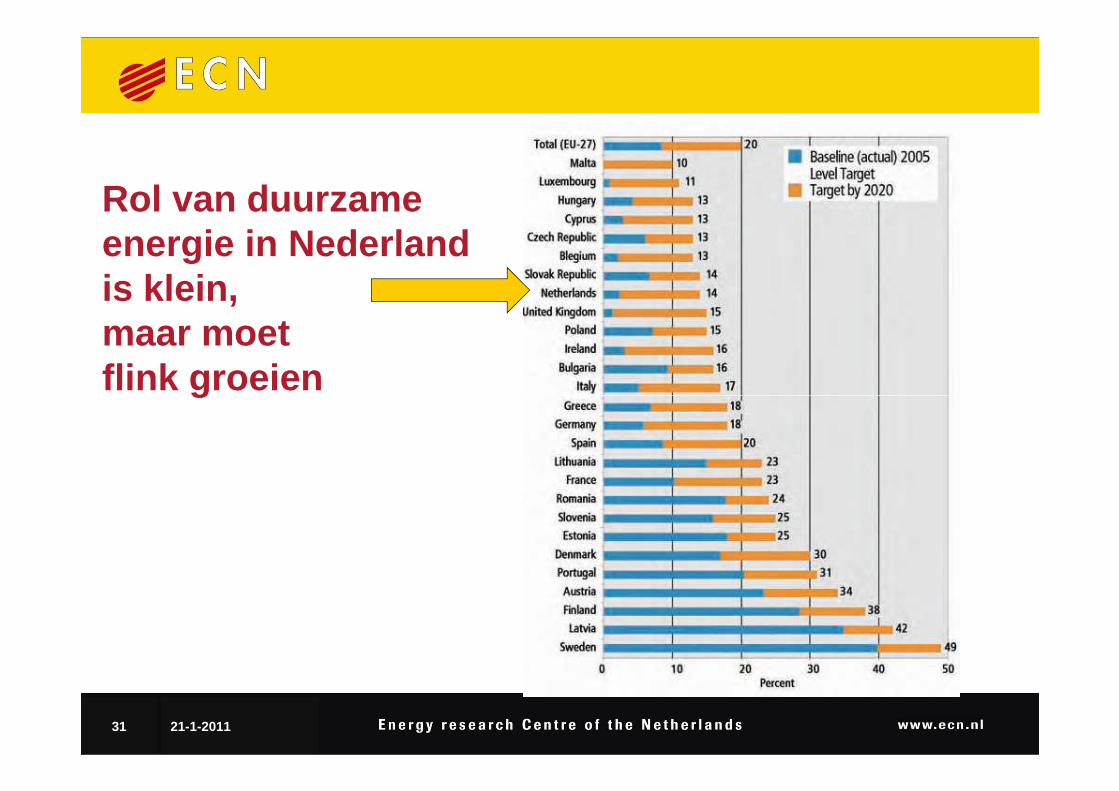
Rol van duurzameenergie in Nederlandis klein,maar moet flink groeienflink groeien
31 21-1-2011
Conclusies
• Een duurzame energievoorziening is mogelijk, maar dit vergt een grote tranistie, veel beleid en een goede coördinatie
• Nederland is nog vooral een gas- en olieland met • Nederland is nog vooral een gas- en olieland met een kleine thuismarkt hernieuwbare energie
• Er bestaan nog volop kansen voor Nederlandse bedrijven op gebied van hernieuwbare energie, vooal bij zon-PV, wind offshore en bio-energie
32 21-1-2011
Vragen?
33 21-1-2011
Reserve sheetsExterne ontwikkelingen
34 21-1-2011
Betaalbaar, betrouwbaar, schoon
• Betaalbaarheid: gaat goed, nog wel• Betrouwbaarheid: gaat goed, in veel regio’s • Schoon: Internationaal zwak klimaatbeleid,
lage CO prijslage CO2 prijs• Breed besef bij bedrijven en burgers dat
verduurzaming nodig is• Hernieuwbare energie groeit sterk, de maakindustrie
verschuift naar China en India
35 21-1-2011
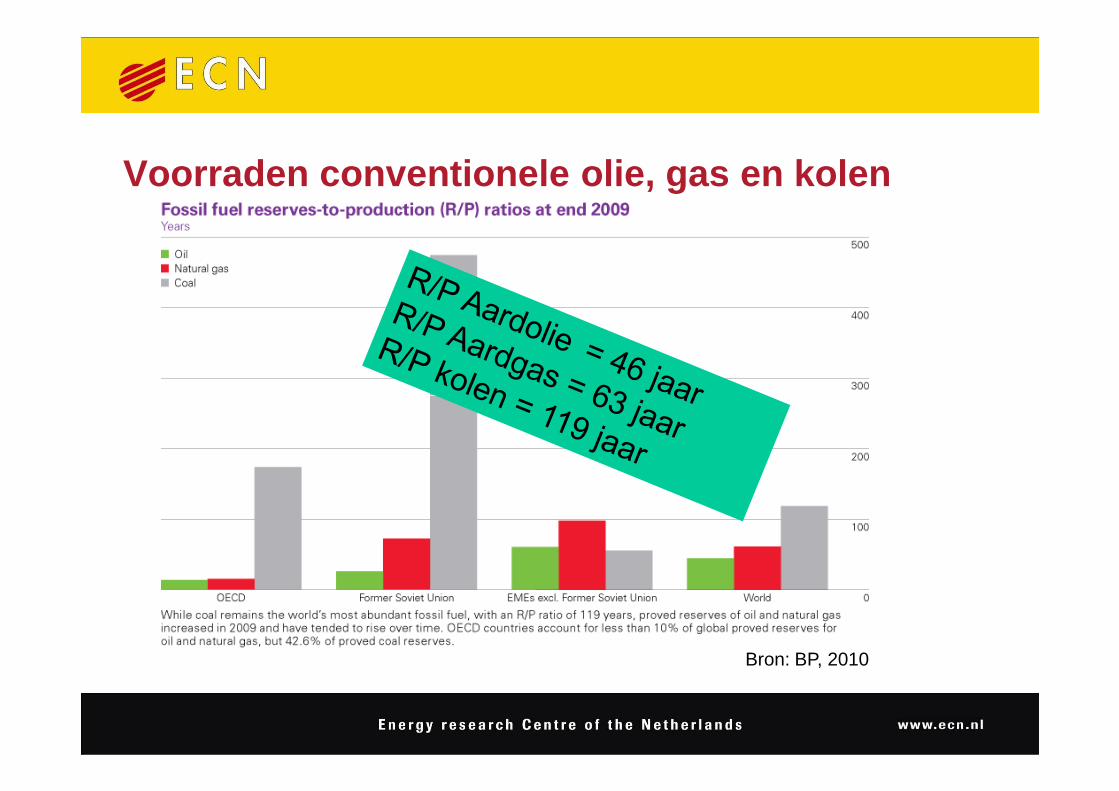
Voorraden conventionele olie, gas en kolen
Bron: BP, 2010
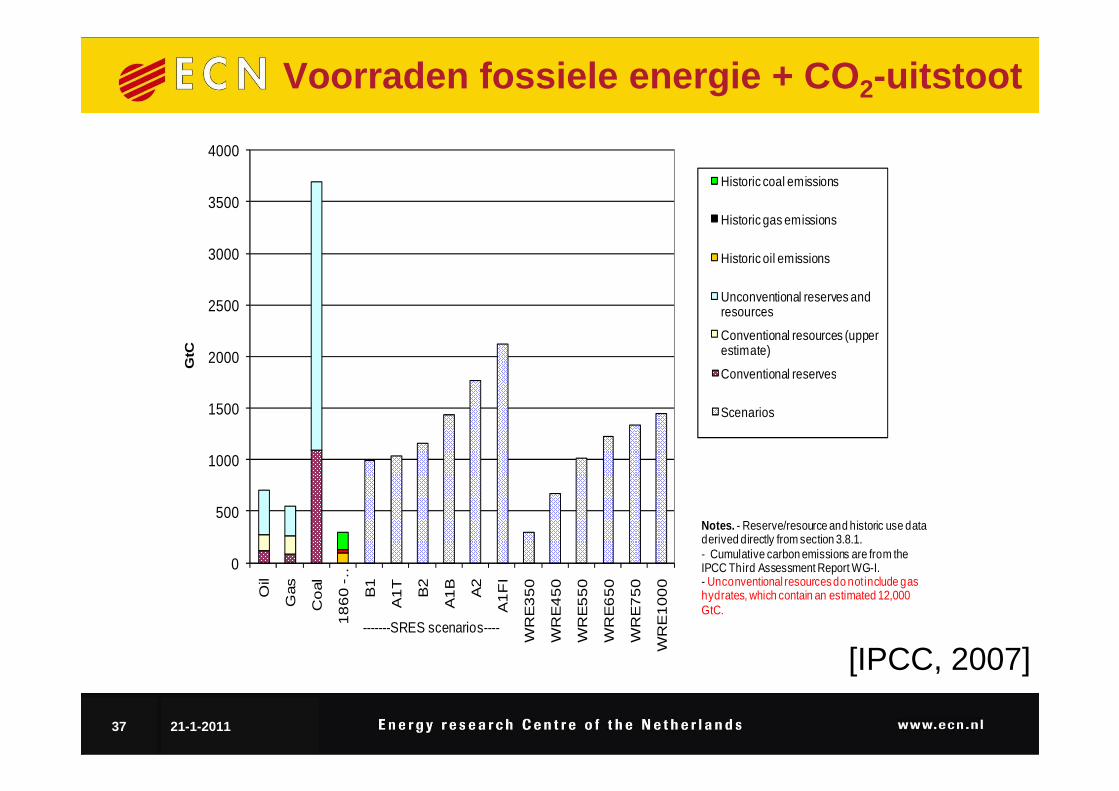
Voorraden fossiele energie + CO 2-uitstoot
2000
2500
3000
3500
4000
GtC
Historic coal emissions
Historic gas emissions
Historic oil emissions
Unconventional reserves and resources
Conventional resources (upper estimate)
Conventional reserves
37 21-1-2011
0
500
1000
1500
Oil
Gas
Co
al
18
60
-…
B1
A1
T
B2
A1
B
A2
A1
FI
WR
E3
50
WR
E4
50
WR
E5
50
WR
E6
50
WR
E7
50
WR
E1
00
0
Scenarios
Notes. - Reserve/resource and historic use data derived directly from section 3.8.1.- Cumulative carbon emissions are from the IPCC Third Assessment Report WG-I.- Unconventional resources do not include gas hydrates, which contain an estimated 12,000 GtC.
-------SRES scenarios----
[IPCC, 2007]
Externe ontwikkelingen
• 2006-2009: hoge prijzen en hoge ambities- Ambitieuze doelen (NL+EC)- Toegenomen energieprijzen en zorg over
voorzieningszekerheid- Veel vertrouwen in vrijwillige instrumenten en subsidies- Veel vertrouwen in vrijwillige instrumenten en subsidies
• 2010-2012: “new realities”- Economische en financiële crisis- Lagere energieprijzen, minder zorg over voorzieningszekerheid- Energie en klimaatbeleid moet ook bedrijvigheid geven, minder
ambitieus- Minder subsidies, verschuiving naar meer regelgeving en
verplichtingen
38 21-1-2011
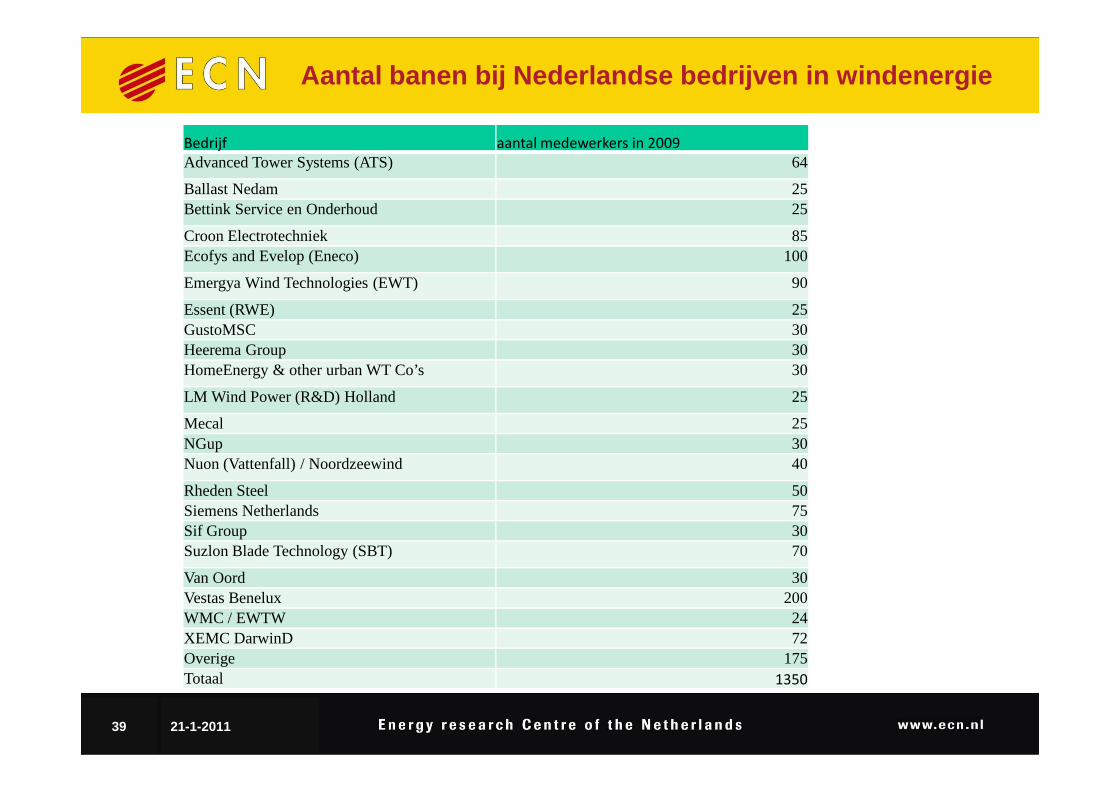
Aantal banen bij Nederlandse bedrijven in windenerg ie
Bedrijf aantal medewerkers in 2009
Advanced Tower Systems (ATS) 64
Ballast Nedam 25Bettink Service en Onderhoud 25
Croon Electrotechniek 85Ecofys and Evelop (Eneco) 100
Emergya Wind Technologies (EWT) 90
Essent (RWE) 25GustoMSC 30Heerema Group 30HomeEnergy & other urban WT Co’s 30
LM Wind Power (R&D) Holland 25LM Wind Power (R&D) Holland 25
Mecal 25NGup 30Nuon (Vattenfall) / Noordzeewind 40
Rheden Steel 50Siemens Netherlands 75Sif Group 30Suzlon Blade Technology (SBT) 70
Van Oord 30Vestas Benelux 200WMC / EWTW 24XEMC DarwinD 72Overige 175Totaal 1350
39 21-1-2011
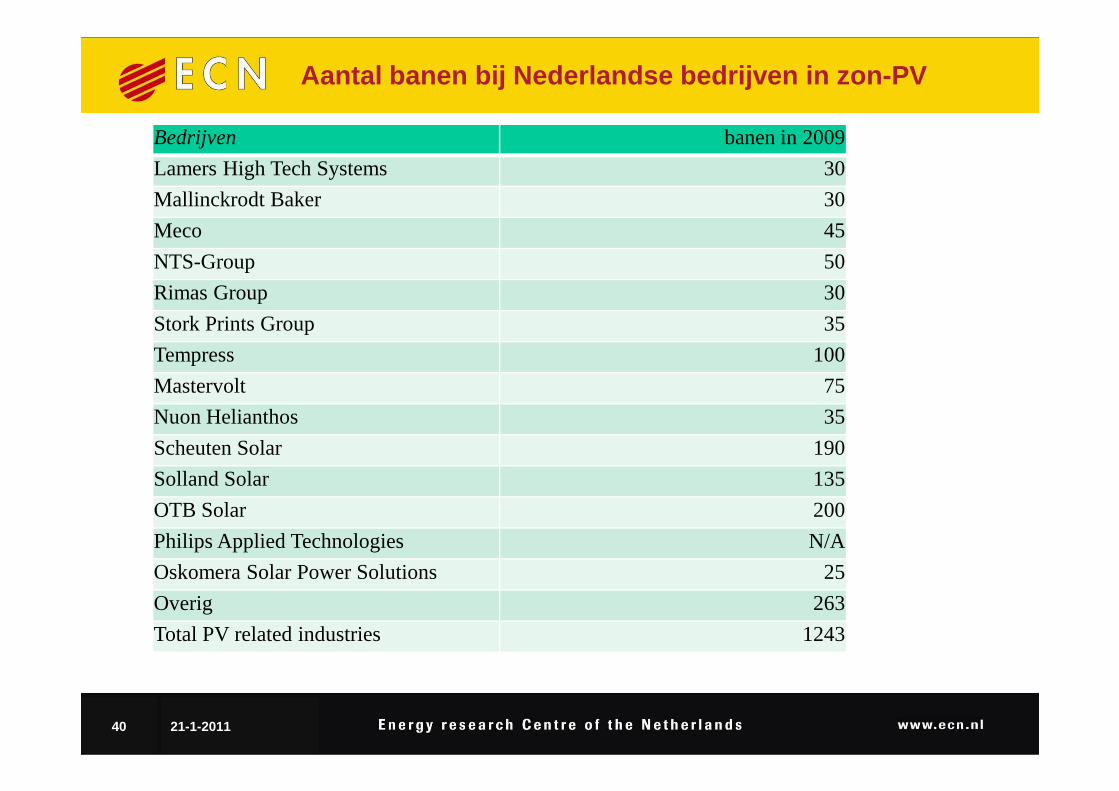
Bedrijven banen in 2009
Lamers High Tech Systems 30
Mallinckrodt Baker 30
Meco 45
NTS-Group 50
Rimas Group 30
Stork Prints Group 35
Tempress 100
Mastervolt 75
Aantal banen bij Nederlandse bedrijven in zon-PV
Mastervolt 75
Nuon Helianthos 35
Scheuten Solar 190
Solland Solar 135
OTB Solar 200
Philips Applied Technologies N/A
Oskomera Solar Power Solutions 25
Overig 263
Total PV related industries 1243
40 21-1-2011