Metal Hydride Electrodes Stability of LaNis-related - Technische
109
Metal Hydride Electrodes Stability of LaNis-related Compounds Proefschrift ter verkrijging van de graad van doctor ill Of;: technische wetenschappen aan de Technische Hogeschool Eindhoven, op gezag van de rector magnificlls, prof. dr. S. T. M. Ackermans, voor een commissie aangewezen door het college van dekanen in het opellbaar tc verdedigen op vrijdag 2 november 1984 te 16.00 uur door Johannes Jozef Gerardus Stephanus Adrianus Willems geboren te Eindhoven
Transcript of Metal Hydride Electrodes Stability of LaNis-related - Technische
Metal Hydride Electrodes Stability of LaNis-related
Compounds
Proefschrift
ter verkrijging van de graad van doctor ill Of;: technische wetenschappen aan de Technische
Hogeschool Eindhoven, op gezag van de rector magnificlls, prof. dr. S. T. M. Ackermans, voor
een commissie aangewezen door het college van dekanen in het opellbaar tc verdedigen op
vrijdag 2 november 1984 te 16.00 uur
door
Johannes Jozef Gerardus Stephanus Adrianus Willems
geboren te Eindhoven

Dil proefschrift is gocdgekeurd door de promot.orcil prof E. BarG'Ildrechl en prof. dr. A. R. Mil:dema

aan Marie-Jose Linda en Tom

Oit procfschrift is ook v"L,chcn~n ~ls S\lpplement No.1 van Philips Journal (If Rc~c""ch Vol. 39 (1984).
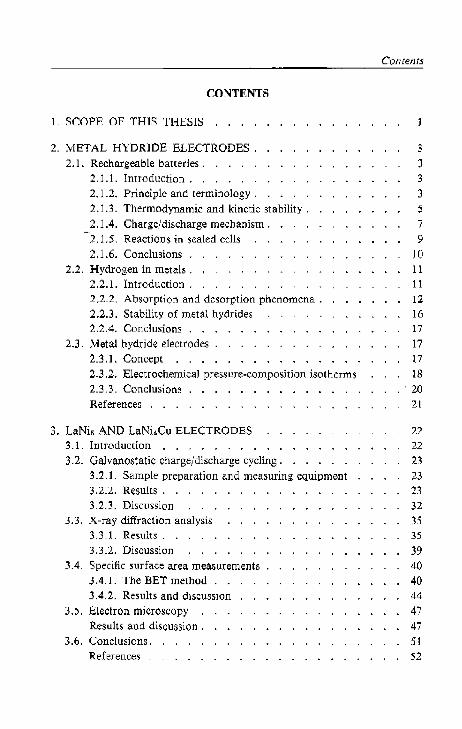
Contents
CONTENTS
I. SCOPE OF THIS THESIS
2. METAL HYDRIDE ELECTRODES. 3 2.1. Rechargeable batteries. 3
2.1.1. Introduction . 3 2.1.2. Principle and terminology. 3 2.1.3. Thermodynamic and kinetic stability. 5 2.1.4. Charge/discharge mechanism. 7
-2.1.5. Reactions in scaled cells 9 2.1.6. Conclusions 10
2.2. Hydrogen in metals , 11
2.2.1. Introduction , 11 2,2.2, Absorption and desorption phenomena . 12 2,2.3. Stability of metal hydrides 16
2.2.4. Conclusions 17
2.3. Metal hydride electrodes . 17 2.3.1. Concept 17
2.3,2. Electrochemical pressure-composition isotherms 18 2.3.3. Conclusions ·20
References 21
3. LaNis AND LaNi.Cu ELECTRODES 22 3.1. Introduction 22
3.2. Galvanostatie charge/discharge cycling. 23 3.2.1. Sample preparation and measuring equipment 23 3.2.2. Results. 23 3.2,3. Discussion 32
3.3. X-ray diffraction analysis 35 3.3,1. Results. 35
3.3.2. Discussion 39 3.4. Specific surface area measurements 40
3.4. I. The BET method 40 3.4.2. Results and discussion 44
3.5. Electron microscopy 47 Results and discussion. 47
3.6. Conclusions . 51 References 52

Contents
4. MUJ TICOMPONENT ELECTRODES.
4.1. Introduct.ion . . . . . . .
4.2. Lattice expansion and stability.
4.2.1. Electrochemical data.
4.2.2. Cryst<lllographi~ data
4.2.3. Di$Cll.,-~ion. . .
4.3. Specific surface area
Results and discllssion .
4.4. Interrup(l;d galvanOf;talic cycling
Re~ullS and discussion.
4.5. Conclusions.
RGfcrcm;cs . . . . .
5. SI2ALI2D NICKEL-HYDRIDE BATTERIES.
5.1. Cdl GOnCepl
5.2. Electrode materialf;. . .
5.2.1. lntroduction. . .
5.2.2. Negative eledrode. 5.2.3. po&irivc dCClrode .
5.3. Electrode and cell constrllction
5.3.1. Electrode preparation
5.3.2. Cell design
':;.3.3. Cell conf;tfllction . .
5.4. Results and discussion. . .
5.4.1. Cdl A; high-rate cycling
5.4.2. Cell B; lEe test. . . .
5.4.3. Cell C; high-rate cycling
5.4.4. Cell D; overcharging and ovcrdbcharging 5.5. Conclusions.
References . . . .
6. FINAL CONCLUSIONS
ACJ<NOWJ..FDOEMENT
Li~t 01' ,'-ymbob
Summary
Sal11envatting
Levensloop .
Dankwoord
54 54 :56 56 58
62 64
65 65 65 69 70
71
71
72
72
72 75
75 75
77 n 80 so 83 84 87 89 90
91
92
93
95
97
99 Ion

Chapter 1 Scope oj this thesis
1. SCOPE OF THIS THESIS
Batteries are the power source for [I1any products and the number of applications will certainly increase as the performance of batterje~ is improved. There exist primary (non-rechargeable) and secondary (rechargeable) batteries. The two most well-known secondary bat.terie$ are the lead-acid and the nickcIcadmium cell. Important features required for a new rechargeable battery are: higher energy density, higher power density, longer durability, maintenancefree operation, lower costs and non-polluting. Evidently, many of these featureS a[~ determined by the physico-chemical properties of the battery, such as the storage capacity of the electrodes, the stability of the electrode/electrolyte system and the charge/discharge mechanism of the electrode reactions.
As a result of the discovery of intermetaltic compounds which are capable of absorbing and desorbing hydrogen at prcssures around 1 atm and near [00[11 temperature a new type of rechargeable battery electrodes has become realizable: the metal hydride electrode- During the charging of such an electrode, hydrogen is formed by the electrochemical reduction of water and is subsequently absorbed by the intermetallic compound. During discharging, the stored hydrogen is rdeascd and oxidized. The considerations which have led to the concept of a metal bydride electrode are given in chap. 2_
LaNis and LaNi.Cu have been most-promising materials for application in rechargeable battery electrodes because of the rapid and reversibl;; storage of large quantities of hydrogen in these intermetallic compounds_ However, the storage capacity of both LaNh and LaNi4Cu electrodes declines drastically during repeated charge/discharge cycling- This deterioration process has been investigated by means of X-ray diffraction analysis, gas adsorption (BET) measurements and electron microscopy. Based upon our findings we hypothesized that hydride electrodes, made of an intermetallic compound which shows less lattice expan~ion than LaNic; on hydriding, should be more stable than LaNic; electrodes (chap. 3).
More than twenty different intermetallic compounds, in which lanthanum and nickel had been partially replaced by similar clements, have been prepared to examine this hypothesis. The volume expansion of these LaNi5-related compounds on hydrogen gas absorption, as determined from X-ray dift-raction measurements, and the stability of the corresponding el;;ctrode~ are indeed correlated. The stability of these multicomponent electrodes was evaluated from capacity loss measurements in half-cells in series of approximately six hundred charge/discharge cycles. Several multicomponent ;;lectrodes exhibited an excellent stability. The effect of the specific surface area and of the charge/ discharge cycle r;;gime on the stability has also been investigated. Chapter 4

1. 1. C. Willems
is concluded with a description of a possible mechanism for the degradation of met.al hydridc electrodes.
The combination of the metal hydride electrode and the recharge<1ble nic;kcl electrode prQvitics a nickel-hydride battery. Based upon the behaviour of both e1ectrocles, a sealed nickel-hydride cell is expect.ed to have .,>ever·al advantages, e.g. the capability of being chargcd and discharged at high rates and during many cycles. Also, prolonged Qven;harging and overdischarging should be feasible withollt detrimental eITecls. Several sealed nickel-hydride:: cells which comprise a hydride electrode madc of one of the stable intermetallic compounds have been constructed. The properties of these lirst sealed nickelhydride batterje.~ are discusscd in chap. 5.
2

Chapter 2 Metal hydride electrodes
2. METAL HYDRIDE ELECTRODES
2.1. Rechargeable batteries
2.1.1. Introduction
In 1800 Alk,sandro Volta ') r~port!;:d a device for converting chemical energy inlo electricity. This device, which is now known as the Volta pile, was the first chemical power source or galvanic battery. In Volta's cells, zinc was oxidized at the negative electrode and hydrogen gas was evolved at the positive, silver or copper, elect.rode. In 1860, more than half a ecntury after Volta's discovery, Gaston Plante 2) demonstrated the first rechargeable battery: the lead-acid cell. This cell consisted of two spirally wound lead sheets separated by flannel strips and inserted into sulphuric acid. Plante formed his electrodcs by repeated charging with primary cells and discharging. At the turn of the century alkaline accumulators were invented. In 1899 Waldemar Jungner presented his ideas concerning the advantages of alkaline systems in a patent S).
In this patent Ag,O" Mn(OH). and CuO arc mentioned as positive electrode materials and Cu and Fe(OHh as negat.ive active materials. Also in 1899, T. de Michalovski patented his findings on the nickel-zinc cell 4). The first patent on nickel-cadmium and nickel-iron accumulators was granted to Jllngner in 1901 5). These rechargeable cells were also patented by Thomas Edison; the nickel-iron cell in 1901 6 ) and the nickel-cadmium cell in 1902 7).
Since these early discoveries many combinations of redox couples have been investigated for application in galvanic cells and many electrochemical systems are still being ~tudied 6-\3)" The purpose of this section is not to present. a com· prehensive review. Instead, some well-known rechargeable electrodes are discussed primarily to illustrate our major considerations in the choice of a new battery system- Here, the emphasis will be on the relation between physico-chemical properties and performance. Aspects of coSt and producibility are not discussed-
2.1.2. PrinCiple and terminology
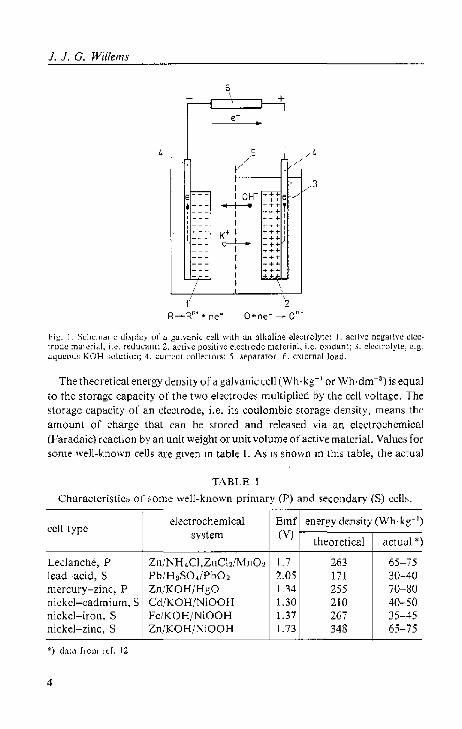
A galvanic cell is a device that converts chemical energy directly into electrical energy. Such a cell consists of two electrodes, spatially separated from each other but in ionic contact via an electrolyte. This is illustrated in fig. I. Whereas one of the electrodes is rather easily oxidized, releasing electrons (the negative electrode), the other onc is preferentially reduced, accepting electrons (the positive clectrode). When the electrons flow through an external load from the negative to the positive electrode, the cell is discharged and electrical energy is generated. A cell is rechargeable if aJI reactions Can be made t.o pro· ceed in the opposite direction by imposing an external potential difference.
3
J. J. G. Willems
4
I __ _ , 1--I • _ ..
l -,- -
6
+
I I OH- ~t1e .,... ... ~ +++,
I :~: 1: I ++ + :
K+ I ~ ~! J + ~tt I + .... + I +++ I + ++
I
R_pn •• ne"
.. 3
~';ig_ I. Schcmadc di. .. pl~y of a galvank cell wilh (.\I1 alkaline elt,:~(:("olytc: J. active negative dcclroul..' rm.lu':I'i~Ll, i.c. n:ulII .. :r.UlL; 2. aelivc posilive electrode m~tcriRl> i.e. O}{l~iant; 3. clccl.rolyl<.:!", c.g . • :I:L\[JCOU!i KOH solutioI1; 4. LlJIT~[H (:olle(;tl)I'~: 5. ,~epaj'ator; 6, external JO~ld.
The theoretical energy density of a galvanic.: cell (Wh-kg-l or Wh·dm-3) is equal
to the storage capacity of the two eler.:trouc~ multiplied by the cell voltage. The ~t.()n\gc ~apacil:y or an elcclrode, i.e. its coulombic storage density, meall~ t.he amounl of charge lhat can be stored and released via an ek(:(rochcmical (Faradaic) ['caclion by an unit weight or unit volume of active malerial. Values for some well-known cells are given in table I. A~ i, ,hown in lhis table, the actual
TARLE I
Characteristics or ~ome well-known primary (P) and seconu<l.ry (S) (:(:ll~_
cell Lype electrochemical Emf energy den~jty (Wh·kg-')
system (V) theoretical actual *)
Leclancl1e, P Zn/NH 4CI,ZnCb/Mn02 1.7 263 65-75 kad~:i(;jd, S Pb/H2S0./Pb02 2.05 171 30-40 mercury-zinc, P Zn/KOH/HgO 1.34 255 70-80 nickel-cadmiurrI, S Cd/KOH/NiOOl I 1.30 210 40-50 nickel-iron, S Fc/KOH/NiOOH 1.37 267 35-45 nickel-zinc, S Zn/KOH/NiOOH 1.73 348 65-75
') dalil f,'Olll ref. 12
4
2. Metal hydride electrodes
energy density of primary (non-rechargeable) and secondary (rechargeable) cells is approximately 30 and 20l\7Q of the theoretical value, respectively. This huge reduction is a consequent/) of the weight of excess active material, electrolyte and additional components and of the voltage loss due to current flow. It therefore depends on the construction of the cell and the magnitude of the current drain.
The power density of galvanic cells (W·kg- 1 or W'dm-8) is determined by the
ability of the cell to be discharged at high rales and by the degree of utilization of active material at these rates. The power density varies strongly with the electrochemical system (rate of electrode reactions) and the cell construction (transport phenomena).
The decisive parameter for many applications is the durability, which may be expressed as service life, i.c. number of years, or as cycle life, Le. number of charge/discharge cycles. The durability is strongly influenced by both the stability of the electrode/electrolyte combination and the charge/discharge mechanism.
2.1.3. Thermodynamic and kinetic stability
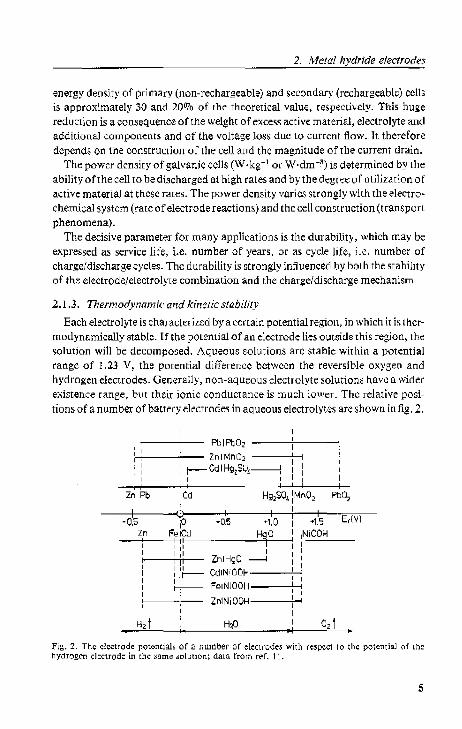
Each electrolyte is characterized by a certain potential region, in which it is thermodynamically stable. I f the potential of an electrode lies outside this region, the solution will be decomposed. Aqueous 501utions arc stable within a potential range of 1.23 V, the potential difference between the reversible oxygen and hydrogen electrodes. Generally, non-aqueous electrolyte solutiom have a wider existence range, but their ionic conductance is much lower. The relative positions of a number of battery electrodes in aqueous electrolytes arc shown in fig. 2.
I I I
I I I PbIPbO, I I I
Lnl Mn02 I I I t , I I : r-- Cd I H91SO.------1 I t I I I I I I I
, I I
Zn Pb r 1 I I I ICd Hg~SO. t MnO~ F'bO, I
I "<Po I I I
E,IVl -0,5 I 'Q5 '1,0 ~1.5
Zn F"etCd HgO ,NiOOH I III I I I ',I I 1,1 I I
I ijl ZntHgO ---" I I 1,1 CdtNiOOH
I t ',r-- I I 'I
I I ~ FetNiOOH I I t
, , ZnlNiOOH ... , I I
H2 t HiJ I O2 t 04
Fig. 2. The ~I~~trode potenti'Ll, of a ,'LlIllbeI' 01' elec!I'odes witl! I'e5p~ct !o !he potential (>1' the hydrogen electrode in the ",Ime wlution; data from I'er. II.
5
.f . .f. (), Willems
The only I.hermodynamically stable cell shown in this figure is the Weston cell, i.e, Cd(Hg) I CdSO. (sal:.) I HgSO. (sat.) I Hg. The open circuit potential of thi, standard cell is 1.01864 Vat 20°C and both electrode potentials lie within the existence range of water.
Masl galvanic cells are thermodynami.:ally umtable and their reactants will therefore be eOrlf;Umr;d without rpenerating electrical energy. This proccss is called self-discharge. The rRt<:s of these side reactions determine whether a cell may b~ considered kinetically stable or not. The zinc electrode potential is 0.4 to 0.5 V more negative than that of the hydrogen electrode. However, hydrogen gas evolul:ion can be suppressed by the useof amalgamated zinc;. Both electrodes of the lead-add cell exceed the boundaries of the stability region severely and can thus react with thl; aqueous solution. Due to lhe large averp01.ential:; required for the hydroger) and oxygen evolution reactions the self-discharge of new lead-acid cdls is practically negligible. On the other hand, during cycling antimony, lI~\lally added to the positive electrode grid, dissolves and is deposited at the active mass of both deet.wdes. This facilitates the evolution of hydrogen and oxygen considerably 14). Several other impurities, e.g. Co, Fe,Cu,Ag, also catalyze the water decomposition reactions. Moreover, lead dioxide IJlay react with the current-~oUecting grid (-'" lead), forming divalenL lead compoundS. As a result, the storecl capacity of the positive electrode decreases and its grid dcgr'ldes. This leads to shedding of the active material. In a similar way, the separator in a silver-zinc cell becomes oxidi7,ed by the high electrode potential of the AgO/ AgzO couple (+ 1.43 V).
Another example illustrating the impot'tance of thermodynamic ~tability is the difference between the widely used cadmium eleetl'ode and Lhe Ie:>:> ~\litable iron electrode. The equilibrium potential of the cadmium electrode is + 0.0), V versus thr; reversible hydrogen eleetl'Ode and Lhat oflhe iron electrode - 0.05 V. Although the quallliialive diA"w:mce is small, this potential difference has a signific~nt consequence: in the non-working state the iron elect.rode corrorJes and the cadmium electrode is corrosion-resistant. Nevertheless, to a lesser ex· tent hydrogen evolution also occurs at the cadmium electrode, parLicularly during charging at high rates and after ageing of the electrode.
The posiLion or the NiOOH electrode potential at the potential axis, just exceeding the upper boundary of the stability region, results in oxygen evolution during charging and in rapid sr:lf-rJischarge of fully charged electrodes.
Thus, the lack or thermodynamic stability of galvanic cells causes a decrease of the coutombic effidency orthe electrodes and degradation of cell components such as the current collector and the separator. In general, the rat!;, of the side reactions arc n~)t nccc~,arily the same at both electrodes and LhllS lhe reactants in the electrodes are unequally consumed. This will hinder rurt.her cycling of rew
6
2. Metal hydride electrodes
chargeable cells. Furthermore, maintenance of the cell is required by the loss of electrolyte and the evolved gases must be able to escape. This prohibits hermetical sealing of the cells.
2.1.4. Charge/discharge mechanism
A large group of electrodes in aqueous solutions is charged and discharged according to a dissolution-precipitation mechanisID. This group cOIDprises the following electrodes: Pb/pbS04 , Pb02/PbSO., Zn/ZnO, Fe/Fe(OHh, Cd/Cd(OHh, Ag/Ag20 and Ag20/AgO. The dissolution-precipitation mechanism involves the intermediate formation of a dissolved species, I.e. metal ion or metal ion complex. which precipitates from the solution to form a new solid phase- For instance, the discharge process of the lead dioxide electrode may be described by the equations 11,14):
PbOi + 4H+ + 2e---->-Pb2+ + 2H20 (Ia)
Pb2• + HSO~ --->- Pbso.l + H+, (lb)
and in a similar way the charge process of a cadmium electrode in alkaline solution 11,12):
Cd(OHh + 2 OH- --->- [Cd(OH).]~[Cd(OH).j2- + 2e----+Cdt + 40B".
(2a)
(2b)
The electrolyte not only servcs as an ionic conductor, but also participates in the electrode reactions, as is shown by these equations. The conductivity of the solution may therefore depend on the state of charge of the electrodes. as for example in lead-acid cells. Furthermore. the accessibility of the internal surface may be rate-determining.
Because of the low concentration of the dissolved metal ion species (C'o = 10-1_10-5 mo!e'l-l) high surface areas and Small diffusion paths are required in Order to obtain reasonable charge/discharge rates. However, inherent in the dissolution-precipitation mechanism is the change that takes place in the porous structure of the electrodes during cycling as a result of redistribution of the active material. A notorious example is the shape change of the zinc electrode l~). Generally, the major morphological changes involve: - nucleation and growth of the new solid phase at the surface of the active
material, already prc~ent: ~ passivation, which consists of shielding the active material by a thin layer
of dense fine-grained discharged material, e.g. the sulphation of lead and lead dioxide electrodes; recrystallization, especially after long waiting periods, which leads to the formation of larger grains and/or mOrc stable modifications, e.g. mCIDory effect of nickel-cadmium cells;
7

1. 1. G. Willems
- dendrite formation, dlle to mass t.ransport limitatioD, which may cause failure by inlernal short-circuiting.
Thus, the magnit.ude Mthe active surface area and its accessibility are decreased during cycling. The delrimenlal cffcCb of the morphological changes increase
S(.rongly with the charge and dischargc rates <lDd with the depth of discharge. The cycle life decreases exponentially with increasing depth of discharge )~),
Therefore, the optimal degree of active mater'ialltlilizalion lie~ bel ween 25 and 45~70 at medium rate~, i.e. dllring discharge periods of 5 to 20 hours. At higher
current densities, e.g. discharging in less thaD ODe hour, the utilization of active ma!criai is progressively reduced. Electrodes without wluble intermediat.es, such as lht; Dickel (hydroxide) electrode, do not suffer such limitations.
The solid :;t.aU; tra.nsitions that take place in the nickel electrode can be summarized by the Bock diagram 16):
P-Ni(OHh ~.B-NiOOH + W + c-
! d b lc o:-NI(OH12:;±y-NIOOH + W + e-.
(3)
Well-crystallized P-Ni(OHh has a layered slruClur<:: with an interlayer distance of 4.605 A. Each layer consists of a hexagonal planar anangement of Ni(U) ions
with an octahedral coordination of oxygen, three oxygen atoms lying above the nickel plane and three lying bdow, The a- and IJ-nickel hydroxides, lIsed in bat.teries, also have a lamellar structure, bUl the cry~lal lalticc i~ highly dis~
ordered. This low crystallinity is considered to be essential for t.he c1cc(.roactivity. Moreover, 1 he int.o;:rsheet distance ofthea-modification is expanded by
the intercalation of waler molecules, d -= 8-8.5 A, which additionally improves th(;: kinetics of the redox reaction.
fi-NiOOH has practically the same layered stf'Ucture, d = 4.85 A, as P-Ni(OHh and can be form(;:d from the latt.er by direct reaction on removing one proton and one electron, according to eq. (3a). y-NiOOH represents a whole family of compounds exhibiting a large intersheet distance, d;;"'- 7 A, with the oxidation state of nickel ranging from + 3,3 to + 3.75. Both water molecules and alkali ions are intercalated between the Ni02 layers.
I t' overcharging is avoided, the nickel electrode ean be cyclcd between jj'-Ni(OHh and/J-NiOOH (eq. 3a). During prolonged overcharging and at high
cha.rge wtes fJ-NiOOI-I is converted into y-NiOOH (cq. 3c), which possesses
a larger storage capacity. Ageing of ,B-NiOOH also favOllr~ lhe format.ion or the: more stable y-modification. Ilecause of the expanded intersheet dbtance
of bOlh a-Ni(OH)z and y-NiOOH, these substances can be directly intercotlverted, even al higher raLes than the IJ "IP III tWHsition. Due to the poor conductivity of divalent nickel hydroxide, J( is about 10-6 O-1·cm-1, the discharge
8
2. Metal hydride electrodes
process stops at an average oxidation state of + 2.3. The complete active mass may be discharged to this level without affecting the cycle life. This enables an overdischarge mechanism, comprising very negative overpotentials (sec. 2.1.5). The a- to fi-Ni(OH)2 transformation involves an increasing crystallinity upon ageing (eq. 3d).
The rates ofthe charge and discharge reactions are considered to be controlled by transport of protons and, possibly, of hydroxyl ions in the solid phase. The proton diffusion coefficients are reported to be 3.1 x 10⁻¹⁰ em 2' S-1 dur:ing charging, I.e. DH+(fj!!l), and 4.6 x 10⁻¹¹ cm2 's-1 during discharging, i.e. DH"(jJ") 1'). Therefore, diffusion of the intercalated protons only becomes rate-limiting at high discharge currents. Depending on the structure, the electrode may be discharged in less than half an hour.
The 4ructural stability makes the solid state transition mechanism much more favourable than the more common dissolution-precipitation mechanism. This is demonstrated both by the remarkable cycling durability of several thousand cycles and the high rate charging and discharging capability of the nickel electrode.
2.1.5. Reactions in sealed "ells
The aim underlying the development of sealed ceUs is to obtain batteries that will operate in any position and without requiring maintenance. The build-up of hazardous gas pressures, due to oxygen and hydrogen evolution(sec. 2.1.3), and the loss of electrolyte must therefore be prevented.
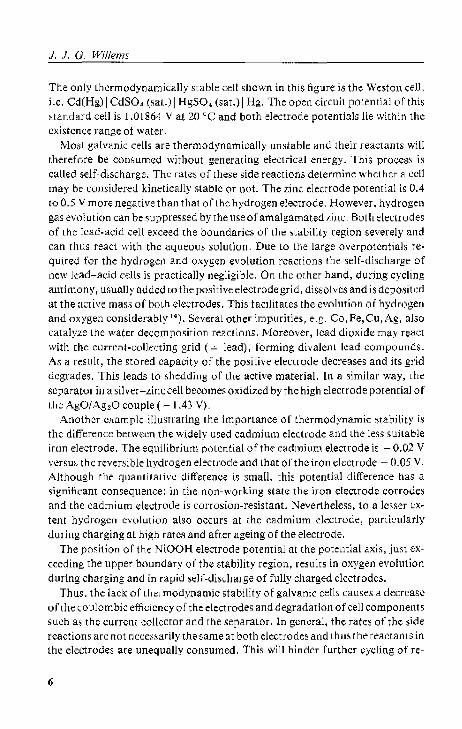
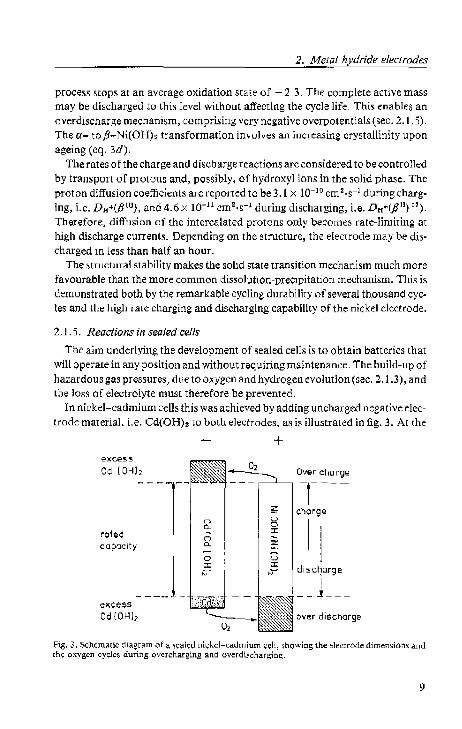
In nickel-cadmium cells this was achieved by adding uncharged negative electrode material. i.e. Cd{OHh to both e1ectTodes, as is illustrated in fig. 3. At the
+ ~)(C~Ss
Co [OHJ2 Over charge
---T -r---~ charge
(") 0
I D. 0
I roted n ~
capaCity "- ::!::
___ .1 0 0-:J: :J:
discharge '" N
__ 1 ___ exce$$ Cd [OHh over discharge
Fig. 3. Schematic oia£ram of a ~cakd nkkd-cadmium ~dl, ,cowing the eleotrOde dimensions and th~ oxyg,n cy,!" during overcharging and overdi,eharging.
9

.I . .I. G. Will(;!ms
end of charging oxygen is evolved at the positive electrode before the negative electrode is completely charged, because oft.he excr:ss of active material in this eIr:ctrode. Sub.5equently, the oxygen formr:d is reduced at the negative electrode. In lhi~ oxygen recombination process the transport of oxygen is rate-determining. Therefore, l.hc cell cont.ains as lillie electrolyte as possible, wetted electrode~ are used instead of flooded ones, and the O~-permeability of the wetted separator plays a maj or role. If the oxygen cycle functions well, t.he state;: 0 f charge of both electrodes does not change during overcharging and t.he total input of electrical energy is dissipated as heat. In a Similar way, the oxygen eval ved at {he positi ve electrode as a resull of side reactions is consumed at the negative elect.rode.
Owing to manufacturing variatiOn>, not all cdls have e;:xaetly the ,ame storage capa.city. In a battery, comprising several ceIb connected in series, the weakest cell may therefore be overdischarged by the current which is imposed by the other cells. Without suitable precautions such an occurrence is accompanied by the decomposition of the elect.rolyt.e, while t.hc cell volt.age is reversed. However, the addition of Cd(OHh to the nickel electrode prcvent~ the cathodic evolution or hydrogen gas. Inst.ead, metallic cadmium is fonned and this reacts with oxygen, now evolved at the cadmium eleclrode. (This electrode thus reaches jts maximum depth of discharger) Again the cell is protecto;:d by an oxygen recombination cycle.
Despite t.he excess of Cd(OHh in both electrodes and the thermodynamic stability of cadmium in aqueous electrolytes, hydrogen gas is evolved l~) due to the poor charge acceptance of aged Cd(OHh and during charging at high current densities. Because the oxidation of hydrogen at the nickel electrode i~ practically negligible, the electrode c~pacities becomC$ unbalanced arld the cell pressure rises. Sealed cell, are therefore equipped with safet.y valves which open at about 20 atm.
The development of entirely sealed lead-acid cells is severely hindered by the gassing of the electrodes (sec. 2. J .3). Catalytic recombination of hydrogen and oxygen in the gas space above the e1eclrolyte is only successful if the gas evolution occurs stoiChiometrically (I-b + ~ O 2). The utilization of auxiliary elcctrodes is not suitable for small cells. An oxygen cycle analogous to that in sealed nickel-c~dmium cells may also be established in lead-acid cells, provided that the electrolyte i.5 immobilized 14). However, the cycle life of such cells is reduced by thc elct:(rolyl.c immobili;;:al.ion 1.0 only 50-100 cycles ll).
2.1.6. Conclusions
I rl OUf battery research, we aimed at a small rechargeable cell, which could be charged and discharged at high rates and would function in any position for several year5 without requiring maintenancc. The small-sized, sealed nickel-

2. Metal hydride electrodes
cadmium cell resembles this type of cell most dosely. However, for reasons given above the performance of the nickel-cadmium cell would be improved if the cadmium electrode could be replaced by a different rechargeable negative electrode, in which the following requirements are fulfilled: (a) charging and discharging occurs via a solid state transition mechanism,
analogous to that of the nickel electrode, and (b) hydrogen gas, possibly evolved during overdischarging, is prevented from
unbalancing the cell or giving rise to hazardous pressures.
2.2. Hydrogen in metals
2_2_ I. Introduction
Hydrogen reacts with elements from most groups of the periodiC sy,tem to form hydrides. Well-known compounds are LiH, MgHz, AIH 3 , CH., NHs. H 20, HCI and PdH •. Although the distinction is not always sharp, these different binary hydrides are usually classified in t.hree categories 1\):
ionic or saline hydrides, e.g. LiH, MgH2 and Hel; covalent hydrides: the prototype is CH., but AIHs also belongs to this class; metallic hydrides: this group comprises the hydrides formed by transition metals.
Our study is concerned with metallic hydrides. In particular, we are interested in metals which are capable of absoring and des orbing hydrogen reversibly in the pressure range around 1 atm and near room temperature.
At 20°C palladium, the most thoroughly investigated hydride-forming element, absorbs hydrogen at an equilibrium pressure of 6 x 10⁻³ atm to form the hydride PdH.". A review of the palladium-hydrogen system up to 1966 Call be found in the book by Lewis iO). The hydrides of vanadium and niobium, VH~ and NbHz, decompose partially to VH and NbH, respectively, near or somewhat abovc rOom temperature at 1 atm. The hydrides of the metals of group IlIA and IVA, e.g. YH z, LaHz, TiHz and ZrH~, are extremely stable and therefore decompose only at very high temperatures. On the other hand, Cr, Mn, Co, Ni and Mo only form hydrides at very high pressures. for example, CrH is stable at 25 °C and 700 atm. Recently, extensive reviews of the binary hydrides of transition metals have been published 21). Clearly, the number of suitable binary metal-hydrogen systems is severely limited by the requirement ofreversibiliLy at ambient temperatures and pressures.
The discovery of the hydriding properties of intermetallic compounds such as LaNh 22,23) and TiFe 24) has provided many new metallic hydrides- Generally, intermetallic compounds of transition metals form ternary hydrides if at least one of their constituents forms a stable binary hydride_ LaNi. is the exponent
11
1. 1. G. Will(;'ms
of a family of AB. compounds, eaeh number consisting of one or more lanthanide elemenb (A) and 3d transition metal elements (B). Most of these ABs compounds are capable of storing reversibly large quantities of hydrogen 2r.,tf.).
A characteristic property of many hydrides is their relatively large hydrogen content ~7). In table II both the volumetric density and the weight fraction of
TABLE 11
Comparison of the hydrogen content of various hydrogen compounds. N" represents the number of hydrogen atoms per unit volume and
Gil gives the weight. pcn;cntage of hydrogen in the various materials. (aftt;r ref. 27)
material NH x lO-~Q (em-~) C H (wt 0/0)
H2 ga5. 150 atm 0.7 100 liquid H 2 , 20 K 4 100 liquid CH. 6 25 TiH2 9 4 LaH3 6.5 2.1 MgH 2 6.5 7.6 TiFeH 2 6 1.9 LaNisHe 5.5 1.4
hydrogen in representative metal hydrides are compartd with those in liquid hydrogen and methane. The hydrogen density in these metal hydrides exceeds that in liquid hydrogen by a factor of 1.5 to 2. The weight fraction of hydrogen in metal hydrides is always considerably lower than in liquid hydrogen because or the weight of the metallic host.
2.2.2. Absorption and desorption phenomena
The absorption and desorption of hydrogen by metals i. most conveniently represented by pressure-composition isotherms. A schematic diagram of such isotherms is given in fig. 4, which comprises the fonowing features.
A small amount of hydrogen gas dissolves in the original metallic host without forming a second phase:
(4)
The absorbed hydrogen atoms occupy interstitial sites in the metal lattice and their concentration depends strongly on the hydrogen pressure. Thi:; hydrogen· poor solid solution is denoted by the a-phase. The next stage involves the ab· sorption of hydrogm after t.he solid sohnion is saturated:
MHy + ~(x - y) H 2 :;± MHx. (5)
12

2. Metal hydride electrodes
p~, 101m] --------------,
'--"---------L---x [HIM]
Fig. 4. Schematic phM~ diagram of a mct.al-hydrl,gen 'y't~m, comprising the pressure-composition isotherms at variou.':i temperatureS; T.r:':- T.r_l'
Now, a new solid phase, referred to as thep-phase, nucleates and grows. This is accompanied by a discontinuous change in the lattice parameters. Ideally, during the a.IP-phase transition the equilibrium pressure remainS constant according to Gibbs' phase rule: F", C - P + 2. Two components C (H~ and M) and three phases P (two solid and one gaseous) are present, so the number of degrees of freedom Fis one. Thus, at a given temperature the pressure is fixed. This constant pressure level is often called the plateau pressure. Even if the host metal consists of an intermetallic compound, in this context, it is considered La
be only one component because of the immobility of its constituents at low temperatures. The concentration region between the saturated solid solution a 8 and the newly formed p-phasep~ can be regarded as a miscibility gap between two well-defined phases.
After the a-phase has been completely converted into the p-phase, further increase of the hydrogen concentration in the metal is accompanied by an increasing equilibrium pressure. Similar to the hydrogen dissolution in the 'empty' host, i.e. the a-phase, hydrogen dissolves in the hydrided P-phasc_
At higher temperatures the influence of the entropy counteracts the tendency to form two separate phases. As a consequence, the miscibility gap becomes smaller with rising temperature and ultimately disappears at the critical temperature T •.
13

1. 1. C. Willems
PII, lalm 1- .... --.. ·_ .. · ....
o 0.2 0.4 0.6 x[HIPdl
l'ig. 5. Ph",e di"gram I'm the palladium-hydrogon 'ySl<'m; frultl ref. 28,
As an example of a very precisely determined phase diagram, the isothenm for the palladium-hydrogen system 2~) are shown in fig. 5, The analogy bel.ween thc schematic diagram of fig. 4 and that of the real system is obvious. The plateau pn;~~ur(;:s in<:rca,e with increasing temperature according to the relation of Van 'I. Holf:
(6)
where R is the gas constant and /':,.ll" and /':,.so are the enthalpy and entropy change per mole H", respectively. Applying this equation to the data of fig. 5 results in tJ.H~I(J - - 41.0 ± 0,4 kJ (mole H 2)-1 and /':,.S~II! = - 97.5 ± 0.8 J (K·mok H 2)-' for I.he palladium-hydrogen system in the temperature range from 20 to 300 "C. The position of the critical point has also been determined with high precision: T, - 291 + 2°C, Xc"" 0.250 ~ 0.005 H/Pd and p< =
19,7 .,- 0.2 atm. Several hydwgen.-ab,orbing materials, e.g. 'fiFe and LaCor" form more than
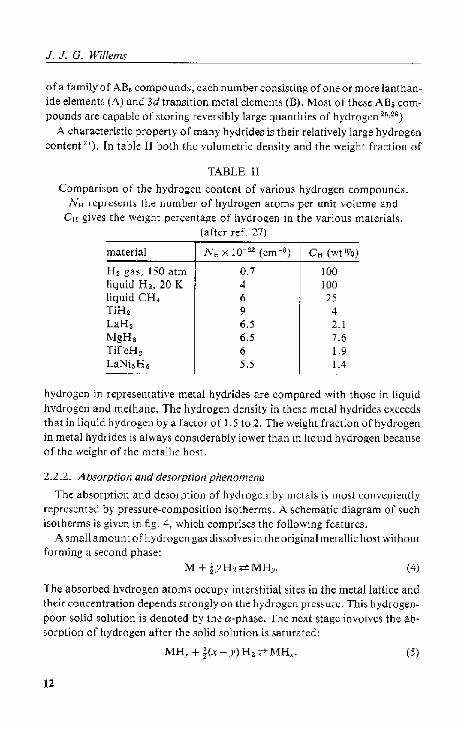
One ordered hydride phase. In the mdal-hydrogen phase diagram the second hydride phase shows up as an additional plateau in the pressure-composition isotherms. Fig. 6 displays the isotherms for the Tife-H2 system ~4), which illustrate this phenomenon. furthermore, it is se.;:n t.hat both hydride~, i.e. 'fiFeH and TiFeH2. have dissociation pressures of more than 1 atm at. 0 'c. The critical temperature of the TiFeH-TiFeH 2 two"phase r.;:gi()n. is approximal.ely 60 cc. This explains the disappearing second plateau in th.;: i,()thcrm~ with inaeasing (.cmpcra(.lln;.
14
2. Metal hydride electrodes
PH, lotmJ----------,
Fig. 6. Desorption isotherms for the Tifc-H, .Iy,l.cm at various ternperatures; from ref. 24.
The isotherms presented in both fig . .5 and fig. 6 have been determined during the desorption of hydrogen. For most materials the absorption process takes place at higher plateau pressures than those at which hydrogen is released. This hysteresis is not caused by a lack of equilibrium. Instead, most investigators have related this effect to thc volume expansion during hydriding. The hysteresis in the absorption/desorption isotherms for TiFe-H2 is rather largc. For example, at 40 "C the first hydride phase TiFeH is formed at the equilibrium pressure of )5 atm. while the desorption pressure is only 7.5 atm. In practical applications, rapid hydrogen uptake is obtained by an applicd pressure of 30 atm at 20 "C.
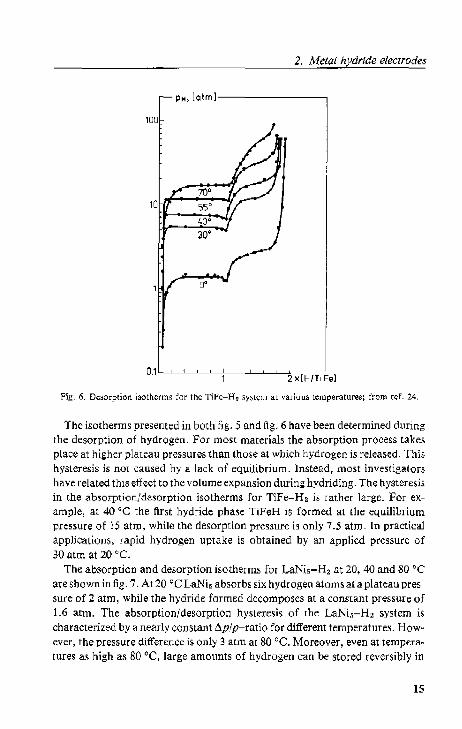
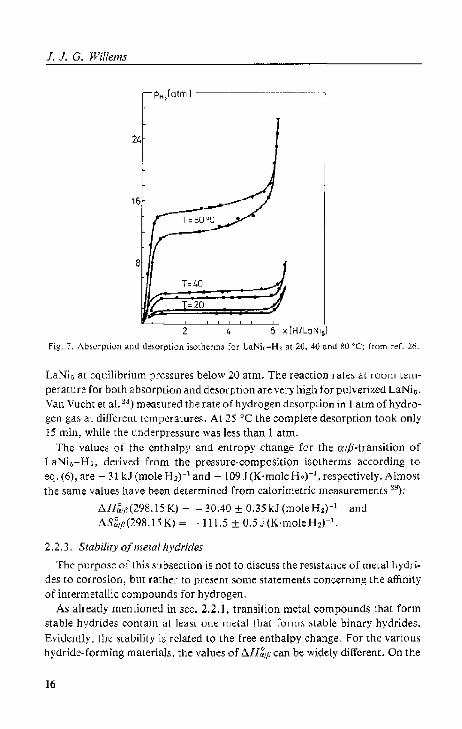
The absorption and desorption isotherms for LaNi5-Hz at 20,40 and 80 ·C are shown in fig. 7. At 20 °C LaNi~ absorbs six hydrogen atoms at a plateau pressure of 2 atm, while the hydride formed decomposes at a constant pressure of 1.6 atm. The absorption/desorption hysteresis of the LaNi5-H2 system is characterized by a nearly constant I'1p/p-ratio for different temperatures. However, the pressure difference is only 3 alm at 80 "C. Moreover, even at tempera" tures as high as 80 "C, large amounts of hydrogen can be stored reversibly in
15
f. f. C. Willems
PH,Iatm 1 -----------------------
24
Fig. 7. Absorption and desorption isolhel'lllS Cor luNio-H, at :ZO, 40 ~nJ ~O 6C; frClm ref_ 26_
LaNi,. at equilibrium pressures below 20 atm. The reaction rates at rOOm temperature for both absorption and desorption are very high for pulveri7.:ed LaNi,. Van Vucht et al. 23) measured the rate of hydrog~n desorption in I atm of hydrogen ga, at different temperaturef.. At 25°C the complete desorption took only 15 min, while the underpl'essure was less than 1 atm-
The values or the enthalpy and entropy change for the alfi'-tranf.ition of LaNi~-HQ, derived from the pressure·composition isotherms according to
eq. (6), are - 31 kJ (mole H2)-' and - 109 -' (K·mole H2)-J, respectively. AlmoM the same values have been det~rmincd rrom calorimetric measuremenb 29):
/',.H,~!{r(298.l5 K) = - 30.40 ± 0.35 kJ (mole Hz)-l and L'l.S~ljl(298.15K) = --111.5 ± 0.5J(K·moleHz)-1_
2.2.3. Stability of metal hydrides
The purpose of this subsection is not to discuss the resistance of metal hydrides to corrosion, but rather to present some statements concerning the affinity of intermetallic compounds for hydrogen.
As already mentioned in sec. 2.2.1, transition metal compounds lhat form stable hydrides contain at least one met.al that fOrm, :;table binary hydrides.
"Evid~ntly, the ~tabjlity i$ related to the free enthalpy change_ For the variOLls hydride-Forming materials, the values of 6.HglfJ can be widely different. On the
16
2. Metal hydride electrodes
other hand, the entropy eH'ect is found to be fairly independent of the host metal. The reason is that the entropy change during hydrogen absorption is dominated by the loss of the entropy of hydrogen gas; the standard value Sil., = 130 J (K·mole H2)-1 at I atm and room temperature- The other entropy effects are relatively small compared with this term. This makes it possible to
express the affinity of metals for hydrogen in terms of 6 HglfJ alone, ~fwe assume I';.SglP = - 110 J (K'mok H 2)"' and define a stahle hyd6de as Ont for which the plateau pressure lies below I atm at 300 K, a stable hydride is Characterized by a formation enthalpy more negative than - 33 kJ (mole H2tl. Small variations in I';.HglfJ cause large shifts in the plateau pressures.
Miedema et al. fOrmulated an empirical relation for estimating the hydride formation enthalpy of intermetallic AB" compounds (n ? 1) 2~,27)
AH(AB"Hx•1 ) = AH(AHx) + !J.H(B"H1 ) -.• (1- F)· AH(AB,,). (7)
The values of x,y and Fvary .~moothly with the composition ofthe intennetallic compound, i.e. with the value of n. The,e value, are tabulated 27). Equation (7)
indicates that the stability of the ternary hydride ABnH<+y increases with decreasing ,tability of the in1Crmetallic compound AB". Thi, is known as the rule of reversed stability. With the help of eq. (7) the plateau pressure of an intermetallic compound can be adj usted by an appropriate choice of its constituents. For instance, at 40 DC the desorption pressure for LaNi5H~ is 3 lltm and for LaNi4CuH5_~ it is 1.5 atm 30). The plateau pressure of LaNi~M-H2 decreases progressively as M represents successively Pd, Ni, Ag, Cu, Co, Fc, Cr, AI O( Mn_ Similarly, an increase of the plateau pressure has been found if La in LaNi, is (partially) rcplaeed by Nd, Gd, Y or Er.
2.2.4. Conclusions
The number of metal-hydrogen systems has been markedly increased by the discovery of the hydriding properties of intermetallic compounds_ Large amounts of hydrogen can be reversibly stored at pressures around I atm near room temperature. The volumetric hydrogen density often exceeds the hydrogen content in liquid hydrogen.
Moreover, the insight gained into intermetallic compound-hydrogen systems enables us to match the properties to the specific requirements. Many applications have been suggested 21,26,31,32). Among these is the utilization of metal hydrides in rechargeable batteries 33-36).
2.3. Metal hydride electrodes
2.3.1. Concept
At the end of sec. 2.1, we formulated the need for a negative battery electrode which can be charged and discharged via a solid state transition mechanism and
17
./ . ./. O. Willems
i, capable of coping with evolved hydrogen gas. In the previous section, it was concluded that many intcrmclallic compounds with interesting hydriding propcrlic~ arc available. The synthesis of these two GQndusions leads to the concept of a rechargeable batt.ery electrode based upon the electrochemical storage of hydrogen in inlcrmetallic compounds. Such an electrod~ will be denoted as a metal hydride electrode.
Charging of a metal hydride electrode consists of Ihe electrochemical reduction of water at the metal surface, resulting in the formation of adsorbed hydrogen atoms. Subsequently, these hydrogen atoms diffuse into the bulk of the host metal to form a metal hydride. Discharging of such an electrode consists of dehydriding, followed by oxidation of the released hydrogen atoms. Inherent in metal hydrides both the ho~t and lhe hydride are good electronic conduGtors. Thus charging and di~eharging proceeds according to
a charge transfer reaction
M + H~O +- e-:;:±M-H ad, + OH-,
di~~olution and diffusion in the solid state
yM-H",,:¢MHy ,
and recrystallization 0 f the condensed phase
x -MH,v:;:±MH •. y
The complete electrode reaction can be described by
M I xHzO + xe-:;:±MH,+xOH-.
(8a)
(8b)
(8c)
(9)
A, i, shown by lhe~e equations, the electrochemical storage capacity is proporlionaito the hydrogen content of the [TIet at hydride and the electrode potential is close to that of the n;:versiblc hydrogen electrode. Decompo~ition of the aqueous eled:rolyle is no longer an unwanted side reaction but is an essential step in the charging process. Moreover, evolved hydrogen gas can be expected to be absorbed or oxidized by the hydride electrode.
2.3.2. Electrochemical pressure-composition isotherms
The hydrogen absorption and desorption characteristics of metals are represented by pressure-composition isotherms. Analogous plots for battery electrode~ are charge/discharge curves. These plots show the variation~ of the electrode potential'"' as a function of the state of charge Q.
The equilibrium potential of the hydride electrode, i.e. of the redox couple of eq. (9), is related to the equilibrium pre,surc for lhe absorption and desorption of hydrogen gas. With the help of the electrochemical cell in fig. 8, this relation
18
2. Metal hydride electrodes
---- ------------------------, ,- -- ----- - -- - - --, ill
, I I
Cu/F'tlH2 H' :111 H+/MH,/MICu' I
101m u' : o' : I I
_________________________ ...1 L ______________ ~
4E
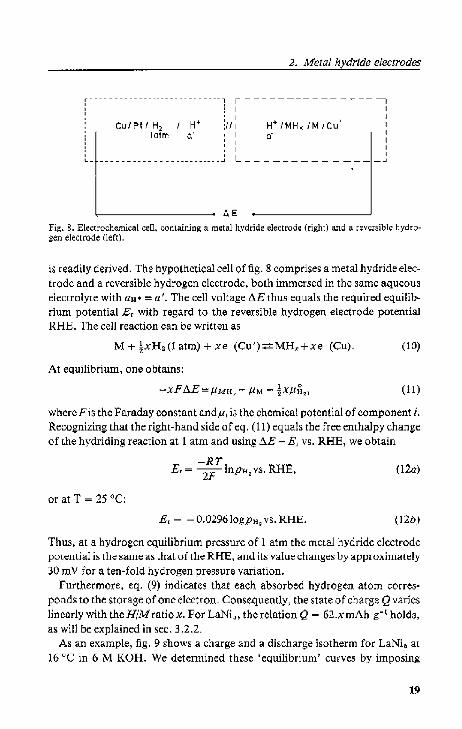
Fig. g. Elec[rochemical cell, containing a metal hydride electrode (righ!) and a reversible hydrogen electrode (left).
is readily derived. The hypothetical cell oftig. 8 comprises a metal hydride electrode and a reversible hydrogen electrode, both immersed in the same aqueous electrolyte with aH. "" a'. The cell voltage AE thus equals the required equilibrium potential Er with regard to the reversible hydrogen electrode potential RHE. The cell reaction can be written as
At equilibrium, one obtains:
-xFAE""'J.iMH, ~ J.iM - ~XJ.iH" (11)
where Pis the Faraday constant and,u, is the chemical potential of component i. Recognizing that the right-hand side of eq. (11) equals the free enthalpy change of the hydriding reaction at 1 atm and using AE = E, vs. RHE, we obtain
-RT E, = ~ Inp"I!, ¥s. RHE, (12a)
or at T = 25°C:
Er = - O.0296IogpH, vs.ltl-IE. (12h)
Thus, at a hydrogen equilibrium pressure of I atm the metal hydride electrode potential is the same as that of the RHE, and its value changes by approximately 30 mY for a ten-fold hydrogen pressure variation.
Furthermore, eq. (9) indicates that each absorbed hydrogen atom corresponds to the storage of One deetroo- COnscqul;:nt1y, the ~tatl;: of cba,ge Q varies linearly with theH/Mratiox. For LaNiij, thcrelatioo Q = 62.xmAh-g- t holds, as will be explained in sec. 3.2.2.
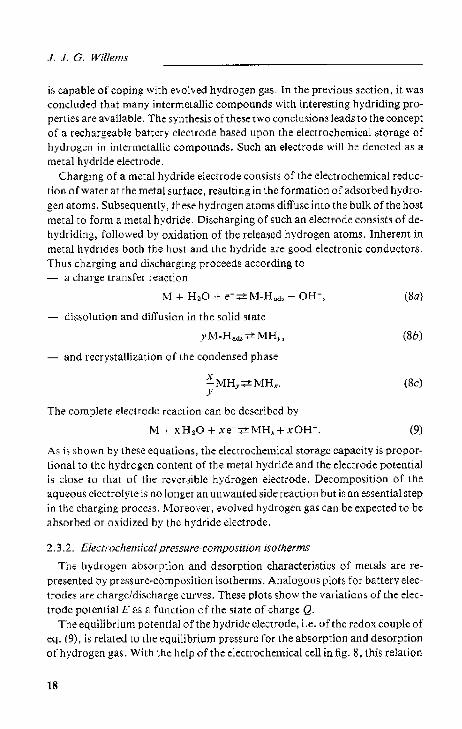
As an example, fig. 9 shows a charge and a discharge isotherm for LaNi. at 16 °C in 6 M KOH. We determined these 'equilibrium' curves by imposing
19
.I . .I. O. Willems
E vsRHE ImVI--------------------,
-100
300
100 200 300 Q ImAh.g·11
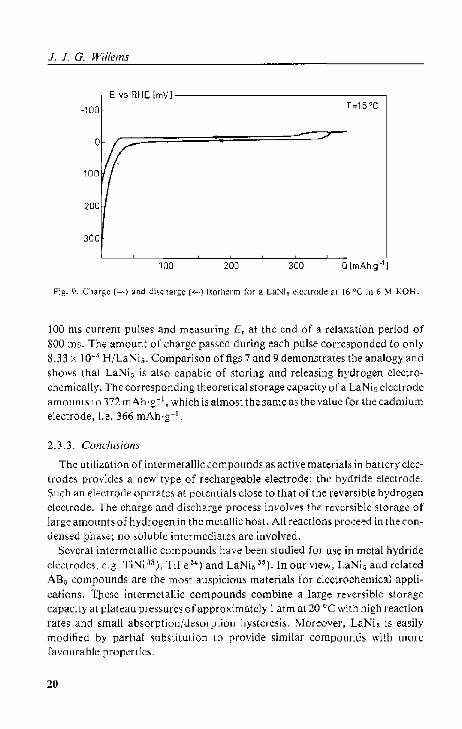
FiS· 9. Charge (-) ~no;l c)i~c;I'"rg<; ( ..... ) i.\()thcrm I'm a L'1Ni, eleclrode m 16 QC in 6 M KOH.
100 ms current pulses and mea.5uring Er at the end of a relaxation period of 800 lm. The amount of (:hargc pM&cd during each pulse corresponded to only 8.33 x 10"" H!LaNi,. Comparison offigs 7 and 9 demonstrates the analogy and shoW:; Ihal LaNi, i~ abo capable of storing and releasing hydrogen electrochemically. The corresponding theoretical storage capacity 0 I' a LaNi, electrode amounts to 372mAh·g-1, which is almost the same as the valuc for the cadmium electrode, I.e. 366 mAh·g- l .
2.3.3. Conclusions
The utilization of intermetallic compounds as active material:; in battery electrodes provides a new type of rechargeable electrode: the hydride electrode. SlH;h an electrode operate:; at potentials elose to that of the reversible hydrogen electrode. The charge and discharge process involves the reversible storage of large amounts of hydrogen in the metallic host. All reactions proceed in the condensed pl1<m~; no soluble int.ermediat.e:; are involved.
Several intcrrnetallic compounds have been studied for use in metal hydride electrodes, e.g. TiNi ,1~), Tire 34) and LaNi~ 3S}. In our view, LaNi s and related
ABo compounds are the most auspicious materials for electrochemical applications. tbese intcrmetallic compounds combine a large reversible Sl.orage capacity at plateau pressures ofapproximateJy I atm at 20 °C with high reaction rates and small absorption/desorption hysteresis. Moreover, LaNi s is easily modified by partial substItUl.ion t.o provide similar compounds with more; favourable properties.
20

2. Metal hydride electrodes
REFERENCES
') A. Volta, Phil. TraIlS, Roy, Soc, 90, 403 (1800). ') G. Plante, Compt. Rend, Acao. Sd. SO, 640 (1860), ') W, Jungnec, Swedisb Pat<;nt 10,177 (1899), ') T, de Micllalow,kl, Briti~h Patent 15,370 (I899); German Patent 112,351 (1899), ') W, J~ngner, Swedi>h Patem 15,567 (1901); Oerm~n Patent 163,170 (1901), 'J T. A. Edi.on, German Patent I 57,29() (1901); U.S, Patem 678,722 (1901). ") T, A, Edison, U,S. <'atent 692,507 (1902), 8) G, Vinal, ~torage Batteries, 4th edilion, John Wiley, New York (1955), 'J S. U. falk and A, J, Salkind, Alkaline Storage Balteries, John Wiley, New York (1969),
.0) H, Bode, Lead-Acid Batteries, John Wiley, New York (1977), ") V, S, Bagotzky and A. M. Skundin, Chemical Power Sources, Academic PreSS, LOIldon
(1980), ") Compreh<;n,ive TreatiSe of Electrochemistry 3: JOilcctroehemical Energy Conv~rsion ~nd
Storage, J, O'M. Bockris et al. (eds,), Plenum <'ress, N<;w York (1981), ") Proo;"dillgs of thc International Power Sources Sympo.,ium, held ill Brighton (U, K,) every
two years from 1962. ") P. Ruot.IOhi, J. Power Sources 2,3 (1977/78). ") J. L. H. M. Hendrikx, Thesis, Technio;aJ Vniv<;r.lity, Eindhoven (1984), ") P. Oliva et aI., J. Power Sources 8, 229 (982). ") D. M. MatArlhur. J, Electrocl!em, Soc, ll7, 729 (1970);
P"w~r Sources 3, D, H, Collins (ed.), Oriel Prc~" Newcastle upon Tyne, 91 (1971). oB) J, Mrha, M, Musilova and J. Jindra, ], Power Sources 8, 403 (1982). ") 0,0. Libowltl, Inorg>lni<) ChemislrY Series, Bumrwortlls, Londoo (1972). '") F. A. L~wi£, Palladium· Hydrogen Systen1, Acad. Prc.", Londun (1967), ") G, i\lefeld and J, Vblkl (<;ds.), HydrQgen in Metals I and U; Topics in Applicd Phy,ics 28
and 29, Springer-Verl.g, Berlin (1978). ") H. Zijl,tra and F, F, Westendorp, Solid Statc Comm. 7, 857 (1969), ") J. H. N. van Vucht, F, A, Kuijpcr,and H. A. G. M. Bruning, Philips Res, Repts, 25,1,3
(1970), ") J, J, Reilly and R. H. Wi<wall, Inorg, Chem, 13, 218 (1974), ") F, A. Kuijpcrs, Tne.lb, UniversilY of Technology, Delft (1973); al,o: Philip, Re,. Repts"
Suppl" No, ~ (l973). ") H. H. van Mal, The.is, UniversilY of Technology, Delft (1976); al.\O: Philip, Res. Repls,
SUDPI., No. I (1976). ~T) K. H. 1. Bu~~how. P, C, P, Bou ten and A" R. Mt~d~m~, R~p. Prog. Phy::;. 45, 937 (1982). ") H, Frieske and E, Wicke, Ber. Bumengcs. phy.\ik. Chern. 11, 48 (1973), ") D, Ohlendorf and H, E, Flotow, J, Chern. Phy,. 73, 2937 (1980), 3") I-i. H, van Mal, K, H, J. Buschow and A. R. Miedema,.I. Les.-Common Met, 35, 65
(1974), 31) H, Buchner, Proe, In!. Seminar Thermochemical Energy Storage, Siockholm, 151 (19~()). ") H. Wen,l, Int. Metals Rev. 27, 140 (1982), ") E. W. JlISti el aI., Energy Conversion 10, 183 (1970). ") M, i\, GUljahr, H, Buchner, K. D. B<;c~u and H. Saufferer, Puwer Sources 4, D, H,
Collins (cd.), Oricl Press, N<;w<;astl<; upon Tync, 79 (1973). "J P. A. Boter, German OITenlegungsschrift 2535091 (1976), .. ) 1-1, F, Biltner and C. C. Sadeock, J. Electrochcm. Soc. 130, 193C (1983),
21
Chapter 3 LaNi5 and LaNi4Cu electrodes
3. LaNis AND IAlNi4Cu ELECTRODES
3.1. IntrQdudion
The appli~ation of metal hydride electrodes in electrochemical cells involves the use of hydrogen as fuel, which is stored in the hydrogen-absorbing electrode. At t.he surface of such an electrode, hydrogen is formed by the electrochemical reduction of water, or stored hydrogen is oxidized
(13)
Thus, both aspects, hydrogen storage (bulk) and electrocatalytic properties (surface), play an important role in the choice of appropriate electrode materials. Moreover, chemical stability of the hydride· forming compound in aqueous electrolytes is an essential feature in attaining practical, rechargeable electrodes.
The possibility of Tapid and reversible storage of large amounts of hydrogen ga8 in LaNi. at a plateau-pressure of about 2 atm at room temperature makes this intermetallic compound an attractive material 1-4). Several investigators have also reported on the capabilit.y of LaNi. to store and release hydrogen electrochemically 0-6).
Ewe et a1.~) found that. the electrochemically determined storage capacity of LaNi o is about half that calculated from the limiting composition LaNisH6 and attributed thi~ observation to a different method of preparation or prelreat" ment. In our view, this mignt. be due to hot-pressing (350 °C) of the electrode pellets. Moreover, they concluded (hat the compound LaNi5 is resistant to corJ"Osion in 6 M KOH.
Boter ij) constructed rechargeable cells, t.he negative electrode of which consisted ofLaNh or oneofthe pseudo-binarY dCTivates of this compound- Andectrode made from LaNi , Cu proved to be especially suitable because of its lower plateau pressure, i.e. PH, < 1 atm at. rOOm temperature, and its capability of high-rate charging and discharging.
The temperature dependence of t.he storage capacity of LaNi5-based electrodes in unsealed cells was studied by Bwnoel et al. 9). The electrochemically measured capacity values decreased with increased temperature as a result of a grOwing amount of hydrogen IOSl by spontaneous hydrogen gas desorption- At. 20°C the st.orage capacity of LaNi~ was found to be 320 mAh _g_l, which is 85°10 of the theoretical value. In order to reduce hydrogen gas desorption in open cells, Percheron-Guegan 10) et al. also used substit.utcd LaNi, compounds. They stated that dectrodes made from these materials could undcrgo a grcat. number of charge/discharge cycles without change of their performance (300 mAh·g-1
at t.emperatures between -!O and 50°C).
22
3. LaNi; and LaNi4CU electrodes
Van Rijswick I) concluded that the choice of intermetallics is severely limited by the required stability in contact with aqueous electrolytes. Only compounds in which the major component is thermodynamically stable against oxidation, Le. nickel and the noble metals, are suitable as metal hydride electrodes.
The maximum storage capacity of the LaNi~ electrodes, studied by Markin et aI. 11 - 13 ) for application in satellite batteries, amounted to 240 mAh·g~l. They also observed a loss of capacity during charge/discharge cycling in 6 M KOH, which they attributed entirely to the presence of oxygen in the cell. On the other hand, Holleck et al. 14) reported a continuous decrease of the storage capacity of LaN!6 due to the presence of water vapour. This instability of the storage material in the cell environment limits the cycle-life of a battery.
Despite all these conflicting results regarding the stability of hydriding materials in aqueous media, Bittner and Badcock 16) concluded in their recent review article that LaNh appears to be the most promising material for electrochemical utilization studied to date.
We investigated LaNi5 and LaNi4Cu electrodes with special emphasis on their behaviour during repeated cycling. The electrochemical performance of these electrodes is discussed in sec. 3.2. The observed capacity loss is analysed with the help of X-ray diffraction, surface area measurements and electron microscopy, presmtcd in sees 3.3,3.4 and 3.5, respectively. In sec. 3.6 the first conclusions arc summarized.
3.2, Galvanostatk charge/discharge cycling
3.2.1. Sample preparation and measuring equipment
All intermetaliic compounds used were prepared by melting a mixture of the composing elements in an arc furnace under an argon atmosphere (20 torr). To obtain better homogenization the samples were turned over and remelted several times. More details of the preparation procedUre have been described by Van MaI 4
). All compounds were examined by X-ray powder diffraction in order to identify the structural parameters and to verify that no second phase was present.
Metal powder was obtained either by crushing and grinding mechanically or by repeated hydrogen gas absorption/desorption cycles. Tbe specific surface area of this powder was determined by krypton gas adsorption measurements (BET), described in sec. 3.4. After pulveri~.ation only the fraction that passed through a 40 !lm sieve was used as active electrode material. Both the cast and the powder of intermetallic compounds were handled in ambient atmosphere without special precautions.
The electrodes were made by mixing active particles with fine copper powder (Merck p.a. electrolytic eu) and cold-pressing this mixture to a porous pellet.
23

J. J. G. Willems
The pellet~ were 8.0 mm in diameter (geometrical area 0.50 cm 2) and aboul 0.5 mm thick; their total weight was approximately 150 mg, so the void volume W<1S about 300/11. Varying the weight ralio aClivc matcrial/~upporting copper powder bCI w~en 1:9 and 1:2 and the applied pressure between 0.4 and 4.0 x 10⁸ Pa did not influencc the electrode performance ~jgnificantly, Only the heavily loaded smnples weredcformcd rrom flat to hemispherical after many charge/di~" charge cycle:;. Most pellets contained about 30 mg active material and were pressed at a pressure of 4.0 x 10ij Pa.
For the eleclrochcmi~al measurements a pellet was attached to a copper rod (u = 11.0mm) by a shrink-sleeve and placed in a glass ceH, as illustrat.ed in fig. 10.
c.e r---~"-'--- 1 ___ ---,
IN, ,e.
~:' ... -- --- ------ --- --! I .... _.- I
6E ' I
i : -' : "> .,!_ .• ::::.-'" : temperature
, co:: :::::r ,~ control we
pellet I'il>. II). SdleIllalic J"pl"y of 1.11<; clcclrodl(lllical cell; w.e., r.e. and c.c. ,(and for workins, rcfcrcl1(,:C ~~n~i COULH~r' dt:l,;!.rodc.
The cell comprised two compartments separaled by porou~ glass c(;)r:.lmic :.Ind both were purged wilh nitrogen. The cell was surrounded by a water ja~ket to wntrol the temperature mo~tIy at 25 "C, As counter and reference electrode we used, respectively, a platin\lm plate (ca. 6 cm~) and a Hg/HgO/6 M KOH electrode. All electrode potential., are given with respect to [his reference electrode whose fqrmal potential is 930 mV mOrC positive than the reversible hydrogen electrode. The electrolyt~ was:.l 6 M KOrl solulion (Merck, p.a. KOH pellets; deionized water). In order to start with a completely wetted inlernal surface the electrode was vacuum-impregnated with electrolyte before cycling.
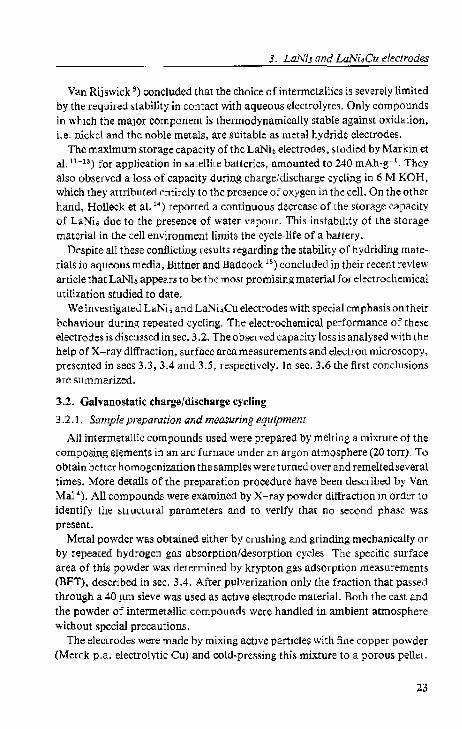
Fig. II shows a block diagram of the autol11<1ted galvanostatic charge/di&charge cycling apparatus to which the glass cell was connected. The micwr.:omputcr controlled the chargc- and discharge-current, the charging period and the flllal disch<1rge pOlerllial anL! cakulated the storage capacity via the measured discharging period. In another mode the dis~harging period could be adjusted. The 4 cells galvanostar/volrmerer unil, designed and b\lilt in ollr laboratory,
24
3. LaNi5 and LaNi4Cu electrodes
micro computer
r - 1--"' : key boord -I entrance
L ___ .,,' __ .,
=gnetic disk I
micro r---computer
ke~ board-en ranee
I printer I f
X-t recorder
I 1'-'- r:e:-volt meter r-- we.
galvanostat 1- c.,e. r--- w.e
4 cells unit cell ~
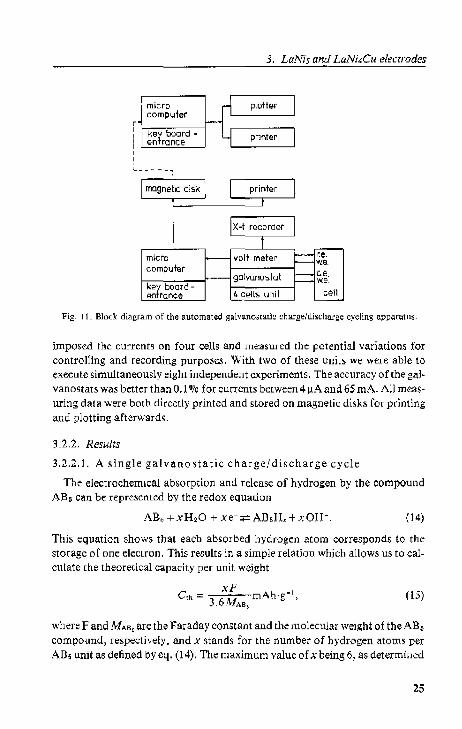
Fig. II. Block diagl'am of the automated galvanostlLtk charge/discharge cycling appanltlIs.
imposed the currents on four cells and measured the potential variations for controlling and recording pUrposes. With two of these units we were able to execute simultaneously eight independent experiments. The accuracy of the gal" vanostats was better than 0.1 % for currcnts between 4IJ.A and 65 rnA. All measuring data were boto directly printed and stored on magnetic disks for printing and plotting afterwards.
3.2.2. Results
3.2.2.1. A single ga!vanostatic charge/discharge cycle
The electrochemical absorption and release of hydrogen by the compound AB5 can be represented by the redox equation
(14)
This equation shows that each absorbed hydrogen atom corresponds to the storagc of one electron. This results in a simple relation Which allows us to calculate the theoretical capacity per unit weight
xF _j
C'h -- 3 6M ~mAh'g , , AB"
(15)
where F and MAD, are the Fa.raday constant and the molecular weight ofthe ABo
compound, respectively, a.nd x stands fOr the number of hydrogen atoms per AB5 unit as defined byeq. (14). The maximum value of x being 6, as determined
25

by hydrogen gas desorption measurements 16), the storage capacity of LaNi, is calculated to be 372 mAh·g"'.
The main purpose of a galvan,)~tatic charge/discharge cycle is to establish the experimental capacity value. Moreover, the potential variations during a cycle provide important information on the processes occurring. A single cycle con· sists of four successive periods: a. charging with a constant cathodic current; moving to the right-hand side
ofeq. (14),
b. resting for a short period, c. discharging with a constant anodic current; returning to the left·hand side
of eq. (14). and finally d. resting.
In battery terminology the rates of charge and discharge are usually expressed in terms of C, where C is the numerical value of the electrode capacity in mAh. This value may be related to the theoretical capacity, C'h, eq. (15), or to a rated capacity as for instance Co, which is defined as the capacity measured when the electrode is completely discharged in five hours '~). AyCrale, i.e. ayCcurrenl, iyc • equals the value of the current which forces the electrode to be charged or discharged completely wilhin y-' hours, assuming no kinetic limilalion.
Fig. 12 depicts a complete third cycle of a typical LaNi. electrode, charged during one hour and discharged, both at a 1.25 Crate (about 14 mAl. Starting at the rest pOlential, - 852 mY, the potential decreased rapidly to about - 1015 mY. At this level the potential stayed virtually constant for about 35 min., and then gradually changed to a more negative, constant value, - 1030 mY. This potential will be referred to as the hydrogen evolution potential, E h •• Ideally, after 48 min. charging with a 1.25 C current the electrode must be completely loaded
--·E[mV] .... _-_ .. _._-_ .. _--------------,
100 RHE
800
600 0 30 60 90 Hminl
Fig_ 12_ The potential variation during the third galvanostmic charge/dischaq;e cycle of a typical LaNi, eleGlrode. BOlh charging and discharging were carried out at 1.25 Crate.
26
3. LaN;, and LaNi4Cu eledrodes
and hydrogen gas evolution should start. However, especially in the case of a new electrode there is no sharp transition from one reaction to the other. After charging was completed, the current was interrupted for 30 s to measure the open circuit potential of the charged electrode; Ee '" - 960 mY.
Subsequently, discharging started and lasted for 44.5 min; 930/0 of the theoretical capacity was recovered at this high rate. The potential difference between the charging and discharging curves, uncompensated for the ohmic resistance ("'" r.17c/d + 2 JR.,) , amounted to approximately 130mV. The electrolyte resistance, R u, was measured by the interruption method at a fully charged electrode evolving hydrogen gas. The R., value between a new storage electrode and a wcH positioned reference electrode was less than 0.1 O. Du6ng repeated charging/discharging R u increased to 0.2 Q, due to changes in the porous structure. When the reference electrode was placed at a relatively large distance from the working electrode (about 2-3 cm), the Ru value reached anlyO.8 n as a result of the high conductivity of a 6 M KOH solution. Discharging was terminated at the moment the potential exceeded a certain previously chosen potential level, called the final discharge potential, Efd • In this experiment Ef~ was chosen to be - 600 mY, but because of the steep rise of the potential near the end of discharge any potential more positive than - 800 mV would be adequate, provided that the copper matrix did not oxidize (E(CufCuzO) = - 460 mY). The steep rise did not result from a fast-growing hydrogen concentration gradient in the Solid phase, but was caused by a general hydrogen depletion- Whcn the current was stopped, the hydrogen concentration levelled off, producing a strong decrease in electrode potential. It is in fact the hydrogen concentration at the interface, together with the pH, that determines the potential. The value measured after a 15 min. relaxation period will be denoted as the discharged electrode potential: Ed= -833mV.
Finally, it should be noted that the whole process took place in the immediate region of the reversible hydrogen electrode potential. For rechargeable negative electrodes in aqueous electrolytes this region is the most favourable potential range.
3.2.2.2. Repeated galvanostatic charge/discharge cycles
a. J..aNi, ELECTRODE
The previous section presented data on the electrode capacity and potentials. An even morc important propety of a rechargeable battery electrode is its endurance. We therefore measured the changes in the performanceofthe electrode during repeated galvanostatic charge/discharge cycling. Fig. 13 depicts the decay of the storage capacity of a LaNi~ electrode as a function of the cycle number, n. Each dot in this graph represents the capacity of a cycle, discharged at the
27
J, J, C. Willems
C imAh.g-'] .. ---------.- ...... .
300
.... ' .•. ~
200 ~ l',"",-,
n =94 •...• '..,:
~ .... rr.i/l .... ·1··, . .,.
100
100 200 n (cycles]
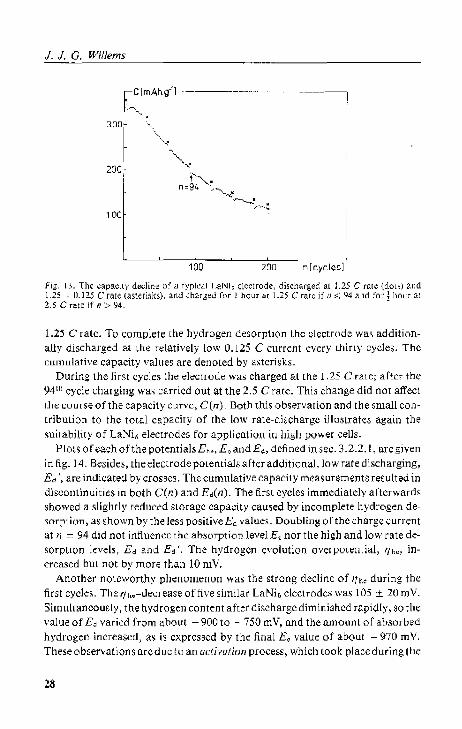
fig. 13. The capacilY ".dine of a tYDk~1 LaNi, electrode, dischs.'ged al 1.25 C tale (dOLS) ~lId 1.25 I· n.125 Crate (aslel'isks). and charged for 1 hOllr"t 1.25 C rate it' n ,;; 94 and 1'01' J hOltr aL 2.5 C ratc if n >- 94,
1.25 C rate. To complete the hydrogen desorption t.he electrode wa:; additionally discharged at the relatively low 0.125 C current every thirty cycles. The cUrIllLiativ[;) capacity values are denoted by a~tcri~b.
During the firS!: cycks the electrode was charged at the 1.25 C rate; after the 94. 11 cycle charging was carried out at the 2,5 C rate. This change did not affeet t.he course of the capacity curve, C(n). Both this observation and the small contribution to the total capacity of the low rate-discharge iJ!ust.rate:; again the suitability of LaNb electrodes fOr' application in high power cells.
PIOl S of each ohhe potentials E '<, Eo and E~, defined in sec. 3.2.2, I, are given in fig. 14. Besides, the electrode potentials after additional, low rate discharging, E~', are indicated by crosses. The cumulative capaeit.y m~asurements resulted in discontinuities in both C(n) and Ed(I1), The first cycles immediately afterwards showed a slightly reduced ~toragc capacity cau,~ed by incomplete hydrogen desorption, as shown by the less positive Ed value". Doubling 0 fthc chargc current at n "" 94 did not infiuerlec the absorptionleveJ E< nor the high and low rate desorption levels, Ed and Ed '. The hydrogCn evolution overpotentiul, 'lhe, increased but not by more than 10 mY,
Another' noteworthy phenomenon was the stmng decline of t'/Il< during th(; first cycle,. The t'/ho-decrease of five similar LaNi. electrodes was !O5 ± 20 m V. SimultaneouSly, the hydrogen content after discharge diminiShed rapidly, SO the value of Eo varied from about - 900 to ·-750 mY, and the amount of absorbed hydrogen increased, as i5 expressed by the final Eo value of about. - 970 mY. These observations areduc to an activation process, which took place during (he
28
3. LaNi:; and LaNi4Cu electrodes
E:lmV]··-·
1050 n .94 I
.'-. .... , ........ -'----", ........... ,." .... ".....,--...... _ .. ,." .. , ..... , .............. ' ....... " ..... _...,. .......... __ ....• __ .... __ ., ....... _, ..... --' ... _ ..... ,,,.
RHE:
850
·"'l·\~~·~I"'~·I.:',';..'(),.y,.:,.:,:.C .. ;.:.~.::.\:~',,~ ..... ~,'.~I.·:'...,'.J,".'- '/::-'0:' Ed
• Ed
(,50
100 200 n I cyGies]
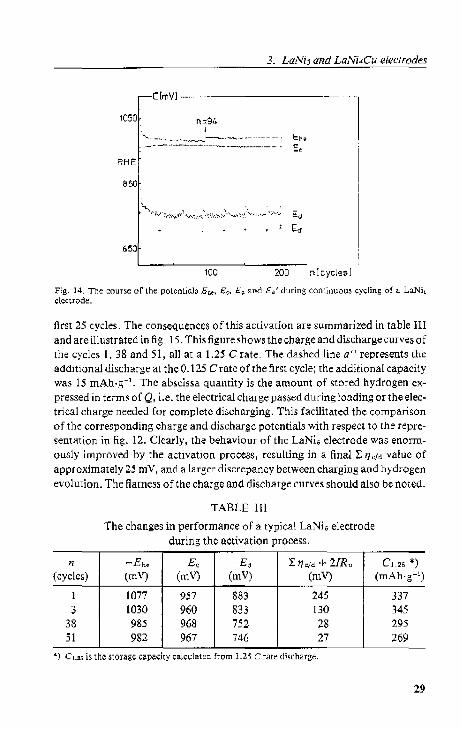
Pig. 14. The c<)ur.e of the polenlials Eo" e" 6". and E.' during COn[illUOUS cycling or" LaNio electrode.
first 25 cycles. The consequences of this activation are summarized in table III and are illustrated in fig. 15. This figure shows the charge and discharge curves of the cycles 1,38 and 51, all at a 1.25 C rate. The dashed line aU represents the additional discharge at the O. t 25 C rate of the first cycle; the additional capacity was 15 mAh·g-1
• The abscissa quantity is the amount of ~tored hydrogen expressed in terms of Q, i.e. the electrical charge passed during loading or the electrical charge needed for complete discharging. This facilitated the compari~()n of the corresponding charge and discharge potentials with respecllo the representation in fig. 12. Clearly, the behaviour of the LaNi" electrode was enormously improved by the activation process, resulting in a finall: /]c/d value of approximately 25 mY, and a larger discrepancy between charging and hydrogen evolution. The flatness of the charge and diSCharge curves should also be noted.
n (cycles)
1
3 38 51
TABLE III
The changes in performance of a typical LaNi. electrode during the activation process.
~Eh. -E< -E~ 'E 17</d +- 2IR" (mV) (mV) (mV) (mV)
1077 957 883 245 1030 960 833 130 985 968 752 28 982 967 746 27
*) Cu, is the storage capacity calclli.tod from 1.25 C rate discharge.
Cl.25 *) (mAh·g- 1)
337 345 295
269
29
j. j. G. Willems
-E[mV]
Ed
400
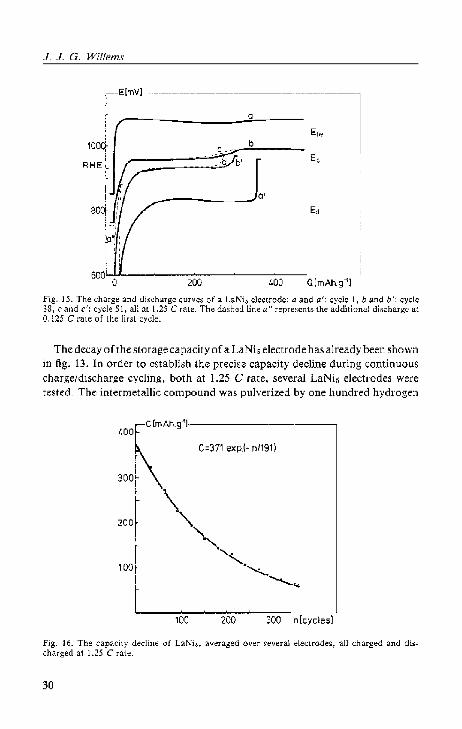
Fig. 15. The charge and di<chargc curVeS of a LaNi, electrode: a and a': cycle I, b and /:I': cycle l8 f (: and (I: cycle 51, all aL 1.25 C ral~. The da.shed line all r~presents the additional discharge at Q. U5 Craie of the Iirsl cyde.
The decay of the storage capacity of a LaNis electrode has already been shown ill fig. 13. IIi order to cstabli.~h the precise capacity decline during continuous charge/discharge cycling, both at 1.25 C rate, several LaNi& electrodes were tested. The intermetallic compound was pulverized by one hundred hydrogen
ctmAh.g-'l--------400 -
100 200 300 n kyclesl
Fig. 16. The capacily dedine of LaNi •• averaged Over .everal electrodes, all charged and dbchMged al 1.25 Craie.
30
3. LaNis and LaNi4Cu electrodes
gas absorption/desorption cycles, as described in sec. 3.4. Prior to cycling, each electrode was polarized at - 850 m V for 16 hours while the electrolyte was purged with nitrogen. Then the oxygen reduction current had decreased to
50 J.l.A or less. The final discharge potential amounted to - 600 m V. The sum of the 1.25 C and the 0.125 C rate capacities is considered to be the total storage capacity, C. The average C, values of several LaNi, electrodes as a function of the cycle number, n, arC represented by asterisks in fig. 16. If the C value of the first cycle is disregarded because of the activation process, the remaining C, points give a very satisfactory fit to the relation
Ct = Co exp ( - n~)' (16)
with Co = 371 mAh·g-1 and n* = 191 cycles. Co stands forthe starting capacity and almost equals the theoretical value as calculated from eq. (15). The parameter n * reflects the decay rate, and can be regarded as a stability constant. The fitting curve is also drawn in fig. 16. The cumulative capacity values of a single electrode which had been charged and discharged up to 360 times are displayed as dots. Obviously, there is a good agreement with the extrapolated curve_
b. LaNi.Cu ELECTRODE
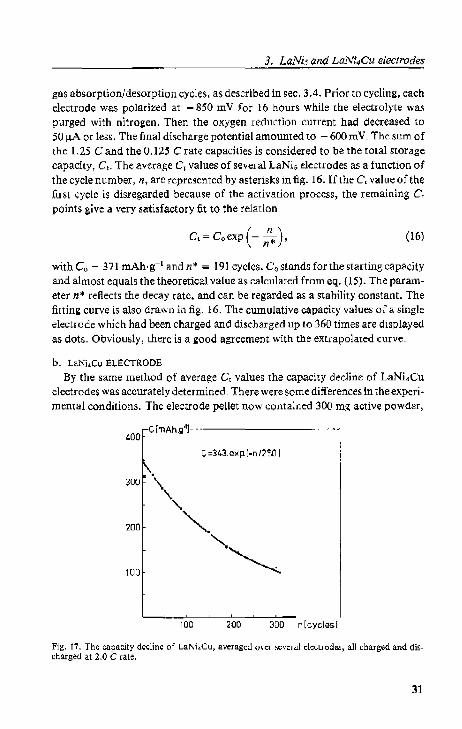
By the same method of average C values the capacity decline of LaNi.Cu electrodes was accurately determined- There were SOmt differences in the experi· mental conditions. The electrode pellet now contained 300 mg active powder,
400 C[mAh.g"]- -.--------
C "343_e~p-I·n/2S0 I
JOO
200
100
100 200 300 n [cycles!
Fig. 17. The capacity decline of LaNi,Cu, averaged over ,everal electrodes, all charged and discharged at 2.0 Craie.
31
J. J. C. Willems
encapsulated in a matrix of600 mg copper and its geometrical area was 3.0 cm 2•
The dectrod~s wer.;: r;ycled against a rechargeable Ni(OHlz/NiOOH electrode wilhout purging 0 rthe deet.rolyt.e by nitrogen 8). Both charging and discharging of the electrodes were carried out at a2.0 Crale, and thelinal discharge potential was - 700 mY. The total storage capacity was determined as the cumulative value of a five-steps-discharging at different rates in the sequence: 2.0 C; 1.0 C; 0.5 C; 0.25 C and (l_125 C rate-
However, the result was again an exponential decay runction but in this case with Co = 343 mAh·g- 1 and n~ = 250 cycles. Fig. 17 displays the average C, V<i! ue, (asterisks), the single electrode C, values after more than 200 cycles (dots) and thc fitt.ing curve_ The maximum hydrogen content calculated from this Co
value, 5.6 H/LaNi,Cu, corresponds very well with hydrogen gas desorption data 13). The relation of eq. (16) proved to be valid for de.')eribing the capacity loss of the intel'metallic compound electrodes.
3.2_3_ Dis(:ussion
3.2.3.1. High cycle rate
The high rate of the electrochemical absorption and release of hydrogen by LaNi, and LaNi.Cu electrodes is due to the fast hydrogen diffusion in the metal(-hydride) and the small particle size. The hydrogen diffusion coefficient D at 300 K, in LaNi 5 H 6 and infJ-TiFeB 1.03, as derived from NMR or qua~i·ela.5t.ic neutron scattedng experiments 19), i.Q X 10-" and 2 x 10-12 em 2 'S-,I, respectivtiy. It lms been suggested that the relatively fast hydrogen diffusion in LaNi.lh is caused by a high d<:grr.:e of disorder in the occupation of the interstitial sites.
Van Mal') examined microscopically the size distribution of LaNi5 powder after one, twenty and one hundred gas absorptiOn/desorption cycles. He found that after twel\!Y cycles no appreciable changes occurred and that t he part icle diameter's were diwibuted around 4 )-lm. 'rhe specific surface area of a sample after twenty cycles, as determined by the BET gas absorplion method, was found to be 0.25 m2 .g-1 • Assuming spherical particles of identical size (see sec. 3.4) a diameter of 3 )Ull is deduced.
These data enable us lo estimale the time scale of the hydrogen transport process via the l'oot-mean-square displacement equation
( 17)
Here a stands for 1 he dilTw;ion layer thickness_ For Ii = 2 I-lm, the LaNi. particle radius, the pedod I is calculated to be I s. Even during charging and discharging at a 2.5 C fate, which takes 24 min each, limitations due to hydrogen atom diffusion in the metal lattice can be disregarded. Transport limitation at the liquid side of the interface is also not expected in 6 M KOH with
32
3. LaNi> and LaNi4Cu electrodes
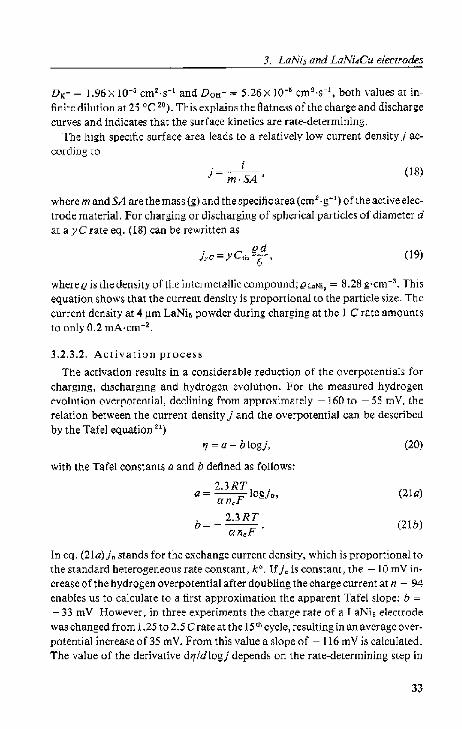
DK. = 1.96 X 10⁻⁵ cm2 's-1 and D oH - "" 526 X 1O-~ cm 2 ·s-1, both values at in
finite dilution at 25 °c 20). This explains the flatness of the charge and discharge curves and indicates that the surface kinetics are rate-determining.
The high specific surface area leads to a relatively low current density j according to
. i }=m·SA' (18)
where m and SA are the mass (g) and the specific area (cm2 .g- l) of theacti vee lec
trode material. For charging or discharging of ~pherical particles of diameter d at a yC rate eq. (18) can be rewritten as
(19)
where (! is the density of the intermetallic compound; ihoNi, = 8.28 g·cm-3• This
equation shows that the current density is proportional to the particle size. Thc current density at 4 11m LaNi~ powder during charging at the I C ratc amounts to only 0.2 mA·cm-2 •
3.2.3.2. Activation process
The activation results in a considerable reduction of the overpotentials for charging, discharging and hydrogen evolution. For the measured hydrogen evolution overpotential, declining from approximately -160 to - 55 mY, the relation between the current density j and the overpotential can be described by the Tafel equatiOn 21)
IJ =a+ blogj,
with the Tafel constantS a and b defined as follows:
2.3RT . a = --F-Iog]o, an,
(20)
(21a)
(2Ib)
In eq. (2Ia)jo stands for the exchange current density, which is proportional to
the standard heterogeneous rate constant, kO. H jo is constant, the - 10 mY inCreaSe of the hydrogen overpotential after doubling the charge current at n = 94 enables us to calculate to a first approximation the apparent Tafel slope: b = - 33 mY. However, in three experiments the charge rate of a LaNi 5 electrode was changed from 1.25 to 2.5 Crate at the 15 th cycle, resulting in an avcHlgc Overpotential increase of 35 mY. From this value a slope of - 116 mY is calculated. The value of the derivative drtldlogj depends on the rate-determining step in
33
J. J. C. Willems
the reaction sequence 22)_ For a slow proton discharge (Volmer reaction) the charar:teristic valuc is - 120 mV. If the combination of the hydrogcn atoms (Tafel reaction) is rate-determining a slope of - 30 mVis found. Apparently the mechanism of the hydrogen evolution reaction changes dudng cycling.
At a ~onstant charge ratc and with the assumption that b doe~ not vary belwecn the nth and the kth cycle, the eq8 (19) to (21) can bc combined to
(kO Id)" 17" - 7/- = b log (kD/d)k' (22)
Applying this equation to the activation process with b = - 116 mV shows that the quotient kO/d after activation is 8 times the starting value. The activation process is therefore due t.o further disintegration of the metal powder (decrease of d), even aft.e;:r OnC hundred hydrogen gas absorption/desorption cyclcs, and/or an improvement of the electrocatalytic properties of the electrode surface (incr'ease of kO).
The fact that all overpotentials, j,e. for charging, discharging and hydrogen evolution, were equally reduce;:d by about 105 mV can also be explained in two ways. The current density Wi'!S dec[e;:ased by further' cracking or these three;: reactiom po~~es~ed an identical rate-determining step, which was accelerated. This common step must be the Volmer reaction
(23)
This is consis(.e;:nt. wit.h hoth the steep Tafel slope during the activation and the increasing absorbed hydrogen level. The dist.inction between a variation in par" ticle size 01' rate constant cannot be made on the basis of this observation.
3,2,3,3, Capacity dccay
Figs 16 and 17 show the;: drastic capacity loss of LaNio and LaNi,Cu electrodes. I f we define the cycle life of a rechargeable electrode as the num ber of cycles during which the ~torage;: capacity has declined to 60% of the 5tarting value, the cycle life of these elect.rodes is restricted to about one hundred cycles. To meet the req\lired endurance of one thousand cycles, the stabilit.y must be improved by a factor of len.
Van Rijswick ij) hM already poirHed out that the' demonstrated' :;uitability of i'! hydroge;:n-storing LaNi(; electrode was rather surprising because lanthanum is a metal that readily reacts with water_ The equilibrium potential of the reaction
Laf 3 H~O~La(OHh + 3M+ + 3c-, (24)
is - 2.07 V with respect to the reversible hydrogen electrode'~). The increase in nobility due to the;: format.ion of the intermetallic compound cannot possibly bridge 2.0 volts. As it more;: important effect of the formation of a compound, it
34
3. LaNi5 and LaNi4Cu electrodes
might be expected that in a regular packed structure of several kinds of atoms the selective oxidation of the least noble metal would leave a surface layer of the more noble metal, which would then determine the corrosion properties. Xn this way, Van Rijswick suggested that compounds rich in cobalt, nickel or copper would be protected against corrosion by a thermodynamically stable surface layer.
Obviously, the protection is insufficient. The surface layer may possess an open structure, still allowing lanthanum to reach the electrode/electrolyte interface. Alternatively cracking of the metallic powder may continue, progressively yielding fresh surface. If the latter explanation holds, as partly suggested by the activation process, coating of the fine metal particles with a protective layer of for instance palladium or a passive oxide 24.2~) will not provide a solution for the severe deterioration. To characterize the degradation both the oxidation reaction and the disintegration of the intermetallic compound need further examination.
3.3. X-ray diffraction analysis
3.3.1. Results
X-ray diffraction analyses were carried out to identify the structural parameters ofthe pure and the hydrided intermetallic compounds and to determine the compositional changes in electrode samples after galvanostatic cycling. The X-ray diffraction diagrams were 0 btained on powdered specimens. using Cu(Ka) radiation in combination with a graphite monochromator. The diffractometer used was a Philips PW 1130/90, equipped with a vertical goniometer PW 1050. Hydriding of the ground interrnetallics was implemented by exposure to hydrogen gas of 150 atm for 24 hours. To prevent desorption dUJ:ing recording, the hydrided powders were coated with glue.
Fig. 18 displays the X-ray diagrams of LaNi~, LaNi4Cu and their hydrides. The diagrams (a) and (d) show that the intermetallic compounds consist merely of one phase which was identified as the hexagonal CaCu. type of structure 26);
this crystal structure is described in space group P6/mmm. The broadened peaks of fig. I8(b) indicate the deformation of the solid phase after one hundred hydrogen gas absorption/desorption cycles at ambient temperature. Besides lattice deformation, the line broadening may partially be attributed to the small size of some crystallite fragments. However, no additional lines, due to a second phase, appeared. The X-ray diagram of LaNi6H6 (c) and that of LaNi4CuH •. !) (e) are similar to (a) and (d), respectively, but with all peaks shifted to smaller diffraction angles, indicating the same hexagonal structure but with larger lattice parameters. Despite the glue coating some hydrogen gas had desorbcd from LaNi,H 6 and thus a small amount of LaNi6Ho.3 had been
35
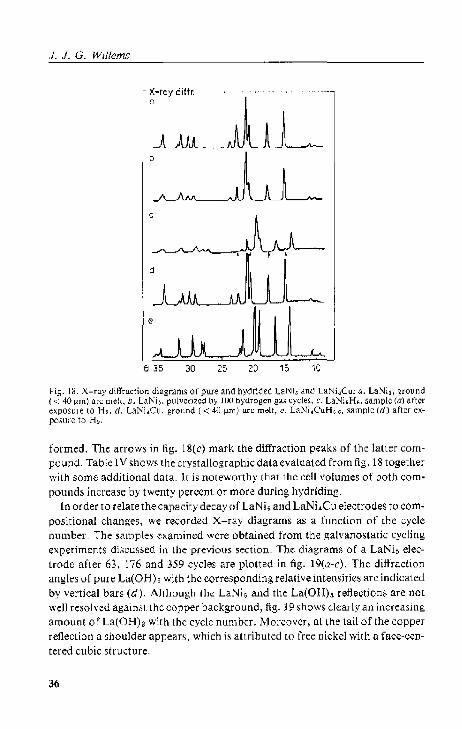
J. J. G. Willems
X-ray diffr. o
e 35 30 25 20 15 10
Fig. IN. X-ray dilfraction dhlgnl'tlS of pu!'e and hydrided 1,~Ni, and LaNi,Cu: d. LaNi" ground « 40l1rn) ar~ l!lell, b. LaNi" pulvcri7cd t,y 100 hydmgcn ga.' cycles, ,\ LaNi,H" sample «7) Mt~r eXpOlllle to H" d, laNi.C\I, gro"nd « 40 11m) are melt, e. LaNi,CuH, .• , samplc (Ii) .ft.cr expo,mc to H"
formed. The arrow~ in 11g. J8(c) mark the diffraction peak> of the laller compound. Table I V shows the crystallographic data evaluated from fig. 18 together with some additional data. It is noteworthy that the cell volumes of both compounds increase by twenty pc:rCCnl. Or more during hydriding.
In order to relate the capacity decay of LaNi. and LaNi,jCu electrodes to compositional changes, we recorded X-ray diagrams as a function of the cycle number. The sample~ examined were obtained from the galvano:;tatie cycling expc:rimenh diEicus,ed in the previous section, The diagrams of a LaNi, electrode after 63, 176 and 359 cycles are plot.t~d in fig. J9(a-c). The diffraction angles of puro; La(OH)s with the corresponding relative intensilie~ arc indicated by vertical bars (d), Although the LaNi, and the La(OHh refJection& are rIOt well resolved agains1. I.he copper background, fig, 19 shows clearly an increasing amount 0 r La(OH)a with the cycle number, Moreover, at the tail of the copper reflection a shoulder appears, which is attributed to free nickel with a face-c<:ntered cubic structure,
36
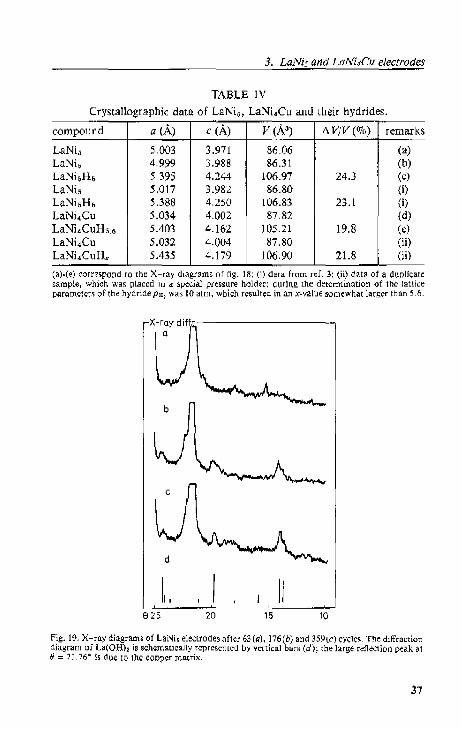
3. LaNi5 and LaNi4Cu electrodes
TABLE IV
Crystallographic data of LaNi" LaNi.Cu and their bydrides.
compound a (A) c (A) v(N) fl. V/V (0/0) remarks
LaNi. 5.003 3.971 86.06 (a) LaNi, 4-999 3.988 86.31 (b) LaNi,H" 5.395 4.244 106.97 24.3 (c) LaNis 5.017 3.982 86.80 0) LaNi 5H & 5.388 4.250 106.83 23.1 (i) LaNi.Cu 5.034 4_002 87.82 (d) LaNi.CuHu 5,403 4.162 105_21 19.8 (e) LaNi 1Cu 5.032 4.004 87.80 (il) LaNi.CuH, 5.435 4.179 106,90 21.8 (ij)
(a)-(e) COffGSp08d t.o tho X-ray diagrams or fig. 18; 0) d.t.a from ref. 3; (ii) data 01' a d~I[)Ii<;at< sample. which was placed in a special pressure holder; during the determination of the lattice parameterl of the hydride PH, was to atm. which resulted in an x-value somewhat larger than 5_6_
II e 25 20 15 10
Fig, 19, X-ray diagrams of LaNi. electrodes after 63 (tI). I 76(b) and 359(c) cycles- Tho diffraction diagram of La(OH), is schematically represent.ed by vertical ba" (d); the large reflection peak at & = ~1.76· is O\lC to the coP):'cr [\latrix_
37

J- j, C. Wiffems
The X-ray diagrams of the LaNi.Cu electrodes exhibit a much better peakhcightfbackground fatio. as shown in fig. 20. With increasing cycle number the LaNi.Cu peaks (un$hadcd) diminish and the La(OHh peaks (shaded) grow. Again niCkel shoulders (dotted) appear at the tails ofthe copper reflection peaks, These diagrams prove explicitly that dUring ga)vanostatic charge/discharge cycling LaNis and LaNi 4Cu electrodes are converted according to
LaNis + 3 H20""" La(OHh + 5 Ni + ~ H2 (25a) and
LaNi.Cu + 3 HzO---->- La(OHh ,. 5 NL~Cu,. + ~ H •• (25b)
respectively.
X-ray, diftr
e 25 20 15 10 rig_ 20_ X-ray difj"[actioIl arlaly,i, of LaNi,Cu ~l~~trodes as a [unction of the cyde number: ,,{; 0, h: 2" (-': 6:5, d: 87. e: 148 arldj: IRH cyclcs_ Reflections due to LaNi,Cu, La(OI-I), alld Ni (or Ni.,eu.,) arc indicated by lIIlshad~d, shiLdeJ and d<:>lt~d, respectively, The dilImction peak> of the COpper matrix appear at e - 21.76" and 0 = 25_35"_
38
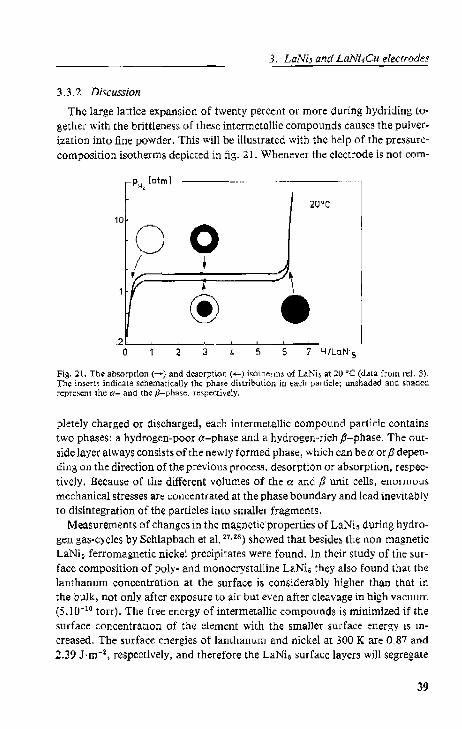
3. LaNi5 and LaNi4Cu electrodes
3.3.2_ Discussion
The large lattice expansion of twenty percent or more during hydriding together with the brittleness of these intermetallic compounds causes the pulver. ization into fine powder. This will be illustrated with the help of the pressurccomposition isothe.ms depicted in fig. 21. Whenever the elcctrode is not com-
5 6 7 H/LaNis
Fig, 21. The at>sorption (---.-) and desorption (+-) isOtherms of LaNi, at 20'C (data from ,'e!', 3)Th~ ins~rts indicate schematically the pha,e distribution in ea~h particle; ullshaded ano shoed represent the 0:- and (h~ fi-phase, respectively,
pletely charged or discharged, each intermetallie compound particle contains two phases: a hydrogen-poor a-phase and a hydrogen"rjch p-phase. The outside layer always consists ofthe newly formed phase, which can bea or fJ depending on the direction of the previous process, desorption or absorption, respectively. Because of the different volumes of the a and p unit cells, enormouS mechanical stresses are concentrated at the phase boundary and lead inevitably to disintegration of the particles into smaller fragments.
Measurements of changes in the magnctkproperties of LaNi5 during hydrogen gas-cycles by Schlapbach et al. 27.28) showed that besides the non-magnetic LaNi 5 ferromagnetic nickel precipitates were found. In their study of the surface composition of poly- and monocrystalline LaNi5 they also found that the lanthanum concentration at the surface is considerably higher than that in the bulk, not only after exposure to air but even after cleavage in high vacuum (5.1O- 1Q torr). The free energy of inter metallic compounds is minimized if the surface concentration of the element with the smaller surface energy is increased. The surface energies of lanthanum and nickel at 300 K are 0.87 and 2.39 J·m-~, respectively, and therefore the LaNi. surface layers will segregate
39
1. 1. O. Wi!l('ms
into lanthanum and nil:kel ~9). Schlapbaeh eL al. suggested that the continuing segregation during cycling is nOt due to the hydrogen gas it~elf. They suggested thai_ i( i~ due instead either to the temperature rise (increase of mobility), caused by the heat of hydriding, or to the oxygen or water impurities in the hydrogen gas. which oxidize the lanthanum at the 5urface.
The fOl'matiun of LaNisHe from LaNi" by the absorption of hydrogen gas i~ an exothermic reaction with t1H,iJIJ c= - 30.4 kJ·(mole H~t'- The heat capacity cpo (298.15 K) of LaNh and LaNir,H s is 152 and 236JK-1 mole- t , respectively 'HI). Hence, in a adiabatic system or locally in a large storage container the temperature may increase considerably (1'1 T: 400 to 500 K) upon hydriding. In an elel:trochemical cell. (-he heat due to this hydride formation enthalpy will not be dissipated. in such a cell, heat is only generated due to the overpotentials during ~urrent flow. Howev(;:r, the heat effect of LaNi, electrodes is negligible as a re,ulL of the low overpotemials, even at high CU/'r'Cnts_
The free energy change of the LaNi6 oxidation according 1:0 eq. (25a) equals the 1'10° of the reaction of lanth~num with water (eq. 24) minw; (:h(;: /}.O" of the formation of I:h~ compound LaNi". 'Thus, n~gl~cting the entropy change of th~ LaNis formation from lanthanum and nickel.
AGO(LaNir. oxidation) ~ - noF E"- 1l.Ht(LaNi~). (26)
This leads to ~GO(LaNi5 oxidation) = -472 kJ-(mole LaNl;)-l, which is almost fuur times t1l1t(LaNi s) """' - 127 kJ ·(mole LaNi,)-'- So, in aqeuous environments the driving fOfce fOr the segregation of LaNi. is not thc diffcrcnce in the surface energy of the constituents but the strong affinity of LaN!. for water. This explains the observed discrepancy in I:apacity loss after electro~hemically (6 M KOH) and volumetrically (pure Hz gas) cycling.
Thus, the intermetallic i;ompound electrodes decompose into oxidation products whkh are inactive fOl' the storage of hydrogen. Because the charge transfer reactions of the corrosion process, i. e. thc reduction of water and the oxidation of lanthanum, OCeur readily, the segregation of LaNi, must be the rate-determining step. It can therefore be expected that the specific surface area would play an important role iJ~ the fatc of the capacity decay.
3.4. Specific surface area measurements
3.4.1. The BET method
The specific surface area of pure in[(;rmetallic compound powdefs and electrode pdkts was determined from gas adsorption measurements, applying the BET method s'). In 1938 Brunauer, Emmct arld Teller derived an equation to describe a multilayer adsorption isotherm, which is now generally known as the BET equation
40

3. LaNi3 and LaNi4Cu electrodes
cp (27)
(Pe-p)[t +(c-l) :J where p and Po are the pressure and the saturation pressure of the adsorbate. and Vand Vm are the total volume of gas adsorbed and the volume adsorbed at monolayer coverage. The parameter c is defined as
(28)
and indicates the relative preference of an adsorbatc molecule for attaching itself to the adsorbent or to a layer already covered by the adsorbate. E.w. and E~.p refer to the adsorption and the vaporization free energies. Thus, the BET equation describes the volume of gas adsorbed at different values of PfPe in terms of two parameters Vm and c, It should be noted that Vm equals the volume of gas which would be adsorbed if a monolayer was formed; it is not assumed that the monolayer is completely filled, Therefore, the surface area A may be evaluated from Vm if the area occupied per absorbate molecule ()o is known
(29)
where V"'OI is the molar volume of the adsorbate at the same p and T as Vm ;
NA is Avogadro's number. To evaluate Vm , eq. (27) can be rearranged into the following linear form
.!... _p_= c- I . E..+ _1_. V Po-P cV" Po cV",
(30)
This form suggests that a plot of pf(V.(po - p)) versus pfpe should yield a straight line with slope m = (,. - l)f(cVm) and intercept b = (CVmt'. Now it is easily seen that Vm =(m + bt'. In the rangeO.OS :e::: pfPe :< 0.30 the linear form of the BET equation fits the eJ(perimental data very well for a variety of gases and adsorbents. This feature has made the BET method a standard technique for surface area determination.
Many of OUr samples were electrode pellets, consisting of approximately 120 mg copper powder and only 30 mg active material. To determine the specific surface area of the active material with an accuracy of at least 0-2 m~ 'g-l, the deviation from the average of the measured areas should not exceed 6.1 0·$ m~_ The determination of such small areas with the required accuracy was achieved by means of a special experimental approach, We used krypton as adsorbate and a turbo-molecular high vacuum pump for thoroughly remOving adsorbed contaminants from both the apparatus and the samples. The BET apparatus was
41
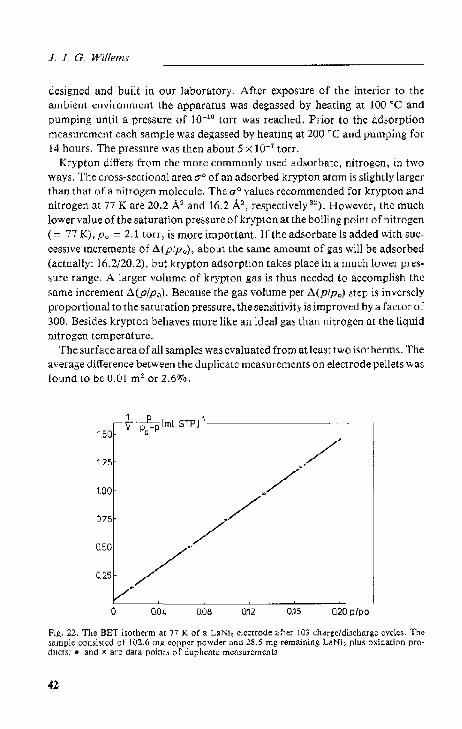
.I . .I. G. Willems
designed and built in our laboratory. After exposure of the interior to the ambient environment. the apparatus was degassed by heating at 100°C and pumping until a prcssurc of 10-10 torr was reached. Prior to the adsorption measuremcnt each sample was degassed by heating at 200°C and pumping for 14 hours. The pressure was then about 5 X 10⁻⁷ torr,
Krypton dijrer~ from the morc commonly used adsorbate, nitrogen, in two ways. The cross-sectional area 0'0 of an adsorbed krypton atom is slightly larger than that of a ni(rogr;:n molcculc. The dO values recommended for krypton and nitrogen at 77 K are 20.2 A2 and 16.2 A2, respectively3~). Howr;:ver, the much lower value of the saturation pressure 0 f krypton at the boiling point of nitrogen ('" 77 K), po = 2.1 torr, i~ more import.ant. I f the adsorbate is added with successive incremenb of Ll (pip,,) , about the same amount of gas will be adsorbed (actually: 16,2/20.2), but krypton adsorption takes place in a much lower pn:ssure range. A larger volume of krypton gas is thus needed to accomplish I.he &ame increment Ll(plpo). Because the gas volume per t;(plpo) step is inversely proportional to the saturation pressure, the sensitivity is improved by a factor of 300. Besides krypton behaves more like an ideal ga8 than nit.rogen at the liquid nitrogen t.emperat.ure.
The surface area of all samples was evaluated from at le,,~t t.wo isotherllls. The average diH'erence bet.ween t.he duplicate llleasurements on electrode pellet.s was fOLind [0 be 0.01 m 2 or 2.6070.
150. ~'R[m' STPr
1
D
1.25 / . 1.0.0. ~/ D75 ./
/ 0.50. ..
/ 0..25 ~
0 00.4 DOS 012 0..16 0.20 p/po
Fig. 22. The BET isotherm at 77 K of a LaNi, electrode aft.er 103 charge/discharge cycles. The sample consi~tc(1 of 102.(> mg copper powder and 28.5 rng remainitlg LaNi, plus oxidation products; .. and)( arc data poim.'; of duplicatt! m~a~iLlrernents,
42

3. LaNi3 and LaNi4Cu e/edrodes
Concluding this scction, a practical example of the method will bc given. The two isothcnns of a LaNi~ pellet after 103 charge/discharge cycles, plotted in fig. 22, coincide. Obviously, the linear form of the BET equation fits well. The results, evaluated from the data of fig. 22 and summarized in table V, show the excellent agreement between the two measurementS. The surface area of the pellet, A, is 0" 7586 m2
• From the electrochemical experiments it is known that after 103 charge/discharge cycles only 58010 of the LaNi. is still present and 421\'D of the initial material has been converted to oxidation products. The specific area of the remaining LaNi, plUS the formed oxidation products, $A,I.,,,odo, expressed in m2.g-1 LaNi. starting material, is calculated from A according to
S A ( mcu ) AOiO.lrod. = -- - -- . SA Cu, mt..IlNi~ mLIlNl~
(31)
whcre m~.Nj, is the mass of LaN •• assuming no oxidation took place; mc" and SA cu are the mass and the specific surface area of the copper powder in the pellet.
The SAc" of a pressed, dry pellet amounts to 0.216 m2 .g- 1• After 37 cycles,
canied out by potentiodynamic scanning in the potential range of a real electrode, we measured a specific surface area 0[0.292 m2.g- l • The electrode potential of a LaNi. electrode acted as the 'function generator' for the potentiostat, which controlled the copper pellet potential. The increase is due to oxidation of the copper surface, wetted by 6 M KOH. Because the electrode potential was always negative with respect to the Cu/Cu20 reversible potential (~460 mY), this oxidation was caused by oxygen afte, the electrode was removed from the cell, despite thorough rinsing in water and methanol immediately and further storing in a desiccator fOr 24 hours. Therefore, we assumed the value of 0.292 m2 .g- i to be independent of the number of cycles. The SA.1«t,od. value of the sample in fig. 22 is 26.8 m2 .g- i
.
TABLE V
Results evaluated from the data points of fig. 22.
parameter ,-points ,,·points average
b (ml STp)-1 0,0263 0.0314 m (m! STP)-l 7.1I9J 7.1315
Vm (mr STP) 0.1400 0.1396 0.1398 A (m2) 0.7595 0.7577 0.7586
43
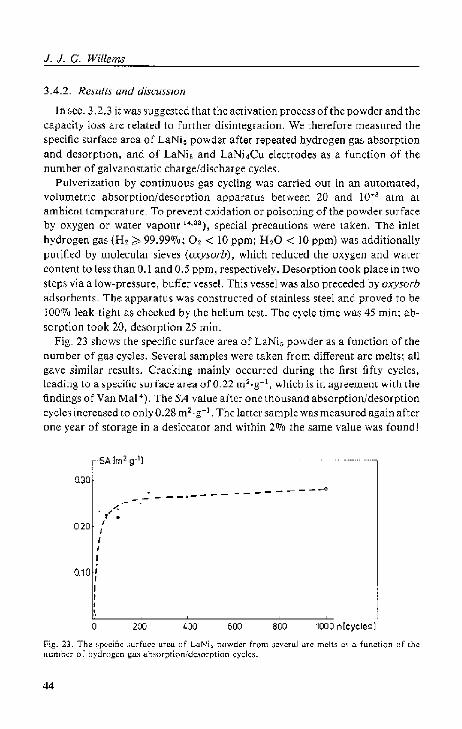
J. J. G. Willems
3.4.2. Res411s and discussion
In &CC. 3.2.3 it was suggested that the activation process ofthe powder and the capacity loss are rdated to further disintegration. We therefore measured the specific surface area of LaNis powder aft.er repeated hydrogen gas absorption and desorption, and of LaNis and LaNj 1Cu electrode~ a~ a function of the number of galvanostatic charge/discharge cycles.
Pulverization by continuous gas cycling was carried out in an automated, volumetric absorption/desorption apparatu> between 20 and lO~a atm at ambient temperature. To prevent oxidation or poisoning of the powder surface by oxygen or water vapoUl' 14.3~), special precalllions were taken. The inlet
hydrogen gas (H 2 ~?-. 99.990/0; O~ < 10 ppm; H~O < 10 ppm) was additionally pu6fir:d by molecular sieves (oxysorb), which reduced the oxygen and water COntr:nt to less than 0.1 and 0.5 ppm, respective/yo Desorption took place in two steps via a low-pressure, buffer vessel. This vessel was also preceded by oxysorb ads()rbents. The apparatus was constructed of stainless steel and proved to be 100% leak-tight a& chcchd by the helium test. The cycle time was 45 min; ab· sorption took 20, desorption 25 min.
Fig. 23 shows the specific surface area of LaNi r, powder as a function of the number of gas cycles. Several samples were taken from different arc melts; all gave similar results. Cracking mainly occurred during the first fifty cycles, leading to a specific surface area of 0.22 m 2.g-1, which is in agreement with the findings of Van MaI 4
). The SA value after one thousand absorption/ desorption cycle:; increased to only 0.28 m 2 • g-l. The latter sample was measured again after one year of storage in a desiccator and within 2% the same value was found!
Q30
/'. , . 020 /
I , I
0.10 ., , I I I
o
... ._ ....... _---------OZI
~_--101-- ...... -
200 400 600 800 1000 idcycles]
Fig. 2:3. Th~ specific .~urfacc area of LaN]/'. powder from .~cv~raJ ar~ melts 8.'i a function of t.he number ()r byurllgC[l ga:; ahsorpt.ion/Jcsorpt.i(ln .;,:yclcs.
44

3. LaNij and LaNi4CU electrodes
Assuming the powder consists of spherical particles, all with diameter d, we can ea8ily evaluate this typical length from the specific surface area
6 d == .Q' SA . (32)
The final size ofLaNi~ particles, corresponding to SA = 0.28 mz.g-!, is 2.6j..1.m. The 'diameter' of the crystallites in these arc melt samples varied from 100 to 200 ~m, as determined microscopically. Thus, not only the crystallites arc separated from each other, but also transcrystalline fractures oCCUj" as a result of cycling.
The specific surface area of LaNi4Cu after several gas-cycles was found to be 0.24 m2 .g- l . We also determined the specific surface area, obtained after grinding LaNis powder by mechanical means and passing it through a 40 J,l-m sieve. The result was remarkable: 0.25 m 2.g-1 • Apparently, there is a characteristic limiting value for the specific surface area of this type of intermetallic compound under mechanical strCSS.
The determination of the specific surface area of a LaNi5 electrode after repeated electrochemical cycling was described in the previous sec. (3.4.1). Fig. 24(a)
BO 'SA [m 2.g.'J 0)
60
40
20
0 100 300 n(cyclesl
BO -SA[m 2 .g'l b) LeNi5
50·
:~ 0""';' I o Q2 0.4 0.6 0.8 10 (1-CICo I
Fig. 24. The specific smface area of LaNi, (0) and bNi,Cu (.) electrodes. eXllressed in m"S-' (g refers to iniual active material). The charge/discharge ratc5 of the LaNi, arrd the LaNi,Cr' clectro· des were 1,25 and l.O C, respectively. (a) and (b) di'play the dependence on the cycle number ano on lhe fraction of oxidation products, re5pectively.
45
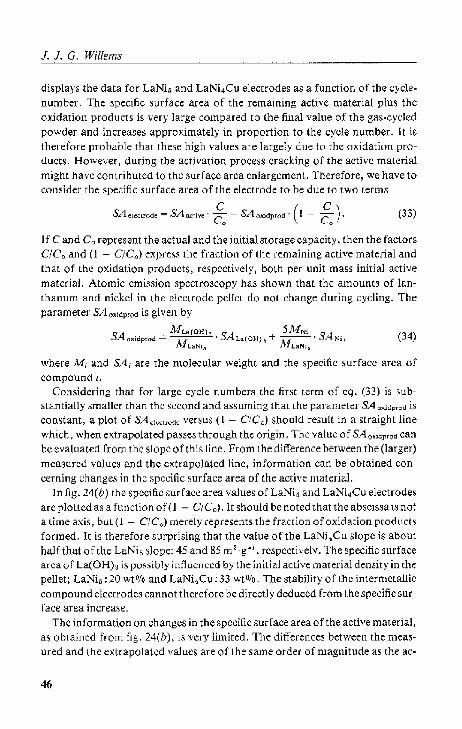
J. J. G. Willems
displays the data for LaNi5 and LaNi4Cu electrodes as a function of the cyclenumber. The specific surface area of the remaining active material plus thc oxidation products is very large compared to the final value of the gas-cycled powder and increases approximately in proportion to the cycle number- It is therefore probable that these high values are largely due t.o the oxidat.ion products. However, during t.he act.ivation process cracking of the active material might have conI ributed to t.hc $ur facc area enlargement.. Therefore, we have to consider the specific surface area of the electrode to be due to two terms
(33)
If C and Co represent the actual and the initial storage capacity, t.hen the factor's ClCo and (1 - C/Co) expre~s the fraction of the remaining active material and thal of the oxidat.ion product.s, respectively, both per unit mass initial active material. Atomic emission spectroscopy has shown that the amounts of lanthanum and nickel in the electrode pclIct do not change during cycling. The parameter SA"idp,od is given by
(34)
where Mi and SA i are the molecular weight. and t.he speCific surface area of compound i.
Considering that for large cycle numbers the tim term of eq. (33) is :;ubstantially smaller than the second and assuming lhat the parameter SA oxi~p,o~ is constant, a plot. of SA ,1o<1,0(k ver~us (I - Cleo) should result in a straight line which, when e)(trapolated passes through the origin. The value of SA o,ldp,od can be evaluat.ed from the slope oflhis linc. Prom the difference between the (larger) measur~d values and the /;xtrapolat.ed line, information can be obtained concerning ~hanges in thc ,pceifie surface area of the active material.
In fig. 24(b) the specific surface area values of LaNi, and LaNi 4Cu ekctrodes arC ploued as a fU[lction of (1- CICo). It should be noted that the abscissa. is not. a lime axis, but (I - c/eo) merely represents the fraction of oxidation prodl1cts formed. It is therefore surprising that the value of the LaNi,Cu slope is about h,dfthat of the LaNi5 slope: 45 and 85 mZ_g- 1
, respectively. The specific surface arca of La(OH)~ is possibly influenced by the initial active material density in the pellet; LaNi5; 20 wt% and taNi,Cu: 33 wt(t/o. Th/; stabilit.y of the intermetallic compound electrodes cannot therefore be directly deduced From the specific SU(
fac/; area increase_ The information on changes in the spceiHe surface area ofthe active material,
as obtained from fig. 24(b), is very limited. The differences between the measured and (he ex(rapolat.ed values are of (he same order of magnitude as the ac-
46
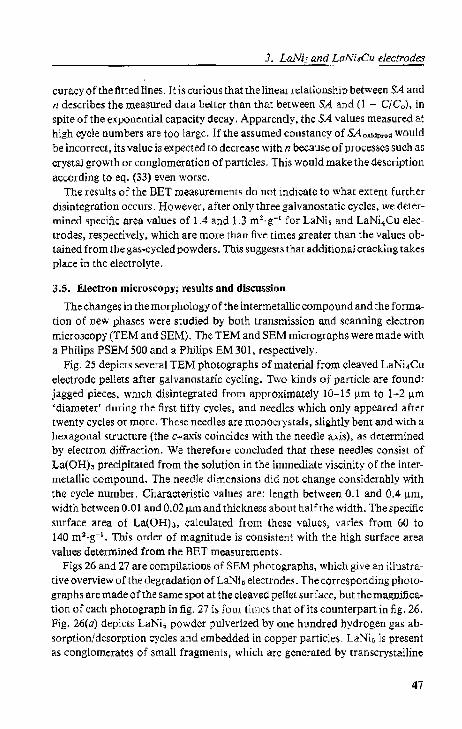
3. LaNis and LaNi4Cu electrodes
curacy of the fined lines. It is curious that the linear relationship between SA and 11 describes the measured data better than that between SA and (I - C/Co), in spite of the exponential capacity decay. Apparently, the SA values measured at high cycle numbers are too large. !fthe assumed constancy of SAo,udp'Od would be incorrect, its value is expected to decrease with n because of processes such as crystal growth or conglomeration of particles. This would make the description according to eQ. (33) even worse.
The results of the BET measurements do not indicate to what extent further disintegration occurs. However, after only three galvanostatic cycles, we determined specific area values of 1.4 and 1.3 m2
. g-l for LaNi5 and LaNi.Cu electrodes, respectively, which are more than five times greater than the values obtained from the gas-cycled powders. This suggests that additional cracking takes place in the electrolyte.
3.5. Electron microscopy; results and discussion
The changes in the morphology of the intermetallic compound and the formation of new phases were studied by both transmission and scanning electron microscopy (TEM and SEM). The TEM and SEM micrographs were made with a Philips PSEM 500 and a Philips EM 301, respectively.
Fig. 25 depicts several TEM photographs of material from cleaved LaNi.Cu electrode pellets after galvanostatic cycling. Two kinds of particle are found: jagged pieces, which disintegrated from approximately 10-15 !lm to 1-2 wn 'diameter' during the first fifty cycles, and needles which only appeared after twenty cycles or more. These needles are monocrystals, slightly bent and with a hexagonal structure (the c-axis coincides with the needle axis), as determined by electron diffraction. We therefore concluded that these needles consist of La(OHh precipitated from the solution in the immediate viscinity of the intermetallic compound. The needle dimensions did not change considerably with the cycle number. Characteristic values are: length between 0.1 and 0.4 !lm, width between 0.01 and 0.02 J-Lm and thickness about halfthc width. The specific surface area of La(OH)s, calculated from these values, varies from 60 to 140 m2 .g-1 • This order of magnitude is consistent with the high surface area values determined from the BET measurements.
Figs 26 and 27 are compilations of SEM photographs, which give an illustrative overview of the degradation of LaNi~ electrodes. The cOrresponding photographs are made of the same spot at the cleaved pellet surface, but the magnification of cach photograph in fig. 27 is four times that of its counterpart in fig. 26. Fig. 26(a) depicts LaNis powder pulverized by one hundred hydrogen gas absorption/desorption cycles and embedded in copper particles. LaNi. is present as conglomerates of small fragments, which are generated by transcrystalline
47
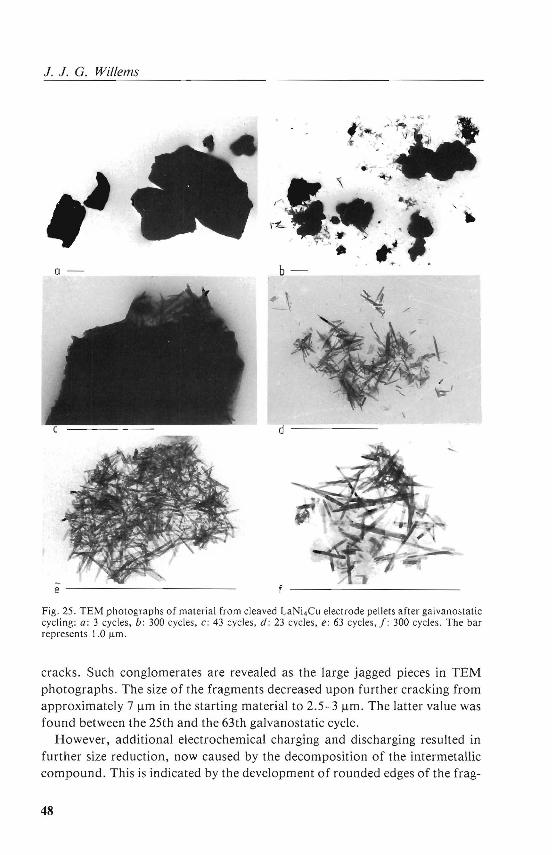
J. J. G. Willems
d
-e --------------------------
Fig. 25. TEM photographs of material from cleaved LaNi.Cu electrode pellets after galvanostatic cycling: a: 3 cycles, b: 300 cycles, c : 43 cycles, d: 23 cycles, e: 63 cycles, J: 300 cycles. The bar represents 1.0 ~m.
cracks. Such conglomerates are revealed as the large jagged pieces in TEM photographs. The size of the fragments decreased upon further cracking from approximately 7 ~m in the starting material to 2.5-3 ~m. The latter value was found between the 25th and the 63th galvanostatic cycle.
However, additional electrochemical charging and discharging resulted in further size reduction, now caused by the decomposition of the intermetallic compound. This is indicated by the development of rounded edges of the frag-
48
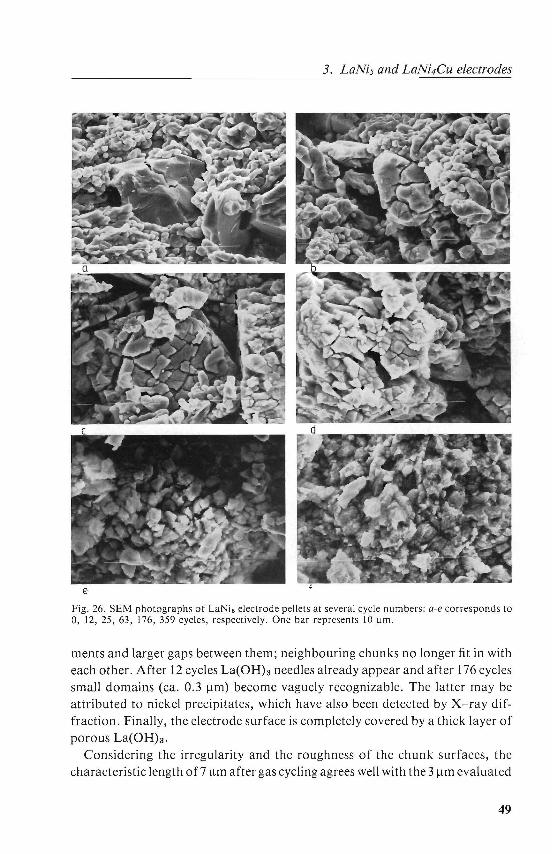
3. LaNi5 and LaNi4Cu electrodes
Fig. 26. SEM photographs of LaNi 5 electrode pellets at several cycle numbers: G-e corresponds to 0, J 2, 25, 63, 176, 359 cycles, respectively. One bar represents 10 I-lm.
ments and larger gaps between them; neighbouring chunks no longer fit in with each other. After 12 cycles La(OHh needles already appear and after 176 cycles small domains (ca. 0.3 ~m) become vaguely recognizable. The latter may be attributed to nickel precipitates, which have also been detected by X-ray diffraction. Finally, the electrode surface is completely covered by a thick layer of porous La(OHh.
Considering the irregularity and the roughness of the chunk surfaces, the characteristic length of7 ~m after gas cycling agrees well with the 3 ~m evaluated
49

J. J. G. Willems
Fig. 27. SE:vJ photographs of LaNis electrode pellets; identical to fig . 26 but at a larger magnification: one bar represents 1.0 !J.m.
on the assumption of smooth, spherical particles from the BET result of 0.25 m 2 .g- 1
• The size reduction of these fragments as a result of additional cracking is less than a factor of 3, which. accounts only partly for the decreasing overpotential during the activation process. Consequently, the heterogeneous rate constant of the charge transfer reaction has increased during the activation process.
The thickness of the electrode pellets was accurately determined by means of low-magnification SEM photographs. The thickness of LaNi5 electrodes, con-
50
3. LaNh and LaNi4Cu electrodes
taining about 80 wt% copper, gradually increased with growing La(OHh concentration from 0.45 to 0.69 mm (> 500/0!) without the electrodes falling apart. The mechanical strength of the copper matrix ensured the maintenance of electrical contact.
3.6. Conclusions
The large amount of hydrogen stored and released electrochemically in LaNi6
and LaNi.Cu is practically the same as that determined from gas absorption/desorption experiments on these matefials. The rechargeable electrodes made from these intermetallic compounds allow high rate charging and discharging of the full capacity at low overpotentials in the vicinity of the reversible hydrogen electrode potential.
During repeated cycling the storge capacity declines drastically as a result of the conversion of the inter metallic compounds into La(OH)s and 3d transition metal precipitates- This conversion process can be descdbed by the exponential decay function
C(n) = coexp ( - :~). (35)
The n* value for these compounds is about 200 cycles. To meet the requirements of practical rechargeable battery electrodes, it should be increased by a factor of ro.
The rate-determining step in the deterioration process is the segregation of the inwmetaUic compound. Because of the heterogeneous character of this reaction, its rate can be expected to change proportionally with the specific surface area. The final surface area value of hydrogen-gas·cycled LaNi~ and LaNi 4Cu powder amounts to 0_25 m~ .g-l. However, during the first 25 to 50 galvanostatic cycles, i.e. during the activation process, the surface area of the active material is increased by a factor of 2 to 3 as a result of further disintegration. This increase did not progressively affect the capacity degradation rate. On the contrary, for all 350 cycles the rate ofthe degradation process continuously decreased with the cycle number
d I v = - -C(n) = -C(n).
dn n* (36)
This observation may be interpreted in terms of a gradual improvement of the surface layer protection, because this layer becomes more and more enriched by precipitates of the mNe noble element(s). But even after a considerable fraction of the intermetallic compound has been con verted, the protection w;nains completely insufficient.
51
J, J. G. Willems
Another explanation for the diminishing conversion rate follows from the fact that eq. (36) is a first order rate equation. The degradation ratc is proportional to the actual capacity, i.e. to the amount of remaining active material. This is a naher unexpected relationship for a heterogeneous reaction. However, it ~ugge~t~ that the <.:<l.p.{(;ity decay is related 1.0 the storage process. This meanS that the rate"determining ~tcp, i.e. Ihe segregation of the intermetallic compounds, depends on th~ ~.b:;orption and r!':lease of hydl'ogen by this compound. The thermodynamical, driving force for segregation is the large d~r;r~asr; of the Gibbs free energy due to t.he formation of La(OH)s. However, Ow mobility of the constituent elements at room temperature is very low. Because of the negligible heat ef-rect~ of LaNi, ele<;trodcs, the rate of the segregation reaction i~ nN increased by a temperature rise. Therefore the kinetics of t.he segregation reaction should be affected by the repeated expan~ion and shrinkage of the partideo during (;yding. The mechanical stress accompanying this 'respiration' prO~G~o Gan 0<; regarded a~ t.he 'driving' focee for the 'peristaltic' t.ran~port. or lanthanum to the surface. A~ a consequence of this latter explanation, we formula(.cd the hypothesis
lhat a I'eduction of the lattice expansion during hydriding should lead to more stable metal hydride electrodes.
REFERI3NCliS
') II, Zijl,LI'a and F. F. Wcslcndorp, SQlid Stale C(lmm. 1. 857 (1969). ') ,I. H. N. van V,,~h I. I'. A. K u ij I'e" and II. A, G. M, Br LII)i I)g, Philip., Re<. Rop!.". 25, 133
(1970). ') r. A. Kui,ipCI"s, The,;" Ul1ivcr,ity (ll' leehnology. Delft (1973), al;o: Pililip~ R~.'. Rept<.
Sllppl, NQ 2 (1<)7». <) H. M. v,u, MOll, rhcsis, Universily uf Technology, Pdf! (lg76), also: Philirs Re,. ReI'L',
SIIPP!., No. I (1976) . . ') H. Ewe. E. W. Jllni and K, Stephan, ".J1Crgy Conver,ic)n 13. 109 (1973), ') P. A. Il () L er, U.S, PaLMI 4,004,943 (1977) ;'l1 d German Offenlegung,,,,hrift 25 35 091 (1976),
"nd rl"u!;.S. unptLbldled alLhut1gh pI'escntcd at the Int. Power SClurce, SYI)lP" Bl'ightOll (19741·
'i) G. 1l")JIOi!1. J. Sal'l'adin, M. HOl1llC"'SY, A. !'eroherDI! • .I. C. Aehard and I .. Sehlapb,'ch. C()rlllT)ul)iOLiOr\ at i.S.E. Meeting, M"r~OIl."i" j""Lnce (t975).
') M. H. J, van Ri.iswick, Proc. lnt. Symp. Hy<lTiJ~~ for Energy Swrage. Geilo, Norway, 261 (1977)
0) G. BI'onoel, J. SarriHHn, M. BOllncmay, A. Pert:h-eroll\ J. C, !\~hard and L. Schlapbadl, 1,11. J. 01' Hy(lrogcn Encrgy 1,251 (19i6).
10) A, Pcrchcrol1-(lIlCgsl1,.1. C. Adlaru 1 J. Sarrac1iIl and G. Brol1ocl, Pro.;::. lilt. Symp. Hydrides for 12nergy Slm"ge, Ceilo, Norway. 485 (1977).
11') T. L. Markill\ N, J, Uddgcr, i{. Hennet and R. M. DelL, PrOt;, 28th Power SO\lfCCS Symp., Allanlic Cily, 1;1(' (I~n).
I') T. L. Markin, l{. Ikrllleu, N. J, BI'ieigcr and R. M. Dell, Power Source, 8 (J. ]"hnmp~ClIl, ctl.)\ AGtc.iemi( rr~t;~, <lbMI', 29 (1981).
") T. L. Markin and R. M. I)dl..I. E)cc1roanai. Chem. 118,217 (1981). ") G. L. Hllileck, J. R. Driscoll ~lJ1<J H. E. Paul, J. Le,,"-CllmmOn Met. 74, 379 (19~O). !O) II. F. Billncr and C C H(-l(l('ock,.I. Elcctrochcl11. SDC. 130, 193C (1983). '") K, 1-1,.1. Bu,\chow ~Il(l H. H. v~ln M"I..1. Lc·,,-C,lmrnoll Mel. 29,203 (1972).
52
3. LaM5 and LaNi4Cu elecrrodes
17) International Electrotcchnical Commission. Sub-Committee 21 A: Alk~lin<; Accumulators, publicalion 285.
IS) H. H. van M~l, K_ H_ J. Buschow :\nd A_ R_ Miedema. J. l..C\.\-C(}",mon Met. 35, 6~ (1974).
") K. H. J- Bu,chow, P. C. P. HOlltcn and A. R. Miedema, Rep_ Prog. Phys. 45, 937 (1982)_ '0) L Newman. ElemOChcmkal Sy"t~rns, Premicc-Hall, EnglewDod ClilIs (1973). 'C) A. J. Bard and L R_ Faulkner. Electrochemic.l M<thods, John Wiley &. Son,. New York
(1980). ") J. O'M. Bockr;, a"d D. Dralie, Elect.rochemical Sciencc, Taylor & Francis, London
(1972)_ ") M_ Pourbaix, Alias of Electrochemical Equilibria in Aqueou, Solution. NACF, H(>Il,"m
(1974)_ ") N. Boos and M. ZUchnet". Z. NaturfDrsth. Teil A. 31, 754 (1976)_ "l 13_ Schroder. H. W. Schroder and E. yon Rellscll, Patentschrifi DE 3234671 CL '") 1. H_ Wernick and S- (leller, Acta Cryst. 12,662 (1959)_ ") L. Schlapbach, A_ Seiler, H. C. Sieglll~nn, T vanWaldkirch, P. /.(ir~herarld C. R.
B r l\ n d j e, Il\! J _ Hydroge'l Energy 4, 21 (1979)_ OS) L_ Sch lap badl, A. Se i ler. F. St u~h i and H. C. S iegm ann, J_ Loss-Common Mel. 73. 145
(1980)_ 29) A. R. MicdcIT\~. Z_ Metallkde. 69,455 (I97Hl_ 3') D. Ohlendorf .nd 1-1. E. Flotow. J- Chern_ Phy,. 73,2937 (l980J-") P_ C_ H ieme,'z. Principlcs of Colloid and Surface Chemistry, Mared Dekke,·. New York
(1977). ") A. L. McCcllan and H_ F_ Harnsbergcr. J. Coll_ 1nt_ Sci. 23, 577 (ll,)(l7)_ SO) G. D. Sandrock and P_ D. Goodell, J_ I.c.\.s-C(lrniTl()J' Met. 73. 161 ()980)_
S3
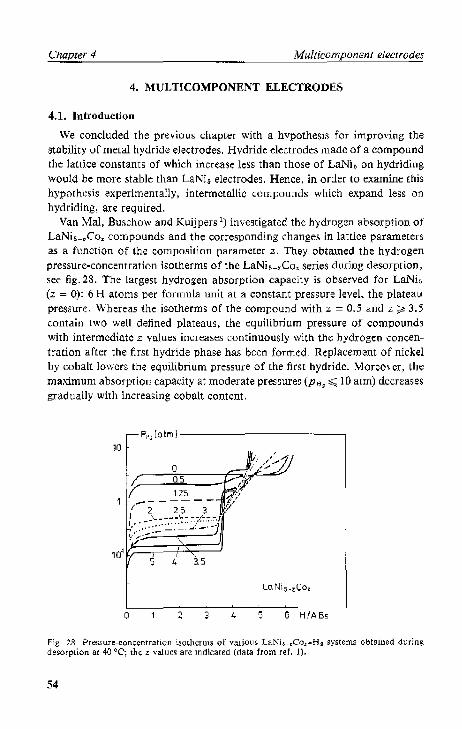
Chapter 4 Multicomponent electrodes
4. MULTICOMPONENT ELEC1'ROO£S
4.1. Introduction
We concluded the previous chapter with a hypothe~is for improving the stability of metal hydride electrodes. Hydride electrodes made of a compOllnd the lattice constants of which increase less than those of LaNi~ on hydriding would be more stable than LaN!. electrodes. Hence, in order to examine this hypoth~sis experimentally, intermctallic compounds which expand less on hydriding, an; required.
Van Mal, Bu~chow and Kuijpers 1) investigated the hydrogen absorption of LaNi 6 _,Co, compounds and the corresponding changes in lattice parameters as a function of the composition parameter z. Tbey obtained the hydrogen pressure-concentration isotherms of the LaNi 6_ ZCo, series during desorption, see fig.28. The largest hydrogen absorption capacity is observed for LaNi" (z = 0): 6 H atoms per formula unit at a constant pressure level, the plateau pressure. Whereas the isotherms of the compound with z = 0.5 and z ;e 3.5 contain two well defined plateaus, the equilibrium pressure of compounds with intermediate z values increases continuOllsly with the bydrogen concentration after the first hydride phase has been forrned- Replacement of nickel by cobalt lowcrs the equilibrium pressure of the first hydride. Moreovl;:" thl;: maximum absorption capacity at moderate pressures (Pll, ,;;; 10 atm) decreases gradually with increasing cobalt content.
FI<,[olm) ----------
10
5 " 35
o 3 5 6 HIABs
Fig. 28. Pr",.,ure-con~~ntra(ion isotherms or vaJ'ious LaNi,-,Co,-H, systems obtained durins desorption at 40 'C; t.he z values arc indicated (data from ref. 1).
54
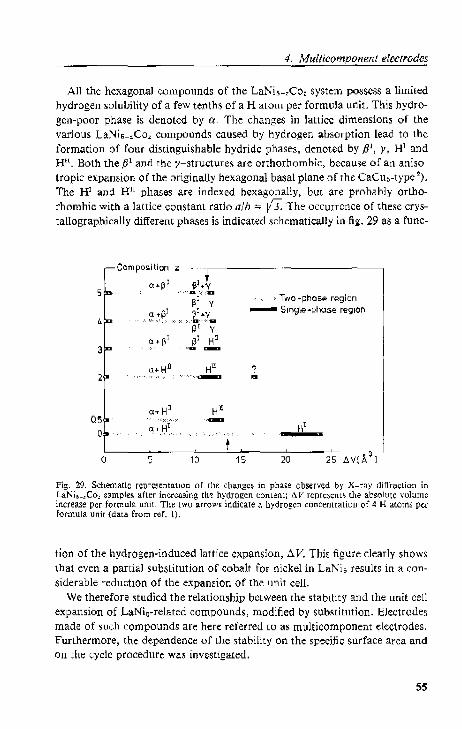
4. Mu/ticomponenl electrodes
All the hexagonal compounds of the LaNi~-zCo, system possess a limited hydrogen solubility of a few tenths of a H atom per formula unit. This hydrogen-poor phase is denoted by a. The changes in lattice dimensions of the various LaNis-.Coz compounds caused by hydrogen absorption lead to the formation of four distinguishable hydride phases, denoted by jJl, y, HI and H". Both the pi and the y-structure~ are orthorhombic, because of an aniso" tropic expansion of the originally hexagonal basal plane of the CaC1I5-type~). The HI and HII phases are indexed hexagonally, but are probably orthorhombic with a lattice constant ratio alb", Vi The occurrence of these erystallograpllically different phases is indicated schematically in fig. 29 as a func-
·-Composition z
() .~I
. (] ~(l!
a'l>l
(H Hn
cx.HTI
q+W.
0 5
't Il.l.y
··Ii;I·'.~';:,D
~l 'I ~l.y · .. :::·:·:tIiiII
i3 I 'I
l Hll .-.
Hil .-Hn .-
10 15
Two -pnas@ region _ SIr'lgle-pnose region
., ..
Fig. 29. Schematic repr<:-~enlati{}n of !lIe changcs in phase observ~d by X-ray ditrraction in LaNi,_,co, samples atkr increasing tile hYdrog~n tDrIlent: t, V rcprc~ent~ the absolutc volume increase per fonnula unit. The two arrow' indicate a hydrogen cl)ncentratioll of 4 Ii: ~to[tI5 per forrnula unit (data from ref. 1).
tion of the hydrogen·induced lattice expansion, D. V. Thi5 figure clearly shows that even a partial substitution of cobalt for nickel in LaNi, results in a considerable reduction of the expansion of the unit cell.
We therefore studied the relationship between the stability and the unit cell expansion of LaNis-related compounds, modified by substitution. Electrodes made of such compounds are here referred to as multicomponent dcctrodes. Furthermore, the dependence of the stability on the specific surface area and on the cydr:: procedure was jnv~stigated.
55
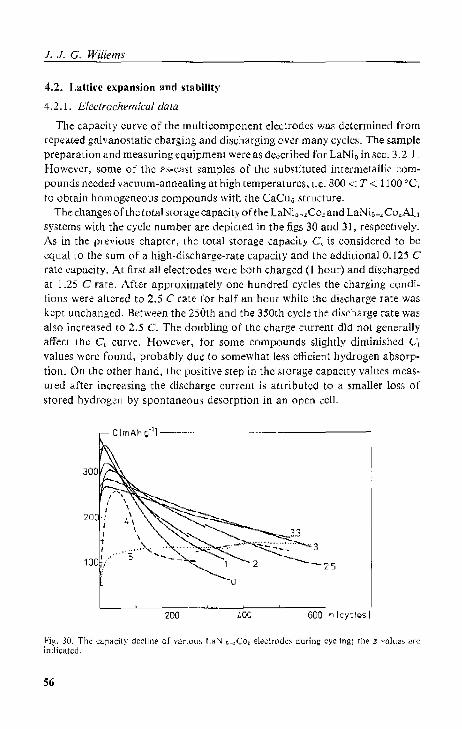
1 .. r G, Willems
4.2_ Lattkc expansion and stability
4.2.1. t:leclrochemical data
The capacity eurve of the multieomponent electrodes wa~ det.ermined from rcpr;:at.ed galvanostatic charging and di~ch<lrging over many cydc;~. The sample preparation and measuring ~quipment were as described for LaNi~ in sec. 3.2, J, However, ~OU1e of the as-cast samples of the subst.it.uted intermetallie eompounds needed vacuum-annealing at high temperatures, i.i;, 800 < T <: 1100 cc, to obtain homogeneolls compounds with the CaCu o structure.
The changes of the lot.al storage capacity oUhe LaNi._,Co,and LaNi,_,Co"AL system, wit.h the cycle number are depicted in the figs 30 and J I, respecl.ively. As in the previous chapter, the total storage capacity C, is considered (0 be equal to the sum of a high-dir,charge-nHe capacity and the additional 0,125 C rate capacity. At flrst all dectrodes Wert bot.h charged (1 hour) and disctlarged at 1.25 Crate. After approximately one hundred cycles the charging c~ll1di" (ions were altered to 2.5 C rate fOr huH an hour while the discharge rate was kept. unchanged. Iktween the 250th and the 350th cycle the discharge rate was also increased to 2.5 C. The doubling of thc charge current did not generally affect the C, curve. However, for some compound~ slightly diminished C. values werc found, probably due to somewhat less efficient hydrogen absorption. On the other hand, the positive step in thc stomge capacity values measured after increasing the discharge current is attribut<:d to a smaller loss of s!.Ored hydrogGn by spontaneou, desorption in an open cell.
o
200 400 600 n Icycles I
Fig. 30. Tht <.:apacity clcclint~ of V~l.rilJll!-; I .aNi!}_<Co", eledrod<.::-i during cyclin&; th\:~ z VaILlt)~ arc inciicate(l.
56
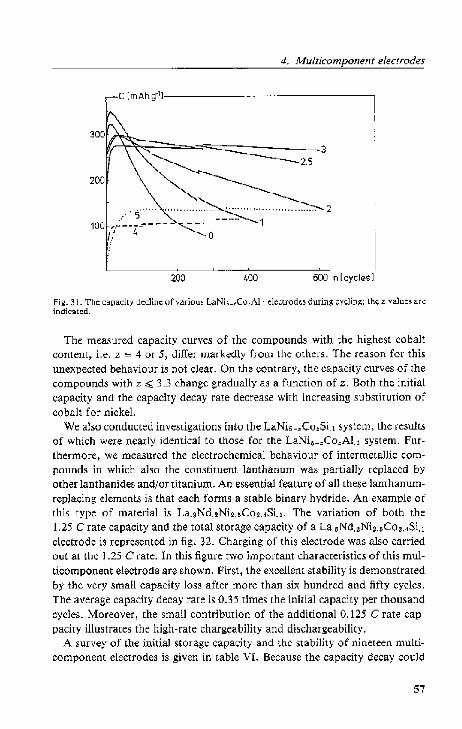
4, Mullicomponent electrodes
C (mAhg-11------
~~~253
200 .~2 100 ".::'~~~------ -~'~~'~~1
Ii 4 0
200 400 500 n Icyde$l
Fig. 31, The capacity dedioo "f vadou> LaNi,_,Co,i\i., eleclfodes during eyeliDS; the z value; are indicated.
The measured capacity curves of the compounds with th;;: highest cobalt content, i.e, Z '" 4 or 5, differ markedly from the others, The reason for this unexpected behaviour is not clear. On the contrary, the capacity curves of the compounds with z -:;;;; 3,3 change gradually as a function of z, Both the initial capacity and the capacity decay rate decrease with increasing substitution of cobalt for nickeL
We also conducted investigations into the LaNi5-,Co.Si,1 system, the results of which were nearly identical to those for the LaNi~_zCozALI system, Furthermore, we measured the electrochemical behaviour of intermetallic compounds in which also the constituent lanthanum was partially replaced by other lanthanides and/or titanium, An essential feature of all these lanthanumreplacing elements is that each forms a stable binary hydride. An example of this type of material is La.sNd.2NiuCouSLJ, The variation of both the 1,25 C rate capacity and the total storage capacity of a La,8Nd,zNiuCo2,1Si,j electrode is represen.ted in fig. 32. Charging of this electrode was also carried out at the 1.25 C rate. In this figure two important characteristics of this multicompon.ent electrode are shown. First, the excellent stability is demonstrated by the very small capacity loss after more than six hundred and fifty cycles, The average capacity decay rate is 0.35 times the initial capacity per thousand cycles. Moreover, the small contribution of the additional 0,125 Crate cappacity illustrates the high-rate chargeability and dischargeability,
A survey of th;;: initial storage capacity and the stability of nineteen mulLicomponent electrodes is given in table VI. Because the capacity decay could
57

1. 1. C. Willems
C [mAh.g-'I·------------
300
/.-~-.-.~.-.--.-.-.-.~.-.-.-.-.--.-.-.-.-.
20
100
200 400 600 ntcycies]
Fig. 32. The capacity curves of' a La.,Nd.,Nh.,Co",$i,1 electrode; uppor: Iotal >lurage capacity, lower: 1.25 C rate capacity.
not generally be described by a simple linear or exponential function, the stability is expressed in terms of a capacity ratio
C,(400) S400 = C,(O) . (37)
Here, C,(O) and C,(400) represent respectively the initial total storage capacity, determined from extrapolat.ion to the zeroth cycle, and the remaining total storage capacity after four hundred cycles. Although this stability parameter has been chosen rather arbitrarily, it facilitates comparison of the tested materials. Several compounds wef(~ found to lose less than twenty percent of their storage capacity after four hundred cycles (S400 ~ .80), and thereforc arC designated as stable electrode materials.
Table VI also gives the number of stored hydrogen atoms per formula unit, x, the value of wbich was calculated from c.(O) according to eq. (15). Within a group of materials, with or without aluminium or silicon, the stability is inversely related to the number of stored hydrogen atoms. H. Peisl 3
) has reported that t.he absorption of hydrogen by metals increases the unit .:dl volume by 2.9 Aa per stored hydrogen atom independent of the material. This already suggests a relationship between the stability and the expansion of the lattice.
4.2.2. Cryslallographic data
The crystallographic data for the substituted intermetallic compounds and their hydrides were determined by X-ray diffraction analysis. The experimental approach was the same as that used for LaNi~ and LaNi.Cu samplcs.
58
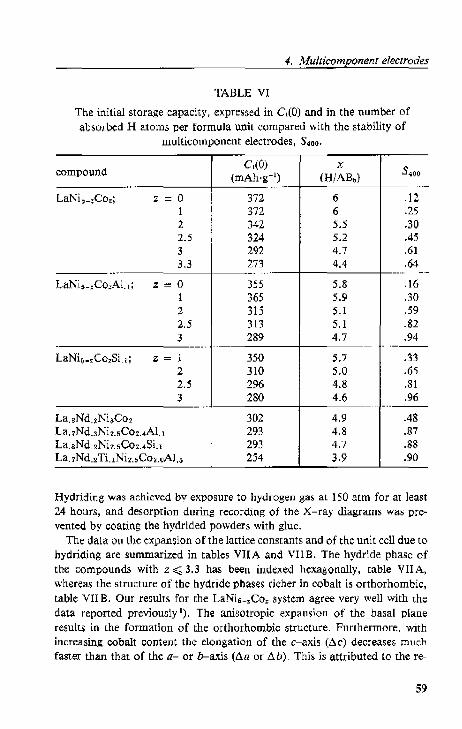
4. Multh:omponent electrodes
TABLE VI
The initial storage capacity. expressed in C(O) and in the number of absorbed H atoms per formula unit compared with the stability of
mu!ticomponent electrodes, S400.
C,(O) X Si(J1) compound (mAh·g-1) (BlAB,) ... , .. - .... -
LaNi 6 _.Co.; " = 0 372 6 .12 1 372 6 .25 2 342 5.5 .30 2.5 324 5.2 .45 3 292 4.7 .61 3.3 273 4.4 .64
.",.T" ._ .... .. - --"'" ... -
LaNi 5 _.Co.AI,I; z "" 0 355 5.8 .16 1 365 5.9 .30 2 315 5.1 .59 2.5 313 5.1 .82 3 289 4.7 .94
. __ ._- . - ._--LaNi~_.CozSL I;
" = 1 350 5.7 .33 2 310 5.0 .65 2.5 296 4.8 .81 3 280 4.6 .96
... , .. -- ..... ,,---
La.sNd.~Ni~C02 302 4.9 .48 La. 7Nd.sNi z.sCo:.4AI. l 293 4.8 .87 La.sNd.2Niz.5COZ.4Si.1 293 4.7 .88 La.7Nd.2TL1NiuCoz.(JAI.5 254 3.9 .90
Hydriding was achieved by exposure to hydrogen gas at 150 atm for at least 24 hours, and desorption during recording of the X-ray diagrams was prevented by coating tbe hydrided powders with glue.
The data On the expansion of the lattice constants and of the unit cell due to hydriding are summarized in tables VUA and VIIB. The hydride phase of the compounds with z;;;:; 3.3 has been indexed hexagonally, table VilA, whereas the structure of the hydride phases richer in cobalt is orthorhombic, table VII B. Our results for the LaNi6-.Co. system agree very well with the data reported previously I). The anisotropic expansion of the basal plane results in the formation of the orthorhombi1; stmcture. Furthermore, with increasing cobalt 1;Qntent the elongation of the c-axis (floc) decreases much faster than that of the a- or b-axis (floa or flob). This is attributed to the re-
59
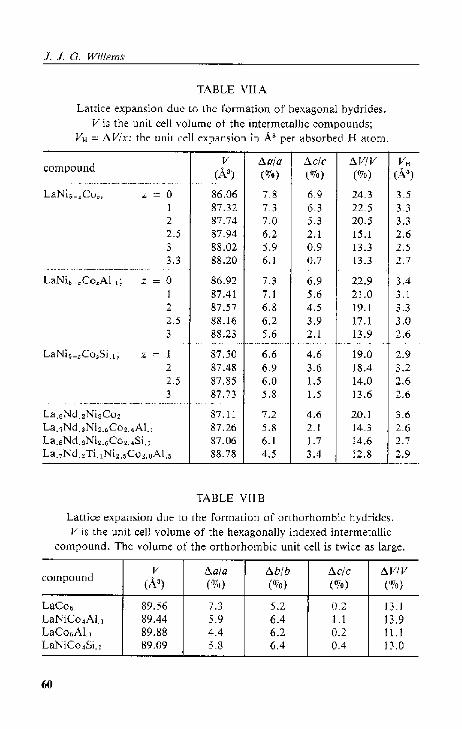
1. 1. G. Willems
TABLE VIlA
Lattice expansion due to the i'ormation of hexagonal hydrides. V is the unit eell volume of the intermetallic compounds;
hI '" AV!x: the unit cell expansion in AS per :,jbsorbed H atom.
compound V Aa!a Aclc AVIV VH
(As) (010) (0/0) (0/0) (N) .. ,." .. " ...... _,.,.""."".,,--_ ..... _- n.", •• ""
LaNi&_,Co,; z - 0 86.06 7.8 6.9 24.3 3.5 1 87.32 7.3 6.3 n5 3-3 2 87.74 7.0 5.3 20.5 3.3 2.5 87.94 6.2 2.1 15.1 2.6 3 88.02 5.9 0.9 13.3 2.5 3.3 88.20 6.1 0.7 13.3 2.7
.. __ . -_ ... _--_ .. _-----_ ...
I...:,jNio -,Co,AI. I; z = 0 86.92 7.3 6.9 22.9 3.4 1 87.41 7.1 5.6 21.0 3.1 2 87.57 6.8 4.5 19.1 3.3 2.5 88.16 6.2 3.9 17.1 3.0 3 88.23 5.6 2.1 13.9 2.6 .. . , ..... __ ._-,., ........ , .. ... .... ... , ... -- ..
LaNi~_zCozSi.l; z - 1 87.50 6.6 4.6 19.0 2.9 2 87.48 6.9 3.6 18.4 3.2 2.5 87.85 6.0 1.5 14.0 2.6 3 87.73 5.8 1.5 13.6 2.6
.. ""." .... "" .. ,-_ .. ,-",.,-,.",."., .. , .. ,"'" ..
La,BNd. 2 Ni 3Co2 87.11 7.2 4.6 20.1 3.6 La.7Nd.3Nh,.C02 .• AL, 87.26 5.8 2.1 14.3 2.6 La.8Nd. 2 Nb. r.Co u Si. 1 87.06 6.1 1.7 14.6 2.7 La.7Nd.iri.lNi~.>OhQAI.5 88.78 4.5 3.4 12.8 2.9
TABLE VllB
Lattice expansion due to the formation of orthorhombic hydrides. V is t.he unit cell volume of the hexagonally indexed intermetallic
compound. The volume of the orthorhombic unit cell is twice as large.
compound V tlala Ablb Aclc AVIV
(A3) (OJo) (%) (070) ( °10)
LaCo 6 89.56 7.3 5.2 0.2 13.1
LaNiCo.AI. , 89.44 5.9 6.4 l.l 13.9 LaCo"ALl 89.88 4.4 6.2 0.2 11.1 LaNiCo.Si. 1 89.09 5.8 6.4 0.4 13.0
60
4. Multicomponent electrodes
duced number of absorbed hydrogen atoms; these hydrogc;n atoms preferentially occupy sites in the metal layers perpendicular to the c-axis ;).
The volume expansion of the unit cell decreases from twenty four percent for compounds rich in nickel to about thirteen percent for compounds containing nickel and cobalt in the ratio 2: 3. Further replacement of nickel by cobalt does not appreciably influence the volume expansion. Table VIlA also gives the volume expansion of the unit cell per stored hydrogen atom. For the calculation of this quantity the electrochemically-determined x value given in table VI was used. Although the average value of the 'hydrogen atom volume', VH , is 2.9 Aa (the value reported by Peisl 3» the intermetaliic compounds can easily be divided into two group~: the nickel rich materials (z ~ 0, J or 2) with Vl;i = 3.3 A3 and the compounds with VH = L7 As.
This observation may be ascribed to the loss of the original volume contraction which generally accompanies the formation of intermetallic compounds. The volume contraction upon formation of AB~ compounds is due to a redistribution of the electronic charge between the electropositive lanthanide atoms with a low electron density and the electronegative cobalt or nickel atoms with a high electron density 4).lf one calculates the volumes of the LaNis and the LaCo~ unit cell from the atomic volumes of the pure constituents 92.0 and'92.S As are found, respectively. Comparison of these values with the unit cell volume presented in the tables VII A and VII B shows that the volume contraction upon the formation of ABo compounds is much larger for the nickel rich compounds than for the cobalt rich compounds. On the other hand, hydrogen absorption results in a partial reestablishment of the atomic volumes because the electron density of hydrogen is smaller than that ofnjckd Or cobalt. A larger apparent hydrogen at,)m volume is therefore expected for the nickel rich intermetallic compounds. As an advantageous consequence, the storage capacity does not decline in pror portion to the reduction of the volume expansion, but less rapidly.
The e1eclrochemical and crystallographic data may only be rdated to one another if the corresponding hydride phases have the same composition. The composition of a hydride, i.e. the value of x in ABsH" depends on the hydrogen equilibrium pressure. In electrochemical experiments in an op~n cell the maximum 'pseudo-equilibrium' hydrogen pressure is about 10 atm, as is indicated by the open circuit potential of fully charged electrodes, E< = - 960 mV. The volume expansion of the inlcrmetallic compound La.sNd. 2Ni 2."Co2.4SL on hydriding was also determined during exposure to hydrogen gas at different pressures. As sample holder for recording X-ray diagrams, we used a pressure vessel which comprised a beryllium window. The sample was a porous pellet consisting of an equal amount of La.sNd2Ni2.5C02.~Si.l powder and nickel powder.
61

J. J. G. Willems
1.145 -r=====1-·~17otmJ
1.123 - .. ~ 11 otmJ 1.107-- ... hydride : ~o
two phose region: a, and ~o
1.012 "~-r-~"";'-I - soturated solid salution: a, 1.000 ............ intermetall"lc compound
u Fig. 33. The volume expansion of I .. a.,Nd.,Ni, .• (;o, .• $i., due to hydriding at 25 ·C; PH, .,;; 9 atm.
The relative volume change of this intermetallic compound at different ~tages of hydriding is illustrated in fig. 33. Whereas the lattice expansion of LaNi~, 24.30"(0 is mainly due to the phase transition LaNi5H.3 ...... LaNi5H~, only a volume incrca~c of 9.5 0/G i~ found for the saturated solid solulion-hydride transition (a,-/3Q) of La.~Nd.~Ni~.5Co, .• Si.l' After this phase transition the volume gradually increases as more hydrogen atoms dissolve in the hydride phase. The volume expansion determined from the hydride phase which was prepared by exposure to 150atm and glue coating is thesameas that of the hydride which is in equilibrium with hydrogen gas of 7 atm. Thus, the expansion data of tahle VII also describe the volume increase during electrochemical charging.
4.2.3. Discussion
The data on the stability of muiticomponent electrodes during repeated charging and discharging and on the lattice expansion of the corresponding intermetallic compounds during hydriding have already br::en presented in the previous sections. In fig. 34 we have plotted the stability parameter S.oo as a function of the relative volume increase. Two classes of intermetallic compound can be discerned: compounds of the LaNIo-,Co. system and materials containing a small amount. of aluminium or silicon. For both classes the stability increases proportionally to th~ decreasing volume expansion. The increasing anisotropy of the lattice expansion with increasing cobalt content (table VIlA) is no obstacle for the growing stability.
62
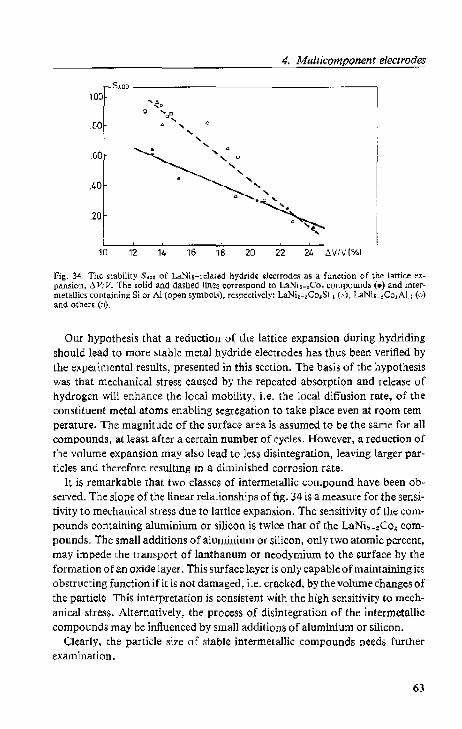
4. Multicomponent electrodes
SWD
100
,80
.60
.40
.20
10 12 14 16 18 20 22 24 llVIVI%)
Fig. 34, The stability Sou, of LaNi,-rehued hydl'ide el~ctrodc" as a function of the lattic. expansion. j,V/V. '(,he solid aad dashed liMS ~orre"pond to LaNi,_,Co, COIllPound. (.) and intermetallics cont",ining Si or Al (open symbols), respectively: LaNio-,Co,Si" (A), LaNi,",Co,AI" (0) and others (n).
Our hypothesis that a reduction of the lattice expansion during hydriding should lead to more stable metal hydride electrodes has thus been verified by the experimental results, presented in this section. The basis of the hypothesis was that mechanical streSS caused by the repeated absorption and release of hydrogen will enhance the local mobility, Le. the local diffusion rate, of th~ constituent metal atoms enabling segregation to take place even at room temperature. The magnitude of the surface area is assumed to be the same for all compounds, at least after a certain number of cycles. However, a reduction of the volume expansion may also lead to les:; disintegration, leaving larger particles and therefore resulting in a diminished corrosion rate,
It is remarkable that two classes of intermetallic compound have been ob· served. The slope of the linear relationships of fig. 34 is a measure for the sensitivity to mechanical stress due to lattice expansion. The sensitivity of the com· pounds containing aluminium Or silicon is twice that of the LaNh-.Co. compounds. The small additions of aluminium or silicon, only two atomic percent, may impede the transport of lanthanum or neodymium to the surface by the formation of an oxide layer. This surface layer is only capable of maintaining its obstructing function if it is not damaged, i.e. cracked, by the volume changes of the particle. This interpretation is consistent with the high sensitivity to mechanical stress. Alternatively, the process of disintegration of the intermetalJic compounds may be influenced by smaIl additions of aluminium or silicon.
Clearly, the particle size of stable intermetallic compounds needs further examination.
63

j, j, G. Willems
4.3. Specific surface area; results and diseu~sion
lhe ~(ability of several multicomponent electrodes is higher than that of LaNi" by a faClor of %ven to eight, Hit is assumed that the corrosion rate per unit surface area is independent of the material, the final particle size of these stable intel'metallie compounds should be seven to eight times larger than that of LaNi 5 •
The specific sllrrace area of the ~table compounds La.7Nd.2 Ti.1Ni2.5C02.oA1.5 and La.sNd. 2 Ni u Co 2.,Si,1 after pulverization by continuous gas cycling was determined by the BEl method; ~ce sec. 3.4. After 25 to 50 hydrogen gas ab~orptjon/desorption cycles the 'final' particle ~izc wa, Obt.ained. The COrreSponding value of thl;! sp~citic sllrface area was found to be 0.25 m2.g-1, as shown in table Vlli. The powd~r obt.ain~d by mechanical grinding had ap-
TABLE VIII
The specific surface area or La,~Nd,2Ti,lNiz'QC02,QAl'Q and La.sNd. 2 Ni u Co 2 .• Si 1 powder as a function of thl;! number of
hydrogen gas absorption/desorption cycles.
compound n (Cyd~8) SA (m~·g-I)
25 0.26 150 0.23 300 0.23
La.7Nd.2 Ti.1Niz.5C02.oA1.~
715 0.25
25 (l.lS 75 0.25 98 0.21
750 0.19 *) 0.17
') Pulvcri'''tiOI1 wss carried Oll[ b~ mechanical gl'indi'lg,
pro)(imat.ely the same specific surface area. Thus, as a result of repeated hydrogen gas absorption and desorption, these stable compounds crack at the same rate and to the same extent as LaNis and LaNi4Cu.
The increase of the BET surface area of La.8Nd.2Ni2.sCoz.4Si.l electrodes due to electrochemical cycling wa~ also measured. These electrodes were made from powder, pulverized by 75 hydrogen gas cycles. BNh charging and discharging were carried out at 1.25 C rat.e. At eVl;!ry thirtieth cycle the eketrode was additionally discharged at 0.125 C rate. The capacity curves of one of these electrodes hav~ already been shown in fig. 32. During galvanostatic cycling the specific surface area, SA, increased in proport.ion to the cycle number, n,
64

4. MU/licomponent electrodes
according to the relationship: SA = 2.13 + 0.03511 m~-g-\. As with LaNi. electrodes, the possible increase in surface area caused by additional cracking was overshadowed by the high specific surface area of the oxidation products.
The improvement of the reaction kinetics due to the activation process of these La,sNd_ 2Niu C0 2_.Si_ 1 electrodes is comparable to that of LaNis electrodes. Within 40 cycles the overpotential for hydrogen evolution measured at eight electrodes, decreased by 92 ± 6 mY. Application of eq. (22) with the Tafel slope b = -118 mV indicates that the quotient (ko/d) after activation is 6 times the initial value. For LaNi5 electrodes we found a factor of 8. However, scanning electron micrographs showed that the LaNi~ particle size was reduced less than 3 times.
The changes in thc morphology of the multicomponent eleGtrodes during electrochemical cycling were also investigated by scanning electron microscopy, The SEM photographs of La,~Nd_;Ni;_r.Co2.4Si_l electrodes are shown in fig. 35, The selected micrographs, showing two magnifications of three cleaved electrode pellets, give a good illustration of the alterations due to cycling- The micrographs of an unu~ed electrode in fig. 35(a) and (b) display a conglomerate of the disintegrated intermetallic compound embedded in a copper matrix. These photographs are indistinguishable from those for fresh LaNi5 electrodc~; for comparison see figs 26(a) and27(a). After approximately 40 cycles hydroxide needles have been precipitated and the average fragment size has diminished from 7 to 5 J-lm. During further cycling the electrode morphology does not change appreciably- The micrographs of fig. 35(e) and (1) show the fragments after 666 cycles. The jagged structure with its sharp edges is still present_
Whereas during electrochemical charging and discharging thc ,pecific surface area of LaNi6 powdr':r increased from 0.25 to 0,70 m2 'g- l
, the specific surface area of stable intermetallic compounds only grew from 0.25 to 0.35 m2_g~1_ This difference between LaNis electrodes and stable multicomponent electrodes can not account for the obSGrvcd stability improvement. The corrosion rate is therefore mainly determined by factor, other than the specific surface area, The relationship bctween the stability' and the lattice expansion on hydriding must primaAily be a consequence of the enhanced segregation rate during cycling.
4.4. Interrupted galvallostatic cycling; results and discussion
All the capacity GurVeS presented so far have been measured by continuous repetition of charge/discharge cycles as described in sec. 3.2. This procedure for examining materials results in a capacity decay rate per cycle, which gives a lifetime eXpressed in a number of feasible cycles, i ,e. the cycle life. Besides the cycle life, the time dependence of the storage capacity is also an essential aspect of the electrode stability,
65

1. 1. C. Willems
Fig. 35. SEM photographs of cleaved La.8Nd. 2Ni 2.bCo2.4Si. 1 electrodes after 0 (a and b), 41 (c and d) and 666 cycles (e and f). One bar represents 10 ~m in a, c and e, and 1 ~m in b, d and/.
from repeated charge/discharge cycles at 1.25 C/ 1.25 C rate the capacity decay rate of La.sNd. 2Ni2.5C0 2 . 4Si. 1 electrodes was found to be 0.35 times the initial capacity per thousand cycles. Cycling of the same electrode material at 2.5 C12.5 C rate resulted in a capacity loss of 25070 after one thousand cycles. Halving the cycle period from two hours to one seems to lower the decay rate . Alternatively, these data can be interpreted as a capacity decay rate of 0.30 X 10⁻³ Co per cycle, determined with an accuracy of 0.05 x 10⁻³ Co per cycle.
66
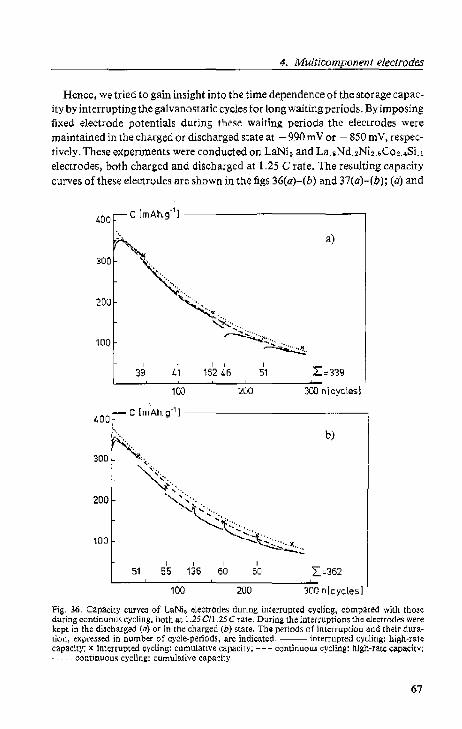
4. Multicompol'lel'lt electrodes
Hence, we tried to gain insight into the time dependence of the storage capacity by interrupting the ga[vanostatic cycles for long waiting periods. By imposing fixed electrode potentials during these waiting periods the electrodes were maintained in the charged or discharged state at - 990mV or - 850 mY, respectively. These experiments were conducted on LaNi. and La.sNd. 2 Ni:l. oCo2 .• SLl electrodes, both charged and discharged at 1.25 C rate. The resulting capacity curves of these electrodes are shown in the figs 36(a)-(b) and 37(a)-(b); (a) and
400
300
200
100
400
c ImAh.g,1] -----
'" .. , .. ".\:"" -
I
39 1
41
~.
~~~, I ,
16246 I
51
a)
L=339
100 200 300 n[cyclesl
C [mAh.\J-1]------------
I 51
b)
I I I I 55 136 60 60 I:~352
~--~--~-~-~-~-~~ 100 200 300 nlcycles]
Fig. 36. Capacity curves of LaNi, eleOtrodes during interrupted cycling, compared with those during continuous cycling, both at 1.25 ell ,25 C rate. During the interl'\lpTion~ the electrodes were kept in the discharged (a) or in the charged (b) state. The periods of interruption and their duration, expressed in number of cycle-periods. are indicated. -- interrupted cycling: high-rate capacity;)( interrupted oycling: cumulative capacity; --- continuous cycling: high-rate capadty; ..... cOlltinuou~ cycling: cumulative capacity.
67
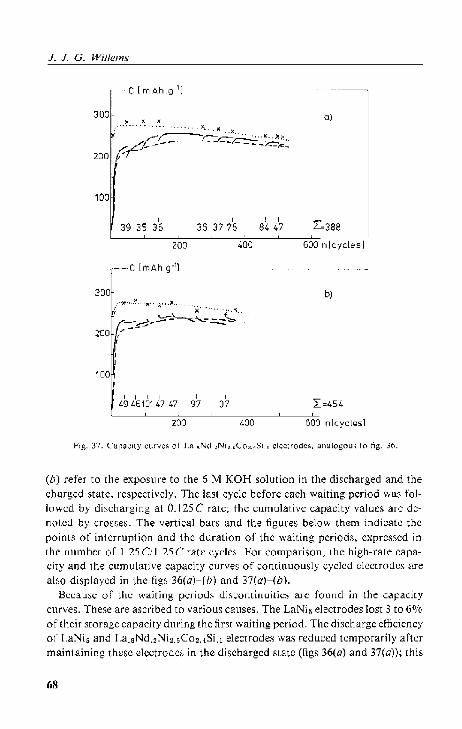
1. 1. U. Wiflems
C[mAh.g']
300-" ,." .... - _. , " .••. , . - •. ,J<;., . ~" .~,.
~r~J:-...c:-~··)!"" ---:1- --- ~ - -- - - - -<="," 200 ~'r-~
100
I I I I I I
39 35 35 36 37 75
200 1,00
·--·C [mAhg·1]
300·· /.-'Il; .... ~.' "X" 'x" .K., ..... 'x ....... ""';';'
R ~~~~'\..~~ 200 /'
I I I I I
100 I
j I [ I I I 494613147 47 97
zoo
I
37
400
I I 8447
0)
2::,,388
600 n[cycles]
b)
2:=454
600 n!cycles]
(b) refer to the exposure to the 6 M KOH solution in the discharged and the charged state, respectively. The last cycle before each waiting period wa~ fo)· lowc.=d by discharging at 0.125 C ratc.=; the cumulative capacity values arC denot:<ed by Cr055e~. The vertical bar~ and the figures below them indicat.e the point~ of inlerrLIplion and t.he duration of the wait.ing periods, expressed in the numher of 1.25 C/1.25 C rate cycles. For c.=omparison, the high-rate capacity and the cumulative capacity curves of continuously cycled electrodes arc abo displayed in (he figs 36(a)-(h) and 37(a)-(b).
Ikeau~c of the waiting pcriod~ discontinuities arc found in lhe capacily curves. These are ascribed to various causes. The LaNi~ electrodes lost 3 to 60/0 of their storage capacity during the first waiting period. The discharge efficimcy of LaNis and La.aNd.2Nb.,Co2.1Si.l electrodes was reduced temporarily after maintaining th~se de~trodcs in j he difieharged state (figs 36(0) and 37(a)); this
68
4. Multicomponent electrodes
was shown by the less positive values of the open circuit potential aft.cr discharge. On the other hand, the discharge kinetics wcre improved by the storage of these electrodes in the charged state (figs 36(b) and 37(b». The oxidation of the stored hydrogen atoms takcs place at nickel and/or cobalt sites. It is possible that the number and/or the activity of these sites were increased and decreased by the imposed potentials: -990 mY and -850 mY, r~spectiveIy. If this is the case, then the change in active sites should occur even at - 850 mY, notwithstanding the more positive oXidation potentials of nickel and cobalt: E(Ni/Ni(OHh} = - 820 mY and E(Co/Co(OH)2) = - 825 mY.
Despite the observed discontinuities, the interrupted capacity curves of both materials very closely resemble the corresponding capacity curves determined from continuous charging and dischargin.g. Disregarding the slight capacity los~ of LaNi5 , exposure of both charged and discharged electrodes to the electrolyte has no detrimental effect on the storage capacity. Corro:;ion of t.hc intermetallic compounds only occurs during cycling. Consequently, corrosion musl be relaled to the process of expansion and shrinkage of the intermetallic compound particles and not to the completely expanded state. During both charging and discharging a large hydrogen concentration jump, located at the phasc boundary, moves through the particles. Hence, the large mechanical stress induced by the distorted lattices at the phase boundary also travel~ through the particles and evidently vanishes when the 'new' crystal structure has been formed.
4.5. Conciusion8
The volume expansion of a $~rieo of pseudo-binary AB. compounds upon nydriding varies between thirteen and twenty-four percent, depending on the chosen composition of the substituted compound. Because of the different values of the 'hydrogen atom volume' the initial storage capacity declines less rapidly than in proportion to the reduction of the lattice expansion from 372 to about 280 mAh·g- l
.
The enormous improvement in stability due to t.he reduclion of the lattice expansion is not caused by reduced disintegration of the intermetallic compounds. After a certain number of electrochemical cycles the specific surface area of the intermctailic compounds only varies from 0.35 to 0.70 m 2.g-1•
The capacity loss of both LaNi,. and multicomponem electrodes is directly related to the charging and the discharging process. The degradation of the imermetallic compounds proceeds only during cycling and provided that an oxidizing agent, e.g. water or oxygen, is present. Because of the low mobililY of the constituent elements at room temperature, the ratc-determining step of the corrosion reaction is the segregation of the intermetallic compounds into
69
f. f. O. Willems
lanthanides and 3d transition metals. The 3d mctal~ form small metallic crystallites. Lanthanum and neodymium are immediately oxidized by water and ~ubsequently precipitate as hydroxide needles. As a result, the chemical potential of lanthanum and neodymium at the solid-liquid interface is maintained at a very low valuc. Ncvcrtheles~. diffusion only occurs simultaneously with the process of expansion and shrinkage of the intermetallic compound particles- Heat effects are not involved. The activation energy for diffusion should therefore be diminished by the mechanical stress, which results from the lattice expansion upon hydriding. This incn::ased mobility is located near the phase boundary _ As a consequence, during charging and discharging a zone of enhanced mobility travels through the inlermetallic compound paJticle~. enabling the transport of lanthanum and neodymium to the surface. This mechanism for the degradation process is strongly supported by the linear relationship established between the stability of metal hydride electrodes and the decreasing lattice expansion. In this way, the hypot.hesis formulated in chap. 3 has been verified.
There is no such a travelling zone of enhanced mobility in materials in which a separate hydride phase will not be formed upon hydrogen absorption. In terms of pressure-concentration isotherms this means that the hydrogen equilibrium pressun.: of ~uch a material should gradually increase with increasing hydmgen Content (sloping plateau). The degradation mechanism discllssed above therefore implies that electrodes made from amorphous alloys should be more stable than those made from the corresponding crystalline intermetallic compounds.
Two classes of intermetallic compounds can be discerned: compounds of the LaNio_.Co. system and materials containing a small amount of aluminium or silicon. Electrode~ made from one of the materials of the latter class are exceptionally stable provided that its lattice expansion is minimal. Only thirty percent of the initial storage capacity of La.I!Nd.;Ni" .• Co:! .• Si. 1 is lost after one thousand cycles. Besides the particular influence of the small volume expansion, this high stability is attributed to the formation of oxide layers COll
taining aluminium or silicon. These surface layers function as an additional hindrance for the transport of the lanthanide clements to the solid-liquid interface.
REFERENCES
') H. H. van Mal. K. H. J. BLlschow and r. A. Kuijpers,.I. Less-Common Me!. 32, 289 (1973).
') F. A. KuijpcLs. Tllesis, Univcl'sity or Technology, Delft (1973), al>o: Philip' Re,. Rep!..'. SlIPP!., No.2 (1973).
") H. Peisl. Hydr'ogen in melal, I, Topics in Appije<;l Physics. in Q. Aldel d and J. v (ilkl (eds). Spriugcl·-Vel'lag. Berlin (1978).
<) K. H. J. Buschow, P. C. P. Boulell and A. R. Miedema. Rep. hog. Phys. 45. 937 (1%2).
70
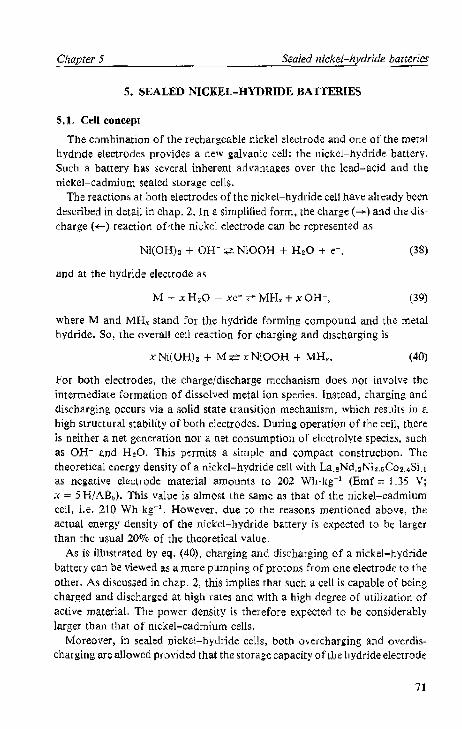
Chapter 5 Sealed nickel-hydride batteries
5. SEALED NICKH-HYDRIDE BATTERIES
5.1. Cell concept
The combination of the rechargeable nickel electrode and one of the metal hydride electrodes provides a new galvanic cell: the nickel-hydride battery. Such a battery has several inherent advantages over the lead-acid and the nickel-cadmium sealed storage cells.
The reaction, at both electrodes of the nickel-hydride cell have already be~'I'l described in detail in chap. 2. In a simplified form, lhe charge (-) and the discharge (+-) reaction of,the nickel electrode can be represented as
(38)
and at the hydride electrode as
M + xHzO + xc- ~ MI-L + xOH-, (39)
where M and MH, stand for the hydride forming compound and the metal hydride. So, the overall cell reaction for charging and discharging is
x Ni(OHh + M+=xNiOOH + MHx. (40)
For both electrodes, the charge/discharge mechanism does not involve the intermediate formation of dissolved metal ion species. Instead, charging and discharging occurs via a solid state transition mechanism, which results in a high structural stability of both electrodes. During operation of the cell, there is neither a net generation nor a net consumption of electrolyte species, such as OH- and H 20. This permits a simple and compact construction. The theoretical energy density of a nickel-hydride cell with La_sNd. 2 Ni •. &Co2.4Si.l as negative electrode material amounts to 202 Wh-kg-1 (Emf""' L35 V; x = 5 H/ABJ;). This value is almost the same as that of the nickel-cadmium cell, i.e. 210 Wh'kg~l. However, due to the reasons mentioned above, the actual energy density of the niekd-hydride battery is expected to be larger than the usual 200/0 of the theoretical value.
As is illustrated by eq. (40), charging and discharging of a nickel-hydride battery can be viewed as a mere pumping of protons from one electrode to the other. As discussed in chap. 2, this implies that such a cell is capable of being charged and discharged at high raLes and with a high degree of utilization of active material. The power density is therefore expected to be considerably larger than that of nickel-cadmium cells.
Moreover, in sealed nickel-hydride cells, both overcharging and overdischarging are allQwcd provided that the storage capacity of the hydride electrode
71
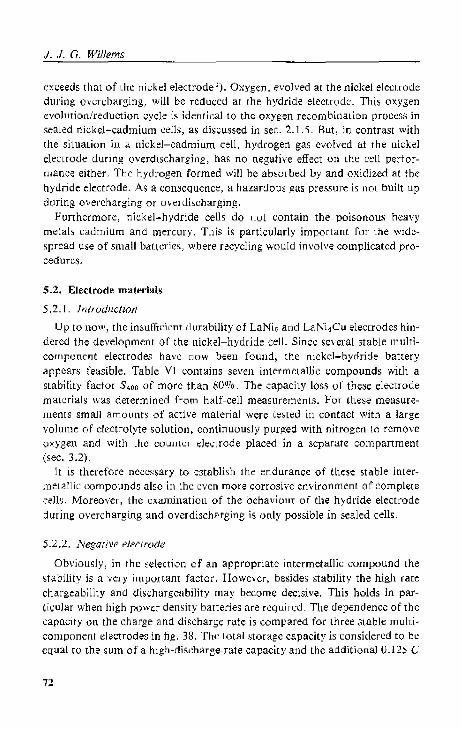
J. J. G. Willems
Gx~eeds that of the nir:kel electrode I). OxYgen, evolved at the nickel electrode during ovcr~h'Hging, will be rcduced at the hydride eiectrod(·. This oxygen evollJtion/reduction cycle is identical to the oxygen recombination prOCeSS in sealed nickel-cadmium cells, as discussed in sec. 2.1. 5. But, in contrast with the situation in a nickel-cadmium cell, hydrogen gas evolved at the nickel electrode during overdischarging, has no negative effect OIl the cell performance either. Thc hydrogen formed will be absorbed by and oxidized at the hydride electrode. As a consequence, a ha:l:ardous gas pressure is not built up d\lring ovetcharging or overdischarging.
Fllrthermore, nickel-hydride cells do not contain the poisonous heavy metals cadmium and mercury. This is particlliarly important for the widespread llse of small bat:ttri~~, where recycling would involve complicated procedure~.
5.2. Electrode mah~I'i!lls
5.2.1. In(rodl.lctiofl
Up to now, the insufficient dllrability of LaNi~ and LaNi,Cu electrodes hindercd the development. of the nickel-hydride cell. Since several stable multicomponent electrodes have now been found, the nickel-hydride battery
appcar~ feasible. Table VI contains seven intermetaUic compounds with a stability factor S400 of morc than 80%. The capaciLy los$ of thesr: electrode matcrials was determined from half-cell measurements. f.or these measurements small amounts of active material were tested in contact with a large volume of electrolyte solution, continuously purged with nitrogen to remove oxygen and with Lhe c()un(.cr ~l~ctrode placed in a scparate compartment (sec. 3.2).
[t is therefore neccssary t.o establish the endurance of these stable intermetallic compounds also in the even more corrosive environmerlt of compkte cells. Moreover, thc examination of the behaviour of the hydride electrode
during overcharging and overdischarging is only possible in sealed cells.
5.2.2. Negative elec{rode
Obviollsly, in the ~el~ction of an appl"Opriate intennetallic compound the stability is a very important factor. Howevcr, besides stability the high rate chargeabllity and dischargeability may become decisive. This holds in particular when high pOW~r density batteries ate required_ The dependence of the capacity on the charge and discharge rate is compared for three stable multicomponent. electrodes in fig. 38. Thc total ,storage capacity is considered tQ he equal to the wm of a high-discharge-rate capacity and thc additional 0.125 C
72
5. Sealed nickel-hydride butteries
rate capacity. The total storage capacity was determined every thirtieth cycle and tho: resulting CUrVeS are similar to those of the figs 30 and 31. Successively, three different cycle regimes were applied: 0) cycling was starto:d with both charging and discharging at 1.25 Crate, Oi) after about one hundred cycles the charge rate was doubled to 2.5 C, and (iii) at approximately the three hundredth cycle the discharge rate was also in-
creased to 2.5 C. In all cases, the final discharge potential remained - .550 mY.
C[mAh.g:1)--------------------,
300
200 400 600 n[cycles!
Fig. 38. The total storage capacity (e!ashee! curves) ane! the high-rate "opacity (,did lines) of several multicomponent electrodes as a function of the Cycle number alU! for variou.1 rate,: charge rate: 1.25 Cif II ,~; <d 100 and 2.5 C if 11;> '" 100; dbcharge rate: 1.25 C if n .;; '" 300 and 2.5 C if f/ > '" 300; (.) La.,Nc!.,Ni,.,Co",AI,,; (_) L.Ni,Co,AI,,; ( .. ) La"Ti.,N".,Co".AI,.,
The total storage capacities, measured for the three multicomponent electrodes of fig. 38, only differ slightly, but the amounts of charge recovered at high discharge rates vary considerably for the various compounds. For La,7Nd,3Ni2•sC02,4AL electrodes the fraction of the high-discharge-rate capacity lies between 85 and 90~lo and is almost independent of the applied cycle regime, On the other hand, the 1.25 C rate capacity of electrodes made from LaNi:rCOsAl.! and La.9 Ti.!Niu C0 2A1.5 is about 75 and 4011'0 of the total capacity value, respectively. Moreover, for these electrodes doubling of the discharge current to 2.5 C additionally results in substantially reduced capacities.
For the three electrodes, neither the L25 C rate capacities, nor the total storage capacities arC affected when only the charge curro:nt is increaso:d. Evidently, the charge kinetics 0 f these electrodes proceed more easify, than the kinetics of the discharge reactions. This is also clearly demonstrated by the first
73
charge/discharge cycle. While a ncw electrode is capable of accepting charge at 1.25 C rate, less than 101170 is generally recovered during di~chargc at the same nl.!e. Possibly, the electrochemic<oll oxidation of Stored hydrogen is the rateIimiling slep. This assumplion is supported by the observation that self-dis~
charge of fully charged electrodes in open cells takes place via the sp~)ntaneous escape of hydrog~n gas. However, different hydrogen diffusion rates in the C(
andp-phasc may also playa role. As is seen from fig. 38, the intermetallic compound La.7Nd. 3Ni u Co •.• AI. 1
is mOre favourable than LaNizCO$AI.1 and La.aTL,NiuCo2Al.5 for applicalion in high power density batteries, despite its slightly lower stability. The
behaviour of La.~Nd.2Ni2."CQ2,4Si,1 electrodes is almosl identical to that of La.7Nd.aNi2.~Co2.4AI." as is shown by table VI and comparison of the figs 32 and 38. Because the compound containing silicon had been ch<olracterizcd more extensively (chap. 4), tllis int~rmetallic compound was selected for the first
experiments in sealed cells. The potential variations of a La,8Nd.2NjuCQ~.4Si.l electrode in 6 M KOH
at 25 "C are depicted as a function of the slate of charge Q in fig. 39. Similar to
the determination of the LaNi6 isotherms, shown in fig. 9, we approached the
equilibrium state by imposing 100 ms current pulses <oInd measuring the induced potential transients. With the amount of ch<olrge passed dUring each pulse cor
responding to 1.25 x 10⁻⁴ HI AB~, the relaxation process took about 500 ms. We
measured the equilibrium potential after 700 ms.
Roth the charge and the discharge isotherm shows a plateau between Q = 30 and Q = 210mAh'g- l
, which is a consequence of the alp-transition. The bound·
-ElmV]
1000 T.25'C
t ~o
600 -~.-.... , ·'''''-''00 200 300--0 lrnAn.g·l ]
Fig. 39. Charge ( ..... ) ~nd dikharge ( ..... ) iWlherrtl fur ~ La.sNd.,Ni,.,Co,.,Si .• electrode at 25 'C in 6 M KOH measured vs. Hg/!-!/l,O I'efe,'ence eiectl'Ooe. Tile low~r an d the opper boundary of th~ two phase region, Oi, and /J., ar~ indicated by arrows.
74
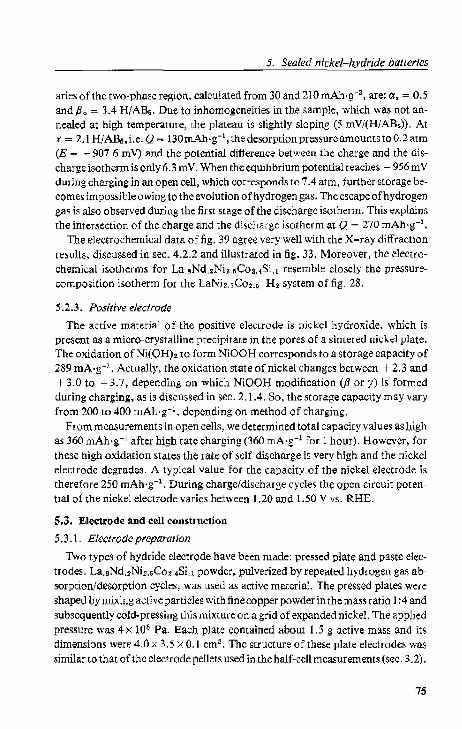
5. Sealed nickel-hydride balleties
aries of the two-phase region, calculated from 30 and 210 mAh·g-2 , are: a, = 0.5
andPo == 3.4 H/ABs. Due to inhomogeneities in the sample, which was not annealed at high temperature, the plateau is slightly sloping (5 mV/(H/AB.)). At
x = 2.1 H/AB~,i.e. Q .. 130mAh·g- l, the desorption pressure amounts to 0,2 atm
(E = - 907,6 m V) and the potential difference between the charge and the discharge isotherm is only6.3 mY. When the equilibrium potential reaches - 956mV during charging in an open cell, which corresponds to 7.4 atm, further storage becomes impossible owing to the evolution of hydrogen gas. The escape of hydrogen
gas is also observed dUring the first stage of the discharge isotherm. This explains the intersection of the charge and the discharge isotherm at Q '" 270 mAh·g- l
•
The electrochemical data of fig. 39 agree very well with the X-ray diffraction
results, discussed in sec. 4.2.2 and illustrated in fig. 33. Moreover, the electro
chemical isotherms for La.sNd.2Niz,6C02,4Si,1 resemble closely the pressurecomposition isotherm for the LaNi2,5Co2.~-H2 system of fig. 28.
5.2.3. Positive electrode
The active material of the positive electrode is nickel hydroxide, which is present as a micro-crystalline precipitate in the pores of a sintered nickel plate. The oxidation of Ni(OH); to form NiOOH corresponds to a storage capacity of
289 mA·g-1, Actually, the oxidation state of nickel changes between + 2.3 and + 3.0 to + 3.7, depending on which NiOOH modification (P or y) is formed during charging, as is discussed in sec. 2.1.4. So, the storage capacity may vary from 200 to 400 mAh·g-1, depending on method of charging.
From measurements in open cells, we determined total capacity values as high as 360 mAh'g-1 after high rate charging (360 mA·g-l for 1 hour). However, for
these high oxidation states the rate of self-discharge is very high and the nickel electrode degrades. A typical value for the capacity of the nickel electrode is therefore 250 mAh·g- l
. During charge/discharge cycles the opcn circuit potential of the nickel electrode varies between 1.20 and 1.50 V vs. RHE.
5.3. Elef;trode a.nd cell construction
S ,3.1. Electrode preparation
Two types of hydride electrode have been made: pressed plate and paste elec
trodes. La.aNd.2Ni2.6Co2.4Si.! powder, pulverized by repeated hydrogen gas absorption/desorption cycles, was used as active material. The pressed plates were
shaped by mixing active particles with fine copper powder in the mass ratio 1 :4 and
subsequently cold-pressing this mixture on a grid of expanded nickeL The applied
pressure was 4 x 10⁸ Pa. Each plate contained about 1.5 g active mass and its dimensions were 4.0 x 3.5 x 0.1 ems. The structure of these plate electrodes was
similar to that ofthe electrode pellets used in the half-cell measurements (sec. 3.2).
75
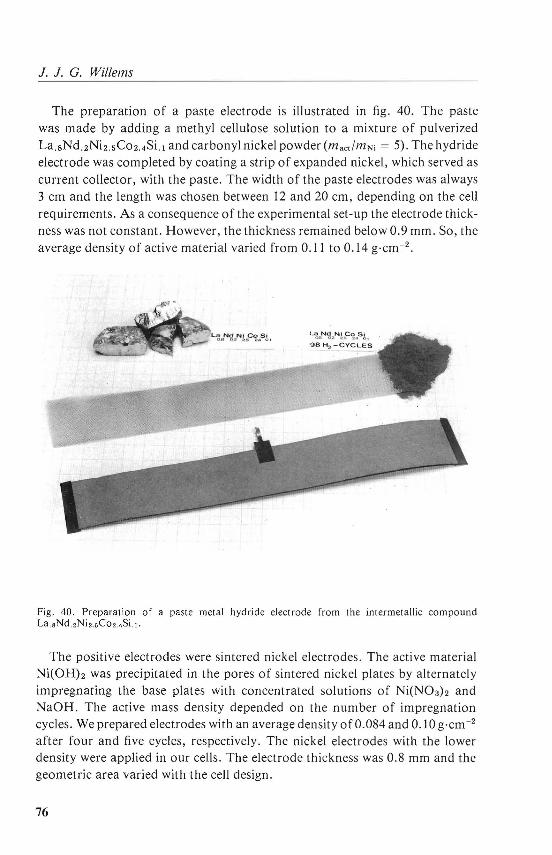
J. J. G. Willems
The preparation of a paste electrode is illustrated in fig. 40. The paste was made by adding a methyl cellulose solution to a mixture of pulverized La.sNd.2Ni2.sC02.4Si.l and carbonyl nickel powder (mact lmNi = 5). The hydride electrode was completed by coating a strip of expanded nickel, which served as current collector, with the paste. The width of the paste electrodes was always 3 cm and the length was chosen between 12 and 20 cm, depending on the cell requirements. As a consequence of the experimental set-up the electrode thickness was not constant. However, the thickness remained below 0.9 mm. So, the average density of active material varied from 0 . 11 to 0 . 14 g·cm-2.
La Nd Ni CQ S I 00 O:l :"t> "''' o .
98 H 2 -CYCLE S
Fig. 40. Preparation of a paste metal hydride electrode from the intermetallic compound La.8Nd,2Ni2.5Co2.4Si. l .
The positive electrodes were sintered nickel electrodes. The active material Ni(OH)2 was precipitated in the pores of sintered nickel plates by alternately impregnating the base plates with concentrated solutions of Ni(N0 3h and NaOH. The active mass density depended on the number of impregnation cycles. We prepared electrodes with an average density of 0.084 and 0.10 g·cm-2
after four and five cycles, respectively. The nickel electrodes with the lower density were applied in our cells. The electrode thickness was 0.8 mm and the geometric area varied with the cell design.
76
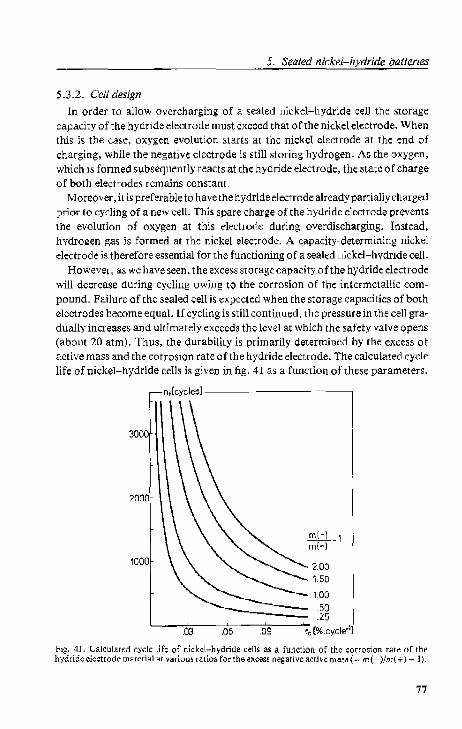
5, Sealed nickel-hydride batteries
5.3.2. Cell design
In order to allow overcharging of a 5ealed nickel-hydride cell the storage capacity of the hydride electrode must exceed that of the nickel electrode. When this is the case, oxygen evolution starts at the nickel electrode at the end of charging, while the negative electrode is still storing hydrogen, As the oxygen, which is formed subsequently reacts at the hydride electrode, the statc of charge of both electrod~s rcmains constant.
Moreover, it is preferable to have the hydride electrode already partially charged prior to cycling of a new cell. This spare charge of the hydride electrode prevents the evolution of oxygen at this electrode during overdischarging. Instead, hydrogen gas )s formed at the nickel electrode. A capacity-determining nickel electrode is therefore essential for the functioning of a sealed nickel-hydride cell.
However, as we have seen, the excess storagccapacity ofthe hydride electrode will decrease during cycling owing to the corrosion of the intermetallic compound. Failure of the sealed cell is expected when the storage capacities of both dectrodes become equal. If cycling is still continued, the pressure in the cell gra· dually increases and ultimately exceeds the level at which the safety valve opens (about 20 atm). Thus, the durabilily is primarily determined by the excess of active mass and the corrosion rate ofthe hydride electrode. The calculated cycle life of nickel-hydride cells is given in fig. 41 as a function of the~e parameters.
nflcycle$l----
3000
2000
1000
.03 ,05 .09
200 1.50
100 .50 .25
re [%.cycle·1l
Fig, 41, Calculated cycle life of nickel-hydride telli as a fUQction or the corrosion rale of the hydride electrode ])lateriatat v;,ri,m, ratio; for the excess nesativc active mas. (= m( -)Im( T) - I),
77
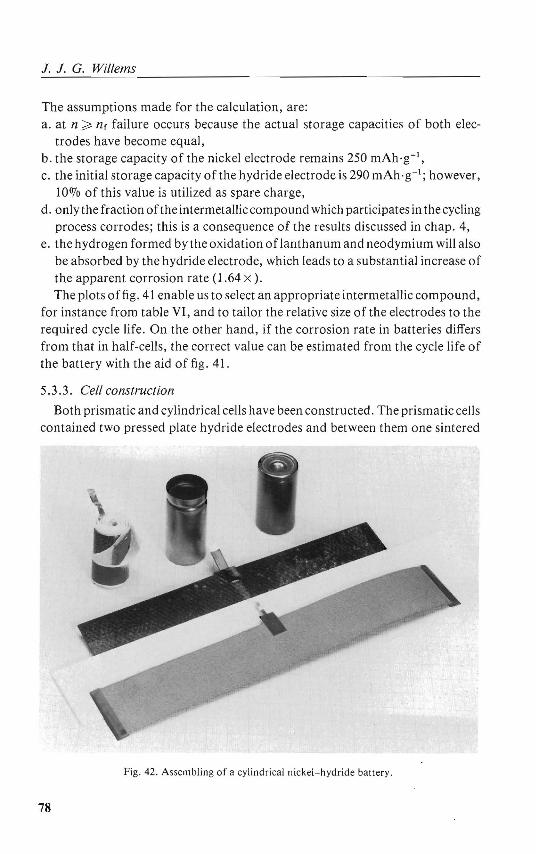
1. 1. G. Willems
The assumptions made for the calculation, are: a. at n ~ nr failure occurs because the actual storage capacities of both elec
trodes have become equal, b. the storage capacity of the nickel electrode remains 250 mAh'g- l, c. the initial storage capacity of the hydride electrode is 290 mAh· g-l; however,
100/0 of this value is utilized as spare charge, d. only the fraction of the intermetallic compound which participates in the cycling
process corrodes; this is a consequence of the results discussed in chap . 4, e. the hydrogen formed by the oxidation of lanthanum and neodymium will also
be absorbed by the hydride electrode, which leads to a substantial increase of the apparent corrosion rate (1.64 x). The plots offig. 41 enable us to select an appropriate intermetallic compound,
for instance from table VI, and to tailor the relative size of the electrodes to the required cycle life. On the other hand, if the corrosion rate in batteries differs from that in half-cells, the correct value can be estimated from the cycle life of the battery with the aid of fig. 41.
5.3.3. Cell construction
Both prismatic and cylindrical cells have been constructed. The prismatic cells contained two pressed plate hydride electrodes and between them one sintered
Fig . 42. Assembling of a cylindrical nickel-h ydride ba ttery.
78

5. Sealed nickel-hydride batteries
nickel electrode, which is enveloped by a separator (polyamide; 0.2 mm thick). For the cylindrical cells, a paste hydride electrode, completely enclosed in separator cloth and a nickel electrode strip were rolled together and placed in a battery can (sub C size; 0 i = 21 mm), as illustrated in fig. 42. A solution of 5 M KOH and 1 M LiOH was used as electrolyte. After the electrodes plus separator were thoroughly wetted by means of vacuum impregnation, the surplus electrolyte was removed.
Fig. 43. Cylindrical nickel-hydride test cell and pressure vessel.
79
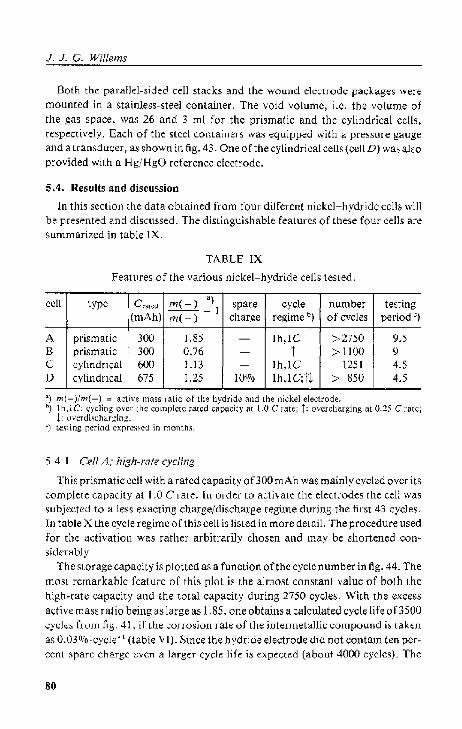
J. J. G. Willems
Both the paraUd-sided cell stacks and the wound dGGtrodG pack(l.ges wen~ mounted in a stainless-steel container. The void volume, i.c. the volume of the gas space, was 26 and 3 ml for the prismatic and the cylindrical cells, rE;'~pectively. Each of the steel containers was equipped with a pressure gauge and a transduGer, as shown in fig. 43. One ofthecylindrieal eclls{ccll D) was also provided wil.h a Hg/HgO reference electrode.
5.4. Results and disclission
In this section the data obtained from four diITcrent nickel-hydride cclls will
be presented and discussed. The distinguishable features of these four cells are summari7.e;:d in table IX.
TABLE IX
Features of the various nickel-hyddde cells tested.
cell type C"fll-c;(1 111(-) ") spare cycle number testing (mAh)
---I charge regime b) of cycles period ") rn( +)
A prismatic 300 1.8.5 - Ih,le ':>2750 9.5 B prismatic 300 0.76 - t >1100 ',)
C cylindrical 600 1.13 - Ih,le 1251 4.5 D cylindrical 675 1.25 100/0 Ih,lC;H ;..-. 850 4.5
") m(-)/m(+) ~ active mass I'~lio of" Ihe hydride and Ihe nickel electrode. h) I h,i C: cycling over tile complete rated capacity at 1.0 Crate; T: overcharging at 0.25 C r~tc;
1: overdi.'icharging_ 0) I.e.,ting reriod cxprc~,cd in montll.'.
5.4.1. Cell A; high-rate cycling
This prismatic cell with a rated capacity onoo mAh was mainlycycl~d ovcr its complete capacity at 1.0 C rate. In order to activate lhe electrodes the cell was
~ubjected t.o a k~s exacting charge/discharge regime during the first 43 cycles. In table X the cycle regime of this cell is listed in mOre detail. The procedure used
for the activation was rather arbitrarily chosen and may be shortened con"
~idcrably.
The sl.orage capacity is ploued as a function of the cyclcnumberin fig. 44. The
most remarkable feature of this plot is the almost constant value of both the
high-rate capacity and the total capacity during 2750 cycle~. With the excess
aGtiv(;: OlaS~ ratio being as large as 1.85, one obtains a calculated cycle:: life orJ500 Gycks from fig. 41 , if the corro3ion rate ofthe intermetallic compound i:; taken as t).()3U7o ·c;ycle" \ (table VI). Since the;: hydride electrode;: did not contain ten percent spare chargc ~vcn a larger eycle life is expeGted (about 4000 cycles). The
80
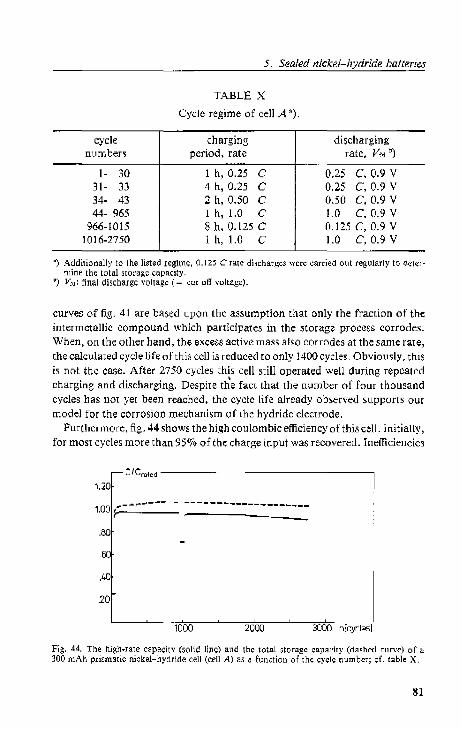
5. Sealed nickel-hydride batteries
cycle numbers
1- 30 31- 33 34- 43 44- 965
966-1015 1016-2750
TABLE X
Cycle regime of cell A").
charging period, rate
1 h, 0.25 C 4 h, 0.25 C 2 h, 0.50 C I h, 1.0 C 8 h, 0.125 C 1 h, 1.0 C
discharging rate, Vt~ b)
0.25 C, 0.9 V 0.25 C, 0,9 V 0.50 C, 0.9 V 1.0 C, 0.9 V 0.125 C, 0.9 V 1.0 C, 0.9 V
0) Additionally to the list~d r~gill1c, 0.125 C ralC discharges were carried out regularly to oetermine the total storage capacity.
0) V,.: tinal discharge voltage (= cut tiff voltage).
curves of fig. 41 are based upon the assumption that only the fraction of the intermetallic compound which participates in the storage process corrodes. When, on the other hand, the exceSS active mass also corrodes at the same rate, the calculated cycle life ofthi. cdl is reduced to only 1400 cycles, Obviously, this is not the case. After 2750 cycles this cell still operated well during repealed charging and discharging. Despite the fact that the number or four thousand cycles has not yet been reached, the cycle life already observed supports our model for the corrosion meChanism of the hydride electrode.
Furthermore, fig. 44 shows the high coulombic efficiency ofthis cell. Init.ially, for most cycles more than 950/0 of the charge input wa~ recovered. Inefficiencies
CICrated ----
1.20
1.00 p.. ___ r----- "'-_-_-_-_-_-_-_-_-_-~-_-_-~-_-_-_-~--_-
.80
60
.40
.20
1000 2000 3000 n[cyclE'51
Fig. 44. The high-rate capacity (solid linc) and ih~ lotal lioragc ~apacity (dashed curve) or a 300 mAh prismatic nickel-hydride cell (cell A) as a fUtlCiion of ihc cycle numb~r; cf. I.able x.
81

1. 1. C. Willems
w.;:r/; dUi;: to oxyg;;:n evolut.ion at the nickel electrode (sec. 2.1.3)- As a consequence small pressure peaks (0.03 atm) were ob&erved at the end of the charging period. After approximately 1750 cycles a :,light degradation of the nickel electrode became noticeable from a decreasing coulombic efficjencyThis degradation was accompanied by larger pressure variation:; p~r ~yck, for instance 0.09 atm for the 2700 '1> cycle.
DUring fifty cycle.,> (966-1015) the cell was charged and discharged over its complete capacity at 0.125 C rate with a coulombic efficiency of only seventy percent. Although the fraction of the charge jnput used fM oxygen evolution is expected 10 inercas~ with decreasing cycling rate, seventy percent efficiency is unusually low. Pos&ibly, the history of the cell, being one of conrtt.inuous charging and discharging at a high rate for almo~I a thousand times, has led to the fMmation of catalytic sites for the oxygen evolution reaction.
Three important voltage leveh of this nickel-hydride cell are given as a function of the cycle number in fig_ 45. The dOlted line represents the voltages determined at the end of the charge process, ViCe). The open circuit vollage of the charged battery, V~,(e), was measured 30 .5econd:; arttr V,Ce). The cell voltage denoted as Vo,(d) i~ the open circuit voltage measured 15 minute~ after discharging was compietcd.
Vo [VI----------·
1.50 ; ...... -- ..... -........................................... ..
'"
100
oso-
1000 2000
v, lei Voo lel
3000 n[cyclesl
Fig. 45, CharacLeI'i:nic voll[l.gcs of cell A a."i a function Df the t:yd~ Ilurnb!t!'; V/«') (cprc!;cnt;e;; the c~l1 volLage aL Lh~ 0nd of <,hargiI1S; I/,,·lc:) and V.Jd) 'Land for the open CirC\lil vollage of the charged and 1he discllarg~(l "cll, re,pecli·vely_
The lower voltage levels Vi(e) and Voc(c) determined for the first thirty cycles (I h, 0.25 C) and for the fifty cycles from n = 966 to n = 1015 (8 h, 0.125 C) indicate that I he battery was incompletely charged. For the other cycles the three chMacteristic cell voltages remained almo,t constant: VJ(e) = 1.56 V, Voc(c) '"
82
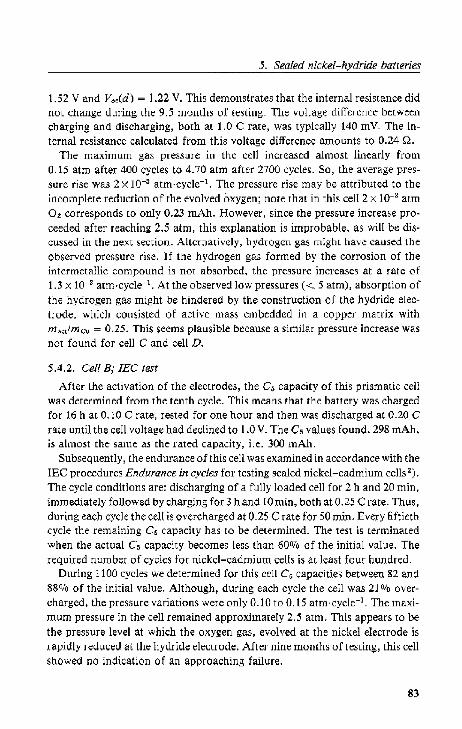
5. Sealed nickel-hydride batteries
1.52 V and Vo,(d) = 1.22 V. This demonstrates that the internal resistance did not change during the 9.5 months of testing. The voltage difference between charging and discharging, both at 1.0 C rate, was typically 140 mY. The internal resistance calculated from this voltage difference amounts to 0.24 Q.
The maximum gas pressure in thc cell incrcased almost linearly from 0.15 atm after 400 cycles to 4.70 atm after 2700 cycles. So, the average pressure rise was 2 X 10⁻³ atm·cycle- I • The pressure rise may be attributed to the incomplete reduction of the evolved oxygen; note that in this cell 2 x 10⁻³ atm O~ corresponds to only 0.23 mAh. However, since the pressure increase proceeded after reaching 2.5 atm, this explanation is improbable, as will be discussed in the next section. Alt.cmativcly, hydrogcn gas might have caused the observed prcssure rise. If the hydrogen gas formed by the corrosion of the inter metallic compound is not absorbed, the pressure increases at a rate of 1.3 x 10⁻³ atm·cycle- I • At the observed low pressures « 5 atm), absorption of the hydrogen gas might be hindered by the construction of the hydride electrode, which consisted of active mass embedded in a copper matrix with rrI.OI!rrlc. = 0.25. This seems plausible because a similar pressure increase was not found for cell e and cell D,
5.4.2. Cell B; lEe test
After the activation of the electrodes, the e~ capacity of this prismatic cell was determined from the tenth cycle. This means that the battery was charged for 16 h at 0,10 C rate, rested for one hour and then was discharged at 0.20 C rate until tbe cell voltage had declined to 1.0 V. The Cs values found, 298 mAh, is almost the same as the rated capacity, i.e. 300 mAh.
Subsequently, the endurance of this cell was examined in accordance with the lEe procedures Endurance in cycles for testing sealed nickel-cadmium cells 2).
The cycle conditions are: discharging of a fully loaded cell for 2 hand 20 min, immediately followed by charging for 3 hand IOmin, both atO,25 C rate. Thus. during each cycle the celt is overcharged at 0.25 C rate for 50 min. Every fiftieth cycle the remaining e~ capacity has to be determined. The test is terminated when the actual Cs capacity becomes less than 600/0 of the initial value. The n:quired number of cydes fo( nickel-cadmium cells is at lea:;;t four hundred.
During 1100 cycles we determined for this cell C, capacities between 82 and 880/0 of the initial value, Although, during each cycle the cell was 21 % overcbarged, the pressure variations were only 0,10 to 0.15 atm·cycle- I . The maximum pressure in the cell remained approximately 2.5 atm. This appears to be the pressure level at which the oxygen gas, evolved at the nickel electrode is rapidly reduced at the hydride electrode. After nine months of testing, this cell showed nO indication of an approaching failure.
83

J. J. C. Willems
5.4.3. Cell C; high-rate (Yding
A nalogQus to t.he testing of the prismatic cell A, the endurance of the cylindrical cell C was examined by repeated charging and discharging over its complete. rated capacity at 1.0 C rate_ The procedure for the activation of the elec· trode consisted of twenty lower rate cycles. The precise cycle regime is inr.lie,:ated in table Xl.
cycle numbers
1- 2 3- 14
15- 20 21-1251
TABLE Xl
Cycle regime of cell C').
c;harging period, rate
10 h, 0.05 C 4 h, 0.25 C 2 h, 0.50 C I h, 1.0 C
discharging rate, VId b)
0.05 C, 0.9 V 0.25 C, 0.9 V 0.50 C, 0.9 V ),0 C, 0.9 V
") Additionally to the li,teu regime. 0.125 C !'ale discharge.\ wcre carriod out regularly lO dele,.· mine t.he t()l.al stOn.lgC c£.tP-'I.:.:iLy.
') Vr,,: final discharge V<llL3go ( <'L11 olr voltage),
On the assumption lhal the corrosion rate of the intermClallic compound is only O.OY'lo·cycle- 1 (table VI), the cycle life of this cell should be 2140 cycles according to fig. 41. If one accounts for the absence of 10070 spare charge in lhe hydride electrode, a lifetime of 2580 cycles is calculated. When, on the other hand, not only thr;: frac.:lion of intel'lnetallic compound that participates in the
C/C,oled ------
120
100
80
.60
.40··
20
1000
Fie.. 46. The high-r,.t<; c"p"city (",lid line) and the total storag~ capacity (!"~hcJ curve) M a 600 mAil cylindrical nick<;l-hydride cell (edl C) a, a 1"c"lclion of tl10 eyel, 111lmber; d. table Xl.
84
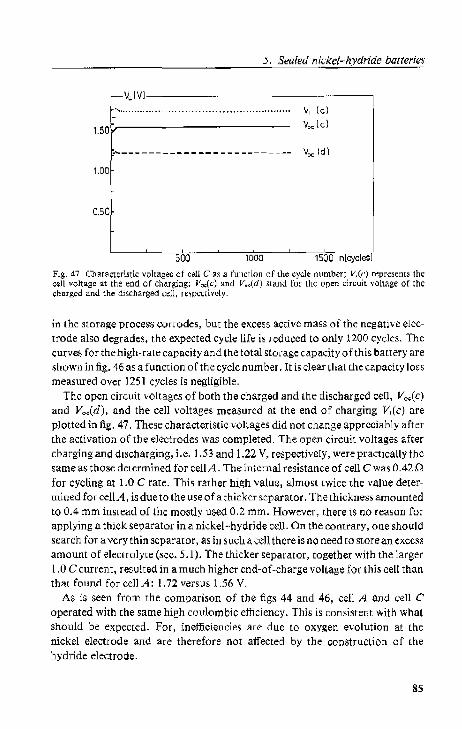
5. Sealed nickel-hydride batteries
V.[V]-----'''''' ---_. __ .,"'"', ..................................... .
1. 50 v------------v; (e]
v"" k]
..... ------------------------- Voo id]
1.00
0.50
500 1000 1500 n[cycles]
Fig. 47. Char~etc"stic voltages of cell C as a function of the cycle number; V,(c) represems the cell voltage at the erld of charging; v.,(c) and V .. (d) stand for the open circuit vOltage of the cn~rgcd and the discharged cell, respectively.
in the storage process GOrrOdes, but the excess active mass of the negative electrode also degrade~, the expected cycle life is reduced to only 1200 cyGlcs. The curves for the high-rate capacity and the total storage capacity oUhis battery are ~hown in fig. 46 as a function 0 f the eycle num ber. It is clear that the capacity lo~~ measured over 1251 cycles is negligible.
The open circuit voltages of both the charged and the discharged cell, Voo(c) and V~.(d), and the cell voltages measured at the end of charging Vrlc) are plotted in fig. 47. These characteristic voHages did not change appreciably after the activation of the electrOdes was completed. The open circuit voltages after charging and discharging, i.e. 1.53 and 1.22 V, respectively, were practically thc same as those determined for cell A. Thr;: internal resistance of cell C was 0.42 0 for cycling at 1.0 C rate. This rather high value, almost twice the value determined for cellA, is dueto the use of a thicker separator. The thickness amounted to 0.4 mm instead of the mostly used 0.2 mm. However, there is no reason for applying a thick separator in a nickel-hydride cd), On the contrary, one should search for a very thin separator, as in such a cell there is no need to store an exccss amount of electrolyte (sec. 5.1). The thicker separator, together with the larger 1.0 C current, resulted in a much higher end-of-charge voltage for this cell than that found for cell A: 1.72 versus 1.56 V.
As is seen from the comparison of the figs 44 and 46, cell A and Gell C operated with the same high coulombic efficiency. This is consistent with what should be expected. For, inefficiencies are due to oxygen evolution at the nickel electrode and are therefore not affected by the construction of the hydride electrode.
8S
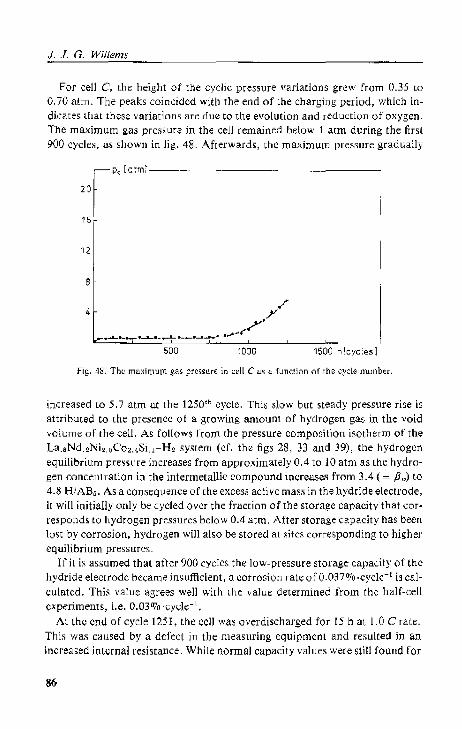
J. J. G. Wi!lr;ms
For cell C, th~ height of the cyclic pressure variations grew from 0.35 to 0.70 atm. The peaks coincided with the end of the chargi[]g period, which in
dicates lhat these variations are due to the evolution and reciuction of oxygen.
The maximum gas pressure in the cell remained bdow 1 atm during the first
900 cycles, a.s shown in fig. 48. Afterwards, [he maximum pressure gradually
Pc [atml--·-··
20
16
$'
4 yo'" .,.Y'
_ ......... _._ ............ _.,..,.L..._._. __ .................. ,JIo .... r· 500 1000 1500 n Icycles I
I'ig. 48. The muxill1\llll gas PI'CSSLlr€ in cell C a., a hll1ction of the cycle IltllnbeL
increased to 5.7 atm at the 1250'h cycle. This slow but steady pressure rise is
attrihuted to the presence ()f a growing amount of hydrogen g&5 in the void
volume of the cell. As follow, from the pressure-compor.ition isotherm of the
La.8Nd.~Ni~,oCo2.1Si.l-H2 system (cf. the figs 28, 33 and 39), the hydrogen
equilibrium pressure increases from approximately 0.4 to 10 atm as the hydro
gen concentration in the intermetallic compound increases from 3.4 (= flo) to
4.8 H/AB~. As a con,eq\Jence of the excess aCl:ive mas,~ in the hydride elecll'ode,
it will initially only be cycled over the fraction of the storage capacity that corresponds to hydrogen pressures below 0.4 atm, After storage capacity has been
lost by corrosion, hydrogen will also be stored at sites c()rresponding to higher
equilibrium pressures.
If it is assumed that after 900 cycles th/; low-pressure storage capacit.y of t.he
hydride electrode hecame insufficient, a corrosion rate ofO.037110·cycle- 1 is cal
culated. This value agrees well with the value determined from the half-cell
experiments, Le. 0.03070 'cyde- 1•
At thc end of cycle 1251, t.he cell was overdischarged for 15 h at 1.0 Crate.
This was caused by a defect in the measuring equipmcI1l and resulted in an
incl'eased internal resistance. While normal capacity values were still found ror
86
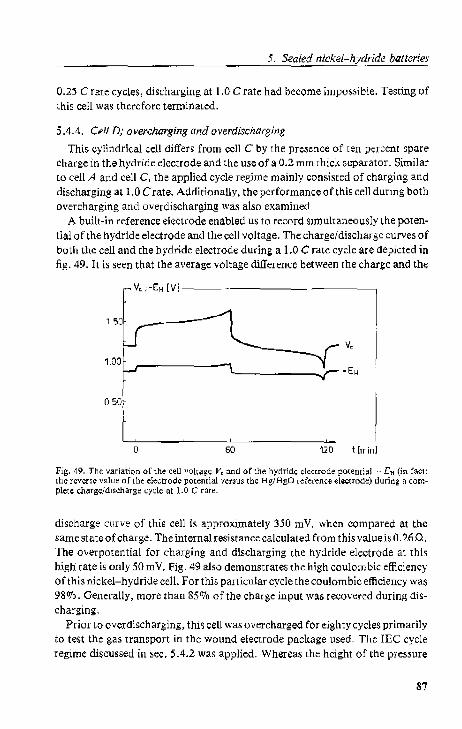
5. Sealed nickel-hydride batteries
0.25 C rate cycles, discharging at 1.0 C rate had become impossible. Testing of this cell was therefore terminated.
5.4.4. Cell D; overcharging and overdischarging
This cylindrical cell differs from cdl C by the presence of ten percent spare charge in the hydride electrode and the use of a 0.2 mm thick separator. Similar to cell A and cell C, the applied cycle regime mainly consisted of charging and discharging at 1.0 Crate, Additionally, the performance orthis cell during both overcharging and overdischarging was also examined.
A builHn reference electrode enabled Us to record simultaneously the potential orthe hydride electrode and the cdl voltage. The charge/discharge curves of both the cell and the hydride electrode during a 1.0 C rate cycle are depicted in fig. 49. It is seen that the average voltage difference between the charge and the
Vo ;-EH [VI----·· .. ----- .~------;
0.50
o 60 120 t[minl
Fig. 49. The variation of the cell volta~c v, and of the h~dridc electrode potentiaJ .... EH (in fact: [he reverlc valuo of the electrode potential versus the HSI BgO reference electrode) during a complet~ ch~,g~/di,charge cycle at !.O Crate.
discharge curve of this cell is approximately 350 mV, whcn compared at thc same state of charge. The internal resjstance calculated from this value is 0.26,Q. The overpotential for charging and discharging the hydride electrode at this high rate is only 50 m V. Fig. 49 also demonstrates the high coulom bie efficiency of this nickel-hydride cdl. For this particular cycle the coulombic efficiency was 98070. Generally, more than 850/0 of the charge input was recovered during discharging.
Prior to overdischarging, this cell was overcharged for eighty cycles primarily to test the gas transport in the wound electrode package used- The lEe cycle regime discussed in sec. 5.4.2 was applied. Whereas the height of the pressure
87
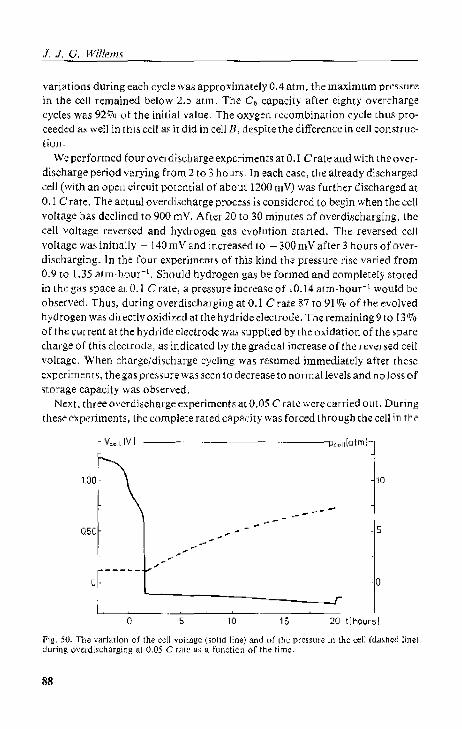
.f. J. G. Willems
variations during each cycle was approximately 0.4 atm, the maximum preSsure in the ccll r~mained below 2.5 atlll. The Co capacity after eighty overcharge cycles was 92170 of the inilial value_ The oxygen rCcombination cycle lhus proceeded as weB in lhis cell as it did in cell B, despite the difference in cell construetiol1-
We performed four overdischarge experiments at 0.1 Crate and with lheoverdischarge period varying from 2 to 3 hours_ In each case, the aJready discharged cell (with an open circuit potential of aboUl I200mV) was further discharged at 0.1 C rate. The actual overdischarge process is considered 1-0 begin when the ccll voltage has declined to 900 illY. After 20 to 30 minutes of overdi~charging, lhe cell volt.age reversed and hydrogen gas evolution started. The reversed cell voltage wa5 initially - 140 mVand increased LO - 300 mVafter 3 hours of overdischarging. In the four experiments of this kind th~ pressure rise varied from 0.9 to 1.35 alm -hour-I. Should hydrogen gas be formed and completely stored in the gas space al. 0.1 C rate, a pre~sure increase of 10.14 alm·hour- 1 would be observed. Thus, during overdischargiog at 0.1 Crate 87 to 91 070 of the evolved hydrogen was directly oxidiz.;:d at the hydride electrode. Th.;: remaining 910 1301~ of the currenl at the hyddde electrode was supplied by the oxidation of the spare charge of this electrode, as indicaled by the gradual increase of the reversed cell voltage. When charge/di5charge eyding was resumed immedialely after these experiment~, the gas preSSlJre was seen lO decrease to normal levels and no loss of storage capacity was observed.
Next, three ovcrdi~charge experiment, at 0.05 C rale were carried oul. During these experiments, lhc complete rated capacity was forced lhrough the cell in the
Vo.IIIV I ---- ·----IPo"lIiatmi·-
10
---050 -5
0- -0
o 5 10 15 20 l[hOursi
rig. 50_ The variarion of the cell voltage (solid line) and (,f (he prcsslII'e in the cell (da_'heel line) during overdi,charging at 0.05 C ral" "I a fllllCtiOrl of the time_
88
J. Sealed nicke/~hydride batteries
reverse direction. The variation of the cell voltage and of the pressure is presented for one of these experiments in fig. 50. Almost identical results were found for the two other experiments. Again, the discharged cell was additionally discharged, now at 0.05 C rate, and the actual overdischarge process was considered to start from 900 mY. Only after 2.5 hours, the cell voltage had declined to 900mY and it took another 1.5 hours before the voltage reversed and the pressure began to rise. Similar to the overdischarge experimenls at 0.1 C rate, the reversed cell VOltage increased, but now from - 110 to - 210 mY. The initial pressure in the cell was 1.2 atm; this value resulted from repeated cycling at 1.0 C rate. The average pressure rise amounted to 0.33 atm·h-1 • This means that 93(J1o of the hydrogen evolved at the nickel electmde was simultaneously oxidized at the hydride electrode. Moreover, the pressure curve flattened as the hydrogen gas pressure increased.
In all cases, the hydrogen pressure in the cell decreased, cven when cycling at 1.0 C rate was immediately resumed, and the space charge in the hydride elec· trodethu5 restored. The value of the storage capacity, determined from the first eycle aftcr the twenty hours of overdi.~charging was still 79fJ!o of the rated capacity. Normal storage capacities were measured for the next cycles.
5.5. Conclusions
Four sealed nickel-hydride cells have been tested with the emphasis on the durability of the hydride electrode. The intcrmetallic compound La.8Nd. 2Ni u Co z.1Si.! was used as active negative electrode material. The reo suits obtained from these cells confirm that only the fraction of the intermetallie compound that participates in the cycling proccss corrodes. Moreover, these results indicate that the corrosion rate du6ng cycling in sealed cells is approximately the same as the rate determined from half-cell experiments. Nickelhydride cells, which comprise one of the newly developed stable intermetallic compounds, are therefore expected to withstand the standard endurance tests for rechargeable batteries. For instance, thc cell which was examined in accordance with the IEe procedure exceeded the required cycle life by a factor of three withollt any indication of an approaching failure.
Moreover, it was shown that sealed nickel-hydride cells can be overcharged and overdischarged without building up an unacceptably high gas pressure. Both the oxygen recombination cycle during overcharging and the hydrogen recombination cycle dUring overdischarging proceed well provided that the cell is adequately designed.
The tested cells had been constructed with normal components but were not optimized for maximum energy density andlor maximum power density. How· ever, a sealed nickel-hydride cell compriSing a wound package made of a
89
1. 1. G. Wiltems
56 em; nickel electrode with 5.0 g Ni(OHh and of a 60 cm 2 hydride electrodc with 8.4 g La.8Nd.2Nb~Co2.<Si.l, which fits in a sub C size battery can, may be conslructed in the same way. The capacity of ~uch a nickel-hydride cell is 1.25 Ab and according to fig. 41 it.s lifetime will considerably exceed one thousand cyde~.
REFERENCES
') H. J. H. van Deu!.ekom, U.S. Patent 4,214,043 (1980). ') International ElecLroLechnkat Commi51iOIl, SLLb"Commitlee 21 A: Alkaline Accumut"tQf~,
PLll'licaLion 285.
90
Chapler 6 Final conclusions
6. FINAL CONCLUSIONS
The intermetallic compounds LaNh and LaNi,Cu are not suitable for application in (echargeable battery electrodes. The corrosion of these materials causes a strong decline of the storage capacity. However, by means of further alloying several very stable pseudo-binary AB. compounds have been foundFor instance the capacity loss of a La_ sNd.2Ni u Co 2 •• SLl electrode is only thirty percent after one thousand cycles.
The stability of hydride electrodes may be explained in terms of an unique transport process. The rate-determining step in the corrosion reaction is the transport of the lanthanide elements to the solid-liquid interface layer. Normally, the mobility of the atoms in intermetallic compounds is practically zero at room temperature. However, a zone of enhanced mobility induced by the distorted lattices is present in the intermetallic compound particles and located at the boundary between the hydrogen poor and the hydrogen rich phase. During charging and discharging, this zone travels through the particles, enhancing the transport of the rare earth elements to the surface. As a con" sequence, the corrosion takes only place during cycling and the corrion ratc changes in proportion to the lattice distortion. Thus, intermetallic compounds are more stable as they expand less during hydrogen absorption. Moreover, the stability of intermetallic compounds which contain small amounts of silicon or aluminium is further improved by the formation of an oxide layer which functions as an additional hindrance for the transport of the lanthanide elements to the solid-liquid interface.
Now that a viable hydride electrode has been found, sealed nickel-hydride batteries with a durability of more than one thousand cycles can be constructed. As both electrodes operate via a fast solid state transition mech· anism, these batteries are capable of being charged and discharged completely in less than one hour, while still functioning at high efficiencies. An oxygen recombination cycle enables repeated overcharging of sealed nickel·hydride batteries. As a result of the absorption and oxidation of hydrogen gas by the;: hydride electrode, prolonged overdischarging is also possible without detrimental consequences for the further use of the battery.
In addition to the advantages already mentioned, the absence of poisonous heavy metals, such as cadmium and mercury, is expected to facilitate the wide· spread application of sealed nickel-hydride batteries.
91

J. J. G, Willems
ACKNOWLEDGEMEN'f
The research reported in this dissertation has been done at the Philips Research Laboratories, Eindhoven, The Netherlands. I am indebted to the management of that laboratory for allowing me to complete this thesis.
In particular I wish to thank Messrs. J. R. van Beek. and H. C. Donkers!o<)t for our fruitful cooperation. Without their contribution in the fidd of electrochemical and metallurgical research <) f hydride forming materials this thesis w<)uld not have been realized.
The technical support by Mrs. A. C. Reynders and Messrs. L. Kerkhofs and J . .I. F. Heuts was invaluable for the numer<)us experiments characteristic for this type of battery research. I appreciate their dedication very much.
Finally, I wish to express my gratitude to Dr. G. Frens for the inspiring discmsions and his support of the investigations and to prof. E. Barendrecht and prof. Dr. A. R. Miedema for their critical reviewing of the manuscript.
92
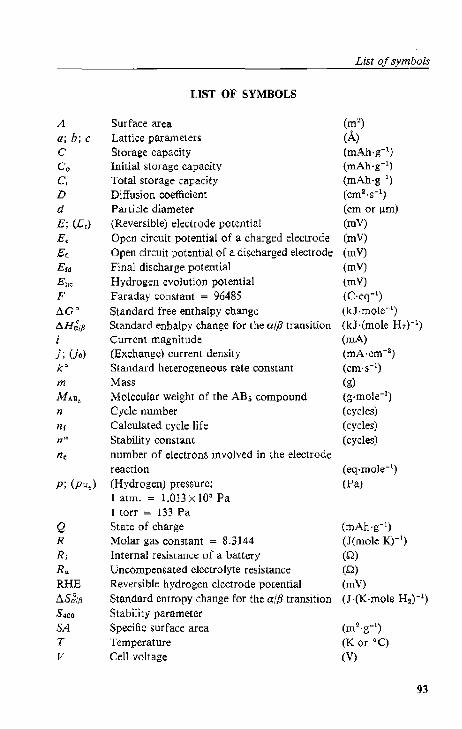
A
a; b; c C CQ
C, D d E; (Er)
Eo Eo Era
E h<
F ~Go
tlH~1ft i j; (jo)
k O
m
MAD, n nr n*
Q R
Ri Ru RHE ~S~lfj S400
SA T V
LIST OF SYMBOLS
Surface area Lattice parameters Storage capacity Initial storage capacity Total storage capacity Diffusion coefficicnt Particle diameter (Reversible) electrode potential Open circuit potential of a charged electrode Open circuit potential of a discharged electrode Final discharge potential Hydrogen evolution potential Faraday constant = 96485 Standard free enthalpy changc Standard enhalpy change for the alP transition Currcnt magnitude (Exchange) current density Standard heterogeneous rate constant Mass Molecular weight of the AB. compound Cycle number Calculated cycle life Stability constant number of electrons involved in the electrode reaction (Hydrogen) pressurc; I atm_ = 1.013 x 10⁵ Pa I torr"" 133 Pa State of charge Molar gas constant = 8,3144 Internal resistance of a battery Uncompensated clectrolyte resistance Reversible hydrogen electrode potential Standard entropy change for the alfi transition Stability parameter Specific surface area Temperature Cell voltage
List of symbols
(m2) (A) (mAh-g-1)
(mAh-g-1)
(mAh-g-l) (cm2-s- l )
(em or Ilm) (mV)
(mV)
(mV)
(mV) (mY) (C-cq-l) (l<J-rnole- 1
)
(kJ-(mole HZ)-I)
(mA) (mA-cm-2)
(cm-s- I )
(g) (g-mole- I )
(cycles) (cycles) (cycles)
(rnAh-g-l) (J(mole K)-l)
(0) (0) (mY) (J-(K-mole H2tl)
(m~-g-l)
(K Or 0c) (V)
93

1.1. C. Willems
hie) Cell voltage at I.he end of charging (V)
Voo(e) Open circuit voltage of a charged cell (V)
Voc(d) Open circuit voltage of a discharged cell (V) V Unil cell volume (A~) V Gas volume (ml) x Hydrogen eOnltnl = HIM-ratio y (dis-)charge rate (hours-I) z Composit.ion parameter indicating the cobalt.
content a Transfer eocfficicnl' in Tafel equation a; (Ct,) Hydrogen p()Or phase (saturaled) 13; (130) Hydr'ogen r'ieh phase (initially formed) 6 Diffu,ion layer I.hickness (em or J.Lm) II Ovcrpolential (mV) IIh. Over'potential for the hydrogen evolution
reaction (mV)
].";1 'I" Slim of overpotentials for charging and dis-charging (mV)
0 X-ray diITraction angle (degree) (! Density (g·cm-3)
(J0 Cross sectional area (AZ)
94
Summary
SUMMARY
In the present battery research, we aimed at a rechargeable cell, which could be charged and discharged at high rates and would function in any position for several years and without requiring maintenance. The metal hydride electrode is a rechargeable negative battery electrode based upon the revcrsible storage of hydrogen in metals. During the charging of such an electrode, hydrogen is formed by the electrochemical reduction of water and is $ubseq utntly absorbed by the metal. During discharging, the stored hydrogen is released and oxidized.
The intermetallic compounds LaNi5 and LaNi.Cu, both belonging to the group of metals which is capable of absorbing and desorbing large quantities of hydrogen at pressures around 1 atm and near room temperature have been considered most-promising materials for application in rechargeable batteries. How(;:ver, during repeated charging and discharging thc storage capacity of both LaNi o and LaNi.Cu electrodes declines exponentially as a result of corrosion of these intermetallic compounds, Consequently, the durability of these electrodes is limited to approximately 100 cycles.
X-ray diffraction analysis and electron microscopy studies showed that during electrochemical charging and discharging intermetallic ABs compounds are converted into hydroxide needles of A(OHh and metallic precipitates of B, No further substantial reduction of the particle size occurs during electrochemical cycling, if one starts with metal powder with a specific SUrface area of about 0,25 m2'g- I , as determined by the BET method, The exponential decay of the storage capacity suggests that the corrosion reaction is affected by the repeated expansion and shrinkage of the intermetallic compound particles, which accompanies the charge/discharge cycles, We therefore hypothesized that hydride electrodes, made of an intermetallic compound which shows less lattice expansion than LaNi5 on hydriding. should be more stable than LaNis electrodes,
More than twenty different intermetallic compounds, in which lanthanum and nickel had been partially replaced by other elements, have been prepared to examine this hypothesis. As a result several multicomponent electrodes which exhibit an excellent stability have been fOund" For instance, the capacity loss of a La.BNd.2Ni2.5Coz.~Si.l electrode is only thirty percent after one thousand cycles.
Comparison of the volume expansion of these LaNi5-related compounds and the stability of the corresponding electrodes demonstrates that the stability indeed increases in proportion to the decreasing volume expansion. The improvement in stability is considerably larger for intermetallic compounds which contain small amounts of aluminium or silicon, We have also established that cor-
95
1- J. G, Willems
rosion only occurs during charging and discharging and not during rest. These a bservations may be explained in terms of a unique mass transport process in the intennetallic compound particles.
Now that a viable hydride electrode has been found, ~eakd nickel-hydride batteries Wilh a durability or mOre (han One thousand cycles call be constructed. The properties of these batteries are measured- Sealed nickel-hydride batteries are capable of beiIlg charged and discharged in less thall one hour. Both prolonged overcharging and overdischarging are possible. Furthermore, t.hey do not contain poisonous heuvy metals such as cadmium and mercury.
96
Samenvatting
SAMJi:NVATTING
Oit batterijenonderzoek was gericht op de ontwikkelingen van een gesloten herlaadbare eel. die sne! geladcn en ontladen kan worden en die gedurende meerdcre jaren goed funktioneert in elke stand en zander dat onderhoud vereist is. De metaalhydride-elektrode is een herlaadbare, negatieve batterij-e1ektrade. die gebaseerd is op de rcversibele opslag van waterstof in metalen. Tijdens het laden van een dergelijke elektrode wordt waterstof gevormd door de elektrochemische reduktie van water en vervoJgens gcabsorbeerd door het metaaI- Tijdens ontladen komt de opgeslagcn waterstof vrij en wordt geoxideerd.
De intermetallische verbindingen LaNis en LaNi 4Cu, die beide behoren lOl
de groep van metalen die in staat is grote hoeveelheden watcrstof te absorberen en desorberen bij kamertemperatuur en drukken van ongeveer I atm, leken aanvankdijk vee! bclovende mate6alen voor toepassing in herlaadbare batterijen- Eehter, als gevo!g van korrosie van deze intermetallische verbindingen neemt de opslagkapaciteit van zowel LaNi, als LaNi.Cu elektroden exponentieel af tijdens herhaald laden en ontladen. Hierdoor is de levensduur van deze eIektroden beperkt tot sleehts circa 100 cyeli_
Met R6ntgen-diffraktie analyse en elektronenmicroscopie is aangetoond dal de intermetallische ASs verbindingen tijdens dektrochcmische Iaad/ontlaadcyeli omgezet worden in naaldvormig A(OHh hydroxide en metallische B precipitaten. Uitgaande van metaalpoeder met een specifiek oppervlak van ongeveer 0.25 m2_g~1 (BET methode) treedt vrijwd geen verdcre verklcining van de dec!tjesgrootte op tijdcns c1ektrochemisch laden en ontladen. De exponentieIe afname van de opslagkapaciteit doet vermoeden dat de korrosiereaktie bei'nvloed wordt door de herhaalde uitl.etting en inkrimping van de metaaldeeltjes, waarmee de laadiontlaad-cycIi gepaard gaan. Daarom hebben wij verondersteld dat hydride-elektroden, die gemaakt zijn van een intermetallische verbinding waarvan het volume door waterstofabsorptie minder toeneemt dan dat van LaN is, stabieler wuden zijn dan LaNis elektroden.
Met deze veronderstelling als werkhypothese zijn meer dan twimig verschillende intermetallisehe verbindingen, waarin lanthaan en nikkeI gedeeltelijk zijn vervangen door andere elementen, bereid. Hierbij zijn meerdere multikomponenten elektroden met een uitstekende stabiliteit gevonden. 20 is bij· voorbeeld het kapaciteitsverlies van een La.BNd.~Ni2.5Co2.4Si.l c1cktrode slechts dertig procem na duizend cycIi_
Vit een vergeJijking van de volume-uitzetting van deze LaNi.-achtige verbindingen met de stabiliteit van de korrcsponderende elektroden blijkt dat de stabiliteit inderdaad evenredig toeneemt met afnemende volume-expansie. De
97

J. J. O. Willems
stabiliteitsverbetering is aanzienlijk groter voor intennetallische verbindingen, die kleine hoeveelheden aluminium of silicium bevatten. Ook is vastgesteld dat korrosie aileen optreedt tijdens laden en ontladen en niet tijdens rust. Deze waarnemingen kunnen verklaard worden in termen van een uniek massatrans" port-proces in de metaaldeeltjes.
Door de vinding van een Ievcnsvatbare hydride-elektrode kunnen gesloten nikkel-hydride batterijen met een levensduur van meer dan duizend laad/ontlaad-cycH worden gemaakt" Dc eigenschappen van deze batterijen zijn gemeten, Desloten nikkel-hydride batterijen kunnen in minder dan 1 uur gc" laden en ontladen worden en zijn langdurig overlaadbaar en Qverontlaadbaar. Bovendien bevatten ze geen giftige zware metalen zoals cadmium en kwik.
98

Levensloop
LEVENSLOOP
Han Willems werd op 6 mei 1955 te Eindhoven geboren, en behaalde het diploma HBS-B aan het Rythovius College te Eersel in 1972. In hetzelfde jaar begon hij met zijn studie Scheikundige Technologie aan de Technische Hogcschool Eindhoven. Het kandidaatsexamen wcrd in 1976 afgeiegd, waarna op 25 april 1979 deze studi!;: met lof werd afgesloten. Zijn afstudeeronderzoek verrichtte hij in de vakgroep Elektrochemie onder [eiding van prof. E. Barendrecht. Daarnaast vervulde hij in dele vakgroep divers!;: studentassistentschappen.
Van mei 1979 tot juli 1984 was hij werkzaam als wetenschappelijk medewerker van het Philips Natuurkundig Laboratorium te Eindhoven. Hier werd in de groep Grensvlakchemie, die geleid word! door Dr. O. Frens, het onderzoek verricht op grand waarvan dit proefschrift tot stand kwam_
Sinds augustus 1984 maakt hU d!;:el uit van de Philips' produktdivisie Verlichting en Batterijen.
99

Dankwoord
OANRWOORD
Het onderzoek waarover in dil. proeheh,ift gerapport~~nj worr.lt, is verrir.:ht in het Philips Natuurkundig Laboral.orjum I.e Eindhoven. Ik ben de direkl.il; van r.lit.l~boratorium zeer erkentelijk vaor cle gelegenheid clie zij mij geboden heefl Om dil. proefschrift te voltooien.
Ook clank ik in het bijzonder de heren J. R. van Beek en H. C. Donkersloot voor onze Vl'uchtbare samenwerking. Zonder hun bijdragerl, respcklicvdijk op het gebied van het ekktrochl;misch en het metallurgisch onderzoek van hydride-vormende ma\crialen had dit proefschrift niet tot stanr.l kunnen komen.
VOOl" het goed verla pen van de vele expcrimenten was de jcchnischc ondersteuning door Mevr. A. C. Reyndcrs en de heren L. Kcrkhofs en J. J. F. Heuts onmisbaaL Voor hun grote toewijcling hen ik hcn zcer crkentdijk.
Tot slot wil ik ook mijn dank ultspreken aan Dr. G. Prens VOOr dc inspircrende diskussies en zijn ondersleuning van het werk en aan mijn bcide prornolOrCn proL K Barenr.lrecht en prof. Dr. A. R. Miedema voar het krilisch bespceken van het manu'cript..
100

J. J. G. Willems
Stellingen bij het proefschrift:
Metal Hydride Electrodes Stability of LaNis-related
Compounds
2 november 1984
T.H. Eindhoven
I.
Het anomale aUiodotering8gedrag van boor tijdens de epitaxiale groei van silidum kan verklaard worden door rekening te houden met chemische reakties in de gasfase.
S, 13. Kulkarni and A. A. K07.ul, ElccTi"ochcm. Soc. Meeting HO-2, Hollywood, Flol'ida, Ex[, Ab~lr. N(}. 540 (1980).
De stabiIiteiL vall dc, doo)" Schoonman en medewerkers gebruikte sonde voor de elektrochemische bcpaling van he! waterstofgehalle in melalen ;cal aanzienlijk toenemen indien bij kamertcmperatuur het palladiumhydride PdH. 6
word! g~bruikt als referenlie-clcktrOde .
.r. Scl1oonman, D. L. France~chtt1:i onJ.r. W. Hannekcn, HCL i:lunsenges. PrlYS, Cbern. 86, 701 (1982).
3.
In ionogene krislalkn is altijd )"uil1lte!ading aanwezig. De ovcrmaat aan lading, die onl1liddellijk ondcr he!. oppervlak is gelokaliseerd in een dunne !aag, wordl gek()mpcn~eerd door extra lading van legenge$tdd teken, dk <:ich dieper in het kristal in een meer uitgestrekte laag bevindt.
4.
De mogelijke toepassing van perfluoroverbindingen ter verbetering van d~ waterhuishouding in zink·lu~ht·cellen biedt interessante vooruitzichlcn.
5.
He!. vcrs~hiI in snelheid waarmee he[ ctsproc;es van het halfgeleidermateriaal InP verloopl in zoutz.uur, enerzijds, en in opJossingcn van Hel in gei<:onsenlrccrd a~jjnzuur, anderzijds, kan nie[ vtrklaard worden met een zuiver eJektrochemisch oxydatiemechanisl1le.
S. Adachi "flU H. Kawaguchi, J, Electt'ochem, Soc. 128, 1342 (1981) P. H. L. NClu.cn,.1. Elcctrochem. Soc., ve"schi,bll rlajaar 1984.
6.
Vit het waterstofabsorptiegedrag voIgt da! amorf LaNi. opgebouwd gedacht kan worden uit vele mikrogebiedjes, die zich onderscheiden door verschillende lanthaan/nikkel-ratio's.
7.
Tegen de, door Stadler en Boehm getrokken konklusie dat de deeltjesgrootte van fotochemisch neergeslagen platina 01' Ti02 eenvoudig beheersbaar is, bestaan ernstige bedenkingen.
K.-H. Stadler and H. P. Boehm, Proc. 8,h 1m. Congress on Catalysis. Berlin. 2·6 July 1984, Vol. IV, p. 803·814.
8.
Ben herlaadbare batterij is een chemische reaktor waarin chemische energie omkeerbaar wordt omgezet in elektrische energie. Vanwege hun gekompliceerdheid verdienen de processen in dergelijke reaktoren ook de aandacht van proceskundige chemici.
Het verdient aanbeveling om in leerlingendossiers niet langer het beroep van de vader 01' te nemen.
10,
De opdracht van een proefschrift aan geliefde personen wekt de indruk dat het proefschrift voor hen is geschreven.


![1 TCP Libra: Exploring RTT-Fairness for TCPcheung/Courses/558/Syllabus/... · Massoulie, Johari and Tan addressed the stability in network congestion control schemes [18]. Vinnicombe](https://static.fdocuments.nl/doc/165x107/600d3e2c4db9b872512b3b02/1-tcp-libra-exploring-rtt-fairness-for-cheungcourses558syllabus-massoulie.jpg)