Generating Templates and Growth Charts for School-Aged ... · school-age brain development....
46
Generating Templates and Growth Charts for School-Aged Brain Development Hao-Ming Dong 1,2,3 , F. Xavier Castellanos 4,5 , Ning Yang 2,3,6 , Zhe Zhang 1,2,3 , Ye He 1,2,3,7 , Lei Zhang 1,2,3 , Ting Xu 1,2,3,8 , Avram J. Holmes 9 , B.T. Thomas Yeo 10 , Feiyan Chen 3,11 , Bin Wang 3,12 , Christian Beckmann 13 , Tonya White 14,15 , Olaf Sporns 7 , Jiang Qiu 3,16 , Tingyong Feng 16 , Antao Chen 16 , Xun Liu 1,2,3 , Xu Chen 16 , Xuchu Weng 3,17 , Michael P. Milham 5,8 , Xi-Nian Zuo 1,2,3,17,18,19,20* 1 Department of Psychology, University of Chinese Academy of Sciences (CAS), Beijing, China 2 CAS Key Laboratory of Behavioral Sciences, Institute of Psychology, Beijing, China 3 Research Center for Lifespan Development of Brain and Mind, CAS Institute of Psychology, Beijing, China 4 Department of Child and Adolescent Psychiatry, New York University School of Medicine, New York, USA 5 Nathan Kline Institute for Psychiatric Research, Orangeburg, New York, USA 6 Department of Criminal Psychology, Chinese People’s Public Security University, Beijing, China 7 Department of Psychological and Brain Sciences, Indiana University, Bloomington, USA 8 Child Mind Institute, New York, USA 9 Department of Psychology, Yale University, New Haven, USA 10 Department of Electrical and Computer Engineering, Clinical Imaging Research Centre, N.1 Institute for Health and Memory Networks Program, National University of Singapore, Singapore 11 Department of Physics, Zhejiang University, Hangzhou, China 12 Binzhou Medical University, Yantai, China 13 Donders Institute, Radboud University Medical Centre, Nijmegen, Netherlands 14 Department of Child and Adolescent Psychiatry, Erasmus University, Rotterdam, Netherlands 15 Department of Radiology, Erasmus University Medical Centre, Rotterdam, Netherlands 16 School of Psychology, Southwest University, Chongqing, China 17 Institute for Brain Research and Rehabilitation, South China Normal University, Guangzhou, China 18 Institute of Children Health, Changzhou Children’s Hospital, Changzhou, China 19 School of Education Science, Nanning Normal University, Nanning, China 20 Magnetic Resonance Imaging Research Center, CAS Institute of Psychology, Beijing, China *Corresponding author: Xi-Nian Zuo, PhD, Chinese Academy of Sciences Emails: [email protected] or [email protected] Office/Fax: +86-10-64853798; Cell: +8613810191181 . CC-BY-NC-ND 4.0 International license not certified by peer review) is the author/funder. It is made available under a The copyright holder for this preprint (which was this version posted August 28, 2019. . https://doi.org/10.1101/747352 doi: bioRxiv preprint
Transcript of Generating Templates and Growth Charts for School-Aged ... · school-age brain development....
Generating Templates and Growth Charts for School-Aged Brain Development
Hao-Ming Dong1,2,3, F. Xavier Castellanos4,5, Ning Yang2,3,6, Zhe Zhang1,2,3, Ye
He1,2,3,7, Lei Zhang1,2,3, Ting Xu1,2,3,8, Avram J. Holmes9, B.T. Thomas Yeo10, Feiyan
Chen3,11, Bin Wang3,12, Christian Beckmann13, Tonya White14,15, Olaf Sporns7, Jiang
Qiu3,16, Tingyong Feng16, Antao Chen16, Xun Liu1,2,3, Xu Chen16, Xuchu Weng3,17,
Michael P. Milham5,8, Xi-Nian Zuo1,2,3,17,18,19,20*
1 Department of Psychology, University of Chinese Academy of Sciences (CAS), Beijing, China
2 CAS Key Laboratory of Behavioral Sciences, Institute of Psychology, Beijing, China
3 Research Center for Lifespan Development of Brain and Mind, CAS Institute of Psychology, Beijing,
China
4 Department of Child and Adolescent Psychiatry, New York University School of Medicine, New York,
USA
5 Nathan Kline Institute for Psychiatric Research, Orangeburg, New York, USA
6 Department of Criminal Psychology, Chinese People’s Public Security University, Beijing, China
7 Department of Psychological and Brain Sciences, Indiana University, Bloomington, USA
8 Child Mind Institute, New York, USA
9 Department of Psychology, Yale University, New Haven, USA
10 Department of Electrical and Computer Engineering, Clinical Imaging Research Centre, N.1
Institute for Health and Memory Networks Program, National University of Singapore, Singapore
11 Department of Physics, Zhejiang University, Hangzhou, China
12 Binzhou Medical University, Yantai, China
13 Donders Institute, Radboud University Medical Centre, Nijmegen, Netherlands
14 Department of Child and Adolescent Psychiatry, Erasmus University, Rotterdam, Netherlands
15 Department of Radiology, Erasmus University Medical Centre, Rotterdam, Netherlands
16 School of Psychology, Southwest University, Chongqing, China
17 Institute for Brain Research and Rehabilitation, South China Normal University, Guangzhou, China
18 Institute of Children Health, Changzhou Children’s Hospital, Changzhou, China
19 School of Education Science, Nanning Normal University, Nanning, China
20 Magnetic Resonance Imaging Research Center, CAS Institute of Psychology, Beijing, China
*Corresponding author:
Xi-Nian Zuo, PhD, Chinese Academy of Sciences
Emails: [email protected] or [email protected]
Office/Fax: +86-10-64853798; Cell: +8613810191181
.CC-BY-NC-ND 4.0 International licensenot certified by peer review) is the author/funder. It is made available under aThe copyright holder for this preprint (which wasthis version posted August 28, 2019. . https://doi.org/10.1101/747352doi: bioRxiv preprint
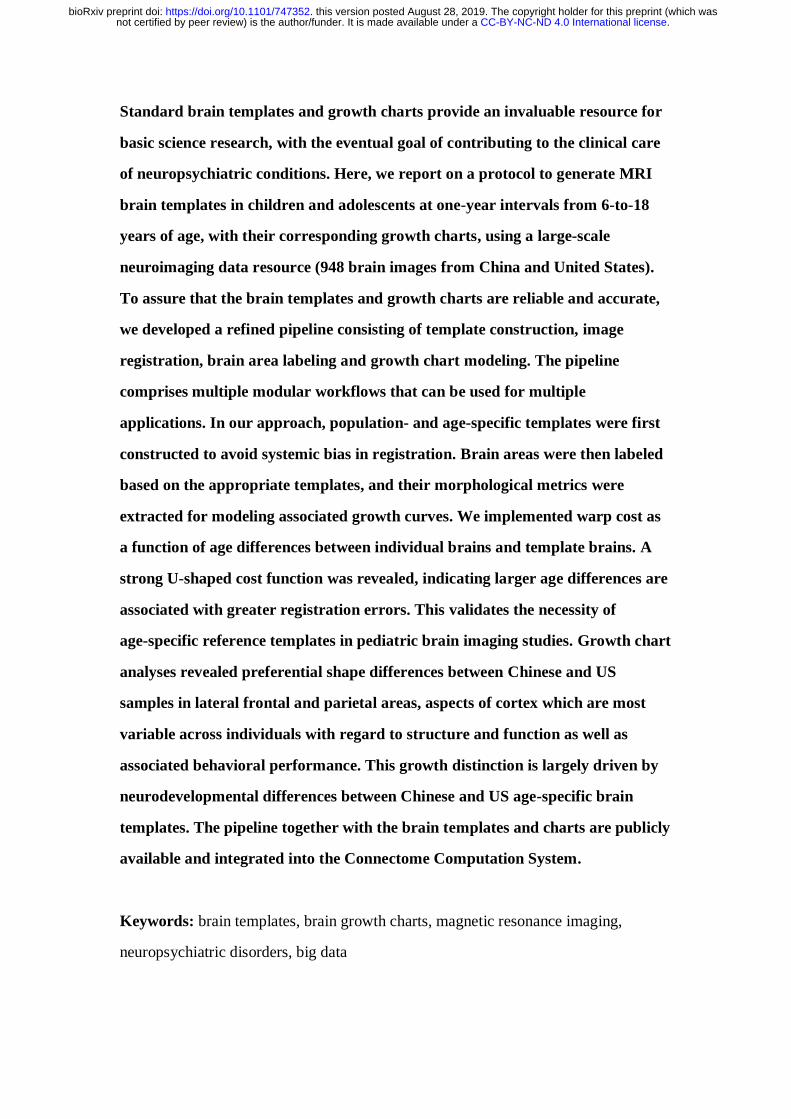
Standard brain templates and growth charts provide an invaluable resource for
basic science research, with the eventual goal of contributing to the clinical care
of neuropsychiatric conditions. Here, we report on a protocol to generate MRI
brain templates in children and adolescents at one-year intervals from 6-to-18
years of age, with their corresponding growth charts, using a large-scale
neuroimaging data resource (948 brain images from China and United States).
To assure that the brain templates and growth charts are reliable and accurate,
we developed a refined pipeline consisting of template construction, image
registration, brain area labeling and growth chart modeling. The pipeline
comprises multiple modular workflows that can be used for multiple
applications. In our approach, population- and age-specific templates were first
constructed to avoid systemic bias in registration. Brain areas were then labeled
based on the appropriate templates, and their morphological metrics were
extracted for modeling associated growth curves. We implemented warp cost as
a function of age differences between individual brains and template brains. A
strong U-shaped cost function was revealed, indicating larger age differences are
associated with greater registration errors. This validates the necessity of
age-specific reference templates in pediatric brain imaging studies. Growth chart
analyses revealed preferential shape differences between Chinese and US
samples in lateral frontal and parietal areas, aspects of cortex which are most
variable across individuals with regard to structure and function as well as
associated behavioral performance. This growth distinction is largely driven by
neurodevelopmental differences between Chinese and US age-specific brain
templates. The pipeline together with the brain templates and charts are publicly
available and integrated into the Connectome Computation System.
Keywords: brain templates, brain growth charts, magnetic resonance imaging,
neuropsychiatric disorders, big data
.CC-BY-NC-ND 4.0 International licensenot certified by peer review) is the author/funder. It is made available under aThe copyright holder for this preprint (which wasthis version posted August 28, 2019. . https://doi.org/10.1101/747352doi: bioRxiv preprint
Introduction
Growth charts are an invaluable resource for enhancing public health. They are
essential for screening the developmental status of individuals and monitoring their
abnormal growth as an early detection tool1. Deviations from normative age-expected
values are used to trigger evaluations for underlying abnormal factors, which can
provide important developmental information to clinicians and parents. Extending this
approach to the evaluation of an individual’s neurodevelopmental status has been
impeded by the lack of reliable growth charts for the human brain. Magnetic
resonance imaging (MRI) is increasingly being employed to map human brain
development. Anatomical MRI (aMRI) can capture developmental changes of brain
morphology2,3, which comprise full-brain geometrical transformations (e.g., cortical
thinning and surface expansion)4,5. For example, changes in cortical thinning
trajectories have been linked with inter-individual differences in IQ in children and
adolescents6. Such developmental effects in brain structure have also been shown to
be detectable across adulthood7 and are supported by brain network studies using
diffusion-weighted (dMRI) and resting-state functional (rfMRI) imaging methods8,9,
providing the framework for quantifying multimodal brain development at the
population level10,11. Although sparse, efforts to translate developmental trajectories
into growth charts have begun to be initiated for neuropsychiatric conditions12-14,
which are believed to have abnormal neurodevelopmental origins15,16.
Despite the promise of developmental population neuroscience, a number of key
.CC-BY-NC-ND 4.0 International licensenot certified by peer review) is the author/funder. It is made available under aThe copyright holder for this preprint (which wasthis version posted August 28, 2019. . https://doi.org/10.1101/747352doi: bioRxiv preprint
issues must be addressed prior to establishing brain growth charts for clinical use.
First, reliability of MRI-based measurements must meet clinical standards on
measurements of individual differences17-19. Core anatomic MRI measures (e.g.,
volume, cortical thickness, surface area) currently meet this standard20, but most
dMRI and rfMRI measures do not due to multiple confounds and substantial random
error21,22. This suggests aMRI-derived measures could provide the bases for
developing reliable imaging markers of clinically useful growth charts. Their high
reliability makes it possible to attain highly valid charts, though of course, does not
guarantee this23. Second, MRI samples of brain development cohorts for building
growth charts are currently limited. Large-scale brain development cohorts are
fundamental for charting growth24-26, but unfortunately obtaining longitudinal
assessments across multiple centers with the same protocols is rare27,28. Previous
studies have demonstrated the necessity of creating growth charts for height, weight
and head circumference for specific populations or countries29, which is likely even
more important for brain growth charts, given the neurodevelopmental diversity likely
arising from differences in ethnicity and culture. Finally, detection of differences
could be biased by using inappropriate analyses performed at the population level. For
example, neuroimaging studies have already documented biases from using generic
brain templates for multiple age ranges30-35, indicating the need of a full range of
age-specific brain templates across school age (6-18 years). Despite the public health
importance of creating normative charts12,36-39, a protocol addressing these issues to
.CC-BY-NC-ND 4.0 International licensenot certified by peer review) is the author/funder. It is made available under aThe copyright holder for this preprint (which wasthis version posted August 28, 2019. . https://doi.org/10.1101/747352doi: bioRxiv preprint
generate brain templates and growth charts for school-age development is lacking.
This protocol was designed to begin to fill this gap. It consists of an integrative
pipeline for generating brain templates and growth charts of children and adolescents.
Volumetric measurements were quantified with aMRI of 674 school-age brains from
two accelerated longitudinal cohorts with the same experimental design obtained in
the United States (Enhanced Nathan Kline Institute Rockland Sample - eNKI
sample)40 and China (Chinese Color Nest Project - CCNP)10,41, respectively. Standard
brain templates were constructed annually for each year of age and serve as a
field-wide resource for generating growth charts on morphological development of
brain tissues, lobes and networks. These brain templates and growth charts were
validated across two cultures to offer an initial normative reference for studies of
school-age brain development.
Development of the protocol
Construction of reliable brain grow charts at the area-level relies heavily on the
accurate localization of brain areas across individuals, i.e., MRI image registration.
Registration is commonly used to automatically label individual images from atlases
defined on standard brain templates. Previous studies33,34,42 have shown two factors
that account for the most variance during template registration, ethnicity and age.
Ethnicity plays a critical role in shaping brain morphology43. For instance, significant
volumetric differences were observed between Chinese and Caucasian adult brain
.CC-BY-NC-ND 4.0 International licensenot certified by peer review) is the author/funder. It is made available under aThe copyright holder for this preprint (which wasthis version posted August 28, 2019. . https://doi.org/10.1101/747352doi: bioRxiv preprint
templates33,42, indicating a rounder global shape and shorter axial distance in Chinese
adults. Dynamic neurodevelopmental factors affect brain maturation, suggesting such
brain morphological differences should also be observable during childhood or
adolescence. Therefore, creating a custom brain template from a homogenous
population has been strongly recommended to improve registration performance44.
However, the desirability of population- and age-specific brain templates for
modeling growth charts has not been prioritized.
In the single exception, group differences in registration errors relating to ethnic
and developmental factors were tested34. However, the utility and generalizability of
their templates was limited by the small sample size (n=138) from a single imaging
site using relatively broad age intervals (2 years). Moreover, the relationship between
registration errors and age in pediatric samples has yet to be examined and quantified.
Thus, to improve the accuracy of brain growth charts, we established a protocol,
i.e., a pipeline consisting of brain template construction, image registration, regional
area labeling and growth chart modeling. In the pipeline, two population- and
age-specific templates (Figure 1) were first constructed to avoid systemic bias in
registration (Institute of Psychology, Chinese Academy of sciences (IPCAS) and
Nathan Kline Institute (NKI) brain templates), then brain areas were automatically
labeled based on the age- and ethnicity-matched templates, and finally their
morphological metrics were extracted for modeling growth charts.
.CC-BY-NC-ND 4.0 International licensenot certified by peer review) is the author/funder. It is made available under aThe copyright holder for this preprint (which wasthis version posted August 28, 2019. . https://doi.org/10.1101/747352doi: bioRxiv preprint
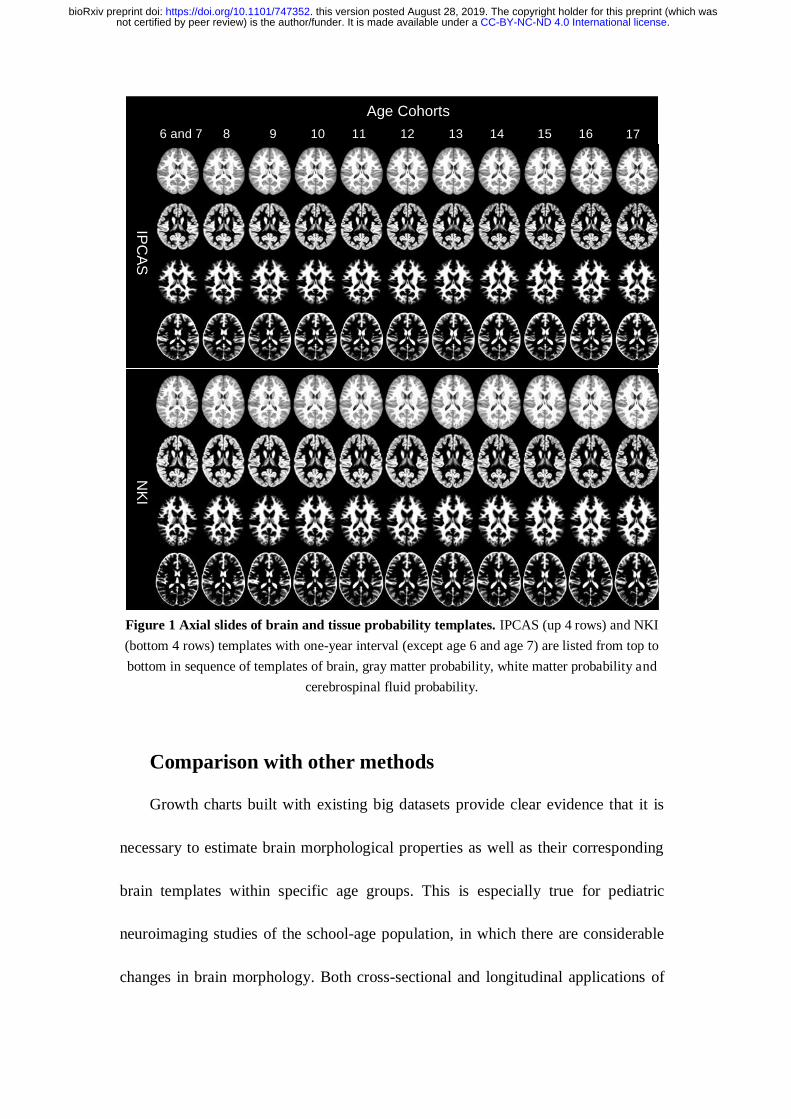
Figure 1 Axial slides of brain and tissue probability templates. IPCAS (up 4 rows) and NKI
(bottom 4 rows) templates with one-year interval (except age 6 and age 7) are listed from top to
bottom in sequence of templates of brain, gray matter probability, white matter probability and
cerebrospinal fluid probability.
Comparison with other methods
Growth charts built with existing big datasets provide clear evidence that it is
necessary to estimate brain morphological properties as well as their corresponding
brain templates within specific age groups. This is especially true for pediatric
neuroimaging studies of the school-age population, in which there are considerable
changes in brain morphology. Both cross-sectional and longitudinal applications of
IPC
AS
NK
I
Age Cohorts
6 and 7 8 9 10 11 12 13 14 15 16 17
.CC-BY-NC-ND 4.0 International licensenot certified by peer review) is the author/funder. It is made available under aThe copyright holder for this preprint (which wasthis version posted August 28, 2019. . https://doi.org/10.1101/747352doi: bioRxiv preprint
growth charts are facilitated by choosing proper templates, where the typical value is
delivering valid atlas information, i.e., defining regional areas in individual brains.
Previous studies have demonstrated that different ages and ethnicities increase
the deformation costs associated with morphing anatomical regions between
individual brains, which if done poorly, can result in mismatches in brain
segmentation tissue profiles33,34. This is supported by our findings that even with an
identical brain atlas, morphological metrics can differ substantially when registered
to different brain templates. Ideally, these metrics should be identical. In practice,
the method with lower registration errors or costs is preferred.
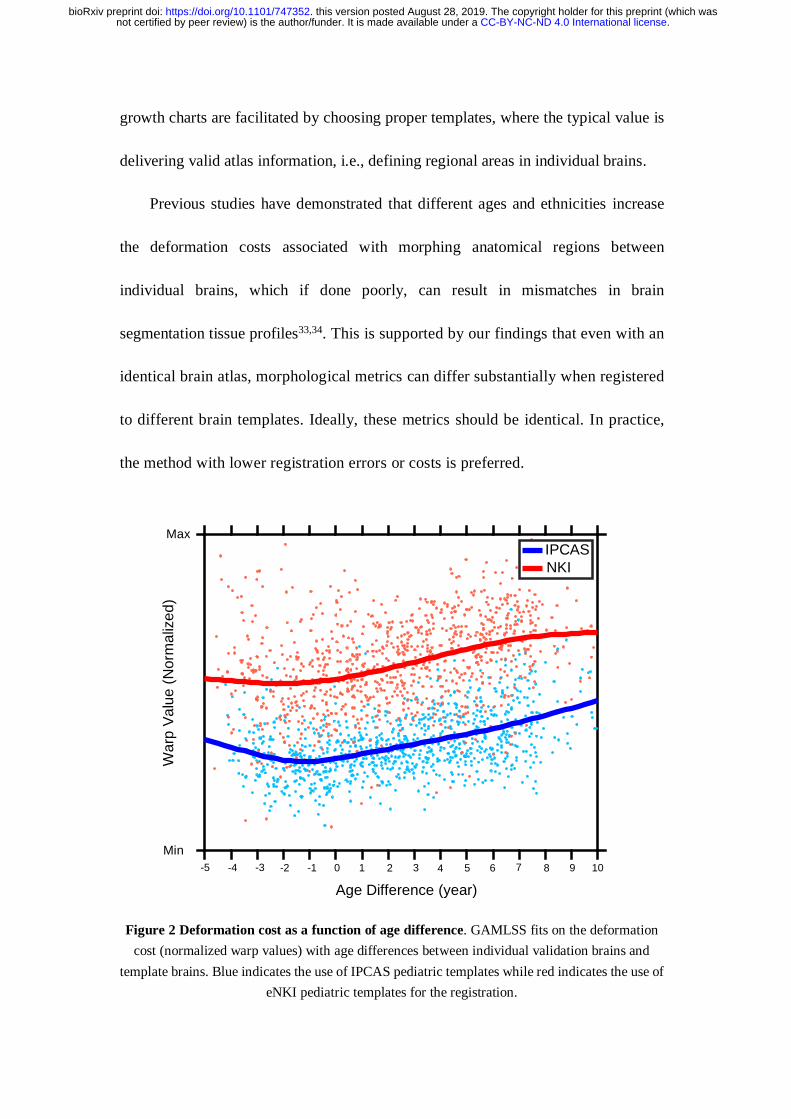
Figure 2 Deformation cost as a function of age difference. GAMLSS fits on the deformation
cost (normalized warp values) with age differences between individual validation brains and
template brains. Blue indicates the use of IPCAS pediatric templates while red indicates the use of
eNKI pediatric templates for the registration.
IPCAS
NKI
-5 -4 -3 -2 -1 0 1 2 3 4 5 6 7 8 9 10
IPCAS
NKI
Wa
rp V
alu
e (
Norm
aliz
ed
)
Max
Min
Age Difference (year)
.CC-BY-NC-ND 4.0 International licensenot certified by peer review) is the author/funder. It is made available under aThe copyright holder for this preprint (which wasthis version posted August 28, 2019. . https://doi.org/10.1101/747352doi: bioRxiv preprint
As demonstrated in Figure 2, we observed that registration costs were related to
national origin and stage of development. This was particularly well illustrated by
using age-specific brain templates for the longitudinal CCNP and eNKI samples to
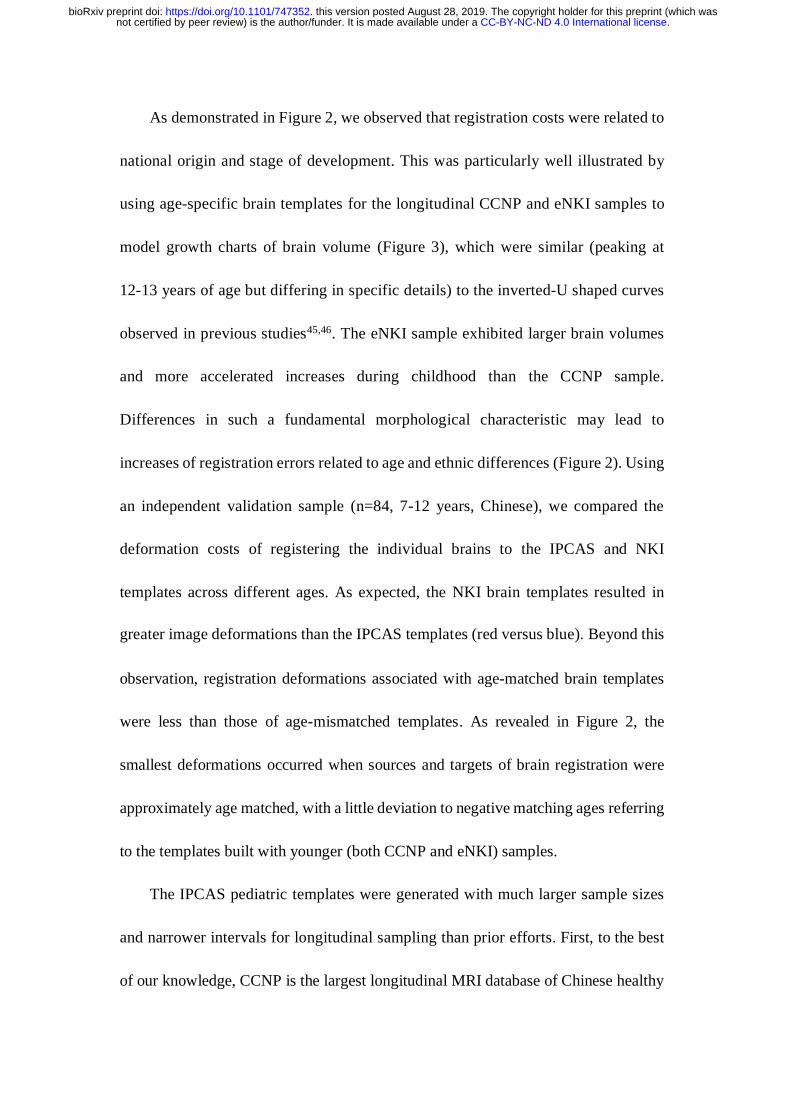
model growth charts of brain volume (Figure 3), which were similar (peaking at
12-13 years of age but differing in specific details) to the inverted-U shaped curves
observed in previous studies45,46. The eNKI sample exhibited larger brain volumes
and more accelerated increases during childhood than the CCNP sample.
Differences in such a fundamental morphological characteristic may lead to
increases of registration errors related to age and ethnic differences (Figure 2). Using
an independent validation sample (n=84, 7-12 years, Chinese), we compared the
deformation costs of registering the individual brains to the IPCAS and NKI
templates across different ages. As expected, the NKI brain templates resulted in
greater image deformations than the IPCAS templates (red versus blue). Beyond this
observation, registration deformations associated with age-matched brain templates
were less than those of age-mismatched templates. As revealed in Figure 2, the
smallest deformations occurred when sources and targets of brain registration were
approximately age matched, with a little deviation to negative matching ages referring
to the templates built with younger (both CCNP and eNKI) samples.
The IPCAS pediatric templates were generated with much larger sample sizes
and narrower intervals for longitudinal sampling than prior efforts. First, to the best
of our knowledge, CCNP is the largest longitudinal MRI database of Chinese healthy
.CC-BY-NC-ND 4.0 International licensenot certified by peer review) is the author/funder. It is made available under aThe copyright holder for this preprint (which wasthis version posted August 28, 2019. . https://doi.org/10.1101/747352doi: bioRxiv preprint
school-age children. The number of scans (n = 674) is nearly 5 times and 13 times
larger than previous studies by Xie et al.34 (n = 138) and Luo et al.32(n = 53),
respectively. Second, the pediatric MRI images were collected from typically
developing children recruited from primary and middle/high schools at three
imaging sites, which are widely distributed in China, making the sample more
representative of the Chinese healthy pediatric population than samples recruited
from clinical sites.
Figure 3 Growth charts of brain tissue volume. Growth charts of Intracranial Volume (ICV),
Gray Matter (GM), White Matter (WM) and Cerebral Spinal Fluid (CSF). The black line is derived
from CCNP samples while the gray line is based on eNKI samples.
CCNP
eNKIeNKI
CCNP
GM
(m
l)
1000
800
600
400
Age (year)
CCNP
eNKI
CCNP
eNKI
6 8 10 12 14 16 18
Age (year)
2000
1800
1600
1400
1200
1000
ICV
(m
l)
6 8 10 12 14 16 18
CCNP
eNKIeNKI
CCNP600
500
400
300
200
CS
F
(ml)
6 8 10 12 14 16 18
Age (year)
CCNP
eNKIeNKI
CCNP
600
500
400
300
700
6 8 10 12 14 16 18
Age (year)
WM
(m
l)
.CC-BY-NC-ND 4.0 International licensenot certified by peer review) is the author/funder. It is made available under aThe copyright holder for this preprint (which wasthis version posted August 28, 2019. . https://doi.org/10.1101/747352doi: bioRxiv preprint
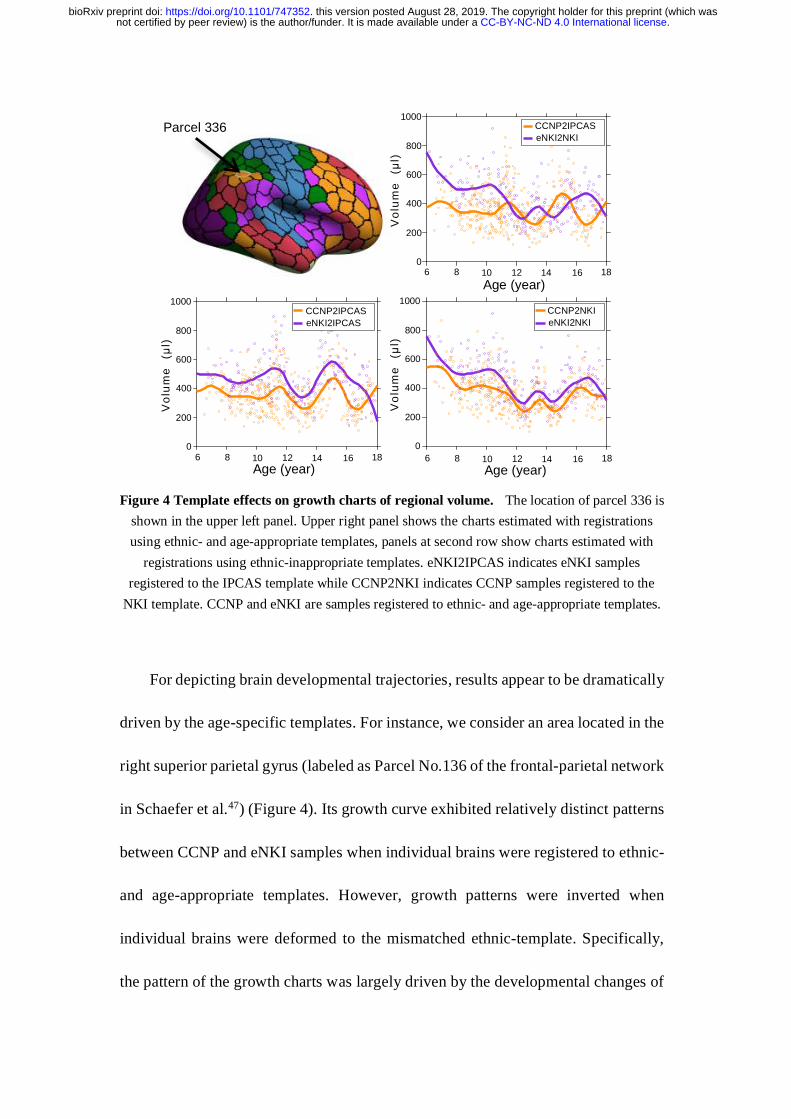
Figure 4 Template effects on growth charts of regional volume. The location of parcel 336 is
shown in the upper left panel. Upper right panel shows the charts estimated with registrations
using ethnic- and age-appropriate templates, panels at second row show charts estimated with
registrations using ethnic-inappropriate templates. eNKI2IPCAS indicates eNKI samples
registered to the IPCAS template while CCNP2NKI indicates CCNP samples registered to the
NKI template. CCNP and eNKI are samples registered to ethnic- and age-appropriate templates.
For depicting brain developmental trajectories, results appear to be dramatically
driven by the age-specific templates. For instance, we consider an area located in the
right superior parietal gyrus (labeled as Parcel No.136 of the frontal-parietal network
in Schaefer et al.47) (Figure 4). Its growth curve exhibited relatively distinct patterns
between CCNP and eNKI samples when individual brains were registered to ethnic-
and age-appropriate templates. However, growth patterns were inverted when
individual brains were deformed to the mismatched ethnic-template. Specifically,
the pattern of the growth charts was largely driven by the developmental changes of
CCNP2IPCAS
eNKI2IPCAS
CCNP2IPCAS
eNKI2IPCAS
1000
800
600
400
200
0
Vo
lum
e
(μl)
6 8 10 12 14 16 18
Age (year)
CCNP2NKI
eNKI2NKI
CCNP2NKI
eNKI2NKI
1000
800
600
400
200
0
Vo
lum
e
(μl)
6 8 10 12 14 16 18
Age (year)
Parcel 336 CCNP2IPCAS
eNKI2NKI
CCNP2IPCAS
eNKI2NKI
6 8 10 12 14 16 18
Age (year)
1000
800
600
400
200
0
Vo
lum
e
(μl)
.CC-BY-NC-ND 4.0 International licensenot certified by peer review) is the author/funder. It is made available under aThe copyright holder for this preprint (which wasthis version posted August 28, 2019. . https://doi.org/10.1101/747352doi: bioRxiv preprint
the employed brain templates. The observation that extraction of the areal metric
largely depended on the target templates used for registration held generally across
the whole brain.
Use of ethnic- and age-specific brain templates have not been used in previous
developmental studies. This is partially because small samples are insufficient to
construct such templates and few developmental studies have focused on such areal
scales (small parcels)47. In the present protocol, we showed that for growth chart
modeling, use of improper brain templates would unexpectedly and substantially
distort the estimations of underlying morphological development, making
conclusions questionable.
Applications of the method
For a growing number of longitudinal neuroimaging cohort studies across the
globe in recent years24-28,40,41, identification of typical developmental patterns is one of
the primary research targets. The absence of a standard protocol impedes
generalization between ethnic backgrounds, imaging settings and data processing
procedures. This protocol was initially designed for generating validated and
accurate growth charts but is not limited to only this application. Any MRI study that
focuses on group-level information of individual brains would result in better
precision by applying proper brain templates, especially for interracial and
developmental research in which large morphological differences are expected
across groups.
.CC-BY-NC-ND 4.0 International licensenot certified by peer review) is the author/funder. It is made available under aThe copyright holder for this preprint (which wasthis version posted August 28, 2019. . https://doi.org/10.1101/747352doi: bioRxiv preprint
Limitation and future work
Several limitations must be considered regarding the application of pediatric
templates and the interpretation of growth charts. The proportion of males and
females was balanced in most age groups except the 15-, 16- and 17-year-old age
groups. Given previously reported sex differences in brain development46,48,49,
constructing sex-specific templates in the future would be desirable. Many factors
can affect the construction of pediatric growth charts, including the data
preprocessing pipeline48, modeling methods10, and site effects50. Dynamic
developmental trajectories might be confounded by image registration errors if
inappropriate brain templates are employed. The construction of age-specific brain
templates and developmental trajectories or growth charts should be performed in
tandem. Finally, the age intervals used to define templates in the present studies
were defined provisionally due to the lack of more detailed evidence on brain
development. Nonetheless, the age-specific brain templates generated in the current
study can facilitate the estimation of more precise changes in human brain
morphology during development. Regional volume was employed in this protocol to
demonstrate age and ethnicity effects on brain templates and growth charts. It is an
interesting topic to investigate how such effects can be generalized to other metrics
of human brain morphometry (see reference51 for a review).
Overview of the procedure
.CC-BY-NC-ND 4.0 International licensenot certified by peer review) is the author/funder. It is made available under aThe copyright holder for this preprint (which wasthis version posted August 28, 2019. . https://doi.org/10.1101/747352doi: bioRxiv preprint
We developed a pipeline to construct age-specific brain templates and brain
growth charts together. Specifically, using a large neuroimaging dataset of Chinese
pediatric brain images, we demonstrate for the first time that greater age mismatching
of templates introduces larger registration deformations. Further, these age-specific
templates can improve the accuracy of image registration between individual pediatric
structural brain images, thereby facilitating more reliable and accurate human brain
mapping studies in healthy and clinical pediatric populations. By modeling growth
charts, we found that differences across western and eastern samples were decreased
when examined at large-scale levels, including tissue classes of brain lobe volumes.
At more fine-grained levels of spatial resolution, ethnic differences in cortical surface
area indices became markers, particularly in association cortex, which exhibits greater
flexibility, morphological variability and hemispheric asymmetry52.
Experimental Design
To chart brain growth models, we developed a standard pipeline consisting of
customized brain template construction, robust imaging registration and growth chart
estimation. Ethnicity and age are the two major variables addressed in this work. For
the first two of these steps, we examined a 2 (ethnic levels, CCNP vs. eNKI) × 11 (age
levels) within-subject design to test template effects in registration. The 11 age levels
ranged from 6 to 17 years old; with ages 6 and 7 combined into one group due to
increase sample size (the sample size per age group can be found in Materials). This
.CC-BY-NC-ND 4.0 International licensenot certified by peer review) is the author/funder. It is made available under aThe copyright holder for this preprint (which wasthis version posted August 28, 2019. . https://doi.org/10.1101/747352doi: bioRxiv preprint
generated 22 ethnicity- and age- specific templates. Individual brain images from a
validation dataset were then registered to these 22 templates, with 22 corresponding
registration deformations calculated for each subject. Previous studies applied
group-level comparisons in which registrations were divided into appropriate and
inappropriate groups for estimating the template effects, with paired T tests or
variance analysis performed to assess ethnicity differences in template registration31.
We believe that between-group comparisons are insufficient for revealing age effects
in registration cost, especially for age-ranges spanning from childhood to adolescence.
Hence, we used continuous age differences instead of a categorical age group variable
to model developmental changes. Finally, two curves, corresponding to the ethnicity
factors (CCNP vs. eNKI), with age difference as an independent variable and
deformation value as the dependent variable, were modeled to show ethnicity and age
effects.
For modeling the growth charts of brain morphological metrics, the ethnicity
factor was considered as potentially a confounding variable. Due to the lack of
ethnic-specific templates in the past, the MNI template has been usually utilized as the
default. To test how an ethnicity-unspecific template affects morphological estimation,
we performed a 2 × 2 mixed design with ethnicity as the between-group factor (CCNP
vs. eNKI) and appropriateness as the within-group factor (brain images registered to
ethnic-matched and ethnic-mismatched templates). Two registrations were performed
for each participant. For a child from the CCNP sample, ethnicity-appropriate
.CC-BY-NC-ND 4.0 International licensenot certified by peer review) is the author/funder. It is made available under aThe copyright holder for this preprint (which wasthis version posted August 28, 2019. . https://doi.org/10.1101/747352doi: bioRxiv preprint
registration refers to using an IPCAS age-appropriate template while
ethnicity-inappropriate refers to using an NKI age-appropriate template, and similarly
for participants in the eNKI sample. The 400-unit areal parcellation (in MNI space)47
was extracted based on the above two registrations for each subject and their growth
charts were modeled, generating four growth charts (gc) for each brain area: 1)
CCNP-gc (CCNP samples registered to the IPCAS templates), 2) eNKI-gc (eNKI
samples registered to the NKI template), 3) CCNP2NKI-gc (CCNP samples registered
to the NKI template), 4) eNKI2IPCAS-gc (eNKI samples registered to the IPCAS
template). We hypothesized that the former two charts would be more appropriate
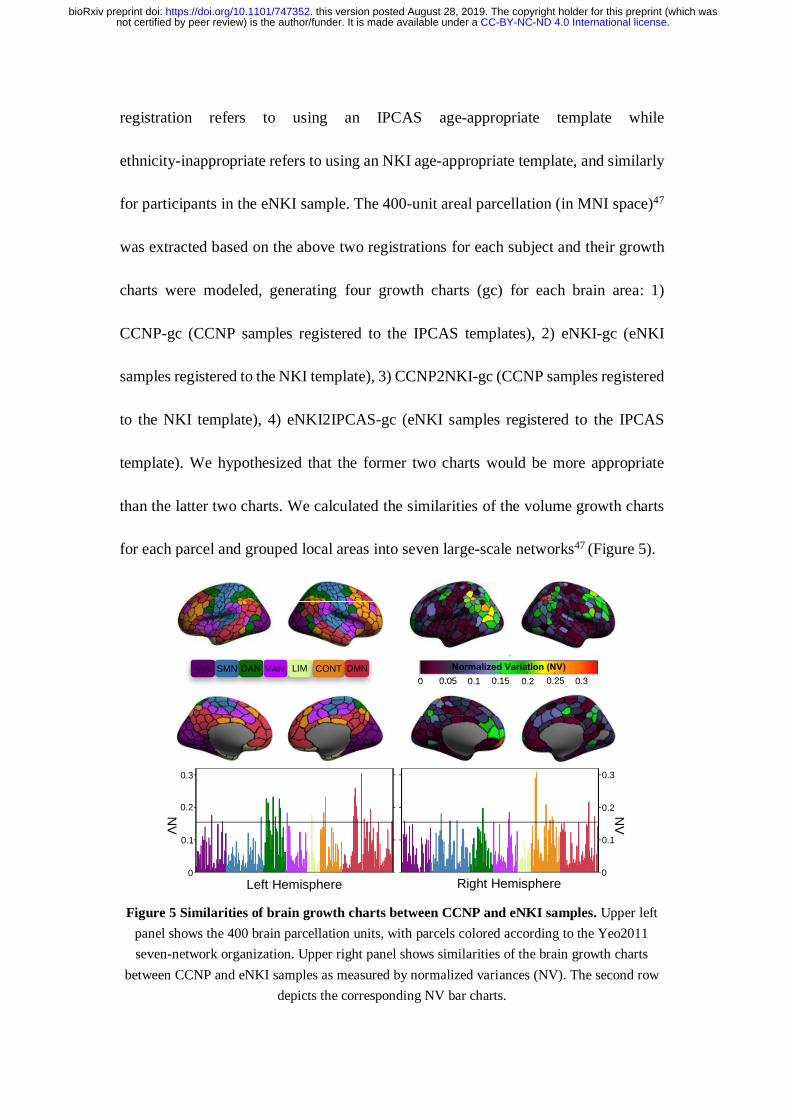
than the latter two charts. We calculated the similarities of the volume growth charts
for each parcel and grouped local areas into seven large-scale networks47 (Figure 5).
Figure 5 Similarities of brain growth charts between CCNP and eNKI samples. Upper left
panel shows the 400 brain parcellation units, with parcels colored according to the Yeo2011
seven-network organization. Upper right panel shows similarities of the brain growth charts
between CCNP and eNKI samples as measured by normalized variances (NV). The second row
depicts the corresponding NV bar charts.
0.3
0.2
0.1
0
0.3
0.2
0.1
0
Left Hemisphere Right Hemisphere
0 0.05 0.1 0.15 0.2 0.25 0.3
VIS SMN DAN VAN LIM CONT DMN
NV
Normalized Variation (NV)
NV
.CC-BY-NC-ND 4.0 International licensenot certified by peer review) is the author/funder. It is made available under aThe copyright holder for this preprint (which wasthis version posted August 28, 2019. . https://doi.org/10.1101/747352doi: bioRxiv preprint
Materials
Equipment
Software
A computer with Linux or Unix environment or MAC OS pre-installed and with
Bash shell scripting is required to run the algorithm.
Neuroimaging processing software included:
FSL (http://fsl.fmrib.ox.ac.uk/fsl/fslwiki/FslInstallation)53
ANTs (http://stnava.github.io/ANTs)54
volBrain (http://volbrain.upv.es)55
Statistical software R with the GAMLSS56 package installed for growth chart
modeling.
Template construction
Participants
MRI scans (n=774) were collected from 496 school-age (age range 6-18 years)
typically developing children (TDC) of the Chinese Han population at three brain
imaging sites. The final dataset passing quality control procedures consisted of the
SWU413 sample41 (196 TDC scanned at the Faculty of Psychology, Southwest
University in Chongqing), the SMU130 sample57 (130 TDC scanned at the First
Hospital of Shanxi Medical University in Taiyuan) and the PKU131 sample58-60 (131
TDC obtained from the Beijing site of ADHD200 sample shared via the International
.CC-BY-NC-ND 4.0 International licensenot certified by peer review) is the author/funder. It is made available under aThe copyright holder for this preprint (which wasthis version posted August 28, 2019. . https://doi.org/10.1101/747352doi: bioRxiv preprint
Data-sharing Initiative). Specifically, the SWU413 dataset was acquired as a trial
stage implementation of the developmental phase of the Chinese Color Nest Project
(CCNP-SWU413)10, which is a five-year accelerated longitudinal study designed to
delineate normative trajectories of brain development of Chinese children41. The age
and sex distributions of overall MRI scans for the three samples are listed in Table 1.
For the enhanced NKI (eNKI) Rockland Sample40, a total of 561 scans were
collected from 323 school-aged children. After the same quality control procedure
applied for CCNP samples, a total of 190 scans from 133 TDC were included for our
final analyses. Of note, CCNP and eNKI datasets both are accelerated longitudinal
designs, were initially designed with matched age span and imaging resolution.
Participants in the CCNP and eNKI sample who had a history of neurological or
mental disorder, family history of such disorders, organic brain diseases, physical
contraindication to MRI scanning, a total Child Behavior Checklist (CBCL) T-score
higher than 70, or a Wechsler Intelligence Scale for Children IQ standard score lower
than 80 were excluded.
CCNP and eNKI projects obtained the Institutional Review Board approval from
IPCAS and NKI respectively. Written informed assent and consent were obtained
from both participants and their parents/guardians. The details of the other samples
can be found in previous reports57-59. According to the matched age and imaging
resolution as well as the identical experimental design (Table 2 and Figure 6), both
CCNP-SWU413 and eNKI samples were employed for the growth chart modeling.
.CC-BY-NC-ND 4.0 International licensenot certified by peer review) is the author/funder. It is made available under aThe copyright holder for this preprint (which wasthis version posted August 28, 2019. . https://doi.org/10.1101/747352doi: bioRxiv preprint
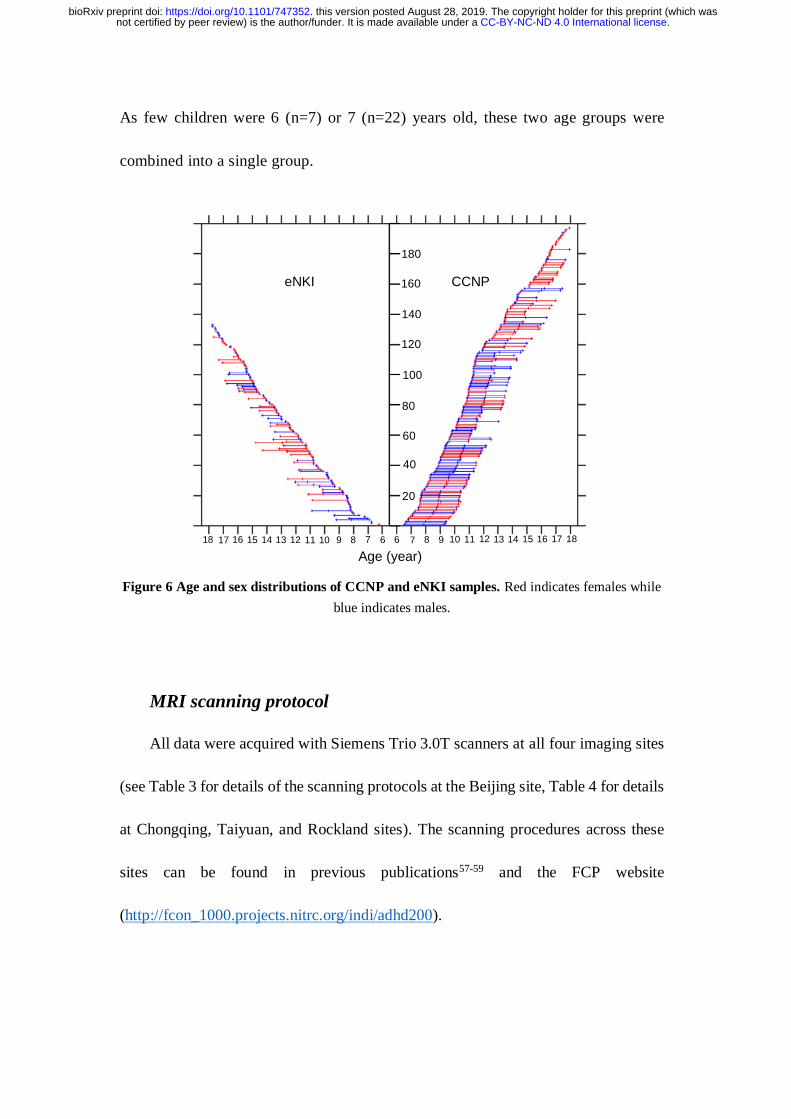
As few children were 6 (n=7) or 7 (n=22) years old, these two age groups were
combined into a single group.
Figure 6 Age and sex distributions of CCNP and eNKI samples. Red indicates females while
blue indicates males.
MRI scanning protocol
All data were acquired with Siemens Trio 3.0T scanners at all four imaging sites
(see Table 3 for details of the scanning protocols at the Beijing site, Table 4 for details
at Chongqing, Taiyuan, and Rockland sites). The scanning procedures across these
sites can be found in previous publications57-59 and the FCP website
(http://fcon_1000.projects.nitrc.org/indi/adhd200).
180
160
140
120
100
80
60
40
20
18 17 16 15 14 13 12 11 10 9 8 7 6 6 7 8 9 10 11 12 13 14 15 16 17 18
eNKI CCNP
Age (year)
.CC-BY-NC-ND 4.0 International licensenot certified by peer review) is the author/funder. It is made available under aThe copyright holder for this preprint (which wasthis version posted August 28, 2019. . https://doi.org/10.1101/747352doi: bioRxiv preprint
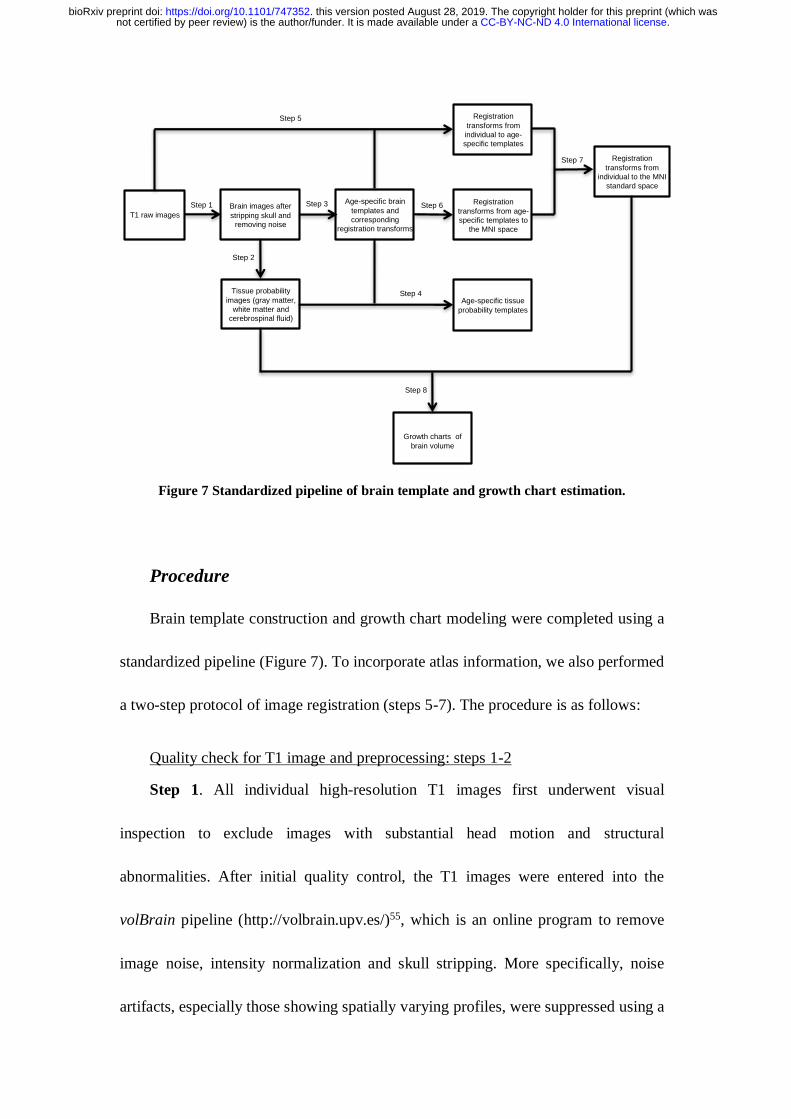
Figure 7 Standardized pipeline of brain template and growth chart estimation.
Procedure
Brain template construction and growth chart modeling were completed using a
standardized pipeline (Figure 7). To incorporate atlas information, we also performed
a two-step protocol of image registration (steps 5-7). The procedure is as follows:
Quality check for T1 image and preprocessing: steps 1-2
Step 1. All individual high-resolution T1 images first underwent visual
inspection to exclude images with substantial head motion and structural
abnormalities. After initial quality control, the T1 images were entered into the
volBrain pipeline (http://volbrain.upv.es/)55, which is an online program to remove
image noise, intensity normalization and skull stripping. More specifically, noise
artifacts, especially those showing spatially varying profiles, were suppressed using a
T1 raw images
Brain images after
stripping skull and
removing noise
Step 1
Step 2
Step 3 Age-specific brain
templates and
corresponding
registration transforms
Step 4Tissue probability
images (gray matter,
white matter and
cerebrospinal fluid)
Age-specific tissue
probability templates
Step 5 Registration
transforms from
individual to age-
specific templates
Registration
transforms from age-
specific templates to
the MNI space
Step 6
Step 7 Registration
transforms from
individual to the MNI
standard space
Growth charts of
brain volume
Step 8
.CC-BY-NC-ND 4.0 International licensenot certified by peer review) is the author/funder. It is made available under aThe copyright holder for this preprint (which wasthis version posted August 28, 2019. . https://doi.org/10.1101/747352doi: bioRxiv preprint
highly effective filter with spatially adaptive nonlocal means (SANLM)61,62. Initial
image inhomogeneity correction was performed using N4 bias correction63. Next,
the individual images were transformed to the MNI152 standard template space using
advanced normalization tools (ANTs) with a linear transformation64 and further
processed by fine correction of image inhomogeneity to improve image quality65. A
piecewise linear mapping of image intensity66 was performed to normalize the
intensities of gray matter (GM), white matter (WM), and cerebrospinal fluid (CSF) to
mean intensities of 150, 250 and 50, respectively. This procedure was implemented
to eliminate the effect of site on MRI signals and to improve brain extraction and
skull stripping. Brain extraction was implemented using the nonlocal intracranial
cavity extraction (NICE) algorithm67, which is an evolution of brain extraction based
on the nonlocal segmentation technique (BEaST)68. NICE was built based on a
multi-atlas label fusion strategy and a library of segmentation priors (pediatric dataset:
age = 24.8 ± 2.4 months; normal adult dataset: age = 24 - 75 years) required for
intracranial cavity labeling and has been demonstrated to outperform other skull
stripping methods.
The above brain extraction was visually inspected to detect misclassification of
tissues. If brain tissue was excluded from the segmentation, the brain mask was
manually edited to ensure the quality of the brain extraction. To further check image
quality, the signal-to-noise ratio (SNR), the contrast-to-noise ratio (CNR), the GM
SNR and the WM SNR were computed for each image as described in reference69.
.CC-BY-NC-ND 4.0 International licensenot certified by peer review) is the author/funder. It is made available under aThe copyright holder for this preprint (which wasthis version posted August 28, 2019. . https://doi.org/10.1101/747352doi: bioRxiv preprint
Specifically, the SNR was calculated as the mean signal within the brain tissue
divided by the standard deviation of the air signal. The GM SNR and the WM SNR
were calculated as the SNR within the GM and WM tissue, respectively. The CNR
was calculated as the mean GM intensity minus the mean WM intensity divided by the
standard deviation of the air intensity. Any image with any of these quantitative
metrics below the 1st percentile was discarded. All the above steps were implemented
as part of the Connectome Computation System (CCS) shared via GitHub70.
Step 2. To obtain probability tissue maps of individual brains, we segmented all
individual brain images into GM, WM and CSF using the FSL FAST algorithm
without settings of any prior probability maps71. Partial volume maps derived from
FAST were used to estimate the proportion of a specific tissue within a voxel,
measuring the tissue’s probability to construct tissue probability templates.
Intracranial volume (ICV) was the number of all the voxels in the brain mask.
Example FAST command for tissue classification:
fast -n 3 -g -b -o <individual_pve> -p <input brain image>
Brain template construction: steps 3-4
Step 3. The brain template construction pipeline in ANTs was employed to build
the pediatric brain templates. This pipeline requires no prior information for template
construction72 and has been applied to the pediatric sample previously73. It is capable
of extracting population-level representative images of the brain and other tissues
.CC-BY-NC-ND 4.0 International licensenot certified by peer review) is the author/funder. It is made available under aThe copyright holder for this preprint (which wasthis version posted August 28, 2019. . https://doi.org/10.1101/747352doi: bioRxiv preprint
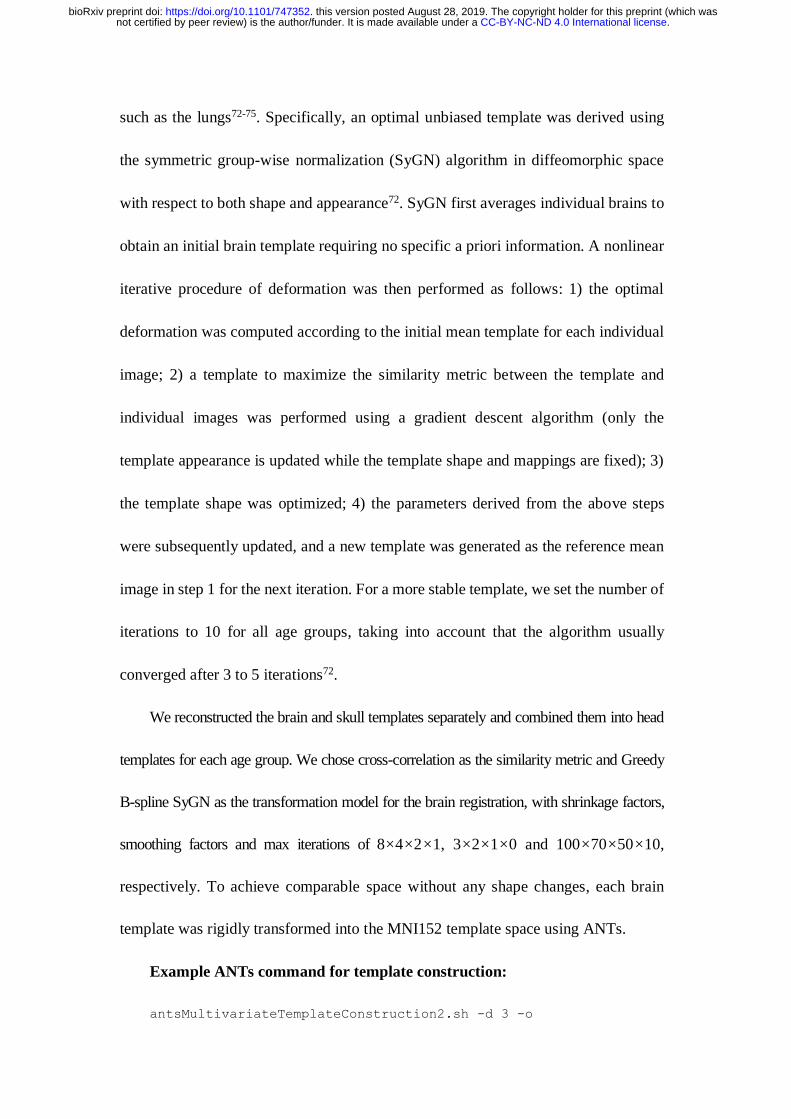
such as the lungs72-75. Specifically, an optimal unbiased template was derived using
the symmetric group-wise normalization (SyGN) algorithm in diffeomorphic space
with respect to both shape and appearance72. SyGN first averages individual brains to
obtain an initial brain template requiring no specific a priori information. A nonlinear
iterative procedure of deformation was then performed as follows: 1) the optimal
deformation was computed according to the initial mean template for each individual
image; 2) a template to maximize the similarity metric between the template and
individual images was performed using a gradient descent algorithm (only the
template appearance is updated while the template shape and mappings are fixed); 3)
the template shape was optimized; 4) the parameters derived from the above steps
were subsequently updated, and a new template was generated as the reference mean
image in step 1 for the next iteration. For a more stable template, we set the number of
iterations to 10 for all age groups, taking into account that the algorithm usually
converged after 3 to 5 iterations72.
We reconstructed the brain and skull templates separately and combined them into head
templates for each age group. We chose cross-correlation as the similarity metric and Greedy
B-spline SyGN as the transformation model for the brain registration, with shrinkage factors,
smoothing factors and max iterations of 8×4×2×1, 3×2×1×0 and 100×70×50×10,
respectively. To achieve comparable space without any shape changes, each brain
template was rigidly transformed into the MNI152 template space using ANTs.
Example ANTs command for template construction:
antsMultivariateTemplateConstruction2.sh -d 3 -o
.CC-BY-NC-ND 4.0 International licensenot certified by peer review) is the author/funder. It is made available under aThe copyright holder for this preprint (which wasthis version posted August 28, 2019. . https://doi.org/10.1101/747352doi: bioRxiv preprint
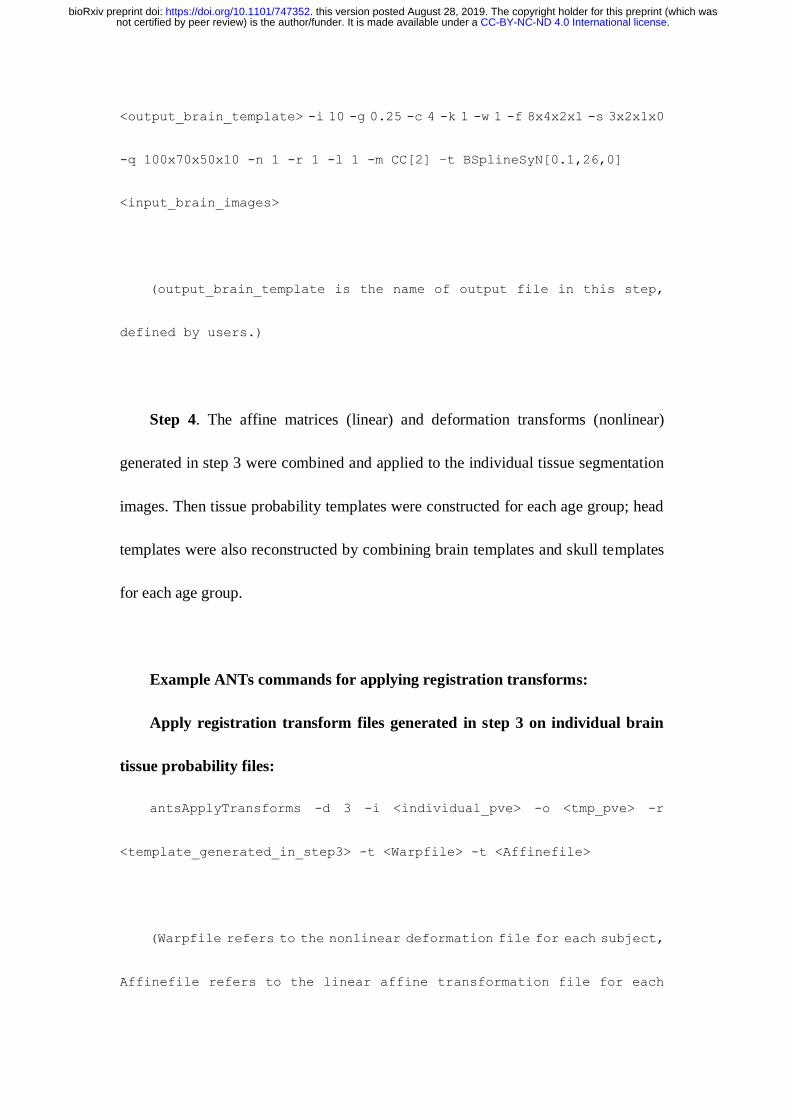
<output_brain_template> -i 10 -g 0.25 -c 4 -k 1 -w 1 -f 8x4x2x1 -s 3x2x1x0
-q 100x70x50x10 -n 1 -r 1 -l 1 -m CC[2] –t BSplineSyN[0.1,26,0]
<input_brain_images>
(output_brain_template is the name of output file in this step,
defined by users.)
Step 4. The affine matrices (linear) and deformation transforms (nonlinear)
generated in step 3 were combined and applied to the individual tissue segmentation
images. Then tissue probability templates were constructed for each age group; head
templates were also reconstructed by combining brain templates and skull templates
for each age group.
Example ANTs commands for applying registration transforms:
Apply registration transform files generated in step 3 on individual brain
tissue probability files:
antsApplyTransforms -d 3 -i <individual_pve> -o <tmp_pve> -r
<template_generated_in_step3> -t <Warpfile> -t <Affinefile>
(Warpfile refers to the nonlinear deformation file for each subject,
Affinefile refers to the linear affine transformation file for each
.CC-BY-NC-ND 4.0 International licensenot certified by peer review) is the author/funder. It is made available under aThe copyright holder for this preprint (which wasthis version posted August 28, 2019. . https://doi.org/10.1101/747352doi: bioRxiv preprint
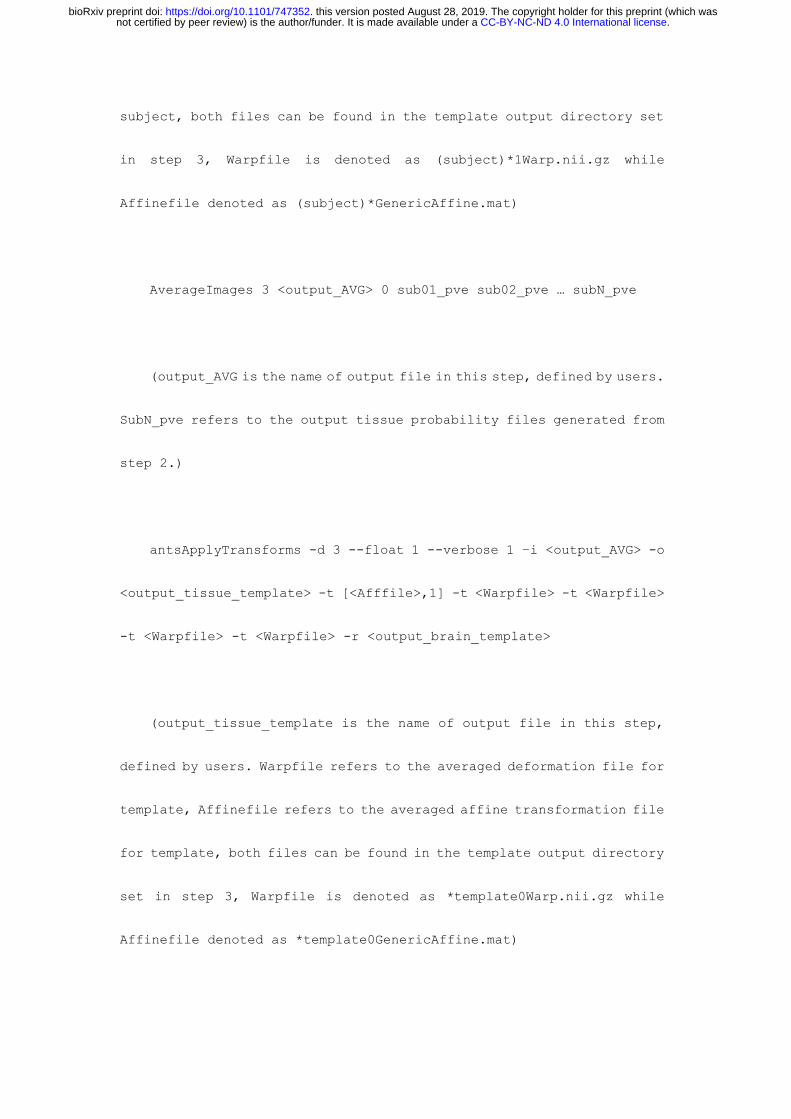
subject, both files can be found in the template output directory set
in step 3, Warpfile is denoted as (subject)*1Warp.nii.gz while
Affinefile denoted as (subject)*GenericAffine.mat)
AverageImages 3 <output_AVG> 0 sub01_pve sub02_pve … subN_pve
(output_AVG is the name of output file in this step, defined by users.
SubN_pve refers to the output tissue probability files generated from
step 2.)
antsApplyTransforms -d 3 --float 1 --verbose 1 –i <output_AVG> -o
<output_tissue_template> -t [<Afffile>,1] -t <Warpfile> -t <Warpfile>
-t <Warpfile> -t <Warpfile> -r <output_brain_template>
(output_tissue_template is the name of output file in this step,
defined by users. Warpfile refers to the averaged deformation file for
template, Affinefile refers to the averaged affine transformation file
for template, both files can be found in the template output directory
set in step 3, Warpfile is denoted as *template0Warp.nii.gz while
Affinefile denoted as *template0GenericAffine.mat)
.CC-BY-NC-ND 4.0 International licensenot certified by peer review) is the author/funder. It is made available under aThe copyright holder for this preprint (which wasthis version posted August 28, 2019. . https://doi.org/10.1101/747352doi: bioRxiv preprint
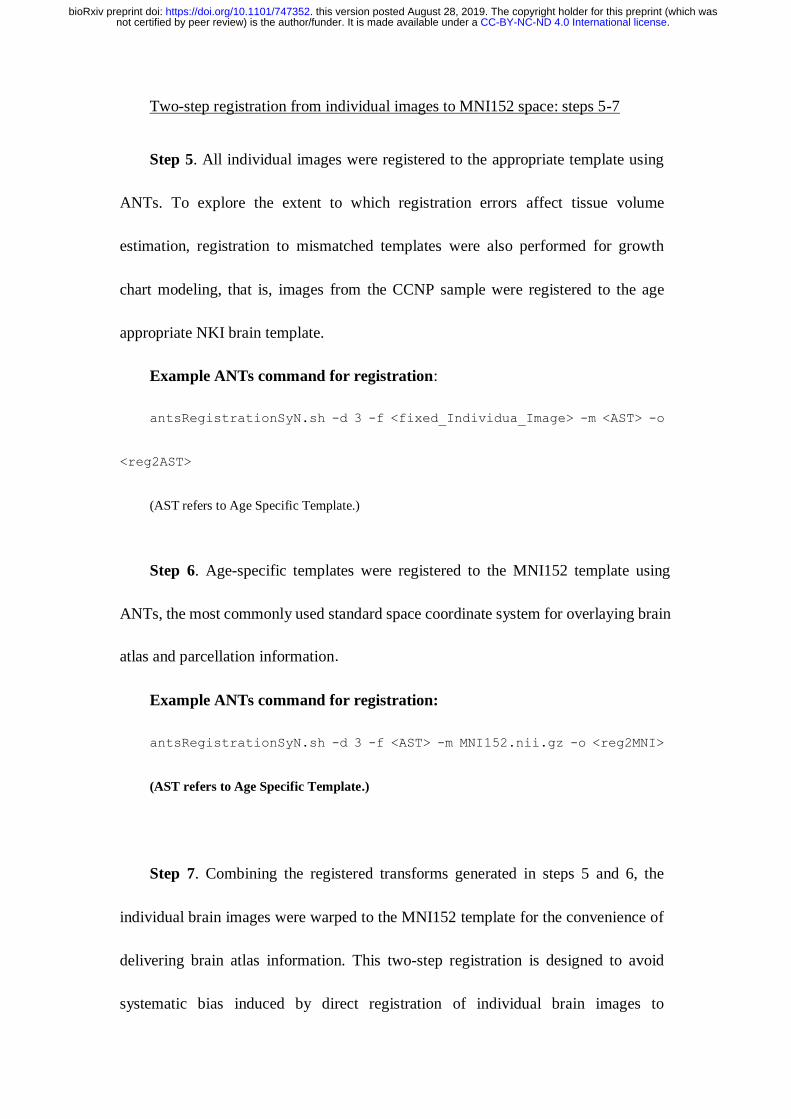
Two-step registration from individual images to MNI152 space: steps 5-7
Step 5. All individual images were registered to the appropriate template using
ANTs. To explore the extent to which registration errors affect tissue volume
estimation, registration to mismatched templates were also performed for growth
chart modeling, that is, images from the CCNP sample were registered to the age
appropriate NKI brain template.
Example ANTs command for registration:
antsRegistrationSyN.sh -d 3 -f <fixed_Individua_Image> -m <AST> -o
<reg2AST>
(AST refers to Age Specific Template.)
Step 6. Age-specific templates were registered to the MNI152 template using
ANTs, the most commonly used standard space coordinate system for overlaying brain
atlas and parcellation information.
Example ANTs command for registration:
antsRegistrationSyN.sh -d 3 -f <AST> -m MNI152.nii.gz -o <reg2MNI>
(AST refers to Age Specific Template.)
Step 7. Combining the registered transforms generated in steps 5 and 6, the
individual brain images were warped to the MNI152 template for the convenience of
delivering brain atlas information. This two-step registration is designed to avoid
systematic bias induced by direct registration of individual brain images to
.CC-BY-NC-ND 4.0 International licensenot certified by peer review) is the author/funder. It is made available under aThe copyright holder for this preprint (which wasthis version posted August 28, 2019. . https://doi.org/10.1101/747352doi: bioRxiv preprint
mismatched age- and Chinese-specific brain templates while maintaining the integrity
of the brain atlas information as much as possible.
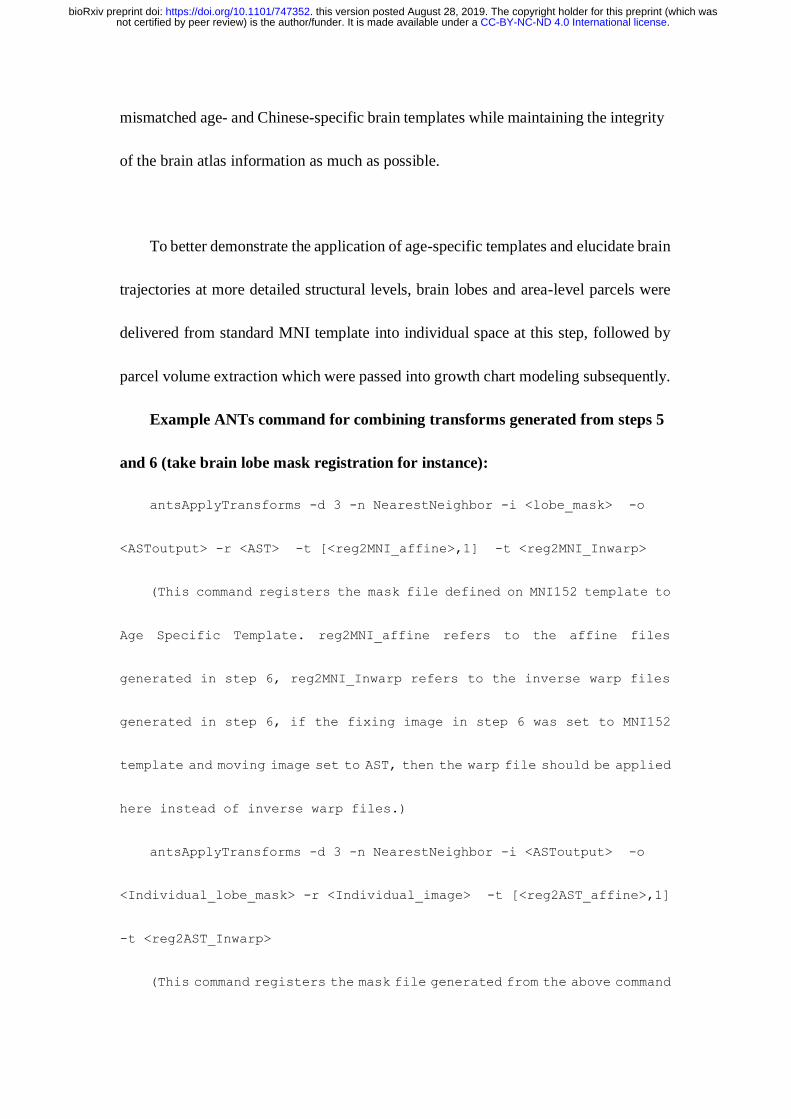
To better demonstrate the application of age-specific templates and elucidate brain
trajectories at more detailed structural levels, brain lobes and area-level parcels were
delivered from standard MNI template into individual space at this step, followed by
parcel volume extraction which were passed into growth chart modeling subsequently.
Example ANTs command for combining transforms generated from steps 5
and 6 (take brain lobe mask registration for instance):
antsApplyTransforms -d 3 -n NearestNeighbor -i <lobe_mask> -o
<ASToutput> -r <AST> -t [<reg2MNI_affine>,1] -t <reg2MNI_Inwarp>
(This command registers the mask file defined on MNI152 template to
Age Specific Template. reg2MNI_affine refers to the affine files
generated in step 6, reg2MNI_Inwarp refers to the inverse warp files
generated in step 6, if the fixing image in step 6 was set to MNI152
template and moving image set to AST, then the warp file should be applied
here instead of inverse warp files.)
antsApplyTransforms -d 3 -n NearestNeighbor -i <ASToutput> -o
<Individual_lobe_mask> -r <Individual_image> -t [<reg2AST_affine>,1]
-t <reg2AST_Inwarp>
(This command registers the mask file generated from the above command
.CC-BY-NC-ND 4.0 International licensenot certified by peer review) is the author/funder. It is made available under aThe copyright holder for this preprint (which wasthis version posted August 28, 2019. . https://doi.org/10.1101/747352doi: bioRxiv preprint
to individual image. reg2AST_affine refers to the affine files generated
in step 5, reg2AST_Inwarp refers to the inverse warp files generated in
step 5, if the fixing image in step 5 was set to Age Specific template
and moving image set to individual image, then the warp file should be
applied here instead of inverse warp files.)
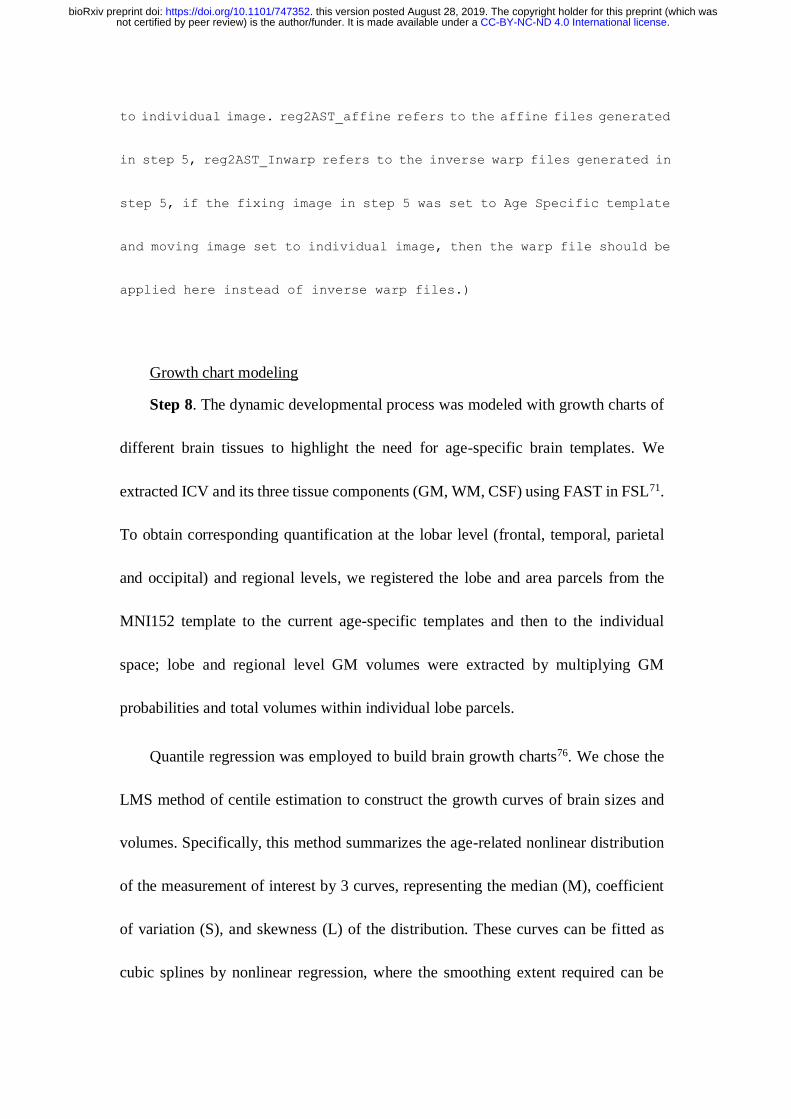
Growth chart modeling
Step 8. The dynamic developmental process was modeled with growth charts of
different brain tissues to highlight the need for age-specific brain templates. We
extracted ICV and its three tissue components (GM, WM, CSF) using FAST in FSL71.
To obtain corresponding quantification at the lobar level (frontal, temporal, parietal
and occipital) and regional levels, we registered the lobe and area parcels from the
MNI152 template to the current age-specific templates and then to the individual
space; lobe and regional level GM volumes were extracted by multiplying GM
probabilities and total volumes within individual lobe parcels.
Quantile regression was employed to build brain growth charts76. We chose the
LMS method of centile estimation to construct the growth curves of brain sizes and
volumes. Specifically, this method summarizes the age-related nonlinear distribution
of the measurement of interest by 3 curves, representing the median (M), coefficient
of variation (S), and skewness (L) of the distribution. These curves can be fitted as
cubic splines by nonlinear regression, where the smoothing extent required can be
.CC-BY-NC-ND 4.0 International licensenot certified by peer review) is the author/funder. It is made available under aThe copyright holder for this preprint (which wasthis version posted August 28, 2019. . https://doi.org/10.1101/747352doi: bioRxiv preprint
expressed in terms of smoothing parameters or equivalent degrees of freedom. The
above analysis was performed using GAMLSS implemented in R (version 3.4.3)56.
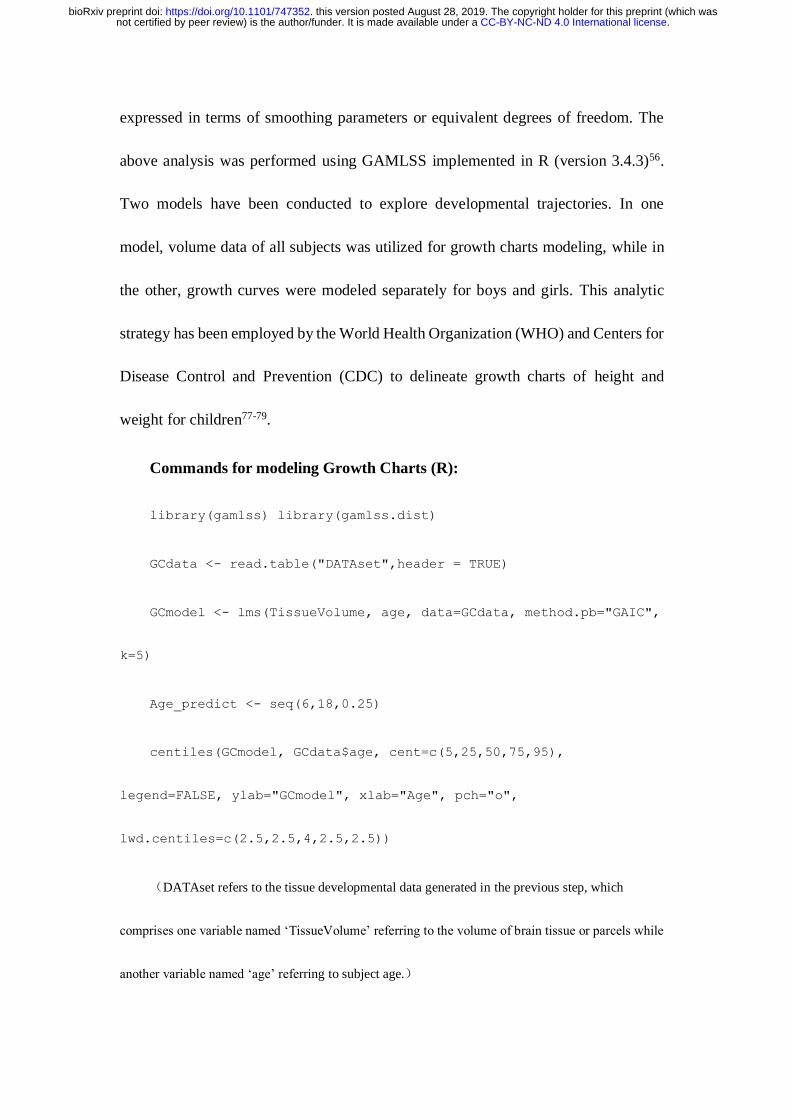
Two models have been conducted to explore developmental trajectories. In one
model, volume data of all subjects was utilized for growth charts modeling, while in
the other, growth curves were modeled separately for boys and girls. This analytic
strategy has been employed by the World Health Organization (WHO) and Centers for
Disease Control and Prevention (CDC) to delineate growth charts of height and
weight for children77-79.
Commands for modeling Growth Charts (R):
library(gamlss) library(gamlss.dist)
GCdata <- read.table("DATAset",header = TRUE)
GCmodel <- lms(TissueVolume, age, data=GCdata, method.pb="GAIC",
k=5)
Age_predict <- seq(6,18,0.25)
centiles(GCmodel, GCdata$age, cent=c(5,25,50,75,95),
legend=FALSE, ylab="GCmodel", xlab="Age", pch="o",
lwd.centiles=c(2.5,2.5,4,2.5,2.5))
(DATAset refers to the tissue developmental data generated in the previous step, which
comprises one variable named ‘TissueVolume’ referring to the volume of brain tissue or parcels while
another variable named ‘age’ referring to subject age.)
.CC-BY-NC-ND 4.0 International licensenot certified by peer review) is the author/funder. It is made available under aThe copyright holder for this preprint (which wasthis version posted August 28, 2019. . https://doi.org/10.1101/747352doi: bioRxiv preprint
Timing
Step 1 takes 10-20 minutes per subject. Step 2 takes approximately 5 minutes
using a computer with a Xeon E5 2GHz CPU. Template construction in step 3 takes
considerable time, depending on sample size and number of iterations. For instance,
the 11-year-old template built from 108 images with 10 iterations took 17 hours 7
minutes using ANTs. Step 4 should take about 5-10 minutes depending on sample
size. In steps 5-7, the most time-consuming operation is ANTs registration (about
50 minutes to register to the age-specific template per subject). (Total time was
about 20 hours for the 11-year-old group.) All data processing was performed on a
cluster server with 24 nodes and 300 CPU cores at IPCAS, which processed the
registration computation in parallel.
Validation of Template Use
Two new pediatric neuroimaging datasets from Weifang Medical University80 and
Zhejiang University81,82, including 84 structural MRI scans, were employed to
validate the necessity of constructing age- and ethnicity-matched MRI templates
using brain deformation cost function (see age, sex and scanning protocols in
Tables 5 and 6).
Procedure
.CC-BY-NC-ND 4.0 International licensenot certified by peer review) is the author/funder. It is made available under aThe copyright holder for this preprint (which wasthis version posted August 28, 2019. . https://doi.org/10.1101/747352doi: bioRxiv preprint
The brain templates were validated by a standardized pipeline, the details are as
follows:
Validation-Step 1. The validation data were subjected to the same preprocessing
pipeline as the template data described in last section, step 1.
Validation-Step 2. Each individual T1-weighted (T1w) brain image, following
denoising and skull stripping, was fed into ANTs for further registration to each brain
template. For each individual, 11 registrations were performed with our Chinese
age-specific pediatric (IPCAS) MRI templates, and 11 registrations with the NKI
pediatric MRI templates.
Validation-Step 3. We calculated the warping distance at each voxel for deformation
registration and then averaged the values across all brain voxels to represent the extent of
individual deformation. The individual warp values were transferred into Z scores for
inter-subject group analysis. For each age-specific template, a template age was also obtained
by averaging all subjects’ ages within the group, which later subtract the age of the subject of
each scan in the validation group to represent the age difference between the target template
and the source individual brain image. An age difference of zero indicates a perfect match
between the age of the template and the age of the individual, while a negative age difference
indicates that the individual is older than the template age, and a positive value
.CC-BY-NC-ND 4.0 International licensenot certified by peer review) is the author/funder. It is made available under aThe copyright holder for this preprint (which wasthis version posted August 28, 2019. . https://doi.org/10.1101/747352doi: bioRxiv preprint
indicates that the individual is younger than the template age. As the age span in the
validation group ranged from 7 to 12 years, the resulting age differences ranged from
-5 to 10 years. Generalized Additive Models for Location Scale and Shape
(GAMLSS) were finally applied to model changes in the registration warp curve with
age differences. We expected to observe an age effect for registration deformation,
that is, more age mismatch between the target template and the source individual
would result in more registration deformations and registration costs, i.e., less
efficient registration.
Comparison of Brain Growth Charts (CCNP vs. eNKI)
To quantitatively estimate the diversity of growth charts attributed to ethnicity,
the normalized variance (NV) was calculated across 400 brain parcel units in MNI
space47 contrasting CCNP and eNKI samples, with the NV values calculated as
follows:
NV =d(V
CCNP-V
eNKI)
(VCCNP
+VeNKI
) / 2,
where V is a vector referring to the parcel unit volume at every age point
estimated in the last step; the standard deviation of the differences between the two
samples was calculated to characterize the degree of chart shape dispersion across
different ages. To exclude potential confounding, it was normalized by the mean
parcel volume. Large NV values indicate diversity while small values indicate the
growth curves share similar shapes (Figure 8).
.CC-BY-NC-ND 4.0 International licensenot certified by peer review) is the author/funder. It is made available under aThe copyright holder for this preprint (which wasthis version posted August 28, 2019. . https://doi.org/10.1101/747352doi: bioRxiv preprint
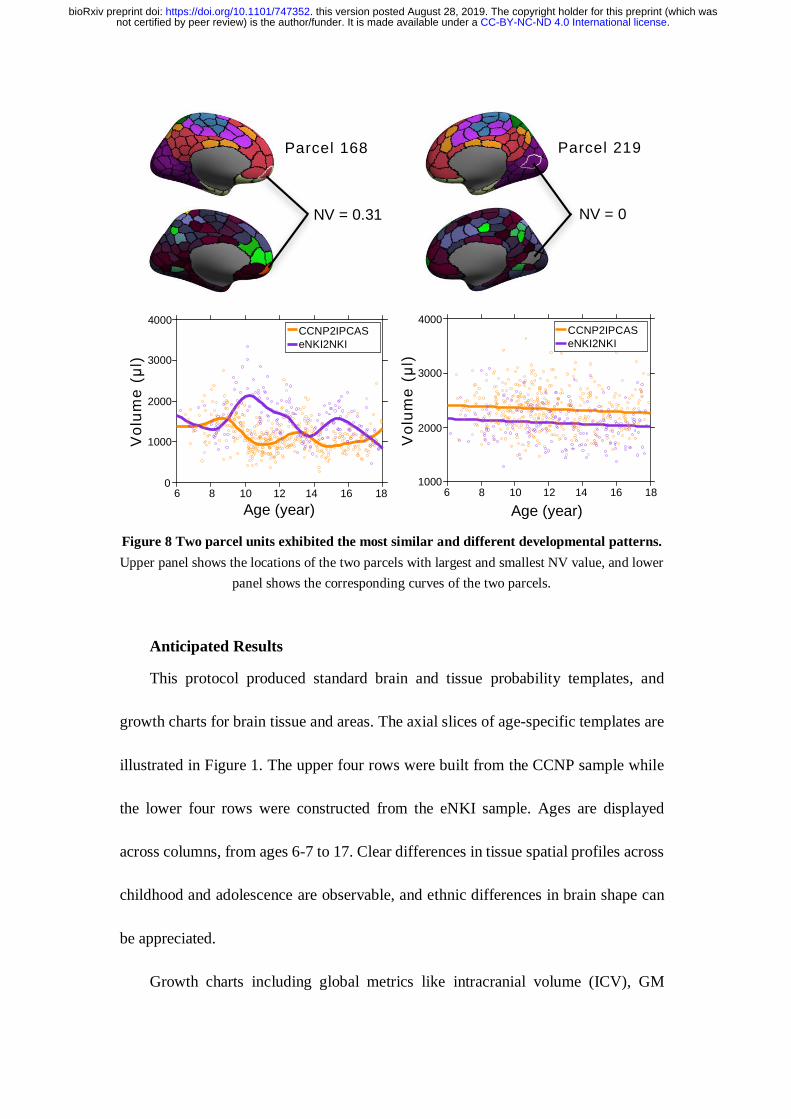
Figure 8 Two parcel units exhibited the most similar and different developmental patterns.
Upper panel shows the locations of the two parcels with largest and smallest NV value, and lower
panel shows the corresponding curves of the two parcels.
Anticipated Results
This protocol produced standard brain and tissue probability templates, and
growth charts for brain tissue and areas. The axial slices of age-specific templates are
illustrated in Figure 1. The upper four rows were built from the CCNP sample while
the lower four rows were constructed from the eNKI sample. Ages are displayed
across columns, from ages 6-7 to 17. Clear differences in tissue spatial profiles across
childhood and adolescence are observable, and ethnic differences in brain shape can
be appreciated.
Growth charts including global metrics like intracranial volume (ICV), GM
NV = 0.31 NV = 0
CCNP2IPCAS
eNKI2NKI
6 8 10 12 14 16 18
CCNP2IPCAS
eNKI2NKI
4000
3000
2000
1000
0
Vo
lum
e (μ
l)
Age (year)
CCNP2IPCAS
eNKI2NKI
6 8 10 12 14 16 18
CCNP2IPCAS
eNKI2NKI
4000
3000
2000
1000
Vo
lum
e (μ
l)
Age (year)
Parcel 219Parcel 168
.CC-BY-NC-ND 4.0 International licensenot certified by peer review) is the author/funder. It is made available under aThe copyright holder for this preprint (which wasthis version posted August 28, 2019. . https://doi.org/10.1101/747352doi: bioRxiv preprint
volume, WM volume and CSF are also displayed in Figure 3 for CCNP and eNKI
samples with all subjects combined and separately for males and females in sFigure 1.
At a more refined scale, growth charts of regional brain volumes were compared.
The similarity of trajectories between CCNP and eNKI samples was estimated for
each area and depicted in Figure 5. Large differences were mostly observed in the
association cortex while the primary cortex exhibited similar developmental
trajectories. To better define the distribution of NVs among hierarchical brain
networks, the bar graphs of regional NVs is also shown in Figure 5, with colors
indicating the 7 large scale brain networks and left and right hemispheres shown
separately. Overall, the left hemisphere demonstrated greater diversity, specifically in
the default and dorsal attention networks, although the right hemisphere
frontal-parietal network varied the most between ethnicities. The regional trajectories
of maximum and minimum NVs in the left hemisphere are shown in Figure 8, with an
absolute opposite pattern clearly revealed for the area with the largest NV value. The
trajectories of areas with small NV values were almost identical across childhood and
adolescence. Compared with the variety in mesoscopic brain areas, developmental
trajectories at the level of brain lobes exhibited more similar patterns (sFigure 2).
Funding
This work was supported in part by the Natural Science Foundation of China
(81220108014), the National Basic Research (973) Program (2015CB351702), the
.CC-BY-NC-ND 4.0 International licensenot certified by peer review) is the author/funder. It is made available under aThe copyright holder for this preprint (which wasthis version posted August 28, 2019. . https://doi.org/10.1101/747352doi: bioRxiv preprint
China - Netherlands CAS-NWO Programme (153111KYSB20160020), Beijing
Municipal Science and Tech Commission (Z161100002616023, Z171100000117012),
the Major Project of National Social Science Foundation of China (14ZDB161), the
National R&D Infrastructure and Facility Development Program of China,
Fundamental Science Data Sharing Platform (DKA2017-12-02-21), and Guangxi
BaGui Scholarship (201621). BTTY is funded by the Singapore National Research
Foundation (NRF) Fellowship (Class of 2017).
Conflict of Interest Statement
The authors declare that the research was conducted in the absence of any
commercial or financial relationships that could be construed as a potential conflict of
interest.
Acknowledgments
The authors thank Dr. Arno Klein from Child Mind Institute and Dr. Zhi Yang
from Shanghai Mental Health Center for their highly valuable comments on templates
validation and brain morphological metric quantifications. We would like to thank all
parents and children participating in this study as well as all the support from schools
and community.
.CC-BY-NC-ND 4.0 International licensenot certified by peer review) is the author/funder. It is made available under aThe copyright holder for this preprint (which wasthis version posted August 28, 2019. . https://doi.org/10.1101/747352doi: bioRxiv preprint
References
1 Scherdel, P. et al. Growth monitoring as an early detection tool: a systematic
review. Lancet Diabetes Endocrinol 4, 447-456 (2016).
2 Lenroot, R. K. & Giedd, J. N. Brain development in children and adolescents:
insights from anatomical magnetic resonance imaging. Neurosci Biobehav Rev 30,
718-729 (2006).
3 Lerch, J. P. et al. Studying neuroanatomy using MRI. Nat Neurosci 20,
314-326 (2017).
4 Raznahan, A. et al. Patterns of coordinated anatomical change in human
cortical development: a longitudinal neuroimaging study of maturational coupling.
Neuron 72, 873-884 (2011).
5 Reardon, P. K. et al. Normative brain size variation and brain shape diversity
in humans. Science 360, 1222-1227 (2018).
6 Shaw, P. et al. Intellectual ability and cortical development in children and
adolescents. Nature 440, 676-679 (2006).
7 Schnack, H. G. et al. Changes in thickness and surface area of the human
cortex and their relationship with intelligence. Cereb Cortex 25, 1608-1617 (2015).
8 Baum, G. L. et al. Modular Segregation of Structural Brain Networks Supports
the Development of Executive Function in Youth. Curr Biol 27, 1561-1572 e1568
(2017).
9 Dosenbach, N. U. et al. Prediction of individual brain maturity using fMRI.
Science 329, 1358-1361 (2010).
10 Zuo, X. N. et al. Human Connectomics across the Life Span. Trends Cogn Sci
21, 32-45 (2017).
11 Barbey, A. K. Network Neuroscience Theory of Human Intelligence. Trends
Cogn Sci 22, 8-20 (2018).
12 Di Martino, A. et al. Unraveling the miswired connectome: a developmental
perspective. Neuron 83, 1335-1353 (2014).
13 Gur, R. C. et al. Neurocognitive growth charting in psychosis spectrum
youths. JAMA Psychiatry 71, 366-374 (2014).
14 Kessler, D., Angstadt, M. & Sripada, C. Growth Charting of Brain
Connectivity Networks and the Identification of Attention Impairment in Youth. JAMA
Psychiatry 73, 481-489 (2016).
15 Lee, F. S. et al. Mental health. Adolescent mental health--opportunity and
obligation. Science 346, 547-549 (2014).
16 Paus, T., Keshavan, M. & Giedd, J. N. Why do many psychiatric disorders
emerge during adolescence? Nat Rev Neurosci 9, 947-957 (2008).
17 Xing, X.-X. & Zuo, X.-N. The anatomy of reliability: a must read for future
human brain mapping. Sci. Bull 63, 1606-1607 (2018).
18 Zuo, X. N., Biswal, B. B. & Poldrack, R. A. Editorial: Reliability and
Reproducibility in Functional Connectomics. Front Neurosci 13, 117 (2019).
19 Zuo, X. N., Xu, T. & Milham, M. P. Harnessing reliability for neuroscience
research. Nat Hum Behav, doi:10.1038/s41562-019-0655-x (2019).
.CC-BY-NC-ND 4.0 International licensenot certified by peer review) is the author/funder. It is made available under aThe copyright holder for this preprint (which wasthis version posted August 28, 2019. . https://doi.org/10.1101/747352doi: bioRxiv preprint
20 Madan, C. R. & Kensinger, E. A. Test-retest reliability of brain morphology
estimates. Brain Inform 4, 107-121 (2017).
21 Buchanan, C. R., Pernet, C. R., Gorgolewski, K. J., Storkey, A. J. & Bastin, M.
E. Test-retest reliability of structural brain networks from diffusion MRI. Neuroimage
86, 231-243 (2014).
22 Zuo, X. N. & Xing, X. X. Test-retest reliabilities of resting-state FMRI
measurements in human brain functional connectomics: a systems neuroscience
perspective. Neurosci Biobehav Rev 45, 100-118 (2014).
23 Streiner, D. L., Norman, G. R. & Cairney, J. Health measurement scales: a
practical guide to their development and use. (Oxford University Press, USA, 2015).
24 Satterthwaite, T. D. et al. The Philadelphia Neurodevelopmental Cohort: A
publicly available resource for the study of normal and abnormal brain development in
youth. Neuroimage 124, 1115-1119 (2016).
25 Somerville, L. H. et al. The Lifespan Human Connectome Project in
Development: A large-scale study of brain connectivity development in 5-21 year olds.
Neuroimage 183, 456-468 (2018).
26 White, T. et al. Pediatric population-based neuroimaging and the Generation R
Study: the intersection of developmental neuroscience and epidemiology. Eur J
Epidemiol 28, 99-111 (2013).
27 Casey, B. J. et al. The Adolescent Brain Cognitive Development (ABCD)
study: Imaging acquisition across 21 sites. Dev Cogn Neurosci 32, 43-54 (2018).
28 Giedd, J. N. et al. Child psychiatry branch of the National Institute of Mental
Health longitudinal structural magnetic resonance imaging study of human brain
development. Neuropsychopharmacology 40, 43-49 (2015).
29 Ertem, I. O. et al. Similarities and differences in child development from birth
to age 3 years by sex and across four countries: a cross-sectional, observational study.
Lancet Glob Health 6, e279-e291 (2018).
30 Bhalerao, G. V. et al. Construction of population-specific Indian MRI brain
template: Morphometric comparison with Chinese and Caucasian templates. Asian J
Psychiatr 35, 93-100 (2018).
31 Liang, P. et al. Construction of brain atlases based on a multi-center MRI
dataset of 2020 Chinese adults. Sci Rep 5, 18216 (2015).
32 Luo, Y. et al. Intensity and sulci landmark combined brain atlas construction
for Chinese pediatric population. Hum Brain Mapp 35, 3880-3892 (2014).
33 Tang, Y. et al. The construction of a Chinese MRI brain atlas: a morphometric
comparison study between Chinese and Caucasian cohorts. Neuroimage 51, 33-41
(2010).
34 Xie, W. et al. The construction of MRI brain/head templates for Chinese
children from 7 to 16 years of age. Dev Cogn Neurosci 15, 94-105 (2015).
35 Zhao, T. et al. Unbiased age-specific structural brain atlases for Chinese
pediatric population. Neuroimage 189, 55-70 (2019).
36 Milham, M. P., Craddock, R. C. & Klein, A. Clinically useful brain imaging
for neuropsychiatry: How can we get there? Depress Anxiety 34, 578-587 (2017).
.CC-BY-NC-ND 4.0 International licensenot certified by peer review) is the author/funder. It is made available under aThe copyright holder for this preprint (which wasthis version posted August 28, 2019. . https://doi.org/10.1101/747352doi: bioRxiv preprint
37 Shaw, P. Maps of the Development of the Brain's Functional Architecture:
Could They Provide Growth Charts for Psychiatry? JAMA Psychiatry 73, 445-446
(2016).
38 Marquand, A. F., Wolfers, T., Mennes, M., Buitelaar, J. & Beckmann, C. F.
Beyond Lumping and Splitting: A Review of Computational Approaches for
Stratifying Psychiatric Disorders. Biol Psychiatry Cogn Neurosci Neuroimaging 1,
433-447 (2016).
39 Marquand, A. F. et al. Conceptualizing mental disorders as deviations from
normative functioning. Mol Psychiatry, doi:10.1038/s41380-019-0441-1 (2019).
40 Nooner, K. B. et al. The NKI-Rockland Sample: A Model for Accelerating the
Pace of Discovery Science in Psychiatry. Front Neurosci 6, 152 (2012).
41 YANG, N. et al. Chinese Color Nest Project: Growing up in China. Chinese
Science Bulletin 62, 3008-3022 (2017).
42 Wang, X. et al. Probabilistic MRI brain anatomical atlases based on 1,000
Chinese subjects. PLoS One 8, e50939 (2013).
43 Zilles, K., Kawashima, R., Dabringhaus, A., Fukuda, H. & Schormann, T.
Hemispheric shape of European and Japanese brains: 3-D MRI analysis of intersubject
variability, ethnical, and gender differences. Neuroimage 13, 262-271 (2001).
44 Klein, A. et al. Evaluation of volume-based and surface-based brain image
registration methods. Neuroimage 51, 214-220 (2010).
45 Giedd, J. N. et al. Brain development during childhood and adolescence: a
longitudinal MRI study. Nat Neurosci 2, 861-863, doi:10.1038/13158 (1999).
46 Lenroot, R. K. et al. Sexual dimorphism of brain developmental trajectories
during childhood and adolescence. Neuroimage 36, 1065-1073,
doi:10.1016/j.neuroimage.2007.03.053 (2007).
47 Schaefer, A. et al. Local-Global Parcellation of the Human Cerebral Cortex
from Intrinsic Functional Connectivity MRI. Cereb Cortex 28, 3095-3114 (2018).
48 Ducharme, S. et al. Trajectories of cortical thickness maturation in normal
brain development--The importance of quality control procedures. Neuroimage 125,
267-279 (2016).
49 Gennatas, E. D. et al. Age-Related Effects and Sex Differences in Gray Matter
Density, Volume, Mass, and Cortical Thickness from Childhood to Young Adulthood.
J Neurosci 37, 5065-5073 (2017).
50 Tamnes, C. K. et al. Development of the Cerebral Cortex across Adolescence:
A Multisample Study of Inter-Related Longitudinal Changes in Cortical Volume,
Surface Area, and Thickness. J Neurosci 37, 3402-3412 (2017).
51 Klein, A. et al. Mindboggling morphometry of human brains. PLoS Comput
Biol 13, e1005350 (2017).
52 Mesulam, M. M. From sensation to cognition. Brain 121 ( Pt 6), 1013-1052
(1998).
53 Jenkinson, M., Beckmann, C. F., Behrens, T. E., Woolrich, M. W. & Smith, S.
M. Fsl. Neuroimage 62, 782-790 (2012).
54 Avants, B. B., Tustison, N. & Song, G. Advanced normalization tools
(ANTS). Insight j 2, 1-35 (2009).
.CC-BY-NC-ND 4.0 International licensenot certified by peer review) is the author/funder. It is made available under aThe copyright holder for this preprint (which wasthis version posted August 28, 2019. . https://doi.org/10.1101/747352doi: bioRxiv preprint
55 Manjon, J. V. & Coupe, P. volBrain: An Online MRI Brain Volumetry
System. Front Neuroinform 10, 30 (2016).
56 Stasinopoulos, D. M. & Rigby, R. A. Generalized additive models for location
scale and shape (GAMLSS) in R. Journal of Statistical Software 23, 1-46 (2007).
57 Li, H. J. et al. Surface-based regional homogeneity in first-episode, drug-naive
major depression: a resting-state FMRI study. Biomed Res Int 2014, 374828 (2014).
58 Cao, Q. et al. Abnormal neural activity in children with attention deficit
hyperactivity disorder: a resting-state functional magnetic resonance imaging study.
Neuroreport 17, 1033-1036 (2006).
59 Cao, X. et al. Abnormal resting-state functional connectivity patterns of the
putamen in medication-naive children with attention deficit hyperactivity disorder.
Brain Res 1303, 195-206 (2009).
60 ADHD Consortium. The ADHD-200 Consortium: A Model to Advance the
Translational Potential of Neuroimaging in Clinical Neuroscience. Front Syst Neurosci
6, 62 (2012).
61 Manjon, J. V., Coupe, P., Marti-Bonmati, L., Collins, D. L. & Robles, M.
Adaptive non-local means denoising of MR images with spatially varying noise levels.
J Magn Reson Imaging 31, 192-203 (2010).
62 Zuo, X. N. & Xing, X. X. Effects of non-local diffusion on structural MRI
preprocessing and default network mapping: statistical comparisons with
isotropic/anisotropic diffusion. PLoS One 6, e26703 (2011).
63 Tustison, N. J. et al. N4ITK: improved N3 bias correction. IEEE transactions
on medical imaging 29, 1310 (2010).
64 Avants, B. B. et al. A reproducible evaluation of ANTs similarity metric
performance in brain image registration. Neuroimage 54, 2033-2044 (2011).
65 Ashburner, J. & Friston, K. J. Unified segmentation. Neuroimage 26, 839-851
(2005).
66 Lotjonen, J. M. et al. Fast and robust multi-atlas segmentation of brain
magnetic resonance images. Neuroimage 49, 2352-2365 (2010).
67 Manjon, J. V. et al. Nonlocal intracranial cavity extraction. Int J Biomed
Imaging 2014, 820205 (2014).
68 Eskildsen, S. F. et al. BEaST: brain extraction based on nonlocal segmentation
technique. Neuroimage 59, 2362-2373 (2012).
69 Zuo, X. N. et al. An open science resource for establishing reliability and
reproducibility in functional connectomics. Sci Data 1, 140049 (2014).
70 Xu, T., Yang, Z., Jiang, L., Xing, X.-X. & Zuo, X.-N. A connectome
computation system for discovery science of brain. Science Bulletin 60, 86-95 (2015).
71 Zhang, Y., Brady, M. & Smith, S. Segmentation of brain MR images through a
hidden Markov random field model and the expectation-maximization algorithm. IEEE
transactions on medical imaging 20, 45-57 (2001).
72 Avants, B. B. et al. The optimal template effect in hippocampus studies of
diseased populations. Neuroimage 49, 2457-2466 (2010).
73 Avants, B. B. et al. The pediatric template of brain perfusion. Sci Data 2,
150003 (2015).
.CC-BY-NC-ND 4.0 International licensenot certified by peer review) is the author/funder. It is made available under aThe copyright holder for this preprint (which wasthis version posted August 28, 2019. . https://doi.org/10.1101/747352doi: bioRxiv preprint
74 Klein, A. et al. Evaluation of 14 nonlinear deformation algorithms applied to
human brain MRI registration. Neuroimage 46, 786-802 (2009).
75 Murphy, K. et al. Evaluation of registration methods on thoracic CT: the
EMPIRE10 challenge. IEEE transactions on medical imaging 30, 1901-1920 (2011).
76 Rigby, R. A. & Stasinopoulos, D. M. Generalized additive models for
location, scale and shape. Journal of the Royal Statistical Society: Series C (Applied
Statistics) 54, 507-554 (2005).
77 Borghi, E. et al. Construction of the World Health Organization child growth
standards: selection of methods for attained growth curves. Stat Med 25, 247-265
(2006).
78 Flegal, K. M. & Cole, T. J. Construction of LMS parameters for the Centers
for Disease Control and Prevention 2000 growth charts. Natl Health Stat Report, 1-3
(2013).
79 W.H.O. Multicentre Growth Reference Study Group. WHO Child Growth
Standards based on length/height, weight and age. Acta Paediatr Suppl 450, 76-85
(2006).
80 Long, J., Zhao, K., Wang, B., Li, L. & Shen, X. Influence of mental abacus
calculation practice on mental arithmetic in children: a fMRI study. International
Journal of Medical Radiology 32, 209-212, 220 (2009).
81 Hu, Y. et al. Enhanced white matter tracts integrity in children with abacus
training. Hum Brain Mapp 32, 10-21 (2011).
82 Li, Y., Wang, Y., Hu, Y., Liang, Y. & Chen, F. Structural changes in left
fusiform areas and associated fiber connections in children with abacus training:
evidence from morphometry and tractography. Front Hum Neurosci 7, 335 (2013).
.CC-BY-NC-ND 4.0 International licensenot certified by peer review) is the author/funder. It is made available under aThe copyright holder for this preprint (which wasthis version posted August 28, 2019. . https://doi.org/10.1101/747352doi: bioRxiv preprint
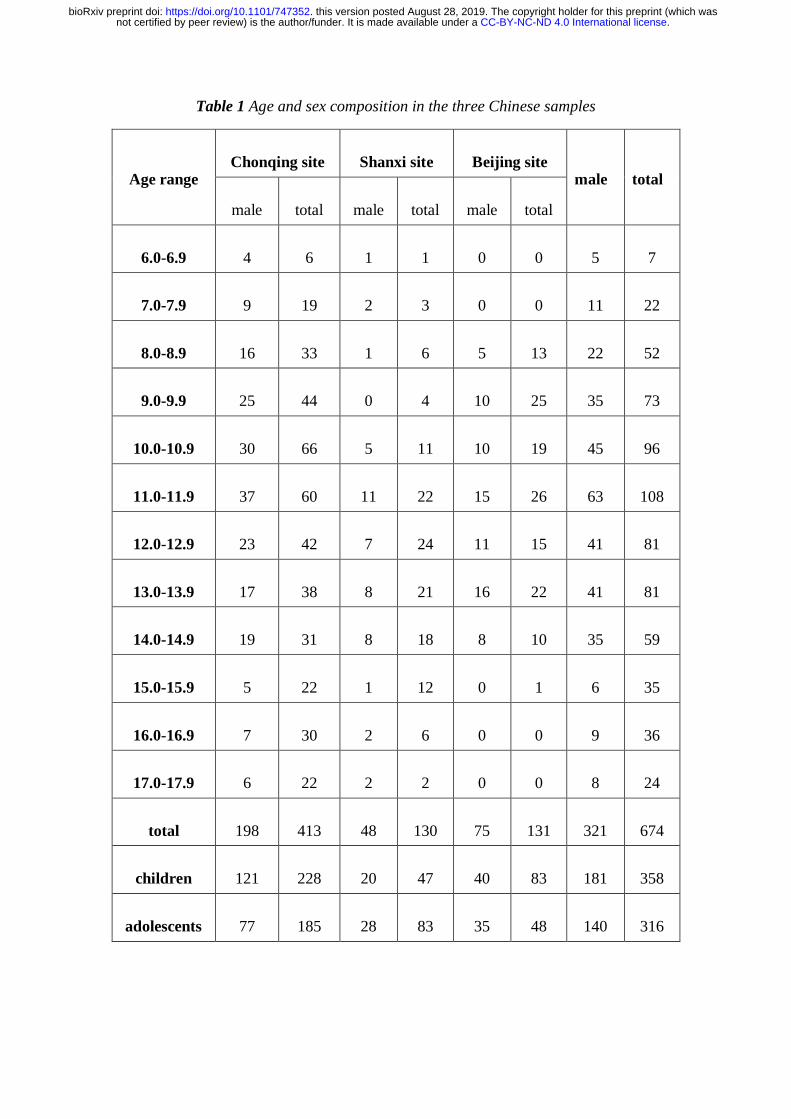
Table 1 Age and sex composition in the three Chinese samples
Age range Chonqing site Shanxi site Beijing site
male total
male total male total male total
6.0-6.9 4 6 1 1 0 0 5 7
7.0-7.9 9 19 2 3 0 0 11 22
8.0-8.9 16 33 1 6 5 13 22 52
9.0-9.9 25 44 0 4 10 25 35 73
10.0-10.9 30 66 5 11 10 19 45 96
11.0-11.9 37 60 11 22 15 26 63 108
12.0-12.9 23 42 7 24 11 15 41 81
13.0-13.9 17 38 8 21 16 22 41 81
14.0-14.9 19 31 8 18 8 10 35 59
15.0-15.9 5 22 1 12 0 1 6 35
16.0-16.9 7 30 2 6 0 0 9 36
17.0-17.9 6 22 2 2 0 0 8 24
total 198 413 48 130 75 131 321 674
children 121 228 20 47 40 83 181 358
adolescents 77 185 28 83 35 48 140 316
.CC-BY-NC-ND 4.0 International licensenot certified by peer review) is the author/funder. It is made available under aThe copyright holder for this preprint (which wasthis version posted August 28, 2019. . https://doi.org/10.1101/747352doi: bioRxiv preprint
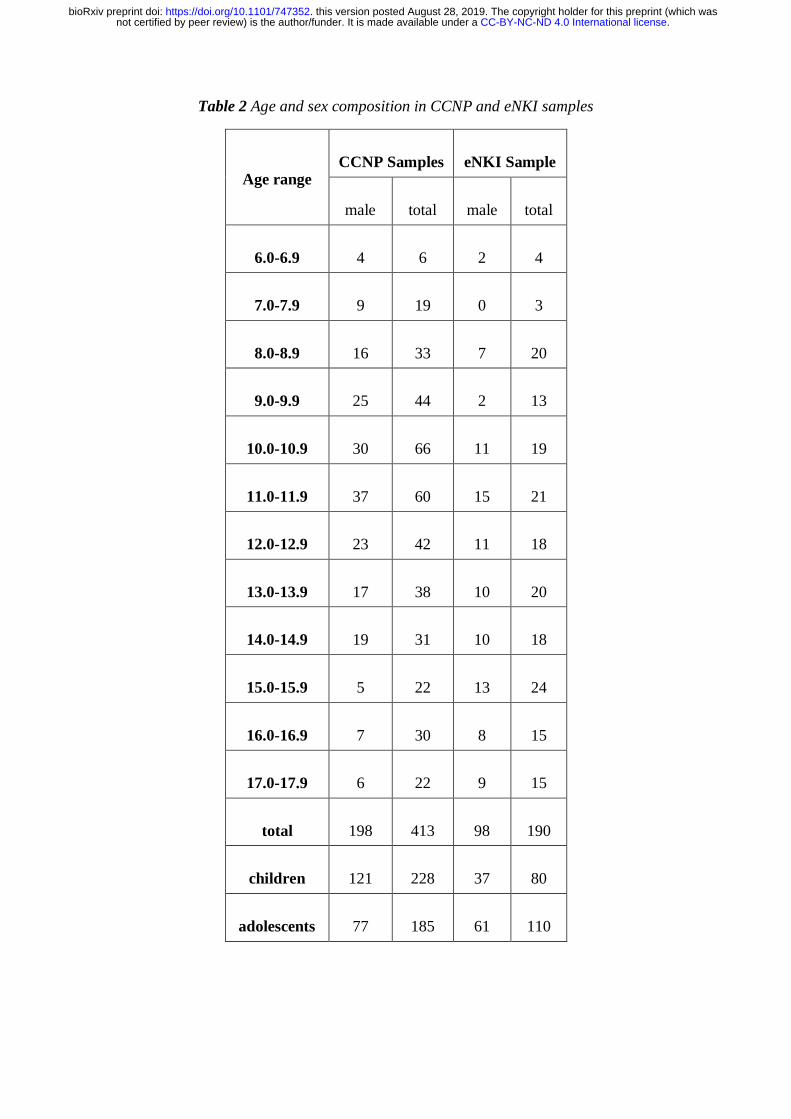
Table 2 Age and sex composition in CCNP and eNKI samples
Age range CCNP Samples eNKI Sample
male total male total
6.0-6.9 4 6 2 4
7.0-7.9 9 19 0 3
8.0-8.9 16 33 7 20
9.0-9.9 25 44 2 13
10.0-10.9 30 66 11 19
11.0-11.9 37 60 15 21
12.0-12.9 23 42 11 18
13.0-13.9 17 38 10 20
14.0-14.9 19 31 10 18
15.0-15.9 5 22 13 24
16.0-16.9 7 30 8 15
17.0-17.9 6 22 9 15
total 198 413 98 190
children 121 228 37 80
adolescents 77 185 61 110
.CC-BY-NC-ND 4.0 International licensenot certified by peer review) is the author/funder. It is made available under aThe copyright holder for this preprint (which wasthis version posted August 28, 2019. . https://doi.org/10.1101/747352doi: bioRxiv preprint
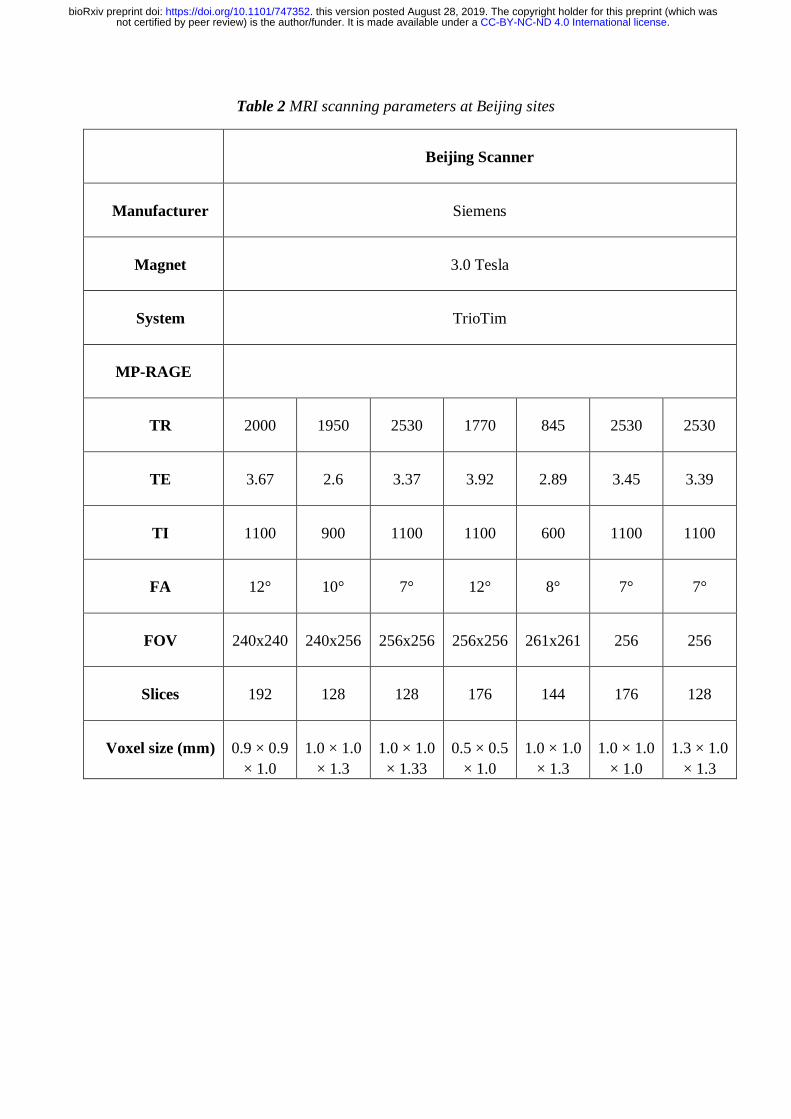
Table 2 MRI scanning parameters at Beijing sites
Beijing Scanner
Manufacturer Siemens
Magnet 3.0 Tesla
System TrioTim
MP-RAGE
TR 2000 1950 2530 1770 845 2530 2530
TE 3.67 2.6 3.37 3.92 2.89 3.45 3.39
TI 1100 900 1100 1100 600 1100 1100
FA 12° 10° 7° 12° 8° 7° 7°
FOV 240x240 240x256 256x256 256x256 261x261 256 256
Slices 192 128 128 176 144 176 128
Voxel size (mm) 0.9 × 0.9
× 1.0
1.0 × 1.0
× 1.3
1.0 × 1.0
× 1.33
0.5 × 0.5
× 1.0
1.0 × 1.0
× 1.3
1.0 × 1.0
× 1.0
1.3 × 1.0
× 1.3
.CC-BY-NC-ND 4.0 International licensenot certified by peer review) is the author/funder. It is made available under aThe copyright holder for this preprint (which wasthis version posted August 28, 2019. . https://doi.org/10.1101/747352doi: bioRxiv preprint
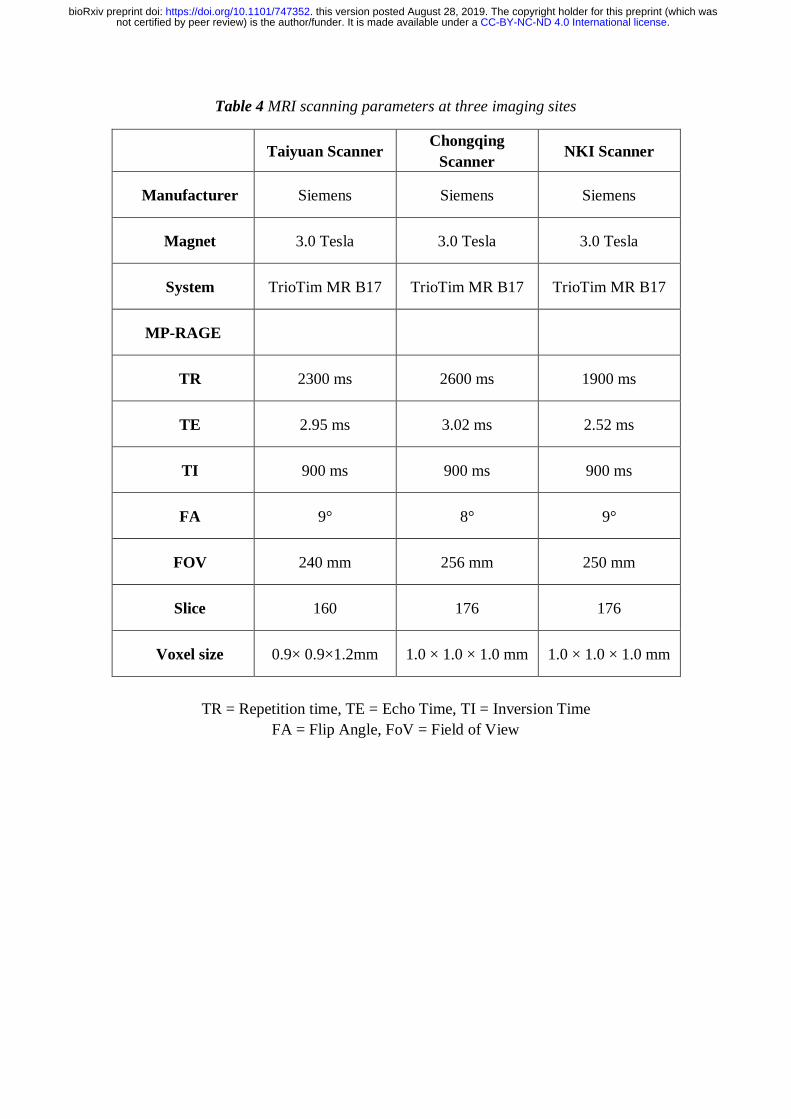
Table 4 MRI scanning parameters at three imaging sites
Taiyuan Scanner Chongqing
Scanner NKI Scanner
Manufacturer Siemens Siemens Siemens
Magnet 3.0 Tesla 3.0 Tesla 3.0 Tesla
System TrioTim MR B17 TrioTim MR B17 TrioTim MR B17
MP-RAGE
TR 2300 ms 2600 ms 1900 ms
TE 2.95 ms 3.02 ms 2.52 ms
TI 900 ms 900 ms 900 ms
FA 9° 8° 9°
FOV 240 mm 256 mm 250 mm
Slice 160 176 176
Voxel size 0.9× 0.9×1.2mm 1.0 × 1.0 × 1.0 mm 1.0 × 1.0 × 1.0 mm
TR = Repetition time, TE = Echo Time, TI = Inversion Time
FA = Flip Angle, FoV = Field of View
.CC-BY-NC-ND 4.0 International licensenot certified by peer review) is the author/funder. It is made available under aThe copyright holder for this preprint (which wasthis version posted August 28, 2019. . https://doi.org/10.1101/747352doi: bioRxiv preprint
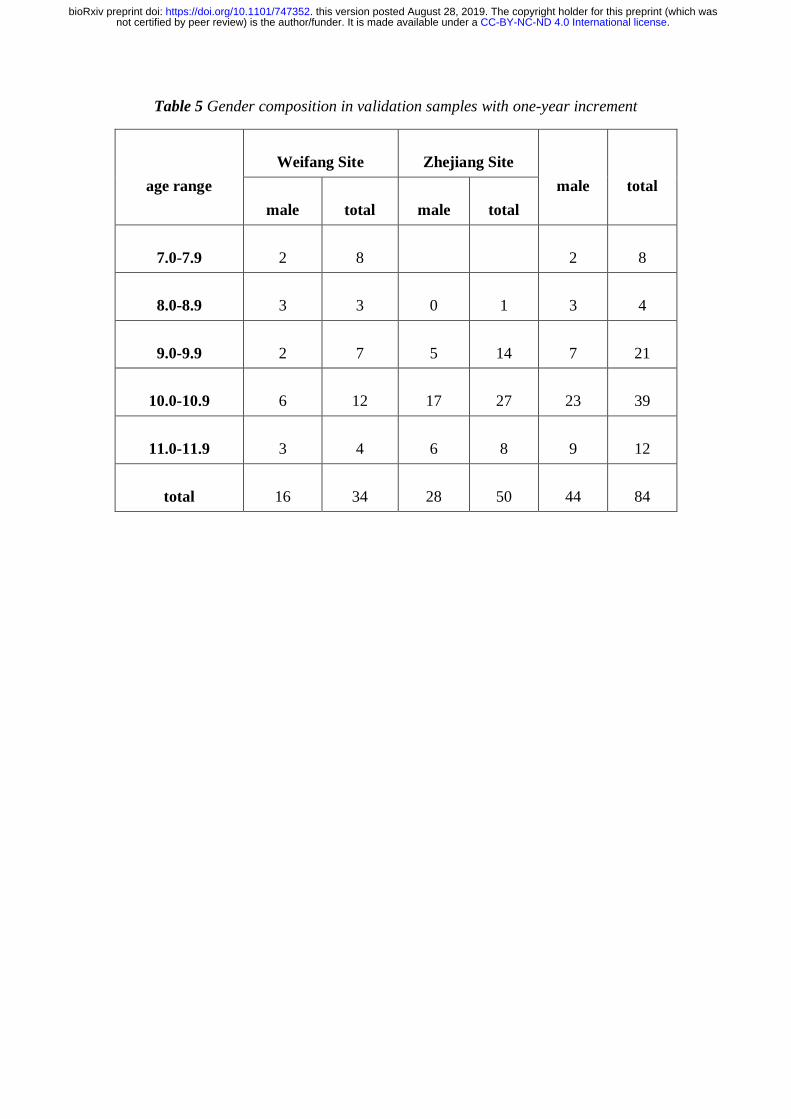
Table 5 Gender composition in validation samples with one-year increment
age range
Weifang Site Zhejiang Site
male total
male total male total
7.0-7.9 2 8 2 8
8.0-8.9 3 3 0 1 3 4
9.0-9.9 2 7 5 14 7 21
10.0-10.9 6 12 17 27 23 39
11.0-11.9 3 4 6 8 9 12
total 16 34 28 50 44 84
.CC-BY-NC-ND 4.0 International licensenot certified by peer review) is the author/funder. It is made available under aThe copyright holder for this preprint (which wasthis version posted August 28, 2019. . https://doi.org/10.1101/747352doi: bioRxiv preprint
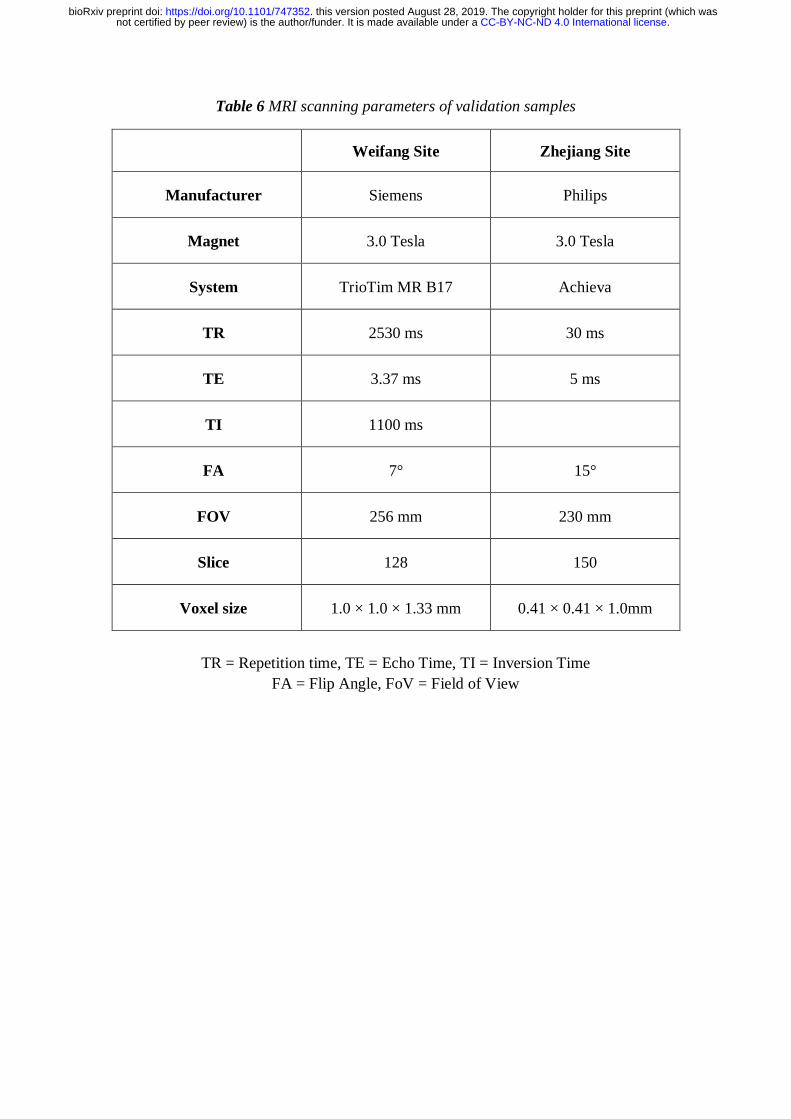
Table 6 MRI scanning parameters of validation samples
Weifang Site Zhejiang Site
Manufacturer Siemens Philips
Magnet 3.0 Tesla 3.0 Tesla
System TrioTim MR B17 Achieva
TR 2530 ms 30 ms
TE 3.37 ms 5 ms
TI 1100 ms
FA 7° 15°
FOV 256 mm 230 mm
Slice 128 150
Voxel size 1.0 × 1.0 × 1.33 mm 0.41 × 0.41 × 1.0mm
TR = Repetition time, TE = Echo Time, TI = Inversion Time
FA = Flip Angle, FoV = Field of View
.CC-BY-NC-ND 4.0 International licensenot certified by peer review) is the author/funder. It is made available under aThe copyright holder for this preprint (which wasthis version posted August 28, 2019. . https://doi.org/10.1101/747352doi: bioRxiv preprint