Galaxy Zoo: ‘Hanny’s Voorwerp’, a quasar light echo? · Galaxy Zoo: ‘Hanny’s Voorwerp’,...
13
arXiv:0906.5304v1 [astro-ph.CO] 29 Jun 2009 Mon. Not. R. Astron. Soc. 000, 1–13 (2008) Printed 1 July 2009 (MN L A T E X style file v2.2) Galaxy Zoo: ‘Hanny’s Voorwerp’, a quasar light echo? ⋆ Chris J. Lintott 1 †, Kevin Schawinski 1,2,3 , William Keel 4,5 ‡, Hanny van Arkel 6 , Nicola Bennert 7,8 , Edward Edmondson 9 , Daniel Thomas 9 , Daniel J.B. Smith 10 , Peter D. Herbert 11 , Matt J. Jarvis 11 , Shanil Virani 3 ,Dan Andreescu 12 , Steven P. Bamford 8 , Kate Land 1 , Phil Murray 13 , Robert C. Nichol 8 , M. Jordan Raddick 14 , Anˇ ze Slosar 15 , Alex Szalay 14 , Jan Vandenberg 14 1 Department of Physics, University of Oxford, Oxford OX1 3RH, UK. 2 Department of Physics, Yale University, New Haven, CT 06511, USA 3 Yale Center for Astronomy and Astrophysics, Yale University, P.O. Box 208121, New Haven, CT 06520, USA 4 Dept. of Physics and Astronomy, University of Alabama, Box 870324, Tuscaloosa, AL 35487, USA. 5 SARA Observatory 6 Netherlands School System 7 Institute of Geophysics and Planetary Physics, University of California, Riverside, CA 92521 8 Physics Department, University of California, Santa Barbara, CA 93106, USA. 9 Institute of Cosmology & Gravitation, University of Portsmouth, UK. 10 Astrophysics Research Institute, Liverpool John Moores University, Twelve Quays House Egerton Wharf, Birkenhead, CH41 1LD, UK. 11 Centre for Astrophysics, Science & Technology Research Institute, University of Hertfordshire, Hatfield, UK. 12 LinkLab, 4506 Graystone Ave., Bronx, NY 10471, USA. 13 Fingerprint Digital Media, 9 Victoria Close, Newtownards, Co. Down, Northern Ireland, BT23 7GY, UK. 14 Department of Physics and Astronomy, Johns Hopkins University, 3400 N. Charles St., Baltimore, MD 21218, USA. 15 Berkeley Centre for Cosmological Physics, Lawrence Berkeley National Laboratory and Physics Department, Berkeley, CA 94720, USA. October 2008 ABSTRACT We report the discovery of an unusual object near the spiral galaxy IC 2497, discovered by visual inspection of the Sloan Digital Sky Survey (SDSS) as part of the Galaxy Zoo project. The object, known as Hanny’s Voorwerp, is bright in the SDSS g band due to unusually strong [OIII] 4959, 5007 emission lines. We present the results of the first targeted observations of the object in the optical, UV and X-ray, which show that the object contains highly ionized gas. Although the line ratios are similar to extended emission-line regions near luminous AGN, the source of this ionization is not apparent. The emission-line properties, and lack of x-ray emission from IC 2497, suggest either a highly obscured AGN with a novel geometry arranged to allow photoionization of the object but not the galaxy’s own circumnuclear gas, or, as we argue, the first detection of a quasar light echo. In this case, either the luminosity of the central source has decreased dramatically or else the obscuration in the system has increased within 10 5 years. This object may thus represent the first direct probe of quasar history on these timescales. Key words: galaxies: active, galaxies: individual: IC 2497, quasars:general, galaxies: pecu- liar ⋆ This publication has been made possible by the participation of more than 100,000 volunteers in the Galaxy Zoo project. Their contributions are individually acknowledged at http://www.galaxyzoo.org/Volunteers.aspx † E-mail: [email protected] (CJL) ‡ Visiting Astronomer, Kitt Peak National Observatory, National Optical Astronomy Observatory, which is operated by the Association of Universi- ties for Research in Astronomy (AURA) under cooperative agreement with the National Science Foundation. 1 INTRODUCTION The Galaxy Zoo project 1 (Lintott et al. 2008) has completed a morphological classification of almost 900,000 objects drawn from the Sloan Digital Sky Survey (SDSS; York et al. 2000; Adelman-McCarthy et al. 2007). By combining classifications 1 www.galaxyzoo.org c 2008 RAS
Transcript of Galaxy Zoo: ‘Hanny’s Voorwerp’, a quasar light echo? · Galaxy Zoo: ‘Hanny’s Voorwerp’,...
arX
iv:0
906.
5304
v1 [
astr
o-ph
.CO
] 29
Jun
200
9Mon. Not. R. Astron. Soc.000, 1–13 (2008) Printed 1 July 2009 (MN LATEX style file v2.2)
Galaxy Zoo: ‘Hanny’s Voorwerp’, a quasar light echo?⋆
Chris J. Lintott1†, Kevin Schawinski1,2,3, William Keel4,5‡, Hanny van Arkel6,Nicola Bennert7,8, Edward Edmondson9, Daniel Thomas9, Daniel J.B. Smith10,Peter D. Herbert11, Matt J. Jarvis11, Shanil Virani3,Dan Andreescu12, Steven P.Bamford8, Kate Land1, Phil Murray13, Robert C. Nichol8, M. Jordan Raddick14,Anze Slosar15, Alex Szalay14, Jan Vandenberg14
1Department of Physics, University of Oxford, Oxford OX1 3RH, UK.2 Department of Physics, Yale University, New Haven, CT 06511, USA3 Yale Center for Astronomy and Astrophysics, Yale University, P.O. Box 208121, New Haven, CT 06520, USA4 Dept. of Physics and Astronomy, University of Alabama, Box 870324, Tuscaloosa, AL 35487, USA.5 SARA Observatory6 Netherlands School System7 Institute of Geophysics and Planetary Physics, Universityof California, Riverside, CA 925218 Physics Department, University of California, Santa Barbara, CA 93106, USA.9 Institute of Cosmology & Gravitation, University of Portsmouth, UK.10 Astrophysics Research Institute, Liverpool John Moores University, Twelve Quays House Egerton Wharf, Birkenhead, CH41 1LD, UK.11 Centre for Astrophysics, Science & Technology Research Institute, University of Hertfordshire, Hatfield, UK.12 LinkLab, 4506 Graystone Ave., Bronx, NY 10471, USA.13Fingerprint Digital Media, 9 Victoria Close, Newtownards,Co. Down, Northern Ireland, BT23 7GY, UK.14Department of Physics and Astronomy, Johns Hopkins University, 3400 N. Charles St., Baltimore, MD 21218, USA.15Berkeley Centre for Cosmological Physics, Lawrence Berkeley National Laboratory and Physics Department, Berkeley, CA 94720, USA.
October 2008
ABSTRACTWe report the discovery of an unusual object near the spiral galaxy IC 2497, discovered byvisual inspection of the Sloan Digital Sky Survey (SDSS) as part of the Galaxy Zoo project.The object, known as Hanny’s Voorwerp, is bright in the SDSSg band due to unusually strong[OIII ] 4959, 5007 emission lines. We present the results of the first targeted observations ofthe object in the optical, UV and X-ray, which show that the object contains highly ionizedgas. Although the line ratios are similar to extended emission-line regions near luminousAGN, the source of this ionization is not apparent. The emission-line properties, and lack ofx-ray emission from IC 2497, suggest either a highly obscured AGN with a novel geometryarranged to allow photoionization of the object but not the galaxy’s own circumnuclear gas, or,as we argue, the first detection of a quasar light echo. In thiscase, either the luminosity of thecentral source has decreased dramatically or else the obscuration in the system has increasedwithin 10
5 years. This object may thus represent the first direct probe of quasar history onthese timescales.
Key words: galaxies: active, galaxies: individual: IC 2497, quasars:general, galaxies: pecu-liar
⋆ This publication has been made possible by the participation of morethan 100,000 volunteers in the Galaxy Zoo project. Their contributions areindividually acknowledged at http://www.galaxyzoo.org/Volunteers.aspx† E-mail: [email protected] (CJL)‡ Visiting Astronomer, Kitt Peak National Observatory, National OpticalAstronomy Observatory, which is operated by the Association of Universi-ties for Research in Astronomy (AURA) under cooperative agreement withthe National Science Foundation.
1 INTRODUCTION
The Galaxy Zoo project1 (Lintott et al. 2008) has completeda morphological classification of almost 900,000 objects drawnfrom the Sloan Digital Sky Survey (SDSS; York et al. 2000;Adelman-McCarthy et al. 2007). By combining classifications
1 www.galaxyzoo.org
c© 2008 RAS
2 Lintott et al.
made by more than 100,000 participants, it proved possible to com-pile catalogues of morphology which are of comparable accuracy tothose produced by professional astronomers, despite beingan orderof magnitude larger. The data produced were primarily intended foruse in the study of the properties of the population of galaxies (e.g.Bamford et al. 2008), but visual inspection of images from surveyssuch as the SDSS provides an excellent way of identifying unusualobjects within the data set.
In this paper, we discuss an unusual structure, colloquiallyknown as ‘Hanny’s Voorwerp’2 discovered by Hanny van Arkelin the vicinity of the spiral galaxy IC 2497. We report this discov-ery and present the results of initial follow-up observations in thevisible, ultraviolet and X-ray regions of the spectrum. We considerthe emission-line spectrum in detail, and consider possible sourcesfor the observed degree of ionization.
2 PRE-EXISTING OBSERVATIONS OF IC 2497
While there are no pre-existing observations of our target,theneighbouring galaxy IC 2497, is included in several surveys. It hasa measured redshift ofz = 0.0502213 (Fisher et al. 1995). Assum-ing, as we will throughout this paper,H0 = 71, Ωm = 0.27 andΩλ = 0.73 (Dunkley et al. 2008) this redshift corresponds to a lu-minosity distance of 220.4 Mpc and a scale of 969pc arcsec−1.With an absolute magnitude ofMr = −22.1 mag it is a lumi-nous system around 1.7 mags brighter thanM∗,r (Blanton et al.2003). The SDSS imaging shows it as a disk galaxy with a largebulge and two fainter spiral arms, as shown in Figure 1. IC 2497is also detected at radio wavelengths in the Very Large Array(VLA) FIRST survey (Becker et al. 1995), with a flux 16.1±0.8mJy at 1.4 GHz, and hence a radio luminosity ofL1.4 GHz =
1.00 ± 0.05 × 10²³ WHz−1.IC 2497 was also detected byIRAS(the Infrared Astronom-
ical Satellite) at 25, 60, and 100µm, with values from the point-source catalogue giving it an infrared luminosity ofLIR = 3.9 ×
1011L⊙ (Sanders & Mirabel 1996), and is thus a Luminous In-fraRed Galaxy (LIRG). However, inspection of the IRAS data usingthe Infrared Sky Atlas (IRAS) tool at the Infrared Processing andAnalysis Centre (IPAC4) web archive shows that the 60µm mea-surement (and possibly the others) may be confused with a strongersource about 2 arcminutes to its south.
To verify the IRAS fluxes, we used the SCANPI web tool fromIPAC to retrieve fluxes for each detector crossing of IC 2497,es-tablishing the absence of confusing sources and averaging the scansfor measurement. The resulting flux densities were 0.14, 0.22, 2.04,and 3.71 Jy in the 12, 25, 60, and 100µm bands respectively, witherrors of 0.02, 0.02, 0.02, and 0.06 Jy. Using the FIR parame-ter from Lonsdale et al. (1985) the luminosity from 42-122µm is6×1044 erg s−1. Despite the high luminosity for such an ordinary-looking galaxy, we note that the FIR energy distribution suggestsemission from a source which is colder than most AGN-dominatedsources.
2 ‘Voorwerp’ is Dutch for object.3 NASA/IPAC Extragalactic Database,http://nedwww.ipac.caltech.edu/4 http://www.ipac.caltech.edu
3 IMAGING DATA
3.1 SDSS Imaging Data & Photometric Properties
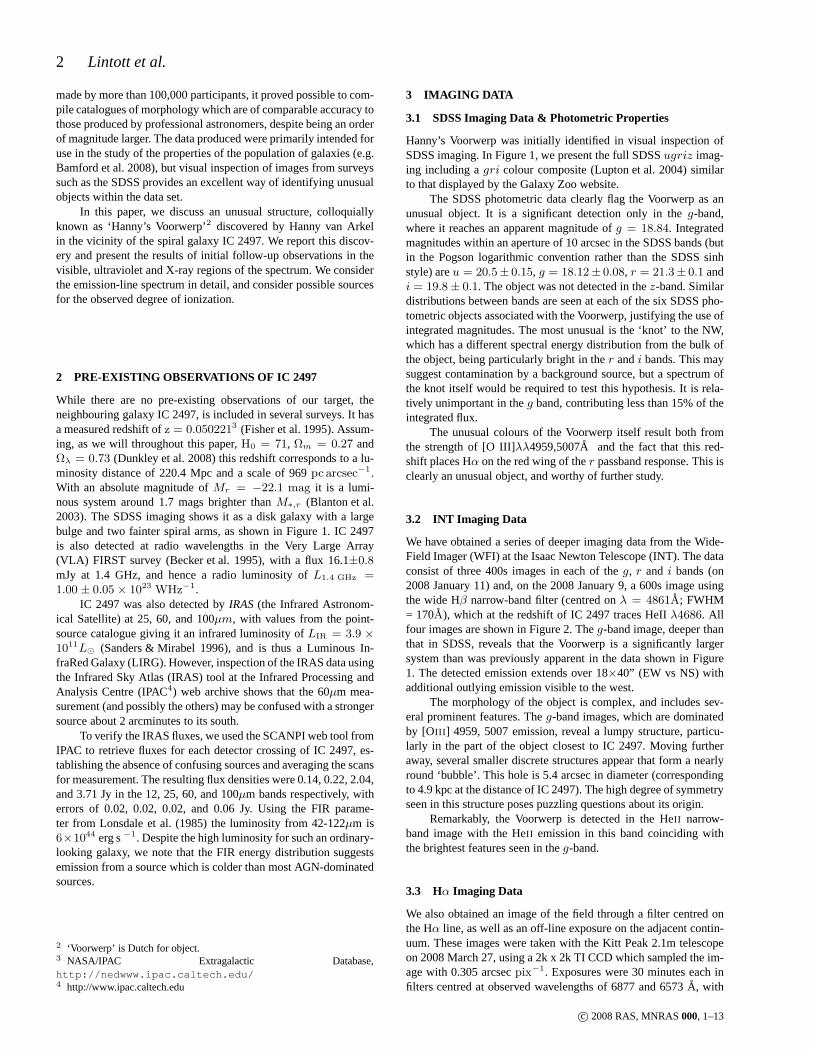
Hanny’s Voorwerp was initially identified in visual inspection ofSDSS imaging. In Figure 1, we present the full SDSSugriz imag-ing including agri colour composite (Lupton et al. 2004) similarto that displayed by the Galaxy Zoo website.
The SDSS photometric data clearly flag the Voorwerp as anunusual object. It is a significant detection only in theg-band,where it reaches an apparent magnitude ofg = 18.84. Integratedmagnitudes within an aperture of 10 arcsec in the SDSS bands (butin the Pogson logarithmic convention rather than the SDSS sinhstyle) areu = 20.5± 0.15, g = 18.12± 0.08, r = 21.3± 0.1 andi = 19.8 ± 0.1. The object was not detected in thez-band. Similardistributions between bands are seen at each of the six SDSS pho-tometric objects associated with the Voorwerp, justifyingthe use ofintegrated magnitudes. The most unusual is the ‘knot’ to theNW,which has a different spectral energy distribution from thebulk ofthe object, being particularly bright in ther andi bands. This maysuggest contamination by a background source, but a spectrum ofthe knot itself would be required to test this hypothesis. Itis rela-tively unimportant in theg band, contributing less than 15% of theintegrated flux.
The unusual colours of the Voorwerp itself result both fromthe strength of [O III]λλ4959,5007A and the fact that this red-shift places Hα on the red wing of ther passband response. This isclearly an unusual object, and worthy of further study.
3.2 INT Imaging Data
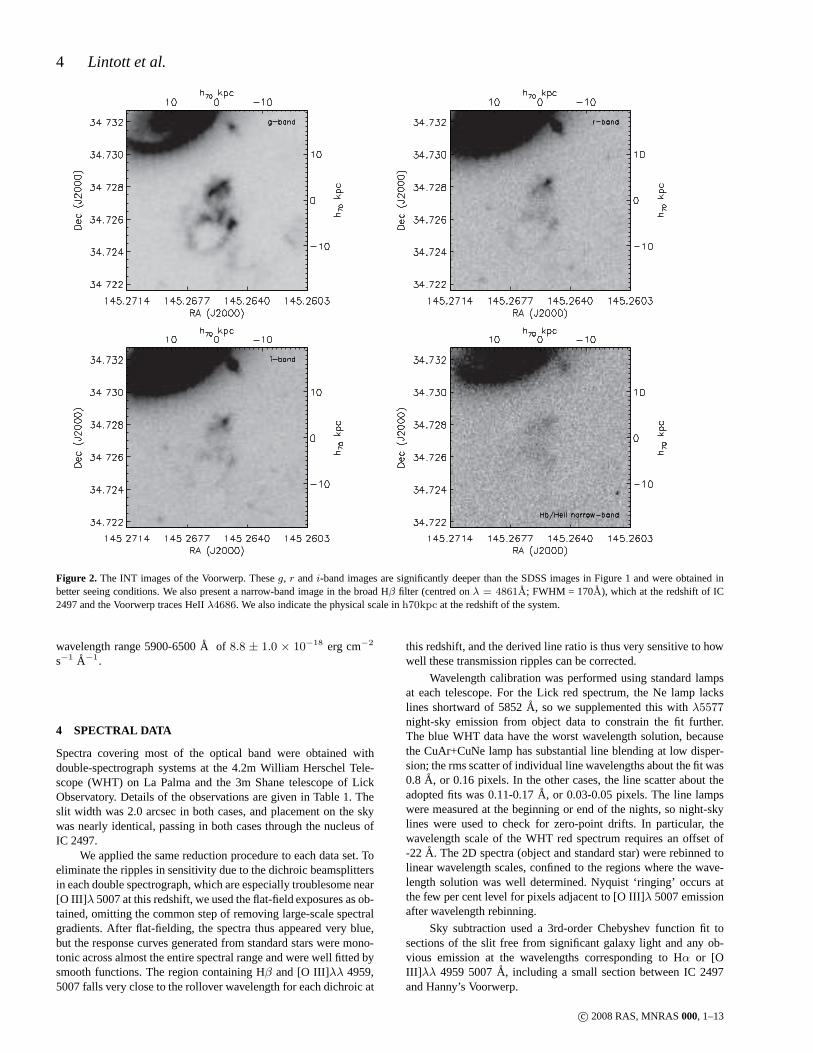
We have obtained a series of deeper imaging data from the Wide-Field Imager (WFI) at the Isaac Newton Telescope (INT). The dataconsist of three 400s images in each of theg, r and i bands (on2008 January 11) and, on the 2008 January 9, a 600s image usingthe wide Hβ narrow-band filter (centred onλ = 4861A; FWHM= 170A), which at the redshift of IC 2497 traces HeIIλ4686. Allfour images are shown in Figure 2. Theg-band image, deeper thanthat in SDSS, reveals that the Voorwerp is a significantly largersystem than was previously apparent in the data shown in Figure1. The detected emission extends over 18×40” (EW vs NS) withadditional outlying emission visible to the west.
The morphology of the object is complex, and includes sev-eral prominent features. Theg-band images, which are dominatedby [OIII ] 4959, 5007 emission, reveal a lumpy structure, particu-larly in the part of the object closest to IC 2497. Moving furtheraway, several smaller discrete structures appear that forma nearlyround ‘bubble’. This hole is 5.4 arcsec in diameter (correspondingto 4.9 kpc at the distance of IC 2497). The high degree of symmetryseen in this structure poses puzzling questions about its origin.
Remarkably, the Voorwerp is detected in the HeII narrow-band image with the HeII emission in this band coinciding withthe brightest features seen in theg-band.
3.3 Hα Imaging Data
We also obtained an image of the field through a filter centred onthe Hα line, as well as an off-line exposure on the adjacent contin-uum. These images were taken with the Kitt Peak 2.1m telescopeon 2008 March 27, using a 2k x 2k TI CCD which sampled the im-age with 0.305 arcsecpix−1. Exposures were 30 minutes each infilters centred at observed wavelengths of 6877 and 6573A, with
c© 2008 RAS, MNRAS000, 1–13
‘Hanny’s Voorwerp’, a quasar light echo? 3
Figure 1. The SDSS images of the main galaxy IC 2497 and the Voorwerp. Weshow each of the five SDSS images (u, g, r, i andz separately as well asa three-colourgri composite (Lupton et al. 2004). The latter is similar to the Galaxy Zoo image in which the Voorwerp was discovered. IC 2497is clearlyvisible in all five bands, while the Voorwerp is strikingly prominent only in theg-band. It is marginally detected in theu, r, andi-bands, and undetected inz.We also indicate the physical scale inh70kpc at the redshift of the system.
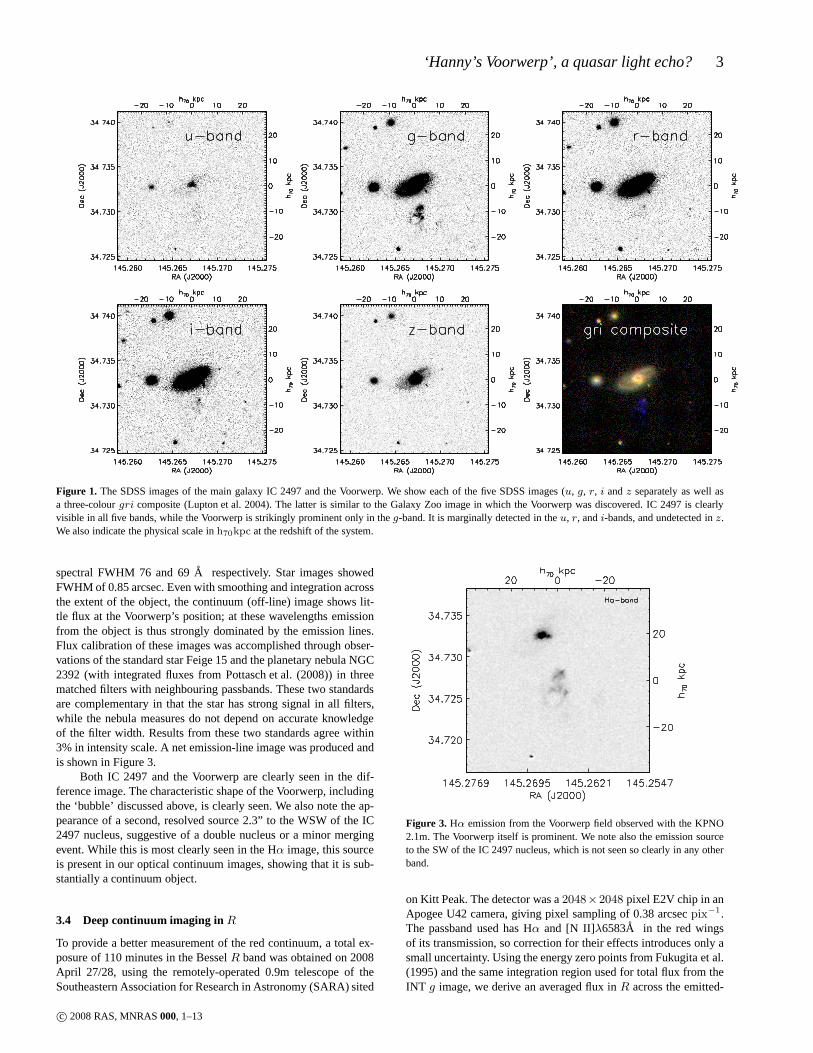
spectral FWHM 76 and 69A respectively. Star images showedFWHM of 0.85 arcsec. Even with smoothing and integration acrossthe extent of the object, the continuum (off-line) image shows lit-tle flux at the Voorwerp’s position; at these wavelengths emissionfrom the object is thus strongly dominated by the emission lines.Flux calibration of these images was accomplished through obser-vations of the standard star Feige 15 and the planetary nebula NGC2392 (with integrated fluxes from Pottasch et al. (2008)) in threematched filters with neighbouring passbands. These two standardsare complementary in that the star has strong signal in all filters,while the nebula measures do not depend on accurate knowledgeof the filter width. Results from these two standards agree within3% in intensity scale. A net emission-line image was produced andis shown in Figure 3.
Both IC 2497 and the Voorwerp are clearly seen in the dif-ference image. The characteristic shape of the Voorwerp, includingthe ‘bubble’ discussed above, is clearly seen. We also note the ap-pearance of a second, resolved source 2.3” to the WSW of the IC2497 nucleus, suggestive of a double nucleus or a minor mergingevent. While this is most clearly seen in the Hα image, this sourceis present in our optical continuum images, showing that it is sub-stantially a continuum object.
3.4 Deep continuum imaging in R
To provide a better measurement of the red continuum, a totalex-posure of 110 minutes in the BesselR band was obtained on 2008April 27/28, using the remotely-operated 0.9m telescope oftheSoutheastern Association for Research in Astronomy (SARA)sited
Figure 3. Hα emission from the Voorwerp field observed with the KPNO2.1m. The Voorwerp itself is prominent. We note also the emission sourceto the SW of the IC 2497 nucleus, which is not seen so clearly inany otherband.
on Kitt Peak. The detector was a2048×2048 pixel E2V chip in anApogee U42 camera, giving pixel sampling of 0.38 arcsecpix−1.The passband used has Hα and [N II]λ6583A in the red wingsof its transmission, so correction for their effects introduces only asmall uncertainty. Using the energy zero points from Fukugita et al.(1995) and the same integration region used for total flux from theINT g image, we derive an averaged flux inR across the emitted-
c© 2008 RAS, MNRAS000, 1–13
4 Lintott et al.
Figure 2. The INT images of the Voorwerp. Theseg, r andi-band images are significantly deeper than the SDSS images inFigure 1 and were obtained inbetter seeing conditions. We also present a narrow-band image in the broad Hβ filter (centred onλ = 4861A; FWHM = 170A), which at the redshift of IC2497 and the Voorwerp traces HeIIλ4686. We also indicate the physical scale inh70kpc at the redshift of the system.
wavelength range 5900-6500A of 8.8 ± 1.0 × 10⁻¹⁸ erg cm−2
s−1 A−1.
4 SPECTRAL DATA
Spectra covering most of the optical band were obtained withdouble-spectrograph systems at the 4.2m William Herschel Tele-scope (WHT) on La Palma and the 3m Shane telescope of LickObservatory. Details of the observations are given in Table1. Theslit width was 2.0 arcsec in both cases, and placement on the skywas nearly identical, passing in both cases through the nucleus ofIC 2497.
We applied the same reduction procedure to each data set. Toeliminate the ripples in sensitivity due to the dichroic beamsplittersin each double spectrograph, which are especially troublesome near[O III] λ 5007 at this redshift, we used the flat-field exposures as ob-tained, omitting the common step of removing large-scale spectralgradients. After flat-fielding, the spectra thus appeared very blue,but the response curves generated from standard stars were mono-tonic across almost the entire spectral range and were well fitted bysmooth functions. The region containing Hβ and [O III]λλ 4959,5007 falls very close to the rollover wavelength for each dichroic at
this redshift, and the derived line ratio is thus very sensitive to howwell these transmission ripples can be corrected.
Wavelength calibration was performed using standard lampsat each telescope. For the Lick red spectrum, the Ne lamp lackslines shortward of 5852A, so we supplemented this withλ5577
night-sky emission from object data to constrain the fit further.The blue WHT data have the worst wavelength solution, becausethe CuAr+CuNe lamp has substantial line blending at low disper-sion; the rms scatter of individual line wavelengths about the fit was0.8 A, or 0.16 pixels. In the other cases, the line scatter about theadopted fits was 0.11-0.17A, or 0.03-0.05 pixels. The line lampswere measured at the beginning or end of the nights, so night-skylines were used to check for zero-point drifts. In particular, thewavelength scale of the WHT red spectrum requires an offset of-22 A. The 2D spectra (object and standard star) were rebinned tolinear wavelength scales, confined to the regions where the wave-length solution was well determined. Nyquist ‘ringing’ occurs atthe few per cent level for pixels adjacent to [O III]λ 5007 emissionafter wavelength rebinning.
Sky subtraction used a 3rd-order Chebyshev function fit tosections of the slit free from significant galaxy light and any ob-vious emission at the wavelengths corresponding to Hα or [OIII] λλ 4959 5007A, including a small section between IC 2497and Hanny’s Voorwerp.
c© 2008 RAS, MNRAS000, 1–13
‘Hanny’s Voorwerp’, a quasar light echo? 5
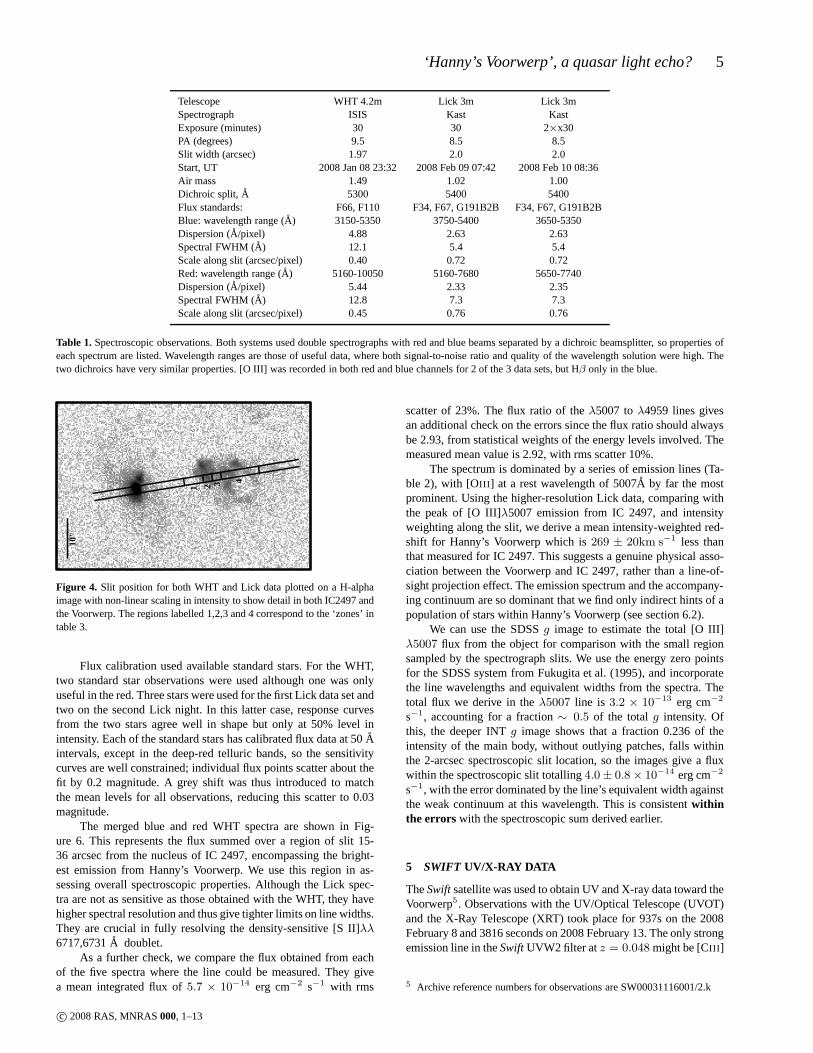
Telescope WHT 4.2m Lick 3m Lick 3mSpectrograph ISIS Kast KastExposure (minutes) 30 30 2×x30PA (degrees) 9.5 8.5 8.5Slit width (arcsec) 1.97 2.0 2.0Start, UT 2008 Jan 08 23:32 2008 Feb 09 07:42 2008 Feb 10 08:36Air mass 1.49 1.02 1.00Dichroic split,A 5300 5400 5400Flux standards: F66, F110 F34, F67, G191B2B F34, F67, G191B2BBlue: wavelength range (A) 3150-5350 3750-5400 3650-5350Dispersion (A/pixel) 4.88 2.63 2.63Spectral FWHM (A) 12.1 5.4 5.4Scale along slit (arcsec/pixel) 0.40 0.72 0.72Red: wavelength range (A) 5160-10050 5160-7680 5650-7740Dispersion (A/pixel) 5.44 2.33 2.35Spectral FWHM (A) 12.8 7.3 7.3Scale along slit (arcsec/pixel) 0.45 0.76 0.76
Table 1. Spectroscopic observations. Both systems used double spectrographs with red and blue beams separated by a dichroic beamsplitter, so properties ofeach spectrum are listed. Wavelength ranges are those of useful data, where both signal-to-noise ratio and quality of the wavelength solution were high. Thetwo dichroics have very similar properties. [O III] was recorded in both red and blue channels for 2 of the 3 data sets, but Hβ only in the blue.
10"
1 2 3 4
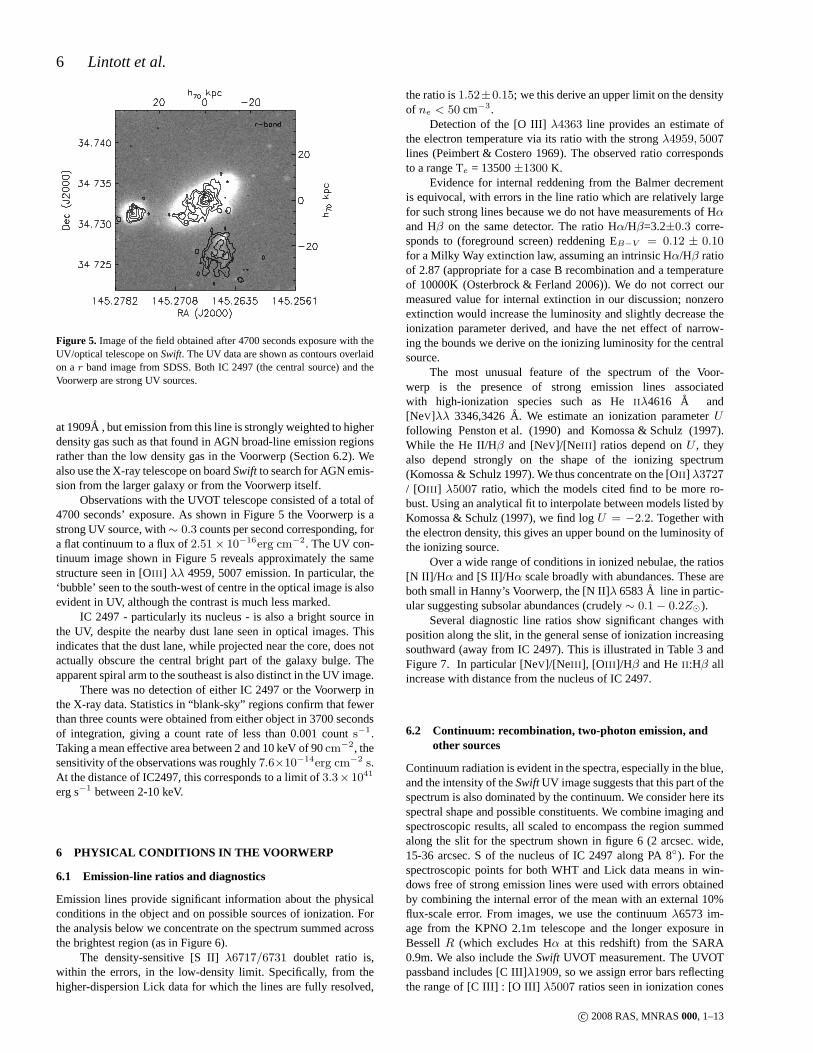
Figure 4. Slit position for both WHT and Lick data plotted on a H-alphaimage with non-linear scaling in intensity to show detail inboth IC2497 andthe Voorwerp. The regions labelled 1,2,3 and 4 correspond tothe ‘zones’ intable 3.
Flux calibration used available standard stars. For the WHT,two standard star observations were used although one was onlyuseful in the red. Three stars were used for the first Lick dataset andtwo on the second Lick night. In this latter case, response curvesfrom the two stars agree well in shape but only at 50% level inintensity. Each of the standard stars has calibrated flux data at 50Aintervals, except in the deep-red telluric bands, so the sensitivitycurves are well constrained; individual flux points scatterabout thefit by 0.2 magnitude. A grey shift was thus introduced to matchthe mean levels for all observations, reducing this scatterto 0.03magnitude.
The merged blue and red WHT spectra are shown in Fig-ure 6. This represents the flux summed over a region of slit 15-36 arcsec from the nucleus of IC 2497, encompassing the bright-est emission from Hanny’s Voorwerp. We use this region in as-sessing overall spectroscopic properties. Although the Lick spec-tra are not as sensitive as those obtained with the WHT, they havehigher spectral resolution and thus give tighter limits on line widths.They are crucial in fully resolving the density-sensitive [S II]λλ6717,6731A doublet.
As a further check, we compare the flux obtained from eachof the five spectra where the line could be measured. They givea mean integrated flux of5.7 × 10−14 erg cm−2 s−1 with rms
scatter of 23%. The flux ratio of theλ5007 toλ4959 lines givesan additional check on the errors since the flux ratio should alwaysbe 2.93, from statistical weights of the energy levels involved. Themeasured mean value is 2.92, with rms scatter 10%.
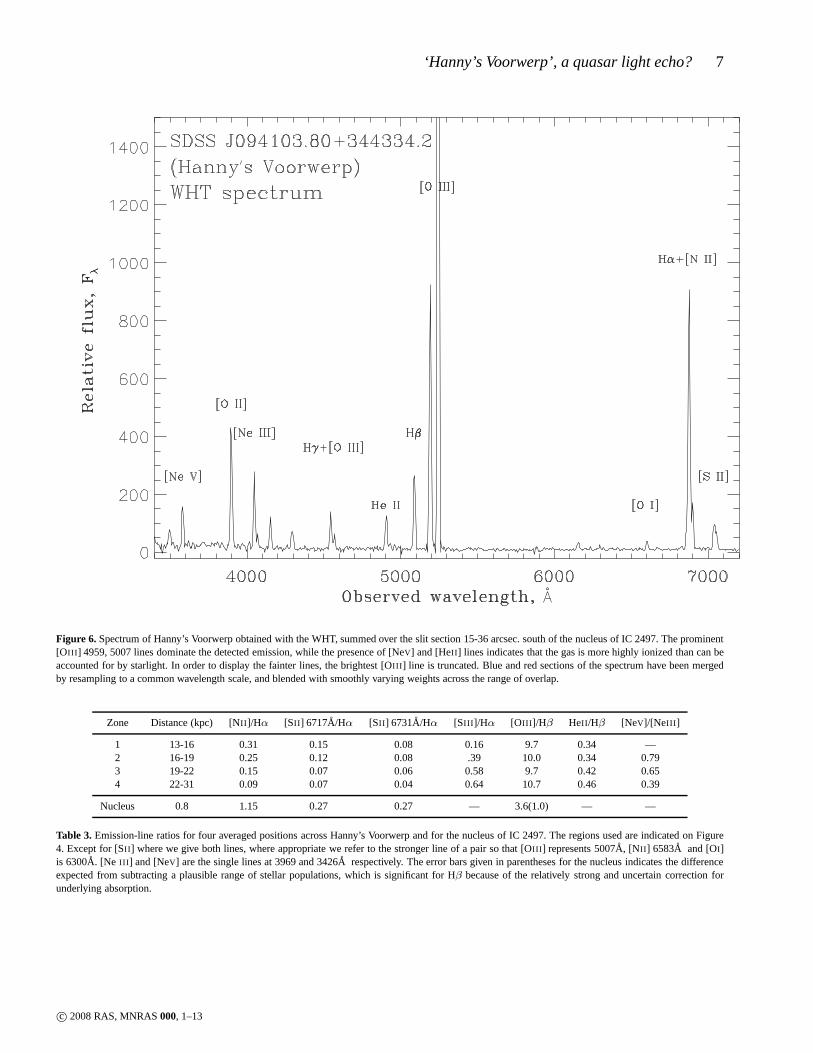
The spectrum is dominated by a series of emission lines (Ta-ble 2), with [OIII ] at a rest wavelength of 5007A by far the mostprominent. Using the higher-resolution Lick data, comparing withthe peak of [O III]λ5007 emission from IC 2497, and intensityweighting along the slit, we derive a mean intensity-weighted red-shift for Hanny’s Voorwerp which is269 ± 20km s−1 less thanthat measured for IC 2497. This suggests a genuine physical asso-ciation between the Voorwerp and IC 2497, rather than a line-of-sight projection effect. The emission spectrum and the accompany-ing continuum are so dominant that we find only indirect hintsof apopulation of stars within Hanny’s Voorwerp (see section 6.2).
We can use the SDSSg image to estimate the total [O III]λ5007 flux from the object for comparison with the small regionsampled by the spectrograph slits. We use the energy zero pointsfor the SDSS system from Fukugita et al. (1995), and incorporatethe line wavelengths and equivalent widths from the spectra. Thetotal flux we derive in theλ5007 line is 3.2 × 10⁻¹³ erg cm−2
s−1, accounting for a fraction∼ 0.5 of the totalg intensity. Ofthis, the deeper INTg image shows that a fraction 0.236 of theintensity of the main body, without outlying patches, fallswithinthe 2-arcsec spectroscopic slit location, so the images give a fluxwithin the spectroscopic slit totalling4.0 ± 0.8 × 10⁻¹⁴ erg cm−2
s−1, with the error dominated by the line’s equivalent width againstthe weak continuum at this wavelength. This is consistentwithinthe errors with the spectroscopic sum derived earlier.
5 SWIFT UV/X-RAY DATA
TheSwiftsatellite was used to obtain UV and X-ray data toward theVoorwerp5. Observations with the UV/Optical Telescope (UVOT)and the X-Ray Telescope (XRT) took place for 937s on the 2008February 8 and 3816 seconds on 2008 February 13. The only strongemission line in theSwiftUVW2 filter atz = 0.048 might be [CIII ]
5 Archive reference numbers for observations are SW00031116001/2.k
c© 2008 RAS, MNRAS000, 1–13
6 Lintott et al.
Figure 5. Image of the field obtained after 4700 seconds exposure with theUV/optical telescope onSwift. The UV data are shown as contours overlaidon ar band image from SDSS. Both IC 2497 (the central source) and theVoorwerp are strong UV sources.
at 1909A , but emission from this line is strongly weighted to higherdensity gas such as that found in AGN broad-line emission regionsrather than the low density gas in the Voorwerp (Section 6.2). Wealso use the X-ray telescope on boardSwiftto search for AGN emis-sion from the larger galaxy or from the Voorwerp itself.
Observations with the UVOT telescope consisted of a total of4700 seconds’ exposure. As shown in Figure 5 the Voorwerp is astrong UV source, with∼ 0.3 counts per second corresponding, fora flat continuum to a flux of2.51 × 10−16erg cm−2. The UV con-tinuum image shown in Figure 5 reveals approximately the samestructure seen in [OIII ] λλ 4959, 5007 emission. In particular, the‘bubble’ seen to the south-west of centre in the optical image is alsoevident in UV, although the contrast is much less marked.
IC 2497 - particularly its nucleus - is also a bright source inthe UV, despite the nearby dust lane seen in optical images. Thisindicates that the dust lane, while projected near the core,does notactually obscure the central bright part of the galaxy bulge. Theapparent spiral arm to the southeast is also distinct in the UV image.
There was no detection of either IC 2497 or the Voorwerp inthe X-ray data. Statistics in “blank-sky” regions confirm that fewerthan three counts were obtained from either object in 3700 secondsof integration, giving a count rate of less than 0.001 counts−1.Taking a mean effective area between 2 and 10 keV of 90cm−2, thesensitivity of the observations was roughly7.6×10−14erg cm−2 s.At the distance of IC2497, this corresponds to a limit of3.3× 1041
erg s−1 between 2-10 keV.
6 PHYSICAL CONDITIONS IN THE VOORWERP
6.1 Emission-line ratios and diagnostics
Emission lines provide significant information about the physicalconditions in the object and on possible sources of ionization. Forthe analysis below we concentrate on the spectrum summed acrossthe brightest region (as in Figure 6).
The density-sensitive [S II]λ6717/6731 doublet ratio is,within the errors, in the low-density limit. Specifically, from thehigher-dispersion Lick data for which the lines are fully resolved,
the ratio is1.52±0.15; we this derive an upper limit on the densityof ne < 50 cm−3.
Detection of the [O III]λ4363 line provides an estimate ofthe electron temperature via its ratio with the strongλ4959, 5007lines (Peimbert & Costero 1969). The observed ratio correspondsto a range Te = 13500±1300 K.
Evidence for internal reddening from the Balmer decrementis equivocal, with errors in the line ratio which are relatively largefor such strong lines because we do not have measurements of Hαand Hβ on the same detector. The ratio Hα/Hβ=3.2±0.3 corre-sponds to (foreground screen) reddening EB−V = 0.12 ± 0.10for a Milky Way extinction law, assuming an intrinsic Hα/Hβ ratioof 2.87 (appropriate for a case B recombination and a temperatureof 10000K (Osterbrock & Ferland 2006)). We do not correct ourmeasured value for internal extinction in our discussion; nonzeroextinction would increase the luminosity and slightly decrease theionization parameter derived, and have the net effect of narrow-ing the bounds we derive on the ionizing luminosity for the centralsource.
The most unusual feature of the spectrum of the Voor-werp is the presence of strong emission lines associatedwith high-ionization species such as HeIIλ4616 A and[NeV]λλ 3346,3426A. We estimate an ionization parameterUfollowing Penston et al. (1990) and Komossa & Schulz (1997).While the He II/Hβ and [NeV]/[NeIII ] ratios depend onU , theyalso depend strongly on the shape of the ionizing spectrum(Komossa & Schulz 1997). We thus concentrate on the [OII ] λ3727
/ [OIII ] λ5007 ratio, which the models cited find to be more ro-bust. Using an analytical fit to interpolate between models listed byKomossa & Schulz (1997), we find logU = −2.2. Together withthe electron density, this gives an upper bound on the luminosity ofthe ionizing source.
Over a wide range of conditions in ionized nebulae, the ratios[N II]/H α and [S II]/Hα scale broadly with abundances. These areboth small in Hanny’s Voorwerp, the [N II]λ 6583A line in partic-ular suggesting subsolar abundances (crudely∼ 0.1 − 0.2Z⊙).
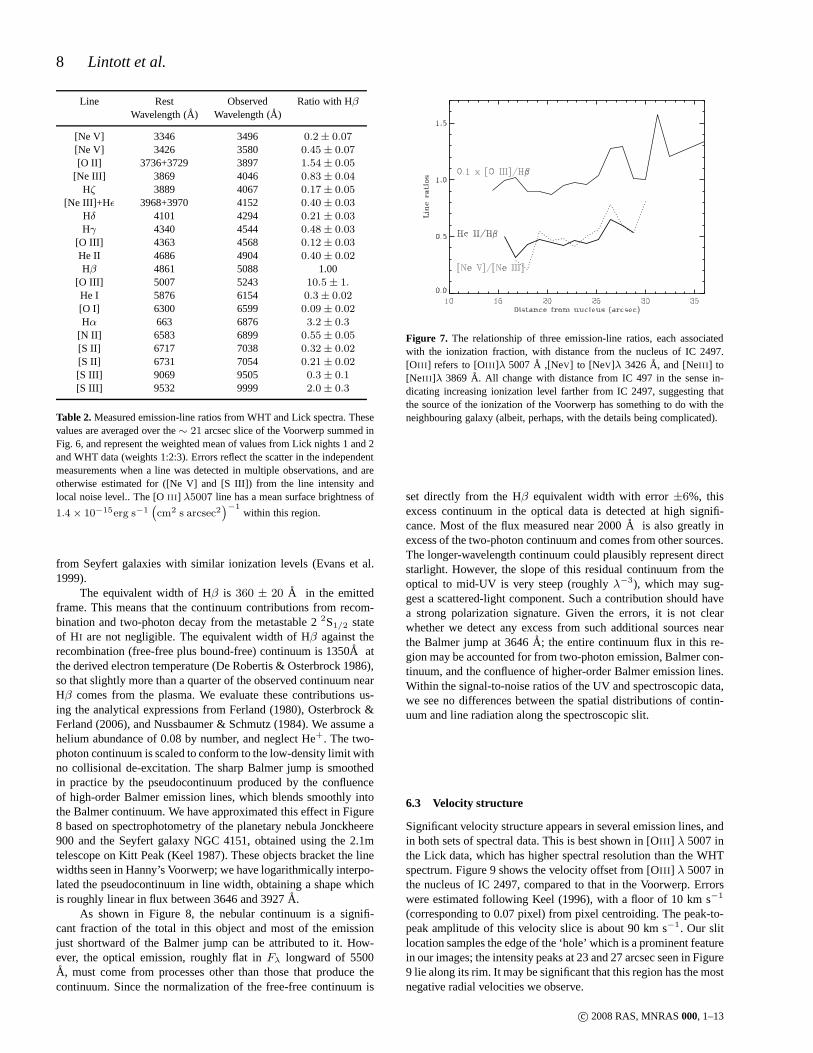
Several diagnostic line ratios show significant changes withposition along the slit, in the general sense of ionization increasingsouthward (away from IC 2497). This is illustrated in Table 3andFigure 7. In particular [NeV]/[NeIII ], [OIII ]/Hβ and HeII :Hβ allincrease with distance from the nucleus of IC 2497.
6.2 Continuum: recombination, two-photon emission, andother sources
Continuum radiation is evident in the spectra, especially in the blue,and the intensity of theSwiftUV image suggests that this part of thespectrum is also dominated by the continuum. We consider here itsspectral shape and possible constituents. We combine imaging andspectroscopic results, all scaled to encompass the region summedalong the slit for the spectrum shown in figure 6 (2 arcsec. wide,15-36 arcsec. S of the nucleus of IC 2497 along PA 8). For thespectroscopic points for both WHT and Lick data means in win-dows free of strong emission lines were used with errors obtainedby combining the internal error of the mean with an external 10%flux-scale error. From images, we use the continuumλ6573 im-age from the KPNO 2.1m telescope and the longer exposure inBessellR (which excludes Hα at this redshift) from the SARA0.9m. We also include theSwift UVOT measurement. The UVOTpassband includes [C III]λ1909, so we assign error bars reflectingthe range of [C III] : [O III] λ5007 ratios seen in ionization cones
c© 2008 RAS, MNRAS000, 1–13
‘Hanny’s Voorwerp’, a quasar light echo? 7
Figure 6. Spectrum of Hanny’s Voorwerp obtained with the WHT, summed over the slit section 15-36 arcsec. south of the nucleus of IC 2497. The prominent[OIII ] 4959, 5007 lines dominate the detected emission, while thepresence of [NeV] and [HeII ] lines indicates that the gas is more highly ionized than canbeaccounted for by starlight. In order to display the fainter lines, the brightest [OIII ] line is truncated. Blue and red sections of the spectrum have been mergedby resampling to a common wavelength scale, and blended withsmoothly varying weights across the range of overlap.
Zone Distance (kpc) [NII ]/Hα [SII ] 6717A/Hα [SII ] 6731A/Hα [SIII ]/Hα [OIII ]/Hβ HeII /Hβ [NeV]/[NeIII ]
1 13-16 0.31 0.15 0.08 0.16 9.7 0.34 —2 16-19 0.25 0.12 0.08 .39 10.0 0.34 0.793 19-22 0.15 0.07 0.06 0.58 9.7 0.42 0.654 22-31 0.09 0.07 0.04 0.64 10.7 0.46 0.39
Nucleus 0.8 1.15 0.27 0.27 — 3.6(1.0) — —
Table 3. Emission-line ratios for four averaged positions across Hanny’s Voorwerp and for the nucleus of IC 2497. The regions used are indicated on Figure4. Except for [SII ] where we give both lines, where appropriate we refer to the stronger line of a pair so that [OIII ] represents 5007A, [N II ] 6583A and [OI]is 6300A. [Ne III ] and [NeV] are the single lines at 3969 and 3426A respectively. The error bars given in parentheses for the nucleus indicates the differenceexpected from subtracting a plausible range of stellar populations, which is significant for Hβ because of the relatively strong and uncertain correction forunderlying absorption.
c© 2008 RAS, MNRAS000, 1–13
8 Lintott et al.
Line Rest Observed Ratio with HβWavelength (A) Wavelength (A)
[Ne V] 3346 3496 0.2 ± 0.07
[Ne V] 3426 3580 0.45 ± 0.07
[O II] 3736+3729 3897 1.54 ± 0.05
[Ne III] 3869 4046 0.83 ± 0.04
Hζ 3889 4067 0.17 ± 0.05
[Ne III]+H ǫ 3968+3970 4152 0.40 ± 0.03
Hδ 4101 4294 0.21 ± 0.03
Hγ 4340 4544 0.48 ± 0.03
[O III] 4363 4568 0.12 ± 0.03
He II 4686 4904 0.40 ± 0.02
Hβ 4861 5088 1.00[O III] 5007 5243 10.5 ± 1.
He I 5876 6154 0.3 ± 0.02
[O I] 6300 6599 0.09 ± 0.02
Hα 663 6876 3.2 ± 0.3
[N II] 6583 6899 0.55 ± 0.05
[S II] 6717 7038 0.32 ± 0.02
[S II] 6731 7054 0.21 ± 0.02
[S III] 9069 9505 0.3 ± 0.1
[S III] 9532 9999 2.0 ± 0.3
Table 2. Measured emission-line ratios from WHT and Lick spectra. Thesevalues are averaged over the∼ 21 arcsec slice of the Voorwerp summed inFig. 6, and represent the weighted mean of values from Lick nights 1 and 2and WHT data (weights 1:2:3). Errors reflect the scatter in the independentmeasurements when a line was detected in multiple observations, and areotherwise estimated for ([Ne V] and [S III]) from the line intensity andlocal noise level.. The [OIII ] λ5007 line has a mean surface brightness of
1.4 × 10⁻¹⁵erg s−1(
cm2 s arcsec2)−1
within this region.
from Seyfert galaxies with similar ionization levels (Evans et al.1999).
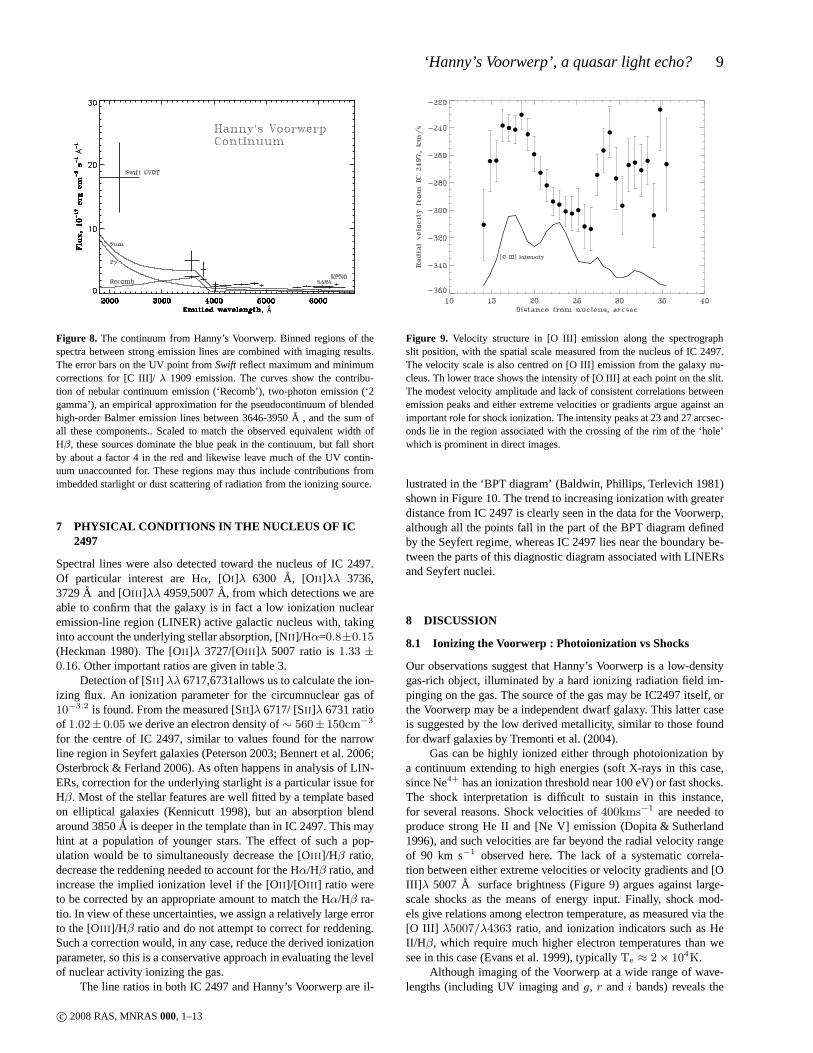
The equivalent width of Hβ is 360 ± 20 A in the emittedframe. This means that the continuum contributions from recom-bination and two-photon decay from the metastable 22S1/2 stateof HI are not negligible. The equivalent width of Hβ against therecombination (free-free plus bound-free) continuum is 1350A atthe derived electron temperature (De Robertis & Osterbrock1986),so that slightly more than a quarter of the observed continuum nearHβ comes from the plasma. We evaluate these contributions us-ing the analytical expressions from Ferland (1980), Osterbrock &Ferland (2006), and Nussbaumer & Schmutz (1984). We assume ahelium abundance of 0.08 by number, and neglect He+. The two-photon continuum is scaled to conform to the low-density limit withno collisional de-excitation. The sharp Balmer jump is smoothedin practice by the pseudocontinuum produced by the confluenceof high-order Balmer emission lines, which blends smoothlyintothe Balmer continuum. We have approximated this effect in Figure8 based on spectrophotometry of the planetary nebula Jonckheere900 and the Seyfert galaxy NGC 4151, obtained using the 2.1mtelescope on Kitt Peak (Keel 1987). These objects bracket the linewidths seen in Hanny’s Voorwerp; we have logarithmically interpo-lated the pseudocontinuum in line width, obtaining a shape whichis roughly linear in flux between 3646 and 3927A.
As shown in Figure 8, the nebular continuum is a signifi-cant fraction of the total in this object and most of the emissionjust shortward of the Balmer jump can be attributed to it. How-ever, the optical emission, roughly flat inFλ longward of 5500A, must come from processes other than those that produce thecontinuum. Since the normalization of the free-free continuum is
Figure 7. The relationship of three emission-line ratios, each associatedwith the ionization fraction, with distance from the nucleus of IC 2497.[OIII ] refers to [OIII ]λ 5007A ,[NeV] to [NeV]λ 3426A, and [NeIII ] to[NeIII ]λ 3869 A. All change with distance from IC 497 in the sense in-dicating increasing ionization level farther from IC 2497,suggesting thatthe source of the ionization of the Voorwerp has something todo with theneighbouring galaxy (albeit, perhaps, with the details being complicated).
set directly from the Hβ equivalent width with error±6%, thisexcess continuum in the optical data is detected at high signifi-cance. Most of the flux measured near 2000A is also greatly inexcess of the two-photon continuum and comes from other sources.The longer-wavelength continuum could plausibly represent directstarlight. However, the slope of this residual continuum from theoptical to mid-UV is very steep (roughlyλ−3), which may sug-gest a scattered-light component. Such a contribution should havea strong polarization signature. Given the errors, it is notclearwhether we detect any excess from such additional sources nearthe Balmer jump at 3646A; the entire continuum flux in this re-gion may be accounted for from two-photon emission, Balmer con-tinuum, and the confluence of higher-order Balmer emission lines.Within the signal-to-noise ratios of the UV and spectroscopic data,we see no differences between the spatial distributions of contin-uum and line radiation along the spectroscopic slit.
6.3 Velocity structure
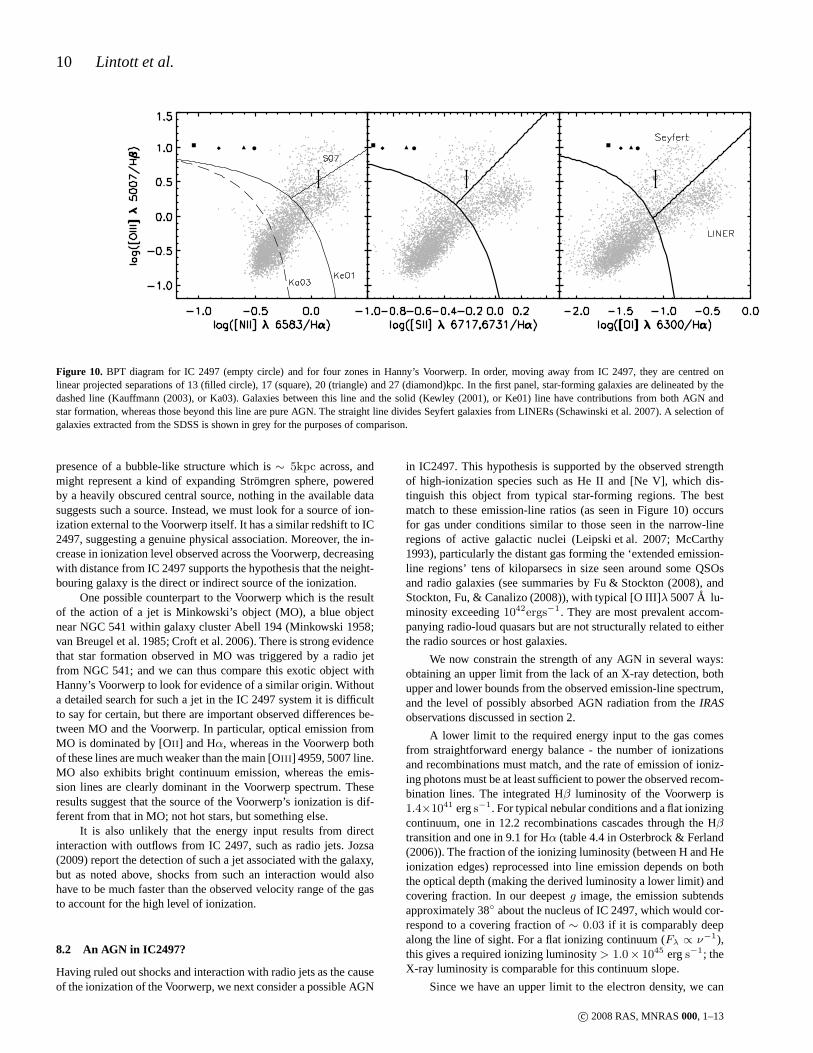
Significant velocity structure appears in several emissionlines, andin both sets of spectral data. This is best shown in [OIII ] λ 5007 inthe Lick data, which has higher spectral resolution than theWHTspectrum. Figure 9 shows the velocity offset from [OIII ] λ 5007 inthe nucleus of IC 2497, compared to that in the Voorwerp. Errorswere estimated following Keel (1996), with a floor of 10 km s−1
(corresponding to 0.07 pixel) from pixel centroiding. The peak-to-peak amplitude of this velocity slice is about 90 km s−1. Our slitlocation samples the edge of the ‘hole’ which is a prominent featurein our images; the intensity peaks at 23 and 27 arcsec seen in Figure9 lie along its rim. It may be significant that this region has the mostnegative radial velocities we observe.
c© 2008 RAS, MNRAS000, 1–13
‘Hanny’s Voorwerp’, a quasar light echo? 9
Figure 8. The continuum from Hanny’s Voorwerp. Binned regions of thespectra between strong emission lines are combined with imaging results.The error bars on the UV point fromSwift reflect maximum and minimumcorrections for [C III]/ λ 1909 emission. The curves show the contribu-tion of nebular continuum emission (‘Recomb’), two-photonemission (‘2gamma’), an empirical approximation for the pseudocontinuum of blendedhigh-order Balmer emission lines between 3646-3950A , and the sum ofall these components.. Scaled to match the observed equivalent width ofHβ, these sources dominate the blue peak in the continuum, but fall shortby about a factor 4 in the red and likewise leave much of the UV contin-uum unaccounted for. These regions may thus include contributions fromimbedded starlight or dust scattering of radiation from theionizing source.
7 PHYSICAL CONDITIONS IN THE NUCLEUS OF IC2497
Spectral lines were also detected toward the nucleus of IC 2497.Of particular interest are Hα, [OI]λ 6300 A, [OII ]λλ 3736,3729A and [OIII ]λλ 4959,5007A, from which detections we areable to confirm that the galaxy is in fact a low ionization nuclearemission-line region (LINER) active galactic nucleus with, takinginto account the underlying stellar absorption, [NII ]/Hα=0.8±0.15(Heckman 1980). The [OII ]λ 3727/[OIII ]λ 5007 ratio is1.33 ±
0.16. Other important ratios are given in table 3.Detection of [SII ] λλ 6717,6731allows us to calculate the ion-
izing flux. An ionization parameter for the circumnuclear gas of10−3.2 is found. From the measured [SII ]λ 6717/ [SII ]λ 6731 ratioof 1.02± 0.05 we derive an electron density of∼ 560± 150cm−3
for the centre of IC 2497, similar to values found for the narrowline region in Seyfert galaxies (Peterson 2003; Bennert et al. 2006;Osterbrock & Ferland 2006). As often happens in analysis of LIN-ERs, correction for the underlying starlight is a particular issue forHβ. Most of the stellar features are well fitted by a template basedon elliptical galaxies (Kennicutt 1998), but an absorptionblendaround 3850A is deeper in the template than in IC 2497. This mayhint at a population of younger stars. The effect of such a pop-ulation would be to simultaneously decrease the [OIII ]/Hβ ratio,decrease the reddening needed to account for the Hα/Hβ ratio, andincrease the implied ionization level if the [OII ]/[O III ] ratio wereto be corrected by an appropriate amount to match the Hα/Hβ ra-tio. In view of these uncertainties, we assign a relatively large errorto the [OIII ]/Hβ ratio and do not attempt to correct for reddening.Such a correction would, in any case, reduce the derived ionizationparameter, so this is a conservative approach in evaluatingthe levelof nuclear activity ionizing the gas.
The line ratios in both IC 2497 and Hanny’s Voorwerp are il-
Figure 9. Velocity structure in [O III] emission along the spectrographslit position, with the spatial scale measured from the nucleus of IC 2497.The velocity scale is also centred on [O III] emission from the galaxy nu-cleus. Th lower trace shows the intensity of [O III] at each point on the slit.The modest velocity amplitude and lack of consistent correlations betweenemission peaks and either extreme velocities or gradients argue against animportant role for shock ionization. The intensity peaks at23 and 27 arcsec-onds lie in the region associated with the crossing of the rimof the ‘hole’which is prominent in direct images.
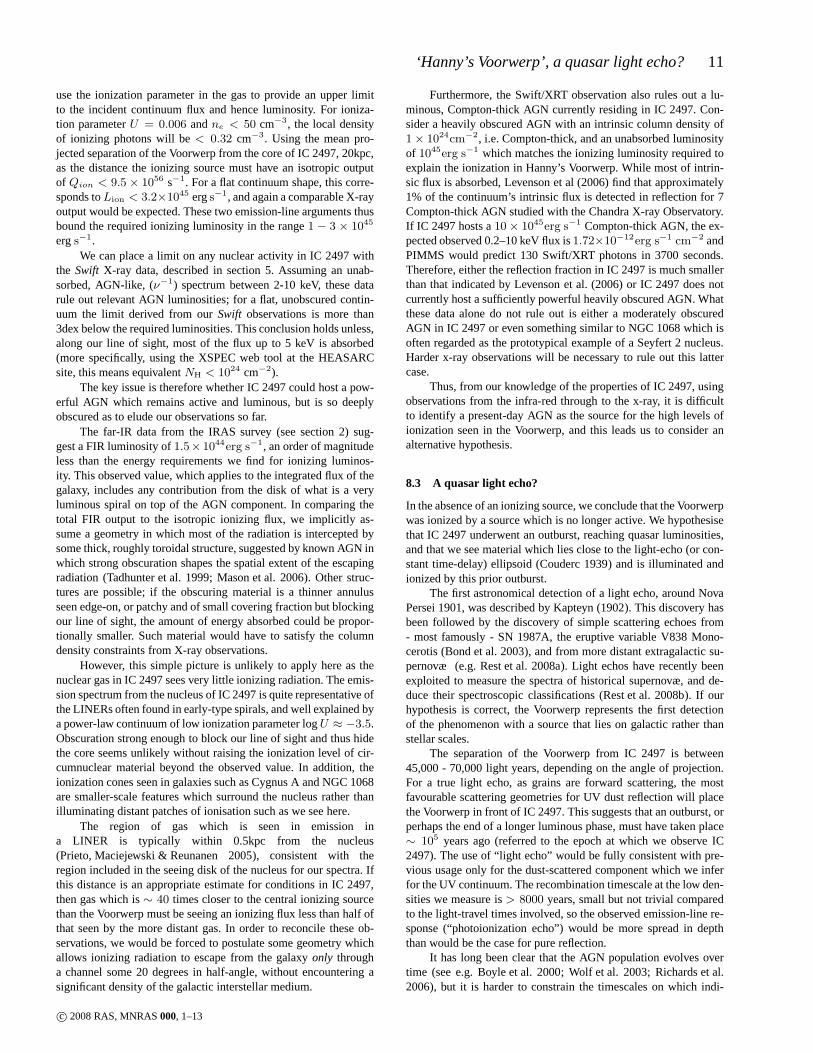
lustrated in the ‘BPT diagram’ (Baldwin, Phillips, Terlevich 1981)shown in Figure 10. The trend to increasing ionization with greaterdistance from IC 2497 is clearly seen in the data for the Voorwerp,although all the points fall in the part of the BPT diagram definedby the Seyfert regime, whereas IC 2497 lies near the boundarybe-tween the parts of this diagnostic diagram associated with LINERsand Seyfert nuclei.
8 DISCUSSION
8.1 Ionizing the Voorwerp : Photoionization vs Shocks
Our observations suggest that Hanny’s Voorwerp is a low-densitygas-rich object, illuminated by a hard ionizing radiation field im-pinging on the gas. The source of the gas may be IC2497 itself,orthe Voorwerp may be a independent dwarf galaxy. This latter caseis suggested by the low derived metallicity, similar to those foundfor dwarf galaxies by Tremonti et al. (2004).
Gas can be highly ionized either through photoionization bya continuum extending to high energies (soft X-rays in this case,since Ne4+ has an ionization threshold near 100 eV) or fast shocks.The shock interpretation is difficult to sustain in this instance,for several reasons. Shock velocities of400kms−1 are needed toproduce strong He II and [Ne V] emission (Dopita & Sutherland1996), and such velocities are far beyond the radial velocity rangeof 90 km s−1 observed here. The lack of a systematic correla-tion between either extreme velocities or velocity gradients and [OIII] λ 5007 A surface brightness (Figure 9) argues against large-scale shocks as the means of energy input. Finally, shock mod-els give relations among electron temperature, as measuredvia the[O III] λ5007/λ4363 ratio, and ionization indicators such as HeII/Hβ, which require much higher electron temperatures than wesee in this case (Evans et al. 1999), typicallyTe ≈ 2 × 10⁴K.
Although imaging of the Voorwerp at a wide range of wave-lengths (including UV imaging andg, r and i bands) reveals the
c© 2008 RAS, MNRAS000, 1–13
10 Lintott et al.
Figure 10. BPT diagram for IC 2497 (empty circle) and for four zones in Hanny’s Voorwerp. In order, moving away from IC 2497, they are centred onlinear projected separations of 13 (filled circle), 17 (square), 20 (triangle) and 27 (diamond)kpc. In the first panel, star-forming galaxies are delineated by thedashed line (Kauffmann (2003), or Ka03). Galaxies between this line and the solid (Kewley (2001), or Ke01) line have contributions from both AGN andstar formation, whereas those beyond this line are pure AGN.The straight line divides Seyfert galaxies from LINERs (Schawinski et al. 2007). A selection ofgalaxies extracted from the SDSS is shown in grey for the purposes of comparison.
presence of a bubble-like structure which is∼ 5kpc across, andmight represent a kind of expanding Stromgren sphere, poweredby a heavily obscured central source, nothing in the available datasuggests such a source. Instead, we must look for a source of ion-ization external to the Voorwerp itself. It has a similar redshift to IC2497, suggesting a genuine physical association. Moreover, the in-crease in ionization level observed across the Voorwerp, decreasingwith distance from IC 2497 supports the hypothesis that the neight-bouring galaxy is the direct or indirect source of the ionization.
One possible counterpart to the Voorwerp which is the resultof the action of a jet is Minkowski’s object (MO), a blue objectnear NGC 541 within galaxy cluster Abell 194 (Minkowski 1958;van Breugel et al. 1985; Croft et al. 2006). There is strong evidencethat star formation observed in MO was triggered by a radio jetfrom NGC 541; and we can thus compare this exotic object withHanny’s Voorwerp to look for evidence of a similar origin. Withouta detailed search for such a jet in the IC 2497 system it is difficultto say for certain, but there are important observed differences be-tween MO and the Voorwerp. In particular, optical emission fromMO is dominated by [OII ] and Hα, whereas in the Voorwerp bothof these lines are much weaker than the main [OIII ] 4959, 5007 line.MO also exhibits bright continuum emission, whereas the emis-sion lines are clearly dominant in the Voorwerp spectrum. Theseresults suggest that the source of the Voorwerp’s ionization is dif-ferent from that in MO; not hot stars, but something else.
It is also unlikely that the energy input results from directinteraction with outflows from IC 2497, such as radio jets. Jozsa(2009) report the detection of such a jet associated with thegalaxy,but as noted above, shocks from such an interaction would alsohave to be much faster than the observed velocity range of thegasto account for the high level of ionization.
8.2 An AGN in IC2497?
Having ruled out shocks and interaction with radio jets as the causeof the ionization of the Voorwerp, we next consider a possible AGN
in IC2497. This hypothesis is supported by the observed strengthof high-ionization species such as He II and [Ne V], which dis-tinguish this object from typical star-forming regions. The bestmatch to these emission-line ratios (as seen in Figure 10) occursfor gas under conditions similar to those seen in the narrow-lineregions of active galactic nuclei (Leipski et al. 2007; McCarthy1993), particularly the distant gas forming the ‘extended emission-line regions’ tens of kiloparsecs in size seen around some QSOsand radio galaxies (see summaries by Fu & Stockton (2008), andStockton, Fu, & Canalizo (2008)), with typical [O III]λ 5007A lu-minosity exceeding1042ergs−1. They are most prevalent accom-panying radio-loud quasars but are not structurally related to eitherthe radio sources or host galaxies.
We now constrain the strength of any AGN in several ways:obtaining an upper limit from the lack of an X-ray detection,bothupper and lower bounds from the observed emission-line spectrum,and the level of possibly absorbed AGN radiation from theIRASobservations discussed in section 2.
A lower limit to the required energy input to the gas comesfrom straightforward energy balance - the number of ionizationsand recombinations must match, and the rate of emission of ioniz-ing photons must be at least sufficient to power the observed recom-bination lines. The integrated Hβ luminosity of the Voorwerp is1.4×1041 ergs−1. For typical nebular conditions and a flat ionizingcontinuum, one in 12.2 recombinations cascades through theHβtransition and one in 9.1 for Hα (table 4.4 in Osterbrock & Ferland(2006)). The fraction of the ionizing luminosity (between Hand Heionization edges) reprocessed into line emission depends on boththe optical depth (making the derived luminosity a lower limit) andcovering fraction. In our deepestg image, the emission subtendsapproximately 38 about the nucleus of IC 2497, which would cor-respond to a covering fraction of∼ 0.03 if it is comparably deepalong the line of sight. For a flat ionizing continuum (Fλ ∝ ν−1),this gives a required ionizing luminosity> 1.0× 1045 ergs−1; theX-ray luminosity is comparable for this continuum slope.
Since we have an upper limit to the electron density, we can
c© 2008 RAS, MNRAS000, 1–13
‘Hanny’s Voorwerp’, a quasar light echo? 11
use the ionization parameter in the gas to provide an upper limitto the incident continuum flux and hence luminosity. For ioniza-tion parameterU = 0.006 andne < 50 cm−3, the local densityof ionizing photons will be< 0.32 cm−3. Using the mean pro-jected separation of the Voorwerp from the core of IC 2497, 20kpc,as the distance the ionizing source must have an isotropic outputof Qion < 9.5 × 1056 s−1. For a flat continuum shape, this corre-sponds toLion < 3.2×1045 ergs−1, and again a comparable X-rayoutput would be expected. These two emission-line arguments thusbound the required ionizing luminosity in the range1 − 3 × 1045
ergs−1.We can place a limit on any nuclear activity in IC 2497 with
the Swift X-ray data, described in section 5. Assuming an unab-sorbed, AGN-like, (ν−1) spectrum between 2-10 keV, these datarule out relevant AGN luminosities; for a flat, unobscured contin-uum the limit derived from ourSwift observations is more than3dex below the required luminosities. This conclusion holds unless,along our line of sight, most of the flux up to 5 keV is absorbed(more specifically, using the XSPEC web tool at the HEASARCsite, this means equivalentNH < 1024 cm−2).
The key issue is therefore whether IC 2497 could host a pow-erful AGN which remains active and luminous, but is so deeplyobscured as to elude our observations so far.
The far-IR data from the IRAS survey (see section 2) sug-gest a FIR luminosity of1.5× 1044erg s−1, an order of magnitudeless than the energy requirements we find for ionizing luminos-ity. This observed value, which applies to the integrated flux of thegalaxy, includes any contribution from the disk of what is a veryluminous spiral on top of the AGN component. In comparing thetotal FIR output to the isotropic ionizing flux, we implicitly as-sume a geometry in which most of the radiation is interceptedbysome thick, roughly toroidal structure, suggested by knownAGN inwhich strong obscuration shapes the spatial extent of the escapingradiation (Tadhunter et al. 1999; Mason et al. 2006). Other struc-tures are possible; if the obscuring material is a thinner annulusseen edge-on, or patchy and of small covering fraction but blockingour line of sight, the amount of energy absorbed could be propor-tionally smaller. Such material would have to satisfy the columndensity constraints from X-ray observations.
However, this simple picture is unlikely to apply here as thenuclear gas in IC 2497 sees very little ionizing radiation. The emis-sion spectrum from the nucleus of IC 2497 is quite representative ofthe LINERs often found in early-type spirals, and well explained bya power-law continuum of low ionization parameter logU ≈ −3.5.Obscuration strong enough to block our line of sight and thushidethe core seems unlikely without raising the ionization level of cir-cumnuclear material beyond the observed value. In addition, theionization cones seen in galaxies such as Cygnus A and NGC 1068are smaller-scale features which surround the nucleus rather thanilluminating distant patches of ionisation such as we see here.
The region of gas which is seen in emission ina LINER is typically within 0.5kpc from the nucleus(Prieto, Maciejewski & Reunanen 2005), consistent with theregion included in the seeing disk of the nucleus for our spectra. Ifthis distance is an appropriate estimate for conditions in IC 2497,then gas which is∼ 40 times closer to the central ionizing sourcethan the Voorwerp must be seeing an ionizing flux less than half ofthat seen by the more distant gas. In order to reconcile theseob-servations, we would be forced to postulate some geometry whichallows ionizing radiation to escape from the galaxyonly througha channel some 20 degrees in half-angle, without encountering asignificant density of the galactic interstellar medium.
Furthermore, the Swift/XRT observation also rules out a lu-minous, Compton-thick AGN currently residing in IC 2497. Con-sider a heavily obscured AGN with an intrinsic column density of1 × 1024cm−2, i.e. Compton-thick, and an unabsorbed luminosityof 1045erg s−1 which matches the ionizing luminosity required toexplain the ionization in Hanny’s Voorwerp. While most of intrin-sic flux is absorbed, Levenson et al (2006) find that approximately1% of the continuum’s intrinsic flux is detected in reflectionfor 7Compton-thick AGN studied with the Chandra X-ray Observatory.If IC 2497 hosts a10 × 1045erg s−1 Compton-thick AGN, the ex-pected observed 0.2–10 keV flux is1.72×10−12erg s−1 cm−2 andPIMMS would predict 130 Swift/XRT photons in 3700 seconds.Therefore, either the reflection fraction in IC 2497 is much smallerthan that indicated by Levenson et al. (2006) or IC 2497 does notcurrently host a sufficiently powerful heavily obscured AGN. Whatthese data alone do not rule out is either a moderately obscuredAGN in IC 2497 or even something similar to NGC 1068 which isoften regarded as the prototypical example of a Seyfert 2 nucleus.Harder x-ray observations will be necessary to rule out thislattercase.
Thus, from our knowledge of the properties of IC 2497, usingobservations from the infra-red through to the x-ray, it is difficultto identify a present-day AGN as the source for the high levels ofionization seen in the Voorwerp, and this leads us to consider analternative hypothesis.
8.3 A quasar light echo?
In the absence of an ionizing source, we conclude that the Voorwerpwas ionized by a source which is no longer active. We hypothesisethat IC 2497 underwent an outburst, reaching quasar luminosities,and that we see material which lies close to the light-echo (or con-stant time-delay) ellipsoid (Couderc 1939) and is illuminated andionized by this prior outburst.
The first astronomical detection of a light echo, around NovaPersei 1901, was described by Kapteyn (1902). This discovery hasbeen followed by the discovery of simple scattering echoes from- most famously - SN 1987A, the eruptive variable V838 Mono-cerotis (Bond et al. 2003), and from more distant extragalactic su-pernovæ (e.g. Rest et al. 2008a). Light echos have recently beenexploited to measure the spectra of historical supernovæ, and de-duce their spectroscopic classifications (Rest et al. 2008b). If ourhypothesis is correct, the Voorwerp represents the first detectionof the phenomenon with a source that lies on galactic rather thanstellar scales.
The separation of the Voorwerp from IC 2497 is between45,000 - 70,000 light years, depending on the angle of projection.For a true light echo, as grains are forward scattering, the mostfavourable scattering geometries for UV dust reflection will placethe Voorwerp in front of IC 2497. This suggests that an outburst, orperhaps the end of a longer luminous phase, must have taken place∼ 105 years ago (referred to the epoch at which we observe IC2497). The use of “light echo” would be fully consistent withpre-vious usage only for the dust-scattered component which we inferfor the UV continuum. The recombination timescale at the lowden-sities we measure is> 8000 years, small but not trivial comparedto the light-travel times involved, so the observed emission-line re-sponse (“photoionization echo”) would be more spread in depththan would be the case for pure reflection.
It has long been clear that the AGN population evolves overtime (see e.g. Boyle et al. 2000; Wolf et al. 2003; Richards etal.2006), but it is harder to constrain the timescales on which indi-
c© 2008 RAS, MNRAS000, 1–13
12 Lintott et al.
vidual objects undergo change. The connection between AGN andmergers suggests that the subsequently triggered AGN episodeslast typically for 108 years (Stockton 1982; Bahcall et al. 1997)and may last for up to109 years (Bennert et al. 2008). Thepresence of young stellar populations in many quasar hostgalaxies suggest that their activity is connected to starburstswith a similar timescale of∼ 108 years (Canalizo & Stockton2001; Miller & Sheinis 2003). At the other end of the scale,there have been numerous detections of AGN which flare ontimescales of years (Storchi-Bergmann, Baldwin & Wilson 1993;Cappellari et al 1999). The timescale we infer for the shutdown ofactivity in IC 2497, of∼ 105 years, is intermediate between theseextremes. Short timescales≈ 106 years have been suggested forepisodes of luminous AGN activity both from the distribution ofderived Eddington ratios (Hopkins & Hernquist 2008) and statis-tics of QSO absorption systems at high redshift (Kirkman & Tytler2008).
The lowest redshift quasar in the SDSS DR5 catalogue(Schneider et al. 2007) lies at z=0.08, but this sample systemati-cally excludes systems at lower redshift. Our best comparison iswith Barger et al. (2005). Taking the 2-8keV luminosity of1044 (aconservative estimate for the flux required to produce the ionizationfraction we observe) the local space density of such luminous AGNis no greater than3 × 10−7Mpc3. This suggests that there shouldbe one such system at a redshift ofz < 0.04, so the presence ofsuch activity in IC 2497, while unusual, is not entirely unexpected.
If the obscuration along the line of sight to the Voorwerp hasremained constant, then the AGN in IC 2497 must have undergoneeither an extremely bright flare or else reached the end of an ex-tended period of high luminosity. In either case, detailed observa-tion of the Voorwerp would enable us to reconstruct the history ofthe source, probing AGN variability on timescales of105 years forthe first time. This hypothesis suggests further observations whichcould test it, and, if it is correct, uncover the details of the object’shistory. We would expect the scattered continuum to be polarizedand show broad QSO emission lines in reflection; this spectral sig-nature would be brightest in the UV, possibly within the range ofGALEX for such a large and diffuse target. The variation in ioniza-tion parameter might trace changes in the ionizing luminosity; mea-surements of the density across the object could separate densityand time effects. The origin of the gas (and scattering dust)in theVoorwerp may have been a dwarf galaxy, probably close enoughto IC 2497 to have been tidally disrupted. Near-IR imagery athighresolution may be the best way to search for star clusters from apre-existing stellar population with minimal interference from thevery blue scattered light and the nebular continuum emission.
9 CONCLUSION
We have presented observations of Hanny’s Voorwerp, an objectfirst identified through visual inspection of the Sloan Digital SkySurvey as part of the Galaxy Zoo project. The object, near to andat the same redshift as IC 2497, a spiral galaxy, is highly ionizedand has a spectrum dominated by emission lines, particularly [OIII ]λλ 4959,5007, with no sign of any contribution from a stellar com-ponent to the Voorwerp itself. Both the Voorwerp and its neigh-bouring galaxy are strong UV sources, but neither was detected inX-ray observations carried out with theSwiftsatellite. This lack ofX-ray detections, and the limits derived from IRAS observationsof IC 2497, provides a strong constraint on the luminosity ofanyionizing source. We are left with two possible conclusions.Either
an AGN in IC 2497 is heavily obscured but still able to ionize theVoorwerp, which extends over almost 20 degrees, or else the ioniz-ing source is no longer present. In the latter case, the Voorwerp rep-resents the first instance of a light echo being seen from a quasar-luminous AGN. In either case IC 2497 furnishes a nearby exampleof a galaxy which either is, or was shortly before the epoch atwhichwe observe it, a quasar host galaxy.
Detailed further observations, particularly observations in theradio and deep optical imaging, will be required to confirm ourhypothesis. However, it is clear that such a light echo wouldprovidean unusual - possibly unique - opportunity to probe the variation ofan AGN on timescales of∼ 105 years, reconstructing its history byobserving echoes from different parts of the Voorwerp.
ACKNOWLEDGEMENTS
CJL acknowledges support from the STFC Science in Society Pro-gram. WK acknowledges support from a College Leadership BoardFaculty fellowship. KS is supported by the Henry Skynner Ju-nior Research Fellowship at Balliol College, Oxford. NB is sup-ported through a grant from the National Science Foundation, (AST0507450) and the Space Telescope Science Institute, which is oper-ated by The Association of Universities for Research in Astronomy,Inc., under NASA contract No. NAS526555.
We thank the Lick Observatory staff for their assistance inobtaining our data, and Misty Bentz, Jonelle Walsh and Jong-HakWoo for obtaining an additional spectrum at Lick Observatory. R.Antonucci provided helpful comments on an earlier draft of thismanuscript, and Gary Ferland provided helpful reminders offinepoints of nebular astrophysics. Pamela Gay also helped refine thefinal draft. Our anonymous referee was also responsible for sub-stantial improvements to the reduction and analysis. We acknowl-edge the use of public data from theSwift data archive, and thankthe Swift operations team for their rapid response to our data re-quest. The William Herschel and Isaac Newton Telescopes areop-erated on the island of La Palma by the Isaac Newton Group in theSpanish Observatorio del Roque de los Muchachos of the Institutode Astrofısica de Canarias.
This research has made use of the NASA/IPAC Extragalac-tic Database (NED) which is operated by the Jet Propulsion Labo-ratory, California Institute of Technology, under contract with theNational Aeronautics and Space Administration.
Funding for the SDSS and SDSS-II has been provided bythe Alfred P. Sloan Foundation, the Participating Institutions, theNational Science Foundation, the U.S. Department of Energy,the National Aeronautics and Space Administration, the JapaneseMonbukagakusho, the Max Planck Society, and the Higher Ed-ucation Funding Council for England. The SDSS Web Site ishttp://www.sdss.org/.
The SDSS is managed by the Astrophysical Research Con-sortium for the Participating Institutions. The Participating Institu-tions are the American Museum of Natural History, AstrophysicalInstitute Potsdam, University of Basel, University of Cambridge,Case Western Reserve University, University of Chicago, DrexelUniversity, Fermilab, the Institute for Advanced Study, the JapanParticipation Group, Johns Hopkins University, the Joint Institutefor Nuclear Astrophysics, the Kavli Institute for ParticleAstro-physics and Cosmology, the Korean Scientist Group, the ChineseAcademy of Sciences (LAMOST), Los Alamos National Labora-tory, the Max-Planck-Institute for Astronomy (MPIA), the Max-Planck-Institute for Astrophysics (MPA), New Mexico StateUni-
c© 2008 RAS, MNRAS000, 1–13
‘Hanny’s Voorwerp’, a quasar light echo? 13
versity, Ohio State University, University of Pittsburgh,Universityof Portsmouth, Princeton University, the United States Naval Ob-servatory, and the University of Washington.
REFERENCES
Adelman-McCarthy et al., 2007, in press, arXiv 0707.3413Bahcall, J.N., Kirhakos, S., Saxe, D.H. & Schneider, D.P., 1997,ApJ, 479, 642
Baldwin, J.A., Phillips, M.M. & Terlevich, R., 1981, PASP, 93, 5Barger, A.J., et al., 2005, AJ, 129, 578Becker, R.H., White, R.L., Helfand, D.J., 1995, ApJ, 450, 559Best, P.N., et al., 2005, MNRAS, 362, 25Bennert et al., 2006, A&A, 459, 55Bennert et al., 2008, ApJ, 677, 846Blanton, M.R. et al., ApJ, 592, 819Boller, Th et al., 2002, MNRAS, 329, 1Bond, H.E., et al., 2003, Nature, 422, 405Boyle, B.J., et al., 2000, MNRAS, 317, 1014van Breugel, W., Filippenko, A.V., Heckman, T, Miley, G, 1985,ApJ, 293, 83
Canalizo, G., & Stockton, A., 2001, ApJ, 555, 719Cappellari et al., 1999, ApJ, 519, 117Couderc, P., 1939, Annales, d’Astrophysique, 2, 271Croft, S. et al., 2006, ApJ, 647, 1040De Robertis, M.M. & Osterbrock, D.E., 1986, PASP, 98, 629Dopita, M.A. & Sutherland, R.S., 1996, ApJS, 102, 161Dunkley, J. et al, submitted to ApJS, astro-ph/0803.0586Evans, I., Koratkar, A., Allen, M., Dopita, M., & Tsvetanov,Z.1999, ApJ, 521, 531
Ferland, G.J., 1980, PASP, 92, 596Fisher, K.B. et al., 1995, ApJS, 100, 69Fu, H. & Stockton, A., 2008, ApJ, in the press (astro-ph/0809.1117)
Fukugita, M., Shimasaku, K., & Ichakawa, T. 1995, PASP, 107,925
Heckman, T.M., A&A, 87, 152Hopkins, P.F. & Hernquist, L., 2008, ApJ submitted),aXiv.org:0809.3789
Jozsa, G.I.G. et al., Accepted by A&A, arXiv.org:0905.1851Kapteyn, J.C., 1902, Astronomische Nachricheten, 157, 201J.2006, AJ, 132, 2233
Kauffmann, G. et al. 2003, MNRAS, 346, 1055Keel, W.C., 1987, A&A, 172, 43Keel, W.C., 1996, ApJS, 106, 27Keel, W.C., White, R.E., III, Owen, F.N., & Ledlow, M.J.,2006,ApJS, 106, 27
Kennicutt, R.C, 1998, ApJ, 498, 541Kewley, L.J., et al., 2001, ApJ, 556, 121Kirkman, D. & Tytler, D., 2008, MNRAS (submitted),arXiv.org:009.2277
Komossa, S. & Schulz, H., 1997, A&A, 323, 31Leipski, C. et al, 2007, A&A, 467, 895Levenson, N.A., Heckman, T.M., Krolik, J.H., Weaver, K.A. &Zycki, P.T., 2006, ApJ, 648, 111
Lintott, C. & the Galaxy Zoo team, 2008, MNRAS, 389, 1179Lonsdale, C. J., & Helou, G. 1985, Cataloged galaxies and quasarsobserved in the IRAS survey, Pasadena: Jet Propulsion Labora-tory (JPL)
Lupton, R. et al., PASP, 2004, 116McCarthy, 1993, ARA&A, 31, 639
Mason et al., 2006, ApJ, 640, 624Melbourne, J. et al., 2004, AJ, 127, 686Miller, J.S. & Sheinis, A.I., 2003, ApJL, 588, L9Minkowski, R., 1958, PASP, 70, 143Nussbaumer, H. & Schmutz, W., 1984, A&A, 138, 495Osterbrock, D.E. & Ferland, G.J., 2006, Astrophysics of gaseousnebulæ and Active Galactic Nuclei, Second edition, UniversityScience Books, Sausalito, California.
Peimbert, M. & Costero, R., 1969, Boletın de los Observatoriosde Tonantzintla y Tacubaya, 5, 3
Penston, M.V. et al., 1990, A&A, 236, 53Peterson, B.M., 2003, An introduction to active galactic nuclei,Cambridge University Press, Cambridge.
Pottasch, S. R., Bernard-Salas, J., & Roellig, T. L. 2008, A&A,481, 393
Preito, M.A., Maciejewski, W. & Reunanen, J., 2005, AJ, 130,1472
Rest, A. et al., 2008a, ApJ, 680, 1137Rest, A. et al., 2008b, ApJ, 681, L81Richards, G. et al., 2006, AJ, 131, 2766Sanders, D.B. & Mirabel, I.F., 1996, ARA& A, 34, 749Schawinski, K., et al., 2007, MNRAS, 382, 1415Schneider, D.P. et al., 2007, AJ, 134, 102Stockton, A., 1982, ApJ, 257, 33Stockton, A.,Fu, H., & Canalizo, G. 2008, NewAR 50, 694Storchi-Bergmann, T., Baldwin, J.A. & Wilson, A.S., 1993, ApJL,410, L11
Tadhunter, C.N., et al., 1999, ApJ, 512, L91Tremonti et al., ApJ, 613, 898Wolf, C., Wisotzki, L., Borch, A., Dye, S., Kleinheinrich, M.,Meisenheimer, K., 2003, A&A, 408, 499
York, D.G., 2000, AJ, 120, 1579
c© 2008 RAS, MNRAS000, 1–13