FUGRO N.V. Annual Report 2012 - Jaarverslag.com · E [email protected] Commercial Register The...
212
Annual Report 2012 FUGRO N.V.
Transcript of FUGRO N.V. Annual Report 2012 - Jaarverslag.com · E [email protected] Commercial Register The...
AN
NU
AL
RE
PO
RT
20
12
FU
GR
O N
.V.
Annua l Re p o r t 2012F U G RO N .V.
Fugro JV2012 ENG – 5e proef – 01/03/2013 Fugro JV2012 ENG – 5e proef – 01/03/2013
Fugro N.V.
Veurse Achterweg 10
2264 SG Leidschendam
P.O. Box 41
2260 AA Leidschendam
The Netherlands
T +31 (0)70 3111422
F +31 (0)70 3202703
www.fugro.com
Commercial Register The Hague
Trade Registry no 27120091
VAT no 00 56 21 409 B01
C o l o p h o n
Fugro N.V.
Veurse Achterweg 10
2264 SG Leidschendam
The Netherlands
T +31 (0)70 3111422
F +31 (0)70 3202703
Realisation:
C&F Report Amsterdam B.V.
Photography and images:
Fugro N.V.
Fugro has endeavoured to fulfil all legal requirements
related to copyright. Anyone who, despite this, is of
the opinion that other copyright regulations could
be applicable should contact Fugro.
A Dutch translation of this annual report is
available. In matters of any misinterpretation
the official English annual report will prevail.
This annual report is also available on www.fugro.com.
Cautionary statement regarding forward-looking statements
This annual report may contain forward-looking statements. Forward-looking statements are statements that are not historical facts, including
(but not limited to) statements expressing or implying Fugro’s beliefs, expectations, intentions, forecasts, estimates or predictions (and the
assumptions underlying them). Forward-looking statements necessarily involve risks and uncertainties. The actual future results and situations
may therefore differ materially from those expressed or implied in any forward-looking statements. Such differences may be caused by various
factors (including, but not limited to, developments in the oil and gas industry and related markets, currency risks and unexpected operational
setbacks). Any forward-looking statements contained in this annual report are based on information currently available to Fugro’s management.
Fugro assumes no obligation to make a public announcement in each case where there are changes in information related to, or if there are
otherwise changes or developments in respect of, the forward-looking statements in this annual report.
Fugro JV2012 ENG – 5e proef – 01/03/2013 Fugro JV2012 ENG – 5e proef – 01/03/2013
C o n t e n t s
A n n u a l R e p o r t 2 0 1 2
■ Preface 2
■ Fugro at a glance 5
Major developments in 2012 5
Key figures 6
Mission and profile 8
Fugro’s activities 9
Financial targets and strategy 10
Information for shareholders 12
■ Report of the Supervisory Board 17
■ Report of the Board of Management 25
General 25
Financial accounting review and results summary 26
Divestment majority Geoscience division and closing
Seabed Geosolutions joint venture with CGG 27
Acquisitions 28
Employees 29
Capacity planning 29
Financial 30
Dividend proposal 36
Market developments and trends 36
Backlog 39
Post balance sheet date events 39
Outlook 40
Important and interesting contracts 43
Geotechnical division 46
Survey division 48
Geoscience division 50
■ Theme: Building the future 53
■ Corporate Social Responsibility 69
■ Risk Management 84
■ Corporate Governance 91
■ Financial statements 2012 101
1 Consolidated statement of comprehensive
income 102
2 Consolidated statement of financial position 104
3 Consolidated statement of changes in equity 106
4 Consolidated statement of cash f lows 108
5 Notes to the consolidated financial statements 110
6 Subsidiaries and investments of Fugro N.V.
accounted for using the equity method 188
7 Company balance sheet 191
8 Company income statement 192
9 Notes to the company financial statements 193
10 Other information 198
Report of Stichting Administratiekantoor Fugro
(‘Trust Office’) 202
Historical review 204
Glossary 206
2
■ P r e f a c e
D e a r S t a ke h o l d e r,
In our 50th anniversary year we are pleased to report a
strong finish to the year resulting in the highest annual
revenue (EUR 2,952 million) and net profit (EUR 291.6
million) ever reported in the history of Fugro. Except for
weakness in our subsea activities, the Survey and the
Geotechnical divisions delivered a good performance.
The Geoscience division surpassed expectations with an
overall better vessel utilisation than planned and strong
multi-client performance with good sales of new data.
The main event in the year 2012 was the successful
divestment of the majority of the Geoscience division to
CGG at a preliminary estimated net transaction gain in
2013 of around EUR 200 million (subject to post comple-
tion adjustments) and entry into the Seabed Geosolutions
JV with CGG, in which Fugro has a 60% controlling stake.
These transactions were completed 31st January 2013
and 16th February 2013, respectively. Completion of the
transaction strongly improved our balance sheet and our
gearing ratio now stands at around 30%.
The company went through management changes at the
top and reverted to the historic model with a CEO leading
the company supported by an executive committee. Less
noticed but key to our future, the company successfully
moved to a regional management structure to improve
business efficiency, execution and control.
Mid-December we were confronted with an event that
required specific attention. We received a whistleblower
letter with allegations concerning elements of the
company’s financial reporting. The Supervisory Board
and Board of Management took immediate action.
We informed KPMG, our statutory auditors, and the
company also immediately engaged law firm De Brauw
Blackstone Westbroek to lead and carry out an in-depth,
independent investigation into the allegations of the
whistleblower. In turn they engaged Deloitte Forensic &
Dispute Services to support the financial investigation.
The investigation was carried out under the supervision
of our Supervisory Board. Given the fact the allegations
concerned elements of the company’s financial
reporting, KPMG expanded its team and the company
engaged an additional support team from PwC to assist
with enhanced financial closing procedures.
The independent investigation led by De Brauw
Blackstone Westbroek was completed shortly prior to the
publication of this Annual Report 2012 and the Financial
Statements 2012. There were no material adverse
findings from the investigation and the enhanced
financial closing procedures did not result in any
material adverse consequences for our Financial
Statements 2012. The Supervisory Board has consented
with the Financial Statements 2012 and KPMG has issued
an unqualified auditor’s report on these financial
statements.
The high degree of scrutiny has brought to light areas
where our financial processes can be improved. We will
quickly start implementation and expect to have most
work done by the end of 2013.
We look forward to the future with confidence. Thanks
to the Geoscience transaction we have a very strong
balance sheet. For the most part we operate solid,
profitable and cash generative businesses. Where we
don’t, for example in Subsea services, we will implement
required improvement measures. Current success is no
guarantee for the future. As a result of the divestment of
some 25% of our business, it is the right time to
re-examine who we are and what opportunities we have
in a fast changing world to restore our revenue base and
continue to grow from there. We have engaged a leading
international consultancy group to assist us in a review
of our global strategy which we expect to largely
complete at the time we announce our half year results.
In the strategy process we will review the role of the
corporate centre, shareholder value creation, business
and financial controls, our business portfolio and growth
potential, global regionalisation trends, increasing use of
joint ventures, feedback from the 2012 financial closing
process, ever increasing governance demands and
demands from stakeholders for more detail. At the same
time it is a key requirement for us to retain our deeply
engrained, success driven business culture, our core
values based on trust and open and direct
communication, and entrepreneurship deep into the
organisation.
Preface 3
The majority of our business is within the oil and gas
sector. Industry surveys indicate continued growth of
investments in this sector and we expect to benefit
accordingly. We will strongly focus on improving our
subsea business. In 2013 this business will be separately
headed and will be separately reported as the Subsea
division. Most of our other business is subject to the
general economy, which we expect to continue to be
weak in Europe and somewhat more positive elsewhere.
In weakly performing areas we have adjusted or are
continuing to adjust our businesses to ensure they
contribute positively to overall performance. We are also
excited about the opportunities for the Seabed
Geosolutions JV with CGG which will contribute to our
revenue and profit growth. 2013 will be a start-up year in
which we build up the JV. The overall outlook for this
business is strong as its seabed technology has more
focus on the development and production segment of the
oil and gas market.
The year behind us has not been easy. We are in good
shape, with a strong balance sheet, with most of our
business performing well, with focus on areas that need
improvement, a strategic review well underway, and
with our eye on opportunities to profitably grow the
company.
Yours sincerely
Paul van Riel
Chairman of the Board of Management
Chief Executive Officer

4
5Fugro at a glanceFugro at a glance
■ F u g r o a t a g l a n c e■ F u g r o a t a g l a n c e
■ M A J O R D E V E L O P M E N T S I N 2 0 1 2
• As part of the transaction, Fugro and CGG also announced they would form a seabed joint venture with a 60/40 split Fugro/CGG with Fugro in control. This part of the transaction was completed 16 February 2013. The joint venture is called Seabed Geosolutions.
• Following the divestment it was decided that Fugro will review its strategy. This strategy process will be completed in the course of the second half of the year.
• This was Fugro’s best year ever in its 50 years of existence with a record revenue of EUR 2,953 million and a net result of EUR 291.6 million.
• On 24 September 2012 Fugro and CGG announced that they have signed an agreement under which CGG will acquire the majority of Fugro’s Geoscience division, excluding the multi-client library and ocean bottom nodes business, for a cash consideration of EUR 1.2 billion. The transaction closed with effective date 31 January 2013 (for more details we refer to a separate paragraph in this report).
The term ‘shares’ as used in this Annual Report should, with respect to ordinary shares issued by Fugro N.V., be construed to include certifi cates of shares (also referred to as ‘share certifi cates’ or ‘depositary receipts’ for shares) issued by Stichting Administratiekantoor Fugro (also referred to as ‘Fugro Trust Offi ce’ or ‘Trust Offi ce’), unless the context otherwise requires or unless it is clear from the context that this is not the case. For further information please refer to page 95.
In this Annual Report, Fugro N.V. is also referred to as ‘the Company’ or ‘Fugro’. Fugro N.V. and its subsidiary companies are together referred to as ‘the Group’.
G e n e r a l
C o n t i n u e d a n d d i s c o n t i n u e d C o n t i n u e d
• In 2012 Fugro’s revenue increased by 14.5% to EUR 2,952.7 million (2011: EUR 2,577.8 million). Revenue increased organically by 3.9% and by 3.9% as a result of acquisitions. The foreign currency effect was 6.7% positive. The effect of disposals was nil.
• Net result went up by 1.4% to EUR 291.6 million (2011: EUR 287.6 million).
• EBITDA was EUR 648.8 million (2011: EUR 581.0 million)
• The EBIT of EUR 417.3 million (2011: EUR 349.3 million) is mainly influenced by:
– no longer depreciating assets held for sale of EUR 33 million;
– gain on finance lease of Geo Pacific EUR 16.9 million;
– week subsea market; – low utilization ocean bottom nodes first half of
2012; – write off minority participation technology
company (EUR 21 million); – amortisation of data libraries EUR 143 million
(2011: EUR 69 million).
• Net profit margin was 9.9% (2011: 11.2%).
• Earnings per share was stable at EUR 3.63 (2011: EUR 3.63).
• Backlog at the beginning of 2013 amounted to EUR 1,776.2 million. This is 4.9% higher than at the beginning of 2012 (EUR 1,692.6 million).
• It is proposed to increase the dividend for 2012 to EUR 2.00 per share, consisting of a regular dividend of EUR 1.50 increased by an one-off extra dividend of EUR 0.50 in connection with the divestment of the Geoscience business. The total dividend of EUR 2.00 per share will be paid at the choice of the shareholder in cash or in shares. If no choice is made, the dividend will be paid in shares.
• In 2012 Fugro’s total revenue increased by 16.5% from EUR 1,858.0 million in 2011 to EUR 2,165.0 million in 2012. Revenue increased organically by 5.3% and by 4.9% as a result of acquisitions. The foreign currency effect was 6.3% positive. The effect of disposals was nil.
• Net result from continued operations is EUR 232.8 million in 2012 (2011: EUR 293.9 million), a decrease of 20.8%.
• EBITDA was EUR 467.0 million (2011: EUR 481.9 million)
• Results from operating activities (EBIT) were 12.4% lower at EUR 308.3 million (2011: EUR 352.0 million). The lower EBIT is mainly influenced by:
– week subsea market; – low utilization ocean bottom nodes first
half of 2012; – write off minority participation technology
company (EUR 21 million); – amortisation of data libraries EUR 143 million
(2011: EUR 69 million).
• Net profit margin was 10.8% (2011: 15.8%).
• The earnings per share for 2012 is EUR 2.90 (2011: EUR 3.71).
• Backlog at the beginning of 2013 is EUR 1,514.2 million. This is 11.1% higher than EUR 1,362.7 million in 2012.
5
6
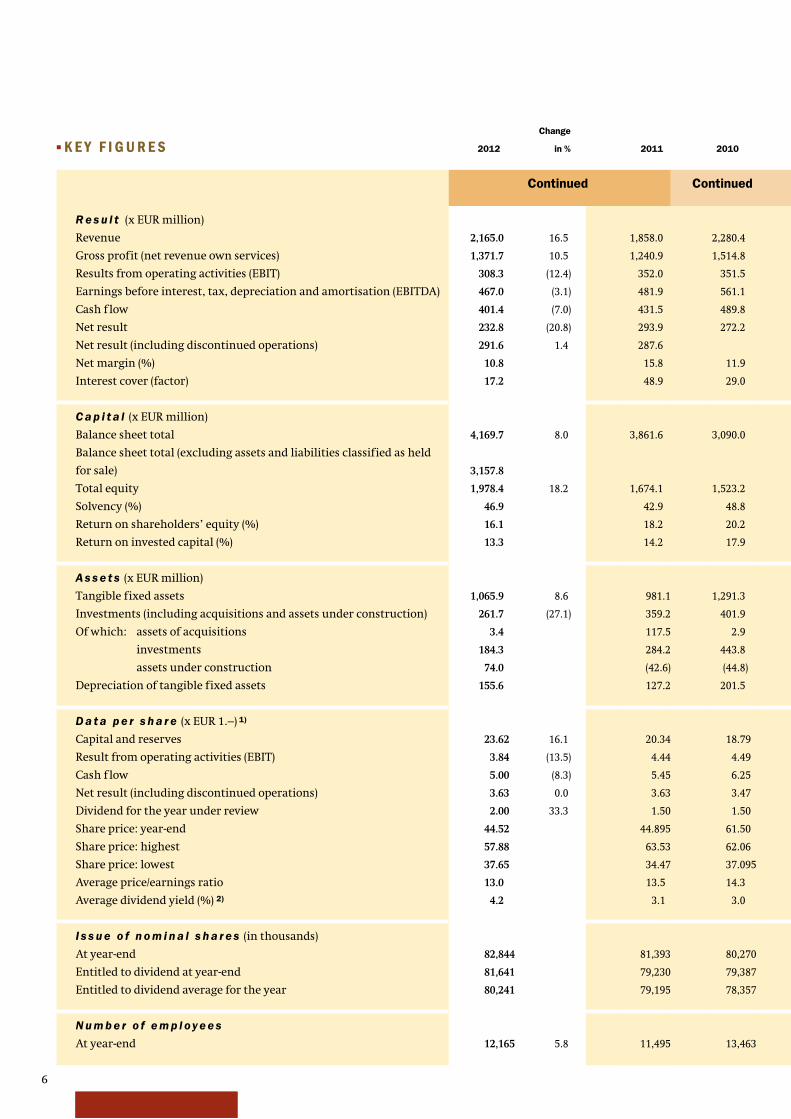
■ K E Y F I G U R E S 2012
Change
in % 2011 2010
Continued Continued
R e s u l t (x EUR million)
Revenue 2,165.0 16.5 1,858.0 2,280.4
Gross profit (net revenue own services) 1,371.7 10.5 1,240.9 1,514.8
Results from operating activities (EBIT) 308.3 (12.4) 352.0 351.5
Earnings before interest, tax, depreciation and amortisation (EBITDA) 467.0 (3.1) 481.9 561.1
Cash f low 401.4 (7.0) 431.5 489.8
Net result 232.8 (20.8) 293.9 272.2
Net result (including discontinued operations) 291.6 1.4 287.6
Net margin (%) 10.8 15.8 11.9
Interest cover (factor) 17.2 48.9 29.0
C a p i t a l (x EUR million)
Balance sheet total 4,169.7 8.0 3,861.6 3,090.0
Balance sheet total (excluding assets and liabilities classified as held
for sale) 3,157.8
Total equity 1,978.4 18.2 1,674.1 1,523.2
Solvency (%) 46.9 42.9 48.8
Return on shareholders’ equity (%) 16.1 18.2 20.2
Return on invested capital (%) 13.3 14.2 17.9
A s s e t s (x EUR million)
Tangible fixed assets 1,065.9 8.6 981.1 1,291.3
Investments (including acquisitions and assets under construction) 261.7 (27.1) 359.2 401.9
Of which: assets of acquisitions 3.4 117.5 2.9
investments 184.3 284.2 443.8
assets under construction 74.0 (42.6) (44.8)
Depreciation of tangible fixed assets 155.6 127.2 201.5
D a t a p e r s h a r e (x EUR 1.–) 1)
Capital and reserves 23.62 16.1 20.34 18.79
Result from operating activities (EBIT) 3.84 (13.5) 4.44 4.49
Cash f low 5.00 (8.3) 5.45 6.25
Net result (including discontinued operations) 3.63 0.0 3.63 3.47
Dividend for the year under review 2.00 33.3 1.50 1.50
Share price: year-end 44.52 44.895 61.50
Share price: highest 57.88 63.53 62.06
Share price: lowest 37.65 34.47 37.095
Average price/earnings ratio 13.0 13.5 14.3
Average dividend yield (%) 2) 4.2 3.1 3.0
I s s u e o f n o m i n a l s h a r e s (in thousands)
At year-end 82,844 81,393 80,270
Entitled to dividend at year-end 81,641 79,230 79,387
Entitled to dividend average for the year 80,241 79,195 78,357
N u m b e r o f e m p l oy e e s
At year-end 12,165 5.8 11,495 13,463
7Fugro at a glance
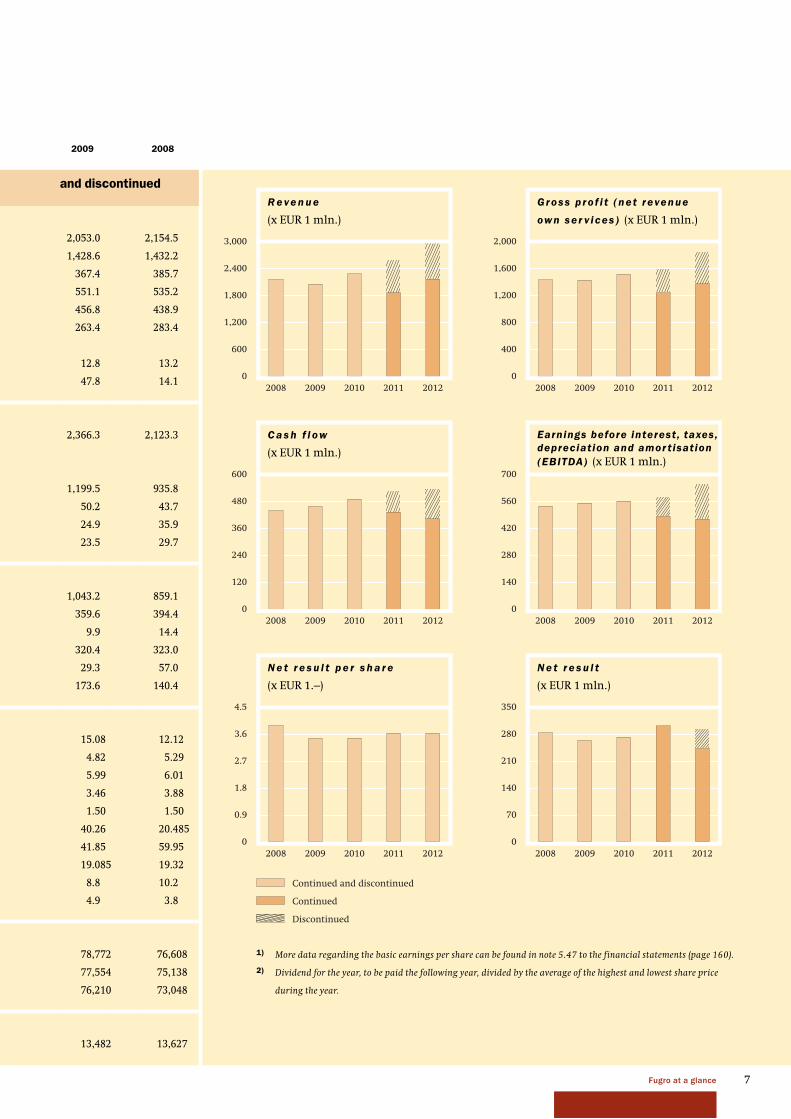
0
600
1,200
1,800
2,400
3,000
20122011201020092008
R e ve n u e
(x EUR 1 mln.)
0
400
800
1,200
1,600
2,000
20122011201020092008
Gross p ro f i t (net revenue
own ser v ices ) (x EUR 1 mln.)
0
120
240
360
480
600
20122011201020092008
C a s h f l ow
(x EUR 1 mln.)
0
0.9
1.8
2.7
3.6
4.5
20122011201020092008
N e t r e s u l t p e r s h a r e
(x EUR 1.–)
0
140
280
420
560
700
20122011201020092008
Earnings before interest, taxes,
depreciation and amor tisation
(EBITDA) (x EUR 1 mln.)
2009 2008
and discontinued
2,053.0 2,154.5
1,428.6 1,432.2
367.4 385.7
551.1 535.2
456.8 438.9
263.4 283.4
12.8 13.2
47.8 14.1
2,366.3 2,123.3
1,199.5 935.8
50.2 43.7
24.9 35.9
23.5 29.7
1,043.2 859.1
359.6 394.4
9.9 14.4
320.4 323.0
29.3 57.0
173.6 140.4
15.08 12.12
4.82 5.29
5.99 6.01
3.46 3.88
1.50 1.50
40.26 20.485
41.85 59.95
19.085 19.32
8.8 10.2
4.9 3.8
78,772 76,608
77,554 75,138
76,210 73,048
13,482 13,627
1) More data regarding the basic earnings per share can be found in note 5.47 to the financial statements (page 160).
2) Dividend for the year, to be paid the following year, divided by the average of the highest and lowest share price
during the year.
0
70
140
210
280
350
20122011201020092008
N e t r e s u l t
(x EUR 1 mln.)
Continued
Continued and discontinued
Discontinued
8
■ M I S S I O N A N D P RO F I L E
M i s s i o n
Fugro’s mission is to be the world’s leading service
provider for the collection and interpretation of data
relating to the earth’s surface and sub-surface and
for associated services and advice in support of
infrastructure development on land, along the coast
and on the seabed.
Fugro’s activities are carried out across the world,
onshore, offshore and from the air, and are primarily
aimed at the:
• oil and gas industry
• construction industry
• mining sector
• governments
Fugro achieves this mission through:
• customer focus
• the provision of high-quality, innovative services
• professional, specialised employees
• advanced, unique technologies and systems
• a worldwide presence in which the exchange of
knowledge and expertise, both internally and
externally with the client, plays a central role.
P r o f i l e
Fugro provides the people, equipment, expertise and
technology that support the exploration, development,
production and transportation of the world’s natural
resources. Fugro also provides its clients with the
technical data and information required to design,
construct and maintain structures and infrastructure
in a safe, reliable and efficient manner.
Services are mostly provided locally and are supported
by a global knowledge base and resource pool of
experienced personnel. The services are often offered
in combination in order to achieve the optimum results
for the clients.
Fugro operates as an independent service provider
and has no commercial or other direct interests in the
projects of its clients. As Fugro is often involved in the
early exploration and development phase of (potential)
projects, confidentiality about Fugro’s engagements is
essential in many cases.
Fugro’s clients operate in many locations and under
different conditions. To be able to meet their needs in
the best possible way, Fugro’s organisational structure
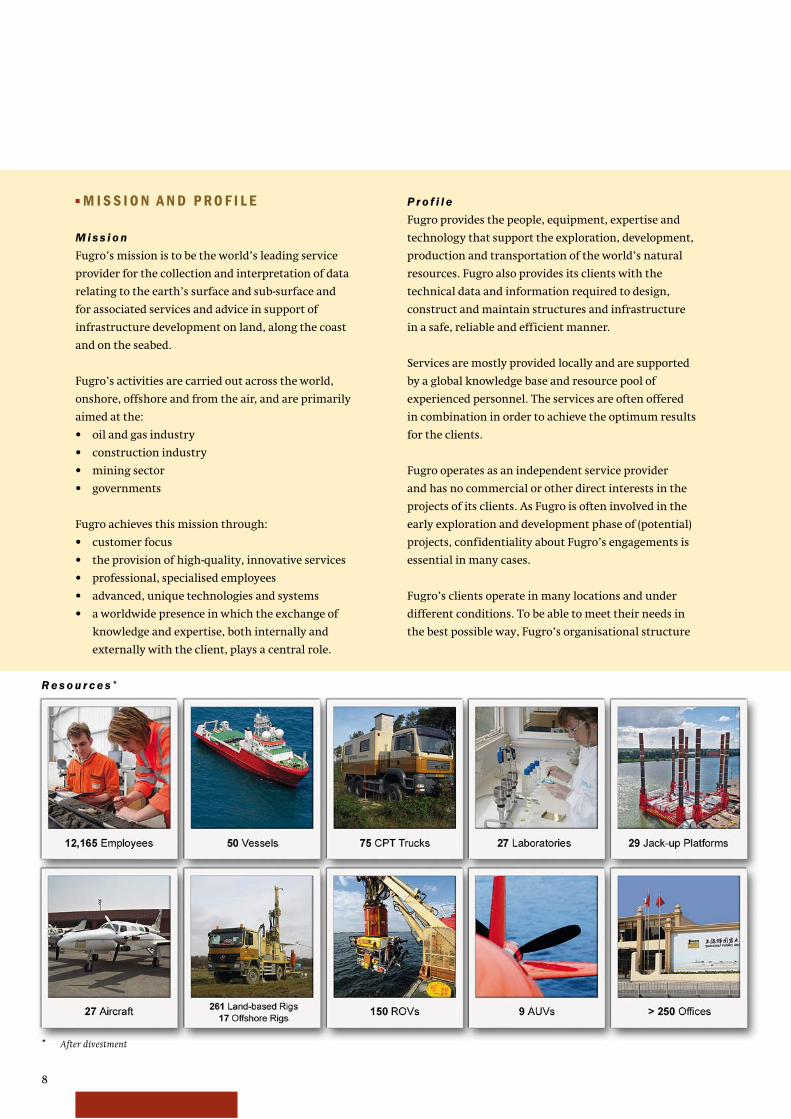
R e s o u r c e s *
* After divestment
9Fugro at a glance
is decentralised and client-oriented, delivering a wide
range of services in a variety of operating environments
and conditions. Fugro delivers these services from a
global network of offices and facilities.
Fugro strives to achieve strong market positions based on
(in-house developed) technologies, high-value services
and a strong international or regional presence.
Fugro was founded in the Netherlands in 1962 and
is listed on the Amsterdam stock exchange of NYSE
Euronext since 1992. Fugro was included in the
AEX-index as of September 2008.
Fugro grows organically and through acquisitions, and
by the end of 2012 employed some 14,600 staff in more
than 60 countries. After the divestment the number of
employees is 12,165.
■ F U G RO ’ S A C T I V I T I E S
Fugro provides a unique range of services and activities
worldwide. These have been organised in three divisions:
Geotechnical, Survey and Geoscience.
G e o t e c h n i c a l
The Geotechnical division investigates the engineering
properties and geologic characteristics of near-surface
soils and rocks using (in-house developed) proprietary
technologies, advises on foundation design, provides
construction materials testing, pavement assessment
and installation support. Geoconsulting integrates
engineering geophysics and geology assessment with
geotechnical engineering analysis to solve geohazard and
engineering problems in order to provide solutions for
the projects of our clients. These services support clients’
projects worldwide in the onshore (land), near shore
(coastal) and offshore environments, including deep
water. Typical projects include support of infrastructure
development and maintenance, large design and
construction projects, f lood protection and support of
the design and installation of oil and gas facilities, wind
farms and mine sites.
S u r vey
The Survey division provides a range of services in
support of the oil and gas industry, renewables,
commercial and civil industries, as well as governments
and other organisations. It encompasses numerous
offshore, subsea and geospatial activities as well as global
positioning systems that support these and other Group
activities. Offshore services include geophysical
investigation for geohazards, pipeline and cable routes,
inspection and construction support services,
hydrographic charting and meteorological and
oceanographic studies. Subsea services revolve around
the use of remotely operated vehicles (ROVs) in support
of drilling as well as inspection, repair and maintenance
(IRM) services of subsea assets. These services expand
into light well intervention services in support of oil and
gas production. Geospatial services concentrate on land
survey and aerial and satellite mapping services for a
wide range of clients. Fugro’s global positioning system
(which augments GPS and Glonass signals to provide
precise positioning globally) are used for the foregoing
services but are also provided on a subscription basis to
clients in the oil and gas industry as well as agriculture.
G e o s c i e n c e
The Geoscience division provides services and products
associated with collecting, processing, interpreting,
managing and storing geophysical, geochemical and
geological data. These data sets are used for evaluating
the presence of natural resources, including oil, gas,
water and minerals, and for optimising the exploration,
appraisal, development and production of those
resources. A broad range of geophysical data sets are
collected including marine seismic, gravity, magnetics
and electromagnetics.
The data sets are collected at sea, on the seabed, from the
air and on land using vessels, low flying airplanes and
helicopters. Clients are oil and gas companies, mining
companies and governmental organisations.
All activities in the Geoscience division, except for the
multi-client data library and the ocean bottom nodes
business, have been sold to CGG. In the future, these
businesses will continued to be referred to as the
Geoscience Division.
10
■ F I N A N C I A L TA R G E T S A N D S T R AT E G Y
F i n a n c i a l t a r ge t s
Fugro’s target is to achieve, under comparable economic
circumstances, a structural increase in earnings per
share for its shareholders. Fugro’s long-term policy is
aimed at generating a steady growth in net result based
on increasing revenue.
Important financial targets are:
• growth in earnings per share averaging 10% per
annum
• strong cash f low with an average annual growth
per share of 10%
• maintaining a healthy balance sheet and solvency
(> 33¹/³ %)
• interest cover (EBIT/Interest) of more than 5
Fugro’s financial strategy is aimed at the utilisation
and/or optimisation of:
• the ratio between risk and return of the various
business activities
• the ratio between shareholders’ equity and short-
term/long-term borrowings
• the use of both public and private capital markets
• the duration and phasing of the different financing
components
S t r a t e g y
Fugro aims at achieving equilibrium between its various
activities in order to be able to meet its targets. Fugro
strives for a balance between services related to
exploration, development and production activities for
the oil and gas industry, and those related to other
markets, such as mining and construction. This also
results in a combination of offshore and onshore
activities. Moreover, Fugro strives for a balanced
geographical spread. This, and the diverse range of
related activities, reduces Fugro’s sensitivity to market
f luctuations in a particular sector. As an independent
service provider, Fugro provides a broad spread of
services to its clients. The elements of geographical
diversity, range of services and wide client base
contribute to our ability to control our business risks.
Fugro strives for growth, both organically and through
acquisitions. To achieve organic growth Fugro invests in
equipment and human capital. Organic growth is also
achieved by actively developing new technologies and
services.
In the most important market sector – oil and gas –
the spread of Fugro’s services across the exploration,
development and production phases is a key factor.
This means Fugro provides services in many phases of
the (20 – 30 year) life-cycle of an oil or gas field. Avoiding
dependence on one phase of this market or single group
of clients is an essential component of Fugro’s strategy.
The result is a business that is less cyclical.
Profit margins vary per service and activity depending on
the specific market circumstances. For the more risky or
capital intensive activities a higher profit margin is
aimed for than the overall company average.
The long-term aim is to achieve robust but controlled
profit growth through:
• a broad but cohesive services portfolio
• the manner in which Fugro is financed
• the market-oriented international organisational
structure
• continuous development and training of employees
• specific investments in equipment and technology
• management focus on increasing net result
Fugro strives to improve profitability with a focus
on core activities and niche markets by:
• increasing operational scale
• building strong market positions
• continuing research and development
• cooperation and development for and with clients
• being selective about the projects that are taken on
• acquiring companies with a high added-value
• leveraging and optimising capabilities and resources
Over the period 2005 – 2008 revenues from both
continued and discontinued doubled and the net profit
margin increased from 8.6% to 13.2%. As from late 2008
the market conditions have been negatively influenced
by the global economic downturn, resulting in a slight
decrease in both revenue and net profit in 2009. In the
course of the second half of 2010 revenue growth was
resumed and continued in 2011 and 2012. Price pressure
remained in some segments, resulting in moderate profit
increases in 2010 through 2012. The oil and gas industry
is expected to modestly increase investments in 2013 and
some improvement in market conditions is anticipated
in this sector. The timing of recovery of the world
economy is still difficult, which may affect other sectors
in which Fugro operates.
Fugro has recently started a process to review its strategy
after the divestment of the majority of its geoscience
business in January 2013. The review is taking place with
the help of an external consulting firm and will be
11Fugro at a glance
completed by mid year. Fugro will communicate the
outcome in the course of the second half year 2013.
M a r ke t p o s i t i o n s
Fugro’s strategy is based primarily on securing and,
where possible, expanding strong market positions.
Complementing and broadening its package of closely
related services provides a competitive advantage.
Growth in adjacent sectors, by responding actively and
f lexibly to market developments and client needs, is also
an important component of the strategy.
On land, Fugro’s major clients are governments, industry
and construction companies in local and regional
markets. In these markets Fugro holds strong regional
positions.
At sea, the major clients are oil and gas companies, and
offshore contractors that operate in a global market.
Fugro has a leading position in offshore survey and
offshore geotechnical activities. In other market
segments, like mining and precise positioning, Fugro
holds leading market positions in niche markets with
a large variety of clients.
A c q u i s i t i o n s
To broaden its base and ensure continued sustainable
growth, Fugro usually completes a number of
acquisitions each year. Generally these serve to
strengthen or improve current market positions or to
obtain special technologies. Because acquisitions always
involve an element of risk, a thorough and extensive due
diligence is carried out before the decision to acquire
a company is taken. This limits the risks considerably.
Acquisition evaluation is based not only on financial
criteria but also on:
• added-value for Fugro
• cohesion with Fugro’s activities and services
• match with Fugro’s culture
• growth potential
• a strong position in a niche market or region
• technical and management qualities
• risk profile
R e s e a r c h a n d d e ve l o p m e n t
Research and development is of strategic importance
to Fugro. The search for ways to expand and improve
services to clients is unceasing and cooperation with
clients plays a major role in this. Many new ideas are
generated through joint development projects and often
developments take place in close cooperation with a
client because the client is interested in solving a specific
problem. Research relating to special measuring
equipment and analytical methods also plays an
important role in enhancing Fugro’s services. Its global
market position is, to a great extent, dependent on
high-value equipment, technologies and software.
Measurements are becoming increasingly detailed and
even the most complex data needs to be interpreted.
To this end, increasingly knowledge is exchanged or
combined within the company in order to arrive at
solutions or new developments. This process often
involves clients. Part of this research and development
expense is incurred as costs for the execution of projects.
C o o p e r a t i o n a n d s c a l e a d va n t a ge s
Effective cooperation between Fugro’s business units is
promoted at various levels. Critical mass is also a key
factor for the successful execution of large assignments.
Capacity utilisation and cooperation are optimised
through the exchange of equipment, employees and
expertise between the various activities and by extensive
employee training. Fugro promotes technological
advancement by clustering the knowledge available
within and outside the Group. The integration of
information systems and the utilisation of scale
advantages enhance the service provided to clients.
At the start of the year Fugro introduced a regional and
global service line based organisation to make the
cooperation even more effective by supporting decision
taking at the regional or global service line level to
address large and/or complex projects.
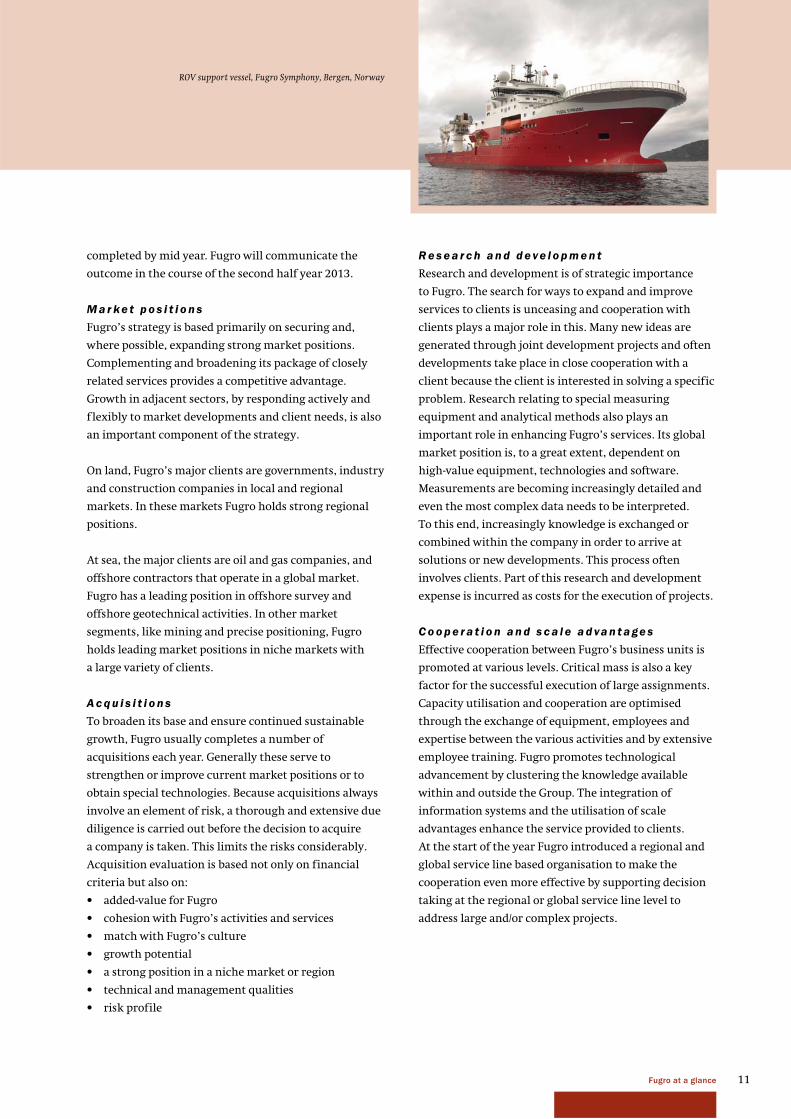
ROV support vessel, Fugro Symphony, Bergen, Norway
12
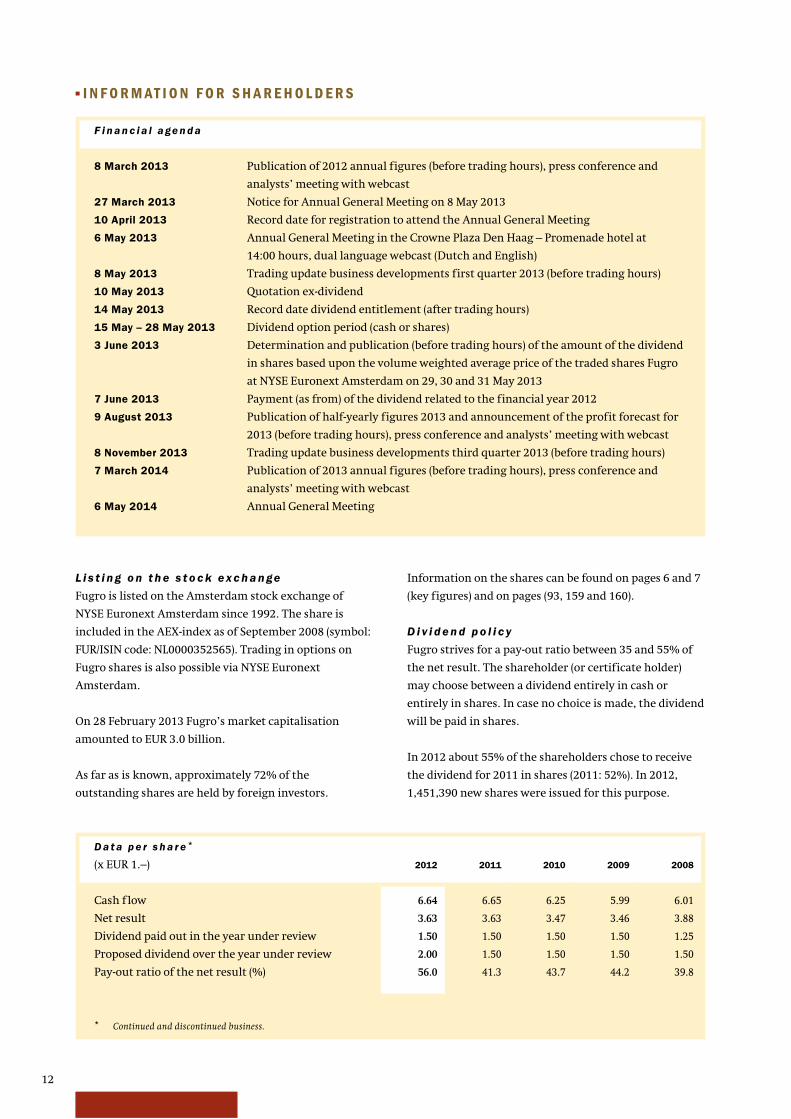
D a t a p e r s h a r e *
(x EUR 1.–) 2012 2011 2010 2009 2008
Cash f low 6.64 6.65 6.25 5.99 6.01
Net result 3.63 3.63 3.47 3.46 3.88
Dividend paid out in the year under review 1.50 1.50 1.50 1.50 1.25
Proposed dividend over the year under review 2.00 1.50 1.50 1.50 1.50
Pay-out ratio of the net result (%) 56.0 41.3 43.7 44.2 39.8
■ I N F O R M AT I O N F O R S H A R E H O L D E R S
L i s t i n g o n t h e s t o c k e x c h a n ge
Fugro is listed on the Amsterdam stock exchange of
NYSE Euronext Amsterdam since 1992. The share is
included in the AEX-index as of September 2008 (symbol:
FUR/ISIN code: NL0000352565). Trading in options on
Fugro shares is also possible via NYSE Euronext
Amsterdam.
On 28 February 2013 Fugro’s market capitalisation
amounted to EUR 3.0 billion.
As far as is known, approximately 72% of the
outstanding shares are held by foreign investors.
Information on the shares can be found on pages 6 and 7
(key figures) and on pages (93, 159 and 160).
D i v i d e n d p o l i c y
Fugro strives for a pay-out ratio between 35 and 55% of
the net result. The shareholder (or certificate holder)
may choose between a dividend entirely in cash or
entirely in shares. In case no choice is made, the dividend
will be paid in shares.
In 2012 about 55% of the shareholders chose to receive
the dividend for 2011 in shares (2011: 52%). In 2012,
1,451,390 new shares were issued for this purpose.
F i n a n c i a l a ge n d a
8 March 2013 Publication of 2012 annual figures (before trading hours), press conference and
analysts’ meeting with webcast
27 March 2013 Notice for Annual General Meeting on 8 May 2013
10 April 2013 Record date for registration to attend the Annual General Meeting
6 May 2013 Annual General Meeting in the Crowne Plaza Den Haag – Promenade hotel at
14:00 hours, dual language webcast (Dutch and English)
8 May 2013 Trading update business developments first quarter 2013 (before trading hours)
10 May 2013 Quotation ex-dividend
14 May 2013 Record date dividend entitlement (after trading hours)
15 May – 28 May 2013 Dividend option period (cash or shares)
3 June 2013 Determination and publication (before trading hours) of the amount of the dividend
in shares based upon the volume weighted average price of the traded shares Fugro
at NYSE Euronext Amsterdam on 29, 30 and 31 May 2013
7 June 2013 Payment (as from) of the dividend related to the financial year 2012
9 August 2013 Publication of half-yearly figures 2013 and announcement of the profit forecast for
2013 (before trading hours), press conference and analysts’ meeting with webcast
8 November 2013 Trading update business developments third quarter 2013 (before trading hours)
7 March 2014 Publication of 2013 annual figures (before trading hours), press conference and
analysts’ meeting with webcast
6 May 2014 Annual General Meeting
* Continued and discontinued business.
13Fugro at a glance
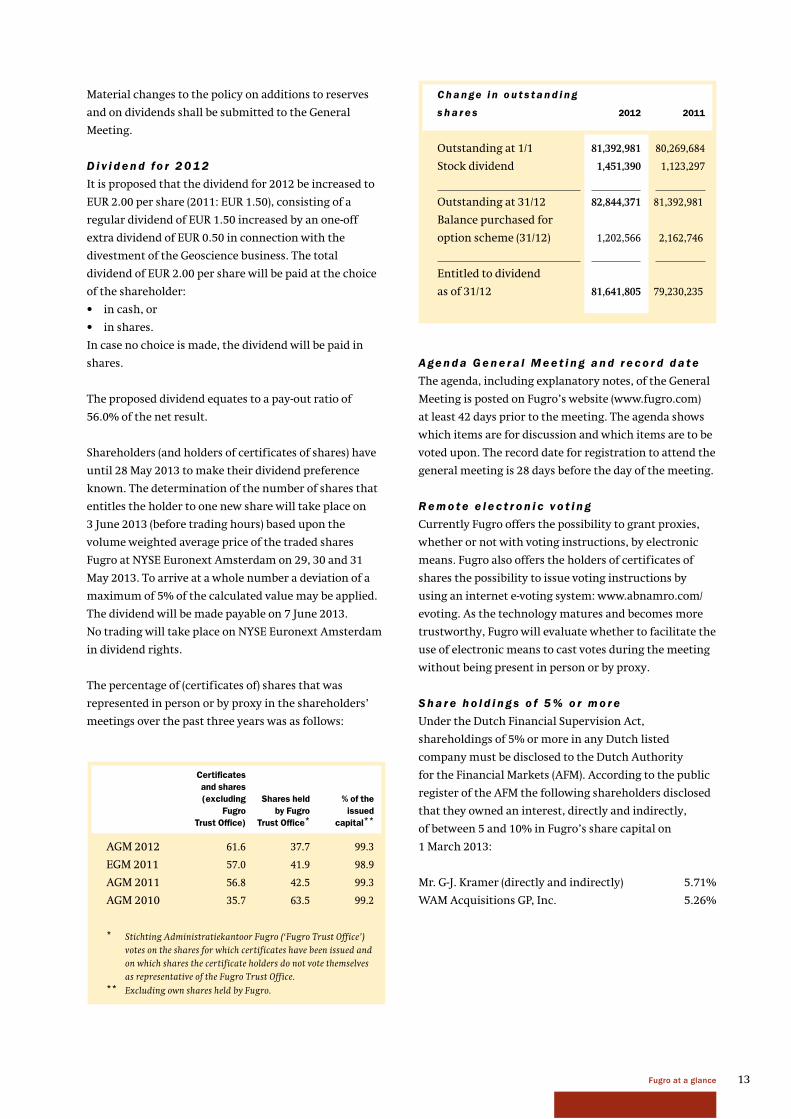
C h a n ge i n o u t s t a n d i n g
s h a r e s 2012 2011
Outstanding at 1/1 81,392,981 80,269,684
Stock dividend 1,451,390 1,123,297
Outstanding at 31/12 82,844,371 81,392,981
Balance purchased for
option scheme (31/12) 1,202,566 2,162,746
Entitled to dividend
as of 31/12 81,641,805 79,230,235
Certifi cates
and shares
(excluding
Fugro
Trust Offi ce)
Shares held
by Fugro
Trust Offi ce*
% of the
issued
capital**
AGM 2012 61.6 37.7 99.3
EGM 2011 57.0 41.9 98.9
AGM 2011 56.8 42.5 99.3
AGM 2010 35.7 63.5 99.2
* Stichting Administratiekantoor Fugro (‘Fugro Trust Office’) votes on the shares for which certificates have been issued and on which shares the certificate holders do not vote themselves as representative of the Fugro Trust Office.
** Excluding own shares held by Fugro.
Material changes to the policy on additions to reserves
and on dividends shall be submitted to the General
Meeting.
D i v i d e n d fo r 2 0 1 2
It is proposed that the dividend for 2012 be increased to
EUR 2.00 per share (2011: EUR 1.50), consisting of a
regular dividend of EUR 1.50 increased by an one-off
extra dividend of EUR 0.50 in connection with the
divestment of the Geoscience business. The total
dividend of EUR 2.00 per share will be paid at the choice
of the shareholder:
• in cash, or
• in shares.
In case no choice is made, the dividend will be paid in
shares.
The proposed dividend equates to a pay-out ratio of
56.0% of the net result.
Shareholders (and holders of certificates of shares) have
until 28 May 2013 to make their dividend preference
known. The determination of the number of shares that
entitles the holder to one new share will take place on
3 June 2013 (before trading hours) based upon the
volume weighted average price of the traded shares
Fugro at NYSE Euronext Amsterdam on 29, 30 and 31
May 2013. To arrive at a whole number a deviation of a
maximum of 5% of the calculated value may be applied.
The dividend will be made payable on 7 June 2013.
No trading will take place on NYSE Euronext Amsterdam
in dividend rights.
The percentage of (certificates of) shares that was
represented in person or by proxy in the shareholders’
meetings over the past three years was as follows:
A ge n d a G e n e r a l M e e t i n g a n d r e c o r d d a t e
The agenda, including explanatory notes, of the General
Meeting is posted on Fugro’s website (www.fugro.com)
at least 42 days prior to the meeting. The agenda shows
which items are for discussion and which items are to be
voted upon. The record date for registration to attend the
general meeting is 28 days before the day of the meeting.
R e m o t e e l e c t r o n i c v o t i n g
Currently Fugro offers the possibility to grant proxies,
whether or not with voting instructions, by electronic
means. Fugro also offers the holders of certificates of
shares the possibility to issue voting instructions by
using an internet e-voting system: www.abnamro.com/
evoting. As the technology matures and becomes more
trustworthy, Fugro will evaluate whether to facilitate the
use of electronic means to cast votes during the meeting
without being present in person or by proxy.
S h a r e h o l d i n g s o f 5 % o r m o r e
Under the Dutch Financial Supervision Act,
shareholdings of 5% or more in any Dutch listed
company must be disclosed to the Dutch Authority
for the Financial Markets (AFM). According to the public
register of the AFM the following shareholders disclosed
that they owned an interest, directly and indirectly,
of between 5 and 10% in Fugro’s share capital on
1 March 2013:
Mr. G-J. Kramer (directly and indirectly) 5.71%
WAM Acquisitions GP, Inc. 5.26%
14
Options are granted annually on 31 December and the
option exercise price is equal to the price of the
certificates of shares at the closing of NSYE Euronext
Amsterdam on the last trading day of the year. The
vesting period for the granted options is three years
starting at the first of January of the year following the
grant date. The option period is six years. The options
granted are unconditional and are not subject to any
further conditions of exercise, except that the option
holder is still employed by Fugro or one of its operating
companies. Standard exceptions apply to the latter rule
in connection with retirement, long-term disability and
death. In the event that a public offer is considered
hostile and such offer is declared unconditionally, all
options become immediately exercisable.
Options are granted in such a way that at any moment
the maximum number of outstanding options to acquire
shares in Fugro will not exceed 7.5% of the issued
ordinary share capital, taking into account the number
of shares repurchased for the option plan. In order to
mitigate dilution, it is Fugro’s policy to purchase own
(certificates of) shares to cover the options granted with
the result that no new shares are issued when options
are exercised.
In 2012 Fugro purchased nil shares (2011: 2,250,000 at an
average price of EUR 48.92 per share). On 31 December
2012 a total of 1,202,556 own shares were held. These
shares are not entitled to dividend and there are no
voting rights attached to these shares. The exercise of all
outstanding options as of 31 December 2012, including
the options granted on this date, could – after having
used the purchased shares – lead to an increase of the
issued share capital by a maximum of 6.4%. As stated
above it is Fugro’s policy to purchase own shares to cover
the options granted with the result that no new shares
are issued when options are exercised. Since the 1st of
January 2013 a total of 18,650 options were exercised.
I n ve s t o r r e l a t i o n s
Fugro offers comprehensive information regarding the
company on its website and through general meetings
and presentations to analysts, meetings and
presentations to (institutional) investors and press and
by means of press releases. Shareholders and certificate
holders are able to follow general meetings and
presentations in real time, for example by means of
webcasting or telephone. After the meetings, the
presentations are posted on the website. The
presentations are given particularly during the periods
March/April and August/September. During these
As stated on page 95, only certificates of shares of Fugro
are listed on NYSE Euronext Amsterdam. These
certificates are issued by the Fugro Trust Office, which
carries out the administration of the underlying shares
(for which it has issued the certificates). On 1 March 2013
the Fugro Trust Office administered 97.70% of the issued
(underlying) shares.
Pa r t i c i p a t i o n s a n d e m p l oy e e o p t i o n s
As far as is known, on 31 December 2012 around one
percent of Fugro’s share capital was held by members of
the Board of Management and other employees within
the Group. Of the total number of employee options
granted during the past years, 5,441,620 options
(excluding the option grants as per 31 December 2012)
were still outstanding on 31 December 2012.
A total number of 1,093,300 new options, with an
exercise price of EUR 44.52 were granted to a total of
674 employees on 31 December 2012. Of these options,
20% were granted to the four members of the Board of
Management (see also pages 184 and 185).
Options on Fugro shares are granted to a broad group of
employees. The granting of options is dependent on the
achievement of the targets of the Group as a whole and
of the individual operating companies as well as on the
contribution of the relevant employee to the long term
development of the company. Option grants to members
of the Board of Management are based upon the
remuneration policy and the option scheme that were
adopted and approved respectively by the Annual
General Meeting on 14 May 2008.
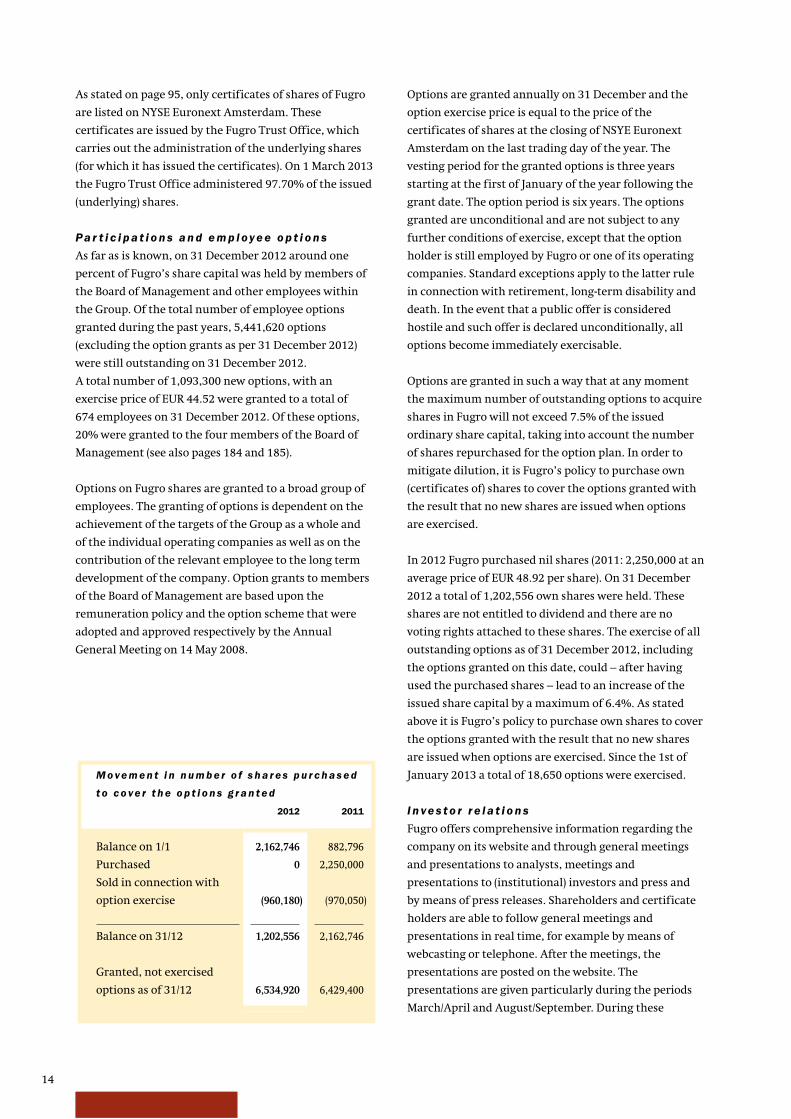
M o ve m e n t i n n u m b e r o f s h a r e s p u r c h a s e d
t o c o ve r t h e o p t i o n s g r a n t e d
2012 2011
Balance on 1/1 2,162,746 882,796
Purchased 0 2,250,000
Sold in connection with
option exercise (960,180) (970,050)
Balance on 31/12 1,202,556 2,162,746
Granted, not exercised
options as of 31/12 6,534,920 6,429,400
15Fugro at a glance
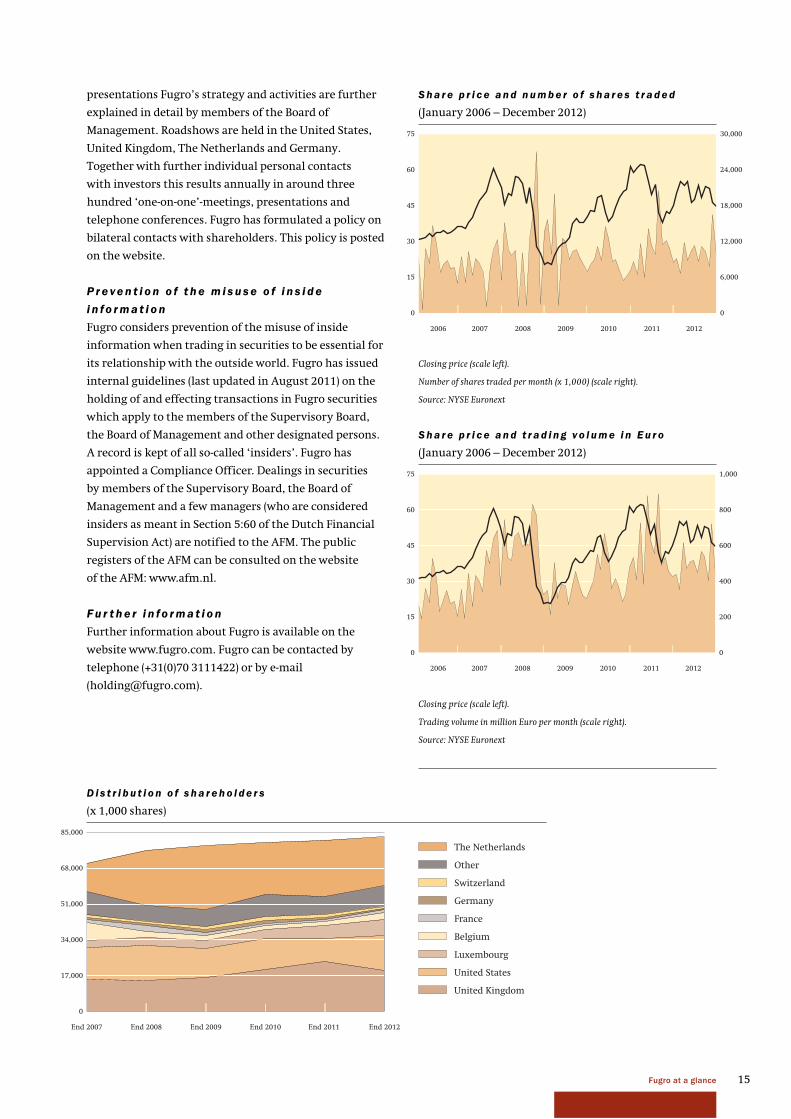
D i s t r i b u t i o n o f s h a r e h o l d e r s
(x 1,000 shares)
0
17,000
34,000
51,000
68,000
85,000
End 2012End 2011 End 2010End 2009End 2008End 2007
United Kingdom
United States
Luxembourg
Germany
Switzerland
Belgium
France
Other
The Netherlands
presentations Fugro’s strategy and activities are further
explained in detail by members of the Board of
Management. Roadshows are held in the United States,
United Kingdom, The Netherlands and Germany.
Together with further individual personal contacts
with investors this results annually in around three
hundred ‘one-on-one’-meetings, presentations and
telephone conferences. Fugro has formulated a policy on
bilateral contacts with shareholders. This policy is posted
on the website.
P r e ve n t i o n o f t h e m i s u s e o f i n s i d e
i n fo r m a t i o n
Fugro considers prevention of the misuse of inside
information when trading in securities to be essential for
its relationship with the outside world. Fugro has issued
internal guidelines (last updated in August 2011) on the
holding of and effecting transactions in Fugro securities
which apply to the members of the Supervisory Board,
the Board of Management and other designated persons.
A record is kept of all so-called ‘insiders’. Fugro has
appointed a Compliance Officer. Dealings in securities
by members of the Supervisory Board, the Board of
Management and a few managers (who are considered
insiders as meant in Section 5:60 of the Dutch Financial
Supervision Act) are notified to the AFM. The public
registers of the AFM can be consulted on the website
of the AFM: www.afm.nl.
F u r t h e r i n fo r m a t i o n
Further information about Fugro is available on the
website www.fugro.com. Fugro can be contacted by
telephone (+31(0)70 3111422) or by e-mail
0
15
30
45
60
75
0
6,000
12,000
18,000
24,000
30,000
2011 201220102009200820072006
S h a r e p r i c e a n d n u m b e r o f s h a r e s t r a d e d
(January 2006 – December 2012)
0
15
30
45
60
75
0
200
400
600
800
1,000
2011 201220102009200820072006
Closing price (scale left).
Trading volume in million Euro per month (scale right).
Source: NYSE Euronext
Closing price (scale left).
Number of shares traded per month (x 1,000) (scale right).
Source: NYSE Euronext
S h a r e p r i c e a n d t r a d i n g v o l u m e i n E u r o
(January 2006 – December 2012)
16
name Mr. F.H. Schreve (1942)
function Chairman
committee member remuneration and nomination committee
nationality Dutch
fi rst appointed 1983 until 10 May 2011 and 14 December 2011
current term until AGM 2013
expertise management strategy and risks inherent to the company’s
business; management selection, nomination and selection;
compliance; shareholder and employee relations
other functions Supervisory Board member HVC N.V.; Chairman of the Board
Foundation preference shares H.E.S. Beheer N.V., Foundation
Administration Office for shares of TKH and Foundation
Waarborgfonds Sport; Supervisory Board Chairman Sint
Lucas Andreas Ziekenhuis and Foundation National Park
De Hoge Veluwe
name Mr. J.A. Colligan (1942)
committee member audit committee (chairman as of 8 February 2013)
nationality British
fi rst appointed 2003
current term until AGM 2015
expertise management strategy and risks inherent to the company’s
business; management selection, nomination and selection,
oil and gas sector, innovation and technology development
other functions Director Society of Petroleum Engineers Foundation
name Mr. G-J. Kramer (1942)
committee Chairman remuneration and nomination committee
nationality Dutch
fi rst appointed 2006
current term until AGM 2014
expertise management selection, nomination and selection;
management strategy and the company’s risk profile;
compliance; oil and gas sector
other functions Chairman Supervisory Board ASM International N.V.;
Vice-chairman Supervisory Board Damen Shipyards Group;
Supervisory Board member N.V. Bronwater leiding Doorn and
Energie Beheer Nederland B.V.; Chairman Supervisory Board
Delft Technical University; Chairman Service Organisation
Protestant Churches in the Netherlands; Chairman Board
Amsterdam Sinfonietta and Chairman Board The Hague
Philharmonic; Board member Leiden Pieterskerk Foundation,
Foundation Beelden aan Zee Museum and The Concertgebouw
Fund Foundation; Member Advisory Board De Nieuwe Kerk
and Frans Hals Museum
name Mr. Th. Smith (1942)
committee member remuneration and nomination committee
nationality American
fi rst appointed 2002
current term until AGM 2014
expertise management strategy and the company’s risk profile;
management selection, nomination and selection; innovation
and technology development; the oil and gas sector
other functions Chairman Board Smith Global Services, Inc.; Board member
Houston Advanced Research Center; Director WWW United,
Inc. and Satterfield & Pontikes, Inc.
name Mr. F.J.G.M. Cremers (1952)*
function Vice-chairman
committee Chairman audit committee
nationality Dutch
fi rst appointed 2005
expertise financial administration, financing; internal risk
management and control systems; compliance; oil and gas
sector; shareholder and employee relations
other functions Supervisory Board member N.V. Nederlandse Spoorwegen
(vice-chairman), SBM Offshore N.V., Vopak N.V., Unibail-
Rodamco S.E., Luchthaven Schiphol N.V. and Parcom Capital
B.V. Board member Foundation preference shares Philips and
Foundation preference shares Heijmans. Member of the
Capital Market Committee of the Netherlands Authority for
the Financial Markets (AFM)
* Mr. Cremers stepped down as member of the Supervisory Board on
7 February 2013.
name Mrs. M. Helmes (1965)
committee member audit committee
nationality German
fi rst appointed 2009
current term until AGM 2013
expertise financial administration and accounting; internal risk
management and control systems; financing and general
financial management
other functions Chief Financial Officer Celesio AG, Stuttgart, Germany;
Supervisory Board member Brocacef Holding N.V.
name Mr. H.L.J. Noy (1951)
committee member audit committee (as of 8 February 2013)
nationality Dutch
fi rst appointed 2012
current term until AGM 2016
expertise management of listed consulting/engineering company;
strategy; internal risk management and control systems;
shareholder and employee relations
previous position Chairman Executive Board and CEO ARCADIS N.V. until
16 May 2012
other functions Supervisory Board member Royal BAM NV, Board member
VEUO (The Dutch Association of Listed Companies);
Extraordinary Board member Dutch Safety Board; Board
member ING Trust Office and of Foundation Administration
Office for shares of TKH Group
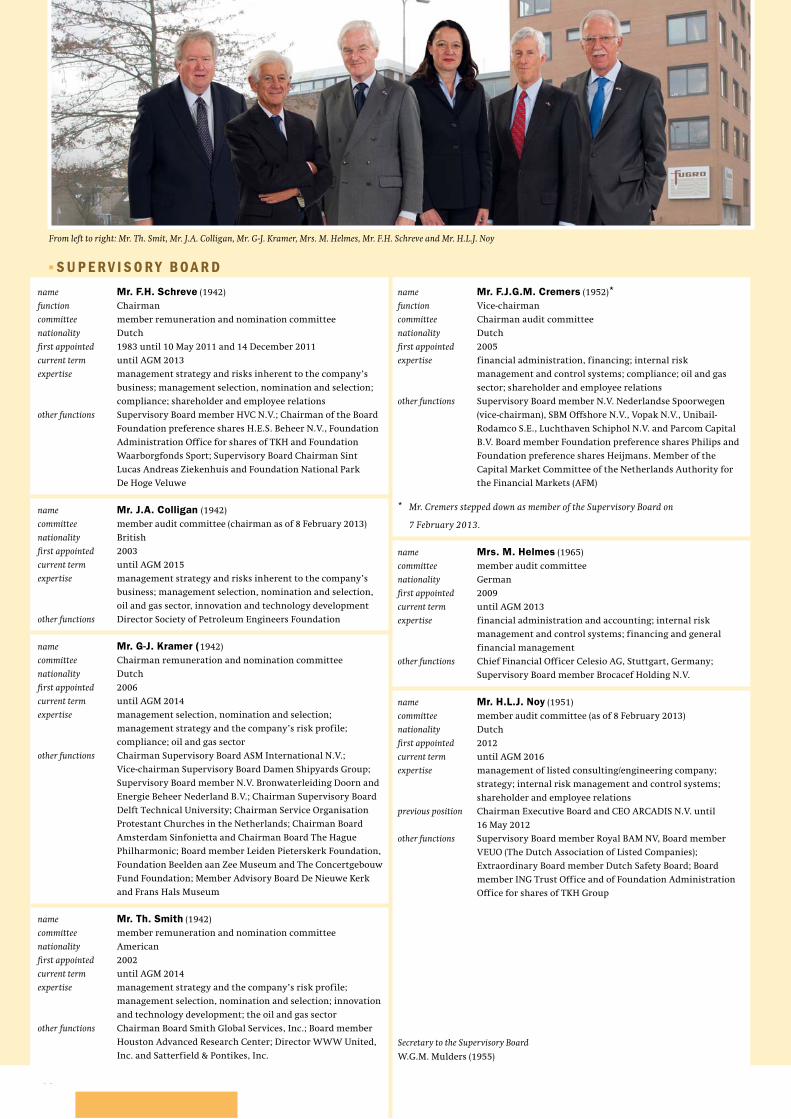
From left to right: Mr. Th. Smit, Mr. J.A. Colligan, Mr. G-J. Kramer, Mrs. M. Helmes, Mr. F.H. Schreve and Mr. H.L.J. Noy
Secretary to the Supervisory Board
W.G.M. Mulders (1955)
■ S U P E R V I S O R Y BO A R D
17Report of the Supervisory Board
In many respects the year 2012 was quite turbulent. In
many areas of the world, there was a continuation of the
unpredictable and volatile economic environment. The
year for Fugro was highlighted by Fugro’s 50th
anniversary and the agreement to divest the majority of
the Geoscience division. Completion of this divestment
and the formation of the Seabed Geosolutions joint
venture, which came to completion in January/February
2013, were key priorities. The Supervisory Board is
confident that the strategic choices made will contribute
to the performance of Fugro. The review and execution
of the updated general strategy in the second half of
2013 are essential for the future of Fugro.
F i n a n c i a l s t a t e m e n t s 2 0 1 2 a n d d i v i d e n d
This Annual Report includes the Financial Statements
2012, which are accompanied by an unqualified
independent auditor’s report of the external auditor,
KPMG Accountants N.V. (KPMG). These Financial
Statements were prepared in accordance with
International Financial Reporting Standards (IFRS) as
adopted by the European Union and section 9 of Book 2
Dutch Civil Code.
We have discussed the Annual Report, including the
Financial Statements with the Board of Management in
the presence of KPMG. Furthermore we reviewed the
auditor’s report and the quality of internal risk
management and control systems. We are of the opinion
that the Financial Statements and the report by the
Board of Management provide a true and fair view of the
state of affairs of Fugro including the management
policies pursued.
We propose that the shareholders adopt the Financial
Statements 2012 and discharge the members of the
Board of Management in office in the 2012 financial year
for its management of the company during 2012 and the
members of the Supervisory Board in office for its
supervision over said management. We endorse the
proposal of the Board of Management to increase the
dividend for 2012 to EUR 2.00 per share, consisting of a
regular dividend of EUR 1.50 increased by an one-off
extra dividend of EUR 0.50 in connection with the
divestment of the Geoscience business. The total
dividend of EUR 2.00 per share will be paid at the choice
of the shareholder in cash or in shares. The amount of
the dividend in shares will be determined and published
on Monday 3 June 2013 before trading hours. If no
choice is made, the dividend will be paid in shares.
The ex-dividend date is 10 May 2013 and the dividend is
paid as from Friday 7 June 2013. The proposed regular
dividend of EUR 1.50 equates to a pay-out ratio of 42%
of the net result. The total dividend of EUR 2.00 equates
to a pay-out ratio of 56% of the net result.
C o m p o s i t i o n a n d p r o f i l e
o f t h e S u p e r v i s o r y B o a r d
The Supervisory Board comprises six members being of
American, British, Dutch and German nationality. Their
biographies are listed on page 16 of this annual report.
The Supervisory Board has prepared a profile defining its
size and composition, taking into account the nature of
the company and its activities. The composition of the
Supervisory Board and the combined knowledge, skills,
experience and expertise, their independence as well as
the different ages and gender should be such that it best
fits the profile and the strategy of the company.
Diversity has been, and will continue to be, an important
consideration in the selection processes for (re)
appointment of Supervisory Directors. At the same time,
the first priority when considering vacancies is quality,
expertise, experience, independence, nationality and age.
As a result the Supervisory Board is currently not able to
indicate if the requirement of achieving a 30% of each
sex among Supervisory Board members is achievable in
the next 3 years. When Mr. Schreve steps down after the
closing of the AGM on 8 May 2013 the Supervisory Board
comprises five members including one female member
(20%). The Supervisory Board is greatly indebted to its
Chairman, Mr. F.H. Schreve, for his ‘return’ in December
2011 and all his work on the Supervisory Board and would
like to express its great appreciation for his commitment
during, especially, the past eighteen months.
The Supervisory Board attaches great importance to the
independence of its members. All Supervisory Board
members are independent within the meaning of the
Dutch Corporate Governance Code (‘Code’). Supervisory
Board members do not carry out any other functions that
could jeopardise their independence. With the exception
of Mr. G-J. Kramer, none of the Supervisory Board
members possesses Fugro options or shares. Mr. Kramer
■ R e p o r t o f t h e S u p e r v i s o r y B o a r d
18
designed to achieve the targets as well as the strategies
for the various business lines; market developments; the
annual budget; the (quarterly) financial results; share
price development; potential acquisitions and
divestments; post acquisition analysis; corporate social
responsibility; health, safety and environment;
important investments and divestments; management
development and succession; human resources;
information and communication technology; the main
risks inherent to the company’s activities as well as the
Board of Management’s opinion regarding the set-up and
functioning of the internal risk management and control
system; compliance with primary and secondary
legislation; shareholder relationship; and the corporate
governance structure. The meeting reports of the Audit
Committee and of the Remuneration and Nomination
Committee were also discussed.
Next to the regular agenda items, the following items
were discussed:
In January the budget for 2012 was approved. The
functioning of the members of the Board of Management
and their remuneration were discussed and also the
possibility and the advantage of granting a call option by
Fugro to Foundation Protective Preference Shares with
respect to the protective preference shares. Furthermore
projections of acquisitions of the past years were
reviewed. Attention was also paid to the Report of the
Dutch Monitoring Committee Corporate Governance of
December 2011.
In March the Supervisory Board discussed its own
functioning. The proposal to grant a call option on
protective preference shares to Foundation Protective
Preference Shares was approved as well as the dividend
proposal (as a large shareholder Mr. Kramer did not
participate in the discussions and decision). The strategy
of the Geoscience division was discussed. The Annual
Report 2011 was approved.
In May the Supervisory Board discussed the Geotechnical
strategy as well as the strategy of Subsea Services. The
Board of Management presented a focus on strategic
growth directions and their intention to undertake a
holds a 5.71% interest in Fugro (as stated on page 13).
Both the composition of the Supervisory Board and the
expertise and experience of its individual members
comply with all corporate governance rules and
requirements. The division of duties within the
Supervisory Board and the procedure of the Supervisory
Board are laid down in terms of reference. These terms
(including the terms of reference of the Audit Committee
and of the Remuneration and Nomination Committee)
are posted on Fugro’s website.
M e e t i n g s i n 2 0 1 2
The Supervisory Board met eight times in 2012. Five
meetings were regularly scheduled two-day meetings.
Two meetings were held as a conference call. The Board
of Management attended all those meetings but in some
cases part of the meetings was held without (all)
members of the Board of Management being present.
During none of the regular meetings one of the
Supervisory Directors was regularly absent. The overall
attendance percentage was 92%. Members who were
absent always informed the Chairman in advance of
their views on the items on the agenda and designated
other Supervisory Directors to proxy for them. Outside
of the regular meetings and calls the Chairman was in
regular contact with the chairman of the Board of
Management and with other members of the Board of
Management when necessary or useful.
In May members of the Supervisory Board attended part
of Fugro’s annual ‘May Managers meeting’ and also the
meetings and activities with regard to the celebration of
Fugro’s 50th anniversary. In November a meeting was
combined with visits to operating companies in
Singapore and Hong Kong, whereby presentations on
business activities, labour market, politics and
demographics and discussion with senior management
took place. These company visits take place annually and
provide additional insight into the quality of local
operations and management.
In the meetings with the Board of Management the
recurring items on the agenda were amongst others the
operational and financial targets; the general strategy
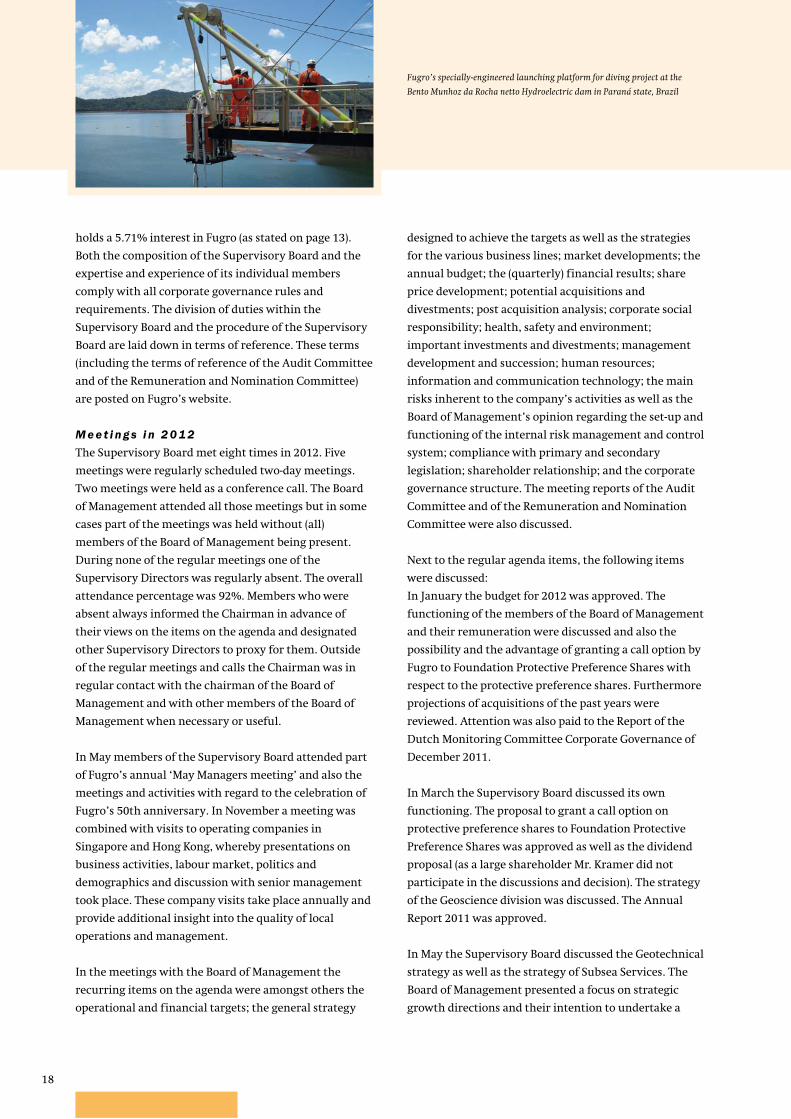
Fugro’s specially-engineered launching platform for diving project at the
Bento Munhoz da Rocha netto Hydroelectric dam in Paraná state, Brazil
19Report of the Supervisory Board
W h i s t l e b l owe r l e t t e r
Mid-December the Supervisory Board was confronted
with an event that required specific attention. A
whistleblower letter was received with allegations
concerning elements of the company’s financial
reporting. The Supervisory Board and Board of
Management took immediate action. KPMG was
informed and the company also immediately engaged
law firm De Brauw Blackstone Westbroek (DBBW) to lead
and carry out a thorough, detailed and broad,
independent investigation into the allegations of the
whistleblower. In turn they engaged Deloitte Forensic &
Dispute Services to support the investigation.
The investigation was carried out under the supervision
of the Supervisory Board. Given the fact the allegations
concerned elements of the company’s financial
reporting, KPMG expanded its team and the company
engaged an additional support team from PwC to
assist with enhanced financial closing procedures. The
independent investigation led by DBBW was completed
shortly prior to the publication of this Annual Report
2012. There were no material adverse findings from
the investigation and the enhanced financial closing
procedures did not result in any material adverse
consequences for the Financial Statements 2012. The
high degree of scrutiny has brought to light areas where
the financial processes can be improved. The Board of
Management will quickly start implementation and
expect to have most work done by the end of 2013. The
strategic review that is ongoing pays attention also to
reinforcing corporate functions, including the financial
organisation.
F u n c t i o n i n g o f t h e B o a r d o f M a n a ge m e n t
a n d o f t h e S u p e r v i s o r y B o a r d
The Supervisory Board evaluated the performance and
the remuneration of the Board of Management and its
individual members. This evaluation was prepared by the
Remuneration and Nomination Committee by
conducting interviews with each member of the Board of
Management. The results were discussed in a closed
plenary meeting of the Supervisory Board.
The Supervisory Board also reviewed its own
performance and its individual members. The self-
assessment of the Supervisory Board focused primarily
on composition, independence, expertise, mix of
professionalism and experience, training and knowledge,
board effectiveness and responsibility, team
effectiveness, quality of the information received and the
frequency of meetings, chairmanship, relationship with
the Board of Management, contacts with the Board of
review of all options for Fugro’s marine streamer seismic
data acquisition business and associated activities. With
respect to safety, the Supervisory Board was informed on
a new initiative (iPower) that was initiated to put more
emphasis in the role of each individual employee in
recognizing hazardous situations and taking the
necessary actions.
In August the Supervisory Board was further informed
on the ongoing discussions with relevant market parties
following Fugro’s announcement on 30 May 2012 that it
would review all options for its marine streamer seismic
data acquisition business and associated activities.
In September two extraordinary Supervisory Board
meetings were held in order to discuss and subsequently
to approve the proposals of the Board of Management to
divest the majority of the Geoscience division to CGG and
to enter into a seabed geosolutions joint venture with
CGG.
In November the Supervisory Board was updated on the
completion process of the transaction with CGG as well
as on vessel management issues. The valuation of the
multi-client data library was also discussed. Furthermore
the strategy of Offshore Survey and an updated strategy
of Subsea Services were discussed.
Considerable time was spent on discussion with the
Board of Management on the overall strategy and the
realisation of the strategic targets which continue to
require fine-tuning. It was agreed to review the general
strategy with the aim to refine the current strategy in
the context of the divestment of the majority of the
Geoscience division and the formation of the Seabed
Geosolutions joint venture, market developments and
the changing environment in which Fugro operates.
The strategy review includes an analysis of the central
holding and the support functions it provides in light of
the changing business environment and governance and
compliance requirements. This review will take place in
the course of 2013.
The Supervisory Board also discussed in several meetings
the functioning of the Board of Management. In the
November meeting it was agreed with Mr. Steenbakker
that he would step down as chairman and member of the
Board of Management as of 16 November 2012.
Subsequently Mr. P. van Riel was appointed as his
successor. The trading update and the outlook for the
full year were also discussed and reviewed.
20
R e m u n e r a t i o n a n d N o m i n a t i o n C o m m i t t e e
In 2012 the members of the Remuneration and
Nomination Committee were Messrs. G-J. Kramer
(chairman), F.H. Schreve and Th. Smith. The Committee
met formally three times, mostly in the presence of the
chairman of the Board of Management but also met
informally on a number of occasions. The recurring
topics that were discussed included, amongst others,
the remuneration policy for the members of the Board
of Management and their remuneration and the
composition, succession and performance evaluation
of both the members of Board of Management and the
Supervisory Board, as well as the functioning of the
Board of Management.
The Remuneration Report for the year 2012 was prepared
in accordance with best practice provision II.2.12 of the
Code and approved by the Supervisory Board. This
Report contains an account of the manner in which the
remuneration (and nomination) policy has been executed
in 2012. The Remuneration Report 2012 is posted on
Fugro’s website. A summary is provided hereunder.
Summary Remuneration Report 2012
The objective of the remuneration policy is to provide a
remuneration system such that performance that is
pursuant to the results and strategy of Fugro is rewarded
and also that qualified and experienced management can
be recruited, motivated and retained.
The key elements of the remuneration policy are as
follows:
• fixed salary;
• annual bonus (short-term incentive), depending on
targets determined in advance with a maximum of
twelve months (100%) of annual fixed salary. The
bonus is related to quantified financial targets and
this will account for 2/3 of the annual bonus and the
other part of the bonus is related to non-financial /
personal targets and will account for 1/3 of the annual
bonus. The financial targets and the weighing given
to the individual financial elements are as follows:
earnings per share 60%, net profit margin 20% and
return on capital employed 20%. The non-financial
targets are based on Fugro’s strategic agenda. These
are qualitative individual targets and/or collective
targets that are the responsibility of one or more
directors and that can be influenced by them. These
targets could include, among other things, health
safety and environment, corporate social
responsibility and personal development;
Management and other senior managers, workload and
functioning of colleagues. This internal self-assessment
was based on individual discussions with the Chairman
and on questionnaires, which were completed by each
Supervisory Board member and plenary discussed in a
closed meeting. The outcome of the self-assessment was
concluded positively but led to some suggestions for
improvement. These suggestions relate, amongst others,
that more time should be available for discussion on
strategy issues.
Au d i t C o m m i t t e e
In 2012 the members of the Audit Committee were
Messrs. F.J.G.M. Cremers (chairman) and J.A. Colligan
and Mrs. M. Helmes. The composition of the Audit
Committee is in accordance with the requirements of the
Code. Collectively the members possess the required
experience and financial expertise. Mr. Cremers and
Mrs. Helmes were acting as financial experts within the
meaning of the Code. The Audit Committee met three
times in 2012. The external auditor (KPMG) attended all
these meetings. Mr. H.L.J. Noy attended the meetings as
well. The financial statements 2011 and the 2012 half-
yearly results were discussed during the relevant
meetings. Topics such as taxation, claims and disputes,
compliance and the economic crisis were discussed.
Risk areas, such as hedging, f luctuations in currency
exchange rates, valuation of the multi-client data library,
impairment and insurance, agency agreements were also
discussed as was the functioning of the internal risk
management and control system and the 2012 audit plan
of the internal audit function. In December attention
was paid to accounting and related financial issues with
regard to the closing of the transaction with CGG. The
Audit Committee also discussed new Dutch legislation
which makes it mandatory for audit firms to rotate and
that a new (other than KPMG) external auditor has to be
appointed in 2016 at the latest.
At least once every four years the Audit Committee and
the entire Supervisory Board conduct a thorough
assessment of the functioning of the external auditor in
accordance with best practice provision V.2.3 of the Code.
The previous assessment took place in 2010 when KPMG
was reappointed as the external auditor. In 2012 the
functioning of the external auditor was reviewed by the
Board of Management and discussed in the Audit
Committee. The outcome was positive. Rotation of the
lead audit engagement partner of KPMG took place at the
end of 2011.
21Report of the Supervisory Board
R e m u n e r a t i o n i n 2 0 1 2
B o a r d o f M a n a ge m e n t
Fixed salary 2012
The fixed salaries of the members of the Board of
Management were adjusted in accordance with the
changes in the Board of Management as of 1 January
2012. More details are provided in the Remuneration
Report.
Annual bonus 2011
At the beginning of 2012 the Remuneration and
Nomination Committee evaluated the predetermined
2011 annual bonus targets. Based on the results for the
non-financial and financial targets, the Supervisory
Board has established the extent to which the targets for
2011 were achieved. The Supervisory Board concluded
that the personal (non-financial) targets were all met.
The financial performance compared to the financial
targets came at approximately five months. As a result
the Supervisory Board decided to award to each of the
members of the Board of Management an annual bonus
of nine month’s annual fixed salary for the year 2011
(paid in 2012).
Stock options 2012
As per 31 December 2012 a total number of 219,000 stock
options were granted to the members of the Board of
Management. The exercise price of these options is EUR
44.52 (the closing price of the shares at NYSE Euronext
Amsterdam on 31 December 2012). The option period is
six years and the options can only be exercised after
1 January 2016 (vesting period is three years).
Further details of Fugro’s remuneration policy and of the
remuneration of the individual members of the Board of
Management, broken down into its various components,
are presented in the Financial Statements on page 186
and in the Remuneration Report.
Supervisory Board
There were no changes in the remuneration of the
members of the Supervisory Board. Further details are
presented in the Financial Statements on page 186 and in
the Remuneration Report.
Nomination
The main topics discussed were the composition of the
Supervisory Board and of the Board of Management,
appointments and reappointments, senior management
succession, talent identification and diversity, including
gender related.
• stock options (long-term incentive). The stock options
for the Board of Management form part of a broad
option scheme that is in existence already many years
and that is applicable to more than 600 employees
worldwide. Options are granted on the basis of the
contribution to the long term development of Fugro,
among which the development of the long term
strategy, on the basis of measurable targets such as
the (growth) targets in the strategic plan and in the
annual budget. This part of the income of members of
the Board of Management (and other senior
management) also depends on the Fugro share price
and is therefore linked to the value of Fugro;
• pension provisions and fringe benefits. Pension is
based upon a customary pension scheme and on an
available premium system. The fringe benefits are
commensurate with the position held.
The actual (financial and non-financial) targets are not
disclosed because they qualify as competition-sensitive
and hence commercially confidential and potentially
price sensitive information.
Before determining the remuneration of individual
members of the Board of Management, the Supervisory
Board analyses the possible outcomes of the variable
remuneration components and how they may affect the
remuneration. The remuneration policy within the
Fugro Group is also taken into account. In an
unfortunate situation, the Supervisory Board may
recover from the members of the Board of Management
any variable remuneration awarded on the basis of
incorrect financial or other data. Payment of variable
remuneration to the members of the Board of
Management is subject to the correctness of the relevant
(financial) data for the relevant year. Under
circumstances, for instance if the predetermined targets/
performance criteria would produce an unfair result due
to extraordinary circumstances, the Supervisory Board
has the discretionary authority to make adjustments
(upward or downward) to the amount of the annual
bonus. If the Supervisory Board would during the year
decide on the payment of severance pay or other special
remuneration to one or more members of the Board of
Management, an account and an explanation of this
remuneration shall be included in the remuneration
report. Until now, the amount of an annual bonus has
never been adjusted nor has a special remuneration been
paid.
22
C o m p o s i t i o n a n d ( r e ) a p p o i n t m e n t s B o a r d
o f M a n a ge m e n t a n d S u p e r v i s o r y B o a r d
Board of Management
In the AGM held on 22 May 2012 Mr. A. Jonkman and
Mr. J. Rüegg were reappointed to the Board of
Management. Mr. Rüegg was reappointed for an
additional one year to be in charge of the Survey division
and will take retirement after the AGM in May 2013.
In November 2012 the Supervisory Board and Mr.
Steenbakker jointly agreed that Mr. Steenbakker would
step down as chairman and member of the Board of
Management because of a difference of opinion with
respect to the vision regarding the direction for the
company. Mr. P. van Riel was appointed as his successor.
Mr. S. J. Thomson and Mr. M. R.F. Heine were appointed
as successors of Mr. Rüegg (68) who will retire after the
AGM in May 2013. Mr. Thomson will manage Subsea
Services and Mr. Heine will manage Survey. Mr. Thomson
is also proposed for appointment to the Board of
Management at the AGM in May 2013.
The size and composition of the Board of Management
and the combined experience and expertise should be
such that best fits the profile and strategy of the
company. This aim for the best fit in combination with
the availability of qualifying candidates has led to a
Board of Management in which currently all four
members are male. Attention is paid to gender diversity
in the profiles of new Board of Management members.
Unfortunately, not many women fill senior positions in
the highly technical environment in which Fugro
operates. Nevertheless, the company encourages the
development of female talents which has already led to
several appointments in key management positions.
With the recent successful sale of the majority of the
Geoscience activities, the execution of the strategic
review and the reinforcement of corporate functions,
Fugro enters a new stage in its development. In this
connection, Mr Jonkman has indicated that he would
like to step down following the AGM in 2014.
Mr. Jonkman served as CFO and member of the Board of
Management of Fugro N.V. for 9 years during a period of
strong growth of the company. The Supervisory Board
has initiated the search for a successor and expects to be
able to complete the process towards the end of 2013.
After a transition period and the preparation of the 2013
financial statements, Mr Jonkman will transfer his
duties to the new CFO. Thereafter he will be engaged in
special projects at the request of the Chairman of the
Board of Management.
Supervisory Board
In the AGM held on 22 May 2012, Mr. Noy was appointed
as member of the Supervisory Board. He will take over
the chairmanship of Mr. Schreve after the closing of the
AGM in May 2013.
On 11 February 2013 it was announced that Mr. Cremers
has stepped down as member of the Supervisory Board.
The pace with which changes within the financial
organisation are implemented and that decisions of the
Supervisory Board in respect thereof were not adequately
carried through, are the reasons for his decision. As
announced in November 2012, Fugro is conducting a
review of its strategy. This also encompasses the holding
functions including the financial organisation and
processes. It was considered important that the results of
the strategy review are also included in changes of the
financial organisation. The Supervisory Board regrets
the decision of Mr. Cremers and thanks him for his
contributions during the almost eight years that he was
a Supervisory Director and chairman of the Audit
Committee.
In order to deal with the vacancy in the Audit Committee
Mr. Noy was appointed as member of the Audit
Committee and Mr. Colligan was appointed chairman.
Mrs. M. Helmes is proposed for reappointment to the
Supervisory Board at the AGM in May 2013.
I n c o n c l u s i o n
We would like to thank the shareholders for the trust
they have put in the company and we would like to
express our appreciation and thanks to all Fugro
employees (including the employees who meanwhile
joined CGG) for their support, hard work and
contribution to the company’s performance in 2012.
We express our confidence in the Board of Management
to lead the company forward. We are aware of the
challenges 2013 will bring us, but we trust that Fugro
can cope with these challenges.
Leidschendam, 7 March 2013
F.H. Schreve, Chairman
J.A. Colligan
M. Helmes
G-J. Kramer
H.L.J. Noy
Th. Smith

23
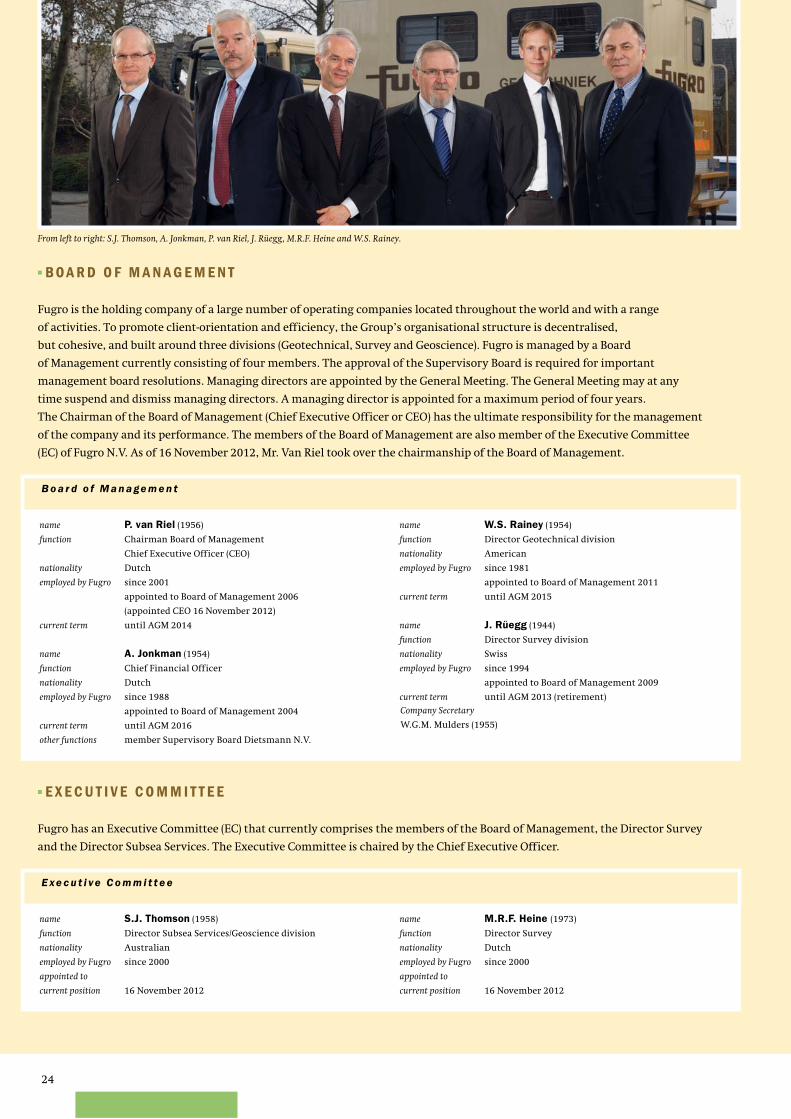
24
name S.J. Thomson (1958)
function Director Subsea Services/Geoscience division
nationality Australian
employed by Fugro since 2000
appointed to
current position 16 November 2012
name M.R.F. Heine (1973)
function Director Survey
nationality Dutch
employed by Fugro since 2000
appointed to
current position 16 November 2012
name P. van Riel (1956)
function Chairman Board of Management
Chief Executive Officer (CEO)
nationality Dutch
employed by Fugro since 2001
appointed to Board of Management 2006
(appointed CEO 16 November 2012)
current term until AGM 2014
name A. Jonkman (1954)
function Chief Financial Officer
nationality Dutch
employed by Fugro since 1988
appointed to Board of Management 2004
current term until AGM 2016
other functions member Supervisory Board Dietsmann N.V.
name W.S. Rainey (1954)
function Director Geotechnical division
nationality American
employed by Fugro since 1981
appointed to Board of Management 2011
current term until AGM 2015
name J. Rüegg (1944)
function Director Survey division
nationality Swiss
employed by Fugro since 1994
appointed to Board of Management 2009
current term until AGM 2013 (retirement)
B o a r d o f M a n a ge m e n t
E xe c u t i ve C o m m i t t e e
Company Secretary
W.G.M. Mulders (1955)
■ BO A R D O F M A N A G E M E N T
Fugro is the holding company of a large number of operating companies located throughout the world and with a range
of activities. To promote client-orientation and efficiency, the Group’s organisational structure is decentralised,
but cohesive, and built around three divisions (Geotechnical, Survey and Geoscience). Fugro is managed by a Board
of Management currently consisting of four members. The approval of the Supervisory Board is required for important
management board resolutions. Managing directors are appointed by the General Meeting. The General Meeting may at any
time suspend and dismiss managing directors. A managing director is appointed for a maximum period of four years.
The Chairman of the Board of Management (Chief Executive Officer or CEO) has the ultimate responsibility for the management
of the company and its performance. The members of the Board of Management are also member of the Executive Committee
(EC) of Fugro N.V. As of 16 November 2012, Mr. Van Riel took over the chairmanship of the Board of Management.
■ E X E C U T I V E C O M M I T T E E
Fugro has an Executive Committee (EC) that currently comprises the members of the Board of Management, the Director Survey
and the Director Subsea Services. The Executive Committee is chaired by the Chief Executive Officer.
From left to right: S.J. Thomson, A. Jonkman, P. van Riel, J. Rüegg, M.R.F. Heine and W.S. Rainey.
25Report of the Board of Management
■ R e p o r t o f t h e B o a r d o f M a n a g e m e n t
■ G E N E R A L
Major events in 2012 included the US elections continued
unrest in the Arab world, economic uncertainties in
Europe and the USA and the continued pressure on the
European Union and the Euro. At the same time the oil
price remained at a high level in line with the long term
outlook for continued need for oil and gas.
In 2012, as in 2011, the effects on Fugro were limited
thanks to our position in the oil and gas market, our
strategy to focus on providing a broad range of services
across the value chain of our customers, and our
client-, regional-, and market diversity, all healthy
differentiators for Fugro.
Fugro had a number of special events in 2012. We
celebrated the 50th anniversary of the company and
entered into the negotiations around the divestment of
the majority of the activities of the Geoscience division.
These negotiations resulted in a sales and purchase
agreement with CGG in France. The transaction closed
with effective date 31 January 2013 (for more details we
refer to a separate paragraph in this report on page 27).
In addition, Fugro entered into the Seabed Geosolutions
joint venture with CGG which closed 16 February 2013.
Fugro has a 60% stake in this joint venture and has
control. Further, it was decided that Fugro will review its
strategy in order to optimise stakeholders’ interests. This
review is in progress and we will share the outcome with
stakeholders in the course of the second half year 2013.
The demand for energy remained stable, as reflected in
oil prices of around USD 112 per barrel (Brent). As a
result, and in order to compensate for depletion and
meet the expected increase in future demand, the oil and
gas industry has further increased its spending on global
exploration and production. Oil and gas will remain
important for decades. Although use of energy from
renewable sources such as offshore wind farms is
growing rapidly, it still only makes a small contribution
globally. Also the impact of shale gas will be increasingly
important for the world energy supply.
Many of Fugro’s activities are related to energy. Global
developments have resulted in an increasing demand for
our services in various activities, but fell short of earlier
expectations. This applies specifically to marine seismic
surveys and subsea support services for offshore
installations, where weak volumes in specific
geographical regions are lower. Demand for offshore
construction-related services picked up slightly during
the year, but recent publications of companies operating
in this part of the business indicate that recovery could
be slower than originally anticipated.
The picture in non oil and gas sectors in which Fugro
operates showed regional variations. Demand for
services for large infrastructure projects in Europe and
the United States, for example, remained weak.
Although activities that largely depend on government
funding, such as infrastructure, aerial mapping and
construction, were generally under economic pressure in
the ‘old economies’, we saw great opportunities in
emerging areas like Kazakhstan and East Africa. Mining-
related work recovered early 2012 after a few difficult
years, but became quiet again after a short period of
time.
The growth in revenue continued. Fugro achieved record
revenue (continued and discontinued business) for the
year of EUR 2,952.7 million (2011: EUR 2,577.8 million).
The increase was attributed to all divisions.
Continuing price pressure in a number of sectors
resulted in a lower net profit margin (continued
and discontinued business) of 9.9% (2011: 11.2%).
In absolute terms, however, net profit for the year was
EUR 291.6 million which exceeded that of any previous
year, including the IFRS related effects of the divestment
in 2013, which are in balance insignificant on the net
result of 2012. The net result after tax for the continued
business is EUR 232.8 million (2011: EUR 293.9 million)
and a net profit margin 10.8% (2011: 15.8%). The lower
margin is primarily due to the short fall in Subsea
services and ocean bottom nodes (first half year 2012).
Fugro’s financial position is solid and was further
secured early 2013 by the sale of the majority of the
Geoscience division to CGG. At closing Fugro received
some EUR 700 million in cash, which improved our
financial situation, after repayment of a portion of the
debt, and has a positive effect on the gearing.
Fugro’s broad range of services enables the company to
offer one-stop-shopping solutions to clients for complex
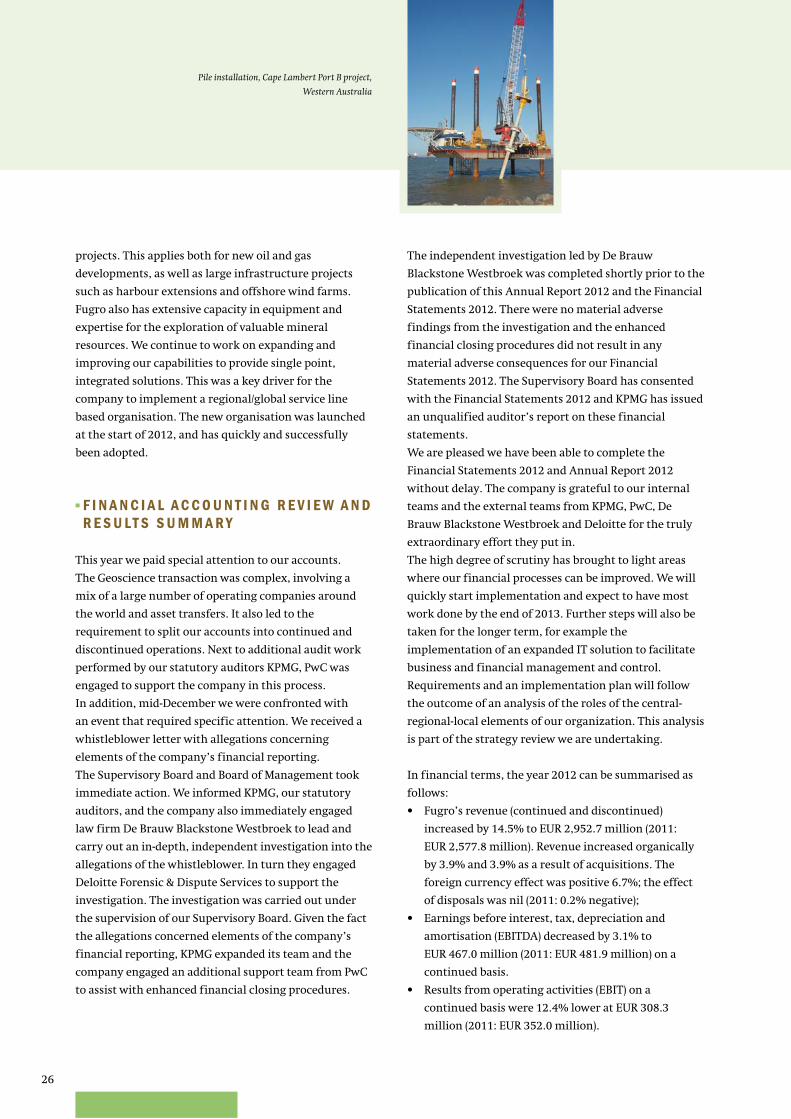
26
The independent investigation led by De Brauw
Blackstone Westbroek was completed shortly prior to the
publication of this Annual Report 2012 and the Financial
Statements 2012. There were no material adverse
findings from the investigation and the enhanced
financial closing procedures did not result in any
material adverse consequences for our Financial
Statements 2012. The Supervisory Board has consented
with the Financial Statements 2012 and KPMG has issued
an unqualified auditor’s report on these financial
statements.
We are pleased we have been able to complete the
Financial Statements 2012 and Annual Report 2012
without delay. The company is grateful to our internal
teams and the external teams from KPMG, PwC, De
Brauw Blackstone Westbroek and Deloitte for the truly
extraordinary effort they put in.
The high degree of scrutiny has brought to light areas
where our financial processes can be improved. We will
quickly start implementation and expect to have most
work done by the end of 2013. Further steps will also be
taken for the longer term, for example the
implementation of an expanded IT solution to facilitate
business and financial management and control.
Requirements and an implementation plan will follow
the outcome of an analysis of the roles of the central-
regional-local elements of our organization. This analysis
is part of the strategy review we are undertaking.
In financial terms, the year 2012 can be summarised as
follows:
• Fugro’s revenue (continued and discontinued)
increased by 14.5% to EUR 2,952.7 million (2011:
EUR 2,577.8 million). Revenue increased organically
by 3.9% and 3.9% as a result of acquisitions. The
foreign currency effect was positive 6.7%; the effect
of disposals was nil (2011: 0.2% negative);
• Earnings before interest, tax, depreciation and
amortisation (EBITDA) decreased by 3.1% to
EUR 467.0 million (2011: EUR 481.9 million) on a
continued basis.
• Results from operating activities (EBIT) on a
continued basis were 12.4% lower at EUR 308.3
million (2011: EUR 352.0 million).
projects. This applies both for new oil and gas
developments, as well as large infrastructure projects
such as harbour extensions and offshore wind farms.
Fugro also has extensive capacity in equipment and
expertise for the exploration of valuable mineral
resources. We continue to work on expanding and
improving our capabilities to provide single point,
integrated solutions. This was a key driver for the
company to implement a regional/global service line
based organisation. The new organisation was launched
at the start of 2012, and has quickly and successfully
been adopted.
■ F I N A N C I A L A C C O U N T I N G R E V I E W A N D R E S U LT S S U M M A R Y
This year we paid special attention to our accounts.
The Geoscience transaction was complex, involving a
mix of a large number of operating companies around
the world and asset transfers. It also led to the
requirement to split our accounts into continued and
discontinued operations. Next to additional audit work
performed by our statutory auditors KPMG, PwC was
engaged to support the company in this process.
In addition, mid-December we were confronted with
an event that required specific attention. We received a
whistleblower letter with allegations concerning
elements of the company’s financial reporting.
The Supervisory Board and Board of Management took
immediate action. We informed KPMG, our statutory
auditors, and the company also immediately engaged
law firm De Brauw Blackstone Westbroek to lead and
carry out an in-depth, independent investigation into the
allegations of the whistleblower. In turn they engaged
Deloitte Forensic & Dispute Services to support the
investigation. The investigation was carried out under
the supervision of our Supervisory Board. Given the fact
the allegations concerned elements of the company’s
financial reporting, KPMG expanded its team and the
company engaged an additional support team from PwC
to assist with enhanced financial closing procedures.
Pile installation, Cape Lambert Port B project,
Western Australia
27Report of the Board of Management
bottom cable and permanent reservoir monitoring
activities. Fugro agreed to make a cash payment of
EUR 225 million to CGG in order to achieve a 60%
controlling interest in the joint venture. By
combining the strengths of both companies, the
Seabed Geosolutions joint venture will have an
immediate market leading position in seabed
geophysical activities, and will benefit from a good
synergy with Fugro’s subsea activities.
The formation of the Seabed Geosolutions joint
venture increases exposure to the development and
extended production phase in the life cycle of oil and
gas fields, which is typically characterised by stable,
long term service contracts.
• Fugro and CGG have agreed to enter into a
non-exclusive sales and marketing agreement,
operated by CGG for sale of part of the Fugro marine
streamer seismic multi-client library. Revenues will
benefit from the larger combined global sales force
and broad range of client contacts of the partners. All
multi-client personnel have transferred to CGG. Fugro
retains the right to sell all or parts of the library to
other parties. This provides Fugro with maximum
flexibility to unlock the value of its library. Except for
reprocessing to keep the library fresh and finishing a
small number of projects. Fugro does not anticipate
further significant investing in its marine streamer
multi-client library.
• A global strategic technological and commercial
partnership under which CGG and Fugro grant each
other preferred supplier status for selected products
and services required for the operation of their
respective businesses. Parties will also pursue
opportunities related to the launch of new
technologies.
The partnership will provide revenue enhancing
opportunities to both Fugro and CGG, and will benefit
from the leading positions both parties have in their
respective markets.
The purchase price of EUR 1.2 billion was settled on
closing on 31 January 2013. As part of the transaction,
Fugro agreed to grant CGG a vendor loan of EUR 225
million, which is drawn in two tranches (EUR 125 million
on closing of the main transaction on 31 January 2013
and EUR 100 million after closing of the airborne part,
which will take a few months longer as some
administrative steps need to be concluded as well as
government approval to transfer some parts of the
equipment). An amount of some EUR 700 million has
• Net result attributable to owners of the Company
went up with 1.4% to EUR 291.6 million (2011:
EUR 287.6 million).
• Earnings per share (continued and discontinued) was
stable at EUR 3.63 (2011: EUR 3.63).
• The net book value of the marine streamer
multi-client seismic libraries at the end of 2012
amounted to EUR 458 million (31 December 2011:
EUR 333.8 million). Some 90% of the net book value
of the libraries is related to recently acquired 3-D
data.
It is proposed to increase the dividend for 2012 to
EUR 2.00 per share, consisting of a regular dividend of
EUR 1.50 increased by an one-off extra dividend of
EUR 0.50 in connection with the divestment of the
Geoscience business.
Fugro won contracts for several attractive projects
during the year. Some examples of these are discussed
on pages 43, 44 and 45.
■ D I V E S T M E N T M A J O R I T Y G E O S C I E N C E D I V I S I O N A N D C L O S I N G S E A B E D G E O S O L U T I O N S J O I N T V E N T U R E W I T H C G G
Fugro and CGG announced on 24 September 2012 that
they signed an agreement under which CGG acquired
Fugro’s Geoscience division, excluding the marine
streamer seismic multi-client library and ocean bottom
nodes business, for a total cash consideration of EUR 1.2
billion.
The transaction, which was closed with effective date
31 January 2013, is a result of Fugro’s review of all
options regarding its marine streamer seismic data
acquisition business and associated activities that it
announced in May 2012. This divestment allows Fugro to
exit the capital intensive and volatile marine streamer
seismic segment of the oil and gas exploration market
where it does not have a leading market position.
Further to the transaction, Fugro and CGG formed three
strategic partnerships:
• The formation of the Seabed Geosolutions joint
venture – the global leader in seabed geophysics,
which was closed on 16 February 2013. This joint
venture includes Fugro’s and CGG’s ocean bottom
nodes businesses and CGG’s transition zone, ocean
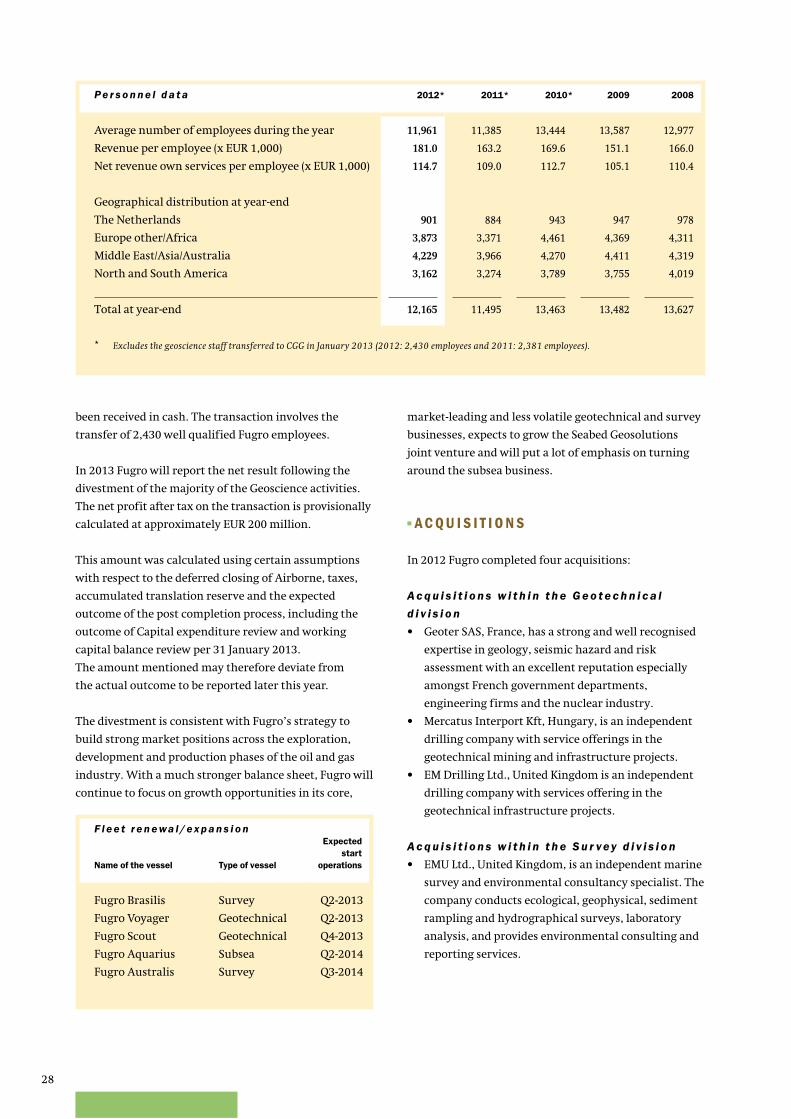
28
market-leading and less volatile geotechnical and survey
businesses, expects to grow the Seabed Geosolutions
joint venture and will put a lot of emphasis on turning
around the subsea business.
■ A C QU I S I T I O N S
In 2012 Fugro completed four acquisitions:
A c q u i s i t i o n s w i t h i n t h e G e o t e c h n i c a l
d i v i s i o n
• Geoter SAS, France, has a strong and well recognised
expertise in geology, seismic hazard and risk
assessment with an excellent reputation especially
amongst French government departments,
engineering firms and the nuclear industry.
• Mercatus Interport Kft, Hungary, is an independent
drilling company with service offerings in the
geotechnical mining and infrastructure projects.
• EM Drilling Ltd., United Kingdom is an independent
drilling company with services offering in the
geotechnical infrastructure projects.
A c q u i s i t i o n s w i t h i n t h e S u r vey d i v i s i o n
• EMU Ltd., United Kingdom, is an independent marine
survey and environmental consultancy specialist. The
company conducts ecological, geophysical, sediment
rampling and hydrographical surveys, laboratory
analysis, and provides environmental consulting and
reporting services.
been received in cash. The transaction involves the
transfer of 2,430 well qualified Fugro employees.
In 2013 Fugro will report the net result following the
divestment of the majority of the Geoscience activities.
The net profit after tax on the transaction is provisionally
calculated at approximately EUR 200 million.
This amount was calculated using certain assumptions
with respect to the deferred closing of Airborne, taxes,
accumulated translation reserve and the expected
outcome of the post completion process, including the
outcome of Capital expenditure review and working
capital balance review per 31 January 2013.
The amount mentioned may therefore deviate from
the actual outcome to be reported later this year.
The divestment is consistent with Fugro’s strategy to
build strong market positions across the exploration,
development and production phases of the oil and gas
industry. With a much stronger balance sheet, Fugro will
continue to focus on growth opportunities in its core,
F l e e t r e n e wa l / e x p a n s i o n
Name of the vessel Type of vessel
Expected
start
operations
Fugro Brasilis Survey Q2-2013
Fugro Voyager Geotechnical Q2-2013
Fugro Scout Geotechnical Q4-2013
Fugro Aquarius Subsea Q2-2014
Fugro Australis Survey Q3-2014
Pe r s o n n e l d a t a 2012* 2011* 2010* 2009 2008
Average number of employees during the year 11,961 11,385 13,444 13,587 12,977
Revenue per employee (x EUR 1,000) 181.0 163.2 169.6 151.1 166.0
Net revenue own services per employee (x EUR 1,000) 114.7 109.0 112.7 105.1 110.4
Geographical distribution at year-end
The Netherlands 901 884 943 947 978
Europe other/Africa 3,873 3,371 4,461 4,369 4,311
Middle East/Asia/Australia 4,229 3,966 4,270 4,411 4,319
North and South America 3,162 3,274 3,789 3,755 4,019
Total at year-end 12,165 11,495 13,463 13,482 13,627
* Excludes the geoscience staff transferred to CGG in January 2013 (2012: 2,430 employees and 2011: 2,381 employees).
29Report of the Board of Management
■ C A PA C I T Y P L A N N I N G
A large part of Fugro’s revenue is generated by offering
niche services in related markets by combining state-of-
the-art technology and knowledge on a global scale.
Over the years Fugro has achieved a leading position in
several niche markets, and in order to be able to
maintain such positions it requires continuous
development, upgrading and advancement of the
technologies used. To optimise efficiency, Fugro uses
lot of equipment that is developed in-house, based on the
company’s operational experience. Maintaining the
ownership of such equipment is part of Fugro’s strategy.
This is underpinned by an ongoing long term investment
program in key assets such as purpose-build vessels and
operational equipment. In order to maintain f lexibility,
part of the vessel f leet capacity is based on long and short
term charters, in particular for those activities that can
be performed from more standardised vessels.
Extensions of charters will be considered taking into
account the backlog and prospects for future work.
Fugro also uses vessels that are chartered on a project-by-
project basis.
Fugro has placed as announced earlier, orders for five
newly built vessels to become operational in the period
2013 through 2014 as shown in the table on page 28.
All vessels will be owned and designed to Fugro’s
specifications.
In the course of 2012 the following changes took place in
the vessel f leet:
G e o t e c h n i c a l d i v i s i o n
The construction of two new deepwater vessels as
replacement vessels will be completed in 2013. A number
of vessels were chartered for short periods to meet peak
workloads.
S u r v ey d i v i s i o n
A new built survey vessel, the Fugro Equator,
commenced services in the third quarter of 2012.
The f leet was further expanded through the acquisition
of two 2nd hand vessels (Fugro Equinox and Fugro
Supporter) during the last quarter of 2012. In Subsea
Services, vessels continue to be mainly chartered for
medium to long term durations and only one own ROV
support vessel, intended for the Brazilian market, is
under construction.
The financing of the vessels is covered by existing
facilities and expected future operating cash f lows.
Reasons for acquisitions include obtaining new or
additional technology and increasing market share.
The annual revenue of the companies acquired in 2012
amounts to EUR 25.1 million. The total cost of the
acquisitions completed in 2012 was EUR 27.5 million.
For more detailed information on acquisitions that took
place in 2012, reference is made to the Financial
statements on pages 134, 135 and 136.
■ E M P L OY E E S
N u m b e r o f e m p l oy e e s
At the end of 2012 the number of employees was 12,165
(2011: 11,495) excluding the geoscience staff transferring
to CGG in January 2013 (2,430). In a number of business
units reductions in staff were implemented during the
year. The net effect of these reductions and new hires in
business units where market conditions were favourable,
was an addition of 453 employees. This was an increase
of 217 staff through acquisitions. The average number of
employees for the financial year on a continued basis
was 11,961 (2011: 11,385), an increase of 5.1%. Fugro also
works with a large group of experienced and long serving
freelance workers who are regularly deployed on a
project basis. The use of freelance workers provides
Fugro with the f lexibility to respond to variations in
manpower requirements. As a result of increasing
demand some more freelancers were hired in 2012.
Fugro mainly employs local employees and deploys a
small number of expatriates.
Despite the global shortage of specialists, Fugro has been
successful when it comes to recruiting experienced and
professional employees. Increasingly, this is coordinated
on a global basis. Fugro’s recruitment success is helped
by the global spread of its activities and the opportunities
that Fugro can offer to innovative and entrepreneurial
staff.
Fugro continues to invest in training and education in
order to guarantee a high standard of services. Once
again, as in prior years, recruiting young talent was
deemed critical in 2012. New employees also get access to
knowledge and experience through on-the-job training
and by working together with experienced employees in
small teams on projects. Fugro also actively invests in
ensuring a healthy and safe work environment.
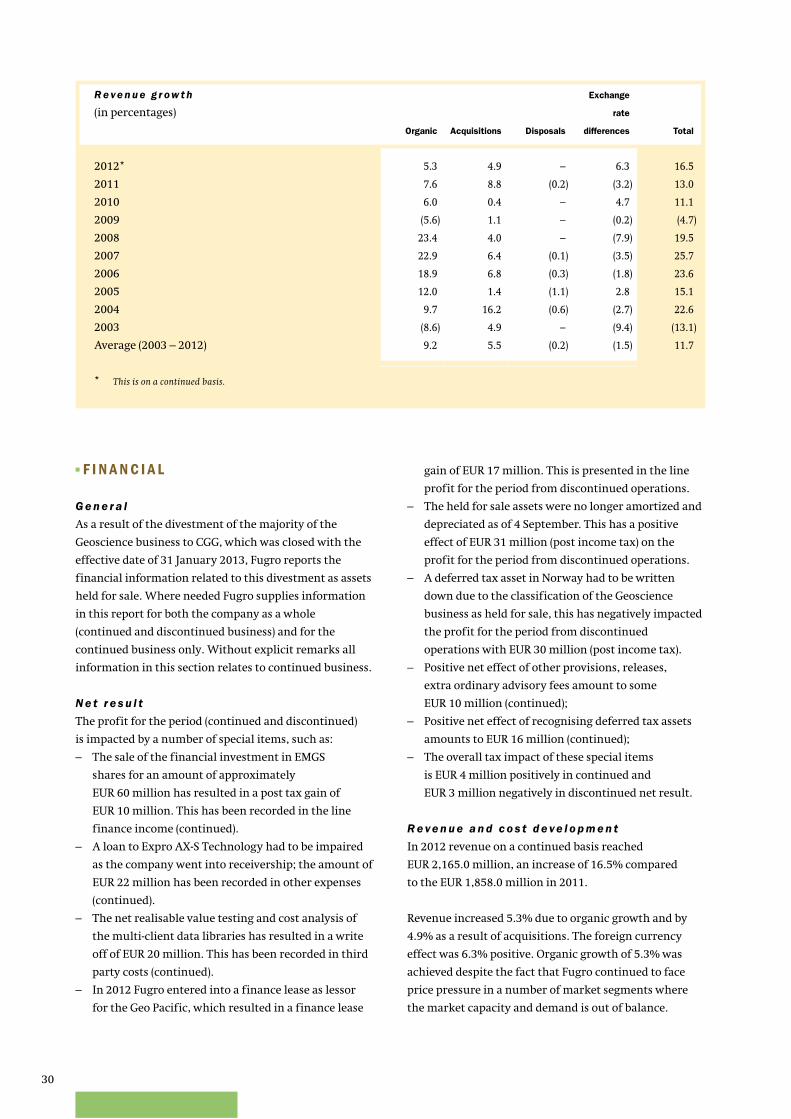
30
■ F I N A N C I A L
G e n e r a l
As a result of the divestment of the majority of the
Geoscience business to CGG, which was closed with the
effective date of 31 January 2013, Fugro reports the
financial information related to this divestment as assets
held for sale. Where needed Fugro supplies information
in this report for both the company as a whole
(continued and discontinued business) and for the
continued business only. Without explicit remarks all
information in this section relates to continued business.
N e t r e s u l t
The profit for the period (continued and discontinued)
is impacted by a number of special items, such as:
– The sale of the financial investment in EMGS
shares for an amount of approximately
EUR 60 million has resulted in a post tax gain of
EUR 10 million. This has been recorded in the line
finance income (continued).
– A loan to Expro AX-S Technology had to be impaired
as the company went into receivership; the amount of
EUR 22 million has been recorded in other expenses
(continued).
– The net realisable value testing and cost analysis of
the multi-client data libraries has resulted in a write
off of EUR 20 million. This has been recorded in third
party costs (continued).
– In 2012 Fugro entered into a finance lease as lessor
for the Geo Pacific, which resulted in a finance lease
gain of EUR 17 million. This is presented in the line
profit for the period from discontinued operations.
– The held for sale assets were no longer amortized and
depreciated as of 4 September. This has a positive
effect of EUR 31 million (post income tax) on the
profit for the period from discontinued operations.
– A deferred tax asset in Norway had to be written
down due to the classification of the Geoscience
business as held for sale, this has negatively impacted
the profit for the period from discontinued
operations with EUR 30 million (post income tax).
– Positive net effect of other provisions, releases,
extra ordinary advisory fees amount to some
EUR 10 million (continued);
– Positive net effect of recognising deferred tax assets
amounts to EUR 16 million (continued);
– The overall tax impact of these special items
is EUR 4 million positively in continued and
EUR 3 million negatively in discontinued net result.
R e ve n u e a n d c o s t d e ve l o p m e n t
In 2012 revenue on a continued basis reached
EUR 2,165.0 million, an increase of 16.5% compared
to the EUR 1,858.0 million in 2011.
Revenue increased 5.3% due to organic growth and by
4.9% as a result of acquisitions. The foreign currency
effect was 6.3% positive. Organic growth of 5.3% was
achieved despite the fact that Fugro continued to face
price pressure in a number of market segments where
the market capacity and demand is out of balance.
R e ve n u e g r ow t h
(in percentages)
Organic Acquisitions Disposals
Exchange
rate
differences Total
2012* 5.3 4.9 – 6.3 16.5
2011 7.6 8.8 (0.2) (3.2) 13.0
2010 6.0 0.4 – 4.7 11.1
2009 (5.6) 1.1 – (0.2) (4.7)
2008 23.4 4.0 – (7.9) 19.5
2007 22.9 6.4 (0.1) (3.5) 25.7
2006 18.9 6.8 (0.3) (1.8) 23.6
2005 12.0 1.4 (1.1) 2.8 15.1
2004 9.7 16.2 (0.6) (2.7) 22.6
2003 (8.6) 4.9 – (9.4) (13.1)
Average (2003 – 2012) 9.2 5.5 (0.2) (1.5) 11.7
* This is on a continued basis.
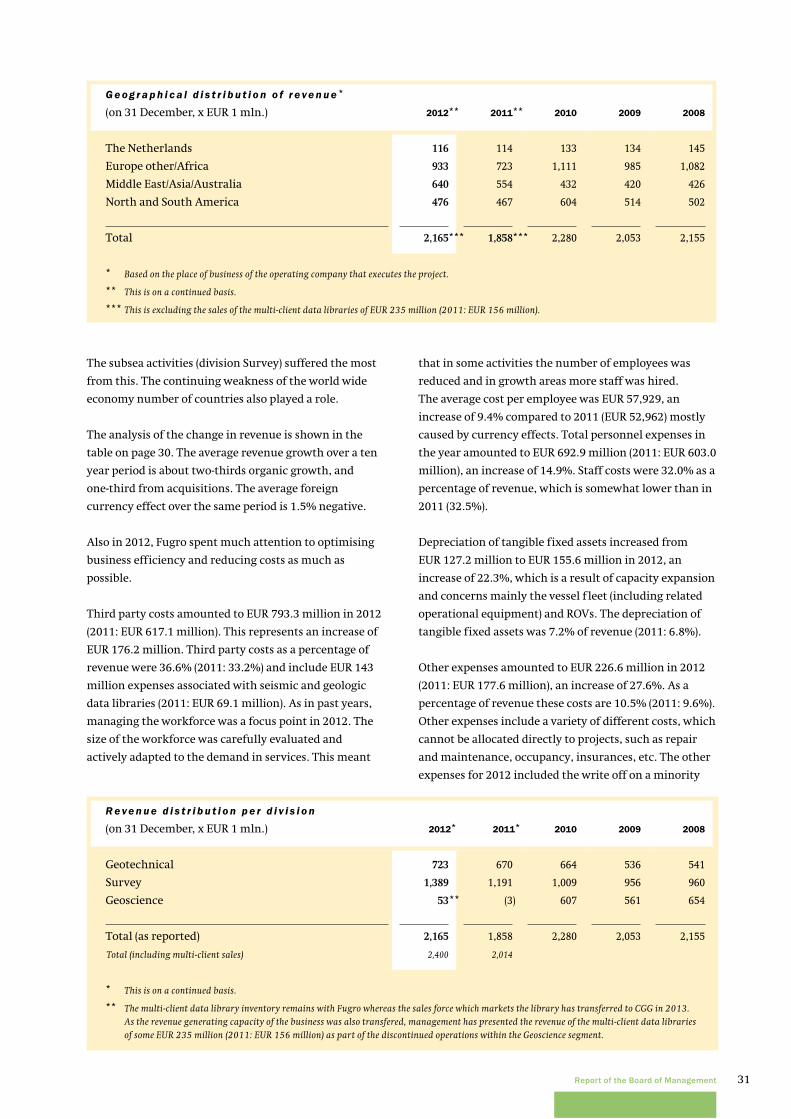
31Report of the Board of Management
The subsea activities (division Survey) suffered the most
from this. The continuing weakness of the world wide
economy number of countries also played a role.
The analysis of the change in revenue is shown in the
table on page 30. The average revenue growth over a ten
year period is about two-thirds organic growth, and
one-third from acquisitions. The average foreign
currency effect over the same period is 1.5% negative.
Also in 2012, Fugro spent much attention to optimising
business efficiency and reducing costs as much as
possible.
Third party costs amounted to EUR 793.3 million in 2012
(2011: EUR 617.1 million). This represents an increase of
EUR 176.2 million. Third party costs as a percentage of
revenue were 36.6% (2011: 33.2%) and include EUR 143
million expenses associated with seismic and geologic
data libraries (2011: EUR 69.1 million). As in past years,
managing the workforce was a focus point in 2012. The
size of the workforce was carefully evaluated and
actively adapted to the demand in services. This meant
that in some activities the number of employees was
reduced and in growth areas more staff was hired.
The average cost per employee was EUR 57,929, an
increase of 9.4% compared to 2011 (EUR 52,962) mostly
caused by currency effects. Total personnel expenses in
the year amounted to EUR 692.9 million (2011: EUR 603.0
million), an increase of 14.9%. Staff costs were 32.0% as a
percentage of revenue, which is somewhat lower than in
2011 (32.5%).
Depreciation of tangible fixed assets increased from
EUR 127.2 million to EUR 155.6 million in 2012, an
increase of 22.3%, which is a result of capacity expansion
and concerns mainly the vessel f leet (including related
operational equipment) and ROVs. The depreciation of
tangible fixed assets was 7.2% of revenue (2011: 6.8%).
Other expenses amounted to EUR 226.6 million in 2012
(2011: EUR 177.6 million), an increase of 27.6%. As a
percentage of revenue these costs are 10.5% (2011: 9.6%).
Other expenses include a variety of different costs, which
cannot be allocated directly to projects, such as repair
and maintenance, occupancy, insurances, etc. The other
expenses for 2012 included the write off on a minority
R e ve n u e d i s t r i b u t i o n p e r d i v i s i o n
(on 31 December, x EUR 1 mln.) 2012* 2011* 2010 2009 2008
Geotechnical 723 670 664 536 541
Survey 1,389 1,191 1,009 956 960
Geoscience 53 (3) 607 561 654
Total (as reported) 2,165 1,858 2,280 2,053 2,155
Total (including multi-client sales) 2,400 2,014
* This is on a continued basis.
** The multi-client data library inventory remains with Fugro whereas the sales force which markets the library has transferred to CGG in 2013. As the revenue generating capacity of the business was also transfered, management has presented the revenue of the multi-client data libraries of some EUR 235 million (2011: EUR 156 million) as part of the discontinued operations within the Geoscience segment.
**
G e og r a p h i c a l d i s t r i b u t i o n o f r e ve n u e *
(on 31 December, x EUR 1 mln.) 2012 2011 2010 2009 2008
The Netherlands 116 114 133 134 145
Europe other/Africa 933 723 1,111 985 1,082
Middle East/Asia/Australia 640 554 432 420 426
North and South America 476 467 604 514 502
Total 2,165 1,858 2,280 2,053 2,155
* Based on the place of business of the operating company that executes the project.
** This is on a continued basis.
*** This is excluding the sales of the multi-client data libraries of EUR 235 million (2011: EUR 156 million).
** **
*** ***
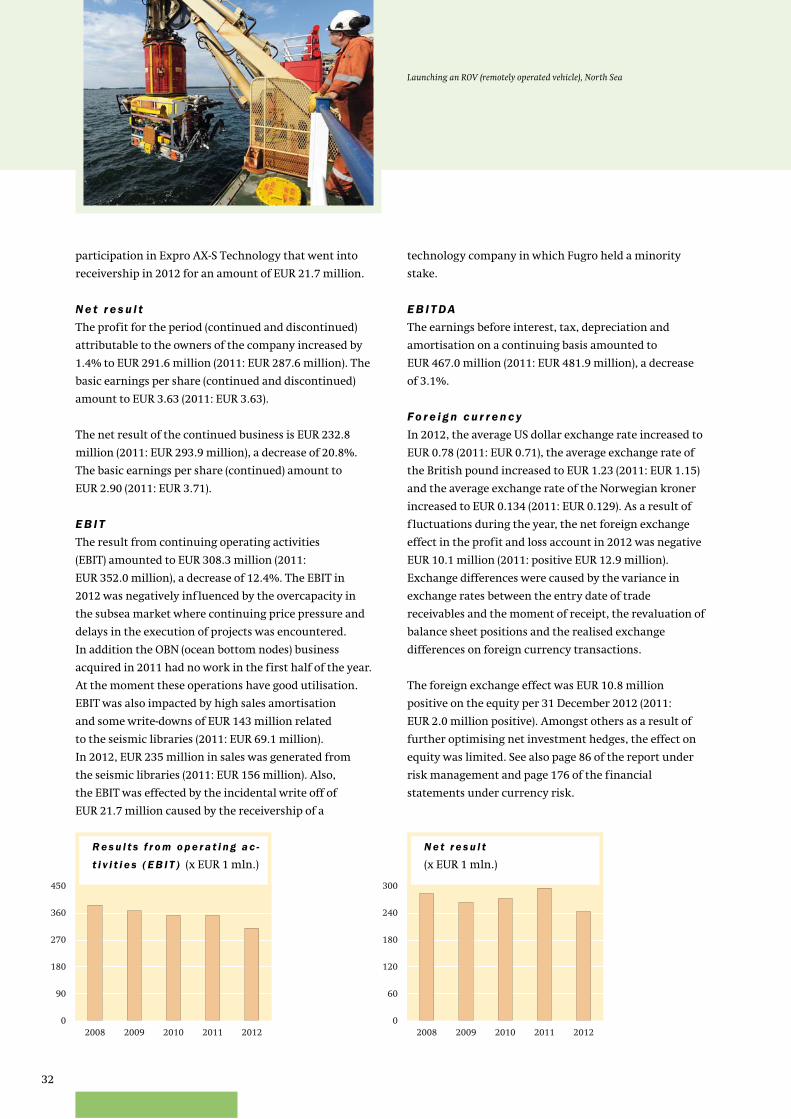
32
technology company in which Fugro held a minority
stake.
E B I T DA
The earnings before interest, tax, depreciation and
amortisation on a continuing basis amounted to
EUR 467.0 million (2011: EUR 481.9 million), a decrease
of 3.1%.
Fo r e i g n c u r r e n c y
In 2012, the average US dollar exchange rate increased to
EUR 0.78 (2011: EUR 0.71), the average exchange rate of
the British pound increased to EUR 1.23 (2011: EUR 1.15)
and the average exchange rate of the Norwegian kroner
increased to EUR 0.134 (2011: EUR 0.129). As a result of
f luctuations during the year, the net foreign exchange
effect in the profit and loss account in 2012 was negative
EUR 10.1 million (2011: positive EUR 12.9 million).
Exchange differences were caused by the variance in
exchange rates between the entry date of trade
receivables and the moment of receipt, the revaluation of
balance sheet positions and the realised exchange
differences on foreign currency transactions.
The foreign exchange effect was EUR 10.8 million
positive on the equity per 31 December 2012 (2011:
EUR 2.0 million positive). Amongst others as a result of
further optimising net investment hedges, the effect on
equity was limited. See also page 86 of the report under
risk management and page 176 of the financial
statements under currency risk.
participation in Expro AX-S Technology that went into
receivership in 2012 for an amount of EUR 21.7 million.
N e t r e s u l t
The profit for the period (continued and discontinued)
attributable to the owners of the company increased by
1.4% to EUR 291.6 million (2011: EUR 287.6 million). The
basic earnings per share (continued and discontinued)
amount to EUR 3.63 (2011: EUR 3.63).
The net result of the continued business is EUR 232.8
million (2011: EUR 293.9 million), a decrease of 20.8%.
The basic earnings per share (continued) amount to
EUR 2.90 (2011: EUR 3.71).
E B I T
The result from continuing operating activities
(EBIT) amounted to EUR 308.3 million (2011:
EUR 352.0 million), a decrease of 12.4%. The EBIT in
2012 was negatively influenced by the overcapacity in
the subsea market where continuing price pressure and
delays in the execution of projects was encountered.
In addition the OBN (ocean bottom nodes) business
acquired in 2011 had no work in the first half of the year.
At the moment these operations have good utilisation.
EBIT was also impacted by high sales amortisation
and some write-downs of EUR 143 million related
to the seismic libraries (2011: EUR 69.1 million).
In 2012, EUR 235 million in sales was generated from
the seismic libraries (2011: EUR 156 million). Also,
the EBIT was effected by the incidental write off of
EUR 21.7 million caused by the receivership of a
0
90
180
270
360
450
20122011201020092008
R e s u l t s f r o m o p e r a t i n g a c -
t i v i t i e s ( E B I T ) (x EUR 1 mln.)
0
60
120
180
240
300
20122011201020092008
N e t r e s u l t
(x EUR 1 mln.)
Launching an ROV (remotely operated vehicle), North Sea
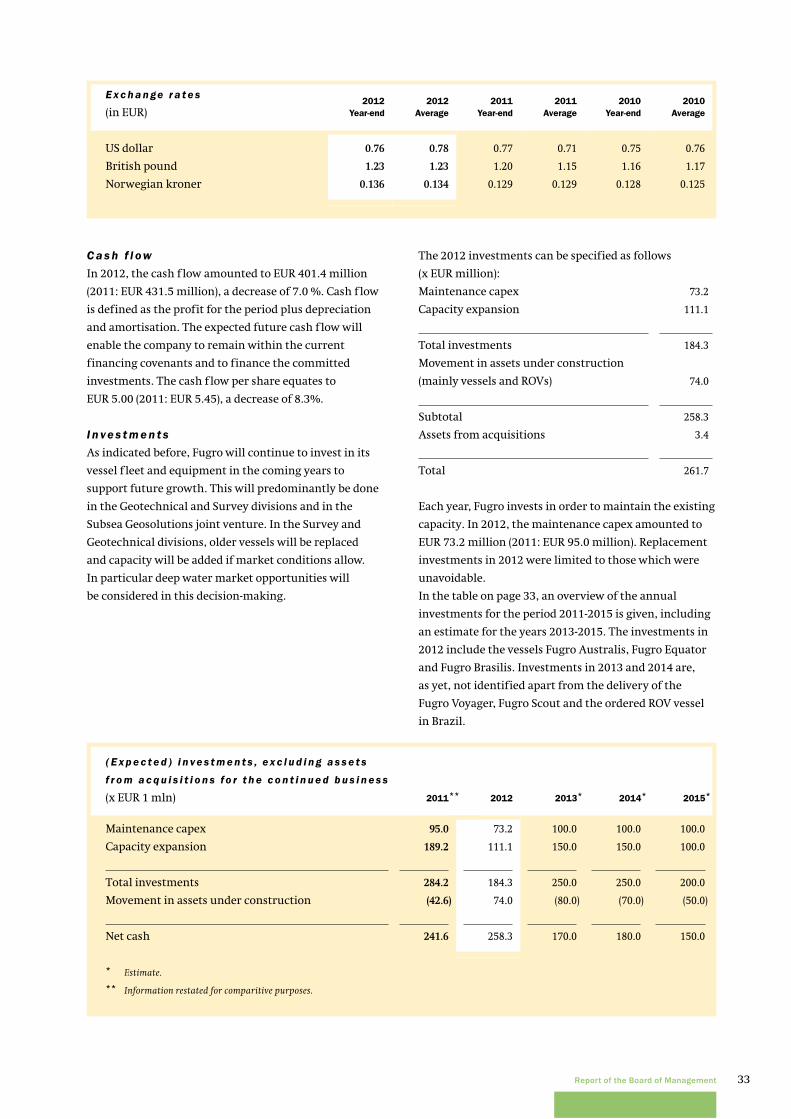
33Report of the Board of Management
The 2012 investments can be specified as follows
(x EUR million):
Maintenance capex 73.2
Capacity expansion 111.1
Total investments 184.3
Movement in assets under construction
(mainly vessels and ROVs) 74.0
Subtotal 258.3
Assets from acquisitions 3.4
Total 261.7
Each year, Fugro invests in order to maintain the existing
capacity. In 2012, the maintenance capex amounted to
EUR 73.2 million (2011: EUR 95.0 million). Replacement
investments in 2012 were limited to those which were
unavoidable.
In the table on page 33, an overview of the annual
investments for the period 2011-2015 is given, including
an estimate for the years 2013-2015. The investments in
2012 include the vessels Fugro Australis, Fugro Equator
and Fugro Brasilis. Investments in 2013 and 2014 are,
as yet, not identified apart from the delivery of the
Fugro Voyager, Fugro Scout and the ordered ROV vessel
in Brazil.
C a s h f l ow
In 2012, the cash f low amounted to EUR 401.4 million
(2011: EUR 431.5 million), a decrease of 7.0 %. Cash f low
is defined as the profit for the period plus depreciation
and amortisation. The expected future cash f low will
enable the company to remain within the current
financing covenants and to finance the committed
investments. The cash f low per share equates to
EUR 5.00 (2011: EUR 5.45), a decrease of 8.3%.
I n ve s t m e n t s
As indicated before, Fugro will continue to invest in its
vessel f leet and equipment in the coming years to
support future growth. This will predominantly be done
in the Geotechnical and Survey divisions and in the
Subsea Geosolutions joint venture. In the Survey and
Geotechnical divisions, older vessels will be replaced
and capacity will be added if market conditions allow.
In particular deep water market opportunities will
be considered in this decision-making.
( E x p e c t e d ) i n ve s t m e n t s , e x c l u d i n g a s s e t s
f r o m a c q u i s i t i o n s fo r t h e c o n t i n u e d b u s i n e s s
(x EUR 1 mln) 2011 2012 2013* 2014* 2015*
Maintenance capex 95.0 73.2 100.0 100.0 100.0
Capacity expansion 189.2 111.1 150.0 150.0 100.0
Total investments 284.2 184.3 250.0 250.0 200.0
Movement in assets under construction (42.6) 74.0 (80.0) (70.0) (50.0)
Net cash 241.6 258.3 170.0 180.0 150.0
* Estimate.
** Information restated for comparitive purposes.
**
E x c h a n ge r a t e s
(in EUR)2012
Year-end
2012
Average
2011
Year-end
2011
Average
2010
Year-end
2010
Average
US dollar 0.76 0.78 0.77 0.71 0.75 0.76
British pound 1.23 1.23 1.20 1.15 1.16 1.17
Norwegian kroner 0.136 0.134 0.129 0.129 0.128 0.125
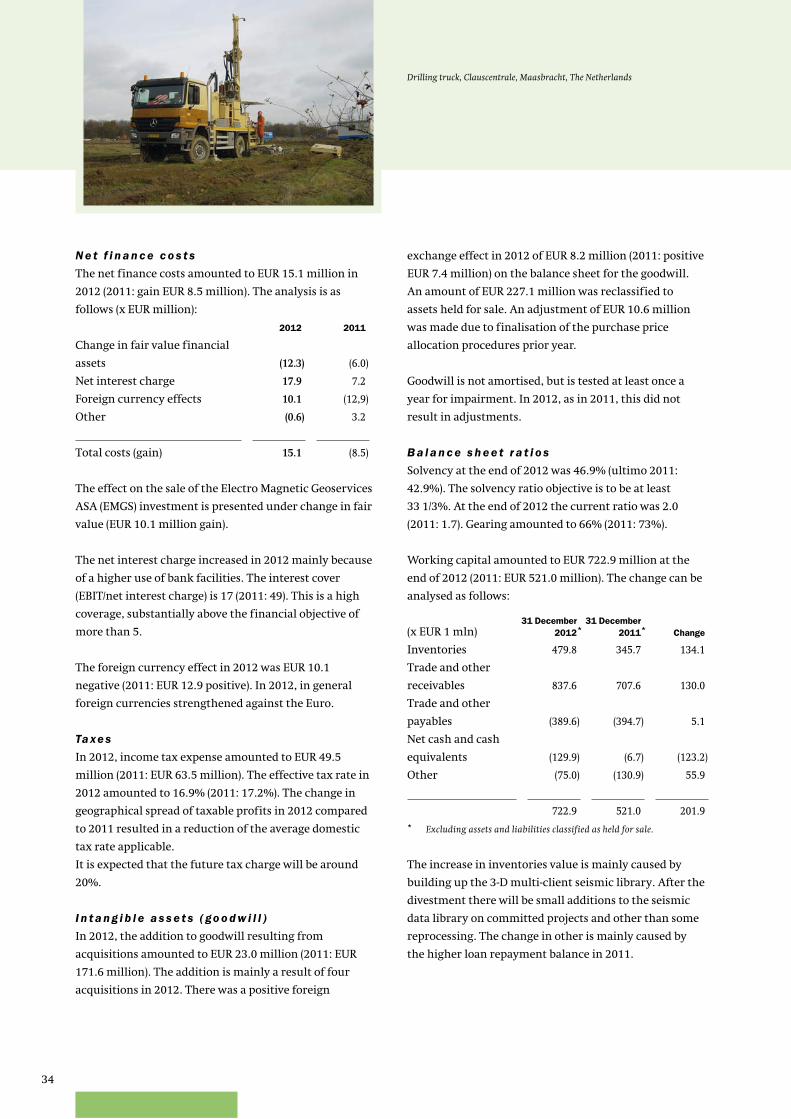
34
exchange effect in 2012 of EUR 8.2 million (2011: positive
EUR 7.4 million) on the balance sheet for the goodwill.
An amount of EUR 227.1 million was reclassified to
assets held for sale. An adjustment of EUR 10.6 million
was made due to finalisation of the purchase price
allocation procedures prior year.
Goodwill is not amortised, but is tested at least once a
year for impairment. In 2012, as in 2011, this did not
result in adjustments.
B a l a n c e s h e e t r a t i o s
Solvency at the end of 2012 was 46.9% (ultimo 2011:
42.9%). The solvency ratio objective is to be at least
33 1/3%. At the end of 2012 the current ratio was 2.0
(2011: 1.7). Gearing amounted to 66% (2011: 73%).
Working capital amounted to EUR 722.9 million at the
end of 2012 (2011: EUR 521.0 million). The change can be
analysed as follows:
(x EUR 1 mln)31 December
2012
31 December
2011 Change
Inventories 479.8 345.7 134.1
Trade and other
receivables 837.6 707.6 130.0
Trade and other
payables (389.6) (394.7) 5.1
Net cash and cash
equivalents (129.9) (6.7) (123.2)
Other (75.0) (130.9) 55.9
722.9 521.0 201.9
* Excluding assets and liabilities classified as held for sale.
The increase in inventories value is mainly caused by
building up the 3-D multi-client seismic library. After the
divestment there will be small additions to the seismic
data library on committed projects and other than some
reprocessing. The change in other is mainly caused by
the higher loan repayment balance in 2011.
**
N e t f i n a n c e c o s t s
The net finance costs amounted to EUR 15.1 million in
2012 (2011: gain EUR 8.5 million). The analysis is as
follows (x EUR million):
2012 2011
Change in fair value financial
assets (12.3) (6.0)
Net interest charge 17.9 7.2
Foreign currency effects 10.1 (12,9)
Other (0.6) 3.2
Total costs (gain) 15.1 (8.5)
The effect on the sale of the Electro Magnetic Geoservices
ASA (EMGS) investment is presented under change in fair
value (EUR 10.1 million gain).
The net interest charge increased in 2012 mainly because
of a higher use of bank facilities. The interest cover
(EBIT/net interest charge) is 17 (2011: 49). This is a high
coverage, substantially above the financial objective of
more than 5.
The foreign currency effect in 2012 was EUR 10.1
negative (2011: EUR 12.9 positive). In 2012, in general
foreign currencies strengthened against the Euro.
Ta xe s
In 2012, income tax expense amounted to EUR 49.5
million (2011: EUR 63.5 million). The effective tax rate in
2012 amounted to 16.9% (2011: 17.2%). The change in
geographical spread of taxable profits in 2012 compared
to 2011 resulted in a reduction of the average domestic
tax rate applicable.
It is expected that the future tax charge will be around
20%.
I n t a n g i b l e a s s e t s ( go o d w i l l )
In 2012, the addition to goodwill resulting from
acquisitions amounted to EUR 23.0 million (2011: EUR
171.6 million). The addition is mainly a result of four
acquisitions in 2012. There was a positive foreign
Drilling truck, Clauscentrale, Maasbracht, The Netherlands
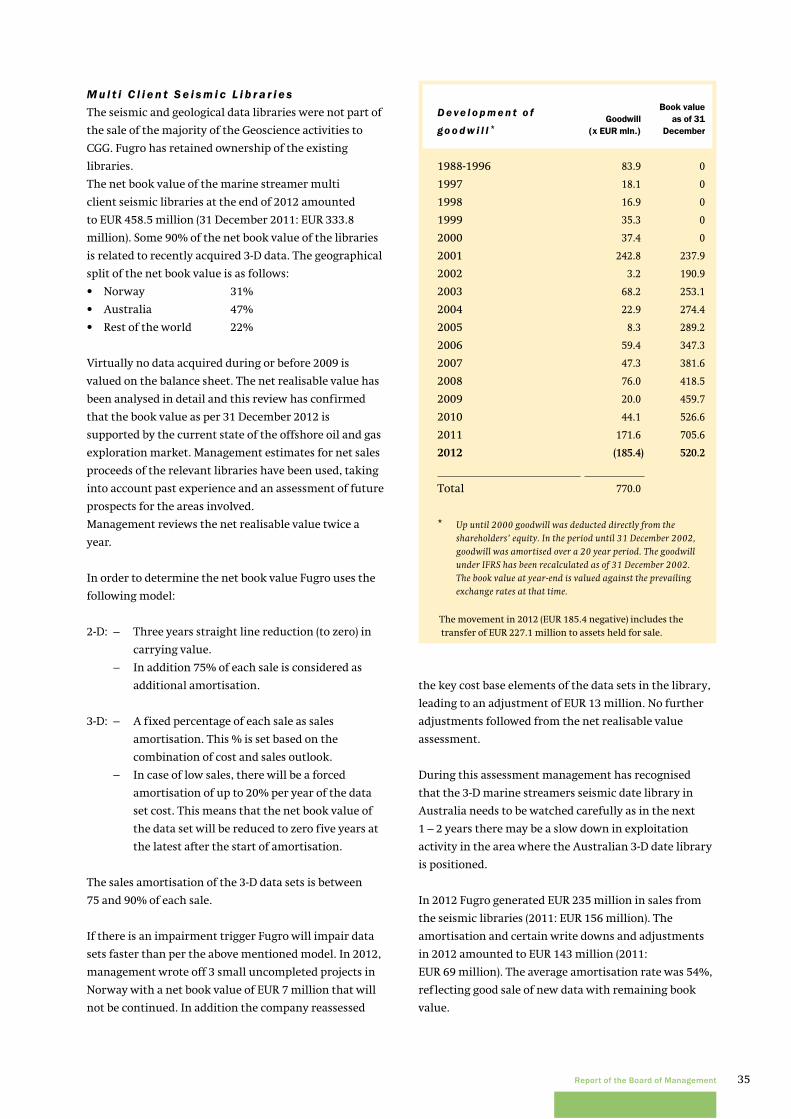
35Report of the Board of Management
the key cost base elements of the data sets in the library,
leading to an adjustment of EUR 13 million. No further
adjustments followed from the net realisable value
assessment.
During this assessment management has recognised
that the 3-D marine streamers seismic date library in
Australia needs to be watched carefully as in the next
1 – 2 years there may be a slow down in exploitation
activity in the area where the Australian 3-D date library
is positioned.
In 2012 Fugro generated EUR 235 million in sales from
the seismic libraries (2011: EUR 156 million). The
amortisation and certain write downs and adjustments
in 2012 amounted to EUR 143 million (2011:
EUR 69 million). The average amortisation rate was 54%,
reflecting good sale of new data with remaining book
value.
M u l t i C l i e n t S e i s m i c L i b r a r i e s
The seismic and geological data libraries were not part of
the sale of the majority of the Geoscience activities to
CGG. Fugro has retained ownership of the existing
libraries.
The net book value of the marine streamer multi
client seismic libraries at the end of 2012 amounted
to EUR 458.5 million (31 December 2011: EUR 333.8
million). Some 90% of the net book value of the libraries
is related to recently acquired 3-D data. The geographical
split of the net book value is as follows:
• Norway 31%
• Australia 47%
• Rest of the world 22%
Virtually no data acquired during or before 2009 is
valued on the balance sheet. The net realisable value has
been analysed in detail and this review has confirmed
that the book value as per 31 December 2012 is
supported by the current state of the offshore oil and gas
exploration market. Management estimates for net sales
proceeds of the relevant libraries have been used, taking
into account past experience and an assessment of future
prospects for the areas involved.
Management reviews the net realisable value twice a
year.
In order to determine the net book value Fugro uses the
following model:
2-D: – Three years straight line reduction (to zero) in
carrying value.
– In addition 75% of each sale is considered as
additional amortisation.
3-D: – A fixed percentage of each sale as sales
amortisation. This % is set based on the
combination of cost and sales outlook.
– In case of low sales, there will be a forced
amortisation of up to 20% per year of the data
set cost. This means that the net book value of
the data set will be reduced to zero five years at
the latest after the start of amortisation.
The sales amortisation of the 3-D data sets is between
75 and 90% of each sale.
If there is an impairment trigger Fugro will impair data
sets faster than per the above mentioned model. In 2012,
management wrote off 3 small uncompleted projects in
Norway with a net book value of EUR 7 million that will
not be continued. In addition the company reassessed
D e ve l o p m e n t o f
go o d w i l l *Goodwill
(x EUR mln.)
Book value
as of 31
December
1988-1996 83.9 0
1997 18.1 0
1998 16.9 0
1999 35.3 0
2000 37.4 0
2001 242.8 237.9
2002 3.2 190.9
2003 68.2 253.1
2004 22.9 274.4
2005 8.3 289.2
2006 59.4 347.3
2007 47.3 381.6
2008 76.0 418.5
2009 20.0 459.7
2010 44.1 526.6
2011 171.6 705.6
2012 (185.4) 520.2
Total 770.0
* Up until 2000 goodwill was deducted directly from the shareholders’ equity. In the period until 31 December 2002, goodwill was amortised over a 20 year period. The goodwill under IFRS has been recalculated as of 31 December 2002. The book value at year-end is valued against the prevailing exchange rates at that time.
The movement in 2012 (EUR 185.4 negative) includes the
transfer of EUR 227.1 million to assets held for sale.
36
Norway performed very strongly this year on the back
of new licensing rounds and high exploration interest.
The revenue breakdown is as follows:
(x EUR 1 mln) 2012 2011
Norway 156.7 97.9
Australia 35.5 26.6
Rest of the world 43.0 31.7
Of importance is to mention that data confidentiality in
Australia extends over 15 years and even longer in the
USA. In Norway it is 10 years. The period of data
confidentiality is the length of time over which the data
retains its full commercial multi-client value.
The marine streamer seismic multi-client libraries were
not part of the sale of the majority of the Geoscience
activities to CGG. Fugro retains full ownership of the
libraries. CGG has taken over all of the sales force for this
activity and will market the Fugro 3-D library on behalf
of Fugro and will receive a broker fee for this activity.
Fugro anticipates making a similar arrangement for the
2-D library with another multi-client player. The Fugro
and CGG libraries have very little overlap and the
combined libraries will be attractive for clients. Fugro,
as owner of the data sets, in addition has the right to sell
the library in parts or as a whole to interested parties.
Except for completing certain data acquisition projects,
Fugro’s investment in the marine streamer seismic
multi-client libraries as from 2013 onwards will be
limited to activities like reprocessing and special
processing to update and enhance the sales potential of
the data sets in the library. In particular in the next
couple of years Fugro expects to benefit from a strong
cash inflow from sales of its data sets. Sales thereafter
are expected to continue over the full life time of the
various data sets, but in aggregate are expected to taper
off towards the end of the life time of the library.
It is anticipated that the newly formed (majority owned
and consolidated) ‘Seabed Geosolutions’ joint venture
with CGG will acquire new multi-client data sets, which
will result in building up a new seabed multi-client data
library. The development of the size and value of this
library cannot be indicated at this stage.
F i n a n c i n g
In the second half of 2011 Fugro was refinanced. Fugro
reached agreement with 27 US and UK based investors
with respect to so called US Private Placement loans
(USPP) with a value expressed in US dollars of 909
million. The original currencies are US dollar 750
million, EUR 35 million and British pound 67.5 million.
The loans have a maturity of 7, 10 and 12 years and have
an average coupon of some 4.5%.
Fugro also reached agreement in 2011 with a number of
individual banks for committed facilities up to a total
value of EUR 775 million for 5 years. These facilities were
made available by eight internationally operating banks.
The interest is based on a grid and is Euribor plus
130 BPS. The loans and facilities include, amongst others,
the following covenants:
• EBITDA / interest > 2.5
• Debt / EBITDA < 3.0
• Solvency > 33¹/³%
On closing of the transaction with CGG Fugro received
some EUR 700 million cash from CGG. This provides
Fugro with ample funds to finance future expansion.
■ D I V I D E N D P RO P O S A L
It is proposed that the dividend for 2012 be increased to
EUR 2.00 per share (2011: EUR 1.50), consisting of a
regular dividend of EUR 1.50 increased by an one-off
extra dividend of EUR 0.50 in connection with the
divestment of the Geoscience business. The total
dividend of EUR 2.00 per share will be paid at the choice
of the shareholder:
• in cash, or
• in shares
In case no choice is made, the dividend will be paid in
shares. The proposed regular dividend of EUR 1.50
equates to a pay-out ratio of 42% of the net result.
The total dividend of EUR 2.00 equates to a pay-out ratio
of 56% of the net result.
■ M A R K E T D E V E L O P M E N T S A N D T R E N D S
Tr e n d s
Fugro aligns its services to its key private and public
sectors, providing support and resources tailored to the
specific needs of each. The diversity of the sectors
ranging from oil and gas renewables to infrastructure
and building ensures that Fugro’s dependency on a
single market is limited, which supports a balanced
growth and continued profitability.
At the beginning of 2013 the long term drivers for the
American economy are more positive. The shale gas and
oil revolution is driving new growth to the economy and
large companies are seen to be moving back to the US,
attracted by low energy cost. In Europe, the effects of
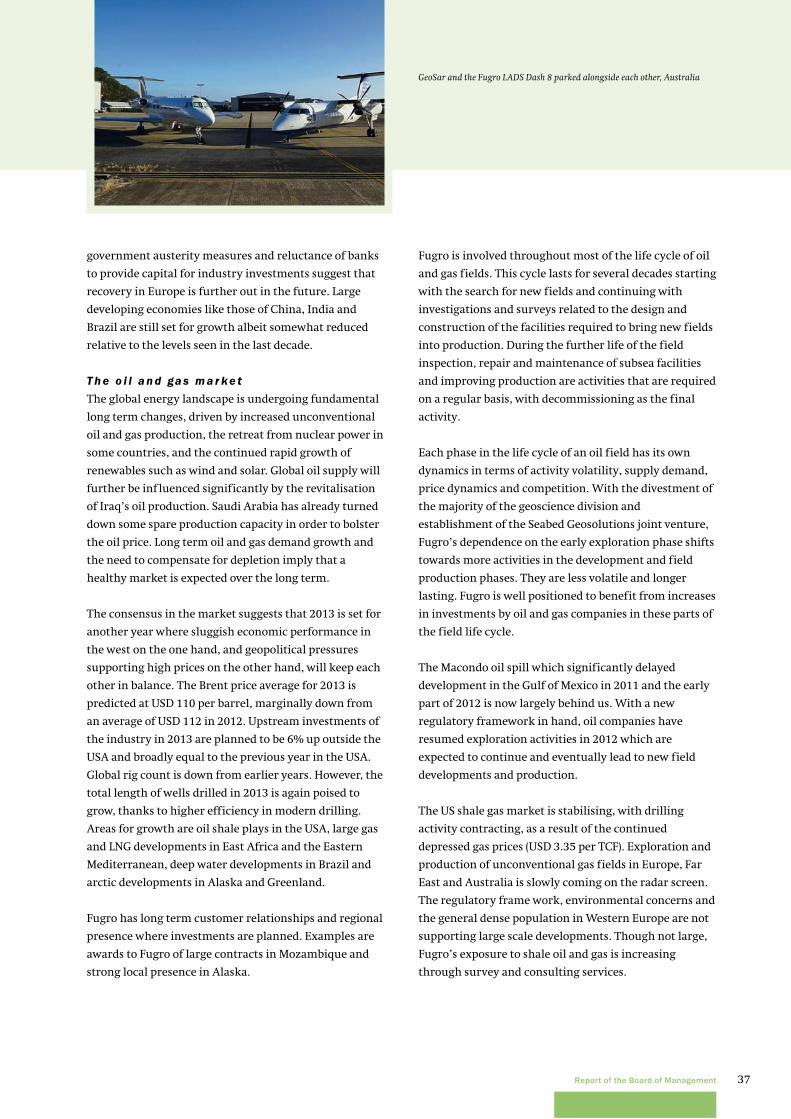
37Report of the Board of Management
government austerity measures and reluctance of banks
to provide capital for industry investments suggest that
recovery in Europe is further out in the future. Large
developing economies like those of China, India and
Brazil are still set for growth albeit somewhat reduced
relative to the levels seen in the last decade.
T h e o i l a n d ga s m a r ke t
The global energy landscape is undergoing fundamental
long term changes, driven by increased unconventional
oil and gas production, the retreat from nuclear power in
some countries, and the continued rapid growth of
renewables such as wind and solar. Global oil supply will
further be influenced significantly by the revitalisation
of Iraq’s oil production. Saudi Arabia has already turned
down some spare production capacity in order to bolster
the oil price. Long term oil and gas demand growth and
the need to compensate for depletion imply that a
healthy market is expected over the long term.
The consensus in the market suggests that 2013 is set for
another year where sluggish economic performance in
the west on the one hand, and geopolitical pressures
supporting high prices on the other hand, will keep each
other in balance. The Brent price average for 2013 is
predicted at USD 110 per barrel, marginally down from
an average of USD 112 in 2012. Upstream investments of
the industry in 2013 are planned to be 6% up outside the
USA and broadly equal to the previous year in the USA.
Global rig count is down from earlier years. However, the
total length of wells drilled in 2013 is again poised to
grow, thanks to higher efficiency in modern drilling.
Areas for growth are oil shale plays in the USA, large gas
and LNG developments in East Africa and the Eastern
Mediterranean, deep water developments in Brazil and
arctic developments in Alaska and Greenland.
Fugro has long term customer relationships and regional
presence where investments are planned. Examples are
awards to Fugro of large contracts in Mozambique and
strong local presence in Alaska.
Fugro is involved throughout most of the life cycle of oil
and gas fields. This cycle lasts for several decades starting
with the search for new fields and continuing with
investigations and surveys related to the design and
construction of the facilities required to bring new fields
into production. During the further life of the field
inspection, repair and maintenance of subsea facilities
and improving production are activities that are required
on a regular basis, with decommissioning as the final
activity.
Each phase in the life cycle of an oil field has its own
dynamics in terms of activity volatility, supply demand,
price dynamics and competition. With the divestment of
the majority of the geoscience division and
establishment of the Seabed Geosolutions joint venture,
Fugro’s dependence on the early exploration phase shifts
towards more activities in the development and field
production phases. They are less volatile and longer
lasting. Fugro is well positioned to benefit from increases
in investments by oil and gas companies in these parts of
the field life cycle.
The Macondo oil spill which significantly delayed
development in the Gulf of Mexico in 2011 and the early
part of 2012 is now largely behind us. With a new
regulatory framework in hand, oil companies have
resumed exploration activities in 2012 which are
expected to continue and eventually lead to new field
developments and production.
The US shale gas market is stabilising, with drilling
activity contracting, as a result of the continued
depressed gas prices (USD 3.35 per TCF). Exploration and
production of unconventional gas fields in Europe, Far
East and Australia is slowly coming on the radar screen.
The regulatory frame work, environmental concerns and
the general dense population in Western Europe are not
supporting large scale developments. Though not large,
Fugro’s exposure to shale oil and gas is increasing
through survey and consulting services.
GeoSar and the Fugro LADS Dash 8 parked alongside each other, Australia
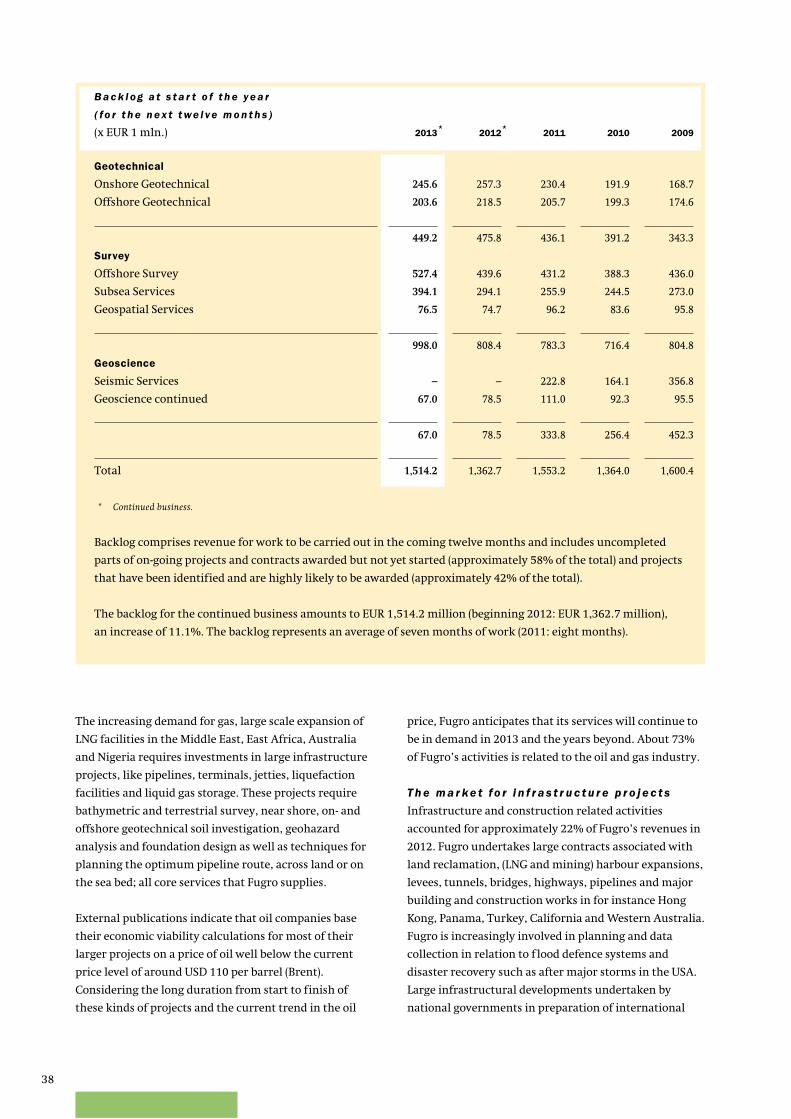
38
price, Fugro anticipates that its services will continue to
be in demand in 2013 and the years beyond. About 73%
of Fugro’s activities is related to the oil and gas industry.
T h e m a r ke t fo r i n f r a s t r u c t u r e p r o j e c t s
Infrastructure and construction related activities
accounted for approximately 22% of Fugro’s revenues in
2012. Fugro undertakes large contracts associated with
land reclamation, (LNG and mining) harbour expansions,
levees, tunnels, bridges, highways, pipelines and major
building and construction works in for instance Hong
Kong, Panama, Turkey, California and Western Australia.
Fugro is increasingly involved in planning and data
collection in relation to f lood defence systems and
disaster recovery such as after major storms in the USA.
Large infrastructural developments undertaken by
national governments in preparation of international
The increasing demand for gas, large scale expansion of
LNG facilities in the Middle East, East Africa, Australia
and Nigeria requires investments in large infrastructure
projects, like pipelines, terminals, jetties, liquefaction
facilities and liquid gas storage. These projects require
bathymetric and terrestrial survey, near shore, on- and
offshore geotechnical soil investigation, geohazard
analysis and foundation design as well as techniques for
planning the optimum pipeline route, across land or on
the sea bed; all core services that Fugro supplies.
External publications indicate that oil companies base
their economic viability calculations for most of their
larger projects on a price of oil well below the current
price level of around USD 110 per barrel (Brent).
Considering the long duration from start to finish of
these kinds of projects and the current trend in the oil
B a c k l og a t s t a r t o f t h e y e a r
( fo r t h e n e x t t we l ve m o n t h s )
(x EUR 1 mln.) 2013 2012 2011 2010 2009
Geotechnical
Onshore Geotechnical 245.6 257.3 230.4 191.9 168.7
Offshore Geotechnical 203.6 218.5 205.7 199.3 174.6
449.2 475.8 436.1 391.2 343.3
Survey
Offshore Survey 527.4 439.6 431.2 388.3 436.0
Subsea Services 394.1 294.1 255.9 244.5 273.0
Geospatial Services 76.5 74.7 96.2 83.6 95.8
998.0 808.4 783.3 716.4 804.8
Geoscience
Seismic Services – – 222.8 164.1 356.8
Geoscience continued 67.0 78.5 111.0 92.3 95.5
67.0 78.5 333.8 256.4 452.3
Total 1,514.2 1,362.7 1,553.2 1,364.0 1,600.4
* Continued business.
Backlog comprises revenue for work to be carried out in the coming twelve months and includes uncompleted
parts of on-going projects and contracts awarded but not yet started (approximately 58% of the total) and projects
that have been identified and are highly likely to be awarded (approximately 42% of the total).
The backlog for the continued business amounts to EUR 1,514.2 million (beginning 2012: EUR 1,362.7 million),
an increase of 11.1%. The backlog represents an average of seven months of work (2011: eight months).
* *

39Report of the Board of Management
■ B A C K L O G
At the beginning of 2013 the backlog (from continued
business) of work to be carried out during the year
amounted to EUR 1,514.2 million.
The proportion of definite orders is 58% (beginning 2012:
55%). The backlog calculation is based on year-end
exchange rates in EUR and is 4.9% higher than at the
beginning of 2012. Of the increase in backlog, 0.3%
(negative) is related to foreign currency effects. The
backlog has increased as a result of somewhat improving
market circumstances and for a small part through
acquisitions.
Over the long term the order backlog typically equaled
about eight months revenue. The current backlog equals
some seven months of revenue for the year.
■ P O S T B A L A N C E S H E E T DAT E E V E N T S
On 28 January 2013, the Company and CGG completed a
transaction under which CGG acquired Fugro’s
Geoscience division, excluding the multi-client library
and the Fugro ocean bottom nodes business.
The effective date of the transaction is 31 January 2013,
with the exception of the Airborne activities and certain
minor other assets which will be closed upon once all
equipment license transfer and administrative
authorizations have been received (expected to occur
in 2013). The total transaction value amounts to
EUR 1.2 billion on a cash and debt free basis. An amount
of some EUR 700 million has been received in cash.
The expected net profit after tax on the transaction
including the deferred closings is expected to amount to
approximately EUR 200 million. This amount was
calculated based on certain assumptions with respect to
the deferred closing of Airborne, taxes, accumulated
translation reserve and the expected outcome of the post
completion process, including the outcome of Capital
expenditure review and working capital balance review
per 31 January 2013. The amount mentioned may
therefore deviate from the actual outcome to be reported
later this year.
Parties have agreed that part of the consideration will be
satisfied in the form of a vendor loan from Fugro to CGG.
On 31 January 2013 the vendor loan amounts to EUR 125
million and will increase to EUR 225 million upon the
events such as the Olympic Games and World
Championship Football are a growing part of Fugro land
activities.
The company has strengthened its market position by
supplying solutions that integrate data collection and
earth science consulting, to our clients. This fulfils the
customer’s preference for contracting these services
to a single, independent global service provider.
With a focus on the larger infrastructure projects and
by early positioning with the key players in the
development of these projects, Fugro has been able to
mitigate the impact of the global slowdown in
infrastructure activity. Where stimulus programs such
as that initiated in the USA after the onset of the
financial crisis in 2008 were an important source of
revenue in the past few years, these have significantly
reduced in 2012. More reduction is foreseen in 2013,
due the continued weakness of government finances
in most OECD countries.
M i n i n g a n d o t h e r m a r ke t s e g m e n t s
The price of commodities such as copper, iron ore, coal
and nickel were performing well in the early months of
2012, but continued global economic uncertainty led to a
steep decline in commodity prices in the second part of
2012. Mining companies continued to be squeezed by
falling commodity prices amid rising capital and
operating expenses. In some parts of the world
development and production of certain mining projects
are also being threatened by an increase in resource
nationalism and civil unrest. The afore mentioned
trends caused hesitation in driving exploration and
development of mineral resources. Hence demand for
Fugro services in this sector reduced during 2012.
Despite a lull in the last months of 2012, it is believed
that demand for commodities will remain steady for the
long term, propelled by strong growth in China and
other emerging nations such as India and eventually
Africa. Our exposure to mining will in the near future
decrease as a result of the divestment of the airborne
geophysical activities. Services in mining and these other
niche markets accounted for 5% of Fugro’s activities in
2012.
Fugro not only supplies services to the aforementioned
markets but also to a number of other niche markets.
These services include the sale of accurate positioning
signals, route surveys for offshore telecommunication
cables, and airborne mapping using laser and radar
technology for governmental authorities and other
public bodies.
40
activities. This transaction was closed on 16 February
2013. In addition to the contribution of the ocean bottom
nodes business to Seabed Geosolutions, Fugro has paid
EUR 225 million to CGG with respect to Seabed
Geosolutions. Subsequent to the closing, Fugro holds a
60% interest in Seabed Geosolutions and CGG holds a
40% interest. Fugro controls and will consolidate Seabed
Geosolutions showing a minority interest for 40%.
The contribution by CGG of its ocean bottom nodes,
transition zone, ocean bottom cable and permanent
reservoir monitoring activities against a 40% interest in
Seabed Geosolutions and EUR 225 million constitutes a
business combination under IFRS. Fugro has not yet
completed a purchase price allocation on this acquisition
and the impact of this transaction on the fair value of the
assets acquired and liabilities assumed is unknown at the
date of these financial statements.
As per 7 February 2013, mr. F.J.G.M. Cremers has stepped
down as vice-chairman of the Supervisory Board and as
chairman of the Audit Committee. Mr. J.A. Colligan took
over the chairmanship of the Audit Committee.
Mr. H.L.J. Noy became member of the Audit Committee.
■ O U T L O O K
The continued business and operations in the year 2013
started off without significant issues, despite the
continued uncertainties in global markets. On 31
January 2013, the divestment of the majority of the
geoscience division and on 16 February 2013 the
establishment of the Seabed Geosolutions JV were
successfully completed. A strategic initiative commenced
early in the year to review the strategy of Fugro and to
review the existing business portfolio, new niches and
growth opportunities going forward. This is being done
with support of an outside consulting firm.
Despite the divestment of exploration related activities,
a significant part of the revenue is still generated from
the oil and gas industry. With an estimated level of
investment in 2013 of over USD 600 billion, an
increase of some 6% from the 2012 figures, the oil and
gas industry is planning for a continued high level of
investment. Recent reports point to declining production
outputs and decreasing reserves of some of the major
international oil companies will drive continued
investment in oil and gas projects. A stable oil price
of around USD 110 per barrel (Brent) is above the
threshold that drives new projects in the exploration and
development in more frontier areas, including deeper
closing of the Airborne activities. The loan agreement
carries interest of 5.5% and provides Fugro with
collateral. The loan agreement also includes a repayment
schedule that requires repayment of, at a minimum, half
of the loan amount before the end of 2013 and the
remainder, in annual repayments, before the end of 2018.
The multi-client library, with a book value of EUR 458
million at 31 December 2012, remains with Fugro while
all multi-client personnel have transferred to CGG as part
of the transaction. After closing of the transaction Fugro
will further limit the development of the multi-client
library reprocessing and the completion of limited
ongoing projects. Any new investments will be made
by CGG.
As part of the transaction both parties entered into a
non-exclusive sales and marketing agreement under
which CGG will sell licenses to the multi-client library
that is still owned by Fugro for a revenue based fee with
respect to 3-D, another party will sell 2-D. Fugro will
retain the right to enter into non-exclusive agreements
with other parties as well as an outright sale of (all or
parts of) the library.
Share options held by Fugro employees that will be
transferred to CGG and were exercisable at completion
can be exercised until 15 December 2013, provided the
exercising option holder is employed by a member of the
CGG Group, after which date these options will expire. If
the employees joining CGG exercise these options after
the transaction, Fugro is responsible for delivering the
shares. The stock options that had not vested at
completion of the transaction, will be replaced by a CGG
phantom share option plan with the similar terms and
conditions as Fugro’s share option plan. If these options
are exercised after vesting, CGG will pay the option
holder the difference between Fugro’s opening share
price on the day of exercise and the exercise price of the
option.
Furthermore Fugro entered into a strategic partnership
with CGG, which includes a global technical and
commercial agreement, under which CGG and Fugro
grant each other preferred supplier status for services
and equipment, which will be supplied on an arm’s
length basis.
Finally, Fugro and CGG also established a new entity,
Seabed Geosolutions, which includes Fugro’s and CGG’
ocean bottom nodes business and CGG’ transition zone,
ocean bottom cable and permanent reservoir monitoring
41Report of the Board of Management
requirements such as in Australia and Brazil have caused
significant upward pressure on costs.There is a natural
slowing down of developments to cope with increasing
cost.
Developing new oil and gas production requires
investments in large oil and gas infrastructure projects,
like on- and offshore pipelines, terminals, jetties and
storage and processing facilities. These projects require
services like bathymetric and terrestrial survey, near-,
on- and offshore geotechnical soil investigation,
geohazard analyses and foundation design as well as
techniques for planning the optimum pipeline routes,
across land or on the sea bottom. The geographic spread
of the Survey and Geotechnical divisions supports the
client at the front end of the development, up to
involvement in the detailed design and working with
the engineering and construction contractors locally.
This provides the client with the ability to contract all
earth related services to one company, a competitive
advantage for Fugro.
With the divestment of the majority of the geoscience
division, Fugro’s dependence on the mineral exploration
market is much reduced. Mineral prices in general are
expected to hold thanks to Far East demand and it is
expected that this will continue to drive mine
development. Fugro’s techniques are used in the support
of mining activities and will benefit Fugro land survey
and geotechnical businesses which are key suppliers of
these services to the world’s mining companies.
Fugro is expecting a strengthening of activity in most
market sectors in which it operates. This is supported by
current tender activity and an improving backlog. Fugro
has been able to significantly enhance its financial
position as a result of the divestment of the majority of
the geoscience division on 31 January 2013. The proceeds
of the divestment and the continued long term financing
provides financially required resources for future
investment opportunities to expand and broaden
activities both organically and through acquisitions.
As in previous years, we will first publish a quantitative
outlook for 2013 in August, at the time of the publication
of the 2013 half-yearly report.
water. With a well balanced portfolio of services
including services to support deep water development
and arctic activities, Fugro should continue to benefit
from the investment the industry is projecting in the
coming years.
Fugro’s activities in the infrastructure and construction,
water management and renewable energy markets are,
amongst others, dependent on the world wide economy
and how government deficits will impact public and
private investment. Europe’s efforts to continue to invest
in offshore wind farms, an important market for Fugro,
will continue with many European Union member states
adopting policies to seriously change the energy mix
over the next 20-30 years to reduce dependence on fossil
fuels. Asia and the United States seem to be following
this trend. Fugro’s international footprint, the efforts to
focus on the larger, more complex projects, bundling of
services and maintaining leadership in data acquisition
and consulting have created a robust competitive
position in these markets for Fugro.
The International Energy Agency indicates that in the
next decennia the world crude oil demand will continue
to increase to approximately 90 million barrels per day
(mb/d) in 2020 from approximately 85 million mb/d
today. The supply of crude oil is impacted by the
increasing depletion rates of existing oil fields. By 2020,
expectation is that current production capacity will have
declined by an estimated 25% due to depletion. In total
30% of new capacity will need to be added by 2020, a
gigantic task. Meeting the growing demand for energy in
the world will mostly come from an increased supply of
natural gas. Together, those developments will require
the industry to focus on maximising production from
existing oil and gas fields and the exploration and
development of new fields. The establishment of the
Seabed Geosolutions JV, with services specifically aimed
at development and production enhancement of existing
oil and gas fields, provides unique solutions to support
clients with these challenges.
The investments the oil and gas industry is making in
subsea infrastructure, offshore production facilities and
pipelines, will lead to a growing demand for subsea
services, such as inspection, repair and maintenance
(IRM). Fugro’s survey and subsea business lines provide a
global foot print that offers vessels, equipment like ROVs
and AUVs and highly experienced staff to all regions in
which our clients operate. Although expected
investments in subsea in 2012 are lagging on the
expectations earlier in the year, for most projects this
merely indicates delays. Supply side and regulatory
42
B o a r d o f M a n a ge m e n t d e c l a r a t i o n p u r s u a n t
t o s e c t i o n 5 : 2 5 c o f t h e F i n a n c i a l M a r ke t s
S u p e r v i s i o n A c t i n t h e N e t h e r l a n d s
To the best of the Board of Management’s knowledge the
financial statements (pages 102 to 197) give a true and
fair view of the assets, liabilities, financial position and
profit or loss of Fugro N.V. and the companies included
jointly in the consolidation, and the annual report gives a
true and fair view of the situation on the balance sheet
date and the business development during the financial
year of Fugro N.V. and the Group companies for which
the financial information is recognised in its financial
statements. The principal risks and uncertainties with
which Fugro N.V. is confronted, are described in this
annual report.
Leidschendam, 7 March 2013
P. van Riel, Chairman Board of Management /
Chief Executive Officer
A. Jonkman, Chief Financial Officer
W.S. Rainey, Director Geotechnical division
J. Rüegg, Director Survey division
43Report of the Board of Management
• Antarctica – Fugro Brasil played a central role in the salvage of a sunken barge containing 10,000 liters of fuel
from the pristine waters of Antarctica. The DSV Gulmar Atlantis, under contract with Petrobras, carried out
the operation with a team of expert saturation divers and ROV operators from Fugro.
• Australia – Fugro continued works as part of Woodside’s proposed Browse LNG development near James Price
Point, north of Broome in Western Australia. Fugro’s work scope included the onshore geotechnical and
geohydrological investigation for the proposed LNG facility and performing the nearshore investigation for
the port and loading facilities for the proposed development. The total value of the contracts was in excess of
AUD 25 million.
• Australia, Norway, United Kingdom and United States – Fugro acquired a total of 38,000km² of multi-client
seismic data. The largest surveys were acquired in the Norwegian Barents Sea and industry showed a very
strong interest for the new data in this prolific region. Fugro also acquired almost 8,000km² in the Joint
Development Zone between Australia and Timor Leste with good funding from the industry. Fugro continued
to invest in 2-D projects in the Barents Sea and Northern Brazil and almost 40,000 line km was added to the
library.
• Azerbaijan – McDermott Caspian Contractors Inc. awarded Fugro a two-year contract for provision of all
survey, positioning and ROV services on their Chirag Oil Platform (COP) development project in Azerbaijan
which will include three FCV ROV’s.
• Cambodia – Fugro conducted digital elevation models and digital ortho photography over an area of 884km² for
the Chinese Railway Engineering Corporation. The information will be used for the planning and construction
of a railway from inland Cambodia at the proposed Preah Vinear mine to Samit Port on the coast. Total length
of the rail route is approximately 420 line-km.
• Canada – Fugro was contracted to survey icebergs in order to be able to build accurate 3-D models. The client
was looking to build upon a database of iceberg properties including size, shape, depth, height, and surface
variability – properties that are used in ice engineering to calculate mass, impact loads, and seabed scouring
characteristics.
• Canada – Fugro completed a 5,000km2 seismic 3-D survey during a single ice free season offshore
Newfoundland.
• Ghana – ENI Ghana awarded Fugro three large contracts as part of the Sankofa and Gye Nyame Offshore Cape
Three Points (OCTP) block development offshore Ghana comprising offshore geophysical and geotechnical,
onshore geophysical and geotechnical, and metocean services. Total combined value of the contracts is
estimated at USD 27 million. The work commenced onshore in January 2013 and Fugro will be on site until
approximately March 2014.
• Guinea – Fugro was awarded a contract for the definition of the geodetic framework over the Simandou mine
development (mine site, railway, port) for Rio Tinto. Simandou will be the largest integrated iron ore mine and
infrastructure project ever developed in Africa.
■ I M P O R TA N T A N D I N T E R E S T I N G C O N T R A C T S
44
• Hong Kong, Singapore, Malaysia and Vietnam – Fugro worked on major nearshore site investigations, on
projects related to the Hong Kong – Zhuhai- Macao Bridge and the Chek Lap Kok airport third runway projects
in Hong Kong, as well as various infrastructure and oil and gas-related projects in Singapore, Malaysia and
Vietnam. Also in Hong Kong, Fugro worked on major long-term materials testing contracts for both the
government and private-sector clients, and provided instrumentation and monitoring services on several
construction contracts related to the Express Rail Link high-speed rail project.
• India – Fugro Singapore was awarded a large offshore geotechnical investigation contract by Reliance
Industries Ltd on the East Coast of India. Fugro performed geotechnical investigations, laboratory testing and
foundation design studies to allow detailed design of subsea infrastructure for the Dhirubhai Satellite Fields
located in water depths of up to 1,850m.
• Indonesia – Fugro was awarded a year-long metocean measurement contract for ENI Muara Bakau. The services
are required to support detailed engineering design for the development of the Jangkrik field, and the 70km
export pipeline. The works comprise deployment of six moorings in water depths from 10m to 400m,
measuring current profiles, waves, meteorology and water levels.
• Iraq – Shell Iraq awarded Fugro a large geophysical survey and geotechnical investigation for their South Gas
Utilisation Project in Iraq.
• Italy – Fugro Seacore was awarded a large contract by Titan-Micoperi to contribute to the recovery of the Costa
Concordia. Raising the cruise vessel , which is twice as heavy as the Titanic, from two giant rock outcrops in the
sea has been described as one of the toughest marine recovery operations in modern history. Fugro Seacore will
drill the offshore foundations for six platforms, the three largest platforms equaling the size of a rugby pitch.
• Malaysia – Fugro was awarded a long term five-year with two year extension options by Murphy Oil in Malaysia
to support the drilling and construction activities on their deepwater fields in Malaysia. The contract base case
scope of supply is to provide the Fugro TSM operated multi-purpose vessel Havila Harmony as a platform,
complete with a deepwater ROV with tooling spread and full time six man ROV crew.
• Mexico – Fugro (Mexico) in conjunction with long-time associates, Constructora Subacuatica Diavaz, S.A. de
C.V., has been awarded a large offshore multi-site high resolution geophysical and geotechnical survey by
Mexico’s national oil company PEMEX. Activity started in September 2012 and will continue through to
August 2013.
• Mozambique – Fugro concluded a three-year frame agreement with Anadarko for positioning, subsea and
geotechnical services on board a client provided vessel. In addition, Fugro is to conduct year-long metocean
measurements services for ENI to support detailed engineering and design for the development of the Mamba
field in the Ravuma Basin Area 4, the 60km export pipeline and coastal unloading facility.
• Netherlands – Fugro-Geoteam carried out a 3,100km2 3-D seismic acquisition project in an area of the North Sea
crossing two major shipping lines, and with 26 permanent installations that had to be under-shot. Two seismic
3-D vessels, one large 12-streamer C-class vessel and one 8-streamer vessel, were allocated to this special project.
• Norway – Fugro has been awarded a hydrographic charting contract with the Norwegian Hydrographic Service
(NHS). This survey is part of the Mareano project covering appr. 11,000km² in the Barents Sea. Mareano is
Norway’s program to fill knowledge gaps related to seabed conditions and biodiversity along the northern
coast.
45Report of the Board of Management
• Norway – Fugro Seastar has been awarded a contract with the European Committee to define and specify the
commercial services component of the Galileo navigation satellite system. The contract will be executed in
cooperation with SDC and Thales of France and Trimble Navigation of the USA.
• Panama – Fugro is providing site investigation services to support the expansion of the Panama Canal. It is
expected that canal capacity will double by 2014 thereby making it able to take standard-sized LNG tankers
possibly originating from ports along the Gulf of Mexico.
• Russia / Germany – Fugro was awarded a contract for the inspection of the dual Nord Stream Project pipelines
through the Baltic Sea from Russia to Germany. This is the largest pipeline survey and inspection project ever
undertaken by Fugro.
• Saudi Arabia – Snamprogetti Saudi Arabia (SAIPEM) awarded Fugro a four-year contract for all survey, ROV and
positioning services across the Middle East Region.
• Tanzania – Fugro was awarded a contract by Beach Petroleum for a 2-D seismic survey at Tanganyika Lake.
The work included 2,270 line-km of 2-D seismic. A local ferry was completely refurbished and upgraded with
the necessary equipment on board to acquire and quality control process the 2-D seismic data after it has
been acquired.
• United Kingdom – Fugro is to conduct a review of benthic and fish ecology, marine mammals, birds,
underwater noise, coastal and shelf processes, with respect to wind farm post-construction monitoring.
The objectives of the contract are to review the post-construction monitoring strategies, methodologies
and conclusions with respect to all English wind farms that have currently been constructed.
• United States – Fugro Atlantic has been appointed to conduct a geological and geophysical survey for the
Virginia Wind Energy Area (WEA) within the Atlantic outer continental shelf. The WEA encompasses 112,799
acres at a distance of 23.5 nautical miles offshore Virginia Beach and the Port of Hampton Roads.
• United States – The US Department of Energy has selected Fugro GeoConsulting Inc. for two research projects
to advance understanding of resource-grade gas hydrates. The first award is for developing plans for a pressure-
coring program and the second award is for developing methods and tools to better understand the gas hydrate
reservoirs through seismic imaging and rock physics. The research and planning will be done within a twelve
month period in 2012 and 2013.
• United States – Fugro performed geotechnical studies related to the design of a storm protection complex
throughout the New Orleans drainage district in connection with the Gulf Intracoastal Waterway West. The
complex is designed to reduce the f lood risks for residences and businesses in the project area from a storm
surge associated with a tropical event. This complex was operated for the first time in August 2012 in response
to Hurricane Isaac.
• Global – Fugro is actively involved in projects that are contributing to the rising global supply of LNG (liquefied
natural gas) to meet increased demand driven by economic growth in Asia and the shutdown of the nuclear
power industry in Japan. Supply growth opportunities where Fugro is providing services for developing gas
liquefaction infrastructure are coming from North America (including Alaska), SE Asia (Malaysia and
Indonesia), the Middle East, especially Qatar, Australia and PNG, and East Africa, particularly Mozambique.
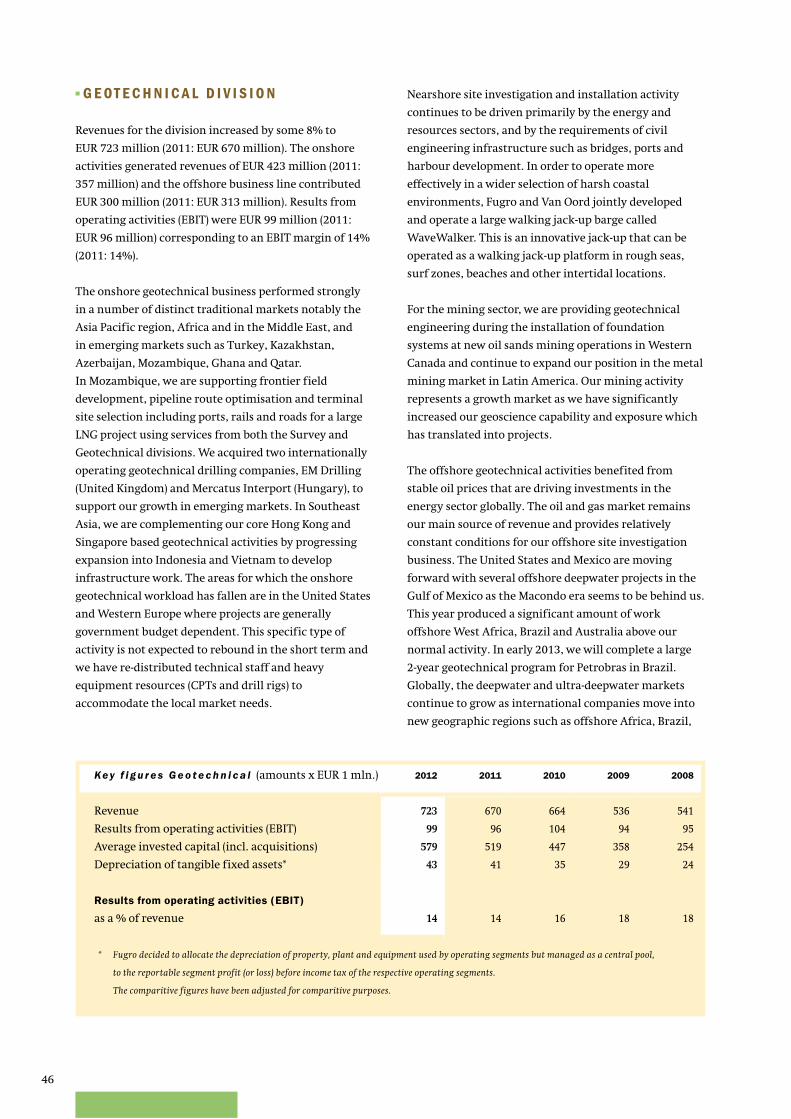
46
Key f i g u r e s G e o t e c h n i c a l (amounts x EUR 1 mln.) 2012 2011 2010 2009 2008
Revenue 723 670 664 536 541
Results from operating activities (EBIT) 99 96 104 94 95
Average invested capital (incl. acquisitions) 579 519 447 358 254
Depreciation of tangible fixed assets* 43 41 35 29 24
Results from operating activities (EBIT)
as a % of revenue 14 14 16 18 18
* Fugro decided to allocate the depreciation of property, plant and equipment used by operating segments but managed as a central pool,
to the reportable segment profit (or loss) before income tax of the respective operating segments.
The comparitive figures have been adjusted for comparitive purposes.
■ G E OT E C H N I C A L D I V I S I O N
Revenues for the division increased by some 8% to
EUR 723 million (2011: EUR 670 million). The onshore
activities generated revenues of EUR 423 million (2011:
357 million) and the offshore business line contributed
EUR 300 million (2011: EUR 313 million). Results from
operating activities (EBIT) were EUR 99 million (2011:
EUR 96 million) corresponding to an EBIT margin of 14%
(2011: 14%).
The onshore geotechnical business performed strongly
in a number of distinct traditional markets notably the
Asia Pacific region, Africa and in the Middle East, and
in emerging markets such as Turkey, Kazakhstan,
Azerbaijan, Mozambique, Ghana and Qatar.
In Mozambique, we are supporting frontier field
development, pipeline route optimisation and terminal
site selection including ports, rails and roads for a large
LNG project using services from both the Survey and
Geotechnical divisions. We acquired two internationally
operating geotechnical drilling companies, EM Drilling
(United Kingdom) and Mercatus Interport (Hungary), to
support our growth in emerging markets. In Southeast
Asia, we are complementing our core Hong Kong and
Singapore based geotechnical activities by progressing
expansion into Indonesia and Vietnam to develop
infrastructure work. The areas for which the onshore
geotechnical workload has fallen are in the United States
and Western Europe where projects are generally
government budget dependent. This specific type of
activity is not expected to rebound in the short term and
we have re-distributed technical staff and heavy
equipment resources (CPTs and drill rigs) to
accommodate the local market needs.
Nearshore site investigation and installation activity
continues to be driven primarily by the energy and
resources sectors, and by the requirements of civil
engineering infrastructure such as bridges, ports and
harbour development. In order to operate more
effectively in a wider selection of harsh coastal
environments, Fugro and Van Oord jointly developed
and operate a large walking jack-up barge called
WaveWalker. This is an innovative jack-up that can be
operated as a walking jack-up platform in rough seas,
surf zones, beaches and other intertidal locations.
For the mining sector, we are providing geotechnical
engineering during the installation of foundation
systems at new oil sands mining operations in Western
Canada and continue to expand our position in the metal
mining market in Latin America. Our mining activity
represents a growth market as we have significantly
increased our geoscience capability and exposure which
has translated into projects.
The offshore geotechnical activities benefited from
stable oil prices that are driving investments in the
energy sector globally. The oil and gas market remains
our main source of revenue and provides relatively
constant conditions for our offshore site investigation
business. The United States and Mexico are moving
forward with several offshore deepwater projects in the
Gulf of Mexico as the Macondo era seems to be behind us.
This year produced a significant amount of work
offshore West Africa, Brazil and Australia above our
normal activity. In early 2013, we will complete a large
2-year geotechnical program for Petrobras in Brazil.
Globally, the deepwater and ultra-deepwater markets
continue to grow as international companies move into
new geographic regions such as offshore Africa, Brazil,
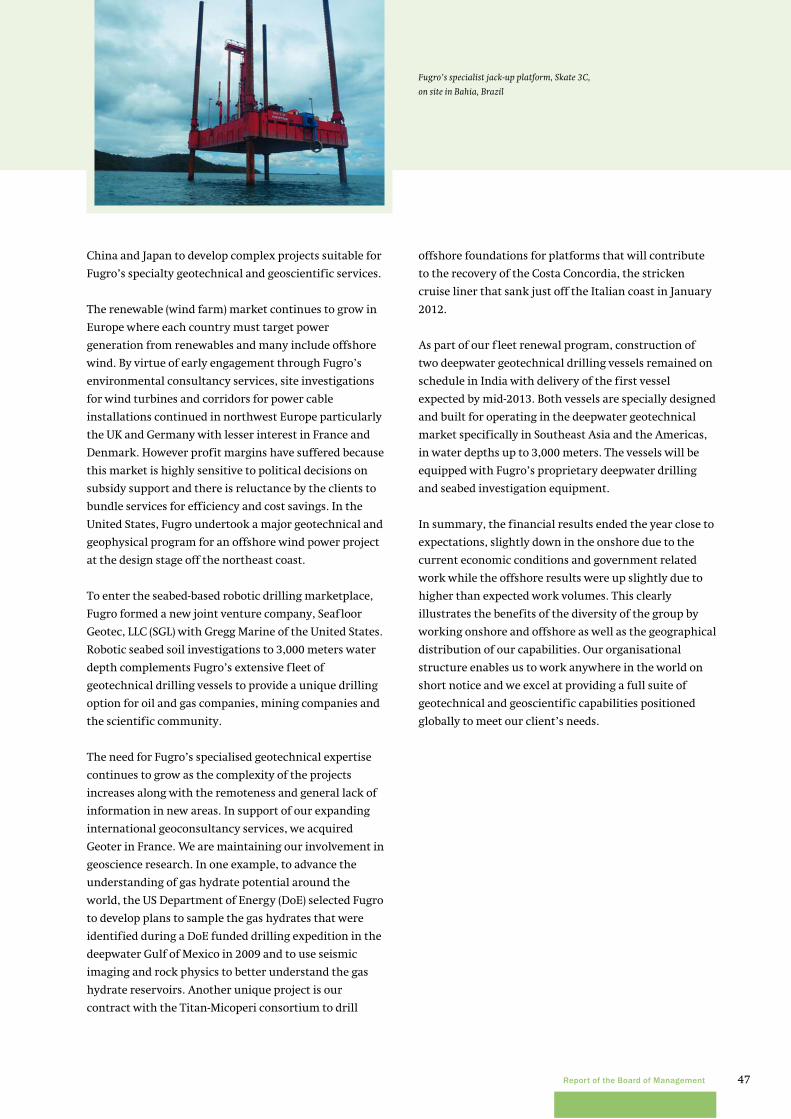
47Report of the Board of Management
China and Japan to develop complex projects suitable for
Fugro’s specialty geotechnical and geoscientific services.
The renewable (wind farm) market continues to grow in
Europe where each country must target power
generation from renewables and many include offshore
wind. By virtue of early engagement through Fugro’s
environmental consultancy services, site investigations
for wind turbines and corridors for power cable
installations continued in northwest Europe particularly
the UK and Germany with lesser interest in France and
Denmark. However profit margins have suffered because
this market is highly sensitive to political decisions on
subsidy support and there is reluctance by the clients to
bundle services for efficiency and cost savings. In the
United States, Fugro undertook a major geotechnical and
geophysical program for an offshore wind power project
at the design stage off the northeast coast.
To enter the seabed-based robotic drilling marketplace,
Fugro formed a new joint venture company, Seafloor
Geotec, LLC (SGL) with Gregg Marine of the United States.
Robotic seabed soil investigations to 3,000 meters water
depth complements Fugro’s extensive f leet of
geotechnical drilling vessels to provide a unique drilling
option for oil and gas companies, mining companies and
the scientific community.
The need for Fugro’s specialised geotechnical expertise
continues to grow as the complexity of the projects
increases along with the remoteness and general lack of
information in new areas. In support of our expanding
international geoconsultancy services, we acquired
Geoter in France. We are maintaining our involvement in
geoscience research. In one example, to advance the
understanding of gas hydrate potential around the
world, the US Department of Energy (DoE) selected Fugro
to develop plans to sample the gas hydrates that were
identified during a DoE funded drilling expedition in the
deepwater Gulf of Mexico in 2009 and to use seismic
imaging and rock physics to better understand the gas
hydrate reservoirs. Another unique project is our
contract with the Titan-Micoperi consortium to drill
offshore foundations for platforms that will contribute
to the recovery of the Costa Concordia, the stricken
cruise liner that sank just off the Italian coast in January
2012.
As part of our f leet renewal program, construction of
two deepwater geotechnical drilling vessels remained on
schedule in India with delivery of the first vessel
expected by mid-2013. Both vessels are specially designed
and built for operating in the deepwater geotechnical
market specifically in Southeast Asia and the Americas,
in water depths up to 3,000 meters. The vessels will be
equipped with Fugro’s proprietary deepwater drilling
and seabed investigation equipment.
In summary, the financial results ended the year close to
expectations, slightly down in the onshore due to the
current economic conditions and government related
work while the offshore results were up slightly due to
higher than expected work volumes. This clearly
illustrates the benefits of the diversity of the group by
working onshore and offshore as well as the geographical
distribution of our capabilities. Our organisational
structure enables us to work anywhere in the world on
short notice and we excel at providing a full suite of
geotechnical and geoscientific capabilities positioned
globally to meet our client’s needs.
Fugro’s specialist jack-up platform, Skate 3C,
on site in Bahia, Brazil
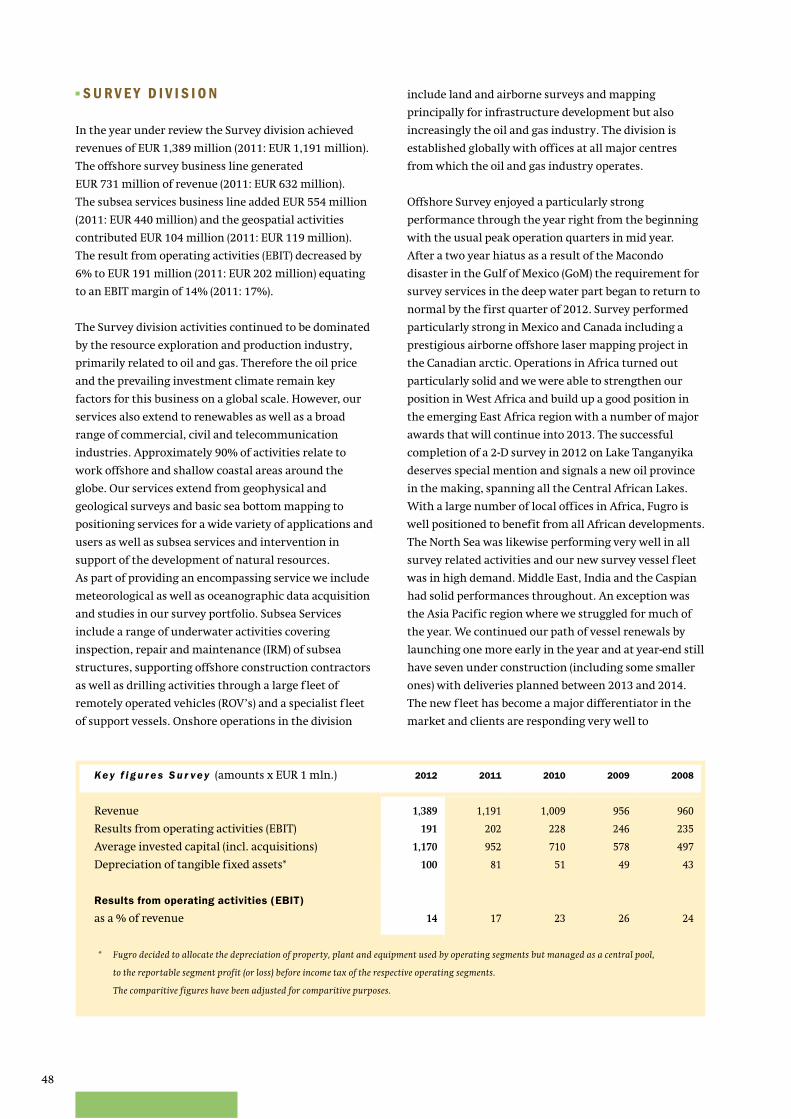
48
■ S U R V E Y D I V I S I O N
In the year under review the Survey division achieved
revenues of EUR 1,389 million (2011: EUR 1,191 million).
The offshore survey business line generated
EUR 731 million of revenue (2011: EUR 632 million).
The subsea services business line added EUR 554 million
(2011: EUR 440 million) and the geospatial activities
contributed EUR 104 million (2011: EUR 119 million).
The result from operating activities (EBIT) decreased by
6% to EUR 191 million (2011: EUR 202 million) equating
to an EBIT margin of 14% (2011: 17%).
The Survey division activities continued to be dominated
by the resource exploration and production industry,
primarily related to oil and gas. Therefore the oil price
and the prevailing investment climate remain key
factors for this business on a global scale. However, our
services also extend to renewables as well as a broad
range of commercial, civil and telecommunication
industries. Approximately 90% of activities relate to
work offshore and shallow coastal areas around the
globe. Our services extend from geophysical and
geological surveys and basic sea bottom mapping to
positioning services for a wide variety of applications and
users as well as subsea services and intervention in
support of the development of natural resources.
As part of providing an encompassing service we include
meteorological as well as oceanographic data acquisition
and studies in our survey portfolio. Subsea Services
include a range of underwater activities covering
inspection, repair and maintenance (IRM) of subsea
structures, supporting offshore construction contractors
as well as drilling activities through a large f leet of
remotely operated vehicles (ROV’s) and a specialist f leet
of support vessels. Onshore operations in the division
include land and airborne surveys and mapping
principally for infrastructure development but also
increasingly the oil and gas industry. The division is
established globally with offices at all major centres
from which the oil and gas industry operates.
Offshore Survey enjoyed a particularly strong
performance through the year right from the beginning
with the usual peak operation quarters in mid year.
After a two year hiatus as a result of the Macondo
disaster in the Gulf of Mexico (GoM) the requirement for
survey services in the deep water part began to return to
normal by the first quarter of 2012. Survey performed
particularly strong in Mexico and Canada including a
prestigious airborne offshore laser mapping project in
the Canadian arctic. Operations in Africa turned out
particularly solid and we were able to strengthen our
position in West Africa and build up a good position in
the emerging East Africa region with a number of major
awards that will continue into 2013. The successful
completion of a 2-D survey in 2012 on Lake Tanganyika
deserves special mention and signals a new oil province
in the making, spanning all the Central African Lakes.
With a large number of local offices in Africa, Fugro is
well positioned to benefit from all African developments.
The North Sea was likewise performing very well in all
survey related activities and our new survey vessel f leet
was in high demand. Middle East, India and the Caspian
had solid performances throughout. An exception was
the Asia Pacific region where we struggled for much of
the year. We continued our path of vessel renewals by
launching one more early in the year and at year-end still
have seven under construction (including some smaller
ones) with deliveries planned between 2013 and 2014.
The new fleet has become a major differentiator in the
market and clients are responding very well to
Key f i g u r e s S u r vey (amounts x EUR 1 mln.) 2012 2011 2010 2009 2008
Revenue 1,389 1,191 1,009 956 960
Results from operating activities (EBIT) 191 202 228 246 235
Average invested capital (incl. acquisitions) 1,170 952 710 578 497
Depreciation of tangible fixed assets* 100 81 51 49 43
Results from operating activities (EBIT)
as a % of revenue 14 17 23 26 24
* Fugro decided to allocate the depreciation of property, plant and equipment used by operating segments but managed as a central pool,
to the reportable segment profit (or loss) before income tax of the respective operating segments.
The comparitive figures have been adjusted for comparitive purposes.
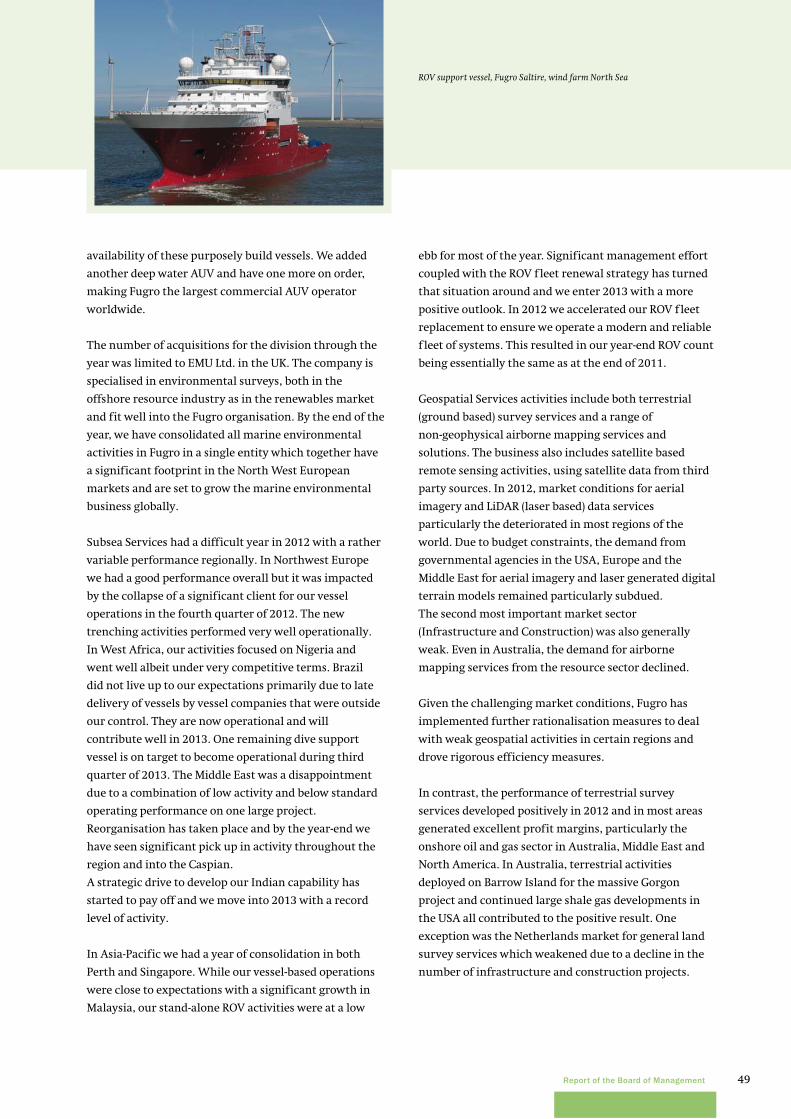
49Report of the Board of Management
availability of these purposely build vessels. We added
another deep water AUV and have one more on order,
making Fugro the largest commercial AUV operator
worldwide.
The number of acquisitions for the division through the
year was limited to EMU Ltd. in the UK. The company is
specialised in environmental surveys, both in the
offshore resource industry as in the renewables market
and fit well into the Fugro organisation. By the end of the
year, we have consolidated all marine environmental
activities in Fugro in a single entity which together have
a significant footprint in the North West European
markets and are set to grow the marine environmental
business globally.
Subsea Services had a difficult year in 2012 with a rather
variable performance regionally. In Northwest Europe
we had a good performance overall but it was impacted
by the collapse of a significant client for our vessel
operations in the fourth quarter of 2012. The new
trenching activities performed very well operationally.
In West Africa, our activities focused on Nigeria and
went well albeit under very competitive terms. Brazil
did not live up to our expectations primarily due to late
delivery of vessels by vessel companies that were outside
our control. They are now operational and will
contribute well in 2013. One remaining dive support
vessel is on target to become operational during third
quarter of 2013. The Middle East was a disappointment
due to a combination of low activity and below standard
operating performance on one large project.
Reorganisation has taken place and by the year-end we
have seen significant pick up in activity throughout the
region and into the Caspian.
A strategic drive to develop our Indian capability has
started to pay off and we move into 2013 with a record
level of activity.
In Asia-Pacific we had a year of consolidation in both
Perth and Singapore. While our vessel-based operations
were close to expectations with a significant growth in
Malaysia, our stand-alone ROV activities were at a low
ebb for most of the year. Significant management effort
coupled with the ROV fleet renewal strategy has turned
that situation around and we enter 2013 with a more
positive outlook. In 2012 we accelerated our ROV fleet
replacement to ensure we operate a modern and reliable
f leet of systems. This resulted in our year-end ROV count
being essentially the same as at the end of 2011.
Geospatial Services activities include both terrestrial
(ground based) survey services and a range of
non-geophysical airborne mapping services and
solutions. The business also includes satellite based
remote sensing activities, using satellite data from third
party sources. In 2012, market conditions for aerial
imagery and LiDAR (laser based) data services
particularly the deteriorated in most regions of the
world. Due to budget constraints, the demand from
governmental agencies in the USA, Europe and the
Middle East for aerial imagery and laser generated digital
terrain models remained particularly subdued.
The second most important market sector
(Infrastructure and Construction) was also generally
weak. Even in Australia, the demand for airborne
mapping services from the resource sector declined.
Given the challenging market conditions, Fugro has
implemented further rationalisation measures to deal
with weak geospatial activities in certain regions and
drove rigorous efficiency measures.
In contrast, the performance of terrestrial survey
services developed positively in 2012 and in most areas
generated excellent profit margins, particularly the
onshore oil and gas sector in Australia, Middle East and
North America. In Australia, terrestrial activities
deployed on Barrow Island for the massive Gorgon
project and continued large shale gas developments in
the USA all contributed to the positive result. One
exception was the Netherlands market for general land
survey services which weakened due to a decline in the
number of infrastructure and construction projects.
ROV support vessel, Fugro Saltire, wind farm North Sea
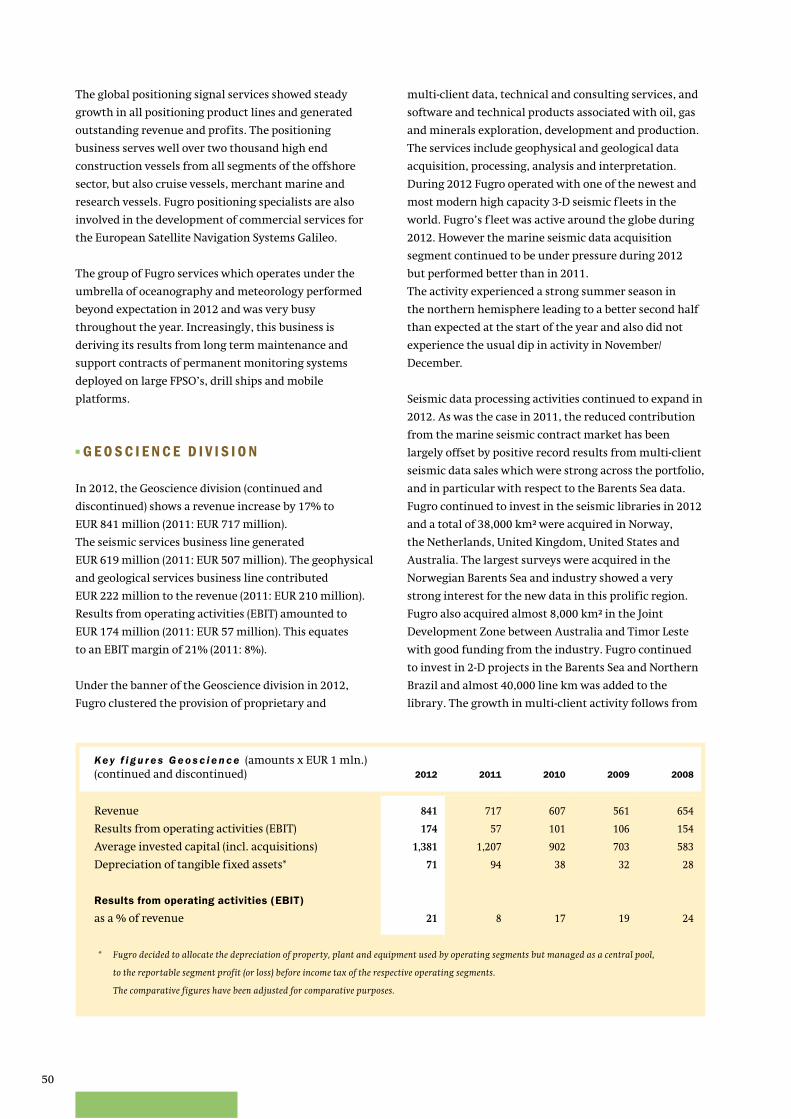
50
Key f i g u r e s G e o s c i e n c e (amounts x EUR 1 mln.)(continued and discontinued) 2012 2011 2010 2009 2008
Revenue 841 717 607 561 654
Results from operating activities (EBIT) 174 57 101 106 154
Average invested capital (incl. acquisitions) 1,381 1,207 902 703 583
Depreciation of tangible fixed assets* 71 94 38 32 28
Results from operating activities (EBIT)
as a % of revenue 21 8 17 19 24
* Fugro decided to allocate the depreciation of property, plant and equipment used by operating segments but managed as a central pool,
to the reportable segment profit (or loss) before income tax of the respective operating segments.
The comparative figures have been adjusted for comparative purposes.
The global positioning signal services showed steady
growth in all positioning product lines and generated
outstanding revenue and profits. The positioning
business serves well over two thousand high end
construction vessels from all segments of the offshore
sector, but also cruise vessels, merchant marine and
research vessels. Fugro positioning specialists are also
involved in the development of commercial services for
the European Satellite Navigation Systems Galileo.
The group of Fugro services which operates under the
umbrella of oceanography and meteorology performed
beyond expectation in 2012 and was very busy
throughout the year. Increasingly, this business is
deriving its results from long term maintenance and
support contracts of permanent monitoring systems
deployed on large FPSO’s, drill ships and mobile
platforms.
■ G E O S C I E N C E D I V I S I O N
In 2012, the Geoscience division (continued and
discontinued) shows a revenue increase by 17% to
EUR 841 million (2011: EUR 717 million).
The seismic services business line generated
EUR 619 million (2011: EUR 507 million). The geophysical
and geological services business line contributed
EUR 222 million to the revenue (2011: EUR 210 million).
Results from operating activities (EBIT) amounted to
EUR 174 million (2011: EUR 57 million). This equates
to an EBIT margin of 21% (2011: 8%).
Under the banner of the Geoscience division in 2012,
Fugro clustered the provision of proprietary and
multi-client data, technical and consulting services, and
software and technical products associated with oil, gas
and minerals exploration, development and production.
The services include geophysical and geological data
acquisition, processing, analysis and interpretation.
During 2012 Fugro operated with one of the newest and
most modern high capacity 3-D seismic f leets in the
world. Fugro’s f leet was active around the globe during
2012. However the marine seismic data acquisition
segment continued to be under pressure during 2012
but performed better than in 2011.
The activity experienced a strong summer season in
the northern hemisphere leading to a better second half
than expected at the start of the year and also did not
experience the usual dip in activity in November/
December.
Seismic data processing activities continued to expand in
2012. As was the case in 2011, the reduced contribution
from the marine seismic contract market has been
largely offset by positive record results from multi-client
seismic data sales which were strong across the portfolio,
and in particular with respect to the Barents Sea data.
Fugro continued to invest in the seismic libraries in 2012
and a total of 38,000 km² were acquired in Norway,
the Netherlands, United Kingdom, United States and
Australia. The largest surveys were acquired in the
Norwegian Barents Sea and industry showed a very
strong interest for the new data in this prolific region.
Fugro also acquired almost 8,000 km² in the Joint
Development Zone between Australia and Timor Leste
with good funding from the industry. Fugro continued
to invest in 2-D projects in the Barents Sea and Northern
Brazil and almost 40,000 line km was added to the
library. The growth in multi-client activity follows from
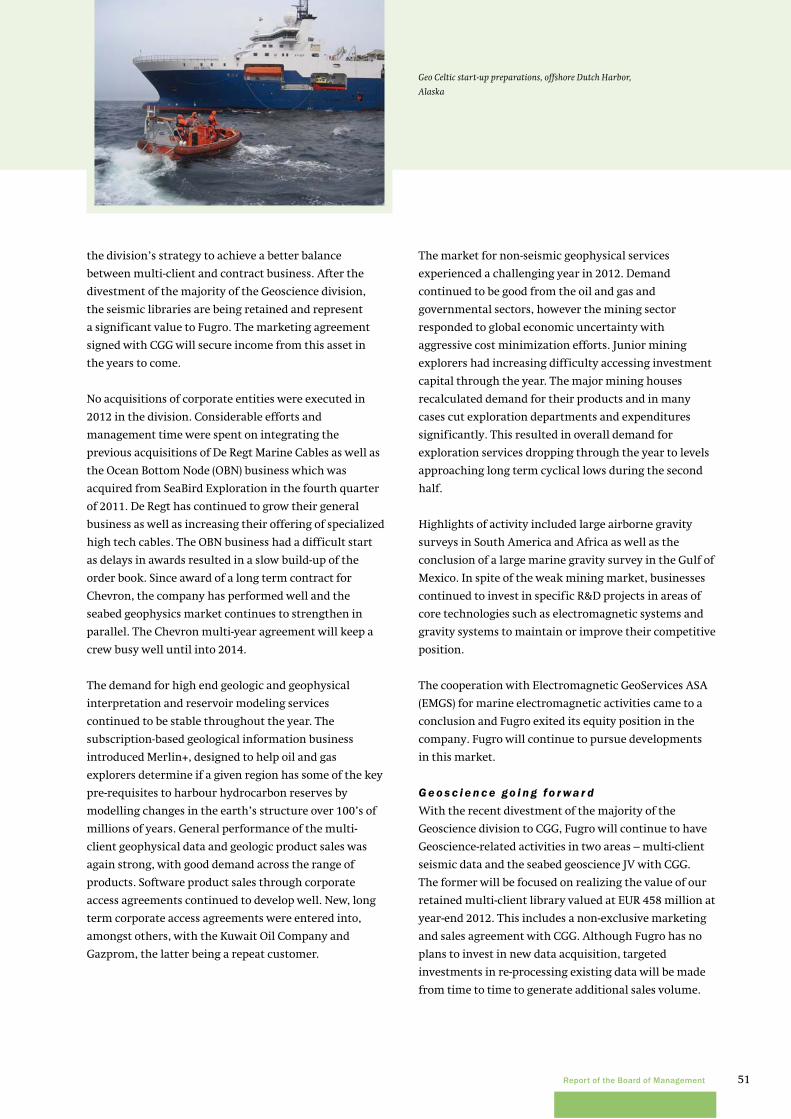
51Report of the Board of Management
the division’s strategy to achieve a better balance
between multi-client and contract business. After the
divestment of the majority of the Geoscience division,
the seismic libraries are being retained and represent
a significant value to Fugro. The marketing agreement
signed with CGG will secure income from this asset in
the years to come.
No acquisitions of corporate entities were executed in
2012 in the division. Considerable efforts and
management time were spent on integrating the
previous acquisitions of De Regt Marine Cables as well as
the Ocean Bottom Node (OBN) business which was
acquired from SeaBird Exploration in the fourth quarter
of 2011. De Regt has continued to grow their general
business as well as increasing their offering of specialized
high tech cables. The OBN business had a difficult start
as delays in awards resulted in a slow build-up of the
order book. Since award of a long term contract for
Chevron, the company has performed well and the
seabed geophysics market continues to strengthen in
parallel. The Chevron multi-year agreement will keep a
crew busy well until into 2014.
The demand for high end geologic and geophysical
interpretation and reservoir modeling services
continued to be stable throughout the year. The
subscription-based geological information business
introduced Merlin+, designed to help oil and gas
explorers determine if a given region has some of the key
pre-requisites to harbour hydrocarbon reserves by
modelling changes in the earth’s structure over 100’s of
millions of years. General performance of the multi-
client geophysical data and geologic product sales was
again strong, with good demand across the range of
products. Software product sales through corporate
access agreements continued to develop well. New, long
term corporate access agreements were entered into,
amongst others, with the Kuwait Oil Company and
Gazprom, the latter being a repeat customer.
The market for non-seismic geophysical services
experienced a challenging year in 2012. Demand
continued to be good from the oil and gas and
governmental sectors, however the mining sector
responded to global economic uncertainty with
aggressive cost minimization efforts. Junior mining
explorers had increasing difficulty accessing investment
capital through the year. The major mining houses
recalculated demand for their products and in many
cases cut exploration departments and expenditures
significantly. This resulted in overall demand for
exploration services dropping through the year to levels
approaching long term cyclical lows during the second
half.
Highlights of activity included large airborne gravity
surveys in South America and Africa as well as the
conclusion of a large marine gravity survey in the Gulf of
Mexico. In spite of the weak mining market, businesses
continued to invest in specific R&D projects in areas of
core technologies such as electromagnetic systems and
gravity systems to maintain or improve their competitive
position.
The cooperation with Electromagnetic GeoServices ASA
(EMGS) for marine electromagnetic activities came to a
conclusion and Fugro exited its equity position in the
company. Fugro will continue to pursue developments
in this market.
G e o s c i e n c e go i n g fo r wa r d
With the recent divestment of the majority of the
Geoscience division to CGG, Fugro will continue to have
Geoscience-related activities in two areas – multi-client
seismic data and the seabed geoscience JV with CGG.
The former will be focused on realizing the value of our
retained multi-client library valued at EUR 458 million at
year-end 2012. This includes a non-exclusive marketing
and sales agreement with CGG. Although Fugro has no
plans to invest in new data acquisition, targeted
investments in re-processing existing data will be made
from time to time to generate additional sales volume.
Geo Celtic start-up preparations, offshore Dutch Harbor,
Alaska
52
The seabed geoscience joint venture is called Seabed
Geosolutions. Fugro and CGG retain full ownership of the
business on a 60%/40% basis respectively.
The company will focus on acquiring, processing and
interpreting geoscience data on or near to the seabed,
from the transition zone to the deep water environment.
It is already the largest company in the world in this
market segment and will benefit from access to parent
company technical and commercial resources to support
its growth.
All our activities in the Geoscience division, except for
the multi-client library and the ocean bottom nodes
business, have been sold to CGG. In the future, these
businesses will continued to be referred to as Geoscience
Division.
Building the future
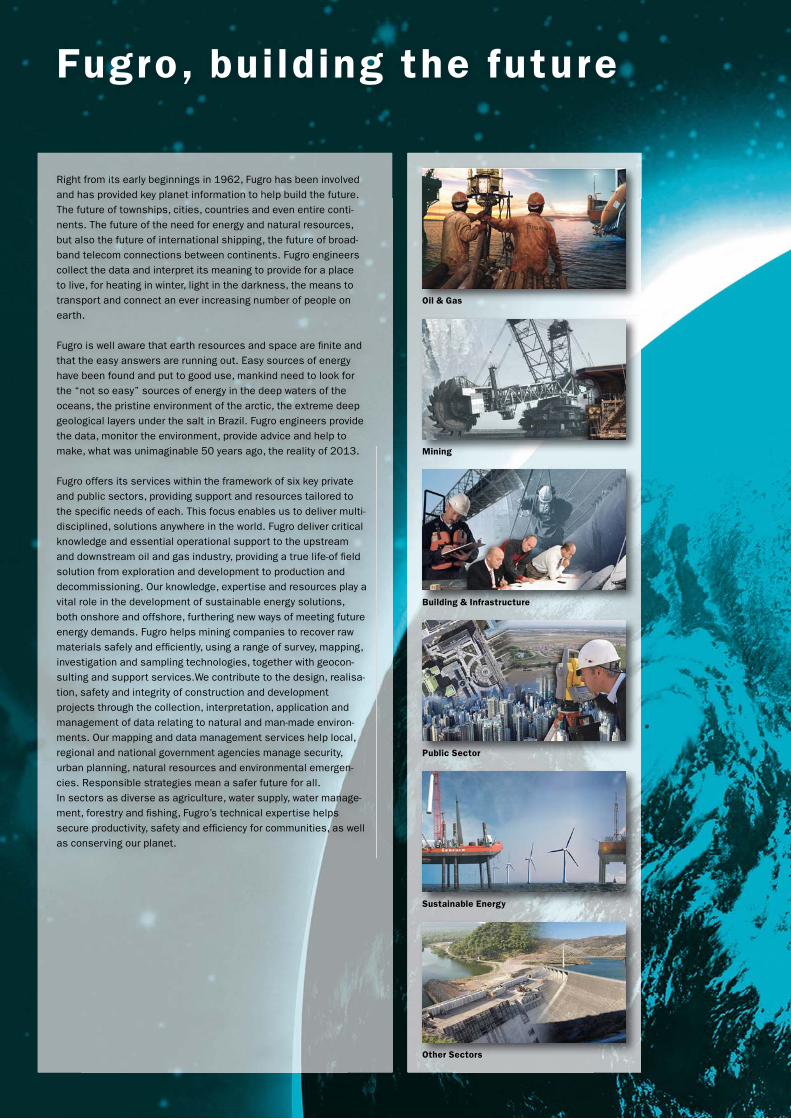
Right from its early beginnings in 1962, Fugro has been involved
and has provided key planet information to help build the future.
The future of townships, cities, countries and even entire conti-
nents. The future of the need for energy and natural resources,
but also the future of international shipping, the future of broad-
band telecom connections between continents. Fugro engineers
collect the data and interpret its meaning to provide for a place
to live, for heating in winter, light in the darkness, the means to
transport and connect an ever increasing number of people on
earth.
Fugro is well aware that earth resources and space are fi nite and
that the easy answers are running out. Easy sources of energy
have been found and put to good use, mankind need to look for
the “not so easy” sources of energy in the deep waters of the
oceans, the pristine environment of the arctic, the extreme deep
geological layers under the salt in Brazil. Fugro engineers provide
the data, monitor the environment, provide advice and help to
make, what was unimaginable 50 years ago, the reality of 2013.
Fugro offers its services within the framework of six key private
and public sectors, providing support and resources tailored to
the specifi c needs of each. This focus enables us to deliver multi-
disciplined, solutions anywhere in the world. Fugro deliver critical
knowledge and essential operational support to the upstream
and downstream oil and gas industry, providing a true life-of fi eld
solution from exploration and development to production and
decommissioning. Our knowledge, expertise and resources play a
vital role in the development of sustainable energy solutions,
both onshore and offshore, furthering new ways of meeting future
energy demands. Fugro helps mining companies to recover raw
materials safely and effi ciently, using a range of survey, mapping,
investigation and sampling technologies, together with geocon-
sulting and support services.We contribute to the design, realisa-
tion, safety and integrity of construction and development
projects through the collection, interpretation, application and
management of data relating to natural and man-made environ-
ments. Our mapping and data management services help local,
regional and national government agencies manage security,
urban planning, natural resources and environmental emergen-
cies. Responsible strategies mean a safer future for all.
In sectors as diverse as agriculture, water supply, water manage-
ment, forestry and fi shing, Fugro’s technical expertise helps
secure productivity, safety and effi ciency for communities, as well
as conserving our planet.
Fugro, bui lding the future
Oil & Gas
Mining
Building & Infrastructure
Public Sector
Sustainable Energy
Other Sectors

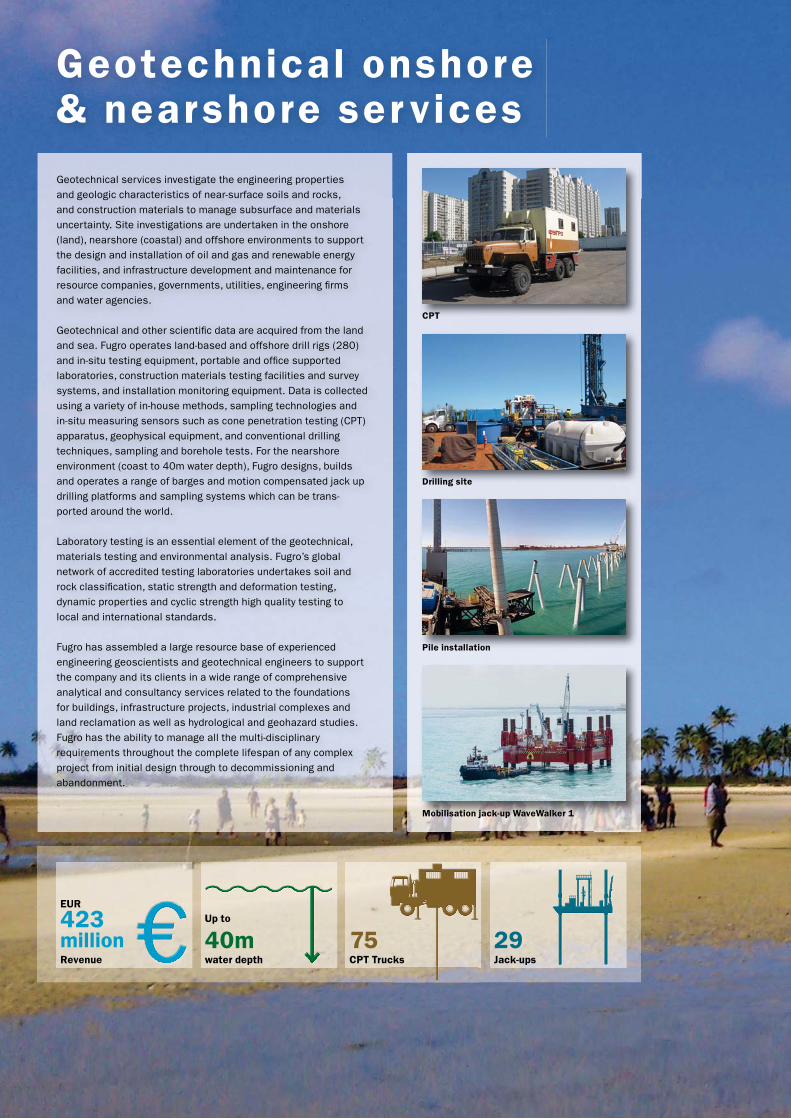
Revenue
EUR
423 million
water depth
Up to
Mobilisation jack-up WaveWalker 1
Pile installation
Drilling site
CPT
40m
Geotechnical onshore & nearshore ser vices
Geotechnical services investigate the engineering properties
and geologic characteristics of near-surface soils and rocks,
and construction materials to manage subsurface and materials
uncertainty. Site investigations are undertaken in the onshore
(land), nearshore (coastal) and offshore environments to support
the design and installation of oil and gas and renewable energy
facilities, and infrastructure development and maintenance for
resource companies, governments, utilities, engineering fi rms
and water agencies.
Geotechnical and other scientifi c data are acquired from the land
and sea. Fugro operates land-based and offshore drill rigs (280)
and in-situ testing equipment, portable and offi ce supported
laboratories, construction materials testing facilities and survey
systems, and installation monitoring equipment. Data is collected
using a variety of in-house methods, sampling technologies and
in-situ measuring sensors such as cone penetration testing (CPT)
apparatus, geophysical equipment, and conventional drilling
techniques, sampling and borehole tests. For the nearshore
environment (coast to 40m water depth), Fugro designs, builds
and operates a range of barges and motion compensated jack up
drilling platforms and sampling systems which can be trans-
ported around the world.
Laboratory testing is an essential element of the geotechnical,
materials testing and environmental analysis. Fugro’s global
network of accredited testing laboratories undertakes soil and
rock classifi cation, static strength and deformation testing,
dynamic properties and cyclic strength high quality testing to
local and international standards.
Fugro has assembled a large resource base of experienced
engineering geoscientists and geotechnical engineers to support
the company and its clients in a wide range of comprehensive
analytical and consultancy services related to the foundations
for buildings, infrastructure projects, industrial complexes and
land reclamation as well as hydrological and geohazard studies.
Fugro has the ability to manage all the multi-disciplinary
requirements throughout the complete lifespan of any complex
project from initial design through to decommissioning and
abandonment.
CPT Trucks
75Jack-ups
29
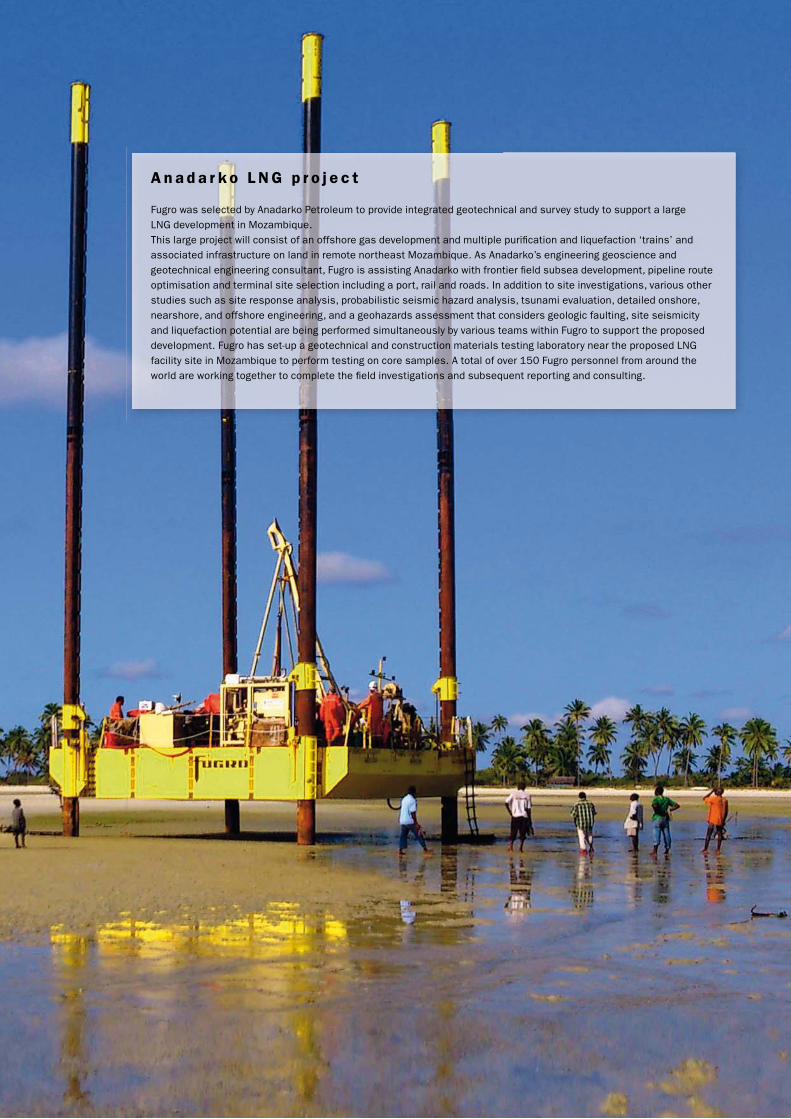
A n a d a r k o L N G p r o j e c t
Fugro was selected by Anadarko Petroleum to provide integrated geotechnical and survey study to support a large
LNG development in Mozambique.
This large project will consist of an offshore gas development and multiple purifi cation and liquefaction ‘trains’ and
associated infrastructure on land in remote northeast Mozambique. As Anadarko’s engineering geoscience and
geotechnical engineering consultant, Fugro is assisting Anadarko with frontier fi eld subsea development, pipeline route
optimisation and terminal site selection including a port, rail and roads. In addition to site investigations, various other
studies such as site response analysis, probabilistic seismic hazard analysis, tsunami evaluation, detailed onshore,
nearshore, and offshore engineering, and a geohazards assessment that considers geologic faulting, site seismicity
and liquefaction potential are being performed simultaneously by various teams within Fugro to support the proposed
development. Fugro has set-up a geotechnical and construction materials testing laboratory near the proposed LNG
facility site in Mozambique to perform testing on core samples. A total of over 150 Fugro personnel from around the
world are working together to complete the fi eld investigations and subsequent reporting and consulting.
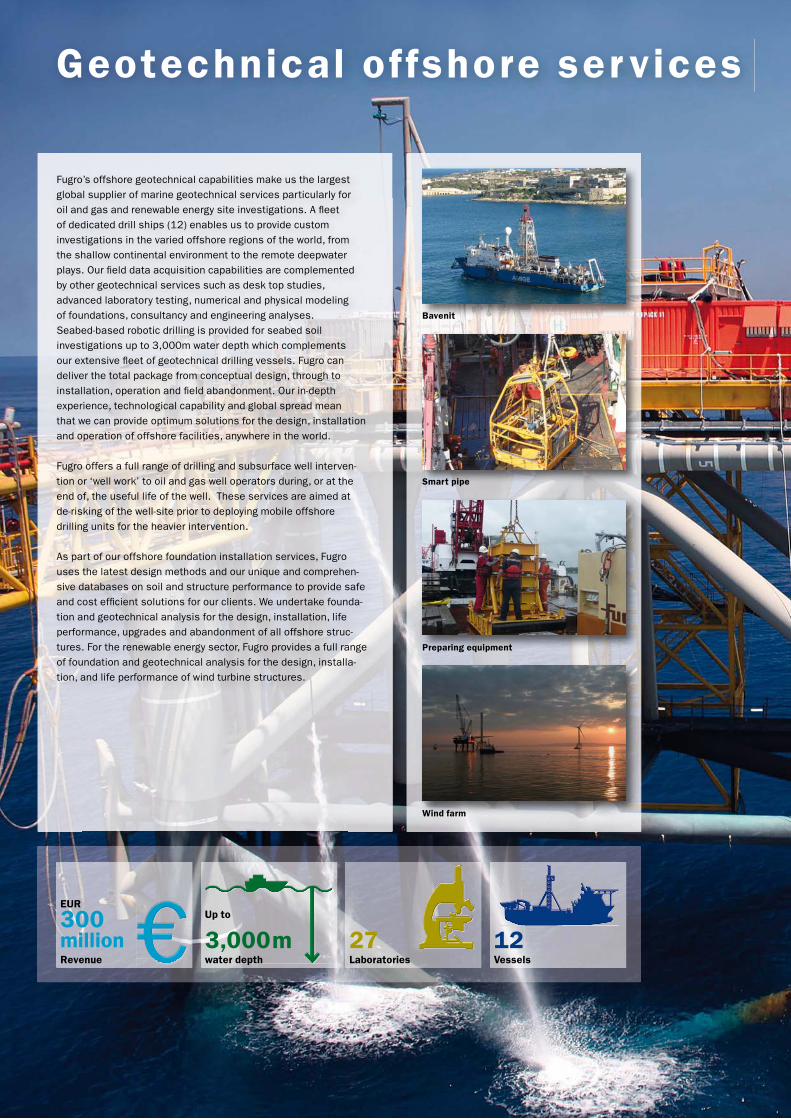
Fugro’s offshore geotechnical capabilities make us the largest
global supplier of marine geotechnical services particularly for
oil and gas and renewable energy site investigations. A fl eet
of dedicated drill ships (12) enables us to provide custom
investigations in the varied offshore regions of the world, from
the shallow continental environment to the remote deepwater
plays. Our fi eld data acquisition capabilities are complemented
by other geotechnical services such as desk top studies,
advanced laboratory testing, numerical and physical modeling
of foundations, consultancy and engineering analyses.
Seabed-based robotic drilling is provided for seabed soil
investigations up to 3,000m water depth which complements
our extensive fl eet of geotechnical drilling vessels. Fugro can
deliver the total package from conceptual design, through to
installation, operation and fi eld abandonment. Our in-depth
experience, technological capability and global spread mean
that we can provide optimum solutions for the design, installation
and operation of offshore facilities, anywhere in the world.
Fugro offers a full range of drilling and subsurface well interven-
tion or ‘well work’ to oil and gas well operators during, or at the
end of, the useful life of the well. These services are aimed at
de-risking of the well-site prior to deploying mobile offshore
drilling units for the heavier intervention.
As part of our offshore foundation installation services, Fugro
uses the latest design methods and our unique and comprehen-
sive databases on soil and structure performance to provide safe
and cost effi cient solutions for our clients. We undertake founda-
tion and geotechnical analysis for the design, installation, life
performance, upgrades and abandonment of all offshore struc-
tures. For the renewable energy sector, Fugro provides a full range
of foundation and geotechnical analysis for the design, installa-
tion, and life performance of wind turbine structures.
EUR
300 million
Geotechnical offshore ser vices
Vessels
12Revenue
Wind farm
Preparing equipment
Smart pipe
Bavenit
water depth
Up to
3,000 mLaboratories
27
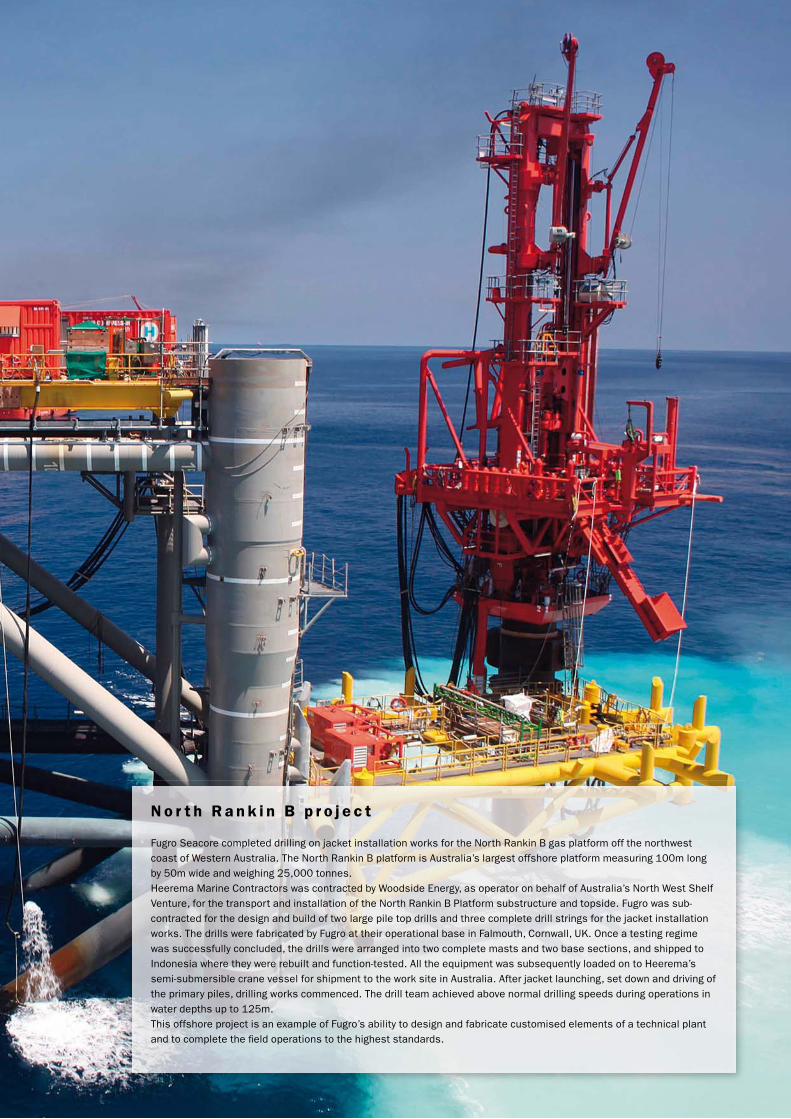
N o r t h R a n k i n B p r o j e c t
Fugro Seacore completed drilling on jacket installation works for the North Rankin B gas platform off the northwest
coast of Western Australia. The North Rankin B platform is Australia’s largest offshore platform measuring 100m long
by 50m wide and weighing 25,000 tonnes.
Heerema Marine Contractors was contracted by Woodside Energy, as operator on behalf of Australia’s North West Shelf
Venture, for the transport and installation of the North Rankin B Platform substructure and topside. Fugro was sub-
contracted for the design and build of two large pile top drills and three complete drill strings for the jacket installation
works. The drills were fabricated by Fugro at their operational base in Falmouth, Cornwall, UK. Once a testing regime
was successfully concluded, the drills were arranged into two complete masts and two base sections, and shipped to
Indonesia where they were rebuilt and function-tested. All the equipment was subsequently loaded on to Heerema’s
semi-submersible crane vessel for shipment to the work site in Australia. After jacket launching, set down and driving of
the primary piles, drilling works commenced. The drill team achieved above normal drilling speeds during operations in
water depths up to 125m.
This offshore project is an example of Fugro’s ability to design and fabricate customised elements of a technical plant
and to complete the fi eld operations to the highest standards.
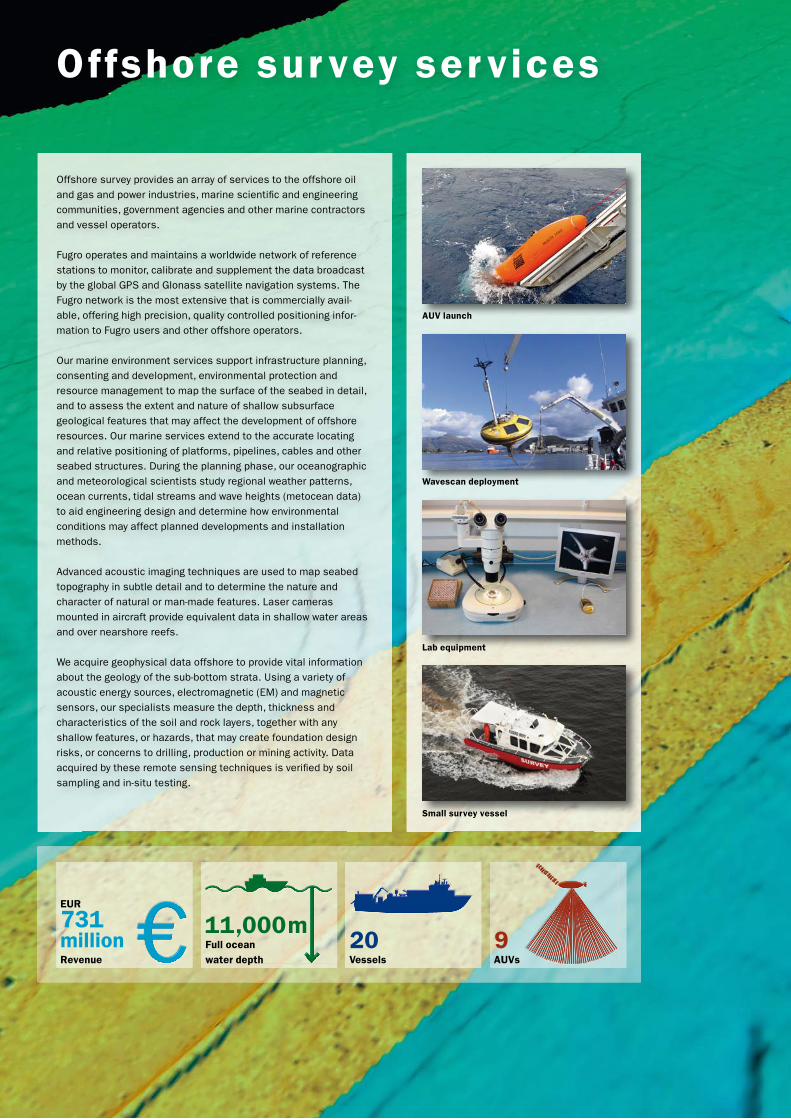
Offshore survey provides an array of services to the offshore oil
and gas and power industries, marine scientifi c and engineering
communities, government agencies and other marine contractors
and vessel operators.
Fugro operates and maintains a worldwide network of reference
stations to monitor, calibrate and supplement the data broadcast
by the global GPS and Glonass satellite navigation systems. The
Fugro network is the most extensive that is commercially avail-
able, offering high precision, quality controlled positioning infor-
mation to Fugro users and other offshore operators.
Our marine environment services support infrastructure planning,
consenting and development, environmental protection and
resource management to map the surface of the seabed in detail,
and to assess the extent and nature of shallow subsurface
geological features that may affect the development of offshore
resources. Our marine services extend to the accurate locating
and relative positioning of platforms, pipelines, cables and other
seabed structures. During the planning phase, our oceanographic
and meteorological scientists study regional weather patterns,
ocean currents, tidal streams and wave heights (metocean data)
to aid engineering design and determine how environmental
conditions may affect planned developments and installation
methods.
Advanced acoustic imaging techniques are used to map seabed
topography in subtle detail and to determine the nature and
character of natural or man-made features. Laser cameras
mounted in aircraft provide equivalent data in shallow water areas
and over nearshore reefs.
We acquire geophysical data offshore to provide vital information
about the geology of the sub-bottom strata. Using a variety of
acoustic energy sources, electromagnetic (EM) and magnetic
sensors, our specialists measure the depth, thickness and
characteristics of the soil and rock layers, together with any
shallow features, or hazards, that may create foundation design
risks, or concerns to drilling, production or mining activity. Data
acquired by these remote sensing techniques is verifi ed by soil
sampling and in-situ testing.
Small survey vessel
Lab equipment
Wavescan deployment
AUV launch
Of fshore sur vey ser vices
EUR
731 millionRevenue
Full ocean
water depth
11,000 m
Vessels AUVs
20 9
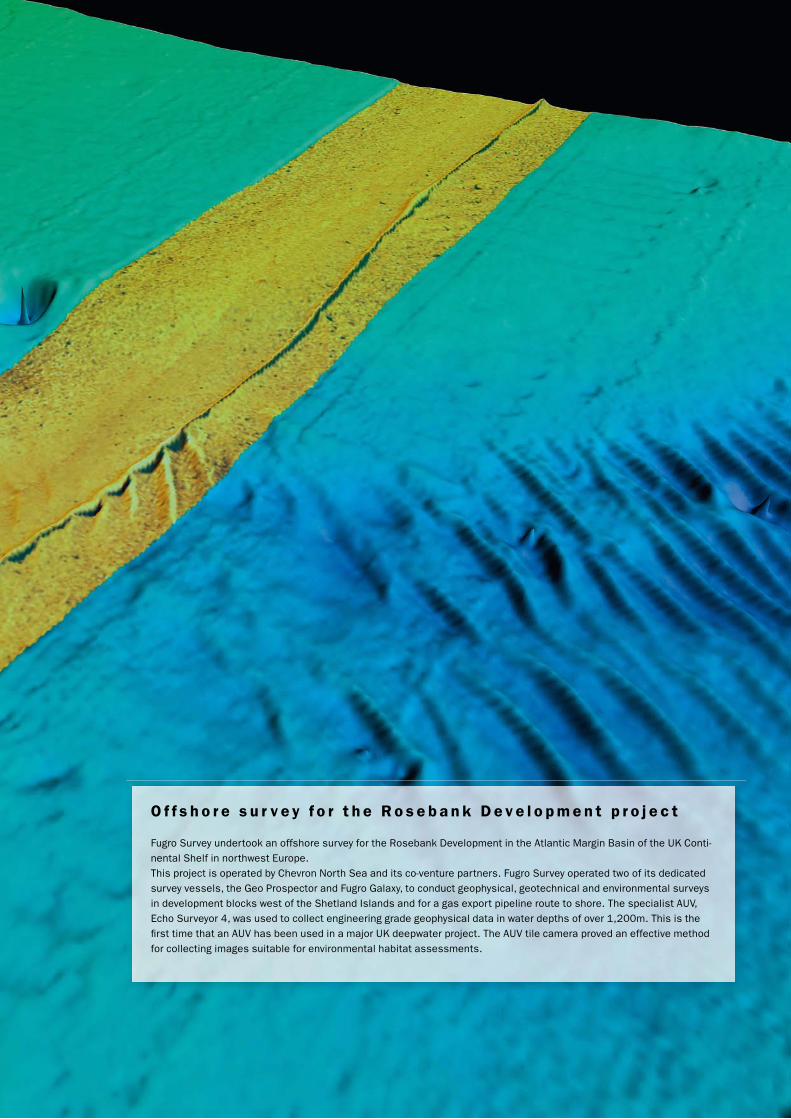
O f f s h o r e s u r v e y f o r t h e R o s e b a n k D e v e l o p m e n t p r o j e c t
Fugro Survey undertook an offshore survey for the Rosebank Development in the Atlantic Margin Basin of the UK Conti-
nental Shelf in northwest Europe.
This project is operated by Chevron North Sea and its co-venture partners. Fugro Survey operated two of its dedicated
survey vessels, the Geo Prospector and Fugro Galaxy, to conduct geophysical, geotechnical and environmental surveys
in development blocks west of the Shetland Islands and for a gas export pipeline route to shore. The specialist AUV,
Echo Surveyor 4, was used to collect engineering grade geophysical data in water depths of over 1,200m. This is the
fi rst time that an AUV has been used in a major UK deepwater project. The AUV tile camera proved an effective method
for collecting images suitable for environmental habitat assessments.
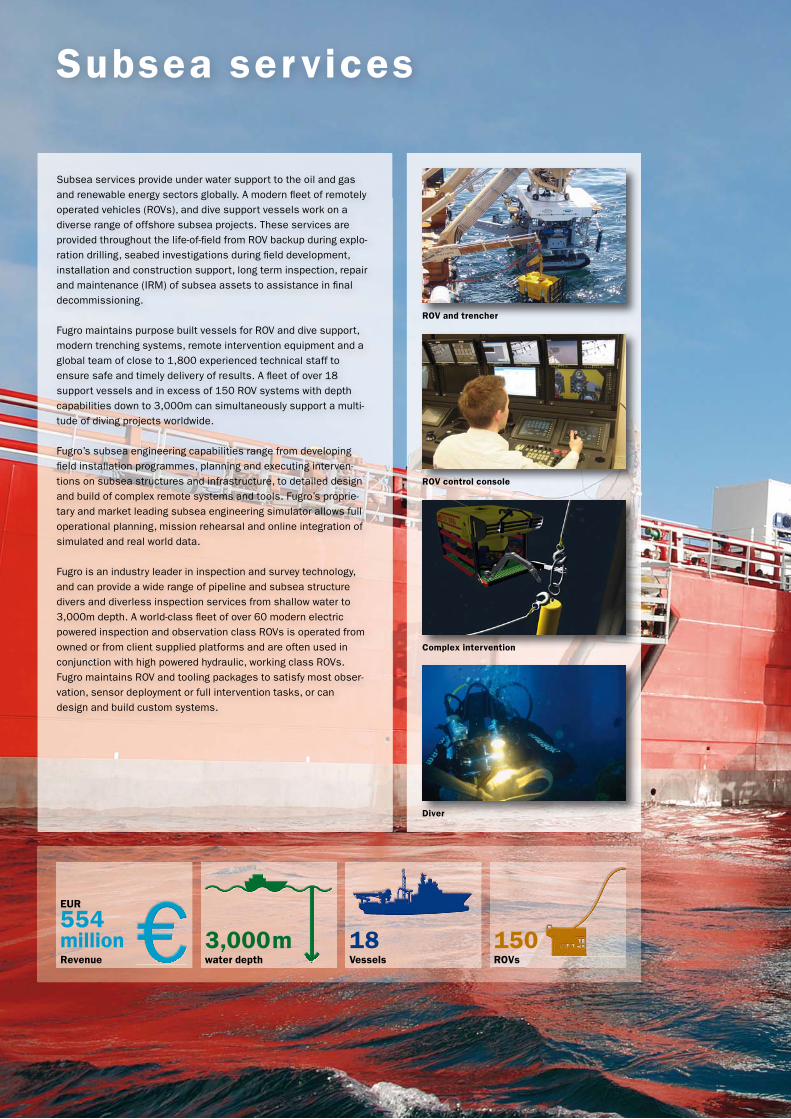
Subsea services provide under water support to the oil and gas
and renewable energy sectors globally. A modern fl eet of remotely
operated vehicles (ROVs), and dive support vessels work on a
diverse range of offshore subsea projects. These services are
provided throughout the life-of-fi eld from ROV backup during explo-
ration drilling, seabed investigations during fi eld development,
installation and construction support, long term inspection, repair
and maintenance (IRM) of subsea assets to assistance in fi nal
decommissioning.
Fugro maintains purpose built vessels for ROV and dive support,
modern trenching systems, remote intervention equipment and a
global team of close to 1,800 experienced technical staff to
ensure safe and timely delivery of results. A fl eet of over 18
support vessels and in excess of 150 ROV systems with depth
capabilities down to 3,000m can simultaneously support a multi-
tude of diving projects worldwide.
Fugro’s subsea engineering capabilities range from developing
fi eld installation programmes, planning and executing interven-
tions on subsea structures and infrastructure, to detailed design
and build of complex remote systems and tools. Fugro’s proprie-
tary and market leading subsea engineering simulator allows full
operational planning, mission rehearsal and online integration of
simulated and real world data.
Fugro is an industry leader in inspection and survey technology,
and can provide a wide range of pipeline and subsea structure
divers and diverless inspection services from shallow water to
3,000m depth. A world-class fl eet of over 60 modern electric
powered inspection and observation class ROVs is operated from
owned or from client supplied platforms and are often used in
conjunction with high powered hydraulic, working class ROVs.
Fugro maintains ROV and tooling packages to satisfy most obser-
vation, sensor deployment or full intervention tasks, or can
design and build custom systems.
Diver
Complex intervention
ROV control console
ROV and trencher
Subsea ser vices
EUR
554 millionRevenue water depth
3,000 mVessels
18 150ROVs
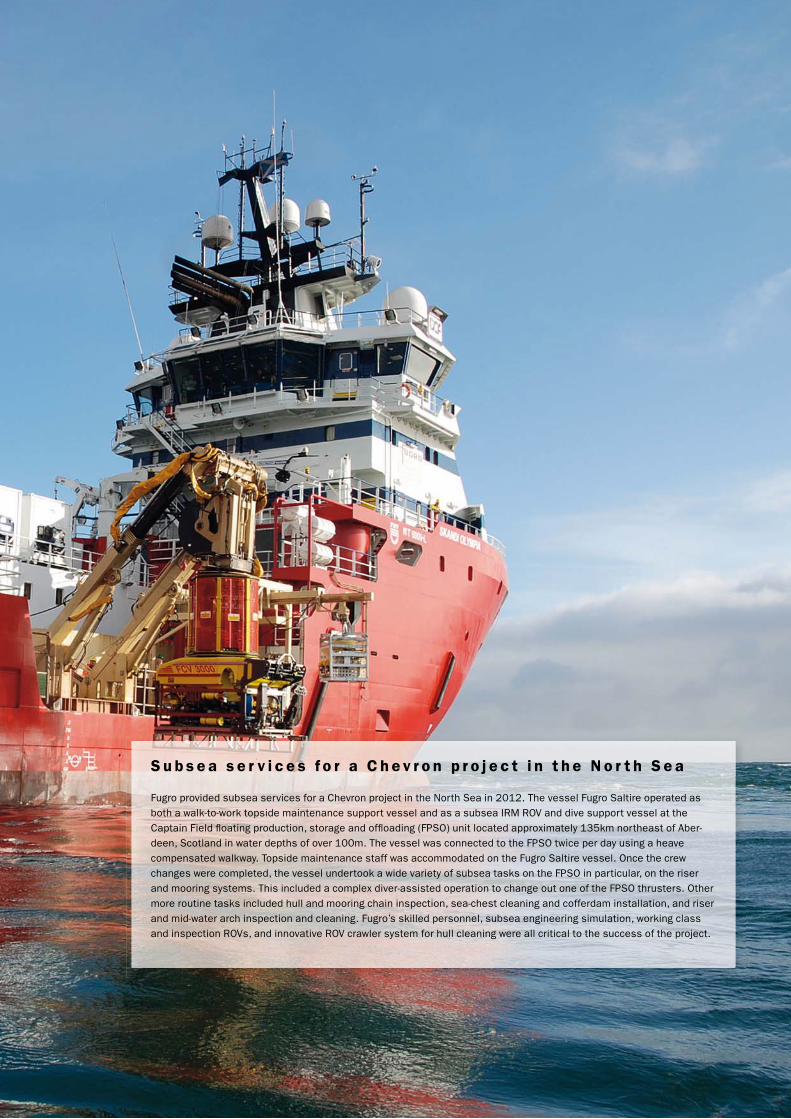
S u b s e a s e r v i c e s f o r a C h e v r o n p r o j e c t i n t h e N o r t h S e a
Fugro provided subsea services for a Chevron project in the North Sea in 2012. The vessel Fugro Saltire operated as
both a walk-to-work topside maintenance support vessel and as a subsea IRM ROV and dive support vessel at the
Captain Field fl oating production, storage and offl oading (FPSO) unit located approximately 135km northeast of Aber-
deen, Scotland in water depths of over 100m. The vessel was connected to the FPSO twice per day using a heave
compensated walkway. Topside maintenance staff was accommodated on the Fugro Saltire vessel. Once the crew
changes were completed, the vessel undertook a wide variety of subsea tasks on the FPSO in particular, on the riser
and mooring systems. This included a complex diver-assisted operation to change out one of the FPSO thrusters. Other
more routine tasks included hull and mooring chain inspection, sea-chest cleaning and cofferdam installation, and riser
and mid-water arch inspection and cleaning. Fugro’s skilled personnel, subsea engineering simulation, working class
and inspection ROVs, and innovative ROV crawler system for hull cleaning were all critical to the success of the project.

Geospatial services encompass a complete range of survey and
mapping capabilities using satellite, aerial and terrestrial based
sensors to acquire geospatial data for government agencies, utili-
ties, energy and resource sectors. The data is processed to
create GIS-based solutions in support of land management, infra-
structure planning, resource exploration and development, urban
planning, economic development, emergency response, engi-
neering activities and environmental monitoring.
Spurred on by the availability of maps and earth imagery on the
Internet, there is a growing trend to represent and visualize the
fast changing world through more accurate and detailed maps,
aerial images, and 3-D models. To meet the growing demand for
precise and up-to-date geospatial data, Fugro provides special-
ized aerial mapping services. They consist of FLI-MAP narrow
corridor mapping of electric utilities, railroad and other infrastruc-
ture; specialized imagery of towns and cities; and GeoSAR
(Geographic Synthetic Aperture Radar) ultra wide-area mapping
activities. Terrestrial based survey services not only provide
conventional land survey services particularly for the energy
industry but also support a range of specialised niche services
such as dimensional control, metrology in industrial plants, geo-
monitoring, subsurface infrastructure mapping, mobile mapping
and static laser scanning. The data acquired using the wide-
ranging survey sensors is processed (using proprietary software)
to produce information for creating geospatial images, maps and
3-D models. This enables our clients to visualize the results of
the surveys in a convenient digital environment to aid their deci-
sion making processes.
Our other customary mapping services comprise the acquisition
of digital aerial imagery from which a wide range of products such
as photogrammetric mapping, digital elevation models, digital
terrain models, topographic datasets and thematic maps can be
generated. Additional services include wide-area LiDAR (Light
Detection And Ranging) laser mapping services for fast and accu-
rate elevation modeling for engineering-grade corridor mapping
and large area topographic and bathymetric mapping.
3-D modelling
Thermal rating
DRIVE-MAP
Surveyor
Geospatial ser vices
EUR
104 millionRevenue On land
5–10 mAircraftsLiDAR systems
2716 1616

C S X r a i l p r o j e c t
Fugro was contracted for the last 3-years by a major freight rail company, CSX, to collect and process high-resolution
LiDAR data and imagery over their entire rail network in the eastern half of the United States.
This information is being used to support the creation of an accurate positional database of rail features required for
Positive Train Control (PTC) operations. By the end of 2012, Fugro had collected over 40,000km of data using Fugro’s
FLI-MAP LiDAR system that was installed in a helicopter; rail areas obscured from aerial data collection were captured
using Fugro’s DRIVE-MAP mobile LiDAR system operating on the railway lines. Feature identifi cation, precise positioning,
and automatic feature extraction were accomplished using a combination of Fugro’s data processing experts and
CSX in-house data processors using Fugro’s FLIP7 LiDAR processing software. Imagery captured with the FLI-MAP
system was made available throughout CSX by custom integration of Fugro’s FLI-Track-Web application and
CSX’s in-house GIS system.
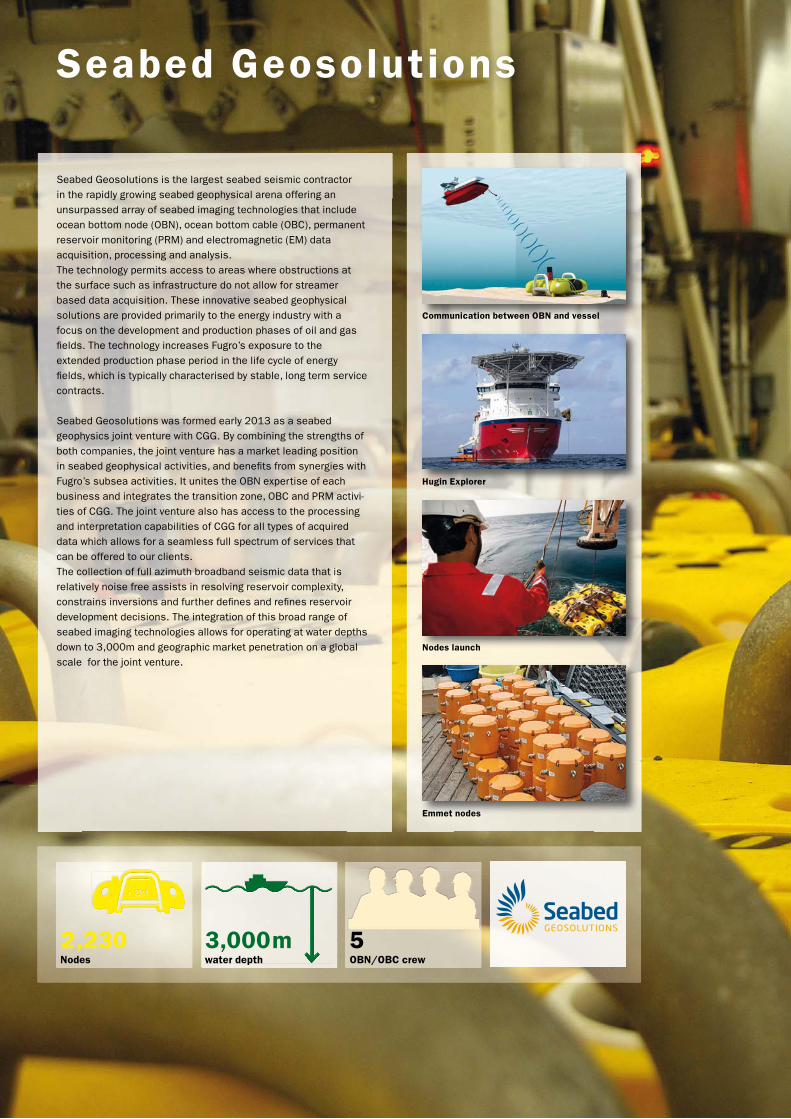
Seabed Geosolutions is the largest seabed seismic contractor
in the rapidly growing seabed geophysical arena offering an
unsurpassed array of seabed imaging technologies that include
ocean bottom node (OBN), ocean bottom cable (OBC), permanent
reservoir monitoring (PRM) and electromagnetic (EM) data
acquisition, processing and analysis.
The technology permits access to areas where obstructions at
the surface such as infrastructure do not allow for streamer
based data acquisition. These innovative seabed geophysical
solutions are provided primarily to the energy industry with a
focus on the development and production phases of oil and gas
fi elds. The technology increases Fugro’s exposure to the
extended production phase period in the life cycle of energy
fi elds, which is typically characterised by stable, long term service
contracts.
Seabed Geosolutions was formed early 2013 as a seabed
geophysics joint venture with CGG. By combining the strengths of
both companies, the joint venture has a market leading position
in seabed geophysical activities, and benefi ts from synergies with
Fugro’s subsea activities. It unites the OBN expertise of each
business and integrates the transition zone, OBC and PRM activi-
ties of CGG. The joint venture also has access to the processing
and interpretation capabilities of CGG for all types of acquired
data which allows for a seamless full spectrum of services that
can be offered to our clients.
The collection of full azimuth broadband seismic data that is
relatively noise free assists in resolving reservoir complexity,
constrains inversions and further defi nes and refi nes reservoir
development decisions. The integration of this broad range of
seabed imaging technologies allows for operating at water depths
down to 3,000m and geographic market penetration on a global
scale for the joint venture.
Seabed Geosolutions
Emmet nodes
Nodes launch
Hugin Explorer
Communication between OBN and vessel
Nodes
2,230OBN/OBC crew
5water depth
3,000 m
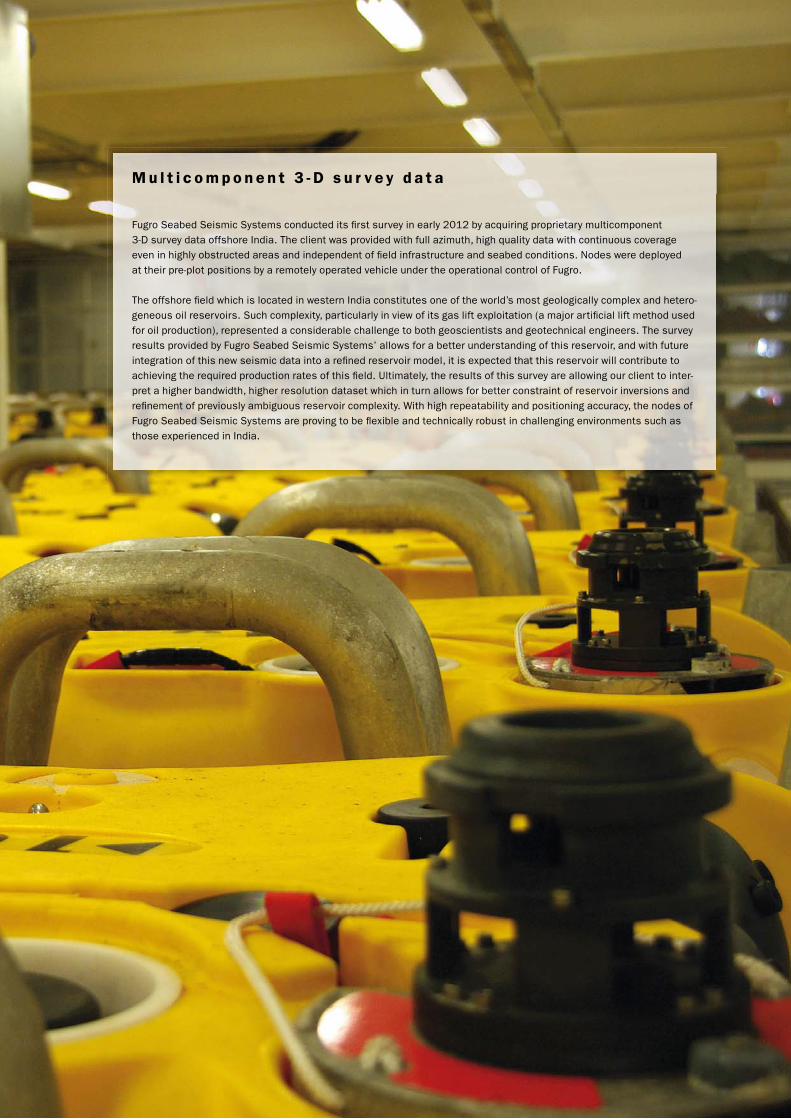
M u l t i c o m p o n e n t 3 - D s u r v e y d a t a
Fugro Seabed Seismic Systems conducted its fi rst survey in early 2012 by acquiring proprietary multicomponent
3-D survey data offshore India. The client was provided with full azimuth, high quality data with continuous coverage
even in highly obstructed areas and independent of fi eld infrastructure and seabed conditions. Nodes were deployed
at their pre-plot positions by a remotely operated vehicle under the operational control of Fugro.
The offshore fi eld which is located in western India constitutes one of the world’s most geologically complex and hetero-
geneous oil reservoirs. Such complexity, particularly in view of its gas lift exploitation (a major artifi cial lift method used
for oil production), represented a considerable challenge to both geoscientists and geotechnical engineers. The survey
results provided by Fugro Seabed Seismic Systems’ allows for a better understanding of this reservoir, and with future
integration of this new seismic data into a refi ned reservoir model, it is expected that this reservoir will contribute to
achieving the required production rates of this fi eld. Ultimately, the results of this survey are allowing our client to inter-
pret a higher bandwidth, higher resolution dataset which in turn allows for better constraint of reservoir inversions and
refi nement of previously ambiguous reservoir complexity. With high repeatability and positioning accuracy, the nodes of
Fugro Seabed Seismic Systems are proving to be fl exible and technically robust in challenging environments such as
those experienced in India.

Corporate SocialResponsibi l i ty
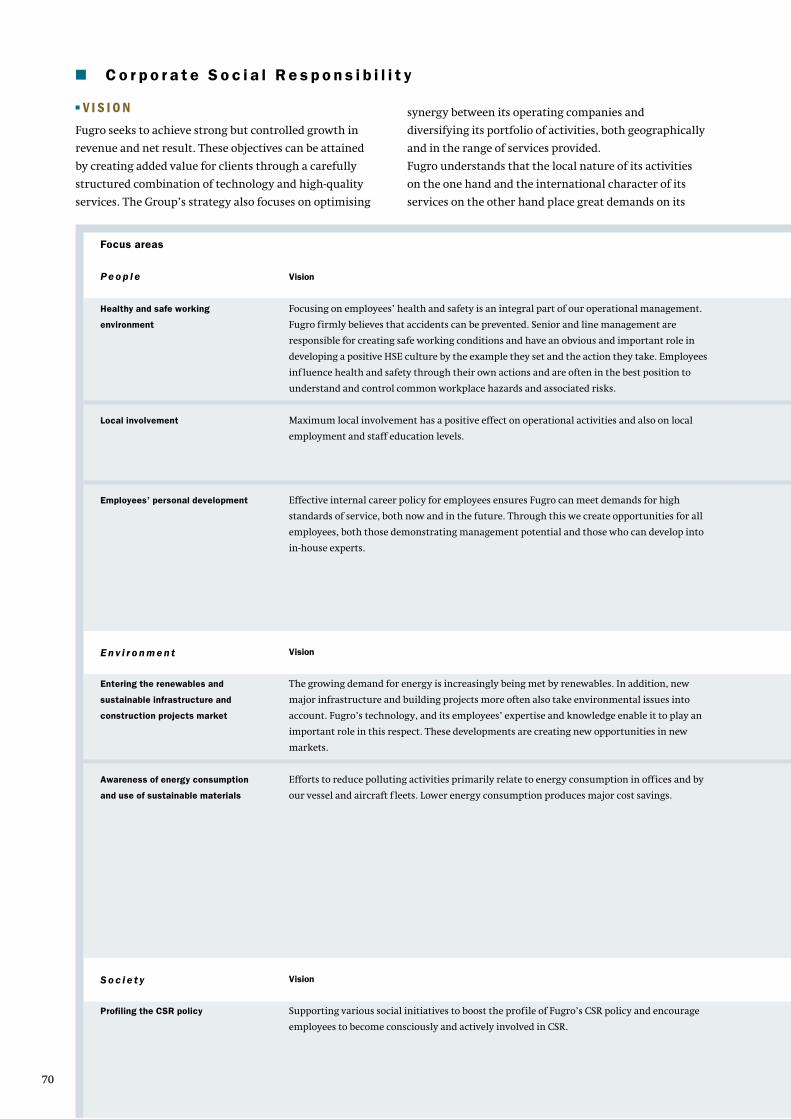
70
■ C o r p o r a t e S o c i a l R e s p o n s i b i l i t y
■ V I S I O N
Fugro seeks to achieve strong but controlled growth in
revenue and net result. These objectives can be attained
by creating added value for clients through a carefully
structured combination of technology and high-quality
services. The Group’s strategy also focuses on optimising
synergy between its operating companies and
diversifying its portfolio of activities, both geographically
and in the range of services provided.
Fugro understands that the local nature of its activities
on the one hand and the international character of its
services on the other hand place great demands on its
Focus areas
Pe o p l e Vision
Healthy and safe working
environment
Focusing on employees’ health and safety is an integral part of our operational management.
Fugro firmly believes that accidents can be prevented. Senior and line management are
responsible for creating safe working conditions and have an obvious and important role in
developing a positive HSE culture by the example they set and the action they take. Employees
influence health and safety through their own actions and are often in the best position to
understand and control common workplace hazards and associated risks.
Local involvement Maximum local involvement has a positive effect on operational activities and also on local
employment and staff education levels.
Employees’ personal development Effective internal career policy for employees ensures Fugro can meet demands for high
standards of service, both now and in the future. Through this we create opportunities for all
employees, both those demonstrating management potential and those who can develop into
in-house experts.
E n v i r o n m e n t Vision
Entering the renewables and
sustainable infrastructure and
construction projects market
The growing demand for energy is increasingly being met by renewables. In addition, new
major infrastructure and building projects more often also take environmental issues into
account. Fugro’s technology, and its employees’ expertise and knowledge enable it to play an
important role in this respect. These developments are creating new opportunities in new
markets.
Awareness of energy consumption
and use of sustainable materials
Efforts to reduce polluting activities primarily relate to energy consumption in offices and by
our vessel and aircraft f leets. Lower energy consumption produces major cost savings.
S o c i e t y Vision
Profiling the CSR policy Supporting various social initiatives to boost the profile of Fugro’s CSR policy and encourage
employees to become consciously and actively involved in CSR.
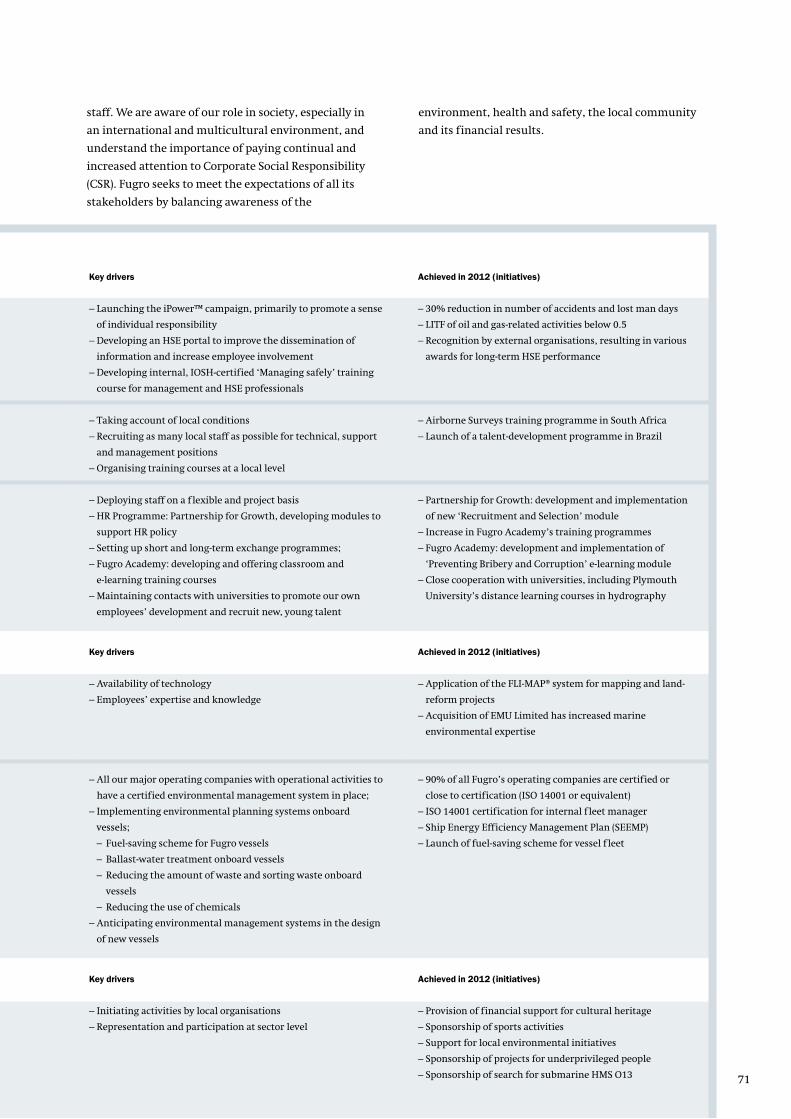
71Corporate Social Responsibility
staff. We are aware of our role in society, especially in
an international and multicultural environment, and
understand the importance of paying continual and
increased attention to Corporate Social Responsibility
(CSR). Fugro seeks to meet the expectations of all its
stakeholders by balancing awareness of the
environment, health and safety, the local community
and its financial results.
Key drivers Achieved in 2012 (initiatives)
– Launching the iPower™ campaign, primarily to promote a sense
of individual responsibility
– Developing an HSE portal to improve the dissemination of
information and increase employee involvement
– Developing internal, IOSH-certified ‘Managing safely’ training
course for management and HSE professionals
– 30% reduction in number of accidents and lost man days
– LITF of oil and gas-related activities below 0.5
– Recognition by external organisations, resulting in various
awards for long-term HSE performance
– Taking account of local conditions
– Recruiting as many local staff as possible for technical, support
and management positions
– Organising training courses at a local level
– Airborne Surveys training programme in South Africa
– Launch of a talent-development programme in Brazil
– Deploying staff on a f lexible and project basis
– HR Programme: Partnership for Growth, developing modules to
support HR policy
– Setting up short and long-term exchange programmes;
– Fugro Academy: developing and offering classroom and
e-learning training courses
– Maintaining contacts with universities to promote our own
employees’ development and recruit new, young talent
– Partnership for Growth: development and implementation
of new ‘Recruitment and Selection’ module
– Increase in Fugro Academy’s training programmes
– Fugro Academy: development and implementation of
‘Preventing Bribery and Corruption’ e-learning module
– Close cooperation with universities, including Plymouth
University’s distance learning courses in hydrography
Key drivers Achieved in 2012 (initiatives)
– Availability of technology
– Employees’ expertise and knowledge
– Application of the FLI-MAP® system for mapping and land-
reform projects
– Acquisition of EMU Limited has increased marine
environmental expertise
– All our major operating companies with operational activities to
have a certified environmental management system in place;
– Implementing environmental planning systems onboard
vessels;
– Fuel-saving scheme for Fugro vessels
– Ballast-water treatment onboard vessels
– Reducing the amount of waste and sorting waste onboard
vessels
– Reducing the use of chemicals
– Anticipating environmental management systems in the design
of new vessels
– 90% of all Fugro’s operating companies are certified or
close to certification (ISO 14001 or equivalent)
– ISO 14001 certification for internal f leet manager
– Ship Energy Efficiency Management Plan (SEEMP)
– Launch of fuel-saving scheme for vessel f leet
Key drivers Achieved in 2012 (initiatives)
– Initiating activities by local organisations
– Representation and participation at sector level
– Provision of financial support for cultural heritage
– Sponsorship of sports activities
– Support for local environmental initiatives
– Sponsorship of projects for underprivileged people
– Sponsorship of search for submarine HMS O13
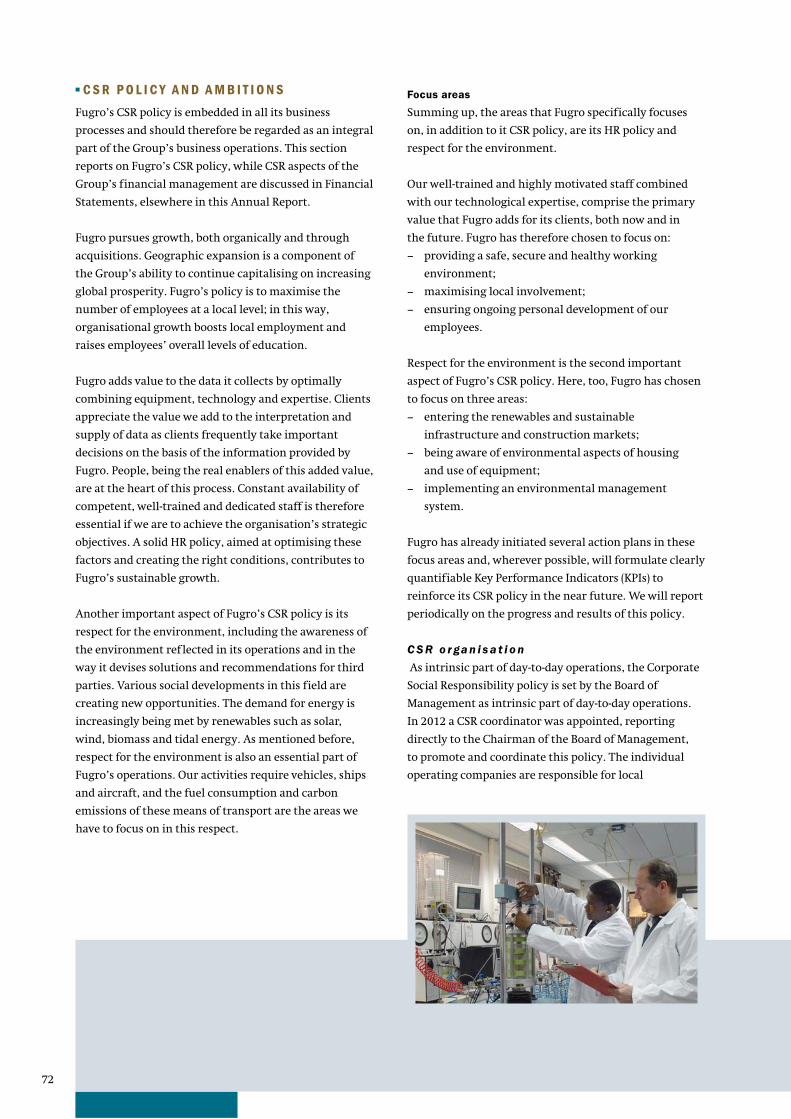
72
■ C S R P O L I C Y A N D A M B I T I O N S
Fugro’s CSR policy is embedded in all its business
processes and should therefore be regarded as an integral
part of the Group’s business operations. This section
reports on Fugro’s CSR policy, while CSR aspects of the
Group’s financial management are discussed in Financial
Statements, elsewhere in this Annual Report.
Fugro pursues growth, both organically and through
acquisitions. Geographic expansion is a component of
the Group’s ability to continue capitalising on increasing
global prosperity. Fugro’s policy is to maximise the
number of employees at a local level; in this way,
organisational growth boosts local employment and
raises employees’ overall levels of education.
Fugro adds value to the data it collects by optimally
combining equipment, technology and expertise. Clients
appreciate the value we add to the interpretation and
supply of data as clients frequently take important
decisions on the basis of the information provided by
Fugro. People, being the real enablers of this added value,
are at the heart of this process. Constant availability of
competent, well-trained and dedicated staff is therefore
essential if we are to achieve the organisation’s strategic
objectives. A solid HR policy, aimed at optimising these
factors and creating the right conditions, contributes to
Fugro’s sustainable growth.
Another important aspect of Fugro’s CSR policy is its
respect for the environment, including the awareness of
the environment reflected in its operations and in the
way it devises solutions and recommendations for third
parties. Various social developments in this field are
creating new opportunities. The demand for energy is
increasingly being met by renewables such as solar,
wind, biomass and tidal energy. As mentioned before,
respect for the environment is also an essential part of
Fugro’s operations. Our activities require vehicles, ships
and aircraft, and the fuel consumption and carbon
emissions of these means of transport are the areas we
have to focus on in this respect.
Focus areas
Summing up, the areas that Fugro specifically focuses
on, in addition to it CSR policy, are its HR policy and
respect for the environment.
Our well-trained and highly motivated staff combined
with our technological expertise, comprise the primary
value that Fugro adds for its clients, both now and in
the future. Fugro has therefore chosen to focus on:
− providing a safe, secure and healthy working
environment;
− maximising local involvement;
− ensuring ongoing personal development of our
employees.
Respect for the environment is the second important
aspect of Fugro’s CSR policy. Here, too, Fugro has chosen
to focus on three areas:
− entering the renewables and sustainable
infrastructure and construction markets;
− being aware of environmental aspects of housing
and use of equipment;
− implementing an environmental management
system.
Fugro has already initiated several action plans in these
focus areas and, wherever possible, will formulate clearly
quantifiable Key Performance Indicators (KPIs) to
reinforce its CSR policy in the near future. We will report
periodically on the progress and results of this policy.
C S R o r ga n i s a t i o n
As intrinsic part of day-to-day operations, the Corporate
Social Responsibility policy is set by the Board of
Management as intrinsic part of day-to-day operations.
In 2012 a CSR coordinator was appointed, reporting
directly to the Chairman of the Board of Management,
to promote and coordinate this policy. The individual
operating companies are responsible for local
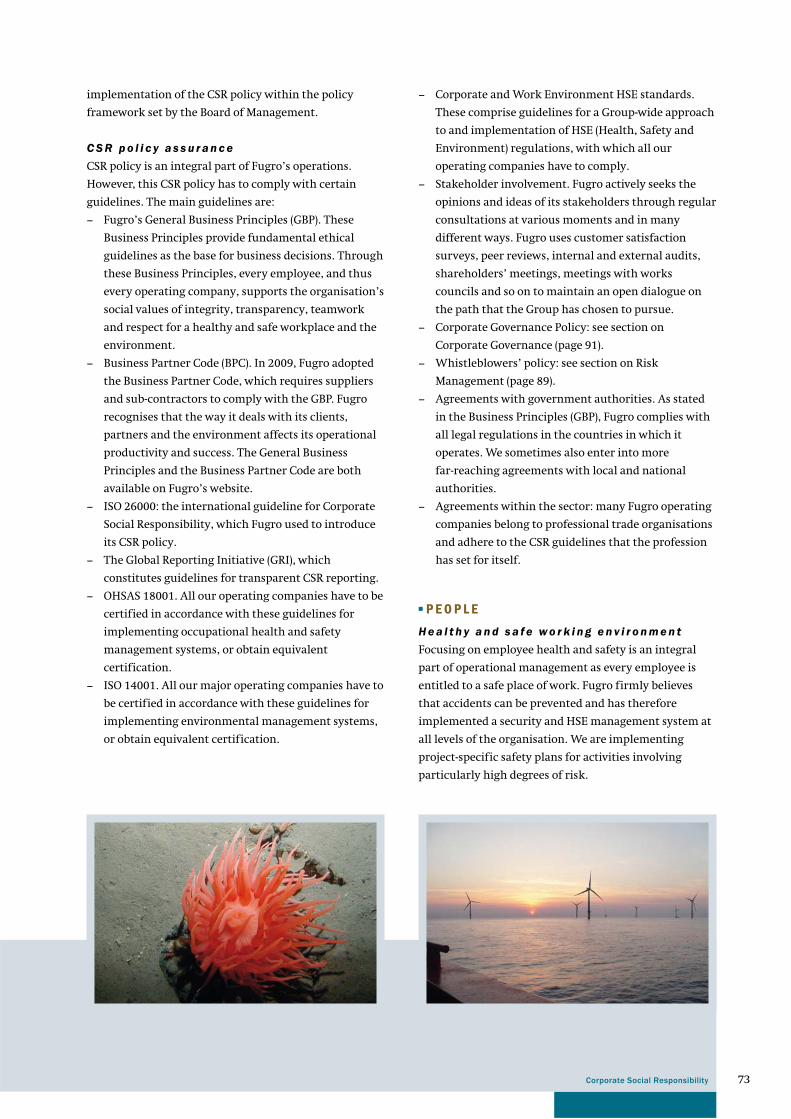
73
implementation of the CSR policy within the policy
framework set by the Board of Management.
C S R p o l i c y a s s u r a n c e
CSR policy is an integral part of Fugro’s operations.
However, this CSR policy has to comply with certain
guidelines. The main guidelines are:
− Fugro’s General Business Principles (GBP). These
Business Principles provide fundamental ethical
guidelines as the base for business decisions. Through
these Business Principles, every employee, and thus
every operating company, supports the organisation’s
social values of integrity, transparency, teamwork
and respect for a healthy and safe workplace and the
environment.
− Business Partner Code (BPC). In 2009, Fugro adopted
the Business Partner Code, which requires suppliers
and sub-contractors to comply with the GBP. Fugro
recognises that the way it deals with its clients,
partners and the environment affects its operational
productivity and success. The General Business
Principles and the Business Partner Code are both
available on Fugro’s website.
− ISO 26000: the international guideline for Corporate
Social Responsibility, which Fugro used to introduce
its CSR policy.
− The Global Reporting Initiative (GRI), which
constitutes guidelines for transparent CSR reporting.
− OHSAS 18001. All our operating companies have to be
certified in accordance with these guidelines for
implementing occupational health and safety
management systems, or obtain equivalent
certification.
− ISO 14001. All our major operating companies have to
be certified in accordance with these guidelines for
implementing environmental management systems,
or obtain equivalent certification.
− Corporate and Work Environment HSE standards.
These comprise guidelines for a Group-wide approach
to and implementation of HSE (Health, Safety and
Environment) regulations, with which all our
operating companies have to comply.
− Stakeholder involvement. Fugro actively seeks the
opinions and ideas of its stakeholders through regular
consultations at various moments and in many
different ways. Fugro uses customer satisfaction
surveys, peer reviews, internal and external audits,
shareholders’ meetings, meetings with works
councils and so on to maintain an open dialogue on
the path that the Group has chosen to pursue.
− Corporate Governance Policy: see section on
Corporate Governance (page 91).
− Whistleblowers’ policy: see section on Risk
Management (page 89).
− Agreements with government authorities. As stated
in the Business Principles (GBP), Fugro complies with
all legal regulations in the countries in which it
operates. We sometimes also enter into more
far-reaching agreements with local and national
authorities.
− Agreements within the sector: many Fugro operating
companies belong to professional trade organisations
and adhere to the CSR guidelines that the profession
has set for itself.
■ P E O P L E
H e a l t h y a n d s a f e wo r k i n g e n v i r o n m e n t
Focusing on employee health and safety is an integral
part of operational management as every employee is
entitled to a safe place of work. Fugro firmly believes
that accidents can be prevented and has therefore
implemented a security and HSE management system at
all levels of the organisation. We are implementing
project-specific safety plans for activities involving
particularly high degrees of risk.
Corporate Social Responsibility
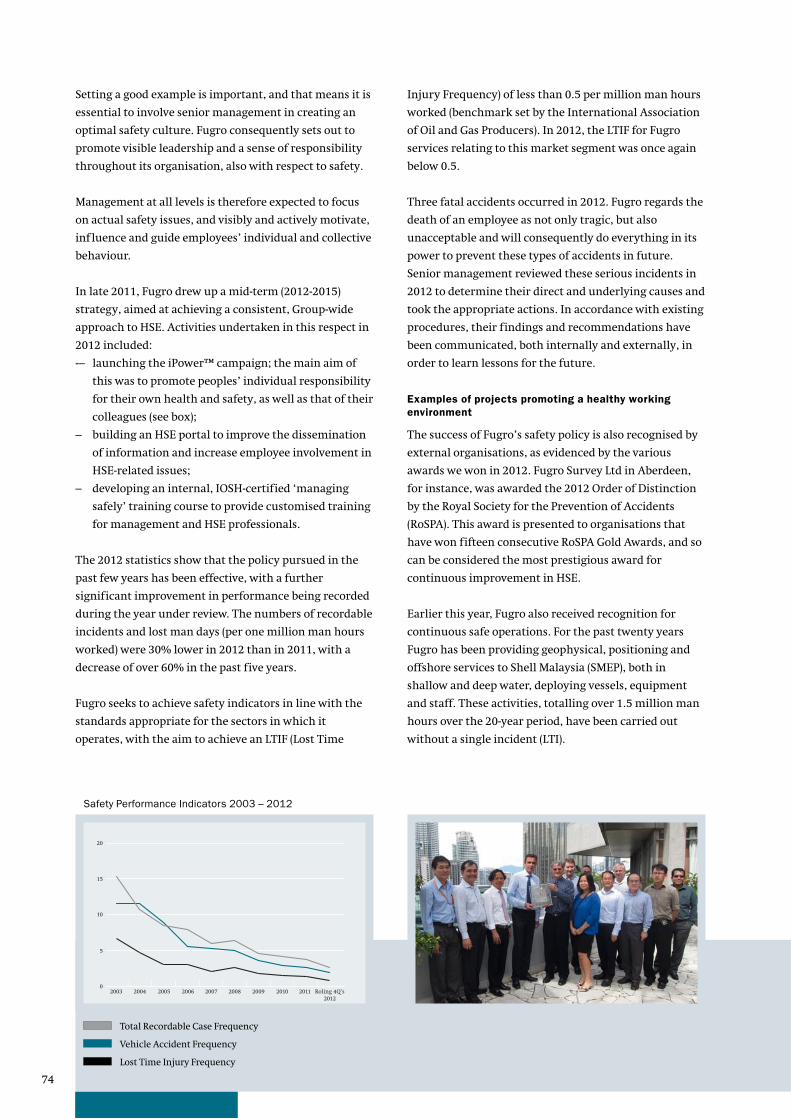
74
0
5
10
15
20
2010 2011 Roling 4Q’s2012
2009200820072004 2005 20062003
Total Recordable Case Frequency
Vehicle Accident Frequency
Lost Time Injury Frequency
Safety Performance Indicators 2003 – 2012
Injury Frequency) of less than 0.5 per million man hours
worked (benchmark set by the International Association
of Oil and Gas Producers). In 2012, the LTIF for Fugro
services relating to this market segment was once again
below 0.5.
Three fatal accidents occurred in 2012. Fugro regards the
death of an employee as not only tragic, but also
unacceptable and will consequently do everything in its
power to prevent these types of accidents in future.
Senior management reviewed these serious incidents in
2012 to determine their direct and underlying causes and
took the appropriate actions. In accordance with existing
procedures, their findings and recommendations have
been communicated, both internally and externally, in
order to learn lessons for the future.
Examples of projects promoting a healthy working
environment
The success of Fugro’s safety policy is also recognised by
external organisations, as evidenced by the various
awards we won in 2012. Fugro Survey Ltd in Aberdeen,
for instance, was awarded the 2012 Order of Distinction
by the Royal Society for the Prevention of Accidents
(RoSPA). This award is presented to organisations that
have won fifteen consecutive RoSPA Gold Awards, and so
can be considered the most prestigious award for
continuous improvement in HSE.
Earlier this year, Fugro also received recognition for
continuous safe operations. For the past twenty years
Fugro has been providing geophysical, positioning and
offshore services to Shell Malaysia (SMEP), both in
shallow and deep water, deploying vessels, equipment
and staff. These activities, totalling over 1.5 million man
hours over the 20-year period, have been carried out
without a single incident (LTI).
Setting a good example is important, and that means it is
essential to involve senior management in creating an
optimal safety culture. Fugro consequently sets out to
promote visible leadership and a sense of responsibility
throughout its organisation, also with respect to safety.
Management at all levels is therefore expected to focus
on actual safety issues, and visibly and actively motivate,
influence and guide employees’ individual and collective
behaviour.
In late 2011, Fugro drew up a mid-term (2012-2015)
strategy, aimed at achieving a consistent, Group-wide
approach to HSE. Activities undertaken in this respect in
2012 included:
-– launching the iPower™ campaign; the main aim of
this was to promote peoples’ individual responsibility
for their own health and safety, as well as that of their
colleagues (see box);
– building an HSE portal to improve the dissemination
of information and increase employee involvement in
HSE-related issues;
– developing an internal, IOSH-certified ‘managing
safely’ training course to provide customised training
for management and HSE professionals.
The 2012 statistics show that the policy pursued in the
past few years has been effective, with a further
significant improvement in performance being recorded
during the year under review. The numbers of recordable
incidents and lost man days (per one million man hours
worked) were 30% lower in 2012 than in 2011, with a
decrease of over 60% in the past five years.
Fugro seeks to achieve safety indicators in line with the
standards appropriate for the sectors in which it
operates, with the aim to achieve an LTIF (Lost Time
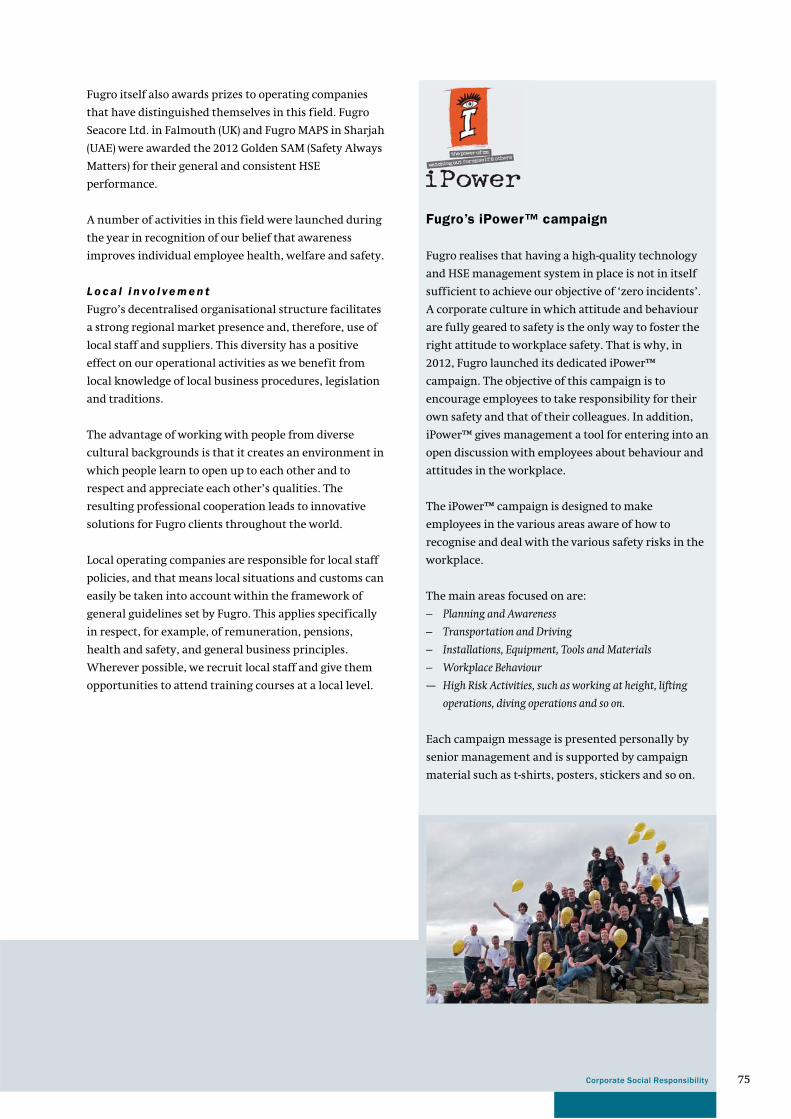
75Corporate Social Responsibility
Fugro’s iPower™ campaign
Fugro realises that having a high-quality technology
and HSE management system in place is not in itself
sufficient to achieve our objective of ‘zero incidents’.
A corporate culture in which attitude and behaviour
are fully geared to safety is the only way to foster the
right attitude to workplace safety. That is why, in
2012, Fugro launched its dedicated iPower™
campaign. The objective of this campaign is to
encourage employees to take responsibility for their
own safety and that of their colleagues. In addition,
iPower™ gives management a tool for entering into an
open discussion with employees about behaviour and
attitudes in the workplace.
The iPower™ campaign is designed to make
employees in the various areas aware of how to
recognise and deal with the various safety risks in the
workplace.
The main areas focused on are:
– Planning and Awareness
– Transportation and Driving
– Installations, Equipment, Tools and Materials
– Workplace Behaviour
-– High Risk Activities, such as working at height, lifting
operations, diving operations and so on.
Each campaign message is presented personally by
senior management and is supported by campaign
material such as t-shirts, posters, stickers and so on.
Fugro itself also awards prizes to operating companies
that have distinguished themselves in this field. Fugro
Seacore Ltd. in Falmouth (UK) and Fugro MAPS in Sharjah
(UAE) were awarded the 2012 Golden SAM (Safety Always
Matters) for their general and consistent HSE
performance.
A number of activities in this field were launched during
the year in recognition of our belief that awareness
improves individual employee health, welfare and safety.
L o c a l i n v o l ve m e n t
Fugro’s decentralised organisational structure facilitates
a strong regional market presence and, therefore, use of
local staff and suppliers. This diversity has a positive
effect on our operational activities as we benefit from
local knowledge of local business procedures, legislation
and traditions.
The advantage of working with people from diverse
cultural backgrounds is that it creates an environment in
which people learn to open up to each other and to
respect and appreciate each other’s qualities. The
resulting professional cooperation leads to innovative
solutions for Fugro clients throughout the world.
Local operating companies are responsible for local staff
policies, and that means local situations and customs can
easily be taken into account within the framework of
general guidelines set by Fugro. This applies specifically
in respect, for example, of remuneration, pensions,
health and safety, and general business principles.
Wherever possible, we recruit local staff and give them
opportunities to attend training courses at a local level.
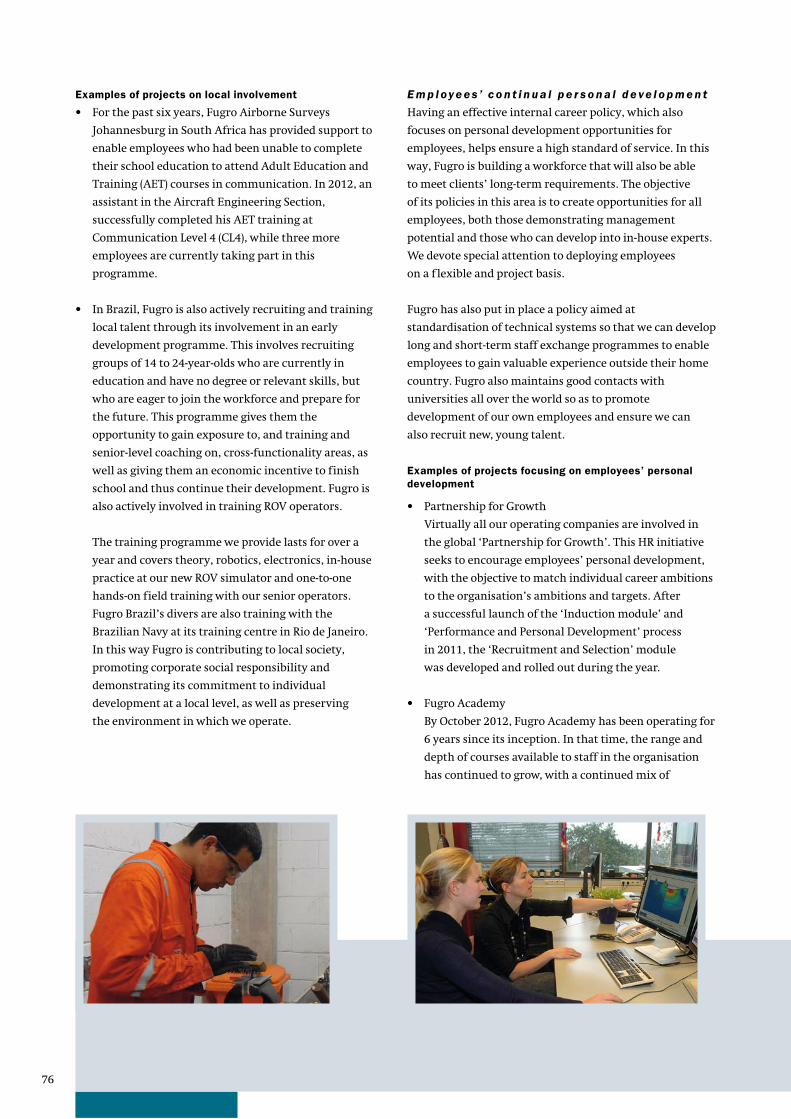
76
Examples of projects on local involvement
• For the past six years, Fugro Airborne Surveys
Johannesburg in South Africa has provided support to
enable employees who had been unable to complete
their school education to attend Adult Education and
Training (AET) courses in communication. In 2012, an
assistant in the Aircraft Engineering Section,
successfully completed his AET training at
Communication Level 4 (CL4), while three more
employees are currently taking part in this
programme.
• In Brazil, Fugro is also actively recruiting and training
local talent through its involvement in an early
development programme. This involves recruiting
groups of 14 to 24-year-olds who are currently in
education and have no degree or relevant skills, but
who are eager to join the workforce and prepare for
the future. This programme gives them the
opportunity to gain exposure to, and training and
senior-level coaching on, cross-functionality areas, as
well as giving them an economic incentive to finish
school and thus continue their development. Fugro is
also actively involved in training ROV operators.
The training programme we provide lasts for over a
year and covers theory, robotics, electronics, in-house
practice at our new ROV simulator and one-to-one
hands-on field training with our senior operators.
Fugro Brazil’s divers are also training with the
Brazilian Navy at its training centre in Rio de Janeiro.
In this way Fugro is contributing to local society,
promoting corporate social responsibility and
demonstrating its commitment to individual
development at a local level, as well as preserving
the environment in which we operate.
E m p l oy e e s ’ c o n t i n u a l p e r s o n a l d e ve l o p m e n t
Having an effective internal career policy, which also
focuses on personal development opportunities for
employees, helps ensure a high standard of service. In this
way, Fugro is building a workforce that will also be able
to meet clients’ long-term requirements. The objective
of its policies in this area is to create opportunities for all
employees, both those demonstrating management
potential and those who can develop into in-house experts.
We devote special attention to deploying employees
on a f lexible and project basis.
Fugro has also put in place a policy aimed at
standardisation of technical systems so that we can develop
long and short-term staff exchange programmes to enable
employees to gain valuable experience outside their home
country. Fugro also maintains good contacts with
universities all over the world so as to promote
development of our own employees and ensure we can
also recruit new, young talent.
Examples of projects focusing on employees’ personal
development
• Partnership for Growth
Virtually all our operating companies are involved in
the global ‘Partnership for Growth’. This HR initiative
seeks to encourage employees’ personal development,
with the objective to match individual career ambitions
to the organisation’s ambitions and targets. After
a successful launch of the ‘Induction module’ and
‘Performance and Personal Development’ process
in 2011, the ‘Recruitment and Selection’ module
was developed and rolled out during the year.
• Fugro Academy
By October 2012, Fugro Academy has been operating for
6 years since its inception. In that time, the range and
depth of courses available to staff in the organisation
has continued to grow, with a continued mix of
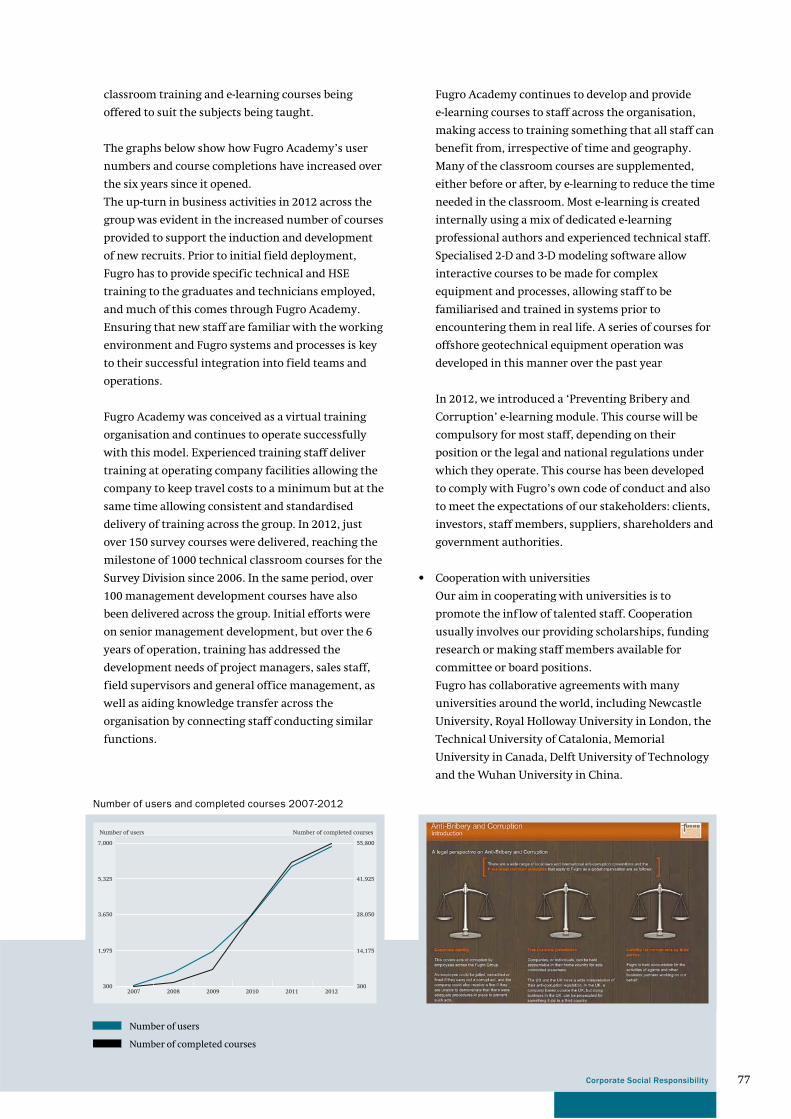
77
classroom training and e-learning courses being
offered to suit the subjects being taught.
The graphs below show how Fugro Academy’s user
numbers and course completions have increased over
the six years since it opened.
The up-turn in business activities in 2012 across the
group was evident in the increased number of courses
provided to support the induction and development
of new recruits. Prior to initial field deployment,
Fugro has to provide specific technical and HSE
training to the graduates and technicians employed,
and much of this comes through Fugro Academy.
Ensuring that new staff are familiar with the working
environment and Fugro systems and processes is key
to their successful integration into field teams and
operations.
Fugro Academy was conceived as a virtual training
organisation and continues to operate successfully
with this model. Experienced training staff deliver
training at operating company facilities allowing the
company to keep travel costs to a minimum but at the
same time allowing consistent and standardised
delivery of training across the group. In 2012, just
over 150 survey courses were delivered, reaching the
milestone of 1000 technical classroom courses for the
Survey Division since 2006. In the same period, over
100 management development courses have also
been delivered across the group. Initial efforts were
on senior management development, but over the 6
years of operation, training has addressed the
development needs of project managers, sales staff,
field supervisors and general office management, as
well as aiding knowledge transfer across the
organisation by connecting staff conducting similar
functions.
Fugro Academy continues to develop and provide
e-learning courses to staff across the organisation,
making access to training something that all staff can
benefit from, irrespective of time and geography.
Many of the classroom courses are supplemented,
either before or after, by e-learning to reduce the time
needed in the classroom. Most e-learning is created
internally using a mix of dedicated e-learning
professional authors and experienced technical staff.
Specialised 2-D and 3-D modeling software allow
interactive courses to be made for complex
equipment and processes, allowing staff to be
familiarised and trained in systems prior to
encountering them in real life. A series of courses for
offshore geotechnical equipment operation was
developed in this manner over the past year
In 2012, we introduced a ‘Preventing Bribery and
Corruption’ e-learning module. This course will be
compulsory for most staff, depending on their
position or the legal and national regulations under
which they operate. This course has been developed
to comply with Fugro’s own code of conduct and also
to meet the expectations of our stakeholders: clients,
investors, staff members, suppliers, shareholders and
government authorities.
• Cooperation with universities
Our aim in cooperating with universities is to
promote the inflow of talented staff. Cooperation
usually involves our providing scholarships, funding
research or making staff members available for
committee or board positions.
Fugro has collaborative agreements with many
universities around the world, including Newcastle
University, Royal Holloway University in London, the
Technical University of Catalonia, Memorial
University in Canada, Delft University of Technology
and the Wuhan University in China.
300
1,975
3,650
5,325
7,000
Number of users Number of completed courses
300
14,175
28,050
41,925
55,800
201220112008 2009 20102007
Number of users
Number of completed courses
Number of users and completed courses 2007-2012
Corporate Social Responsibility
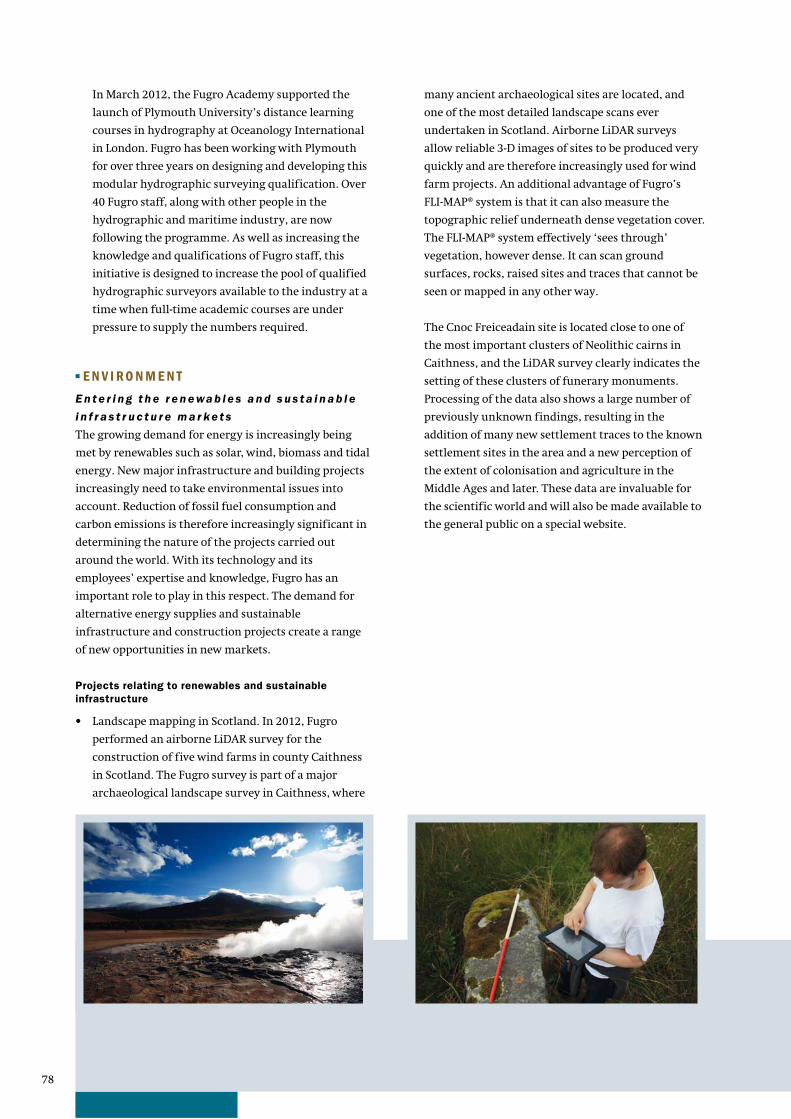
78
In March 2012, the Fugro Academy supported the
launch of Plymouth University’s distance learning
courses in hydrography at Oceanology International
in London. Fugro has been working with Plymouth
for over three years on designing and developing this
modular hydrographic surveying qualification. Over
40 Fugro staff, along with other people in the
hydrographic and maritime industry, are now
following the programme. As well as increasing the
knowledge and qualifications of Fugro staff, this
initiative is designed to increase the pool of qualified
hydrographic surveyors available to the industry at a
time when full-time academic courses are under
pressure to supply the numbers required.
■ E N V I RO N M E N T
E n t e r i n g t h e r e n e wa b l e s a n d s u s t a i n a b l e
i n f r a s t r u c t u r e m a r ke t s
The growing demand for energy is increasingly being
met by renewables such as solar, wind, biomass and tidal
energy. New major infrastructure and building projects
increasingly need to take environmental issues into
account. Reduction of fossil fuel consumption and
carbon emissions is therefore increasingly significant in
determining the nature of the projects carried out
around the world. With its technology and its
employees’ expertise and knowledge, Fugro has an
important role to play in this respect. The demand for
alternative energy supplies and sustainable
infrastructure and construction projects create a range
of new opportunities in new markets.
Projects relating to renewables and sustainable
infrastructure
• Landscape mapping in Scotland. In 2012, Fugro
performed an airborne LiDAR survey for the
construction of five wind farms in county Caithness
in Scotland. The Fugro survey is part of a major
archaeological landscape survey in Caithness, where
many ancient archaeological sites are located, and
one of the most detailed landscape scans ever
undertaken in Scotland. Airborne LiDAR surveys
allow reliable 3-D images of sites to be produced very
quickly and are therefore increasingly used for wind
farm projects. An additional advantage of Fugro’s
FLI-MAP® system is that it can also measure the
topographic relief underneath dense vegetation cover.
The FLI-MAP® system effectively ‘sees through’
vegetation, however dense. It can scan ground
surfaces, rocks, raised sites and traces that cannot be
seen or mapped in any other way.
The Cnoc Freiceadain site is located close to one of
the most important clusters of Neolithic cairns in
Caithness, and the LiDAR survey clearly indicates the
setting of these clusters of funerary monuments.
Processing of the data also shows a large number of
previously unknown findings, resulting in the
addition of many new settlement traces to the known
settlement sites in the area and a new perception of
the extent of colonisation and agriculture in the
Middle Ages and later. These data are invaluable for
the scientific world and will also be made available to
the general public on a special website.
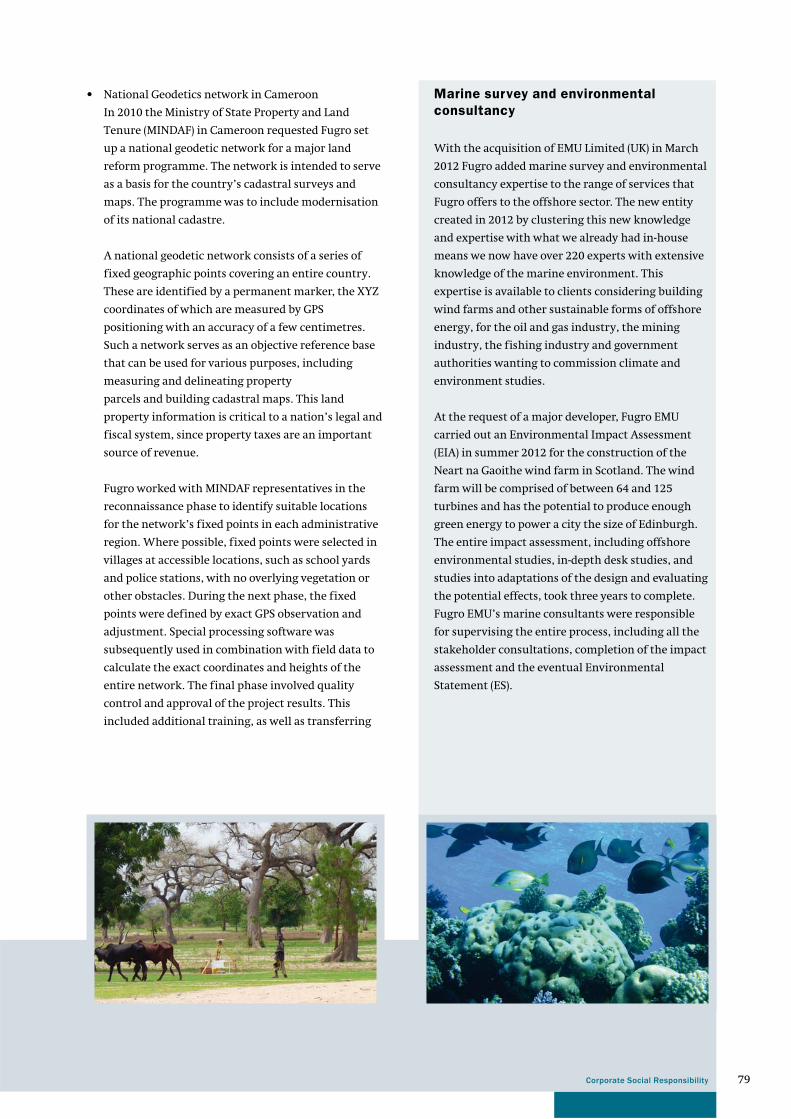
79
• National Geodetics network in Cameroon
In 2010 the Ministry of State Property and Land
Tenure (MINDAF) in Cameroon requested Fugro set
up a national geodetic network for a major land
reform programme. The network is intended to serve
as a basis for the country’s cadastral surveys and
maps. The programme was to include modernisation
of its national cadastre.
A national geodetic network consists of a series of
fixed geographic points covering an entire country.
These are identified by a permanent marker, the XYZ
coordinates of which are measured by GPS
positioning with an accuracy of a few centimetres.
Such a network serves as an objective reference base
that can be used for various purposes, including
measuring and delineating property
parcels and building cadastral maps. This land
property information is critical to a nation’s legal and
fiscal system, since property taxes are an important
source of revenue.
Fugro worked with MINDAF representatives in the
reconnaissance phase to identify suitable locations
for the network’s fixed points in each administrative
region. Where possible, fixed points were selected in
villages at accessible locations, such as school yards
and police stations, with no overlying vegetation or
other obstacles. During the next phase, the fixed
points were defined by exact GPS observation and
adjustment. Special processing software was
subsequently used in combination with field data to
calculate the exact coordinates and heights of the
entire network. The final phase involved quality
control and approval of the project results. This
included additional training, as well as transferring
Marine survey and environmental
consultancy
With the acquisition of EMU Limited (UK) in March
2012 Fugro added marine survey and environmental
consultancy expertise to the range of services that
Fugro offers to the offshore sector. The new entity
created in 2012 by clustering this new knowledge
and expertise with what we already had in-house
means we now have over 220 experts with extensive
knowledge of the marine environment. This
expertise is available to clients considering building
wind farms and other sustainable forms of offshore
energy, for the oil and gas industry, the mining
industry, the fishing industry and government
authorities wanting to commission climate and
environment studies.
At the request of a major developer, Fugro EMU
carried out an Environmental Impact Assessment
(EIA) in summer 2012 for the construction of the
Neart na Gaoithe wind farm in Scotland. The wind
farm will be comprised of between 64 and 125
turbines and has the potential to produce enough
green energy to power a city the size of Edinburgh.
The entire impact assessment, including offshore
environmental studies, in-depth desk studies, and
studies into adaptations of the design and evaluating
the potential effects, took three years to complete.
Fugro EMU’s marine consultants were responsible
for supervising the entire process, including all the
stakeholder consultations, completion of the impact
assessment and the eventual Environmental
Statement (ES).
Corporate Social Responsibility
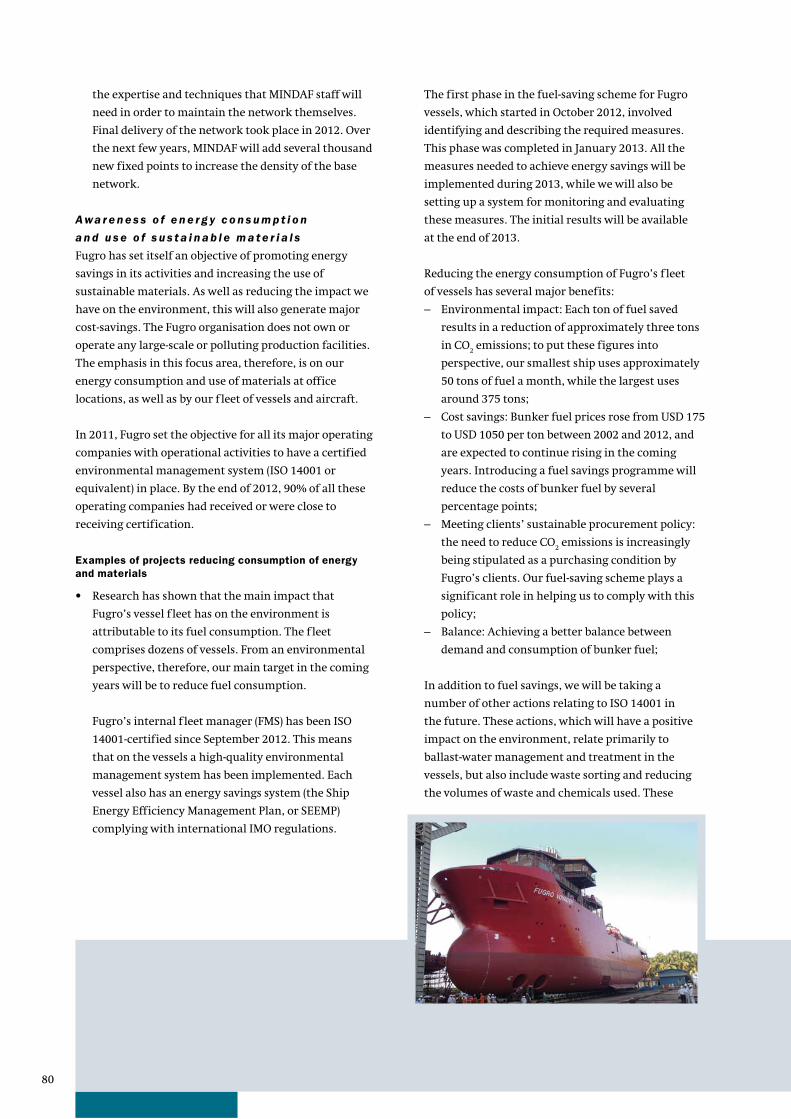
80
the expertise and techniques that MINDAF staff will
need in order to maintain the network themselves.
Final delivery of the network took place in 2012. Over
the next few years, MINDAF will add several thousand
new fixed points to increase the density of the base
network.
Awa r e n e s s o f e n e r g y c o n s u m p t i o n
a n d u s e o f s u s t a i n a b l e m a t e r i a l s
Fugro has set itself an objective of promoting energy
savings in its activities and increasing the use of
sustainable materials. As well as reducing the impact we
have on the environment, this will also generate major
cost-savings. The Fugro organisation does not own or
operate any large-scale or polluting production facilities.
The emphasis in this focus area, therefore, is on our
energy consumption and use of materials at office
locations, as well as by our f leet of vessels and aircraft.
In 2011, Fugro set the objective for all its major operating
companies with operational activities to have a certified
environmental management system (ISO 14001 or
equivalent) in place. By the end of 2012, 90% of all these
operating companies had received or were close to
receiving certification.
Examples of projects reducing consumption of energy
and materials
• Research has shown that the main impact that
Fugro’s vessel f leet has on the environment is
attributable to its fuel consumption. The f leet
comprises dozens of vessels. From an environmental
perspective, therefore, our main target in the coming
years will be to reduce fuel consumption.
Fugro’s internal f leet manager (FMS) has been ISO
14001-certified since September 2012. This means
that on the vessels a high-quality environmental
management system has been implemented. Each
vessel also has an energy savings system (the Ship
Energy Efficiency Management Plan, or SEEMP)
complying with international IMO regulations.
The first phase in the fuel-saving scheme for Fugro
vessels, which started in October 2012, involved
identifying and describing the required measures.
This phase was completed in January 2013. All the
measures needed to achieve energy savings will be
implemented during 2013, while we will also be
setting up a system for monitoring and evaluating
these measures. The initial results will be available
at the end of 2013.
Reducing the energy consumption of Fugro’s f leet
of vessels has several major benefits:
– Environmental impact: Each ton of fuel saved
results in a reduction of approximately three tons
in CO2 emissions; to put these figures into
perspective, our smallest ship uses approximately
50 tons of fuel a month, while the largest uses
around 375 tons;
– Cost savings: Bunker fuel prices rose from USD 175
to USD 1050 per ton between 2002 and 2012, and
are expected to continue rising in the coming
years. Introducing a fuel savings programme will
reduce the costs of bunker fuel by several
percentage points;
– Meeting clients’ sustainable procurement policy:
the need to reduce CO2 emissions is increasingly
being stipulated as a purchasing condition by
Fugro’s clients. Our fuel-saving scheme plays a
significant role in helping us to comply with this
policy;
– Balance: Achieving a better balance between
demand and consumption of bunker fuel;
In addition to fuel savings, we will be taking a
number of other actions relating to ISO 14001 in
the future. These actions, which will have a positive
impact on the environment, relate primarily to
ballast-water management and treatment in the
vessels, but also include waste sorting and reducing
the volumes of waste and chemicals used. These
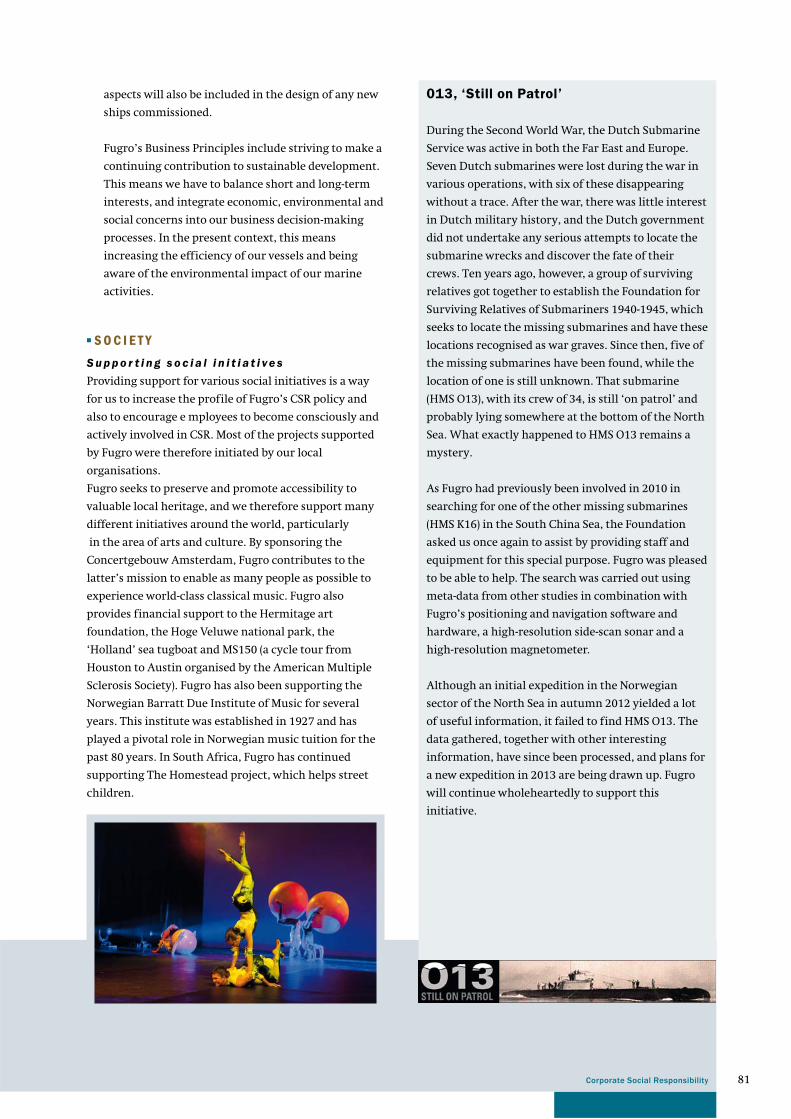
81
aspects will also be included in the design of any new
ships commissioned.
Fugro’s Business Principles include striving to make a
continuing contribution to sustainable development.
This means we have to balance short and long-term
interests, and integrate economic, environmental and
social concerns into our business decision-making
processes. In the present context, this means
increasing the efficiency of our vessels and being
aware of the environmental impact of our marine
activities.
■ S O C I E T Y
S u p p o r t i n g s o c i a l i n i t i a t i ve s
Providing support for various social initiatives is a way
for us to increase the profile of Fugro’s CSR policy and
also to encourage e mployees to become consciously and
actively involved in CSR. Most of the projects supported
by Fugro were therefore initiated by our local
organisations.
Fugro seeks to preserve and promote accessibility to
valuable local heritage, and we therefore support many
different initiatives around the world, particularly
in the area of arts and culture. By sponsoring the
Concertgebouw Amsterdam, Fugro contributes to the
latter’s mission to enable as many people as possible to
experience world-class classical music. Fugro also
provides financial support to the Hermitage art
foundation, the Hoge Veluwe national park, the
‘Holland’ sea tugboat and MS150 (a cycle tour from
Houston to Austin organised by the American Multiple
Sclerosis Society). Fugro has also been supporting the
Norwegian Barratt Due Institute of Music for several
years. This institute was established in 1927 and has
played a pivotal role in Norwegian music tuition for the
past 80 years. In South Africa, Fugro has continued
supporting The Homestead project, which helps street
children.
013, ‘Still on Patrol’
During the Second World War, the Dutch Submarine
Service was active in both the Far East and Europe.
Seven Dutch submarines were lost during the war in
various operations, with six of these disappearing
without a trace. After the war, there was little interest
in Dutch military history, and the Dutch government
did not undertake any serious attempts to locate the
submarine wrecks and discover the fate of their
crews. Ten years ago, however, a group of surviving
relatives got together to establish the Foundation for
Surviving Relatives of Submariners 1940-1945, which
seeks to locate the missing submarines and have these
locations recognised as war graves. Since then, five of
the missing submarines have been found, while the
location of one is still unknown. That submarine
(HMS O13), with its crew of 34, is still ‘on patrol’ and
probably lying somewhere at the bottom of the North
Sea. What exactly happened to HMS O13 remains a
mystery.
As Fugro had previously been involved in 2010 in
searching for one of the other missing submarines
(HMS K16) in the South China Sea, the Foundation
asked us once again to assist by providing staff and
equipment for this special purpose. Fugro was pleased
to be able to help. The search was carried out using
meta-data from other studies in combination with
Fugro’s positioning and navigation software and
hardware, a high-resolution side-scan sonar and a
high-resolution magnetometer.
Although an initial expedition in the Norwegian
sector of the North Sea in autumn 2012 yielded a lot
of useful information, it failed to find HMS O13. The
data gathered, together with other interesting
information, have since been processed, and plans for
a new expedition in 2013 are being drawn up. Fugro
will continue wholeheartedly to support this
initiative.
Corporate Social Responsibility
82
Sector representation/participation
1 . 0 I n d u s t r y C o m m i t t e e s / A d v i s o r y b o d i e s
Fugro’s contribution
International Standards Organization (ISO) Member of working groups for developing new standards:
– Offshore structures for the petroleum and natural gas industries
– Marine soils investigation
– Marine geophysical investigations
International Society for Soil Mechanics and Geotechnical
Engineering (ISSMGE)
Secretary and membership of the Offshore Geotechnics Committee
Membership of the In situ-testing Committee
Society for Underwater Technology (SUT) Membership of:
– Offshore Site Investigation and Geotechnics Committee (OSIF)
– Working Group on Developing Guidance Notes on Site
Investigations for Offshore Renewable Energy Projects
– Working Group on Guidance Notes for Reducing Risks
of ‘Top Hole Drilling’
– Honorary Secretary of the Houston branch
International Association of Oil and Gas Producers (OGP) Membership of the Committee for Guidelines and Technical
Memoranda assessing the risks of offshore drilling
International Marine Contractors Association (IMCA) Membership of the Offshore Survey Management Committee
Membership of the Sustainable Energy Working Group
2 . 0 Jo i n t I n d u s t r y P r o j e c t s ( J I P )
a n d r e s e a r c h
Fugro’s contribution
‘Lateral Pile behaviour in Chalk (JIP)’
– Determining pile load/behaviour in marl and limestone soils
for purposes of gathering information for the wind energy
sector
Active participation and financial contribution
SAFEBUCK (JIP) Active participation
– Designing underwater pipelines to prevent potential lateral
buckling
Jack-up spud can foundations (JIP) Active participation
– Research into the effects of existing seafloor depressions on
the stability of offshore platform foundations
MUMOLADE (JIP) Associated partner
– Multiscale modelling of landslides and debris f lows
Australia, New Zealand and South Africa. As well as
promoting healthy activity, Fugro’s support also boosts
local tourism and, therefore, the local economy.
These are just a few examples of how Fugro is helping
local communities through activities ranging from major
projects to smaller-scale support.
In addition to focusing on art and preserving cultural
heritage, Fugro also supports various local and larger-
scale sports events. We have been the main sponsor of
the Western Australian rugby team Emirates Western
Force since 2012, for instance. The team plays in the
highest Super Rugby competition. Super Rugby
tournaments involve a series of friendly matches
between the leading teams in the domestic leagues of
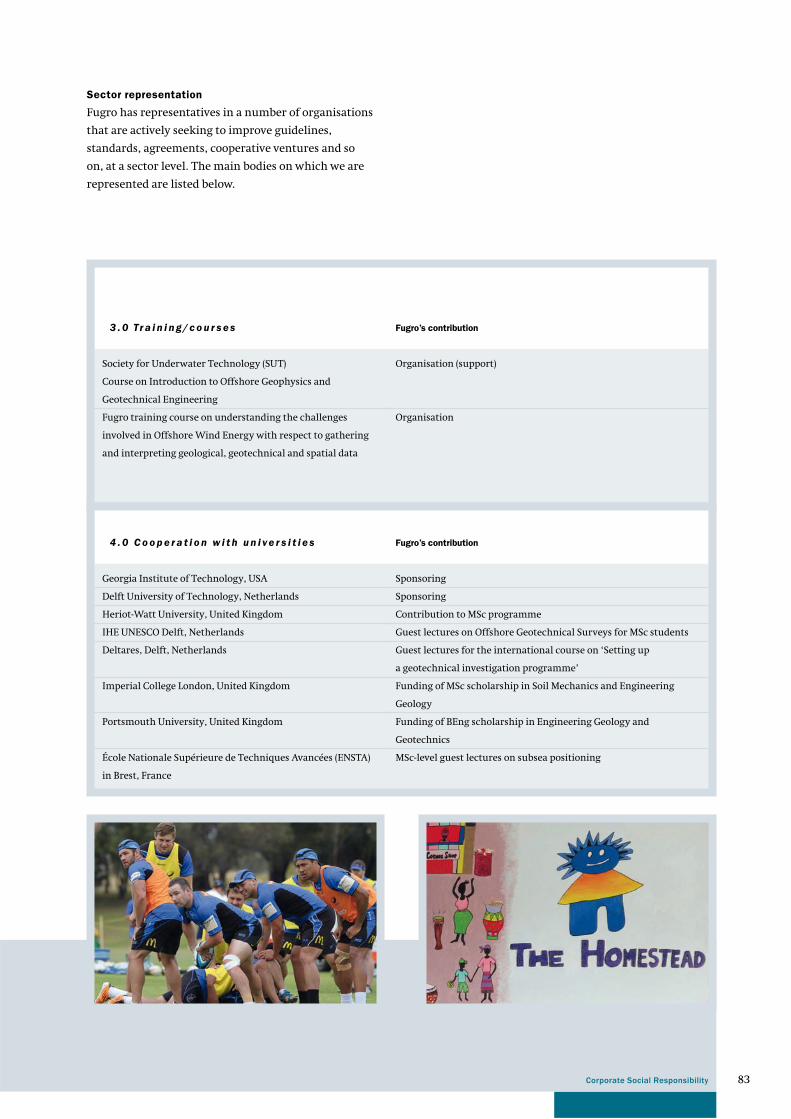
83
3 . 0 Tr a i n i n g / c o u r s e s
Fugro’s contribution
Society for Underwater Technology (SUT)
Course on Introduction to Offshore Geophysics and
Geotechnical Engineering
Organisation (support)
Fugro training course on understanding the challenges
involved in Offshore Wind Energy with respect to gathering
and interpreting geological, geotechnical and spatial data
Organisation
4 . 0 C o o p e r a t i o n w i t h u n i ve r s i t i e s
Fugro’s contribution
Georgia Institute of Technology, USA Sponsoring
Delft University of Technology, Netherlands Sponsoring
Heriot-Watt University, United Kingdom Contribution to MSc programme
IHE UNESCO Delft, Netherlands Guest lectures on Offshore Geotechnical Surveys for MSc students
Deltares, Delft, Netherlands Guest lectures for the international course on ‘Setting up
a geotechnical investigation programme’
Imperial College London, United Kingdom Funding of MSc scholarship in Soil Mechanics and Engineering
Geology
Portsmouth University, United Kingdom Funding of BEng scholarship in Engineering Geology and
Geotechnics
École Nationale Supérieure de Techniques Avancées (ENSTA)
in Brest, France
MSc-level guest lectures on subsea positioning
Sector representation
Fugro has representatives in a number of organisations
that are actively seeking to improve guidelines,
standards, agreements, cooperative ventures and so
on, at a sector level. The main bodies on which we are
represented are listed below.
Corporate Social Responsibility
84
G e n e r a l
Fugro’s risk management policy is aimed at the long-
term sustainable management of its business activities
and the limiting or, where meaningful, hedging of the
associated risks. Due to the wide diversity of markets,
clients and regions and its broad portfolio of activities,
quantifying all the existing risks relevant to the Group as
a whole is virtually impossible. Risks are, however,
quantified wherever possible and useful. This applies
amongst others to the influence of the exchange rate of
the US dollar, the Norwegian kroner and the British
pound. See page 32.
S t r e n g t h s
• Consistent execution of strategy as an independent
service provider
• Good market position in many niche markets
worldwide
• Professional employees who receive continuous
additional training
• High-quality technology and services provision
• Cooperation between business units
• Healthy financial position
We a k n e s s e s
• Sensitivity to rapid, sharp f luctuations in, amongst
others, the exchange rate of the US dollar, the
Norwegian kroner and the British pound
• Much of the revenue depends on investment by the
oil and gas industry
O p p o r t u n i t i e s
• Increased investment by the oil and gas industry,
amongst others related to depletion of existing fields
• Increasing demand for oil and gas with a growing
world population
• Optimisation of existing oil and gas fields
• More and larger infrastructure projects, including
coastline protection and pipelines
• Developments in unconventional oil and gas fields
• Upcoming markets such as Brazil, India and China
• Increasing demand for non-fossil energy sources
T h r e a t s
• Economic and financial instability as a result of the
euro crisis
• Political instability in countries and/or regions
important to Fugro
• Payment risk of clients with low financial strength
• Pressure on prices by clients as a result of lower
demand and/or overcapacity in certain market
segments
• Strong decrease of the oil price compared to the
present level of USD 110 per barrel (Brent), leading to
lower investments by the oil and gas industry
• Offshore operations in a number of regions around
the globe are vulnerable to acts of piracy
• Cuts in government spending
■ R i s k M a n a g e m e n t
F u g r o ’s l o n g - t e r m r i s k s a r e l i m i t e d d u e t o :
• The diversity of activities in more than one
international market segment
• No clients with contracts accounting for more
than around 4% of Fugro’s total annual
revenue
• Use of own modern technologies and
professional employees
• The ability to adjust quickly to exchange rate
and price changes as most contracts are of
short duration
• Geographical spread of the activities
• A balanced and f lexible vessel f leet
composition (owned and chartered)
• Current liabilities (EUR 714 million excluding
liabilities classified as held for sale) amount
to 17% of the balance sheet total
• Limited risk related to pension obligations
• Good internal risk management and control
systems
• Part of the (manpower) capacity being hired-in
on a f lexible basis, among which free lance
staff
• Strong financial position to support future
growth
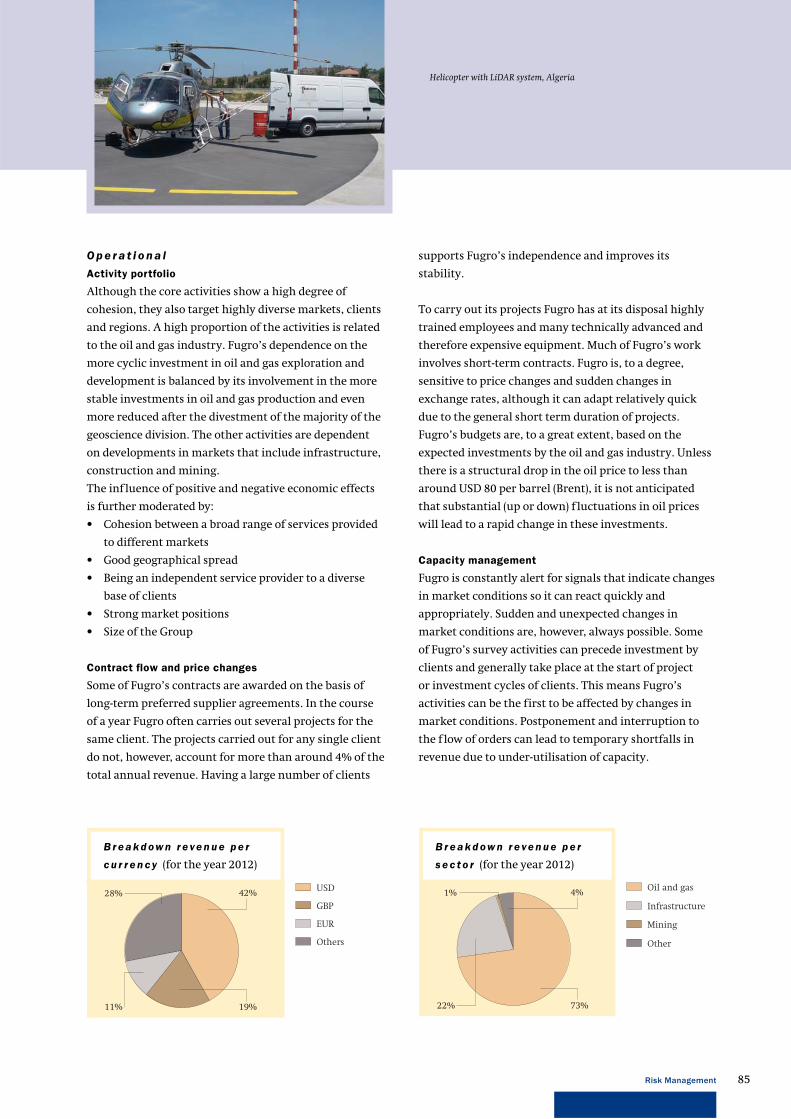
85Risk Management
B r e a k d ow n r e ve n u e p e r
c u r r e n c y (for the year 2012)
B r e a k d ow n r e ve n u e p e r
s e c t o r (for the year 2012)
Oil and gas
Infrastructure
Mining
Other
4%
73%
1%
22%
42%
19%
28%
11%
Others
USD
GBP
EUR
O p e r a t i o n a l
Activity portfolio
Although the core activities show a high degree of
cohesion, they also target highly diverse markets, clients
and regions. A high proportion of the activities is related
to the oil and gas industry. Fugro’s dependence on the
more cyclic investment in oil and gas exploration and
development is balanced by its involvement in the more
stable investments in oil and gas production and even
more reduced after the divestment of the majority of the
geoscience division. The other activities are dependent
on developments in markets that include infrastructure,
construction and mining.
The influence of positive and negative economic effects
is further moderated by:
• Cohesion between a broad range of services provided
to different markets
• Good geographical spread
• Being an independent service provider to a diverse
base of clients
• Strong market positions
• Size of the Group
Contract flow and price changes
Some of Fugro’s contracts are awarded on the basis of
long-term preferred supplier agreements. In the course
of a year Fugro often carries out several projects for the
same client. The projects carried out for any single client
do not, however, account for more than around 4% of the
total annual revenue. Having a large number of clients
supports Fugro’s independence and improves its
stability.
To carry out its projects Fugro has at its disposal highly
trained employees and many technically advanced and
therefore expensive equipment. Much of Fugro’s work
involves short-term contracts. Fugro is, to a degree,
sensitive to price changes and sudden changes in
exchange rates, although it can adapt relatively quick
due to the general short term duration of projects.
Fugro’s budgets are, to a great extent, based on the
expected investments by the oil and gas industry. Unless
there is a structural drop in the oil price to less than
around USD 80 per barrel (Brent), it is not anticipated
that substantial (up or down) f luctuations in oil prices
will lead to a rapid change in these investments.
Capacity management
Fugro is constantly alert for signals that indicate changes
in market conditions so it can react quickly and
appropriately. Sudden and unexpected changes in
market conditions are, however, always possible. Some
of Fugro’s survey activities can precede investment by
clients and generally take place at the start of project
or investment cycles of clients. This means Fugro’s
activities can be the first to be affected by changes in
market conditions. Postponement and interruption to
the f low of orders can lead to temporary shortfalls in
revenue due to under-utilisation of capacity.
Helicopter with LiDAR system, Algeria
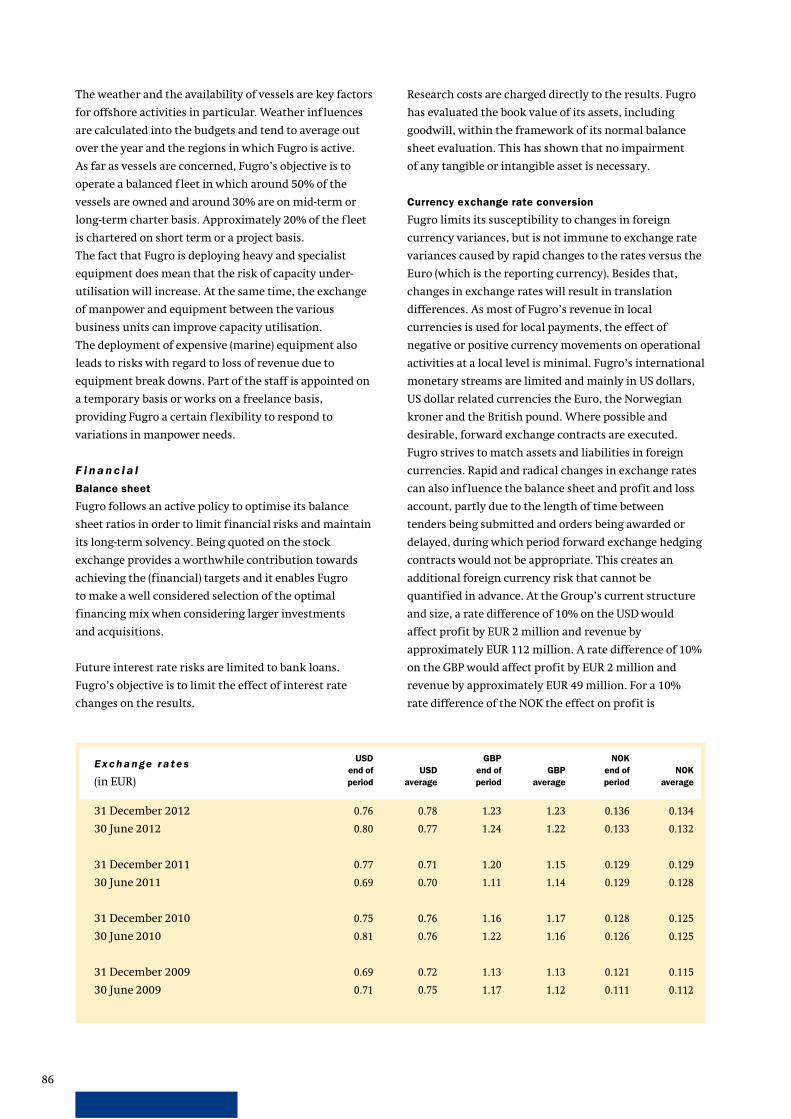
86
The weather and the availability of vessels are key factors
for offshore activities in particular. Weather influences
are calculated into the budgets and tend to average out
over the year and the regions in which Fugro is active.
As far as vessels are concerned, Fugro’s objective is to
operate a balanced f leet in which around 50% of the
vessels are owned and around 30% are on mid-term or
long-term charter basis. Approximately 20% of the f leet
is chartered on short term or a project basis.
The fact that Fugro is deploying heavy and specialist
equipment does mean that the risk of capacity under-
utilisation will increase. At the same time, the exchange
of manpower and equipment between the various
business units can improve capacity utilisation.
The deployment of expensive (marine) equipment also
leads to risks with regard to loss of revenue due to
equipment break downs. Part of the staff is appointed on
a temporary basis or works on a freelance basis,
providing Fugro a certain f lexibility to respond to
variations in manpower needs.
F i n a n c i a l
Balance sheet
Fugro follows an active policy to optimise its balance
sheet ratios in order to limit financial risks and maintain
its long-term solvency. Being quoted on the stock
exchange provides a worthwhile contribution towards
achieving the (financial) targets and it enables Fugro
to make a well considered selection of the optimal
financing mix when considering larger investments
and acquisitions.
Future interest rate risks are limited to bank loans.
Fugro’s objective is to limit the effect of interest rate
changes on the results.
Research costs are charged directly to the results. Fugro
has evaluated the book value of its assets, including
goodwill, within the framework of its normal balance
sheet evaluation. This has shown that no impairment
of any tangible or intangible asset is necessary.
Currency exchange rate conversion
Fugro limits its susceptibility to changes in foreign
currency variances, but is not immune to exchange rate
variances caused by rapid changes to the rates versus the
Euro (which is the reporting currency). Besides that,
changes in exchange rates will result in translation
differences. As most of Fugro’s revenue in local
currencies is used for local payments, the effect of
negative or positive currency movements on operational
activities at a local level is minimal. Fugro’s international
monetary streams are limited and mainly in US dollars,
US dollar related currencies the Euro, the Norwegian
kroner and the British pound. Where possible and
desirable, forward exchange contracts are executed.
Fugro strives to match assets and liabilities in foreign
currencies. Rapid and radical changes in exchange rates
can also influence the balance sheet and profit and loss
account, partly due to the length of time between
tenders being submitted and orders being awarded or
delayed, during which period forward exchange hedging
contracts would not be appropriate. This creates an
additional foreign currency risk that cannot be
quantified in advance. At the Group’s current structure
and size, a rate difference of 10% on the USD would
affect profit by EUR 2 million and revenue by
approximately EUR 112 million. A rate difference of 10%
on the GBP would affect profit by EUR 2 million and
revenue by approximately EUR 49 million. For a 10%
rate difference of the NOK the effect on profit is
E x c h a n ge r a t e s
(in EUR)
USD
end of
period
USD
average
GBP
end of
period
GBP
average
NOK
end of
period
NOK
average
31 December 2012 0.76 0.78 1.23 1.23 0.136 0.134
30 June 2012 0.80 0.77 1.24 1.22 0.133 0.132
31 December 2011 0.77 0.71 1.20 1.15 0.129 0.129
30 June 2011 0.69 0.70 1.11 1.14 0.129 0.128
31 December 2010 0.75 0.76 1.16 1.17 0.128 0.125
30 June 2010 0.81 0.76 1.22 1.16 0.126 0.125
31 December 2009 0.69 0.72 1.13 1.13 0.121 0.115
30 June 2009 0.71 0.75 1.17 1.12 0.111 0.112
87Risk Management
of specialist services and to strengthen its market
position.
Fugro’s global ICT infrastructure is designed to support
the needs of a decentralised global organisation in an
efficient, reliable and secure manner. The ICT needs of
individual Fugro companies vary according to the size
and operational activities of each company. Typically,
company managers have local responsibility for their
Local Area Network (LAN) infrastructure including its
support. At a local or regional level, operating companies
are encouraged to share ICT knowhow and support
services in order to generate efficiencies of scale.
However, at a global level, the Interface between every
operating company’s LAN and that of any other Fugro
company or the ‘outside world’ is monitored and
controlled by a dedicated team of ICT security specialists,
using state-of-the-art ‘firewall’ systems and other ICT
security related systems.
In 2012, Fugro’s in-house ICT security team consisting of
a global ICT security officer and seven regional ICT
security personnel. This team is responsible for
maintaining and monitoring the security aspects of
Fugro’s ICT infrastructure, such as access to the internet,
e-mail and intranet applications. The ICT security team is
independent from the ICT support staff in the operating
companies.
As a group, Fugro works to mitigate ICT related risks
through a variety of measures, which are constantly
under review:
• The adoption of new third party software and
software upgrades (such as that used in the office
environment) is generally delayed until sufficient
time has passed to prove that the software is stable
and does not pose a security risk. Once adopted for
use, critical ‘patches’ to fix software bugs are applied
as they become available.
• Proprietary software is subject to comprehensive
testing procedures before operational use.
• Access to client data and other confidential
information is restricted to specific people in the
operating company concerned, who have a legitimate
reason for such access.
• Fugro’s central web hosting facilities are protected
by high-end web application firewalls specifically
designed to protect the applications from known
attack vectors.
• Data communications within Fugro’s global wide area
network (WAN) are channelled over an encrypted
EUR 5 million and on revenue by approximately
EUR 21 million.
Pension provisions
Fugro maintains pension schemes for its employees in
accordance with regulations and customs which prevail
in each of the countries in which Fugro operates.
Since 1 January 2005 Fugro operates an average salary
based pension scheme in the Netherlands. This is
classified as a ‘defined benefit’ scheme. The pension
commitments in the Netherlands are fully re-insured on
the basis of a guarantee contract. The accrued benefits
are fully financed.
The employees of De Regt participate in the Metalektro
sector collective arrangement. There are no risks for
Fugro following this arrangement. This arrangement
will be transferred as part of the discontinued business
to CGG in 2013.
In the United States Fugro has a 401K system for its
employees. Fugro contributes towards the deposits of its
employees in accordance with agreed rules and taking
the regulations of the Internal Revenue Service (IRS),
the American federal tax authority, into account.
This system is free of risk for Fugro.
In the United Kingdom Fugro operates a number of
pension schemes. All the schemes available to new
employees are defined contribution schemes. There is
one defined benefit scheme open for long-serving
employees and there are other defined benefit schemes
which have been closed but which have on-going
obligations to their members. Measures have been taken
to ensure these obligations can be paid when required.
In the other countries where Fugro has organised
retirement provisions for its employees, obligations
arising from these provisions are covered by items
recognised in the balance sheet of the relevant operating
company.
Information and communication technology (ICT)
Fugro relies on a range of ICT systems (including
hardware, software, computer networks and
communication links) to manage its business, support
operations and to deliver many of the advanced
technological solutions which help to differentiate the
company in the marketplace. While much of the office
based hardware and software used by Fugro are proven
off-the-shelf products, Fugro actively develops
proprietary hardware and software to facilitate its range
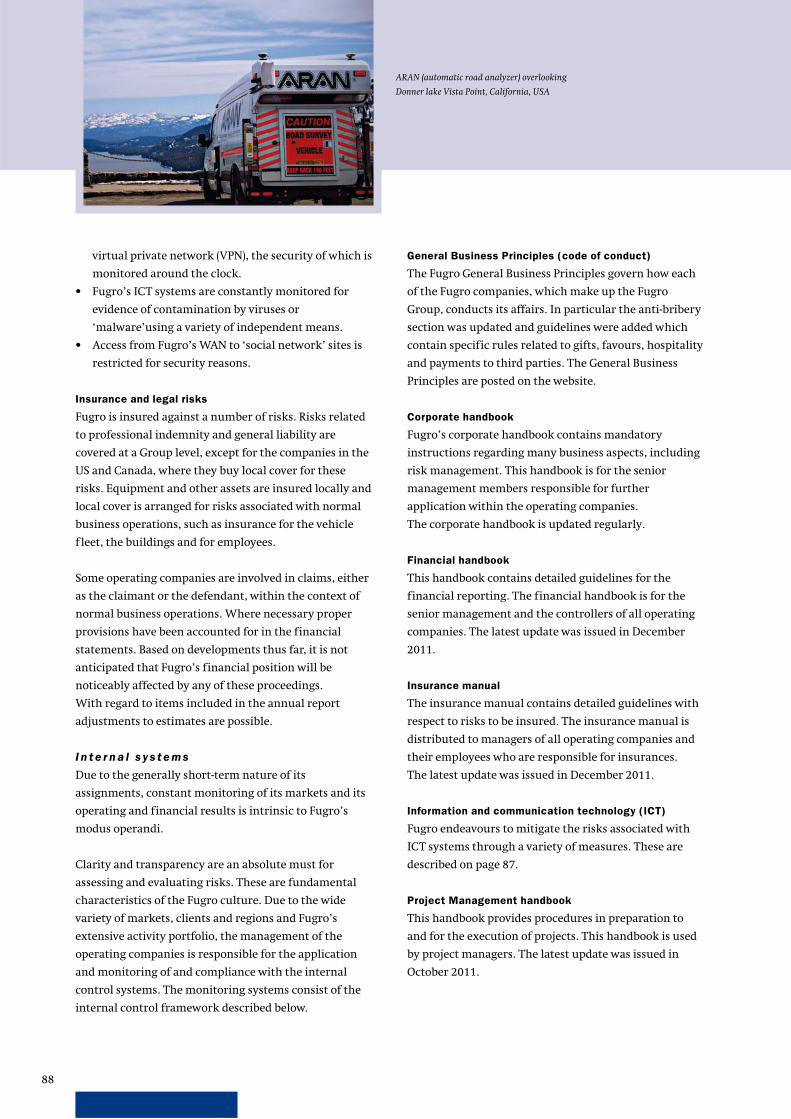
88
General Business Principles (code of conduct)
The Fugro General Business Principles govern how each
of the Fugro companies, which make up the Fugro
Group, conducts its affairs. In particular the anti-bribery
section was updated and guidelines were added which
contain specific rules related to gifts, favours, hospitality
and payments to third parties. The General Business
Principles are posted on the website.
Corporate handbook
Fugro’s corporate handbook contains mandatory
instructions regarding many business aspects, including
risk management. This handbook is for the senior
management members responsible for further
application within the operating companies.
The corporate handbook is updated regularly.
Financial handbook
This handbook contains detailed guidelines for the
financial reporting. The financial handbook is for the
senior management and the controllers of all operating
companies. The latest update was issued in December
2011.
Insurance manual
The insurance manual contains detailed guidelines with
respect to risks to be insured. The insurance manual is
distributed to managers of all operating companies and
their employees who are responsible for insurances.
The latest update was issued in December 2011.
Information and communication technology (ICT)
Fugro endeavours to mitigate the risks associated with
ICT systems through a variety of measures. These are
described on page 87.
Project Management handbook
This handbook provides procedures in preparation to
and for the execution of projects. This handbook is used
by project managers. The latest update was issued in
October 2011.
virtual private network (VPN), the security of which is
monitored around the clock.
• Fugro’s ICT systems are constantly monitored for
evidence of contamination by viruses or
‘malware’using a variety of independent means.
• Access from Fugro’s WAN to ‘social network’ sites is
restricted for security reasons.
Insurance and legal risks
Fugro is insured against a number of risks. Risks related
to professional indemnity and general liability are
covered at a Group level, except for the companies in the
US and Canada, where they buy local cover for these
risks. Equipment and other assets are insured locally and
local cover is arranged for risks associated with normal
business operations, such as insurance for the vehicle
f leet, the buildings and for employees.
Some operating companies are involved in claims, either
as the claimant or the defendant, within the context of
normal business operations. Where necessary proper
provisions have been accounted for in the financial
statements. Based on developments thus far, it is not
anticipated that Fugro’s financial position will be
noticeably affected by any of these proceedings.
With regard to items included in the annual report
adjustments to estimates are possible.
I n t e r n a l s y s t e m s
Due to the generally short-term nature of its
assignments, constant monitoring of its markets and its
operating and financial results is intrinsic to Fugro’s
modus operandi.
Clarity and transparency are an absolute must for
assessing and evaluating risks. These are fundamental
characteristics of the Fugro culture. Due to the wide
variety of markets, clients and regions and Fugro’s
extensive activity portfolio, the management of the
operating companies is responsible for the application
and monitoring of and compliance with the internal
control systems. The monitoring systems consist of the
internal control framework described below.
ARAN (automatic road analyzer) overlooking
Donner lake Vista Point, California, USA
89Risk Management
External audit
The financial statements of Fugro and most of its
subsidiaries are audited annually by external auditors.
These audits take place on the basis of generally accepted
auditing standards. The performance of the external
auditor is evaluated annually. The current external
auditor, KPMG Accountants N.V., was appointed as Group
auditor by the Annual General Meeting of Shareholders
in 2010. In principle, the (re)appointment of the external
auditor will be on the agenda of the Annual General
Meeting of Shareholders in 2014. Fugro will review the
new Dutch legislation with respect to change of audit
firms in 2015 and will act as required.
Advisory roles
If necessary, professional external advice is sought of
third parties. The external auditor does not act in an
advisory capacity, except for occasionally due diligence
as part of mergers and acquisitions and activities relating
to the financial statements.
Safety
Key operational subsidiaries are externally certified in
accordance with OHSAS 18001 or equivalent. Compliance
audits are done by internal specialists and by external
agencies when re-certification has to take place.
Quality
Where required Fugro operating companies work in
accordance with the relevant certificates such as
ISO 9001 or equivalent. Compliance audits are carried
out internally, by clients and by external agencies.
Environment
Fugro has set a goal that all key operational subsidiaries
will have a certified environmental management system
according to ISO 14001 or equivalent. By the end of 2012,
almost 90% of these subsidiaries were certified or close
to certification. As with quality certification, compliance
audits are carried out, both internally and by external
agencies.
Whistleblowers arrangements
Employees have the possibility of reporting alleged
irregularities of a general, operational or financial
nature in any Fugro operating company, worldwide,
without jeopardising their legal position.
A whistleblower policy is posted on Fugro’s website.
Planning
The business plans of every Fugro unit are translated
into budgets. Adherence to the budgets is checked on a
monthly basis. Any unforeseen circumstances that arise,
or any substantial deviation from the budgets, must
be reported immediately by the management of the
operating company to the responsible division director.
The monthly reports submitted by the operational
management to Fugro include an analysis of the
achievements versus the approved plans and a forecast
for the coming period.
Authorisation level
Managers are bound by clear authorisation restrictions
regarding representation. Projects and contracts with
a value or risk that exceeds a specified amount must
be approved in accordance with the applicable
authorisation matrix which is updated from time to time
by the Board of Management. The most recent update is
from August 2012.
Letter of representation
Every six months all managers and controllers of
operating companies and the responsible division
director sign a detailed statement regarding the financial
reporting and internal control.
Internal Audit
Somewhat less internal audits of the various operating
companies were carried out in 2012, due to the CGG
transaction. The findings are reported directly to the
responsible division director. The findings are also
shared with the Audit Committee.
Peer reviews
‘Peer reviews’ are also carried out on a regular basis.
A peer review involves a review of an operating company
by a team from other operating companies. The results
are reported directly to the responsible division director.
Audit Committee
The Audit Committee comprises three members of the
Supervisory Board and it ensures an independent
monitoring of the risk management process from the
perspective of its supervisory role. The Audit Committee
focuses on the quality of the internal and external
reporting, the effectiveness of the internal audits and the
functioning of the external auditor. Further information
on the Audit Committee is available on page 20 and in
the terms of reference of the Audit Committee. These
terms of reference (included in the terms of reference of
the Supervisory Board) are posted on Fugro’s website.
90
D e c l a r a t i o n r e ga r d i n g r i s k m a n a ge m e n t
Taking the above into account, to the best knowledge of
and in the opinion of the Board of Management, Fugro’s
internal risk management and control systems as
described in this annual report provide a reasonable
assurance that the financial reporting does not contain
any errors of material importance and these systems
worked properly in the year under review.
91
■ C o r p o r a t e G o v e r n a n c e
Corporate Governance
G e n e r a l
Fugro subscribes to the Dutch Corporate Governance
Code, which is based on the principle accepted in the
Netherlands that a company is a long-term alliance
between the various parties involved in the company.
The stakeholders are the groups and individuals who,
directly or indirectly, influence – or are influenced by –
the attainment of the company’s objects: e.g. employees,
shareholders and other lenders, suppliers, clients, the
public sector and civil society. The Board of Management
and the Supervisory Board have overall responsibility
for weighing up these interests, generally with a view
to ensuring the continuity of the enterprise, while the
company endeavours to create long-term shareholder
value.
It is very important for Fugro to achieve a balance
between the interests of its various stakeholders. Good
entrepreneurship, integrity, openness and transparent
management as well as good supervision of the
management are the starting points for Fugro’s
corporate governance structure.
D u t c h C o r p o r a t e G o ve r n a n c e C o d e
The Dutch Corporate Governance Code (Code) was
initially set up by the Tabaksblat Committee in
December 2003. Fugro’s corporate governance structure
was approved by the Annual General Meeting (AGM) in
May 2004. The Code was revised in December 2008. On
10 December 2009 the Dutch legislator designated the
revised Code by decree as the new corporate governance
code as defined by sections 2:391 Dutch Civil Code.
For Fugro the revised Code became effective
retrospectively as per 1 January 2009 and had hardly
any consequences for Fugro’s corporate governance
structure. The full text of the Code is available at
www.commissiecorporategovernance.nl.
In accordance with the recommendations of the
Corporate Governance Code Monitoring Committee the
broad outline of Fugro’s corporate governance structure
and compliance with the principles and best practices of
the Code – including explanation of a few deviations –
was discussed in the AGM held on 6 May 2010. Since that
date no substantial changes have been made to the
corporate governance structure.
Each substantial change in the corporate governance
structure of Fugro and in the compliance of the Code
shall be submitted to the General Meeting for discussion
under a separate agenda item.
B r o a d o u t l i n e C o r p o r a t e G o ve r n a n c e
s t r u c t u r e a n d c o m p l i a n c e w i t h t h e C o d e
The broad outline of Fugro’s corporate governance
structure is explained in this chapter and also on Fugro’s
website. All underlying documentation is posted on the
website.
Fugro’s corporate governance structure, its supervision
and the way it is reported are in line with the Code.
The Code contains principles and best practice provisions
that regulate relations between the Board of
Management, the Supervisory Board and the General
Meeting. The principles may be regarded as reflecting
the general views on good corporate governance, which
enjoy wide support. They have been elaborated in the
form of specific best practice provisions. Companies may
depart from the best practice provisions. Departures may
be justified in certain circumstances. Each year Fugro
indicates expressly in the annual report to what extent it
has applied the best practice provisions in the Code and,
if it did not do so, why and to what extent it did not apply
them.
Fugro takes the view that shareholders, the media,
corporate governance ‘rating agencies’ and proxy
advisors should carefully assess the reason for each and
every departure from the Code’s provisions and they
should avoid a ‘tick-a-box’ mentality. A shareholder
should vote as he sees fit. A shareholder who makes use
of the voting advice of a third party is expected to form
his own judgment on the voting policy of this adviser and
the voting advice provided by him.
Compliance with the Code in 2012
A full overview (‘Comply or Explain’-report) of Fugro’s
compliance with the Code in 2012 is posted on the
website. Fugro’s corporate governance structure is fully
in line with the recommendations in the Code except for
the points below. All deviations were approved earlier by
the General Meeting of Shareholders.
92
Best practice provision IV.2.1
In accordance with this provision the Board of the Fugro
Trust Office (or ‘Trust Office’) enjoys the confidence of
the holders of certificates and operates independently
of Fugro. One deviation from this provision is that the
terms of administration of the Trust Office do not
stipulate the instances in which and the conditions
under which holders of certificates may ask the Trust
Office to convene a meeting, except with respect of the
right to nominate a candidate for appointment to the
Board of the Trust Office (see further the explanation
on best practice provision IV.2.2).
Best practice provision IV.2.2
According to this provision the meeting of holders of
certificates may make recommendations to the Board of
the Trust Office for the appointment of a member to the
Board. The Board has decided that holders of certificates
representing at least 15% of the issued share capital in
the form of certificates of shares may request that
a meeting of holders of certificates is convened in order
to make recommendations for the appointment
of a member to the Board.
Best practice provision IV.2.5
According to this provision the Trust Office, in exercising
its voting rights, should be guided ‘primarily by the
interests of the holders of certificates, taking the
interests of the company and its affiliated enterprise
into account’. The articles of association and the terms
of administration of the Trust Office provide that if
the Trust Office exercises the voting rights, it will do
this in such manner that the interest of Fugro and its
enterprise, as well as the interests of all stakeholders,
will be safeguarded as best as possible (article 2 of the
articles of association and article 4 of the terms of
administration). The interests of some stakeholders need
not necessarily at all times run parallel with that of other
stakeholders. For example, some will have a short term
focus whilst others have a long term focus. It is up to the
Board of the Trust Office to, after balancing the interests,
come to a well considered decision on the exercise of the
voting rights. In addition, when considering the exercise
of voting rights the Board in any case takes into
consideration the (Dutch) law as well as the articles of
association and the terms of administration of the Trust
Office. The Board can (also) opt, for reasons of its own, to
not exercise the voting rights on the shares held by the
Trust Office.
Best practice provision III.3.5
The term of the appointment of the Chairman of the
Supervisory Board, Mr. F.H. Schreve, deviates from this
provision because he has already served as a member of
Fugro’s Supervisory Board for longer than twelve years.
Mr. Schreve will step down at the end of the AGM that
will be held on 6 May 2013. He will be succeeded by
Mr. H.L.J. Noy. See for further details page 22.
Principle III.5 and best practice provision III.5.11
The Supervisory Board does not have a separate
remuneration committee and nomination committee.
In May 2005 the at that time separate remuneration
committee and nomination committee were, with the
approval of the AGM, amalgamated into one committee
that carries out the tasks in both areas. The reason for
the amalgamation was that a separate remuneration
committee and nomination committee (with separate
meetings) had proven impractical due to the fact that
the Supervisory Board is small and three of its members
are not resident in the Netherlands. The chairman of
the Remuneration and Nomination Committee is
Mr. G-J. Kramer, who was a member of Fugro’s Board
of Management until the end of 2005. This is not fully
in compliance with the provision that the chairmanship
of the remuneration committee (but there is no separate
remuneration committee) is not filled by a former
member of the Board of Management.
Principle IV.2
Maintaining its operational independence is crucial for
Fugro (see page 95 for a further explanation).
One of the ways to safeguard this independence is share
certification. Although the Code provides that the
certification structure is not meant as a protective
measure, Fugro has chosen, in the interest of its clients,
to also view the certification structure as part of its
protective measures. During the performance of its
assignments Fugro often receives extremely confidential
information. Fugro can only perform its assignments if it
can secure the confidential nature of such information
towards its clients.
The second reason for the certification structure is the
prevention of possible harmful effects as a result of
absenteeism in the shareholders’ meetings of Fugro.
Fugro considers it not to be in the interest of its
stakeholders in general that through absenteeism an
accidental majority can, based only on its own interest,
force through its opinion. To prevent this, ties in with
this Principle IV.2.
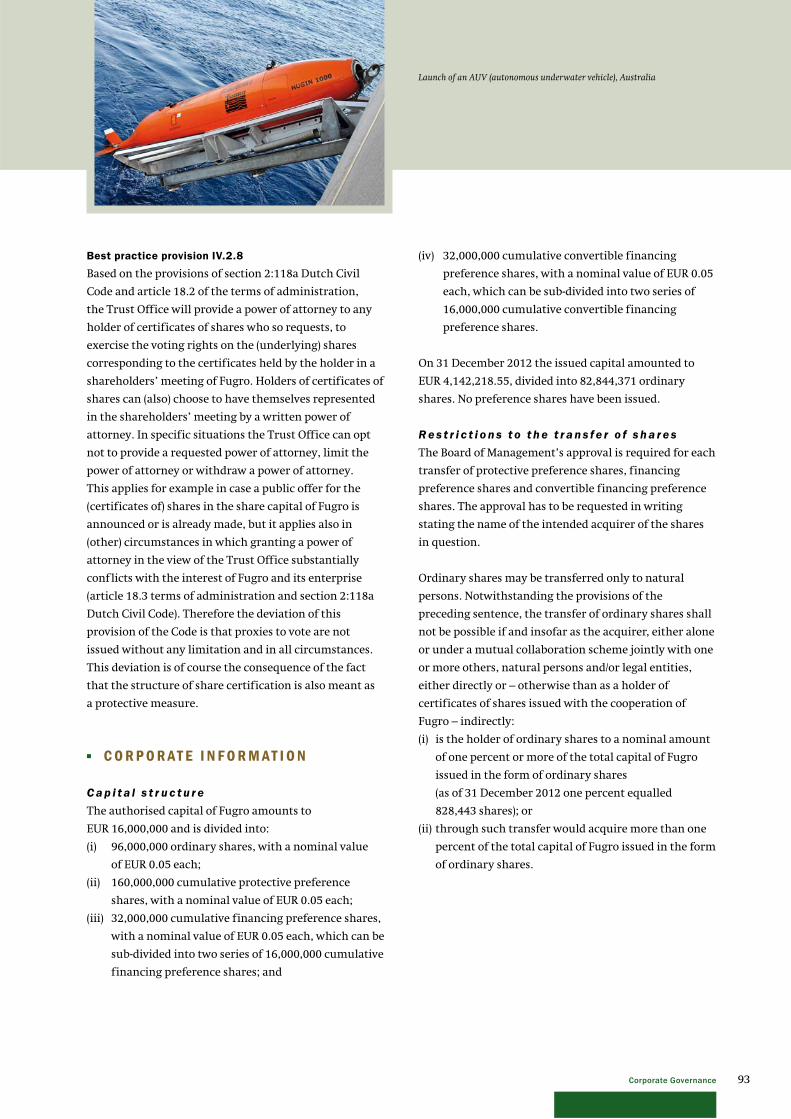
93Corporate Governance
(iv) 32,000,000 cumulative convertible financing
preference shares, with a nominal value of EUR 0.05
each, which can be sub-divided into two series of
16,000,000 cumulative convertible financing
preference shares.
On 31 December 2012 the issued capital amounted to
EUR 4,142,218.55, divided into 82,844,371 ordinary
shares. No preference shares have been issued.
R e s t r i c t i o n s t o t h e t r a n s f e r o f s h a r e s
The Board of Management’s approval is required for each
transfer of protective preference shares, financing
preference shares and convertible financing preference
shares. The approval has to be requested in writing
stating the name of the intended acquirer of the shares
in question.
Ordinary shares may be transferred only to natural
persons. Notwithstanding the provisions of the
preceding sentence, the transfer of ordinary shares shall
not be possible if and insofar as the acquirer, either alone
or under a mutual collaboration scheme jointly with one
or more others, natural persons and/or legal entities,
either directly or – otherwise than as a holder of
certificates of shares issued with the cooperation of
Fugro – indirectly:
(i) is the holder of ordinary shares to a nominal amount
of one percent or more of the total capital of Fugro
issued in the form of ordinary shares
(as of 31 December 2012 one percent equalled
828,443 shares); or
(ii) through such transfer would acquire more than one
percent of the total capital of Fugro issued in the form
of ordinary shares.
Best practice provision IV.2.8
Based on the provisions of section 2:118a Dutch Civil
Code and article 18.2 of the terms of administration,
the Trust Office will provide a power of attorney to any
holder of certificates of shares who so requests, to
exercise the voting rights on the (underlying) shares
corresponding to the certificates held by the holder in a
shareholders’ meeting of Fugro. Holders of certificates of
shares can (also) choose to have themselves represented
in the shareholders’ meeting by a written power of
attorney. In specific situations the Trust Office can opt
not to provide a requested power of attorney, limit the
power of attorney or withdraw a power of attorney.
This applies for example in case a public offer for the
(certificates of) shares in the share capital of Fugro is
announced or is already made, but it applies also in
(other) circumstances in which granting a power of
attorney in the view of the Trust Office substantially
conflicts with the interest of Fugro and its enterprise
(article 18.3 terms of administration and section 2:118a
Dutch Civil Code). Therefore the deviation of this
provision of the Code is that proxies to vote are not
issued without any limitation and in all circumstances.
This deviation is of course the consequence of the fact
that the structure of share certification is also meant as
a protective measure.
■ C O R P O R AT E I N F O R M AT I O N
C a p i t a l s t r u c t u r e
The authorised capital of Fugro amounts to
EUR 16,000,000 and is divided into:
(i) 96,000,000 ordinary shares, with a nominal value
of EUR 0.05 each;
(ii) 160,000,000 cumulative protective preference
shares, with a nominal value of EUR 0.05 each;
(iii) 32,000,000 cumulative financing preference shares,
with a nominal value of EUR 0.05 each, which can be
sub-divided into two series of 16,000,000 cumulative
financing preference shares; and
Launch of an AUV (autonomous underwater vehicle), Australia
94
If article 17 of the articles of association of Fugro is
not applicable, then article 11, sub 1 of the terms of
administration of the Trust Office is applicable. In
accordance with article 11, sub 1, a holder of certificates
of shares who as a result of conversion acquires ordinary
shares in the capital of Fugro may only transfer these
ordinary shares to a third party if he or she has first
offered these shares to the Trust Office. Also applies that
the holder of certificates who as a result of conversion
acquires ordinary shares in the capital of Fugro, during
the period that article 11, sub 1 is applicable shall:
(i) not encumber the acquired shares with a right of lien
or a right of usufruct, whereby the voting right on
these shares shall be granted to the holder of the right
of lien or the usufructuary; and
(ii) not grant a proxy to vote on the acquired shares nor
accept any voting instructions from third parties
regarding the manner in which he exercises the
voting rights on these shares.
S u b s t a n t i a l i n t e r e s t s i n F u g r o
As far as Fugro is aware of, the shareholders with an
interest in Fugro’s share capital of more than 5% are
reported on page 13.
P r o t e c t i ve m e a s u r e s ( e x t r a o r d i n a r y c o n t r o l
r i g h t s ; l i m i t a t i o n o f v o t i n g r i g h t s )
When carrying out assignments Fugro can have access to
clients’ extremely confidential information. For this
reason Fugro can only carry out its activities if it can
safeguard its independence in relation to its clients.
The main point of Fugro’s protection against a hostile
takeover depends on the one hand on certification of
the ordinary shares and, on the other hand, on the
possibility of Fugro to issue cumulative protective
preference shares. In addition to this, protective
preference shares may also be issued by the Fugro
subsidiaries Fugro Consultants International N.V.
and Fugro Financial International N.V. to Stichting
Continuïteit Fugro (see page 95). The primary
aim of the protective measures is to safeguard Fugro’s
independence in relation to its clients.
The restrictions to the transfer of ordinary shares stated
above are not applicable to:
(a) the transfer of ordinary shares to Fugro itself or
to a subsidiary of Fugro;
(b) the transfer or issue of ordinary shares to, or the
exercise of a right to subscribe for ordinary shares by,
a trust office or to another legal person, if in respect
of such a trust office or other legal person the Board
of Management with the approval of the Supervisory
Board has by an irrevocable resolution wholly or
partially lifted the restrictions limiting the transfer
or issue of ordinary shares, to which lifting of
restrictions conditions may be attached; in respect
of another legal person as referred to above, such
restrictions may be lifted only to the extent that such
may be required to permit that legal person to avail
itself of the facility of the participation exemption,
as at present provided for in section 13 of the
Corporation Tax Act 1969;
(c) the transfer of ordinary shares acquired by Fugro
itself or the issue by Fugro of ordinary shares, if such
a transfer or issue takes place within the framework
of either a collaborative arrangement with or the
acquisition of another enterprise, or a legal merger,
or the acquisition of a participating interest or the
expansion thereof, in respect of which the Board of
Management with the approval of the Supervisory
Board by an irrevocable resolution has wholly or
partially lifted the restrictions limiting the transfer
or issue of ordinary shares, to which lifting of
restrictions conditions may be attached;
(d) the transfer or transmission of ordinary shares to
shareholders who on 31 March 1992 were recorded as
shareholders in the shareholders’ register of Fugro,
if in respect of such a transfer or transmission the
Board of Management, with the approval of the
Supervisory Board, by an irrevocable resolution
wholly or partially lifted the restrictions limiting the
transfer of ordinary shares, to which lifting of
restrictions conditions may be attached;
(e) the transfer or transmission of ordinary shares to
group companies of legal person-shareholders who on
31 March 1992 were recorded as shareholders in the
shareholders’ register of Fugro, if in respect of such a
transfer or transmission the Board of Management,
with the approval of the Supervisory Board, by an
irrevocable resolution wholly or partially lifted the
restrictions limiting the transfer of ordinary shares,
to which lifting of restrictions conditions may be
attached.
95Corporate Governance
independence and/or continuity and/or identity of Fugro
and the relevant businesses, as well as all activities which
are incidental to or which may be conducive to any of the
foregoing. The Foundation aims to achieve its objects
independent from Fugro, by acquiring protective
preference shares and by exercising the rights attached
to such shares. Fugro has entered into an option
agreement with the Foundation pursuant to which the
Foundation was granted the right to acquire cumulative
preference protective shares in Fugro’s share capital,
each share with a nominal value of EUR 0.05, up to an
amount to be determined by the Foundation up to a
maximum equal to 100% minus 1 share of the aggregate
nominal value of ordinary shares and preference
financing shares in Fugro that are held by third parties at
the time the right to acquire preference protective shares
is exercised by the Foundation. By entering into the
option agreement, the Foundation is in a position to
achieve its objects – i.e. safeguarding the company and
its businesses – autonomously, independently and
effectively should the occasion occur. The (Board of)
Foundation Protective Preference Shares operates
completely independent of Fugro. For the composition
of the Board of the Foundation see page 200.
S t i c h t i n g C o n t i n u ï t e i t F u g r o ( ‘ Fo u n d a t i o n
C o n t i n u i t y ’ )
The (call) option on protective preference shares granted
by Fugro Consultants International N.V. and Fugro
Financial International N.V. (both registered in Curaçao)
to Foundation Continuity has been approved by the
AGM in 1999. The objective of Foundation Continuity
corresponds to that of Foundation Protective Preference
Shares. The protective measures described above shall be
put up, especially in a takeover situation, when this is in
the interest of Fugro to protect its independence and also
in defining Fugro’s position in relation to that of the
raider and the raider’s plans and it creates the possibility,
when necessary, to look for alternatives. The protective
measures will not be put up to protect the Board of
Management’s own position. Due to the uncertainty
regarding the situations with which Fugro could be
confronted, the use of protective measures in
circumstances other than those described above cannot
be discounted. For the composition of the Board of
Foundation Continuity see page 200.
F u g r o Tr u s t O f f i c e ( ‘ Tr u s t O f f i c e ’ )
Only (non-voting) certificates of shares are listed and
traded on NYSE Euronext Amsterdam. These
exchangeable certificates are issued by the Trust Office
and the Board of the Trust Office exercises the voting
rights on the underlying shares in such manner that the
interests of Fugro and its enterprise, as well as the
interests of all stakeholders, are safeguarded as best
possible. The (Board of the) Trust Office operates
completely independent of Fugro. For the composition of
the Board of the Trust Office see page 200.
Holders of certificates (and their authorised proxies):
• may, after timely written notification, attend and
speak at shareholders’ meetings;
• are entitled to request from the Trust Office a proxy
to exercise the voting rights on the (underlying)
shares corresponding to their certificates. The Trust
Office may solely limit, exclude or revoke this proxy
if:
a) a public offer has been announced or made on the
(certificates of) shares of Fugro or if a justifiable
expectation prevails that such an offer shall be
made, without agreement thereon having
necessarily been reached with Fugro;
b) a holder of certificates or a number of holders of
certificates, in accordance with an agreement
between and among them to co-operate, together
or not, with subsidiaries, acquire at least 25% of
the issued capital of Fugro; or
c) in the opinion of the Trust Office, the exercise of
voting rights by a holder of certificates constitutes
a real conflict of interests with those of Fugro;
• may, provided they are natural persons and they have
not entered into an agreement between and among
them to co-operate, exchange their certificates for
ordinary shares entitled to vote up to a maximum
of 1% of the issued share capital of Fugro per
shareholder.
S t i c h t i n g B e s c h e r m i n g s p r e f e r e n t e
a a n d e l e n F u g r o ( ‘ Fo u n d a t i o n P r o t e c t i ve
P r e f e r e n c e S h a r e s ’ )
The objects of Foundation Protective Preference Shares
are to attend to Fugro’s interests and of Fugro’s
businesses as well as the businesses of the entities
that form part of the Group, in such way that Fugro’s
interests and the interests of the relevant businesses
as well as the interests of all parties involved, are
safeguarded to the extent possible, and that Fugro
and the relevant businesses are defended to the extent
possible against factors that could negatively affect the
96
At least one (Annual) General Meeting is convened each
year. Extraordinary General Meetings are convened as
often as the Supervisory Board or the Board of
Management deems this necessary. The shareholders’
meeting is chaired by the chairman of the Supervisory
Board. The Supervisory Board and the Board of
Management provide the shareholders’ meeting with all
the information requested, unless there is a very good
reason why providing the information would not be in
the interests of Fugro.
A p p o i n t m e n t a n d d i s m i s s a l o f m e m b e r s o f
t h e B o a r d o f M a n a ge m e n t a n d S u p e r v i s o r y
B o a r d
The members of both the Board of Management and the
Supervisory Board are appointed by the General Meeting
for a maximum period of four years on a binding
nomination of the Supervisory Board. The binding
nature of such a nomination may, however, be overruled
by a resolution adopted by an absolute majority of the
votes cast by the General Meeting, provided such
majority represents more than one-third of the issued
share capital. If this proportion of the capital is not
represented at the meeting, but an absolute majority of
the votes cast is in favour of a resolution to cancel the
binding nature of the nomination, a new meeting may
be convened at which the resolution may be passed by an
absolute majority of votes, regardless of the proportion
of the capital represented at the meeting. If a binding
nomination has not been made or has not been made in
due time, the General Meeting may appoint a Managing
Director or a Supervisory Director at its discretion.
Unless the resolution is proposed by the Supervisory
Board, the General Meeting may only pass a resolution to
suspend or dismiss a member of the Board of
Management or Supervisory Board with a majority of
two-thirds of the votes cast, which majority represents
more than one-half of the issued capital. With regard to
the overruling of the binding nature of a nomination by
the Supervisory Board and the decision to suspend or
dismiss a member of the Board of Management or
Supervisory Board, convening a second meeting
pursuant to section 2:120, subsection 3, Dutch Civil
Code shall not be permitted.
O p t i o n s c h e m e
Fugro has a stock option scheme that was approved by
the AGM on 14 May 2008. Details of the option scheme
are described on page 14 of this Annual Report.
Employee options on ordinary shares are granted to
the members of the Board of Management and other
employees in such way that at any moment the
maximum number of outstanding options to acquire
ordinary shares in Fugro will not exceed 7.5% of the
issued ordinary share capital. In order to mitigate
dilution, it is Fugro’s policy to purchase own shares to
cover the option scheme with the result that no new
shares are issued when options are exercised. The total
number of options to be granted is subject to the
approval of the Supervisory Board as is the grant of
options to members of the Board of Management itself.
A g r e e m e n t s w i t h a s h a r e h o l d e r t h a t c o u l d
p r o v i d e a r e a s o n fo r l i m i t a t i o n o f t h e
t r a n s f e r o f ( c e r t i f i c a t e s o f ) s h a r e s
If article 11, sub 1 of the terms of administration of the
Trust Office is applicable (see also above), exchange of
certificates into ordinary shares is only possible if the
holder of certificates who acquires ordinary shares in the
capital of Fugro as a result of the exchange, shall accept
the stipulations pursuant to section 11, sub 1 of the
terms of administration.
F u n c t i o n i n g o f t h e G e n e r a l M e e t i n g
The powers of the (Annual) General Meeting are
stipulated in legislation and in the articles of association
of Fugro and can be stated concisely as follows: approval
of decisions that would cause a major change to the
identity or character of Fugro or its business;
appointment and dismissal of members of the Board of
Management and of the Supervisory Board; adoption of
the remuneration policy for the members of the Board
of Management; approval of the stock option scheme
for the members of the Board of Management;
determination of the remuneration of members of the
Supervisory Board; adoption of the financial statements;
discharge of members of the Board of Management and
of the Supervisory Board; approval of the profit
appropriation; authorisation to acquire own shares, to
issue shares (or to grant rights to subscribe for shares)
and to restrict or exclude pre-emptive rights in respect of
shares; and approval of decisions to amend the articles
of association or to dissolve Fugro. In addition, the
following is discussed in the (Annual) General Meeting:
the annual report, changes to the profile of the
Supervisory Board, the dividend policy and substantial
changes in the corporate governance structure of Fugro
and in the compliance with the Code.
97Corporate Governance
(a) resolve on the issue of – and/or on the granting of
rights to subscribe for – all ordinary shares and
all sorts of financing preference shares (not the
protective preference shares) in which the authorised
capital is divided at the date of the relevant
resolution;
(b) restrict and/or to exclude pre-emption rights that
accrue to shareholders upon issue of (grant of rights
to subscribe for) ordinary shares and/or financing
preference shares.
The authorisation of the Board of Management with
respect to the issue of ordinary shares and financing
preference shares and/or to grant rights to subscribe for
ordinary shares and financing preference shares was
limited to 10% of the issued share capital of Fugro at the
time of the issue plus an additional 10% of the issued
capital of Fugro at the time of the issue in connection
with or on the occasion of mergers and acquisitions.
The Board of Management may resolve, with the
approval of the Supervisory Board, to dispose of shares
acquired by Fugro in its own capital.
C o n s e q u e n c e s o f p u b l i c b i d fo r m a j o r
a g r e e m e n t s
Fugro differentiates three categories of agreements as
referred to in the Decree on Section 10 EU Takeover
Directive:
a) Credit facility with Rabobank of EUR 150 million for
five years. This agreement was implemented in 2011
and EUR 82 million of the facility has been utilised.
The facility may be cancelled in the event of a ‘change
of ownership’ of Fugro whereupon all or part of the
loans may become immediately due and payable.
Credit facility with ING Bank N.V. of EUR 150 million
for five years. This agreement was implemented in
2011 and EUR 82 million of the facility has been
utilised. The facility may be cancelled in the event
of a ‘change of ownership’ of Fugro whereupon all
or part of the loans may become immediately due
and payable.
Credit facility with The Royal Bank of Scotland N.V.
of EUR 100 million for five years. This agreement
was implemented in 2011 and EUR 55 million of the
facility has been utilised. The facility may be
cancelled in the event of a ‘change of ownership’
of Fugro whereupon all or part of the loans may
become immediately due and payable.
A m e n d m e n t o f t h e a r t i c l e s o f a s s o c i a t i o n
A resolution to amend the articles of association of Fugro
may be passed only on a proposal thereto of the Board of
Management with the prior approval of the Supervisory
Board and by a majority of at least two-thirds of the votes
cast at a General Meeting at which at least one-half of the
issued capital is represented. If at a General Meeting at
which the proposal to amend the articles of association is
to be considered, the required part of the capital is not
represented, then a second meeting may be convened at
which second meeting the resolution to amend the
articles of association may be passed, irrespective of the
part of the capital represented at such meeting, provided
such resolution is adopted by a majority of at least
two-thirds of the votes cast. Insofar as a resolution to
amend the articles of association brings about a change
in the rights vested in the holders of protective
preference shares or the holders of financing preference
shares or the holders of convertible financing preference
shares, such a resolution shall require the approval of
the meeting of holders of protective preference shares or
the meeting of holders of financing preference shares or
the meeting of the holders of convertible financing
preference shares, as the case may be.
Fugro’s articles of association were last amended on
28 June 2010 and are posted on the website.
Au t h o r i s a t i o n o f t h e B o a r d o f M a n a ge m e n t
w i t h r e ga r d t o t h e a c q u i s i t i o n ( p u r c h a s e )
o f ow n s h a r e s a n d t h e i s s u e o f s h a r e s
Fugro regularly proposes to its shareholders to authorise
the Board of Management to acquire and to issue shares.
On 22 May 2012 the AGM authorised the Board of
Management for a period of 18 months as from 22 May
2012 until 22 November 2013, to, subject to the approval
of the Supervisory Board, cause Fugro to purchase its
own (certificates of) shares, up to a maximum of 10% of
the issued capital at the date of acquisition, either
through purchase on a stock exchange or otherwise, at a
price, excluding expenses, not lower than the nominal
value of the shares and not higher than 10% above the
average of the closing price of the certificates of the
shares on NYSE Euronext Amsterdam for the five
business days before the day on which the purchase is
made.
Also on 22 May 2012 the AGM designated the Board of
Management as the corporate body which is authorised
for a period of 18 months as of 22 May 2012 until
22 November 2013, to, subject to the approval of the
Supervisory Board,
98
consolidate or merge with any other person or legal
entity if either a) Fugro shall be the surviving or
continuing person, or b) the surviving, continuing
or resulting person or legal entity that purchases,
acquires or otherwise acquires all or substantially
all of the assets of the company i) is a solvent entity
organised under the laws of any approved jurisdiction
(any of the following jurisdictions: the Netherlands,
The United States, Canada and any country which is a
member of the EU (other than Greece) at the time of
the date of the agreement, ii) is engaged in any similar
line of business as Fugro and iii) expressly assumes
the obligations of Fugro under this agreement in a
writing which is in form and substance reasonably
satisfactory to the holders of at least 51% of the
outstanding principal amount of the notes.
Fugro has also concluded long term loans with
American and British institutional investors in 2011.
In case of a ‘Change of Control’ Fugro shall give
written notice of such fact to all holders of the loan
notes. The notice shall contain an offer by Fugro to
prepay the entire unpaid principal amount of loan
notes held by each holder at 100% of the principal
amount of such loan notes at par (and without any
make-whole, premium, penalty or make-whole
amount whatsoever or howsoever described),
together with interest accrued thereon to the
prepayment date selected by Fugro.
c) Joint Venture agreement between Fugro Consultants
International N.V. and CGGVeritas S.A. (CGG) dated
27 January 2013. This agreement contains a change of
control clause with respect to the situation that a
third party, other than an affiliate of Fugro or CGG
acquires direct or indirect control over i) the affairs of
Fugro or CGG; ii) more than 30% of the voting rights
in the capital of Fugro or CGG; or iii) on the
appointment or dismissal of the majority of the
managing directors or a board of directors of Fugro or
CGG.
d) Employee option agreements. The employee option
agreements stipulate that in the event of a
restructuring of the share capital of Fugro or a
merger of Fugro with any other legal entity, the
option holder is entitled for every option to such
securities, cash or other property as to which a
shareholder of Fugro is entitled per share
immediately prior to the restructuring or merger,
unless the option period is shortened by Fugro. In the
event of a restructuring of its share capital or merger
with another company, Fugro may shorten the option
Credit facility with HSBC Bank Plc. of EUR 100 million
for five years. This agreement was implemented in
2011 and EUR 55 million of the facility has been
utilised. The facility may be cancelled in the event
of a ‘change of ownership’ of Fugro whereupon all
or part of the loans may become immediately due and
payable.
Credit facility with BNP Paribas S.A. of EUR 100
million for five years. This agreement was
implemented in 2011 and EUR 55 million of the
facility has been utilised. The facility may be
cancelled in the event of a ‘change of ownership’
of Fugro whereupon all or part of the loans may
become immediately due and payable.
Credit facility with Barclays Bank Plc. of
EUR 75 million for five years. This agreement was
implemented in 2011 and EUR 41 million of the
facility has been utilised. The facility may be
cancelled in the event of a ‘change of ownership’ of
Fugro whereupon all or part of the loans may become
immediately due and payable.
Credit facility with ABNAMRO Bank N.V. of
EUR 50 million for five years. This agreement was
implemented in 2011 and EUR 27 million of the
facility has been utilised. The facility may be
cancelled in the event of a ‘change of ownership’
of Fugro whereupon all or part of the loans may
become immediately due and payable.
Credit facility with Credit Suisse A.G. of
EUR 50 million for five years. This agreement was
implemented in 2011 and EUR 27 million of the
facility has been utilised. The facility may be
cancelled in the event of a ‘change of ownership’ of
Fugro whereupon all or part of the loans may become
immediately due and payable.
Credit facility with Rabobank of EUR 100 million for
five years. This agreement was implemented in 2008
and the facility has been fully utilised. The facility is
being repaid in quarterly instalments. The facility
may be cancelled in the event of a ‘change of
ownership’ of Fugro whereupon all or part of the
loans may become immediately due and payable.
b) Private Placement USD loans. As described in
paragraph 5.46.2 of the Financial statements, Fugro
has concluded long term loans with American and
British institutional investors in 2002. The terms and
conditions of these loans provide that Fugro may
99Corporate Governance
• the information regarding the functioning of Fugro’s
General Meeting, and the authority and rights of
Fugro’s shareholders and holders of certificates of
shares, as required by section 3a sub b of the Decree,
can be found in the chapter on ‘Corporate
Governance’;
• the information regarding the composition and
functioning of Fugro’s Board of Management, the
Supervisory Board and its Committees, as required
by section 3a sub c of the Decree, can be found in
the relevant sections of the chapter on ‘Corporate
Governance’, the Report of the Supervisory Board
and on pages 16 and 24; and
• the information concerning the disclosure of the
information required by the Decree on Section 10 EU
Takeover Directive, as required by section 3b of the
Decree, may be found in the chapter on ‘Corporate
Governance’.
This corporate governance statement is also available
on Fugro’s website.
period so as to terminate immediately prior to the
time at which the restructuring or merger is
effectuated. In the event that a public offer is
considered hostile and such offer is declared
unconditional, all options become immediately
exercisable.
Pa y m e n t t o m e m b e r s o f t h e B o a r d o f
M a n a ge m e n t o n t e r m i n a t i o n o f e m p l oy m e n t
r e s u l t i n g f r o m a p u b l i c b i d
Fugro has not entered into any agreements with
members of the Board of Management or employees
that provide for a specific severance pay on termination
of employment as a result of a public bid within the
meaning of section 5:70 or 5:74 of the Dutch Act on
Financial Supervision. The employment agreements with
the members of the Board of Management do –
in accordance with the Code – provide for a general
severance pay amounting to a maximum of one year’s
base salary which in principle is applicable in the event
of termination or annulment of the employment
agreement. These severance payments are also applicable
in the event that said persons in reasonableness cannot
continue to perform their function any longer as result
of a change in circumstances such that continuing to
fulfil their function can no longer be asked of them.
This could be the case if Fugro is wound-up, merged
or taken over, or undergoes a far-reaching restructuring
or a fundamental change of policy.
C o r p o r a t e G o ve r n a n c e s t a t e m e n t
This is a statement concerning corporate governance
as referred to in section 2a of the decree on additional
requirements for annual reports (Vaststellingsbesluit
nadere voorschriften inhoud jaarverslag) effective as of
1 January 2010 (the ‘Decree’). The information required
to be included in this corporate governance statement
as described in sections 3, 3a and 3b of the Decree can be
found in the following chapters, sections and pages of
this Annual Report 2012 and are deemed to be included
and repeated in this statement:
• the information concerning compliance with the
Dutch Corporate Governance Code, as required by
section 3 of the Decree, can be found in the chapter
on ‘Corporate Governance’;
• the information concerning Fugro’s main features of
the internal risk management and control systems
relating to the financial reporting process, as
required by section 3a sub a of the Decree, can
be found in the chapter on ‘Risk Management’;

1 Consolidated statement of comprehensive income 102
2 Consolidated statement of financial position 104
3 Consolidated statement of changes in equity 106
4 Consolidated statement of cash f lows 108
5 Notes to the consolidated financial statements 110
6 Subsidiaries and investments of Fugro N.V.
accounted for using the equity method 188
7 Company balance sheet 191
8 Company income statement 192
9 Notes to the company financial statements 193
10 Other information 198
10.1 Independent Auditor’s report 198
10.2 Subsequent events 200
10.3 Foundation Boards 200
10.4 Statutory provisions regarding the appropriation
of profit 200
10.5 Proposal regarding the appropriation of profit 201
Report of Stichting Administratiekantoor Fugro
(‘Trust Office’) 202
Historical review 204
Glossary 206
F U G R O N . V.
F i n a n c i a l s t a t e m e n t s 2 0 1 2
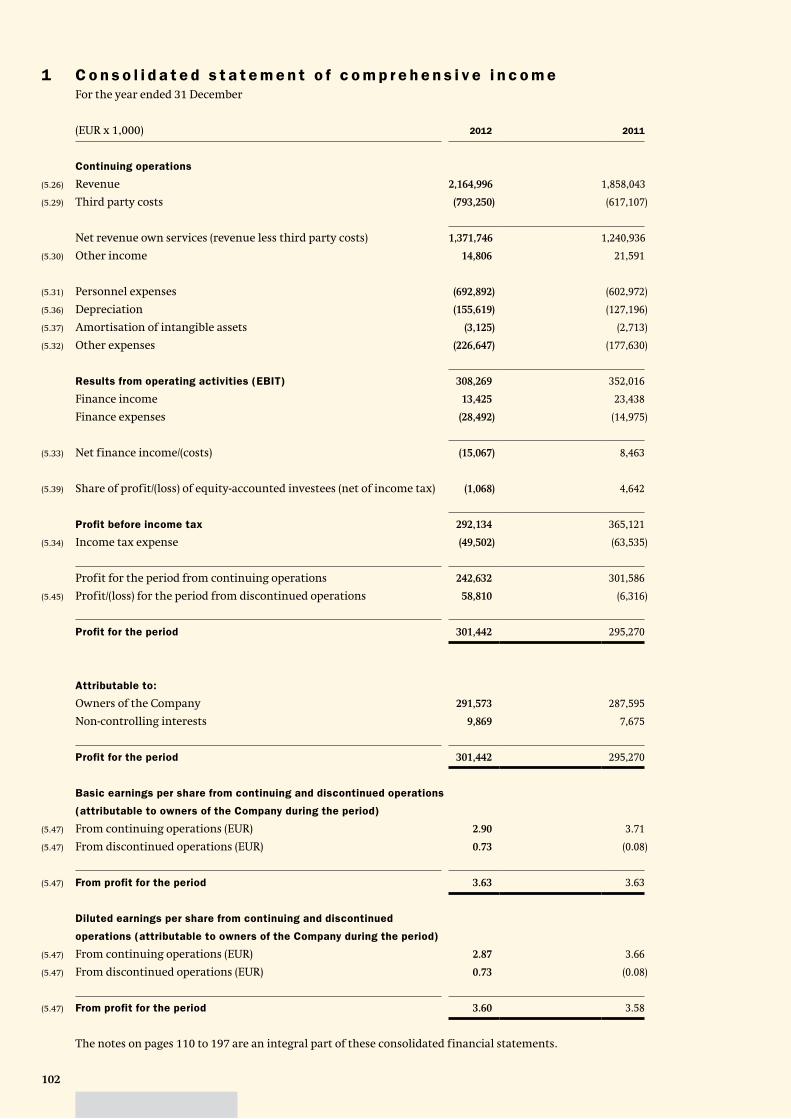
102
1 C o n s o l i d a t e d s t a t e m e n t o f c o m p r e h e n s i v e i n c o m eFor the year ended 31 December
(EUR x 1,000) 2012 2011
Continuing operations
(5.26) Revenue 2,164,996 1,858,043
(5.29) Third party costs (793,250) (617,107)
Net revenue own services (revenue less third party costs) 1,371,746 1,240,936
(5.30) Other income 14,806 21,591
(5.31) Personnel expenses (692,892) (602,972)
(5.36) Depreciation (155,619) (127,196)
(5.37) Amortisation of intangible assets (3,125) (2,713)
(5.32) Other expenses (226,647) (177,630)
Results from operating activities (EBIT) 308,269 352,016
Finance income 13,425 23,438
Finance expenses (28,492) (14,975)
(5.33) Net finance income/(costs) (15,067) 8,463
(5.39) Share of profit/(loss) of equity-accounted investees (net of income tax) (1,068) 4,642
Profit before income tax 292,134 365,121
(5.34) Income tax expense (49,502) (63,535)
Profit for the period from continuing operations 242,632 301,586
(5.45) Profit/(loss) for the period from discontinued operations 58,810 (6,316)
Profit for the period 301,442 295,270
Attributable to:
Owners of the Company 291,573 287,595
Non-controlling interests 9,869 7,675
Profit for the period 301,442 295,270
Basic earnings per share from continuing and discontinued operations
(attributable to owners of the Company during the period)
(5.47) From continuing operations (EUR) 2.90 3.71
(5.47) From discontinued operations (EUR) 0.73 (0.08)
(5.47) From profit for the period 3.63 3.63
Diluted earnings per share from continuing and discontinued
operations (attributable to owners of the Company during the period)
(5.47) From continuing operations (EUR) 2.87 3.66
(5.47) From discontinued operations (EUR) 0.73 (0.08)
(5.47) From profit for the period 3.60 3.58
The notes on pages 110 to 197 are an integral part of these consolidated financial statements.
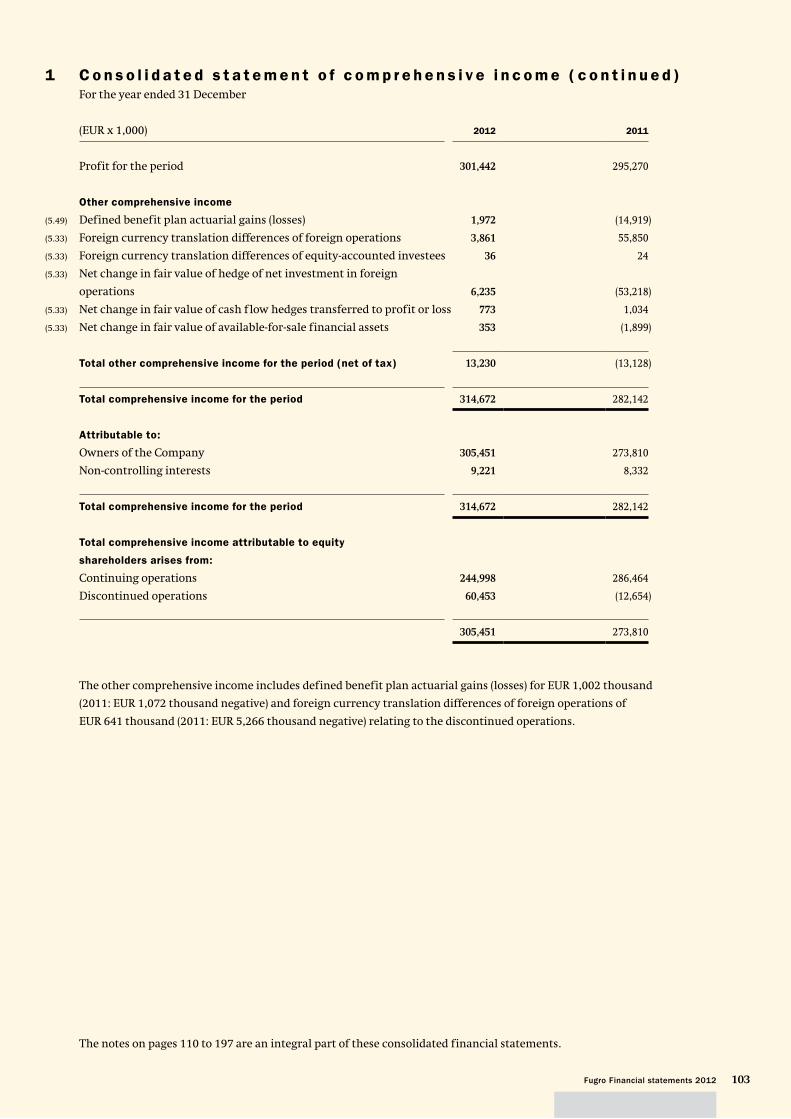
103Fugro Financial statements 2012
1 C o n s o l i d a t e d s t a t e m e n t o f c o m p r e h e n s i v e i n c o m e ( c o n t i n u e d )For the year ended 31 December
(EUR x 1,000) 2012 2011
Profit for the period 301,442 295,270
Other comprehensive income
(5.49) Defined benefit plan actuarial gains (losses) 1,972 (14,919)
(5.33) Foreign currency translation differences of foreign operations 3,861 55,850
(5.33) Foreign currency translation differences of equity-accounted investees 36 24
(5.33) Net change in fair value of hedge of net investment in foreign
operations 6,235 (53,218)
(5.33) Net change in fair value of cash f low hedges transferred to profit or loss 773 1,034
(5.33) Net change in fair value of available-for-sale financial assets 353 (1,899)
Total other comprehensive income for the period (net of tax) 13,230 (13,128)
Total comprehensive income for the period 314,672 282,142
Attributable to:
Owners of the Company 305,451 273,810
Non-controlling interests 9,221 8,332
Total comprehensive income for the period 314,672 282,142
Total comprehensive income attributable to equity
shareholders arises from:
Continuing operations 244,998 286,464
Discontinued operations 60,453 (12,654)
305,451 273,810
The other comprehensive income includes defined benefit plan actuarial gains (losses) for EUR 1,002 thousand
(2011: EUR 1,072 thousand negative) and foreign currency translation differences of foreign operations of
EUR 641 thousand (2011: EUR 5,266 thousand negative) relating to the discontinued operations.
The notes on pages 110 to 197 are an integral part of these consolidated financial statements.
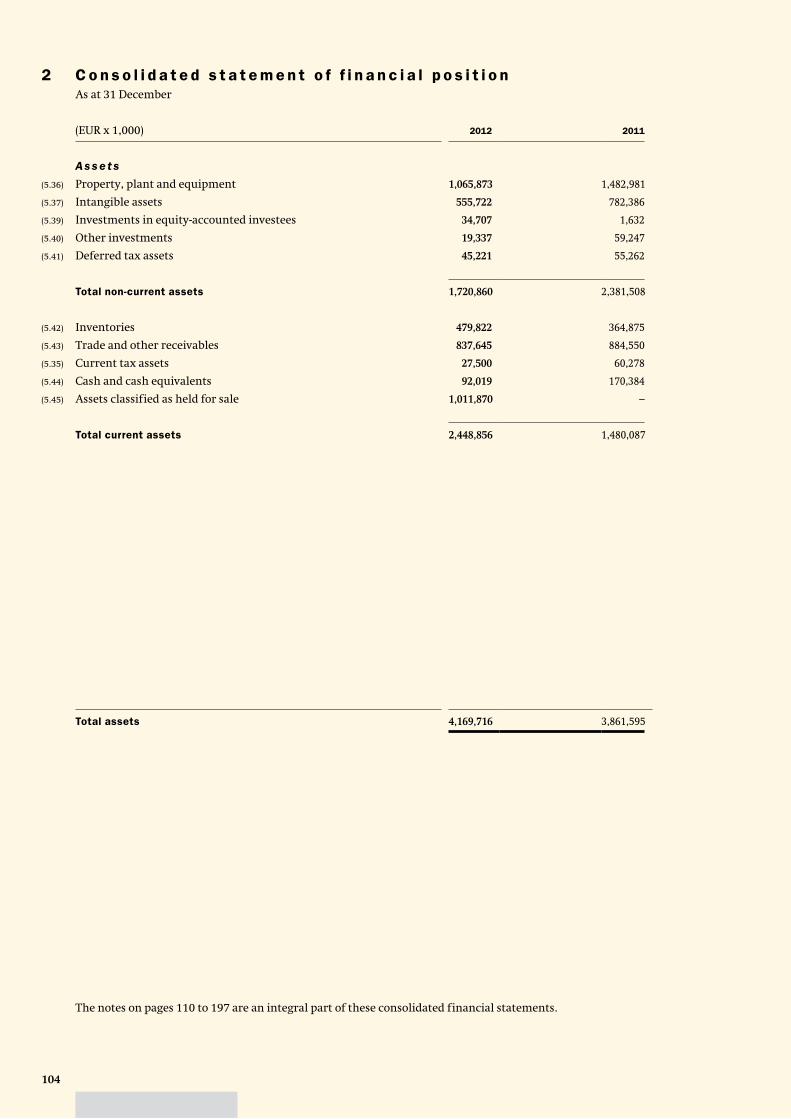
104
2 C o n s o l i d a t e d s t a t e m e n t o f f i n a n c i a l p o s i t i o nAs at 31 December
(EUR x 1,000) 2012 2011
A s s e t s
(5.36) Property, plant and equipment 1,065,873 1,482,981
(5.37) Intangible assets 555,722 782,386
(5.39) Investments in equity-accounted investees 34,707 1,632
(5.40) Other investments 19,337 59,247
(5.41) Deferred tax assets 45,221 55,262
Total non-current assets 1,720,860 2,381,508
(5.42) Inventories 479,822 364,875
(5.43) Trade and other receivables 837,645 884,550
(5.35) Current tax assets 27,500 60,278
(5.44) Cash and cash equivalents 92,019 170,384
(5.45) Assets classified as held for sale 1,011,870 –
Total current assets 2,448,856 1,480,087
Total assets 4,169,716 3,861,595
The notes on pages 110 to 197 are an integral part of these consolidated financial statements.
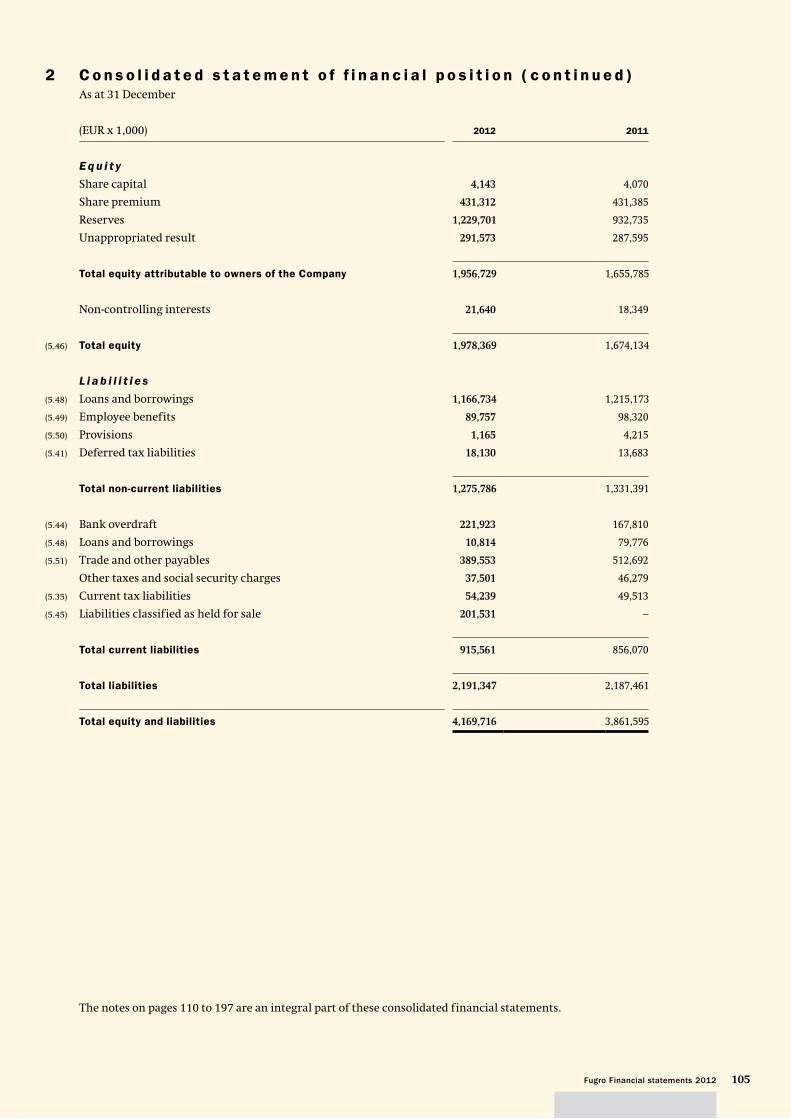
105Fugro Financial statements 2012
2 C o n s o l i d a t e d s t a t e m e n t o f f i n a n c i a l p o s i t i o n ( c o n t i n u e d )As at 31 December
(EUR x 1,000) 2012 2011
E q u i t y
Share capital 4,143 4,070
Share premium 431,312 431,385
Reserves 1,229,701 932,735
Unappropriated result 291,573 287,595
Total equity attributable to owners of the Company 1,956,729 1,655,785
Non-controlling interests 21,640 18,349
(5.46) Total equity 1,978,369 1,674,134
L i a b i l i t i e s
(5.48) Loans and borrowings 1,166,734 1,215,173
(5.49) Employee benefits 89,757 98,320
(5.50) Provisions 1,165 4,215
(5.41) Deferred tax liabilities 18,130 13,683
Total non-current liabilities 1,275,786 1,331,391
(5.44) Bank overdraft 221,923 167,810
(5.48) Loans and borrowings 10,814 79,776
(5.51) Trade and other payables 389,553 512,692
Other taxes and social security charges 37,501 46,279
(5.35) Current tax liabilities 54,239 49,513
(5.45) Liabilities classified as held for sale 201,531 –
Total current liabilities 915,561 856,070
Total liabilities 2,191,347 2,187,461
Total equity and liabilities 4,169,716 3,861,595
The notes on pages 110 to 197 are an integral part of these consolidated financial statements.
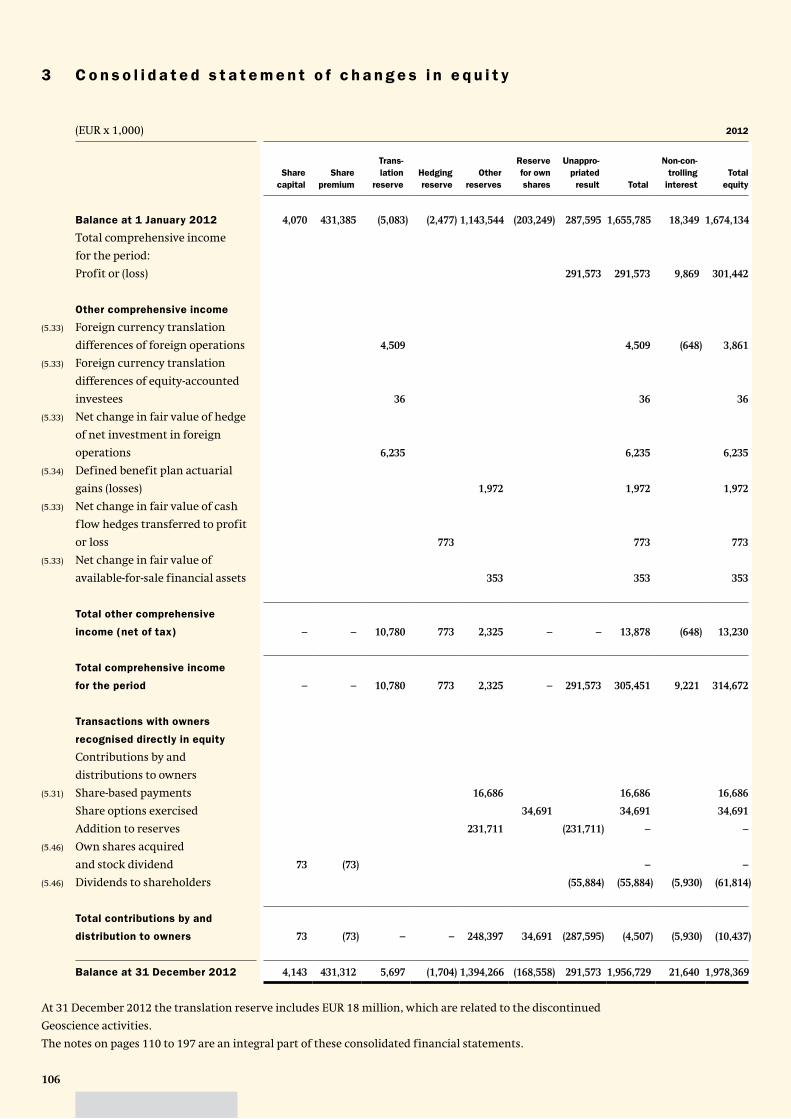
106
3 C o n s o l i d a t e d s t a t e m e n t o f c h a n g e s i n e q u i t y
(EUR x 1,000) 2012
Share
capital
Share
premium
Trans -
lation
reserve
Hedging
reserve
Other
reserves
Reserve
for own
shares
Unappro-
priated
result Total
Non-con-
trolling
interest
Total
equity
Balance at 1 January 2012 4,070 431,385 (5,083) (2,477) 1,143,544 (203,249) 287,595 1,655,785 18,349 1,674,134
Total comprehensive income
for the period:
Profit or (loss) 291,573 291,573 9,869 301,442
Other comprehensive income
(5.33) Foreign currency translation
differences of foreign operations 4,509 4,509 (648) 3,861
(5.33) Foreign currency translation
differences of equity-accounted
investees 36 36 36
(5.33) Net change in fair value of hedge
of net investment in foreign
operations 6,235 6,235 6,235
(5.34) Defined benefit plan actuarial
gains (losses) 1,972 1,972 1,972
(5.33) Net change in fair value of cash
f low hedges transferred to profit
or loss 773 773 773
(5.33) Net change in fair value of
available-for-sale financial assets 353 353 353
Total other comprehensive
income (net of tax) – – 10,780 773 2,325 – – 13,878 (648) 13,230
Total comprehensive income
for the period – – 10,780 773 2,325 – 291,573 305,451 9,221 314,672
Transactions with owners
recognised directly in equity
Contributions by and
distributions to owners
(5.31) Share-based payments 16,686 16,686 16,686
Share options exercised 34,691 34,691 34,691
Addition to reserves 231,711 (231,711) – –
(5.46) Own shares acquired
and stock dividend 73 (73) – –
(5.46) Dividends to shareholders (55,884) (55,884) (5,930) (61,814)
Total contributions by and
distribution to owners 73 (73) – – 248,397 34,691 (287,595) (4,507) (5,930) (10,437)
Balance at 31 December 2012 4,143 431,312 5,697 (1,704) 1,394,266 (168,558) 291,573 1,956,729 21,640 1,978,369
At 31 December 2012 the translation reserve includes EUR 18 million, which are related to the discontinued
Geoscience activities.
The notes on pages 110 to 197 are an integral part of these consolidated financial statements.
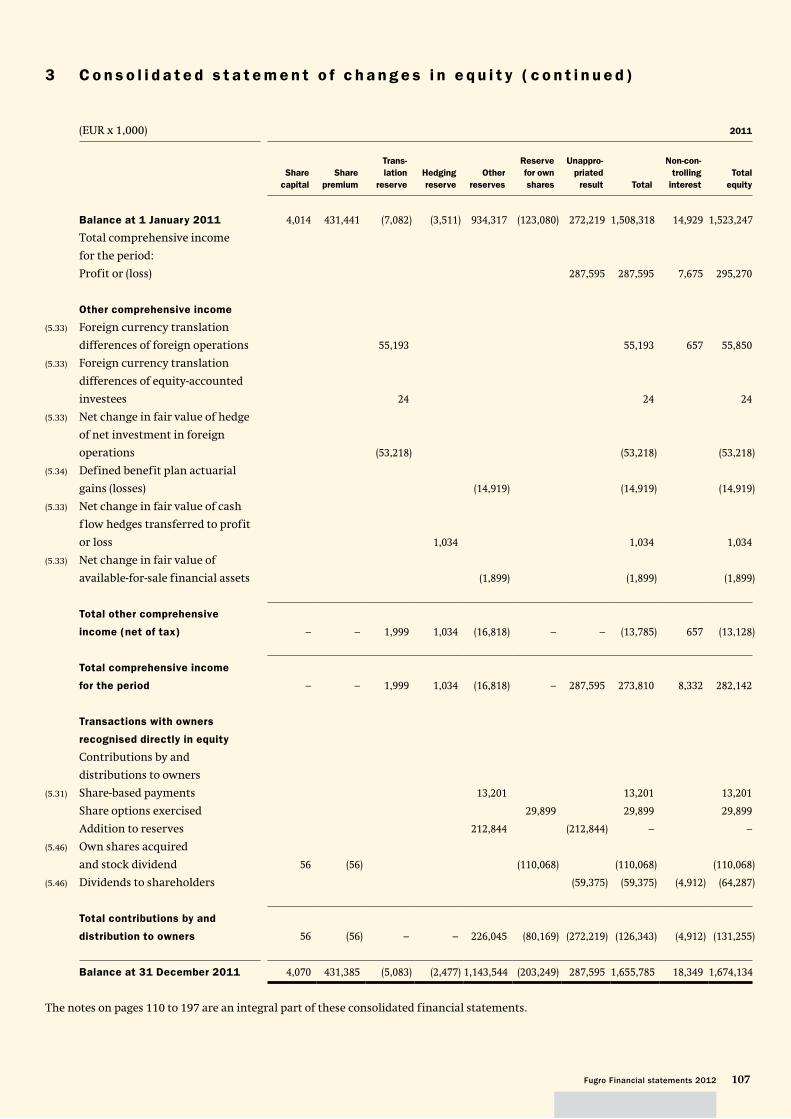
107Fugro Financial statements 2012
3 C o n s o l i d a t e d s t a t e m e n t o f c h a n g e s i n e q u i t y ( c o n t i n u e d )
(EUR x 1,000) 2011
Share
capital
Share
premium
Trans -
lation
reserve
Hedging
reserve
Other
reserves
Reserve
for own
shares
Unappro-
priated
result Total
Non-con-
trolling
interest
Total
equity
Balance at 1 January 2011 4,014 431,441 (7,082) (3,511) 934,317 (123,080) 272,219 1,508,318 14,929 1,523,247
Total comprehensive income
for the period:
Profit or (loss) 287,595 287,595 7,675 295,270
Other comprehensive income
(5.33) Foreign currency translation
differences of foreign operations 55,193 55,193 657 55,850
(5.33) Foreign currency translation
differences of equity-accounted
investees 24 24 24
(5.33) Net change in fair value of hedge
of net investment in foreign
operations (53,218) (53,218) (53,218)
(5.34) Defined benefit plan actuarial
gains (losses) (14,919) (14,919) (14,919)
(5.33) Net change in fair value of cash
f low hedges transferred to profit
or loss 1,034 1,034 1,034
(5.33) Net change in fair value of
available-for-sale financial assets (1,899) (1,899) (1,899)
Total other comprehensive
income (net of tax) – – 1,999 1,034 (16,818) – – (13,785) 657 (13,128)
Total comprehensive income
for the period – – 1,999 1,034 (16,818) – 287,595 273,810 8,332 282,142
Transactions with owners
recognised directly in equity
Contributions by and
distributions to owners
(5.31) Share-based payments 13,201 13,201 13,201
Share options exercised 29,899 29,899 29,899
Addition to reserves 212,844 (212,844) – –
(5.46) Own shares acquired
and stock dividend 56 (56) (110,068) (110,068) (110,068)
(5.46) Dividends to shareholders (59,375) (59,375) (4,912) (64,287)
Total contributions by and
distribution to owners 56 (56) – – 226,045 (80,169) (272,219) (126,343) (4,912) (131,255)
Balance at 31 December 2011 4,070 431,385 (5,083) (2,477) 1,143,544 (203,249) 287,595 1,655,785 18,349 1,674,134
The notes on pages 110 to 197 are an integral part of these consolidated financial statements.
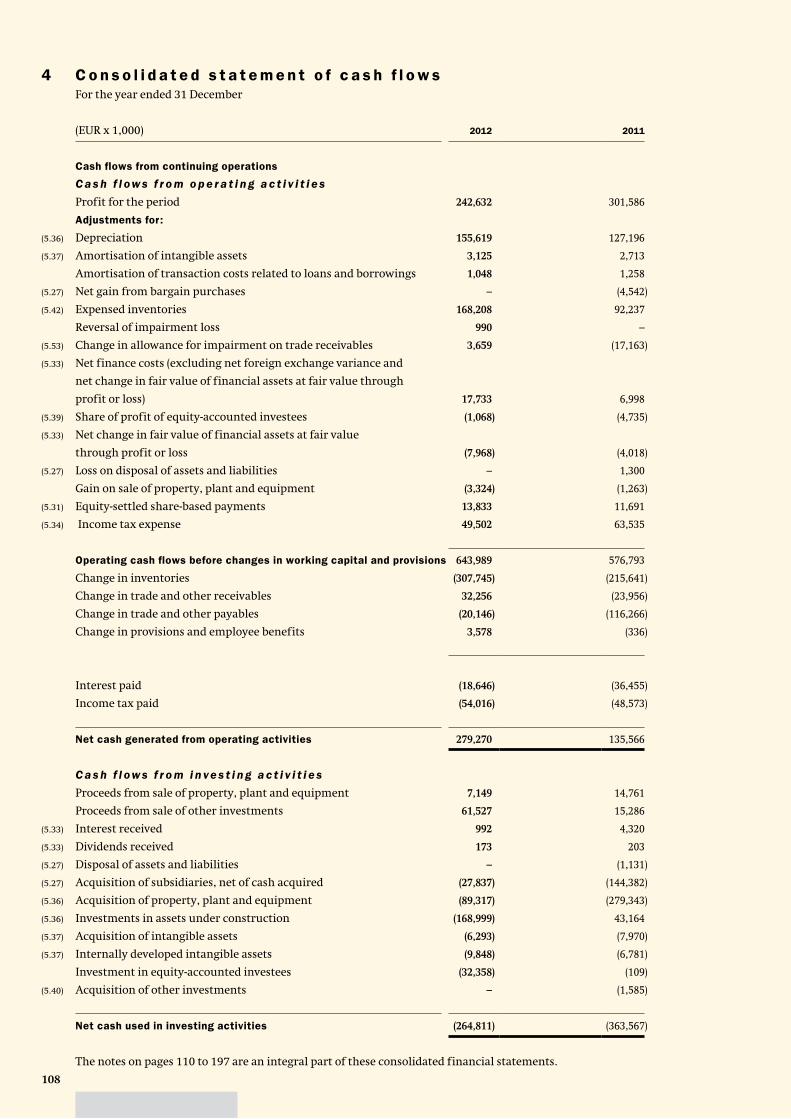
108
4 C o n s o l i d a t e d s t a t e m e n t o f c a s h f l o w sFor the year ended 31 December
(EUR x 1,000) 2012 2011
Cash flows from continuing operations
C a s h f l ow s f r o m o p e r a t i n g a c t i v i t i e s
Profit for the period 242,632 301,586
Adjustments for:
(5.36) Depreciation 155,619 127,196
(5.37) Amortisation of intangible assets 3,125 2,713
Amortisation of transaction costs related to loans and borrowings 1,048 1,258
(5.27) Net gain from bargain purchases – (4,542)
(5.42) Expensed inventories 168,208 92,237
Reversal of impairment loss 990 –
(5.53) Change in allowance for impairment on trade receivables 3,659 (17,163)
(5.33) Net finance costs (excluding net foreign exchange variance and
net change in fair value of financial assets at fair value through
profit or loss) 17,733 6,998
(5.39) Share of profit of equity-accounted investees (1,068) (4,735)
(5.33) Net change in fair value of financial assets at fair value
through profit or loss (7,968) (4,018)
(5.27) Loss on disposal of assets and liabilities – 1,300
Gain on sale of property, plant and equipment (3,324) (1,263)
(5.31) Equity-settled share-based payments 13,833 11,691
(5.34) Income tax expense 49,502 63,535
Operating cash flows before changes in working capital and provisions 643,989 576,793
Change in inventories (307,745) (215,641)
Change in trade and other receivables 32,256 (23,956)
Change in trade and other payables (20,146) (116,266)
Change in provisions and employee benefits 3,578 (336)
Interest paid (18,646) (36,455)
Income tax paid (54,016) (48,573)
Net cash generated from operating activities 279,270 135,566
C a s h f l ow s f r o m i n ve s t i n g a c t i v i t i e s
Proceeds from sale of property, plant and equipment 7,149 14,761
Proceeds from sale of other investments 61,527 15,286
(5.33) Interest received 992 4,320
(5.33) Dividends received 173 203
(5.27) Disposal of assets and liabilities – (1,131)
(5.27) Acquisition of subsidiaries, net of cash acquired (27,837) (144,382)
(5.36) Acquisition of property, plant and equipment (89,317) (279,343)
(5.36) Investments in assets under construction (168,999) 43,164
(5.37) Acquisition of intangible assets (6,293) (7,970)
(5.37) Internally developed intangible assets (9,848) (6,781)
Investment in equity-accounted investees (32,358) (109)
(5.40) Acquisition of other investments – (1,585)
Net cash used in investing activities (264,811) (363,567)
The notes on pages 110 to 197 are an integral part of these consolidated financial statements.
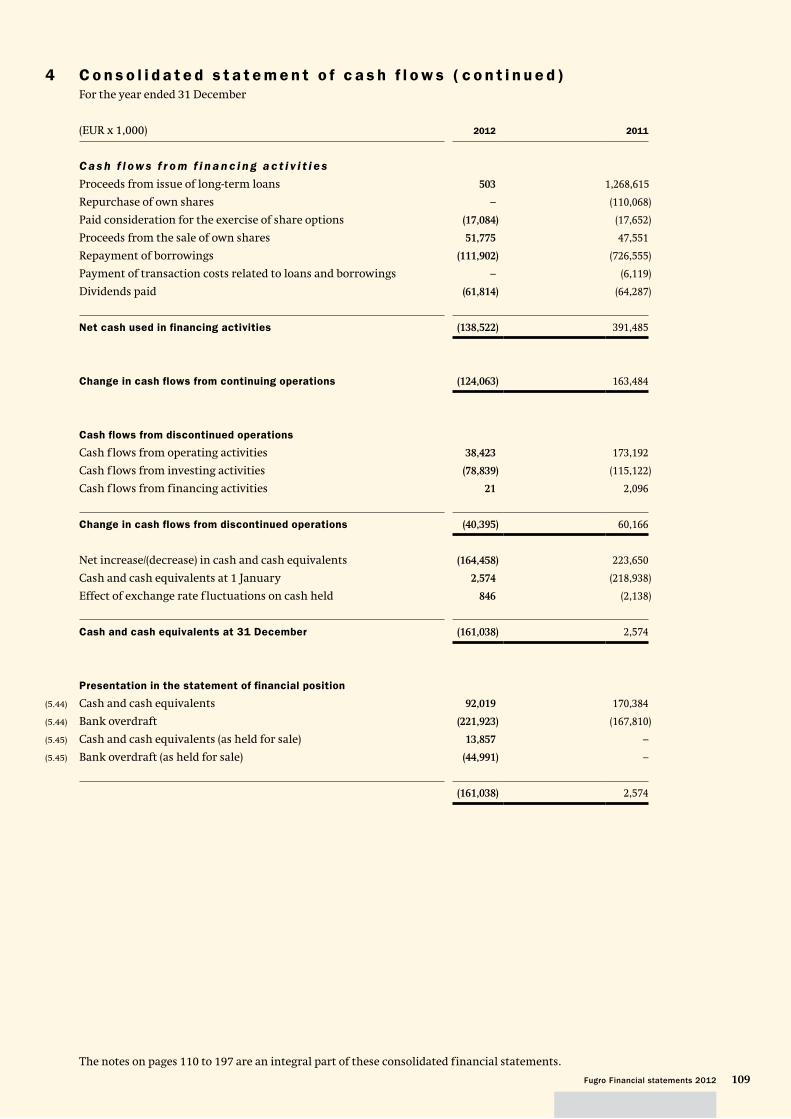
109Fugro Financial statements 2012
4 C o n s o l i d a t e d s t a t e m e n t o f c a s h f l o w s ( c o n t i n u e d )For the year ended 31 December
(EUR x 1,000) 2012 2011
C a s h f l ow s f r o m f i n a n c i n g a c t i v i t i e s
Proceeds from issue of long-term loans 503 1,268,615
Repurchase of own shares – (110,068)
Paid consideration for the exercise of share options (17,084) (17,652)
Proceeds from the sale of own shares 51,775 47,551
Repayment of borrowings (111,902) (726,555)
Payment of transaction costs related to loans and borrowings – (6,119)
Dividends paid (61,814) (64,287)
Net cash used in financing activities (138,522) 391,485
Change in cash flows from continuing operations (124,063) 163,484
Cash flows from discontinued operations
Cash f lows from operating activities 38,423 173,192
Cash f lows from investing activities (78,839) (115,122)
Cash f lows from financing activities 21 2,096
Change in cash flows from discontinued operations (40,395) 60,166
Net increase/(decrease) in cash and cash equivalents (164,458) 223,650
Cash and cash equivalents at 1 January 2,574 (218,938)
Effect of exchange rate f luctuations on cash held 846 (2,138)
Cash and cash equivalents at 31 December (161,038) 2,574
Presentation in the statement of financial position
(5.44) Cash and cash equivalents 92,019 170,384
(5.44) Bank overdraft (221,923) (167,810)
(5.45) Cash and cash equivalents (as held for sale) 13,857 –
(5.45) Bank overdraft (as held for sale) (44,991) –
(161,038) 2,574
The notes on pages 110 to 197 are an integral part of these consolidated financial statements.
110
5 N o t e s t o t h e c o n s o l i d a t e d f i n a n c i a l s t a t e m e n t s
5.1 G e n e r a l
Fugro N.V., hereinafter to be referred to as ‘Fugro’ or ‘the Company’, has its corporate seat in The Netherlands.
The address of the Company’s principal office is Veurse Achterweg 10, 2264 SG, Leidschendam, The
Netherlands. The consolidated financial statements of Fugro as at and for the year ended 31 December 2012
include Fugro and its subsidiaries (together referred to as the ‘Group’) and the Group’s interests in equity-
accounted investees. A summary of the main subsidiaries is included in chapter 6. Fugro is a global service
provider with regard to the collection and interpretation of data relating to the earth’s surface and sub-surface
and for associated services and advice in support of infrastructure development on land, along the coast and on
the seabed.
5.2 S t a t e m e n t o f c o m p l i a n c e
The consolidated financial statements have been prepared in accordance with International Financial
Reporting Standards (IFRS) as adopted by the European Union (EU-IFRS) and with Part 9 of Book 2 of the
Netherlands Civil Code.
On 7 March 2013 the Board of Management authorised the financial statements for issue. Publication will take
place on 8 March 2013 and the financial statements will be submitted for adoption to the Annual General
Meeting on 8 May 2013.
The financial statements will be submitted for adoption to the Annual General Meeting on 8 May 2013.
The official language for the financial statements is the English language as approved by the Annual General
Meeting on 10 May 2011. With reference to the Company income statement of Fugro N.V., use has been made
of the exemption pursuant to section 2:402 of the Netherlands Civil Code.
5.3 B a s i s o f p r e p a r a t i o n
5.3.1 Functional and presentation currency
The financial statements are presented in EUR x 1,000, unless mentioned otherwise. The Euro is the functional
and presentation currency of the Company.
5.3.2 Basis of measurement
The financial statements have been prepared on the basis of historical cost, except that the following assets
and liabilities are stated at their fair value: derivative financial instruments, financial instruments at fair value
through profit or loss, available-for-sale financial assets and plan assets associated with defined benefit plans.
5.3.3 Use of estimates and judgements
The preparation of the consolidated financial statements requires management to make judgements,
estimates and assumptions that affect the application of accounting policies and the reported amounts
of assets, liabilities, income and expenses. Actual results may differ materially from these estimates.
The estimates and associated assumptions are based on historical experience and various other factors that
are believed to be reasonable under the circumstances, the result of which form the basis of making the
judgements about the carrying values of the assets and liabilities that are not readily apparent from other
sources. The estimates and the underlying assumptions are reviewed on an ongoing basis. Revisions to
accounting estimates are recognised in the period in which the estimates are revised, if the revision affects
only that period, or in the period of the revision and future periods if the revision affects both current and
future periods.
Key sources of estimation uncertainty and references to the notes which include information about
assumptions and estimation uncertainties that have a significant risk of resulting in a material adjustment
within the next financial year are included in note 5.62.
111Fugro Financial statements 2012
5.3.4 Changes in accounting policies
No significant changes in accounting policies were applicable during the year ended 31 December 2012.
5.3.5 New standards and interpretations
For the following new standards Fugro has not opted for early adoption:
As of 1 January 2013, IAS 19 Employee benefits (revised) will become effective. The main changes are:
– the elimination of the corridor approach and to recognise all actuarial gains and losses in OCI as they occur;
– the immediate recognition of all past service costs
– the replacement of the interest cost and expected return on plan assets with a net interest amount that is
calculated by applying the discount rate to the net defined benefit liability (asset).
As Fugro has no unrecognised past service costs and Fugro already recognises actuarial gains and losses
directly in equity through other comprehensive income the impact on the equity position as per 1 January
2013 is nil. The impact of IAS 19 revised on the income statement, resulting from the replacement of the
expected return on plan assets by the discount rate would have affected the 2012 income statement by an
estimated increase in pension expenses of around EUR 2.5 million (based on the parameters at 1 January 2012).
The amendment to IAS 1 ‘Presentation of financial statements – Presentation of items of other comprehensive
income’ is effective for annual periods beginning on or after 1 July 2012. The amendments require an entity
to present the items of other comprehensive income that may be reclassified to profit or loss in the future
if certain conditions are met, separately from those that would never be reclassified to profit or loss.
The amendments to IFRS 7, ‘Financial instruments: Disclosures – Offsetting financial assets and financial
liabilities’, focus on quantitative information about recognized financial instruments that are offset in the
statement of financial position, as well as those recognized financial instruments that are subject to master
netting or similar arrangements irrespective of whether they are offset. The converged offsetting disclosures
in IFRS 7 are for annual periods beginning on or after 1 January 2013 and are to be retrospectively applied.
IFRS 9 Financial Instruments, as issued in 2009 and revised in 2010, is required to be adopted by 2015 under
the presumption that the standard is endorsed by the European Union. The Standard could change the
classification or measurement of financial assets upon adoption; the full impact of the changes in accounting
for financial instruments has not been determined.
IFRS 10 ‘Consolidated Financial Statements’, IFRS 11 ‘Joint Arrangements’, IFRS 12 ‘Disclosure of Interests
in Other Entities’ and revised standards IAS 27 ‘Separate Financial Statements’ and IAS 28 ‘Investments in
Associates and Joint Ventures’ were issued during 2011 and are required to be adopted, with retrospective
effect, by 2014. The standards reinforce the principles for determining when an investor controls another
entity, amend in certain cases the accounting for arrangements where an investor has joint control and
introduce changes to certain disclosures. The impact of the changes is currently under review, although
adoption of these standards is not expected to significantly impact the financial statements.
IFRS 13 ‘Fair Value Measurement’ was issued during 2011 and is required to be adopted, with prospective
effect, by 2013. The standard affects nearly all instances where assets and liabilities are currently measured
at fair value, primarily by refining the measurement concept to represent an asset or liability’s exit value.
The standard also introduces certain additional considerations to the measurement process. The impact of
the changes is currently under review although adoption is not expected to significantly impact the
financial statements.
112
5.3.6 Divestment of Geoscience activities
On 24 September 2012, Fugro announced the divestment of the majority of its Geoscience division excluding
the multi-client library and the Ocean Bottom Nodes for a total consideration of EUR 1.2 billion to CGG on a
cash and debt free basis. The transaction is closed on 28 January 2013 with an effective date as of 31 January
2013. The Airborne activities and certain minor assets will be transferred at a later moment, once all
equipment licence transfer and administrative authorizations have been received. Both parties have agreed
that as part of the EUR 1.2 billion cash transaction, EUR 125 million will be in the form of a vendor loan.
The vendor loan will be increased to EUR 225 million with the closing of Airborne, which is expected in 2013.
The divestment allows Fugro to exit the capital intensive and volatile seismic segment of the oil and gas
exploration market where it does not have a leading market position. This is consistent with Fugro’s strategy
to build strong market positions and a broad, cohesive service portfolio and to maintain a balance of its
services across the exploration, development and production phases of the oil and gas industry. Fugro will
continue to focus on growth opportunities in its core, market-leading and less volatile geotechnical and survey
businesses. Furthermore, Fugro and CGG also established a new entity, Seabed Geosolutions, which includes
Fugro’s and CGG’s ocean bottom nodes business and CGG’s transition zone, ocean bottom cable and permanent
reservoir monitoring activities.
As a consequence, the Geoscience activities are reported as ‘discontinued operations’ in the Consolidated
Statement of comprehensive income and as ‘assets classified as held for sale’ in the Consolidated Statement
of Financial position as of 31 December 2012. As prescribed by IFRS 5, the 31 December 2011 Consolidated
Statement of Financial Position has not been adjusted. In the Consolidated Statement of Comprehensive
Income for 2011 and 2012, the net profit/(loss) for the period of the discontinued Geoscience component has
been presented on a separate line ‘profit/(loss) for the period from discontinued operations’. The 2011
consolidated statement of comprehensive income statement has been adjusted for comparability purposes.
The 2012 and 2011 consolidated statement of cash f lows includes separate cash f lows and cash balances of the
discontinued business. Further details relating to the discontinued Geoscience division is presented in note
5.45.
5.4 S i g n i f i c a n t a c c o u n t i n g p o l i c i e s
The accounting policies set out below have been applied consistently by all subsidiaries and equity-accounted
investees to all periods presented in these consolidated financial statements.
5.4.1 Basis of consolidation
5.4.1.1 Accounting for business combinations
Business combinations are accounted for using the acquisition method as at the acquisition date, which is the
date on which control is transferred to the Group. Control is the power to govern the financial and operating
policies of an entity so as to obtain benefits from its activities. In assessing control, the Group takes into
consideration potential voting rights that currently are exercisable.
Acquisitions on or after 1 January 2010
For acquisitions on or after 1 January 2010, the Group measures goodwill at the acquisition date as:
– the fair value of the consideration transferred; plus
– the recognised amount of any non-controlling interests in the acquiree; plus
– the fair value of the existing equity interest in the acquiree, if the business combination is in stages; less
– the net recognised amount (generally fair value) of the identifiable assets acquired and liabilities assumed.
When the excess is negative, a bargain purchase gain is recognised immediately in profit or loss.
The consideration transferred does not include amounts related to the settlement of pre-existing
relationships. Such amounts are generally recognised in profit or loss.
113Fugro Financial statements 2012
Costs related to the acquisition, other than those associated with the issue of debt or equity securities, that
the Group incurs in connection with a business combination are expensed as incurred.
Any contingent consideration payable is recognised at fair value at the acquisition date. If the contingent
consideration is classified as equity, it is not re-measured and settlement is accounted for within equity.
Otherwise, subsequent changes to the fair value of the contingent consideration are recognised in profit
or loss.
When share-based payment awards (replacement awards) are required to be exchanged for awards held by
the acquiree’s employees (acquiree’s awards) and relate to past services, then all or a portion of the amount
of the acquirer’s replacement awards is included in measuring the consideration transferred in the business
combination. This determination is based on the market-based value of the replacement awards compared
with the market-based value of the acquiree’s awards and the extent to which the replacement awards relate
to past and/or future service.
5.4.1.2 Subsidiaries
Subsidiaries are those entities controlled by the Group, taking into account the impact of potential voting
rights that are presently exercisable. Control exists when the Group has the power, directly or indirectly, to
govern the financial and operating policies of an entity so as to obtain benefits from its activities. The financial
statements of subsidiaries are included in the consolidated financial statements from the date that control
commences until the date that control ceases.
On the loss of control, the Group derecognises the assets and liabilities of the subsidiary, any non-controlling
interest and the other components of equity related to the subsidiary. Any surplus or deficit arising on the
loss of control is recognised in profit or loss. If the Group retains any interest in the previous subsidiary, it is
accounted for as an equity-accounted investee or as an available for sale financial asset depending on the level
of influence retained.
5.4.2 Equity-accounted investees
Equity-accounted investees are those entities in which the Group has significant influence, but not control,
over the financial and operating policies. Significant influence is presumed to exist when the Group holds
between 20% and 50% of the voting power of another entity. Refer to note 5.10 for the accounting policy for
equity-accounted investees.
5.4.3 Other investments
Other investments are those entities in whose activities the Group holds a non-controlling interest and has
no control or significant influence. Refer to note 5.11 for the accounting policy for other investments.
5.4.4 Transactions eliminated on consolidation
Intra-group balances and transactions, and any unrealised income and expenses arising from intra-group
transactions, are eliminated in preparing the consolidated financial statements. Unrealised gains arising
from transactions with equity-accounted investees are eliminated against the investment to the extent of
the Group’s interest in the investee. Unrealised losses are eliminated in the same way as unrealised gains,
but only to the extent that there is no evidence of impairment.
5.5 Fo r e i g n c u r r e n c y
5.5.1 Foreign currency transactions and translation
Transactions in foreign currencies are translated to the respective functional currencies of Group entities
at exchange rates at the dates of the transactions.
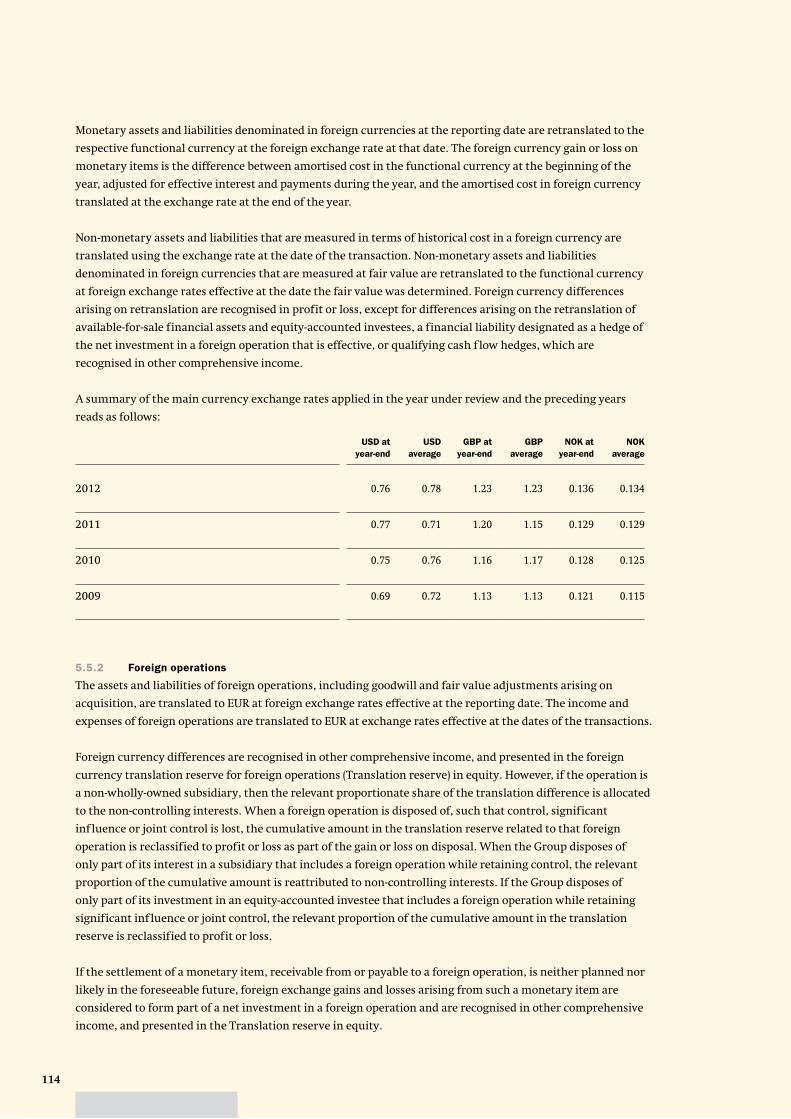
114
Monetary assets and liabilities denominated in foreign currencies at the reporting date are retranslated to the
respective functional currency at the foreign exchange rate at that date. The foreign currency gain or loss on
monetary items is the difference between amortised cost in the functional currency at the beginning of the
year, adjusted for effective interest and payments during the year, and the amortised cost in foreign currency
translated at the exchange rate at the end of the year.
Non-monetary assets and liabilities that are measured in terms of historical cost in a foreign currency are
translated using the exchange rate at the date of the transaction. Non-monetary assets and liabilities
denominated in foreign currencies that are measured at fair value are retranslated to the functional currency
at foreign exchange rates effective at the date the fair value was determined. Foreign currency differences
arising on retranslation are recognised in profit or loss, except for differences arising on the retranslation of
available-for-sale financial assets and equity-accounted investees, a financial liability designated as a hedge of
the net investment in a foreign operation that is effective, or qualifying cash f low hedges, which are
recognised in other comprehensive income.
A summary of the main currency exchange rates applied in the year under review and the preceding years
reads as follows:
USD at
year-end
USD
average
GBP at
year-end
GBP
average
NOK at
year-end
NOK
average
2012 0.76 0.78 1.23 1.23 0.136 0.134
2011 0.77 0.71 1.20 1.15 0.129 0.129
2010 0.75 0.76 1.16 1.17 0.128 0.125
2009 0.69 0.72 1.13 1.13 0.121 0.115
5.5.2 Foreign operations
The assets and liabilities of foreign operations, including goodwill and fair value adjustments arising on
acquisition, are translated to EUR at foreign exchange rates effective at the reporting date. The income and
expenses of foreign operations are translated to EUR at exchange rates effective at the dates of the transactions.
Foreign currency differences are recognised in other comprehensive income, and presented in the foreign
currency translation reserve for foreign operations (Translation reserve) in equity. However, if the operation is
a non-wholly-owned subsidiary, then the relevant proportionate share of the translation difference is allocated
to the non-controlling interests. When a foreign operation is disposed of, such that control, significant
influence or joint control is lost, the cumulative amount in the translation reserve related to that foreign
operation is reclassified to profit or loss as part of the gain or loss on disposal. When the Group disposes of
only part of its interest in a subsidiary that includes a foreign operation while retaining control, the relevant
proportion of the cumulative amount is reattributed to non-controlling interests. If the Group disposes of
only part of its investment in an equity-accounted investee that includes a foreign operation while retaining
significant influence or joint control, the relevant proportion of the cumulative amount in the translation
reserve is reclassified to profit or loss.
If the settlement of a monetary item, receivable from or payable to a foreign operation, is neither planned nor
likely in the foreseeable future, foreign exchange gains and losses arising from such a monetary item are
considered to form part of a net investment in a foreign operation and are recognised in other comprehensive
income, and presented in the Translation reserve in equity.
115Fugro Financial statements 2012
5.5.3 Hedge of a net investment in foreign operations
The Group applies hedge accounting to foreign currency differences arising between the functional currency
of the foreign operation and the functional currency of Fugro (EUR), regardless of whether the net investment
is held directly or through an intermediate parent.
Foreign currency differences arising on the (re-)translation of a financial liability designated as a hedge of
a net investment in a foreign operation are recognised in other comprehensive income to the extent that the
hedge is effective, and are presented within equity in the Translation reserve. To the extent that the hedge is
ineffective, such differences are recognised in profit or loss. When the hedged net investment is disposed of,
the relevant amount in the Translation reserve is transferred to profit or loss as part of the profit or loss on
disposal.
5.6 D e t e r m i n a t i o n o f f a i r va l u e s
A number of the Group’s accounting policies and disclosures require the determination of fair value, for both
financial and non-financial assets and liabilities. Fair values have been determined for measurement and/or
disclosure purposes based on the following methods. When applicable, additional information on the
determination of fair values is disclosed in the notes of the specific asset or liability.
5.6.1 Property, plant and equipment
The fair value of property, plant and equipment recognised as a result of a business combination is the
estimated amount for which a property could be exchanged on the date of acquisition between a willing buyer
and a willing seller in an arm’s length transaction after proper marketing wherein the parties had each acted
knowledgeably. The fair value of items of plant, equipment, fixtures and fittings is based on the market
approach and cost approaches using quoted market prices for similar items when available and depreciated
replacement cost when appropriate. Depreciated replacement cost estimates reflect adjustments for physical
deterioration as well as functional and economic obsolescence.
5.6.2 Intangible assets
The fair value of patents and trademarks acquired in a business combination is based on the discounted
estimated royalty payments that have been avoided as a result of the patent or trademark being owned.
The fair value of customer relationships acquired in a business combination is determined using the multi-
period excess earnings method, whereby the subject asset is valued after deducting a fair return on all other
assets that are part of creating the related cash f lows. The fair value of other intangible assets is based on the
discounted cash f lows expected to be derived from the use and eventual sale of the assets.
5.6.3 Inventories
The fair value of inventories (including seismic and geological libraries) acquired in a business combination
is determined based on the estimated selling price in the ordinary course of business less the estimated costs
of completion and sale, and a reasonable profit margin based on the effort required to complete and sell the
inventories.
5.6.4 Equity and debt securities
The fair value of equity and debt securities is determined by reference to their quoted closing bid price at
the reporting date, or if unquoted, determined using a valuation technique. Valuation techniques employed
include market multiples and discounted cash f low analysis using expected future cash f lows and a market-
related discount rate. The fair value of held-to-maturity investments is determined for disclosure purposes
only.
116
5.6.5 Trade and other receivables
The fair value of trade and other receivables, is estimated at the present value of future cash f lows, discounted
at the market rate of interest at the reporting date. This fair value is determined for disclosure purposes or
when such assets are acquired in a business combination.
5.6.6 Forward exchange contracts and interest rate swaps
The fair value of forward exchange contracts is based on their quoted price, if available. If a quoted price is
not available, then fair value is estimated by discounting the difference between the contractual forward price
and the current forward price for the residual maturity of the contract using a risk-free interest rate (based on
government bonds).
The fair value of interest rate swaps is based on broker quotes. Those quotes are tested for reasonableness by
discounting estimated future cash f lows based on the terms and maturity of each contract and using market
interest rates for a similar instrument at the measurement date. Fair values reflect the credit risk of the
instrument and include adjustments to take account of the credit risk of the Group entity and counterparty
when appropriate.
5.6.7 Other non-derivative financial liabilities
Fair value, which is determined for disclosure purposes, is calculated based on the present value of future
principal and interest cash f lows, discounted at the market rate of interest at the reporting date. For financial
leases the market rate of interest is determined by reference to similar lease agreements.
5.6.8 Share-based payment transactions
The fair value of the employee share options are measured using a binomial model. Measurement inputs
include the share price on the measurement date (year-end date of the year of granting), the exercise price of
the instrument, expected volatility (based on an evaluation of the historic volatility of Fugro’s (certificates of)
shares, particularly over the historic period commensurate with the expected term), expected term of the
instruments (based on historical experience and general option holder behaviour), expected dividends and the
risk-free interest rate (based on government bonds). Service and non-market performance conditions attached
to the transactions are not taken into account in determining fair value.
5.7 F i n a n c i a l i n s t r u m e n t s
5.7.1 Non-derivative financial assets
The Group initially recognises loans and receivables and deposits on the date that they are originated. All other
financial assets (including assets designated at fair value through profit or loss) are recognised initially on the
trade date, which is the date that the Group becomes a party to the contractual provisions of the instrument.
The Group derecognises a financial asset when the contractual rights to the cash f lows from the asset expire,
or it transfers the rights to receive the contractual cash f lows on the financial asset in a transaction in which
substantially all the risks and rewards of ownership of the financial asset are transferred. Any interest in
transferred financial assets that is created or retained by the Group is recognised as a separate asset or liability.
Financial assets and liabilities are offset and the net amount presented in the statement of financial position
when, and only when, the Group has a legal right to offset the amounts and intends either to settle on a net
basis or to realise the asset and settle the liability simultaneously.
The Group classifies non-derivative financial assets into the following categories: financial assets at fair value
through profit or loss, held-to-maturity financial assets, loans and receivables and available-for-sale financial
assets. Reference is made to note 5.11 and 5.57.
117Fugro Financial statements 2012
Loans and receivables comprise cash and cash equivalents and trade and other receivables. Cash and cash
equivalents comprise cash balances and call deposits with original maturities of three months or less.
5.7.2 Non-derivative financial liabilities
The Group initially recognises debt securities issued and subordinated liabilities on the date that they are
originated. All other financial liabilities are recognised initially on the trade date, which is the date that the
Group becomes a party to the contractual provisions of the instrument.
The Group derecognises a financial liability when its contractual obligations are discharged, cancelled or
expire.
Financial liabilities and assets are offset and the net amount presented in the statement of financial position
when, and only when, the Group has a legal right to offset the amounts and intends either to settle on a net
basis or to realise the asset and settle the liability simultaneously.
Other financial liabilities are recognised initially at fair value net off any directly attributable transaction
costs. Subsequent to initial recognition, these financial liabilities are measured at amortised cost using the
effective interest method.
Other financial liabilities comprise loans and borrowings, bank overdrafts, and trade and other payables.
Reference is made to note 5.14 Cash and cash equivalents and note 5.51 Trade and other payables.
5.7.3 Derivative financial instruments, including hedge accounting
The Group holds derivative financial instruments to hedge its exposure to foreign exchange risks arising from
operational and financing activities. In accordance with its treasury policy, the Group does not hold or issue
derivative financial instruments for trading purposes. Derivatives that do not qualify for hedge accounting
are accounted for as trading instruments.
Embedded derivatives are separated from the host contract and accounted for separately if the economic
characteristics and risks of the host contract and the embedded derivative are not closely related, a separate
instrument with the same terms as the embedded derivative would meet the definition of a derivative, and the
combined instrument is not measured at fair value through profit or loss.
On initial designation of the derivative as the hedging instrument, the Group formally documents the
relationship between the hedging instrument and hedged item, including the risk management objectives
and strategy in undertaking the hedge transaction and the hedged risk, together with the methods that will
be used to assess the effectiveness of the hedging relationship. The Group makes an assessment, both at the
inception of the hedge relationship as well as on an ongoing basis, of whether the hedging instruments are
expected to be ‘highly effective’ in offsetting the changes in the fair value or cash f lows of the respective
hedged items attributable to the hedged risk, and whether the actual results of each hedge are within a range
of 80-125%. For a cash f low hedge of a forecast transaction, the transaction should be highly probable to occur
and should present an exposure to variations in cash f lows that could ultimately affect reported profit or loss.
Derivatives are recognised initially at fair value; attributable transaction costs are recognised in profit or loss
as incurred. Subsequent to initial recognition, derivatives are measured at fair value, and changes therein are
accounted for as described below.
118
5.7.3.1 Cash flow hedges
When a derivative is designated as the hedging instrument in a hedge of the variability in cash f lows
attributable to a particular risk associated with a recognised asset or liability or a highly probable forecast
transaction that could affect profit or loss, the effective portion of changes in the fair value of the derivative
is recognised in other comprehensive income and presented in the Hedging reserve in equity.
The amount recognised in the Hedging reserve is removed and included in profit or loss in the same period as
the hedged cash f lows affect profit or loss under the same line item in the statement of comprehensive income
as the hedged item. Any ineffective portion of changes in the fair value of the derivative is recognised
immediately in profit or loss.
If the hedging instrument no longer meets the criteria for hedge accounting, expires or is sold, terminated or
exercised, or the designation is revoked, then hedge accounting is discontinued prospectively. The cumulative
gain or loss previously recognised in other comprehensive income and presented in the Hedging reserve
in equity remains there until the forecast transaction affects profit or loss. When the hedged item is a
non-financial asset, the amount accumulated in equity is included in the carrying amount of the asset when
the asset is recognised. If the forecast transaction is no longer expected to occur, then the balance in equity
is reclassified in profit or loss.
5.7.3.2 Other non-trading derivatives
When a derivative financial instrument is not designated in a hedge relationship that qualifies for hedge
accounting, all changes in its fair value are recognised immediately in profit or loss.
5.8 P r o p e r t y , p l a n t a n d e q u i p m e n t
5.8.1 Owned assets
Items of property, plant and equipment are measured at cost less accumulated depreciation and accumulated
impairment losses (refer accounting policy 5.16). The cost of property, plant and equipment includes
expenditure that is directly attributable to the acquisition of the asset. The cost of self-constructed assets
includes the costs of materials and direct labour, any other costs directly attributable to bringing the assets to
a working condition for their intended use, the costs of dismantling and removing the items and restoring
the site on which they are located and capitalised borrowing costs. Cost also may include transfers from equity
of any gain or loss on qualifying cash f low hedges of foreign currency purchases of property, plant and
equipment. Purchased software that is integral to the functionality of the related equipment is capitalised as
part of that equipment.
Property, plant and equipment that is being constructed or developed for future use is classified as property,
plant and equipment under construction and stated at cost until construction or development is complete,
at which time it is reclassified as land and buildings, plant and equipment, vessels or other property, plant
and equipment. When parts of an item of property, plant and equipment have different useful lives, they
are accounted for as separate items (major components) of property, plant and equipment.
The gain or loss on disposal of an item of property, plant and equipment is determined by comparing the
proceeds from disposal with the carrying amount of the property, plant and equipment, and is recognised
net within ‘other income’ or ‘other expenses’ in profit or loss.
5.8.2 Leased assets
Leases in terms of which the Group assumes substantially all the risks and rewards of ownership are classified
as finance leases. Upon initial recognition the leased asset is measured at an amount equal to the lower of
its fair value and the present value of the minimum lease payments.
119Fugro Financial statements 2012
Subsequent to initial recognition, the asset is accounted for in accordance with the accounting policy
applicable to that asset. Other leases are operating leases and are not recognised in the Group’s statement
of financial position. Lease payments are accounted for as described in accounting policy 5.23.2.
5.8.3 Subsequent cost
Subsequent expenditure is capitalised only when it is probable that the future economic benefits associated
with the expenditure will f low to the Group, and its cost can be measured reliably. Ongoing repairs and
maintenance is expensed as incurred.
5.8.4 Depreciation
Depreciation is based on the cost of an asset less its residual value. Significant components of individual assets
are assessed and if a component has a useful life that is different from the remainder of that asset, that
component is depreciated separately. Depreciation is recognised in profit or loss on a straight-line basis over
the estimated useful lives of each component of an item of property, plant and equipment. Leased assets are
depreciated over the shorter of the lease term and their useful lives unless it is reasonably certain that the
Group will obtain ownership by the end of the lease term. Depreciation methods, useful lives and residual
values are reviewed at each reporting date and adjusted if appropriate. The estimated useful lives for the
current and comparative period of significant items of property, plant and equipment are as follows:
Category Years
Land and buildings
Land Infinite
Buildings 20 – 40
Fixtures and fittings 5 – 10
Vessels
Vessels and jack-ups 2 – 25
Plant and equipment
Plant and equipment 4 – 10
Survey equipment 3 – 5
Aircraft 5 – 10
AUVs and ROVs 6 – 7
Computers and office equipment 3 – 4
Transport equipment 4
Other
Maintenance 3 – 5
Used plant and machinery 1 – 2
5.9 I n t a n g i b l e a s s e t s
5.9.1 Goodwill
Goodwill that arises upon the acquisition of subsidiaries is presented with intangible assets. For the
measurement of goodwill at initial recognition, refer to note 5.4.1.1 Accounting for business combinations.
120
Goodwill is measured at cost less accumulated impairment losses. Goodwill is allocated to cash generating
units and is not amortised but is tested for impairment annually or when there is an indication for impairment
(refer accounting policy 5.16). In respect of equity-accounted investees, the carrying amount of goodwill is
included in the carrying amount of the investment, and any impairment loss is allocated to the carrying
amount of the equity-accounted investee as a whole.
5.9.2 Research and development
Expenditure on research activities, undertaken with the prospect of gaining new scientific or technical
knowledge and understanding, is recognised in profit or loss as incurred.
Development activities involve a plan or design for the production of new or substantially improved products
and processes. Development expenditure is capitalised only if development costs can be measured reliably,
the product or process is technically and commercially feasible, future economic benefits are probable,
and the Group intends to and has sufficient resources to complete development and to use or sell the asset.
The capitalised expenditure includes the cost of materials, direct labour, overhead costs that are directly
attributable to preparing the asset for its intended use, and capitalised borrowing costs. Other development
expenditure is recognised in profit or loss as incurred. Capitalised development expenditure is measured at
cost less accumulated amortisation and accumulated impairment losses (refer accounting policy 5.16).
5.9.3 Software and other intangible assets
Software and other intangible assets acquired or developed by the Group and that have finite useful lives
are measured at cost less accumulated amortisation and accumulated impairment losses (refer accounting
policy 5.16).
5.9.4 Subsequent expenditure
Subsequent expenditure on capitalised intangible assets is capitalised only when it increases the future
economic benefits embodied in the specific asset to which it relates. All other expenditure, including
expenditure on internally generated goodwill and brands, is recognised in profit or loss as incurred.
5.9.5 Amortisation
Amortisation is based on the cost of an asset less its residual value. Amortisation is recognised in profit or loss
on a straight-line basis over the estimated useful lives of intangible assets unless such lives are indefinite.
Goodwill and intangibles assets with an indefinite life are systematically tested for impairment annually or
when there is an indication for impairment (refer accounting policy 5.16). Other intangible assets and software
are amortised from the date they are available for use. The estimated useful life of software and other
capitalised development costs is, in general, five years. Amortisation methods, useful lives and residual values
are reviewed at each reporting date and adjusted if appropriate.
5.10 I n ve s t m e n t s i n e q u i t y - a c c o u n t e d i n ve s t e e s
Investments in equity-accounted investees are accounted for using the equity method and are recognised
initially at cost. The Group’s investment includes goodwill identified on acquisition, net of any accumulated
impairment losses (refer accounting policy 5.16). The consolidated financial statements include the Group’s
share of the income and expenses and equity movements of equity-accounted investees, after adjustments to
align the accounting policies with those of the Group, from the date that significant influence commences
until the date that significant influence ceases. When the Group’s share of losses exceeds the carrying amount
of the equity-accounted investee, the carrying amount is reduced to nil and recognition of further losses is
discontinued except to the extent that the Group has incurred legal or constructive obligations or has made
payments on behalf of the investee.
121Fugro Financial statements 2012
5.11 O t h e r i n ve s t m e n t s
5.11.1 Other investments in equity instruments
Other investments in equity instruments do not have a quoted market price in an active market. As the fair
value cannot be reliably measured the equity instruments are stated at cost. Dividends received are accounted
for in profit or loss when these become due.
5.11.2 Financial assets at fair value through profit or loss
A financial asset is classified at fair value through profit or loss if it is classified as held for trading or is
designated as such upon initial recognition. Financial assets are designated at fair value through profit or loss
if the Group manages such investments and makes purchase and sale decisions based on their fair value in
accordance with the Group’s documented risk management or investment strategy. Attributable transaction
costs are recognised in profit or loss as incurred. Financial assets at fair value through profit or loss are
measured at fair value, and changes therein are recognised in profit or loss.
Financial assets designated at fair value through profit or loss comprise equity securities that otherwise would
have been classified as available for sale.
5.11.3 Long-term loans and other long-term receivables
Long-term loans and other long-term receivables are financial assets with fixed or determinable payments
that are not quoted in an active market. Such assets are recognised initially at fair value net off any directly
attributable transaction costs. Subsequent to initial recognition, loans and receivables are measured at
amortised cost using the effective interest method; less any impairment losses (refer to accounting policy 5.16).
5.11.4 Available-for-sale financial assets
Available for sale financial assets are non-derivative financial assets that are designated as available for sale or
are not classified in any of the above categories of financial assets. Subsequent to initial recognition, they are
measured at fair value and changes therein, other than impairment losses (refer to note 5.16) and foreign
currency differences on available-for-sale debt instruments (refer to note 5.5.1), are recognised in other
comprehensive income and presented in the other reserves in equity. When an investment is derecognised,
the cumulative gain or loss accumulated in equity is reclassified to profit or loss.
Available-for-sale financial assets comprise equity securities and debt securities.
5.12 I n ve n t o r i e s
5.12.1 Seismic and geological data libraries
The seismic and geological data libraries consist of completed and in progress collection of seismic and
geological data that can be sold non-exclusively to one or more clients. These seismic and geological data
libraries are measured at the lower of cost and net realisable value. The costs of completed and in progress
libraries comprise of directly attributable data collection, data processing, other direct costs and related
overheads (including borrowing costs and transit costs where applicable).
As it is expected that sales lead to a lower net realisable value of the seismic and geological data, these expected
decreases in value are taken into account at the moment of sale throughout the financial year. The costs of
each sale of data is based on a percentage of the total costs to the estimated total sales revenue (sales ratio).
This sales ratio is based on historical patterns and depending on the category of data, we use a sales ratio
between 20-90% corresponding with the total estimated costs over total estimated sales.
122
The Group evaluates the net realisable value on a regular basis and reassesses the net realisable value at each
reporting date. Net realisable value is based on estimated sales during the period in which the data is expected
to be marketed, net of selling costs, which includes amongst other fees to be paid to CGG under the marketing
and sales agreement.
Net realisable value is based on estimated future cash f lows, which involves significant judgment (refer to 5.62
for estimates and management judgements).
5.12.2 Other inventories
Other inventories are measured at the lower of cost and net realisable value. The cost of other inventories
is based on the first-in first-out principle, and includes expenditure incurred in acquiring the inventories,
production or conversion costs and other costs incurred in bringing them to their existing location and
condition. Net realisable value of other inventories is the estimated selling price in the ordinary course of
business, less the estimated costs of completion and selling expenses.
5.13 Tr a d e a n d o t h e r r e c e i va b l e s
Services rendered on contract work completed but not yet billed to customers are included in trade and
other receivables as unbilled revenues on completed contracts.
Trade and other receivables are recognised initially at fair value plus any directly attributable transaction
costs. Subsequent to initial recognition they are measured at amortised cost using the effective interest
method less, any impairment losses (refer accounting policy 5.16).
5.14 C a s h a n d c a s h e q u i va l e n t s
Cash and cash equivalents, comprising cash balances and call deposits, are recognised initially at fair value
plus any directly attributable transaction costs. Subsequent to initial recognition they are measured at
amortised cost using the effective interest method less, any impairment losses (refer accounting policy 5.16).
Bank overdrafts that are repayable on demand and form an integral part of the Group’s cash management are
included as a component of cash and cash equivalents for the purpose of the consolidated statement of cash
f lows.
5.15 A s s e t s o f d i s p o s a l g r o u p c l a s s i f i e d a s h e l d fo r s a l e a n d d i s c o n t i n u e d
o p e r a t i o n s
Non-current assets, or disposal groups comprising assets and liabilities, that are expected to be recovered
primarily through sale rather than through continuing use, are classified as held for sale. Immediately before
classification as held for sale, the assets, or components of a disposal group, are remeasured in accordance with
the Group’s accounting policies. Thereafter generally the assets, or disposal group, are measured at the lower
of their carrying amount and fair value less cost to sell. Any impairment loss on a disposal group first is
allocated to goodwill, and then to remaining assets and liabilities on pro rata basis, except that no loss is
allocated to inventories, financial assets, deferred tax assets, employee benefit assets, investment property
and biological assets, which continue to be measured in accordance with the Group’s accounting policies.
Impairment losses on initial classification as held for sale and subsequent gains or losses on remeasurement
are recognised in profit or loss.
Once classified as held for sale, intangible assets and property, plant and equipment are no longer amortised
or depreciated and any equity-accounted investees are no longer equity-accounted.
123Fugro Financial statements 2012
A discontinued operation is a component of the Group’s business, the operation and cash f lows of which
can be clearly distinguished from the rest of the Group and which:
– represents a separate major line of business or geographical area of operations;
– is part of a single coordinated plan to dispose of a separate major line of business of geographical area
of operations; or
– is a subsidiary acquired exclusive with a view to resale.
Classification as a discontinued operation occurs on disposal or when the operation meets the criteria to
be classified as held for sale, if earlier. When an operation is classified as a discontinued operation, the
Comparative Statement of Comprehensive Income has been re-presented as if the operation had been
discontinued from the start of the comparative year.
Further disclosure on the assets and liabilities classified as held for sale and discontinued operations is
included in note 5.45.
5.16 I m p a i r m e n t
5.16.1 Non-derivative financial assets
A financial asset not carried at fair value through profit or loss is assessed at each reporting date to determine
whether there is objective evidence that it is impaired. A financial asset is impaired if objective evidence
indicates that a loss event has occurred after the initial recognition of the asset, and that the loss event had
a negative effect on the estimated future cash f lows of that asset that can be estimated reliably.
The Group considers evidence of impairment for receivables at both a specific asset and collective level.
All individually significant receivables are assessed for specific impairment. All individually significant
receivables found not to be specifically impaired are then collectively assessed for any impairment that has
been incurred but not yet identified. Receivables that are not individually significant are collectively assessed
for impairment by grouping together receivables with similar risk characteristics. In assessing collective
impairment the Group uses historical trends of the probability of default, the timing of recoveries and the
amount of loss incurred, adjusted for management’s judgement as to whether current economic and credit
conditions are such that the actual losses are likely to be greater or less than suggested by historical trends.
An impairment loss in respect of a financial asset measured at amortised cost is calculated as the difference
between its carrying amount and the present value of the estimated future cash f lows discounted at the asset’s
original effective interest rate. Losses are recognised in profit or loss and reflected in an allowance account
against receivables. Interest on the impaired asset continues to be recognised through the unwinding of the
discount. When a subsequent event causes the amount of impairment loss to decrease, the decrease in
impairment loss is reversed through profit or loss.
Impairment losses on available-for-sale financial assets are recognised by reclassifying the losses accumulated
in other comprehensive income, and presented in equity, to profit or loss. The cumulative loss that is
reclassified from other comprehensive income to profit or loss is the difference between the acquisition cost,
net of any principal repayment and amortisation, and the current fair value, less any impairment loss
recognised previously in profit or loss. Changes in impairment provisions attributable to application of the
effective interest method are reflected as a component of interest income. If, in a subsequent period, the fair
value of an impaired available-for-sale debt security increases and the increase can be related objectively
to an event occurring after the impairment loss was recognised in profit or loss, then the impairment loss
is reversed, with the amount of the reversal recognised in profit or loss. Any subsequent recovery in the
fair value of an impaired available-for-sale equity security is recognised in other comprehensive income.
124
5.16.2 Non-financial assets
The carrying amounts of the Group’s non-financial assets other than inventories, assets arising from employee
benefits and deferred tax assets (refer accounting policy 5.24), are reviewed at each reporting date to determine
whether there is any indication of impairment. If any such indication exists, then the asset’s recoverable
amount is estimated. For goodwill, and intangible assets that have indefinite useful lives or that are not yet
available for use, the recoverable amount is estimated each year at the same time. An impairment loss is
recognised if the carrying amount of an asset or its related cash-generating unit exceeds its estimated
recoverable amount. Impairment losses are recognised in profit or loss. Impairment losses recognised in
respect of cash-generating units are allocated first to reduce the carrying amount of any goodwill allocated to
the cash-generating unit (or group of cash-generating units) and then to reduce the carrying amount of the
other assets in the cash-generating unit (or group of cash-generating units) on a pro rata basis.
The recoverable amount of an asset or cash-generating unit (CGU) is the greater of its value in use and its fair
value less costs to sell. In assessing value in use, the estimated future cash f lows are discounted to their present
value using a pre-tax discount rate that reflects current market assessments of the time value of money and
the risks specific to the asset or cash-generating unit. For the purpose of impairment testing, assets that cannot
be tested individually are grouped together into the smallest group of assets that generates cash inflows from
continuing use that are largely independent of the cash inflows of other assets or cash-generating unit. Subject
to an operating segment ceiling test, for the purposes of goodwill impairment testing, CGUs to which goodwill
has been allocated, are aggregated so that the level at which impairment testing is performed reflects the
lowest level at which goodwill is monitored for internal reporting purposes. Goodwill acquired in a business
combination is allocated to groups of cash generating units that are expected to benefit from the synergies of
the combination.
The Group’s corporate assets do not generate separate cash inflows and are utilised by more than one cash-
generating unit. Corporate assets are allocated to cash-generating units on a reasonable and consistent basis
and tested for impairment as part of the testing of the cash generating units to which the corporate asset is
allocated.
An impairment loss in respect of goodwill is not reversed. In respect of other assets, impairment losses
recognised in prior periods are reviewed at each reporting date for any indications that the loss has decreased
or no longer exists. An impairment loss is reversed if there has been a change in the estimates used to
determine the recoverable amount. An impairment loss is reversed only to the extent that the asset’s carrying
amount does not exceed the carrying amount that would have been determined, net of depreciation or
amortisation, if no impairment loss had been recognised.
5.17 S h a r e c a p i t a l
5.17.1 Share capital
Share capital is classified as equity. The term ‘shares’ as used in the financial statements should, with respect
to ordinary shares issued by Fugro, be construed to include certificates of shares (‘share certificates’ or
‘depositary receipts’ for shares) issued by ‘Stichting Administratiekantoor Fugro’ (also referred to as ‘Fugro
Trust Office’ or ‘Trust Office’), unless the context otherwise requires or unless it is clear from the context that
this is not the case. Incremental costs directly attributable to the issue of ordinary shares and share options are
recognised as a deduction from equity, net of any tax effects.
5.17.2 Repurchase and sale of shares
When shares are repurchased or sold, the amount of the consideration paid or received, including direct
attributable costs, net of any tax effects, is recognised as a change in equity. Repurchased shares and related
results are reported as reserve for own shares and presented separately as a component of total equity.
125Fugro Financial statements 2012
5.17.3 Dividends
Dividends are recognised as a liability in the period in which they are declared.
5.18 L o a n s a n d b o r r ow i n g s
Loans and borrowings are recognised initially at fair value, less attributable transaction costs. Subsequent
to initial recognition, borrowings are measured at amortised cost using the effective interest rate method.
5.19 E m p l oy e e b e n e f i t s
5.19.1 Defined contribution plans
A defined contribution plan is a post-employment benefit plan under which an entity pays fixed contributions
into a separate entity and will have no legal or constructive obligation to pay further amounts. Obligations for
contributions to defined contribution pension plans are recognised as an employee benefit expense in profit
or loss in the periods during which services are rendered by employees. Prepaid contributions are recognised
as an asset to the extent that a cash refund or a reduction in future payments is available. Contributions
to a defined contribution plan that are due more than 12 months after the end of the period in which the
employees render the service are discounted to their present value.
5.19.2 Defined benefit plans
A defined benefit plan is a post-employment benefit plan other than a defined contribution plan. The Group’s
net obligation in respect of defined benefit pension plans is calculated separately for each plan by estimating
the amount of future benefit that employees have earned in return for their service in the current and prior
periods; that benefit is discounted to determine the present value. Any unrecognised past service costs and the
fair value of plan assets are deducted. The discount rate is the yield at the reporting date on AA credit-rated
corporate bonds that have maturity dates approximating the terms of the Group’s obligations and that are
denominated in the same currency in which the benefits are expected to be paid. The calculation is performed
by qualified actuaries using the projected unit credit method. When the calculation results in a benefit to the
Group, the recognised asset is limited to the total of any unrecognised past service costs and the present value
of economic benefits available in the form of any future refunds from the plan or reductions in future
contributions to the plan. In order to calculate the present value of economic benefits, consideration is given
to any minimum funding requirements that apply to any plan in the Group. An economic benefit is available
to the Group if it is realisable during the life of the plan, or on settlement of the plan liabilities.
When the benefits of a plan are improved, the portion of the increased benefit related to past service by
employees is recognised in profit or loss on a straight-line basis over the average period until the benefits
become vested. To the extent that the benefits vest immediately, the expense is recognised immediately
in profit or loss.
The Group recognises all actuarial gains and losses arising from defined benefit plans in other comprehensive
income and all expenses related to defined benefit plans in personnel expenses in profit or loss.
The Group recognises gains and losses on the curtailment or settlement of a defined benefit plan when the
curtailment or settlement occurs. The gain or loss on curtailment comprises any resulting change in the fair
value of plan assets and change in the present value of defined benefit obligation and any related actuarial
gains and losses and past service costs that had not previously been recognised.
5.19.3 Other long-term employee benefits
The Group’s net obligation in respect of long-term employee benefits, other than pension plans, is the amount
of future benefit that employees have earned in return for their service in the current and prior periods; that
benefit is discounted to determine its present value, and the fair value of any assets is deducted. The discount
rate is the yield at the reporting date on AA credit-rated corporate bonds that have maturity dates
126
approximating the terms of the Group’s obligations and that are denominated in the same currency in which
the benefits are expected to be paid. The calculation is performed using the projected unit credit method.
Any actuarial gains or losses are recognised in profit or loss in the period in which they arise.
5.19.4 Share-based payments
The share option scheme allows some assigned Group employees to acquire shares in Fugro. The fair value of
granted options is recognised as an employee expense, with a corresponding increase in equity. The fair value
is determined on the date of granting and is spread over the period during which the employees become
unconditionally entitled to the options. The amount recognised as an expense is adjusted to reflect the number
of options for which the related service vesting conditions are expected to be met, such that the amount
ultimately recognised as an expense is based on the number of options that meet the related service conditions
at the vesting date.
5.20 P r o v i s i o n s
A provision is recognised if, as a result of a past event, the Group has a present legal or constructive obligation
that can be estimated reliably, and it is probable that an outflow of economic benefits will be required to settle
the obligation. Provisions are determined by discounting the expected future cash f lows at a pre-tax rate that
reflects current market assessments of the time value of money and, where appropriate, the risks specific to
the liability. The unwinding of the discount is recognised as finance cost.
5.20.1 Restructuring
A provision for restructuring is recognised when the Group has approved a detailed and formal restructuring
plan, and the restructuring either has commenced or has been announced publicly. Future operating losses
are not provided for.
5.20.2 Onerous contracts
A provision for onerous contracts is recognised when the expected benefits to be derived by the Group from
a contract are lower than the unavoidable cost of meeting its obligations under the contract. The provision is
measured at the present value of the lower of the expected cost of terminating the contract and the expected
net cost of continuing with the contract. Before a provision is established, the Group recognises any
impairment loss on the assets associated with that contract.
5.21 Tr a d e a n d o t h e r p a ya b l e s
Trade and other payables are recognised initially at fair value plus any directly attributable transaction costs.
Subsequent to initial recognition they are measured at amortised cost using the effective interest method.
5.22 R e ve n u e
Revenue comprises the fair value of the consideration received or receivable for the sale of goods and services
rendered in the ordinary course of the Group’s activities. Revenue is shown net of value-added tax, rebates and
discounts and after eliminating sales within the Group.
The Group recognises revenue when persuasive evidence exists, usually in the form of an executed sales
agreement, the amount of revenue can be measured reliably, it is probable that future economic benefits
will f low to the entity and when specific criteria have been met for each of the Group’s activities as described
below. The Group bases its estimates on historical results, taking into consideration the type of customer,
the type of transaction and the specifics of each arrangement.
Revenue from sales of goods, seismic and geological data, and software licences and subscription income do
not qualify as a significant category of revenue as referred to in IAS 18.35 (b); however for completeness sake
the relating revenue recognition policies are set out in 5.22.2, 5.22.3 and 5.22.4.
127Fugro Financial statements 2012
5.22.1 Services rendered
Revenue from services rendered to third parties relate to fixed price contracts and ‘cost plus’ contracts (mainly
daily rates or rates per (square) kilometre). This revenue is recognised in profit or loss in proportion to the stage
of completion of the transaction at the reporting date. The stage of completion is assessed using the proportion
of contract cost incurred for work performed to the reporting date, compared to total contract cost (as this
method is most appropriate for the majority of the services provided by the Group), which are mainly based
on daily rates for staff and equipment or rates per (square) kilometre for vessels and airplanes.
5.22.2 Sales of goods
Revenue from the sale of goods is recognised when the significant risks and rewards of ownership have been
transferred to the buyer, recovery of the consideration is probable, the associated costs of goods can be
estimated reliably, and there is no continuing management involvement with the goods.
No revenue is recognised if there are significant uncertainties regarding recovery of the consideration due
or associated costs. An expected loss on a contract is recognised immediately in profit or loss.
5.22.3 Seismic and geological data
Revenue from the sale of non-exclusive seismic and geological data libraries results from (i) pre-commitments
and (i) sales of data after completion of a data library which have been (substantially) delivered to the client.
Pre-commitments on seismic and geological data library sales are recorded as advance instalments.
Pre-commitments are recognized as revenue when data collection has commenced, based on the stage of
completion, as services are rendered. Sales of data after completion are recognised as revenue when data have
(substantially) been delivered to the client. Multiple (service) elements, such as annual maintenance fees or
training fees, are accounted for over the period in which these services have been delivered to the customer,
using a straight line basis over the term of the contract. The amount of revenue allocated to each element is
based upon the relative fair values of the various elements.
5.22.4 Software licences and subscription income
Software licences and subscription income are recognised in the period during which the underlying services
have been provided, using a straight line basis over the term of the contract.
5.22.5 Net revenue own service (revenue less third party costs)
Net revenue own service comprises all revenue minus costs incurred with third parties related to the
employment of resources (in addition to the resources deployed by the Group) and other third party cost such
as charter-lease costs and other cost required for the execution of various projects.
5.22.6 Other income
Other income concerns income not related to the key business activities of the Group, such as income from
the sale of non-monetary assets and/or liabilities, exceptional and/or non-recurring income.
5.22.7 Government grants
Government grants are recognised initially as deferred income at fair value when there is reasonable assurance
that they will be received and the Group will comply with the conditions associated with the grant. Grants that
compensate the Group (partly) for expenses incurred are recognised in profit or loss on a systematic basis in
the same periods in which the expenses are recognised. Grants that (partly) compensate the Group for the cost
of an asset are recognised in profit or loss on a systematic basis over the useful life of the asset.
128
5.23 E x p e n s e s
5.23.1 Third party costs
Third party costs are matched with related revenues on contracts and accounted for on a historical cost basis.
5.23.2 Lease payments
A lease is an agreement whereby the lessor conveys to the lessee in return for a payment, or series of payments,
the right to use an asset for an agreed period of time.
When assets are leased out under a finance lease, the present value of the lease payments is recognised as a
receivable. The difference between the gross receivable and the present value of the receivable is recognised
as unearned finance income.
Payments made under operating leases are recognised in profit or loss on a straight-line basis over the term of
the lease. Lease incentives received are recognised as an integral part of the total lease expense, over the term
of the lease.
Minimum lease payments made under finance leases are apportioned between the finance expense and the
reduction of the outstanding liability. The finance expense is allocated to each period during the lease term
so as to produce a constant periodic rate of interest on the remaining balance of the liability.
At inception of an arrangement, the Group determines whether such an arrangement is or contains a lease.
A specific asset is the subject of a lease if fulfilment of the arrangement is dependent on the use of that
specified asset. An arrangement conveys the right to use the asset if the arrangement conveys to the Group
the right to control the use of the underlying asset.
At inception or upon reassessment of the arrangement, the Group separates payments and other consideration
required by such an arrangement into those for the lease and those for other elements on the basis of their
relative fair values. If the Group concludes for a finance lease that it is impracticable to separate the payments
reliably, then an asset and a liability are recognised at an amount equal to the fair value of the underlying
asset. Subsequently the liability is reduced as payments are made and an imputed finance charge on the
liability is recognised using the Group’s incremental borrowing rate.
5.23.3 Net finance costs
Net finance costs consist of finance costs, finance income and foreign currency gains and losses.
Finance costs comprise interest expense on borrowings, unwinding of the discount on provisions, losses on
disposal of available-for-sale financial assets, fair value losses on financial assets at fair value through profit
or loss, impairment losses recognised on financial assets (other than trade receivables), and losses on hedging
instruments that are recognised in profit or loss.
Finance income comprises interest income on funds invested (including available-for-sale financial assets),
dividend income, gains on the disposal of available-for-sale financial assets, fair value gains on financial assets
at fair value through profit or loss, gains on the re-measurement to fair value of any pre-existing interest in an
acquiree, and gains on hedging instruments that are recognised in profit or loss. Interest income is recognised
in profit or loss as it accrues, using the effective interest method. Dividend income is recognised in profit or
loss on the date the Group’s right to receive payment is established, which in the case of quoted shares is
normally the ex-dividend date.
Borrowing costs that are not directly attributable to the acquisition, construction or production of a qualifying
asset are recognised in profit or loss using the effective interest method.
129Fugro Financial statements 2012
Foreign currency gains and losses are reported on a net basis as either finance income or finance cost
depending on whether foreign currency movements are in a net gain or net loss position.
5.24 I n c o m e t a x
Income tax expense comprises current and deferred tax. Current tax and deferred tax is recognised in profit
or loss except to the extent that it relates to a business combination, or items recognised directly in equity or
in other comprehensive income.
Current tax is the expected tax payable or receivable on the taxable income or loss for the year, using tax rates
enacted or substantively enacted at the reporting date, and any adjustment to tax payable in respect of
previous years. Current tax payable also includes any tax liability arising from the declaration of dividends.
Deferred tax is recognised in respect of temporary differences between the carrying amounts of assets and
liabilities for financial reporting purposes and the amounts used for taxation purposes. Deferred tax is not
recognised for: taxable temporary differences arising on the initial recognition of goodwill; temporary
differences on the initial recognition of assets or liabilities in a transaction that is not a business combination
and that affects neither accounting nor taxable profit or loss; and temporary differences related to investments
in subsidiaries and jointly controlled entities to the extent that it is probable that they will not reverse in
the foreseeable future. Deferred tax is measured at the tax rates that are expected to be applied to temporary
differences when they reverse, based on the laws that have been enacted or substantively enacted by the
reporting date. Deferred tax assets and liabilities are offset if there is a legally enforceable right to offset
current tax liabilities and assets, and they relate to income taxes levied by the same tax authority on the same
taxable entity, or on different tax entities, but they intend to settle current tax liabilities and assets on a net
basis or their tax assets and liabilities will be realised simultaneously.
A deferred tax asset is recognised for unused tax losses, tax credits and deductible temporary differences, to
the extent that it is probable that future taxable profits will be available against which the asset can be utilised.
Deferred tax assets are reviewed at each reporting date and are reduced to the extent that it is no longer
probable that the related tax benefit will be realised.
Additional income taxes that arise from the distribution of dividends are recognised at the same time as the
liability to pay the related dividend.
In determining the amount of current and deferred tax the Group takes into account the impact of uncertain
tax positions and whether additional taxes and interest may be due. The Group believes that its accruals for tax
liabilities are adequate for all open tax years based on its assessment of many factors, including interpretations
of tax law and prior experience. This assessment relies on estimates and assumptions and may involve a series
of judgements about future events. New information may become available that causes the Group to change its
judgement regarding the adequacy of existing tax liabilities; such changes to tax liabilities will impact tax
expense in the period that such a determination is made.
5.25 S t a t e m e n t o f c a s h f l ow s
The consolidated statement of cash f lows is prepared using the indirect method. The cash f low statement
distinguishes between operating, investing and financing activities. Cash f lows in foreign currencies are
converted at the exchange rate at the dates of the transactions. Currency exchange differences on cash held are
separately shown. Payments and receipts of corporate taxes are included as cash f low from operating activities
and interest paid is shown as cash f low from operating activities. Cash f lows as a result from acquisition/
divestment of financial interest in subsidiaries and equity accounted investees are included as cash f low from
investing activities, taking into account the available cash in these interests. Dividends paid are part of the cash
f low from financing activities.
130
5.26 S e g m e n t r e p o r t i n g
An operating segment is a component of the Group that engages in business activities from which it may earn
revenues and incur expenses, including revenues and expenses that relate to transactions with any of the
Group’s other components. All operating segments’ operating results are reviewed regularly by the Group’s
Executive Committee to make decisions about resources to be allocated to the segment and to assess its
performance, and for which discrete financial information is available.
Inter-segment pricing is determined on an arm’s length basis. Segment results, assets and liabilities include
items directly attributable to a segment as well as those that can be allocated on a reasonable basis.
Unallocated items comprise mainly income tax assets and liabilities, loans and borrowings and corporate
assets and head office expenses. Segment capital expenditure is the total cost incurred during the year to
acquire property, plant and equipment, and intangible assets other than goodwill.
5.26.1 Operating segments
As an engineering firm with operations throughout the world, the Group delivers its services to clients located
all over the globe and collects and interprets data related to the earth’s surface and the soil and rock beneath.
On the basis of this data the Group provides advice, generally for purposes related to the oil and gas industry,
the mining industry and the construction industry. The Group has three reportable segments, which are the
Group’s divisions. The divisions offer different products and services, and are managed separately because they
require different technology and marketing strategies. For each of the divisions, the Executive Committee
reviews internal management reports on a monthly basis. The following summary describes the operations
in each of the Group’s reportable segments:
Geotechnical
The Geotechnical division investigates the engineering properties and geological characteristics of near-surface
soils and rocks using (in-house developed) proprietary technologies, advises on foundation design, provides
construction materials testing, pavement assessment and installation support services. These services support
clients’ projects worldwide in the onshore, near shore and offshore environments, including deep water.
Typical projects include support of infrastructure development and maintenance, large construction projects,
f lood protection and support of the design and installation of oil and gas facilities and windfarms.
Survey
The Survey division provides a range of services in support of the oil and gas industry, renewables and
commercial and civil industries, as well as governments and other organisations. It encompasses numerous
offshore, subsea and geospatial activities as well as global positioning systems that support these and other
Group activities. Offshore services include geophysical investigations for geohazards, pipeline and cable
routes, inspection and construction support services, hydrographic charting and meteorological and
oceanographic studies. Subsea services revolve around the use of remotely operated vehicles (ROV) in support
of drilling as well as inspection, repair and maintenance (IRM) services of subsea assets. These services are
expanded to well intervention in support of oil and gas extraction. Geospatial services concentrate on land
survey and aerial/satellite mapping services for a wide range of clients. Fugro’s global positioning system (GPS)
which augments GPS and Glonass signals to provide globally precise positioning are used for the foregoing
services but also are provided on a subscription basis to a wide range of clients in industry as well as
agriculture.
131Fugro Financial statements 2012
Geoscience
The Geoscience division provides services and products associated with collecting, processing, interpreting,
managing and storing geophysical and geological data. These data sets are used for evaluating the presence
of natural resources, including oil, gas, water and minerals, and for optimising the exploration, appraisal,
development and production of those resources. A broad range of geophysical data sets are collected including
marine seismic, gravity, magnetics and electromagnetics. The data sets are collected at sea, from the air and on
land using vessels, low flying airplanes and helicopters. Clients are oil and gas companies, mining companies
and governmental organisations.
A significant part of the Geoscience division has been classified as held for sale and presented as discontinued
operations. In the segment disclosures, the Geoscience information has been separated into retained (Ocean
Bottom Nodes/ Multiclient) and discontinued categories.
The segments are managed on a worldwide basis, and operate in four principal geographical areas,
The Netherlands, Europe other/Africa, Middle East/Asia/Australia and the Americas. In presenting information
on the basis of geographical segments, segment revenue is based on the geographical location of operating
companies. The allocation of segment assets is based on the geographical location of the operating company
using the assets.
Information regarding the results of each reportable segment is included below. Performance is measured
based on segment profit before income tax, as included in the internal management reports that are reviewed
by the Group’s Executive Committee. Segment profit is used to measure performance as management believes
that such information is the most relevant in evaluating the results of certain segments relative to other
entities that operate within these industries.
Fugro decided to allocate the depreciation of property, plant and equipment, used by operating segments
but managed as a central pool, to the reportable segment profit (or loss) before income tax of the respective
operating segments. This allocation was made in the light of Fugro’s decision to review all options for marine
streamer seismic data business and associated activities. The comparable figures for past years have been
adjusted for comparison purposes.
Unallocated assets are assets that are used by more than one reporting segment, and principally comprise
in 2012, 2011 and 2010 property, plant and equipment, equity-accounted investees and other investments,
deferred tax assets, current tax assets, derivative financial instrument assets and cash and cash equivalents
which are used as part of the Group’s financing offset arrangements.
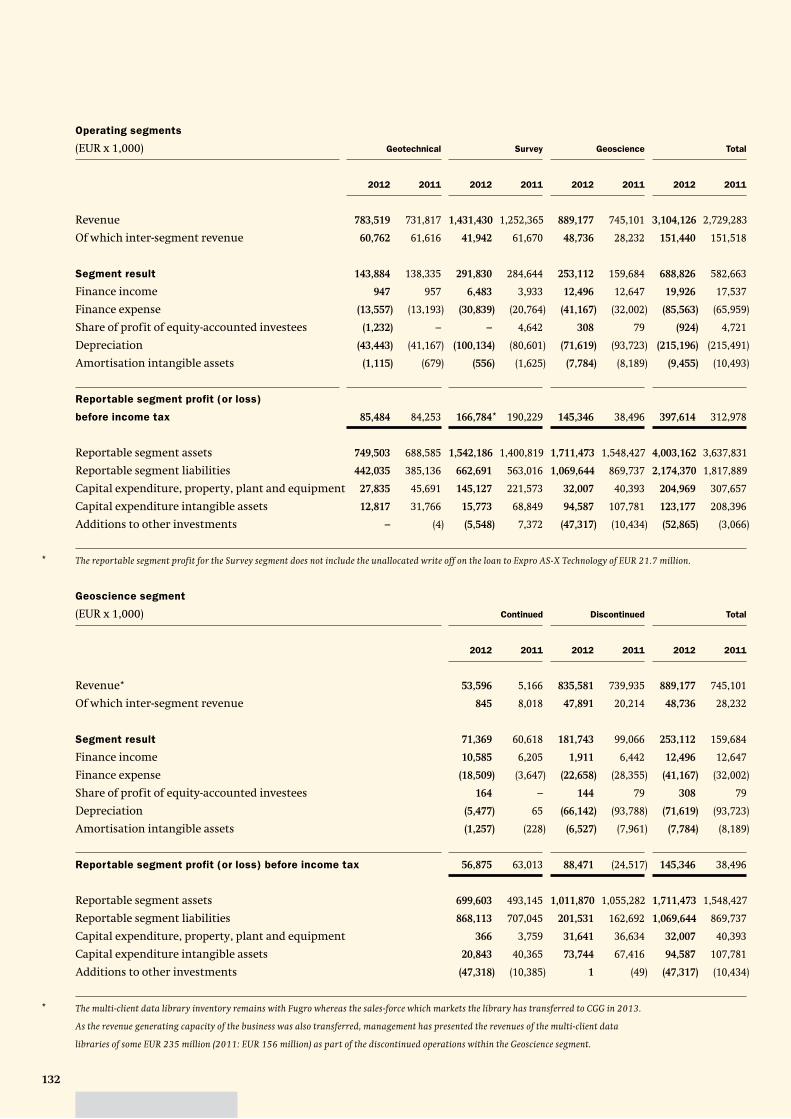
132
Operating segments
(EUR x 1,000) Geotechnical Survey Geoscience Total
2012 2011 2012 2011 2012 2011 2012 2011
Revenue 783,519 731,817 1,431,430 1,252,365 889,177 745,101 3,104,126 2,729,283
Of which inter-segment revenue 60,762 61,616 41,942 61,670 48,736 28,232 151,440 151,518
Segment result 143,884 138,335 291,830 284,644 253,112 159,684 688,826 582,663
Finance income 947 957 6,483 3,933 12,496 12,647 19,926 17,537
Finance expense (13,557) (13,193) (30,839) (20,764) (41,167) (32,002) (85,563) (65,959)
Share of profit of equity-accounted investees (1,232) – – 4,642 308 79 (924) 4,721
Depreciation (43,443) (41,167) (100,134) (80,601) (71,619) (93,723) (215,196) (215,491)
Amortisation intangible assets (1,115) (679) (556) (1,625) (7,784) (8,189) (9,455) (10,493)
Reportable segment profit (or loss)
before income tax 85,484 84,253 166,784 190,229 145,346 38,496 397,614 312,978
Reportable segment assets 749,503 688,585 1,542,186 1,400,819 1,711,473 1,548,427 4,003,162 3,637,831
Reportable segment liabilities 442,035 385,136 662,691 563,016 1,069,644 869,737 2,174,370 1,817,889
Capital expenditure, property, plant and equipment 27,835 45,691 145,127 221,573 32,007 40,393 204,969 307,657
Capital expenditure intangible assets 12,817 31,766 15,773 68,849 94,587 107,781 123,177 208,396
Additions to other investments – (4) (5,548) 7,372 (47,317) (10,434) (52,865) (3,066)
* The reportable segment profit for the Survey segment does not include the unallocated write off on the loan to Expro AS-X Technology of EUR 21.7 million.
Geoscience segment
(EUR x 1,000) Continued Discontinued Total
2012 2011 2012 2011 2012 2011
Revenue* 53,596 5,166 835,581 739,935 889,177 745,101
Of which inter-segment revenue 845 8,018 47,891 20,214 48,736 28,232
Segment result 71,369 60,618 181,743 99,066 253,112 159,684
Finance income 10,585 6,205 1,911 6,442 12,496 12,647
Finance expense (18,509) (3,647) (22,658) (28,355) (41,167) (32,002)
Share of profit of equity-accounted investees 164 – 144 79 308 79
Depreciation (5,477) 65 (66,142) (93,788) (71,619) (93,723)
Amortisation intangible assets (1,257) (228) (6,527) (7,961) (7,784) (8,189)
Reportable segment profit (or loss) before income tax 56,875 63,013 88,471 (24,517) 145,346 38,496
Reportable segment assets 699,603 493,145 1,011,870 1,055,282 1,711,473 1,548,427
Reportable segment liabilities 868,113 707,045 201,531 162,692 1,069,644 869,737
Capital expenditure, property, plant and equipment 366 3,759 31,641 36,634 32,007 40,393
Capital expenditure intangible assets 20,843 40,365 73,744 67,416 94,587 107,781
Additions to other investments (47,318) (10,385) 1 (49) (47,317) (10,434)
* The multi-client data library inventory remains with Fugro whereas the sales-force which markets the library has transferred to CGG in 2013.
As the revenue generating capacity of the business was also transferred, management has presented the revenues of the multi-client data
libraries of some EUR 235 million (2011: EUR 156 million) as part of the discontinued operations within the Geoscience segment.
*
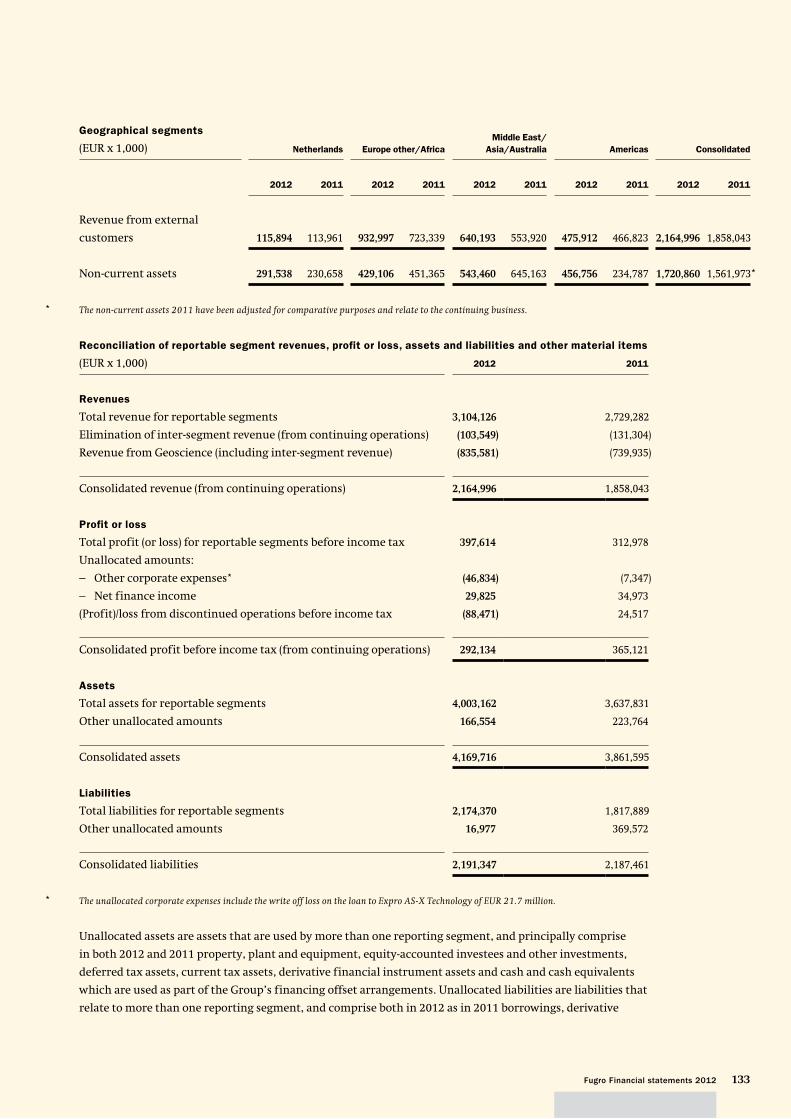
133Fugro Financial statements 2012
Geographical segments
(EUR x 1,000) Netherlands Europe other/Africa
Middle East/
Asia/Australia Americas Consolidated
2012 2011 2012 2011 2012 2011 2012 2011 2012 2011
Revenue from external
customers 115,894 113,961 932,997 723,339 640,193 553,920 475,912 466,823 2,164,996 1,858,043
Non-current assets 291,538 230,658 429,106 451,365 543,460 645,163 456,756 234,787 1,720,860 1,561,973*
* The non-current assets 2011 have been adjusted for comparative purposes and relate to the continuing business.
Reconciliation of reportable segment revenues, profit or loss, assets and liabilities and other material items
(EUR x 1,000) 2012 2011
Revenues
Total revenue for reportable segments 3,104,126 2,729,282
Elimination of inter-segment revenue (from continuing operations) (103,549) (131,304)
Revenue from Geoscience (including inter-segment revenue) (835,581) (739,935)
Consolidated revenue (from continuing operations) 2,164,996 1,858,043
Profit or loss
Total profit (or loss) for reportable segments before income tax 397,614 312,978
Unallocated amounts:
– Other corporate expenses* (46,834) (7,347)
– Net finance income 29,825 34,973
(Profit)/loss from discontinued operations before income tax (88,471) 24,517
Consolidated profit before income tax (from continuing operations) 292,134 365,121
Assets
Total assets for reportable segments 4,003,162 3,637,831
Other unallocated amounts 166,554 223,764
Consolidated assets 4,169,716 3,861,595
Liabilities
Total liabilities for reportable segments 2,174,370 1,817,889
Other unallocated amounts 16,977 369,572
Consolidated liabilities 2,191,347 2,187,461
* The unallocated corporate expenses include the write off loss on the loan to Expro AS-X Technology of EUR 21.7 million.
Unallocated assets are assets that are used by more than one reporting segment, and principally comprise
in both 2012 and 2011 property, plant and equipment, equity-accounted investees and other investments,
deferred tax assets, current tax assets, derivative financial instrument assets and cash and cash equivalents
which are used as part of the Group’s financing offset arrangements. Unallocated liabilities are liabilities that
relate to more than one reporting segment, and comprise both in 2012 as in 2011 borrowings, derivative
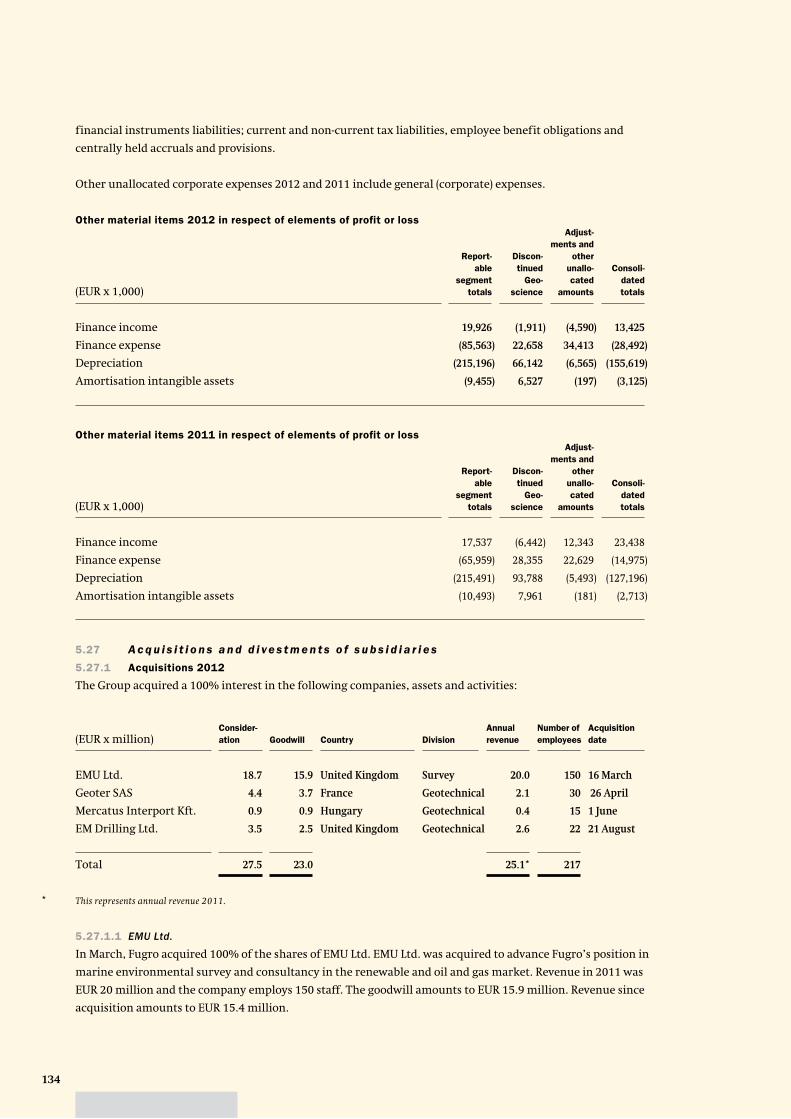
134
financial instruments liabilities; current and non-current tax liabilities, employee benefit obligations and
centrally held accruals and provisions.
Other unallocated corporate expenses 2012 and 2011 include general (corporate) expenses.
Other material items 2012 in respect of elements of profit or loss
(EUR x 1,000)
Report-
able
segment
totals
Discon-
tinued
Geo-
science
Adjust-
ments and
other
unallo-
cated
amounts
Consoli-
dated
totals
Finance income 19,926 (1,911) (4,590) 13,425
Finance expense (85,563) 22,658 34,413 (28,492)
Depreciation (215,196) 66,142 (6,565) (155,619)
Amortisation intangible assets (9,455) 6,527 (197) (3,125)
Other material items 2011 in respect of elements of profit or loss
(EUR x 1,000)
Report-
able
segment
totals
Discon-
tinued
Geo-
science
Adjust-
ments and
other
unallo-
cated
amounts
Consoli-
dated
totals
Finance income 17,537 (6,442) 12,343 23,438
Finance expense (65,959) 28,355 22,629 (14,975)
Depreciation (215,491) 93,788 (5,493) (127,196)
Amortisation intangible assets (10,493) 7,961 (181) (2,713)
5.27 A c q u i s i t i o n s a n d d i ve s t m e n t s o f s u b s i d i a r i e s
5.27.1 Acquisitions 2012
The Group acquired a 100% interest in the following companies, assets and activities:
(EUR x million)Consider-
ation Goodwill Country Division
Annual
revenue
Number of
em ployees
Acquisition
date
EMU Ltd. 18.7 15.9 United Kingdom Survey 20.0 150 16 March
Geoter SAS 4.4 3.7 France Geotechnical 2.1 30 26 April
Mercatus Interport Kft. 0.9 0.9 Hungary Geotechnical 0.4 15 1 June
EM Drilling Ltd. 3.5 2.5 United Kingdom Geotechnical 2.6 22 21 August
Total 27.5 23.0 25.1* 217
* This represents annual revenue 2011.
5.27.1.1 EMU Ltd.
In March, Fugro acquired 100% of the shares of EMU Ltd. EMU Ltd. was acquired to advance Fugro’s position in
marine environmental survey and consultancy in the renewable and oil and gas market. Revenue in 2011 was
EUR 20 million and the company employs 150 staff. The goodwill amounts to EUR 15.9 million. Revenue since
acquisition amounts to EUR 15.4 million.
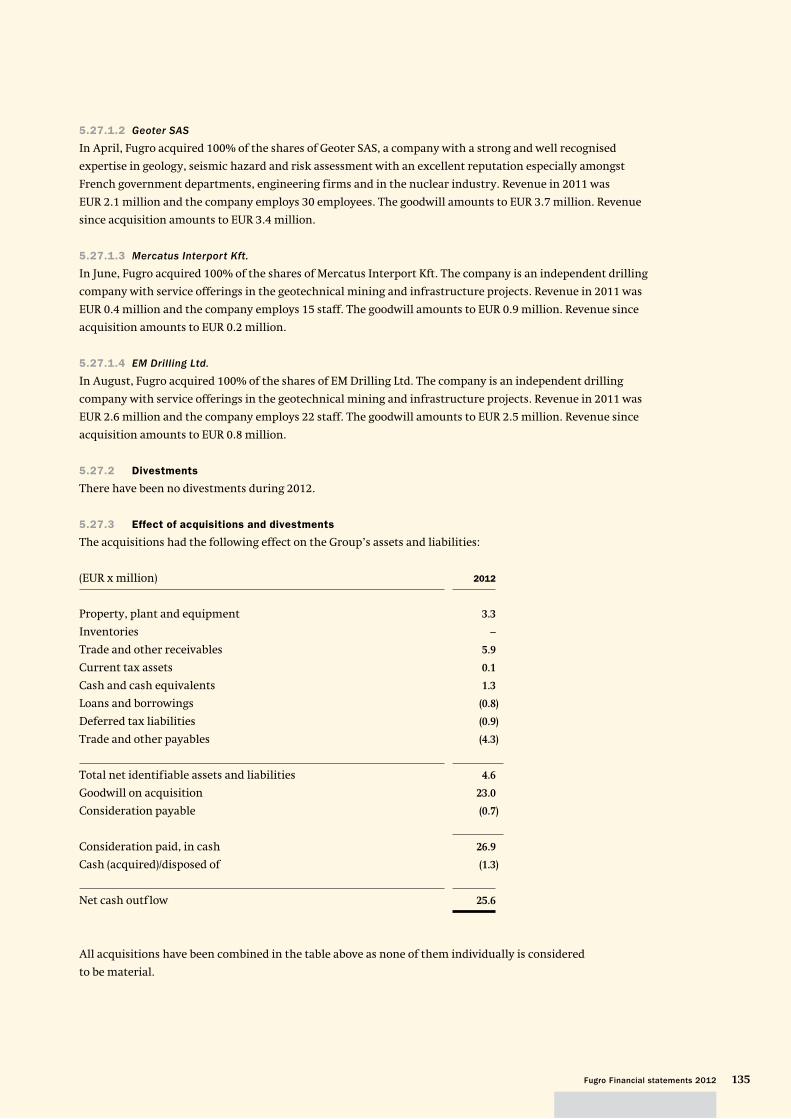
135Fugro Financial statements 2012
5.27.1.2 Geoter SAS
In April, Fugro acquired 100% of the shares of Geoter SAS, a company with a strong and well recognised
expertise in geology, seismic hazard and risk assessment with an excellent reputation especially amongst
French government departments, engineering firms and in the nuclear industry. Revenue in 2011 was
EUR 2.1 million and the company employs 30 employees. The goodwill amounts to EUR 3.7 million. Revenue
since acquisition amounts to EUR 3.4 million.
5.27.1.3 Mercatus Interport Kft.
In June, Fugro acquired 100% of the shares of Mercatus Interport Kft. The company is an independent drilling
company with service offerings in the geotechnical mining and infrastructure projects. Revenue in 2011 was
EUR 0.4 million and the company employs 15 staff. The goodwill amounts to EUR 0.9 million. Revenue since
acquisition amounts to EUR 0.2 million.
5.27.1.4 EM Drilling Ltd.
In August, Fugro acquired 100% of the shares of EM Drilling Ltd. The company is an independent drilling
company with service offerings in the geotechnical mining and infrastructure projects. Revenue in 2011 was
EUR 2.6 million and the company employs 22 staff. The goodwill amounts to EUR 2.5 million. Revenue since
acquisition amounts to EUR 0.8 million.
5.27.2 Divestments
There have been no divestments during 2012.
5.27.3 Effect of acquisitions and divestments
The acquisitions had the following effect on the Group’s assets and liabilities:
(EUR x million) 2012
Property, plant and equipment 3.3
Inventories –
Trade and other receivables 5.9
Current tax assets 0.1
Cash and cash equivalents 1.3
Loans and borrowings (0.8)
Deferred tax liabilities (0.9)
Trade and other payables (4.3)
Total net identifiable assets and liabilities 4.6
Goodwill on acquisition 23.0
Consideration payable (0.7)
Consideration paid, in cash 26.9
Cash (acquired)/disposed of (1.3)
Net cash outflow 25.6
All acquisitions have been combined in the table above as none of them individually is considered
to be material.
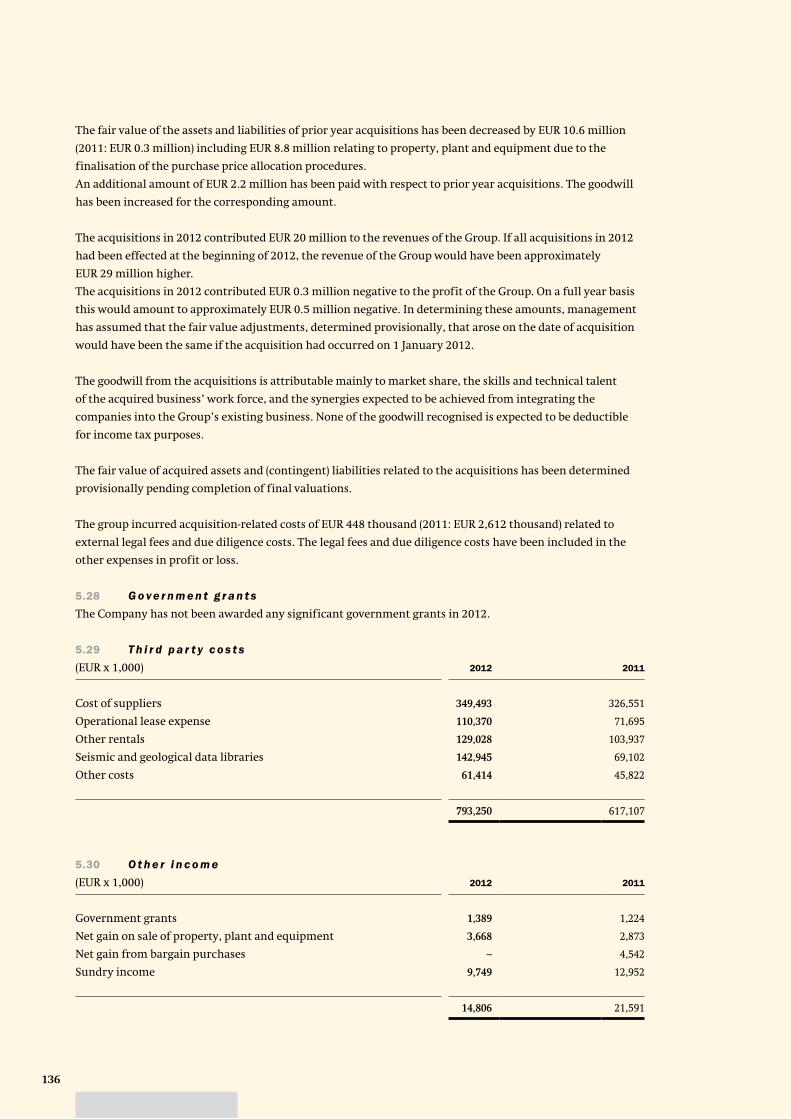
136
The fair value of the assets and liabilities of prior year acquisitions has been decreased by EUR 10.6 million
(2011: EUR 0.3 million) including EUR 8.8 million relating to property, plant and equipment due to the
finalisation of the purchase price allocation procedures.
An additional amount of EUR 2.2 million has been paid with respect to prior year acquisitions. The goodwill
has been increased for the corresponding amount.
The acquisitions in 2012 contributed EUR 20 million to the revenues of the Group. If all acquisitions in 2012
had been effected at the beginning of 2012, the revenue of the Group would have been approximately
EUR 29 million higher.
The acquisitions in 2012 contributed EUR 0.3 million negative to the profit of the Group. On a full year basis
this would amount to approximately EUR 0.5 million negative. In determining these amounts, management
has assumed that the fair value adjustments, determined provisionally, that arose on the date of acquisition
would have been the same if the acquisition had occurred on 1 January 2012.
The goodwill from the acquisitions is attributable mainly to market share, the skills and technical talent
of the acquired business’ work force, and the synergies expected to be achieved from integrating the
companies into the Group’s existing business. None of the goodwill recognised is expected to be deductible
for income tax purposes.
The fair value of acquired assets and (contingent) liabilities related to the acquisitions has been determined
provisionally pending completion of final valuations.
The group incurred acquisition-related costs of EUR 448 thousand (2011: EUR 2,612 thousand) related to
external legal fees and due diligence costs. The legal fees and due diligence costs have been included in the
other expenses in profit or loss.
5.28 G o ve r n m e n t g r a n t s
The Company has not been awarded any significant government grants in 2012.
5.29 T h i r d p a r t y c o s t s
(EUR x 1,000) 2012 2011
Cost of suppliers 349,493 326,551
Operational lease expense 110,370 71,695
Other rentals 129,028 103,937
Seismic and geological data libraries 142,945 69,102
Other costs 61,414 45,822
793,250 617,107
5.30 O t h e r i n c o m e
(EUR x 1,000) 2012 2011
Government grants 1,389 1,224
Net gain on sale of property, plant and equipment 3,668 2,873
Net gain from bargain purchases – 4,542
Sundry income 9,749 12,952
14,806 21,591
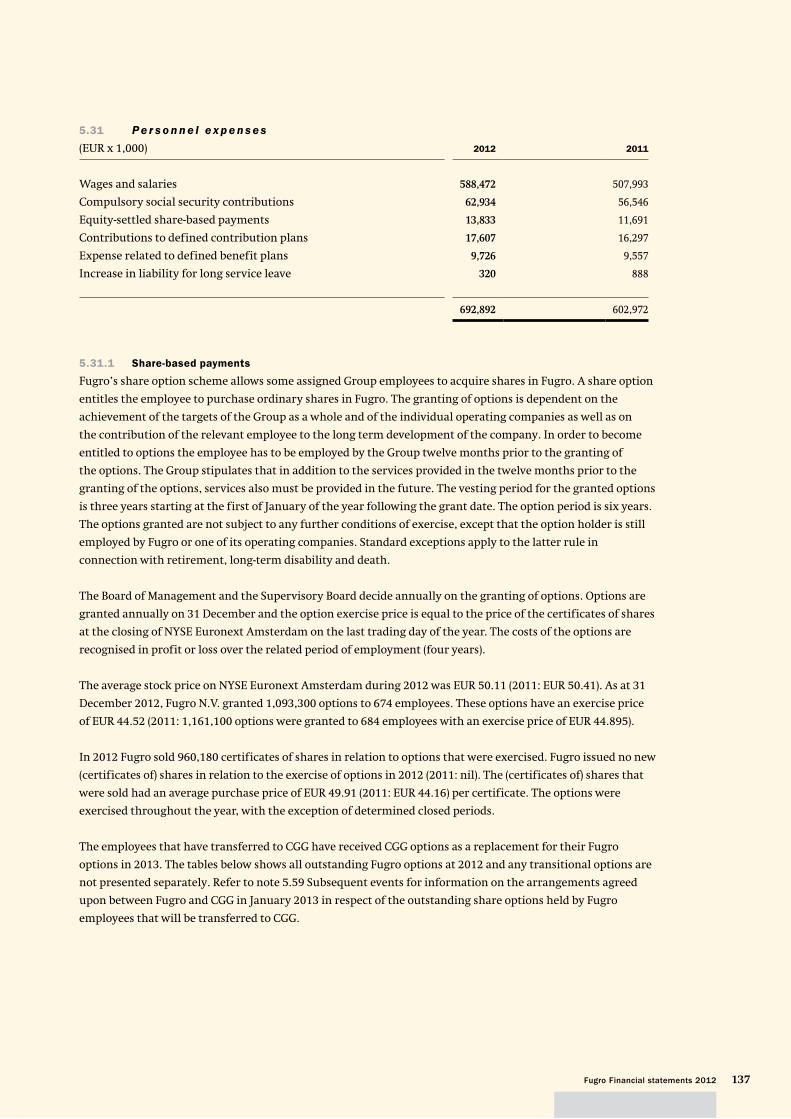
137Fugro Financial statements 2012
5.31 Pe r s o n n e l e x p e n s e s
(EUR x 1,000) 2012 2011
Wages and salaries 588,472 507,993
Compulsory social security contributions 62,934 56,546
Equity-settled share-based payments 13,833 11,691
Contributions to defined contribution plans 17,607 16,297
Expense related to defined benefit plans 9,726 9,557
Increase in liability for long service leave 320 888
692,892 602,972
5.31.1 Share-based payments
Fugro’s share option scheme allows some assigned Group employees to acquire shares in Fugro. A share option
entitles the employee to purchase ordinary shares in Fugro. The granting of options is dependent on the
achievement of the targets of the Group as a whole and of the individual operating companies as well as on
the contribution of the relevant employee to the long term development of the company. In order to become
entitled to options the employee has to be employed by the Group twelve months prior to the granting of
the options. The Group stipulates that in addition to the services provided in the twelve months prior to the
granting of the options, services also must be provided in the future. The vesting period for the granted options
is three years starting at the first of January of the year following the grant date. The option period is six years.
The options granted are not subject to any further conditions of exercise, except that the option holder is still
employed by Fugro or one of its operating companies. Standard exceptions apply to the latter rule in
connection with retirement, long-term disability and death.
The Board of Management and the Supervisory Board decide annually on the granting of options. Options are
granted annually on 31 December and the option exercise price is equal to the price of the certificates of shares
at the closing of NYSE Euronext Amsterdam on the last trading day of the year. The costs of the options are
recognised in profit or loss over the related period of employment (four years).
The average stock price on NYSE Euronext Amsterdam during 2012 was EUR 50.11 (2011: EUR 50.41). As at 31
December 2012, Fugro N.V. granted 1,093,300 options to 674 employees. These options have an exercise price
of EUR 44.52 (2011: 1,161,100 options were granted to 684 employees with an exercise price of EUR 44.895).
In 2012 Fugro sold 960,180 certificates of shares in relation to options that were exercised. Fugro issued no new
(certificates of) shares in relation to the exercise of options in 2012 (2011: nil). The (certificates of) shares that
were sold had an average purchase price of EUR 49.91 (2011: EUR 44.16) per certificate. The options were
exercised throughout the year, with the exception of determined closed periods.
The employees that have transferred to CGG have received CGG options as a replacement for their Fugro
options in 2013. The tables below shows all outstanding Fugro options at 2012 and any transitional options are
not presented separately. Refer to note 5.59 Subsequent events for information on the arrangements agreed
upon between Fugro and CGG in January 2013 in respect of the outstanding share options held by Fugro
employees that will be transferred to CGG.
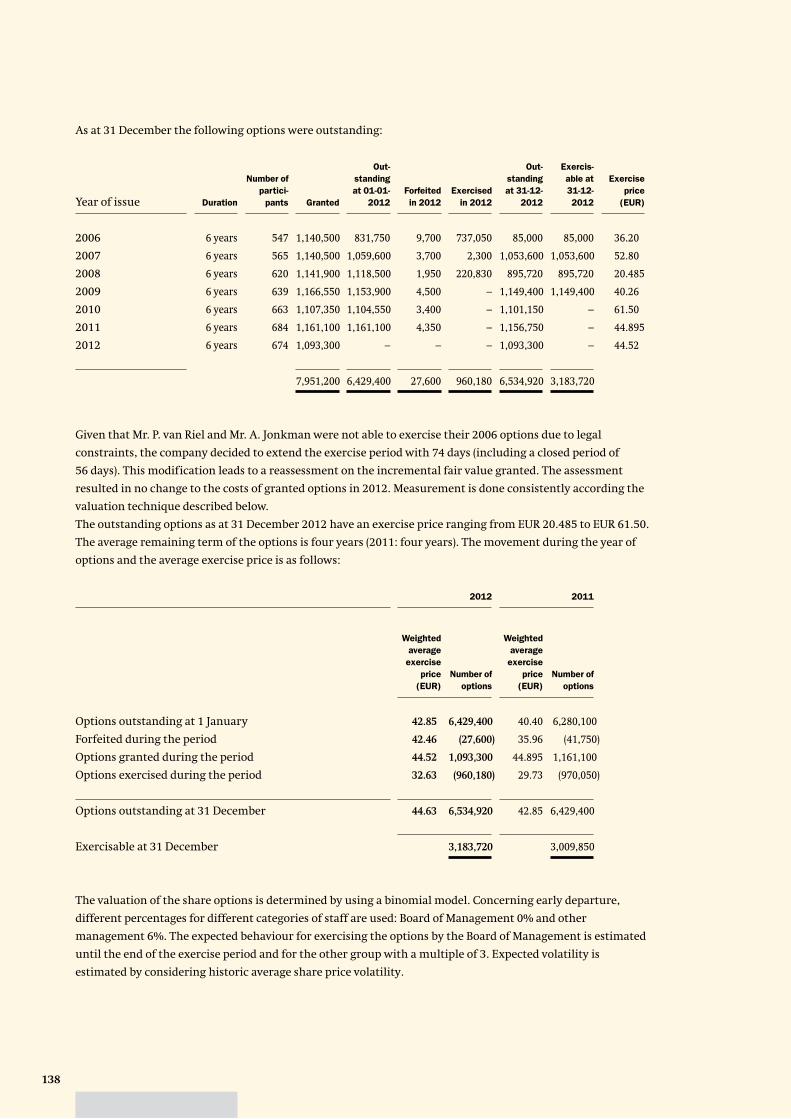
138
As at 31 December the following options were outstanding:
Year of issue Duration
Number of
partici-
pants Granted
Out-
standing
at 01-01-
2012
Forfeited
in 2012
Exercised
in 2012
Out-
standing
at 31-12-
2012
Exercis-
able at
31-12-
2012
Exercise
price
(EUR)
2006 6 years 547 1,140,500 831,750 9,700 737,050 85,000 85,000 36.20
2007 6 years 565 1,140,500 1,059,600 3,700 2,300 1,053,600 1,053,600 52.80
2008 6 years 620 1,141,900 1,118,500 1,950 220,830 895,720 895,720 20.485
2009 6 years 639 1,166,550 1,153,900 4,500 – 1,149,400 1,149,400 40.26
2010 6 years 663 1,107,350 1,104,550 3,400 – 1,101,150 – 61.50
2011 6 years 684 1,161,100 1,161,100 4,350 – 1,156,750 – 44.895
2012 6 years 674 1,093,300 – – – 1,093,300 – 44.52
7,951,200 6,429,400 27,600 960,180 6,534,920 3,183,720
Given that Mr. P. van Riel and Mr. A. Jonkman were not able to exercise their 2006 options due to legal
constraints, the company decided to extend the exercise period with 74 days (including a closed period of
56 days). This modification leads to a reassessment on the incremental fair value granted. The assessment
resulted in no change to the costs of granted options in 2012. Measurement is done consistently according the
valuation technique described below.
The outstanding options as at 31 December 2012 have an exercise price ranging from EUR 20.485 to EUR 61.50.
The average remaining term of the options is four years (2011: four years). The movement during the year of
options and the average exercise price is as follows:
2012 2011
Weighted
average
exercise
price
(EUR)
Number of
options
Weighted
average
exercise
price
(EUR)
Number of
options
Options outstanding at 1 January 42.85 6,429,400 40.40 6,280,100
Forfeited during the period 42.46 (27,600) 35.96 (41,750)
Options granted during the period 44.52 1,093,300 44.895 1,161,100
Options exercised during the period 32.63 (960,180) 29.73 (970,050)
Options outstanding at 31 December 44.63 6,534,920 42.85 6,429,400
Exercisable at 31 December 3,183,720 3,009,850
The valuation of the share options is determined by using a binomial model. Concerning early departure,
different percentages for different categories of staff are used: Board of Management 0% and other
management 6%. The expected behaviour for exercising the options by the Board of Management is estimated
until the end of the exercise period and for the other group with a multiple of 3. Expected volatility is
estimated by considering historic average share price volatility.
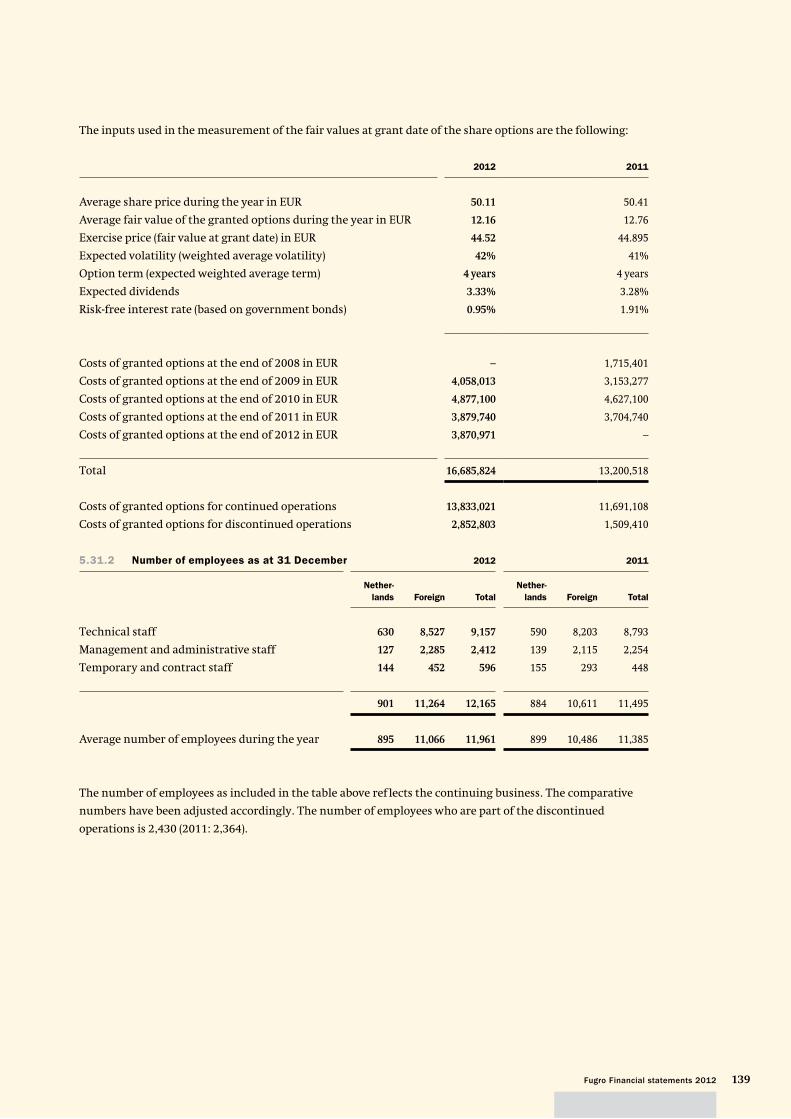
139Fugro Financial statements 2012
The inputs used in the measurement of the fair values at grant date of the share options are the following:
2012 2011
Average share price during the year in EUR 50.11 50.41
Average fair value of the granted options during the year in EUR 12.16 12.76
Exercise price (fair value at grant date) in EUR 44.52 44.895
Expected volatility (weighted average volatility) 42% 41%
Option term (expected weighted average term) 4 years 4 years
Expected dividends 3.33% 3.28%
Risk-free interest rate (based on government bonds) 0.95% 1.91%
Costs of granted options at the end of 2008 in EUR – 1,715,401
Costs of granted options at the end of 2009 in EUR 4,058,013 3,153,277
Costs of granted options at the end of 2010 in EUR 4,877,100 4,627,100
Costs of granted options at the end of 2011 in EUR 3,879,740 3,704,740
Costs of granted options at the end of 2012 in EUR 3,870,971 –
Total 16,685,824 13,200,518
Costs of granted options for continued operations 13,833,021 11,691,108
Costs of granted options for discontinued operations 2,852,803 1,509,410
5.31.2 Number of employees as at 31 December 2012 2011
Nether-
lands Foreign Total
Nether-
lands Foreign Total
Technical staff 630 8,527 9,157 590 8,203 8,793
Management and administrative staff 127 2,285 2,412 139 2,115 2,254
Temporary and contract staff 144 452 596 155 293 448
901 11,264 12,165 884 10,611 11,495
Average number of employees during the year 895 11,066 11,961 899 10,486 11,385
The number of employees as included in the table above reflects the continuing business. The comparative
numbers have been adjusted accordingly. The number of employees who are part of the discontinued
operations is 2,430 (2011: 2,364).

140
5.32 O t h e r e x p e n s e s
(EUR x 1,000) 2012 2011
Maintenance and operational supplies 50,257 48,626
Indirect operating expenses 54,406 44,903
Occupancy costs 36,169 33,430
Communication and office equipment 32,833 27,186
Write off USD 25 million loan to Expro AX-S Technology
(refer to note 5.40.2) 21,733 –
Restructuring costs 830 222
Research cost 342 645
Loss on disposal of property, plant and equipment 344 1,610
Marketing and advertising costs 7,968 7,375
Other 21,765 13,633
226,647 177,630
Audit fees, presented under other expenses, as charged by KPMG are disclosed in note 9.13.
5.33 N e t f i n a n c e ( i n c o m e ) c o s t s
(EUR x 1,000) 2012 2011
Interest income on loans and receivables (992) (4,320)
Dividend income on available-for-sale financial assets (173) (203)
Net change in fair value of financial assets at fair value
through profit or loss (refer to note 5.40.3) (12,260) (6,008)
Net foreign exchange variance – (12,907)
Finance income (13,425) (23,438)
Interest expense on financial liabilities measured at amortised cost 18,898 11,521
Net change in fair value of derivatives (547) 1,387
Net change in fair value of financial assets at fair value
through profit or loss – 2,067
Net foreign exchange variance 10,141 –
Finance expense 28,492 14,975
Net finance (income)/costs recognised in profit or loss 15,067 (8,463)
The foreign exchange variances have developed negatively as a result of the weakening of the Euro against the
other major currencies.
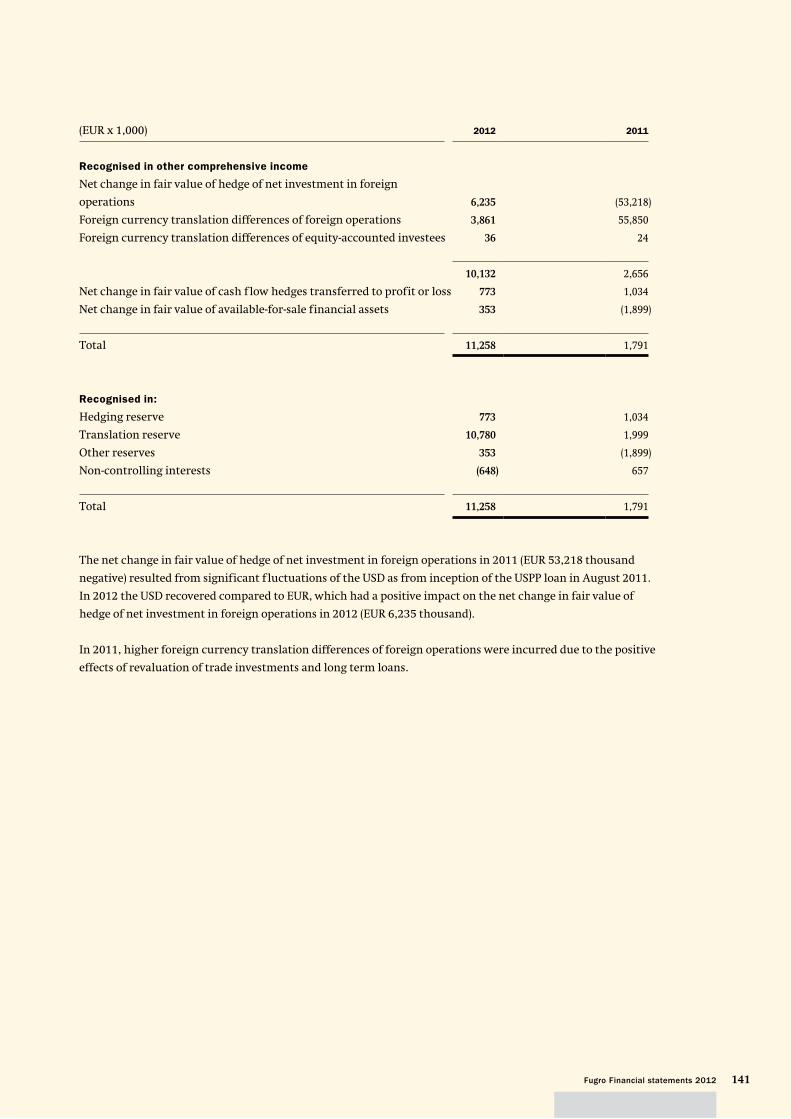
141Fugro Financial statements 2012
(EUR x 1,000) 2012 2011
Recognised in other comprehensive income
Net change in fair value of hedge of net investment in foreign
operations 6,235 (53,218)
Foreign currency translation differences of foreign operations 3,861 55,850
Foreign currency translation differences of equity-accounted investees 36 24
10,132 2,656
Net change in fair value of cash f low hedges transferred to profit or loss 773 1,034
Net change in fair value of available-for-sale financial assets 353 (1,899)
Total 11,258 1,791
Recognised in:
Hedging reserve 773 1,034
Translation reserve 10,780 1,999
Other reserves 353 (1,899)
Non-controlling interests (648) 657
Total 11,258 1,791
The net change in fair value of hedge of net investment in foreign operations in 2011 (EUR 53,218 thousand
negative) resulted from significant f luctuations of the USD as from inception of the USPP loan in August 2011.
In 2012 the USD recovered compared to EUR, which had a positive impact on the net change in fair value of
hedge of net investment in foreign operations in 2012 (EUR 6,235 thousand).
In 2011, higher foreign currency translation differences of foreign operations were incurred due to the positive
effects of revaluation of trade investments and long term loans.
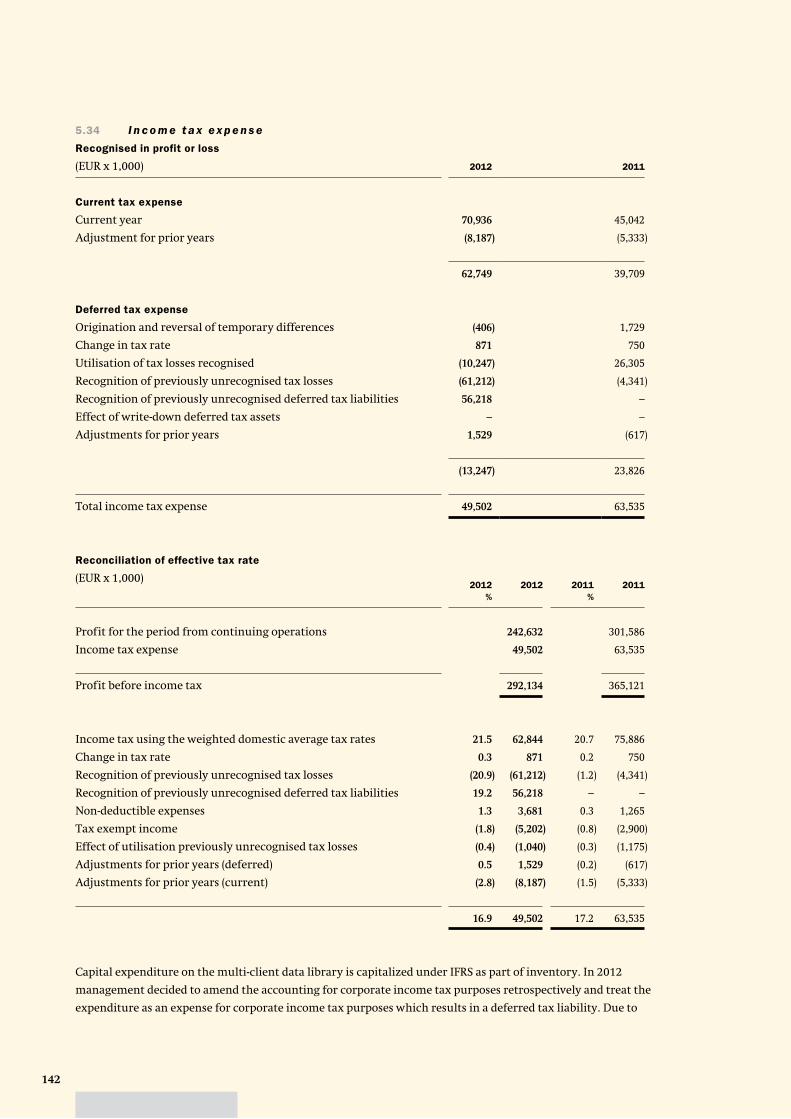
142
5.34 I n c o m e t a x e x p e n s e
Recognised in profit or loss
(EUR x 1,000) 2012 2011
Current tax expense
Current year 70,936 45,042
Adjustment for prior years (8,187) (5,333)
62,749 39,709
Deferred tax expense
Origination and reversal of temporary differences (406) 1,729
Change in tax rate 871 750
Utilisation of tax losses recognised (10,247) 26,305
Recognition of previously unrecognised tax losses (61,212) (4,341)
Recognition of previously unrecognised deferred tax liabilities 56,218 –
Effect of write-down deferred tax assets – –
Adjustments for prior years 1,529 (617)
(13,247) 23,826
Total income tax expense 49,502 63,535
Reconciliation of effective tax rate
(EUR x 1,000)2012
%
2012 2011
%
2011
Profit for the period from continuing operations 242,632 301,586
Income tax expense 49,502 63,535
Profit before income tax 292,134 365,121
Income tax using the weighted domestic average tax rates 21.5 62,844 20.7 75,886
Change in tax rate 0.3 871 0.2 750
Recognition of previously unrecognised tax losses (20.9) (61,212) (1.2) (4,341)
Recognition of previously unrecognised deferred tax liabilities 19.2 56,218 – –
Non-deductible expenses 1.3 3,681 0.3 1,265
Tax exempt income (1.8) (5,202) (0.8) (2,900)
Effect of utilisation previously unrecognised tax losses (0.4) (1,040) (0.3) (1,175)
Adjustments for prior years (deferred) 0.5 1,529 (0.2) (617)
Adjustments for prior years (current) (2.8) (8,187) (1.5) (5,333)
16.9 49,502 17.2 63,535
Capital expenditure on the multi-client data library is capitalized under IFRS as part of inventory. In 2012
management decided to amend the accounting for corporate income tax purposes retrospectively and treat the
expenditure as an expense for corporate income tax purposes which results in a deferred tax liability. Due to
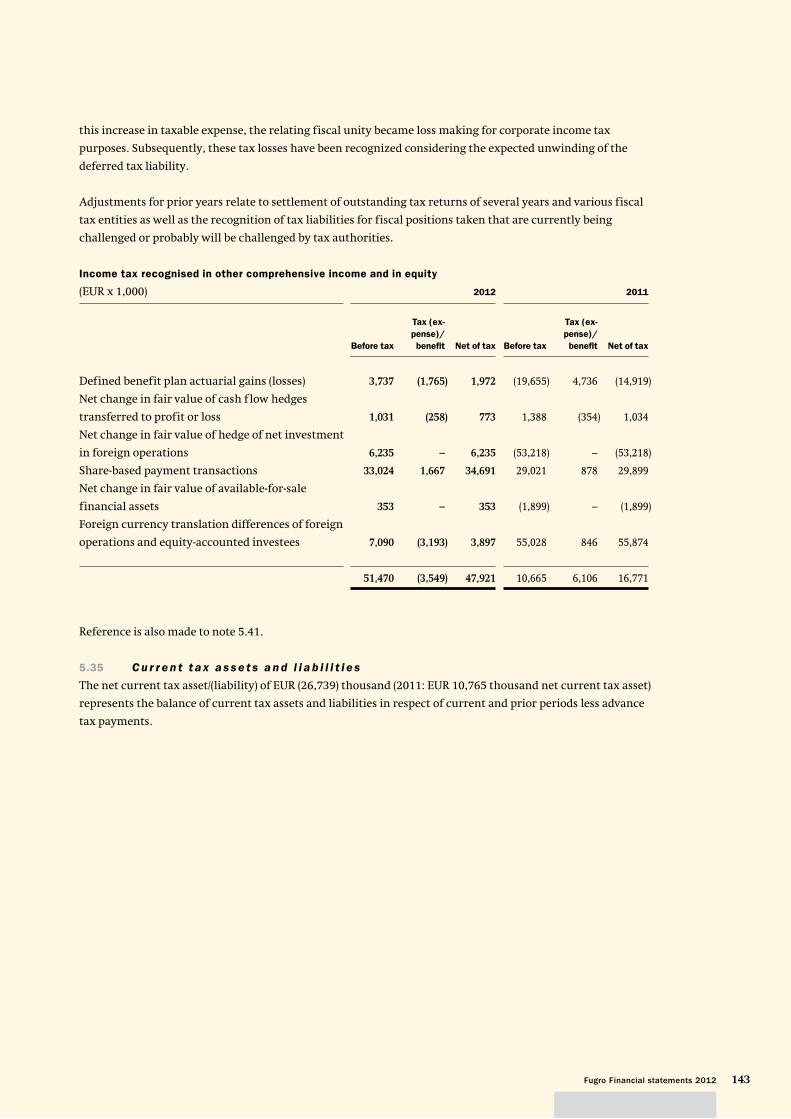
143Fugro Financial statements 2012
this increase in taxable expense, the relating fiscal unity became loss making for corporate income tax
purposes. Subsequently, these tax losses have been recognized considering the expected unwinding of the
deferred tax liability.
Adjustments for prior years relate to settlement of outstanding tax returns of several years and various fiscal
tax entities as well as the recognition of tax liabilities for fiscal positions taken that are currently being
challenged or probably will be challenged by tax authorities.
Income tax recognised in other comprehensive income and in equity
(EUR x 1,000) 2012 2011
Before tax
Tax (ex-
pense)/
benefi t Net of tax Before tax
Tax (ex-
pense)/
benefi t Net of tax
Defined benefit plan actuarial gains (losses) 3,737 (1,765) 1,972 (19,655) 4,736 (14,919)
Net change in fair value of cash f low hedges
transferred to profit or loss 1,031 (258) 773 1,388 (354) 1,034
Net change in fair value of hedge of net investment
in foreign operations 6,235 – 6,235 (53,218) – (53,218)
Share-based payment transactions 33,024 1,667 34,691 29,021 878 29,899
Net change in fair value of available-for-sale
financial assets 353 – 353 (1,899) – (1,899)
Foreign currency translation differences of foreign
operations and equity-accounted investees 7,090 (3,193) 3,897 55,028 846 55,874
51,470 (3,549) 47,921 10,665 6,106 16,771
Reference is also made to note 5.41.
5.35 C u r r e n t t a x a s s e t s a n d l i a b i l i t i e s
The net current tax asset/(liability) of EUR (26,739) thousand (2011: EUR 10,765 thousand net current tax asset)
represents the balance of current tax assets and liabilities in respect of current and prior periods less advance
tax payments.
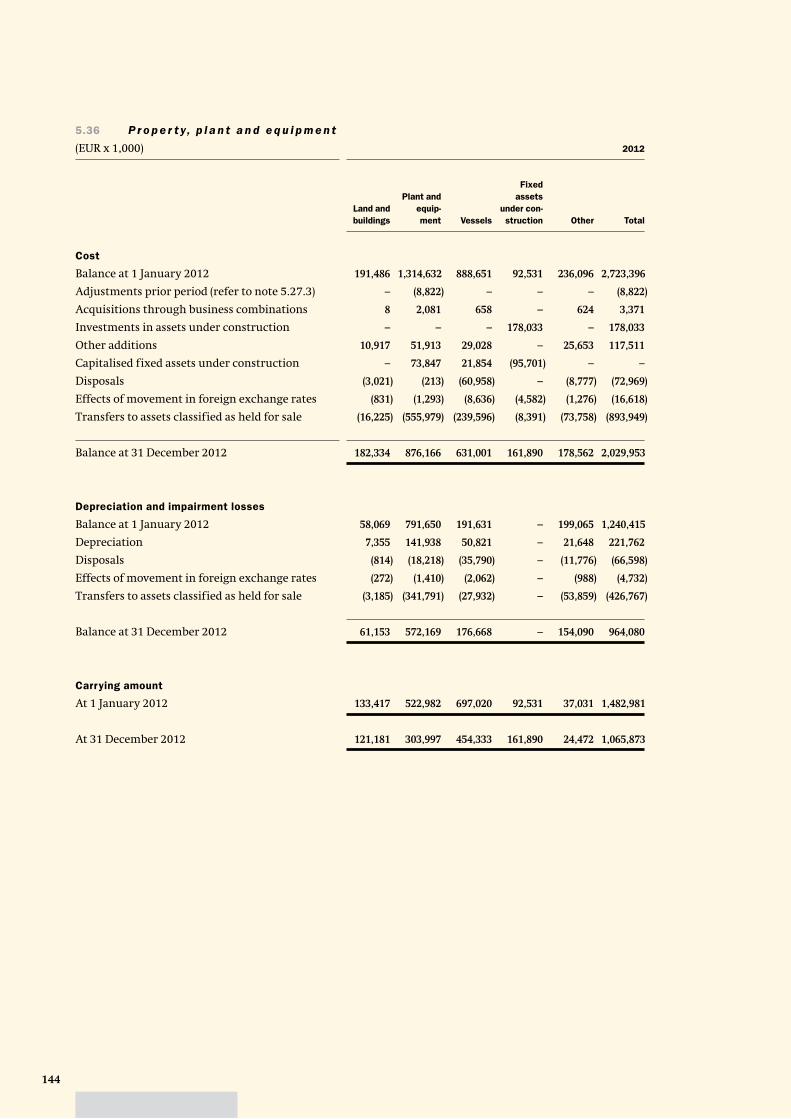
144
5.36 P r o p e r t y , p l a n t a n d e q u i p m e n t
(EUR x 1,000) 2012
Land and
buildings
Plant and
equip-
ment Vessels
Fixed
assets
under con-
struction Other Total
Cost
Balance at 1 January 2012 191,486 1,314,632 888,651 92,531 236,096 2,723,396
Adjustments prior period (refer to note 5.27.3) – (8,822) – – – (8,822)
Acquisitions through business combinations 8 2,081 658 – 624 3,371
Investments in assets under construction – – – 178,033 – 178,033
Other additions 10,917 51,913 29,028 – 25,653 117,511
Capitalised fixed assets under construction – 73,847 21,854 (95,701) – –
Disposals (3,021) (213) (60,958) – (8,777) (72,969)
Effects of movement in foreign exchange rates (831) (1,293) (8,636) (4,582) (1,276) (16,618)
Transfers to assets classified as held for sale (16,225) (555,979) (239,596) (8,391) (73,758) (893,949)
Balance at 31 December 2012 182,334 876,166 631,001 161,890 178,562 2,029,953
Depreciation and impairment losses
Balance at 1 January 2012 58,069 791,650 191,631 – 199,065 1,240,415
Depreciation 7,355 141,938 50,821 – 21,648 221,762
Disposals (814) (18,218) (35,790) – (11,776) (66,598)
Effects of movement in foreign exchange rates (272) (1,410) (2,062) – (988) (4,732)
Transfers to assets classified as held for sale (3,185) (341,791) (27,932) – (53,859) (426,767)
Balance at 31 December 2012 61,153 572,169 176,668 – 154,090 964,080
Carrying amount
At 1 January 2012 133,417 522,982 697,020 92,531 37,031 1,482,981
At 31 December 2012 121,181 303,997 454,333 161,890 24,472 1,065,873
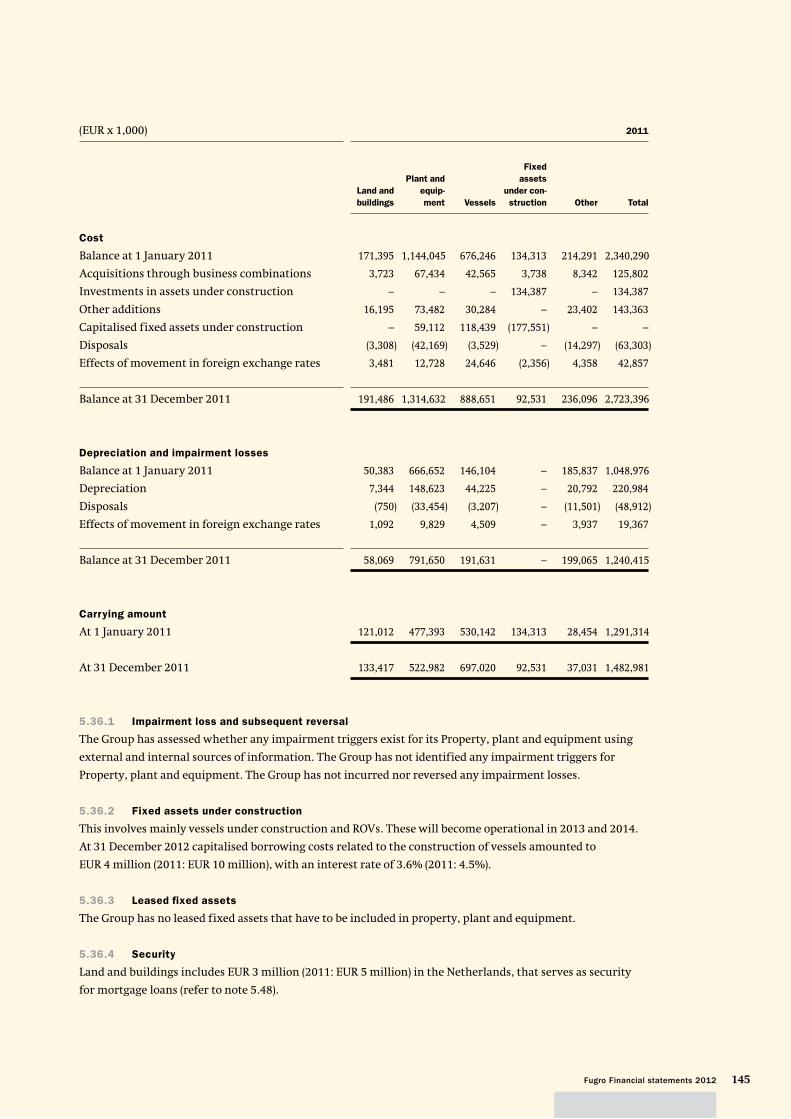
145Fugro Financial statements 2012
(EUR x 1,000) 2011
Land and
buildings
Plant and
equip-
ment Vessels
Fixed
assets
under con-
struction Other Total
Cost
Balance at 1 January 2011 171,395 1,144,045 676,246 134,313 214,291 2,340,290
Acquisitions through business combinations 3,723 67,434 42,565 3,738 8,342 125,802
Investments in assets under construction – – – 134,387 – 134,387
Other additions 16,195 73,482 30,284 – 23,402 143,363
Capitalised fixed assets under construction – 59,112 118,439 (177,551) – –
Disposals (3,308) (42,169) (3,529) – (14,297) (63,303)
Effects of movement in foreign exchange rates 3,481 12,728 24,646 (2,356) 4,358 42,857
Balance at 31 December 2011 191,486 1,314,632 888,651 92,531 236,096 2,723,396
Depreciation and impairment losses
Balance at 1 January 2011 50,383 666,652 146,104 – 185,837 1,048,976
Depreciation 7,344 148,623 44,225 – 20,792 220,984
Disposals (750) (33,454) (3,207) – (11,501) (48,912)
Effects of movement in foreign exchange rates 1,092 9,829 4,509 – 3,937 19,367
Balance at 31 December 2011 58,069 791,650 191,631 – 199,065 1,240,415
Carrying amount
At 1 January 2011 121,012 477,393 530,142 134,313 28,454 1,291,314
At 31 December 2011 133,417 522,982 697,020 92,531 37,031 1,482,981
5.36.1 Impairment loss and subsequent reversal
The Group has assessed whether any impairment triggers exist for its Property, plant and equipment using
external and internal sources of information. The Group has not identified any impairment triggers for
Property, plant and equipment. The Group has not incurred nor reversed any impairment losses.
5.36.2 Fixed assets under construction
This involves mainly vessels under construction and ROVs. These will become operational in 2013 and 2014.
At 31 December 2012 capitalised borrowing costs related to the construction of vessels amounted to
EUR 4 million (2011: EUR 10 million), with an interest rate of 3.6% (2011: 4.5%).
5.36.3 Leased fixed assets
The Group has no leased fixed assets that have to be included in property, plant and equipment.
5.36.4 Security
Land and buildings includes EUR 3 million (2011: EUR 5 million) in the Netherlands, that serves as security
for mortgage loans (refer to note 5.48).
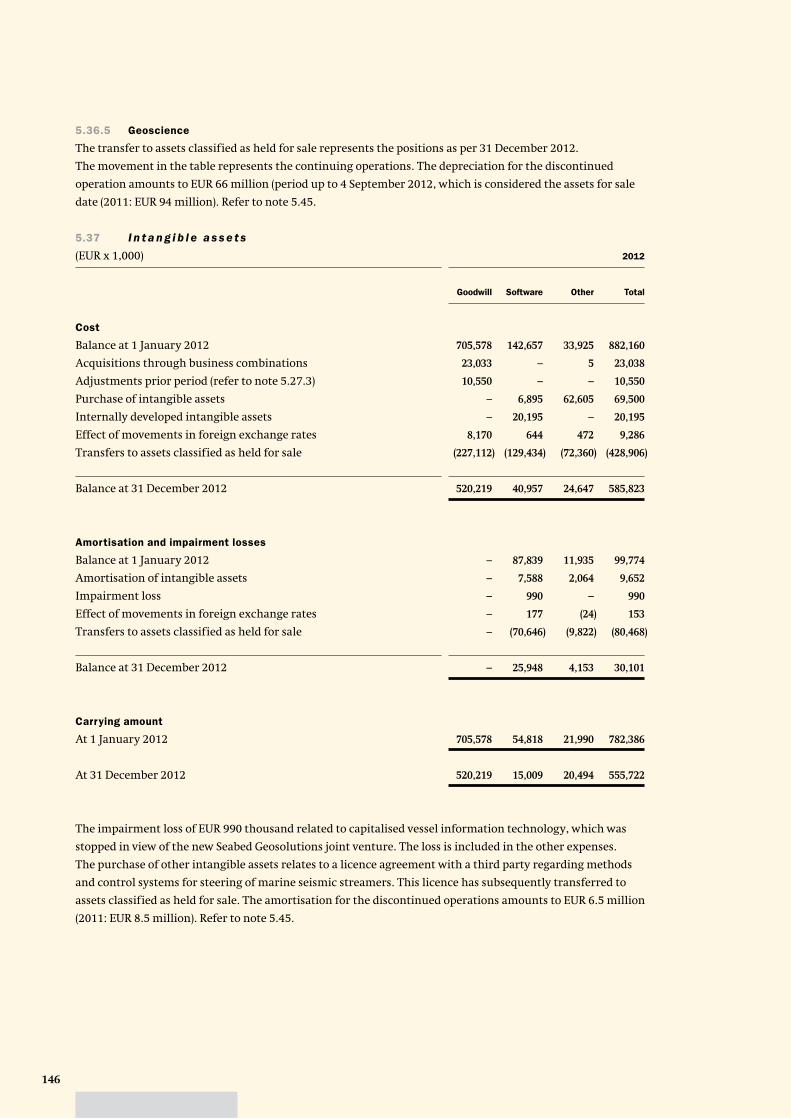
146
5.36.5 Geoscience
The transfer to assets classified as held for sale represents the positions as per 31 December 2012.
The movement in the table represents the continuing operations. The depreciation for the discontinued
operation amounts to EUR 66 million (period up to 4 September 2012, which is considered the assets for sale
date (2011: EUR 94 million). Refer to note 5.45.
5.37 I n t a n g i b l e a s s e t s
(EUR x 1,000) 2012
Goodwill Software Other Total
Cost
Balance at 1 January 2012 705,578 142,657 33,925 882,160
Acquisitions through business combinations 23,033 – 5 23,038
Adjustments prior period (refer to note 5.27.3) 10,550 – – 10,550
Purchase of intangible assets – 6,895 62,605 69,500
Internally developed intangible assets – 20,195 – 20,195
Effect of movements in foreign exchange rates 8,170 644 472 9,286
Transfers to assets classified as held for sale (227,112) (129,434) (72,360) (428,906)
Balance at 31 December 2012 520,219 40,957 24,647 585,823
Amortisation and impairment losses
Balance at 1 January 2012 – 87,839 11,935 99,774
Amortisation of intangible assets – 7,588 2,064 9,652
Impairment loss – 990 – 990
Effect of movements in foreign exchange rates – 177 (24) 153
Transfers to assets classified as held for sale – (70,646) (9,822) (80,468)
Balance at 31 December 2012 – 25,948 4,153 30,101
Carrying amount
At 1 January 2012 705,578 54,818 21,990 782,386
At 31 December 2012 520,219 15,009 20,494 555,722
The impairment loss of EUR 990 thousand related to capitalised vessel information technology, which was
stopped in view of the new Seabed Geosolutions joint venture. The loss is included in the other expenses.
The purchase of other intangible assets relates to a licence agreement with a third party regarding methods
and control systems for steering of marine seismic streamers. This licence has subsequently transferred to
assets classified as held for sale. The amortisation for the discontinued operations amounts to EUR 6.5 million
(2011: EUR 8.5 million). Refer to note 5.45.
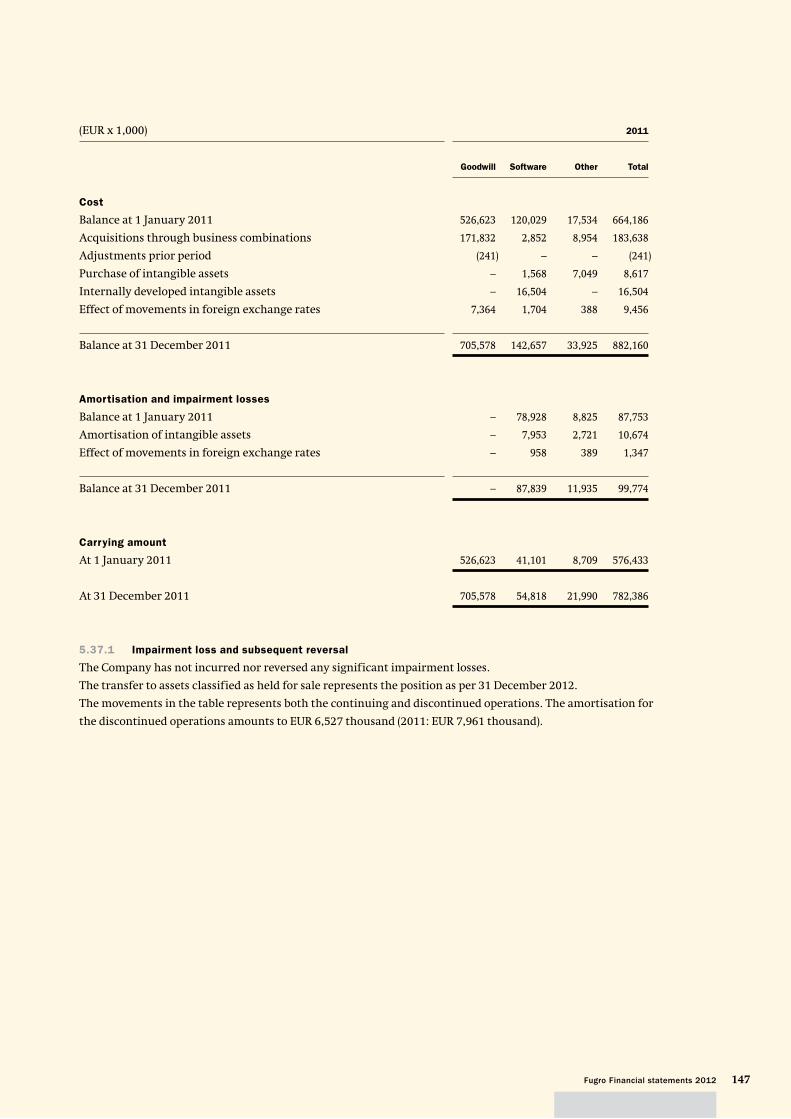
147Fugro Financial statements 2012
(EUR x 1,000) 2011
Goodwill Software Other Total
Cost
Balance at 1 January 2011 526,623 120,029 17,534 664,186
Acquisitions through business combinations 171,832 2,852 8,954 183,638
Adjustments prior period (241) – – (241)
Purchase of intangible assets – 1,568 7,049 8,617
Internally developed intangible assets – 16,504 – 16,504
Effect of movements in foreign exchange rates 7,364 1,704 388 9,456
Balance at 31 December 2011 705,578 142,657 33,925 882,160
Amortisation and impairment losses
Balance at 1 January 2011 – 78,928 8,825 87,753
Amortisation of intangible assets – 7,953 2,721 10,674
Effect of movements in foreign exchange rates – 958 389 1,347
Balance at 31 December 2011 – 87,839 11,935 99,774
Carrying amount
At 1 January 2011 526,623 41,101 8,709 576,433
At 31 December 2011 705,578 54,818 21,990 782,386
5.37.1 Impairment loss and subsequent reversal
The Company has not incurred nor reversed any significant impairment losses.
The transfer to assets classified as held for sale represents the position as per 31 December 2012.
The movements in the table represents both the continuing and discontinued operations. The amortisation for
the discontinued operations amounts to EUR 6,527 thousand (2011: EUR 7,961 thousand).
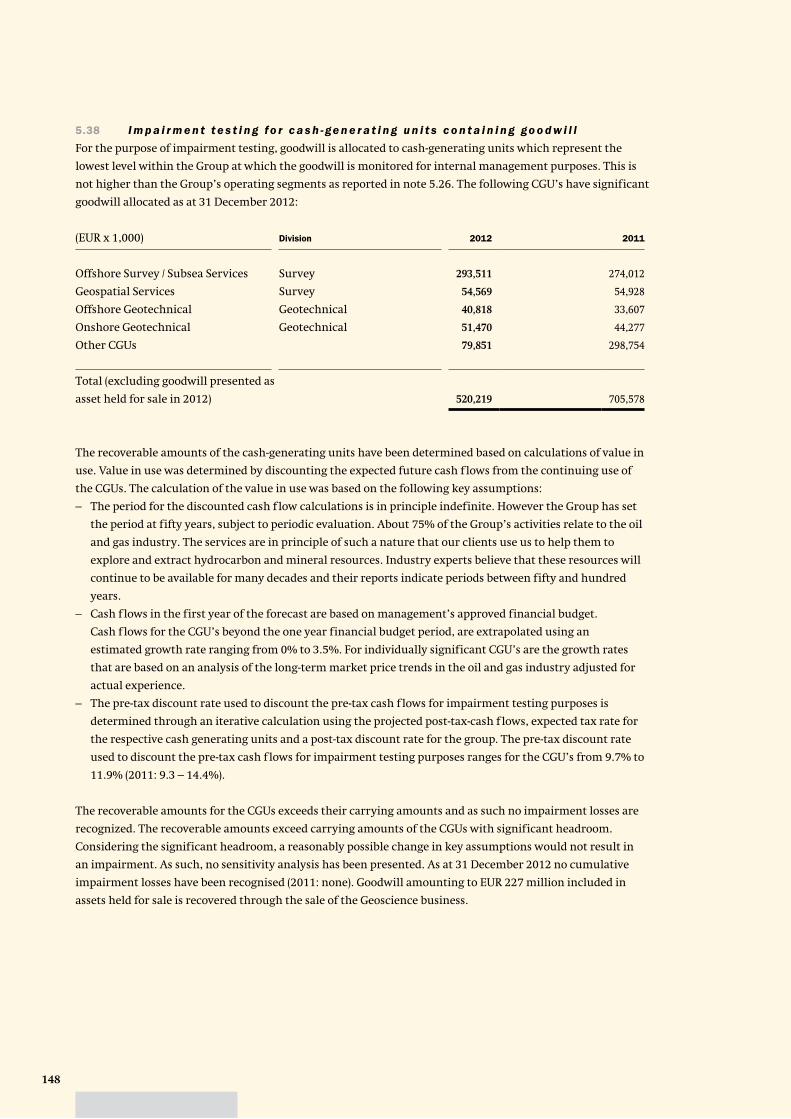
148
5.38 I m p a i r m e n t t e s t i n g fo r c a s h - ge n e r a t i n g u n i t s c o n t a i n i n g go o d w i l l
For the purpose of impairment testing, goodwill is allocated to cash-generating units which represent the
lowest level within the Group at which the goodwill is monitored for internal management purposes. This is
not higher than the Group’s operating segments as reported in note 5.26. The following CGU’s have significant
goodwill allocated as at 31 December 2012:
(EUR x 1,000) Division 2012 2011
Offshore Survey / Subsea Services Survey 293,511 274,012
Geospatial Services Survey 54,569 54,928
Offshore Geotechnical Geotechnical 40,818 33,607
Onshore Geotechnical Geotechnical 51,470 44,277
Other CGUs 79,851 298,754
Total (excluding goodwill presented as
asset held for sale in 2012) 520,219 705,578
The recoverable amounts of the cash-generating units have been determined based on calculations of value in
use. Value in use was determined by discounting the expected future cash f lows from the continuing use of
the CGUs. The calculation of the value in use was based on the following key assumptions:
– The period for the discounted cash f low calculations is in principle indefinite. However the Group has set
the period at fifty years, subject to periodic evaluation. About 75% of the Group’s activities relate to the oil
and gas industry. The services are in principle of such a nature that our clients use us to help them to
explore and extract hydrocarbon and mineral resources. Industry experts believe that these resources will
continue to be available for many decades and their reports indicate periods between fifty and hundred
years.
– Cash f lows in the first year of the forecast are based on management’s approved financial budget.
Cash f lows for the CGU’s beyond the one year financial budget period, are extrapolated using an
estimated growth rate ranging from 0% to 3.5%. For individually significant CGU’s are the growth rates
that are based on an analysis of the long-term market price trends in the oil and gas industry adjusted for
actual experience.
– The pre-tax discount rate used to discount the pre-tax cash f lows for impairment testing purposes is
determined through an iterative calculation using the projected post-tax-cash f lows, expected tax rate for
the respective cash generating units and a post-tax discount rate for the group. The pre-tax discount rate
used to discount the pre-tax cash f lows for impairment testing purposes ranges for the CGU’s from 9.7% to
11.9% (2011: 9.3 – 14.4%).
The recoverable amounts for the CGUs exceeds their carrying amounts and as such no impairment losses are
recognized. The recoverable amounts exceed carrying amounts of the CGUs with significant headroom.
Considering the significant headroom, a reasonably possible change in key assumptions would not result in
an impairment. As such, no sensitivity analysis has been presented. As at 31 December 2012 no cumulative
impairment losses have been recognised (2011: none). Goodwill amounting to EUR 227 million included in
assets held for sale is recovered through the sale of the Geoscience business.
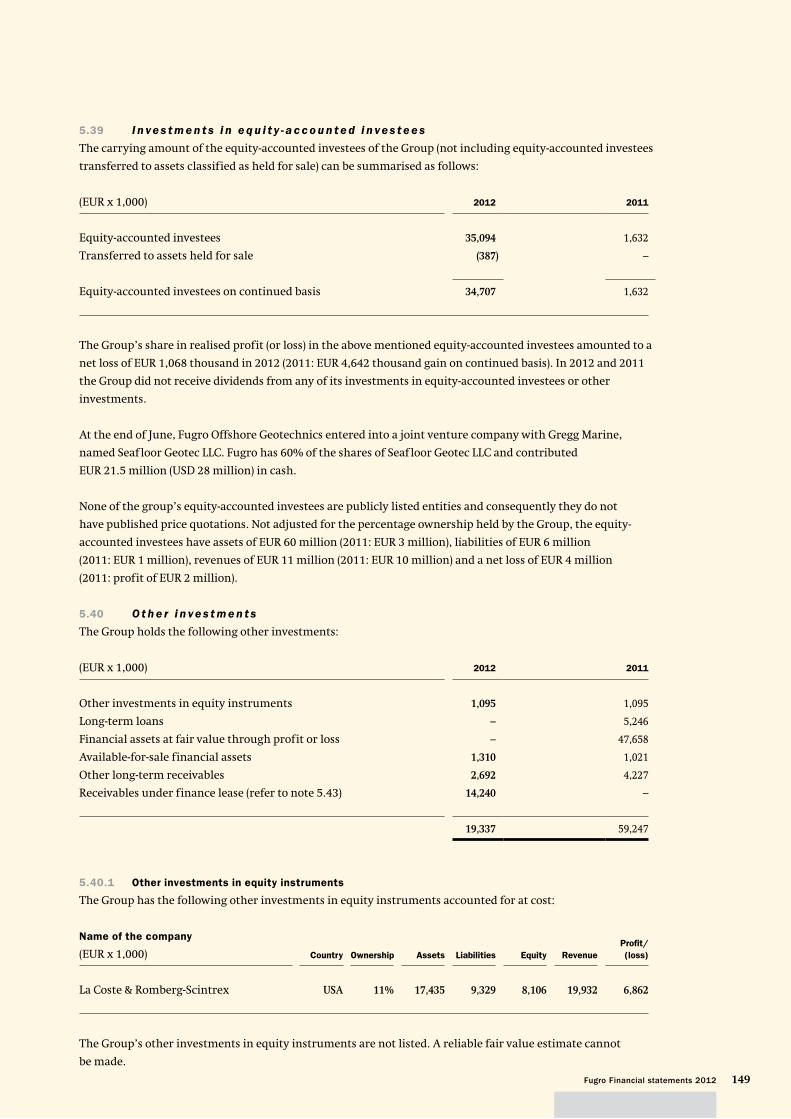
149Fugro Financial statements 2012
5.39 I n ve s t m e n t s i n e q u i t y - a c c o u n t e d i n ve s t e e s
The carrying amount of the equity-accounted investees of the Group (not including equity-accounted investees
transferred to assets classified as held for sale) can be summarised as follows:
(EUR x 1,000) 2012 2011
Equity-accounted investees 35,094 1,632
Transferred to assets held for sale (387) –
Equity-accounted investees on continued basis 34,707 1,632
The Group’s share in realised profit (or loss) in the above mentioned equity-accounted investees amounted to a
net loss of EUR 1,068 thousand in 2012 (2011: EUR 4,642 thousand gain on continued basis). In 2012 and 2011
the Group did not receive dividends from any of its investments in equity-accounted investees or other
investments.
At the end of June, Fugro Offshore Geotechnics entered into a joint venture company with Gregg Marine,
named Seafloor Geotec LLC. Fugro has 60% of the shares of Seafloor Geotec LLC and contributed
EUR 21.5 million (USD 28 million) in cash.
None of the group’s equity-accounted investees are publicly listed entities and consequently they do not
have published price quotations. Not adjusted for the percentage ownership held by the Group, the equity-
accounted investees have assets of EUR 60 million (2011: EUR 3 million), liabilities of EUR 6 million
(2011: EUR 1 million), revenues of EUR 11 million (2011: EUR 10 million) and a net loss of EUR 4 million
(2011: profit of EUR 2 million).
5.40 O t h e r i n ve s t m e n t s
The Group holds the following other investments:
(EUR x 1,000) 2012 2011
Other investments in equity instruments 1,095 1,095
Long-term loans – 5,246
Financial assets at fair value through profit or loss – 47,658
Available-for-sale financial assets 1,310 1,021
Other long-term receivables 2,692 4,227
Receivables under finance lease (refer to note 5.43) 14,240 –
19,337 59,247
5.40.1 Other investments in equity instruments
The Group has the following other investments in equity instruments accounted for at cost:
Name of the company
(EUR x 1,000) Country Ownership Assets Liabilities Equity Revenue
Profi t/
(loss)
La Coste & Romberg-Scintrex USA 11% 17,435 9,329 8,106 19,932 6,862
The Group’s other investments in equity instruments are not listed. A reliable fair value estimate cannot
be made.
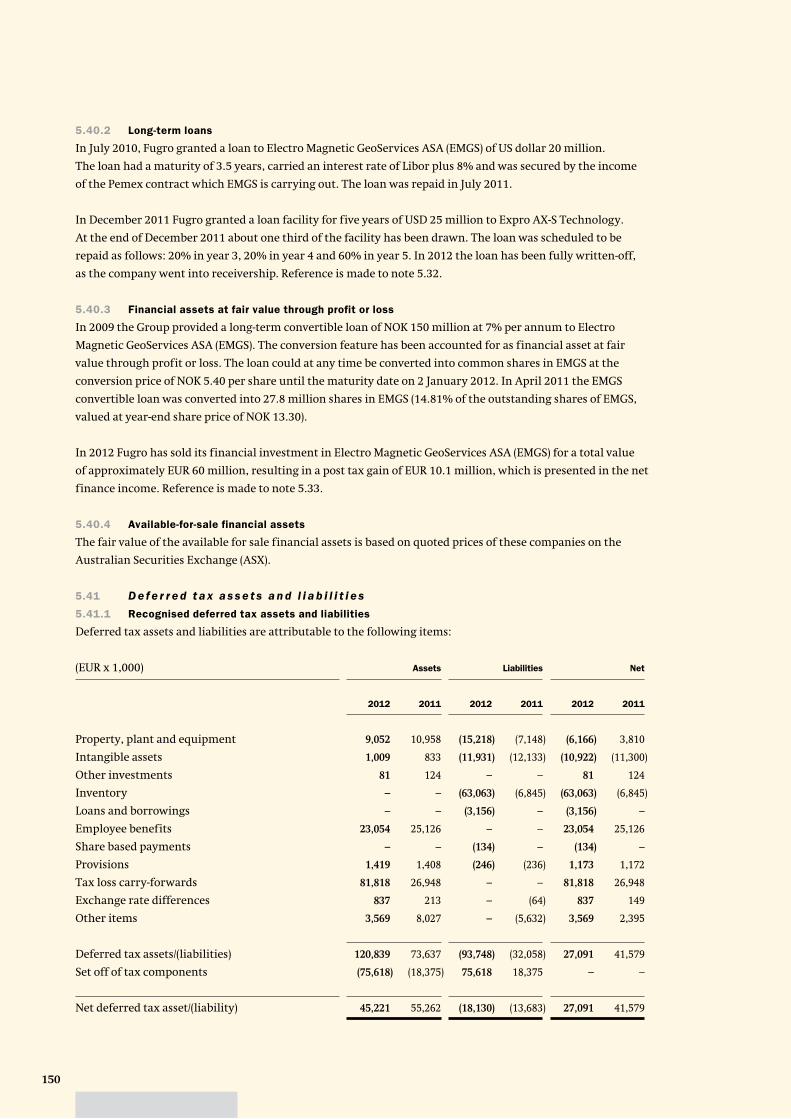
150
5.40.2 Long-term loans
In July 2010, Fugro granted a loan to Electro Magnetic GeoServices ASA (EMGS) of US dollar 20 million.
The loan had a maturity of 3.5 years, carried an interest rate of Libor plus 8% and was secured by the income
of the Pemex contract which EMGS is carrying out. The loan was repaid in July 2011.
In December 2011 Fugro granted a loan facility for five years of USD 25 million to Expro AX-S Technology.
At the end of December 2011 about one third of the facility has been drawn. The loan was scheduled to be
repaid as follows: 20% in year 3, 20% in year 4 and 60% in year 5. In 2012 the loan has been fully written-off,
as the company went into receivership. Reference is made to note 5.32.
5.40.3 Financial assets at fair value through profit or loss
In 2009 the Group provided a long-term convertible loan of NOK 150 million at 7% per annum to Electro
Magnetic GeoServices ASA (EMGS). The conversion feature has been accounted for as financial asset at fair
value through profit or loss. The loan could at any time be converted into common shares in EMGS at the
conversion price of NOK 5.40 per share until the maturity date on 2 January 2012. In April 2011 the EMGS
convertible loan was converted into 27.8 million shares in EMGS (14.81% of the outstanding shares of EMGS,
valued at year-end share price of NOK 13.30).
In 2012 Fugro has sold its financial investment in Electro Magnetic GeoServices ASA (EMGS) for a total value
of approximately EUR 60 million, resulting in a post tax gain of EUR 10.1 million, which is presented in the net
finance income. Reference is made to note 5.33.
5.40.4 Available-for-sale financial assets
The fair value of the available for sale financial assets is based on quoted prices of these companies on the
Australian Securities Exchange (ASX).
5.41 D e f e r r e d t a x a s s e t s a n d l i a b i l i t i e s
5.41.1 Recognised deferred tax assets and liabilities
Deferred tax assets and liabilities are attributable to the following items:
(EUR x 1,000) Assets Liabilities Net
2012 2011 2012 2011 2012 2011
Property, plant and equipment 9,052 10,958 (15,218) (7,148) (6,166) 3,810
Intangible assets 1,009 833 (11,931) (12,133) (10,922) (11,300)
Other investments 81 124 – – 81 124
Inventory – – (63,063) (6,845) (63,063) (6,845)
Loans and borrowings – – (3,156) – (3,156) –
Employee benefits 23,054 25,126 – – 23,054 25,126
Share based payments – – (134) – (134) –
Provisions 1,419 1,408 (246) (236) 1,173 1,172
Tax loss carry-forwards 81,818 26,948 – – 81,818 26,948
Exchange rate differences 837 213 – (64) 837 149
Other items 3,569 8,027 – (5,632) 3,569 2,395
Deferred tax assets/(liabilities) 120,839 73,637 (93,748) (32,058) 27,091 41,579
Set off of tax components (75,618) (18,375) 75,618 18,375 – –
Net deferred tax asset/(liability) 45,221 55,262 (18,130) (13,683) 27,091 41,579
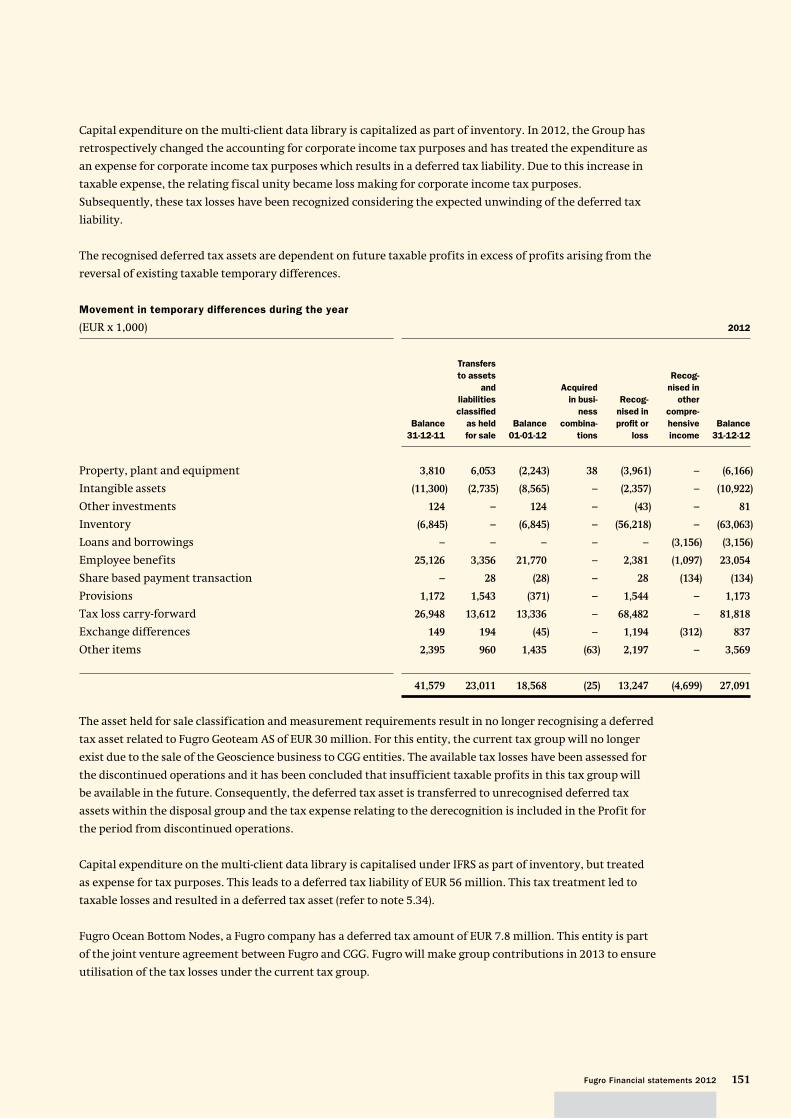
151Fugro Financial statements 2012
Capital expenditure on the multi-client data library is capitalized as part of inventory. In 2012, the Group has
retrospectively changed the accounting for corporate income tax purposes and has treated the expenditure as
an expense for corporate income tax purposes which results in a deferred tax liability. Due to this increase in
taxable expense, the relating fiscal unity became loss making for corporate income tax purposes.
Subsequently, these tax losses have been recognized considering the expected unwinding of the deferred tax
liability.
The recognised deferred tax assets are dependent on future taxable profits in excess of profits arising from the
reversal of existing taxable temporary differences.
Movement in temporary differences during the year
(EUR x 1,000) 2012
Balance
31-12-11
Transfers
to assets
and
liabilities
classifi ed
as held
for sale
Balance
01-01-12
Acquired
in busi-
ness
combina-
tions
Recog-
nised in
profi t or
loss
Recog-
nised in
other
compre-
hensive
income
Balance
31-12-12
Property, plant and equipment 3,810 6,053 (2,243) 38 (3,961) – (6,166)
Intangible assets (11,300) (2,735) (8,565) – (2,357) – (10,922)
Other investments 124 – 124 – (43) – 81
Inventory (6,845) – (6,845) – (56,218) – (63,063)
Loans and borrowings – – – – – (3,156) (3,156)
Employee benefits 25,126 3,356 21,770 – 2,381 (1,097) 23,054
Share based payment transaction – 28 (28) – 28 (134) (134)
Provisions 1,172 1,543 (371) – 1,544 – 1,173
Tax loss carry-forward 26,948 13,612 13,336 – 68,482 – 81,818
Exchange differences 149 194 (45) – 1,194 (312) 837
Other items 2,395 960 1,435 (63) 2,197 – 3,569
41,579 23,011 18,568 (25) 13,247 (4,699) 27,091
The asset held for sale classification and measurement requirements result in no longer recognising a deferred
tax asset related to Fugro Geoteam AS of EUR 30 million. For this entity, the current tax group will no longer
exist due to the sale of the Geoscience business to CGG entities. The available tax losses have been assessed for
the discontinued operations and it has been concluded that insufficient taxable profits in this tax group will
be available in the future. Consequently, the deferred tax asset is transferred to unrecognised deferred tax
assets within the disposal group and the tax expense relating to the derecognition is included in the Profit for
the period from discontinued operations.
Capital expenditure on the multi-client data library is capitalised under IFRS as part of inventory, but treated
as expense for tax purposes. This leads to a deferred tax liability of EUR 56 million. This tax treatment led to
taxable losses and resulted in a deferred tax asset (refer to note 5.34).
Fugro Ocean Bottom Nodes, a Fugro company has a deferred tax amount of EUR 7.8 million. This entity is part
of the joint venture agreement between Fugro and CGG. Fugro will make group contributions in 2013 to ensure
utilisation of the tax losses under the current tax group.
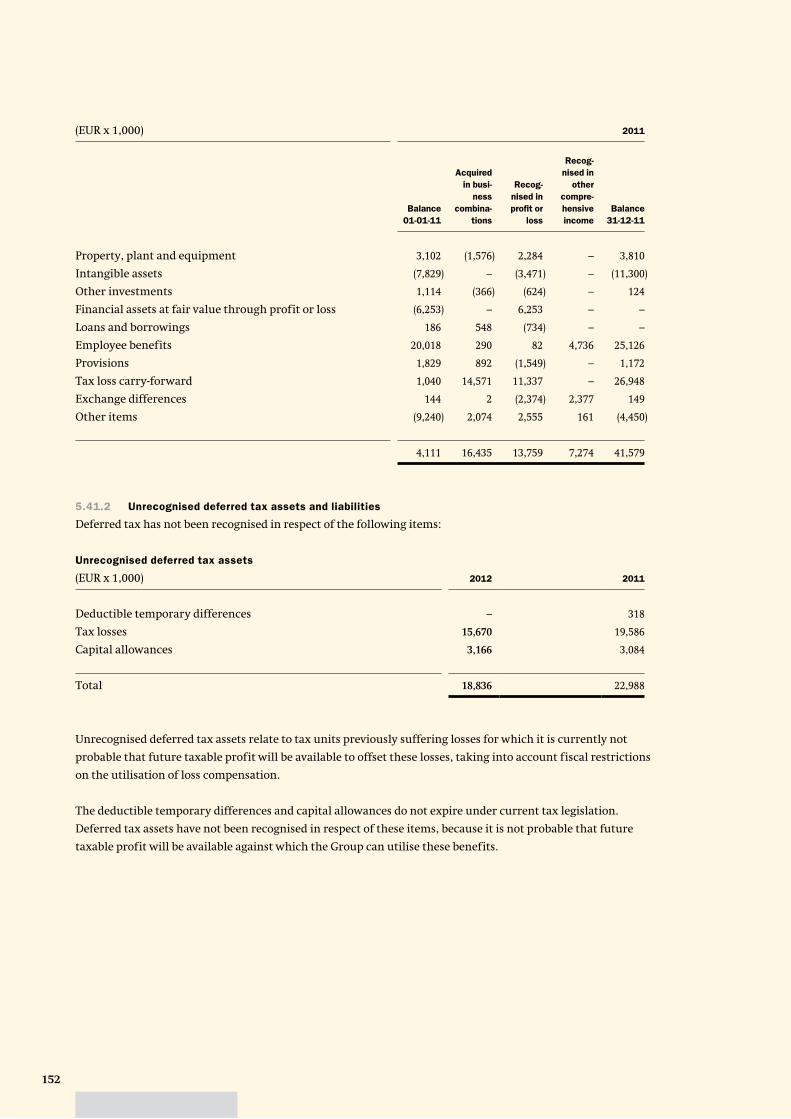
152
(EUR x 1,000) 2011
Balance
01-01-11
Acquired
in busi-
ness
combina-
tions
Recog-
nised in
profi t or
loss
Recog-
nised in
other
compre-
hensive
income
Balance
31-12-11
Property, plant and equipment 3,102 (1,576) 2,284 – 3,810
Intangible assets (7,829) – (3,471) – (11,300)
Other investments 1,114 (366) (624) – 124
Financial assets at fair value through profit or loss (6,253) – 6,253 – –
Loans and borrowings 186 548 (734) – –
Employee benefits 20,018 290 82 4,736 25,126
Provisions 1,829 892 (1,549) – 1,172
Tax loss carry-forward 1,040 14,571 11,337 – 26,948
Exchange differences 144 2 (2,374) 2,377 149
Other items (9,240) 2,074 2,555 161 (4,450)
4,111 16,435 13,759 7,274 41,579
5.41.2 Unrecognised deferred tax assets and liabilities
Deferred tax has not been recognised in respect of the following items:
Unrecognised deferred tax assets
(EUR x 1,000) 2012 2011
Deductible temporary differences – 318
Tax losses 15,670 19,586
Capital allowances 3,166 3,084
Total 18,836 22,988
Unrecognised deferred tax assets relate to tax units previously suffering losses for which it is currently not
probable that future taxable profit will be available to offset these losses, taking into account fiscal restrictions
on the utilisation of loss compensation.
The deductible temporary differences and capital allowances do not expire under current tax legislation.
Deferred tax assets have not been recognised in respect of these items, because it is not probable that future
taxable profit will be available against which the Group can utilise these benefits.
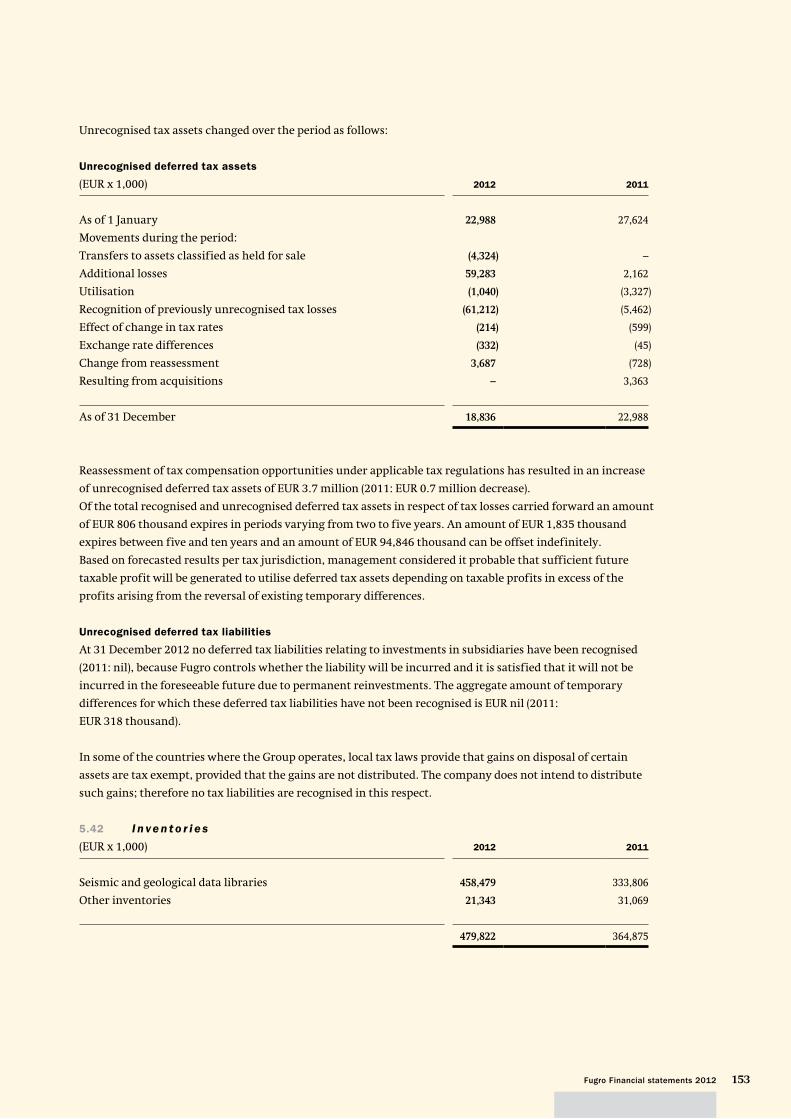
153Fugro Financial statements 2012
Unrecognised tax assets changed over the period as follows:
Unrecognised deferred tax assets
(EUR x 1,000) 2012 2011
As of 1 January 22,988 27,624
Movements during the period:
Transfers to assets classified as held for sale (4,324) –
Additional losses 59,283 2,162
Utilisation (1,040) (3,327)
Recognition of previously unrecognised tax losses (61,212) (5,462)
Effect of change in tax rates (214) (599)
Exchange rate differences (332) (45)
Change from reassessment 3,687 (728)
Resulting from acquisitions – 3,363
As of 31 December 18,836 22,988
Reassessment of tax compensation opportunities under applicable tax regulations has resulted in an increase
of unrecognised deferred tax assets of EUR 3.7 million (2011: EUR 0.7 million decrease).
Of the total recognised and unrecognised deferred tax assets in respect of tax losses carried forward an amount
of EUR 806 thousand expires in periods varying from two to five years. An amount of EUR 1,835 thousand
expires between five and ten years and an amount of EUR 94,846 thousand can be offset indefinitely.
Based on forecasted results per tax jurisdiction, management considered it probable that sufficient future
taxable profit will be generated to utilise deferred tax assets depending on taxable profits in excess of the
profits arising from the reversal of existing temporary differences.
Unrecognised deferred tax liabilities
At 31 December 2012 no deferred tax liabilities relating to investments in subsidiaries have been recognised
(2011: nil), because Fugro controls whether the liability will be incurred and it is satisfied that it will not be
incurred in the foreseeable future due to permanent reinvestments. The aggregate amount of temporary
differences for which these deferred tax liabilities have not been recognised is EUR nil (2011:
EUR 318 thousand).
In some of the countries where the Group operates, local tax laws provide that gains on disposal of certain
assets are tax exempt, provided that the gains are not distributed. The company does not intend to distribute
such gains; therefore no tax liabilities are recognised in this respect.
5.42 I n ve n t o r i e s
(EUR x 1,000) 2012 2011
Seismic and geological data libraries 458,479 333,806
Other inventories 21,343 31,069
479,822 364,875
154
Seismic and geological data libraries
The marine streamer seismic data libraries were not part of the sale of the majority of the Geoscience activities
to CGG. Fugro has retained ownership of the existing marine streamer seismic data libraries.
The carrying value of these seismic libraries as at 31 December 2012 amounts to EUR 458.5 million
(31 December 2011: EUR 333.8 million).
Seismic and geological data libraries are stated at the lower cost and net realisable value. The net realisable
value analysis in 2012 libraries led to a write down of EUR 13 million (2011: EUR nil), partly caused by the
decision not to further source projects following the transaction with CGG.
The carrying value consists of 2-D and 3-D data sets. 3-D data sets constitute more than 80% of the carrying
value of the data libraries as at 31 December 2012. Some 90% of the carrying value relates to 3-D data which
were acquired and processed after 2009. No data acquired during or before 2009 is significantly valued on the
balance sheet as at 31 December 2012.
The geographical split of the carrying value of the data libraries as at 31 December 2012 is as follows:
– Norway: 31%
– Australia: 47%
– Rest of the world: 22%
The seismic data libraries are stated at the lower of cost and net realisable value. In order to determine net
realisable value Fugro uses a model that includes amortisation to approximate net realisable value, including:
– straight line amortisation (3 years for 2-D data sets, for 3-D data sets a minimum annual reduction of 20% of
the carrying value commencing after the ready for sale date
– sales related amortisation (75% for 2-D data sets, 33%-90% for 3-D data sets), and
– impairment (when, after applying the above amortisations, the net realisable value determined using a
discounted cash f low model exceeds the carrying value).
For the 3-D data libraries capitalised as at 31 December 2012, the estimated sales related amortisation in case
of a sale is set to between 75% and 90% Combined with the 10% sales commission that has to be paid to CGG
under the non-exclusive sales and marketing agreement, the expected net contribution to Profit for the period
relating to these 3-D data sets is expected to be limited in the near future.
The determination of net realisable value requires significant judgment and is based on expected sales cash
f lows. Management first assesses whether write offs to net realisable value for individual libraries are needed
based on specific circumstances. Then management assesses write offs of data libraries by reference in groups
of libraries with similar characteristics, with respect to amongst others 2-D versus 3-D, customers and
geographical area. The group uses sales estimates that are based on the budget plan for next year, sales
prospects and an outlook for the seismic industry.
In 2012, the company wrote off 3 small uncompleted projects in Norway for EUR 7 million as these are not
expected to be completed following the CGG transaction. In addition the company reassessed the key cost base
elements of the data sets in the library, leading to an adjustment of EUR 13 million (refer to above). No further
adjustments followed from the net realisable value assessment.
During 2012 Fugro generated EUR 235 million (2011: EUR 156 million) sales from the seismic libraries.
Total straight line amortisation and additional sales related amortisation amounted to EUR 143 million
(2011: EUR 69 million) and was charged to the income statement as third party costs.
155Fugro Financial statements 2012
The key assumptions for net realisable value include:
– estimated sales cash f lows by significant library and grouping thereof;
– a sales cash f low growth percentage of 3% per year;
– up to a 10-year period in which the data is expected to be marketed; and
– discount rate of 9.5%.
An increase of the discount rate with 1 percent point to 10.5% or decrease of the expected sales cash f lows by
1 percent point to 2% does not result in an impairment. Changes in assumptions, in particular the expected
sales cash f lows, could significantly affect the net realisable value and result in a write-off of the carrying value
of the data libraries. Management currently expects that on average between 4-5 years of sales are needed to
recover the carrying value of the data libraries as at 31 December 2012. Management has also recognised that
the 3-D marine streamer seismic data library in Australia needs to be watched carefully as in the next 1-2 years
there may be a slow down in exploration activity in the area where the Australian 3-D data library is
positioned.
Other inventories
In December 2012 EUR 25,089 thousand (2011: EUR 24,135 thousand) of other inventories was recognised as an
expense and EUR 174 thousand (2011: EUR 277 thousand) was written down. The write down is included in
third party costs.
5.43 Tr a d e a n d o t h e r r e c e i va b l e s
(EUR x 1,000) 2012 2011
Unbilled revenue on completed projects 219,412 221,550
Trade receivables 516,744 494,058
Non-trade receivables 97,278 168,942
Receivables under finance lease 4,211 –
837,645 884,550
Unbilled revenue on completed projects includes aggregated costs and recognised profits, net of recognised
losses for all contracts in progress for which this amount exceeds progress billings. At 31 December 2012 trade
receivables include retentions of EUR 7.0 million (2011: EUR 8.6 million) relating to completed projects.
Trade receivables are shown net of impairment losses amounting to EUR 34.7 million (2011: EUR 30.2 million)
arising from identified doubtful receivables from customers. Trade receivables were impaired taking into
account the financial position of the debtors, the days outstanding and expected outcome of negotiations and
legal proceedings against debtors. Unbilled revenue on completed projects does not include impairment losses
(2011: nil). Non-trade receivables include among others pre-payments and VAT receivables.
156
On 31 December 2012, the Group entered into a 5 years lease agreement which transfers the risks incidental to
ownership of the Geo Pacific to a third party. This agreement classifies as a finance lease. Management has
determined the future minimum lease payments under the contract as follows:
(EUR x 1,000) 2012
Total future
payments Dis counted
Unearned
interest income
Not later than one year 4,350 4,211 139
Between one and five years 17,463 14,240 3,223
Total 21,813 18,451 3,362
The implicit rate used in calculating the present value of the future minimum lease payments amounts to 6%.
Reference is made to note 5.53 and 5.55 for detailed information on the credit and currency risks,
and impairment losses related to trade receivables.
5.44 C a s h a n d c a s h e q u i va l e n t s
(EUR x 1,000) 2012 2011
Cash and cash equivalents 92,019 170,384
Bank overdraft (221,923) (167,810)
Cash and cash equivalents in the consolidated statement of cash f lows (129,904) 2,574
157Fugro Financial statements 2012
5.45 A s s e t s a n d l i a b i l i t i e s c l a s s i f i e d a s h e l d fo r s a l e a n d d i s c o n t i n u e d
o p e r a t i o n s
The Company’s divestment of a large part of its Geoscience business as described in Note 5.3.6 has been
classified as held for sale and a discontinued operation upon meeting IFRS 5 criteria for classification of assets
held for sale on 4 September 2012. The sale of this division, excluding the multiclient library and Ocean
Bottom Nodes business, to CGG has been finalised on 28 January 2013 and has been effected on 31 January
2013.
At 31 December 2012, the assets and liabilities comprising the disposal group classified as held for sale
are as follows:
(EUR x 1,000) 2012
Assets classified as held for sale
Property, plant and equipment 467,182
Intangible assets 348,438
Investments in equity accounted investees 387
Other investments 1,006
Deferred tax assets 13,560
Inventories 15,691
Trade and other receivables 140,452
Current tax assets 11,297
Cash and cash equivalents 13,857
Total assets classified as held for sale 1,011,870
(EUR x 1,000) 2012
Liabilities classified as held for sale
Loans and borrowings 2,117
Employee benefits 10,026
Deferred tax liabilities 6,741
Bank overdraft 44,991
Interest-bearing loans and borrowings 485
Trade and other payables 118,662
Other taxes and social security charges 8,711
Current tax liabilities 9,798
Total liabilities classified as held for sale 201,531
As from 4 September 2012 the Geoscience activities are classified as assets held for sale. As from this moment
depreciation of property, plant and equipment and intangible assets ceased, which has an effect after tax
of EUR 31 million (positive) on profit for the period. The intangible assets include an amount of EUR 227
million of goodwill, which relates to the disposal group.
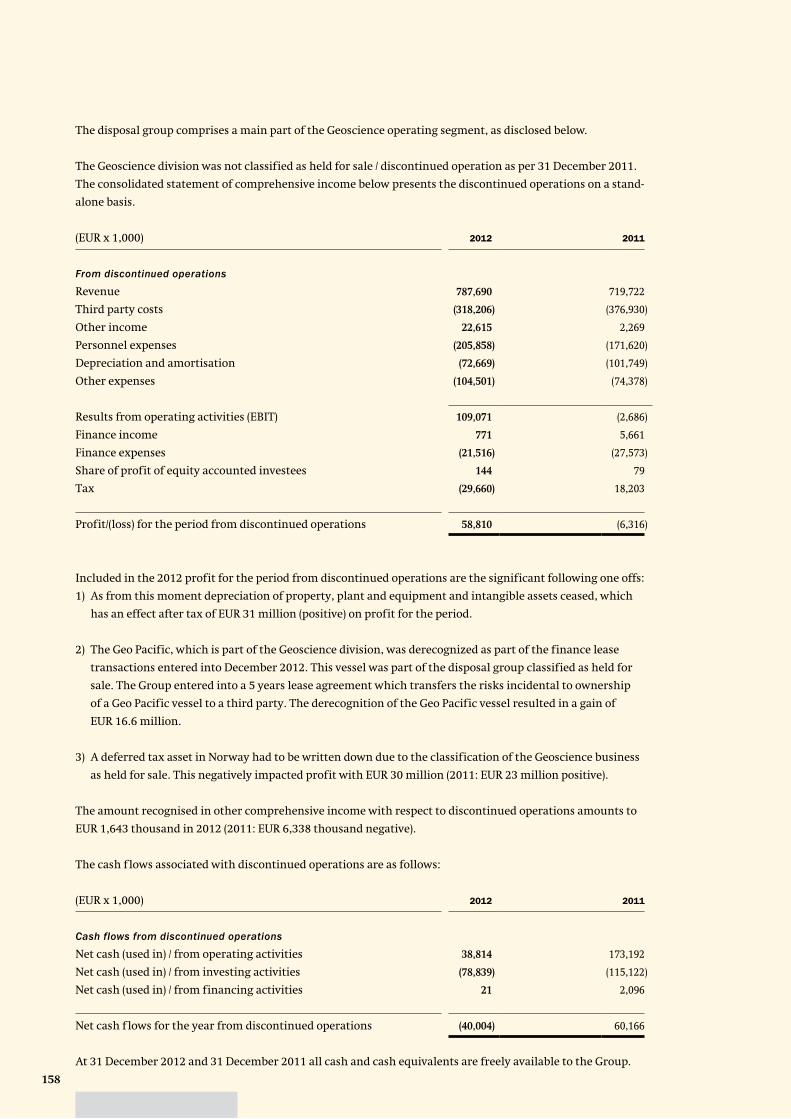
158
The disposal group comprises a main part of the Geoscience operating segment, as disclosed below.
The Geoscience division was not classified as held for sale / discontinued operation as per 31 December 2011.
The consolidated statement of comprehensive income below presents the discontinued operations on a stand-
alone basis.
(EUR x 1,000) 2012 2011
From discontinued operations
Revenue 787,690 719,722
Third party costs (318,206) (376,930)
Other income 22,615 2,269
Personnel expenses (205,858) (171,620)
Depreciation and amortisation (72,669) (101,749)
Other expenses (104,501) (74,378)
Results from operating activities (EBIT) 109,071 (2,686)
Finance income 771 5,661
Finance expenses (21,516) (27,573)
Share of profit of equity accounted investees 144 79
Tax (29,660) 18,203
Profit/(loss) for the period from discontinued operations 58,810 (6,316)
Included in the 2012 profit for the period from discontinued operations are the significant following one offs:
1) As from this moment depreciation of property, plant and equipment and intangible assets ceased, which
has an effect after tax of EUR 31 million (positive) on profit for the period.
2) The Geo Pacific, which is part of the Geoscience division, was derecognized as part of the finance lease
transactions entered into December 2012. This vessel was part of the disposal group classified as held for
sale. The Group entered into a 5 years lease agreement which transfers the risks incidental to ownership
of a Geo Pacific vessel to a third party. The derecognition of the Geo Pacific vessel resulted in a gain of
EUR 16.6 million.
3) A deferred tax asset in Norway had to be written down due to the classification of the Geoscience business
as held for sale. This negatively impacted profit with EUR 30 million (2011: EUR 23 million positive).
The amount recognised in other comprehensive income with respect to discontinued operations amounts to
EUR 1,643 thousand in 2012 (2011: EUR 6,338 thousand negative).
The cash f lows associated with discontinued operations are as follows:
(EUR x 1,000) 2012 2011
Cash flows from discontinued operations
Net cash (used in) / from operating activities 38,814 173,192
Net cash (used in) / from investing activities (78,839) (115,122)
Net cash (used in) / from financing activities 21 2,096
Net cash f lows for the year from discontinued operations (40,004) 60,166
At 31 December 2012 and 31 December 2011 all cash and cash equivalents are freely available to the Group.
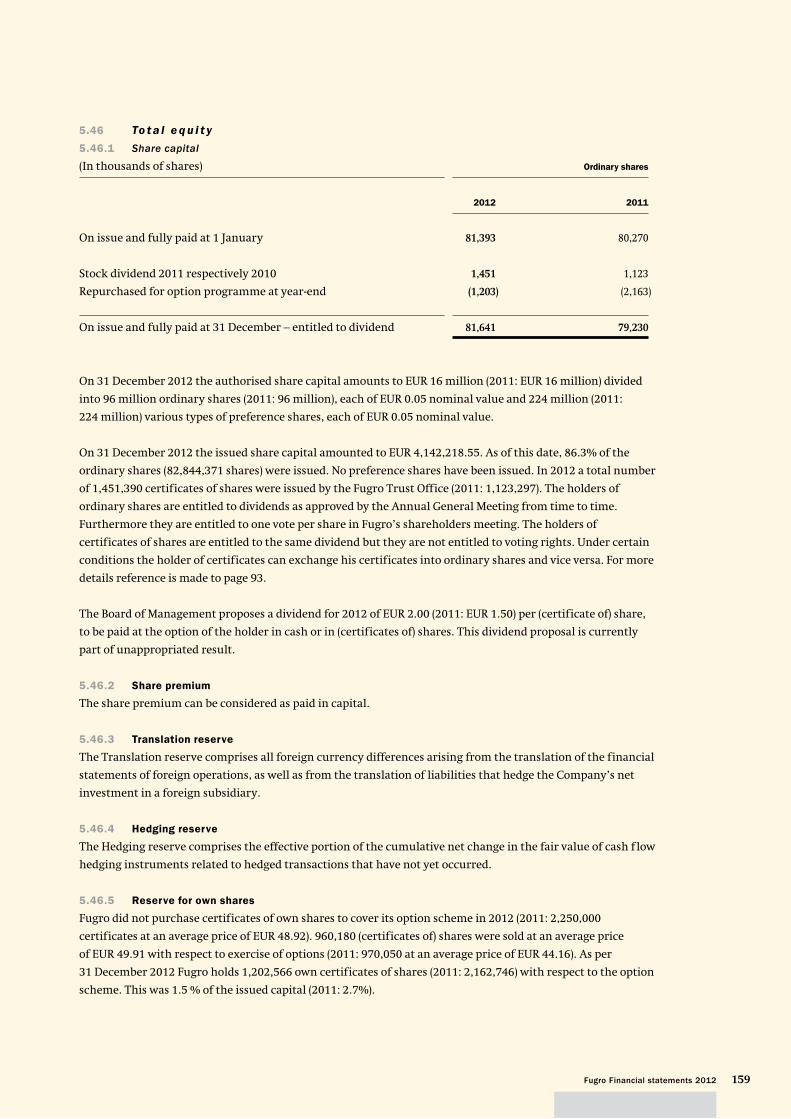
159Fugro Financial statements 2012
5.46 To t a l e q u i t y
5.46.1 Share capital
(In thousands of shares) Ordinary shares
2012 2011
On issue and fully paid at 1 January 81,393 80,270
Stock dividend 2011 respectively 2010 1,451 1,123
Repurchased for option programme at year-end (1,203) (2,163)
On issue and fully paid at 31 December – entitled to dividend 81,641 79,230
On 31 December 2012 the authorised share capital amounts to EUR 16 million (2011: EUR 16 million) divided
into 96 million ordinary shares (2011: 96 million), each of EUR 0.05 nominal value and 224 million (2011:
224 million) various types of preference shares, each of EUR 0.05 nominal value.
On 31 December 2012 the issued share capital amounted to EUR 4,142,218.55. As of this date, 86.3% of the
ordinary shares (82,844,371 shares) were issued. No preference shares have been issued. In 2012 a total number
of 1,451,390 certificates of shares were issued by the Fugro Trust Office (2011: 1,123,297). The holders of
ordinary shares are entitled to dividends as approved by the Annual General Meeting from time to time.
Furthermore they are entitled to one vote per share in Fugro’s shareholders meeting. The holders of
certificates of shares are entitled to the same dividend but they are not entitled to voting rights. Under certain
conditions the holder of certificates can exchange his certificates into ordinary shares and vice versa. For more
details reference is made to page 93.
The Board of Management proposes a dividend for 2012 of EUR 2.00 (2011: EUR 1.50) per (certificate of) share,
to be paid at the option of the holder in cash or in (certificates of) shares. This dividend proposal is currently
part of unappropriated result.
5.46.2 Share premium
The share premium can be considered as paid in capital.
5.46.3 Translation reserve
The Translation reserve comprises all foreign currency differences arising from the translation of the financial
statements of foreign operations, as well as from the translation of liabilities that hedge the Company’s net
investment in a foreign subsidiary.
5.46.4 Hedging reserve
The Hedging reserve comprises the effective portion of the cumulative net change in the fair value of cash f low
hedging instruments related to hedged transactions that have not yet occurred.
5.46.5 Reserve for own shares
Fugro did not purchase certificates of own shares to cover its option scheme in 2012 (2011: 2,250,000
certificates at an average price of EUR 48.92). 960,180 (certificates of) shares were sold at an average price
of EUR 49.91 with respect to exercise of options (2011: 970,050 at an average price of EUR 44.16). As per
31 December 2012 Fugro holds 1,202,566 own certificates of shares (2011: 2,162,746) with respect to the option
scheme. This was 1.5 % of the issued capital (2011: 2.7%).
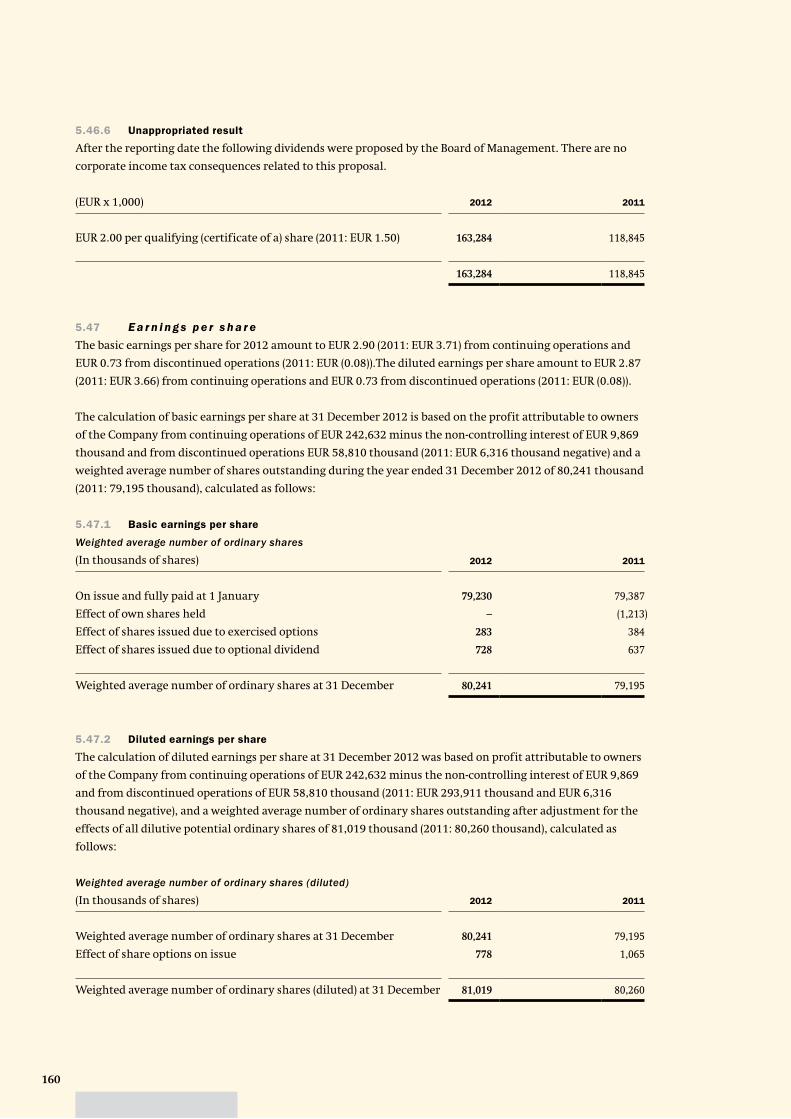
160
5.46.6 Unappropriated result
After the reporting date the following dividends were proposed by the Board of Management. There are no
corporate income tax consequences related to this proposal.
(EUR x 1,000) 2012 2011
EUR 2.00 per qualifying (certificate of a) share (2011: EUR 1.50) 163,284 118,845
163,284 118,845
5.47 E a r n i n g s p e r s h a r e
The basic earnings per share for 2012 amount to EUR 2.90 (2011: EUR 3.71) from continuing operations and
EUR 0.73 from discontinued operations (2011: EUR (0.08)).The diluted earnings per share amount to EUR 2.87
(2011: EUR 3.66) from continuing operations and EUR 0.73 from discontinued operations (2011: EUR (0.08)).
The calculation of basic earnings per share at 31 December 2012 is based on the profit attributable to owners
of the Company from continuing operations of EUR 242,632 minus the non-controlling interest of EUR 9,869
thousand and from discontinued operations EUR 58,810 thousand (2011: EUR 6,316 thousand negative) and a
weighted average number of shares outstanding during the year ended 31 December 2012 of 80,241 thousand
(2011: 79,195 thousand), calculated as follows:
5.47.1 Basic earnings per share
Weighted average number of ordinary shares
(In thousands of shares) 2012 2011
On issue and fully paid at 1 January 79,230 79,387
Effect of own shares held – (1,213)
Effect of shares issued due to exercised options 283 384
Effect of shares issued due to optional dividend 728 637
Weighted average number of ordinary shares at 31 December 80,241 79,195
5.47.2 Diluted earnings per share
The calculation of diluted earnings per share at 31 December 2012 was based on profit attributable to owners
of the Company from continuing operations of EUR 242,632 minus the non-controlling interest of EUR 9,869
and from discontinued operations of EUR 58,810 thousand (2011: EUR 293,911 thousand and EUR 6,316
thousand negative), and a weighted average number of ordinary shares outstanding after adjustment for the
effects of all dilutive potential ordinary shares of 81,019 thousand (2011: 80,260 thousand), calculated as
follows:
Weighted average number of ordinary shares (diluted)
(In thousands of shares) 2012 2011
Weighted average number of ordinary shares at 31 December 80,241 79,195
Effect of share options on issue 778 1,065
Weighted average number of ordinary shares (diluted) at 31 December 81,019 80,260
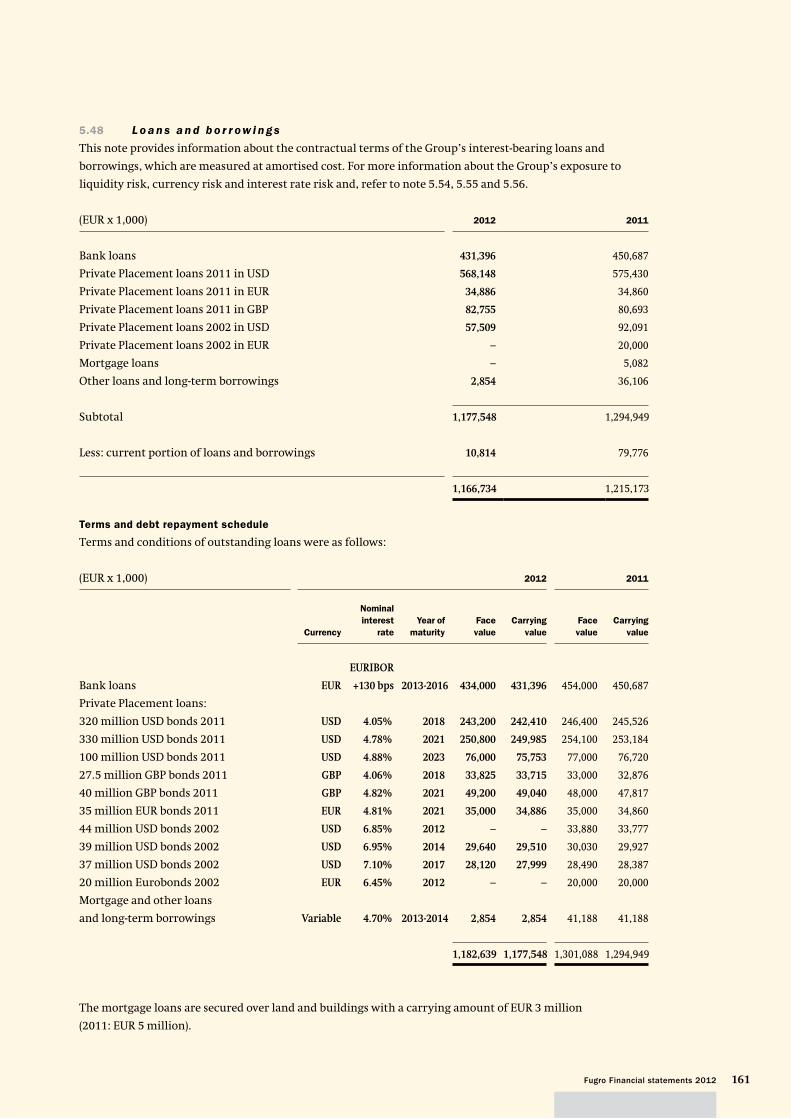
161Fugro Financial statements 2012
5.48 L o a n s a n d b o r r ow i n g s
This note provides information about the contractual terms of the Group’s interest-bearing loans and
borrowings, which are measured at amortised cost. For more information about the Group’s exposure to
liquidity risk, currency risk and interest rate risk and, refer to note 5.54, 5.55 and 5.56.
(EUR x 1,000) 2012 2011
Bank loans 431,396 450,687
Private Placement loans 2011 in USD 568,148 575,430
Private Placement loans 2011 in EUR 34,886 34,860
Private Placement loans 2011 in GBP 82,755 80,693
Private Placement loans 2002 in USD 57,509 92,091
Private Placement loans 2002 in EUR – 20,000
Mortgage loans – 5,082
Other loans and long-term borrowings 2,854 36,106
Subtotal 1,177,548 1,294,949
Less: current portion of loans and borrowings 10,814 79,776
1,166,734 1,215,173
Terms and debt repayment schedule
Terms and conditions of outstanding loans were as follows:
(EUR x 1,000) 2012 2011
Currency
Nominal
interest
rate
Year of
maturity
Face
value
Carrying
value
Face
value
Carrying
value
Bank loans EUR
EURI BOR
+130 bps 2013-2016 434,000 431,396 454,000 450,687
Private Placement loans:
320 million USD bonds 2011 USD 4.05% 2018 243,200 242,410 246,400 245,526
330 million USD bonds 2011 USD 4.78% 2021 250,800 249,985 254,100 253,184
100 million USD bonds 2011 USD 4.88% 2023 76,000 75,753 77,000 76,720
27.5 million GBP bonds 2011 GBP 4.06% 2018 33,825 33,715 33,000 32,876
40 million GBP bonds 2011 GBP 4.82% 2021 49,200 49,040 48,000 47,817
35 million EUR bonds 2011 EUR 4.81% 2021 35,000 34,886 35,000 34,860
44 million USD bonds 2002 USD 6.85% 2012 – – 33,880 33,777
39 million USD bonds 2002 USD 6.95% 2014 29,640 29,510 30,030 29,927
37 million USD bonds 2002 USD 7.10% 2017 28,120 27,999 28,490 28,387
20 million Eurobonds 2002 EUR 6.45% 2012 – – 20,000 20,000
Mortgage and other loans
and long-term borrowings Variable 4.70% 2013-2014 2,854 2,854 41,188 41,188
1,182,639 1,177,548 1,301,088 1,294,949
The mortgage loans are secured over land and buildings with a carrying amount of EUR 3 million
(2011: EUR 5 million).
162
5.48.1 Bank loans
In 2008 agreement was reached with Rabobank for a revolving facility of EUR 100 million, maturing in 2013.
The Rabobank facility is repaid in quarterly instalments of EUR 5 million. Outstanding amount is
EUR 10 million as at 31 December 2012.
In November 2011 Fugro signed agreements with eight banks for committed multicurrency revolving facilities
with a maturity of five years. The total amount of these bilateral agreements with the banks is
EUR 775 million. Rabobank and ING Bank N.V. provided EUR 150 million each, The Royal Bank of Scotland N.V.,
BNP Paribas S.A. and HSBC Bank Plc. provided each EUR 100 million, Barclays Bank Plc. provided
EUR 75 million, ABN AMRO Bank N.V. and Credit Suisse AG provided EUR 50 million each.
The interest of the bank loans under the multicurrency revolving facilities is LIBOR, or in relation to any
EUR loan EURIBOR, plus a margin based on Debt/ EBITDA margin at each completed half year. The average
interest rate of the facilities is currently EURIBOR plus 130 base points. At 31 December 2012 a total amount
of EUR 424 million of the new facilities was in use (55%), the loans were all drawn in euro.
5.48.2 Private Placement loans
In May 2002 long-term loans were concluded with twenty American and two British institutional investors.
As per 8 May 2007 the Group terminated a Cross Currency Swap (foreign exchange contract related to the
US Dollar exposure of the loans). The cumulative exchange differences as per termination date have been
added to equity (Hedging reserve) and are being charged to profit or loss during the remaining term of the
loan. This resulted during 2012 in a cost of EUR 1,031 thousand (2011: EUR 1,388 thousand).
In August 2011 long-term loans were concluded with twenty-five American and two British institutional
investors for a total amount equivalent to USD 909 million, with maturities of 7, 10 and 12 years and fixed
interest rates.
At reporting date all the Private Placement loans are valued at the closing rate. The currency exchange
difference on the loans between the initial exchange rate and the exchange rate at the reporting date is
accounted for in the Translation reserve. For the year under review the currency exchange differences on
the Private Placement loans amount to EUR 6,235 thousand positive (2011: EUR 58,950 thousand negative).
5.48.3 Covenant requirements
Both the committed multicurrency revolving facilities as well as the Private Placement loans contain covenant
requirements which can be summarised as follows:
– Equity > EUR 200 million (only applicable to Private Placement loans 2002)
– Consolidated EBITDA plus Operating Lease Expense/ Consolidated Interest Expense plus Operating Lease
Expense > 2.5
– Consolidated Net Financial Indebtedness/Consolidated EBITDA < 3.0
– Solvency: Consolidated Net Worth/Balance sheet total > 1.0: 3.0
– Consolidated Financial Indebtedness of the Subsidiaries < 15%, for the Private Placement loans and
< 20% for the bank loans, of the consolidated balance sheet total
– Fugro declared dividend < 60% of the profits of the Group for such financial year (only applicable to Private
Placement loans 2011). As can be concluded from the table below, at the twelve month rolling forward
measurement dates in 2012 and 2011, Fugro complied with the above conditions.
– The sale of the Geoscience activities does not trigger repayment and/or default conditions included in the
agreements.
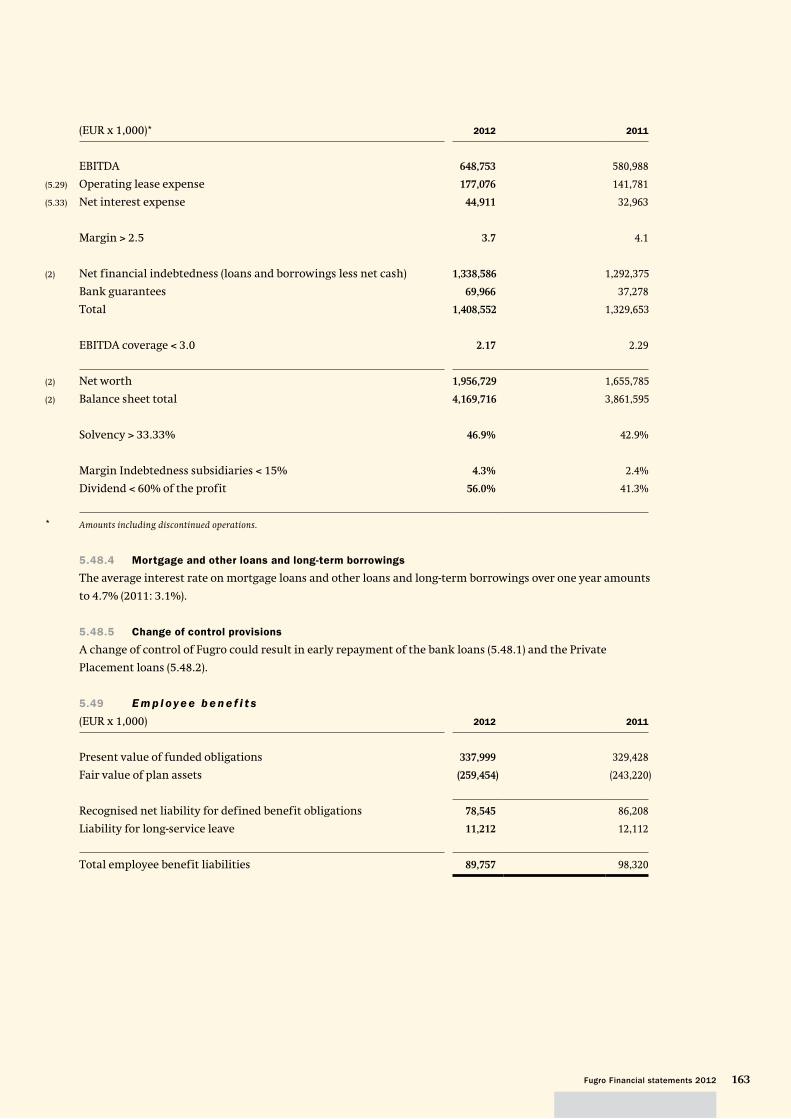
163Fugro Financial statements 2012
(EUR x 1,000)* 2012 2011
EBITDA 648,753 580,988
(5.29) Operating lease expense 177,076 141,781
(5.33) Net interest expense 44,911 32,963
Margin > 2.5 3.7 4.1
(2) Net financial indebtedness (loans and borrowings less net cash) 1,338,586 1,292,375
Bank guarantees 69,966 37,278
Total 1,408,552 1,329,653
EBITDA coverage < 3.0 2.17 2.29
(2) Net worth 1,956,729 1,655,785
(2) Balance sheet total 4,169,716 3,861,595
Solvency > 33.33% 46.9% 42.9%
Margin Indebtedness subsidiaries < 15% 4.3% 2.4%
Dividend < 60% of the profit 56.0% 41.3%
* Amounts including discontinued operations.
5.48.4 Mortgage and other loans and long-term borrowings
The average interest rate on mortgage loans and other loans and long-term borrowings over one year amounts
to 4.7% (2011: 3.1%).
5.48.5 Change of control provisions
A change of control of Fugro could result in early repayment of the bank loans (5.48.1) and the Private
Placement loans (5.48.2).
5.49 E m p l oy e e b e n e f i t s
(EUR x 1,000) 2012 2011
Present value of funded obligations 337,999 329,428
Fair value of plan assets (259,454) (243,220)
Recognised net liability for defined benefit obligations 78,545 86,208
Liability for long-service leave 11,212 12,112
Total employee benefit liabilities 89,757 98,320
164
The Group makes contributions to a number of pension plans, both defined benefit plans as well as defined
contribution plans, that provide pension benefits for employees upon retirement in a number of countries.
The most important plans relate to plans in the Netherlands, United Kingdom, Norway and the United States;
details of which are as follows:
– In the Netherlands the Group provides for a pension plan based on average salary. This plan qualifies as
a defined benefit scheme. The pension entitlements from this plan are insured with an insurance company
that guarantees the accrued pension entitlements. The scheme includes a (conditional) indexation of
pension benefits as far as the return on the separated investments exceeds the actuarial required interest.
– The employees of De Regt Marine Cables B.V. participate in the industry-wide pension fund for the
Metalektro sector. The industry wide pension fund qualifies as a multi-employer pension plan, and the fund
is not able to provide sufficient information to account for this pension plan as defined benefit. Hence, we
account for this plan as a defined contribution plan. For one of the directors of De Regt Marine Cables B.V.
a defined benefit plan is applicable.
– In the United Kingdom the Group operates two defined benefit pension schemes considering either
a guaranteed minimum pension or a maximum lump sum entitlement. The pension schemes have been
closed in previous years for new participants, but include the on-going obligations to their members (both
former and present employees). The pension scheme assets are held in separate Trustee-administered funds.
The scheme includes indexation in line with RPI.
– In Norway a defined benefit pension plan exists that, combined with the available State pension plan, leads
to a pension at the age of 67 years based on a defined maximum. The entitlements are insured with an
insurance company.
– In the United States of America the Group operates a 401K plan for its employees. The Group contributes
towards the deposits of its employees in accordance with agreed rules and taking into account the
regulations of the IRS, the US tax authority. This plan qualifies as a defined contribution plan.
A number of pension schemes at individual companies in the Netherlands and Norway will be transferred
as part of the transaction with CGG in 2013.
Liability for defined benefit obligations
Plan assets consist of the following:
(EUR x 1,000) 2012 2011
Equity securities 87,664 78,491
Government bonds 140,233 136,234
Corporate bonds 21,596 18,271
Real estate 2,074 3,582
Cash 7,887 6,642
259,454 243,220
165Fugro Financial statements 2012
Movements in the present value of the funded defined benefit obligations
(EUR x 1,000) 2012 2011
Defined benefit obligations at 1 January 329,428 272,497
Acquisitions – 1,918
Transfers to liabilities classified as held for sale (24,362) –
Benefits paid by the plan (5,467) (4,499)
Contributions paid by plan participants 2,004 2,069
Current service costs and interest (see below) 21,237 21,906
Actuarial gains and losses recognised in other
comprehensive income (see below) 9,944 30,495
Effect of movement in exchange rates 5,215 5,042
Defined benefit obligations at 31 December 337,999 329,428
Movement in the fair value of plan assets
(EUR x 1,000) 2012 2011
Fair value of plan assets at 1 January 243,220 207,978
Acquisitions – 1,229
Transfers to liabilities classified as held for sale (14,617) –
Contributions paid by the employer 8,830 10,306
Contributions paid by plan participants 1,847 2,069
Benefits paid by the plan (5,467) (4,499)
Expected return on plan assets 11,511 11,715
Actuarial gains and losses recognised in other
comprehensive income (see below) 10,914 10,840
Effect of movement in exchange rates 3,216 3,582
Fair value of plan assets at 31 December 259,454 243,220
Expenses recognised in profit or loss
(EUR x 1,000) 2012 2011
Current service costs 7,620 7,540
Interest on obligation 13,617 14,366
21,237 21,906
Expected return on plan assets (11,511) (11,715)
9,726 10,191
166
The expenses are recognised in the following line items in the statement of comprehensive income:
(EUR x 1,000) 2012 2011
Personnel expenses 9,726 10,191
Actual return on plan assets
(EUR x 1,000) 2012 2011
Actual return on plan assets 22,425 22,555
Actuarial gains and losses recognised directly in other comprehensive income
(EUR x 1,000) 2012 2011
Cumulative amount at 1 January (53,120) (32,909)
Impact of the discontinued business 7,934 –
Recognised during the year 970 (19,655)
Effect of movement in exchange rates (1,214) (556)
Cumulative amount at 31 December (45,430) (53,120)
Refer to note 5.34 with respect to the income tax impact on the actuarial gain of EUR 970 (2011: EUR 19,655
negative).
Actuarial assumptions
Principal actuarial assumptions at the reporting date (expressed as a range of weighted averages):
2012 2011
UK Norway NL UK Norway NL
Discount rate at 31 December 4.35% – 4.60% 3.9% 3.3% 4.60% – 4.75% 2.6% 4.3%
Expected return on plan assets 5.50% – 5.80% 4.00% 4.0% 6.10% – 6.30% 4.10% 5.0%
Future salary increases 2.60% 3.5% 2.0% 2.70% 3.5% 2.0%
Medical cost trend rate n/a n/a n/a n/a n/a n/a
Future pension increases 2.60% – 3.00% 3.25% 1.0% 2.70% – 3.10% 3.25% 2.0%
The financial effects of differences between the actuarial assumptions and actuals for the pension liability
and plan assets are included in the actuarial gains and losses.
Assumptions regarding future mortality are based on published statistics and mortality tables:
Netherlands: Generation table 2010-2060 for men and women, an age correction of (– 1: – 1)
is applied.
United Kingdom: Base table 90% of S1NXA tables or SAPS and CMI 2009 1% long term + 1 year for future
mortality improvements
Norway: K2005 + 10/15
167Fugro Financial statements 2012
The calculation of the defined benefit obligation is sensitive to the mortality assumptions. As the actuarial
estimates of mortality continue to be refined, an increase of one year in the lives is considered reasonably
possible in the next financial year. The effect of this change would be an increase in the employee benefit
liability by EUR 9.5 million.
The overall expected long-term rate of return on assets for 2012 is 4.7%. The expected long-term rate of return
is based on the portfolio as a whole and not on the sum of the returns on individual asset categories. The return
is based exclusively on historical returns, without adjustments.
Historical information
(EUR x 1,000) 2012 2011 2010 2009 2008
Present value of the defined obligation 337,999 329,428 272,497 244,362 190,269
Fair value of plan assets 259,454 243,220 207,978 179,643 143,757
Deficit in the plan (78,545) (86,208) (64,519) (64,719) (46,512)
Experience adjustments arising on plan liabilities (6,125) 10,910 1,418 1,269 (1,982)
Experience adjustments arising on plan assets 10,914 10,840 7,066 14,603 (35,150)
The estimated planned contributions 2013 amount to EUR 10.7 million (estimate 2012: EUR 10.5 million).
For the discontinued business the estimated planned contributions 2013 amount to EUR 1.3 million.
5.50 P r o v i s i o n s
(EUR x 1,000) 2012
2011
Proce-
dures Total
Proce-
dures Total
Balance at 1 January 4,215 4,215 5,204 5,204
Provisions made during the year 880 880 765 765
Provisions used during the year – – – –
Provisions reversed during the year (3,930) (3,930) (1,837) (1,837)
Unwinding of discount – – 83 83
Balance at 31 December 1,165 1,165 4,215 4,215
Non-current 1,165 1,165 4,215 4,215
Procedures
The Group is involved in several legal proceedings in various jurisdictions (including the USA) as a result of its
normal business activities, either as plaintiff or as defendant. The Board of Management ensures that these
cases are vigorously defended. Fugro has set up adequate provisions for those claims where management
believes it is probable that a liability has been incurred and the amount is reasonably estimable. These
provisions are reviewed periodically and adjusted if necessary. Considering the expected duration of the (legal)
proceedings, management does not expect the legal actions, for which a provision has been set-up, to be
completed within the next year. The expected outflows of economic benefits have been discounted at a rate of
4.5%, and are based on management’s best estimate. Final settlements can differ from this estimate, and could
require revisions to the estimated provisions. In 2012, Fugro determined that it would no longer be probable
168
that a legal claim will be pursued and therefore no further cost are expected. Consequently part of the
provision for procedures has been reversed.
5.51 Tr a d e a n d o t h e r p a ya b l e s
(EUR x 1,000) 2012 2011
Trade payables 136,285 155,485
Advance instalments to work in progress 35,592 43,726
Fair value derivatives – 438
Non-trade payables 217,676 313,043
Balance at 31 December 389,553 512,692
Non-trade payables include accrued expenses of invoices to be received, employee related accruals, interest
payable and considerations payable regarding acquisitions.
5.52 F i n a n c i a l r i s k m a n a ge m e n t
5.52.1 Overview
The Company’s risk management policy includes the long-term sustainable management of its business
activities and where possible, the mitigation of the associated business risks. Based on the nature and relative
significance of the risks related to the Group’s wide diversity of markets, clients and regions and its broad
portfolio of activities the risks have been quantified to the extent possible.
The Group has exposure to the following risks from its use of financial instruments:
– credit risk
– liquidity risk
– market risk
This note presents information about the Group’s exposure to each of the above risks, the Group’s objectives,
policies and processes for measuring and managing risk, and the Group’s management of capital.
The Board of Management has overall responsibility for the establishment and oversight of the Group’s risk
management framework.
The Group’s risk management policies are established to identify and analyse the risks faced by the Group,
to set appropriate risk limits and controls, and to monitor risks and adherence to limits. Risk management
policies and systems are reviewed regularly to reflect changes in market conditions and the Group’s activities.
The Group, through its training and management standards and procedures, aims to develop a disciplined
and constructive control environment in which all employees understand their role and obligations.
The Audit Committee oversees how management monitors compliance with the Group’s risk management
policies and procedures and reviews the adequacy of the risk management framework in relation to the risks
faced by the Group. The Audit Committee is assisted in its oversight role by internal audit. Both regular and
ad hoc reviews of risk management controls and procedures are performed, the results of which are reported
directly to the Board of Management and Executive Committee. A summary of important observations is
reported to the Audit Committee.
169Fugro Financial statements 2012
5.52.2 Credit risk
Credit risk is the risk of financial loss to the Group if a customer or counterparty to a financial instrument fails
to meet its contractual obligations, and arises principally from the Group’s receivables from customers.
Trade and other receivables
The Group’s exposure to credit risk is influenced mainly by the individual characteristics of each client.
However, management also considers the composition of the Group’s client base, including the default risk of
the industry and country in which clients operate, as these factors may have an influence on credit risk. As the
Group operates to a large extent in the oil and gas industry a significant portion of trade and other receivables
relates to clients from this industry.
Some of the Group’s orders are awarded on the basis of long-term preferred supplier agreements. In the course
of a year Fugro often carries out multiple projects for the same client. The projects carried out for any single
client do not, however, account for more than 4% on an annual basis of the total revenue. Having a large
number of clients and short project time spans mitigates Fugro’s credit risk as the individual amounts
receivable with the same client are limited.
New customers are analysed individually for creditworthiness before payment and delivery terms and
conditions are offered. The Group’s review may include external ratings, where available, and in some cases
bank references. Customers that fail to meet the Group’s benchmark creditworthiness may transact with the
Group only on a prepayment basis or have to provide a bank guarantee.
The majority of the Group’s clients has done business with the Group for many years and significant losses
have only occurred incidentally in prior years. However, as a result of the expected negative effects of the
current worldwide economic crisis the credit risk has increased significantly. Clients that are known to have
negative credit characteristics are individually monitored by the group controllers. Findings are reported
on a bi-weekly basis to the Board of Management. If clients fail to pay timely the Group re-assesses the
creditworthiness and stronger debt collection is started if deemed necessary. The Group publishes an
internal list of clients that need extra attention before a contract is closed.
The Board of Management reviews frequently the outstanding trade receivables. Local management is
requested to take additional precaution in working with these clients.
The Group establishes an allowance for impairment that represents its estimate of incurred losses in respect of
trade and other receivables. The main components of this allowance are a specific loss component that relates
to individually significant exposures, and a collective loss component established for groups of similar
receivables in respect of losses that have been incurred but not yet identified. The collective loss allowance is
determined based on historical data of payment statistics for similar financial assets.
The Group held cash and cash equivalents of EUR 92.0 million at 31 December 2012 (2011: EUR 170.4 million),
which represents its maximum credit exposure on these assets. The cash and cash equivalents are held with
bank and financial institution counterparties, which have ‘investment grade’ credit ratings.
Guarantees
In principle Fugro does not provide parent company guarantees to its subsidiaries, unless significant
commercial reasons exist. Fugro has filed declarations of joint and several liability for a number of subsidiaries
at the Chambers of Commerce. Fugro has filed a list with the Chamber of Commerce which includes all
financial interests of Fugro as well as a reference to each subsidiary for which such a declaration of liability has
been deposited. At 31 December 2012 and at 31 December 2011 no significant guarantees were outstanding.
170
5.52.3 Liquidity risk
Liquidity risk is the risk that the Group will encounter difficulty in meeting the obligations associated with
its financial liabilities that are settled by delivering cash or another financial asset. The Group’s approach to
managing liquidity is to ensure, as far as possible, that it will always have sufficient liquidity to meet its
liabilities when due, under both normal and stressed conditions, without incurring unacceptable losses or
risking damage to the Group’s reputation.
The Group monitors cash f low on a regular basis. Consolidated cash f low information including a six months
projection is reported on a monthly basis to the Executive Committee, ensuring that the Group has sufficient
cash on demand (or available lines of credit) to meet expected operational expenditures for the next half-year,
including the servicing of financial obligations from lease commitments not included in the statement of
financial position and investment programs in vessels. Cash f lows exclude the potential impact of extreme
circumstances that cannot reasonably be predicted, such as natural disasters. The Group maintains the
following lines of credit:
– A total amount of bilateral revolving facility agreements with eight banks totalling EUR 775 million.
Rabobank and ING Bank N.V. provided EUR 150 million each, The Royal Bank of Scotland N.V., BNP Paribas
S.A. and HSBC Bank Plc. provided each EUR 100 million, Barclays Bank Plc. provided EUR 75 million,
ABN AMRO Bank N.V. and Credit Suisse provided EUR 50 million each. At 31 December 2012 an amount
of EUR 424 million was drawn (55%).
– Revolving line of credit with Rabobank of EUR 100 million, maturing in May 2013. The Rabobank facility is
fully drawn at 31 December 2012. The facility is being repaid in equal quarterly instalments. The balance at
31 December 2012 is EUR 10 million.
– A variety of unsecured overdraft facilities in various currencies totalling around EUR 597 million of which
EUR 234 million has been drawn at 31 December 2012 (2011: around EUR 580 million with EUR 122 million
drawn).
– US Private Placement loans totalling EUR 746 million. The facility needs to be repaid, in fixed instalments
denominated in the several currencies, as follows: In 2014 EUR 30 million, in 2017 EUR 28 million, in 2018
EUR 277 million, in 2021 EUR 335 million and in 2023 EUR 76 million.
5.52.4 Market risk
Market risk includes changes in market prices, such as foreign exchange rates, interest rates and equity prices
which will affect the Group’s income or the value of its holdings of financial instruments. The objective of
market risk management is to manage and control market risk exposures within acceptable parameters, while
optimising the return.
Currency risk
The global nature of the business of the Group exposes the operations and reported financial results and cash
f lows to the risks arising from fluctuations in exchange rates. The Group’s business is exposed to currency risk
whenever it has revenues in a currency that is different from the currency in which it incurs the costs of
generating those revenues. In the case that the revenues can be offset against the costs incurred in the same
currency, the balance may be affected if the value of the currency in which the revenues and costs are
generated varies relative to the Euro. This risk exposure primarily affects those operations of the Group that
generate a portion of their revenue in foreign currencies and incur their costs primarily in Euros.
Cash inflows and outflows of the operating segments are offset if they are denominated in the same currency.
This means that revenue generated in a particular currency balance out costs in the same currency, even if the
revenues arise from a different transaction than that in which the costs are incurred. As a result, only the
unmatched amounts are subject to currency risk.
171Fugro Financial statements 2012
To mitigate the impact of currency exchange rate f luctuations, the Group continually assesses the exposure
to currency risks and if deemed necessary a portion of those risks is hedged by using derivative financial
instruments. The principal derivative financial instruments used to cover foreign currency exposure are
forward foreign currency exchange contracts. Given the current investment program in vessels and the fact
that the majority of the investments are denominated in US dollar, the Group is currently not using derivative
financial instruments as positive cash f low in US dollar from operations is offset to a large extent by these
investments.
Interest on borrowings is denominated in the currency of the borrowing. Generally, borrowings are
denominated in currencies that match the cash f lows generated by the underlying operations of the Group,
primarily Euro and US dollar. This provides an economic hedge without derivatives being entered into and
therefore hedge accounting is not applied in these circumstances.
The Group’s investment in its subsidiaries with US dollar as functional currency is partly hedged by means
of the US dollar Private Placement loans, which mitigates the currency risk arising from the subsidiary’s net
assets. The Group’s investment in its subsidiaries in the United Kingdom is partly hedged by means of the
GB pound Private Placement loans. The Group’s investments in other subsidiaries are not hedged.
The hedge on the investment is fully effective. Consequently all exchange differences relating to this hedge
have been accounted for in other comprehensive income. The Group is sensitive to translation differences
resulting from translation of its operations in non-Euro currencies to Euros.
Interest rate risk
The Group’s liabilities bear both fixed and variable interests. The Group’s objective is to limit the effect
of interest rate changes on the results by matching long term investment with long term (fixed interest)
financing as much as possible. The Group continuously considers interest rate swaps to limit significant
(short term) interest exposures.
5.52.5 Capital Management
The Board of Management’s policy is to maintain a strong capital base in order to retain investor, creditor and
market confidence and to sustain future development of the business. Capital consists of share capital,
retained earnings and non-controlling interests of the Group. The Board of Management monitors the
geographic spread of shareholders, the return on capital as well as the level of dividends to ordinary share
holders. The Board strives:
– for a dividend pay-out ratio of 35 to 55% of the net result. The proposed total dividend pay-out for 2012 is
56.0% of the net result (2011: 41.3%)
– to maintain a healthy financial position with a targeted solvency of > 33.33%. Solvency at the end of 2012
was 46.9% (2011: 42.9%)
– to maintain a balance between the higher returns that might be possible with higher levels of borrowings
and the advantages and security afforded by a sound capital position. The Group’s objective is to achieve
a healthy return on shareholders’ equity. The return in 2012 was 16.1% (2011: 18.2%). In comparison ratio
EBITDA/(operational lease expenses plus interest expenses) is 3.7 (2011: 4.1).
From time to time Fugro purchases its own certificates of shares. These certificates are used to cover the
options granted by Fugro. Purchase and sale decisions are made on a specific transaction basis by the Board
of Management. Fugro does not have a defined share buy-back plan.
There were no changes to the Group’s approach to capital management during the year.
The Group is subject to the externally imposed capital requirements related to covenant requirements as set
out in note 5.48.3. As per 31 December 2012 and 31 December 2011 the Group complied with all imposed
external capital requirements.
172
5.53 C r e d i t r i s k
Exposure to credit risk
(EUR x 1,000) Carrying amount
2012 2011
Other investments in equity instruments 1,095 1,095
Available-for-sale financial assets 1,310 1,021
Long-term loans – 5,246
Financial assets at fair value through profit or loss – 47,658
Other long-term receivables 2,692 4,227
Unbilled revenue on completed projects 219,412 221,550
Trade receivables 516,744 494,058
Non-trade receivables 97,278 168,942
Receivables under finance lease 18,451 –
Cash and cash equivalents 92,019 170,384
949,001 1,114,181
The maximum exposure to credit risk at the reporting date is the carrying amount of each class of financial
assets mentioned above. The Group holds no collateral as security on the long-term loans.
The maximum exposure for trade receivables and unbilled revenue on completed contracts at the reporting
date by geographic region was:
(EUR x 1,000) Carrying amount
2012 2011
Netherlands 43,561 45,201
Europe other 285,272 275,977
Africa 32,285 43,810
Middle East 89,924 56,904
Asia 120,825 115,198
Australia 53,522 60,585
Americas 110,767 117,933
736,156 715,608
173Fugro Financial statements 2012
The maximum exposure to credit risk for trade receivables and unbilled revenue on completed contracts
at the reporting date by type of customer was:
(EUR x 1,000) Carrying amount
2012 2011
Oil and gas 561,737 537,780
Infrastructure 141,809 131,083
Mining 5,207 23,627
Other 27,403 23,118
736,156 715,608
Impairment losses
The ageing of trade receivables and unbilled revenue on completed contracts at the reporting date was:
– As of 31 December 2012, trade receivables and unbilled revenue on completed projects of
EUR 736,156 thousand (2011: EUR 715,608 thousand) were fully performing.
– As of 31 December 2012, trade receivables of EUR 246,303 thousand (2011: EUR 202,288 thousand)
were past due but not impaired. These relate to a number of independent customers for whom there
is no recent history of default. The average credit term for these trade receivables is 30 days.
– As of 31 December 2012, trade receivables and unbilled revenue on completed projects of
EUR 34,716 thousand (2011: EUR 30,151 thousand) were impaired and provided for.
The individually impaired receivables mainly relate to customers, which are in difficult economic situations.
It was assessed that a portion of the receivables is expected to be recovered. The ageing of trade receivables and
unbilled revenue on completed projects is as follows:
(EUR x 1,000) 2012 2011
Gross
Impair-
ment Gross
Impair-
ment
From 0 to 30 days 489,852 – 513,320 –
From 31 to 60 days 139,546 – 89,850 –
From 61 to 90 days 42,842 – 44,583 6,074
Over 90 days 91,597 34,716 88,458 22,396
Retentions and special items 7,035 – 9,548 1,681
770,872 34,716 745,759 30,151
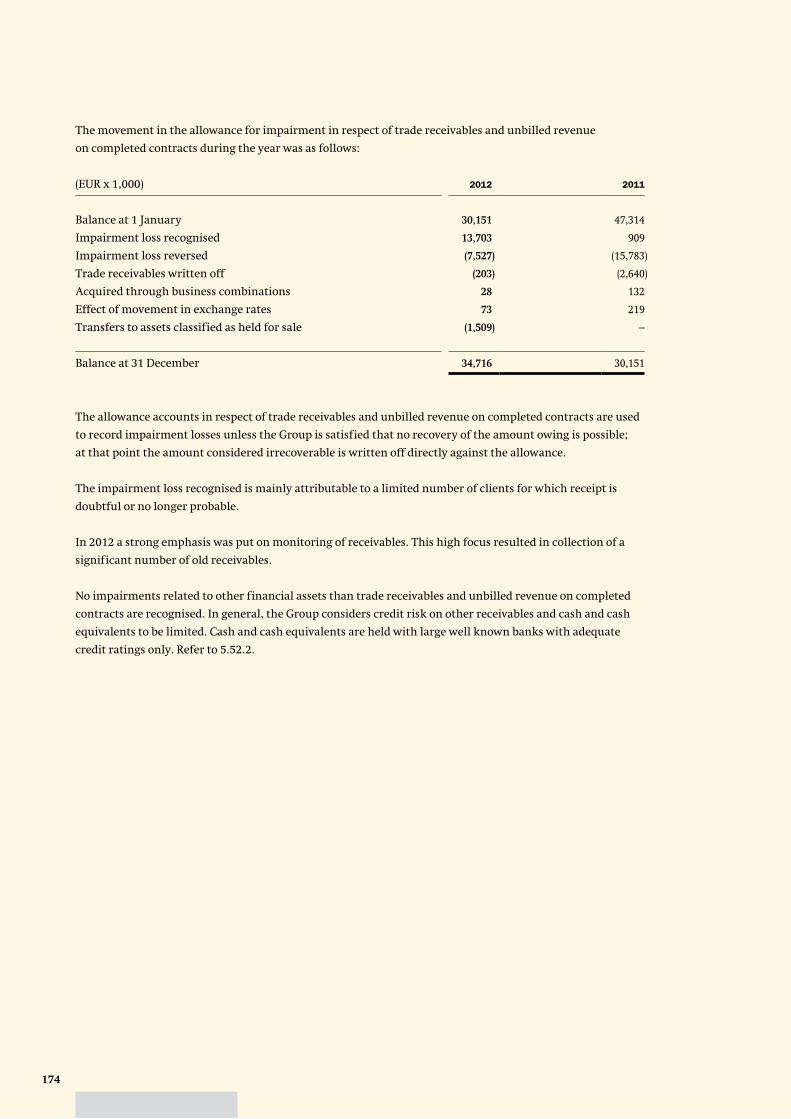
174
The movement in the allowance for impairment in respect of trade receivables and unbilled revenue
on completed contracts during the year was as follows:
(EUR x 1,000) 2012 2011
Balance at 1 January 30,151 47,314
Impairment loss recognised 13,703 909
Impairment loss reversed (7,527) (15,783)
Trade receivables written off (203) (2,640)
Acquired through business combinations 28 132
Effect of movement in exchange rates 73 219
Transfers to assets classified as held for sale (1,509) –
Balance at 31 December 34,716 30,151
The allowance accounts in respect of trade receivables and unbilled revenue on completed contracts are used
to record impairment losses unless the Group is satisfied that no recovery of the amount owing is possible;
at that point the amount considered irrecoverable is written off directly against the allowance.
The impairment loss recognised is mainly attributable to a limited number of clients for which receipt is
doubtful or no longer probable.
In 2012 a strong emphasis was put on monitoring of receivables. This high focus resulted in collection of a
significant number of old receivables.
No impairments related to other financial assets than trade receivables and unbilled revenue on completed
contracts are recognised. In general, the Group considers credit risk on other receivables and cash and cash
equivalents to be limited. Cash and cash equivalents are held with large well known banks with adequate
credit ratings only. Refer to 5.52.2.
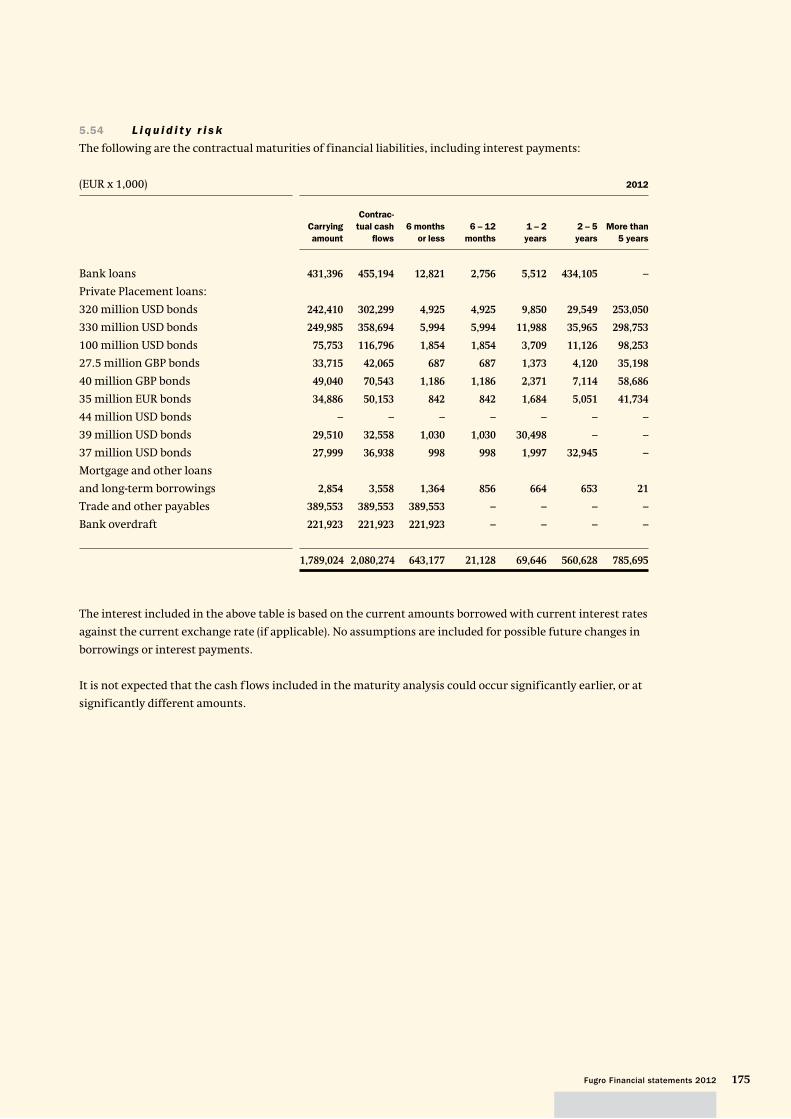
175Fugro Financial statements 2012
5.54 L i q u i d i t y r i s k
The following are the contractual maturities of financial liabilities, including interest payments:
(EUR x 1,000) 2012
Carrying
amount
Contrac-
tual cash
fl ows
6 months
or less
6 – 12
months
1 – 2
years
2 – 5
years
More than
5 years
Bank loans 431,396 455,194 12,821 2,756 5,512 434,105 –
Private Placement loans:
320 million USD bonds 242,410 302,299 4,925 4,925 9,850 29,549 253,050
330 million USD bonds 249,985 358,694 5,994 5,994 11,988 35,965 298,753
100 million USD bonds 75,753 116,796 1,854 1,854 3,709 11,126 98,253
27.5 million GBP bonds 33,715 42,065 687 687 1,373 4,120 35,198
40 million GBP bonds 49,040 70,543 1,186 1,186 2,371 7,114 58,686
35 million EUR bonds 34,886 50,153 842 842 1,684 5,051 41,734
44 million USD bonds – – – – – – –
39 million USD bonds 29,510 32,558 1,030 1,030 30,498 – –
37 million USD bonds 27,999 36,938 998 998 1,997 32,945 –
Mortgage and other loans
and long-term borrowings 2,854 3,558 1,364 856 664 653 21
Trade and other payables 389,553 389,553 389,553 – – – –
Bank overdraft 221,923 221,923 221,923 – – – –
1,789,024 2,080,274 643,177 21,128 69,646 560,628 785,695
The interest included in the above table is based on the current amounts borrowed with current interest rates
against the current exchange rate (if applicable). No assumptions are included for possible future changes in
borrowings or interest payments.
It is not expected that the cash f lows included in the maturity analysis could occur significantly earlier, or at
significantly different amounts.
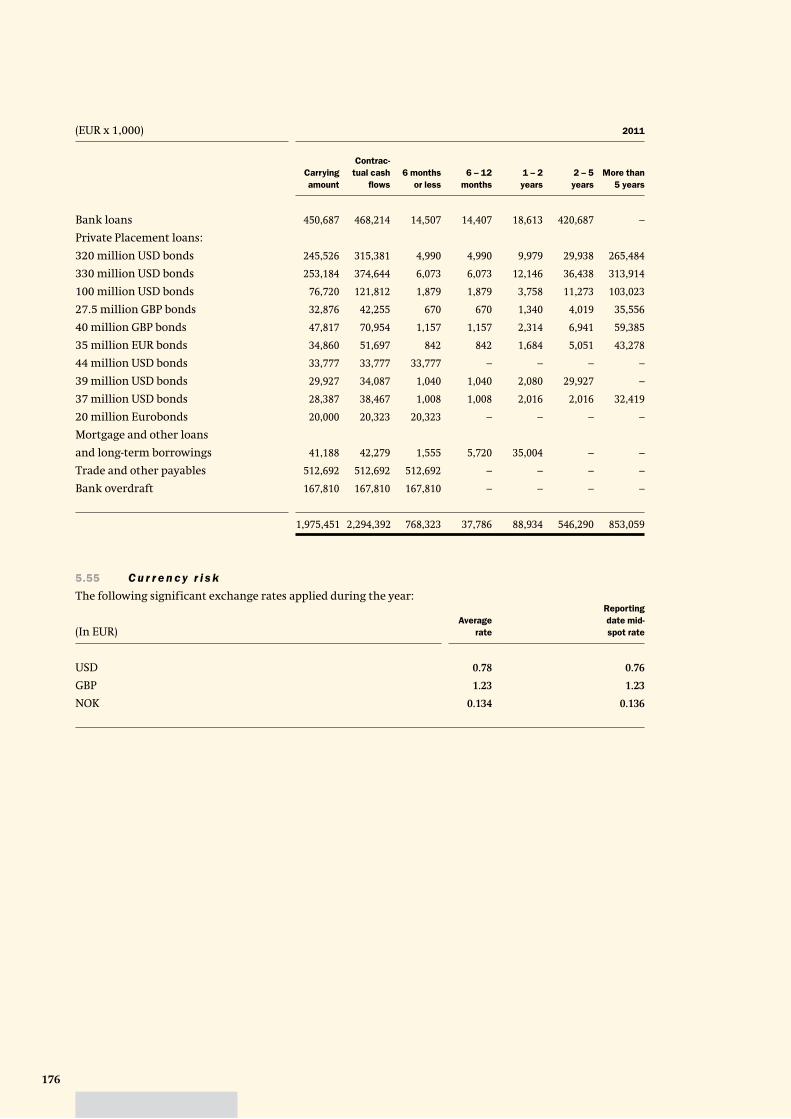
176
(EUR x 1,000) 2011
Carrying
amount
Contrac-
tual cash
fl ows
6 months
or less
6 – 12
months
1 – 2
years
2 – 5
years
More than
5 years
Bank loans 450,687 468,214 14,507 14,407 18,613 420,687 –
Private Placement loans:
320 million USD bonds 245,526 315,381 4,990 4,990 9,979 29,938 265,484
330 million USD bonds 253,184 374,644 6,073 6,073 12,146 36,438 313,914
100 million USD bonds 76,720 121,812 1,879 1,879 3,758 11,273 103,023
27.5 million GBP bonds 32,876 42,255 670 670 1,340 4,019 35,556
40 million GBP bonds 47,817 70,954 1,157 1,157 2,314 6,941 59,385
35 million EUR bonds 34,860 51,697 842 842 1,684 5,051 43,278
44 million USD bonds 33,777 33,777 33,777 – – – –
39 million USD bonds 29,927 34,087 1,040 1,040 2,080 29,927 –
37 million USD bonds 28,387 38,467 1,008 1,008 2,016 2,016 32,419
20 million Eurobonds 20,000 20,323 20,323 – – – –
Mortgage and other loans
and long-term borrowings 41,188 42,279 1,555 5,720 35,004 – –
Trade and other payables 512,692 512,692 512,692 – – – –
Bank overdraft 167,810 167,810 167,810 – – – –
1,975,451 2,294,392 768,323 37,786 88,934 546,290 853,059
5.55 C u r r e n c y r i s k
The following significant exchange rates applied during the year:
(In EUR)Average
rate
Reporting
date mid-
spot rate
USD 0.78 0.76
GBP 1.23 1.23
NOK 0.134 0.136
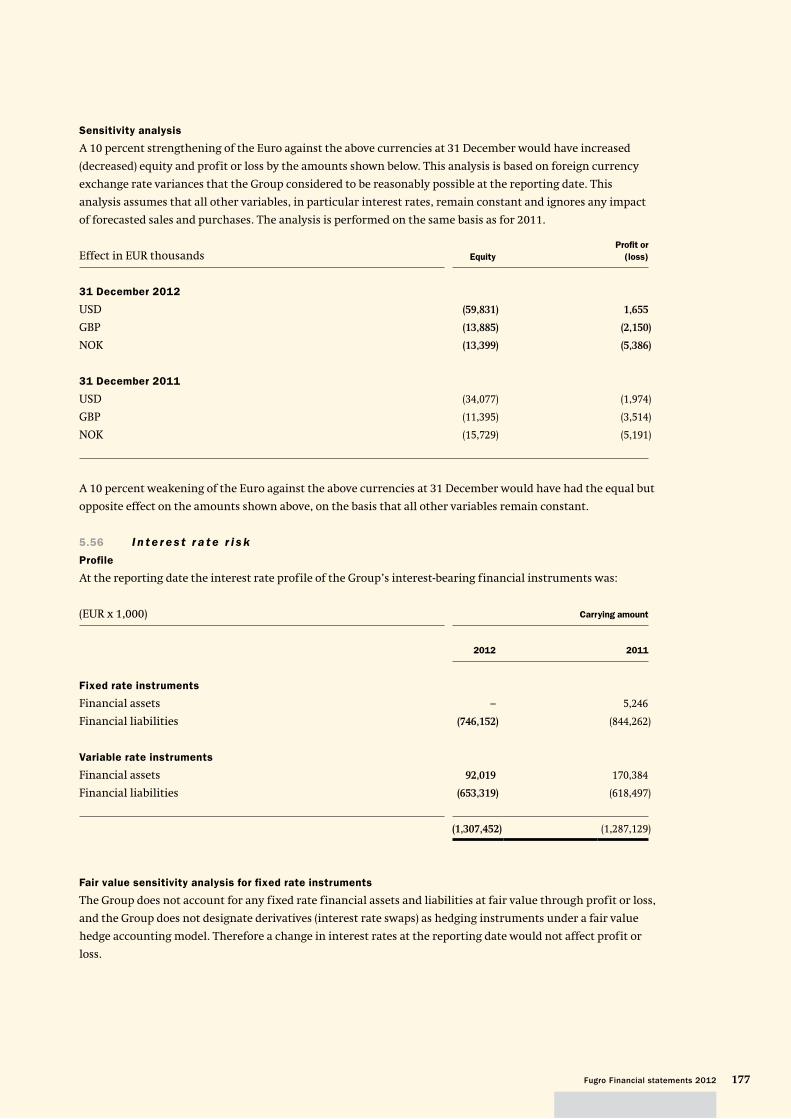
177Fugro Financial statements 2012
Sensitivity analysis
A 10 percent strengthening of the Euro against the above currencies at 31 December would have increased
(decreased) equity and profit or loss by the amounts shown below. This analysis is based on foreign currency
exchange rate variances that the Group considered to be reasonably possible at the reporting date. This
analysis assumes that all other variables, in particular interest rates, remain constant and ignores any impact
of forecasted sales and purchases. The analysis is performed on the same basis as for 2011.
Effect in EUR thousands Equity
Profi t or
(loss)
31 December 2012
USD (59,831) 1,655
GBP (13,885) (2,150)
NOK (13,399) (5,386)
31 December 2011
USD (34,077) (1,974)
GBP (11,395) (3,514)
NOK (15,729) (5,191)
A 10 percent weakening of the Euro against the above currencies at 31 December would have had the equal but
opposite effect on the amounts shown above, on the basis that all other variables remain constant.
5.56 I n t e r e s t r a t e r i s k
Profile
At the reporting date the interest rate profile of the Group’s interest-bearing financial instruments was:
(EUR x 1,000) Carrying amount
2012 2011
Fixed rate instruments
Financial assets – 5,246
Financial liabilities (746,152) (844,262)
Variable rate instruments
Financial assets 92,019 170,384
Financial liabilities (653,319) (618,497)
(1,307,452) (1,287,129)
Fair value sensitivity analysis for fixed rate instruments
The Group does not account for any fixed rate financial assets and liabilities at fair value through profit or loss,
and the Group does not designate derivatives (interest rate swaps) as hedging instruments under a fair value
hedge accounting model. Therefore a change in interest rates at the reporting date would not affect profit or
loss.
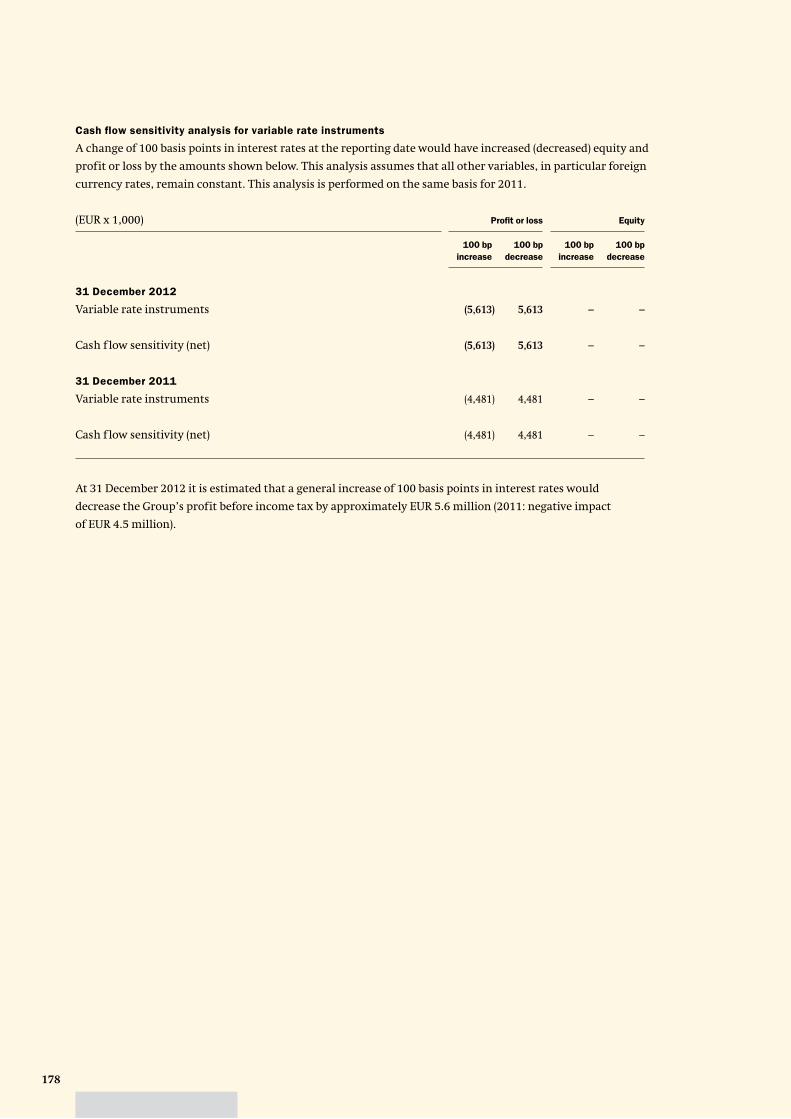
178
Cash flow sensitivity analysis for variable rate instruments
A change of 100 basis points in interest rates at the reporting date would have increased (decreased) equity and
profit or loss by the amounts shown below. This analysis assumes that all other variables, in particular foreign
currency rates, remain constant. This analysis is performed on the same basis for 2011.
(EUR x 1,000) Profi t or loss Equity
100 bp
increase
100 bp
decrease
100 bp
increase
100 bp
decrease
31 December 2012
Variable rate instruments (5,613) 5,613 – –
Cash f low sensitivity (net) (5,613) 5,613 – –
31 December 2011
Variable rate instruments (4,481) 4,481 – –
Cash f low sensitivity (net) (4,481) 4,481 – –
At 31 December 2012 it is estimated that a general increase of 100 basis points in interest rates would
decrease the Group’s profit before income tax by approximately EUR 5.6 million (2011: negative impact
of EUR 4.5 million).
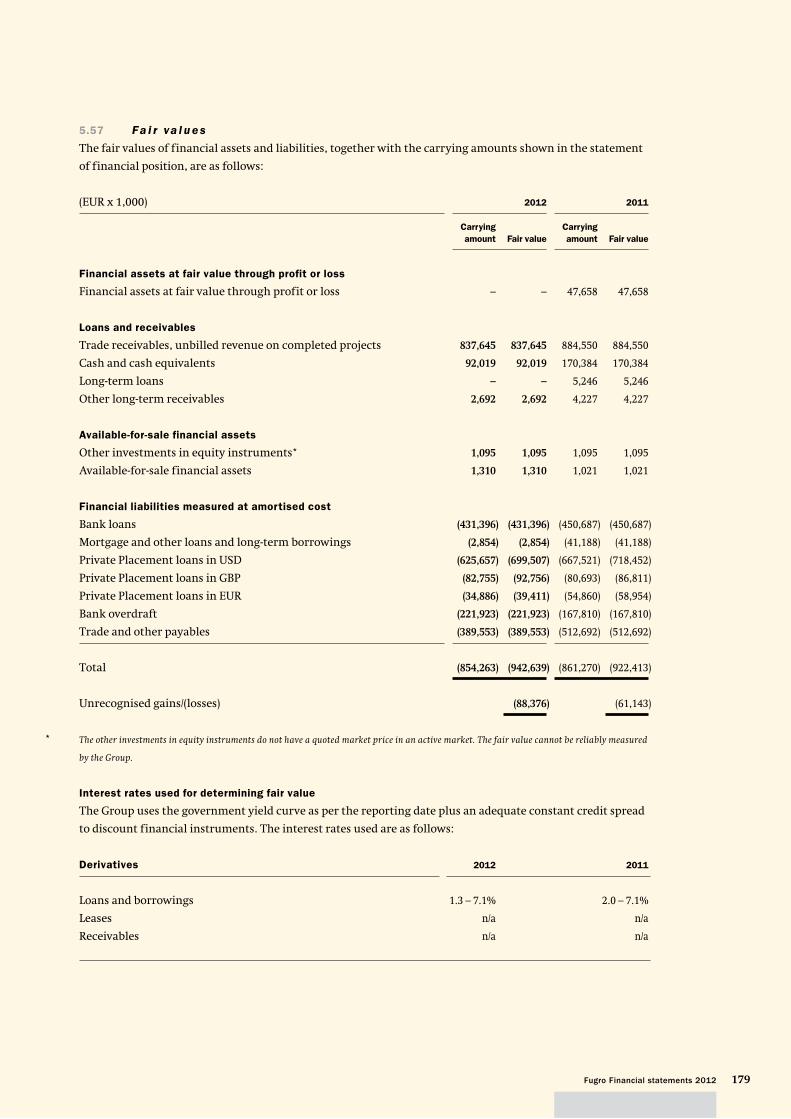
179Fugro Financial statements 2012
5.57 Fa i r va l u e s
The fair values of financial assets and liabilities, together with the carrying amounts shown in the statement
of financial position, are as follows:
(EUR x 1,000) 2012 2011
Carrying
amount Fair value
Carrying
amount Fair value
Financial assets at fair value through profit or loss
Financial assets at fair value through profit or loss – – 47,658 47,658
Loans and receivables
Trade receivables, unbilled revenue on completed projects 837,645 837,645 884,550 884,550
Cash and cash equivalents 92,019 92,019 170,384 170,384
Long-term loans – – 5,246 5,246
Other long-term receivables 2,692 2,692 4,227 4,227
Available-for-sale financial assets
Other investments in equity instruments* 1,095 1,095 1,095 1,095
Available-for-sale financial assets 1,310 1,310 1,021 1,021
Financial liabilities measured at amortised cost
Bank loans (431,396) (431,396) (450,687) (450,687)
Mortgage and other loans and long-term borrowings (2,854) (2,854) (41,188) (41,188)
Private Placement loans in USD (625,657) (699,507) (667,521) (718,452)
Private Placement loans in GBP (82,755) (92,756) (80,693) (86,811)
Private Placement loans in EUR (34,886) (39,411) (54,860) (58,954)
Bank overdraft (221,923) (221,923) (167,810) (167,810)
Trade and other payables (389,553) (389,553) (512,692) (512,692)
Total (854,263) (942,639) (861,270) (922,413)
Unrecognised gains/(losses) (88,376) (61,143)
* The other investments in equity instruments do not have a quoted market price in an active market. The fair value cannot be reliably measured
by the Group.
Interest rates used for determining fair value
The Group uses the government yield curve as per the reporting date plus an adequate constant credit spread
to discount financial instruments. The interest rates used are as follows:
Derivatives 2012 2011
Loans and borrowings 1.3 – 7.1% 2.0 – 7.1%
Leases n/a n/a
Receivables n/a n/a
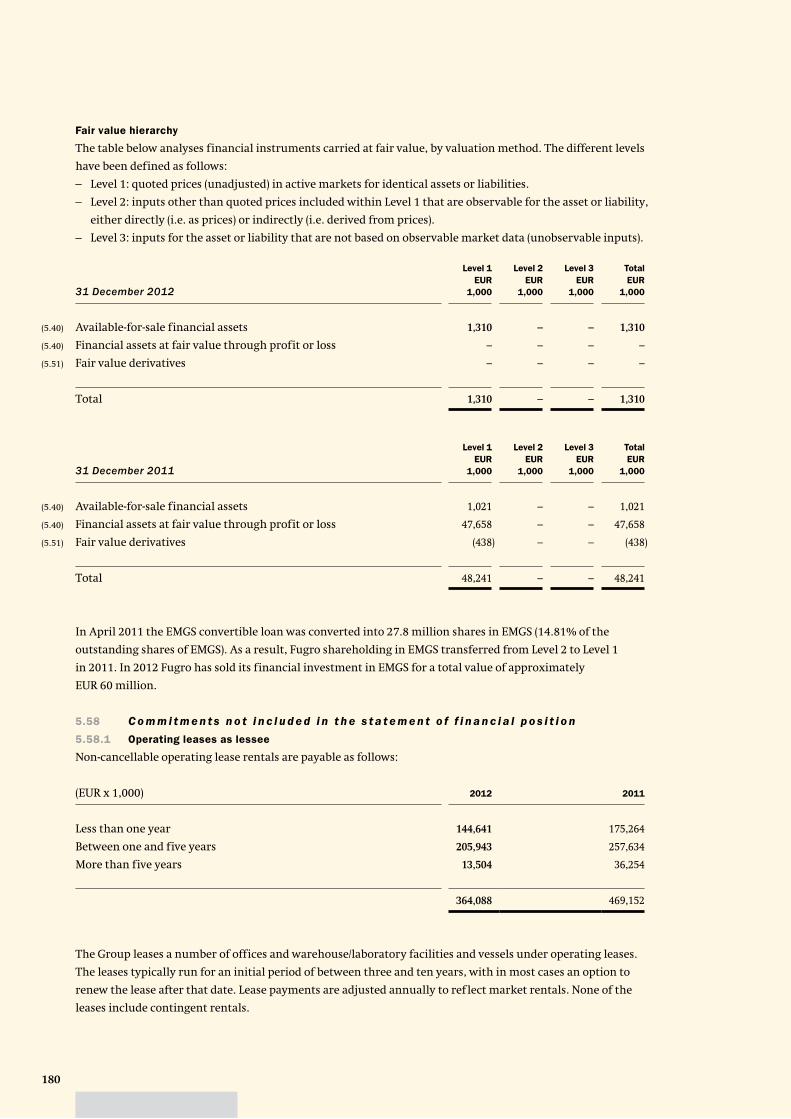
180
Fair value hierarchy
The table below analyses financial instruments carried at fair value, by valuation method. The different levels
have been defined as follows:
– Level 1: quoted prices (unadjusted) in active markets for identical assets or liabilities.
– Level 2: inputs other than quoted prices included within Level 1 that are observable for the asset or liability,
either directly (i.e. as prices) or indirectly (i.e. derived from prices).
– Level 3: inputs for the asset or liability that are not based on observable market data (unobservable inputs).
31 December 2012
Level 1
EUR
1,000
Level 2
EUR
1,000
Level 3
EUR
1,000
Total
EUR
1,000
(5.40) Available-for-sale financial assets 1,310 – – 1,310
(5.40) Financial assets at fair value through profit or loss – – – –
(5.51) Fair value derivatives – – – –
Total 1,310 – – 1,310
31 December 2011
Level 1
EUR
1,000
Level 2
EUR
1,000
Level 3
EUR
1,000
Total
EUR
1,000
(5.40) Available-for-sale financial assets 1,021 – – 1,021
(5.40) Financial assets at fair value through profit or loss 47,658 – – 47,658
(5.51) Fair value derivatives (438) – – (438)
Total 48,241 – – 48,241
In April 2011 the EMGS convertible loan was converted into 27.8 million shares in EMGS (14.81% of the
outstanding shares of EMGS). As a result, Fugro shareholding in EMGS transferred from Level 2 to Level 1
in 2011. In 2012 Fugro has sold its financial investment in EMGS for a total value of approximately
EUR 60 million.
5.58 C o m m i t m e n t s n o t i n c l u d e d i n t h e s t a t e m e n t o f f i n a n c i a l p o s i t i o n
5.58.1 Operating leases as lessee
Non-cancellable operating lease rentals are payable as follows:
(EUR x 1,000) 2012 2011
Less than one year 144,641 175,264
Between one and five years 205,943 257,634
More than five years 13,504 36,254
364,088 469,152
The Group leases a number of offices and warehouse/laboratory facilities and vessels under operating leases.
The leases typically run for an initial period of between three and ten years, with in most cases an option to
renew the lease after that date. Lease payments are adjusted annually to reflect market rentals. None of the
leases include contingent rentals.
181Fugro Financial statements 2012
During the year an amount of EUR 239 million was recognised as an expense in profit or loss in respect
of operating leases and other rentals (2011: EUR 176 million).
5.58.2 Capital commitments
At 31 December 2012 the Group has contractual obligations to purchase property, plant and equipment
for EUR 275.9 million (2011: EUR 277.7 million).
5.58.3 Contingencies
Some Group companies are, as a result of their normal business activities, involved either as plaintiffs or
defendants in claims. Based on information presently available and management’s best estimate, it is not
probable that the financial position of the Group will be significantly influenced by any of these matters.
Should the actual outcome differ from the assumptions and estimates, the financial position of the Group
would be impacted. Fugro N.V. and its Dutch operating companies form a fiscal unity for corporate tax.
Each of the operating companies is severally liable for corporate tax to be paid by the fiscal unity.
5.59 S u b s e q u e n t e ve n t s
On 28 January 2013, the Company and CGG completed a transaction under which CGG acquired Fugro’s
Geoscience division, excluding the multi-client library and the Fugro ocean bottom nodes business.
The effective date of the transaction is 31 January 2013, with the exception of the Airborne activities and
certain minor other assets which will be closed upon once all equipment license transfer and administrative
authorizations have been received (expected to occur in 2013). The total transaction value amounts to
EUR 1.2 billion on a cash and debt free basis. The expected gain is provisionally calculated at approximately
EUR 200 million. This amount was calculated based on certain assumptions with respect to the deferred
closing of Airborne, taxes, accumulated translation reserve and the expected outcome of the post
completion process, including the outcome of Capital expenditure review and working capital balance review
per 31 January 2013. The amount mentioned may therefore deviate from the actual outcome to be reported
later this year.
Parties have agreed that part of the consideration will be satisfied in the form of a vendor loan from Fugro to
CGG. On 31 January 2013 the vendor loan amounts to EUR 125 million and will increase to EUR 225 million
upon the closing of the Airborne activities. The loan agreement carries interest of 5.5% and provides Fugro
with collateral. The loan agreement also includes a repayment schedule that requires repayment of, at a
minimum, half of the loan amount before the end of 2013 and the remainder, in annual repayments, before
the end of 2018.
The multi-client library, with a book value of EUR 458 million at 31 December 2012, remains with Fugro while
all multi-client sales and marketing staff have transferred to CGG as part of the transaction. After closing of the
transaction Fugro will stop the further development of the multi-client library and any new investments will
be made by CGG. As part of the transaction both parties entered into a non-exclusive sales and marketing
agreement under which CGG will sell licenses to the multi-client library that is still owned by Fugro for a
revenue based fee. Fugro will retain the right to enter into non-exclusive agreements with other parties as well
as an outright sale of (all or parts of) the library.
Share options held by Fugro employees that will be transferred to CGG and were exercisable at completion can
be exercised until 15 December 2013, after which date these options will expire. The stock options that had not
vested at completion of the transaction, will be replaced by a CGG phantom share option plan with the similar
terms and conditions as Fugro’s share option plan. If these options are exercised after vesting, CGG will pay the
option holder the difference between Fugro’s opening share price on the day of exercise and the exercise price
of the option.
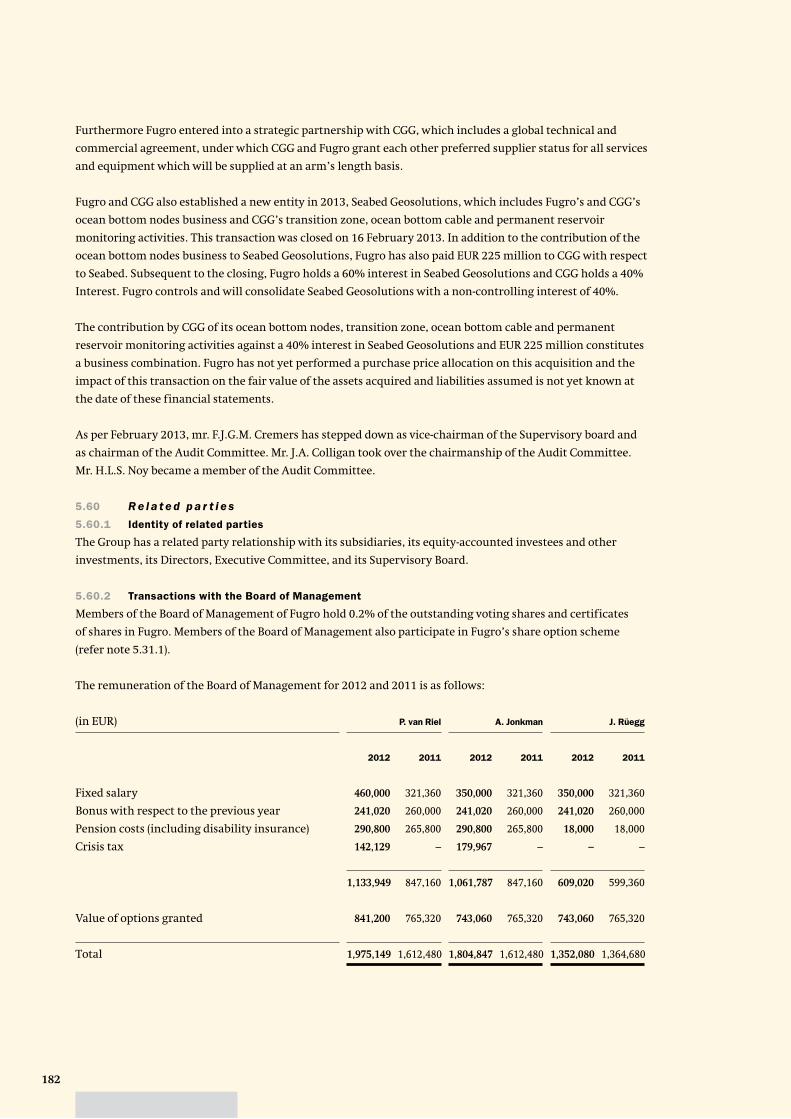
182
Furthermore Fugro entered into a strategic partnership with CGG, which includes a global technical and
commercial agreement, under which CGG and Fugro grant each other preferred supplier status for all services
and equipment which will be supplied at an arm’s length basis.
Fugro and CGG also established a new entity in 2013, Seabed Geosolutions, which includes Fugro’s and CGG’s
ocean bottom nodes business and CGG’s transition zone, ocean bottom cable and permanent reservoir
monitoring activities. This transaction was closed on 16 February 2013. In addition to the contribution of the
ocean bottom nodes business to Seabed Geosolutions, Fugro has also paid EUR 225 million to CGG with respect
to Seabed. Subsequent to the closing, Fugro holds a 60% interest in Seabed Geosolutions and CGG holds a 40%
Interest. Fugro controls and will consolidate Seabed Geosolutions with a non-controlling interest of 40%.
The contribution by CGG of its ocean bottom nodes, transition zone, ocean bottom cable and permanent
reservoir monitoring activities against a 40% interest in Seabed Geosolutions and EUR 225 million constitutes
a business combination. Fugro has not yet performed a purchase price allocation on this acquisition and the
impact of this transaction on the fair value of the assets acquired and liabilities assumed is not yet known at
the date of these financial statements.
As per February 2013, mr. F.J.G.M. Cremers has stepped down as vice-chairman of the Supervisory board and
as chairman of the Audit Committee. Mr. J.A. Colligan took over the chairmanship of the Audit Committee.
Mr. H.L.S. Noy became a member of the Audit Committee.
5.60 R e l a t e d p a r t i e s
5.60.1 Identity of related parties
The Group has a related party relationship with its subsidiaries, its equity-accounted investees and other
investments, its Directors, Executive Committee, and its Supervisory Board.
5.60.2 Transactions with the Board of Management
Members of the Board of Management of Fugro hold 0.2% of the outstanding voting shares and certificates
of shares in Fugro. Members of the Board of Management also participate in Fugro’s share option scheme
(refer note 5.31.1).
The remuneration of the Board of Management for 2012 and 2011 is as follows:
(in EUR) P. van Riel A. Jonkman J. Rüegg
2012 2011 2012 2011 2012 2011
Fixed salary 460,000 321,360 350,000 321,360 350,000 321,360
Bonus with respect to the previous year 241,020 260,000 241,020 260,000 241,020 260,000
Pension costs (including disability insurance) 290,800 265,800 290,800 265,800 18,000 18,000
Crisis tax 142,129 – 179,967 – – –
1,133,949 847,160 1,061,787 847,160 609,020 599,360
Value of options granted 841,200 765,320 743,060 765,320 743,060 765,320
Total 1,975,149 1,612,480 1,804,847 1,612,480 1,352,080 1,364,680
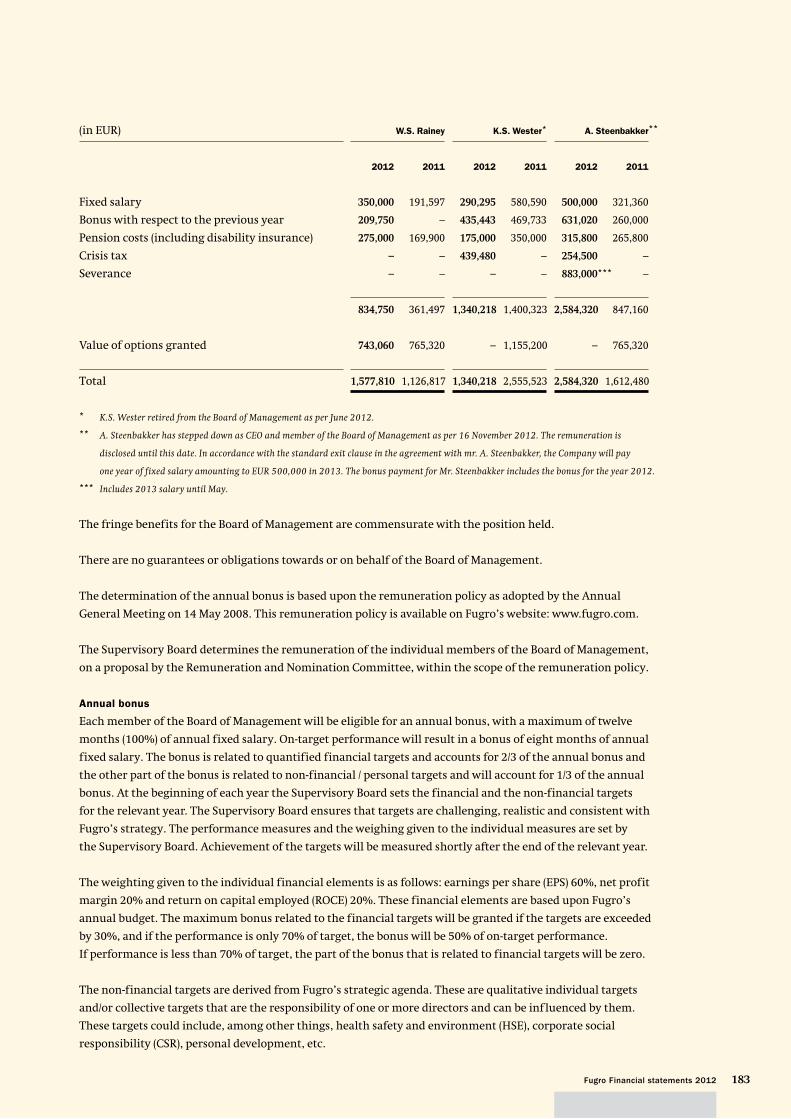
183Fugro Financial statements 2012
(in EUR) W.S. Rainey K.S. Wester* A. Steenbakker
2012 2011 2012 2011 2012 2011
Fixed salary 350,000 191,597 290,295 580,590 500,000 321,360
Bonus with respect to the previous year 209,750 – 435,443 469,733 631,020 260,000
Pension costs (including disability insurance) 275,000 169,900 175,000 350,000 315,800 265,800
Crisis tax – – 439,480 – 254,500 –
Severance – – – – 883,000 –
834,750 361,497 1,340,218 1,400,323 2,584,320 847,160
Value of options granted 743,060 765,320 – 1,155,200 – 765,320
Total 1,577,810 1,126,817 1,340,218 2,555,523 2,584,320 1,612,480
* K.S. Wester retired from the Board of Management as per June 2012.
** A. Steenbakker has stepped down as CEO and member of the Board of Management as per 16 November 2012. The remuneration is
disclosed until this date. In accordance with the standard exit clause in the agreement with mr. A. Steenbakker, the Company will pay
one year of fixed salary amounting to EUR 500,000 in 2013. The bonus payment for Mr. Steenbakker includes the bonus for the year 2012.
*** Includes 2013 salary until May.
The fringe benefits for the Board of Management are commensurate with the position held.
There are no guarantees or obligations towards or on behalf of the Board of Management.
The determination of the annual bonus is based upon the remuneration policy as adopted by the Annual
General Meeting on 14 May 2008. This remuneration policy is available on Fugro’s website: www.fugro.com.
The Supervisory Board determines the remuneration of the individual members of the Board of Management,
on a proposal by the Remuneration and Nomination Committee, within the scope of the remuneration policy.
Annual bonus
Each member of the Board of Management will be eligible for an annual bonus, with a maximum of twelve
months (100%) of annual fixed salary. On-target performance will result in a bonus of eight months of annual
fixed salary. The bonus is related to quantified financial targets and accounts for 2/3 of the annual bonus and
the other part of the bonus is related to non-financial / personal targets and will account for 1/3 of the annual
bonus. At the beginning of each year the Supervisory Board sets the financial and the non-financial targets
for the relevant year. The Supervisory Board ensures that targets are challenging, realistic and consistent with
Fugro’s strategy. The performance measures and the weighing given to the individual measures are set by
the Supervisory Board. Achievement of the targets will be measured shortly after the end of the relevant year.
The weighting given to the individual financial elements is as follows: earnings per share (EPS) 60%, net profit
margin 20% and return on capital employed (ROCE) 20%. These financial elements are based upon Fugro’s
annual budget. The maximum bonus related to the financial targets will be granted if the targets are exceeded
by 30%, and if the performance is only 70% of target, the bonus will be 50% of on-target performance.
If performance is less than 70% of target, the part of the bonus that is related to financial targets will be zero.
The non-financial targets are derived from Fugro’s strategic agenda. These are qualitative individual targets
and/or collective targets that are the responsibility of one or more directors and can be influenced by them.
These targets could include, among other things, health safety and environment (HSE), corporate social
responsibility (CSR), personal development, etc.
**
***
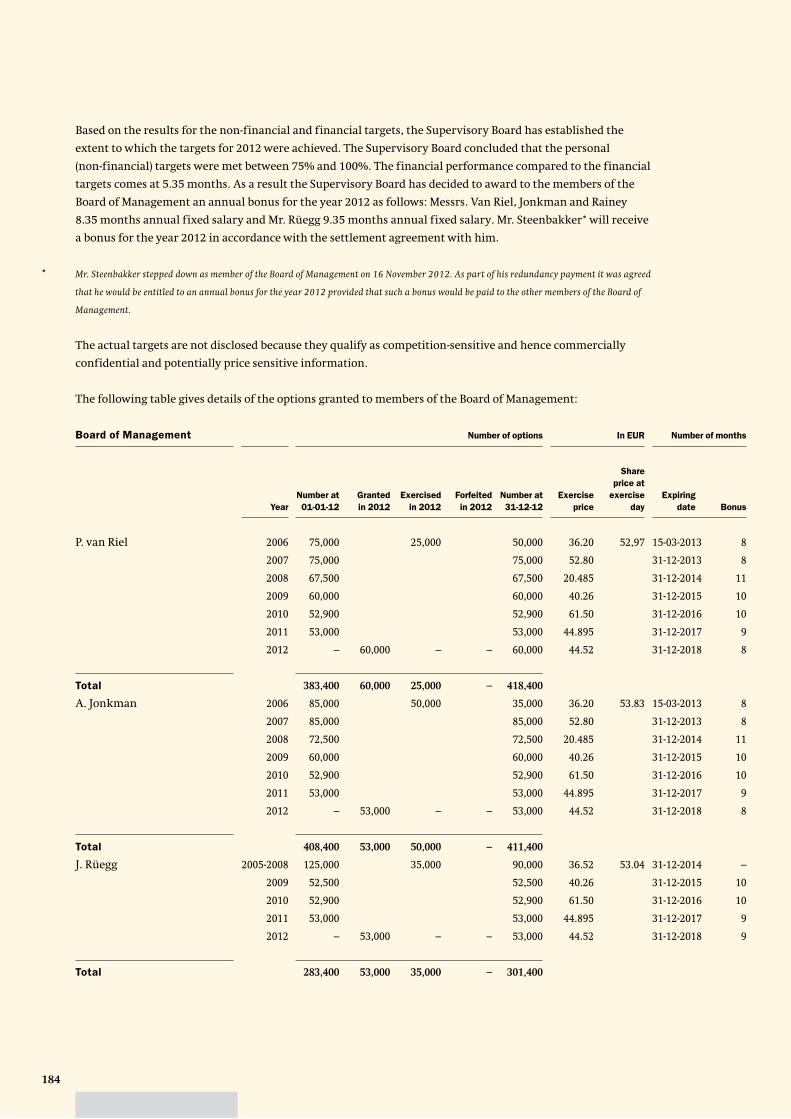
184
Based on the results for the non-financial and financial targets, the Supervisory Board has established the
extent to which the targets for 2012 were achieved. The Supervisory Board concluded that the personal
(non-financial) targets were met between 75% and 100%. The financial performance compared to the financial
targets comes at 5.35 months. As a result the Supervisory Board has decided to award to the members of the
Board of Management an annual bonus for the year 2012 as follows: Messrs. Van Riel, Jonkman and Rainey
8.35 months annual fixed salary and Mr. Rüegg 9.35 months annual fixed salary. Mr. Steenbakker* will receive
a bonus for the year 2012 in accordance with the settlement agreement with him.
* Mr. Steenbakker stepped down as member of the Board of Management on 16 November 2012. As part of his redundancy payment it was agreed
that he would be entitled to an annual bonus for the year 2012 provided that such a bonus would be paid to the other members of the Board of
Management.
The actual targets are not disclosed because they qualify as competition-sensitive and hence commercially
confidential and potentially price sensitive information.
The following table gives details of the options granted to members of the Board of Management:
Board of Management Number of options In EUR Number of months
Year
Number at
01-01-12
Granted
in 2012
Exercised
in 2012
Forfeited
in 2012
Number at
31-12-12
Exercise
price
Share
price at
exercise
day
Expiring
date Bonus
P. van Riel 2006 75,000 25,000 50,000 36.20 52,97 15-03-2013 8
2007 75,000 75,000 52.80 31-12-2013 8
2008 67,500 67,500 20.485 31-12-2014 11
2009 60,000 60,000 40.26 31-12-2015 10
2010 52,900 52,900 61.50 31-12-2016 10
2011 53,000 53,000 44.895 31-12-2017 9
2012 – 60,000 – – 60,000 44.52 31-12-2018 8
Total 383,400 60,000 25,000 – 418,400
A. Jonkman 2006 85,000 50,000 35,000 36.20 53.83 15-03-2013 8
2007 85,000 85,000 52.80 31-12-2013 8
2008 72,500 72,500 20.485 31-12-2014 11
2009 60,000 60,000 40.26 31-12-2015 10
2010 52,900 52,900 61.50 31-12-2016 10
2011 53,000 53,000 44.895 31-12-2017 9
2012 – 53,000 – – 53,000 44.52 31-12-2018 8
Total 408,400 53,000 50,000 – 411,400
J. Rüegg 2005-2008 125,000 35,000 90,000 36.52 53.04 31-12-2014 –
2009 52,500 52,500 40.26 31-12-2015 10
2010 52,900 52,900 61.50 31-12-2016 10
2011 53,000 53,000 44.895 31-12-2017 9
2012 – 53,000 – – 53,000 44.52 31-12-2018 9
Total 283,400 53,000 35,000 – 301,400
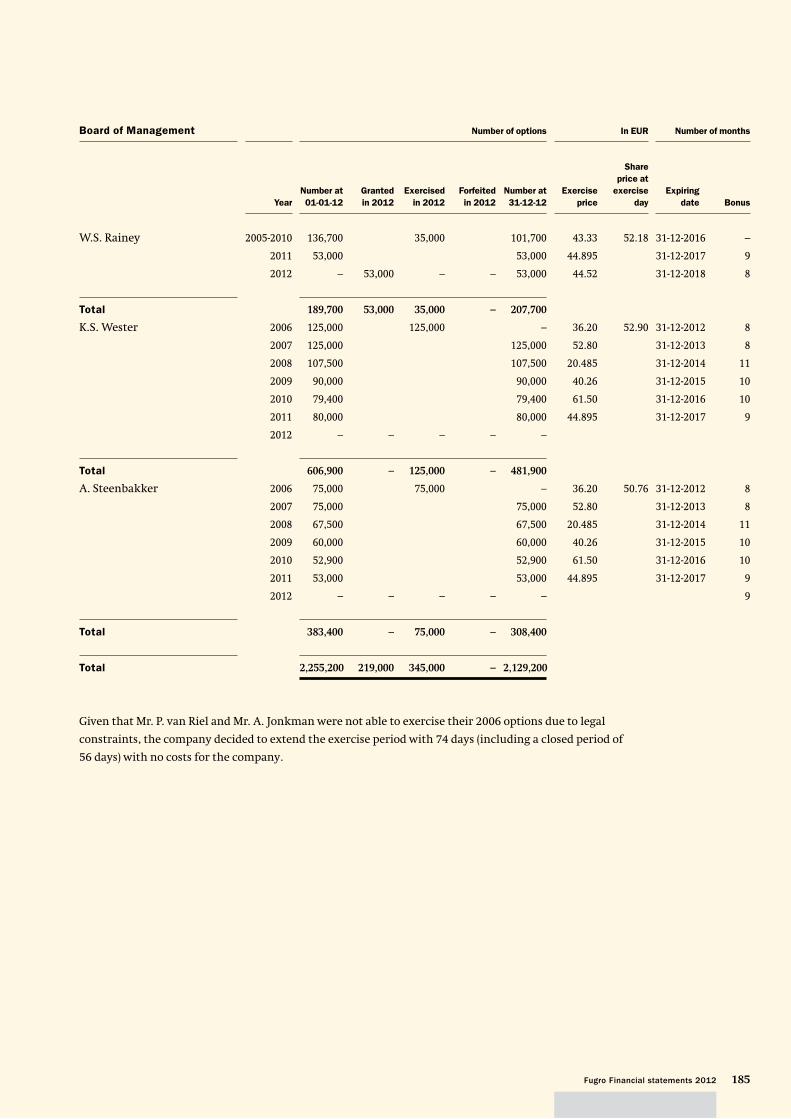
185Fugro Financial statements 2012
Board of Management Number of options In EUR Number of months
Year
Number at
01-01-12
Granted
in 2012
Exercised
in 2012
Forfeited
in 2012
Number at
31-12-12
Exercise
price
Share
price at
exercise
day
Expiring
date Bonus
W.S. Rainey 2005-2010 136,700 35,000 101,700 43.33 52.18 31-12-2016 –
2011 53,000 53,000 44.895 31-12-2017 9
2012 – 53,000 – – 53,000 44.52 31-12-2018 8
Total 189,700 53,000 35,000 – 207,700
K.S. Wester 2006 125,000 125,000 – 36.20 52.90 31-12-2012 8
2007 125,000 125,000 52.80 31-12-2013 8
2008 107,500 107,500 20.485 31-12-2014 11
2009 90,000 90,000 40.26 31-12-2015 10
2010 79,400 79,400 61.50 31-12-2016 10
2011 80,000 80,000 44.895 31-12-2017 9
2012 – – – – –
Total 606,900 – 125,000 – 481,900
A. Steenbakker 2006 75,000 75,000 – 36.20 50.76 31-12-2012 8
2007 75,000 75,000 52.80 31-12-2013 8
2008 67,500 67,500 20.485 31-12-2014 11
2009 60,000 60,000 40.26 31-12-2015 10
2010 52,900 52,900 61.50 31-12-2016 10
2011 53,000 53,000 44.895 31-12-2017 9
2012 – – – – – 9
Total 383,400 – 75,000 – 308,400
Total 2,255,200 219,000 345,000 – 2,129,200
Given that Mr. P. van Riel and Mr. A. Jonkman were not able to exercise their 2006 options due to legal
constraints, the company decided to extend the exercise period with 74 days (including a closed period of
56 days) with no costs for the company.
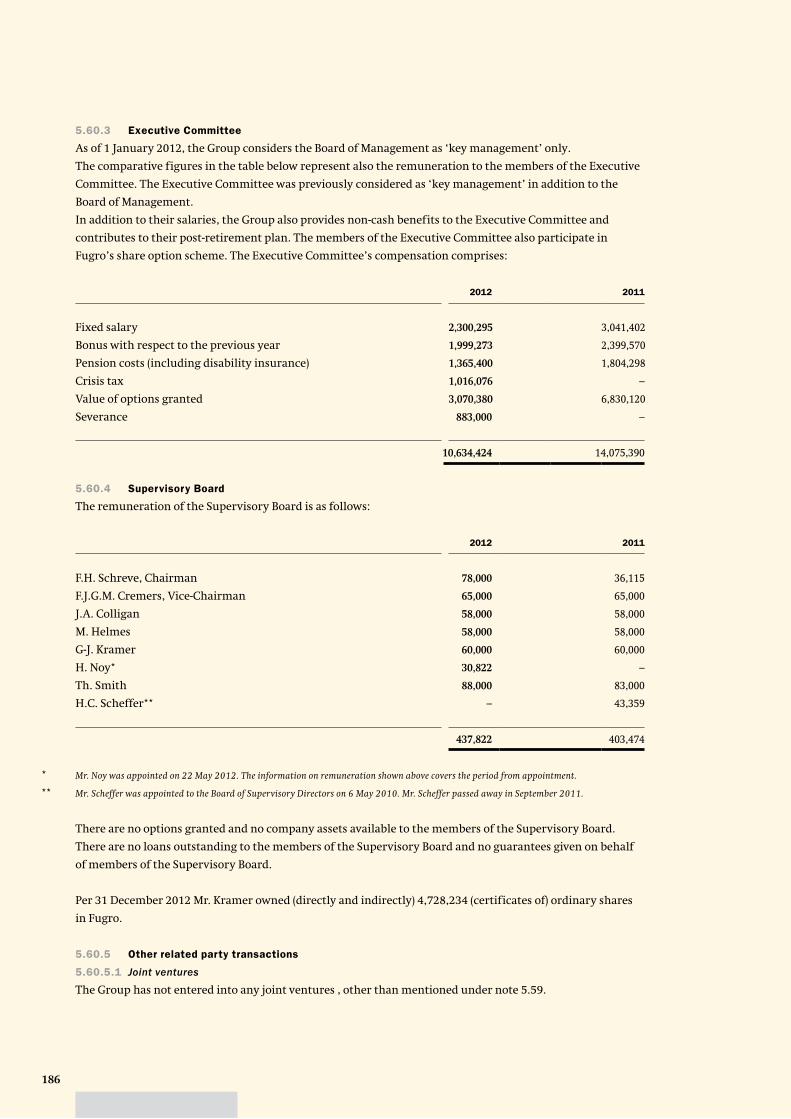
186
5.60.3 Executive Committee
As of 1 January 2012, the Group considers the Board of Management as ‘key management’ only.
The comparative figures in the table below represent also the remuneration to the members of the Executive
Committee. The Executive Committee was previously considered as ‘key management’ in addition to the
Board of Management.
In addition to their salaries, the Group also provides non-cash benefits to the Executive Committee and
contributes to their post-retirement plan. The members of the Executive Committee also participate in
Fugro’s share option scheme. The Executive Committee’s compensation comprises:
2012 2011
Fixed salary 2,300,295 3,041,402
Bonus with respect to the previous year 1,999,273 2,399,570
Pension costs (including disability insurance) 1,365,400 1,804,298
Crisis tax 1,016,076 –
Value of options granted 3,070,380 6,830,120
Severance 883,000 –
10,634,424 14,075,390
5.60.4 Supervisory Board
The remuneration of the Supervisory Board is as follows:
2012 2011
F.H. Schreve, Chairman 78,000 36,115
F.J.G.M. Cremers, Vice-Chairman 65,000 65,000
J.A. Colligan 58,000 58,000
M. Helmes 58,000 58,000
G-J. Kramer 60,000 60,000
H. Noy* 30,822 –
Th. Smith 88,000 83,000
H.C. Scheffer** – 43,359
437,822 403,474
* Mr. Noy was appointed on 22 May 2012. The information on remuneration shown above covers the period from appointment.
** Mr. Scheffer was appointed to the Board of Supervisory Directors on 6 May 2010. Mr. Scheffer passed away in September 2011.
There are no options granted and no company assets available to the members of the Supervisory Board.
There are no loans outstanding to the members of the Supervisory Board and no guarantees given on behalf
of members of the Supervisory Board.
Per 31 December 2012 Mr. Kramer owned (directly and indirectly) 4,728,234 (certificates of) ordinary shares
in Fugro.
5.60.5 Other related party transactions
5.60.5.1 Joint ventures
The Group has not entered into any joint ventures , other than mentioned under note 5.59.
187Fugro Financial statements 2012
5.61 S u b s i d i a r i e s
5.61.1 Significant subsidiaries
For an overview of (significant) subsidiaries we refer to chapter 6.
5.62 E s t i m a t e s a n d m a n a ge m e n t j u d ge m e n t s
Management discussed with the Audit Committee the development in and choice of critical accounting
principles and estimates and the application of such principles and estimates.
Key sources of estimation uncertainty
The preparation of financial statements in conformity with EU-IFRS requires management to make
judgements, estimates and assumptions that affect the application of accounting policies and the reported
amounts of assets, liabilities, income and expenses. Actual results may differ from these estimates. Estimates
and underlying assumptions are reviewed on an ongoing basis. Revisions to accounting estimates are
recognised in the period in which the estimates are revised if the revision affects only that period, or in the
period of the revision and future periods if the revision affects both current and future periods. Information
about critical judgements in applying accounting policies that have the most significant effect on the amounts
recognised in the consolidated financial statements is included in the following notes:
– Deferred tax: The assumptions used in recognition and measurement of deferred taxes are disclosed in
note 5.41.
– Impairments: Impairment analyses, amongst other relating to vessels, are performed whenever a triggering
event has occurred to determine whether the carrying value exceeds the recoverable amount. Goodwill is at
least tested for impairment annually. Impairment tests are based on estimates of future cash f lows. The
accounting policies regarding impairments are included in note 5.16. Note 5.38 contains information about
the key assumptions used to determine the recoverable amount of the various cash generating units.
Specific information on credit risk is disclosed in notes 5.52.2 and 5.53. These notes contain information
about the assumptions used relating to impairment of trade receivables, unbilled revenue on completed
projects and other receivables and appropriate sensitivity analysis.
– Assets and liabilities from employee benefits: Actuarial assumptions are established to anticipate future
events and are used in calculating pension and other post retirement benefit expenses and liabilities. These
factors include assumptions with respect to interest rates, expected investment returns on plan assets, rates
of future compensation increases, turnover rates and life expectancy. Note 5.49 contains information about
the (actuarial) assumptions related to employee benefits. Actuarial gains and losses related to defined
benefit plans are accounted for in other comprehensive income.
– Seismic and geological data libraries: significant estimates relate mainly to the determination of net
realisable value. The determination of net realisable value requires significant judgment and is determined
based on expected sales cash f lows. Management first assess whether write downs to net realisable value for
individual libraries is needed based on specific circumstances. Then management assess write downs of data
libraries by reference in groups of libraries with similar characteristics, with respect to amongst others 2-D
versus 3-D, customers and geographical area. The group uses sales estimates that are based on our budget
plan for next year, sales prospects and an outlook for the seismic industry. Changes in assumptions, in
particular the expected sales cash f lows, could significantly affect the net realisable value and write- down
to the carrying value of our multi-client data library.
– Other provisions, tax and other contingencies: Information on the assumptions used in estimating the
effect of legal claims is included in note 5.24 and 5.50.
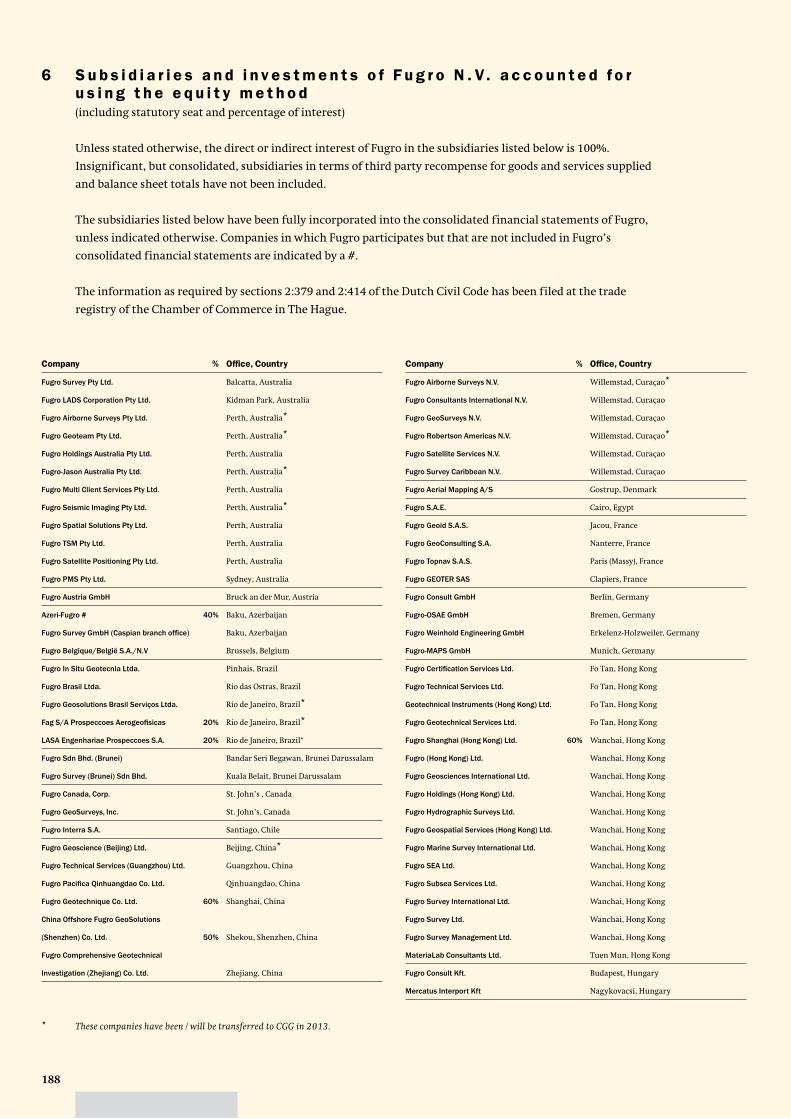
188
Unless stated otherwise, the direct or indirect interest of Fugro in the subsidiaries listed below is 100%.
Insignificant, but consolidated, subsidiaries in terms of third party recompense for goods and services supplied
and balance sheet totals have not been included.
The subsidiaries listed below have been fully incorporated into the consolidated financial statements of Fugro,
unless indicated otherwise. Companies in which Fugro participates but that are not included in Fugro’s
consolidated financial statements are indicated by a #.
The information as required by sections 2:379 and 2:414 of the Dutch Civil Code has been filed at the trade
registry of the Chamber of Commerce in The Hague.
6 S u b s i d i a r i e s a n d i n v e s t m e n t s o f F u g r o N . V. a c c o u n t e d f o r u s i n g t h e e q u i t y m e t h o d(including statutory seat and percentage of interest)
Fugro Survey Pty Ltd. Balcatta, Australia
Fugro LADS Corporation Pty Ltd. Kidman Park, Australia
Fugro Airborne Surveys Pty Ltd. Perth, Australia*
Fugro Geoteam Pty Ltd. Perth, Australia*
Fugro Holdings Australia Pty Ltd. Perth, Australia
Fugro-Jason Australia Pty Ltd. Perth, Australia*
Fugro Multi Client Services Pty Ltd. Perth, Australia
Fugro Seismic Imaging Pty Ltd. Perth, Australia*
Fugro Spatial Solutions Pty Ltd. Perth, Australia
Fugro TSM Pty Ltd. Perth, Australia
Fugro Satellite Positioning Pty Ltd. Perth, Australia
Fugro PMS Pty Ltd. Sydney, Australia
Fugro Austria GmbH Bruck an der Mur, Austria
Azeri-Fugro # 40% Baku, Azerbaijan
Fugro Survey GmbH (Caspian branch offi ce) Baku, Azerbaijan
Fugro Belgique/België S.A./N.V Brussels, Belgium
Fugro In Situ Geotecnia Ltda. Pinhais, Brazil
Fugro Brasil Ltda. Rio das Ostras, Brazil
Fugro Geosolutions Brasil Serviços Ltda. Rio de Janeiro, Brazil*
Fag S/A Prospeccoes Aerogeofi sicas 20% Rio de Janeiro, Brazil*
LASA Engenhariae Prospeccoes S.A. 20% Rio de Janeiro, Brazil*
Fugro Sdn Bhd. (Brunei) Bandar Seri Begawan, Brunei Darussalam
Fugro Survey (Brunei) Sdn Bhd. Kuala Belait, Brunei Darussalam
Fugro Canada, Corp. St. John’s , Canada
Fugro GeoSurveys, Inc. St. John’s, Canada
Fugro Interra S.A. Santiago, Chile
Fugro Geoscience (Beijing) Ltd. Beijing, China*
Fugro Technical Services (Guangzhou) Ltd. Guangzhou, China
Fugro Pacifi ca Qinhuangdao Co. Ltd. Qinhuangdao, China
Fugro Geotechnique Co. Ltd. 60% Shanghai, China
China Offshore Fugro GeoSolutions
(Shenzhen) Co. Ltd. 50% Shekou, Shenzhen, China
Fugro Comprehensive Geotechnical
Investigation (Zhejiang) Co. Ltd. Zhejiang, China
Fugro Airborne Surveys N.V. Willemstad, Curaçao*
Fugro Consultants International N.V. Willemstad, Curaçao
Fugro GeoSurveys N.V. Willemstad, Curaçao
Fugro Robertson Americas N.V. Willemstad, Curaçao*
Fugro Satellite Services N.V. Willemstad, Curaçao
Fugro Survey Caribbean N.V. Willemstad, Curaçao
Fugro Aerial Mapping A/S Gostrup, Denmark
Fugro S.A.E. Cairo, Egypt
Fugro Geoid S.A.S. Jacou, France
Fugro GeoConsulting S.A. Nanterre, France
Fugro Topnav S.A.S. Paris (Massy), France
Fugro GEOTER SAS Clapiers, France
Fugro Consult GmbH Berlin, Germany
Fugro-OSAE GmbH Bremen, Germany
Fugro Weinhold Engineering GmbH Erkelenz-Holzweiler, Germany
Fugro-MAPS GmbH Munich, Germany
Fugro Certifi cation Services Ltd. Fo Tan, Hong Kong
Fugro Technical Services Ltd. Fo Tan, Hong Kong
Geotechnical Instruments (Hong Kong) Ltd. Fo Tan, Hong Kong
Fugro Geotechnical Services Ltd. Fo Tan, Hong Kong
Fugro Shanghai (Hong Kong) Ltd. 60% Wanchai, Hong Kong
Fugro (Hong Kong) Ltd. Wanchai, Hong Kong
Fugro Geosciences International Ltd. Wanchai, Hong Kong
Fugro Holdings (Hong Kong) Ltd. Wanchai, Hong Kong
Fugro Hydrographic Surveys Ltd. Wanchai, Hong Kong
Fugro Geospatial Services (Hong Kong) Ltd. Wanchai, Hong Kong
Fugro Marine Survey International Ltd. Wanchai, Hong Kong
Fugro SEA Ltd. Wanchai, Hong Kong
Fugro Subsea Services Ltd. Wanchai, Hong Kong
Fugro Survey International Ltd. Wanchai, Hong Kong
Fugro Survey Ltd. Wanchai, Hong Kong
Fugro Survey Management Ltd. Wanchai, Hong Kong
MateriaLab Consultants Ltd. Tuen Mun, Hong Kong
Fugro Consult Kft. Budapest, Hungary
Mercatus Interport Kft Nagykovacsi, Hungary
Company % Offi ce, Country Company % Offi ce, Country
* These companies have been / will be transferred to CGG in 2013.
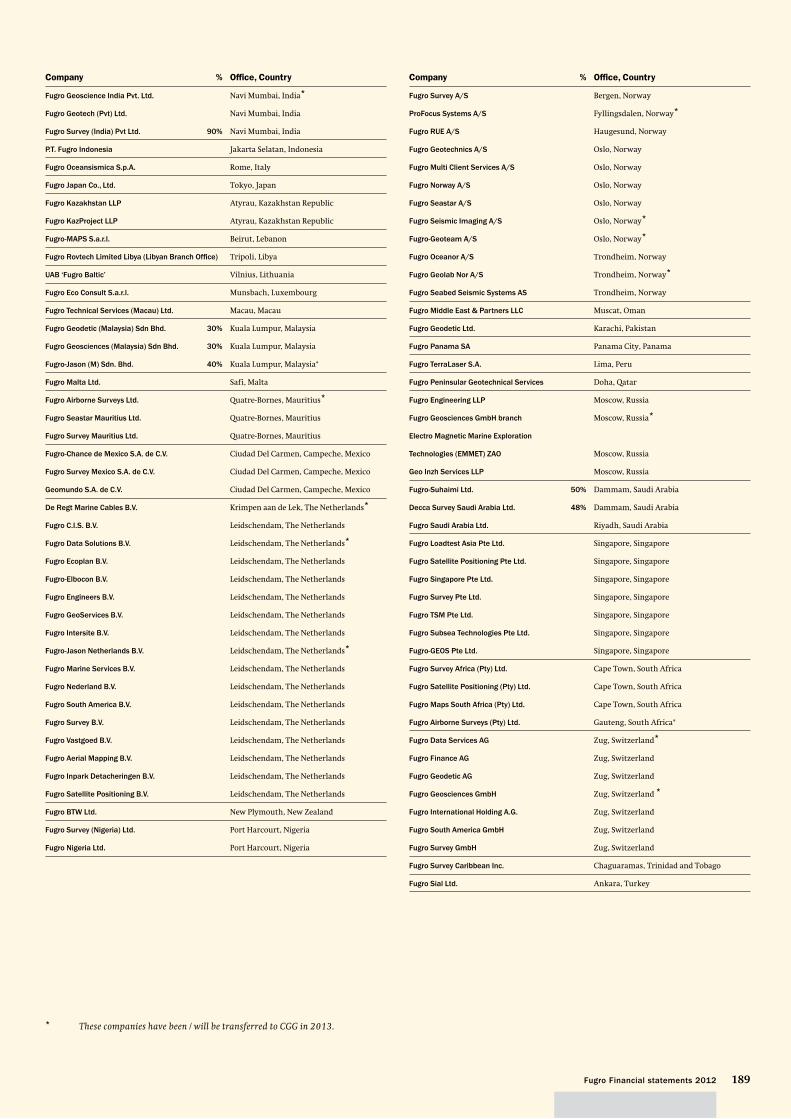
189Fugro Financial statements 2012
Fugro Geoscience India Pvt. Ltd. Navi Mumbai, India*
Fugro Geotech (Pvt) Ltd. Navi Mumbai, India
Fugro Survey (India) Pvt Ltd. 90% Navi Mumbai, India
P.T. Fugro Indonesia Jakarta Selatan, Indonesia
Fugro Oceansismica S.p.A. Rome, Italy
Fugro Japan Co., Ltd. Tokyo, Japan
Fugro Kazakhstan LLP Atyrau, Kazakhstan Republic
Fugro KazProject LLP Atyrau, Kazakhstan Republic
Fugro-MAPS S.a.r.l. Beirut, Lebanon
Fugro Rovtech Limited Libya (Libyan Branch Offi ce) Tripoli, Libya
UAB ‘Fugro Baltic’ Vilnius, Lithuania
Fugro Eco Consult S.a.r.l. Munsbach, Luxembourg
Fugro Technical Services (Macau) Ltd. Macau, Macau
Fugro Geodetic (Malaysia) Sdn Bhd. 30% Kuala Lumpur, Malaysia
Fugro Geosciences (Malaysia) Sdn Bhd. 30% Kuala Lumpur, Malaysia
Fugro-Jason (M) Sdn. Bhd. 40% Kuala Lumpur, Malaysia*
Fugro Malta Ltd. Safi, Malta
Fugro Airborne Surveys Ltd. Quatre-Bornes, Mauritius*
Fugro Seastar Mauritius Ltd. Quatre-Bornes, Mauritius
Fugro Survey Mauritius Ltd. Quatre-Bornes, Mauritius
Fugro-Chance de Mexico S.A. de C.V. Ciudad Del Carmen, Campeche, Mexico
Fugro Survey Mexico S.A. de C.V. Ciudad Del Carmen, Campeche, Mexico
Geomundo S.A. de C.V. Ciudad Del Carmen, Campeche, Mexico
De Regt Marine Cables B.V. Krimpen aan de Lek, The Netherlands*
Fugro C.I.S. B.V. Leidschendam, The Netherlands
Fugro Data Solutions B.V. Leidschendam, The Netherlands*
Fugro Ecoplan B.V. Leidschendam, The Netherlands
Fugro-Elbocon B.V. Leidschendam, The Netherlands
Fugro Engineers B.V. Leidschendam, The Netherlands
Fugro GeoServices B.V. Leidschendam, The Netherlands
Fugro Intersite B.V. Leidschendam, The Netherlands
Fugro-Jason Netherlands B.V. Leidschendam, The Netherlands*
Fugro Marine Services B.V. Leidschendam, The Netherlands
Fugro Nederland B.V. Leidschendam, The Netherlands
Fugro South America B.V. Leidschendam, The Netherlands
Fugro Survey B.V. Leidschendam, The Netherlands
Fugro Vastgoed B.V. Leidschendam, The Netherlands
Fugro Aerial Mapping B.V. Leidschendam, The Netherlands
Fugro Inpark Detacheringen B.V. Leidschendam, The Netherlands
Fugro Satellite Positioning B.V. Leidschendam, The Netherlands
Fugro BTW Ltd. New Plymouth, New Zealand
Fugro Survey (Nigeria) Ltd. Port Harcourt, Nigeria
Fugro Nigeria Ltd. Port Harcourt, Nigeria
Fugro Survey A/S Bergen, Norway
ProFocus Systems A/S Fyllingsdalen, Norway*
Fugro RUE A/S Haugesund, Norway
Fugro Geotechnics A/S Oslo, Norway
Fugro Multi Client Services A/S Oslo, Norway
Fugro Norway A/S Oslo, Norway
Fugro Seastar A/S Oslo, Norway
Fugro Seismic Imaging A/S Oslo, Norway*
Fugro-Geoteam A/S Oslo, Norway*
Fugro Oceanor A/S Trondheim, Norway
Fugro Geolab Nor A/S Trondheim, Norway*
Fugro Seabed Seismic Systems AS Trondheim, Norway
Fugro Middle East & Partners LLC Muscat, Oman
Fugro Geodetic Ltd. Karachi, Pakistan
Fugro Panama SA Panama City, Panama
Fugro TerraLaser S.A. Lima, Peru
Fugro Peninsular Geotechnical Services Doha, Qatar
Fugro Engineering LLP Moscow, Russia
Fugro Geosciences GmbH branch Moscow, Russia*
Electro Magnetic Marine Exploration
Technologies (EMMET) ZAO Moscow, Russia
Geo Inzh Services LLP Moscow, Russia
Fugro-Suhaimi Ltd. 50% Dammam, Saudi Arabia
Decca Survey Saudi Arabia Ltd. 48% Dammam, Saudi Arabia
Fugro Saudi Arabia Ltd. Riyadh, Saudi Arabia
Fugro Loadtest Asia Pte Ltd. Singapore, Singapore
Fugro Satellite Positioning Pte Ltd. Singapore, Singapore
Fugro Singapore Pte Ltd. Singapore, Singapore
Fugro Survey Pte Ltd. Singapore, Singapore
Fugro TSM Pte Ltd. Singapore, Singapore
Fugro Subsea Technologies Pte Ltd. Singapore, Singapore
Fugro-GEOS Pte Ltd. Singapore, Singapore
Fugro Survey Africa (Pty) Ltd. Cape Town, South Africa
Fugro Satellite Positioning (Pty) Ltd. Cape Town, South Africa
Fugro Maps South Africa (Pty) Ltd. Cape Town, South Africa
Fugro Airborne Surveys (Pty) Ltd. Gauteng, South Africa*
Fugro Data Services AG Zug, Switzerland*
Fugro Finance AG Zug, Switzerland
Fugro Geodetic AG Zug, Switzerland
Fugro Geosciences GmbH Zug, Switzerland *
Fugro International Holding A.G. Zug, Switzerland
Fugro South America GmbH Zug, Switzerland
Fugro Survey GmbH Zug, Switzerland
Fugro Survey Caribbean Inc. Chaguaramas, Trinidad and Tobago
Fugro Sial Ltd. Ankara, Turkey
Company % Offi ce, Country Company % Offi ce, Country
* These companies have been / will be transferred to CGG in 2013.
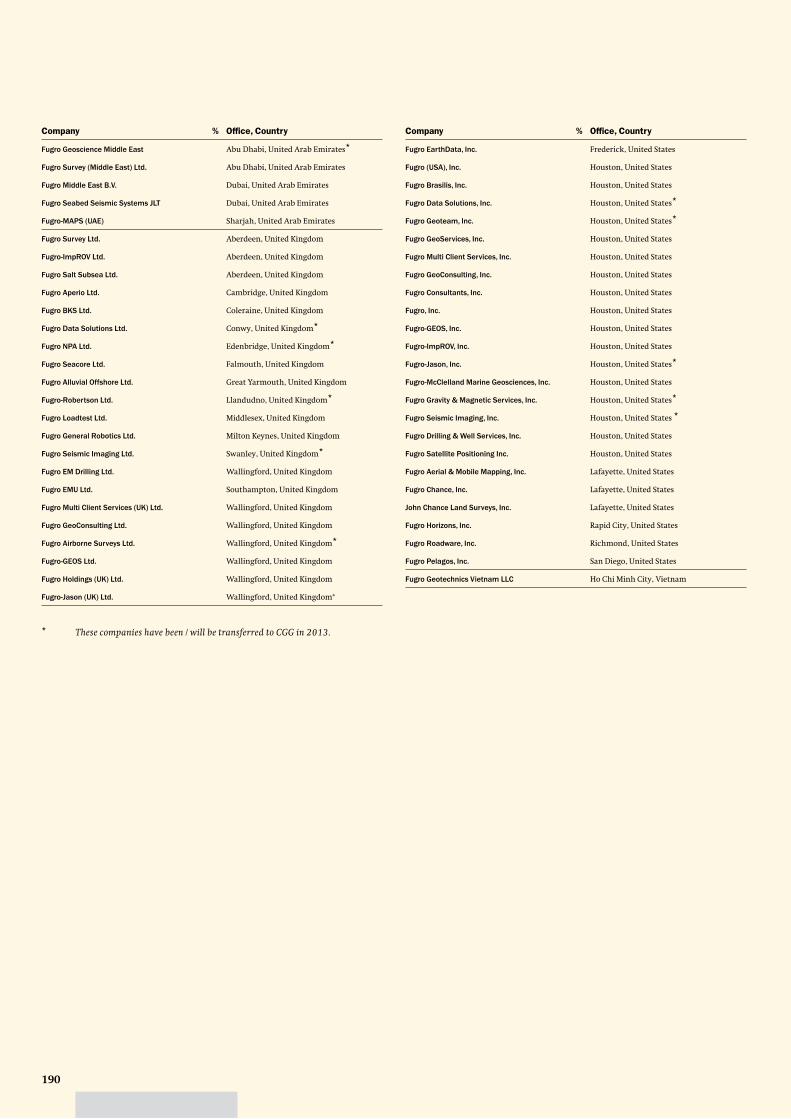
190
Fugro Geoscience Middle East Abu Dhabi, United Arab Emirates*
Fugro Survey (Middle East) Ltd. Abu Dhabi, United Arab Emirates
Fugro Middle East B.V. Dubai, United Arab Emirates
Fugro Seabed Seismic Systems JLT Dubai, United Arab Emirates
Fugro-MAPS (UAE) Sharjah, United Arab Emirates
Fugro Survey Ltd. Aberdeen, United Kingdom
Fugro-ImpROV Ltd. Aberdeen, United Kingdom
Fugro Salt Subsea Ltd. Aberdeen, United Kingdom
Fugro Aperio Ltd. Cambridge, United Kingdom
Fugro BKS Ltd. Coleraine, United Kingdom
Fugro Data Solutions Ltd. Conwy, United Kingdom*
Fugro NPA Ltd. Edenbridge, United Kingdom*
Fugro Seacore Ltd. Falmouth, United Kingdom
Fugro Alluvial Offshore Ltd. Great Yarmouth, United Kingdom
Fugro-Robertson Ltd. Llandudno, United Kingdom*
Fugro Loadtest Ltd. Middlesex, United Kingdom
Fugro General Robotics Ltd. Milton Keynes, United Kingdom
Fugro Seismic Imaging Ltd. Swanley, United Kingdom*
Fugro EM Drilling Ltd. Wallingford, United Kingdom
Fugro EMU Ltd. Southampton, United Kingdom
Fugro Multi Client Services (UK) Ltd. Wallingford, United Kingdom
Fugro GeoConsulting Ltd. Wallingford, United Kingdom
Fugro Airborne Surveys Ltd. Wallingford, United Kingdom*
Fugro-GEOS Ltd. Wallingford, United Kingdom
Fugro Holdings (UK) Ltd. Wallingford, United Kingdom
Fugro-Jason (UK) Ltd. Wallingford, United Kingdom*
Fugro EarthData, Inc. Frederick, United States
Fugro (USA), Inc. Houston, United States
Fugro Brasilis, Inc. Houston, United States
Fugro Data Solutions, Inc. Houston, United States*
Fugro Geoteam, Inc. Houston, United States*
Fugro GeoServices, Inc. Houston, United States
Fugro Multi Client Services, Inc. Houston, United States
Fugro GeoConsulting, Inc. Houston, United States
Fugro Consultants, Inc. Houston, United States
Fugro, Inc. Houston, United States
Fugro-GEOS, Inc. Houston, United States
Fugro-ImpROV, Inc. Houston, United States
Fugro-Jason, Inc. Houston, United States*
Fugro-McClelland Marine Geosciences, Inc. Houston, United States
Fugro Gravity & Magnetic Services, Inc. Houston, United States*
Fugro Seismic Imaging, Inc. Houston, United States *
Fugro Drilling & Well Services, Inc. Houston, United States
Fugro Satellite Positioning Inc. Houston, United States
Fugro Aerial & Mobile Mapping, Inc. Lafayette, United States
Fugro Chance, Inc. Lafayette, United States
John Chance Land Surveys, Inc. Lafayette, United States
Fugro Horizons, Inc. Rapid City, United States
Fugro Roadware, Inc. Richmond, United States
Fugro Pelagos, Inc. San Diego, United States
Fugro Geotechnics Vietnam LLC Ho Chi Minh City, Vietnam
Company % Offi ce, Country Company % Offi ce, Country
* These companies have been / will be transferred to CGG in 2013.
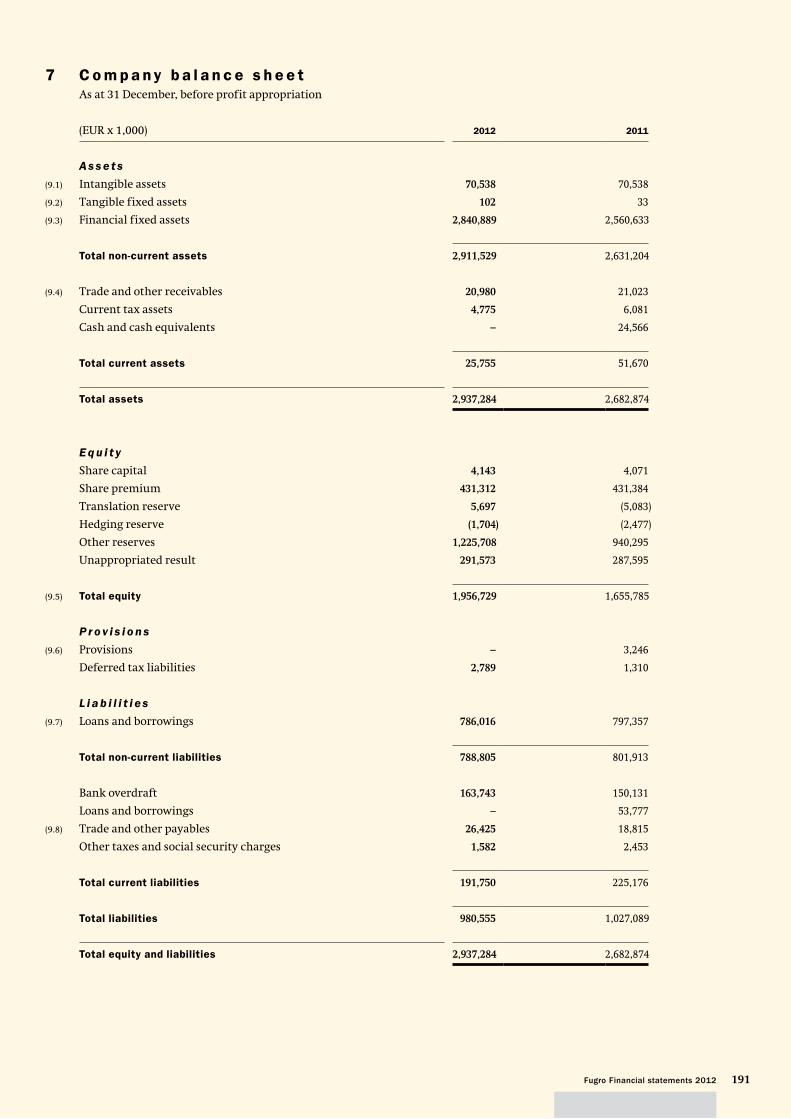
191Fugro Financial statements 2012
(EUR x 1,000) 2012 2011
A s s e t s
(9.1) Intangible assets 70,538 70,538
(9.2) Tangible fixed assets 102 33
(9.3) Financial fixed assets 2,840,889 2,560,633
Total non-current assets 2,911,529 2,631,204
(9.4) Trade and other receivables 20,980 21,023
Current tax assets 4,775 6,081
Cash and cash equivalents – 24,566
Total current assets 25,755 51,670
Total assets 2,937,284 2,682,874
E q u i t y
Share capital 4,143 4,071
Share premium 431,312 431,384
Translation reserve 5,697 (5,083)
Hedging reserve (1,704) (2,477)
Other reserves 1,225,708 940,295
Unappropriated result 291,573 287,595
(9.5) Total equity 1,956,729 1,655,785
P r o v i s i o n s
(9.6) Provisions – 3,246
Deferred tax liabilities 2,789 1,310
L i a b i l i t i e s
(9.7) Loans and borrowings 786,016 797,357
Total non-current liabilities 788,805 801,913
Bank overdraft 163,743 150,131
Loans and borrowings – 53,777
(9.8) Trade and other payables 26,425 18,815
Other taxes and social security charges 1,582 2,453
Total current liabilities 191,750 225,176
Total liabilities 980,555 1,027,089
Total equity and liabilities 2,937,284 2,682,874
7 C o m p a ny b a l a n c e s h e e tAs at 31 December, before profit appropriation
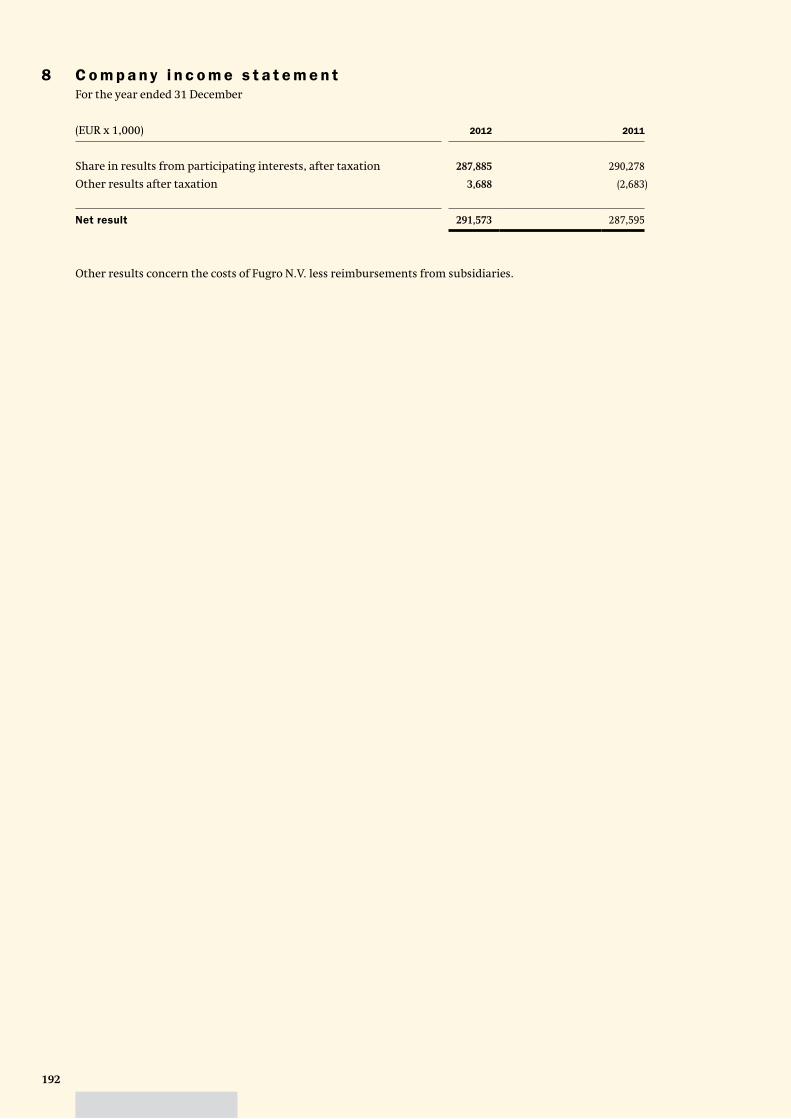
192
(EUR x 1,000) 2012 2011
Share in results from participating interests, after taxation 287,885 290,278
Other results after taxation 3,688 (2,683)
Net result 291,573 287,595
Other results concern the costs of Fugro N.V. less reimbursements from subsidiaries.
8 C o m p a ny i n c o m e s t a t e m e n tFor the year ended 31 December
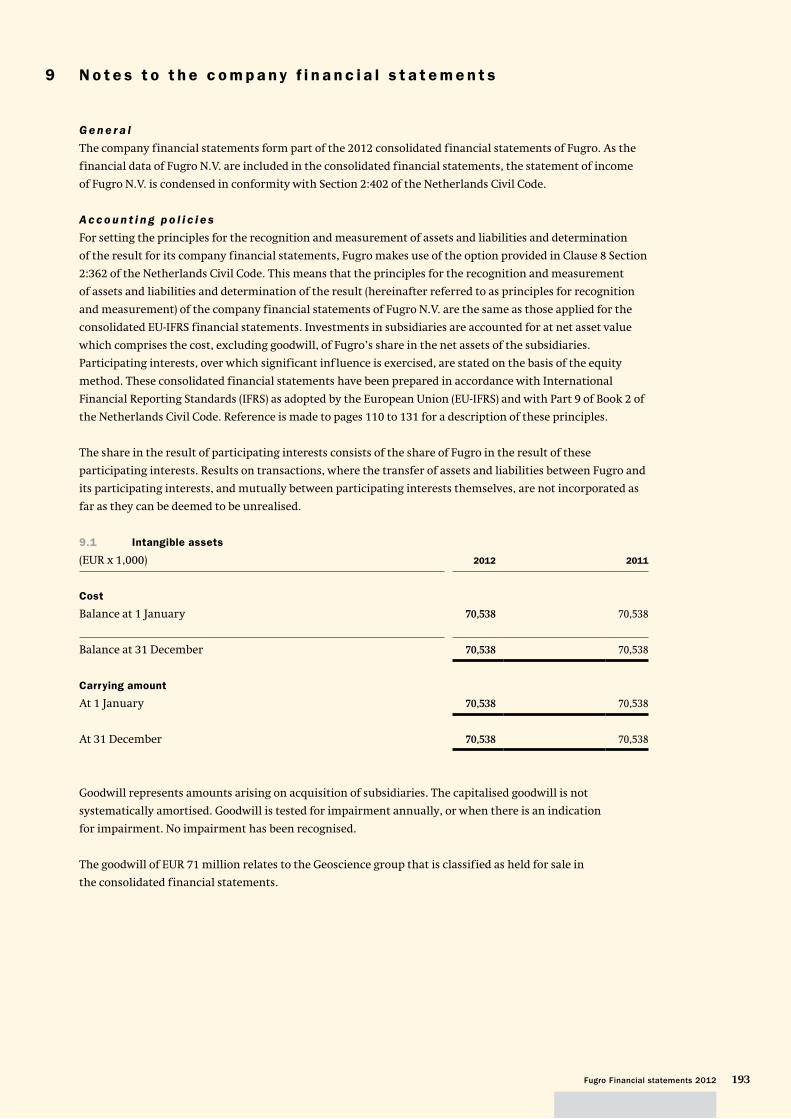
193Fugro Financial statements 2012
G e n e r a l
The company financial statements form part of the 2012 consolidated financial statements of Fugro. As the
financial data of Fugro N.V. are included in the consolidated financial statements, the statement of income
of Fugro N.V. is condensed in conformity with Section 2:402 of the Netherlands Civil Code.
A c c o u n t i n g p o l i c i e s
For setting the principles for the recognition and measurement of assets and liabilities and determination
of the result for its company financial statements, Fugro makes use of the option provided in Clause 8 Section
2:362 of the Netherlands Civil Code. This means that the principles for the recognition and measurement
of assets and liabilities and determination of the result (hereinafter referred to as principles for recognition
and measurement) of the company financial statements of Fugro N.V. are the same as those applied for the
consolidated EU-IFRS financial statements. Investments in subsidiaries are accounted for at net asset value
which comprises the cost, excluding goodwill, of Fugro’s share in the net assets of the subsidiaries.
Participating interests, over which significant influence is exercised, are stated on the basis of the equity
method. These consolidated financial statements have been prepared in accordance with International
Financial Reporting Standards (IFRS) as adopted by the European Union (EU-IFRS) and with Part 9 of Book 2 of
the Netherlands Civil Code. Reference is made to pages 110 to 131 for a description of these principles.
The share in the result of participating interests consists of the share of Fugro in the result of these
participating interests. Results on transactions, where the transfer of assets and liabilities between Fugro and
its participating interests, and mutually between participating interests themselves, are not incorporated as
far as they can be deemed to be unrealised.
9.1 Intangible assets
(EUR x 1,000) 2012 2011
Cost
Balance at 1 January 70,538 70,538
Balance at 31 December 70,538 70,538
Carrying amount
At 1 January 70,538 70,538
At 31 December 70,538 70,538
Goodwill represents amounts arising on acquisition of subsidiaries. The capitalised goodwill is not
systematically amortised. Goodwill is tested for impairment annually, or when there is an indication
for impairment. No impairment has been recognised.
The goodwill of EUR 71 million relates to the Geoscience group that is classified as held for sale in
the consolidated financial statements.
9 N o t e s t o t h e c o m p a ny f i n a n c i a l s t a t e m e n t s
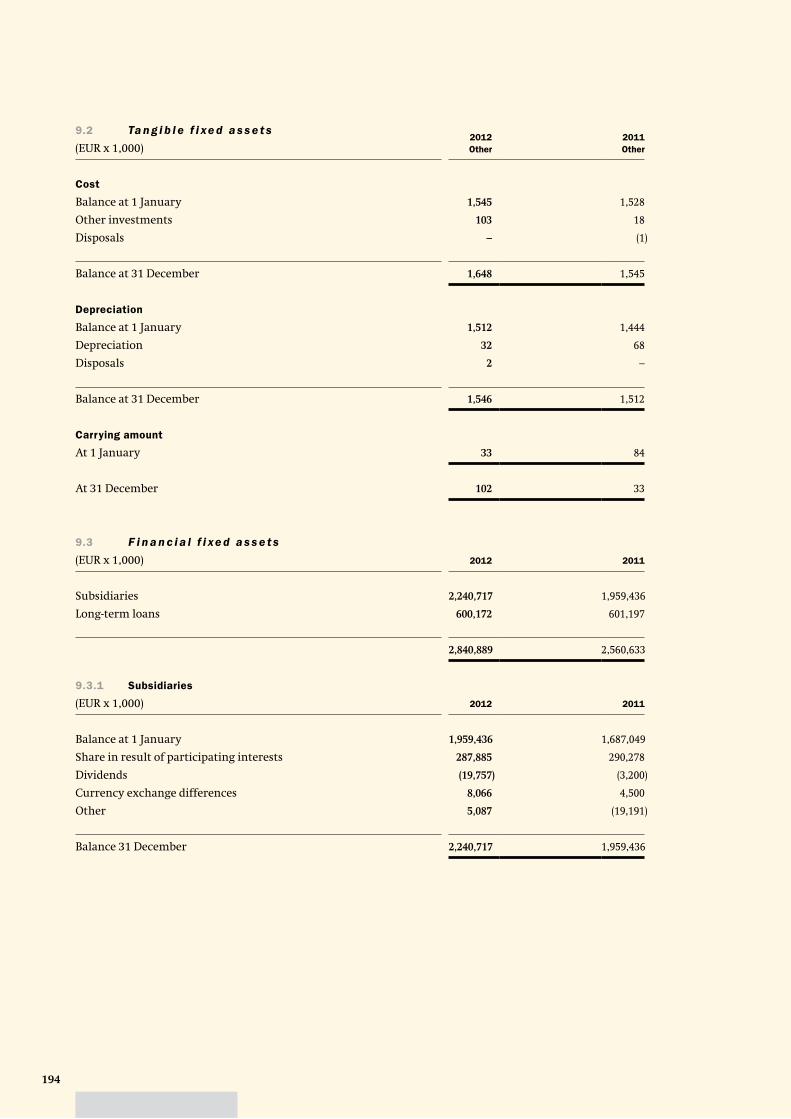
194
9.2 Ta n g i b l e f i xe d a s s e t s
(EUR x 1,000)2012
Other
2011
Other
Cost
Balance at 1 January 1,545 1,528
Other investments 103 18
Disposals – (1)
Balance at 31 December 1,648 1,545
Depreciation
Balance at 1 January 1,512 1,444
Depreciation 32 68
Disposals 2 –
Balance at 31 December 1,546 1,512
Carrying amount
At 1 January 33 84
At 31 December 102 33
9.3 F i n a n c i a l f i xe d a s s e t s
(EUR x 1,000) 2012 2011
Subsidiaries 2,240,717 1,959,436
Long-term loans 600,172 601,197
2,840,889 2,560,633
9.3.1 Subsidiaries
(EUR x 1,000) 2012 2011
Balance at 1 January 1,959,436 1,687,049
Share in result of participating interests 287,885 290,278
Dividends (19,757) (3,200)
Currency exchange differences 8,066 4,500
Other 5,087 (19,191)
Balance 31 December 2,240,717 1,959,436
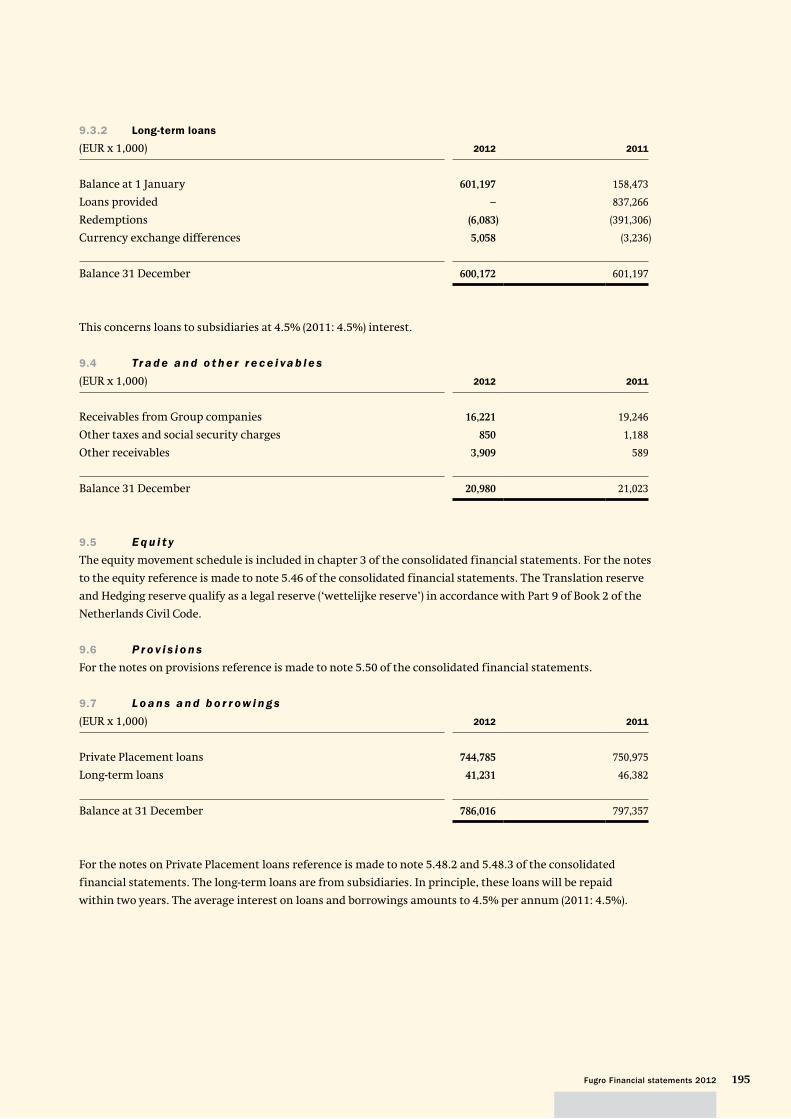
195Fugro Financial statements 2012
9.3.2 Long-term loans
(EUR x 1,000) 2012 2011
Balance at 1 January 601,197 158,473
Loans provided – 837,266
Redemptions (6,083) (391,306)
Currency exchange differences 5,058 (3,236)
Balance 31 December 600,172 601,197
This concerns loans to subsidiaries at 4.5% (2011: 4.5%) interest.
9.4 Tr a d e a n d o t h e r r e c e i va b l e s
(EUR x 1,000) 2012 2011
Receivables from Group companies 16,221 19,246
Other taxes and social security charges 850 1,188
Other receivables 3,909 589
Balance 31 December 20,980 21,023
9.5 E q u i t y
The equity movement schedule is included in chapter 3 of the consolidated financial statements. For the notes
to the equity reference is made to note 5.46 of the consolidated financial statements. The Translation reserve
and Hedging reserve qualify as a legal reserve (‘wettelijke reserve’) in accordance with Part 9 of Book 2 of the
Netherlands Civil Code.
9.6 P r o v i s i o n s
For the notes on provisions reference is made to note 5.50 of the consolidated financial statements.
9.7 L o a n s a n d b o r r ow i n g s
(EUR x 1,000) 2012 2011
Private Placement loans 744,785 750,975
Long-term loans 41,231 46,382
Balance at 31 December 786,016 797,357
For the notes on Private Placement loans reference is made to note 5.48.2 and 5.48.3 of the consolidated
financial statements. The long-term loans are from subsidiaries. In principle, these loans will be repaid
within two years. The average interest on loans and borrowings amounts to 4.5% per annum (2011: 4.5%).
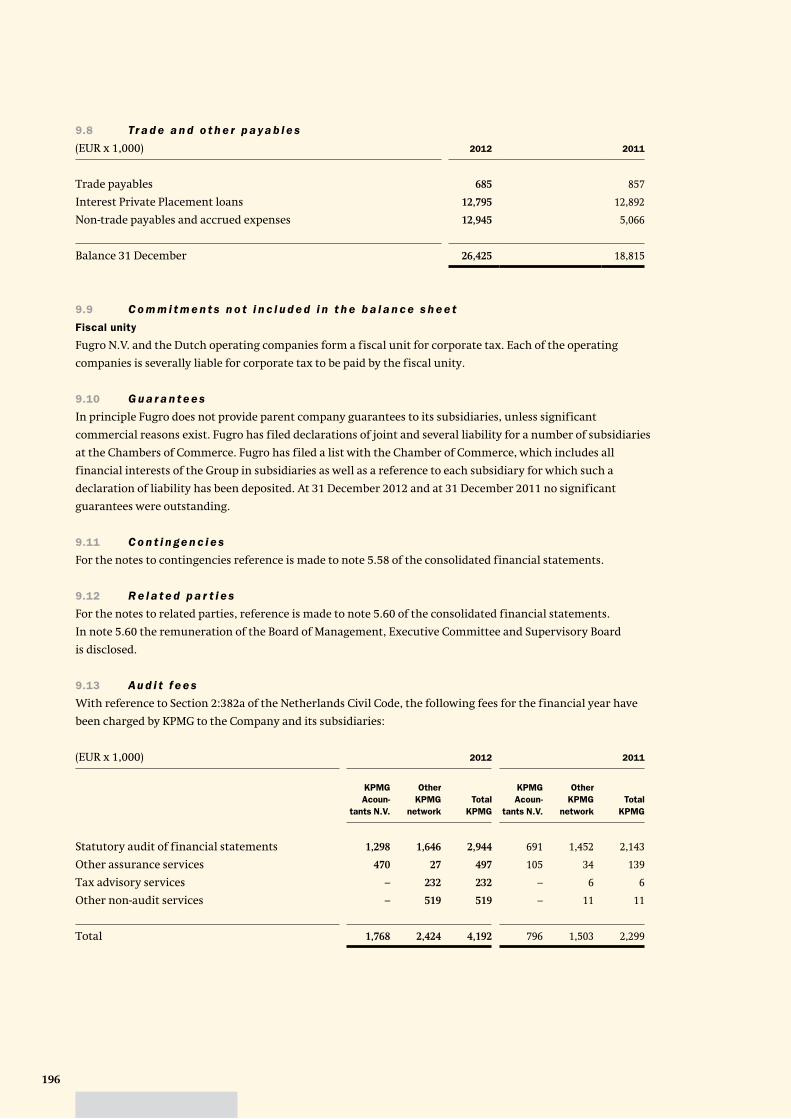
196
9.8 Tr a d e a n d o t h e r p a ya b l e s
(EUR x 1,000) 2012 2011
Trade payables 685 857
Interest Private Placement loans 12,795 12,892
Non-trade payables and accrued expenses 12,945 5,066
Balance 31 December 26,425 18,815
9.9 C o m m i t m e n t s n o t i n c l u d e d i n t h e b a l a n c e s h e e t
Fiscal unity
Fugro N.V. and the Dutch operating companies form a fiscal unit for corporate tax. Each of the operating
companies is severally liable for corporate tax to be paid by the fiscal unity.
9.10 G u a r a n t e e s
In principle Fugro does not provide parent company guarantees to its subsidiaries, unless significant
commercial reasons exist. Fugro has filed declarations of joint and several liability for a number of subsidiaries
at the Chambers of Commerce. Fugro has filed a list with the Chamber of Commerce, which includes all
financial interests of the Group in subsidiaries as well as a reference to each subsidiary for which such a
declaration of liability has been deposited. At 31 December 2012 and at 31 December 2011 no significant
guarantees were outstanding.
9.11 C o n t i n ge n c i e s
For the notes to contingencies reference is made to note 5.58 of the consolidated financial statements.
9.12 R e l a t e d p a r t i e s
For the notes to related parties, reference is made to note 5.60 of the consolidated financial statements.
In note 5.60 the remuneration of the Board of Management, Executive Committee and Supervisory Board
is disclosed.
9.13 Au d i t f e e s
With reference to Section 2:382a of the Netherlands Civil Code, the following fees for the financial year have
been charged by KPMG to the Company and its subsidiaries:
(EUR x 1,000) 2012 2011
KPMG
Acoun-
tants N.V.
Other
KPMG
network
Total
KPMG
KPMG
Acoun-
tants N.V.
Other
KPMG
network
Total
KPMG
Statutory audit of financial statements 1,298 1,646 2,944 691 1,452 2,143
Other assurance services 470 27 497 105 34 139
Tax advisory services – 232 232 – 6 6
Other non-audit services – 519 519 – 11 11
Total 1,768 2,424 4,192 796 1,503 2,299
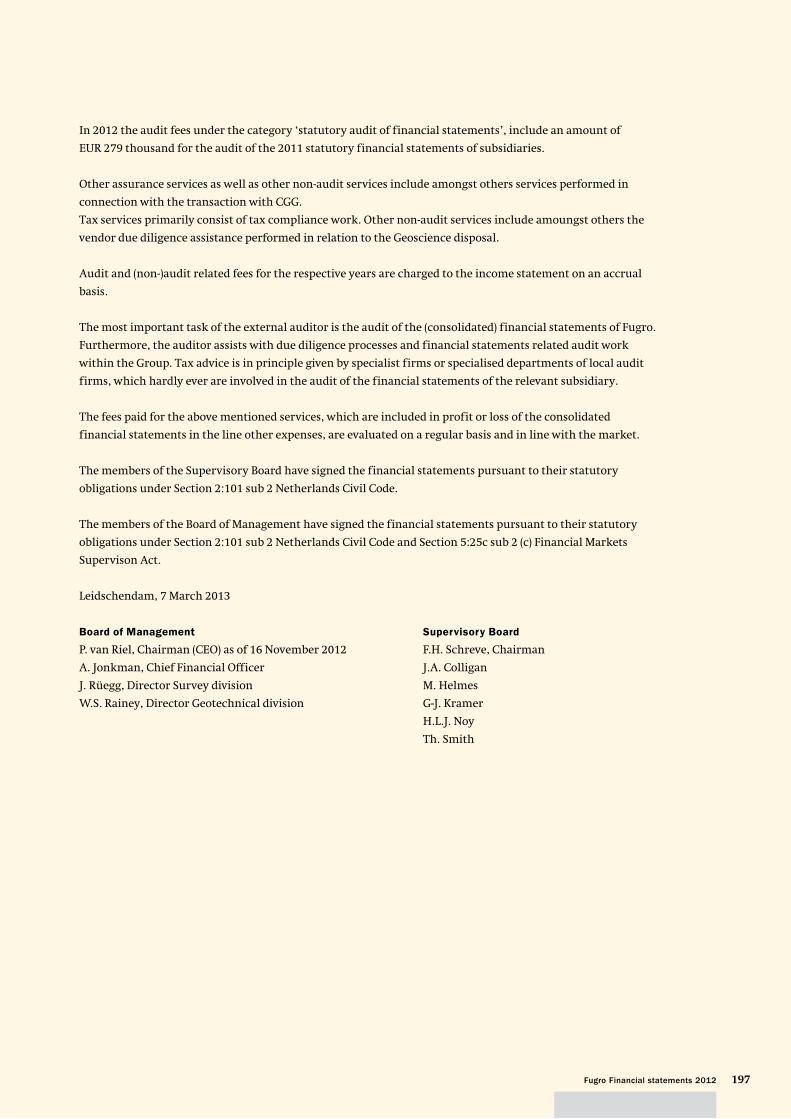
197Fugro Financial statements 2012
In 2012 the audit fees under the category ‘statutory audit of financial statements’, include an amount of
EUR 279 thousand for the audit of the 2011 statutory financial statements of subsidiaries.
Other assurance services as well as other non-audit services include amongst others services performed in
connection with the transaction with CGG.
Tax services primarily consist of tax compliance work. Other non-audit services include amoungst others the
vendor due diligence assistance performed in relation to the Geoscience disposal.
Audit and (non-)audit related fees for the respective years are charged to the income statement on an accrual
basis.
The most important task of the external auditor is the audit of the (consolidated) financial statements of Fugro.
Furthermore, the auditor assists with due diligence processes and financial statements related audit work
within the Group. Tax advice is in principle given by specialist firms or specialised departments of local audit
firms, which hardly ever are involved in the audit of the financial statements of the relevant subsidiary.
The fees paid for the above mentioned services, which are included in profit or loss of the consolidated
financial statements in the line other expenses, are evaluated on a regular basis and in line with the market.
The members of the Supervisory Board have signed the financial statements pursuant to their statutory
obligations under Section 2:101 sub 2 Netherlands Civil Code.
The members of the Board of Management have signed the financial statements pursuant to their statutory
obligations under Section 2:101 sub 2 Netherlands Civil Code and Section 5:25c sub 2 (c) Financial Markets
Supervison Act.
Leidschendam, 7 March 2013
Board of Management Supervisory Board
P. van Riel, Chairman (CEO) as of 16 November 2012 F.H. Schreve, Chairman
A. Jonkman, Chief Financial Officer J.A. Colligan
J. Rüegg, Director Survey division M. Helmes
W.S. Rainey, Director Geotechnical division G-J. Kramer
H.L.J. Noy
Th. Smith
198
10.1 I n d e p e n d e n t Au d i t o r ’s r e p o r t
To: the Supervisory Board and Shareholders of Fugro N.V.
Report on the financial statements
We have audited the accompanying financial statements
2012 of Fugro N.V., Leidschendam, as set out on pages 102
to 197. The financial statements include the consolidated
financial statements and the company financial
statements. The consolidated financial statements
comprise the consolidated statement of financial
position as at 31 December 2012, the consolidated
statements of comprehensive income, of changes in
equity and of cash f lows for the year then ended,
and notes, comprising a summary of the significant
accounting policies and other explanatory information.
The company financial statements comprise the
company balance sheet as at 31 December 2012, the
company income statement for the year then ended
and the notes, comprising a summary of the accounting
policies and other explanatory information.
Board of Management’s responsibility
The Board of Management is responsible for the
preparation and fair presentation of these financial
statements in accordance with International Financial
Reporting Standards as adopted by the European Union
and with Part 9 of Book 2 of the Netherlands Civil Code,
and for the preparation of the Report of the Board of
Management in accordance with Part 9 of Book 2 of the
Netherlands Civil Code. Furthermore, the Board of
Management is responsible for such internal control
as it determines is necessary to enable the preparation
of the financial statements that are free from material
misstatement, whether due to fraud or error.
1 0 O t h e r i n f o r m a t i o n
Auditor’s responsibility
Our responsibility is to express an opinion on these
financial statements based on our audit. We conducted
our audit in accordance with Dutch law, including the
Dutch Standards on Auditing. This requires that we
comply with ethical requirements and plan and perform
the audit to obtain reasonable assurance about whether
the financial statements are free from material
misstatement.
An audit involves performing procedures to obtain audit
evidence about the amounts and disclosures in the
financial statements. The procedures selected depend
on the auditor’s judgment, including the assessment
of the risks of material misstatement of the financial
statements, whether due to fraud or error. In making
those risk assessments, the auditor considers internal
control relevant to the entity’s preparation and fair
presentation of the financial statements in order to
design audit procedures that are appropriate in the
circumstances, but not for the purpose of expressing
an opinion on the effectiveness of the entity’s internal
control. An audit also includes evaluating the
appropriateness of accounting policies used and the
reasonableness of accounting estimates made by the
Board of Management, as well as evaluating the overall
presentation of the financial statements.
We believe that the audit evidence we have obtained
is sufficient and appropriate to provide a basis for our
audit opinion.
Opinion with respect to the consolidated financial
statements
In our opinion, the consolidated financial statements
give a true and fair view of the financial position of Fugro
N.V. as at 31 December 2012 and of its result and its cash
f lows for the year then ended in accordance with
International Financial Reporting Standards as adopted
by the European Union and with Part 9 of Book 2 of the
Netherlands Civil Code.
Opinion with respect to the company financial
statements
In our opinion, the company financial statements give a
true and fair view of the financial position of Fugro N.V.
as at 31 December 2012 and of its result for the year then
ended in accordance with Part 9 of Book 2 of the
Netherlands Civil Code.
199Fugro Financial statements 2012
Report on other legal and regulatory requirements
Pursuant to the legal requirements under Section 2:393
sub 5 at e and f of the Netherlands Civil Code, we have no
deficiencies to report as a result of our examination
whether the Report of the Board of Management, to the
extent we can assess, has been prepared in accordance
with Part 9 of Book 2 of this Code, and whether the
information as required under Section 2:392 sub 1 at b – h
has been annexed. Further, we report that the Report of
the Board of Management, to the extent we can assess, is
consistent with the financial statements as required by
Section 2:391 sub 4 of the Netherlands Civil Code.
Amstelveen, 7 March 2013
KPMG Accountants N.V.
R.P. Kreukniet RA
200
10.2 S u b s e q u e n t e ve n t s
Reference is made to note 5.59.
10.3 Fo u n d a t i o n B o a r d s
Stichting Administratiekantoor Fugro
(‘Fugro Trust Office’)
The Board of the Fugro Trust Office, Leidschendam,
The Netherlands, is composed as follows:
name function term
R. van der Vlist, Chairman Board member 2016
L.P.E.M. van den Boom Board member 2013
J.F. van Duyne Board member 2015
J.A.W.M. van Rooijen Board member 2013
All Board members are independent of Fugro.
Stichting Beschermingspreferente aandelen Fugro
(‘Foundation Protective Preference Shares’)
The Board of Foundation Protective Preference Shares,
Leidschendam, The Netherlands, is composed as follows:
name function term
M.W. den Boogert, Chairman Board member B 2014
M.A.M. Boersma Board member B 2014
R.J.A. van der Bruggen Board member B 2016
J.C. de Mos Board member B 2013
F.H. Schreve Board member A 2013
All Board members, with the exception of
Mr. F.H. Schreve, are independent of Fugro. Mr. Schreve
is the Chairman of the Supervisory Board of Fugro.
Stichting Continuïteit Fugro (‘Foundation Continuity’)
The Board of Foundation Continuity, Curaçao,
is composed as follows:
name function term
G.E. Elias, Chairman Board member B 2016
A.C.M. Goede Board member B 2013
R. de Paus Board member B 2015
M. van der Plank Board member B 2014
F.H. Schreve Board member A
indefinite*
* In capacity as a member of the Supervisory Board of Fugro.
All Board members, with the exception of
Mr. F.H. Schreve, are independent of Fugro. Mr. Schreve
is the Chairman of the Supervisory Board of Fugro.
10.4 S t a t u t o r y p r o v i s i o n s r e ga r d i n g
t h e a p p r o p r i a t i o n o f p r o f i t
The provisions regarding the appropriation of profit are
contained in article 36 of the Articles of Association of
Fugro and, as far as relevant, read as follows:
36.2 a. The profit shall, if sufficient, be applied first
in payment to the holders of protective
preference shares of a percentage as specified
below of the compulsory amount paid on
these shares as at the commencement of the
financial year for which the distribution is
made.
b. The percentage referred to above in
subparagraph a. shall be equal to the average
of the Euribor interest charged for loans with
a term of one year – weighted by the number
of days for which this interest was applicable –
during the financial year for which the
distribution is made, increased by at most four
percentage points; this increase shall each time
be fixed by the Board of Management for a
period of five years, after approval by the
Supervisory Board.
36.3 a. Next, if possible, a dividend shall be paid on the
financing preference shares of each series and
on the convertible financing preference shares
of each series, equal to a percentage calculated
on the amount effectively paid on the
financing preference shares of the respective
series and the convertible financing preference
shares of the respective series, including
a share premium, if any, upon the first issue of
the series in question, and which percentage
shall be related to the average effective return
on ‘state loans general with a term of
7 - 8 years’, calculated and determined in the
manner as described hereinafter.
b. The percentage of the dividend for the
financing preference shares of each or for the
convertible financing preference shares of each
series, as the case may be, shall be calculated
by taking the arithmetic mean of the average
effective return on the aforesaid loans, as
published by Bloomberg, or if Bloomberg
does not publish this information, by Reuters,
for the last five stock market trading days
preceding the day of the first issue of financing
preference shares of the respective series or the
convertible financing preference shares of the
respective series, as the case may be, or
201Fugro Financial statements 2012
preceding the day on which the dividend
percentage is adjusted, increased or decreased,
if applicable, by a mark-up or mark-down set
by the Board of Management upon issue and
approved by the Supervisory Board of at most
two percentage points, depending on the
market conditions then obtaining, which
mark-up or mark-down may differ for each
series, or, if Reuters does not publish this
information or if such state loan and
information source that is or are most
comparable thereto as to be determined by
the board of Management and approved by
the Supervisory Board.
36.4 If in any financial year the profit is insufficient
to make the distributions referred to above in
paragraph 3 of this article, then in subsequent
financial years the provisions of paragraph 3
shall not apply until the deficit has been made
good and until the provisions of paragraph 3
have been applied or until the Board of
Management, with the approval of the
Supervisory Board, resolves to charge an
amount equal to the deficit to the freely
distributable reserves, with the exception
of the reserves which have been set aside as
share premium upon the issue of financing
preference shares or convertible financing
preference shares.
36.5 If the first issue of financing preference shares
or convertible financing preference shares
of a series takes place during the course of a
financial year, the dividend for that financial
year on the respective series of financing
preference shares or convertible financing
preference shares shall be decreased
proportionately up to the first day of such
issue.
36.6 After application of paragraphs 2 to 5 no
further distribution of shall be made on the
protective preference shares, the financing
preference shares or the convertible financing
preference shares.
36.7 Of any profit remaining after application
of the paragraphs 2 to 5 such amount shall
be allocated to the reserves by the Board of
Management with the approval of the
Supervisory Board as the Board of Management
shall deem necessary. Insofar as the profit is
not allocated to the reserves pursuant to the
provisions of the preceding sentence, it shall
be at the disposal of the General Meeting of
Shareholders either for allocation in whole or
in part to the reserves or for distribution in
whole or in part to the holders of ordinary
shares pro rata to the aggregate amount of
their ordinary shares.
10.5 P r o p o s a l r e ga r d i n g t h e
a p p r o p r i a t i o n o f p r o f i t
In accordance with article 36 of the Articles of
Association, it shall be proposed to the Annual General
Meeting on 8 May 2013 that the net result of EUR 291.6
million be appropriated as follows: EUR 163.3 million
(EUR 2.00 per share) as dividend to holders of (certificates
of) ordinary shares, to be paid either in cash or in
(certificates of) ordinary shares, and the remaining
EUR 128.0 million to be allocated to the reserves.
The dividend proposal is stated on page 17 of the Report
of the Supervisory Board and also on page 36.
202
R e p o r t o f S t i c h t i n g A d m i n i s t r a t i e k a n t o o r
F u g r o ( ‘ Tr u s t O f f i c e ’ )
In accordance with article 19 of the conditions of
administration for registered shares in the share capital
of Fugro N.V. (‘Fugro’) and best practice provision IV.2.6
of the Corporate Governance Code, the undersigned
issues the following report to the holders of certificates
of ordinary shares Fugro.
During the 2012 reporting year all the Trust Office’s
activities were related to the administration of ordinary
shares against which certificates have been issued.
During 2012 the Board met twice. The meeting of
12 April 2012 was dedicated, among other things, to the
preparation for the Annual General Meeting of Fugro
on 22 May 2012. The meeting of 13 September 2012,
after the publication of Fugro’s half-yearly results, was
dedicated, among other things, to the composition of
the Board and to general business developments. It was
discussed also if it would be necessary or useful to
convene a meeting of holders of certificates. It was
decided that at the moment this was not the case. Prior
to both meetings the Board discussed with the Board of
Management and the Supervisory Board of Fugro the
activities and performance of Fugro on the basis of the
Annual Report 2011 and the Half-yearly report 2012
respectively. Corporate Governance within Fugro and
the Trust Office was also discussed in both meetings.
All the Trust Office’s Board members are independent of
Fugro. The Board may offer holders of certificates the
opportunity to recommend candidates for appointment
to the Board. The voting policy of the Trust Office has
been laid down in a document that can be found on the
website: www.fugro.com/corporate/admkantoor.asp.
The Trust Office is authorised to accept voting
instructions from holders of certificates and to cast
these votes during a general meeting of Fugro.
The Board attended the annual general meeting of Fugro
held on 22 May 2012. In this meeting the Trust Office
represented 37.7% of the votes cast. The Trust Office
voted in favour of all the proposals submitted to the
meeting. In accordance with the terms of administration,
holders of certificates were offered the opportunity
to vote, in accordance with their own opinion, as
authorised representatives of the Trust Office.
This opportunity was taken by holders of certificates
who represented 55.7% of the votes cast.
In accordance with the roster, Mr. R. van der Vlist
stepped down as a member of the Trust Office’s Board
on 30 June 2012. The previous report of the Trust Office
stated that the Board intended reappointing
Mr. Van der Vlist as a Board member for a period of four
years. In accordance with article 4.3 of the articles of
association, the Board offered holders of certificates
who represent at least 15% of the issued certificates the
opportunity to request, until 6 April 2012, that the Board
convenes a meeting of holders of certificates in order
to recommend a candidate to the Trust Office’s Board.
As no request for a meeting of holders of certificates was
submitted, in its meeting of 12 April 2012 the Board, in
accordance with its announced intention, reappointed
Mr. Van der Vlist as a member of the Board for a period of
four years. The Board also reappointed Mr. Van der Vlist
as Chairman.
In accordance with the roster, on 30 June 2013
Mr. L.P.E.M. van den Boom and Mr. J.A.W.M. van Rooijen
will step down as members of the Trust Office’s Board.
The Trust Office intends reappointing Mr. Van den Boom
and Mr. J.A.W.M. van Rooijen as Board members for a
period of four years. In accordance with article 4.3 of the
articles of association, the Board offers holders of
certificates who represent at least 15% of the issued
certificates the opportunity to request, until 8 April
2013, that the Board convenes a meeting of holders of
certificates in order to recommend two candidates to the
Trust Office’s Board. The request should be submitted in
writing and should state the name and address of the
recommended candidates.
203Fugro Financial statements 2012
At present the Board of the Trust Office comprises:
1. Mr. R. van der Vlist, Chairman
2. Mr. L.P.E.M. van den Boom
3. Mr. J.F. van Duyne
4. Mr. J.A.W.M. van Rooijen
Mr. Van der Vlist was Company Secretary of N.V.
Koninklijke Nederlandsche Petroleum Maatschappij.
Mr. Van den Boom was a member of the Board
of Management of NIB Capital Bank N.V. and he
is a Senior Partner of PARK Corporate Finance.
Mr. Van Duyne was Chairman of the Board of
Management of Koninklijke Hoogovens N.V. and
afterwards joint Chief Executive Officer of Corus
Group PLC.
Mr. Van Rooijen was, amongst others, Chairman of KPMG
Corporate finance N.V. and member (CFO) of the Board of
Management of KPMG Holding N.V.
In 2012 the total remuneration of the members of the
Board amounted to EUR 31,000 and the total costs
of the Trust Office amounted to EUR 109,031.
On 31 December 2012, 80,935,740 ordinary shares with
a nominal value of EUR 0.05 were in administration
against which 80,935,740 certificates of ordinary shares
had been issued. During the financial year 42,138
certificates were exchanged into ordinary shares and
4,153,426 ordinary shares were exchanged into
certificates. A total number of 1,280,017 certificates
of ordinary shares were issued as a result of the stock
dividend.
The activities related to the administration of the shares
are carried out by the administrator of the Trust Office:
Administratiekantoor van het Algemeen Administratie-
en Trustkantoor B.V. in Amsterdam, The Netherlands.
The Trust Office’s address is: Veurse Achterweg 10,
2264 SG Leidschendam, The Netherlands.
Leidschendam, 27 February 2013
The Board
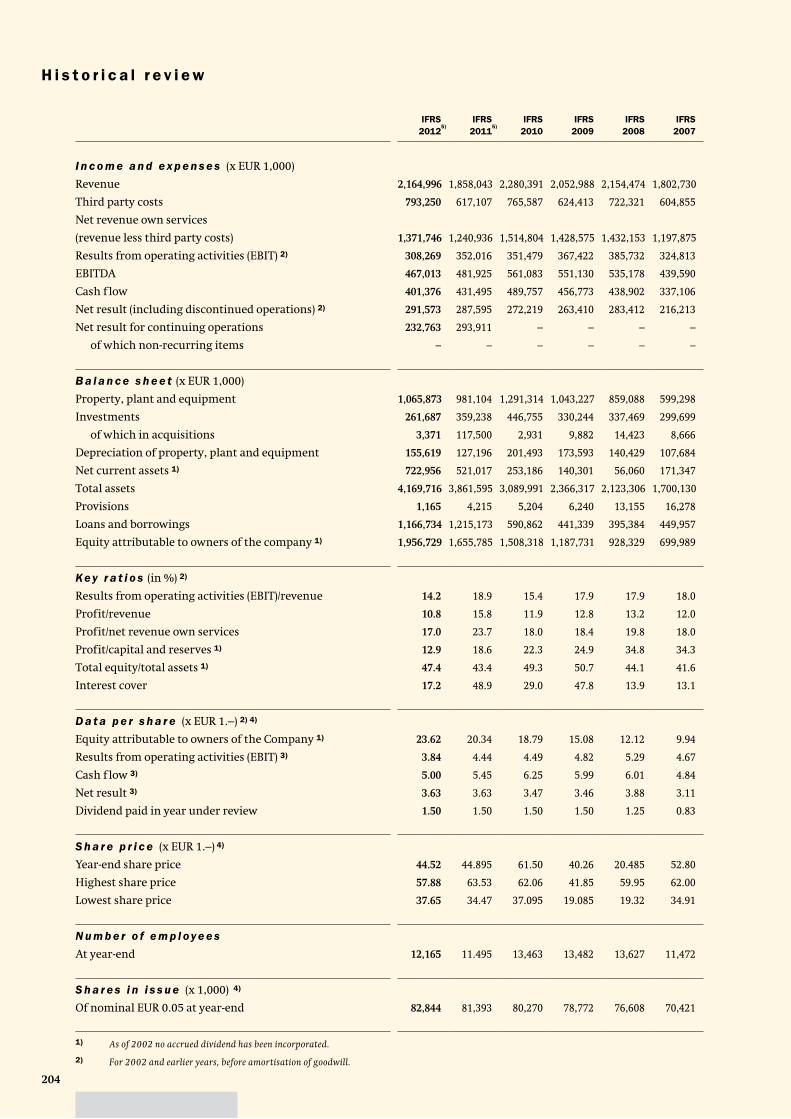
204
IFRS
2012
IFRS
2011
IFRS
2010
IFRS
2009
IFRS
2008
IFRS
2007
I n c o m e a n d e x p e n s e s (x EUR 1,000)
Revenue 2,164,996 1,858,043 2,280,391 2,052,988 2,154,474 1,802,730
Third party costs 793,250 617,107 765,587 624,413 722,321 604,855
Net revenue own services
(revenue less third party costs) 1,371,746 1,240,936 1,514,804 1,428,575 1,432,153 1,197,875
Results from operating activities (EBIT) 2) 308,269 352,016 351,479 367,422 385,732 324,813
EBITDA 467,013 481,925 561,083 551,130 535,178 439,590
Cash f low 401,376 431,495 489,757 456,773 438,902 337,106
Net result (including discontinued operations) 2) 291,573 287,595 272,219 263,410 283,412 216,213
Net result for continuing operations 232,763 293,911 – – – –
of which non-recurring items – – – – – –
B a l a n c e s h e e t (x EUR 1,000)
Property, plant and equipment 1,065,873 981,104 1,291,314 1,043,227 859,088 599,298
Investments 261,687 359,238 446,755 330,244 337,469 299,699
of which in acquisitions 3,371 117,500 2,931 9,882 14,423 8,666
Depreciation of property, plant and equipment 155,619 127,196 201,493 173,593 140,429 107,684
Net current assets 1) 722,956 521,017 253,186 140,301 56,060 171,347
Total assets 4,169,716 3,861,595 3,089,991 2,366,317 2,123,306 1,700,130
Provisions 1,165 4,215 5,204 6,240 13,155 16,278
Loans and borrowings 1,166,734 1,215,173 590,862 441,339 395,384 449,957
Equity attributable to owners of the company 1) 1,956,729 1,655,785 1,508,318 1,187,731 928,329 699,989
Key r a t i o s (in %) 2)
Results from operating activities (EBIT)/revenue 14.2 18.9 15.4 17.9 17.9 18.0
Profit/revenue 10.8 15.8 11.9 12.8 13.2 12.0
Profit/net revenue own services 17.0 23.7 18.0 18.4 19.8 18.0
Profit/capital and reserves 1) 12.9 18.6 22.3 24.9 34.8 34.3
Total equity/total assets 1) 47.4 43.4 49.3 50.7 44.1 41.6
Interest cover 17.2 48.9 29.0 47.8 13.9 13.1
D a t a p e r s h a r e (x EUR 1.–) 2) 4)
Equity attributable to owners of the Company 1) 23.62 20.34 18.79 15.08 12.12 9.94
Results from operating activities (EBIT) 3) 3.84 4.44 4.49 4.82 5.29 4.67
Cash f low 3) 5.00 5.45 6.25 5.99 6.01 4.84
Net result 3) 3.63 3.63 3.47 3.46 3.88 3.11
Dividend paid in year under review 1.50 1.50 1.50 1.50 1.25 0.83
S h a r e p r i c e (x EUR 1.–) 4)
Year-end share price 44.52 44.895 61.50 40.26 20.485 52.80
Highest share price 57.88 63.53 62.06 41.85 59.95 62.00
Lowest share price 37.65 34.47 37.095 19.085 19.32 34.91
N u m b e r o f e m p l oy e e s
At year-end 12,165 11.495 13,463 13,482 13,627 11,472
S h a r e s i n i s s u e (x 1,000) 4)
Of nominal EUR 0.05 at year-end 82,844 81,393 80,270 78,772 76,608 70,421
1) As of 2002 no accrued dividend has been incorporated.
2) For 2002 and earlier years, before amortisation of goodwill.
5) 5)
H i s t o r i c a l r e v i e w
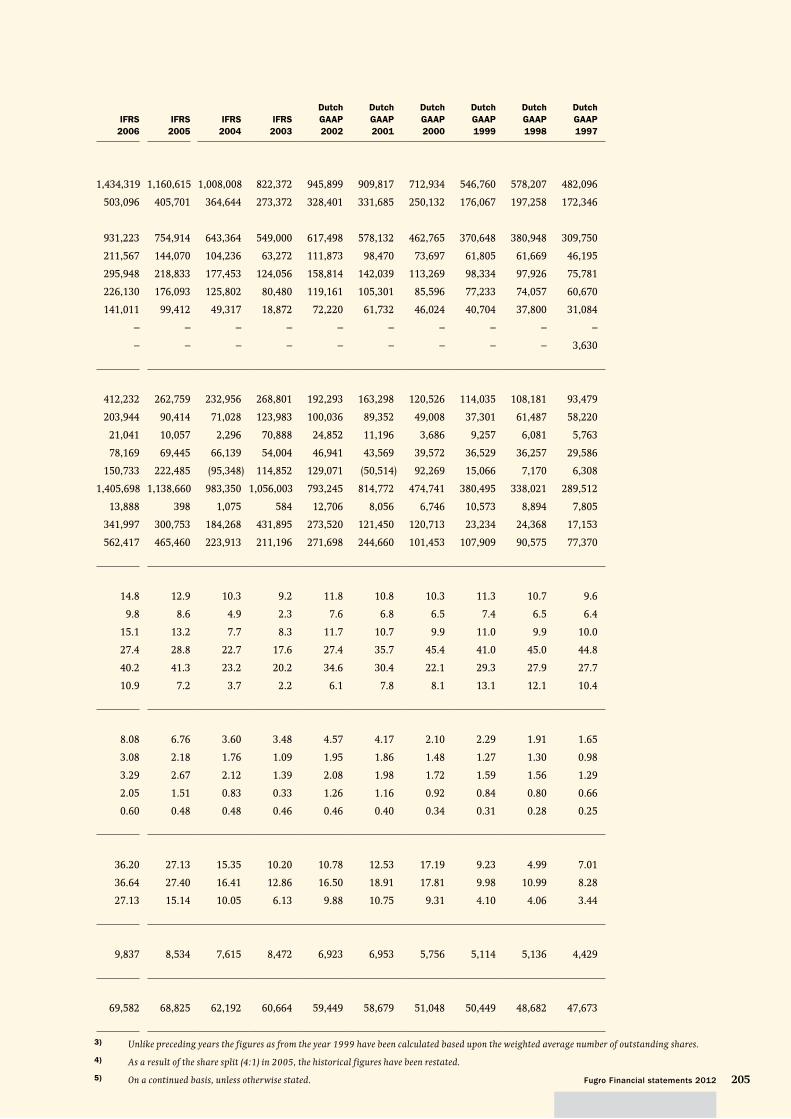
205Fugro Financial statements 2012
3) Unlike preceding years the figures as from the year 1999 have been calculated based upon the weighted average number of outstanding shares.
4) As a result of the share split (4:1) in 2005, the historical figures have been restated.
5) On a continued basis, unless otherwise stated.
IFRS
2006
IFRS
2005
IFRS
2004
IFRS
2003
Dutch
GAAP
2002
Dutch
GAAP
2001
Dutch
GAAP
2000
Dutch
GAAP
1999
Dutch
GAAP
1998
Dutch
GAAP
1997
1,434,319 1,160,615 1,008,008 822,372 945,899 909,817 712,934 546,760 578,207 482,096
503,096 405,701 364,644 273,372 328,401 331,685 250,132 176,067 197,258 172,346
931,223 754,914 643,364 549,000 617,498 578,132 462,765 370,648 380,948 309,750
211,567 144,070 104,236 63,272 111,873 98,470 73,697 61,805 61,669 46,195
295,948 218,833 177,453 124,056 158,814 142,039 113,269 98,334 97,926 75,781
226,130 176,093 125,802 80,480 119,161 105,301 85,596 77,233 74,057 60,670
141,011 99,412 49,317 18,872 72,220 61,732 46,024 40,704 37,800 31,084
– – – – – – – – – –
– – – – – – – – – 3,630
412,232 262,759 232,956 268,801 192,293 163,298 120,526 114,035 108,181 93,479
203,944 90,414 71,028 123,983 100,036 89,352 49,008 37,301 61,487 58,220
21,041 10,057 2,296 70,888 24,852 11,196 3,686 9,257 6,081 5,763
78,169 69,445 66,139 54,004 46,941 43,569 39,572 36,529 36,257 29,586
150,733 222,485 (95,348) 114,852 129,071 (50,514) 92,269 15,066 7,170 6,308
1,405,698 1,138,660 983,350 1,056,003 793,245 814,772 474,741 380,495 338,021 289,512
13,888 398 1,075 584 12,706 8,056 6,746 10,573 8,894 7,805
341,997 300,753 184,268 431,895 273,520 121,450 120,713 23,234 24,368 17,153
562,417 465,460 223,913 211,196 271,698 244,660 101,453 107,909 90,575 77,370
14.8 12.9 10.3 9.2 11.8 10.8 10.3 11.3 10.7 9.6
9.8 8.6 4.9 2.3 7.6 6.8 6.5 7.4 6.5 6.4
15.1 13.2 7.7 8.3 11.7 10.7 9.9 11.0 9.9 10.0
27.4 28.8 22.7 17.6 27.4 35.7 45.4 41.0 45.0 44.8
40.2 41.3 23.2 20.2 34.6 30.4 22.1 29.3 27.9 27.7
10.9 7.2 3.7 2.2 6.1 7.8 8.1 13.1 12.1 10.4
8.08 6.76 3.60 3.48 4.57 4.17 2.10 2.29 1.91 1.65
3.08 2.18 1.76 1.09 1.95 1.86 1.48 1.27 1.30 0.98
3.29 2.67 2.12 1.39 2.08 1.98 1.72 1.59 1.56 1.29
2.05 1.51 0.83 0.33 1.26 1.16 0.92 0.84 0.80 0.66
0.60 0.48 0.48 0.46 0.46 0.40 0.34 0.31 0.28 0.25
36.20 27.13 15.35 10.20 10.78 12.53 17.19 9.23 4.99 7.01
36.64 27.40 16.41 12.86 16.50 18.91 17.81 9.98 10.99 8.28
27.13 15.14 10.05 6.13 9.88 10.75 9.31 4.10 4.06 3.44
9,837 8,534 7,615 8,472 6,923 6,953 5,756 5,114 5,136 4,429
69,582 68,825 62,192 60,664 59,449 58,679 51,048 50,449 48,682 47,673
206
G l o s s a r y
Te c h n i c a l t e r m s
2-D Seismic: Acoustic measuring technology which uses single vessel-towed
hydrophone streamers. This technique generates a 2-D cross-Article of the deep seabed
and is used primarily when initially reconnoitring for the presence of oil or gas
reservoirs.
3-D Seismic: Acoustic measuring technology which uses multiple vessel-towed long
hydrophone streamers. This technique generates a 3-D model of the deep seabed and is
used to locate and analyse oil and gas reservoirs.
AUV (Autonomous Underwater Vehicle): An unmanned submersible launched
from a ‘mother-vessel’ but not connected to it via a cable. Propulsion and control are
autonomous and use pre-defi ned mission protocols.
Construction Support: Offshore services related to the installation and construction
of structures such as pipelines, drilling platforms and other oil and gas related
infrastructure, usually involving the use of ROVs.
DGPS (Differential Global Positioning System): A GPS based positioning system
using territorial reference points to enhance accuracy.
EM: Electromagnetic.
Gas hydrates: mixture of semi-solid methane gas and water molecules that are
created by water pressure and cold temperatures found deep in the ocean.
Geophysics: The mapping of subterranean soil characteristics using non-invasive
techniques such as sound.
Geoscience: A range of scientifi c disciplines (geology, geophysics, petroleum
engineering, bio stratifi cation, geochemistry, etc.) related to the study of rocks,
fossils and fl uids.
Geotechnics: The determination of subterranean soil characteristics using invasive
techniques such as probing, drilling and sampling.
Glonass: Global Navigation Satellite System.
GPS: Global Positioning System.
Gravity: Precision gravity measurements to detect geological and other anomalies.
LiDAR: a measuring system based on laser technology that can make extremely
accurate recordings from an aircraft.
LNG: Liquifi ed Natural Gas
Multi-client data: Data collected at own risk and expense and sold to several clients.
RoqSCAN: RoqSCAN is a fully portable, automated, quantitative rock properties/
mineralogical analyser which has been developed exclusively by Fugro and Carl Zeiss
for use at the oil and gas well site.
ROV (Remotely Operated Vehicle): Unmanned submersible launched from a vessel
and equipped with measuring and manipulation equipment. A cable to the mother-
vessel provides power, video and data communication.
Seismic: Acoustic measurement of seabed characteristics and stratifi cation with the
objective of detecting oil and gas. These measurements are conducted using specialised
vessels equipped with powerful acoustic energy sources and long receiving streamers
(hydrophones) to measure (sub) seabed acoustic echoes.
Starfi x: DGPS positioning system, specifi cally for use offshore. This system is intended
for the professional user and, in addition to a high degree of accuracy, is equipped with
a wide range of data analysis and quality control possibilities.
WTI: West Texas Intermediate is a crude oil benchmark.
F i n a n c i a l t e r m s
Cash fl ow: The profi t for the period attributable to equity holders of the company
plus depreciation, amortisation of intangible fi xed assets and minority interest.
Dividend yield: Dividend as a percentage of the (average) share price.
EBIT: Result from operating activities.
EBITDA: Result from operating activities before depreciation and amortisation.
Gearing: Loans and borrowings plus bank overdraft minus cash and cash equivalents,
divided by shareholders equity.
Interest cover: Result from operating activities (EBIT) compared with the net interest
charges.
Invested capital: The capital made available to the Company, i.e. Group equity
plus the available loans and the balance of current account deposits/withdrawals.
Net profi t margin: profi t as a percentage of Revenue.
Pay-out ratio of the net result: The pay-out ratio of the net result is defi ned as
proposed dividend, multiplied by the number of shares entitled to dividend, divided
by one thousand, divided by the net result.
Private Placement: Long-term fi nancing (7 – 15 years), entered into in May 2002
and in August 2011 via private placements with American and British institutional
investors.
Return on invested capital: EBIT divided by the average of the current and
previous year of total assets less current liabilities.
Solvency: Shareholders’ equity as a percentage of the balance sheet total.


Fugro N.V.
Veurse Achterweg 10
2264 SG Leidschendam
P.O. Box 41
2260 AA Leidschendam
The Netherlands
T +31 (0)70 3111422
F +31 (0)70 3202703
www.fugro.com
Commercial Register The Hague
Trade Registry no 27120091
VAT no 00 56 21 409 B01
C o l o p h o n
Fugro N.V.
Veurse Achterweg 10
2264 SG Leidschendam
The Netherlands
T +31 (0)70 3111422
F +31 (0)70 3202703
Realisation:
C&F Report Amsterdam B.V.
Photography and images:
Fugro N.V.
Fugro has endeavoured to fulfil all legal requirements
related to copyright. Anyone who, despite this, is of
the opinion that other copyright regulations could
be applicable should contact Fugro.
A Dutch translation of this annual report is
available. In matters of any misinterpretation
the official English annual report will prevail.
This annual report is also available on www.fugro.com.
Cautionary statement regarding forward-looking statements
This annual report may contain forward-looking statements. Forward-looking statements are statements that are not historical facts, including
(but not limited to) statements expressing or implying Fugro’s beliefs, expectations, intentions, forecasts, estimates or predictions (and the
assumptions underlying them). Forward-looking statements necessarily involve risks and uncertainties. The actual future results and situations
may therefore differ materially from those expressed or implied in any forward-looking statements. Such differences may be caused by various
factors (including, but not limited to, developments in the oil and gas industry and related markets, currency risks and unexpected operational
setbacks). Any forward-looking statements contained in this annual report are based on information currently available to Fugro’s management.
Fugro assumes no obligation to make a public announcement in each case where there are changes in information related to, or if there are
otherwise changes or developments in respect of, the forward-looking statements in this annual report.
Fugro JV2012 ENG – 5e proef – 01/03/2013 Fugro JV2012 ENG – 5e proef – 01/03/2013

AN
NU
AL
RE
PO
RT
20
12
FU
GR
O N
.V.
Annua l Re p o r t 2012FUGRO N .V.
Fugro JV2012 ENG – 5e proef – 01/03/2013 Fugro JV2012 ENG – 5e proef – 01/03/2013