
DEMAND RESPONSE POLICIES FOR THE - DiVA portal906745/FULLTEXT01.pdf · 3 DEMAND RESPONSE POLICIES...
247
Transcript of DEMAND RESPONSE POLICIES FOR THE - DiVA portal906745/FULLTEXT01.pdf · 3 DEMAND RESPONSE POLICIES...

1
DEMAND RESPONSE POLICIES FOR THE
IMPLEMENTATION OF SMART GRIDS
Elta Koliou

2
3
DEMAND RESPONSE POLICIES FOR THE
IMPLEMENTATION OF SMART GRIDS
Proefschrift
ter verkrijging van de graad van doctor aan de Technische Universiteit Delft
op gezag van de Rector Magnificus prof. ir . K. C. A. M. Luyben voorzitter van het College voor Promoties,
in het openbaar te verdedigen op vri jdag 18 maart 2016 om 10.00 uur
door
Elta KOLIOU MSc, Economics and Management of Network Industries
geboren te Gjirokaster

4
This dissertation has been approved by the:
promotor: Prof. dr. ir. P.M. Herder
copromotor: Dr. ir. R. A. Hakvoort
Composition of the doctoral committee:
Rector Magnificus chairman Prof. dr. ir. P.M. Herder Technische Universiteit Delft Dr. ir. R. A. Hakvoort Technische Universiteit Delft
Independent members:
Prof. dr. Ir. Rolf Künneke Technische Universiteit Delft
Prof. dr. ir. Tomás Gómez Comillas Pontifical University
Prof. dr. ir Mikael Amelin KTH Royal Institute of Technology
Prof. dr. Yannick Perez Supélec/Paris Sud XI
Prof. dr. Annelies Huygen Universiteit van Amsterdam (UvA)
Dr. Ir. Marloes Dignum Technische Universiteit Delft, opponent
Prof. dr. ir. M.P.C. Weijnen Technische Universiteit Delft, reserve member
TRITA-EE 2016:009 ISSN 1653-5146 ISBN 978-94-6169-842-1
Cover. Designed by Tijs Hensen.
Printed in the Netherlands
Copyright © 2016 by E. Koliou All rights reserved. No part of the material protected by this copyright notice may be reproduced or utilized in any form or by any means, electronic or mechanical, including photocopying, recording or by any information storage and retrieval system, without written permission from the author
5
Dit proefschrift is goedgekeurd door de promotor:
Prof. dr. ir. P.M. Herder
copromotor: Dr. ir. R. A. Hakvoort
Samenstelling promotiecommissie:
Rector Magnificus voorzitter Prof. dr. ir. P.M. Herder Technische Universiteit Delft, promotor Dr. ir. R. A. Hakvoort Technische Universiteit Delft, copromotor Prof. dr. Ir. Rolf Künneke Technische Universiteit Delft Prof. dr. ir. Tomás Gómez Comillas Pontifical University Prof. dr. ir Mikael Amelin KTH Royal Institute of Technology Prof. dr. Yannick Perez Supélec/Paris Sud XI Prof. dr. Annelies Huygen Universiteit van Amsterdam (UvA) Dr. Ir. Marloes Dignum Technische Universiteit Delft, opponent
Prof. dr. ir. M.P.C. Weijnen Technische Universiteit Delft, reserve member
This research was funded by the European Commission through the Erasmus Mundus
Joint Doctorate Program and Delft University of Technology.
Key words: Demand response, smart grids, dynamic pricing, balancing, policy, tariffs
Cover. Designed by Tijs Hensen.
Printed in the Netherlands
TRITA-EE 2016:009 ISSN 1653-5146 ISBN 978-94-6169-842-1
Copyright © 2016 by E. Koliou All rights reserved. No part of the material protected by this copyright notice may be reproduced or utilized in any form or by any means, electronic or mechanical, including photocopying, recording or by any information storage and retrieval system, without written permission from the author

6
SETS Joint Doctorate
The Erasmus Mundus Joint Doctorate in Sustainable Energy Technologies and
Strategies, SETS Joint Doctorate, is an international programme run by six institutions in
cooperation:
Comillas Pontifical University, Madrid, Spain
Delft University of Technology, Delft, the Netherlands
Florence School of Regulation, Florence, Italy
Johns Hopkins University, Baltimore, USA
KTH Royal Institute of Technology, Stockholm, Sweden
University Paris-Sud 11, Paris, France
The Doctoral Degrees issued upon completion of the programme are issued by
Comillas Pontifical University, Delft University of Technology, and KTH Royal Institute of
Technology.
The Degree Certificates are giving reference to the joint programme. The doctoral
candidates are jointly supervised, and must pass a joint examination procedure set up by
the three institutions issuing the degrees.
This Thesis is a part of the examination for the doctoral degree. The invested
degrees are official in Spain, the Netherlands and Sweden, respectively.
SETS Joint Doctorate was awarded the Erasmus Mundus excellence label by the
European Commission in year 2010, and the European Commission’s Education,
Audiovisual and Culture Executive Agency, EACEA, has supported the funding of this
programme.
The EACEA is not to be held responsible for contents of the Thesis.

7

8
This book is dedicated to my dad Lefter, the greatest advocate for education and my
biggest supporter. Through everything that we have been through he has always put my
and my sister’s education as the priority. This book is as much his hard work and
dedication as it is my accomplishment.

9
10
Table of Contents
Summary ............................................................................................................................ 17
Samenvatting ..................................................................................................................... 21
Acknowledgements ............................................................................................................ 26
Chapter 1 ~ Introduction to the smart grid ........................................................................ 29
2 Background ................................................................................................................ 29
3 The smart grid and the energy transition .................................................................. 30
3.1 Enabling an active and reactive demand side .................................................. 31
3.2 End users, the smart grid and demand response ............................................. 32
4 Stating the problem: issues with demand response integration .............................. 33
4.1 Coordination of demand response flexibility ................................................... 34
4.2 Split-incentives of implementation .................................................................. 34
4.3 Research objectives .......................................................................................... 35
5 Thesis outline............................................................................................................. 36
Chapter 2 ~ Deducing demand response for smart grids ................................................... 39
1 The smart grid ........................................................................................................... 39
1.1 The surge for smart grids and demand response research .............................. 40
1.1.1 The U.S. smart grid ....................................................................................... 40
1.1.2 The European smart grid .............................................................................. 41
1.1.3 Linking U.S. and European smart grids ......................................................... 42
1.2 Defining the smart grid research domains ....................................................... 42
2 Activating demand in the smart grid ......................................................................... 44
2.1 Explicit demand response ................................................................................. 48
2.2 Implicit demand response ................................................................................ 49
2.3 Understanding the dualities of demand response programs ........................... 50
3 Implementation of demand response ....................................................................... 51
11
3.1 Summarizing the possible benefits of implementation ................................... 52
3.2 Research gaps .................................................................................................. 53
4 Synthesis ................................................................................................................... 53
Chapter 3 ~ Quantifying price responsiveness ................................................................... 56
1 Introduction .............................................................................................................. 56
2 Demand and energy use ........................................................................................... 57
2.1 Consumer behavior .......................................................................................... 57
2.2 Electricity prices in Europe ............................................................................... 58
2.3 Price-based demand response mechanisms .................................................... 60
2.3.1 Tariff design for the Netherlands ................................................................ 61
2.3.2 Value of price-based programs .................................................................... 63
3 Evaluation of price-based demand response: the theory ........................................ 63
3.1 Price elasticity of demand ................................................................................ 64
3.2 Elasticity of substitution ................................................................................... 65
3.3 Factors impacting elasticity values .................................................................. 67
3.3.1 Time and technology impact on elasticity ................................................... 67
3.3.2 Effects of learning and experience on price elasticity ................................. 68
3.3.3 Impact of the price level (in the market) on price elasticity ........................ 68
4 Price-based demand response in practice ................................................................ 69
4.1 Modeling of the residential load ...................................................................... 69
4.1.1 Choice of agent based-modeling and Repast Simphony 2.0 ....................... 71
4.1.2 Appliance ownership and use ...................................................................... 72
4.1.3 Consumer archetypes .................................................................................. 75
4.1.4 Activity ......................................................................................................... 77
4.2 Load shifting ..................................................................................................... 80
5 Price-based demand response simulation assessment ............................................ 86
12
5.1 Costs, benefits and flexibility of end-user demand under currently system
conditions ...................................................................................................................... 86
5.1.1 Individual and system costs under current conditions ................................. 86
5.1.2 Implications of demand response in different time steps ........................... 87
5.1.3 Flexibility in accordance with price mechanism ........................................... 89
5.1.4 Peak demand ................................................................................................ 91
5.2 Technology impact and demand response evaluation of price based
mechanisms ................................................................................................................... 91
5.2.1 Cost of electricity .......................................................................................... 92
5.2.2 Elasticity of consumers ................................................................................. 93
5.2.3 Peak demand ................................................................................................ 94
5.2.4 EV and PV penetration discussion ................................................................ 95
6 Model verification, validation and sensitivity ........................................................... 96
6.1 Model verification............................................................................................. 96
6.2 Validation .......................................................................................................... 96
6.3 Sensitivity analysis ............................................................................................ 97
7 Concluding remarks ................................................................................................... 97
Chapter 4 ~ Aggregation and access to electricity markets ............................................. 100
1 Introduction ............................................................................................................. 100
2 Motivation ............................................................................................................... 101
3 Demand response activation ................................................................................... 102
3.1 Aggregation at each level ............................................................................... 102
3.1.1 Individual household level aggregation ...................................................... 102
3.1.2 Community level ........................................................................................ 104
3.1.3 PowerMatcher aggregation conceptualization ......................................... 105
3.2 The aggregator ................................................................................................ 106
3.2.1 The retailer ................................................................................................. 107
13
3.2.2 Independent aggregator ............................................................................ 108
3.3 Value of demand response flexibility ............................................................. 109
3.3.1 Transmission system operator .................................................................. 110
3.3.2 Distribution system operator .................................................................... 110
3.3.3 Generator .................................................................................................. 110
3.3.4 Retailers (energy suppliers) ....................................................................... 110
3.3.5 Balance responsible party ......................................................................... 111
4 Intricacies of market participation for demand response ...................................... 111
4.1 The market convolution ................................................................................. 111
4.1.1 General overview in Europe ...................................................................... 112
4.1.2 Market specifications in the Netherlands.................................................. 113
4.2 The real value from trading DR flexibility ...................................................... 118
5 The complexity of demand response, the ‘good’ ................................................... 120
5.1 Ownership of ‘demand response’ by independent aggregators ................... 121
5.2 Demand response impact on supplier and BRP portfolio .............................. 121
5.3 Resolving the ownership of demand response: balance responsibility for
aggregators ................................................................................................................. 122
6 Conclusions and recommendations ........................................................................ 124
Chapter 5 ~ Demand response participation in the balancing mechanism ..................... 127
1 Introduction ............................................................................................................ 127
2 Motivation and initiatives for engaging demand response .................................... 128
2.1 The European balancing mechanism ............................................................. 130
2.2 Balance management complexity in liberalized electricity markets .............. 133
2.2.1 European level recognition of demand response flexibility ...................... 135
2.2.2 Demand response in the balancing mechanism ........................................ 136
3 German electricity system ...................................................................................... 139
3.1 Overview of the German balancing mechanism ............................................ 139
14
3.2 Interruptible loads in the balancing mechanism ............................................ 140
4 Barriers to demand side flexibility ........................................................................... 141
4.1 Balance responsibility ..................................................................................... 142
4.2 Balance service provision ............................................................................... 143
4.3 Imbalance settlement ..................................................................................... 144
4.3.1 Balance responsibility and cost allocation ................................................. 145
5 Conclusion and recommendations .......................................................................... 147
Chapter 6 ~ Economic incentives for distribution-system operators to engage demand
response ........................................................................................................................... 151
1 Introduction ............................................................................................................. 151
2 Distribution in the European smart grid: role, responsibilities and tariffs .............. 153
2.1 Role and responsibilities ................................................................................. 153
2.1.1 Traditional .................................................................................................. 153
2.1.2 Smart grid ................................................................................................... 153
2.2 Distribution remuneration .............................................................................. 154
2.2.1 Underlying theory of network pricing ........................................................ 154
2.2.2 Tariff design ................................................................................................ 156
2.3 Distribution in Europe ..................................................................................... 159
3 Assessment of distribution cost drivers and signaling of demand response .......... 160
3.1 Cost structure of distribution-system operator .............................................. 160
3.2 Optimizing costs of short-term distribution operation .................................. 161
4 Quantifying demand response ................................................................................ 162
4.1 Swedish regulatory model .............................................................................. 163
4.2 Quantifying the impact of demand response ................................................. 164
4.2.1 Demand response for the reducing power losses ...................................... 166
4.2.2 Demand response for alleviating peak loads ............................................. 168
4.2.3 Demand response for postponing network investments ........................... 170
15
5 Economic outcome ................................................................................................. 172
5.1 Discussion of simulation results ..................................................................... 173
5.1.1 Power losses .............................................................................................. 173
5.1.2 Peak loads .................................................................................................. 174
5.1.3 Grid investments ....................................................................................... 176
6 Distribution smart-grid costs and demand response ............................................. 178
6.1 The smart-grid environment .......................................................................... 178
6.2 Costs for incorporating smart-grid upgrades ................................................. 178
7 Conclusions and recommendations ........................................................................ 180
Chapter 7 ~ The aggregator in practice ........................................................................... 183
1 Demand response and emerging problems to overcome ...................................... 183
1.1 Coordination .................................................................................................. 183
1.1.1 Demand response for commercial use and coordination ......................... 186
1.1.2 Demand response for technical use and coordination .............................. 187
1.2 Split incentives ............................................................................................... 188
1.2.1 Issues on different levels ........................................................................... 188
1.2.2 Correcting the split incentives problem .................................................... 190
2 Aggregator models in practice ................................................................................ 192
2.1 Successful aggregators ................................................................................... 192
2.1.1 Energy Pool ................................................................................................ 192
2.1.2 Voltalis ....................................................................................................... 193
2.2 A European demand response framework .................................................... 194
3 Demand response and the greater system perspective ......................................... 194
3.1 The actual impact of small end-user demand response ................................ 195
3.2 The impact of storage, ‘more grid’ and grid defection .................................. 195
4 Remarks .................................................................................................................. 196
Chapter 8 ~ Conclusions and recommendations ............................................................. 198
16
1 Conclusions and answers to research questions ..................................................... 198
2 Recommendations ................................................................................................... 202
3 Future research ....................................................................................................... 205
4 Final thoughts .......................................................................................................... 206
List of abbreviations ......................................................................................................... 209
Appendix........................................................................................................................... 211
References ........................................................................................................................ 220
List of publications............................................................................................................ 242
Curriculum vitae ............................................................................................................... 244
17
Summary Introduction
The European Commission is in need of coherent and consistent set of policies and
measures which will bring Europe into a new energy era of sustainability,
competitiveness and security of supply. Accordingly, the smart grids vision launched in
2006 in a movement towards reforming and modernizing electricity markets and
networks in a bold and visionary program of research, development and demonstration.
On this foundation, the European Union is taking a user-centric stance to developing
smart grid systems as “electricity networks that can intelligently integrate the behavior
and actions of all users connected to it generators, consumers, and those that do both in
order to efficiently deliver sustainable, economic and secure electricity supplies1”. Smart
grids for Europe employ both products and services in combination with ICT to meet the
challenges and opportunities of the 21st
century.
Stating the problem
Market liberalization has forced utility unbundling in Europe, hence altering the
relationship between market players and the system operator. Several European
countries have an established tradition of contracting large energy intensive end-users
(accounting for over one third of the total electricity demand) flexibility either through
pricing schemes or some form of load control mechanism. Also, residential demand
accounts for almost one third of a flexibility resource that remains to be tapped. In a
liberalized electricity sector with a smart grid vision that is committed to market-based
operation, consumers have now become the focal point of decision-making at every level
of the process of producing, delivering and consuming electricity. Hence, the
incorporation of end-users into electricity markets becomes the focus of this work.
1 European Technology Platform for Smart Grids (2011)
18
With the grasp of smart grid solutions in sight, discussions have shifted the focus of
system security measures away from generation capacity; apart from modifying the
supply side, demand may also be exploited to keep the system in balance. Specifically,
demand response (DR) is the concept of consumer load modification as a result of price
signaling generation adequacy or state of grid reliability. Implementation of DR
mechanisms (in various forms) is one of the smart grid solutions investigated towards
improving the efficiency of electricity markets and maintaining system-wide stability.
Although a smart grid paradigm in theory obliges the incorporation of an active demand
side through DR, there exist some unavoidable barriers to market. Firstly, when
compared to other factors of household expenditure, electricity accounts for a relatively
low cost and therefore becomes a low priority for end users. Secondly, enabling DR smart
grid solutions is costly, with the brunt of the brunt of investments lying on the
distribution system operator that is bound by regulatory remuneration. Finally, there is
hype at present in implementing DR solutions that will allow end users to become active
market participants; the existing market mechanisms are not properly designed to
handle an active demand side. Accordingly, this research tackles the following research
question:
How can residential end-user consumption flexibility be promoted successfully through
demand response methods in a smart grid?
Analysis
This work began on the premise of researching policies for the implementation of smart
grids. In view of that, the work evolved towards the implementation of demand
response. Herein is a summary of the contributions of this thesis to the state-of-the-art
on the implications of accessing, signaling and releasing end-user flexibility into the
electricity system.
An extensive analysis of demand response activation of end-user flexibility through price-
based mechanisms indicates that consumers can be approached with a menu of price
programs which reflect the market conditions more dynamically. A simulation case study
of the Netherlands points to time-of-use pricing as the optimal program, followed by
critical-peak pricing in accordance with the residential peak hours. Although real-time-
pricing is a desired program by policymakers in a smart grid environment, the results
indicate limited demand responsiveness.
19
When considering the active volume-based market participation of end-users
aggregation is critical. A detailed analysis of the processes, costs and potential gains from
active spot market participation is presented. The investigation reveals the importance of
balance responsibility throughout the settlement and delivery of trades, with timing,
volume and program specifications as the principal barriers to demand-side integration
in short term European electricity markets.
An assessment of the various short term electricity markets reveals that the balancing
mechanisms can integrate aggregated demand response as a reserve. An analysis of the
German balancing mechanism illustrates that demand response is undermined by three
mechanism design aspects: minimum bidding volume, minimum bid duration and binding
up and down bids. Moreover, demand response is further hindered by the vagueness in
the specifications for (i) balance responsibility, (ii) balance service provision and (iii)
imbalance settlement procedures.
Often DR is discussed in terms of the implementation by competitive market parties,
leaving out the load shifting impacts for the distribution system operators. A study is
conducted on the economic effect of consumption flexibility under current regulatory
remuneration on distribution-system operators using Sweden as a case study is also
presented. Results indicate DR leads to savings for the distribution-system operator,
which might be used towards smart-grid investments. Peak demand is and will continue
to be a main driver for grid costs and therefore should be a focal point in tariff design
adopting capacity based tariffication.
Conclusions
It is important to note that the smart grid changes anticipated through the incorporation
of an active demand side pose at least some threat to a system that already works quite
well in balancing supply and demand. Accordingly, demand response is more a desired
solution for future power systems with vast renewable integration.
Security of supply, sustainability and economic efficiency represent the energy policy
drivers of Europe. Such policy pillars are not “naturally aligned vectors2” yet need to find
the right balance of market and regulation to co-exist harmoniously. For demand
2 (Mott MacDonald, 2013)
20
response this means designing innovative remuneration schemes that ensure the
alignment of short-run operational and long-run investment and recovery objectives.
When it comes to billing, regulators need to communicate to suppliers the importance of
dynamic pricing as an initial step towards electricity market awareness through
transparency. The results in this work point to a time-of-use tariff in accordance with the
hours pertaining to the base, shoulder and peak hours of the spot market exchange.
Although this research reveals little monetary value for consumers to have real-time
pricing, because of the awareness and transparency brought by such pricing it should still
become an available option. Additionally, Tariffs can also be designed per distribution
system in order to make sure that peak grid hours coincide with the tariff as well.
Dynamic network tariffs can also be considered with a capacity component. Capacity
based grid tariffs should incentivize consumers to stay below a certain threshold power
level.
For volume–based demand response solutions aggregators are pivotal facilitators in the
market processes. Aggregators are already showing their influence by stirring the
conversation on the existing market mechanisms and their favoritism for large
generators. From this work, it is advised that national regulatory bodies lead the way in
the next phase of aggregated demand response by tackling the issue of balance
responsibility of the aggregator. The various short term electricity markets can only be
accessed through transparent arrangements instigating mutual cooperation between
balance responsible parties, retailers and aggregators. The aggregators are already
leading the movement in activating demand, but it is the regulators who hold the key in
both birth and sustainability of demand side activation and integration.
An important overall observation is that a smart grid is simply a means to an end but an
end in itself. Note, active end-users represent a small piece of the physical smart grid,
but they are the most powerful movers in realizing the vision. This work has revealed
that the involvement of consumers in market dynamics is both complex and costly
yielding little benefit for the customers. Rather, is the overall awareness that
transparency in market process that will yield understanding and in the end acceptance
and support for the smart grid.

21
Samenvatting
Introductie
De Europese Commissie heeft behoefte aan een set van coherente en consistent
beleidsmaatregelen die Europa brengen in een nieuwe energie tijdperk van
duurzaamheid, concurrentievermogen en continuïteit van de energievoorziening. In deze
trend is de smart grids visie in 2006 gelanceerd om hervorming en modernisering van
energiemarkten en elektriciteitsnetwerken in een visionair programma te plaatsen voor
onderzoek, ontwikkeling en demonstratie. Op dit fundament plaatst de Europese Unie de
gebruiker centraal in de ontwikkeling van smart grid-systemen als
"elektriciteitsnetwerken die op intelligente wijze het gedrag en de acties van alle
aangesloten gebruikers, producenten, consumenten te integreren, en van deze die zowel
consumeren als produceren voor efficiënte, duurzame, economische en zekere levering
van elektriciteit". Smart grids in Europa dienen zowel producten en diensten aan in
combinatie met ICT om de uitdagingen en kansen van de 21ste eeuw aan te gaan.
Probleemstelling
De liberalisering van de markt heeft geleid tot gedwongen splitsing van nutsbedrijven in
Europa, dus het veranderen van de relatie tussen marktpartijen en de netbeheerder.
Verscheidene Europese landen hebben een grote aantal energie-intensieve
eindgebruikers (goed voor meer dan een derde van de totale vraag naar elektriciteit) die
flexibiliteit aanbieden, hetzij via prijsregelingen of enige vorm van directe
controlemechanismen op de energievraag. Ook residentiële energievraag is goed voor
bijna een derde van een flexibiliteit, welke nog niet werkelijk gebruikt wordt. In een
geliberaliseerde elektriciteitssector met een smart grid visie welke zich inzet voor een
markt gebaseerde operatie, worden consumenten nu het middelpunt van de
besluitvorming op elk niveau van het proces van de productie, levering en verbruik van
elektriciteit. Vandaar dat de integratie van de eindgebruikers in de elektriciteitsmarkten
de focus van dit werk is.
Met het oog op smart grid-oplossingen is het waarborgen van continuïteit van de
electriciteitsvoorziening niet alleen weggelegd voor productie capaciteiten, door

22
vraagverschuivingen kan nu ook de electriciteits vraag worden benut om het systeem in
evenwicht te houden. In het bijzonder, is vraag en respons (DR) het concept voor het
wijzigen van de electriciteitsvraag als gevolg van de prijs signalering of de toestand van
de betrouwbaarheid van het net. Implementatie van vraag response mechanismen (in
verschillende vormen) is een van de smart grid-oplossingen die onderzocht is richting de
verbetering van de efficiëntie van de elektriciteitsmarkten en het onderhoud van
stabiliteit in het hele systeem.
Hoewel een smart grid paradigma in theorie de een actieve vraagzijde door middel van
vraag response vereist, bestaan er een aantal onvermijdelijke barrières voor de markt.
Enerzijds, in vergelijking met andere gezinsuitgaven vertegenwoordigt elektriciteit
relatief lage kosten en vormt daarom een lage prioriteit voor eindgebruikers. Ten tweede
zijn vraag response smart grid-oplossingen kostbaar, waar de meeste investeringen op
last van de distributienetbeheerder valt die is gebonden door de gereguleerde
inkomsten. Tot slot is er hype op dit moment bij de uitvoering van vraag response
oplossingen waarmee eindgebruikers actieve deelnemers vormen op markt; de
bestaande marktmechanismen zijn niet goed ontworpen om een actieve vraagzijde te
hanteren. Dit onderzoek behandeld hierdoor de volgende onderzoeksvraag:
Hoe kan flexible electriciteitsvraag van de eindgebruiker met succes worden bevorderd
door vraagrespons mechanismen in een smart grid?
Analyse
Dit werk begon met het uitgangspunt om beleid voor de implementatie van smart grids
te onderzoeken. Hier vanuit is dit werk geëvolueerd richting de implementatie van vraag
response. Hierin is een samenvatting van de bijdragen van dit proefschrift aan de huidige
status van de implicaties van de toegang tot, signalering en het vrijgeven van de
gebruikersflexibiliteit in het elektriciteitssysteem.
Een uitgebreide analyse van de activatie van vraag response van de eindgebruiker via
prijs mechanismen geeft aan dat de consument kan worden benaderd met een menu van
prijs programma’s die een dynamische weerspiegeling geven van de
marktomstandigheden. Een simulatie casus van Nederland wijst dat time of use pricing
(TOU) als het meest optimale werkt, gevolgd door Critical Peak Pricing (CPP) welke
overeenkomt met de residentiële piekuren. Hoewel de real-time-pricing een gewenst

23
programma is door beleidsmakers in een smart grid-omgeving, geven de resultaten
beperkte responsiviteit aan met deze methode.
Aggregatie van de eindgebruikers is van cruciaal belang bij het overwegen van het
actieve participatie in de markt. Een gedetailleerde analyse van de processen, kosten en
potentiële voordelen van actieve deelname spotmarkt is gepresenteerd. Uit het
onderzoek blijkt dat de belangrijkste belemmeringen gevormd worden door balancerings
verantwoordelijkheid binnen de afwikkeling en levering van de transacties met tijd,
volume en programma specificaties voor de integratie van vraag response op korte
termijn markten van de Europese elektriciteitssector.
Uit een analyse van de verschillende korte termijn markten blijkt dat in de
balanceringsmechanismen de geaggregeerde vraag response als reserve kan worden
geïntegreerd. Een analyse van de Duitse balanceringsmechanismen illustreert dat de
vraag reponse wordt ondermijnd door drie ontwerp aspecten: minimum volume van
biedingen, minimum duur van het bod en gebonden op en neer biedingen. Bovendien is
de vraag en respons verder gehinderd door de onduidelijkheid in de specificaties van (i)
balancerings verantwoordelijke, (ii) de balans dienstverlening en (iii) procedures voor de
onbalansverrekening.
Vaak wordt vraag response besproken in termen van uitvoering door concurrerende
marktpartijen, waardoor belasting verschuiven voor de distributienetbeheerders wordt
ondermijnd. Een onderzoek is uitgevoerd naar de economische gevolgen van flexibele
vraag onder de huidige regelgeving voor de distributie-netbeheerders in Zweden. De
resultaten geven aan dat vraag response leidt tot besparingen voor de distributie
netwerk beheerder, die kunnen worden gebruikt voor investeringen in de smart-grid.
Pieken in de vraag blijven een van de belangrijkste drivers voor netwerkkosten en zou
daarom een centraal punt in het tarief ontwerp moeten zijn met vaststelling van tarieven
die op capaciteit gebaseerd zijn.
Conclusies
Het is belangrijk op te merken dat met smart grids veranderingen worden geanticipeerd
door een actieve vraagzijde welke een bedreiging kan vormen voor een systeem dat al
redelijk goed werkt met het in evenwicht brengen van vraag en aanbod. Daarom is vraag
response meer een gewenste oplossing voor toekomstige energiesystemen met grotere
integratie van duurzame integratie.

24
Continuïteit van de energievoorziening, duurzaamheid en economische efficiëntie
vertegenwoordigen de het energie beleid in Europa. Deze pijlers zijn niet "van nature
uitgelijnde vectoren" en daardoor is het nodig om de juiste balans tussen markt en
regelgeving te vinden om dit geheel harmonieus te kunnen laten werken. Voor vraag
response betekent dit dat innovatieve beloningsregelingen moeten worden ontworpen
die de uitlijning waarborgen van korte termijn operationele doelen en lange termijn
investeringen en het terugverdienen van deze kosten.
Als het gaat om facturering, moeten reguleerders het belang van dynamische prijsstelling
aan leveranciers communiceren als een eerste stap in de richting van elektriciteitsmarkt
bewustzijn door middel van transparantie. De resultaten in dit werk richten op een time-
of-use tarief, overeenkomstig met de uren die betrekking hebben tot de basis, schouder
en piekuren van de spothandel van elektriciteit. Hoewel uit dit onderzoek blijkt dat er
weinig monetaire waarde voor de consument is om real-time prijzen te hebben, toch zou
het door de bewustwording en transparantie die zulke prijzen met zich meebrengen nog
steeds een beschikbare optie blijven. Daarnaast kunnen tarieven ook worden ontworpen
per distributiesysteem in om ervoor te zorgen dat de piek uren van het netwerk
samenvallen met het tarief. Dynamische nettarieven kunnen ook worden beschouwd
met een capaciteit component. Op capaciteit gebaseerde nettarieven moeten de
consument stimuleren om onder een bepaalde vermogensdrempel te blijven,
Voor volume gebaseerde vraag response oplossingen zijn aggregatoren onmisbare zijn
facilitators in de markt processen. Aggregatoren hebben al hun invloed laten zien door
het opbrengen van de discussie op de bestaande marktmechanismen en de bevoorrechte
positie voor grote generatoren. Het is geadviseerd dat de nationale regelgevende
instanties het voortouw nemen in de volgende fase van de geaggregeerde vraag
response door het aanpakken van het probleem van de balans verantwoordelijkheid van
de aggregatoren. De verschillende korte termijn markten kunnen alleen toegankelijk
worden via transparante regelingen die aanzetten tot onderlinge samenwerking tussen
de balans verantwoordelijke partijen, leveranciers en aggregatoren. De aggregatoren
leiden op dit moment al de beweging in het activeren van de vraagzijde, maar het is de
toezichthouders die de sleutel in had heeft voor zowel de initiele fase en de
duurzaamheid van de activatie van de vraagzijde.
Een belangrijke algemene observatie is dat een smart grid een gewoon middel is tot een
doel, maar geen doel op zich. Actieve eindgebruikers vertegenwoordigen een klein stukje
van de fysieke smart grid, maar ze zijn de meest sterke drijfveren in het realiseren van de

25
visie. Uit dit werk is gebleken dat de betrokkenheid van de consument in de markt
dynamiek complex is en kostbaar, met weinig voordeel voor de eindgebruikers. Toch
brengt de transparantie in het markt proces begrip en uiteindelijke acceptatie en steun
voor de smart grid.

26
Acknowledgements
My PhD journey began slightly over four years ago at the Energy and Industry Section in
the Faculty of Technology Policy and Management at Technische Universiteit Delft, as
part of the Erasmus Mundus Joint Doctorate in Sustainable Energy Technology and
Strategies (SETS). This period in my life has been filled with excitement and growth, just
as much personally at it has been professionally and academically. I would like to take
this opportunity to express my gratitude towards the incredible individuals that made
this experience a life-changing one.
First and foremost, I would like to thank my copromotor Rudi Hakvoort for all the
support and guidance he has given me through this process. In one of our first
conversations, I distinctly remember Rudi saying that during the PhD I would not only
become an expert on my topic, but also in these four years we would build a toolkit that I
could access for the remainder of my career. At this time, I can say confidently that
through challenging conversation, which paved the pathways to my research, we have
achieved this and so much more. Secondly, I would like to express my gratitude to my
promotor, Paulien Herder; thank you for being an encouraging mentor and for providing
me with the guidance and support that has allowed me to grow as a researcher. Paulien’s
and Rudi’s advice on both my research as well as on my career have been invaluable. To
my committee members: I would like to thank you for the positive and constructive
feedback and evaluation despite the short review time.
Thank you to my colleagues in Delft for constantly inspiring me through conversation and
helping me see my work as part of the bigger picture of what we are trying to achieve in
Energy and Industry. Laurens, your willingness to share your vast knowledge and support
my research with recommendations for Master’s students has changed the course of
work for the better; and Chris, your enthusiasm and excitement for data have been
infectious. Hamilcar, Remco, Joolie, Martti, Catalin, Andy, Binod, José-Pablo, Alireza,
Prad, Amineh, Yashar, Joao, Jorge, Jochem, Esther, Ben, Ying, Salman, Binod and Kaveri
thank you for all the wonderful times. Cherrelle, thanks for the research collaborations
and endless high level discussions. I am grateful for all the officemates I have had over

27
the years, which have motivated and supported the daily endeavors my research: Émile,
Reinier, Riccardo, Behzad, Yesh, Paolo, Sriram, Ronald and Amit.
For the SETS mobility, I spent time at KTH Royal Institute of Technology and would like to
express my gratitude to the School of Electrical Engineering and Lennart Söder for
hosting me and guiding my work while in Stockholm. Spending time in a different
academic environment in the Nordics was an enriching and a positively challenging
experience for me. I want to thank a few of my officemates at KTH: Yalin, Harold, and
Afshin; a very special thank you to Ezgi for all wonderful times exploring the best cafes
for fika across the city. Angela, although we were never physically in the same office, I’m
grateful for our connection at SETS meetings, which yielded inspiring conversation and in
the end resulted in a research collaboration.
The SETS program has exposed me to a multitude of incredible individuals from across
continents and broadened my understanding of the world around me. I wish I could
name everyone in SETS, but we have grown over the years and it would be too many
names to list; nevertheless, I appreciate meeting you all and spending time at our annual
meetings and in mobility paths. I would like to take this opportunity to thank Andrés
González García for his support from day one of the EMIN Master’s program and his
encouragement to apply for the SETS PhD. The SETS program has had a profound impact
on how I view the world; thank you to the organizers and institutions for initiating this
joint effort.
To my close friends in Delft whom I have shared many meals, coffees, beers and overall
unforgettable experiences with: Thank you Daniel, Marcello, Fabricio, Kon and Bea for
being a part of my life these four years; I look forward to many more meetings all around
the world in the coming years. Thanks Jörn for being an incredible colleague and true
friend in all the good and challenging moments along the way. Marie, you have been the
voice of reason and intellect for me and always a shoulder I could lean on for all the
curveballs that life throws. Alejandra, thank you for all the encouraging conversations
and Spanish flavor in my life in Holland. Layla, you will always be an inspiration and the
older sister I never had; thanks for sharing your wisdom and kindness with me. Donna,
you just get all the Greek and American challenges one faces while abroad—thank you
for just getting it all and for listening with true understanding.
My friends from home have stood by me no matter where I happened to be in the world.
Thanks you Bona, Joe, Doctor, Christine and Jordan for always supporting me.

28
Thank you Tijs for sharing your curiosity for the world with me; my life has been an
endless adventure with you and I wouldn’t have it any other way. Your trust and support
gets me through every day with a smile of my face.
Last but not least, I would like to thank my parents for the sacrifices they made to ensure
my access to education. My mother, Kalipso, passed away when I was 19 after an eight-
year battle with cancer, and unfortunately, was only able to see me graduate from high
school. My father, Lefter, has been a source of inspiration throughout; supporting me
through every exam and deadline, never doubting my ability to make it to the finish line.
Thanks dad for always believing in me and for your dedication to my education. Lambrini,
you are my sister and best friend, and I want to thank you for being my biggest fan.
Thank you for listening to me every day Lamb; no matter how near or far, continent or
time zone, you are always there for me through the good times and challenging ones.
Elta Koliou
Delft, February 2016
29
Chapter 1 ~ Introduction to
the smart grid Traditional power systems consist of large scale generation interconnected to
meet the electricity needs of end-users, succeeding electrification as the
greatest engineering achievement of the 20th
century (U.S. National Academy
of Engineering, 2003). Hence, policy-makers and engineers of today are left to
deal with the externalities resulting from electrification: climate change
mitigation via the decarbonization of the traditional energy model. Specifically,
constant and rising demand for electricity worldwide have prompted a
transformation in both production and consumption processes inclusive of
accommodating large scale renewable energy sources (RES) and local
integration of a variety of distributed energy resources (DER): distributed
generation (DG), local storage, electric vehicles (EVs) and an overall active
demand (Ackermann et al., 2001; Pérez-Arriaga et al., 2013). Specifically, the
current large centralized generation supply following stochastic end-user
consumption patterns will move towards a system paradigm that is far more
intricate and interactive. In future power systems, suppliers and consumers are
expected to cooperatively optimize system decision making. This concept, with
its wide array of functions and capabilities is branded as a ‘smart grid’.
2 Background
Schweppe et al. (1980) introduce the smart grid more than three decades ago as a
philosophy where suppliers of electricity (i.e. generators) and consumers remain in
equilibrium via mutual cooperation and response to price and system reliability signals.
This approach is initially referred to as “Homeostatic Utility Control” a concept that takes
advantage of “the economic response to price on the part of suppliers and consumers
combined with the revolutionary developments occurring in the fields of communication
and computation to develop an efficient, internally-correcting control scheme (Schweppe
30
et al., 1980)”. Schweppee et al. (1981) emphasize that such changes “… may appear to be
revolutionary but are actually evolutionary” and that “… the implementation of
Homeostatic Control can have major impacts on costs and how we as a society treat
electric energy.” The smart grid, in essence, is an upgraded version of the existing
electricity system. Presenting this early state of the art literature on the topic is critical to
illustrate that the smart grid is a byproduct of societal developments worldwide to
improve the quality of energy services to end-users.
On this foundation, the European Union is taking a user-centric stance to developing
smart grid systems as “electricity networks that can intelligently integrate the behavior
and actions of all users connected to it generators, consumers, and those that do both in
order to efficiently deliver sustainable, economic and secure electricity supplies (ETP,
2011)”.
3 The smart grid and the energy transition
A smart grid requires a strong penetration of renewable generation (both large scale and
locally distributed) in addition to undertaking the electrification of transport and heating.
Such a transformation will be facilitated by the integration of control and communication
technologies which enable: (i) active demand participation, (ii) energy conservation and
efficiency measures, (iii) the creation of new services and business models at the retail
level and (iv) the integration of local electricity markets into national ones and beyond
(Pérez-arriaga, 2013). Hence, physical smart grid developments are imposing big
technical and financial challenges for sustaining reliability in power systems (Seebach et
al., 2009; Torriti et al., 2010), especially due to services being met by systems demanding
central control, in turn ensuring security of supply via overcapacity.
Following the restructuring of the electricity sector resulting in liberalization of markets,
discussions have shifted the focus of system security measures away from generation
capacity. Apart from modifying the supply side, demand may also be exploited (Lijesen,
2007). Specifically, demand response (DR) is the concept of consumer load modification
as a result of price signaling generation adequacy or state of grid reliability (Braithwait
and Eakin, 2002; DOE, 2006). Implementation of DR mechanisms (in various forms) is one
of the smart grid solutions investigated towards improving the efficiency of electricity
markets and maintaining system-wide stability.
31
3.1 Enabling an active and reactive demand side
Aggregate production and consumption in a power system needs to instantaneously and
continuously match. In order to help the system operator achieve this necessary
generation/load balance several types of controllable reserves are retained (Kirby, 2003).
Accordingly, power systems are traditionally built and operated under a ‘supply follows
demand’ philosophy which can be criticized for a variety of reasons (Schweppe et al.,
1980):
inefficient use of fuel with the fast activation of reserves;
average and peak load differ significantly therefore extra generation and
transport capacity must exist to supply the peak demand;
fixed electricity prices for end-users discourage ‘demand to follow supply’;
isolating consumers from real-time supply side matters prompts vulnerability to
both short term (e.g. blackouts) and long term (e.g. capacity) emergencies.
The existing preventative archetype of surplus grid and generation capacity cannot
financially or operatively keep up with the increasing grid and market complexities.
Although energy efficiency in appliances and a financial crisis have helped mitigate the
rise in electricity demand in recent years, the electrification of different sectors such as
heating and transport pledge an overall demand increase in the smart grid. Rising
demand requires further grid and generation capacity investments. The current
overcapacity approach is not financially sustainable in the future where by 2020 alone,
European electricity networks alone require an estimated 600 billion Euros in
investments (Eurelectric, 2014). Moreover, deep penetration of renewable and
decentralized generation needs real-time monitoring and reactiveness which entails
further technology investment.
Liberalization forcing unbundling has altered the relationship between market players
and the system operator, while technology has progressed to allow loads to be
responsive and reactive (Kirby, 2003). In order to keep the power system supply and
demand in balance, several countries in Europe have an established tradition of
contracting large energy intensive end-user flexibility either through dynamic pricing
schemes or direct load control (Torriti et al., 2010). Large industrial consumers make up
approximately 36.1% of the total electricity demand in the EU (EEA, 2013). Besides,
residential demand represents 30.9% of the total (EEA, 2013), that is almost one third of
32
a flexibility resource that remains to be tapped. Strbac (2008) reasons that with policy
committed to market-based operation in a deregulated electricity sector, consumers
become the focal point of decision-making at every level of the process.
3.2 End users, the smart grid and demand response
For end-users, developments in the electricity sector correspond to rising bills. On
average, household electricity prices in Europe have risen 4% yearly (EC, 2014). The
current fixed tariff schemes shield consumers from continuous price instabilities.
Nevertheless, such an approach to billing is not sustainable, especially with an emergent
changing supply system implying increasing volatility in prices. As the system evolves, so
must the end-users of electricity. The previously static demand side is expected to follow
generation more closely, with price signals as the driving stimulus to change.
Specifically, the concept of demand response in Europe implies “changes in electric usage
by end-use consumers from their normal load patterns in response to changes in
electricity prices and/or incentive payments designed to adjust electricity usage, or in
response to the acceptance of the consumer’s bid, including through aggregation (ACER,
2012).” Provision of demand response can be broken down into two broad categories
(which are not mutually exclusive): (i) controllable demand response which is
dispatchable similar to generation and (ii) price-based demand response consisting of
dynamic tariff schemes (DOE, 2006). The concept of ‘demand response’ implies savings in
accordance with the forgone consumption which in turn point to market oriented
solutions.
A recent press release from the European Commission appropriately titled Energy: New
market design to pave the way for a new deal for consumers’ sums up the focus on end-
users and demand response for Europe: “Europe's electricity system finds itself in the
middle of a period of profound change. The share of electricity produced by renewables
will grow from 25% today to 50% in 2030 […] New enabling technologies such as smart
grids, smart metering, smart homes, self-generation and storage equipment are
empowering citizens to take ownership of the energy transition, using these new
technologies to reduce their bills and participate actively in the market (EC, 2015a).”
33
4 Stating the problem: issues with demand response
integration
When looking at future power systems warranting the incorporation of demand side
flexibility, there are some unavoidable barriers to market. Initial issues arise with the low
priority consumers place on load modification on account of the relatively low cost of
electricity (when compared to other factors of household expenditure). Moreover, smart
grid investments enabling DR are costly and therefore access to capital is limited and
realized by few. Finally, DR can be considered a secondary attributed of other ‘products
and services’ in electricity markets that, until now, has received little attention in design
and implementation (OECD/IEA, 2007).
Overall, the low consumer prioritization, limited access to capital and deficient market
mechanisms lead to inadequate coordination of DR flexibility. Such barriers to
implementation yield overall split-incentives of system stakeholders warranting the use
of DR for different purposes (Hakvoort and Koliou, 2015; OECD/IEA, 2007). In essence
the integration of DR flexibility falls under the umbrella of a principle agent problem,
where two parties engaged in a contract have different goals and different levels of
information. Accordingly, information asymmetry, uncertainty and risk arise (OECD/IEA,
2007).
Bellow follows a brief discussion of the coordination problem and arising split-incentives
in the context DR. Note, although coordination and split-incentives are discussed
separately, the topics are interrelated results of market barriers to harvesting DR. When
tackling split-incentives, coordination is indirectly affected and vice-versa, see Figure 1
(Hakvoort and Koliou, 2015).
34
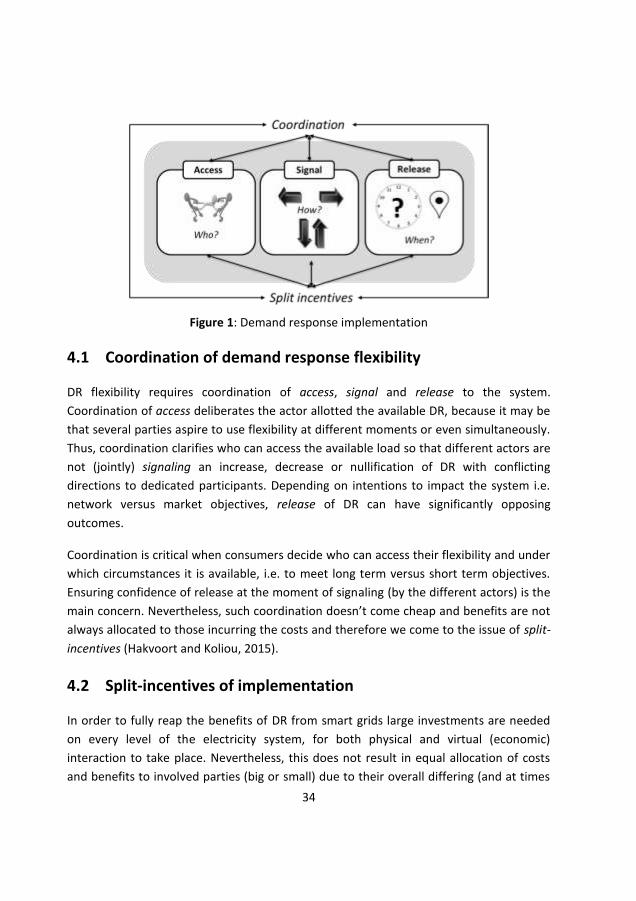
Figure 1: Demand response implementation
4.1 Coordination of demand response flexibility
DR flexibility requires coordination of access, signal and release to the system.
Coordination of access deliberates the actor allotted the available DR, because it may be
that several parties aspire to use flexibility at different moments or even simultaneously.
Thus, coordination clarifies who can access the available load so that different actors are
not (jointly) signaling an increase, decrease or nullification of DR with conflicting
directions to dedicated participants. Depending on intentions to impact the system i.e.
network versus market objectives, release of DR can have significantly opposing
outcomes.
Coordination is critical when consumers decide who can access their flexibility and under
which circumstances it is available, i.e. to meet long term versus short term objectives.
Ensuring confidence of release at the moment of signaling (by the different actors) is the
main concern. Nevertheless, such coordination doesn’t come cheap and benefits are not
always allocated to those incurring the costs and therefore we come to the issue of split-
incentives (Hakvoort and Koliou, 2015).
4.2 Split-incentives of implementation
In order to fully reap the benefits of DR from smart grids large investments are needed
on every level of the electricity system, for both physical and virtual (economic)
interaction to take place. Nevertheless, this does not result in equal allocation of costs
and benefits to involved parties (big or small) due to their overall differing (and at times
35
opposing) intentions. When costs are incurred by some while benefits fall with others,
this leads to a problem of split-incentives inhibiting the development of smart grid
systems facilitating demand response integration (Hakvoort and Koliou, 2015).
4.3 Research objectives
In order for deregulated and competitive power markets to function efficiently and
effectively it is regarded as a well-established and necessary condition that consumption
flexibility must increase. Essentially, this work deals with market based means of
(successfully) promoting a change in household energy end-use of electricity. The focus
of the research remains on economic incentives inclusive of, dynamic pricing contracts,
dynamic distribution signals and the aggregation of DR for participation in the various
short-term electricity markets.
As a market provision, the availability of customer flexibility should be financially
compensated at a level which stimulates customers to engage. From the perspective of
the end-user (who is delivering the flexibility), the choice of DR should remain active
since a change in consumption habits can have a slight or significant effect on desired
living comfort. This work will discuss the ways in which end-users can become active
demand response flexibility providers and the (possible) associated benefits.
This research aims to answer this research question: How can residential end-user
consumption flexibility be promoted successfully through demand response methods in a
smart grid?
To help answer this question, the following set of sub-questions is also answered:
1. What is motivating the utilization of aggregated demand response flexibility in
the European power system?
2. Amongst the options of demand response mechanisms and deemed flexible
load, what is the value to the actors in the electricity value chain of utilizing the
available flexibility?
3. What are the barriers impeding the large-scale introduction and utilization of
aggregated demand response in electricity markets and how can they be
overcome?
4. Who will drive the aggregated demand response engagement in the smart grid
paradigm? Will it be a market stimulus or regulatory intervention?
36
5 Thesis outline
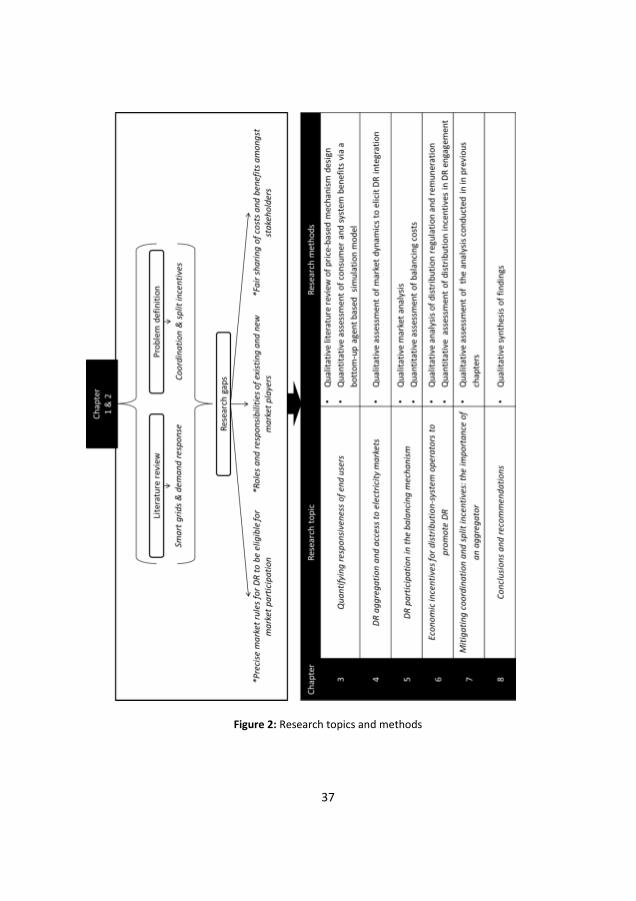
DR implementation falls with the domain the smart grid, a complex socio-technical
energy system with a multiplicity of physical, economic, political and social interactions.
The research thus employs both qualitative and quantitative research methods in order
to address the main question and sub-questions, see summary Figure 2. The research
begins in Chapter 2 with a literature review of the emergence of the smart grid notion
and how DR plays a focal role. Moreover, chapter 2 also deduces the theories,
mechanisms, implementation and overall implications of integrating end-user flexibility
into the larger system, in this way identifying the research gaps to be filled in the
subsequent chapters. Chapter 3 thus focuses the discussion on the feasibility of demand
response in terms of load which can be activated for flexibility. Also, Chapter 3
investigates the significance of price responsiveness for individual households and the
system via the quantification of consumer elasticity; a simulation model is built bottom-
up to gain further insights. Chapter 4 analyses the implications of aggregation and, along
with it, the complexity of market access for aggregators and end-users. Chapter 5 focuses
on the arrangements to accessing balancing markets. Chapter 6 deals with the impact of
demand load shifting on the costs to distribution system operators. Chapter 7
summarizes the motivating factors, and gives advice to tackling the problems of
coordination and split incentives. Finally, chapter 8 provides concluding remarks for
policymakers and researchers on the topic of demand response policies for the
implementation of grids.
37
Figure 2: Research topics and methods

38
39
Chapter 2 ~ Deducing demand
response for smart grids The previous chapter introduced the smart grid and emerging notions for the
shifting paradigm in power system design and operation, giving special
attention to the incorporation of demand activation through demand response
(DR) in Europe. The following chapter begins with a summary of the state of
the art and policy introduction of the smart grid and DR, accordingly
identifying the research gaps. Basic theories and concepts pertaining to the
implementation of DR policies for smart grids are also discussed. The synthesis
coveys a literature review and research conducted in Koliou et al. (20133) and
Hakvoort and Koliou (20154).
1 The smart grid
In order to assess the smart grid it is import to take a look at the state of the art research
development in smart grids. A Scopus5 search reveals that ‘smart grid’ as academic
nomenclature surfaced in 2002 with few publications. Starting in 2007 smart grid
academic literature increases exponentially to this day. In 2007 it is also observed that
demand response (DR) research publications also spike significantly, with an influx of
publications to date (Scopus, 2015). The combined research on ‘demand response’ and
‘smart grids’ begins in 2007 as well, and to date continues to rise significantly every year
since. The research areas of main focus are energy, engineering and computer science,
3 Koliou, E.; Eid, C.; Hakvoort, R.A., Development of Demand Side Response in liberalized electricity markets: Policies for effective market design in Europe, in 10th International Conference on the European Energy Market (EEM), Stockholm, 27-31 May 2013.
4 Hakvoort, R.A., Koliou, E., 2015. Energy Management and Demand Side Response, in: U.C. Sharma et Al., Energy Management, Energy Science and Technology Series. Studium Press LLC, USA, pp. 53–97.
5 Scopus is the largest abstract and citation database of peer-reviewed state of the art literature inclusive of scientific journals, books and conference proceedings. Scopus includes smart tools to track, analyze and visualize research data (Scopus, 2015).
40
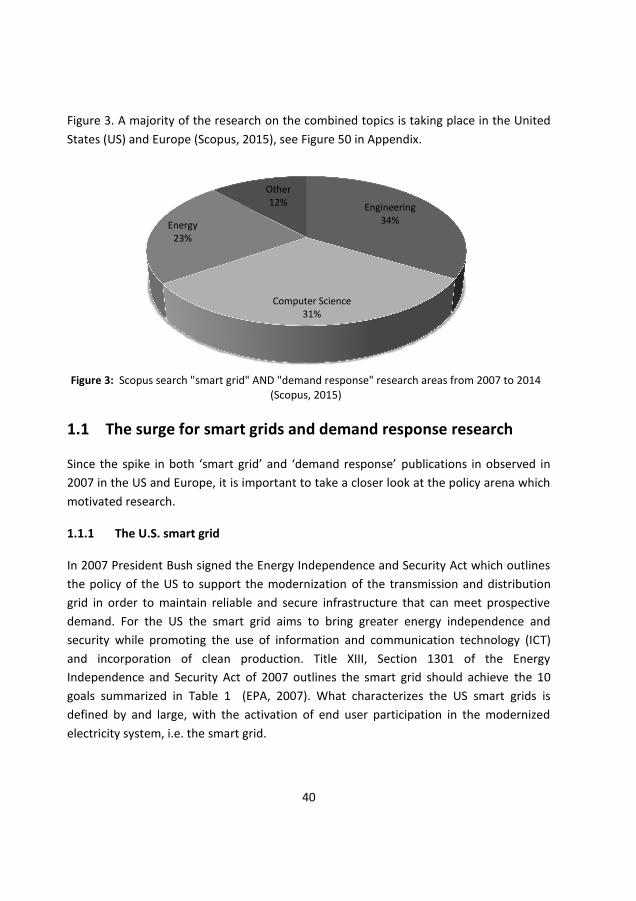
Figure 3. A majority of the research on the combined topics is taking place in the United
States (US) and Europe (Scopus, 2015), see Figure 50 in Appendix.
Figure 3: Scopus search "smart grid" AND "demand response" research areas from 2007 to 2014
(Scopus, 2015)
1.1 The surge for smart grids and demand response research
Since the spike in both ‘smart grid’ and ‘demand response’ publications in observed in
2007 in the US and Europe, it is important to take a closer look at the policy arena which
motivated research.
1.1.1 The U.S. smart grid
In 2007 President Bush signed the Energy Independence and Security Act which outlines
the policy of the US to support the modernization of the transmission and distribution
grid in order to maintain reliable and secure infrastructure that can meet prospective
demand. For the US the smart grid aims to bring greater energy independence and
security while promoting the use of information and communication technology (ICT)
and incorporation of clean production. Title XIII, Section 1301 of the Energy
Independence and Security Act of 2007 outlines the smart grid should achieve the 10
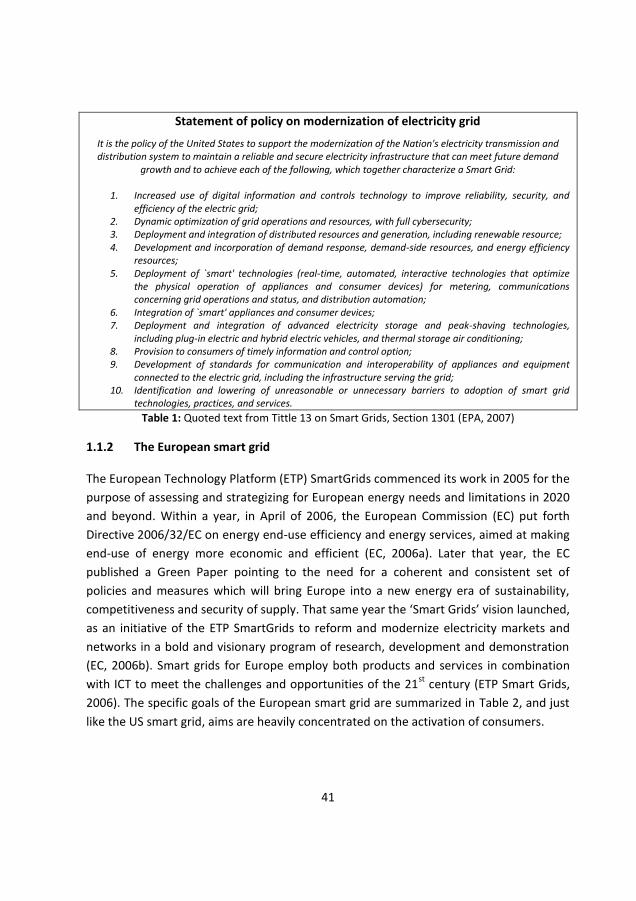
goals summarized in Table 1 (EPA, 2007). What characterizes the US smart grids is
defined by and large, with the activation of end user participation in the modernized
electricity system, i.e. the smart grid.
Engineering 34%
Computer Science 31%
Energy 23%
Other 12%
41
Statement of policy on modernization of electricity grid
It is the policy of the United States to support the modernization of the Nation's electricity transmission and distribution system to maintain a reliable and secure electricity infrastructure that can meet future demand
growth and to achieve each of the following, which together characterize a Smart Grid:
1. Increased use of digital information and controls technology to improve reliability, security, and efficiency of the electric grid;
2. Dynamic optimization of grid operations and resources, with full cybersecurity; 3. Deployment and integration of distributed resources and generation, including renewable resource; 4. Development and incorporation of demand response, demand-side resources, and energy efficiency
resources; 5. Deployment of `smart' technologies (real-time, automated, interactive technologies that optimize
the physical operation of appliances and consumer devices) for metering, communications concerning grid operations and status, and distribution automation;
6. Integration of `smart' appliances and consumer devices; 7. Deployment and integration of advanced electricity storage and peak-shaving technologies,
including plug-in electric and hybrid electric vehicles, and thermal storage air conditioning; 8. Provision to consumers of timely information and control option; 9. Development of standards for communication and interoperability of appliances and equipment
connected to the electric grid, including the infrastructure serving the grid; 10. Identification and lowering of unreasonable or unnecessary barriers to adoption of smart grid
technologies, practices, and services.
Table 1: Quoted text from Tittle 13 on Smart Grids, Section 1301 (EPA, 2007)
1.1.2 The European smart grid
The European Technology Platform (ETP) SmartGrids commenced its work in 2005 for the
purpose of assessing and strategizing for European energy needs and limitations in 2020
and beyond. Within a year, in April of 2006, the European Commission (EC) put forth
Directive 2006/32/EC on energy end-use efficiency and energy services, aimed at making
end-use of energy more economic and efficient (EC, 2006a). Later that year, the EC
published a Green Paper pointing to the need for a coherent and consistent set of
policies and measures which will bring Europe into a new energy era of sustainability,
competitiveness and security of supply. That same year the ‘Smart Grids’ vision launched,
as an initiative of the ETP SmartGrids to reform and modernize electricity markets and
networks in a bold and visionary program of research, development and demonstration
(EC, 2006b). Smart grids for Europe employ both products and services in combination
with ICT to meet the challenges and opportunities of the 21st
century (ETP Smart Grids,
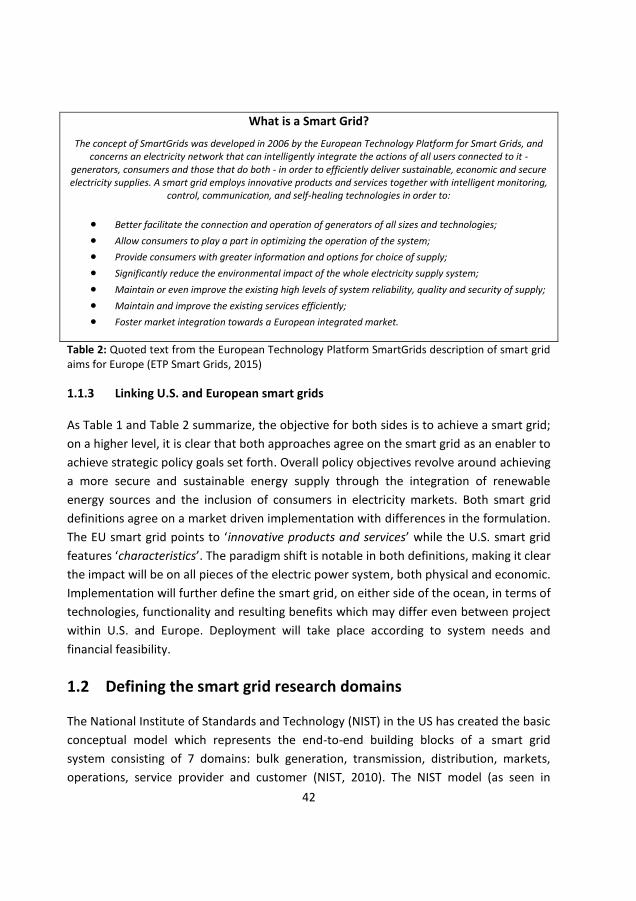
2006). The specific goals of the European smart grid are summarized in Table 2, and just
like the US smart grid, aims are heavily concentrated on the activation of consumers.
42
What is a Smart Grid?
The concept of SmartGrids was developed in 2006 by the European Technology Platform for Smart Grids, and concerns an electricity network that can intelligently integrate the actions of all users connected to it -
generators, consumers and those that do both - in order to efficiently deliver sustainable, economic and secure electricity supplies. A smart grid employs innovative products and services together with intelligent monitoring,
control, communication, and self-healing technologies in order to:
Better facilitate the connection and operation of generators of all sizes and technologies;
Allow consumers to play a part in optimizing the operation of the system;
Provide consumers with greater information and options for choice of supply;
Significantly reduce the environmental impact of the whole electricity supply system;
Maintain or even improve the existing high levels of system reliability, quality and security of supply;
Maintain and improve the existing services efficiently;
Foster market integration towards a European integrated market.
Table 2: Quoted text from the European Technology Platform SmartGrids description of smart grid aims for Europe (ETP Smart Grids, 2015)
1.1.3 Linking U.S. and European smart grids
As Table 1 and Table 2 summarize, the objective for both sides is to achieve a smart grid;
on a higher level, it is clear that both approaches agree on the smart grid as an enabler to
achieve strategic policy goals set forth. Overall policy objectives revolve around achieving
a more secure and sustainable energy supply through the integration of renewable
energy sources and the inclusion of consumers in electricity markets. Both smart grid
definitions agree on a market driven implementation with differences in the formulation.
The EU smart grid points to ‘innovative products and services’ while the U.S. smart grid
features ‘characteristics’. The paradigm shift is notable in both definitions, making it clear
the impact will be on all pieces of the electric power system, both physical and economic.
Implementation will further define the smart grid, on either side of the ocean, in terms of
technologies, functionality and resulting benefits which may differ even between project
within U.S. and Europe. Deployment will take place according to system needs and
financial feasibility.
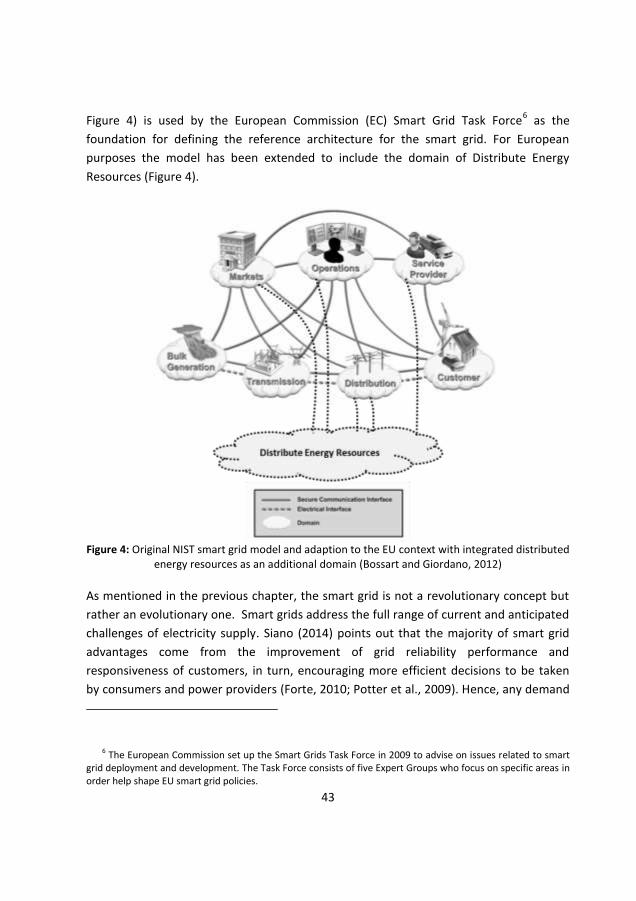
1.2 Defining the smart grid research domains
The National Institute of Standards and Technology (NIST) in the US has created the basic
conceptual model which represents the end-to-end building blocks of a smart grid
system consisting of 7 domains: bulk generation, transmission, distribution, markets,
operations, service provider and customer (NIST, 2010). The NIST model (as seen in
43
Figure 4) is used by the European Commission (EC) Smart Grid Task Force6 as the
foundation for defining the reference architecture for the smart grid. For European
purposes the model has been extended to include the domain of Distribute Energy
Resources (Figure 4).
Figure 4: Original NIST smart grid model and adaption to the EU context with integrated distributed
energy resources as an additional domain (Bossart and Giordano, 2012)
As mentioned in the previous chapter, the smart grid is not a revolutionary concept but
rather an evolutionary one. Smart grids address the full range of current and anticipated
challenges of electricity supply. Siano (2014) points out that the majority of smart grid
advantages come from the improvement of grid reliability performance and
responsiveness of customers, in turn, encouraging more efficient decisions to be taken
by consumers and power providers (Forte, 2010; Potter et al., 2009). Hence, any demand
6 The European Commission set up the Smart Grids Task Force in 2009 to advise on issues related to smart grid deployment and development. The Task Force consists of five Expert Groups who focus on specific areas in order help shape EU smart grid policies.
44
side action to modify consumption load accounts for an integral part of the smart grid
(IEA, 2007; Saffre and Gedge, 2010; Vos, 2009; Zhong et al., 2010)
For Europe specifically, the smart grid definition7 emphasizes an ultimate goal to
establish an electricity system that fosters the involvement of all connected users for
coordination to mutually optimize the delivery of electricity. Nevertheless, steering the
transition towards a smart grid is a complex and long-term process rather than a task,
requiring a balance between market profitability and energy policy goals (Bossart and
Giordano, 2012). It is communicated time and time again that demand side activation is
an integral part of this transition.
As pointed out in chapter 1, the involvement of end-users in the smart grid is beset by an
existing electricity system built under a philosophy of generation follows demand.
Accompanying market processes and regulation have been established in order to cater
to large scale generation to meet demand. Below follows a summary of ways in which
demand can become active followed by an analysis of the benefits. Concluding remarks
will illustrate the research gaps in market processes and regulations for the
implementation of an active demand side this thesis will address.
2 Activating demand in the smart grid
Producing a load shape change is regarded as demand side management: in all forms, it
incorporates the planning and implementation of activities aimed at influencing end-
users of electricity to modify consumption and related patterns with the use of
technology and programs (Gellings, 1985), inclusive of energy efficiency (strategic
conservation) and DR (peak clipping, valley filling and load shifting). See Figure 5 for a
summary of the load modifications.
7 European smart grids are “electricity networks that can intelligently integrate the behavior and actions of all users connected to it generators, consumers, and those that do both in order to efficiently deliver sustainable, economic and secure electricity supplies (ETP, 2011)”.
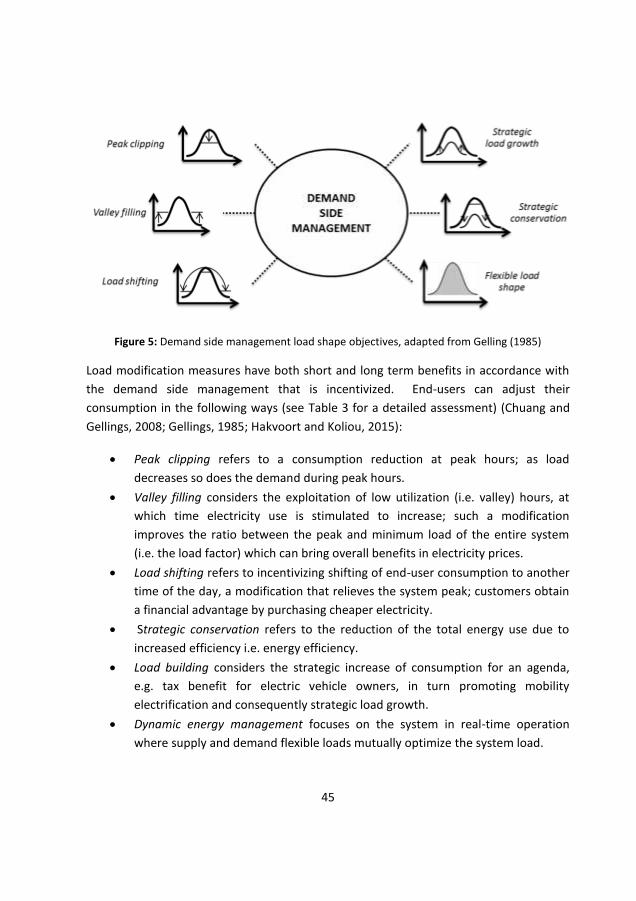
45
Figure 5: Demand side management load shape objectives, adapted from Gelling (1985)
Load modification measures have both short and long term benefits in accordance with
the demand side management that is incentivized. End-users can adjust their
consumption in the following ways (see Table 3 for a detailed assessment) (Chuang and
Gellings, 2008; Gellings, 1985; Hakvoort and Koliou, 2015):
Peak clipping refers to a consumption reduction at peak hours; as load
decreases so does the demand during peak hours.
Valley filling considers the exploitation of low utilization (i.e. valley) hours, at
which time electricity use is stimulated to increase; such a modification
improves the ratio between the peak and minimum load of the entire system
(i.e. the load factor) which can bring overall benefits in electricity prices.
Load shifting refers to incentivizing shifting of end-user consumption to another
time of the day, a modification that relieves the system peak; customers obtain
a financial advantage by purchasing cheaper electricity.
Strategic conservation refers to the reduction of the total energy use due to
increased efficiency i.e. energy efficiency.
Load building considers the strategic increase of consumption for an agenda,
e.g. tax benefit for electric vehicle owners, in turn promoting mobility
electrification and consequently strategic load growth.
Dynamic energy management focuses on the system in real-time operation
where supply and demand flexible loads mutually optimize the system load.
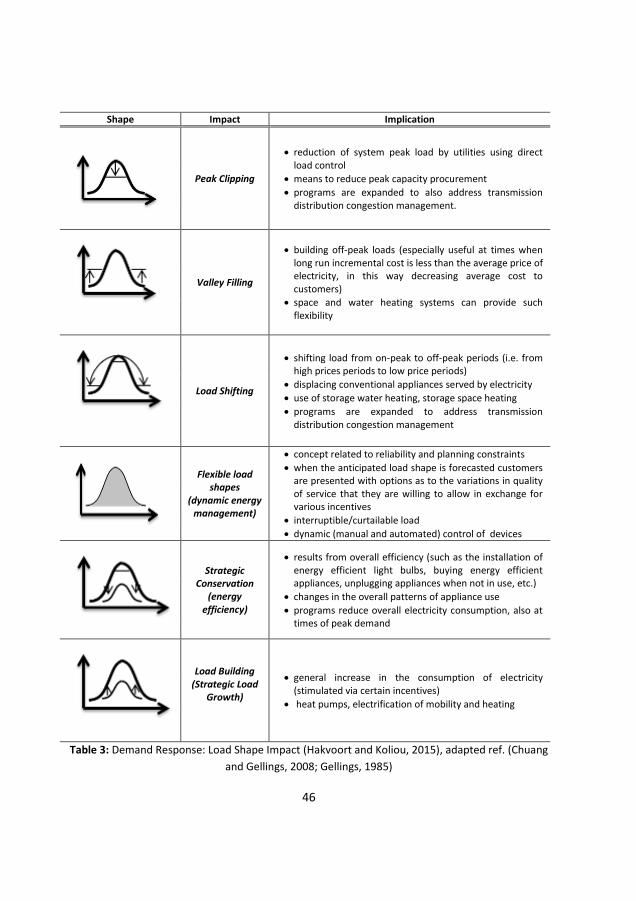
46
Shape Impact Implication
Peak Clipping
reduction of system peak load by utilities using direct load control
means to reduce peak capacity procurement
programs are expanded to also address transmission distribution congestion management.
Valley Filling
building off-peak loads (especially useful at times when long run incremental cost is less than the average price of electricity, in this way decreasing average cost to customers)
space and water heating systems can provide such flexibility
Load Shifting
shifting load from on-peak to off-peak periods (i.e. from high prices periods to low price periods)
displacing conventional appliances served by electricity
use of storage water heating, storage space heating
programs are expanded to address transmission distribution congestion management
Flexible load shapes
(dynamic energy management)
concept related to reliability and planning constraints
when the anticipated load shape is forecasted customers are presented with options as to the variations in quality of service that they are willing to allow in exchange for various incentives
interruptible/curtailable load
dynamic (manual and automated) control of devices
Strategic Conservation
(energy efficiency)
results from overall efficiency (such as the installation of energy efficient light bulbs, buying energy efficient appliances, unplugging appliances when not in use, etc.)
changes in the overall patterns of appliance use
programs reduce overall electricity consumption, also at times of peak demand
Load Building (Strategic Load
Growth)
general increase in the consumption of electricity (stimulated via certain incentives)
heat pumps, electrification of mobility and heating
Table 3: Demand Response: Load Shape Impact (Hakvoort and Koliou, 2015), adapted ref. (Chuang
and Gellings, 2008; Gellings, 1985)
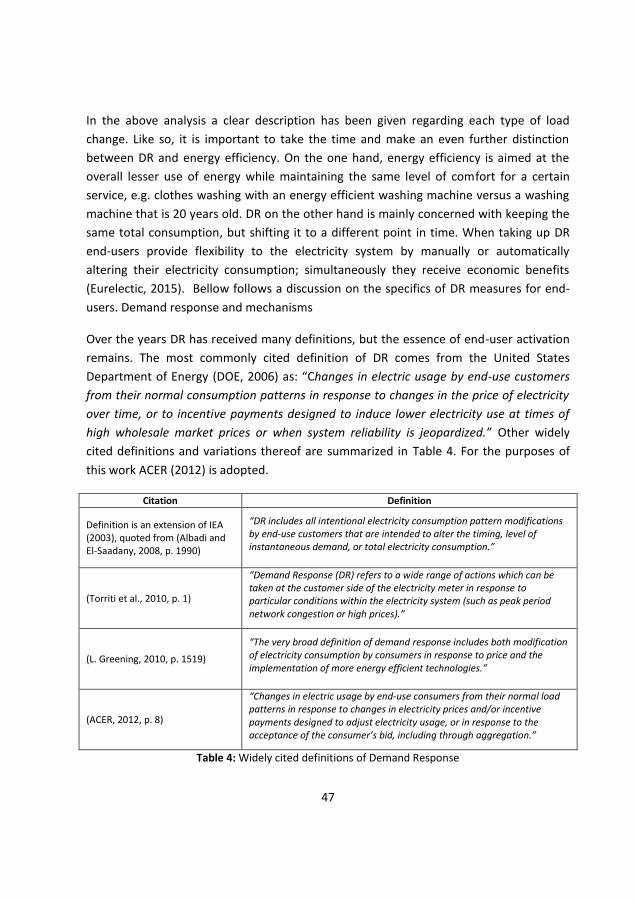
47
In the above analysis a clear description has been given regarding each type of load
change. Like so, it is important to take the time and make an even further distinction
between DR and energy efficiency. On the one hand, energy efficiency is aimed at the
overall lesser use of energy while maintaining the same level of comfort for a certain
service, e.g. clothes washing with an energy efficient washing machine versus a washing
machine that is 20 years old. DR on the other hand is mainly concerned with keeping the
same total consumption, but shifting it to a different point in time. When taking up DR
end-users provide flexibility to the electricity system by manually or automatically
altering their electricity consumption; simultaneously they receive economic benefits
(Eurelectic, 2015). Bellow follows a discussion on the specifics of DR measures for end-
users. Demand response and mechanisms
Over the years DR has received many definitions, but the essence of end-user activation
remains. The most commonly cited definition of DR comes from the United States
Department of Energy (DOE, 2006) as: “Changes in electric usage by end-use customers
from their normal consumption patterns in response to changes in the price of electricity
over time, or to incentive payments designed to induce lower electricity use at times of
high wholesale market prices or when system reliability is jeopardized.” Other widely
cited definitions and variations thereof are summarized in Table 4. For the purposes of
this work ACER (2012) is adopted.
Citation Definition
Definition is an extension of IEA (2003), quoted from (Albadi and El-Saadany, 2008, p. 1990)
“DR includes all intentional electricity consumption pattern modifications by end-use customers that are intended to alter the timing, level of instantaneous demand, or total electricity consumption.”
(Torriti et al., 2010, p. 1)
“Demand Response (DR) refers to a wide range of actions which can be taken at the customer side of the electricity meter in response to particular conditions within the electricity system (such as peak period network congestion or high prices).”
(L. Greening, 2010, p. 1519)
“The very broad definition of demand response includes both modification of electricity consumption by consumers in response to price and the implementation of more energy efficient technologies.”
(ACER, 2012, p. 8)
“Changes in electric usage by end-use consumers from their normal load patterns in response to changes in electricity prices and/or incentive payments designed to adjust electricity usage, or in response to the acceptance of the consumer’s bid, including through aggregation.”
Table 4: Widely cited definitions of Demand Response
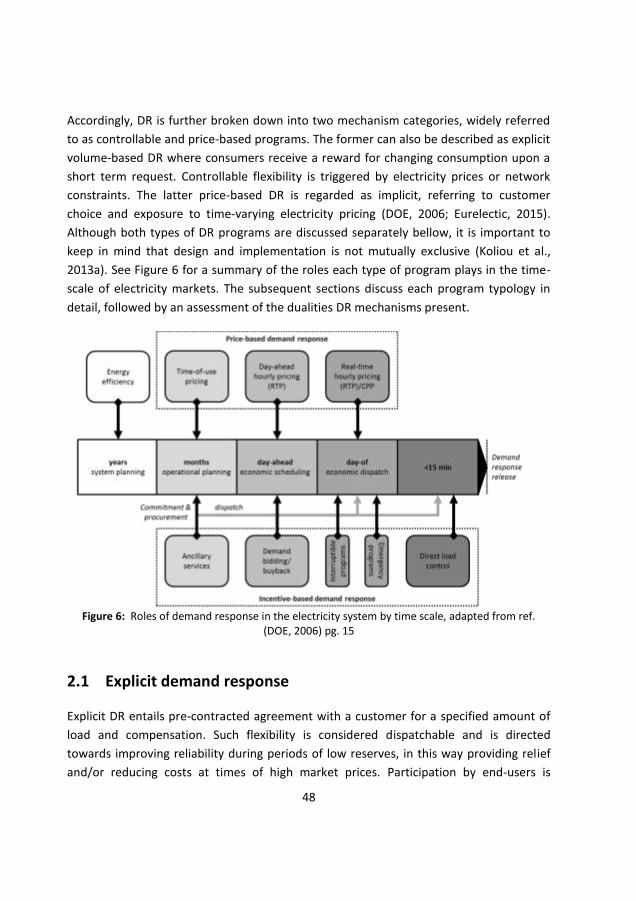
48
Accordingly, DR is further broken down into two mechanism categories, widely referred
to as controllable and price-based programs. The former can also be described as explicit
volume-based DR where consumers receive a reward for changing consumption upon a
short term request. Controllable flexibility is triggered by electricity prices or network
constraints. The latter price-based DR is regarded as implicit, referring to customer
choice and exposure to time-varying electricity pricing (DOE, 2006; Eurelectic, 2015).
Although both types of DR programs are discussed separately bellow, it is important to
keep in mind that design and implementation is not mutually exclusive (Koliou et al.,
2013a). See Figure 6 for a summary of the roles each type of program plays in the time-
scale of electricity markets. The subsequent sections discuss each program typology in
detail, followed by an assessment of the dualities DR mechanisms present.
Figure 6: Roles of demand response in the electricity system by time scale, adapted from ref.
(DOE, 2006) pg. 15
2.1 Explicit demand response
Explicit DR entails pre-contracted agreement with a customer for a specified amount of
load and compensation. Such flexibility is considered dispatchable and is directed
towards improving reliability during periods of low reserves, in this way providing relief
and/or reducing costs at times of high market prices. Participation by end-users is
49
considered voluntary; a penalty scheme is usually established to ensure that enrolled
customers comply with their agreement (Bossart and Giordano, 2012; Braithwait and
Eakin, 2002). Explicit DR programs include the following (DOE, 2006):
Direct Load Control, which entails the cycling and on/off control of
appliances for a pre-defined period.
Interruptible/Curtailable Services that involve a customer choosing a fixed
power level to which they must reduce load upon an announced event.
Demand Bidding/Buyback consisting of flexibility being traded in the short
term markets (day-ahead, intraday and balancing) in the same way as
generation.
Emergency Demand Response which is short term reliability driven, such
that participating customers receive incentive payments for quick and
direct load reductions in an event.
Ancillary Services that consist of bidding load for curtailment into the
reserve markets of the system operator to be paid the market price for
energy and/or a pre-set capacity premium for committing to be on standby.
Explicit DR is more geared towards helping the system under distress in the short term
and usually consists of pre-specified payments, not always reflective of the market price
in real-time (Demand Bidding/Buyback is an exception). In the subsequent section the
menu of price-based measures available for consumers is discussed.
2.2 Implicit demand response
Implicit DR programs are designed on the premise of dynamic price changes in electricity
production. Traditionally, end-users have been charged a fixed none time varying price
for electricity; price-based mechanisms are alternatives to this traditional paradigm. The
idea is that customers will ‘follow generation’ mirrored in the electricity market prices.
Consumers are incentivized to reduce electricity use according to the actual value of
energy in the market, in turn conceding implementation success to end-user behavior
and related characteristics (Bossart and Giordano, 2012; Braithwait and Eakin, 2002;
Masiello et al., 2013). Price-based signals consist of (DOE, 2006):
Time-of-Use (TOU) prices varying by season, week and day of the week ;
depending on the time of day unit prices are sent for at least 2 (but usually
3 or more) different time blocks of the day.
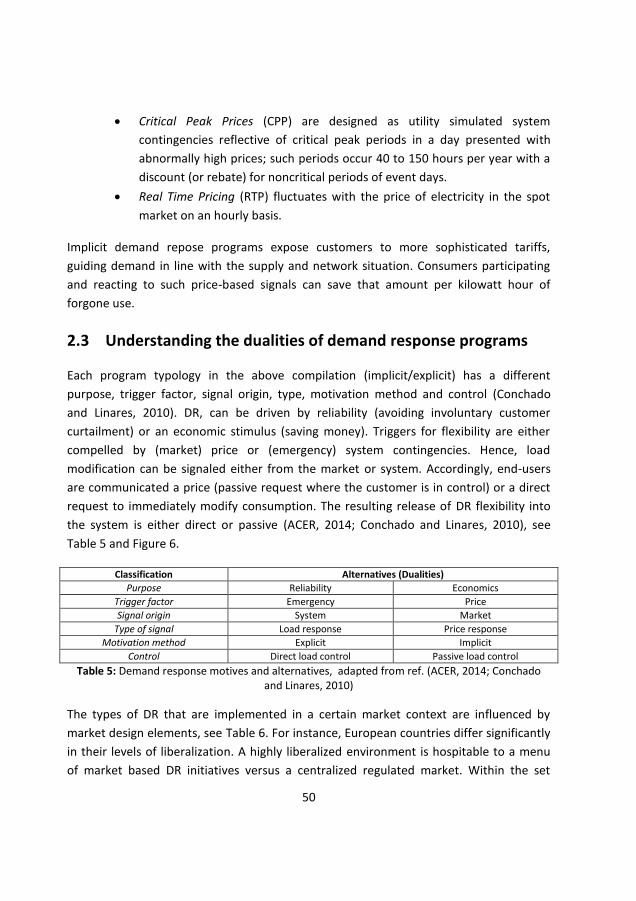
50
Critical Peak Prices (CPP) are designed as utility simulated system
contingencies reflective of critical peak periods in a day presented with
abnormally high prices; such periods occur 40 to 150 hours per year with a
discount (or rebate) for noncritical periods of event days.
Real Time Pricing (RTP) fluctuates with the price of electricity in the spot
market on an hourly basis.
Implicit demand repose programs expose customers to more sophisticated tariffs,
guiding demand in line with the supply and network situation. Consumers participating
and reacting to such price-based signals can save that amount per kilowatt hour of
forgone use.
2.3 Understanding the dualities of demand response programs
Each program typology in the above compilation (implicit/explicit) has a different
purpose, trigger factor, signal origin, type, motivation method and control (Conchado
and Linares, 2010). DR, can be driven by reliability (avoiding involuntary customer
curtailment) or an economic stimulus (saving money). Triggers for flexibility are either
compelled by (market) price or (emergency) system contingencies. Hence, load
modification can be signaled either from the market or system. Accordingly, end-users
are communicated a price (passive request where the customer is in control) or a direct
request to immediately modify consumption. The resulting release of DR flexibility into
the system is either direct or passive (ACER, 2014; Conchado and Linares, 2010), see
Table 5 and Figure 6.
Classification Alternatives (Dualities)
Purpose Reliability Economics
Trigger factor Emergency Price
Signal origin System Market
Type of signal Load response Price response
Motivation method Explicit Implicit
Control Direct load control Passive load control
Table 5: Demand response motives and alternatives, adapted from ref. (ACER, 2014; Conchado and Linares, 2010)
The types of DR that are implemented in a certain market context are influenced by
market design elements, see Table 6. For instance, European countries differ significantly
in their levels of liberalization. A highly liberalized environment is hospitable to a menu
of market based DR initiatives versus a centralized regulated market. Within the set
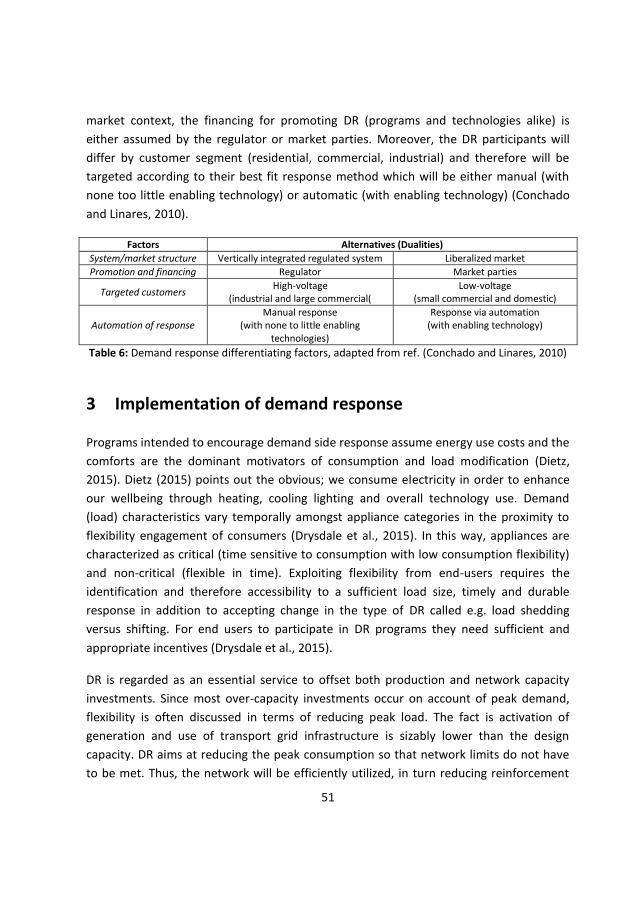
51
market context, the financing for promoting DR (programs and technologies alike) is
either assumed by the regulator or market parties. Moreover, the DR participants will
differ by customer segment (residential, commercial, industrial) and therefore will be
targeted according to their best fit response method which will be either manual (with
none too little enabling technology) or automatic (with enabling technology) (Conchado
and Linares, 2010).
Factors Alternatives (Dualities)
System/market structure Vertically integrated regulated system Liberalized market
Promotion and financing Regulator Market parties
Targeted customers High-voltage
(industrial and large commercial( Low-voltage
(small commercial and domestic)
Automation of response Manual response
(with none to little enabling technologies)
Response via automation (with enabling technology)
Table 6: Demand response differentiating factors, adapted from ref. (Conchado and Linares, 2010)
3 Implementation of demand response
Programs intended to encourage demand side response assume energy use costs and the
comforts are the dominant motivators of consumption and load modification (Dietz,
2015). Dietz (2015) points out the obvious; we consume electricity in order to enhance
our wellbeing through heating, cooling lighting and overall technology use. Demand
(load) characteristics vary temporally amongst appliance categories in the proximity to
flexibility engagement of consumers (Drysdale et al., 2015). In this way, appliances are
characterized as critical (time sensitive to consumption with low consumption flexibility)
and non-critical (flexible in time). Exploiting flexibility from end-users requires the
identification and therefore accessibility to a sufficient load size, timely and durable
response in addition to accepting change in the type of DR called e.g. load shedding
versus shifting. For end users to participate in DR programs they need sufficient and
appropriate incentives (Drysdale et al., 2015).
DR is regarded as an essential service to offset both production and network capacity
investments. Since most over-capacity investments occur on account of peak demand,
flexibility is often discussed in terms of reducing peak load. The fact is activation of
generation and use of transport grid infrastructure is sizably lower than the design
capacity. DR aims at reducing the peak consumption so that network limits do not have
to be met. Thus, the network will be efficiently utilized, in turn reducing reinforcement
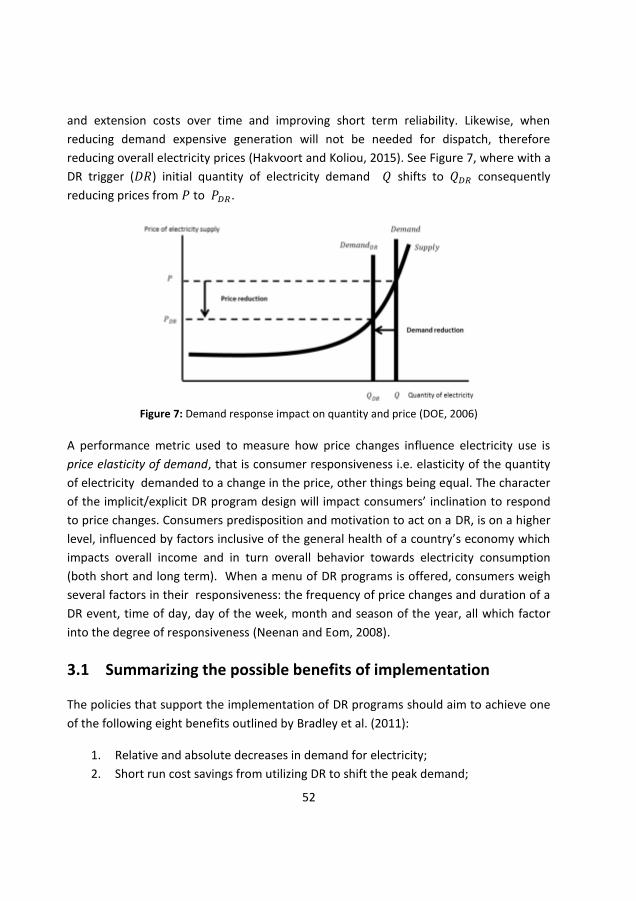
52
and extension costs over time and improving short term reliability. Likewise, when
reducing demand expensive generation will not be needed for dispatch, therefore
reducing overall electricity prices (Hakvoort and Koliou, 2015). See Figure 7, where with a
DR trigger (𝐷𝑅) initial quantity of electricity demand 𝑄 shifts to 𝑄𝐷𝑅 consequently
reducing prices from 𝑃 to 𝑃𝐷𝑅.
Figure 7: Demand response impact on quantity and price (DOE, 2006)
A performance metric used to measure how price changes influence electricity use is
price elasticity of demand, that is consumer responsiveness i.e. elasticity of the quantity
of electricity demanded to a change in the price, other things being equal. The character
of the implicit/explicit DR program design will impact consumers’ inclination to respond
to price changes. Consumers predisposition and motivation to act on a DR, is on a higher
level, influenced by factors inclusive of the general health of a country’s economy which
impacts overall income and in turn overall behavior towards electricity consumption
(both short and long term). When a menu of DR programs is offered, consumers weigh
several factors in their responsiveness: the frequency of price changes and duration of a
DR event, time of day, day of the week, month and season of the year, all which factor
into the degree of responsiveness (Neenan and Eom, 2008).
3.1 Summarizing the possible benefits of implementation
The policies that support the implementation of DR programs should aim to achieve one
of the following eight benefits outlined by Bradley et al. (2011):
1. Relative and absolute decreases in demand for electricity;
2. Short run cost savings from utilizing DR to shift the peak demand;
53
3. Displacing new power plant investment by using DR to shift the demand at peak
to off-peak;
4. Use of DR as a reserve for emergencies and/or unforeseen events;
5. The provision of DR as a standby reserve and balancing for renewable
generation;
6. The use of DR in conjunction with other distributed energy resources;
7. The reduction in transmission network investment via a decrease in network
congestion and avoiding transmission grid reinforcement
8. The use of DR for improving efficiency in distribution network investment and
reducing losses, especially in light of Smart Grid investments.
The estimation of benefits then can be exploited from DR programs depends on several
factors for the customer (L. a. Greening, 2010): customer load profile; customer demand
elasticity; level of response at peak periods; fixed and variable costs avoided in
transmission, distribution and generation; pricing and incentives for compliance (and
penalties for noncompliance); cost of implementing the program.
3.2 Research gaps
It cannot be denied that DR will play a role which some believe to be critical, in the
implementation of smart grids in Europe. Nonetheless, there are important research
areas that require further investigation in order to stimulate the discussion on regulatory
and policy recommendations. Specifically, in order to ensure access to all parties a closer
look should be taken at (Siano, 2014): (i) the precise market rules for DR to be eligible for
market participation; (ii) the roles and responsibilities of existing and new market players
and; (iii) assurance of the fair sharing of costs and benefits amongst stakeholders.
4 Synthesis
In this chapter the smart grid origins in academic literature were presented as a policy
vision of the European Commission for the realization of sustainable, secure and
affordable electricity supply. Therefore, the basic underlying theories of DR, mechanisms
and impact of flexibility system release have been presented. With the above discussion
having established implications of implementing DR, the subsequent chapters will
address the research gaps (3.2) in policy and regulation, market organization and

54
realization of benefits from implemented programs. The research will reveal why
policymakers, regulators, system operators and market parties are demonstrating
renewed interest in demand side measures on the premise of reducing peak demand,
improving operational efficiency, averting incremental capacity (grid and generation)
costs and enhancing the overall system reliability. Ultimately, the remaining chapters will
focus on revealing the true incentives (if any) for implementing in demand DR programs.

55
56
Chapter 3 ~ Quantifying
price responsiveness
The previous chapter served as a backdrop for the theory of implementing
demand response (DR) as a power system flexibility resource. In order to gain
further insight into the value of DR, this chapter focuses on the design,
feasibility and overall consumer and system benefits of adopting price-based
DR mechanisms. The analysis and assessment in this chapter is based on
Koliou et al. (2013b)8 and work conducted in collaboration with Mahalingam
(2013)9.
1 Introduction
Demand response (DR) improves security of supply while access to flexibility in electricity
markets prompts efficiency and liquidity (Albadi and El-Saadany, 2008). As discussed in
Chapter 2, DR provision can be broken down into two broad program classifications for
implementation: (i) controllable DR which is dispatchable similar to generation and, (ii)
price-based DR consisting of sophisticated dynamic tariff schemes (DOE, 2006). The
evaluation of DR behavior under a price-based tariff portfolio remains a subject of
limited exploration in literature (Dave et al., 2013); this chapter aims to fill this
knowledge gap in the following sections.
8 Koliou, E., Mahalingam, A., Hakvoort, R., 2013b. Assessment of Residential Demand Side Response: Implementation of Price-Based Mechanisms in the Dutch Day-Ahead Market, in: IAEE Europe, Düsseldorf, Germany.
9 Mahalingam, A., 2013. Modeling of residential demand response of smart electricity grids to day ahead markets. Master thesis, Delft University of Technology, the Netherlands.
57
2 Demand and energy use
Household energy use varies significantly as a result of physical and behavioral factors.
Total power use of a household (inclusive of both consumption and production) results
from the available electrical appliance stock. Quantity of electricity use depends on the
frequency and habit of use patterns resulting from the type of household and time (hour
of the day, day of the week, season of the year) (Du et al., 2011; Paatero and Lund,
2006). End-use behavior differs with respect to family size, age of household members
and gender. Lutzenhiser (1993)10
concludes that “…the residential sector consumption
seems to be characterized by variability and change, with human behavior playing a
central role in both the short-term and long-term initiation, maintenance and alteration
of energy flows.”
2.1 Consumer behavior
As a social science, economics observes the choices people make based on their available
alternatives. Like so, economics is considered the ‘dismal science’ because it always
points out the tradeoffs people face (MIT, 2011). The social part of economics examines
people’s behavior while a scientific approach is taken to observing choices. Overall,
individual consumers purchase goods or services and seek to gain the most ‘bang for
their buck’, this is referred to as utility maximization of rationally behaving consumers
(Rittenberg and Tregarthen, 2011). When considering electricity consumption behavior
of consumers, price and income are the key determinants in their utility maximization
(Neenan and Eom, 2008). Nevertheless, utility is subjective and varies widely from one
person to the next not to mention the fact that consumers are not always rational.
When considering consumer behavior it is important to note that it is highly complex to
analyze and seldom follows traditional and rational economic decision-making theories.
On a daily basis individuals are faced with immense amounts of information and choices.
Although the options are there, humans are ‘boundedly rational’ with limited cognitive
resources of information gathering and processing, naturally constraining them from
making optimal decisions (Frederiks et al., 2015; Simon, 1959). Hence, household
10 An extensive review of studies from the 1970s leading the 1990s on the variations in energy use in and between individual households.
58
decisions regarding energy consumption systematically deviate from utility-maximization
rational (Friedman and Hausker, 1988), and more accurately towards one that is
satisficing. A satisficing decision is one that is a good enough option, but is not
necessarily the optimal one (Simon, 1956). Specifically, “Decision makers can satisfice
either by finding optimum solutions for a simplified world, or by finding satisfactory
solutions for a more realistic world. Neither approach, in general, dominates the other,
and both have continued to co-exist in the world of management science (Simon in
Lindbeck (1992, p. 350).”
End-user decision making is not reliably predictable in accordance with what people
know is the ‘best’ or sense is the ‘right’ action to take. What people actually do and what
they say they will do are often very different (Frederiks et al., 2015). In the domains of
human behavior Frederiks et al. (2015) note action gaps in knowledge, value, attitude
and intention. For energy use this simply translates to people knowing the importance of
energy savings for mitigating climate change, yet not proceeding with practical actions
towards the transformation of their energy use.
Although individual end-user behavior varies significantly and illustrates patterns of
irregularity, there are several high level factors influencing how consumers are
predisposed and motivated to respond to electricity price signals that are derived with
confidence and predictability. Such factors include the general health of the economy,
which in turn, impacts the income of consumers and overall profitability in addition to
the availability of substitutes (or in the case of electricity lack thereof) essential to
maintaining the overall welfare with price changes. Fundamentally, mechanisms that
impact load modification behavior are the result of changes in consumer income and
electricity market prices (Neenan and Eom, 2008). In the section below follows a
discussion on the electricity prices in the European Union (EU).
2.2 Electricity prices in Europe
Prior to discussing price-based DR it is important to make explicit what energy prices and
costs entail. The prices paid by consumers reflect several components of the system
which are influenced by both markets and implemented policy. Accordingly, the energy
component of the bill consists of wholesale prices, retailing, network, taxes and levies.
Wholesale prices represent the costs incurred by generators inclusive of capital,
operational and decommissioning expenditures. In a well-functioning competitive market
59
environment, market clearing price is determined by the marginal cost of production.
This means the market price is equal to the cost of bringing in that last (i.e. marginal) unit
of capacity in any given clearing period (generally on an hourly basis). In a well-designed
wholesale market that is sufficiently competitive, generation units with the lowest cost
are called first and high-cost units run infrequently in periods of peak demand. Hence,
the mix of generation capacity in the system is managed economically efficiently on an
hour-by-hour basis.
Retailing represents the supplier costs for procuring and providing electricity to final
users based on the clearing prices of wholesale markets or via long term bilateral
contracts. Network charges encompass both transmission and distribution costs for
operation, maintenance, expansion and network losses. On top of the network costs,
charges for public service obligations11
and technology support12
are added. Moreover,
taxes and levies are also applied in the end-user bill, as part of the taxation instruments,
e.g. the EU value added tax (VAT)13
, and targeted levies for achieving energy and climate
policy objectives (EC, 2014). Figure 8 illustrates the cost of electricity for end-users in the
EU member states; in the figure energy prices, taxes and levies are illustrated. Network
charges for households are not included since they vary significantly amongst the
member states, for example, absolute charges range from 0.022 €/kWh to 0.097 €/kWh
(EC, 2014). Average EU prices are observed in the Netherlands, see Figure 8.
11 For example, decommissioning of nuclear power plants. 12 For example, renewable support schemes. 13 The EU VAT is an additional tax on goods and services within the member states ranging from 17% to 27%
among the member states. For more information see http://ec.europa.eu/taxation_customs/resources/documents/taxation/vat/how_vat_works/rates/vat_rates_en.pdf.
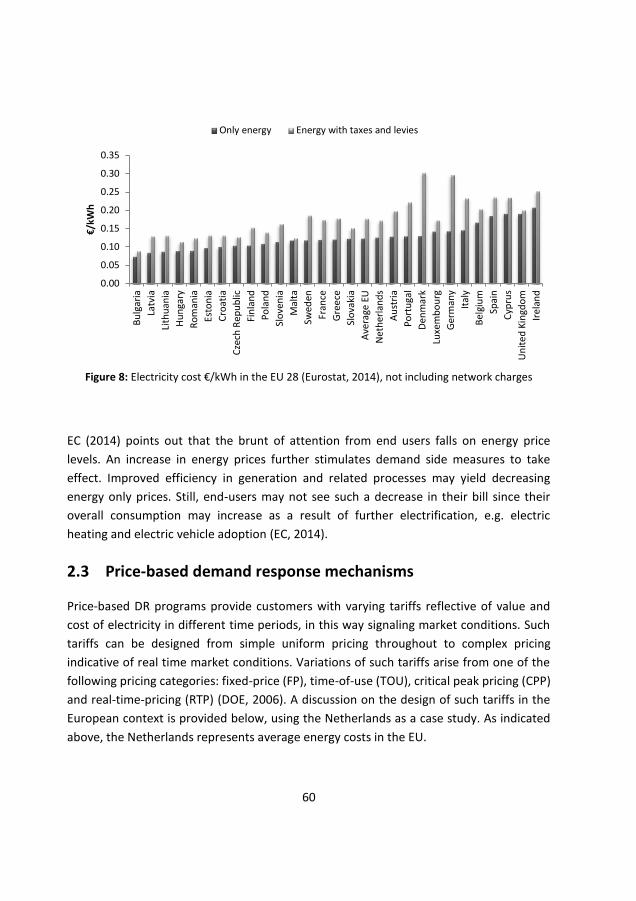
60
Figure 8: Electricity cost €/kWh in the EU 28 (Eurostat, 2014), not including network charges
EC (2014) points out that the brunt of attention from end users falls on energy price
levels. An increase in energy prices further stimulates demand side measures to take
effect. Improved efficiency in generation and related processes may yield decreasing
energy only prices. Still, end-users may not see such a decrease in their bill since their
overall consumption may increase as a result of further electrification, e.g. electric
heating and electric vehicle adoption (EC, 2014).
2.3 Price-based demand response mechanisms
Price-based DR programs provide customers with varying tariffs reflective of value and
cost of electricity in different time periods, in this way signaling market conditions. Such
tariffs can be designed from simple uniform pricing throughout to complex pricing
indicative of real time market conditions. Variations of such tariffs arise from one of the
following pricing categories: fixed-price (FP), time-of-use (TOU), critical peak pricing (CPP)
and real-time-pricing (RTP) (DOE, 2006). A discussion on the design of such tariffs in the
European context is provided below, using the Netherlands as a case study. As indicated
above, the Netherlands represents average energy costs in the EU.
0.00
0.05
0.10
0.15
0.20
0.25
0.30
0.35
Bu
lgar
ia
Latv
ia
Lith
uan
ia
Hu
nga
ry
Ro
man
ia
Esto
nia
Cro
atia
Cze
ch R
epu
blic
Fin
lan
d
Po
lan
d
Slo
ven
ia
Mal
ta
Swed
en
Fran
ce
Gre
ece
Slo
vaki
a
Ave
rage
EU
Net
her
lan
ds
Au
stri
a
Po
rtu
gal
Den
mar
k
Luxe
mb
ou
rg
Ger
man
y
Ital
y
Bel
giu
m
Spai
n
Cyp
rus
Un
ite
d K
ingd
om
Irel
and
€/k
Wh
Only energy Energy with taxes and levies
61
2.3.1 Tariff design for the Netherlands
At the most basic level, fixed prices are uniform throughout the day and can have
seasonal variations. Average FP in the European residential sector are 0.20 €/kWh,
inclusive of taxes and levies. When looking at the Netherlands, consumers pay
approximately 0.21 €/kWh. Supply (wholesale generation) is a non-varying component in
the bill accounting for approximately a quarter of total cost; price varies in accordance
with the retailer generation mix (ranging between 0.047 Euro and 0.064 Euro per kWh),
the energy tax is usually a fixed at 0.12 €/kWh which is paid with another levied fixed tax
of 0.0036 €/kWh to finance sustainable energy projects. Retailers also include a VAT of
21% to the whole bill (Energievergelijken, 2015). As of 2009 Dutch consumers pay a fixed
capacity tariff (€/kW) for network usage (Eurelectric, 2013) which ends up being an
additional 20 percent cost to the energy charges discussed14
.
With a dynamic tariff schemes (TOU, RTP and CPP) the electricity price, inclusive of all its
components, has the possibility to vary on an hourly basis with short term prices of the
day-ahead, intra-day and balancing markets (Bossart and Giordano, 2012; Braithwait and
Eakin, 2002; DOE, 2006; Masiello et al., 2013) . Widely cited work on dynamic tariff
design consider day-ahead market prices as the optimal signal for price-based DR
(Faruqui et al., 2009; Hamidi et al., 2009) because of the ability to plan 24 hours in
advance, since households currently employ manual response with the possibility of
automation under smart grid conditions (Abdisalaam et al., 2012). For the Netherlands
we take the values from the Power Spot Exchange for the Netherlands (APX)15
, see
Figure 9.
14 Total yearly network costs are a fixed price of 227.80 Euro per year per household (Energievergelijken, 2015).
15 The average traded volume is approximately 45% of yearly electricity consumption in the Netherlands (APX, 2014b).
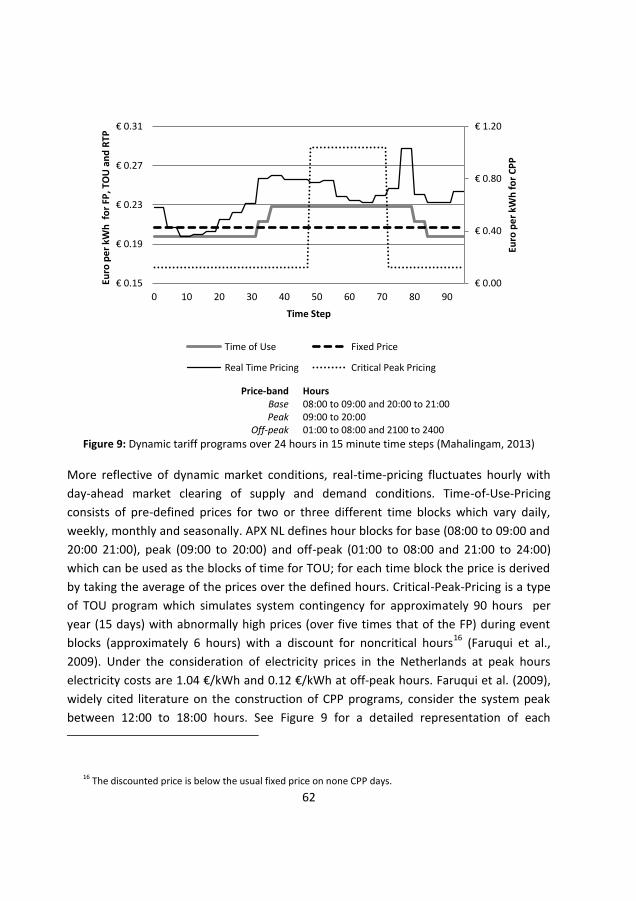
62
Price-band Hours
Base 08:00 to 09:00 and 20:00 to 21:00 Peak 09:00 to 20:00
Off-peak 01:00 to 08:00 and 2100 to 2400
Figure 9: Dynamic tariff programs over 24 hours in 15 minute time steps (Mahalingam, 2013)
More reflective of dynamic market conditions, real-time-pricing fluctuates hourly with
day-ahead market clearing of supply and demand conditions. Time-of-Use-Pricing
consists of pre-defined prices for two or three different time blocks which vary daily,
weekly, monthly and seasonally. APX NL defines hour blocks for base (08:00 to 09:00 and
20:00 21:00), peak (09:00 to 20:00) and off-peak (01:00 to 08:00 and 21:00 to 24:00)
which can be used as the blocks of time for TOU; for each time block the price is derived
by taking the average of the prices over the defined hours. Critical-Peak-Pricing is a type
of TOU program which simulates system contingency for approximately 90 hours per
year (15 days) with abnormally high prices (over five times that of the FP) during event
blocks (approximately 6 hours) with a discount for noncritical hours16
(Faruqui et al.,
2009). Under the consideration of electricity prices in the Netherlands at peak hours
electricity costs are 1.04 €/kWh and 0.12 €/kWh at off-peak hours. Faruqui et al. (2009),
widely cited literature on the construction of CPP programs, consider the system peak
between 12:00 to 18:00 hours. See Figure 9 for a detailed representation of each
16 The discounted price is below the usual fixed price on none CPP days.
€ 0.00
€ 0.40
€ 0.80
€ 1.20
€ 0.15
€ 0.19
€ 0.23
€ 0.27
€ 0.31
0 10 20 30 40 50 60 70 80 90
Euro
pe
r kW
h f
or
CP
P
Euro
pe
r kW
h f
or
FP, T
OU
an
d R
TP
Time Step
Time of Use Fixed Price
Real Time Pricing Critical Peak Pricing
63
program throughout a 24 hour time period (every 15 minutes). Price mechanisms
illustrated in Figure 9 include taxes and levies but not network costs.
2.3.2 Value of price-based programs
Dynamic tariffs are not a new phenomenon, yet a new wave of interest has emerged
focusing on measurement of flexibility provided with such rates. Electricity market
stakeholders are interested in dynamic pricing as a way to improve overall efficiency in
system operation, reduce demand during peak periods and alleviate incremental costs of
capacity investment (Neenan and Eom, 2008).
The Department of Energy and Climate Change of the UK reports a literature review of 30
trials which indicate that residential end-users do indeed shift electricity demand in
response to dynamic pricing signals. However, the size of the a shift varies across tariff
types and trials, anywhere from 0% to 38% (DECC, 2013). It is also highlighted that efforts
to automate the provision of flexibility is shown to deliver the greatest and most
sustained shifts. Generally, a combination of automation, dynamic pricing programs and
enhanced information deliver the highest level of demand responsiveness. Evidence
remains inconclusive on whether or not real-time pricing will be adopted by residential
users; to date this price program has not produced the desired shift in demand (DECC,
2013).
When considering a menu of tariff programs, end-user sensitivity to price changes can be
measured by calculating the elasticity of consumer demand (Neenan and Eom, 2008).
See the following sections for a detailed description.
3 Evaluation of price-based demand response: the theory
As communicated by the law of demand, all other things being equal, end-users consume
more of a good when prices are low and less when prices rise. The question at hand is
how much more or less will they consume when considering the different price-based
mechanisms described above?
64
3.1 Price elasticity of demand
Consumer behavior under price changes is referred to as the ‘price elasticity of demand’
or ‘own-price elasticity’ (𝐸𝑑), in essence determining the consumers’ ability to take
advantage of the change in price. Associating the responsiveness of consumers according
to sector (residential, commercial, industrial) is the ‘value’ market stakeholders are
interested in deriving prior to implementing large scale DR programs (Neenan and Eom,
2008). Specifically, 𝐸𝑑 is the change in consumer demand for a good or service that
results from a unit change in the price calculated as follows (see):
(1) 𝐸𝑑 =%∆𝑄
%∆𝑃
where %∆𝑄 represents the percent change in quantity of electricity demanded (in kWh)
resulting from the percent change in the price %∆𝑃 of electricity (in €/kWh). The
resulting value is usually negative due to the (desired) consumer response: when the
price of electricity increases, consumers should tend to demand less. Like so, the value of
𝐸𝑑 characterizes the degree of consumer price responsiveness as the estimation in the
level of demand change.
The degree of consumer price response is determined by the frequency of price change,
time of day or season of the year and by how much and for how long the signal is
triggered (Neenan and Eom, 2008). Along these lines, there are significant regional
differences as a result of climate, level of substitute prices and demographic variables
(Bernstein and Griffin, 2006). See Figure 10 for a summary of average own-price elasticity
values from residential dynamic pricing programs, where 𝐸𝑑 ranges from -0.055 for
TOU17
, -0.08 for RTP18
and -0.535 for CPP19
; overall these studies indicate that demand is
relatively inelastic since the increase in price is proportionately larger than the decrease
in quantity of electricity demanded. Specifically, demand is considered to be elastic with
17 (Tishler, 1984) 18 (Summit Blue Consulting, 2007) 19 (Cooke, 2011)
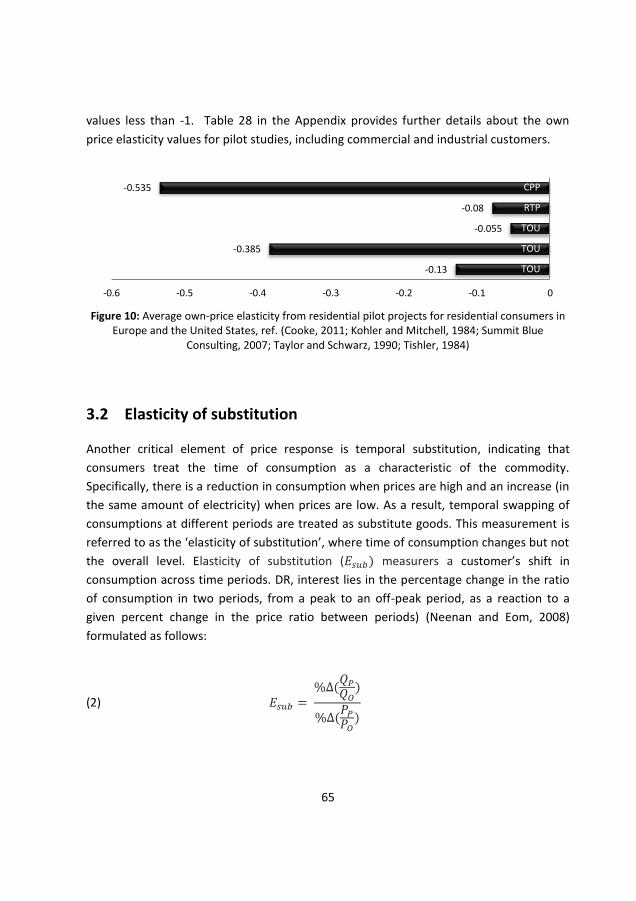
65
values less than -1. Table 28 in the Appendix provides further details about the own
price elasticity values for pilot studies, including commercial and industrial customers.
Figure 10: Average own-price elasticity from residential pilot projects for residential consumers in
Europe and the United States, ref. (Cooke, 2011; Kohler and Mitchell, 1984; Summit Blue Consulting, 2007; Taylor and Schwarz, 1990; Tishler, 1984)
3.2 Elasticity of substitution
Another critical element of price response is temporal substitution, indicating that
consumers treat the time of consumption as a characteristic of the commodity.
Specifically, there is a reduction in consumption when prices are high and an increase (in
the same amount of electricity) when prices are low. As a result, temporal swapping of
consumptions at different periods are treated as substitute goods. This measurement is
referred to as the ‘elasticity of substitution’, where time of consumption changes but not
the overall level. Elasticity of substitution (𝐸𝑠𝑢𝑏) measurers a customer’s shift in
consumption across time periods. DR, interest lies in the percentage change in the ratio
of consumption in two periods, from a peak to an off-peak period, as a reaction to a
given percent change in the price ratio between periods) (Neenan and Eom, 2008)
formulated as follows:
(2) 𝐸𝑠𝑢𝑏 = %∆(
𝑄𝑃
𝑄𝑂)
%∆(𝑃𝑃
𝑃𝑂)
-0.13
-0.385
-0.055
-0.08
-0.535
-0.6 -0.5 -0.4 -0.3 -0.2 -0.1 0
TOU
TOU
TOU
RTP
CPP
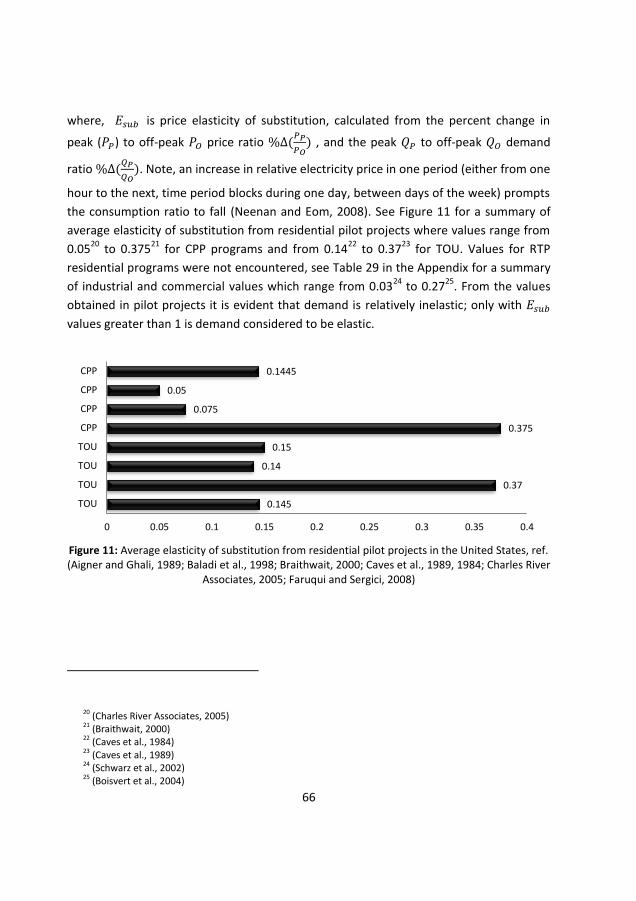
66
where, 𝐸𝑠𝑢𝑏 is price elasticity of substitution, calculated from the percent change in
peak (𝑃𝑃) to off-peak 𝑃𝑂 price ratio %∆(𝑃𝑃
𝑃𝑂) , and the peak 𝑄𝑃 to off-peak 𝑄𝑂 demand
ratio %∆(𝑄𝑃
𝑄𝑂). Note, an increase in relative electricity price in one period (either from one
hour to the next, time period blocks during one day, between days of the week) prompts
the consumption ratio to fall (Neenan and Eom, 2008). See Figure 11 for a summary of
average elasticity of substitution from residential pilot projects where values range from
0.0520
to 0.37521
for CPP programs and from 0.1422
to 0.3723
for TOU. Values for RTP
residential programs were not encountered, see Table 29 in the Appendix for a summary
of industrial and commercial values which range from 0.0324
to 0.2725
. From the values
obtained in pilot projects it is evident that demand is relatively inelastic; only with 𝐸𝑠𝑢𝑏
values greater than 1 is demand considered to be elastic.
Figure 11: Average elasticity of substitution from residential pilot projects in the United States, ref. (Aigner and Ghali, 1989; Baladi et al., 1998; Braithwait, 2000; Caves et al., 1989, 1984; Charles River
Associates, 2005; Faruqui and Sergici, 2008)
20 (Charles River Associates, 2005) 21 (Braithwait, 2000) 22 (Caves et al., 1984) 23 (Caves et al., 1989) 24 (Schwarz et al., 2002) 25 (Boisvert et al., 2004)
0.145
0.37
0.14
0.15
0.375
0.075
0.05
0.1445
0 0.05 0.1 0.15 0.2 0.25 0.3 0.35 0.4
TOU
TOU
TOU
TOU
CPP
CPP
CPP
CPP
67
The calculation of price elasticity of demand and elasticity of substitution are regarded as
robust measurements for price responsiveness to price-based DR programs, however,
they required detailed data on both load and price households pay (Goldman et al.,
2007).
3.3 Factors impacting elasticity values
Price elasticity is a way of anticipating the expected consumer response to a modification
in the price level of electricity. Since this is a way of forecasting expected consumer
savings, system impact and retailer revenues, reliable predictions are critical in attracting
participants to demand-response programs. Therefore, certain factors must be
considered when seeking responsive consumers: time frame, technology and learning
and overall price levels.
3.3.1 Time and technology impact on elasticity
In the long-term, price responsive demand is expected to count as a resource in capacity
planning for the system. When considering elasticity in relation to price, the time frame
is a critical component denoting the level of change in consumption. In the short-run,
consumers seek to make adjustments in their initial demand within their available means
of comfort, appliance stock and sensitivity to price. With time and persisting price
increases, consumers are further motivated to replace their appliance stock with more
efficient devices in addition to adjusting their behavior. Overall, in the long-run, the load
modification associated with changes in price is greater than in the short-run, since
consumers’ change the way they value and consume electricity, in turn yielding more
elastic demand. Such a modification may take years to implement due to behavioral
adjustment in addition to the capital investment needed to alter the appliance stock
(Neenan and Eom, 2008).
Elasticity values are estimated to fit each sector in the economy (residential, commercial,
transport, industry etc.). However, overall heterogeneity within the sector of consumers
exists as a result of the appliance stock of each household. Access to technology has
proven to increase levels of consumer elasticity (Braithwait and Eakin, 2002; Charles
River Associates, 2005). In Figure 10 (and Table 28 in the Appendix) and Figure 11 (and
Table 29 in the Appendix), the studies with the higher values of elasticity had
incorporated enabling technology (Neenan and Eom, 2008). In a meta-analysis including
36 studies from 1947 to 1997 on residential electricity price sensitivity, own price
68
elasticities range from ‐0.076 to ‐2.01 in the short-run and ‐0.07 to ‐2.5 in the long-run.
Average short-run own-price elasticity is -0.28 and -0.81 for the long run (Espey and
Espey, 2004).
3.3.2 Effects of learning and experience on price elasticity
Studies have shown that over time consumers illustrate a higher elasticity, both for price
and substitution (Taylor and Schwarz, 1990). For example, Duke Power conducted an 8
year study on an RTP program where participating commercial and industrial firms
collectively exhibited an hourly elasticity of substitution below 0.2 in 1995, increasing to
0.25 by 1999 (Schwarz et al., 2002). Such learning over time is a point to note in rate
design as a result of the evolution in the institutional context. Nevertheless, such a case
may not always hold true.
Although consumers may acquire more efficient appliances over time, it is important to
note that end-users become increasingly dependent on electricity acquiring more
technology and gadgets. Chang and Hsing (1991) conducted an aggregated-level analysis
of the American residential sector not partaking in time-of-use programs during the years
1950 to 1987. The study revealed that in the long-run, own-price elasticity for electricity
demand had declined steadily from -2.1 to -1.2 as result of the increasing dependency of
consumers on electric appliances that provide convenience, entertainment or both for
which there are few direct substitutes.
3.3.3 Impact of the price level (in the market) on price elasticity
Over the years electricity prices have not remained constant as result of rising fuel costs,
new technologies and levels of consumption in a European-wide economic recession.
Neenan and Eom (2008) suggest that the level of electricity prices impacts values of price
elasticity of demand which make elasticity subject to thresholds in prices and quantitates
(see 2.2). Such a response to price levels may be attributed to the set of appliances
deemed available for flexibility use. Gupta and Danielsen (1998) find that when
considering RTP programs, consumers with access to local generation will only ‘respond’
if the price is above a certain threshold.
Below follows an assessment of the above mentioned factors impacting DR via price-
based mechanisms under a simulation case study of the Dutch residential sector from
Koliou et al. (2013) and Mahalingam (2013).
69
4 Price-based demand response in practice
A very important part of DR involves consistent evaluation of demand-side to supply-side
alternatives to assess their cost-effectiveness (Gyamfi et al., 2013) which can be done
when consumers are given price-based signals to modify consumption (Dave et al.,
2013). Household load data is of high value to stakeholders in the energy sector, but
nevertheless, such figures remain sensitive and difficult to obtain in a smart grid
environment concerned with cyber security.
For end-users the consideration of DR programs is still in an exploratory phase, with little
understanding on the attainable value (Torriti et al., 2010). This work seeks to obtain
insight through the use of simulation as a useful tool towards understanding the impact
of relevant programs.
4.1 Modeling of the residential load
Literature points to three main types of modeling methods for the residential sector
(Grandjean et al., 2011): (i) top-down modeling; (ii) bottom-up; (iii) hybrid. Top-down
models of residential load analyze total load curves which can have different levels of
granularity, but overall treat the residential load as a giant energy pool without
consideration of individual household consumption. Ideally it is measured aggregated are
representative end-uses cases. Bottom-up modeling methodologies entail a construction
of the load starting from the smallest possible system units, the individual appliances,
and successively aggregate such units in order to reach higher system levels (Widén et
al., 2009). Ideally, this data results from observed and measured household activity
which is specific to each appliance and household of the geographic area of study. A
bottom-up construction can be achieved with actual measured data of households or can
be simulated. A hybrid approach combines both bottom-up and top-down approaches.
Models can be developed according to each typology described. Note, access to actual
household data and appliance use profiles is ideal for each method. But, this data is not
easy to access on account of associated privacy and security issues. Top-down models
(commonly) employ past measures and are not capturing future changes and evolutions
in load (Bartels et al., 1992) and hence are better suited for determining supply-side
requirements (Swan and Ugursal, 2009).

70
Grandjean et al. (2011) find that top-down and hybrid methods do not explicitly capture
future changes in residential load which result from individual domestic appliances and
occupant behavior. Bottom-up models have the ability to incorporate individual
electricity use of appliances and households, in this way extrapolating the data to
exemplify a representative region or country (Swan and Ugursal, 2009).
Swan and Ugursal (2009) point out that bottom-up modeling as a way to identify both
the individual contribution in addition to the aggregate impact of consumption to the
total. There are two bottom-up approaches consisting of statistical and engineering
methods to modeling. Statistical methods are used for attributing historical household
behavior to particular uses (Swan and Ugursal, 2009, p. 1824). Differently, engineering
bottom-up modeling does not require historical information and can fully develop
consumption performance on the basis of current data (Swan and Ugursal, 2009, p.
1828). For the purpose of this work we use the engineering method consisting of three
identified techniques which have been adapted to this work:
1. Distribution of appliances among consumers which pertain to the appliance
ownership and use profile for the country.
2. Archetypes to classify end-user consumption profiles which can be scaled to
represent the whole country.
3. Sample of actual consumption data representative of each end-user
consumption profile representative of the country.
Agent-based modeling allows for simulations to capture the heterogeneous nature of
actors (agents) and their respective behavior, which Bryson et al. (2007) reason makes it
useful for investigating socio-technical complexity. Accordingly, bottom-up agent based
modeling is applied in this work to explore how DR allows consumers to change their
time dependent electricity consuming behavior considering techniques 1 to 3 from Swan
and Ugursal (2009). This work makes use of the bottom-up modeling the residential
sector of the Netherlands using an agent-based method in Repast Simphony26
open
source simulation platform.
26 http://repast.sourceforge.net/repast_simphony.php

71
4.1.1 Choice of agent based-modeling and Repast Simphony 2.0
An agent based modeling approach allows for the simulation of actions and interaction of
autonomous heterogeneous agents with a goal of assessing their effects on the system
as whole (Hong et al., 2013; Jennings, 2000). In particular, agent-based modeling is
rooted in individual decision making and human social and organizational behavior (Hong
et al., 2013). Nevertheless, no simulation approach is perfect and a model is only useful
for the purpose which it is constructed. Agent-based modeling drawbacks may arise from
the very granularity and level of detail; they tend to be very sensitive to initial conditions
and to small variations in interaction rules. The model inputs determine if the outputs
should be used for qualitative or quantitative insights (Crooks, 2006). For this use case
agent based modeling allows the capture of the heterogeneity of the residential sector,
where end-users possess different characteristics and exhibit complex behavior giving
rise to aggregate system level implications.
As an open source software under continuous development, Repast Simphony 2.0 offers
flexibility in model development and use with its wide range of tools and plug-ins. For
effective model design and simulation of experiments, Repast uses Java as the machine-
user level language, therefore laying the foundation for simple communication. This
environment allows for the development of a model that is thorough, flexible and
extendable. Extendibility and flexibility are key in this model; changes in the user panel
can be adapted to study other country residential sectors. Moreover, this environment
allows for a friendly user panel interface (Figure 12) that can be operated by individuals
who do not have experience with Java coding and seek to gain actionable insight.
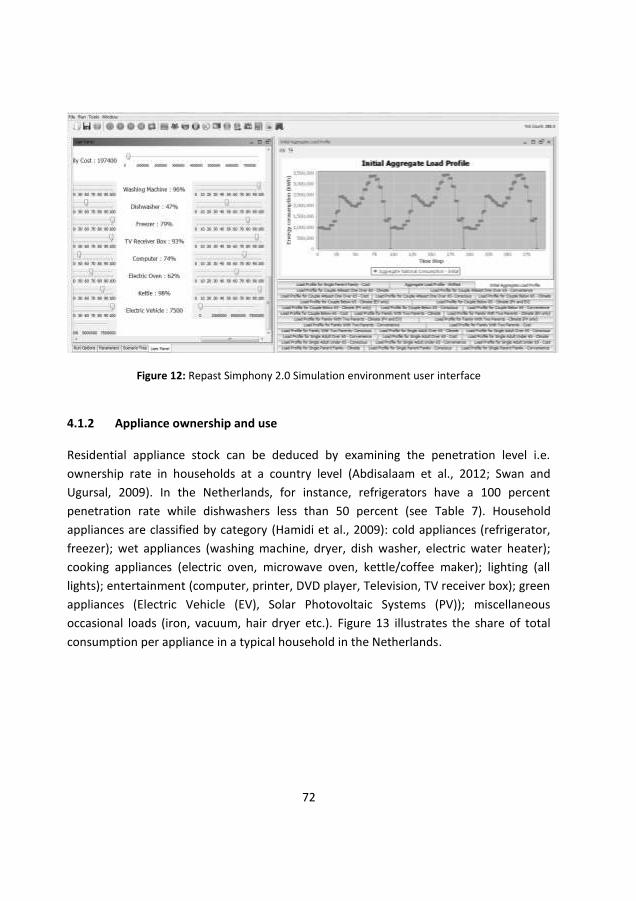
72
Figure 12: Repast Simphony 2.0 Simulation environment user interface
4.1.2 Appliance ownership and use
Residential appliance stock can be deduced by examining the penetration level i.e.
ownership rate in households at a country level (Abdisalaam et al., 2012; Swan and
Ugursal, 2009). In the Netherlands, for instance, refrigerators have a 100 percent
penetration rate while dishwashers less than 50 percent (see Table 7). Household
appliances are classified by category (Hamidi et al., 2009): cold appliances (refrigerator,
freezer); wet appliances (washing machine, dryer, dish washer, electric water heater);
cooking appliances (electric oven, microwave oven, kettle/coffee maker); lighting (all
lights); entertainment (computer, printer, DVD player, Television, TV receiver box); green
appliances (Electric Vehicle (EV), Solar Photovoltaic Systems (PV)); miscellaneous
occasional loads (iron, vacuum, hair dryer etc.). Figure 13 illustrates the share of total
consumption per appliance in a typical household in the Netherlands.
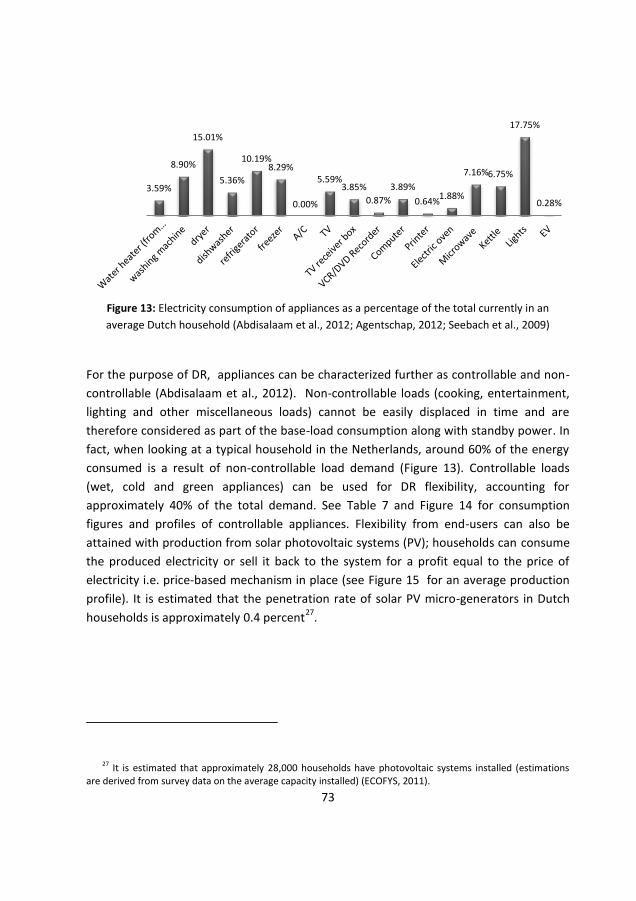
73
Figure 13: Electricity consumption of appliances as a percentage of the total currently in an
average Dutch household (Abdisalaam et al., 2012; Agentschap, 2012; Seebach et al., 2009)
For the purpose of DR, appliances can be characterized further as controllable and non-
controllable (Abdisalaam et al., 2012). Non-controllable loads (cooking, entertainment,
lighting and other miscellaneous loads) cannot be easily displaced in time and are
therefore considered as part of the base-load consumption along with standby power. In
fact, when looking at a typical household in the Netherlands, around 60% of the energy
consumed is a result of non-controllable load demand (Figure 13). Controllable loads
(wet, cold and green appliances) can be used for DR flexibility, accounting for
approximately 40% of the total demand. See Table 7 and Figure 14 for consumption
figures and profiles of controllable appliances. Flexibility from end-users can also be
attained with production from solar photovoltaic systems (PV); households can consume
the produced electricity or sell it back to the system for a profit equal to the price of
electricity i.e. price-based mechanism in place (see Figure 15 for an average production
profile). It is estimated that the penetration rate of solar PV micro-generators in Dutch
households is approximately 0.4 percent27
.
27 It is estimated that approximately 28,000 households have photovoltaic systems installed (estimations are derived from survey data on the average capacity installed) (ECOFYS, 2011).
3.59%
8.90%
15.01%
5.36%
10.19% 8.29%
0.00%
5.59% 3.85%
0.87%
3.89%
0.64% 1.88%
7.16% 6.75%
17.75%
0.28%
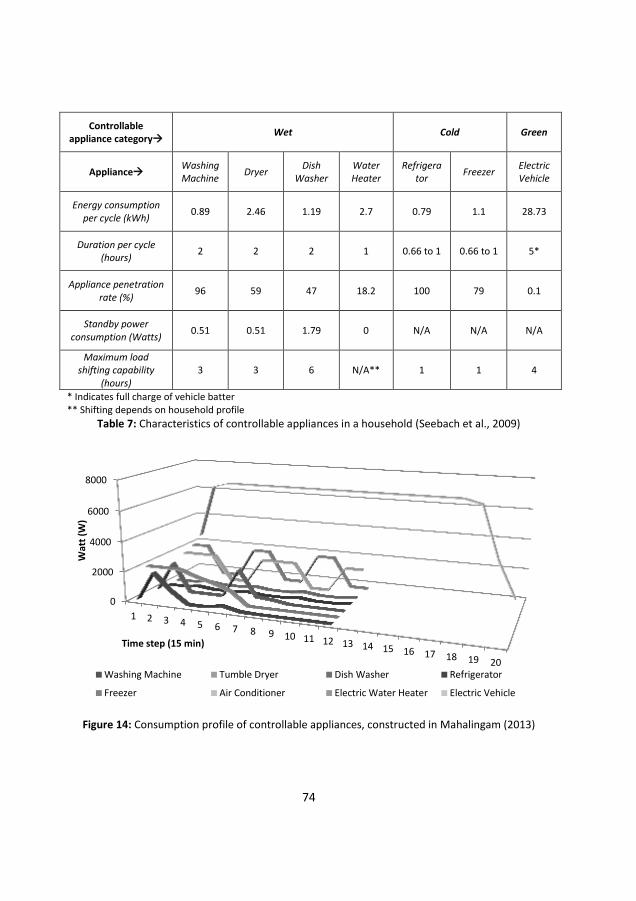
74
Controllable appliance category
Wet Cold Green
Appliance Washing Machine
Dryer Dish
Washer Water Heater
Refrigerator
Freezer Electric Vehicle
Energy consumption per cycle (kWh)
0.89 2.46 1.19 2.7 0.79 1.1 28.73
Duration per cycle (hours)
2 2 2 1 0.66 to 1 0.66 to 1 5*
Appliance penetration rate (%)
96 59 47 18.2 100 79 0.1
Standby power consumption (Watts)
0.51 0.51 1.79 0 N/A N/A N/A
Maximum load shifting capability
(hours) 3 3 6 N/A** 1 1 4
* Indicates full charge of vehicle batter ** Shifting depends on household profile
Table 7: Characteristics of controllable appliances in a household (Seebach et al., 2009)
Figure 14: Consumption profile of controllable appliances, constructed in Mahalingam (2013)
0
2000
4000
6000
8000
1 2 3 4 5 6 7 8 9 10 11 12 13 14 15 16 17 18 19 20
Wat
t (W
)
Time step (15 min)
Washing Machine Tumble Dryer Dish Washer Refrigerator
Freezer Air Conditioner Electric Water Heater Electric Vehicle
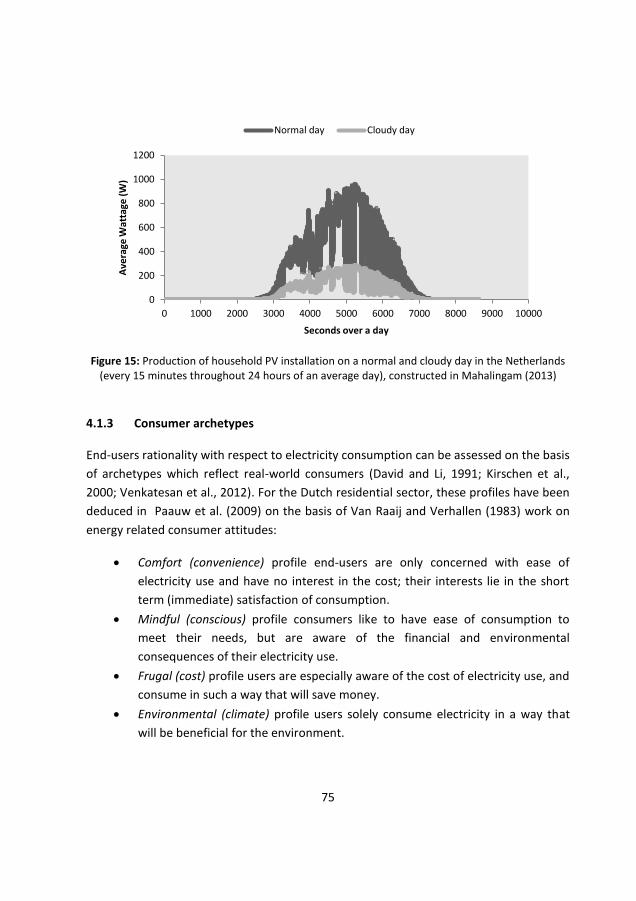
75
Figure 15: Production of household PV installation on a normal and cloudy day in the Netherlands
(every 15 minutes throughout 24 hours of an average day), constructed in Mahalingam (2013)
4.1.3 Consumer archetypes
End-users rationality with respect to electricity consumption can be assessed on the basis
of archetypes which reflect real-world consumers (David and Li, 1991; Kirschen et al.,
2000; Venkatesan et al., 2012). For the Dutch residential sector, these profiles have been
deduced in Paauw et al. (2009) on the basis of Van Raaij and Verhallen (1983) work on
energy related consumer attitudes:
Comfort (convenience) profile end-users are only concerned with ease of
electricity use and have no interest in the cost; their interests lie in the short
term (immediate) satisfaction of consumption.
Mindful (conscious) profile consumers like to have ease of consumption to
meet their needs, but are aware of the financial and environmental
consequences of their electricity use.
Frugal (cost) profile users are especially aware of the cost of electricity use, and
consume in such a way that will save money.
Environmental (climate) profile users solely consume electricity in a way that
will be beneficial for the environment.
0
200
400
600
800
1000
1200
0 1000 2000 3000 4000 5000 6000 7000 8000 9000 10000
Ave
rage
Wat
tage
(W
)
Seconds over a day
Normal day Cloudy day
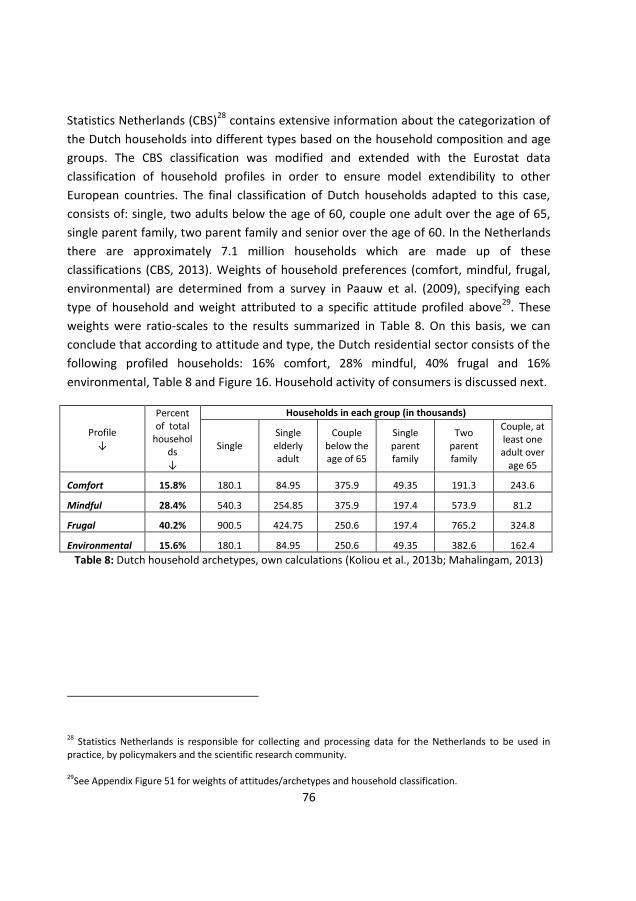
76
Statistics Netherlands (CBS)28
contains extensive information about the categorization of
the Dutch households into different types based on the household composition and age
groups. The CBS classification was modified and extended with the Eurostat data
classification of household profiles in order to ensure model extendibility to other
European countries. The final classification of Dutch households adapted to this case,
consists of: single, two adults below the age of 60, couple one adult over the age of 65,
single parent family, two parent family and senior over the age of 60. In the Netherlands
there are approximately 7.1 million households which are made up of these
classifications (CBS, 2013). Weights of household preferences (comfort, mindful, frugal,
environmental) are determined from a survey in Paauw et al. (2009), specifying each
type of household and weight attributed to a specific attitude profiled above29
. These
weights were ratio-scales to the results summarized in Table 8. On this basis, we can
conclude that according to attitude and type, the Dutch residential sector consists of the
following profiled households: 16% comfort, 28% mindful, 40% frugal and 16%
environmental, Table 8 and Figure 16. Household activity of consumers is discussed next.
Profile ↓
Percent of total
households ↓
Households in each group (in thousands)
Single Single elderly adult
Couple below the age of 65
Single parent family
Two parent family
Couple, at least one adult over
age 65
Comfort 15.8% 180.1 84.95 375.9 49.35 191.3 243.6
Mindful 28.4% 540.3 254.85 375.9 197.4 573.9 81.2
Frugal 40.2% 900.5 424.75 250.6 197.4 765.2 324.8
Environmental 15.6% 180.1 84.95 250.6 49.35 382.6 162.4
Table 8: Dutch household archetypes, own calculations (Koliou et al., 2013b; Mahalingam, 2013)
28 Statistics Netherlands is responsible for collecting and processing data for the Netherlands to be used in practice, by policymakers and the scientific research community.
29See Appendix Figure 51 for weights of attitudes/archetypes and household classification.
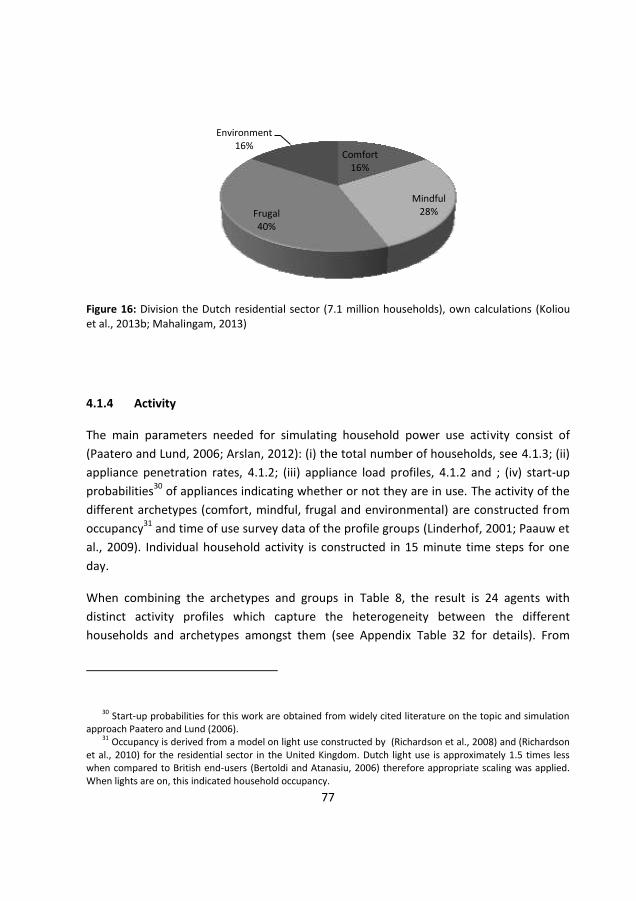
77
Figure 16: Division the Dutch residential sector (7.1 million households), own calculations (Koliou et al., 2013b; Mahalingam, 2013)
4.1.4 Activity
The main parameters needed for simulating household power use activity consist of
(Paatero and Lund, 2006; Arslan, 2012): (i) the total number of households, see 4.1.3; (ii)
appliance penetration rates, 4.1.2; (iii) appliance load profiles, 4.1.2 and ; (iv) start-up
probabilities30
of appliances indicating whether or not they are in use. The activity of the
different archetypes (comfort, mindful, frugal and environmental) are constructed from
occupancy31
and time of use survey data of the profile groups (Linderhof, 2001; Paauw et
al., 2009). Individual household activity is constructed in 15 minute time steps for one
day.
When combining the archetypes and groups in Table 8, the result is 24 agents with
distinct activity profiles which capture the heterogeneity between the different
households and archetypes amongst them (see Appendix Table 32 for details). From
30 Start-up probabilities for this work are obtained from widely cited literature on the topic and simulation approach Paatero and Lund (2006).
31 Occupancy is derived from a model on light use constructed by (Richardson et al., 2008) and (Richardson et al., 2010) for the residential sector in the United Kingdom. Dutch light use is approximately 1.5 times less when compared to British end-users (Bertoldi and Atanasiu, 2006) therefore appropriate scaling was applied. When lights are on, this indicated household occupancy.
Comfort 16%
Mindful 28% Frugal
40%
Environment 16%

78
these, only couples under the age of 65 and families with two parents have either a
micro-generator (PV systems) installed, own an electric vehicle or both32
. The
consumption activity of the 24 households is scaled to depict the entire residential load
of the country. Figure 17 illustrates the steps in the bottom-up construction of the
residential load, starting first with the individual household, followed by activity of the
different archetypes and finally scaling to a country level. Such a superimposition
technique is widely used in industry and state of the art simulations, e.g. Abdisalaam et
al. (2012); Boots (2011); Du et al. (2011). In order to confirm the representativeness of
the load, the curve is validated33
by existing literature on the load demand curve for the
Dutch residential sector: Movares (2013); Van Ouirsouw and Cobben (2011); Agentschap,
(2011); Abdisalaam et al. (2012). Figure 18 illustrates the result of using the modeling
technique described herein.
32 Result was drawn after consulting with a Dutch PV installation company (Joop Keyzer BV) about their customer demographics.
33 Further validation and verification is discussed below in section 6 and in Appendix Table 31.
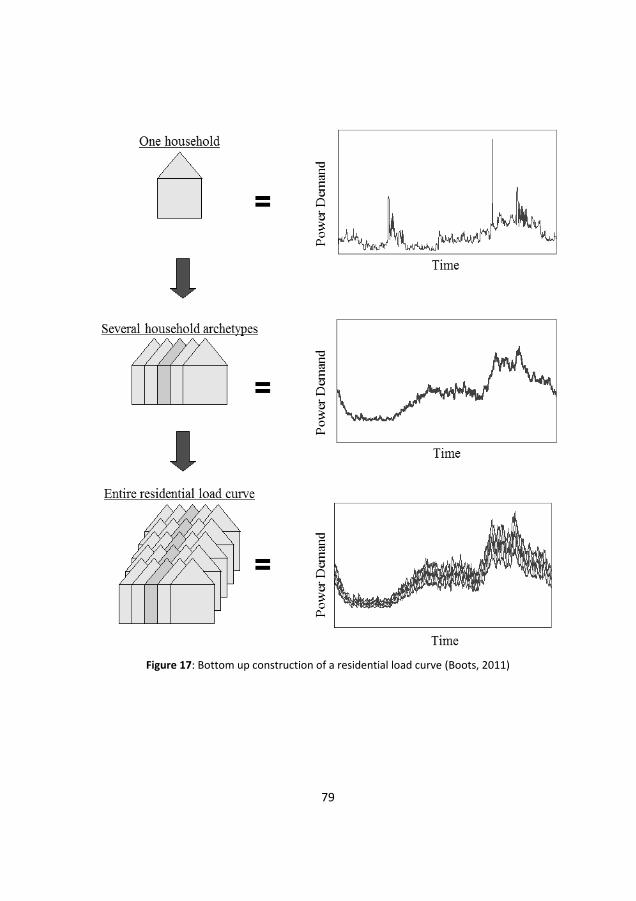
79
Figure 17: Bottom up construction of a residential load curve (Boots, 2011)
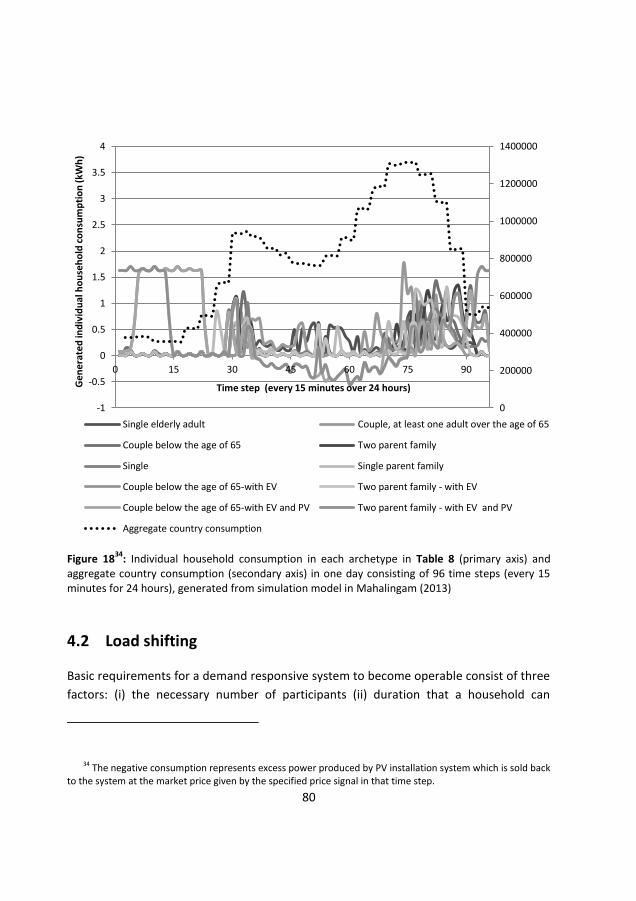
80
4.2 Load shifting
Basic requirements for a demand responsive system to become operable consist of three
factors: (i) the necessary number of participants (ii) duration that a household can
34 The negative consumption represents excess power produced by PV installation system which is sold back to the system at the market price given by the specified price signal in that time step.
Figure 18
34: Individual household consumption in each archetype in Table 8 (primary axis) and
aggregate country consumption (secondary axis) in one day consisting of 96 time steps (every 15 minutes for 24 hours), generated from simulation model in Mahalingam (2013)
0
200000
400000
600000
800000
1000000
1200000
1400000
-1
-0.5
0
0.5
1
1.5
2
2.5
3
3.5
4
0 15 30 45 60 75 90
Ge
ne
rate
d in
div
idu
al h
ou
seh
old
co
nsu
mp
tio
n (
kWh
)
Time step (every 15 minutes over 24 hours)
Single elderly adult Couple, at least one adult over the age of 65
Couple below the age of 65 Two parent family
Single Single parent family
Couple below the age of 65-with EV Two parent family - with EV
Couple below the age of 65-with EV and PV Two parent family - with EV and PV
Aggregate country consumption
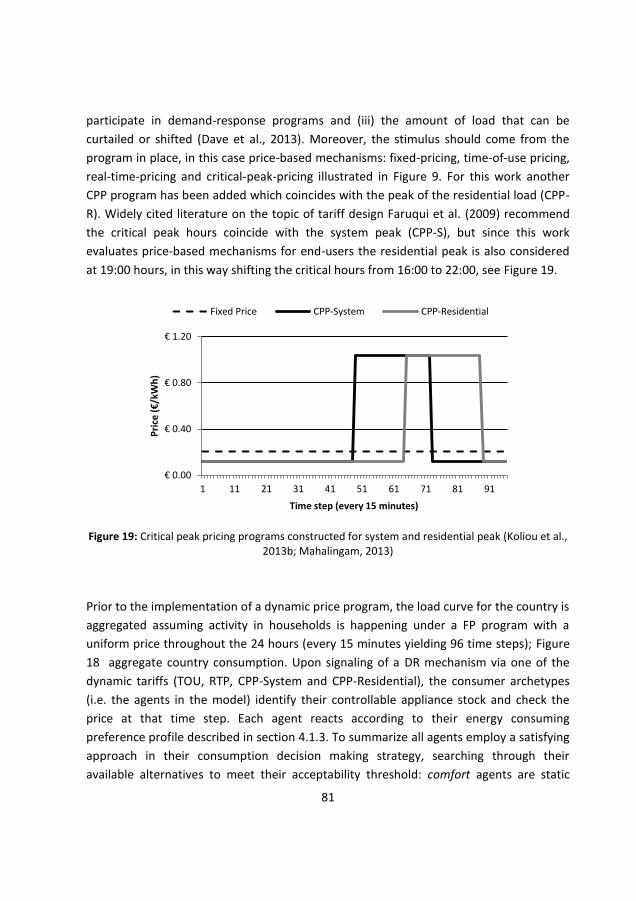
81
participate in demand-response programs and (iii) the amount of load that can be
curtailed or shifted (Dave et al., 2013). Moreover, the stimulus should come from the
program in place, in this case price-based mechanisms: fixed-pricing, time-of-use pricing,
real-time-pricing and critical-peak-pricing illustrated in Figure 9. For this work another
CPP program has been added which coincides with the peak of the residential load (CPP-
R). Widely cited literature on the topic of tariff design Faruqui et al. (2009) recommend
the critical peak hours coincide with the system peak (CPP-S), but since this work
evaluates price-based mechanisms for end-users the residential peak is also considered
at 19:00 hours, in this way shifting the critical hours from 16:00 to 22:00, see Figure 19.
Figure 19: Critical peak pricing programs constructed for system and residential peak (Koliou et al.,
2013b; Mahalingam, 2013)
Prior to the implementation of a dynamic price program, the load curve for the country is
aggregated assuming activity in households is happening under a FP program with a
uniform price throughout the 24 hours (every 15 minutes yielding 96 time steps); Figure
18 aggregate country consumption. Upon signaling of a DR mechanism via one of the
dynamic tariffs (TOU, RTP, CPP-System and CPP-Residential), the consumer archetypes
(i.e. the agents in the model) identify their controllable appliance stock and check the
price at that time step. Each agent reacts according to their energy consuming
preference profile described in section 4.1.3. To summarize all agents employ a satisfying
approach in their consumption decision making strategy, searching through their
available alternatives to meet their acceptability threshold: comfort agents are static
€ 0.00
€ 0.40
€ 0.80
€ 1.20
1 11 21 31 41 51 61 71 81 91
Pri
ce (
€/k
Wh
)
Time step (every 15 minutes)
Fixed Price CPP-System CPP-Residential
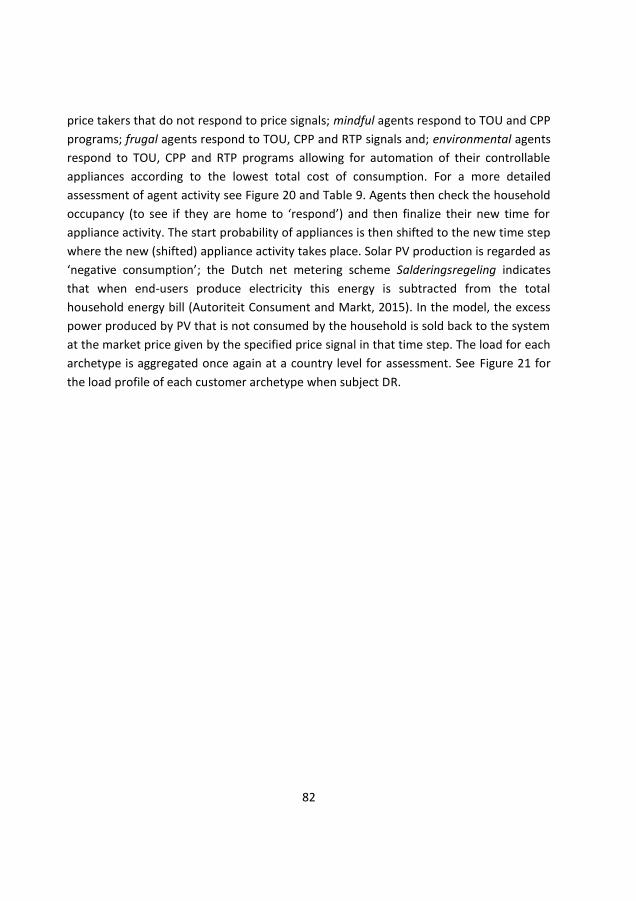
82
price takers that do not respond to price signals; mindful agents respond to TOU and CPP
programs; frugal agents respond to TOU, CPP and RTP signals and; environmental agents
respond to TOU, CPP and RTP programs allowing for automation of their controllable
appliances according to the lowest total cost of consumption. For a more detailed
assessment of agent activity see Figure 20 and Table 9. Agents then check the household
occupancy (to see if they are home to ‘respond’) and then finalize their new time for
appliance activity. The start probability of appliances is then shifted to the new time step
where the new (shifted) appliance activity takes place. Solar PV production is regarded as
‘negative consumption’; the Dutch net metering scheme Salderingsregeling indicates
that when end-users produce electricity this energy is subtracted from the total
household energy bill (Autoriteit Consument and Markt, 2015). In the model, the excess
power produced by PV that is not consumed by the household is sold back to the system
at the market price given by the specified price signal in that time step. The load for each
archetype is aggregated once again at a country level for assessment. See Figure 21 for
the load profile of each customer archetype when subject DR.
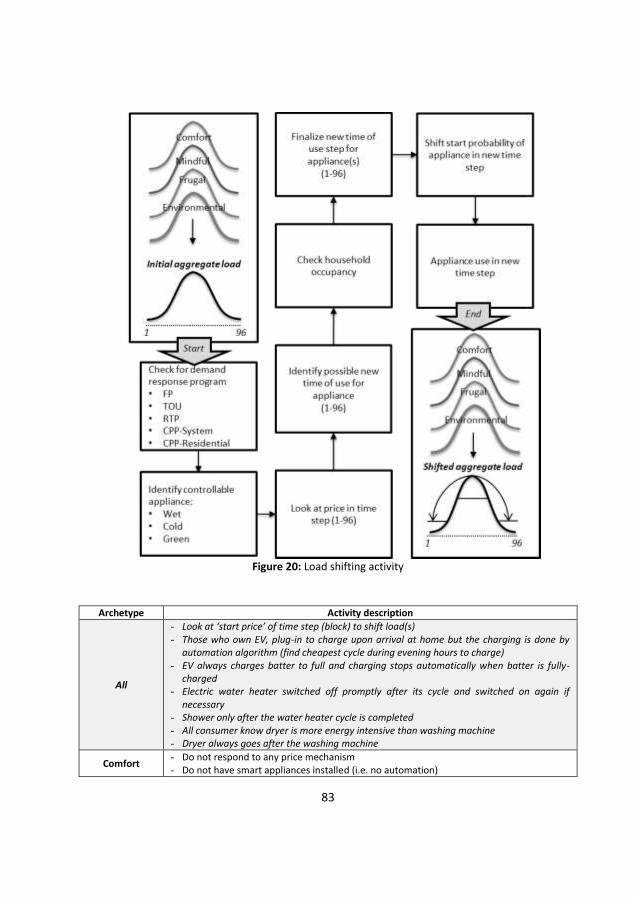
83
Figure 20: Load shifting activity
Archetype Activity description
All
- Look at ‘start price’ of time step (block) to shift load(s) - Those who own EV, plug-in to charge upon arrival at home but the charging is done by
automation algorithm (find cheapest cycle during evening hours to charge) - EV always charges batter to full and charging stops automatically when batter is fully-
charged - Electric water heater switched off promptly after its cycle and switched on again if
necessary - Shower only after the water heater cycle is completed - All consumer know dryer is more energy intensive than washing machine - Dryer always goes after the washing machine
Comfort - Do not respond to any price mechanism - Do not have smart appliances installed (i.e. no automation)

84
- Make use of microwave for cooking hot meals all the time - Excess use of lights (mostly unnecessary) - All appliances are on standby when not in use - Dryer ‘immediately’ follows washing machine
Mindful
- Only respond to TOU and CPP programs - No smart appliances installed (i.e. no automated) - They do not shift usage of water heater to any price signal - Lights are not unnecessarily on - Load shifting for certain appliances :maximum shift for washing machine and dryer = ± 3
hours; max shifting for dishwasher = ± 6 hours (Stamminger and Friedrich-Wilhelms, 2008)
- Only look at start price of the time block to make a shifting decision - Dryer ‘immediately’ follows washing machine; they take the lowest start price for the
washing machine to begin washing - Have to be at home and awake in order to do laundry/dyer - Dishwasher switched on only 30 minutes after dinner time (19:00)
Frugal
- Respond to TOU, CPP and RTP programs by looking at the start price in the time block they want to use their controllable appliances
- No smart appliances installed (i.e. no automation) - They shift water heater - Only look at start price of the time block to make a response decision - Wait to do washer, dryer and dishwasher until prices are low - Have to be at home and awake in order to do laundry/dyer and dishwasher - Use the dryer if they own one - Willing to shift dinner time to accommodate the use of dishwasher at cheapest starting
price - Willing to shift dinner time in case of conflict with cheapest water heater starting price
time step/block
Environmental
- Respond to TOU, CPP and RTP programs - Have smart appliances installed (automated) to react to price signals - Have combo washer/dryer (no need to change clothes to dryer manually) - Automated washing and drying (pre-programmed) so they do not have to be home or
awake to wash/dry - Aware of time-step power requirements of the appliances and so find the cheapest
‘cycle’ to shift their loads - Have the possibility to own PV and/or EV - Refrigerator and freezer are smart devices and automatic load control applies - Use energy saving lighting bulbs (CFL3575% more efficient) and light not unnecessarily on - High-efficiency water heaters/PV-based water heating - Standby power consumption for all appliances is zero - Willing to shift their dinner time to accommodate the use of dishwasher at cheapest
cycle - Willing to shift their dinner time in case of conflict with cheapest water heater cycle
Table 9: Description of consumer archetypes and detailed activity in the simulation (Mahalingam,
2013)
35 Compact fluorescent light bulb
85
Figure 21: Load profile for and average household of each preference archetype, generated from
(Mahalingam, 2013)
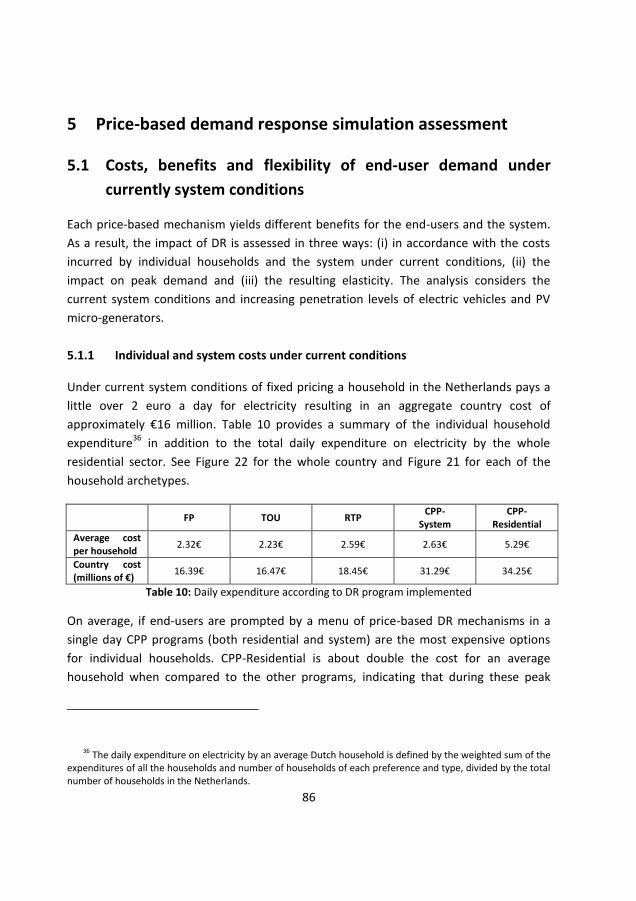
86
5 Price-based demand response simulation assessment
5.1 Costs, benefits and flexibility of end-user demand under
currently system conditions
Each price-based mechanism yields different benefits for the end-users and the system.
As a result, the impact of DR is assessed in three ways: (i) in accordance with the costs
incurred by individual households and the system under current conditions, (ii) the
impact on peak demand and (iii) the resulting elasticity. The analysis considers the
current system conditions and increasing penetration levels of electric vehicles and PV
micro-generators.
5.1.1 Individual and system costs under current conditions
Under current system conditions of fixed pricing a household in the Netherlands pays a
little over 2 euro a day for electricity resulting in an aggregate country cost of
approximately €16 million. Table 10 provides a summary of the individual household
expenditure36
in addition to the total daily expenditure on electricity by the whole
residential sector. See Figure 22 for the whole country and Figure 21 for each of the
household archetypes.
FP TOU RTP CPP-
System CPP-
Residential
Average cost per household
2.32€ 2.23€ 2.59€ 2.63€ 5.29€
Country cost (millions of €)
16.39€ 16.47€ 18.45€ 31.29€ 34.25€
Table 10: Daily expenditure according to DR program implemented
On average, if end-users are prompted by a menu of price-based DR mechanisms in a
single day CPP programs (both residential and system) are the most expensive options
for individual households. CPP-Residential is about double the cost for an average
household when compared to the other programs, indicating that during these peak
36 The daily expenditure on electricity by an average Dutch household is defined by the weighted sum of the expenditures of all the households and number of households of each preference and type, divided by the total number of households in the Netherlands.
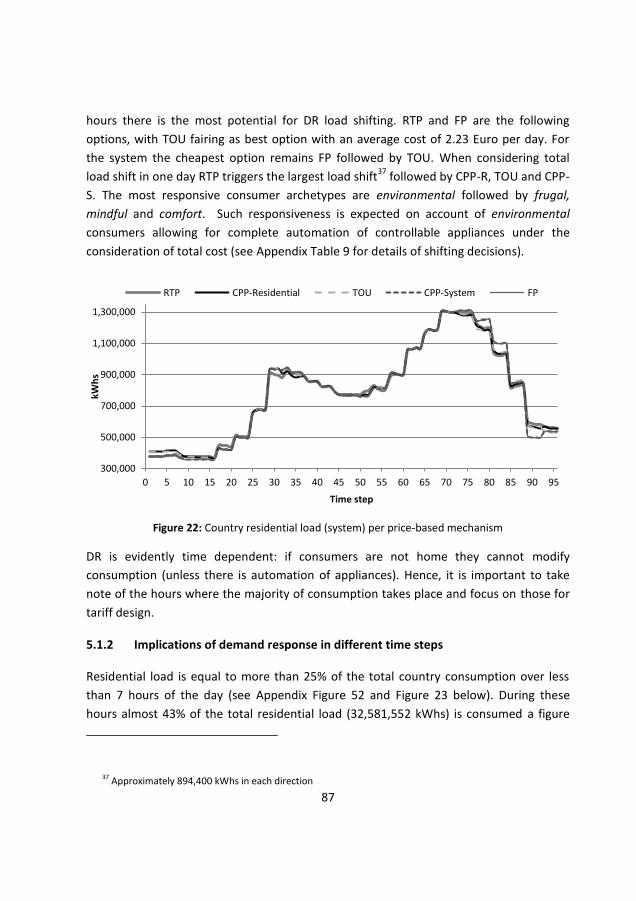
87
hours there is the most potential for DR load shifting. RTP and FP are the following
options, with TOU fairing as best option with an average cost of 2.23 Euro per day. For
the system the cheapest option remains FP followed by TOU. When considering total
load shift in one day RTP triggers the largest load shift37
followed by CPP-R, TOU and CPP-
S. The most responsive consumer archetypes are environmental followed by frugal,
mindful and comfort. Such responsiveness is expected on account of environmental
consumers allowing for complete automation of controllable appliances under the
consideration of total cost (see Appendix Table 9 for details of shifting decisions).
Figure 22: Country residential load (system) per price-based mechanism
DR is evidently time dependent: if consumers are not home they cannot modify
consumption (unless there is automation of appliances). Hence, it is important to take
note of the hours where the majority of consumption takes place and focus on those for
tariff design.
5.1.2 Implications of demand response in different time steps
Residential load is equal to more than 25% of the total country consumption over less
than 7 hours of the day (see Appendix Figure 52 and Figure 23 below). During these
hours almost 43% of the total residential load (32,581,552 kWhs) is consumed a figure
37 Approximately 894,400 kWhs in each direction
300,000
500,000
700,000
900,000
1,100,000
1,300,000
0 5 10 15 20 25 30 35 40 45 50 55 60 65 70 75 80 85 90 95
kWh
s
Time step
RTP CPP-Residential TOU CPP-System FP
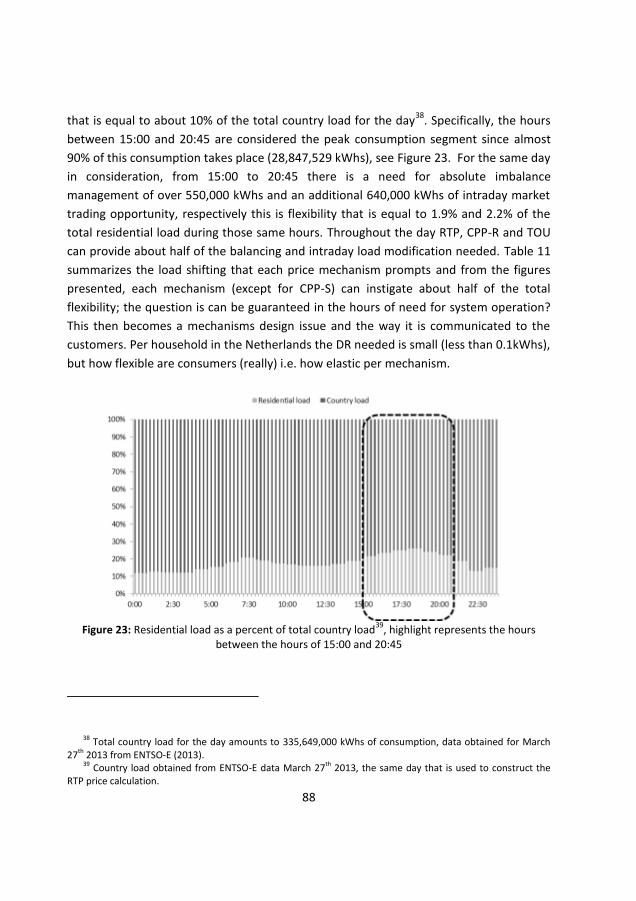
88
that is equal to about 10% of the total country load for the day38
. Specifically, the hours
between 15:00 and 20:45 are considered the peak consumption segment since almost
90% of this consumption takes place (28,847,529 kWhs), see Figure 23. For the same day
in consideration, from 15:00 to 20:45 there is a need for absolute imbalance
management of over 550,000 kWhs and an additional 640,000 kWhs of intraday market
trading opportunity, respectively this is flexibility that is equal to 1.9% and 2.2% of the
total residential load during those same hours. Throughout the day RTP, CPP-R and TOU
can provide about half of the balancing and intraday load modification needed. Table 11
summarizes the load shifting that each price mechanism prompts and from the figures
presented, each mechanism (except for CPP-S) can instigate about half of the total
flexibility; the question is can be guaranteed in the hours of need for system operation?
This then becomes a mechanisms design issue and the way it is communicated to the
customers. Per household in the Netherlands the DR needed is small (less than 0.1kWhs),
but how flexible are consumers (really) i.e. how elastic per mechanism.
Figure 23: Residential load as a percent of total country load
39, highlight represents the hours
between the hours of 15:00 and 20:45
38 Total country load for the day amounts to 335,649,000 kWhs of consumption, data obtained for March 27th 2013 from ENTSO-E (2013).
39 Country load obtained from ENTSO-E data March 27th 2013, the same day that is used to construct the RTP price calculation.
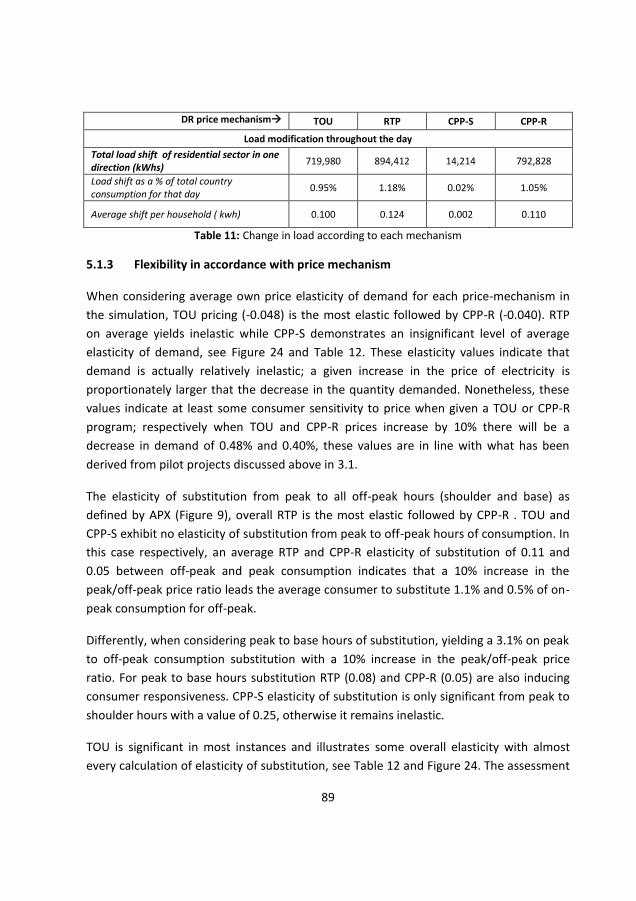
89
DR price mechanism TOU RTP CPP-S CPP-R
Load modification throughout the day
Total load shift of residential sector in one direction (kWhs)
719,980 894,412 14,214 792,828
Load shift as a % of total country consumption for that day
0.95% 1.18% 0.02% 1.05%
Average shift per household ( kwh) 0.100 0.124 0.002 0.110
Table 11: Change in load according to each mechanism
5.1.3 Flexibility in accordance with price mechanism
When considering average own price elasticity of demand for each price-mechanism in
the simulation, TOU pricing (-0.048) is the most elastic followed by CPP-R (-0.040). RTP
on average yields inelastic while CPP-S demonstrates an insignificant level of average
elasticity of demand, see Figure 24 and Table 12. These elasticity values indicate that
demand is actually relatively inelastic; a given increase in the price of electricity is
proportionately larger that the decrease in the quantity demanded. Nonetheless, these
values indicate at least some consumer sensitivity to price when given a TOU or CPP-R
program; respectively when TOU and CPP-R prices increase by 10% there will be a
decrease in demand of 0.48% and 0.40%, these values are in line with what has been
derived from pilot projects discussed above in 3.1.
The elasticity of substitution from peak to all off-peak hours (shoulder and base) as
defined by APX (Figure 9), overall RTP is the most elastic followed by CPP-R . TOU and
CPP-S exhibit no elasticity of substitution from peak to off-peak hours of consumption. In
this case respectively, an average RTP and CPP-R elasticity of substitution of 0.11 and
0.05 between off-peak and peak consumption indicates that a 10% increase in the
peak/off-peak price ratio leads the average consumer to substitute 1.1% and 0.5% of on-
peak consumption for off-peak.
Differently, when considering peak to base hours of substitution, yielding a 3.1% on peak
to off-peak consumption substitution with a 10% increase in the peak/off-peak price
ratio. For peak to base hours substitution RTP (0.08) and CPP-R (0.05) are also inducing
consumer responsiveness. CPP-S elasticity of substitution is only significant from peak to
shoulder hours with a value of 0.25, otherwise it remains inelastic.
TOU is significant in most instances and illustrates some overall elasticity with almost
every calculation of elasticity of substitution, see Table 12 and Figure 24. The assessment
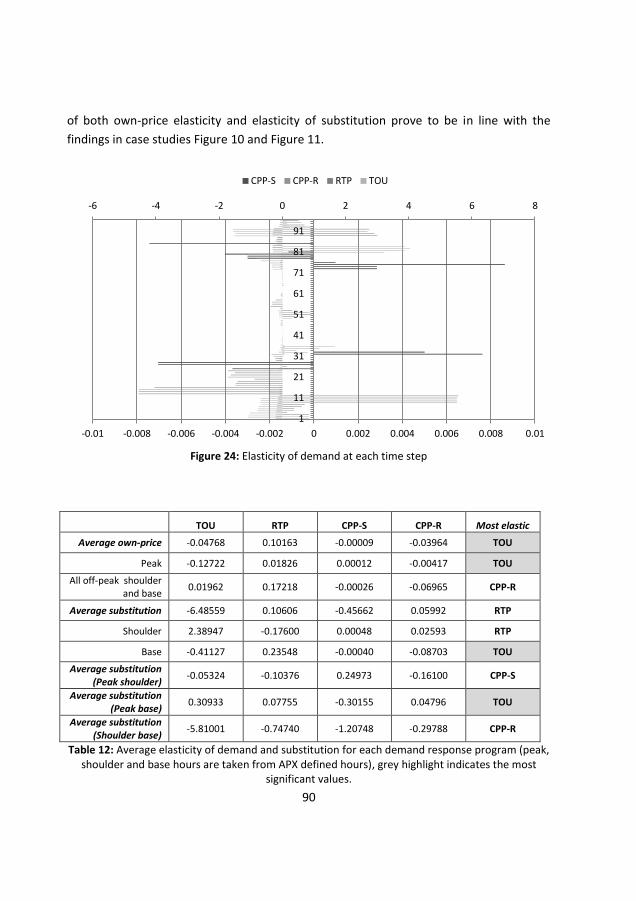
90
of both own-price elasticity and elasticity of substitution prove to be in line with the
findings in case studies Figure 10 and Figure 11.
Figure 24: Elasticity of demand at each time step
TOU RTP CPP-S CPP-R Most elastic
Average own-price -0.04768 0.10163 -0.00009 -0.03964 TOU
Peak -0.12722 0.01826 0.00012 -0.00417 TOU
All off-peak shoulder and base
0.01962 0.17218 -0.00026 -0.06965 CPP-R
Average substitution -6.48559 0.10606 -0.45662 0.05992 RTP
Shoulder 2.38947 -0.17600 0.00048 0.02593 RTP
Base -0.41127 0.23548 -0.00040 -0.08703 TOU
Average substitution (Peak shoulder)
-0.05324 -0.10376 0.24973 -0.16100 CPP-S
Average substitution (Peak base)
0.30933 0.07755 -0.30155 0.04796 TOU
Average substitution (Shoulder base)
-5.81001 -0.74740 -1.20748 -0.29788 CPP-R
Table 12: Average elasticity of demand and substitution for each demand response program (peak, shoulder and base hours are taken from APX defined hours), grey highlight indicates the most
significant values.
-6 -4 -2 0 2 4 6 8
-0.01 -0.008 -0.006 -0.004 -0.002 0 0.002 0.004 0.006 0.008 0.01
1
11
21
31
41
51
61
71
81
91
CPP-S CPP-R RTP TOU
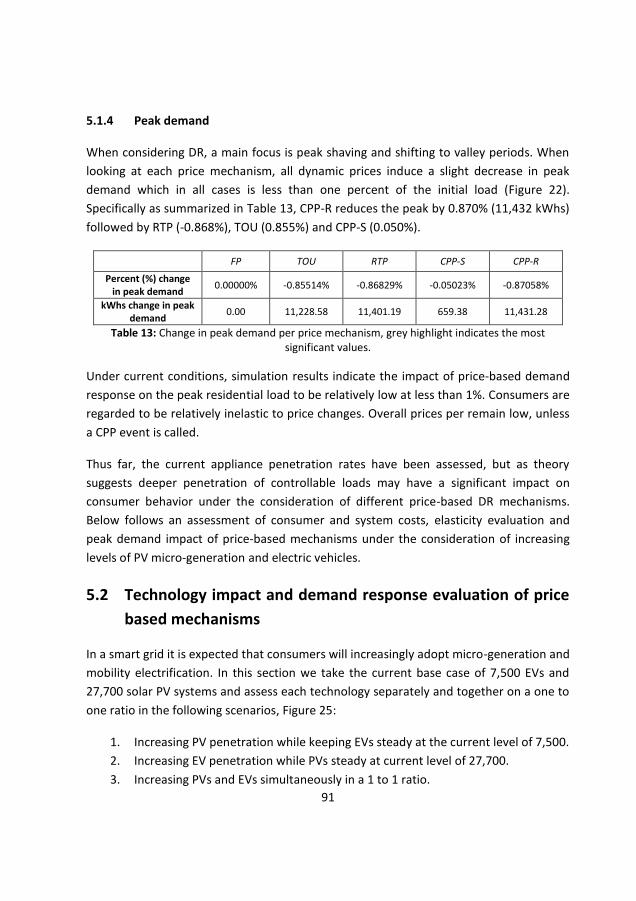
91
5.1.4 Peak demand
When considering DR, a main focus is peak shaving and shifting to valley periods. When
looking at each price mechanism, all dynamic prices induce a slight decrease in peak
demand which in all cases is less than one percent of the initial load (Figure 22).
Specifically as summarized in Table 13, CPP-R reduces the peak by 0.870% (11,432 kWhs)
followed by RTP (-0.868%), TOU (0.855%) and CPP-S (0.050%).
FP TOU RTP CPP-S CPP-R
Percent (%) change in peak demand
0.00000% -0.85514% -0.86829% -0.05023% -0.87058%
kWhs change in peak demand
0.00 11,228.58 11,401.19 659.38 11,431.28
Table 13: Change in peak demand per price mechanism, grey highlight indicates the most significant values.
Under current conditions, simulation results indicate the impact of price-based demand
response on the peak residential load to be relatively low at less than 1%. Consumers are
regarded to be relatively inelastic to price changes. Overall prices per remain low, unless
a CPP event is called.
Thus far, the current appliance penetration rates have been assessed, but as theory
suggests deeper penetration of controllable loads may have a significant impact on
consumer behavior under the consideration of different price-based DR mechanisms.
Below follows an assessment of consumer and system costs, elasticity evaluation and
peak demand impact of price-based mechanisms under the consideration of increasing
levels of PV micro-generation and electric vehicles.
5.2 Technology impact and demand response evaluation of price
based mechanisms
In a smart grid it is expected that consumers will increasingly adopt micro-generation and
mobility electrification. In this section we take the current base case of 7,500 EVs and
27,700 solar PV systems and assess each technology separately and together on a one to
one ratio in the following scenarios, Figure 25:
1. Increasing PV penetration while keeping EVs steady at the current level of 7,500.
2. Increasing EV penetration while PVs steady at current level of 27,700.
3. Increasing PVs and EVs simultaneously in a 1 to 1 ratio.
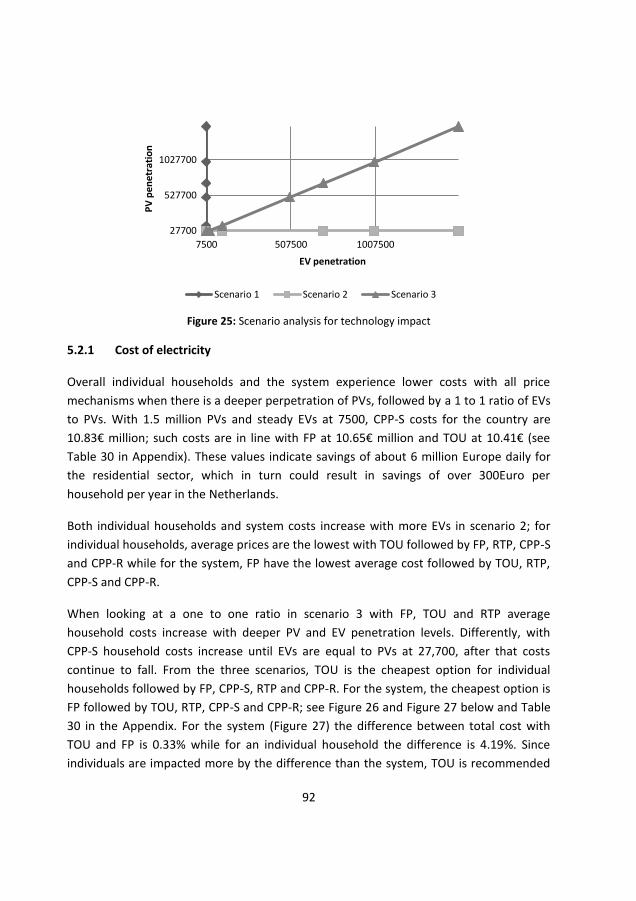
92
Figure 25: Scenario analysis for technology impact
5.2.1 Cost of electricity
Overall individual households and the system experience lower costs with all price
mechanisms when there is a deeper perpetration of PVs, followed by a 1 to 1 ratio of EVs
to PVs. With 1.5 million PVs and steady EVs at 7500, CPP-S costs for the country are
10.83€ million; such costs are in line with FP at 10.65€ million and TOU at 10.41€ (see
Table 30 in Appendix). These values indicate savings of about 6 million Europe daily for
the residential sector, which in turn could result in savings of over 300Euro per
household per year in the Netherlands.
Both individual households and system costs increase with more EVs in scenario 2; for
individual households, average prices are the lowest with TOU followed by FP, RTP, CPP-S
and CPP-R while for the system, FP have the lowest average cost followed by TOU, RTP,
CPP-S and CPP-R.
When looking at a one to one ratio in scenario 3 with FP, TOU and RTP average
household costs increase with deeper PV and EV penetration levels. Differently, with
CPP-S household costs increase until EVs are equal to PVs at 27,700, after that costs
continue to fall. From the three scenarios, TOU is the cheapest option for individual
households followed by FP, CPP-S, RTP and CPP-R. For the system, the cheapest option is
FP followed by TOU, RTP, CPP-S and CPP-R; see Figure 26 and Figure 27 below and Table
30 in the Appendix. For the system (Figure 27) the difference between total cost with
TOU and FP is 0.33% while for an individual household the difference is 4.19%. Since
individuals are impacted more by the difference than the system, TOU is recommended
27700
527700
1027700
7500 507500 1007500
PV
pe
ne
trat
ion
EV penetration
Scenario 1 Scenario 2 Scenario 3
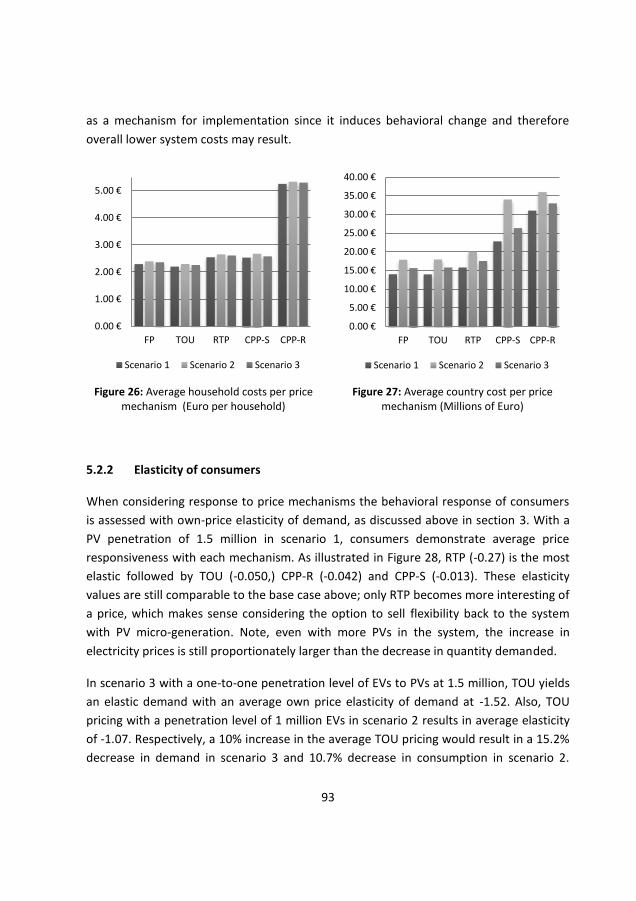
93
as a mechanism for implementation since it induces behavioral change and therefore
overall lower system costs may result.
Figure 26: Average household costs per price
mechanism (Euro per household)
Figure 27: Average country cost per price
mechanism (Millions of Euro)
5.2.2 Elasticity of consumers
When considering response to price mechanisms the behavioral response of consumers
is assessed with own-price elasticity of demand, as discussed above in section 3. With a
PV penetration of 1.5 million in scenario 1, consumers demonstrate average price
responsiveness with each mechanism. As illustrated in Figure 28, RTP (-0.27) is the most
elastic followed by TOU (-0.050,) CPP-R (-0.042) and CPP-S (-0.013). These elasticity
values are still comparable to the base case above; only RTP becomes more interesting of
a price, which makes sense considering the option to sell flexibility back to the system
with PV micro-generation. Note, even with more PVs in the system, the increase in
electricity prices is still proportionately larger than the decrease in quantity demanded.
In scenario 3 with a one-to-one penetration level of EVs to PVs at 1.5 million, TOU yields
an elastic demand with an average own price elasticity of demand at -1.52. Also, TOU
pricing with a penetration level of 1 million EVs in scenario 2 results in average elasticity
of -1.07. Respectively, a 10% increase in the average TOU pricing would result in a 15.2%
decrease in demand in scenario 3 and 10.7% decrease in consumption in scenario 2.
0.00 €
1.00 €
2.00 €
3.00 €
4.00 €
5.00 €
FP TOU RTP CPP-S CPP-R
Scenario 1 Scenario 2 Scenario 3
0.00 €
5.00 €
10.00 €
15.00 €
20.00 €
25.00 €
30.00 €
35.00 €
40.00 €
FP TOU RTP CPP-S CPP-R
Scenario 1 Scenario 2 Scenario 3
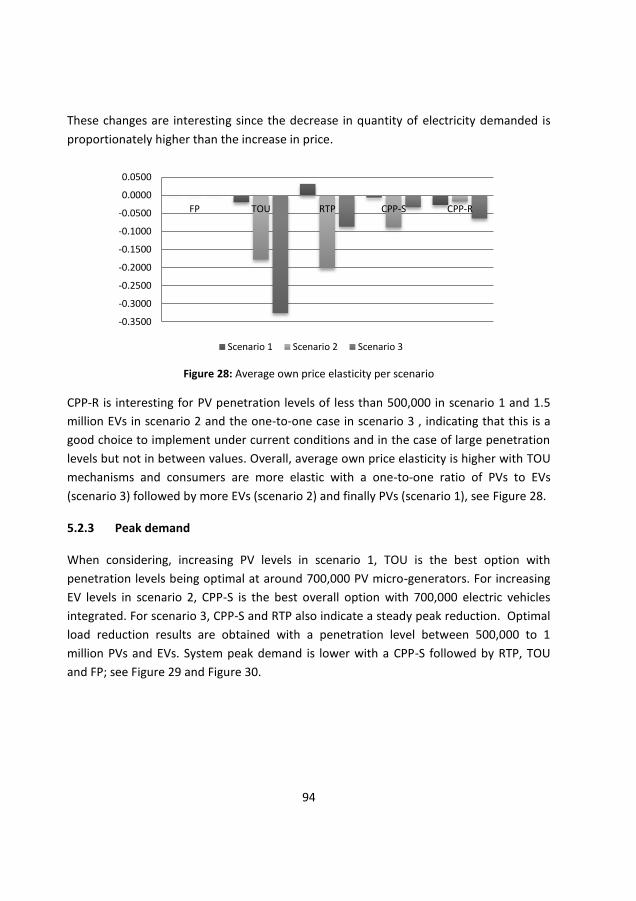
94
These changes are interesting since the decrease in quantity of electricity demanded is
proportionately higher than the increase in price.
Figure 28: Average own price elasticity per scenario
CPP-R is interesting for PV penetration levels of less than 500,000 in scenario 1 and 1.5
million EVs in scenario 2 and the one-to-one case in scenario 3 , indicating that this is a
good choice to implement under current conditions and in the case of large penetration
levels but not in between values. Overall, average own price elasticity is higher with TOU
mechanisms and consumers are more elastic with a one-to-one ratio of PVs to EVs
(scenario 3) followed by more EVs (scenario 2) and finally PVs (scenario 1), see Figure 28.
5.2.3 Peak demand
When considering, increasing PV levels in scenario 1, TOU is the best option with
penetration levels being optimal at around 700,000 PV micro-generators. For increasing
EV levels in scenario 2, CPP-S is the best overall option with 700,000 electric vehicles
integrated. For scenario 3, CPP-S and RTP also indicate a steady peak reduction. Optimal
load reduction results are obtained with a penetration level between 500,000 to 1
million PVs and EVs. System peak demand is lower with a CPP-S followed by RTP, TOU
and FP; see Figure 29 and Figure 30.
-0.3500
-0.3000
-0.2500
-0.2000
-0.1500
-0.1000
-0.0500
0.0000
0.0500
FP TOU RTP CPP-S CPP-R
Scenario 1 Scenario 2 Scenario 3
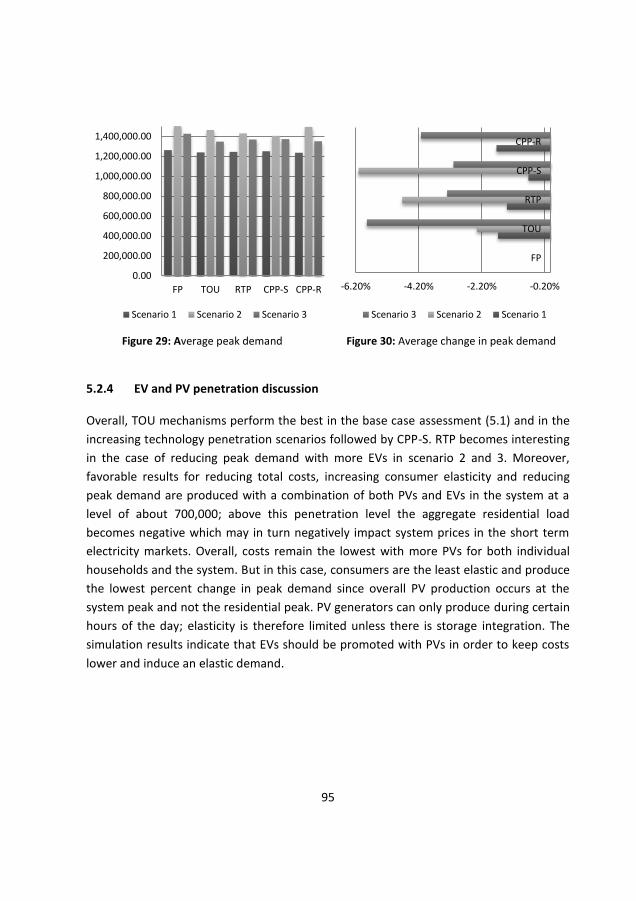
95
Figure 29: Average peak demand
Figure 30: Average change in peak demand
5.2.4 EV and PV penetration discussion
Overall, TOU mechanisms perform the best in the base case assessment (5.1) and in the
increasing technology penetration scenarios followed by CPP-S. RTP becomes interesting
in the case of reducing peak demand with more EVs in scenario 2 and 3. Moreover,
favorable results for reducing total costs, increasing consumer elasticity and reducing
peak demand are produced with a combination of both PVs and EVs in the system at a
level of about 700,000; above this penetration level the aggregate residential load
becomes negative which may in turn negatively impact system prices in the short term
electricity markets. Overall, costs remain the lowest with more PVs for both individual
households and the system. But in this case, consumers are the least elastic and produce
the lowest percent change in peak demand since overall PV production occurs at the
system peak and not the residential peak. PV generators can only produce during certain
hours of the day; elasticity is therefore limited unless there is storage integration. The
simulation results indicate that EVs should be promoted with PVs in order to keep costs
lower and induce an elastic demand.
0.00
200,000.00
400,000.00
600,000.00
800,000.00
1,000,000.00
1,200,000.00
1,400,000.00
FP TOU RTP CPP-S CPP-R
Scenario 1 Scenario 2 Scenario 3
-6.20% -4.20% -2.20% -0.20%
FP
TOU
RTP
CPP-S
CPP-R
Scenario 3 Scenario 2 Scenario 1
96
6 Model verification, validation and sensitivity40
6.1 Model verification
Verification is the process of determining that the model implementation is executed
appropriately, in such a way that it accurately represents the desired conceptual
descriptions and specifications. This model was built in Repast Symphony and for
verification of accuracy and consistency manual calculations were conducted in MS Excel.
In essence, model verification ensures the accuracy of the model. For agent based
modeling there are 4 parts to verification (Dam et al., 2012): (i) recording and tracking
agent behavior; (ii) single agent testing; (iii) interaction testing; (iv) multi-agent testing.
See Appendix Table 31 for a detailed model verification assessment.
6.2 Validation
The application of price-based demand response with a menu of price options (FP, TOU,
CPP and RTP) has not been extensively applied to the residential electricity sector of the
Netherlands. Current investigations consist of a few executed pilot projects and several
others in pipeline, but not all information is publicly available, in turn making historical
validation difficult to execute. A face validation was conducted with smart grid expert Dr.
Rudi Hakvoort41
(TU Delft) on the underlying model assumptions and methodology. A
literature review from international studies on the application of price-based demand
response in the residential sector corroborates the conducted analysis above. For
instance, Faruqui et al. (2009) determine that dynamic tariffs for have the potential to
reduce system peak demand from 1% to 9%; such results are consistent with the findings
of the simulation outputs in this work. When considering elasticity values, the model
outputs are in line with those summarized in Neenan (2008) and in the review above in
section 3 for all the simulated price mechanisms.
40 See Mahalingam (2013) for a further detailed assessment. 41 (Netherlands Enterprise Agency, 2014)
97
6.3 Sensitivity analysis
In order to understand the sensitivity of the modeling parameters used for simulation,
two sets of experiments were carried out considering: (i) the appliance penetration levels
and (ii) number of households of each archetype. For a reference comparison, the
percent of peak reduction in considered, see appendix Figure 53 and Figure 54.
The sensitivity analysis reveals that the frugal household archetypes are the most critical
parameter for most price-mechanisms. Moreover, with a change in the penetration rate
or appliances, EVs are the most sensitive of all appliances, having the greatest influence
on reducing peak demand. Moreover, on account of their potential to shift the time
when system peak occurs, electric water heaters and dishwashers are also regarded as
critical parameters.
7 Concluding remarks
At the individual household level electricity load curves vary a great deal (Paatero and
Lund, 2006) as a result of consumers’ behavior and therefore consumption patterns are
not fully rigid (He et al., 2013b), although frequently habitual (Lopes et al., 2012). The
correlation between ‘predictability’ and ‘flexibility’ of load is not straightforward. Being
predictable doesn’t necessarily mean that a load could be more easily shed or postponed
(He et al., 2013b). Accordingly, the above results corroborate these facts about end-user
consumption and the possibility for DR activation through price-based mechanisms.
Under current conditions, simulation results indicate the impact of price-based demand
response on the peak residential load to be relatively low at less than one percent;
consumers are relatively inelastic and overall prices per average household and for the
country remain low, unless a critical peak pricing event is called for specified hours. A
critical-peak pricing mechanism considering the residential peak (CPP-R) yields double
the costs of average fixed pricing for households on the day of an event, indicating that
during these peak hours there is the most potential for DR load shifting to occur.
As evidence from other studies and pilot projects in addition to the simulation analysis
above, an increase in the price of electricity is proportionately larger than the decrease in
the quantity of electricity end-users demand. The values resulting from the simulation
indicate some consumer sensitivity to price when given blocks of dynamic prices to

98
respond to, specifically TOU and CPP. For an average consumer the brunt of daily
consumption occurs during a specific time block, tariffs should focus their design on
targeting those hours of consumption making it as simple as possible for consumers to
respond (especially by finding ways to invest and promote automation).
Overall, average own price elasticity is higher with TOU mechanisms and consumers are
more elastic with a one-to-one ratio of PVs to EVs, followed by only more EVs and finally
only more PVs. These results indicate that if we want a better balance in the system the
mass of increasing production should be stimulated alongside that consumption but not
past a level where the residential load yields negative aggregate consumption (unless
this is the system objective).
When promoting demand response through price, attention should be paid to the
desired level of response. Although demand is currently inelastic, the right mix of
technology perpetration may result in high levels of response. Regulators should take
now of the level of response they desire from end users.

99
100
Chapter 4 ~ Aggregation
and access to electricity markets
In the previous chapter the estimation of responsive load was discussed in
detail followed by an analysis of the design of price based mechanisms. A
simulation case study revealed that residential load is relatively unresponsive,
but nonetheless can be stimulated through a carefully designed price-based
mechanism. In this chapter, the facet of alleviating system distress through
explicit (volume-based) demand response is considered in work resulting from
Koliou et al. (2015a, 2015b)42
and in the collaboration of Abdul Muhaimin
(2015)43
.
1 Introduction
The contracting of demand response (DR) for volume-based services will be done by an
‘aggregator’. The aggregator will pool the demand flexibility offered by customers acting
“…towards the grid as one entity, including local aggregation of demand (Demand
Response management) and supply (generation management)” (EC TF for Smart Grids,
2011). In the transforming European electricity system, the aggregator is not a clearly
42 Koliou, E., Abdul Muhaimin, T., Hakvoort, R.A., Kremers, R., 2015a. Complexity of demand response integration in European electricity markets, in: 12th International Conference on the European Energy Market, Lisbon Portugal.
Koliou, E., Abdul Muhaimin, T., Hakvoort, R.A., Kremers, R., 2015b. Complexity of end-user access to European electricity markets: The case of aggregation for demand response. Working paper at Delft University of Technology, the Netherlands.
43 Abdul Muhaimin, T., 2015. Electricity market of the future: assessing economic feasibility and regulatory constraints for demand response aggregators in Europe. Master thesis, Delft University of Technology, the Netherlands.
101
identifiable actor. Roles and responsibilities of this emerging party are still in
development and so is the market structure for appropriate integration. As the
coordination of flexible load from consumers is an intricate process of procurement and
execution, this chapter examines the deemed ‘aggregator’ with the aim of understanding
which market party is best fit to participate in the various short term electricity markets.
Using the Netherlands as a case study, a detailed analysis of the processes, costs and
potential gains from active spot market participation is presented. The aim of this
chapter is to bring to light some of the complexities facing aggregated DR incorporation
in the European electricity system.
2 Motivation
The European Commission (EC) addressed the need for the implementation of intelligent
metering systems to assist active participation of consumers in the electricity supply
markets back in 2009. In Directive 2009/72/EC it is specified that at least 80 percent of
households shall be equipped with intelligent electricity metering systems by 2020 (EC,
2013a). More recently, the Energy Efficiency Directive 2012/27/EU (EC, 2012), ENTSO-E44
Demand Connection Code (ENTSO-E, 2013a), and the ACER45
Framework Guidelines on
Electricity Balancing (ACER, 2012) communicate the need for end-user activation. Such
documentation conveys to member states that DR resources through aggregation should
be facilitated to participate alongside supply in both wholesale and retail markets (Koliou
et al., 2014). Specifically, Article 15.8 of the Energy Efficiency Directive (2012/27/EU)
provides a legal basis for further development of DR in the European member states (EC,
2012). Thus far there have not been any consequences on member states for not
complying with the energy efficiency directive ‘requirements’ on demand side response.
A brunt of the focus remains to getting end- users access to smart meters.
Note, the above mentioned communications place an emphasis on the aggregation of
small end-users (EC, 2013a). The consensus is that the residential sector is an untapped
pool of system-wide flexibility, a more cost-effective solution when compared to
increasing large scale generation capacity and grid reinforcement (both transmission and
44 European Network of Transmission System Operators for Europe (ENTSO-E) (ENTSO-E, 2013a) 45 Agency for the Cooperation of Energy Regulators (ACER) (ACER, 2012)
102
distribution) (Ikäheimo et al., 2010; Strbac, 2008). This cost efficient solution is
increasingly interesting on account of recent developments in information and
communication technology which have opened new opportunities for demand side
initiatives in the innovation of the residential electricity business (Strbac, 2008; Torriti et
al., 2010). But, the success of DR is highly dependent on effective knowledge of
consumer characteristics and respective behavior patterns (Paatero and Lund, 2006).
Below follows a discussion on the complexity of DR and the entity appointed for
aggregation of such flexibility.
3 Demand response activation
When it comes to residential electricity consumption there are some undeniable
characteristics to consider, which are discussed extensively in Chapter 3. Essentially,
household electricity consumption (and production) results from the use of electrical
appliances, which means that consumers are not always aware of the consumption
and/or production taking place. Moreover, demand fluctuates widely within a household
and from one household to the next according to time of day, day of the week and
season (Paatero and Lund, 2006). Owing to such characteristics, the activation of
flexibility entails careful examination of the capability of individual loads and groups
(Valero et al., 2006). Such an examination can be provided by an aggregator (EC TF for
Smart Grids, 2011; FENIX, 2009; Prüggler, 2013). Below the authors present an analysis
on the access to flexibility and scale followed by a discussion on the deemed aggregating
entity.
3.1 Aggregation at each level
DR flexibility comes in different sizes which must be pooled. Aggregation takes place in
individual households and neighborhoods/communities for service provision to market
parties in need of flexibility: transmission system operators (TSOs), distribution system
operators (DSOs), retailers, generators and balance responsible parties (BRPs) (FENIX,
2009).
3.1.1 Individual household level aggregation
For individual households, aggregated DR is dependent on access to distributed energy
resources and enabling technology to provide flexibility. Specifically, such technology
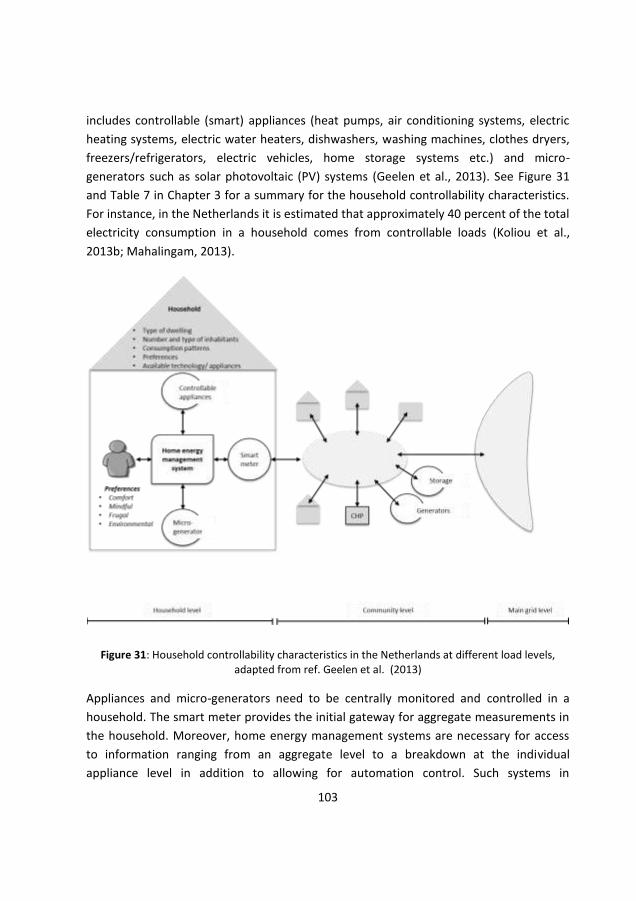
103
includes controllable (smart) appliances (heat pumps, air conditioning systems, electric
heating systems, electric water heaters, dishwashers, washing machines, clothes dryers,
freezers/refrigerators, electric vehicles, home storage systems etc.) and micro-
generators such as solar photovoltaic (PV) systems (Geelen et al., 2013). See Figure 31
and Table 7 in Chapter 3 for a summary for the household controllability characteristics.
For instance, in the Netherlands it is estimated that approximately 40 percent of the total
electricity consumption in a household comes from controllable loads (Koliou et al.,
2013b; Mahalingam, 2013).
Figure 31: Household controllability characteristics in the Netherlands at different load levels, adapted from ref. Geelen et al. (2013)
Appliances and micro-generators need to be centrally monitored and controlled in a
household. The smart meter provides the initial gateway for aggregate measurements in
the household. Moreover, home energy management systems are necessary for access
to information ranging from an aggregate level to a breakdown at the individual
appliance level in addition to allowing for automation control. Such systems in
104
combination with smart metering stimulate household awareness and have the potential
to instigate savings from the provided insight. Home energy management systems act as
the interface between a consumer’s flexibility device and the aggregator coordinating
flexibility scheduling. The existing supplier of a consumer, deemed aggregator, or the
consumer himself can install this interface. Note that in home energy management
systems differentiation is indispensable. Provided that ‘one size does not fit all’, different
forms of feedback interaction and visualization will be required for the various target
types of households (Geelen et al., 2013).
3.1.2 Community level
Access to more DR products and services becomes available when a collection of
appliances, micro-generators and storage devices form a community of pooled flexibility
(Figure 31). For instance, at a community level shared distributed generators (DG)
include several photovoltaic systems in addition to micro-wind turbines. At times when
there is excess wind or sunlight, electricity from such generators can be stored in
community storage systems or individual household battery systems. Moreover, at a
community level electric vehicles can, for instance, charge at community charging
stations from locally produced electricity. Community combined heat and power units
(CHP), generators, batteries and charging stations are managed individually by the
owners or by community cooperatives. All these sources of flexibility can be pooled into
the portfolio of one aggregator or several (Ikäheimo et al., 2010).
Building up a large and flexible portfolio which provides both local and system support is
a complex task to undertake by multiple ‘agents’ in the system, whether it is through
automation or manual control. For individual households and the community, an
aggregator can aid in the access, signaling and the scheduling of DR release in order to
keep the balance between supply and demand (Ikäheimo et al., 2010). In a dynamic
multi-agent system an appropriate market-based control approach for matching supply
and demand in electricity systems is needed for appropriate coordination (Kok et al.,
2005); such a task has been undertaken in the PowerMatcher conceptualization and
implementation (Flexiblepower Alliance Network, 2015; Geelen et al., 2013; Kok et al.,
2005). This platform was developed in the Netherlands by a consortium of researchers
(academic and industry) along with regulated and commercial market player
(Flexiblepower Alliance Network, 2015).
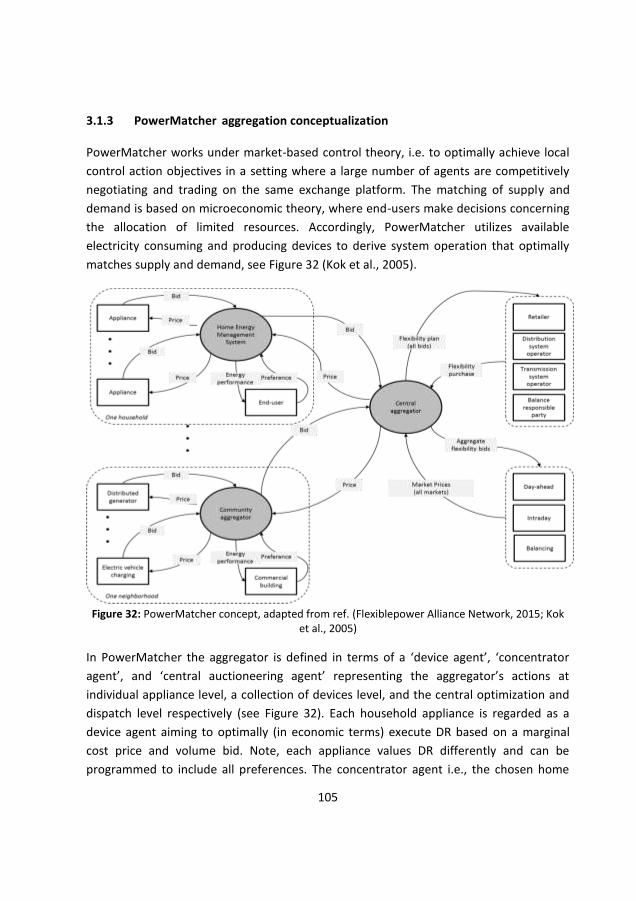
105
3.1.3 PowerMatcher aggregation conceptualization
PowerMatcher works under market-based control theory, i.e. to optimally achieve local
control action objectives in a setting where a large number of agents are competitively
negotiating and trading on the same exchange platform. The matching of supply and
demand is based on microeconomic theory, where end-users make decisions concerning
the allocation of limited resources. Accordingly, PowerMatcher utilizes available
electricity consuming and producing devices to derive system operation that optimally
matches supply and demand, see Figure 32 (Kok et al., 2005).
Figure 32: PowerMatcher concept, adapted from ref. (Flexiblepower Alliance Network, 2015; Kok
et al., 2005)
In PowerMatcher the aggregator is defined in terms of a ‘device agent’, ‘concentrator
agent’, and ‘central auctioneering agent’ representing the aggregator’s actions at
individual appliance level, a collection of devices level, and the central optimization and
dispatch level respectively (see Figure 32). Each household appliance is regarded as a
device agent aiming to optimally (in economic terms) execute DR based on a marginal
cost price and volume bid. Note, each appliance values DR differently and can be
programmed to include all preferences. The concentrator agent i.e., the chosen home
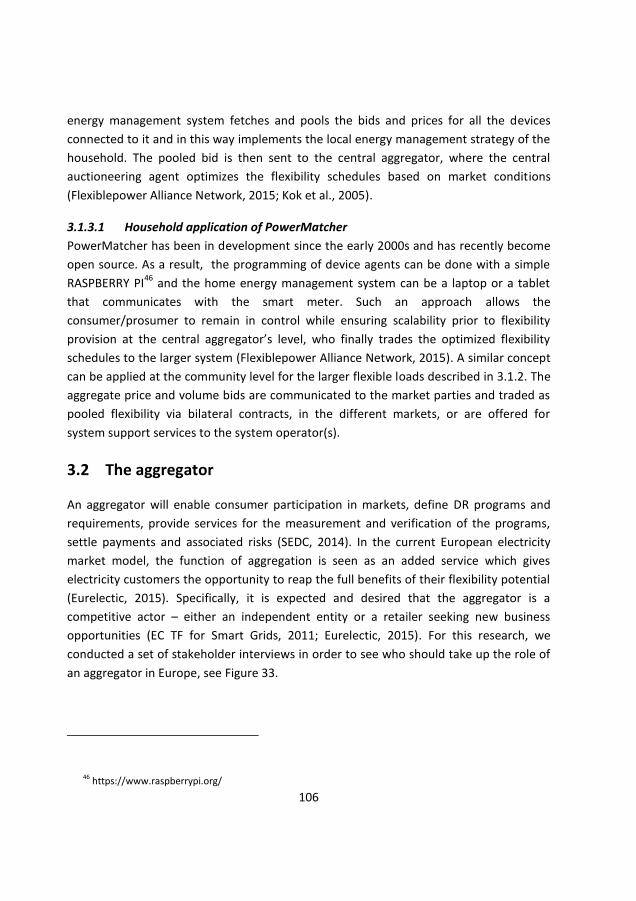
106
energy management system fetches and pools the bids and prices for all the devices
connected to it and in this way implements the local energy management strategy of the
household. The pooled bid is then sent to the central aggregator, where the central
auctioneering agent optimizes the flexibility schedules based on market conditions
(Flexiblepower Alliance Network, 2015; Kok et al., 2005).
3.1.3.1 Household application of PowerMatcher
PowerMatcher has been in development since the early 2000s and has recently become
open source. As a result, the programming of device agents can be done with a simple
RASPBERRY PI46
and the home energy management system can be a laptop or a tablet
that communicates with the smart meter. Such an approach allows the
consumer/prosumer to remain in control while ensuring scalability prior to flexibility
provision at the central aggregator’s level, who finally trades the optimized flexibility
schedules to the larger system (Flexiblepower Alliance Network, 2015). A similar concept
can be applied at the community level for the larger flexible loads described in 3.1.2. The
aggregate price and volume bids are communicated to the market parties and traded as
pooled flexibility via bilateral contracts, in the different markets, or are offered for
system support services to the system operator(s).
3.2 The aggregator
An aggregator will enable consumer participation in markets, define DR programs and
requirements, provide services for the measurement and verification of the programs,
settle payments and associated risks (SEDC, 2014). In the current European electricity
market model, the function of aggregation is seen as an added service which gives
electricity customers the opportunity to reap the full benefits of their flexibility potential
(Eurelectic, 2015). Specifically, it is expected and desired that the aggregator is a
competitive actor – either an independent entity or a retailer seeking new business
opportunities (EC TF for Smart Grids, 2011; Eurelectic, 2015). For this research, we
conducted a set of stakeholder interviews in order to see who should take up the role of
an aggregator in Europe, see Figure 33.
46 https://www.raspberrypi.org/
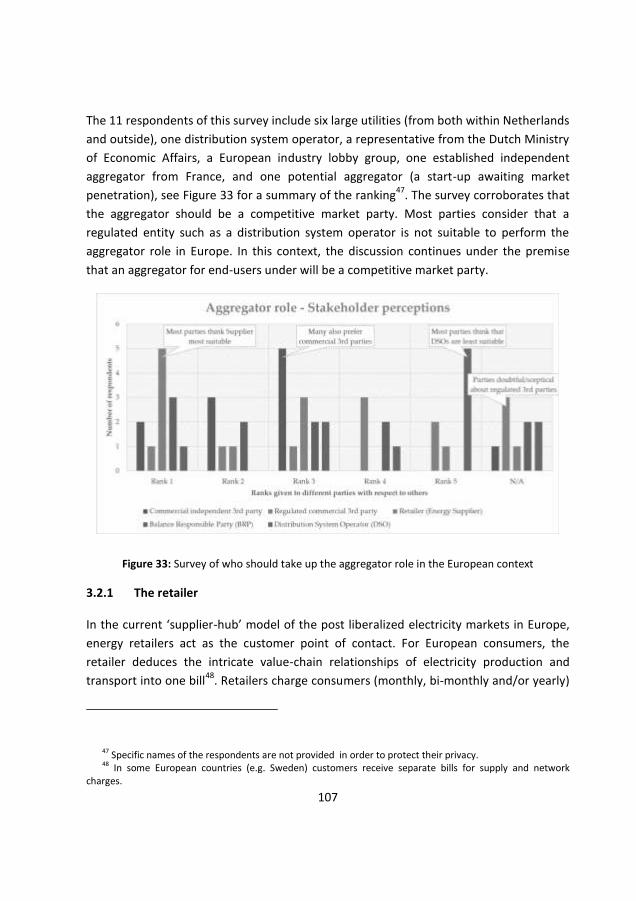
107
The 11 respondents of this survey include six large utilities (from both within Netherlands
and outside), one distribution system operator, a representative from the Dutch Ministry
of Economic Affairs, a European industry lobby group, one established independent
aggregator from France, and one potential aggregator (a start-up awaiting market
penetration), see Figure 33 for a summary of the ranking47
. The survey corroborates that
the aggregator should be a competitive market party. Most parties consider that a
regulated entity such as a distribution system operator is not suitable to perform the
aggregator role in Europe. In this context, the discussion continues under the premise
that an aggregator for end-users under will be a competitive market party.
Figure 33: Survey of who should take up the aggregator role in the European context
3.2.1 The retailer
In the current ‘supplier-hub’ model of the post liberalized electricity markets in Europe,
energy retailers act as the customer point of contact. For European consumers, the
retailer deduces the intricate value-chain relationships of electricity production and
transport into one bill48
. Retailers charge consumers (monthly, bi-monthly and/or yearly)
47 Specific names of the respondents are not provided in order to protect their privacy. 48 In some European countries (e.g. Sweden) customers receive separate bills for supply and network
charges.
108
to act as the intermediary responsible for procuring their electricity. While retailers are
only responsible for procurement of generation supply to customers, in most European
countries they combine the billing for the supply component (generation and retail),
network (transmission and distribution), related taxes and other fees such as metering.
In some European countries (e.g. Sweden) customers receive a separate bill for network
charges (Eurelectric, 2013).
It can be argued that retailers are currently in the best position to become aggregators
since they have established relationships with balance responsible parties, network
operators and customers. As the direct contact to customers, suppliers have contractual
access to the data of end users. Moreover, retailers also carry balance responsibility and
have access to all electricity markets, both short and long term. Note, retailers range
from over 1000 in Germany to just half of that in Italy, 45 in the Netherlands and only 13
in Portugal (EC, 2013b), so it does not mean that all can enter the aggregation business
and become profitable.
3.2.2 Independent aggregator
Independent aggregators consist of competitive (and often new) market parties looking
to make a profit by providing DR aggregation and additional services to end-users and
market parties. Aggregation value maximization may come from attempting to offer as
many services as possible, including trading aggregated flexibility of individual household
appliances in the various markets and providing household data analytics services for
optimizing electricity usage (Eurelectic, 2015; Eurelectric, 2015; FENIX, 2009). Differently,
aggregators can also maximize profits by specializing in a flexibility service depending on
their customer base, available technologies and costs. For instance, with a large electric
vehicle fleet an aggregator can focus his business model on aggregation, charging
coordination and ‘release’ of demand flexibility to the system (Ikäheimo et al., 2010).
Currently in the Netherlands you have companies such as PlugSurfing (2015) and
GreenFlux (2015) which focus on electric vehicle charging. Companies such as BELECTRIC
(2015) combine a variety of distributed energy resource services for both households and
communities including rooftop and community photovoltaic systems, electric vehicle
charging and energy storage. This type of specialization may result in such parties
becoming aggregators on account of having access to larger loads than the average
household. The specialized aggregator model may prevail since different types of loads
compel the use of different technologies (Ikäheimo et al., 2010). There is also the
possibility that these new parties may become the new point of contact with the

109
consumers, taking the contract handling responsibility away from the retailer (but this is
unlikely).
Currently in the Netherlands there are four active aggregators in the market:
Powerhouse (RWE Group), Agro Energy, Energie Data Maatschappij49
and NL
Noodvermogenpool50
. These aggregators are pooling demand-side resources from
greenhouses, hospitals, small industries with CHP and load shedding capabilities (DRIP,
2015). As of now, households are not in the portfolio of these aggregators.
Bellow follows a discussion on the value of such flexibility as it is currently perceived by
the stakeholders warranting the use of aggregated DR.
3.3 Value of demand response flexibility
As indicated above, the aggregator actively pools together flexibility from energy
resources of its customers and offers them to electricity market participants. Such
interactions become feasible through bilateral contracting or by submitting offers in the
organized electricity markets. Flexibility buyers can be either regulated, competitive or
both and will activate technical DR that requires location specific aggregation,
commercial DR necessitating distributed aggregation or even both, see Table 14.
Regulated actors include distribution and transmission system operators concerned with
the physical delivery of electricity, at the lowest possible cost to consumers and with the
highest quality possible. Competitive actors include retailers, generators and balance
responsible parties wanting to use DR for profit maximization in electricity trading.
Type of demand response→ Technical
(location specific aggregation)
Commercial
(distributed aggregation) Entity contracting flexibility↓
Distribution System Operator (DSO)
Transmission system operator
Generator
Retailer (Energy Supplier)
Balance Responsible Party (BRP)
Table 14: Summary of parties interested in flexibility and their respective use of demand response
49 Energy Data Company 50 NL Emergency Power Pool
110
3.3.1 Transmission system operator
The (transmission) system operator can use the flexibility of customers as reserve
capacity to maintain stability in the system at the lowest possible cost. With an increase
in RES generation capacity the local contribution to system stability is gaining relevance.
For instance, one reason is the simultaneous failure of several wind turbines in a wind
farm, leading to the dispatch of fast reserves to compensate for the imbalance. Because
of the limited size of (mainly gas) spinning reserves, an appropriate (and maybe even
cheaper) solution seems to be the deployment of local flexibility (Hakvoort and Koliou,
2015).
3.3.2 Distribution system operator
As a network manager subject to regulatory oversight, distribution system operators
have the responsibility to transport electricity to their customers at the lowest possible
cost with the highest quality. For the distribution grid, DR has a twofold physical
application: mitigation of grid overload at peaks and system balance maintenance of
supply and demand (Strbac, 2008). The physical release of DR will reduce costs related
to grid losses, investments and overall maintenance (Hakvoort and Koliou, 2015; E Koliou
et al., 2014).
3.3.3 Generator
Generators can use customer flexibility to absorb electricity production at times of
overcapacity. This can be especially useful for the rapid mitigation of unexpected
fluctuations in the output of intermittent production recourses, such as wind and solar
power. In turn, this would help reduce system balancing costs for the balance
responsible party (Hakvoort and Koliou, 2015). Generators can employ storage systems
close to the production site in order to reduce ‘spillage’ and trade this as flexible load
(Pandzic et al., 2014).
3.3.4 Retailers (energy suppliers)
Energy suppliers will use flexibility to reduce demand during system peak, at which time
the purchase of energy is expensive, and shift the load to a time when electricity is
cheaper. If suppliers are confident in the responsiveness of their customers, they can
procure the purchase of electricity at times when prices are low. In the case where the
supplier is the deemed aggregator he will also sell the flexibility from his customers to
111
other market parties in either bilateral contracts or in the short term markets (Hakvoort
and Koliou, 2015). Large suppliers are also balance responsible parties for themselves
and other parties. As a balance responsible party, the retailer is also in charge of
monitoring own power balance and that of the parties for which they carry balance
responsibility. Having access to DR flexibility gives them significant leverage in the
optimization of their imbalance position (Eurelectric, 2015).
3.3.5 Balance responsible party
Balance responsible parties create schedules of electricity supply and demand at
connecting points to the grid for their customers (suppliers and generators alike). The
derived schedules are provided to the TSOs on a daily basis, with BRPs carrying the
penalties for deviations from the set schedules. Using DR flexibility, a balance responsible
party can balance his own electricity supply and demand at the lowest cost possible, in
this way creating added value for himself and his customers. Note, balancing costs are
directly passed down to consumers (Eurelectric, 2015; FENIX, 2009).
4 Intricacies of market participation for demand response
In the same way large-scale generators operate production plants central aggregators
will control their ‘virtual’ power plants of aggregated flexibility. Accordingly, trading
entails access to the various short term spot markets inclusive of day-ahead and intraday.
As part of system support management to the transmission system operator aggregators
can also participate in the balancing markets. Such activities involve flexibility operation
that does not necessitate location specificity. If transmission and distribution system
operators need aggregated flexibility for congestion management, then DR has location
specific components attached (FENIX, 2009).
4.1 The market convolution
Inherently, once electricity is generated it must be consumed or stored, which, in turn,
makes the planning of supply a critical matter. Planning is done at different time scales
classified as various markets: forward/future market, spot markets (including the day-
ahead market and the intra-day market) and real-time/balancing market. Forward
markets operate within a range of a few days to a year (or more) prior to actual delivery
(ERGEG, 2009). This analysis focuses on the spot markets, day-ahead and intraday.
112
4.1.1 General overview in Europe
The day-ahead market operates one day before the date of delivery (D-1) and clears the
market for each hour of the delivery day (D). The intra-day market operates in near real-
time, one-hour ahead or even closer to the delivery time. Trades in each market (day-
ahead, intra-day and balancing) must be finalized before the ‘gate closure’ time when the
balance responsible parties of generators and loads notify the expected physical
positions of connected parties to the transmission system operator. After gate closure no
further trace can occur in the respective market (ERGEG, 2009). Program time units
(PTUs) are used for scheduling and settlement of programs from the electricity market
participants. PTUs can be 15 minutes, 30 minutes or 1 hour depending on the market
design characteristics of the member state (Mott MacDonald, 2013). The market
functions in such a way that balance responsible parties and/or generators of electricity
try to balance supply and demand first in the day-ahead market and then in the intra-day
market (for remaining imbalances), followed by real-time balancing in the
imbalance/reserve markets operated by the system operator. System operators may also
call on balancing bids before the gate closure of intra-day market (ERGEG, 2009; Mott
MacDonald, 2013).
The market structure, as it currently stands, is built from the perspective of large scale
generation plants i.e., generation is always made to follow demand. Accordingly, both
the European commission and industry lobby groups emphasize that DR proliferation is
inherently vulnerable to institutional barriers arising from an existing system design
framework which caters to large generation units (Eurelectric, 2015; SEDC, 2014). The
Smart Energy Demand Coalition (SEDC), a dedicated industry group representing the
requirements of programs involving demand side participation, provides some general
guidelines for bringing DR to market, namely, timing, volume, and program specifications
(SEDC, 2014), see Table 15 for a summary. Timing specifications are very much related to
the design of the DR program and the notice, duration, frequency and intervals of
flexibility release; volume is concerned with the minimum and maximum limits for
activation and; program specifications focus on the pricing methods, measurement and
verification techniques and the associated penalties for non-compliance. The analysis
continues with a deduction of the timing specifications in the spot markets in the
Netherlands, touching upon the volume and program specifications.
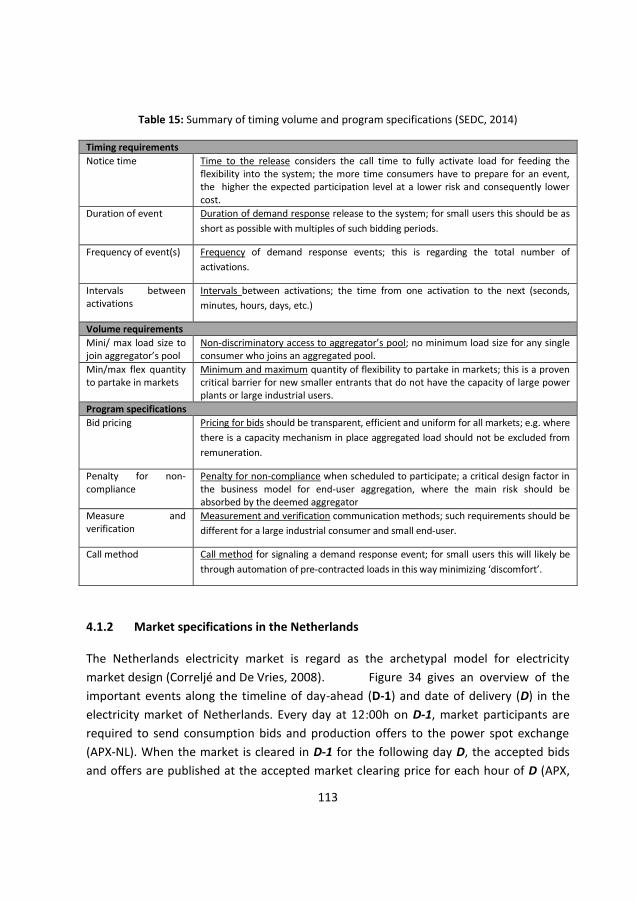
113
Table 15: Summary of timing volume and program specifications (SEDC, 2014)
Timing requirements
Notice time Time to the release considers the call time to fully activate load for feeding the flexibility into the system; the more time consumers have to prepare for an event, the higher the expected participation level at a lower risk and consequently lower cost.
Duration of event Duration of demand response release to the system; for small users this should be as
short as possible with multiples of such bidding periods.
Frequency of event(s) Frequency of demand response events; this is regarding the total number of
activations.
Intervals between activations
Intervals between activations; the time from one activation to the next (seconds,
minutes, hours, days, etc.)
Volume requirements
Mini/ max load size to join aggregator’s pool
Non-discriminatory access to aggregator’s pool; no minimum load size for any single consumer who joins an aggregated pool.
Min/max flex quantity to partake in markets
Minimum and maximum quantity of flexibility to partake in markets; this is a proven critical barrier for new smaller entrants that do not have the capacity of large power plants or large industrial users.
Program specifications
Bid pricing Pricing for bids should be transparent, efficient and uniform for all markets; e.g. where
there is a capacity mechanism in place aggregated load should not be excluded from
remuneration.
Penalty for non-compliance
Penalty for non-compliance when scheduled to participate; a critical design factor in the business model for end-user aggregation, where the main risk should be absorbed by the deemed aggregator
Measure and verification
Measurement and verification communication methods; such requirements should be
different for a large industrial consumer and small end-user.
Call method Call method for signaling a demand response event; for small users this will likely be
through automation of pre-contracted loads in this way minimizing ‘discomfort’.
4.1.2 Market specifications in the Netherlands
The Netherlands electricity market is regard as the archetypal model for electricity
market design (Correljé and De Vries, 2008). Figure 34 gives an overview of the
important events along the timeline of day-ahead (D-1) and date of delivery (D) in the
electricity market of Netherlands. Every day at 12:00h on D-1, market participants are
required to send consumption bids and production offers to the power spot exchange
(APX-NL). When the market is cleared in D-1 for the following day D, the accepted bids
and offers are published at the accepted market clearing price for each hour of D (APX,
114
2014a). After the publishing of D-1 results, the balance responsible parties are required
to send their Energy-programs (E-programs) to the system operator (Tennet) before
14:00 hours on the same day D-1. The E-programs contain information about the
aggregate energy for each hour of the next day. Such programs include all injections and
withdrawals from the grid by generators and consumers (typically consumers are
represented in the market by retailers). Each generator and consumer connected to the
grid has a unique EAN code that identifies them; this code is used in the detailed E-
program provided to Tennet (TenneT, 2012).
Before 14:00 hours on D-1, balance responsible parties also send a Transmission-
program (T-program) to relevant distribution system operators, indicating the
transmission flows for the next day. This will tell the distribution system operators how
much electricity needs to be sourced from or fed into the grid at different connection
points. At 15:30 hours on D-1,Tennet authorizes the E-programs after performing a
consistency check with the T-programs; this is referred to as a V-program51
. Tennet uses
the V-program to notify BRPs about discrepancies and departures from their submitted
E-program after actual set-off calculations and settlements are made. The idea here is
that BRPs should have a zero balance in their file since the procured supply should match
the demand forecast in their submitted E and T programs. The transfer of all these
programs between the players is done through a standard messaging format known as
EDINE (TenneT, 2012).
Note, after submitting the E-program and T-program to Tennet (at 14:00 on D-1), BRPs
cannot make amendments to their schedules until Tennet has approved them at 15:30.
After approval, the BRPs can keep modifying their E-programs until 1 hour before the
delivery PTU (set at 15 minutes in line to the balancing market settlements in the
Netherlands) on D. For instance, BRPs can change their respective E-programs for the
PTU on D from 00:00 to 00:15 hours until 23:00 hrs on D-1. Amendments to original
programs are checked and approved by Tennet once every 15 minutes, until 1 hour
before the PTU of delivery (TenneT, 2012).
51 Verrekening program, set-off program in Dutch.
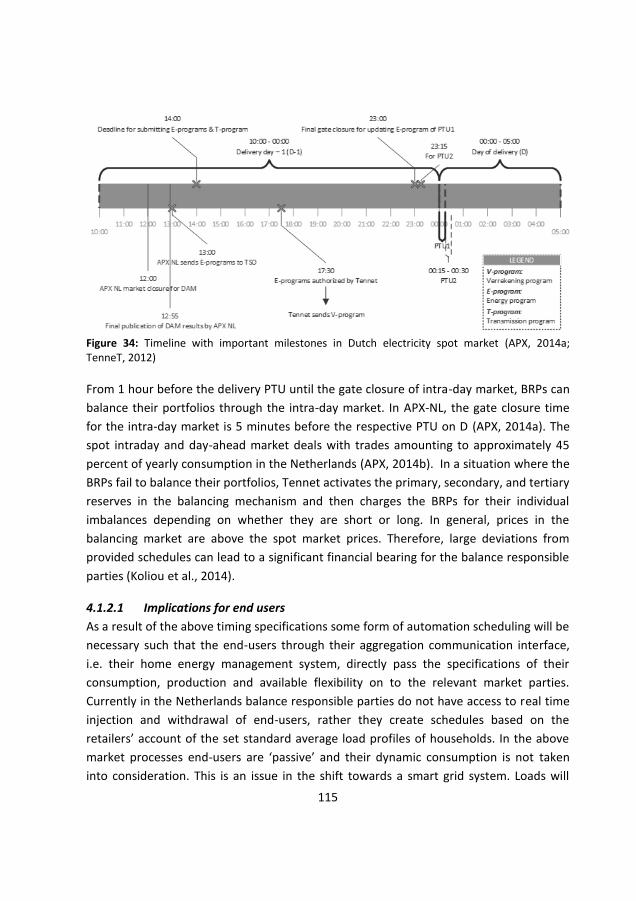
115
Figure 34: Timeline with important milestones in Dutch electricity spot market (APX, 2014a; TenneT, 2012)
From 1 hour before the delivery PTU until the gate closure of intra-day market, BRPs can
balance their portfolios through the intra-day market. In APX-NL, the gate closure time
for the intra-day market is 5 minutes before the respective PTU on D (APX, 2014a). The
spot intraday and day-ahead market deals with trades amounting to approximately 45
percent of yearly consumption in the Netherlands (APX, 2014b). In a situation where the
BRPs fail to balance their portfolios, Tennet activates the primary, secondary, and tertiary
reserves in the balancing mechanism and then charges the BRPs for their individual
imbalances depending on whether they are short or long. In general, prices in the
balancing market are above the spot market prices. Therefore, large deviations from
provided schedules can lead to a significant financial bearing for the balance responsible
parties (Koliou et al., 2014).
4.1.2.1 Implications for end users
As a result of the above timing specifications some form of automation scheduling will be
necessary such that the end-users through their aggregation communication interface,
i.e. their home energy management system, directly pass the specifications of their
consumption, production and available flexibility on to the relevant market parties.
Currently in the Netherlands balance responsible parties do not have access to real time
injection and withdrawal of end-users, rather they create schedules based on the
retailers’ account of the set standard average load profiles of households. In the above
market processes end-users are ‘passive’ and their dynamic consumption is not taken
into consideration. This is an issue in the shift towards a smart grid system. Loads will

116
become increasingly stochastic and might endanger the above market operation
procedures and threaten system security, unless, (close to) real time
consumption/production is explicitly communicated. Closer to real time data will only
become feasible with the deeper penetration of smart metering which is currently
underway to meet the 2020 target.
4.1.2.2 An example of aggregated end-user flexibility in the spot market
Entrance into the short term electricity markets is complex and costly for parties seeking
opportunity. Initial fixed costs are to the tune of 41,500€, of which almost seventy
percent amount to the membership fee. Additional transaction fees apply for intraday
and day-ahead trading and clearing per megawatt hour (MWh) (APX, 2015), see Table 16.
An aggregators’ revenue for participating in these market can be calculated as follows:
(1) 𝑅 = 𝑉′ ∗ 𝑃 − 𝑉′(𝑡 + 𝑐)
Where 𝑅 is equal to the total revenue from the market (either intraday or day-ahead), 𝑉′
is the volume demand side flexibility in Mwhs, 𝑃 the price in the market, 𝑡 the trading fee
and 𝑐 the clearing fee per MWh in the respective market.
Fixed fees for APX spot market
Membership Entrance fee Membership fee Technology fee
Trading € 5,000 € 28,500 € 5,000
Clearing - € 3,000 -
Transaction fees
Intraday Day Ahead
Trading (𝑡) €/MWh 0.095 €/MWh 0.07
Clearing (𝑐) €/MWh 0.01 €/MWh0.01
Table 16: APX fees to partake in short term markets in the Netherlands (APX, 2015)
To participate in the spot markets, traders must have a minimum volume of 0.1MWh
(APX, 2015, 2014a). A summary of average, maximum and minimum allowed prices and
those actually reached in the spot markets is given in Table 17. If an aggregator is seeking
to provide the minimum load in order to participate in the spot market he needs to have
load 𝑉′ that is equivalent to about 70 household dishwashers.52
In the day-ahead market,
an aggregator is looking at approximate revenues of 4€ with an average market price
(39.16€/MWh) and a maximum of 14.2€ with the highest price reached for the year. The
52 At 65°C a dishwasher consumes approximately 1.44 kWh at very use (Carbon Footprint, 2015)

117
maximum threshold price in APX-NL for the day-ahead market is set at 3000€/ MWh, if
this price is reached the aggregator is looking at a revenue of 300€. It is important to
keep in mind that such a price has not been reached in recent years, and if the market
continues to work properly such prices will not appear in the coming years as well. If the
same calculations are done for the intraday market, the aggregator will earn
approximately 6€ with average prices and 50€ with the maximum price. If the maximum
allowed price of 99,9999€ is reached then the aggregator can make up to 10,000€; but
again this case is highly unlikely if the market is working properly. It is important to keep
in mind that such revenues must be divided amongst the customers, include underlying
transaction costs and still leave enough room for the aggregator and customer to make a
profit. See Table 18 for a summary of the possible revenues.
Allowed max in APX
Max price reached
Yearly average
price
Min price reached
Allowed min in APX
Day ahead market prices in €/Mwh 3,000.00€ 142.38€ 39.16€ 0.01€ -5,000.00€
Intraday market prices in €/Mwh 99,999.90€ 500.00€ 59.96€ 0.00€ -99,999.90€
Table 17: APX-NL spot market prices, ref. (APX, 2014a, 2012; Nordpoolspot, 2012)
Spot markets become more interesting once more load becomes available. Taking the
sample of 70 customers in the previous example, if these customers offer flexibility from
their dishwasher (1.44 kWh53
) in addition to their washing machine (2.3 kWhs), clothes
dryer (3.3 kWhs) (Carbon Footprint, 2015) and TESLA PowerWall home battery (7 kWh)
(TESLA motors, 2015), the spot market value of flexibility becomes more interesting.
When aggregated, this flexibility adds up to 1MWh and yields almost a tenfold increase
in revenues with average prices in the spot markets.
As the simplified illustration indicates, it is possible to aggregate the minimum load
needed for aggregated DR to participate in the spot markets. In the following section a
discussion on the further intricacies of market trading brings to light further complexities
in trading for aggregators.
53 Kilowatt-hour, 1 Khw is equal to 0.001 Mwhs
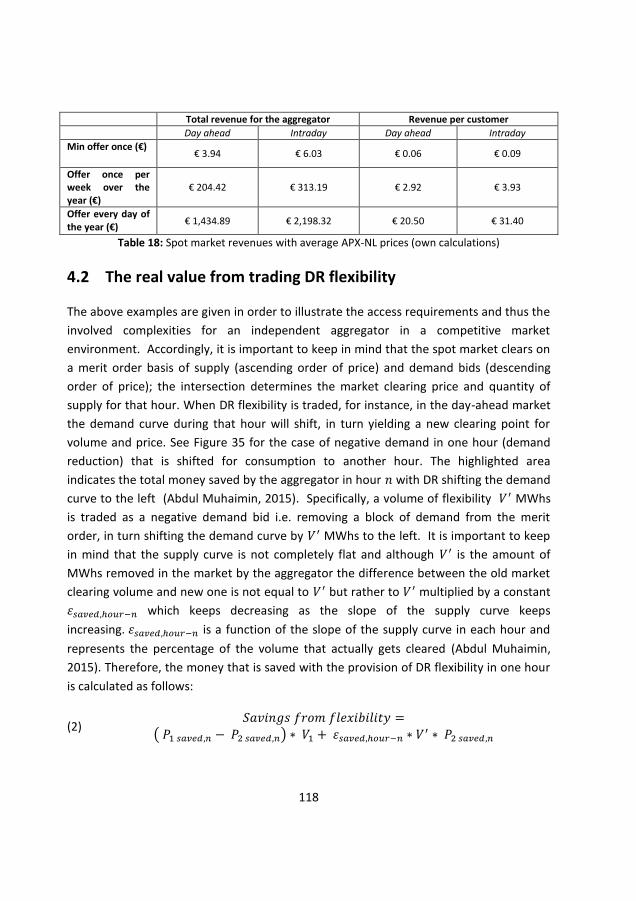
118
Total revenue for the aggregator Revenue per customer
Day ahead Intraday Day ahead Intraday
Min offer once (€) € 3.94 € 6.03 € 0.06 € 0.09
Offer once per week over the year (€)
€ 204.42 € 313.19 € 2.92 € 3.93
Offer every day of the year (€)
€ 1,434.89 € 2,198.32 € 20.50 € 31.40
Table 18: Spot market revenues with average APX-NL prices (own calculations)
4.2 The real value from trading DR flexibility
The above examples are given in order to illustrate the access requirements and thus the
involved complexities for an independent aggregator in a competitive market
environment. Accordingly, it is important to keep in mind that the spot market clears on
a merit order basis of supply (ascending order of price) and demand bids (descending
order of price); the intersection determines the market clearing price and quantity of
supply for that hour. When DR flexibility is traded, for instance, in the day-ahead market
the demand curve during that hour will shift, in turn yielding a new clearing point for
volume and price. See Figure 35 for the case of negative demand in one hour (demand
reduction) that is shifted for consumption to another hour. The highlighted area
indicates the total money saved by the aggregator in hour 𝑛 with DR shifting the demand
curve to the left (Abdul Muhaimin, 2015). Specifically, a volume of flexibility 𝑉′ MWhs
is traded as a negative demand bid i.e. removing a block of demand from the merit
order, in turn shifting the demand curve by 𝑉′ MWhs to the left. It is important to keep
in mind that the supply curve is not completely flat and although 𝑉′ is the amount of
MWhs removed in the market by the aggregator the difference between the old market
clearing volume and new one is not equal to 𝑉′ but rather to 𝑉′ multiplied by a constant
𝜀𝑠𝑎𝑣𝑒𝑑,ℎ𝑜𝑢𝑟−𝑛 which keeps decreasing as the slope of the supply curve keeps
increasing. 𝜀𝑠𝑎𝑣𝑒𝑑,ℎ𝑜𝑢𝑟−𝑛 is a function of the slope of the supply curve in each hour and
represents the percentage of the volume that actually gets cleared (Abdul Muhaimin,
2015). Therefore, the money that is saved with the provision of DR flexibility in one hour
is calculated as follows:
(2) 𝑆𝑎𝑣𝑖𝑛𝑔𝑠 𝑓𝑟𝑜𝑚 𝑓𝑙𝑒𝑥𝑖𝑏𝑖𝑙𝑖𝑡𝑦 =
( 𝑃1 𝑠𝑎𝑣𝑒𝑑,𝑛 − 𝑃2 𝑠𝑎𝑣𝑒𝑑,𝑛) ∗ 𝑉1 + 𝜀𝑠𝑎𝑣𝑒𝑑,ℎ𝑜𝑢𝑟−𝑛 ∗ 𝑉′ ∗ 𝑃2 𝑠𝑎𝑣𝑒𝑑,𝑛
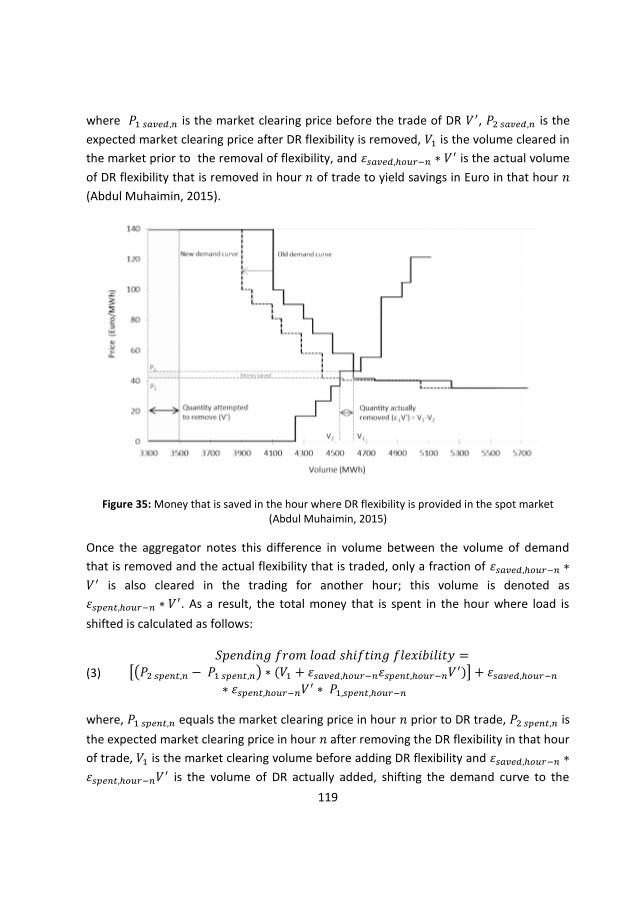
119
where 𝑃1 𝑠𝑎𝑣𝑒𝑑,𝑛 is the market clearing price before the trade of DR 𝑉′, 𝑃2 𝑠𝑎𝑣𝑒𝑑,𝑛 is the
expected market clearing price after DR flexibility is removed, 𝑉1 is the volume cleared in
the market prior to the removal of flexibility, and 𝜀𝑠𝑎𝑣𝑒𝑑,ℎ𝑜𝑢𝑟−𝑛 ∗ 𝑉′ is the actual volume
of DR flexibility that is removed in hour 𝑛 of trade to yield savings in Euro in that hour 𝑛
(Abdul Muhaimin, 2015).
Figure 35: Money that is saved in the hour where DR flexibility is provided in the spot market (Abdul Muhaimin, 2015)
Once the aggregator notes this difference in volume between the volume of demand
that is removed and the actual flexibility that is traded, only a fraction of 𝜀𝑠𝑎𝑣𝑒𝑑,ℎ𝑜𝑢𝑟−𝑛 ∗
𝑉′ is also cleared in the trading for another hour; this volume is denoted as
𝜀𝑠𝑝𝑒𝑛𝑡,ℎ𝑜𝑢𝑟−𝑛 ∗ 𝑉′. As a result, the total money that is spent in the hour where load is
shifted is calculated as follows:
(3)
𝑆𝑝𝑒𝑛𝑑𝑖𝑛𝑔 𝑓𝑟𝑜𝑚 𝑙𝑜𝑎𝑑 𝑠ℎ𝑖𝑓𝑡𝑖𝑛𝑔 𝑓𝑙𝑒𝑥𝑖𝑏𝑖𝑙𝑖𝑡𝑦 =
[(𝑃2 𝑠𝑝𝑒𝑛𝑡,𝑛 − 𝑃1 𝑠𝑝𝑒𝑛𝑡,𝑛) ∗ (𝑉1 + 𝜀𝑠𝑎𝑣𝑒𝑑,ℎ𝑜𝑢𝑟−𝑛𝜀𝑠𝑝𝑒𝑛𝑡,ℎ𝑜𝑢𝑟−𝑛𝑉′)] + 𝜀𝑠𝑎𝑣𝑒𝑑,ℎ𝑜𝑢𝑟−𝑛
∗ 𝜀𝑠𝑝𝑒𝑛𝑡,ℎ𝑜𝑢𝑟−𝑛𝑉′ ∗ 𝑃1,𝑠𝑝𝑒𝑛𝑡,ℎ𝑜𝑢𝑟−𝑛
where, 𝑃1 𝑠𝑝𝑒𝑛𝑡,𝑛 equals the market clearing price in hour 𝑛 prior to DR trade, 𝑃2 𝑠𝑝𝑒𝑛𝑡,𝑛 is
the expected market clearing price in hour 𝑛 after removing the DR flexibility in that hour
of trade, 𝑉1 is the market clearing volume before adding DR flexibility and 𝜀𝑠𝑎𝑣𝑒𝑑,ℎ𝑜𝑢𝑟−𝑛 ∗
𝜀𝑠𝑝𝑒𝑛𝑡,ℎ𝑜𝑢𝑟−𝑛𝑉′ is the volume of DR actually added, shifting the demand curve to the
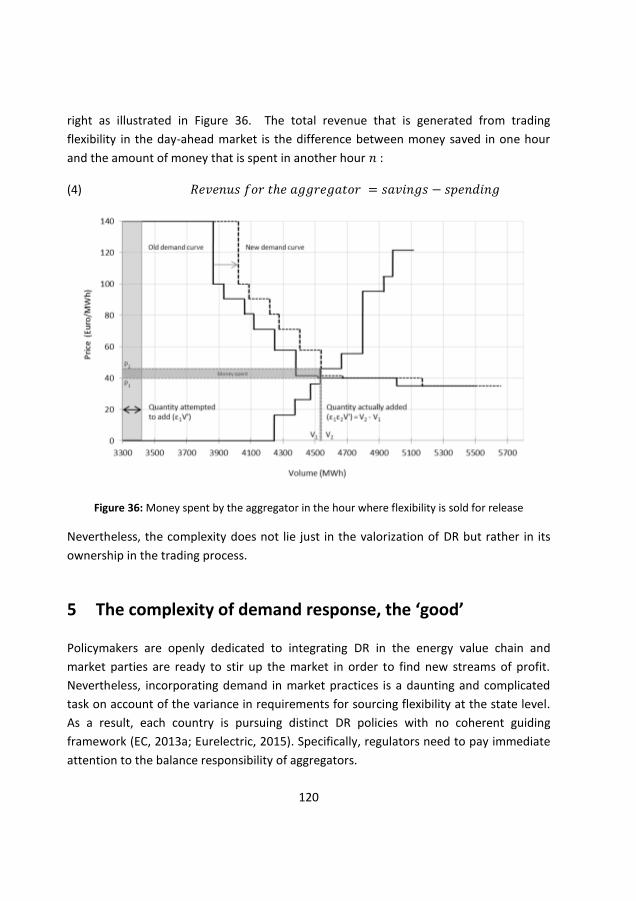
120
right as illustrated in Figure 36. The total revenue that is generated from trading
flexibility in the day-ahead market is the difference between money saved in one hour
and the amount of money that is spent in another hour 𝑛 :
(4) 𝑅𝑒𝑣𝑒𝑛𝑢𝑠 𝑓𝑜𝑟 𝑡ℎ𝑒 𝑎𝑔𝑔𝑟𝑒𝑔𝑎𝑡𝑜𝑟 = 𝑠𝑎𝑣𝑖𝑛𝑔𝑠 − 𝑠𝑝𝑒𝑛𝑑𝑖𝑛𝑔
Figure 36: Money spent by the aggregator in the hour where flexibility is sold for release
Nevertheless, the complexity does not lie just in the valorization of DR but rather in its
ownership in the trading process.
5 The complexity of demand response, the ‘good’
Policymakers are openly dedicated to integrating DR in the energy value chain and
market parties are ready to stir up the market in order to find new streams of profit.
Nevertheless, incorporating demand in market practices is a daunting and complicated
task on account of the variance in requirements for sourcing flexibility at the state level.
As a result, each country is pursuing distinct DR policies with no coherent guiding
framework (EC, 2013a; Eurelectric, 2015). Specifically, regulators need to pay immediate
attention to the balance responsibility of aggregators.
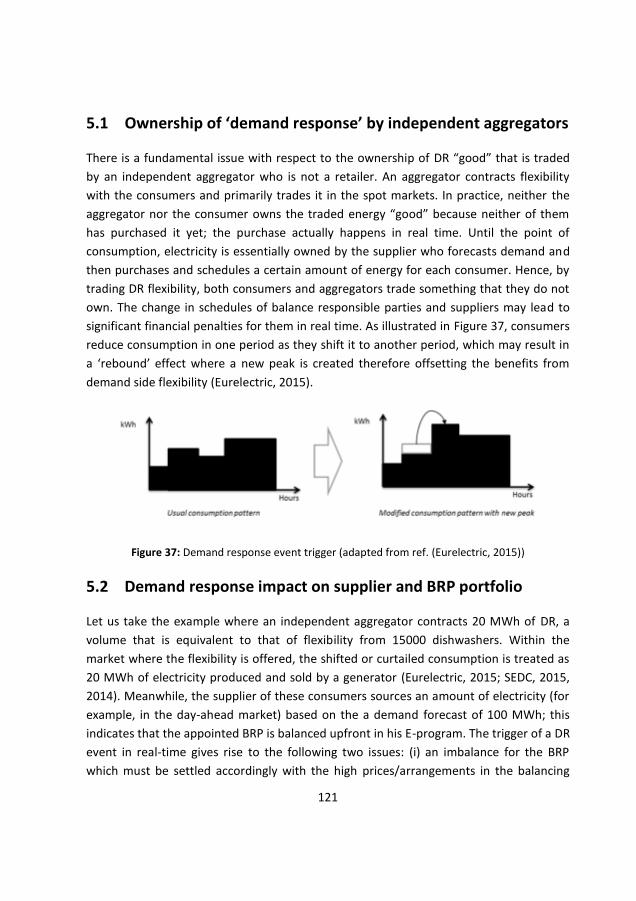
121
5.1 Ownership of ‘demand response’ by independent aggregators
There is a fundamental issue with respect to the ownership of DR “good” that is traded
by an independent aggregator who is not a retailer. An aggregator contracts flexibility
with the consumers and primarily trades it in the spot markets. In practice, neither the
aggregator nor the consumer owns the traded energy “good” because neither of them
has purchased it yet; the purchase actually happens in real time. Until the point of
consumption, electricity is essentially owned by the supplier who forecasts demand and
then purchases and schedules a certain amount of energy for each consumer. Hence, by
trading DR flexibility, both consumers and aggregators trade something that they do not
own. The change in schedules of balance responsible parties and suppliers may lead to
significant financial penalties for them in real time. As illustrated in Figure 37, consumers
reduce consumption in one period as they shift it to another period, which may result in
a ‘rebound’ effect where a new peak is created therefore offsetting the benefits from
demand side flexibility (Eurelectric, 2015).
Figure 37: Demand response event trigger (adapted from ref. (Eurelectric, 2015))
5.2 Demand response impact on supplier and BRP portfolio
Let us take the example where an independent aggregator contracts 20 MWh of DR, a
volume that is equivalent to that of flexibility from 15000 dishwashers. Within the
market where the flexibility is offered, the shifted or curtailed consumption is treated as
20 MWh of electricity produced and sold by a generator (Eurelectric, 2015; SEDC, 2015,
2014). Meanwhile, the supplier of these consumers sources an amount of electricity (for
example, in the day-ahead market) based on the a demand forecast of 100 MWh; this
indicates that the appointed BRP is balanced upfront in his E-program. The trigger of a DR
event in real-time gives rise to the following two issues: (i) an imbalance for the BRP
which must be settled accordingly with the high prices/arrangements in the balancing
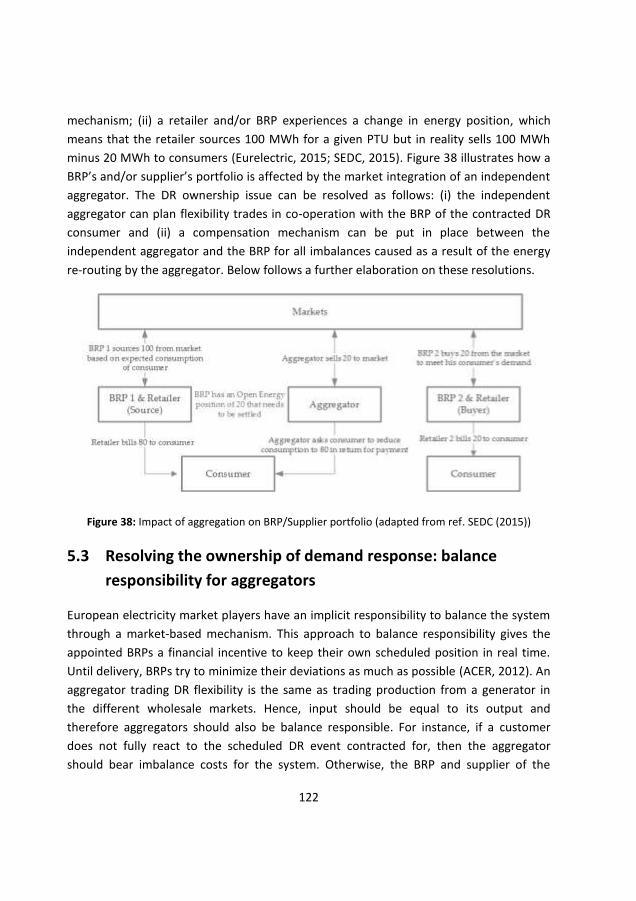
122
mechanism; (ii) a retailer and/or BRP experiences a change in energy position, which
means that the retailer sources 100 MWh for a given PTU but in reality sells 100 MWh
minus 20 MWh to consumers (Eurelectric, 2015; SEDC, 2015). Figure 38 illustrates how a
BRP’s and/or supplier’s portfolio is affected by the market integration of an independent
aggregator. The DR ownership issue can be resolved as follows: (i) the independent
aggregator can plan flexibility trades in co-operation with the BRP of the contracted DR
consumer and (ii) a compensation mechanism can be put in place between the
independent aggregator and the BRP for all imbalances caused as a result of the energy
re-routing by the aggregator. Below follows a further elaboration on these resolutions.
Figure 38: Impact of aggregation on BRP/Supplier portfolio (adapted from ref. SEDC (2015))
5.3 Resolving the ownership of demand response: balance
responsibility for aggregators
European electricity market players have an implicit responsibility to balance the system
through a market-based mechanism. This approach to balance responsibility gives the
appointed BRPs a financial incentive to keep their own scheduled position in real time.
Until delivery, BRPs try to minimize their deviations as much as possible (ACER, 2012). An
aggregator trading DR flexibility is the same as trading production from a generator in
the different wholesale markets. Hence, input should be equal to its output and
therefore aggregators should also be balance responsible. For instance, if a customer
does not fully react to the scheduled DR event contracted for, then the aggregator
should bear imbalance costs for the system. Otherwise, the BRP and supplier of the

123
customer will bear additional imbalance costs from DR. Eurelectric (2015) propose three
methods to reformulating the relationship with BRPs in such a way that incorporates
information and financial flows. Firstly, the independent aggregator and the BRP can
come to a bilateral agreement on data exchange and remuneration for DR (and resulting
imbalances). In this way they will come to a mutually beneficial solution to monetary and
data exchanges. Secondly, the relationship can also be regulated in such a way that the
compensation mechanism and data interaction are specified by the aggregator at a
regulated price. The third approach to deal with flexibility imbalances is to have the
system operator manually bring the BRPs back to balance after an event. Based on the
activated DR, the resulting imbalances caused by the customer to the BRPs portfolio are
then charged back to the customer. The customers then get compensated by the
aggregator for the flexibility they provided in accordance with their contract. All three
solutions are feasible, but no single one is the best solution, see Table 19 for a summary
and assessment. We propose each member state can make a decision based on their
current market design. Ideally, the more market based the solution the better in the
liberalized market setting.
Method Financial compensation Assessment Bilateral agreement established amongst the parties
Final compensation is agreed between the aggregator, BRP and supplier. .
(+)If such contracts are standardized this may initiate a large scale roll-out and therefore facilitate market access for independent aggregator (-) Incumbent BRPs and suppliers may exhibit market power and refuse contracts to aggregators
Regulated agreement established by the regulator
The aggregator directly compensates the respective BRP and or supplier at a regulated price for accessing their scheduled consumption as demand response flexibility.
(+) Diminishes apprehensions over the exercise of market power by incumbent BRPs and suppliers (-) Hinders innovative pricing solutions by aggregator (-) Running the risk that this type of pricing may not compensate the supplier and BRP appropriately (-)Such remuneration gives way to “none-market based arbitration” between the set regulated price and wholesale market prices
Corrective ‘action’ agreement based on metered date on what has been sold to the supplier and what has been taken by the aggregator
BRP and supplier are compensated by their customers at the contracted Rates. In turn, the aggregators compensate the customers for proving flexibility to them.
(+)The pricing process is transparent (-)Meter data adjustments may not be fully transparent for the customer (-)Considerable effort to correct adjusted volumes is needed by the system operator (-)Difficult to implement for small customers
Table 19: Compensation options for BRP, aggregator and consumer (adapted from ref. Eurelectric (2015))
124
6 Conclusions and recommendations
The benefits from DR flexibility range from short term real time operation to long term
investment planning. In the above analysis it has become evident that integrating
demand side flexibility into the system is a complex task on account of the aggregation
complexity specifications that have not yet been deduced.
In the current European context of liberalized electricity markets it is expected that
aggregators will be competitive market parties, either independent aggregators or
retailers with flexibility as an additional service. In essence, retailers are in the best
position to become the deemed end-user aggregators participating in the various
markets because of the existing consumer base, balance responsibility, market access
and financial stability. It can also be argued that this is a way to hedge against the
complexity of the retailer, BRP and independent aggregator relationship (5).
Nevertheless, it will be tricky for retailers to gain this position since their business
essentially depends on selling MWhs, and with DR they are ‘curtailing’ their own profits.
So the way in which they will provide the aggregation services will vary from an
independent aggregator since their core business model in electricity markets differs.
Independent aggregators can also exist and occupy a certain portion of the aggregation
market, if they make a move at an early stage and occupy a large enough portion of the
end-users with larger flexible loads such as electric vehicle sand solar photovoltaics.
Independent aggregators may become more common and overall profitable with
community level aggregation (3.1). As illustrated in section 4.1.2 gaining access to
markets is not a simple nor cheap task and the resulting revenues with small trading
volumes are virtually none. For independent aggregators to survive in the long run they
need to sophisticate their business model through the use of data to create new and
innovative services not provided by retailers such as data analytics, e.g. consulting on
which supplier and contract to choose).
Aggregated demand side response in European electricity markets is an inevitable and
vital component for achieving the European smart grid. The current approach towards
aggregation in electricity markets has no coherent European tactic. The Energy Efficiency
Directive (2012/27/EU), ENTSO-E Demand Connection Code and the ACER Framework
Guidelines on Electricity Balancing provide the basis by acknowledging the importance of
DR but do not offer specifics for implementation with respect to timing, volume and
program specifications. From this research, it is recommended that national regulatory

125
bodies lead the way in the next phase by consolidating the issue of balance
responsibility. The stimulus of mutual cooperation between balance responsible parties,
retailers and aggregators is critical in achieving end-user market integration. Although
the deemed aggregators will lead the flexibility movement, regulators hold the key in
both birth and sustainability of demand side activation and integration.

126
127
Chapter 5 ~ Demand
response participation in the balancing mechanism
In the previous chapter the concept of aggregation for demand response
(DR) and complexity of access to spot markets was discussed in detail
revealing the intricacies in exchanges and the importance of balance
responsibility. To continue is this line of complexity assessment, this chapter
considers an analysis of the German balancing mechanism for the
participation of aggregated DR based on work from Koliou et al. (2014)54
.
1 Introduction
Previous research reveals that the most dominant share of “intermittency costs” in a
power system are the result of balancing costs due to imperfect wind and solar forecast,
followed by transmission and distribution network costs (Seebach et al., 2009; Strbac,
2008). Due to measures in restructured markets focusing on the short-run modifications
of behavior (L. Greening, 2010), this work concentrates on the participation of
aggregated demand response (DR) in the real-time balancing energy market, which is
considered the last market in which electricity can be traded (Van der Veen, 2012).
Exploitation of demand side flexibility is expected to yield positive benefits in the
economic efficiency of deregulated electricity markets, enhance reliability and relieve
congestion and network constraints (L. Greening, 2010; Strbac, 2008).
54 Koliou, E., Eid, C., Chaves-Ávila, J.P., Hakvoort, R.A., 2014. Demand response in liberalized electricity markets: Analysis of aggregated load participation in the German balancing mechanism. Energy 71, 245–254. doi:10.1016/j.energy.2014.04.067
128
So far, there has been a lot of discussion on the importance of utilizing DR in European
electricity markets (with large renewable energy resource (RES) penetration).
Nonetheless, there has been minimal analysis of existing electricity market organization
and how DR participation is impeded with current requirements; the work aims to fill this
knowledge gap.
2 Motivation and initiatives for engaging demand response
Power systems have some inherent undisputable characteristics. Firstly, in real time,
supply and demand must always be in balance. Secondly, electric power is not
economically storable at a large scale. Moreover, costs of producing electrical energy
vary considerably with respect to technology and fuel input. Finally, consumption of
electric energy varies over time on account of consumer behavior. As a result of these
properties, the provision of electricity requires balance management necessary to
safeguard the security of electricity supply from producers to consumers through the
electricity network (Aghaei and Alizadeh, 2013; Van der Veen, 2012). The European
power system has a set point of system frequency balance which must be narrowly
maintained at 50 Hertz. Electricity is thusly traded in organized markets in accordance
with the prescribed system limitations. In this way, electricity markets can be classified
with the time of delivery in forward, day-ahead, intra-day and balancing markets (see
Figure 39 for details). Note: about half of the electricity consumed is traded in forward
markets, which take place days and even months ahead of delivery usually consisting of
long-term bilateral contracts. The day-ahead spot market plays an important role in
terms of volumes traded, taking supply and demand bids for every hour of the next day
until the settlement of clearing price.55
There is also the possibility to trade in the intra-
day markets (Chaves-Avila and Hakvoort, 2013).
Currently, Transmission System Operators (TSOs) in Europe own their network but are
still subject to regulatory supervision. The TSO is responsible for power transport and
system operation, including balance management within a power system56
(Van der
55 Combined traded volume in day-ahead European wholesale power trading platforms amounted to 318.5 TWh, 52% of the total electricity consumption (EC, 2013c).
56 System operation services also consist of voltage control and black-start capability.
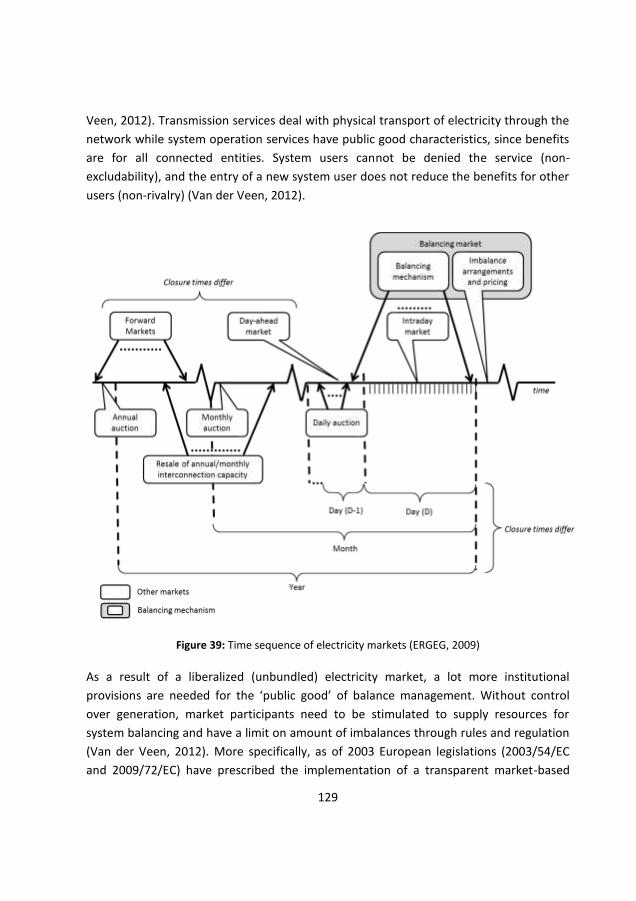
129
Veen, 2012). Transmission services deal with physical transport of electricity through the
network while system operation services have public good characteristics, since benefits
are for all connected entities. System users cannot be denied the service (non-
excludability), and the entry of a new system user does not reduce the benefits for other
users (non-rivalry) (Van der Veen, 2012).
Figure 39: Time sequence of electricity markets (ERGEG, 2009)
As a result of a liberalized (unbundled) electricity market, a lot more institutional
provisions are needed for the ‘public good’ of balance management. Without control
over generation, market participants need to be stimulated to supply resources for
system balancing and have a limit on amount of imbalances through rules and regulation
(Van der Veen, 2012). More specifically, as of 2003 European legislations (2003/54/EC
and 2009/72/EC) have prescribed the implementation of a transparent market-based
130
mechanism that is cost-reflective of the supply and purchase of electricity needed in the
framework of balancing requirements (EC, 2009, 2003; Niesten and Jolink, 2014).
Balancing is defined as “the situation after markets have closed (gate closure (GC)) in
which a TSO acts to ensure that demand is equal to supply, in and near real time”
(ENTSO-E, 2013b) and thusly a balancing market is considered an institutional
arrangement that establishes market-based balance management (Van der Veen, 2012).
Below, the follows a summary of the current organization of the European balancing
mechanism in liberalized European electricity markets (Figure 39).
2.1 The European balancing mechanism
In the synchronous zone of continental Europe, market participants use periods for
scheduling and settlement of the “Energy Programs” commonly referred to as Program
Time Units (PTUs). For instance, Germany and the Netherlands make use of 15 minute
PTUs. In principle, producers and consumers alike, have the legal ex-ante responsibility
to provide the TSO with schedules of electricity consumed and injected in the network
(Mott MacDonald, 2013). Any party that has one or more connecting points to a grid
bears program responsibility for these connecting points. This is referred to as balance
responsibility, where the party concerned (referred to as the Balance Responsible Party
or BRP) is supposed to draw up programs relating to their expected electricity supply and
demand. BRPs supply these Energy Programs to the TSO on a daily basis. While BRPs are
responsible for balancing their own electricity supply and demand in accordance with
their schedules, the TSO is responsible for balancing electricity supply and demand in real
time for the entire electricity network. Because BRPs are often not able to achieve their
own balance in real time, the TSO resolves these individual imbalances for the entire
network. The BRPs are penalized through balance pricing for their deviations and
surpluses in consumption. These prices are time-dependent and need to be paid to the
TSO. The total imbalance of the system (and individual BRPs) is the net value of positive
and negative deviations. To maintain the real-time and system-wide balance, BRPs can
supply so-called balancing power in the reserve market to the TSO, which is rewarded
through an availability payment (Van der Veen, 2012).
When an energy firm wishes to supply balancing power to the TSO, it needs to be
registered as a BRP. More specifically, the TSO procures balancing power for a certain
period from any Balancing Service Provider (BSP) and sells it to the Balance Responsible
Parties that cause the imbalance in the control area (Van der Veen, 2012). For instance,
131
currently in Germany, there are over 5000 BSPs (Hirth and Ziegenhagen, 2013). Firms
that are registered by the TSO as BRPs may take over the program responsibility of other
actors in the industry. Balancing energy can be provided by generation and consumption
sources that are technically capable of meeting the requirements.
The balancing market lies at the intersection of financial transactions (the energy market)
and physical exchanges (the power system). The balancing mechanism serves to procure
electricity that corresponds directly to the real-time adjustment (regulation) of
generation and consumption, in order to maintain the system in balance (Van der Veen,
2012). Balancing services differ in terms of function, activation time, method, scope and
duration. The European Network of Transmission System Operators for Electricity (ETSO-
E) considers the terms Frequency Containment Reserves (FCR), Frequency Restoration
Reserves (FRR) and Replacement Reserves (RR) (ENTSO-E, 2012). For the purpose of this
work, the authors use the classification of Union for the Coordination of the Transmission
of Electricity (UCTE): primary, secondary and tertiary control (see Table 20 for further
details) (Van der Veen, 2012).
The balancing market has two distinct features: (i) it’s a single buyer market with the
Transmission System Operator as the single buyer (instead of a two-sided auction), and
(ii) the demand is determined by the system imbalance volume, which is small but highly
volatile, and must be met (Van der Veen, 2012). The TSO procures for balancing services
via an organized market or through bilateral contracts. The amount of available reserve
capacity (MW57
) is based on the expectations of real-time needs in capacity markets. The
selected bids receive an availability payment. When the capacity market is separated
from the energy component (MWh58
), the contracted capacity bidders are usually
obliged to bid into the energy market at a predefined price (within a certain price range)
or they can set the price independently (Chaves-Avila and Hakvoort, 2013).
57 Megawatt 58 Megawatt hour
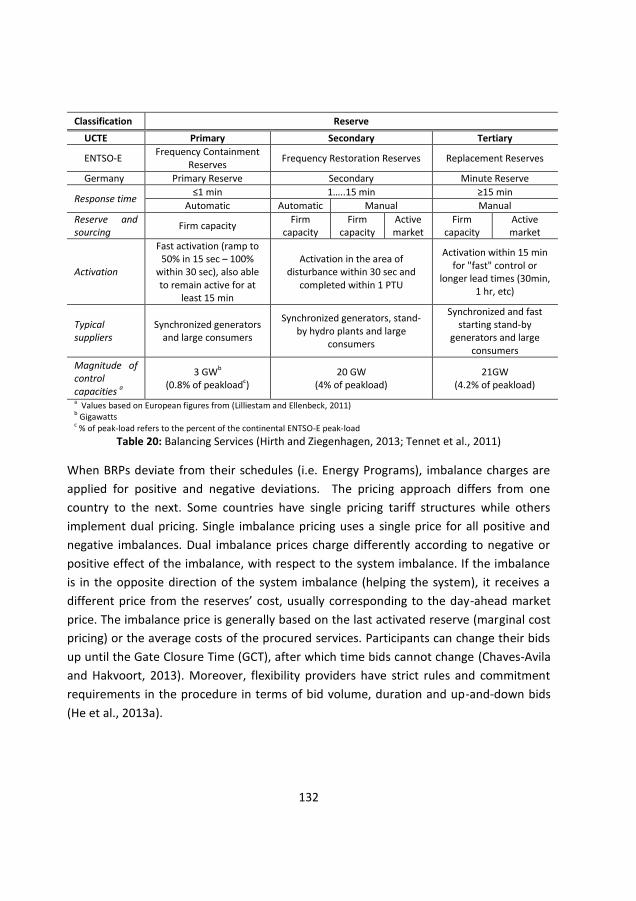
132
Classification Reserve
UCTE Primary Secondary Tertiary
ENTSO-E Frequency Containment
Reserves Frequency Restoration Reserves Replacement Reserves
Germany Primary Reserve Secondary Minute Reserve
Response time ≤1 min 1…..15 min ≥15 min
Automatic Automatic Manual Manual
Reserve and sourcing
Firm capacity Firm
capacity Firm
capacity Active market
Firm capacity
Active market
Activation
Fast activation (ramp to 50% in 15 sec – 100%
within 30 sec), also able to remain active for at
least 15 min
Activation in the area of disturbance within 30 sec and
completed within 1 PTU
Activation within 15 min for "fast" control or
longer lead times (30min, 1 hr, etc)
Typical suppliers
Synchronized generators and large consumers
Synchronized generators, stand-by hydro plants and large
consumers
Synchronized and fast starting stand-by
generators and large consumers
Magnitude of control capacities a
3 GWb
(0.8% of peakloadc) 20 GW
(4% of peakload) 21GW
(4.2% of peakload)
a Values based on European figures from (Lilliestam and Ellenbeck, 2011) b Gigawatts c % of peak-load refers to the percent of the continental ENTSO-E peak-load
Table 20: Balancing Services (Hirth and Ziegenhagen, 2013; Tennet et al., 2011)
When BRPs deviate from their schedules (i.e. Energy Programs), imbalance charges are
applied for positive and negative deviations. The pricing approach differs from one
country to the next. Some countries have single pricing tariff structures while others
implement dual pricing. Single imbalance pricing uses a single price for all positive and
negative imbalances. Dual imbalance prices charge differently according to negative or
positive effect of the imbalance, with respect to the system imbalance. If the imbalance
is in the opposite direction of the system imbalance (helping the system), it receives a
different price from the reserves’ cost, usually corresponding to the day-ahead market
price. The imbalance price is generally based on the last activated reserve (marginal cost
pricing) or the average costs of the procured services. Participants can change their bids
up until the Gate Closure Time (GCT), after which time bids cannot change (Chaves-Avila
and Hakvoort, 2013). Moreover, flexibility providers have strict rules and commitment
requirements in the procedure in terms of bid volume, duration and up-and-down bids
(He et al., 2013a).
133
2.2 Balance management complexity in liberalized electricity
markets
Van der Veen (2012) points out that balance management is first and foremost
concerned with operational security of supply, a real-time process subject to ensuring
adequate capacity to meet the demand at all times. As mentioned above, at each point
in time the total production of electricity must equal the total consumption in order to
keep the system frequency stable. If the system is out of balance, power stability and
quality of electricity supply will deteriorate, which may trigger the disconnection of
system components (production and consumption alike), and ultimately result in power
blackouts.
In a report for the EC Directorate General of Energy, Mott MacDonald (2013) states that
under the classic framework of planning, operating and governing European power
systems, the energy policy drivers of security of supply, sustainability and economic
efficiency are not “naturally aligned vectors”. Precisely, the increasing penetration of
less-predictable renewable and distributed energy technologies, energy market
liberalization and the more active participation of market actors (both producers and
consumers) may call for a parallel increase in corrective action by TSOs (Mott
MacDonald, 2013).
Traditionally, power systems are designed under a prevention oriented operating
philosophy. On the generation side, the total capacity of installed generation is larger
than the system maximum demand. Therefore, system security is achieved through
preventive measures, with no need for any immediate corrective action to be taken
following a contingency. Such decisions ensure the security of supply in the face of
uncertainty, with ample availability of generation to meet the unforeseen variations in
demand (Strbac, 2008). Adopted sustainability targets for the integration of 27% RES in
European power systems will inevitably increase both the size and frequency of short-
term adjustments in power flows to correct for real-time imbalances. As a result, current
provisions under which TSOs maintain power balance and system control may no longer
be able to reliably and efficiently cope with the increased requirements for balancing
needs in real-time (Mott MacDonald, 2013). Preventative measures will still be necessary
for overall efficiency, but corrective actions will become increasingly important in real
time operation. Strbac (2008) argues that policy commitment to market-based operation
134
and deregulation of the electricity industry places consumers of electricity in the center
of the decision-making process.
Just like in Europe, in the mid-1990’s, the United States (US) also experienced electricity
sector unbundling which prompted interest in facilitating the development of
competitive electricity markets. Arising issues consisted of price volatility and spikes,
perceived market power, reliability concerns during system peak demand conditions and
failure to produce expected benefits to consumers. Such dilemmas led policymakers to
conclude that DR, in all of its different forms, is essential to the efficient functioning of
wholesale electricity markets. It is important to keep in mind that such a demand-centric
approach was recognized much earlier in the US. Interest in demand-side flexibility
sprang in the early 1970’s from the penetration of air conditioning in American homes,
resulting in needle peaks and reduced load factors in demand profiles. At this time there
was increasing recognition of rising system costs to meet the peaking loads, and thusly
utilities began to view demand load management as a reliability resource (Cappers et al.,
2010). Currently, the majority of demand resources are provided by large industrial and
commercial users—roughly half of all energy consumption in the US (FERC, 2012).
Programs offered often concentrate on peak clipping to mitigate concerns of security of
supply, consequently explaining the strong focus to date on incentive-based programs
that deliver more controllable forms of load response (Cooke, 2011). FERC (2012) reports
a total of 20,256 MW of actual peak reductions from demand resources. The following
four DR programs made up 80 percent of the total reported potential in peak reduction:
load utilized as a capacity resource 29%; Interruptible/Curtailable service 24%; Direct
Load Control 15%; and Time-of-Use tariff 12% (FERC, 2012). The Federal Energy
Regulatory Commission (FERC) articulates that to a certain degree, demand response
resources can be utilized as substitutes for generation and transmission depending on
the location of generation or demand resource. When substituting generation, demand
flexibility serves as an adequacy resource for local peak generation replacement assisting
in optimal dispatching (FERC, 2008),
The European Smart Energy Demand Coalition (SEDC) has published a report on
recommendations for a Demand Response Action Plan for Europe, emphasizing that
Europe should take example from the US market for demand response, especially since
in 2012 businesses and homeowners earned over 2 billion Euro in direct revenues above
bill savings and avoided investment. A majority of such savings were within the balancing
and capacity markets (SEDC, 2012). This is the aim of having DR available and tradable in
135
the real-time operation of the European power system. Recent European level initiatives,
which have recognized demand response as a future component of European power
system operation, include the Energy Efficiency Directive (EED (EC, 2012); Demand
Connection Code (DCC) (ENTSO-E, 2013a); and the Framework Guidelines on Electricity
Balancing from the Agency for Cooperation of European Regulators (ACER) (ACER, 2012).
2.2.1 European level recognition of demand response flexibility
The Energy Efficiency Directive (2012/27/EU) establishes a common framework for the
promotion of energy efficiency in order to achieve the 20% headline target for 2020 (EC,
2012). The Directive states that national regulatory authorities should be able to ensure
that the taken measures support price-based and controllable DR which enables equal
market opportunities to consumer loads alongside supply. Such measures include access
and participation of aggregated demand in balancing, reserve and other system services
markets. The promoted measures are subject to the inherent technical constraints of
network management. TSOs and distribution system operators (DSOs) are encouraged to
have close cooperation with aggregators and consumers in order to define the technical
requirements of market participation and scope of demand side capabilities. Currently,
incentives arising from transmission and distribution tariffs are hampering the
participation of DR in balancing markets and ancillary services procurement (EC, 2012).
The directive has explicitly recognized DR as a valuable resource in future power system
operation, laying down some guidelines for removing energy market barriers and
overcoming market failures impeding efficiency in the supply and use of energy.
Identified obstacles include (EC, 2012):
Inequality of market entry opportunities alongside generation in wholesale and
retail markets
Incentives for investment in transmission and distribution tariff remuneration
Regulation hampering participation in balancing markets and ancillary services
procurement
Lacking cooperation between TSOs, DSOs, aggregators and consumers
Missing outline of technical requirements for the capabilities of demand side
participation
Specification of aggregation standards and requirements.
136
In order to aid European-wide system and market integration, in 2011 the European
Commission mandated the establishment of European Network Codes59
. Amid the codes
developed by ENTSO-E is the Demand Connection Code (DCC), identifying the connection
requirements necessary for the preservation or the restoration of electricity network
stability from demand-side facilities (including end users and/or households). ENTSO-E
assures that the DCC embraces Smart Grid models for achieving the fundamental
principles of European policy: RES penetration, security of supply and the integration of a
European electricity system and market (ENTSO-E, 2013a, 2013c).
In addition to the Energy Efficiency Directive and the Demand Connection Code, ACER
also identifies the participation of DR and RES for balancing in the Framework Guidelines
on Electricity Balancing (ACER, 2012). The terms and conditions related to balancing
explicitly state that network codes shall facilitate the participation of DR in the balancing
mechanism. As a result, codes must allow for the aggregation of small units (both
demand and generation) in addition to permitting load entities and intermittent
generation units (whether through aggregators or not) to become providers of balancing
services (sec. 2.3). Accordingly, the procurement of balancing services requires the
standardization of products (e.g. technical constraints, speed of activation, minimum bid
size, etc.) Product standards stipulated in the codes shall take into account the technical
characteristics of available balancing resources (demand and renewable generation units,
as well as smaller generation units) across Europe such that they satisfy the needs of
TSOs to balance the system (sec. 3.2). In order to ensuring an economically efficient use
of DR as a balancing resource, harmonization of pricing methods is recommended. In this
way, correct price signals and incentives may be passed on to market participants for
balancing energy products (sec. 3.3.1). For the procurement of contracted reserves, ACER
(2012) recommend that the code limits the duration of contracts that inhibit the
participation of new entrants (demand response and renewable generators as well as
small generators) (sec. 3.4.1).
2.2.2 Demand response in the balancing mechanism
On account of the integration of intermittent generation (both small and large scale), a
coherent framework for system control must be adopted in line with the drastically
59 Network Codes (or Grid Codes) refer to the parameters and technical specifications of connected users to the electricity network in order to ensure proper and secure functioning of the system.
137
different physical characteristics, cost structure and attributes of future power systems
(Mott MacDonald, 2013). Demand response potential and feasibility are dependent on
the shape of electricity markets; this is influenced by the generation mix and amount of
available reserve capacity, amount of variable RES and capacity needed to balance
intermittency, and the level of consumer peak demand that can be considered as
shiftable load, along with time and duration of availability (Cappers et al., 2012; Prüggler,
2013). Demand response capacity in Europe is in the magnitude of 25 GW60
, accounting
for 5% of the peak-load capacity (Lilliestam and Ellenbeck, 2011). European-wide
initiatives are focusing on demand response from residential load, motivated by recent
progress in ICT and control systems. Such actions enable the deployment of aggregated
interconnected Distributed Energy Resources placed in different locations by managing
them to work as a Virtual Power Plant. Operation by an aggregator allows even the
smallest user to participate in electricity markets and contribute to the process of energy
cost reduction (Aghaei and Alizadeh, 2013). In EC taskforce for Smart Grids (2011) argue
that the more local the balancing of the network, the less losses incurred in overall flow.
Accordingly, demand response is motivated by maintaining efficient operation of the
power system and is materialized by the market which utilizes it (see Table 21 for details
for a summary of forward, spot and balancing market). Aggregated flexibility is
recommended to participate in the correction of short-term operational deviations
(Seebach et al., 2009). Balancing requires a fast response time compared to spot and
forward markets. Consumer loads have advantages, which include fast reaction, smooth
activation, low expected costs, and are well dispersed in the distribution grid (Xu et al.,
2011). Timely delivery of flexibility can be provided by aggregators acting as BRPs
contracted for balancing reserves and/or energy. It is important to note that
requirements differ depending on the type of balancing services. Hence, aggregated DR is
not suitable for all controls.
Primary reserves in Europe are determined on a synchronous area-wide basis. Typically,
they are either unpaid or remunerated only for capacity (Euro/MW) and not for energy
(Euro/MWh). Currently, primary control is dimensioned to handle a maximum power
deviation of +/-3000MW equal to the simultaneous outage of the two largest generation
units in the continental European network. This volume is non-negotiable since it is set to
60 Gigawatt
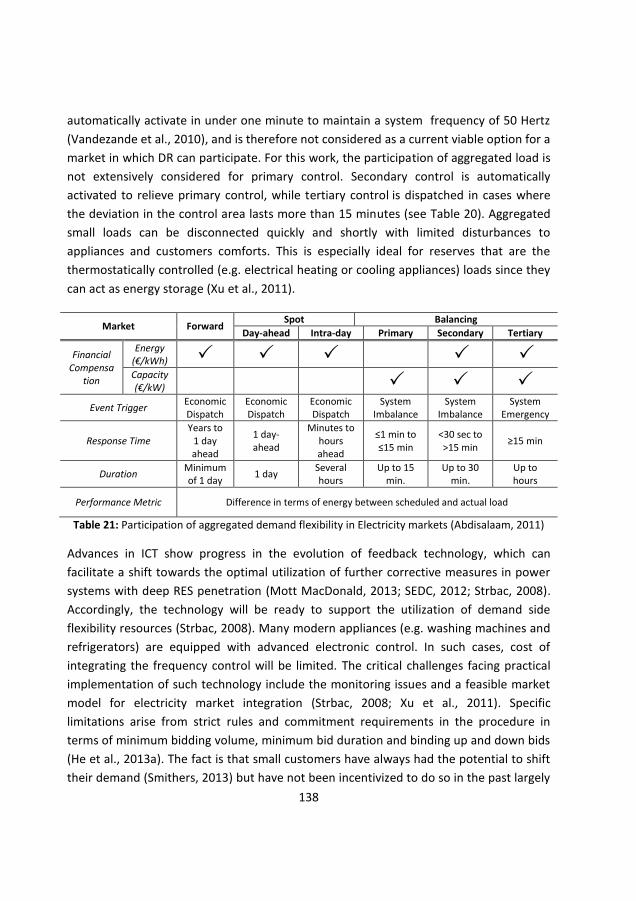
138
automatically activate in under one minute to maintain a system frequency of 50 Hertz
(Vandezande et al., 2010), and is therefore not considered as a current viable option for a
market in which DR can participate. For this work, the participation of aggregated load is
not extensively considered for primary control. Secondary control is automatically
activated to relieve primary control, while tertiary control is dispatched in cases where
the deviation in the control area lasts more than 15 minutes (see Table 20). Aggregated
small loads can be disconnected quickly and shortly with limited disturbances to
appliances and customers comforts. This is especially ideal for reserves that are the
thermostatically controlled (e.g. electrical heating or cooling appliances) loads since they
can act as energy storage (Xu et al., 2011).
Market Forward Spot Balancing
Day-ahead Intra-day Primary Secondary Tertiary
Financial Compensa
tion
Energy (€/kWh)
Capacity (€/kW)
Event Trigger Economic Dispatch
Economic Dispatch
Economic Dispatch
System Imbalance
System Imbalance
System Emergency
Response Time Years to
1 day ahead
1 day-ahead
Minutes to hours ahead
≤1 min to ≤15 min
<30 sec to >15 min
≥15 min
Duration Minimum of 1 day
1 day Several hours
Up to 15 min.
Up to 30 min.
Up to hours
Performance Metric Difference in terms of energy between scheduled and actual load
Table 21: Participation of aggregated demand flexibility in Electricity markets (Abdisalaam, 2011)
Advances in ICT show progress in the evolution of feedback technology, which can
facilitate a shift towards the optimal utilization of further corrective measures in power
systems with deep RES penetration (Mott MacDonald, 2013; SEDC, 2012; Strbac, 2008).
Accordingly, the technology will be ready to support the utilization of demand side
flexibility resources (Strbac, 2008). Many modern appliances (e.g. washing machines and
refrigerators) are equipped with advanced electronic control. In such cases, cost of
integrating the frequency control will be limited. The critical challenges facing practical
implementation of such technology include the monitoring issues and a feasible market
model for electricity market integration (Strbac, 2008; Xu et al., 2011). Specific
limitations arise from strict rules and commitment requirements in the procedure in
terms of minimum bidding volume, minimum bid duration and binding up and down bids
(He et al., 2013a). The fact is that small customers have always had the potential to shift
their demand (Smithers, 2013) but have not been incentivized to do so in the past largely
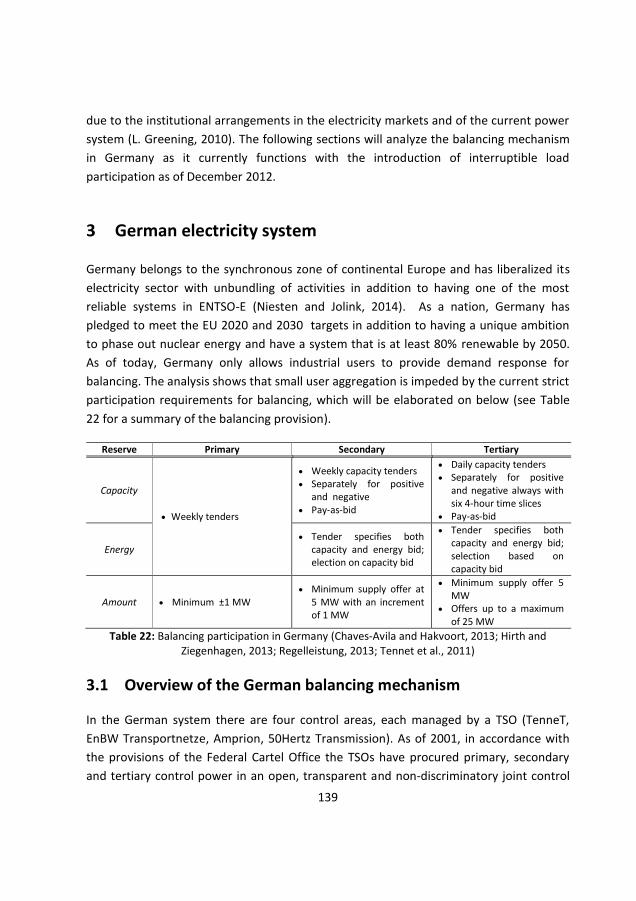
139
due to the institutional arrangements in the electricity markets and of the current power
system (L. Greening, 2010). The following sections will analyze the balancing mechanism
in Germany as it currently functions with the introduction of interruptible load
participation as of December 2012.
3 German electricity system
Germany belongs to the synchronous zone of continental Europe and has liberalized its
electricity sector with unbundling of activities in addition to having one of the most
reliable systems in ENTSO-E (Niesten and Jolink, 2014). As a nation, Germany has
pledged to meet the EU 2020 and 2030 targets in addition to having a unique ambition
to phase out nuclear energy and have a system that is at least 80% renewable by 2050.
As of today, Germany only allows industrial users to provide demand response for
balancing. The analysis shows that small user aggregation is impeded by the current strict
participation requirements for balancing, which will be elaborated on below (see Table
22 for a summary of the balancing provision).
Reserve Primary Secondary Tertiary
Capacity
Weekly tenders
Weekly capacity tenders Separately for positive
and negative Pay-as-bid
Daily capacity tenders Separately for positive
and negative always with six 4-hour time slices
Pay-as-bid
Energy Tender specifies both
capacity and energy bid; election on capacity bid
Tender specifies both capacity and energy bid; selection based on capacity bid
Amount Minimum ±1 MW Minimum supply offer at
5 MW with an increment of 1 MW
Minimum supply offer 5 MW
Offers up to a maximum of 25 MW
Table 22: Balancing participation in Germany (Chaves-Avila and Hakvoort, 2013; Hirth and Ziegenhagen, 2013; Regelleistung, 2013; Tennet et al., 2011)
3.1 Overview of the German balancing mechanism
In the German system there are four control areas, each managed by a TSO (TenneT,
EnBW Transportnetze, Amprion, 50Hertz Transmission). As of 2001, in accordance with
the provisions of the Federal Cartel Office the TSOs have procured primary, secondary
and tertiary control power in an open, transparent and non-discriminatory joint control
140
power market (Regelleistung, 2013). Since 1st December 2007, German TSOs have been
meeting their control requirements through shared calls for tender. Balancing service
markets have been fully integrated as of 2009. The German imbalance
mechanism/settlement uses an average cost structure. The TSO concerned commits to
providing the power control products for up to 60 minutes after the occurrence of a
power imbalance, after an hour the Balance Responsible Party concerned must take care
of the compensation. The TSOs ask for capacity and energy bids on a weekly market for
both primary and secondary control power. During the capacity phase, just the capacity
price is considered and real time activation is based on the energy price. Both prices of
secondary and tertiary control are set pay-as-bid. Tertiary control is a daily call for tender
(Chaves-Avila and Hakvoort, 2013; Hirth and Ziegenhagen, 2013; Regelleistung, 2013;
Tennet et al., 2011). Below the follows a discussion on the participation of demand
response in the form of interruptible load for balancing in Germany, which hinders the
deeper penetration of smaller aggregated loads as a result of three design aspects of the
mechanism argued in He et al. (2013a): minimum bidding volume, minimum bid duration
and binding up and down bids.
3.2 Interruptible loads in the balancing mechanism
Since 20 December 2012 regulation has made it possible for interruptible load to
participate in the German balancing mechanism as a result of the Ordinance on
Interruptible Load Agreements (AbLaV)61
. For balancing purposes of secondary and
tertiary control, DR interruptible loads are defined as major consumption units
connected at least at 110kV voltage level. The German transmission system operators
issue a call for tenders each month for 3,000MW of equal amounts62
of immediately
interruptible loads (SOL) and quickly interruptible loads (SNL). SOL loads are dispatched
by the TSO (or automatically by frequency relays) within a second of frequency
deviations and SNL is activated within 15 minutes. Interruptible loads have a minimum
tender quantity of 50MW and a maximum of 200MW with the following three availability
options: (i) at least four times a week several times a day for at least 15 minutes at a time
for a duration of up to one hour per day or (ii) once every seven days be available
continuously for at least four hours at any given time or (iii) once every 14 days
61 An amendment of the Energy Industry Act (EnWG). 62 1500MW of SOL and 1500MW of SNL.
141
continuously for at least eight hours at any given time. Participants earn 2,500 Euros per
month per MW of reduced capacity. Since the inclusion of interruptible loads in
balancing in July 2013, flexibility providers have earned between 395-400 Euros per
megawatt hour (€/MWh) from the market. Since July 2013 and until the end of
September 2013 demand response has contributed a total of 1,936MWhs of balancing
flexibility (736MWhs SOL and 1,200MWhs SNL). These figures constitute a small amount
of the total positive system imbalances consisting of 1,887,549MWhs during the same
timeframe (Regelleistung, 2013).
Thus far, the current design has stimulated little participation in the German balancing
market from individual demand side sources, with none coming from aggregation. Note,
common tendering of tertiary reserve rules state that “pooling is possible within a
control area; cross-control-area pooling is only permissible if conducted with a view to
reaching a minimum supply offer (Regelleistung, 2013).”63
Below other fundamental
barriers are identified which need to be overcome in order for aggregated demand
response from small loads to be considered as a viable balancing resource, utilizing
Germany as an example.
4 Barriers to demand side flexibility
Even though initiatives on a European level insist on demand side participation in the
balancing mechanism, there are still setbacks to aggregation as a viable resource. DR
barriers are linked to the vertically integrated structure that used to be the foundation of
the electricity sector. Existing market rules and regulation for flexibility services have
been developed in a context without demand response and largely focused on
generation side resources (Strbac, 2008; Torriti et al., 2010). This may imply the under-
valuation of DR resources compared to traditional ones in the existing market models
(He et al., 2013a). The remaining discussion will focus on the aggregator barriers to
participation in the balancing market in line with the three pillars to the mechanism: (i)
balance responsibility, (ii) balance service provision and (iii) imbalance settlement
(Chaves-Ávila et al., 2014).
63 https://www.regelleistung.net/ip/action/static/ausschreibungMrl
142
4.1 Balance responsibility
Balance Responsible Parties are financially accountable for deviations from the binding
schedules submitted to the system operator but can also transfer this responsibility to
another actor. As discussed in the introduction, an emerging actor in European electricity
markets is the aggregator. In an unbundled sector the role of the aggregator lacks a clear
definition in terms of roles and responsibilities in the value chain of electricity. Today
retailers take over balance responsibility for end-users and it is unclear with the provision
of DR who the consumer will transfer this responsibility to—will it remain the retailer,
the aggregator or will they be one and the same? In the European market context, the
aggregator is most desired as a competitive actor since he has access to electricity
markets. To this end, electricity retailers are expanding their business or new
independent entities (solely functioning as aggregators) are entering the market
(Hashmi, 2011).
As of early 2014, Entelios AG was the only commercial independent aggregator in
Germany (with retailers gearing to take up new business opportunities)64
. Entelios AG
offers a fully automated industrial Demand-Response-as-a-Service ™ (DRaaS™). The
DRaaS™ solution can provide fully automated pooling meeting up to secondary control
reserve requirements.65
Such a service provision is still not market accessible for small
users (even though devices from Entelios AG can be installed which allow for pooling
capability66
). In order to provide the flexibility and controllability necessary to support
secure system operation, aggregated load from small end users must take over the
responsibilities from large conventional power plants. It is still uncertain if small end
users can provide the magnitude of necessary balancing load, a minimum of ±1MW when
an average household consumes a few kilowatts on a daily basis. Load availability from
end-users is determined by two factors: the number of customers in the market who
have demand response capability and the elasticity of each customer (Masiello et al.,
2013). In the case where end-users become active market participants through demand
response with an aggregator as the gateway, their consumption behavior is monitored
64 Since this research was conducted Entelios AG has been taken over by the American company EnerNoc. EnerNoc continues to provide the same services as Entelios. For further details on the acquisition see <http://investor.enernoc.com/releasedetail.cfm?releaseid=825659>
65 http://entelios.com/entelios/ 66 http://entelios.com/solutions/entelios-e-box/
143
and penalized for deviation in accordance with the mechanism in place. In such a system
participating end-users should not be responsible for subsidizing the imbalances created
by others since their role is now different. End-users should be rewarded for aiding in
alleviating system imbalances and penalized when exacerbating the system imbalance.
4.2 Balance service provision
Provision of balancing services is dependent on the procurement schemes and the
remuneration to producers (Chaves-Ávila et al., 2014). German tenders for capacity and
energy are put out together by the four TSO’s for the whole system on a weekly basis for
secondary and day-ahead for tertiary control. For a commercial aggregator, shorter
planning periods would decrease forecasting error in addition to risks associated with
non-compliance penalties. Currently interruptible loads can only participate once a week
in accordance with the tendering dates calendar (Regelleistung, 2013).
For an aggregator, as an up and coming player lacking experience in balancing
participation, shorter planning periods would decrease forecasting error in addition to
risks associated with non-compliance penalties. Primary and secondary requirements
have been reduced in Germany in recent years67
, but are still too high for aggregated DR
to participate. The current mechanism has fixed units for participation with a minimum
capacity the balance service provider must have in addition to bidding with fixed
intervals of ±1MW. Due to the aggregator dependence on the real-time electricity
demand of its group of consumers, which consequently define the level of available DR,
such strict requirements impede the participation of aggregated load.
A critical variable of the balancing market is the time at which bids become final (Chaves-
Ávila et al., 2014). Flexibility of market participants is highly dependent on the gate
closure time being closer to real time. In Germany, gate closure provides less flexibility
for actors since the closest GCT is day-ahead. For an aggregator more flexibility allows for
further certainty in the service provision. For instance, in the Netherlands, gate closure is
up to an hour prior to delivery (Chaves-Avila and Hakvoort, 2013). For an aggregator,
such flexibility allows for more certainty in the service provision.
67 For instance, the minimum supply offer for tertiary control was 10 MW since 1st December 2011 and has been reduced to 5 MW as from 3rd July 2012 with the introduction of automatic activation.
144
4.3 Imbalance settlement
The settlement of imbalances is concerned with costs and pricing of imbalances (Chaves-
Ávila et al., 2014). In future scenarios, demand response may not be competing with
traditional balancing sources since more RES implies a system in demand of great
flexibility (Aghaei and Alizadeh, 2013). From a cost perspective, for an aggregator to
financially recover his provision of demand response from the market, the costs related
to activation should be lower than the marginal cost of conventional balancing units.
However, the variable costs are related to signaling DR for activation, monitoring,
administration and data storage in real-time resulting in increasing volatility as a result of
ex-post transactions needed for billing purposes. Such aspects are still in the pilot phase
and are very specific to the market design and project specifications (Hashmi, 2011).
Chaves-Ávila and Hakvoort (2013) argue that correct imbalance price signals are also
highly dependent on the energy pricing of reserves. In Germany this is done via a pay-as-
bid mechanism. The German market participants rely on imbalance prices which are
calculated as the average cost of the energy component of secondary and tertiary
control. Economic theory attests to pricing based on the system marginal cost as the
transparent and efficient way to allocate imbalance costs (Chaves-Avila and Hakvoort,
2013; Tennet et al., 2011). Vandezande et al. (2010) and ACER (2012) support that
imbalance pricing should be based on marginal pricing, unless, the TSOs provide a
detailed analysis to the national regulatory authority demonstrating that the use of a
different price method is more efficient. The ACER (2012) guidelines express a need for
pricing method harmonization in the network codes in order to give the correct price
signals and incentives to market participants (sec. 3.3.1). TenneT, E-Bridge and GEN
Nederland (2011) argue that dynamic transparency and cost reflective pricing diminishes
incentives for gaming in a competitive market.
In order for DR to participate in the real-time energy markets, it would be important to
consider how their performance is to be monitored (Masiello et al., 2013). Demand
response through aggregation requires independent verification of the activated load for
balancing. On the one hand, forecast in a balancing environment with minimal
transparency and long lags in disclosure time could create incentives for gaming, since
bid quantities depend on the forecast of demand which cannot easily be verified by the
TSO (Chaves-Avila and Hakvoort, 2013). Thermal generation sources, on the other hand,
determine their supply with much more certainty for bidding into different markets.
145
However, activated demand response resources depend on forecasted demand, the
monitored real-time demand and participation of DR after activation or signaling by the
aggregator for a large group of consumers. It should be corroborated that, for example,
an aggregated load curtailment is purely coming from DR. Forecasting and monitoring of
the DR should be confirmed, for instance by an independent party possibly the Balance
Group Manager68
in the control zone. This similar issue arises with other unconventional
flexibility resources such as wind participation in balancing mechanisms (Chaves-Avila
and Hakvoort, 2013; Hirth and Ziegenhagen, 2013). Verification monitoring will be crucial
in order to avoid gaming, especially when the network is congested and need for
alternate flexibility is higher.
4.3.1 Balance responsibility and cost allocation
Hirth and Ziegenhagen (2013) point out that the German balance mechanism is designed
to be cost-neutral, such that all costs for control energy69
are paid by unbalanced BRPs
who then distribute it to their consumers. To illustrate the cost and benefits of having
balance responsibility, the authors have taken a look at the imbalances of Vattefall AB (a
BRP in Germany) in the distribution area of Berlin for the year 2012 (see Table 23). In
total, Vattenfall AB paid the TSO 58,147.06Euros for its yearly imbalances, while the TSO
paid the BRP 61,455.93Euro for helping with system imbalances. The costs for
imbalances of the BRP are equally socialized amongst all end-users through the so-called
reconciliation mechanism (EC, 2010). In the Vattenfall AB situation (summarized in Table
23), the imbalance costs are recovered with a profit of over 3,000Euros from the TSO for
consuming in the opposite direction of the system imbalance. These calculations are
based on actual program deviations and imbalance prices which were posted one month
after deviations occurred. If there was more transparency, closer to real time, in the
direction of which the system was going, then BRPs could stimulate consumers to
become more responsive. In turn, they would gain system flexibility, which they could
aggregate to sell to the TSO for a profit or simply use it to take advantage of the profits
to be gained from helping the system.
68 The Balancing Group Manager is responsible for a balanced quarterly hour balance (trade balance) and the outstanding deviations balance in control zone in Germany.
69 Capacity costs are added to grid fees and are not allocated via the imbalance price (Hirth and Ziegenhagen, 2013).
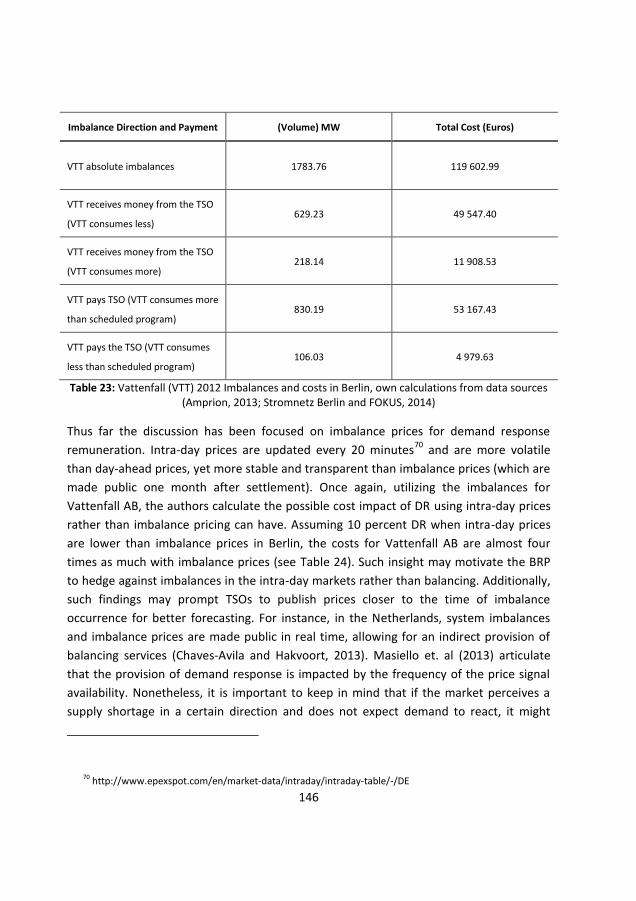
146
Imbalance Direction and Payment (Volume) MW Total Cost (Euros)
VTT absolute imbalances 1783.76 119 602.99
VTT receives money from the TSO
(VTT consumes less) 629.23 49 547.40
VTT receives money from the TSO
(VTT consumes more) 218.14 11 908.53
VTT pays TSO (VTT consumes more
than scheduled program) 830.19 53 167.43
VTT pays the TSO (VTT consumes
less than scheduled program) 106.03 4 979.63
Table 23: Vattenfall (VTT) 2012 Imbalances and costs in Berlin, own calculations from data sources (Amprion, 2013; Stromnetz Berlin and FOKUS, 2014)
Thus far the discussion has been focused on imbalance prices for demand response
remuneration. Intra-day prices are updated every 20 minutes70
and are more volatile
than day-ahead prices, yet more stable and transparent than imbalance prices (which are
made public one month after settlement). Once again, utilizing the imbalances for
Vattenfall AB, the authors calculate the possible cost impact of DR using intra-day prices
rather than imbalance pricing can have. Assuming 10 percent DR when intra-day prices
are lower than imbalance prices in Berlin, the costs for Vattenfall AB are almost four
times as much with imbalance prices (see Table 24). Such insight may motivate the BRP
to hedge against imbalances in the intra-day markets rather than balancing. Additionally,
such findings may prompt TSOs to publish prices closer to the time of imbalance
occurrence for better forecasting. For instance, in the Netherlands, system imbalances
and imbalance prices are made public in real time, allowing for an indirect provision of
balancing services (Chaves-Avila and Hakvoort, 2013). Masiello et. al (2013) articulate
that the provision of demand response is impacted by the frequency of the price signal
availability. Nonetheless, it is important to keep in mind that if the market perceives a
supply shortage in a certain direction and does not expect demand to react, it might
70 http://www.epexspot.com/en/market-data/intraday/intraday-table/-/DE
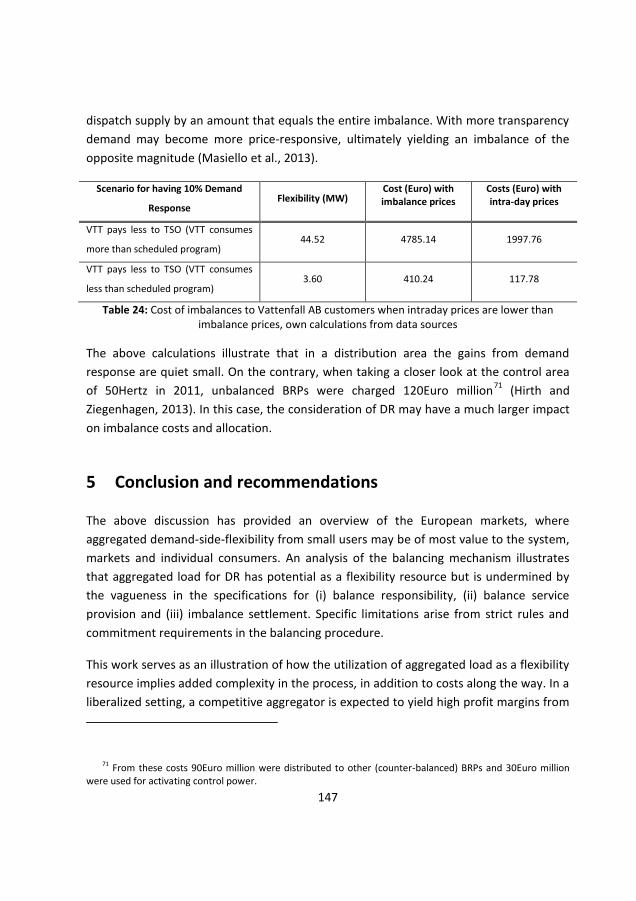
147
dispatch supply by an amount that equals the entire imbalance. With more transparency
demand may become more price-responsive, ultimately yielding an imbalance of the
opposite magnitude (Masiello et al., 2013).
Scenario for having 10% Demand
Response Flexibility (MW)
Cost (Euro) with imbalance prices
Costs (Euro) with intra-day prices
VTT pays less to TSO (VTT consumes
more than scheduled program) 44.52 4785.14 1997.76
VTT pays less to TSO (VTT consumes
less than scheduled program) 3.60 410.24 117.78
Table 24: Cost of imbalances to Vattenfall AB customers when intraday prices are lower than imbalance prices, own calculations from data sources
The above calculations illustrate that in a distribution area the gains from demand
response are quiet small. On the contrary, when taking a closer look at the control area
of 50Hertz in 2011, unbalanced BRPs were charged 120Euro million71
(Hirth and
Ziegenhagen, 2013). In this case, the consideration of DR may have a much larger impact
on imbalance costs and allocation.
5 Conclusion and recommendations
The above discussion has provided an overview of the European markets, where
aggregated demand-side-flexibility from small users may be of most value to the system,
markets and individual consumers. An analysis of the balancing mechanism illustrates
that aggregated load for DR has potential as a flexibility resource but is undermined by
the vagueness in the specifications for (i) balance responsibility, (ii) balance service
provision and (iii) imbalance settlement. Specific limitations arise from strict rules and
commitment requirements in the balancing procedure.
This work serves as an illustration of how the utilization of aggregated load as a flexibility
resource implies added complexity in the process, in addition to costs along the way. In a
liberalized setting, a competitive aggregator is expected to yield high profit margins from
71 From these costs 90Euro million were distributed to other (counter-balanced) BRPs and 30Euro million were used for activating control power.
148
DR which will be passed onto participating consumers. Nevertheless, commercial
aggregation exists virtually while technical operation is a real-time event. Procurement of
balancing services requires the standardization of products which should take into
account the technical characteristics of available balancing resources (in this case
demand response) in such a way that satisfies the needs of TSOs to balance the system.
On account of increasing intricacies in the production and consumption processes of
electricity, full transparency of network function is critical. The regulator may appoint a
new party as aggregator or extend the functions of existing regulated actors such as the
DSO. The distribution system operator is the closest physical connection to consumers
and is already aiming to minimize costs with a high quality of service provision. However,
difficulties could arise with the desired nature of DR utilization. Demand side flexibility
can both aid distribution system reliability and help the TSO in the balancing mechanism.
DSOs would need more location-specific aggregation (so aggregation of demand in their
control area) while for balancing of the system this is less of a need due to the fact that it
is then seen as a single node system. Regulation of activities requires aggregators to
adhere to a set of pre-defined efficiency targets regarding the administrative process (ex-
ante, real-time and ex-post) of load aggregation for balancing in addition to a clear
definition of what purpose the DR will be used for. Aggregators need control of the load
and TSOs need a guarantee of the supply flexibility. Balance management is designed for
the security of electricity supply to all connected users which must be guaranteed by the
TSO. As a result standardization (e.g. technical constraints, speed of activation, minimum
bid size, etc.) is crucial in the diversified participation of a range of products from sources
other than traditional generation. The authors suggest that an aggressive approach to
mitigate constraints to entrance barriers for DR is to allow priority access to aggregators
in the balancing market. In the European setting, where CO2 mitigation, RES penetration
and energy efficiency are of high importance on energy policy agendas, priority access to
aggregated DR is an interesting consideration since it is then comparable with the RES
priority access in electricity markets. This can be tried in the German market as balancing
provision by interruptible loads becomes more common practice.
Regulation which considers DR should facilitate a level-playing field for participating
actors. As a viable market resource, aggregated DR is still in infantile stages of
consideration, and the above investigation simply serves as an illustration for the drivers
and emerging barriers in market design. There are others who argue that accurate
monitoring of reserves from many small-sized, autonomous appliances is economically

149
impractical and technically unnecessary. Nevertheless, European power systems are in
the midst of radical changes, which will need innovative, new solutions for markets and
operation. Aggregated demand response is one alleviation strategy to a system of
increasing need of flexibility resources.

150
151
Chapter 6 ~ Economic
incentives for distribution-system operators to engage demand response
The previous chapters focused the assessment of demand response on signals
derived from electricity markets. Note, residential demand response will
essentially occur at the low voltage grid level, therefore having a significant
impact on the capital and operational expenditure of the distribution system
operator. This chapter investigates the economic effect of consumption
flexibility under current regulatory remuneration on distribution-system
operators with a Swedish case study based on work conducted in Koliou et al.
(2014; 2015c)72
and Eklund (2014)73
.
1 Introduction
Electricity networks are in the midst of a radical smart-grid transformation which
will accommodate the local integration of a variety of distributed energy resources
(DER): distributed generation (DG), local storage, electric vehicles (EVs) and overall active
72 Koliou, E., Eklund, T., Picciariello, A., Söder, L., Bartusch, C., Alvehag, K., Hakvoort, R.A., 2014. Economic Impact of Demand Response on Costs to Distribution System Operators, in: 37th IAEE International Conference. New York, NY, USA.
Koliou, E., Bartusch, C., Picciariello, A., Eklund, T., Söder, L., Hakvoort, R.A., 2015c. Quantifying distribution-system operators’ economic incentives to promote residential demand response. Util. Policy 35, 28–40. doi:10.1016/j.jup.2015.07.001
73 Eklund, T., 2014. Impact of Demand Response on Distribution System Operators’ Economy. Master thesis, KTH Royal Institute of Technology, Stockholm Sweden.
152
demand (Ackermann et al., 2001; Pérez-Arriaga et al., 2013). Along these lines, local
distribution networks will compel greater flexibility. One flexibility resource that
remains largely untapped is residential demand response (DR). The value of this
opportunity will vary according to the type of service, location in the system, agent
accessing the flexibility and the time at which the flexibility becomes available (Pérez-
Arriaga et al., 2013). When subject to demand-response programs, general actions that a
customer can take include decreasing consumption during peak periods where prices are
high and shifting consumption during peak periods to off-peak (Albadi and El-Saadany,
2008).
The proliferation of DR in an electricity system will have multiple effects in terms of
inducing cost management and mitigating environmental impact (Strbac, 2008). DR is of
great interest as a flexibility resource, but nonetheless has not been thoroughly
investigated in order to assess the rage of potential savings that can be achieved in the
electricity value chain; electricity distribution is one of these lacking domains. For the
distribution-system operator, both peak shaving and peak-load shifting will have the
same effect on the grid in terms of reduced power flow through the network at a given
time (Pérez-Arriaga et al., 2013). Hence, DR has a twofold application for the grid: to add
a flexibility resource for system balancing, and to mitigate both transmission and
distribution overload (Strbac, 2008). This chapter will focus on exploring the latter
influence for distribution-system operators to reduce the level of load variations in the
system.
Fundamentally, “bringing demand response to fruition” (Bartusch and Alvehag, 2014) via
implementation programs is a matter of technical system operation; that is, a real-time
strategy requiring transparency of grid activity. At present, DR (from small end-users) as
a competitive activity is difficult to achieve due to escalating complexities in both the
production and consumption of electricity. Distribution-system operators provide the
closest physical connection to customers. With full access to information about the
status of the local network, including consumption and production profiles of so-called
“prosumers,” distribution-system operators are the most pragmatic entity to signal and
access end-user flexibility under present system design (Elta Koliou et al., 2014).
By 2020, it is estimated that European electricity networks will require investments in the
range of 600 billion Euros, of which over half will be in distribution grids. It is estimated
that by 2035, investments in distribution will grow 75 percent compared to current levels
153
(Eurelectric, 2014). It is thus important to focus on mitigating distribution system costs
and optimizing smart-grid investments. This study provides insight into the impact of DR
on the minimization of costs for the distribution-system operator.
2 Distribution in the European smart grid: role,
responsibilities and tariffs
2.1 Role and responsibilities
2.1.1 Traditional
As regulated natural monopolies, distribution-system operators exhibit high fixed (sunk)
costs, economies of scale, loss of efficiency with competition, and the provision of a
public good to which citizens cannot be denied access. Traditional electricity networks
are designed to handle extreme cases of maximum power flow that seldom occur due to
the hourly, daily, weekly, monthly and seasonal variance in grid load. Tailoring the grid to
fit such dimensions is costly (Forsberg and Fritz, 2001), but nonetheless consistent with
current tariffs set by European regulators.
2.1.2 Smart grid
In a smart-grid environment, the roles and responsibilities of actors in the value chain of
electricity evolve in order to accommodate the integration of distributed generation,
energy-efficiency services, electric vehicles and their charging points, local balancing,
flexibility procurement, smart-energy systems, and large volumes of data (FSR and
BNetzA, 2014). Distribution-system operators are at the heart of successfully
implementing changes at the consumer level all while warranting to end-users a high
level of reliability and quality of service via optimal system planning, development,
connection, operation and facilitation of the retail market (Eurelectric, 2013). Escalating
intricacies in system architecture are increasing the complexity and dynamics of service
provision, in turn bringing to light the paucity of accurate economic signals to grid users
under the regulated tariff (Pérez-Arriaga et al., 2013).
154
2.2 Distribution remuneration
Economic incentives for distribution-system operators (and therefore customers) are
pre-defined in the tariffs set by the regulator. Strictly speaking, "power regulation" is an
umbrella concept referring to both the remuneration of total (or allowed) network costs
and the allocation of these costs to network users. It is important to make the distinction
between network regulation (in a strict sense limited to the remuneration of total
allowed network costs and the incentives this offers to network operators) and network
tariffication (which is then dedicated to the allocation of these costs to the users, yielding
full-cost recovery). Such costs consist of operational expenditure (OPEX) and capital
expenditure (CAPEX). The former pertain to daily operational expenses of power-flow
management while the latter consist of long-term investments made in physical assets
(Hakvoort et al., 2013).
2.2.1 Underlying theory of network pricing
Fundamentally, when looking at network pricing, there is a conflict between short-term
and long-term objectives. Active distribution management is concerned with short-term
grid operation, which signals long-term network expansion depending on how the
network is being used. Electricity distribution exhibits a high degree of asset-specificity,
with capital expenditures that are exponentially larger when compared to operational
expenditures (de Joode et al., 2009).
In theory, optimal tariffs (with respect to allocative efficiency) are reached on economic
principles of marginal cost, with a change in the total cost arising when the quantity
produced increases by one unit. In Europe, wholesale electricity markets have evolved
towards sending optimal economic signals via marginal-cost pricing for energy trading on
at least an hour-by-hour basis to incorporate the short-term costs of electricity
production. If such an approach is taken in pricing distribution it would entail the use of
energy sale or purchase prices as pertaining to each node in the grid (Reneses and
Rodríguez, 2014). Along these lines, marginal-cost application would be inclusive of
power losses and congestion constraints, taking the network capacity as a given. The
setting of tariffs based on short-run marginal costs has several shortcomings. At the
155
distribution level it requires locational marginal pricing, that is, nodal pricing74
, which is
theoretically optimal for communicating losses and congestion in real time. However, at
the distribution level, the network is rarely used to its full capacity. As a result,
congestion is virtually nonexistent (except when manifested into relatively rare outages).
In turn, little to no recovery of the total cost of service provision is signaled at present,
which in turn provides very little incentive for future demand-side developments
(Reneses and Rodríguez, 2014). Reneses and Rodríguez-Ortega (2014) point to an
application in Pérez-Arriaga et al. (1995) and Ponce de Leão and Saraiva (2003) where
cost recovery is below 25 percent for transmission and estimated to be even lower at the
distribution level. Full cost recover requires the addition of extra costs, which in turn
distorts the message that short-run marginal pricing is meant to send. The short-run
marginal-cost method is optimal for pricing operational expenditures in distribution
(Economics, 2013; Gómez, 2013; Hakvoort et al., 2013; Similä et al., 2011), at least for
Europe if not elsewhere.
Furthermore, investments in networks are considered discrete and therefore take the
existing grid as a baseline and optimize expansion for a given trend in demand (Reneses
and Rodríguez, 2014). When considering investments, marginal pricing then considers
long-run costs, which are exponentially larger. In this sense, long-run marginal pricing can
be calculated via demand and technology forecasts in two forms. First, the marginally
incremental approach takes into consideration permanent demand increments over the
relevant years and looks at the present value of future costs. Second, through an average
incremental-cost approach, demand and technology developments are also forecasted
but project costs are averaged yearly by dividing by the present value of the change in
demand (Economics, 2013; Gómez, 2013; Hakvoort et al., 2013; Similä et al., 2011).
The marginal incremental approach is the theoretical ‘pure’ estimate of long-run costs,
but is more difficult to calculate. Specifically, in a smart-grid investment environment
that fosters the energy-efficient appliances and demand-response programs, technology
risk is high and demand forecasts difficult to appraise. An average-cost approach allows
the incorporation of investment lumps to be smoothed. Simultaneously, future levels
74 Nodal pricing is applied in the United States, but there are some fundamental differences in system operation and market. Basically, in the United States there is a pool where market and physical system are optimized simultaneously while in Europe the market and physical gird clear separately on a day-ahead basis and optimize coordination until the moment of delivery at the day.
156
and trends in costs of rising demand are reflected over time (Similä et al., 2011). In the
long-term, the calculated network remuneration must promote efficient development of
the grid for the benefit of network users. In the tariff it may be important to provide
customers incentives to use the network efficiently, which may include location-specific
and time-specific rates (Hakvoort et al., 2013; Similä et al., 2011). Tariff regulation at a
minimum has to meet three objectives (Hakvoort et al., 2013):
1. The total tariff revenue must cover the incurred costs, i.e. the capital and
operating cost of the infrastructure should be fully covered by the grid tariffs.
2. Tariffs must be non-discriminatory. Similar network use (by the same or other
market party) should result in the same conditions for the same rate in order to
not disturb the electricity market.
3. Tariffs must be transparent. The methodology for determining the rates should
be clear to all network users.
Below follows a discussion of the specific tariff design elements.
2.2.2 Tariff design
For the distribution-system operator, network use refers to consumption (electricity
withdrawal), production (electricity injection), and prosumption (combined withdrawal
and injection). Distribution network fees have three critical facets: (i) the initial network
connection charge (a one-time flat payment in Euro); (ii) network tariff level (use-of-
system charge) for allowed revenue during the regulatory period and; (iii) the network
tariff structure75
, i.e. network charges according to consumer categories, periods of grid
use, and the mobility of loads when considering DER (Eurelectric, 2013). The initial
connection charge becomes critical when connecting own distributed generation (e.g.
solar photovoltaics) since it pertains to who bears the cost responsibility for externalities
imposed to the system.76
The tariff level pertains to the amount of remunerated recovery
for the distribution system operator during the regulatory period, an aspect that
75 The customer charge is at times incorporated in the use-of-system charge. 76 This charge can be shallow, shallowish, or deep. A shallow charge means the developer of the DG bears
the grid connection cost; a shallowish charge indicates that the DG owner (household) bears the connection and a share of the grid reinforcement cost; a deep charge puts the full responsibility of the grid connection and grid reinforcement cost on the DG owner. In most European countries DG owners are subject to a shallow charge.
157
becomes critical under the consideration of new investments in the (smarter) grid.
Finally, the network tariff structure is relevant with regard to stimulating end-user
flexibility (Pérez-Arriaga et al., 2013). All three aspects are important with respect to
distribution-system operator remuneration, but we focus the remainder of our
discussion on the smart-grid tariff structure.
A widely cited publication on network tariff design (Pérez-Arriaga and Smeers, 2003)
finds that in a perfect system: (i) network charges are computed ex-ante (i.e. prior to
delivery of electricity to customers): (ii) network charges do not depend on commercial
transactions (i.e. electricity market trading); and (iii) network costs are allocated to those
who cause them or who benefit from the deployment of the assets (on the basis of the
beneficiary-pays principle). The problem with the current method is that although the
rates cover costs, limited economic incentives are given to network users (Eurelectric,
2013; Similä et al., 2011).
2.2.2.1 Tariff structure
The network tariff is commonly referred to as the use-of-system charge paid periodically
by consumers (either monthly or bi-monthly), incorporating volumetric and/or capacity
components (Gómez, 2013). Design of the use-of-system charge requires the
identification of cost drivers followed by the determination of appropriate rate schemes.
As briefly mentioned above, general cost drivers consist of CAPEX and OPEX in addition
to other miscellaneous expenditures deemed either variable or fixed costs (de Joode et
al., 2009; Eurelectric, 2013). Volumetric charges are proportional to the energy demand
charged in Euros per kilowatt-hour (€/kWh). Capacity charges are a reflection of the load
contribution to peak demand in the network charged in Euros per kilowatt (€/kW) or
Euros per kilowatt per month, depending on the structure of the tariff. Other fees
include customer charges for management and support that (more often than not) are a
part of the use-of-system charge (Gómez, 2013).
Table 25 summarizes the distribution-tariff design options with their direct impact on
load: strategic conservation (overall energy efficiency resulting in reduced consumption);
peak shaving (only a reduction at peak hours); load shifting (displacing load from peak
hours to off-peak); and valley filling (increasing load consumption at off-peak hours).
Recent studies (Pérez-Arriaga et al., 2013; Ramos et al., 2014; Reneses and Rodríguez,
2014) on the future of distribution recommend that at the most basic level tariffs should
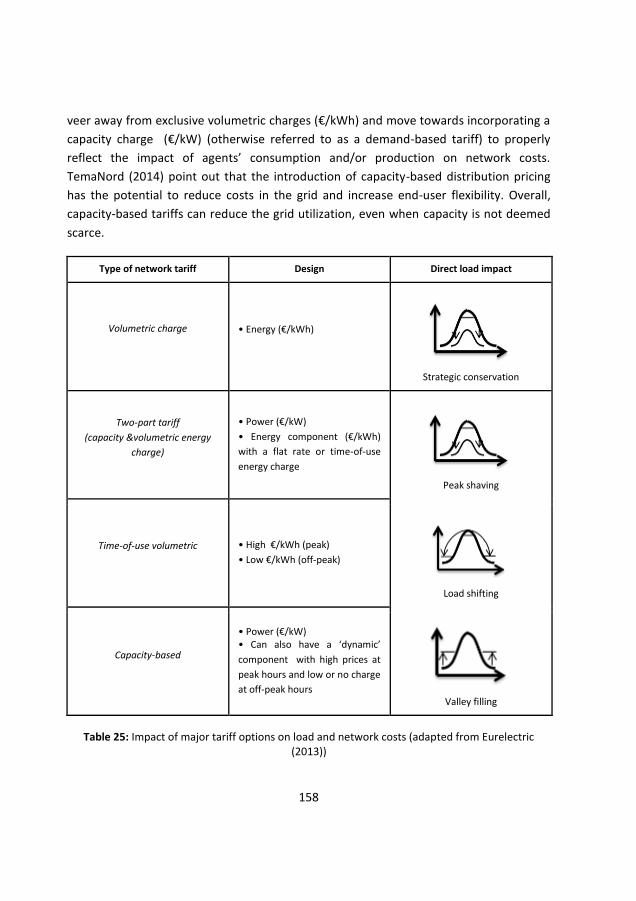
158
veer away from exclusive volumetric charges (€/kWh) and move towards incorporating a
capacity charge (€/kW) (otherwise referred to as a demand-based tariff) to properly
reflect the impact of agents’ consumption and/or production on network costs.
TemaNord (2014) point out that the introduction of capacity-based distribution pricing
has the potential to reduce costs in the grid and increase end-user flexibility. Overall,
capacity-based tariffs can reduce the grid utilization, even when capacity is not deemed
scarce.
Type of network tariff Design Direct load impact
Volumetric charge
• Energy (€/kWh)
Strategic conservation
Two-part tariff
(capacity &volumetric energy
charge)
• Power (€/kW)
• Energy component (€/kWh)
with a flat rate or time-of-use
energy charge
Peak shaving
Time-of-use volumetric • High €/kWh (peak)
• Low €/kWh (off-peak)
Load shifting
Capacity-based
• Power (€/kW) • Can also have a ‘dynamic’
component with high prices at
peak hours and low or no charge
at off-peak hours Valley filling
Table 25: Impact of major tariff options on load and network costs (adapted from Eurelectric (2013))
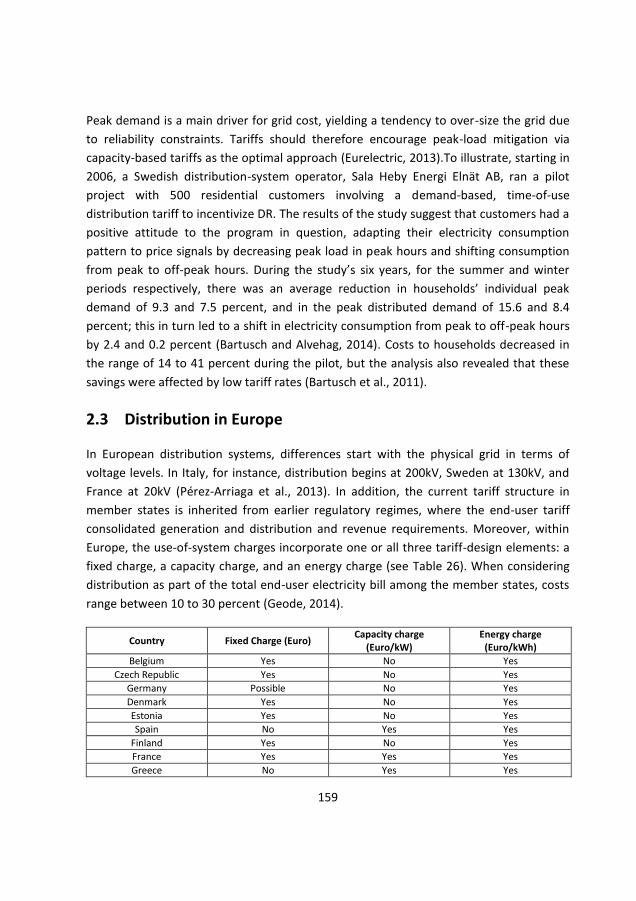
159
Peak demand is a main driver for grid cost, yielding a tendency to over-size the grid due
to reliability constraints. Tariffs should therefore encourage peak-load mitigation via
capacity-based tariffs as the optimal approach (Eurelectric, 2013).To illustrate, starting in
2006, a Swedish distribution-system operator, Sala Heby Energi Elnät AB, ran a pilot
project with 500 residential customers involving a demand-based, time-of-use
distribution tariff to incentivize DR. The results of the study suggest that customers had a
positive attitude to the program in question, adapting their electricity consumption
pattern to price signals by decreasing peak load in peak hours and shifting consumption
from peak to off-peak hours. During the study’s six years, for the summer and winter
periods respectively, there was an average reduction in households’ individual peak
demand of 9.3 and 7.5 percent, and in the peak distributed demand of 15.6 and 8.4
percent; this in turn led to a shift in electricity consumption from peak to off-peak hours
by 2.4 and 0.2 percent (Bartusch and Alvehag, 2014). Costs to households decreased in
the range of 14 to 41 percent during the pilot, but the analysis also revealed that these
savings were affected by low tariff rates (Bartusch et al., 2011).
2.3 Distribution in Europe
In European distribution systems, differences start with the physical grid in terms of
voltage levels. In Italy, for instance, distribution begins at 200kV, Sweden at 130kV, and
France at 20kV (Pérez-Arriaga et al., 2013). In addition, the current tariff structure in
member states is inherited from earlier regulatory regimes, where the end-user tariff
consolidated generation and distribution and revenue requirements. Moreover, within
Europe, the use-of-system charges incorporate one or all three tariff-design elements: a
fixed charge, a capacity charge, and an energy charge (see Table 26). When considering
distribution as part of the total end-user electricity bill among the member states, costs
range between 10 to 30 percent (Geode, 2014).
Country Fixed Charge (Euro) Capacity charge
(Euro/kW) Energy charge
(Euro/kWh)
Belgium Yes No Yes
Czech Republic Yes No Yes
Germany Possible No Yes
Denmark Yes No Yes
Estonia Yes No Yes
Spain No Yes Yes
Finland Yes No Yes
France Yes Yes Yes
Greece No Yes Yes
160
Italy No Yes Yes
Lithuania Possible No Yes
Netherlands Yes Yes No
Norway Yes Seldom Yes
Poland Yes No Yes
Portugal No Yes Yes
Sweden Yes Seldom Yes
Table 26: Residential use-of-system charges for select European countries, ref. data Eurelectric (2013)
3 Assessment of distribution cost drivers and signaling of
demand response
In a survey conducted by Eurelectric (Eurelectric, 2014), distribution-system operators
across Europe consider smart metering, network automation, and investments in DR and
integration of distributed and renewable generation to be the most important
investments for smart-grids. For distribution-system operators, the signaling of a
demand–response program can have an economic influence on the minimization of costs
with respect to power losses in the grid and peak load, both factors consequently
affecting ongoing grid investments (Bartusch and Alvehag, 2014; Eurelectric, 2013).
3.1 Cost structure of distribution-system operator
The structure of full costs differs from one distribution-system operator to another in
Europe, but the basic cost factors remain the same. In Capagemini (2008a), a comparison
of gross distribution costs per MWh delivered reveals a variation from 9 Euro per MWh
to more than 50 Euro per MWh. As Figure 40 reveals, for the average cost European
distribution-system operator, 25 percent of costs are related to asset financing and
depreciation, 34 percent to network operation, 20 percent to transmission access and 5
percent to losses. The remaining costs pertain to taxes and customer service. More than
40 percent of annual costs are directly linked to the volume of net delivered energy; such
costs pertain to transmission access, power losses, and customer service. More than half
of the total costs are deemed either fully or party controllable. The consensus among
European policymaker and lobbyists is that improved consumption efficiency can
improve distribution-system operators’ long-term economic performance (Capgemini,
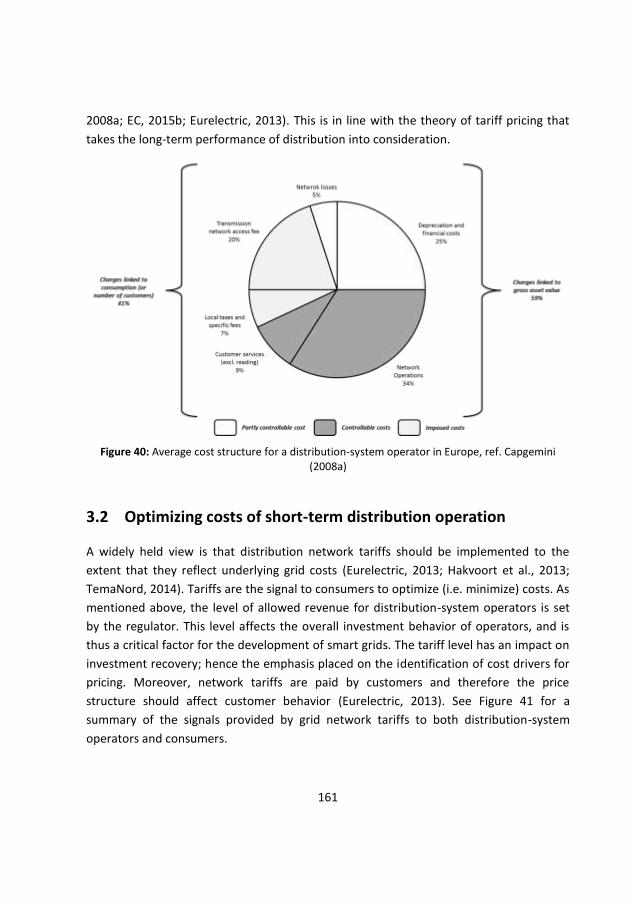
161
2008a; EC, 2015b; Eurelectric, 2013). This is in line with the theory of tariff pricing that
takes the long-term performance of distribution into consideration.
Figure 40: Average cost structure for a distribution-system operator in Europe, ref. Capgemini (2008a)
3.2 Optimizing costs of short-term distribution operation
A widely held view is that distribution network tariffs should be implemented to the
extent that they reflect underlying grid costs (Eurelectric, 2013; Hakvoort et al., 2013;
TemaNord, 2014). Tariffs are the signal to consumers to optimize (i.e. minimize) costs. As
mentioned above, the level of allowed revenue for distribution-system operators is set
by the regulator. This level affects the overall investment behavior of operators, and is
thus a critical factor for the development of smart grids. The tariff level has an impact on
investment recovery; hence the emphasis placed on the identification of cost drivers for
pricing. Moreover, network tariffs are paid by customers and therefore the price
structure should affect customer behavior (Eurelectric, 2013). See Figure 41 for a
summary of the signals provided by grid network tariffs to both distribution-system
operators and consumers.
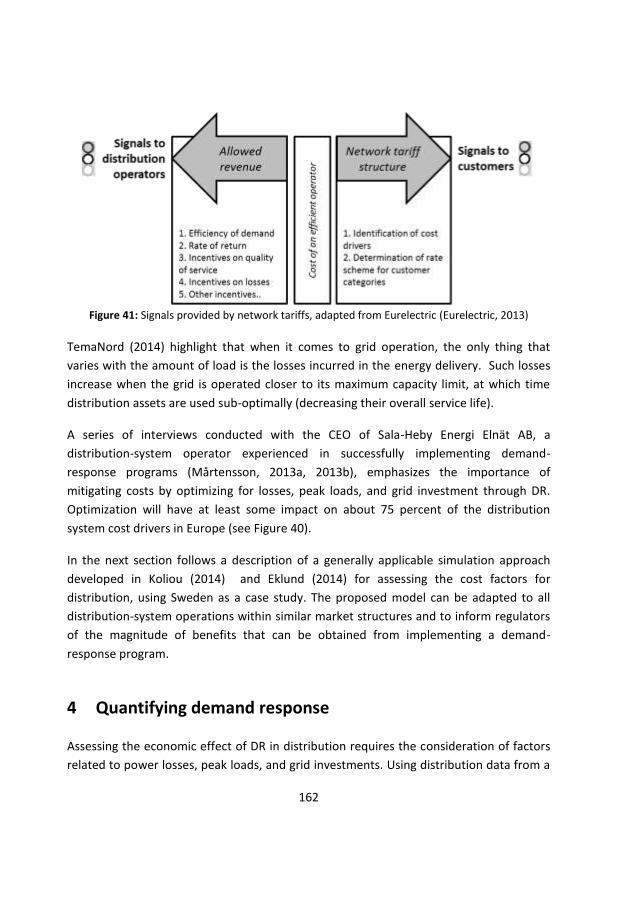
162
Figure 41: Signals provided by network tariffs, adapted from Eurelectric (Eurelectric, 2013)
TemaNord (2014) highlight that when it comes to grid operation, the only thing that
varies with the amount of load is the losses incurred in the energy delivery. Such losses
increase when the grid is operated closer to its maximum capacity limit, at which time
distribution assets are used sub-optimally (decreasing their overall service life).
A series of interviews conducted with the CEO of Sala-Heby Energi Elnät AB, a
distribution-system operator experienced in successfully implementing demand-
response programs (Mårtensson, 2013a, 2013b), emphasizes the importance of
mitigating costs by optimizing for losses, peak loads, and grid investment through DR.
Optimization will have at least some impact on about 75 percent of the distribution
system cost drivers in Europe (see Figure 40).
In the next section follows a description of a generally applicable simulation approach
developed in Koliou (2014) and Eklund (2014) for assessing the cost factors for
distribution, using Sweden as a case study. The proposed model can be adapted to all
distribution-system operations within similar market structures and to inform regulators
of the magnitude of benefits that can be obtained from implementing a demand-
response program.
4 Quantifying demand response
Assessing the economic effect of DR in distribution requires the consideration of factors
related to power losses, peak loads, and grid investments. Using distribution data from a
163
Swedish operator, an analysis was conducted to quantify the impact of DR. We begin
with an introduction to the Swedish regulatory model in order to understand how tariffs
are set, followed by an assessment of the costs subject to potential optimization.
4.1 Swedish regulatory model
Regulatory oversight from the Energy Markets Inspectorate (the Swedish regulator) runs
for a four-year period. The current regulatory period is from 2012 to 2015, with
distribution tariff remuneration determined via an ex-ante revenue cap. As illustrated in
Figure 42, distribution costs are split into capital and operating expenditures. CAPEX are
the costs associated with the ‘asset base’77 for distribution (equipment and depreciation
during the supervision period). OPEX are split into controllable costs (e.g. staff and
services) and non-controllable costs (including network power losses, taxes, authority
fees, and charges for connecting to the sub-transmission level, known as the feeding-grid
charge). Under the current framework, costs regarded as controllable are subject to an
efficiency target, while costs regarded as non-controllable are not (EI, 2009; NordREG,
2011). Note, with the right framework of incentives some losses may be controllable as
discussed below.
Distribution is comprised of complex processes of physical system operation that are
governed by regulatory arrangements (ERGEG, 2008). The added flexibility of DR is aimed
at improving system efficiency, but it also intensifies the already intricate processes of
the distribution-system operator (Balijepalli et al., 2011; Capgemini, 2008b; Shaw et al.,
2007). At present, the traditional system comprising of downstream power flows is
challenged by the integration of distributed energy resources. Distribution-system
operators along with regulators are reacting to developments in upstream generation
patterns and prices while simultaneously managing local developments in both
production and consumption (Pérez-Arriaga et al., 2013).
77 The asset base includes power lines, cables, substations, transformers, systems for operating assets, and meters.
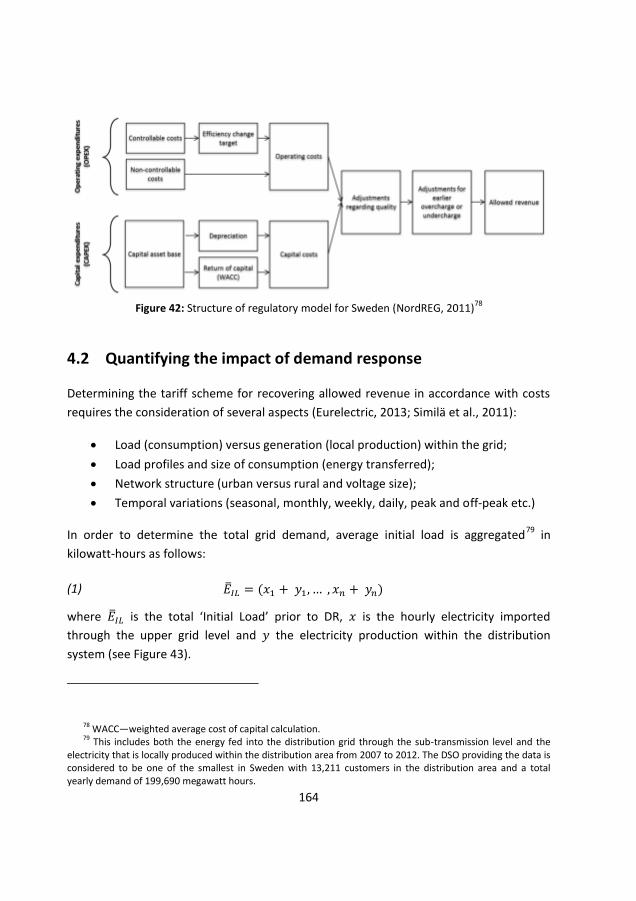
164
Figure 42: Structure of regulatory model for Sweden (NordREG, 2011)
78
4.2 Quantifying the impact of demand response
Determining the tariff scheme for recovering allowed revenue in accordance with costs
requires the consideration of several aspects (Eurelectric, 2013; Similä et al., 2011):
Load (consumption) versus generation (local production) within the grid;
Load profiles and size of consumption (energy transferred);
Network structure (urban versus rural and voltage size);
Temporal variations (seasonal, monthly, weekly, daily, peak and off-peak etc.)
In order to determine the total grid demand, average initial load is aggregated79
in
kilowatt-hours as follows:
(1) �̅�𝐼𝐿 = (𝑥1 + 𝑦1, … , 𝑥𝑛 + 𝑦𝑛)
where �̅�𝐼𝐿 is the total ‘Initial Load’ prior to DR, 𝑥 is the hourly electricity imported
through the upper grid level and 𝑦 the electricity production within the distribution
system (see Figure 43).
78 WACC—weighted average cost of capital calculation. 79 This includes both the energy fed into the distribution grid through the sub-transmission level and the
electricity that is locally produced within the distribution area from 2007 to 2012. The DSO providing the data is considered to be one of the smallest in Sweden with 13,211 customers in the distribution area and a total yearly demand of 199,690 megawatt hours.
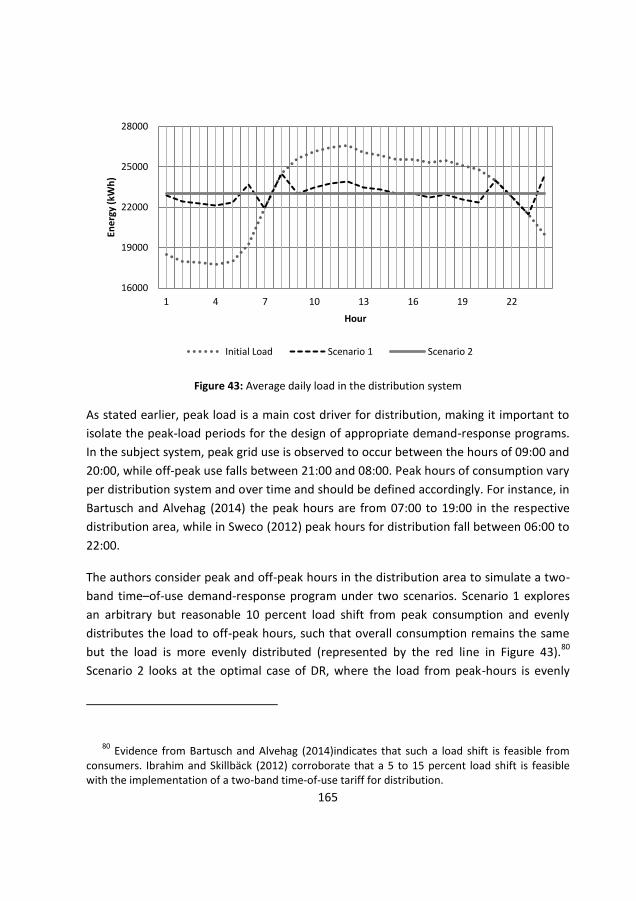
165
Figure 43: Average daily load in the distribution system
As stated earlier, peak load is a main cost driver for distribution, making it important to
isolate the peak-load periods for the design of appropriate demand-response programs.
In the subject system, peak grid use is observed to occur between the hours of 09:00 and
20:00, while off-peak use falls between 21:00 and 08:00. Peak hours of consumption vary
per distribution system and over time and should be defined accordingly. For instance, in
Bartusch and Alvehag (2014) the peak hours are from 07:00 to 19:00 in the respective
distribution area, while in Sweco (2012) peak hours for distribution fall between 06:00 to
22:00.
The authors consider peak and off-peak hours in the distribution area to simulate a two-
band time–of-use demand-response program under two scenarios. Scenario 1 explores
an arbitrary but reasonable 10 percent load shift from peak consumption and evenly
distributes the load to off-peak hours, such that overall consumption remains the same
but the load is more evenly distributed (represented by the red line in Figure 43).80
Scenario 2 looks at the optimal case of DR, where the load from peak-hours is evenly
80 Evidence from Bartusch and Alvehag (2014)indicates that such a load shift is feasible from
consumers. Ibrahim and Skillbäck (2012) corroborate that a 5 to 15 percent load shift is feasible with the implementation of a two-band time-of-use tariff for distribution.
16000
19000
22000
25000
28000
1 4 7 10 13 16 19 22
Ene
rgy
(kW
h)
Hour
Initial Load Scenario 1 Scenario 2
166
distributed throughout the off-peak hours in order to yield a flat distribution load curve
(the green line in Figure 43). A flat load simulation is aimed at representing the ideal
power-demand curve that a smart grid seeks in order to improve system efficiency, cost
effectiveness, and overall reliability and power quality. One of the means used to achieve
these smart grid goals is via flattening of the power-demand curve. Along these lines,
recommendations for the utilization of DR point to a more evenly distributed load
without changing the total amount of electricity consumed i.e. minimizing discomfort for
the consumer. Simulating a flat load is a means of capturing the optimization all
distributed energy resources in a distribution area (Carillo Aparicio et al., 2014).
Both scenarios illustrate the impact of a time-of-use distribution tariff specifically
targeted at incentivizing the use of the grid below a certain capacity threshold. As
mentioned above, capacity based tariffs aid in promoting optimal utilization of the
distribution system (see 2.2.2.1 and Table 25).
On the basis of the above analysis, load shift (�̅�𝐿𝑆) from DR is constructed as follows:
(2) �̅�𝐿𝑆 = 𝑓(�̅�𝐼𝐿) = (𝑧1,𝐿𝑆, 𝑧2,𝐿𝑆, … , 𝑧𝑛,𝐿𝑆)
�̅�𝐿𝑆 is comprised of hourly load data from �̅�𝐼𝐿 and is then adjusted by the demand-
response load shifting estimation(s) (for both scenario 1 and 2),𝑓(𝑥), where 𝑧
corresponds to each hour with DR which is calculated as the respective modification per
peak hour to an off-peak hour per scenario. For scenario 1, at each of the peak hours per
day for the year there is a 10 percent load reduction that is then shifted and evenly
distributed to the off-peak hours. For scenario 2, the load is optimized to yield a flat load
curve over one year such that the overall consumption for a specific year does not
change. See Figure 43 for average values of one day over the year.
Considering a feasible 10 percent load shift and an optimal flattened load, we continue
with an analysis of the cost factors that can be optimized by engaging DR: power losses,
peak loads, and grid investments (via postponement or avoidance).
4.2.1 Demand response for the reducing power losses
Since we are concerned with the aggregate impact of power losses, the simulation
assumes that load is equal in all parts of the distribution grid (which is not the case in
reality). Total distribution network power losses are the aggregated differences between
the measured power entering the grid and that which is consumed (measured at the
167
customer meter) (ERGEG, 2008). Swedish distribution-system operators are required to
purchase electricity from the spot market (Nord Pool81
) to cover power losses occurring
within their grid (as is the case in other European countries, including the Netherlands);
this is regarded as the cost of covering losses (EI, 2009; NordREG, 2011).
Power losses in a distribution system can be both non-technical and technical and both
fixed and variable. The implementation of a demand–response program can only impact
the minimization of variable technical losses in the distribution system. Non-technical
losses consist of delivered electricity that is not compensated, such as theft, errors in
metering, non-metered delivery,82
and own consumption by the operator (ERGEG, 2008).
Such losses can be costly but cannot be affected by DR. Fixed technical losses are
independent of power flow, such as those resulting from iron loss in transformers
(ERGEG, 2008), and are therefore not affected by load management. Comparatively,
variable technical losses (occurring in transformers as well as power lines) can be
mitigated by DR since they are the direct cause of natural resistance in power lines (Shaw
et al., 2007). In Sweden, electric power transmission and distribution losses equal
approximately 7 percent of total yearly electricity production (World bank, 2015). For the
distribution-system operator analyzed in this simulation,83
average losses for the year are
4.3 percent, below the European average (see Figure 40).
Variable power losses are proportional to the squared power flow within the grid (that is,
precisely yielding a quadratic value relative to load). As a result, the simulation considers
this proportionality to create a loss vector ( ∆𝐿) varying with the load output when the
load goes from 𝑃𝑎 to 𝑃𝑏:
(3) ∆𝐿= 𝑃𝑎
2 − 𝑃𝑏2
𝑃𝑎2
For both the initial load curve �̅�𝐼𝐿 and shifted �̅�𝐿𝑆 curves (feasible and optimal) average
variable losses (𝐿𝑣) are calculated as follows:
81 More information, see http://www.nordpoolspot.com 82 For example, public lighting 83 Sala-Heby Energi Elnät AB.
168
(4) 𝐿𝑣 = 0.043 (1 − 𝐿𝑓𝑣)
𝐿𝑓𝑣 corresponds to the proportion of fixed to variable ones (Shaw et al., 2007), set at 1 to
5 for this system (Mårtensson, 2013a). Total (variable) losses can then be compared
using �̅�𝐿𝑆 and �̅�𝐼𝐿 (before and after DR for both scenarios), in this way determining the
impact of DR in kilowatt-hours, which can then be multiplied by the spot market price for
economic evaluation purposes.
4.2.2 Demand response for alleviating peak loads
Distribution-system operators incur costs at the connection point to the high-voltage
transmission grid (Gómez, 2013; Rodríguez Ortega et al., 2008). In order to pass
electricity from the transmission to the distribution grid, Swedish distribution-system
operators pay a ‘feeding-grid’ charge for the withdrawal from or injection to the grid. The
fee is divided into three parts that are updated on a yearly basis and paid for monthly by
customers (E.ON, 2013; Fortum Distribution, 2013; Vattenfall Distribution, 2013). The
first part is a fixed capacity fee that is paid in Euros regardless of the amount of power or
energy transferred. Since the remuneration is fixed ex-ante, load shifting has no impact
on this charge. The second component is a variable charge for the actual energy
transferred during the year, calculated on the basis of a pre-specified fixed price per
kWh; only overall load reduction will have an effect so this charge will not be affected by
load shifting (since the total energy consumed remains the same). Finally, a variable
capacity component (€/kW) is charged to the distribution-system operator for staying
within a subscribed level of maximum power on the grid. Once this pre-specified level is
surpassed, the operator is charged a higher fee per kW. In the past year, the distribution-
system operator paid 20€ per kW for the agreed level and 30€ per kW for deviations84
.
When signaling DR, load shifting from peak to off-peak hours decreases the peak capacity
level (Mårtensson, 2013b). The maximum level of power is a complicated component to
calculate due to the stochastic nature of end-user consumption patterns. To illustrate,
Sweden has a capricious climate and homes are heated with electricity, with potentially
devastating consequences for distribution-system operators. From one year to the next,
electricity consumption from residential customers may vary ±10 percent as a result of
84 182 SEK for the agreed level and 273 SEK for deviating (December 8th, 2014 exchange rate).
169
home heating (ERGEG, 2008). In this context, minimizing the pre-defined peak capacity
leads to overall lower costs for the distribution-system operator (Mårtensson, 2013b).
At each distribution connection point this power level is optimized differently, depending
on the connection to the high-voltage operator85
. For this simulation we take the
Vattenfall approach (Vattenfall Distribution, 2013) to optimize the subscribed power
level by averaging the 2 maximum load values per month over the year, as indicated in
equation 5.
(5) 𝐸𝐿𝑚,𝑚𝑎𝑥 = 𝑥1 + 𝑥2
2
𝐸𝐿𝑚,𝑚𝑎𝑥 is the maximum subscribed power defined by regional grid operator for a given
load curve of year 𝑚 where 𝑥1 and 𝑥2 are the two highest capacity values in the grid for
the year 𝑚. Any penalty for deviating from the set subscribed level is settled for a given
year by comparing the actual maximum capacity (𝐸𝑑) with the subscribed maximum
power (𝐸𝐿𝑚,𝑚𝑎𝑥) in the contract. Total costs for the feeding grid for any given year are
calculated as follows:
(6) 𝐶𝐿𝑚 = 𝐸𝑑 ∗ 𝐶𝑑 + 𝐸𝐿𝑚,𝑚𝑎𝑥 ∗ 𝐶𝑝
where 𝐶𝐿𝑚 is the total cost for year 𝑚, 𝐶𝑑 the deviation cost per kW and 𝐶𝑝 the cost for
the contracted capacity level.Yearly variations allow the simulation to capture demand
fluctuations between years. The model therefore optimizes the maximum level with the
accessible load data over the 5-year period as a result of the lowest possible sum of costs
for the difference between the initial and shifted loads for both scenarios:
(7) ∆𝑓𝑒𝑒= 𝐶𝐼𝐿𝑐,𝑜𝑝𝑡 − 𝐶𝐿𝑆𝑐,𝑜𝑝𝑡
where ∆𝑓𝑒𝑒 represents the change in costs for the specific regional capacity level
contract, 𝐶𝐼𝐿𝑐,𝑜𝑝𝑡 is the change in cost for the optimal capacity value of the initial load
85 Fortum changes the level on a weekly basis using the mean of the two highest hourly values during each calendar week (Fortum Distribution, 2013). For comparison, E.ON takes seasonal variations into consideration and separates winter weekdays from the rest of the year. The maximum power is then calculated by using the mean of the two highest monthly load values for the year for winter and non-winter days (E.ON, 2013).
170
without DR and 𝐶𝐿𝑆𝑐,𝑜𝑝𝑡 is the optimized cost for the shifted load capacity with DR
calculated for both scenario 1 and 2.
4.2.3 Demand response for postponing network investments
Distribution investment costs come in two forms that cannot be considered as mutually
exclusive since equipment has long lifecycles: investing in new equipment at the end of
their lifecycle, and upgrading existing assets to cope with higher demand (Mårtensson,
2013a). The standard lifetime for distribution assets is estimated at 40 years; in order to
mitigate short-run marginal costs, increasing the depreciation rate by 5 to 10 years has
been recommended (Sweco, 2010). It can be argued that if demand variations are
minimized, grid assets could be better utilized over their lifetime and their service lives
extended. Specifically, peak-load shifting decreases load fluctuations as long as extreme
demand variations remain low (Eurelectric, 2013). With cautious use of distribution
assets, equipment upgrades and replacements can be postponed by several years or
even avoided altogether (which might further extend lifetimes). Subsequently, our
simulation mainly considers investments that are mostly geared towards grid upgrades
to existing equipment to cope with rising demand rather than the full replacement of
equipment.
We use the net present value (𝑁𝑃𝑉) methodology, commonly used to sum up the
current value of cash flows over the time that investments are active:
(8) 𝑁𝑃𝑉 = ∑𝐶𝑖
(1 + 𝑟)𝑖− 𝐾
𝑛
𝑖=0
where 𝑛 is the number of years of active investment, 𝐶𝑖 the cash flow for year 𝑖, 𝑟 the
rate of discount pre-set at 0.052 86
. 𝐾 is the initial investment in year zero and it is
disregarded in this part of the simulation since incorporating it in the calculation for
postponing future investments presents a negative cash flow; we present the values as
positive in the economic outcome below. The net worth of this distribution-system
86 Prescribed value by the Swedish Energy Markets Inspectorate for the regulatory period 2012-2015 (EI, 2011).
171
operator is approximately 15 million Euro 87
, with increasing assets at an approximate
average rate of 1.6 percent yearly (PROFF.se, 2013).
For the simulation, we consider the optimal case, where the grid is utilized to its full
capacity. We therefore model the actual maximum capacity instead of the subscribed
(agreed upon) level discussed in in section 4.2.2. Savings are reflected in the decrease in
asset investment until the point in time (the year) when the grid load is expected to
surpass the available physical network capacity.
The impact of DR is represented as the maximum peak ratio (𝐸𝑚𝑎𝑥) between the initial
peak load (𝐸𝐼𝐿,𝑚𝑎𝑥) and shifted peak load (𝐸𝐿𝑆,𝑚𝑎𝑥).
(9) 𝐸𝑚𝑎𝑥 = 𝐸𝐼𝐿,𝑚𝑎𝑥
𝐸𝐿𝑆,𝑚𝑎𝑥
The inverse of this ratio yields the number of years that demand-response
implementation can postpone future investments in the grid per our simulation:
(10) 𝐸𝑚𝑎𝑥 = (1 + 𝐼)𝑛
where 𝐼 is the estimated increase in grid assets88
, (in this case I=0.016, representing the
yearly average 1.6% increase in grid assets of the distribution-system operator in
question) and 𝑛 the years of investment load shifting saves. To solve for 𝑛, the equation
can be written as follows:
(11) 𝑛 = ln 𝐸𝑚𝑎𝑥
ln (𝐼 + 1)
Postponed investments are then valued and discounted over years 𝑛 to obtain the 𝑁𝑃𝑉.
However, a value for the postponed investments for each year must be established first.
The investment at year zero (𝐶0) is calculated as the multiplication of the maximum peak
ratio (𝐸𝑚𝑎𝑥) with the current distribution asset-base 𝐴:
87 Specifically, 14,410,0854 Euro with the exchange rate of December 8th, 2014 (133,989,000 SEK). 88 Average yearly increase in distribution assets is derived from historical values of capital assets for the
distribution-system operator from 2009 to 2012 (PROFF.se, 2013).
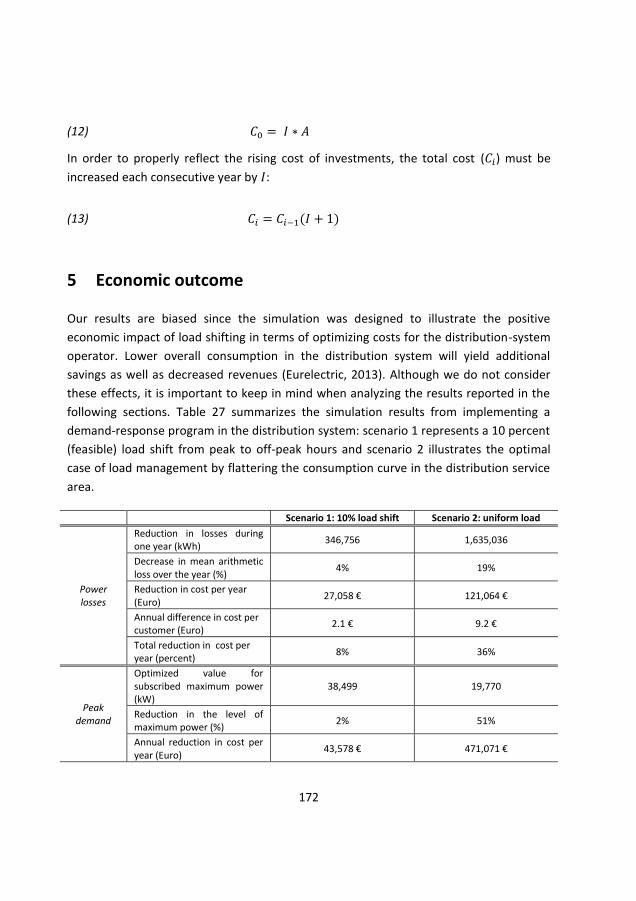
172
(12) 𝐶0 = 𝐼 ∗ 𝐴
In order to properly reflect the rising cost of investments, the total cost (𝐶𝑖) must be
increased each consecutive year by 𝐼:
(13) 𝐶𝑖 = 𝐶𝑖−1(𝐼 + 1)
5 Economic outcome
Our results are biased since the simulation was designed to illustrate the positive
economic impact of load shifting in terms of optimizing costs for the distribution-system
operator. Lower overall consumption in the distribution system will yield additional
savings as well as decreased revenues (Eurelectric, 2013). Although we do not consider
these effects, it is important to keep in mind when analyzing the results reported in the
following sections. Table 27 summarizes the simulation results from implementing a
demand-response program in the distribution system: scenario 1 represents a 10 percent
(feasible) load shift from peak to off-peak hours and scenario 2 illustrates the optimal
case of load management by flattering the consumption curve in the distribution service
area.
Scenario 1: 10% load shift Scenario 2: uniform load
Power losses
Reduction in losses during one year (kWh)
346,756 1,635,036
Decrease in mean arithmetic loss over the year (%)
4% 19%
Reduction in cost per year (Euro)
27,058 € 121,064 €
Annual difference in cost per customer (Euro)
2.1 € 9.2 €
Total reduction in cost per year (percent)
8% 36%
Peak demand
Optimized value for subscribed maximum power (kW)
38,499 19,770
Reduction in the level of maximum power (%)
2% 51%
Annual reduction in cost per year (Euro)
43,578 € 471,071 €
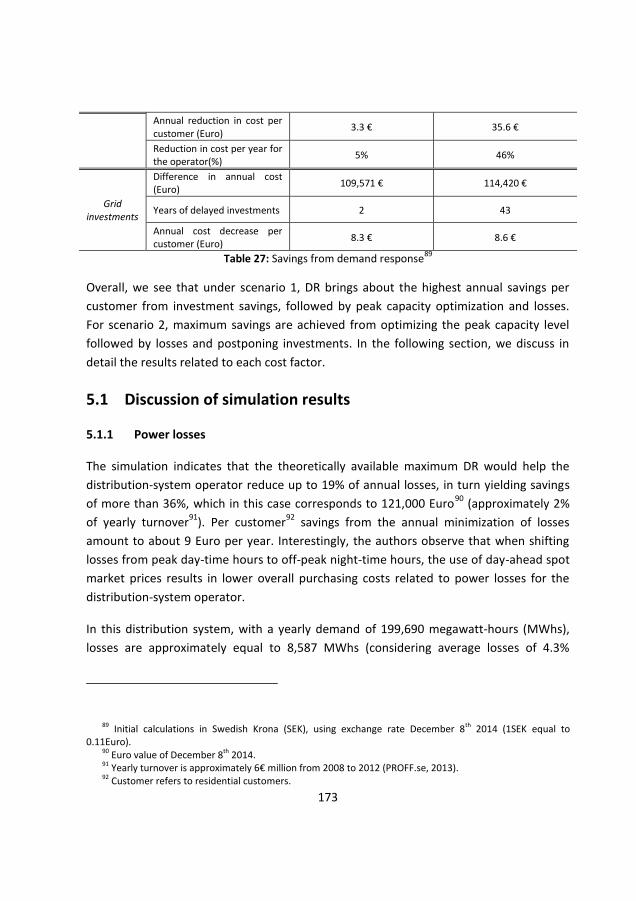
173
Annual reduction in cost per customer (Euro)
3.3 € 35.6 €
Reduction in cost per year for the operator(%)
5% 46%
Grid investments
Difference in annual cost (Euro)
109,571 € 114,420 €
Years of delayed investments 2 43
Annual cost decrease per customer (Euro)
8.3 € 8.6 €
Table 27: Savings from demand response89
Overall, we see that under scenario 1, DR brings about the highest annual savings per
customer from investment savings, followed by peak capacity optimization and losses.
For scenario 2, maximum savings are achieved from optimizing the peak capacity level
followed by losses and postponing investments. In the following section, we discuss in
detail the results related to each cost factor.
5.1 Discussion of simulation results
5.1.1 Power losses
The simulation indicates that the theoretically available maximum DR would help the
distribution-system operator reduce up to 19% of annual losses, in turn yielding savings
of more than 36%, which in this case corresponds to 121,000 Euro90
(approximately 2%
of yearly turnover91
). Per customer92
savings from the annual minimization of losses
amount to about 9 Euro per year. Interestingly, the authors observe that when shifting
losses from peak day-time hours to off-peak night-time hours, the use of day-ahead spot
market prices results in lower overall purchasing costs related to power losses for the
distribution-system operator.
In this distribution system, with a yearly demand of 199,690 megawatt-hours (MWhs),
losses are approximately equal to 8,587 MWhs (considering average losses of 4.3%
89 Initial calculations in Swedish Krona (SEK), using exchange rate December 8th 2014 (1SEK equal to 0.11Euro).
90 Euro value of December 8th 2014. 91 Yearly turnover is approximately 6€ million from 2008 to 2012 (PROFF.se, 2013). 92 Customer refers to residential customers.
174
mentioned above 4.2.1). When considering losses, savings can be achieved in different
orders of magnitude depending on the procurement pricing method: fixed ex-ante
contracting (no real time dynamics), day-ahead pricing, intraday pricing, and imbalance
pricing. Although real-time market transparency for procurement is optimal, current
regulation regards losses as non-controllable and these costs are passed to consumers,
which gives distribution-system operators have little incentive to seek the engagement of
consumers in demand-response programs.
In most European countries, the distribution-system operators are responsible for the
procurement of electricity for losses (e.g. Austria, Belgium, Switzerland, Germany,
Denmark, Estonia, Finland, France, Lithuania, Netherlands, Poland and Sweden);
otherwise, this responsibility falls to the electricity suppliers although this does not
necessarily mean that the distributors do not receive incentives with regard to losses
reductions (Eurelectric, 2013).
5.1.2 Peak loads
An optimal flattened load curve suggests that the subscribed level of power could
theoretically be decreased by a maximum of 51%, resulting in 46% cost savings and
corresponding to more than 471,000 Euro93 for the distribution-system operator. With a
10-percent load shift, the subscribed level of peak load can decrease by 2% and reduce
annual costs for the distribution-system operator by 5%. Since there is no guarantee of
end-user DR, capitalizing on this potential is still a high-risk endeavor. Even if DR is able
to reduce part of the load fluctuations, some peaks will still persist and those will
ultimately determine the costs related to the peak-capacity charge.
Peak demand has been and continues to be the main driver for network costs (Rodríguez
Ortega et al., 2008). In this way, distribution-system operators can ‘buy’ lower risk by
increasing their maximum level of subscribed power or promoting consumption flexibility
through demand-response programs. Hedging for risk of maximum subscribed power
implies the existence of an optimal level that will be different for each distribution-
system operator (considering regional, seasonal, monthly, weekly, and hourly variations).
93 Euro value of December 8th 2014.
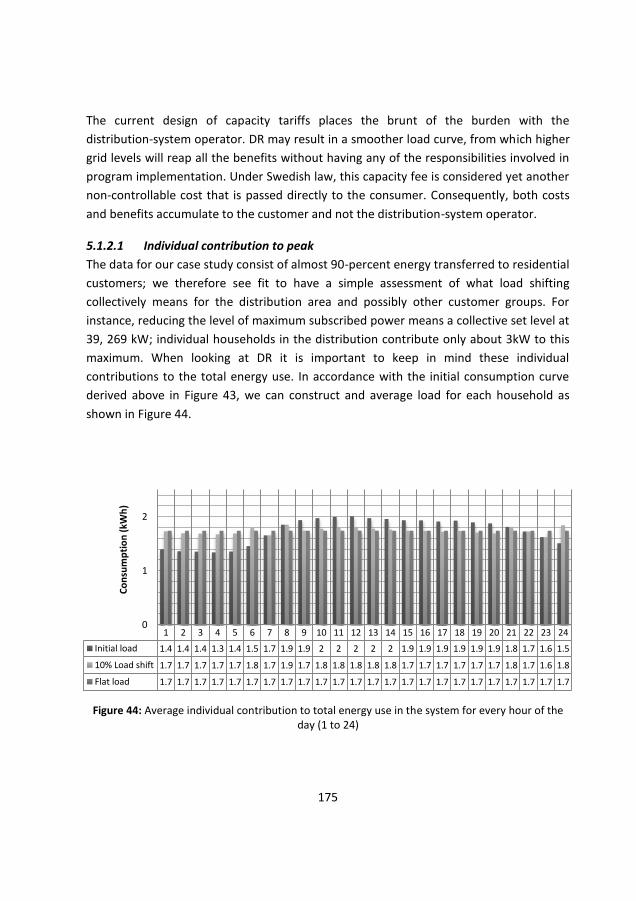
175
The current design of capacity tariffs places the brunt of the burden with the
distribution-system operator. DR may result in a smoother load curve, from which higher
grid levels will reap all the benefits without having any of the responsibilities involved in
program implementation. Under Swedish law, this capacity fee is considered yet another
non-controllable cost that is passed directly to the consumer. Consequently, both costs
and benefits accumulate to the customer and not the distribution-system operator.
5.1.2.1 Individual contribution to peak
The data for our case study consist of almost 90-percent energy transferred to residential
customers; we therefore see fit to have a simple assessment of what load shifting
collectively means for the distribution area and possibly other customer groups. For
instance, reducing the level of maximum subscribed power means a collective set level at
39, 269 kW; individual households in the distribution contribute only about 3kW to this
maximum. When looking at DR it is important to keep in mind these individual
contributions to the total energy use. In accordance with the initial consumption curve
derived above in Figure 43, we can construct and average load for each household as
shown in Figure 44.
Figure 44: Average individual contribution to total energy use in the system for every hour of the
day (1 to 24)
1 2 3 4 5 6 7 8 9 10 11 12 13 14 15 16 17 18 19 20 21 22 23 24
Initial load 1.4 1.4 1.4 1.3 1.4 1.5 1.7 1.9 1.9 2 2 2 2 2 1.9 1.9 1.9 1.9 1.9 1.9 1.8 1.7 1.6 1.5
10% Load shift 1.7 1.7 1.7 1.7 1.7 1.8 1.7 1.9 1.7 1.8 1.8 1.8 1.8 1.8 1.7 1.7 1.7 1.7 1.7 1.7 1.8 1.7 1.6 1.8
Flat load 1.7 1.7 1.7 1.7 1.7 1.7 1.7 1.7 1.7 1.7 1.7 1.7 1.7 1.7 1.7 1.7 1.7 1.7 1.7 1.7 1.7 1.7 1.7 1.7
0
1
2
Co
nsu
mp
tio
n (
kWh
)
176
Individual consumers have an average maximum hourly consumption of 2 kWhs at peak
hour and a minimum of 1.3 kWhs at an off-peak hour. The difference between the
maximum and minimum consumption is roughly equal to the displacement of a load of
laundry94
. With a 10 percent load shift, maximum average consumption is 1.8 kWhs with
a minimum of 1.6 kWhs, a difference roughly equal to heating 2 liters of water in a
kettle95
. These figures illustrate that on an individual basis, households have to do very
little to shift load from peak to off-peak hours. Key questions, though, are how important
is it for consumers to do things at a specific time and what appliances are they willing
and able to have controlled in order to comply with demand-response programs? With
visual aid from smart meters, in-home displays, and smart-phone applications, the set
level of power for the distribution system and individual contributions to the peak can be
communicated to end-users. Consumers can consciously decide to stay below the
threshold by manually choosing not to use certain appliances at communicated hours. In
order to not disturb comfort, household appliances can also be programed to
automatically respond to the distribution system needs at times of distress either
signaled by peaking conditions or congestion.
5.1.3 Grid investments
The relevance of the simulation for grid infrastructure investments is surrounded by the
most uncertainty, and yet is of most interest when considering optimal grid utilization
over the long term. Distribution-system operators face specific and changing needs that
are hard to plan for in advance (for example, which distributed generation technologies
will be favored by consumers or the penetration level of electric vehicles). Moreover,
distribution equipment has long lifecycles; as a result upgrades and re-investment needs
are difficult to forecast. On this basis, it is difficult to estimate with accuracy the expected
new investments and upgrades over the coming years. Delaying investments for 2 years
is a way of optimizing for short-term operational objectives (2.2.1). An investment delay
of 43 years allows the simulation to capture the cumulative long-term effects of optimal
operations. It was indicated that the average lifetime of distribution assets is at least 40
years (Sweco, 2010), with maintenance and upgrades needed over the lifetime but not
94 EU energy label A-rated gives an average consumption at 40°C using a 2kg load to be 0.63 kWh (Carbon Footprint, 2015).
95 A measure from ref. carbon footprint (Carbon Footprint, 2015).
177
necessarily replacement. A 43 year outlook with DR is an indication that equipment can
be used to its full lifetime without needing replacement.
Overall, the simulation shows that in the optimal case of DR, the grid could be designed
to cope with only half of the current demand, yielding nearly a one-third reduction in the
net present value of the current asset base. The simulations suggest that postponing
future investments over a period of 43 years can accumulate savings of greater than
117,000 Euro96
and 8.6 Euro97
per customer (with maximum shifting capability), whereas
a modest 10 percent DR over a period of 2 years still saves more than 109,000 Euro per
year for the distribution-system operator and 8.3 Euro per customer. Both scenarios
involving postponed investments display similar yearly savings potential for both the
distribution-system operator and customers. Such results further support a shift in focus
towards signals that impact peak load and losses, especially since grid investments are
directly affected by power losses and the maximum load levels reached. As pointed out
by Rodríguez-Ortega et al. (2008), operators’ incurred costs for covering power losses
are in the same order of magnitude as costs of grid investments. This means that if one
or both of these factors are targeted via demand-response programs, grid infrastructure
investments will be directly affected.
These quantified benefits can be captured by end-users upon implementation of a
demand-response mechanism. Currently in Sweden and most European countries,
regulatory periods span an average of 4 years for distribution-system operators, a short
time frame that may not allow consumers to realize financial savings during the same
period. One recommendation from a European perspective is to increase the regulatory
period to greater than 4 years (as is the case in the RIIO model of the UK, which allows
for an 8-year period) such that resulting benefits produced from smart-grid investments
and services are more associated to the regulatory period during which they are
implemented (Pérez-Arriaga et al., 2013).
96 Euro value of December 8th 2014. 97 Euro value of December 8th 2014.
178
6 Distribution smart-grid costs and demand response
As mentioned above, when it comes to quantifying the benefits of DR, the impact on
investments is uncertain. This uncertainty escalates when taking into consideration the
capital expenditure for investments in smart-grid equipment needed for the full
exploitation of demand-side flexibility. Using the Swedish case, we quantify some of
these costs for the distribution-system operator.
6.1 The smart-grid environment
Tariff design is concerned with the allocation of network costs and the stimulus of
appropriate incentives by establishing a process for determining who pays for what
services and how much (Rodríguez Ortega et al., 2008). Significant changes are expected
in the current Swedish regulatory model for the coming 2016 to 2019 period based on
the impact of distributed energy resources (Eurelectric, 2014). Capital expenditures will
see an initial temporary spike when accounting for future costs that incorporate vast
enabling technology. Returns on these investments will likely not be realized during a
short regulatory period, hence the consideration of long-term average costs as discussed
in section 2.2.1. Operational expenditures will also see an increase as a result of the new
roles and responsibilities of the distribution-system operator as a market facilitator in
smart-grid implementation (Pérez-Arriaga et al., 2013).
6.2 Costs for incorporating smart-grid upgrades
In order to stimulate DR in households it is important to install the necessary equipment
for such capability. For the distribution-system operator, this entails upgrades to the
current physical system, which is difficult to estimate due to the limited availability of
cost figures for intelligent infrastructure and the information and communication
technologies needed for DR (Prüggler, 2013). Considering calculations from Meisl et al.
(2012), costs for demand-response enabling infrastructure amount to about one
thousand Euro for a single household (which is about 5 times the calculated cost of the
smart meter rollout98
per household in Sweden). This five-fold difference in cost is a
98 The cost of smart-meter implementation in Sweden was approximately 200€ per household, resulting in a total implementation cost of approximately 1 to 1.5 billion Euro for the country. See Renner et al. (2011)
179
result of integrating information and communication technology, specifically a micro-grid
controller and sensors and actuators (Meisl et al., 2012; Prüggler, 2013). This estimate is
evenly divided in terms of smart-grid investments in the distribution-control aggregation
system and the installation of sensors and other software (both in the grid and
households). Meisl et al. (2012) also expect equipment maintenance costs at an average
50 Euro per household per year. In our simulation, the cost of an upgrade to a ‘smart-
grid’ system would be upwards of 13.2 million Euros, compared to a smart-meter rollout
cost of approximately 2.7 million Euros. To put these values in perspective, the smart-
grid investment is comparable to the current net worth of the distribution-system valued
at 14.5 million Euros. Essentially, the upgrade to a smart grid entails doubling of the
current asset base. Given this investment scale and associated technological risk, it is
understandable why Eurelectric (2014), emphasizes the role of predictable and stable of
regulation in attracting the necessary financial capital.
The truth of the matter is that upgrading a system smart-grid status increases overall
investments and therefore costs; this is a fact that regulation needs to embrace. Pursuing
the implementation of a time-of-use demand-response program at this stage allows for
savings to accrue in the coming years. Specifically, in Sweden where customers already
receive a separate bill for network charges (Eurelectric, 2013), this type of program may
prevail to incentivize customer load modification. It can be argued that separate billing
causes more confusion for end-users. In the case of countries like Sweden where such
billing practices are the norm, the existing system design can be used for the
proliferation of demand-response programs at the distribution level. Our case study
indicates that a modest DR of 10 percent at peak hours can be incentivized under present
conditions with little to no additional costs through a change in the tariff that provides a
time varying capacity charge to consumers. The accrued savings of almost 200 thousand
Euros99
yearly (see Table 27) can either go towards smart-grid investments or reduce
customer bills. Once the cloud of uncertainty over which type of smart-grid investments
should prevail in a specific system settles and costs are made more clear, appropriate
regulation will catch up, conventional investments will be displaced, thus reducing long
run capacity costs and enabling the effective integration of distributed energy resources
without compromising the quality of supply. Our proposed approach simply allows for an
http://www.wec-policies.enerdata.eu/Documents/cases-studies/Smart_Billing.pdf 99 Euro value of December 8th 2014.
180
incremental action to be taken in the short term until smart-grid practices become
further entrenched.
7 Conclusions and recommendations
Distribution-system operators will bear the brunt of investments needed as passive end-
users become active agents in both consumption and production. The stimulus of DR is
one way of curbing rising electricity costs. This study developed a way of analyzing and
quantifying the effects of a tariff- based demand-response program in this context. The
above taken approach can be adopted by other distribution-system operators and
regulators seeking insight into the economic benefits they can amass from the
implementation of a time-of-use capacity tariff.
Based on our analysis, it is evident that moving load from peak to off-peak hours has
several direct effects on distribution costs with different ranges of magnitude. In our
simulated case study, we assess power losses, peak loads, and grid investments under a
feasible 10 percent load shift scenario and an optimal scenario of a flattened distribution
load. The overall assessment indicates that decreasing peak consumption will reduce
overall costs both for the distribution-system operator and consumers since it directly
impacts about 75 percent of the cost drivers for an average European operator (see
Figure 40).
As mentioned earlier, due to their resistive nature, power losses increase proportionately
to power flow (load squared) and therefore both losses in the system and costs for
covering them will decline significantly when load is shifted from peak to off-peak hours.
Although losses in an average European distribution system account for approximately 5
percent of total distribution costs, optimizing can have other direct impacts. Losses
increase when the grid is operated closer to its maximum capacity when assets are not
used optimally. Specifically, operating the grid near its maximum capability on a long-
term basis will decrease the average lifetime of assets and equipment, in turn raising
investment costs which might otherwise be postponed or avoided. More certainty about
the utilization of grid allows for better forecasts in grid planning and therefore more
robust tariff design. A time-varying capacity-based tariff that promotes efficient use of
the grid is recommended. Moreover, pricing can also decrease the maximum subscribed

181
level of power to upper levels of the system while additionally minimizing the likelihood
of surpassing the set threshold.
The above simulation indicates that 10 percent DR at peak hours reduces the overall
level of maximum subscribed capacity by 2 percent and reduces the yearly costs of the
distribution-system operator by 5 percent. If all customers within the distribution area
were incentivized to collectively remain below a certain threshold, then further savings
can accrue. We recommend a simple way of approaching consumers collectively for
initial engagement and incremental smart-grid changes thereafter.
Incentivizing a flatter load via load shifting in the distribution level throughout the day
will affect the system overall (as residential demand is a quarter of the total demand in
most European countries). An initiative to smooth load via energy efficiency and load
shifting methods will lead to cost savings at the wholesale electricity level, which implies
lower procurement costs for suppliers, and savings in grid investment for the network
operator in terms of supply and network investments. At peak-demand times, potentially
more expensive generation is dispatched at higher wholesale generation prices. A more
uniform load throughout the day should yield lower costs and prices overall. Moreover,
as illustrated in the simulation, peak demand determines the amount of network
capacity that is required for both transmission and distribution.
Regulators have a daunting task in designing innovative remuneration schemes that
ensure the alignment of short-run operational and long-run investment and recovery
objectives. Our analysis on distribution costs recommends that variable capacity-based
tariffs are the proper approach to signaling the short-term status of the grid to end users
which in turn instigates load responsiveness that will yield long-term benefits in the form
of optimal use of grid assets.
Our study offers insight into quantifying the magnitude of economic benefits that can be
achieved with demand-response flexibility in the distribution system. The simulation
approach provides the first step in quantifying the considerable benefits that can be
gained from implementing a time-of-use demand-response program tailored to an
electricity distribution area.

182

183
Chapter 7 ~ The aggregator
in practice The previous chapters discussed the complexity of access, signal and release of
demand response flexibility. In order to have value for the system and
participating customers there is a need for appropriate coordination and
alignment of involved actors’ incentives; such a an assessment will be
conducted in this chapter on the basis of Hakvoort and Koliou (2015)100
.
1 Demand response and emerging problems to overcome
As it has been presented in the previous chapters, different actors want to take
advantage of the available customer flexibility. Through explicit and implicit programs
consumers will be given signals (price and rewards) for increasing, decreasing and
declining the participation in demand response (DR). Hence, the problems of
coordination and misalignment of actor incentives emerge. Although in the following
sections the problems are discusses separately, it is important to note that they are not
mutually exclusive and are interdependent.
1.1 Coordination
The coordination problem arises when dealing with the signaling of a DR program and
the way in which customers react and prioritize response in line with the five value
propositions (Abdul Muhaimin, 2015; Koliou et al., 2015a, 2015b):
1. Balance responsible party (BRP) and supplier portfolio optimization
through a reduction of imbalance costs. With confidence in the provision
100 Hakvoort, R.A., Koliou, E., 2015. Energy Management and Demand Side Response, in: U.C. Sharma et Al., Energy Management, Energy Science and Technology Series. Studium Press LLC, USA, pp. 53–97.
184
of demand response, energy suppliers can better procure the purchase of
electricity. Large suppliers may also be BRPs for themselves and others.
Regardless of being retailers or not, BRPs are in charge of observing power
balance for those which they carry balance responsibility. Having access to
demand response flexibility gives them significant leverage in the
optimization of their imbalance position with the system operator. Portfolio
optimization is critical since all costs are passed down to end users.
2. Balancing market trading participation. The balancing mechanism is
regarded as the most profitable when compared to day-ahead and intra-
day markets since it corresponds to higher prices. On account of market
design specifications, aggregated demand response is best suited to
participate in the secondary reserves.
3. Trading in the spot markets (day-ahead and intra-day) can be done for
both consumption and production flexibility. Such trade will allow for
aggregated demand response to participate on equal footing with
generators.
4. Congestion management for the transmission system operator (TSO). This
value proposition is more relevant for large industrial users connected to
the high voltage grid.
5. Congestion management and voltage control for the distribution system
operator (DSO). As a system operator, the DSO has to maintain a certain
quality of service to the users in the distribution grid. Demand response can
be a tool for managing injections and withdrawals from the distribution
network. This value proposition will become increasingly valuable in future
smart grid context incorporating an array of distributed energy resources.
In principle, Hakvoort and Koliou (2015) point out that there are nine possible mitigation
strategies to the coordination problem (illustrated schematically in Figure 45 where the
arrow is pointing to the party selling the flexibility); in which arrangements for access to
flexibility can be made either by the supplier or independent aggregator in order to meet
these five objectives. The methods are described in detail in Table 33 in the Appendix.
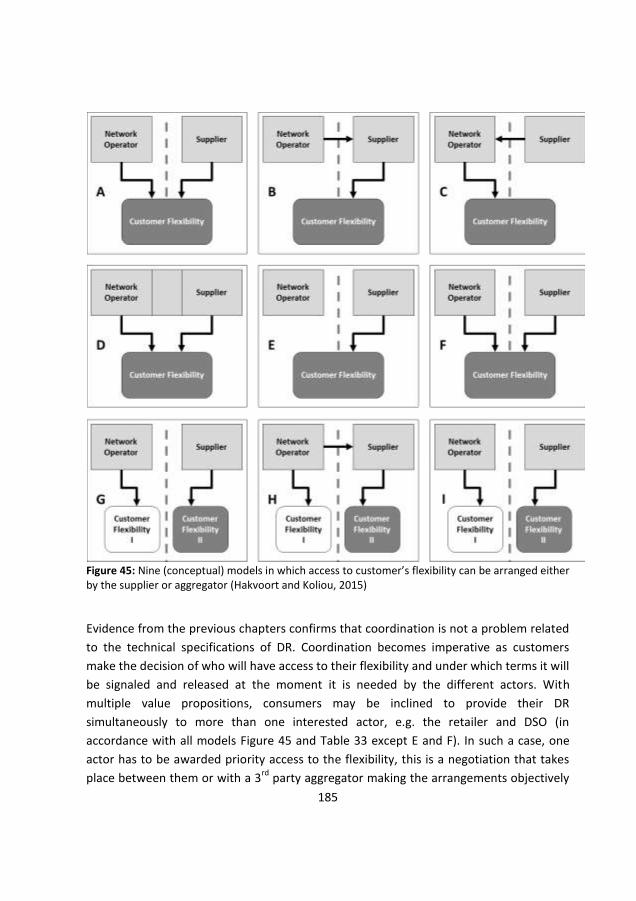
185
Figure 45: Nine (conceptual) models in which access to customer’s flexibility can be arranged either by the supplier or aggregator (Hakvoort and Koliou, 2015)
Evidence from the previous chapters confirms that coordination is not a problem related
to the technical specifications of DR. Coordination becomes imperative as customers
make the decision of who will have access to their flexibility and under which terms it will
be signaled and released at the moment it is needed by the different actors. With
multiple value propositions, consumers may be inclined to provide their DR
simultaneously to more than one interested actor, e.g. the retailer and DSO (in
accordance with all models Figure 45 and Table 33 except E and F). In such a case, one
actor has to be awarded priority access to the flexibility, this is a negotiation that takes
place between them or with a 3rd
party aggregator making the arrangements objectively
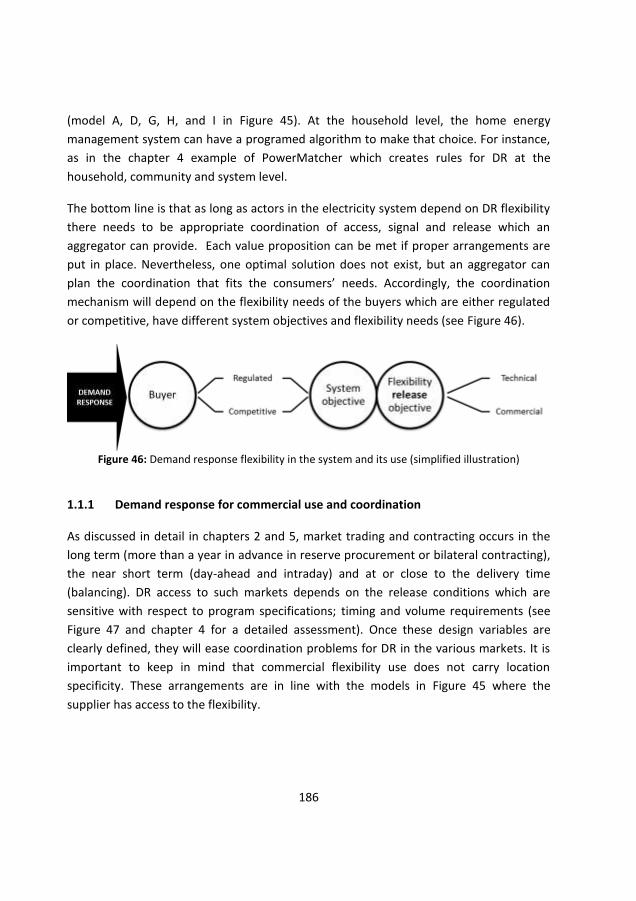
186
(model A, D, G, H, and I in Figure 45). At the household level, the home energy
management system can have a programed algorithm to make that choice. For instance,
as in the chapter 4 example of PowerMatcher which creates rules for DR at the
household, community and system level.
The bottom line is that as long as actors in the electricity system depend on DR flexibility
there needs to be appropriate coordination of access, signal and release which an
aggregator can provide. Each value proposition can be met if proper arrangements are
put in place. Nevertheless, one optimal solution does not exist, but an aggregator can
plan the coordination that fits the consumers’ needs. Accordingly, the coordination
mechanism will depend on the flexibility needs of the buyers which are either regulated
or competitive, have different system objectives and flexibility needs (see Figure 46).
Figure 46: Demand response flexibility in the system and its use (simplified illustration)
1.1.1 Demand response for commercial use and coordination
As discussed in detail in chapters 2 and 5, market trading and contracting occurs in the
long term (more than a year in advance in reserve procurement or bilateral contracting),
the near short term (day-ahead and intraday) and at or close to the delivery time
(balancing). DR access to such markets depends on the release conditions which are
sensitive with respect to program specifications; timing and volume requirements (see
Figure 47 and chapter 4 for a detailed assessment). Once these design variables are
clearly defined, they will ease coordination problems for DR in the various markets. It is
important to keep in mind that commercial flexibility use does not carry location
specificity. These arrangements are in line with the models in Figure 45 where the
supplier has access to the flexibility.
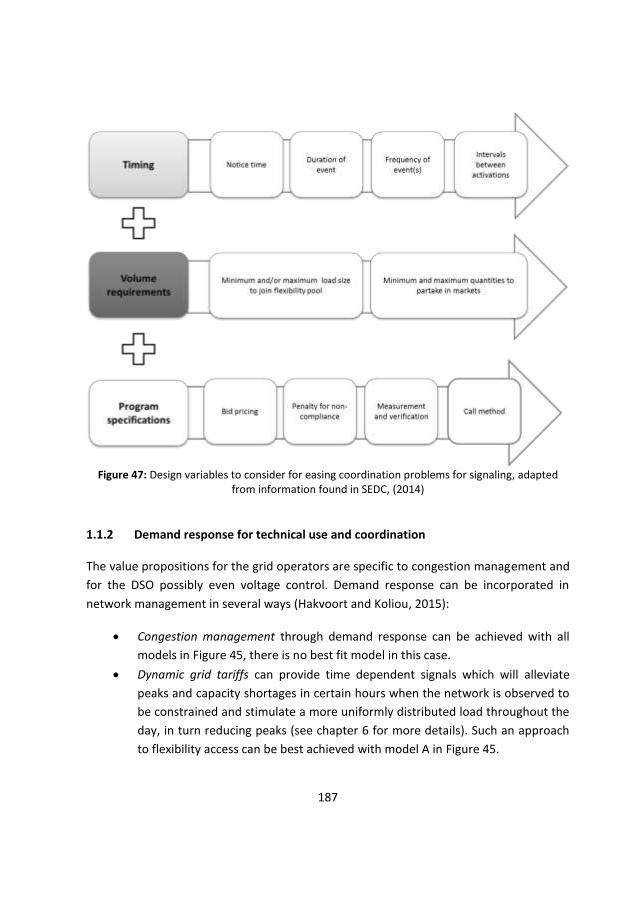
187
Figure 47: Design variables to consider for easing coordination problems for signaling, adapted
from information found in SEDC, (2014)
1.1.2 Demand response for technical use and coordination
The value propositions for the grid operators are specific to congestion management and
for the DSO possibly even voltage control. Demand response can be incorporated in
network management in several ways (Hakvoort and Koliou, 2015):
Congestion management through demand response can be achieved with all
models in Figure 45, there is no best fit model in this case.
Dynamic grid tariffs can provide time dependent signals which will alleviate
peaks and capacity shortages in certain hours when the network is observed to
be constrained and stimulate a more uniformly distributed load throughout the
day, in turn reducing peaks (see chapter 6 for more details). Such an approach
to flexibility access can be best achieved with model A in Figure 45.
188
Grid operators can offer interruptible/curtailable load contracts along with
suppliers; in these contracts it can be made explicit that the grid operator has
priority access to the flexibility as with model C in Figure 45.
Network operators can refuse the transport to specific consumers. Such a
mechanism can only work if it is implemented on the basis of objective criteria
and properly communicated to the customer with an appropriate financial
compensation provided. This can be achieved with model F in Figure 45.
An aggregator can communicate the program in place to other market parties in order to
allow for optimal coordination between commercial and technical signals that do not
impede nor oppose each other.
1.2 Split incentives
The implementation of demand-response programs brings about benefits but also extra
costs for the parties involved which are not equally distributed; costs sometimes fall with
one party while the benefits accrue with another. Such allocation inhibits the further
integration of DR flexibility and is called the split-incentives problem which plays on many
levels of electricity system.
1.2.1 Issues on different levels
1.2.1.1 Suppliers, consumers and network operators
As mentioned in chapter 4, the supplier business model depends on selling kWhs to their
consumers in turn questioning if suppliers are in the best position to provide a menu of
DR options that will be appropriately profitable for the end user. Furthermore, suppliers
provide market related signals to customers which are not always in line with the status
of the grid therefore giving rise to the question of grid versus market signaling: which
should have priority and how can this incentive differentiation be communicated to
consumers providing flexibility? These incentive issues are heavily interrelated to
coordination and can be overcome with transparent arrangements possibly made by the
aggregator as a neutral facilitator.
1.2.1.2 Micro-generation from small users
At a lower system level, households are increasingly investing in own micro-generation
(mostly solar photovoltaic (PV) systems). Ultimately, micro-generation may result in
higher overall costs for the supplier since he has to hedge for providing electricity when
189
solar generation is insufficient to meet demand in the system (Hakvoort and Koliou,
2015). Furthermore, system imbalances may increase due to the volatility of both supply
and demand, in turn worsening the position of BRPs and suppliers. Grid operators in
turn, will need to cope with bi-directional power flow and re-evaluate their investments
in terms of the peak system demand and losses incurred.
Eid et al. (2014) conclude that the remuneration scheme for end users with micro-
generation presents an important dilemma between incentivizing the proliferation of
distributed renewable generation and securing the distribution system operators’
financial stability, especially because of the prevailing net metering arrangements.
Through the current netting mechanisms consumers get financial benefits. By consuming
their own production end-users evade network charges and energy taxes101
. Consumers
who do not have solar panels still bear the costs of renewable support schemes, value
added tax etc., while those without bypass them. To illustrate, let us take the example of
the Dutch netting mechanism Salderingsregeling.
According to Salderingsregeling, if a household consumer generates electricity from
renewable sources for own consumption or delivery back to the grid, the total energy
produced and supplied back to the system is subtracted from the total consumption in
the energy bill (in accordance with the meter reading) (Autoriteit Consument and Markt,
2015). The caveats in the regulation state that (i) there is a limit i.e. a netting boundary
(salderingsgrens) and (ii) that electricity that is supplied back into the grid must be fed
through the same line as the one through which the consumer receives electricity from
the larger system (i.e. you cannot feed excess electricity to your neighbor). Each
consumer has a different netting boundary which is equal to the total energy supplied to
the customer from the system. If a consumer feeds more electricity into the grid then his
netting limit, then the supplier pays a feed-in- tariff for the energy to the consumer. If
net consumption is more than what is fed back into the grid then the consumer pays that
amount to the energy supplier (inclusive of energy and network charges). If production is
more than the contracted consumption the consumer is paid the feed-in tariff for the
excess production. The boundary limit along with the bypassing of charges provide
101Energy taxes corresponding to over 30% (on average) of the electricity bill in Europe calculated as a fixed percentage of energy delivered by suppliers to consumers (EC, 2014), for a more in depth analysis see chapter 3, section 2.1.
190
misleading incentives for the adoption of micro-generation and should therefore be re-
evaluated (Abdul Muhaimin, 2015).
1.2.1.3 Perverse incentives
The main focus of DR tends to remain with load shifting in order to minimize peaks both
in the market and network, but such a concentration on one facet can lead to severe
perverse effects for the system. Torriti (2012) points to the case of implementing a
mandatory time-of-use tariff in Italy where the intended overall peak load shifting was
achieved but with some perverse affects. The total energy bill of customers decreased
while the total energy consumption increased by about 13%, in turn creating new system
peaks and large shoulders.
It may very well be the case that customers decide to completely opt out of any and all
demand response programs that are offered to them. In such a case end-users do not
incur any costs but nevertheless experience benefits directly from the measures taken by
other parties in the system.
1.2.2 Correcting the split incentives problem
Issues arising from split incentives can be mitigated with the appropriate design of
arrangements so that benefits lie with the parties involved in realizing the implantation
of DR. The fact is some parties bare relatively high costs while others have relatively high
benefits and mutual financial compensation is not easily agreed upon. Designing any
mechanism in a smart grid environment with a multitude of players involved that do not
share the same goal is no easy task. This is where an aggregator can play a critical role as
a facilitator, illustrated schematically in Figure 48 (Hakvoort and Koliou, 2015):
Suppliers can directly transfer benefits to their customers through reduced fixed
tariffs, dynamic tariffs or even individually tailored tariffs. Otherwise, 3rd
party
aggregators can provide the menu of options from suppliers to consumers and
in this way define a contract with consumers.
Network operators can directly pass he benefits of DR to consumers through a
network tariff. Consumers can opt for a dynamic grid tariffs (see chapter 6 for
details) or decide on other specifications for providing flexibility. Although
flexibility provision arrangements can be done directly between the customer
and network operator, an aggregator can step in and make the necessary
contractual agreement.
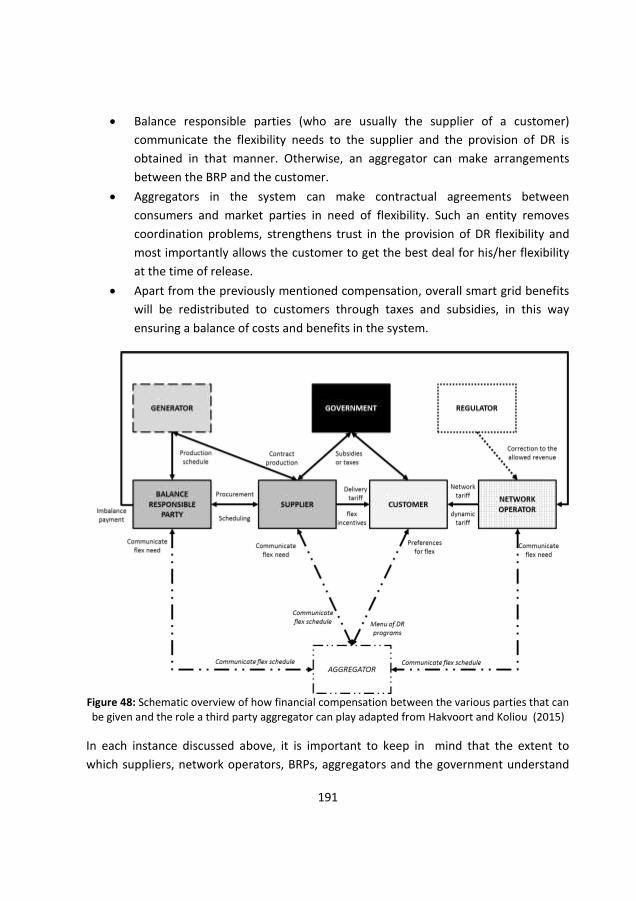
191
Balance responsible parties (who are usually the supplier of a customer)
communicate the flexibility needs to the supplier and the provision of DR is
obtained in that manner. Otherwise, an aggregator can make arrangements
between the BRP and the customer.
Aggregators in the system can make contractual agreements between
consumers and market parties in need of flexibility. Such an entity removes
coordination problems, strengthens trust in the provision of DR flexibility and
most importantly allows the customer to get the best deal for his/her flexibility
at the time of release.
Apart from the previously mentioned compensation, overall smart grid benefits
will be redistributed to customers through taxes and subsidies, in this way
ensuring a balance of costs and benefits in the system.
Figure 48: Schematic overview of how financial compensation between the various parties that can be given and the role a third party aggregator can play adapted from Hakvoort and Koliou (2015)
In each instance discussed above, it is important to keep in mind that the extent to
which suppliers, network operators, BRPs, aggregators and the government understand

192
the costs and benefits to the whole system and to all other actors is critical in
determining exactly what component from the benefits can be passed on to the
consumers (Hakvoort and Koliou, 2015). Again, this is why the role of the aggregator is
emphasized, since he acts as a neutral organizer and implementer seeking to get the best
‘contract’ for the flexibility of the customers because that is the only way he will make a
profit as well. Hence, the interests of the aggregator are more aligned with the consumer
than other parties in the system.
2 Aggregator models in practice
In previous sections aggregators have been discussed in terms of what they can achieve.
It is important to note that on the industry side of things certain models are already
implemented while other are in the development phase taking note of best practices
along the way. Below follows a summary on successful aggregators practicing in the
European market along with a discussion on a framework developed for operating a fully
functional flexible European energy system.
2.1 Successful aggregators
2.1.1 Energy Pool
Energy Pool102
is a demand response service provider working mostly in France with
operations in Belgium, United Kingdom, Norway, South Korea and Japan (Chamoy, 2015).
The aggregator identifies a flexibility margin for large-scale end users, and on a process
by process basis coordinates their participation in electricity markets through their
network operations centers. Current customers include cement factories, paper mills,
steel works, food processing facilities, hospitals and cold storage facilities. These
customers are spread out across and thus do are not geographically bound. Profit is
generated from end-user participation in the aggregate energy pool resources which are
optimized for participation in markets through: (i) load curtailment at peak hours or grid
constrained instances and; (ii) load stimulation to increase consumption at off-peak
hours. Customer remuneration is achieved either via a fixed rate per MW that is available
102 http://www.energy-pool.eu/en
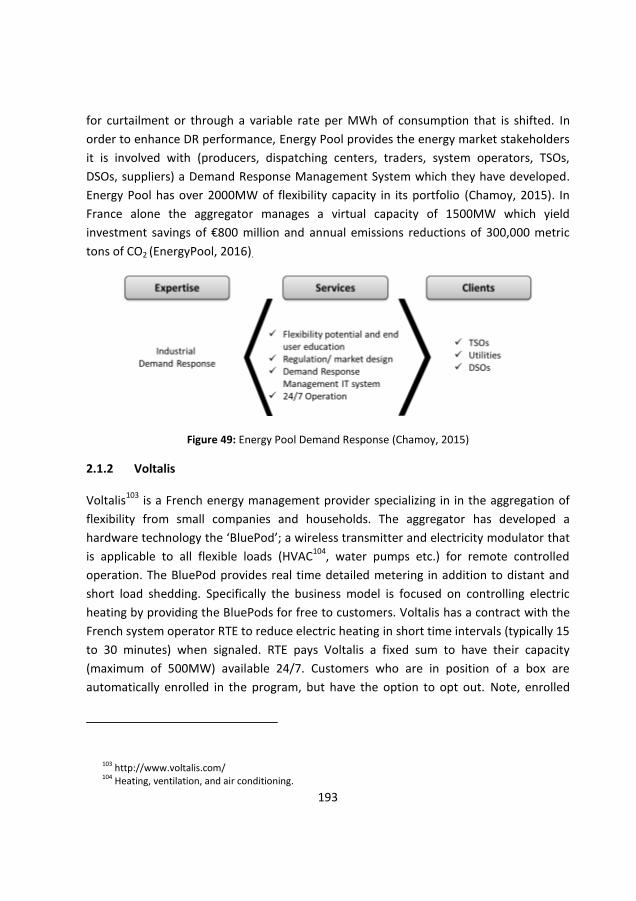
193
for curtailment or through a variable rate per MWh of consumption that is shifted. In
order to enhance DR performance, Energy Pool provides the energy market stakeholders
it is involved with (producers, dispatching centers, traders, system operators, TSOs,
DSOs, suppliers) a Demand Response Management System which they have developed.
Energy Pool has over 2000MW of flexibility capacity in its portfolio (Chamoy, 2015). In
France alone the aggregator manages a virtual capacity of 1500MW which yield
investment savings of €800 million and annual emissions reductions of 300,000 metric
tons of CO2 (EnergyPool, 2016).
Figure 49: Energy Pool Demand Response (Chamoy, 2015)
2.1.2 Voltalis
Voltalis103
is a French energy management provider specializing in in the aggregation of
flexibility from small companies and households. The aggregator has developed a
hardware technology the ‘BluePod’; a wireless transmitter and electricity modulator that
is applicable to all flexible loads (HVAC104
, water pumps etc.) for remote controlled
operation. The BluePod provides real time detailed metering in addition to distant and
short load shedding. Specifically the business model is focused on controlling electric
heating by providing the BluePods for free to customers. Voltalis has a contract with the
French system operator RTE to reduce electric heating in short time intervals (typically 15
to 30 minutes) when signaled. RTE pays Voltalis a fixed sum to have their capacity
(maximum of 500MW) available 24/7. Customers who are in position of a box are
automatically enrolled in the program, but have the option to opt out. Note, enrolled
103 http://www.voltalis.com/ 104 Heating, ventilation, and air conditioning.
194
customers do not receive a financial compensation every time their load is modified;
rather they see a reduction in their overall electricity bill as a result of these interruptions
(Bivas, 2015; Voltalis, 2016). This aggregator approach has a direct benefit for the
consumers on their monthly electricity bill and even greater benefits for the system in
the short and long term. In the short term it helps manage grid constraints and reduces
the need for peaking expensive generation while in the long term it deters investment in
both network and generation.
2.2 A European demand response framework
Although there is a lot of interest in demand response flexibility, there is still a need for
the development of market models for appropriate incorporation and value extraction.
The Universal Smart Energy Framework (USEF) is attempting just that with definitions on
roles and responsibilities, process flows and information flows. USEF was founded in
2013 by seven key European market players105
who are active across the smart energy
value chain. As part of the European Smart Grid Task Force Expert Group 3 on the
establishment regulatory recommendations for smart grid deployment, USEF provides
an extended market model revolving around the use of locational energy flexibility. USEF
recognizes that small business and residential consumer flexibility has value when
aggregated; this value can be monetized by an aggregator who is responsible for buying
and selling. Essentially, the framework delivers a common standard for delivering a smart
energy future by defining each stakeholder roles in the energy market, how they interact
and how they can benefit from exchanges (USEF, 2016). This framework is an attempt
towards defining a European approach to aggregation that fits on top of existing market
models.
3 Demand response and the greater system perspective
Bossart and Giordano (2012) point to the coordination and split incentives problems as
inhibiting factors in achieving the expected social value of smart grids. Demand response
is a tool for achieving decarbonization of the electricity sector for climate change
105 ABB, Alliander, DNV-GL, Essent, IBM, ICT Automation, Stedin
195
mitigation and will ultimately bring about affordability for the present and future
consumer energy costs.
3.1 The actual impact of small end-user demand response
The European Union 2030 targets include increasing the share of renewable electricity
production to at least 27% of total consumption in each member state and decrease
emissions by 40% when compared to 1990 levels. In chapter 3 it was concluded that
optimal levels of PV and electric vehicle integration peak between 700,000 and 1 million.
Once again using the Netherlands as an example, where in 2014 decentralized106
generation was approximately 30 TWh107
(CBS Statistics Netherlands, 2015), less than 1
million PVs yield a maximum production that is less than 1 TWh at midday. Such figures
indicate that small consumers will have little impact on achieving the European headline
for renewable energy resource integration (Abdul Muhaimin, 2015).
3.2 The impact of storage, ‘more grid’ and grid defection
Electricity storage is considered to be a complementary (and maybe even a substitution)
to DR for absorbing fluctuations from renewable generation and in turn enhancing
flexibility on all system levels. On upper levels of the gird, storage can absorb excess RES
production and make a profit by participating in both the spot and balancing markets. On
a local level similar absorption and release can be achieved, especially through the use of
electric vehicles and batteries. Note, when considering the installed capacity of storage
value decreases as the size of the storage system increases; cost reduction in the system
resulting from storage is shared by more kW of installed capacity. Overall, storage can
reduce the cost of the system, all while generating profit for the storage operator.
Depending on the merit order of generation in a system, storage may result in the
increase of CO2 emissions from electricity production, which goes against the European
climate and energy targets (Mavrokapnidou et al., 2015).
Mavrokapnidou et al. (2015) also find that the value of storage decreases slightly when
more ‘grid enters’ they system, but overall system costs decline very little. Therefore,
106 Sources include thermal power plants which deliver to an industrial grid or to the medium and low voltage grid in addition to all production of electricity by wind energy, hydro and solar energy. 107 Terawatt-hour
196
‘more grid’ for the larger system mainly acts as a substitute for storage and not as a
complement for improving the economic performance of the system. DR and ‘more grid’
experience a similar interplay. For instance, ‘more gird’ at the transmission an
distribution level diminish the need for DR in 2 out of the 5 value propositions.
Moreover, Mavrokapnidou et al. (2015) point to (depending on the generation mix and
hence merit order) storage increasing emissions while ‘more grid’ keeps emmisisons at
current levels.
The majority of the analysis has focused the discussion on DR to the larger system, to
which connection proves to be costly in itself. A recent study from the United States
Rocky Mountain Institute (Bronski et al., 2014) outlines a detailed analysis on grid
defection using storage in conjunction with micro-generation from PV systems. The study
suggest that PV together with storage can make the electric grid an ‘option’ without
compromising the reliability and even produces a lower electricity price than the current
retail price.
4 Remarks
The success of DR depends on the active participation and appropriate coordination of all
relevant parties, hence giving rise to a need for a common framework. Because of the
array of split incentives between parties, barriers arise which inhibit and even prevent
implementation. Problems with coordination and split incentives are prevalent in the
wide spectrum of distributed energy resource solutions that will need harmonization in
the smart grid. A third party which is deemed the ‘aggregator’ can aid in alleviating
arising problems and improve the transparency in the system processes.
The majority of the analysis in this work has been done based on the current system
perspective and the flexibility that small consumers can provide with the possibility of
creating added value for individuals and the system. But it is also important to consider
other aspects, inclusive of alternatives in this assessment in accordance with innovation
to support sustainability and value creation that can accrue for the system and actors.

197
198
Chapter 8 ~ Conclusions
and recommendations The aim of this final chapter is to provide a summary of findings and research
contributions of demand response implementation in the evolving smart grid
paradigm. Recommendations are made for aggregation services, market
design, tariffs, policy and regulation in addition to providing suggestions for
future research.
1 Conclusions and answers to research questions
Although interest in demand response research has seen a surge in recent years, it is
important to note that the implementation of such mechanisms is not a byproduct of the
smart grid shift. Rather, the development of information and communication technology
has made the application of demand response mechanisms a possibility on a superior
scale than ever before. Investigating demand response from small end-users in this work
is motivated by the growing interest of policymakers to have active end-user
participation in a system where households have traditionally remained passive.
It is clearly communicated that demand response proliferation is an inevitable and vital
component to achieving the European climate policy objectives and targets in emerging
smart grid systems. This work provides: insight into the complexity of market
arrangements for the eligibility of demand response to participate in various short term
electricity markets; an examination and breakdown of the roles and responsibilities of
existing and newly emerging market players and; recommendations on the fair allocation
of costs and benefits amongst the various (smart grid) stakeholders. As a result, the
following research question is answered: How can end-user consumption flexibility be
promoted successfully through demand response methods in a smart grid?

199
End-user demand response flexibility will have value for the system and added value to
the individual customer when implemented through the various demand response
programs.
Price-based demand response
Dynamic pricing is aimed at improving the overall efficiency of system operation and
reducing demand at peaking hours. Load responsiveness will also serve to alleviate
incremental costs of investment in capacity for both generation and the grid, in turn
yielding both direct and indirect benefits for all parties in the electricity value chain. For
households, time varying tariffs encourage load shifting but do not necessarily aim to
induce overall load reduction. Price-based mechanisms are offering an opportunity to
save money and gain insight into own electricity costs resulting from their consumption
patterns.
The brunt of attention in demand response focuses on electricity market prices. Fact is
that prices for households are relatively low and may not be the right incentive for
promoting an active demand side. The final spending on electricity for the average
household is a small percentage of total expenses. Findings indicate that demand
response may only save cents per day for an average consumer. Larger savings are in
store with automated response, which is currently not a mass market solution. From this
work it is concluded that the promotion of real-time pricing is not the optimal savings
choice for a customer. Even with automation, savings are not significant enough to offset
the investments in technology that are needed. From this work (and in agreement with
other research in the field) it is determined that time-of-use tariffs derived from prices in
the day-ahead market are the current advised approach to dynamic pricing for end-
users.
Price-based demand response mechanisms are low cost means of offering load
management services to all European households through the retail electricity contract.
Especially with time-of-use pricing variations (including critical-peak pricing), price-based
demand response can be integrated with different levels of complexity under current
system conditions, with or without smart metering and other embedded information and
communication technology.
Similarly, a price-based demand response can also be signaled through the distribution
tariff, in turn incentivizing an overall flatter load throughout the day in the distribution
area. Specifically, the analysis conducted on distribution costs endorses that a variable

200
capacity-based time-of-use tariff is a way of signaling the short-term status of the grid to
end-users. Such a tariff instigates load responsiveness that can also yield long-term
benefits resulting from the optimal use of grid assets. Specifically, shifting load from peak
to off-peak hours has several direct effects on distribution costs in terms of peak load
alleviation, loss reduction and postponement of investments. The reduced peaking
consumption will decrease overall costs for the distribution-system operator and
consumers. Demand response can have a direct impact on approximately 75 percent of
the cost drivers for an average European distribution grid operator.
Volume-based demand response
Volume-based demand response needs aggregation for participating in the various
electricity markets, in addition to being eligible as system support service to grid
operators. In the current European system, gaining access to markets is not a simple nor
cheap task and the resulting revenues with the small trading volumes of aggregated end-
user load are low to nearly none. Flexibility aggregators have strict rules and
commitment requirements to abide by that are inherently in place for large industrial
and commercial parties. The existing market procedures do not address the program
specifications, volume and time requirements of aggregated flexibility to be an eligible
and competitive product/service.
Hesitation on the aptness of aggregated flexibility is in many ways a consequence of the
vagueness surrounding the party which will be the aggregator. In the current European
context, where liberalization prompts market based-solutions, it is expected that
aggregators will be competitive market parties. Thus, aggregators can be independent
third parties or retailers with flexibility as an additional service. The way in which each
aggregator will provide services varies.
Independent aggregators can have a first mover advantage in the market for end-user
flexibility aggregation, occupying a specific portion of customers with larger flexible loads
such as electric vehicles and solar photovoltaics. Specifically, independent aggregators
may gain from community level aggregation. Results indicate that revenues from trading
small volumes which meet the minimum requirements are near null. Independent
aggregators cannot survive if their business depends exclusively on trading in the short
term electricity markets.
The trading of demand response by an independent aggregator in the day-ahead, intra-
day and balancing markets brings to light a vital concern of ownership of demand
201
response, the “good”. A third party (that is not the retailer) contracts demand response
flexibility from the consumer which is then aimed for trade, and herein lies the problem.
In fact the neither the third party aggregator nor the consumer own the energy “good”
they are trading since neither of them has purchased it yet.
The purchase of energy happens in real time; electricity is owned by the supplier and it is
not until the point of consumption that it is owned by the consumer. Both consumers
and third party aggregators are actually trading a good they do not own. Retailers are the
ones who forecast demand for their customers and then purchase and schedule a certain
amount of energy for each. Moreover, suppliers take on balance responsibility for their
contracted customers. With the trade of demand response, aggregators are generating
schedule disruptions for suppliers and appointed balance responsible parties. The change
in forecasted schedules of balance responsible parties and suppliers results in real time
balancing activation and overall financial penalizations for deviations.
Demand response participation in the markets can only be achieved through transparent
arrangements instigating mutual cooperation between balance responsible parties,
retailers and aggregators. It is expected that aggregators will lead the demand response
flexibility movement, but it is the regulators holding the keys to both birth and
sustainability of demand side activation and integration.
On the one hand, appointing the retailer as an aggregator is a way to avoid scheduling
disruptions from demand response flexibility trade. On the other hand, a supplier’s
business model depends on selling more kilowatt-hours which complicates the incentives
for promoting volume-based demand response. Practically speaking, retailers are in the
best position to become aggregators for end-user flexibility. When considering
participation in the various electricity markets retailers have an existing customer base,
they carry balance responsibility for their contracted customers in addition to having
established market access and financial stability.
An analysis of the balancing mechanism points to the frequency restoration reserves
market as a profitable platform for aggregators to explore. Demand response activation
for balancing is undermined by the vagueness in the balancing specifications for: (i)
balance responsibility of an aggregator; (ii) balance service provision specifications of
procurement and activation and; (iii) imbalance settlement.
202
Balance responsibility is required for all connected users in the grid; retailers appoint a
balance responsible party for their contracted customers. Independent aggregators do
not yet carry balance responsibility nor do they have a contract with a balance
responsible party. For the trade of aggregated demand response flexibility, no clear
guidelines exist in the retailer, balance responsible party and independent aggregator
relationship. Such ambiguity complicates the provision of aggregated flexibility,
especially when considering the long planning periods for reserves procurement and
activation. Overall, there needs to be trust in the use aggregated flexibility which can
only occur through proper monitoring for final imbalance settlement payments to take
place.
2 Recommendations
Policymakers are urged to take into consideration that the smart grid paradigm proposes
a radical transformation to a system that already works quite well when it comes to
matching supply and demand (both physically and economically). Incremental steps to
achieving this transformation are advised, in this way best practices can be deduced
along the way. The following recommendations are derived from this research for the
implementation of demand response.
Aggregation and aggregators
The application of demand response is an inherently complex process on account of the
multitude of actors involved for the access, signaling and release of flexibility. In both
price-based and volume-based solutions facilitation is key to smoothing the process,
hence the emergence of aggregators. Retailers have an easier transition into the
aggregator role, but nonetheless have self-interests that do not align with those of
maximizing demand response value for customers. Regulators need to assure retailer-
aggregators are acting in the best interest of the customers; providing end-users with a
full menu of load management options, not just ones that serve the retailers best
interest for portfolio optimization.
The objectives of independent aggregators are more transparent and in line with those
of the customers, but nevertheless third parties face obstacles when integrating into an
electricity system that is dominated by few large players. If the market is to work
properly, it is advised that national regulatory bodies lead the way in the next phase by

203
consolidating the issue of flexibility ownership, starting with a mandate for aggregators
to carry balance responsibility. This will allow for transparency in the demand response
processes for the market parties involved and minimization of overall costs of
unforeseen imbalances. In turn, trust is ensured in the services independent aggregators
are providing.
Independent aggregators do not have the market share nor experience which suppliers
possess. In order to ensure long-run success in the competitive electricity market, third
party aggregators need to cultivate a more sophisticated business model which
comprises of more than flexibility trade. Business opportunities need to be innovative,
new and not already provided by a supplier. New business opportunities can come in the
form of data services and analytics, e.g. consulting customers on technology investment,
supplier choice and contract options.
Market design
Existing market instruments for the provision of flexibility services have been drafted in a
context without load bundling and a large focus on generation side resources. In order to
value demand response on equal footing as traditional services, some recommendations
are derived for market integration into the balancing mechanism.
Notably, availability and activation of balancing services is directly dependent on the
procurement schemes. For an aggregator, shorter planning periods would decrease
forecasting error and in turn associated non-compliance penalties. Participation in the
balancing mechanism is also subject to rigid minimum capacity units for admittance in
addition to fixed bidding intervals. Regulators and system operators should re-visit these
strict requirements and allow for aggregated capacity to meet such conditions.
Monitoring and verification are also vital components of flexibility activation. In order to
avoid gaming, especially at times when the grid is congested and demand for alternate
sources of flexibility are higher.
The time at which bids become final is a critical variable of market design. Hence,
available flexibility is highly dependent on the gate closure time being as close to the
delivery time as possible, in this way ensuring the delivery of scheduled products. The
Dutch gate closure time, set at one hour prior to delivery, is advised for adoption by
other member states on account of its proximity to real-time delivery. Devising a specific
gate closure time for demand response flexibility scheduling may also be a good way to
integrate demand response. The access to demand response flexibility is also impacted

204
by the frequency of price signal availability. Therefore, prices should be made available
as close to the end of delivery as possible.
Letting the market work is the desired approach to integrating demand response, but it
may need a helping hand from regulation. An aggressive approach towards integrating
demand response as a reserve can be to allow priority access to independent
aggregators in the balancing market.
A flexibility market that runs in parallel with the existing markets can also be considered
as a way to optimize use of the wide range of from various distributed energy resources.
This market can be overseen by the system operator in order to ensure transparency and
effective operation.
Tariffs
Regulators have a daunting task at hand which is monitoring and stimulating
competition, all while designing innovative remuneration schemes that ensure the
alignment of short-run operational and long-run investment and recovery objectives for
grid operators.
Electricity consumption and production are time dependent; both sides should have
transparency and co-optimize the matching of supply and demand. For electricity billing,
regulators need to communicate to retailers the importance of introducing more
dynamic pricing options to end-users and together come up with an action plan that will
result in adoption in the coming years. From this work, a time-of-use tariff is
recommended in accordance with the hours pertaining to the base, shoulder and peak
hours of the spot market exchange. More tailored tariffs can also be designed per
distribution system with the grid operator in order to make sure that peak grid hours
coincide with the tariff as well. Dynamic transport rates can also be designed with a
capacity component in such way that incentivizes consumers to stay below a certain
threshold power level. Real time tariffs are not advised at this time, but if consumers
want them they should be given the option.
Policy
Article 15.8 of the Energy Efficiency Directive (2012/27/EU) provides a legal basis for
further development of demand response in the European member states with support
from the ENTSO-E Demand Connection Code (ongoing) and the ACER Framework
Guidelines on Electricity Balancing. Although these European level communications
205
provide the foundation by acknowledging the importance of demand response from end-
users, they do not offer detailed specifications for European-wide implementation.
Future communications should consider strict guidelines on what Europe needs to
achieve as a whole. Such legislation should provide a ‘demand response’ target such as
that of renewable generation, energy efficiency and emissions.
3 Future research
This thesis has covered a wide range of topics for the implantation of demand response.
Research to follow is therefore suggested to have more focus on specific issues which
have been brought to light.
Market specifications
Existing market mechanisms accommodate large consumers and producers as flexibility
resources, in this way considering small consumers to be passive entities. In order to
activate demand response, future work needs to concentrate on addressing the timing,
program and volume specifications that will facilitate the integration of aggregated
flexibility. Timing specifications directly reflect the design of a demand response program
and the notice, duration, frequency and intervals of the release of flexibility. Program
specifications concentrate on the definition of pricing options, measurement and
verification techniques and related penalties for non-compliance. Volume requirements
refer to minimum and maximum limits for eligibility and activation. Minimum bid
requirements and bidding up and down bids are still catering to large flexibility providers,
system operators and regulators need to revisit the technical requirements and see how
they can lower the sizes without jeopardizing system operation.
Aggregation business
Above, it is recommended that aggregators sophisticate their business model and further
develop revenue streams that do not pertain to direct electricity trade in the various
electricity markets. As data from households with smart meters, smart thermostats and
in-home-displays becomes increasingly available, an investigation is encouraged into the
innovative business solutions that can emerge. Together with the business innovation,
policy and regulation, research on the mitigation of privacy and security concerns is also
suggested.

206
As retailers seek to become aggregators of demand response services from end-users
and other distributed energy resources, there is fundamental concern that arises: with
demand response suppliers are curtailing their own profits. Is it really profitable for
retailers to be aggregators? This is a question that can be further investigated along with
the upcoming sophisticated business models of independent.
Tariff design
Earlier it was mentioned that dynamic grid and retail tariffs should not be giving opposing
signals. An investigation on combinations of the various tariff options for distribution and
retail can reveal the benefits and drawbacks of coordinated tariffs.
4 Final thoughts
As a viable market flexibility resource, aggregated demand response is still in infantile
stages of consideration, and the above investigation simply serves as an illustration for
the drivers and emerging barriers to application. In this research it is concluded that the
smart grid shift is expected to bring out the best that the existing infrastructure and
market organization offer. Upgrades and modifications should be tailored to make better
the system that is in place and not concentrate on achieving a perfect paradigm which
does not exist.
From day one I have tried to answer this question to myself “what are policies for the
implementation of smart grids?” Now, I can say with some degree of certainty that they
are the strategies that will pave the way to a more sustainable future and that a smart
grid is a means to an end but an end in itself. End-users are a small piece of the electricity
system puzzle, physically and economically, but in turn are the most powerful in making
change happen. Getting consumers involved in the dynamics of the electricity system
may not yield great financial benefits for them, but will result in overall understanding of
the functionality of the smart grid. Knowledge is power which produces strategies for
implementing smart grids.

207

208
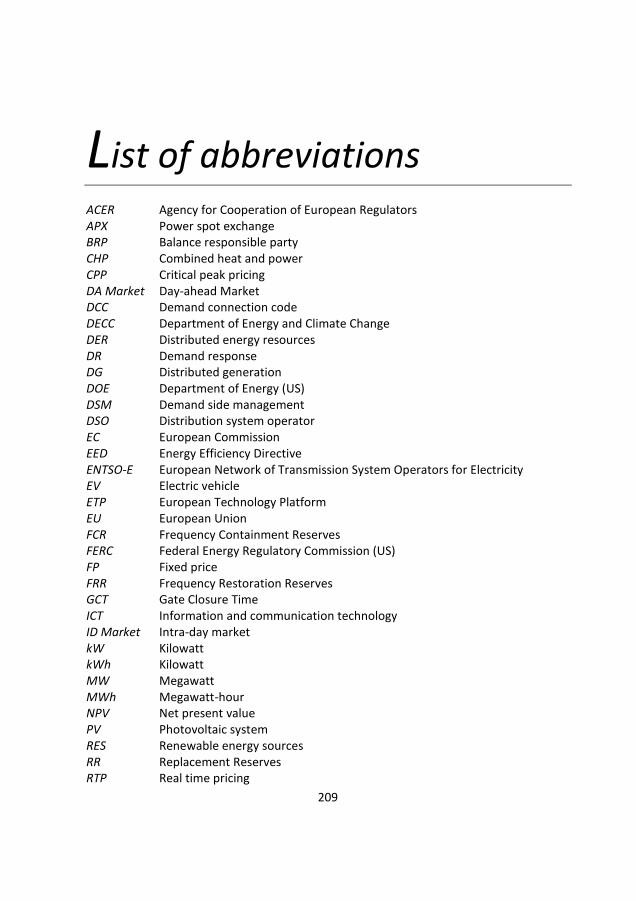
209
List of abbreviations ACER Agency for Cooperation of European Regulators APX Power spot exchange BRP Balance responsible party CHP Combined heat and power CPP Critical peak pricing DA Market Day-ahead Market DCC Demand connection code DECC Department of Energy and Climate Change DER Distributed energy resources DR Demand response DG Distributed generation DOE Department of Energy (US) DSM Demand side management DSO Distribution system operator EC European Commission EED Energy Efficiency Directive ENTSO-E European Network of Transmission System Operators for Electricity EV Electric vehicle ETP European Technology Platform EU European Union FCR Frequency Containment Reserves FERC Federal Energy Regulatory Commission (US) FP Fixed price FRR Frequency Restoration Reserves GCT Gate Closure Time ICT Information and communication technology ID Market Intra-day market kW Kilowatt kWh Kilowatt MW Megawatt MWh Megawatt-hour NPV Net present value PV Photovoltaic system RES Renewable energy sources RR Replacement Reserves RTP Real time pricing

210
SEDC Smart Energy Demand Coalition TOU Time-of-use TSO Transmission system operator TWh Terawatt-hour VAT value added tax (Europe)
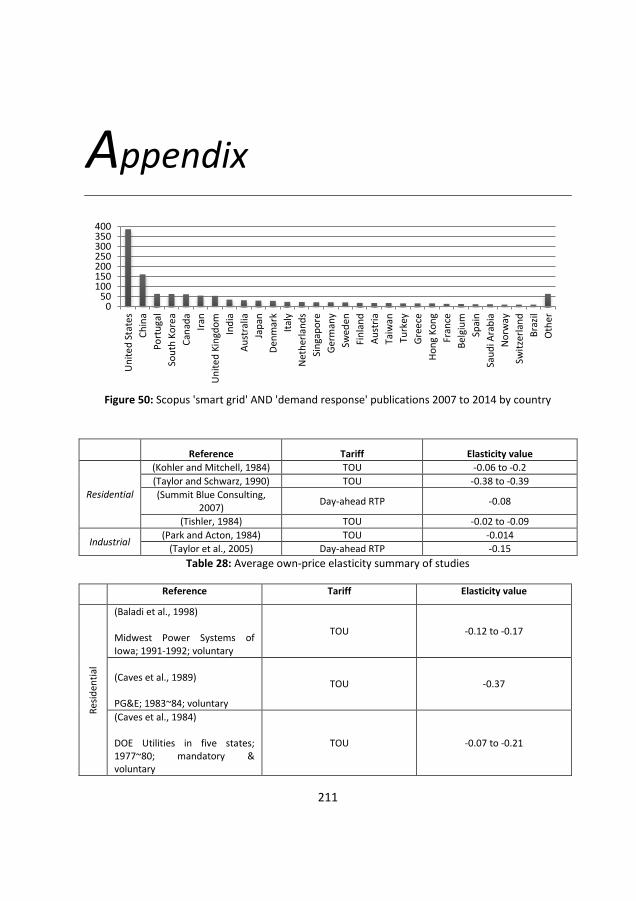
211
Appendix
Figure 50: Scopus 'smart grid' AND 'demand response' publications 2007 to 2014 by country
Reference Tariff Elasticity value
Residential
(Kohler and Mitchell, 1984) TOU -0.06 to -0.2
(Taylor and Schwarz, 1990) TOU -0.38 to -0.39
(Summit Blue Consulting, 2007)
Day-ahead RTP -0.08
(Tishler, 1984) TOU -0.02 to -0.09
Industrial (Park and Acton, 1984) TOU -0.014
(Taylor et al., 2005) Day-ahead RTP -0.15
Table 28: Average own-price elasticity summary of studies
Reference Tariff Elasticity value
Res
iden
tial
(Baladi et al., 1998) Midwest Power Systems of Iowa; 1991-1992; voluntary
TOU -0.12 to -0.17
(Caves et al., 1989) PG&E; 1983~84; voluntary
TOU -0.37
(Caves et al., 1984) DOE Utilities in five states; 1977~80; mandatory & voluntary
TOU -0.07 to -0.21
050
100150200250300350400
Un
ite
d S
tate
s
Ch
ina
Po
rtu
gal
Sou
th K
ore
a
Can
ada
Iran
Un
ite
d K
ingd
om
Ind
ia
Au
stra
lia
Jap
an
Den
mar
k
Ital
y
Net
her
lan
ds
Sin
gap
ore
Ger
man
y
Swed
en
Fin
lan
d
Au
stri
a
Taiw
an
Turk
ey
Gre
ece
Ho
ng
Ko
ng
Fran
ce
Bel
giu
m
Spai
n
Sau
di A
rab
ia
No
rway
Swit
zerl
and
Bra
zil
Oth
er
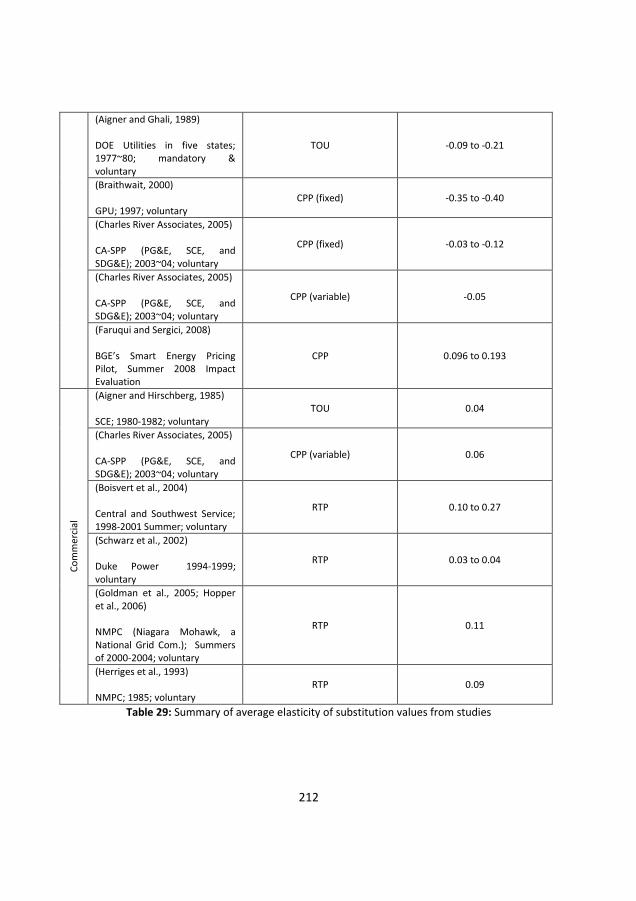
212
(Aigner and Ghali, 1989) DOE Utilities in five states; 1977~80; mandatory & voluntary
TOU -0.09 to -0.21
(Braithwait, 2000) GPU; 1997; voluntary
CPP (fixed) -0.35 to -0.40
(Charles River Associates, 2005) CA-SPP (PG&E, SCE, and SDG&E); 2003~04; voluntary
CPP (fixed) -0.03 to -0.12
(Charles River Associates, 2005) CA-SPP (PG&E, SCE, and SDG&E); 2003~04; voluntary
CPP (variable) -0.05
(Faruqui and Sergici, 2008) BGE’s Smart Energy Pricing Pilot, Summer 2008 Impact Evaluation
CPP 0.096 to 0.193
Co
mm
erci
al
(Aigner and Hirschberg, 1985) SCE; 1980-1982; voluntary
TOU 0.04
(Charles River Associates, 2005) CA-SPP (PG&E, SCE, and SDG&E); 2003~04; voluntary
CPP (variable) 0.06
(Boisvert et al., 2004) Central and Southwest Service; 1998-2001 Summer; voluntary
RTP 0.10 to 0.27
(Schwarz et al., 2002) Duke Power 1994-1999; voluntary
RTP 0.03 to 0.04
(Goldman et al., 2005; Hopper et al., 2006) NMPC (Niagara Mohawk, a National Grid Com.); Summers of 2000-2004; voluntary
RTP 0.11
(Herriges et al., 1993) NMPC; 1985; voluntary
RTP 0.09
Table 29: Summary of average elasticity of substitution values from studies
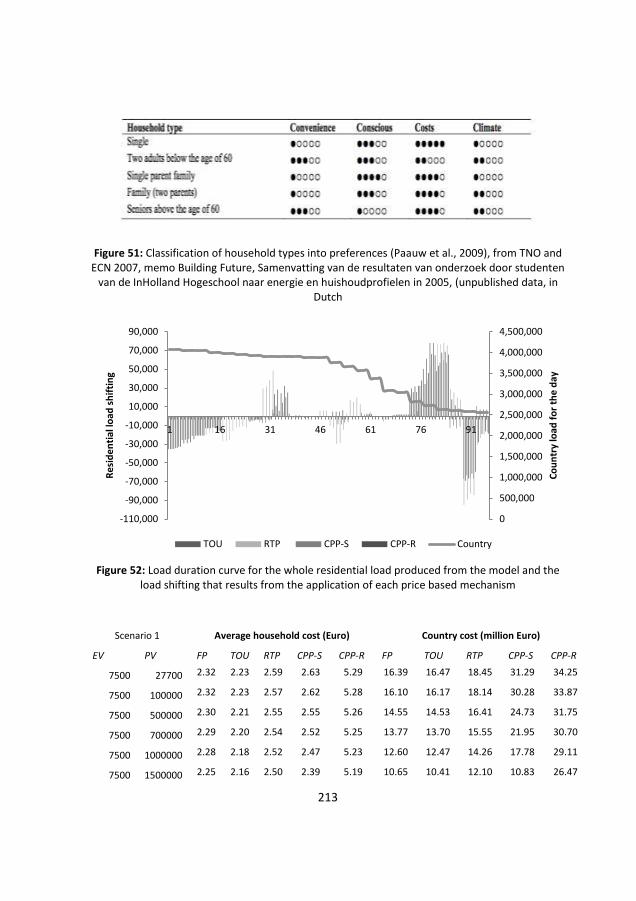
213
Figure 51: Classification of household types into preferences (Paauw et al., 2009), from TNO and ECN 2007, memo Building Future, Samenvatting van de resultaten van onderzoek door studenten
van de InHolland Hogeschool naar energie en huishoudprofielen in 2005, (unpublished data, in Dutch
Figure 52: Load duration curve for the whole residential load produced from the model and the
load shifting that results from the application of each price based mechanism
Scenario 1 Average household cost (Euro) Country cost (million Euro)
EV PV FP TOU RTP CPP-S CPP-R FP TOU RTP CPP-S CPP-R
7500 27700 2.32 2.23 2.59 2.63 5.29 16.39 16.47 18.45 31.29 34.25
7500 100000 2.32 2.23 2.57 2.62 5.28 16.10 16.17 18.14 30.28 33.87
7500 500000 2.30 2.21 2.55 2.55 5.26 14.55 14.53 16.41 24.73 31.75
7500 700000 2.29 2.20 2.54 2.52 5.25 13.77 13.70 15.55 21.95 30.70
7500 1000000 2.28 2.18 2.52 2.47 5.23 12.60 12.47 14.26 17.78 29.11
7500 1500000 2.25 2.16 2.50 2.39 5.19 10.65 10.41 12.10 10.83 26.47
0
500,000
1,000,000
1,500,000
2,000,000
2,500,000
3,000,000
3,500,000
4,000,000
4,500,000
-110,000
-90,000
-70,000
-50,000
-30,000
-10,000
10,000
30,000
50,000
70,000
90,000
1 16 31 46 61 76 91
Co
un
try
load
fo
r th
e d
ay
Re
sid
en
tial
load
sh
ifti
ng
TOU RTP CPP-S CPP-R Country
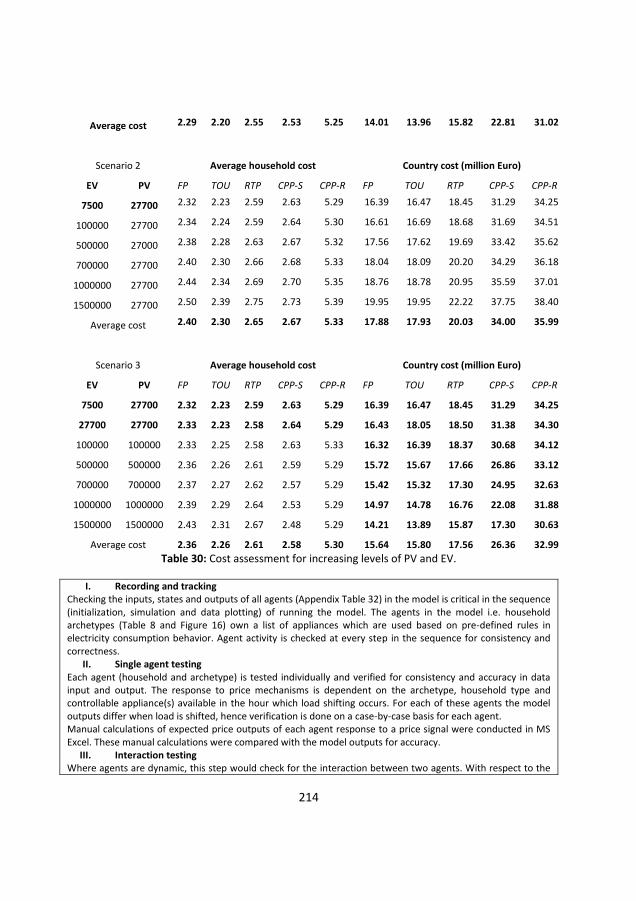
214
Average cost 2.29 2.20 2.55 2.53 5.25 14.01 13.96 15.82 22.81 31.02
Scenario 2 Average household cost Country cost (million Euro)
EV PV FP TOU RTP CPP-S CPP-R FP TOU RTP CPP-S CPP-R
7500 27700 2.32 2.23 2.59 2.63 5.29 16.39 16.47 18.45 31.29 34.25
100000 27700 2.34 2.24 2.59 2.64 5.30 16.61 16.69 18.68 31.69 34.51
500000 27000 2.38 2.28 2.63 2.67 5.32 17.56 17.62 19.69 33.42 35.62
700000 27700 2.40 2.30 2.66 2.68 5.33 18.04 18.09 20.20 34.29 36.18
1000000 27700 2.44 2.34 2.69 2.70 5.35 18.76 18.78 20.95 35.59 37.01
1500000 27700 2.50 2.39 2.75 2.73 5.39 19.95 19.95 22.22 37.75 38.40
Average cost 2.40 2.30 2.65 2.67 5.33 17.88 17.93 20.03 34.00 35.99
Scenario 3 Average household cost Country cost (million Euro)
EV PV FP TOU RTP CPP-S CPP-R FP TOU RTP CPP-S CPP-R
7500 27700 2.32 2.23 2.59 2.63 5.29 16.39 16.47 18.45 31.29 34.25
27700 27700 2.33 2.23 2.58 2.64 5.29 16.43 18.05 18.50 31.38 34.30
100000 100000 2.33 2.25 2.58 2.63 5.33 16.32 16.39 18.37 30.68 34.12
500000 500000 2.36 2.26 2.61 2.59 5.29 15.72 15.67 17.66 26.86 33.12
700000 700000 2.37 2.27 2.62 2.57 5.29 15.42 15.32 17.30 24.95 32.63
1000000 1000000 2.39 2.29 2.64 2.53 5.29 14.97 14.78 16.76 22.08 31.88
1500000 1500000 2.43 2.31 2.67 2.48 5.29 14.21 13.89 15.87 17.30 30.63
Average cost 2.36 2.26 2.61 2.58 5.30 15.64 15.80 17.56 26.36 32.99
Table 30: Cost assessment for increasing levels of PV and EV.
I. Recording and tracking Checking the inputs, states and outputs of all agents (Appendix Table 32) in the model is critical in the sequence (initialization, simulation and data plotting) of running the model. The agents in the model i.e. household archetypes (Table 8 and Figure 16) own a list of appliances which are used based on pre-defined rules in electricity consumption behavior. Agent activity is checked at every step in the sequence for consistency and correctness.
II. Single agent testing Each agent (household and archetype) is tested individually and verified for consistency and accuracy in data input and output. The response to price mechanisms is dependent on the archetype, household type and controllable appliance(s) available in the hour which load shifting occurs. For each of these agents the model outputs differ when load is shifted, hence verification is done on a case-by-case basis for each agent. Manual calculations of expected price outputs of each agent response to a price signal were conducted in MS Excel. These manual calculations were compared with the model outputs for accuracy.
III. Interaction testing Where agents are dynamic, this step would check for the interaction between two agents. With respect to the

215
space in the model, the household agents are considered to be ‘static agents’. Interaction occurs between the various price-based DR mechanisms, hence, their interaction is observed and checked for consistency.
IV. Multi-agent testing Multi-agent testing is the last step in the model verification where the outputs of the model as a whole are verified. This testing involved the interaction of agents and emergent patterns. For this mode, the emergent pattern consists of two an aggregate country load profile curves (i) before load shifting and (ii) after load shifting. These curves were verified with previously build load curves in MS Excel. In order to check for stability of the model, multiple runs with the same set of parameters for the agents were performed and repeated for all the implemented price-based mechanisms.
Table 31: Model verification
HOUSEHOLD TYPE NAME OF THE AGENT
Single adult under the age 65 Single Adult Under 65 Conscious Household
Single Adult Under 65 Cost Household
Single Adult Under 65 Convenience Household
Single Adult Under 65 Climate Household
Single adult over the age of 65 Single Adult Over 65 Conscious Household
Single Adult Over 65 Cost Household
Single Adult Over 65 Convenience Household
Single Adult Over 65 Climate Household
Couple below the age of 65 Couple Under 65 Conscious Household
Couple Under 65 Cost Household
Couple Under 65 Convenience Household
Couple Under 65 Climate without PV And EV Household
Couple Under 65 Climate With EV Only Household
Couple Under 65 Climate With PV Only Household
Couple Under 65 Climate With PV And EV Household
Couple at least one over the age of 65 Couple Atleast One Over 65 Conscious Household
Couple Atleast One Over 65 Cost Household
Couple Atleast One Over 65 Convenience Household
Couple Atleast One Over 65 Climate Household
Single parent family Single Parent Family Conscious Household
Single Parent Family Cost Household
Single Parent Family Convenience Household
Single Parent Family Climate Household
Family with two parents Family With Two Parents Conscious Household
Family With Two Parents Cost Household
Family With Two Parents Convenience Household
Family With Two Parents Climate without PV And EV Household
Family With Two Parents Climate With EV Only Household
Family With Two Parents Climate With PV Only Household
Family With Two Parents Climate With PV And EV Household
Table 32: List of agents representative of each household type and each preference type
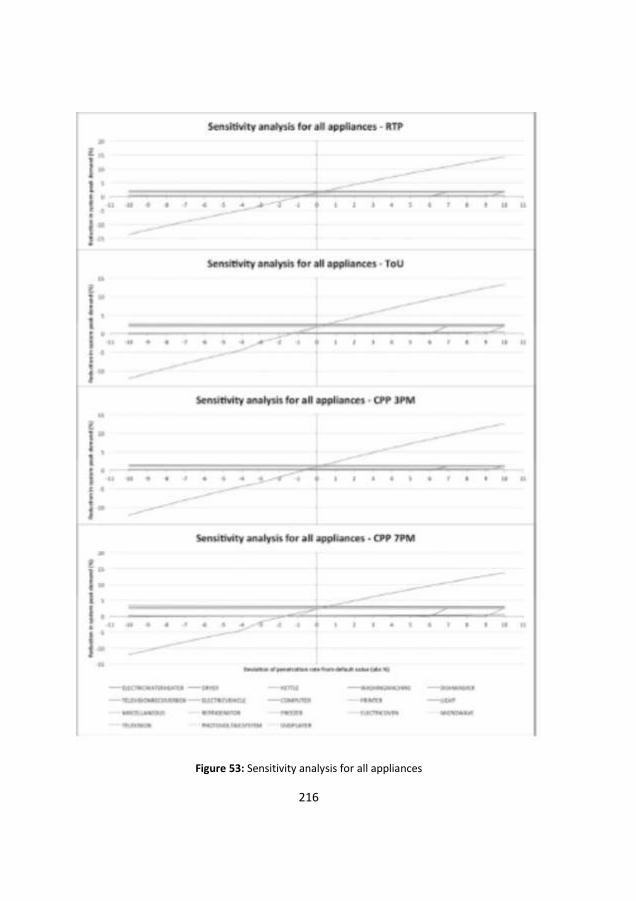
216
Figure 53: Sensitivity analysis for all appliances
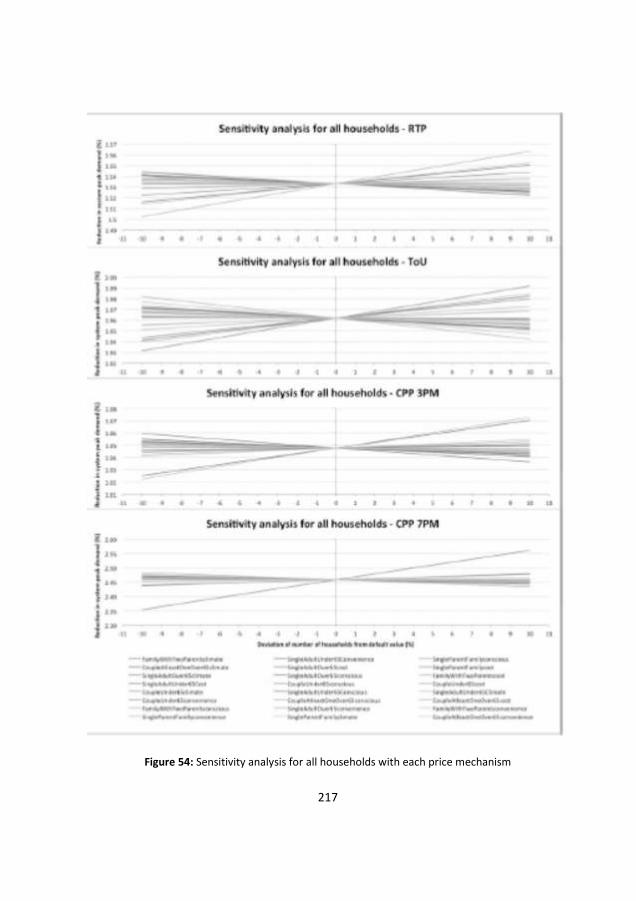
217
Figure 54: Sensitivity analysis for all households with each price mechanism

218
MODEL DESCRIPTION ADVANTAGES DISADVANTAGES
A The grid operator and the supplier both have access to the flexibility of customers.
Flexibility is allotted to the party that attaches the greatest value to Demand Response, depending on the 'market' for flexibility, where the price and the type of contract (duration, size and condition) is determined.
Coordination Problem. There is no guarantee that the operator can access the control as needed without investments in control and signaling technology. If sufficient flexibility is not available then network expansions are inevitable. Ergo, limited benefits for the network operator.
B
The supplier (has priority) access to customers and the flexibility. The system operator may receive a portion of the flexibility from the supplier.
The optimization of the value of flexibility is achieved by one party (the supplier). In consultation with the network operator, the supplier provides (part of) the flexibility to the operator. For the network it is clear how much flexibility will be available (with certainty).
It is necessary to arrange the interaction between the supplier and the network operator in new market models.
C
The system operator (has priority) access to the flexibility of customers and the supplier may receive a part of it through the network.
The network operator has maximum certainty about the availability of flexibility. In this case, unused flexibility can be offered to the market by the network operator.
The operator will have the key role in assigning flexibility instead of the market. In this case there will only be limited flexibility available for the market and there will not be optimal use of flexibility on all sides.
D The network operator and supplier shall agree on the use of flexibility.
The grid operator and the supplier will co- optimize the combined use of flexibility.
Coordination between the operator and the various suppliers may prove to be a struggle under the current market (including competition between suppliers and independent network).
E Only the supplier has access to flexibility.
Complete and optimal deployment of flexibility for the market.
No possibility to use for savings in network investment flexibility.
F Only the operator has access to flexibility.
Complete and optimal deployment of flexibility for savings in network investment.
No possibility to use for market flexibility.
G Breakdown of flexibility in the market network operators and suppliers.
Both the operator and the suppliers have (any part of) the flexibility.
The arbitrary (not market) allocation of flexibility to the operator and the supplier can result to be suboptimal. In this case it must be determined how this allocation will take

219
place.
H
Breakdown of flexibility in the market for the network operators and suppliers. In this case the operator can obtain additional flexibility for suppliers.
Both the operator and the suppliers have (any part of) the flexibility. The unused portion can be sold to the grid (according to model B).
The arbitrary (not market) allocation of flexibility to the operator and the supplier can result to be suboptimal for the network operator. A separate market model should be implemented that facilitates the sale of flexibility.
I
In the market both network operators and suppliers can obtain additional flexibility to provide the grid.
Both the operator and the suppliers have (any part of) the flexibility. The unused portion can be resold to the supplier (according to model C).
The arbitrary (not market) allocation of flexibility to the supplier and network operator can result suboptimal for the network operator. A new market model should be implemented that facilitates sale of flexibility.
Table 33: Description of the nine (conceptual) solutions to the coordination problem, with some pros and cons (Hakvoort and Koliou, 2015).
220
References Abdisalaam, A., 2011. Residential Demand Response In Competitive Electricity Markets.
TU Eindhoven.
Abdisalaam, A., Lampropoulos, I., Frunt, J., Verbong, G.P.J., Kling, W.L., 2012. Assessing the economic benefits of flexible residential load participation in the Dutch day-ahead auction and balancing market, in: 9th International Conference on the European Energy Market. Florence.
Abdul Muhaimin, T., 2015. Electricity market of the future: assessing economic feasibility and regulatory constraints for demand response aggregators in Europe. Delft University of Technology.
ACER, 2014. Demand side flexibility: The potential benefits and state of play in the European Union.
ACER, 2012. Framework Guidelines on Electricity Balancing. Ljubljana.
Ackermann, T., Andersson, G., Söder, L., 2001. Distributed generation: a definition. Electr. Power Syst. Res. 57, 195–204. doi:10.1016/S0378-7796(01)00101-8
Agentschap, 2012. Senternovem Databank [WWW Document]. URL http://www.senternovem.databank.nl/ (accessed 8.25.13).
Agentschap, 2011. Energy Report 2011. The Hague.
Aghaei, J., Alizadeh, M.-I., 2013. Demand response in smart electricity grids equipped with renewable energy sources: A review. Renew. Sustain. Energy Rev. 18, 64–72. doi:10.1016/j.rser.2012.09.019
Aigner, D.J., Ghali, K., 1989. Self-selection in the residential electricity time-of-use pricing experiments. J. Appl. Econom. 4, S131–S144. doi:10.1002/jae.3950040507
221
Aigner, D.J., Hirschberg, J.G., 1985. Commercial/Industrial Customer Response to Time-of-Use Electricity Prices: Some Experimental Results. RAND J. Econ. 16, 341–355. doi:10.2307/2555562
Albadi, M.H., El-Saadany, E.F., 2008. A summary of demand response in electricity markets. Electr. Power Syst. Res. 78, 1989–1996. doi:10.1016/j.epsr.2008.04.002
Amprion, 2013. Balancing Power settlement with balancing group managers.
APX, 2015. APX Power NL [WWW Document]. URL https://www.apxgroup.com/trading-clearing/apx-power-nl/ (accessed 6.18.15).
APX, 2014a. APX Power NL Market Instrument Specifications APX Power.
APX, 2014b. Power NL - Yearly Overview 2014.
APX, 2012. Day-ahead market data for 2012 permitted access.
Autoriteit Consument and Markt, 2015. Wat is salderen? En hoe werkt het?
Baladi, M.S., Herriges, J.A., Sweeney, T.J., 1998. Residential response to voluntary time-of-use electricity rates. Resour. Energy Econ. 20, 225–244. doi:10.1016/S0928-7655(97)00025-0
Balijepalli, V.S.K.M., Pradhan, V., Khaparde, S.A., Shereef, R.M., 2011. Review of demand response under smart grid paradigm. Innov. Smart Grid Technol. - India (ISGT India), 2011 IEEE PES. doi:10.1109/ISET-India.2011.6145388
Bartels, R., Fiebig, D.G., Garben, M., Lumsdaine, R., 1992. An end-use electricity load simulation model. Util. Policy 2, 71–82. doi:10.1016/0957-1787(92)90055-N
Bartusch, C., Alvehag, K., 2014. Further exploring the potential of residential demand response programs in electricity distribution. Appl. Energy 125, 39–59. doi:10.1016/j.apenergy.2014.03.054
Bartusch, C., Wallin, F., Odlare, M., Vassileva, I., Wester, L., 2011. Introducing a demand-based electricity distribution tariff in the residential sector: Demand response and customer perception. Energy Policy 39, 5008–5025. doi:10.1016/j.enpol.2011.06.013
222
BELECTRIC, 2015. BELECTRIC [WWW Document]. URL http://www.belectric.com/en/home/ (accessed 6.6.15).
Bernstein, M. a, Griffin, J., 2006. Regional Differences in the Price-Elasticity of Demand for Energy.
Bertoldi, P., Atanasiu, B., 2006. Residential Lighting Consumption and Saving Potential in the Enlarged EU, in: 4th International Conference on Energy Efficiency in Domestic Appliances and Lighting Vol.2. pp. 545–560.
Bivas, P., 2015. Demand Response for Small Consumers in France: Workshop on DR in the EU [WWW Document]. URL http://iet.jrc.ec.europa.eu/energyefficiency/sites/energyefficiency/files/files/documents/events/9.voltalis_short_prez_for_jrc_workshop_on_dr_23oct15.pdf
Boisvert, R., Cappers, P., Neenan, B., Scott, B., 2004. Industrial and Commercial Customer Response To Real Time Electricity Prices, Working Paper.
Boots, M., 2011. Profielgenerator: Beschrijving Sepath (nieuw).
Bossart, S., Giordano, V., 2012. Assessing Smart Grid Benefits and Impacts: EU and U.S. Initiatives. doi:10.2790/63747
Bradley, P., Leach, M., Torriti, J., 2011. A review of current and future costs and benefits of demand response for electricity.
Braithwait, S., 2000. Residential TOU Price Response in the Presence of Interactive Communication Equipment, in: Faruqui, A., Eakin, K. (Eds.), Pricing in Competitive Electricity Markets SE - 22, Topics in Regulatory Economics and Policy Series. Springer US, pp. 359–373. doi:10.1007/978-1-4615-4529-3_22
Braithwait, S.D., Eakin, K., 2002. THE ROLE OF DEMAND RESPONSE IN ELECTRIC POWER MARKET DESIGN.
Bronski, P., Creyts, J., Guccione, L., Madrazo, M., Mandel, J., Rader, B., Seif, D., Lilienthal, P., Glassmire, J., Abromowitz, J., Crowdis, M., Richardson, J., Schmitt, E., Tocco, H., 2014. The Economics of Grid Defection: When and Where Distributed Solar Generation plus Storage Competes with Traditional Utility Service. Boulder, Colorado, USA.
223
Bryson, J.J., Ando, Y., Lehmann, H., 2007. Agent-based modelling as scientific method: a case study analysing primate social behaviour. Philos. Trans. R. Soc. London B Biol. Sci. 362, 1685–1699.
Capgemini, 2008a. Overview of Electricity Distribution in Europe: Summary from Capgemini’s 2008 European benchmarking survey.
Capgemini, 2008b. Demand Response: a decisive breakthrough for Europe, How Europe could save Gigawatts, Billions of Euros and Millions of tons of CO2.
Cappers, P., Goldman, C., Kathan, D., 2010. Demand response in U.S. electricity markets: Empirical evidence. Energy 35, 1526–1535. doi:10.1016/j.energy.2009.06.029
Cappers, P., Mills, A., Goldman, C., Wiser, R., Eto, J.H., 2012. An assessment of the role mass market demand response could play in contributing to the management of variable generation integration issues. Energy Policy 48, 420–429. doi:10.1016/j.enpol.2012.05.040
Carbon Footprint, 2015. Household energy consumption [WWW Document]. URL http://www.carbonfootprint.com/energyconsumption.html (accessed 6.18.15).
Carillo Aparicio, S., Eiva Rojo, F.J., Petretto, G., Gigliucc, I.G., Honrubia-Escribano, A., Gimenez De Urtasun, L Alonso Herranz A, G.-G.M., 2014. Assessment of the Power Curve Flattening Method: An Approach to Smart Grids, in: CIRED Workshop - Rome, 11-12 June 2014.
Caves, D.W., Christensen, L.R., Herriges, J.A., 1984. Consistency of residential customer response in time-of-use electricity pricing experiments. J. Econom. 26, 179–203. doi:10.1016/0304-4076(84)90017-4
Caves, D.W., Herriges, J.A., Kuester, K.A., 1989. Load Shifting Under Voluntary Residential Time-of-Use Rates. Energy J. 10, 83–99. doi:10.2307/41322373
CBS, 2013. CBS Statline [WWW Document]. URL http://statline.cbs.nl/StatWeb/selection/?DM=SLEN&PA=37312ENG&LA=EN&VW =T, (accessed 5.24.13).
CBS Statistics Netherlands, 2015. Electricity and heat: production and input by energy commodity.
224
Chamoy, A.-S., 2015. Demand Response in practice Energy Pool ? Who are we ? Brussels.
Chang, H.S., Hsing, Y., 1991. The demand for residential electricity: new evidence on time-varying elasticities. Appl. Econ. 23, 1251–1256. doi:10.1080/00036849100000165
Charles River Associates, 2005. Impact Evaluation of the California Statewide Pricing Pilot.
Chaves-Avila, J.P., Hakvoort, R.A., 2013. Participation of wind power on the European balancing mechanisms. Eur. Energy Mark. (EEM), 2013 10th Int. Conf. doi:10.1109/EEM.2013.6607288
Chaves-Ávila, J.P., van der Veen, R.A.C., Hakvoort, R.A., 2014. The interplay between imbalance pricing mechanisms and network congestions – Analysis of the German electricity market. Util. Policy 28, 52–61. doi:10.1016/j.jup.2013.11.005
Chuang, A.S., Gellings, C.W., 2008. Demand-side Integration in a Restructured Electric Power Industry, in: CIGRE. Paris.
Conchado, A., Linares, P., 2010. The Economic Impact of Demand-Response Programs on Power Systems: A survey of the State of the Art Working Paper WP02/2010.
Cooke, D., 2011. Empowering customer choice in electricity markets.
Correljé, A.F., De Vries, L.J., 2008. Competitive Electricity Markets, Competitive Electricity Markets. Elsevier. doi:10.1016/B978-008047172-3.50006-4
Crooks, A.T., 2006. Principles and Concepts of Agent-based Modeling for Developing Geospatial Simulations.
Dam, K.H. Van, Nikolic, I., Lukszo, Z., 2012. Agent-‐based modelling of socio-‐technical systems. Springer London.
Dave, S., Sooriyabandara, M., Yearworth, M., 2013. System behaviour modelling for demand response provision in a smart grid. Energy Policy 61, 172–181. doi:10.1016/j.enpol.2013.05.098
225
David, A.K., Li, Y.Z., 1991. Consumer rationality assumptions in the real time pricing of electricity, in: International Conference on Advances in Power System Control, Operation and Management, 1991. APSCOM-91., 1991. pp. 391–396 vol.1.
De Joode, J., Jansen, J.C., van der Welle, A.J., Scheepers, M.J.J., 2009. Increasing penetration of renewable and distributed electricity generation and the need for different network regulation. Energy Policy 37, 2907–2915. doi:10.1016/j.enpol.2009.03.014
DECC, 2013. Demand Side Response in the domestic sector- a literature review of major trials.
Dietz, T., 2015. Altruism, self-interest, and energy consumption. Proc. Natl. Acad. Sci. 112, 1654–1655. doi:10.1073/pnas.1423686112
DOE, 2006. Benefits of Demand Response in Electricity Markets and Reccomendations for Achieving them.
DRIP, 2015. Value pools and business models for Demand Response in the industry. Deliverable B1.2.
Drysdale, B., Wu, J., Jenkins, N., 2015. Flexible demand in the GB domestic electricity sector in 2030. Appl. Energy 139, 281–290. doi:10.1016/j.apenergy.2014.11.013
Du, W., Bots, P.W.G., Slootweg, J.G., 2011. Monte Carlo simulation of load profiles for low-voltage electricity distribution grid asset planning, in: Proceedings of the 21st International Conference on Electricity Distribution (CIRED 2011), 6-9 June 2011, Frankfurt, Germany.
E.ON, 2013. Elnätsprislista regionnät Syd (Electricity Networks Pricelist South Region).
EC, 2015a. Energy: New market design to pave the way for a new deal for consumers.
EC, 2015b. Draft Horizon 2020 Work Programme 2014-2015 in the area of “ Secure , Clean and Efficient Energy ’.
EC, 2014. Energy prices and costs in Europe.
226
EC, 2013a. Incorporing demand side flexibility, in particular demand response, in electricity markets SWD(2013) 442.
EC, 2013b. Total number of electricity retailers to final consumers [WWW Document]. URL http://ec.europa.eu/eurostat/statistics-explained/index.php/File:Total_number_of_electricity_retailers_to_final_consumers_2013.png (accessed 6.6.15).
EC, 2013c. Quarterly Report on European Electricity Markets.
EC, 2012. Directive 2012/27/EU of the European Parliament and of the Council of 25 October 2012 on energy efficiency.
EC, 2010. The functioning of retail electricity markets for consumers in the European Union.
EC, 2009. Directive of 2009/72/EC of the European Parliament and of the Council of 13 July 2009 Concerning Common Rules for the Internal Market in Electricity and Repealing Directive 2003/54/EC.
EC, 2006a. DIRECTIVE 2006/32/EC on energy end-use efficiency and energy services.
EC, 2006b. Green Paper. A European strategy for sustainable, competitive and secure energy. Brussels.
EC, 2003. Directive 2003/54/EC of the European Parliament and of the Council of 26 June 2003 concerning common rules for the internal market in electricity, Regulation.
EC TF for Smart Grids, 2011. EU Commission Task Force for Smart Grids Expert Group 3 : Roles and Responsibilities of Actors involved in the Smart Grids Deployment.
ECOFYS, 2011. National Survey Report of PV Power Applications in The Netherlands.
Economics, F., 2013. Tariff Implementation Report: A report prepared for Ergon Energy. Australia.
EEA, 2013. Final electriciyt consumption by sector in the EU-27 [WWW Document]. URL http://www.eea.europa.eu/data-and-maps/figures/final-electricity-consumption-by-sector-5
227
EI, 2011. Kalkylränta i elnätsverksamhet (Cost of capital in network operations).
EI, 2009. Förhandsreglering av elnätsavgifter - principiella val i viktiga frågor (Ex-ante regualtion of electricity network charges-principled choices on key issues).
Eid, C., Reneses Guillén, J., Frías Marín, P., Hakvoort, R., 2014. The economic effect of electricity net-metering with solar PV: Consequences for network cost recovery, cross subsidies and policy objectives. Energy Policy 75, 244–254. doi:10.1016/j.enpol.2014.09.011
Eklund, T., 2014. Impact of Demand Response on Distribution System Operators’ Economy. KTH Royal Institute of Technology, Stockholm Sweden.
Energievergelijken, 2015. Compare energy in the Netherlands [WWW Document]. URL https://www.energievergelijken.nl (accessed 7.7.15).
EnergyPool, 2016. EnergyPool [WWW Document]. URL http://www.energy-pool.eu/en
ENTSO-E, 2013a. Network Code on Demand Connection (DCC) [WWW Document]. URL http://networkcodes.entsoe.eu/connection-codes/demand-connection-code/
ENTSO-E, 2013b. Balancing and Ancillary Services Markets.
ENTSO-E, 2013c. How can the Demand Connection Code facilitate Demand Side Response measures across Europe ?
ENTSO-E, 2013d. Consumption Data Hourly load value of a specific country for a specific day March 27th 2013 [WWW Document]. URL https://www.entsoe.eu/data/data-portal/consumption/Pages/default.aspx (accessed 11.12.14).
ENTSO-E, 2012. Survey on Ancillary Services Procurement and Electricity Balancing Market Design.
EPA, 2007. Energy Independence and Security Act TITLE XIII--SMART GRID.
ERGEG, 2009. Revised ERGEG Guidelines of Good Practice for Electricity Balancing Markets Integration ( GGP-EBMI ).
228
ERGEG, 2008. Treatment of Losses by Network Operators. ERGEG Position Paper for public consultation Ref: E08-ENM-04-03.
Espey, J. a., Espey, M., 2004. Turning on the lights: a meta-analysis of residential electricity demand elasticities. J. Agric. Appl. Econ. 36, 65–81.
ETP, 2011. Smart Grids [WWW Document]. URL http://www.smartgrids.eu/documents/TRIPTICO SG.pdf
ETP Smart Grids, 2015. The SmartGrids European Technology Platform [WWW Document]. URL http://www.smartgrids.eu/ETPSmartGrids (accessed 9.9.15).
ETP Smart Grids, 2006. European Smart Grids Technology Platform: Vision and Strategy for Europe’s Electricity Networks of the Future.
Eurelectic, 2015. Everything you always wanted to know about demand response. doi:D/2015/12.105/11
Eurelectric, 2015. Designing fair and equitable market rules for demand response aggregation. doi:: D/2015/12.105/5
Eurelectric, 2014. ELECTRICITY DISTRIBUTION INVESTMENTS : WHAT REGULATORY FRAMEWORK DO WE NEED ? doi:D/2014/12.105/16; 2014
Eurelectric, 2013. Network tariff structure for a smart energy system. doi:D/2013/12.105/24
Eurostat, 2014. Electricity prices for domestic consumers in Europe (excluding taxes and levies).
Faruqui, A., Hledik, R., Tsoukalis, J., 2009. The Power of Dynamic Pricing. Electr. J. 22, 42–56. doi:10.1016/j.tej.2009.02.011
Faruqui, A., Sergici, S., 2008. BGE’s Smart Energy Pricing Pilot, Summer 2008 Impact Evaluation.
FENIX, 2009. Flexible Electricity Networks to Integrate the Expected Energy Evolution, Evolution.
229
FERC, 2012. Assessment of Demand Response & Advanced Metering.
FERC, 2008. Assessment of Demand Response and Advanced Metering.
Flexiblepower Alliance Network, 2015. Power Matcher Suite [WWW Document]. URL http://flexiblepower.github.io/why/powermatcher/ (accessed 6.6.15).
Forsberg, K., Fritz, P., 2001. Methods to Secure Peak Load Capacity on Deregulated Electricity Markets: A summary of papers and presentation from the Market Design 2001 conference.
Forte, V.J., 2010. Smart Grid at National Grid. Innov. Smart Grid Technol. (ISGT), 2010. doi:10.1109/ISGT.2010.5434729
Fortum Distribution, 2013. Nätpriser - Effektabonnemang vid 220 kV (Swedish).
Frederiks, E.R., Stenner, K., Hobman, E. V., 2015. Household energy use: Applying behavioural economics to understand consumer decision-making and behaviour. Renew. Sustain. Energy Rev. 41, 1385–1394. doi:10.1016/j.rser.2014.09.026
Friedman, L., Hausker, K., 1988. Residential energy consumption: Models of consumer behavior and their implications for rate design. J. Consum. Policy 11, 287–313. doi:10.1007/BF00411952
FSR, BNetzA, 2014. Forum on Legal Issues of Energy Regulation Brussels. Brussels.
Geelen, D., Reinders, A., Keyson, D., 2013. Empowering the end-user in smart grids: Recommendations for the design of products and services. Energy Policy 61, 151–161. doi:10.1016/j.enpol.2013.05.107
Gellings, C.W., 1985. No Title. Proc. IEEE 73, 1468 – 1470. doi:10.1109/PROC.1985.13318
Geode, 2014. Flexibility in Tomorrow ’ s Energy System: DSOs ’ Approach.
Goldman, C., Hopper, N., Bharvirkar, R., 2007. Estimating Demand Response Market Potential among Large Commercial and Industrial Customers: A Scoping Study.
230
Goldman, C.A., Hopper, N.C., Bharvirkar, R., Neenan, B., Boisvert, R., Cappers, P., Pratt, D., Butkins, K., 2005. Customer Strategies for Responding to Day-Ahead Market Hourly Electricity Pricing. LBNL, Berkeley.
Gómez, T., 2013. Electricity Distribution, in: Pérez-Arriaga, I.J. (Ed.), Regulation of the Power Sector SE - 5, Power Systems. Springer London, pp. 199–250. doi:10.1007/978-1-4471-5034-3_5
Grandjean, A., Binet, G., Bieret, J., Adnot, J., Duplessis, B., 2011. A functional analysis of electrical load curve modelling for some households specific electricity end-uses, in: 6th International Conference on Energy Efficiency in Domestic Appliances and Lighting (EEDAL’11). Copenhague, Denmark.
Greenflux, 2015. Greenflux [WWW Document].
Greening, L., 2010. Demand response resources: Who is responsible for implementation in a deregulated market? Energy 35, 1518–1525. doi:10.1016/j.energy.2009.12.013
Greening, L. a., 2010. Demand response resources: Who is responsible for implementation in a deregulated market? Energy 35, 1518–1525. doi:10.1016/j.energy.2009.12.013
Gupta, N.K., Danielsen, A.L., 1998. Real-time Pricing: Ready for the Meter?: An Empirical Study of Consumer Response.
Gyamfi, S., Krumdieck, S., Urmee, T., 2013. Residential peak electricity demand response—Highlights of some behavioural issues. Renew. Sustain. Energy Rev. 25, 71–77. doi:10.1016/j.rser.2013.04.006
Hakvoort, R., Knops, H., Koutstaal, P., Welle, A. Van Der, Gerdes, J., 2013. De tariefsystematiek van het elektriciteitsnet (in Dut.
Hakvoort, R.A., Koliou, E., 2015. Energy Management and Demand Side Response, in: U.C. Sharma et Al., Energy Management, Energy Science and Technology Series. Studium Press LLC, USA, pp. 53–97.
Hamidi, V., Li, F., Robinson, F., 2009. Demand response in the UK’s domestic sector. Electr. Power Syst. Res. 79, 1722–1726. doi:10.1016/j.epsr.2009.07.013
231
Hashmi, M., 2011. Survey of smart grids concepts worldwide.
He, X., Hancher, L., Azevedo, I., Keyaert, N., Meeus, L., Glachant, J.-M., Zorn, A., 2013a. Shift, not drift : towards active demand response and beyond. doi:FSR_PB_2013_04.pdf
He, X., Keyaerts, N., Azevedo, I., Meeus, L., Hancher, L., Glachant, J.M., 2013b. How to engage consumers in demand response: A contract perspective. Util. Policy 27, 108–122. doi:10.1016/j.jup.2013.10.001
Herriges, J.A., Baladi, S.M., Caves, D.W., Neenan, B.F., 1993. The Response of Industrial Customers to Electric Rates Based Upon Dynamic Marginal Costs. Rev. Econ. Stat. 75, 446–454. doi:10.2307/2109458
Hirth, L., Ziegenhagen, I., 2013. Balancing Power and Variable Renewables: A Glimpse at German Data, in: Proceding of 13th IAEE European Conference. Düsseldorf, Germany.
Hong, Z., Son, Y.-J., Chiu, Y.-C., Head, L., Feng, Y., Xi, H., Kim, S., Hickman, M., 2013. A Primer for Agent-Based Simulation and Modeling in Transportation Applications.
Hopper, N., Goldman, C., Neenan, B., 2006. Demand Response from Day-Ahead Hourly Pricing for Large Customers. Electr. J. 19, 52–63. doi:10.1016/j.tej.2006.02.002
Ibrahim, H., Skillbäck, M., 2012. Evaluation methods for market models used in smart grids: An application for the Stockholm Royal Seaport.
IEA, 2007. Task XI: Time of Use Pricing and Energy Use for Demand Management Delivery.
IEA, 2003. The Power to Choose, Demand Response in Liberalised Electricity Markets.
Ikäheimo, J., Evens, C., Kärkkäinen, S., 2010. DER Aggregator Business : the Finnish Case.
Jennings, N.R., 2000. On agent-based software engineering. Artif. Intell. 117, 277–296. doi:10.1016/S0004-3702(99)00107-1
Kirby, B.J., 2003. Spinning Reserve From Responsive Loads.
232
Kirschen, D.S., Strbac, G., Cumperayot, P., de Paiva Mendes, D., 2000. Factoring the elasticity of demand in electricity prices. Power Syst. IEEE Trans. doi:10.1109/59.867149
Kohler, D.F., Mitchell, B.M., 1984. Response to residential time-of-use electricity rates. J. Econom. 26, 141–177. doi:10.1016/0304-4076(84)90016-2
Kok, J.K., Warmer, C.J., Kamphuis, I.G., 2005. PowerMatcher: multiagent control in the electricity infrastructure, in: Fourth International Joint Conference on Autonomous Agents and Multiagent Systems. New York, USA. doi:10.1145/1082473.1082807
Koliou, E., Abdul Muhaimin, T., Hakvoort, R.A., Kremers, R., 2015a. Complexity of demand response integration in European electricity markets, in: 12th International Conference on the European Energy Market, Lisbon Portugal.
Koliou, E., Abdul Muhaimin, T., Hakvoort, R.A., Kremers, R., 2015b. Complexity of end-user access to European electricity markets: The case of aggregation for demand response. Delft, the Netherlands.
Koliou, E., Bartusch, C., Picciariello, A., Eklund, T., Söder, L., Hakvoort, R.A., 2015c. Quantifying distribution-system operators’ economic incentives to promote residential demand response. Util. Policy 35, 28–40. doi:10.1016/j.jup.2015.07.001
Koliou, E., Eid, C., Chaves-Ávila, J.P., Hakvoort, R.A., 2014. Demand response in liberalized electricity markets: Analysis of aggregated load participation in the German balancing mechanism. Energy 71, 245–254. doi:10.1016/j.energy.2014.04.067
Koliou, E., Eid, C., Hakvoort, R., 2013a. Development of Demand Side Response in liberalized electricity markets: Policies for effective market design in Europe, in: 10th International Conference on European Energy Markets. pp. 1–8. doi:10.1109/EEM.2013.6607403
Koliou, E., Eklund, T., Picciariello, A., Söder, L., Bartusch, C., Alvehag, K., Hakvoort, R.A., 2014. Economic Impact of Demand Response on Costs to Distribution System Operators, in: 37th IAEE International Conference. New York, NY, USA.
Koliou, E., Mahalingam, A., Hakvoort, R., 2013b. Assessment of Residential Demand Side Response: Implementation of Price-Based Mechanisms in the Dutch Day-Ahead Market, in: IAEE Europe. Düsseldorf.
233
Lijesen, M.G., 2007. The real-time price elasticity of electricity. Energy Econ. 29, 249–258. doi:10.1016/j.eneco.2006.08.008
Lilliestam, J., Ellenbeck, S., 2011. Energy security and renewable electricity trade—Will Desertec make Europe vulnerable to the “energy weapon”? Energy Policy 39, 3380–3391. doi:10.1016/j.enpol.2011.03.035
Lindbeck, A., 1992. Economic Sciences, 1969-1980: The Sveriges Riksbank (Bank of Sweden) Prize in Economic Sciences in Memory of Alfred Nobel, BANK OF SWEDEN PRIZE IN ECONOMIC SCIENCES IN MEMORY OF ALFRED NOBEL. World Scientific.
Linderhof, V.G.M., 2001. Household demand for energy, water and the collection of waste: a microeconometric analysis. University of Groningen.
Lopes, M.A.R., Antunes, C.H., Martins, N., 2012. Energy behaviours as promoters of energy efficiency: A 21st century review. Renew. Sustain. Energy Rev. 16, 4095–4104. doi:10.1016/j.rser.2012.03.034
Lutzenhiser, L., 1993. Social and Behavioral Aspects of Energy use. Annu. Rev. Energy Environ. 18, 247–289. doi:10.1146/annurev.eg.18.110193.001335
Mahalingam, A., 2013. Modeling of residential demand response of smart electricity grids to day ahead markets. Delft University of Technology.
Mårtensson, K., 2013a. Interview, CEO Sala-Heby Energi Elnät AB.
Mårtensson, K., 2013b. Interview, CEO Sala-Heby Energi Elnät AB.
Masiello, R., Harrison, J., Mukerji, R., 2013. Market Dynamics of Integrating Demand Response into Wholesale Energy Markets. Electr. J. 26, 8–19. doi:10.1016/j.tej.2013.06.006
Mavrokapnidou, M., Koirala, P.B., Hakvoort, R.A., Herder, P., 2015. The Interplay between Storage and Flexibility in the Power Systems, in: 9TH International Renewable Energy Storage Conference (IRES). Düsseldorf, Germany.
Meisl, M., Leber, T., Pollhammer, K., Kupzog, F., Haslinger, J., Wächter, P., SterbikLamina, J., Ornetzeder, M., Schiffleitner, A., Stachura, M., 2012. Demand Response Empfehlungen im Energieversorgungssystem 2020. (in German). Oldenburg.
234
MIT, 2011. OPENCOURSEWARE Principles of Microeconomics Lecture 1. [WWW Document]. URL http://ocw.mit.edu/courses/economics/14-01sc-principles-of-microeconomics-fall-2011/Syllabus/#_R_T (accessed 7.7.15).
Mott MacDonald, 2013. Impact Assessment on European Electricity Balancing Market.
Movares, Netbeheer, 2013. Laadstrategie Elektrisch Wegvervoer Autorisatieblad, in Dutch.
Neenan, B., Eom, J., 2008. Price Elasticity of Demand for Electricity : A Primer and Synthesis.
Netherlands Enterprise Agency, 2014. Who is who guide: players in the Dutch smart-grid sector [WWW Document]. URL http://www.rvo.nl/sites/default/files/2014/11/Who is who guide 2014 - Players in the Dutch smart grid sector_0.pdf
Niesten, E., Jolink, A., 2014. Absence of a market in the Dutch balancing mechanism: European rules versus specific investments. Eur. J. Law Econ. 38, 71–90. doi:10.1007/s10657-013-9411-2
NIST, 2010. NIST framework and roadmap for Smart Grid interoperability standards.
Nordpoolspot, 2012. Intraday prices and volumes for 2012 [WWW Document]. URL http://www.nordpoolspot.com/Market-data1/Elbas/ (accessed 3.5.15).
NordREG, 2011. Economic regulation of electricity grids in Nordic countries. Nordic Energy Regulators.
OECD/IEA, 2007. Mind the Gap: Quantifying Principle-Agent Problem sin Energy Efficinecy.
Paatero, J. V, Lund, P.D., 2006. A model for generating household electricity load profiles. Int. J. Energy Res. 30, 273–290. doi:10.1002/er.1136
Paauw, J., Roosien, B., Aries, M.B.C., Guerra Santin, O., 2009. “ENERGY PATTERN GENERATOR”:UNDERSTANDING THE EFFECT OF USER BEHAVIOUR ON ENERGY SYSTEMS.
235
Pandzic, H., Wang, Y., Qiu, T., Dvorkin, Y., Kirschen, D.S., 2014. Near-Optimal Method for Siting and Sizing of Distributed Storage in a Transmission Network. Power Syst. IEEE Trans. doi:10.1109/TPWRS.2014.2364257
Park, R.E., Acton, J.P., 1984. Large business customer response to time-of-day electricity rates. J. Econom. 26, 229–252. doi:10.1016/0304-4076(84)90019-8
Pérez-Arriaga, I., Smeers, Y., 2003. Guidelines on Tariff Setting, in: Transport Pricing of Electricity Networks SE - 7. Springer US, pp. 175–203. doi:10.1007/978-1-4757-3756-1_7
Pérez-arriaga, I.J., 2013. Regulation of the Power Sector. Springer London Heidelberg New York Dordrecht. doi:DOI 10.1007/978-1-4471-5034-3
Perez-Arriaga, I.J., Rubio, F.J., Puerta, J.F., Arceluz, J., Marin, J., 1995. Marginal pricing of transmission services: an analysis of cost recovery. Power Syst. IEEE Trans. doi:10.1109/59.373981
Pérez-Arriaga, I.J., Ruester, S., Schwenen, S., Battle, C., Glachant, J.-M., 2013. From Distribution Networks to Smart Distribution Systems: Rethinking the Regulation of European Electricity DSOs. doi:10.2870/78510
PlugSurfing, 2015. PlugSurfing [WWW Document]. URL https://www.plugsurfing.com/ (accessed 6.6.15).
Ponce de Leao, M.T., Saraiva, J.T., 2003. Solving the revenue reconciliation problem of distribution network providers using long-term marginal prices. Power Syst. IEEE Trans. doi:10.1109/TPWRS.2002.807076
Potter, C.W., Archambault, A., Westrick, K., 2009. Building a smarter smart grid through better renewable energy information. Power Syst. Conf. Expo. 2009. PSCE ’09. IEEE/PES. doi:10.1109/PSCE.2009.4840110
PROFF.se, 2013. Sala-Heby Energi Elnät AB - SALA – Nyckeltal.
Prüggler, N., 2013. Economic potential of demand response at household level—Are Central-European market conditions sufficient? Energy Policy 60, 487–498. doi:10.1016/j.enpol.2013.04.044
236
Ramos, A., Rivero Puente, E., Six, D., 2014. Development of methodologies and tools for new and evolving DSO roles for efficient DRES integration in distribution networks.
Regelleistung, 2013. The German transmission system operators internet platform for tendering control reserve.
Reneses, J., Rodríguez, M., 2014. Distribution pricing: theoretical principles and practical approaches. IET Gener. Transm. Distrib. 8, 1645–1655. doi:10.1049/iet-gtd.2013.0817
Renner, S., Albu, M., Van Elburg, H., Heinemann, C., Lazicki, A., Penttinen, L., Puente, F., Saele, H., 2011. European Smart Metering Landscape Report. Vienna.
Richardson, I., Thomson, M., Infield, D., 2008. A high-resolution domestic building occupancy model for energy demand simulations. Energy Build. 40, 1560–1566. doi:10.1016/j.enbuild.2008.02.006
Richardson, I., Thomson, M., Infield, D., Clifford, C., 2010. Domestic electricity use: A high-resolution energy demand model. doi:10.1016/j.enbuild.2010.05.023
Rittenberg, L., Tregarthen, T., 2011. Chapter 1: What is economics. pp. 2–27.
Rodríguez Ortega, M.P., Pérez-Arriaga, J.I., Abbad, J.R., González, J.P., 2008. Distribution network tariffs: A closed question? Energy Policy 36, 1712–1725. doi:10.1016/j.enpol.2008.01.025
Saffre, F., Gedge, R., 2010. Demand-Side Management for the Smart Grid. Netw. Oper. Manag. Symp. Work. (NOMS Wksps), 2010 IEEE/IFIP. doi:10.1109/NOMSW.2010.5486558
Schwarz, P.M., Taylor, T.N., Birmingham, M., Dardan, S.L., 2002. INDUSTRIAL RESPONSE TO ELECTRICITY REAL-TIME PRICES: SHORT RUN AND LONG RUN. Econ. Inq. 40, 597–610. doi:10.1093/ei/40.4.597
Schweppe, F.C., Tabors, R.D., Kirtley, J.L., Outhred, H.R., Pickel, F.H., Cox, A.J., 1980. Homeostatic Utility Control. IEEE Trans. Power Appar. Syst. 99, 1151–1163. doi:10.1109/TPAS.1980.319745
237
Scopus, 2015. About Scopus [WWW Document]. URL http://www.elsevier.com/solutions/scopus (accessed 9.6.15).
SEDC, 2015. Enabling independent aggregation in the European electricity markets.
SEDC, 2014. Mapping Demand Response in Europe Today.
SEDC, 2012. A Demand Response Action Plan For Europe.
Seebach, D., Timpe, C., Bauknect, D., 2009. Costs and Benefits of Smart Appliances in Europe.
Shaw, R., Attree, M., Jackson, T., Kay, M., 2007. Reducing distribution losses by delaying peak domestic demand, in: CIRED2007, 19th International Conference on Electricity Distribution.
Siano, P., 2014. Demand response and smart grids—A survey. Renew. Sustain. Energy Rev. 30, 461–478. doi:10.1016/j.rser.2013.10.022
Similä, L., Koreneff, G., Kekkonen, V., 2011. Network tariff structures in Smart Grid environment.
Simon, H.A., 1959. Theories of Decision-Making in Economics and Behavioral Science. Am. Econ. Rev. 49, 253–283.
Simon, H.A., 1956. Rational choice and the structure of the environment. Psychol. Rev. doi:10.1037/h0042769
Smithers, B., 2013. Creating the right environment for demand- side response, OFGEM.
Stamminger, R., Friedrich-Wilhelms, R., 2008. Synergy Potential of Smart Appliances: D2.3 of WP 2 from the Smart-A project.
Strbac, G., 2008. Demand side management: Benefits and challenges. Energy Policy 36, 4419–4426. doi:10.1016/j.enpol.2008.09.030
Stromnetz Berlin, FOKUS, F., 2014. Netzdaten Berlin - das Pilotportal.
238
Summit Blue Consulting, 2007. Evaluation of the 2006 Energy-Smart Pricing Plan. Evaluation.
Swan, L.G., Ugursal, V.I., 2009. Modeling of end-use energy consumption in the residential sector: A review of modeling techniques. Renew. Sustain. Energy Rev. 13, 1819–1835. doi:10.1016/j.rser.2008.09.033
Sweco, 2012. LOKALNÄTSTARIFFER – STRUKTUR OCH UTFORMNING (Swedish).
Sweco, 2010. Reglering av elnätsföretagens intäkter - regelmässiga avskrivningstider (Regulation of network companies income - regular depreciation schedules) Sweco, Energiguide AB. Stockholm.
Taylor, T., Schwarz, P., Cochell, J., 2005. 24/7 Hourly Response to Electricity Real-Time Pricing with up to Eight Summers of Experience. J. Regul. Econ. 27, 235–262. doi:10.1007/s11149-005-6623-6
Taylor, T.N., Schwarz, P.M., 1990. The Long-Run Effects of a Time-of-Use Demand Charge. RAND J. Econ. 21, 431–445. doi:10.2307/2555618
TemaNord, 2014. Demand response in the Nordic electricity market Input to strategy on demand flexibility. Copenhagen.
TenneT, 2012. Implementation Guide.
Tennet, E-bridge, GEN Nederland, 2011. Imbalance Management TenneT Analysis report.
TESLA motors, 2015. POWERWALL Tesla Home Battery [WWW Document].
Tishler, A., 1984. A model of industrial demand for electricity under time-of-use pricing and three labor shifts. Resour. Energy 6, 107–127. doi:10.1016/0165-0572(84)90013-6
Torriti, J., 2012. Price-based demand side management: Assessing the impacts of time-of-use tariffs on residential electricity demand and peak shifting in Northern Italy. Energy 44, 576–583. doi:10.1016/j.energy.2012.05.043
239
Torriti, J., Hassan, M.G., Leach, M., 2010. Demand response experience in Europe: Policies, programmes and implementation. Energy 35, 1575–1583. doi:10.1016/j.energy.2009.05.021
U.S. National Academy of Engineering, 2003. Greatest achievements of the 20th century [WWW Document]. URL http://www.greatachievements.org/?id=2949
USEF, 2016. Universal Smart Energy Framework [WWW Document]. URL http://www.usef.energy/
Valero, S., Ortiz, M., Senabre, C., Alvarez, C., 2006. Methods for customer and demand response policies selection in new electricity markets. doi:10.1049/iet-gtd
Van der Veen, R.A.C., 2012. Designing Multinational Electricity Balancing Markets. Delft University of Technology.
Van Oirsouw, P., Cobben, J.F.G., 2011. Netten voor distributie van elektriciteit: Phase to Phase. Alliander and Agentschap NL, p. 704.
Van Raaij, W.F., Verhallen, T.M.M., 1983. A behavioral model of residential energy use. J. Econ. Psychol. 3, 39–63. doi:10.1016/0167-4870(83)90057-0
Vandezande, L., Meeus, L., Belmans, R., Saguan, M., Glachant, J.-M., 2010. Well-functioning balancing markets: A prerequisite for wind power integration. Energy Policy 38, 3146–3154. doi:10.1016/j.enpol.2009.07.034
Vattenfall Distribution, 2013. Regionnätstariffer 2013 (Swedish).
Venkatesan, N., Solanki, J., Solanki, S.K., 2012. Residential Demand Response model and impact on voltage profile and losses of an electric distribution network. Appl. Energy 96, 84–91. doi:10.1016/j.apenergy.2011.12.076
Voltalis, 2016. Voltalis [WWW Document]. URL http://www.voltalis.com/
Vos, A., 2009. Effective business models for demand response under the Smart Grid paradigm. Power Syst. Conf. Expo. 2009. PSCE ’09. IEEE/PES. doi:10.1109/PSCE.2009.4840261
240
Widén, J., Lundh, M., Vassileva, I., Dahlquist, E., Ellegård, K., Wäckelgård, E., 2009. Constructing load profiles for household electricity and hot water from time-use data—Modelling approach and validation. Energy Build. 41, 753–768. doi:10.1016/j.enbuild.2009.02.013
World bank, 2015. Power transmission and distribution losses (% output), 2010-2014.
Xu, Z., Ostergaard, J., Togeby, M., 2011. Demand as Frequency Controlled Reserve. Power Syst. IEEE Trans. doi:10.1109/TPWRS.2010.2080293
Zhong, J., Kang, C., Liu, K., 2010. Demand side management in China. Power Energy Soc. Gen. Meet. 2010 IEEE. doi:10.1109/PES.2010.5589964

241
242
List of publications
Peer-reviewed journal articles
Elta Koliou, Cherrelle Eid, José Pablo Chaves Ávila and Rudi A. Hakvoort. Demand
response in liberalized electricity markets: Analysis of aggregated load participation in
the German balancing mechanism. Energy Journal, Volume 71, July 2014, Pages 245–
254.
Elta Koliou, Cajsa Bartusch, Angela Picciariello, Tobias Eklund, Lennart Söder, Rudi A.
Hakvoort. Quantifying distribution-system operators' economic incentives to promote
residential demand response. Utilities Policy, Volume 35, August 2015, Pages 28–40 .
Binod Prasad Koirala, Elta Koliou, Jonas Friege, Rudi A. Hakvoort, Paulien M. Herder,
Energetic communities for community energy: A review of key issues and trends shaping
integrated community energy systems, Renewable and Sustainable Energy Reviews,
Volume 56, April 2016, Pages 722-744.
Under review
Elta Koliou, Tariq Abdul Muhaimin, Rudi A. Hakvoort and Robbert Kremers. Complexity
of end-user access to European electricity markets: The case of aggregation for demand
response. Working paper submitted for publication, 2015.
Cherrelle Eid, Elta Koliou, Mercedes Valles, Javier Reneses Guillén, Rudi A. Hakvoort.
Dynamic Pricing and Electricity Demand Response: Existing barriers and next steps.
Working paper submitted for publication, 2015.
243
Conference proceedings
Elta Koliou, Arjun Mahalingam and R.A. Hakvoort. Assessment of Residential Demand
Side Response: Implementation of Price-Based Mechanisms in the Dutch Day-Ahead
Market. IAEE Conference (18-21 August 2013, Düsseldorf)
Elta Koliou, Cherrelle Eid and R.A. Hakvoort. Development of Demand Side Response in
Liberalized Electricity Markets: Policies for Effective Market Design in Europe. EEM13(27-
31 May 2013, Stockholm Sweden)
Elta Koliou, Tobias Eklund , Angela Picciariello , Lennart Söder , Cajsa Bartusch , Karin
Alvehag , R.A. Hakvoort, Economic Impact of Demand Response on Costs to Distribution
System Operators. 37th IAEE International Conference, New York, USA (15-18 June 2014)
Elta Koliou, Tariq Abdul Muhaimin, Rudi A. Hakvoort and Robbert Kremers. Complexity of
demand response integration in European electricity markets, 12th International
Conference on the European Energy Market (EEM) , vol., no., pp.1-5, 19-22, Lisbon May
2015
Book chapter
Rudi A. Hakvoort & Elta Koliou, 2015. Energy Management and Demand Side Response,
in: U.C. Sharma et Al., Energy Management, Energy Science and Technology Series.
Studium Press LLC, USA, pp. 53–97.
Book contribution
Alexander de Haan and Pauline de Heer. Solving Complex Problems: Professional Group
Decision-Making Support in Highly Complex Situations. Publisher: Eleven International
Publishing (2012)

244
Curriculum vitae
Elta Koliou was born on July 27th
, 1987. She
grew up in Tenafly, a town in the state of
New Jersey in the United States. Elta was an
active member of the local community,
volunteering as an Emergency Medical
Technician for the local ambulance
association. In 2005 she graduated from
Tenafly High School and obtained a Bachelor
of Arts in 2009 from Union College (New
York) with a double major in Economics and
Classics and a minor in Spanish.
Elta went on to complete an Erasmus Mundus Joint Master in Economics and
Management of Network Industries. As part of the Master’s program, she spent one year
at Comillas Pontifical University (Madrid, Spain) where she obtained a Masters in the
Electric Power Industry (2010) and one year at the University of Paris-Sud XI (Paris,
France) where she received a Master’s in Numerical Economics and Network Industries
(2011).
In September 2011 she began an Erasmus Mundus Joint Doctorate in Sustainable Energy
Technologies and Strategies (SETS) at Delft University of Technology (Delft, the
Netherlands). As part of the SETS program, she spent 10 months at KTH Royal Institute of
Technology (Stockholm, Sweden). During her research Elta published 3 journal papers,
presented in international conferences, collaborated with other researchers and
supervised master thesis projects.

245
246