De mondiale watercyclus Arjen Hoekstra - IHE Delft Gastcollege in de collegeserie ‘Duurzaamheid...
72
De mondiale watercyclus Arjen Hoekstra - IHE Delft Gastcollege in de collegeserie ‘Duurzaamheid van Energievoorzieningssystemen’ Utrecht, 17 september 2001
-
date post
19-Dec-2015 -
Category
Documents
-
view
215 -
download
0
Transcript of De mondiale watercyclus Arjen Hoekstra - IHE Delft Gastcollege in de collegeserie ‘Duurzaamheid...
De mondiale watercyclus
Arjen Hoekstra - IHE Delft
Gastcollege in de collegeserie
‘Duurzaamheid van Energievoorzieningssystemen’
Utrecht, 17 september 2001
Overzicht
• Overzicht van waterbeschikbaarheid op aarde• Overzicht van typen watergebruik
• Wat is waterschaarste?• Wat gebeurt er bij intensief watergebruik?• Dynamiek van watersystemen.• Wat betekent klimaatsverandering voor de
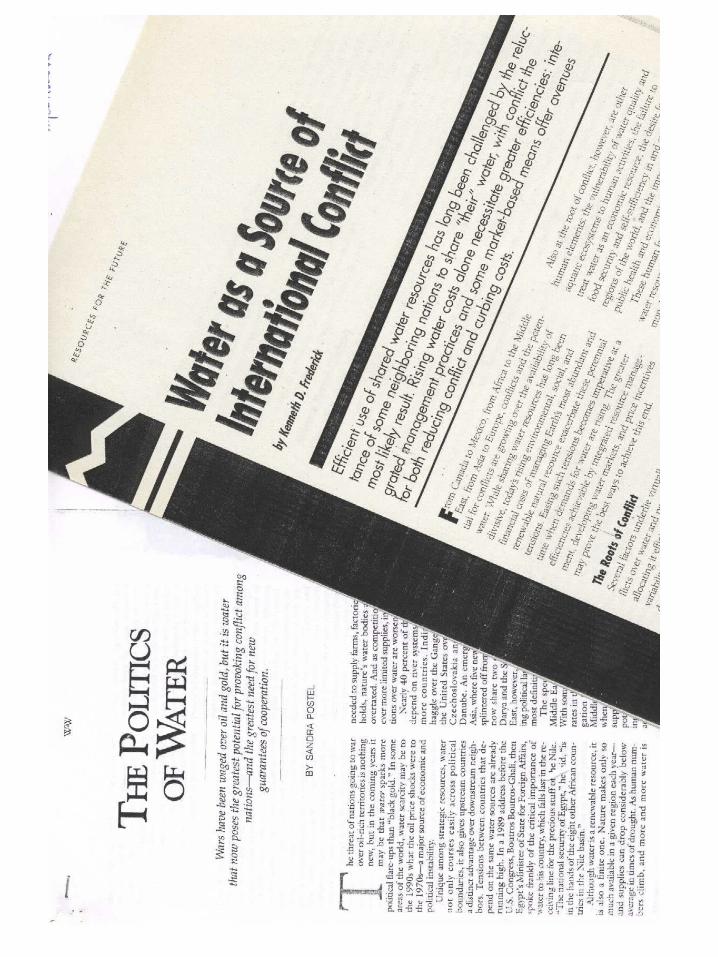
watervoorziening?• Wat weten we eigenlijk over zeespiegelstijging?• Zijn oorlogen over water waarschijnlijk?• Water in de context van wereldhandel en
globalisering
Water on earth
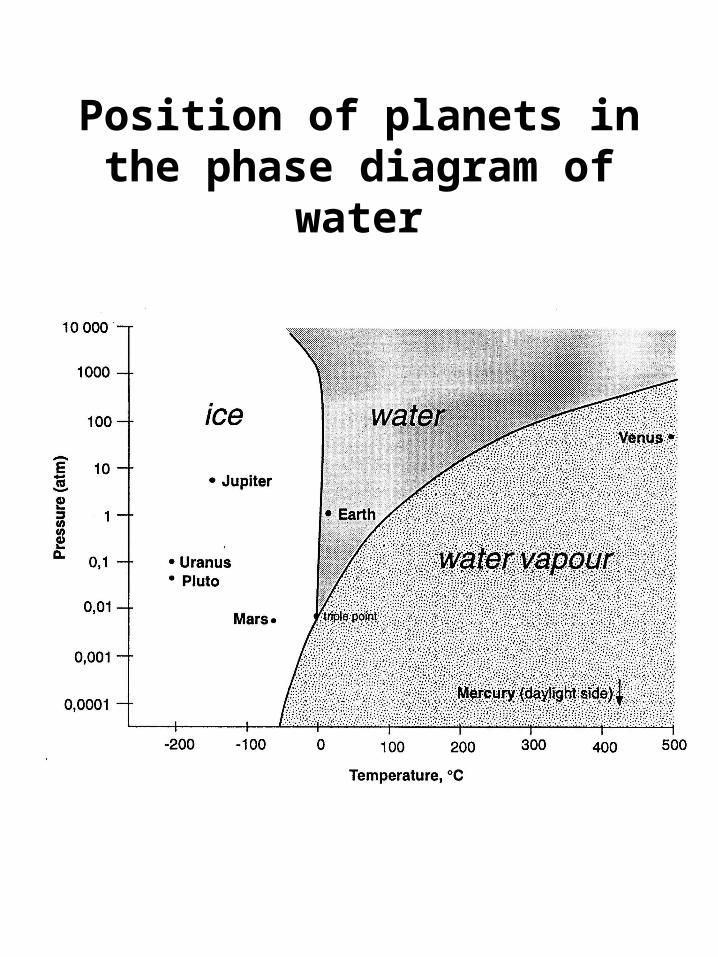
Position of planets in the phase diagram of water
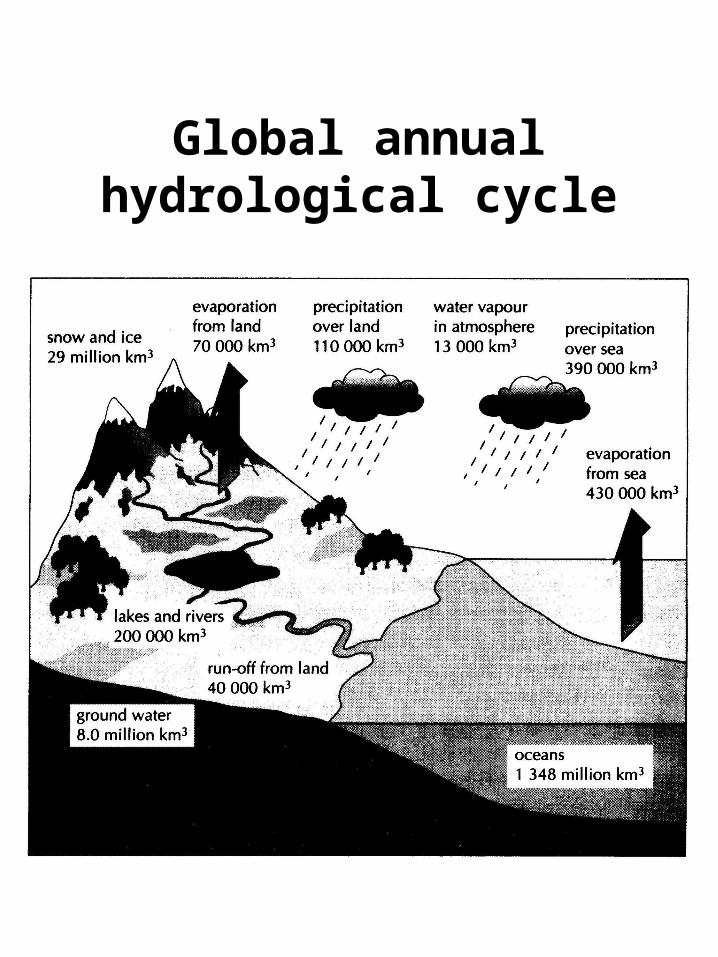
Global annual hydrological cycle
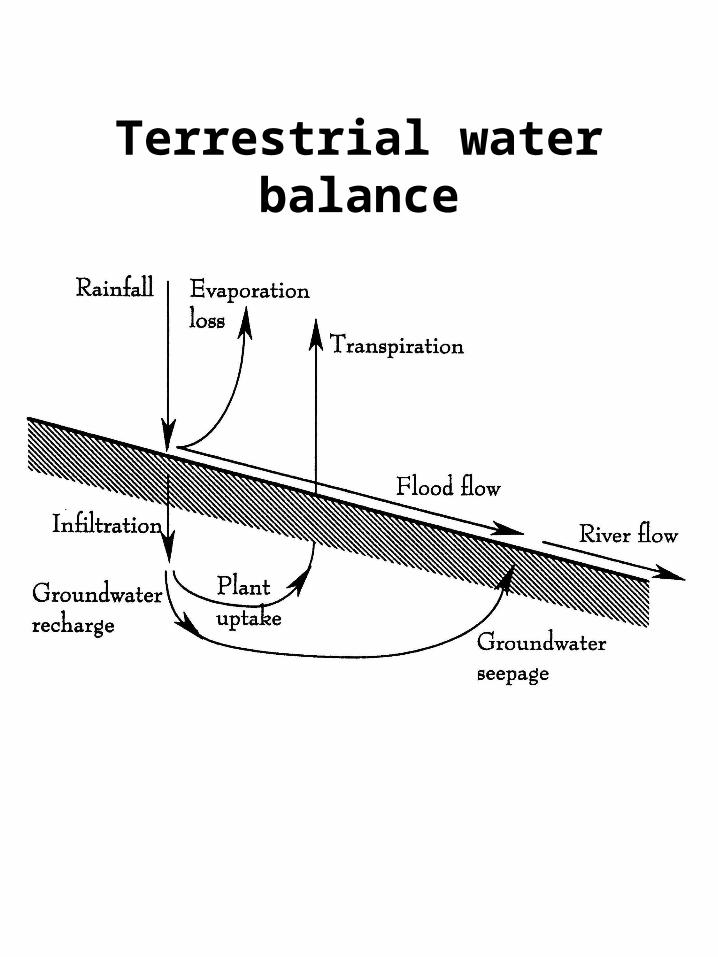
Terrestrial water balance
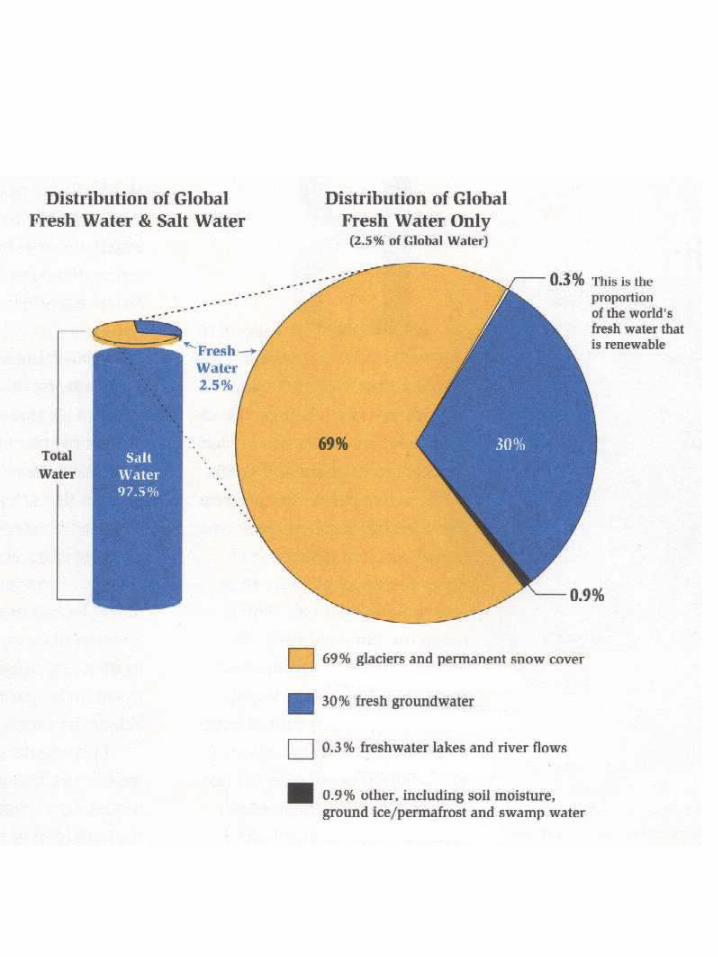
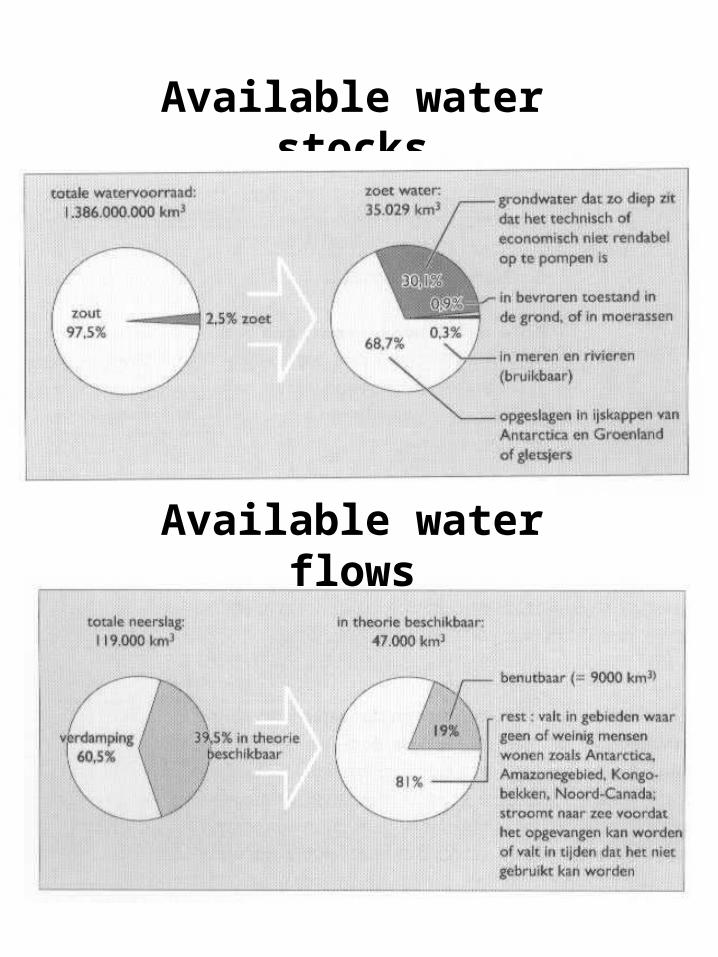
Available water stocks
Available water flows
Water use by man
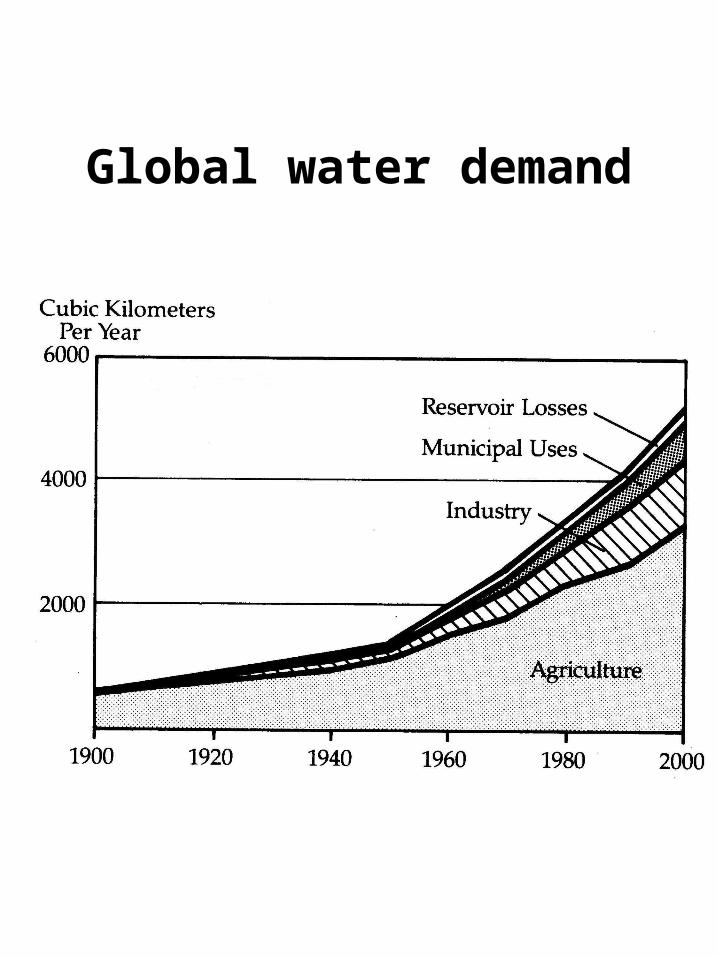
Global water demand
0
200
0
400
0
600
0
800
0
100
00
120
00
140
00
160
00
180
00
190
019
20
194
019
60
198
020
00
202
020
40
206
020
80
210
0
e12
kg
/yr
Fa
lke
nm
ark
an
d L
ind
h (
19
74
) A
Fa
lke
nm
ark
an
d L
ind
h (
19
74
) B
Ko
rzu
n e
t a
l. (1
97
8)
L'v
ovi
ch (
19
79
) I
L'v
ovi
ch (
19
79
) II
L'v
ovi
ch a
nd
Wh
ite (
19
90
)S
hik
lom
an
ov
(19
89
, 1
99
0,
19
93
)
Sh
iklo
ma
no
v (1
99
7)
Ma
rga
t (1
99
4)
Lo
wM
arg
at
(19
94
) H
igh
Ra
skin
et
al (
19
95
, 1
99
6)
Ra
skin
et
al.
(19
97
) L
ow
Ra
skin
et
al.
(19
97
) M
idR
ask
in e
t a
l. (1
99
7)
Hig
hH
oe
kstr
a (
19
98
) H
iera
rch
ist
Ho
eks
tra
(1
99
8)
Eg
alit
aria
nH
oe
kstr
a (
19
98
) In
div
idu
alis
t
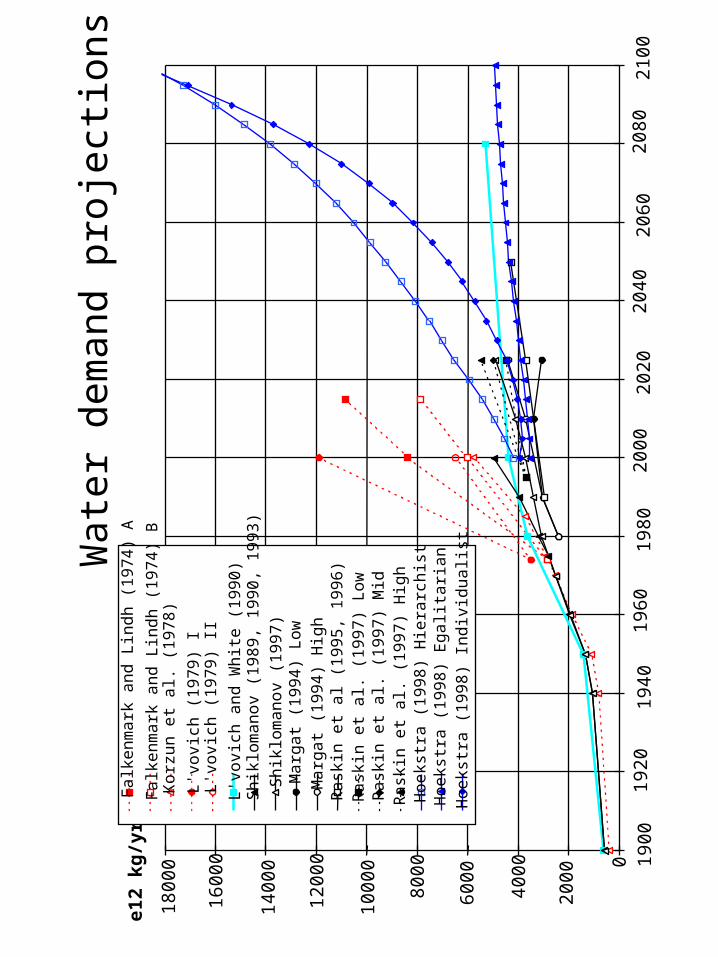
Wa
ter
de
ma
nd
pro
ject
ion
s
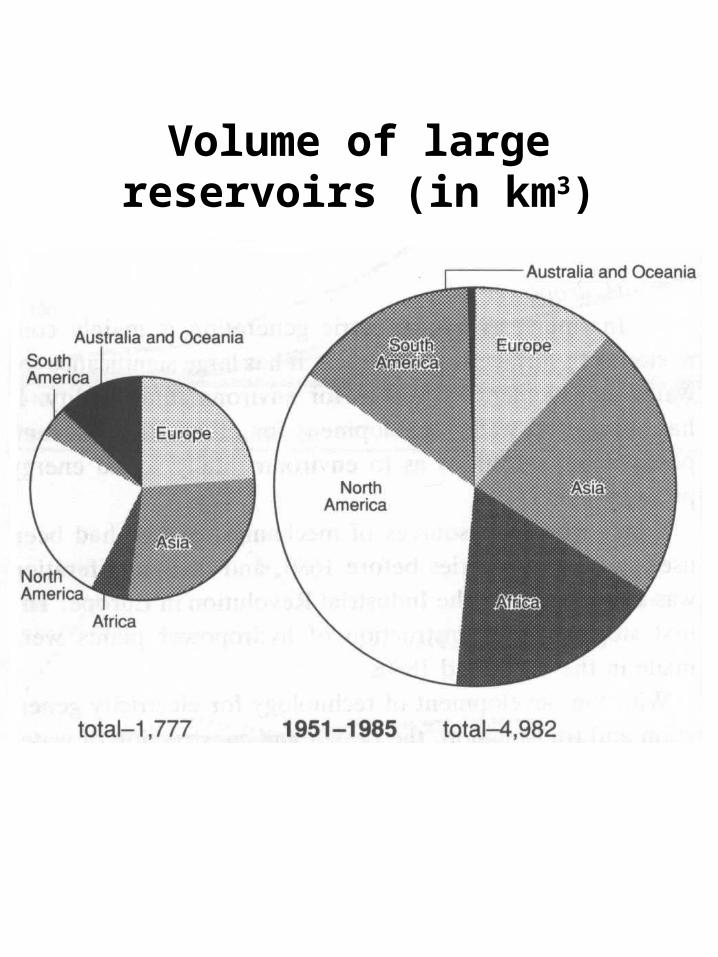
Volume of large reservoirs (in km3)
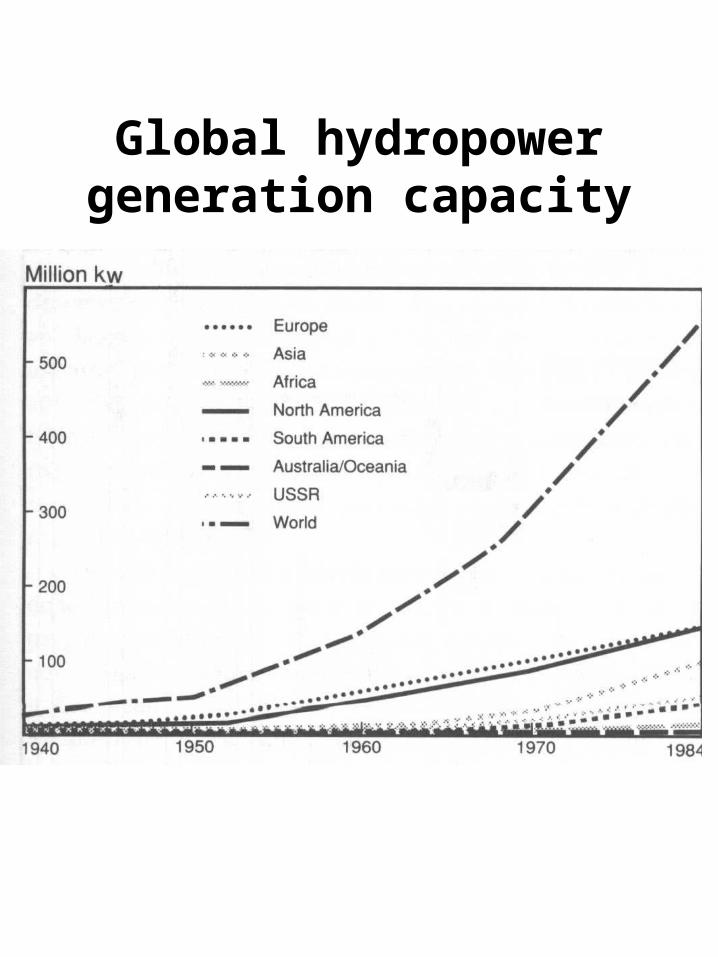
Global hydropower generation capacity
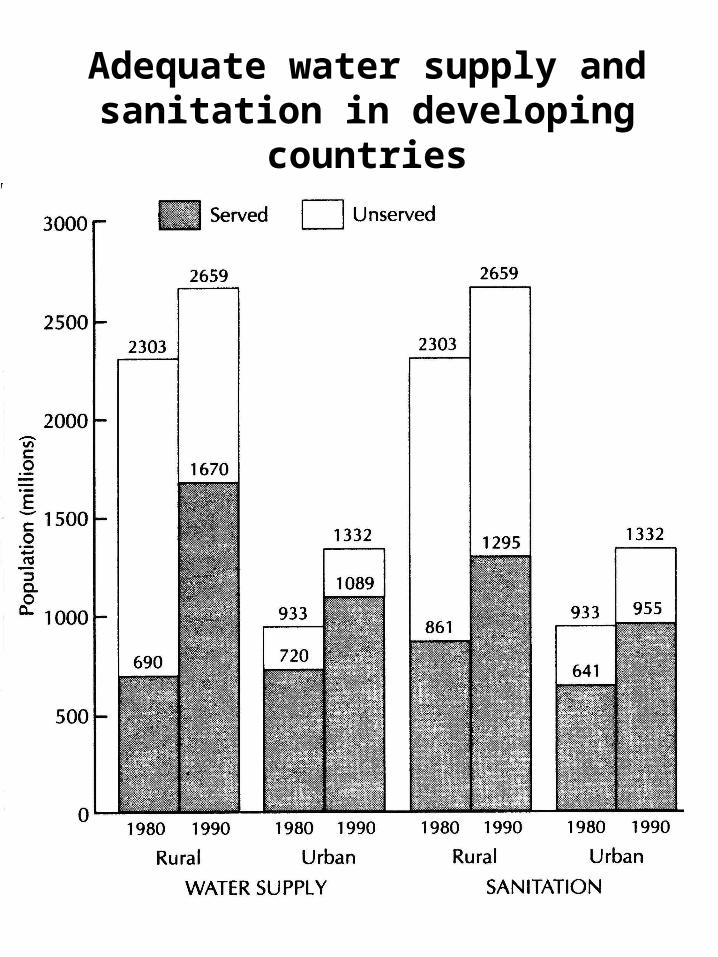
Adequate water supply and sanitation in developing countries
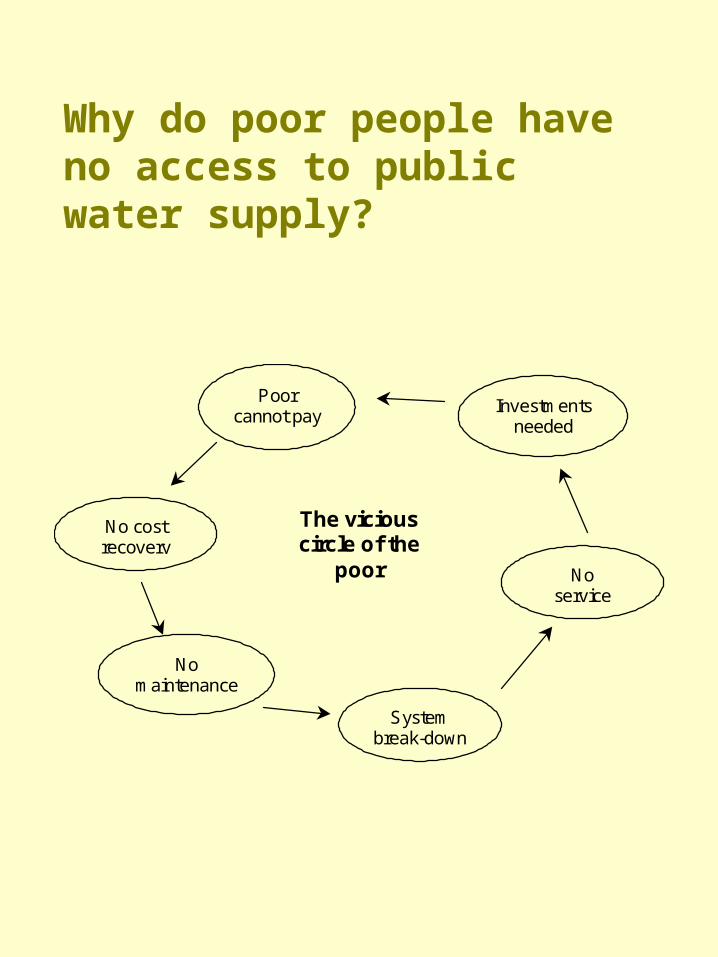
Why do poor people have no access to public water supply?
Poorcannot pay
No costrecovery
Nomaintenance
Systembreak-down
Noservice
Investmentsneeded
The viciouscircle of the
poor
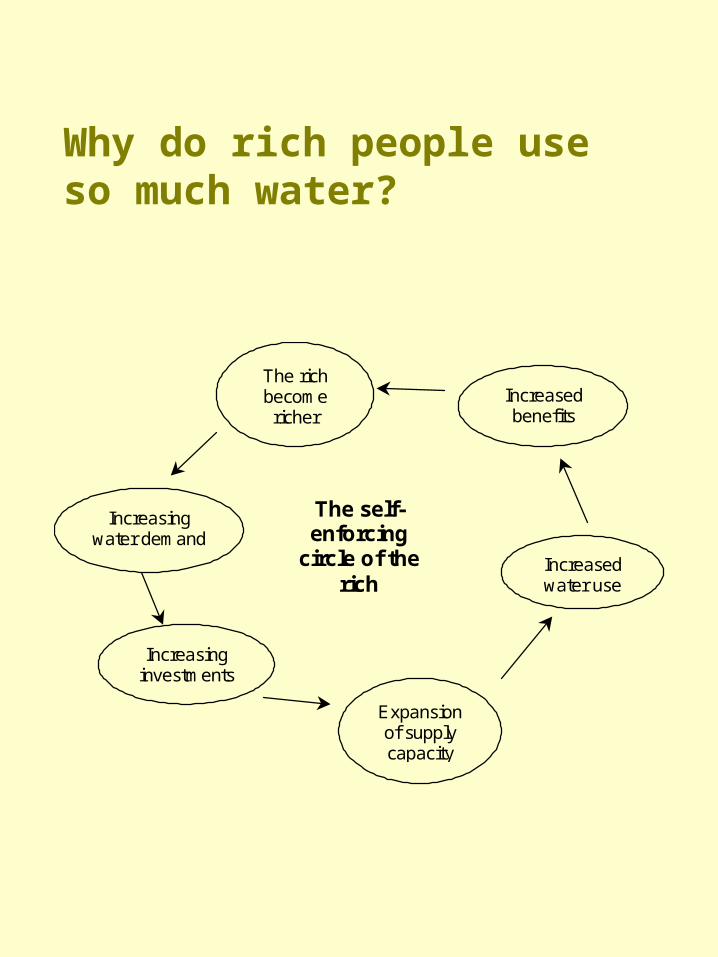
Why do rich people use so much water?
The richbecomericher
Increasingwater demand
Increasinginvestments
Expansionof supplycapacity
Increasedwater use
Increasedbenefits
The self-enforcing
circle of therich
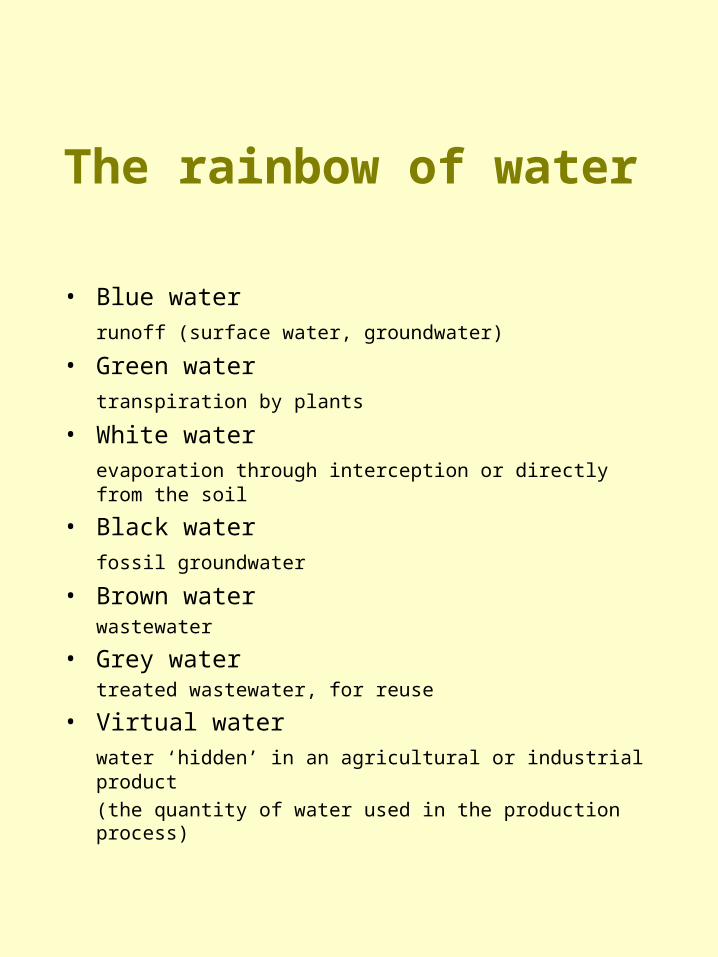
The rainbow of water
• Blue water
runoff (surface water, groundwater)
• Green water
transpiration by plants
• White water
evaporation through interception or directly from the soil
• Black water
fossil groundwater
• Brown waterwastewater
• Grey watertreated wastewater, for reuse
• Virtual water
water ‘hidden’ in an agricultural or industrial product
(the quantity of water used in the production process)
Water scarcity
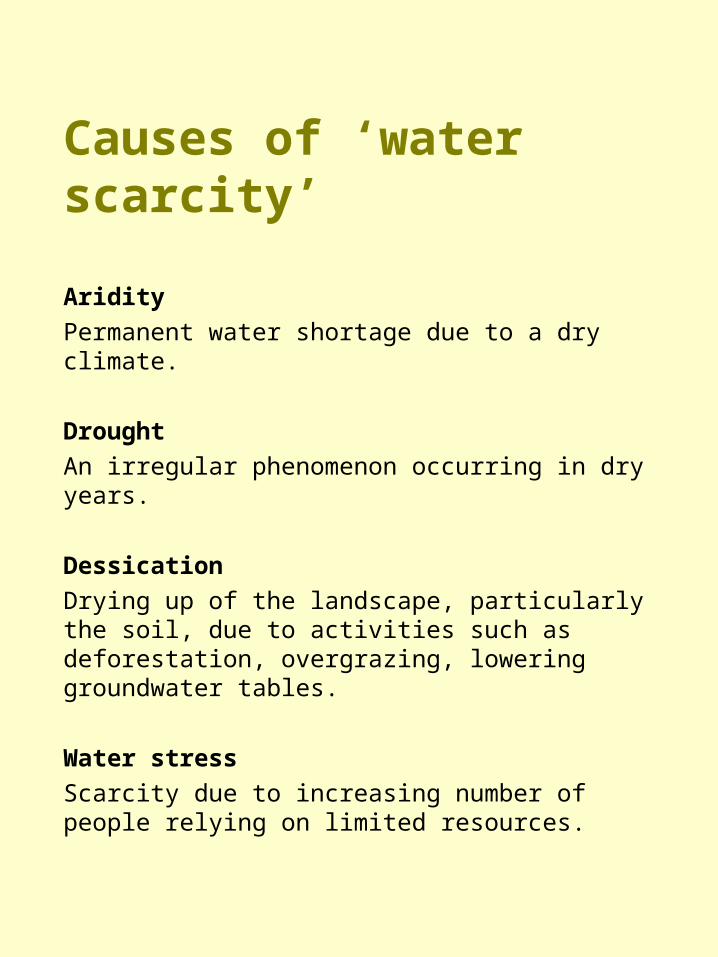
Causes of ‘water scarcity’
Aridity
Permanent water shortage due to a dry climate.
Drought
An irregular phenomenon occurring in dry years.
Dessication
Drying up of the landscape, particularly the soil, due to activities such as deforestation, overgrazing, lowering groundwater tables.
Water stress
Scarcity due to increasing number of people relying on limited resources.
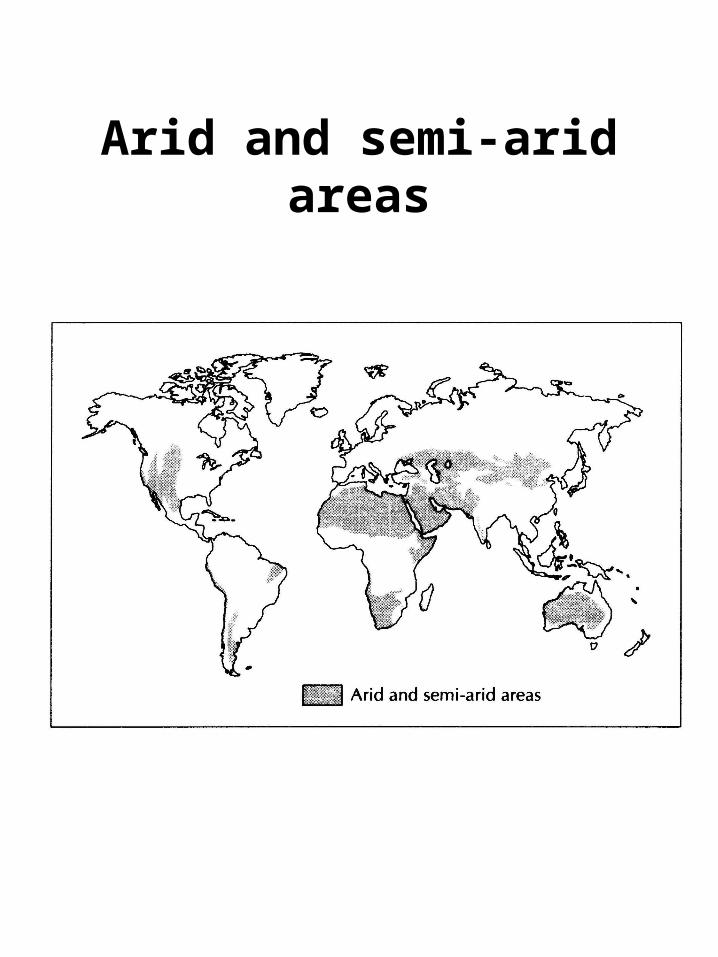
Arid and semi-arid areas
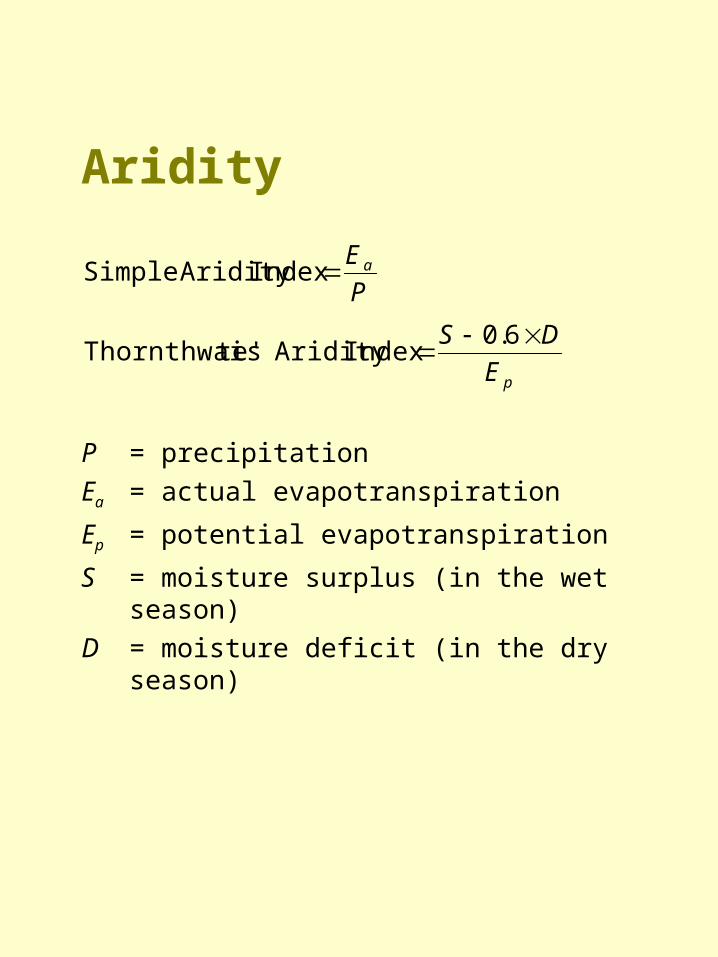
Aridity
P = precipitation
Ea = actual evapotranspiration
Ep = potential evapotranspiration
S = moisture surplus (in the wet season)
D = moisture deficit (in the dry season)
pE
DS
6.0Index Aridity ste'Thornthwai
P
EaIndex Aridity Simple
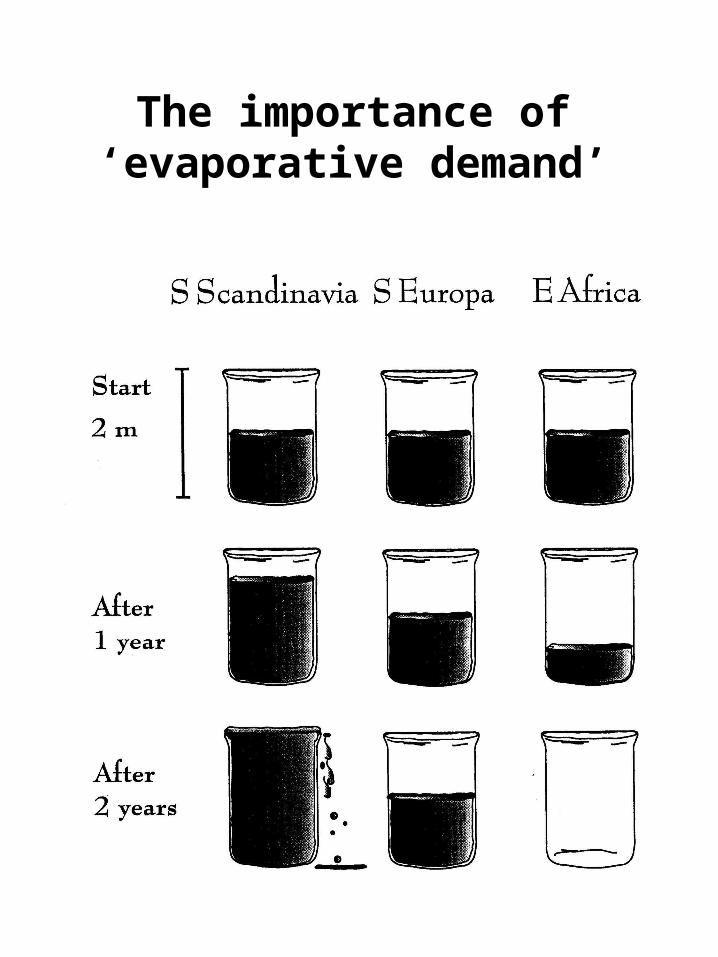
The importance of ‘evaporative demand’
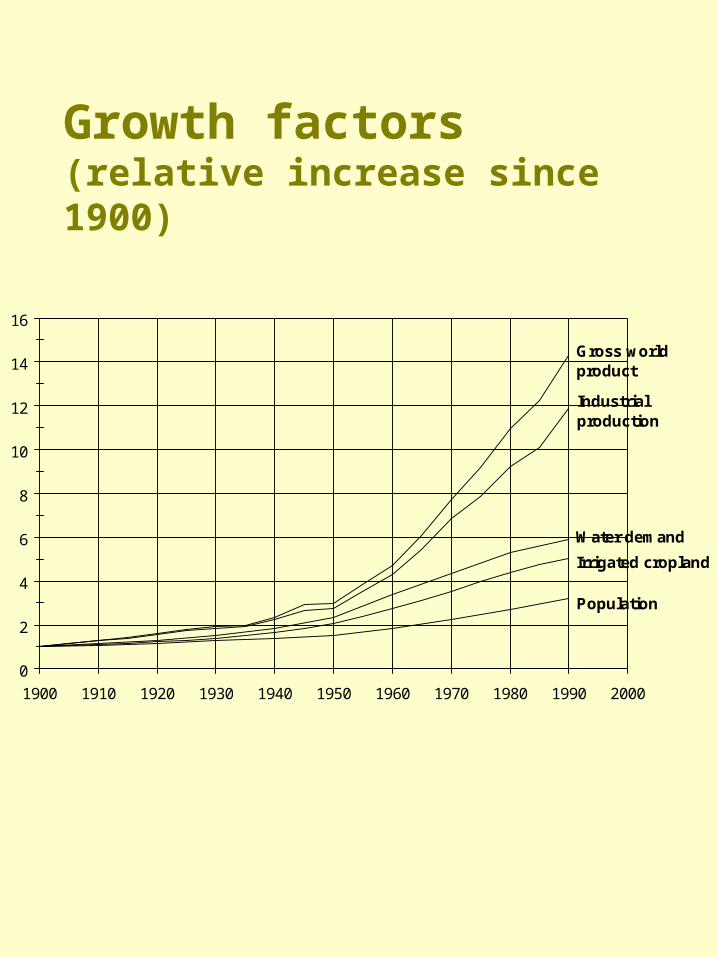
Growth factors(relative increase since 1900)
0
2
4
6
8
10
12
14
16
1900 1910 1920 1930 1940 1950 1960 1970 1980 1990 2000
Gross worldproduct
Industrialproduction
Water demand
Irrigated cropland
Population
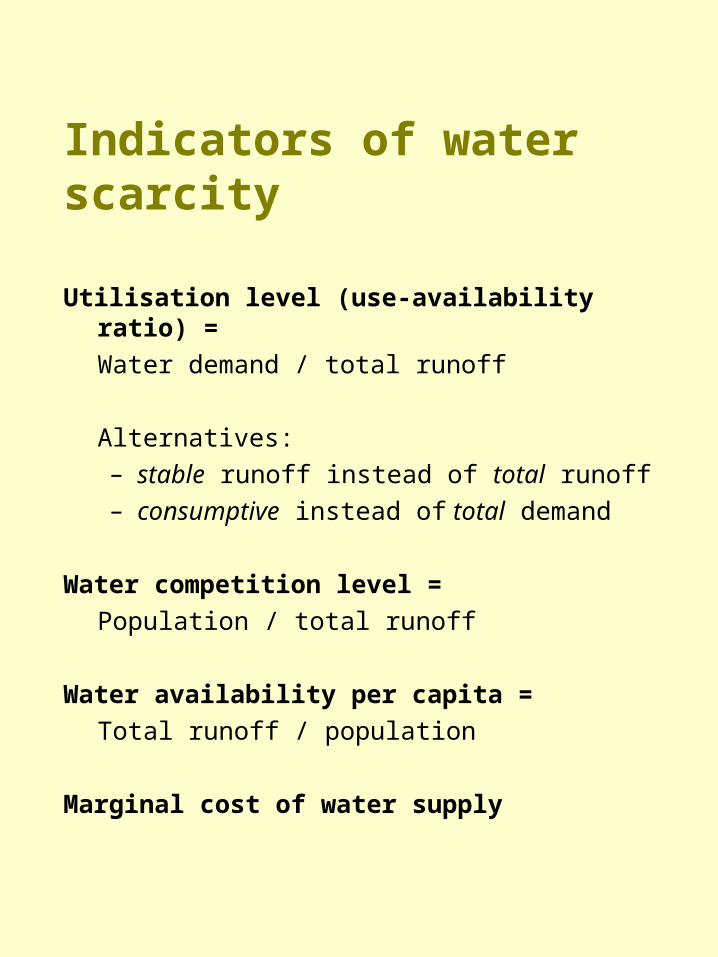
Indicators of water scarcity
Utilisation level (use-availability ratio) =
Water demand / total runoff
Alternatives:– stable runoff instead of total runoff– consumptive instead of total demand
Water competition level =
Population / total runoff
Water availability per capita =
Total runoff / population
Marginal cost of water supply
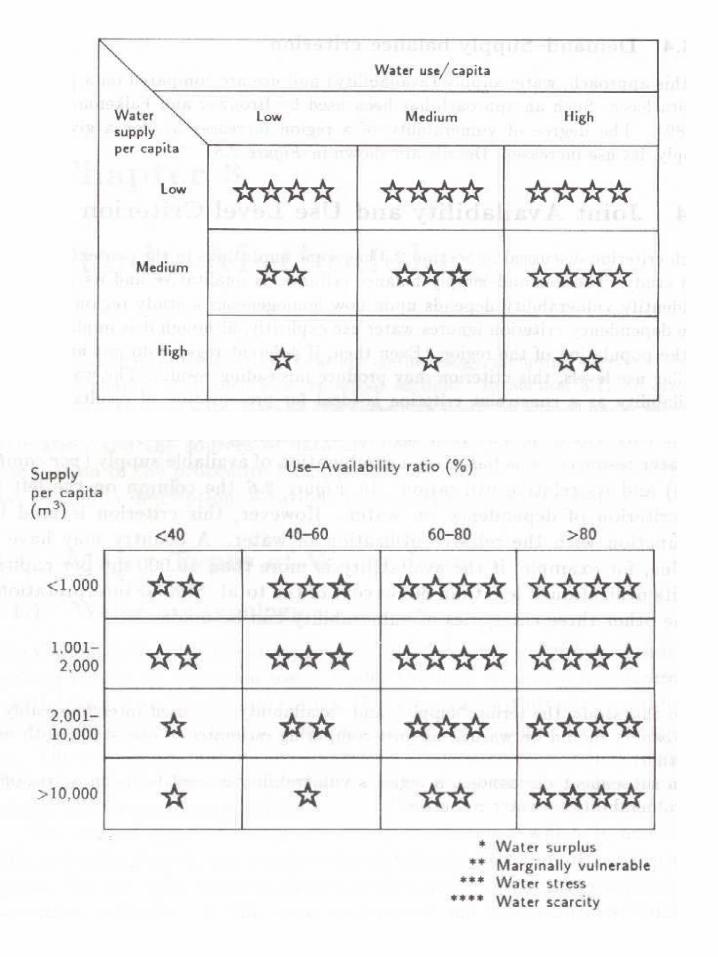
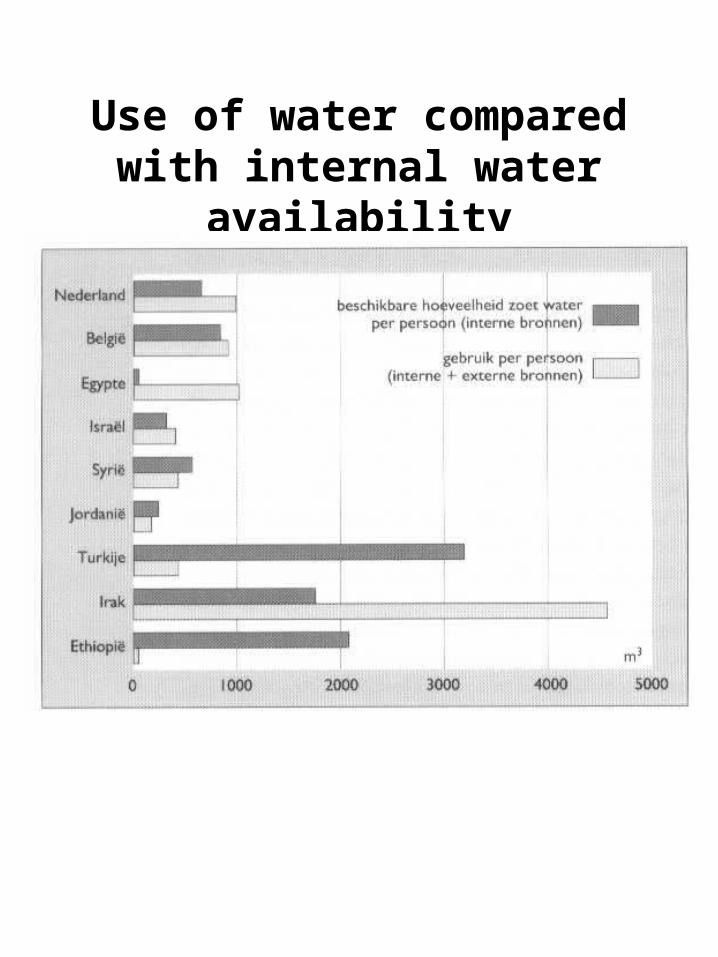
Use of water compared with internal water availability
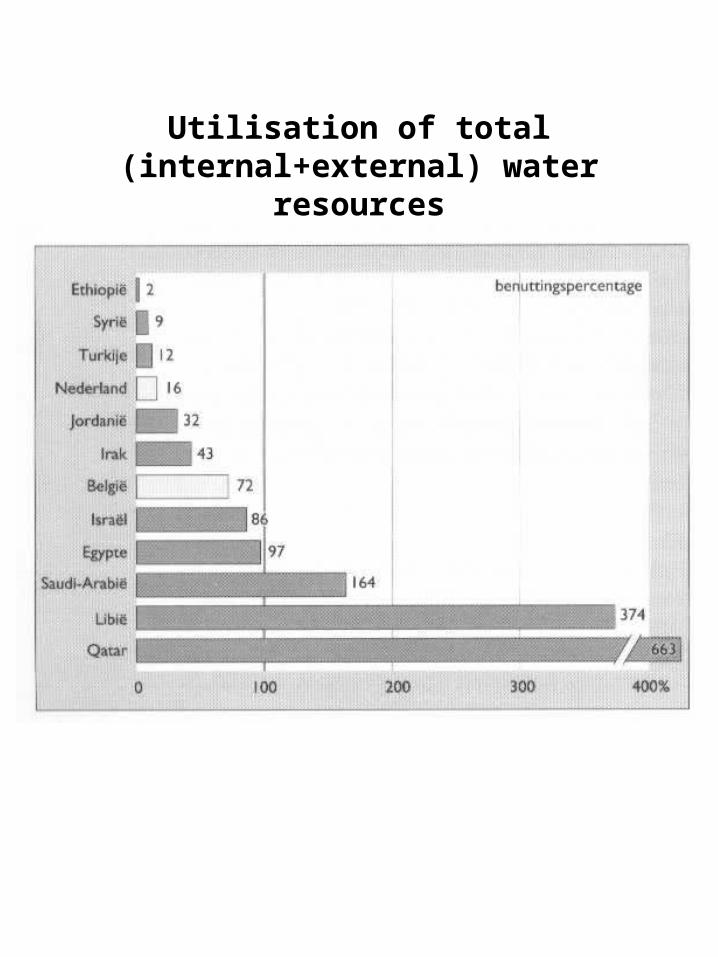
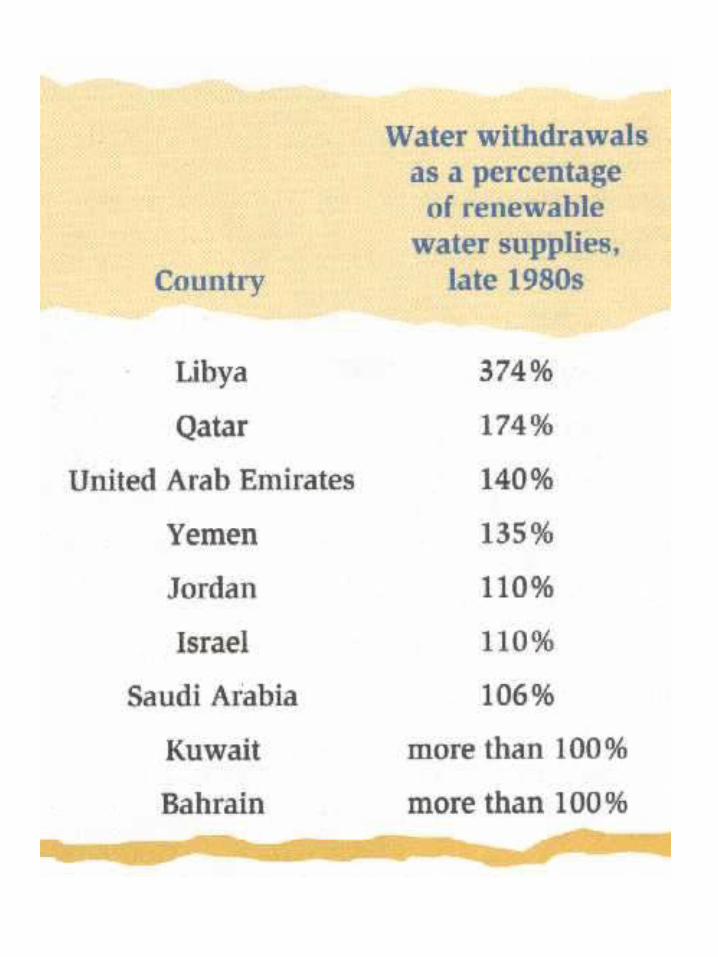
Utilisation of total (internal+external) water resources
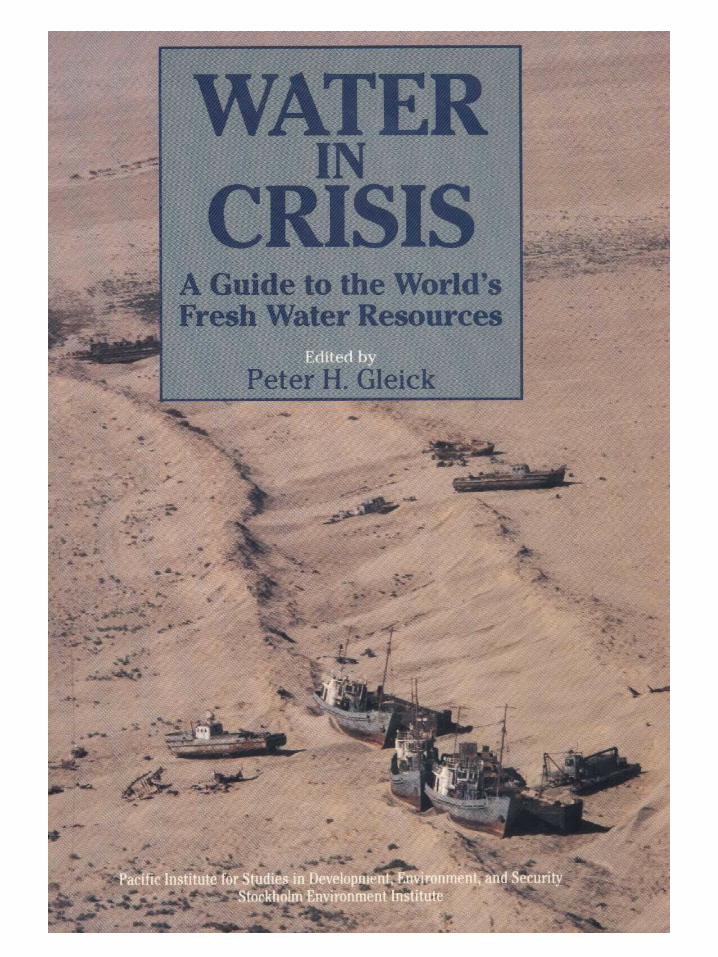
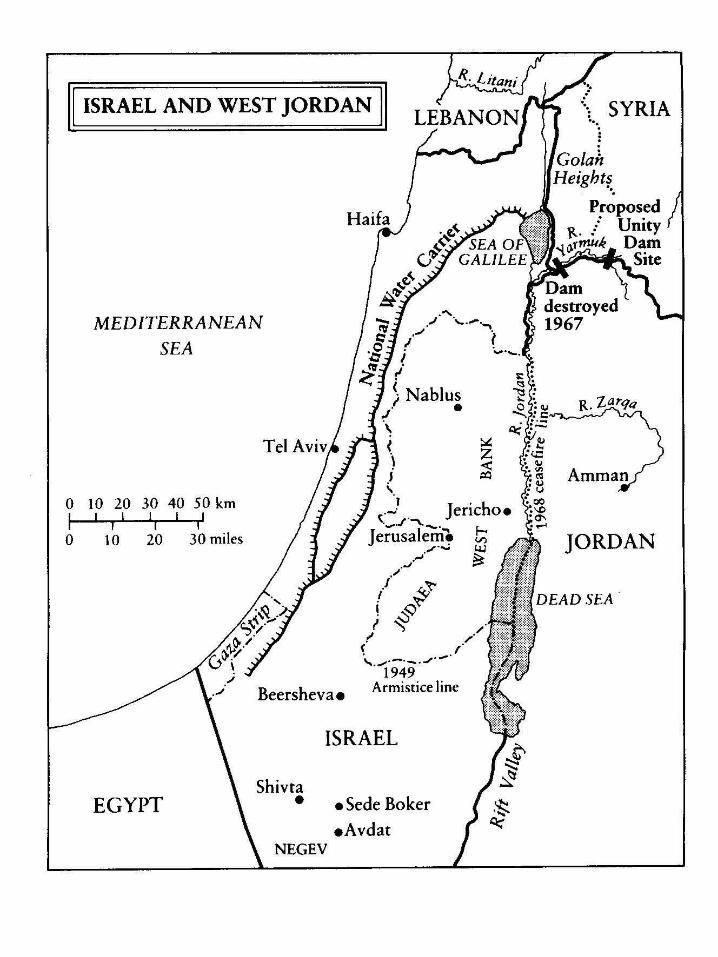
Conflicts over water
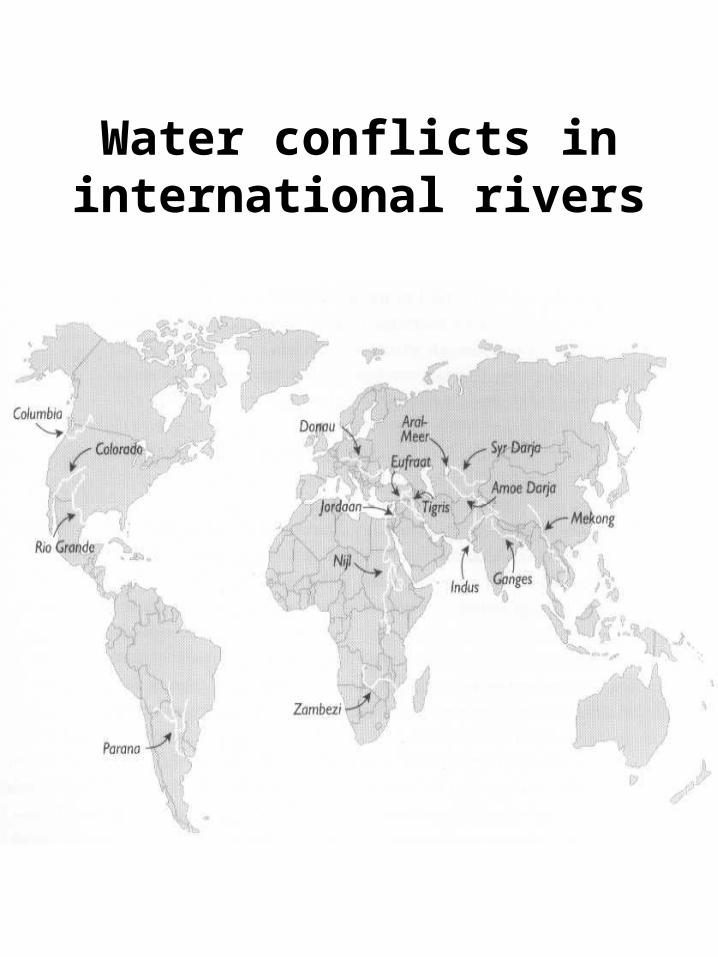
Water conflicts in international rivers
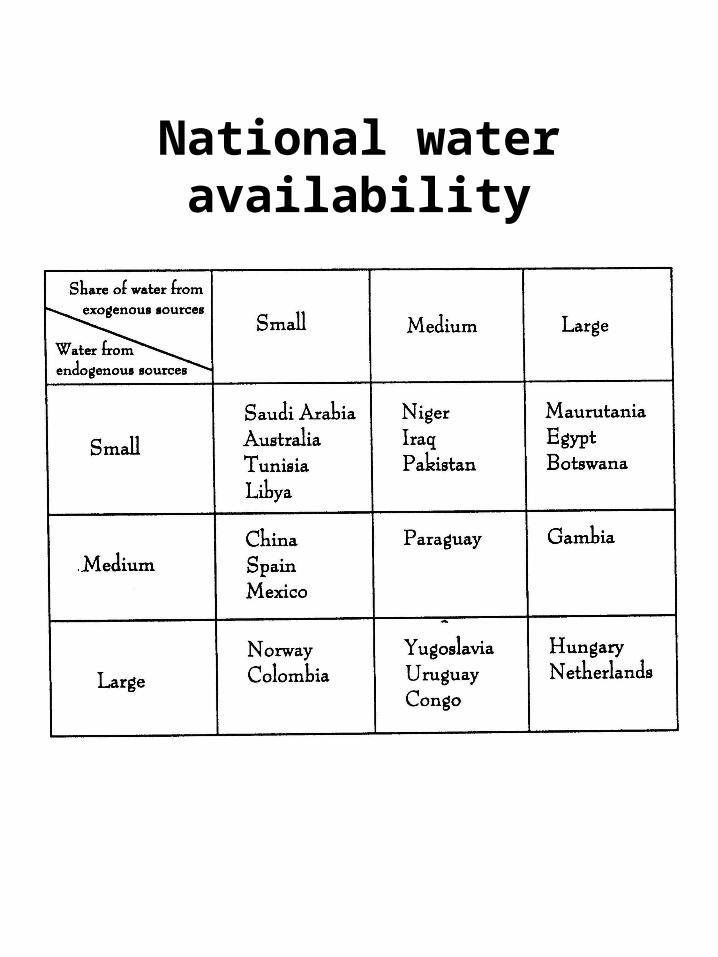
National water availability
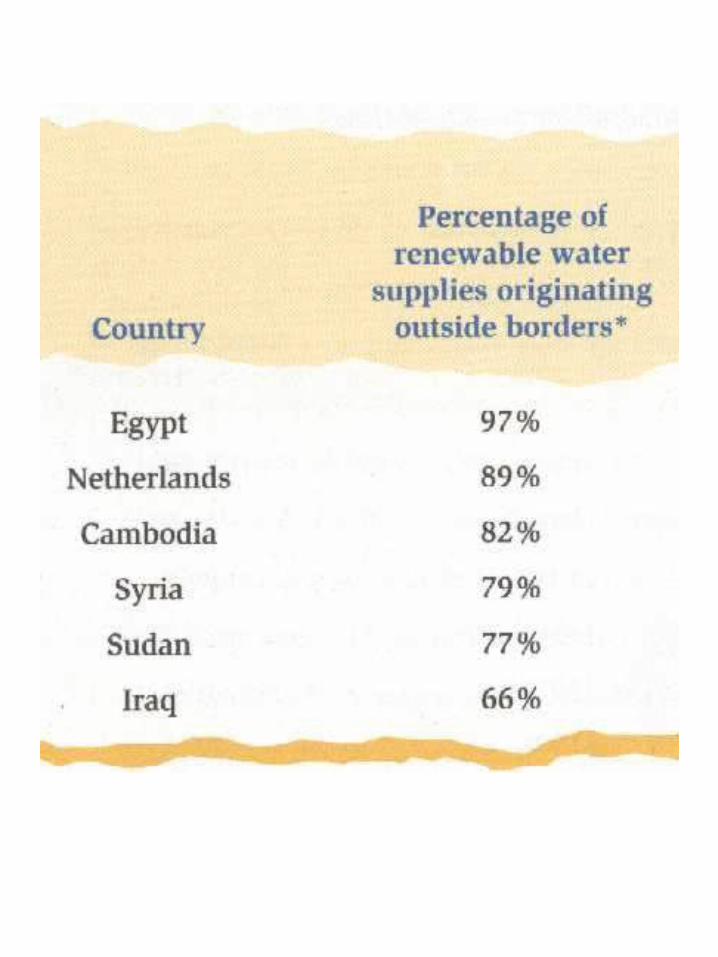
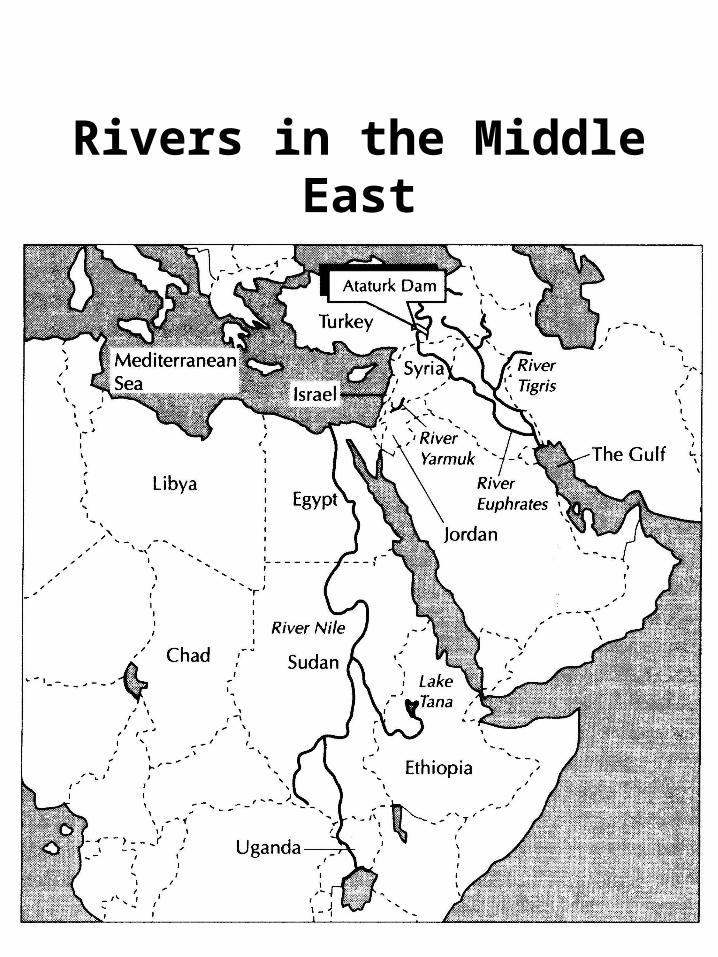
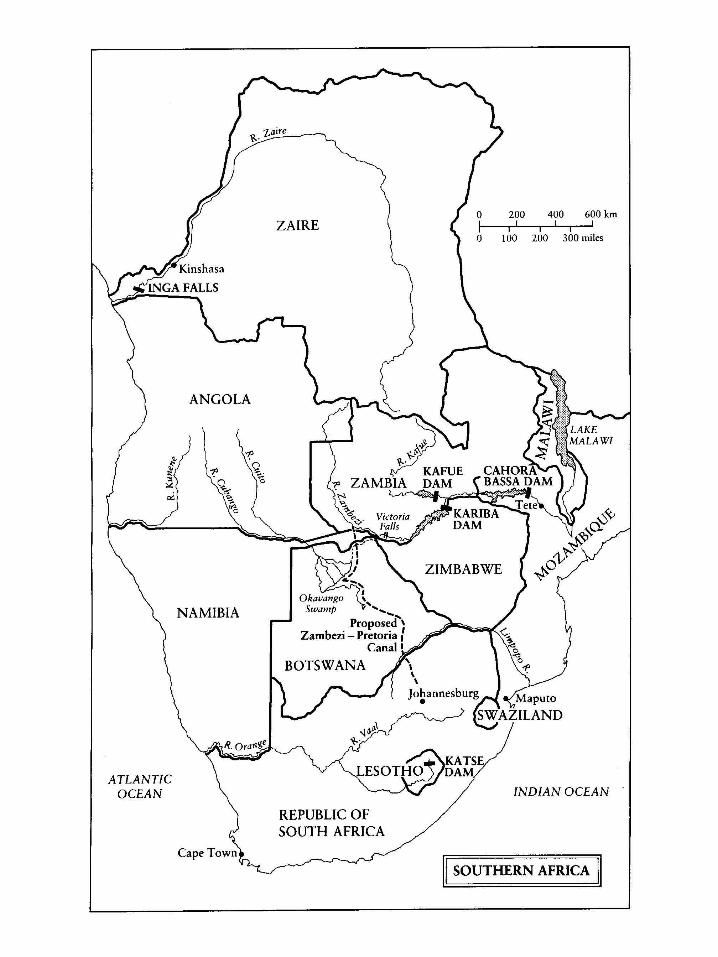
Rivers in the Middle East
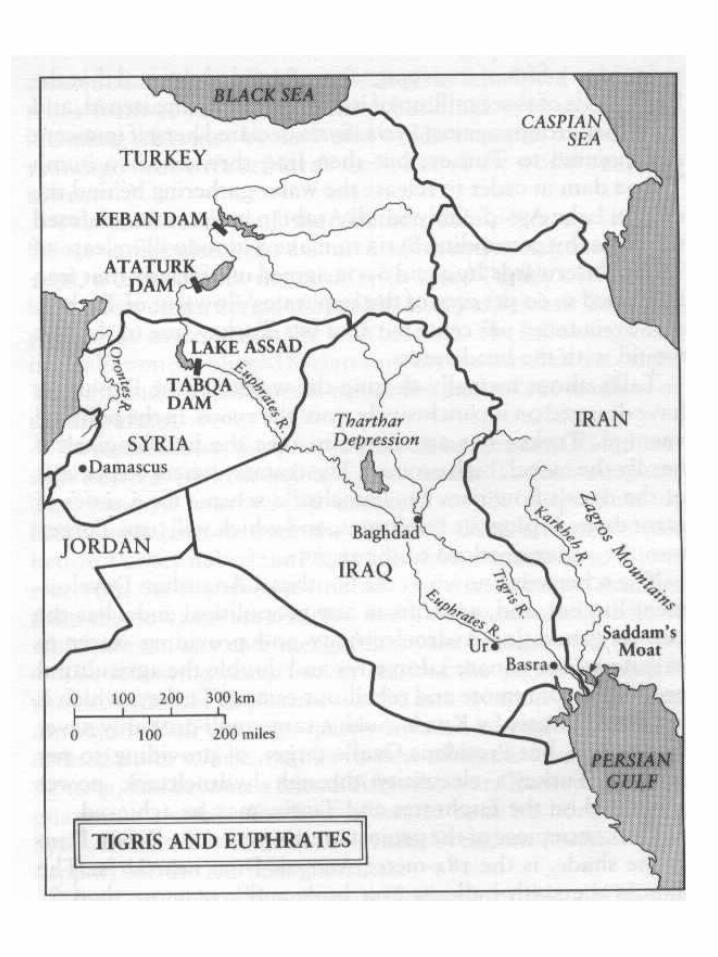
Southeast Anatolia Project
Euphrates and Tigris:
• Turkey, Syria, Saudi Arabia, Iraq, Iran.• 1992: Atatürk Dam in Turkey.
Turkey: “Allah gave oil to them, but water to us.”
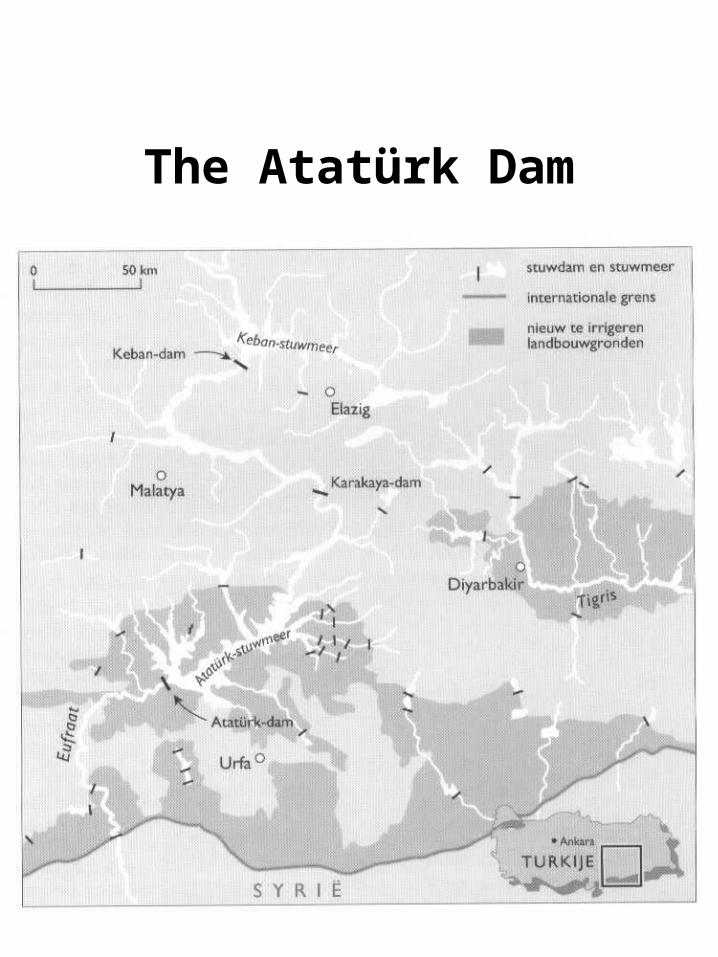
The Atatürk Dam
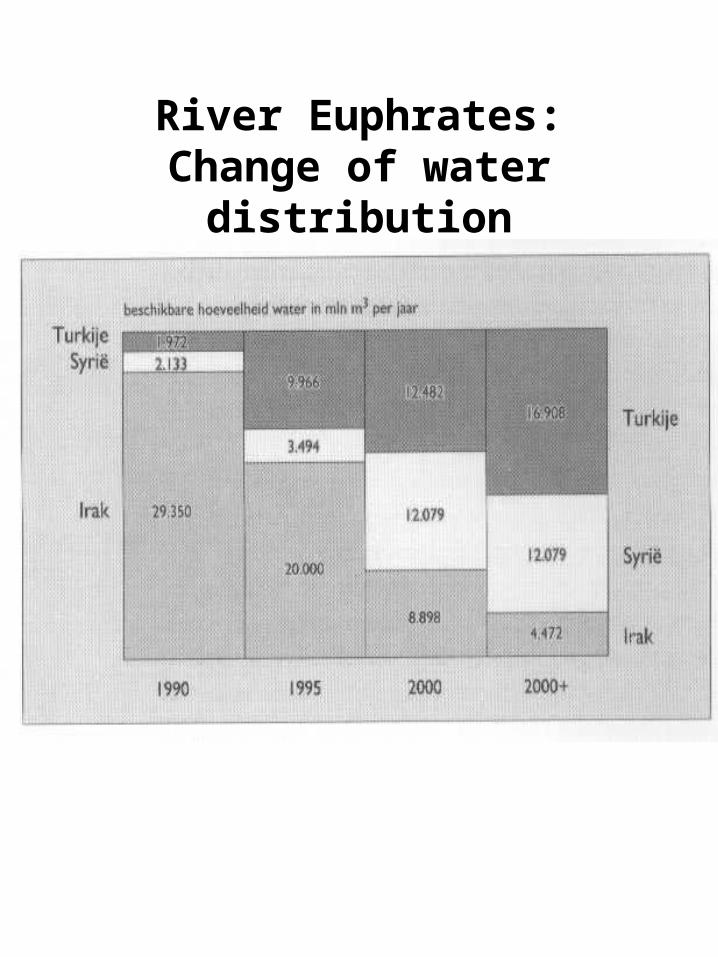
River Euphrates:Change of water distribution
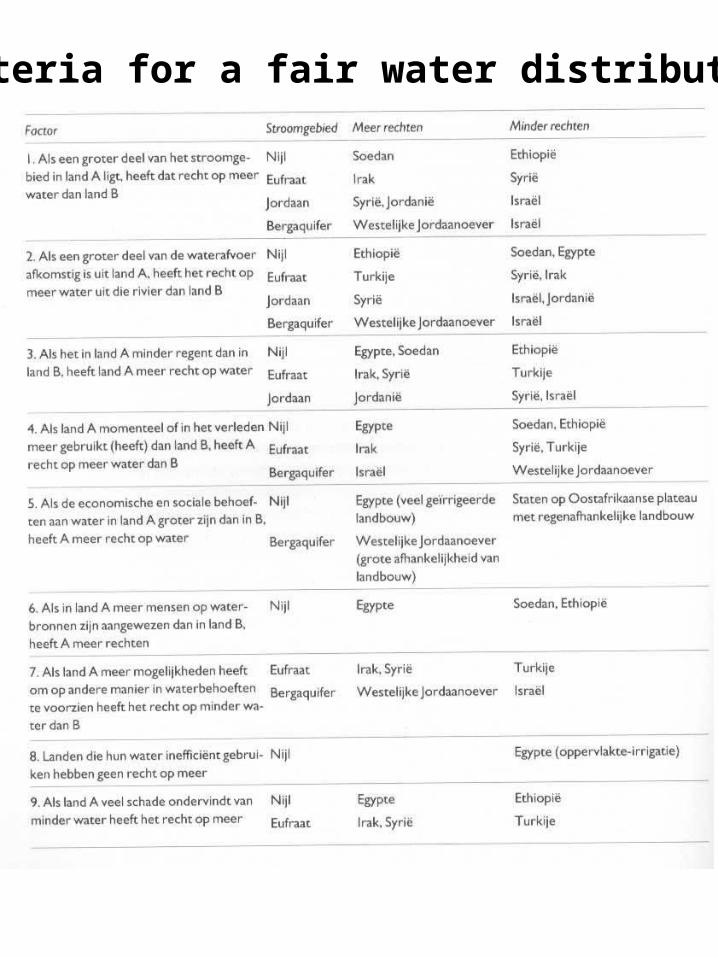
Criteria for a fair water distribution
Effects ofintensive water use
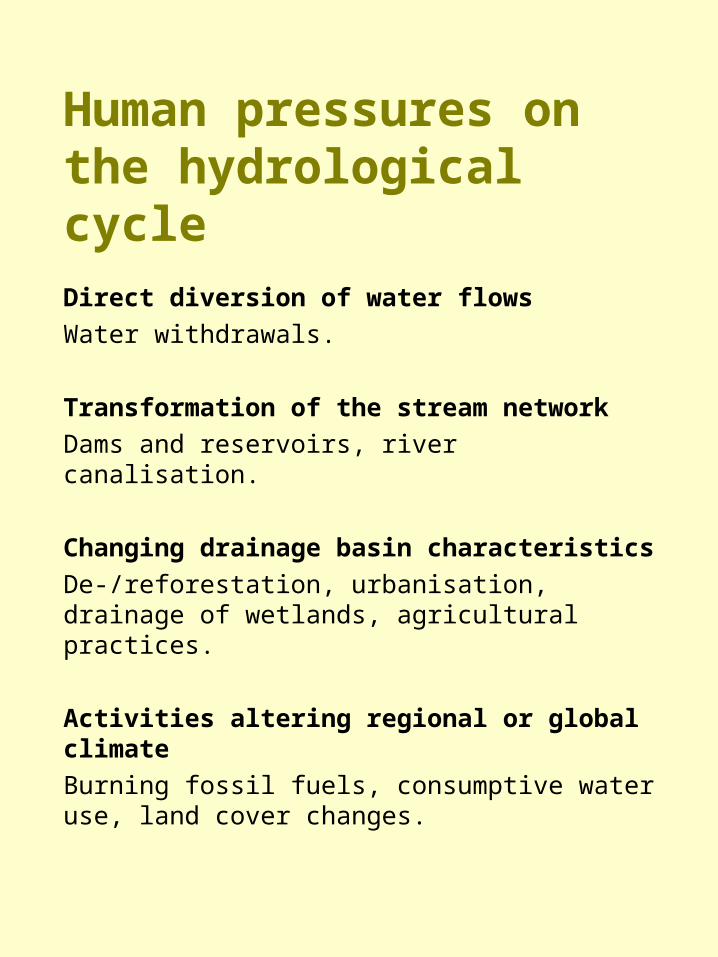
Human pressures on the hydrological cycle
Direct diversion of water flows
Water withdrawals.
Transformation of the stream network
Dams and reservoirs, river canalisation.
Changing drainage basin characteristics
De-/reforestation, urbanisation, drainage of wetlands, agricultural practices.
Activities altering regional or global climate
Burning fossil fuels, consumptive water use, land cover changes.
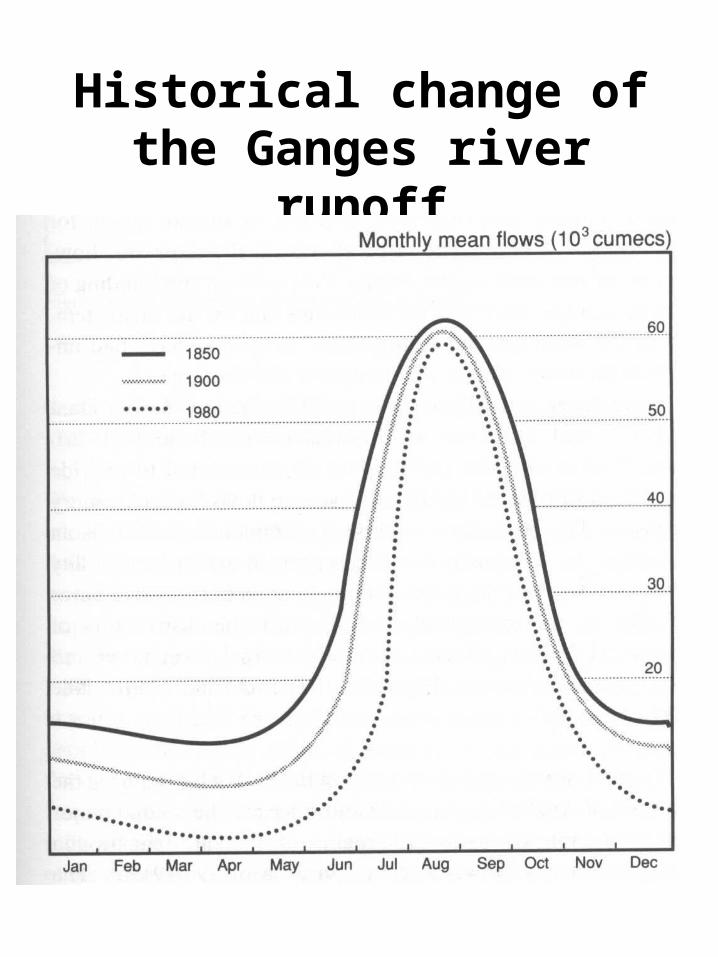
Historical change of the Ganges river runoff
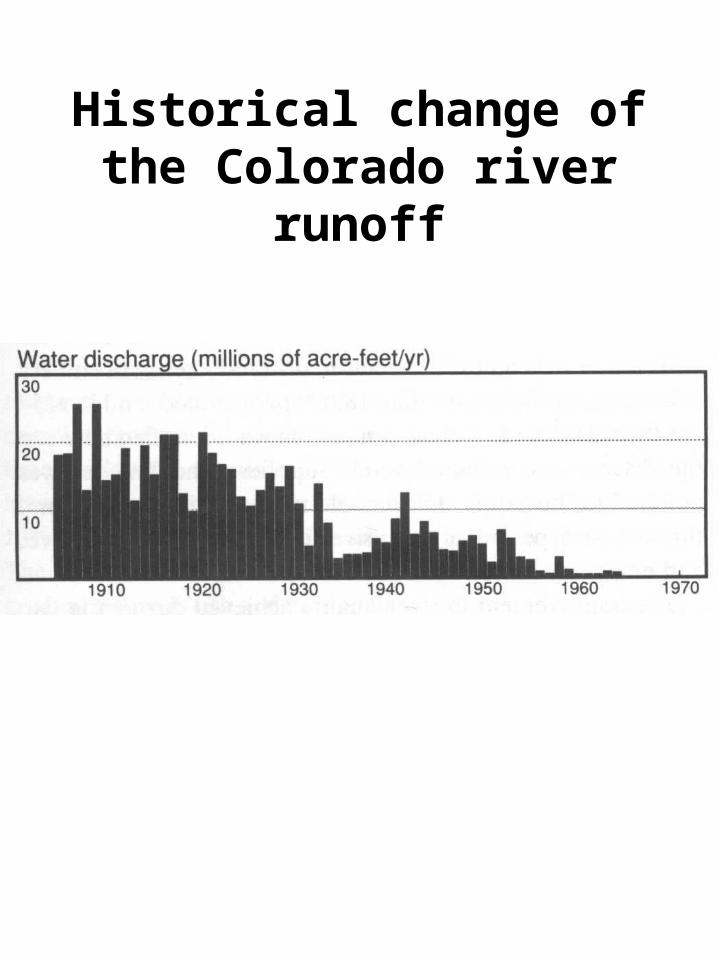
Historical change of the Colorado river runoff
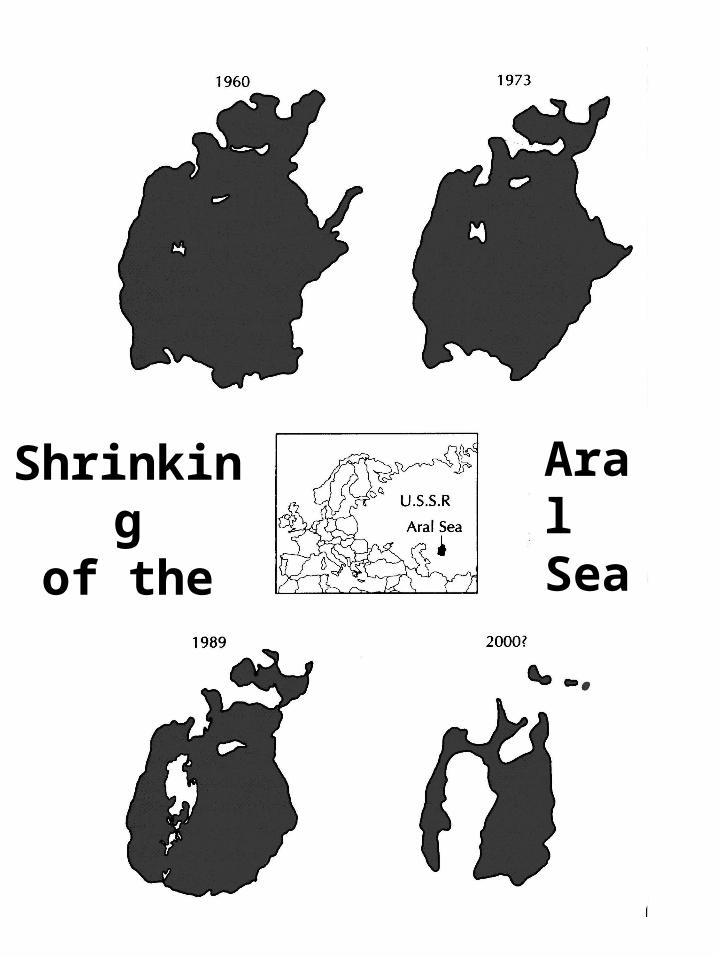
Shrinkingof the
AralSea
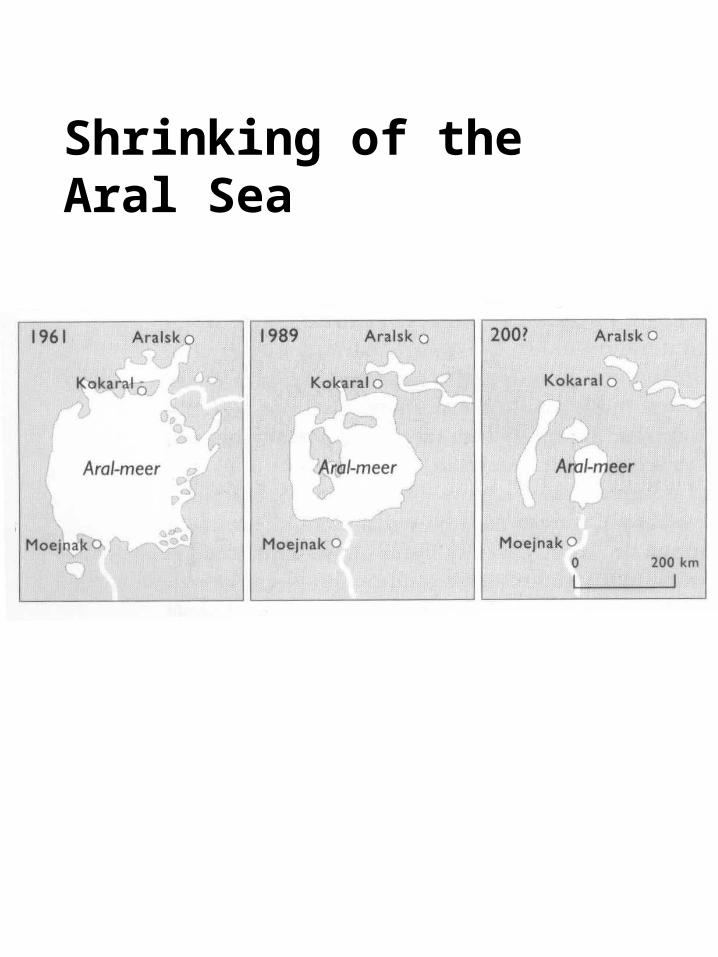
Shrinking of the Aral Sea
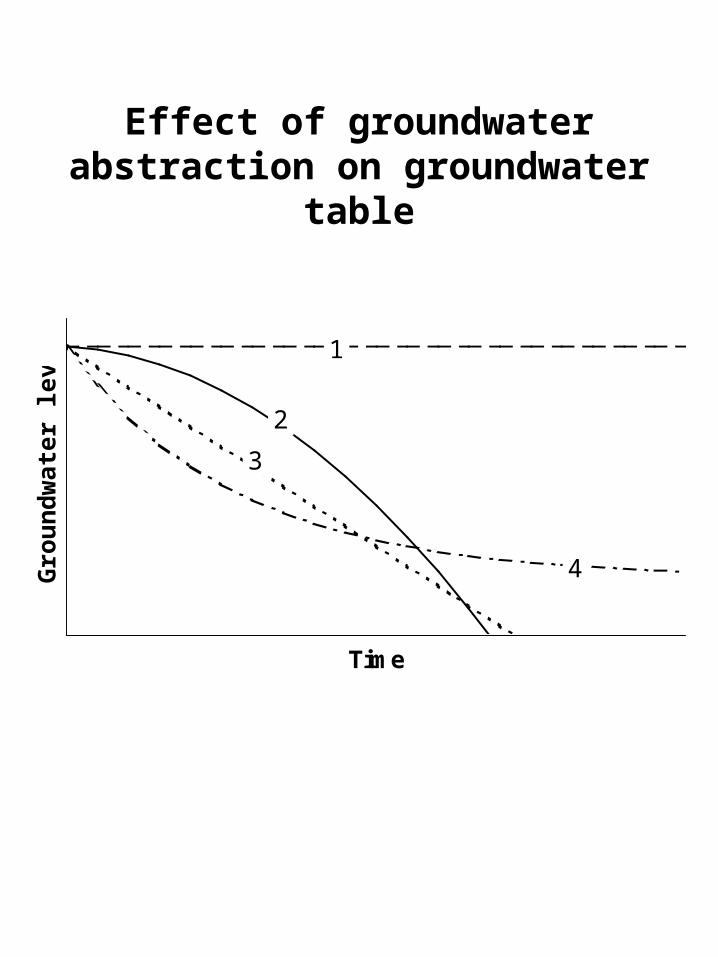
Effect of groundwater abstraction on groundwater table
Time
Gro
un
dw
ate
r le
ve
l
1
2
3
4
Water pollution

P.m.
Effects of land use changes

P.m.
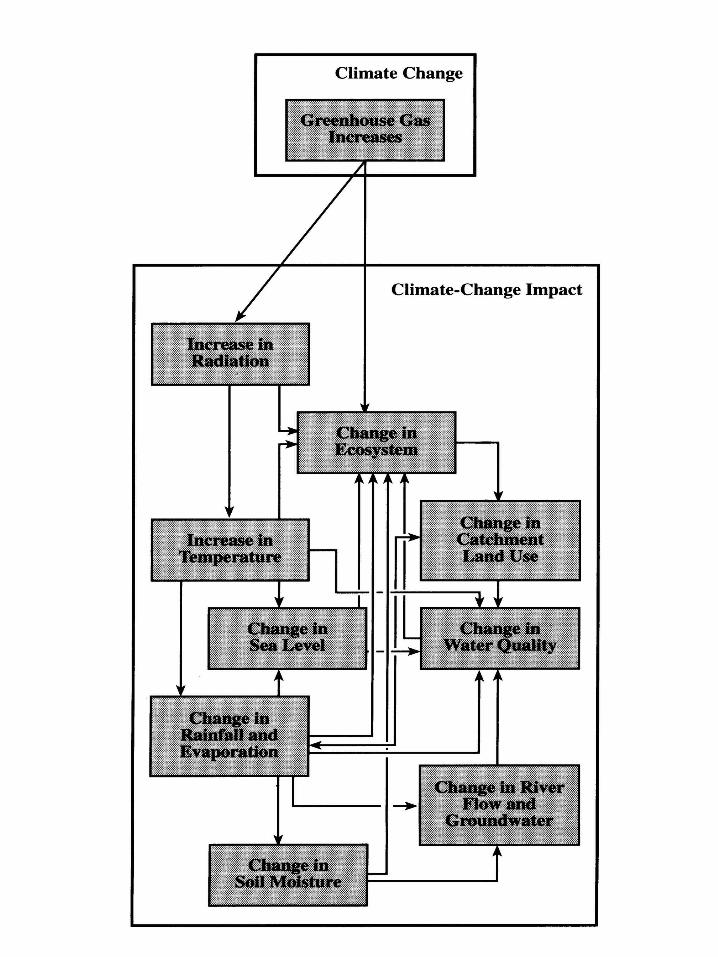
Effects of climate change
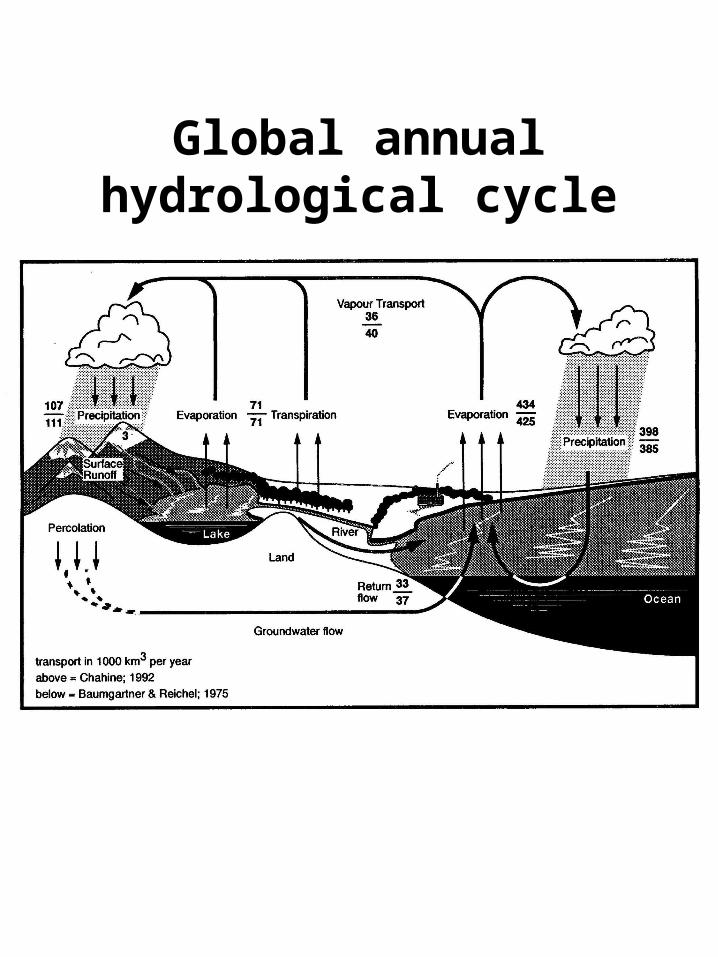
Global annual hydrological cycle
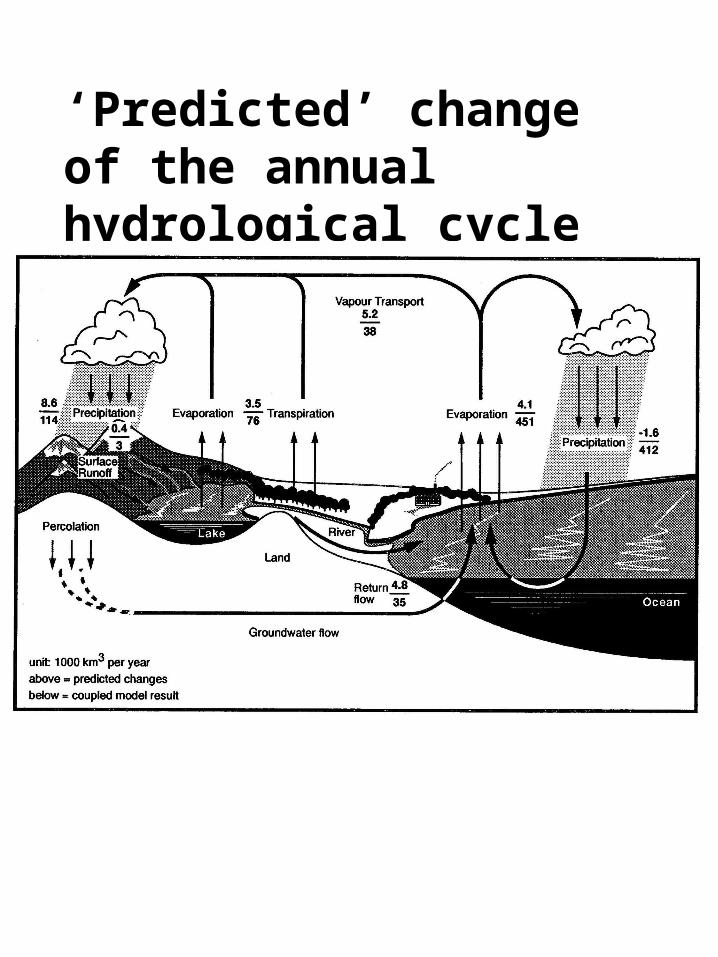
‘Predicted’ change of the annual hydrological cycle
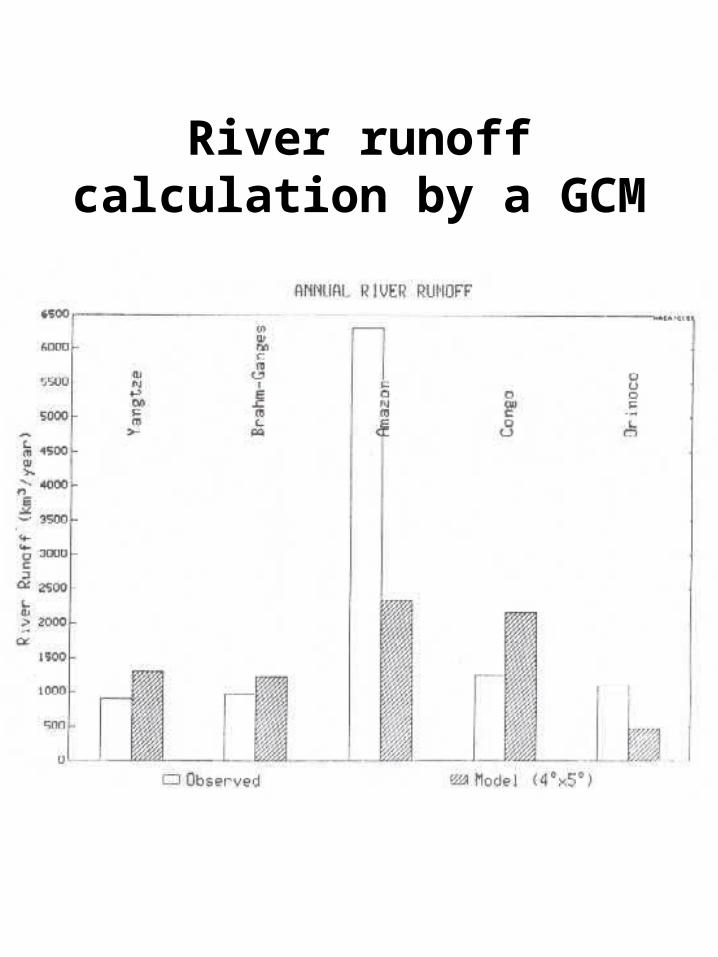
River runoff calculation by a GCM
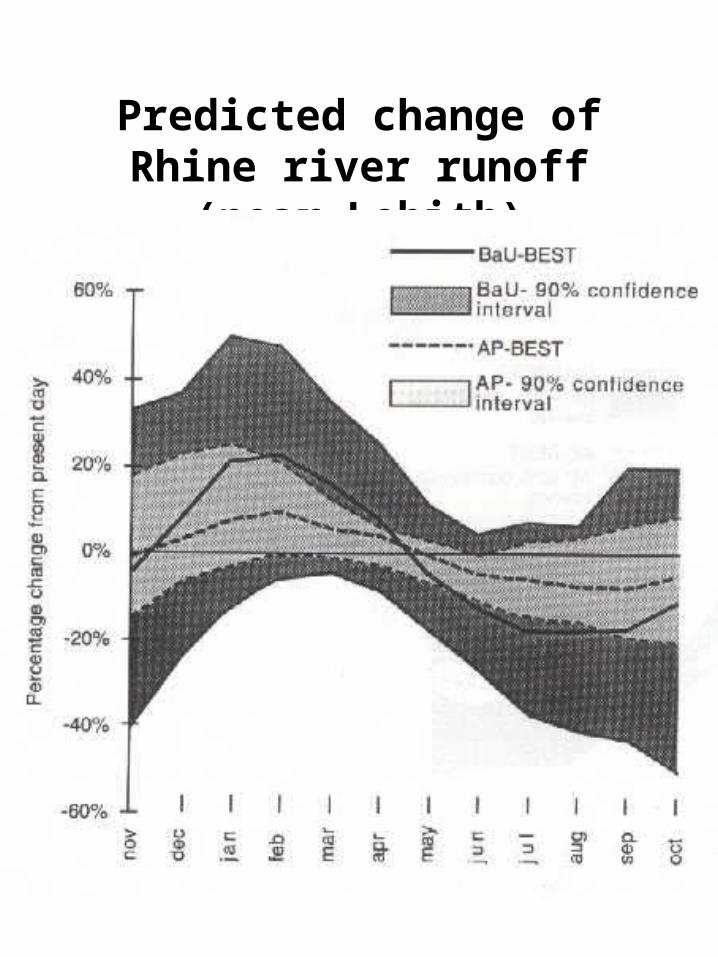
Predicted change of Rhine river runoff (near Lobith)
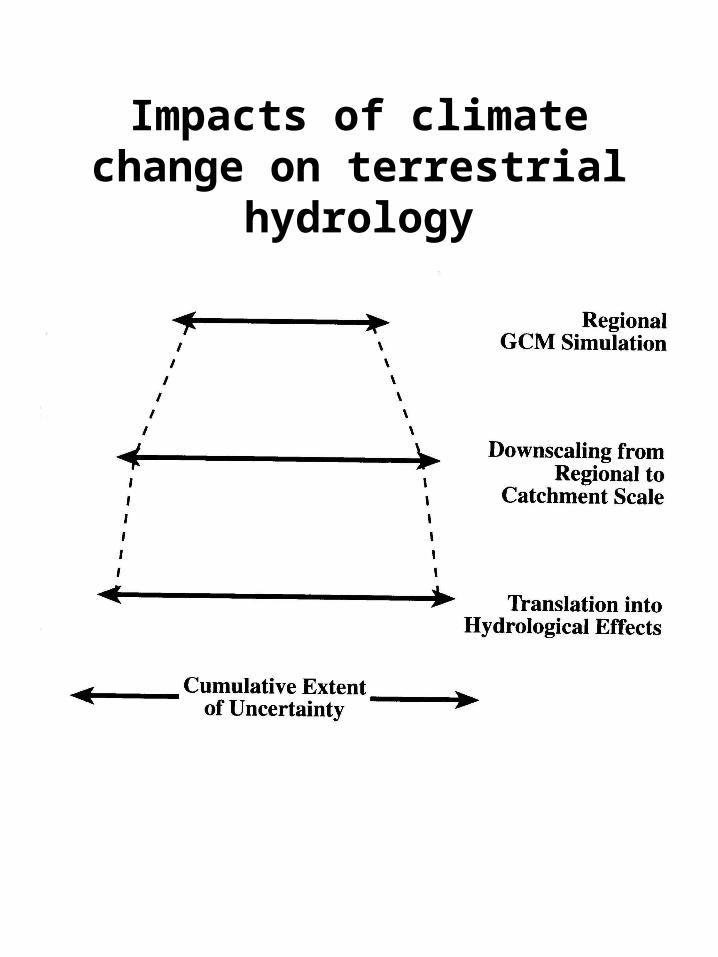
Impacts of climate change on terrestrial hydrology
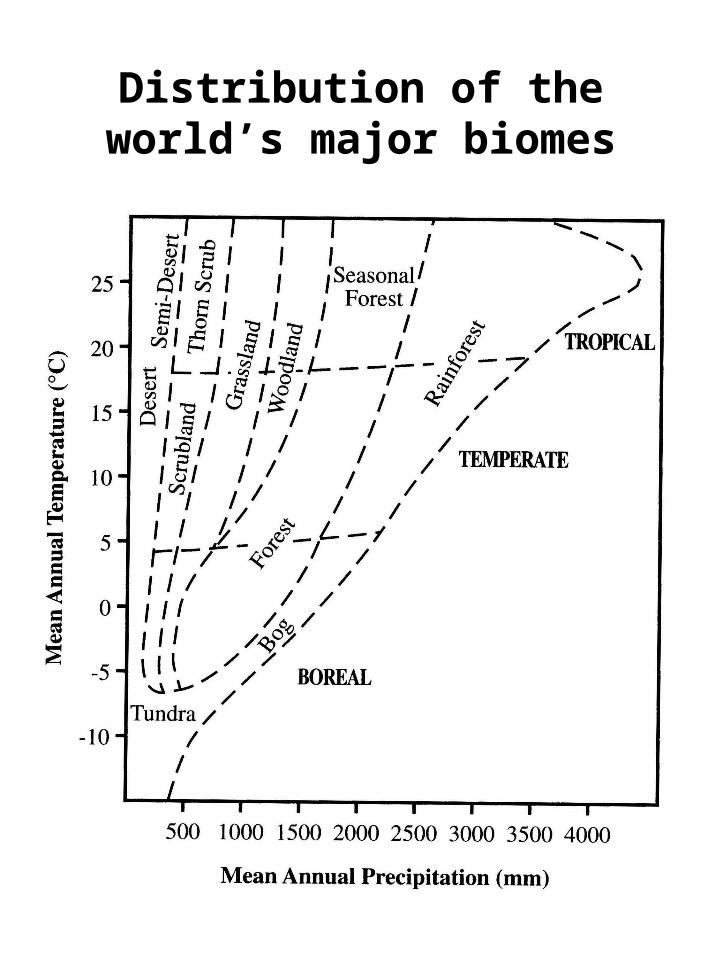
Distribution of the world’s major biomes
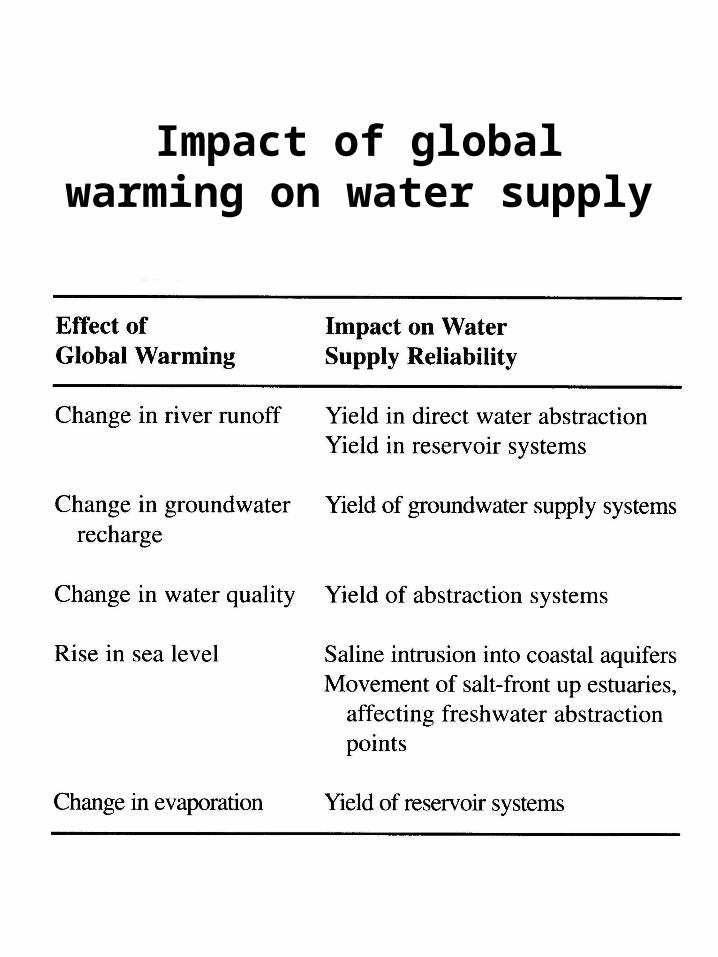
Impact of global warming on water supply
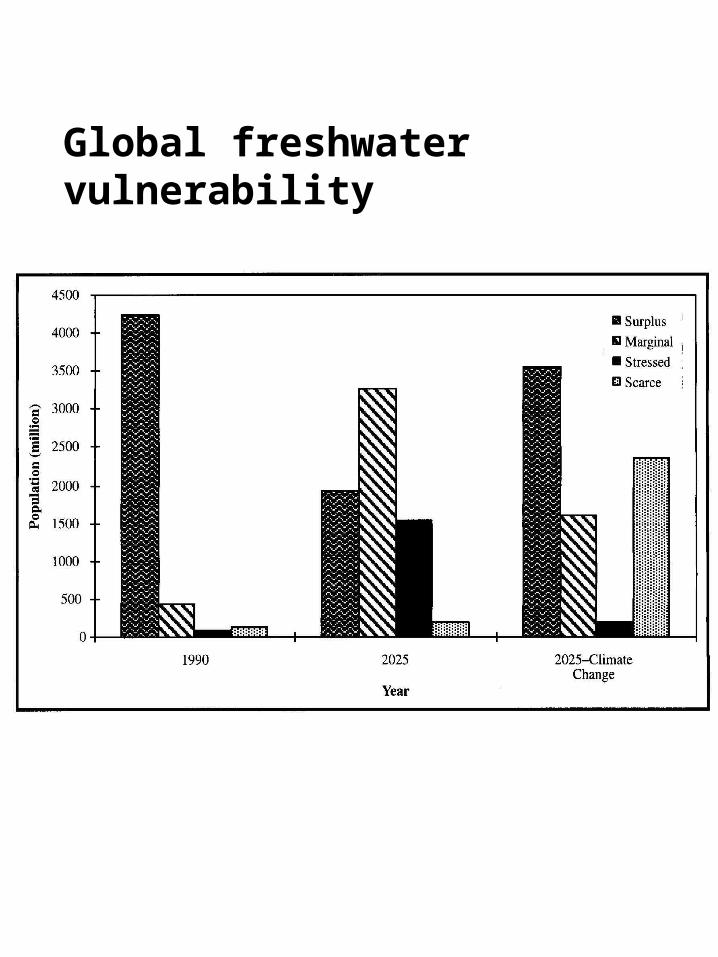
Global freshwater vulnerability
Sea level rise
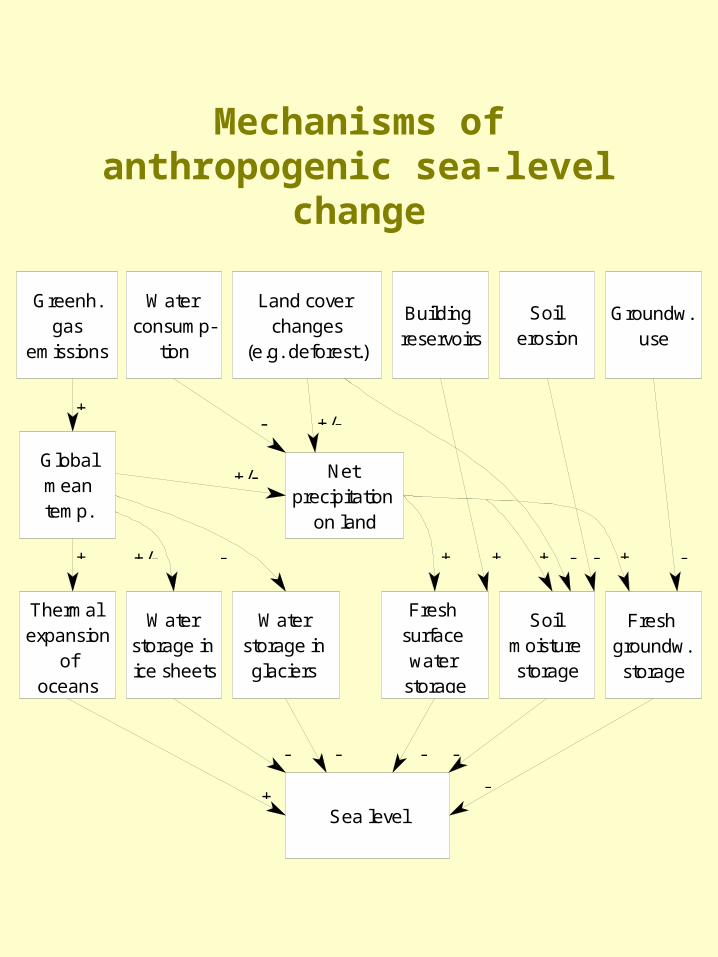
Mechanisms of anthropogenic sea-level change
Water storage in glaciers
Globalmeantemp.
Land cover changes
(e.g. deforest.)
Water consump-
tion
Building reservoirs
Soil erosion
Water storage in ice sheets
Thermal expansion
of oceans
Sea level
Net precipitation
on land
+ +/-
Groundw. use
Soil moisture storage
Fresh groundw. storage
Fresh surface water
storage
---
-
+/-
- + + + +
-
----
+
Greenh.gas
emissions
++/-
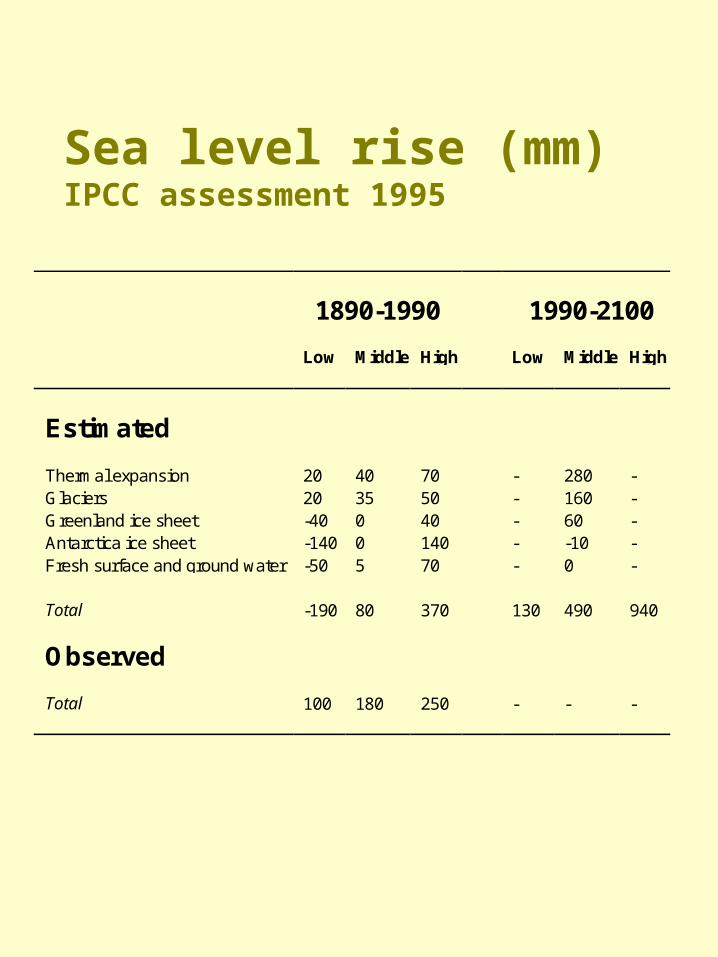
Sea level rise (mm)IPCC assessment 1995
1890-1990 1990-2100
Low Middle High Low Middle High
Estimated
Thermal expansion 20 40 70 - 280 -Glaciers 20 35 50 - 160 -Greenland ice sheet -40 0 40 - 60 -Antarctica ice sheet -140 0 140 - -10 -Fresh surface and ground water -50 5 70 - 0 -
Total -190 80 370 130 490 940
Observed
Total 100 180 250 - - -
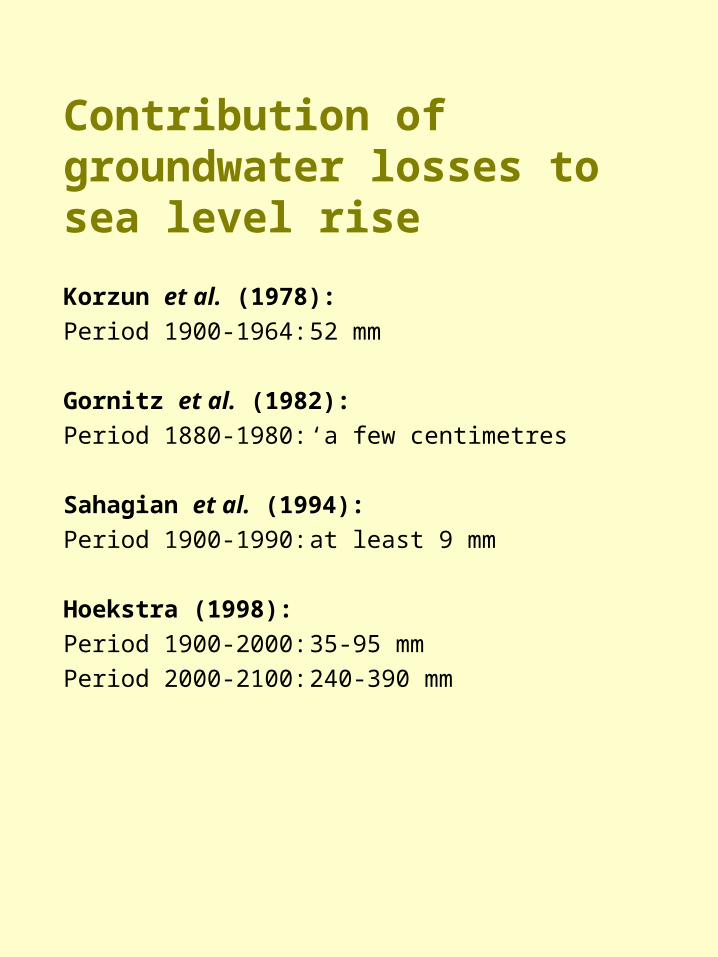
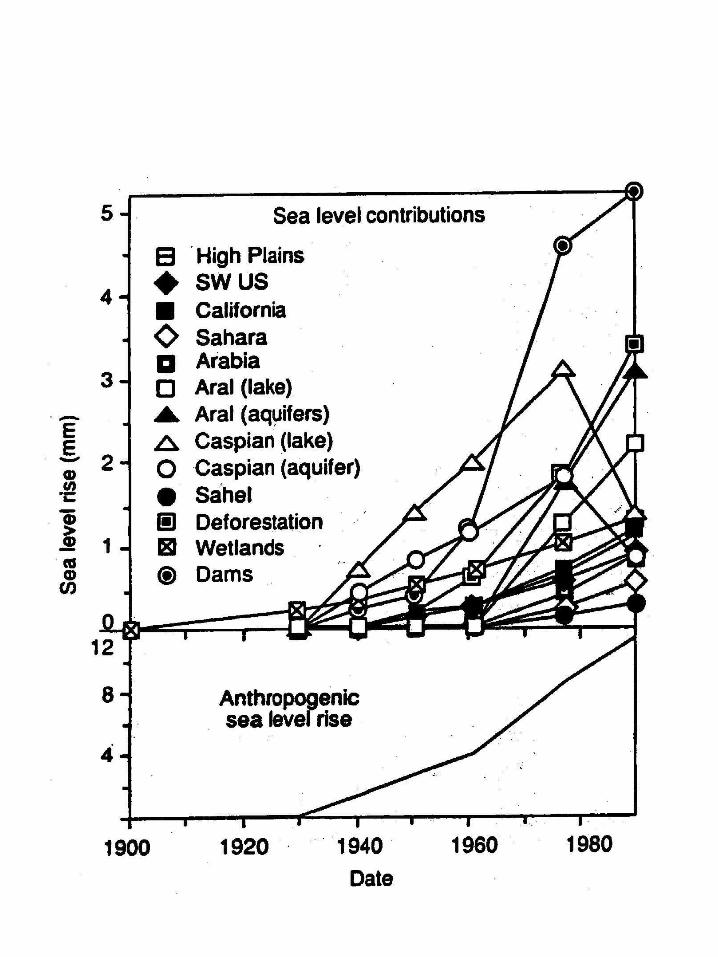
Contribution of groundwater losses to sea level rise
Korzun et al. (1978):
Period 1900-1964: 52 mm
Gornitz et al. (1982):
Period 1880-1980: ‘a few centimetres
Sahagian et al. (1994):
Period 1900-1990: at least 9 mm
Hoekstra (1998):
Period 1900-2000: 35-95 mm
Period 2000-2100: 240-390 mm
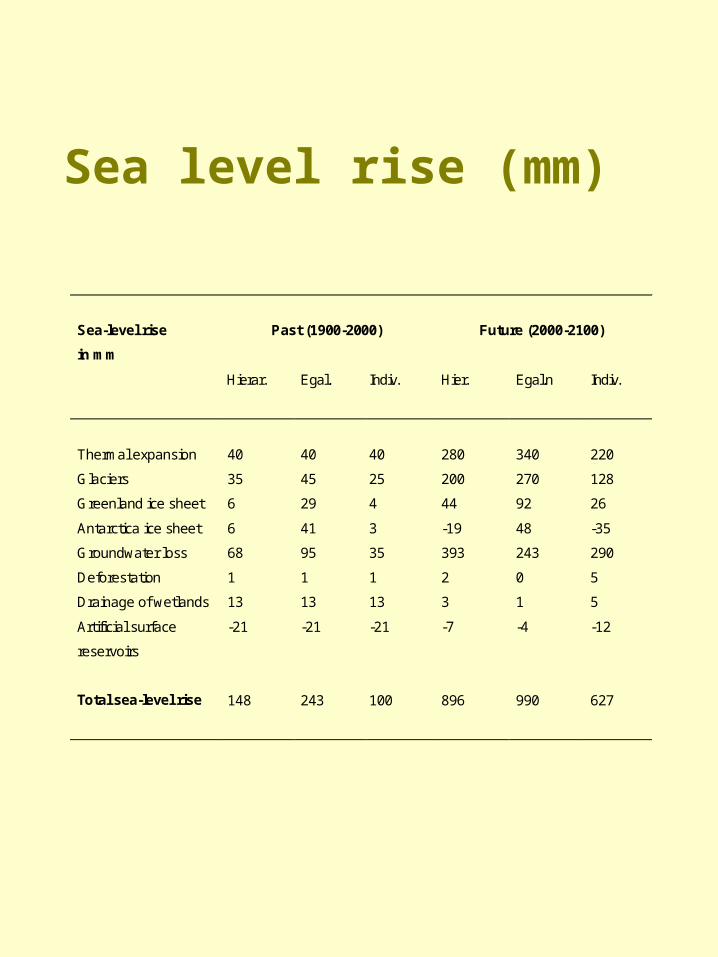
Sea level rise (mm)
Sea-level rise
in mm
Past (1900-2000) Future (2000-2100)
Hierar. Egal. Indiv. Hier. Egal.n Indiv.
Thermal expansion 40 40 40 280 340 220
Glaciers 35 45 25 200 270 128
Greenland ice sheet 6 29 4 44 92 26
Antarctica ice sheet 6 41 3 -19 48 -35
Groundwater loss 68 95 35 393 243 290
Deforestation 1 1 1 2 0 5
Drainage of wetlands 13 13 13 3 1 5
Artificial surface
reservoirs
-21 -21 -21 -7 -4 -12
Total sea-level rise 148 243 100 896 990 627
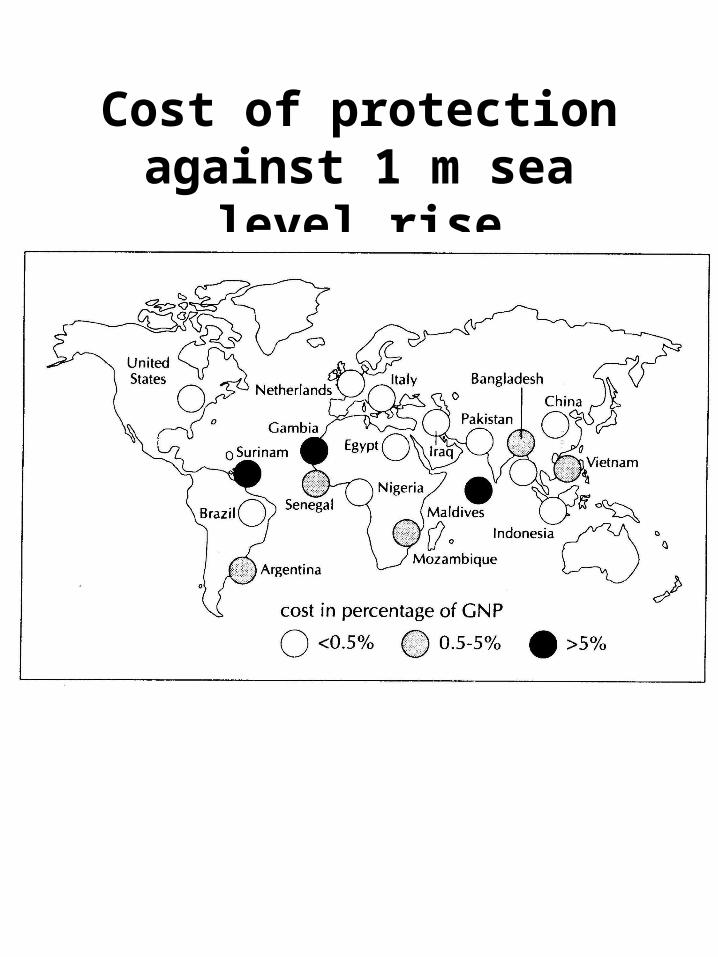
Cost of protection against 1 m sea level rise