A cybernetic modelling approach for cell biology -...
208
A cybernetic modelling approach for cell biology Case study of the Central Nitrogen Metabolism in Saccharomyces cerevisiae Een cybernetische model aanpak voor cel biologie Het centraal stikstof metabolisme in Saccharomyces cerevisiae als voorbeeld (met een samenvatting in het Nederlands) PROEFSCHRIFT ter verkrijging van de graad van doctor aan de Universiteit Utrecht op gezag van de Rector Magnificus Prof. Dr. H.O. Voorma, ingevolge het besluit van het College voor Promoties in het openbaar te verdedigen op maandag 10 januari 2000 des middags om 16.15 uur door Natal Adriaan Wilhelm van Riel Geboren op 22 februari 1973 te Gilze
-
Upload
duongnguyet -
Category
Documents
-
view
218 -
download
0
Transcript of A cybernetic modelling approach for cell biology -...
A cybernetic modelling approach for cellbiology
Case study of the Central Nitrogen Metabolism inSaccharomyces cerevisiae
Een cybernetische model aanpak voor cel biologieHet centraal stikstof metabolisme in Saccharomyces cerevisiae als voorbeeld
(met een samenvatting in het Nederlands)
PROEFSCHRIFT
ter verkrijging van de graad van doctoraan de Universiteit Utrecht
op gezag van de Rector Magnificus Prof. Dr. H.O. Voorma,ingevolge het besluit van het College voor Promoties
in het openbaar te verdedigenop maandag 10 januari 2000 des middags om 16.15 uur
door
Natal Adriaan Wilhelm van Riel
Geboren op 22 februari 1973 te Gilze
Promotor: Prof. Dr. Ir. C. T. VerripsVerbonden aan de vakgroep Moleculaire Celbiologie, UniversiteitUtrecht
Co-promotor: Dr. Ir. M.L.F. GiuseppinVerbonden aan Biological Food Processes unit, UnileverResearch Vlaardingen
The research described in this thesis was supported by the EC DGXII Framework IV CellFactory programme and Unilever Research Vlaardingen.
ISBN: 90-393-2294-5
3
Contents
Chapter 1 Introduction; Metabolic Engineering and Central NitrogenMetabolism in Saccharomyces cerevisiae
5
Chapter 2 A structured minimal parameter model of the Central NitrogenMetabolism in Saccharomyces cerevisiae: the prediction of thebehaviour of mutants
33
Chapter 3 Dynamic optimal control of homeostasis; an integrative systemapproach for modelling of the Central Nitrogen Metabolism inSaccharomyces cerevisiae
61
Chapter 4 Analysis of a kinetic and cybernetic model for Metabolic Engineeringpurposes
87
Chapter 5 Background information for a physiological study ofglutamate synthase (GOGAT) in Saccharomyces cerevisiae
105
Chapter 6 Physiological study of a ∆glt1 (GOGAT) mutant of Saccharomycescerevisiae
119
Chapter 7 Circuit simulation of transcription in Central Nitrogen Metabolism ofS. cerevisiae
155
Chapter 8 Metabolic pathway analysis: the holistic model as a scientificanalytical tool for cell biology
179
Abbreviations and nomenclature 195
Summary 199
Samenvatting 202
Het proefschrift: een eenvoudig verhaal 205
Dankwoord 206
Curriculum vitae 207
List of publications 208

4
Chapter 1
Introduction; Metabolic Engineering and the CentralNitrogen Metabolism in Saccharomyces cerevisiae
Natal A.W. van Riel
Chapter 16
Abstract
In this introduction aspects of Metabolic Engineering of micro-organisms are described. Itis pointed out that it is necessary to develop mathematical models of cellular metabolismto engineer a microbial cell efficiently. A biological system has several characteristicswhich make it fundamentally different from physical systems. The development ofpredictive mathematical models of such systems results in some specific problems forwhich, so far, no satisfying and complete modelling framework is available. The existingmodel approaches are discussed with their applications and drawbacks. Approaches suchas Metabolic Flux Analysis, and Metabolic Control Theory have applications, but alsoessential shortcomings. Techniques based on detailed kinetic information are being usedas well, but in general the required quality and amount of kinetic information is notavailable. Furthermore, when it is available, its applicability to in vivo systems is notreadily established. Based on the problem definition and the existing type of models, thespecifications of an alternative modelling framework are given.The so-called Central Nitrogen Metabolism of the eukaryotic micro-organismSaccharomyces cerevisiae is used as model system throughout the reported study. Themost relevant (biological) knowledge of this system is summarised and some openquestions are discussed.
1.1 Metabolic Engineering
1.1.1 General introductionTraditionally, (theoretical) physics have been focused on universality, whereas biologylooks more for understanding of the variety present in nature. In the search for universallaws in physical theory, mathematical models have proven very successful. Mathematicalmodels combine many observations into one framework and enable the prediction of newsituations (synthesis and prediction). Biological theories have traditionally beensuggestive rather than predictive, explanatory and inductive rather than deductive(Lumsden et al., 1997).Cell biology (comprising physiology, biochemistry and molecular biology) is focused onhow cells operate. In contrast to general biology, cellular biology is dominated by aphysical approach, which tries to reduce cells to molecules. This suggests cell biology isonly the chemical physics of living matter. However, living organisms are much morecomplex and diverse than physical systems. For a real understanding of the cell also theevolutionary aspect, dealing more with why questions, needs to be integrated. Holismmust join reductionism.Both in traditional mathematically based sciences as well as in biology, computer powergives the opportunity to deal with more complex, nonlinear systems. Ideas related tononlinear systems, like self-organisation, strange attractors, symmetry breakingbifurcations, chaos etc., can be found in most academic fields. Increasing computer powercombined with the rapidly increasing amount of data available in cell biology (such ascomplete biochemical maps, complete genomes of micro-organisms etc.) suggest thatthere should be opportunities to significantly move forward both in the science area as
Introduction 7
well as in useful, or profitable applications (Bailey, 1998; Edwards and Palsson, 1998;Palsson, 1997).
In this introduction the approaches which have shown to be most successful for themathematical modelling of cell biology are systematically discussed. It will give thebiologist an idea of how a mathematical model could be developed and what the specificcharacteristics of the models are. The system engineer or applied mathematician gets anoverview of the status, difficulties and needs with respect to the application ofmathematical models for cell biology. For the metabolic engineer familiar approaches arearranged in a less common hierarchy of model complexity. In the second part, the modelsystem will be described: a specific part of the metabolism of a micro-organism. This givesthe modellers a glance of the type of system under consideration and will give thebiologists a brief overview of an area not commonly studied.
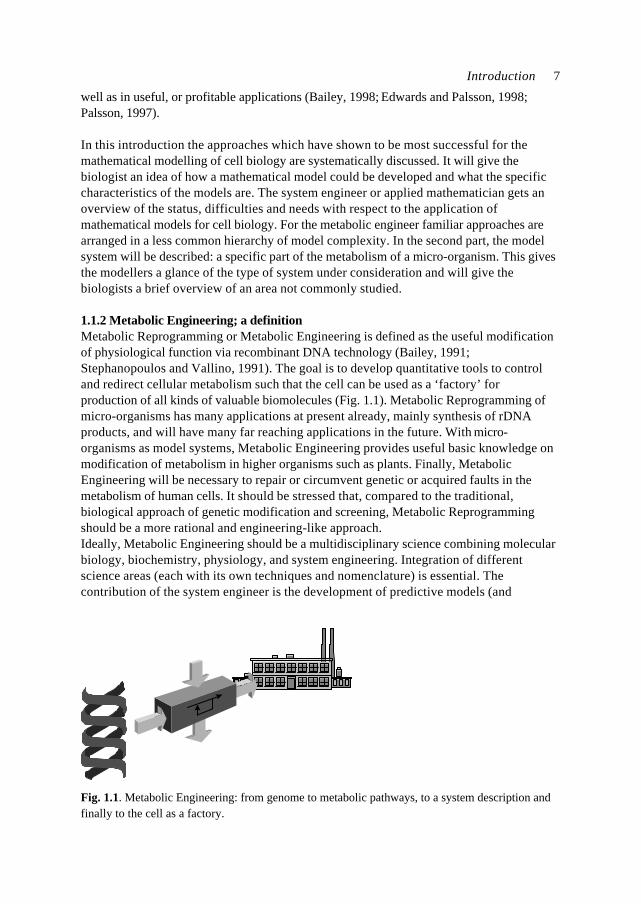
1.1.2 Metabolic Engineering; a definitionMetabolic Reprogramming or Metabolic Engineering is defined as the useful modificationof physiological function via recombinant DNA technology (Bailey, 1991;Stephanopoulos and Vallino, 1991). The goal is to develop quantitative tools to controland redirect cellular metabolism such that the cell can be used as a ‘factory’ forproduction of all kinds of valuable biomolecules (Fig. 1.1). Metabolic Reprogramming ofmicro-organisms has many applications at present already, mainly synthesis of rDNAproducts, and will have many far reaching applications in the future. With micro-organisms as model systems, Metabolic Engineering provides useful basic knowledge onmodification of metabolism in higher organisms such as plants. Finally, MetabolicEngineering will be necessary to repair or circumvent genetic or acquired faults in themetabolism of human cells. It should be stressed that, compared to the traditional,biological approach of genetic modification and screening, Metabolic Reprogrammingshould be a more rational and engineering-like approach.Ideally, Metabolic Engineering should be a multidisciplinary science combining molecularbiology, biochemistry, physiology, and system engineering. Integration of differentscience areas (each with its own techniques and nomenclature) is essential. Thecontribution of the system engineer is the development of predictive models (and
Fig. 1.1. Metabolic Engineering: from genome to metabolic pathways, to a system description andfinally to the cell as a factory.
Chapter 18
modelling tools) to evaluate the feasibility of a genetic alteration a priori to efficientlyincrease the number of experimental successes.
1.1.3 Metabolic analysisAlthough certain micro-organisms such as the bacterium E. coli and the yeastSaccharomyces cerevisiae (commonly known as baker’s yeast) have been studiedintensively for many decades, the available knowledge is often ambiguous (severaldifferent hypotheses can exist for observed phenomena). The understanding ofmetabolism is limited, even of its fundamental principles. This is a rather unfavourableposition to start engineering. Fundamental science and engineering have to be integratedand before micro-organisms can be genetically engineered, careful analysis of the systemis necessary.Due to increasing automation of laboratory techniques, the amount of data is rapidlyincreasing. For the amount of genomic information on the Internet a similar rule can besuggested as for computer power (doubling each 12 months, Moore's law, 1965). Anadditional advantage of automation can be more standardised methods and therefore morecomparable data-sets. In combination with information technology also the accessibilityof the data is improving. For analysis and understanding of microbial cells it is essential totransform the data and information into knowledge. Especially for engineering aquantitative understanding of the cell is necessary. Mathematical models are quantitativeand, implemented as computer models , they can combine many observations of complexsystems into one framework. They are efficient tools for problem analysis. In the secondhalf of this century mathematical models have been developed and successfully used formicrobiology. Usually these were empirical models describing macroscopic properties ofcell populations, such as the Monod model which relates the growth rate to the substrateconcentration 1). In contrast, most models used by biologists to describe the processes inthe cell are still based on linguistic descriptions and hypotheses, often summarised in anabstract scheme. These models are pure qualitative descriptions, limited to relativelysimple systems and a small number of observations. The large amount of data available istoo complex to be handled by just reasoning. New tools are necessary which analyse thefunction of genes and their products in the system in which they operate. Mathematicalmodels are not a goal as such, but are useful tools to increase our understanding andinitiate new experiments. The results of such model-driven experiments in turn can be usedto validate or improve the model. The mathematical model is an essential part of thescientific cycle.
1.1.4 Mathematical models for cell biology and Metabolic Engineering: problemdefinitionBiological systems have several characteristics which make them fundamentally differentfrom physical systems.
1) To yield fundamental knowledge of intracellular metabolism, the models should be so-calledwhite-box models with a direct relation between model structure and the underlying biochemicalsystem. In general, it is also technically impossible to generate the large amount of data necessaryfor black-box models, e.g. polynomials, rational functions, or neural nets.
Introduction 9
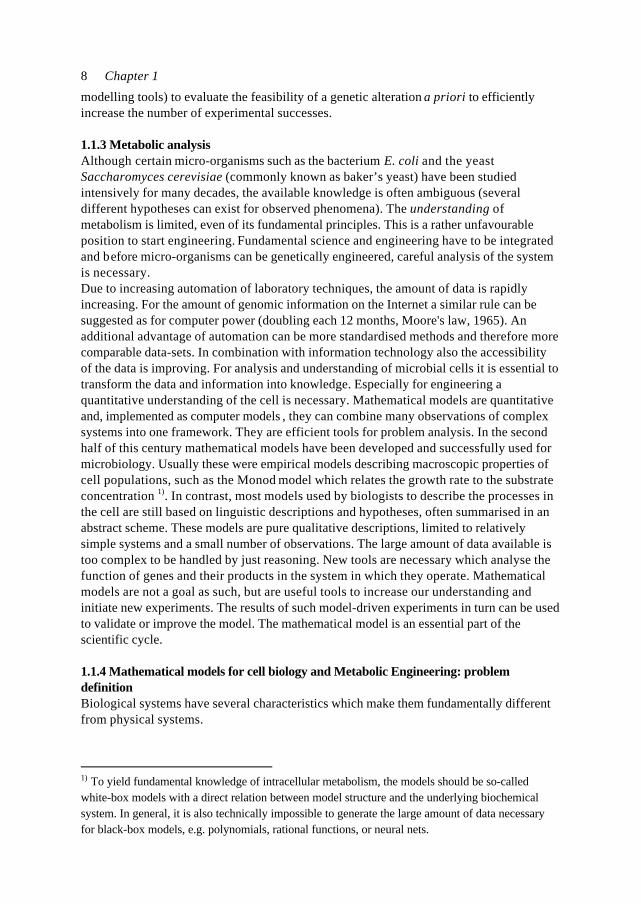
1) Nonlinear systems. In the range in whichmetabolism (and biological systems in general)operates in practice, all processes are essentiallyhighly non-linear. Linearising the system for theoperational range, which is the general approachto model physical systems, is only relevant if theoperational range is reduced to a singleoperating point (Fig. 1.2).2) Very open systems. For modelling it isessential to make the system as simple aspossible. Reduce the system to the essentialpart for which a limited number of inputs andoutputs are defined. It is important to decidewhat belongs to the system to be modelled, i.e.define the appropriate system boundaries. Thesurrounding of the system can only influencethe system itself via the defined inputs. The
difficulty with biological compared to physical systems is that, for every (artificial) systemboundary, there remain a relatively large number of interactions with the surrounding,both at the level of material transport as well as at the level of signal exchange. Cells,especially in multi-cellular organisms, are very open systems. For the modelling ofmicrobial cells the most natural system boundary would be the cell wall. This means thatthe whole cell is the system to model. As mentioned, empirical, macroscopic models areavailable, but both for cell biology and Metabolic Engineering the intracellular processesand usually a specific part of metabolism is most relevant (microscopic models). For thissubsystem detailed information needs to be included, but it is not efficient (or evenpossible so far) to include the same level of detail for all the processes in the cell. Modeldevelopment usually coincides with rough assumptions and lumping of effects withrespect to the surrounding. Whenever the metabolic system of interest is defined, itshould be realised what the (implicit) underlying assumptions with respect to thesurrounding are.3) Limited and heterogeneous datasets. An important, practical problem in quantitativemetabolic modelling are the limited, inconsistent datasets, often from experiments notdesigned for that purpose. Since cell biology and Metabolic Engineering aremultidisciplinary, the data are derived from different sources and are very heterogeneous.With respect to this problem, the genetic discipline has improved enormously during thelast years, mainly driven by the genome sequencing projects and related automation oftechniques. Large databases are available with sequence information of hundreds ofgenomes and intelligent bioinformatics tools are available to search and comparesequences. In contrast to its genetic information (genotype), the way the cell actuallydevelops (phenotype) is less predefined. No databases with physiological data are(publicly) available.
Despite the large attention and research investments world wide, progress in the field ofMetabolic Engineering is relatively slow. Progress is being made in the various fields ofmodelling of metabolic processes (Varner and Ramkrishna, 1999), but it is also clear that in
X
tFig. 1.2 Linearisation (1st orderapproximation) at a certain point in time ofa growth curve of biomass X described by:
teXXXX µµ 0=⇒=&
Chapter 110
this era of massive release and availability of data on genomes and proteomes of micro-organisms, the physiological knowledge, abstracted as metabolic modelling, lags behindand needs special attention. The lack of understanding could limit the speed of research inthe long term (Bailey, 1998; Giuseppin et al., 1999). There is no satisfying and completemodelling framework available to enable metabolic pathway engineering. Besides bettermolecular biological and biochemical tools, modelling tools have to be developed whichenable the prediction of the results of the modification of metabolism. The modelling toolsneeded are dynamic modelling techniques for the quantification of metabolic fluxes andconcentrations. Model validation (testing) should result from investigating the predictivepower of the developed models, i.e. extrapolation of the model to situations not present inthe original dataset(s). With the model purpose in mind, in this work the prediction of thebehaviour of mutants (gene deletion or overexpression) is analysed. Due to the nature ofthe system, a proper prediction of the phenotype of certain mutants can never guaranteethe correct prediction of other mutants. There is always a limit on predictive power. Thatthese limits are usually unknown is inherent to predictive models, but especially true forbiosystems.
1.1.5 Mathematical models for cell biology and Metabolic Engineering: existingapproachesBefore the different available metabolic modelling approaches are reviewed, a general(mathematical) description of the system is given. A system of states x(t) which change intime and with a set of time dependent inputs u(t), can be described by a set of nonlineardifferential equations in time:
( ))(),( tutxfdt
xdx ==& (1.1)
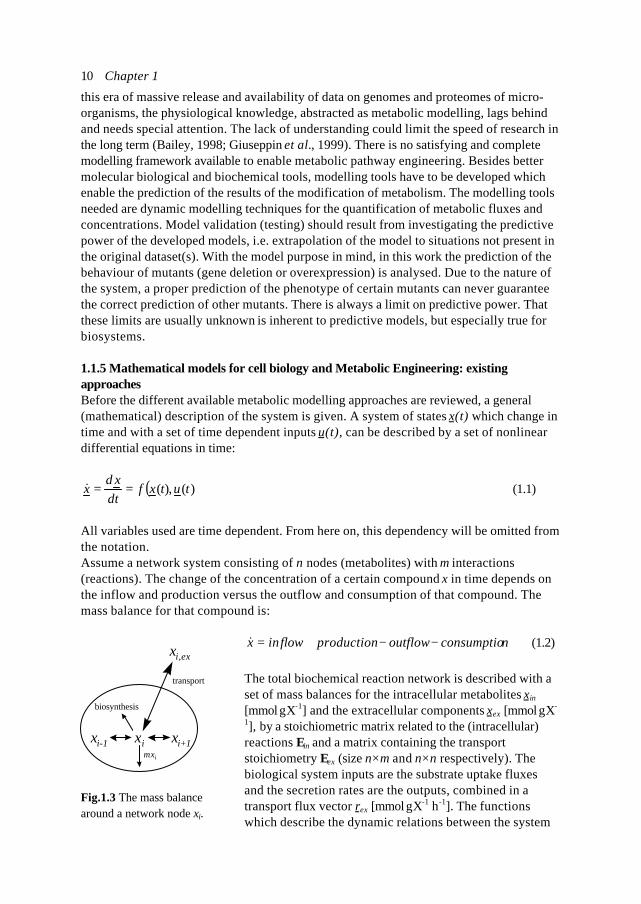
All variables used are time dependent. From here on, this dependency will be omitted fromthe notation.Assume a network system consisting of n nodes (metabolites) with m interactions(reactions). The change of the concentration of a certain compound x in time depends onthe inflow and production versus the outflow and consumption of that compound. Themass balance for that compound is:
nconsumptiooutflowproductionflowinx −−+=& (1.2)
The total biochemical reaction network is described with aset of mass balances for the intracellular metabolites xin
[mmol⋅gX-1] and the extracellular components xex [mmol⋅gX-
1], by a stoichiometric matrix related to the (intracellular)reactions Ein and a matrix containing the transportstoichiometry Eex (size n×m and n×n respectively). Thebiological system inputs are the substrate uptake fluxesand the secretion rates are the outputs, combined in atransport flux vector rex [mmol⋅gX-1⋅h-1]. The functionswhich describe the dynamic relations between the system
xixi-1µ xi
biosynthesis
transport
xi,ex
xi+1
Fig.1.3 The mass balancearound a network node xi.
Introduction 11
nodes are grouped in a vector of intracellular rates rin [mmol⋅gX-1⋅h-1]. The dilution of thecomponent pools through growth of the cell is determined by the specific growth rate µ[h-1] and can be described by term - µ xin. The system equation (Eq. 1.1) can be written as:
exexinininin rxrx EE +−= µ& (1.3)
The mass balance for a network node is visualised in Fig. 1.3. In literature the transportrates are often indicated as a flux vector Φ, equal to Φ = Eex rex in Eq. 1.3.The different model approaches for metabolic networks in literature are all based on thisgeneral description of the mass balances. The way the reaction rates rin, the transportfluxes rex and the specific growth rate µ are modelled, depends on the informationavailable and the goal of the model.
To determine which level of complexity is necessary for metabolic models it is interestingto classify the systems and the models to their level of complexity. According to thesystem hierarchy of Boulding (1956), the relevant levels of complexity for modelling ofmicro-organisms are:
1. Static network The metabolic stoichiometric network2. Simple dynamic system
(predefined, time-dependent)Several coupled (enzymatic) reactions
3. Controlled system(communication, feedback,homeostasis, ‘first order cybernetics’)
Part of the cellular metabolism including(local) regulation
4. Self-regulating system(self-reference, adaptation andmorphogenesis 2 'second-ordercybernetics')
Complete metabolic network withdifferent levels of regulation
For a system of complexity level 1 an accurate model at level 1 in principle will be suitablefor all applications. When a system at a certain level of complexity is modelled at a lowerlevel, then this model will always have limited application. As discussed before this isgenerally the case; simplification is the essence of modelling. For understanding andmodelling of the metabolic network of micro-organisms, models at complexity level 4 arenecessary. Level 4, would also be most appropriate with respect to the development oftools for Metabolic Reprogramming.
Steady-state model When time is eliminated from the mass balances ( 0 =x& ) then the
dynamic model reduces to a steady-state / static model. The system differential equations(Eq. 1.3) reduce to a set of algebraic equations, describing only the stoichiometricrelations of the metabolic network:
2) Adaptation is often called 'morphogenesis' in cybernetic terminology, which should not beconfused with microbial meaning.
Chapter 112
exexininin rxr EE +−= µ0 (1.4)
In this approach, which is called Flux Analysis (or Metabolic Flux Analysis, or FluxBalance Analysis) the stoichiometry in Ein and Eex, is assumed to be constant and usuallythe dilution through growth µ xin is assumed to be relatively small and is ignored. Ideally,the unknown intracellular reaction rates rin in steady-state can be calculated from theuptake and secretion fluxes rex:
( )exexinin
rr EE 1−−= (1.5)
Usually the transport fluxes can be most easily determined, often in the steady-state of achemostat experiment (as discussed below):
( )X
xxDr exifeedi
iex,,
,
−= I = 1, ..., n (1.6)
xi,feed: concentration in the feed [mM]xi,ex: residual (extracellular) concentration [mM]D: dilution rate [h -1]X: biomass concentration [g ⋅l-1]
Since Eq. 1.5 is a matrix equation, the calculation comes down to solving a set of nequations with m unknowns (the reaction rates). In principle this is possible if n > m. Massbalance equations which are dependent, such as the equations in a linear pathway, do notyield additional information (do not provide additional constraints) to calculate theunknown rates. After elimination of such dependent relations, typically the number ofremaining unknown relations between the nodes m* is larger than the number of remainingmass balances n*. The number of combinations of rin which fulfil Eq. 1.5 is infinite. Thestoichiometry of the network does not uniquely specify rin.In mathematical terminology: if Ein has full rank and is non-singular, then rin can becalculated as a function of Ein, Eex, and rex; Eq. 1.5 is determined. The degree of freedom ofthe system is m-Rank(Ein) and should be ≤ 0 to yield an unique solution.- When the degree of freedom is < 0, then there are more mass balance equations thanunknown rates; the system is overdetermined. This redundancy in the flux equations canbe used to calculate a best solution for the unknown rates given the variance present inthe data used to calculated the transport rates according to Eq. 1.6. Then Eq. 1.5 becomesa linear regression equation (i.e. a Least Squares algorithm):
( ) exTexin
Tinin rr 111ˆ −−−= CEECE (1.7)
The hat ^ denotes that the calculated rates are best estimates. C is the covariance matrixassociated with the measured fluxes.- However, as indicated, usually the opposite is true (Eq. 1.5 is underdetermined) and thenumber of possible distributions of rin is infinite. The number of unknowns has to bereduced. An experimental approach is to study the in vivo distribution of stable isotopes,
Introduction 13
such as 13C or 15N (e.g. Holmes et al., 1991, Tesch et al., 1999), using Nuclear MagneticResonance.Besides a mathematical analysis, this situation of an underdetermined system can begiven a biological interpretation. The freedom present in the mass balances, i.e. in thestoichiometric matrix Ein, represents the metabolic capabilities / flexibility of the metabolicnetwork. The mathematical null space of stoichiometric matrix Ein is the metabolicgenotype of the system, i.e. all allowable flux distributions by the given set of metabolicgenes (Edwards and Palsson, 1998). In nature, the particular flux distribution chosen bythe cell (the metabolic phenotype), depends on the genotype, the environment and theregulatory mechanisms within the cell. This information is not present in the staticstoichiometric network. Without specifying the (complex) underlying regulation, theproblem can be mathematically defined as a Linear Programming problem. An optimalsolution can be found, given the flexibility present in the stoichiometric matrix Ein and agoal function, capturing a postulated strategy (Edwards and Palsson, 1998). The steady-state flux distribution is optimised, usually with maximisation of the growth rate as goal.The growth rate is the result of the whole metabolism, both anabolism and catabolism.Most directly related to growth is the biosynthesis of building blocks for the cell(anabolism). Therefore the biosynthetic fluxes, which are a subsection of rin and which aregrouped in rbiosynth, can be maximised (numerically implemented as minimisation of -rbiosynth).Due to obvious biochemical limitations on the maximal fluxes allowed in a metabolicnetwork, the search space for the maximisation is bounded with lower and upper bounds,rlb and rub respectively:
biosynthubrrlbr
rr −=≤≤ ˆminargˆ subject to: exexinin rr EE −=ˆ (1.8)
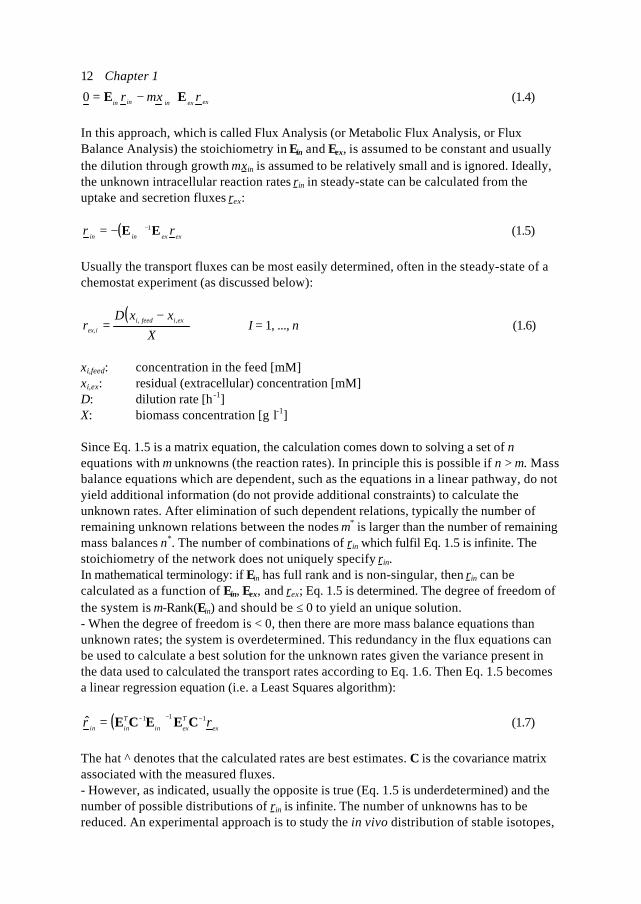
Box 1.1The algebraic relation x2 = 0.5 + (x1 - 0.5)2 in the interval [0, 0] ≤ [x1 , x2] ≤ [1, 1] has an infinitenumber of solutions, namely the parabola visualised.Two options which yield the same unique solution are:- add the relation x2 = x1 (the straight line in the figure) and solve the determined set of twoequations with two unknowns- assume the ‘strategy’ or ‘goal’ is to have x2 as small as possible and solve
2]1,1[]2,1[]0,0[
21 minarg],[ xxxxx ≤≤
=
Both options result in: x2 = x1 = 0.5.
0 10
1
x1
x2
Chapter 114
The hat (^) indicates that the rates are (best) estimates. Mathematically and numericallythis is a straightforward approach, but as a stoichiometric model of cellular metabolismthis needs some extra thought. This approach is called Flux Balance Analysis withOptimisation (e.g. Bonarius et al., 1998; Fell and Small, 1986; Savinell and Palsson, 1992)and has been visualised in Box 1.1.
These stoichiometric models are of a level 1 complexity and are usually insufficient forengineering problems. Nevertheless, FA has been very useful to deal with metabolicnetworks from a more system analytic point of view, instead as a summation of enzymes(reductionistic). FA can give insight in the changes in flux distribution at different steady-state conditions (e.g. Van Gulik and Heijnen, 1995) and even during the pseudo-steady-state of a fedbatch (Jørgensen et al., 1995). FA also has been successfully used inMetabolic Engineering applications (e.g. Vallino and Stephanopoulos, 1993; Park et al.,1997). However, for (advanced) Metabolic Analysis and Engineering dynamic and morecomplex models are necessary.
Sensitivity analysis of the steady-state Differential analysis is a common tool inengineering (also called sensitivity analysis). For metabolic systems, this approach wasintroduced by Kacser and Burns (1973) and Heinrich and Rapoport (1974) and was calledMetabolic Control Analysis (MCA). Besides a specific name also a specific nomenclaturewas adopted for metabolic systems.The system properties that are characteristic for MCA are the flux control coefficients andelasticity coefficients. The flux control coefficients quantify the influence of the individualenzyme activities on the overall flux through a pathway. The elasticity coefficientsquantify the influence of the pool levels on the individual pathway reaction. The elasticitycoefficients are properties of single enzymes ('local' properties) and the controlcoefficients are properties of the system as a whole. The elasticity coefficient of anenzyme is not a constant property of that enzyme, but depends on the system. Theexperimental approach to determine the MCA coefficients is to manipulate the individualpathway enzymes and to measure the influence on the overall system behaviour. Thismanipulation often involves genetic modification of the enzymes or the use of inhibitorsand is very laborious. When a dynamic model is available (see below), then of course themodel sensitivities can be calculated and therefore also its MCA equivalents. On the basisof a thermodynamic description of reaction rates the elasticity coefficients can becalculated directly from the pool levels of metabolites at steady-state (e.g. Westerhoff etal., 1987; Nielsen, 1997). The restriction of this approach is that it can only be used for theanalysis of simple pathways (or pathways which have been reduced (lumped) into a fewoverall conversions).The power of MCA lies not in the principle of sensitivity analysis, but in the evolvingtheorems (e.g. Kell and Westerhoff, 1986). The flux control coefficients and the elasticitycoefficients are related through the so-called flux control connectivity theorem.According to the flux control summation theorem the normalised flux control coefficientssum to 1. These theorems clearly showed that the enzymes in metabolic pathways form anetwork with distributed control and together determine the overall system behaviour.
Introduction 15
MCA meant a small revolution within biochemistry and has evolved to almost a scienceon its own with a strong mathematical base.The sensitivities resulting from MCA can be used as a first order approximation of thedynamics, which results in a linearisation of the system around an operating point (Fig.1.2). It has to be stressed that such extrapolation to develop dynamic models is not theaim of the MCA framework. MCA should be used to describe the distribution of controlwithin a metabolic network in steady-state. There is an increasing number publications inwhich MCA has been successfully used (e.g. Nielsen and Jørgensen, 1995; Simpson etal., 1998).
Dynamic models of small metabolic networks To describe (and predict) the metabolicdynamics after a perturbation / excitation ( 0 ≠x& ), the reaction rates between the network
nodes can be mechanistically modelled. A priori knowledge and / or assumptions aboutthe dynamic relations between the system nodes, such as enzyme kinetics, are transferredinto parametric model expressions, with parameters θ (length p). The system equation (1.3)can be written as:
),(),(),( θθµθ xrxxxrx exexinininin EE +−=& (1.9)
To complete the model, the parameters θ have to be estimated based on experimental data.The difference between the N (time) points of experimental data x data and thecorresponding simulated model states x̂ is the model error ε. Ideally, when this error is
zero, the model exactly describes (fits) the response. The purpose is to find an optimal setθ which reduces the model error as much as possible. Numerical algorithms are availableto perform such optimisation. The model error ε is included in a so-called cost (objective)function JN which is minimised by the optimisation algorithm. This procedure is discussedin Chapter 4 in detail. The model simulation (state trajectories) follow from (numerical)integration of Eq. 1.9:
( )dtrxrxxft
texexininininin ∫ +−+=
0
0,ˆ EE µ (1.10)
The initial conditions x0 of all model compounds have to be known (measured) orestimated as well.
As discussed before, the relations rin(x,θ) will be nonlinear equations to describe theobservations on the biological system. The kinetic formula's used in literature vary fromMichaelis-Menten kinetics (the most simple form) to very complicated structuresincorporating inhibitors and enzyme modulators. Most approaches are based on in vitrostudied enzyme kinetics and the applicability to in vivo systems is not readily established.These models have a level 2 complexity and only yield acceptable results for small, simpleand often linear3) metabolic pathways.
3) The term linear pathway means without branches or cycles and has nothing to do with the typeof mathematical description of its dynamics.
Chapter 116
Dynamic models of metabolic networks including regulation For dynamic models of morecomplex metabolic systems it is necessary to include regulation in the model. Controlledsystems will always include at least one loop of information flow providing feedback. It isimportant to make a clear distinction between (conversion of) mass / energy and signaltransduction (information level). A metabolic system consists of thousands of differentcomponents operating in multiple compartments and at time scales between 10-6 and 104
seconds (for phosphorylation / dephosphorylation reactions and biomass growthrespectively). A cell is not an ideally mixed, homogenous bioreactor; many reactions occurthrough vectorial processes (enzymes are often arranged as functional clusters, whichpass a substrate from one active site to the other). A prerequisite for such a system toyield a stable organism is the presence of several hierarchical levels of regulation.Hierarchy in the regulation should also be included in the models. Both in nature and insystems developed by man, control of slow processes often takes place at a higher, moreglobal level than that of fast processes, which are often locally controlled. In Chapter 7several cellular regulatory principles are discussed. Below a hierarchy for the regulation in(mathematical models of) cells is proposed.One option to construct such models is to extend the (parametric) dynamic model forsimple metabolic networks as previously described with parametric expressions ofregulatory loops for enzyme activity and gene transcription. This introduces additionalparameters, to be estimated with experimental data. In principle mechanistic models areideal. However, for metabolic systems this will result in complex models with a largenumber of unknown parameters which need to be estimated. Large, high quality data-setsare necessary. Usually these can be easily obtained for physical systems, but not forbiological systems.The combination of in vivo studied kinetics and regulation (at different levels) is animportant improvement to the kinetic modelling approach (Rizzi et al., 1997; Van Riel et al.,1998), nevertheless the results are still not really satisfying. For Metabolic Engineeringproblems in general, the level of in vivo kinetic information needed for such kineticmodelling is not available. It is extremely laborious to generate all the necessary (highquality) data in dynamic experiments. Furthermore, most of the parameters are valid forlimited working conditions such as media, strains and cultivation conditions.
In the mid 80's two approaches emerged to include regulation in models of biochemicalpathways, which recognised that cells have certain holistic properties which cannot be(directly) reduced to its elements. In 1988 Bellgardt introduced the Metabolic Regulatorconcept (Bellgardt, 1988, 1991). It was explicitly realised that the in vivo regulation, whichcouples the different metabolic pathways and essentially determines the response toenvironmental conditions, was at that time not accessible. A combination of a massbalance model and the assumption that normally growing cells try to maximise theirmetabolic activity resulted in a similar static model formulation as used for Flux BalanceAnalysis with optimisation (Eq. 1.8). To create a dynamic model feedback control loopsare included for all pathways to regulate the metabolic activity, without a kinetic base forthe regulators.The second approach is the cybernetic modelling framework initiated by Ramkrishna andco-workers (Kompala et al., 1984). Originally the framework was used for macroscopic
Introduction 17
input-output models describing substrate uptake, growth and product formation. Morerecently, Varner et al. (1998, 1999a, 1999b) have extended the framework for application tomore complex, intracellular metabolism. Straightforward enzyme kinetics are used todescribe the interaction between the network nodes and the regulation focuses on thefunctionality of the pathways and subsystems. The effect of this regulation is very strongand dominates the system dynamics, reducing the importance of the correct description ofthe in vivo enzyme kinetics. In most of these studies the metabolic strategy (again) is tomaximise the resulting growth rate. The economic principle of ‘return on investment’ isused as implementation of the strategy. Despite this relatively simple strategy, theperformance of these models is remarkably good. Both approaches will be discussed againin Chapter 8.
1.1.6 Specification of the requirements for an appropriate frameworkAlthough several different approaches of metabolic modelling exist and progress is beingmade, especially at the level of more sophisticated kinetic modelling, there is still no modelframework with a level 4 complexity. The mathematical modelling of cellular control is stillunderdeveloped (e.g. Bailey, 1998, Giuseppin et al., 1999). None of the availableapproaches results in self-regulating models which show biological very relevantphenomena such as adaptation. Most approaches are based upon model techniques inuse to model systems at a level 2 complexity, such as enzyme kinetics. Although such abottom-up technique is important for data analysis, to improve understanding and toidentify open questions, this did not yet result in acceptable models for intracellularmetabolism, especially when applied to more complex and / or unknown parts ofmetabolism.By contrast, there is a different approach, the holistic or system approach. The concept oflooking at the characteristics of a system as a whole is not just a simplification used by(system) engineers. Neither is the idea of emergent properties, which cannot be deducedfrom the elementary parts of a system, a pure artificial concept only introduced becausecertain knowledge is not yet available. Also in fundamental physics, emergence andholistic properties occur (Lumsden et al., 1997). For example, with more detailed, nonlinearcomputer models of individual water molecules, indeed more and more of the specific,emergent characteristics of water as liquid can be understood (reduced). On the otherhand, for example, the emergent superfluid properties of helium at very low temperaturescannot be derived from the detailed models of the individual atoms (irreducibleemergence). There is a holistic principle (the Bose-Einstein statistics) which applies tolarge numbers of helium atoms. The idea not to look at the low level enzyme kinetics, butto focus on the functionality of the subsystems, clearly links with self-regulating systemsand models (level 4 of complexity) and to the ideas adopted by Bellgardt and Ramkrishnaand co-workers at the level of regulation of metabolic networks.
For an integrated system approach of metabolic systems, the concept of an evolutionaryfitness landscape, traditionally used to study evolution and population dynamics (e.g.Kauffman, 1993), could be useful. The evolutionary field, or fitness landscape, is anabstract information space which defines the possible variations within the laws ofphysics and chemistry. As already discussed, Flux Balance Analysis with Optimisation
Chapter 118
and the Metabolic Regulator concept are based on this idea, where a postulated metabolicstrategy is the fitness function.The responses of cells under natural conditions have evolved to the optimal level given acertain ecological niche. The Darwinian principle of the survival of the fittest results incells that have not one but a series of optimal responses arising from basic strategies. Thecell can be regarded as an adaptive, cybernetic system. Cybernetics was originally definedas the science of communication and control (Wiener, 1948) and grew out of Shannon'sinformation theory, which was designed to optimise the transfer of information throughcommunication channels. It is the study of systems which can be mapped using loops in anetwork defining the flow of information. (Appropriately the word cybernetics is derivedfrom the Greek for "pilot). In the context of metabolic modelling, a cybernetic system canbe defined as an optimal, self-controlling system with strategies (Giuseppin et al., 1999,Giuseppin and Van Riel, 2000). Cells have the capability to carry out various differentstrategies, used in the allocation problem which the cells face. Typical biological and alsoorganism or cell specific phenomena can be interpreted as resulting from one or acombination of strategies. Organism specific strategies could be maximisation of thegrowth rate or maximisation of the consumption of certain preferred substrates. Thecombination of strategies used, will depend on both the environment and the status of thecell itself. The cellular environment, such as the nutrients available, relates to the inputs ordirect opportunities as sensed by the cell. The status of the cell is determined by thecurrent capabilities of the cellular machinery and the potential to add or increasecapabilities as given by induction or modulation. Also preprogrammed responses arepresent, which are required to survive, grow and compete. Cells may make by-products tohinder competitors or become dormant (sporulate) if internal or external conditions are notoptimal.At a higher abstraction level, for the definition of the holistic properties of cellular controlin a model, two general concepts in biology are postulated to be the base of all theseregulatory phenomena: control of homeostasis and adaptation. (The terminology isadopted from control engineering.)1) Feedback control is present to maintain homeostasis of the metabolic pools.Homeostasis is an important concept in biology to explain processes like hormonalbalance, maintenance of temperature, etc. From a control engineering point of view, thefeedback loop is a tracking controller, which reduces the effect of environmentaldisturbances (noise).2) Biological systems deal with growth, change and emergence and react to changes intheir environment, i.e. they are adaptive. Biological systems include feedforwardregulation, which causes adaptation and is the driving forces behind change.From a system analytical point of view, feedback control enables the organism to maintainitself in its changing environment and feedforward regulation gives it a chance to adapt toenvironmental changes.In Metabolic Engineering, ideally, the cell is regarded as a factory to make useful things.Usually this analogy of a cell as a factory is limited to that idea only. However, like afactory, the cell as a cybernetic system is also operating in a competitive environment(Giuseppin et al., 1999). Knowing the total inventory of the factory i.e. all the enzymes andother proteins, does not indicate how it works, what its performance will be or how toimprove it. During the evolution of cells, the proteins and various cell structures have
Introduction 19
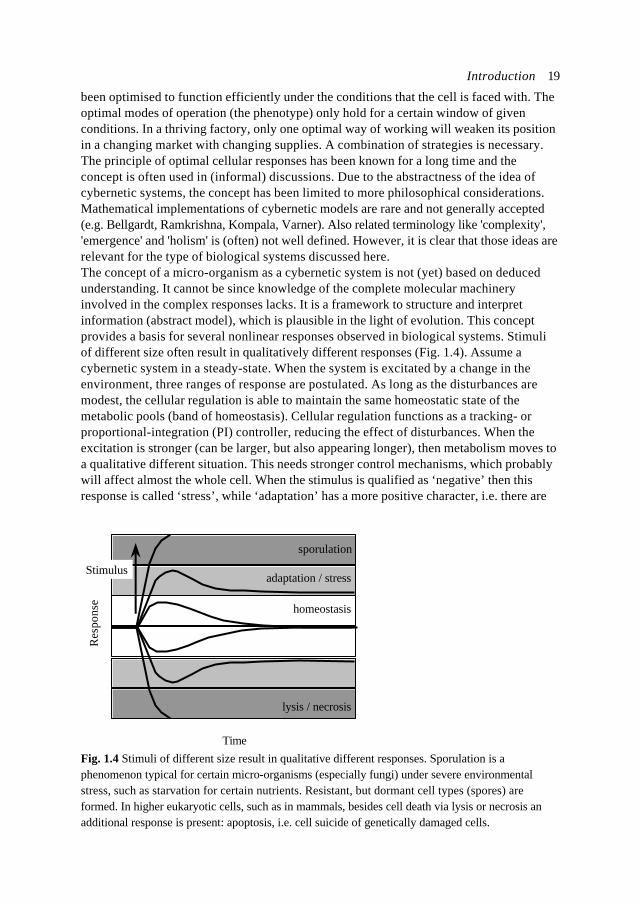
been optimised to function efficiently under the conditions that the cell is faced with. Theoptimal modes of operation (the phenotype) only hold for a certain window of givenconditions. In a thriving factory, only one optimal way of working will weaken its positionin a changing market with changing supplies. A combination of strategies is necessary.The principle of optimal cellular responses has been known for a long time and theconcept is often used in (informal) discussions. Due to the abstractness of the idea ofcybernetic systems, the concept has been limited to more philosophical considerations.Mathematical implementations of cybernetic models are rare and not generally accepted(e.g. Bellgardt, Ramkrishna, Kompala, Varner). Also related terminology like 'complexity','emergence' and 'holism' is (often) not well defined. However, it is clear that those ideas arerelevant for the type of biological systems discussed here.The concept of a micro-organism as a cybernetic system is not (yet) based on deducedunderstanding. It cannot be since knowledge of the complete molecular machineryinvolved in the complex responses lacks. It is a framework to structure and interpretinformation (abstract model), which is plausible in the light of evolution. This conceptprovides a basis for several nonlinear responses observed in biological systems. Stimuliof different size often result in qualitatively different responses (Fig. 1.4). Assume acybernetic system in a steady-state. When the system is excitated by a change in theenvironment, three ranges of response are postulated. As long as the disturbances aremodest, the cellular regulation is able to maintain the same homeostatic state of themetabolic pools (band of homeostasis). Cellular regulation functions as a tracking- orproportional-integration (PI) controller, reducing the effect of disturbances. When theexcitation is stronger (can be larger, but also appearing longer), then metabolism moves toa qualitative different situation. This needs stronger control mechanisms, which probablywill affect almost the whole cell. When the stimulus is qualified as ‘negative’ then thisresponse is called ‘stress’, while ‘adaptation’ has a more positive character, i.e. there are
Res
pons
e
Time
homeostasis
adaptation / stress
sporulation
Stimulus
lysis / necrosis
Fig. 1.4 Stimuli of different size result in qualitative different responses. Sporulation is aphenomenon typical for certain micro-organisms (especially fungi) under severe environmentalstress, such as starvation for certain nutrients. Resistant, but dormant cell types (spores) areformed. In higher eukaryotic cells, such as in mammals, besides cell death via lysis or necrosis anadditional response is present: apoptosis, i.e. cell suicide of genetically damaged cells.
Chapter 120
new opportunities for the cell. With a too large excitation, the system is 'out-of-control'(the related mathematical model becomes unstable) and cell lysis, or apoptosis inmammalian cells, results. (See Box 1.2 for a physical analogy.) It has to be realised that thedifferent labels used to indicate the three bands of control, are rather arbitrarily anddepend on the considered system. For example, in Fig 1.4 sporulation is regarded as theresponse of an out-of-control system, at least compared to normally growing cells. Ofcourse the microbiologist will argue that this is a typical and powerful adaptive response.The bands of control are introduced from a mathematical modelling point of view and canhave several biological analogies.With the cell as cybernetic system, it can also readily be understood why the efforts toredirect metabolic flux towards a specific goal, using recombinant DNA methods, have metwith mixed success. The specific goal of the Metabolic Engineering is not the optimumoutcome from the micro-organisms 'point of view'. Accordingly, the micro-organism willresist through its internal control machinery, which appears to be very sophisticated androbust. Cells and metabolic circuits are redundant, i.e. they are able to adjust in theabsence of a gene, without changes to the phenotype. Metabolic robustness is definedas: the ability of the metabolic circuit to adjust to decreased fluxes through essentialenzymes without changes to the phenotype (Edwards and Palsson, 1998). With goodinsight in the control of metabolism it should even be possible to use the resistance to fluxredistribution to our advantage.
Our application field of the metabolic analysis and engineering efforts is focused on themodification at amino acid level. As model system the Central Nitrogen Metabolism(CNM) in baker's yeast is used. The system is described in the next section.
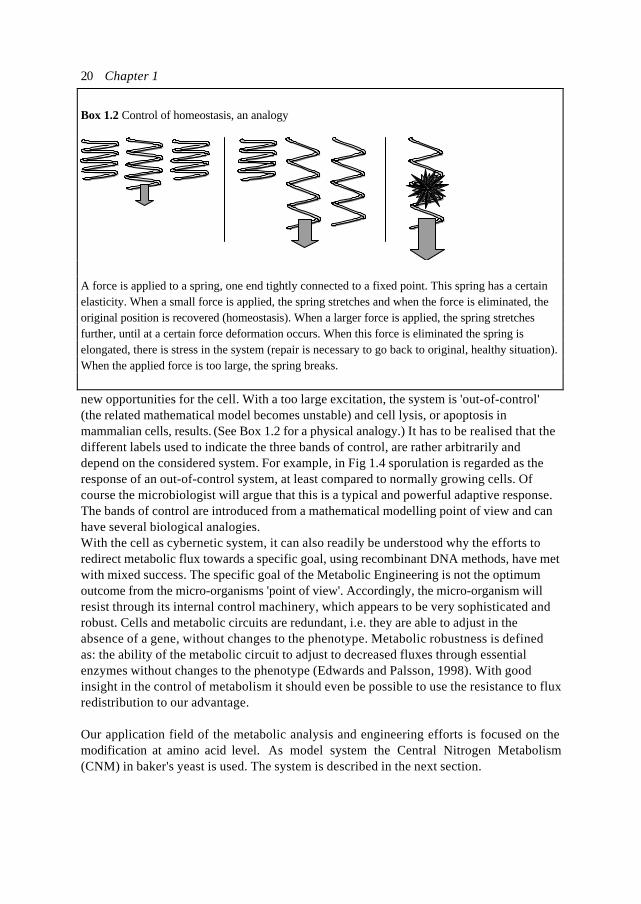
Box 1.2 Control of homeostasis, an analogy
A force is applied to a spring, one end tightly connected to a fixed point. This spring has a certainelasticity. When a small force is applied, the spring stretches and when the force is eliminated, theoriginal position is recovered (homeostasis). When a larger force is applied, the spring stretchesfurther, until at a certain force deformation occurs. When this force is eliminated the spring iselongated, there is stress in the system (repair is necessary to go back to original, healthy situation).When the applied force is too large, the spring breaks.
Introduction 21
1.2 Central Nitrogen Metabolism in S. cerevisiae
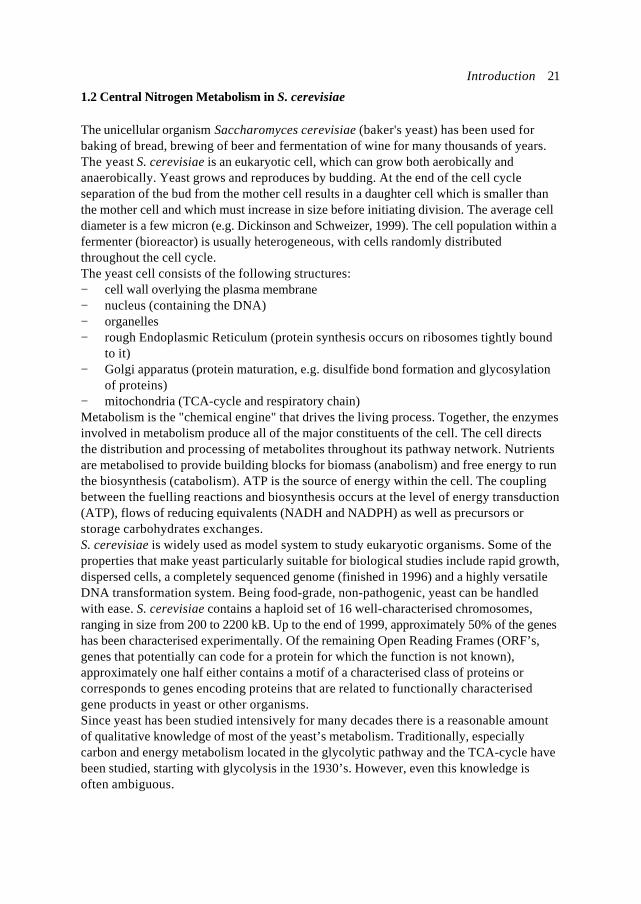
The unicellular organism Saccharomyces cerevisiae (baker's yeast) has been used forbaking of bread, brewing of beer and fermentation of wine for many thousands of years.The yeast S. cerevisiae is an eukaryotic cell, which can grow both aerobically andanaerobically. Yeast grows and reproduces by budding. At the end of the cell cycleseparation of the bud from the mother cell results in a daughter cell which is smaller thanthe mother cell and which must increase in size before initiating division. The average celldiameter is a few micron (e.g. Dickinson and Schweizer, 1999). The cell population within afermenter (bioreactor) is usually heterogeneous, with cells randomly distributedthroughout the cell cycle.The yeast cell consists of the following structures:− cell wall overlying the plasma membrane− nucleus (containing the DNA)− organelles− rough Endoplasmic Reticulum (protein synthesis occurs on ribosomes tightly bound
to it)− Golgi apparatus (protein maturation, e.g. disulfide bond formation and glycosylation
of proteins)− mitochondria (TCA-cycle and respiratory chain)Metabolism is the "chemical engine" that drives the living process. Together, the enzymesinvolved in metabolism produce all of the major constituents of the cell. The cell directsthe distribution and processing of metabolites throughout its pathway network. Nutrientsare metabolised to provide building blocks for biomass (anabolism) and free energy to runthe biosynthesis (catabolism). ATP is the source of energy within the cell. The couplingbetween the fuelling reactions and biosynthesis occurs at the level of energy transduction(ATP), flows of reducing equivalents (NADH and NADPH) as well as precursors orstorage carbohydrates exchanges.S. cerevisiae is widely used as model system to study eukaryotic organisms. Some of theproperties that make yeast particularly suitable for biological studies include rapid growth,dispersed cells, a completely sequenced genome (finished in 1996) and a highly versatileDNA transformation system. Being food-grade, non-pathogenic, yeast can be handledwith ease. S. cerevisiae contains a haploid set of 16 well-characterised chromosomes,ranging in size from 200 to 2200 kB. Up to the end of 1999, approximately 50% of the geneshas been characterised experimentally. Of the remaining Open Reading Frames (ORF’s,genes that potentially can code for a protein for which the function is not known),approximately one half either contains a motif of a characterised class of proteins orcorresponds to genes encoding proteins that are related to functionally characterisedgene products in yeast or other organisms.Since yeast has been studied intensively for many decades there is a reasonable amountof qualitative knowledge of most of the yeast’s metabolism. Traditionally, especiallycarbon and energy metabolism located in the glycolytic pathway and the TCA-cycle havebeen studied, starting with glycolysis in the 1930’s. However, even this knowledge isoften ambiguous.
Chapter 122
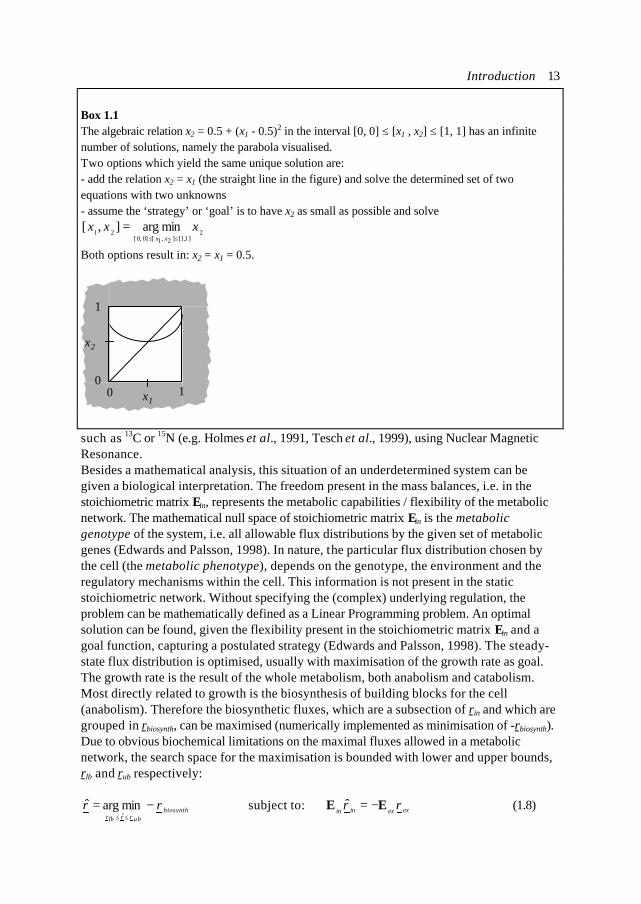
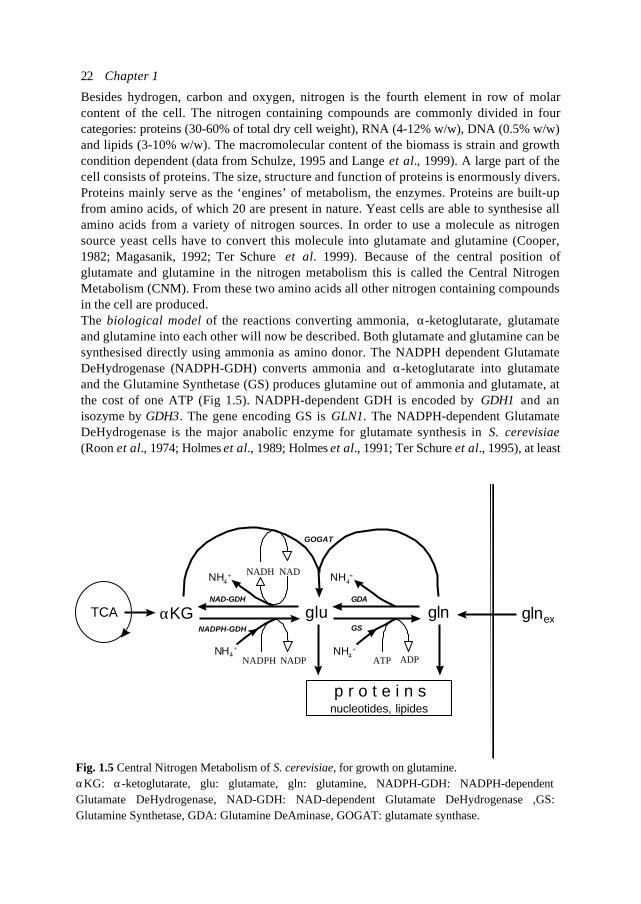
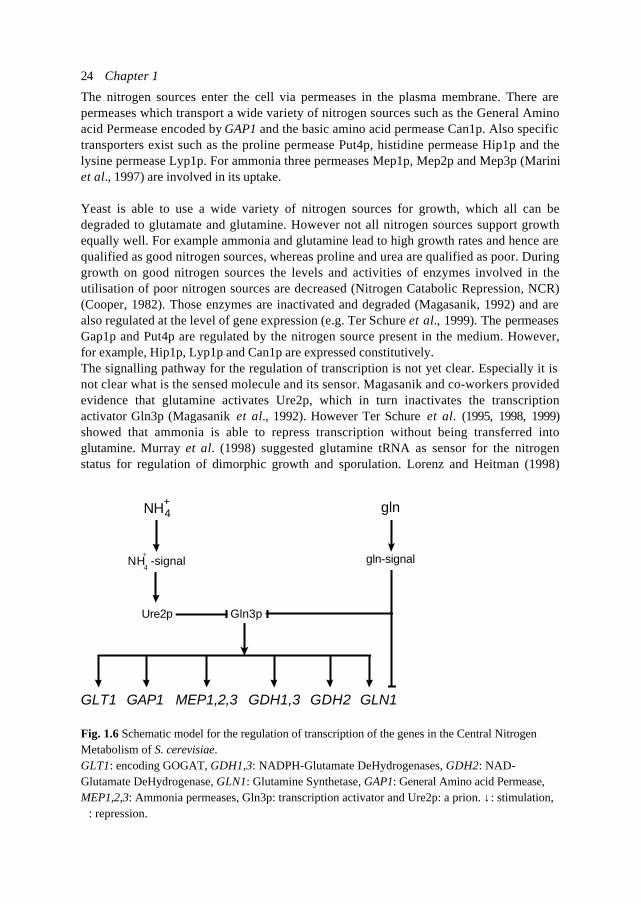
Besides hydrogen, carbon and oxygen, nitrogen is the fourth element in row of molarcontent of the cell. The nitrogen containing compounds are commonly divided in fourcategories: proteins (30-60% of total dry cell weight), RNA (4-12% w/w), DNA (0.5% w/w)and lipids (3-10% w/w). The macromolecular content of the biomass is strain and growthcondition dependent (data from Schulze, 1995 and Lange et al., 1999). A large part of thecell consists of proteins. The size, structure and function of proteins is enormously divers.Proteins mainly serve as the ‘engines’ of metabolism, the enzymes. Proteins are built-upfrom amino acids, of which 20 are present in nature. Yeast cells are able to synthesise allamino acids from a variety of nitrogen sources. In order to use a molecule as nitrogensource yeast cells have to convert this molecule into glutamate and glutamine (Cooper,1982; Magasanik, 1992; Ter Schure et al. 1999). Because of the central position ofglutamate and glutamine in the nitrogen metabolism this is called the Central NitrogenMetabolism (CNM). From these two amino acids all other nitrogen containing compoundsin the cell are produced.The biological model of the reactions converting ammonia, α-ketoglutarate, glutamateand glutamine into each other will now be described. Both glutamate and glutamine can besynthesised directly using ammonia as amino donor. The NADPH dependent GlutamateDeHydrogenase (NADPH-GDH) converts ammonia and α-ketoglutarate into glutamateand the Glutamine Synthetase (GS) produces glutamine out of ammonia and glutamate, atthe cost of one ATP (Fig 1.5). NADPH-dependent GDH is encoded by GDH1 and anisozyme by GDH3. The gene encoding GS is GLN1. The NADPH-dependent GlutamateDeHydrogenase is the major anabolic enzyme for glutamate synthesis in S. cerevisiae(Roon et al., 1974; Holmes et al., 1989; Holmes et al., 1991; Ter Schure et al., 1995), at least
glu glnGS
GDA
GOGAT
NADPH NADP
NADH NAD
ATP ADP
p r o t e i n snucleotides, lipides
TCA glnexNADPH-GDH
NAD-GDH
NH4+NH4
+
NH4+ NH4
+
αKG
Fig. 1.5 Central Nitrogen Metabolism of S. cerevisiae, for growth on glutamine.αKG: α-ketoglutarate, glu: glutamate, gln: glutamine, NADPH-GDH: NADPH-dependentGlutamate DeHydrogenase, NAD-GDH: NAD-dependent Glutamate DeHydrogenase ,GS:Glutamine Synthetase, GDA: Glutamine DeAminase, GOGAT: glutamate synthase.
Introduction 23
for growth on ammonia.In nitrogen rich natural environments and especially in certain production processes (e.g.beer brewing, wine fermentations), yeast cells grow on all kinds of (mixtures of) nitrogensources. During amino acid catabolism certain by-products are produced, among othersthe so-called fusel alcohols (e.g. Dickinson and Schweizer, 1999). These flavours areimportant elements of the overall taste impression of fermented food products. Whenglutamine is the sole nitrogen source for growth, glutamate in principle can be producedby 1) glutamate synthase (GOGAT), 2) glutaminases (GDA) and 3) via the NADPH-GDH(Roon, 1974; Magasanik, 1992). GOGAT, which is NADH dependent in S. cerevisiae,converts one molecule of glutamine and one molecule of α-ketoglutarate into twomolecules of glutamate. GOGAT is encoded by GLT1 (Valenzuela, 1998). The glutaminasesdegrade glutamine to glutamate and ammonia (Soberón and González; 1987a, 1987b). Thelatter can be used in the NADPH-GDH reaction. Not much is known about theglutaminase(s) in S. cerevisiae. The encoding genes are not known. The glutaminases areassumed to be cofactor independent.The NAD-dependent Glutamate DeHydrogenase (NAD-GDH) degrades glutamate into α-ketoglutarate and ammonia. NAD-GDH is encoded by GDH2. This reaction is active underamino acid catabolism, resulting in a net flux of C5 carbon skeletons towards the TCA-cycle. It provides the cell with ammonia used in the synthesis reactions of for exampleglutamine, arginine, asparagine and histidine.The combination of NAD-GDH and its countercurrent reaction catalysed by NADPH-GDHcould form a cycle. The redox state of the cell determines the equilibria of these reactions.The redox cofactors are often related to or even control typical cellular responses,especially overflow metabolism / by-product formation. The combination of GDA and GSis more likely to result in a cycle, when operating simultaneously.Due to the subcellular compartments in the cell (mitochondria, nucleus, vacuoles etc.), it isoften essential for understanding cell physiology to distinguish several pools of onecompound. For the CNM of yeast at least two pools of α-ketoglutarate can bedistinguished. Part of the CNM takes place in the cytosol since both the NAD- andNADPH-GDH of S. cerevisiae are cytosolic (Hollenberg et al., 1970; Perlman and Mahler,1970), whereas α-ketoglutarate production by the TCA-cycle is of course located in themitochondria. With this consideration, a simultaneously operating combination ofNADPH-GDH and NAD-GDH does not necessarily lead to a cycle, but could serve toreplenish one of the several α-ketoglutarate pools.The combinatory action of GS and GOGAT is known to be the major pathway for ammoniaassimilation in bacteria and plants (Chock et al., 1985; Holmes et al., 1991). The GOGAT-pathway is believed to be of minor importance in S. cerevisiae. (e.g. Roon et al., 1974;Bogonez et al., 1985). However, results of Folch et al. (1989), Lacerda et al. (1990) andValenzuela (1998) indicate that the physiological role of GOGAT in baker's yeast could bemore important than is generally assumed. In E. coli it is known that the regulation ofGOGAT / GS is a central part of the control of nitrogen metabolism and forms a linkbetween the nitrogen and carbon metabolism (Chock et al., 1985). Also in Neurosporacrassa and S. cerevisiae there are indications that the GS / GOGAT pathway could be the(regulatory) link between carbon / energy- and nitrogen metabolism (Mora et al., 1987 andFlores-Samaniego et al., 1993). However, so far no detailed information on the dynamics ofthis cycle in defined continuous cultures has been reported.
Chapter 124
The nitrogen sources enter the cell via permeases in the plasma membrane. There arepermeases which transport a wide variety of nitrogen sources such as the General Aminoacid Permease encoded by GAP1 and the basic amino acid permease Can1p. Also specifictransporters exist such as the proline permease Put4p, histidine permease Hip1p and thelysine permease Lyp1p. For ammonia three permeases Mep1p, Mep2p and Mep3p (Mariniet al., 1997) are involved in its uptake.
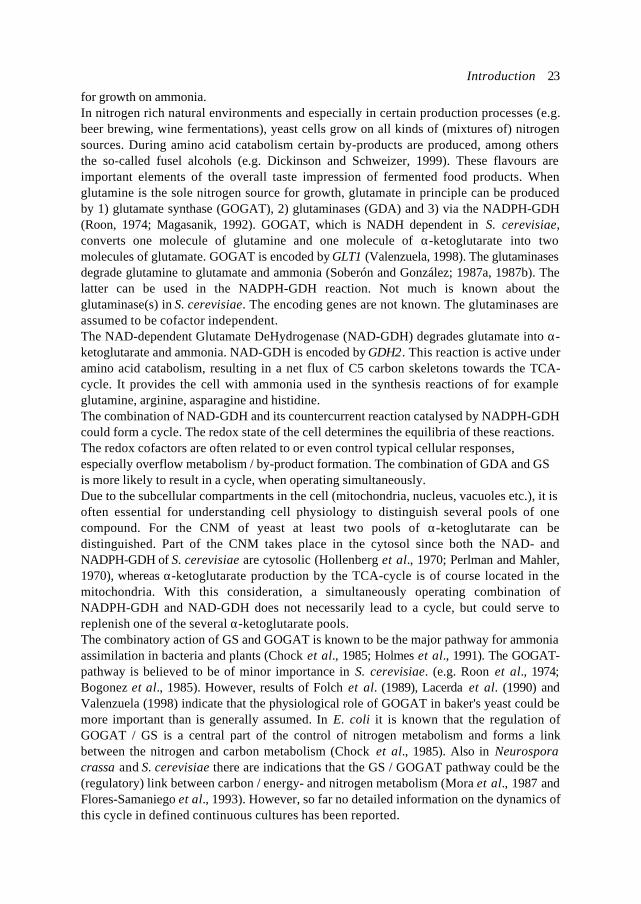
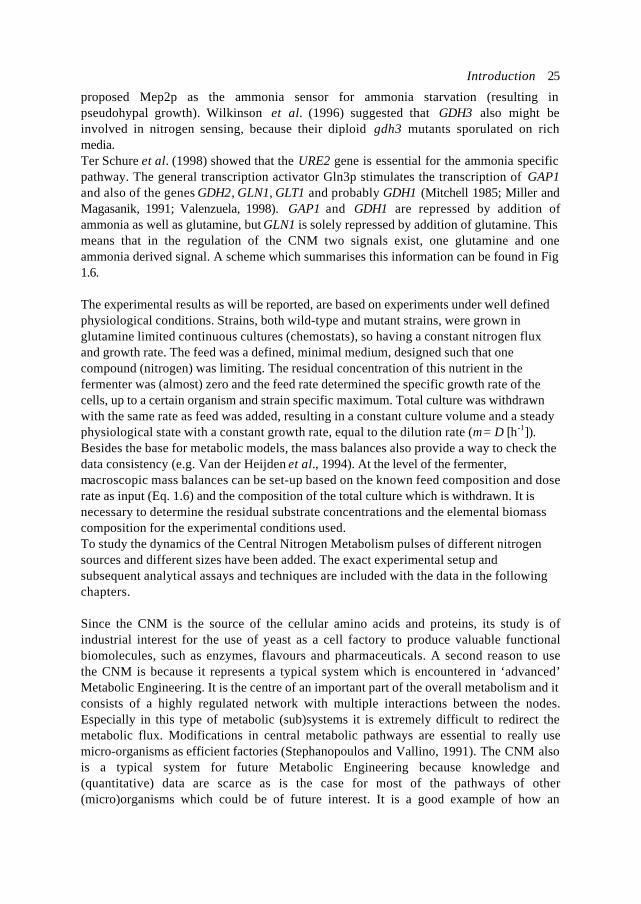
Yeast is able to use a wide variety of nitrogen sources for growth, which all can bedegraded to glutamate and glutamine. However not all nitrogen sources support growthequally well. For example ammonia and glutamine lead to high growth rates and hence arequalified as good nitrogen sources, whereas proline and urea are qualified as poor. Duringgrowth on good nitrogen sources the levels and activities of enzymes involved in theutilisation of poor nitrogen sources are decreased (Nitrogen Catabolic Repression, NCR)(Cooper, 1982). Those enzymes are inactivated and degraded (Magasanik, 1992) and arealso regulated at the level of gene expression (e.g. Ter Schure et al., 1999). The permeasesGap1p and Put4p are regulated by the nitrogen source present in the medium. However,for example, Hip1p, Lyp1p and Can1p are expressed constitutively.The signalling pathway for the regulation of transcription is not yet clear. Especially it isnot clear what is the sensed molecule and its sensor. Magasanik and co-workers providedevidence that glutamine activates Ure2p, which in turn inactivates the transcriptionactivator Gln3p (Magasanik et al., 1992). However Ter Schure et al. (1995, 1998, 1999)showed that ammonia is able to repress transcription without being transferred intoglutamine. Murray et al. (1998) suggested glutamine tRNA as sensor for the nitrogenstatus for regulation of dimorphic growth and sporulation. Lorenz and Heitman (1998)
Gln3pUre2p
-signalNH +
4gln-signal
NH + 4 gln
GLN1GLT1 GAP1 MEP1,2,3 GDH1,3 GDH2
Fig. 1.6 Schematic model for the regulation of transcription of the genes in the Central NitrogenMetabolism of S. cerevisiae.GLT1: encoding GOGAT, GDH1,3: NADPH-Glutamate DeHydrogenases, GDH2: NAD-Glutamate DeHydrogenase, GLN1: Glutamine Synthetase, GAP1: General Amino acid Permease,MEP1,2,3: Ammonia permeases, Gln3p: transcription activator and Ure2p: a prion. ↓: stimulation,⊥: repression.
Introduction 25
proposed Mep2p as the ammonia sensor for ammonia starvation (resulting inpseudohypal growth). Wilkinson et al. (1996) suggested that GDH3 also might beinvolved in nitrogen sensing, because their diploid gdh3 mutants sporulated on richmedia.Ter Schure et al. (1998) showed that the URE2 gene is essential for the ammonia specificpathway. The general transcription activator Gln3p stimulates the transcription of GAP1and also of the genes GDH2, GLN1, GLT1 and probably GDH1 (Mitchell 1985; Miller andMagasanik, 1991; Valenzuela, 1998). GAP1 and GDH1 are repressed by addition ofammonia as well as glutamine, but GLN1 is solely repressed by addition of glutamine. Thismeans that in the regulation of the CNM two signals exist, one glutamine and oneammonia derived signal. A scheme which summarises this information can be found in Fig1.6.
The experimental results as will be reported, are based on experiments under well definedphysiological conditions. Strains, both wild-type and mutant strains, were grown inglutamine limited continuous cultures (chemostats), so having a constant nitrogen fluxand growth rate. The feed was a defined, minimal medium, designed such that onecompound (nitrogen) was limiting. The residual concentration of this nutrient in thefermenter was (almost) zero and the feed rate determined the specific growth rate of thecells, up to a certain organism and strain specific maximum. Total culture was withdrawnwith the same rate as feed was added, resulting in a constant culture volume and a steadyphysiological state with a constant growth rate, equal to the dilution rate (µ = D [h-1]).Besides the base for metabolic models, the mass balances also provide a way to check thedata consistency (e.g. Van der Heijden et al., 1994). At the level of the fermenter,macroscopic mass balances can be set-up based on the known feed composition and doserate as input (Eq. 1.6) and the composition of the total culture which is withdrawn. It isnecessary to determine the residual substrate concentrations and the elemental biomasscomposition for the experimental conditions used.To study the dynamics of the Central Nitrogen Metabolism pulses of different nitrogensources and different sizes have been added. The exact experimental setup andsubsequent analytical assays and techniques are included with the data in the followingchapters.
Since the CNM is the source of the cellular amino acids and proteins, its study is ofindustrial interest for the use of yeast as a cell factory to produce valuable functionalbiomolecules, such as enzymes, flavours and pharmaceuticals. A second reason to usethe CNM is because it represents a typical system which is encountered in ‘advanced’Metabolic Engineering. It is the centre of an important part of the overall metabolism and itconsists of a highly regulated network with multiple interactions between the nodes.Especially in this type of metabolic (sub)systems it is extremely difficult to redirect themetabolic flux. Modifications in central metabolic pathways are essential to really usemicro-organisms as efficient factories (Stephanopoulos and Vallino, 1991). The CNM alsois a typical system for future Metabolic Engineering because knowledge and(quantitative) data are scarce as is the case for most of the pathways of other(micro)organisms which could be of future interest. It is a good example of how an
Chapter 126
integrated, multidisciplinary approach can result in both fundamental and applicableknowledge.
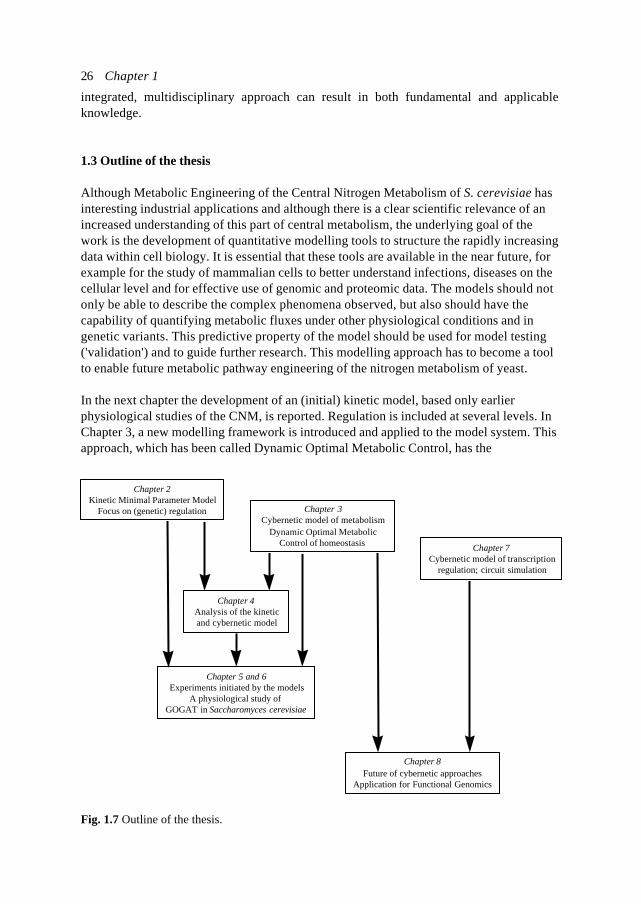
1.3 Outline of the thesis
Although Metabolic Engineering of the Central Nitrogen Metabolism of S. cerevisiae hasinteresting industrial applications and although there is a clear scientific relevance of anincreased understanding of this part of central metabolism, the underlying goal of thework is the development of quantitative modelling tools to structure the rapidly increasingdata within cell biology. It is essential that these tools are available in the near future, forexample for the study of mammalian cells to better understand infections, diseases on thecellular level and for effective use of genomic and proteomic data. The models should notonly be able to describe the complex phenomena observed, but also should have thecapability of quantifying metabolic fluxes under other physiological conditions and ingenetic variants. This predictive property of the model should be used for model testing('validation') and to guide further research. This modelling approach has to become a toolto enable future metabolic pathway engineering of the nitrogen metabolism of yeast.
In the next chapter the development of an (initial) kinetic model, based only earlierphysiological studies of the CNM, is reported. Regulation is included at several levels. InChapter 3, a new modelling framework is introduced and applied to the model system. Thisapproach, which has been called Dynamic Optimal Metabolic Control, has the
Chapter 2Kinetic Minimal Parameter Model
Focus on (genetic) regulation Chapter 3Cybernetic model of metabolism
Dynamic Optimal MetabolicControl of homeostasis
Chapter 4Analysis of the kineticand cybernetic model
Chapter 5 and 6Experiments initiated by the models
A physiological study of GOGAT in Saccharomyces cerevisiae
Chapter 7Cybernetic model of transcription
regulation; circuit simulation
Chapter 8Future of cybernetic approaches
Application for Functional Genomics
Fig. 1.7 Outline of the thesis.
Introduction 27
characteristics as described in section 1.1.6. Although model properties do not necessarilymatch the system properties, model analysis is relevant for engineering and can also beused as a tool to focus new experiments (Chapter 4).The models suggested an importantrole for GOGAT for certain physiological conditions and follow-up experiments have beeninitiated. In Chapter 5 the available information on GOGAT in S. cerevisiae is reviewed.Next, the experimental results of an extensive physiological study of a GOGAT negativemutant are reported in Chapter 6. In Chapter 7 the regulation at transcription level of CNMin S. cerevisiae is analysed in a cellular circuit model. Chapter 8 is a concluding review onmetabolic modelling. Besides applications for Metabolic Engineering also the potential ofmathematical models for rapidly emerging areas such as (functional) genomics andproteomics is discussed. The relation between the chapters is indicated in Fig. 1.7.
References
Bailey, J.E. (1991). Towards a science of metabolic engineering. Science 252: 1668-1675.
Bailey, J.E. (1998). Mathematical modeling and analysis in biochemical engineering: pastaccomplishments and future opportunities. Biotechnol. Prog. 14: 8-20.
Bellgardt, K.-H. (1988) Proceedings of the 4th International Conference on Computer Applicationsin Fermentation Technology (Fish, N. M. and Fox, R. I. eds), pp. 79-92, Elsevier Applied Science,London.
Bellgardt, K.-H. (1991). Cell Models. In "Biotechnology" (Schügerl, K.H. ed.), Vol. 4, pp. 269-298.
Bogonez, E., Satrústegui, J. and Machado, A. (1985) Regulation by ammonium of glutamatedehydrogenase (NADP+) from Saccharomyces cerevisiae. J. Gen. Microbiol. 133, pp. 1425-1432.
Boulding, K.E., (1956). General system theory - the skeleton of science, General Systems I.
Chock, P.B., Shacter, E., Jurgensen, S.R. and Rhee, S.G. (1985) Cyclic cascade systems in metabolicregulation. Curr. Top. Cell. Regul., 27, pp. 3-12.
Cooper, T.G. (1982) Nitrogen metabolism in Saccharomyces cerevisiae. In: The molecular biologyof the yeast Saccharomyces cerevisiae (Strathern, J.N. et al., eds) pp. 39-99. Cold Spring HarborLaboratory, Cold Spring Harbor, New York.
Dickinson, J.R. and Schweizer, M. (1999) The metabolism molecular physiology of Saccharomycescerevisiae. Taylor and Francis.
Edwards, J.S. and Palsson, B.O. (1998) How will bioinformatics influence metabolic engineering?Biotechnol. Bioeng. 58: 162-169.
Fell, D.A. and Small, J.R. (1986). Fat synthesis in adipose tissue. An examination of stoichiometricconstraints. Biochem. J. 238: 781-786.
Chapter 128
Flores-Samaniego, B., Olivera, H. and González, A. (1993) Glutamine synthesis is a regulatorysignal controlling glucose catabolism in Saccharomyces cerevisiae. J. Bacteriol. 175: 7705-7706.
Folch, J.-L., Antaramián, A., Bravo, A., Brunner, A. and González, A. (1989) Isolation andcharacterization of a Saccharomyces cerevisiae mutant with impaired glutamate synthase activity.J. Bacteriol. 171, pp. 6776-6781.
Giuseppin, M.L.F., Verrips, C.T. and Van Riel, N.A.W. (1999) The Cell-Factory needs a model ofa factory TIBTECH 17: 383-384.
Giuseppin, M.L.F. and Van Riel, N.A.W. (2000) Metabolic modelling of Saccharomyces cerevisiaeusing the optimal control of homeostasis; a cybernetic model definition. Metabol. Eng. 2: 1-20 .
Groen, A.K. et al., 1987….
Heinrich, R. and Rapoport, T. (1974) A linear steady state treatment of enzymatic chains. Generalproperties, control and effector strength. Eur. J. Biochem. 42: 89-95.
Hollenberg C.P., Riks, W.F. and Borst, P. (1970) The glutamate dehydrogenases of yeast: extra-mitochondrial enzymes. Biochim. Biophys. Acta 201: 13-19.
Holmes, A.R., Collings, A., Farnden, K.J.F. and Sepherd, M.G. (1989) Ammonium assimilation byCandida albicans and other yeasts: evidence for activity of glutamate synthase. J. Gen. Microbiol.135: 1424-1430.
Holmes, A.R., Mcaughton, G.S., More, R.D. and Sepherd, M.G. (1991) Ammonium assimilationby Candida albicans and other yeasts: a 13N isotope study. Can. J. Microbiol. 37, pp. 226-232.
Jørgensen, H, Nielsen, J. and Villadsen, J. (1995) Metabolic flux distributions in Penicilliumchrysogenum during fed-batch cultivations. Biotechnol. Bioeng. 46: 117-131.
Kacser, H. and Burns, J.A. (1973) The control of flux. SEB Symposia. XXVIII: 65-144.
Kauffman, S.A. (1993) The origins of order: self-organization and selection in evolution. OxfordUniversity Press.
Kell, D.B. and Westerhoff, H.V. (1986) Metabolic control theory: its role in microbiology andbiotechnology. FEMS Microbiology Reviews, 39: 305-320.
Kompala, D.S., Ramkrishna, D. and Tsao, G.T. (1984) Cybernetic modeling of microbial growth onmultiple substrates. Biotechnol. Bioeng, 26, 1272-1281.
Lange, H.C., van Dijken, J.P. and Heijnen, J.J. (1999) Statistical reconciliation of the elemental andpolymeric biomass composition data of S. cerevisiae. Submitted.
Introduction 29
Lacerda, V., Marsden, A., Buzato, J.B. and Ledingham, W.M. (1990) Studies on ammoniumassimilation in continuous cultures of S. cerevisiae under carbon and nitrogen limitation. Proc. -Eur. Congr. Biotechnol., 5th, 2: 1075-1078.
Lorenz, M.C. and Heitman, J. (1998) The MEP2 ammonium permease regulates pseudohyphaldifferentiation in Saccharomyces cerevisiae. EMBO journal 17: 1236-1247.
Lumsden, C.J., Brandts, W.A. and Trainor, L.E.H. (1997) Physical theory in biology: foundationsand explorations. World Scientific.
Magasanik, B. (1992) Regulation of nitrogen utilization. In: The molecular and cellular biology ofthe yeast Saccharomyces cerevisiae: gene expression (Jones, E.W. et al., eds) pp. 283-317. ColdSpring Harbor Laboratory Press, Cold Spring Harbor, New York.
Marini, A.M., SoussiBoudekou, S., Vissers, S. and André, B. (1997) A family of ammoniumtransporters in Saccharomyces cerevisiae. Mol. Cell. Biol. 17: 4282-4293.
Miller, S.M. and Magasanik, B. (1991) Role of the complex upstream region of the GDH2 gene innitrogen regulation of the NAD-linked glutamate dehydrogense in Saccharomyces cerevisiae. Mol.Cell. Biol. 11: 6229-6247.
Mitchell, A.P. (1985) The GLN1 locus of Saccharomyces cerevisiae encodes glutamine synthetase.Genetics. 111: 243-248.
Mora, Y., Hernandez, G. and Mora, J. (1987) Regulation of carbon and nitrogen flow by glutamatesynthase in Neurospora crassa. J. Gen. Microbiol. 133: 1667-1674.
Murray, L.E., Rowley, N., Dawes, I.W., Johnston, G.C. and Singer, R.A. (1998) A yeast glutaminetRNA signals nitrogen status for regulation of dimorphic growth and sporulation.Proc.Natl.Acad.Sci. 95: 8619-8624.
Nielsen, J. and Jørgensen, H.S. (1995) Metabolic control analysis of the penicillin biosyntheticpathway in a high yielding strain of Penicillium chrysogenum. Biotechnol. Prog. 11: 299-305.
Nielsen, J. (1997) Metabolic control analysis of biochemical pathways based on a thermokineticdescription of reaction rates. Biochem. J. 321: 133-138.
Palsson, B.O. (1997) What lies beyond bioinformatics? Nat. Biotechnol. 15: 3-4.
Park, S.M., Sinskey, A.J. and Stephanopoulos, G. (1997) Metabolic and physiological studies ofCorynebacterium glutamicum mutants. Biotechnol. Bioeng. 55: 864-879.
Perlman, P.S. and Mahler, H.R. (1970) Intracellular localization of enzymes in yeast. ABB. 136:245-259.
Chapter 130
Rizzi, M., Baltes, M., Theobald, U. and Reuss, M. (1997) In vivo analysis of metabolic dynamicsin Saccharomyces cerevisiae: II. Mathematical model. Biotechnol. Bioeng. 55: 592-608.
Roon, R.J., Even, H.L. and Larimore, F. (1974) Glutamate synthase: properties of the reducednicotinamide adenine dinucleotide-dependent enzyme from Saccharomyces cerevisiae. J. Bacteriol.118: 89-95.
Savinell, J.M. and Palsson, B.O. (1992) Network analysis of intermediary metabolism using linearoptimization. I. Development of mathematical formalism. J. Theor. Biol., 154, pp. 421-454.
Schulze, U. (1995) Anaerobic physiology of Saccharomyces cerevisiae, Ph.D. thesis, TechnicalUniversity of Denmark.
Simpson, T.W., Shimizu, H. and Stephanopoulos, G. (1998) Experimental determination of groupflux control coefficients in metabolic networks. Biotechnol. Bioeng. 58: 149-153.
Soberón, M. and González, A. (1987a) Physiological role of glutaminase activity in Saccharomycescerevisiae. J. Gen. Microbiol. 133: 1-8.
Soberón, M. and González, A. (1987b) Glutamine degradation through ω-amidase pathway inSaccharomyces cerevisiae. J. Gen. Microbiol. 133: 9-14.
Stephanopoulos, G. and Vallino, J. (1991) Network rigidity and metabolic engineering in metaboliteoverproduction. Science 252: 1675-1681.
Ter Schure, E.G., Silljé, H.H.W., Raeven, L.J.R.M., Boonstra, J., Verkleij, A.J. and Verrips, C.T.(1995) Nitrogen-regulated transcription and enzyme activities in continuous cultures ofSaccharomyces cerevisiae. Microbiology. 141: 1101-1108.
Ter Schure, E.G., Silljé, H.H.W., Vermeulen, E.E., Kalhorn, J., Verkleij, A.J., Boonstra, J. andVerrips, C.T. (1998) Repression of nitrogen catabolic genes by ammonia and glutamine in nitrogen-limited continuous cultures of Saccharomyces cerevisiae. Microbiology 144: 1451-1462.
Ter Schure, E.G., Van Riel, N.A.W., and Verrips, C.T. (1999) The role of ammonia metabolism fornitrogen catabolite repression in Saccharomyces cerevisiae. FEMS Microbiology Reviews In press.
Tesch, M., De Graaf, A.A. and Sahm, H. (1998) In vivo fluxes in the ammonium assimilatorypathways in Corynebacterium glutamicum studied by 15N nuclear magnetic resonance. Appl.Environ. Microbiol. 65: 1099-1109.
Valenzuela L., Ballario P., Aranda C., Filetici P. and González A. (1998) Regulation of expressionof GLT1, the gene encoding glutamate synthase in Saccharomyces cerevisiae. J. Bacteriol. 180:3533-3540.
Vallino, J.J. and Stephanopoulos, G. (1993) Metabolic flux distributions in Corynebacteriumglutamicum during growth and lysine overproduction. Biotechnol. Bioeng. 41: 633-646.
Introduction 31
Van der Heijden, R.T.J.M., Heijnen, J.J., Hellinga, C., Romein, B. and Luyben, K.Ch.A.M. (1994)Linear constraint relations in biochemical reaction systems: I classification of the calculability andthe balanceability of conversion rates. Biotech. Bioeng. 43: 3-10.
Van Gulik, W.M. and Heijnen, J.J. (1995) A metabolic network stoichiometry analysis of microbialgrowth and product formation. Biotechnol. Bioeng. 48: 681-698.
Van Riel, N.A.W., Giuseppin, M.L.F., Ter Schure, E.G. and Verrips, C.T. (1998) A Structured,Minimal Parameter Model of the Central Nitrogen Metabolism in Saccharomyces cerevisiae: thePrediction of the Behaviour of Mutants. J. Theor. Biol. 191: 397-414.
Varner J. and Ramkrishna, D. (1998) Application of cybernetic models to metabolic engineering:investigation of storage pathways. Biotechnol. Bioeng. 58: 282-291.
Varner, J. and Ramkrishna, D. (1999a) Metabolic engineering from a cybernetic perspective. 1.Theoretical preliminaries. Biotechnol. Prog. 15: 407-425.
Varner, J. and Ramkrishna, D. (1999b) Metabolic engineering from a cybernetic perspective. 2.Qualitative investigation of nodal architectures and their response to genetic perturbation.Biotechnol. Prog. 15: 426-438.
Westerhoff, H.V., Plomp, P.J., Groen, A.K. and Wanders, R.J. (1987) Thermodynamics of thecontrol of metabolism. Cell Biophys. 11: 239-267.
Wilkinson, B.M., James, C.M. and Walmsley, R.M. (1996) Partial deletion of the Saccharomycescerevisiae GDH3 gene results in novel starvation phenotypes. Microbiology 142: 1667-1673.

32
Chapter 2
A Structured Minimal Parameter Model of the CentralNitrogen Metabolism in Saccharomyces cerevisiae: the
Prediction of the Behaviour of Mutants
Natal A.W. van Riel1, Marco L.F. Giuseppin2, Eelko G. ter Schure2 and C. Theo Verrips1,2
1 Department of Molecular Cell Biology,Institute of BiomembranesUtrecht University, Padualaan 8, 3584 CH Utrecht, The Netherlands
2 Unilever Research Vlaardingen, Olivier van Noortlaan 120, 3133 AT Vlaardingen,The Netherlands
Published in: J. Theor. Biol. (1998) 191: 397-414.
Chapter 234
Abstract
In order to enable future metabolic pathway engineering of a complex system, such as thenitrogen metabolism in yeast, mathematical modelling tools have to be developed. Thestoichiometric and biochemical characteristics of the glutamate and glutamine nodes (theCentral Nitrogen Metabolism, CNM) are qualitatively known. Quantitative knowledgeabout the dynamics of the network lacks and needs to be developed for metabolicreprogramming. A model-based-experiment approach is proposed in which thedevelopment of a model initiates new experiments of which the results then improve themodel. As a first step in this iterative system identification cycle, recent experimental data,both qualitative and quantitative, obtained from defined studies on the CNM of the yeastSaccharomyces cerevisiae have been translated into an initial mathematical model. Themodel approach is based on a combination of Flux Analysis and simple enzyme kinetics.The model is constructed using non-linear Ordinary Differential Equations and regulationof the synthesis and activity of key enzymes of the CNM is included. The parameters ofthe model are estimated with a constrained Least Squares algorithm using the steady-stateand dynamic pulse data of a glutamine limited continuous culture. The resulting modeldescribes a continuous culture of a wild type strain correctly and in general the trends ofthe dynamic behaviour after both glutamine and ammonia pulses to this culture are good.Inclusion of countercurrent reactions and compartmentation in the model is essential forthe descriptive quality of the model under dynamic conditions. It is clear that moreexperimental work is needed. The model indicates that the GOGAT / Glutamine Synthetase(GS) pathway plays a more important physiological stabilising role in yeast than isgenerally assumed. New, model-based, experiments have to investigate the function ofGOGAT, especially under dynamic conditions. Also redox cofactors and ATP have to bemeasured.The resulting model is validated with data of similar experiments with a GS - mutant. Thequality of the prediction of the behaviour of this mutant is comparable to the descriptiveproperty, which is a very promising result, taking into account the limited datasetcompared to the system complexity.
2.1. Introduction
The challenge is to develop a dynamic, mathematical model of the CNM which describesand predicts fluxes and concentrations. As discussed in the previous chapter, the modelshould not only be able to describe the complex phenomena observed, but also shouldhave the capability of quantifying metabolic fluxes under other physiological conditionsand genetic variants. This predictive property of the model should be used as the truemodel validation. This modelling approach has to become a tool to enable future metabolicpathway engineering of the nitrogen metabolism of yeast.This paper does not present the final version of a descriptive model of the yeast CNM,because the quantitative knowledge of this part of yeast metabolism is too limited for this.The goal is to show how an (initial) model can be constructed, based on qualitativeknowledge on regulation and quantitative data (both from steady-state and defineddynamic conditions) of only three (intracellular) metabolites, i.e. α-ketoglutarate,
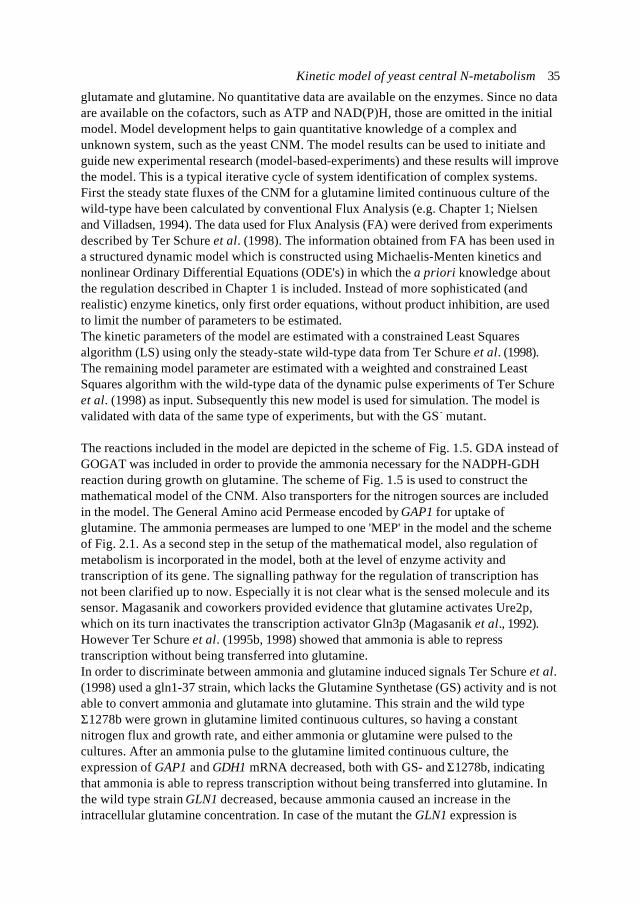
Kinetic model of yeast central N-metabolism 35
glutamate and glutamine. No quantitative data are available on the enzymes. Since no dataare available on the cofactors, such as ATP and NAD(P)H, those are omitted in the initialmodel. Model development helps to gain quantitative knowledge of a complex andunknown system, such as the yeast CNM. The model results can be used to initiate andguide new experimental research (model-based-experiments) and these results will improvethe model. This is a typical iterative cycle of system identification of complex systems.First the steady state fluxes of the CNM for a glutamine limited continuous culture of thewild-type have been calculated by conventional Flux Analysis (e.g. Chapter 1; Nielsenand Villadsen, 1994). The data used for Flux Analysis (FA) were derived from experimentsdescribed by Ter Schure et al. (1998). The information obtained from FA has been used ina structured dynamic model which is constructed using Michaelis-Menten kinetics andnonlinear Ordinary Differential Equations (ODE's) in which the a priori knowledge aboutthe regulation described in Chapter 1 is included. Instead of more sophisticated (andrealistic) enzyme kinetics, only first order equations, without product inhibition, are usedto limit the number of parameters to be estimated.The kinetic parameters of the model are estimated with a constrained Least Squaresalgorithm (LS) using only the steady-state wild-type data from Ter Schure et al. (1998).The remaining model parameter are estimated with a weighted and constrained LeastSquares algorithm with the wild-type data of the dynamic pulse experiments of Ter Schureet al. (1998) as input. Subsequently this new model is used for simulation. The model isvalidated with data of the same type of experiments, but with the GS - mutant.
The reactions included in the model are depicted in the scheme of Fig. 1.5. GDA instead ofGOGAT was included in order to provide the ammonia necessary for the NADPH-GDHreaction during growth on glutamine. The scheme of Fig. 1.5 is used to construct themathematical model of the CNM. Also transporters for the nitrogen sources are includedin the model. The General Amino acid Permease encoded by GAP1 for uptake ofglutamine. The ammonia permeases are lumped to one 'MEP' in the model and the schemeof Fig. 2.1. As a second step in the setup of the mathematical model, also regulation ofmetabolism is incorporated in the model, both at the level of enzyme activity andtranscription of its gene. The signalling pathway for the regulation of transcription hasnot been clarified up to now. Especially it is not clear what is the sensed molecule and itssensor. Magasanik and coworkers provided evidence that glutamine activates Ure2p,which on its turn inactivates the transcription activator Gln3p (Magasanik et al., 1992).However Ter Schure et al. (1995b, 1998) showed that ammonia is able to represstranscription without being transferred into glutamine.In order to discriminate between ammonia and glutamine induced signals Ter Schure et al.(1998) used a gln1-37 strain, which lacks the Glutamine Synthetase (GS) activity and is notable to convert ammonia and glutamate into glutamine. This strain and the wild typeΣ1278b were grown in glutamine limited continuous cultures, so having a constantnitrogen flux and growth rate, and either ammonia or glutamine were pulsed to thecultures. After an ammonia pulse to the glutamine limited continuous culture, theexpression of GAP1 and GDH1 mRNA decreased, both with GS- and Σ1278b, indicatingthat ammonia is able to repress transcription without being transferred into glutamine. Inthe wild type strain GLN1 decreased, because ammonia caused an increase in theintracellular glutamine concentration. In case of the mutant the GLN1 expression is
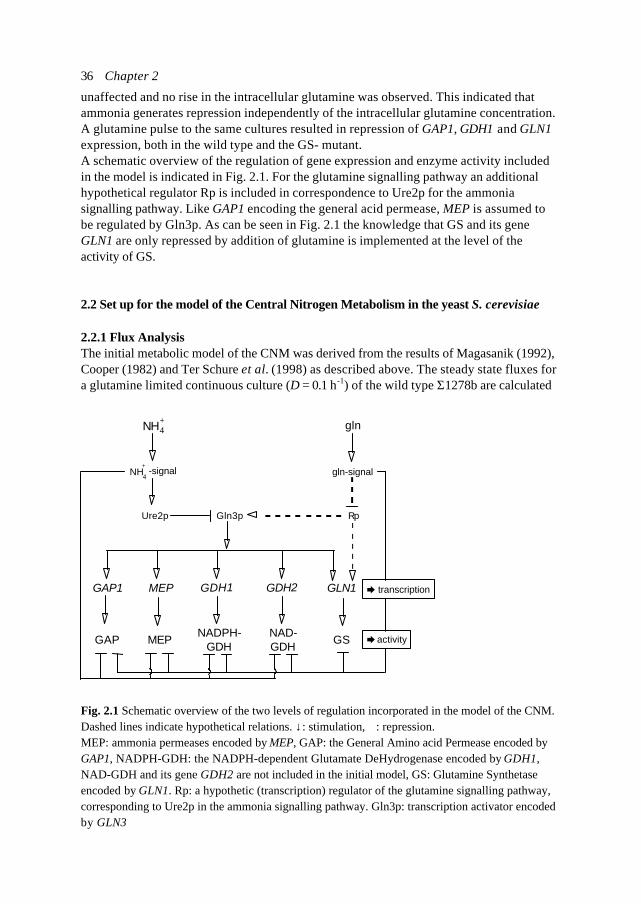
Chapter 236
unaffected and no rise in the intracellular glutamine was observed. This indicated thatammonia generates repression independently of the intracellular glutamine concentration.A glutamine pulse to the same cultures resulted in repression of GAP1, GDH1 and GLN1expression, both in the wild type and the GS- mutant.A schematic overview of the regulation of gene expression and enzyme activity includedin the model is indicated in Fig. 2.1. For the glutamine signalling pathway an additionalhypothetical regulator Rp is included in correspondence to Ure2p for the ammoniasignalling pathway. Like GAP1 encoding the general acid permease, MEP is assumed tobe regulated by Gln3p. As can be seen in Fig. 2.1 the knowledge that GS and its geneGLN1 are only repressed by addition of glutamine is implemented at the level of theactivity of GS.
2.2 Set up for the model of the Central Nitrogen Metabolism in the yeast S. cerevisiae
2.2.1 Flux AnalysisThe initial metabolic model of the CNM was derived from the results of Magasanik (1992),Cooper (1982) and Ter Schure et al. (1998) as described above. The steady state fluxes fora glutamine limited continuous culture (D = 0.1 h-1) of the wild type Σ1278b are calculated
Rp
-signalNH +
4 gln-signal
NH + 4 gln
GAPNAD-GDH
GS
Gln3p
GAP1 MEP GLN1GDH2
Ure2p
è transcription
è activityMEPNADPH-
GDH
GDH1
Fig. 2.1 Schematic overview of the two levels of regulation incorporated in the model of the CNM.Dashed lines indicate hypothetical relations. ↓: stimulation, ⊥: repression.MEP: ammonia permeases encoded by MEP, GAP: the General Amino acid Permease encoded byGAP1, NADPH-GDH: the NADPH-dependent Glutamate DeHydrogenase encoded by GDH1,NAD-GDH and its gene GDH2 are not included in the initial model, GS: Glutamine Synthetaseencoded by GLN1. Rp: a hypothetic (transcription) regulator of the glutamine signalling pathway,corresponding to Ure2p in the ammonia signalling pathway. Gln3p: transcription activator encodedby GLN3
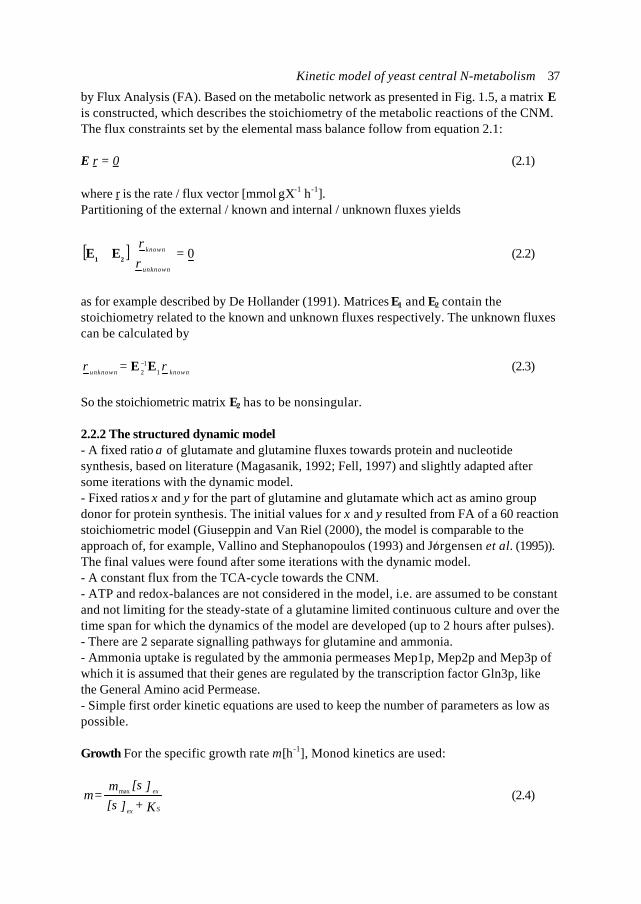
Kinetic model of yeast central N-metabolism 37
by Flux Analysis (FA). Based on the metabolic network as presented in Fig. 1.5, a matrix Eis constructed, which describes the stoichiometry of the metabolic reactions of the CNM.The flux constraints set by the elemental mass balance follow from equation 2.1:
E r = 0 (2.1)
where r is the rate / flux vector [mmol⋅gX-1⋅h-1].Partitioning of the external / known and internal / unknown fluxes yields
[ ] 0=
unknown
known
rr
21 EE (2.2)
as for example described by De Hollander (1991). Matrices E1 and E2 contain thestoichiometry related to the known and unknown fluxes respectively. The unknown fluxescan be calculated by
knownunknownrr
11
2EE −= (2.3)
So the stoichiometric matrix E2 has to be nonsingular.
2.2.2 The structured dynamic model- A fixed ratio α of glutamate and glutamine fluxes towards protein and nucleotidesynthesis, based on literature (Magasanik, 1992; Fell, 1997) and slightly adapted aftersome iterations with the dynamic model.- Fixed ratios x and y for the part of glutamine and glutamate which act as amino groupdonor for protein synthesis. The initial values for x and y resulted from FA of a 60 reactionstoichiometric model (Giuseppin and Van Riel (2000), the model is comparable to theapproach of, for example, Vallino and Stephanopoulos (1993) and Jo/ rgensen et al. (1995)).The final values were found after some iterations with the dynamic model.- A constant flux from the TCA-cycle towards the CNM.- ATP and redox-balances are not considered in the model, i.e. are assumed to be constantand not limiting for the steady-state of a glutamine limited continuous culture and over thetime span for which the dynamics of the model are developed (up to 2 hours after pulses).- There are 2 separate signalling pathways for glutamine and ammonia.- Ammonia uptake is regulated by the ammonia permeases Mep1p, Mep2p and Mep3p ofwhich it is assumed that their genes are regulated by the transcription factor Gln3p, likethe General Amino acid Permease.- Simple first order kinetic equations are used to keep the number of parameters as low aspossible.
Growth For the specific growth rate µ [h-1], Monod kinetics are used:
K+][s][s
= Sex
exµµ max (2.4)
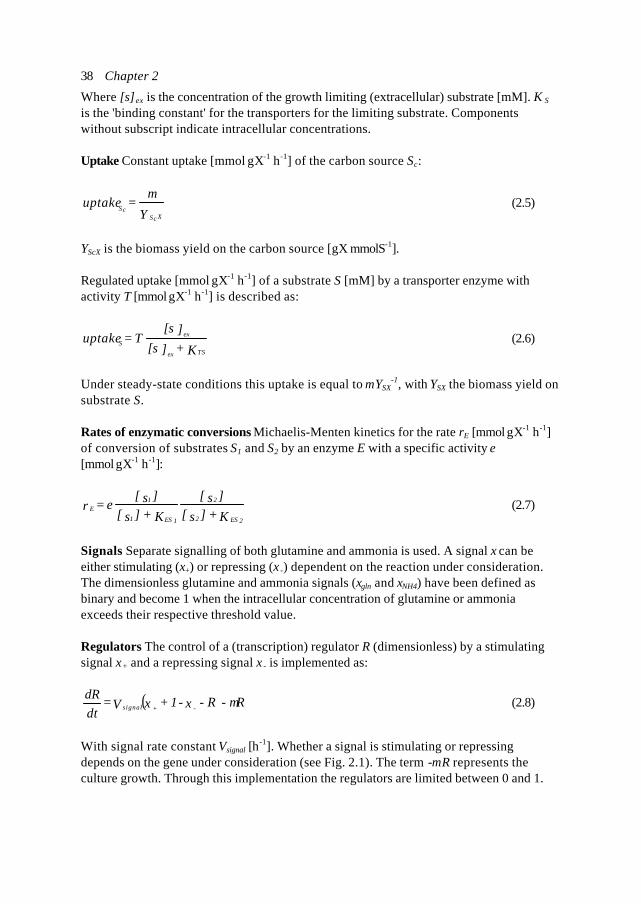
Chapter 238
Where [s]ex is the concentration of the growth limiting (extracellular) substrate [mM]. K S
is the 'binding constant' for the transporters for the limiting substrate. Componentswithout subscript indicate intracellular concentrations.
Uptake Constant uptake [mmol⋅gX-1⋅h-1] of the carbon source Sc:
Y = uptake
XScSc
µ(2.5)
YScX is the biomass yield on the carbon source [gX⋅mmolS-1].
Regulated uptake [mmol⋅gX-1⋅h-1] of a substrate S [mM] by a transporter enzyme withactivity T [mmol⋅gX-1⋅h-1] is described as:
K+][s][s
T = uptakeTSex
exS (2.6)
Under steady-state conditions this uptake is equal to µ YSX-1, with YSX the biomass yield on
substrate S.
Rates of enzymatic conversions Michaelis-Menten kinetics for the rate rE [mmol⋅gX-1⋅h-1]of conversion of substrates S1 and S2 by an enzyme E with a specific activity e[mmol⋅gX-1⋅h-1]:
K+]s[]s[
K+]s[]s[
e = rES 22
2
ES 11
1E (2.7)
Signals Separate signalling of both glutamine and ammonia is used. A signal ξ can beeither stimulating (ξ+) or repressing (ξ -) dependent on the reaction under consideration.The dimensionless glutamine and ammonia signals (ξgln and ξNH4) have been defined asbinary and become 1 when the intracellular concentration of glutamine or ammoniaexceeds their respective threshold value.
Regulators The control of a (transcription) regulator R (dimensionless) by a stimulatingsignal ξ + and a repressing signal ξ - is implemented as:
( ) R - R--1+V = dtdR
-+signal µξξ (2.8)
With signal rate constant Vsignal [h-1]. Whether a signal is stimulating or repressing
depends on the gene under consideration (see Fig. 2.1). The term -µ R represents theculture growth. Through this implementation the regulators are limited between 0 and 1.
Kinetic model of yeast central N-metabolism 39
Enzyme synthesis rates The enzyme synthesis rate [mmol⋅gX-1⋅h-1] is regulated by astimulating regulator R+ which ranges from 0 to 1. For an enzyme E with concentration [e][mmol⋅gX-1], the synthesis rate becomes:
( )[e]-][erR = synth synth+E max (2.9)
If the enzyme concentration [e] is close to its maximum [e]max [mmol⋅gX-1], then theenzyme synthesis (which in the model is equal to the activation of the enzyme) slowsdown. rsynth is the enzyme synthesis rate constant [h -1].When an enzyme is controlled by two stimulating regulators R+1 and R+2 (both rangingbetween 0 and 1) then:
( ) ( )[e]-][erR+R1, = synth synth2++1E maxmin (2.10)
The minimal-operator ('min') is included in order to limit the sum of all regulatory effectorsbetween 0 and 1.In derepressed steady-state conditions (all transcriptional regulators equal to 1), theenzyme synthesis exactly compensates the enzyme outflow / dilution through growth (seebelow).
Dynamics The dynamic part of the model is constructed using Ordinary DifferentialEquations (ODE's). These ODE's are based on straightforward balancing equations for allcomponents C in the network:
catabolism-outflow-anabolism+inflow = dt
d[c](2.11)
The outflow of the components is equal to D×[c] and D = µ in a continuous culture.Besides regulation of gene transcription, the enzyme activity is the second level at whichregulation is incorporated. The NCR regulated enzymes E are directly inactivated by therepressing signals with a rate rinact [mmol⋅gX-1⋅h-1]. The dynamics of the enzymeconcentration [e] are incorporated as:
( ) [e]-r+-synth = dt
d[e]inactglnNH+
4E µξξ (2.12)
In the model, enzyme activities are directly related to the concentrations of the enzymesand these concentrations are continuously diluted through growth, modelled by -µ [e] .For the nonregulated enzymes it is assumed that there is no direct inactivation and thedifferential equation for the concentration is:
[e]-synth = dt
d[e]E µ (2.13)
Chapter 240
External rates Except for the nonlinear, but static Monod equation for the growth of theyeast culture, also a dynamic equation is included to describe the outflow of culture:
D)X-( = dtdX µ (2.14)
When the specific growth rate µ (Eq. 2.4) is equal to D, then the biomass remainsconstant. This is the situation in a continuous culture in steady state.The dynamics of an (extracellular) substrate Sex are described as:
( ) Xuptake-][s-][sD = dt
]d[sSex0
ex (2.15)
where [S]0 is the concentration of the substrate in the medium inflow [mM].
2.2.3 ImplementationThe model is implemented in the software package MATLAB (version 4.2c; TheMathworks Inc., Natick, MA) using the s-functions. The model parameters are estimatedin 3 steps based on data of the glutamine limited continuous cultures of the wild typestrain (Ter Schure et al, 1998). For the first 2 steps a constrained Least Squares algorithm(LS) is used. In the first step the maximal enzyme concentrations [e]max are estimatedbased on a subset of the steady-state data concerning the enzyme concentrations. Thecost function consists of the residuals of the derivatives at t = 0 (so in the LS algorithmthe sum of the squares of the derivatives is taken) of the enzyme concentrations. In asecond estimation step the kinetic parameters are estimated using the steady-state (sub)dataset of the metabolites, with all the residuals of the corresponding derivatives at t = 0as cost function. The non-measured initial concentrations (i.e. the enzyme concentrations)are also estimated in the second estimation step. Finally the glutamine and ammoniatrigger concentrations and the rate constants Vsignal, rsynth and rinact are estimated with aweighted and constrained Least Squares procedure using the data from Ter Schure et al.(1998) of the dynamic pulse experiments with the wild type strain. The approach will bediscussed in more detail in Chapter 4. All measurements of metabolites have been done atleast in triplicate. For the LS the available raw data are interpolated by a cubic splinepolynomial (De Boor, 1978) with a time interval of 0.1 hour. This results in smooth curvesfor the measured metaboliteswhich are more suited as input for an optimisation algorithm. The interpolated andsmoothed data are indicated by a tilde (~). In this third step the optimisation is performedfor each (time) interval k of the (discrete) interpolated and smoothed data kc ]~[ of a
measured metabolite C. The model errors (the difference between the interpolatedexperimental data and the corresponding model output) are minimised. The weight hC,k
which is used for metabolite C for the k th interval included in the LS algorithm, isrepresented by the following formula:
( )ε+]c[ = h i
-1iC,
~ (2.16)
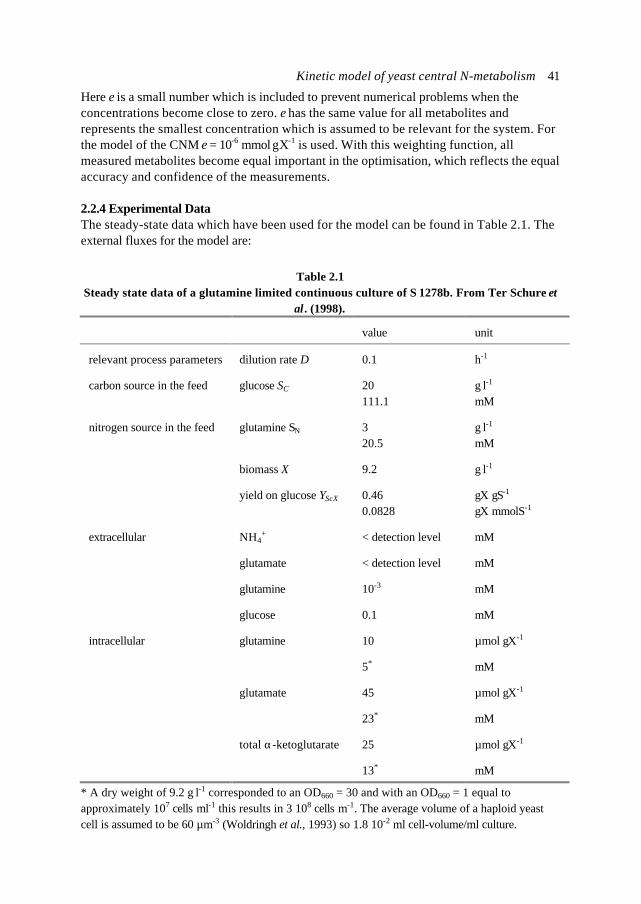
Kinetic model of yeast central N-metabolism 41
Here ε is a small number which is included to prevent numerical problems when theconcentrations become close to zero. ε has the same value for all metabolites andrepresents the smallest concentration which is assumed to be relevant for the system. Forthe model of the CNM ε = 10-6 mmol⋅gX-1 is used. With this weighting function, allmeasured metabolites become equal important in the optimisation, which reflects the equalaccuracy and confidence of the measurements.
2.2.4 Experimental DataThe steady-state data which have been used for the model can be found in Table 2.1. Theexternal fluxes for the model are:
Table 2.1Steady state data of a glutamine limited continuous culture of Σ 1278b. From Ter Schure et
al. (1998).
value unit
relevant process parameters dilution rate D 0.1 h-1
carbon source in the feed glucose SC 20111.1
g⋅l-1
mM
nitrogen source in the feed glutamine SN 320.5
g⋅l-1
mM
biomass X 9.2 g⋅l-1
yield on glucose YScX 0.460.0828
gX⋅gS-1
gX⋅mmolS-1
extracellular NH4+ < detection level mM
glutamate < detection level mM
glutamine 10-3 mM
glucose 0.1 mM
intracellular glutamine 10 µmol⋅gX-1
5* mM
glutamate 45 µmol⋅gX-1
23* mM
total α-ketoglutarate 25 µmol⋅gX-1
13* mM
* A dry weight of 9.2 g⋅l-1 corresponded to an OD660 = 30 and with an OD660 = 1 equal toapproximately 107 cells⋅ml-1 this results in 3⋅108 cells⋅m-1. The average volume of a haploid yeastcell is assumed to be 60 µm-3 (Woldringh et al., 1993) so 1.8⋅10-2 ml cell-volume/ml culture.
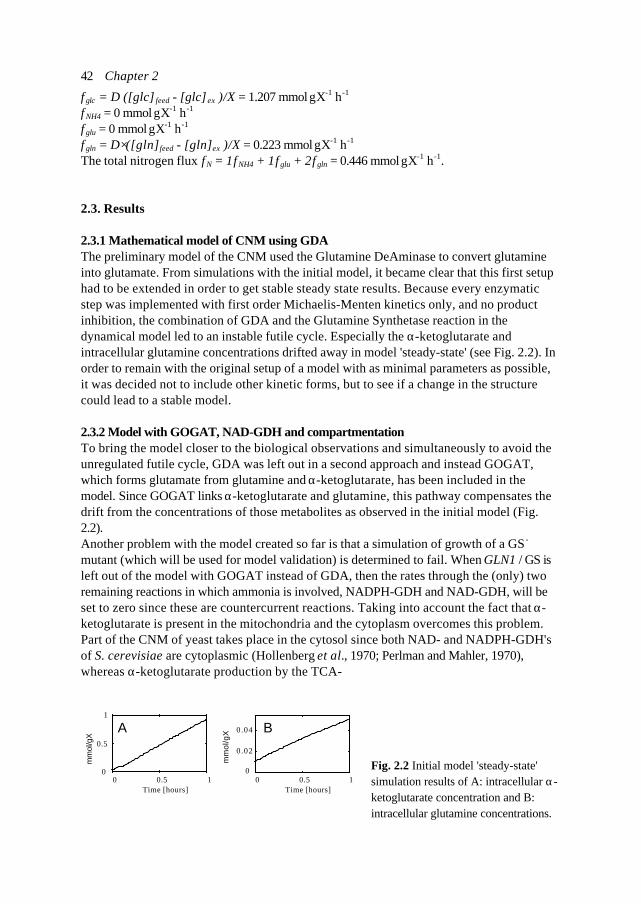
Chapter 242
φglc = D ([glc] feed - [glc] ex )/X = 1.207 mmol⋅gX-1⋅h-1
φNH4 = 0 mmol⋅gX-1⋅h-1
φglu = 0 mmol⋅gX-1⋅h-1
φgln = D⋅ ([gln]feed - [gln]ex )/X = 0.223 mmol⋅gX-1⋅h-1
The total nitrogen flux φN = 1φNH4 + 1φglu + 2φgln = 0.446 mmol⋅gX-1⋅h-1.
2.3. Results
2.3.1 Mathematical model of CNM using GDAThe preliminary model of the CNM used the Glutamine DeAminase to convert glutamineinto glutamate. From simulations with the initial model, it became clear that this first setuphad to be extended in order to get stable steady state results. Because every enzymaticstep was implemented with first order Michaelis-Menten kinetics only, and no productinhibition, the combination of GDA and the Glutamine Synthetase reaction in thedynamical model led to an instable futile cycle. Especially the α-ketoglutarate andintracellular glutamine concentrations drifted away in model 'steady-state' (see Fig. 2.2). Inorder to remain with the original setup of a model with as minimal parameters as possible,it was decided not to include other kinetic forms, but to see if a change in the structurecould lead to a stable model.
2.3.2 Model with GOGAT, NAD-GDH and compartmentationTo bring the model closer to the biological observations and simultaneously to avoid theunregulated futile cycle, GDA was left out in a second approach and instead GOGAT,which forms glutamate from glutamine and α-ketoglutarate, has been included in themodel. Since GOGAT links α-ketoglutarate and glutamine, this pathway compensates thedrift from the concentrations of those metabolites as observed in the initial model (Fig.2.2).Another problem with the model created so far is that a simulation of growth of a GS -
mutant (which will be used for model validation) is determined to fail. When GLN1 / GS isleft out of the model with GOGAT instead of GDA, then the rates through the (only) tworemaining reactions in which ammonia is involved, NADPH-GDH and NAD-GDH, will beset to zero since these are countercurrent reactions. Taking into account the fact that α-ketoglutarate is present in the mitochondria and the cytoplasm overcomes this problem.Part of the CNM of yeast takes place in the cytosol since both NAD- and NADPH-GDH'sof S. cerevisiae are cytoplasmic (Hollenberg et al., 1970; Perlman and Mahler, 1970),whereas α-ketoglutarate production by the TCA-
0 0.5 10
0.02
0.04
mm
ol/g
X
0 0.5 10
0.5
1
mm
ol/g
X
BA
Time [hours]Time [hours]
Fig. 2.2 Initial model 'steady-state'simulation results of A: intracellular α-ketoglutarate concentration and B:intracellular glutamine concentrations.
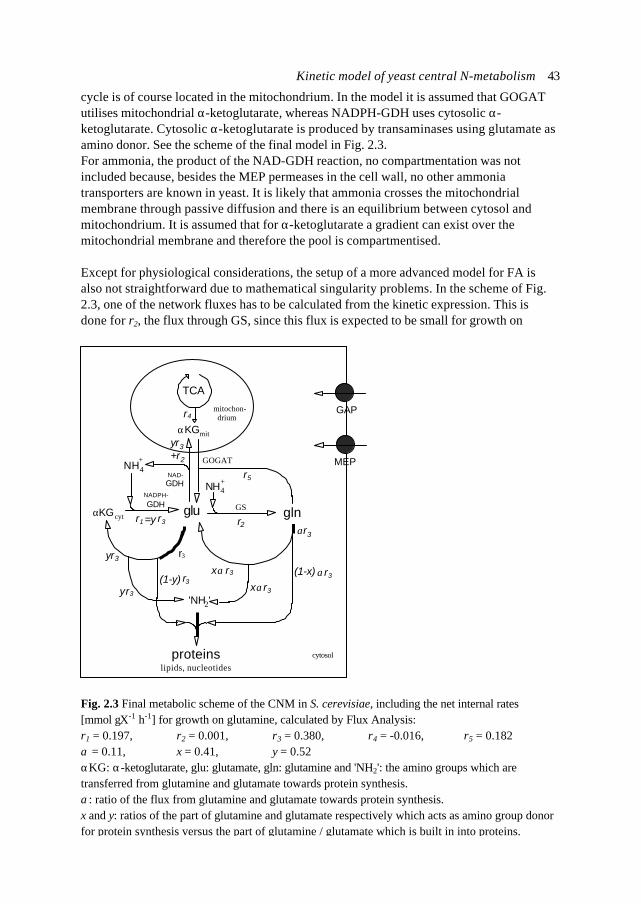
Kinetic model of yeast central N-metabolism 43
cycle is of course located in the mitochondrium. In the model it is assumed that GOGATutilises mitochondrial α-ketoglutarate, whereas NADPH-GDH uses cytosolic α-ketoglutarate. Cytosolic α-ketoglutarate is produced by transaminases using glutamate asamino donor. See the scheme of the final model in Fig. 2.3.For ammonia, the product of the NAD-GDH reaction, no compartmentation was notincluded because, besides the MEP permeases in the cell wall, no other ammoniatransporters are known in yeast. It is likely that ammonia crosses the mitochondrialmembrane through passive diffusion and there is an equilibrium between cytosol andmitochondrium. It is assumed that for α-ketoglutarate a gradient can exist over themitochondrial membrane and therefore the pool is compartmentised.
Except for physiological considerations, the setup of a more advanced model for FA isalso not straightforward due to mathematical singularity problems. In the scheme of Fig.2.3, one of the network fluxes has to be calculated from the kinetic expression. This isdone for r2, the flux through GS, since this flux is expected to be small for growth on
gluαKGcyt
NADPH-
GDH GS
cytosol
GOGAT
GAP
gln
proteinslipids, nucleotides
NH +
4
TCA
mitochon- drium
NAD-GDH
'NH '2
r4
r5
r3
r3αxr3α(1-x)
r3y
αr3
r1 r3=y
r3(1-y)r3αx
r2
MEP
NH + 4
αKGmit
yr3
yr3+r2
Fig. 2.3 Final metabolic scheme of the CNM in S. cerevisiae, including the net internal rates[mmol⋅gX-1⋅h-1] for growth on glutamine, calculated by Flux Analysis:r1 = 0.197, r2 = 0.001, r3 = 0.380, r4 = -0.016, r5 = 0.182α = 0.11, x = 0.41, y = 0.52αKG: α-ketoglutarate, glu: glutamate, gln: glutamine and 'NH2': the amino groups which aretransferred from glutamine and glutamate towards protein synthesis.α: ratio of the flux from glutamine and glutamate towards protein synthesis.x and y: ratios of the part of glutamine and glutamate respectively which acts as amino group donorfor protein synthesis versus the part of glutamine / glutamate which is built in into proteins.
Chapter 244
glutamine and therefore even a relatively large error in the calculation of this flux willalmost have no effect on the other fluxes. Based on Eq. 2.7 this rate becomes:
[ ][ ]
[ ][ ] K+NH
NH K+glu
glu GS = r= r
GSNH+4
+4 in
in+4
GSgluin
inGS 2 (2.17)
From initial simulations an intracellular (effective) ammonia concentration of approximately0.2 mM ⋅gX-1 ≈ 102 mM 1)) appeared to be suitable. Take GS = 1. With average in vitrovalues KGSglu = 4.4 mM and KGSNH4 = 1.4 mM from literature (see Table 2.2) and a steady-state intracellular glutamate concentration of 23 mM (Table 2.1), this results in a (steady-state) flux of approximately 0.83 mM ⋅h-1 ≈ 1.6 µmol⋅gX-1⋅h-1 4)). This value is used asadditional known flux (r2) in Flux Analysis.
4) For the conversion of amounts per dry weight to true concentrations a factor of 1.96 ml cell-volume/gX is used. A dry weight of 9.2 g⋅l-1 corresponded to an OD660 = 30 and with an OD660 = 1
Table 2.2Estimated kinetic (model) parameters and the in vitro KS values from literature, based on
Lineweaver-Burk plots
kinetic parameter from model(apparent KS)[mM]
from literature[mM]
KGSNH4 1.4* 1.0 4) 1.8 5) for E. coli
KGSglu 4.4* 6.3 4) 2.4 5) for E. coli
KNADPH-GDHNH4 1.8 1113) 0.36)
KNADPH-GDHαKG 56 0.95 3) 1.0-4.06)
KGOGATgln 20 1.0 2) 0.756) for C.albicans
KGOGATαKG 0.71 0.14 2) 0.065 6) for C.albicans
KNAD-GDHglu 490 20 1)
KMEP 51 0.25-2 7) for growth on methylamine
KGAP for growth on glutamine 5.1
Kglc 150
1) Hemmings (1984) 2) Roon et al. (1974)3) Grisolia et al. (1964) 4) Mitchell and Magasanik (1983)5) Barman (1969) 6) Holmes et al. (1989)7) Dubois and Grenson (1979) * not included in parameter estimation
Kinetic model of yeast central N-metabolism 45
Then the stoichiometric matrix becomes:
nodeKGnodenglnodeglu
y
x
mitαα
α
−−−
−−=
111000101100
20)1(2010
MMM
E
r1 = y×r3, as is clear from the model assumptions and Fig. 2.2. This relation is left out ofthe stoichiometric matrix and the related rate vector:
[ ]r r r r = r 5432glngluNH+4
T Mφφφ
The part of vector r left from the vertical dots consists of the known fluxes and to the rightthe unknown rates are found. According to Magasanik (1992) and Fell (1997) 88% of thecellular nitrogen is provided by glutamate and 12% by glutamine. With these initial valuesand after some iterations with the dynamic model the optimal ratio appeared to be 90%glutamate and 10% glutamine, so α = 0.11. This is also in good agreement with the resultsof FA of the 60 reaction metabolic model (data not shown). It is assumed that this ratio αremains constant. From the same FA and some iterations of the dynamic model it resultedthat the ratios of the part of glutamine and glutamate which acts as amino group donor for
equal to approximately 107 cells⋅ml-1 this results in 3⋅108 cells⋅ml-1. The average volume of a haploidyeast cell is assumed to be 60 µm-3 (Woldringh et al., 1993) so 1.8⋅10-2 ml cell-volume/ml culture.
Table 2.3Other model parameters
µmax 0.4 h-1
GSmax 1.1 mmol⋅gX-1
NADPH-GDHmax 2.5 mmol⋅gX-1
NAD-GDHmax 5.2 mmol⋅gX-1
GOGATmax 1.1 mmol⋅gX-1
MEPmax 1.4 mmol⋅gX-1
GAPmax 2.8 mmol⋅gX-1
rsynth 0.8 h-1
rinact 8 mmol⋅gX-1⋅h-1
Vsignal 0.8 h-1
glutamine trigger concentration 0.1 mmol⋅gX-1
ammonia trigger concentration 0.6 mmol⋅gX-1
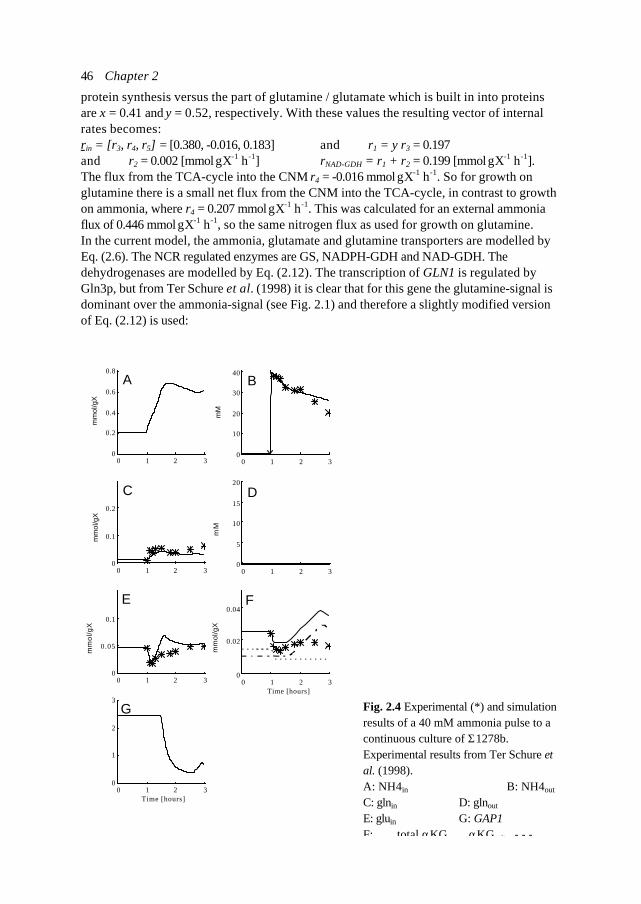
Chapter 246
protein synthesis versus the part of glutamine / glutamate which is built in into proteinsare x = 0.41 and y = 0.52, respectively. With these values the resulting vector of internalrates becomes:rin = [r3, r4, r5] = [0.380, -0.016, 0.183] and r1 = y r3 = 0.197and r2 = 0.002 [mmol⋅gX-1⋅h-1] rNAD-GDH = r1 + r2 = 0.199 [mmol⋅gX-1⋅h-1].The flux from the TCA-cycle into the CNM r4 = -0.016 mmol⋅gX-1⋅h-1. So for growth onglutamine there is a small net flux from the CNM into the TCA-cycle, in contrast to growthon ammonia, where r4 = 0.207 mmol⋅gX-1⋅h-1. This was calculated for an external ammoniaflux of 0.446 mmol⋅gX-1⋅h-1, so the same nitrogen flux as used for growth on glutamine.In the current model, the ammonia, glutamate and glutamine transporters are modelled byEq. (2.6). The NCR regulated enzymes are GS, NADPH-GDH and NAD-GDH. Thedehydrogenases are modelled by Eq. (2.12). The transcription of GLN1 is regulated byGln3p, but from Ter Schure et al. (1998) it is clear that for this gene the glutamine-signal isdominant over the ammonia-signal (see Fig. 2.1) and therefore a slightly modified versionof Eq. (2.12) is used:
Fig. 2.4 Experimental (*) and simulationresults of a 40 mM ammonia pulse to acontinuous culture of Σ1278b.Experimental results from Ter Schure etal. (1998).A: NH4in B: NH4out
C: glnin D: glnout
E: gluin G: GAP1F: total αKG, .... αKGmit, ⋅-⋅-⋅-
0 1 2 30
0.2
0.4
0.6
0.8
0 1 2 30
0.1
0.2
0 1 2 30
0.05
0.1
0 1 2 30
1
2
3
Time [hours]
C
E
G
A
mm
ol/g
Xm
mol
/gX
mm
ol/g
X
0 1 2 30
10
20
30
40
0 1 2 30
5
10
15
20
0 1 2 30
0.02
0.04
Time [hours]
B
D
F
mm
ol/g
Xm
Mm
M
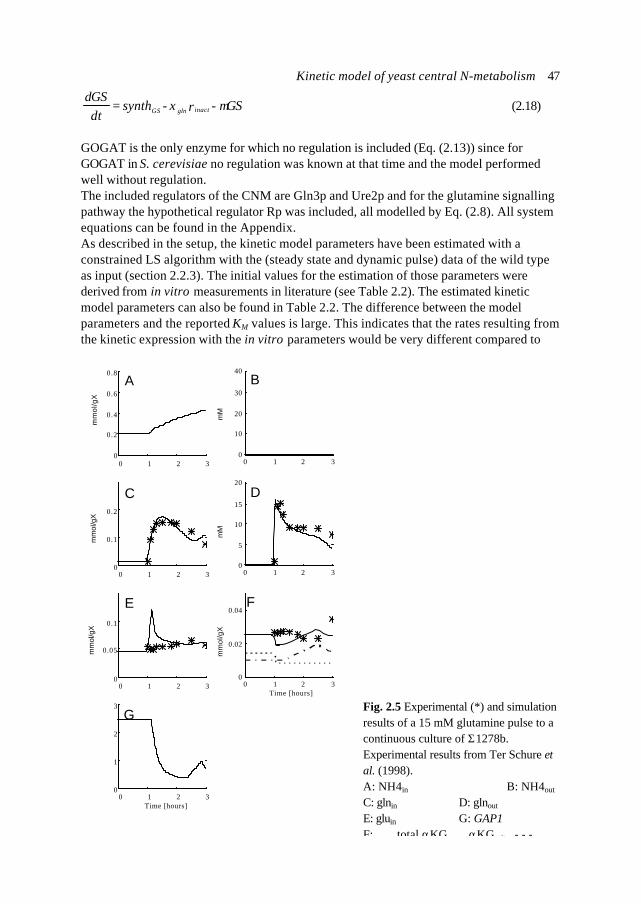
Kinetic model of yeast central N-metabolism 47
GS-r-synth = dt
dGSinactglnGS µξ (2.18)
GOGAT is the only enzyme for which no regulation is included (Eq. (2.13)) since forGOGAT in S. cerevisiae no regulation was known at that time and the model performedwell without regulation.The included regulators of the CNM are Gln3p and Ure2p and for the glutamine signallingpathway the hypothetical regulator Rp was included, all modelled by Eq. (2.8). All systemequations can be found in the Appendix.As described in the setup, the kinetic model parameters have been estimated with aconstrained LS algorithm with the (steady state and dynamic pulse) data of the wild typeas input (section 2.2.3). The initial values for the estimation of those parameters werederived from in vitro measurements in literature (see Table 2.2). The estimated kineticmodel parameters can also be found in Table 2.2. The difference between the modelparameters and the reported KM values is large. This indicates that the rates resulting fromthe kinetic expression with the in vitro parameters would be very different compared to
0 1 2 30
0.2
0.4
0.6
0.8
0 1 2 30
0.1
0.2
0 1 2 30
0.05
0.1
0 1 2 30
1
2
3
Time [hours]
C
A
E
G
mm
ol/g
Xm
mol
/gX
mm
ol/g
X
0 1 2 30
10
20
30
40
0 1 2 30
5
10
15
20
0 1 2 30
0.02
0.04
Time [hours]
D
F
B
mM
mM
mm
ol/g
X
Fig. 2.5 Experimental (*) and simulationresults of a 15 mM glutamine pulse to acontinuous culture of Σ1278b.Experimental results from Ter Schure etal. (1998).A: NH4in B: NH4out
C: glnin D: glnout
E: gluin G: GAP1F: total αKG, .... αKGmit, ⋅-⋅-⋅-
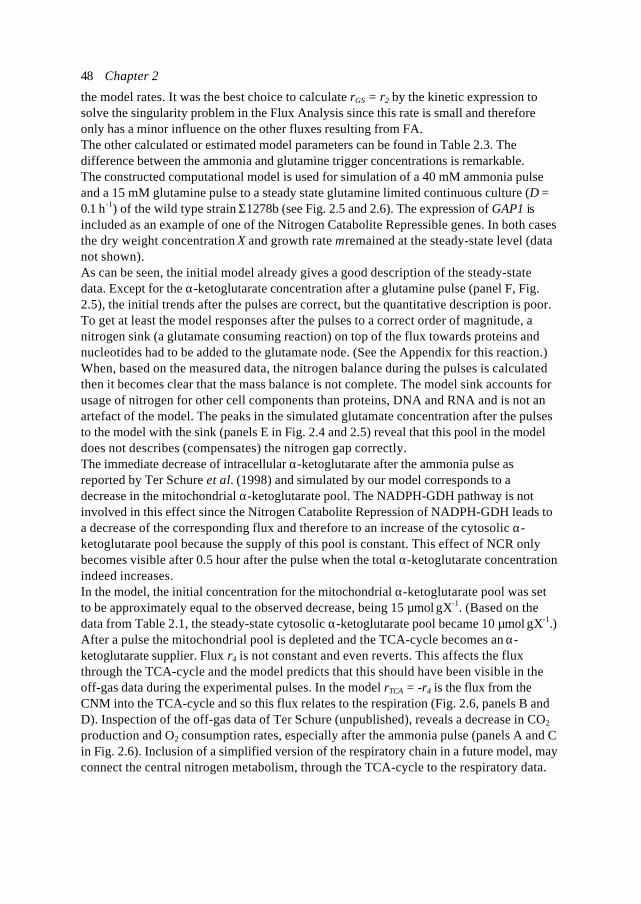
Chapter 248
the model rates. It was the best choice to calculate rGS = r2 by the kinetic expression tosolve the singularity problem in the Flux Analysis since this rate is small and thereforeonly has a minor influence on the other fluxes resulting from FA.The other calculated or estimated model parameters can be found in Table 2.3. Thedifference between the ammonia and glutamine trigger concentrations is remarkable.The constructed computational model is used for simulation of a 40 mM ammonia pulseand a 15 mM glutamine pulse to a steady state glutamine limited continuous culture (D =0.1 h-1) of the wild type strain Σ1278b (see Fig. 2.5 and 2.6). The expression of GAP1 isincluded as an example of one of the Nitrogen Catabolite Repressible genes. In both casesthe dry weight concentration X and growth rate µ remained at the steady-state level (datanot shown).As can be seen, the initial model already gives a good description of the steady-statedata. Except for the α-ketoglutarate concentration after a glutamine pulse (panel F, Fig.2.5), the initial trends after the pulses are correct, but the quantitative description is poor.To get at least the model responses after the pulses to a correct order of magnitude, anitrogen sink (a glutamate consuming reaction) on top of the flux towards proteins andnucleotides had to be added to the glutamate node. (See the Appendix for this reaction.)When, based on the measured data, the nitrogen balance during the pulses is calculatedthen it becomes clear that the mass balance is not complete. The model sink accounts forusage of nitrogen for other cell components than proteins, DNA and RNA and is not anartefact of the model. The peaks in the simulated glutamate concentration after the pulsesto the model with the sink (panels E in Fig. 2.4 and 2.5) reveal that this pool in the modeldoes not describes (compensates) the nitrogen gap correctly.The immediate decrease of intracellular α-ketoglutarate after the ammonia pulse asreported by Ter Schure et al. (1998) and simulated by our model corresponds to adecrease in the mitochondrial α-ketoglutarate pool. The NADPH-GDH pathway is notinvolved in this effect since the Nitrogen Catabolite Repression of NADPH-GDH leads toa decrease of the corresponding flux and therefore to an increase of the cytosolic α-ketoglutarate pool because the supply of this pool is constant. This effect of NCR onlybecomes visible after 0.5 hour after the pulse when the total α-ketoglutarate concentrationindeed increases.In the model, the initial concentration for the mitochondrial α-ketoglutarate pool was setto be approximately equal to the observed decrease, being 15 µmol⋅gX-1. (Based on thedata from Table 2.1, the steady-state cytosolic α-ketoglutarate pool became 10 µmol⋅gX-1.)After a pulse the mitochondrial pool is depleted and the TCA-cycle becomes an α-ketoglutarate supplier. Flux r4 is not constant and even reverts. This affects the fluxthrough the TCA-cycle and the model predicts that this should have been visible in theoff-gas data during the experimental pulses. In the model rTCA = -r4 is the flux from theCNM into the TCA-cycle and so this flux relates to the respiration (Fig. 2.6, panels B andD). Inspection of the off-gas data of Ter Schure (unpublished), reveals a decrease in CO2
production and O2 consumption rates, especially after the ammonia pulse (panels A and Cin Fig. 2.6). Inclusion of a simplified version of the respiratory chain in a future model, mayconnect the central nitrogen metabolism, through the TCA-cycle to the respiratory data.
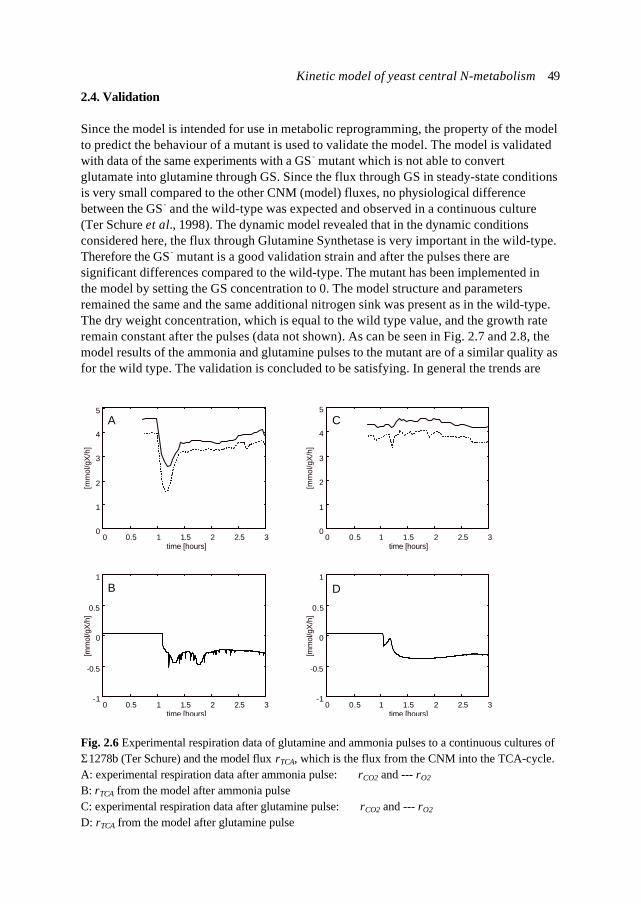
Kinetic model of yeast central N-metabolism 49
2.4. Validation
Since the model is intended for use in metabolic reprogramming, the property of the modelto predict the behaviour of a mutant is used to validate the model. The model is validatedwith data of the same experiments with a GS - mutant which is not able to convertglutamate into glutamine through GS. Since the flux through GS in steady-state conditionsis very small compared to the other CNM (model) fluxes, no physiological differencebetween the GS - and the wild-type was expected and observed in a continuous culture(Ter Schure et al., 1998). The dynamic model revealed that in the dynamic conditionsconsidered here, the flux through Glutamine Synthetase is very important in the wild-type.Therefore the GS - mutant is a good validation strain and after the pulses there aresignificant differences compared to the wild-type. The mutant has been implemented inthe model by setting the GS concentration to 0. The model structure and parametersremained the same and the same additional nitrogen sink was present as in the wild-type.The dry weight concentration, which is equal to the wild type value, and the growth rateremain constant after the pulses (data not shown). As can be seen in Fig. 2.7 and 2.8, themodel results of the ammonia and glutamine pulses to the mutant are of a similar quality asfor the wild type. The validation is concluded to be satisfying. In general the trends are
0 0.5 1 1.5 2 2.5 3time [hours]
0 0.5 1 1.5 2 2.5 3time [hours]
0 0.5 1 1.5 2 2.5 3time [hours]
[mm
ol/g
X/h
]
0 0.5 1 1.5 2 2.5 3
0
1
2
3
4
5
0
1
2
3
4
5
-1
-0.5
0
0.5
1
-1
-0.5
0
0.5
1
time [hours]
[mm
ol/g
X/h
]
C
B D
A
[mm
ol/g
X/h
]
[mm
ol/g
X/h
]
Fig. 2.6 Experimental respiration data of glutamine and ammonia pulses to a continuous cultures ofΣ1278b (Ter Schure) and the model flux rTCA, which is the flux from the CNM into the TCA-cycle.A: experimental respiration data after ammonia pulse: rCO2 and --- rO2
B: rTCA from the model after ammonia pulseC: experimental respiration data after glutamine pulse: rCO2 and --- rO2
D: rTCA from the model after glutamine pulse
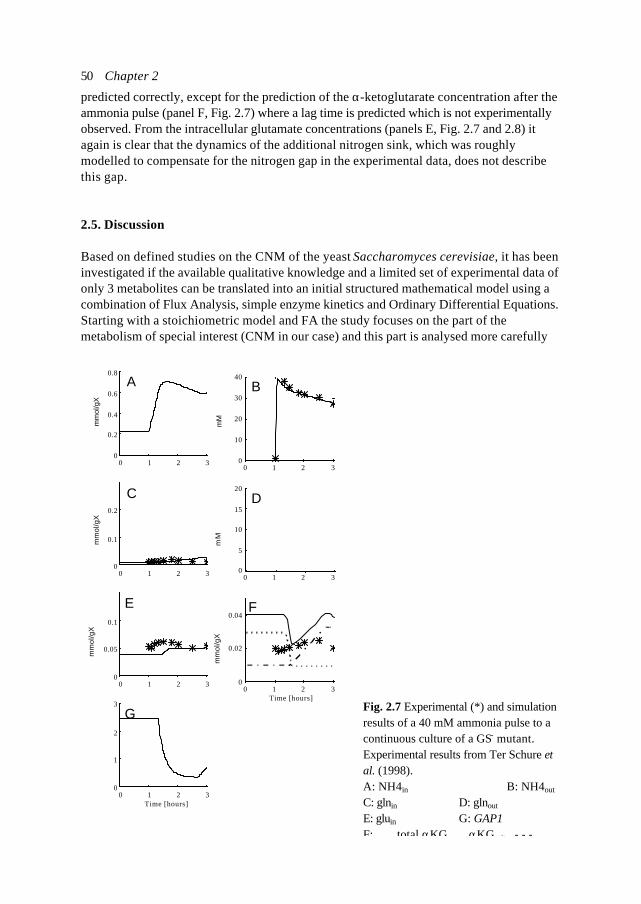
Chapter 250
predicted correctly, except for the prediction of the α-ketoglutarate concentration after theammonia pulse (panel F, Fig. 2.7) where a lag time is predicted which is not experimentallyobserved. From the intracellular glutamate concentrations (panels E, Fig. 2.7 and 2.8) itagain is clear that the dynamics of the additional nitrogen sink, which was roughlymodelled to compensate for the nitrogen gap in the experimental data, does not describethis gap.
2.5. Discussion
Based on defined studies on the CNM of the yeast Saccharomyces cerevisiae, it has beeninvestigated if the available qualitative knowledge and a limited set of experimental data ofonly 3 metabolites can be translated into an initial structured mathematical model using acombination of Flux Analysis, simple enzyme kinetics and Ordinary Differential Equations.Starting with a stoichiometric model and FA the study focuses on the part of themetabolism of special interest (CNM in our case) and this part is analysed more carefully
0 1 2 30
0.2
0.4
0.6
0.8
0 1 2 30
0.1
0.2
mm
ol/g
X
0 1 2 30
0.05
0.1
0 1 2 30
1
2
3
Time [hours]
C
E
G
A
mm
ol/g
Xm
mol
/gX
0 1 2 30
10
20
30
40
0 1 2 30
5
10
15
20
0 1 2 30
0.02
0.04
Time [hours]
B
D
F
mm
ol/g
Xm
Mm
M
Fig. 2.7 Experimental (*) and simulationresults of a 40 mM ammonia pulse to acontinuous culture of a GS- mutant.Experimental results from Ter Schure etal. (1998).A: NH4in B: NH4out
C: glnin D: glnout
E: gluin G: GAP1F: total αKG, .... αKGmit, ⋅-⋅-⋅-
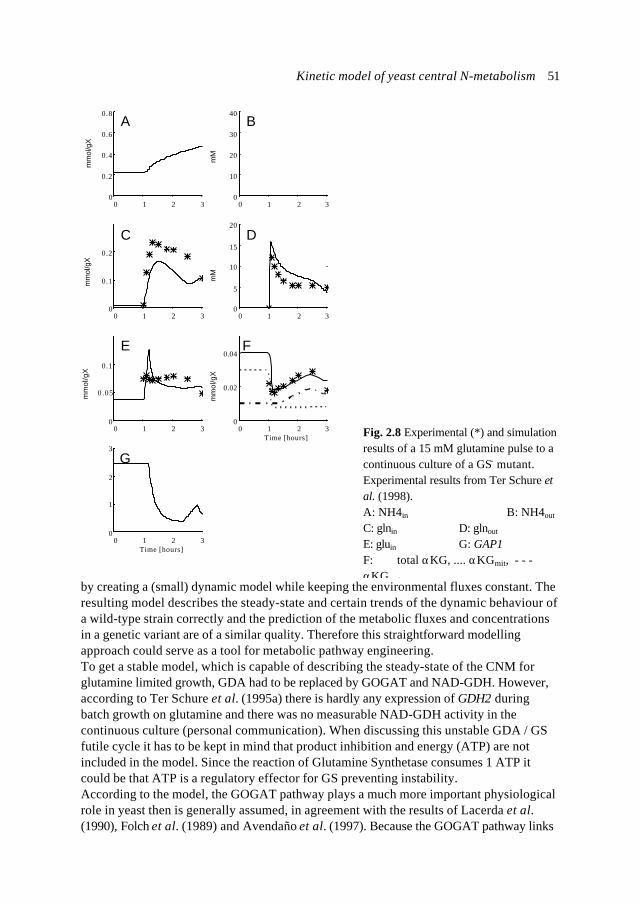
Kinetic model of yeast central N-metabolism 51
by creating a (small) dynamic model while keeping the environmental fluxes constant. Theresulting model describes the steady-state and certain trends of the dynamic behaviour ofa wild-type strain correctly and the prediction of the metabolic fluxes and concentrationsin a genetic variant are of a similar quality. Therefore this straightforward modellingapproach could serve as a tool for metabolic pathway engineering.To get a stable model, which is capable of describing the steady-state of the CNM forglutamine limited growth, GDA had to be replaced by GOGAT and NAD-GDH. However,according to Ter Schure et al. (1995a) there is hardly any expression of GDH2 duringbatch growth on glutamine and there was no measurable NAD-GDH activity in thecontinuous culture (personal communication). When discussing this unstable GDA / GSfutile cycle it has to be kept in mind that product inhibition and energy (ATP) are notincluded in the model. Since the reaction of Glutamine Synthetase consumes 1 ATP itcould be that ATP is a regulatory effector for GS preventing instability.According to the model, the GOGAT pathway plays a much more important physiologicalrole in yeast then is generally assumed, in agreement with the results of Lacerda et al.(1990), Folch et al. (1989) and Avendaño et al. (1997). Because the GOGAT pathway links
0 1 2 30
0.2
0.4
0.6
0.8
0 1 2 30
0.1
0.2
0 1 2 30
0.05
0.1
0 1 2 30
1
2
3
Time [hours]
C
A
E
G
mm
ol/g
Xm
mol
/gX
mm
ol/g
X
0.02
0.04
0 1 2 30
10
20
30
40
0 1 2 30
5
10
15
20
0 1 2 30
Time [hours]
D
F
B
mM
mM
mm
ol/g
X
Fig. 2.8 Experimental (*) and simulationresults of a 15 mM glutamine pulse to acontinuous culture of a GS- mutant.Experimental results from Ter Schure etal. (1998).A: NH4in B: NH4out
C: glnin D: glnout
E: gluin G: GAP1F: total αKG, .... αKGmit, ⋅-⋅-⋅-αKGcyt
Chapter 252
α-ketoglutarate and glutamine it stabilises the dynamic network. From this, it can beconcluded that the current concept of net steady-state fluxes can be a misguidingrepresentation of the actual intracellular processes, especially when combining it withdynamics. Based on the presented model and data evaluation it is concluded that it isworthwhile to study the function of GOGAT / GS pathway in S. cerevisiae more carefully.In the development of the model, compartmentation of the α-ketoglutarate pool was anessential step. How the transport of α-ketoglutarate across the mitochondrial membranestakes place is not known. This also should be further investigated.Analysis of the experimental data revealed a discrepancy in the nitrogen balance, whichhas been compensated for by adding an additional nitrogen sink in the model. 40 minutesafter the glutamine pulse this nitrogen gap is approximately 650 µmol⋅gX-1 for the wildtype. If we assume that the experimental data of Ter Schure et al. (1998) are correct thenthis could mean that the (unmeasured) intracellular ammonia concentration has increaseddramatically (although this is not predicted by the model), or that the assumption of aconstant protein composition and synthesis rate is not correct, or that the concentrationof another nitrogen containing metabolite has increased and the model should beextended. An amino acid of which it is known that it can accumulate in large amounts inyeast cells is arginine (Westenberg et al., 1989). The model predicts the dynamicbehaviour of this pool and this could be helpful for its identification.The measured and simulated uptake patterns after ammonia pulses (Fig. 2.4 and 2.7) arevery similar to what Schulze (1995) observed after ammonia pulses to anaerobic nitrogenlimited continuous cultures of S. cerevisiae. The simulation results are in agreement withthe qualitative explanation of Schulze for this pattern. Initially ammonia is taken up at themaximum rate of the permease system until the intracellular ammonium concentrationreaches a threshold value and the permeases become inhibited and uptake is stopped.Next ammonia uptake is reinitiated at a rate determined by the intracellular demand forammonia (which is lower than the initial uptake rate). The model indicates how thedifferent network components interact resulting in the highly regulated uptake mechanismthat is observed. From the data of Ter Schure et al. (1998) it is clear that 40 minutes after a15 mM glutamine pulse the uptake of glutamine virtually ceases. However from these datathe glutamine uptake pattern for the first 40 minutes after the pulse is not clear. Again themodel indicates possible processes in the metabolic network resulting in the observeduptake.
2.6. Conclusions and future work
For a structured dynamic model the Flux Analysis has to be extended with countercurrent,independent enzyme reactions and compartmentation. It is not adequate to regard themetabolism just as a network only with net fluxes, like usually done in literature. To get astable model it is, at least numerically, necessary to give the model more degrees offreedom so that it is able to control the fluxes in a faster, more robust and refined way.This is an indication that the yeast cells also use a less straightforward control and it islikely that the bidirectionality of most pathways is used, possible as a sensing function.When more data are available, the model can be refined by inclusion of more realisticenzyme kinetics with product inhibition.
Kinetic model of yeast central N-metabolism 53
Since most of the enzymes involved are cofactor dependent and since the GOGAT / GSpathway is linked with the ATP generation via the TCA activity, it is likely that inclusionof NAD(H), NADP(H) and ATP could improve the model. It has to be kept in mind that todo this, it is also necessary to take into account large other parts of the yeast metabolism,which are also still largely unquantified.It is clear that more experimental work is needed before the nitrogen metabolism in yeast isunderstood and a truly good descriptive model can be created. On the other hand, thiswork proves that with the combination of an available dataset (of only 3 metabolites), FluxAnalysis, simple kinetics and qualitative knowledge about regulation, it is possible tocreate one structured, dynamic model, which describes and predicts the steady-state and,to some extend, the dynamic responses after both ammonia and a glutamine pulses toboth a wild-type and a mutant strain. The resulting model is an interesting basical tool,which can guide future research on CNM of yeast. However there are a few importantprerequisites for this modelling approach:- Reliable data-sets of steady-state and defined dynamic experiments, have to be available,both for parameter estimation and validation. In general, the available data from literatureare too scarce and lack focus for use in quantitative studies.- Some kind of regulation has to be incorporated and therefore in the experimental studiesattention has to be paid to the regulatory aspects of the yeast cell.The model can predict to some extent the dynamics of a mutant which in steady-statehardly differs from the wild-type, but responds significantly different to the pulses. This isa very important advantage of the more complicated, but dynamic model above staticmodels as a tool for genetic engineering.A common method used in measurement and control engineering to investigate thecontrol characteristics of a dynamic model is (parameter) sensitivity analysis. In analysisof metabolism this approach is more or less equivalent to the Metabolic Control Analysisand this will be used to analyse the GOGAT / GS cycle more carefully.The results and discussion presented, indicate that the initial mathematical model can beused to guide and direct new molecular biological and physiological research (model-based-experiments). In new experiments the GOGAT-pathway has to be taken intoaccount, ATP, NAD(H), NADP(H) have to be measured and attention should be paid topotential additional or changing nitrogen pools. The experimental results will be used toimprove the model. It would be interesting to repeat the experiments as described by TerSchure et al. (1998) with a GOGAT negative mutant and compare experimental and modelresults to verify if the choice to include GOGAT in the model was correct. The model willalso be used to predict the effects of other disturbances to the CNM such as glutamatepulses and this will be experimentally validated.
AcknowledgementsThis work has been supported by the EC DGXII Framework IV Cell Factory programme.
References
Avendaño, A., Deluna, A., Olivera, H., Valenzuela, L. and González, A. (1997). GDH3 encodes aglutamate dehydrogenase isoenzyme, a previously unrecognized route for glutamate biosynthesis inSaccharomyces cerevisiae. J. Bacteriol. 179: 5594-5597.
Chapter 254
Barman, T.E. (1969). Enzyme Handbook. vol. 1, Springer-Verlag Berlin Heidelberg New York.
Bogonez, E., Satrústegui, J. and Machado, A. (1985). Regulation by ammonium of glutamatedehydrogenase (NADP+) from Saccharomyces cerevisiae. J. Gen. Microbiol. 133: 1425-1432.
Chock, P.B., Shacter, E., Jurgensen, S.R. and Rhee, S.G. (1985). Cyclic cascade systems inmetabolic regulation. Curr. Top. Cell. Regul., 27: 3-12.
Cooper, T.G. (1982). Nitrogen metabolism in Saccharomyces cerevisiae. In: The molecular biologyof the yeast Saccharomyces cerevisiae (Strathern, J.N. et al., eds) pp. 39-99. Cold Spring HarborLaboratory, Cold Spring Harbor, New York.
De Boor, C. (1978). A practical guide to splines, Springer-Verlag, Berlin.
De Hollander, J.A. (1991). The use of stoichiometric relations for the description and analyses ofmicrobial cultures. Antonie van Leeuwenhoek. 60: 257-273.
Dubois, E. and Grenson, M. (1979) Methylamine / Ammonia uptake systems in Saccharomycescerevisiae: multiplicity and regulation. Molec. gen. Genet. 175: 67-76.
Fell, D. (1997). Understanding the control of metabolism, Portland press, London and Miami.
Flores-Samaniego, B., Olivera, H. and González, A. (1993). Glutamine synthesis is a regulatorysignal controlling glucose catabolism in Saccharomyces cerevisiae. J. Bacteriol. 175: 7705-7706.
Folch, J.-L., Antaramián, A., Bravo, A., Brunner, A. and González, A. (1989). Isolation andcharacterization of a Saccharomyces cerevisiae mutant with impaired glutamate synthase activity.J. Bacteriol. 171: 6776-6781.
Giuseppin M.L.F. and Van Riel, N.A.W. (2000). Metabolic modeling of Saccharomyces cerevisiaeusing the optimal control of homeostasis; a cybernetic model definition. Metab. Eng. 2: 1-20.
Grisolia S., Quijada, C.L. and Fernandez, M. (1964). Glutamate dehydrogenase from yeast and fromanimal tissues. BBA. 81: 61-70.
Hemmings, B.A. (1984). The role of protein phosphorylation in the regulation of theNAD-dependent glutamate dehydrogenase from yeast. In: Enzyme regulation by reversiblephosphorylation- further advances (Cohen, eds). pp. 155-165. Elsevier Science Publishers B.V.
Hollenberg C.P., Riks, W.F. and Borst, P. (1970). The glutamate dehydrogenases of yeast: extra-mitochondrial enzymes. BBA. 201: 13-19.
Holmes, A.R., Collings, A., Farnden, K.J.F. and Sepherd, M.G. (1989). Ammonium assimilation byCandida albicans and other yeasts: evidence for activity of glutamate synthase. J. Gen. Microbiol.135: 1424-1430.
Kinetic model of yeast central N-metabolism 55
Holmes, A.R., Mcaughton, G.S., More, R.D. and Sepherd, M.G. (1991). Ammonium assimilationby Candida albicans and other yeasts: a 13N isotope study. Can. J. Microbiol. 37: 226-232.
Jo/ rgensen H., Nielsen, J. and Villadsen, J. (1995). Metabolic flux distributions in Penicilliumchrysogenum during fed-batch cultivations. Biotechnol.Bioeng. 46: 117-131.
Lacerda, V., Marsden, A., Buzato, J.B. and Ledingham, W.M. (1990). Studies on ammoniumassimilation in continuous cultures of S. cerevisiae under carbon and nitrogen limitation. Proc. -Eur. Congr. Biotechnol., 5th, vol. 2, pp. 1075-1078.
Magasanik, B. (1992). Regulation of nitrogen utilization. In: The molecular and cellular biology ofthe yeast Saccharomyces cerevisiae: gene expression (Jones, E.W. et al., eds) pp. 283-317. ColdSpring Harbor Laboratory Press, Cold Spring Harbor, New York.
Marini, A-M., Vissers, S., Urrestarazu, A. and André, B. (1994). Cloning and expression of theMEP1 gene encoding an ammonium transporter in Saccharomyces cerevisiae. EMBO J. 13: 3456-3463.
Marini, A-M., Vissers, S. and André, B. (1995). Ammonium transport in Saccharomycescerevisiae. Yeast. 11, S425.
Miller, S.M. and Magasanik, B. (1991). Role of the complex upstream region of the GDH2 gene innitrogen regulation of the NAD-linked glutamate dehydrogense in Saccharomyces cerevisiae. Mol.Cell. Biol. 11: 6229-6247.
Mitchell, A.P. and Magasanik, B. (1983). Purification and properties of glutamine synthetase fromSaccharomyces cerevisiae. J. Biol. Chem. 258: 119-124.
Mitchell, A.P. (1985). The GLN1 locus of Saccharomyces cerevisiae encodes glutamine synthetase.Genetics. 111: 243-248.
Mora, Y., Hernandez, G. and Mora, J. (1987). Regulation of carbon and nitrogen flow by glutamatesynthase in Neurospora crassa. J. Gen. Microbiol. 133: 1667-1674.
Nielsen, J. and Villadsen, C.L. (1994) Bioreaction engineering principles. Plenum, New York.
Perlman, P.S. and Mahler, H.R. (1970). Intracellular localization of enzymes in yeast. ABB. 136:245-259.
Roon, R.J., Even, H.L. and Larimore, F. (1974). Glutamate synthase: properties of the reducednicotinamide adenine dinucleotide-dependent enzyme from Saccharomyces cerevisiae. J. Bacteriol.118: 89-95.
Schulze, U. (1995). Anaerobic physiology of Saccharomyces cerevisiae. PhD Thesis, Dep. ofBiotechnology, Tech. University of Denmark.
Chapter 256
Soberón, M. and González, A. (1987a). Physiological role of glutaminase activity in Saccharomycescerevisiae. J. Gen. Microbiol. 133: 1-8.
Soberón, M. and González, A. (1987b). Glutamine degradation through ω-amidase pathway inSaccharomyces cerevisiae. J. Gen. Microbiol. 133: 9-14.
Ter Schure, E.G., Silljé, H.H.W., Raeven, J., Boonstra, J., Verkleij, A.J. and Verrips, C.T. (1995a).Nitrogen regulated transcription and enzyme activities in continuous cultures of Saccharomycescerevisiae. Microbiology. 141: 1101-1108.
Ter Schure, E.G., Silljé, H.H.W., Verkleij, A.J., Boonstra, J. and Verrips, C.T. (1995b). Theconcentration of ammonia regulates nitrogen metabolism in Saccharomyces cerevisiae. J. Bacteriol.177: 6671-6675.
Ter Schure, E.G., Silljé, H.H.W., Vermeulen, E.E., Kalhorn, J., Verkleij, A.J., Boonstra, J. andVerrips, C.T. (1998). Repression of nitrogen catabolic genes by ammonia and glutamine in nitrogen-limited continuous cultures of Saccharomyces cerevisiae. Microbiology 144: 1451-1462.
Vallino, J.J. and Stephanopoulos, G. (1993). Metabolic flux distributions in Corynebacteriumglutamicum during growth and lysine overproduction. Biotechnol. Bioeng. 41: 633-646.
Westenberg, B., Boller, T. and Wiemken, A. (1989). Lack of arginine- and polyphosphate-storagepools in a vacuole-deficient mutant (end1) of Saccharomyces cerevisiae. FEB. 254: 133-136.
Woldringh, C.L., Huls, P.G. and Vischer, N.O.E. (1993). Volume growth of daughter and parentcells during the cell cycle of Saccharomyces cerevisiae a/α as determined by image cytometry. J.Bacteriol. 175: 3174-3181.
Appendix: Model equations
Growth
K+][gln][gln
= Sex
exµµ max (2.18)
UptakeConstant uptake [mmol⋅gX-1⋅h-1] of glucose:
Y = uptake
glcXglc
µ(2.19)
Regulated ammonia and glutamine uptake:
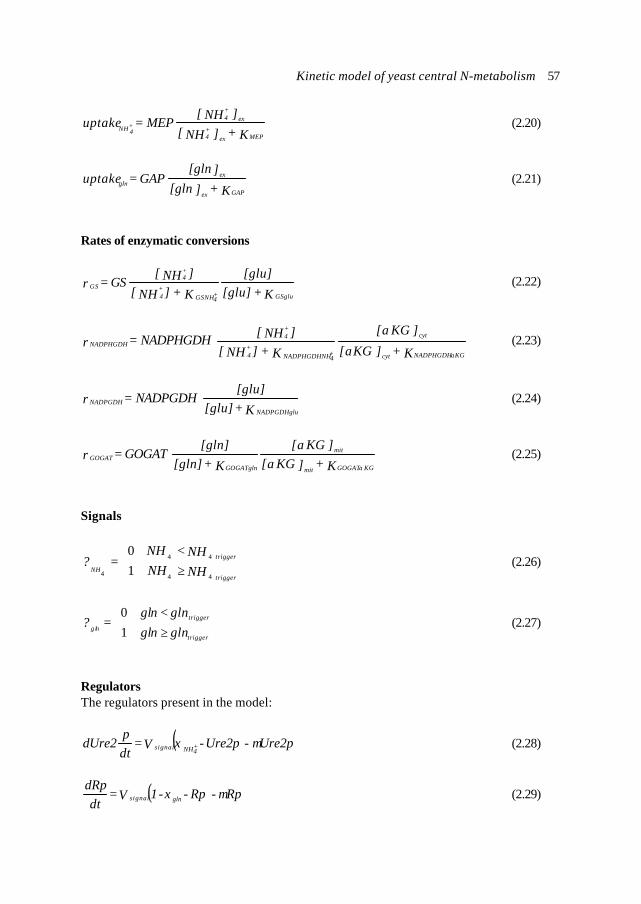
Kinetic model of yeast central N-metabolism 57
K+]NH[]NH[
MEP= uptakeMEPex
+4
ex+4
NH+4
(2.20)
K+][gln][gln
GAP = uptakeGAPex
exgln (2.21)
Rates of enzymatic conversions
K+[glu][glu]
K+]NH[]NH[
GS = rGSgluGSNH+
4
+4
+4
GS (2.22)
K+]KG[
]KG[
K+]NH[]NH[NADPHGDH = r
KGNADPHGDHcyt
cyt
NADPHGDHNH+4
+4
+4
NADPHGDH
αα
α(2.23)
K+[glu][glu]
NADPGDH = rNADPGDHglu
NADPGDH (2.24)
K+]KG[]KG[
K+[gln]
[gln]GOGAT = r
KGGOGATmit
mit
GOGATglnGOGAT
ααα
(2.25)
Signals
≥= ++
++
+44
44
4 10
NH NHNH <NH
?trigger
trigger
NH(2.26)
≥=
ngl nglngl <ngl
?trigger
trigger
ng l 10
(2.27)
RegulatorsThe regulators present in the model:
( ) Ure2p - Ure2p-V = dtp
dUre2 NH+4signal µξ (2.28)
( ) Rp - Rp--1V = dt
dRpglnsignal µξ (2.29)
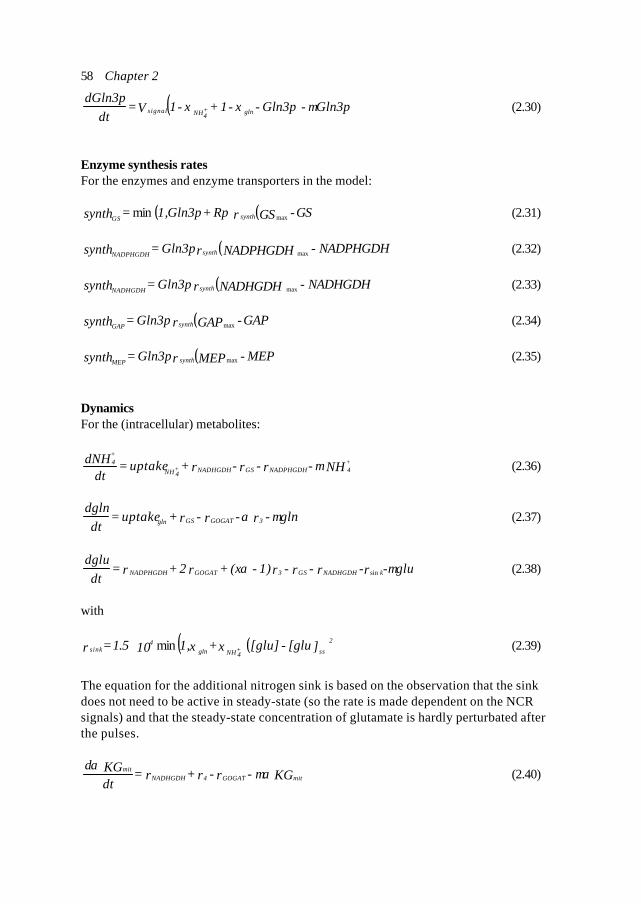
Chapter 258
( ) Gln3p - Gln3p--1+-1V = dt
dGln3pglnNH+
4signal µξξ (2.30)
Enzyme synthesis ratesFor the enzymes and enzyme transporters in the model:
( ) ( )GS-GSrRp+Gln3p1, = synth synthGS maxmin (2.31)
( )NADPHGDH-NADPHGDHrGln3p = synth synthNADPHGDH max (2.32)
( )NADHGDH-NADHGDHrGln3p = synth synthNADHGDH max (2.33)
( )GAP-GAPrGln3p = synth synthGAP max (2.34)
( )MEP-MEPrGln3p = synth synthMEP max (2.35)
DynamicsFor the (intracellular) metabolites:
NH-r-r-r+uptake = dt
dNH +4NADPHGDHGSNADHGDHNH+
4
+4 µ (2.36)
gln-r-r-r+uptake = dt
dgln3GOGATGSgln µα (2.37)
glu-r-r-r-r1)-(x+r2+r = dt
dglukNADHGDHGS3GOGATNADPHGDH µα sin (2.38)
with
( )( )][glu-[glu] +1, 101.5 = r ss
2
NH+4gln
4sink ξξmin⋅ (2.39)
The equation for the additional nitrogen sink is based on the observation that the sinkdoes not need to be active in steady-state (so the rate is made dependent on the NCRsignals) and that the steady-state concentration of glutamate is hardly perturbated afterthe pulses.
KG-r-r+r = dtKGd
mitGOGAT4NADHGDHmit µα
α(2.40)
Kinetic model of yeast central N-metabolism 59
KG-r-ry = dtKGd
cytNADHGDH3cyt µαα
(2.41)
For the model enzymes:
GS-r-synth = dt
dGSinactg lGS µξ (2.42)
( ) NADPHGDH-r+-synth = dt
dNADPHGDHinactglnNH+
4NADPHGDH µξξ (2.43)
( ) NADHGDH-r+-synth = dt
dNADHGDHinactglnNH+
4NADHGDH µξξ (2.44)
( ) MEP-r+-synth = dt
dMEPinactglnNH+
4MEP µξξ (2.45)
( ) GAP-r+-synth = dt
dGAPinactglnNH+
4GAP µξξ (2.46)
GOGAT-synth = dt
dGOGATGOGAT µ (2.47)
External ratesFor the biomass:
D)X-( = dtdX
µ (2.48)
The substrates:
( ) Xuptake-]NH[-]NH[D = dt
]NHd[NH+
4ex+40
+4
ex+4 (2.49)
( ) Xuptake-][gln-][glnD = dt
]d[glnglnex0
ex (2.50)

60
Chapter 3
Dynamic Optimal Control of Homeostasis; an integrativesystem approach for modelling of the Central Nitrogen
Metabolism in Saccharomyces cerevisiae
Natal A.W. van Riel1, Marco L.F. Giuseppin2 and C. Theo Verrips1,2
1 Department of Molecular Cell Biology, Institute of BiomembranesUtrecht University, Padualaan 8, 3584 CH Utrecht, The Netherlands
2 Unilever Research Vlaardingen, Olivier van Noortlaan 120, 3133 AT Vlaardingen, TheNetherlands
To be published in: Metabolic Eng. (2000) 2, in press.
Chapter 362
Abstract
The theory of Dynamic Optimal Metabolic Control (DOMC), as developed by Giuseppinand Van Riel (2000), is applied to model the Central Nitrogen Metabolism (CNM) inSaccharomyces cerevisiae. The CNM represents a typical system encountered inadvanced Metabolic Engineering. The CNM is the source of the cellular amino acids andproteins, including flavours and potentially valuable biomolecules, therefore it is also ofindustrial interest. In the DOMC approach the cell is regarded as an optimally controlledsystem. Given the metabolic genotype the cell faces a control problem to maintain anoptimal flux distribution in a changing environment. The regulation is based on strategiesand balances feedback control of homeostasis and feedforward regulation for adaptation.The DOMC approach is an integrative, holistic approach, not based on mechanisticdescriptions and (therefore) not biased by the variation present in biochemical andmolecular biological data. It is an effective tool to structure the rapidly increasing amountof data on the function of genes and pathways.The DOMC model is used successfully to predict the responses of pulses of ammonia andglutamine to nitrogen limited continuous cultures of a wild-type strain and a GlutamineSynthetase negative mutant. The simulation results are validated with experimental data.
3.1. Introduction
The kind of mathematical model to be developed, depends on the goal for which it will beused. For advanced Metabolic Engineering, a (quantitative) understanding of the micro-organism as a self-regulating system is necessary and therefore the applied mathematicalmodelling tools should have the same characteristics. Another, closely related area of cellscience in which there is need for new modelling tools, is in functional genomics (a.o. theassignment of function to open reading frames in the sequenced genomes of organisms).Among others, Bailey (1998) and Edwards and Palsson (1998) recognise the need for amathematical framework to structure those data.In contrast to the reductionistic kinetic models, the new approach of Dynamic OptimalMetabolic Control (DOMC), as developed by Giuseppin and Van Riel (2000), focuses onthe functionality of the system as a whole and its subsystems (a holistic approach). Thecell is regarded as an adaptive, cybernetic system with strategies. The strategies are usedin the allocation problem which the cells face: balancing maximisation of the growth rateand related synthesis of building blocks given the available nutrients in the environment.In engineering terms, this is a multi-dimensional non-linear optimal control problem.Based on the principle of Flux Balance Analysis with optimisation (FBA, e.g. Bonarius etal., 1998; Fell and Small, 1986; Savinell and Palsson, 1992), a DOMC model is able todescribe / predict the dynamic behaviour, without the need of detailed mechanisticinformation.In the new DOMC approach, the optimal flux distribution is used to predict the dynamicnetwork responses to relatively small and short-term perturbations, without the need fordata from dynamic experiments. DOMC is focused on a Dynamic Optimal Control ofHomeostasis (DOCH) of the metabolic pools. For this, the metabolic strategy applied forthe static situation in FBA with optimisation has to be extended with strategies and
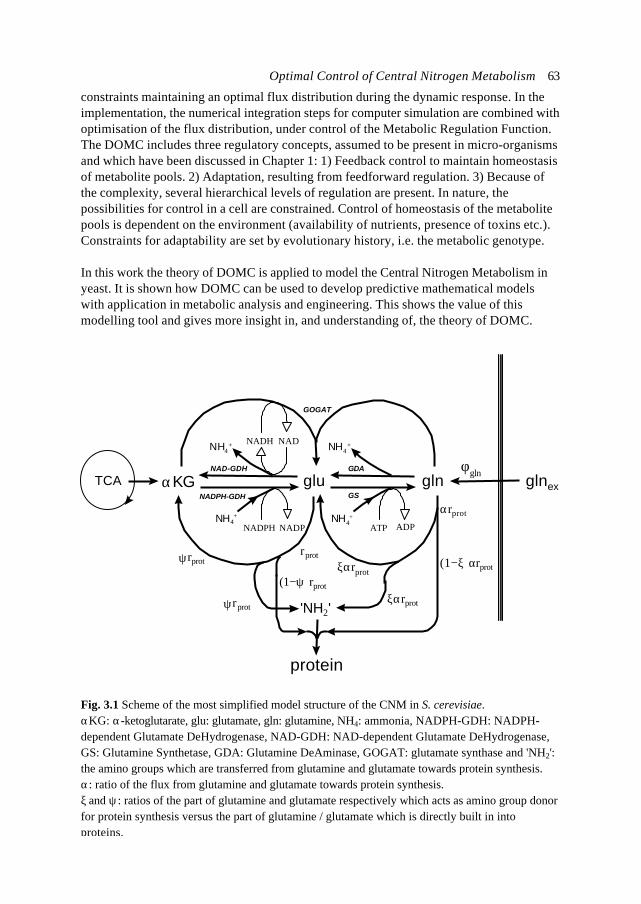
Optimal Control of Central Nitrogen Metabolism 63
constraints maintaining an optimal flux distribution during the dynamic response. In theimplementation, the numerical integration steps for computer simulation are combined withoptimisation of the flux distribution, under control of the Metabolic Regulation Function.The DOMC includes three regulatory concepts, assumed to be present in micro-organismsand which have been discussed in Chapter 1: 1) Feedback control to maintain homeostasisof metabolite pools. 2) Adaptation, resulting from feedforward regulation. 3) Because ofthe complexity, several hierarchical levels of regulation are present. In nature, thepossibilities for control in a cell are constrained. Control of homeostasis of the metabolitepools is dependent on the environment (availability of nutrients, presence of toxins etc.).Constraints for adaptability are set by evolutionary history, i.e. the metabolic genotype.
In this work the theory of DOMC is applied to model the Central Nitrogen Metabolism inyeast. It is shown how DOMC can be used to develop predictive mathematical modelswith application in metabolic analysis and engineering. This shows the value of thismodelling tool and gives more insight in, and understanding of, the theory of DOMC.
glu glnGS
GDA
GOGAT
NADPH NADP
NADH NAD
ATP ADP
TCA glnexNADPH-GDH
NAD-GDH
NH4+NH4
+
NH4+ NH4
+
αKGφgln
protein
2'NH '
ψrprotrprot
(1−ψ)rprot
ξαrprot
ξαrprot(1−ξ)αrprot
αrprot
ψrprot
Fig. 3.1 Scheme of the most simplified model structure of the CNM in S. cerevisiae.αKG: α-ketoglutarate, glu: glutamate, gln: glutamine, NH4: ammonia, NADPH-GDH: NADPH-dependent Glutamate DeHydrogenase, NAD-GDH: NAD-dependent Glutamate DeHydrogenase,GS: Glutamine Synthetase, GDA: Glutamine DeAminase, GOGAT: glutamate synthase and 'NH2':the amino groups which are transferred from glutamine and glutamate towards protein synthesis.α: ratio of the flux from glutamine and glutamate towards protein synthesis.ξ and ψ: ratios of the part of glutamine and glutamate respectively which acts as amino group donorfor protein synthesis versus the part of glutamine / glutamate which is directly built in intoproteins.
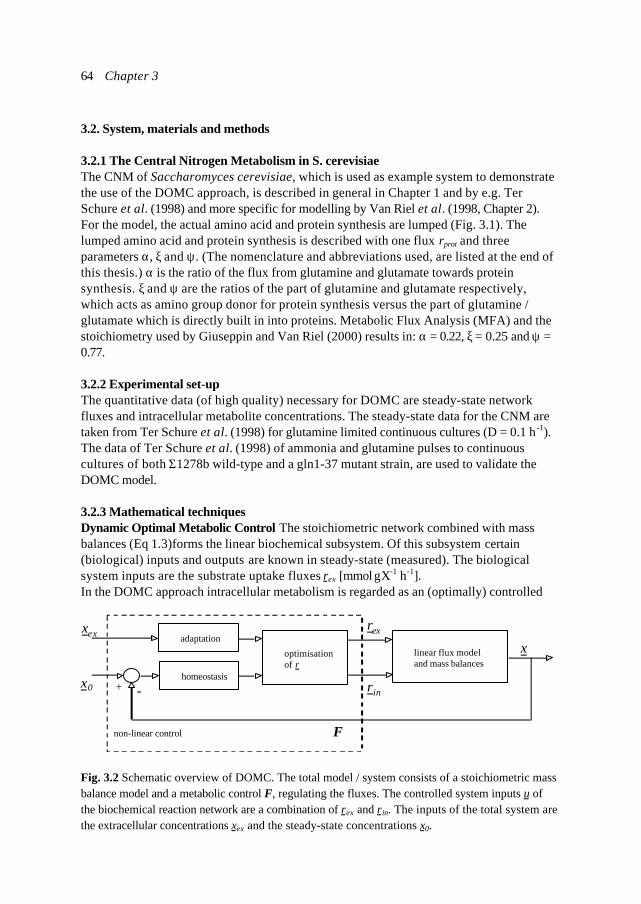
Chapter 364
3.2. System, materials and methods
3.2.1 The Central Nitrogen Metabolism in S. cerevisiaeThe CNM of Saccharomyces cerevisiae, which is used as example system to demonstratethe use of the DOMC approach, is described in general in Chapter 1 and by e.g. TerSchure et al. (1998) and more specific for modelling by Van Riel et al. (1998, Chapter 2).For the model, the actual amino acid and protein synthesis are lumped (Fig. 3.1). Thelumped amino acid and protein synthesis is described with one flux rprot and threeparameters α, ξ and ψ. (The nomenclature and abbreviations used, are listed at the end ofthis thesis.) α is the ratio of the flux from glutamine and glutamate towards proteinsynthesis. ξ and ψ are the ratios of the part of glutamine and glutamate respectively,which acts as amino group donor for protein synthesis versus the part of glutamine /glutamate which is directly built in into proteins. Metabolic Flux Analysis (MFA) and thestoichiometry used by Giuseppin and Van Riel (2000) results in: α = 0.22, ξ = 0.25 and ψ =0.77.
3.2.2 Experimental set-upThe quantitative data (of high quality) necessary for DOMC are steady-state networkfluxes and intracellular metabolite concentrations. The steady-state data for the CNM aretaken from Ter Schure et al. (1998) for glutamine limited continuous cultures (D = 0.1 h -1).The data of Ter Schure et al. (1998) of ammonia and glutamine pulses to continuouscultures of both Σ1278b wild-type and a gln1-37 mutant strain, are used to validate theDOMC model.
3.2.3 Mathematical techniquesDynamic Optimal Metabolic Control The stoichiometric network combined with massbalances (Eq 1.3)forms the linear biochemical subsystem. Of this subsystem certain(biological) inputs and outputs are known in steady-state (measured). The biologicalsystem inputs are the substrate uptake fluxes rex [mmol⋅gX-1⋅h-1].In the DOMC approach intracellular metabolism is regarded as an (optimally) controlled
adaptation
+ -
non-linear control F
optimisationof r
homeostasis
linear flux modeland mass balances
x0
xxex
rin
rex
Fig. 3.2 Schematic overview of DOMC. The total model / system consists of a stoichiometric massbalance model and a metabolic control F, regulating the fluxes. The controlled system inputs u ofthe biochemical reaction network are a combination of rex and rin. The inputs of the total system arethe extracellular concentrations xex and the steady-state concentrations x0.
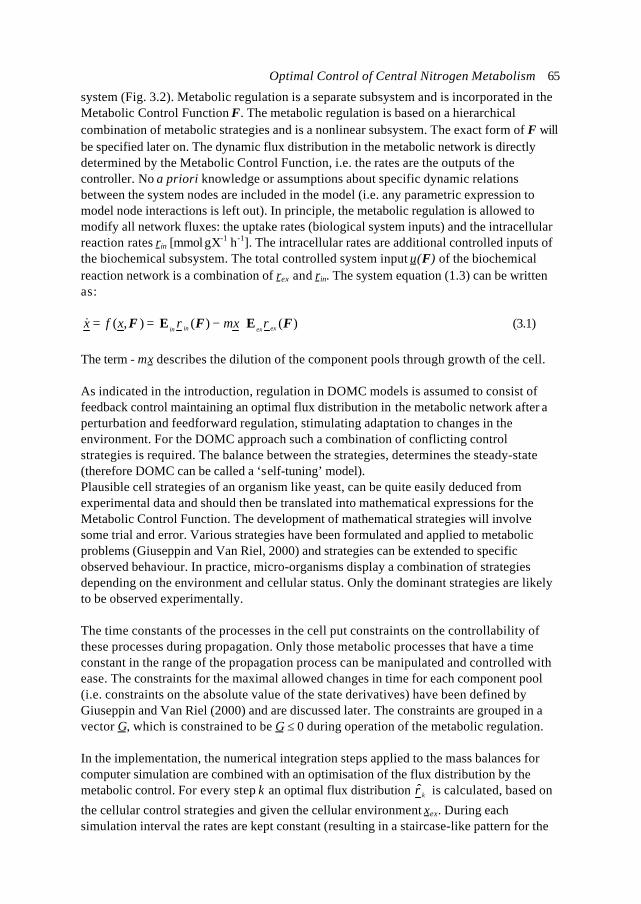
Optimal Control of Central Nitrogen Metabolism 65
system (Fig. 3.2). Metabolic regulation is a separate subsystem and is incorporated in theMetabolic Control Function F. The metabolic regulation is based on a hierarchicalcombination of metabolic strategies and is a nonlinear subsystem. The exact form of F willbe specified later on. The dynamic flux distribution in the metabolic network is directlydetermined by the Metabolic Control Function, i.e. the rates are the outputs of thecontroller. No a priori knowledge or assumptions about specific dynamic relationsbetween the system nodes are included in the model (i.e. any parametric expression tomodel node interactions is left out). In principle, the metabolic regulation is allowed tomodify all network fluxes: the uptake rates (biological system inputs) and the intracellularreaction rates rin [mmol⋅gX-1⋅h-1]. The intracellular rates are additional controlled inputs ofthe biochemical subsystem. The total controlled system input u(F) of the biochemicalreaction network is a combination of rex and rin. The system equation (1.3) can be writtenas:
== ),( Fxfx& )()( FF exexinin rxr EE +− µ (3.1)
The term - µ x describes the dilution of the component pools through growth of the cell.
As indicated in the introduction, regulation in DOMC models is assumed to consist offeedback control maintaining an optimal flux distribution in the metabolic network after aperturbation and feedforward regulation, stimulating adaptation to changes in theenvironment. For the DOMC approach such a combination of conflicting controlstrategies is required. The balance between the strategies, determines the steady-state(therefore DOMC can be called a ‘self-tuning’ model).Plausible cell strategies of an organism like yeast, can be quite easily deduced fromexperimental data and should then be translated into mathematical expressions for theMetabolic Control Function. The development of mathematical strategies will involvesome trial and error. Various strategies have been formulated and applied to metabolicproblems (Giuseppin and Van Riel, 2000) and strategies can be extended to specificobserved behaviour. In practice, micro-organisms display a combination of strategiesdepending on the environment and cellular status. Only the dominant strategies are likelyto be observed experimentally.
The time constants of the processes in the cell put constraints on the controllability ofthese processes during propagation. Only those metabolic processes that have a timeconstant in the range of the propagation process can be manipulated and controlled withease. The constraints for the maximal allowed changes in time for each component pool(i.e. constraints on the absolute value of the state derivatives) have been defined byGiuseppin and Van Riel (2000) and are discussed later. The constraints are grouped in avector G, which is constrained to be G ≤ 0 during operation of the metabolic regulation.
In the implementation, the numerical integration steps applied to the mass balances forcomputer simulation are combined with an optimisation of the flux distribution by themetabolic control. For every step k an optimal flux distribution kr̂ is calculated, based on
the cellular control strategies and given the cellular environment xex. During eachsimulation interval the rates are kept constant (resulting in a staircase-like pattern for the
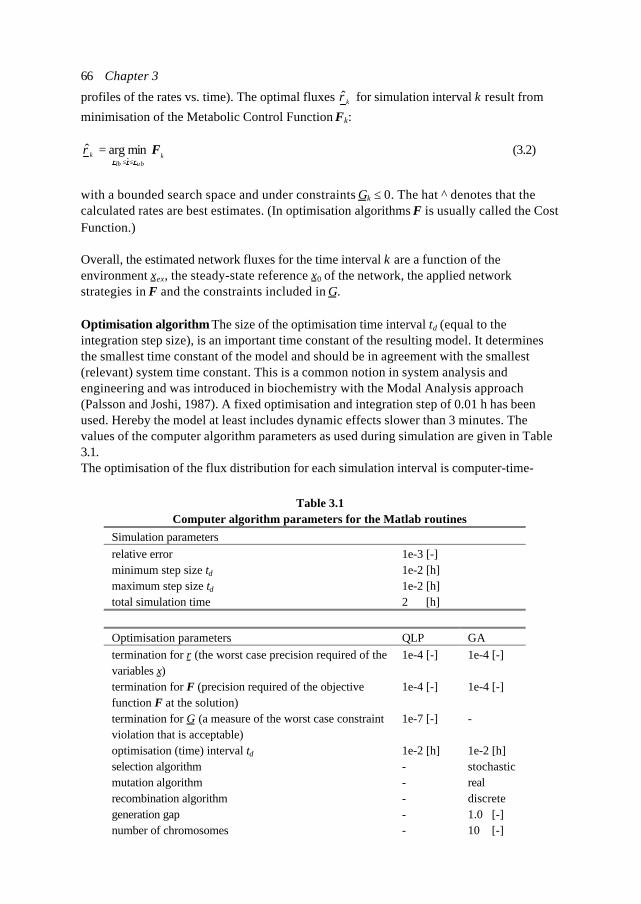
Chapter 366
profiles of the rates vs. time). The optimal fluxes kr̂ for simulation interval k result from
minimisation of the Metabolic Control Function Fk:
kublb
kr Frrr ≤≤
=ˆminargˆ (3.2)
with a bounded search space and under constraints Gk ≤ 0. The hat ^ denotes that thecalculated rates are best estimates. (In optimisation algorithms F is usually called the CostFunction.)
Overall, the estimated network fluxes for the time interval k are a function of theenvironment xex, the steady-state reference x0 of the network, the applied networkstrategies in F and the constraints included in G.
Optimisation algorithm The size of the optimisation time interval tδ (equal to theintegration step size), is an important time constant of the resulting model. It determinesthe smallest time constant of the model and should be in agreement with the smallest(relevant) system time constant. This is a common notion in system analysis andengineering and was introduced in biochemistry with the Modal Analysis approach(Palsson and Joshi, 1987). A fixed optimisation and integration step of 0.01 h has beenused. Hereby the model at least includes dynamic effects slower than 3 minutes. Thevalues of the computer algorithm parameters as used during simulation are given in Table3.1.The optimisation of the flux distribution for each simulation interval is computer-time-
Table 3.1Computer algorithm parameters for the Matlab routines
Simulation parametersrelative error 1e-3 [-]minimum step size tδ 1e-2 [h]maximum step size tδ 1e-2 [h]total simulation time 2 [h]
Optimisation parameters QLP GAtermination for r (the worst case precision required of thevariables x)
1e-4 [-] 1e-4 [-]
termination for F (precision required of the objectivefunction F at the solution)
1e-4 [-] 1e-4 [-]
termination for G (a measure of the worst case constraintviolation that is acceptable)
1e-7 [-] -
optimisation (time) interval tδ 1e-2 [h] 1e-2 [h]selection algorithm - stochasticmutation algorithm - realrecombination algorithm - discretegeneration gap - 1.0 [-]number of chromosomes - 10 [-]
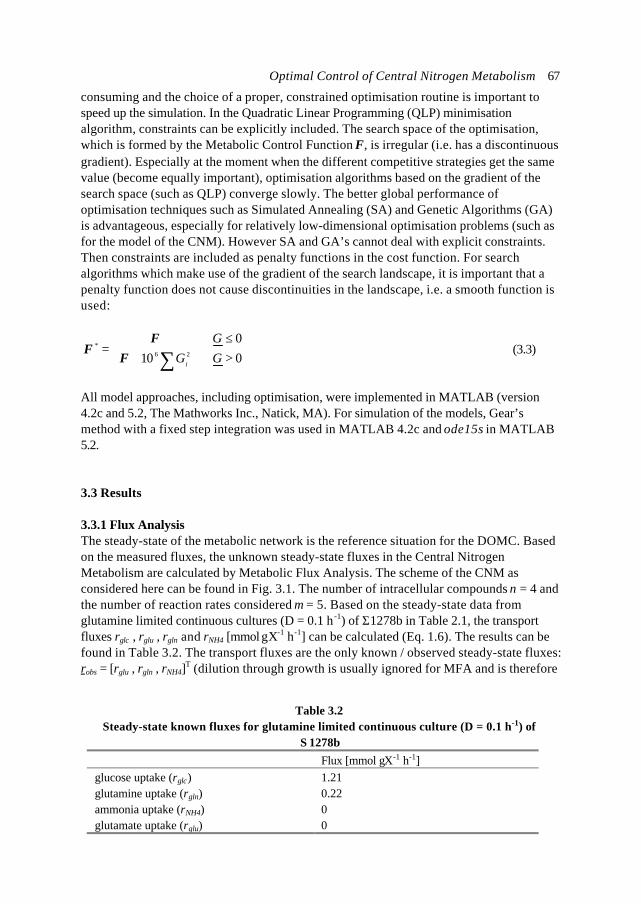
Optimal Control of Central Nitrogen Metabolism 67
consuming and the choice of a proper, constrained optimisation routine is important tospeed up the simulation. In the Quadratic Linear Programming (QLP) minimisationalgorithm, constraints can be explicitly included. The search space of the optimisation,which is formed by the Metabolic Control Function F, is irregular (i.e. has a discontinuousgradient). Especially at the moment when the different competitive strategies get the samevalue (become equally important), optimisation algorithms based on the gradient of thesearch space (such as QLP) converge slowly. The better global performance ofoptimisation techniques such as Simulated Annealing (SA) and Genetic Algorithms (GA)is advantageous, especially for relatively low-dimensional optimisation problems (such asfor the model of the CNM). However SA and GA’s cannot deal with explicit constraints.Then constraints are included as penalty functions in the cost function. For searchalgorithms which make use of the gradient of the search landscape, it is important that apenalty function does not cause discontinuities in the landscape, i.e. a smooth function isused:
>∀+≤∀
= ∑ 0100
26*
GGG
iFF
F (3.3)
All model approaches, including optimisation, were implemented in MATLAB (version4.2c and 5.2, The Mathworks Inc., Natick, MA). For simulation of the models, Gear’smethod with a fixed step integration was used in MATLAB 4.2c and ode15s in MATLAB5.2.
3.3 Results
3.3.1 Flux AnalysisThe steady-state of the metabolic network is the reference situation for the DOMC. Basedon the measured fluxes, the unknown steady-state fluxes in the Central NitrogenMetabolism are calculated by Metabolic Flux Analysis. The scheme of the CNM asconsidered here can be found in Fig. 3.1. The number of intracellular compounds n = 4 andthe number of reaction rates considered m = 5. Based on the steady-state data fromglutamine limited continuous cultures (D = 0.1 h -1) of Σ1278b in Table 2.1, the transportfluxes rglc , rglu , rgln and rNH4 [mmol⋅gX-1⋅h-1] can be calculated (Eq. 1.6). The results can befound in Table 3.2. The transport fluxes are the only known / observed steady-state fluxes:robs = [rglu , rgln , rNH4]
T (dilution through growth is usually ignored for MFA and is therefore
Table 3.2Steady-state known fluxes for glutamine limited continuous culture (D = 0.1 h-1) of
Σ 1278bFlux [mmol⋅gX-1⋅h-1]
glucose uptake (rglc) 1.21glutamine uptake (rgln) 0.22ammonia uptake (rNH4) 0glutamate uptake (rglu) 0
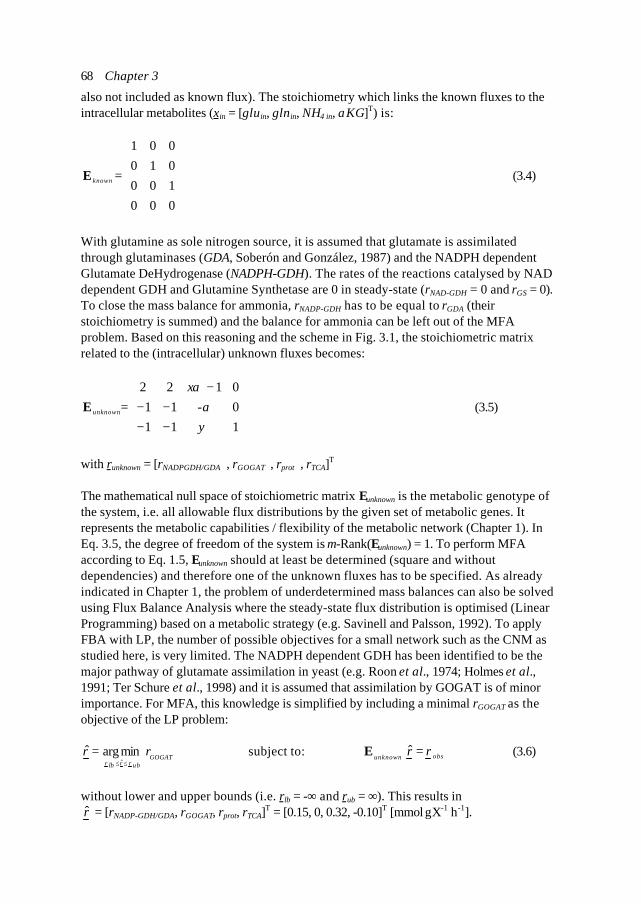
Chapter 368
also not included as known flux). The stoichiometry which links the known fluxes to theintracellular metabolites (xin = [gluin, glnin, NH4 in, αKG]T) is:
=
000100010001
knownE (3.4)
With glutamine as sole nitrogen source, it is assumed that glutamate is assimilatedthrough glutaminases (GDA, Soberón and González, 1987) and the NADPH dependentGlutamate DeHydrogenase (NADPH-GDH). The rates of the reactions catalysed by NADdependent GDH and Glutamine Synthetase are 0 in steady-state (rNAD-GDH = 0 and rGS = 0).To close the mass balance for ammonia, rNADP-GDH has to be equal to rGDA (theirstoichiometry is summed) and the balance for ammonia can be left out of the MFAproblem. Based on this reasoning and the scheme in Fig. 3.1, the stoichiometric matrixrelated to the (intracellular) unknown fluxes becomes:
1110-110122
−−−−
−=
ψα
ξα
unknownE (3.5)
with runknown = [rNADPGDH/GDA , rGOGAT , rprot , rTCA]T
The mathematical null space of stoichiometric matrix Eunknown is the metabolic genotype ofthe system, i.e. all allowable flux distributions by the given set of metabolic genes. Itrepresents the metabolic capabilities / flexibility of the metabolic network (Chapter 1). InEq. 3.5, the degree of freedom of the system is m-Rank(Eunknown) = 1. To perform MFAaccording to Eq. 1.5, Eunknown should at least be determined (square and withoutdependencies) and therefore one of the unknown fluxes has to be specified. As alreadyindicated in Chapter 1, the problem of underdetermined mass balances can also be solvedusing Flux Balance Analysis where the steady-state flux distribution is optimised (LinearProgramming) based on a metabolic strategy (e.g. Savinell and Palsson, 1992). To applyFBA with LP, the number of possible objectives for a small network such as the CNM asstudied here, is very limited. The NADPH dependent GDH has been identified to be themajor pathway of glutamate assimilation in yeast (e.g. Roon et al., 1974; Holmes et al.,1991; Ter Schure et al., 1998) and it is assumed that assimilation by GOGAT is of minorimportance. For MFA, this knowledge is simplified by including a minimal rGOGAT as theobjective of the LP problem:
GOGATubrrlbr
rr≤≤
=ˆminargˆ subject to: obsunknown rr =⋅ ˆE (3.6)
without lower and upper bounds (i.e. rlb = -∞ and rub = ∞). This results inr̂ = [rNADP-GDH/GDA, rGOGAT, rprot, rTCA]T = [0.15, 0, 0.32, -0.10]T [mmol⋅gX-1⋅h-1].
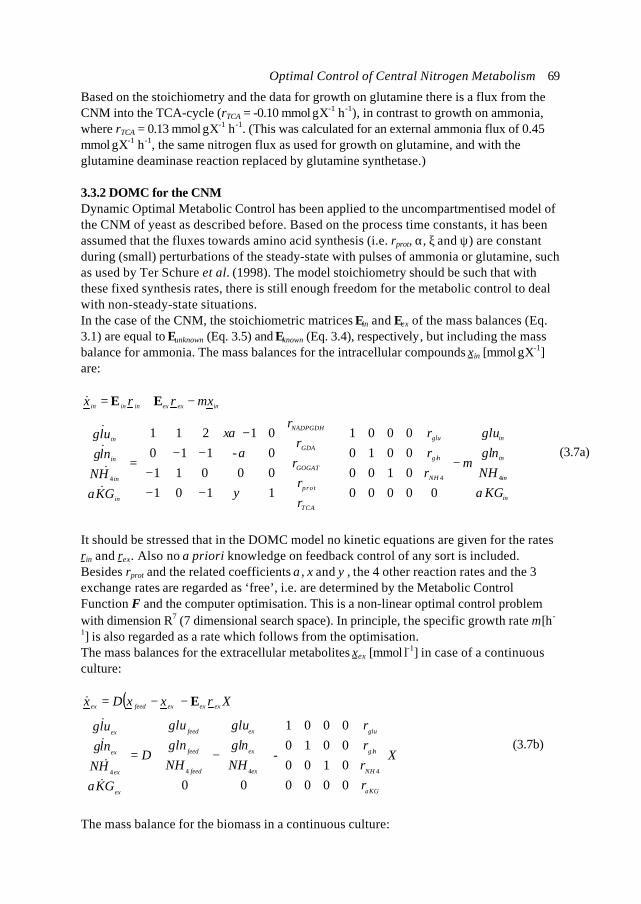
Optimal Control of Central Nitrogen Metabolism 69
Based on the stoichiometry and the data for growth on glutamine there is a flux from theCNM into the TCA-cycle (rTCA = -0.10 mmol⋅gX-1⋅h-1), in contrast to growth on ammonia,where rTCA = 0.13 mmol⋅gX-1⋅h-1. (This was calculated for an external ammonia flux of 0.45mmol⋅gX-1⋅h-1, the same nitrogen flux as used for growth on glutamine, and with theglutamine deaminase reaction replaced by glutamine synthetase.)
3.3.2 DOMC for the CNMDynamic Optimal Metabolic Control has been applied to the uncompartmentised model ofthe CNM of yeast as described before. Based on the process time constants, it has beenassumed that the fluxes towards amino acid synthesis (i.e. rprot, α, ξ and ψ) are constantduring (small) perturbations of the steady-state with pulses of ammonia or glutamine, suchas used by Ter Schure et al. (1998). The model stoichiometry should be such that withthese fixed synthesis rates, there is still enough freedom for the metabolic control to dealwith non-steady-state situations.In the case of the CNM, the stoichiometric matrices Ein and Eex of the mass balances (Eq.3.1) are equal to Eunknown (Eq. 3.5) and Eknown (Eq. 3.4), respectively, but including the massbalance for ammonia. The mass balances for the intracellular compounds xin [mmol⋅gX-1]are:
It should be stressed that in the DOMC model no kinetic equations are given for the ratesrin and rex. Also no a priori knowledge on feedback control of any sort is included.Besides rprot and the related coefficients α, ξ and ψ, the 4 other reaction rates and the 3exchange rates are regarded as ‘free’, i.e. are determined by the Metabolic ControlFunction F and the computer optimisation. This is a non-linear optimal control problemwith dimension R7 (7 dimensional search space). In principle, the specific growth rate µ [h-
1] is also regarded as a rate which follows from the optimisation.The mass balances for the extracellular metabolites xex [mmol⋅l-1] in case of a continuousculture:
( )
X
rrrr
NHngl
glu
NHngl
glu
D
GKHNnlgulg
XrxxDx
KG
NH
ng l
glu
ex
ex
ex
feed
feed
feed
ex
ex
ex
ex
exexexfeedex
−
⇒−−=
αα4444
0000010000100001
-
00
=
&&
&&
& E
(3.7b)
The mass balance for the biomass in a continuous culture:
−
+
−−−
−−−
⇒−+=
in
in
in
in
NH
ng l
glu
TCA
prot
GOGAT
GDA
NADPGDH
in
in
in
in
inexexininin
KGNH
nglglu
rrr
rr
rr
r
GKHNnlgulg
xrrx
α
µ
ψ
αξα
α
µ
444
00000010000100001
1101000110-11001211
=
&&
&&
& EE
(3.7a)
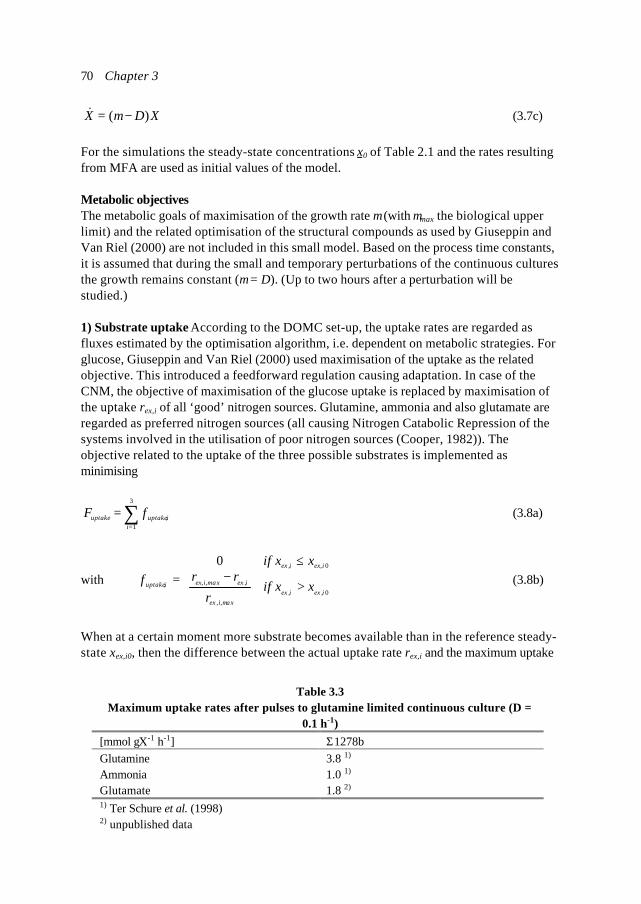
Chapter 370
XDX )( −= µ& (3.7c)
For the simulations the steady-state concentrations x0 of Table 2.1 and the rates resultingfrom MFA are used as initial values of the model.
Metabolic objectivesThe metabolic goals of maximisation of the growth rate µ (with µmax the biological upperlimit) and the related optimisation of the structural compounds as used by Giuseppin andVan Riel (2000) are not included in this small model. Based on the process time constants,it is assumed that during the small and temporary perturbations of the continuous culturesthe growth remains constant (µ = D). (Up to two hours after a perturbation will bestudied.)
1) Substrate uptake According to the DOMC set-up, the uptake rates are regarded asfluxes estimated by the optimisation algorithm, i.e. dependent on metabolic strategies. Forglucose, Giuseppin and Van Riel (2000) used maximisation of the uptake as the relatedobjective. This introduced a feedforward regulation causing adaptation. In case of theCNM, the objective of maximisation of the glucose uptake is replaced by maximisation ofthe uptake rex,i of all ‘good’ nitrogen sources. Glutamine, ammonia and also glutamate areregarded as preferred nitrogen sources (all causing Nitrogen Catabolic Repression of thesystems involved in the utilisation of poor nitrogen sources (Cooper, 1982)). Theobjective related to the uptake of the three possible substrates is implemented asminimising
∑=
=3
1,
iiuptakeuptake fF (3.8a)
with
>−
≤=
0,,,,
,,,
0,,
,
0
iexiexaxmiex
iexaxmiex
iexiex
iuptake xxifr
rrxxif
f (3.8b)
When at a certain moment more substrate becomes available than in the reference steady-state xex,i0, then the difference between the actual uptake rate rex,i and the maximum uptake
Table 3.3Maximum uptake rates after pulses to glutamine limited continuous culture (D =
0.1 h-1)[mmol⋅gX-1⋅h-1] Σ1278bGlutamine 3.8 1)
Ammonia 1.0 1)
Glutamate 1.8 2)
1) Ter Schure et al. (1998)2) unpublished data
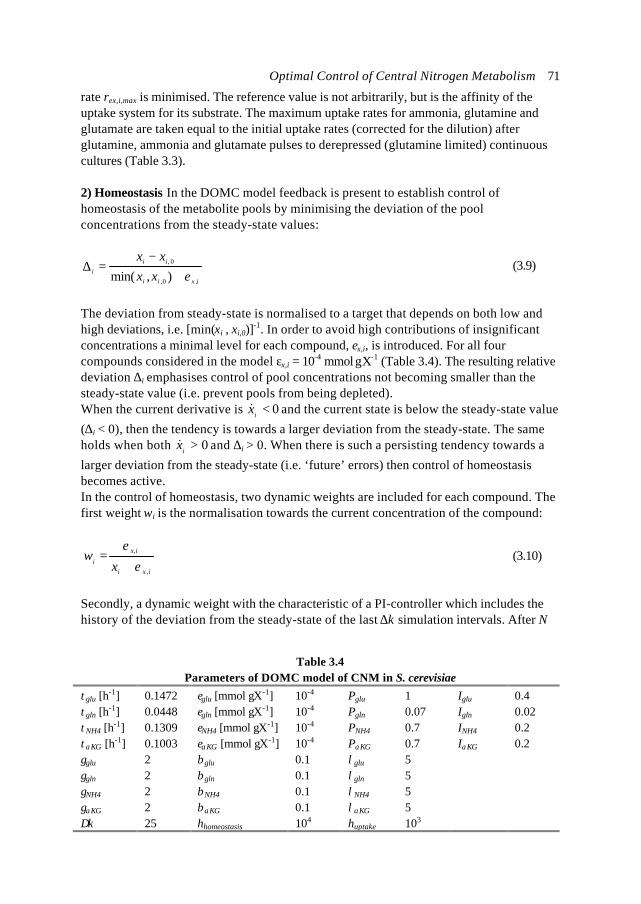
Optimal Control of Central Nitrogen Metabolism 71
rate rex,i,max is minimised. The reference value is not arbitrarily, but is the affinity of theuptake system for its substrate. The maximum uptake rates for ammonia, glutamine andglutamate are taken equal to the initial uptake rates (corrected for the dilution) afterglutamine, ammonia and glutamate pulses to derepressed (glutamine limited) continuouscultures (Table 3.3).
2) Homeostasis In the DOMC model feedback is present to establish control ofhomeostasis of the metabolite pools by minimising the deviation of the poolconcentrations from the steady-state values:
ixii
iii xx
xx
,0,
0,
),min( ε+−
=∆ (3.9)
The deviation from steady-state is normalised to a target that depends on both low andhigh deviations, i.e. [min(xi , xi,0)]
-1. In order to avoid high contributions of insignificantconcentrations a minimal level for each compound, εx,i, is introduced. For all fourcompounds considered in the model εx,i = 10-4 mmol⋅gX-1 (Table 3.4). The resulting relativedeviation ∆i emphasises control of pool concentrations not becoming smaller than thesteady-state value (i.e. prevent pools from being depleted).When the current derivative is 0<ix& and the current state is below the steady-state value
(∆i < 0), then the tendency is towards a larger deviation from the steady-state. The sameholds when both 0>ix& and ∆i > 0. When there is such a persisting tendency towards a
larger deviation from the steady-state (i.e. ‘future’ errors) then control of homeostasisbecomes active.In the control of homeostasis, two dynamic weights are included for each compound. Thefirst weight wi is the normalisation towards the current concentration of the compound:
ixi
ix
i xw
,
,
ε
ε
+= (3.10)
Secondly, a dynamic weight with the characteristic of a PI-controller which includes thehistory of the deviation from the steady-state of the last ∆k simulation intervals. After N
Table 3.4Parameters of DOMC model of CNM in S. cerevisiae
τglu [h-1] 0.1472 εglu [mmol⋅gX-1] 10-4 Pglu 1 Iglu 0.4τgln [h-1] 0.0448 εgln [mmol⋅gX-1] 10-4 Pgln 0.07 Igln 0.02τNH4 [h-1] 0.1309 εNH4 [mmol⋅gX-1] 10-4 PNH4 0.7 INH4 0.2ταKG [h-1] 0.1003 εαKG [mmol⋅gX-1] 10-4 PαKG 0.7 IαKG 0.2γglu 2 βglu 0.1 λglu 5γgln 2 βgln 0.1 λgln 5γNH4 2 βNH4 0.1 λNH4 5γαKG 2 βαKG 0.1 λαKG 5∆k 25 hhomeostasis 104 huptake 103
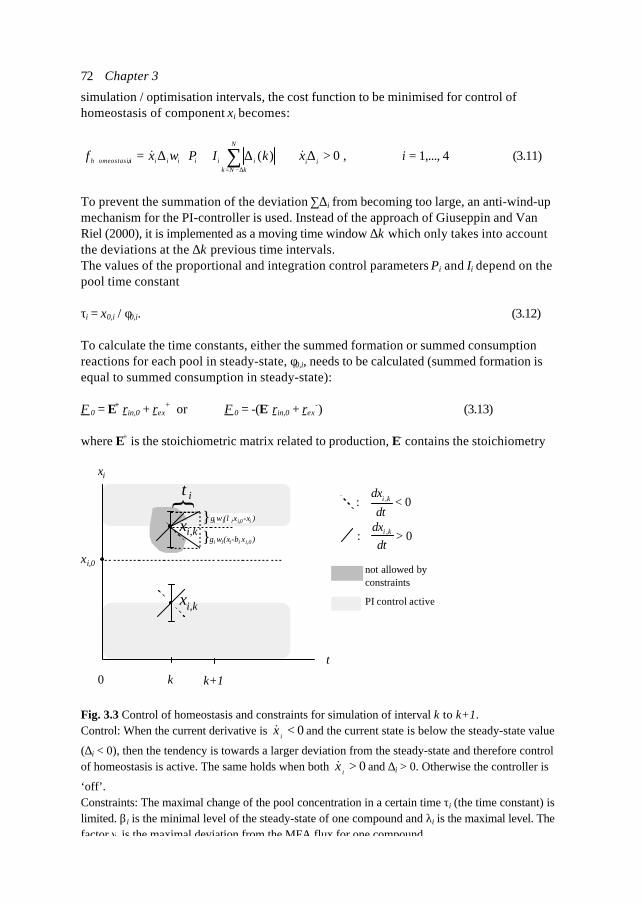
Chapter 372
simulation / optimisation intervals, the cost function to be minimised for control ofhomeostasis of component xi becomes:
∆+∆= ∑
∆−=
N
kNkiiiiiiiomeostasish kIPwxf )(, & 0>∆∀ iix& , i = 1,..., 4 (3.11)
To prevent the summation of the deviation ∑∆i from becoming too large, an anti-wind-upmechanism for the PI-controller is used. Instead of the approach of Giuseppin and VanRiel (2000), it is implemented as a moving time window ∆k which only takes into accountthe deviations at the ∆k previous time intervals.The values of the proportional and integration control parameters Pi and Ii depend on thepool time constant
τi = x0,i / φ0,i. (3.12)
To calculate the time constants, either the summed formation or summed consumptionreactions for each pool in steady-state, φ0,i, needs to be calculated (summed formation isequal to summed consumption in steady-state):
Φ0 = E+ rin,0 + rex+ or Φ0 = -(E- rin,0 + rex
-) (3.13)
where E+ is the stoichiometric matrix related to production, E- contains the stoichiometry
xi
t
0
xi,0
PI control active
not allowed byconstraints
k k+1
xi,k
}τi
}γ i wi(xi-βi xi,0 )xi,k
0: , <dt
dx ki
0: , >dt
dx ki
}γi wi(λ i xi,0-xi )
Fig. 3.3 Control of homeostasis and constraints for simulation of interval k to k+1.Control: When the current derivative is 0<ix& and the current state is below the steady-state value
(∆i < 0), then the tendency is towards a larger deviation from the steady-state and therefore controlof homeostasis is active. The same holds when both 0>ix& and ∆i > 0. Otherwise the controller is
‘off’.Constraints: The maximal change of the pool concentration in a certain time τi (the time constant) islimited. βi is the minimal level of the steady-state of one compound and λi is the maximal level. Thefactor γi is the maximal deviation from the MFA flux for one compound.
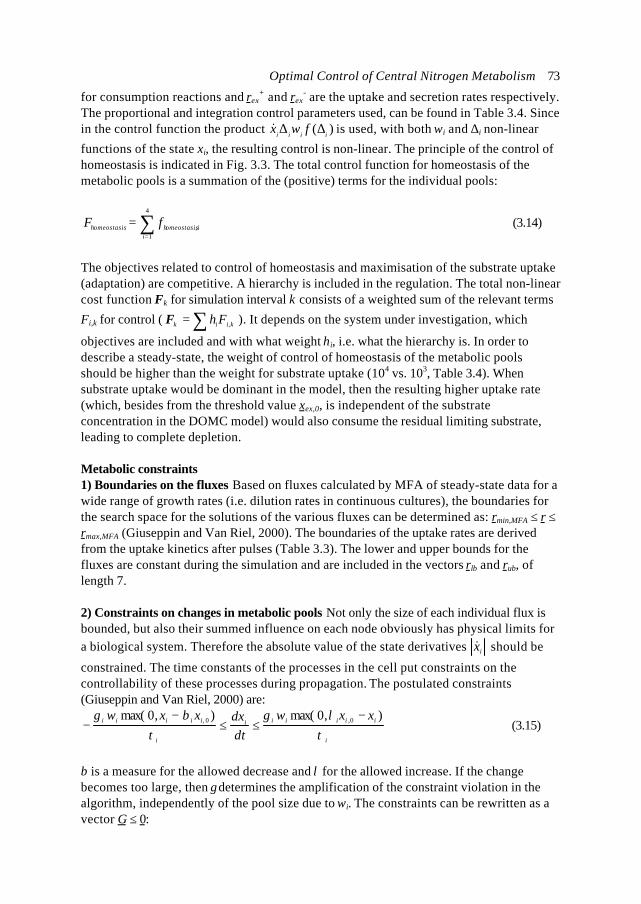
Optimal Control of Central Nitrogen Metabolism 73
for consumption reactions and rex+ and rex
- are the uptake and secretion rates respectively.The proportional and integration control parameters used, can be found in Table 3.4. Sincein the control function the product )( iiii fwx ∆∆& is used, with both wi and ∆i non-linear
functions of the state xi, the resulting control is non-linear. The principle of the control ofhomeostasis is indicated in Fig. 3.3. The total control function for homeostasis of themetabolic pools is a summation of the (positive) terms for the individual pools:
∑=
=4
1,
iiomeostasishomeostasish fF (3.14)
The objectives related to control of homeostasis and maximisation of the substrate uptake(adaptation) are competitive. A hierarchy is included in the regulation. The total non-linearcost function Fk for simulation interval k consists of a weighted sum of the relevant terms
Fi,k for control ( ∑= kiik Fh ,F ). It depends on the system under investigation, which
objectives are included and with what weight hi, i.e. what the hierarchy is. In order todescribe a steady-state, the weight of control of homeostasis of the metabolic poolsshould be higher than the weight for substrate uptake (104 vs. 103, Table 3.4). Whensubstrate uptake would be dominant in the model, then the resulting higher uptake rate(which, besides from the threshold value xex,0, is independent of the substrateconcentration in the DOMC model) would also consume the residual limiting substrate,leading to complete depletion.
Metabolic constraints1) Boundaries on the fluxes Based on fluxes calculated by MFA of steady-state data for awide range of growth rates (i.e. dilution rates in continuous cultures), the boundaries forthe search space for the solutions of the various fluxes can be determined as: rmin,MFA ≤ r ≤rmax,MFA (Giuseppin and Van Riel, 2000). The boundaries of the uptake rates are derivedfrom the uptake kinetics after pulses (Table 3.3). The lower and upper bounds for thefluxes are constant during the simulation and are included in the vectors rlb and rub, oflength 7.
2) Constraints on changes in metabolic pools Not only the size of each individual flux isbounded, but also their summed influence on each node obviously has physical limits fora biological system. Therefore the absolute value of the state derivatives ix& should be
constrained. The time constants of the processes in the cell put constraints on thecontrollability of these processes during propagation. The postulated constraints(Giuseppin and Van Riel, 2000) are:
i
iiiiii
i
iiiii xxwdtdxxxw
τλγ
τβγ ),0max(),0max( 0,0, −
≤≤−
− (3.15)
β is a measure for the allowed decrease and λ for the allowed increase. If the changebecomes too large, then γ determines the amplification of the constraint violation in thealgorithm, independently of the pool size due to wi. The constraints can be rewritten as avector G ≤ 0:
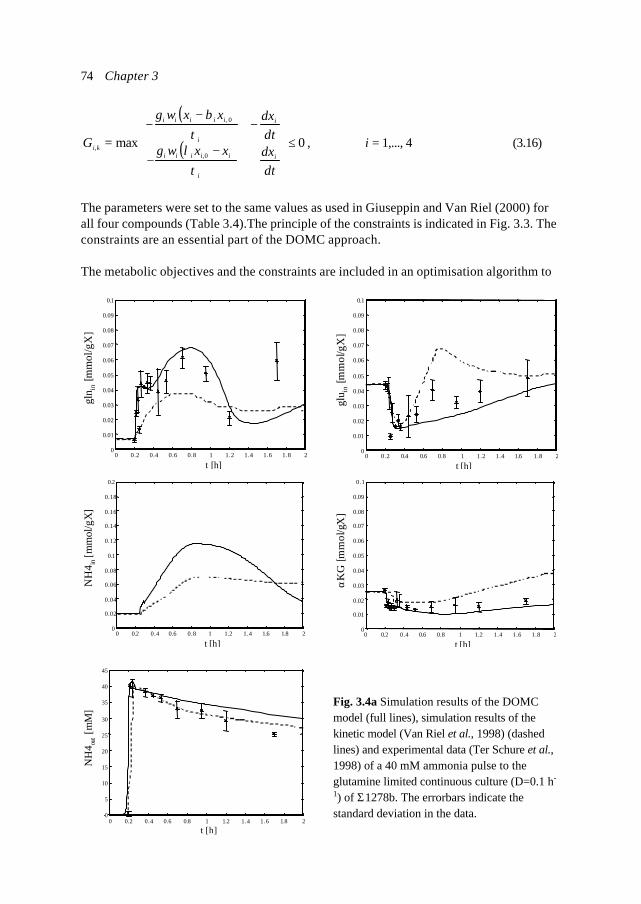
Chapter 374
( )
( ) 0max0,
0,
, ≤
+−
−
−−
−=
dtdxxxwdtdxxxw
Gi
i
iiiii
i
i
iiiii
ki
τλγ
τβγ
, i = 1,..., 4 (3.16)
The parameters were set to the same values as used in Giuseppin and Van Riel (2000) forall four compounds (Table 3.4).The principle of the constraints is indicated in Fig. 3.3. Theconstraints are an essential part of the DOMC approach.
The metabolic objectives and the constraints are included in an optimisation algorithm to
gln
in [m
mol
/gX
]
0 0.2 0.4 0.6 0.8 1 1.2 1.4 1.6 1.8 20
0.01
0.02
0.03
0.04
0.05
0.06
0.07
0.08
0.09
0.1
t [h]
glu
in [m
mol
/gX
]
0 0.2 0.4 0.6 0.8 1 1.2 1.4 1.6 1.8 20
0.01
0.02
0.03
0.04
0.05
0.06
0.07
0.08
0.09
0.1
t [h]
NH
4 in [m
mol
/gX
]
0 0.2 0.4 0.6 0.8 1 1.2 1.4 1.6 1.8 20
0.02
0.04
0.06
0.08
0.1
0.12
0.14
0.16
0.18
0.2
t [h]
αK
G [m
mol
/gX
]
0 0.2 0.4 0.6 0.8 1 1.2 1.4 1.6 1.8 20
0.01
0.02
0.03
0.04
0.05
0.06
0.07
0.08
0.09
0.1
t [h]
NH
4 out [
mM
]
0 0.2 0.4 0.6 0.8 1 1.2 1.4 1.6 1.8 20
5
10
15
20
25
30
35
40
45
t [h]
Fig. 3.4a Simulation results of the DOMCmodel (full lines), simulation results of thekinetic model (Van Riel et al., 1998) (dashedlines) and experimental data (Ter Schure et al.,1998) of a 40 mM ammonia pulse to theglutamine limited continuous culture (D=0.1 h-
1) of Σ1278b. The errorbars indicate thestandard deviation in the data.
Optimal Control of Central Nitrogen Metabolism 75
calculate the optimal fluxes kr̂ for each simulation interval (Eq. 3.2).
3.3.3 Simulation resultsThe Dynamic Optimal Metabolic Control model of the Central Nitrogen Metabolism inyeast is used to simulate perturbations of steady-state continuous cultures of both a wild-type and a mutant strain. The model predictions are compared to experimental data of TerSchure et al. (1998) and to the simulation results of the kinetic model of Van Riel et al.(1998).From the experimental data after the pulses it is clear that the model cannot be complete.After the pulses, the nitrogen which is being taken up is not purely recovered in theintracellular glutamate and glutamine pool. According to simulations with both the DOMCand the kinetic model the total ‘missing’ nitrogen cannot be found in intracellular ammoniaeither. From measurements of the pools of all amino acids after pulses (Chapter 6) it isclear that the assumption of a constant flux toward protein synthesis and a constant ratioof the amino acid pools cannot be justified. To correct the model, to some extent, for thisknowledge an extra flux is added which withdraws glutamate, just like in the kinetic modelof the CNM (Van Riel et al., 1998).
The results of a 40 mM ammonia pulse to the wild-type strain can be found in Fig. 3.4. Thederivatives for the first optimisation step of a steady-state simulation are not zero. Sincethe dilution through growth was ignored in Metabolic Flux Analysis, but included in thedynamic model, the derivatives are equal to -µ⋅xi,0. The initial 0<ix& results in states xi
which are bit below the steady-state values xi,0 after one simulation interval, i.e. ∆i < 0, andcontrol of homeostasis of the metabolic pools is (a little) active. After these (numerical)initialisation effects, the pools reach the steady-state concentrations (Fig. 3.4a) and boththe control function for homeostasis and for adaptation are zero (Fig. 3.4b). When theammonia pulse is given, instantly there is a large surplus of the limiting substrate (NH4,ex >NH4,ex,0). In the steady-state culture there was no ammonia consumption, so at the momentof the pulse there is a large difference between the actual
0 0.2 0.4 0.6 0.8 1 1.2 1.4 1.6 1.8 20
10
20
30
40
50
60
70
80
90
100
t [h]
cont
rol f
unct
ions
homeostasisuptake
Fig. 3.4b Representation of thecontrol functions forhomeostasis (o) and adaptation(+) after a 40 mM ammoniapulse to the wild-type.
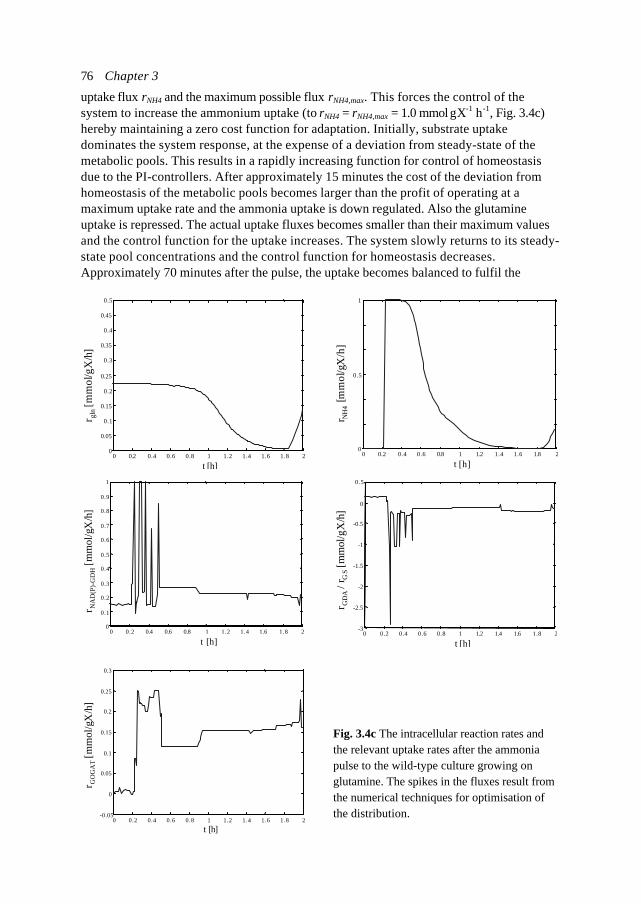
Chapter 376
uptake flux rNH4 and the maximum possible flux rNH4,max. This forces the control of thesystem to increase the ammonium uptake (to rNH4 = rNH4,max = 1.0 mmol⋅gX-1⋅h-1, Fig. 3.4c)hereby maintaining a zero cost function for adaptation. Initially, substrate uptakedominates the system response, at the expense of a deviation from steady-state of themetabolic pools. This results in a rapidly increasing function for control of homeostasisdue to the PI-controllers. After approximately 15 minutes the cost of the deviation fromhomeostasis of the metabolic pools becomes larger than the profit of operating at amaximum uptake rate and the ammonia uptake is down regulated. Also the glutamineuptake is repressed. The actual uptake fluxes becomes smaller than their maximum valuesand the control function for the uptake increases. The system slowly returns to its steady-state pool concentrations and the control function for homeostasis decreases.Approximately 70 minutes after the pulse, the uptake becomes balanced to fulfil the
0 0.2 0.4 0.6 0.8 1 1.2 1.4 1.6 1.8 20
0.05
0.1
0.15
0.2
0.25
0.3
0.35
0.4
0.45
0.5
t [h]
r gln [
mm
ol/g
X/h
]
00 0.2 0.4 0.6 0.8 1 1.2 1.4 1.6 1.8 2
0.5
1
t [h]
r NH
4 [m
mol
/gX
/h]
0 0.2 0.4 0.6 0.8 1 1.2 1.4 1.6 1.8 20
0.1
0.2
0.3
0.4
0.5
0.6
0.7
0.8
0.9
1
t [h]
r NA
D(P
)-G
DH [m
mol
/gX
/h]
-30 0.2 0.4 0.6 0.8 1 1.2 1.4 1.6 1.8 2
-2.5
-2
-1.5
-1
-0.5
0
0.5
t [h]
r GD
A /
r GS [
mm
ol/g
X/h
]
0 0.2 0.4 0.6 0.8 1 1.2 1.4 1.6 1.8 2-0.05
0
0.05
0.1
0.15
0.2
0.25
0.3
t [h]
r GO
GA
T [m
mol
/gX
/h]
Fig. 3.4c The intracellular reaction rates andthe relevant uptake rates after the ammoniapulse to the wild-type culture growing onglutamine. The spikes in the fluxes result fromthe numerical techniques for optimisation ofthe distribution.
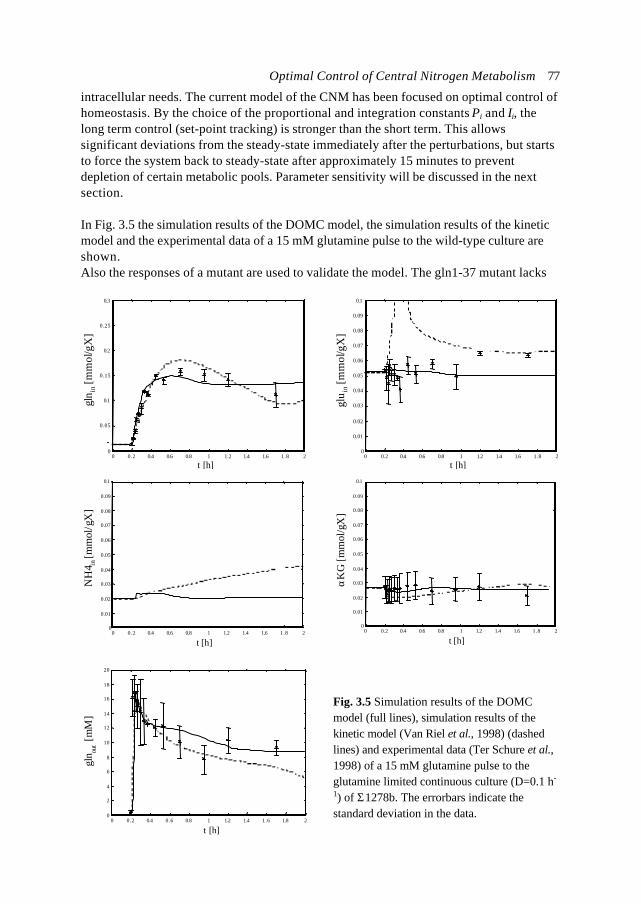
Optimal Control of Central Nitrogen Metabolism 77
intracellular needs. The current model of the CNM has been focused on optimal control ofhomeostasis. By the choice of the proportional and integration constants Pi and Ii, thelong term control (set-point tracking) is stronger than the short term. This allowssignificant deviations from the steady-state immediately after the perturbations, but startsto force the system back to steady-state after approximately 15 minutes to preventdepletion of certain metabolic pools. Parameter sensitivity will be discussed in the nextsection.
In Fig. 3.5 the simulation results of the DOMC model, the simulation results of the kineticmodel and the experimental data of a 15 mM glutamine pulse to the wild-type culture areshown.Also the responses of a mutant are used to validate the model. The gln1-37 mutant lacks
0 0.2 0.4 0.6 0.8 1 1.2 1.4 1.6 1.8 20
0.05
0.1
0.15
0.2
0.25
0.3
gln
in [
mm
ol/g
X]
t [h]0 0.2 0.4 0.6 0.8 1 1.2 1.4 1.6 1.8 2
0
0.01
0.02
0.03
0.04
0.05
0.06
0.07
0.08
0.09
0.1
glu
in [
mm
ol/g
X]
t [h]
0 0.2 0.4 0.6 0.8 1 1.2 1.4 1.6 1.8 20
0.01
0.02
0.03
0.04
0.05
0.06
0.07
0.08
0.09
0.1
NH
4 in [m
mol
/gX
]
t [h]0 0.2 0.4 0.6 0.8 1 1.2 1.4 1.6 1.8 2
0
0.01
0.02
0.03
0.04
0.05
0.06
0.07
0.08
0.09
0.1
αK
G [m
mol
/gX
]
t [h]
0 0.2 0.4 0.6 0.8 1 1.2 1.4 1.6 1.8 20
2
4
6
8
10
12
14
16
18
20
t [h]
gln
out [
mM
]
Fig. 3.5 Simulation results of the DOMCmodel (full lines), simulation results of thekinetic model (Van Riel et al., 1998) (dashedlines) and experimental data (Ter Schure et al.,1998) of a 15 mM glutamine pulse to theglutamine limited continuous culture (D=0.1 h-
1) of Σ1278b. The errorbars indicate thestandard deviation in the data.
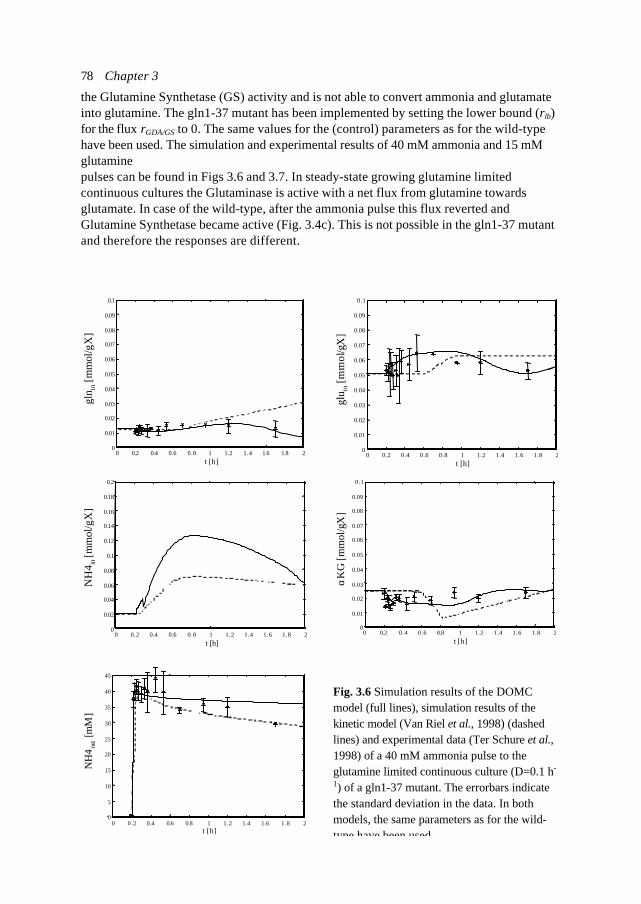
Chapter 378
the Glutamine Synthetase (GS) activity and is not able to convert ammonia and glutamateinto glutamine. The gln1-37 mutant has been implemented by setting the lower bound (rlb)for the flux rGDA/GS to 0. The same values for the (control) parameters as for the wild-typehave been used. The simulation and experimental results of 40 mM ammonia and 15 mMglutaminepulses can be found in Figs 3.6 and 3.7. In steady-state growing glutamine limitedcontinuous cultures the Glutaminase is active with a net flux from glutamine towardsglutamate. In case of the wild-type, after the ammonia pulse this flux reverted andGlutamine Synthetase became active (Fig. 3.4c). This is not possible in the gln1-37 mutantand therefore the responses are different.
glu
in [m
mol
/gX
]
0 0.2 0.4 0.6 0.8 1 1.2 1.4 1.6 1.8 20
0.01
0.02
0.03
0.04
0.05
0.06
0.07
0.08
0.09
0.1
t [h]
gln
in [m
mol
/gX
]
0 0.2 0.4 0.6 0.8 1 1.2 1.4 1.6 1.8 20
0.01
0.02
0.03
0.04
0.05
0.06
0.07
0.08
0.09
0.1
t [h]
Fig. 3.6 Simulation results of the DOMCmodel (full lines), simulation results of thekinetic model (Van Riel et al., 1998) (dashedlines) and experimental data (Ter Schure et al.,1998) of a 40 mM ammonia pulse to theglutamine limited continuous culture (D=0.1 h-
1) of a gln1-37 mutant. The errorbars indicatethe standard deviation in the data. In bothmodels, the same parameters as for the wild-type have been used.
NH
4 out [
mM
]
0 0.2 0.4 0.6 0.8 1 1.2 1.4 1.6 1.8 20
5
10
15
20
25
30
35
40
45
t [h]
NH
4 in [m
mol
/gX
]
0 0.2 0.4 0.6 0.8 1 1.2 1.4 1.6 1.8 20
0.02
0.04
0.06
0.08
0.1
0.12
0.14
0.16
0.18
0.2
t [h]
αK
G [
mm
ol/g
X]
0 0.2 0.4 0.6 0.8 1 1.2 1.4 1.6 1.8 20
0.01
0.02
0.03
0.04
0.05
0.06
0.07
0.08
0.09
0.1
t [h]
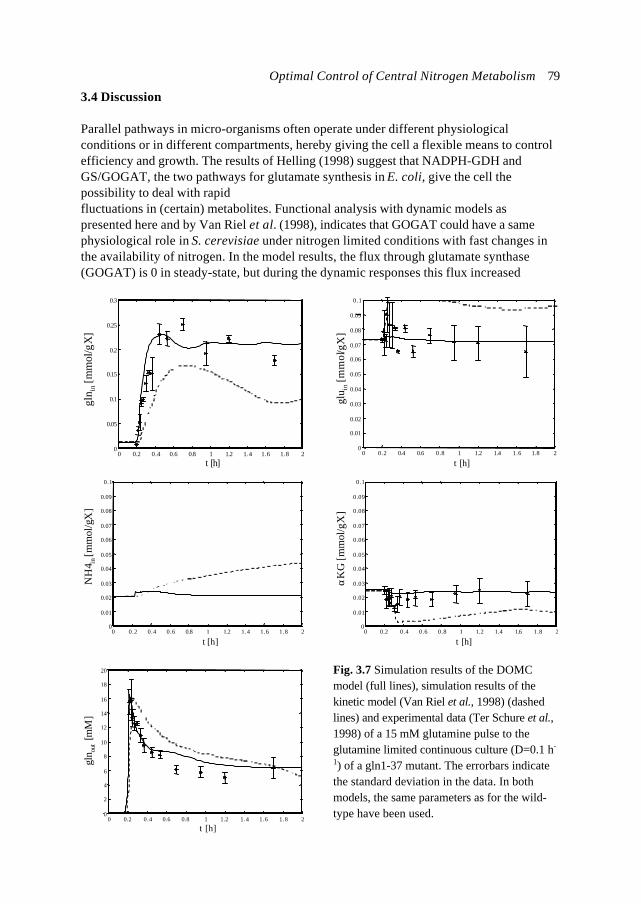
Optimal Control of Central Nitrogen Metabolism 79
3.4 Discussion
Parallel pathways in micro-organisms often operate under different physiologicalconditions or in different compartments, hereby giving the cell a flexible means to controlefficiency and growth. The results of Helling (1998) suggest that NADPH-GDH andGS/GOGAT, the two pathways for glutamate synthesis in E. coli, give the cell thepossibility to deal with rapidfluctuations in (certain) metabolites. Functional analysis with dynamic models aspresented here and by Van Riel et al. (1998), indicates that GOGAT could have a samephysiological role in S. cerevisiae under nitrogen limited conditions with fast changes inthe availability of nitrogen. In the model results, the flux through glutamate synthase(GOGAT) is 0 in steady-state, but during the dynamic responses this flux increased
0 0.2 0.4 0.6 0.8 1 1.2 1.4 1.6 1.8 20
0.05
0.1
0.15
0.2
0.25
0.3
t [h]
gln
in [
mm
ol/g
X]
0 0.2 0.4 0.6 0.8 1 1.2 1.4 1.6 1.8 20
0.01
0.02
0.03
0.04
0.05
0.06
0.07
0.08
0.09
0.1
t [h]
glu
in [m
mol
/gX
]
0 0.2 0.4 0.6 0.8 1 1.2 1.4 1.6 1.8 20
0.01
0.02
0.03
0.04
0.05
0.06
0.07
0.08
0.09
0.1
t [h]
NH
4 in [m
mol
/gX
]
0 0.2 0.4 0.6 0.8 1 1.2 1.4 1.6 1.8 20
0.01
0.02
0.03
0.04
0.05
0.06
0.07
0.08
0.09
0.1
t [h]
αK
G [m
mol
/gX
]
Fig. 3.7 Simulation results of the DOMCmodel (full lines), simulation results of thekinetic model (Van Riel et al., 1998) (dashedlines) and experimental data (Ter Schure et al.,1998) of a 15 mM glutamine pulse to theglutamine limited continuous culture (D=0.1 h-
1) of a gln1-37 mutant. The errorbars indicatethe standard deviation in the data. In bothmodels, the same parameters as for the wild-type have been used.
0 0.2 0.4 0.6 0.8 1 1.2 1.4 1.6 1.8 20
2
4
6
8
10
12
14
16
18
20
t [h]
gln
out [
mM
]
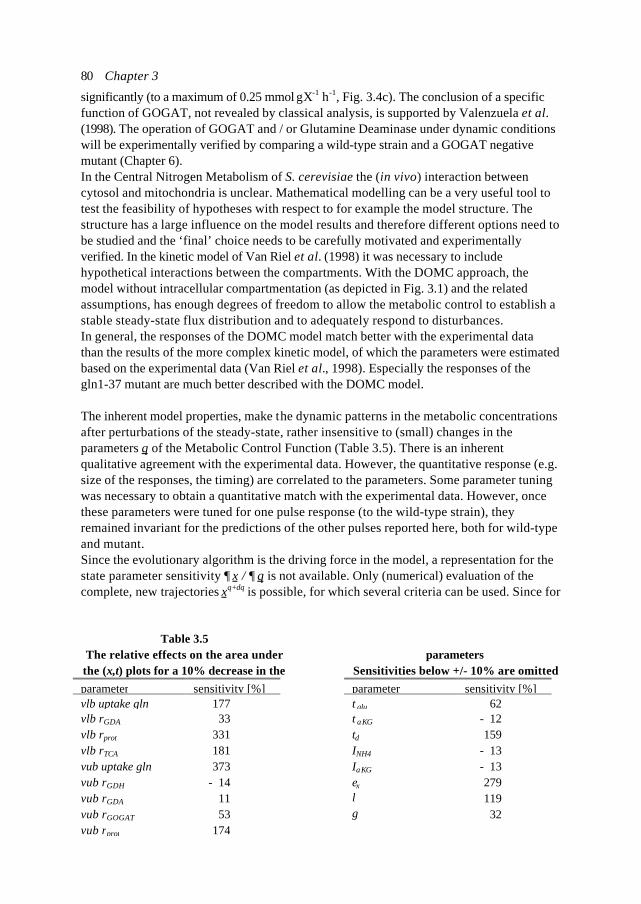
Chapter 380
significantly (to a maximum of 0.25 mmol⋅gX-1⋅h-1, Fig. 3.4c). The conclusion of a specificfunction of GOGAT, not revealed by classical analysis, is supported by Valenzuela et al.(1998). The operation of GOGAT and / or Glutamine Deaminase under dynamic conditionswill be experimentally verified by comparing a wild-type strain and a GOGAT negativemutant (Chapter 6).In the Central Nitrogen Metabolism of S. cerevisiae the (in vivo) interaction betweencytosol and mitochondria is unclear. Mathematical modelling can be a very useful tool totest the feasibility of hypotheses with respect to for example the model structure. Thestructure has a large influence on the model results and therefore different options need tobe studied and the ‘final’ choice needs to be carefully motivated and experimentallyverified. In the kinetic model of Van Riel et al. (1998) it was necessary to includehypothetical interactions between the compartments. With the DOMC approach, themodel without intracellular compartmentation (as depicted in Fig. 3.1) and the relatedassumptions, has enough degrees of freedom to allow the metabolic control to establish astable steady-state flux distribution and to adequately respond to disturbances.In general, the responses of the DOMC model match better with the experimental datathan the results of the more complex kinetic model, of which the parameters were estimatedbased on the experimental data (Van Riel et al., 1998). Especially the responses of thegln1-37 mutant are much better described with the DOMC model.
The inherent model properties, make the dynamic patterns in the metabolic concentrationsafter perturbations of the steady-state, rather insensitive to (small) changes in theparameters θ of the Metabolic Control Function (Table 3.5). There is an inherentqualitative agreement with the experimental data. However, the quantitative response (e.g.size of the responses, the timing) are correlated to the parameters. Some parameter tuningwas necessary to obtain a quantitative match with the experimental data. However, oncethese parameters were tuned for one pulse response (to the wild-type strain), theyremained invariant for the predictions of the other pulses reported here, both for wild-typeand mutant.Since the evolutionary algorithm is the driving force in the model, a representation for thestate parameter sensitivity ∂ x / ∂ θ is not available. Only (numerical) evaluation of thecomplete, new trajectories xθ+δθ is possible, for which several criteria can be used. Since for
parametersSensitivities below +/- 10% are omittedparameter sensitivity [%]τglu 62ταKG - 12td 159INH4 - 13IαKG - 13εx 279λ 119γ 32
Table 3.5The relative effects on the area underthe (x,t) plots for a 10% decrease in theparameter sensitivity [%]vlb uptake gln 177vlb rGDA 33vlb rprot 331vlb rTCA 181vub uptake gln 373vub rGDH - 14vub rGDA 11vub rGOGAT 53vub rprot 174
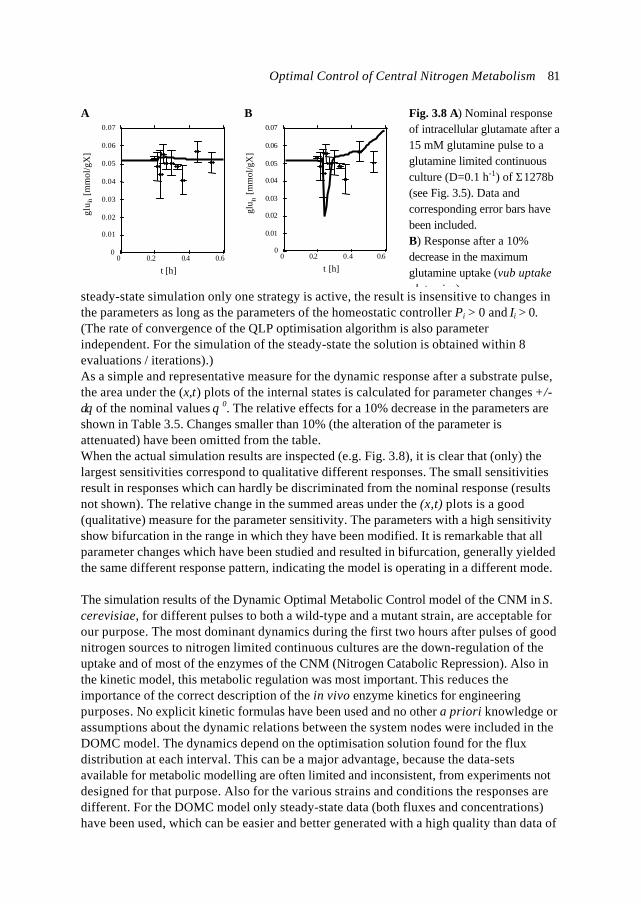
Optimal Control of Central Nitrogen Metabolism 81
steady-state simulation only one strategy is active, the result is insensitive to changes inthe parameters as long as the parameters of the homeostatic controller Pi > 0 and Ii > 0.(The rate of convergence of the QLP optimisation algorithm is also parameterindependent. For the simulation of the steady-state the solution is obtained within 8evaluations / iterations).)As a simple and representative measure for the dynamic response after a substrate pulse,the area under the (x,t) plots of the internal states is calculated for parameter changes +/-δθ of the nominal values θ 0. The relative effects for a 10% decrease in the parameters areshown in Table 3.5. Changes smaller than 10% (the alteration of the parameter isattenuated) have been omitted from the table.When the actual simulation results are inspected (e.g. Fig. 3.8), it is clear that (only) thelargest sensitivities correspond to qualitative different responses. The small sensitivitiesresult in responses which can hardly be discriminated from the nominal response (resultsnot shown). The relative change in the summed areas under the (x,t) plots is a good(qualitative) measure for the parameter sensitivity. The parameters with a high sensitivityshow bifurcation in the range in which they have been modified. It is remarkable that allparameter changes which have been studied and resulted in bifurcation, generally yieldedthe same different response pattern, indicating the model is operating in a different mode.
The simulation results of the Dynamic Optimal Metabolic Control model of the CNM in S.cerevisiae, for different pulses to both a wild-type and a mutant strain, are acceptable forour purpose. The most dominant dynamics during the first two hours after pulses of goodnitrogen sources to nitrogen limited continuous cultures are the down-regulation of theuptake and of most of the enzymes of the CNM (Nitrogen Catabolic Repression). Also inthe kinetic model, this metabolic regulation was most important. This reduces theimportance of the correct description of the in vivo enzyme kinetics for engineeringpurposes. No explicit kinetic formulas have been used and no other a priori knowledge orassumptions about the dynamic relations between the system nodes were included in theDOMC model. The dynamics depend on the optimisation solution found for the fluxdistribution at each interval. This can be a major advantage, because the data-setsavailable for metabolic modelling are often limited and inconsistent, from experiments notdesigned for that purpose. Also for the various strains and conditions the responses aredifferent. For the DOMC model only steady-state data (both fluxes and concentrations)have been used, which can be easier and better generated with a high quality than data of
A
glu
in [m
mol
/gX
]
t [h]0 0.2 0.4 0.6
0
0.01
0.02
0.03
0.04
0.05
0.06
0.07
B
glu
in [m
mol
/gX
]
t [h]0 0.2 0.4 0.6
0
0.01
0.02
0.03
0.04
0.05
0.06
0.07
Fig. 3.8 A) Nominal responseof intracellular glutamate after a15 mM glutamine pulse to aglutamine limited continuousculture (D=0.1 h-1) of Σ1278b(see Fig. 3.5). Data andcorresponding error bars havebeen included.B) Response after a 10%decrease in the maximumglutamine uptake (vub uptakeglutamine).
Chapter 382
in vivo dynamics. The DOMC is a flexible approach in which a certain observation or ideaof the experimentator for the biological system can be incorporated and tested as athought experiment. Besides an advantage, this is also a risk of the DOMC approach.When the approach is not carefully used and validated, very irrealistic results can beobtained. However, validation is essential for all models.
The different optimisation algorithms as discussed in Section 3.2.3 yielded the same modelresponses (results not shown). The model with QLP is much faster than theimplementation with a GA (which is a ‘global’ search algorithm). For the optimal controlproblem in the CNM a non-linear, local search algorithm, such as QLP, is sufficient. Thisindicates that, given the metabolic network and the measured uptake fluxes, the estimatedsteady-state fluxes are globally optimal and are the best reference flux distribution to startdynamic simulations.
The (slowly) increasing number of positive results with a cybernetic approach indicate itsvalidity as a tool, especially for engineering purposes. Most likely it is impossible to reallyproof that a ‘cybernetic’ approach of biological systems is correct. However, it is aplausible approach. In nature, micro-organisms have evolved to survive under a widerange of external conditions. The various types of micro-organisms in ecological nicheshave developed strategies to survive and to compete adequately. They can adapt theirmetabolism within their genetic capabilities (genotype) with a given response time. Therobustness and redundancy in metabolism also cause problems in genome projects forgene assignment, because the physiological function often cannot be straightforwardlyrevealed. On the other hand, the possibilities for control in a cell are clearly constrained.Some knock-out mutations are lethal, i.e. the modified cells are not able to adapt to thenew genotype, within the constraints set by evolution. It is probably much more efficientto focus on these functional system characteristics to understand and quantitativelymodel cellular metabolism, instead of a reductionistic approach.
The DOMC framework is a heuristic approach, not suited to study metabolism inmechanistic detail. The DOMC models describe the global behaviour of an optimallycontrolled biochemical network. Models such as these should not be considered asdefinitive descriptions of metabolic networks, but rather as an approach that allows tounderstand the capabilities of complex systems. The approach is (especially) scientific atthe system level, in the sense that it gives fundamental insight in the emergent propertiesand functionality of complex metabolic networks.The DOMC principle can very well be used in a modular and / or hybrid modellingapproach in which various modelling techniques are combined. Structurally, the approachcan also be extended to subcellular modules such as mitochondria, vacuoles andperoxisomes. When it is necessary to study a particular (small) part of metabolism inmechanistic detail, the DOMC approach can be used to model (approximate) itsintracellular surrounding. This makes it a valuable tool to be combined with kineticmodelling, in which necessary assumptions on the intracellular surrounding usuallyseverely limit the quality of the model (e.g. Van Riel et al., 1998). Apart from modelling thesubstrate uptake rex of the CNM as free fluxes determined by the metabolic control, theobserved uptake kinetics have also been modelled with a Michaelis-Menten relation for
Optimal Control of Central Nitrogen Metabolism 83
the transporters. Then the regulation of the transporters has to be modelled explicitly(according to Van Riel et al., 1998). This hybrid model yielded the same responses asshown with a strictly DOMC approach. This shows that the DOMC model not only yieldsacceptable responses when compared to experimental data, but also is realistic withrespect to a mechanistic (sub)model of the underlying system.
3.5 Conclusions
Dynamic Optimal Metabolic Control is an integrative, system analytical approach, yieldingholistic models. A gene and its product are modelled in the context of their physiologicalfunction. Both for Metabolic Engineering and Functional Genomics there is the need formathematical modelling tools with such characteristics. Our motivation to develop the newapproach, matches well to the personal commentary of Bailey (1998) on the subject ofmathematical modelling in biochemical engineering. The DOMC framework is a flexibleapproach, suitable to structure knowledge and test related hypotheses based on therapidly increasing amount of ‘semi-quantitative’ information from Functional Genomicsand ‘global metabolite pool analysis’ techniques (e.g. Tweedale et al., 1998).Bioinformatics with analysis of the hierarchical genetics-to-physiology relationship willlead to the discovery of biological ‘rules’ and ‘principles’ upon which design of biologicalsystems will rely (Edwards and Palsson, 1998). This kind of information can be extractedwith an approach such as DOMC and, in return, it will also improve the quality of theDOMC models. The major advantage of DOMC above FBA with optimisation is that it cananalyse dynamic responses, which can be very important to reveal the function of certaingene products, such as for example glutamate synthase (GOGAT) in Saccharomycescerevisiae.
Acknowledgements
This work was part of EC Cell Factory project 'From gene to product in yeast; a quantitativeapproach', sponsored by the DGXII Framework IV programme. We would like to thank Prof. HansWesterhoff (Free University of Amsterdam, The Netherlands) for his useful suggestions whenpreparing this manuscript.
References
Bailey, J.E. (1991). Towards a science of metabolic engineering. Science 252: 1668-1675.
Bailey, J.E. (1998). Mathematical modeling and analysis in biochemical engineering: pastaccomplishments and future opportunities. Biotechnol.Prog. 14: 8-20.
Bellgardt, K.H., Hopf, N., Luttman, R. and Deckwer, W.D. (1986). A new approach fordevelopment of structured growth models. Proc. Computer applications in fermentation technology:modelling and control of biotechnological processes. 79-92.
Chapter 384
Bonarius, H.P.J., Timmerarends, B., de Gooijer, C.D and Tramper, J. (1998). Metabolic-balancingtechniques vs. 13C tracer experiments to determine metabolic fluxes in hybridoma cells. Biotechnol.Bioeng. 58: 258-262.
Cooper, T.G. (1982). Nitrogen metabolism in Saccharomyces cerevisiae. In: The molecular biologyof the yeast Saccharomyces cerevisiae (Strathern, J.N. et al., eds) pp. 39-99. Cold Spring HarborLaboratory, Cold Spring Harbor, New York.
Edwards, J.S. and Palsson, B.O. (1998). How will bioinformatics influence metabolic engineering?Biotechnol.Bioeng. 58: 162-169.
Fell, D.A. and Small, J.R. (1986). Fat synthesis in adipose tissue. An examination of stoichiometricconstraints. Biochem. J. 238: 781-786.
Fell, D. (1997). Understanding the control of metabolism, Portland press, London and Miami.
Giuseppin M.L.F. and Van Riel, N.A.W. (2000). Metabolic modeling of Saccharomyces cerevisiaeusing the optimal control of homeostasis; a cybernetic model definition. Metab. Eng. 2: 1-20.
Helling R.B. (1998). Pathway choice in glutamate synthesis in Escherichia coli. J. Bacteriol.180:4571-4575.
Hollenberg C.P., Riks, W.F. and Borst, P. (1970). The glutamate dehydrogenases of yeast: extra-mitochondrial enzymes. BBA. 201: 13-19.
Holmes, A.R., Mcaughton, G.S., More, R.D. and Sepherd, M.G. (1991). Ammonium assimilationby Candida albicans and other yeasts: a 13N isotope study. Can. J. Microbiol. 37: 226-232.
Kell, D.B. and Westerhoff, H.V. (1986). Metabolic control theory: its role in microbiology andbiotechnology. FEMS Microbiology Reviews, 39: 305-320.
Kompala, D.S., Ramkrishna, D. and Tsao, G.T. (1984). Cybernetic modeling of microbial growth onmultiple substrates. Biotechnol. Bioeng. 26: 1272-1281.
Magasanik, B. (1992). Regulation of nitrogen utilization. In: The molecular and cellular biology ofthe yeast Saccharomyces cerevisiae: gene expression (Jones, E.W. et al., eds) pp. 283-317. ColdSpring Harbor Laboratory Press, Cold Spring Harbor, New York.
Perlman, P.S. and Mahler, H.R. (1970). Intracellular localization of enzymes in yeast. ABB. 136:245-259.
Palsson, B.O. and Joshi, A. (1987). On the dynamic order of structured Escherichia coli growthmodels. Biotechnol. Bioeng. 29: 789-792.
Rizzi, M., Baltes, M., Theobald, U. and Reuss, M. (1997). In vivo analysis of metabolic dynamicsin Saccharomyces cerevisiae: II. Mathematical model. Biotechnol. Bioeng. 55: 592-608.
Optimal Control of Central Nitrogen Metabolism 85
Roon, R.J., Even, H.L. and Larimore, F. (1974). Glutamate synthase: properties of the reducednicotinamide adenine dinucleotide-dependent enzyme from Saccharomyces cerevisiae. J. Bacteriol.118: 89-95.
Savageau, M.A. (1969). Biochemical systems analysis I. Some mathematical properties of the ratelaw for the component enzymatic reactions J. Theor. Biol. 25: 365-369.
Savinell, J.M. and Palsson, B.O. (1992). Network analysis of intermediary metabolism using linearoptimisation. I. Development of mathematical formalism. J. Theor. Biol., 154: 421-454.
Soberón, M. and González A. (1987). Physiological role of glutaminase activity in Saccharomycescerevisiae. J. Gen. Microbiol. 133, 1-8.
Stephanopoulos, G. and Vallino, J. (1991). Network rigidity and metabolic engineering in metaboliteoverproduction. Science 252: 1675-1681.
Ter Schure, E.G., Silljé, H.H.W., Vermeulen, E.E., Kalhorn, J., Verkleij, A.J., Boonstra, J. andVerrips, C.T. (1998). Repression of nitrogen catabolic genes by ammonia and glutamine in nitrogen-limited continuous cultures of Saccharomyces cerevisiae. Microbiology 144: 1451-1462.
Ter Schure, E.G., van Riel, N.A.W. and Verrips, C.T. (1999). The role of ammonia metabolism fornitrogen catabolite repression in Saccharomyces cerevisiae. FEMS Microbiology Reviews In press.
Tweeddale, H., Notley-McRobb, L. and Ferenci, T. (1998). Effect of slow growth on metabolism ofEscherichia coli, as revealed by global metabolite pool (‘Metabolome’) analysis. J.Bacteriol. 180:5109-5116.
Valenzuela, L., Ballario, P., Aranda, C, Filetici, P. and González, A. (1998). Regulation ofexpression of GLT1, the gene encoding glutamate synthase in Saccharomyces cerevisiae. J.Bacteriol. 180: 3533-3540.
Van Riel, N.A.W., Giuseppin, M.L.F., Ter Schure, E.G. and Verrips, C.T. (1998). A Structured,Minimal Parameter Model of the Central Nitrogen Metabolism in Saccharomyces cerevisiae: thePrediction of the Behaviour of Mutants. J. Theor. Biol. 191: 397-414.
Varma, A. and Palsson, B.O. (1994). Stoichiometric flux balance models quantitatively predictgrowth and metabolic by-product secretion in wild-type Escherichia coli W3110. Appl. Environ.Microbiol. 60: 3724-3731.
Varner J. and Ramkrishna, D. (1998). Application of cybernetic models to metabolic engineering:investigation of storage pathways. Biotechnol. Bioeng. 58: 282-291.
Wiener, N. (1948/1961). Cybernetics, or Control and Communication in the Animal and theMachine. Cambridge, MA: MIT Press.

86
Model Analysis 87
Chapter 4
Analysis of a kinetic and cybernetic model for MetabolicEngineering purposes
Natal A.W. van Riel
Chapter 488
Abstract
Although model properties do not necessarily match the system properties, modelanalysis is relevant for engineering and can also be used as a tool to focus newexperiments. The problem of parameter estimation for kinetic models with regulation isdiscussed and a suitable approach is described. The parameter space of a kinetic model ofthe Central Nitrogen Metabolism of S. cerevisiae is analysed. Since the Dynamic OptimalMetabolic Control approach is based on estimation and optimisation of the fluxdistribution, a similar approach is used to investigate the flux space of such a model. Theresults stress the pitfalls of kinetic modelling and the essential differences with DynamicOptimal Metabolic Control models.
4.1 Introduction
The fundamental principles for the development of mathematical models of metabolicnetworks are rather simple. As shown in Chapter 1 most models are based on massbalances for which the conversion rates are related to the metabolite concentrations.However, the actual implementation of relevant dynamic, nonlinear, mathematical modelsfor metabolic networks is rather complex and (therefore) details are often not included inliterature. Different approaches with different applications can be used to fill-in thedynamic relations between the network nodes. Enzyme kinetics are most commonly used(Chapter 2, Van Riel et al., 1998). In the Dynamic Optimal Metabolic Control (DOMC)approach the relations between metabolic pool concentrations and the reaction rates arenot explicitly defined, but result from the flexibility present in the genome and a dynamicsearch through a fitness landscape (Chapter 3, Van Riel et al., 2000). Although mostcomputer simulation packages have sophisticated numerical routines for model simulation,careful implementation is essential, especially for the highly nonlinear models necessaryfor biological systems. Otherwise all kind of numerical emergent phenomena can result.Due to the system complexity, validation of predictive cellular models is in principleimpossible. Model testing is at least difficult and laborious. It is important to analyse theinherent model properties. There are several model characteristics which can be used toanalyse the model quality from a mathematical point of view. It has to be realised that thisare model characteristics and especially for biological systems no direct relation with theunderlying system can be guaranteed. Nevertheless, such analysis can suggest newdirections of interesting (or profitable) research. The metabolic models have beenanalysed in the time domain, in contrast to many engineering applications which focus onthe (complex) frequency domain.The goal of a proper model setup is to minimise the model error. A model consists of amathematical structure, which includes the order of the model and the number ofparameters p, and secondly the parameter values θ. The choice of a suitable structure isessential. When a parametric models is used the (unknown) parameters need to bedetermined. In the theory of model error analysis two types of model errors aredistinguished (e.g. Van Riel, 1995):- a model bias or undermodelling error, because the model (of course) cannot include thecomplete system (the actual system is not part of the model set).
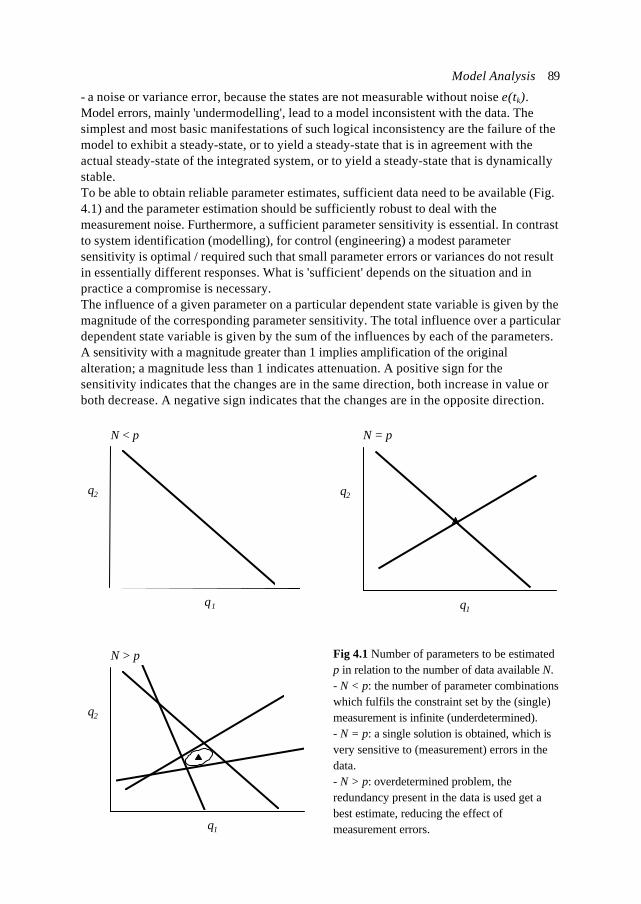
Model Analysis 89
- a noise or variance error, because the states are not measurable without noise e(tk).Model errors, mainly 'undermodelling', lead to a model inconsistent with the data. Thesimplest and most basic manifestations of such logical inconsistency are the failure of themodel to exhibit a steady-state, or to yield a steady-state that is in agreement with theactual steady-state of the integrated system, or to yield a steady-state that is dynamicallystable.To be able to obtain reliable parameter estimates, sufficient data need to be available (Fig.4.1) and the parameter estimation should be sufficiently robust to deal with themeasurement noise. Furthermore, a sufficient parameter sensitivity is essential. In contrastto system identification (modelling), for control (engineering) a modest parametersensitivity is optimal / required such that small parameter errors or variances do not resultin essentially different responses. What is 'sufficient' depends on the situation and inpractice a compromise is necessary.The influence of a given parameter on a particular dependent state variable is given by themagnitude of the corresponding parameter sensitivity. The total influence over a particulardependent state variable is given by the sum of the influences by each of the parameters.A sensitivity with a magnitude greater than 1 implies amplification of the originalalteration; a magnitude less than 1 indicates attenuation. A positive sign for thesensitivity indicates that the changes are in the same direction, both increase in value orboth decrease. A negative sign indicates that the changes are in the opposite direction.
θ1
θ2
N > p Fig 4.1 Number of parameters to be estimatedp in relation to the number of data available N.- N < p: the number of parameter combinationswhich fulfils the constraint set by the (single)measurement is infinite (underdetermined).- N = p: a single solution is obtained, which isvery sensitive to (measurement) errors in thedata.- N > p: overdetermined problem, theredundancy present in the data is used get abest estimate, reducing the effect ofmeasurement errors.
θ1
θ2
N < p
θ1
θ2
N = p
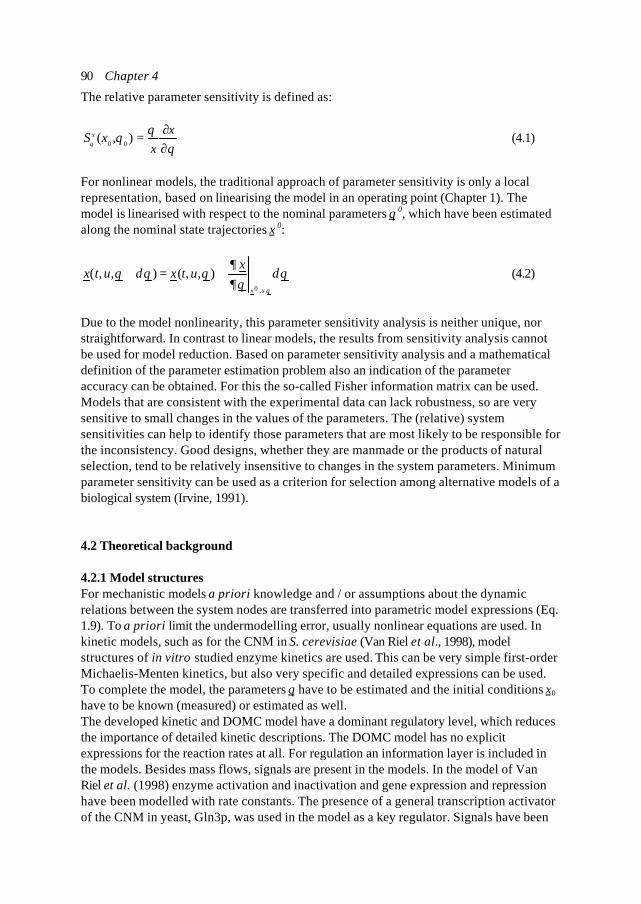
Chapter 490
The relative parameter sensitivity is defined as:
θθθθ ∂
∂= xx
xS x ),( 00 (4.1)
For nonlinear models, the traditional approach of parameter sensitivity is only a localrepresentation, based on linearising the model in an operating point (Chapter 1). Themodel is linearised with respect to the nominal parameters θ 0, which have been estimatedalong the nominal state trajectories x 0:
θδθ∂
∂θθδθ
θ,,0
),,(),,(ux
xutxutx +=+ (4.2)
Due to the model nonlinearity, this parameter sensitivity analysis is neither unique, norstraightforward. In contrast to linear models, the results from sensitivity analysis cannotbe used for model reduction. Based on parameter sensitivity analysis and a mathematicaldefinition of the parameter estimation problem also an indication of the parameteraccuracy can be obtained. For this the so-called Fisher information matrix can be used.Models that are consistent with the experimental data can lack robustness, so are verysensitive to small changes in the values of the parameters. The (relative) systemsensitivities can help to identify those parameters that are most likely to be responsible forthe inconsistency. Good designs, whether they are manmade or the products of naturalselection, tend to be relatively insensitive to changes in the system parameters. Minimumparameter sensitivity can be used as a criterion for selection among alternative models of abiological system (Irvine, 1991).
4.2 Theoretical background
4.2.1 Model structuresFor mechanistic models a priori knowledge and / or assumptions about the dynamicrelations between the system nodes are transferred into parametric model expressions (Eq.1.9). To a priori limit the undermodelling error, usually nonlinear equations are used. Inkinetic models, such as for the CNM in S. cerevisiae (Van Riel et al., 1998), modelstructures of in vitro studied enzyme kinetics are used. This can be very simple first-orderMichaelis-Menten kinetics, but also very specific and detailed expressions can be used.To complete the model, the parameters θ have to be estimated and the initial conditions x0
have to be known (measured) or estimated as well.The developed kinetic and DOMC model have a dominant regulatory level, which reducesthe importance of detailed kinetic descriptions. The DOMC model has no explicitexpressions for the reaction rates at all. For regulation an information layer is included inthe models. Besides mass flows, signals are present in the models. In the model of VanRiel et al. (1998) enzyme activation and inactivation and gene expression and repressionhave been modelled with rate constants. The presence of a general transcription activatorof the CNM in yeast, Gln3p, was used in the model as a key regulator. Signals have been
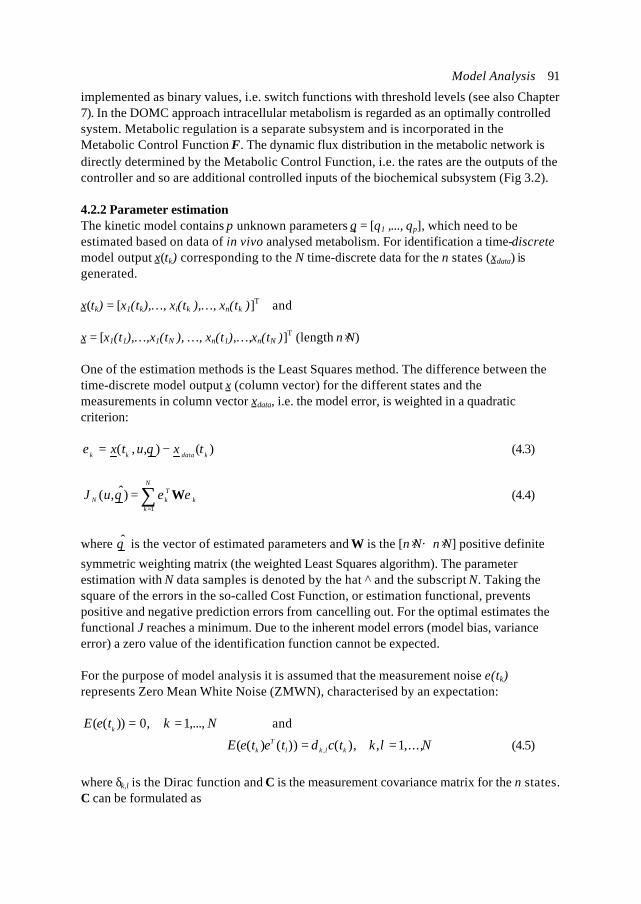
Model Analysis 91
implemented as binary values, i.e. switch functions with threshold levels (see also Chapter7). In the DOMC approach intracellular metabolism is regarded as an optimally controlledsystem. Metabolic regulation is a separate subsystem and is incorporated in theMetabolic Control Function F. The dynamic flux distribution in the metabolic network isdirectly determined by the Metabolic Control Function, i.e. the rates are the outputs of thecontroller and so are additional controlled inputs of the biochemical subsystem (Fig 3.2).
4.2.2 Parameter estimationThe kinetic model contains p unknown parameters θ = [θ1 ,..., θp], which need to beestimated based on data of in vivo analysed metabolism. For identification a time-discretemodel output x(tk) corresponding to the N time-discrete data for the n states (xdata) isgenerated.
x(tk) = [x1(tk),…, xi(tk ),…, xn(tk )]T and
x = [x1(t1),…,x1(tN ), …, xn(t1),…,xn(tN )]T (length n⋅N)
One of the estimation methods is the Least Squares method. The difference between thetime-discrete model output x (column vector) for the different states and themeasurements in column vector xdata, i.e. the model error, is weighted in a quadraticcriterion:
)(),,( kdatakk txutx −= θε (4.3)
∑=
=N
kk
TkN uJ
1
)ˆ,( εεθ W (4.4)
where θ̂ is the vector of estimated parameters and W is the [n⋅N× n⋅N] positive definite
symmetric weighting matrix (the weighted Least Squares algorithm). The parameterestimation with N data samples is denoted by the hat ^ and the subscript N. Taking thesquare of the errors in the so-called Cost Function, or estimation functional, preventspositive and negative prediction errors from cancelling out. For the optimal estimates thefunctional J reaches a minimum. Due to the inherent model errors (model bias, varianceerror) a zero value of the identification function cannot be expected.
For the purpose of model analysis it is assumed that the measurement noise e(tk)represents Zero Mean White Noise (ZMWN), characterised by an expectation:
NkteE k ,...,1,0))(( == and
NlktcteteE klklT
k ,...,1,),())()(( , == δ (4.5)
where δk,l is the Dirac function and C is the measurement covariance matrix for the n states.C can be formulated as
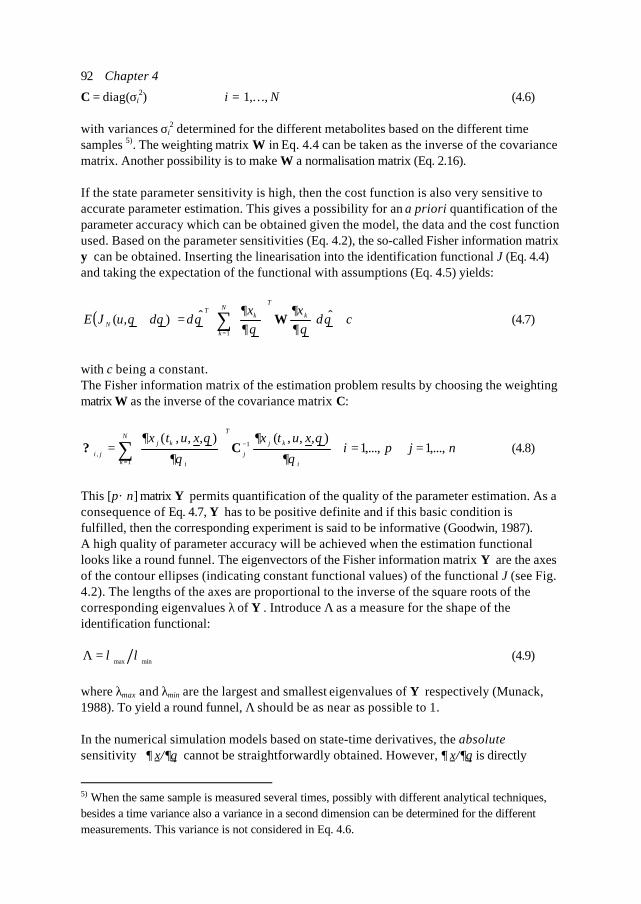
Chapter 492
C = diag(σi2) i = 1,…, N (4.6)
with variances σi2 determined for the different metabolites based on the different time
samples 5). The weighting matrix W in Eq. 4.4 can be taken as the inverse of the covariancematrix. Another possibility is to make W a normalisation matrix (Eq. 2.16).
If the state parameter sensitivity is high, then the cost function is also very sensitive toaccurate parameter estimation. This gives a possibility for an a priori quantification of theparameter accuracy which can be obtained given the model, the data and the cost functionused. Based on the parameter sensitivities (Eq. 4.2), the so-called Fisher information matrixψ can be obtained. Inserting the linearisation into the identification functional J (Eq. 4.4)and taking the expectation of the functional with assumptions (Eq. 4.5) yields:
( ) cxx
uJEN
k
k
T
kT
N +
=+ ∑
=
θδθ∂
∂θ∂
∂θδθδθ ˆˆ),(
1
W (4.7)
with c being a constant.The Fisher information matrix of the estimation problem results by choosing the weightingmatrix W as the inverse of the covariance matrix C:
njpixutxxutxN
k i
kj
j
T
i
kj
ji ,...,1,...,1),,,(),,,(
1
1, ==
= ∑
=
−
∂θ
θ∂
∂θ
θ∂C? (4.8)
This [p×n] matrix Ψ permits quantification of the quality of the parameter estimation. As aconsequence of Eq. 4.7, Ψ has to be positive definite and if this basic condition isfulfilled, then the corresponding experiment is said to be informative (Goodwin, 1987).A high quality of parameter accuracy will be achieved when the estimation functionallooks like a round funnel. The eigenvectors of the Fisher information matrix Ψ are the axesof the contour ellipses (indicating constant functional values) of the functional J (see Fig.4.2). The lengths of the axes are proportional to the inverse of the square roots of thecorresponding eigenvalues λ of Ψ . Introduce Λ as a measure for the shape of theidentification functional:
minmax λλ=Λ (4.9)
where λmax and λmin are the largest and smallest eigenvalues of Ψ respectively (Munack,1988). To yield a round funnel, Λ should be as near as possible to 1.
In the numerical simulation models based on state-time derivatives, the absolutesensitivity ∂ x/∂θ cannot be straightforwardly obtained. However, ∂ x/∂θ is directly
5) When the same sample is measured several times, possibly with different analytical techniques,besides a time variance also a variance in a second dimension can be determined for the differentmeasurements. This variance is not considered in Eq. 4.6.
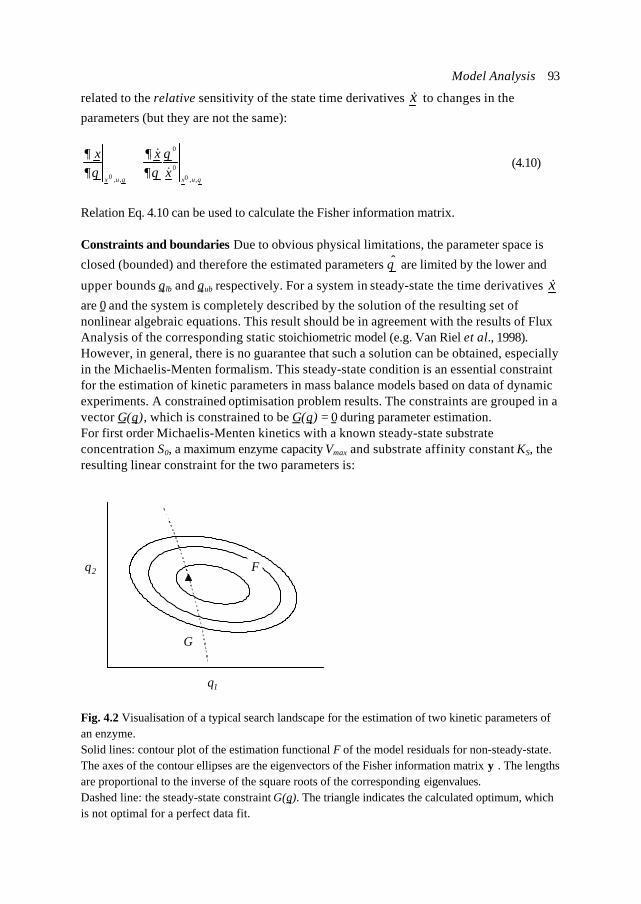
Model Analysis 93
related to the relative sensitivity of the state time derivatives &x to changes in the
parameters (but they are not the same):
θθ
θθ∂
∂θ∂
∂
,,00
0
,,0 uxuxx
xx&
&∝ (4.10)
Relation Eq. 4.10 can be used to calculate the Fisher information matrix.
Constraints and boundaries Due to obvious physical limitations, the parameter space is
closed (bounded) and therefore the estimated parameters θ̂ are limited by the lower and
upper bounds θlb and θub respectively. For a system in steady-state the time derivatives &xare 0 and the system is completely described by the solution of the resulting set ofnonlinear algebraic equations. This result should be in agreement with the results of FluxAnalysis of the corresponding static stoichiometric model (e.g. Van Riel et al., 1998).However, in general, there is no guarantee that such a solution can be obtained, especiallyin the Michaelis-Menten formalism. This steady-state condition is an essential constraintfor the estimation of kinetic parameters in mass balance models based on data of dynamicexperiments. A constrained optimisation problem results. The constraints are grouped in avector G(θ), which is constrained to be G(θ) = 0 during parameter estimation.For first order Michaelis-Menten kinetics with a known steady-state substrateconcentration S0, a maximum enzyme capacity Vmax and substrate affinity constant KS, theresulting linear constraint for the two parameters is:
θ1
θ2 F
G
Fig. 4.2 Visualisation of a typical search landscape for the estimation of two kinetic parameters ofan enzyme.Solid lines: contour plot of the estimation functional F of the model residuals for non-steady-state.The axes of the contour ellipses are the eigenvectors of the Fisher information matrix ψ . The lengthsare proportional to the inverse of the square roots of the corresponding eigenvalues.Dashed line: the steady-state constraint G(θ). The triangle indicates the calculated optimum, whichis not optimal for a perfect data fit.
Chapter 494
00
0max S
rS
VK s −= (4.11)
The steady-state flux r0 is obtained by Flux Analysis. The steady-state constraint reducesthe two-dimensional search space for the estimation of Vmax and KS, to a one-dimensionalproblem. Such constraints largely determine the result of the estimation procedure (Fig.4.2).In principle, constraints reduce the search subspace and are therefore advantageous.However, especially nonlinear constraints can complicate the convergence of theoptimisation algorithm.
Algorithms For linear systems an exact solution of the Least Squares problem isguaranteed. The solution results from matrix algebra and the algorithm is fast. Fornonlinear models as discussed here, the Least Squares problem is no longer linear in θ andan iterative search process is necessary. There are different algorithms with differentapplications, advantages and drawbacks. In general convergence to the global optimum isnot guaranteed.
Algorithms based on the gradients of the search spaceIn the Quadratic Linear Programming (QLP) minimisation algorithm, which is based on agradient search, constraints can be explicitly included by applying the so-called Kuhn-Tucker equations. The Kuhn-Tucker equations are based on Lagrangian multipliers. If thesearch space of the optimisation is irregular (i.e. has a discontinuous gradient),optimisation algorithms based on the gradient of the search space (such as QLP)converge slowly. When the parameter sensitivity can be explicitly calculated then thisgradient can be included in the optimisation algorithm to speed up computation.
Algorithms with randomnessAlgorithms with a certain randomness in the search have a better (global) performance,especially for irregular or discrete fitness landscapes. Examples are Simulated Annealing(SA, e.g. Kirkpatrick et al., 1983) and Genetic Algorithms (GA, Guan and Aral, 1999). Thealgorithms use a lot of computer time and are especially effective for relatively low-dimensional optimisation problems. The common used SA and GA’s cannot deal withexplicit constraints. Then constraints are included as penalty functions in the costfunction. To implement a clear constraint, a function which results in a discontinuity in thelandscape is preferred. However, for search algorithms which make use of the gradient ofthe landscape, a certain smoothness is important for faster convergence. The penaltyfunction used results from a compromise (e.g. Eq 3.3).
4.2.3 Data generation and handlingThe experiments and models are based on a steady-state situation, i.e. a chemostatculture. This steady-state is perturbated to reveal the dynamics of the underlying system.In physiological studies often step changes in the dilution rate are applied to investigatethe fast responses of the cells (e.g. Duboc et al., 1998). A less common approach is toincrease and decrease the dilution rate gradually, called an accelerostat (A-stat, Paalme
Model Analysis 95
and Villu, 1992). This gives the possibility to focus on slower processes in the cell.Compound pools with a high turnover rate are in a pseudo-steady-state situation, whereasthe concentrations of compounds with a longer half-life are constantly forced to change,depending on the acceleration used. Effects specifically related to certain substrates areoften studied by adding pulses of this substrate. Nitrogen metabolism and especially theeffect of Nitrogen Catabolic Repression has been studied in nitrogen limited continuousculture fermentations by adding pulses of different size and different type of nitrogensource (Ter Schure et al., 1998; Chapter 6). A dataset of both the relevant intra- as well asthe extracellular compound concentrations is obtained in a time period from t0 to tf. Thestart time t0 is before the steady-state is perturbed. The end time depends on the relevantdynamics under consideration. With sophisticated experimental setups, experimental timewindows of a few milliseconds have been obtained (Rizzi et al., 1997). For the CNM theresponses haven been measured during two hours. At the level of pool concentrations,the related fluxes and the effect of transcription repression this is the most relevantresponse time window. The exact experimental setup and the biochemical and molecularbiological analytical assays used, will be described in Chapter 6.
Pre-filtering The raw data can be filtered before being used as input for an optimisationalgorithm. This results in smooth curves for the measured metabolites. High frequenciespresent in the data, either from measurement noise or dynamics not included in the model,and outliers are filtered out. In Chapter 2 (Van Riel et al., 1998) the raw data have beeninterpolated by a cubic spline polynomial with a time interval of 0.1 hour. Pre-filtering canbe advantageous, but it has to be realised that this transforms the random measurementvariance error into a bias error. In fact, the filter is an intermediate, black-box model. If thefinal, mechanistic model is not a subset of the intermediate model, then pre-filtering willessentially influence the parameter estimates.
Data subsets Ideally, the whole parameter set should be estimated in one step. However,the complexity of the optimisation problem increases exponentially with its dimension (i.e.number of parameters to be estimated). The combination of a highly nonlinear kineticmodel and the nonlinear constraints for steady-state always resulted in a very complexparameter estimation problem. For the practical cases used (i.e. Chapter 2), convergencecould never be obtained when the complete parameter set was estimated in one step usingthe whole dataset.A practical solution was to split the dataset in several subsets related to qualitativelydifferent situations in the observed responses. Also the total parameter vector θ isdivided in subsets, based on which parameters are observable for each data subset. Theprocedure used for parameter estimation of metabolic models is outlined below.
Procedure1. Check parameter correlation. Directly related parameters are better not included in thesame optimisation step.2. Identify the time of perturbation tp and split the dataset in a part from t0 - tp (indicated byxdata,ss) and a subset from tp - tf (indicated as xdata,p).
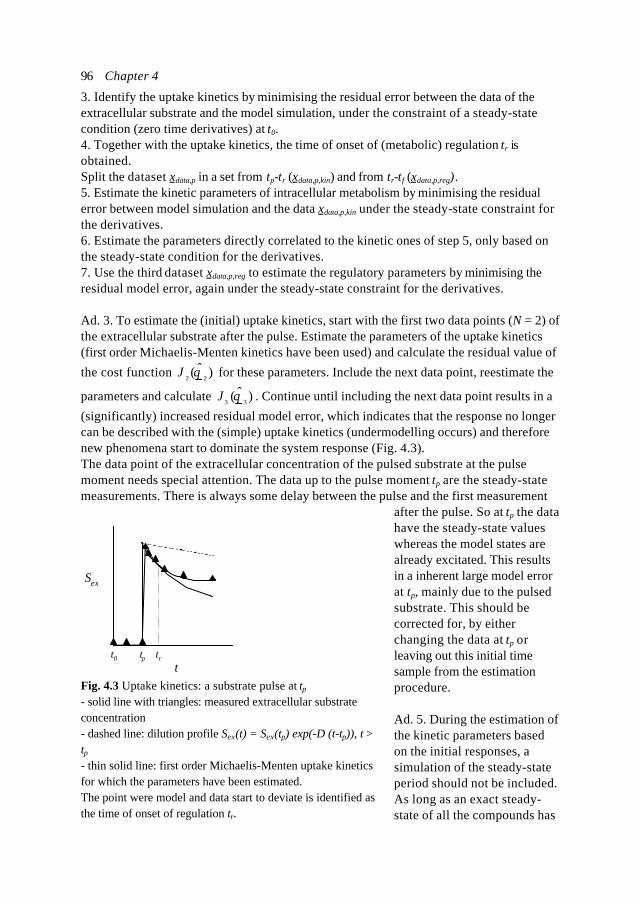
Chapter 496
3. Identify the uptake kinetics by minimising the residual error between the data of theextracellular substrate and the model simulation, under the constraint of a steady-statecondition (zero time derivatives) at t0.4. Together with the uptake kinetics, the time of onset of (metabolic) regulation tr isobtained.Split the dataset xdata,p in a set from tp-tr (xdata,p,kin) and from tr-tf (xdata,p,reg).5. Estimate the kinetic parameters of intracellular metabolism by minimising the residualerror between model simulation and the data xdata,p,kin under the steady-state constraint forthe derivatives.6. Estimate the parameters directly correlated to the kinetic ones of step 5, only based onthe steady-state condition for the derivatives.7. Use the third dataset xdata,p,reg to estimate the regulatory parameters by minimising theresidual model error, again under the steady-state constraint for the derivatives.
Ad. 3. To estimate the (initial) uptake kinetics, start with the first two data points (N = 2) ofthe extracellular substrate after the pulse. Estimate the parameters of the uptake kinetics(first order Michaelis-Menten kinetics have been used) and calculate the residual value of
the cost function )ˆ( 22 θJ for these parameters. Include the next data point, reestimate the
parameters and calculate )ˆ( 33 θJ . Continue until including the next data point results in a
(significantly) increased residual model error, which indicates that the response no longercan be described with the (simple) uptake kinetics (undermodelling occurs) and thereforenew phenomena start to dominate the system response (Fig. 4.3).The data point of the extracellular concentration of the pulsed substrate at the pulsemoment needs special attention. The data up to the pulse moment tp are the steady-statemeasurements. There is always some delay between the pulse and the first measurement
after the pulse. So at tp the datahave the steady-state valueswhereas the model states arealready excitated. This resultsin a inherent large model errorat tp, mainly due to the pulsedsubstrate. This should becorrected for, by eitherchanging the data at tp orleaving out this initial timesample from the estimationprocedure.
Ad. 5. During the estimation ofthe kinetic parameters basedon the initial responses, asimulation of the steady-stateperiod should not be included.As long as an exact steady-state of all the compounds has
t
Sex
t0 tp tr
Fig. 4.3 Uptake kinetics: a substrate pulse at tp- solid line with triangles: measured extracellular substrateconcentration- dashed line: dilution profile Sex(t) = Sex(tp) exp(-D (t-tp)), t >tp- thin solid line: first order Michaelis-Menten uptake kineticsfor which the parameters have been estimated.The point were model and data start to deviate is identified asthe time of onset of regulation tr.
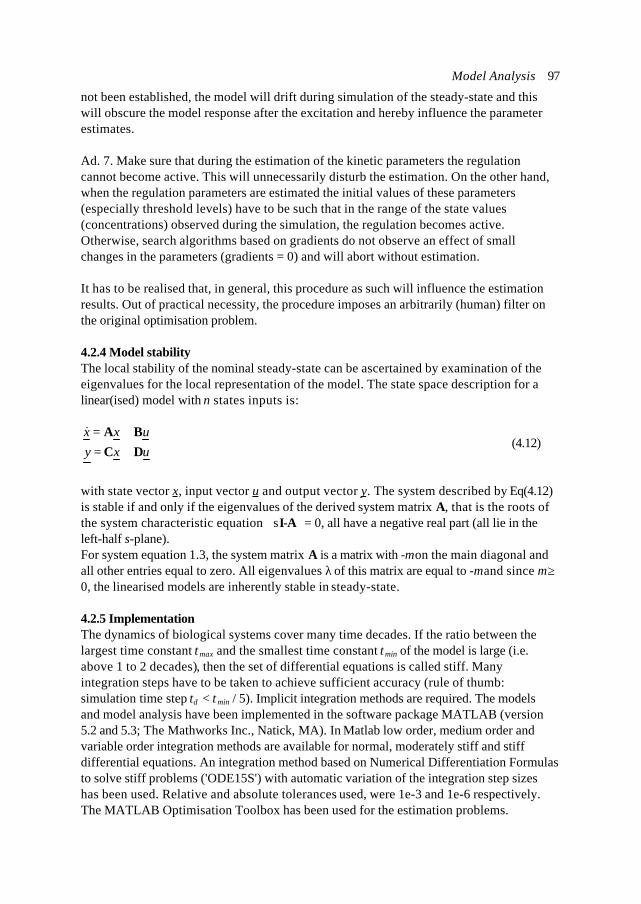
Model Analysis 97
not been established, the model will drift during simulation of the steady-state and thiswill obscure the model response after the excitation and hereby influence the parameterestimates.
Ad. 7. Make sure that during the estimation of the kinetic parameters the regulationcannot become active. This will unnecessarily disturb the estimation. On the other hand,when the regulation parameters are estimated the initial values of these parameters(especially threshold levels) have to be such that in the range of the state values(concentrations) observed during the simulation, the regulation becomes active.Otherwise, search algorithms based on gradients do not observe an effect of smallchanges in the parameters (gradients = 0) and will abort without estimation.
It has to be realised that, in general, this procedure as such will influence the estimationresults. Out of practical necessity, the procedure imposes an arbitrarily (human) filter onthe original optimisation problem.
4.2.4 Model stabilityThe local stability of the nominal steady-state can be ascertained by examination of theeigenvalues for the local representation of the model. The state space description for alinear(ised) model with n states inputs is:
uxyuxx
DCBA
+=+=&
(4.12)
with state vector x, input vector u and output vector y. The system described by Eq(4.12)is stable if and only if the eigenvalues of the derived system matrix A, that is the roots ofthe system characteristic equation sI-A= 0, all have a negative real part (all lie in theleft-half s-plane).For system equation 1.3, the system matrix A is a matrix with -µ on the main diagonal andall other entries equal to zero. All eigenvalues λ of this matrix are equal to -µ and since µ ≥0, the linearised models are inherently stable in steady-state.
4.2.5 ImplementationThe dynamics of biological systems cover many time decades. If the ratio between thelargest time constant τmax and the smallest time constant τmin of the model is large (i.e.above 1 to 2 decades), then the set of differential equations is called stiff. Manyintegration steps have to be taken to achieve sufficient accuracy (rule of thumb:simulation time step tδ < τmin / 5). Implicit integration methods are required. The modelsand model analysis have been implemented in the software package MATLAB (version5.2 and 5.3; The Mathworks Inc., Natick, MA). In Matlab low order, medium order andvariable order integration methods are available for normal, moderately stiff and stiffdifferential equations. An integration method based on Numerical Differentiation Formulasto solve stiff problems ('ODE15S') with automatic variation of the integration step sizeshas been used. Relative and absolute tolerances used, were 1e-3 and 1e-6 respectively.The MATLAB Optimisation Toolbox has been used for the estimation problems.
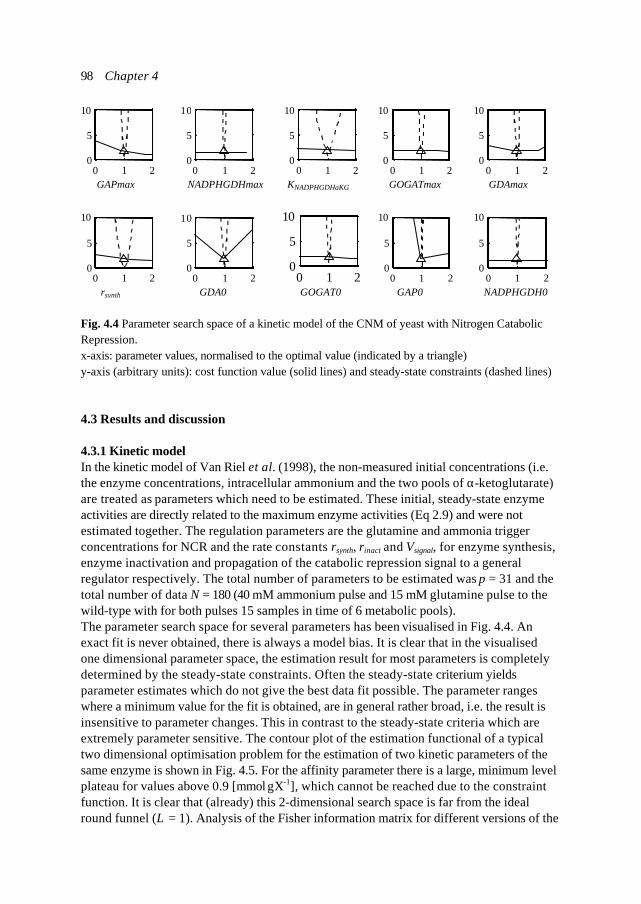
Chapter 498
4.3 Results and discussion
4.3.1 Kinetic modelIn the kinetic model of Van Riel et al. (1998), the non-measured initial concentrations (i.e.the enzyme concentrations, intracellular ammonium and the two pools of α-ketoglutarate)are treated as parameters which need to be estimated. These initial, steady-state enzymeactivities are directly related to the maximum enzyme activities (Eq 2.9) and were notestimated together. The regulation parameters are the glutamine and ammonia triggerconcentrations for NCR and the rate constants rsynth, rinact and Vsignal, for enzyme synthesis,enzyme inactivation and propagation of the catabolic repression signal to a generalregulator respectively. The total number of parameters to be estimated was p = 31 and thetotal number of data N = 180 (40 mM ammonium pulse and 15 mM glutamine pulse to thewild-type with for both pulses 15 samples in time of 6 metabolic pools).The parameter search space for several parameters has been visualised in Fig. 4.4. Anexact fit is never obtained, there is always a model bias. It is clear that in the visualisedone dimensional parameter space, the estimation result for most parameters is completelydetermined by the steady-state constraints. Often the steady-state criterium yieldsparameter estimates which do not give the best data fit possible. The parameter rangeswhere a minimum value for the fit is obtained, are in general rather broad, i.e. the result isinsensitive to parameter changes. This in contrast to the steady-state criteria which areextremely parameter sensitive. The contour plot of the estimation functional of a typicaltwo dimensional optimisation problem for the estimation of two kinetic parameters of thesame enzyme is shown in Fig. 4.5. For the affinity parameter there is a large, minimum levelplateau for values above 0.9 [mmol⋅gX-1], which cannot be reached due to the constraintfunction. It is clear that (already) this 2-dimensional search space is far from the idealround funnel (Λ = 1). Analysis of the Fisher information matrix for different versions of the
0 1 20
5
10
GOGATmax
0 1 20
5
10
rsynth 0 1 2
0
5
10
GAP0 0 1 2
0
5
10
NADPHGDH0 0 1 2
0
5
10
GDA0 0 1 2
0
5
10
GOGAT0
0 1 20
5
10
GAPmax 0 1 2
0
5
10
NADPHGDHmax 0 1 2
0
5
10
KNADPHGDHaKG
0 1 20
5
10
GDAmax
Fig. 4.4 Parameter search space of a kinetic model of the CNM of yeast with Nitrogen CatabolicRepression.x-axis: parameter values, normalised to the optimal value (indicated by a triangle)y-axis (arbitrary units): cost function value (solid lines) and steady-state constraints (dashed lines)
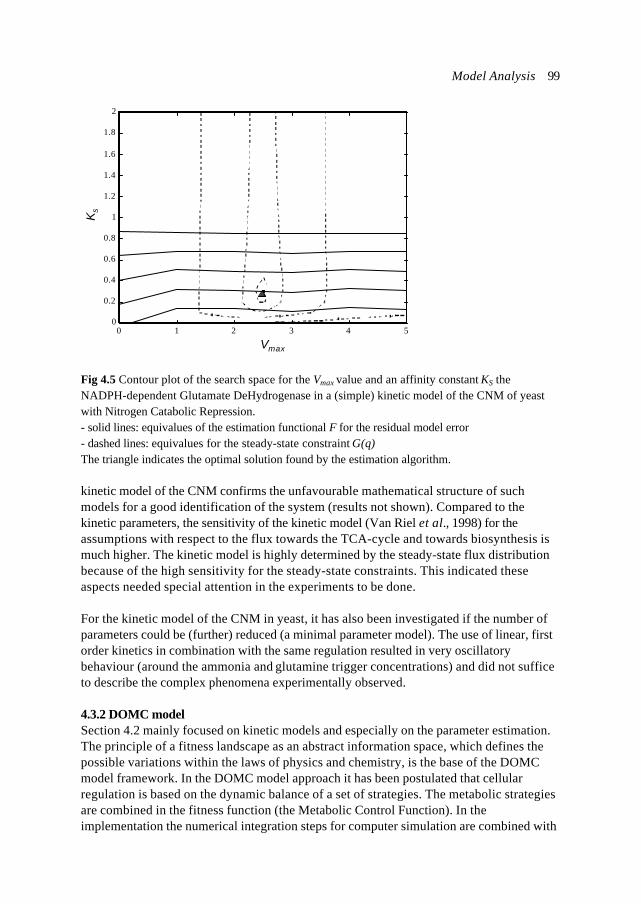
Model Analysis 99
kinetic model of the CNM confirms the unfavourable mathematical structure of suchmodels for a good identification of the system (results not shown). Compared to thekinetic parameters, the sensitivity of the kinetic model (Van Riel et al., 1998) for theassumptions with respect to the flux towards the TCA-cycle and towards biosynthesis ismuch higher. The kinetic model is highly determined by the steady-state flux distributionbecause of the high sensitivity for the steady-state constraints. This indicated theseaspects needed special attention in the experiments to be done.
For the kinetic model of the CNM in yeast, it has also been investigated if the number ofparameters could be (further) reduced (a minimal parameter model). The use of linear, firstorder kinetics in combination with the same regulation resulted in very oscillatorybehaviour (around the ammonia and glutamine trigger concentrations) and did not sufficeto describe the complex phenomena experimentally observed.
4.3.2 DOMC modelSection 4.2 mainly focused on kinetic models and especially on the parameter estimation.The principle of a fitness landscape as an abstract information space, which defines thepossible variations within the laws of physics and chemistry, is the base of the DOMCmodel framework. In the DOMC model approach it has been postulated that cellularregulation is based on the dynamic balance of a set of strategies. The metabolic strategiesare combined in the fitness function (the Metabolic Control Function). In theimplementation the numerical integration steps for computer simulation are combined with
0 1 2 3 4 50
0.2
0.4
0.6
0.8
1
1.2
1.4
1.6
1.8
2
Vmax
Ks
Fig 4.5 Contour plot of the search space for the Vmax value and an affinity constant KS theNADPH-dependent Glutamate DeHydrogenase in a (simple) kinetic model of the CNM of yeastwith Nitrogen Catabolic Repression.- solid lines: equivalues of the estimation functional F for the residual model error- dashed lines: equivalues for the steady-state constraint G(θ)The triangle indicates the optimal solution found by the estimation algorithm.
Chapter 4100
a continuous optimisation of the flux distribution r given the cell strategies and the(changing) environment. For a DOMC model no optimal parameters are estimated, but thereaction rates at each simulation interval result from evolution in a dynamic fitnesslandscape. As mentioned before, for numerical simulation sophisticated integrationalgorithms are available which dynamically change the step size based on the timeconstants observed for the model. In the implementation of the DOMC model the timeintervals tδ at which the fluxes are reestimated, are fixed. The size of this simulation timeinterval is an important time constant of the resulting model. This time constant should bein agreement with the system dynamics (Van Riel et al., 2000).For the DOMC approach a set of hierarchical and conflicting rules is required, incombination with a certain minimal network complexity and flexibility (mathematical nullspace of stoichiometry). Like the parameter estimation for the kinetic model was aconstrained optimisation problem, also the possibilities of a changing optimal fluxdistribution are constrained. The time constants of the processes in the cell (Eq. 3.10), putconstraints on the controllability of these processes during propagation. The constraintsare grouped in a vector G(θ), which is constrained to be G(θ) ≤ 0 during operation of themetabolic regulation. For the regulation negative and positive feedback need to be presentand in balance. This balance, which is an unstable equilibrium, determines the steady-state (it is a ‘self-tuning model’). As long as the strategy for homeostasis is dominant, thelocal representation of the model will be stable. When the normally growing cell culture issignificantly disturbed, the cells need to adapt. This is only possible if the localrepresentation becomes unstable (i.e. real parts of the eigenvalues > 0) through thefeedforward regulation present. For the model of the CNM in yeast the strategy ofconsuming the preferred substrate became dominant (Van Riel et al., 2000). Normally, astable situation will be recovered, either with the original balance of strategies (originalstate) or the cell might have established a new equilibrium in another state. When thesystem remains unstable during or after a disturbance this means cell death (Chapter 1).
Since an evolutionary algorithm is in the heart of the model, there is no direct link betweenthe metabolite concentrations (the model states) and the reaction rates and transportfluxes. Model analysis is important to get an idea how the DOMC model works. The ratespace of the optimisation problem has been analysed by varying the rates over the rangebetween the lower and upper bounds used in the estimation. For the steady-statesimulation, the control of homeostasis is the only active strategy in the model. The DOMCmodel never is in an exact steady-state due to numerical noise during simulation (also innature a cell will never encounter a constant environment). However, the PI-controllerscompensate the effect of these disturbances, resulting in a robust steady-state simulation(in contrast to the steady-state simulation of kinetic models). After a substrate pulse, theflux distribution results from a combination of the Metabolic Control Function, includingtwo active strategies, and the constraints (Fig. 4.6). For the situation visualised, theconstraint on the intracellular glutamine pool mainly determined the uptake flux to bemuch lower than the maximum uptake rate. Since α-ketoglutarate, ammonia and glutamateare involved in the combined, bidirectional NADPH- and NAD-dependent GDH pathway(Van Riel et al., 2000), the resulting rate is dependent on the constraints for those threepools. The area without constraint violation coincides with the actual minimum of theMetabolic Control Function. For the estimated optimal fluxes no constraints are violated,
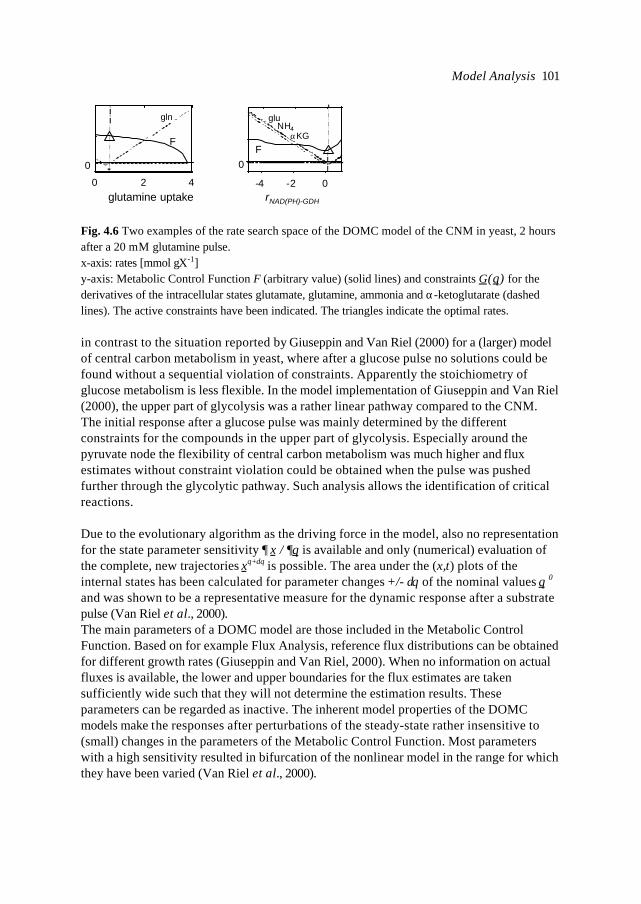
Model Analysis 101
in contrast to the situation reported by Giuseppin and Van Riel (2000) for a (larger) modelof central carbon metabolism in yeast, where after a glucose pulse no solutions could befound without a sequential violation of constraints. Apparently the stoichiometry ofglucose metabolism is less flexible. In the model implementation of Giuseppin and Van Riel(2000), the upper part of glycolysis was a rather linear pathway compared to the CNM.The initial response after a glucose pulse was mainly determined by the differentconstraints for the compounds in the upper part of glycolysis. Especially around thepyruvate node the flexibility of central carbon metabolism was much higher and fluxestimates without constraint violation could be obtained when the pulse was pushedfurther through the glycolytic pathway. Such analysis allows the identification of criticalreactions.
Due to the evolutionary algorithm as the driving force in the model, also no representationfor the state parameter sensitivity ∂ x / ∂θ is available and only (numerical) evaluation ofthe complete, new trajectories xθ+δθ is possible. The area under the (x,t) plots of theinternal states has been calculated for parameter changes +/- δθ of the nominal values θ 0
and was shown to be a representative measure for the dynamic response after a substratepulse (Van Riel et al., 2000).The main parameters of a DOMC model are those included in the Metabolic ControlFunction. Based on for example Flux Analysis, reference flux distributions can be obtainedfor different growth rates (Giuseppin and Van Riel, 2000). When no information on actualfluxes is available, the lower and upper boundaries for the flux estimates are takensufficiently wide such that they will not determine the estimation results. Theseparameters can be regarded as inactive. The inherent model properties of the DOMCmodels make the responses after perturbations of the steady-state rather insensitive to(small) changes in the parameters of the Metabolic Control Function. Most parameterswith a high sensitivity resulted in bifurcation of the nonlinear model in the range for whichthey have been varied (Van Riel et al., 2000).
0 2 4
0
glutamine uptake
gln
F
-4 -2 0
0
rNAD(PH)-GDH
gluNH4
αKG
F
Fig. 4.6 Two examples of the rate search space of the DOMC model of the CNM in yeast, 2 hoursafter a 20 mM glutamine pulse.x-axis: rates [mmol⋅gX-1]y-axis: Metabolic Control Function F (arbitrary value) (solid lines) and constraints G(θ) for thederivatives of the intracellular states glutamate, glutamine, ammonia and α-ketoglutarate (dashedlines). The active constraints have been indicated. The triangles indicate the optimal rates.
Chapter 4102
4.4. Conclusions
The high parameter sensitivity of kinetic networks, caused by the steady-stateconstraints, makes such models less attractive from a mathematical point of view. Due tothe presence of the PI-controllers in the regulation of the DOMC model, this model is morerobust than the kinetic model. In the current kinetic model most initial conditions (enzymeactivities, protein levels etc.) were unknown and needed to be estimated. With theongoing improvement of analytical (high-throughput) techniques, such as used forproteomics, several of these model parameters can be experimentally determined, herebyfurther improving the model.
References
Duboc, P, Von Stockar, U. and Villadsen, J. (1998) Simple generic model for dynamic experimentswith Saccharomyces cerevisiae in continuous culture: decoupling between anabolism andcatabolism. Biotechnol. Bioeng., 60: 180-189.
Giuseppin, M.L.F. and Van Riel, N.A.W. (2000) Metabolic modelling of Saccharomyces cerevisiaeusing the optimal control of homeostasis; a cybernetic model definition. Metabol. Eng. 2: 1-20 .
Goodwin, G.C. (1987) Identification: experiment design. In Systems and control encyclopedia Vol.4, pp 2257-2267, Pergamon, Oxford.
Guan, J. and Aral, M.M. (1999) Progressive genetic algorithm for solution of optimizationproblems with nonlinear equality and inequality constraints. Appl. Math. Modelling 23: 329-343.
Irvine, D.H. (1991) Mathematically controlled comparisons. In Canonical Nonlinear Modeling(Voit, E.O., ed) pp 90-109, Van Nostrand Reinhold Co., Inc, New York
Kirkpatrick, S., Gelatt, C.D. and Vecchi, M.P. (1983) Optimization by simulated annealing.Science, 220: 671-680.
Munack, A. (1988) Optimal feeding strategy for identification of Monod type model by fed batchexperiments. In Proceedings of the 4th International Conference on Computer Applications inFermentation Technology (Fish, N. M. and Fox, R. I. eds), Elsevier Applied Science, London.
Paalme, T. and Villu, R. (1992) Proc. IFAC Modeling and Control of Biotechnical Processes,Colorado, USA. pp 299-301.
Rizzi, M., Baltes, M., Theobald, U. and Reuss, M. (1997) In vivo analysis of metabolic dynamicsin Saccharomyces cerevisiae: II. Mathematical model. Biotechnol. Bioeng. 55: 592-608.
Van Riel, N.A.W. (1995) Algorithms for estimation of model errors and uncertainties arising inblack box system identification. Master’s Thesis, Eindhoven University of Technology.

Model Analysis 103
Van Riel, N.A.W., Giuseppin, M.L.F., Ter Schure, E.G. and Verrips, C.T. (1998) A Structured,Minimal Parameter Model of the Central Nitrogen Metabolism in Saccharomyces cerevisiae: thePrediction of the Behaviour of Mutants. J. Theor. Biol. 191: 397-414.
Van Riel, N.A.W., Giuseppin, M.L.F. and Verrips, C.T. (2000) Dynamic optimal control ofhomeostasis; an integrative system approach for modelling of the Central Nitrogen Metabolism inSaccharomyces cerevisiae. Metabolic Eng. 2: In press.

104
Chapter 5
Background information for a physiological study ofGlutamate Synthase (GOGAT) in Saccharomyces cerevisiae
Natal A.W. van Riel
Chapter 5106
Abstract
This chapter summarises some relevant background information obtained before andduring the study of the physiology of a GOGAT negative mutant of S. cerevisiae as willbe reported in Chapter 6. It makes the results of Chapter 6 more accessible. Mostinformation has been derived from literature and database searches on Internet.Knowledge on the physiological role of Glutamate Synthase (GOGAT) in Saccharomycescerevisiae is discussed, also in reference to its function in other organisms. Some generalaspects of amino acid metabolism of S. cerevisiae are summarised.
5.1 Glutamate Synthase (GOGAT)
Glutamate Synthase (Glutamate amide-2-OxoGlutarate AminoTransferase, GOGAT) is partof the Central Nitrogen Metabolism of most prokaryotes and eukaryotes, also of highereukaryotes such as plants. Glutamate synthase belongs to the class of oxidoreductases. Itis a route for glutamate biosynthesis, catalysing reductive transfer of the L-glutamineamide group to the C2 carbon of α-ketoglutarate yielding 2 molecules of glutamate. It is aniron-sulphur flavoprotein (Miller and Stadtman, 1972).Three classes of GOGAT from different sources can be discriminated that differ inmolecular mass, kinetics, localisation and cofactor specificity (Cogoni et al., 1995; Vanoniand Curti, 1999): 1) NADPH-GOGAT (EC 1.4.1.13) in bacteria, 2) Fd-GOGAT (EC 1.4.7.1,reduced ferredoxin as cofactor) in cyanobacteria and plants and 3) NADH-GOGAT (EC1.4.1.14) in yeast, fungi, plants and lower animals. The combinatory action of GS andGOGAT is known to be the major pathway for ammonia assimilation in bacteria and plants(Chapter 1). Fd-GOGAT is the major glutamate synthase in green tissues and is localisedin chloroplast stroma of plants. This GOGAT is responsible for the turnover of glutamateduring photorespiration (e.g. Hayakawa et al., 1992). NADH-GOGAT in plants is mainlylocalised in various forms of plastids in the cells of nongreen tissues (Hayakawa et al.,1999).Among the enzymes in nitrogen metabolism GOGAT has been studied least (Vanoni andCurti, 1999). In the organisms in which GOGAT has been studied it is only one of thebiosynthetic routes to produce glutamate. Usually growth on ammonium as nitrogensource is discussed. Under ammonium excess, this nitrogen source is assimilated byGlutamate Dehydrogenase(s) (GDH), yielding glutamate, and Glutamine Synthetase (GS)producing glutamine. In contrast to the high in vitro affinity for ammonia of GS, GDH hasa low affinity for ammonia. The concerted action of GS and GOGAT is likely involved inammonium assimilation and glutamate synthesis under ammonium limitation. Often acombination of parallel pathways is observed with a branch with a low affinity and highcapacity and the other with a high affinity and lower capacity (Teixeira de Mattos andNeijssel, 1997). Such a double enzyme system is an effective adaptation mechanism (Bray,1995). The models of Van Riel et al. (1998, 2000) suggested that GOGAT in S. cerevisiaegives the cell a flexible means to control efficiency and the possibility to deal with fastchanges in the availability of nitrogen. The high affinity pathway for glutamate synthesis,consisting of the combined action of GS and GOGAT, requires ATP. The metabolic
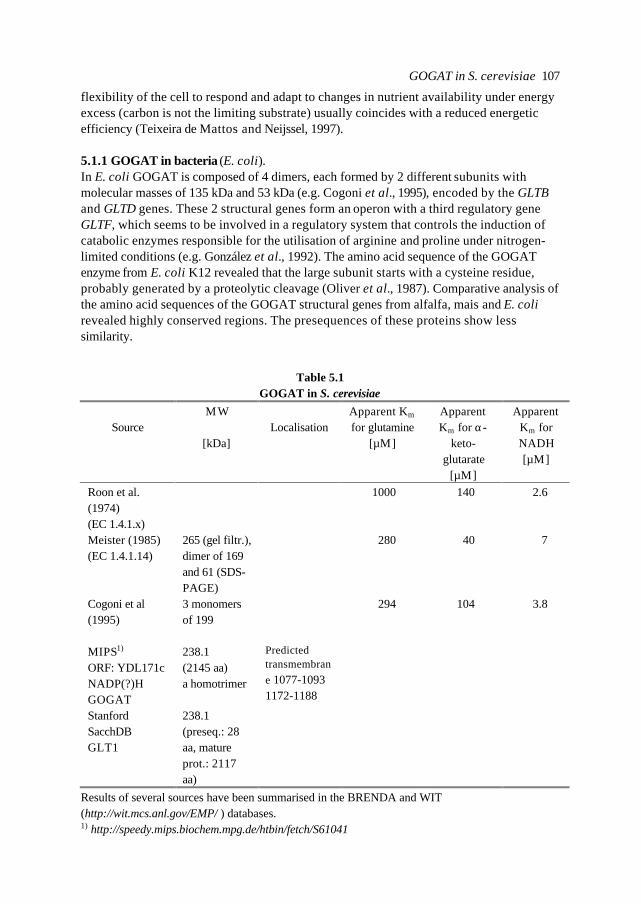
GOGAT in S. cerevisiae 107
flexibility of the cell to respond and adapt to changes in nutrient availability under energyexcess (carbon is not the limiting substrate) usually coincides with a reduced energeticefficiency (Teixeira de Mattos and Neijssel, 1997).
5.1.1 GOGAT in bacteria (E. coli).In E. coli GOGAT is composed of 4 dimers, each formed by 2 different subunits withmolecular masses of 135 kDa and 53 kDa (e.g. Cogoni et al., 1995), encoded by the GLTBand GLTD genes. These 2 structural genes form an operon with a third regulatory geneGLTF, which seems to be involved in a regulatory system that controls the induction ofcatabolic enzymes responsible for the utilisation of arginine and proline under nitrogen-limited conditions (e.g. González et al., 1992). The amino acid sequence of the GOGATenzyme from E. coli K12 revealed that the large subunit starts with a cysteine residue,probably generated by a proteolytic cleavage (Oliver et al., 1987). Comparative analysis ofthe amino acid sequences of the GOGAT structural genes from alfalfa, mais and E. colirevealed highly conserved regions. The presequences of these proteins show lesssimilarity.
Table 5.1GOGAT in S. cerevisiae
SourceM W
[kDa]Localisation
Apparent Km
for glutamine[µM]
ApparentKm for α-
keto-glutarate
[µM]
ApparentKm forNADH[µM]
Roon et al.(1974)(EC 1.4.1.x)
1000 140 2.6
Meister (1985)(EC 1.4.1.14)
265 (gel filtr.),dimer of 169and 61 (SDS-PAGE)
280 40 7
Cogoni et al(1995)
3 monomersof 199
294 104 3.8
MIPS1)
ORF: YDL171cNADP(?)HGOGAT
238.1(2145 aa)a homotrimer
Predictedtransmembrane 1077-10931172-1188
StanfordSacchDBGLT1
238.1(preseq.: 28aa, matureprot.: 2117aa)
Results of several sources have been summarised in the BRENDA and WIT(http://wit.mcs.anl.gov/EMP/ ) databases.1) http://speedy.mips.biochem.mpg.de/htbin/fetch/S61041
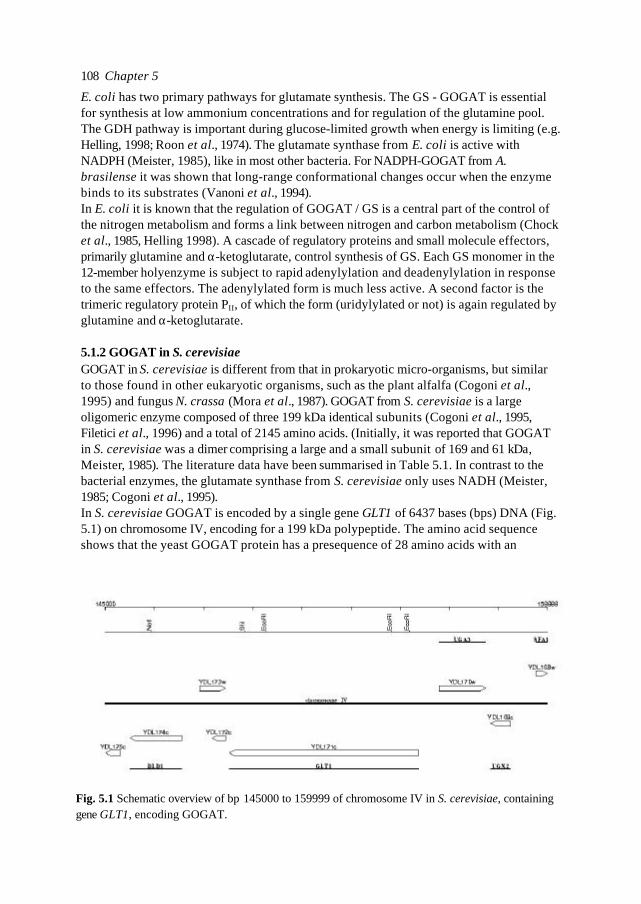
Chapter 5108
E. coli has two primary pathways for glutamate synthesis. The GS - GOGAT is essentialfor synthesis at low ammonium concentrations and for regulation of the glutamine pool.The GDH pathway is important during glucose-limited growth when energy is limiting (e.g.Helling, 1998; Roon et al., 1974). The glutamate synthase from E. coli is active withNADPH (Meister, 1985), like in most other bacteria. For NADPH-GOGAT from A.brasilense it was shown that long-range conformational changes occur when the enzymebinds to its substrates (Vanoni et al., 1994).In E. coli it is known that the regulation of GOGAT / GS is a central part of the control ofthe nitrogen metabolism and forms a link between nitrogen and carbon metabolism (Chocket al., 1985, Helling 1998). A cascade of regulatory proteins and small molecule effectors,primarily glutamine and α-ketoglutarate, control synthesis of GS. Each GS monomer in the12-member holyenzyme is subject to rapid adenylylation and deadenylylation in responseto the same effectors. The adenylylated form is much less active. A second factor is thetrimeric regulatory protein PII, of which the form (uridylylated or not) is again regulated byglutamine and α-ketoglutarate.
5.1.2 GOGAT in S. cerevisiaeGOGAT in S. cerevisiae is different from that in prokaryotic micro-organisms, but similarto those found in other eukaryotic organisms, such as the plant alfalfa (Cogoni et al.,1995) and fungus N. crassa (Mora et al., 1987). GOGAT from S. cerevisiae is a largeoligomeric enzyme composed of three 199 kDa identical subunits (Cogoni et al., 1995,Filetici et al., 1996) and a total of 2145 amino acids. (Initially, it was reported that GOGATin S. cerevisiae was a dimer comprising a large and a small subunit of 169 and 61 kDa,Meister, 1985). The literature data have been summarised in Table 5.1. In contrast to thebacterial enzymes, the glutamate synthase from S. cerevisiae only uses NADH (Meister,1985; Cogoni et al., 1995).In S. cerevisiae GOGAT is encoded by a single gene GLT1 of 6437 bases (bps) DNA (Fig.5.1) on chromosome IV, encoding for a 199 kDa polypeptide. The amino acid sequenceshows that the yeast GOGAT protein has a presequence of 28 amino acids with an
Fig. 5.1 Schematic overview of bp 145000 to 159999 of chromosome IV in S. cerevisiae, containinggene GLT1, encoding GOGAT.
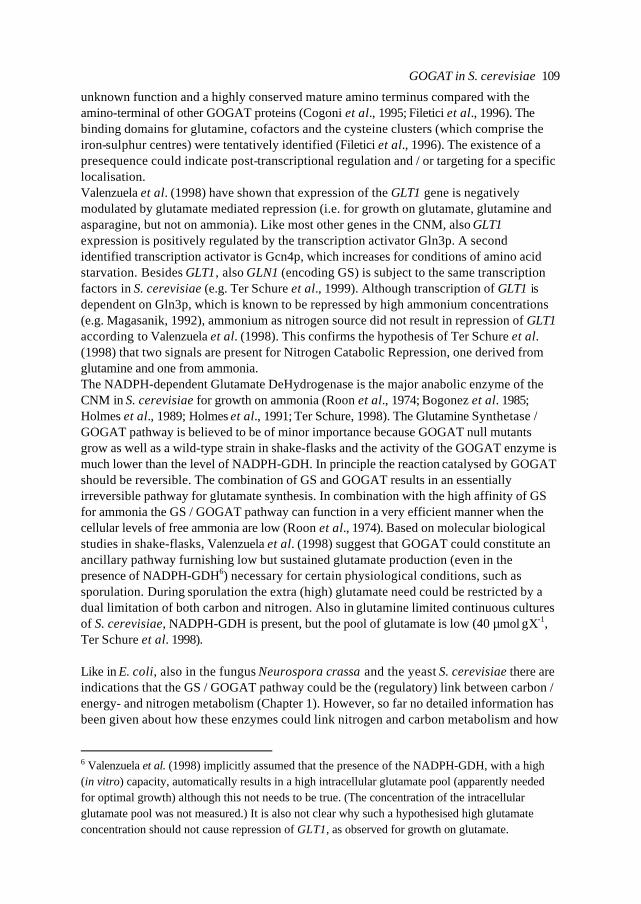
GOGAT in S. cerevisiae 109
unknown function and a highly conserved mature amino terminus compared with theamino-terminal of other GOGAT proteins (Cogoni et al., 1995; Filetici et al., 1996). Thebinding domains for glutamine, cofactors and the cysteine clusters (which comprise theiron-sulphur centres) were tentatively identified (Filetici et al., 1996). The existence of apresequence could indicate post-transcriptional regulation and / or targeting for a specificlocalisation.Valenzuela et al. (1998) have shown that expression of the GLT1 gene is negativelymodulated by glutamate mediated repression (i.e. for growth on glutamate, glutamine andasparagine, but not on ammonia). Like most other genes in the CNM, also GLT1expression is positively regulated by the transcription activator Gln3p. A secondidentified transcription activator is Gcn4p, which increases for conditions of amino acidstarvation. Besides GLT1, also GLN1 (encoding GS) is subject to the same transcriptionfactors in S. cerevisiae (e.g. Ter Schure et al., 1999). Although transcription of GLT1 isdependent on Gln3p, which is known to be repressed by high ammonium concentrations(e.g. Magasanik, 1992), ammonium as nitrogen source did not result in repression of GLT1according to Valenzuela et al. (1998). This confirms the hypothesis of Ter Schure et al.(1998) that two signals are present for Nitrogen Catabolic Repression, one derived fromglutamine and one from ammonia.The NADPH-dependent Glutamate DeHydrogenase is the major anabolic enzyme of theCNM in S. cerevisiae for growth on ammonia (Roon et al., 1974; Bogonez et al. 1985;Holmes et al., 1989; Holmes et al., 1991; Ter Schure, 1998). The Glutamine Synthetase /GOGAT pathway is believed to be of minor importance because GOGAT null mutantsgrow as well as a wild-type strain in shake-flasks and the activity of the GOGAT enzyme ismuch lower than the level of NADPH-GDH. In principle the reaction catalysed by GOGATshould be reversible. The combination of GS and GOGAT results in an essentiallyirreversible pathway for glutamate synthesis. In combination with the high affinity of GSfor ammonia the GS / GOGAT pathway can function in a very efficient manner when thecellular levels of free ammonia are low (Roon et al., 1974). Based on molecular biologicalstudies in shake-flasks, Valenzuela et al. (1998) suggest that GOGAT could constitute anancillary pathway furnishing low but sustained glutamate production (even in thepresence of NADPH-GDH6) necessary for certain physiological conditions, such assporulation. During sporulation the extra (high) glutamate need could be restricted by adual limitation of both carbon and nitrogen. Also in glutamine limited continuous culturesof S. cerevisiae, NADPH-GDH is present, but the pool of glutamate is low (40 µmol⋅gX-1,Ter Schure et al. 1998).
Like in E. coli, also in the fungus Neurospora crassa and the yeast S. cerevisiae there areindications that the GS / GOGAT pathway could be the (regulatory) link between carbon /energy- and nitrogen metabolism (Chapter 1). However, so far no detailed information hasbeen given about how these enzymes could link nitrogen and carbon metabolism and how
6 Valenzuela et al. (1998) implicitly assumed that the presence of the NADPH-GDH, with a high(in vitro) capacity, automatically results in a high intracellular glutamate pool (apparently neededfor optimal growth) although this not needs to be true. (The concentration of the intracellularglutamate pool was not measured.) It is also not clear why such a hypothesised high glutamateconcentration should not cause repression of GLT1, as observed for growth on glutamate.
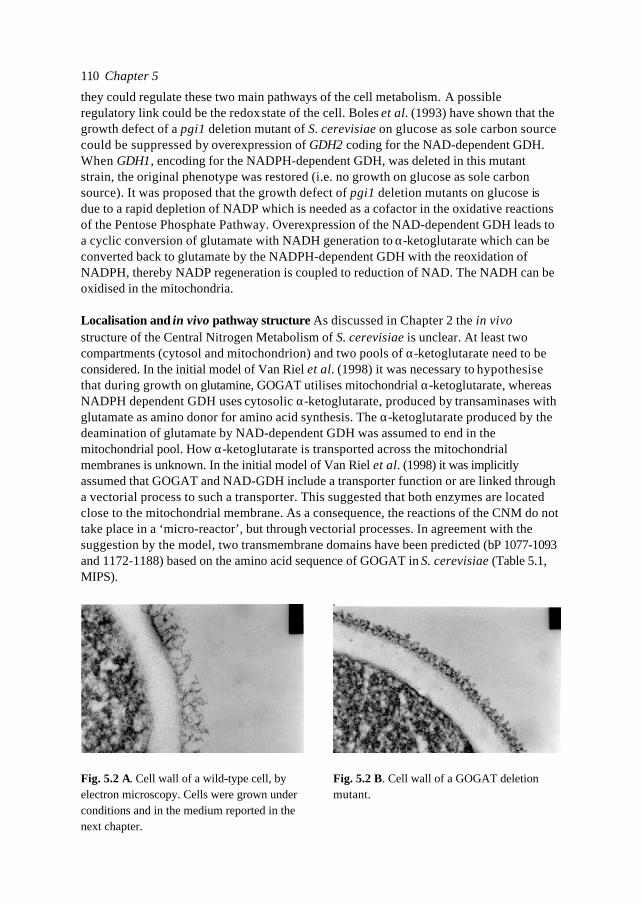
Chapter 5110
they could regulate these two main pathways of the cell metabolism. A possibleregulatory link could be the redox state of the cell. Boles et al. (1993) have shown that thegrowth defect of a pgi1 deletion mutant of S. cerevisiae on glucose as sole carbon sourcecould be suppressed by overexpression of GDH2 coding for the NAD-dependent GDH.When GDH1, encoding for the NADPH-dependent GDH, was deleted in this mutantstrain, the original phenotype was restored (i.e. no growth on glucose as sole carbonsource). It was proposed that the growth defect of pgi1 deletion mutants on glucose isdue to a rapid depletion of NADP which is needed as a cofactor in the oxidative reactionsof the Pentose Phosphate Pathway. Overexpression of the NAD-dependent GDH leads toa cyclic conversion of glutamate with NADH generation to α-ketoglutarate which can beconverted back to glutamate by the NADPH-dependent GDH with the reoxidation ofNADPH, thereby NADP regeneration is coupled to reduction of NAD. The NADH can beoxidised in the mitochondria.
Localisation and in vivo pathway structure As discussed in Chapter 2 the in vivostructure of the Central Nitrogen Metabolism of S. cerevisiae is unclear. At least twocompartments (cytosol and mitochondrion) and two pools of α-ketoglutarate need to beconsidered. In the initial model of Van Riel et al. (1998) it was necessary to hypothesisethat during growth on glutamine, GOGAT utilises mitochondrial α-ketoglutarate, whereasNADPH dependent GDH uses cytosolic α-ketoglutarate, produced by transaminases withglutamate as amino donor for amino acid synthesis. The α-ketoglutarate produced by thedeamination of glutamate by NAD-dependent GDH was assumed to end in themitochondrial pool. How α-ketoglutarate is transported across the mitochondrialmembranes is unknown. In the initial model of Van Riel et al. (1998) it was implicitlyassumed that GOGAT and NAD-GDH include a transporter function or are linked througha vectorial process to such a transporter. This suggested that both enzymes are locatedclose to the mitochondrial membrane. As a consequence, the reactions of the CNM do nottake place in a ‘micro-reactor’, but through vectorial processes. In agreement with thesuggestion by the model, two transmembrane domains have been predicted (bP 1077-1093and 1172-1188) based on the amino acid sequence of GOGAT in S. cerevisiae (Table 5.1,MIPS).
Fig. 5.2 A. Cell wall of a wild-type cell, byelectron microscopy. Cells were grown underconditions and in the medium reported in thenext chapter.
Fig. 5.2 B. Cell wall of a GOGAT deletionmutant.
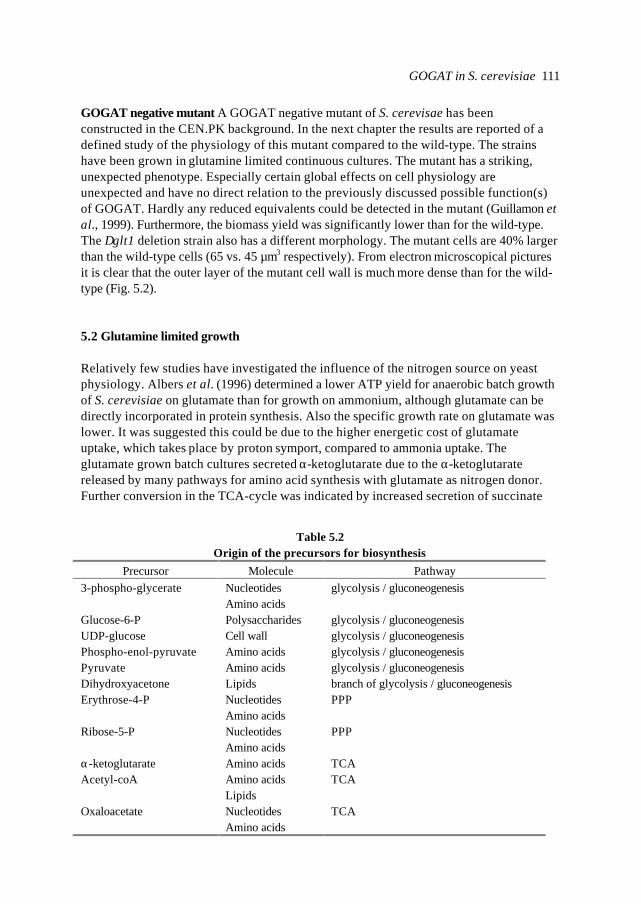
GOGAT in S. cerevisiae 111
GOGAT negative mutant A GOGAT negative mutant of S. cerevisae has beenconstructed in the CEN.PK background. In the next chapter the results are reported of adefined study of the physiology of this mutant compared to the wild-type. The strainshave been grown in glutamine limited continuous cultures. The mutant has a striking,unexpected phenotype. Especially certain global effects on cell physiology areunexpected and have no direct relation to the previously discussed possible function(s)of GOGAT. Hardly any reduced equivalents could be detected in the mutant (Guillamon etal., 1999). Furthermore, the biomass yield was significantly lower than for the wild-type.The ∆glt1 deletion strain also has a different morphology. The mutant cells are 40% largerthan the wild-type cells (65 vs. 45 µm3 respectively). From electron microscopical picturesit is clear that the outer layer of the mutant cell wall is much more dense than for the wild-type (Fig. 5.2).
5.2 Glutamine limited growth
Relatively few studies have investigated the influence of the nitrogen source on yeastphysiology. Albers et al. (1996) determined a lower ATP yield for anaerobic batch growthof S. cerevisiae on glutamate than for growth on ammonium, although glutamate can bedirectly incorporated in protein synthesis. Also the specific growth rate on glutamate waslower. It was suggested this could be due to the higher energetic cost of glutamateuptake, which takes place by proton symport, compared to ammonia uptake. Theglutamate grown batch cultures secreted α-ketoglutarate due to the α-ketoglutaratereleased by many pathways for amino acid synthesis with glutamate as nitrogen donor.Further conversion in the TCA-cycle was indicated by increased secretion of succinate
Table 5.2Origin of the precursors for biosynthesis
Precursor Molecule Pathway3-phospho-glycerate Nucleotides glycolysis / gluconeogenesis
Amino acidsGlucose-6-P Polysaccharides glycolysis / gluconeogenesisUDP-glucose Cell wall glycolysis / gluconeogenesisPhospho-enol-pyruvate Amino acids glycolysis / gluconeogenesisPyruvate Amino acids glycolysis / gluconeogenesisDihydroxyacetone Lipids branch of glycolysis / gluconeogenesisErythrose-4-P Nucleotides PPP
Amino acidsRibose-5-P Nucleotides PPP
Amino acidsα-ketoglutarate Amino acids TCAAcetyl-coA Amino acids TCA
LipidsOxaloacetate Nucleotides TCA
Amino acids
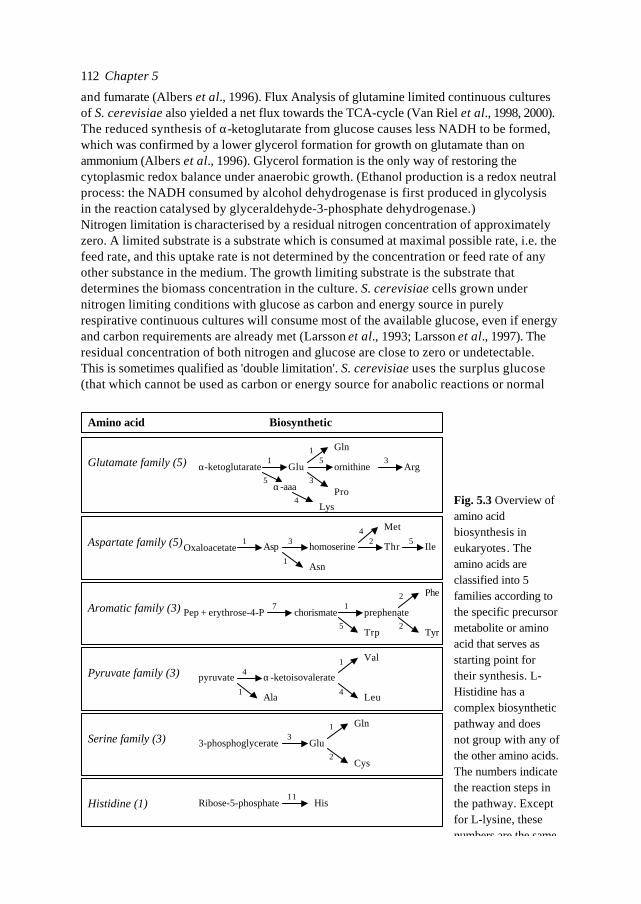
Chapter 5112
and fumarate (Albers et al., 1996). Flux Analysis of glutamine limited continuous culturesof S. cerevisiae also yielded a net flux towards the TCA-cycle (Van Riel et al., 1998, 2000).The reduced synthesis of α-ketoglutarate from glucose causes less NADH to be formed,which was confirmed by a lower glycerol formation for growth on glutamate than onammonium (Albers et al., 1996). Glycerol formation is the only way of restoring thecytoplasmic redox balance under anaerobic growth. (Ethanol production is a redox neutralprocess: the NADH consumed by alcohol dehydrogenase is first produced in glycolysisin the reaction catalysed by glyceraldehyde-3-phosphate dehydrogenase.)Nitrogen limitation is characterised by a residual nitrogen concentration of approximatelyzero. A limited substrate is a substrate which is consumed at maximal possible rate, i.e. thefeed rate, and this uptake rate is not determined by the concentration or feed rate of anyother substance in the medium. The growth limiting substrate is the substrate thatdetermines the biomass concentration in the culture. S. cerevisiae cells grown undernitrogen limiting conditions with glucose as carbon and energy source in purelyrespirative continuous cultures will consume most of the available glucose, even if energyand carbon requirements are already met (Larsson et al., 1993; Larsson et al., 1997). Theresidual concentration of both nitrogen and glucose are close to zero or undetectable.This is sometimes qualified as 'double limitation'. S. cerevisiae uses the surplus glucose(that which cannot be used as carbon or energy source for anabolic reactions or normal
Amino acid Biosynthetic
Glutamate family (5)
Aspartate family (5)
Aromatic family (3)
Pyruvate family (3)
Serine family (3)
Histidine (1)
α-ketoglutarate Glu
Gln
Pro
Arg
α-aaa
Lys
ornithine1
5
4
1
3
5 3
Oxaloacetate Asp
Met
Thrhomoserine14
1
3 2
Pep + erythrose-4-P chorismate
Phe
prephenate7
2
2
1
pyruvate
Val
Leu
41
4
3-phosphoglycerate Glu
Gln3
1
2
Ribose-5-phosphate His11
Cys
α-ketoisovalerate
Ala1
Asn
Ile5
Tyr5
Trp
Fig. 5.3 Overview ofamino acidbiosynthesis ineukaryotes. Theamino acids areclassified into 5families according tothe specific precursormetabolite or aminoacid that serves asstarting point fortheir synthesis. L-Histidine has acomplex biosyntheticpathway and doesnot group with any ofthe other amino acids.The numbers indicatethe reaction steps inthe pathway. Exceptfor L-lysine, thesenumbers are the same
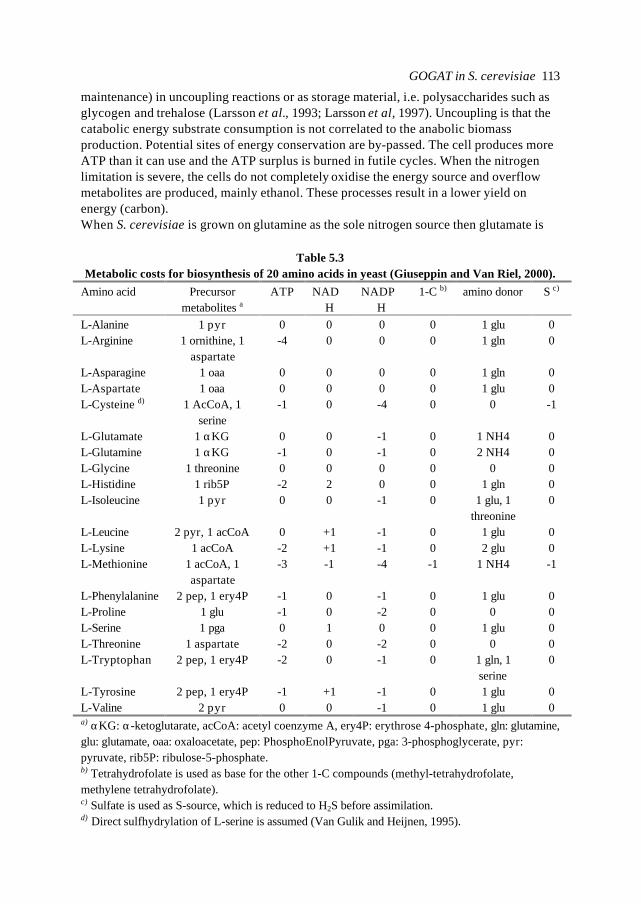
GOGAT in S. cerevisiae 113
maintenance) in uncoupling reactions or as storage material, i.e. polysaccharides such asglycogen and trehalose (Larsson et al., 1993; Larsson et al, 1997). Uncoupling is that thecatabolic energy substrate consumption is not correlated to the anabolic biomassproduction. Potential sites of energy conservation are by-passed. The cell produces moreATP than it can use and the ATP surplus is burned in futile cycles. When the nitrogenlimitation is severe, the cells do not completely oxidise the energy source and overflowmetabolites are produced, mainly ethanol. These processes result in a lower yield onenergy (carbon).When S. cerevisiae is grown on glutamine as the sole nitrogen source then glutamate is
Table 5.3Metabolic costs for biosynthesis of 20 amino acids in yeast (Giuseppin and Van Riel, 2000).
Amino acid Precursormetabolites a
ATP NADH
NADPH
1-C b) amino donor S c)
L-Alanine 1 pyr 0 0 0 0 1 glu 0L-Arginine 1 ornithine, 1
aspartate-4 0 0 0 1 gln 0
L-Asparagine 1 oaa 0 0 0 0 1 gln 0L-Aspartate 1 oaa 0 0 0 0 1 glu 0L-Cysteine d) 1 AcCoA, 1
serine-1 0 -4 0 0 -1
L-Glutamate 1 αKG 0 0 -1 0 1 NH4 0L-Glutamine 1 αKG -1 0 -1 0 2 NH4 0L-Glycine 1 threonine 0 0 0 0 0 0L-Histidine 1 rib5P -2 2 0 0 1 gln 0L-Isoleucine 1 pyr 0 0 -1 0 1 glu, 1
threonine0
L-Leucine 2 pyr, 1 acCoA 0 +1 -1 0 1 glu 0L-Lysine 1 acCoA -2 +1 -1 0 2 glu 0L-Methionine 1 acCoA, 1
aspartate-3 -1 -4 -1 1 NH4 -1
L-Phenylalanine 2 pep, 1 ery4P -1 0 -1 0 1 glu 0L-Proline 1 glu -1 0 -2 0 0 0L-Serine 1 pga 0 1 0 0 1 glu 0L-Threonine 1 aspartate -2 0 -2 0 0 0L-Tryptophan 2 pep, 1 ery4P -2 0 -1 0 1 gln, 1
serine0
L-Tyrosine 2 pep, 1 ery4P -1 +1 -1 0 1 glu 0L-Valine 2 pyr 0 0 -1 0 1 glu 0a) αKG: α-ketoglutarate, acCoA: acetyl coenzyme A, ery4P: erythrose 4-phosphate, gln: glutamine,glu: glutamate, oaa: oxaloacetate, pep: PhosphoEnolPyruvate, pga: 3-phosphoglycerate, pyr:pyruvate, rib5P: ribulose-5-phosphate.b) Tetrahydrofolate is used as base for the other 1-C compounds (methyl-tetrahydrofolate,methylene tetrahydrofolate).c) Sulfate is used as S-source, which is reduced to H2S before assimilation.d) Direct sulfhydrylation of L-serine is assumed (Van Gulik and Heijnen, 1995).
Chapter 5114
synthesised from glutamine by the combination of GOGAT and glutaminases (Magasanik,1992). Soberón and González (1987a, 1987b) detected 2 glutaminases in S. cerevisiae strainS288C, one readily extractable form (glutaminase B) and a membrane-bound enzyme(glutaminase A). Glutaminase B activity was inhibited in vivo by pyruvate accumulation.Strikingly, the genes encoding these enzymes have not been identified yet. This mayindicatethat the enzyme glutaminase as such does not exist and that its activity results fromsynthesis and degradation of other amino acids derived from glutamine and degraded toglutamate (or α-ketoglutarate) and ammonia. In the physiological study of the ∆glt1mutant, the responses of the intracellular free pools of amino acids to glutamine andglutamate pulses will be determined. Biosynthetic reactions which use glutamine as aminodonor are the synthesis of histidine and tryptophane and possible the formation ofalanine, arginine and asparagine. The literature on the amino acid biosynthetic routes inyeast is ambiguous (e.g. Jones and Fink, 1982; Van Gulik and Heijnen, 1995; Giuseppinand Van Riel, 2000).
5.3 Amino acid synthesis in S. cerevisiae
Yeast is able to synthesise all nitrogen containing compounds from the two central aminoacids glutamate and glutamine. Carbohydrate precursors for biomass synthesis arewithdrawn at various stages of glycolysis, Pentose Phosphate Pathway and TCA-cycle(Table 5.2). The amino acids are classified into 5 families according to the specificprecursor metabolite or amino acid that serves as starting point for their synthesis (Fig.5.3).
The total metabolic costs for biosynthesis of the 20 most common amino acids in yeastsare shown in Table 5.3. Several amino acids are synthesised exclusively in themitochondria, such as leucine (e.g. Jones and Fink, 1982). Furthermore severalbiosynthetic routes are partly located in the mitochondria, e.g. for arginine, isoleucine,lysine and valine. The precursors also need to be available in the right cell compartment.The synthesis and degradation pathways of amino acids can be localised in differentcompartments, such as glycine degradation in the mitochondria and synthesis in thecytosol, the same holds for proline.
AcknowledgementsDr. W. Müller (Department of Molecular Cell Biology, Utrecht University) for ElectronMicroscopy.
References
Albers, E., Larsson, C., Lidén, G., Niklasson, C. and Gustafsson, L. (1996) Influence of the nitrogensource on Saccharomyces cerevisiae anaerobic growth and product formation Appl. Environ.Microbiol. 62: 3187-3195.
GOGAT in S. cerevisiae 115
Bray, D. (1995) Protein molecules as computational elements in living cells. Nature 376: 307-312.
Boles, E., Lehnert, W. and Zimmermann, F.K. (1993) The role of the NAD-dependent glutamatedehydrogenase in restoring growth on glucose of a Saccharomyces cerevisiae phosphoglucoseisomerase mutant. Eur. J. Biochem. 217: 469-477.
Cogoni, C., Valenzuela, L., González-Halphen, D., Olivera, H., Macino, G., Ballario, P. andGonzález, A. (1995) Saccharomyces cerevisiae has a single glutamate synthase gene coding for aplant-like high-molecular-weight polypeptide. J. Bacteriol. 177: 792-798.
Chock, P.B., Shacter, E., Jurgensen, S.R. and Rhee, S.G. (1985) Cyclic cascade systems in metabolicregulation. Curr. Top. Cell. Regul. 27: 3-12.
Filetici, P.; Martegani, M.P.; Valenzuela, L.; González, A.; Ballario, P. (1996) Sequence of the glt1gene from Saccharomyces cerevisiae reveals the domain-structure of yeast glutamate synthase.Yeast 12: 1359-1366.
Goffeau, M. and Boutry, M. (1986) Three proton pumping ATPases in yeast. TIBS 3: 164-168.
Guillamon, J.M., Van Riel, N.A.W., and Verrips, C.T. (1999) In preparation.
Giuseppin, M.L.F. and Van Riel, N.A.W. (2000) Metabolic modelling of Saccharomyces cerevisiaeusing the optimal control of homeostasis; a cybernetic model definition. Metabol. Eng. 2: 1-20 .
Hayakawa, T., Yamaya, T., Kamachi, K. and Ojima, K. (1992) Purification, characterization, andimmunological properties of NADH-dependent glutamate synthase from rice cell cultures. PlantPhysiol. 98: 1317-1322.
Hayakawa, T., Hopkins, L., Peat, L.J. Yamaya, T. and Tobin, A.K. (1999) Quantitativeintercellular localization of NADH-dependent glutamate synthase protein in different types of rootcells in rice plants. Plant Physiol. 199: 409-416.
Helling R.B. (1998) Pathway choice in glutamate synthesis in Escherichia coli. J. Bacteriol.180:4571-4575.
Holmes, A.R., Collings, A., Farnden, K.J.F. and Sepherd, M.G. (1989) Ammonium assimilation byCandida albicans and other yeasts: evidence for activity of glutamate synthase. J. Gen. Microbiol.135: 1424-1430.
Jones, E.W. and Fink, G.R. (1982) Regulation of amino acid and nucleotide biosynthesis in yeast.In: The molecular biology of the yeast Saccharomyces cerevisiae, metabolism and gene expression(Strathern, J.N., Jones, E.W. and Broach, J.R., eds.) pp. 181-299. Cold Spring Harbor LaboratoryPress, Cold Spring Harbor, New York.
Chapter 5116
Larsson, C., von Stockar, U., Marison, I., Gustafsson, L. (1993) Growth and metabolism ofSaccharomyces cerevisiae in chemostat cultures under carbon-, nitrogen-, or carbon- and nitrogen-limiting conditions. J. Bacteriol., 175: 4809-4816.
Larsson, C., Nilsson, A., Blomberg, A., Gustafsson, L. (1997) Glycolytic flux is conditionallycorrelated with ATP concentration in Saccharomyces cerevisiae: a chemostat study under carbon-or nitrogen-limiting conditions. J. Bacteriol. 179: 7243-7250.
Magasanik, B. (1992) Regulation of nitrogen utilization. In: The molecular and cellular biology ofthe yeast Saccharomyces cerevisiae: gene expression (Jones, E.W. et al., eds) pp. 283-317. ColdSpring Harbor Laboratory Press, Cold Spring Harbor, New York.
Meister, A. (1985) Glutamate Synthase from Escherichia coli, Klebsiella aerogenes andSaccharomyces cerevisiae. Methods Enzymol. 113: 327-337.
Miller, R.E. and Stadtman (1972) J. Biol. Chem. 247: 7407.
Mora, Y., Hernandez, G. and Mora, J. (1987) Regulation of carbon and nitrogen flow by glutamatesynthase in Neurospora crassa. J. Gen. Microbiol. 133: 1667-1674.
Oliver, G., Gosset, G., Sanchez-Pescador, R., Lozoya, E., Ku, L.M., Flores, N., Becerril, B., Valle,F. and Bolivar, F. (1987) Determination of the nucleotide sequence for the glutamate synthasestructural genes of E. coli K-12. Gene 60: 1-11.
Roon, R.J., Even, H.L. and Larimore, F. (1974) Glutamate synthase: properties of the reducednicotinamide adenine dinucleotide-dependent enzyme from Saccharomyces cerevisiae. J. Bacteriol.118: 89-95.
Soberón, M. and González, A. (1987a) Physiological role of glutaminase activity in Saccharomycescerevisiae. J. Gen. Microbiol. 133: 1-8.
Soberón, M. and González, A. (1987b) Glutamine degradation through ω-amidase pathway inSaccharomyces cerevisiae. J. Gen. Microbiol. 133: 9-14.
Schulze, U. (1995) Anaerobic physiology of Saccharomyces cerevisiae, Ph.D. thesis, TechnicalUniversity of Denmark.
Teixeira de Mattos, M.J. and Neijssel, O.M. (1997) Bioenergetic consequences of microbialadaptation to low-nutrient environments. J. Biotechnol. 59: 117-126.
Ter Schure, E.G., Silljé, H.H.W., Vermeulen, E.E., Kalhorn, J., Verkleij, A.J., Boonstra, J. andVerrips, C.T. (1998) Repression of nitrogen catabolic genes by ammonia and glutamine in nitrogen-limited continuous cultures of Saccharomyces cerevisiae. Microbiology 144: 1451-1462.
Ter Schure, E.G., Van Riel, N.A.W., and Verrips, C.T. (1999) The role of ammonia metabolism fornitrogen catabolite repression in Saccharomyces cerevisiae. FEMS Microbiology Reviews In press.
GOGAT in S. cerevisiae 117
Valenzuela, L., Ballario, P., Aranda, C, Filetici, P., González, A. (1998) Regulation of expression ofGLT1, the gene encoding glutamate synthase in Saccharomyces cerevisiae. J. Bacteriol. 180: 3533-3540.
Van Gulik, W.M. and Heijnen, J.J. (1995) A metabolic network stoichiometry analysis of microbialgrowth and product formation. Biotechnol. Bioeng. 48: 681-698.
Vanoni ,M.A., Mazzoni, A., Fumagalli, P., Negri, A., Zanetti, G. and Curti, B. (1994) Interdomainloops and conformational changes of glutamate synthase as detected by limited proteolysis. Eur. J.Biochem.. 226: 505-515.
Vanoni, M.A. and Curti, B. (1999) Reviews - Glutamate synthase: A complex iron-sulfurflavoprotein. CMLS - Cellular and Molecular Life Sciences 55: 617-638.
Van Riel, N.A.W., Giuseppin, M.L.F., Ter Schure, E.G. and Verrips, C.T. (1998) A Structured,Minimal Parameter Model of the Central Nitrogen Metabolism in Saccharomyces cerevisiae: thePrediction of the Behaviour of Mutants. J. Theor. Biol. 191: 397-414.
Van Riel, N.A.W., Giuseppin, M.L.F. and Verrips, C.T. (2000) Dynamic optimal metabolic controltheory: a cybernetic approach for modelling of the central nitrogen metabolism of S. cerevisiae.Metabol. Eng. 2: In press.
Voet, D. and Voet, J.G. (1995) Biochemistry second edition. Wiley.

118
Chapter 6
Physiological study of a ∆GLT1 (GOGAT) mutant ofSaccharomyces cerevisiae
Natal A.W. van Riel1, José M. Guillamon3, Marco L.F. Giuseppin2 and C. Theo Verrips1,2
1 Department of Molecular Cell Biology, Institute of BiomembranesUtrecht University, Padualaan 8, 3584 CH Utrecht, The Netherlands
2 Unilever Research VlaardingenOlivier van Noortlaan 120, 3133 AT Vlaardingen, The Netherlands
3 Departament de Bioquimica i BiotecnollogiaUniversitat Rovira i Vigili, Av. Ramón y Cajal 70, 43005 Tarragona, Spain
Chapter 6120
Abstract
Initiated by the results of previously developed mathematical models, the Central NitrogenMetabolism in S. cerevisiae has been further investigated. Different models haveindicated that the glutamate synthase (GOGAT) pathway plays a more importantphysiological role in yeast than is generally assumed. This pathway could give the cell thepossibility to deal with rapid fluctuations in glutamine availability. The responses of botha GOGAT negative (∆glt1) mutant and a wild-type strain after pulsing different nitrogensources and different concentrations to glutamine limited continuous cultures have beendetermined.In this work the data of the pulse experiments have been embedded in a broaderphysiological interpretation and have been discussed in the context of the DynamicOptimal Metabolic Control modelling framework. This framework is focused on the holisticfunction of the various aspects of Central Nitrogen Metabolism. Improved understandingof the physiological function of the different parallel pathways is necessary if the flux inCentral Nitrogen Metabolism of S. cerevisiae needs to be redirected for MetabolicEngineering applications.New data have been presented on growth and especially the effect of the nitrogen /carbon ratio in the medium. As previously suggested by the model, GOGAT appeared tobe associated to the mitochondria, which is a crucial aspect for its in vivo function. Thechange in elemental biomass composition after a nitrogen pulse has been determined.Within 2 hours the nitrogen content of the biomass increased by 14%, information whichis especially relevant for the models. It has been hypothesised that the low biomass yieldand high by-product formation for the mutant are related to a redox imbalance.
6.1 Introduction
Glutamine is a preferred nitrogen source for the yeast Saccharomyces cerevisiae.Glutamine represses the metabolism of other nitrogen sources which can be present in richmedia used for production processes. This makes the study of glutamine catabolismparticularly relevant. Glutamine catabolism is poorly known (Chapter 1), in contrast to thatof glucose as the most preferred carbon source. For growth on glutamine, glutamatesynthase (GOGAT) and glutaminases are the possible pathways for glutaminedegradation and glutamate production. In the latter case, the ammonia produced can beused by NADPH-dependent Glutamate DeHydrogenase, also producing glutamate. Fromglutamate and glutamine the cell can synthesise all other nitrogen containing compounds,e.g. proteins, nucleotides and lipids. There is controversy about the relevance andfunction of the parallel pathways for glutamate biosynthesis. A good characterisation ofthe dynamic properties of the Central Nitrogen Metabolism is essential when thismetabolism is to be engineered. Metabolic redundancy is common in central metabolismand if not of all parallel pathways the function is known, this will cause unexpectedproblems when a related metabolic flux needs to be redirected. Information on the functionof such pathways usually can only be obtained in well defined physiological studies,often employing mutant strains (e.g. Luttik et al. 1998; Ter Schure et al., 1998). Both forGOGAT and the glutaminase pathway no such data have been reported.
Physiology of GOGAT negative S. cerevisiae 121
The physiological study as presented, was driven by previous mathematical models of theCNM in yeast (Van Riel et al., 1998, 2000). Mathematical models provide highly efficientand compact frameworks to structure available information. Besides serving asengineering tools they help to focus experimental effort and fuel new hypotheses. Withthe (dynamic) computer simulation models several knowledge gaps for the CNM in S.cerevisiae have been identified and some striking predictions and suggestions were made(Van Riel et al., 1998, 2000). The biologically most important prediction was the proposedimportant role of GOGAT for growth on glutamine, especially when the availability ofnitrogen changes quickly.For a further physiological characterisation of the CNM in yeast, with special attention onthe function of GOGAT, a GOGAT negative (∆glt1) mutant strain (VWk274 LEU+) hasbeen studied in glutamine limited continuous cultures, with pulses of different nitrogensources and of different size (Guillamon et al., 1999). As reference, the same experimentswere done with a wild-type strain (CEN.PK-113D, also called VWk43). A large number ofintracellular and extracellular metabolites were analysed during the steady-state and afterthe pulses. The responses of some genes coding for enzymes of the CNM have also beenstudied. As suggested in the discussion of the kinetic model (Van Riel et al., 1998), theredox state in the cell was taken into account and the NAD(H) and NADP(H)concentrations have been determined as well as the reduced and oxidised form ofglutathione (GSH and GSSG respectively). From the mathematical models it was also clearthat within two hours after the pulses the synthesis of nitrogen containing compounds,other than glutamine and glutamate, should increase. Van Riel et al. (1998) suggested thata nitrogen containing compound derived from glutamate, such as glutathione, could beused for storage of excess nitrogen after nitrogen pulses. The results of the pulseexperiments showed that GOGAT indeed plays an important role in CNM, especially forglutamate synthesis when glutamine is the sole nitrogen source (Guillamon et al., 1999).As mentioned in Chapter 5, the ∆glt1 mutant had several unexpected phenotypes. Themost striking was the completely changed redox state of the cell. The almost complete lackof reduced equivalents (NAD(P)H) also reduced ethanol formation, a drastic effect for S.cerevisiae. Instead, large amounts of acetaldehyde were present in the supernatant.Guillamon et al. (1999) suggested that maintaining a correct redox equilibrium in the cellcould be one of the main roles of GOGAT in yeast. In this chapter the data of the pulseexperiments have been embedded in a broader physiological study. New data arepresented on growth of the wild-type and the GOGAT negative mutant strain on differentnitrogen sources and different initial concentrations. In continuous cultures the effect ofthe ratio of nitrogen versus carbon in the feed has been studied. The consistency of thesteady-state data is checked with elemental mass balances. The pulse experiment data arediscussed on the basis of a classification of the different dynamic responses. This allowsthe interpretation of the responses in the context of the Dynamic Optimal MetabolicControl concept (Giuseppin and Van Riel, 2000; Van Riel et al., 2000). Since the substratelimited continuous cultures resulted in well defined physiological steady-states,disturbances of the homeostasis could be studied. With substrate pulses of variousconcentrations it was possible to observe some of the qualitative different responses ashypothesised within the DOMC framework.The developed kinetic model contained an unexpected structure of the CNM (Van Riel etal., 1998). This model structure indicated that GOGAT was in, or associated to the
Chapter 6122
mitochondrial membrane and that it could use mitochondrial α-ketoglutarate to produceglutamate. This was a first suggestion of a protein connecting the TCA-cycle to CNM.More recently this idea was confirmed by the appearance of a GOGAT structureprediction which shows several transmembrane domains (Chapter 5). In the current workthe localisation of GOGAT has been studied by fractionation of the mitochondria.For a more consistent dataset also the change in the elemental composition of the biomasshas been determined after one of the pulses. These data complemented the results of thechanges in nitrogen contained in free amino acid pools and glutathione (Guillamon et al.,1999).
6.2 Materials and methods
6.2.1 StrainsA GOGAT negative mutant was constructed in the diploid strain CEN.PK219 carrying aleu2 marker. The gene was deleted using the method of PCR-targeting with short-flankinghomology (Wach et al., 1994). The DNA fragments for homologous integration weregenerated by PCR using a loxP-KanMX-loxP cassette with kanamycin resistance asdominant marker (Guldener et al., 1996). After tetrad analyses of the resultingheterozygous deletion strain, the correct integration was verified by diagnostic PCR andsubsequently the KanR gene was removed by expressing the cre recombinase (verified byPCR). In the resulting strain VWk274 (MAT a, leu2-3,112, glt1(41,6000)::loxP), the leu2mutations were removed by transformation with a wild-type LEU2 gene derived fromYDpLEU (Berben et al., 1991) yielding strain VWk274 LEU+.
6.2.2 Growth conditionsMicrotitre batch fermentations The growth rates of VWk43 (wild-type) and VWpk274LEU+ (∆glt1 mutant) for different nitrogen sources and with different concentrations havebeen determined in microtitre plates in combination with an automatic Optical Densityreader at 600 nm (Bioscreen C, Labsystems). The pre-cultures were grown overnight in adefined, minimal medium with glutamine as sole nitrogen source (same medium as forcontinuous culture experiments, see below). In the 2×100 well microtitre plates, 395 µlmedium was inoculated with 5 µl pre-culture. While shaking (temperature 30°C), every 10minutes the OD at 600 nm was determined during 47.5 hours. (Every strain was inoculatedfour times on the same medium.) All media were based on the minimal medium for thecontinuous culture experiments as described below. The nitrogen sources were glutamine,glutamate, proline and ammonium. For all substrates the same amount of nitrogen wasincluded in the media (glutamine contains two nitrogen atoms). The concentrations usedwere 41.1, 10, 5, 1 or 0.2 N-mol⋅l-1. The specific growth rates µ [h-1] have been determinedfrom the OD readings in the time period from 2 to 12 hours after inoculation when allcultures were exponentially growing (after an initial, short lag phase). Linear regressionwas applied on the ln(OD600) data.
Continuous culture fermentations Continuous culture experiments with pulses ofglutamine and glutamate were repeatedly carried out in different fermenters at differentsites. Initial experiments (of which some data will be reported) were done in 0.5 l
Physiology of GOGAT negative S. cerevisiae 123
fermentors (Sixfors, INFORS AG) with 450 ml working volume. For the pulse experiments2.0 l fermentors with a working volume of 1.0 or 1.5 litre have been used (Fourforsfermenter, INFORS AG and BiofloIII fermentor, New Brunswick Scientific) connected to acomputer controller unit running with Wizcon (PC Soft International) or AdvancedFermentation Software (New Brunswick Scientific).The inocula were grown in shake-flasks at 30°C and 135 - 180 rpm in YPD medium (yeastextract, peptone and 2% glucose) or the defined minimal medium used for the continuouscultures (see below). After overnight growth, 50 - 80 ml preculture was used to inoculatethe fermenters. S. cerevisiae strains VWk43 (wild-type) and VWk274 LEU+ (∆glt1) weregrown aerobically at 30°C during batch fermentation. The pH in the fermentor wasautomatically controlled at 5.0 by addition of 2M or 3M KOH. The oxygen tension waskept above 20% air saturation to assure aerobic growth. The stirrer speed was set between300 and 600 rpm. Carbon dioxide and oxygen concentrations in the exhaust gas of thefermentor were measured on line by either an Uras3G CO2 analyser and a Magnos4G O2
analyser (Hartmann and Braun) or by a mass spectrometer (Prima 600, ThIS Gas AnalysesSystems BV). With the mass spectrometer the ethanol concentration in the exhaust gas ofthe fermenter was also measured.After batch growth, the continuous culture was started when less than 100 ppm of ethanolwas present in the off-gas and the Respiration Coefficient (RQ, the ratio of CO2 EvolutionRate (CER [mmol⋅l-1⋅h-1]) and Oxygen Uptake Rate (OUR [mmol⋅l-1⋅h-1])) was below 0.9,usually after overnight growth. The continuous feed was started at a dilution rate of 0.1 h -
1. The volume of the fermentor adjusted itself to the working volume by withdrawing theexcess volume. The substrate flow was controlled using a feedback controller, based onweight. The first steady-state was assumed to be reached after 5 times the dilution time (50h). The growth conditions were essentially as previously described (e.g. Ter Schure et al,1995).The in the continuous cultures used minimal medium was based on the medium accordingto Egli (e.g. Sierkstra et al., 1992) with 20 g⋅l-1 glucose, but ammonium chloride as nitrogensource was replaced by different concentrations of glutamine, ranging from 2.0 to 5.5 g ⋅l-1.The actual glucose and glutamine concentrations were determined enzymatically (seebelow). During dissolving and solution storage glutamine degrades into equimolaramounts of ammonia, especially at higher temperatures (such as room temperature) and inphosphate buffers (Khan and Elia, 1991). No associated glutamate is formed, most likelypyroglutamate (a cyclised amino acid) is the other degradation product. Most of the pulseexperiments were done with (approximately) 2.5 g⋅l-1 glutamine in the feed. Struktolantifoam agent was added to the medium at a concentration of 100 µl⋅l-1 (0.01%).Above a certain critical growth rate µcrit, S. cerevisiae grows respiro-fermentatively andproduces ethanol. The µcrit in carbon limited cultures was determined in so-calledaccelerostat experiments in which the dilution rate is continuously increased. Anacceleration of 0.01 h -2 has been used.
Four pulses (20 mM or 10 mM glutamine or 40 mM or 20 mM glutamate) were added to theglutamine limited steady-state cultures. Approximately 40 ml of a sterilised, concentratedstock solution was injected aseptically (within 10 seconds). After each pulse samples weretaken and the culture was allowed to reach steady-state before a new experiment was done
Chapter 6124
(at least 24 hours). The glutamine pulses were half the concentration of the glutamateones so as to add the same amount of nitrogen.
6.2.3 Sampling and sample preparationSamples for the determination of intracellular metabolites and cofactors were takenaseptically from the fermentor, quenched immediately and extracted to assay metaboliteswith high turnover rates. Essentially the method developed by Gonzalez et al. (1997) wasused. An aliquot of the culture was dropped into 5 volumes of 60% methanol diluted withHepes buffer (10 mM, pH 7.5) kept at -40ºC. The mixture was centrifuged at lowtemperatures (the temperature of the suspension should be below -20ºC aftercentrifugation). The supernatant was poured and 3 ml of boiling 75% ethanol diluted withHepes buffer (70 mM, pH 7.5) was added to the pellet and put in an 80ºC waterbath for 3minutes. The ethanol was evaporated under a nitrogen flow and the pellet wasresuspended in 1.5 ml of milliQ water. This solution was centrifuged at 5000 rpm for 10 min(4ºC) to clean the supernatant from fines. Supernatant was taken and used for themetabolite assays.To determine extracellular metabolites and amino acids, culture samples were filteredthrough a 0.45 µm pore size filter and frozen. Preparation of cell-free extracts for mRNAisolation was performed as described by Sierkstra et al. (1992).In steady-state experiments approximately 10 ml of culture was sampled for thedetermination of intracellular metabolites and cofactors. For extracellular compoundsabout 15 ml was sampled. 15 ml culture samples were used for biomass determination. Forthe pulse experiments samples were taken at -20, -10, 0, 2, 5, 10, 20, 30, 60, 120 minutes afterthe pulse and often also overnight. 2 or 5 ml of these samples were quenched, 1 ml wasimmediately put at -80°C or frozen in liquid nitrogen for RNA extraction and 1 ml wasfiltered to get the supernatant. Before the pulse and 2 hours after the pulse, samples of atleast 5 ml were taken for biomass determination.For enzyme activity analyses cell lysate was obtained by mixing in a Vibrax with glassbeads (425-600 µm diameter) for 2 times 5 minutes (in 0.1 M potassium phosphate bufferpH 7.0). The lysate was spun down.For the fractionating of intracellular organelles, sheroplasts, prepared using Zymolyase,were broken in a glass Dounce homogeniser.
6.2.4 AnalysesBiomass determination For biomass concentration the culture Dry Cell Weight (DCW)was determined (e.g. Sierkstra et al., 1992). Approximately 10 ml of culture was pipettedinto preweighted and predried glass tubes, the samples were centrifuged, washed withwater, centrifuged again and dried in the oven overnight at 100°C. The tubes were cooleddown in an exsiccator before being weighed again.
Elemental biomass composition The elemental biomass composition was determined witha CHNO analyser from washed and dried biomass (dried overnight at 100°C and cooleddown in an exsiccator).
Extracellular metabolites Carbon compounds (acetaldehyde, acetic acid, ethanol, glyceroland pyruvic acid) were measured by means of HPLC (Shimazu, Aminex HPX-87H column,
Physiology of GOGAT negative S. cerevisiae 125
Biorad, temperature 60°C, H2SO4 solution of pH 2.0 as eluent). To determine the glucoseconcentration in the feed and the supernatant a Cobas Mira S autoanalyser (Hoffmann-LaRoche) was used with the glucose kit from IntruChemie, comprising hexokinase andglucose-6-phosphate-dehydrogenase. Free amino acids were measured by means of HPLCusing the AccQ-tag system (Waters / Millipore, USA) equipped with a reversed-phase C18
column (temperature 37°C). Amino acids were derivatized with 6-aminoquinolyl-N-hydroxysuccinimidyl carbamate (AQC). The separation was performed using a nonlineargradient of 1% to 17% acetonitryl in a 130 mmol⋅l-1 sodium acetate buffer (AccQ.TAGTMeluent). Amino acid derivates were detected by a fluorescence detector; excitation at 245nm and emission at 395 nm. Glutamate and glutamine were also measured using the L-glutamic acid determination kit comprising NAD-dependent glutamate dehydrogenase(Boehringer Manheim cat. no. 139 092). In a two stage reaction, NAD+ reduction duringdeamination of glutamate is stoichiometrically linked to a reoxidation reaction producingformazan, measured at 492 nm. Asparginase (Boehringer Manheim), having a glutaminaseside-activity, was used to transform glutamine into glutamate.
Intracellular metabolites Intracellular carbon metabolites and free amino acids weremeasured as described above. α-Ketoglutarate was measured enzymatically usingglutamate dehydrogenase as described by Bergmeyer et al. (1974) (implemented on CobasMira S). NADH oxidation was measured as a decrease in absorbance at 340 nm. Totalglutathione and its oxidised form (GSSG) were determined in the intracellular samples asdescribed by Griffith (1980), using a Cobas Fara autoanalyser (Hoffmann-La Roche). Themethod for both determinations is almost the same: during the GSSG determination GSH ismasked by vinylpyridine. The concentration of reduced glutathione (GSH) was calculatedfrom these results. The GSH concentration will be reported to be approximately 20 timeslarger than GSSG in the wild-type (41.0 vs. 2.0 µmol⋅gX-1, Table 6.2). However, beforereconciliation of the datasets some experiments resulted in much larger concentrations ofGSSG (up to 23 µmol⋅gX-1) (Guillamon et al., 1999).Redox cofactors were measured fluorometrically as described by Bergmeyer (1974) usingthe reaction catalysed by alcohol dehydrogenase for determination of NAD, glucose-6-phosphate-dehydrogenase for NADP, glycerol-3-phosphate dehydrogenase for NADHand glutathione reductase for NADPH.
Labelling of oligonucleotides and Northern blot analysis For the detection of the ACT1,GAP1, GDH1, GLN1 and H2A/H2B mRNA labelled oligonucleotides were used andNorthern analyses were performed as described previously (Sierkstra et al., 1992; TerSchure et al., 1995). Northern blots for the detection of the GAP1 and GDH1 mRNA levelswere probed with ACT1 as internal control for the amount of RNA blotted and for thedetection of GLN1 mRNA levels H2A/H2B was used as an internal control. Thequantitative results were obtained by calculating the intensity ratio between the gene ofinterest and the reference gene with the maximum expression level observed defined as100%.
GOGAT activity The GOGAT enzyme activity [mAbs⋅(mg protein)-1⋅min-1] was determinedaccording to Roon et al. (1974). NADH oxidation was measured as the decrease inabsorbance at 340 nm during 30 minutes. The enzyme activity was corrected for a blank
Chapter 6126
reaction carried out in the absence of glutamine or α-ketoglutarate. Protein concentrations[g⋅l-1] were determined according to Bradford (1976) with Bovine Serum Albumin (BSA) asstandard.
Fractionating of cell extracts Mitochondria were isolated at pH 6.0 and purified bydensity gradient centrifugation according to De Kroon et al. (1999). Spheroplasts,prepared using Zymolyase, were broken in a glass Dounce homogeniser. Unbrokenspheroplasts, nuclei and debris were removed by centrifugation. The crude mitochondriawere loaded onto sucrose step gradients or Nycodenz gradients. After ultracentrifugationthe purified mitochondria were collected and frozen in liquid nitrogen. GOGAT enzymeactivity was determined as described above, with protein concentrations corrected forBSA present in buffer.
Calculation of CER and OUR The carbon dioxide and oxygen concentrations in the driedexhaust gas (cooled in the headspace to 4°C) of the fermenter were measured online(Section 6.2.2). The gas flow rate of the exhaust gas was measured. Then the CER [mmol⋅l-1⋅h-1] and OUR [mmol⋅l-1⋅h-1] can be calculated according to
( ) 1
2,2, )( −−= minCOingasoutCOoutgas VpqpqCER (6.1)
( ) 1
2,2, )( −−= moutOoutgasinOingas VpqpqOUR (6.2)
in which qgas represents the measured gas flow rate [h -1], Vm is the molar volume atatmospheric pressure and room temperature (22.4 L), pCO2 and pO2 stand for the measuredvolume fraction of CO2 and O2 [%]. The gas volume changes were corrected by
ou t
in
N
N
2
2
%
%or
ou tou t
inin
COO
COO
22
22
%%100
%%100
−−
−−(6.3)
for Prima 600 mass spectrometer and the Uras3G CO2 and Magnos4G O2 analyserrespectively. The oxygen and CO2 in the outflowing culture were neglected.
6.2.5 Mass balancesMass balances were calculated at a macroscopic scale for the fermenter. The recovery ofthe nitrogen or carbon, in principle, should be 100% for a reliable dataset. Since nitrogen isthe most relevant compound in this work, all concentrations were transformed to N-moles.The change in time of the residual (extracellular) concentration of a metabolite xex [N-mmol⋅l-1] was written as a differential equation:
)(, exNNfeedexex xXDDxoutflowculturenflowifeedx
dtdx
+−=−== & (6.4)
xex: residual (extracellular) concentration [N-mmol⋅l-1]
Physiology of GOGAT negative S. cerevisiae 127
D: dilution rate [h -1] 7)
xfeed,N: concentration in the feed in [N-mmol⋅l-1]XN: biomass concentration in [N-mmol⋅l-1]To setup the macroscopic mass balances (also called ‘black box’ description of thebiomass) the elemental biomass composition needs to be known, especially the nitrogencontent.
6.3 Growth rate of wild-type and mutant on different nitrogen sources
The specific growth rate was determined for different nitrogen sources present at differentconcentrations. As could be expected, for growth on glutamine the growth rate of theGOGAT mutant was lower than of the wild-type (Table 6.1). There was no clear influenceof the glutamine concentration in the medium on the growth rate although the growth ratevaried considerably for the wild-type. We report also a noticeable difference in the growthrate between the wild-type and the GOGAT negative mutant for growth on ammonia. Highglutamate concentrations in the medium seemed to hamper growth, both for the wild-typeand the mutant. The results suggested that the mutant might grow slightly faster than the
7) To calculate the effective dilution rate also the added base (for constant pH) needs to be takeninto account.
Table 6.1Specific growth rates µ of wild-type VWk43 and ∆glt1 mutant VWk274 LEU+ in microtitre
plates. The initial concentrations of the nitrogen sources are indicated.glutamine[N-mol⋅l-1]
wild-type[h-1]
∆glt1[h-1]
difference[%]
glutamate[N-mol⋅l-1]
wild-type[h-1]
∆glt1[h-1]
difference[%]
0.2 0.094 0.083 -11.3 0.2 0.100 0.085 -15.11.0 0.110 0.088 -19.5 1.0 0.100 0.095 -6.45.0 0.115 0.087 -24.1 5.0 0.098 0.100 +1.8
10.0 0.109 0.084 -22.9 10.0 0.061 0.067 +8.341.1 0.103 0.086 -16.7 41.1 no
growthnogrowth
average 0.106 0.086 -19.2 average 0.090 0.087 -3.3
proline[N-mol⋅l-1]
wild-type[h-1]
∆glt1[h-1]
difference[%]
ammonia[N-mol⋅l-1]
wild-type[h-1]
∆glt1[h-1]
difference[%]
0.2 0.094 0.083 -12.1 0.2 0.098 0.083 -14.91.0 0.099 0.082 -17.2 1.0 0.091 0.085 -6.85.0 0.090 0.084 -6.7 5.0 n.d. n.d.
10.0 0.092 0.086 -6.2 10.0 0.104 0.088 -14.841.1 0.092 0.087 -5.4 41.1 0.109 0.088 -18.8
average 0.093 0.084 -9.7 average 0.100 0.086 -14.0
n.d.: not determined
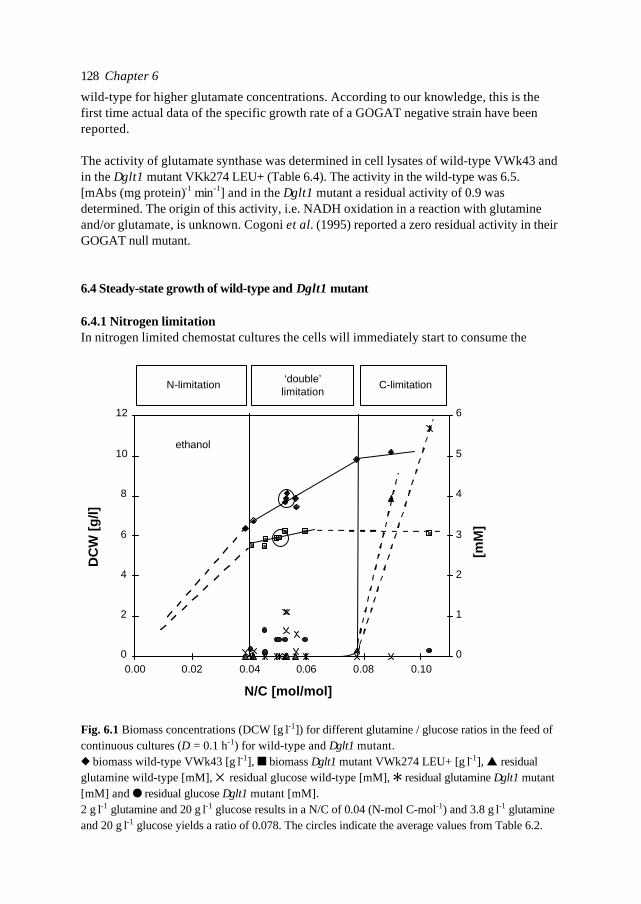
Chapter 6128
wild-type for higher glutamate concentrations. According to our knowledge, this is thefirst time actual data of the specific growth rate of a GOGAT negative strain have beenreported.
The activity of glutamate synthase was determined in cell lysates of wild-type VWk43 andin the ∆glt1 mutant VKk274 LEU+ (Table 6.4). The activity in the wild-type was 6.5.[mAbs⋅(mg protein)-1⋅min-1] and in the ∆glt1 mutant a residual activity of 0.9 wasdetermined. The origin of this activity, i.e. NADH oxidation in a reaction with glutamineand/or glutamate, is unknown. Cogoni et al. (1995) reported a zero residual activity in theirGOGAT null mutant.
6.4 Steady-state growth of wild-type and ∆glt1 mutant
6.4.1 Nitrogen limitationIn nitrogen limited chemostat cultures the cells will immediately start to consume the
0
2
4
6
8
10
12
0.00 0.02 0.04 0.06 0.08 0.10
N/C [mol/mol]
DC
W [
g/l]
0
1
2
3
4
5
6
[mM
]
C-limitation N-limitation
ethanol
‘double’limitation
Fig. 6.1 Biomass concentrations (DCW [g⋅l-1]) for different glutamine / glucose ratios in the feed ofcontinuous cultures (D = 0.1 h-1) for wild-type and ∆glt1 mutant.u biomass wild-type VWk43 [g⋅l-1], n biomass ∆glt1 mutant VWk274 LEU+ [g⋅l-1], s residualglutamine wild-type [mM], 5 residual glucose wild-type [mM], Q residual glutamine ∆glt1 mutant[mM] and l residual glucose ∆glt1 mutant [mM].2 g⋅l-1 glutamine and 20 g⋅l-1 glucose results in a N/C of 0.04 (N-mol⋅C-mol-1) and 3.8 g⋅l-1 glutamineand 20 g⋅l-1 glucose yields a ratio of 0.078. The circles indicate the average values from Table 6.2.
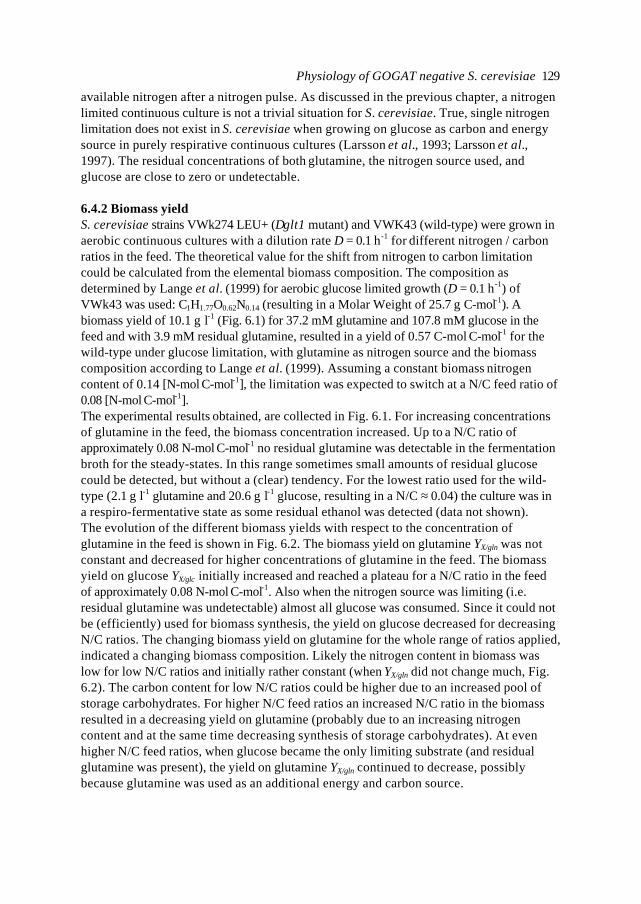
Physiology of GOGAT negative S. cerevisiae 129
available nitrogen after a nitrogen pulse. As discussed in the previous chapter, a nitrogenlimited continuous culture is not a trivial situation for S. cerevisiae. True, single nitrogenlimitation does not exist in S. cerevisiae when growing on glucose as carbon and energysource in purely respirative continuous cultures (Larsson et al., 1993; Larsson et al.,1997). The residual concentrations of both glutamine, the nitrogen source used, andglucose are close to zero or undetectable.
6.4.2 Biomass yieldS. cerevisiae strains VWk274 LEU+ (∆glt1 mutant) and VWK43 (wild-type) were grown inaerobic continuous cultures with a dilution rate D = 0.1 h-1 for different nitrogen / carbonratios in the feed. The theoretical value for the shift from nitrogen to carbon limitationcould be calculated from the elemental biomass composition. The composition asdetermined by Lange et al. (1999) for aerobic glucose limited growth (D = 0.1 h-1) ofVWk43 was used: C1H1.77O0.62N0.14 (resulting in a Molar Weight of 25.7 g⋅C-mol-1). Abiomass yield of 10.1 g⋅l-1 (Fig. 6.1) for 37.2 mM glutamine and 107.8 mM glucose in thefeed and with 3.9 mM residual glutamine, resulted in a yield of 0.57 C-mol⋅C-mol-1 for thewild-type under glucose limitation, with glutamine as nitrogen source and the biomasscomposition according to Lange et al. (1999). Assuming a constant biomass nitrogencontent of 0.14 [N-mol⋅C-mol-1], the limitation was expected to switch at a N/C feed ratio of0.08 [N-mol⋅C-mol-1].The experimental results obtained, are collected in Fig. 6.1. For increasing concentrationsof glutamine in the feed, the biomass concentration increased. Up to a N/C ratio ofapproximately 0.08 N-mol⋅C-mol-1 no residual glutamine was detectable in the fermentationbroth for the steady-states. In this range sometimes small amounts of residual glucosecould be detected, but without a (clear) tendency. For the lowest ratio used for the wild-type (2.1 g⋅l-1 glutamine and 20.6 g⋅l-1 glucose, resulting in a N/C ≈ 0.04) the culture was ina respiro-fermentative state as some residual ethanol was detected (data not shown).The evolution of the different biomass yields with respect to the concentration ofglutamine in the feed is shown in Fig. 6.2. The biomass yield on glutamine YX/gln was notconstant and decreased for higher concentrations of glutamine in the feed. The biomassyield on glucose YX/glc initially increased and reached a plateau for a N/C ratio in the feedof approximately 0.08 N-mol⋅C-mol-1. Also when the nitrogen source was limiting (i.e.residual glutamine was undetectable) almost all glucose was consumed. Since it could notbe (efficiently) used for biomass synthesis, the yield on glucose decreased for decreasingN/C ratios. The changing biomass yield on glutamine for the whole range of ratios applied,indicated a changing biomass composition. Likely the nitrogen content in biomass waslow for low N/C ratios and initially rather constant (when YX/gln did not change much, Fig.6.2). The carbon content for low N/C ratios could be higher due to an increased pool ofstorage carbohydrates. For higher N/C feed ratios an increased N/C ratio in the biomassresulted in a decreasing yield on glutamine (probably due to an increasing nitrogencontent and at the same time decreasing synthesis of storage carbohydrates). At evenhigher N/C feed ratios, when glucose became the only limiting substrate (and residualglutamine was present), the yield on glutamine YX/gln continued to decrease, possiblybecause glutamine was used as an additional energy and carbon source.
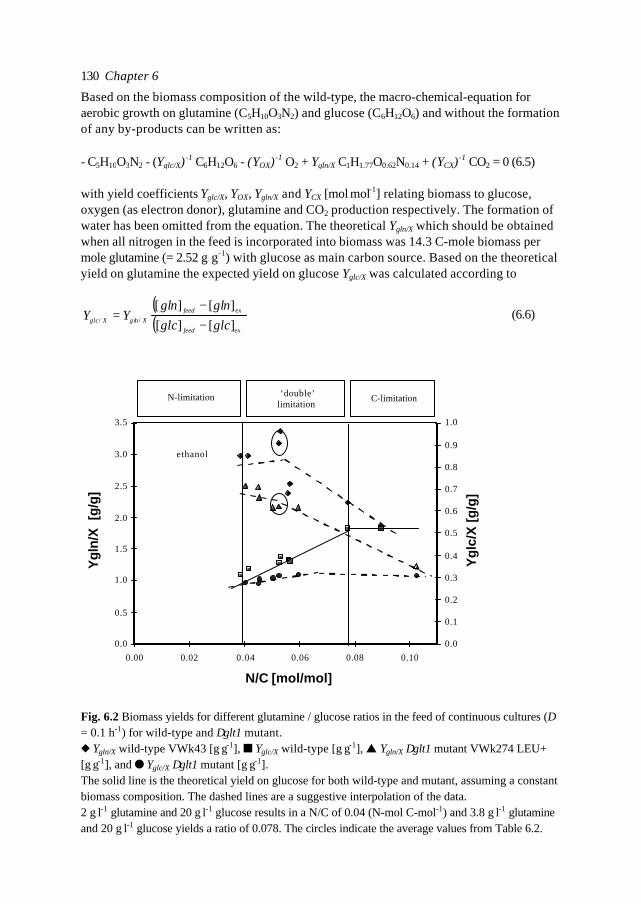
Chapter 6130
Based on the biomass composition of the wild-type, the macro-chemical-equation foraerobic growth on glutamine (C5H10O3N2) and glucose (C6H12O6) and without the formationof any by-products can be written as:
with yield coefficients Yglc/X, YOX, Ygln/X and YCX [mol⋅mol-1] relating biomass to glucose,oxygen (as electron donor), glutamine and CO2 production respectively. The formation ofwater has been omitted from the equation. The theoretical Ygln/X which should be obtainedwhen all nitrogen in the feed is incorporated into biomass was 14.3 C-mole biomass permole glutamine (= 2.52 g⋅g-1) with glucose as main carbon source. Based on the theoreticalyield on glutamine the expected yield on glucose Yglc/X was calculated according to
( )( )exfeed
exfeedXng lXglc glcglc
nglnglYY
][][][][
// −−
= (6.6)
- C5H10O3N2 - (Yglc/X)-1 C6H12O6 - (YOX)-1 O2 + Ygln/X C1H1.77O0.62N0.14 + (YCX)-1 CO2 = 0 (6.5)
0.0
0.5
1.0
1.5
2.0
2.5
3.0
3.5
0.00 0.02 0.04 0.06 0.08 0.10
Ygl
n/X
[g/
g]
0.0
0.1
0.2
0.3
0.4
0.5
0.6
0.7
0.8
0.9
1.0
Yg
lc/X
[g
/g]
ethanol
C-limitation N-limitation ‘double’limitation
N/C [mol/mol]
Fig. 6.2 Biomass yields for different glutamine / glucose ratios in the feed of continuous cultures (D= 0.1 h-1) for wild-type and ∆glt1 mutant.u Ygln/X wild-type VWk43 [g⋅g-1], n Yglc/X wild-type [g⋅g-1], s Ygln/X ∆glt1 mutant VWk274 LEU+[g⋅g-1], and l Yglc/X ∆glt1 mutant [g⋅g-1].The solid line is the theoretical yield on glucose for both wild-type and mutant, assuming a constantbiomass composition. The dashed lines are a suggestive interpolation of the data.2 g⋅l-1 glutamine and 20 g⋅l-1 glucose results in a N/C of 0.04 (N-mol⋅C-mol-1) and 3.8 g⋅l-1 glutamineand 20 g⋅l-1 glucose yields a ratio of 0.078. The circles indicate the average values from Table 6.2.
Physiology of GOGAT negative S. cerevisiae 131
This relation has been included in Fig. 6.2 (solid line). The theoretical yield was onlyslightly lower than the experimental values for the wild-type and the correlation wascorrect, which in fact was unexpected. As just discussed, the biomass was expected tochange with a changing N/C feed ratio. For the calculation of the theoretical yield aconstant biomass composition was assumed. Nevertheless it correlated well with theexperimental values. This could only be explained by assuming that during nitrogenlimitation the uncoupling fluxes were proportional to the excess glucose flux while thestorage carbohydrate synthesis fluxes and the varying biomass composition led to theoffset between theoretical and experimental yield values.In conclusion, purely glucose limiting conditions seemed to start at a nitrogen / carbonfeed ratio above approximately 0.08 when residual glutamine became detectable, inagreement with the expected value. Below ratios of approximately 0.06 N-mol⋅C-mol-1 theyield on glutamine was more constant, indicating that (mainly) the glutamine feedconcentration determined the biomass concentration in the fermenter. Below a N/C ofapproximately 0.04, growth was respiro-fermentative.A hypothesis to explain the ethanol formation at a certain limiting nitrogen level could bederived from the common explanation of respiro-fermentative growth in S. cerevisiae (theCrabtree effect). A limited capacity of the respiratory chain (reoxidising NADH whilegenerating ATP) is assumed. When the flux through glycolysis exceeds the capacity ofthe oxidative phosphorylation, then the excess of reduced equivalents is reoxidised byproducing ethanol (Sonnleiter and Käppeli, 1986). The growth rate at which the Crabtreeeffect becomes visible is called the critical growth rate µcrit. A decreasing nitrogen content
0.0
0.05
0.10
0.15
0.20
0.25
0.30
0.35
0.00 0.02 0.04 0.06 0.08 0.10
N/C [mol/mol]
µ cri
t [h
-1]
‘double’limitation
C-limitation N-limitation
respiro-fermentative growth(ethanol formation)
respiratory growth
Fig. 6.3 Hypothetical relation between nitrogen / carbon ratio in the feed and the critical growth rateµcrit for onset of respiro-fermentative growth. The dashed line indicates the profile of µcrit . The µcrit
in carbon limited cultures has been determined in accelerostat experiments.
Chapter 6132
of the cell for an increasing nitrogen limitation will reduce the levels of the nitrogencontaining macromolecules in the cell. Severe nitrogen limitation will affect the proteinmachinery of the cell, i.e. the amount of enzymes available. It can be hypothesised that inthis situation: 1) only most essential pathways are maintained and 2) the maximumcapacity of those pathways will decrease with a decreasing N/C feed ratio (until the cellsare starved). Therefore, also the capacity of the respiratory chain will decrease with adecreasing N/C feed ratio and this results in a decreasing µcrit. Based on the experimentalfindings it is suggested that for a N/C feed ratio of approximately 0.04 mol⋅mol-1, the criticalgrowth rate has been reduced to 0.1 h -1, which was the dilution rate of the continuousculture experiments. This hypothesis is visualised in Fig. 6.3. The shape of the curve ispurely speculative.
The different physiological windows for varying N/C feed ratios seem to be comparablefor the wild-type VWk43 and the ∆glt1 mutant VWk274 LEU+ (Fig. 6.1 and 6.2). However,in all the steady-states, the biomass yield of the ∆glt1 mutant was significantly lower thanof the wild-type. The theoretical yield on glucose has been calculated to be the same forthe mutant and the wild-type (Fig. 6.2). The lower experimental yield indicates that for themutant it is not correct to assume that no by-products were formed (Eq 6.5).In the second part of this chapter the dynamic responses of the glutamine limited wild-type and mutant cells to different nitrogen pulses will be investigated. For these pulseexperiments a nitrogen / carbon feed ratio of approximately 0.05 N-mol⋅C-mol-1 was aimedat (a combination of 20.0 g⋅l-1 and approximately 2.5 g⋅l-1 glutamine has been used), whichresulted in glutamine limited, completely oxidative growth. Although the actual feed ratioswere prone to (significant) variance, as mentioned before, the experiments based on aresembling feed ratio have been taken as replicate experiments. Average steady-state dataare shown in Table 6.2 and will be used as reference for further evaluation and discussion.In the reference steady-state the biomass yield of the ∆glt1 mutant was 25 % lower thanfor the wild-type (5.9 vs. 7.9 gl-1).
6.4.3 Biomass compositionAs already suggested by the biomass yields for the different nitrogen / carbon feed ratios,the nitrogen / carbon ratio in the biomass for a glutamine limited culture was lower than fora carbon limited culture. For the reference N/C feed ratio the biomass composition of wild-type VWK43 for glutamine limited, aerobic growth (D = 0.1 h-1) was C1H1.72O0.56N0.12
(resulting in a MW of 24.3 g ⋅C-mol-1). The nitrogen content was 9.3% lower than reportedfor carbon (glucose) single limitation at the same growth rate (Lange et al., 1999). Thebiomass composition of the ∆glt1 mutant VWk274 LEU+ under the same growthconditions was: C1H1.71O0.53N0.10 (MW = 23.6 g⋅C-mol-1). Compared to the glutamine limitedwild-type, the nitrogen content of the GOGAT mutant was 15.1% lower. With a decreasingnitrogen content, the degree of reduction of the biomass increased from 3.93 for theglucose limited grown wild-type to 4.24 and 4.35 for the glutamine limited grown wild-typeand ∆glt1 mutant respectively. The low biomass nitrogen content made the lowerexperimental biomass yields of the mutant for glutamine limitation (Fig. 6.1 and 6.2, Table6.2) even more striking. These results indicated that, while the nitrogen from the feed wascompletely consumed, a limited capacity of a certain pathway prevented completemetabolism of the nitrogen substrate. This bottleneck resulted in overflow metabolism and
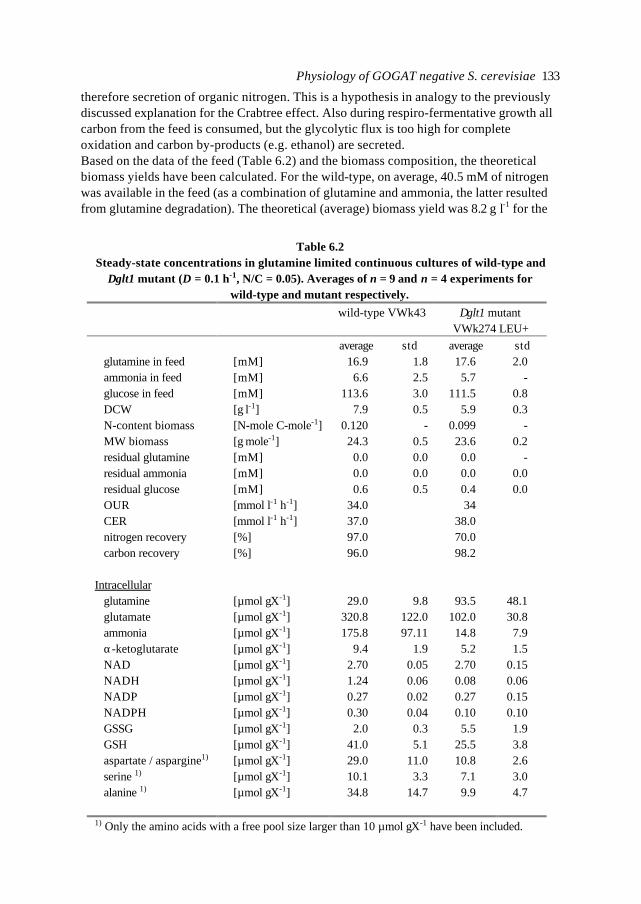
Physiology of GOGAT negative S. cerevisiae 133
therefore secretion of organic nitrogen. This is a hypothesis in analogy to the previouslydiscussed explanation for the Crabtree effect. Also during respiro-fermentative growth allcarbon from the feed is consumed, but the glycolytic flux is too high for completeoxidation and carbon by-products (e.g. ethanol) are secreted.Based on the data of the feed (Table 6.2) and the biomass composition, the theoreticalbiomass yields have been calculated. For the wild-type, on average, 40.5 mM of nitrogenwas available in the feed (as a combination of glutamine and ammonia, the latter resultedfrom glutamine degradation). The theoretical (average) biomass yield was 8.2 g⋅l-1 for the
Table 6.2Steady-state concentrations in glutamine limited continuous cultures of wild-type and
∆glt1 mutant (D = 0.1 h-1, N/C = 0.05). Averages of n = 9 and n = 4 experiments forwild-type and mutant respectively.
wild-type VWk43 ∆glt1 mutantVWk274 LEU+
average std average stdglutamine in feed [mM] 16.9 1.8 17.6 2.0ammonia in feed [mM] 6.6 2.5 5.7 -glucose in feed [mM] 113.6 3.0 111.5 0.8DCW [g⋅l-1] 7.9 0.5 5.9 0.3N-content biomass [N-mole⋅C-mole-1] 0.120 - 0.099 -MW biomass [g⋅mole-1] 24.3 0.5 23.6 0.2residual glutamine [mM] 0.0 0.0 0.0 -residual ammonia [mM] 0.0 0.0 0.0 0.0residual glucose [mM] 0.6 0.5 0.4 0.0OUR [mmol⋅l-1⋅h-1] 34.0 34CER [mmol⋅l-1⋅h-1] 37.0 38.0nitrogen recovery [%] 97.0 70.0carbon recovery [%] 96.0 98.2
Intracellularglutamine [µmol⋅gX-1] 29.0 9.8 93.5 48.1glutamate [µmol⋅gX-1] 320.8 122.0 102.0 30.8ammonia [µmol⋅gX-1] 175.8 97.11 14.8 7.9α-ketoglutarate [µmol⋅gX-1] 9.4 1.9 5.2 1.5NAD [µmol⋅gX-1] 2.70 0.05 2.70 0.15NADH [µmol⋅gX-1] 1.24 0.06 0.08 0.06NADP [µmol⋅gX-1] 0.27 0.02 0.27 0.15NADPH [µmol⋅gX-1] 0.30 0.04 0.10 0.10GSSG [µmol⋅gX-1] 2.0 0.3 5.5 1.9GSH [µmol⋅gX-1] 41.0 5.1 25.5 3.8aspartate / aspargine1) [µmol⋅gX-1] 29.0 11.0 10.8 2.6serine 1) [µmol⋅gX-1] 10.1 3.3 7.1 3.0alanine 1) [µmol⋅gX-1] 34.8 14.7 9.9 4.7
1) Only the amino acids with a free pool size larger than 10 µmol⋅gX-1 have been included.
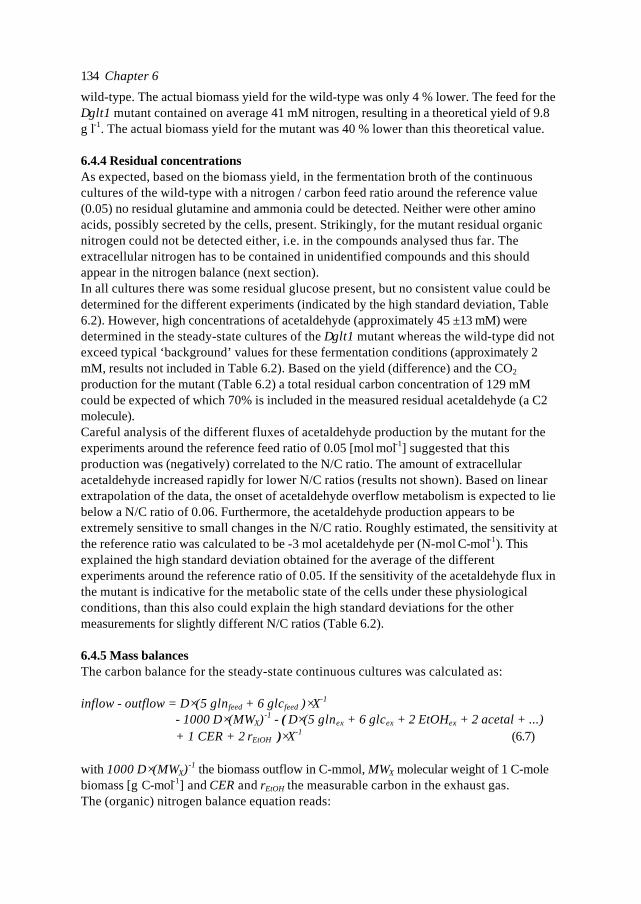
Chapter 6134
wild-type. The actual biomass yield for the wild-type was only 4 % lower. The feed for the∆glt1 mutant contained on average 41 mM nitrogen, resulting in a theoretical yield of 9.8g⋅l-1. The actual biomass yield for the mutant was 40 % lower than this theoretical value.
6.4.4 Residual concentrationsAs expected, based on the biomass yield, in the fermentation broth of the continuouscultures of the wild-type with a nitrogen / carbon feed ratio around the reference value(0.05) no residual glutamine and ammonia could be detected. Neither were other aminoacids, possibly secreted by the cells, present. Strikingly, for the mutant residual organicnitrogen could not be detected either, i.e. in the compounds analysed thus far. Theextracellular nitrogen has to be contained in unidentified compounds and this shouldappear in the nitrogen balance (next section).In all cultures there was some residual glucose present, but no consistent value could bedetermined for the different experiments (indicated by the high standard deviation, Table6.2). However, high concentrations of acetaldehyde (approximately 45 ±13 mM) weredetermined in the steady-state cultures of the ∆glt1 mutant whereas the wild-type did notexceed typical ‘background’ values for these fermentation conditions (approximately 2mM, results not included in Table 6.2). Based on the yield (difference) and the CO2
production for the mutant (Table 6.2) a total residual carbon concentration of 129 mMcould be expected of which 70% is included in the measured residual acetaldehyde (a C2molecule).Careful analysis of the different fluxes of acetaldehyde production by the mutant for theexperiments around the reference feed ratio of 0.05 [mol⋅mol-1] suggested that thisproduction was (negatively) correlated to the N/C ratio. The amount of extracellularacetaldehyde increased rapidly for lower N/C ratios (results not shown). Based on linearextrapolation of the data, the onset of acetaldehyde overflow metabolism is expected to liebelow a N/C ratio of 0.06. Furthermore, the acetaldehyde production appears to beextremely sensitive to small changes in the N/C ratio. Roughly estimated, the sensitivity atthe reference ratio was calculated to be -3 mol acetaldehyde per (N-mol⋅C-mol-1). Thisexplained the high standard deviation obtained for the average of the differentexperiments around the reference ratio of 0.05. If the sensitivity of the acetaldehyde flux inthe mutant is indicative for the metabolic state of the cells under these physiologicalconditions, than this also could explain the high standard deviations for the othermeasurements for slightly different N/C ratios (Table 6.2).
6.4.5 Mass balancesThe carbon balance for the steady-state continuous cultures was calculated as:
inflow - outflow = D⋅ (5 glnfeed + 6 glcfeed )⋅ X-1
- 1000 D⋅ (MWX)-1 - ( D⋅ (5 glnex + 6 glcex + 2 EtOHex + 2 acetal + ...)+ 1 CER + 2 rEtOH )⋅ X-1 (6.7)
with 1000 D⋅ (MWX)-1 the biomass outflow in C-mmol, MWX molecular weight of 1 C-molebiomass [g ⋅C-mol-1] and CER and rEtOH the measurable carbon in the exhaust gas.The (organic) nitrogen balance equation reads:
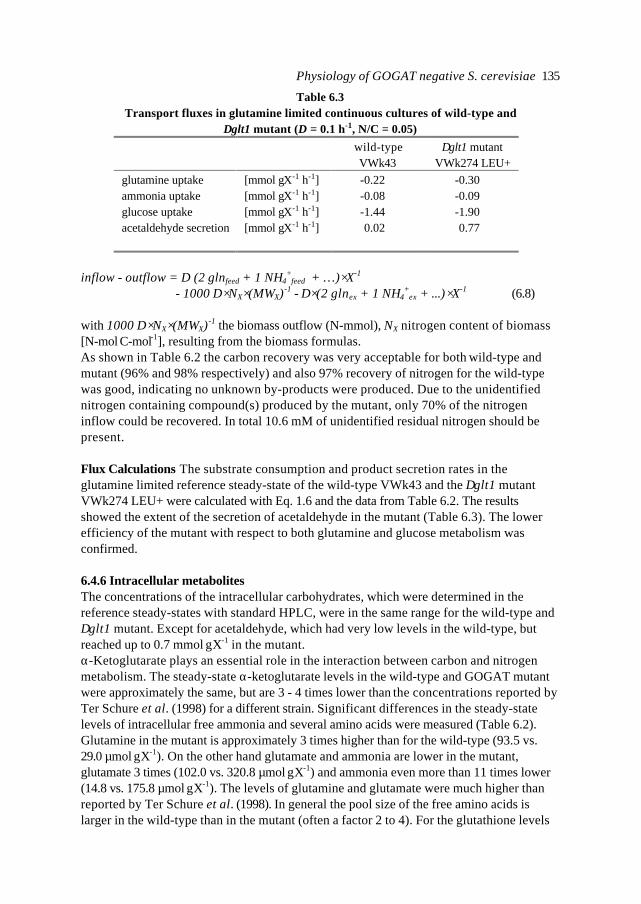
Physiology of GOGAT negative S. cerevisiae 135
inflow - outflow = D (2 glnfeed + 1 NH4+
feed + …)⋅ X-1
- 1000 D⋅ NX⋅ (MWX)-1 - D⋅ (2 glnex + 1 NH4+
ex + ...)⋅ X-1 (6.8)
with 1000 D⋅ NX⋅ (MWX)-1 the biomass outflow (N-mmol), NX nitrogen content of biomass[N-mol⋅C-mol-1], resulting from the biomass formulas.As shown in Table 6.2 the carbon recovery was very acceptable for both wild-type andmutant (96% and 98% respectively) and also 97% recovery of nitrogen for the wild-typewas good, indicating no unknown by-products were produced. Due to the unidentifiednitrogen containing compound(s) produced by the mutant, only 70% of the nitrogeninflow could be recovered. In total 10.6 mM of unidentified residual nitrogen should bepresent.
Flux Calculations The substrate consumption and product secretion rates in theglutamine limited reference steady-state of the wild-type VWk43 and the ∆glt1 mutantVWk274 LEU+ were calculated with Eq. 1.6 and the data from Table 6.2. The resultsshowed the extent of the secretion of acetaldehyde in the mutant (Table 6.3). The lowerefficiency of the mutant with respect to both glutamine and glucose metabolism wasconfirmed.
6.4.6 Intracellular metabolitesThe concentrations of the intracellular carbohydrates, which were determined in thereference steady-states with standard HPLC, were in the same range for the wild-type and∆glt1 mutant. Except for acetaldehyde, which had very low levels in the wild-type, butreached up to 0.7 mmol⋅gX-1 in the mutant.α-Ketoglutarate plays an essential role in the interaction between carbon and nitrogenmetabolism. The steady-state α-ketoglutarate levels in the wild-type and GOGAT mutantwere approximately the same, but are 3 - 4 times lower than the concentrations reported byTer Schure et al. (1998) for a different strain. Significant differences in the steady-statelevels of intracellular free ammonia and several amino acids were measured (Table 6.2).Glutamine in the mutant is approximately 3 times higher than for the wild-type (93.5 vs.29.0 µmol⋅gX-1). On the other hand glutamate and ammonia are lower in the mutant,glutamate 3 times (102.0 vs. 320.8 µmol⋅gX-1) and ammonia even more than 11 times lower(14.8 vs. 175.8 µmol⋅gX-1). The levels of glutamine and glutamate were much higher thanreported by Ter Schure et al. (1998). In general the pool size of the free amino acids islarger in the wild-type than in the mutant (often a factor 2 to 4). For the glutathione levels
Table 6.3Transport fluxes in glutamine limited continuous cultures of wild-type and
∆glt1 mutant (D = 0.1 h-1, N/C = 0.05)wild-typeVWk43
∆glt1 mutantVWk274 LEU+
glutamine uptake [mmol⋅gX-1⋅h-1] -0.22 -0.30ammonia uptake [mmol⋅gX-1⋅h-1] -0.08 -0.09glucose uptake [mmol⋅gX-1⋅h-1] -1.44 -1.90acetaldehyde secretion [mmol⋅gX-1⋅h-1] 0.02 0.77
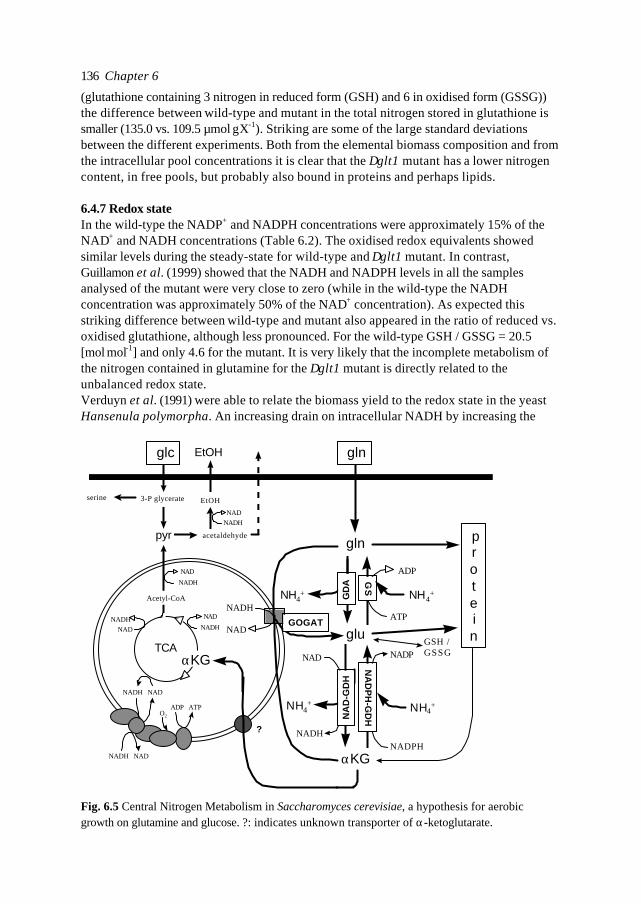
Chapter 6136
(glutathione containing 3 nitrogen in reduced form (GSH) and 6 in oxidised form (GSSG))the difference between wild-type and mutant in the total nitrogen stored in glutathione issmaller (135.0 vs. 109.5 µmol⋅gX-1). Striking are some of the large standard deviationsbetween the different experiments. Both from the elemental biomass composition and fromthe intracellular pool concentrations it is clear that the ∆glt1 mutant has a lower nitrogencontent, in free pools, but probably also bound in proteins and perhaps lipids.
6.4.7 Redox stateIn the wild-type the NADP+ and NADPH concentrations were approximately 15% of theNAD+ and NADH concentrations (Table 6.2). The oxidised redox equivalents showedsimilar levels during the steady-state for wild-type and ∆glt1 mutant. In contrast,Guillamon et al. (1999) showed that the NADH and NADPH levels in all the samplesanalysed of the mutant were very close to zero (while in the wild-type the NADHconcentration was approximately 50% of the NAD+ concentration). As expected thisstriking difference between wild-type and mutant also appeared in the ratio of reduced vs.oxidised glutathione, although less pronounced. For the wild-type GSH / GSSG = 20.5[mol⋅mol-1] and only 4.6 for the mutant. It is very likely that the incomplete metabolism ofthe nitrogen contained in glutamine for the ∆glt1 mutant is directly related to theunbalanced redox state.Verduyn et al. (1991) were able to relate the biomass yield to the redox state in the yeastHansenula polymorpha. An increasing drain on intracellular NADH by increasing the
NH4+
NH4+
gln
glu
gln
NH4+
TCA
glc
αKG
ATP
ADP
NAD
NADH
protein
NADH
NAD
pyr
αKGGSH /GSSG
EtOH
acetaldehyde
EtOH
NADH
NADNADHNAD
NAD
NADH
NADH NAD
NADHNAD
GS
GD
A
GOGAT
NA
D-G
DH
NADPH
NADP
NA
DP
H-G
DH
Acetyl-CoA
3-P glycerateserine
NADH NAD
ADP ATPO2
NH4+
?
Fig. 6.5 Central Nitrogen Metabolism in Saccharomyces cerevisiae, a hypothesis for aerobicgrowth on glutamine and glucose. ?: indicates unknown transporter of α-ketoglutarate.
Physiology of GOGAT negative S. cerevisiae 137
exogenous flux of H2O2 resulted in decreased biomass yields for a catalase negativemutant growing on hydrogen peroxide / glucose mixtures. The destruction process ofH2O2 requires reduction equivalents which must be provided by the respiratory chain(H2O2 partly replaced oxygen as electron acceptor). Extra energy is required for the higherrate of reoxidation and the extra ATP is obtained from glucose metabolism, resulting in alower biomass yield.The almost undetectable NADH pool explains why the ∆glt1 mutant cells secreteacetaldehyde (toxic for the cell) as overflow metabolite instead of ethanol. The AlcoholDeHydrogenase enzyme (present both in cytosol and mitochondria) cannot oxidiseacetaldehyde to produce ethanol. The lack of reduced equivalents suggests the presenceof either an extra drain for NADH and NADPH or the lack of an important supplycompared to the wild-type. This is remarkable because, based on the genetic differencebetween wild-type and mutant, there is no NADH consumption in the CNM of the mutant,whereas in the wild-type the reaction catalysed by GOGAT needs NADH as cofactor.1) As suggested in Chapter 5, it cannot be excluded that glutaminase activity results fromcycles of synthesis and degradation of amino acids derived from glutamine and degradedto glutamate. An option would be to assume that these reactions also require reducedequivalents and are less efficient than GOGAT. No data on possible cofactors ofglutaminase activity have been reported so far. Of the possibilities mentioned in Chapter5, alanine and asparagine synthesis are redox neutral, formation of arginine andtrypophane indeed need NADPH, but histidine synthesis yields NADH (Table 5.3). Thisconsideration does not support the hypothesis of the need of reduced cofactors forglutaminase activity.Another more complex hypothesis is captured in Fig. 6.5. Flux Analysis for growth onglutamine as nitrogen source showed a net flux of α-ketoglutarate from CNM to the TCA-cycle due to the α-ketoglutarate released by the synthesis of many amino acids withglutamate as nitrogen donor (Van Riel et al., 1998, 2000). Strikingly, a transporter in themitochondrial membranes for α-ketoglutarate is not known (to our knowledge). The influxof α-ketoglutarate may lower the activity of the TCA-cycle or even partly reverse the flux.As a result the TCA-cycle needs less pyruvate and in a more extreme case the cycle couldproduce pyruvate or secrete α-ketoglutarate and other cycle intermediates as reported byAlbers et al. (1996) for (anaerobic batch) growth on glutamate. As typical for yeast, thisdifferent flux towards the TCA-cycle does not result in a feedback regulation lowering therate of glycolysis or glucose uptake. Carbohydrates tend to accumulate at the level ofpyruvate, but can be decarboxylated by Pyruvate DeCarboxylase, yielding acetaldehyde,which normally is oxidised to ethanol to be secreted. However, the changed fluxesthrough the TCA-cycle directly influence the redox state. Less NADH is produced andthere might even be a net consumption. When there are not enough reducing equivalents,then ethanol cannot be formed and again acetaldehyde is secreted. That a lower orpossibly reversed activity of the TCA-cycle during growth on amino acids reduces theformation of NADH was supported by the lower glycerol production reported by Alberset al. (1996). A positive role of GOGAT could be suggested in restoring the redox balance.2) An option which cannot be excluded is that in vivo the reaction catalysed by GOGAToperates in the opposite direction from what has been described (and is based on in vitrostudies of the enzyme). Then NADH is produced under glutamate degradation. Forgrowth on glutamine, this means the glutaminases and NADPH-GDH have to carry an
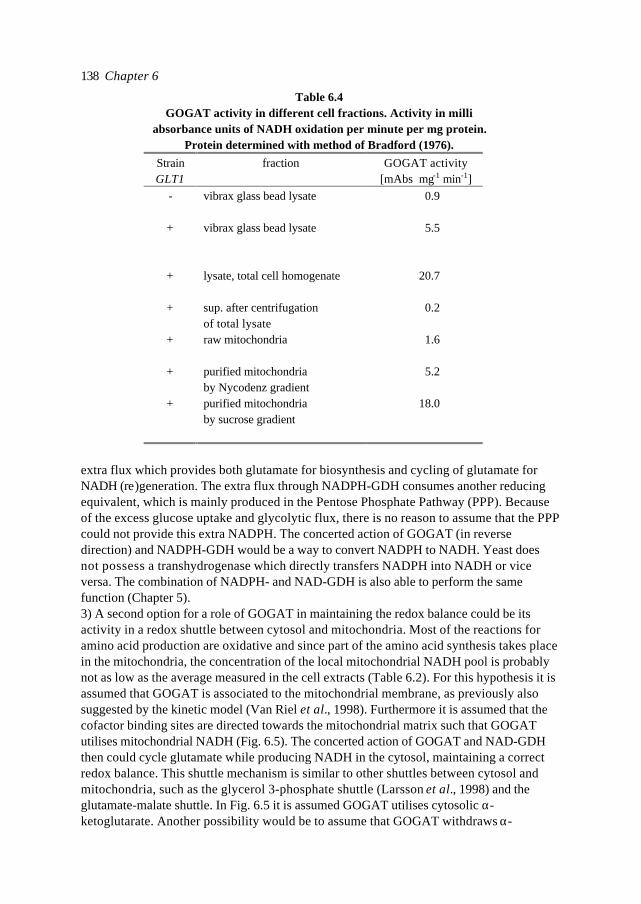
Chapter 6138
extra flux which provides both glutamate for biosynthesis and cycling of glutamate forNADH (re)generation. The extra flux through NADPH-GDH consumes another reducingequivalent, which is mainly produced in the Pentose Phosphate Pathway (PPP). Becauseof the excess glucose uptake and glycolytic flux, there is no reason to assume that the PPPcould not provide this extra NADPH. The concerted action of GOGAT (in reversedirection) and NADPH-GDH would be a way to convert NADPH to NADH. Yeast doesnot possess a transhydrogenase which directly transfers NADPH into NADH or viceversa. The combination of NADPH- and NAD-GDH is also able to perform the samefunction (Chapter 5).3) A second option for a role of GOGAT in maintaining the redox balance could be itsactivity in a redox shuttle between cytosol and mitochondria. Most of the reactions foramino acid production are oxidative and since part of the amino acid synthesis takes placein the mitochondria, the concentration of the local mitochondrial NADH pool is probablynot as low as the average measured in the cell extracts (Table 6.2). For this hypothesis it isassumed that GOGAT is associated to the mitochondrial membrane, as previously alsosuggested by the kinetic model (Van Riel et al., 1998). Furthermore it is assumed that thecofactor binding sites are directed towards the mitochondrial matrix such that GOGATutilises mitochondrial NADH (Fig. 6.5). The concerted action of GOGAT and NAD-GDHthen could cycle glutamate while producing NADH in the cytosol, maintaining a correctredox balance. This shuttle mechanism is similar to other shuttles between cytosol andmitochondria, such as the glycerol 3-phosphate shuttle (Larsson et al., 1998) and theglutamate-malate shuttle. In Fig. 6.5 it is assumed GOGAT utilises cytosolic α-ketoglutarate. Another possibility would be to assume that GOGAT withdraws α-
Table 6.4GOGAT activity in different cell fractions. Activity in milli
absorbance units of NADH oxidation per minute per mg protein.Protein determined with method of Bradford (1976).
StrainGLT1
fraction GOGAT activity[mAbs ⋅mg-1⋅min-1]
- vibrax glass bead lysate 0.9
+ vibrax glass bead lysate 5.5
+ lysate, total cell homogenate 20.7
+ sup. after centrifugationof total lysate
0.2
+ raw mitochondria 1.6
+ purified mitochondriaby Nycodenz gradient
5.2
+ purified mitochondriaby sucrose gradient
18.0
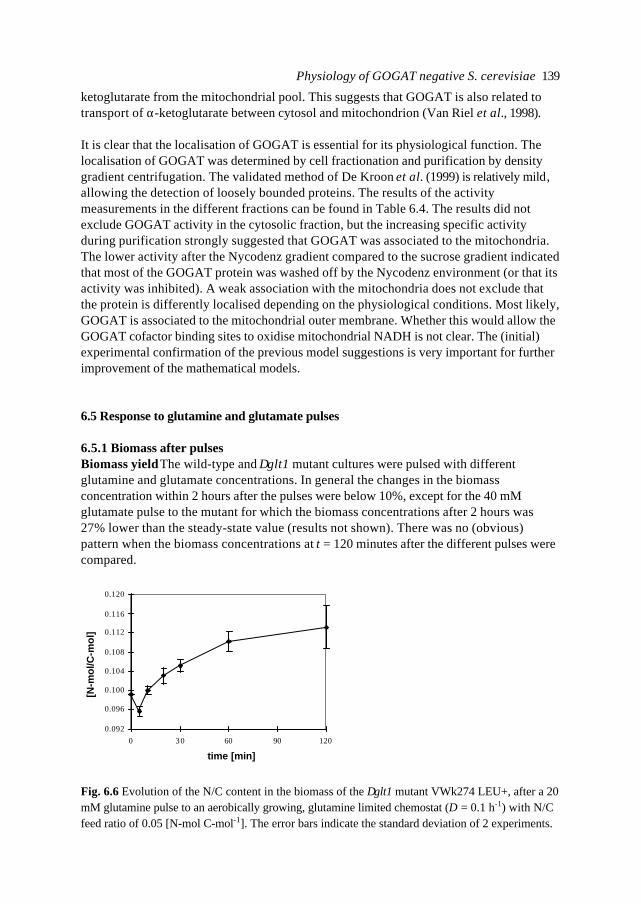
Physiology of GOGAT negative S. cerevisiae 139
ketoglutarate from the mitochondrial pool. This suggests that GOGAT is also related totransport of α-ketoglutarate between cytosol and mitochondrion (Van Riel et al., 1998).
It is clear that the localisation of GOGAT is essential for its physiological function. Thelocalisation of GOGAT was determined by cell fractionation and purification by densitygradient centrifugation. The validated method of De Kroon et al. (1999) is relatively mild,allowing the detection of loosely bounded proteins. The results of the activitymeasurements in the different fractions can be found in Table 6.4. The results did notexclude GOGAT activity in the cytosolic fraction, but the increasing specific activityduring purification strongly suggested that GOGAT was associated to the mitochondria.The lower activity after the Nycodenz gradient compared to the sucrose gradient indicatedthat most of the GOGAT protein was washed off by the Nycodenz environment (or that itsactivity was inhibited). A weak association with the mitochondria does not exclude thatthe protein is differently localised depending on the physiological conditions. Most likely,GOGAT is associated to the mitochondrial outer membrane. Whether this would allow theGOGAT cofactor binding sites to oxidise mitochondrial NADH is not clear. The (initial)experimental confirmation of the previous model suggestions is very important for furtherimprovement of the mathematical models.
6.5 Response to glutamine and glutamate pulses
6.5.1 Biomass after pulsesBiomass yield The wild-type and ∆glt1 mutant cultures were pulsed with differentglutamine and glutamate concentrations. In general the changes in the biomassconcentration within 2 hours after the pulses were below 10%, except for the 40 mMglutamate pulse to the mutant for which the biomass concentrations after 2 hours was27% lower than the steady-state value (results not shown). There was no (obvious)pattern when the biomass concentrations at t = 120 minutes after the different pulses werecompared.
0.092
0.096
0.100
0.104
0.108
0.112
0.116
0.120
0 30 60 90 120
time [min]
[N-m
ol/C
-mol
]
Fig. 6.6 Evolution of the N/C content in the biomass of the ∆glt1 mutant VWk274 LEU+, after a 20mM glutamine pulse to an aerobically growing, glutamine limited chemostat (D = 0.1 h-1) with N/Cfeed ratio of 0.05 [N-mol⋅C-mol-1]. The error bars indicate the standard deviation of 2 experiments.
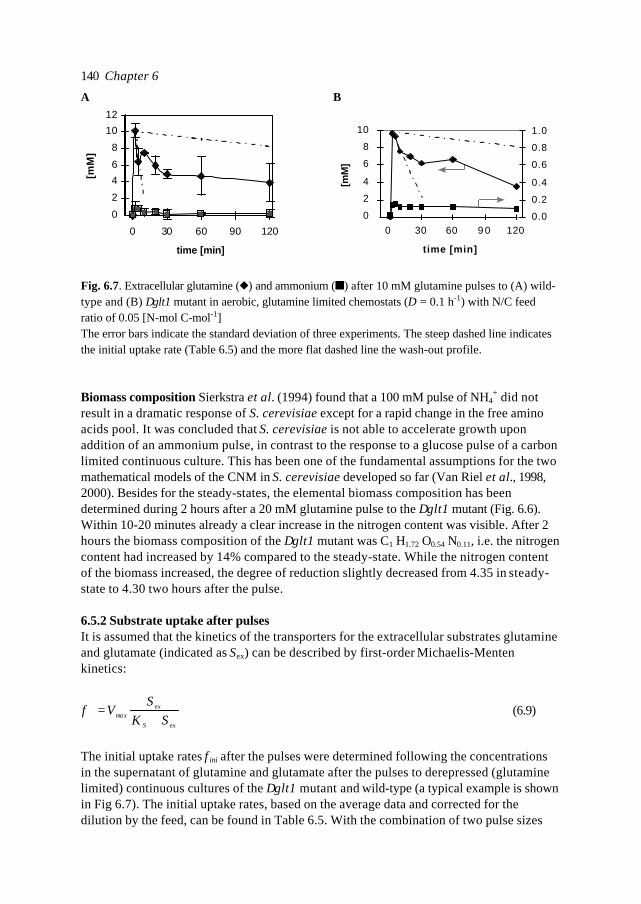
Chapter 6140
Biomass composition Sierkstra et al. (1994) found that a 100 mM pulse of NH4+ did not
result in a dramatic response of S. cerevisiae except for a rapid change in the free aminoacids pool. It was concluded that S. cerevisiae is not able to accelerate growth uponaddition of an ammonium pulse, in contrast to the response to a glucose pulse of a carbonlimited continuous culture. This has been one of the fundamental assumptions for the twomathematical models of the CNM in S. cerevisiae developed so far (Van Riel et al., 1998,2000). Besides for the steady-states, the elemental biomass composition has beendetermined during 2 hours after a 20 mM glutamine pulse to the ∆glt1 mutant (Fig. 6.6).Within 10-20 minutes already a clear increase in the nitrogen content was visible. After 2hours the biomass composition of the ∆glt1 mutant was C1 H1.72 O0.54 N0.11, i.e. the nitrogencontent had increased by 14% compared to the steady-state. While the nitrogen contentof the biomass increased, the degree of reduction slightly decreased from 4.35 in steady-state to 4.30 two hours after the pulse.
6.5.2 Substrate uptake after pulsesIt is assumed that the kinetics of the transporters for the extracellular substrates glutamineand glutamate (indicated as Sex) can be described by first-order Michaelis-Mentenkinetics:
exS
exa xm SK
SV
+=φ (6.9)
The initial uptake rates φini after the pulses were determined following the concentrationsin the supernatant of glutamine and glutamate after the pulses to derepressed (glutaminelimited) continuous cultures of the ∆glt1 mutant and wild-type (a typical example is shownin Fig 6.7). The initial uptake rates, based on the average data and corrected for thedilution by the feed, can be found in Table 6.5. With the combination of two pulse sizes
A
0
2
4
6
8
10
12
0 30 60 90 120
time [min]
[mM
]B
0
2
4
6
8
10
0 30 60 9 0 120
time [min]
[mM
]
0.0
0.2
0.4
0.6
0.8
1.0
Fig. 6.7. Extracellular glutamine (u) and ammonium (n) after 10 mM glutamine pulses to (A) wild-type and (B) ∆glt1 mutant in aerobic, glutamine limited chemostats (D = 0.1 h-1) with N/C feedratio of 0.05 [N-mol⋅C-mol-1]The error bars indicate the standard deviation of three experiments. The steep dashed line indicatesthe initial uptake rate (Table 6.5) and the more flat dashed line the wash-out profile.
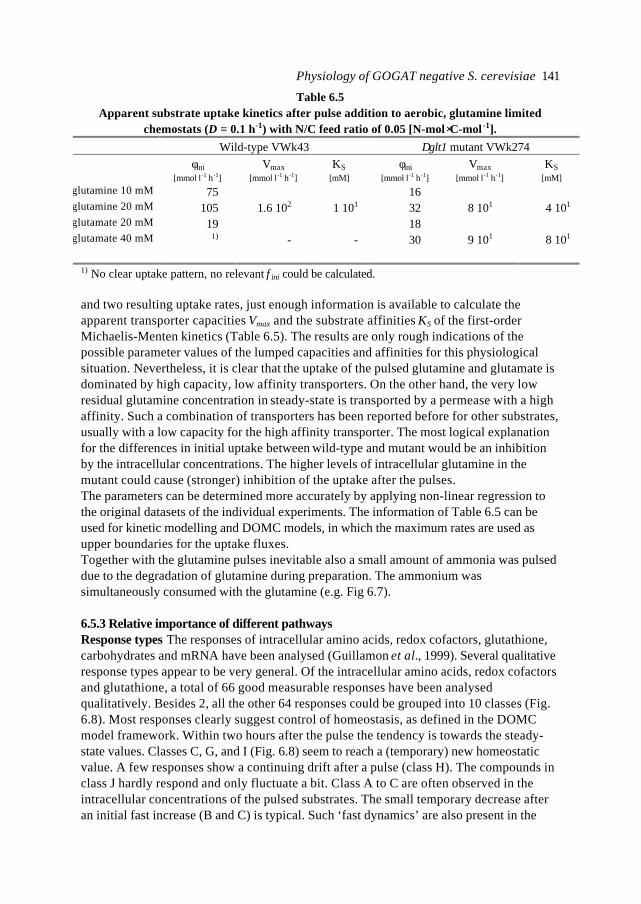
Physiology of GOGAT negative S. cerevisiae 141
and two resulting uptake rates, just enough information is available to calculate theapparent transporter capacities Vmax and the substrate affinities KS of the first-orderMichaelis-Menten kinetics (Table 6.5). The results are only rough indications of thepossible parameter values of the lumped capacities and affinities for this physiologicalsituation. Nevertheless, it is clear that the uptake of the pulsed glutamine and glutamate isdominated by high capacity, low affinity transporters. On the other hand, the very lowresidual glutamine concentration in steady-state is transported by a permease with a highaffinity. Such a combination of transporters has been reported before for other substrates,usually with a low capacity for the high affinity transporter. The most logical explanationfor the differences in initial uptake between wild-type and mutant would be an inhibitionby the intracellular concentrations. The higher levels of intracellular glutamine in themutant could cause (stronger) inhibition of the uptake after the pulses.The parameters can be determined more accurately by applying non-linear regression tothe original datasets of the individual experiments. The information of Table 6.5 can beused for kinetic modelling and DOMC models, in which the maximum rates are used asupper boundaries for the uptake fluxes.Together with the glutamine pulses inevitable also a small amount of ammonia was pulseddue to the degradation of glutamine during preparation. The ammonium wassimultaneously consumed with the glutamine (e.g. Fig 6.7).
6.5.3 Relative importance of different pathwaysResponse types The responses of intracellular amino acids, redox cofactors, glutathione,carbohydrates and mRNA have been analysed (Guillamon et al., 1999). Several qualitativeresponse types appear to be very general. Of the intracellular amino acids, redox cofactorsand glutathione, a total of 66 good measurable responses have been analysedqualitatively. Besides 2, all the other 64 responses could be grouped into 10 classes (Fig.6.8). Most responses clearly suggest control of homeostasis, as defined in the DOMCmodel framework. Within two hours after the pulse the tendency is towards the steady-state values. Classes C, G, and I (Fig. 6.8) seem to reach a (temporary) new homeostaticvalue. A few responses show a continuing drift after a pulse (class H). The compounds inclass J hardly respond and only fluctuate a bit. Class A to C are often observed in theintracellular concentrations of the pulsed substrates. The small temporary decrease afteran initial fast increase (B and C) is typical. Such ‘fast dynamics’ are also present in the
Table 6.5Apparent substrate uptake kinetics after pulse addition to aerobic, glutamine limited
chemostats (D = 0.1 h-1) with N/C feed ratio of 0.05 [N-mol ⋅C-mol -1].Wild-type VWk43 ∆glt1 mutant VWk274
φini[mmol⋅l-1⋅h-1]
Vmax[mmol⋅l-1⋅h-1]
KS[mM]
φini[mmol⋅l-1⋅h-1]
Vmax[mmol⋅l-1⋅h-1]
KS[mM]
glutamine 10 mM 75 16glutamine 20 mM 105 1.6⋅102 1⋅101 32 8⋅101 4⋅101
glutamate 20 mM 19 18glutamate 40 mM 1) - - 30 9⋅101 8⋅101
1) No clear uptake pattern, no relevant φini could be calculated.
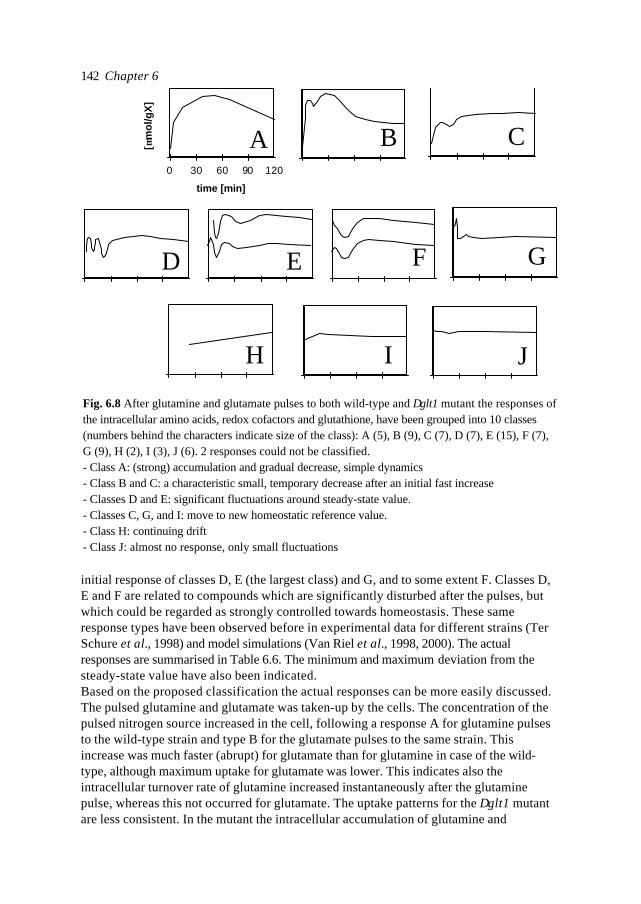
Chapter 6142
initial response of classes D, E (the largest class) and G, and to some extent F. Classes D,E and F are related to compounds which are significantly disturbed after the pulses, butwhich could be regarded as strongly controlled towards homeostasis. These sameresponse types have been observed before in experimental data for different strains (TerSchure et al., 1998) and model simulations (Van Riel et al., 1998, 2000). The actualresponses are summarised in Table 6.6. The minimum and maximum deviation from thesteady-state value have also been indicated.Based on the proposed classification the actual responses can be more easily discussed.The pulsed glutamine and glutamate was taken-up by the cells. The concentration of thepulsed nitrogen source increased in the cell, following a response A for glutamine pulsesto the wild-type strain and type B for the glutamate pulses to the same strain. Thisincrease was much faster (abrupt) for glutamate than for glutamine in case of the wild-type, although maximum uptake for glutamate was lower. This indicates also theintracellular turnover rate of glutamine increased instantaneously after the glutaminepulse, whereas this not occurred for glutamate. The uptake patterns for the ∆glt1 mutantare less consistent. In the mutant the intracellular accumulation of glutamine and
0 30 60 90 120
time [min]
[µm
ol/g
X]
A B C
D E F G
H I J
Fig. 6.8 After glutamine and glutamate pulses to both wild-type and ∆glt1 mutant the responses ofthe intracellular amino acids, redox cofactors and glutathione, have been grouped into 10 classes(numbers behind the characters indicate size of the class): A (5), B (9), C (7), D (7), E (15), F (7),G (9), H (2), I (3), J (6). 2 responses could not be classified.- Class A: (strong) accumulation and gradual decrease, simple dynamics- Class B and C: a characteristic small, temporary decrease after an initial fast increase- Classes D and E: significant fluctuations around steady-state value.- Classes C, G, and I: move to new homeostatic reference value.- Class H: continuing drift- Class J: almost no response, only small fluctuations
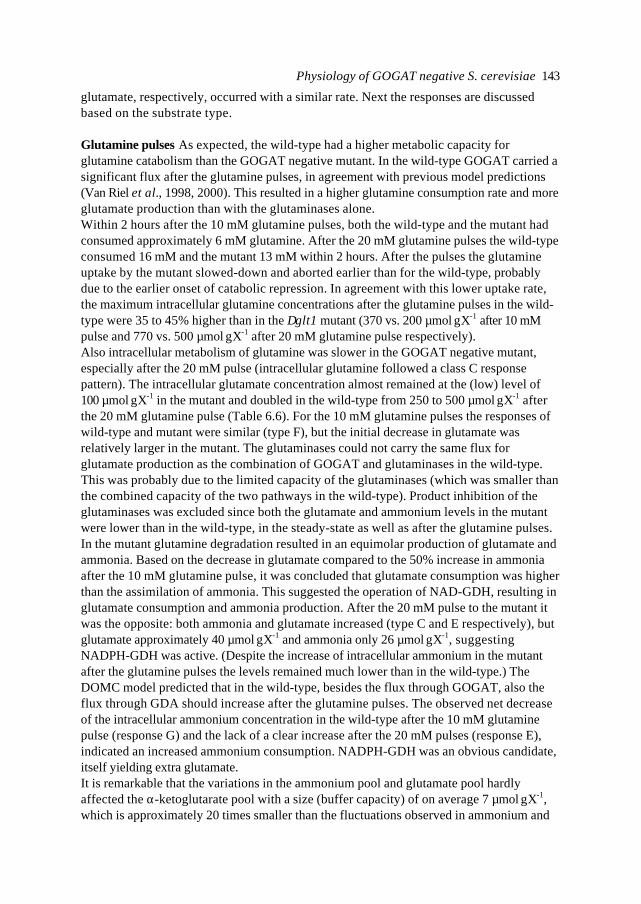
Physiology of GOGAT negative S. cerevisiae 143
glutamate, respectively, occurred with a similar rate. Next the responses are discussedbased on the substrate type.
Glutamine pulses As expected, the wild-type had a higher metabolic capacity forglutamine catabolism than the GOGAT negative mutant. In the wild-type GOGAT carried asignificant flux after the glutamine pulses, in agreement with previous model predictions(Van Riel et al., 1998, 2000). This resulted in a higher glutamine consumption rate and moreglutamate production than with the glutaminases alone.Within 2 hours after the 10 mM glutamine pulses, both the wild-type and the mutant hadconsumed approximately 6 mM glutamine. After the 20 mM glutamine pulses the wild-typeconsumed 16 mM and the mutant 13 mM within 2 hours. After the pulses the glutamineuptake by the mutant slowed-down and aborted earlier than for the wild-type, probablydue to the earlier onset of catabolic repression. In agreement with this lower uptake rate,the maximum intracellular glutamine concentrations after the glutamine pulses in the wild-type were 35 to 45% higher than in the ∆glt1 mutant (370 vs. 200 µmol⋅gX-1 after 10 mMpulse and 770 vs. 500 µmol⋅gX-1 after 20 mM glutamine pulse respectively).Also intracellular metabolism of glutamine was slower in the GOGAT negative mutant,especially after the 20 mM pulse (intracellular glutamine followed a class C responsepattern). The intracellular glutamate concentration almost remained at the (low) level of100 µmol⋅gX-1 in the mutant and doubled in the wild-type from 250 to 500 µmol⋅gX-1 afterthe 20 mM glutamine pulse (Table 6.6). For the 10 mM glutamine pulses the responses ofwild-type and mutant were similar (type F), but the initial decrease in glutamate wasrelatively larger in the mutant. The glutaminases could not carry the same flux forglutamate production as the combination of GOGAT and glutaminases in the wild-type.This was probably due to the limited capacity of the glutaminases (which was smaller thanthe combined capacity of the two pathways in the wild-type). Product inhibition of theglutaminases was excluded since both the glutamate and ammonium levels in the mutantwere lower than in the wild-type, in the steady-state as well as after the glutamine pulses.In the mutant glutamine degradation resulted in an equimolar production of glutamate andammonia. Based on the decrease in glutamate compared to the 50% increase in ammoniaafter the 10 mM glutamine pulse, it was concluded that glutamate consumption was higherthan the assimilation of ammonia. This suggested the operation of NAD-GDH, resulting inglutamate consumption and ammonia production. After the 20 mM pulse to the mutant itwas the opposite: both ammonia and glutamate increased (type C and E respectively), butglutamate approximately 40 µmol⋅gX-1 and ammonia only 26 µmol⋅gX-1, suggestingNADPH-GDH was active. (Despite the increase of intracellular ammonium in the mutantafter the glutamine pulses the levels remained much lower than in the wild-type.) TheDOMC model predicted that in the wild-type, besides the flux through GOGAT, also theflux through GDA should increase after the glutamine pulses. The observed net decreaseof the intracellular ammonium concentration in the wild-type after the 10 mM glutaminepulse (response G) and the lack of a clear increase after the 20 mM pulses (response E),indicated an increased ammonium consumption. NADPH-GDH was an obvious candidate,itself yielding extra glutamate.It is remarkable that the variations in the ammonium pool and glutamate pool hardlyaffected the α-ketoglutarate pool with a size (buffer capacity) of on average 7 µmol⋅gX-1,which is approximately 20 times smaller than the fluctuations observed in ammonium and
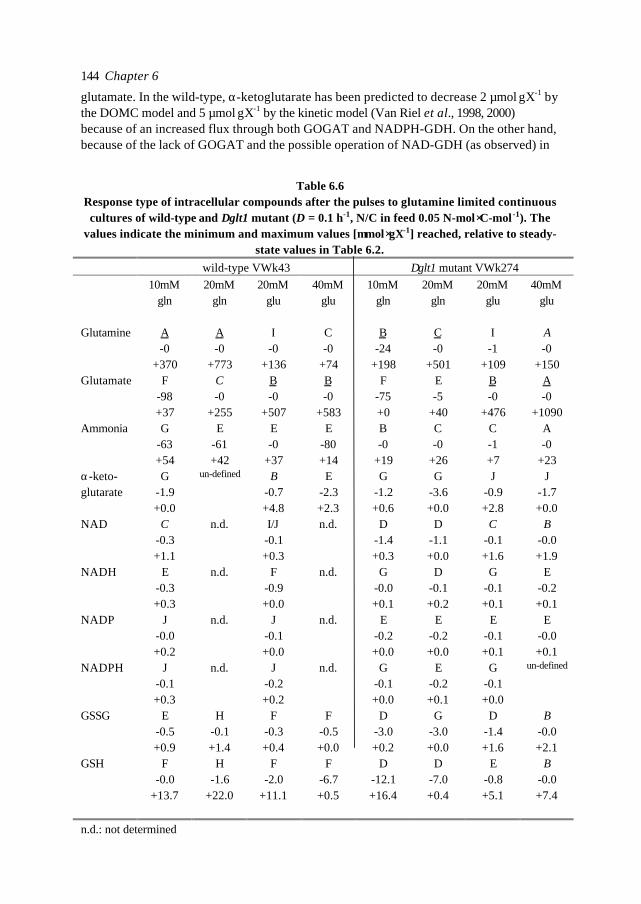
Chapter 6144
glutamate. In the wild-type, α-ketoglutarate has been predicted to decrease 2 µmol⋅gX-1 bythe DOMC model and 5 µmol⋅gX-1 by the kinetic model (Van Riel et al., 1998, 2000)because of an increased flux through both GOGAT and NADPH-GDH. On the other hand,because of the lack of GOGAT and the possible operation of NAD-GDH (as observed) in
Table 6.6Response type of intracellular compounds after the pulses to glutamine limited continuouscultures of wild-type and ∆glt1 mutant (D = 0.1 h-1, N/C in feed 0.05 N-mol⋅C-mol -1). The
values indicate the minimum and maximum values [µmol⋅gX-1] reached, relative to steady-state values in Table 6.2.
wild-type VWk43 ∆glt1 mutant VWk27410mM
gln20mM
gln20mM
glu40mM
glu10mM
gln20mM
gln20mM
glu40mM
glu
Glutamine A-0
+370
A-0
+773
I-0
+136
C-0
+74
B-24
+198
C-0
+501
I-1
+109
A-0
+150Glutamate F
-98+37
C-0
+255
B-0
+507
B-0
+583
F-75+0
E-5
+40
B-0
+476
A-0
+1090Ammonia G
-63+54
E-61+42
E-0
+37
E-80+14
B-0
+19
C-0
+26
C-1+7
A-0
+23α-keto-glutarate
G-1.9+0.0
un-defined B-0.7+4.8
E-2.3+2.3
G-1.2+0.6
G-3.6+0.0
J-0.9+2.8
J-1.7+0.0
NAD C-0.3+1.1
n.d. I/J-0.1+0.3
n.d. D-1.4+0.3
D-1.1+0.0
C-0.1+1.6
B-0.0+1.9
NADH E-0.3+0.3
n.d. F-0.9+0.0
n.d. G-0.0+0.1
D-0.1+0.2
G-0.1+0.1
E-0.2+0.1
NADP J-0.0+0.2
n.d. J-0.1+0.0
n.d. E-0.2+0.0
E-0.2+0.0
E-0.1+0.1
E-0.0+0.1
NADPH J-0.1+0.3
n.d. J-0.2+0.2
n.d. G-0.1+0.0
E-0.2+0.1
G-0.1+0.0
un-defined
GSSG E-0.5+0.9
H-0.1+1.4
F-0.3+0.4
F-0.5+0.0
D-3.0+0.2
G-3.0+0.0
D-1.4+1.6
B-0.0+2.1
GSH F-0.0
+13.7
H-1.6
+22.0
F-2.0
+11.1
F-6.7+0.5
D-12.1+16.4
D-7.0+0.4
E-0.8+5.1
B-0.0+7.4
n.d.: not determined
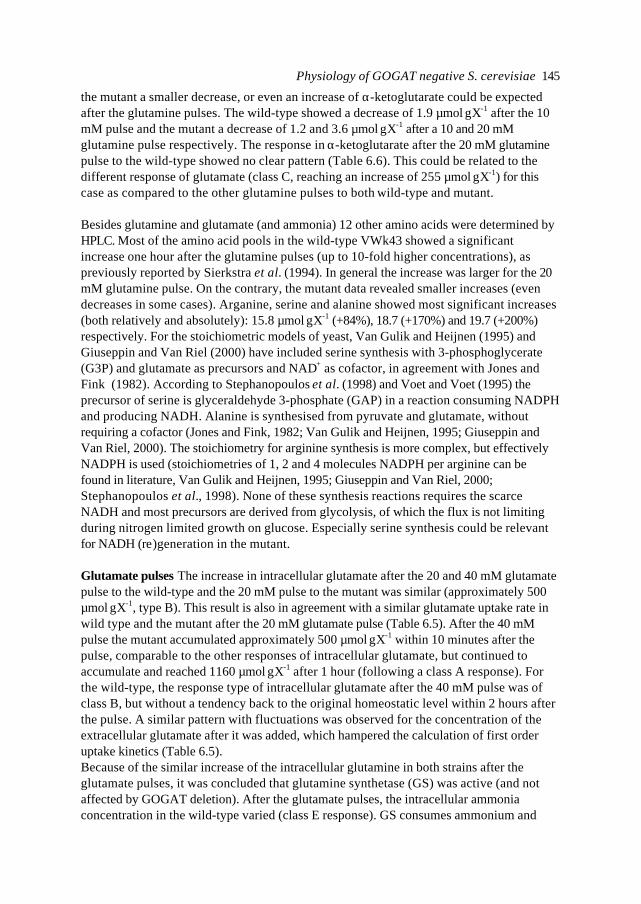
Physiology of GOGAT negative S. cerevisiae 145
the mutant a smaller decrease, or even an increase of α-ketoglutarate could be expectedafter the glutamine pulses. The wild-type showed a decrease of 1.9 µmol⋅gX-1 after the 10mM pulse and the mutant a decrease of 1.2 and 3.6 µmol⋅gX-1 after a 10 and 20 mMglutamine pulse respectively. The response in α-ketoglutarate after the 20 mM glutaminepulse to the wild-type showed no clear pattern (Table 6.6). This could be related to thedifferent response of glutamate (class C, reaching an increase of 255 µmol⋅gX-1) for thiscase as compared to the other glutamine pulses to both wild-type and mutant.
Besides glutamine and glutamate (and ammonia) 12 other amino acids were determined byHPLC. Most of the amino acid pools in the wild-type VWk43 showed a significantincrease one hour after the glutamine pulses (up to 10-fold higher concentrations), aspreviously reported by Sierkstra et al. (1994). In general the increase was larger for the 20mM glutamine pulse. On the contrary, the mutant data revealed smaller increases (evendecreases in some cases). Arganine, serine and alanine showed most significant increases(both relatively and absolutely): 15.8 µmol⋅gX-1 (+84%), 18.7 (+170%) and 19.7 (+200%)respectively. For the stoichiometric models of yeast, Van Gulik and Heijnen (1995) andGiuseppin and Van Riel (2000) have included serine synthesis with 3-phosphoglycerate(G3P) and glutamate as precursors and NAD+ as cofactor, in agreement with Jones andFink (1982). According to Stephanopoulos et al. (1998) and Voet and Voet (1995) theprecursor of serine is glyceraldehyde 3-phosphate (GAP) in a reaction consuming NADPHand producing NADH. Alanine is synthesised from pyruvate and glutamate, withoutrequiring a cofactor (Jones and Fink, 1982; Van Gulik and Heijnen, 1995; Giuseppin andVan Riel, 2000). The stoichiometry for arginine synthesis is more complex, but effectivelyNADPH is used (stoichiometries of 1, 2 and 4 molecules NADPH per arginine can befound in literature, Van Gulik and Heijnen, 1995; Giuseppin and Van Riel, 2000;Stephanopoulos et al., 1998). None of these synthesis reactions requires the scarceNADH and most precursors are derived from glycolysis, of which the flux is not limitingduring nitrogen limited growth on glucose. Especially serine synthesis could be relevantfor NADH (re)generation in the mutant.
Glutamate pulses The increase in intracellular glutamate after the 20 and 40 mM glutamatepulse to the wild-type and the 20 mM pulse to the mutant was similar (approximately 500µmol⋅gX-1, type B). This result is also in agreement with a similar glutamate uptake rate inwild type and the mutant after the 20 mM glutamate pulse (Table 6.5). After the 40 mMpulse the mutant accumulated approximately 500 µmol⋅gX-1 within 10 minutes after thepulse, comparable to the other responses of intracellular glutamate, but continued toaccumulate and reached 1160 µmol⋅gX-1 after 1 hour (following a class A response). Forthe wild-type, the response type of intracellular glutamate after the 40 mM pulse was ofclass B, but without a tendency back to the original homeostatic level within 2 hours afterthe pulse. A similar pattern with fluctuations was observed for the concentration of theextracellular glutamate after it was added, which hampered the calculation of first orderuptake kinetics (Table 6.5).Because of the similar increase of the intracellular glutamine in both strains after theglutamate pulses, it was concluded that glutamine synthetase (GS) was active (and notaffected by GOGAT deletion). After the glutamate pulses, the intracellular ammoniaconcentration in the wild-type varied (class E response). GS consumes ammonium and
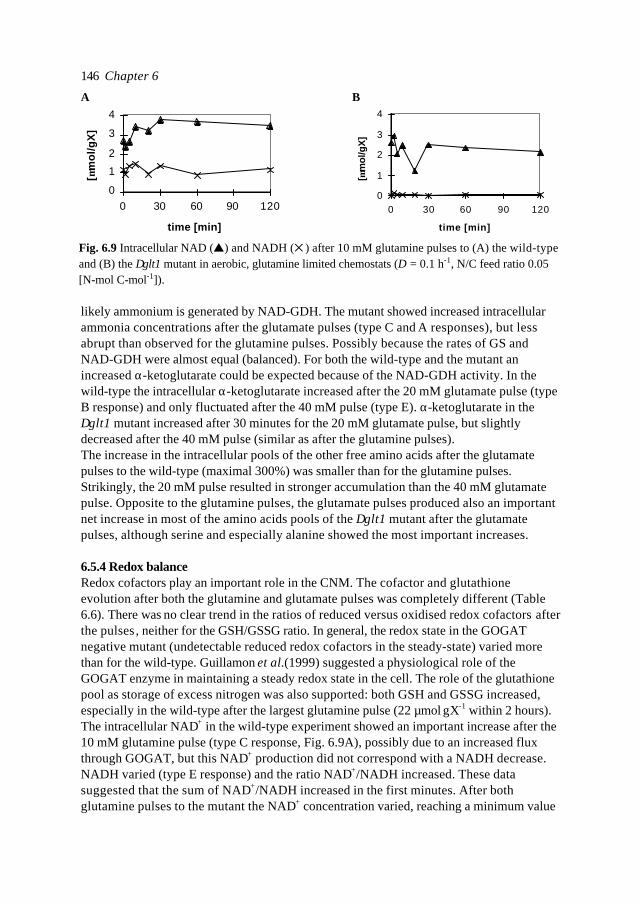
Chapter 6146
likely ammonium is generated by NAD-GDH. The mutant showed increased intracellularammonia concentrations after the glutamate pulses (type C and A responses), but lessabrupt than observed for the glutamine pulses. Possibly because the rates of GS andNAD-GDH were almost equal (balanced). For both the wild-type and the mutant anincreased α-ketoglutarate could be expected because of the NAD-GDH activity. In thewild-type the intracellular α-ketoglutarate increased after the 20 mM glutamate pulse (typeB response) and only fluctuated after the 40 mM pulse (type E). α-ketoglutarate in the∆glt1 mutant increased after 30 minutes for the 20 mM glutamate pulse, but slightlydecreased after the 40 mM pulse (similar as after the glutamine pulses).The increase in the intracellular pools of the other free amino acids after the glutamatepulses to the wild-type (maximal 300%) was smaller than for the glutamine pulses.Strikingly, the 20 mM pulse resulted in stronger accumulation than the 40 mM glutamatepulse. Opposite to the glutamine pulses, the glutamate pulses produced also an importantnet increase in most of the amino acids pools of the ∆glt1 mutant after the glutamatepulses, although serine and especially alanine showed the most important increases.
6.5.4 Redox balanceRedox cofactors play an important role in the CNM. The cofactor and glutathioneevolution after both the glutamine and glutamate pulses was completely different (Table6.6). There was no clear trend in the ratios of reduced versus oxidised redox cofactors afterthe pulses , neither for the GSH/GSSG ratio. In general, the redox state in the GOGATnegative mutant (undetectable reduced redox cofactors in the steady-state) varied morethan for the wild-type. Guillamon et al.(1999) suggested a physiological role of theGOGAT enzyme in maintaining a steady redox state in the cell. The role of the glutathionepool as storage of excess nitrogen was also supported: both GSH and GSSG increased,especially in the wild-type after the largest glutamine pulse (22 µmol⋅gX-1 within 2 hours).The intracellular NAD+ in the wild-type experiment showed an important increase after the10 mM glutamine pulse (type C response, Fig. 6.9A), possibly due to an increased fluxthrough GOGAT, but this NAD+ production did not correspond with a NADH decrease.NADH varied (type E response) and the ratio NAD+/NADH increased. These datasuggested that the sum of NAD+/NADH increased in the first minutes. After bothglutamine pulses to the mutant the NAD+ concentration varied, reaching a minimum value
A
0
1
2
3
4
0 30 60 90 120
time [min]
[µm
ol/g
X]
B
0
1
2
3
4
0 30 60 90 120
time [min]
[µm
ol/g
X]
Fig. 6.9 Intracellular NAD (s) and NADH (5) after 10 mM glutamine pulses to (A) the wild-typeand (B) the ∆glt1 mutant in aerobic, glutamine limited chemostats (D = 0.1 h-1, N/C feed ratio 0.05[N-mol⋅C-mol-1]).
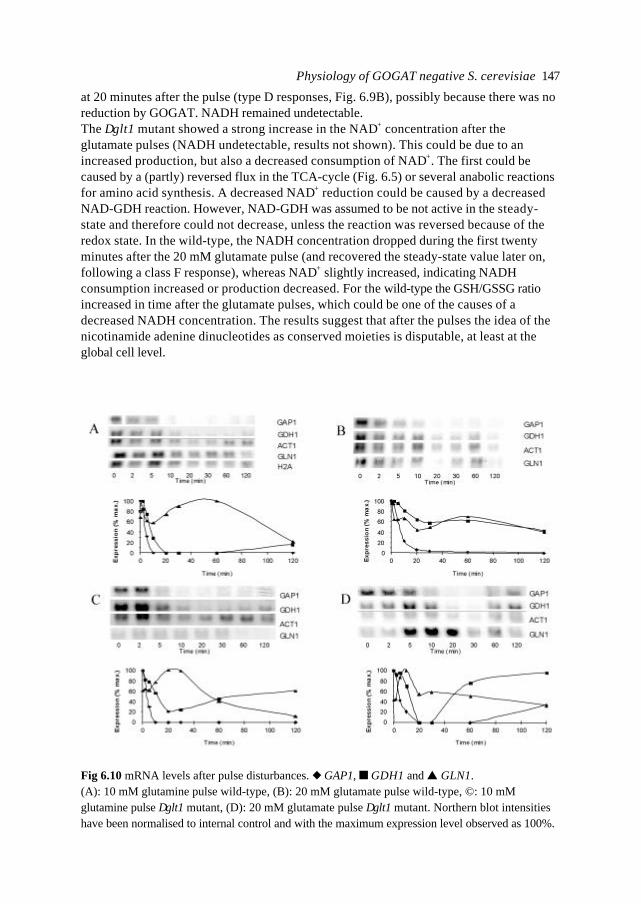
Physiology of GOGAT negative S. cerevisiae 147
at 20 minutes after the pulse (type D responses, Fig. 6.9B), possibly because there was noreduction by GOGAT. NADH remained undetectable.The ∆glt1 mutant showed a strong increase in the NAD+ concentration after theglutamate pulses (NADH undetectable, results not shown). This could be due to anincreased production, but also a decreased consumption of NAD+. The first could becaused by a (partly) reversed flux in the TCA-cycle (Fig. 6.5) or several anabolic reactionsfor amino acid synthesis. A decreased NAD+ reduction could be caused by a decreasedNAD-GDH reaction. However, NAD-GDH was assumed to be not active in the steady-state and therefore could not decrease, unless the reaction was reversed because of theredox state. In the wild-type, the NADH concentration dropped during the first twentyminutes after the 20 mM glutamate pulse (and recovered the steady-state value later on,following a class F response), whereas NAD+ slightly increased, indicating NADHconsumption increased or production decreased. For the wild-type the GSH/GSSG ratioincreased in time after the glutamate pulses, which could be one of the causes of adecreased NADH concentration. The results suggest that after the pulses the idea of thenicotinamide adenine dinucleotides as conserved moieties is disputable, at least at theglobal cell level.
Fig 6.10 mRNA levels after pulse disturbances. u GAP1, n GDH1 and s GLN1.(A): 10 mM glutamine pulse wild-type, (B): 20 mM glutamate pulse wild-type, ©: 10 mMglutamine pulse ∆glt1 mutant, (D): 20 mM glutamate pulse ∆glt1 mutant. Northern blot intensitieshave been normalised to internal control and with the maximum expression level observed as 100%.
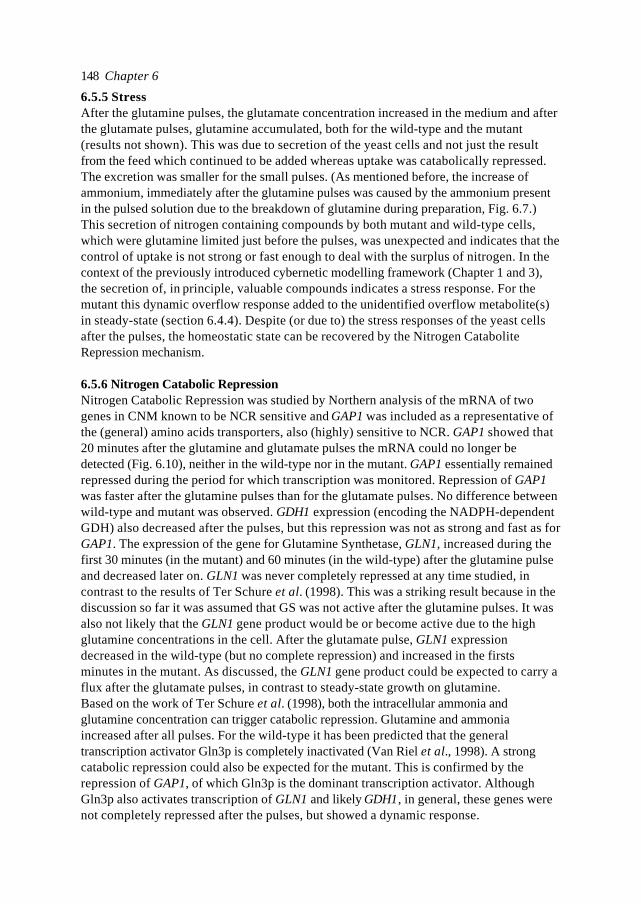
Chapter 6148
6.5.5 StressAfter the glutamine pulses, the glutamate concentration increased in the medium and afterthe glutamate pulses, glutamine accumulated, both for the wild-type and the mutant(results not shown). This was due to secretion of the yeast cells and not just the resultfrom the feed which continued to be added whereas uptake was catabolically repressed.The excretion was smaller for the small pulses. (As mentioned before, the increase ofammonium, immediately after the glutamine pulses was caused by the ammonium presentin the pulsed solution due to the breakdown of glutamine during preparation, Fig. 6.7.)This secretion of nitrogen containing compounds by both mutant and wild-type cells,which were glutamine limited just before the pulses, was unexpected and indicates that thecontrol of uptake is not strong or fast enough to deal with the surplus of nitrogen. In thecontext of the previously introduced cybernetic modelling framework (Chapter 1 and 3),the secretion of, in principle, valuable compounds indicates a stress response. For themutant this dynamic overflow response added to the unidentified overflow metabolite(s)in steady-state (section 6.4.4). Despite (or due to) the stress responses of the yeast cellsafter the pulses, the homeostatic state can be recovered by the Nitrogen CataboliteRepression mechanism.
6.5.6 Nitrogen Catabolic RepressionNitrogen Catabolic Repression was studied by Northern analysis of the mRNA of twogenes in CNM known to be NCR sensitive and GAP1 was included as a representative ofthe (general) amino acids transporters, also (highly) sensitive to NCR. GAP1 showed that20 minutes after the glutamine and glutamate pulses the mRNA could no longer bedetected (Fig. 6.10), neither in the wild-type nor in the mutant. GAP1 essentially remainedrepressed during the period for which transcription was monitored. Repression of GAP1was faster after the glutamine pulses than for the glutamate pulses. No difference betweenwild-type and mutant was observed. GDH1 expression (encoding the NADPH-dependentGDH) also decreased after the pulses, but this repression was not as strong and fast as forGAP1. The expression of the gene for Glutamine Synthetase, GLN1, increased during thefirst 30 minutes (in the mutant) and 60 minutes (in the wild-type) after the glutamine pulseand decreased later on. GLN1 was never completely repressed at any time studied, incontrast to the results of Ter Schure et al. (1998). This was a striking result because in thediscussion so far it was assumed that GS was not active after the glutamine pulses. It wasalso not likely that the GLN1 gene product would be or become active due to the highglutamine concentrations in the cell. After the glutamate pulse, GLN1 expressiondecreased in the wild-type (but no complete repression) and increased in the firstsminutes in the mutant. As discussed, the GLN1 gene product could be expected to carry aflux after the glutamate pulses, in contrast to steady-state growth on glutamine.Based on the work of Ter Schure et al. (1998), both the intracellular ammonia andglutamine concentration can trigger catabolic repression. Glutamine and ammoniaincreased after all pulses. For the wild-type it has been predicted that the generaltranscription activator Gln3p is completely inactivated (Van Riel et al., 1998). A strongcatabolic repression could also be expected for the mutant. This is confirmed by therepression of GAP1, of which Gln3p is the dominant transcription activator. AlthoughGln3p also activates transcription of GLN1 and likely GDH1, in general, these genes werenot completely repressed after the pulses, but showed a dynamic response.
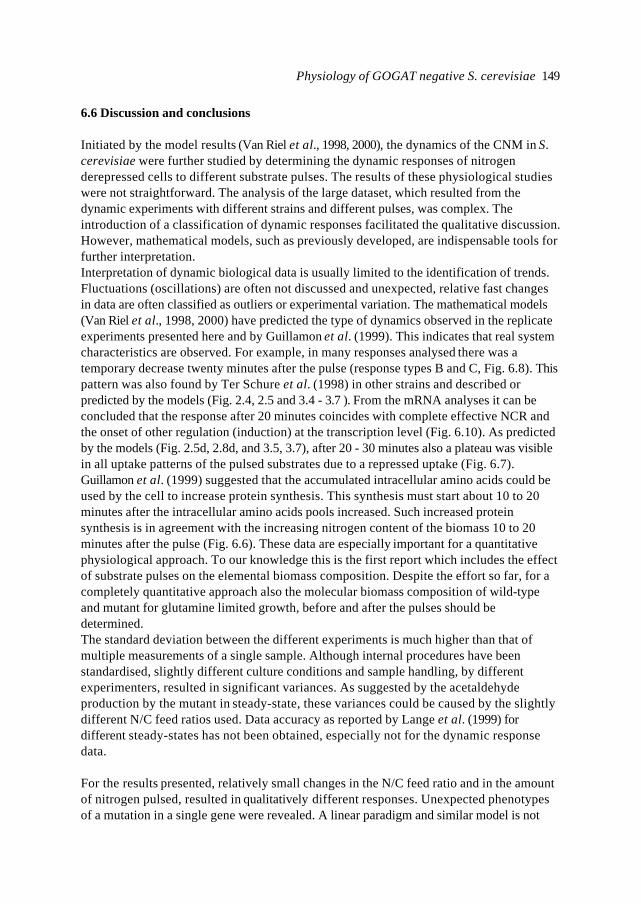
Physiology of GOGAT negative S. cerevisiae 149
6.6 Discussion and conclusions
Initiated by the model results (Van Riel et al., 1998, 2000), the dynamics of the CNM in S.cerevisiae were further studied by determining the dynamic responses of nitrogenderepressed cells to different substrate pulses. The results of these physiological studieswere not straightforward. The analysis of the large dataset, which resulted from thedynamic experiments with different strains and different pulses, was complex. Theintroduction of a classification of dynamic responses facilitated the qualitative discussion.However, mathematical models, such as previously developed, are indispensable tools forfurther interpretation.Interpretation of dynamic biological data is usually limited to the identification of trends.Fluctuations (oscillations) are often not discussed and unexpected, relative fast changesin data are often classified as outliers or experimental variation. The mathematical models(Van Riel et al., 1998, 2000) have predicted the type of dynamics observed in the replicateexperiments presented here and by Guillamon et al. (1999). This indicates that real systemcharacteristics are observed. For example, in many responses analysed there was atemporary decrease twenty minutes after the pulse (response types B and C, Fig. 6.8). Thispattern was also found by Ter Schure et al. (1998) in other strains and described orpredicted by the models (Fig. 2.4, 2.5 and 3.4 - 3.7 ). From the mRNA analyses it can beconcluded that the response after 20 minutes coincides with complete effective NCR andthe onset of other regulation (induction) at the transcription level (Fig. 6.10). As predictedby the models (Fig. 2.5d, 2.8d, and 3.5, 3.7), after 20 - 30 minutes also a plateau was visiblein all uptake patterns of the pulsed substrates due to a repressed uptake (Fig. 6.7).Guillamon et al. (1999) suggested that the accumulated intracellular amino acids could beused by the cell to increase protein synthesis. This synthesis must start about 10 to 20minutes after the intracellular amino acids pools increased. Such increased proteinsynthesis is in agreement with the increasing nitrogen content of the biomass 10 to 20minutes after the pulse (Fig. 6.6). These data are especially important for a quantitativephysiological approach. To our knowledge this is the first report which includes the effectof substrate pulses on the elemental biomass composition. Despite the effort so far, for acompletely quantitative approach also the molecular biomass composition of wild-typeand mutant for glutamine limited growth, before and after the pulses should bedetermined.The standard deviation between the different experiments is much higher than that ofmultiple measurements of a single sample. Although internal procedures have beenstandardised, slightly different culture conditions and sample handling, by differentexperimenters, resulted in significant variances. As suggested by the acetaldehydeproduction by the mutant in steady-state, these variances could be caused by the slightlydifferent N/C feed ratios used. Data accuracy as reported by Lange et al. (1999) fordifferent steady-states has not been obtained, especially not for the dynamic responsedata.
For the results presented, relatively small changes in the N/C feed ratio and in the amountof nitrogen pulsed, resulted in qualitatively different responses. Unexpected phenotypesof a mutation in a single gene were revealed. A linear paradigm and similar model is not
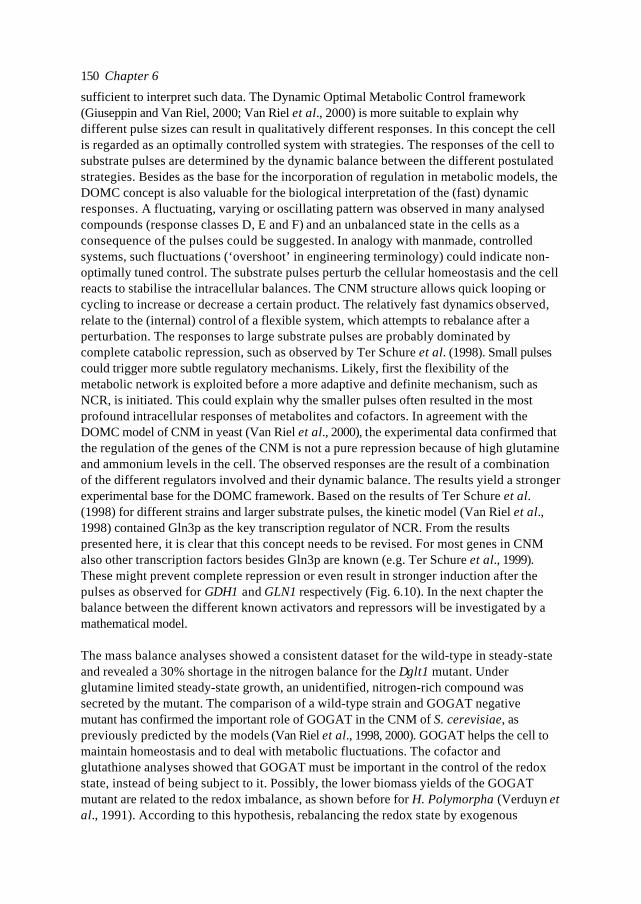
Chapter 6150
sufficient to interpret such data. The Dynamic Optimal Metabolic Control framework(Giuseppin and Van Riel, 2000; Van Riel et al., 2000) is more suitable to explain whydifferent pulse sizes can result in qualitatively different responses. In this concept the cellis regarded as an optimally controlled system with strategies. The responses of the cell tosubstrate pulses are determined by the dynamic balance between the different postulatedstrategies. Besides as the base for the incorporation of regulation in metabolic models, theDOMC concept is also valuable for the biological interpretation of the (fast) dynamicresponses. A fluctuating, varying or oscillating pattern was observed in many analysedcompounds (response classes D, E and F) and an unbalanced state in the cells as aconsequence of the pulses could be suggested. In analogy with manmade, controlledsystems, such fluctuations (‘overshoot’ in engineering terminology) could indicate non-optimally tuned control. The substrate pulses perturb the cellular homeostasis and the cellreacts to stabilise the intracellular balances. The CNM structure allows quick looping orcycling to increase or decrease a certain product. The relatively fast dynamics observed,relate to the (internal) control of a flexible system, which attempts to rebalance after aperturbation. The responses to large substrate pulses are probably dominated bycomplete catabolic repression, such as observed by Ter Schure et al. (1998). Small pulsescould trigger more subtle regulatory mechanisms. Likely, first the flexibility of themetabolic network is exploited before a more adaptive and definite mechanism, such asNCR, is initiated. This could explain why the smaller pulses often resulted in the mostprofound intracellular responses of metabolites and cofactors. In agreement with theDOMC model of CNM in yeast (Van Riel et al., 2000), the experimental data confirmed thatthe regulation of the genes of the CNM is not a pure repression because of high glutamineand ammonium levels in the cell. The observed responses are the result of a combinationof the different regulators involved and their dynamic balance. The results yield a strongerexperimental base for the DOMC framework. Based on the results of Ter Schure et al.(1998) for different strains and larger substrate pulses, the kinetic model (Van Riel et al.,1998) contained Gln3p as the key transcription regulator of NCR. From the resultspresented here, it is clear that this concept needs to be revised. For most genes in CNMalso other transcription factors besides Gln3p are known (e.g. Ter Schure et al., 1999).These might prevent complete repression or even result in stronger induction after thepulses as observed for GDH1 and GLN1 respectively (Fig. 6.10). In the next chapter thebalance between the different known activators and repressors will be investigated by amathematical model.
The mass balance analyses showed a consistent dataset for the wild-type in steady-stateand revealed a 30% shortage in the nitrogen balance for the ∆glt1 mutant. Underglutamine limited steady-state growth, an unidentified, nitrogen-rich compound wassecreted by the mutant. The comparison of a wild-type strain and GOGAT negativemutant has confirmed the important role of GOGAT in the CNM of S. cerevisiae, aspreviously predicted by the models (Van Riel et al., 1998, 2000). GOGAT helps the cell tomaintain homeostasis and to deal with metabolic fluctuations. The cofactor andglutathione analyses showed that GOGAT must be important in the control of the redoxstate, instead of being subject to it. Possibly, the lower biomass yields of the GOGATmutant are related to the redox imbalance, as shown before for H. Polymorpha (Verduyn etal., 1991). According to this hypothesis, rebalancing the redox state by exogenous
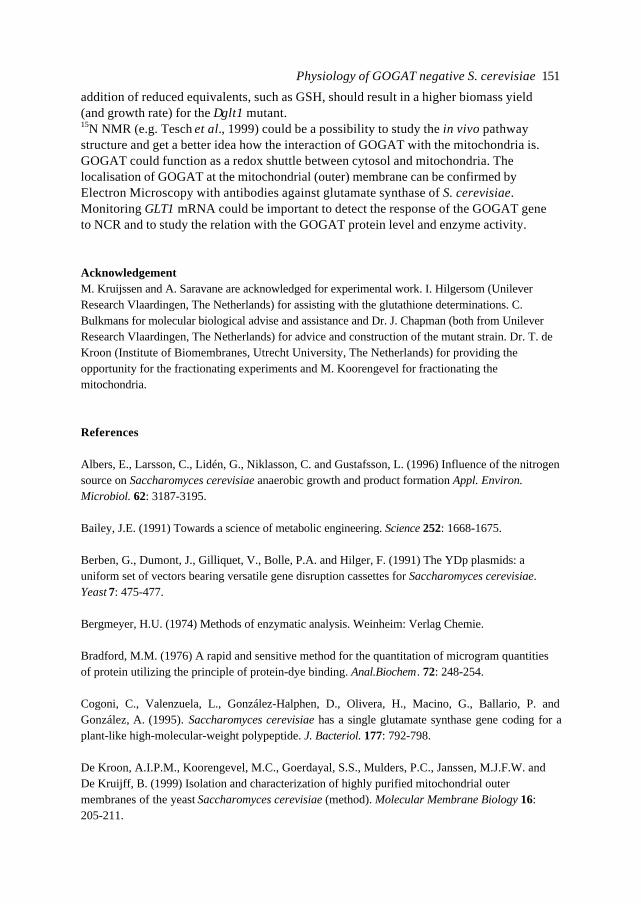
Physiology of GOGAT negative S. cerevisiae 151
addition of reduced equivalents, such as GSH, should result in a higher biomass yield(and growth rate) for the ∆glt1 mutant.15N NMR (e.g. Tesch et al., 1999) could be a possibility to study the in vivo pathwaystructure and get a better idea how the interaction of GOGAT with the mitochondria is.GOGAT could function as a redox shuttle between cytosol and mitochondria. Thelocalisation of GOGAT at the mitochondrial (outer) membrane can be confirmed byElectron Microscopy with antibodies against glutamate synthase of S. cerevisiae.Monitoring GLT1 mRNA could be important to detect the response of the GOGAT geneto NCR and to study the relation with the GOGAT protein level and enzyme activity.
AcknowledgementM. Kruijssen and A. Saravane are acknowledged for experimental work. I. Hilgersom (UnileverResearch Vlaardingen, The Netherlands) for assisting with the glutathione determinations. C.Bulkmans for molecular biological advise and assistance and Dr. J. Chapman (both from UnileverResearch Vlaardingen, The Netherlands) for advice and construction of the mutant strain. Dr. T. deKroon (Institute of Biomembranes, Utrecht University, The Netherlands) for providing theopportunity for the fractionating experiments and M. Koorengevel for fractionating themitochondria.
References
Albers, E., Larsson, C., Lidén, G., Niklasson, C. and Gustafsson, L. (1996) Influence of the nitrogensource on Saccharomyces cerevisiae anaerobic growth and product formation Appl. Environ.Microbiol. 62: 3187-3195.
Bailey, J.E. (1991) Towards a science of metabolic engineering. Science 252: 1668-1675.
Berben, G., Dumont, J., Gilliquet, V., Bolle, P.A. and Hilger, F. (1991) The YDp plasmids: auniform set of vectors bearing versatile gene disruption cassettes for Saccharomyces cerevisiae.Yeast 7: 475-477.
Bergmeyer, H.U. (1974) Methods of enzymatic analysis. Weinheim: Verlag Chemie.
Bradford, M.M. (1976) A rapid and sensitive method for the quantitation of microgram quantitiesof protein utilizing the principle of protein-dye binding. Anal.Biochem. 72: 248-254.
Cogoni, C., Valenzuela, L., González-Halphen, D., Olivera, H., Macino, G., Ballario, P. andGonzález, A. (1995). Saccharomyces cerevisiae has a single glutamate synthase gene coding for aplant-like high-molecular-weight polypeptide. J. Bacteriol. 177: 792-798.
De Kroon, A.I.P.M., Koorengevel, M.C., Goerdayal, S.S., Mulders, P.C., Janssen, M.J.F.W. andDe Kruijff, B. (1999) Isolation and characterization of highly purified mitochondrial outermembranes of the yeast Saccharomyces cerevisiae (method). Molecular Membrane Biology 16:205-211.
Chapter 6152
Dickinson, J.R. and Schweizer, M. (1999) The metabolism molecular physiology of Saccharomycescerevisiae. Taylor & Francis.
Guillamon, J.M., Van Riel, N.A.W., and Verrips, C.T. (1999) In preparation.
Giuseppin M.L.F. and Van Riel N.A.W. (2000) Metabolic modelling of Saccharomyces cerevisiaeusing the optimal control of homeostasis; a cybernetic model definition. Metabol. Eng. 2: 1-20.
Gonzalez, B., Francois, J. and Renaud, M. (1997) A rapid and reliable method for metaboliteextraction in yeast using boiling buffered ethanol. Yeast 13: 1347-1356.
Griffith, O.W. (1980) Determination of glutathione and glutathione disulphide using glutathionereductase and 2-vinylpyridine. Analytical biochemistry 106: 207-212.
Guldener U., Heck S., Fielder T., Beinhauer J., Hegemann J.H. (1996) A new efficient genedisruption cassette for repeated use in budding yeast. Nucleic Acids Res. 24:2519-2524.
Holmes, A.R., Collings, A., Farnden, K.J.F. and Sepherd, M.G. (1989) Ammonium assimilation byCandida albicans and other yeasts: evidence for activity of glutamate synthase. J. Gen. Microbiol.135: 1424-1430.
Jones, E.W. and Fink, G.R. (1982) Regulation of amino acid and nucleotide biosynthesis in yeast.In: The molecular biology of the yeast Saccharomyces cerevisiae, metabolism and gene expression(Strathern, J.N., Jones, E.W. and Broach, J.R., eds.) pp. 181-299. Cold Spring Harbor LaboratoryPress, Cold Spring Harbor, New York.
Khan, K. and Elia, M. (1991) Factors affecting the stability of L-glutamine in solution. ClinicalNutrition 10: 186-192.
Lange, H.C., van Dijken, J.P. and Heijnen, J.J. (1999) Statistical reconciliation of the elemental andpolymeric biomass composition data of S. cerevisiae. submitted.
Larsson, C., von Stockar, U., Marison, I., Gustafsson, L. (1993) Growth and metabolism ofSaccharomyces cerevisiae in chemostat cultures under carbon-, nitrogen-, or carbon- and nitrogen-limiting conditions. J. Bacteriol., 175: 4809-4816.
Larsson, C., Nilsson, A., Blomberg, A., Gustafsson, L. (1997) Glycolytic flux is conditionallycorrelated with ATP concentration in Saccharomyces cerevisiae: a chemostat study under carbon-or nitrogen-limiting conditions. J. Bacteriol., 179: 7243-7250.
Larsson, C., Påhlman, I.-L, Ansell, R., Rigoulet, M., Adler, L. and Gustafsson, L. (1998) Theimportance of the glycerol 3-phosphate shuttle during aerobic growth of Saccharomyces cerevisiae.Yeast 14: 347-357.
Physiology of GOGAT negative S. cerevisiae 153
Luttik, M.A.H., Overkamp, K.M., Kotter, P., De Vries, S., Van Dijken, J.P. and Pronk, J.T. (1998)The Saccharomyces cerevisiae NDE1 and NDE2 genes encode separate mitochondrial NADHdehydrogenases catalyzing the oxidation of cytosolic NADH. J. Biol. Chem. 273: 24529-24534.
Magasanik, B. (1992) Regulation of nitrogen utilization. In: The molecular and cellular biology ofthe yeast Saccharomyces cerevisiae: gene expression (Jones, E.W. et al., eds) pp. 283-317. ColdSpring Harbor Laboratory Press, Cold Spring Harbor, New York.
Paalme, T. and Villu, R. (1992) Proc. IFAC Modeling and Control of Biotechnical Processes,Colorado, USA. pp 299-301.
Roon, R.J., Even, H.L. and Larimore, F. (1974).Glutamate synthase: properties of the reducednicotinamide adenine dinucleotide-dependent enzyme from Saccharomyces cerevisiae. J. Bacteriol.118: 89-95.
Savinell, J.M. and Palsson, B.O. (1992) Network analysis of intermediary metabolism using linearoptimization. I. Development of mathematical formalism. J. Theor. Biol., 154: 421-454.
Sierkstra, L.N., Verbakel, J.M.A. and Verrips, C.T. (1992) Analysis of transcription and translationof glycolytic enzymes in glucose-limited continuous cultures of S. cereviae. J. GeneralMicrobiology 138: 2559-2566.
Sierkstra, L.N., Ter Schure, E.G., Verbakel, J.M.A. and Verrips, C.T. (1994) A nitrogen-limited,glucose repressed, continuous culture of Saccharomyces cerevisiae. Microbiology 140: 593-599.
Soberón, M. and González, A. (1987a) Physiological role of glutaminase activity in Saccharomycescerevisiae. J. Gen. Microbiol. 133: 1-8.
Soberón, M. and González, A. (1987b) Glutamine degradation through ω-amidase pathway inSaccharomyces cerevisiae. J. Gen. Microbiol. 133: 9-14.
Sonnleiter, B. and Käppeli, O. (1986) Growth of Saccharomyces cerevisae is controlled by itslimited respiratory capacity: formulation and verification of a hypothesis. Biotechnol. Bioeng. 28:927-937.
Stephanopoulos, G.N., Aristidou, A.A. and Nielsen, J. (1998) Metabolic Engineering; principlesand methodologies. Academic Press.
Ter Schure, E.G., Silljé, H.H.W., Vermeulen, E.E., Kalhorn, J., Verkleij, A.J., Boonstra, J. andVerrips, C.T. (1998) Repression of nitrogen catabolic genes by ammonia and glutamine in nitrogen-limited continuous cultures of Saccharomyces cerevisiae. Microbiology 144: 1451-1462.
Ter Schure, E.G., Silljé, H.H.W., Raeven, L.J.R.M., Boonstra, J., Verkleij, A.J. and Verrips, C.T.(1995) Nitrogen-regulated transcription and enzyme activities in continuous cultures ofSaccharomyces cerevisiae. Microbiology. 141: 1101-1108.
Chapter 6154
Ter Schure, E.G., Van Riel, N.A.W., and Verrips, C.T. (1999) The role of ammonia metabolism fornitrogen catabolite repression in Saccharomyces cerevisiae. In press.
Tesch, M., De Graaf, A.A. and Sahm, H. (1999) In vivo fluxes in the ammonium assimilatorypathways in Corynebacterium glutamicum studied by 15N nuclear magnetic resonance. Appl.Environ. Microbiol. 65: 1099-1109.
Valenzuela L., Ballario P., Aranda C., Filetici P., González A. (1998) Regulation of expression ofGLT1, the gene encoding glutamate synthase in Saccharomyces cerevisiae. J. Bacteriol. 180: 3533-3540.
Van Gulik, W.M. and Heijnen, J.J. (1995) A metabolic network stoichiometry analysis of microbialgrowth and product formation. Biotechnol. Bioeng. 48: 681-698.
Van Riel, N.A.W., Giuseppin, M.L.F., Ter Schure, E.G. and Verrips, C.T. (1998) A structured,minimal parameter model of the central nitrogen metabolism in Saccharomyces cerevisiae: theprediction of the behaviour of mutants. J. Theor. Biol. 191: 397-414.
Van Riel, N.A.W., Giuseppin, M.L.F. and Verrips, C.T. (2000) Dynamic optimal metabolic controltheory: a cybernetic approach for modelling of the central nitrogen metabolism of S. cerevisiae.Metabol. Eng. 2: In press.
Verduyn, C. Van Wijngaarden, C.J., Scheffes, W.A. and Van Dijken, J.P. (1991) Hydrogen peroxideas an electron acceptor for mitochondrial respiration in the yeast Hansenula polymorpha. Yeast 7:137-146.
Voet, D. and Voet, J.G. (1995) Biochemistry second edition. Wiley.
Wach A., Brachat A., Pohlmann R., Philippsen P. (1994) New heterologous modules for classical orPCR-based gene disruptions in Saccharomyces cerevisiae. Yeast 10: 1793-1808.
Chapter 7
Circuit simulation of transcription in Central NitrogenMetabolism of S. cerevisiae
Natal A.W. van Riel1, Eelko G. ter Schure2, Marco L.F. Giuseppin2 and C. Theo Verrips1,2
1 Department of Molecular Cell Biology, Institute of BiomembranesUtrecht University, Padualaan 8, 3584 CH Utrecht, The Netherlands
2 Unilever Research Vlaardingen, Olivier van Noortlaan 120, 3133 AT Vlaardingen, TheNetherlands
Submitted to: J. Theor. Biol.
Chapter 7156
Abstract
Nitrogen Catabolic Repression is the most important regulatory phenomenon in theCentral Nitrogen Metabolism of S. cerevisiae. Regulation at the transcriptional level isdominant. Many effectors involved have been identified, but the genetic regulatorynetwork is complex and difficult to analyse. Accurate intuitive analysis is almostimpossible. Numerical simulation models provide a check on the intuitive understanding.The model framework used, should correspond and connect to the current situation in cellbiology with an increasing amount of (genetic) data. Without a good framework, ourbiological model of the cell will become confusingly complex without yielding improvedunderstanding.The currently available information for transcription regulation of Nitrogen CatabolicRepression in S. cerevisiae has been integrated in a cybernetic modelling framework,which regards the cell as an optimal controlled system with different strategies. The modelhas been implemented as a cellular simulation circuit, focused on semi-quantitativeaspects. The mathematical model has been used to extract the basic features from thecomplex molecular biological model and check the consistency of this basis. The modelcan be used to efficiently initiate new experiments, making such models an indispensabletool for cell biology.
7.1. Introduction
To use a molecule as nitrogen source, yeast cells have to convert this molecule intoglutamate and glutamine (Cooper, 1982; Magasanik, 1992; Ter Schure et al., 1999). Theglutamate and glutamine nodes are the centre of the nitrogen metabolism (CentralNitrogen Metabolism, CNM) and from these two amino acids all other nitrogen containingcompounds in the cell can be produced (Magasanik, 1992). The CNM consists of a highlyregulated network which has been studied relatively little, as previously discussed.Knowledge and (quantitative) data are scarce and ambiguous. Regulation of the CNM inSaccharomyces cerevisiae occurs at different levels and involves all the ‘tools’ availablein cell biology: compartmentation, regulation of substrate uptake, enzyme activity, post-translational modification and gene transcription.Not all nitrogen sources support growth equally well. During growth on good nitrogensources, such as ammonia, glutamine and asparagine, the levels and activities of enzymesinvolved in the utilisation of poor nitrogen sources are decreased (Nitrogen CatabolicRepression, NCR) (Cooper, 1982). The transcription of the corresponding genes isrepressed and the enzymes are inactivated and degraded (Magasanik, 1992). NCR is themost important regulatory phenomenon in the CNM and for this, regulation at thetranscriptional level is dominant (Ter Schure et al., 1999; Van Riel et al. 1998).Besides through a General Amino Acids Permease Gap1p, located in the plasmamembrane, most nitrogen sources are taken up by specific transporters. Glutamine is takenup by Gap1p and the specific transporter Gnp1p. Proline, a typical example of a poornitrogen source, is taken up by Gap1p and the proline specific permease Put4p. Bothpermeases are repressed during growth on good nitrogen sources. Intracellular proline istransported from the cytoplasm into the mitochondria where it is degraded in three steps,
Circuit simulation of transcription 157
finally yielding glutamate (e.g. Ter Schure et al., 1999). The genes encoding thedegradation enzymes are induced by intracellular proline. Biosynthesis of prolinecomprises reactions which are exactly the reverse of the steps involved in degradation,but the enzymes are encoded by different genes and synthesis takes place in the cytosol.The compartmentalisation ensures that biosynthesis and catabolism are separated.Activation and inactivation of permeases occurs by phosphorylation anddephosphorylation respectively. This posttranslational regulation is fast. Inactivation ofthe permease by dephosphorylation is followed by a slower disappearance of the protein(operating on a minute scale) by ubiquitination and degradation in the vacuole (e.g. TerSchure et al., 1999). The expression of the specific degradation routes of the differentnitrogen sources depends on the availability of the particular nitrogen source. Theprocess of transcription regulation is slower than the inactivation of the proteins and is amedium term regulation.
When detailed enzymatic regulatory information is available, mechanistic models can beconstructed in which regulation of enzyme activity is included via augmented kineticexpressions (e.g. Rizzi et al., 1997). With only post-translation control, the model will notbe able to describe significant physiological adaptation. If detailed information is availablefor individual operons or (small) networks, regulation of transcription can be formulated asa mechanistic model, such as the famous model for the lac operon in E. coli (Lee andBailey, 1984). The use of a key transcription activator Gln3p in the Central NitrogenMetabolism of S. cerevisiae allowed Van Riel et al. (1998) to include gene expressionwithout the availability of detailed information. Much more (qualitative) information isavailable on the regulation of transcription in the CNM of S. cerevisiae (e.g. Ter Schure etal., 1999). However, the regulatory networks are often too complex and difficult to analysewith traditional techniques (Mc Adams and Shapiro, 1995). Intuitive analysis of systemswith time lags and feedback is notoriously difficult and error prone. Numerical simulationmodels provide a check on the intuitive understanding. Living systems have, of course,typical characteristics which distinguish them from physics and chemistry (Chapter 1).Model approaches successful for physical systems only have very limited value for cellbiology. The rapidly improving molecular biological techniques generate an exponentiallyincreasing amount of (genetic) data. Without a good framework to structure suchqualitative data, the information content is hardly used and our biological model of the cellwill become confusingly complex without yielding improved understanding. The modelframework used, should correspond and connect to the current situation in cell biology.
Similar to large and complex electrical circuits, the coordinated action of multiple geneproducts can be viewed as a ‘genetic circuit’ (e.g. Mc Adams and Shapiro, 1995; Palsson,1997), or more appropriately called a ‘cellular circuit’. In this network flows of mass and/orenergy and information can be discriminated (like in a physical controlled system). Onelevel of cellular circuits concerns mass and energy processing in the cell, i.e. metabolismand transport. The many proteins in living cells which have as their primary function thetransfer and processing of information are also functionally linked into biochemicalcircuits. Lastly, there are cellular circuits that may be considered as the cellular fateprocesses (preprogrammed responses), including mitosis, apoptosis and differentiation.The coordinated activity of these processes determines the dynamic state of the cellular
Chapter 7158
functions. Positive and negative feedback loops make the circuit into a robustly controlledsystem with the possibility to respond to its environment by a combination of control ofhomeostasis and adaptation (e.g. Giuseppin and Van Riel, 2000). Because of their highdegree of interconnection, biochemical circuits act as neural networks trained byevolution to respond appropriately to extracellular stimuli (Bray, 1995).Across different micro-organisms, but also in one cell, completely different proteinsperform analogous circuit functions. For electrical circuits there are also many equivalentalternative implementations of any logic function, from which a ‘best’ option can beselected on the basis of criteria such as cost, reliability and power consumption. It can beassumed that evolution has ‘selected’ an optimal biochemical implementation based onthe principle of ‘survival of the fittest’ (Chapter 1). Several modelling approaches havebeen developed which use this concept, all regarding the cell as an optimal strategist, aso-called cybernetic system.In this work the present knowledge of NCR in S. cerevisiae (Ter Schure et al., 1999) isinterpreted in the context of a mathematical model describing the network of geneticregulators and inhibitors. The mathematical model is used to extract the basic featuresfrom the complex molecular biological model and check the consistency of this basis. Dueto the limited quantitative information, extensive simplification of the system wasnecessary. For a (dynamic) mathematical model also additional assumptions need to bemade which fall outside the scope of most of the current molecular biological work. Thesensitivity of the model for the different assumptions can be used to initiate newexperiments with a different focus, efficiently yielding the relevant information for furthercompletion of the understanding of NCR in S. cerevisiae. The model for regulation oftranscription of the CNM is implemented with the ‘hybrid’ approach used by McAdamsand Shapiro (1995). It has to be stressed that the detailed information which was used forthe bacteriophage lambda lysis-lysogeny decision cellular circuit is not available for NCRin CNM. Nevertheless, it will shown how a consistent model can be developed based onavailable information. For the modelling it is postulated that the regulation of transcriptionin CNM has two goals: 1) control of homeostasis of the metabolic pools and 2) selectionof best nitrogen source, in agreement with the cybernetic Dynamic Optimal MetabolicControl framework (DOMC, Giuseppin and Van Riel, 2000; Van Riel et al. 2000). The modelis focused on the qualitative behaviour and analysis of the system. Actual parametervalues are not yet available. Model states and parameters are introduced in a normalisedway.
7.2. Materials and methods
The hybrid model integrates very simple kinetics with the principle of circuit simulation asused by electrical engineers to model and analyse complex (digital) circuits. Switchingfunctions are used to describe the regulatory network. Below (or above) a certain level,variable x has little or no influence on the behaviour of variable y, while above (or below)this level the effect of x on y follows a quick, hyperbolical increase to a constant level. Theuse of such an approach is justified since a predominant feature of biological systems isthe presence of threshold dominated cause and effect relationships between the systemvariables (Plahte et al, 1998). Although the model is aimed at the genetic network, the
Circuit simulation of transcription 159
metabolic pathways cannot be omitted. The signals present in the genetic network arederived from pool concentrations and the effect of regulation in turn should be visible inthe pools (homeostatic control of the metabolic pools is one of the postulated strategies).Substrate uptake is modelled with (non-linear) Blackman enzyme kinetics. The same typeof expressions are also used to describe the interactions between the metabolic networknodes, while pathways are lumped as much as possible. In the case of Blackman kineticsthe enzymatic conversion rate r for a substrate S [mmol⋅g-1] results from
][* Skr = (7.1a)
≥<
=a xma xm
a xm
rrrrrr
r *
**
ifif
(7.1b)
with rate constant k [h-1] and k= (2KS)-1 in the original definition of Blackman, in which KS
is the affinity constant.To realistically describe threshold related phenomena in the cell, in principle gradualfunctions have been used to implement the switches. This is also advantageous in thenumerical implementation of the model. Switching functions are frequently described bysigmoid functions. Let x ≥ 0 be a state variable, θ its threshold and 0 ≤ q ≤ 1 a parameterdetermining the steepness of a sigmoid S. For the methodology of Plahte et al. (1998), thesigmoids need to be continuous and analytic with respect to x and q, with values in theinterval [0,1], strictly increasing. In the model the (biologically relevant) Hill equation hasbeen used as sigmoid with a (normalised) maximum capacity Vmax = 1:
q
xx
qxSZ /1/1
/1
),,(θ
θ+
==
(7.2)
The steepness increases with increasing q, (Fig. 7.1) and when q tends to zero, Zapproaches the unit step function (the infinitely steep Heaviside function) with thresholdθ :
><
==θθ
θxx
xSZ10
)0,,( (7.3)
The step function is the model of an ideal switch. When the underlying biochemistry andmolecular biology is relatively fast and definitive, a cellular circuit can be implementedwith idealised switches and Boolean logic can be used to analyse or design the circuit(Mc Adams and Shapiro, 1995). This is admissible if the resulting equations exhibit thesame qualitative behaviour as the corresponding equations with sigmoid functions.Perturbation of the parameters q such that sigmoids approach step functions (lim q → 0)may not result in bifurcation of the model. Ideal switches (step functions) introduce
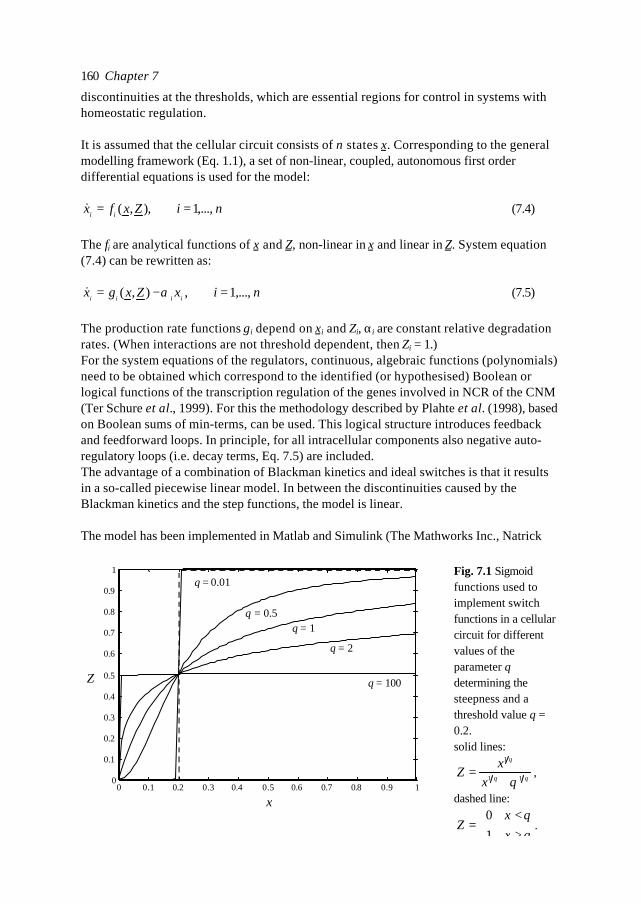
Chapter 7160
discontinuities at the thresholds, which are essential regions for control in systems withhomeostatic regulation.
It is assumed that the cellular circuit consists of n states x. Corresponding to the generalmodelling framework (Eq. 1.1), a set of non-linear, coupled, autonomous first orderdifferential equations is used for the model:
niZxfx ii ,...,1),,( ==& (7.4)
The fi are analytical functions of x and Z, non-linear in x and linear in Z. System equation(7.4) can be rewritten as:
nixZxgx iiii ,...,1,),( =−= α& (7.5)
The production rate functions gi depend on xi and Zi, αi are constant relative degradationrates. (When interactions are not threshold dependent, then Zi = 1.)For the system equations of the regulators, continuous, algebraic functions (polynomials)need to be obtained which correspond to the identified (or hypothesised) Boolean orlogical functions of the transcription regulation of the genes involved in NCR of the CNM(Ter Schure et al., 1999). For this the methodology described by Plahte et al. (1998), basedon Boolean sums of min-terms, can be used. This logical structure introduces feedbackand feedforward loops. In principle, for all intracellular components also negative auto-regulatory loops (i.e. decay terms, Eq. 7.5) are included.The advantage of a combination of Blackman kinetics and ideal switches is that it resultsin a so-called piecewise linear model. In between the discontinuities caused by theBlackman kinetics and the step functions, the model is linear.
The model has been implemented in Matlab and Simulink (The Mathworks Inc., Natrick
x
Z q = 100
0 0.1 0.2 0.3 0.4 0.5 0.6 0.7 0.8 0.9 10
0.1
0.2
0.3
0.4
0.5
0.6
0.7
0.8
0.9
1q = 0.01
q = 0.5q = 1
q = 2
Fig. 7.1 Sigmoidfunctions used toimplement switchfunctions in a cellularcircuit for differentvalues of theparameter qdetermining thesteepness and athreshold value θ =0.2.solid lines:
q
xx
Z 11
1
θ+= ,
dashed line:
><
=θθ
xx
Z10
.
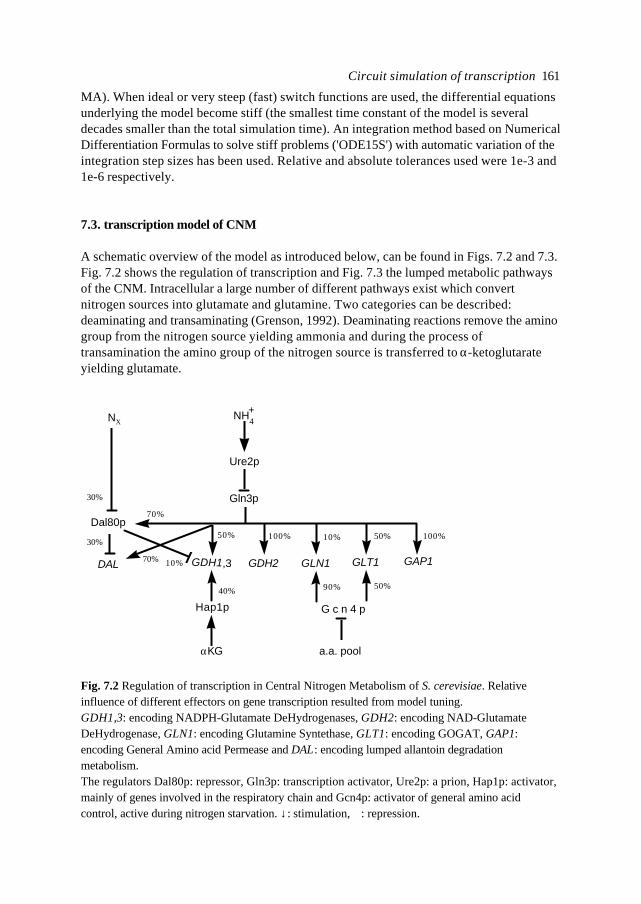
Circuit simulation of transcription 161
MA). When ideal or very steep (fast) switch functions are used, the differential equationsunderlying the model become stiff (the smallest time constant of the model is severaldecades smaller than the total simulation time). An integration method based on NumericalDifferentiation Formulas to solve stiff problems ('ODE15S') with automatic variation of theintegration step sizes has been used. Relative and absolute tolerances used were 1e-3 and1e-6 respectively.
7.3. transcription model of CNM
A schematic overview of the model as introduced below, can be found in Figs. 7.2 and 7.3.Fig. 7.2 shows the regulation of transcription and Fig. 7.3 the lumped metabolic pathwaysof the CNM. Intracellular a large number of different pathways exist which convertnitrogen sources into glutamate and glutamine. Two categories can be described:deaminating and transaminating (Grenson, 1992). Deaminating reactions remove the aminogroup from the nitrogen source yielding ammonia and during the process oftransamination the amino group of the nitrogen source is transferred to α-ketoglutarateyielding glutamate.
Gln3p
Ure2p
NH+4
αKG
GDH1,3
Hap1p
DAL
NX
50%
40%
10%70%
30%
Dal80p70%
30%
GAP1
100%
GDH2
100%
GLN1
90%
10%
a.a. pool
G c n 4 p
GLT1
50%
50%
Fig. 7.2 Regulation of transcription in Central Nitrogen Metabolism of S. cerevisiae. Relativeinfluence of different effectors on gene transcription resulted from model tuning.GDH1,3: encoding NADPH-Glutamate DeHydrogenases, GDH2: encoding NAD-GlutamateDeHydrogenase, GLN1: encoding Glutamine Syntethase, GLT1: encoding GOGAT, GAP1:encoding General Amino acid Permease and DAL: encoding lumped allantoin degradationmetabolism.The regulators Dal80p: repressor, Gln3p: transcription activator, Ure2p: a prion, Hap1p: activator,mainly of genes involved in the respiratory chain and Gcn4p: activator of general amino acidcontrol, active during nitrogen starvation. ↓: stimulation, ⊥: repression.
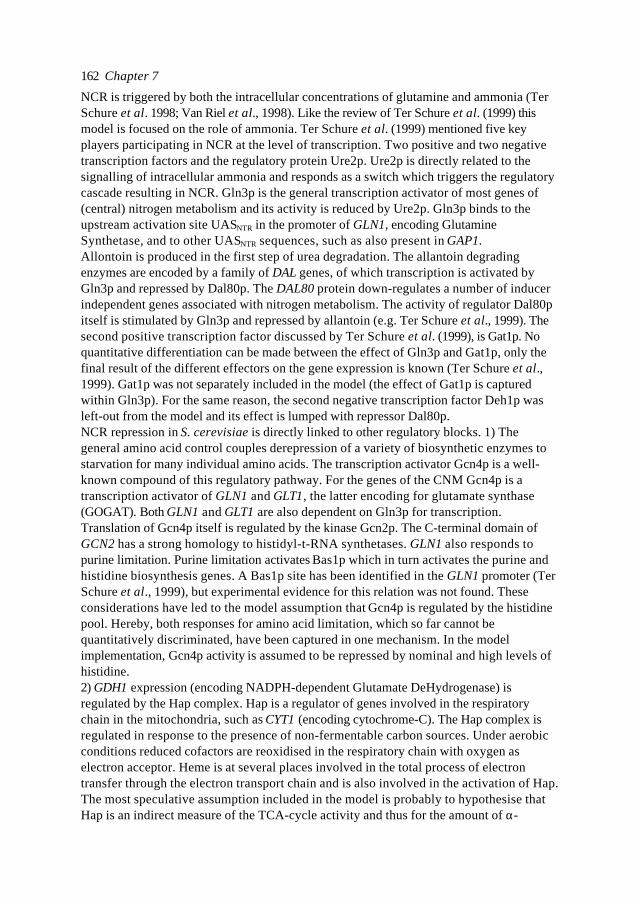
Chapter 7162
NCR is triggered by both the intracellular concentrations of glutamine and ammonia (TerSchure et al. 1998; Van Riel et al., 1998). Like the review of Ter Schure et al. (1999) thismodel is focused on the role of ammonia. Ter Schure et al. (1999) mentioned five keyplayers participating in NCR at the level of transcription. Two positive and two negativetranscription factors and the regulatory protein Ure2p. Ure2p is directly related to thesignalling of intracellular ammonia and responds as a switch which triggers the regulatorycascade resulting in NCR. Gln3p is the general transcription activator of most genes of(central) nitrogen metabolism and its activity is reduced by Ure2p. Gln3p binds to theupstream activation site UASNTR in the promoter of GLN1, encoding GlutamineSynthetase, and to other UASNTR sequences, such as also present in GAP1.Allontoin is produced in the first step of urea degradation. The allantoin degradingenzymes are encoded by a family of DAL genes, of which transcription is activated byGln3p and repressed by Dal80p. The DAL80 protein down-regulates a number of inducerindependent genes associated with nitrogen metabolism. The activity of regulator Dal80pitself is stimulated by Gln3p and repressed by allantoin (e.g. Ter Schure et al., 1999). Thesecond positive transcription factor discussed by Ter Schure et al. (1999), is Gat1p. Noquantitative differentiation can be made between the effect of Gln3p and Gat1p, only thefinal result of the different effectors on the gene expression is known (Ter Schure et al.,1999). Gat1p was not separately included in the model (the effect of Gat1p is capturedwithin Gln3p). For the same reason, the second negative transcription factor Deh1p wasleft-out from the model and its effect is lumped with repressor Dal80p.NCR repression in S. cerevisiae is directly linked to other regulatory blocks. 1) Thegeneral amino acid control couples derepression of a variety of biosynthetic enzymes tostarvation for many individual amino acids. The transcription activator Gcn4p is a well-known compound of this regulatory pathway. For the genes of the CNM Gcn4p is atranscription activator of GLN1 and GLT1, the latter encoding for glutamate synthase(GOGAT). Both GLN1 and GLT1 are also dependent on Gln3p for transcription.Translation of Gcn4p itself is regulated by the kinase Gcn2p. The C-terminal domain ofGCN2 has a strong homology to histidyl-t-RNA synthetases. GLN1 also responds topurine limitation. Purine limitation activates Bas1p which in turn activates the purine andhistidine biosynthesis genes. A Bas1p site has been identified in the GLN1 promoter (TerSchure et al., 1999), but experimental evidence for this relation was not found. Theseconsiderations have led to the model assumption that Gcn4p is regulated by the histidinepool. Hereby, both responses for amino acid limitation, which so far cannot bequantitatively discriminated, have been captured in one mechanism. In the modelimplementation, Gcn4p activity is assumed to be repressed by nominal and high levels ofhistidine.2) GDH1 expression (encoding NADPH-dependent Glutamate DeHydrogenase) isregulated by the Hap complex. Hap is a regulator of genes involved in the respiratorychain in the mitochondria, such as CYT1 (encoding cytochrome-C). The Hap complex isregulated in response to the presence of non-fermentable carbon sources. Under aerobicconditions reduced cofactors are reoxidised in the respiratory chain with oxygen aselectron acceptor. Heme is at several places involved in the total process of electrontransfer through the electron transport chain and is also involved in the activation of Hap.The most speculative assumption included in the model is probably to hypothesise thatHap is an indirect measure of the TCA-cycle activity and thus for the amount of α-
Circuit simulation of transcription 163
ketoglutarate available for amino acid biosynthesis during growth on ammonia. Hap isassumed to link (part) of the mitochondrial transcription regulatory pathways to the CNMvia GDH1. During normal aerobic batch growth, Hap is active and the gene product inturn stimulates transcription of GDH1.Transcription of GDH1 is also activated by Gln3p and repressed by Dal80p. The influenceof Leu3p on GDH1 transcription (Ter Schure et al., 1999) was not included in the model,because no data were available for α-isopropylmalate concentrations.The pathway for glutamate degradation is catalysed by NAD-dependent GlutamateDeHydrogenase, encoded by GDH2. This gene has six difference sequence elementspresent in its promoter (e.g. Ter Schure et al., 1999), a.o. a Gln3p binding site (UASNTR).Only this nitrogen related regulation for GDH2 has been included in the model. A thirdgene encoding a Glutamate DeHydrogenase has been found (GDH3) and like GDH1 itsproduct is NADPH dependent (Wilkinson et al. 1996; Avendaño et al. 1997). Thephysiological role of this isozyme is unknown and therefore also its known regulation bythe cAMP response cis element (Wilkinson et al., 1996) has not been included in thetranscription model. A sixth pathway is present in the CNM of S. cerevisiae. Aglutaminase activity has been determined in cell extracts (Soberón and González, 1987) anda yeast mutant deleted for GOGAT is able to grow on glutamine as sole nitrogen source(Van Riel et al., Chapter 6). However, the gene(s) encoding glutaminase(s) have not beenidentified yet. Other enzymes, such as asparginase, are known to have a glutaminedegrading side reaction.The ammonia specific transporters are encoded by 3 genes: MEP1, MEP2 and MEP3(Marini et al., 1997). These permeases are expressed when low ammonia concentrationsare present and repressed for higher ammonia concentrations. Transcription of GAP1 isactivated by Gln3p.The actual degradation pathways were not included in the model implementation, butthree different types of nitrogen substrates are taken into account:
glu
α KG
glnGLN1GDH1
NH4+
TCA
histidine
GCN4
HAP
URE2 proteinsnucleotides
lipides
GAP1
NZ
DAL
NX
NY
MEP
Fig. 7.3 Lumped metabolic pathways of CNM in S. cerevisiae as included in the model. Solid linesindicate mass transfer and dashed lines represent signals. The permease names DAL, MEP, andGAP1, indicate lumped transporters of the three substrate types considered in the model and are assuch not directly related to the underlying biology (see model assumptions).
Chapter 7164
1) NX: substrates which are deaminated, yielding ammonia, with a rate which is lowerthan the capacity of the NADPH-GDH.
2) NY: substrates which are deaminated with a rate which is higher than the capacity ofNADPH-GDH. This results in accumulation of ammonia and therefore NCR throughtranscription repressor Ure2p and activator Gln3p.
3) NZ: substrates which are transaminated yielding glutamate and glutamate itself.Examples:NX - adenine, allantoin, cytidine, guanine, proline, serine, threonine, ureumNY - ammonia, asparagine, glutamineNZ - alanine, aspartate, isoleucine, leucine, methionine, ornitine, phenylalanine,tryptophan, tyrosine, valine- Nitrogen substrates NX are uniquely transported and metabolised through the systemencoded by the DAL genes.- The transporters of substrates NY are lumped and all indicated by ‘Mep’. Transcriptionof MEP is induced by its substrates NY, which is the only control included for MEP.- Gap1p is assumed to transport all the substrates NZ, which are transaminated.- In the model Dal80p is not only a regulator of allantoin metabolism, but for metabolism ofall substrates of type NX. Dal80p activity is assumed to be repressed by all substrates NX
(Fig. 7.2).- For growth on substrates yielding ammonia, GDH1 is expressed to assimilate ammoniafor glutamate synthesis. Substrates which are transaminated to glutamate need ammoniafor the synthetase reaction to produce glutamine with a rate rGln1p. This ammonia isprovided by the NAD-GDH with a rate rGdh2p. NAD-GDH also needs to provide theammonia for protein, lipid and nucleotide synthesis, equal to µ⋅[NH4
+]. For a closedammonia balance, the NAD-GDH reaction rate needs to be equal to
rGdh2p = rGln1p + µ⋅[NH4+] (7.6)
The relative influence of the different regulators for the genes are tuned based on theresulting (qualitative) behaviour of the model. Because sufficient, quantitative data lackand the model is focused on a semi-quantitative description, in general, all time constantsfor both activation and repression are set to 10.0 h -1 for simplicity.
Macroscopic model The model consists of a macroscopic part with differential equationsto describe the fermenter (i.e. batch, fedbatch, continuous culture) and the biomassgrowth. Based on data of Ter Schure et al. (1995), the growth rate was modelled as:
µ =0.185⋅φN valid for 0.05 < µ < µub (7.7)
with φN the uptake flux in [mmol-N⋅g-1⋅h-1]. For growth on ammonium this relation wasderived for a dilution rate up to a µub = 0.3 h-1 in ammonium limited continuous cultures.
The mass balance for the biomass X during batch growth is:
XdtdX
µ= (7.8)
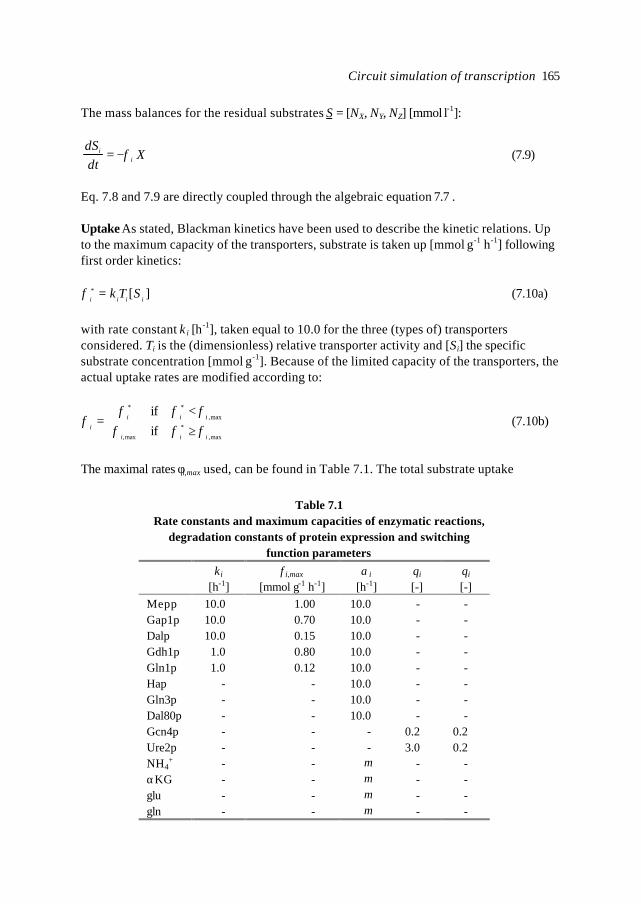
Circuit simulation of transcription 165
The mass balances for the residual substrates S = [NX, NY, NZ] [mmol⋅l-1]:
XdtdS
ii φ−= (7.9)
Eq. 7.8 and 7.9 are directly coupled through the algebraic equation 7.7 .
Uptake As stated, Blackman kinetics have been used to describe the kinetic relations. Upto the maximum capacity of the transporters, substrate is taken up [mmol⋅g-1⋅h-1] followingfirst order kinetics:
][*iiii
STk=φ (7.10a)
with rate constant k i [h-1], taken equal to 10.0 for the three (types of) transporters
considered. Ti is the (dimensionless) relative transporter activity and [Si] the specificsubstrate concentration [mmol⋅g-1]. Because of the limited capacity of the transporters, theactual uptake rates are modified according to:
≥<
=max,
*max,
max,**
ifif
iii
iiii φφφ
φφφφ (7.10b)
The maximal rates φi,max used, can be found in Table 7.1. The total substrate uptake
Table 7.1Rate constants and maximum capacities of enzymatic reactions,
degradation constants of protein expression and switchingfunction parameters
k i
[h-1]φi,max
[mmol⋅g-1⋅h-1]αi
[h-1]θi
[-]qi
[-]Mepp 10.0 1.00 10.0 - -Gap1p 10.0 0.70 10.0 - -Dalp 10.0 0.15 10.0 - -Gdh1p 1.0 0.80 10.0 - -Gln1p 1.0 0.12 10.0 - -Hap - - 10.0 - -Gln3p - - 10.0 - -Dal80p - - 10.0 - -Gcn4p - - - 0.2 0.2Ure2p - - - 3.0 0.2NH4
+ - - µ - -αKG - - µ - -glu - - µ - -gln - - µ - -
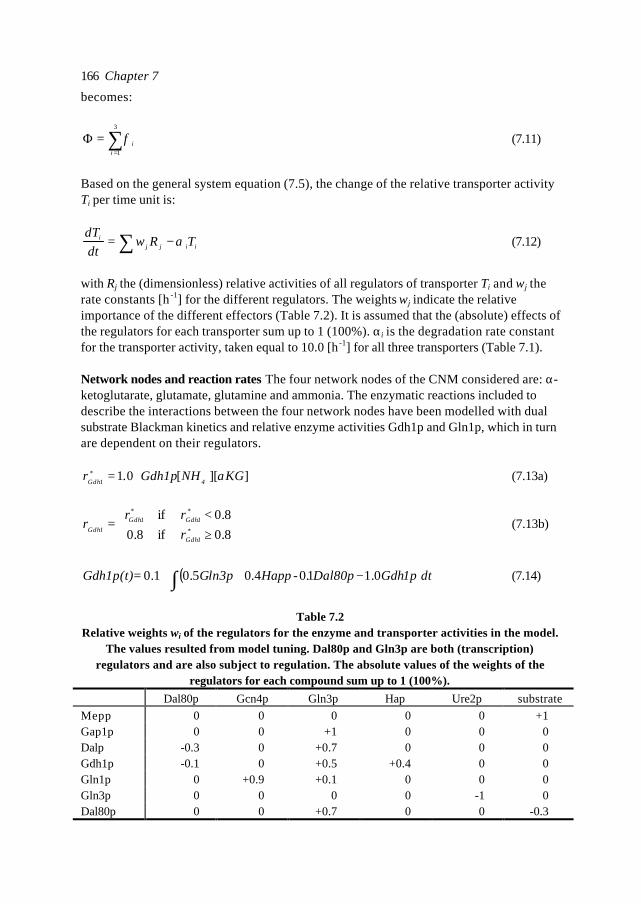
Chapter 7166
becomes:
∑=
=Φ3
1iiφ (7.11)
Based on the general system equation (7.5), the change of the relative transporter activityTi per time unit is:
iijji TRw
dtdT
α−= ∑ (7.12)
with Rj the (dimensionless) relative activities of all regulators of transporter Ti and wj therate constants [h -1] for the different regulators. The weights wj indicate the relativeimportance of the different effectors (Table 7.2). It is assumed that the (absolute) effects ofthe regulators for each transporter sum up to 1 (100%). αi is the degradation rate constantfor the transporter activity, taken equal to 10.0 [h -1] for all three transporters (Table 7.1).
Network nodes and reaction rates The four network nodes of the CNM considered are: α-ketoglutarate, glutamate, glutamine and ammonia. The enzymatic reactions included todescribe the interactions between the four network nodes have been modelled with dualsubstrate Blackman kinetics and relative enzyme activities Gdh1p and Gln1p, which in turnare dependent on their regulators.
]][[0.1* KGNH1pGdhr41Gdh
α+⋅= (7.13a)
≥<
=8.0if8.08.0if
*
**
1Gdh
1Gdh1Gdh1Gdh r
rrr (7.13b)
( )∫ −++= dt1pGdhDal80p.-Happ.3pnGl1p(t)Gdh 0.110405.01.0 (7.14)
Table 7.2Relative weights wi of the regulators for the enzyme and transporter activities in the model.
The values resulted from model tuning. Dal80p and Gln3p are both (transcription)regulators and are also subject to regulation. The absolute values of the weights of the
regulators for each compound sum up to 1 (100%).Dal80p Gcn4p Gln3p Hap Ure2p substrate
Mepp 0 0 0 0 0 +1Gap1p 0 0 +1 0 0 0Dalp -0.3 0 +0.7 0 0 0Gdh1p -0.1 0 +0.5 +0.4 0 0Gln1p 0 +0.9 +0.1 0 0 0Gln3p 0 0 0 0 -1 0Dal80p 0 0 +0.7 0 0 -0.3
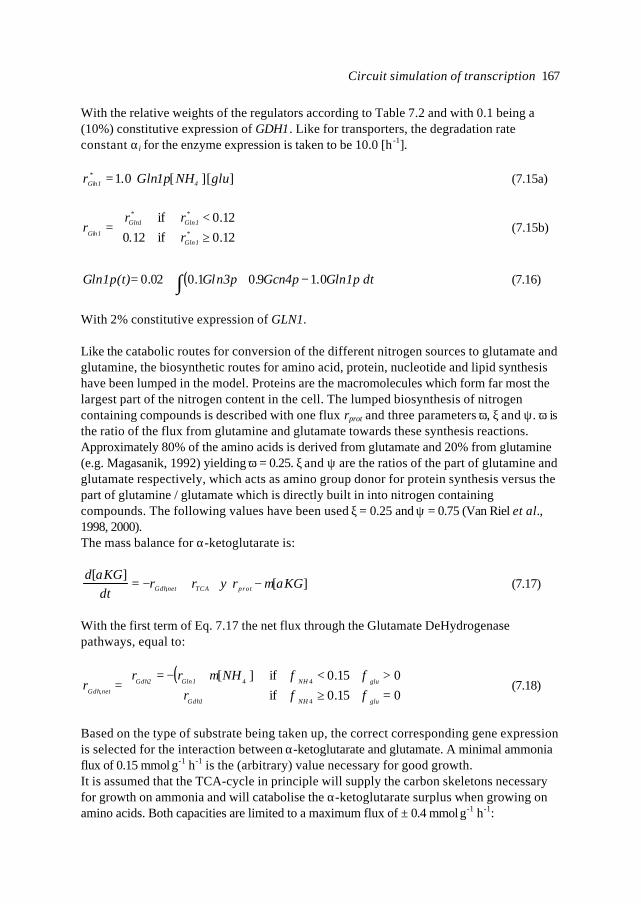
Circuit simulation of transcription 167
With the relative weights of the regulators according to Table 7.2 and with 0.1 being a(10%) constitutive expression of GDH1. Like for transporters, the degradation rateconstant αi for the enzyme expression is taken to be 10.0 [h -1].
]][[0.1* gluNH1pnGlr 41nGl+⋅= (7.15a)
≥<
=12.0if12.012.0if
*1nGl
*1nGl
*1nGl
1nGl rrr
r (7.15b)
( )∫ −++= dt1pnGl4pGcn.3pnGl1p(t)nGl 0.1901.002.0 (7.16)
With 2% constitutive expression of GLN1.
Like the catabolic routes for conversion of the different nitrogen sources to glutamate andglutamine, the biosynthetic routes for amino acid, protein, nucleotide and lipid synthesishave been lumped in the model. Proteins are the macromolecules which form far most thelargest part of the nitrogen content in the cell. The lumped biosynthesis of nitrogencontaining compounds is described with one flux rprot and three parameters ω, ξ and ψ. ω isthe ratio of the flux from glutamine and glutamate towards these synthesis reactions.Approximately 80% of the amino acids is derived from glutamate and 20% from glutamine(e.g. Magasanik, 1992) yielding ω = 0.25. ξ and ψ are the ratios of the part of glutamine andglutamate respectively, which acts as amino group donor for protein synthesis versus thepart of glutamine / glutamate which is directly built in into nitrogen containingcompounds. The following values have been used ξ = 0.25 and ψ = 0.75 (Van Riel et al.,1998, 2000).The mass balance for α-ketoglutarate is:
][][
, KGrrrdtKGd
protTCAnetGdh αµψα
−++−= (7.17)
With the first term of Eq. 7.17 the net flux through the Glutamate DeHydrogenasepathways, equal to:
( )
=∨≥>∧<+−=
=+
015.0if015.0if][
4
44,
gluNH1Gdh
gluNH1nGl2GdhnetGdh r
NHrrr
φφφφµ
(7.18)
Based on the type of substrate being taken up, the correct corresponding gene expressionis selected for the interaction between α-ketoglutarate and glutamate. A minimal ammoniaflux of 0.15 mmol⋅g-1⋅h-1 is the (arbitrary) value necessary for good growth.It is assumed that the TCA-cycle in principle will supply the carbon skeletons necessaryfor growth on ammonia and will catabolise the α-ketoglutarate surplus when growing onamino acids. Both capacities are limited to a maximum flux of ± 0.4 mmol⋅g-1⋅h-1:
Chapter 7168
][,* KGrrr protnetGdhTCA αµψ +−= (7.19a)
≥<<−
−≤−=
4.0if4.04.04.0if
4.0if4.0
*
**
*
TCA
TCATCA
TCA
TCA
rrr
rr
(7.19b)
For the rate of protein synthesis, including the quantitatively less important synthesis ofnucleotides and lipids, a very simple equation is used, based on continuous culture dataand Metabolic Flux Analysis (Giuseppin and Van Riel, 2000; Ter Schure et al., 1995).
spro t mr += µ3 (7.20)
The maintenance parameter used ms was set to zero for convenience.The last term of Eq. 7.17 describes the dilution of the α-ketoglutarate pool throughgrowth, i.e. the degradation rate constant in Eq. 7.5 αi = µ.The mass balances for the other three nodes are:
][)1(][
, glurrrdtglud
protGSnetGdhglu µψφ −−+−+= (7.21)
][][
nglrrdt
ngldprotGS µω −−= (7.22)
][][
4,44 ++
−−−= NHrrdt
NHdGSnetGdhNH µφ (7.23)
with φglu = φZ (Eq. 7.10) and φNH4 = φX + φY. For growth on glutamine in a pseudo-steady-state(no change in intracellular ammonium pool) a fraction 0.5 rprot is deaminated to yieldglutamate (Van Riel et al, 1999) and the remainder ω⋅rprot is directly used for biosynthesis,so 0.5 rprot + ω⋅rprot = 2 φgln (each glutamine contains 2 nitrogen). For the current model,without cofactors included, the net effect is the same if it is assumed that first allglutamine is deaminated resulting in a supply φglu and then a fraction ω⋅rprot is used forglutamine synthesis. Although glutamine is part of the CNM network in the model, growthon glutamine can be treated as any other substrate of the three defined categories.
Regulation - It is assumed that when the reaction of NADPH-GDH runs at full speed, i.e.0.8 mmol⋅g-1⋅h-1, the α-ketoglutarate pool is reduced because the supply of α-ketoglutaratethrough the TCA-cycle and resulting from deamination during amino acid synthesis islimiting. As discussed, in the model this is translated to the (relative) α-ketoglutarate poolbeing the activator of Hap, which in turn activates GDH1 transcription. Based on Eq. 7.12the mass balance for Hap becomes:
Circuit simulation of transcription 169
pHapKGKG
dtpdHap 10.10
][][1
0
−=αα
(7.24)
[αKG]0 is the homeostatic (reference) pool concentration. Hap1p is continuouslydegraded and diluted with a rate α = 10.0.- NCR is triggered by the ammonium concentration, which activates Ure2p. In the modelthis trigger is switched on when ammonia accumulates to 300% of the reference value(actual values used, are given below).
=
+
+
qNH
NHS2pUre ,0.3,
][
][
04
4
q
q
q
NH
NH
NH
NH
/1
/1
04
4
/1
04
4
0.3][
][
][
][
+
=
+
+
+
+
>
≤=
+
+
+
+
0.3][][
if1
0.3][][
if0
04
4
04
4
NHNHNHNH
(7.25)
With all steepness parameters q equal to 0.2 (corresponding to a Hill coefficient of 5.0,which is high from a biochemical point of view).- Gln3p is only controlled by Ure2p (Fig 7.2):
3pnGl2pUredt
3pndGl0.10)1( −−= (7.26)
- The inactivation of Dal80p by the substrates NX is included as -wi Dal80p to prevent therepression resulting in a negative state for Dal80p. To cause repression, with a timeconstant of 0.3 [h -1], the substrate NX needs to be present above the threshold value of 0.1mmol⋅g-1.
>+−≤−
=1.0][if)0.103.0(7.01.0][if0.107.0
X
X
N80pDal3pnGlN80pDal3pnGl
dt80pdDal
(7.27)
Also Dal80p is degraded with a constant rate α = 10.0.- For the time being, nitrogen starvation with Gcn4p as regulator is directly dependent onthe glutamine pool:
= q
nGl
nGlS4pGcn ,
][
][,2.0
0
q
q
q
nGlnGl
/1
0
/1
/1
][][
2.0
2.0
+
=
>
≤=
2.0][][
if0
2.0][][
if1
0
0
nGlnGlnGlnGl
(7.28)
When the glutamine pool decreases to less than 20% of its homeostatic / referenceconcentration, then the starvation response is initiated. The threshold value resulted frommodel tuning, but is rather insensitive (any value between 10 and 30% gives similar
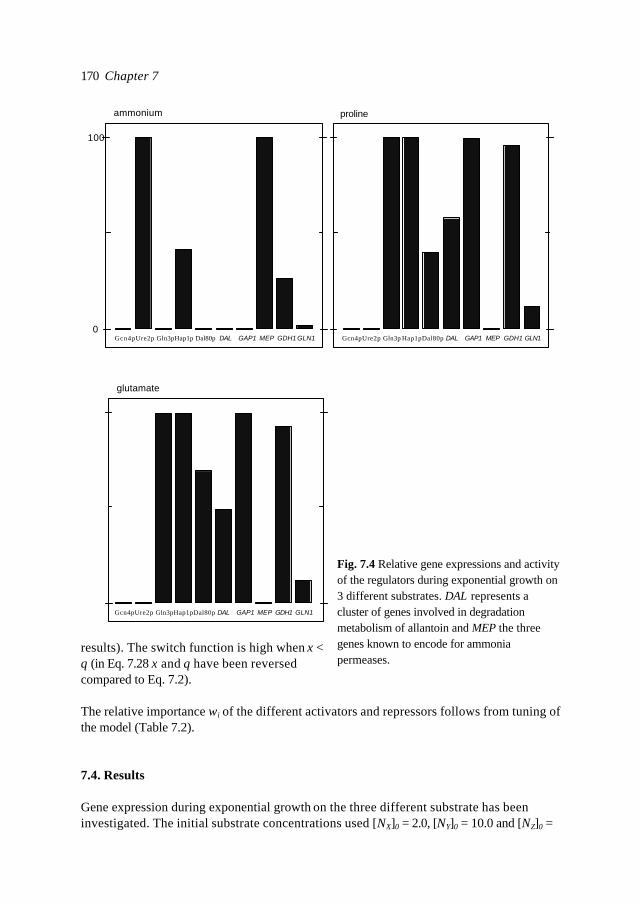
Chapter 7170
results). The switch function is high when x <θ (in Eq. 7.28 x and θ have been reversedcompared to Eq. 7.2).
The relative importance wi of the different activators and repressors follows from tuning ofthe model (Table 7.2).
7.4. Results
Gene expression during exponential growth on the three different substrate has beeninvestigated. The initial substrate concentrations used [NX]0 = 2.0, [NY]0 = 10.0 and [NZ]0 =
glutamate
Gcn4pUre2p Gln3pHap1pDal80p DAL GAP1 MEP GDH1 GLN1
Fig. 7.4 Relative gene expressions and activityof the regulators during exponential growth on3 different substrates. DAL represents acluster of genes involved in degradationmetabolism of allantoin and MEP the threegenes known to encode for ammoniapermeases.
ammonium proline
100
0Gcn4pUre2p Gln3p Hap1pDal80p DAL GAP1 MEP GDH1 GLN1Gcn4pUre2p Gln3pHap1p Dal80p DAL GAP1 MEP GDH1 GLN1
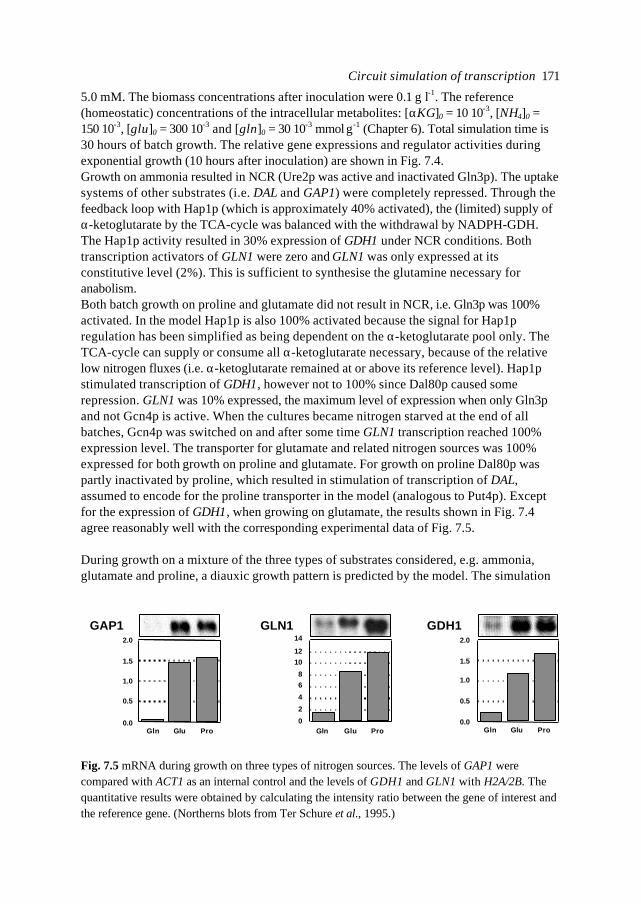
Circuit simulation of transcription 171
5.0 mM. The biomass concentrations after inoculation were 0.1 g⋅l-1. The reference(homeostatic) concentrations of the intracellular metabolites: [αKG]0 = 10⋅10-3, [NH4]0 =150⋅10-3, [glu]0 = 300⋅10-3 and [gln]0 = 30⋅10-3 mmol⋅g-1 (Chapter 6). Total simulation time is30 hours of batch growth. The relative gene expressions and regulator activities duringexponential growth (10 hours after inoculation) are shown in Fig. 7.4.Growth on ammonia resulted in NCR (Ure2p was active and inactivated Gln3p). The uptakesystems of other substrates (i.e. DAL and GAP1) were completely repressed. Through thefeedback loop with Hap1p (which is approximately 40% activated), the (limited) supply ofα-ketoglutarate by the TCA-cycle was balanced with the withdrawal by NADPH-GDH.The Hap1p activity resulted in 30% expression of GDH1 under NCR conditions. Bothtranscription activators of GLN1 were zero and GLN1 was only expressed at itsconstitutive level (2%). This is sufficient to synthesise the glutamine necessary foranabolism.Both batch growth on proline and glutamate did not result in NCR, i.e. Gln3p was 100%activated. In the model Hap1p is also 100% activated because the signal for Hap1pregulation has been simplified as being dependent on the α-ketoglutarate pool only. TheTCA-cycle can supply or consume all α-ketoglutarate necessary, because of the relativelow nitrogen fluxes (i.e. α-ketoglutarate remained at or above its reference level). Hap1pstimulated transcription of GDH1, however not to 100% since Dal80p caused somerepression. GLN1 was 10% expressed, the maximum level of expression when only Gln3pand not Gcn4p is active. When the cultures became nitrogen starved at the end of allbatches, Gcn4p was switched on and after some time GLN1 transcription reached 100%expression level. The transporter for glutamate and related nitrogen sources was 100%expressed for both growth on proline and glutamate. For growth on proline Dal80p waspartly inactivated by proline, which resulted in stimulation of transcription of DAL,assumed to encode for the proline transporter in the model (analogous to Put4p). Exceptfor the expression of GDH1, when growing on glutamate, the results shown in Fig. 7.4agree reasonably well with the corresponding experimental data of Fig. 7.5.
During growth on a mixture of the three types of substrates considered, e.g. ammonia,glutamate and proline, a diauxic growth pattern is predicted by the model. The simulation
Gln Glu Pro
6
4
2
0
14
12
10
8
GLN1GAP1
Gln Glu Pro
2.0
1.5
1.0
0.5
0.0
GDH1
Gln Glu Pro
2.0
1.5
1.0
0.5
0.0
Fig. 7.5 mRNA during growth on three types of nitrogen sources. The levels of GAP1 werecompared with ACT1 as an internal control and the levels of GDH1 and GLN1 with H2A/2B. Thequantitative results were obtained by calculating the intensity ratio between the gene of interest andthe reference gene. (Northerns blots from Ter Schure et al., 1995.)
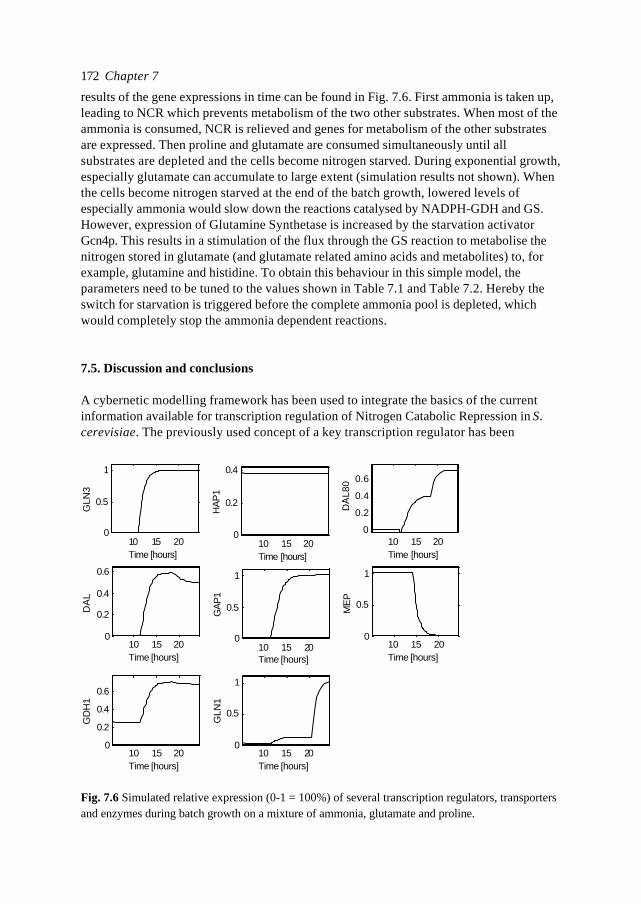
Chapter 7172
results of the gene expressions in time can be found in Fig. 7.6. First ammonia is taken up,leading to NCR which prevents metabolism of the two other substrates. When most of theammonia is consumed, NCR is relieved and genes for metabolism of the other substratesare expressed. Then proline and glutamate are consumed simultaneously until allsubstrates are depleted and the cells become nitrogen starved. During exponential growth,especially glutamate can accumulate to large extent (simulation results not shown). Whenthe cells become nitrogen starved at the end of the batch growth, lowered levels ofespecially ammonia would slow down the reactions catalysed by NADPH-GDH and GS.However, expression of Glutamine Synthetase is increased by the starvation activatorGcn4p. This results in a stimulation of the flux through the GS reaction to metabolise thenitrogen stored in glutamate (and glutamate related amino acids and metabolites) to, forexample, glutamine and histidine. To obtain this behaviour in this simple model, theparameters need to be tuned to the values shown in Table 7.1 and Table 7.2. Hereby theswitch for starvation is triggered before the complete ammonia pool is depleted, whichwould completely stop the ammonia dependent reactions.
7.5. Discussion and conclusions
A cybernetic modelling framework has been used to integrate the basics of the currentinformation available for transcription regulation of Nitrogen Catabolic Repression in S.cerevisiae. The previously used concept of a key transcription regulator has been
10 15 200
0.5
1
Time [hours]
GLN
3
10 15 200
0.2
0.4
0.6
Time [hours]
DA
L
10 15 200
0.2
0.4
0.6
Time [hours]
GD
H1
DA
L80
10 15 200
0.2
0.4
0.6
Time [hours]
ME
P
10 15 200
0.5
1
Time [hours]
10 15 200
0.2
0.4
Time [hours]
HA
P1
10 15 200
0.5
1
Time [hours]
GA
P1
10 15 200
0.5
1
Time [hours]
GLN
1
Fig. 7.6 Simulated relative expression (0-1 = 100%) of several transcription regulators, transportersand enzymes during batch growth on a mixture of ammonia, glutamate and proline.
Circuit simulation of transcription 173
extended. In the context of the Dynamic Optimal Metabolic Control approach (Giuseppinand Van Riel, 2000; Van Riel et al. 2000), which regards the cell as an optimal controlledsystem with strategies, a cellular simulation circuit was developed. The outcome of thecircuit, and hereby the resulting phenotype, is dependent on internal ‘health’ andextracellular environment.The model contains several crude simplifications. For example, to make the expression ofthe Mep-family of transporters only dependent on the availability of their substrate. AGln3p dependency could also be included. With the current model parameters, the switchfor the starvation response is triggered before the complete ammonia pool is depleted.Another possibility would have been to include a hypothetical activation by Gcn4p oftranscription of GDH2 during starvation. Then the concerted action of GS and NAD-GDHcould have catabolised the stored glutamate. This regulatory link is unknown.The model has been focused on qualitative aspects since the available information inliterature (reviewed by Ter Schure et al., 1999) is also mainly qualitative. Values of thedegradation rate constants αi and enzymatic rate constants k i were all taken equal to 1.0 or10.0 for simplicity. The availability of experimental values of the first order rate constantsfor the different regulation processes could improve the model significantly and wouldmake it suitable for the prediction of more specific responses. With the currently availablemolecular biological and biochemical techniques, it should be possible to determine theseparameters. As long as the relative parameter values were the same, the qualitativebehaviour of the model did not change (did not cause bifurcation). The main parameterswhich needed to be tuned for the model, were the relative influences of the differenttranscription factors on the different genes in the CNM. The parameters were not reallyestimated, but tuned in a ‘fuzzy’ process. Since not enough (quantitative) data wereavailable, tuning was based on the experience and observations of the molecular biologist/ physiologist.
The time delay mechanisms, especially transcription delays and signal accumulationdelays, are central to the correct function of the circuit. Time delays in the circuit provide(asynchronous) short-term memory. In physical circuits (mainly electronic) ambiguousresults are prevented. It is not allowed that the outcome of the circuit is dependent on theinitial conditions, or on a variable delay in the circuit (digital electronic circuits are -still-usually synchronised by a clock). For the cellular circuit, the opposite is true. The result ofthe cellular circuit is not linearly predefined, but results from the competition betweendifferent pathways and strategies. This results in the typical nonlinear behaviour and thepossibility for adaptation. A ‘fuzzy logic’ circuit design results, although the explicitfuzzy-logic formalism was not used. Lee et al. (1999) have developed a fuzzy-logicapproach based on qualitative knowledge of enzyme properties to compensate forinadequately modelled kinetics. Here, the approach has been extended to gene expression,an option also mentioned by Varner and Ramkrishna (1999). The combination of cellularcircuits and the possibility to determine fuzzy parameters based on transcription data,provides a framework to exploit the data obtained from genomic experiments.The model confirms earlier results that NCR in yeast is not only aimed at selecting the bestnitrogen source, but that this strategy is balanced by control of homeostasis in the cell.The repression not only affects genes involved in the metabolism of poor nitrogensources, but also genes in CNM. Although a constitutive level of the glutamate and
Chapter 7174
glutamine synthesising genes could be expected during NCR, this could not be detected(Minehart and Magasanik 1992; Daugherty et al., 1993; Ter Schure et al., 1995). From themodel it is clear that during NCR for growth on ammonium only a 2% constitutive level ofGS is already sufficient to support normal growth. This kind of levels is difficult to detectexperimentally.The sensitivities of the UASNTR elements of GDH2, GLN1 and GAP1 to Gln3p are different(Stanbrough et al., 1995). When the UASNTR sites function in combination with other sites,the observed regulatory response is a combination of the different sites (called a ‘hybrid’response, Ter Schure et al., 1999). The concentrations of regulatory proteins and theenzyme activities in the pseudo-steady-state of the model, are determined by the dynamicbalance between protein production and degradation. A short regulatory protein half-liferesults in low steady-state regulation signal levels and a short time to steady-state. Innature, cells actively control protein signal degradation rates and thus steady-state signallevels (e.g. McAdams and Shapiro, 1995).Since the model could be kept relatively simple, no hierarchy needed to be included.However, for a wider applicability the model needs to be extended and differenthierarchical levels are needed. In the current model, the effect of the amino acid starvationresponse via Gcn4p was very roughly approximated, the same holds for the Hap regulator.Of both systems more information is available. Likely a same type of model as reportedhere for the CNM can be developed for both subsystems. A hierarchy will be necessary tocoordinate the interaction between the three blocks in a larger model.To describe and predict more complex responses, such as after substrate pulses, themodel parameters will need to be estimated based on experimental data. Besides extendingthe model to include more details, it is very important to use the model to design newexperiments. The model suggestions regarding the relative importance of the differenttranscription activators and repressors need to be validated by experimental data. Suchstudies should use molecular biological and physiological approaches and in turn, theresults can be used to improve the model.
References
Avendaño, A., Deluna, A., Olivera, H., Valenzuela, L. and González, A. (1997). GDH3 encodes aglutamate dehydrogenase isoenzyme, a previously unrecognized route for glutamate biosynthesis inSaccharomyces cerevisiae. J. Bacteriol. 179: 5594-5597.
Bray, D. (1995). Protein molecules as computational elements in living cells. Nature. 376: 307-312.
Cooper, T.G. (1982). Nitrogen metabolism in Saccharomyces cerevisiae. In: The molecular biologyof the yeast Saccharomyces cerevisiae (Strathern, J.N. et al., eds) pp. 39-99. Cold Spring HarborLaboratory, Cold Spring Harbor, New York.
Daugherty, J.R., Rai, R., El Berry, H.M. and Cooper, T.G. (1993). Regulatory circuit for responsesof nitrogen catabolic gene expression to the GLN3 and DAL80 proteins and nitrogen cataboliterepression in Saccharomyces cerevisiae. J. Bacteriol. 175: 64-73.
Circuit simulation of transcription 175
Giuseppin, M.L.F. and van Riel, N.A.W. (2000). Metabolic modelling of Saccharomyces cerevisiaeusing the optimal control of homeostasis; a cybernetic model definition. Metabolic Eng. 2: 1-20.
Grenson, M. (1992). Amino acid transporters in yeast: structure, function and regulation. De Pont,Molecular aspects of transfer proteins. Chapter 7, pp 219-245. Elsevier Publishers BV.
Lee, S.B. and Bailey, J.E. (1984). Genetically structured models for lac promoter-operator functionin Escherichia coli chromosome and in multicopy plasmids: lac operator function. Biotechnol.Bioeng. 26: 1372-1382.
Lee, B., Yen, J., Yang, L. and Liao, J.C. (1999). Incorporating qualitative knowledge in enzymekinetic models using fuzzy logic. Biotechnol. Bioeng. 62: 722-729.
Magasanik, B. (1992). Regulation of nitrogen utilization. In: The molecular and cellular biology ofthe yeast Saccharomyces cerevisiae: gene expression (Jones, E.W. et al., eds) pp. 283-317. ColdSpring Harbor Laboratory Press, Cold Spring Harbor, New York.
Marini, A.M., SoussiBoudekou, S., Vissers, S. and André, B. (1997). A family of ammoniumtransporters in Saccharomyces cerevisiae. Mol. Cell. Biol. 17: 4282-4293.
McAdams, H.H. and Shapiro, L. (1995). Circuit simulation of genetic networks. Science. 269: 650-656.
Minehart, P.L. and Magasanik, B. (1992). Sequence of the GLN1 gene of Saccharomyces cerevisiae:Role of the upstream region in regulation of glutamine synthetase expression. J Bacteriol. 174:1828-1836.
Plahte, E., Mestl, T. and Omholt, S.W. (1998). A methodological basis for description and analysisof systems with complex switchlike interactions. J. Math. Biol. 36: 321-348.
Rizzi, M., Baltes, M., Theobald, U. and Reuss, M. (1997). In vivo analysis of metabolic dynamicsin Saccharomyces cerevisiae: II. Mathematical model. Biotechnol. Bioeng. 55: 592-608.
Soberón, M. and González, A. (1987). Physiological role of glutaminase activity in Saccharomycescerevisiae. J. Gen. Microbiol. 133: 1-8.
Stanbrough, M., and Magasanik, B. (1995). Transcriptional and posttranslational regulation of thegeneral amino acid permease of Saccharomyces cerevisiae. J. Bacteriol. 177: 94-102.
Stanbrough, M., Rowen, D.W. and Magasanik, B. (1995). Role of the GATA factors Gln3p andNil1p of Saccharomyces cerevisiae in the expression of nitrogen-regulated genes. Proc. Natl. Acad.Sci. 92: 9450-9454
Ter Schure, E.G., Silljé, H.H.W., Raeven, L.J.R.M., Boonstra, J., Verkleij, A.J. and Verrips, C.T.(1995). Nitrogen-regulated transcription and enzyme activities in continuous cultures ofSaccharomyces cerevisiae. Microbiology. 141: 1101-1108.
Chapter 7176
Ter Schure, E.G., Van Riel, N.A.W., and Verrips, C.T. (1999). The role of ammonia metabolism fornitrogen catabolite repression in Saccharomyces cerevisiae. FEMS Microbiology Reviews In press.
Valenzuela, L., Ballario, P., Aranda, C, Filetici, P., González, A. (1998). Regulation of expression ofGLT1, the gene encoding glutamate synthase in Saccharomyces cerevisiae. J. Bacteriol. 180: 3533-3540.
Van Riel, N.A.W., Giuseppin, M.L.F., Ter Schure, E.G. and Verrips, C.T. (1998). A Structured,Minimal Parameter Model of the Central Nitrogen Metabolism in Saccharomyces cerevisiae: thePrediction of the Behaviour of Mutants. J. Theor. Biol. 191: 397-414.
Van Riel, N.A.W., Giuseppin, M.L.F. and Verrips, C.T. (2000). Dynamic optimal control ofhomeostasis; an integrative system approach for modelling of the Central Nitrogen Metabolism inSaccharomyces cerevisiae. Metabolic Eng. 2: In press.
Wilkinson, B.M., James, C.M. and Walmsley, R.M. (1996). Partial deletion of the Saccharomycescerevisiae GDH3 gene results in novel starvation phenotypes. Microbiology 142: 1667-1673.

177

178
Chapter 8
Metabolic Pathway Analysis:the holistic model as a scientific analytical tool for cell
biology
Natal A.W. van Riel 1, Marco L.F. Giuseppin 2 and C. Theo Verrips 1,2
1 Department of Molecular Cell Biology, Institute of BiomembranesUtrecht University, Padualaan 8, 3584 CH Utrecht, The Netherlands
2 Unilever Research Vlaardingen, Olivier van Noortlaan 120, 3133 AT Vlaardingen, TheNetherlands
In preparation for: Molecular Microbiology
Chapter 8180
AbstractThe emerging area of functional genomics and proteomics draws a lot of attention. Due tothe exponentially increasing amount of information, biology experiences a profound seriesof paradigm changes. However, the potential information content of the obtained data ishardly used. The knowledge generated is at the level of identification of (more) genes orORF's which appear to be (also) related or subjected to certain phenomena. This type ofinformation only confirms how little we know, but does not increase our understanding ofthe cell. To really exploit the opportunities of all kinds of high-throughput techniques, aframework is necessary to structure the data. Bioinformatics tools (i.e. databases,intelligent search engines) combined with mathematical computer models could providesuch a framework. Mathematical models are very compact descriptions of hypotheses andknowledge and provide an excellent way to check the consistency of our view of the cell.As such, mathematical modelling serves as an essential scientific tool to help the cellbiologist to understand the cell as a living system. The use of mathematical models canchange our view of cellular processes at essential points and fuel new experiments.Most (classic) model approaches are reductionistic, i.e. focus on individual buildingblocks of the cell. In general the information necessary for kinetic models of in vivometabolism is not available. In this chapter, more recent model approaches, which use theconcept of a cell as an (optimal) controlled system, and their potential value for dataevaluation, are discussed.
8.1 Metabolic Engineering and Functional Genomics
The purpose of this final chapter is not to give a thorough review of the mathematicalmodelling of metabolic pathways. Modelling in biochemical engineering has recently beenreviewed and commented (Bailey, 1998; Varner and Ramkrishna, 1999a) and severalengineering journals have devoted special issues to this topic (Biotechnol. Bioeng. vol.58, 1998, J. Biotechnol. vol. 71, 1999). In Chapter 1 the most important modellingapproaches have been presented according to the model complexity. In contrast to the(traditional) reductionistic models, this work has been focused on more holistic models(Chapter 3 and 7). More and more relevant applications appear, while fundamentaldiscussions on the appropriateness of the principle and the different implementations arevivid.During the 80’s, accurate, specialised molecular biological techniques became available.Techniques for gene disruption, overexpression and promoter replacement are wellestablished. Since the beginning of the 90’s much effort has been used for MetabolicEngineering of micro-organisms (e.g. Bailley, 1991), not extremely successful so far. This ismainly because there is a very large gap between modifying a gene and the goal ofrationally redirecting the phenotype and the related fluxes in metabolic pathways at will.The relationship between genetics and physiology has many layers, of which many havenot been properly specified. Nevertheless, cellular engineers and industrial scientistsattempt to manipulate and exploit the cellular pathways, while continuously striving tounderstand how the factory of life operates. On one hand the goal can be killing orinhibiting micro-organisms for (hygienic) food processing, or to prevent and curemicrobial (pathogenic) infections. On the other hand, there is interest to enhanceproduction capabilities of an organism to produce various biomolecules of commercial
Conclusions - Holistic models as a scientific tool 181
interest. The genetic tools for Metabolic Engineering are in place, but currently there is nosingle, complete, predictive approach to analyse and to design new metabolic pathways ina more rational way. Most successes in Metabolic Engineering have been obtained inmodifying production pathways in secondary metabolism. Modification of the primairmetabolic pathways, sourcing the pathways in which the products of interest are formed,is essential to really use micro-organisms as efficient factories. Because of their centralposition and sophisticated, robust control, it is extremely difficult to redirect the metabolicflux in this type of metabolic (sub)systems (Stephanopoulos and Vallino, 1991). Toaccurately describe the processes in central pathways, more and better data arenecessary. Despite the surge of interest in Metabolic Engineering, a great disparity stillexists between the power of available molecular biological techniques and the ability torationally analyse biochemical networks (Stephanopoulos, 1994).
While understanding of cell physiology stayed behind, the genetic tools have beenautomated and therefore became faster, cheaper and more reliable. This technologicaldevelopment occurred in close relation with genome sequencing projects. The emergingarea of Functional Genomics and proteomics draws a lot of attention. Cell biology isbecoming an information science. Currently, focus is on the information contained inDNA. Proteomics links information on gene expression to protein quantities and allowsthe identification of post-translational modification of proteins. However, the potentialinformation content of the obtained data is hardly used. The knowledge generated is atthe level of identification of ORF's (Open Reading Frames are genes that potentially cancode for a protein for which the function is not known) which appear to be (also) relatedor subjected to certain phenomena. This type of information only confirms how little weknow, but does not increase our understanding of the cell. Without the tools to mine dataand fuel hypothesis-driven laboratory-based research, genome sequencing risksbecoming expensive molecular stamp-collecting (Pallen, 1999). To really exploit theopportunities of all kind of high-throughput techniques, a framework is necessary tostructure the data, as recognised by Bailey (1998) and Edwards and Palsson (1998) anddiscussed in a special edition of Biotechnol. Prog., vol. 15 (e.g. Hatzimanikatis et al., 1999;Kao, 1999; Schilling et al., 1999a; Schilling et al., 1999b).Both for Metabolic Engineering and Functional Genomics, the bottleneck lies in analysisand interpretation of data. It is necessary to develop understanding of how the cell meetsits metabolic objectives through the analysis of its metabolic pathways. The use of(traditional) bioinformatic tools (i.e. databases, intelligent search engines) is usually onlyaimed at predicting protein structure from sequence and, based on the protein structure,the putative biochemical function is postulated. Dubious assumptions concerningsimilarity of genes and gene complexes in different species are made (Strothman, 1997).This does not provide a sufficient framework to identify the physiological function of agene product. A combination of the bioinformatic tools and mathematical computermodels could provide such a framework.
8.2 Use of mathematical models
Traditionally, most fundamental questions in cell science are of qualitative nature and theavailable data are often qualitative, at best ‘semi-quantitative’. More appropriate tools are
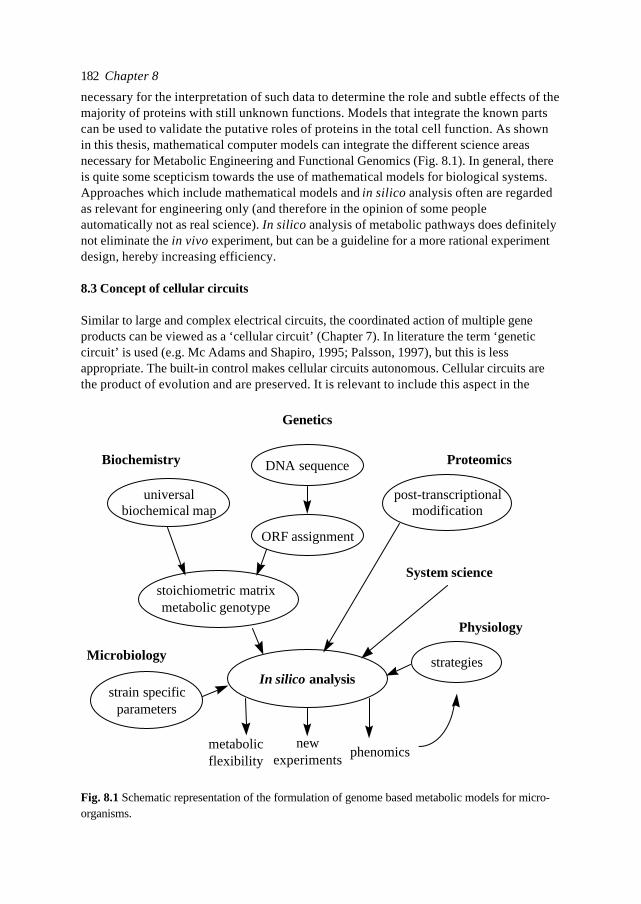
Chapter 8182
necessary for the interpretation of such data to determine the role and subtle effects of themajority of proteins with still unknown functions. Models that integrate the known partscan be used to validate the putative roles of proteins in the total cell function. As shownin this thesis, mathematical computer models can integrate the different science areasnecessary for Metabolic Engineering and Functional Genomics (Fig. 8.1). In general, thereis quite some scepticism towards the use of mathematical models for biological systems.Approaches which include mathematical models and in silico analysis often are regardedas relevant for engineering only (and therefore in the opinion of some peopleautomatically not as real science). In silico analysis of metabolic pathways does definitelynot eliminate the in vivo experiment, but can be a guideline for a more rational experimentdesign, hereby increasing efficiency.
8.3 Concept of cellular circuits
Similar to large and complex electrical circuits, the coordinated action of multiple geneproducts can be viewed as a ‘cellular circuit’ (Chapter 7). In literature the term ‘geneticcircuit’ is used (e.g. Mc Adams and Shapiro, 1995; Palsson, 1997), but this is lessappropriate. The built-in control makes cellular circuits autonomous. Cellular circuits arethe product of evolution and are preserved. It is relevant to include this aspect in the
Biochemistry
universalbiochemical map
Genetics
Microbiology
System science
In silico analysisstrategies
Physiology
DNA sequence
stoichiometric matrixmetabolic genotype
ORF assignment
strain specificparameters
phenomicsmetabolicflexibility
newexperiments
Proteomics
post-transcriptionalmodification
Fig. 8.1 Schematic representation of the formulation of genome based metabolic models for micro-organisms.
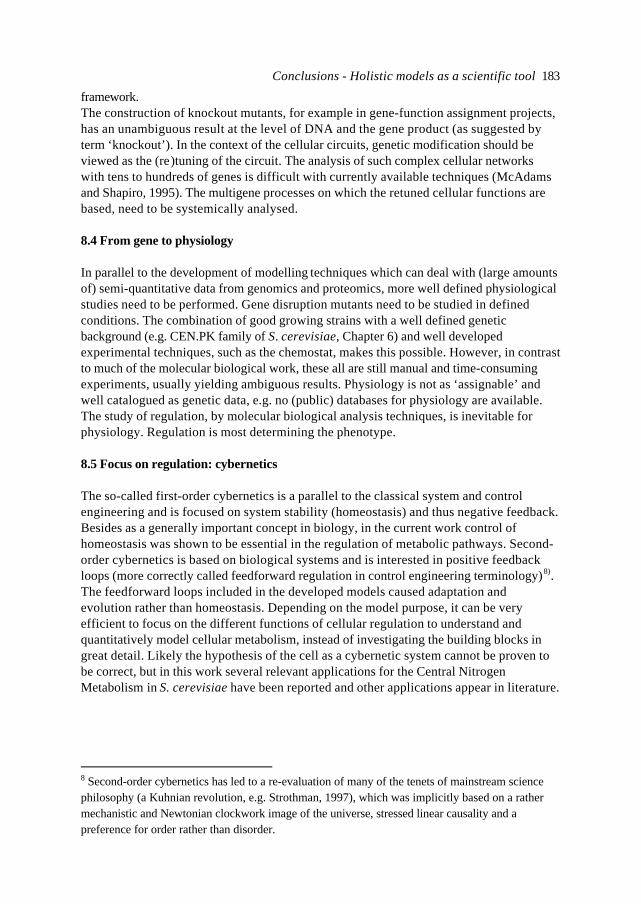
Conclusions - Holistic models as a scientific tool 183
framework.The construction of knockout mutants, for example in gene-function assignment projects,has an unambiguous result at the level of DNA and the gene product (as suggested byterm ‘knockout’). In the context of the cellular circuits, genetic modification should beviewed as the (re)tuning of the circuit. The analysis of such complex cellular networkswith tens to hundreds of genes is difficult with currently available techniques (McAdamsand Shapiro, 1995). The multigene processes on which the retuned cellular functions arebased, need to be systemically analysed.
8.4 From gene to physiology
In parallel to the development of modelling techniques which can deal with (large amountsof) semi-quantitative data from genomics and proteomics, more well defined physiologicalstudies need to be performed. Gene disruption mutants need to be studied in definedconditions. The combination of good growing strains with a well defined geneticbackground (e.g. CEN.PK family of S. cerevisiae, Chapter 6) and well developedexperimental techniques, such as the chemostat, makes this possible. However, in contrastto much of the molecular biological work, these all are still manual and time-consumingexperiments, usually yielding ambiguous results. Physiology is not as ‘assignable’ andwell catalogued as genetic data, e.g. no (public) databases for physiology are available.The study of regulation, by molecular biological analysis techniques, is inevitable forphysiology. Regulation is most determining the phenotype.
8.5 Focus on regulation: cybernetics
The so-called first-order cybernetics is a parallel to the classical system and controlengineering and is focused on system stability (homeostasis) and thus negative feedback.Besides as a generally important concept in biology, in the current work control ofhomeostasis was shown to be essential in the regulation of metabolic pathways. Second-order cybernetics is based on biological systems and is interested in positive feedbackloops (more correctly called feedforward regulation in control engineering terminology) 8).The feedforward loops included in the developed models caused adaptation andevolution rather than homeostasis. Depending on the model purpose, it can be veryefficient to focus on the different functions of cellular regulation to understand andquantitatively model cellular metabolism, instead of investigating the building blocks ingreat detail. Likely the hypothesis of the cell as a cybernetic system cannot be proven tobe correct, but in this work several relevant applications for the Central NitrogenMetabolism in S. cerevisiae have been reported and other applications appear in literature.
8 Second-order cybernetics has led to a re-evaluation of many of the tenets of mainstream sciencephilosophy (a Kuhnian revolution, e.g. Strothman, 1997), which was implicitly based on a rathermechanistic and Newtonian clockwork image of the universe, stressed linear causality and apreference for order rather than disorder.
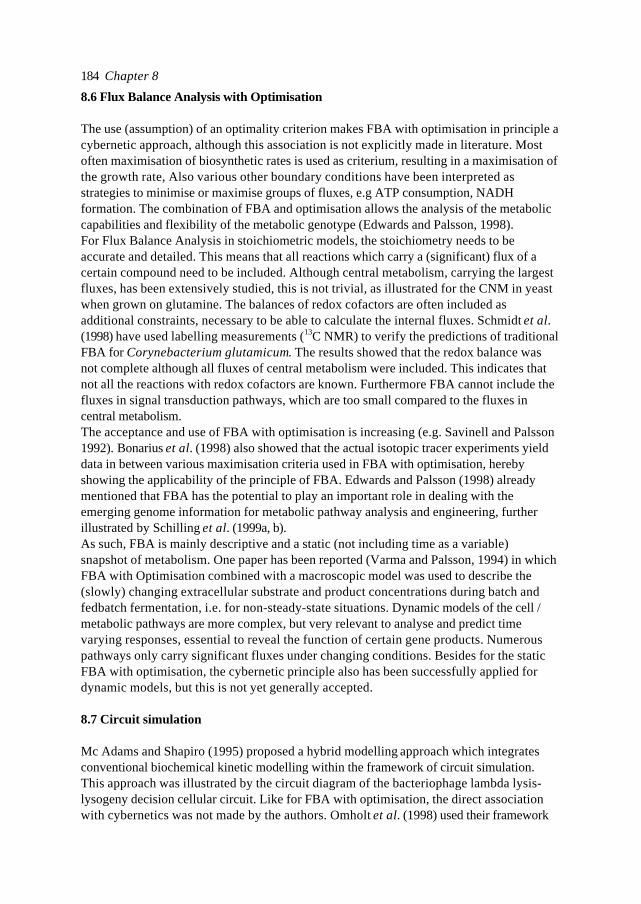
Chapter 8184
8.6 Flux Balance Analysis with Optimisation
The use (assumption) of an optimality criterion makes FBA with optimisation in principle acybernetic approach, although this association is not explicitly made in literature. Mostoften maximisation of biosynthetic rates is used as criterium, resulting in a maximisation ofthe growth rate, Also various other boundary conditions have been interpreted asstrategies to minimise or maximise groups of fluxes, e.g ATP consumption, NADHformation. The combination of FBA and optimisation allows the analysis of the metaboliccapabilities and flexibility of the metabolic genotype (Edwards and Palsson, 1998).For Flux Balance Analysis in stoichiometric models, the stoichiometry needs to beaccurate and detailed. This means that all reactions which carry a (significant) flux of acertain compound need to be included. Although central metabolism, carrying the largestfluxes, has been extensively studied, this is not trivial, as illustrated for the CNM in yeastwhen grown on glutamine. The balances of redox cofactors are often included asadditional constraints, necessary to be able to calculate the internal fluxes. Schmidt et al.(1998) have used labelling measurements (13C NMR) to verify the predictions of traditionalFBA for Corynebacterium glutamicum. The results showed that the redox balance wasnot complete although all fluxes of central metabolism were included. This indicates thatnot all the reactions with redox cofactors are known. Furthermore FBA cannot include thefluxes in signal transduction pathways, which are too small compared to the fluxes incentral metabolism.The acceptance and use of FBA with optimisation is increasing (e.g. Savinell and Palsson1992). Bonarius et al. (1998) also showed that the actual isotopic tracer experiments yielddata in between various maximisation criteria used in FBA with optimisation, herebyshowing the applicability of the principle of FBA. Edwards and Palsson (1998) alreadymentioned that FBA has the potential to play an important role in dealing with theemerging genome information for metabolic pathway analysis and engineering, furtherillustrated by Schilling et al. (1999a, b).As such, FBA is mainly descriptive and a static (not including time as a variable)snapshot of metabolism. One paper has been reported (Varma and Palsson, 1994) in whichFBA with Optimisation combined with a macroscopic model was used to describe the(slowly) changing extracellular substrate and product concentrations during batch andfedbatch fermentation, i.e. for non-steady-state situations. Dynamic models of the cell /metabolic pathways are more complex, but very relevant to analyse and predict timevarying responses, essential to reveal the function of certain gene products. Numerouspathways only carry significant fluxes under changing conditions. Besides for the staticFBA with optimisation, the cybernetic principle also has been successfully applied fordynamic models, but this is not yet generally accepted.
8.7 Circuit simulation
Mc Adams and Shapiro (1995) proposed a hybrid modelling approach which integratesconventional biochemical kinetic modelling within the framework of circuit simulation.This approach was illustrated by the circuit diagram of the bacteriophage lambda lysis-lysogeny decision cellular circuit. Like for FBA with optimisation, the direct associationwith cybernetics was not made by the authors. Omholt et al. (1998) used their framework
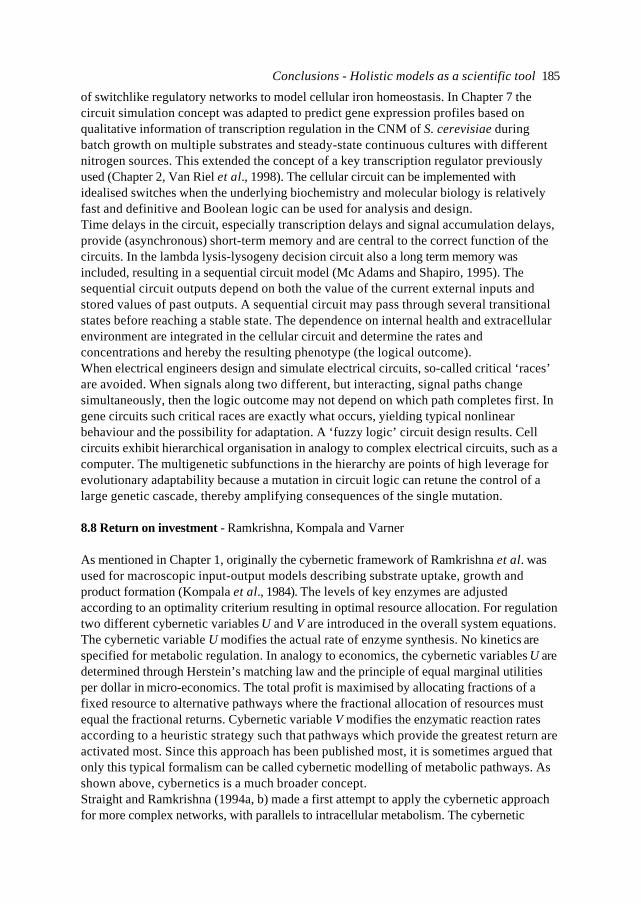
Conclusions - Holistic models as a scientific tool 185
of switchlike regulatory networks to model cellular iron homeostasis. In Chapter 7 thecircuit simulation concept was adapted to predict gene expression profiles based onqualitative information of transcription regulation in the CNM of S. cerevisiae duringbatch growth on multiple substrates and steady-state continuous cultures with differentnitrogen sources. This extended the concept of a key transcription regulator previouslyused (Chapter 2, Van Riel et al., 1998). The cellular circuit can be implemented withidealised switches when the underlying biochemistry and molecular biology is relativelyfast and definitive and Boolean logic can be used for analysis and design.Time delays in the circuit, especially transcription delays and signal accumulation delays,provide (asynchronous) short-term memory and are central to the correct function of thecircuits. In the lambda lysis-lysogeny decision circuit also a long term memory wasincluded, resulting in a sequential circuit model (Mc Adams and Shapiro, 1995). Thesequential circuit outputs depend on both the value of the current external inputs andstored values of past outputs. A sequential circuit may pass through several transitionalstates before reaching a stable state. The dependence on internal health and extracellularenvironment are integrated in the cellular circuit and determine the rates andconcentrations and hereby the resulting phenotype (the logical outcome).When electrical engineers design and simulate electrical circuits, so-called critical ‘races’are avoided. When signals along two different, but interacting, signal paths changesimultaneously, then the logic outcome may not depend on which path completes first. Ingene circuits such critical races are exactly what occurs, yielding typical nonlinearbehaviour and the possibility for adaptation. A ‘fuzzy logic’ circuit design results. Cellcircuits exhibit hierarchical organisation in analogy to complex electrical circuits, such as acomputer. The multigenetic subfunctions in the hierarchy are points of high leverage forevolutionary adaptability because a mutation in circuit logic can retune the control of alarge genetic cascade, thereby amplifying consequences of the single mutation.
8.8 Return on investment - Ramkrishna, Kompala and Varner
As mentioned in Chapter 1, originally the cybernetic framework of Ramkrishna et al. wasused for macroscopic input-output models describing substrate uptake, growth andproduct formation (Kompala et al., 1984). The levels of key enzymes are adjustedaccording to an optimality criterium resulting in optimal resource allocation. For regulationtwo different cybernetic variables U and V are introduced in the overall system equations.The cybernetic variable U modifies the actual rate of enzyme synthesis. No kinetics arespecified for metabolic regulation. In analogy to economics, the cybernetic variables U aredetermined through Herstein’s matching law and the principle of equal marginal utilitiesper dollar in micro-economics. The total profit is maximised by allocating fractions of afixed resource to alternative pathways where the fractional allocation of resources mustequal the fractional returns. Cybernetic variable V modifies the enzymatic reaction ratesaccording to a heuristic strategy such that pathways which provide the greatest return areactivated most. Since this approach has been published most, it is sometimes argued thatonly this typical formalism can be called cybernetic modelling of metabolic pathways. Asshown above, cybernetics is a much broader concept.Straight and Ramkrishna (1994a, b) made a first attempt to apply the cybernetic approachfor more complex networks, with parallels to intracellular metabolism. The cybernetic
Chapter 8186
regulation included so far dealt with an optimal resource allocation only. A modularapproach was introduced with a library consisting of a linear, a convergent, a divergentand a cyclic pathway, each with its own cybernetic regulation. Recently, Varner andRamkrishna (1999b, c, d) have extended the framework for application to intracellularmetabolism. Straightforward enzyme kinetics are used to describe the interaction betweenthe network nodes and the regulation focuses on the functionality of the pathways andsubsystems. Metabolic regulation is hierarchically composed of a local and a globalcomponent. At the local level an optimum resource allocation policy, based oncompetition for key cellular resources, is assumed. The global regulatory componentcontrols how this local structure is assimilated into the overall functioning of the system.The physiological and molecular biological knowledge of regulation is incorporated at theglobal level. The global regulatory components control how the local structure isassimilated into the overall control of the system. The global control variables act ason/off switches, once this switch is in the ‘on’ position, the local control variable willgovern the allocation of key cellular resources in an optimal manner. When a processbelongs to more than one distinct form of competition and / or is sensitive to multipleglobal nutritional signals then this process can have multiple types of local and globalcontrol.Varner and Ramkrishna (1998) modelled the storage pathways of S. cerevisiae. Theresponse of Corynebacterium lactofermentum to the diversion of the flux from lysineproduction towards threonine in batch cultivation was predicted correctly (Varner andRamkrishna, 1999e). The effects of overexpression of phosphofructokinase and pyruvatekinase on the glycolysis of E. coli were also predicted (Varner, personal communication).The last years the approach has become better suitable to model intracellular pathways, atthe cost of an increased mathematical complexity of the framework.
8.9 Metabolic Regulator concept - Bellgardt
Bellgardt et al. (1988) explicitly realised that the in vivo regulation which couples thedifferent metabolic pathways and determines the response to environmental conditions,was at that time not accessible, but the information also now still is mainly qualitative ofnature. Extensive preassumptions and simplifications are needed to bring this intomathematical equations. In contrast to the complex regulatory pathways, the view of thewhole is often much simpler.In 1988 Bellgardt introduced the Metabolic Regulator concept (Bellgardt, 1988, 1991). Theavailable knowledge about kinetics and stoichiometry is included in a stationarymechanistic model based on mass balances. No assumptions on the structure or kineticsof metabolic regulation have to be made. Since (in steady-state) no accumulation of anysubstrate in the cells occurs, the metabolic regulation of all pathways is such that theirturnover rate is exactly controlled by the slowest reaction or uptake step, called the masterreaction. In a chemostat this is the uptake of the growth-limiting substrate. This impliesthat, by regulating their pathways, cells are trying to maximise their metabolic activity.This static underlying maximum principle was called Metabolic Coordinatior J:
J(r) = µ → maximum (8.1)
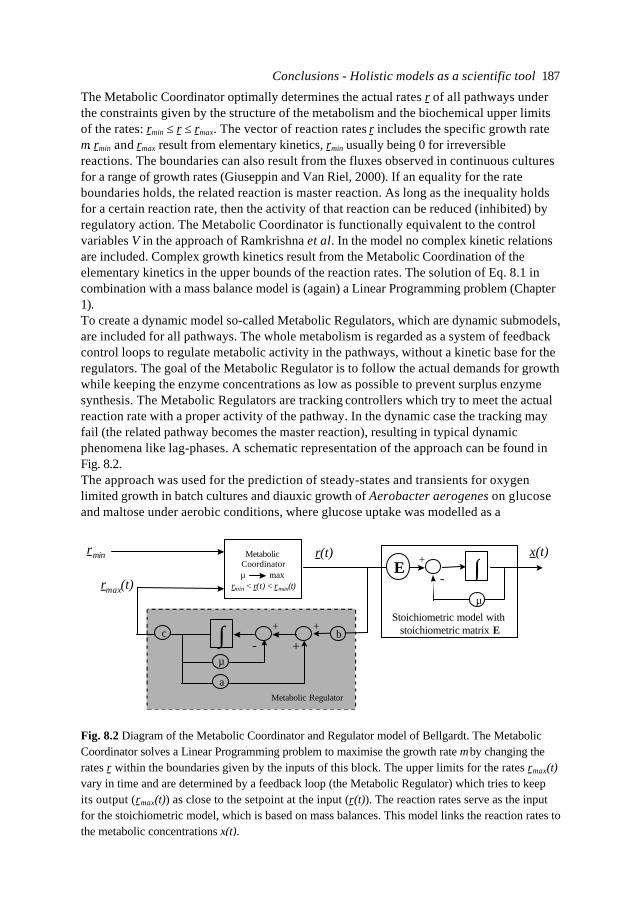
Conclusions - Holistic models as a scientific tool 187
The Metabolic Coordinator optimally determines the actual rates r of all pathways underthe constraints given by the structure of the metabolism and the biochemical upper limitsof the rates: rmin ≤ r ≤ rmax. The vector of reaction rates r includes the specific growth rateµ. rmin and rmax result from elementary kinetics, rmin usually being 0 for irreversiblereactions. The boundaries can also result from the fluxes observed in continuous culturesfor a range of growth rates (Giuseppin and Van Riel, 2000). If an equality for the rateboundaries holds, the related reaction is master reaction. As long as the inequality holdsfor a certain reaction rate, then the activity of that reaction can be reduced (inhibited) byregulatory action. The Metabolic Coordinator is functionally equivalent to the controlvariables V in the approach of Ramkrishna et al. In the model no complex kinetic relationsare included. Complex growth kinetics result from the Metabolic Coordination of theelementary kinetics in the upper bounds of the reaction rates. The solution of Eq. 8.1 incombination with a mass balance model is (again) a Linear Programming problem (Chapter1).To create a dynamic model so-called Metabolic Regulators, which are dynamic submodels,are included for all pathways. The whole metabolism is regarded as a system of feedbackcontrol loops to regulate metabolic activity in the pathways, without a kinetic base for theregulators. The goal of the Metabolic Regulator is to follow the actual demands for growthwhile keeping the enzyme concentrations as low as possible to prevent surplus enzymesynthesis. The Metabolic Regulators are tracking controllers which try to meet the actualreaction rate with a proper activity of the pathway. In the dynamic case the tracking mayfail (the related pathway becomes the master reaction), resulting in typical dynamicphenomena like lag-phases. A schematic representation of the approach can be found inFig. 8.2.The approach was used for the prediction of steady-states and transients for oxygenlimited growth in batch cultures and diauxic growth of Aerobacter aerogenes on glucoseand maltose under aerobic conditions, where glucose uptake was modelled as a
Metabolic Regulator
Stoichiometric model with stoichiometric matrix E
x(t)rmin r(t)MetabolicCoordinatorµ max
rmin < r(t) < rmax(t)rmax(t)
∫ +
+µ
+
-
a
c b
∫+
-E
µ
Fig. 8.2 Diagram of the Metabolic Coordinator and Regulator model of Bellgardt. The MetabolicCoordinator solves a Linear Programming problem to maximise the growth rate µ by changing therates r within the boundaries given by the inputs of this block. The upper limits for the rates rmax(t)vary in time and are determined by a feedback loop (the Metabolic Regulator) which tries to keepits output (rmax(t)) as close to the setpoint at the input (r(t)). The reaction rates serve as the inputfor the stoichiometric model, which is based on mass balances. This model links the reaction rates tothe metabolic concentrations x(t).
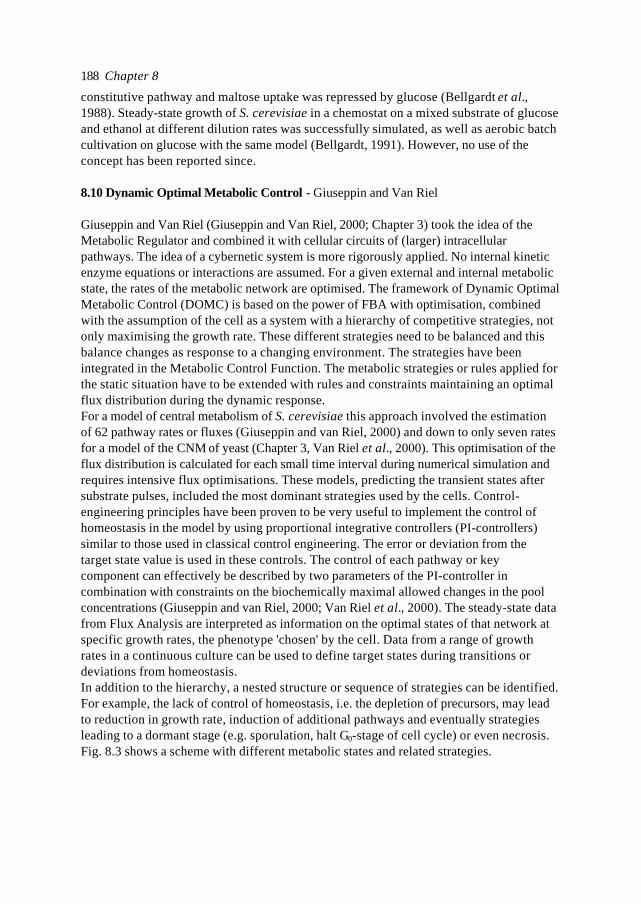
Chapter 8188
constitutive pathway and maltose uptake was repressed by glucose (Bellgardt et al.,1988). Steady-state growth of S. cerevisiae in a chemostat on a mixed substrate of glucoseand ethanol at different dilution rates was successfully simulated, as well as aerobic batchcultivation on glucose with the same model (Bellgardt, 1991). However, no use of theconcept has been reported since.
8.10 Dynamic Optimal Metabolic Control - Giuseppin and Van Riel
Giuseppin and Van Riel (Giuseppin and Van Riel, 2000; Chapter 3) took the idea of theMetabolic Regulator and combined it with cellular circuits of (larger) intracellularpathways. The idea of a cybernetic system is more rigorously applied. No internal kineticenzyme equations or interactions are assumed. For a given external and internal metabolicstate, the rates of the metabolic network are optimised. The framework of Dynamic OptimalMetabolic Control (DOMC) is based on the power of FBA with optimisation, combinedwith the assumption of the cell as a system with a hierarchy of competitive strategies, notonly maximising the growth rate. These different strategies need to be balanced and thisbalance changes as response to a changing environment. The strategies have beenintegrated in the Metabolic Control Function. The metabolic strategies or rules applied forthe static situation have to be extended with rules and constraints maintaining an optimalflux distribution during the dynamic response.For a model of central metabolism of S. cerevisiae this approach involved the estimationof 62 pathway rates or fluxes (Giuseppin and van Riel, 2000) and down to only seven ratesfor a model of the CNM of yeast (Chapter 3, Van Riel et al., 2000). This optimisation of theflux distribution is calculated for each small time interval during numerical simulation andrequires intensive flux optimisations. These models, predicting the transient states aftersubstrate pulses, included the most dominant strategies used by the cells. Control-engineering principles have been proven to be very useful to implement the control ofhomeostasis in the model by using proportional integrative controllers (PI-controllers)similar to those used in classical control engineering. The error or deviation from thetarget state value is used in these controls. The control of each pathway or keycomponent can effectively be described by two parameters of the PI-controller incombination with constraints on the biochemically maximal allowed changes in the poolconcentrations (Giuseppin and van Riel, 2000; Van Riel et al., 2000). The steady-state datafrom Flux Analysis are interpreted as information on the optimal states of that network atspecific growth rates, the phenotype 'chosen' by the cell. Data from a range of growthrates in a continuous culture can be used to define target states during transitions ordeviations from homeostasis.In addition to the hierarchy, a nested structure or sequence of strategies can be identified.For example, the lack of control of homeostasis, i.e. the depletion of precursors, may leadto reduction in growth rate, induction of additional pathways and eventually strategiesleading to a dormant stage (e.g. sporulation, halt G0-stage of cell cycle) or even necrosis.Fig. 8.3 shows a scheme with different metabolic states and related strategies.
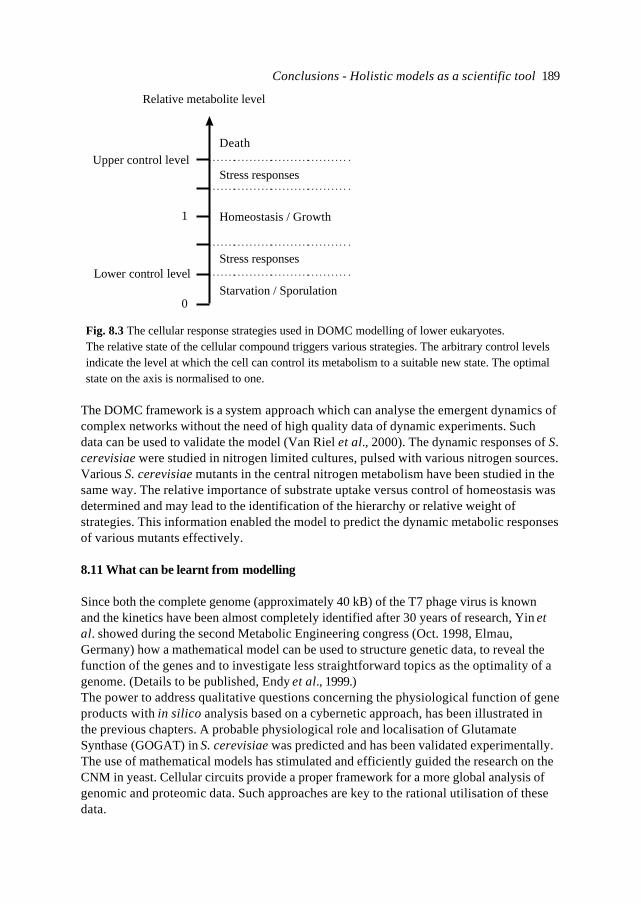
Conclusions - Holistic models as a scientific tool 189
The DOMC framework is a system approach which can analyse the emergent dynamics ofcomplex networks without the need of high quality data of dynamic experiments. Suchdata can be used to validate the model (Van Riel et al., 2000). The dynamic responses of S.cerevisiae were studied in nitrogen limited cultures, pulsed with various nitrogen sources.Various S. cerevisiae mutants in the central nitrogen metabolism have been studied in thesame way. The relative importance of substrate uptake versus control of homeostasis wasdetermined and may lead to the identification of the hierarchy or relative weight ofstrategies. This information enabled the model to predict the dynamic metabolic responsesof various mutants effectively.
8.11 What can be learnt from modelling
Since both the complete genome (approximately 40 kB) of the T7 phage virus is knownand the kinetics have been almost completely identified after 30 years of research, Yin etal. showed during the second Metabolic Engineering congress (Oct. 1998, Elmau,Germany) how a mathematical model can be used to structure genetic data, to reveal thefunction of the genes and to investigate less straightforward topics as the optimality of agenome. (Details to be published, Endy et al., 1999.)The power to address qualitative questions concerning the physiological function of geneproducts with in silico analysis based on a cybernetic approach, has been illustrated inthe previous chapters. A probable physiological role and localisation of GlutamateSynthase (GOGAT) in S. cerevisiae was predicted and has been validated experimentally.The use of mathematical models has stimulated and efficiently guided the research on theCNM in yeast. Cellular circuits provide a proper framework for a more global analysis ofgenomic and proteomic data. Such approaches are key to the rational utilisation of thesedata.
1
Relative metabolite level
0
Homeostasis / Growth
Stress responses
DeathUpper control level
Lower control levelStress responses
Starvation / Sporulation
Fig. 8.3 The cellular response strategies used in DOMC modelling of lower eukaryotes.The relative state of the cellular compound triggers various strategies. The arbitrary control levelsindicate the level at which the cell can control its metabolism to a suitable new state. The optimalstate on the axis is normalised to one.
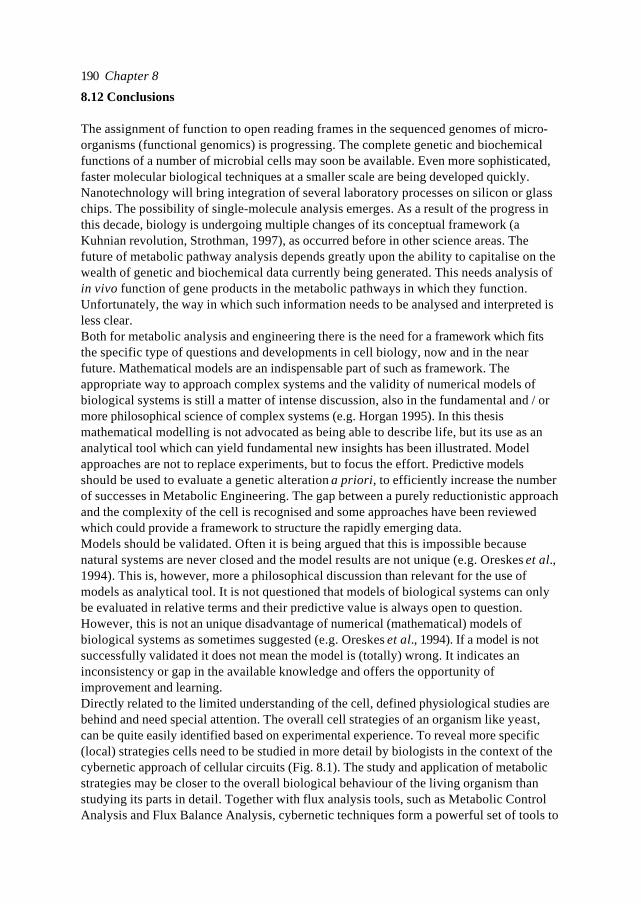
Chapter 8190
8.12 Conclusions
The assignment of function to open reading frames in the sequenced genomes of micro-organisms (functional genomics) is progressing. The complete genetic and biochemicalfunctions of a number of microbial cells may soon be available. Even more sophisticated,faster molecular biological techniques at a smaller scale are being developed quickly.Nanotechnology will bring integration of several laboratory processes on silicon or glasschips. The possibility of single-molecule analysis emerges. As a result of the progress inthis decade, biology is undergoing multiple changes of its conceptual framework (aKuhnian revolution, Strothman, 1997), as occurred before in other science areas. Thefuture of metabolic pathway analysis depends greatly upon the ability to capitalise on thewealth of genetic and biochemical data currently being generated. This needs analysis ofin vivo function of gene products in the metabolic pathways in which they function.Unfortunately, the way in which such information needs to be analysed and interpreted isless clear.Both for metabolic analysis and engineering there is the need for a framework which fitsthe specific type of questions and developments in cell biology, now and in the nearfuture. Mathematical models are an indispensable part of such as framework. Theappropriate way to approach complex systems and the validity of numerical models ofbiological systems is still a matter of intense discussion, also in the fundamental and / ormore philosophical science of complex systems (e.g. Horgan 1995). In this thesismathematical modelling is not advocated as being able to describe life, but its use as ananalytical tool which can yield fundamental new insights has been illustrated. Modelapproaches are not to replace experiments, but to focus the effort. Predictive modelsshould be used to evaluate a genetic alteration a priori, to efficiently increase the numberof successes in Metabolic Engineering. The gap between a purely reductionistic approachand the complexity of the cell is recognised and some approaches have been reviewedwhich could provide a framework to structure the rapidly emerging data.Models should be validated. Often it is being argued that this is impossible becausenatural systems are never closed and the model results are not unique (e.g. Oreskes et al.,1994). This is, however, more a philosophical discussion than relevant for the use ofmodels as analytical tool. It is not questioned that models of biological systems can onlybe evaluated in relative terms and their predictive value is always open to question.However, this is not an unique disadvantage of numerical (mathematical) models ofbiological systems as sometimes suggested (e.g. Oreskes et al., 1994). If a model is notsuccessfully validated it does not mean the model is (totally) wrong. It indicates aninconsistency or gap in the available knowledge and offers the opportunity ofimprovement and learning.Directly related to the limited understanding of the cell, defined physiological studies arebehind and need special attention. The overall cell strategies of an organism like yeast,can be quite easily identified based on experimental experience. To reveal more specific(local) strategies cells need to be studied in more detail by biologists in the context of thecybernetic approach of cellular circuits (Fig. 8.1). The study and application of metabolicstrategies may be closer to the overall biological behaviour of the living organism thanstudying its parts in detail. Together with flux analysis tools, such as Metabolic ControlAnalysis and Flux Balance Analysis, cybernetic techniques form a powerful set of tools to
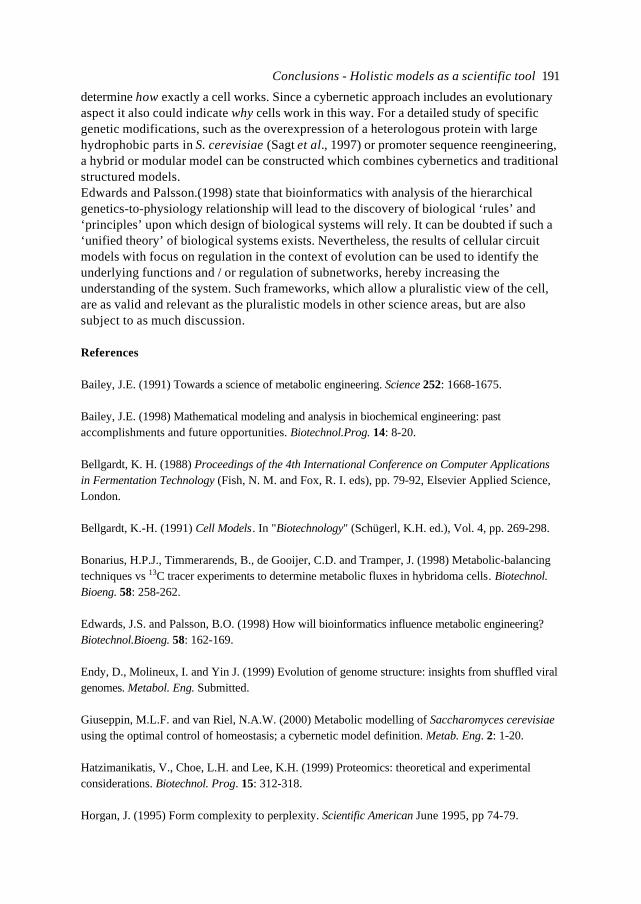
Conclusions - Holistic models as a scientific tool 191
determine how exactly a cell works. Since a cybernetic approach includes an evolutionaryaspect it also could indicate why cells work in this way. For a detailed study of specificgenetic modifications, such as the overexpression of a heterologous protein with largehydrophobic parts in S. cerevisiae (Sagt et al., 1997) or promoter sequence reengineering,a hybrid or modular model can be constructed which combines cybernetics and traditionalstructured models.Edwards and Palsson.(1998) state that bioinformatics with analysis of the hierarchicalgenetics-to-physiology relationship will lead to the discovery of biological ‘rules’ and‘principles’ upon which design of biological systems will rely. It can be doubted if such a‘unified theory’ of biological systems exists. Nevertheless, the results of cellular circuitmodels with focus on regulation in the context of evolution can be used to identify theunderlying functions and / or regulation of subnetworks, hereby increasing theunderstanding of the system. Such frameworks, which allow a pluralistic view of the cell,are as valid and relevant as the pluralistic models in other science areas, but are alsosubject to as much discussion.
References
Bailey, J.E. (1991) Towards a science of metabolic engineering. Science 252: 1668-1675.
Bailey, J.E. (1998) Mathematical modeling and analysis in biochemical engineering: pastaccomplishments and future opportunities. Biotechnol.Prog. 14: 8-20.
Bellgardt, K. H. (1988) Proceedings of the 4th International Conference on Computer Applicationsin Fermentation Technology (Fish, N. M. and Fox, R. I. eds), pp. 79-92, Elsevier Applied Science,London.
Bellgardt, K.-H. (1991) Cell Models. In "Biotechnology" (Schügerl, K.H. ed.), Vol. 4, pp. 269-298.
Bonarius, H.P.J., Timmerarends, B., de Gooijer, C.D. and Tramper, J. (1998) Metabolic-balancingtechniques vs 13C tracer experiments to determine metabolic fluxes in hybridoma cells. Biotechnol.Bioeng. 58: 258-262.
Edwards, J.S. and Palsson, B.O. (1998) How will bioinformatics influence metabolic engineering?Biotechnol.Bioeng. 58: 162-169.
Endy, D., Molineux, I. and Yin J. (1999) Evolution of genome structure: insights from shuffled viralgenomes. Metabol. Eng. Submitted.
Giuseppin, M.L.F. and van Riel, N.A.W. (2000) Metabolic modelling of Saccharomyces cerevisiaeusing the optimal control of homeostasis; a cybernetic model definition. Metab. Eng. 2: 1-20.
Hatzimanikatis, V., Choe, L.H. and Lee, K.H. (1999) Proteomics: theoretical and experimentalconsiderations. Biotechnol. Prog. 15: 312-318.
Horgan, J. (1995) Form complexity to perplexity. Scientific American June 1995, pp 74-79.
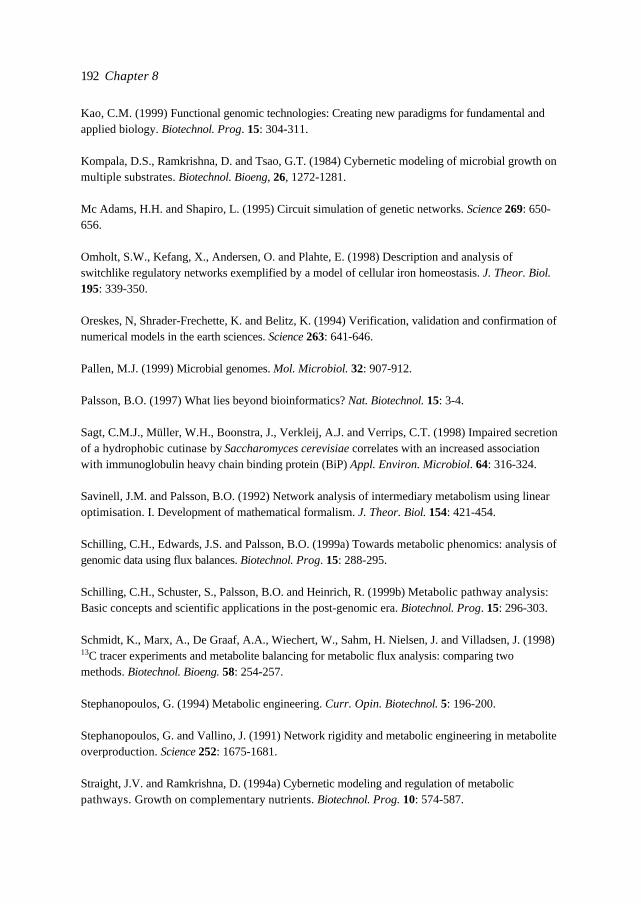
Chapter 8192
Kao, C.M. (1999) Functional genomic technologies: Creating new paradigms for fundamental andapplied biology. Biotechnol. Prog. 15: 304-311.
Kompala, D.S., Ramkrishna, D. and Tsao, G.T. (1984) Cybernetic modeling of microbial growth onmultiple substrates. Biotechnol. Bioeng, 26, 1272-1281.
Mc Adams, H.H. and Shapiro, L. (1995) Circuit simulation of genetic networks. Science 269: 650-656.
Omholt, S.W., Kefang, X., Andersen, O. and Plahte, E. (1998) Description and analysis ofswitchlike regulatory networks exemplified by a model of cellular iron homeostasis. J. Theor. Biol.195: 339-350.
Oreskes, N, Shrader-Frechette, K. and Belitz, K. (1994) Verification, validation and confirmation ofnumerical models in the earth sciences. Science 263: 641-646.
Pallen, M.J. (1999) Microbial genomes. Mol. Microbiol. 32: 907-912.
Palsson, B.O. (1997) What lies beyond bioinformatics? Nat. Biotechnol. 15: 3-4.
Sagt, C.M.J., Müller, W.H., Boonstra, J., Verkleij, A.J. and Verrips, C.T. (1998) Impaired secretionof a hydrophobic cutinase by Saccharomyces cerevisiae correlates with an increased associationwith immunoglobulin heavy chain binding protein (BiP) Appl. Environ. Microbiol. 64: 316-324.
Savinell, J.M. and Palsson, B.O. (1992) Network analysis of intermediary metabolism using linearoptimisation. I. Development of mathematical formalism. J. Theor. Biol. 154: 421-454.
Schilling, C.H., Edwards, J.S. and Palsson, B.O. (1999a) Towards metabolic phenomics: analysis ofgenomic data using flux balances. Biotechnol. Prog. 15: 288-295.
Schilling, C.H., Schuster, S., Palsson, B.O. and Heinrich, R. (1999b) Metabolic pathway analysis:Basic concepts and scientific applications in the post-genomic era. Biotechnol. Prog. 15: 296-303.
Schmidt, K., Marx, A., De Graaf, A.A., Wiechert, W., Sahm, H. Nielsen, J. and Villadsen, J. (1998)13C tracer experiments and metabolite balancing for metabolic flux analysis: comparing twomethods. Biotechnol. Bioeng. 58: 254-257.
Stephanopoulos, G. (1994) Metabolic engineering. Curr. Opin. Biotechnol. 5: 196-200.
Stephanopoulos, G. and Vallino, J. (1991) Network rigidity and metabolic engineering in metaboliteoverproduction. Science 252: 1675-1681.
Straight, J.V. and Ramkrishna, D. (1994a) Cybernetic modeling and regulation of metabolicpathways. Growth on complementary nutrients. Biotechnol. Prog. 10: 574-587.
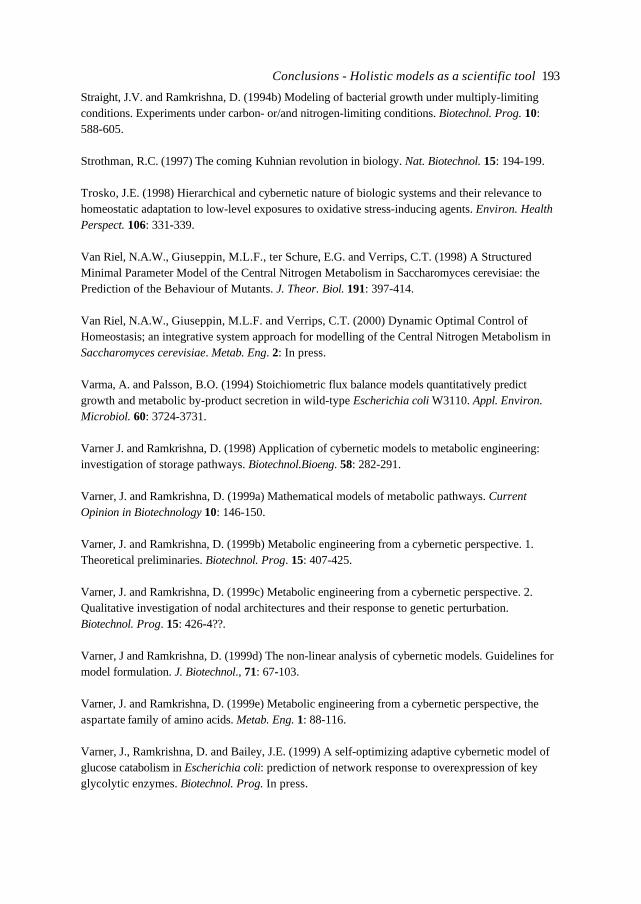
Conclusions - Holistic models as a scientific tool 193
Straight, J.V. and Ramkrishna, D. (1994b) Modeling of bacterial growth under multiply-limitingconditions. Experiments under carbon- or/and nitrogen-limiting conditions. Biotechnol. Prog. 10:588-605.
Strothman, R.C. (1997) The coming Kuhnian revolution in biology. Nat. Biotechnol. 15: 194-199.
Trosko, J.E. (1998) Hierarchical and cybernetic nature of biologic systems and their relevance tohomeostatic adaptation to low-level exposures to oxidative stress-inducing agents. Environ. HealthPerspect. 106: 331-339.
Van Riel, N.A.W., Giuseppin, M.L.F., ter Schure, E.G. and Verrips, C.T. (1998) A StructuredMinimal Parameter Model of the Central Nitrogen Metabolism in Saccharomyces cerevisiae: thePrediction of the Behaviour of Mutants. J. Theor. Biol. 191: 397-414.
Van Riel, N.A.W., Giuseppin, M.L.F. and Verrips, C.T. (2000) Dynamic Optimal Control ofHomeostasis; an integrative system approach for modelling of the Central Nitrogen Metabolism inSaccharomyces cerevisiae. Metab. Eng. 2: In press.
Varma, A. and Palsson, B.O. (1994) Stoichiometric flux balance models quantitatively predictgrowth and metabolic by-product secretion in wild-type Escherichia coli W3110. Appl. Environ.Microbiol. 60: 3724-3731.
Varner J. and Ramkrishna, D. (1998) Application of cybernetic models to metabolic engineering:investigation of storage pathways. Biotechnol.Bioeng. 58: 282-291.
Varner, J. and Ramkrishna, D. (1999a) Mathematical models of metabolic pathways. CurrentOpinion in Biotechnology 10: 146-150.
Varner, J. and Ramkrishna, D. (1999b) Metabolic engineering from a cybernetic perspective. 1.Theoretical preliminaries. Biotechnol. Prog. 15: 407-425.
Varner, J. and Ramkrishna, D. (1999c) Metabolic engineering from a cybernetic perspective. 2.Qualitative investigation of nodal architectures and their response to genetic perturbation.Biotechnol. Prog. 15: 426-4??.
Varner, J and Ramkrishna, D. (1999d) The non-linear analysis of cybernetic models. Guidelines formodel formulation. J. Biotechnol., 71: 67-103.
Varner, J. and Ramkrishna, D. (1999e) Metabolic engineering from a cybernetic perspective, theaspartate family of amino acids. Metab. Eng. 1: 88-116.
Varner, J., Ramkrishna, D. and Bailey, J.E. (1999) A self-optimizing adaptive cybernetic model ofglucose catabolism in Escherichia coli: prediction of network response to overexpression of keyglycolytic enzymes. Biotechnol. Prog. In press.

194
Abbreviations and nomenclature 195
Abbreviations and nomenclature
CER: CO2 Evolution RateCNM: Central Nitrogen MetabolismDCW: Dry Cell WeightDOCH: Dynamic Optimal Control of HomeostasisDOMC: Dynamic Optimal Metabolic ControlFA: Flux AnalysisFBA: Flux Balance AnalysisGA: Genetic AlgorithmLP: Linear ProgrammingLS: Least SquaresMCA: Metabolic Control AnalysisMFA: Metabolic Flux AnalysisMW: Molecular WeightNCR: Nitrogen Catabolic RepressionNMR: Nuclear Magnetic ResonanceOD: Optical DensityODE: Ordinary Differential EquationORF: Open Reading FrameOUR: Oxygen Uptake RateQLP: Quadratic Linear ProgrammingRQ: Respiratory QuotientSA: Simulated AnnealingUAS: Upstream Activation Site
Model components:αKG: α-ketoglutarateC: carbon sourceDal: indicating lumped allantoin degradation metabolismDal80p: repressor of a number of inducer independent genes associated with
nitrogen metabolismGAP: General Amino acid PermeaseGAP1: gene encoding GAPGcn4p: activator of general amino acid controlGDA: Glutamine DeAminaseGDH1,3: genes encoding NADPH-GDHGDH2: gene encoding NAD-GDHGLN1: gene encoding GSGln3p: key transcription activator in CNMGLT1: gene encoding GOGATglc: glucosegln: glutamineglu: glutamateGOGAT:Glutamate amide-2-OxoGlutarate AminoTransferase / glutamate synthase
Abbreviations and nomenclature196
GS: Glutamine SynthetaseHap: transcription activator, mainly of genes involved in the respiratory chainMEP: several ammonia permeasesMEP1,2,3: genes encoding MEPN: nitrogen sourceNADPH-GDH: NADPH-dependent Glutamate DeHydrogenaseNAD-GDH: NAD-dependent Glutamate DeHydrogenase'NH2': amino groupRp: hypothetic component of the glutamine signalling pathwayUre2p: prion, component of the ammonia signalling pathwayX: biomass [g ⋅l-1]
Subscripts:cyt: cytosolicex: extracellularf: finalin: intracellularlb: lower boundsmit: mitochondrialobs: observedp: perturbationprot: proteinr: regulationss: steady-stateub: upper bounds0: initial value or homeostatic (steady-state) reference value or nominal
value or contained in medium inflow+: formation reaction or stimulating-: consumption reaction or repressing
Superscripts:~: interpolated, filtered^: estimated⋅: (1st order) time derivative
Process parameters:YSX : biomass yield on a substrate S [gX⋅gS-1]D: dilution rate [h -1]µ : specific growth rate [h -1]µmax: maximal specific growth rate [h -1]µcrit: critical growth rate for onset of respiro-fermentative growth [h -1]
Mathematics:α : ratio of the flux from glutamine and glutamate towards synthesis of
nitrogen containing compounds, or degradation rate constant [h -1]βi: minimal level of the steady-state of a compound [mmol⋅gX-1]
Abbreviations and nomenclature 197
δ : small change or Dirac function∆k : (discrete) time window∆i: relative deviation from steady-state [mmol⋅gX-1]ε : model errorεx,i: smallest concentration which is relevant for model state xi [mmol⋅gX-1]φ : transport flux or summed formation or consumption reaction rates for a
metabolic pool [mmol⋅gX-1⋅h-1]Φ : sum of transport fluxes φ [mmol⋅gX-1⋅h-1]γi: maximal deviation from the steady-state flux for a compound
[mmol⋅gX-1⋅h-1]λi: maximal level of the steady-state of a compound [mmol⋅gX-1], or
eigenvalueΛ: ratio of largest and smallest eigenvalue of Fisher information matrix ψθ : a parameter in general, or threshold value of a switch function [mmol⋅gX-
1]τi: time constant of a metabolic pool [h]ω : ratio of the flux from glutamine and glutamate towards synthesis of
nitrogen containing compounds (see also α)ξ : binair signal, or ratio of the part of glutamine which acts as amino group
donor for synthesis of nitrogen containing compounds versus the partof glutamine which is built in into proteins
ψ : ratio of the part of glutamate which acts as amino group donor forsynthesis of nitrogen containing compounds versus the part ofglutamate which is built in into proteins
ψ: Fisher information matrix
A: system matrix[c]: concentration of a metabolite C [mmol⋅gX-1]C: covariance matrix[e]: concentration of an enzyme E [mmol⋅gX-1]e: activity of an enzyme E [mmol⋅gX-1⋅h-1] or (zero mean white)
measurement noiseE: expectation or enzymeE: stoichiometric matrixf: term of cost function FF: cost function, Metabolic Control FunctionG: vector with constraintsh: weights for the weighted Least Squares algorithm and the Metabolic
Control FunctionIi: integration control parameterJ: cost function / estimation functional, or Metabolic Coordinatork : rate constant [h -1], or k th simulation and optimisation time intervalKS: Michaelis-Menten affinity constant [mmol⋅gX-1]m: number of reaction ratesms: maintenancen: number of states (intracellular compounds)
Abbreviations and nomenclature198
N: total number of data points in time and total number of simulation andoptimisation time intervals
p: number of parameters, or volume fraction [%]Pi: proportional control parameterq: gas flow rate [h -1], or parameter determining the steepness of a switch
functionr: (internal) rate vector [mmol⋅gX-1⋅h-1]rsynth: enzyme synthesis rate constant [h -1]rinact: enzyme inactivation rate [mmol⋅gX-1⋅h-1]R: activity of a regulator [-][s]: concentration of a substrate S [mmol⋅l-1]S: substrate, or sigmoid functionSθ
x: relative parameter sensitivity of state x for parameter θtδ : simulation and optimisation time interval [h]T: activity of a transporter [mmol⋅gX-1⋅h-1]u: system inputs [mmol⋅gX-1⋅h-1]U: cybernetic variableV: cybernetic variableVm: molar volume [l]Vmax: maximum enzyme capacity [mmol⋅gX-1⋅h-1]Vsignal: rate constant of signal propagation [h -1]wi: relative weight factorW: weighting matrixx: state (metabolic pool concentrations [mmol⋅gX-1]), or ratio of the part of
glutamine which acts as amino group donor for synthesis of nitrogencontaining compounds versus the part of glutamine which is built ininto proteins (see also ξ)
y: output, or ratio of the part of glutamate which acts as amino groupdonor for synthesis of nitrogen containing compounds versus the partof glutamate which is built in into proteins (see also ψ)
Z: switch function
Summary 199
Summary
To ensure progress in the field of cell biology and more specific for the areas of MetabolicEngineering and Functional Genomics, integration of disciplines is essential. Mathematicalmodels, combined with computer power, can provide a suitable framework to analyse andstructure the rapidly increasing amount of data, resulting in improved understanding ofthe processes in the cell. To predict the effect of genetic modification and to analyse andpredict the physiological role of gene products, the models have to be dynamic.Although systems with essential different characteristics than physical ones are studied,cell biology so far completely adopted the reductionistic paradigm so successful inphysics. In biology the application of mechanistic modelling is less straightforwardbecause of the nature of the system and the information available. The key distinctionbetween conventional chemical reaction systems and metabolic networks is the influenceof regulation and control. This is often missing in kinetic metabolic network models. Theconventional kinetic modelling lacks a description of the forces driving adaptation,whereas adaptability is a key characteristic of biological systems. Alternative modellingapproaches need to be developed.
The Central Nitrogen Metabolism in the yeast Saccharomyces cerevisiae (the glutamateand glutamine nodes) has been used as example system. It is a highly connected networkembedded in the centre of metabolism. Although S. cerevisiae is a model organism andhas been intensively studied, the physiology of its Central Nitrogen Metabolism is poorlyunderstood, especially not quantitatively. Not only the in vivo kinetics and regulation arenot known, even the structure of the biochemical pathways is unclear.
Genetic regulation is essential for kinetic models, prediction of the function of GOGATThe incorporation of genetic regulation in kinetic models, although it was in anapproximate way by a key transcription regulator, was shown to be an essentialimprovement of the kinetic modelling approach. This was necessary to describe andpredict the complex dynamic behaviour of the Central Nitrogen Metabolism in both a wild-type and a mutant strain after substrate pulses.The physiological role of glutamate synthase (GOGAT), one of the pathways in CentralNitrogen Metabolism, was predicted to be the rebalancing of the intracellular metabolicpools after disturbance of the homeostatic state. Based on this functionality, GOGAT wassuggested to be associated to the mitochondrial membrane, operating in a vectorialprocess.
New model framework: prediction of dynamic flux distributions based on strategies andstoichiometry onlyBased on existing model approaches which include a postulated strategy, a new modelframework has been developed. The Dynamic Optimal Metabolic Control framework istailor-made for the specific type of problems encountered in cell biology. The cell isregarded as an optimally regulated system with strategies (a cybernetic system).Internally, the cell must meet specific requirements during the cell cycle. Externally, theavailability of nutrients and various other conditions may change by numerous factors.
Summary200
The cell can deal with them by applying various strategies. The strategies included in aDynamic Optimal Metabolic Control model can be hierarchical, but also competing at thesame level. The resulting phenotype is determined by the balance between the strategies.The two basic strategies postulated for metabolic regulation in the models are growth andadaptation to ecological niches, at the same time maintaining homeostasis with targetsthat are needed for current flux demands. The strategies may conflict and have to behandled within the boundaries set by the metabolic capabilities of the cell. The balance isnot a stable equilibrium, but will change during a response and a different strategy canbecome dominant. This results in adaptation and a different phenotype. The DynamicOptimal Metabolic Control approach focuses on the functionality of the system as awhole and its subsystems and is mainly aimed at predicting the fluxes in a metabolicnetwork. In the implementation a numerical optimisation algorithm was used as thecybernetic regulator (called the Metabolic Control Function). Like for Flux Analysis, onlysteady-state data are necessary. The dynamics result from the postulated strategies andconstraints.
New cybernetic model approach is better than kinetic modelThe predictions by the Dynamic Optimal Metabolic Control model of the responses tosubstrate pulses were better than the description and prediction by the kinetic model. Theby the kinetic model suggested function of the parallel pathways in the Central NitrogenMetabolism was confirmed. The behaviour of mutants was predicted satisfactorily.Although the Dynamic Optimal Metabolic Control model as such lacks mechanistic detail,it is instrumental in modelling pathway regulation. Also the properties as a mathematicalmodel, such as stability and parameter sensitivity, are better than for the kinetic model.
Model predictions of the physiological function and localisation of GOGAT werecorrectThe dynamics and flexibility present in the Central Nitrogen Metabolism have beenextensively studied under defined physiological conditions in continuous cultures of awild-type and a GOGAT negative mutant strain. The experimental results fit into theDynamic Optimal Metabolic Control framework, indicating why different pulse sizesresulted in qualitatively different responses. The model predictions of the function ofGOGAT and also the suggestion of its localisation have been experimentally confirmed.The results show a good integration of disciplines and how mathematical models can beused to efficiently fuel new experiments.
GOGAT is a redox regulatorGOGAT has a second very important, but completely new function in S. cerevisiae. Fromthe experimental results it is clear that GOGAT is important for the regulation of the redoxbalance in the cell. The low biomass yield and high formation of by-products for theGOGAT mutant are probably directly related to the redox imbalance.
The cybernetic approach is applicable for Functional GenomicsThe combination of regulatory strategies for the mathematical model and only qualitativedata on transcription regulation of the Central Nitrogen Metabolism in yeast has beensuccessfully integrated in a cellular circuit model describing Nitrogen Catabolic

Summary 201
Repression. The basic features from the complex molecular biological model have beenextracted with the circuit model and the consistency of this basis was checked. The modelstructure is such that more realistic parameter values can be readily determined whenexperimental data become available in the near future from further improved high-throughput techniques. The cybernetic framework can be efficiently used to analyse andinterpret data from genomics and proteomics.
Samenvatting202
Samenvatting
Om voortgang in het vakgebied van de celbiologie te verzekeren en in het bijzonder voorMetabolic Engineering en Functional Genomics is integratie van disciplines essentieel.Wiskundige modellen, in combinatie met computer rekenkracht, kunnen een geschiktraamwerk bieden om de snel toenemende hoeveelheid data te analyseren en testructureren, hetgeen resulteert in een beter begrip van de processen in de cel. Om heteffect van een genetische verandering te voorspellen en om de fysiologische functie vangen producten te analyseren en te voorspellen, moeten de modellen dynamisch zijn.De celbiologie heeft tot nu toe het reductionistische paradigma, dat zo succesvol is in defysica, volledig overgenomen. Dit terwijl in de celbiologie systemen met essentieel andereeigenschappen dan die van fysische systemen bestudeerd worden. In de biologie is detoepassing van mechanistische modellen niet triviaal vanwege het soort systeem en debeschikbare informatie. Het essentiële verschil tussen conventionele chemische reactiesystemen en metabole netwerken is de invloed van sturing en regeling. Dit ontbreekt vaakin kinetische metabole modellen. De conventionele kinetische modellen missen eenbeschrijving van de krachten die adaptatie bewerkstelligen, terwijl het vermogen totaanpassen toch een essentiële eigenschap is van biologische systemen. Alternatievemodel benaderingen moeten daarom ontwikkeld worden.
Het centrale stikstof metabolisme in de gist Saccharomyces cerevisiae (de glutamaat englutamine knooppunten) is gebruikt als modelsysteem. Dit is een intern sterk verbondennetwerk, dat bovendien deel uit maakt van het centrale metabolisme. S. cerevisiae is eenmodel organisme en is daardoor intensief bestudeerd. Toch is het begrip van de fysiologievan het centrale strikstof metabolisme beperkt en zeker niet kwantitatief van aard. Nietalleen zijn de in vivo kinetiek en regulatie onbekend, ook de structuur van debiochemische routes is onduidelijk.
Genetische regulatie is essentieel voor kinetische modellen, de functie van GOGATvoorspeldHet is aangetoond dat het opnemen van genetische regulatie in kinetische modellen, ookal is het een eenvoudige benadering met een centrale transcriptie regulator, een essentiëleverbetering is van de kinetische model aanpak. Dit was noodzakelijk om het complexe,dynamische gedrag van het centrale stikstof metabolisme van zowel een wild-type en eenmutant na het toevoegen van substraat pulsen te beschrijven en te voorspellen.Glutamaat synthase (GOGAT) is een route in het centrale stikstof metabolisme met eenonbekende fysiologische functie. Door de modellen is voorspeld dat GOGAT betrokkenzou zijn bij het opnieuw balanceren van de intracellulaire metaboliet niveaus na eenverstoring van de homeostase. Op basis van deze functionaliteit is gesuggereerd datGOGAT geassocieerd zou moeten zijn met het mitochondrieel membraan en werkzaam ineen vectorieel proces.
Een nieuw model raamwerk: het voorspellen van de dynamische flux distributies opbasis van alleen strategieën en stoichiometrie
Samenvatting 203
Op basis van bestaande model aanpakken die een strategie voor het cellulaire systeempostuleren, is een nieuw model raamwerk ontwikkeld. Het Dynamic Optimal MetabolicControl raamwerk is specifiek ontworpen voor het type problemen dat in de celbiologievoorkomt. De cel wordt beschouwd als een optimaal gereguleerd systeem met strategieën(een cybernetisch systeem). Intracellulair moet de cel voorzien in de specifiekebenodigdheden tijdens de cel cyclus. Door vele oorzaken kunnen extracellulair debeschikbaarheid van voedingsstoffen en verschillende andere condities veranderen. Decel kan hiermee omgaan door verschillende strategieën toe te passen. De strategieën ineen Dynamic Optimal Metabolic Control model kunnen hiërarchisch zijn, maar kunnen ookconcurreren op hetzelfde niveau. Het resulterend fenotype wordt bepaald door de balanstussen de strategieën. De twee voor metabole regulatie gepostuleerde basis strategieënzijn groei en adaptatie aan ecologische niches en tegelijkertijd handhaven vanhomeostase, hetgeen gericht is op de in de cel noodzakelijke fluxen. De strategieënkunnen conflicterend zijn en moeten opereren binnen de grenzen van de metabolecapaciteit van de cel. De balans is geen stabiel evenwicht, maar zal tijdens een responsveranderen en een andere strategie kan dominant worden. Dit resulteert in adaptatie eneen ander fenotype. De Dynamic Optimal Metabolic Control aanpak is gericht op defunctionaliteit van het totale systeem en de subsystemen en heeft vooral het voorspellenvan fluxen in een metabool netwerk als doel. In de implementatie is een numeriekoptimalisatie algoritme gebruikt als de cybernetische regulator (de zogenaamde MetabolicControl Function). Zoals voor Flux Analyse, zijn alleen steady-state data nodig. Dedynamica resulteert uit de gepostuleerde strategieën en metabole beperkingen.
Het nieuwe cybernetische model is beter dan het kinetische modelDe voorspellingen met het Dynamic Optimal Metabolic Control model van de responsenop substraat pulsen zijn beter dan de beschrijving en voorspelling met het kinetischemodel. De voorspelde functie van de parallelle routes in het centrale stikstof metabolismeis bevestigd. Het gedrag van de mutanten werd voldoende voorspeld. Hoewel hetDynamic Optimal Metabolic Control model als zodanig geen mechanistische kennis bevat,is het een stap voorwaart bij het modelleren van de regulatie van metabole netwerken. Ookde eigenschappen als wiskundig model, zoals stabiliteit en parameter gevoeligheid zijnbeter dan voor het kinetische model.
De model voorspellingen van de fysiologische functie en lokalisatie van GOGAT warenjuistDe dynamica en flexibiliteit aanwezig in het centrale stikstof metabolisme zijn uitvoerigbestudeerd onder goed gedefinieerde fysiologische condities in continu cultures met eenwild-type en een GOGAT negatieve mutant. De experimentele resultaten sluiten aan bij hetDynamic Optimal Metabolic Control raamwerk, hetgeen aangeeft waarom verschillendepuls groottes leidden tot kwalitatief verschillende responsen. De model voorspellingenover de functie van GOGAT en ook de suggestie over de lokalisatie van het enzym zijnexperimenteel bevestigd. De resultaten tonen een goede integratie van disciplines en latenzien hoe wiskundige modellen gebruikt kunnen worden om op een efficiënte maniernieuwe experimenten te initiëren.
GOGAT is een redox regulator
Samenvatting204
GOGAT heeft een tweede, erg belangrijke, maar volledig nieuwe functie in S. cerevisiae.Uit de experimentele resultaten blijkt dat GOGAT belangrijk is voor de regulatie van deredox balans in de cel. De lage biomassa opbrengst en de grote vorming van bijproductendoor de GOGAT mutant houden waarschijnlijk direct verband met de redox onbalans.
De cybernetische benadering kan toegepast worden voor Functional GenomicsHoewel alleen kwalitatieve informatie over transcriptie regulatie van het centrale stikstofmetabolisme beschikbaar was, is dit succesvol geïntegreerd met het cybernetischeconcept in een cellulair circuit model dat stikstof katabole repressie beschrijft. Met hetcircuit model zijn de elementaire kenmerken uit het complexe, moleculair biologische modelgehaald en is de consistentie van deze basis gecontroleerd. De model structuur is zodanigdat meer realistische parameter waardes eenvoudig bepaald kunnen worden indien in denabije toekomst experimentele data beschikbaar komen door verder verbeterde high-throughput technieken. Het cybernetische raamwerk kan efficiënt gebruikt worden omdata van genomics en proteomics te analyseren en vooral ook interpreteren.
Samenvatting 205
Het proefschrift: een eenvoudig verhaal
Wiskundige modellen van levende cellen zijn essentieel om meer en nieuwe kennis uitexperimentele gegevens te halen. Hierdoor krijgen we een beter inzicht in de werking vande cel. Voor dit proefschrift is een nieuw type model ontwikkeld. De aanpak is toegepastop een klein deel van het totale reactie-netwerk in de bakkers gist cel: het zogenaamdecentrale stikstof metabolisme. Van één van de routes in dit metabolisme was de functie totnu toe onbekend. Met het model is de mogelijke functie voorspeld. Op basis van hetmodel zijn heel doelgericht nieuwe experimenten uitgevoerd. Hierbij is bewezen dat devoorspelling van het model juist was. De resultaten van die experimenten zijn gebruikt omhet model verder te verbeteren (enzovoort). Met het model is ook het effect vanaangebrachte veranderingen in het DNA van de cel (genetische modificatie) correctvoorspeld. Het is aangetoond dat voor bepaalde vragen of problemen het nieuwe typemodel beter is dan de traditionele aanpak.
Een cel bevat vele duizenden componenten en reacties. Onze kennis hierover is nogsteeds vrij beperkt. Hierdoor is het welhaast onmogelijk om heel nauwkeurige modellenvan de hele cel te maken. Een aantal essentiële aspecten van de processen in een celkunnen echter met wiskundige modellen beschreven worden zonder dat precies bekend iswelke moleculen erbij betrokken zijn. Deze processen hebben vooral te maken met deregulatie binnen de cel. In de nieuwe modelaanpak wordt aangenomen dat de cel enigszinsintelligent is. Hoe de cel reageert op veranderingen in de omgeving is gebaseerd op devraag: 'wat is het beste voor de cel?'. De cel wordt beschouwd als een optimaalgereguleerd (cybernetisch) systeem.
De (extra) kennis die de modellen opleveren over gist en andere micro-organismen kantoegepast worden voor de productie van vele (traditionele) voedingsmiddelen zoalsbrood, kaas, bier, wijn en gerechten uit de Aziatische keuken. In grote bioreactoren(fermentoren) worden micro-organismen ook gebruikt voor de industriële productie vanspecifieke biomoleculen, zoals penicilline. Het inzicht in eencellige organismen wordtbovendien gebruikt bij het voorkomen of genezen van problemen in complexereorganismen, zoals kanker bij de mens. Uiteindelijk zijn hierbij geschikte wiskundigemodellen onontbeerlijk.
206
Dankwoord
Allereerst wil ik Theo en Marco bedanken voor het vertrouwen dat een 'elektricien' een(zinvolle) bijdrage zou kunnen leveren aan een complex vakgebied als de celbiologie.Marco’s kennis van de gist fysiologie is belangrijk geweest bij het onderzoek, evenals hetbeschikbaar stellen van de faciliteiten in de unit. Van Theo zullen vooral zijnenthousiasme, visie en volle agenda me bij blijven. Ik hoop dat ik iets van jullieverwachtingen waar heb kunnen maken. Ik vind het toch wel een beetje jammer dat ikgekozen heb voor een toekomst buiten deze erg interessante tak van sport.Michel, Anand en Marieke, ik hoop dat jullie net zoveel van jullie stage en/ofafstudeerprojecten geleerd hebben als ik. Het experimentele werk was zeker nieteenvoudig. Dit zal José ook kunnen bevestigen. José, ik hoop dat je op de universiteit vanTarragona de vruchten van je verblijf in Utrecht kunt plukken. De ondersteuning van hetsecretariaat wil ik niet ongenoemd laten. Vooral Dieneke als intermediair voor Theo wasonmisbaar.Hoewel ik officieel ambtenaar was bij de Universiteit Utrecht heb ik mijn hele onderzoekuitgevoerd bij Unilever Research Vlaardingen. Vier jaar lang heb ik met veel plezier in hetlab gewerkt en niet op de laatste plaats vanwege de collega's. Allemaal heel erg bedankt!In het URL/V lab heb ik ook de nodige (naams-) veranderingen mogen meemaken. Hoewelmijn onderzoek niet in staat is gebleken zich aan dergelijke dynamica aan te passen, heb ikook hier veel van geleerd. Ik ben begonnen in het E-gebouw onder de vlag van deBioprocessing unit (als onderdeel van BNS). Samen met Jan, nog jong en idealistisch, opeen kamer. Het was daar een gezellige club van dronken Denen en andere ‘piepersnijers’.Ondanks zijn eigen stormachtige carrière als 'pijpenfitter', was ome Jan gedurende de vierjaar nooit te beroerd om mij op zijn eigen wijze van repliek te dienen.Na een jaar op en neer lopen tussen fermentor in het A-gebouw en bureau in het E-gebouw, kon ik naar A2 oost verhuizen. Daar kwam mijn bureau vlak bij mijn fermentorenterecht, naast Bart in het ‘computerhok’. (Aan Bart en Jan heb ik trouwens ook eenbijnaam te danken, waarvan het gebruik gelukkig beperkt is gebleven tot enkelen). Inhetzelfde hok zaten ook nog één of meerdere Cap-ers die in de loop der jaren regelmatigververst moesten worden. Jammer dat juist die ene zo lang heeft kunnen blijven…Bart en ook Mikkel hebben me de kunde (of is het toch kunst) van het fermenterenbijgebracht. Vooral als alles fout gaat en het op improvisatie (en zijn PC-vrienden)aankomt, is Bart in z'n element. Ondanks / dankzij de kundige begeleiding van velen is inhet eerste jaar het fermenteren van superkleine gisten mijn skill-base geworden. Mario’sbelangrijkste skill-base is ook vaak van pas gekomen en dan bedoel ik niet alleen in deLabtap. Ook Eelko’s kennis en advies zijn erg waardevol geweest. Toch knap dat jouwboekje nog steeds overeind lijkt te staan, ondanks dat het vier jaar lang bestookt is metvele wiskundige trucs. Het ga jullie allen goed in de Biological Food Processes unit.Verder wil ik iedereen aan het thuisfront bedanken voor de steun en de nodige afleidingtijdens de afgelopen vier jaar. Met betrekking tot dit proefschrift wil ik mijn oudersbedanken voor hun steun en advies bij de keuzes voor school en studie. Natuurlijk wil ikin het heel bijzonder Christel bedanken. Het was goed dat je me af en toe achter decomputer weghaalde. Nu zet ik definitief een punt achter dit boekje en valt er niets meer teveranderen .
207
Curriculum vitae
Natal Adriaan Wilhelm van Riel
22 februari 1973geboren in Gilze
juni 1991atheneum B aan het Paulus lyceum in Tilburg
oktober 1995W.O. Elektrotechniek aan de Technische Universiteit Eindhovenafstudeerrichting Meet- en Regeltechniek (Prof. Dr. Ir. v.d. Bosch)
tot januari 2000assistent-in-opleiding bij de vakgroep Moleculaire Celbiologievan de faculteit Biologie aan de Universiteit Utrechtpromotie-onderzoek bij Unilever Research Vlaardingenonder begeleiding van Prof. Dr. Ir. Verrips en Dr. Ir. Giuseppin
208
List of Publications
Van Riel, N.A.W., Giuseppin, M.L.F., Ter Schure, E.G. and Verrips, C.T. (1998) Astructured, minimal parameter model of the central nitrogen metabolism in Saccharomycescerevisiae: the prediction of the behaviour of mutants. J. Theor. Biol. 191: 397-414.
Van Riel, N.A.W., Giuseppin, M.L.F. and Verrips, C.T. (2000) Dynamic optimal metaboliccontrol theory: a cybernetic approach for modelling of the central nitrogen metabolism ofS. cerevisiae. Metabol. Eng. 2: In press.
Giuseppin, M.L.F., Verrips, C.T. and Van Riel, N.A.W. (1999) The Cell-Factory needs amodel of a factory TIBTECH 17: 383-384.
Giuseppin M.L.F. and Van Riel N.A.W. (2000) Metabolic modelling of Saccharomycescerevisiae using the optimal control of homeostasis; a cybernetic model definition.Metabol. Eng. 2: 1-20.
Ter Schure, E.G., Van Riel, N.A.W., and Verrips, C.T. (1999) The role of ammoniametabolism for nitrogen catabolite repression in Saccharomyces cerevisiae. In press.