2016-04-19 Presentatie Leo Van Broeck.compressed · G E M I D D E L D E O P P E R V L A K T E T E M...
30
KLIMAATTOP LEO VAN BROECK | 2016 BOGDAN & VAN BROECK - KULeuven
Transcript of 2016-04-19 Presentatie Leo Van Broeck.compressed · G E M I D D E L D E O P P E R V L A K T E T E M...
K L I M A A T T O P
LEO VAN BROECK | 2016
BOGDAN & VAN BROECK - KULeuven
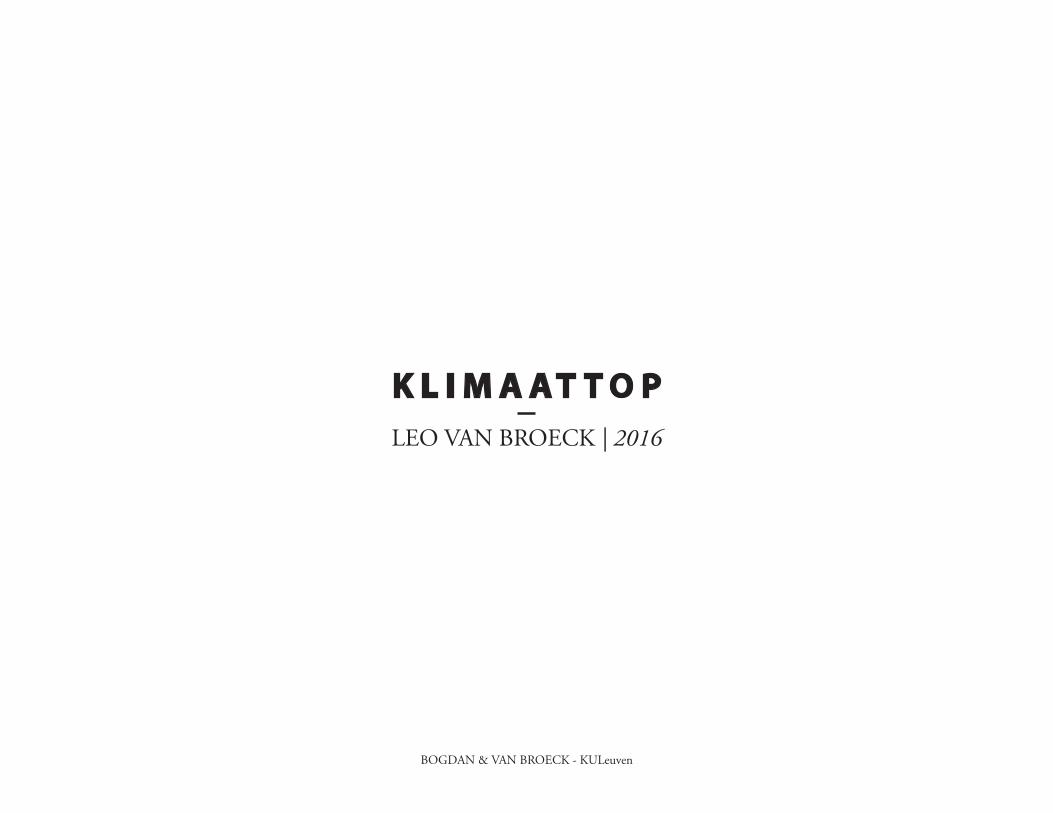
You are
H E R E
BOGDAN & VAN BROECK
Earth (seen from Mars) | © NASA
BOGDAN & VAN BROECK
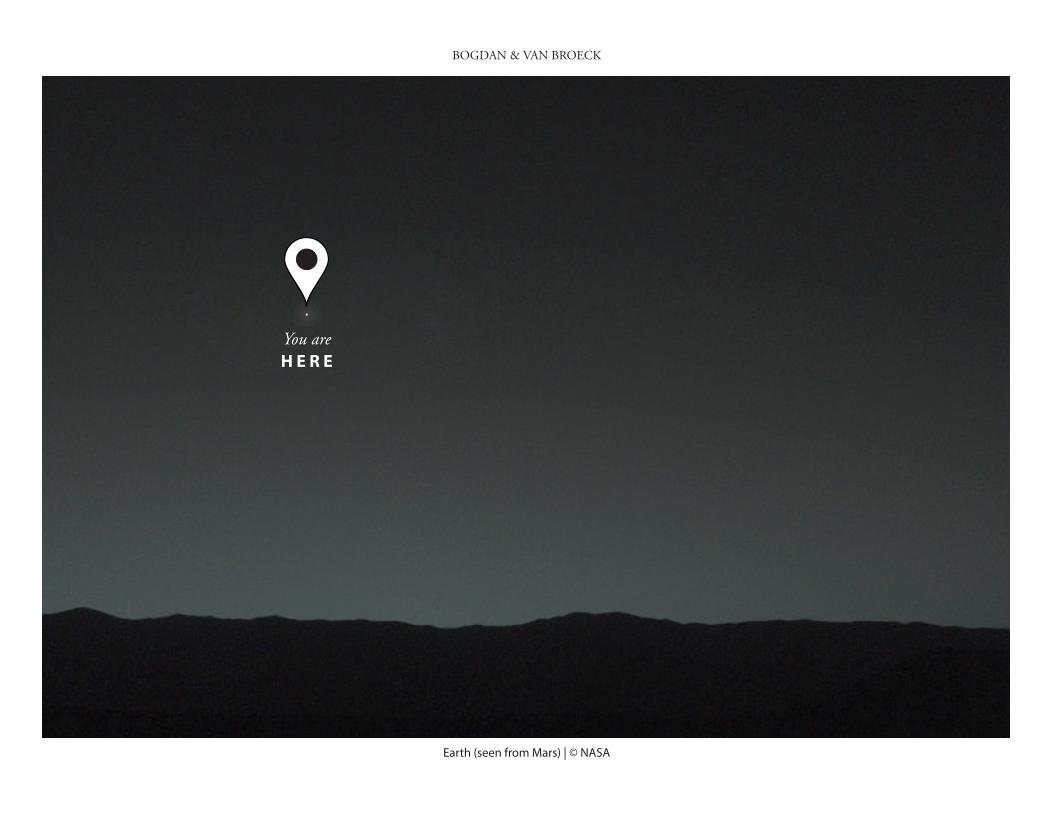
Earth (seen from the Moon) | © NASA
BOGDAN & VAN BROECK
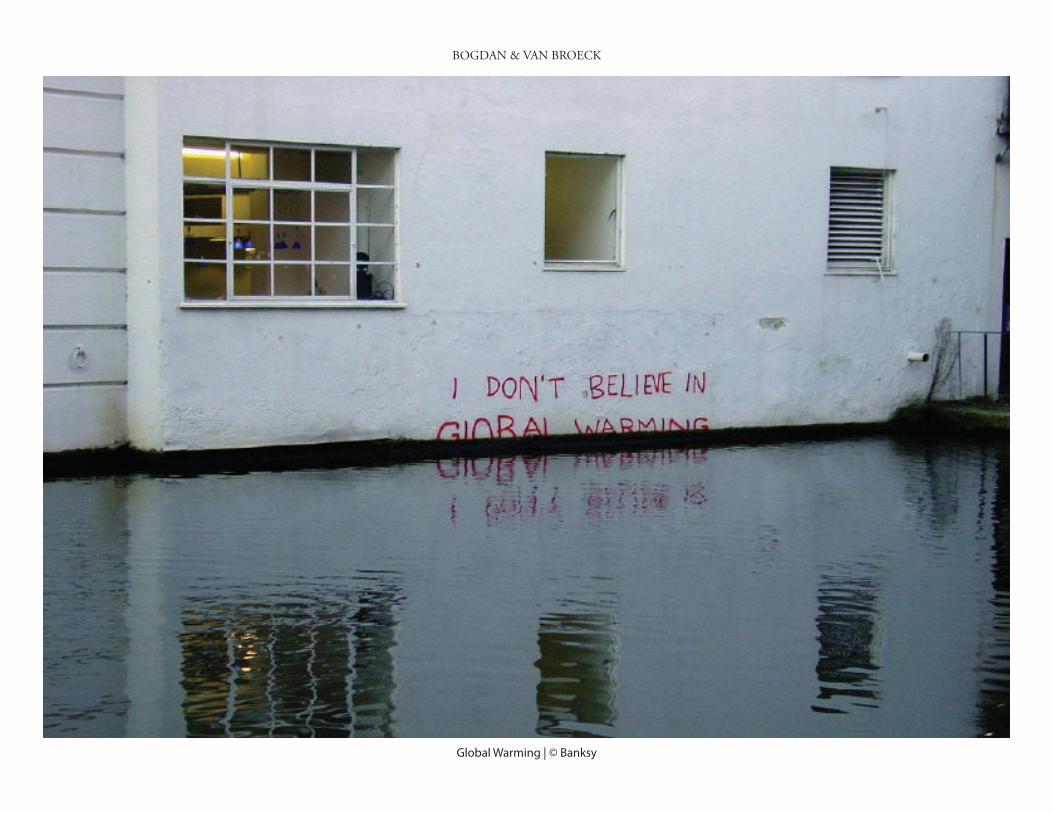
Global Warming | © Banksy
BOGDAN & VAN BROECK
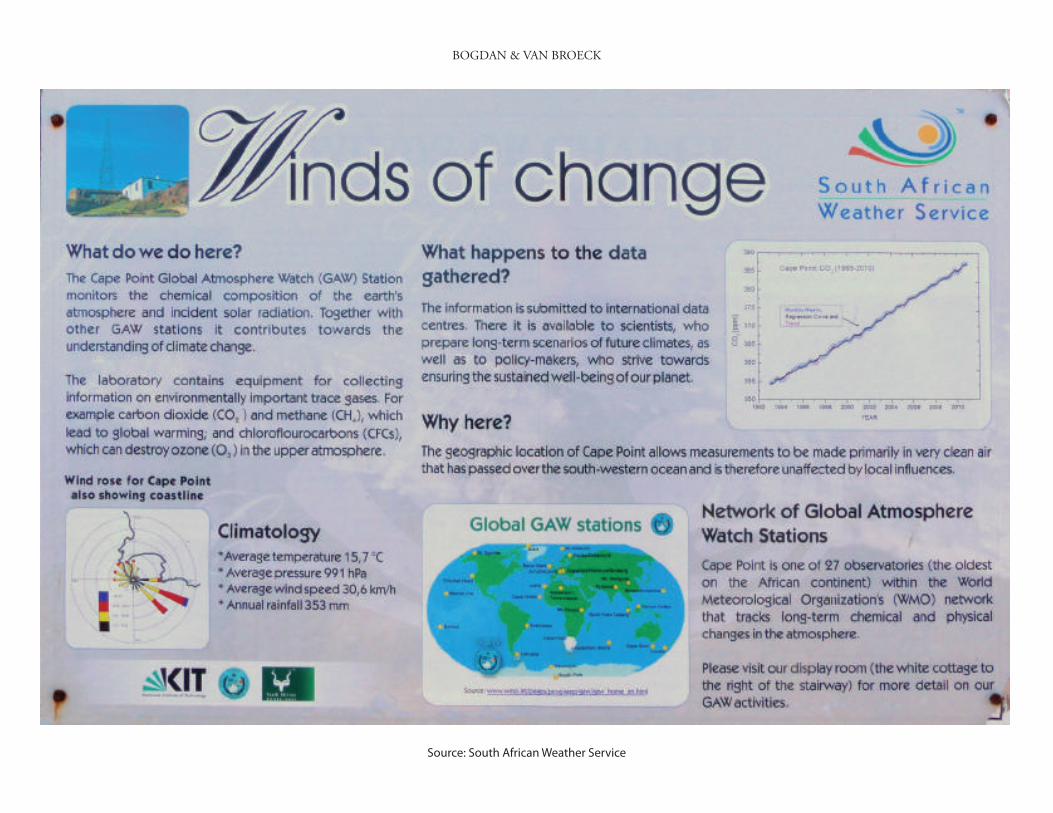
Source: South African Weather Service
BOGDAN & VAN BROECK
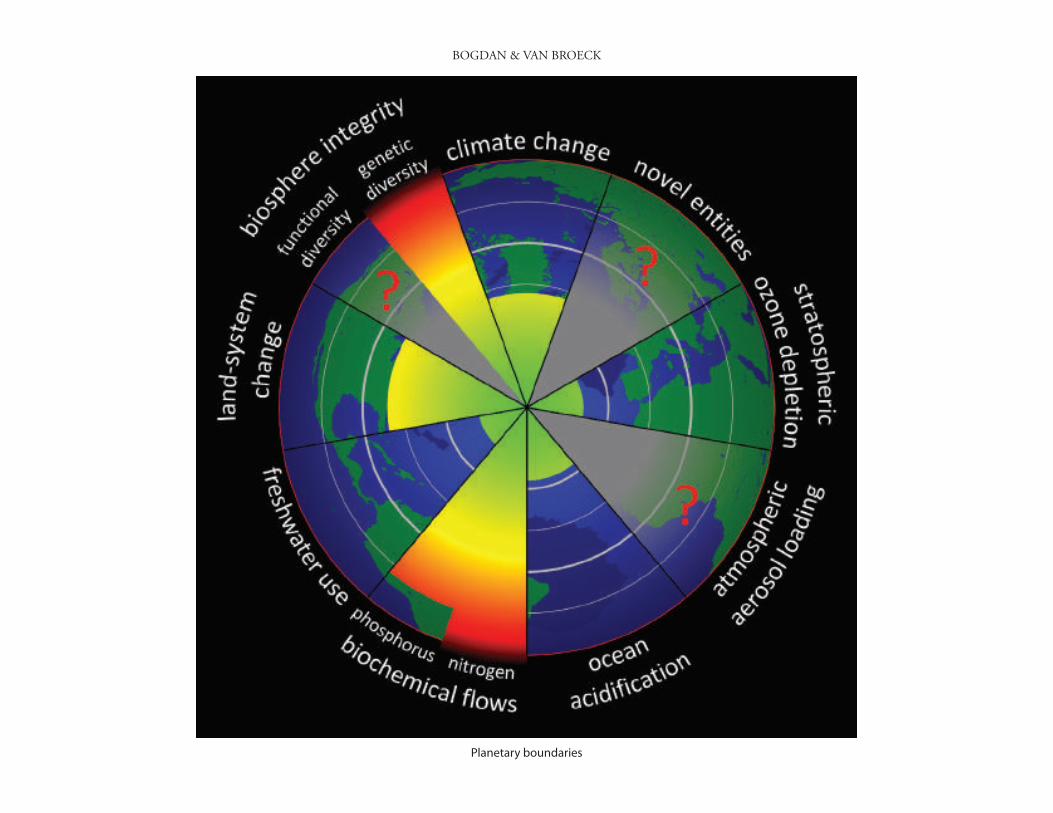
Planetary boundaries
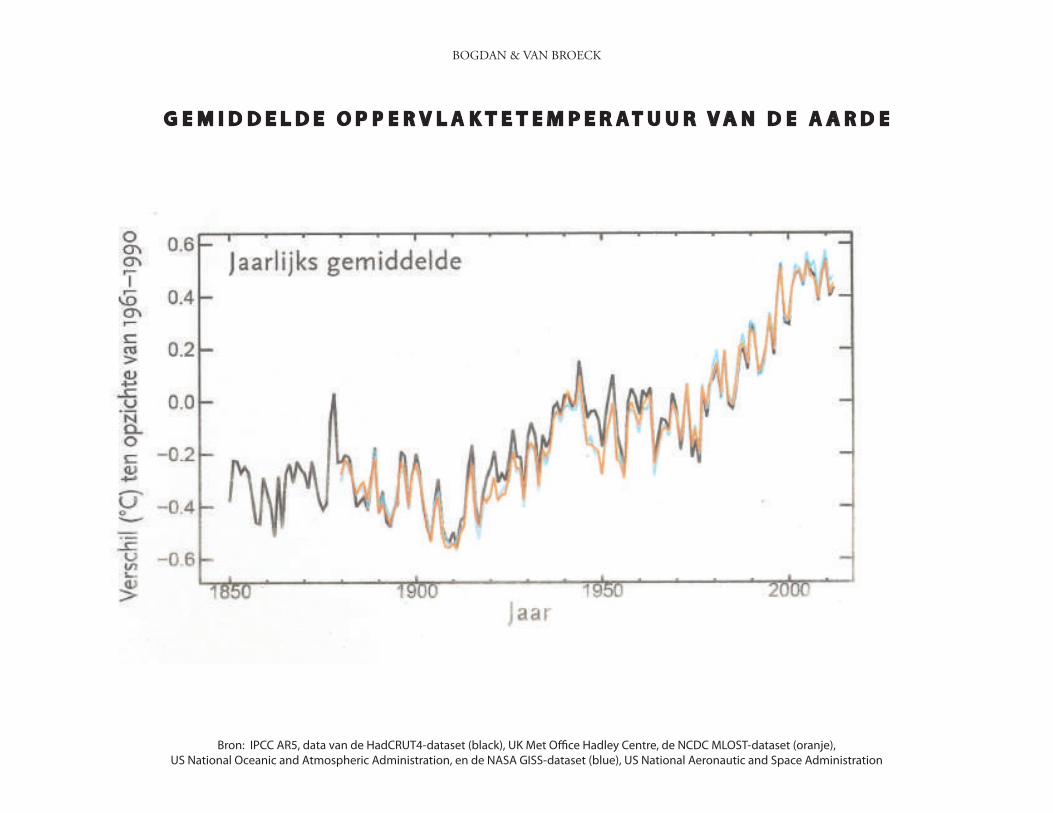
G E M I D D E L D E O P P E R V L A K T E T E M P E R A T U U R V A N D E A A R D E
BOGDAN & VAN BROECK
Bron: IPCC AR5, data van de HadCRUT4-dataset (black), UK Met O#ce Hadley Centre, de NCDC MLOST-dataset (oranje), US National Oceanic and Atmospheric Administration, en de NASA GISS-dataset (blue), US National Aeronautic and Space Administration
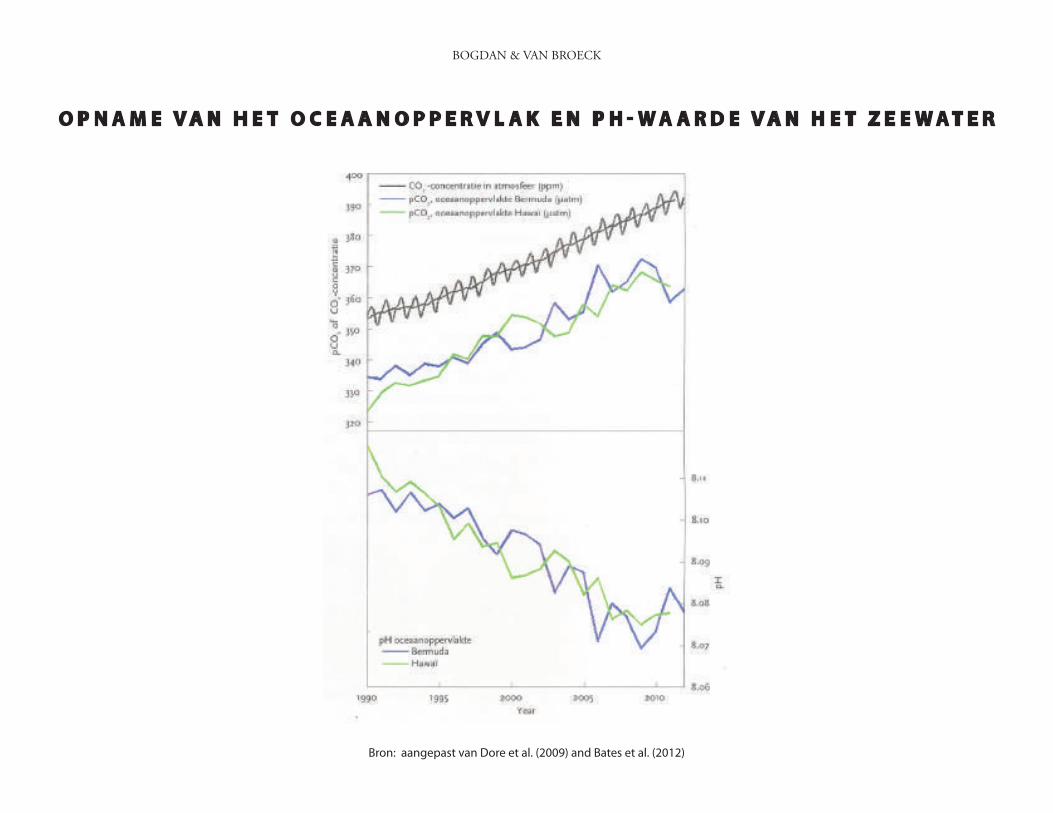
O P N A M E V A N H E T O C E A A N O P P E R V L A K E N P H - W A A R D E V A N H E T Z E E W A T E R
BOGDAN & VAN BROECK
Bron: aangepast van Dore et al. (2009) and Bates et al. (2012)
BOGDAN & VAN BROECK
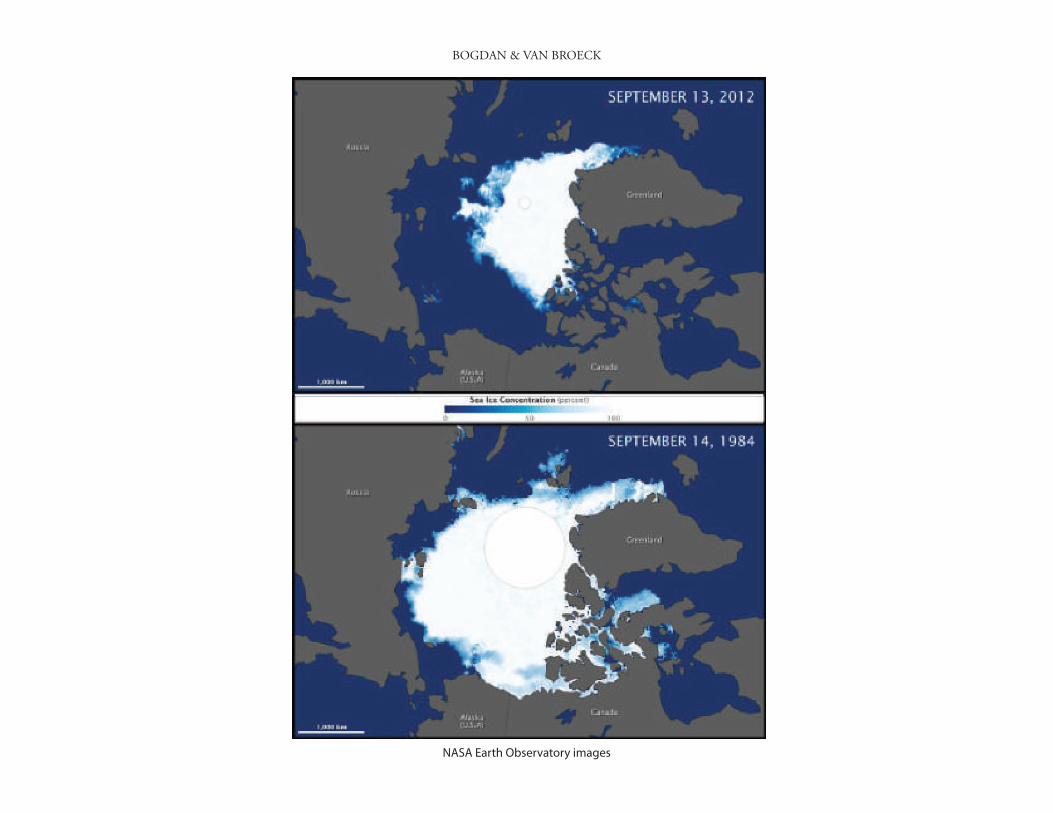
NASA Earth Observatory images
BOGDAN & VAN BROECK
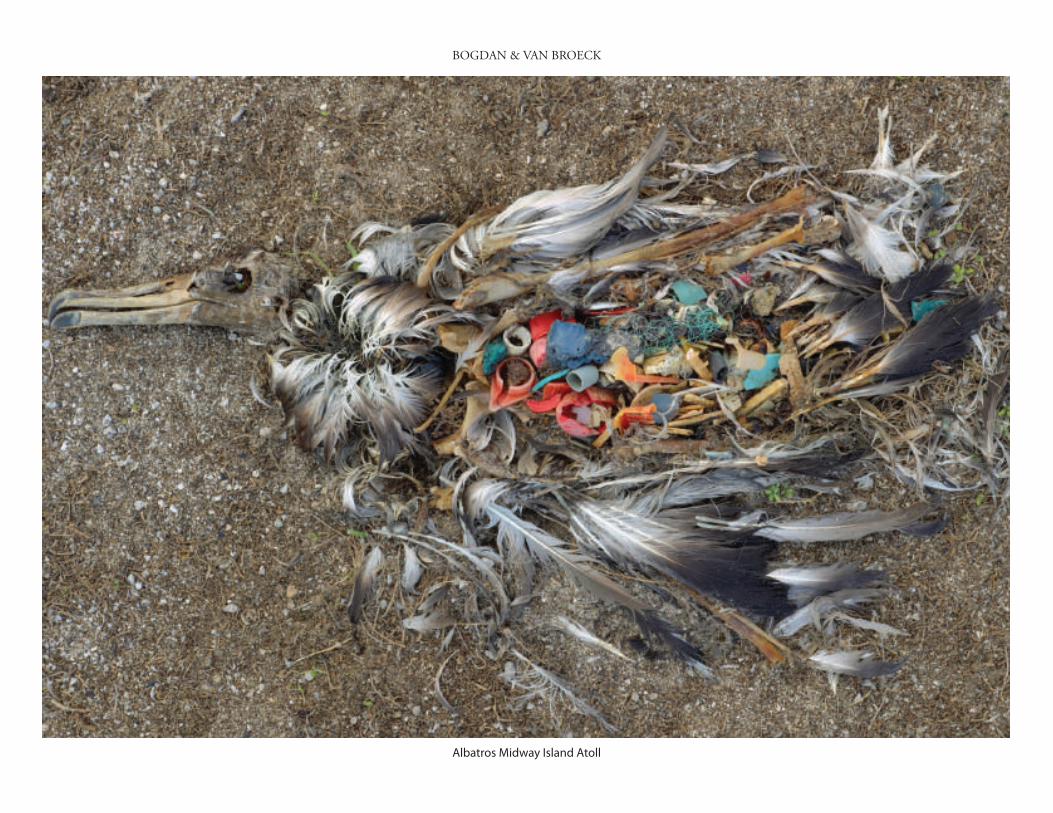
Albatros Midway Island Atoll
BOGDAN & VAN BROECK
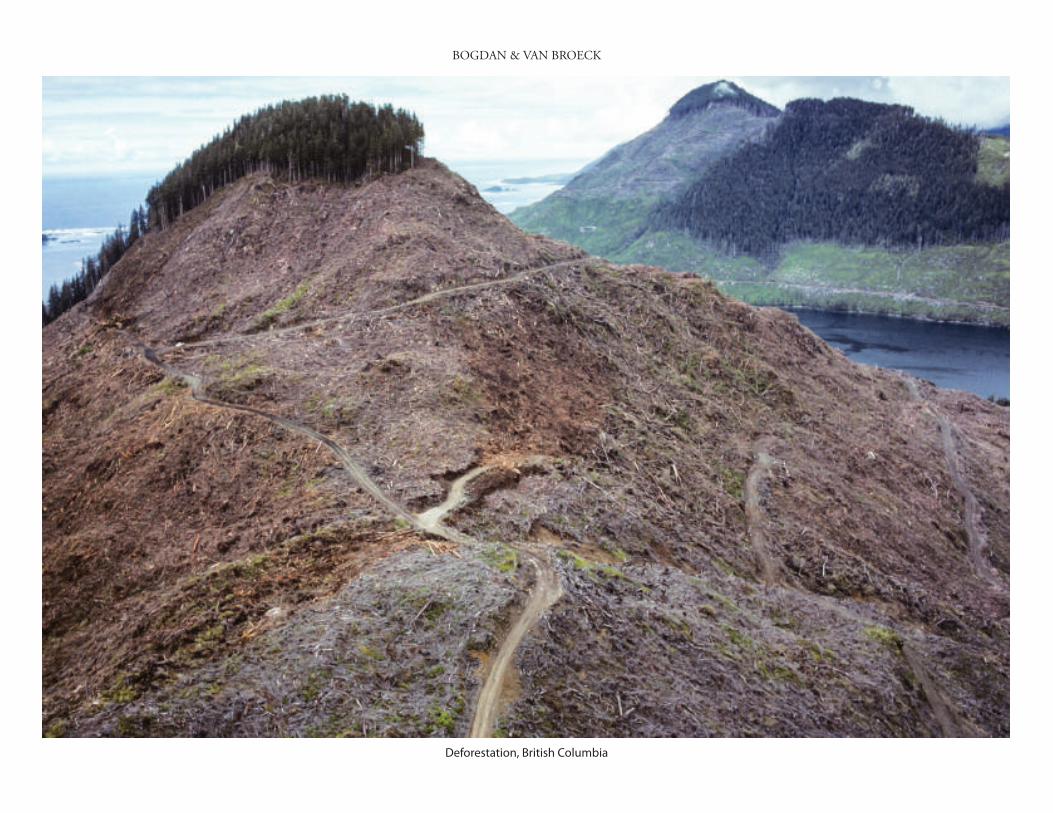
Deforestation, British Columbia
BOGDAN & VAN BROECK
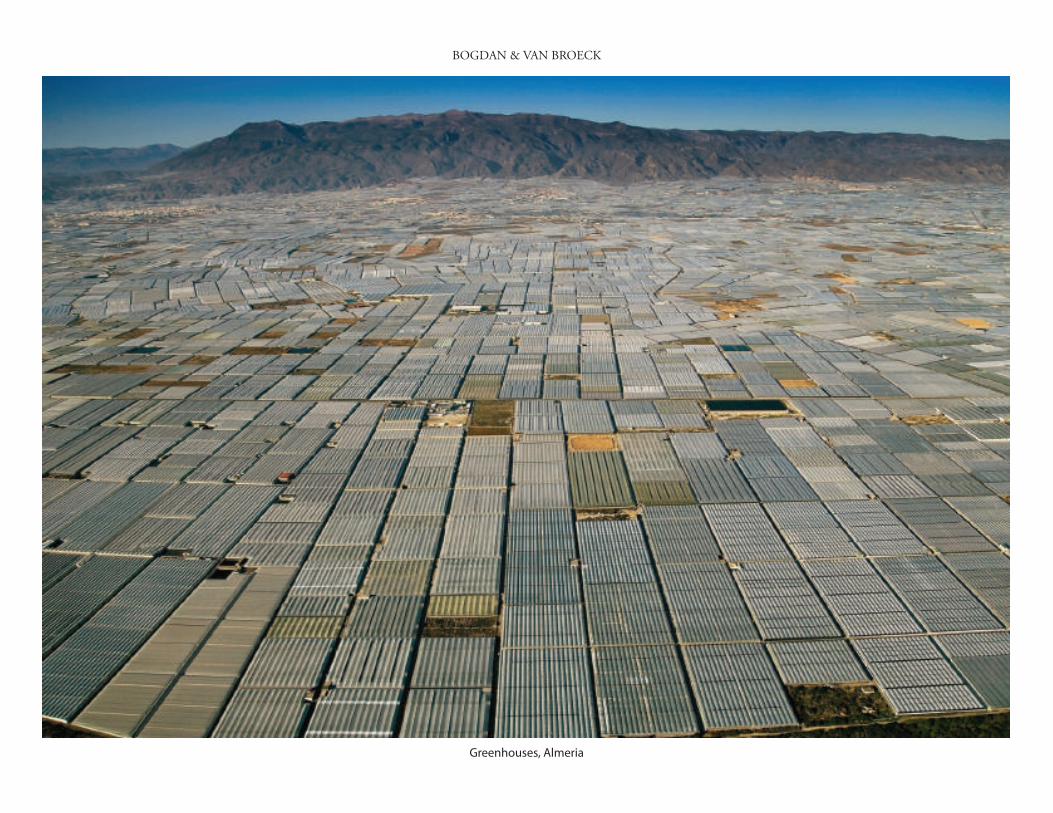
Greenhouses, Almeria
BOGDAN & VAN BROECK
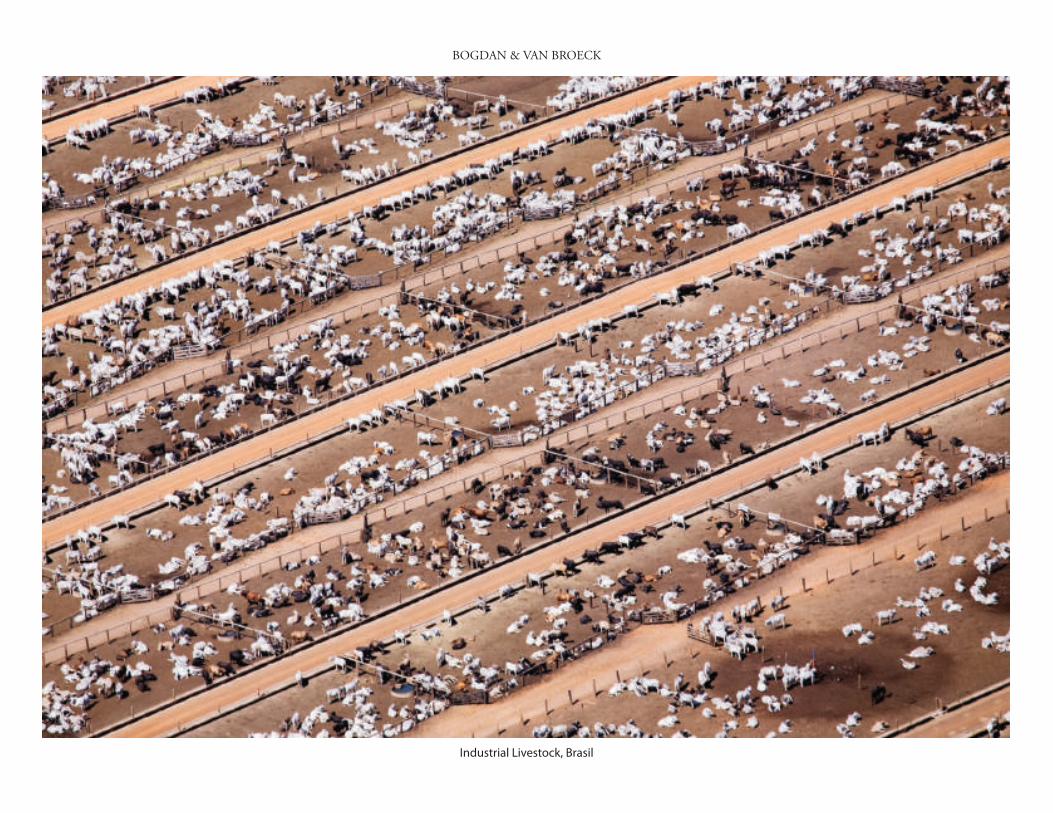
Industrial Livestock, Brasil
BOGDAN & VAN BROECK
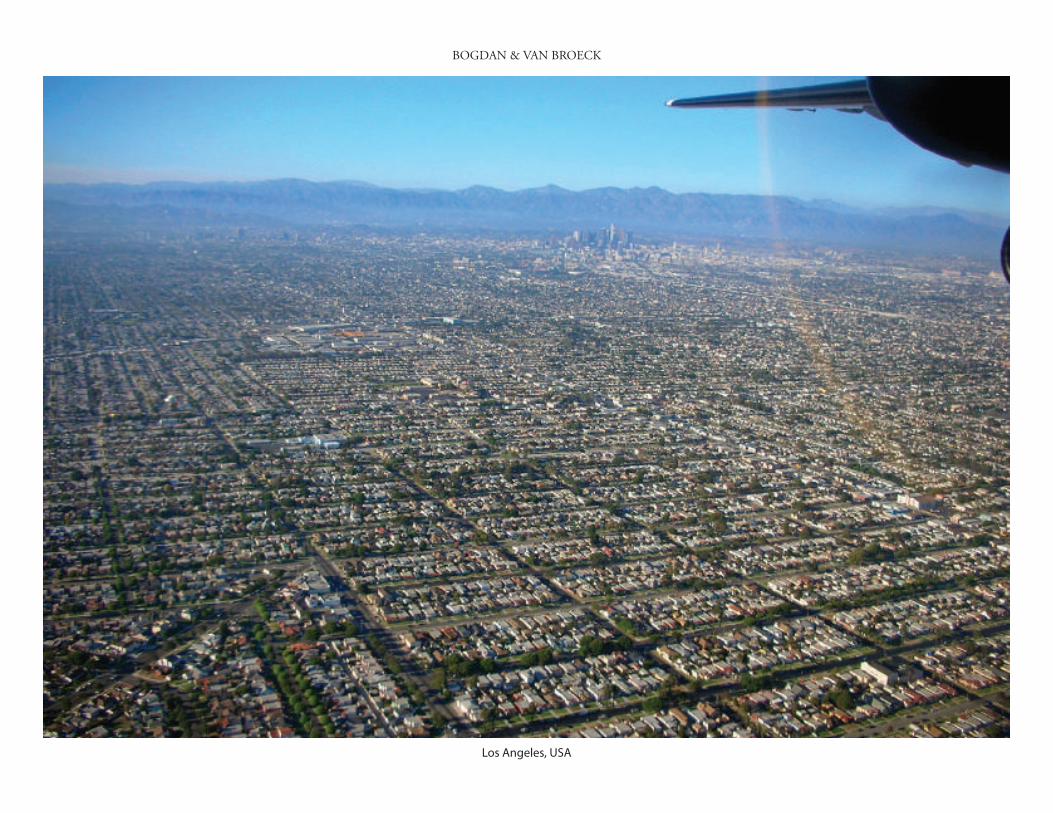
Los Angeles, USA
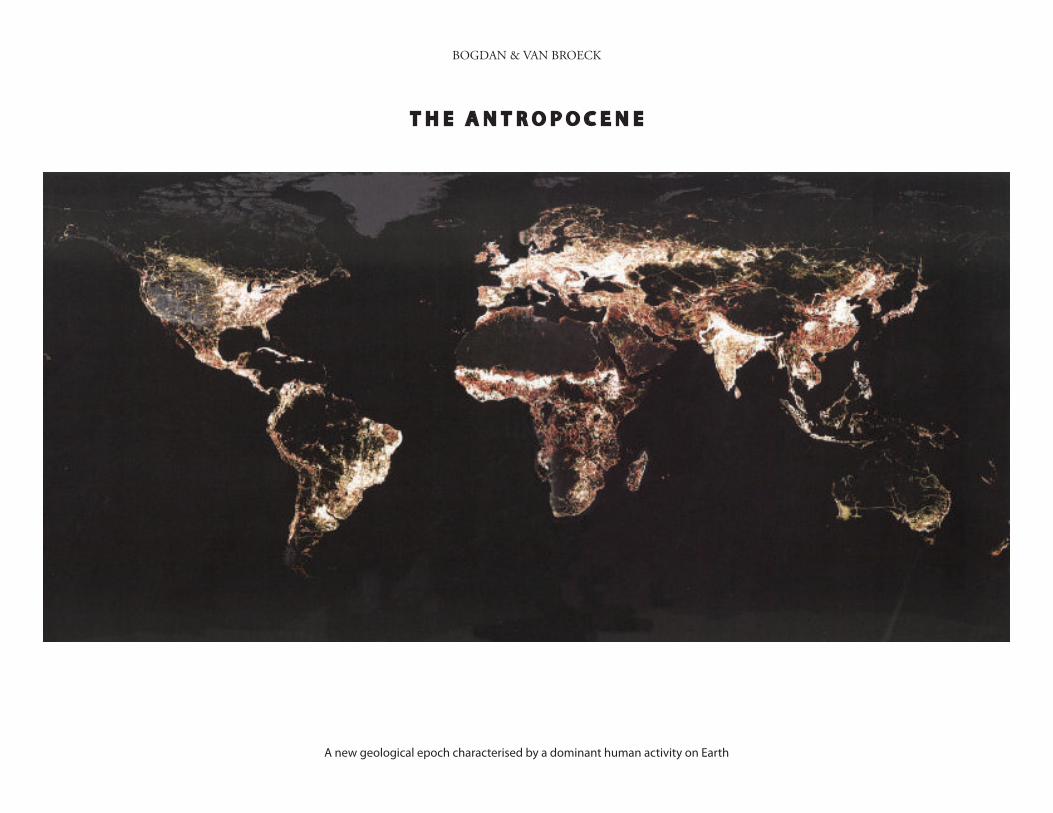
T H E A N T R O P O C E N E
BOGDAN & VAN BROECK
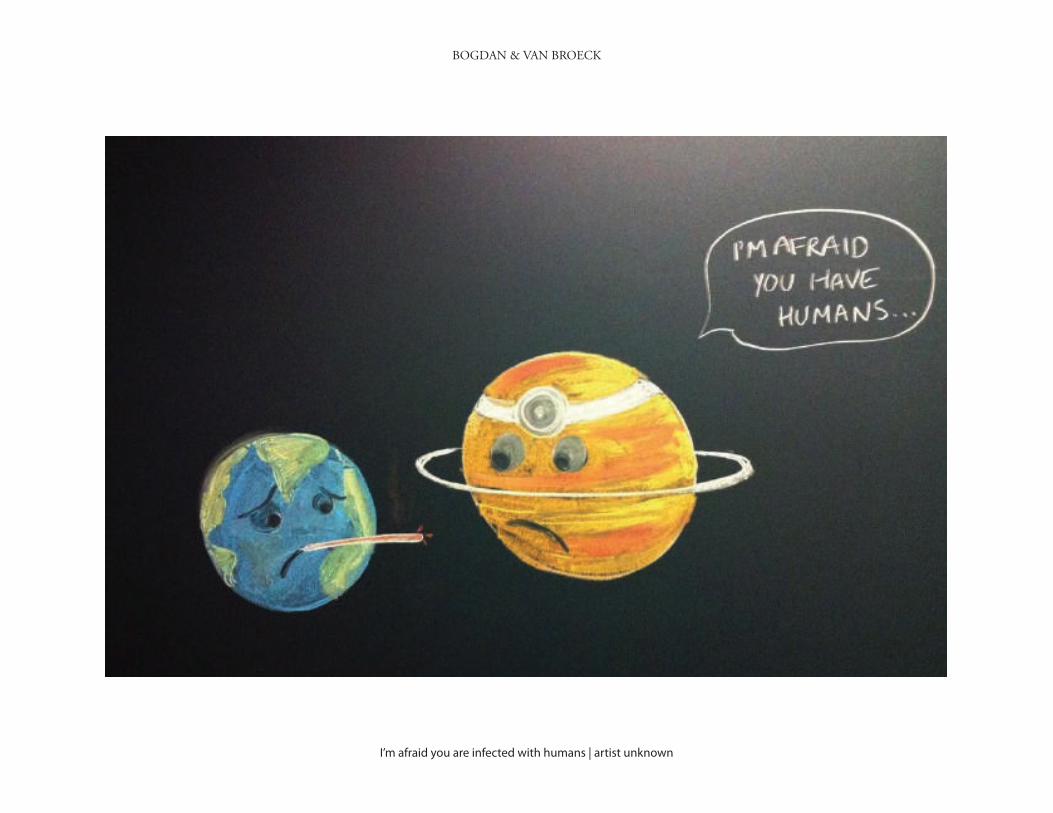
A new geological epoch characterised by a dominant human activity on Earth
BOGDAN & VAN BROECK
I’m afraid you are infected with humans | artist unknown
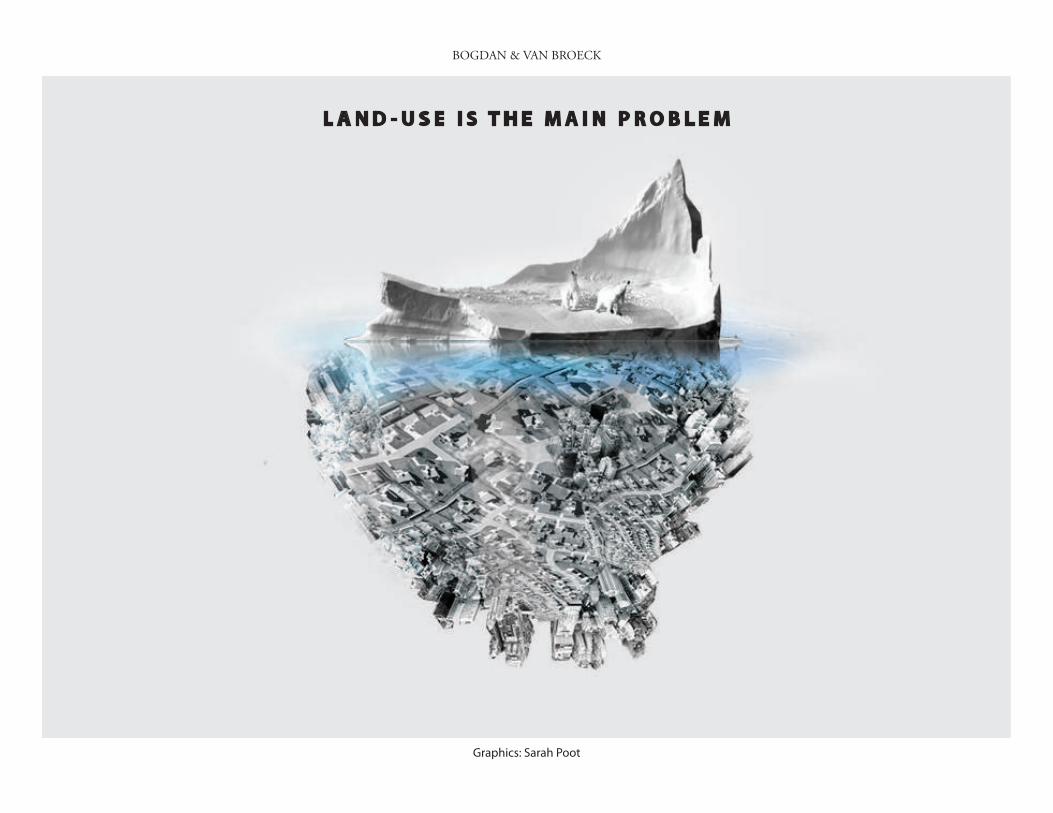
L A N D - U S E I S T H E M A I N P R O B L E M
BOGDAN & VAN BROECK
Graphics: Sarah Poot
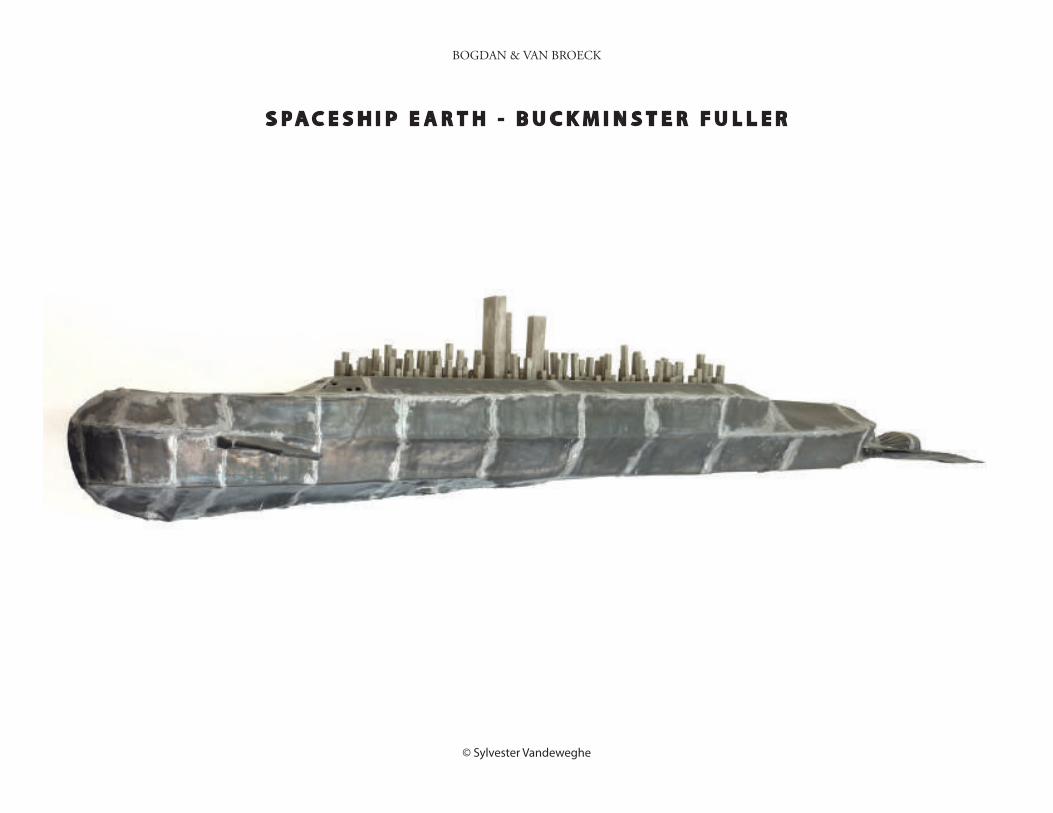
S P A C E S H I P E A R T H - B U C K M I N S T E R F U L L E R
BOGDAN & VAN BROECK
© Sylvester Vandeweghe
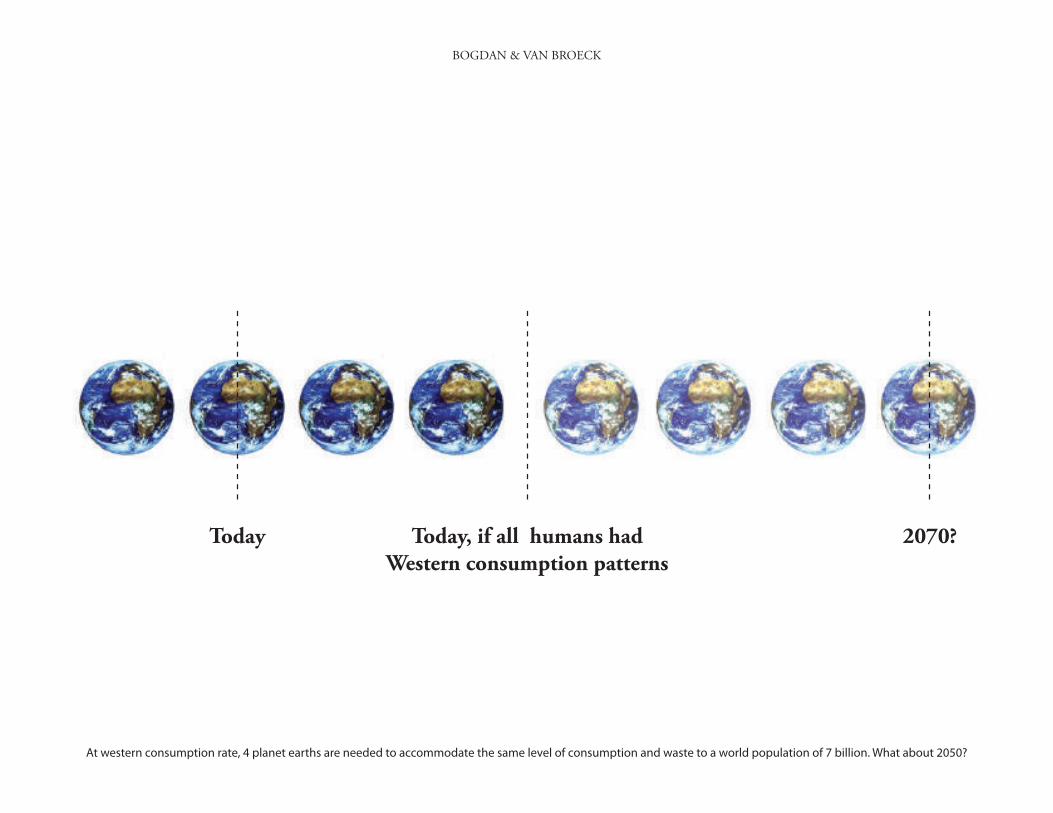
Today Today, if all humans hadWestern consumption patterns
2070?
BOGDAN & VAN BROECK
At western consumption rate, 4 planet earths are needed to accommodate the same level of consumption and waste to a world population of 7 billion. What about 2050?
BOGDAN & VAN BROECK
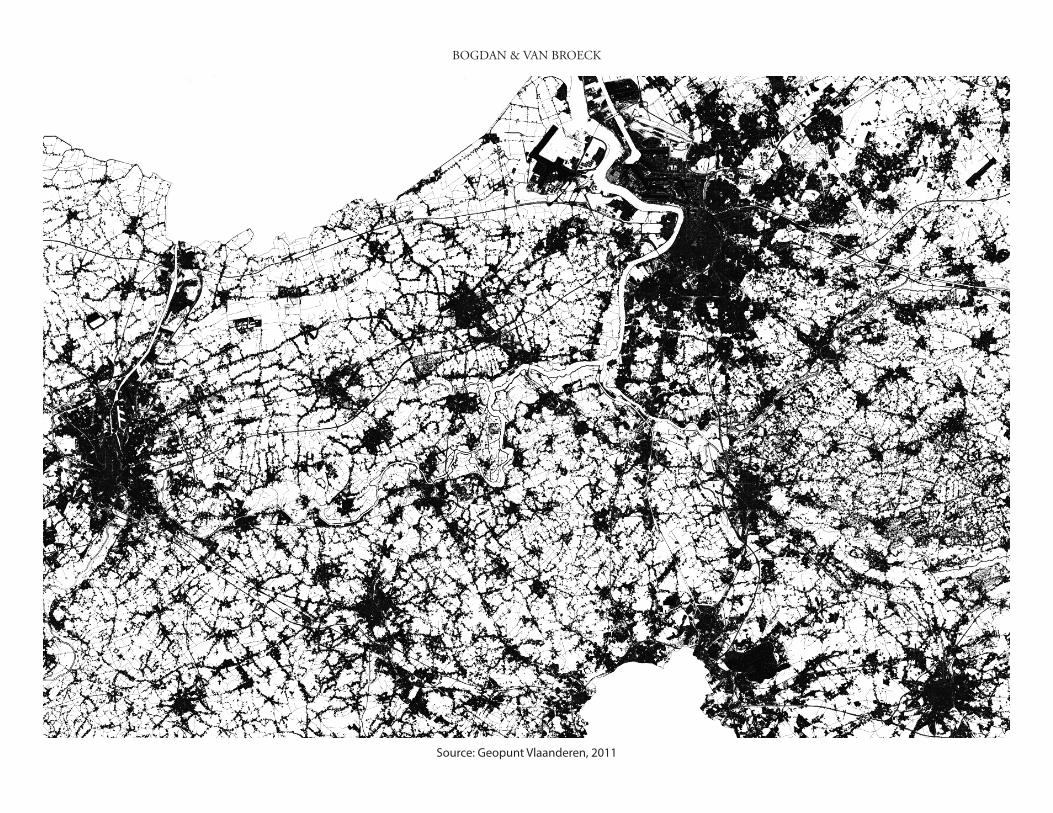
Source: Geopunt Vlaanderen, 2011
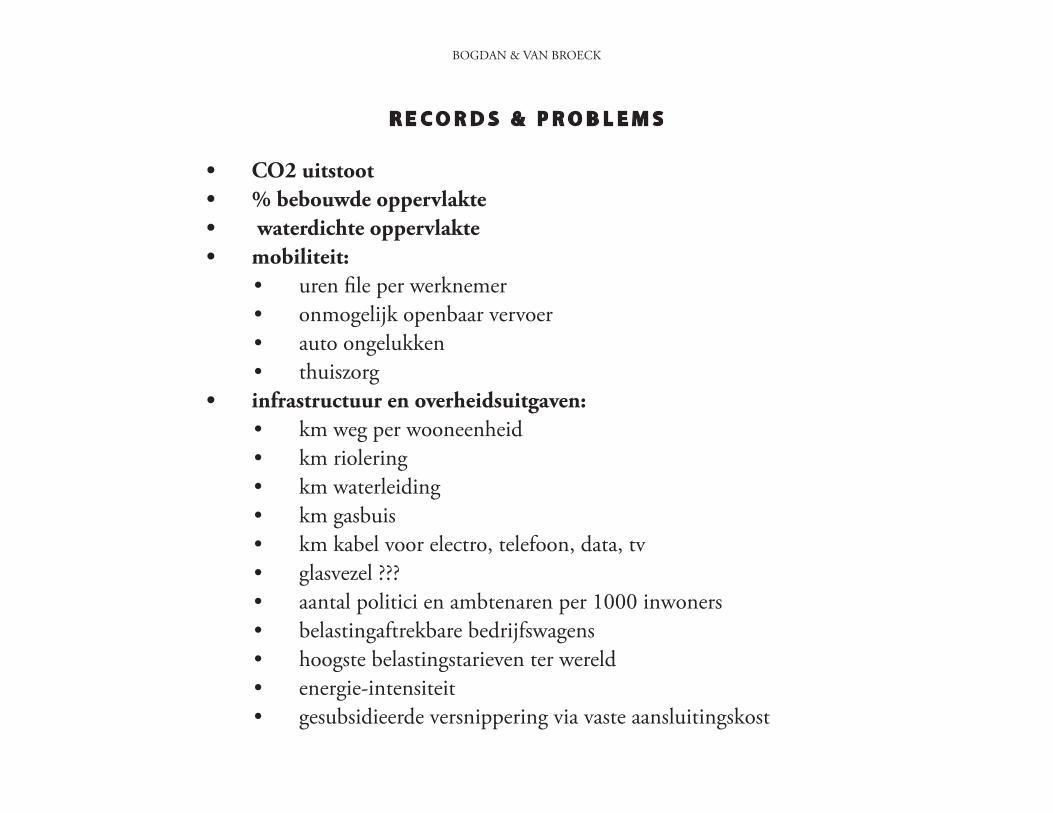
R E C O R D S & P R O B L E M S
• CO2 uitstoot
• % bebouwde oppervlakte
• waterdichte oppervlakte
• mobiliteit:
• uren "le per werknemer
• onmogelijk openbaar vervoer
• auto ongelukken
• thuiszorg
• infrastructuur en overheidsuitgaven :
• km weg per wooneenheid
• km riolering
• km waterleiding
• km gasbuis
• km kabel voor electro, telefoon, data, tv
• glasvezel ???
• aantal politici en ambtenaren per 1000 inwoners
• belastingaftrekbare bedrijfswagens
• hoogste belastingstarieven ter wereld
• energie-intensiteit
• gesubsidieerde versnippering via vaste aansluitingskost
BOGDAN & VAN BROECK
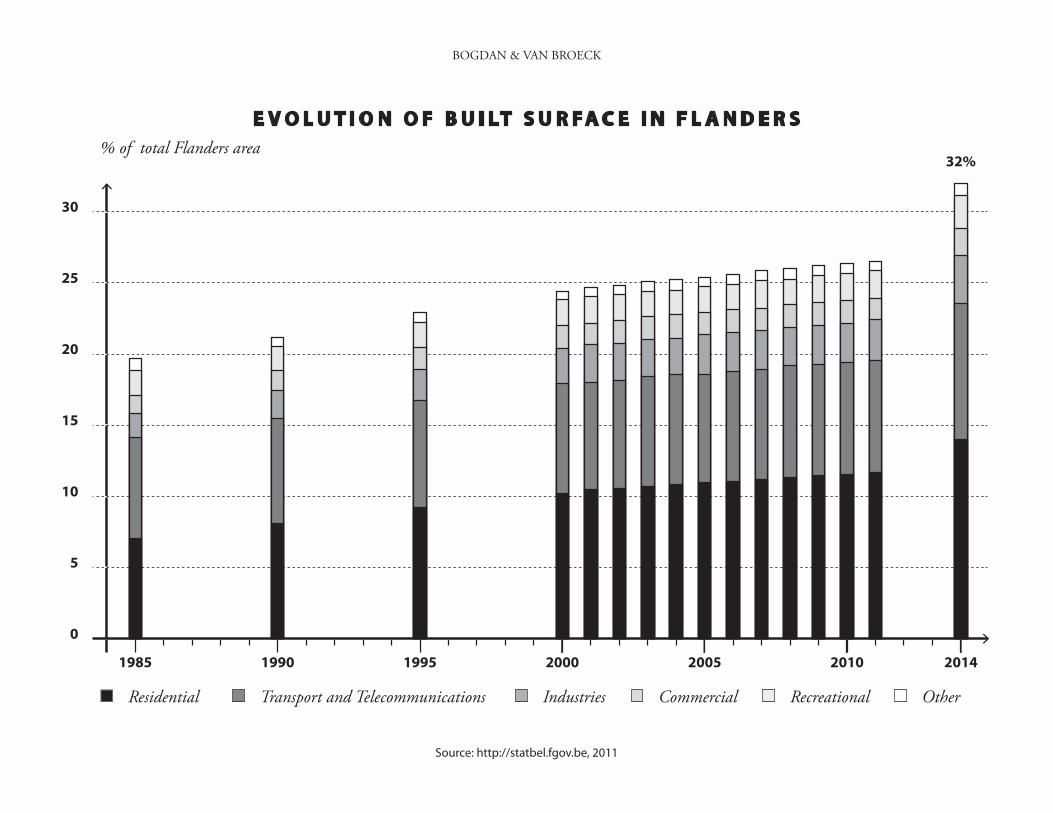
1985
0
5
10
15
20
25
30
1990 1995 2000 2005 2010 2014
32%
Residential
% of total Flanders area
Transport and Telecommunications Industries Commercial Recreational Other
E V O L U T I O N O F B U I LT S U R F A C E I N F L A N D E R S
BOGDAN & VAN BROECK
Source: http://statbel.fgov.be, 2011
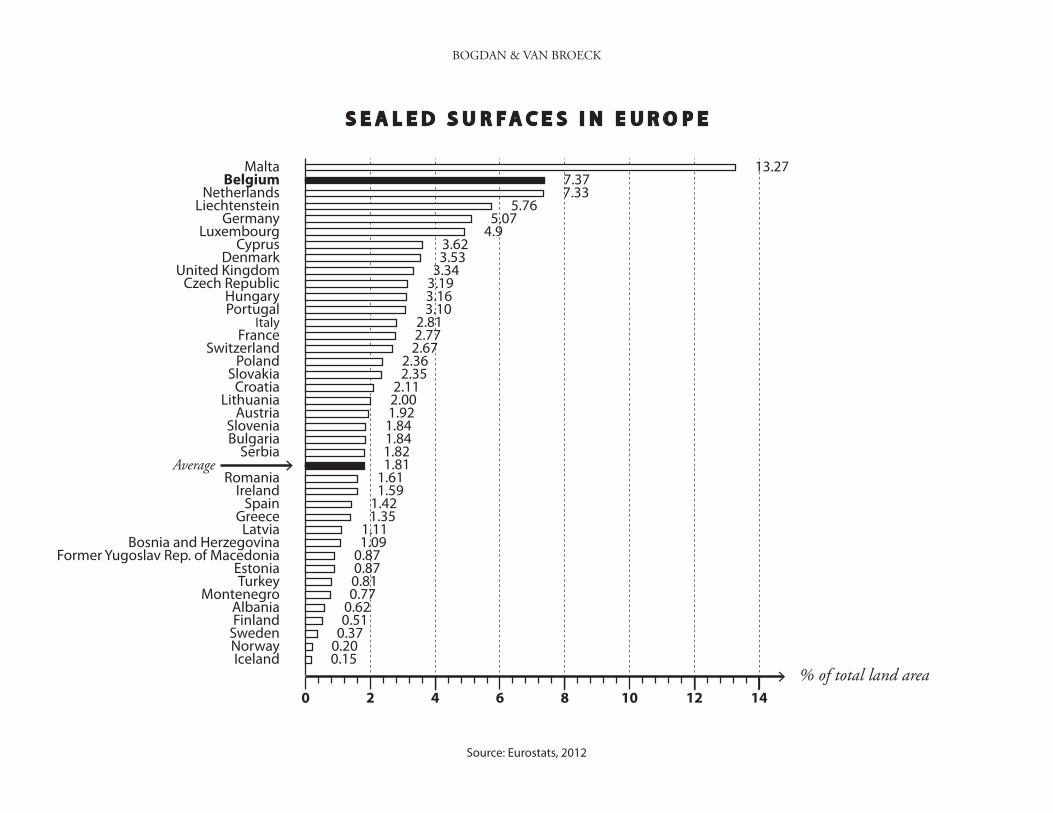
0 2 4 6 8 10 12 14
Malta 13.27Belgium
Netherlands7.377.33
LiechtensteinGermany
LuxembourgCyprus
DenmarkUnited Kingdom
Czech RepublicHungaryPortugal
ItalyFrance
5.765.07
4.93.623.53
3.343.193.163.10
2.812.77
SwitzerlandPoland
SlovakiaCroatia
LithuaniaAustria
SloveniaBulgaria
SerbiaAverage
RomaniaIreland
SpainGreeceLatvia
Former Yugoslav Rep. of MacedoniaEstoniaTurkey
MontenegroAlbaniaFinland
SwedenNorwayIceland
Bosnia and Herzegovina
2.672.362.35
2.112.001.921.841.841.821.81
1.611.59
1.421.35
1.11
0.870.870.810.77
0.620.51
0.370.200.15
1.09
S E A L E D S U R F A C E S I N E U R O P E
% of total land area
BOGDAN & VAN BROECK
Source: Eurostats, 2012
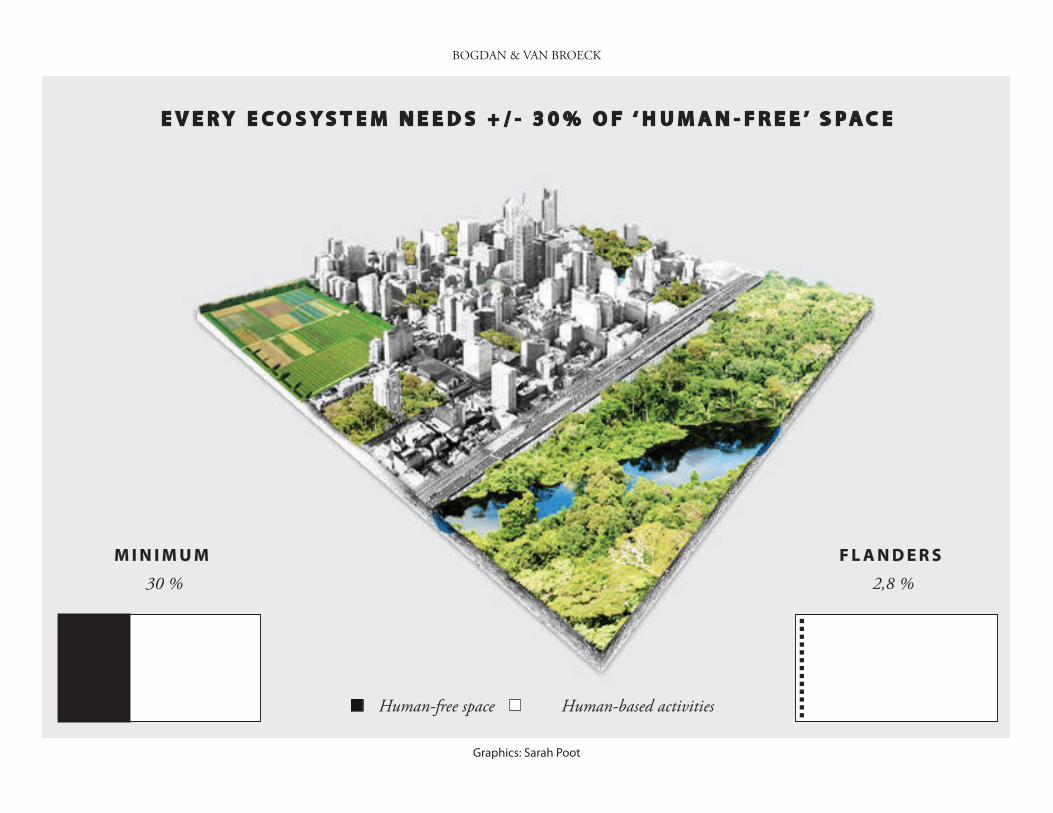
Human-based activities
30 % 2,8 %
M I N I M U M F L A N D E R S
Human-free space
E V E R Y E C O S Y S T E M N E E D S + / - 3 0 % O F ‘ H U M A N - F R E E ’ S P A C E
BOGDAN & VAN BROECK
Graphics: Sarah Poot
BOGDAN & VAN BROECK
BOGDAN & VAN BROECK
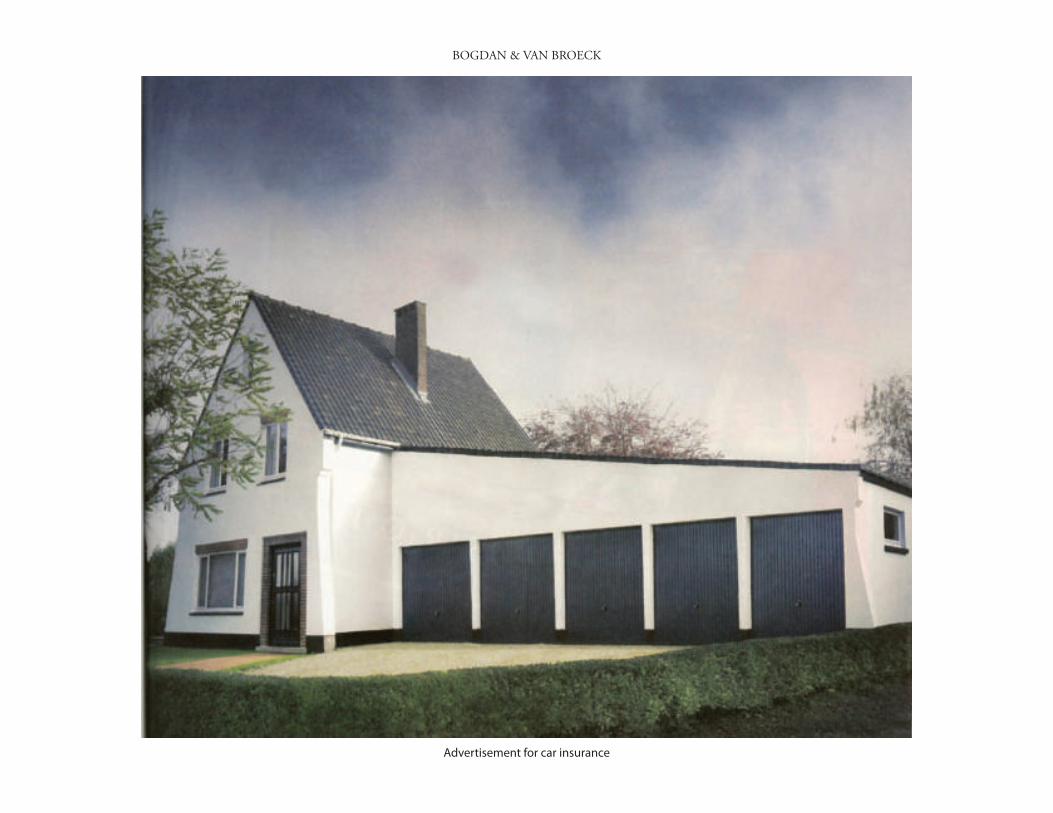
Advertisement for car insurance
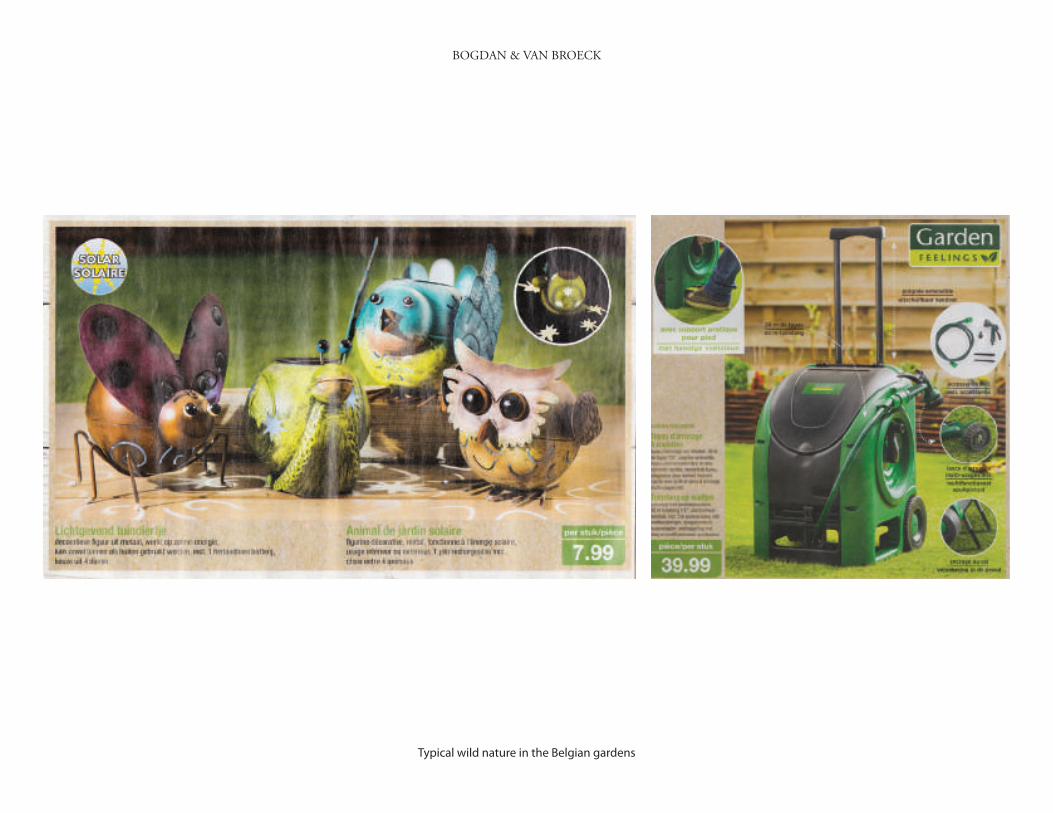
Typical wild nature in the Belgian gardens
BOGDAN & VAN BROECK
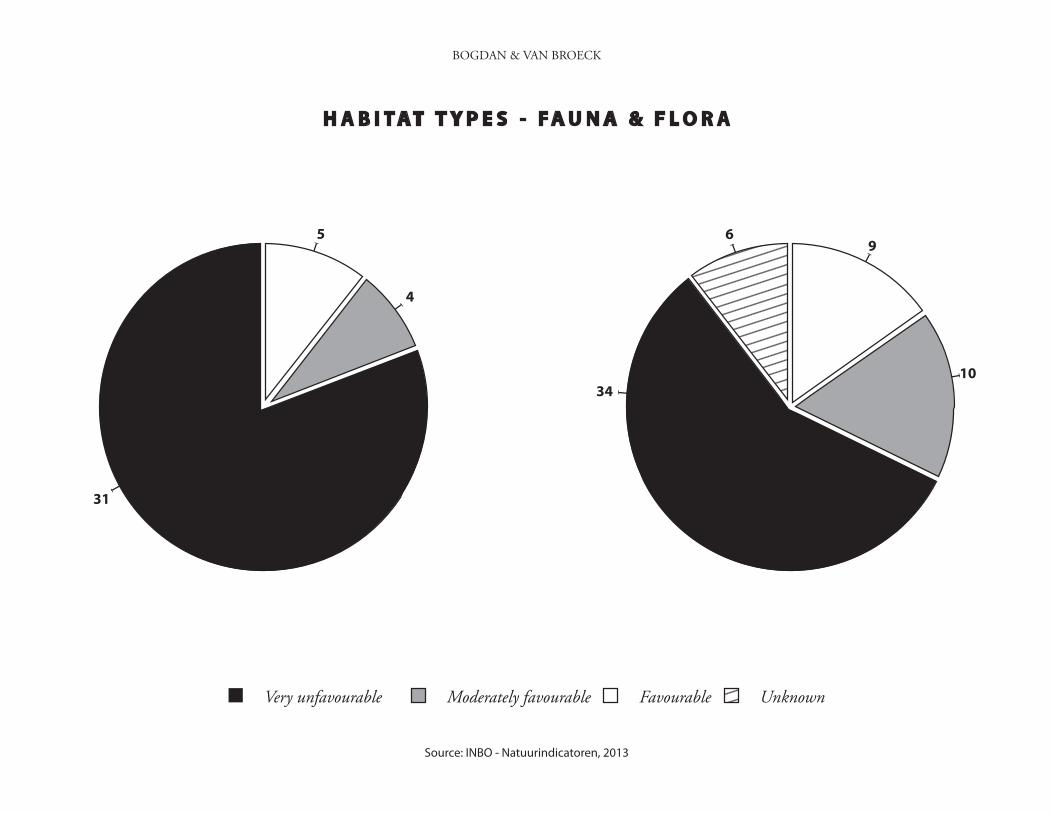
4
5
31
9
10
34
6
Very unfavourable Moderately favourable Favourable Unknown
H A B I T A T T Y P E S - F A U N A & F L O R A
BOGDAN & VAN BROECK
Source: INBO - Natuurindicatoren, 2013
BOGDAN & VAN BROECK
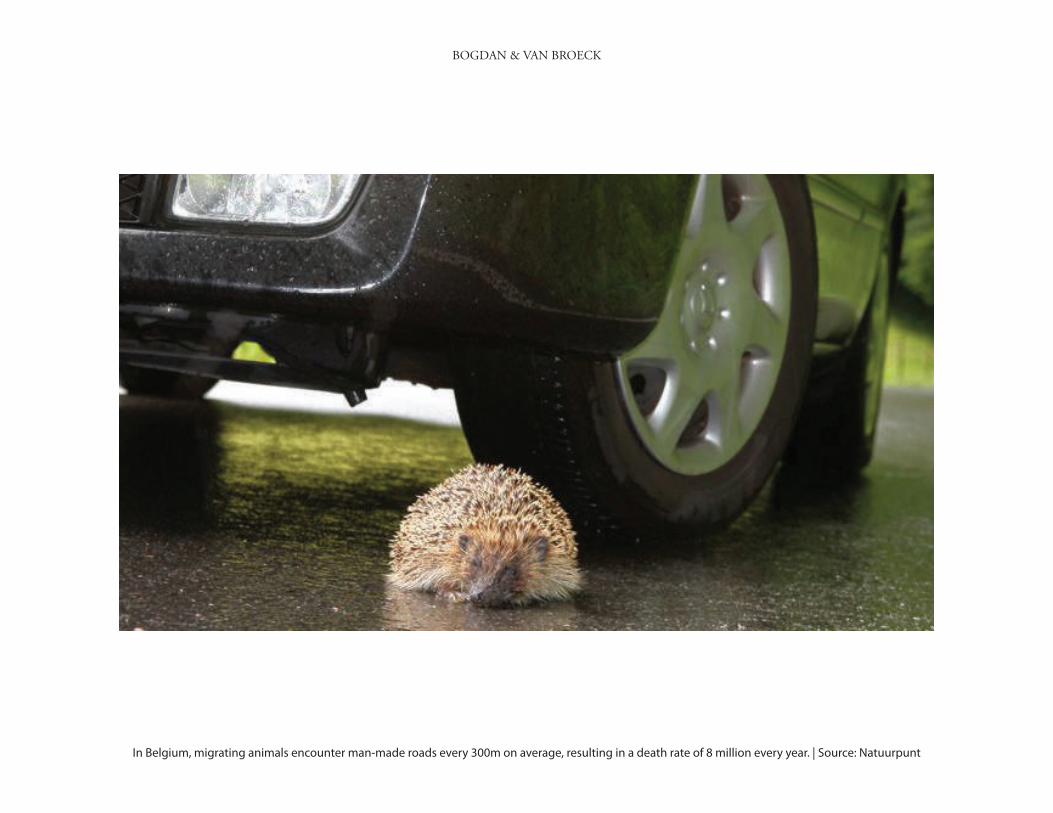
In Belgium, migrating animals encounter man-made roads every 300m on average, resulting in a death rate of 8 million every year. | Source: Natuurpunt
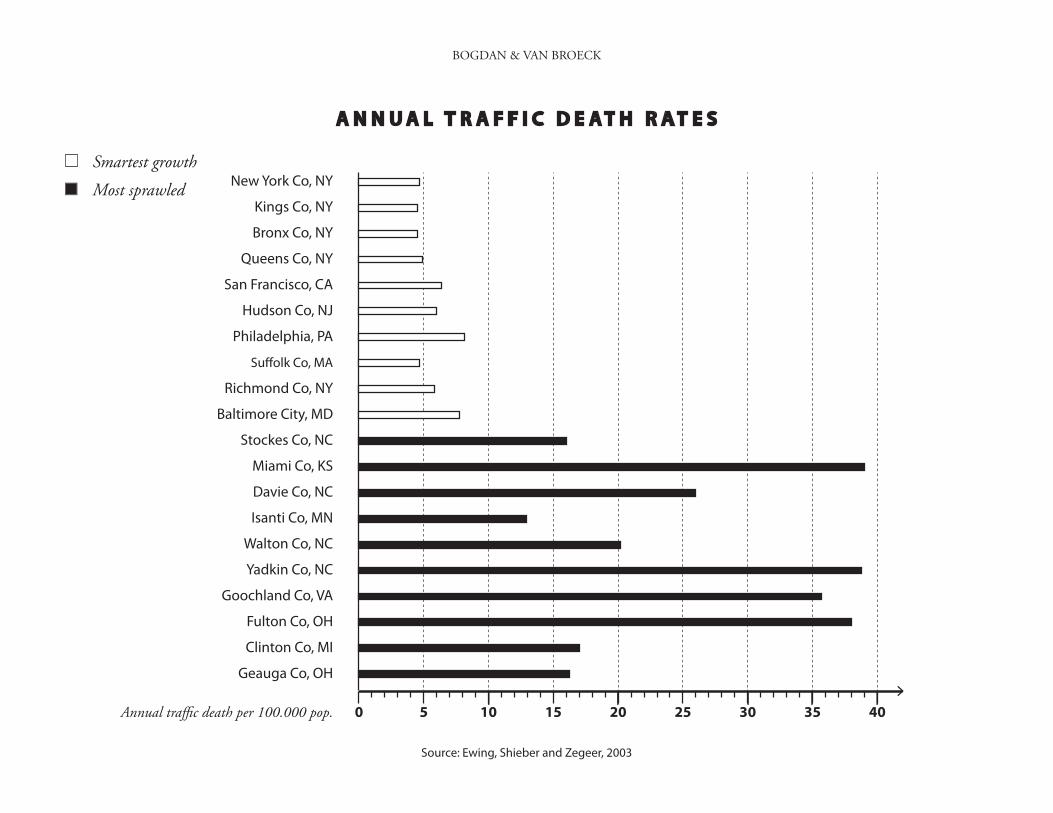
0 5 10 15 20 25 30 35 40
New York Co, NY
Kings Co, NY
Bronx Co, NY
San Francisco, CA
Queens Co, NY
Hudson Co, NJ
Philadelphia, PA
Su"olk Co, MA
Richmond Co, NY
Baltimore City, MD
Stockes Co, NC
Miami Co, KS
Davie Co, NC
Isanti Co, MN
Walton Co, NC
Yadkin Co, NC
Goochland Co, VA
Fulton Co, OH
Clinton Co, MI
Geauga Co, OH
Annual tra!c death per 100.000 pop.
A N N U A L T R A F F I C D E A T H R A T E S
Smartest growth
Most sprawled
BOGDAN & VAN BROECK
Source: Ewing, Shieber and Zegeer, 2003