

Talen
Pages
Wettelijk

7/24/2019 NC Agriculture Statistics
http://slidepdf.com/reader/full/nc-agriculture-statistics 1/2
Nor th Car oli na Deand Con
united states Departmentof Agriculture
Nati onal agri cult uralStatistics Service
When y’a it’s Got to Be
in 2014,
N.C. Ho g In ve nt or yranked 2nd
in the nation
N. C. Ra nk ed 2nd
in t he U .S . i nPoultry & Egg
Cash Receiptsin 2014
N.C.ranked No.1 in
sweet potatoproduction in 2014
NUMBER OF FARMS AND LAND IN FARMS 1
YearNumberof Farms
Land inFarms
AverageSize
Sales Class Estimates
$1,000 –$9,999
$10,000 –$99,000
$100,000 +$1,000 –$9,999
$10,000 –$99,000
$100,000 +
ThousandsThousand
Acres Acres Number Thousand Acres
NORTH CAROLINA
2010 51.5 8,400 163 32,100 10,900 8,500 2,000 1,450 4,9502011 50.8 8,300 163 31,100 11,200 8,500 1,900 1,500 4,9002012 50.2 8,410 168 29,500 12,200 8,500 1,700 1,510 5,2002013 50.0 8,400 168 28,400 13,000 8,600 1,600 1,500 5,3002014 49.5 8,400 170 28,000 12,800 8,700 1,500 1,500 5,400
UNITED STATES
2 010 2 ,15 0 9 15 ,6 60 4 26 1 ,173 ,3 00 6 02 ,74 0 37 3, 48 0 10 3, 35 0 211,19 0 6 01,12 02011 2,131 914, 420 429 1,134, 210 614 ,8 00 3 82, 230 10 0,740 20 4,53 0 60 9,1502012 2,110 914, 60 0 433 1 ,09 0,330 620,6 40 398 ,8 40 96 ,020 195, 34 0 623, 24 02013 2,102 914 ,03 0 435 1 ,0 81, 880 619, 39 0 4 00 ,74 0 95,120 193 ,8 80 625,0302014 2,084 913,000 438 1,054,860 622,150 406,990 90,800 193,820 628,3801 A farm is any establishment from which $1,000 or more of agricultural products were sold or would normally be sold during the year.
NORTH CAROLINA NUMBER OF FARMS AND LAND IN FARMS
Number of Farms Land in Farms
T h o u s a n d F a r m s M
i l l i onA c r
e s
45.0
46.0
47.0
49.0
50.0
52.0
53.0
48.0
51.0
54.0
2007 2008 2009 2010 2011 2012 2013 20148.0
8.4
8.3
8.2
8.1
8.5
8.6
8.7
8.8
8.9
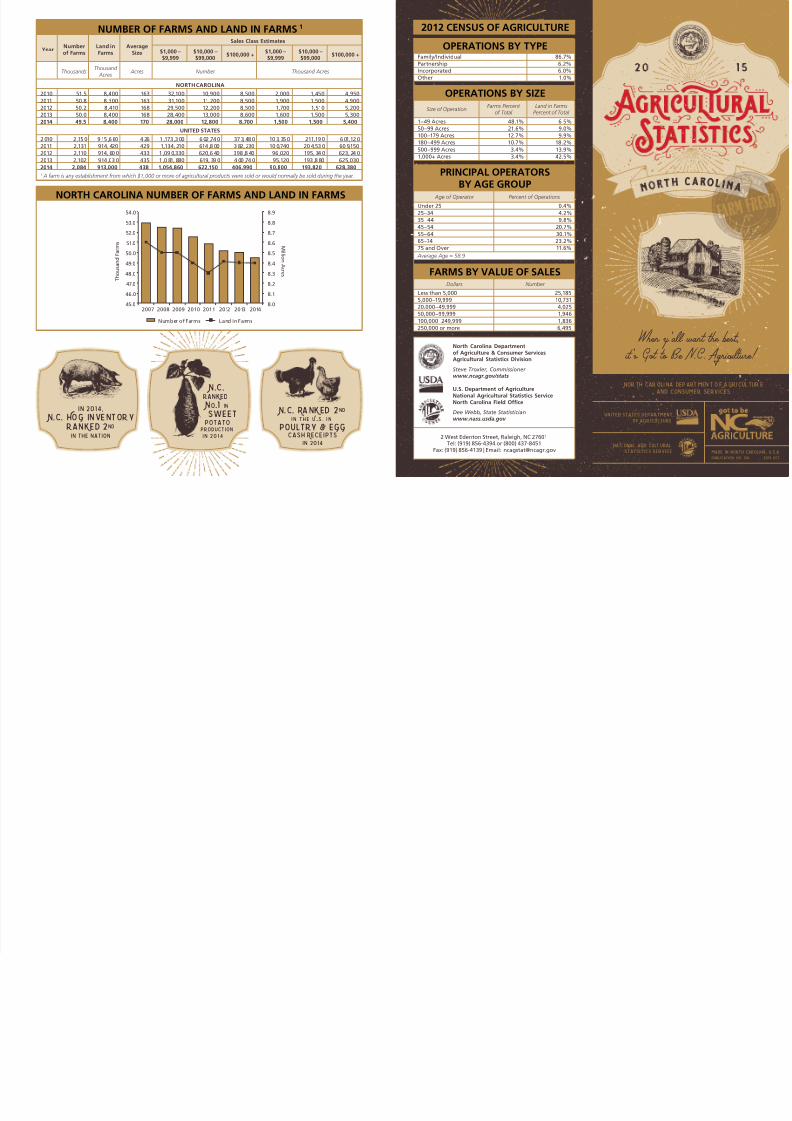
2012 CENSUS OF AGRICULTURE
OPERATIONS BY TYPEFamily/Individual 86.7%Partnership 6.2%Incorporated 6.0%Other 1.0%
OPERATIONS BY SIZE
Size of OperationFarms Percent
of Total Land in Farms
Percent of Total
1–49 Acres 48.1% 6.5%50–99 Acres 21.6% 9.0%
100–179 Acres 12.7% 9.9%180–499 Acres 10.7% 18.2%500–999 Acres 3.4% 13.9%1,000+ Acres 3.4% 42.5%
PRINCIPAL OPERATORSBY AGE GROUP
Age of Operator Percent of Operations
Under 25 0.4%25–34 4.2%35–44 9.8%45–54 20.7%55–64 30.1%65–74 23.2%75 and Over 11.6%
Average Age = 58.9
FARMS BY VALUE OF SALESDollars Number
Less than 5,000 25,1855,000–19,999 10,73120,000–49,999 4,02550,000–99,999 1,946100,000–249,999 1,836250,000 or more 6,495
North Carolina Departmentof Agriculture & Consumer ServicesAgricultural Statistics Division
Steve Troxler, Commissioner
www.ncagr.gov/stats
U.S. Department of AgricultureNational Agricultural Statistics ServiceNorth Carolina Field Office
Dee Webb, State Statisticianwww.nass.usda.gov
2 West Edenton Street, Raleigh, NC 27601Tel: (919) 856-4394 or (800) 437-8451
Fax: (919) 856-4139 | Email: [email protected]
7/24/2019 NC Agriculture Statistics
http://slidepdf.com/reader/full/nc-agriculture-statistics 2/2
NORTH CAROLINA’S RANK IN U.S. AGRICULTU
Rank Item ProductionNC %of US
1 All Tobacco 454 (Mil Lbs) 51.8
Flue-cured Tobacco 451 (Mil Lbs) 78.8
Sweet Potatoes 15,840 (000 Cwt) 53.5
2 All Poultry & Egg Cash Receipts 5,096 (Mil $) 10.6 Hogs & Pigs (12-1-14) 9 (Mil Hd) 13.0 Annual Pig Crop Dec 13 - Nov 14 16.4 (Mil Hd) 14.4 Trout Sold (foodsize) 4.1 (Mil Lbs) 6.7
3 Turkeys 28.5 (Mil Hd) 12.0
4 Strawberries: Fresh Market 154 (000 Cwt) 0.5 Upland Cotton 1 995 (000 Bales) 6.3 Broilers 795 (Mil Hd) 9.3
5 Catfish Sold (foodsize) 4 (Mil Lbs) 2.6 6 Bell Peppers 441 (000 Cwt) 2.9
Burley Tobacco 3 (Mil Lbs) 1.2 Cucumbers: Fresh Market 552 (000 Cwt) 8.0 Peanuts 400 (Mil Lbs) 7.7 Tomatoes: Fresh Market 850 (000 Cwt) 3.1
1 480 Lb. bales.
TOP TEN COUNTIES IN TOTAL FARM CASH RECEICounty Thousand Dollars County
Sampson 1,302,349 Bladen Duplin 1,218,850 Wilkes Union 537,368 Johnston Wayne 495,524 Greene Robeson 483,564 Randolph
1 Includes government payments.
COUNTY CASH RECEIPTS FROM FARM MARKETIIncludes Crops, Livestock & Government Payments
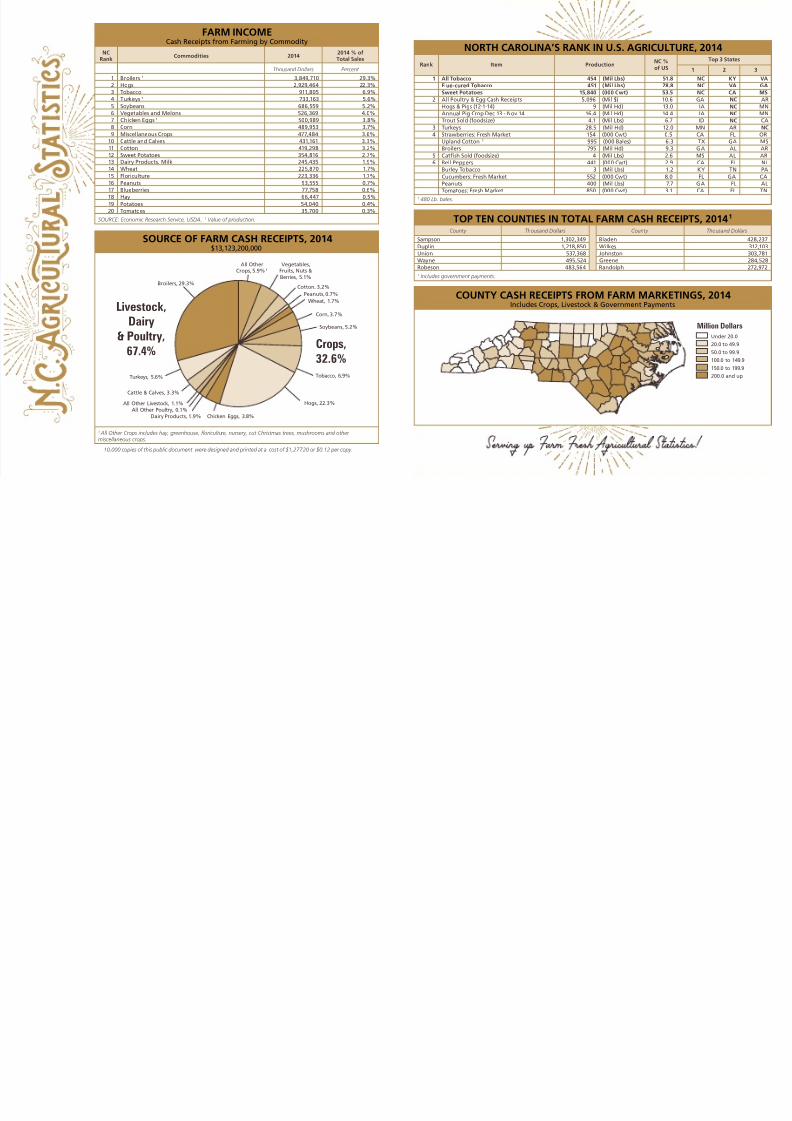
FARM INCOMECash Receipts from Farming by Commodity
NCRank
Commodities 20142014 % ofTotal Sales
Thousand Dollars Percent
1 Broilers 1 3,849,710 29.3%2 Hogs 2,929,464 22.3%3 Tobacco 911,805 6.9%4 Turkeys 1 733,163 5.6%5 Soybeans 686,559 5.2%6 Vegetables and Melons 526,369 4.0%7 Chicken Eggs 1 500,989 3.8%8 Corn 489,953 3.7%9 Miscellaneous Crops 477,484 3.6%
10 Cattle and Calves 431,161 3.3%11 Cotton 419,298 3.2%12 Sweet Potatoes 354,816 2.7%13 Dairy Products, Milk 245,435 1.9%14 Wheat 225,870 1.7%15 Floriculture 223,336 1.7%16 Peanuts 93,555 0.7%17 Blueberries 77,758 0.6%18 Hay 66,447 0.5%19 Potatoes 54,040 0.4%20 Tomatoes 35,700 0.3%
SOURCE: Economic Research Service, USDA. 1 Value of production.
SOURCE OF FARM CASH RECEIPTS, 2014$13,123,200,000
Tobacco, 6.9%
All Other Livestock, 1.1%
Dairy Products, 1.9%
Cattle & Calves, 3.3%
Hogs, 22.3%
All Other Poultry, 0.1%Chicken Eggs, 3.8%
Turkeys, 5.6%
Broilers, 29.3%
Vegetables,Fruits, Nuts &
Berries, 5.1%
Cotton, 3.2%
Corn, 3.7%
Wheat, 1.7%
Peanuts, 0.7%
Soybeans, 5.2%
All OtherCrops, 5.9%
Livestock,
Dairy
& Poultry,
67.4% Crops,
32.6%
1 All Other Crops includes hay, greenhouse, floriculture, nursery, cut Christmas trees, mushrooms and othermiscellaneous crops.
10,000 copies of this public document were designed and printed at a cost of $1,277.20 or $0.12 per copy.
Top Related