Working paper IV - steunpuntbov.be › rapport › Oomsels_WP IV - dimensions of... · Working...
57
Exploring Administrational trust in Flanders: Exploring the dimensions of administrational trust in Flemish public administration Working paper IV Peter Oomsels, Geert Bouckaert & Koen Verhoest
Transcript of Working paper IV - steunpuntbov.be › rapport › Oomsels_WP IV - dimensions of... · Working...
Exploring Administrational trust in Flanders:
Exploring the dimensions of administrational trust in Flemish public administration
Working paper IV
Peter Oomsels, Geert Bouckaert & Koen Verhoest

׀ i ׀
Over ‘Administrational Trust’ Working Papers
In deze Working Papers bespreken we “bestuurlijk vertrouwen” in de Vlaamse overheid. Ze zijn een onderdeel van het onderzoeksproject “Bestuurlijk Vertrouwen” (2012-2015) dat wordt uitgevoerd in het kader van het Steunpunt Bestuurlijke Organisatie – Slagkrachtige Overheid.
In Working Paper I werd bestuurlijk vertrouwen gedefinieerd als “the intentional and behavioural suspension of vulnerability by a trustor boundary spanner on the basis of positive expectations about future actions of a trustee organisation in interorganisational administrative interactions”. Deze definitie is het startpunt voor onze verkenning van de Vlaamse overheid in Working Papers II tot V. De vier leidende vragen voor deze verkenning werden eveneens ontwikkeld in Working Paper I. Elk van deze leidende vragen zal verkend worden in Working Papers II tot V.
Working Paper II: Wat is de rol van bestuurlijk vertrouwen en wantrouwen in de Vlaamse administratie?
Working Paper III: Binnen welke interorganisationele interacties in de
Vlaamse administratie zijn ‘vertrouwensvraagstukken’ prevalent?
Working Paper IV: Wat zijn de dimensies van bestuurlijk vertrouwen in de Vlaamse administratie?
Working Paper V: Wat zijn de bronnen van bestuurlijk vertrouwen en wantrouwen in de Vlaamse administratie?
In Working Papers II tot V vertrekken we van deze vragen om bestuurlijk vertrouwen in de Vlaamse overheid te verkennen op basis van kwantitatieve en kwalitatieve data, die we verzamelden op basis van een onze verkennende vragenlijst (COBRA) en door middel van verkennende interviews met (top)ambtenaren.
׀ ii ׀
About ‘Administrational Trust’ Working Papers
In these Working Papers we are discussing ‘administrational trust’ in the Flemish administration. As such, these papers are part of the output of the research project ‘Administrational Trust’ (2012-2015), which is conducted in the framework of the Policy Research Centre - Governmental Organisation.
In Working Paper I, ‘administrational trust’ was defined as “a subjective evaluation made by boundary spanners regarding their intentional and behavioural suspension of vulnerability on the basis of their expectations of a trustee organisation in particular interorganisational interactions in public administration”. This definition is the starting point for our exploration of the Flemish administration in Working Papers II to V. Furthermore, the four leading questions of this exploration were developed in Working Paper I. Each of these leading questions will be explored in Working Papers II to V.
Working Paper II: What is the role of administrational trust and distrust in the Flemish administration?
Working Paper III: In which interorganisational interactions are administrational ‘trust problems’ prevalent in the Flemish administration?
Working Paper IV: What are the dimensions of administrational trust in the Flemish administration?
Working Paper V: What are the sources of administrational trust and distrust in the Flemish administration?
In Working Papers II to V, we explore administrational trust in the Flemish administration on the basis of these questions, using quantitative data and qualitative data which we collected in 2013 through an exploratory survey (COBRA) and exploratory interviews.
׀ iii ׀
Table of Content
Nederlandstalige samenvatting vii Abstract 1 1. Introduction 2 2. Methodology of this exploratory study 5
> 2.1. Questions and items 5 > 2.1.1. Trustworthiness 7 > 2.1.2. The intended suspension of vulnerability 8 > 2.1.3. Behavioural trust 9 > 2.1.4. Direct question 9 > 2.1.5. Internal consistency 9
3. Exploratory survey: an assessment of the dimensions of trust 11 > 3.1. The Flemish administration 11
> 3.1.1. Distribution 11 > 3.1.2. Descriptive observations 12
> 3.2. Flemish departments and agencies 14 > 3.2.1. Descriptive observations 15 > 3.2.2. Exploring the differences between departments and
agencies 20 > 3.3. Different organisational types in Flemish administration 21
> 3.3.1. Descriptive observations 22 > 3.3.2. Exploring the differences between different organisational
types in Flemish administration 28 > 3.4. Exploring further differences between groups for the
dimensions of trust 30 4. The reciprocal and self-reinforcing characteristics of trust 32
> 4.1. The reciprocal nature of trust 32 > 4.2. The self-reinforcing nature of trust 34
> 4.2.1. Model test : Structural Equation Modelling 35 5. General conclusion: dimensions of trust in Flemish public
administration 40
׀ iv ׀
List of Tables
Table 1: Respondents for quantitative exploration 5 Table 2: Exploratory survey items for dimensions of administrational trust 6 Table 3: Aspects of performance and trustworthiness 7 Table 4: Shapiro-Wilk test of normal distributions for trust dimensions 11 Table 5:Descriptive statistics of dimensions of interorganisational trust in
Flemish administration 13 Table 6:Descriptive statistics of dimensions of interorganisational trust in
Flemish departments and agencies 17 Table 7: Kruskal-Wallis comparison of trust dimensions between
departments and agencies (tied ranks) 20 Table 8:Descriptive statistics of dimensions of interorganisational trust in
Flemish administration, by organisational type 24 Table 9:Kruskal-Wallis comparison of trust dimensions by organisational
types (tied ranks) 28 Table 10:Difference scores for trust of department in their largest agencies
and trust of largest agency in department compared per policy area 34 Table 11: Correlation matrix for CFA and SEM analysis 36 Table 12:Goodness of fit statistics for the structural equation model 38
׀ v ׀
List of figures
Figure 1: The reciprocal and self-reinforcing nature of (dis)trust in interactions 4
Figure 2: Distribution of dimensions of interorganisational trust in Flemish administration 12
Figure 3: Bar chart of mean of dimensions of interorganisational trust in Flemish administration 14
Figure 4: Distribution of dimensions of interorganisational trust in Flemish departments and agencies 16
Figure 5: Bar chart of mean of dimensions of interorganisational trust in Flemish departments and agencies 19
Figure 6: Distribution of dimensions of interorganisational trust in Flemish administration by organisational type 23
Figure 7: Bar chart of mean of dimensions of interorganisational trust in Flemish administration, by organisational type 27
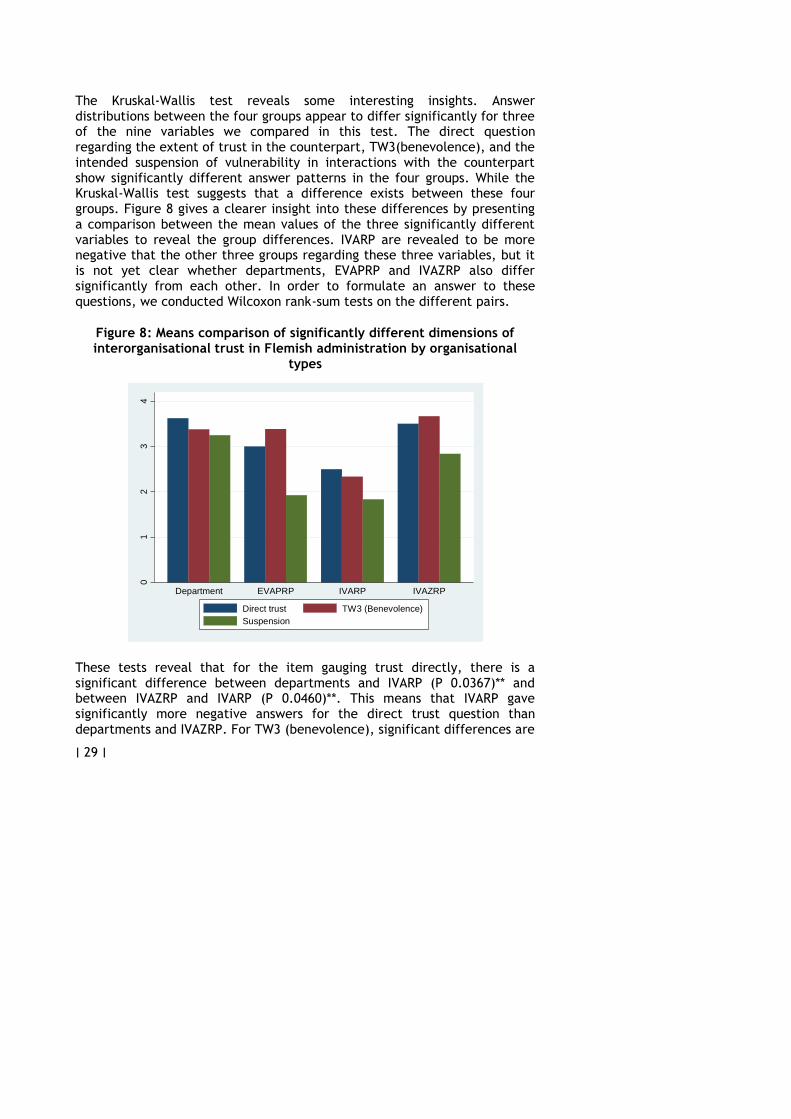
Figure 8: Means comparison of significantly different dimensions of interorganisational trust in Flemish administration by organisational types 29
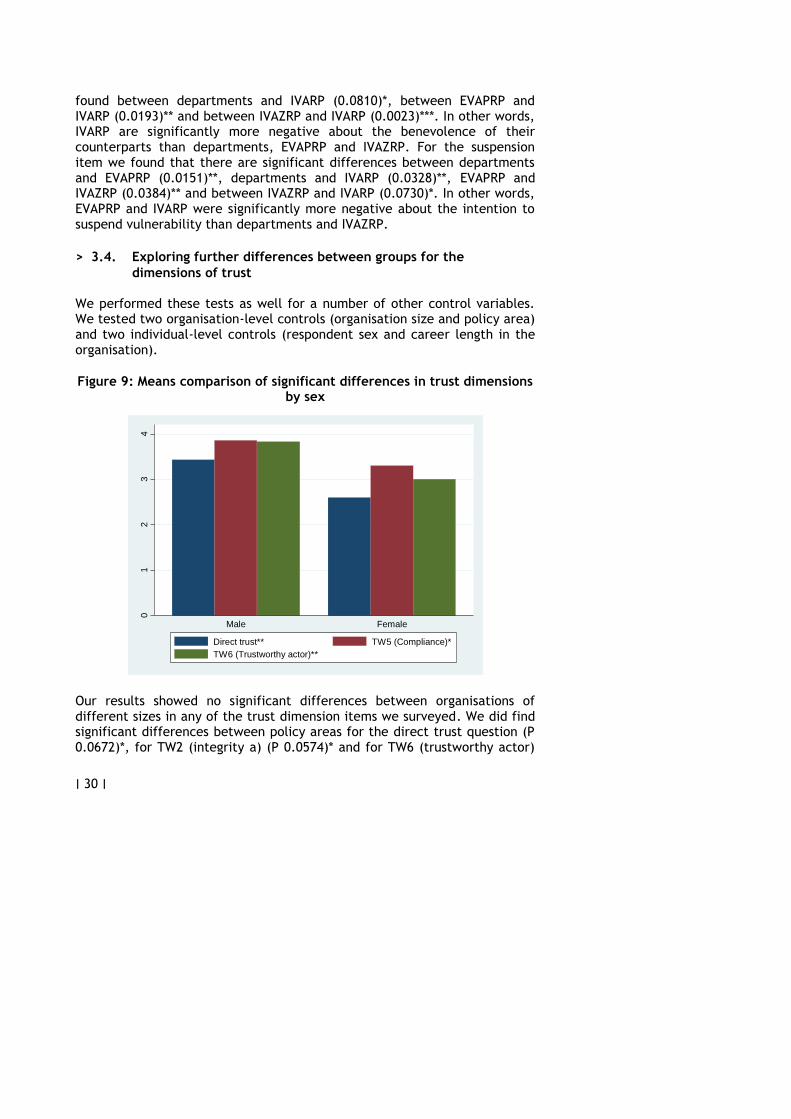
Figure 9: Means comparison of significant differences in trust dimensions by sex 30
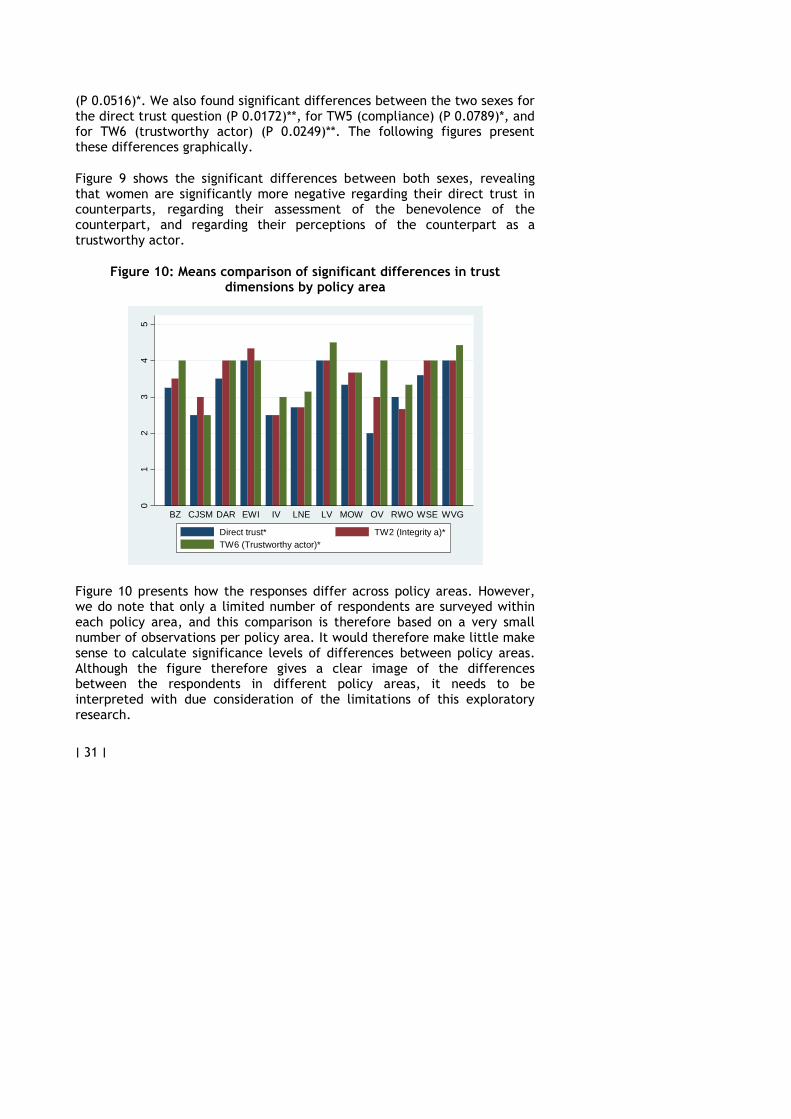
Figure 10: Means comparison of significant differences in trust dimensions by policy area 31
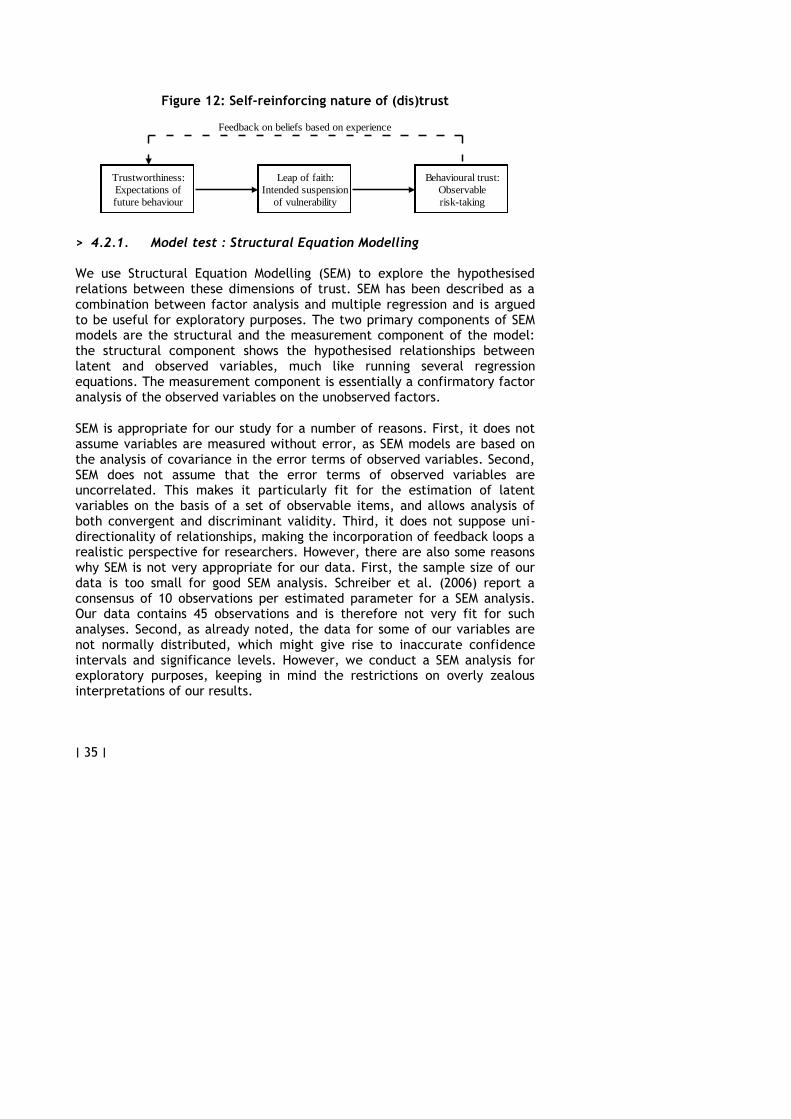
Figure 11: Reciprocal nature of (dis)trust 33 Figure 12: Self-reinforcing nature of (dis)trust 35 Figure 13: Structural equation model of the self-reinforcing nature of
(dis)trust (standardised coefficients) 37


׀ vii ׀
Nederlandstalige samenvatting
Met betrekking tot de verschillende dimensies van bestuurlijk vertrouwen in de Vlaamse administratie identificeerden we drie afzonderlijke dimensies van vertrouwen in de subjectieve evaluatie die ‘boundary spanners’ maken van hun tegenhangers. De gepercipieerde betrouwbaarheid, de bereidheid om een ‘leap of faith’ te maken en kwetsbaarheid tijdelijk op te schorten op basis van onvolledige informatie, en observeerbaar risico-nemend gedrag in interorganisationele interacties worden gezien als drie dimensies van vertrouwen in interorganisationele interacties, die ook als dusdanig geanalyseerd dienen te worden. We stelden verder dat de relaties tussen deze drie dimensies ertoe kunnen leiden dat zowel vertrouwen als wantrouwen wederkerige en zichzelf versterkend fenomenen zijn in interorganisationele interacties.
**Algemene conclusies**
Op basis van verkennend survey-onderzoek concludeerden we dat de meting van vertrouwen als bereidheid om zichzelf kwetsbaar op te stellen een consistent lagere score kreeg toegekend dan de andere dimensies. Departementen bleken significant meer bereid te zijn dan agentschappen om deze ‘leap of faith’ te maken, en hun kwetsbaarheid met betrekking tot een cruciale taak opzij te zetten in interacties met het grootste agentschap uit hun beleidsdomein. IVARP bleken significant negatiever over de benevolentie van hun tegenpartij dan departementen, EVAPRP en IVAZRP. Met betrekking tot de ‘leap of faith’ stelden we vast dat EVAPRP en IVARP significant negatiever waren dan departementen en IVAZRP. Een analyse van controlevariabelen wees op significante verschillen tussen beleidsdomeinen voor de directe vraag die we stelden over vertrouwen, voor TW2 (gepercipieerde integriteit a) en TW6 (…is een betrouwbare actor). Mannelijke respondenten bleken verder significant positiever te zijn met betrekking tot de directe vraag over vertrouwen, TW5 (compliance) en TW6 (… is een betrouwbare actor).
We hebben bovendien empirisch verkend in welke mate de theorie van wederkerig vertrouwen geldig is in de door ons verzamelde data. Een eenvoudige analyse deed uitschijnen dat het gemiddelde verschil tussen het vertrouwen van departementen in hun grootste agentschap, en het vertrouwen van de grootste agentschappen in hun departementen, minder is dan een half punt op een vijfpuntenschaal. We stellen dat dit een eerste
׀ viii ׀
bewijs kan vormen voor de wederkerigheid van bestuurlijk vertrouwen in de Vlaamse administratie.
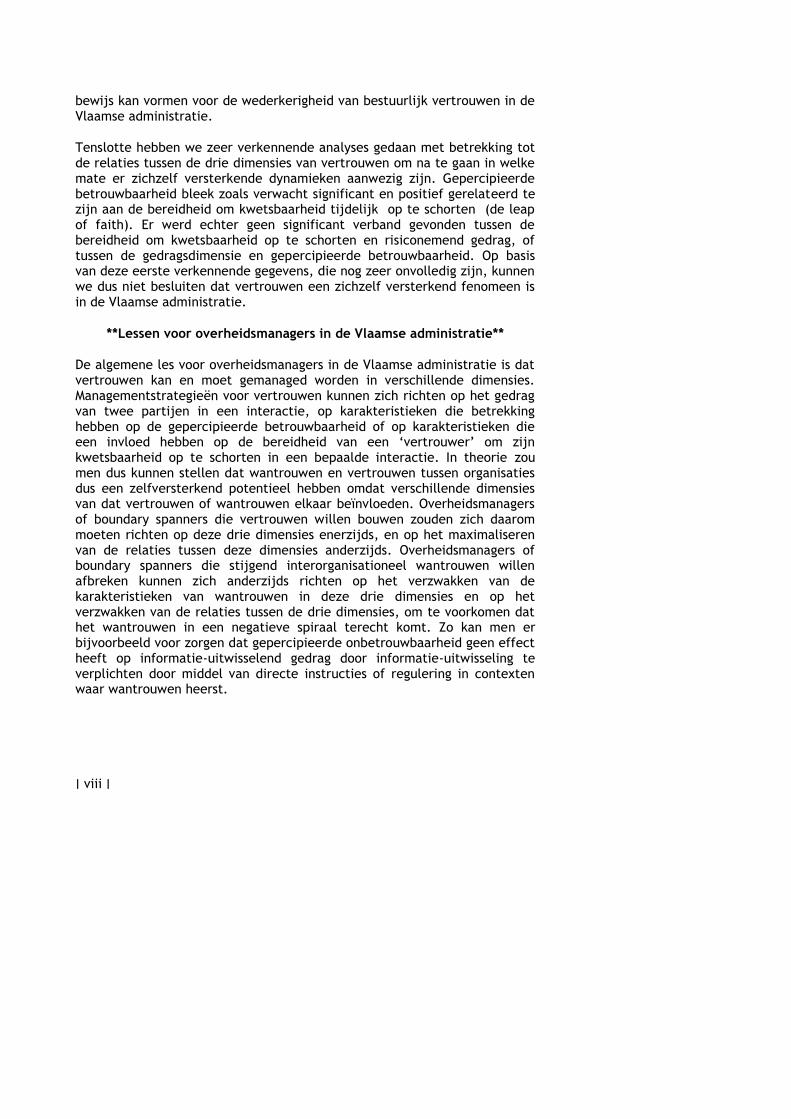
Tenslotte hebben we zeer verkennende analyses gedaan met betrekking tot de relaties tussen de drie dimensies van vertrouwen om na te gaan in welke mate er zichzelf versterkende dynamieken aanwezig zijn. Gepercipieerde betrouwbaarheid bleek zoals verwacht significant en positief gerelateerd te zijn aan de bereidheid om kwetsbaarheid tijdelijk op te schorten (de leap of faith). Er werd echter geen significant verband gevonden tussen de bereidheid om kwetsbaarheid op te schorten en risiconemend gedrag, of tussen de gedragsdimensie en gepercipieerde betrouwbaarheid. Op basis van deze eerste verkennende gegevens, die nog zeer onvolledig zijn, kunnen we dus niet besluiten dat vertrouwen een zichzelf versterkend fenomeen is in de Vlaamse administratie.
**Lessen voor overheidsmanagers in de Vlaamse administratie**
De algemene les voor overheidsmanagers in de Vlaamse administratie is dat vertrouwen kan en moet gemanaged worden in verschillende dimensies. Managementstrategieën voor vertrouwen kunnen zich richten op het gedrag van twee partijen in een interactie, op karakteristieken die betrekking hebben op de gepercipieerde betrouwbaarheid of op karakteristieken die een invloed hebben op de bereidheid van een ‘vertrouwer’ om zijn kwetsbaarheid op te schorten in een bepaalde interactie. In theorie zou men dus kunnen stellen dat wantrouwen en vertrouwen tussen organisaties dus een zelfversterkend potentieel hebben omdat verschillende dimensies van dat vertrouwen of wantrouwen elkaar beïnvloeden. Overheidsmanagers of boundary spanners die vertrouwen willen bouwen zouden zich daarom moeten richten op deze drie dimensies enerzijds, en op het maximaliseren van de relaties tussen deze dimensies anderzijds. Overheidsmanagers of boundary spanners die stijgend interorganisationeel wantrouwen willen afbreken kunnen zich anderzijds richten op het verzwakken van de karakteristieken van wantrouwen in deze drie dimensies en op het verzwakken van de relaties tussen de drie dimensies, om te voorkomen dat het wantrouwen in een negatieve spiraal terecht komt. Zo kan men er bijvoorbeeld voor zorgen dat gepercipieerde onbetrouwbaarheid geen effect heeft op informatie-uitwisselend gedrag door informatie-uitwisseling te verplichten door middel van directe instructies of regulering in contexten waar wantrouwen heerst.
׀ ix ׀
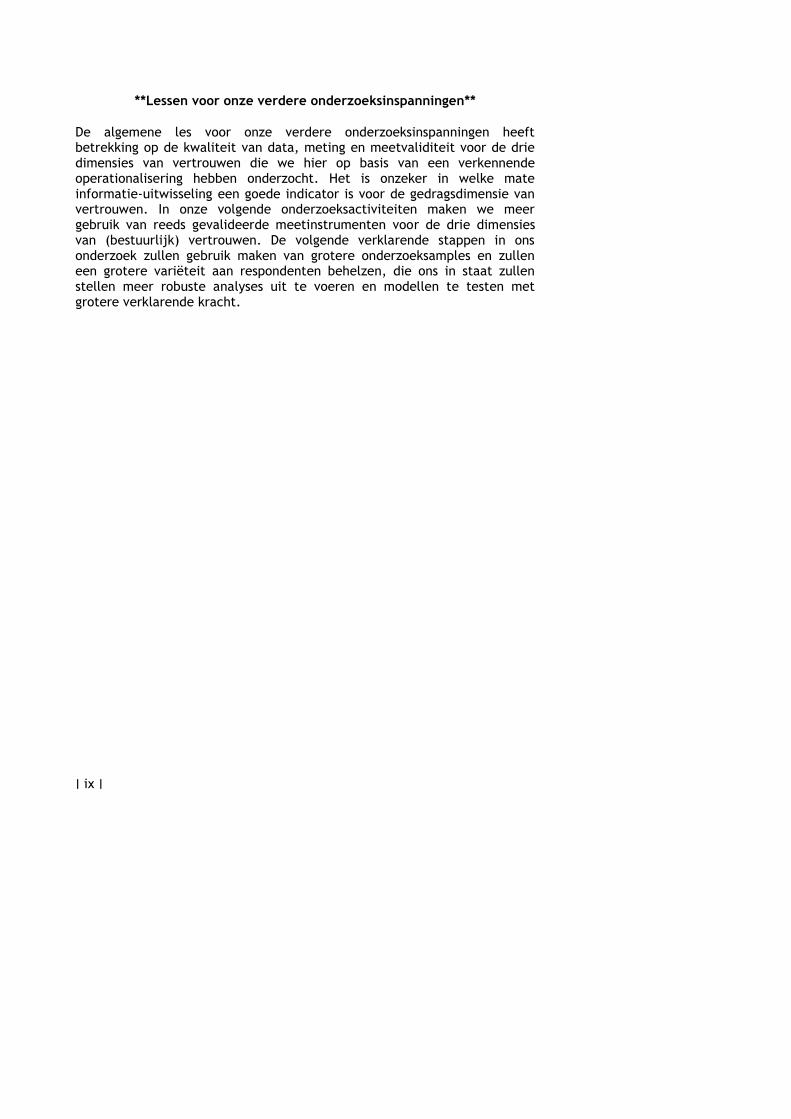
**Lessen voor onze verdere onderzoeksinspanningen**
De algemene les voor onze verdere onderzoeksinspanningen heeft betrekking op de kwaliteit van data, meting en meetvaliditeit voor de drie dimensies van vertrouwen die we hier op basis van een verkennende operationalisering hebben onderzocht. Het is onzeker in welke mate informatie-uitwisseling een goede indicator is voor de gedragsdimensie van vertrouwen. In onze volgende onderzoeksactiviteiten maken we meer gebruik van reeds gevalideerde meetinstrumenten voor de drie dimensies van (bestuurlijk) vertrouwen. De volgende verklarende stappen in ons onderzoek zullen gebruik maken van grotere onderzoeksamples en zullen een grotere variëteit aan respondenten behelzen, die ons in staat zullen stellen meer robuste analyses uit te voeren en modellen te testen met grotere verklarende kracht.

׀ x ׀
׀ 1 ׀
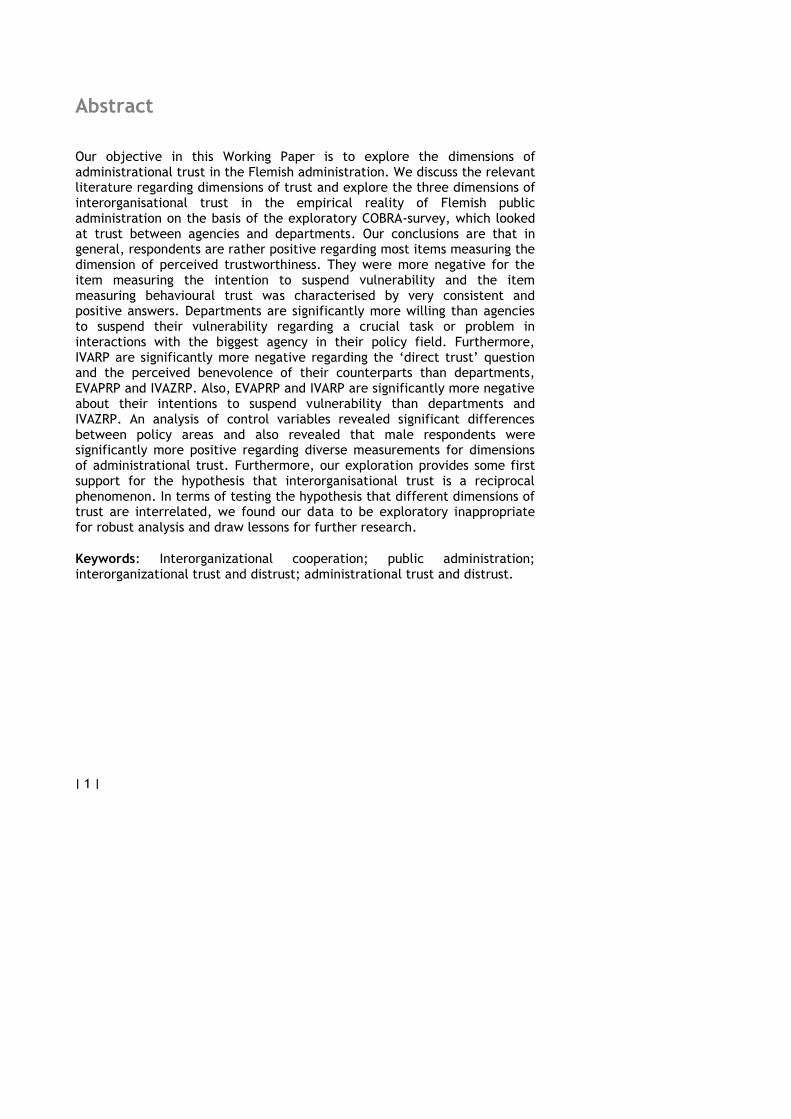
Abstract
Our objective in this Working Paper is to explore the dimensions of administrational trust in the Flemish administration. We discuss the relevant literature regarding dimensions of trust and explore the three dimensions of interorganisational trust in the empirical reality of Flemish public administration on the basis of the exploratory COBRA-survey, which looked at trust between agencies and departments. Our conclusions are that in general, respondents are rather positive regarding most items measuring the dimension of perceived trustworthiness. They were more negative for the item measuring the intention to suspend vulnerability and the item measuring behavioural trust was characterised by very consistent and positive answers. Departments are significantly more willing than agencies to suspend their vulnerability regarding a crucial task or problem in interactions with the biggest agency in their policy field. Furthermore, IVARP are significantly more negative regarding the ‘direct trust’ question and the perceived benevolence of their counterparts than departments, EVAPRP and IVAZRP. Also, EVAPRP and IVARP are significantly more negative about their intentions to suspend vulnerability than departments and IVAZRP. An analysis of control variables revealed significant differences between policy areas and also revealed that male respondents were significantly more positive regarding diverse measurements for dimensions of administrational trust. Furthermore, our exploration provides some first support for the hypothesis that interorganisational trust is a reciprocal phenomenon. In terms of testing the hypothesis that different dimensions of trust are interrelated, we found our data to be exploratory inappropriate for robust analysis and draw lessons for further research.
Keywords: Interorganizational cooperation; public administration; interorganizational trust and distrust; administrational trust and distrust.

׀ 2 ׀
1. Introduction
We have defined administrational trust as “a subjective evaluation made by boundary spanners regarding their intentional and behavioural suspension of vulnerability on the basis of their expectations of a trustee organisation in particular interorganisational interactions in public administration” (Oomsels and Bouckaert 2013). This definition indicates that the subjective evaluation made by boundary spanners, which lies at the basis of administrational trust, consists of multiple dimensions.
First, some of the definitions refer to trust as an expectation, others conceptualize trust as an attitude and still others formulate trust as behaviour. Therefore, some authors have argued that the phenomenon of trust has multiple dimensions (McEvily and Tortoriello 2011; Lewis and Weigert 1985). The first dimension of trust is often discussed as the trustor’s perception of the trustworthiness of the trustee, which is argued to consist of positive expectations of the trustee’s ability, benevolence and integrity in a specific relation (Colquitt et al. 2007; Dietz 2011; Li 2011). Ability refers to the perceived skills, competences and other characteristics that allow the trustee to have influence in some domain. Benevolence is the belief that the trustee wants to do good for reasons that are not completely egocentric, and integrity refers to the belief that the trustee adheres to a set of values and principles that are acceptable to the trustor (Mayer et al. 1995). The dimension of perceived trustworthiness therefore refers to the trustors’ expectations about the trustee regarding these characteristics.
On the basis of their perceptions about the trustworthiness of a trustee, trustors can suspend the existing unpredictability, ambiguity and complexity in interactions, encouraging their willingness to accept vulnerability in a certain relation (Edelenbos and Klijn 2007; Zucker 1986). This is the second dimension of trust. The trustor makes a ‘leap of faith’ on the basis of incomplete information through which risk and vulnerability are suspended (Möllering 2006). This vulnerability is derived from “uncertainty regarding the motives, intentions, and prospective actions of others on whom [actors] depend” (Kramer 1999: 571). The notion of suspension means that a trusting actor is never sure whether he is making the right choice or not. A trusting actor knows that uncertainty, vulnerability and risk are present, but suspends this knowledge on the basis of good reasons “as if it were favorably resolved” (Möllering 2006:115). A trustor suspends vulnerability, not because they don’t know it is present, but because they have good reasons to believe that the trustee will not abuse the suspended vulnerability.
׀ 3 ׀
There is a third dimension of trust that needs to be taken into account as it has been argued that “trust is only involved when the trusting expectation makes a difference to a decision; otherwise what we have is a simple hope” (Luhmann 1979, p. 24). Lewis and Weigert (1985:971) note that “the practical significance of trust lies in the social action it underwrites”. Behavioural trust can therefore be seen as observable risk-taking behaviour in a relational exchange process. As Currall and Judge (1995) explain, such behaviour can result from a trustor’ s willingness to accept vulnerability, but this is not necessarily the case. Risk-taking behaviour can also be present in the absence of willingness to take risks (such as when risk-taking behaviour is enforced by regulations), or it can be absent in the presence of willingness to take risk (such as when risk-taking behaviour is forbidden or obstructed by regulations).
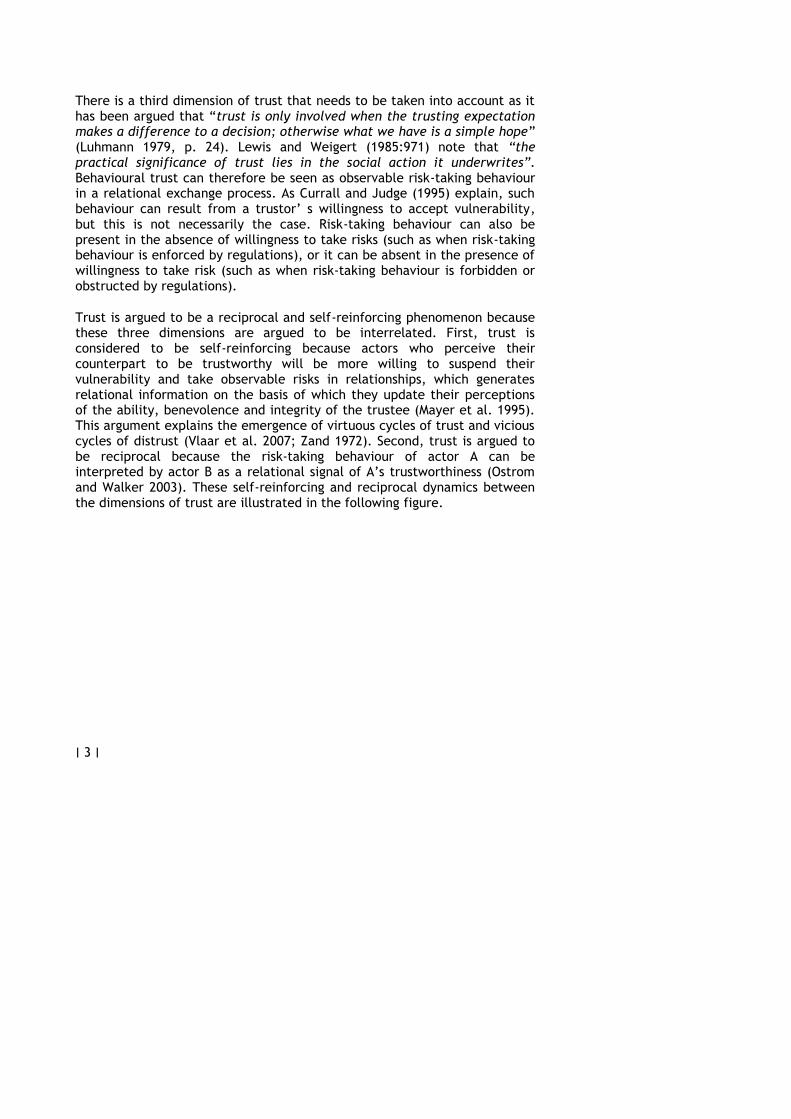
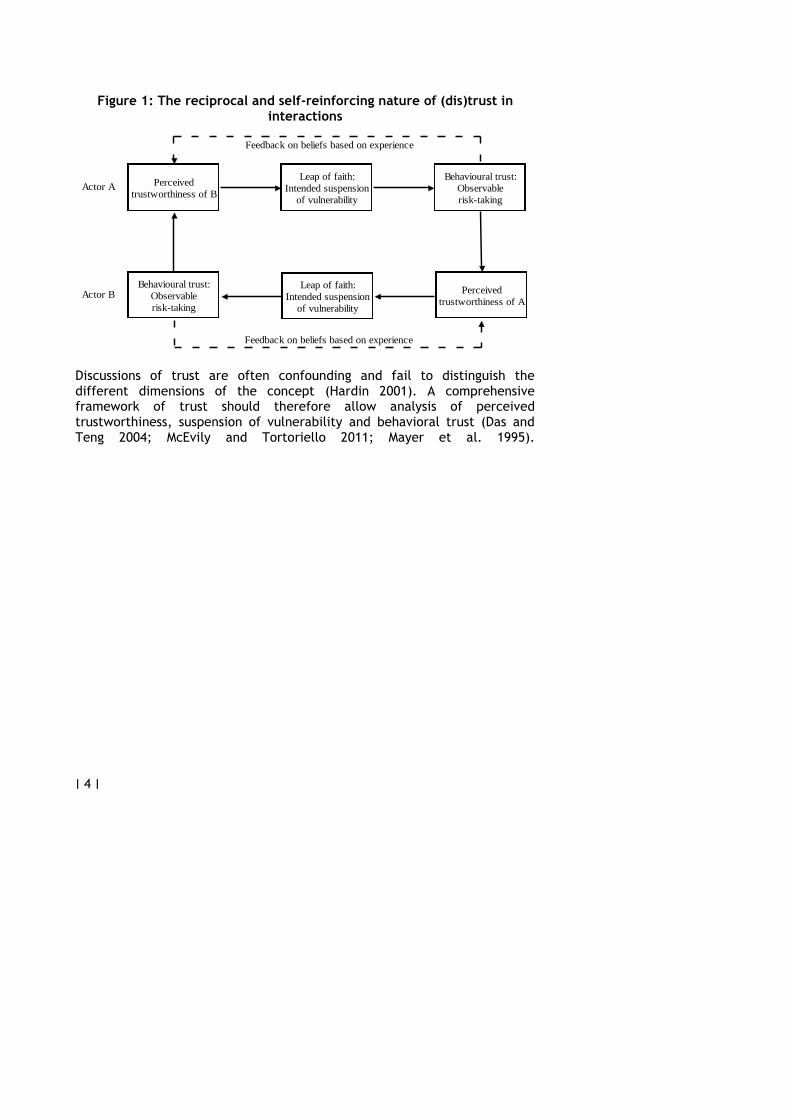
Trust is argued to be a reciprocal and self-reinforcing phenomenon because these three dimensions are argued to be interrelated. First, trust is considered to be self-reinforcing because actors who perceive their counterpart to be trustworthy will be more willing to suspend their vulnerability and take observable risks in relationships, which generates relational information on the basis of which they update their perceptions of the ability, benevolence and integrity of the trustee (Mayer et al. 1995). This argument explains the emergence of virtuous cycles of trust and vicious cycles of distrust (Vlaar et al. 2007; Zand 1972). Second, trust is argued to be reciprocal because the risk-taking behaviour of actor A can be interpreted by actor B as a relational signal of A’s trustworthiness (Ostrom and Walker 2003). These self-reinforcing and reciprocal dynamics between the dimensions of trust are illustrated in the following figure.
׀ 4 ׀
Figure 1: The reciprocal and self-reinforcing nature of (dis)trust in interactions
Leap of faith:
Intended suspension
of vulnerability
Feedback on beliefs based on experience
Perceived
trustworthiness of B
Leap of faith:
Intended suspension
of vulnerability
Behavioural trust:
Observable
risk-taking
Feedback on beliefs based on experience
Perceived
trustworthiness of A
Behavioural trust:
Observable
risk-taking
Actor A
Actor B
Discussions of trust are often confounding and fail to distinguish the different dimensions of the concept (Hardin 2001). A comprehensive framework of trust should therefore allow analysis of perceived trustworthiness, suspension of vulnerability and behavioral trust (Das and Teng 2004; McEvily and Tortoriello 2011; Mayer et al. 1995).

׀ 5 ׀
2. Methodology of this exploratory study
In this section, we will conduct a first exploration of the occurrence and interrelationships between these three dimensions of trust in the Flemish administration. For this, we use quantitative data collected in the 2013 wave of the COBRA survey in Flanders. The following paragraph introduces the variables regarding the dimensions of trust that were incorporated in the survey.
> 2.1. Questions and items
On the basis of this conceptual framework, we investigated these dimensions of interorganisational trust in the Flemish government using exploratory quantitative analysis.
The following table shows the distribution of respondents in the obtained sample.
Table 1: Respondents for quantitative exploration
Policy Area DEP EVAPR
P IVARP
IVAZRP
Total
Administrative Affairs (BZ) 1
3 4 Culture, Youth, Sports & Media (CJSM)
1 1 1 3 6
Services for General Government Policy (DAR)
1
1 2
Economy, Science & Innovation (EWI) 1 1
1 3 International Flanders (iV) 1
1 2
Environment, Nature & Energy (LNE) 2 2 3 7 Agriculture & Fishery (LV) 1
1 2
Mobility & Public Works (MOW) 2
1 3 Education & Training (OV)
1 1
Spatial Planning, Housing & Immovable Heritage (RWO)
1 1 2 4
Work & Social Economy (WSE) 1 2
1 4 Welfare, Public Health & Family (WVG)
1 2 2 2 7
Total 8 12 6 19 45

׀ 6 ׀
The total response rate for this survey was satisfactory at 69%. The response rate for departments was 61%. The response rate for agencies reached 71%.
A set of items was prepared in which senior civil servants of Flemish departments were requested to answer questions about their relation with the biggest agency of their policy field, while senior civil servants in Flemish agencies were requested to answer questions regarding their relationship with the departments of their policy fields. The original survey items are included in the annex to this Working Paper in their Dutch formulation. The exploratory questions regarding the dimensions of interorganisational trust in the Flemish administration are presented in Table 2.
Table 2: Exploratory survey items for dimensions of administrational trust
Items
Trust (direct)
The level of trust by my organisation in […] is high
Trust-worthiness
[…] has enough specialised knowledge and resources to perform their tasks well (Ability)
[…] tries hard to be fair in dealings with others (Integrity a)
[…] is flexible in accommodating to us if special problems or needs arise (Benevolence)
[…] consistently meet their promises towards us (Integrity b)
[…] will comply with the framework of formal rules and procedures that are relevant for our relation (Compliance)
In general, […] is a trustworthy actor (Trustworthy actor)
Suspension We would be comfortable giving […] a task or problem which was critical to us, even if we could not monitor their actions.
Behaviour Our organisation is sharing information with […]
Respondents answered these questions on a five-point scale, which was coded in our analysis as follows:
- “Completely disagree” (1)
- “Rather disagree” (2)
- “Neither disagree nor agree” (3)
׀ 7 ׀
- “Rather agree” (4)
- “Completely agree” (5)
We elaborate on the different items used for our exploration in the following paragraphs.
> 2.1.1. Trustworthiness
Perceived trustworthiness was assessed through one direct and five indirect items.
The direct item asks the straightforward question whether respondents consider their counterpart to be a trustworthy actor. The indirect items are based on the index proposed by Mayer and Davis (1999), which McEvily and Tortoriello (2011) described as an example of a well-developed instrument with high validity. However, we only adopted a limited selection of the items proposed by Mayer and Davis (1999). Regarding concerns with survey parsimony and considering the exploratory objective of this study, a verbatim replication of Mayer and Davis’ (1999) instrument was not appropriate in the COBRA survey.
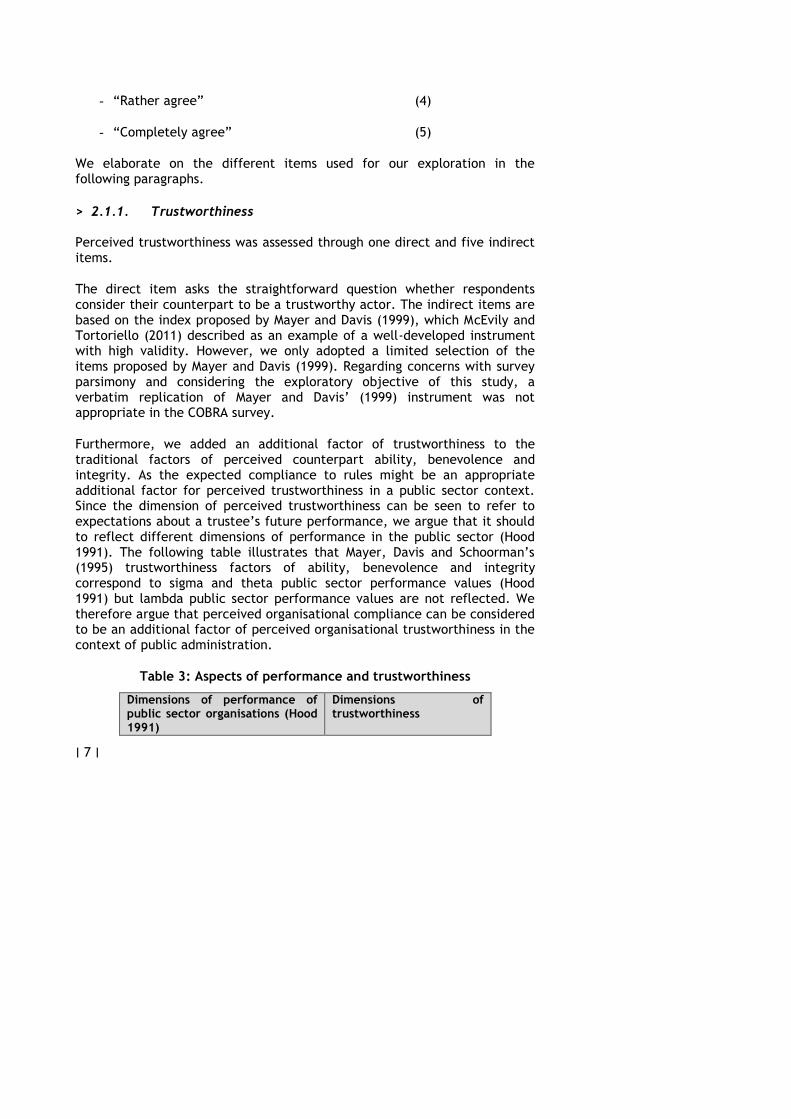
Furthermore, we added an additional factor of trustworthiness to the traditional factors of perceived counterpart ability, benevolence and integrity. As the expected compliance to rules might be an appropriate additional factor for perceived trustworthiness in a public sector context. Since the dimension of perceived trustworthiness can be seen to refer to expectations about a trustee’s future performance, we argue that it should to reflect different dimensions of performance in the public sector (Hood 1991). The following table illustrates that Mayer, Davis and Schoorman’s (1995) trustworthiness factors of ability, benevolence and integrity correspond to sigma and theta public sector performance values (Hood 1991) but lambda public sector performance values are not reflected. We therefore argue that perceived organisational compliance can be considered to be an additional factor of perceived organisational trustworthiness in the context of public administration.
Table 3: Aspects of performance and trustworthiness
Dimensions of performance of public sector organisations (Hood 1991)
Dimensions of trustworthiness

׀ 8 ׀
Sigma: Product values
Ability (Mayer et al. 1995)
Theta: Process values
Integrity and Benevolence (Mayer et al. 1995)
Lambda: Regime values
Compliance (suggested addition)
The validity of our partial adoption of the Mayer and Davis’ (1999) instrument needs to be re-examined due the non-verbatim nature of its replication we conducted here. A reliability analysis of the scale of the six items reveals a Cronbach’s alpha value of 0.867, representing good internal consistency and supporting. An exploratory factor analysis reveals that the six variables all load on a single factor with at least .7459, except for TW1(ability), which falls below the .4 threshold with a factor score of only .2805. We will retain this item in our exploratory descriptive discussion because of its theoretical relevance, but it will be omitted in the final section of this paper in which we use confirmatory factor analysis in a structural equation model to estimate the relationships between trust dimensions1.
> 2.1.2. The intended suspension of vulnerability
The intended suspension of vulnerability is gauged in the survey through the adoption of one item. This item reflects an actor’s willingness to suspend their vulnerability in the relation with their counterpart at face value. The formulation of this item is based based on several questionnaire items that are suggested to tap into actor’s intention to suspend vulnerability by authors such as Curral and Judge (1995) and Cummings and Bromily (1996). While this single-item assessment of the suspension of vulnerability is therefore relatively simple and straightforward we consider it to present an effective exploratory probe into this sensitive but elusive central dimension of interorganisational trust.
1 While our previous discussion suggests that trustworthiness is made up out of four distinct factors (ability, benevolence, integrity and compliance), a confirmatory factor analysis of each of these factors is not possible at this stage of our research because this would require at least three measured variables per factor. However, regarding the exploratory objective of this study, this is no major concern.
׀ 9 ׀
> 2.1.3. Behavioural trust
Acts of trusting can be considered to be what Coleman (1990) defined as ‘trust problems’, which involve the following characteristics2. Such ‘trust problems’ are identified as strategic interactions in which the trustor places some kind of resources at the disposal of trustee, who has the possibility of either honouring or abusing trust. Secondly, the trustor prefers to grant trust if the trustee honours it, but regrets granting trust if the trustee abuses it. Third, there is no binding agreement that protects the trustor from the possibility that the trustee will abuse trust. Finally, there is a time lag between the decision of the trustor and that of the trustee.
On the basis of preliminary discussions with officials in the Flemish administration, we considered the exchange of information between agencies and departments to be an appropriate behavioural operationalisation of such a trust problem. This approach also appeared in private sector research (for instance Becerra and Gupta 2003). We do stress that this is only one choice among many potentially interesting behavioural manifestations of trust, made on the basis of both pragmatic considerations and preliminary discussions with civil servants. Nonetheless, we consider the adopted item to possess sufficiently strong face validity for the exploratory objectives of this study.
> 2.1.4. Direct question
In addition to these indirect items, we also added a direct question to the survey asking respondents to which extent they agreed with the statement that the level of trust they have in their counterparts was high.
> 2.1.5. Internal consistency
An internal consistency analysis for these nine items reveals a Cronbach’s alpha value of 0.877, which represents good internal consistency and therefore suggests that the items measure a single construct. While our
2 ‘Trust problems’ are not necessarily ‘problematic’. Much like ‘research problems’, the word ‘problem’ indicates a puzzle on the basis of which relevant insights regarding a question can be extracted. As such, ‘trust problems’ could also be termed ‘trust puzzles’ to avoid the connotation of a ‘problematic’ situation. However, keeping this remark in mind, we will stay true to Coleman’s original term and refer to ‘trust problems’ throughout this text.
׀ 10 ׀
discussion proposes that trust consists of three different dimensions, confirmatory factor analyses are not possible at this stage, as these analyses require at least three measured items per factor. Our exploratory survey framework does not meet this requirement.
׀ 11 ׀
3. Exploratory survey: an assessment of the
dimensions of trust
> 3.1. The Flemish administration
> 3.1.1. Distribution
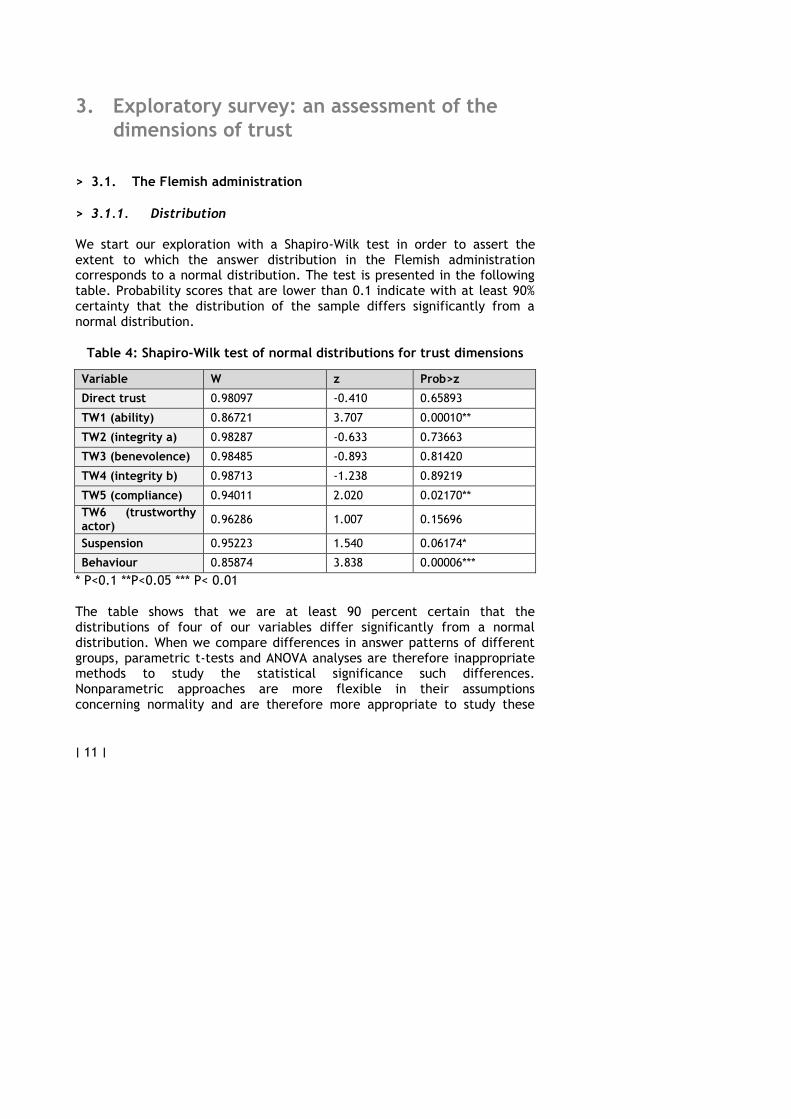
We start our exploration with a Shapiro-Wilk test in order to assert the extent to which the answer distribution in the Flemish administration corresponds to a normal distribution. The test is presented in the following table. Probability scores that are lower than 0.1 indicate with at least 90% certainty that the distribution of the sample differs significantly from a normal distribution.
Table 4: Shapiro-Wilk test of normal distributions for trust dimensions
Variable W z Prob>z
Direct trust 0.98097 -0.410 0.65893
TW1 (ability) 0.86721 3.707 0.00010**
TW2 (integrity a) 0.98287 -0.633 0.73663
TW3 (benevolence) 0.98485 -0.893 0.81420
TW4 (integrity b) 0.98713 -1.238 0.89219
TW5 (compliance) 0.94011 2.020 0.02170**
TW6 (trustworthy actor)
0.96286 1.007 0.15696
Suspension 0.95223 1.540 0.06174*
Behaviour 0.85874 3.838 0.00006***
* P<0.1 **P<0.05 *** P< 0.01
The table shows that we are at least 90 percent certain that the distributions of four of our variables differ significantly from a normal distribution. When we compare differences in answer patterns of different groups, parametric t-tests and ANOVA analyses are therefore inappropriate methods to study the statistical significance such differences. Nonparametric approaches are more flexible in their assumptions concerning normality and are therefore more appropriate to study these
׀ 12 ׀
variables and will therefore be used to assess the significance of group differences in this paper.
> 3.1.2. Descriptive observations
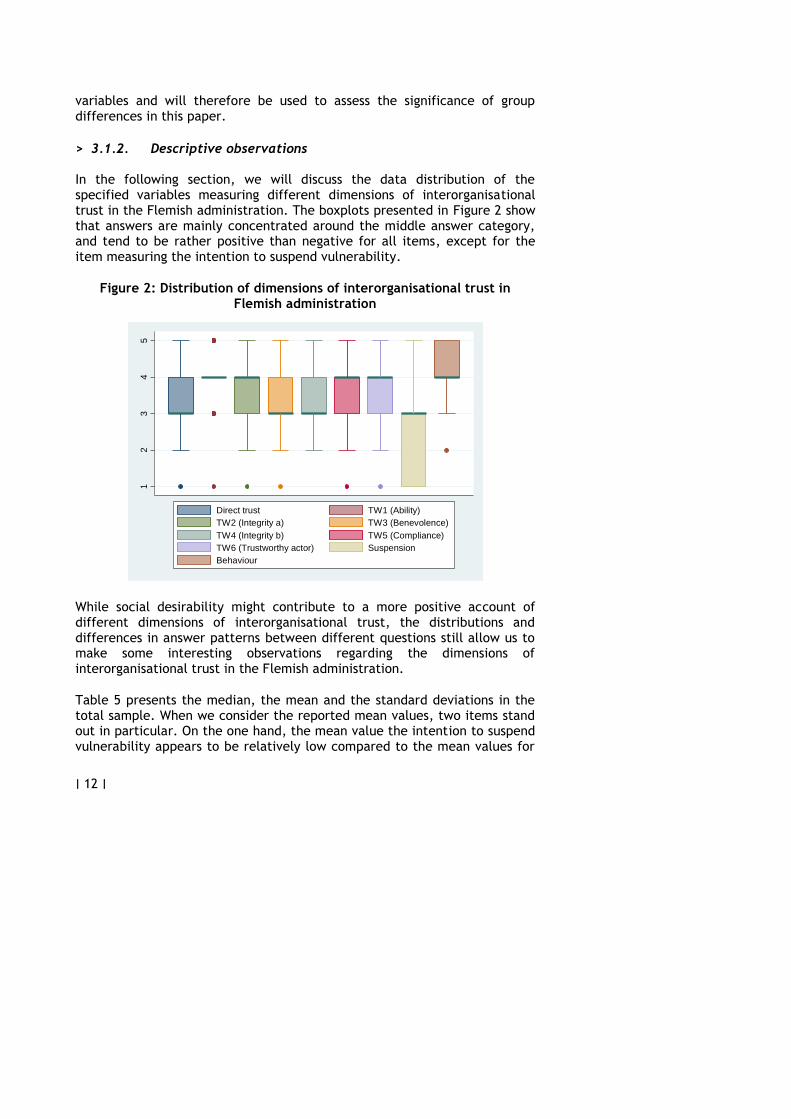
In the following section, we will discuss the data distribution of the specified variables measuring different dimensions of interorganisational trust in the Flemish administration. The boxplots presented in Figure 2 show that answers are mainly concentrated around the middle answer category, and tend to be rather positive than negative for all items, except for the item measuring the intention to suspend vulnerability.
Figure 2: Distribution of dimensions of interorganisational trust in Flemish administration
12
34
5
Direct trust TW1 (Ability)
TW2 (Integrity a) TW3 (Benevolence)
TW4 (Integrity b) TW5 (Compliance)
TW6 (Trustworthy actor) Suspension
Behaviour
While social desirability might contribute to a more positive account of different dimensions of interorganisational trust, the distributions and differences in answer patterns between different questions still allow us to make some interesting observations regarding the dimensions of interorganisational trust in the Flemish administration.
Table 5 presents the median, the mean and the standard deviations in the total sample. When we consider the reported mean values, two items stand out in particular. On the one hand, the mean value the intention to suspend vulnerability appears to be relatively low compared to the mean values for

׀ 13 ׀
the other items we surveyed. The average answer of respondents in the sample was situated between the “rather disagree” and “neither disagree/agree” answer categories. Interestingly, the standard deviation for this item also had the highest relative value, indicating relatively large differences in respondents’ answers to this question. This was already clear from the boxplot in Figure 2, which shows large variance in the collected responses and indicates also a relative dominance of lower response values.
Table 5:Descriptive statistics of dimensions of interorganisational trust in Flemish administration
On the other hand, the mean score for the behavioural dimension of interorganisational trust was relatively high compared to the other items
Dimensions of trust in counterpart N p50 mean sd
Direct The level of trust by my organisation in […] is high
45 3 3.244444 .9571633
Trust-worthiness
[…] has enough specialised knowledge and resources to perform their tasks well (Ability)
45 4 4 .7687061
[…] tries hard to be fair in dealings with others (Integrity a)
45 4 3.444444 .9666144
[…] is flexible in accommodating to us if special problems or needs arise (Benevolence)
45 3 3.355556 .8830617
[…] consistently meet their promises towards us (Integrity b)
45 3 3.333333 .8257228
[…] will comply with the framework of formal rules and procedures that are relevant for our relation (Compliance)
45 4 3.733333 .83666
In general, […] is a trustworthy actor (Trustworthy actor)
45 4 3.644444 .9571633
Suspension
We would be comfortable giving […] a task or problem which was critical to us, even if we could not monitor their actions.
45 3 2.511111 1.198905
Behaviour Our organisation is sharing information with […]
45 4 4.355556 .712089
׀ 14 ׀
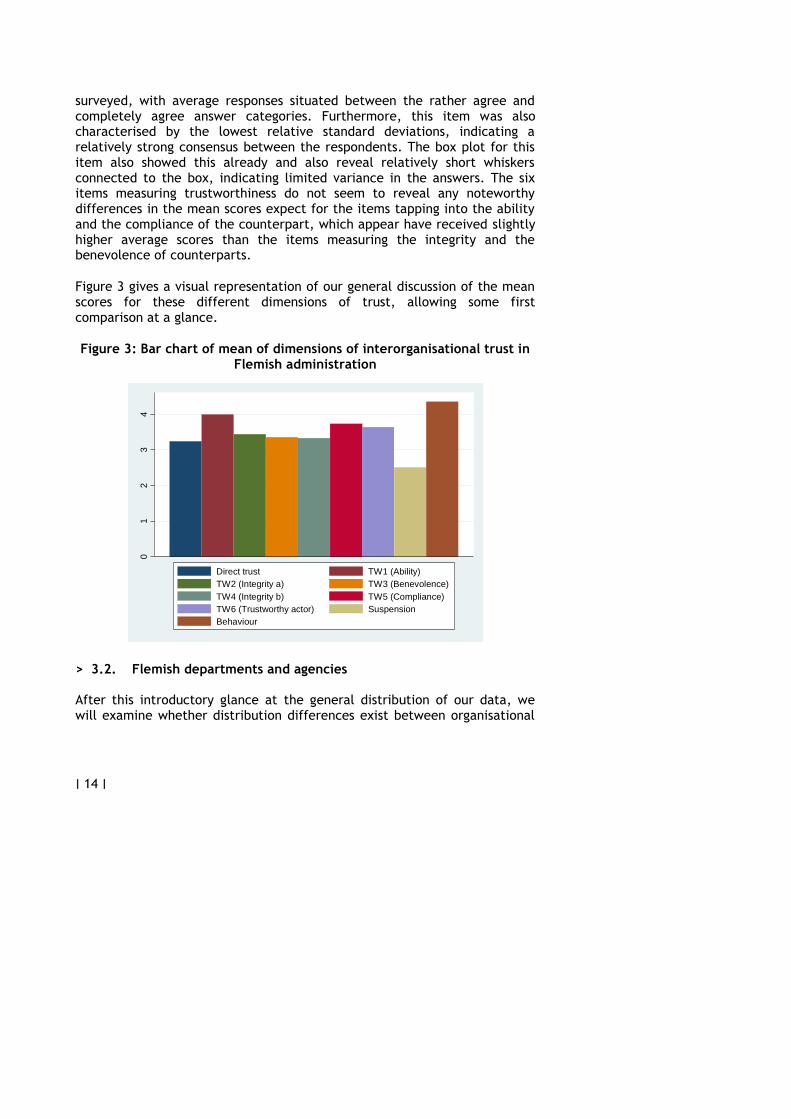
surveyed, with average responses situated between the rather agree and completely agree answer categories. Furthermore, this item was also characterised by the lowest relative standard deviations, indicating a relatively strong consensus between the respondents. The box plot for this item also showed this already and also reveal relatively short whiskers connected to the box, indicating limited variance in the answers. The six items measuring trustworthiness do not seem to reveal any noteworthy differences in the mean scores expect for the items tapping into the ability and the compliance of the counterpart, which appear have received slightly higher average scores than the items measuring the integrity and the benevolence of counterparts.
Figure 3 gives a visual representation of our general discussion of the mean scores for these different dimensions of trust, allowing some first comparison at a glance.
Figure 3: Bar chart of mean of dimensions of interorganisational trust in Flemish administration
01
23
4
Direct trust TW1 (Ability)
TW2 (Integrity a) TW3 (Benevolence)
TW4 (Integrity b) TW5 (Compliance)
TW6 (Trustworthy actor) Suspension
Behaviour
> 3.2. Flemish departments and agencies
After this introductory glance at the general distribution of our data, we will examine whether distribution differences exist between organisational
׀ 15 ׀
groups. Here, we compare the data distribution of Flemish departments and agencies3.
Our discussion starts with a graphic comparison of the answer distributions in departments and agencies in descriptive figures and tables. We then proceed with an examination of the significance of the observed differences between both groups using nonparametric tests.
> 3.2.1. Descriptive observations
Figure 4 presents the distribution of the data in departments and agencies graphically in the form of boxplots. Median, mean and standard deviation values are presented for both organisational groups in Table 6 and the mean values are graphically represented in Figure 5. The following paragraphs are devoted to a discussion of these data.
3 As a result of the BBB (Beter Bestuurlijk Beleid- Better Administrative Policy) reform operation (2000-2006), the Flemish administration was restructured into thirteen homogeneous policy areas. Each of these policy areas consists of a department and a number of agencies. While policy choices are made by the minister responsible for a certain policy area, the department of that policy area focuses on policy planning, preparation, evaluation and support, while the area’s agencies focus mainly on policy implementation and execution.
׀ 16 ׀
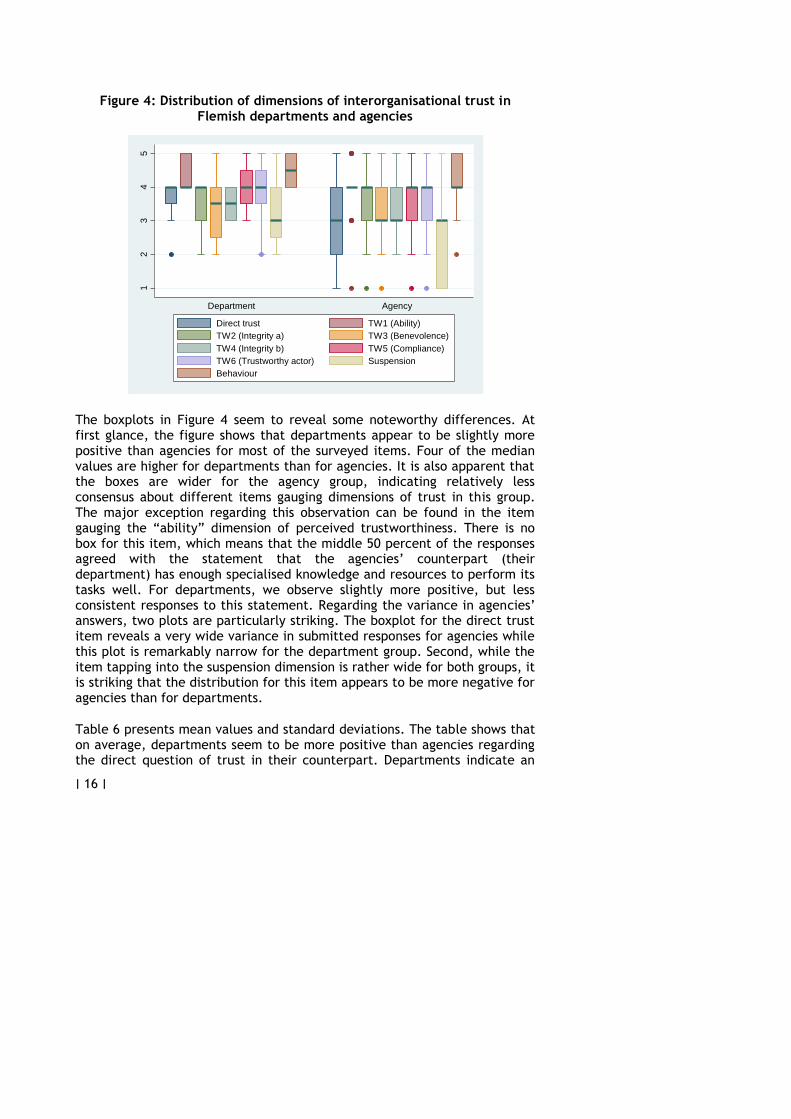
Figure 4: Distribution of dimensions of interorganisational trust in Flemish departments and agencies
12
34
5
Department Agency
Direct trust TW1 (Ability)
TW2 (Integrity a) TW3 (Benevolence)
TW4 (Integrity b) TW5 (Compliance)
TW6 (Trustworthy actor) Suspension
Behaviour
The boxplots in Figure 4 seem to reveal some noteworthy differences. At first glance, the figure shows that departments appear to be slightly more positive than agencies for most of the surveyed items. Four of the median values are higher for departments than for agencies. It is also apparent that the boxes are wider for the agency group, indicating relatively less consensus about different items gauging dimensions of trust in this group. The major exception regarding this observation can be found in the item gauging the “ability” dimension of perceived trustworthiness. There is no box for this item, which means that the middle 50 percent of the responses agreed with the statement that the agencies’ counterpart (their department) has enough specialised knowledge and resources to perform its tasks well. For departments, we observe slightly more positive, but less consistent responses to this statement. Regarding the variance in agencies’ answers, two plots are particularly striking. The boxplot for the direct trust item reveals a very wide variance in submitted responses for agencies while this plot is remarkably narrow for the department group. Second, while the item tapping into the suspension dimension is rather wide for both groups, it is striking that the distribution for this item appears to be more negative for agencies than for departments.
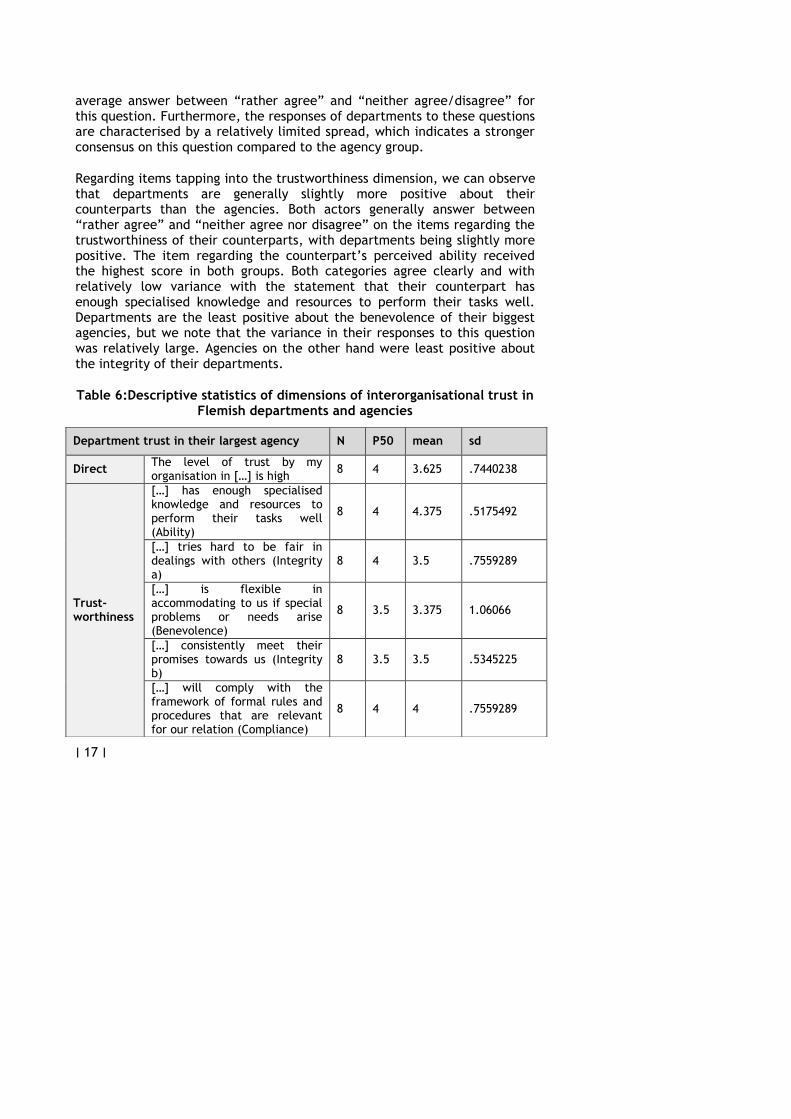
Table 6 presents mean values and standard deviations. The table shows that on average, departments seem to be more positive than agencies regarding the direct question of trust in their counterpart. Departments indicate an
׀ 17 ׀
average answer between “rather agree” and “neither agree/disagree” for this question. Furthermore, the responses of departments to these questions are characterised by a relatively limited spread, which indicates a stronger consensus on this question compared to the agency group.
Regarding items tapping into the trustworthiness dimension, we can observe that departments are generally slightly more positive about their counterparts than the agencies. Both actors generally answer between “rather agree” and “neither agree nor disagree” on the items regarding the trustworthiness of their counterparts, with departments being slightly more positive. The item regarding the counterpart’s perceived ability received the highest score in both groups. Both categories agree clearly and with relatively low variance with the statement that their counterpart has enough specialised knowledge and resources to perform their tasks well. Departments are the least positive about the benevolence of their biggest agencies, but we note that the variance in their responses to this question was relatively large. Agencies on the other hand were least positive about the integrity of their departments.
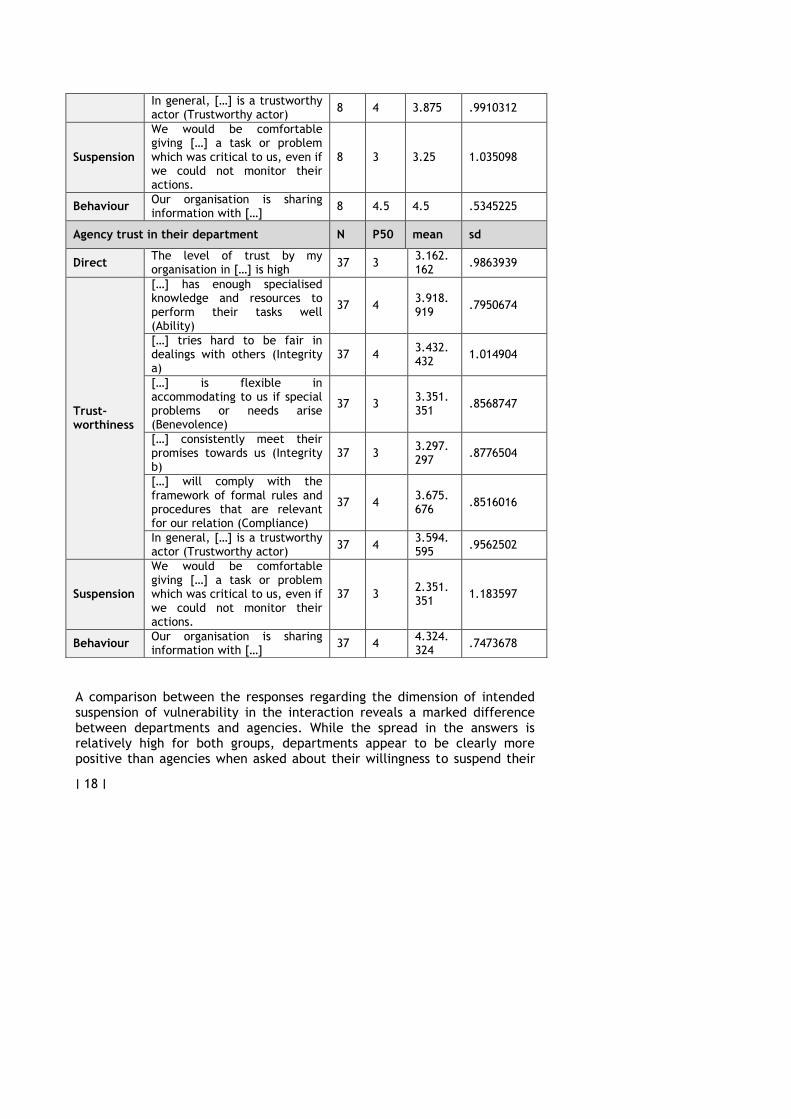
Table 6:Descriptive statistics of dimensions of interorganisational trust in Flemish departments and agencies
Department trust in their largest agency N P50 mean sd
Direct The level of trust by my organisation in […] is high
8 4 3.625 .7440238
Trust-worthiness
[…] has enough specialised knowledge and resources to perform their tasks well (Ability)
8 4 4.375 .5175492
[…] tries hard to be fair in dealings with others (Integrity a)
8 4 3.5 .7559289
[…] is flexible in accommodating to us if special problems or needs arise (Benevolence)
8 3.5 3.375 1.06066
[…] consistently meet their promises towards us (Integrity b)
8 3.5 3.5 .5345225
[…] will comply with the framework of formal rules and procedures that are relevant for our relation (Compliance)
8 4 4 .7559289
׀ 18 ׀
A comparison between the responses regarding the dimension of intended suspension of vulnerability in the interaction reveals a marked difference between departments and agencies. While the spread in the answers is relatively high for both groups, departments appear to be clearly more positive than agencies when asked about their willingness to suspend their
In general, […] is a trustworthy actor (Trustworthy actor)
8 4 3.875 .9910312
Suspension
We would be comfortable giving […] a task or problem which was critical to us, even if we could not monitor their actions.
8 3 3.25 1.035098
Behaviour Our organisation is sharing information with […]
8 4.5 4.5 .5345225
Agency trust in their department N P50 mean sd
Direct The level of trust by my organisation in […] is high
37 3 3.162.162
.9863939
Trust-worthiness
[…] has enough specialised knowledge and resources to perform their tasks well (Ability)
37 4 3.918.919
.7950674
[…] tries hard to be fair in dealings with others (Integrity a)
37 4 3.432.432
1.014904
[…] is flexible in accommodating to us if special problems or needs arise (Benevolence)
37 3 3.351.351
.8568747
[…] consistently meet their promises towards us (Integrity b)
37 3 3.297.297
.8776504
[…] will comply with the framework of formal rules and procedures that are relevant for our relation (Compliance)
37 4 3.675.676
.8516016
In general, […] is a trustworthy actor (Trustworthy actor)
37 4 3.594.595
.9562502
Suspension
We would be comfortable giving […] a task or problem which was critical to us, even if we could not monitor their actions.
37 3 2.351.351
1.183597
Behaviour Our organisation is sharing information with […]
37 4 4.324.324
.7473678
׀ 19 ׀
vulnerability in an interaction with their counterpart. We also observed this in Figure 4, where the boxplots revealed that the lowest 75 percent of the distribution for this question was situated between the completely disagree and neither agree/disagree point. However, the large spread of these data suggests that a lot of variance in responses exists between organisations within each group.
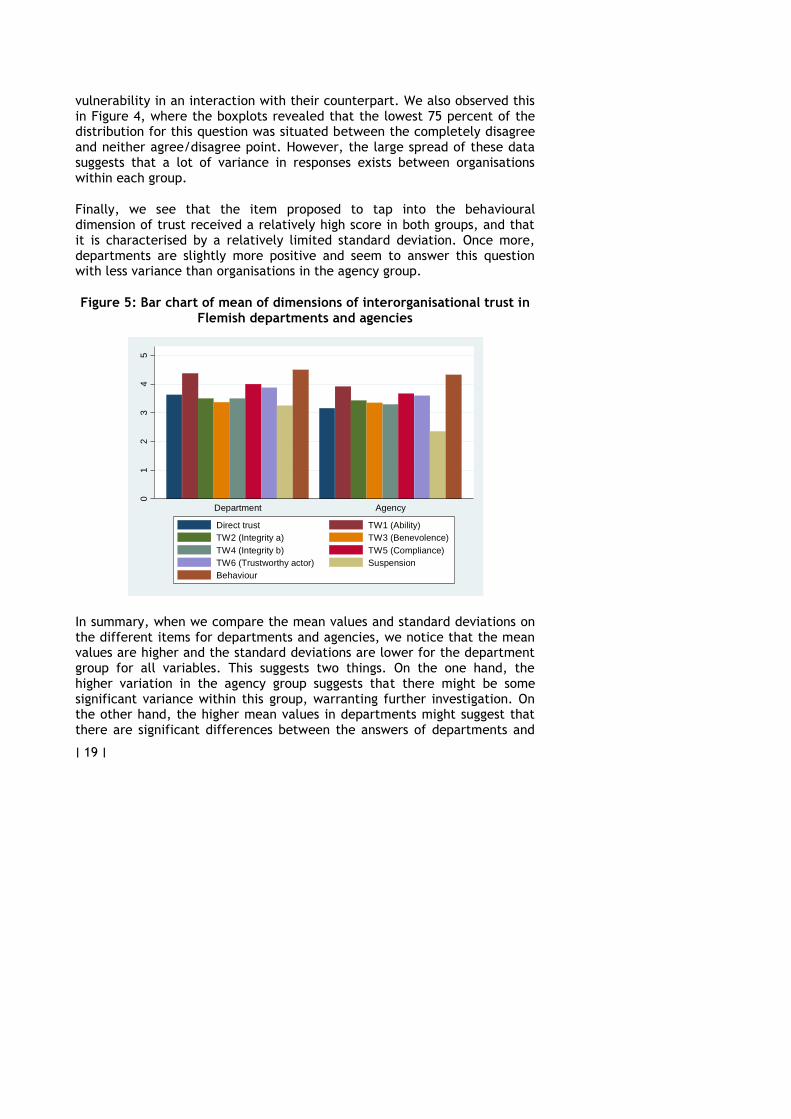
Finally, we see that the item proposed to tap into the behavioural dimension of trust received a relatively high score in both groups, and that it is characterised by a relatively limited standard deviation. Once more, departments are slightly more positive and seem to answer this question with less variance than organisations in the agency group.
Figure 5: Bar chart of mean of dimensions of interorganisational trust in Flemish departments and agencies
01
23
45
Department Agency
Direct trust TW1 (Ability)
TW2 (Integrity a) TW3 (Benevolence)
TW4 (Integrity b) TW5 (Compliance)
TW6 (Trustworthy actor) Suspension
Behaviour
In summary, when we compare the mean values and standard deviations on the different items for departments and agencies, we notice that the mean values are higher and the standard deviations are lower for the department group for all variables. This suggests two things. On the one hand, the higher variation in the agency group suggests that there might be some significant variance within this group, warranting further investigation. On the other hand, the higher mean values in departments might suggest that there are significant differences between the answers of departments and

׀ 20 ׀
agencies. At face value we could suspect a difference to exist between agencies and departments regarding the three dimensions of trust. However, tests for statistical significance of these differences are needed to validate this claim. The following paragraph discusses such a test.
> 3.2.2. Exploring the differences between departments and
agencies
The statistical significance of differences between two populations is usually asserted by performing a t-test or analysis of variance (ANOVA) on the difference between the mean values of the two populations for a variable. These parametric tests require the data not to violate certain assumptions, the most important of which is the assumption of normal data distribution.
However, the distribution in four of our variables differs significantly from a normal distribution. Therefore, the nonparametric Kruskal-Wallis test of differences between groups4 is an appropriate tool to explore whether the differences in the answer patterns bear any statistical significance. While this test is argued to have less validity than its parametric counterpart, we argue that it is adequate for the exploratory objectives of our study and more appropriate regarding the nature of our data distribution. The results of this test are presented in Table 7.
Table 7: Kruskal-Wallis comparison of trust dimensions between departments and agencies (tied ranks)
4 The Kruskal-Wallis test ranks the answers, adds up the ranks for each group and divides the result by the number of observations in the group. It then calculates a test statistic H with a chi-square distribution and 2-1 degrees of freedom since we are comparing two groups (Field 2009). We use test statistics for tied ranks because the 5-point interval scale we used to measure the different variables is expected to result in many tied answers (e.g. we expect that many observations have the same value).
Dimensions of trust in counterpart df H P
Direct The level of trust by my organisation in […] is high
1 1.972 0.1603
Trust-worthiness
[…] has enough specialised knowledge and resources to perform their tasks well (Ability)
1 2.584 0.1080
[…] tries hard to be fair in dealings with others (Integrity a)
1 0.035 0.8507
[…] is flexible in accommodating to us if special problems or needs
1 0.002 0.9622
׀ 21 ׀
* P<0.1 **P<0.05 **P<0.01
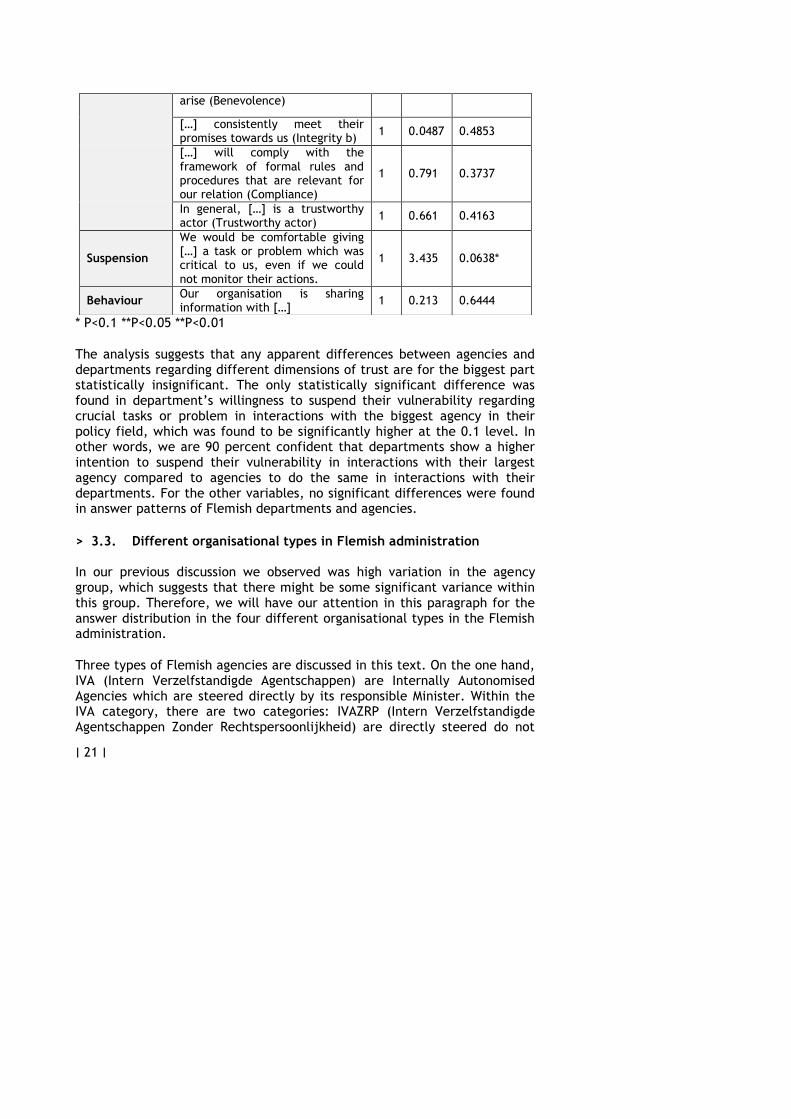
The analysis suggests that any apparent differences between agencies and departments regarding different dimensions of trust are for the biggest part statistically insignificant. The only statistically significant difference was found in department’s willingness to suspend their vulnerability regarding crucial tasks or problem in interactions with the biggest agency in their policy field, which was found to be significantly higher at the 0.1 level. In other words, we are 90 percent confident that departments show a higher intention to suspend their vulnerability in interactions with their largest agency compared to agencies to do the same in interactions with their departments. For the other variables, no significant differences were found in answer patterns of Flemish departments and agencies.
> 3.3. Different organisational types in Flemish administration
In our previous discussion we observed was high variation in the agency group, which suggests that there might be some significant variance within this group. Therefore, we will have our attention in this paragraph for the answer distribution in the four different organisational types in the Flemish administration.
Three types of Flemish agencies are discussed in this text. On the one hand, IVA (Intern Verzelfstandigde Agentschappen) are Internally Autonomised Agencies which are steered directly by its responsible Minister. Within the IVA category, there are two categories: IVAZRP (Intern Verzelfstandigde Agentschappen Zonder Rechtspersoonlijkheid) are directly steered do not
arise (Benevolence)
[…] consistently meet their promises towards us (Integrity b)
1 0.0487 0.4853
[…] will comply with the framework of formal rules and procedures that are relevant for our relation (Compliance)
1 0.791 0.3737
In general, […] is a trustworthy actor (Trustworthy actor)
1 0.661 0.4163
Suspension
We would be comfortable giving […] a task or problem which was critical to us, even if we could not monitor their actions.
1 3.435 0.0638*
Behaviour Our organisation is sharing information with […]
1 0.213 0.6444

׀ 22 ׀
have legal personality of their own, meaning that they legally act on behalf of the Flemish administration. IVARP have their own legal personality, allowing them to legally act in their own name. On the other hand, EVA (Extern Verzelfstandigde Agentschappen) are indirectly steered by their responsible minister through a board of administrators. EVA always have legal personality. This legal personality has a public character for EVAPRP (Extern Verzelfstandigde Agentschappen met Publieke Rechtspersoonlijkheid) and a private character for EVAPRRP (Extern Verzelfstandigde Agentschappen met PRivate Rechtspersoonlijkheid). It can be argued that these different agency types are characterised by different extents of formal autonomy, with IVAZRP having the least formal autonomy, IVARP having some more, EVAPRP even more and EVAPRRP having the highest extent of formal autonomy. In other words, IVAZRP are closest to the influence of the minister and the department, while EVAPRRP are far away. In this section of our exploratory study, we will compare the differences in different dimensions of trust for Departments, IVAZRP, IVARP and EVPRP.
The following paragraphs provide an exploratory discussion of the dimensions of trust in these four groups and an exploration of the significance of observed differences between these groups using non-parametric tests.
> 3.3.1. Descriptive observations
Figure 6 presents the answer distributions and their means in the form of boxplots, which provide some interesting perspectives about the data distribution in these four groups.
In general, we note that the department and IVAZRP groups both show relatively consistent answers, with the boxes that represent the middle fifty percent of the responses being roughly the same size and their median values lying close to each other for the different items. The boxplots for EVAPRP and IVARP reveal more and have different sizes and diverging median values for different items. Furthermore, departments and IVARP appear to be more positive in their responses to the questions while IVAZRP and EVARP appear to be more negative.
׀ 23 ׀
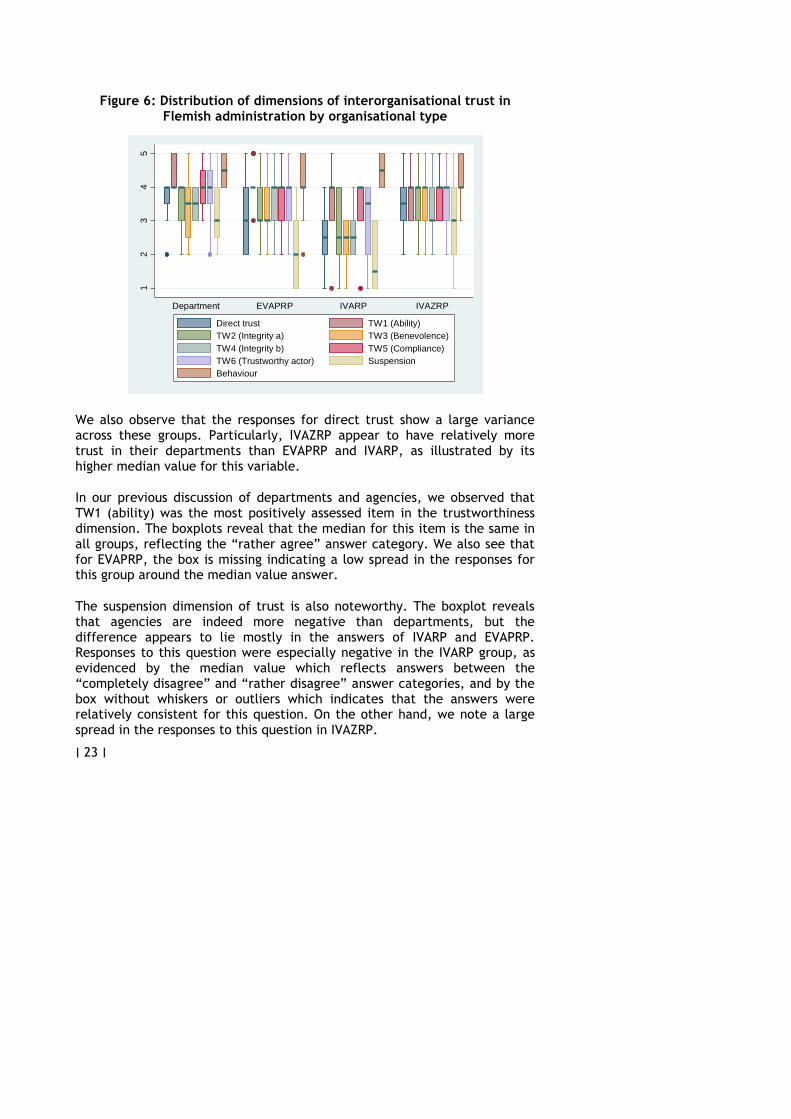
Figure 6: Distribution of dimensions of interorganisational trust in Flemish administration by organisational type
12
34
5
Department EVAPRP IVARP IVAZRP
Direct trust TW1 (Ability)
TW2 (Integrity a) TW3 (Benevolence)
TW4 (Integrity b) TW5 (Compliance)
TW6 (Trustworthy actor) Suspension
Behaviour
We also observe that the responses for direct trust show a large variance across these groups. Particularly, IVAZRP appear to have relatively more trust in their departments than EVAPRP and IVARP, as illustrated by its higher median value for this variable.
In our previous discussion of departments and agencies, we observed that TW1 (ability) was the most positively assessed item in the trustworthiness dimension. The boxplots reveal that the median for this item is the same in all groups, reflecting the “rather agree” answer category. We also see that for EVAPRP, the box is missing indicating a low spread in the responses for this group around the median value answer.
The suspension dimension of trust is also noteworthy. The boxplot reveals that agencies are indeed more negative than departments, but the difference appears to lie mostly in the answers of IVARP and EVAPRP. Responses to this question were especially negative in the IVARP group, as evidenced by the median value which reflects answers between the “completely disagree” and “rather disagree” answer categories, and by the box without whiskers or outliers which indicates that the answers were relatively consistent for this question. On the other hand, we note a large spread in the responses to this question in IVAZRP.
׀ 24 ׀
Finally, we noted in the previous section that the item gauging behavioural trust received the most positive answers in both departments and agencies. The boxplot complements this finding by showing that this is the case for all organisational types.
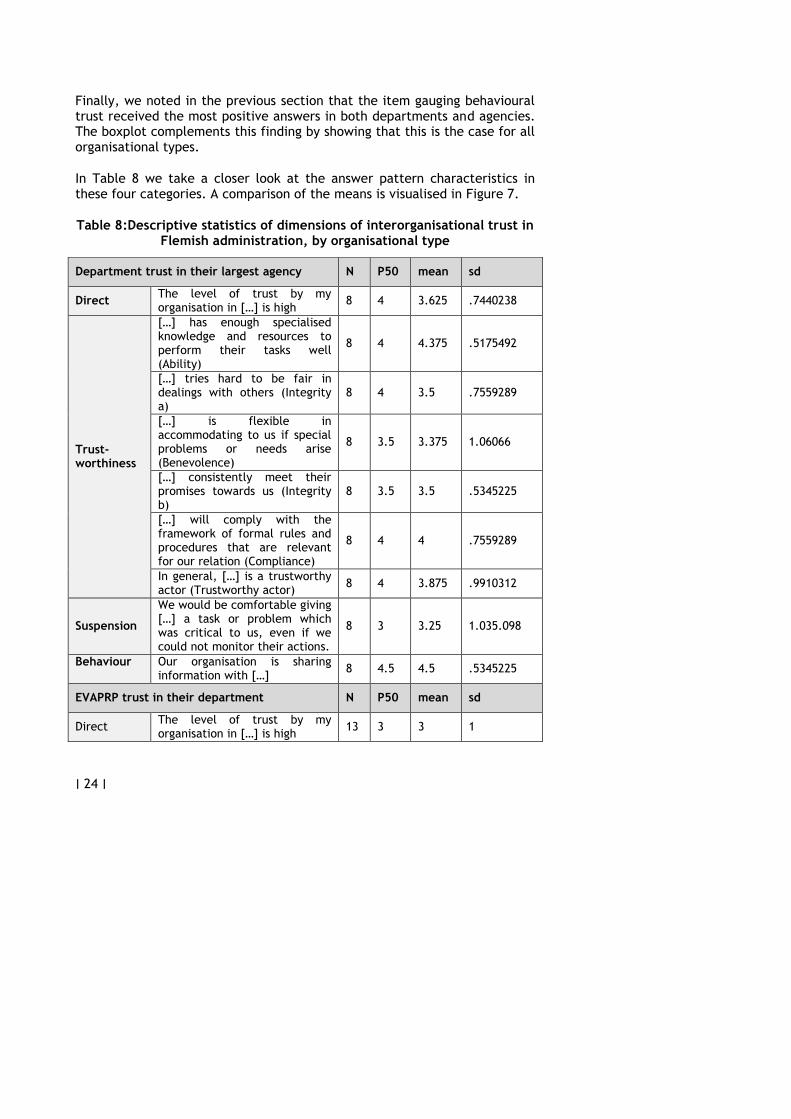
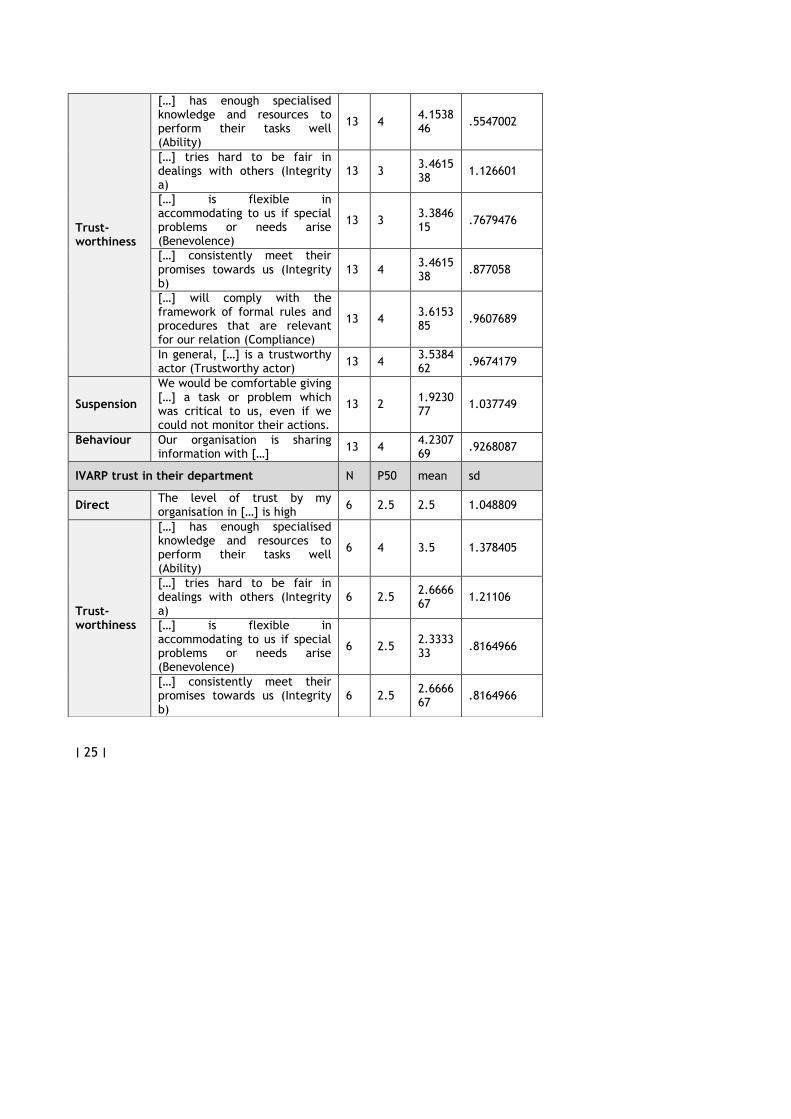
In Table 8 we take a closer look at the answer pattern characteristics in these four categories. A comparison of the means is visualised in Figure 7.
Table 8:Descriptive statistics of dimensions of interorganisational trust in Flemish administration, by organisational type
Department trust in their largest agency N P50 mean sd
Direct The level of trust by my organisation in […] is high
8 4 3.625 .7440238
Trust-worthiness
[…] has enough specialised knowledge and resources to perform their tasks well (Ability)
8 4 4.375 .5175492
[…] tries hard to be fair in dealings with others (Integrity a)
8 4 3.5 .7559289
[…] is flexible in accommodating to us if special problems or needs arise (Benevolence)
8 3.5 3.375 1.06066
[…] consistently meet their promises towards us (Integrity b)
8 3.5 3.5 .5345225
[…] will comply with the framework of formal rules and procedures that are relevant for our relation (Compliance)
8 4 4 .7559289
In general, […] is a trustworthy actor (Trustworthy actor)
8 4 3.875 .9910312
Suspension
We would be comfortable giving […] a task or problem which was critical to us, even if we could not monitor their actions.
8 3 3.25 1.035.098
Behaviour
Our organisation is sharing information with […]
8 4.5 4.5 .5345225
EVAPRP trust in their department N P50 mean sd
Direct The level of trust by my organisation in […] is high
13 3 3 1
׀ 25 ׀
Trust-worthiness
[…] has enough specialised knowledge and resources to perform their tasks well (Ability)
13 4 4.153846
.5547002
[…] tries hard to be fair in dealings with others (Integrity a)
13 3 3.461538
1.126601
[…] is flexible in accommodating to us if special problems or needs arise (Benevolence)
13 3 3.384615
.7679476
[…] consistently meet their promises towards us (Integrity b)
13 4 3.461538
.877058
[…] will comply with the framework of formal rules and procedures that are relevant for our relation (Compliance)
13 4 3.615385
.9607689
In general, […] is a trustworthy actor (Trustworthy actor)
13 4 3.538462
.9674179
Suspension
We would be comfortable giving […] a task or problem which was critical to us, even if we could not monitor their actions.
13 2 1.923077
1.037749
Behaviour
Our organisation is sharing information with […]
13 4 4.230769
.9268087
IVARP trust in their department N P50 mean sd
Direct The level of trust by my organisation in […] is high
6 2.5 2.5 1.048809
Trust-worthiness
[…] has enough specialised knowledge and resources to perform their tasks well (Ability)
6 4 3.5 1.378405
[…] tries hard to be fair in dealings with others (Integrity a)
6 2.5 2.666667
1.21106
[…] is flexible in accommodating to us if special problems or needs arise (Benevolence)
6 2.5 2.333333
.8164966
[…] consistently meet their promises towards us (Integrity b)
6 2.5 2.666667
.8164966
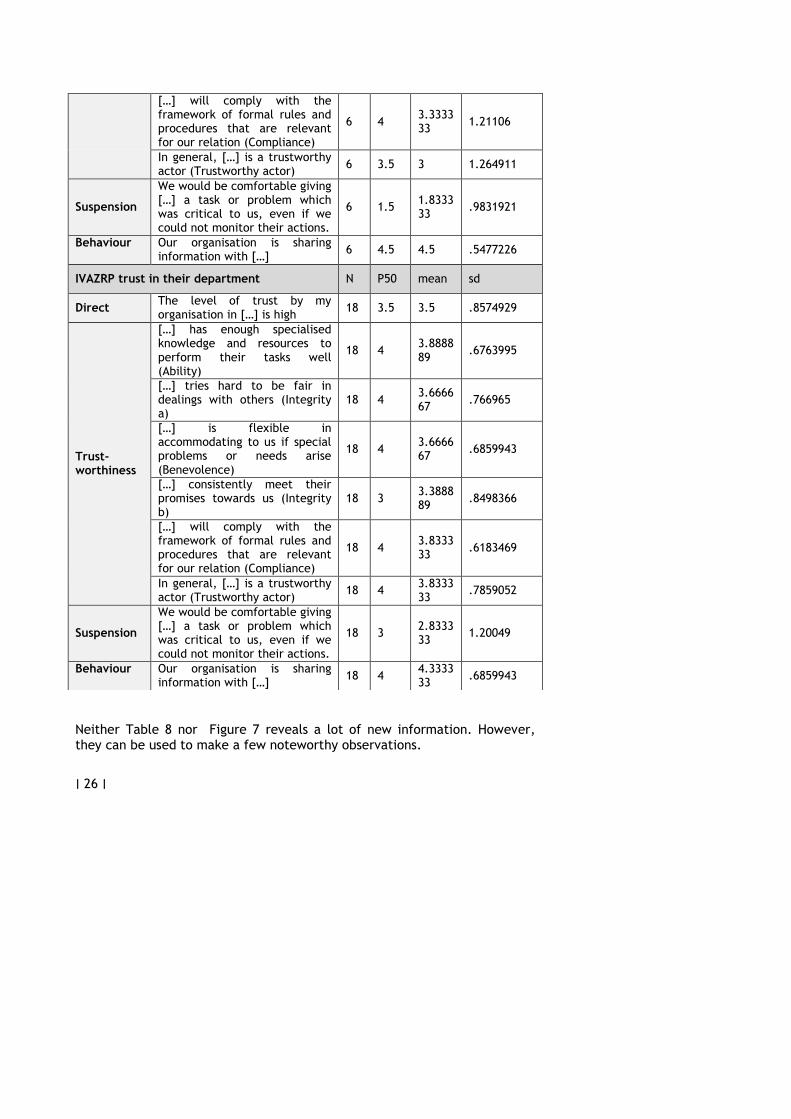
׀ 26 ׀
Neither Table 8 nor Figure 7 reveals a lot of new information. However, they can be used to make a few noteworthy observations.
[…] will comply with the framework of formal rules and procedures that are relevant for our relation (Compliance)
6 4 3.333333
1.21106
In general, […] is a trustworthy actor (Trustworthy actor)
6 3.5 3 1.264911
Suspension
We would be comfortable giving […] a task or problem which was critical to us, even if we could not monitor their actions.
6 1.5 1.833333
.9831921
Behaviour
Our organisation is sharing information with […]
6 4.5 4.5 .5477226
IVAZRP trust in their department N P50 mean sd
Direct The level of trust by my organisation in […] is high
18 3.5 3.5 .8574929
Trust-worthiness
[…] has enough specialised knowledge and resources to perform their tasks well (Ability)
18 4 3.888889
.6763995
[…] tries hard to be fair in dealings with others (Integrity a)
18 4 3.666667
.766965
[…] is flexible in accommodating to us if special problems or needs arise (Benevolence)
18 4 3.666667
.6859943
[…] consistently meet their promises towards us (Integrity b)
18 3 3.388889
.8498366
[…] will comply with the framework of formal rules and procedures that are relevant for our relation (Compliance)
18 4 3.833333
.6183469
In general, […] is a trustworthy actor (Trustworthy actor)
18 4 3.833333
.7859052
Suspension
We would be comfortable giving […] a task or problem which was critical to us, even if we could not monitor their actions.
18 3 2.833333
1.20049
Behaviour
Our organisation is sharing information with […]
18 4 4.333333
.6859943
׀ 27 ׀
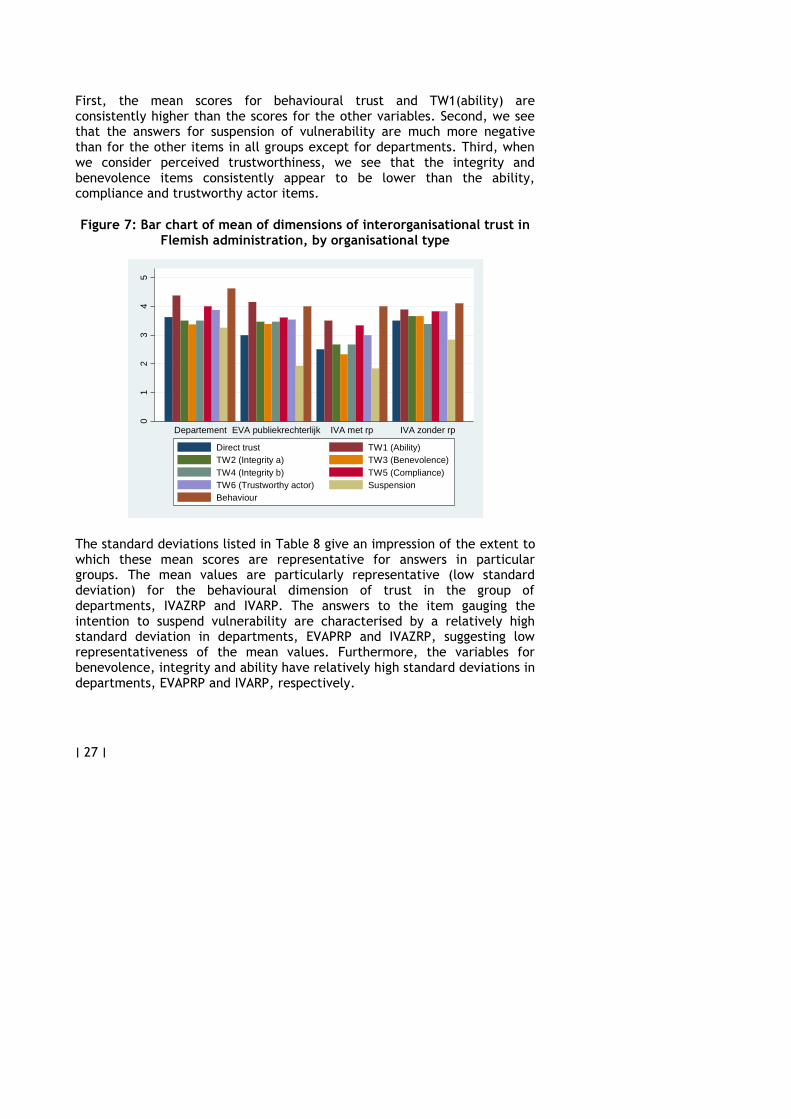
First, the mean scores for behavioural trust and TW1(ability) are consistently higher than the scores for the other variables. Second, we see that the answers for suspension of vulnerability are much more negative than for the other items in all groups except for departments. Third, when we consider perceived trustworthiness, we see that the integrity and benevolence items consistently appear to be lower than the ability, compliance and trustworthy actor items.
Figure 7: Bar chart of mean of dimensions of interorganisational trust in Flemish administration, by organisational type
01
23
45
Departement EVA publiekrechterlijk IVA met rp IVA zonder rp
Direct trust TW1 (Ability)
TW2 (Integrity a) TW3 (Benevolence)
TW4 (Integrity b) TW5 (Compliance)
TW6 (Trustworthy actor) Suspension
Behaviour
The standard deviations listed in Table 8 give an impression of the extent to which these mean scores are representative for answers in particular groups. The mean values are particularly representative (low standard deviation) for the behavioural dimension of trust in the group of departments, IVAZRP and IVARP. The answers to the item gauging the intention to suspend vulnerability are characterised by a relatively high standard deviation in departments, EVAPRP and IVAZRP, suggesting low representativeness of the mean values. Furthermore, the variables for benevolence, integrity and ability have relatively high standard deviations in departments, EVAPRP and IVARP, respectively.
׀ 28 ׀
> 3.3.2. Exploring the differences between different organisational
types in Flemish administration
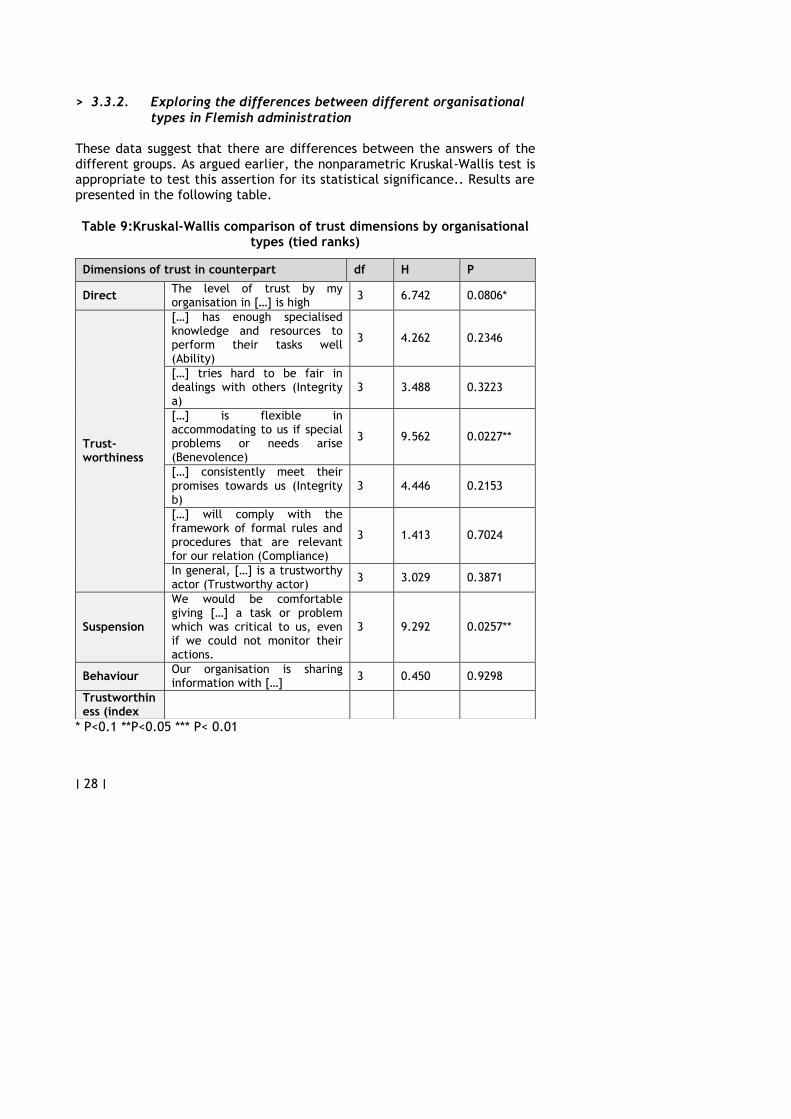
These data suggest that there are differences between the answers of the different groups. As argued earlier, the nonparametric Kruskal-Wallis test is appropriate to test this assertion for its statistical significance.. Results are presented in the following table.
Table 9:Kruskal-Wallis comparison of trust dimensions by organisational types (tied ranks)
* P<0.1 **P<0.05 *** P< 0.01
Dimensions of trust in counterpart df H P
Direct The level of trust by my organisation in […] is high
3 6.742 0.0806*
Trust-worthiness
[…] has enough specialised knowledge and resources to perform their tasks well (Ability)
3 4.262 0.2346
[…] tries hard to be fair in dealings with others (Integrity a)
3 3.488 0.3223
[…] is flexible in accommodating to us if special problems or needs arise (Benevolence)
3 9.562 0.0227**
[…] consistently meet their promises towards us (Integrity b)
3 4.446 0.2153
[…] will comply with the framework of formal rules and procedures that are relevant for our relation (Compliance)
3 1.413 0.7024
In general, […] is a trustworthy actor (Trustworthy actor)
3 3.029 0.3871
Suspension
We would be comfortable giving […] a task or problem which was critical to us, even if we could not monitor their actions.
3 9.292 0.0257**
Behaviour Our organisation is sharing information with […]
3 0.450 0.9298
Trustworthiness (index
׀ 29 ׀
The Kruskal-Wallis test reveals some interesting insights. Answer distributions between the four groups appear to differ significantly for three of the nine variables we compared in this test. The direct question regarding the extent of trust in the counterpart, TW3(benevolence), and the intended suspension of vulnerability in interactions with the counterpart show significantly different answer patterns in the four groups. While the Kruskal-Wallis test suggests that a difference exists between these four groups. Figure 8 gives a clearer insight into these differences by presenting a comparison between the mean values of the three significantly different variables to reveal the group differences. IVARP are revealed to be more negative that the other three groups regarding these three variables, but it is not yet clear whether departments, EVAPRP and IVAZRP also differ significantly from each other. In order to formulate an answer to these questions, we conducted Wilcoxon rank-sum tests on the different pairs.
Figure 8: Means comparison of significantly different dimensions of interorganisational trust in Flemish administration by organisational
types
01
23
4
Department EVAPRP IVARP IVAZRP
Direct trust TW3 (Benevolence)
Suspension
These tests reveal that for the item gauging trust directly, there is a significant difference between departments and IVARP (P 0.0367)** and between IVAZRP and IVARP (P 0.0460)**. This means that IVARP gave significantly more negative answers for the direct trust question than departments and IVAZRP. For TW3 (benevolence), significant differences are
׀ 30 ׀
found between departments and IVARP (0.0810)*, between EVAPRP and IVARP (0.0193)** and between IVAZRP and IVARP (0.0023)***. In other words, IVARP are significantly more negative about the benevolence of their counterparts than departments, EVAPRP and IVAZRP. For the suspension item we found that there are significant differences between departments and EVAPRP (0.0151)**, departments and IVARP (0.0328)**, EVAPRP and IVAZRP (0.0384)** and between IVAZRP and IVARP (0.0730)*. In other words, EVAPRP and IVARP were significantly more negative about the intention to suspend vulnerability than departments and IVAZRP.
> 3.4. Exploring further differences between groups for the
dimensions of trust
We performed these tests as well for a number of other control variables. We tested two organisation-level controls (organisation size and policy area) and two individual-level controls (respondent sex and career length in the organisation).
Figure 9: Means comparison of significant differences in trust dimensions by sex
01
23
4
Male Female
Direct trust** TW5 (Compliance)*
TW6 (Trustworthy actor)**
Our results showed no significant differences between organisations of different sizes in any of the trust dimension items we surveyed. We did find significant differences between policy areas for the direct trust question (P 0.0672)*, for TW2 (integrity a) (P 0.0574)* and for TW6 (trustworthy actor)
׀ 31 ׀
(P 0.0516)*. We also found significant differences between the two sexes for the direct trust question (P 0.0172)**, for TW5 (compliance) (P 0.0789)*, and for TW6 (trustworthy actor) (P 0.0249)**. The following figures present these differences graphically.
Figure 9 shows the significant differences between both sexes, revealing that women are significantly more negative regarding their direct trust in counterparts, regarding their assessment of the benevolence of the counterpart, and regarding their perceptions of the counterpart as a trustworthy actor.
Figure 10: Means comparison of significant differences in trust dimensions by policy area
01
23
45
BZ CJSM DAR EWI IV LNE LV MOW OV RWO WSE WVG
Direct trust* TW2 (Integrity a)*
TW6 (Trustworthy actor)*
Figure 10 presents how the responses differ across policy areas. However, we do note that only a limited number of respondents are surveyed within each policy area, and this comparison is therefore based on a very small number of observations per policy area. It would therefore make little make sense to calculate significance levels of differences between policy areas. Although the figure therefore gives a clear image of the differences between the respondents in different policy areas, it needs to be interpreted with due consideration of the limitations of this exploratory research.

׀ 32 ׀
4. The reciprocal and self-reinforcing
characteristics of trust
In the introduction to this paper, we argued that trust is often considered to be a self-reinforcing and reciprocal phenomenon. On the one hand, trust is argued to be reciprocal because trust placed in a counterpart is perceived to be returned as behavioural acts of trusting are considered to increase the perceived trustworthiness of the trustee in the mind of the trustor. On the other hand, trust is often argued to be a self-reinforcing phenomenon because of dynamics between its three dimensions. Actors that perceive their counterpart to be trustworthy will be more willing to suspend their vulnerability and take observable risks in relationships, which generates relational information on which they can base their expectations of the future behaviour of the trustee. We presented a multidimensional model of trust reflecting both of these arguments in at the end of the introductory paragraph to this paper. In the following paragraphs, we will explore to which extent these expected relationships can be found in the data of our exploratory survey.
> 4.1. The reciprocal nature of trust
Trust placed in a counterpart is argued to be reciprocated because behavioural acts of trusting are considered to impact the trustor’s ideas about the trustworthiness of the trustee.
In our previous discussion, we discussed the answer patterns in the direct trust question for departments and agencies. This discussion revealed that IVARP in general were significantly more negative about their trust in the department than IVAZRP. Furthermore, departments were significantly more positive about their trust in the largest agency of their policy area than IVARP about their trust in the department.

׀ 33 ׀
Figure 11: Reciprocal nature of (dis)trust
Trust in largest
agency
Trust in
departement
Actor A:
department
Actor B:
largest agency
The direct trust variable therefore actually contains two different questions: departments were asked to which extent they trust their largest agency and agencies were asked to which extent they trust departments. Considering the argument that trust is reciprocal, we would therefore expect that the answers given by departments regarding their trust in the largest agencies would be reflected in the answers given by their counterparts. This relationship is visualised in the following Figure 11.
We conducted a very simple and straightforward analysis to assess this hypothesis of reciprocity using the empirical evidence we gathered in our exploratory COBRA-survey. By considering the different policy areas as the units of observation and comparing the responses for the direct trust question between the departments on the one hand and the largest agencies in those policy areas on the other hand, we can calculate the difference scores of both responses regarding this question. Policy areas where either the department or the largest agency did not respond to the survey were eliminated from the analysis, leading us to retain seven policy areas. The differences between the scores of departments and the largest agencies for the respective observations (policy areas) are presented in Table 10.
The mean of the difference scores in these policy areas is 0.43. In other words, the average difference between departments’ trust in their largest departments and the largest department’s trust in their departments is less than half a point on a 5-point scale. We would argue on the basis of this evidence that trust therefore indeed seems to be highly reciprocal: when

׀ 34 ׀
departments have high trust in their agencies, this seems to be reflected by agencies’ high trust in departments.
Table 10:Difference scores for trust of department in their largest agencies and trust of largest agency in department compared per policy
area
Policy area Department score for direct trust
Largest agency score for direct trust
Difference score
A 4 4 0
B 2 1 1
C 4 4 0
D 4 4 0
E 3 3 0
F 4 3 1
G 4 3 1
> 4.2. The self-reinforcing nature of trust
The second perspective is that trust is self-reinforcing because of dynamics between its three dimensions. Actors that perceive their counterpart to be trustworthy will be more willing to suspend their vulnerability and take observable risks in relationships, which generates relational information on which they can base their expectations of the future behaviour of the trustee. This leads us to expect a relationship between the different dimensions of trust, as illustrated in Figure 12.
In this paragraph, we therefore examine the extent to which such relationships are present in the data of our exploratory survey. In what follows, we apply structural equation modelling to examine the relations suggested in Figure 12. However, we must note that the explanatory power of these models is hampered because the assumption of normally distributed data was shown to be violated for both the variable measuring the willingness to be vulnerable to a counterpart and for the variable gauging behavioural trust. Therefore, the following tests of the proposed model are only explorations and should be interpreted with due consideration of these limitations to this exploratory study.
׀ 35 ׀
Figure 12: Self-reinforcing nature of (dis)trust
Trustworthiness:
Expectations of
future behaviour
Leap of faith:
Intended suspension
of vulnerability
Behavioural trust:
Observable
risk-taking
Feedback on beliefs based on experience
> 4.2.1. Model test : Structural Equation Modelling
We use Structural Equation Modelling (SEM) to explore the hypothesised relations between these dimensions of trust. SEM has been described as a combination between factor analysis and multiple regression and is argued to be useful for exploratory purposes. The two primary components of SEM models are the structural and the measurement component of the model: the structural component shows the hypothesised relationships between latent and observed variables, much like running several regression equations. The measurement component is essentially a confirmatory factor analysis of the observed variables on the unobserved factors.
SEM is appropriate for our study for a number of reasons. First, it does not assume variables are measured without error, as SEM models are based on the analysis of covariance in the error terms of observed variables. Second, SEM does not assume that the error terms of observed variables are uncorrelated. This makes it particularly fit for the estimation of latent variables on the basis of a set of observable items, and allows analysis of both convergent and discriminant validity. Third, it does not suppose uni-directionality of relationships, making the incorporation of feedback loops a realistic perspective for researchers. However, there are also some reasons why SEM is not very appropriate for our data. First, the sample size of our data is too small for good SEM analysis. Schreiber et al. (2006) report a consensus of 10 observations per estimated parameter for a SEM analysis. Our data contains 45 observations and is therefore not very fit for such analyses. Second, as already noted, the data for some of our variables are not normally distributed, which might give rise to inaccurate confidence intervals and significance levels. However, we conduct a SEM analysis for exploratory purposes, keeping in mind the restrictions on overly zealous interpretations of our results.
׀ 36 ׀
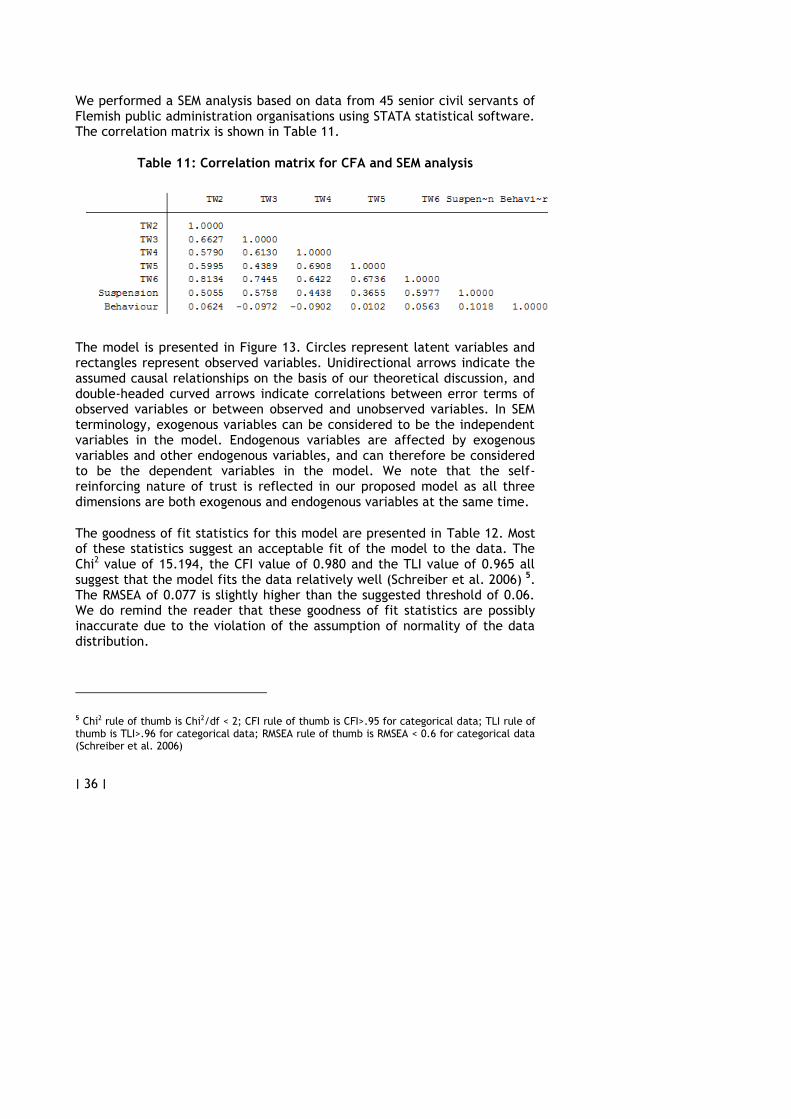
We performed a SEM analysis based on data from 45 senior civil servants of Flemish public administration organisations using STATA statistical software. The correlation matrix is shown in Table 11.
Table 11: Correlation matrix for CFA and SEM analysis
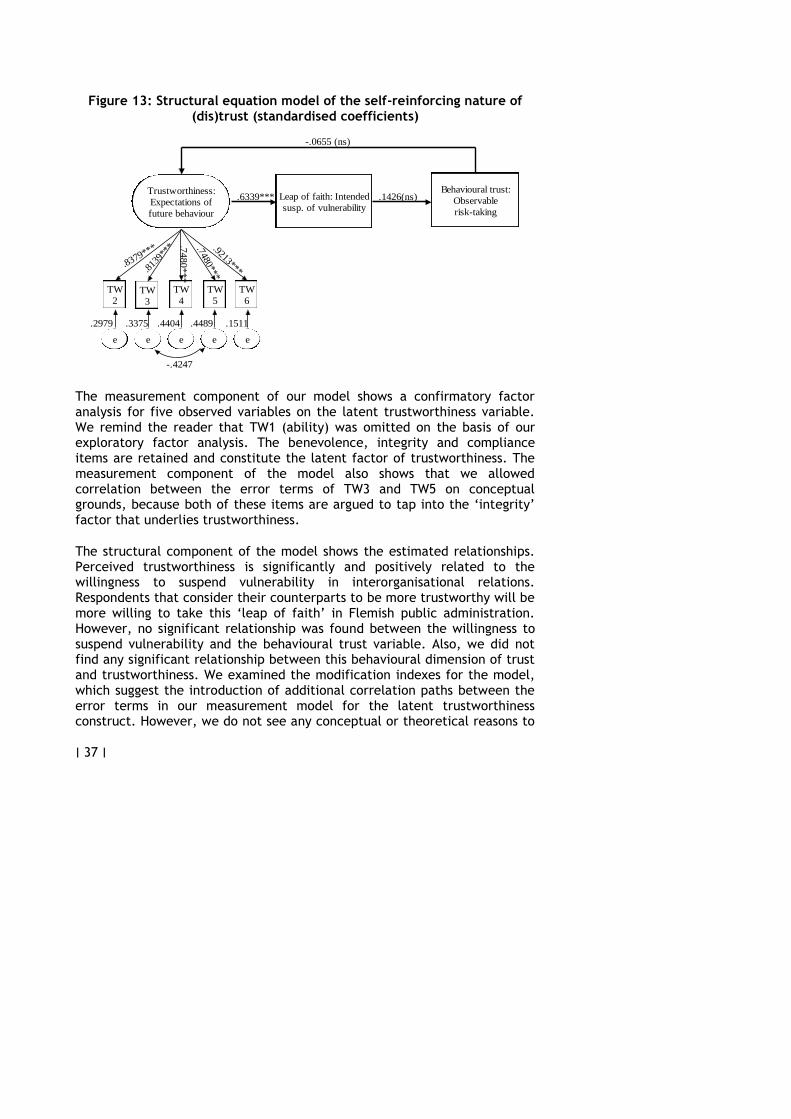
The model is presented in Figure 13. Circles represent latent variables and rectangles represent observed variables. Unidirectional arrows indicate the assumed causal relationships on the basis of our theoretical discussion, and double-headed curved arrows indicate correlations between error terms of observed variables or between observed and unobserved variables. In SEM terminology, exogenous variables can be considered to be the independent variables in the model. Endogenous variables are affected by exogenous variables and other endogenous variables, and can therefore be considered to be the dependent variables in the model. We note that the self-reinforcing nature of trust is reflected in our proposed model as all three dimensions are both exogenous and endogenous variables at the same time.
The goodness of fit statistics for this model are presented in Table 12. Most of these statistics suggest an acceptable fit of the model to the data. The Chi2 value of 15.194, the CFI value of 0.980 and the TLI value of 0.965 all suggest that the model fits the data relatively well (Schreiber et al. 2006) 5. The RMSEA of 0.077 is slightly higher than the suggested threshold of 0.06. We do remind the reader that these goodness of fit statistics are possibly inaccurate due to the violation of the assumption of normality of the data distribution.
5 Chi2 rule of thumb is Chi2/df < 2; CFI rule of thumb is CFI>.95 for categorical data; TLI rule of thumb is TLI>.96 for categorical data; RMSEA rule of thumb is RMSEA < 0.6 for categorical data (Schreiber et al. 2006)
׀ 37 ׀
Figure 13: Structural equation model of the self-reinforcing nature of (dis)trust (standardised coefficients)
Trustworthiness:
Expectations of
future behaviour
Leap of faith: Intended
susp. of vulnerability
Behavioural trust:
Observable
risk-taking
TW
2TW
3
TW
4
TW
5
TW
6
.8379***
.813
9***
.7480*
**
.7480***
.9213***
.6339*** .1426(ns)
-.0655 (ns)
e e e e e
.2979 .3375 .4404 .4489 .1511
-.4247
The measurement component of our model shows a confirmatory factor analysis for five observed variables on the latent trustworthiness variable. We remind the reader that TW1 (ability) was omitted on the basis of our exploratory factor analysis. The benevolence, integrity and compliance items are retained and constitute the latent factor of trustworthiness. The measurement component of the model also shows that we allowed correlation between the error terms of TW3 and TW5 on conceptual grounds, because both of these items are argued to tap into the ‘integrity’ factor that underlies trustworthiness.
The structural component of the model shows the estimated relationships. Perceived trustworthiness is significantly and positively related to the willingness to suspend vulnerability in interorganisational relations. Respondents that consider their counterparts to be more trustworthy will be more willing to take this ‘leap of faith’ in Flemish public administration. However, no significant relationship was found between the willingness to suspend vulnerability and the behavioural trust variable. Also, we did not find any significant relationship between this behavioural dimension of trust and trustworthiness. We examined the modification indexes for the model, which suggest the introduction of additional correlation paths between the error terms in our measurement model for the latent trustworthiness construct. However, we do not see any conceptual or theoretical reasons to
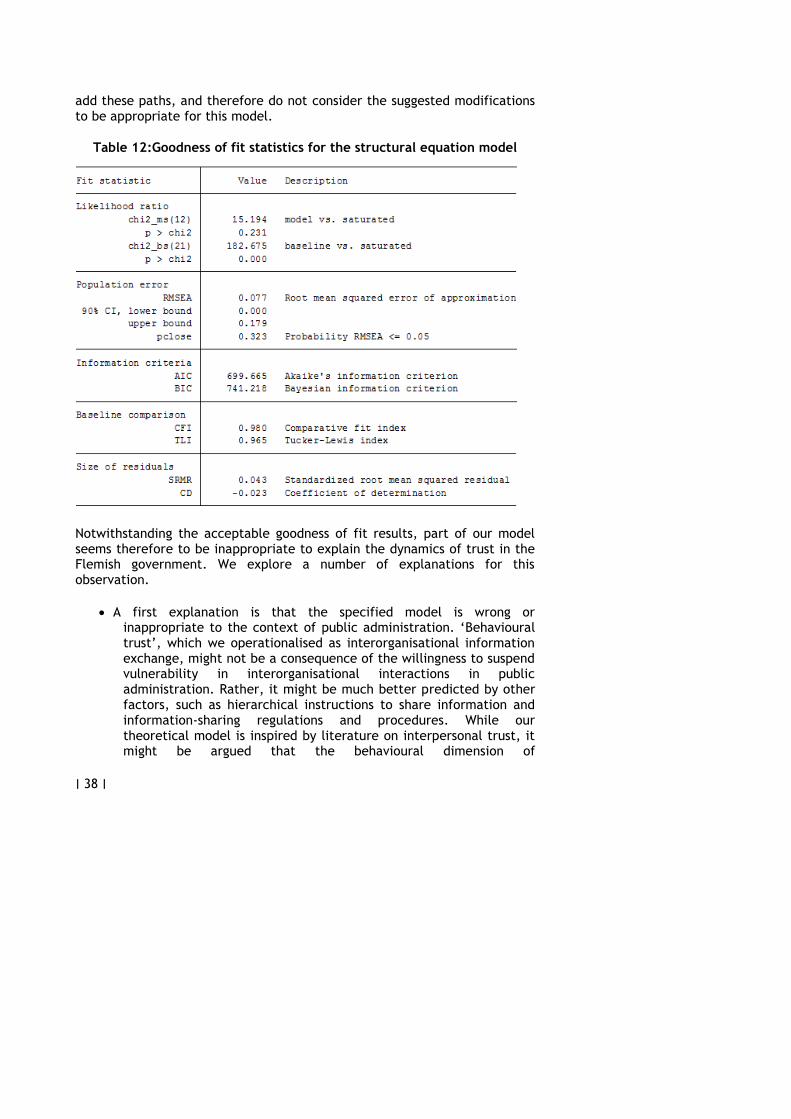
׀ 38 ׀
add these paths, and therefore do not consider the suggested modifications to be appropriate for this model.
Table 12:Goodness of fit statistics for the structural equation model
Notwithstanding the acceptable goodness of fit results, part of our model seems therefore to be inappropriate to explain the dynamics of trust in the Flemish government. We explore a number of explanations for this observation.
A first explanation is that the specified model is wrong or inappropriate to the context of public administration. ‘Behavioural trust’, which we operationalised as interorganisational information exchange, might not be a consequence of the willingness to suspend vulnerability in interorganisational interactions in public administration. Rather, it might be much better predicted by other factors, such as hierarchical instructions to share information and information-sharing regulations and procedures. While our theoretical model is inspired by literature on interpersonal trust, it might be argued that the behavioural dimension of
׀ 39 ׀
interorganisational trust is less responsive to attitudinal considerations because it primarily rooted in regulations, procedures and routines. It is possible to argue that in interpersonal relations, what people actually do is more closely related to what they are willing to do than in the professional context of interorganisational interactions. This explanation deserves further examination in future research steps.
A second explanation for the lack of any clear relationship is that the data are inappropriate for correlation analysis. This is likely the case. We argued that especially for the variable on behavioural trust, the data showed very little variance and its distribution deviated significantly from the normal distribution. To a lesser extent, this problem also occurs for the data distribution of the willingness to suspend vulnerability in interorganisational interactions. This problem can be alleviated by allowing more variance in the answer scales, and by specifying multiple indicators for each dimension of behavioural trust. Problematic indicators can then be deleted from the analysis if this would prove to be necessary.
A third explanation is that our items (especially for the measurement of behavioural trust) are inappropriate and possess insufficient validity. In other words, the item asking for exchange of information does not really measure the behavioural dimension of trust. This is possibly the case, as we only used single items to assess the leap of faith and the behavioural dimension trust. This problem can be alleviated in future research steps by developing multiple items for each dimensions of trust and examining their factor loadings and internal consistency.
Our future empirical research will therefore focus on increasing the quality of the data and measurement of trust dimensions and re-test the model proposed in this section. As such, we will minimise the validity of the second and third explanations of inadequate model fit, and focus only on the first explanation as an alternative model for the relations between dimensions of interorganisational trust in Flemish public administration.
׀ 40 ׀
5. General conclusion: dimensions of trust in
Flemish public administration
This Working Paper started with a conceptual discussion in which three dimensions of trust are identified. The dimension of trustworthiness is argued to refer to positive expectations about an actors’ ability, benevolence, integrity and compliance in a specific relation. The second dimension reflects the trustor’s willingness to suspend vulnerability in a certain relation and take a ‘leap of faith’ on the basis of incomplete information. The third dimension of trust is behavioural and corresponds to observable risk-taking behaviour in interorganisational interactions. Trust can be considered to be a reciprocal and self-reinforcing phenomenon because of dynamics between actors and between these three dimensions, which theoretically explains the emergence of virtuous cycles of trust and vicious cycles of distrust in interorganisational and interpersonal interactions.
We operationalised this framework in the exploratory 2013 COBRA-survey. The survey was completed by senior civil servants in 45 organisational entities of the Flemish administration. Respondents in departments were requested to assess the three dimensions of trust for their relations with their biggest agencies, while respondents in agencies were asked to do the same for their relations with departments. Trustworthiness was assessed through six items that were argued to tap into the expected ability, benevolence, integrity and compliance of the trustee. The leap of faith and the behavioural dimension of trust were operationalised with single item measures.
Descriptive exploration of the survey data showed that respondent answers were generally positive regarding these questions, except for the item measuring the intention to suspend vulnerability. The item measuring behavioural trust was characterised by very consistent and positive scores. The variables were normally distributed, except for TW1, TW5, suspension and behavioural trust. A comparison of these descriptive data between agencies and departments suggests that departments are significantly more willing than agencies to suspend their vulnerability regarding a crucial task or problem in interactions with the biggest agency in their policy field. A comparison of the four organisational types in Flemish administration revealed further significant differences. More specifically, IVARP were significantly more negative regarding the direct trust question than departments and IVAZRP. They were also significantly more negative about
׀ 41 ׀
the benevolence of their counterparts than departments, EVAPRP and IVAZRP. For the suspension item, we found that EVAPRP and IVARP were significantly more negative about their intentions to suspend vulnerability than departments and IVAZRP. An analysis of control variables revealed significant differences between policy areas for the direct trust question, TW2 (integrity a) and TW6(trustworthy actor. Furthermore, male respondents were significantly more positive regarding the direct trust question, TW5(compliance) and TW6(trustworthy actor).
In the final section of this Working Paper, we empirically explored the theory that interorganisational trust has both reciprocal and self-reinforcing characteristics. The reciprocal characteristics of trust were explored by examining the difference scores for the direct trust in counterpart question for departments and the largest agencies in each policy area. This straightforward exploratory analysis showed that the average difference between departments’ trust in their largest departments and the largest department’s trust in their departments is less than half a point on a 5-point scale. We would argue that this constitutes some first exploratory evidence for the reciprocal nature of interorganisational trust in the Flemish organisation.
Finally, we explored the relations between the three dimensions of trust to examine the self-reinforcing nature of trust. These analyses are highly preliminary and limited in their explanatory power because the data available data is not really appropriate for correlational analysis, rendering the significance levels rather unreliable. Keeping this in mind, our exploratory tests of the model making use of Structural Equation Modelling show an acceptable fit of the model to the data. Perceived trustworthiness is significantly and positively related to the willingness to suspend vulnerability in interorganisational relations. No significant relationship was found between the willingness to suspend vulnerability and the behavioural trust variable and between the behavioural dimension of trust and trustworthiness. This partial inaccuracy of the model can be due to different reasons, which need to be taken into account in the further steps in our research. One alternative explanation is that behavioural trust in the context of public administrative interorganisational interactions is less responsive to attitudinal considerations because it is more regulated in regulations, procedures and routines, and is therefore better predicted by factors that are not related to the other two dimensions of trust.
׀ 42 ׀
References
Beccerra, M. and Gupta, A. K. (2003). Perceived Trustworthiness Within the Organization: The Moderating Impact of Communication Frequency on Trustor and Trustee Effects. Organization Science, 14(1), 32-44.
Coleman, J. (1990). Foundations of Social Theory. Cambridge: Harvard University Press.
Colquitt, J. A., Scott, B. A., and Lepine, J. A. (2007). Trust, trustworthiness, and trust propensity: A meta-analytic test of their unique relationships with risk taking and job performance. Journal of Applied Psychology: An International Review, 92, 909-927.
Cummings, L. L. and Bromily, P (1996). The Organizational Trust Inventory (OTI): 'Development and Validation'. In Kramer, R. M. and Tyler, T. R. (ed). Trust in Organisations: Frontiers of Theory and Research (302-330) Thousand Oaks: Sage.
Currall, S. C. and Judge, T. A. (1995). Measuring Trust between Organisational Boundary Role Persons. Organisational Behavior and Human Decision Processes, 64(2), 151-170.
Das, T. K. and Teng, B. S. (2004). The Risk-Based View on Trust: A Conceptual Framework. Journal of Business and Psychology, 19(1), 85-116.
Dietz, G. (2011). Going back to the source: why do people trust each other? Journal of Trust Research, 1(2), 215-222.
Edelenbos, J. and Klijn, E. H (2007). Trust in Complex Decision-Making Networks: A Theoretical and Empirical Exploration. Administration and Society, 39, 25-50.
Field, A. (2009). Discovering Statistics using SPSS. Los Angeles: Sage.
Hardin, R. (2001). Conceptions and Explanations of Trust. In Cook, K. (ed). Trust in Society (3-39) New York: The Russel Sage Foundation.
Hood, C. (1991). A public management for all seasons? Public administration, 69, 3-19.
׀ 43 ׀
Kramer, R. (1999). Trust and Distrust in Organisations: Emerging Perspectives, Enduring Questions. Annual Review of Psychology, 50, 569-598.
Lewicky, R., Tomlinson, E. C., and Gillespie, N. (2006). Models of Interpersonal Trust Development: Theoretical Approaches, Empirical Evidence and Future Directions. Journal of Management, 32, 991-1022.
Lewis, J. and Weigert, A. (1985). Trust as a social reality. Social forces, 63, 967-985.
Li, P. P. (2011). The rigour-relevance balance for engaged scholarship: New frame and new agenda for trust research and beyond. Journal of Trust Research, 1(1), 1-21.
Luhmann, N. (1979). Trust and Power. Chichester: John Wiley & Sons.
Mayer, R. C. and Davis, J. H. (1999). The effect of the performance appraisal system on trust for management: A field quasi-experiment. Journal of Applied Psychology, 84(4), 123-136.
Mayer, R. C., Davis, J. H., and Schoorman, F. D. (1995). An Integrative View of Organizational Trust. Academy of Management Review, 20(3), 709-734.
McEvily, B. and Tortoriello, M. (2011). Measuring trust in organizational research: review and recommendations. Journal of Trust Research, 1(1), 23-63.
Möllering, G. (2006). Trust: Reason, routine, reflexivity. Amsterdam: Elsevier.
Oomsels, P. and Bouckaert, G. (2013). Working Paper I: Studying Interorganizational Trust in Public Administration: A Conceptual and Analytical Framework for 'Administrational Trust', Leuven: Steunpunt Bestuurlijke Organisatie Vlaanderen.
Ostrom, E. and Walker, J. (2003). Trust and Reciprocity. New York: Russel Sage Foundation.

׀ 44 ׀
Schreiber, J., Nora, A., Stage, F. K., Barlow, E. A., and King, J. (2006). Reporting Structural Equation Modeling and Confirmatory Factor Analysis Results: A Review. The Journal of Educational Research, 99(6), 323-337.
Six, F. (2013). Trust in Regulatory Relations: how new insights from trust research improve regulation theory. Public management review, 15(2), 163-185.
Strickland, L. H. (1958). Surveillance and Trust. Journal of Personality, 24, 200-215.
Vlaar, P. W. L., Van den Bosch, F. A. J., and Volberda, H. W. (2005). On the Evolution of Trust, Distrust and Formal Coordination and Control in Interorganisational Relationships: Toward an Integrative Framework. Group and organization management, 32, 406-429.
Zand, D. (1972). Trust and Managerial Problem Solving. Administrative Science Quarterly, 17(2), 229-239.
Zucker, L. G. (1986). Production of Trust: Institutional Sources of Economic Structure, 1840-1920. Research in Organizational Behavior, 8, 53-111.

׀ 45 ׀