MoFiR working paper n° 24 May 2009
26
OWNER IDENTITY AND FIRM PERFORMANCE: EVIDENCE FROM EUROPEAN COMPANIES MARCO CUCCULELLI Università Politecnica delle Marche, Department of Management and Industrial Organization MoFiR MoFiR working paper n° 24 MoFiR working paper n° 24 May 2009
Transcript of MoFiR working paper n° 24 May 2009

OWNER IDENTITY AND FIRM PERFORMANCE: EVIDENCE FROM EUROPEAN COMPANIES
MARCO CUCCULELLI
Università Politecnica delle Marche, Department of Management and Industrial Organization
MoFiR
MoFiR working paper n° 24MoFiR working paper n° 24
May 2009
OWNER IDENTITY AND FIRM PERFORMANCE: EVIDENCE FROM EUROPEAN COMPANIES.
Marco Cucculelli*
Università Politecnica delle Marche - Ancona
Abstract
Empirical evidence of the distribution of firms based on owner identity for a set of European
countries reveals substantial differences. Using the sensitivity of a firm’s sales to demand shocks as a measure of risk-taking behavior, the paper explores if owner identity affects the willingness of the firms to take risk in order to improve their current situation (venturing risk). Consistent with a hypothesis of risk-avoidance behavior, small- and medium-sized family-owned companies appear to under-react to changes in market demand, notably when ownership is highly concentrated and growth options are significant. However, they confirm their status of good performers when pure profitability measures are used. Conversely, industrial- and nonconcentrated family-owned firms appear more prone to deal with venturing risk, especially when the intensity of the risk is large as in the case of fast-growing companies or demand changes in nondomestic markets. [JEL Classification: G32, L25]
Forthcoming in “Rivista di Politica Economica”
SIPI Ed. Roma - Palgrave – McMillan- London
* [email protected] – Facoltà di Economia “Giorgio Fuà” - Università Politecnica delle Marche. The Author wishes to thank Giuliano Conti, Guido Corbetta, Michele Fratianni, Francesco Marchionne, Giacinto Micucci, and participants at the 2006 ETSG Conference (Vienna) and ISAE – Monitoring Italy 2007 (Roma). The usual disclaimer applies.
2
1. - INTRODUCTION
Increasing sales is usually what most people think to be a sign of a successful strategy for a
company. The specialized press often reports examples of companies that indicate sales as their major
targets and use it as a motto for promoting the company. “Our company has grown twenty–fold in the
past twenty years,”1 said the President of Indesit Company, Vittorio Merloni, the largest Italian
producers of household appliances and among the five largest world producers.
High growth rates of sales are not so infrequent to find, especially in early company life, when
a talented entrepreneur invents a new product and sells it to the market. But a long-lasting growth is
far less frequent. It requires a constant upgrading of the firm resource set, in order to seize
opportunities in a rapidly changing environment. It needs a large amount of ability and risk taking;
therefore, despite its importance, many companies may not succeed in achieving it. When asked to
explain the source of his enduring success, President Merloni replied: “Every year, we renew more
than 50% of our products, with respect to their design and technical features”2.
Revenue-oriented strategies are inherently risky and require a particular risk attitude in the
decision makers (entrepreneurs). The reason is not simply casual. Whereas defining actions targeted to
reduce inefficiency and costs (i.e. cost restructuring) is primarily a matter of managerial skills, revenue
generation requires entrepreneurship. The skill required to improve the revenue side of a firm’s
operations (sales) are very different from the managerial ability, but is not different from those needed
to start a new business: firm must reinvent products and find new markets in which they can be sold.
Discovering an area of a firm’s comparative advantage calls for much more innovation and involves
much greater uncertainty than eliminating inefficiencies, especially when the firm faces new
environments in highly competitive export markets (Frydman et al. 1998, Grosfeld and Roland, 1996).
This is more likely to occur in a period of rapid demand changes, when a firm’s sales, far from being
predictable on the basis of an exogenously given demand curve, depend on its ability to accommodate
the largely unpredictable decisions of potential customers and consumers.
Seizing market opportunities typically involves taking risk. Organizations may take risk
hoping to improve their current situation by searching alternative routines and opportunities that
change the status quo (venturing risk: Gomez Mejia et al., 2007). Agency theory stresses that the extent of involvement in risky activities is likely to be
influenced by the ownership of the firm (Fama, 1980, George et al. 2005, Brunninge et al. 2007). The
standard assumption in economics and strategic management is that owner wants the company to
maximize economic profits or shareholder value. However, when markets are incomplete, even profit-
1 Indesit Annual Report, 2001. 2 Il Sole 24 Ore, 10 July 2007.

3
maximizing owners may disagree about corporate strategy, because of different preferences regarding
risk and the time profile of expected cash flow (Thomsen and Pedersen, 2000).
Risk attitude and time horizon play a key role in strategy formulation in family firms. Despite
the fact that long-term perspective could make them more prone, or inherently able, to sustain risk
(Zellweger, 2007), the existence of growth opportunities that expire after the founder’s tenure may
favor a ‘risk-avoidance behavior’ (Almeida and John, 2001). Therefore, family firms will be expected
to reduce, or even to avoid totally, venturing risk in their business decisions.
A general motivation to preserve company control may further encourage ‘risk-avoidance
behavior’ in these companies. As a large proportion of the owner’s wealth is invested in the business,
small- and medium-sized family firms can be expected to be risk-adverse (Demsetz and Lehn, 1985),
to pay less attention to growth-oriented strategies (Upton et al., 2003, Kotey, 2005), and to avoid risky
business decisions that may endanger firm survival (Gomez Mejia, 2007). Similarly, the willingness to
engage in strategic change activities - such as corporate diversification, product innovation, and
entering new international markets - reduces as ownership and control increases (Brunninge et al.,
2007). Therefore, family firms are usually more conservative, resistant to change, blockaded by
internal conflict, and by defensive attitude toward survival. Also, due to the founder’s personal
involvement, there is an unwillingness to change strategy: “over time, owners may become insulated
from environmental and performance changes and may fail to perceive and react to critical
environmental and organizational changes” (Goodstein and Boeker, 1991). Aging may also accentuate
strategic inertia and reduce the ability of the founder to sustain the original competitive advantage of
the company (Cucculelli and Micucci, 2006). In contrast to family firms, industrial- and financial-
owned companies are more likely to follow a strict profit-maximizing behavior. These companies
usually benefit from skilled professional managers who are more likely to undertake ambitious
investment programs to exploit economies of scale and less likely to pursue niche strategies related to
flexibility or product differentiation. Thus, risk avoidance should not be a major concern for these
companies and their ability to seize market opportunities is expected to be large (Thomsen and
Pedersen, 2000).
Empirical evidence of the distribution of firm based on owner identity for a set of European
countries reveals substantial differences (Table A1 in the Appendix). Half of the listed companies in
the UK are owned by financial owners, whereas the situation is totally reverse in Spain, Germany, and
Italy, where more than half of the listed companies are owned by individual investors and industrial
firms. With regards to these last two groups, the share of industrial companies is very large in
Germany (45.6%) and moderate in Italy (29.7%) and Spain (23.1%). Conversely, individual investors
prevail in Italy (26.6%) and Spain (26.0%), whereas their share is the lowest in the UK (1.9%). A
4
similar large dispersion is observed for public owners, whose share varies from null in the UK to 13.4
in Italy, and foreign investors, whose share range from 14.4% in Italy to 34.4% in the UK.
As organizations may take risk by searching alternative routines and opportunities that change
the status quo, different ultimate owners may impact a firm’s strategy according to their attitude to
face risk. Following an agency approach, the paper uses the sensitivity of a firm’s sales to industry
shocks to test if the identity of the owner affects the company’s ability to seize market opportunities,
i.e. to face venturing risk. Sales sensitivity to demand shocks is used to measure how much does the
owners’ attitude toward risk and growth affects the company’s willingness to take actions aimed to
change the status quo. A low (high) sensitivity to demand shocks should therefore signal the
preference to take decisions that are more (less) conservative than needed in a particular market
environment, thus implying a risk-avoiding behavior by the company in its strategic choices.
The empirical results show that owner identity does affect the ability of the company to react
to demand shocks. Consistent with a hypothesis of risk-avoidance behavior, small- and medium-sized
family-owned companies appear to under-react to changes in market demand, notably when ownership
is highly concentrated and growth opportunities are significant. However, these companies confirm
their status of good performers when pure profitability measures are used. Conversely, industrial- and
nonconcentrated family-owned firms appear more prone to deal with venturing risk, especially when
the intensity of risk in a firm’s decision is large, as in the case of fast-growing companies or when
there are changes in demand coming from nondomestic markets.
If the under-reaction to demand shocks is consistent with a risk-avoidance behavior, sectors
may be expected to be less keen to tolerate risk, thus failing to achieve sustained growth, as the share
of their ‘risk-avoiding’ companies increases. Therefore, the owner identity comes out as key issue also
for understanding sectoral and country competitiveness.
The paper is structured as follows. Section 2 presents the empirical methodology, whereas
estimated results are shown in Section 3. Section 4 discusses some implications for sectoral
competitiveness and Section 5 gives some conclusions.
2. - THE EMPIRICAL MODEL
In order to evaluate if the owner identity affects a company’s ability to face venturing risk, the
empirical model tests the responsiveness of a company’s sales to changes in market demand by groups
of ultimate owners. The empirical approach is derived from Bertrand, Mehta and Mullainathan (2002)
and Sraer and Thesmar (2004). Bertrand et al. (2002) use variation in mean industry performance as a
source of profit shocks in the single company, in order to trace the propagation of shocks through a
business group. Sraer and Thesmar estimate a fixed-effect model where single firm’s sensitivity is
identified by the correlation between changes in log sales and in log employment. In both the models,

5
industry shocks are an ideal candidate to measure a firms’ sensitivity since they affect individual firms
but are – to a large extent – beyond the control of individual firms. Regression (1) is estimated by
using a firm’s annual sales as the dependent variable. Independent variables are the Eurostat Annual
Turnover Index (ATI), which proxies for sectoral industry demand, and its interaction with the firm’s
ultimate owner:
(1)
where sales is the turnover of firm i, sector k and time t, controls is a set of control variables
(see next paragraph), and time are time dummies. Firms’ sales are indexed as 2000 = 100.
),,,( 4321 iiiiij FFFFF = is the owner status variable (index j indicates the individual owner), with
4321 ,,, iiii FFFF indicating one of the four firm’s ultimate owners selected: family, industrial
company, financial company, and state (See the Appendix for the AMADEUS definition of ultimate
owner).3 The coefficient b measures the general sensitivity of firms’ sales to industry turnover,
whereas the coefficient cj (from the interaction term Fij*ATI) captures the sensitivity of each group of
owners. A positive (negative) coefficient of this interaction variable signals a greater sensitivity to
industry shocks (Bertrand et al., 2002).
The variable ATI proxies for the industry demand conditions and is given by two different
measures: i) the Eurostat Annual Turnover Index (ATI) for EU15 in nominal terms and ii) the
aggregate turnover by industry (3 digit NACE Rev.1) for the companies included in the sample,
computed by aggregating sales for firms within the same sector and by subtracting firm i turnover
(Bertrand et al., 2002; Sraer and Thesmar, 2004).4
The Annual Turnover Index is a business cycle indicator showing the evolution of the market
of goods and services in the industrial sector. It records the evolution of turnover over longer periods
of time. It is therefore the objective of this indicator to measure the market activity in the industrial
sector in value. The classification follows the NACE Rev.1 (Statistical classification of economic
activities in the European Community, Eurostat, 1996). The turnover of industry index is not deflated.
The version used here is the index 2000=100. The Index breakdown by industry provides a very close
connection between the demand at the European level and the trend of single company sales. The
industry breakdown is for 101 sectors by NACE 3 digits.
3 Regression estimates are based on four selected groups. The remaining owner types are: employees–managers, foundations, insurance companies, mutual and pension funds, and self-owned/cooperative. 4 The second measure, reported under ii), of industry demand conditions closely resembles the dynamics observed in sectoral ATI. Because of the larger significance of the Eurostat ATI in describing the evolution of markets at the European level, the following empirical analysis reports only estimates from this last variable.
iktktktijjktikt timecontrolsdATIFcATIbasales ε+++++= )().()(
6
The choice to select a highly disaggregated index of industry sales (101 sectors) originates
from the drawback signaled by Sraer and Thesmar (2004, pag.19) on aggregate industry data. If the
industry classification is too crude to account for the relevant market of the firm, the estimated
sensitivity parameters may have a substantial downward bias, much akin to a measurement error (i.e. a
13-industry classification may show a very modest explanatory power). This weakness has been
tackled by using a detailed 3-digit 101-industry classification. By estimating equation (1) in double
log, the model provides an empirical measure of the responsiveness of a firm’s turnover to industry
demand. 5
2.1 Control variables
The literature on family firms shows that the concentration of the ownership can a affect
firm’s performance (Demsetz and Villalonga, 2001). In order to isolate the pure effect of family
ownership and to remove performance effects due to ownership concentration, the share of the first
and largest owner, as well as the concentration ratio (CR3) of the first three shareholders in each
company, has been included in each regression as controls.
Also, the number of market segments - in terms of ISIC codes - in which a single company
operates has been controlled for, which is done to exclude the impact of a firm’s ‘external’ growth on
performance. As the company data are aggregated across ISIC codes, it is likely that the actual sales
growth rate can be higher, the larger the number of market segments in which the firm operates.
Controlling for this diversification effect allows for avoiding the underestimation of the sensitivity of a
company’s sales to demand in largely diversified companies.
In the empirical literature on family business, there exist some discrepancies with respect to
the influence that different generations exert on a firm’s growth behavior. Zahra (2005) and Okoroafo
(1999) found that as new generations bring fresh knowledge and strategic renewal, older family-
owned companies will realize higher growth rates of sales compared with their younger counterparts.
Maury (2007) also shows that an active family control is beneficial to performance in older
companies. Vice-versa, the issue of lifecycle, together with the family orientation of newer
generations, supports the hypothesis of a lower growth in older companies compared with younger
ones (Cucculelli and Micucci, 2006). Finally, a very large literature (see Bertrand and Shoar, 2006)
shows that the institutional framework and social norms at country level affect a firm’s performance.
Therefore, controls for age and country dummies have been included.
2.2 Data
5 On the basis of a Breush–Pagan LM test, which is decisive that there are individual effects, and the Hausman test, which suggests that these effects are uncorrelated with other variables in the model, a random effect model has been chosen, also due to the specific interest in time-invariant regressors (identity).

7
Data are available for the decade 1995-2004. The sectoral break includes 101 Nace 3-digit
manufacturing industries. Firm-level data are from the AMADEUS (Analyse MAjor Database from
European Sources) database, collected by Bureau Van Dijk (BvD). The company accounting
statements are harmonized by BvD, making the cross-country comparison reliable. Data are given for
unlisted firms. Due to national legislations, the coverage of financial variables varies across countries.
This limits the number of countries included in the analysis. Given that the firms included in the
Amadeus Top 1 million companies have at least 10 employees, this inclusion criterion makes the
source biased against the smallest companies. The paper then sets a criterion of having a number on
employees in the 20–1,000 range. Thus, the sample provides an excellent possibility to analyze the
behavior of small- and medium-sized firms. Firms in the sample are selected from 26 European
countries. The total number of companies is 9,688, with a high prevalence of Western European
countries (13 countries with 7,856 companies).6
3. - EMPIRICAL RESULTS 3.1 Descriptive statistics
The distribution of the owner identity across industries is not uniform. Table 1 shows that
family-owned firms are prevalent in low-technology sectors, such as footwear, clothing, light
mechanical apparel, plastic, and rubber. They complement almost perfectly with industrial–owned
firms, which are prevalent in scale- and technology-intensive sectors (industrial ownership is prevalent
in 17 two-digit sectors out of 21). State-owned companies are concentrated in the mechanical sector
and in motor vehicle and tobacco industries. Financial ownership is present in motor vehicle industry,
electrical machinery, wood product industry, and chemical industry. These differences suggest that it
is extremely important to take into account industry variations in demand.
Table 1 here
Table 2 provides descriptive statistics for the sample broken down by owner identity. Data in
the last column of Table 2 refer to all firms in the sample, i.e. they include also data from 1,444 firms
whose ultimate owners are different from the four explicitly indicated in the top columns of Table 2.
Residual owners are: Foundations, Employees/Managers, Insurance companies, Mutual and pension
funds, and self-Owned and other unnamed shareholders. Family firms account for 27.4% of the total
6 Because of the lack of most data needed to perform the analysis, Central and East-European companies have been excluded from regressions.
8
sample firms and reach up to 32.3% in the smaller sub-sample of the four identities presented in Table
2; they are younger and show a higher growth rate of sales than the nonfamily firms. However, sales
growth is heavily affected by sectoral demand: when the industry-adjusted growth rate is considered,
the over-performance of family firms does not appear to be substantial.
Profitability does not differ significantly between owners: the ratio of the operating income on
sales and on total assets is close to the sample average for family firms, whereas it is slightly lower for
industrial companies and higher for financial companies. As for the sales growth, state-owned firms
are low performers also in terms of pure profitability.
On average, family firms are moderately smaller (in assets, sales, and employees) than other
firms and exhibit significantly higher growth and superior profitability. These characteristics may raise
a concern that, in addition to an industry effect, the superior performance is driven by the
predominance among them of early stage, high-growth firms (Villalonga and Amit, 2006). A recent
empirical literature on family firms shows that the superior performance promptly disappears when
family members are involved in running the company (Miller et al. 2007): second-generation families
are mainly responsible for poor performance (Villalonga and Amit, 2006, Cucculelli and Micucci,
2007), as well as for the inadequate adoption of managerial practices that drives poor performance
(Bloom Van Reenen, 2007).
Table 2 here
Table 2 also shows significant differences between family and nonfamily firms for variables
related to control. The share of the first shareholder is lower in family firms (74.05%), as well as the
Ultimate Owner (UO) ownership share in total (68.48%). Family and nonfamily firms also differ
significantly in their diversification profile. By counting the number of 4-digit SIC sectors in which
each company operates, in addition to the core sector, the former appears more prone to being
diversified (2.44) than do industrial (2.16) and financial companies (1.95). A similar result also
emerges from the diversification dummy, which is set equal to one if the company operates in two or
more 4-digit SIC. This pattern appears to be consistent with the need for family firms’ owners to
diversify their firm instead of their own portfolio. Finally, a general higher risk aversion of family
firms does not appear to be supported by both the gearing ratio and the ratio of intangible assets on
total assets, which do not differ significantly between ultimate owners.
Growth rates are significantly higher in companies whose largest owner is another company
(industrial ownership) or a family. The discrepancy between profitability and growth seems to be
consistent with the interpretation that for a given ownership share, financial owners induce companies

9
to increase shareholder value, whereas industrial and family owners are more concerned about growth
and survival (Thomsen and Pedersen, 2000, p.701).
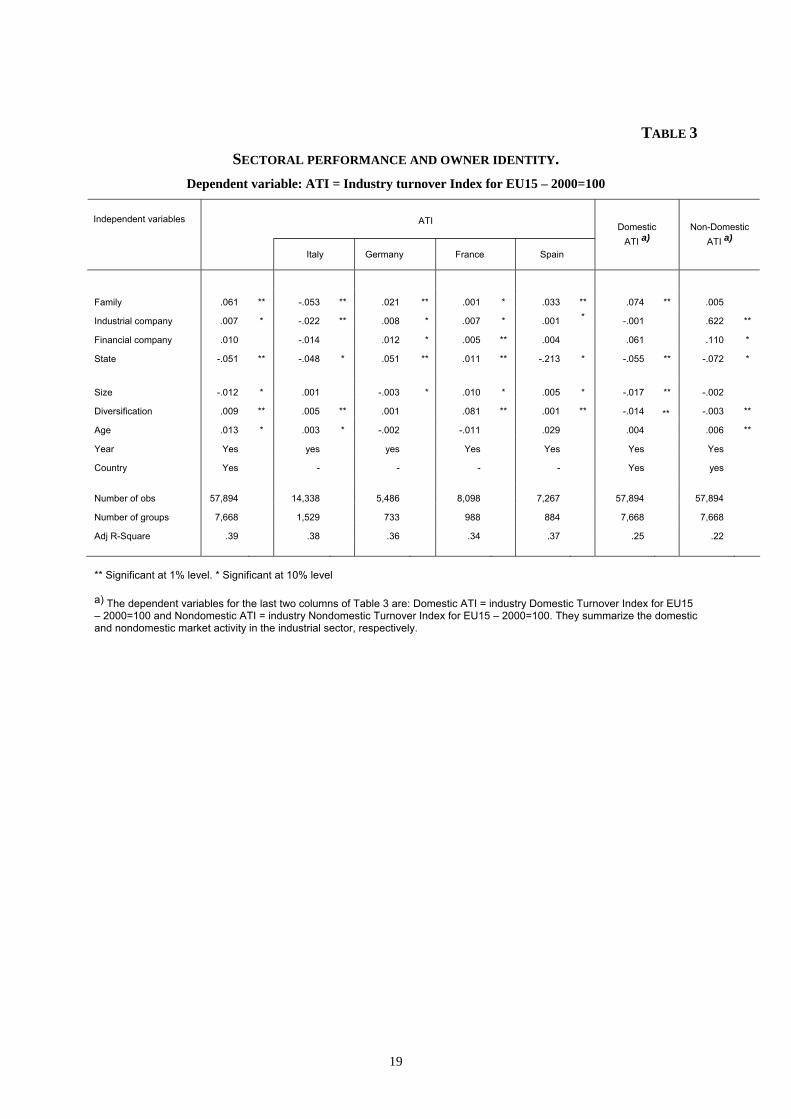
3.2 Profitability and firm growth by groups of ultimate owners.
A first question to be answered is about the characteristics of the sectors in which firms
operate: are family firms in high- or low-growth sectors? By regressing the industry turnover index
ATI (Aggregate Turnover Index) on four dummies indicating ultimate owners, we get a measure of the
sectoral intensity of growth of each group of owners. Column 1 of Table 3 shows that family firms are
in sectors that have experienced a growth of total turnover higher than baseline in the period 1995–
2004. The estimated coefficient is .06 and is statistically significant at a 1% level. Contrarily,
industrial and financial companies (and especially state-owned companies) are in moderate-growth
sectors. The results change slightly if we break up the total sample based on country: Italian family
firms appear to be concentrated in low-growth sectors, whereas French, German, and Spanish firms in
high-growth sectors (Table 3). Finally, family-owned companies are prevalent in sectors which
perform well in domestic markets, whereas industrial and financial companies prevail in sectors that
perform well in nondomestic markets.
Table 3 here
3.3 Growth-oriented or cost-reducing strategy.
Seizing market opportunities is a risky activity. For a company to keep the pace of a rapidly
changing or of an increasing demand is a very difficult task: it involves the ability (or willingness) to
sustain risky decisions that may endanger the control of the company or even its survival. In the next
section, we will provide evidence on this point.
By using firm’s sales as the dependent variable (eq.1), we can test the sensitivity of company
sales to shock affecting industry aggregate turnover. In order to eliminate the sectoral effect due to the
difference in growth rates between industries, we include the term ATI among regressors and estimate
equation (1). Column 1 in Table 4 reports estimated results from equation (1) in which the type of
owner is interacted with the industry sale variable ATI. Firm sales react to changes in demand
approximately by half the industry shocks (0.47 − 0.54). Therefore, for family firms the change in
demand leads to a .40 smaller increase than that for other companies, or only to a 0.10−0.12 increase
in net sales. The responsiveness is higher for industrial companies and financial companies: even if
some differences in estimated values are observed (0.18 − 0.16 for industrial company and 0.12 − 0.11
for financial company), empirical findings show that the industrial and financial ownership has a
positive effect on a firm’s ability to seize market opportunities. Contrarily, family ownership shows
10
negative and statistically significant coefficient, thus confirming difficulty in facing the business risk
involved in following the market demand.
Controls for company size, age, and diversification may avoid ambiguity in the effect of
owner identity if systematic differences in size and other controls affect a firm’s responsiveness to
shocks. Direct effect indicates that firm’s age, size, and diversification do affect the responsiveness to
shocks (Columns 3 and 4 in Table 4). Both age and size have a positive impact on the ability of the
company to follow market demand, whereas diversification reduces firm’s responsiveness. As the
coefficient estimates for interaction variables remain rather stable despite controls (Columns 5 and 6),
in the following we will focus only on the interaction effects.
Table 4 here
How to reconcile this lower responsiveness to shock affecting industry aggregate turnover
with the evidence of good performance in terms of profitability measures? This result may be
consistent with a hypothesis of risk-avoidance behavior by family firms as they are unwilling to
assume a high business risk, i.e. continuously changing existing routines, in order to remain top
performers. However, as they do not underperform other type of owners when pure profitability
measures are used, they appear to succeed in following a cost-reducing or efficiency-seeking strategy.
Whereas the decision to increase sales is inherently risky, and thus may be avoided, the decision to
increase efficiency level may involve a lower degree of risk, thus providing a viable solution to
maintain profitability in family firms.7 This result agrees with the result in recent literature, showing
that family members make it a priority to ensure the survival of the family firms for the next
generation at the cost to forgo growth opportunities (Bertrand and Shoar, 2006).
3.4 Financing and growth behavior
In order to test for the presence of risk-avoidance behavior in the presence of growth
opportunities (Almeida and John, 2001), taking into account the owner preference for self-financing,
we use the well-known concepts of “internally financed growth rate” (IG) and “sustainable growth
rate” (SG), introduced by Higgins (1977) and extensively applied by Demirguc-Kunt and Maksimovic
(1998). In contrast to most of the empirical literature that uses the growth rate of sales or assets as a
measure of growth option, we use these measures because of the linkage they posit between the
financing and growth behaviors. IG is the maximum growth rate that can be financed if a firm relies
7 Reliance on family members rather then professional managers may also lead to inefficiencies in decision making that will, on average, slow a firm’s growth. However, Bloom and van Reenen (2007) show that the lower adoption of management practice in family firms is not systematic and is largely dependent on the effect of primogeniture in the selection of CEO of the company.

11
only on internal resources and maintains its dividend. SG is the maximum sustainable growth rate,
which expresses the maximum growth rate that can be financed without resorting to external equity
finance or to altering the present financial structure. Useful information on how financing decisions
are taken in order to sustain growth can be derived by the comparison of the actual growth rate (G)
with the internal growth rate (IG) and the sustainable growth rate (SG). A company growing at a rate
below or equal to the IG is able to fund its growth by relying on internally generated financial means.
For these companies, the growth behavior should not be constrained by the availability of financial
resources. If growth is higher than SG, then the management uses external resources in a way that
alters the current debt/equity ratio but that is proportional to the internally generated resources.8 In this
last case, the availability of financial resources (and the ability of the management to obtain them)
plays a crucial role in defining the pattern of growth. Limitation of growth in this panel of companies
may denote a will to maintain the company control by limiting the amount of external funds in order to
lower the risk of company distress.
Estimates of the impact of different owner identity are reported in Table 5. The sample has
been split into two different groups: firms with an actual growth lower than IG (G < IG) and firms
with an actual growth higher than SG (G > SG). The comparison of regression estimates in columns
1–2 and 3–4 shows that the negative effect of family ownership is larger for firms with G>SG than for
firms with G < IG.9 Family ownership hurts company performance more heavily in fast-growing
companies than in low-growing firms. Contrarily, the positive effect of industrial ownership is higher
in high-growth companies than in low-growth ones. Finally, for the group of family firms with
nonconcentrated ownership (NC), the estimated results confirm the prevalent empirical literature
which shows that a negative family effect is usually traced out when family ownership concentration
is large and family shareholders cannot benefit from a diversified position in the company equity.
Table 5 here
3.5 The impact of domestic and nondomestic markets.
If following the market demand is a risky activity, seizing opportunities in international
markets could be even riskier. Internationalization requires changes in the organization of the
company and the assumption of increasing risk. It may involve a forced decentralization of power in
order to cope with distant markets, thus endangering the company control within the family.
8 If the realized growth is in between IG and SG, the firm will need additional external finance, such as debt, but the low proportion of debt financing makes the debt/equity ratio to fall. 9 The ratio of Intangible Assets on Total Fixed Assets, used as a measure of growth option, yields a similar result.
12
Complexity could grow excessively and international opening may be perceived as an option entailing
too much risk. Therefore, we should expect that the sensitivity to market demand could be lower in
international markets than in domestic ones if family ownership is detrimental for risk acceptance. In
order to test this hypothesis, we estimate equation (2) by separating domestic industry shocks from
nondomestic ones for each of 15 countries in the sample:
(2)
where sales is the turnover of firm i, sector k, time t and country c, controls is a set of control
variables, and time are time dummies. Similar to previous Eq. (1), the index of industry demand is the
Eurostat Annul Turnover Index (ATI) at country level for the domestic and nondomestic market.
Index m indicates, respectively, total, domestic, and nondomestic demand. Therefore, each company’s
sales are related to the sectoral Turnover index of its own country, both for domestic and nondomestic
market (e.g. the sales of an Italian company are regressed on the Italian Turnover index of domestic
market and the Italian turnover index for sales in nondomestic market). All other symbols are the same
as in Eq.(1). Also in this case, the industry breakdown is for 101 sectors by NACE 3 digits.
The estimated results are summarized in Table 6. Family ownership has a negative and largely
significant impact on company sales when industry shocks come from nondomestic markets, whereas
the sensitivity is positive for the domestic market. Contrarily, industrial and financial ownership show
an almost opposite result, with a limited impact on company sales when shocks are from domestic
markets and a substantial positive effect for nondomestic markets.
Table 6 here
In columns 2, 4, and 6, we allow for the effect of ownership type to differ based on firm’s age.
This additional control does not significantly alter the estimated coefficients and tends to reduce
slightly their numerical values (except for the state-owned firms), but leaves the sign of coefficients
unchanged. The effect of the age on the firm’s sensitivity to industry shock is positive, especially for
family and industrial companies, thus confirming a role for the experience in tackling market demand,
especially in nondomestic markets. For financial-owned companies, the absence of a close relationship
between age and sensitivity may denote a larger availability for these firms, of a set of proprietary
advantages and of specific tools that substitute experience in facing the market.
4. - IMPLICATIONS FOR SECTORAL COMPETITIVENESS.
iktctmktcijj
mktciktc timecontrolsdATIFcATIbasales ε+++++= )().()(

13
Aghion et al. (2005), Bertrand and Shoar (2006), and Zellweger (2007) argue that a negative
relationship between the concentration of family firm and GDP growth at country level should be
expected because of the lower incentives to growth associated with family owners. In discussing the
role of banks in sustaining the long-term growth of Japanese economy, Morck and Yeung (2006)
suppose a similar conclusion by claiming how a governance model that prefers contractual claimants
(debholders) to residual claimant (shareholders) may affect the long-term prospect of growth by
decreasing the level of risk attitude of the business sector. Aghion and Howitt (1992); Aghion, Howitt,
and Mayer-Foulkes (2005); and Fogel, Morck, and Yeung (2005) argue that the investment underlying
‘catch up’ growth and those required to ‘keep up’ are fundamentally different. Once the technological
frontier has been reached, “keeping up” growth requires sustained innovation. This, in turn, requires a
tolerance to risk and instability. Therefore, a trade-off of growth against stability (risk) may emerge as
a macroeconomic effect of a micro-economic risk-avoidance behavior by prevalent owners (Morck
and Yeung, 2006).
A similar trade-off may also emerge at the sectoral level if a different sensitivity to demand
shocks, notably in nondomestic markets, arises as a result of a risk-avoidance behavior. Graph 1 shows
the relationship between the standard deviation of sectoral growth rates for 103 European
manufacturing sectors and the share of family firms in each sector. Using the standard deviation as a
proxy for the degree of sectoral “instability” (or risk), this evidence further supports the assumption of
low tolerance for risk in family firms, which previous estimates have already signaled. Therefore, a
sector may be expected to be less keen to tolerate instability, thus failing to achieve sustained growth,
if family firms are pervasive. Even if rather illustrative, this data are in line with the hypothesis that
governance of corporation is not an unimportant issue in determining the sectoral competitiveness if
different governance systems affect firms’ risk-taking behavior (Bianchi et al., 2005; Tucci et al.,
2007).
5. - CONCLUDING REMARKS.
The large differences in the ownership structure by owner identity may raise a concern about
the different abilities of individual owners to shape the company strategy. As organizations may take
risk by searching alternative routines and opportunities that changes the status quo (venturing risk),
differences in firm sensitivity to market demand may reflect owners’ attitude to take venturing risk.
The paper uses the sensitivity of firm’s sales to industry shock as a measure of the owner’s
attitude toward venturing risk and growth. Empirical evidence shows that owner identity does affect
the ability of the company to react to demand shocks. Consistent with a hypothesis of risk-avoidance
behavior, small- and medium-sized family-owned companies appear to under-react to changes in
market demand, notably when ownership is highly concentrated and growth options are significant.
14
However, they confirm their status of good performers when pure profitability measures are used.
Conversely, industrial- and nonconcentrated family-owned firms appear more prone to deal with
venturing risk, especially when the intensity of the risk is large, as in the case of fast-growing
companies or when there are demand shocks in nondomestic markets.
This result raises the questions if sectoral competitiveness may be negatively affected by a
large incidence of family-owned firms at the sectoral level. If the under-reaction of family firms to
demand shocks is consistent with a general risk-avoidance behavior, then a ‘family firm-intensive’
sector may be expected to be less keen to tolerate instability, thus failing to achieve sustained growth.
Data from a large number of European sectors provide descriptive empirical support to this
conclusion. As a result, the governance of corporation comes out to be a key issue in determining the
industry dynamics at the sectoral level if different governance systems affect firms’ risk-taking
behavior.

15
REFERENCES
ALMEIDA e BRITO J.- JOHN, K., "Leverage and Growth Opportunities: Risk-Avoidance Induced by Risky Debt". EFMA 2001 Lugano. Available at SSRN: http://ssrn.com/abstract=269580
AGHION P. - HOWITT P., “A model of growth through creative destruction”, Econometrica, 60, 1992.
AGHION P. - HOWITT P. - MAYER-FOULKES D., “The effects of financial development convergence: theory and evidence”, Quarterly Journal of Economics, 120 (1), 2005.
ANDERSON R. - REEB D., “Founding-family ownership and firm performance: evidence from the S&P 500”, Journal of Finance, 58 (3), 2003.
BERTRAND, M. - P. MEHTA - S. MULLAINATHAN, “Ferreting out tunneling: An Application to Indian Business Groups”, Quarterly Journal of Economics, 117, 2002.
BERTRAND M, - SCHOAR A. “The role of family in family firms”, Journal of Economic Perspectives, 20- 2, 2006, p.73-96.
BIANCHI M. - BIANCO M. - GIACOMELLI S. - PACCES A.M. - TRENTO S., “Proprietà e controllo delle imprese in Italia. Alle radici delle difficoltà competitive della nostra industria”, Il Mulino, Bologna, 2005.
BLOOM N. - VAN REENEN J., “Measuring and explaining management practices across firms and countries”, Quarterly Journal of Economics, 122, 4, 2007.
BRUNNINGE O. - NORDQVIST M. - WIKLUND J.,”Corporate governance and strategic change in SMEs: the effects of ownership, board composition and top management teams”, Small Business Economics, 29, 2007.
BVDEP, “Ownership database”, Bureau Van Dijk Electronic Publishing, 2006.
CLAESSEN S. - TZIOUMIS K., “Ownership and financing structures of listed and large non-listed corporations”, Corporate Governance, 14/4, 2006.
CUCCULELLI M. - MICUCCI G., “Measuring age effect in entrepreneurship and business”, mimeo, 2006.
CUCCULELLI M. - MICUCCI G., “Family succession and firm performance. Evidence from Italian companies”, Journal of Corporate Finance, 2007.
DEMIRGUC-KUNT A. - MAKSIMOVIC V., “Law, finance and firm growth”, Journal of Finance, 1998.
DEMSETZ H. - VILLALONGA B., “Ownership structure and corporate performance”, Journal of Corporate Finance, 7, 3, 2001, 209-233.
FACCIO M. - LANG L., “The ultimate ownership of western European corporations”, Journal of Financial Economics, 2002.
FAMA E., “Agency problem and the theory of the firm”, Journal of Political Economy, 88, 1980.
FOGEL K. - MORCK R. - YEUNG B., “Big Business Stability and Economic Growth: Is What's Good for General Motors Good for America?”, NBER Working Papers 12394, National Bureau of Economic Research, 2006.
FRYDMAN R. - HESSEL M. - RAPACZYNSKI A., “Why ownership matters?”, Columbia Law School Working paper n.172, 1998.
GOMEZ MEJIA L. - HAYNES K.T. - NUNEZ-NICKEL M. - JACOBSON K. - MOYANO-FUENTES J., “Socio-emotional wealth and business risk in family-controlled firms: evidence from Spanish olive market”, Administrative Science Quarterly, 52, 2007, pag. 106-137.

16
GOODSTEIN J.G. - BOEKER W.B., “Turbulence at the top: a new perspective on governance structure changes and strategic change”, Academy of Management Journal, 34 (2), 1991.
GROSFELD I. - ROLAND G., “Defensive and strategic restructuring in Central European enterprises”, Emergo ,Journal of Transforming Economies and Societies, 3 (4), 1996.
KOTEY B., “Goals, management practices and performance of family SMEs”, International Journal of Entrepreneurial Behaviour and Research, 11, 1, 2005.
LA PORTA R. - LOPEZ DE SILANES F. - SHLEIFER A. - VISHNY R., “Corporate ownership around the world”, Journal of Finance, 1999.
MAURY B., “Family ownership and firm performance: Empirical evidence from Western European corporations”, Journal of Corporate Finance, 12, 2, 2006, pag.321-341.
MILLER L. - LE BRETON–MILLER I. - LESTER R. - CANNELLA A., “Are family firms really superior performers?” Journal of Corporate Finance, 2007.
MOLLY V. - LAVEREN E. - JORISSEN A., “Financing and growth behaviour of family firms: differences between first- and next-generation managed firms”, mimeo, 2006.
MORCK R. - YEUNG B., “Purifying Japan’s banks: issues and implications”, Asian Economic Papers, 5 (1), 2006.
OKOROAFO, S.C., “Internationalization of Family Businesses: Evidence from Northwest Ohio, U.S.A”, Family Business Review, 12, 2, 1999, pag.147-158.
PEDERSEN T. - THOMSEN S., “Ownership structure and value of the largest European firms: the importance of owner identity”, Journal of Management and Governance, 2003.
THOMSEN S. - PEDERSEN T., “Ownership structure and economic performance in the largest European companies”, Strategic Management Journal, 2000.
TUCCI A. - BARBA NAVARETTI G. - FAINI R., “Does family control affect trade performance? Evidence from Italian firms”, CEP WP n.405, 2006.
SRAER D. - THESMAR D., “Performance and behaviour of family firms: evidence from the French stock market”, Institut National de la Statistique et des Etudes Economiques WP, 2004.
UPTON N. - TEAL E.J. - SEAMAN S.L., “Growth goals, strategies and compensation practices of US family and non-family high-growth firms”, The International Journal of Entrepreneurship and Innovation, 4, 2, 2003.
VILLALONGA B. - AMIT R., “How do family ownership, control and management affect firm value?” Journal of Financial Economics, 80, 2006.
WISEMAN R.M. - BROMILEY P., “Toward a model of risk in declining organisations: an empirical examination of risk, performance and decline”, Organisation Science, 7, 1996.
ZAHRA, S.A., “Entrepreneurial risk taking in family firms”, Family Business Review, 18(1), 2005, pages 23-40.
ZELLWEGER, T.,“Time horizon, cost of equity capital and generic investment strategies of firms”, Family Business Review, XX, 1, 2007.

17
TABLE 1
ULTIMATE OWNERS BY SECTORS IN EUROPE
2-digit NACE industry
Financial company
Family or individual
Industrial company
State Total
Wearing apparel; dressing and dyeing of fur 2.7 62.0 33.1 2.3 100
Leather; luggage, handbags, saddlery, and footwear 4.2 61.7 31.7 2.5 100
Office machinery and computers 3.0 60.6 33.3 3.0 100
Textiles 6.9 38.5 53.4 1.1 100
Fabricated metal products, except machinery and eq. 6.0 37.2 53.5 3.2 100
Rubber and plastic products 7.5 34.1 57.0 1.4 100
Motor vehicles, trailers and semi-trailers 10.1 31.4 54.1 4.3 100
Medical, precision and optical instr., watches, clocks 4.9 31.3 52.8 11.1 100
Electrical machinery and apparatus n.e.c. 8.0 30.7 54.2 7.2 100
Publishing, printing and recorded media 5.5 30.6 59.0 4.9 100
Machinery and equipment n.e.c. 6.4 30.3 55.8 7.4 100
Radio, television, and communication equipment 5.9 29.4 51.8 12.9 100
Food products and beverages 5.5 29.4 60.2 5.0 100
Wood and products of wood, except furniture 8.0 28.4 60.0 3.6 100
Other nonmetallic mineral products 7.7 26.7 62.7 2.9 100
Furniture; manufacturing n.e.c. 5.6 26.2 66.4 1.9 100
Basic metals 3.9 25.6 63.6 7.0 100
Other transport equipment 3.6 24.3 54.3 17.9 100
Chemicals and chemical products 6.8 22.3 67.2 3.7 100
Pulp, paper, and paper products 4.2 20.4 72.3 3.1 100
Tobacco 0.0 0.0 68.4 31.6 100
Total 6.1 32.2 56.8 4.9 100
* Gray cells indicate those sectors where the share of each owner is larger than its average value for the total manufacturing industry.

18
TABLE 2
DESCRIPTIVE STATISTICS BY OWNER IDENTITY
Variables Financial company Family or
individuals Industrial company State All firms
Mean Age (median) 33 (27) 27 (22) 32 (26) 35 (22) 31 (24)
Sales growth (%) 20.92 28.43 26.37 15.25 26.15
Sales growth (%) – Industry adj. 2.94 4.79 4.03 1.02 3.35
ROA (%) 6.18 7.28 5.71 6.22 6.25
EBIT (%) 5.12 6.01 4.69 3.13 5.08
Profit per employee (th.EURO) 10.38 9.15 13.67 10.48 12.51
Cost per employee (th.EURO) 26.68 17.49 24.58 8.27 22.06
Asset turnover 4.04 6.37 4.07 6.98 4.84
Asset per employee (th.EURO) 177.63 134.94 201.60 148.08 180.22
Gearing (Loans/Shareholders funds) *100 130.17 132.47 125.45 102.02 126.84
Intangibles on total assets % 2.34 2.03 2.03 5.05 2.04
Employees 283 242 289 628 282
Assets (th.EURO) 41742.4 27197.1 45843.2 56943.0 40636.3
Sales (th.EURO) 51617.5 35831.6 53471.1 32611.1 48933.1
# of SIC sectors (SIC core excluded) 1.95 2.44 2.16 2.41 2.29
Diversification dummy a) .56 .66 .58 .72 .61
% first shareholder 83.47 74.05 85.77 93.16 82.29
% two largest shareholders 90.25 88.70 92.37 98.21 91.41
% three largest shareholders 90.85 91.92 93.51 98.87 93.11
Ultimate Owner ownership share in total 79.72 68.48 85.71 89.58 79.75
Number of firms 647 2,653 4,663 259 9,688b)
Number of firms in Western Europe 588 1,969 4,046 175 7,856 b)
Number of firms in CEECs 59 684 617 84 1,832 b)
a) The diversification dummy is equal to one if the company operates in two 4-digit SIC sectors or more, in addition to the SIC core sector. b) The total number of firms is larger than the sum of the four owners provided in the table because other owners are not tabulated: Foundation, Employees/Managers, Insurance company, Mutual and Pension Funds/Trust/Nominee, Self-owned, and Other unnamed shareholders.
19
TABLE 3
SECTORAL PERFORMANCE AND OWNER IDENTITY. Dependent variable: ATI = Industry turnover Index for EU15 – 2000=100
Independent variables
Italy Germany France Spain
Domestic ATI a)
Non-Domestic ATI a)
Family .061 ** -.053 ** .021 ** .001 * .033 ** .074 ** .005
Industrial company .007 * -.022 ** .008 * .007 * .001 * -.001 .622 **
Financial company .010 -.014 .012 * .005 ** .004 .061 .110 *
State -.051 ** -.048 * .051 ** .011 ** -.213 * -.055 ** -.072 *
Size -.012 * .001 -.003 * .010 * .005 * -.017 ** -.002
Diversification .009 ** .005 ** .001 .081 ** .001 ** -.014 ** -.003 **
Age .013 * .003 * -.002 -.011 .029 .004
.006 **
Year Yes yes yes Yes Yes Yes Yes
Country Yes - - - - Yes yes
Number of obs 57,894 14,338 5,486 8,098 7,267 57,894 57,894
Number of groups 7,668 1,529 733 988 884 7,668 7,668
Adj R-Square .39 .38 .36 .34 .37 .25 .22
** Significant at 1% level. * Significant at 10% level a) The dependent variables for the last two columns of Table 3 are: Domestic ATI = industry Domestic Turnover Index for EU15 – 2000=100 and Nondomestic ATI = industry Nondomestic Turnover Index for EU15 – 2000=100. They summarize the domestic and nondomestic market activity in the industrial sector, respectively.
ATI

20
TABLE 4
FIRM’S SALES SENSITIVITY TO INDUSTRY DEMAND BY OWNER IDENTITY. Dependent variable: Firm’s sale (log) – 2000 =100
Independent variables (1) (2) (3) (4) (5) (6)
ATI .47 ** .54 ** .52 * .61 * .60 * 4.50 *
ATI * Family -.39 ** -.41 ** -.34 ** -.40 ** -.33 ** -.40 **
ATI * Industrial company .18 ** .16 ** .17 * .19 * .17 ** .18 **
ATI * Financial company .12 * .11 ** .14 .12 .12 * .08 *
ATI * State .62 .41 _ _ .06 .05
ATI * Family NC a) .22 ** .20 ** .20 **
Size .14 ** .14 ** 5.81 **
Diversification -.08 ** -.09 ** 2.59 **
Year of incorporation .12 ** .12 ** 2.23 **
ATI * Size .12 ** .16 **
ATI * Diversification -.07 ** -.11 **
ATI * Year of incorp. .09 ** .09 **
Year yes Yes Yes Yes Yes Yes
Country yes Yes Yes Yes Yes Yes
Number of obs 33,949 33,949 33,949 33,949 33,949 33,949
Number of groups 5,761 5,761 5,761 5,761 5,761 5,761
Adj R-Square .38 .39 .44 .46 .40 .44
a) NC means nonconcentrated ownership. This dummy is set equal to one when none of the known shareholders of the company has more than 25% of total or direct ownership and individuals (or families) are the majority among all recorded shareholders, thus indicating a nonconcentrated ownership. Known shareholders can vary from 1 to 6 or more. The group of NC family complements the Family group. ** Significant at 1% level. * Significant at 10% level
Firm’s sale

21
TABLE 5
FIRM’S SALES SENSITIVITY TO INDUSTRY DEMAND.
FINANCING AND GROWTH BEHAVIOR BY OWNER IDENTITY. Dependent variable: Firm’ sale (log) - 2000=100
Independent variables
(1) (2) (3) (4) (5) (6)
ATI .59 * .58 * .42 ** .44 ** .38 ** .36 **
ATI * Family -.27 ** -25 ** -.78 ** -.76 ** -.67 ** -.66 **
ATI * Industrial company .11 * .12 * .67 ** .64 ** .52 ** .54 **
ATI * Financial company .10 .12 -.01 .02 .04 .10
ATI * State _ _ 1.08 * 1.01 .84 .86
ATI * Family NC b) .20 ** .31 ** .26 **
ATI * Size .24 ** .23 ** .31 * .28 * .33 * .32 *
ATI * Diversification -.08 ** -.08 ** -.09 ** -.11 ** -.10 ** -.08 **
ATI * Age .11 ** .12 ** .09 -.10 * .12 .12 *
Year Yes Yes Yes Yes Yes Yes
Country Yes Yes Yes Yes Yes Yes
Number of obs 6,960 6,960 2,923 2,923 3,222 3,222
Number of groups 3,446 3,446 1,542 1,542 1,848 1,848
Adj R-Square .39 .39 .62 .62 .51 .53
a) This sub-sample includes 3,222 firms in the 75th percentile of the distribution of Intangible assets on total assets, that is, all firms with a significant investment in Intangible assets. b) NC means nonconcentrated ownership. This dummy is set equal to one when none of the known shareholders of the company has more that 25% of total or direct ownership and individuals (or families) are the majority among all recorded shareholders, thus indicating a nonconcentrated ownership. Known shareholders can vary from 1 to 6 or more. The group of NC family is not a subset of the Family group. ** Significant at 1% level. * Significant at 10% level
G < IG G > IG
Firm’s sale
Intangibles on Fixed Assets a)

22
TABLE 6
FIRM’S SALES SENSITIVITY TO INDUSTRY DEMAND - DOMESTIC AND NON-DOMESTIC MARKETS.
Dependent variable: Firm’ sale (log) - 2000=100
Independent variables
(1) (2) (3) (4) (5) (6)
ATI (Aggregate Turnover index) a) .28 * .27 * .22 ** .24 ** .19 * .21 *
ATI * Family -.06 ** -.13 ** .16 ** .15 ** -.21 ** -.18 **
ATI * Industrial company .03 * -.01 .04 * .01 * .15 ** .12 **
ATI * Financial company .01 .02 .02 .04 .33 * .24 *
ATI * State .04 -.15 * -.03 -.06 .02 .06
ATI * Family NC b) .09 ** .11 ** .03 * -.05 .11 ** .09 *
ATI * Size .09 ** .14 * .07 ** .16 ** .12 ** .11 *
ATI * Diversification -.02 ** -.08 ** -.04 ** -.11 ** -.04 * -.08
ATI * Age .05 ** .06 * .02 ** .02 .06 * .05 *
ATI * Family * Age .04 ** .05 ** .10 **
ATI * Industrial company * Age .02 ** .05 ** .12 *
ATI * Financial company * Age .00 .00 .02
ATI * State * Age .11 * .02 .14
ATI * Family – NC * Age b) .04 ** .07 * .06 *
Year Yes Yes Yes Yes Yes Yes
Country Yes Yes Yes Yes Yes Yes
Number of obs 32,112 32,112 32,112 32,112 32,112 32,112
Number of groups 4,213 4,213 4,213 4,213 4,213 4,213
Adj R-Square .20 .22 .16 .20 .18 .19
** Significant at 1% level. * Significant at 10% level a) The Aggregate Turnover Index (ATI) used as a regressor is the Total Aggregate Turnover index in columns 1 and 2, the Aggregate Domestic Index in columns 3 and 4, and the Aggregate Nondomestic index in columns 5 and 6, all calculated at country level. b) NC means nonconcentrated ownership. This dummy is set equal to one when none of the known shareholders of the company has more than 25% of total or direct ownership and individuals (or families) are the majority among all recorded shareholders, thus indicating a nonconcentrated ownership. Known shareholders can vary from 1 to 6 or more. The group of NC family is not a subset of the Family group.
Total ATI a) Domestic ATI a)
Firm’s sale
Non- Domestic ATI a)

23
GRAPH 1
STANDARD DEVIATION OF SECTORAL ATI (1996-2004) AND
SHARE OF FAMILY FIRMS OF THE TOTAL FIRMS.
0
0.1
0.2
0.3
0.4
0.00 0.10 0.20 0.30 0.40 0.50 0.60
% of family firms on total firms
Stan
dar d
evia
tion
of s
ecto
ral A
TI -
1996
-200
4

24
APPENDIX
TABLE A1
SHARE OWNERSHIP STRUCTURE OF THE EUROPEAN LISTED COMPANY – 2003.
United Kingdom France Sweden Spain Germany Italy Europe*
Foreign investors 32.3 34.8 33.2 35.1 17.5 14.4 29.0
Private financial companies 50.9 28.5 28.7 15.5 17.0 15.9 32.0
Insurance companies 33.4 4.1 9.2 7.8 5.1 3.4 10.5
Institutional investors 15.3 13.3 17.2 0.0 4.4 7.3 9.6
Banks 2.2 11.1 2.3 7.7 7.5 5.2 6.0
Public Sector 0.0 4.5 9.8 0.3 5.8 13.4 4.0
Individuals and nonfinancial comp. 16.8 32.2 28.3 49.1 59.7 56.3 35.0
Private nonfinancial companies 1.9 23.7 11.0 23.1 45.6 29.7 19.0
Individual investors 14.9 8.5 17.3 26.0 14.1 26.6 16.0 Total 100 100 100 100 100 100 100 * 14 European Stock Exchanges
Source: Federation of European Securities Exchanges (FESE), Share Ownership Structure in Europe, 2004
APPENDIX
AMADEUS BVD INFORMATION – DATA FROM OWNERSHIP DATABASE. BvDEP Independence Indicator To assist users in identifying independent companies, BvDEP has created an Independence Indicator to characterize the degree of independence of a company with regard to its shareholders. The BvDEP Independence Indicators are noted as A, B, C, D, and U. Indicator A is attached to any company with known recorded shareholders, none of which having more than 25% of direct or total ownership. This indicator is further qualified as A+, A, or A- depending on the number of identified shareholders (6 or more, 4–5 or 1–3). BvDEP also gives an A notation to a company that is mentioned by a source (Annual Report, Private Communication or Information Provider) as being the Ultimate Owner of another company, even when its shareholders are not mentioned. A companies are called "Independent companies". Indicator B is attached to any company with a known recorded shareholder, none of which with an ownership percentage (direct, total or calculated total) over 50%, but having one or more shareholders
25
with an ownership percentage above 25%. Also, this indicator is further qualified as B+, B, and B- according to the same criteria relating to the number of recorded shareholders as for indicator A. Indicator C is attached to any company with a recorded shareholder with a total or a calculated total ownership over 50%. The qualification C+ is attributed to C companies in which the summation of direct ownership percentage (all categories of shareholders included) is 50.01% or higher. The C indicator is also given to a company when a source indicates that the company has an ultimate owner, even though its percentage of ownership is unknown. Indicator D is allocated to any company with a recorded shareholder with a direct ownership of over 50%. Indicator U is allocated to companies that do not fall into the previous classification. Ultimate Owner Identification To define an Ultimate Owner, BvDEP analyzes the shareholding structure of a company having a BvDEP Independence Indicator different from A+, A, or A- (which means that the company is independent and consequently has no Ultimate Owner). It looks for the shareholder with the highest direct or total % of ownership. If this shareholder is independent, it is defined as the Ultimate Owner of the subject company and a UO link is created between the subject company. If the highest shareholder is not independent, the same process is repeated until BvDEP finds an Ultimate Owner. Each entity at both ends of a link – shareholder or subsidiary – is given a "type" according to the following classification: - Bank - Financial company - Insurance company - Industrial company - Mutual and pension fund - Foundation & Research institute - Public authorities, States, Governments - Individuals or families - Employees/managers/directors - Self ownership - Private equity - Public - Unnamed private shareholders - Other unnamed shareholders aggregated The last three categories (Public; Unnamed private shareholders, aggregated; Other unnamed shareholders, aggregated) are considered as unable to exert, as such, control over a company. They are disregarded in the qualification of the degree of independence of a company and, as a consequence, in the process of identification of the possible Ultimate Owner of a company. The shareholder information is gathered from several possible sources, including Annual Reports or privately written communications addressed by the company to BvDEP. Although BvDEP characterizes each entry by a "type," it scrupulously respects the wording and spelling given to each entry by the source.