
Timmer PaperAIAA20030352
11
AIAA-2003-0352 1 SUMMARY OF THE DELFT UNIVERSITY WIND TURBINE DEDICATED AIRFOILS W.A. Timmer and R.P.J.O.M. van Rooij Delft University Wind Energy Research Institute, Faculty of Civil Engineering and Geosciences Stevinweg 1, 2628 CN Delft, The Netherlands [email protected], r. [email protected] ABSTRACT This paper gives an overview of the design and wind tunnel test results of the wind turbine dedicated airfoils developed by Delft University of Technology (DUT). The DU-airfoils range in maximum relative thickness from 15% to 40% chord. The first designs were made with XFOIL. Since 1995 RFOIL was used, a modified version of XFOIL, featuring an improved prediction around the maximum lift coefficient and capabilities of predicting the effect of rotation on airfoil characteristics. The measured effect of Gurney flaps, trailing edge wedges, vortex generators and trip wires on the airfoil characteristics of various DU-airfoils is presented. Furthermore, a relation between the thickness of the airfoil leading edge and the angle-of- attack for leading edge separation is given. INTRODUCTION During the last decade some fifteen wind turbine airfoils have been designed at DUT, of which 5 have been extensively tested in the Delft University wind tunnel (LST) and 4 in the low-speed wind tunnel of IAG Stuttgart. Two designs were tested in both wind tunnels to verify specific design features. The goal of the LST-tests was twofold. First, they served as a validation of the design code and a verification of the capabilities of the code to predict specific airfoil features. Furthermore the effect on performance of aerodynamic devices such as Gurney flaps and vortex generators could be studied experimentally. As a result the airfoil designs are well documented and constitute a series of base airfoils from which other designs may be derived with confidence. The airfoils, ranging from 15% to 40% relative thickness, have been developed in a number of projects, funded by the European Union in the framework of the Copyright © 2003 by Delft University of Technology. Published by the American Institute of Aeronautics and Astronautics, Inc. and the American Society of Mechanical Engineers with permission JOULE program, the Netherlands Agency for Energy and the Environment (NOVEM) and by various European blade manufacturers. At present DU airfoils are being used by various wind turbine manufacturers world wide in over 10 different rotor blades for turbines with rotor diameters ranging from 29 m. to over 100 m., corresponding to machines with maximum power ranging from 350 kW to 3.5 MW. In the eighties and early nineties of the last century it was common practice to use existing airfoil families like the 4 digit NACA 44 and the 6 digit NACA 63 series for the design of wind turbine blades. The required thickness in the root was achieved by linearly scaling the coordinates from airfoils with smaller thickness. From calculations and wind tunnel tests it appeared, however, that the thick members of the NACA airfoil family suffer from a severe degradation of the performance due to premature transition. In his period research projects were conducted in various institutes in the US and Europe (e.g. [1] ,[2]) to produce alternatives for the widely used NACA airfoils, especially those with a maximum relative thickness of 21% or more. Three DU-airfoils result from this period, designated DU 91-W1-251, DU 91-W2-250 and DU 93-W-210. In practice most wind turbine manufacturers tune the blades of stall-regulated machines with vortex generators and stall strips. Furthermore the application of Gurney flaps has been considered. In the Delft wind tunnel, tests were performed mostly on airfoil DU 93- W-210 to answer the resulting quest for data concerning the effect on airfoil performance and to give guidelines for locations and sizes of the various tuning devices. Figure 1: A series of DU airfoils for a pitch regulated 55 m diameter r otor.
-
Upload
gerritgroot -
Category
Documents
-
view
228 -
download
0
Transcript of Timmer PaperAIAA20030352
8/12/2019 Timmer PaperAIAA20030352
http://slidepdf.com/reader/full/timmer-paperaiaa20030352 1/11
AIAA-2003-0352
1
SUMMARY OF THE DELFT UNIVERSITY WIND TURBINE DEDICATED AIRFOILS
W.A. Timmer and R.P.J.O.M. van Rooij
Delft University Wind Energy Research Institute,
Faculty of Civil Engineering and Geosciences
Stevinweg 1, 2628 CN Delft, The Netherlands
[email protected], r. [email protected]
ABSTRACT
This paper gives an overview of the design and wind
tunnel test results of the wind turbine dedicated airfoils
developed by Delft University of Technology (DUT).
The DU-airfoils range in maximum relative thickness
from 15% to 40% chord. The first designs were made
with XFOIL. Since 1995 RFOIL was used, a modified
version of XFOIL, featuring an improved prediction
around the maximum lift coefficient and capabilities ofpredicting the effect of rotation on airfoil
characteristics. The measured effect of Gurney flaps,
trailing edge wedges, vortex generators and trip wires
on the airfoil characteristics of various DU-airfoils is
presented. Furthermore, a relation between the
thickness of the airfoil leading edge and the angle-of-
attack for leading edge separation is given.
INTRODUCTION
During the last decade some fifteen wind turbine
airfoils have been designed at DUT, of which 5 have
been extensively tested in the Delft University wind
tunnel (LST) and 4 in the low-speed wind tunnel of
IAG Stuttgart. Two designs were tested in both wind
tunnels to verify specific design features.
The goal of the LST-tests was twofold. First, they
served as a validation of the design code and a
verification of the capabilities of the code to predict
specific airfoil features. Furthermore the effect on
performance of aerodynamic devices such as Gurney
flaps and vortex generators could be studied
experimentally. As a result the airfoil designs are well
documented and constitute a series of base airfoils from
which other designs may be derived with confidence.
The airfoils, ranging from 15% to 40% relative
thickness, have been developed in a number of projects,
funded by the European Union in the framework of the
Copyright © 2003 by Delft University of Technology. Published bythe American Institute of Aeronautics and Astronautics, Inc. and theAmerican Society of Mechanical Engineers with permission
JOULE program, the Netherlands Agency for Energy
and the Environment (NOVEM) and by various
European blade manufacturers. At present DU airfoils
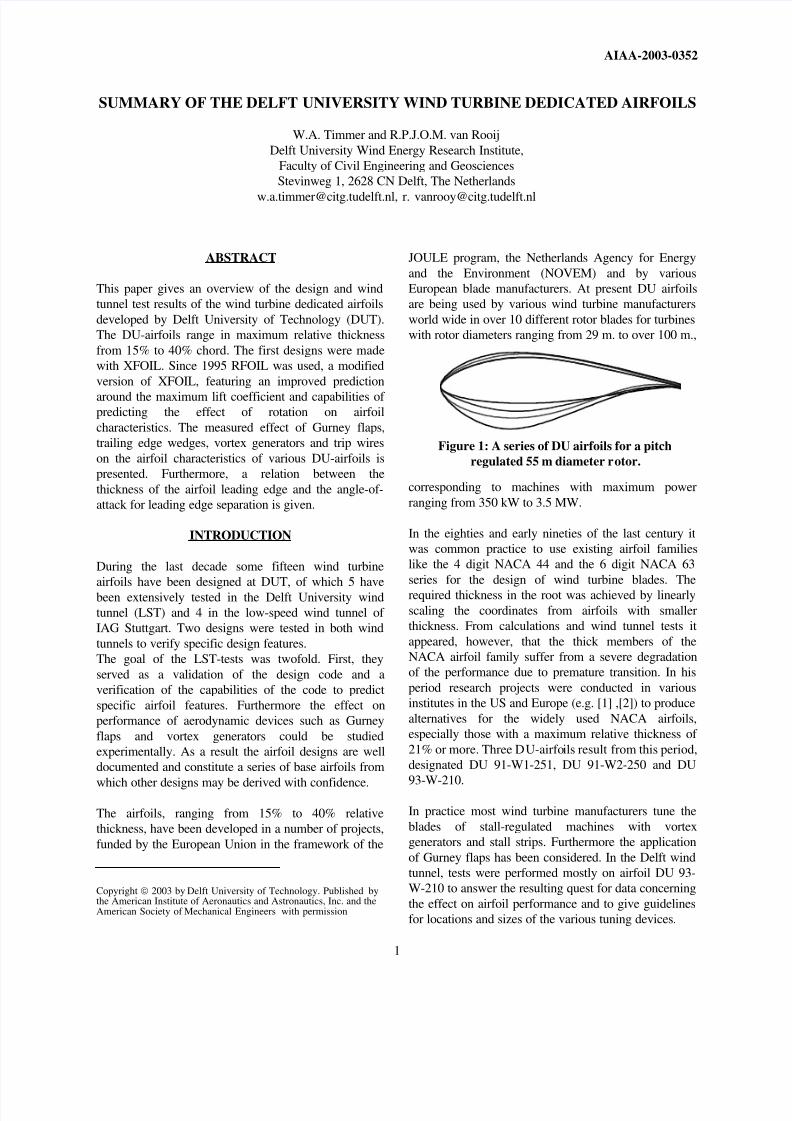
are being used by various wind turbine manufacturers
world wide in over 10 different rotor blades for turbines
with rotor diameters ranging from 29 m. to over 100 m.,
corresponding to machines with maximum power
ranging from 350 kW to 3.5 MW.
In the eighties and early nineties of the last century it
was common practice to use existing airfoil families
like the 4 digit NACA 44 and the 6 digit NACA 63
series for the design of wind turbine blades. The
required thickness in the root was achieved by linearly
scaling the coordinates from airfoils with smaller
thickness. From calculations and wind tunnel tests it
appeared, however, that the thick members of the
NACA airfoil family suffer from a severe degradation
of the performance due to premature transition. In his
period research projects were conducted in various
institutes in the US and Europe (e.g. [1] ,[2]) to produce
alternatives for the widely used NACA airfoils,
especially those with a maximum relative thickness of
21% or more. Three DU-airfoils result from this period,
designated DU 91-W1-251, DU 91-W2-250 and DU
93-W-210.
In practice most wind turbine manufacturers tune the
blades of stall-regulated machines with vortex
generators and stall strips. Furthermore the application
of Gurney flaps has been considered. In the Delft wind
tunnel, tests were performed mostly on airfoil DU 93-
W-210 to answer the resulting quest for data concerning
the effect on airfoil performance and to give guidelines
for locations and sizes of the various tuning devices.
Figure 1: A series of DU airfoils for a pitch
regulated 55 m diameter rotor.
8/12/2019 Timmer PaperAIAA20030352
http://slidepdf.com/reader/full/timmer-paperaiaa20030352 2/11
2
With the growing knowledge of the mechanism behind
wind turbine blade noise and the effect of rotation,
although not yet fully understood, during the second
halve of the nineties a number of airfoils was designed
using an 18% thick tip airfoil with low maximum lift
(DU 95-W-180) and a 30% thick inboard airfoil (DU
97-W-300) as base lines.
The general designation of the DU airfoils is DU yy-W-
xxx, in which DU stands for Delft University, followed
by the last two digits of the year in which the airfoil
was designed, a W denoting the wind energy
application, to distinguish the airfoil from the ones
designed for sailplanes and general aviation and 3 digits
giving 10 times the airfoil maximum thickness in
percent of the chord. In the case of DU 91 there is an
additional number following the W to denote that there
has been more than one design with a thickness of
about 25% that year.
The work on wind turbine airfoils at Delft University
has been the subject of a number of contributions to
consecutive European wind energy conferences, e.g. [3]
to [6], where some of the subjects discussed in this
paper can be found in more detail. In the following the
design philosophy and experimental results for the DU
airfoils will be presented.
EXPERIMENTAL SETUP AND PROCEDURE
Wind tunnel
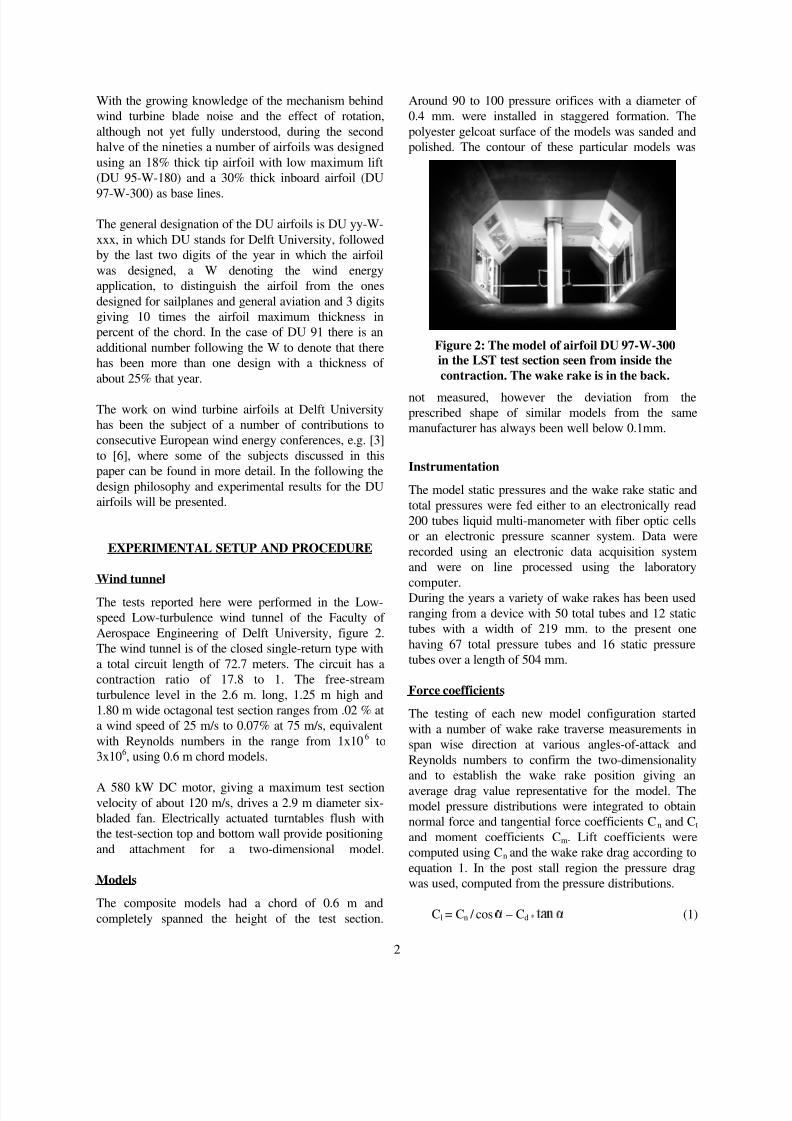
The tests reported here were performed in the Low-
speed Low-turbulence wind tunnel of the Faculty of
Aerospace Engineering of Delft University, figure 2.
The wind tunnel is of the closed single-return type with
a total circuit length of 72.7 meters. The circuit has a
contraction ratio of 17.8 to 1. The free-stream
turbulence level in the 2.6 m. long, 1.25 m high and
1.80 m wide octagonal test section ranges from .02 % at
a wind speed of 25 m/s to 0.07% at 75 m/s, equivalent
with Reynolds numbers in the range from 1x10⁶ to
3x10⁶, using 0.6 m chord models.
A 580 kW DC motor, giving a maximum test sectionvelocity of about 120 m/s, drives a 2.9 m diameter six-
bladed fan. Electrically actuated turntables flush with
the test-section top and bottom wall provide positioning
and attachment for a two-dimensional model.
Models
The composite models had a chord of 0.6 m and
completely spanned the height of the test section.
Around 90 to 100 pressure orifices with a diameter of
0.4 mm. were installed in staggered formation. The
polyester gelcoat surface of the models was sanded and
polished. The contour of these particular models was
not measured, however the deviation from the
prescribed shape of similar models from the same
manufacturer has always been well below 0.1mm.
Instrumentation
The model static pressures and the wake rake static and
total pressures were fed either to an electronically read
200 tubes liquid multi-manometer with fiber optic cells
or an electronic pressure scanner system. Data were
recorded using an electronic data acquisition system
and were on line processed using the laboratory
computer.During the years a variety of wake rakes has been used
ranging from a device with 50 total tubes and 12 static
tubes with a width of 219 mm. to the present one
having 67 total pressure tubes and 16 static pressure
tubes over a length of 504 mm.
Force coefficients
The testing of each new model configuration started
with a number of wake rake traverse measurements in
span wise direction at various angles-of-attack and
Reynolds numbers to confirm the two-dimensionality
and to establish the wake rake position giving an
average drag value representative for the model. The
model pressure distributions were integrated to obtain
normal force and tangential force coefficients Cn and Ct
and moment coefficients Cm. Lift coefficients were
computed using Cn and the wake rake drag according to
equation 1. In the post stall region the pressure drag
was used, computed from the pressure distributions.
Cl = Cn / cos – Cd * (1)
Figure 2: The model of airfoil DU 97-W-300
in the LST test section seen from inside the
contraction. The wake rake is in the back.
8/12/2019 Timmer PaperAIAA20030352
http://slidepdf.com/reader/full/timmer-paperaiaa20030352 3/11
3
Wind tunnel wall corrections
To the measured data the standard wind tunnel wall
corrections for lift-interference and model solid and
wake blockage as given by Allen & Vincenti [7] were
applied. Corrections have also been made for the effect
of solid blockage of the wake rake on the test section
velocity and the effect of the wake rake self-blockage
on the values of the static pressures (and consequently
the dynamic pressure) measured by the wake rake.
The standard position of the wake rake was about 60%
chord length downstream from the model trailing edge.
Effects of roughness
As a standard way to check the sensitivity of the
designs to contamination of the leading edge, 0.35mm
thick zigzag tape was used. The tape leading edge was
located at the model upper surface 5% chord station.
On average for the airfoils tested, at angles around the
maximum lift-to-drag ratio, the critical height ofdistributed roughness as calculated by the method of
Braslow [8] on the 5% chord location is in the order of
0.15 mm. For zigzag tape, having a critical Reynolds
number based on roughness height of about 200 instead
of 600 for grit roughness, the critical height would be
about 0.10 mm. Although not being a roughness
simulation of the worst kind, the zigzag tape of 0.35
mm thickness can therefore be considered as a rather
severe means of tripping.
PREDICTION OF THE TWO-DIMENSIONAL
AIRFOIL CHARACTERISTICS
For the design of the Delft airfoils the XFOIL code was
used. First in the basic version 5.4, after 1996 in a
modified version called RFOIL. The RFOIL code
resulted from a NOVEM funded project called TIDIS
(Three Dimensional effects in Stall), carried out by the
Netherlands Energy Research Foundation ECN, the
National Aerospace Laboratory NLR and Delft
University. The aim of the project was to develop a
method on basis of the existing XFOIL code to
calculate the effect of rotation on airfoil performance.To this end, first the code’s prediction of the airfoil
performance around the two-dimensional maximum lift
was enhanced. Improvement of the numerical stability
was effectuated by using the Schlichting velocity
profiles for the turbulent boundary layer instead of
Swafford’s. Furthermore, the shear lag coefficient in
Green’s lag entrainment equation of the turbulent
boundary layer model was adjusted and deviation from
the equilibrium flow has been coupled to the shape
factor of the boundary layer [9].
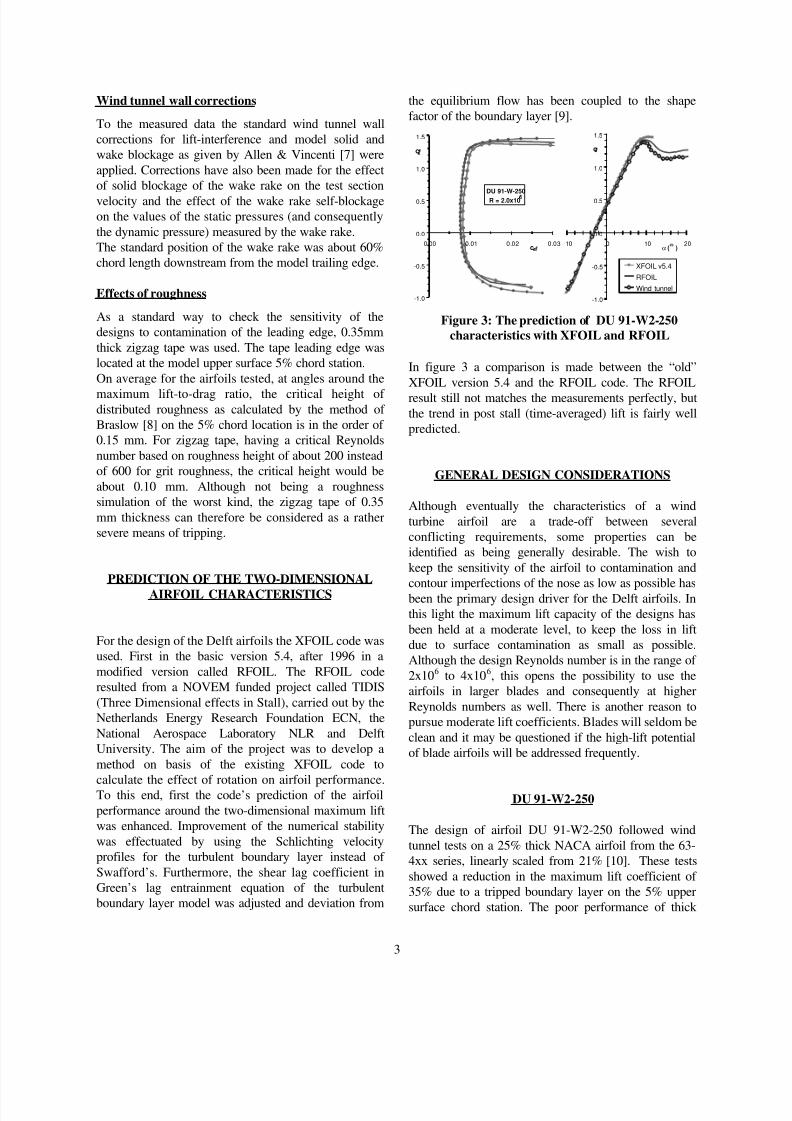
In figure 3 a comparison is made between the “old”
XFOIL version 5.4 and the RFOIL code. The RFOIL
result still not matches the measurements perfectly, but
the trend in post stall (time-averaged) lift is fairly well
predicted.
GENERAL DESIGN CONSIDERATIONS
Although eventually the characteristics of a wind
turbine airfoil are a trade-off between several
conflicting requirements, some properties can be
identified as being generally desirable. The wish to
keep the sensitivity of the airfoil to contamination and
contour imperfections of the nose as low as possible hasbeen the primary design driver for the Delft airfoils. In
this light the maximum lift capacity of the designs has
been held at a moderate level, to keep the loss in lift
due to surface contamination as small as possible.
Although the design Reynolds number is in the range of
2x10⁶ to 4x10
6, this opens the possibility to use the
airfoils in larger blades and consequently at higher
Reynolds numbers as well. There is another reason to
pursue moderate lift coefficients. Blades will seldom be
clean and it may be questioned if the high-lift potential
of blade airfoils will be addressed frequently.
DU 91-W2-250
The design of airfoil DU 91-W2-250 followed wind
tunnel tests on a 25% thick NACA airfoil from the 63-
4xx series, linearly scaled from 21% [10]. These tests
showed a reduction in the maximum lift coefficient of
35% due to a tripped boundary layer on the 5% upper
surface chord station. The poor performance of thick
Figure 3: The prediction of DU 91-W2-250
characteristics with XFOIL and RFOIL
DU 91-W-250
R = 2.0x10
-1.0
-0.5
0.0
0.5
1.0
1.5
0.00 0.01 0.02 0.03c
c
-1.0
-0.5
0.0
0.5
1.0
1.5
-10 0 10 20α (
)
c
XFOIL v5.4
RFOIL
Wind tunnel
8/12/2019 Timmer PaperAIAA20030352
http://slidepdf.com/reader/full/timmer-paperaiaa20030352 4/11
4
NACA-airfoils with leading edge contamination can be
traced to the high upper surface velocities and resulting
high adverse pressure gradients due to the larger upper
surface thickness, giving premature transition and early
separation. The thick airfoils currently in use by most
blade manufacturers all have a restraint upper surface
thickness to avoid this premature turbulent separation.To compensate for the resulting loss in lift of the upper
surface, a certain amount of lower surface aft loading is
incorporated, giving the typical S-shape of the pressure
side. It was the intention to use the new 25% thick DU-
airfoil in stall as well as pitch blades for 500 kW
machines with rotors of about 40 m diameter, which
was still fairly large in the early nineties. This was
translated into the following design goals:
a Cl,max of about 1.4 to 1.5 with a gradual stall,
NACA airfoil (maximum Cl /Cd > 119)
a low sensitivity to leading edge contamination by
ensuring that the transition location is near the
leading edge when approaching stall at a Reynoldsnumber of 3x10
6
trailing edge thickness between 0.5% and 1%c
location of maximum thickness around 30%c
There was no restriction on the moment about the
quarter-chord point. The airfoil was designed with the
earlier XFOIL version 5.4. Measured pressure
distributions are given in figure 4 and the measured
performance at R=3x10⁶ is shown in figure 5. It
appeared that the Cl,max was just off the target of 1.4,
although the calculations predicted a value of 1.53.
The sensitivity of the airfoil to distortion of the
boundary layer at the nose was investigated by applying
zigzag tape of 0.35 mm thickness at the 5% chord
station. Due to the trip the maximum lift coefficient
dropped from 1.37 to 1.16.
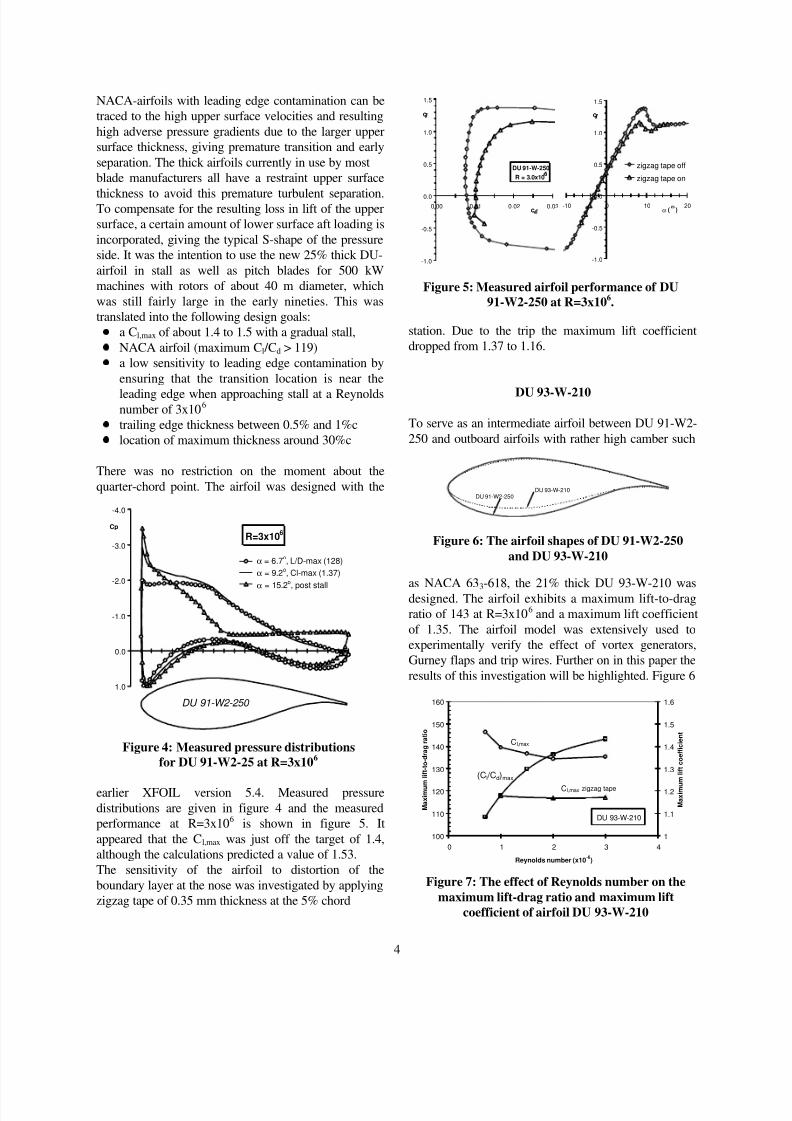
DU 93-W-210
To serve as an intermediate airfoil between DU 91-W2-
250 and outboard airfoils with rather high camber such
as NACA 633-618, the 21% thick DU 93-W-210 wasdesigned. The airfoil exhibits a maximum lift-to-drag
ratio of 143 at R=3x10⁶ and a maximum lift coefficient
of 1.35. The airfoil model was extensively used to
experimentally verify the effect of vortex generators,
Gurney flaps and trip wires. Further on in this paper the
results of this investigation will be highlighted. Figure 6
DU 91-W2-250DU 93-W-210
Figure 6: The airfoil shapes of DU 91-W2-250
and DU 93-W-210
Figure 4: Measured pressure distributions
for DU 91-W2-25 at R=3x10⁶
R=3x10⁶
-4.0
-3.0
-2.0
-1.0
0.0
1.0
Cp
α = 6.7o, L/D-max (128)
α = 9.2o, Cl-max (1.37)
α = 15.2
o
, post stall
DU 91-W2-250
Figure 5: Measured airfoil performance of DU
91-W2-250 at R=3x10⁶.
DU 91-W-250
R = 3.0x10
-1.0
-0.5
0.0
0.5
1.0
1.5
0.00 0.01 0.02 0.03c
c
-1.0
-0.5
0.0
0.5
1.0
1.5
-10 0 10 20α (
)
c
zigzag tape off
zigzag tape on
Figure 7: The effect of Reynolds number on the
maximum lift-drag ratio and maximum lift
coefficient of airfoil DU 93-W-210
100
110
120
130
140
150
160
0 1 2 3 4
Reynolds number (x10-6
)
M a x i m u m l i f t -
t o - d r a g r a t i o
1
1.1
1.2
1.3
1.4
1.5
1.6
M a x i m u
m l i f t
c o e f f i c i e n t
Cl,max
DU 93-W-210
Cl,max zigzag tape
(Cl /Cd)max
8/12/2019 Timmer PaperAIAA20030352
http://slidepdf.com/reader/full/timmer-paperaiaa20030352 5/11
5
depicts the difference between the contours of DU 91
and DU 93. The upper surface thickness of the DU 91
airfoil was generally maintained and the airfoil was
made more laminar by shifting the location of
maximum thickness a few percent backwards in favor
of a high lift-to-drag ratio.
In figure 7 the maximum l/d and the maximum liftcoefficient of DU 93 are depicted. Although the value
of Cl,max at a Reynolds number of 3x10⁶
was a little
disappointing (1.35 instead of the predicted 1.45) the
overall performance of the airfoil, however, certainly in
terms of lift-to-drag ratio, was satisfying.
DU 95-W-180
Design considerations
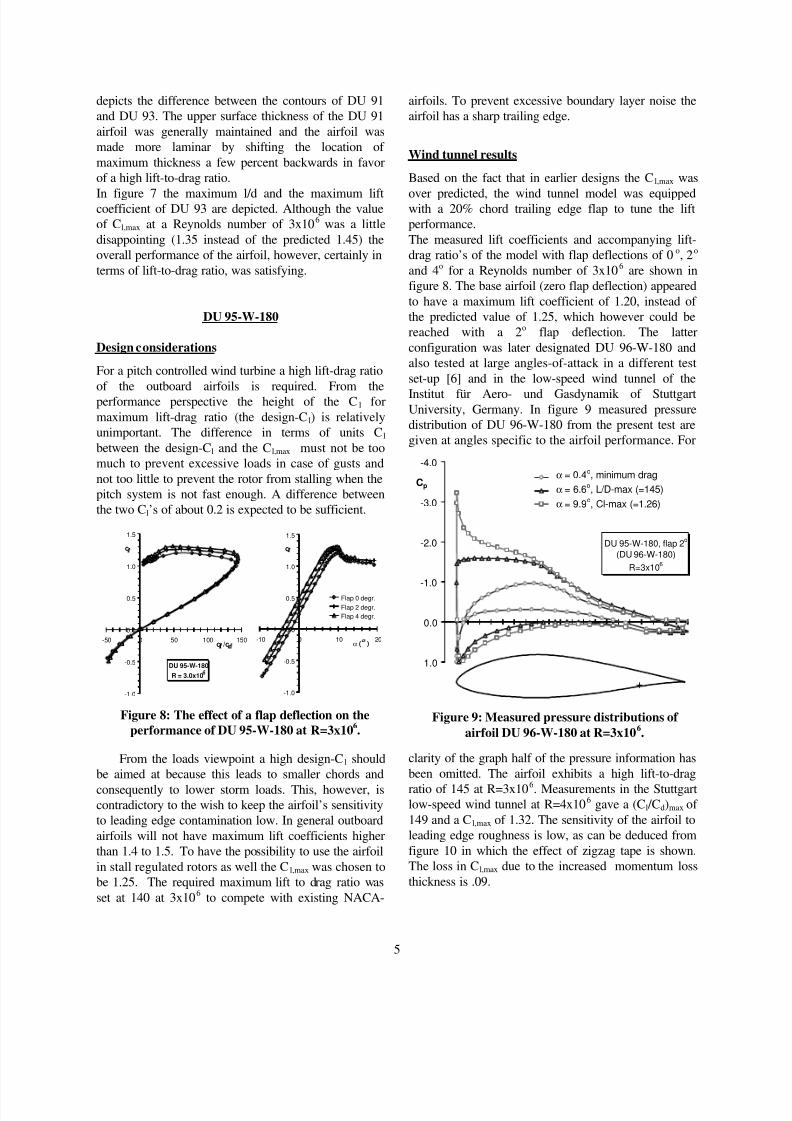
For a pitch controlled wind turbine a high lift-drag ratio
of the outboard airfoils is required. From theperformance perspective the height of the Cl for
maximum lift-drag ratio (the design-Cl) is relatively
unimportant. The difference in terms of units Cl
between the design-Cl and the Cl,max must not be too
much to prevent excessive loads in case of gusts and
not too little to prevent the rotor from stalling when the
pitch system is not fast enough. A difference between
the two Cl’s of about 0.2 is expected to be sufficient.
From the loads viewpoint a high design-Cl should
be aimed at because this leads to smaller chords and
consequently to lower storm loads. This, however, iscontradictory to the wish to keep the airfoil’s sensitivity
to leading edge contamination low. In general outboard
airfoils will not have maximum lift coefficients higher
than 1.4 to 1.5. To have the possibility to use the airfoil
in stall regulated rotors as well the Cl,max was chosen to
be 1.25. The required maximum lift to drag ratio was
set at 140 at 3x10⁶ to compete with existing NACA-
airfoils. To prevent excessive boundary layer noise the
airfoil has a sharp trailing edge.
Wind tunnel results
Based on the fact that in earlier designs the Cl,max was
over predicted, the wind tunnel model was equippedwith a 20% chord trailing edge flap to tune the lift
performance.
The measured lift coefficients and accompanying lift-
drag ratio’s of the model with flap deflections of 0o, 2
o
and 4o for a Reynolds number of 3x10
6 are shown in
figure 8. The base airfoil (zero flap deflection) appeared
to have a maximum lift coefficient of 1.20, instead of
the predicted value of 1.25, which however could be
reached with a 2o flap deflection. The latter
configuration was later designated DU 96-W-180 and
also tested at large angles-of-attack in a different test
set-up [6] and in the low-speed wind tunnel of the
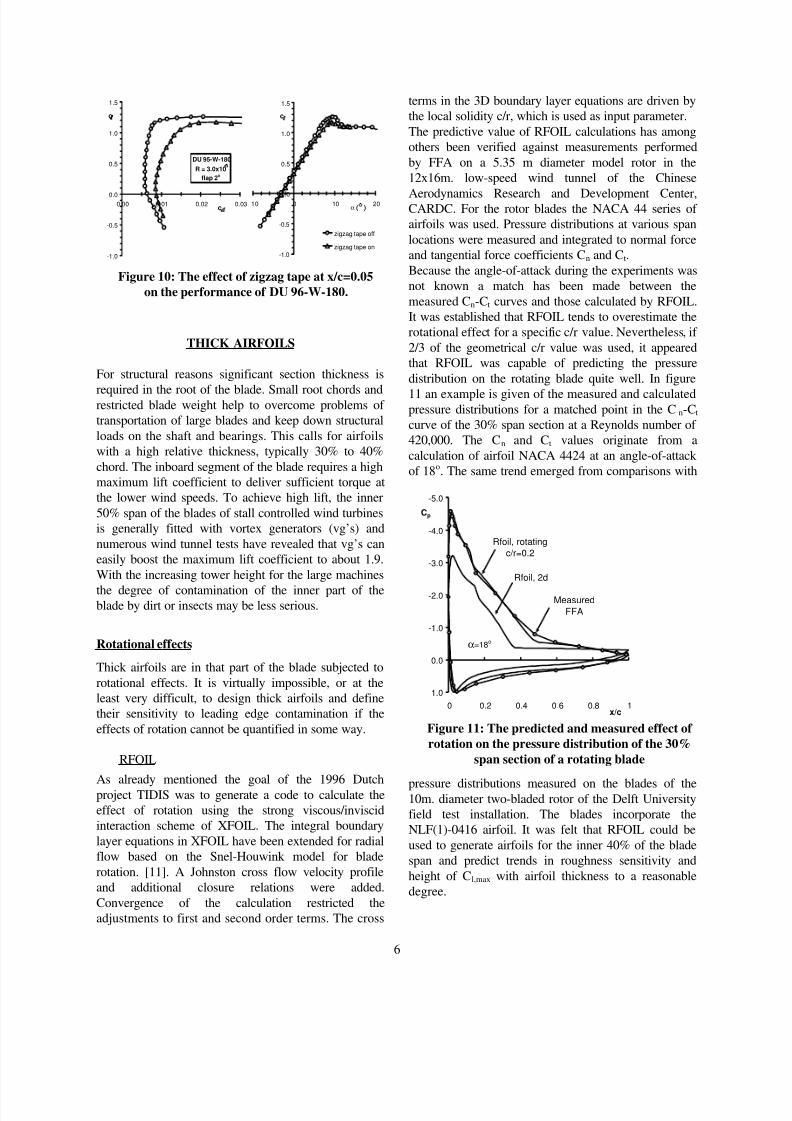
Institut für Aero- und Gasdynamik of StuttgartUniversity, Germany. In figure 9 measured pressure
distribution of DU 96-W-180 from the present test are
given at angles specific to the airfoil performance. For
clarity of the graph half of the pressure information has
been omitted. The airfoil exhibits a high lift-to-drag
ratio of 145 at R=3x10⁶. Measurements in the Stuttgartlow-speed wind tunnel at R=4x10
6 gave a (Cl /Cd)max of
149 and a Cl,max of 1.32. The sensitivity of the airfoil to
leading edge roughness is low, as can be deduced from
figure 10 in which the effect of zigzag tape is shown.
The loss in Cl,max due to the increased momentum loss
thickness is .09.
Figure 9: Measured pressure distributions of
airfoil DU 96-W-180 at R=3x10⁶.
DU 95-W-180, flap 2o
(DU 96-W-180)
R=3x10⁶
-4.0
-3.0
-2.0
-1.0
0.0
1.0
Cp
α = 0.4o, minimum drag
α = 6.6o, L/D-max (=145)
α = 9.9o, Cl-max (=1.26)
Figure 8: The effect of a flap deflection on the
performance of DU 95-W-180 at R=3x10⁶.
DU 95-W-180
R = 3.0x10
-1.0
-0.5
0.0
0.5
1.0
1.5
-50 0 50 100 150c
/c
c
-1.0
-0.5
0.0
0.5
1.0
1.5
-10 0 10 20α ( )
c
Flap 0 degr.
Flap 2 degr.
Flap 4 degr.
8/12/2019 Timmer PaperAIAA20030352
http://slidepdf.com/reader/full/timmer-paperaiaa20030352 6/11
6
THICK AIRFOILS
For structural reasons significant section thickness is
required in the root of the blade. Small root chords andrestricted blade weight help to overcome problems of
transportation of large blades and keep down structural
loads on the shaft and bearings. This calls for airfoils
with a high relative thickness, typically 30% to 40%
chord. The inboard segment of the blade requires a high
maximum lift coefficient to deliver sufficient torque at
the lower wind speeds. To achieve high lift, the inner
50% span of the blades of stall controlled wind turbines
is generally fitted with vortex generators (vg’s) and
numerous wind tunnel tests have revealed that vg’s can
easily boost the maximum lift coefficient to about 1.9.
With the increasing tower height for the large machines
the degree of contamination of the inner part of theblade by dirt or insects may be less serious.
Rotational effects
Thick airfoils are in that part of the blade subjected to
rotational effects. It is virtually impossible, or at the
least very difficult, to design thick airfoils and define
their sensitivity to leading edge contamination if the
effects of rotation cannot be quantified in some way.
RFOIL
As already mentioned the goal of the 1996 Dutchproject TIDIS was to generate a code to calculate the
effect of rotation using the strong viscous/inviscid
interaction scheme of XFOIL. The integral boundary
layer equations in XFOIL have been extended for radial
flow based on the Snel-Houwink model for blade
rotation. [11]. A Johnston cross flow velocity profile
and additional closure relations were added.
Convergence of the calculation restricted the
adjustments to first and second order terms. The cross
terms in the 3D boundary layer equations are driven by
the local solidity c/r, which is used as input parameter.
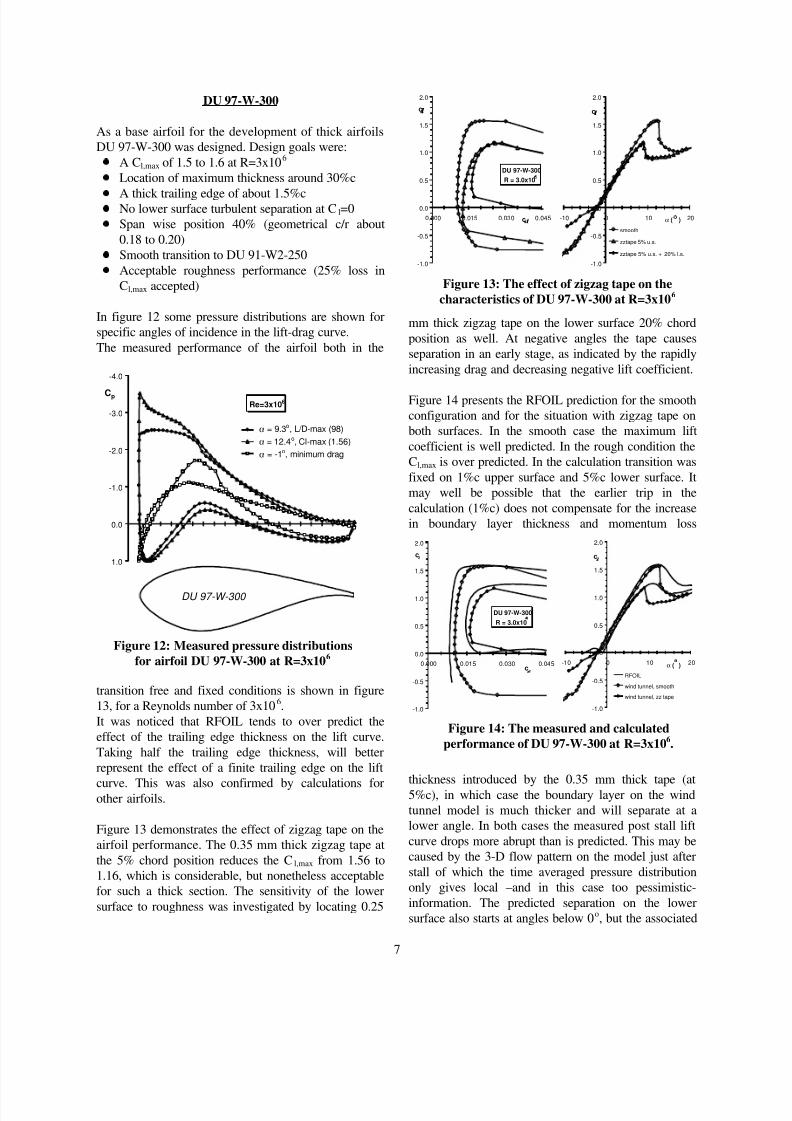
The predictive value of RFOIL calculations has among
others been verified against measurements performed
by FFA on a 5.35 m diameter model rotor in the
12x16m. low-speed wind tunnel of the Chinese
Aerodynamics Research and Development Center,CARDC. For the rotor blades the NACA 44 series of
airfoils was used. Pressure distributions at various span
locations were measured and integrated to normal force
and tangential force coefficients Cn and Ct.
Because the angle-of-attack during the experiments was
not known a match has been made between the
measured Cn-Ct curves and those calculated by RFOIL.
It was established that RFOIL tends to overestimate the
rotational effect for a specific c/r value. Nevertheless, if
2/3 of the geometrical c/r value was used, it appeared
that RFOIL was capable of predicting the pressure
distribution on the rotating blade quite well. In figure
11 an example is given of the measured and calculatedpressure distributions for a matched point in the Cn-Ct
curve of the 30% span section at a Reynolds number of
420,000. The Cn and Ct values originate from a
calculation of airfoil NACA 4424 at an angle-of-attack
of 18o. The same trend emerged from comparisons with
pressure distributions measured on the blades of the10m. diameter two-bladed rotor of the Delft University
field test installation. The blades incorporate the
NLF(1)-0416 airfoil. It was felt that RFOIL could be
used to generate airfoils for the inner 40% of the blade
span and predict trends in roughness sensitivity and
height of Cl,max with airfoil thickness to a reasonable
degree.
-5.0
-4.0
-3.0
-2.0
-1.0
0.0
1.0
0 0.2 0.4 0.6 0.8 1x/c
Cp
Rfoil, rotating
c/r=0.2
Rfoil, 2d
Measured
FFA
α=18o
Figure 11: The predicted and measured effect of
rotation on the pressure distribution of the 30%
span section of a rotating blade
Figure 10: The effect of zigzag tape at x/c=0.05
on the performance of DU 96-W-180.
DU 95-W-180
R = 3.0x10
flap 2o
-1.0
-0.5
0.0
0.5
1.0
1.5
0.00 0.01 0.02 0.03c
c
-1.0
-0.5
0.0
0.5
1.0
1.5
-10 0 10 20α ( )
c
zigzag tape off
zigzag tape on
8/12/2019 Timmer PaperAIAA20030352
http://slidepdf.com/reader/full/timmer-paperaiaa20030352 7/11
7
DU 97-W-300
As a base airfoil for the development of thick airfoils
DU 97-W-300 was designed. Design goals were:
A Cl,max of 1.5 to 1.6 at R=3x10⁶
Location of maximum thickness around 30%c
A thick trailing edge of about 1.5%cNo lower surface turbulent separation at Cl=0
Span wise position 40% (geometrical c/r about
0.18 to 0.20)
Smooth transition to DU 91-W2-250
Acceptable roughness performance (25% loss in
Cl,max accepted)
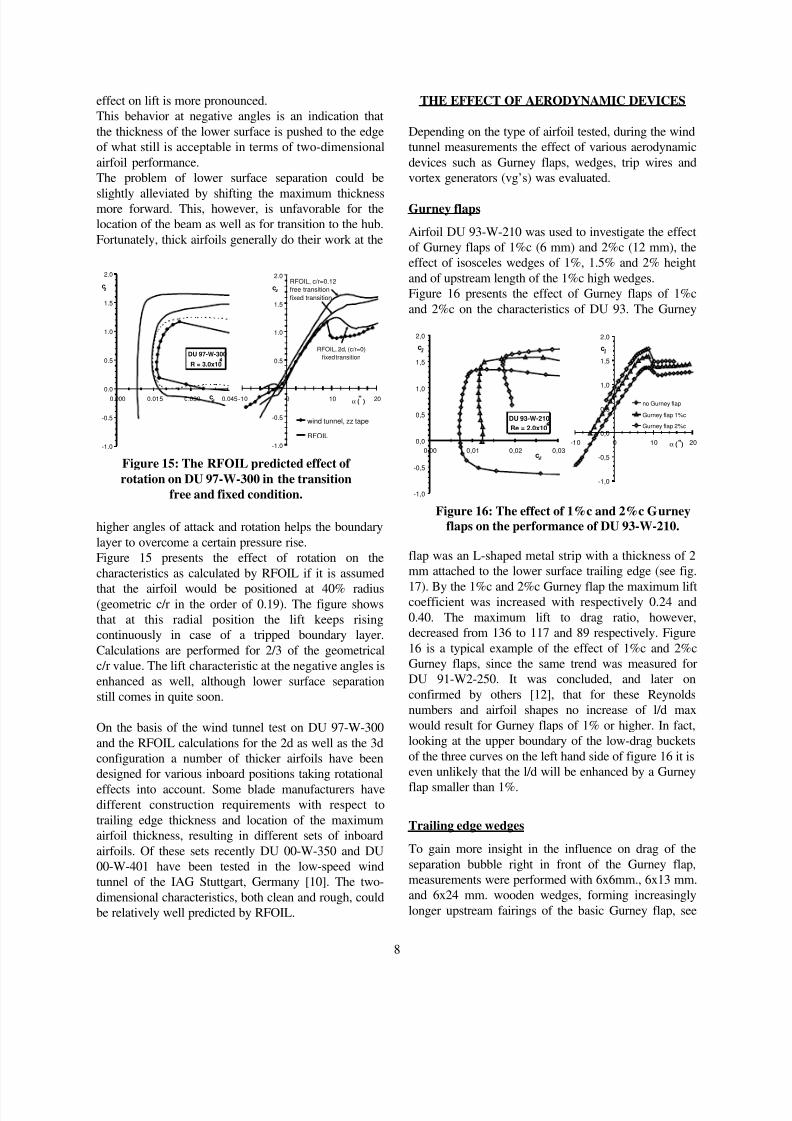
In figure 12 some pressure distributions are shown for
specific angles of incidence in the lift-drag curve.
The measured performance of the airfoil both in the
transition free and fixed conditions is shown in figure
13, for a Reynolds number of 3x10⁶.
It was noticed that RFOIL tends to over predict the
effect of the trailing edge thickness on the lift curve.
Taking half the trailing edge thickness, will better
represent the effect of a finite trailing edge on the lift
curve. This was also confirmed by calculations forother airfoils.
Figure 13 demonstrates the effect of zigzag tape on the
airfoil performance. The 0.35 mm thick zigzag tape at
the 5% chord position reduces the Cl,max from 1.56 to
1.16, which is considerable, but nonetheless acceptable
for such a thick section. The sensitivity of the lower
surface to roughness was investigated by locating 0.25
mm thick zigzag tape on the lower surface 20% chord
position as well. At negative angles the tape causes
separation in an early stage, as indicated by the rapidly
increasing drag and decreasing negative lift coefficient.
Figure 14 presents the RFOIL prediction for the smooth
configuration and for the situation with zigzag tape on
both surfaces. In the smooth case the maximum lift
coefficient is well predicted. In the rough condition the
Cl,max is over predicted. In the calculation transition was
fixed on 1%c upper surface and 5%c lower surface. It
may well be possible that the earlier trip in the
calculation (1%c) does not compensate for the increase
in boundary layer thickness and momentum loss
thickness introduced by the 0.35 mm thick tape (at5%c), in which case the boundary layer on the wind
tunnel model is much thicker and will separate at a
lower angle. In both cases the measured post stall lift
curve drops more abrupt than is predicted. This may be
caused by the 3-D flow pattern on the model just after
stall of which the time averaged pressure distribution
only gives local –and in this case too pessimistic-
information. The predicted separation on the lower
surface also starts at angles below 0o, but the associated
Figure 12: Measured pressure distributions
for airfoil DU 97-W-300 at R=3x10⁶
Re=3x10⁶
-4.0
-3.0
-2.0
-1.0
0.0
1.0
Cp
α = 9.3o, L/D-max (98)
α = 12.4o, Cl-max (1.56)
α = -1o, minimum drag
DU 97-W-300
Figure 13: The effect of zigzag tape on the
characteristics of DU 97-W-300 at R=3x10⁶
DU 97-W-300
R = 3.0x10
-1.0
-0.5
0.0
0.5
1.0
1.5
2.0
0.000 0.015 0.030 0.045c
c
-1.0
-0.5
0.0
0.5
1.0
1.5
2.0
-10 0 10 20α (
)
c
smooth
zztape 5% u.s.
zztape 5% u.s. + 20% l.s.
Figure 14: The measured and calculated
performance of DU 97-W-300 at R=3x10⁶.
DU 97-W-300
R = 3.0x10
-1.0
-0.5
0.0
0.5
1.0
1.5
2.0
0.000 0.015 0.030 0.045c
c
-1.0
-0.5
0.0
0.5
1.0
1.5
2.0
-10 0 10 20α (
)
c
RFOIL
wind tunnel, smooth
wind tunnel, zz tape
8/12/2019 Timmer PaperAIAA20030352
http://slidepdf.com/reader/full/timmer-paperaiaa20030352 8/11
8
effect on lift is more pronounced.
This behavior at negative angles is an indication that
the thickness of the lower surface is pushed to the edge
of what still is acceptable in terms of two-dimensional
airfoil performance.
The problem of lower surface separation could be
slightly alleviated by shifting the maximum thicknessmore forward. This, however, is unfavorable for the
location of the beam as well as for transition to the hub.
Fortunately, thick airfoils generally do their work at the
higher angles of attack and rotation helps the boundary
layer to overcome a certain pressure rise.
Figure 15 presents the effect of rotation on the
characteristics as calculated by RFOIL if it is assumed
that the airfoil would be positioned at 40% radius(geometric c/r in the order of 0.19). The figure shows
that at this radial position the lift keeps rising
continuously in case of a tripped boundary layer.
Calculations are performed for 2/3 of the geometrical
c/r value. The lift characteristic at the negative angles is
enhanced as well, although lower surface separation
still comes in quite soon.
On the basis of the wind tunnel test on DU 97-W-300
and the RFOIL calculations for the 2d as well as the 3d
configuration a number of thicker airfoils have been
designed for various inboard positions taking rotational
effects into account. Some blade manufacturers havedifferent construction requirements with respect to
trailing edge thickness and location of the maximum
airfoil thickness, resulting in different sets of inboard
airfoils. Of these sets recently DU 00-W-350 and DU
00-W-401 have been tested in the low-speed wind
tunnel of the IAG Stuttgart, Germany [10]. The two-
dimensional characteristics, both clean and rough, could
be relatively well predicted by RFOIL.
THE EFFECT OF AERODYNAMIC DEVICES
Depending on the type of airfoil tested, during the wind
tunnel measurements the effect of various aerodynamic
devices such as Gurney flaps, wedges, trip wires and
vortex generators (vg’s) was evaluated.
Gurney flaps
Airfoil DU 93-W-210 was used to investigate the effect
of Gurney flaps of 1%c (6 mm) and 2%c (12 mm), the
effect of isosceles wedges of 1%, 1.5% and 2% height
and of upstream length of the 1%c high wedges.
Figure 16 presents the effect of Gurney flaps of 1%c
and 2%c on the characteristics of DU 93. The Gurney
flap was an L-shaped metal strip with a thickness of 2
mm attached to the lower surface trailing edge (see fig.
17). By the 1%c and 2%c Gurney flap the maximum liftcoefficient was increased with respectively 0.24 and
0.40. The maximum lift to drag ratio, however,
decreased from 136 to 117 and 89 respectively. Figure
16 is a typical example of the effect of 1%c and 2%c
Gurney flaps, since the same trend was measured for
DU 91-W2-250. It was concluded, and later on
confirmed by others [12], that for these Reynolds
numbers and airfoil shapes no increase of l/d max
would result for Gurney flaps of 1% or higher. In fact,
looking at the upper boundary of the low-drag buckets
of the three curves on the left hand side of figure 16 it is
even unlikely that the l/d will be enhanced by a Gurney
flap smaller than 1%.
Trailing edge wedges
To gain more insight in the influence on drag of the
separation bubble right in front of the Gurney flap,
measurements were performed with 6x6mm., 6x13 mm.
and 6x24 mm. wooden wedges, forming increasingly
longer upstream fairings of the basic Gurney flap, see
DU 93-W-210
Re = 2.0x10
-1,0
-0,5
0,0
0,5
1,0
1,5
2,0
0,00 0,01 0,02 0,03c
c
-1,0
-0,5
0,0
0,5
1,0
1,5
2,0
-10 0 10 20α (
)
c
no Gurney flap
Gurney flap 1%c
Gurney flap 2%c
Figure 16: The effect of 1%c and 2%c Gurney
flaps on the performance of DU 93-W-210.
Figure 15: The RFOIL predicted effect of
rotation on DU 97-W-300 in the transition
free and fixed condition.
DU 97-W-300
R = 3.0x10
-1.0
-0.5
0.0
0.5
1.0
1.5
2.0
0.000 0.015 0.030 0.045c
c
-1.0
-0.5
0.0
0.5
1.0
1.5
2.0
-10 0 10 20α ( )
c
wind tunnel, zz tape
RFOIL
RFOIL, c/r=0.12
free transition
fixed transition
RFOIL, 2d, (c/r=0)
fixed transition
8/12/2019 Timmer PaperAIAA20030352
http://slidepdf.com/reader/full/timmer-paperaiaa20030352 9/11
9
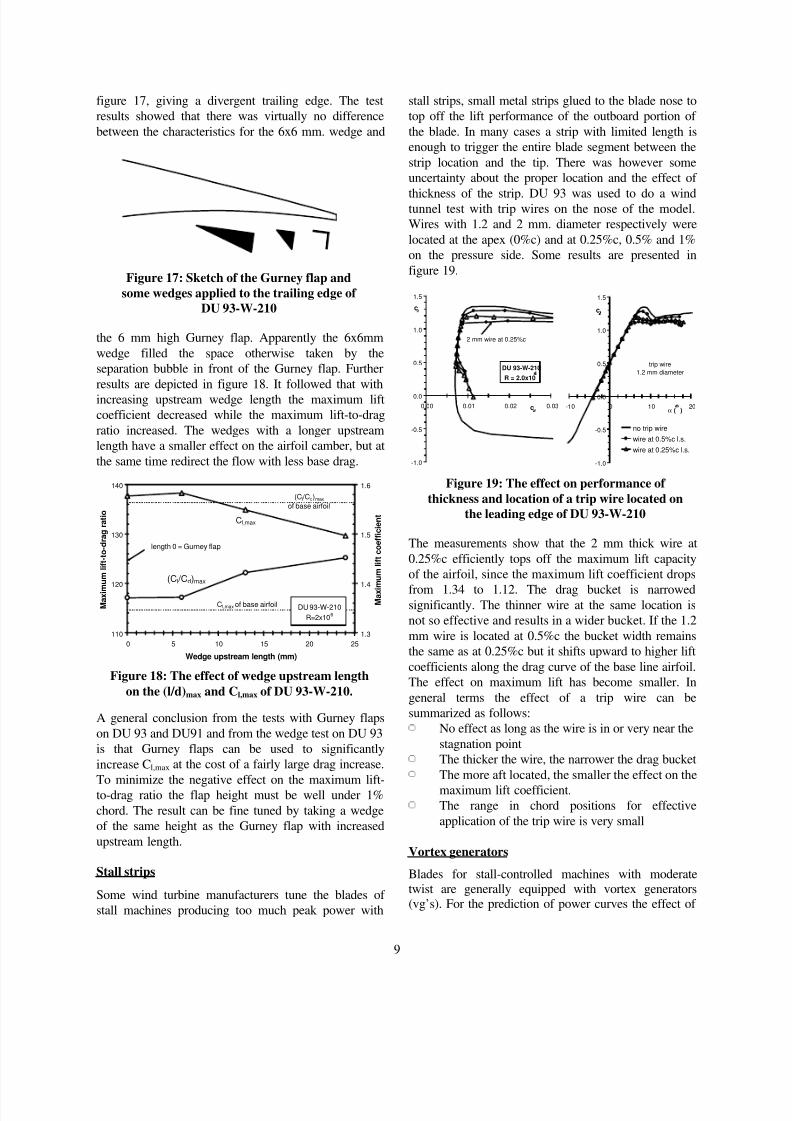
figure 17, giving a divergent trailing edge. The test
results showed that there was virtually no difference
between the characteristics for the 6x6 mm. wedge and
the 6 mm high Gurney flap. Apparently the 6x6mm
wedge filled the space otherwise taken by the
separation bubble in front of the Gurney flap. Further
results are depicted in figure 18. It followed that with
increasing upstream wedge length the maximum lift
coefficient decreased while the maximum lift-to-drag
ratio increased. The wedges with a longer upstream
length have a smaller effect on the airfoil camber, but at
the same time redirect the flow with less base drag.
A general conclusion from the tests with Gurney flaps
on DU 93 and DU91 and from the wedge test on DU 93
is that Gurney flaps can be used to significantly
increase Cl,max at the cost of a fairly large drag increase.
To minimize the negative effect on the maximum lift-to-drag ratio the flap height must be well under 1%
chord. The result can be fine tuned by taking a wedge
of the same height as the Gurney flap with increased
upstream length.
Stall strips
Some wind turbine manufacturers tune the blades of
stall machines producing too much peak power with
stall strips, small metal strips glued to the blade nose to
top off the lift performance of the outboard portion of
the blade. In many cases a strip with limited length is
enough to trigger the entire blade segment between the
strip location and the tip. There was however some
uncertainty about the proper location and the effect of
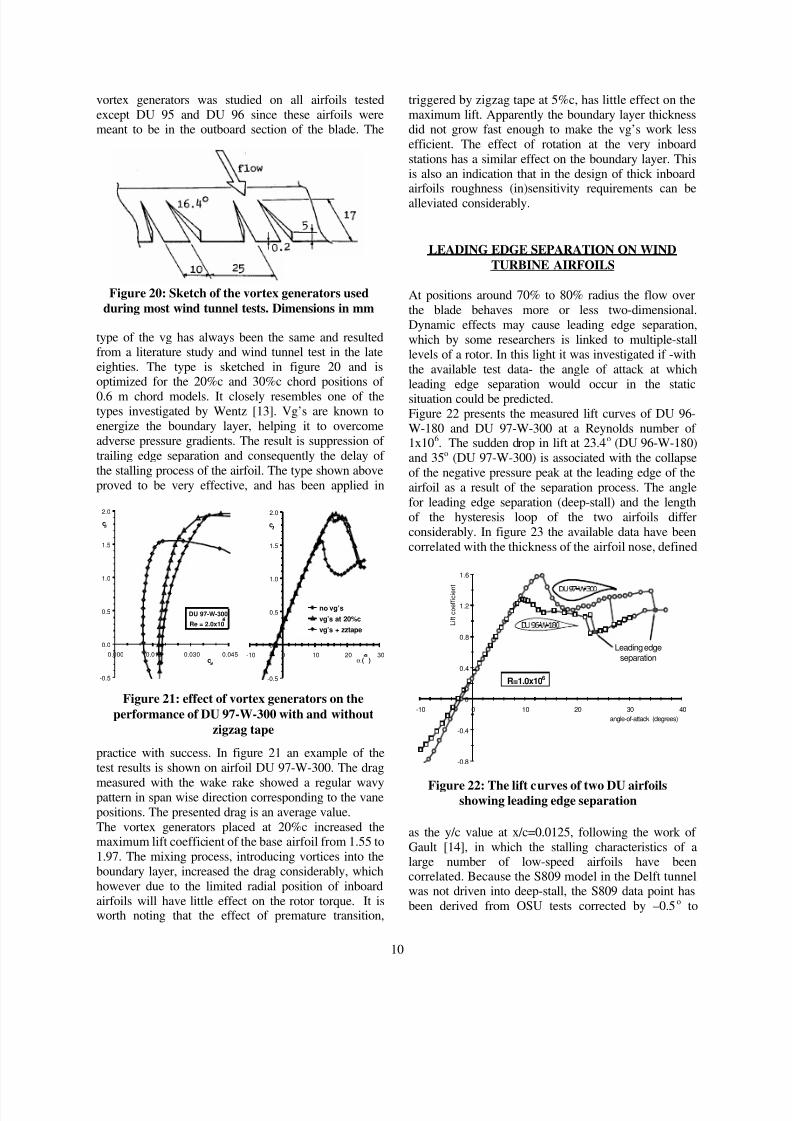
thickness of the strip. DU 93 was used to do a windtunnel test with trip wires on the nose of the model.
Wires with 1.2 and 2 mm. diameter respectively were
located at the apex (0%c) and at 0.25%c, 0.5% and 1%
on the pressure side. Some results are presented in
figure 19.
The measurements show that the 2 mm thick wire at
0.25%c efficiently tops off the maximum lift capacity
of the airfoil, since the maximum lift coefficient drops
from 1.34 to 1.12. The drag bucket is narrowedsignificantly. The thinner wire at the same location is
not so effective and results in a wider bucket. If the 1.2
mm wire is located at 0.5%c the bucket width remains
the same as at 0.25%c but it shifts upward to higher lift
coefficients along the drag curve of the base line airfoil.
The effect on maximum lift has become smaller. In
general terms the effect of a trip wire can be
summarized as follows:
No effect as long as the wire is in or very near the
stagnation point
The thicker the wire, the narrower the drag bucket
The more aft located, the smaller the effect on the
maximum lift coefficient.
The range in chord positions for effective
application of the trip wire is very small
Vortex generators
Blades for stall-controlled machines with moderate
twist are generally equipped with vortex generators
(vg’s). For the prediction of power curves the effect of
Figure 17: Sketch of the Gurney flap and
some wedges applied to the trailing edge of
DU 93-W-210
Figure 19: The effect on performance of
thickness and location of a trip wire located on
the leading edge of DU 93-W-210
DU 93-W-210
R = 2.0x10
-1.0
-0.5
0.0
0.5
1.0
1.5
0.00 0.01 0.02 0.03c
c
-1.0
-0.5
0.0
0.5
1.0
1.5
-10 0 10 20α (
)
c
no trip wire
wire at 0.5%c l.s.
wire at 0.25%c l.s.
trip wire
1.2 mm diameter
2 mm wire at 0.25%c
Figure 18: The effect of wedge upstream length
on the (l/d)max and Cl,max of DU 93-W-210.
110
120
130
140
0 5 10 15 20 25
Wedge upstream length (mm)
M a x i m
u m l i f t -
t o - d r a g r a t i o
1.3
1.4
1.5
1.6
M a x i m u m l i f t
c o e f f i c i e n t
(Cl /Cd)max
Cl,max
DU 93-W-210
R=2x10⁶
Cl,max of base airfoil
(Cl /Cd)max
of base airfoil
length 0 = Gurney flap
8/12/2019 Timmer PaperAIAA20030352
http://slidepdf.com/reader/full/timmer-paperaiaa20030352 10/11
10
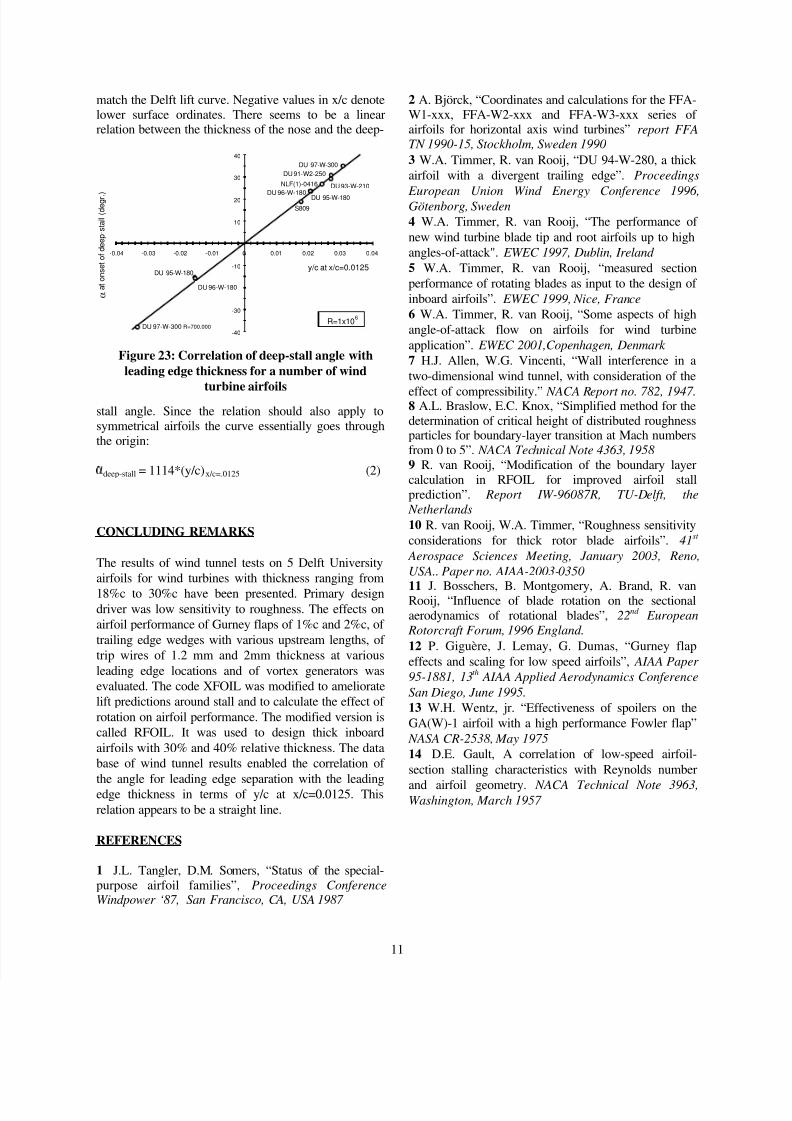
vortex generators was studied on all airfoils tested
except DU 95 and DU 96 since these airfoils weremeant to be in the outboard section of the blade. The
type of the vg has always been the same and resultedfrom a literature study and wind tunnel test in the late
eighties. The type is sketched in figure 20 and isoptimized for the 20%c and 30%c chord positions of
0.6 m chord models. It closely resembles one of thetypes investigated by Wentz [13]. Vg’s are known to
energize the boundary layer, helping it to overcome
adverse pressure gradients. The result is suppression of
trailing edge separation and consequently the delay of
the stalling process of the airfoil. The type shown above
proved to be very effective, and has been applied in
practice with success. In figure 21 an example of the
test results is shown on airfoil DU 97-W-300. The drag
measured with the wake rake showed a regular wavypattern in span wise direction corresponding to the vane
positions. The presented drag is an average value.
The vortex generators placed at 20%c increased themaximum lift coefficient of the base airfoil from 1.55 to
1.97. The mixing process, introducing vortices into the
boundary layer, increased the drag considerably, which
however due to the limited radial position of inboard
airfoils will have little effect on the rotor torque. It isworth noting that the effect of premature transition,
triggered by zigzag tape at 5%c, has little effect on the
maximum lift. Apparently the boundary layer thicknessdid not grow fast enough to make the vg’s work less
efficient. The effect of rotation at the very inboard
stations has a similar effect on the boundary layer. This
is also an indication that in the design of thick inboardairfoils roughness (in)sensitivity requirements can be
alleviated considerably.
LEADING EDGE SEPARATION ON WIND
TURBINE AIRFOILS
At positions around 70% to 80% radius the flow over
the blade behaves more or less two-dimensional.
Dynamic effects may cause leading edge separation,
which by some researchers is linked to multiple-stall
levels of a rotor. In this light it was investigated if -with
the available test data- the angle of attack at which
leading edge separation would occur in the staticsituation could be predicted.
Figure 22 presents the measured lift curves of DU 96-
W-180 and DU 97-W-300 at a Reynolds number of1x10
6. The sudden drop in lift at 23.4
o (DU 96-W-180)
and 35o (DU 97-W-300) is associated with the collapse
of the negative pressure peak at the leading edge of the
airfoil as a result of the separation process. The angle
for leading edge separation (deep-stall) and the length
of the hysteresis loop of the two airfoils differ
considerably. In figure 23 the available data have been
correlated with the thickness of the airfoil nose, defined
as the y/c value at x/c=0.0125, following the work of
Gault [14], in which the stalling characteristics of alarge number of low-speed airfoils have beencorrelated. Because the S809 model in the Delft tunnelwas not driven into deep-stall, the S809 data point has
been derived from OSU tests corrected by –0.5o to
DU 97-W-300
Re = 2.0x10
-0.5
0.0
0.5
1.0
1.5
2.0
0.000 0.015 0.030 0.045c
c
-0.5
0.0
0.5
1.0
1.5
2.0
-10 0 10 20 30α (
)
c
no vg’s
vg’s at 20%c
vg’s + zztape
Figure 21: effect of vortex generators on the
performance of DU 97-W-300 with and without
zigzag tape
Figure 20: Sketch of the vortex generators used
during most wind tunnel tests. Dimensions in mm
Figure 22: The lift curves of two DU airfoilsshowing leading edge separation
-0.8
-0.4
0
0.4
0.8
1.2
1.6
-10 0 10 20 30 40
angle-of-attack (degrees)
L i f t c o e f f i c i e n
t
R=1.0x10⁶
Leading edge
separation
8/12/2019 Timmer PaperAIAA20030352
http://slidepdf.com/reader/full/timmer-paperaiaa20030352 11/11
11
match the Delft lift curve. Negative values in x/c denote
lower surface ordinates. There seems to be a linearrelation between the thickness of the nose and the deep-
stall angle. Since the relation should also apply to
symmetrical airfoils the curve essentially goes through
the origin:
deep-stall = 1114*(y/c)x/c=.0125 (2)
CONCLUDING REMARKS
The results of wind tunnel tests on 5 Delft University
airfoils for wind turbines with thickness ranging from
18%c to 30%c have been presented. Primary design
driver was low sensitivity to roughness. The effects on
airfoil performance of Gurney flaps of 1%c and 2%c, of
trailing edge wedges with various upstream lengths, of
trip wires of 1.2 mm and 2mm thickness at various
leading edge locations and of vortex generators was
evaluated. The code XFOIL was modified to ameliorate
lift predictions around stall and to calculate the effect of
rotation on airfoil performance. The modified version is
called RFOIL. It was used to design thick inboard
airfoils with 30% and 40% relative thickness. The data
base of wind tunnel results enabled the correlation of
the angle for leading edge separation with the leading
edge thickness in terms of y/c at x/c=0.0125. This
relation appears to be a straight line.
REFERENCES
1 J.L. Tangler, D.M. Somers, “Status of the special-
purpose airfoil families”, Proceedings ConferenceWindpower ‘87, San Francisco, CA, USA 1987
2 A. Björck, “Coordinates and calculations for the FFA-
W1-xxx, FFA-W2-xxx and FFA-W3-xxx series ofairfoils for horizontal axis wind turbines” report FFA
TN 1990-15, Stockholm, Sweden 1990
3 W.A. Timmer, R. van Rooij, “DU 94-W-280, a thick
airfoil with a divergent trailing edge”. Proceedings
European Union Wind Energy Conference 1996,Götenborg, Sweden
4 W.A. Timmer, R. van Rooij, “The performance of
new wind turbine blade tip and root airfoils up to high
angles-of-attack". EWEC 1997, Dublin, Ireland
5 W.A. Timmer, R. van Rooij, “measured section
performance of rotating blades as input to the design of
inboard airfoils”. EWEC 1999, Nice, France
6 W.A. Timmer, R. van Rooij, “Some aspects of high
angle-of-attack flow on airfoils for wind turbine
application”. EWEC 2001,Copenhagen, Denmark
7 H.J. Allen, W.G. Vincenti, “Wall interference in a
two-dimensional wind tunnel, with consideration of the
effect of compressibility.” NACA Report no. 782, 1947.8 A.L. Braslow, E.C. Knox, “Simplified method for the
determination of critical height of distributed roughnessparticles for boundary-layer transition at Mach numbers
from 0 to 5”. NACA Technical Note 4363, 1958
9 R. van Rooij, “Modification of the boundary layer
calculation in RFOIL for improved airfoil stall
prediction”. Report IW-96087R, TU-Delft, the
Netherlands
10 R. van Rooij, W.A. Timmer, “Roughness sensitivity
considerations for thick rotor blade airfoils”. 41st
Aerospace Sciences Meeting, January 2003, Reno,
USA.. Paper no. AIAA-2003-0350
11 J. Bosschers, B. Montgomery, A. Brand, R. vanRooij, “Influence of blade rotation on the sectional
aerodynamics of rotational blades”, 22nd European
Rotorcraft Forum, 1996 England.
12 P. Giguère, J. Lemay, G. Dumas, “Gurney flap
effects and scaling for low speed airfoils”, AIAA Paper
95-1881, 13th AIAA Applied Aerodynamics Conference
San Diego, June 1995.
13 W.H. Wentz, jr. “Effectiveness of spoilers on the
GA(W)-1 airfoil with a high performance Fowler flap”
NASA CR-2538, May 1975
14 D.E. Gault, A correlation of low-speed airfoil-
section stalling characteristics with Reynolds number
and airfoil geometry. NACA Technical Note 3963,Washington, March 1957
Figure 23: Correlation of deep-stall angle with
leading edge thickness for a number of wind
turbine airfoils
-40
-30
-20
-10
0
10
20
30
40
-0.04 -0.03 -0.02 -0.01 0 0.01 0.02 0.03 0.04
y/c at x/c=0.0125
α a
t o n s e t o f d e e p - s t a l l ( d e g r .
)
DU 95-W-180
DU 97-W-300 R=700,000R=1x10
6
DU 96-W-180
DU 95-W-180DU 96-W-180
NLF(1)-0416
S809
DU 93-W-210
DU 97-W-300
DU 91-W2-250