
SUSTAINABLE 33 Actual energy consumption in dwellings
254
Olivia Guerra Santín SUSTAINABLE URBAN AREAS 33 Delft Centre for Sustainable Urban Areas The effect of energy performance regulations and occupant behaviour Actual energy consumption in dwellings
Transcript of SUSTAINABLE 33 Actual energy consumption in dwellings
Olivia Guerra Santín
S U S T A I N A B L E
U R B A N A R E A S
33
Delft Centre for Sustainable Urban Areas
Delft University of Technology
Delft University of Technology
The effect of energy performance regulations and occupant behaviour
Actual energy consumption in dwellings
Actual energy consumption in dwellings
The effect of energy performance regulations and occupant behaviour
PROEFSCHRIFT ter verkrijging van de graad van doctoraan de Technische Universiteit Delft,
op gezag van de Rector Magnificus prof. ir. K.Ch.A.M. Luyben,voorzitter van het College voor Promoties,
in het openbaar te verdedigen op dinsdag 19 oktober 2010 om 15.00 uur
door
Olivia GUERRA SANTÍN
Master of Science in Urban Environmental Management, Wageningen University,
geboren te Toluca, Mexico
Dit proefschrift is goedgekeurd door de promotor:Prof. dr. ir. H.J. Visscher,
Copromotor dr L.C.M. Itard
Samenstelling promotiecommissie:Rector Magnificus, voorzitterProf. dr. ir. H.J. Visscher, Technische Universiteit Delft, promotorDr. L.C.M. Itard, Technische Universiteit Delft, copromotorProf. dr. ir. J.D.M. van Hal, Technische Universiteit DelftProf. dr. ir. M.G. Elsinga, Technische Universiteit DelftProf. dr. D.V. Keyson, Technische Universiteit DelftProf. dr. ir. J.L.M. Hensen, Technische Universiteit EindhovenProf. dr. E.M. Steg, Rijksuniversiteit Groningen

Actual energy consumptionin dwellings
The effect of energy performance regulations and occupant behaviour
Olivia Guerra Santín

The series Sustainable Urban Areasis published by IOS Press under the imprint Delft University Press
IOS Press BVNieuwe Hemweg 6b1013 BG AmsterdamThe NetherlandsFax +31 20 6870019E-mail: [email protected]
Sustainable Urban Areas is edited byDelft Centre for Sustainable Urban AreasC/o OTB Research Institute for the built environmentDelft University of TechnologyJaffalaan 92628 BX DelftThe NetherlandsPhone +31 15 2783005Fax +31 15 2784422E-mail [email protected]://www.otb.tudelft.nl
Design: Cyril Strijdonk Ontwerpburo, Gaarnderen; dtp: Yvonne Alkemade and Itziar LasaPrinted in the Netherlands by: Haveka, Alblasserdam ISSN 1574-6410; 33 (print) SBN 978-1-60750-650-8 (print)ISSN 1879-8330; 33 (online) ISBN 978-1-60750-651-5 (online)NUR 755
Legal noticeThe publisher is not responsible for the use which might be made of the fol-lowing information.
Copyright 2010 by Olivia Guerra SantínNo part of this book may be reproduced in any form by print, photoprint, mi-crofilm or any other means, without written permission from the copyright-holder.

Contents
1 Introduction . . . . . . . . . . . . . . . . . . . . . . . . . . . . . . . . . . . . . . . 3 1.1 Energy conservation in residential buildings . . . . . . . . . . . . . . 3 1.2 Background . . . . . . . . . . . . . . . . . . . . . . . . . . . . . . . . . . . . . . . . . 4 1.3 Problem definition . . . . . . . . . . . . . . . . . . . . . . . . . . . . . . . . . . . 6 1.4 Aim of the study. . . . . . . . . . . . . . . . . . . . . . . . . . . . . . . . . . . . . . 8 1.5 Research questions . . . . . . . . . . . . . . . . . . . . . . . . . . . . . . . . . . . 8 1.6 Research methods . . . . . . . . . . . . . . . . . . . . . . . . . . . . . . . . . . . 10 1.7 Data . . . . . . . . . . . . . . . . . . . . . . . . . . . . . . . . . . . . . . . . . . . . . . . 10 1.8 Relationship between research questions and data . . . . . . . 16 1.9 Limitations . . . . . . . . . . . . . . . . . . . . . . . . . . . . . . . . . . . . . . . . . 17 1.10 Structure of thesis . . . . . . . . . . . . . . . . . . . . . . . . . . . . . . . . . . . 19 References. . . . . . . . . . . . . . . . . . . . . . . . . . . . . . . . . . . . . . . . . . 21
2 The effect of occupancy and building characteristics on energy use for space and water heating in Dutch residential stock . . . . . . . . . . . . . . . . . . . . . . . . . . . . . . . . . . 27 Guerra-Santin, O., L. Itard & H. Visscher (2009), Energy and Buildings, 41, pp. 1223-1232. 2.1 Introduction . . . . . . . . . . . . . . . . . . . . . . . . . . . . . . . . . . . . . . . . 27 2.2 State of the art . . . . . . . . . . . . . . . . . . . . . . . . . . . . . . . . . . . . . . 29 2.2.1 Household characteristics . . . . . . . . . . . . . . . . . . . . . . . . . . . . 30 2.2.2 Behaviour . . . . . . . . . . . . . . . . . . . . . . . . . . . . . . . . . . . . . . . . . . 31 2.3 Data and analysis methods . . . . . . . . . . . . . . . . . . . . . . . . . . . 32 2.3.1 Transformed variables . . . . . . . . . . . . . . . . . . . . . . . . . . . . . . . 34 2.3.2 Missing data and univariate outliers . . . . . . . . . . . . . . . . . . . 34 2.4 Results . . . . . . . . . . . . . . . . . . . . . . . . . . . . . . . . . . . . . . . . . . . . 35 2.4.1 Differences in energy use per type of dwelling and insulation level . . . . . . . . . . . . . . . . . . . . . . . . . . . . . . . . . . . . . 35 2.4.2 Results of analysis of variance . . . . . . . . . . . . . . . . . . . . . . . . 35 2.4.3 Regression model for prediction of energy use for space and water heating . . . . . . . . . . . . . . . . . . . . . . . . . . . . . . . . . . . 38 2.4.4 Prediction of energy use for heating according to individual
building characteristics and occupant behaviour . . . . . . . . . 43 2.4.5 Second regression model . . . . . . . . . . . . . . . . . . . . . . . . . . . . . 45 2.5 Discussion . . . . . . . . . . . . . . . . . . . . . . . . . . . . . . . . . . . . . . . . . 47 2.6 Conclusions . . . . . . . . . . . . . . . . . . . . . . . . . . . . . . . . . . . . . . . . 49 References. . . . . . . . . . . . . . . . . . . . . . . . . . . . . . . . . . . . . . . . . . 50
3 The effect of energy performance regulations on energy consumption . . . . . . . . . . . . . . . . . . . . . . . . . . . . . . . . . . . . 57
3.1 Introduction . . . . . . . . . . . . . . . . . . . . . . . . . . . . . . . . . . . . . . . . 57 3.2 Data and methodology . . . . . . . . . . . . . . . . . . . . . . . . . . . . . . . 59 3.2.1 Districts . . . . . . . . . . . . . . . . . . . . . . . . . . . . . . . . . . . . . . . . . . . . 60
3.2.2 Energy consumption . . . . . . . . . . . . . . . . . . . . . . . . . . . . . . . . . 60 3.2.3 EPC calculation . . . . . . . . . . . . . . . . . . . . . . . . . . . . . . . . . . . . . . 62 3.2.4 Methods of analysis . . . . . . . . . . . . . . . . . . . . . . . . . . . . . . . . . . 63 3.3 Results . . . . . . . . . . . . . . . . . . . . . . . . . . . . . . . . . . . . . . . . . . . . . 65 3.3.1 Differences in the energy consumption for space and water
heating for different EPC values and types of dwelling. . . . . 65 3.3.2 Real and predicted energy consumption. . . . . . . . . . . . . . . . . 68 3.3.3 Effect of thermal quality on energy consumption in dwellings . . . . . . . . . . . . . . . . . . . . . . . . . . . . . . . . . . . . . . . . . . . 70 3.4 Validation of the results with a nationwide survey (WoON database) . . . . . . . . . . . . . . . . . . . . . . . . . . . . . . . . . . . . . . . . . . . 72 3.4.1 Relationship between energy indicators and energy consumption (WoON database) . . . . . . . . . . . . . . . . . . . . . . . . 73 3.4.2 Relationship between building characteristics and energy
consumption (WoON database) . . . . . . . . . . . . . . . . . . . . . . . . 74 3.5 Discussion. . . . . . . . . . . . . . . . . . . . . . . . . . . . . . . . . . . . . . . . . . 76 3.5.1 Relationship between the Energy Performance Coefficient and actual energy consumption. . . . . . . . . . . . . . . . . . . . . . . . 76 3.5.2 Actual and expected energy consumption . . . . . . . . . . . . . . . 76 3.5.3 Relationship between building characteristics and energy
consumption. . . . . . . . . . . . . . . . . . . . . . . . . . . . . . . . . . . . . . . . 77 3.6 Conclusions . . . . . . . . . . . . . . . . . . . . . . . . . . . . . . . . . . . . . . . . 78 3.7 Recommendations for policy and practice . . . . . . . . . . . . . . . 79 References. . . . . . . . . . . . . . . . . . . . . . . . . . . . . . . . . . . . . . . . . . 80
4 Occupants’ behaviour Determinantsandeffectsonresidential heating consumption . . . . . . . . . . . . . . . . . . . . . . . . . . . . . . . . . . . . . 85 Guerra-Santin, O. & L Itard (2010), Building Research & Information, 38 (3), pp. 318-338. 4.1 Introduction . . . . . . . . . . . . . . . . . . . . . . . . . . . . . . . . . . . . . . . . 85 4.2 Data and methodology . . . . . . . . . . . . . . . . . . . . . . . . . . . . . . . 88 4.2.1 Building characteristics . . . . . . . . . . . . . . . . . . . . . . . . . . . . . . . 89 4.2.2 Household characteristics. . . . . . . . . . . . . . . . . . . . . . . . . . . . . 89 4.2.3 Occupants’ behaviour . . . . . . . . . . . . . . . . . . . . . . . . . . . . . . . . 90 4.2.4 Energy consumption . . . . . . . . . . . . . . . . . . . . . . . . . . . . . . . . . 91 4.3 Results: analysis of OTB survey . . . . . . . . . . . . . . . . . . . . . . . . 94 4.3.1 Reported behaviour . . . . . . . . . . . . . . . . . . . . . . . . . . . . . . . . . . 94 4.3.2 Effect of occupant behaviour on energy use. . . . . . . . . . . . . . 96 4.3.3 Determinants of the use of heating and ventilation systems . . . . . . . . . . . . . . . . . . . . . . . . . . . . . . . . . . . . . . . . . . . . 98 4.4 Comparison with WoON database . . . . . . . . . . . . . . . . . . . . 103 4.4.1 Effect of behaviour on energy use (WoON survey) . . . . . . . . 103
4.4.2 Determinants on the use of heating and ventilation behaviour (WoON survey) . . . . . . . . . . . . . . . . . . . . . . . . . . . . 106 4.4.3 Relationship between household characteristics and occupant behaviour (WoON survey). . . . . . . . . . . . . . . . . . . . 109 4.5 Discussion. . . . . . . . . . . . . . . . . . . . . . . . . . . . . . . . . . . . . . . . . 110 4.5.1 Effect of occupants’ behaviour on energy use . . . . . . . . . . . 110 4.5.2 Regression model . . . . . . . . . . . . . . . . . . . . . . . . . . . . . . . . . . . 112 4.5.3 Determinants of behaviour: type of heating control ventilation and household characteristics . . . . . . . . . . . . . . 112 4.6 Conclusions. . . . . . . . . . . . . . . . . . . . . . . . . . . . . . . . . . . . . . . . 113 4.6.1 Occupant behaviour and energy consumption . . . . . . . . . . 113 4.6.2 Methodology . . . . . . . . . . . . . . . . . . . . . . . . . . . . . . . . . . . . . . . 115 4.6.3 Recommendations for policy and practice . . . . . . . . . . . . . . 115 4.6.4 Recommendations for further research . . . . . . . . . . . . . . . . 116 References. . . . . . . . . . . . . . . . . . . . . . . . . . . . . . . . . . . . . . . . . 116
5 Behavioural patterns related to energy consumption for heating . . . . . . . . . . . . . . . . . . . . . . . . . . . . . . . . . . . . . . . . . 123
5.1 Introduction . . . . . . . . . . . . . . . . . . . . . . . . . . . . . . . . . . . . . . . 123 5.2 State of the art . . . . . . . . . . . . . . . . . . . . . . . . . . . . . . . . . . . . . 124 5.3 Methodology and data. . . . . . . . . . . . . . . . . . . . . . . . . . . . . . . 126 5.3.1 Approach . . . . . . . . . . . . . . . . . . . . . . . . . . . . . . . . . . . . . . . . . . 126 5.3.2 Research data . . . . . . . . . . . . . . . . . . . . . . . . . . . . . . . . . . . . . . 128 5.3.3 Building characteristics . . . . . . . . . . . . . . . . . . . . . . . . . . . . . . 128 5.3.4 Household characteristics. . . . . . . . . . . . . . . . . . . . . . . . . . . . 130 5.3.5 Occupant behaviour. . . . . . . . . . . . . . . . . . . . . . . . . . . . . . . . . 130 5.4 Results . . . . . . . . . . . . . . . . . . . . . . . . . . . . . . . . . . . . . . . . . . . . 131 5.4.1 Effects of occupant behaviour on energy consumption . . . 132 5.4.2 Factors underlying behaviour: exploratory factor analysis . . . . . . . . . . . . . . . . . . . . . . . . . . . . . . . . . . . . . . . . . . . 133 5.4.3 Behavioural patterns . . . . . . . . . . . . . . . . . . . . . . . . . . . . . . . . 135 5.4.4 Household types: differences in behavioural patterns and energy consumption . . . . . . . . . . . . . . . . . . . . . . . . . . . . . . . . 137 5.4.5 Relationship between behavioural patterns and user profiles. . . . . . . . . . . . . . . . . . . . . . . . . . . . . . . . . . . . . . . . . . . . 138 5.4.6 Relationship between behavioural patterns, user profiles and energy use . . . . . . . . . . . . . . . . . . . . . . . . . . . . . . 140 5.5 Discussion and conclusions . . . . . . . . . . . . . . . . . . . . . . . . . . 141 5.6 Recommendations . . . . . . . . . . . . . . . . . . . . . . . . . . . . . . . . . 143 References. . . . . . . . . . . . . . . . . . . . . . . . . . . . . . . . . . . . . . . . . 144

6 Occupant behaviour in dwellings with improved thermal characteristics .
Evidence of a rebound effect . . . . . . . . . . . . . . . . . . . . . . . 151 6.1 Introduction . . . . . . . . . . . . . . . . . . . . . . . . . . . . . . . . . . . . . . . 151 6.2 Effect of occupant behaviour and building characteristics on energy consumption. . . . . . . . . . . . . . . . . . . . . . . . . . . . . . 152 6.3 Data and methodology . . . . . . . . . . . . . . . . . . . . . . . . . . . . . . 154 6.4 Results . . . . . . . . . . . . . . . . . . . . . . . . . . . . . . . . . . . . . . . . . . . . 156 6.4.1 Variations in energy consumption in dwellings built in different construction periods . . . . . . . . . . . . . . . . . . . . . . . . 156 6.4.2 Effect of building characteristics on energy consumption: do better thermal properties and systems efficiency lead to reductions in energy consumption? . . . . . . . . . . . . . . . . . 157 6.4.3 Effect of occupant behaviour on energy consumption: determining the main factors of occupant behaviour. . . . . 160 6.4.4 Effect of building characteristics on heating behaviour . . . 163 6.4.5 Effect of building characteristics on ventilation behaviour 165 6.5 Discussion and conclusions . . . . . . . . . . . . . . . . . . . . . . . . . . 166 6.5.1 Rebound effect on energy consumption in the Dutch residential stock . . . . . . . . . . . . . . . . . . . . . . . . . . . . . . . . . . . 167 6.5.2 Differences in behaviour determined by building characteristics . . . . . . . . . . . . . . . . . . . . . . . . . . . . . . . . . . . . . 167 6.6 Recommendations . . . . . . . . . . . . . . . . . . . . . . . . . . . . . . . . . 168 References. . . . . . . . . . . . . . . . . . . . . . . . . . . . . . . . . . . . . . . . . 169
7 Conclusions and recommendations . . . . . . . . . . . . . . . . . 175 7.1 Introduction . . . . . . . . . . . . . . . . . . . . . . . . . . . . . . . . . . . . . . . 175 7.2 Effect of energy performance regulations on actual energy
consumption. . . . . . . . . . . . . . . . . . . . . . . . . . . . . . . . . . . . . . . 177 7.3 Effect and determinants of occupant behaviour in actual energy consumption for heating . . . . . . . . . . . . . . . . . . . . . . 180 7.4 Determinants of energy consumption in recently built housing in comparison to the complete housing stock . . . 184 7.5 Data collection: limitations and recommendations . . . . . . 186 7.6 Recommendations . . . . . . . . . . . . . . . . . . . . . . . . . . . . . . . . . . 188 7.6.1 Recommendations for policy . . . . . . . . . . . . . . . . . . . . . . . . . 189 7.6.2 Recommendations for practice . . . . . . . . . . . . . . . . . . . . . . . 191 7.6.3 Recommendations for further research . . . . . . . . . . . . . . . . 191 7.7 Closing remarks . . . . . . . . . . . . . . . . . . . . . . . . . . . . . . . . . . . . 192 Summary . . . . . . . . . . . . . . . . . . . . . . . . . . . . . . . . . . . . . . . 193
Samenvatting . . . . . . . . . . . . . . . . . . . . . . . . . . . . . . . . . . . 201

Appendix 1 EPC calculations . . . . . . . . . . . . . . . . . . . . . . . . . . . . . . . . . 209
Appendix 2 OTB Survey questionnaire . . . . . . . . . . . . . . . . . . . . . . . . . 211
Appendix 3 Regression analysis (complete sample in the WoON data-base) . . . . . . . . . . . . . . . . . . . . . . . . . . . . . . . . . . . . . . . . . . . 235
Curriculum vitae . . . . . . . . . . . . . . . . . . . . . . . . . . . . . . . . . 237


[ 3 ]
1 Introduction
1.1 Energy conservation in residential buildings
In Europe the built environment consumes 40% of the produced energy. A large proportion of this energy is consumed in residential buildings. House-holds account for about 30% of the total building-related energy consumption in OECD countries (Itard & Meijer, 2009). As around 30-57% of the energy con-sumed by households is spent on space and domestic water heating, conser-vation in this area is a matter of vital importance.
Residential buildings have continuously improved in efficiency. Though materials with better thermal properties and more efficient systems have lowered energy consumption for space heating in recent decades, substantial differences in energy consumption are still being observed in similar dwell-ings (Lutzenhiser, 1992; Jeeninga et al., 2001). In 1992 Lutzenhiser showed that energy consumption in similar dwellings occupied by similar households can vary by up to a factor 3. More recently, Jeeninga et al. (2001) found that the actual energy consumption of households living in dwellings with the same theoretical energy performance can vary by up to a factor of two. These dif-ferences in consumption are thought to be caused by differences in occupan-cy patterns (Groot et al., 2008; Haas et al., 1998; Linden et al., 2006; Branco et al., 2004), by the quality of the construction (Nieman, 2007; Gommands, 2007) and by rebound effects (Haas et al., 1998; Hens, 2010). These large variations can point to opportunities that can bring about further reductions in the ener-gy consumption for space heating and boost the efforts to conserve energy worldwide.
Many governments have introduced regulations to make buildings more energy-efficient. Policies and research on energy conservation in buildings are geared primarily to saving energy through technical measures relating to the building envelope and the heating and ventilation installations. However, there are strong indications that energy-saving designs do not always result in the expected energy consumption (Branco et al., 2004; Haas et al., 1998). Although it is widely admitted by experts that the final energy consumption is strongly influenced by household characteristics, lifestyles and occupant behaviour, only a few attempts have been made so far to quantify and under-stand these factors. This research addresses the effect of energy performance regulations and occupant behaviour on energy consumption for space and water heating in residential buildings, since these are believed to be crucial in bringing about further reductions in energy consumption in the residential sector.

[ 4 ]
1.2 Background
Role of regulations in reducing energy consumption for space heatingIn recent decades governments worldwide have implemented energy require-ments in their building regulations in order to reduce levels of energy con-sumed by buildings and to promote more energy-efficient housing. Since 2006 the Energy Performance Building Directive (EPBD) has required all EU mem-ber states to enhance their building regulations by implementing perform-ance-based energy requirements and by introducing energy-label certifica-tion schemes to lower the energy spent on heating, cooling, ventilation, light-ing and domestic hot water in buildings. In the Netherlands energy consump-tion in new buildings has been regulated since 1975, when energy-efficiency requirements consisted of limits on transmission losses based on insulation values. Since 1995 the energy-efficiency requirements have been based on the energy performance coefficient (EPC), a non-dimensional figure that express-es the energy efficiency of a building. Therefore, this research is based on the experiences in the Netherlands with this type of regulations.
In the Dutch regulations, the EPC covers space heating, space cooling, hot tap water, humidification and the electricity needed for mechanical ventila-tion and lighting. The energy used for cooking and for white and brown goods is excluded since it is not building-related. The EPC calculations are based on standard occupancy conditions and fixed values for temperature settings, internal heat gains, ventilation flow rates, heating demand for hot tap water and lighting. These values are based on the standard use of building ameni-ties according to the NEN 5128 norm (see Appendix 1).
The EPC value is obtained by correcting the total expected ener-gy (Qpres;tot) by a neutralisation factor for the size of the dwelling. Hence, although large dwellings consume more energy, they are not penalised for their size if they have the same thermal quality as small dwellings. The detailed calculations for the EPC value can be seen in Appendix 1. The EPC is calculated with the following formula:
where, Qpres;tot is the primary energy consumption in MJAg;verwz is the useful surface of the heated zones of the building in m2Averlies is the heat-transfer surface of the building in m2CEPC is a correction factor to correct for changes in the calculation method when it was changed
Qpres;tot 1
[330 x Ag;verwz ] + [65 x Averlies] CEPC
xEPC =
[ 5 ]
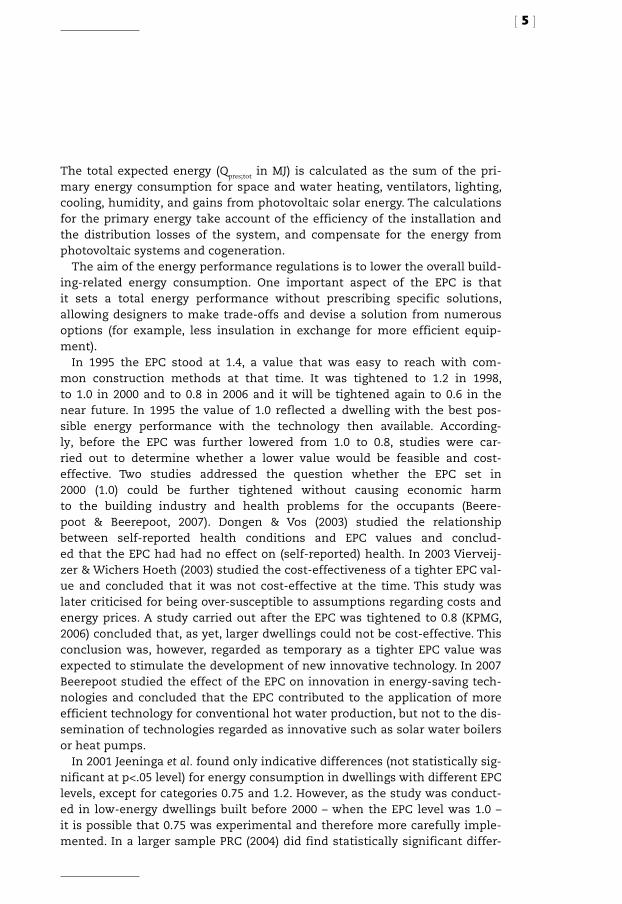
The total expected energy (Qpres;tot in MJ) is calculated as the sum of the pri-mary energy consumption for space and water heating, ventilators, lighting, cooling, humidity, and gains from photovoltaic solar energy. The calculations for the primary energy take account of the efficiency of the installation and the distribution losses of the system, and compensate for the energy from photovoltaic systems and cogeneration.
The aim of the energy performance regulations is to lower the overall build-ing-related energy consumption. One important aspect of the EPC is that it sets a total energy performance without prescribing specific solutions, allowing designers to make trade-offs and devise a solution from numerous options (for example, less insulation in exchange for more efficient equip-ment).
In 1995 the EPC stood at 1.4, a value that was easy to reach with com-mon construction methods at that time. It was tightened to 1.2 in 1998, to 1.0 in 2000 and to 0.8 in 2006 and it will be tightened again to 0.6 in the near future. In 1995 the value of 1.0 reflected a dwelling with the best pos-sible energy performance with the technology then available. According-ly, before the EPC was further lowered from 1.0 to 0.8, studies were car-ried out to determine whether a lower value would be feasible and cost-effective. Two studies addressed the question whether the EPC set in 2000 (1.0) could be further tightened without causing economic harm to the building industry and health problems for the occupants (Beere-poot & Beerepoot, 2007). Dongen & Vos (2003) studied the relationship between self-reported health conditions and EPC values and conclud-ed that the EPC had had no effect on (self-reported) health. In 2003 Vierveij-zer & Wichers Hoeth (2003) studied the cost-effectiveness of a tighter EPC val-ue and concluded that it was not cost-effective at the time. This study was later criticised for being over-susceptible to assumptions regarding costs and energy prices. A study carried out after the EPC was tightened to 0.8 (KPMG, 2006) concluded that, as yet, larger dwellings could not be cost-effective. This conclusion was, however, regarded as temporary as a tighter EPC value was expected to stimulate the development of new innovative technology. In 2007 Beerepoot studied the effect of the EPC on innovation in energy-saving tech-nologies and concluded that the EPC contributed to the application of more efficient technology for conventional hot water production, but not to the dis-semination of technologies regarded as innovative such as solar water boilers or heat pumps.
In 2001 Jeeninga et al. found only indicative differences (not statistically sig-nificant at p<.05 level) for energy consumption in dwellings with different EPC levels, except for categories 0.75 and 1.2. However, as the study was conduct-ed in low-energy dwellings built before 2000 – when the EPC level was 1.0 – it is possible that 0.75 was experimental and therefore more carefully imple-mented. In a larger sample PRC (2004) did find statistically significant differ-
[ 6 ]
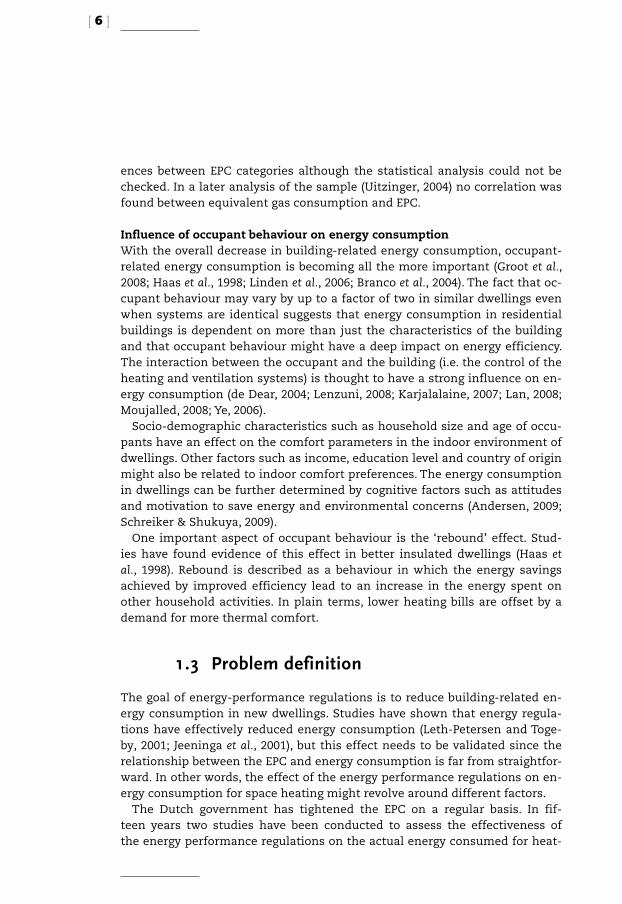
ences between EPC categories although the statistical analysis could not be checked. In a later analysis of the sample (Uitzinger, 2004) no correlation was found between equivalent gas consumption and EPC.
Influence of occupant behaviour on energy consumptionWith the overall decrease in building-related energy consumption, occupant-related energy consumption is becoming all the more important (Groot et al., 2008; Haas et al., 1998; Linden et al., 2006; Branco et al., 2004). The fact that oc-cupant behaviour may vary by up to a factor of two in similar dwellings even when systems are identical suggests that energy consumption in residential buildings is dependent on more than just the characteristics of the building and that occupant behaviour might have a deep impact on energy efficiency. The interaction between the occupant and the building (i.e. the control of the heating and ventilation systems) is thought to have a strong influence on en-ergy consumption (de Dear, 2004; Lenzuni, 2008; Karjalalaine, 2007; Lan, 2008; Moujalled, 2008; Ye, 2006).
Socio-demographic characteristics such as household size and age of occu-pants have an effect on the comfort parameters in the indoor environment of dwellings. Other factors such as income, education level and country of origin might also be related to indoor comfort preferences. The energy consumption in dwellings can be further determined by cognitive factors such as attitudes and motivation to save energy and environmental concerns (Andersen, 2009; Schreiker & Shukuya, 2009).
One important aspect of occupant behaviour is the ‘rebound’ effect. Stud-ies have found evidence of this effect in better insulated dwellings (Haas et al., 1998). Rebound is described as a behaviour in which the energy savings achieved by improved efficiency lead to an increase in the energy spent on other household activities. In plain terms, lower heating bills are offset by a demand for more thermal comfort.
1.3 Problem definition
The goal of energy-performance regulations is to reduce building-related en-ergy consumption in new dwellings. Studies have shown that energy regula-tions have effectively reduced energy consumption (Leth-Petersen and Toge-by, 2001; Jeeninga et al., 2001), but this effect needs to be validated since the relationship between the EPC and energy consumption is far from straightfor-ward. In other words, the effect of the energy performance regulations on en-ergy consumption for space heating might revolve around different factors.
The Dutch government has tightened the EPC on a regular basis. In fif-teen years two studies have been conducted to assess the effectiveness of the energy performance regulations on the actual energy consumed for heat-
[ 7 ]
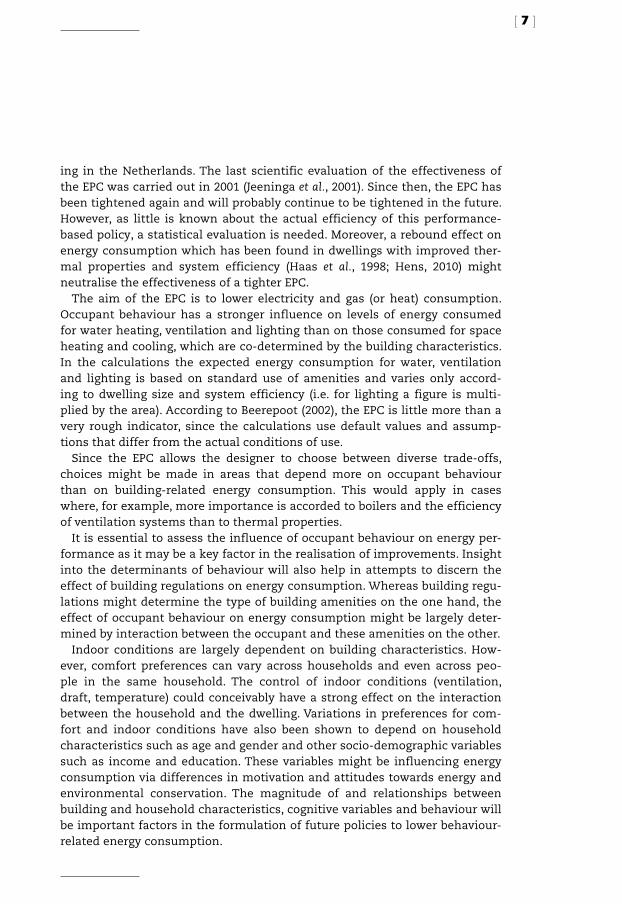
ing in the Netherlands. The last scientific evaluation of the effectiveness of the EPC was carried out in 2001 (Jeeninga et al., 2001). Since then, the EPC has been tightened again and will probably continue to be tightened in the future. However, as little is known about the actual efficiency of this performance-based policy, a statistical evaluation is needed. Moreover, a rebound effect on energy consumption which has been found in dwellings with improved ther-mal properties and system efficiency (Haas et al., 1998; Hens, 2010) might neutralise the effectiveness of a tighter EPC.
The aim of the EPC is to lower electricity and gas (or heat) consumption. Occupant behaviour has a stronger influence on levels of energy consumed for water heating, ventilation and lighting than on those consumed for space heating and cooling, which are co-determined by the building characteristics. In the calculations the expected energy consumption for water, ventilation and lighting is based on standard use of amenities and varies only accord-ing to dwelling size and system efficiency (i.e. for lighting a figure is multi-plied by the area). According to Beerepoot (2002), the EPC is little more than a very rough indicator, since the calculations use default values and assump-tions that differ from the actual conditions of use.
Since the EPC allows the designer to choose between diverse trade-offs, choices might be made in areas that depend more on occupant behaviour than on building-related energy consumption. This would apply in cases where, for example, more importance is accorded to boilers and the efficiency of ventilation systems than to thermal properties.
It is essential to assess the influence of occupant behaviour on energy per-formance as it may be a key factor in the realisation of improvements. Insight into the determinants of behaviour will also help in attempts to discern the effect of building regulations on energy consumption. Whereas building regu-lations might determine the type of building amenities on the one hand, the effect of occupant behaviour on energy consumption might be largely deter-mined by interaction between the occupant and these amenities on the other.
Indoor conditions are largely dependent on building characteristics. How-ever, comfort preferences can vary across households and even across peo-ple in the same household. The control of indoor conditions (ventilation, draft, temperature) could conceivably have a strong effect on the interaction between the household and the dwelling. Variations in preferences for com-fort and indoor conditions have also been shown to depend on household characteristics such as age and gender and other socio-demographic variables such as income and education. These variables might be influencing energy consumption via differences in motivation and attitudes towards energy and environmental conservation. The magnitude of and relationships between building and household characteristics, cognitive variables and behaviour will be important factors in the formulation of future policies to lower behaviour-related energy consumption.
[ 8 ]
1.4 Aim of the study
Nowadays, the aim of energy performance regulations is to decrease the envi-ronmental burden imposed by the energy consumed in the built environment. However, the energy reductions for space heating might fall short of expecta-tions. The effectiveness of energy regulations needs to be verified in order to discern whether more energy savings will be generated by tighter energy reg-ulations. It is thought that occupant behaviour, the actual quality of the con-struction, and rebound effects might be undermining the effect of the regula-tions. The lower the energy consumption of a building, the higher the influ-ence of occupant behaviour may be, but little is known about the ways occu-pants use buildings, and how this affects the use of energy. In addition, with-out accurate statistical data on occupant behaviour it is impossible to predict the effect of future policies on the energy-saving performance in housing.
The aim of this research is to provide insight into the effect of energy per-formance regulations on the energy consumption for space heating and to clarify the role of occupant behaviour in determining this effectiveness. This will enable us to establish whether tighter energy performance regulations are required and to identify the factors (building characteristics) that could be causing households to consume more energy.
1.5 Research questions
This section introduces the three main research questions and sub-questions that have been defined for this study.
Q1: What effect have energy performance regulations had on the actual energy con-sumption in housing? The first research question aims to determine the effect of energy perform-ance regulations on the actual energy consumption for space and water heat-ing in housing built after 1995, the year when energy performance regulations were introduced in the Netherlands. It is important to determine the effect of tighter building regulations on reducing the energy spent on space heating. This question has been broken down into 3 sub-questions:a. What is the effect of a tighter EPC value on energy consumption for heat-
ing? (Chapter 3)b. What is the difference between the actual and predicted energy consump-
tion? (Chapter 3)c. Which building characteristics in the EPC have statistically a major influ-
ence on energy consumption for space heating? (Chapter 3)

[ 9 ]
Q2: What are the effects and the determinants of occupant behaviour on energy con-sumption?After the effect of the EPC and building characteristics in recently built hous-ing has been determined, the second question seeks to identify the occupant behaviour that has a major influence on energy consumption for heating and its determinants. Knowledge about the determinants of behaviour can be used to identify the factors that ought to be addressed in order to promote behaviour that leads to lower energy consumption. In addition, the develop-ment of behavioural patterns of energy consumption will provide insight in-to drivers of behaviour, which can then be properly addressed in policies de-signed to reduce energy consumption. User profiles can be used in energy cal-culations and simulation programmes to deliver more accurate energy pre-dictions. The sub-questions are:a. What is the effect of occupant behaviour on energy consumption from a
statistical perspective? (Chapter 4)b. What are the determinants of the occupant behaviour that have an effect
on energy consumption? (Chapter 4)c. What are the main patterns of occupant behaviour? (Chapter 5)d. Which household categories show significant differences in energy-related
behaviour? (Chapter 5)
Q3: What are the differences between the most important determinants of energy con-sumption for heating in housing built after the introduction of the EPC in comparison with the total housing stock?When determining the building characteristics and the behaviour with the greatest influence on energy consumption the main focus should be on the most effective ways of reducing energy consumption. Comparing the differ-ences between the total housing stock and housing built after the introduc-tion of the EPC can help to further assess the impact of building regulations on energy consumption. The last sub-questions are therefore:a. Which building characteristics have the strongest influence on energy con-
sumption in the total housing stock? (Chapter 2)b. What is the relative importance of behaviour and building characteristics
on energy consumption in the total housing stock? (Chapter 2)c. What are the differences in energy consumption between housing built af-
ter 1995 and the total housing stock? (Chapter 6)d. What are the differences in behaviour determined by building characteris-
tics in the total housing stock? (Chapter 6)
[ 10 ]
1.6 Research methods
This research sought to draw conclusions on the determinants of energy con-sumption at macro level in order to analyse the effects of national energy reg-ulations. The study at macro level was necessary because of the large number of variables that influence energy consumption.
Statistical analyses were therefore used to determine the factors that influence energy consumption for heating. The analyses carried out in this research were exploratory in nature. The objective was to deliver relation-ships between different variables (occupant behaviour, household character-istics and building characteristics) which would then deepen the understand-ing of the relative influence and interaction between the variables and pave the way for energy-consumption predictions for certain groups.
Thanks to the use of standardisations in statistical methods (i.e. stand-ard deviations) statistical analysis also enabled us to systematically compare recently built housing with the total housing stock and also made compari-sons possible with other research and databases. This study made use of mul-tivariate statistical analyses.
Regression analysis was used to predict energy use for heating. According to Schuler et al. (2000), regression equations enable the factors influencing the energy-related aspects of dwelling use to be analysed in a way that sim-ulation tools do not. The use of micro-level data on household behaviour and energy consumption is deemed more suitable for analysing occupant behav-iour (Pachauri, 2004). In addition, according to Freire et al. (2004), regression equations are a faster and easier tool than simulation models to predict ener-gy consumption in a large sample of dwellings. Regression analysis has been used to understand behaviour in different climate conditions and to forecast energy demand.
To analyse the relationships between the different types of variables, differ-ent methods were applied depending on the research question. The types of methods used are explained accordingly in each chapter.
1.7 Data
The statistical analysis required detailed data on occupant behaviour, build-ing characteristics and household characteristics. Four types of data were needed:1. Data on building characteristics, including the EPC value, the type of heat-
ing and ventilation system, the dimensions and characteristics of the build-ing envelope and the heating area.
[ 11 ]
2. Demographic data on household characteristics.3. Data on occupant behaviour in relation to the time spent at home, the use
of ventilation and heating systems, and other activities that consume gasand heat, produce heat, or are sources of pollutants.
4. Data on the actual energy consumption for space and water heating.
A large amount of detailed data and a large enough sample size were needed to carry out the statistical analysis. In addition, practical factors were taken into account to set up the data collection for the study. These factors might however have affected the representability of the data. However, the cost of the random sample in new dwellings in the Netherlands would have been
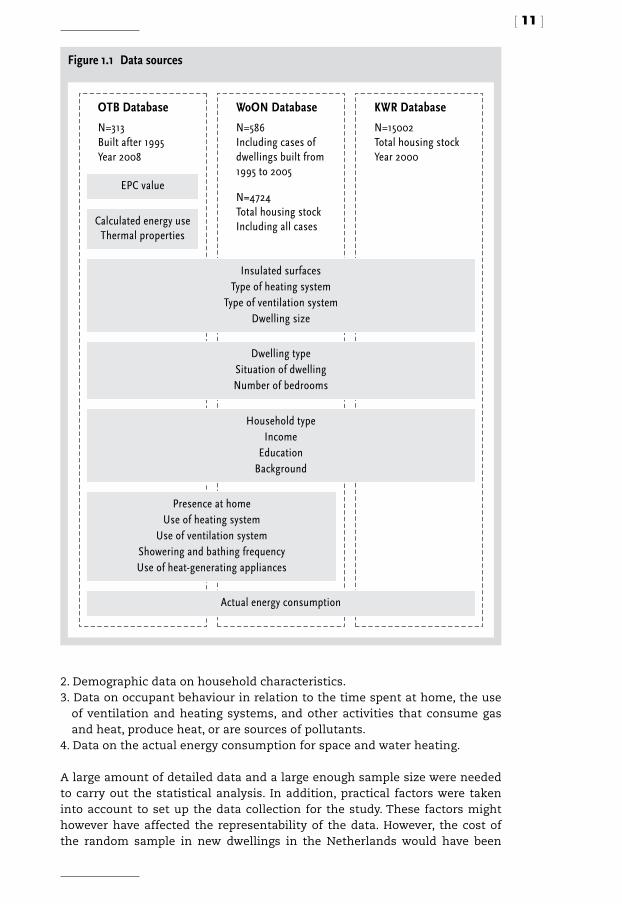
Figure 1.1 Data sources
EPC value
Calculated energy use Thermal properties
Insulated surfacesType of heating system
Type of ventilation systemDwelling size
Dwelling typeSituation of dwellingNumber of bedrooms
Actual energy consumption
Household typeIncome
EducationBackground
Presence at homeUse of heating system
Use of ventilation systemShowering and bathing frequencyUse of heat-generating appliances
OTB Database
N=313Built after 1995Year 2008
WoON Database
N=586Including cases ofdwellings built from1995 to 2005
N=4724Total housing stockIncluding all cases
KWR Database
N=15002Total housing stockYear 2000
[ 12 ]
prohibitive due to the amount of time needed to obtain the EPC data of all sampled houses. Since this analysis is exploratory, no large consequences were expected from this issue. Section 1.9 deals with the possible limitations of this study. In addition, an objective of the research was to study the differ-ences in behaviour in as similar as possible dwellings, to assess the effects of preferences on the use of dwelling provisions.
OTB database Figure 1.1 shows the relationships between the type of data used and the sources. The data on building characteristics and EPC values were taken from EPC documents obtained from municipalities or architects’ firms. The data on household characteristics, occupant behaviour, and energy consumption came from the OTB survey.
The energy performance regulations were introduced in 1995, so this study concerned housing built after this date. Two districts were selected for the OTB survey and the data collection from the EPC files: Leidsche Rijn in Utrecht and Wateringse Veld in The Hague. As these were new neighbour-hoods we could be sure that the sample consisted only of dwellings built after the introduction of the energy performance regulations. Secondly, a survey among households in one and the same area facilitated the acquisi-tion of information about the EPC level of the dwellings. The chosen districts represent the current type of housing development in the Netherlands; they include rented housing and owner-occupied housing and offer a wide variety of dwelling types. In this way we can attempt to generalize the results of this study to the situation in the Netherlands.
Detailed data on building characteristics were needed for the statistical analyses. These were collected from the EPC documents, which were consid-ered a more reliable source than reports from the occupants, though there is some degree of concern about whether the real building characteristics match those defined in the EPC documents. The data obtained from municipalities related to the EPC values and the building characteristics and focused main-ly on the building envelope (insulation, type of materials and glazing) and the heating and ventilation systems. The collected information was then paired with the data from the OTB survey on a case by case basis.
The household survey was carried out in autumn 2008. A low response rate was expected due to the length of the questionnaire and therefore, six thou-sand questionnaires were sent to the districts. A response rate of 5% was obtained. The low rate was also due to the discomfort that some people felt about answering questions on their lifestyle and possessions. A reminder was sent to the households to raise the response rate. Further attempts to raise the rate were stopped after reaching the desired sample size.
The sample size was determined through known formulas (Field, 2005; Tabachnick and Fidell, 2007), and by using a sample size similar to the one
[ 13 ]
used in similar studies (Jeeninga et al., 2001; PRC, 2004; Uitzinger, 2004). According to recent studies, a low response rate should not affect the results. The results from early responses have been found to be similar to results with late responses (Keeter et al., 2006; Curtin et al., 2000; Holbrook et al., 2007). In addition, a similar response rate (5%) is common in internet surveys. The pos-sible limitations of the low response rate are discussed in Section 1.9 and in the conclusions of this thesis.
The survey provided information on occupant behaviour, household charac-teristics and energy consumption. The occupant behaviour referred to the use of the heating and ventilation systems, shower and bathing frequency, and the use of heat-producing appliances and electronics. As the survey was held in the autumn, the respondents were asked to report retrospectively on their behaviour the previous winter. The questionnaire took the form of a series of tables where the respondents could fill in their behaviour and the house-hold characteristics. A condensed version of the questionnaire is provided in Appendix 2.
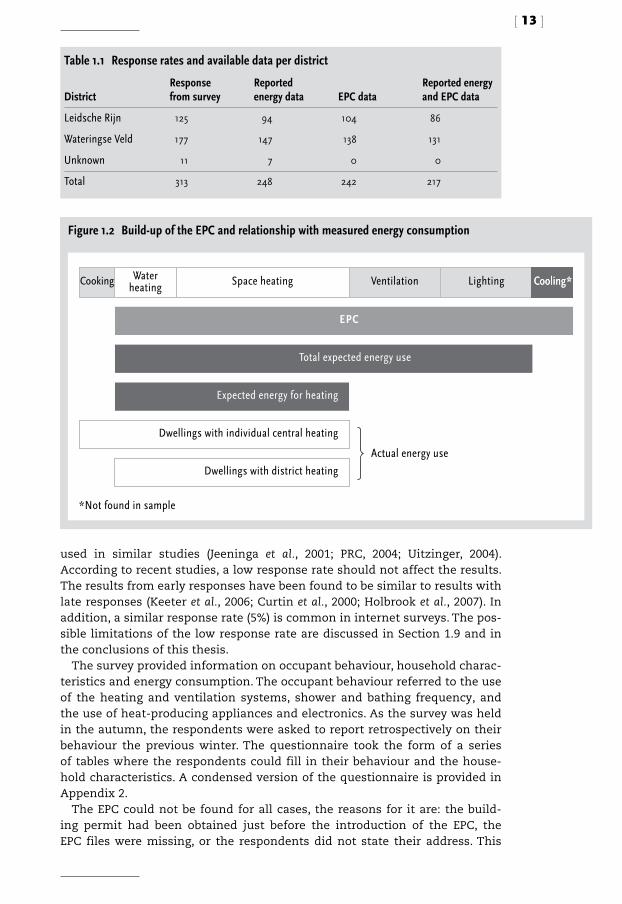
The EPC could not be found for all cases, the reasons for it are: the build-ing permit had been obtained just before the introduction of the EPC, the EPC files were missing, or the respondents did not state their address. This
Table 1.1 Response rates and available data per district
DistrictResponse from survey
Reported energy data EPC data
Reported energy and EPC data
Leidsche Rijn 125 94 104 86
Wateringse Veld 177 147 138 131
Unknown 11 7 0 0
Total 313 248 242 217
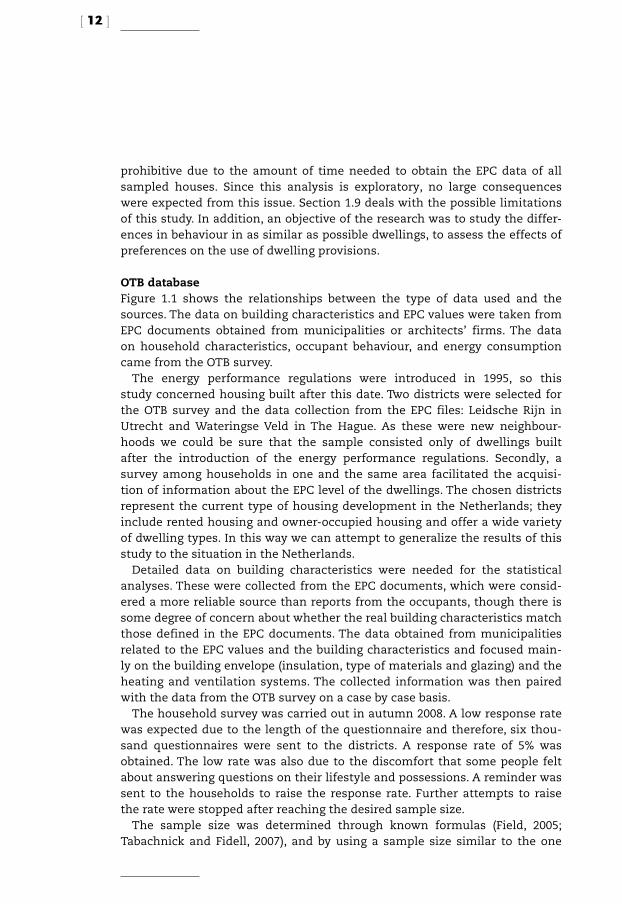
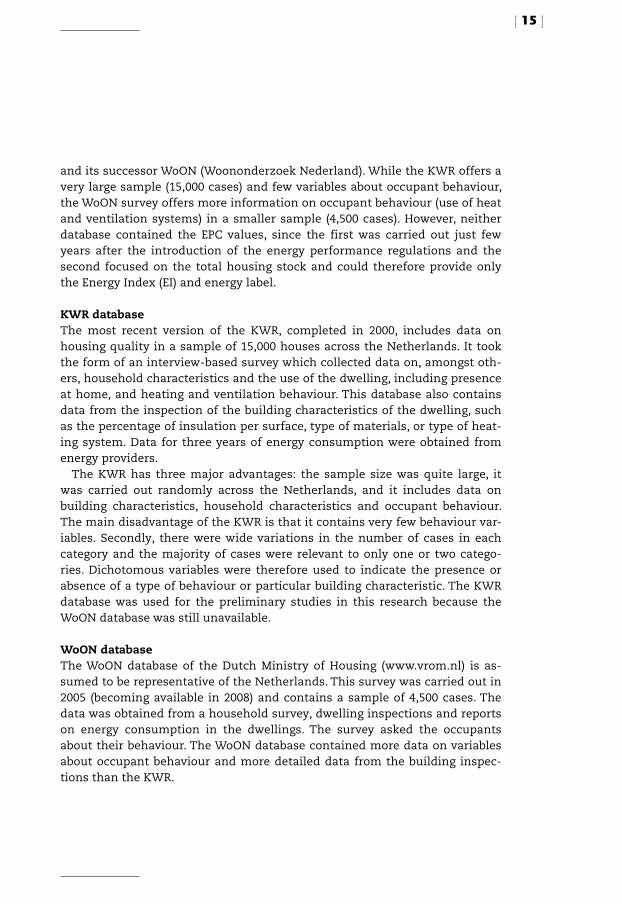
Figure 1.2 Build-up of the EPC and relationship with measured energy consumption
EPC
*Not found in sample
Actual energy use
Dwellings with individual central heating
Dwellings with district heating
Total expected energy use
Expected energy for heating
Cooking Waterheating Space heating Ventilation Lighting Cooling*Cooling*
Dwellings with district heating
Dwellings with individual central heating

[ 14 ]
reduced the size of the sample for some analyses (Table 1.1).The data on actual energy consumption was obtained from the respond-
ents, who reported the energy consumption specified in their last available energy bill. Households in dwellings with individual central heating reported energy consumption in square metres of gas, while households in dwellings with district heating reported it in GJs.
In practice, in dwellings with an electricity and a gas connection (the most common situation in the Netherlands), the measured gas is for cooking and for space and water heating while the measured electricity is for lighting, ventilation, space cooling and appliances. In dwellings with a heat (district heating) and electricity connection the measured heat is for space and water heating, while the measured electricity is for lighting ventilation, space cool-ing, appliances and cooking (Figure 1.2).
Another difference between the energy data reported from homes with individual central heating and district heating is that only gas is reported as primary energy. The EPC calculates the primary energy consumption, which takes account of the efficiency of the energy distribution and conversion out-side the dwelling. Hence, for the purposes of comparison, the same conver-sion factors as in the EPC had to be applied to the energy figures from dwell-ings with district heating.
Both types of dwellings were represented in the sample. Houses with dis-trict heating did not include energy for cooking and a conversion factor was needed to account for the efficiency of the system. In the Netherlands this factor is set at .95 (NEN 5128: 2004). Dwellings with a gas connection did include energy for cooking, but this was considered to be less than 5% (EuroACE, 2004) and therefore should not affect the results.
Only energy consumption for heating was considered in this research. No account was taken of energy for cooling, lighting or ventilators. Energy for heating water was also considered since it was included in the measured data on gas and heat. Data on energy consumption was compared as follows with the sum of the expected energy for space and water heating:
Qpres; heat+tap = Qprim;verw + Qprim;tap
The primary energy for space heating (Qprim;verw) and the primary energy for tap water heating (Qprim;tap) were taken from the EPC documents (see Appendix 1 for more information on the EPC calculations).
Databases from the Ministry of HousingTwo databases from the Dutch Ministry of Housing were used to (1) validate the OTB survey with a nationwide and random sample to overcome the lim-itations discussed in the earlier section and, (2) analyse the situation in the building stock. The databases were KWR (Kwalitatieve Woning Registratie)
[ 15 ]
and its successor WoON (Woononderzoek Nederland). While the KWR offers a very large sample (15,000 cases) and few variables about occupant behaviour, the WoON survey offers more information on occupant behaviour (use of heat and ventilation systems) in a smaller sample (4,500 cases). However, neither database contained the EPC values, since the first was carried out just few years after the introduction of the energy performance regulations and the second focused on the total housing stock and could therefore provide only the Energy Index (EI) and energy label.
KWR databaseThe most recent version of the KWR, completed in 2000, includes data on housing quality in a sample of 15,000 houses across the Netherlands. It took the form of an interview-based survey which collected data on, amongst oth-ers, household characteristics and the use of the dwelling, including presence at home, and heating and ventilation behaviour. This database also contains data from the inspection of the building characteristics of the dwelling, such as the percentage of insulation per surface, type of materials, or type of heat-ing system. Data for three years of energy consumption were obtained from energy providers.
The KWR has three major advantages: the sample size was quite large, it was carried out randomly across the Netherlands, and it includes data on building characteristics, household characteristics and occupant behaviour. The main disadvantage of the KWR is that it contains very few behaviour var-iables. Secondly, there were wide variations in the number of cases in each category and the majority of cases were relevant to only one or two catego-ries. Dichotomous variables were therefore used to indicate the presence or absence of a type of behaviour or particular building characteristic. The KWR database was used for the preliminary studies in this research because the WoON database was still unavailable.
WoON databaseThe WoON database of the Dutch Ministry of Housing (www.vrom.nl) is as-sumed to be representative of the Netherlands. This survey was carried out in 2005 (becoming available in 2008) and contains a sample of 4,500 cases. The data was obtained from a household survey, dwelling inspections and reports on energy consumption in the dwellings. The survey asked the occupants about their behaviour. The WoON database contained more data on variables about occupant behaviour and more detailed data from the building inspec-tions than the KWR.

[ 16 ]
1.8 Relationship between research questions and data
The OTB database was used for research questions 1 and 2, which address the effect of the energy performance regulations (research sub-questions 1.1-1.3 and 2.1-2.2) and occupant behaviour on energy consumption in recently built housing. The WoON database was used to validate the subsequent anal-yses. The OTB database was also used to determine behavioural patterns and household types in sub-questions 2.3-2.4. This part was not validated with the WoON survey because the database did not contain the required data (see Figure 1.3).
Figure 1.3 Data used per research question
RQ 1.1 Real vs. calculated energy consumption
RQ 1.2 Effect of EPC value
RQ 1.3 Effect of building characteristics
Research question 1Effect of energy performanceregulations in energy consumption
(OTB & WoON)
RQ 2.1 Effect on energy consumption
RQ 2.2 Determinants of behaviour
RQ 2.3 Behavioural patterns
RQ 2.4 Household groups
Research question 2Effect of behaviour on energy consumption
(OTB & WoON)
RQ 3.1 Building characteristics in energy consumption
RQ 3.2 Behaviour in energy consumption
RQ 3.3 Building characteristics determining behaviour
RQ 3.4 Differences in energy consumption in recently built and complete housing stock
Research question 3Determinants of energy consumption in recently builtand complete housing stock
(KWR)
(WoON)
Tota
l hou
sing
sto
ck
Rece
ntly
bui
lt ho
usin
gRe
cent
ly b
uilt
hous
ing
Build
ing
char
acte
ristic
sO
ccup
ants
’ beh
avio
ur

[ 17 ]
The third research question, which regards the total housing stock, was answered by an analysis with the KWR and the WoON database. The KWR was used for sub-questions 3.1-3.2 on the determinants of energy consumption in the total housing stock. The WoON database was used for sub-questions 3.3-3.4 to analyse the effect of building characteristics on the housing stock and to compare this with the situation in recently built housing (Figure 1.3). In the figure, question 3 is shown between questions 1 and 2 because it deals with both building characteristics and occupant behaviour.
1.9 Limitations
The results of this study might be limited due to the nature of the sample. First, the OTB survey might be limited due to the low response rate. A random sample across the Netherlands could not be provided since two complete dis-tricts were specifically chosen with a view to obtaining data on the EPC val-ues. To determine the effect of the low response rate, the household charac-teristics in both samples were analysed. It was found that the only difference consisted in a higher than average education and income in the OTB data-base. However, these deviations from the national averages might have been caused by the fact that this study – for reasons explained earlier – focused on-ly on recently built houses.
The results of the OTB survey were therefore compared with the results of the WoON survey. Analyses similar to those applied with the OTB sample were carried out by way of validation. These are discussed accordingly in each chapter.
Furthermore, there were two concerns regarding the quality of the data: (1) the survey collected ‘retrospective’ data on occupant behaviour, which are less reliable than monitored data; (2) there may be differences between the actual building characteristics and those described in the EPC document (for example, the infiltration values are only theoretical).
The reliability of ‘real-time’ data (such as diaries) is also open to question. The best way to obtain high-quality data on occupant behaviour is to moni-tor the actual indoor parameters and HVAC settings, but this is a time-con-suming and expensive option. A survey proved the most appropriate instru-ment to collect data for the statistical analysis of a large number of factors, as intended in this research.
The OTB sample was chosen to be representative for the type of dwelling (flats, detached houses, etc.) but it did not cover all types of HVAC systems currently used in the Netherlands. There were few dwellings with balanced ventilation and no dwellings with heat pumps in the sample. And there were only a few cases of dwellings with solar boilers. The WoON database did, how-ever, contain cases of dwellings with balanced ventilation and heat recovery.
[ 18 ]
Even with the limitations imposed by quality of data, the results of this study provide an insight into the role of energy performance regulations in reducing energy consumption for heating. Energy performance regulations have been used in the Netherlands for 15 years, thus providing an opportuni-
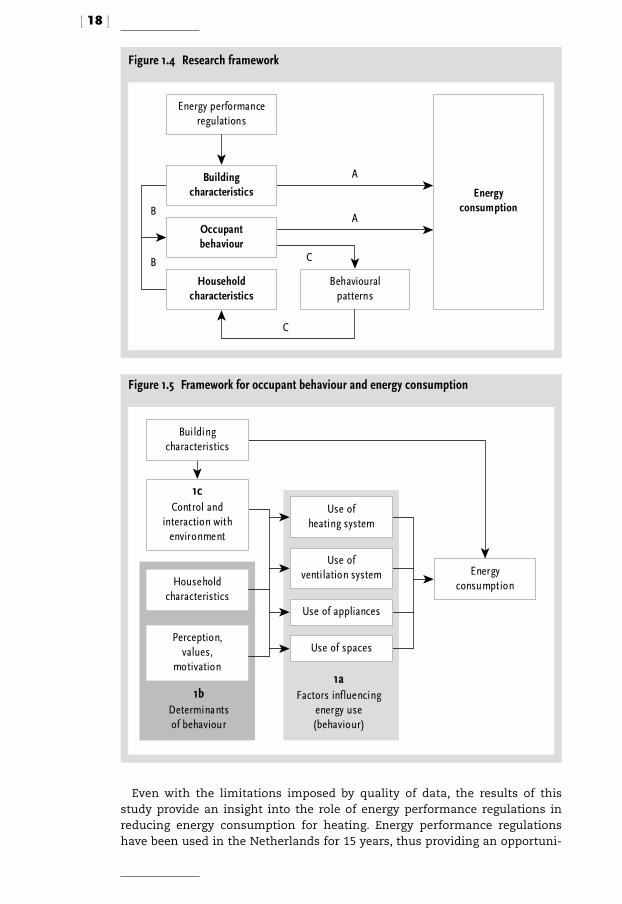
Figure 1.4 Research framework
Behaviouralpatterns
Energyconsumption
Energy performance regulations
Building characteristics
Occupantbehaviour
Household characteristics
B
A
A
C
CB
Figure 1.5 Framework for occupant behaviour and energy consumption
Use ofventilation system
Use of appliances
Use of spaces
Household characteristics
Perception,values,
motivation
1cControl and
interaction with environment
Energy consumption
Buildingcharacteristics
1bDeterminantsof behaviour
1aFactors influencing
energy use(behaviour)
Use ofheating system
[ 19 ]
ty to test this type of regulations, which are being implemented in other Euro-pean countries in the framework of the EPBD.
1.10 Structure of thesisThe framework for this research is shown in Figure 1.4. The research contains four main components influencing energy consumption: building character-istics, energy performance regulations, occupant behaviour and household
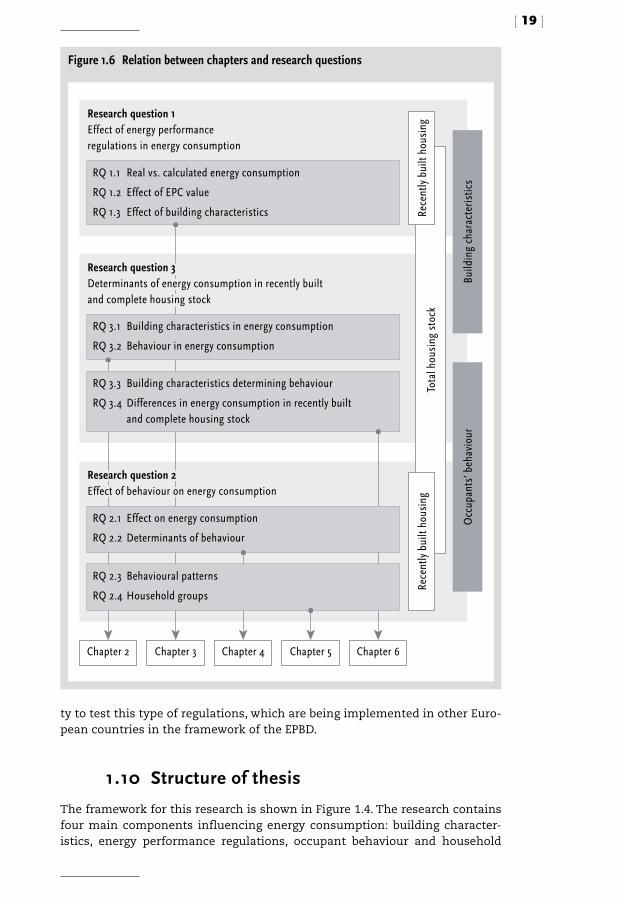
Figure 1.6 Relation between chapters and research questions
Research question 1Effect of energy performanceregulations in energy consumption
Research question 3Determinants of energy consumption in recently builtand complete housing stock
Research question 2Effect of behaviour on energy consumption
Chapter 2 Chapter 3 Chapter 4 Chapter 5 Chapter 6
Tota
l hou
sing
sto
ck
Rece
ntly
bui
lt ho
usin
gRe
cent
ly b
uilt
hous
ing
Build
ing
char
acte
ristic
sO
ccup
ants
’ beh
avio
ur
RQ 1.1 Real vs. calculated energy consumption
RQ 1.2 Effect of EPC value
RQ 1.3 Effect of building characteristics
RQ 2.1 Effect on energy consumption
RQ 2.2 Determinants of behaviour
RQ 2.3 Behavioural patterns
RQ 2.4 Household groups
RQ 3.1 Building characteristics in energy consumption
RQ 3.2 Behaviour in energy consumption
RQ 3.3 Building characteristics determining behaviour
RQ 3.4 Differences in energy consumption in recently built and complete housing stock
[ 20 ]
characteristics. Building characteristics and occupant behaviour affect energy consumption for space and water heating (A). The energy performance coef-ficient (EPC) determines the thermal properties of housing and the efficiency of systems which, in turn, influence energy consumption. The influence of oc-cupant behaviour on energy consumption may be partly determined by build-ing and household characteristics (B). Behavioural patterns can be observed depending on the use of heating and ventilation systems and on household characteristics. If behavioural patterns could be identified, households could be classified into user profiles (C).
In the total housing stock energy consumption is influenced by more types of building characteristic, since there is greater variation in, for example, insulation levels, HVAC systems, and dwelling size. Occupancy patterns can be observed in recently built housing which are different from those in the total housing stock. It is important to recognise the building characteristics that contribute to such differences and that could cause a rebound effect.
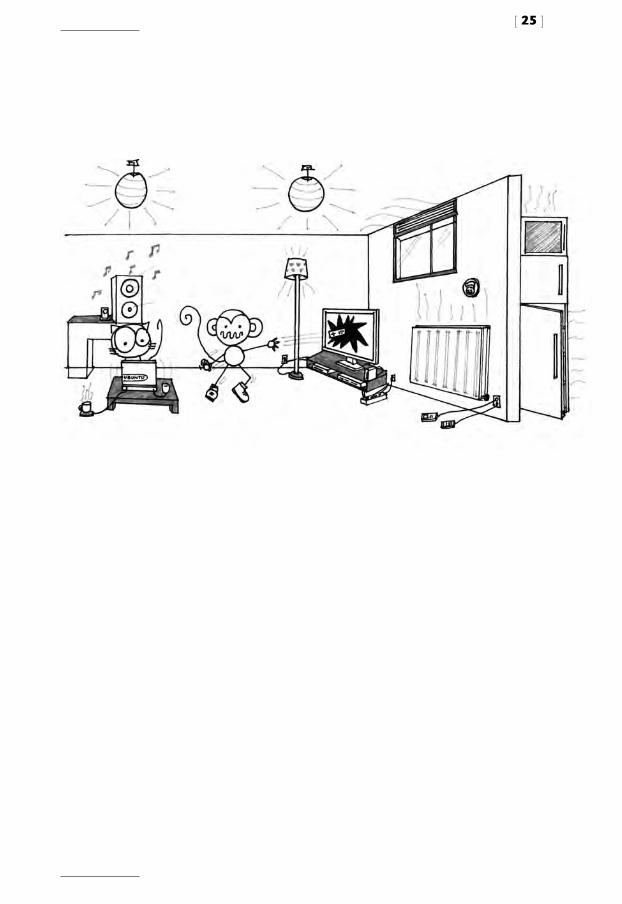
A distinction is drawn between behaviour and use (Kanis, 1998). Behaviour is defined as all the activities that people perform in the house, while use refers to the direct interaction between an occupant and an action to achieve a goal. In this study, behaviour was instead defined as the use of space, sys-tems and other amenities within the house that can influence energy con-sumption for space and water heating, such as the use of heating and ventila-tion systems, opening windows and grilles, bathing and showering frequency, use of space and use of heat-generating appliances and electronics.
Occupant behaviour (1a) is believed to be influenced by household charac-teristics, lifestyle, and cognitive variables (motivation, values and attitudes) (1b). But it can also be influenced by the interaction between the user and the building (1c) and the thermal properties of the building. This research focuses solely on the building and household characteristics that influence occupant behaviour (Figure 1.5).
Figure 1.6 shows the relationship between the chapters and the research questions. Chapter 2 addresses sub-questions 3.1-3.2 regarding the relative effect of building characteristics and occupant behaviour on the total hous-ing stock. Chapter 3 addresses the effect of energy performance regulations in recently built houses, followed by an analysis of the effect of occupant behaviour in Chapter 4. Chapter 4 also studies the determinants of occupant behaviour. This forms the basis for the analysis in Chapter 5, which aims to determine behavioural patterns for user profiles in recently built houses. The total housing stock is studied again in Chapter 6, where the determinants of behaviour are analysed in order to draw a comparison with the situation in recently built housing. The conclusions and recommendations are presented in Chapter 7.
[ 21 ]
References
Andersen, R.V., J. Toftum, K.K. Andersen & B.W. Olessen (2009), ‘Survey of Oc-cupant Behaviour and Control of Indoor Environment in Danish Dwellings’, Energy and Buildings, 41, pp. 11-16.
Becker, R. & M. Paciute (2009), Thermal Comfort in Residential Buildings – Fail-ure to Predict by Standard Model, Building & Environment, 44, pp. 949-960.
Beerepoot, M. (2002), Energy regulations for new building. In search of har-monisation in the European Union, Delft University Press, Delft.
Beerepoot, M. & N. Beerepoot (2007), Government Regulations as an Impe-tus for Innovations, Evidence for Energy Performance Regulation in the Dutch Residential Building Sector, Energy Policy, 35, pp. 4812-4825.
Branco, G., B. Lachal, P. Gallinelli & W. Weber (2004), Expected versus Observed Heat Consumption of a Low Energy Multifamily Complex in Switzerland based on Long-term Experimental Data, Energy and Buildings, 36, pp. 43-555.
Brown, Z. & R.J. Cole (2009), Influence of Occupants’ Knowledge on Comfort Ex-pectations and Behaviour, Building Research & Information, 37 (30), pp. 227-245.
Conner, C.C. & R.L. Lucas (1990), Thermostat related behavior and internal temperatures based on measured data in residences, PNL-7465, Richland, WA: Pacific Northwest Laboratory.
Curtin, R., S. Presser & E. Singer. (2000), The Effects of Response Rate Chang-es on the Index of Consumer Sentiment, Public Opinion Quarterly, 64 (4), pp. 413-428.
de Dear, R. (2004), Thermal Comfort in Practice, Indoor Air, 14 (7), p. 32.
Dongen, F.E.F. & H. Vos (2003), Relatie EPC niveau en zelfgerapporteerde ge-zondheidseffecten. Analyse op basis van geïntegreerde data uit twee onder-zoeken, Rapport 2003-46, Delft TNO-INRO.
Field, A. (2005), Discovering statistics using SPSS: and sex, drugs and rock’n’ roll, 2nd ed., Sage, London.
Freire, R.Z., G.H.C. Oliveira & N. Mendes (2004), Development of regression

[ 22 ]
equation for predicting energy and hydrothermal performance of building, Energy and Buildings, 40, pp. 810-820.
Gommans, L.J. (2008), Energie prestaties van energie-efficiënt gebouwen: tus-sen ontwerp en werkelijkheid, TVVL magazine, September 2008, pp. 18-24.
de Groot E., M. Spiekman & I. Opstelten (2008), Dutch Research into User Be-haviour in Relation to Energy Use of Residences, Proceedings PLEA Conference.
Haas, R., H. Auer & P. Biermayr (1998), The Impact of Consumer Behaviour on Residential Energy Demand for Space Heating, Energy and Buildings, 27, pp. 195-205.
Hens, H., W. Parijs & M. Deurinck (2010), Energy Consumption for heating and rebound effects, Energy and Buildings, 42, pp. 105-110.
Holbrook, A., J. Krosnick, & A. Pfent. (2007), The Causes and Consequences of Response Rates in Surveys by the News Media and Government Contractor Survey Research Firms, in: Lepkowski, James M., N. Clyde Tucker, J. Michael Brick, Edith D. De Leeuw, Lilli Japec, Paul J. Lavrakas, Michael W. Link, & Rob-erta L. Sangster (eds.), Advances in telephone survey methodology, New York, Wiley.
Itard, L. & F. Meijer (2008), Towards a Sustainable Northern European Housing Stock: Figures, facts and future, IOS Press, Amsterdam.
Jeeninga, H., M. Uyterlinde & J. Uitzinger (2001), Energieverbruik van energie-zuinige woningen, Report ECN & IVAM, ECN-C-01-072.
Kanis, H. (1998), Usage centered research for everyday product design, Applied ergonomics, 1 (29), pp. 75-82.
Karjalalainen, S. (2007), Gender Differences in Thermal Comfort and Use of Thermostats in Everyday Thermal Environments, Building and Environment, 42, pp. 1594-1603.
Keeter, S., C. Kennedy, M. Dimock, J. Best & P. Craighill (2006), Gauging the Im-pact of Growing Nonresponse on Estimates from a National RDD Telephone Survey, Public Opinion Quarterly, 70 (5), pp. 759-779.
KPMG (2006), Analyse aannames Regeleffecttoets aanscherping EPC wonin-gen, KPGM Business Advisory Service.
[ 23 ]
Lan, L., Z. Lian, W. Liu & Y. Liu (2008), Investigation of Gender Difference in Thermal Comfort for Chinese People, European Journal of Applied Physiolo-gy, 102 (4), p. 471.
Lenzuni, P., D. Freda & M. Del Guadio (2008), Classification of Thermal En-vironments for Comfort Assessment, The Annals of Occupational Hygiene doi:10.1093/annhyg/mep012.
Linden, A.L., A. Carlsson-Kanyama & B. Eriksson (2006), Efficient and Ineffi-cient Aspects of Residential Energy Behaviour: What are the policy instru-ments for change?, Energy Policy, 34, pp. 1918-1927.
Lutzenhiser, L. (1992), A Question of Control – Alternative patterns of room airconditioner use, Energy and Buildings, 18, pp. 193-200.
Moujalled, B., R. Cantin & G. Guarracino (2008), Comparison of Thermal Com-fort Algorithms in Naturally Ventilated Office Buildings, Energy and Buildings, 40 (12), pp. 2215-2223.
NEN 5128 (2004), Energy Performance of Residential functions and residential buildings: determination method, ics 91.120.10, March.
Nevius, M.J. & S. Pigg (2000), Programmable thermostats that go berserk? Tak-ing a social perspective on space heating in Wisconsin, ACEEE Summer Study in Energy Efficiency in Buildings.
Nicol, J.F. & M.A. Humphrey (2009), New Standards for Comfort and Energy Use in Buildings, Building Research & Information, 37 (1), pp. 68-73. Nieman (2007), Eindrapportage woonkwaliteit binnenmilieu in nieuwbouw-woning, Report Wu060315aaA4.PK, VROM Inspectie Regio Oost, Arnhem.
Pachauri, S. (2004), An Analysis of Cross-sectional Variations in Total House-hold Energy Requirements in India using Micro-survey Data, Energy Policy, 32, pp. 1723-1735.
Papakostas, K.T. & B.A. Satiropoulos (1997), Occupational and Energy Behav-iour Patterns in Greek Residences. Energy and Buildings, 26, pp. 207-213.
PRC Bouwcentrum BV (2004), EPC en energieverbruik nieuwbouwwoningen, Report Novem, Kompas Utrecht.
Schweiker, M. & M. Shukuya (2009), Comparison of Theoretical and Statisti-

[ 24 ]
cal Models of Air-Conditioning-Unit Usage Behaviour in a Residential Setting under Japanese Climatic Conditions, Building and Environment, 44, pp. 2137-2149.
Schuler, A., C. Weber & U. Fahl (2000), Energy Consumption for Space Heating of West-German Household: empirical evidence, scenario projections and pol-icy implications, Energy Policy, 28, pp. 877-894.
Shipworth, M., S.K. Firth, M.I. Gentry, A.J. Wright, D.T. Shipworth & K.J. Lomas (2010), Central heating thermostat settings and timing: building demograph-ics, Building Research & Information, 38, pp. 50-69.
Tabachnick B.G. & L.S. Fidell, (2007), Using multivariate statistics, 5th ed.,Pearson Education, Inc., USA.
Uitzinger, J. (2004), Analyse EPC en energieverbruik bij woningen, Report IVAM/ SenterNovem.
Vierveijzer, P. & A. Wichers Hoeth (2003), Regeleffecttoets, Aanscherping van de EPC van te bouwen woningen naar 0.8, Amersfort, DHV, Website: www.vrom.nl, accessed July 2009.
Ye, X.J., Z.P. Zhou, Z.W. Lian, H.M. Liu, C.Z. Li & Y.M. Liu (2006), Field Study of a Thermal Environment and Adaptive Model in Shanghai, Indoor Air, 16 (4), pp. 320-326.
[ 25 ]

[ 26 ]

[ 27 ]
2 The effect of occupancy and building characteris-
tics on energy use for space and water heating in Dutch residential stock Guerra-Santin, O., L. Itard & H. Visscher (2009), The effect of occu-pancy and building characteristics on energy use for space and water heating in Dutch residential stock, Energy and Buildings, 41, pp. 1223-1232.
AbstractAs a consequence of the improved quality of thermal properties of buildings due to energy regulations, overall energy use associated with building charac-teristics is decreasing, making the role of the occupant more important. Stud-ies have shown that occupant behaviour might play a prominent role in the variation in energy consumption in different households but the extent of such influence is unknown. The impact of the building’s thermal character-istics on space heating demand has been well studied. There is however, lit-tle work done that incorporates the impact of consumer behaviour. This study aims to gain greater insight into the effect of occupant behaviour on energy consumption for space heating by determining its effect on the variation of energy consumption in dwellings while controlling for building characteris-tics. The KWR database from the Ministry of Housing in the Netherlands was used. This study showed that occupant characteristics and behaviour signif-icantly affect energy use (4.2%), but building characteristics still determine a large part of the energy use in a dwelling (42%). Further analysis showed that some occupant behaviour is determined by the type of dwelling or HVAC systems and, therefore, the effect of occupant characteristics might be larger than expected, since these determine the type of dwelling.
2.1 Introduction
Diverse factors have caused an increase in energy use throughout the world. Globalisation has spread the lifestyle of the most developed Western coun-tries worldwide, changing the expectations about the quality of life in many societies to a point where sustainability is no longer possible on a large scale. One of the aspects of lifestyle that causes a high environmental burden in de-veloped countries is the use of energy in buildings. Worldwide, the building industry and the built environment are some of the largest contributors to energy and material use. In the northern part of the European Union, 41% of total final energy consumption comes from buildings, with 30% being used in
[ 28 ]
residential buildings (Itard & Meijer, 2008) According to EuroAce (2004) 57% of the energy consumed in buildings is used for space heating, 25% for hot wa-ter, 11% for lighting and electrical appliances, and 7% for cooking.
Due to the importance of a good quality of the indoor environment and the problems caused by high energy consumption, governments have enacted a series of policies and regulations aimed at increasing the energy efficiency of dwellings and ensuring a good indoor environment. An example of such ini-tiatives is the EPBD, which from 2003 obliged all European member states to implement performance-based energy regulations aimed at decreasing ener-gy consumption in buildings in relation to heating, cooling, ventilation, light-ing and domestic hot water. In addition, efforts to construct low energy build-ings can be observed in several projects and studies worldwide. Neverthe-less, energy savings due to energy conservation measures are suspected to be lower in reality than predicted (Branco et al., 2004; Haas et al., 1998; Hirst & Goeltz, 1985).
The importance of building characteristics has been determined in diverse studies. Leth-Petersen & Togeby (2001) studied the influence of building reg-ulations on energy use, finding that they have been important in reducing energy consumption in new buildings. As a consequence, overall energy use associated with building characteristics is decreasing, making the role of the occupant even more important (Haas et al., 1998; de Groot et al., 2008; Papako-stas & Sotiropoulos, 1997). In the Netherlands, Beerepoot & Beerepoot (2007) found that energy performance regulations have been successful in conserv-ing energy. Nevertheless, the variation in energy consumption is still large for dwellings with the same characteristics.
Studies have shown that occupant behaviour might play a prominent role in the variation in energy consumption in different households (Bran-co et al., 2004; Jeeninga et al., 2001), but the extent of such influence is still unknown. The impact of the building’s thermal characteristics on space heat-ing demand has been well studied, quantified and validated from the view-point of individual buildings and building simulation, and can now be found in various handbooks (for example, Clarke, 2001; Ashrae, 2005; ISO, 2004; ISO, 2008). There has, however, been little work done on the impact of the thermal characteristics of building stock from a statistical perspective. There is also little work that incorporates the impact of consumer behaviour (Haas et al., 1998). In addition, there is little information on the effect of occupant behav-iour taking into account building and household characteristics.
This study aims to gain greater insight into the effect of occupant behav-iour on energy consumption for space heating by determining its effect on the variation of energy consumption in dwellings while controlling for build-ing characteristics. In addition, this study aims to determine the respective effect of building and occupant attributes on energy use, and the relationship between them. The research questions of the study are:

[ 29 ]
1. What are the most important characteristics of the building and occupancy(defined as household characteristics and occupant behaviour) that affectenergy use for space heating?
2.How much of the variation in energy use can be explained with a model combining both types of variables?
3. What is the relationship between building and occupancy characteristics?
Section 2.2 will provide a literature survey which will determine the param-eters used in the model, while Section 2.3 will present the analysis methods and data used. Section 2.4 will present the results of the statistical analyses, firstly introducing the differences in energy use for different types of dwell-ings with different levels of insulation, and secondly introducing the results of the regression analysis and its comparison with a model containing on-ly occupant-related variables. Section 2.5 will provide the conclusions of the study and make recommendations for further research.
2.2 State of the art
The actual amount of energy used in buildings is often different from the cal-culated or expected energy use. According to Haas et al. (1998), energy savings due to conservation measures will be lower in practice than those calculat-ed because the impact of consumer behaviour is neglected. The difference be-tween actual and predicted energy use depends on the final realisation of the construction and the technical installations (Elkhuizen et al., 2006; Nieman, 2007), and on the utilisation of the dwelling’s systems, such as interior tem-perature and ventilation rate (Branco et al., 2004). For example, in this experi-mental study by Branco et al. (2004), conducted over three years in multi-fam-ily buildings in Switzerland, the real energy use was 50% higher than the esti-mated energy use (246 MJ/m2 as opposed to 160 MJ/m2), the differences being due to the real conditions of utilisation, the real performance of the complete technical system and the actual weather conditions. According to the results of an empirical study in the Netherlands by ECN and IVAM (2001), an energy intensive lifestyle in a very energy efficient residence can lead to higher ener-gy use than an energy extensive lifestyle in a less energy efficient residence. In a study on the effect of an energy audit on energy use in dwellings in the USA, Hirst & Goeltz (1985) found that less energy was saved than was predict-ed by the audit.
Energy use for space heating depends on the heat gains and losses of a dwelling, which are determined by its technical and architectural charac-teristics on the one hand and by the behaviour of the residents on the oth-er (Papakostas & Sotiropoulos, 1997). The parameters influencing energy demand for space heating are: the thermal quality of the building, building

[ 30 ]
type, occupant behaviour and climate. Table 2.1 presents international studies that relate energy use to building characteristics, household characteristics and occupant behaviour. These are explained in more detail in the following subsections. More detailed results from international studies and their com-parison with the results of this study can be found in the discussion section.
2.2.1 Household characteristics
Household characteristics have been found to influence energy use for heat-ing in residential buildings. According to several authors, age is an important characteristic determining energy use. In general, older households tend to consume more energy than younger households, especially for space heat-ing (Liao & Chang, 2002; Linden et al., 2006). The number of occupants in the dwelling is also an important parameter for energy use. Linear correlations between household size and energy use have been found in several interna-tional studies (Table 2.1).
Table 2.1 International references per type of study
Building characteristics
Urbanisation rate
Assimakopoulos 1992 (Greece, empirical)
Vintage of building
Assimakopoulos 1992 (Greece)Leth-Petersen & Togeby 2001 (Denmark)Liao & Chang 2002 (USA)Hirst & Goeltz 1985 (USA, monitoring)
Design of dwelling
Assimakopoulos 1992 (Greece)Leth-Petersen & Togeby 2001 (Denmark)Haas et al. 1998 (Australia)Liao & Chang 2002 (USA)Sonderegger 1977-78 (USA)Sardianou 2008 (Greece)Lenzen et al. 2006 (International)Schuler et al. 2000 (Germany)Pachauri 2004 (India)
Insulation Assimakopoulos 1992 (Greece)Haas et al. 1998 (Australia)Sonderegger 1977-78 (USA)Hirst & Goeltz 1985 (USA, monitoring)
Heating systems
Leth-Petersen & Togeby 2001 (Denmark)Hirst & Goeltz 1985 (USA, monitoring)
Energy type Leth-Petersen & Togeby 2001 (Denmark)
Household characteristics
Age respondent, household size, income
Liao & Chang 2002 (USA)Assimakopoulos 1992 (Greece)Jeeninga et al. 2001 (the Netherlands)Vringer 2008 (the Netherlands)Sardianou 2008 (Greece)Lenzen et al. 2006 (International)Schuler et al. 2000 (Germany)Pachauri 2004 (India)Hirst & Goeltz 1985 (USA, monitoring)Biesiot & Noorman 1999 (the Netherlands)
Ownership Leth-Petersen & Togeby 2001 (Denmark)
Behaviour
Preferences in space heating
Leth-Petersen & Togeby 2001 (Denmark)Haas et al. 1998 (Australia)Linden et al. 2006 (Sweden)Jeeninga et al. 2001 (the Netherlands)Tommerup et al. 2007 (Denmark, monitoring)
Presence at home and hot water use
Papakostas & Satiropoulos 1997 (Greece)Boonekamp 2005 (the Netherlands, simulation model)
Ventilation Iwashita & Akasaka 1997 (Japan, monitoring)Ernhorn 1988 (Germany, monitoring)Liddament & Orme 1998 (UK, monitoring)
Values Vringer et al. 2007 (the Netherlands)
[ 31 ]
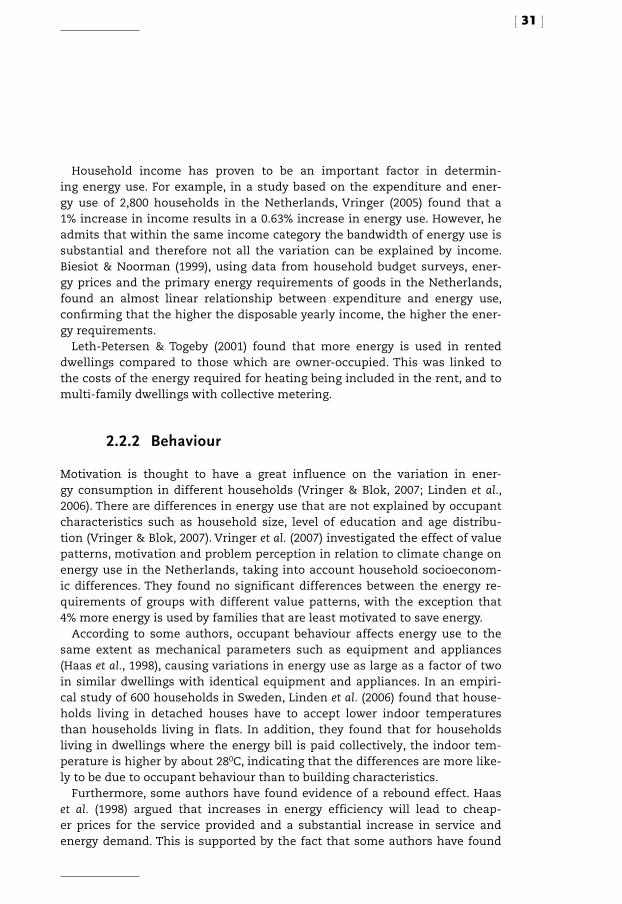
Household income has proven to be an important factor in determin-ing energy use. For example, in a study based on the expenditure and ener-gy use of 2,800 households in the Netherlands, Vringer (2005) found that a 1% increase in income results in a 0.63% increase in energy use. However, he admits that within the same income category the bandwidth of energy use is substantial and therefore not all the variation can be explained by income. Biesiot & Noorman (1999), using data from household budget surveys, ener-gy prices and the primary energy requirements of goods in the Netherlands, found an almost linear relationship between expenditure and energy use, confirming that the higher the disposable yearly income, the higher the ener-gy requirements.
Leth-Petersen & Togeby (2001) found that more energy is used in rented dwellings compared to those which are owner-occupied. This was linked to the costs of the energy required for heating being included in the rent, and to multi-family dwellings with collective metering.
2.2.2 Behaviour
Motivation is thought to have a great influence on the variation in ener-gy consumption in different households (Vringer & Blok, 2007; Linden et al., 2006). There are differences in energy use that are not explained by occupant characteristics such as household size, level of education and age distribu-tion (Vringer & Blok, 2007). Vringer et al. (2007) investigated the effect of value patterns, motivation and problem perception in relation to climate change on energy use in the Netherlands, taking into account household socioeconom-ic differences. They found no significant differences between the energy re-quirements of groups with different value patterns, with the exception that 4% more energy is used by families that are least motivated to save energy.
According to some authors, occupant behaviour affects energy use to the same extent as mechanical parameters such as equipment and appliances (Haas et al., 1998), causing variations in energy use as large as a factor of two in similar dwellings with identical equipment and appliances. In an empiri-cal study of 600 households in Sweden, Linden et al. (2006) found that house-holds living in detached houses have to accept lower indoor temperatures than households living in flats. In addition, they found that for households living in dwellings where the energy bill is paid collectively, the indoor tem-perature is higher by about 280C, indicating that the differences are more like-ly to be due to occupant behaviour than to building characteristics.
Furthermore, some authors have found evidence of a rebound effect. Haas et al. (1998) argued that increases in energy efficiency will lead to cheap-er prices for the service provided and a substantial increase in service and energy demand. This is supported by the fact that some authors have found
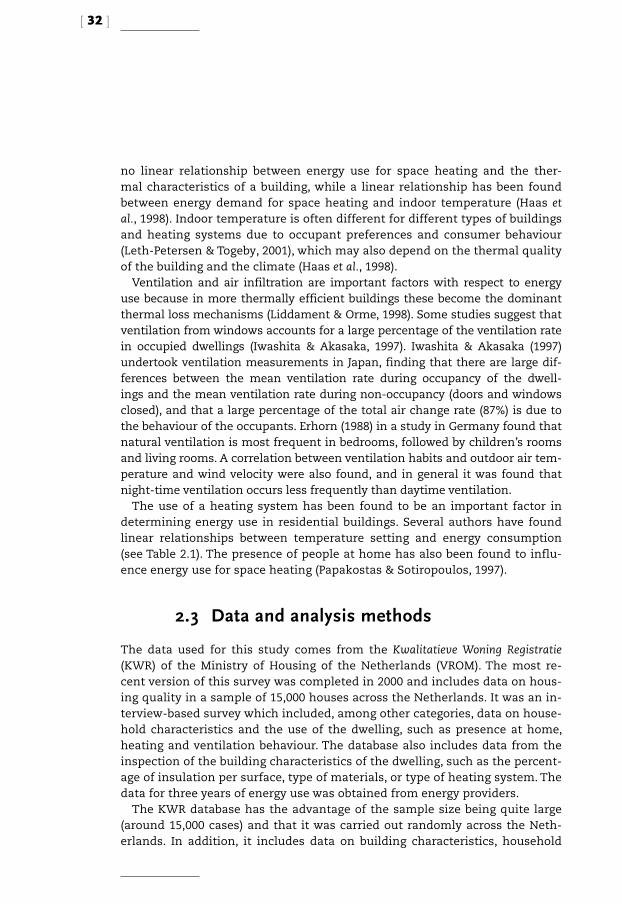
[ 32 ]
no linear relationship between energy use for space heating and the ther-mal characteristics of a building, while a linear relationship has been found between energy demand for space heating and indoor temperature (Haas et al., 1998). Indoor temperature is often different for different types of buildings and heating systems due to occupant preferences and consumer behaviour (Leth-Petersen & Togeby, 2001), which may also depend on the thermal quality of the building and the climate (Haas et al., 1998).
Ventilation and air infiltration are important factors with respect to energy use because in more thermally efficient buildings these become the dominant thermal loss mechanisms (Liddament & Orme, 1998). Some studies suggest that ventilation from windows accounts for a large percentage of the ventilation rate in occupied dwellings (Iwashita & Akasaka, 1997). Iwashita & Akasaka (1997) undertook ventilation measurements in Japan, finding that there are large dif-ferences between the mean ventilation rate during occupancy of the dwell-ings and the mean ventilation rate during non-occupancy (doors and windows closed), and that a large percentage of the total air change rate (87%) is due to the behaviour of the occupants. Erhorn (1988) in a study in Germany found that natural ventilation is most frequent in bedrooms, followed by children’s rooms and living rooms. A correlation between ventilation habits and outdoor air tem-perature and wind velocity were also found, and in general it was found that night-time ventilation occurs less frequently than daytime ventilation.
The use of a heating system has been found to be an important factor in determining energy use in residential buildings. Several authors have found linear relationships between temperature setting and energy consumption (see Table 2.1). The presence of people at home has also been found to influ-ence energy use for space heating (Papakostas & Sotiropoulos, 1997).
2.3 Data and analysis methods
The data used for this study comes from the Kwalitatieve Woning Registratie (KWR) of the Ministry of Housing of the Netherlands (VROM). The most re-cent version of this survey was completed in 2000 and includes data on hous-ing quality in a sample of 15,000 houses across the Netherlands. It was an in-terview-based survey which included, among other categories, data on house-hold characteristics and the use of the dwelling, such as presence at home, heating and ventilation behaviour. The database also includes data from the inspection of the building characteristics of the dwelling, such as the percent-age of insulation per surface, type of materials, or type of heating system. The data for three years of energy use was obtained from energy providers.
The KWR database has the advantage of the sample size being quite large (around 15,000 cases) and that it was carried out randomly across the Neth-erlands. In addition, it includes data on building characteristics, household
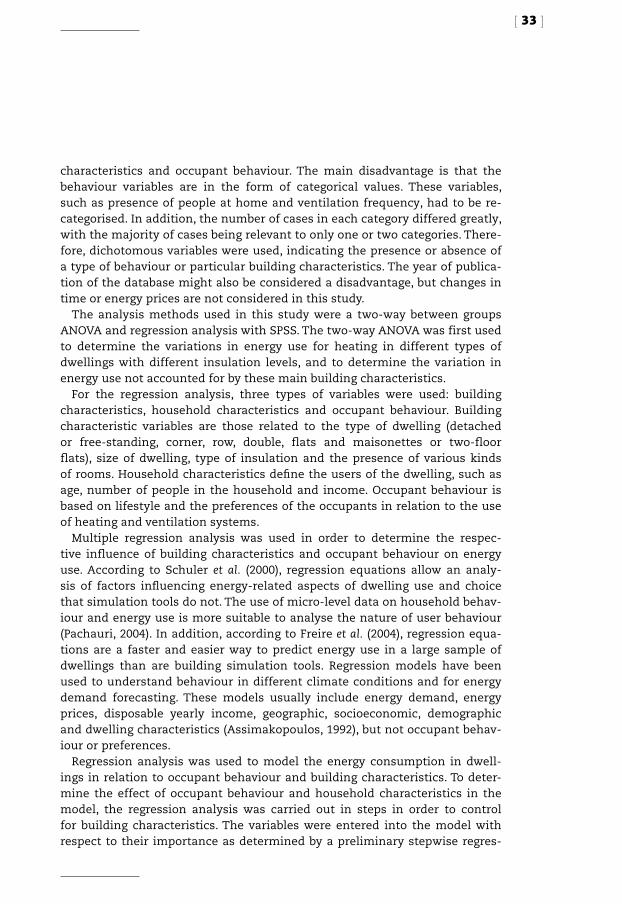
[ 33 ]
characteristics and occupant behaviour. The main disadvantage is that the behaviour variables are in the form of categorical values. These variables, such as presence of people at home and ventilation frequency, had to be re-categorised. In addition, the number of cases in each category differed greatly, with the majority of cases being relevant to only one or two categories. There-fore, dichotomous variables were used, indicating the presence or absence of a type of behaviour or particular building characteristics. The year of publica-tion of the database might also be considered a disadvantage, but changes in time or energy prices are not considered in this study.
The analysis methods used in this study were a two-way between groups ANOVA and regression analysis with SPSS. The two-way ANOVA was first used to determine the variations in energy use for heating in different types of dwellings with different insulation levels, and to determine the variation in energy use not accounted for by these main building characteristics.
For the regression analysis, three types of variables were used: building characteristics, household characteristics and occupant behaviour. Building characteristic variables are those related to the type of dwelling (detached or free-standing, corner, row, double, flats and maisonettes or two-floor flats), size of dwelling, type of insulation and the presence of various kinds of rooms. Household characteristics define the users of the dwelling, such as age, number of people in the household and income. Occupant behaviour is based on lifestyle and the preferences of the occupants in relation to the use of heating and ventilation systems.
Multiple regression analysis was used in order to determine the respec-tive influence of building characteristics and occupant behaviour on energy use. According to Schuler et al. (2000), regression equations allow an analy-sis of factors influencing energy-related aspects of dwelling use and choice that simulation tools do not. The use of micro-level data on household behav-iour and energy use is more suitable to analyse the nature of user behaviour (Pachauri, 2004). In addition, according to Freire et al. (2004), regression equa-tions are a faster and easier way to predict energy use in a large sample of dwellings than are building simulation tools. Regression models have been used to understand behaviour in different climate conditions and for energy demand forecasting. These models usually include energy demand, energy prices, disposable yearly income, geographic, socioeconomic, demographic and dwelling characteristics (Assimakopoulos, 1992), but not occupant behav-iour or preferences.
Regression analysis was used to model the energy consumption in dwell-ings in relation to occupant behaviour and building characteristics. To deter-mine the effect of occupant behaviour and household characteristics in the model, the regression analysis was carried out in steps in order to control for building characteristics. The variables were entered into the model with respect to their importance as determined by a preliminary stepwise regres-

[ 34 ]
sion analysis and the literature study in Section 2.2.
2.3.1 Transformed variables
Most of the variables were shown to be parametric (no large kurtosis or skew-ness and normally distributed in graph) and as having linear relationships, the only exceptions being the dependent variable of ‘energy for space and wa-ter heating (MJ)’ and the variable of ‘useful living area’. Therefore, both varia-bles were transformed according to their characteristics (Field, 2005): the var-iable ‘energy used’ was transformed into its square root and ‘useful living ar-ea’ was transformed with logarithm 10. Nevertheless, further analysis showed no differences in the results or assumptions for models run with the varia-ble ‘energy used’ and the transformed variable of ‘energy used’, therefore, the non-transformed variable was used for an easier interpretation of the results. The variables related to insulation and glazing were modified so they could be entered into the regression. Since the variables had a large number of val-ues at either zero or 100 and very few values around the middle, the varia-bles were transformed into dichotomous variables, with any value under 10% equal to zero and values above 10% equal to 1.
Dichotomous variables were also used for ‘thermostat as temperature con-trol’, ‘heating included in rent’, ‘presence of bath’ and ‘open kitchen’. ‘Home tenure’, originally classified into ‘private rent’, ‘social rent’ and ‘owned’, were recoded dichotomously using ‘private rent’ and ‘others’ because the last two were shown to be not significant. ‘People at home during the day’ and ‘people at home during the weekend’, originally classified into: ‘almost always’, ‘very variable’, ’50-50’ and ‘occasionally or never’, were converted into the dichoto-mous variables ‘almost always home’ and ‘other’.
Dummy variables were used for the type of dwelling. The free-standing dwelling was used as a reference because it is considered to be the most ener-gy-consuming type of dwelling. Therefore ‘free-standing dwelling’ does not appear in the model.
2.3.2 Missing data and univariate outliers
There was missing data for some variables, such as construction year (in 24 cases), temperature setting (in 6 cases), glass insulation (in 4 cases) and lo-cal heating in living room (in 7 cases) in a total sample of 14,848. These val-ues were replaced by the mean in the case of continuous variables and by the mode in the case of dichotomous variables, because the very small number of cases should not affect the model.
Using scatterplots, univariate outliers were found in the following variables:
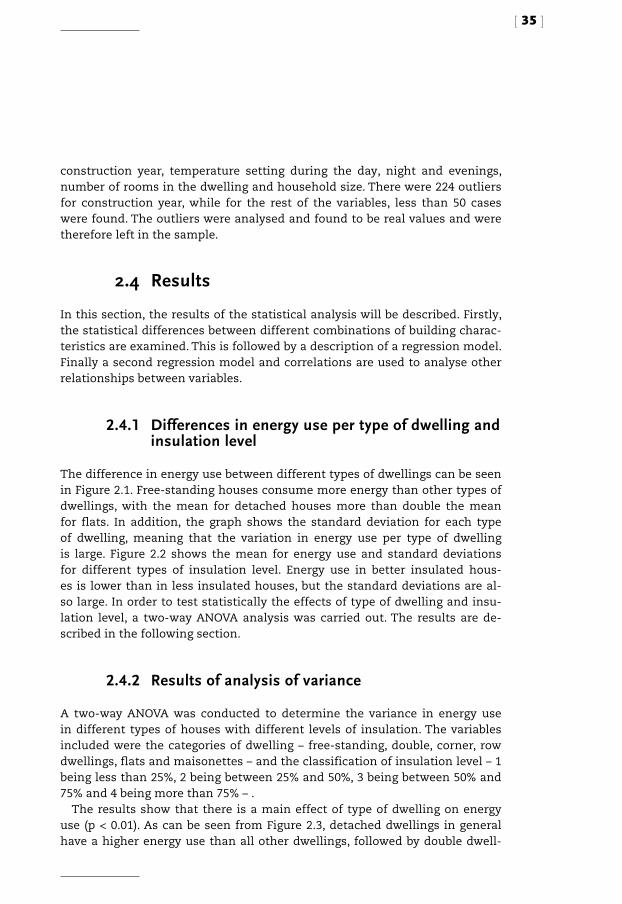
[ 35 ]
construction year, temperature setting during the day, night and evenings, number of rooms in the dwelling and household size. There were 224 outliers for construction year, while for the rest of the variables, less than 50 cases were found. The outliers were analysed and found to be real values and were therefore left in the sample.
2.4 Results
In this section, the results of the statistical analysis will be described. Firstly, the statistical differences between different combinations of building charac-teristics are examined. This is followed by a description of a regression model. Finally a second regression model and correlations are used to analyse other relationships between variables.
2.4.1 Differences in energy use per type of dwelling and insulation level
The difference in energy use between different types of dwellings can be seen in Figure 2.1. Free-standing houses consume more energy than other types of dwellings, with the mean for detached houses more than double the mean for flats. In addition, the graph shows the standard deviation for each type of dwelling, meaning that the variation in energy use per type of dwelling is large. Figure 2.2 shows the mean for energy use and standard deviations for different types of insulation level. Energy use in better insulated hous-es is lower than in less insulated houses, but the standard deviations are al-so large. In order to test statistically the effects of type of dwelling and insu-lation level, a two-way ANOVA analysis was carried out. The results are de-scribed in the following section.
2.4.2 Results of analysis of variance
A two-way ANOVA was conducted to determine the variance in energy use in different types of houses with different levels of insulation. The variables included were the categories of dwelling – free-standing, double, corner, row dwellings, flats and maisonettes – and the classification of insulation level – 1 being less than 25%, 2 being between 25% and 50%, 3 being between 50% and 75% and 4 being more than 75% – .
The results show that there is a main effect of type of dwelling on energy use (p < 0.01). As can be seen from Figure 2.3, detached dwellings in general have a higher energy use than all other dwellings, followed by double dwell-

[ 36 ]
ings, corner dwellings, row dwellings, maisonettes and flats. Statistically sig-nificant differences between all types of dwellings were found.
Furthermore, there is a main effect for class of insulation level (p < 0.01). Statistically significant differences are observed between all levels of insula-tion. Finally, the results show an interaction effect between insulation level and type of dwelling (p < 0.01). In general, the highest insulation classifica-tion is related to the least energy use. However, this is not the case for flats. Flats with Type 4 insulation classification levels are related to more ener-gy use than flats with Type 3 and Type 2 insulation classes, which could be explained by the fact that insulation Type 2 and Type 3 are misrepresented in the sample. The results can be graphically seen in Figure 2.3, where the esti-mated marginal means on energy use are presented for different combina-tions of type of dwelling and insulation degree. Flats use visibly less energy than any other type of dwelling, followed by maisonettes and row houses. It is also apparent that the higher the insulation classification, the less energy is used. The results from the analysis are in accordance with other studies and theories. Table 2.2 shows the number of cases and percentage of the sample for each type of dwelling and insulation level.
Figure 2.1 Mean and standard deviation for energy use (MJ/year) per type of dwelling
20,0000 40,000 60,000 100,00080,000 120,000 140,000 160,000 180,000
Maisonnettes
Flats
Row houses
Corner houses
Double houses
Free-standing houses
Type
of d
wel
ling
Energy (MJ)
Figure 2.2 Mean and standard deviation for energy use (MJ/year) per insulation degree category
0 20,000 40,000 60,000 80,000 100,000 120,000
75-100%
50-75%
25-50%
0-25%
Insu
latio
n
Energy (MJ)

[ 37 ]
Figure 2.3 Mean energy use per type of dwelling and insulation level
40,000
60,000
80,000
100,000
120,000
140,000M
J/ye
ar
Dwelling type
<25%
50-75%
25-50%
>75%
Detachedhouses
Doublehouses
Cornerhouses
Rowhouses
Maisonnettes Flats
Table 2.2 Mean and standard deviation for continuous variables
Mean SD
Energy for space and water heating (MJ) 69,345.30 36,247.55
(LOG) useful living area (m2) 1.95 0.17
Construction year 1,944.43 29.73
Number of rooms 3.95 1.33
Number of heated bedrooms 0.89 1.19
Temperature during the night (in degrees Celsius) 14.76 2.27
Temperature during the evening (in degrees Celsius) 20.28 1.62
Temperature during the day (in degrees Celsius) 19.29 2.23
Age of respondent 51.00 17.00
Household size 2.13 1.18
Income (in euros) 23,866.71 16,496.91

[ 38 ]
2.4.3 Regression model for prediction of energy use for space and water heating
A screening of the variables was done in order to determine the variables to be used in the regression model. Firstly, important variables were identified according to the hypothesis as well as other studies; secondly, a stepwise re-gression analysis was performed to determine the statistically significant contributors to energy use. The selected variables were then introduced into a standard regression analysis. Variables related to ventilation behaviour were found to be not significant and therefore they were left out of the model.
Table 2.3 presents the variable means and standard deviations. The number and percentages of cases for dichotomous and dummy variables are shown in Table 2.2. The equation of the regression model describes the consumption of energy for space heating at the building level on the basis of technical char-acteristics of the building, occupant behaviour and household characteristics. The regression model consists of three steps: a first step including building characteristics, a second step introducing dummy variables for type of dwell-ing and a third step introducing behaviour variables. According to the model
Table 2.3 Number of cases and percentage of cases for dichotomous variables
Number of cases Percentage
Type of dwelling: maisonettes 1,634 11.0%
Type of dwelling: flats 5,583 37.6%
Type of dwelling: row houses 3,718 25.0%
Type of dwelling: double houses 1,014 6.8%
Type of dwelling: corner houses 1,766 11.9%
Insulation of façade 4,991 33.6%
Double glazing 10,968 73.9%
Insulation on ground 2,115 14.2%
Insulation of windows 3,161 21.3%
Insulation in roof 5,376 36.2%
Thermostat as temperature control 9,209 62.0%
Insulation of central-heating pipes 2,474 16.7%
Presence of garage 2,418 16.3%
Presence of shed 7,356 49.5%
Presence of basement 4,307 29.0%
Open kitchen 4,377 29.5%
Presence of bath 5,468 36.8%
Local heating in living room 5,160 34.8%
Always people during weekends 11,211 75.5%
Always people during day 7,707 51.9%
Private rent 5,165 34.8%
Heating included in rent 1,441 9.7%

[ 39 ]
Table 2.4 B, Standard deviation of B and Beta of regression model
B Std. Error B Beta
(Constant) 82,434.12 17,531.15
Step 1. Dwelling characteristics (R2 = 38%)
(LOG) Useful living area 68,736.65 2,366.59 .321***
Construction year -99.80 8.78 -.082***
Insulation of façade -6,692.96 569.73 -.087***
Double glazing -5,237.98 561.27 -.063***
Insulation on ground -6,334.36 728.50 -.061***
Insulation of windows -2,178.48 574.95 -.025***
Insulation in roof -975.71 558.56 -.009
Insulation of central-heating pipes 842.58 269.11 .020**
Number of rooms 1,535.17 276.52 .056***
Presence of garage 3,644.77 729.16 .037***
Presence of shed 1,592.32 517.13 .022**
Presence of basement 2,725.45 515.13 .034***
Open kitchen -1,660.54 523.42 -.021**
Presence of bath 3,072.89 527.10 .041***
Thermostat as temperature control 5,755.98 597.38 .077***
Step 2. Type of dwelling (R2 = 3.8%)
Maisonettes -32,400.93 1,210.10 -.280***
Flats -25,891.05 1,192.08 -.346***
Row houses -25,437.80 1,031.46 -.304***
Double houses -11,594.73 1,175.94 -.081***
Corner houses -14,497.99 1,089.24 -.129***
Step 3. Household characteristics and behaviour (R2 = 4.2%)
Number of heated bedrooms 3,895.47 198.05 .128***
Temperature during the night 834.98 158.40 .037***
Temperature during the evening 972.92 102.46 .061***
Temperature during the day 765.48 124.28 .047***
Local heating in living room 861.76 556.05 .011
Age of respondent 136.19 15.84 .064***
Household size 544.86 241.67 .018*
Private rent 1,515.68 499.62 .020**
Income .09 .02 .043***
Heating included in rent 3,152.95 807.26 .026***
Always people during weekends 2,210.64 565.78 .026***
Always people during day 2,722.26 528.71 .038***
Dependent variable: energy for heating MJ.R2 = .379 for step 1, ∆R2 = .038 for step 2, ∆R2 = .042 for step 3.* = < 0.05, ** = < 0.01 and *** = < 0.001

[ 40 ]
(Model 1), 37.9% (R2 = 0.379) of the variability in energy use is accounted for by building characteristics. An additional 3.8% (R2 = 0.038) is accounted for by the type of dwelling. The addition of behavioural predictors caused the variation to increase by 3.4.2% (R2 = 0.043).
The assumption of independent errors (autocollinearity) has almost cer-tainly been met, the Durbin Watson value being very close to 2 (2.008). A 95% confidence interval for B showed that the model is good. The model seems not to have collinearity problems, because tolerance values and VIF are within the limits. The analysis of residual statistics revealed that there are no large problems with outliers in the model. The values on Cook’s Distances all lie well below 1, there are only 58 (0.4%) beyond 3 times the Leverage Value. In 3.2% of the cases there is a large Mahalanobis distance (approximately, a crit-ical value of Chi-square of 54 for a model of 32 variables), and less than 2% of cases are beyond 3 standard residuals. The covariance ratio and DFBeta sta-tistics were also examined and there were no cases found that would have a large influence on the regression parameters. Therefore we can conclude that our model is fairly accurate. In addition, when the regression analysis was run without outliers and compared with the model with outliers (stand-ard residuals, covariance ratio, Mahalanobis distance and leverage values), no large differences in the outcome were found.
In Table 2.4, the coefficients of B and Standard Error of B as well as the standardised coefficient Beta for all variables in steps 1 (building characteris-tics), 2 (type of dwelling) and 3 (occupant behaviour) of the model are shown. Most of the predictors are statistically significant at the .001 level, with the exception of ‘open kitchen’ and ‘presence of shed’, which are significant at the .01 level, ‘household size’ at a 0.05 level, and ‘insulation in roof’ and ‘local heating in bedroom’, which are not significant.
The regression model predicting the energy for heating can be summarised as:
Energy for space and water heating per year = 82,434.12 (LOG useful living area) (68,736.65 MJ) + (construction year) (99.80 MJ) + (insulation of facade) (6692.96) + (double glazing) (5237.98) + (insulation on ground) (6334.36) + (insulation of win-dows) (2178.48) + (insulation in roof) (975.71) + (insulation of pipes) (842.58) + (number of rooms) (1535.17) + (garage) (3644.77) + (shed) (1592.32) + (basement) (2725.45) + (open kitchen) (-1660.54) + (bath) (3072.89) + (thermostat) (5755.98) (maisonette) (32,400.93 MJ) + (flat) (25,891.05) + (row) (25,437.80) + (double) (11,594.73) + (corner) (14,497.99) heated rooms) (3895.47) + (temperature during the night) (834.98) + (temperature during the evening) (972.92) + (temperature during the day) (765.48) + (local heating in living room) (861.76) + (age respondent) (136.19) + (household size) (544.86) + (private rent) (1515.68) + (income) (0.094) + (heating in rent) (3152.95) + (always people weekdays) (2210.64) + (always people weekends) (2722.26).

[ 41 ]
Building characteristics The B coefficient indicates to what degree each predictor affects the outcome if the effects of the other predictors are held constant. It can be seen that ‘(LOG) useful living area’ is one of the most important predictors of the out-come according the standardised Beta coefficient. The estimate has the ex-pected positive sign, which is in accordance with energy prediction theory at the building level.
The vintage of the dwelling is also important in predicting energy use. New-er dwellings use less energy, also expected by the theory.
The sign of predictors related to insulation are all in accordance with what was expected. The Beta values show that the type of insulation with the most influence in relation to reducing energy use is insulation of the facade, fol-lowed by double glazing, insulation on the ground and insulation of windows, although the differences between insulation on the ground and of the facades are small. Insulation in the roof was shown to be not significant. With one of the lowest Beta values, the insulation of central-heating pipes causes more energy use, which was not expected, since insulation should decrease ener-gy use.
The use of a thermostat for temperature control was shown to increase energy use, in contrast to houses with temperature control in the form of taps. This could be explained by the fact that in dwellings with a thermostat occupants are more aware of the temperature in the home and therefore tend to turn it on more often that those without a thermostat.
Energy use increases with each extra room in the dwelling, as well as with the presence of a garage, shed and basement, possibly because such places are heated. However, if an open kitchen is present, energy use is reduced. The presence of a bath also increases energy use for water heating.
Using dummy coding to analyse the effect of type of dwelling on energy use, and taking a detached dwelling as a reference, we can see that less ener-gy is used in maisonettes, followed by flats and row houses, which show lit-tle difference in energy use. Double dwellings and corner houses also use less energy than detached houses. This indicates that the dwellings that perform
Figure 2.4 Energy saved or spent for an increase of one unit in LOG living area, and by type of dwelling in comparison to detached dwellings
-40,000 -20,000 0 20,000 40,000 60,000 80,000
LOG living area
Maisonnettes
Flats
Row houses
Double houses
Corner houses
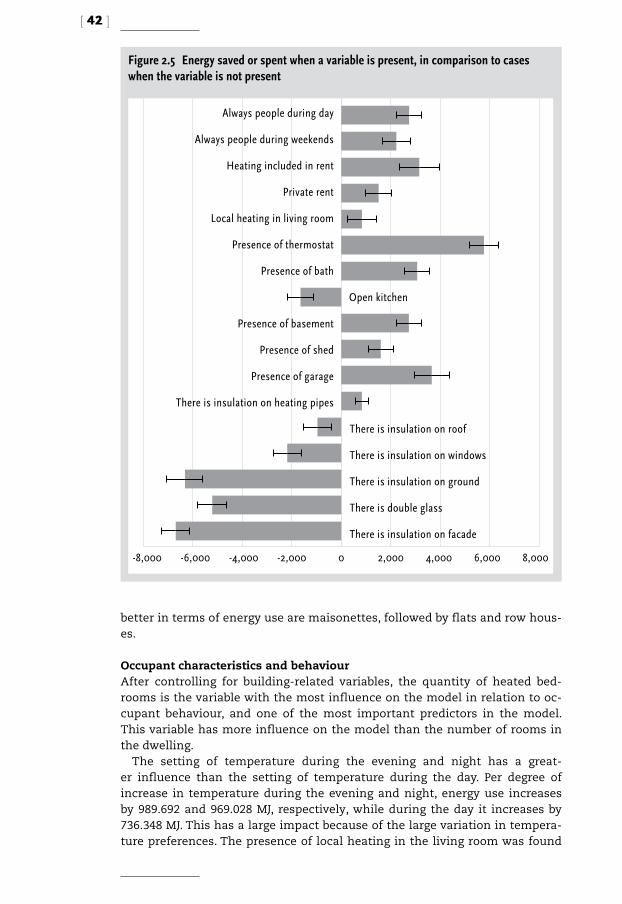
[ 42 ]
better in terms of energy use are maisonettes, followed by flats and row hous-es.
Occupant characteristics and behaviourAfter controlling for building-related variables, the quantity of heated bed-rooms is the variable with the most influence on the model in relation to oc-cupant behaviour, and one of the most important predictors in the model. This variable has more influence on the model than the number of rooms in the dwelling.
The setting of temperature during the evening and night has a great-er influence than the setting of temperature during the day. Per degree of increase in temperature during the evening and night, energy use increases by 989.692 and 969.028 MJ, respectively, while during the day it increases by 736.348 MJ. This has a large impact because of the large variation in tempera-ture preferences. The presence of local heating in the living room was found
Figure 2.5 Energy saved or spent when a variable is present, in comparison to cases when the variable is not present
-8,000 -6,000 -4,000 -2,000 0 2,000 4,000 6,000 8,000
There is insulation on facade
There is double glass
There is insulation on ground
There is insulation on windows
There is insulation on roof
There is insulation on heating pipes
Presence of garage
Presence of shed
Presence of basement
Open kitchen
Presence of bath
Presence of thermostat
Local heating in living room
Private rent
Heating included in rent
Always people during weekends
Always people during day
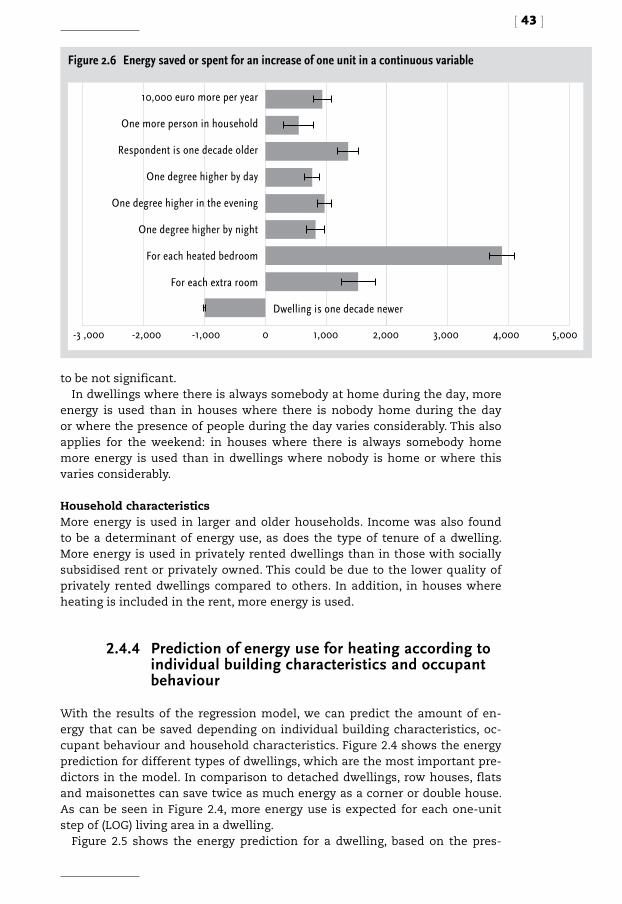
[ 43 ]
to be not significant.In dwellings where there is always somebody at home during the day, more
energy is used than in houses where there is nobody home during the day or where the presence of people during the day varies considerably. This also applies for the weekend: in houses where there is always somebody home more energy is used than in dwellings where nobody is home or where this varies considerably.
Household characteristics More energy is used in larger and older households. Income was also found to be a determinant of energy use, as does the type of tenure of a dwelling. More energy is used in privately rented dwellings than in those with socially subsidised rent or privately owned. This could be due to the lower quality of privately rented dwellings compared to others. In addition, in houses where heating is included in the rent, more energy is used.
2.4.4 Prediction of energy use for heating according to individual building characteristics and occupant behaviour
With the results of the regression model, we can predict the amount of en-ergy that can be saved depending on individual building characteristics, oc-cupant behaviour and household characteristics. Figure 2.4 shows the energy prediction for different types of dwellings, which are the most important pre-dictors in the model. In comparison to detached dwellings, row houses, flats and maisonettes can save twice as much energy as a corner or double house. As can be seen in Figure 2.4, more energy use is expected for each one-unit step of (LOG) living area in a dwelling.
Figure 2.5 shows the energy prediction for a dwelling, based on the pres-
Figure 2.6 Energy saved or spent for an increase of one unit in a continuous variable
-2,000-3 ,000 -1,000 0 1,000 2,000 3,000 4,000 5,000
For each extra room
For each heated bedroom
One degree higher by night
One degree higher in the evening
One degree higher by day
Respondent is one decade older
One more person in household
10,000 euro more per year
Dwelling is one decade newer

[ 44 ]
ence of a building characteristic or behaviour. For example, when an open kitchen is present, a reduction of 1,700 MJ/year is expected, in comparison to cases where no open kitchen is present. The most important variables are the presence of insulation and the presence of a thermostat for temperature con-trol.
Figure 2.6 shows the energy prediction for continuous variables, indicat-ing the energy saved or spent for an increase of one unit of the variable. For example, for an increase of 10,000 euros per year in income, 1,000 MJ/year more energy will be used.
Figures 2.4-2.6 show the importance of a variable in relation to other varia-bles. Of the behaviour variables, the presence of people during the day and on weekends is as important as the presence of a bath or basement, or the insu-lation of windows. A degree Celsius higher in the temperature setting is as important as insulation in the roof or an increase in income by 10,000 euros. Heating an extra bedroom increases energy use by 4,000 MJ/year, while having double glazing decreases energy use by 5,000 MJ/year.
Table 2.5 Comparison of Beta values of regression model with behaviour model
Dwelling characteristics Beta second model Beta model building
(LOG) Living area .321*** .352***
Construction year -.082*** -.065***
Insulation of façade -.087*** -.086***
Double glazing -.063*** -.062***
Insulation on ground -.061*** -.065***
Insulation of windows -.025*** -.020**
Insulation in roof -.009 -.020**
Insulation of heating pipes .020** .021***
Number of rooms .056*** .087***
Presence of garage .037*** .045***
Presence of shed .022** .028***
Presence of basement .034*** .040***
Open kitchen -.021** -.029***
Presence of bath .041*** .039***
Presence of thermostat .077*** .084***
Type of dwelling
Maisonettes -.280*** -.295***
Flats -.346*** -.352***
Row houses -.304*** -.316***
Double houses -.081*** -.082***
Corner houses -.129*** -.134***
Dependent variable: energy for heating MJ.* = < 0.05, ** = < 0.01 and *** = < 0.001

[ 45 ]
2.4.5 Second regression model
A second regression model determining the influence of a building’s char-acteristics while controlling for household characteristics and behaviour, showed large differences in comparison to the original model. R2 = .20 for the first step (only behaviour and household characteristics), R2 = .225 for the second step (building characteristics), and R2 = .033 for the third step (dwell-ing type). Table 2.5 compares the Beta values of the original model to a model with only building characteristics and Table 2.6 compares the regression mod-el with a model with only behaviour and occupant variables. The differenc-es between the main model and the model with only building characteristics are not large. In the behaviour model, there are behaviour variables with large partial correlations, which in principle would indicate a greater influence in the model. Nevertheless, these variables are correlated to variables of build-ing characteristics. Therefore, correlations between variables are further ana-lysed in this section.
For local heating in living room, the Beta value increased from being not significant to .105 and significant at the .001 level. Correlations were found with thermostat and construction year. Partial correlations were used to explore the relationship between these variables, finding a medium nega-tive partial correlation between local heating in living room and the presence of a thermostat (r = .386, p < .001), meaning that the presence of a thermo-stat is associated with no local heating in the living room. A small negative correlation was found between local heating and construction year (r = .271, p < .001), indicating the presence of local heating in the living room of older houses
Table 2.6 Comparison of Beta values of regression model with building model
Household characteristics and behaviour Beta second model Beta model behaviour
Number of heated bedrooms .128*** .216***
Temperature during the night .037*** .108***
Temperature during the evening .061*** .000
Temperature during the day .047*** -.011
Local heating in living room .011 .105***
Age of respondent .064*** .161***
Household size .018* .159***
Private rent .020** .012
Income .043*** .172***
Heating included in rent .026*** -.039***
Always people on weekends .026*** .051***
Always people during the day .038*** .064***
Dependent variable: energy for heating MJ.* = < 0.05, ** = < 0.01 and *** = < 0.001
[ 46 ]
The influence of age of respondent also increased in the behaviour model.A positive small partial correlation was found with useful living area (r = .021, p < .05) and with construction year (r = .141, p < .001), indicating that old households have larger and older houses than young households.
Positive medium partial correlations were found between household size and useful living area (r = .330, p < .001), and household size and number of rooms (r = .424, p < .001), with large households being associated with larger dwellings. Therefore, the increase in the Beta value in relation to household size is a result of these correlations.
The influence of income increased from a Beta value of .043 to .172 and was found to have a positive medium correlation with useful living area (r = .345, p < .001), indicating that households with larger incomes have larger dwell-ings than lower-income households.
The influence in the model due to the number of heated bedrooms also increased in the behaviour model. Positive small partial correlations were found with the presence of a thermostat (r = .220, p < .001), number of rooms (r = .257, p < .001), household size (r = .247, p < .001), and income (r = .109, p < .001), and a negative small partial correlation was found with age of re-spondent (r = .044, p < .001).
A correlation with the presence of a thermostat seems to be the cause of the larger influence of temperature setting during the night in the behaviour model. Small positive partial correlations were found for temperature set-ting during the night and income (r = .066, p < .001), household size (r = .058, p < .001) and thermostat (r = .231, p < .001).
The influence of temperature setting during the evening and during the day was reduced in the behaviour model. Very small negative correlations were found between temperature during the evening and income (r =.046, p < .001) and household size (r = .045, p < .001) and there was a small correlation with age of respondent (r = .147, p < .001) and presence of a thermostat (r = .128, p < .001). Small partial correlations were found for temperature setting during the day with income (r = .138, p < .001), age of respondent (r = .277, p < .001) and pres-ence of a thermostat (r = .186, p < .001).
The presence of a thermostat was found to have a small negative correla-tion with private rent (r = .261, p < .001) and heating included in rent (r = .212, p < .001). In the case of private rent, the Beta value was reduced, while for heating included in rent the value became negative. In both cases this change in the Beta value was due to the fact that variation associated to thermo-stat was included in variables with a larger influence on the model, such as number of heated bedrooms, local heating in living room, and temperature setting.
Due to the fact that temperature settings seem not to have a high corre-lation with the building characteristics introduced in the model, partial cor-relation was used to further explore the relationship between temperature

[ 47 ]
settings and energy quality score as defined in the KWR survey. According to Pearson’s correlation, there was a very small correlation between energy qual-ity scores and temperature setting during the evening (r = .023, p < .01), dur-ing the night (r = .037, p < .001) and during the day (r = .017, p < .05). Therefore, it seems that thermal quality has little influence on the temperature settings in dwellings.
2.5 Discussion
In this study, the results showed that 42% (R2 = .379 for step 1, ∆R2 = .038 for step 2) of the variation in energy use can be attributed to building character-istics. This is similar to the conclusions of a study conducted by Sonderegger (1977-1978) over 6 months in 205 houses in the USA, where the physical fea-tures of dwellings (number of rooms, glass insulation, etc.) explained 54% of the variation in energy use. In Sonderegger’s study, 71% of the unexplained variation was caused by occupant patterns, while in our study only 7.2% of the unexplained variation can be explained by occupant patterns. In contrast, using four regression models based on household energy use in Germany, Schuler et al. (2000) found very low B coefficient values when only the house-hold characteristics were included in the model – with household size and age being statistically significant. In a model that only used building char-acteristics, a higher explanatory power was found (11.7-14.9%), while slight-ly better results were obtained combining both models. Using multivariate re-gression, Pachauri (2004) found that household socioeconomic characteristics, and dwelling attributes influence the total household energy requirements in India, with income being the most important variable, explaining 61.4% of the 66.4% of explained variance due to all the variables: age, dwelling size, house-hold size, region, type of dwelling (multi-family or single family) and agricul-ture as activity. In our research, income did not seem to have such a large ef-fect because dwelling size and other income-affected building characteristics such as dwelling size were introduced first into the model. In addition, socio-economic differences between the countries could also explain the differences.
According to our results, insulation and the presence of a thermostat have, respectively, a positive and negative impact on energy use. Hirst & Goeltz (1985) found that both factors are important for energy use, with both related to energy savings. Therefore, a more detailed analysis of the effect of thermo-stats should be carried out.
The vintage of the building was found to have a positive correlation to ener-gy use. Similar results were found by Leth-Petersen & Togeby (2001) in Den-mark and Liao & Chang (2002) in the USA.
In studies by Haas et al. (1998) in Australia and Sardianou (2008) in Greece, no linear relationship was found between energy use for space heating and

[ 48 ]
the thermal quality of a building, a result that could be due to a different cli-mate. In contrast, insulation was found to be a statistically significant factor in our research, although a very small correlation was found between tem-perature settings and the thermal quality of the building. In addition, in an international study of energy requirements, Lenzen et al. (2006) found signif-icant differences in average energy requirements at equal income levels due to energy conservation technology.
The impact of the differences in the thermal quality of a building does not depend on the type of heating system (Haas et al., 1998). In our research, the type of heating system was not included in the regression model because it was not found to be statistically significant during the screening of variables.
Sardianou (2008) found that dwelling size is a factor influencing energy use, while Sonderegger (1977-78) found that the number of rooms is also a determinant of energy use. Both these findings correspond with those of the present research.
The results of the regression model revealed that temperature setting is important in determining energy use, a similar finding to other internation-al studies. Haas et al. (1998) found that temperature levels and the setting of thermostats significantly influence energy demand in Australia. An empiri-cal study by ECN and IVAM in the Netherlands (Jeeninga et al., 2001) involving 180 households, showed that differences in heating demand is mainly deter-mined by set-point heating temperature. In an empirical study in Sweden, Linden et al. (2006) found that preferences for indoor temperature are contrib-uting factors for energy requirements. Calculations by Tommerup et al. (2007) based on single-family houses in Denmark revealed that the increase in ener-gy consumption is about 10% per degree of indoor temperature.
The dependent variable in the regression model includes energy used for heating water, therefore the presence of a bath was shown to be signifi-cant. In other studies, shower and bathing behaviour also influenced energy requirements for water heating (Jeeninga et al., 2001; Linden et al., 2006).
Income was found to be positively correlated to energy use, similar to the results of Biesiot & Noorman (1999), who found an almost linear relationship between expenditure and energy requirements for direct and indirect energy needs in the Netherlands. Vringer (2005) found that a 1% increase in income results in 0.63% increase in energy use; however, there were large deviations.
According to a literature survey in the Netherlands by Groot et al. (2008), household size, age, presence at home, income, shower and bathing behav-iour, and heating behaviour influence energy use. Through statistical analysis of household energy use in Greece, Sardianou (2008) found that the age of the respondent, household size and ownership were influencing factors on space heating demand. Liao & Chang (2002) found that rented houses, the age of the respondent and the household size were positively correlated with more energy use. Lenzen et al. (2006) found that socioeconomic factors such as the

[ 49 ]
age of the respondent and household size generally have similar influences on energy requirements in different countries, also similar to the results of our study.
Occupant behaviour and household characteristics seem to only predict 5% of the variance in energy use in comparison to building characteristics. How-ever, the data on behaviour does not seem to be ideal for regression anal-ysis due to the fact that most of it is presented in the shape of categorical values and not in continuous variables. To resolve this problem, most of the behaviour variables were transformed into dichotomous variables. Although some variables proved to be significant, other parameters such as ventila-tion behaviour, which has been proven to have an effect on energy use in oth-er studies (Haas et al., 1998), were not found to be significant in this study. Therefore further research on behaviour should be carried out in relation to the effect of the use of mechanical and natural ventilation, and their relation-ship to the use of the heating system.
2.6 Conclusions
The objective of this study was to determine the respective importance of building characteristics, household characteristics and occupant behaviour on energy use for space and water heating in the Netherlands. The KWR da-tabase from the Ministry of Housing in the Netherlands was used. The study consisted of statistical analysis using variables based on the results of other research.
This study showed that occupant characteristics and behaviour significantly affect energy use (4.2% of the variation in energy use for heat-ing), but building characteristics still determine a large part of the energy use in a dwelling (42% of the variation in energy use for heating). Nevertheless, a comparison with a second model showed that some occupant behaviour is determined by the type of dwelling or HVAC systems and, therefore, the effect of occupant characteristics such as income or household size might be larger than expected, since these determine the type of dwelling.
According to the model generated, insulated surfaces decrease the energy used in dwellings, with exception of the insulation of piping which tended to increase energy use. A more detailed analysis should be undertaken to dis-cover the reason for this. Energy use also tends to decrease in newer build-ings and in non-detached dwellings. The presence of a thermostat, garage, shed and basement tend to increase energy use, probably because they affect the behaviour of the users, for example, in their use of rooms or heating in these areas. Having an open kitchen decreases energy use, probably because of the heat generated by cooking and the use of appliances. The presence of a bath increases energy use related to water heating.
[ 50 ]
The continuous presence of people at home increases energy use in com-parison to cases when the users are almost never home or their presence is very variable. Energy use increases when more rooms are heated and with higher temperature settings.
The household characteristics that seem to have an effect on energy use are the age of the respondent, household size and income, all having a posi-tive correlation. In cases of private rent, energy use also increases, probably because privately rented houses are often less energy efficient than socially subsidised rental accommodation and dwellings that are owner-occupied. In cases where heating is included in the rent, energy use also tends to increase.
The presence of a thermostat seems to have a large effect on occupant behaviour. Correlations were found between temperature setting and the number of heated bedrooms. The reason for this effect should be studied fur-ther.
Temperature setting seems to be an important predictor of energy use. Small correlations were found between the temperature setting and occupant characteristics, with income and age being significantly correlated to tem-perature, but having a very low effect. Alternatively, very low though signifi-cant correlations were found between the energy quality score of the dwell-ings and temperature setting, meaning that temperature preferences might be more important that the thermal properties of the dwelling. Therefore the relationship between energy qualities and temperature preferences should be further studied.
AcknowledgmentsThe authors would like to thank Sylvia Jansen for the suggestions in the sta-tistical analysis.
References
Ashrae, ASHRAE Handbook Fundamentals, www.ashrae.org, 2005.
Assimakopoulos, V. (1992), Residential energy demand modeling in developingregions. The use of multivariate statistical techniques, Energy Economics 14 (1), pp. 57-63.
Beerepoot, M. & N. Beerepoot (2007), Government regulations as an impetus for innovations.Evidence for energy performance regulation in the Dutch resi-dential building sector, Energy Policy 35, pp. 4812-4825.
Biesiot, W. & K.J. Noorman (1999), Energy requirements of household con-

[ 51 ]
sumption: a case study of NL, Ecological Economics 28, pp. 367-383.
Branco, G., B. Lachal, P. Gallinelli & W. Weber (2004), Predicted versus observed heat consumption of a low energy multifamily complex in Switzerland based on long-term experimental data, Energy and Buildings 36, pp. 543-555.
Clarke, J.A. (2001), Energy Simulation in Building Design, Butterworth, Heine-mann.
Elkhuizen, P.A., J.E. Scholten, E.G. Rooijakkers, J. de Knegt & L. Deutz (2006), Kwaliteitsborging van installaties – Evaluatie van bestaande instrumenten en een visie voor toekomst, Report TNO bouw/Halmos for SenterNovem.
Erhorn, H. (1988), Influence of meteorological conditions on inhabitants’ be-havior in dwellings with mechanical ventilation, Energy and Buildings 11, pp. 267-275.
EuroACE (2004), Towards Energy Efficient Buildings in Europe, final report June (ec.europa.eu).
Field, A. (2005), Discovering statistics using SPSS: and sex, drugs and rock’n’ roll, 2nd ed., Sage, London.
Freire, R.Z., G.H.C. Oliveira & N. Mendes (2004), Development of regression equation for predicting energy and hydrothermal performance of building, Energy and Buildings 40, pp. 810-820.
Groot, de E., M. Spiekman & I. Opstelten, (2008), Dutch Research into User Be-havior in relation to energy use of residences, Proceedings PLEA Conference, 2008.
Haas, R., H. Auer & P. Biermayr (1998), The impact of consumer behavior on residential energy demand for space heating, Energy and Buildings 27, pp. 195-205.
Hirst, E. & R. Goeltz (1985), Comparison of actual energy saving with audit pre-dictions for homes in the North Central Region of the USA, Building and Envi-ronment 20 (1), pp. 1-6.
ISO 13790, (2004), Thermal Performance of Buildings – Calculation of Energy Use for Space Heating, www.iso.org.
ISO 13790, (2008), Energy Performance of Buildings – Calculation of Energy
[ 52 ]
Use for Space Heating and Cooling, www.iso.org.
Itard, L. & F. Meijer, (2008), Towards a Sustainable Northern European Housing Stock. Figures, Facts and Future, IOS Press, Amsterdam.
Iwashita, G. & H. Akasaka (1997), The effects of human behavior on natu-ral ventilation rate and indoor air environment in summer. A field study on southern Japan, Energy and Buildings 25, pp. 195-205.
Jeeninga, H., M. Uyterlinde & J. Uitzinger (2001), Energieverbruik van energie-zuinige woningen, Report ECN & IVAM, ECN-C-01-072.
Lenzen, W., H. Cohen & S. Pachauri (2006), A comparative multivariate analysis of household energy requirements in Australia, Brazil, Denmark, India and Ja-pan, Energy 31, pp. 181-207.
Leth-Petersen, S. & M. Togeby (2001), Demand for space heating in apartment blocks: measuring effect of policy measures aiming at reducing energy con-sumption, Energy Economics 23, pp. 387-403.
Liao, H.C. & T.F. Chang (2002), Space-heating and water-heating energy de-mands of the aged in the U.S., Energy Economics 24, pp. 267-284.
Liddament, M.W. & M. Orme (1998), Energy and ventilation, Applied Thermal Engineering 18, pp. 1101-1109.
Linden, A.L., A. Carlsson-Kanyama & B. Eriksson (2006), Efficient and ineffi-cient aspects of residential energy behavior: what are the policy instruments for change?, Energy Policy 34, pp. 1918-1927.
Nieman (2007), Eindrapportage woonkwaliteit binnenmilieu in nieuwbouw-woning, Report Wu060315aaA4.PK, VROM Inspectie Regio Oost, Arnhem.
Pachauri, S. (2004), An analysis of cross-sectional variations in total household energy requirements in India using micro-survey data, Energy Policy 32, 1723-1735.
Papakostas, K.T. & B.A. Sotiropoulos (1997), Occupational and energy behavior patterns in Greek residences, Energy and Buildings 26, pp. 207-213.
Sardianou, E. (2008), Estimating space heating determinants: an analysis of Greek households, Energy and Buildings 40, pp. 1084-1093.
[ 53 ]
Schuler, A., C. Weber & U. Fahl (2000), Energy consumption for space heating of west-German household: empirical evidence, scenario projections and poli-cy implications, Energy Policy 28, pp. 877-894.
Sonderegger, R.C. (1997-1998), Movers and stayers: the resident’s contribution to variation across houses in energy consumption for space heating, Energy and Buildings 1, pp. 313-324.
Tommerup, H., J. Rose & S. Svendsen (2007), Energy efficient houses built ac-cording to the energy performance requirements introduced in Denmark in 2006, Energy and Buildings 39, pp. 1123-1130.
Vringer, C.R. (2005), Analysis of the Requirements for Household Consump-tion, Netherlands Environmental Assessment Agency, Bilthoven, thesis.
Vringer, K. & T.A.K. Blok (2007), Household energy requirement and value pat-terns, Energy Policy 35, pp. 553-566.

[ 54 ]
[ 55 ]

[ 56 ]
[ 57 ]
3 The effect of energy per-formance regulations on energy consumption
AbstractGovernments have developed energy performance regulations in order to lower energy consumption in the housing stock. Most of these regulations are based on the thermal quality of the buildings. In the Netherlands the ener-gy efficiency for new buildings is expressed in the EPC (energy performance coefficient). Studies have indicated that energy regulations are successful in lowering the energy consumption in residential buildings. However, the ac-tual energy consumption is usually different from the expected energy con-sumption. This paper explores the effectiveness of energy performance reg-ulations in lowering the energy consumption of dwellings built in the Neth-erlands after 1996. The effect of the EPC and thermal characteristics on ener-gy consumption was determined by statistical analyses of data on actual en-ergy consumption. The results showed that lower EPC levels are not related to lower energy consumption. The expected energy requirement did, however, show a medium-sized correlation with the actual energy consumption. Fur-ther analysis showed that only 18 to 22% of the variation in energy consump-tion could be explained with the building characteristics in the EPC calcula-tion. The large unexplained share suggests that other factors such as occu-pant behaviour and the actual properties of the dwelling could be undermin-ing the effectiveness of the regulations.
3.1 Introduction
Worldwide, the built environment consumes 41% of the energy produced in developed countries. Of all the phases in the life-cycle of buildings the user phase is the most energy-intensive (Itard & Meijer, 2008). In recent decades, governments all over the world have included energy requirements in their building regulations in a bid to lower energy consumption in the housing stock. Most of these regulations are based on the thermal quality of the build-ings and thus aim to reduce the energy spent on heating space.
Since 2003 the Energy Performance Building Directive has required all EU member states to implement performance-based energy regulations (Europe-an Commission, 2003 MB) to lower the energy required for heating, cooling, ventilation, lighting and domestic hot water in buildings. In the Netherlands energy consumption in new buildings has been regulated since 1975. Prior to 1995 energy-efficiency regulations consisted only of limits on transmission losses based on insulation values. In 1995 they were expanded to include the EPC (energy performance coefficient), a non-dimensional figure that express-es the energy efficiency of a building on the basis of the energy consumed for heating, hot water, lighting, ventilation, humidification and cooling. The EPC is determined by dividing the calculated energy requirement of a building by
[ 58 ]
a standardised energy performance, which is based on the heat-transfer sur-face and the total heated area of the dwelling.
The EPC applies a correction for building size to avoid penalising larger dwellings. It sets a limit on energy consumption, allowing designers to make trade-offs and devise a solution from many options (e.g. using more insula-tion or more energy-efficient systems). In 1996 the EPC stood at 1.4, a value that was easy to reach with common construction methods at the time. It was tightened to 1.2 in 1998, to 1.0 in 2000 and to 0.8 in 2006. In addition to the EPC, the energy regulations in the Netherlands apply an Rc≥ 2.5 m2K/W for external walls, roofs and ground floors and a U≤ 4.2 W/m2K for windows, doors and window frames.
Various studies have indicated that energy regulations have been success-ful in lowering energy consumption in residential buildings. Leth-Petersen & Togeby (2001) found that building regulations have played a key role in low-ering energy consumption in new dwellings. They recorded annual energy reductions of 3.5 to 4.8% depending on the type of heating system, though they do stress that some of this result might be due to the independent effect of better insulation, glazing and more efficient boilers. In a Dutch study on the effect of EPC values in ten low-energy projects (146 dwellings) Jeeninga et al. (2001) found that the energy requirement is determined primarily by the building envelope (Rc, U-value of glazing) and the type of dwelling besides the indoor temperature. They found only indicative differences (not statistical-ly significant at p<.05 level) for energy consumption in dwellings with differ-ent EPC levels except for categories 0.75 and 1.2. In yet another Dutch study Beerepoot & Beerepoot (2007) concluded that energy performance regulations have led to the utilisation of more energy-efficient systems.
However, other studies have shown that the actual energy consumption is usually different from the predicted energy consumption. For example, Bran-co et al. (2004) found that actual energy consumption was 50% higher than expected in energy-efficient multifamily dwellings in Denmark. They con-cluded that the difference was due to the exclusion of the actual utilisation conditions and the actual system performance. After discerning a rebound effect of 15-30%, Haas et al. (1998) argued that energy savings from conser-vation measures would be lower than calculated. During a dwelling audit in the USA, Hirst & Goeltz (1985) also found that energy savings were lower than predicted. Some studies have established no relationship between energy consumption and the thermal quality of buildings (Haas et al., 1998; Sardian-ou, 2008).
In the previous chapter, which used statistical analysis to determine the effect of building characteristics, household characteristics and occupant behaviour, indicated that 42% of the variation in energy consumption could be explained by building characteristics. Caldera et al. (2008) and Tiberiu et al. (2008) identified a relationship between energy consumption and certain
[ 59 ]
building characteristics, including the shape of the dwelling and U-values. The EPC aims to reduce the overall building-related energy consumption
in dwellings. In NEN 5128:2001 the EPC is defined as an instrument to assess energy reduction. In this chapter we explore the role of energy performance regulations in lowering the energy consumption for space heating in dwell-ings built after 1996, the year in which new energy requirements were intro-duced in the Netherlands. The aims are (1) to determine the extent of the influence of the EPC level on reductions in energy consumption for heat-ing; (2) to determine whether tighter regulations could help to further reduce energy consumption for space heating; and (3) to identify scope for improve-ment in the regulations in order to bring about a further reduction in energy consumption for heating. We achieved the third aim by studying the building characteristics (included in the EPC) that have a larger influence on energy consumption for space heating.
The effect of the EPC value and thermal characteristics on energy consump-tion was determined by statistical analyses of data on actual energy con-sumption in Dutch dwellings. The OTB Research Institute carried out a survey on housing built after 1996 and paired the data from the respondents with data from EPC calculation files kept by the municipalities. Both the data and the methods are discussed in Section 3.2 Section 3.3 deals with the relation-ship between the actual energy consumption and the energy performance regulations. Section 3.4 extends the results to a larger sample using a data-base from a national household survey. The discussion is presented in Section 3.5 and the conclusions in Section 3.6.
3.2 Data and methodology
During the past fifteen years only three surveys have been conducted to as-sess the effectiveness of the energy performance regulations on the actual energy consumed for heating in the Netherlands. The first was carried out by Jeeninga (2001) on a sample of 146 dwellings, the second by PRC and Uitzinger (2004) on a sample of 649 dwellings, and the last in 2008 by the authors of this paper on a sample of 313 dwellings. In this paper we focus on the sample from 2008, the OTB sample.
The data were drawn from two sources: a survey among households in two districts in the Netherlands (OTB survey) and EPC files from municipalities and architects’ firms. The EPC files belonged to the dwellings where the sur-vey was conducted, thus enabling us to match the response from the survey with the data on building characteristics.
The OTB survey was carried out simultaneously in two districts in the Neth-erlands in autumn 2008. To ensure that the dwellings in the sample fell with-in the timescale of the EPC we specifically chose districts that were built after
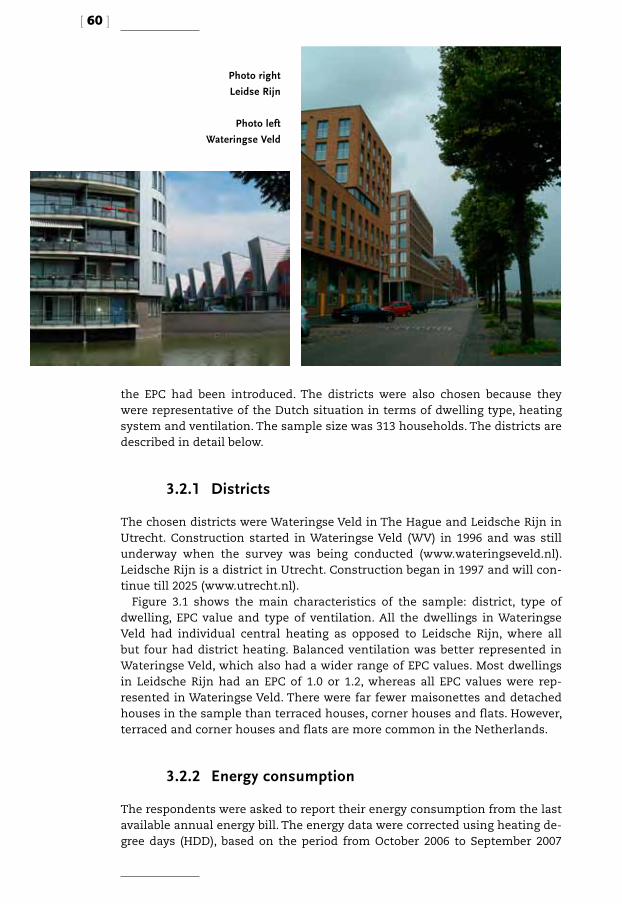
[ 60 ]
the EPC had been introduced. The districts were also chosen because they were representative of the Dutch situation in terms of dwelling type, heating system and ventilation. The sample size was 313 households. The districts are described in detail below.
3.2.1 Districts
The chosen districts were Wateringse Veld in The Hague and Leidsche Rijn in Utrecht. Construction started in Wateringse Veld (WV) in 1996 and was still underway when the survey was being conducted (www.wateringseveld.nl). Leidsche Rijn is a district in Utrecht. Construction began in 1997 and will con-tinue till 2025 (www.utrecht.nl).
Figure 3.1 shows the main characteristics of the sample: district, type of dwelling, EPC value and type of ventilation. All the dwellings in Wateringse Veld had individual central heating as opposed to Leidsche Rijn, where all but four had district heating. Balanced ventilation was better represented in Wateringse Veld, which also had a wider range of EPC values. Most dwellings in Leidsche Rijn had an EPC of 1.0 or 1.2, whereas all EPC values were rep-resented in Wateringse Veld. There were far fewer maisonettes and detached houses in the sample than terraced houses, corner houses and flats. However, terraced and corner houses and flats are more common in the Netherlands.
3.2.2 Energy consumption
The respondents were asked to report their energy consumption from the last available annual energy bill. The energy data were corrected using heating de-gree days (HDD), based on the period from October 2006 to September 2007
Photo rightLeidse Rijn
Photo leftWateringse Veld
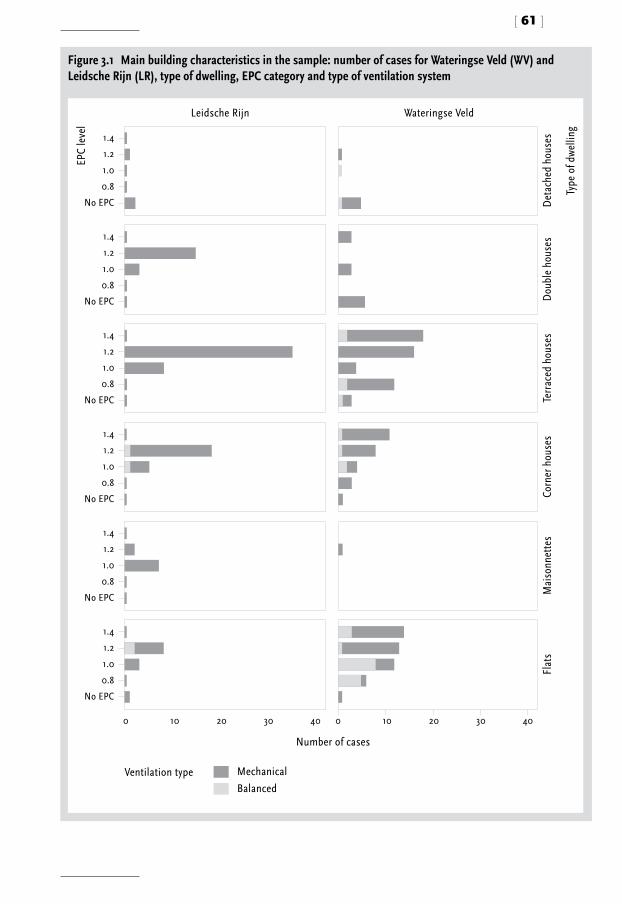
[ 61 ]
Figure 3.1 Main building characteristics in the sample: number of cases for Wateringse Veld (WV) and Leidsche Rijn (LR), type of dwelling, EPC category and type of ventilation system
403020100403020100
No EPC
0.8
1.0
1.2
1.4
No EPC
0.8
1.0
1.2
1.4
No EPC
0.8
1.0
1.2
1.4
No EPC
0.8
1.0
1.2
1.4
No EPC
0.8
1.0
1.2
1.4
No EPC
0.8
1.0
1.2
1.4
Type
of d
wel
ling
Det
ache
d ho
uses
Dou
ble
hous
esTe
rrac
ed h
ouse
s
EPC
leve
l
Wateringse VeldLeidsche Rijn
Corn
er h
ouse
sM
aiso
nnet
tes
Flat
s
Mechanical
Balanced
Number of cases
Ventilation type
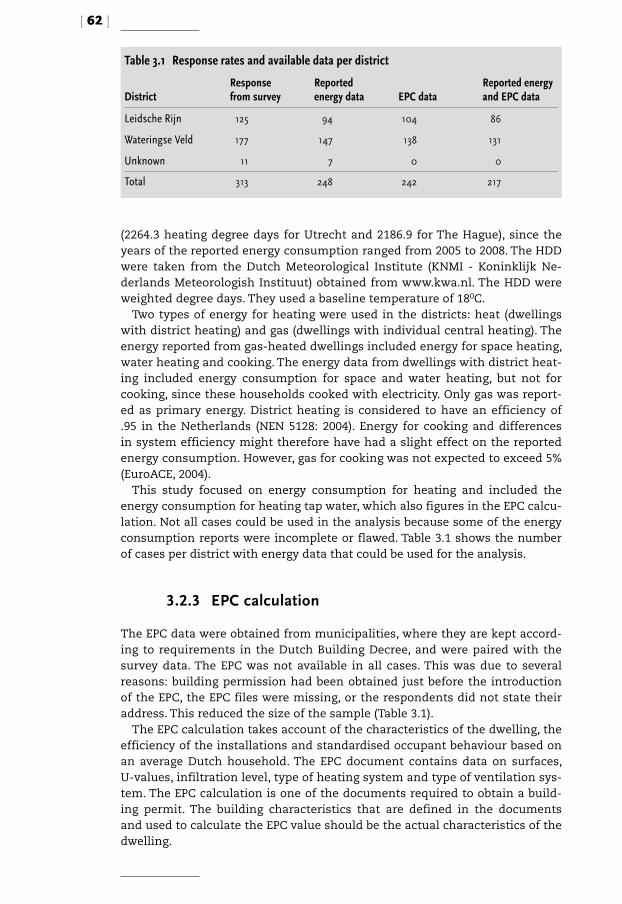
[ 62 ]
(2264.3 heating degree days for Utrecht and 2186.9 for The Hague), since the years of the reported energy consumption ranged from 2005 to 2008. The HDD were taken from the Dutch Meteorological Institute (KNMI - Koninklijk Ne-derlands Meteorologish Instituut) obtained from www.kwa.nl. The HDD were weighted degree days. They used a baseline temperature of 180C.
Two types of energy for heating were used in the districts: heat (dwellings with district heating) and gas (dwellings with individual central heating). The energy reported from gas-heated dwellings included energy for space heating, water heating and cooking. The energy data from dwellings with district heat-ing included energy consumption for space and water heating, but not for cooking, since these households cooked with electricity. Only gas was report-ed as primary energy. District heating is considered to have an efficiency of .95 in the Netherlands (NEN 5128: 2004). Energy for cooking and differences in system efficiency might therefore have had a slight effect on the reported energy consumption. However, gas for cooking was not expected to exceed 5% (EuroACE, 2004).
This study focused on energy consumption for heating and included the energy consumption for heating tap water, which also figures in the EPC calcu-lation. Not all cases could be used in the analysis because some of the energy consumption reports were incomplete or flawed. Table 3.1 shows the number of cases per district with energy data that could be used for the analysis.
3.2.3 EPC calculation
The EPC data were obtained from municipalities, where they are kept accord-ing to requirements in the Dutch Building Decree, and were paired with the survey data. The EPC was not available in all cases. This was due to several reasons: building permission had been obtained just before the introduction of the EPC, the EPC files were missing, or the respondents did not state their address. This reduced the size of the sample (Table 3.1).
The EPC calculation takes account of the characteristics of the dwelling, the efficiency of the installations and standardised occupant behaviour based on an average Dutch household. The EPC document contains data on surfaces, U-values, infiltration level, type of heating system and type of ventilation sys-tem. The EPC calculation is one of the documents required to obtain a build-ing permit. The building characteristics that are defined in the documents and used to calculate the EPC value should be the actual characteristics of the dwelling.
Table 3.1 Response rates and available data per district
DistrictResponse from survey
Reported energy data EPC data
Reported energy and EPC data
Leidsche Rijn 125 94 104 86
Wateringse Veld 177 147 138 131
Unknown 11 7 0 0
Total 313 248 242 217
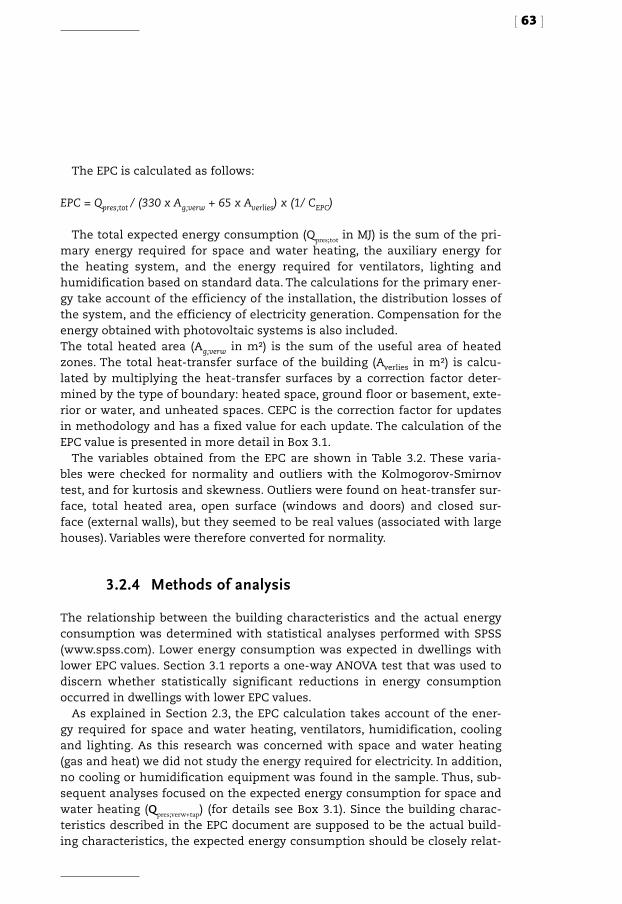
[ 63 ]
The EPC is calculated as follows:
EPC = Qpres;tot / (330 x Ag;verw + 65 x Averlies) x (1/ CEPC)
The total expected energy consumption (Qpres;tot in MJ) is the sum of the pri-mary energy required for space and water heating, the auxiliary energy for the heating system, and the energy required for ventilators, lighting and humidification based on standard data. The calculations for the primary ener-gy take account of the efficiency of the installation, the distribution losses of the system, and the efficiency of electricity generation. Compensation for the energy obtained with photovoltaic systems is also included. The total heated area (Ag;verw in m2) is the sum of the useful area of heated zones. The total heat-transfer surface of the building (Averlies in m2) is calcu-lated by multiplying the heat-transfer surfaces by a correction factor deter-mined by the type of boundary: heated space, ground floor or basement, exte-rior or water, and unheated spaces. CEPC is the correction factor for updates in methodology and has a fixed value for each update. The calculation of the EPC value is presented in more detail in Box 3.1.
The variables obtained from the EPC are shown in Table 3.2. These varia-bles were checked for normality and outliers with the Kolmogorov-Smirnov test, and for kurtosis and skewness. Outliers were found on heat-transfer sur-face, total heated area, open surface (windows and doors) and closed sur-face (external walls), but they seemed to be real values (associated with large houses). Variables were therefore converted for normality.
3.2.4 Methods of analysis
The relationship between the building characteristics and the actual energy consumption was determined with statistical analyses performed with SPSS (www.spss.com). Lower energy consumption was expected in dwellings with lower EPC values. Section 3.1 reports a one-way ANOVA test that was used to discern whether statistically significant reductions in energy consumption occurred in dwellings with lower EPC values.
As explained in Section 2.3, the EPC calculation takes account of the ener-gy required for space and water heating, ventilators, humidification, cooling and lighting. As this research was concerned with space and water heating (gas and heat) we did not study the energy required for electricity. In addition, no cooling or humidification equipment was found in the sample. Thus, sub-sequent analyses focused on the expected energy consumption for space and water heating (Qpres;verw+tap) (for details see Box 3.1). Since the building charac-teristics described in the EPC document are supposed to be the actual build-ing characteristics, the expected energy consumption should be closely relat-
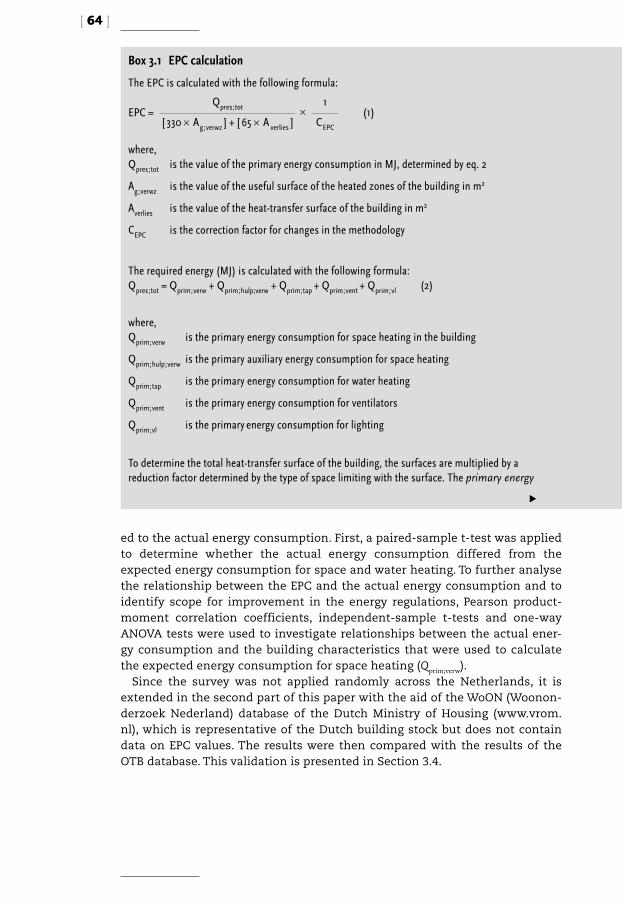
[ 64 ]
Box 3.1 EPC calculation
The EPC is calculated with the following formula:
EPC = Qpres ; tot ×
1
[ 330 × A g ; verwz ] + [ 65 × A verlies ] CEPC
(1)
where,Qpres ; tot is the value of the primary energy consumption in MJ, determined by eq. 2
Ag ; verwz is the value of the useful surface of the heated zones of the building in m2
Averlies is the value of the heat-transfer surface of the building in m2
CEPC is the correction factor for changes in the methodology
The required energy (MJ) is calculated with the following formula:Qpres ; tot = Qprim ; verw + Qprim ; hulp;verw + Qprim ; tap + Qprim ; vent + Qprim ; vl (2)
where,Qprim ; verw is the primary energy consumption for space heating in the building
Qprim ; hulp ; verw is the primary auxiliary energy consumption for space heating
Qprim ; tap is the primary energy consumption for water heating
Qprim ; vent is the primary energy consumption for ventilators
Qprim ; vl is the primary energy consumption for lighting
To determine the total heat-transfer surface of the building, the surfaces are multiplied by a reduction factor determined by the type of space limiting with the surface. The primary energy
ed to the actual energy consumption. First, a paired-sample t-test was applied to determine whether the actual energy consumption differed from the expected energy consumption for space and water heating. To further analyse the relationship between the EPC and the actual energy consumption and to identify scope for improvement in the energy regulations, Pearson product-moment correlation coefficients, independent-sample t-tests and one-way ANOVA tests were used to investigate relationships between the actual ener-gy consumption and the building characteristics that were used to calculate the expected energy consumption for space heating (Qprim;verw).
Since the survey was not applied randomly across the Netherlands, it is extended in the second part of this paper with the aid of the WoON (Woonon-derzoek Nederland) database of the Dutch Ministry of Housing (www.vrom.nl), which is representative of the Dutch building stock but does not contain data on EPC values. The results were then compared with the results of the OTB database. This validation is presented in Section 3.4.
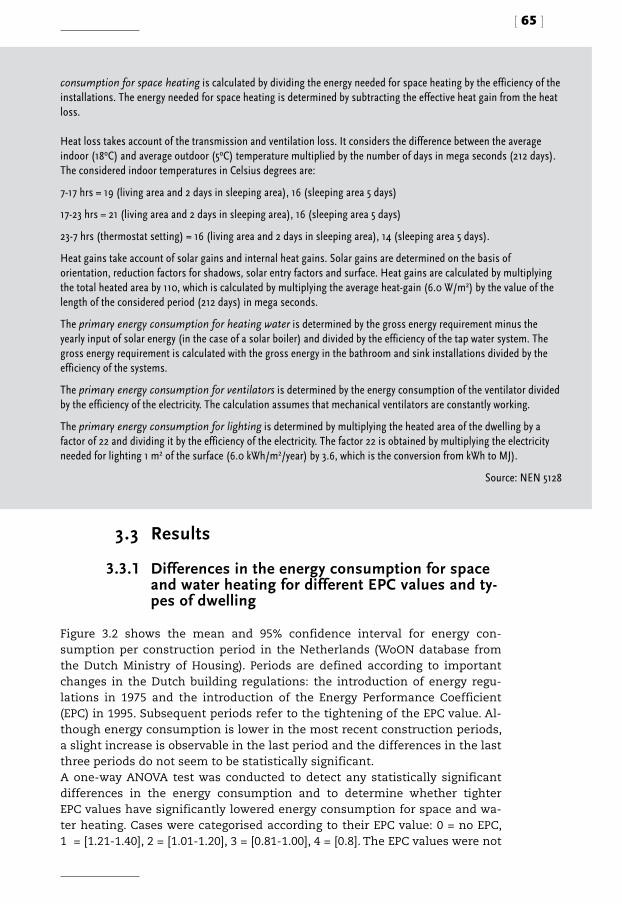
[ 65 ]
3.3 Results
3.3.1 Differences in the energy consumption for space and water heating for different EPC values and ty-pes of dwelling
Figure 3.2 shows the mean and 95% confidence interval for energy con-sumption per construction period in the Netherlands (WoON database from the Dutch Ministry of Housing). Periods are defined according to important changes in the Dutch building regulations: the introduction of energy regu-lations in 1975 and the introduction of the Energy Performance Coefficient (EPC) in 1995. Subsequent periods refer to the tightening of the EPC value. Al-though energy consumption is lower in the most recent construction periods, a slight increase is observable in the last period and the differences in the last three periods do not seem to be statistically significant. A one-way ANOVA test was conducted to detect any statistically significant differences in the energy consumption and to determine whether tighter EPC values have significantly lowered energy consumption for space and wa-ter heating. Cases were categorised according to their EPC value: 0 = no EPC, 1 = [1.21-1.40], 2 = [1.01-1.20], 3 = [0.81-1.00], 4 = [0.8]. The EPC values were not
consumption for space heating is calculated by dividing the energy needed for space heating by the efficiency of the installations. The energy needed for space heating is determined by subtracting the effective heat gain from the heat loss.
Heat loss takes account of the transmission and ventilation loss. It considers the difference between the average indoor (18oC) and average outdoor (5oC) temperature multiplied by the number of days in mega seconds (212 days). The considered indoor temperatures in Celsius degrees are:
7-17 hrs = 19 (living area and 2 days in sleeping area), 16 (sleeping area 5 days)
17-23 hrs = 21 (living area and 2 days in sleeping area), 16 (sleeping area 5 days)
23-7 hrs (thermostat setting) = 16 (living area and 2 days in sleeping area), 14 (sleeping area 5 days).
Heat gains take account of solar gains and internal heat gains. Solar gains are determined on the basis of orientation, reduction factors for shadows, solar entry factors and surface. Heat gains are calculated by multiplying the total heated area by 110, which is calculated by multiplying the average heat-gain (6.0 W/m2) by the value of the length of the considered period (212 days) in mega seconds.
The primary energy consumption for heating water is determined by the gross energy requirement minus the yearly input of solar energy (in the case of a solar boiler) and divided by the efficiency of the tap water system. The gross energy requirement is calculated with the gross energy in the bathroom and sink installations divided by the efficiency of the systems.
The primary energy consumption for ventilators is determined by the energy consumption of the ventilator divided by the efficiency of the electricity. The calculation assumes that mechanical ventilators are constantly working.
The primary energy consumption for lighting is determined by multiplying the heated area of the dwelling by a factor of 22 and dividing it by the efficiency of the electricity. The factor 22 is obtained by multiplying the electricity needed for lighting 1 m2 of the surface (6.0 kWh/m2/year) by 3.6, which is the conversion from kWh to MJ).
Source: NEN 5128
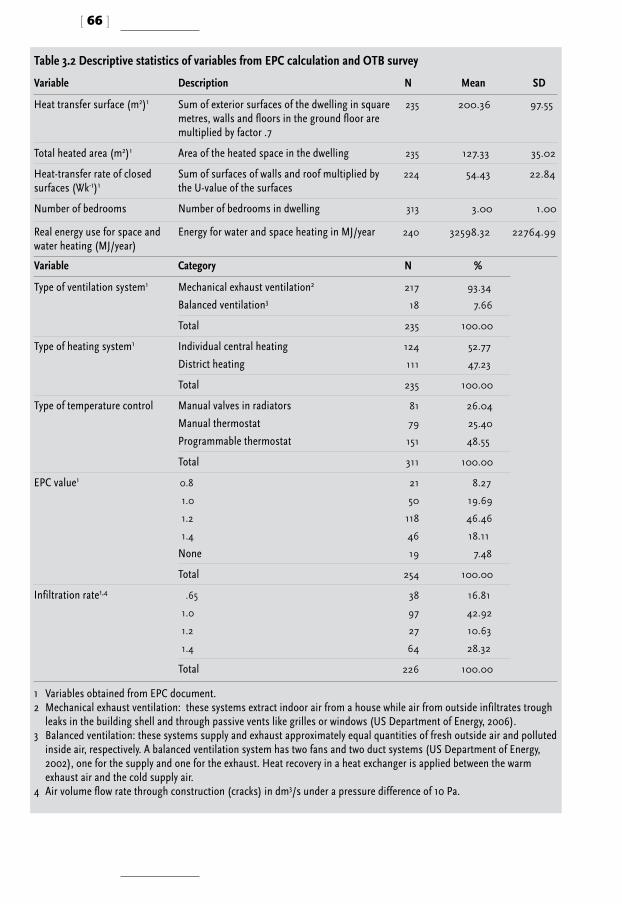
[ 66 ]
Table 3.2 Descriptive statistics of variables from EPC calculation and OTB survey
Variable Description N Mean SD
Heat transfer surface (m2)1 Sum of exterior surfaces of the dwelling in square metres, walls and floors in the ground floor are multiplied by factor .7
235 200.36 97.55
Total heated area (m2)1 Area of the heated space in the dwelling 235 127.33 35.02
Heat-transfer rate of closed surfaces (Wk-1)1
Sum of surfaces of walls and roof multiplied by the U-value of the surfaces
224 54.43 22.84
Number of bedrooms Number of bedrooms in dwelling 313 3.00 1.00
Real energy use for space and water heating (MJ/year)
Energy for water and space heating in MJ/year 240 32598.32 22764.99
Variable Category N %
Type of ventilation system1 Mechanical exhaust ventilation2
Balanced ventilation3
217
18
93.34
7.66
Total 235 100.00
Type of heating system1 Individual central heatingDistrict heating
124
111
52.77
47.23
Total 235 100.00
Type of temperature control Manual valves in radiatorsManual thermostatProgrammable thermostat
81
79
151
26.04
25.40
48.55
Total 311 100.00
EPC value1 0.8
1.0
1.2
1.4
None
21
50
118
46
19
8.27
19.69
46.46
18.11
7.48
Total 254 100.00
Infiltration rate1,4 .65
1.0
1.2
1.4
38
97
27
64
16.81
42.92
10.63
28.32
Total 226 100.00
1 Variables obtained from EPC document.2 Mechanical exhaust ventilation: these systems extract indoor air from a house while air from outside infiltrates trough
leaks in the building shell and through passive vents like grilles or windows (US Department of Energy, 2006).3 Balanced ventilation: these systems supply and exhaust approximately equal quantities of fresh outside air and polluted
inside air, respectively. A balanced ventilation system has two fans and two duct systems (US Department of Energy, 2002), one for the supply and one for the exhaust. Heat recovery in a heat exchanger is applied between the warm exhaust air and the cold supply air.
4 Air volume flow rate through construction (cracks) in dm3/s under a pressure difference of 10 Pa.

[ 67 ]
necessarily related to the year when the EPC was tightened, since lower EPC values than those required by the regulations were also found in the sample. The number of cases in each category is listed in Table 3.2. The ANOVA re-sults revealed a statistically significant difference between the EPC categories (p <.001). Post-hoc analyses were then performed to identify the EPC catego-ries with differences in energy consumption. A Tukey test revealed that sta-tistical differences existed only between dwellings with and without an EPC
Figure 3.2 Mean and 95% confidence interval for energy consumption per construction period
Ener
gy c
onsu
mpt
ion
(m3 )
Construction period
<1945 1946-1974 1975-1995 1996-1997 1998-1999 >2000
800
1,000
1,200
1,400
1,600
1,800
2,000
Figure 3.3 Mean and 95% confidence interval for the actual energy consumption (MJ/m2),total expected energy (MJ/m2) and expected energy for heating (MJ/m2) per EPC value
Ener
gy c
onsu
mpt
ion
(MJ/
m2 )
EPC value
Totalexpected energy
0.8 1.0 1.2 1.4
100
200
300
400
500
600
Actual energyfor heating
Expected energyfor heating
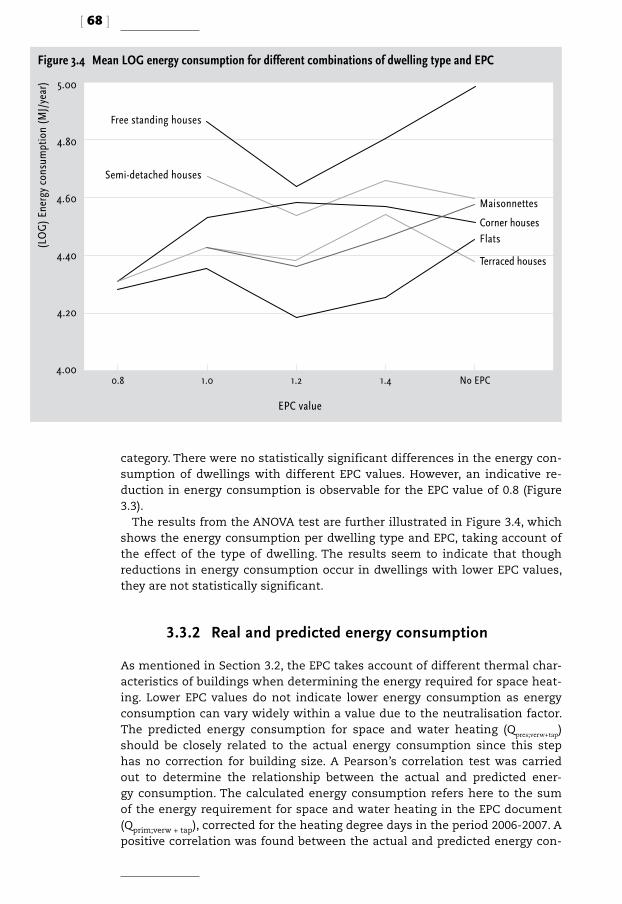
[ 68 ]
category. There were no statistically significant differences in the energy con-sumption of dwellings with different EPC values. However, an indicative re-duction in energy consumption is observable for the EPC value of 0.8 (Figure 3.3).
The results from the ANOVA test are further illustrated in Figure 3.4, which shows the energy consumption per dwelling type and EPC, taking account of the effect of the type of dwelling. The results seem to indicate that though reductions in energy consumption occur in dwellings with lower EPC values, they are not statistically significant.
3.3.2 Real and predicted energy consumption
As mentioned in Section 3.2, the EPC takes account of different thermal char-acteristics of buildings when determining the energy required for space heat-ing. Lower EPC values do not indicate lower energy consumption as energy consumption can vary widely within a value due to the neutralisation factor. The predicted energy consumption for space and water heating (Qpres;verw+tap) should be closely related to the actual energy consumption since this step has no correction for building size. A Pearson’s correlation test was carried out to determine the relationship between the actual and predicted ener-gy consumption. The calculated energy consumption refers here to the sum of the energy requirement for space and water heating in the EPC document (Qprim;verw + tap), corrected for the heating degree days in the period 2006-2007. A positive correlation was found between the actual and predicted energy con-
Figure 3.4 Mean LOG energy consumption for different combinations of dwelling type and EPC
0.8 1.0 1.2 1.4 No EPC
Maisonnettes
Free standing houses
Semi-detached houses
Corner housesFlats
Terraced houses
4.00
4.20
4.40
4.60
4.80
5.00
(LO
G) E
nerg
y co
nsum
ptio
n (M
J/ye
ar)
EPC value
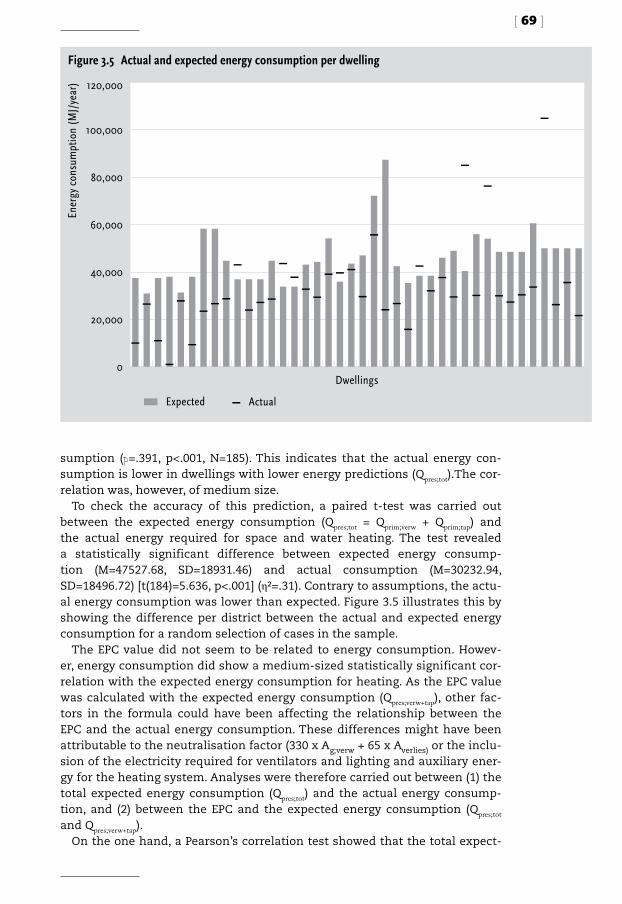
[ 69 ]
sumption (p=.391, p<.001, N=185). This indicates that the actual energy con-sumption is lower in dwellings with lower energy predictions (Qpres;tot).The cor-relation was, however, of medium size.
To check the accuracy of this prediction, a paired t-test was carried out between the expected energy consumption (Qpres;tot = Qprim;verw + Qprim;tap) and the actual energy required for space and water heating. The test revealed a statistically significant difference between expected energy consump-tion (M=47527.68, SD=18931.46) and actual consumption (M=30232.94, SD=18496.72) [t(184)=5.636, p<.001] (η2=.31). Contrary to assumptions, the actu-al energy consumption was lower than expected. Figure 3.5 illustrates this by showing the difference per district between the actual and expected energy consumption for a random selection of cases in the sample.
The EPC value did not seem to be related to energy consumption. Howev-er, energy consumption did show a medium-sized statistically significant cor-relation with the expected energy consumption for heating. As the EPC value was calculated with the expected energy consumption (Qpres;verw+tap), other fac-tors in the formula could have been affecting the relationship between the EPC and the actual energy consumption. These differences might have been attributable to the neutralisation factor (330 x Ag;verw + 65 x Averlies) or the inclu-sion of the electricity required for ventilators and lighting and auxiliary ener-gy for the heating system. Analyses were therefore carried out between (1) the total expected energy consumption (Qpres;tot) and the actual energy consump-tion, and (2) between the EPC and the expected energy consumption (Qpres;tot and Qpres;verw+tap).
On the one hand, a Pearson’s correlation test showed that the total expect-
Ener
gy c
onsu
mpt
ion
(MJ/
year
)Figure 3.5 Actual and expected energy consumption per dwelling
Dwellings0
20,000
40,000
60,000
80,000
100,000
120,000
Expected Actual
[ 70 ]
ed energy consumption (Qpres;tot) was positively correlated to the actual ener-gy consumption (p=.378, p<.001, N=185). The expected energy consumption for space and water heating (Qpres;verw+tap) was also correlated to the actual energy consumption [p=.391, p<.001, N=185). Thus, we conclude that the inclusion of energy consumption for ventilators and auxiliary energy for the heating sys-tem in the EPC does not affect the relationship between the EPC value and the actual energy consumption.
On the other hand, ANOVA tests showed that the total expected energy con-sumption (Qpres;tot) was statistically significantly different for different EPC val-ues [F(3,59.51)=47.47, p<.001]. The same results were found for the expected energy consumption for space and water heating (Qpres;verw+tap) [F(3,58.32)=56.24, p<.001]. Likewise, the expected energy consumption for space and water heat-ing (Qpres;tot and Qpres;verw+tap) normalised per ‘total heating area’ turned out to be statistically significantly different for different EPC values [F(3,65.49)=413.94, p<.001 and F(3,56.80)=228.78, p<.001 respectively]. However, the relationship between the EPC and the expected energy consumption was much clear-er when normalised per ‘total heated area’. Hence, the normalisation factor might have had a small effect on the relationship between the actual energy consumption and the EPC value, although, as seen before (Figure 3.3), no sta-tistically significant difference was found for the actual energy consumption normalised per ‘total heated area’.
3.3.3 Effect of thermal quality on energy consumption in dwellings
Under the energy performance regulations, the designer may choose from dif-ferent options to achieve the expected energy performance. The fact that en-ergy consumption for space and water heating is not statistically significant in dwellings with different EPC values might be explained by trade-offs during the design/calculation phase (i.e. between energy-efficient systems and ther-mal properties). Designers could be opting to reduce energy consumption in ways that are, in reality, less effective. A decision was therefore taken to in-vestigate the relationship between building characteristics and the actual en-ergy consumption. The analyses were conducted without normalisation per total heated area because the effect of dwelling size needed to be determined in relation to other factors. Moreover, as heated area correlated with all the other variables, multicollinearity problems were avoided.
Medium-sized positive statistically significant correlations were found between energy consumption on the one hand and ‘number of bedrooms’, ‘heat-transfer surface’ and ‘heat-transfer rate of the closed surface’ on the other. A small positive correlation was found between ‘total heated area’ and energy consumption (see Table 3.3 for statistics).

[ 71 ]
Analyses were performed to ascertain whether energy consumption was influenced by type of heating and ventilation system, type of temperature control and infiltration level (see Table 3.4 for statistics). An independent-sample t-test compared the energy consumption of dwellings with different types of ventilation and heating systems. A significant difference was found between the energy consumption for mechanical ventilation and balanced ventilation. However, the differences in the means were very small (η2=.033). Although, as shown in Table 3.4, energy consumption is indicatively higher in centrally heated dwellings, no statistically significant difference in the energy consumption was found at a level of .05. However, it should be noted that the energy consumption in dwellings with individual central heating is primary energy, whereas no account is taken of system efficiency in dwellings with district heating (though the difference would be only 5%).
A one-way ANOVA test was conducted to explore the differences in ener-gy consumption for dwellings with different systems of temperature control, namely: manual valves in radiators, manual thermostats, and programmable
Table 3.3 Pearson product-moment correlation coefficients for building-related variables in OTB survey
Variable Variable Statistic N
(LOG) Energy use (MJ/year)
Number of bedrooms r = .311* 240
Heat-transfer surface (m2) r = .366* 191
Heat-transfer rate f closed surface (Wk-1) r = .331* 180
Total heating area (m2) r = .262* 240
* = < .001
Table 3.4 Statistics from independent t-tests and one-way ANOVA for building-related variables in OTB survey
Variable Statistic Mean (SD)
Ventilation type t(216) = 2.962** Mechanical exhaust ventilation M = 4.42 (.30)Balanced ventilation M = 4.20 (.28)
Heating system type t(216) = 0.704 (NS)
Type of temperature control F(2,236) = 3.380* Manual valves in radiator M = 4.36 (.35) Manual thermostat M = 4.38 (.31)Programmable thermostat M = 4.44 (.32)
Type of dwelling F(5,242) = 9.984*** Detached houses M = 4.85 (.23)Semi-detached houses M = 4.52 (.18)Terraced houses M = 4.34 (.31)Corner houses M = 4.49 (.16)Maisonette M = 4.37 (.27)Flat M = 4.25 (.41)
Infiltration level F(3,181) = 0.413 (NS)
Dependent variable: (LOG) Energy use (MJ/year).(LOG) means that the variable was transformed into a normal distribution with logarithm base 10.* = < .05, ** = < .01, *** = < .001, NS = not statistically significant.
[ 72 ]
thermostats, although these are not taken into account in the EPC calcula-tion. A statistically significant difference was found at p<.05 level for all types of temperature control. Post hoc comparisons using the Tukey HSD test indi-cated a statistically significant difference between the energy consumption for manual valves in radiators and for programmable thermostats.
A one-way ANOVA test did not point to any statistically significant differ-ences in the case of dwellings with different levels of infiltration. (It should be noted that these values came from the EPC calculations and not from the actual infiltration rates in the dwellings.)
The correlation between the actual and the expected energy consump-tion turned out to be medium-sized. This difference was further explored by applying a regression analysis to determine the variance in energy consump-tion explained with the thermal properties in the EPC calculation. The regres-sion model can predict 18.6% of the variance in energy consumption with two variables: ‘heat-transfer surface’ and ‘number of bedrooms’. Standardised Beta coefficients showed that ‘heat-transfer surface’ was the most impor-tant variable in the model. The accuracy of the model was tested by analysing the assumptions that led to the belief that the model was fairly accurate (see Table 3.5 for statistics). The equation can be summarised as follows:
(LOG) Energy for heating per year = 3.996 + (heat-transfer surface) (.001) + (number of bedrooms) (.071)
Thus, energy for space heating is mainly determined by the size of the dwell-ing. The results reported in this section seem to indicate that energy con-sumption is more influenced by the thermal characteristics than by the type of heating and ventilation systems. That said, only 18% of the variation is ex-plained. Another 82% is still to be accounted for.
3.4 Validation of the results with a nationwide survey (WoON database)
The OTB survey was performed in two selected districts, and a low response rate was obtained because of the length of the questionnaire and detailed questions. This might also have caused limitations in the results of this anal-ysis. The results were therefore validated with the WoON database of the Dutch Ministry of Housing.
The WoON survey was carried out in the Netherlands by the Ministry of Housing in 2005 (www.vrom.nl). It consisted of two questionnaires for occu-pants and a dwelling inspection. The energy data in the database refer to the actual gas used in the dwelling within a year. The sample consisted of 4,724 cases. In the validation, only houses built after 1996 (according to the inspec-
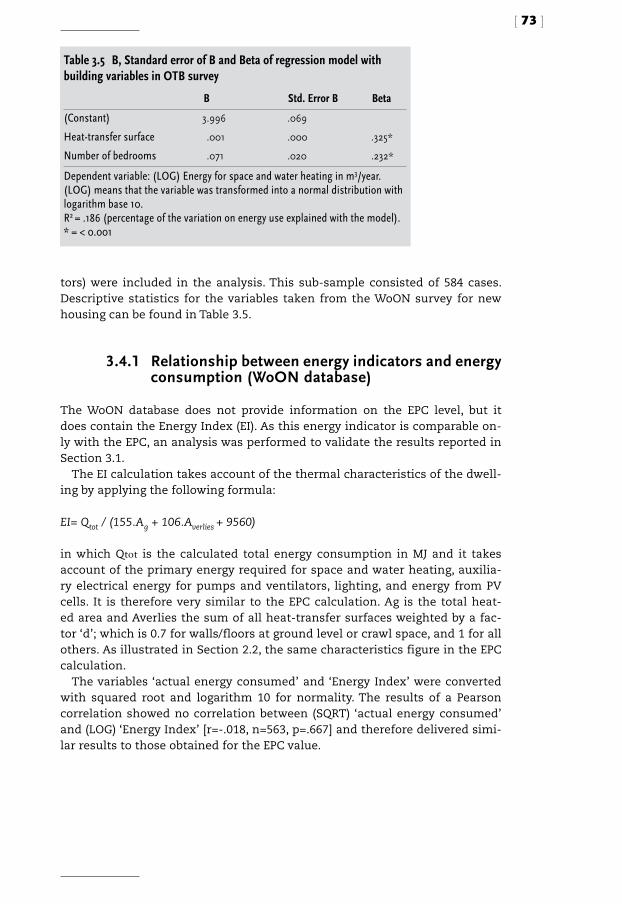
[ 73 ]
tors) were included in the analysis. This sub-sample consisted of 584 cases. Descriptive statistics for the variables taken from the WoON survey for new housing can be found in Table 3.5.
3.4.1 Relationship between energy indicators and energy consumption (WoON database)
The WoON database does not provide information on the EPC level, but it does contain the Energy Index (EI). As this energy indicator is comparable on-ly with the EPC, an analysis was performed to validate the results reported in Section 3.1.
The EI calculation takes account of the thermal characteristics of the dwell-ing by applying the following formula:
EI= Qtot / (155.Ag + 106.Averlies + 9560)
in which Qtot is the calculated total energy consumption in MJ and it takes account of the primary energy required for space and water heating, auxilia-ry electrical energy for pumps and ventilators, lighting, and energy from PV cells. It is therefore very similar to the EPC calculation. Ag is the total heat-ed area and Averlies the sum of all heat-transfer surfaces weighted by a fac-tor ‘d’; which is 0.7 for walls/floors at ground level or crawl space, and 1 for all others. As illustrated in Section 2.2, the same characteristics figure in the EPC calculation.
The variables ‘actual energy consumed’ and ‘Energy Index’ were converted with squared root and logarithm 10 for normality. The results of a Pearson correlation showed no correlation between (SQRT) ‘actual energy consumed’ and (LOG) ‘Energy Index’ [r=-.018, n=563, p=.667] and therefore delivered simi-lar results to those obtained for the EPC value.
Table 3.5 B, Standard error of B and Beta of regression model with building variables in OTB survey
B Std. Error B Beta
(Constant) 3.996 .069
Heat-transfer surface .001 .000 .325*
Number of bedrooms .071 .020 .232*
Dependent variable: (LOG) Energy for space and water heating in m3/year.(LOG) means that the variable was transformed into a normal distribution with logarithm base 10.R2 = .186 (percentage of the variation on energy use explained with the model).* = < 0.001

[ 74 ]
3.4.2 Relationship between building characteristics and energy consumption (WoON database)
The relationship between different building characteristics and energy con-sumption was investigated with a regression analysis which ascertained the generalisation of the results derived from the OTB survey. Non-normal var-iables were converted for normality with either squared root or logarithm
Table 3.6 Variables from WoON survey
Variable Description N Mean SD
Heat-transfer surface (m2) Sum of exterior surfaces of the dwelling in square metres, walls and floors on the ground floor are multiplied by a factor .7
586 138.80 77.63
Total heated area (m2) Area of the heated space in the dwelling 586 130.83 74.61
Open surface (m2) Sum of surfaces of doors, panels and windows 586 29.59 13.34
Non-insulated open surface (m2)
Sum of surfaces of non-insulated doors, panels and windows
435 2.97 1.91
Insulated open surface (m2) Sum of surfaces of double or insulated doors, panels and windows
586 27.73 13.42
Energy for water and space heating (m3/year)
Actual energy used for water and space heating per year
586 1068.89 676.32
Energy Index Energy indicator 586 2.04 .80
Number of bedrooms Number of bedrooms in the dwelling 586 4.02 1.33
Variable Categories N %
Type of ventilation system MechanicalBalanced
476
103
82.2
17.8
Total 586 100
Type of heating system Individual central heatingDistrict heating
488
94
83.8
16.2
Total 582 100
Table 3.7 B, Standard error of B and Beta of regression model with building variables in WoON survey
B Std. Error B Beta
(Constant) -.547 3.476
(LOG) Heat-transfer surface 13.558 2.062 .374**
Number of bedrooms .997 .406 .140*
Dependent variable: (SQRT) energy for space and water heating in m3 gas.(LOG) means that the variable was transformed into a normal distribution with logarithm base 10.R2 = .228 (percentage of the variation on energy use explained with the model).* = < 0.05, ** = < 0.001
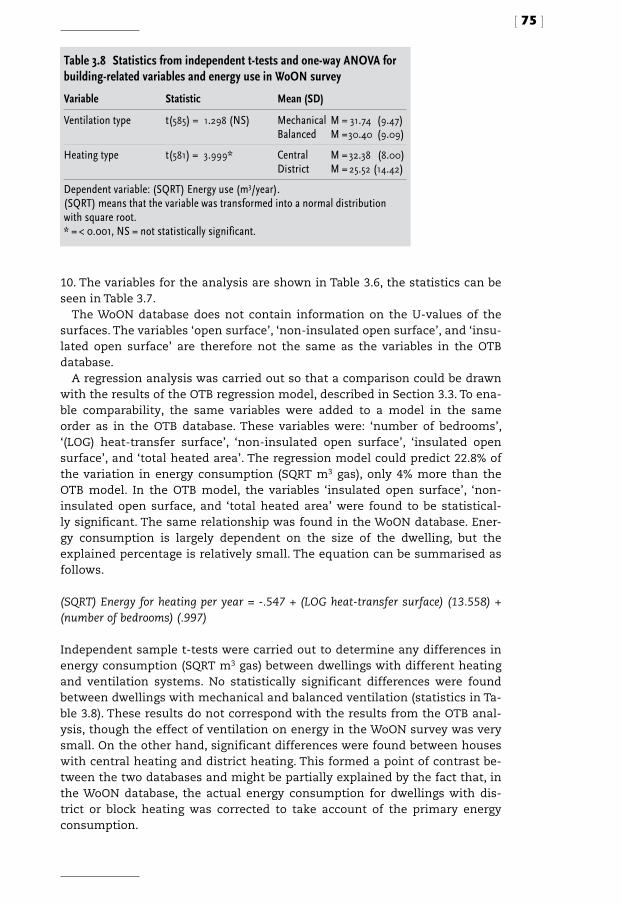
[ 75 ]
10. The variables for the analysis are shown in Table 3.6, the statistics can be seen in Table 3.7.
The WoON database does not contain information on the U-values of the surfaces. The variables ‘open surface’, ‘non-insulated open surface’, and ‘insu-lated open surface’ are therefore not the same as the variables in the OTB database.
A regression analysis was carried out so that a comparison could be drawn with the results of the OTB regression model, described in Section 3.3. To ena-ble comparability, the same variables were added to a model in the same order as in the OTB database. These variables were: ‘number of bedrooms’, ‘(LOG) heat-transfer surface’, ‘non-insulated open surface’, ‘insulated open surface’, and ‘total heated area’. The regression model could predict 22.8% of the variation in energy consumption (SQRT m3 gas), only 4% more than the OTB model. In the OTB model, the variables ‘insulated open surface’, ‘non-insulated open surface, and ‘total heated area’ were found to be statistical-ly significant. The same relationship was found in the WoON database. Ener-gy consumption is largely dependent on the size of the dwelling, but the explained percentage is relatively small. The equation can be summarised as follows.
(SQRT) Energy for heating per year = -.547 + (LOG heat-transfer surface) (13.558) + (number of bedrooms) (.997)
Independent sample t-tests were carried out to determine any differences in energy consumption (SQRT m3 gas) between dwellings with different heating and ventilation systems. No statistically significant differences were found between dwellings with mechanical and balanced ventilation (statistics in Ta-ble 3.8). These results do not correspond with the results from the OTB anal-ysis, though the effect of ventilation on energy in the WoON survey was very small. On the other hand, significant differences were found between houses with central heating and district heating. This formed a point of contrast be-tween the two databases and might be partially explained by the fact that, in the WoON database, the actual energy consumption for dwellings with dis-trict or block heating was corrected to take account of the primary energy consumption.
Table 3.8 Statistics from independent t-tests and one-way ANOVA for building-related variables and energy use in WoON survey
Variable Statistic Mean (SD)
Ventilation type t(585) = 1.298 (NS) Mechanical M = 31.74 (9.47)Balanced M = 30.40 (9.09)
Heating type t(581) = 3.999* Central M = 32.38 (8.00)District M = 25.52 (14.42)
Dependent variable: (SQRT) Energy use (m3/year).(SQRT) means that the variable was transformed into a normal distribution with square root.* = < 0.001, NS = not statistically significant.
[ 76 ]
3.5 Discussion
3.5.1 Relationship between the Energy Performance Coefficient and actual energy consumption
No statistical differences in energy consumption were found for dwellings with different EPC values (.8, 1.0, 1.2, and 1.4), though we did find statistical differences between dwellings built before and after the introduction of the EPC. This indicates that a reduction in energy consumption is seen in dwell-ings built after the introduction of the regulations. The results of the tests suggest that tighter EPC levels do not necessarily reduce the energy con-sumption for space heating. An analysis using the WoON survey of the Min-istry of Housing in the Netherlands showed no statistical correlation between energy consumption and the Energy Index, an energy indicator similar to the EPC.
Since the aim of the EPC is to realise an overall reduction in energy con-sumption, the calculations also take account of the energy required for lighting, cooling and hot water. This factor does not affect the relation-ship between the EPC and the actual energy consumption for space heating because standardised behaviour is used and the energy required for water, ventilation and lighting is therefore based solely in the ‘total heated area’ of the dwelling. Other results showed that the normalisation factor for dwelling size does not pose a problem in the correlation with the actual energy con-sumption. These results are in line with those of Jeeninga et al. (2001) in the Netherlands, who found only indicative differences (not statistically signif-icant at p<.05 level) in energy consumption in dwellings with different EPC levels, except for categories 0.75 and 1.2. However, as the study was conduct-ed in low-energy dwellings constructed before 2000 – when the EPC level was 1.0 – it is conceivable that 0.75 was experimental and was therefore more carefully implemented. In a larger sample, PRC (2004) found strong statisti-cally significant differences between EPC categories. Although the statistical analysis could not be checked and there were concerns about the validity of the results (Itard et al., 2009), it still suggested that the effect of a tighter EPC is better observed in a larger sample. A later analysis of the sample (Uitzinger, 2004) did not, however, find any correlation between equivalent gas consump-tion and EPC.
3.5.2 Actual and expected energy consumption
A positive medium-sized correlation was found between the actual and ex-
[ 77 ]
pected energy consumption. This points to a relationship between build-ing characteristics and actual energy consumption. A closer look at the sam-ple revealed that the actual consumption was higher than the predicted con-sumption. This difference is believed to be caused by the differences between the occupant behaviour considered in the calculations and the actual behav-iour of the occupants in the sample.
3.5.3 Relationship between building characteristics and energy consumption
The determinants of actual energy consumption were further determined by statistical analyses of building characteristics. The results showed corre-lations between the actual energy consumption for water and space heat-ing and the thermal properties of the building. In the OTB sample statisti-cally significant differences were found for different types of ventilation sys-tems and temperature control, though the differences in energy consumption for different ventilation types were very small. An analysis of the effect of the heating system on the actual energy consumption showed no statistically sig-nificant difference for the OTB database and a small significant difference for the WoON database. The differences between the databases may stem from the fact that the OTB database includes district heating data after taking ac-count of system efficiency, while the WoON database does not. These results indicate that thermal characteristics have a greater effect than system effi-ciency on energy consumption.
The validation model based on the WoON database delivered similar results with a slightly larger sample size and a random distribution across the Netherlands. The main differences lay in the larger percentage of vari-ation in energy consumption explained in the WoON sample (18% in OTB, 22% in WoON). Nevertheless, the results of both databases show correlations between thermal characteristics and energy consumption, specifically in rela-tion to the size of the dwelling.
Jeeninga et al. (2001) and Uitzinger (2004) found similar results for the effects of building characteristics, although the regression model in (Uit-zinger, 2004) claimed to predict 70% of the variation which is in contradic-tion with other literature sources. Comparable results were found by Vringer (2005) for household characteristics and occupant behaviour: households that were motivated to save energy consumed 4% less energy than households that were not. In a regression model compiled by Schuler et al. (2000), build-ing characteristics predicted from 11.7 to 14.9% of the variation. The percent-age of unexplained variation in energy consumption is thought to be caused by two factors: the actual characteristics of the building and the actual occu-pant behaviour.
[ 78 ]
Studies have indicated that the unexplained percentage could be relat-ed to practices whereby buildings are not realised according to the official EPC specifications and to HVAC services that are run very differently than assumed on paper. A report by Nieman (2007) showed that 25% of dwellings in a sample of 154 fell short of the EPC requirements: the EPC was incorrect-ly calculated but the building permit was still issued. The realisation of 50% of the dwellings was not in accordance with the data used to calculate the EPC. In a 17-year study that monitored the energy performances of energy-efficient buildings Gommans (2008) found that 40% of solar boilers functioned and only 25% of heat pumps reached the expected efficiency. This was essen-tially due to realisation faults, lack of control and lack of continuous monitor-ing. Another study by Elkhuizen et al. (2006) in office buildings showed that better monitoring could deliver energy savings of up to 28%.
The low correlation between the actual and expected energy consumption might be also be due to differences in occupant behaviour. A regression mod-el of the building characteristics in the EPC calculation can explain 18 to 22% of the variation in energy consumption, but that still leaves 78 to 82% unex-plained. The role of occupant behaviour is analyzed in the following chapter.
3.6 Conclusions
The aim of this study was to explore the role of energy performance regula-tions in lowering the energy consumption for space heating in dwellings that were built after these regulations were introduced. In addition, an analysis was carried out regarding the reductions in energy consumption after the reg-ulations had been tightened.
Although the EPC does not aim specifically to reduce energy consumption for space heating, reductions in this area may be expected. That said, dwell-ings with lower the EPC values do not appear to be correlated to less energy consumption for space and water heating, even when the type of dwelling or total heated area is taken into account.
The lack of correlation between EPC values and energy consumption for heating might be due to three factors: (1) the normalisation factor per dwell-ing size might have a small effect on the correlation between the EPC and energy consumption; however this does not have an effect on the relationship between the expected and actual energy consumption; (2) the differences between the building characteristics as described in the EPC calculations and the actual building characteristics (e.g. actual infiltration level); and (3) the effect of occupant behaviour on energy consumption. The first factor might have an effect on the relationship between the EPC value and the actual ener-gy consumption, while the other two might have an effect on the unaccount-ed 78-82% of the variation in energy consumption identified in this research.
[ 79 ]
A lower EPC value is expected to reduce energy consumption because it increases the energy efficiency of buildings. When the dwellings are built according to the regulations, those with lower EPC would have a lower con-sumption of energy if occupancy conditions are maintained equal in all dwellings. In this case, the energy performance regulations would be effec-tively reducing the energy consumption in newly built dwellings. However, the actual conditions of utilization are not the same in all dwellings. This fact undermines the effectiveness of the energy performance regulations, since the range of behaviour hinders the effect of higher energy efficiency of dwell-ings. Nevertheless, the regulations have ensured that more energy efficient dwellings are being built.
3.7 Recommendations for policy and practice
The fact that actual energy consumption for water and space heating showed a small correlation with the expected energy consumption and the fact that no differences in energy consumption were found in dwellings with differ-ent EPC values indicate that other factors besides building characteristics are having a strong effect on energy consumption. These factors are believed to be related to actual occupant behaviour and the actual properties of the dwellings. Further energy reductions could be achieved by focusing on chang-es in occupant behaviour in relation to the use of the heating and ventilation systems. In addition, thermal quality seems to be more effective than heat-ing-system efficiency in reducing energy consumption for space heating.
The higher expected energy consumption in comparison to the actual ener-gy consumption suggests large differences between the assumed and the actual occupant behaviour. More accurate information on the actual occu-pant behaviour and the identification of behaviour patterns to build energy-user profiles might improve the energy predictions in the energy performance regulations. Although accurate energy prediction is not the aim of the EPC, a better estimation of the actual energy performance and the actual energy savings expected from the introduction or tightening of building regulations, could be achieved.
Infiltration values, insulation levels and other building characteristics might, in reality, be different from those stated in the EPC calculation, there-by undermining the effect of the energy performance regulations. Further research should be aimed at determining whether the real quality of dwell-ings corresponds with the characteristics described in the EPC document and at finding better methods to guarantee the quality of the construction work.
In previous studies correlations were found between building character-istics, occupant behaviour and household characteristics. To gain deeper insight into the real effect of building regulations on energy consumption, it
[ 80 ]
is necessary to understand the influence of building characteristics on occu-pant behaviour, especially in terms of the rebound effect identified in other studies. Such an effect might also be undermining the effectiveness of build-ing regulations.
Given that a tighter EPC did not lower energy consumption for heating and that 78 to 82% of the variation in energy consumption is still unexplained, it might be sensible to search for more efficient means to further lower the energy consumption of recently built housing. This could be achieved by ensuring correct realisation and monitoring of the calculated performanc-es, by paying attention to the knowledge needed by contractors, by imple-menting an effective building control process (Visscher et al., 2003) and by the implementation of policies directed to influence occupant behaviour.
References
Beerepoot, M. & N. Beerepoot (2007), Government Regulations as an Impe-tus for Innovations. Evidence for Energy Performance Regulation in the Dutch Residential Building Sector, Energy Policy, 35, pp. 4812-4825.
Branco, G., B. Lachal, P. Gallinelli & W. Weber (2004), Expected versus Observed Heat Consumption of a Low Energy Multifamily Complex in Switzerland based on Long-term Experimental Data, Energy and Buildings, 36, pp. 543-555.
Caldera, M., S.P. Corgnati & M. Filippi (2008), Energy Demand for Space Heat-ing through a Statistical Approach: application to residential buildings, Ener-gy and Buildings, 40, pp. 1972-1983.
Elkhuizen, P., J.E. Scholten & E. Rooiakkers (2006), Quality Control of HVAC services: evaluation of existing instruments and a vision for the future [in Dutch], TNO Bouw/Halmos report for Senter Novem.
Gommans, L.J. (2008), Energie prestaties van energie-efficiënt gebouwen: tus-sen ontwerp en werkelijkheid, TVVL magazine, September 2008, pp. 18-24.
Haas, R., H. Auer & P. Biermayr (1998), The Impact of Consumer Behaviour on Residential Energy Demand for Space Heating, Energy and Buildings, 27, pp. 195-205.
Hirst, E. & R. Goeltz (1985), Comparison of Actual Energy Saving with Audit Predictions for Homes in the North Central Region of the USA, Building and
[ 81 ]
Environment, 20 (1), pp. 1-6.
Itard, L. & F. Meijer (2008), Towards a Sustainable Northern European Housing Stock. Figures, facts and future, IOS Press, Amsterdam.
Itard, L., A. Meijer & O. Guerra Santin (2009), Consumentenonderzoek Lenteakkoord, OTB/TU Delft report, Delft.
Jeeninga, H., M. Uyterlinde & J. Uitzinger (2001), Energieverbruik van energiezuinige wonin-gen, Report ECN & IVAM, ECN-C-01-072.
Leidelmeijer, K. & P. van Grieken (2005), Wonen en Energie. Stook- en ventilatiegedrag van hu-ishoudens, Report RIGO/VROM 86430.
Leth-Petersen S. & M. Togeby (2001), Demand for Space Heating in Apartment Blocks: measur-ing effect of policy measures aiming at reducing energy consumption, Energy Economics, 23, pp. 387-403.
NEN 5128 norm (2001).
NEN 5128 (2004), Energy Performance of Residential functions and residential buildings: de-termination method, ics 91.120.10, March.
Nieman (2007), Eindrapportage woonkwaliteit binnenmilieu in nieuwbouwwoning, Report Wu060315aaA4.PK, VROM Inspectie Regio Oost, Arnhem.
Olofsson, T., S. Andersson & J.U. Sjogren (2009), Building Energy Parameter Investigations based on Multivariate Analysis, Energy and Buildings, 41, pp. 71-80.
PRC Bouwcentrum BV (2004), EPC en energieverbruik nieuwbouwwoningen, Report Novem, Kompas Utrecht.
Sardianou, E. (2008), Estimating Space Heating Determinants: an analysis of Greek house-holds, Energy and Buildings, 40, pp. 1084-1093.
Schuler, A., C. Weber & U. Fahl (2000), Energy Consumption for Space Heating of West-German Household: empirical evidence, scenario projections and policy implications, Energy Policy, 28, pp. 877-894.
Sonderegger, R.C. (1977-78), Movers and Stayers: the resident’s contribution to variation across houses in energy consumption for space heating, Energy and Buildings, 1, pp. 313-324.
Tiberiu, C., J. Virgone & E. Blanco (2008), Development and Validation of Regression Models to
[ 82 ]
Predict Monthly Heating Demand for Residential Buildings, Energy and Build-ings, 40, pp. 1825-1832.Uitzinger, J. (2004), Analyse EPC en energieverbruik bij woningen, Report IVAM/ SenterNovem. Visscher, H.J., F.M. Meijer & L. Sheridan (2003), Effective and efficient building control, proceedings CIB-CTBUH International Conference on Tall Buildings, Strategies for performance in the aftermath of the World Trade Centre, Malay-sia, 8-10 May, pp. 721-726.
Vringer, C.R., 2005, Analysis of the requirements for household consumption, Netherlands Environmental Assessment Agency, Bilthoven [thesis, ISBN 90-6960-1303].
Website: www.kwa.nl, accessed August 2009.
Website: www.utrecht.nl, accessed July 2009.
Website: www.vrom.nl, accessed July 2009.
Website: www.wateringseveld.nl, accessed July 2009.

[ 83 ]

[ 84 ]

[ 85 ]
4 Occupants’ behaviour Determinants and effects on residential heating consumption
Guerra-Santin, O. & L Itard (2010), Occupants’ behaviour: deter-minants and effects on residential heating consumption, Building Research & Information, 38 (3), pp. 318-338.
AbstractWhat are the key determinants and effects of occupants’ behaviour on energy use for space heating? Statistical analyses were carried out on energy use and self-reported behaviour data from a household survey in the Netherlands. Re-sults showed that the number of usage hours for the heating system have a stronger effect on energy consumption than temperature setting. Small cor-relations were found between energy use and the ventilation system, since most households barely use the ventilation system. The main building char-acteristic determining behaviour is the type of temperature control. House-holds with a programmable thermostat were more likely to keep the radia-tors turned on for more hours than households with a manual thermostat or manual valves on radiators. In relation to household characteristics, the pres-ence of elderly persons in the household proved to be a determining factor in the use of the heating system and ventilation. As a result of wide variations in preferences and lifestyle, occupant behaviour has emerged as an important contributor to energy use in dwellings. The results indicate that the type of heating and ventilation system has an influence on occupant behaviour.
4.1 Introduction
Although building characteristics are known to have a significant effect on energy consumption, their influence in residential buildings has decreased in recent years because governments worldwide have introduced regulations and policies to raise energy performance in the built environment. These reg-ulations are designed first and foremost to increase system efficiency and to improve the thermal properties of new buildings. Meanwhile, renovation programmes are being launched to raise the energy performance of existing buildings.
In 1995 the energy efficiency regulations in the Netherlands were expand-ed to include the EPC (Energy Performance Coefficient). The EPC is calculated on the basis of the energy used for space and water heating, ventilation, light-ing, the efficiency of the installations, and the size of the dwelling. The calcu-lation of energy used for space heating also takes account of solar and inter-nal heat gains and losses through transmission.
These measures, along with ongoing improvements to systems efficiency,

[ 86 ]
materials and construction methods, have significantly reduced the amount of energy used for space heating (Leth-Petersen & Togeby, 2001; Beerepoot & Beerepoot, 2007; Jeeninga et al., 2001). However, studies have indicated that as buildings become more energy-efficient, the behaviour of occupants plays an increasingly important role in consumption (Jeeninga et al., 2001; de Groot et al., 2008; Haas et al., 1998; Papakostas & Satiropoulos, 1997; Andersen et al., 2009). Indeed, the wide variation in energy consumption in buildings with the same physical characteristics is attributed to differences in occupancy pat-terns (Jeeninga et al., 2001; Haas et al., 1998; Linden et al., 2006; Branco et al., 2004) and differences between the calculated and real performance.
Occupancy patterns may be determined by lifestyle, preferences, attitudes, perceptions of comfort, personal background and household characteristics (Andersen et al., 2009; Schweiker & Shukuya, 2009). The results of a study in Japan by Schweiker & Shukuya (2009) indicate that the way people use heat-ing systems is determined more by personal factors such as experience, atti-tude and origin than external conditions. In a Danish study on behaviour, control of HVAC systems and indoor environment, Andersen et al. (2009) found that ventilation and heating behaviour is influenced by, amongst oth-ers, perception, gender and ownership.
The use of heating and ventilation systems can also be influenced by the type of HVAC system in the dwelling. Various authors (Nicol & Humphreys, 2009; de Dear, 2004; Lenzuni et al., 2008; Karjalalainen, 2007; Lan et al., 2008; Moujalled et al., 2008; Ye et al., 2006; Fundamentals volume of the ASHRAE Handbook, 2005) contend that a dynamic interaction between the occupants and the building is crucial in raising levels of comfort. Becker & Pacuik (2009) maintain that thermal adaptation processes are linked to contextual varia-bles such as local climate, occupant expectations and ability to control the environment. Their results of a survey that collected data on hygro-thermal conditions and occupant behaviour pointed to a relationship between ther-mal responses and control and interaction processes in the indoor environ-ment. According to Brown & Cole (2009), the interplay between knowledge, personal control of HVACs and comfort is complex, since there is a relation-ship between knowledge and control, but no relationship with comfort.
Several studies have focused on the effect of the type of thermostat con-trol on energy use, based on the assumption that households with program-mable thermostats set the temperature at a lower level when nobody is home or during night time (setback behaviour). Therefore, a reduction on energy use is assumed in households with programmable thermostat in comparison to households with manual thermostats or no thermostat control.
Nevius & Pigg (2000) carried out a study in 299 houses. They asked the ther-mostat setting during determined times of the day and the average number of hours per week present at home. They found that the presence of ther-mostat has a minimal effect on energy use, and temperature settings do not
[ 87 ]
significantly differ between dwellings with programmable thermostats and dwellings with manual thermostat. In a study on 427 households, Shipworth et al. (2010) found that in dwellings with thermostats, the mean tempera-ture setting is slightly lower than in dwellings without thermostat. They also found that households with programmable thermostat keep the heating sys-tem on for a longer time than households with manual thermostats, though the difference was not statistically significant at .05 level.
In a survey on 279 houses in California, Lutzenhiser (1992) found that households with manual thermostats used less energy in comparison to households with programmable thermostats. According to him manual con-trol involves the deliberate cooling of people or the deliberate preparation of cool space for people, while automatic cooling occurs regardless of occupan-cy or activity.
Conner & Lucas (1990) measured indoor temperature and gathered data on self-reported heating behaviour on 400 households. They found that temper-ature setting in dwellings with programmable thermostats decreased only by 0.50F in comparison to dwellings with manual thermostats. They conclude that programmable thermostats do not significantly decrease the incidence of setback behaviour.
In a previous chapter (Chapter 2) it was found that 42% of the variation in the energy consumed in the Dutch housing stock for heating space and water could be explained by type of dwelling, type of HVAC system, and insulation level. An additional 4.2% could be explained by household characteristics and occupant behaviour. The household characteristics that influenced ener-gy consumption were size, age of respondent, type of ownership, and income. The behavioural influences were the number of heated bedrooms and ther-mostat settings. Nevertheless, only few variables related to occupant behav-iour were investigated. The first part of this study (previous chapter), on the effect of building regulations on energy consumption in dwellings that were built after the introduction of the energy performance regulations, highlight-ed the importance of insulation levels in the variation in energy consump-tion. That said, there are still wide variations in the energy consumption of dwellings with the same EPC. These could be caused by the actual thermal quality of the dwellings and by differences in occupant behaviour.
Energy consumption could be reduced still further if we had a clearer idea of occupant behavioural patterns (trends in the use of heating and ventila-tion systems) that underlie the wide variation in energy consumption. In this paper we seek to determine the importance of occupant behaviour in levels of energy consumption in dwellings built after 1995, the year when energy per-formance requirements were introduced in the Netherlands. The ultimate aim is to ascertain how occupant behaviour influences the effectiveness of building regulations and to gain insight into the relationships between behav-iour, HVAC systems and household characteristics.
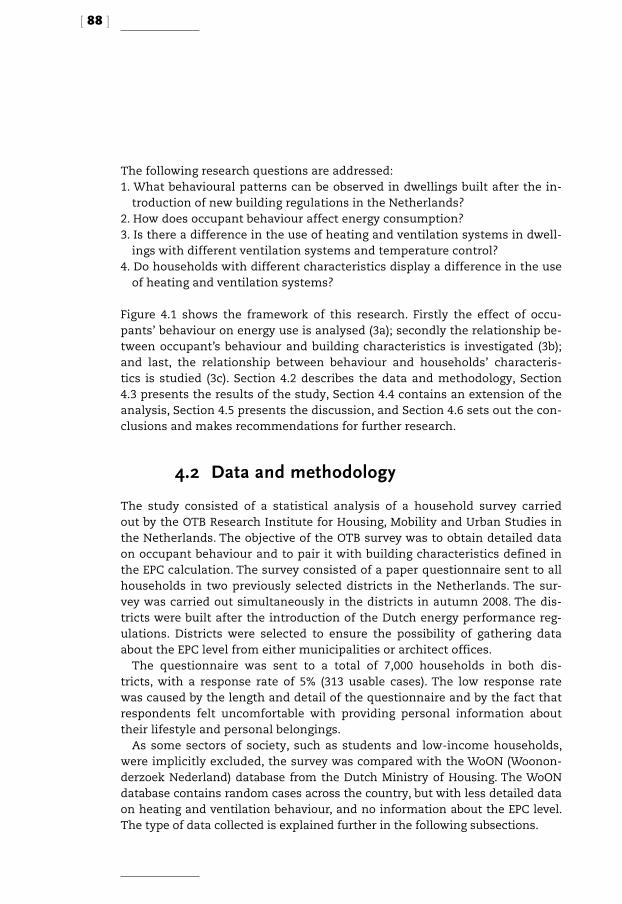
[ 88 ]
The following research questions are addressed:1. What behavioural patterns can be observed in dwellings built after the in-
troduction of new building regulations in the Netherlands?2. How does occupant behaviour affect energy consumption?3. Is there a difference in the use of heating and ventilation systems in dwell-
ings with different ventilation systems and temperature control?4. Do households with different characteristics display a difference in the use
of heating and ventilation systems?
Figure 4.1 shows the framework of this research. Firstly the effect of occu-pants’ behaviour on energy use is analysed (3a); secondly the relationship be-tween occupant’s behaviour and building characteristics is investigated (3b); and last, the relationship between behaviour and households’ characteris-tics is studied (3c). Section 4.2 describes the data and methodology, Section 4.3 presents the results of the study, Section 4.4 contains an extension of the analysis, Section 4.5 presents the discussion, and Section 4.6 sets out the con-clusions and makes recommendations for further research.
4.2 Data and methodology
The study consisted of a statistical analysis of a household survey carried out by the OTB Research Institute for Housing, Mobility and Urban Studies in the Netherlands. The objective of the OTB survey was to obtain detailed data on occupant behaviour and to pair it with building characteristics defined in the EPC calculation. The survey consisted of a paper questionnaire sent to all households in two previously selected districts in the Netherlands. The sur-vey was carried out simultaneously in the districts in autumn 2008. The dis-tricts were built after the introduction of the Dutch energy performance reg-ulations. Districts were selected to ensure the possibility of gathering data about the EPC level from either municipalities or architect offices.
The questionnaire was sent to a total of 7,000 households in both dis-tricts, with a response rate of 5% (313 usable cases). The low response rate was caused by the length and detail of the questionnaire and by the fact that respondents felt uncomfortable with providing personal information about their lifestyle and personal belongings.
As some sectors of society, such as students and low-income households, were implicitly excluded, the survey was compared with the WoON (Woonon-derzoek Nederland) database from the Dutch Ministry of Housing. The WoON database contains random cases across the country, but with less detailed data on heating and ventilation behaviour, and no information about the EPC level. The type of data collected is explained further in the following subsections.
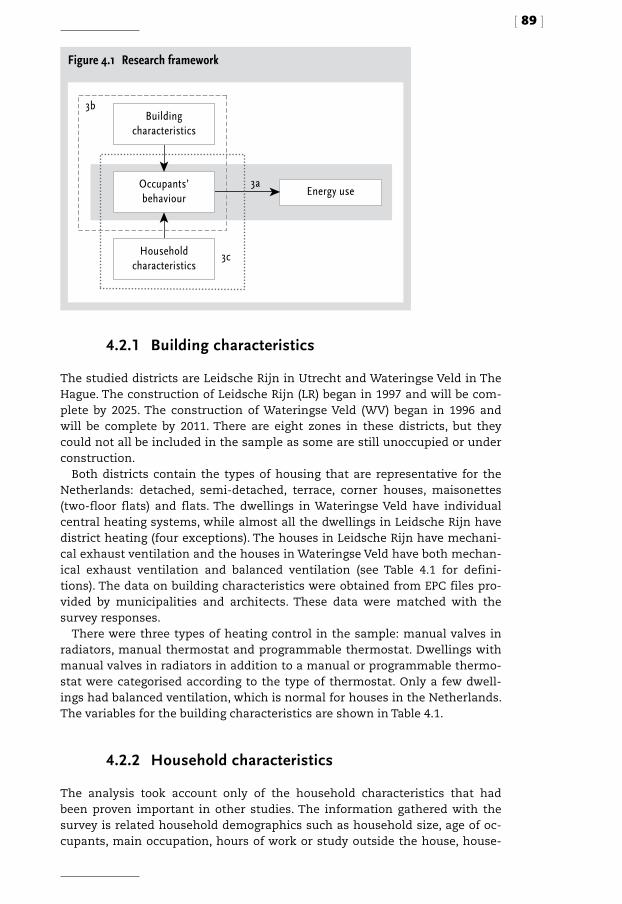
[ 89 ]
4.2.1 Building characteristics
The studied districts are Leidsche Rijn in Utrecht and Wateringse Veld in The Hague. The construction of Leidsche Rijn (LR) began in 1997 and will be com-plete by 2025. The construction of Wateringse Veld (WV) began in 1996 and will be complete by 2011. There are eight zones in these districts, but they could not all be included in the sample as some are still unoccupied or under construction.
Both districts contain the types of housing that are representative for the Netherlands: detached, semi-detached, terrace, corner houses, maisonettes (two-floor flats) and flats. The dwellings in Wateringse Veld have individual central heating systems, while almost all the dwellings in Leidsche Rijn have district heating (four exceptions). The houses in Leidsche Rijn have mechani-cal exhaust ventilation and the houses in Wateringse Veld have both mechan-ical exhaust ventilation and balanced ventilation (see Table 4.1 for defini-tions). The data on building characteristics were obtained from EPC files pro-vided by municipalities and architects. These data were matched with the survey responses.
There were three types of heating control in the sample: manual valves in radiators, manual thermostat and programmable thermostat. Dwellings with manual valves in radiators in addition to a manual or programmable thermo-stat were categorised according to the type of thermostat. Only a few dwell-ings had balanced ventilation, which is normal for houses in the Netherlands. The variables for the building characteristics are shown in Table 4.1.
4.2.2 Household characteristics
The analysis took account only of the household characteristics that had been proven important in other studies. The information gathered with the survey is related household demographics such as household size, age of oc-cupants, main occupation, hours of work or study outside the house, house-
Figure 4.1 Research framework
Energy use3aOccupants’
behaviour
Building characteristics
3b
3cHousehold characteristics

[ 90 ]
hold income, years of residence in the house and type of previous dwelling. As some authors had reported a relationship between age and energy con-sumption, the dichotomous variables ‘presence of elderly persons in the household’ and ‘presence of children in the household’ were analysed. Elderly was defined as occupants over the age of 65 and children as occupants under the age of 12. Educational level was defined as a categorical variable compris-ing three groups: lower education, middle education or technical education and higher education. Income level was defined as a categorical variable (ac-cording to the Dutch Central Bureau Statistics) and refers to the total house-hold income (for definitions see Table 4.1).
The current use of the heating and ventilation system could also be influ-enced by the set-up in the previous house. Since the survey was carried out in relatively new dwellings, the respondents were asked to state whether they had previously lived in a single-family or multi-family dwelling (for defini-tions see Table 4.1).
4.2.3 Occupants’ behaviour
The questionnaire included questions on household characteristics, use of heating and ventilation systems, showering and bathing frequency and ener-gy consumption. The occupants were asked to fill in tables, showing the use of the systems and the time spent at home on weekdays and weekends in winter and summer. Since the survey was carried out in autumn, they were asked to consider their behaviour for a summer and winter week without ex-treme weather conditions (too much wind, rain or cold). Tables were used to collect data on the duration and times that the heating and ventilation sys-tems were used; and on the use of the different rooms in the house.
The data collected in the survey took as far as possible the form of contin-uous variables. All variables were checked for normality and outliers. A Kol-mogorov-Smirnov test was performed to check for kurtosis, skewness and normality of distribution. The non-normal variables were checked for outliers. Since outliers seemed to be accurate data, non-normal variables were either transformed according to their shape with base 10 logarithm or square root (Field 2005), or converted into categories. In cases where this was not possi-
Photo rightWateringe Veld
Photo leftLeidsche Rijn
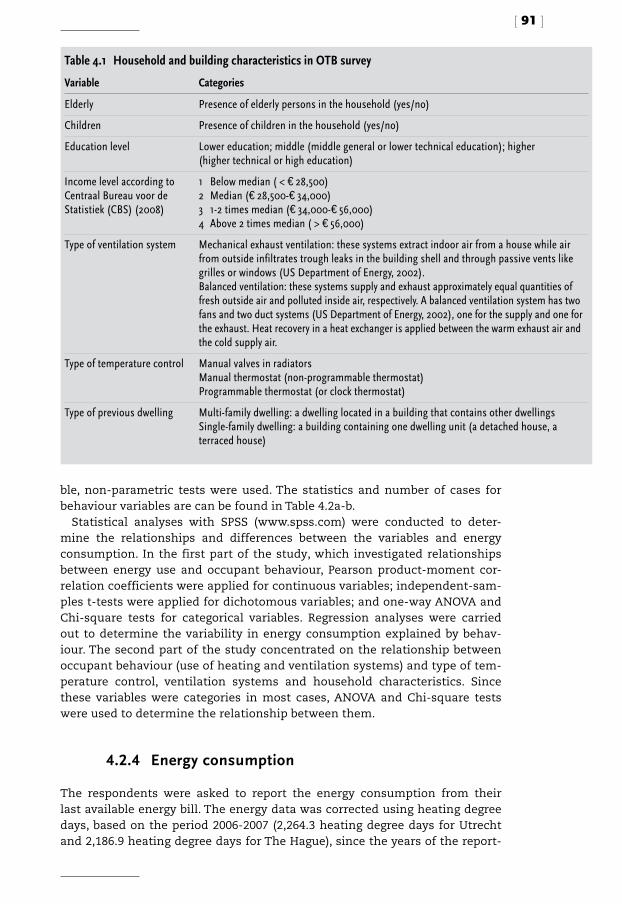
[ 91 ]
ble, non-parametric tests were used. The statistics and number of cases for behaviour variables are can be found in Table 4.2a-b.
Statistical analyses with SPSS (www.spss.com) were conducted to deter-mine the relationships and differences between the variables and energy consumption. In the first part of the study, which investigated relationships between energy use and occupant behaviour, Pearson product-moment cor-relation coefficients were applied for continuous variables; independent-sam-ples t-tests were applied for dichotomous variables; and one-way ANOVA and Chi-square tests for categorical variables. Regression analyses were carried out to determine the variability in energy consumption explained by behav-iour. The second part of the study concentrated on the relationship between occupant behaviour (use of heating and ventilation systems) and type of tem-perature control, ventilation systems and household characteristics. Since these variables were categories in most cases, ANOVA and Chi-square tests were used to determine the relationship between them.
4.2.4 Energy consumption
The respondents were asked to report the energy consumption from their last available energy bill. The energy data was corrected using heating degree days, based on the period 2006-2007 (2,264.3 heating degree days for Utrecht and 2,186.9 heating degree days for The Hague), since the years of the report-
Table 4.1 Household and building characteristics in OTB survey
Variable Categories
Elderly Presence of elderly persons in the household (yes/no)
Children Presence of children in the household (yes/no)
Education level Lower education; middle (middle general or lower technical education); higher (higher technical or high education)
Income level according to Centraal Bureau voor de Statistiek (CBS) (2008)
1 Below median ( < € 28,500)2 Median (€ 28,500-€ 34,000)3 1-2 times median (€ 34,000-€ 56,000)4 Above 2 times median ( > € 56,000)
Type of ventilation system Mechanical exhaust ventilation: these systems extract indoor air from a house while air from outside infiltrates trough leaks in the building shell and through passive vents like grilles or windows (US Department of Energy, 2002).Balanced ventilation: these systems supply and exhaust approximately equal quantities of fresh outside air and polluted inside air, respectively. A balanced ventilation system has two fans and two duct systems (US Department of Energy, 2002), one for the supply and one for the exhaust. Heat recovery in a heat exchanger is applied between the warm exhaust air and the cold supply air.
Type of temperature control Manual valves in radiatorsManual thermostat (non-programmable thermostat)Programmable thermostat (or clock thermostat)
Type of previous dwelling Multi-family dwelling: a dwelling located in a building that contains other dwellingsSingle-family dwelling: a building containing one dwelling unit (a detached house, a terraced house)
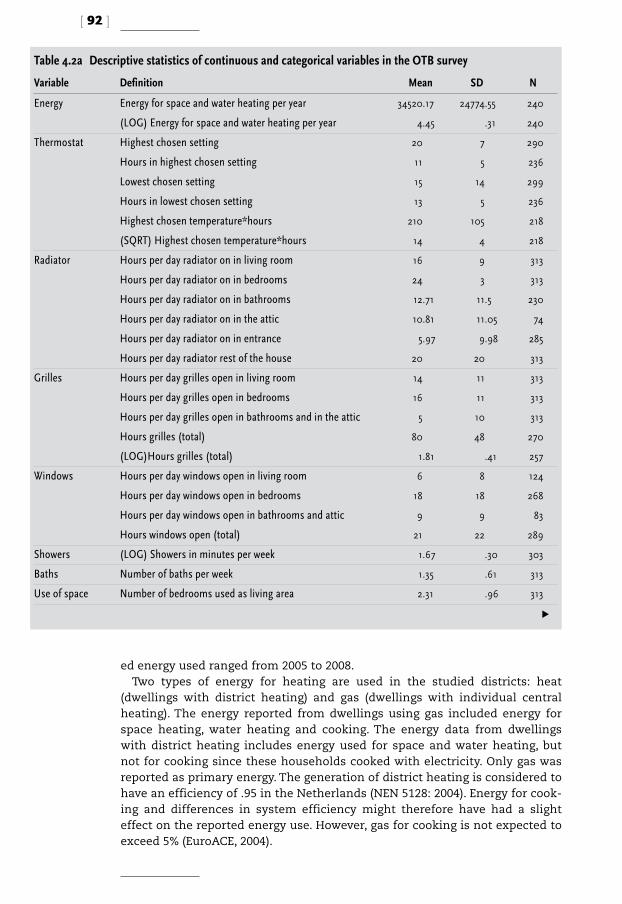
[ 92 ]
ed energy used ranged from 2005 to 2008. Two types of energy for heating are used in the studied districts: heat
(dwellings with district heating) and gas (dwellings with individual central heating). The energy reported from dwellings using gas included energy for space heating, water heating and cooking. The energy data from dwellings with district heating includes energy used for space and water heating, but not for cooking since these households cooked with electricity. Only gas was reported as primary energy. The generation of district heating is considered to have an efficiency of .95 in the Netherlands (NEN 5128: 2004). Energy for cook-ing and differences in system efficiency might therefore have had a slight effect on the reported energy use. However, gas for cooking is not expected to exceed 5% (EuroACE, 2004).
Table 4.2a Descriptive statistics of continuous and categorical variables in the OTB survey
Variable Definition Mean SD N
Energy Energy for space and water heating per year 34520.17 24774.55 240
(LOG) Energy for space and water heating per year 4.45 .31 240
Thermostat Highest chosen setting 20 7 290
Hours in highest chosen setting 11 5 236
Lowest chosen setting 15 14 299
Hours in lowest chosen setting 13 5 236
Highest chosen temperature*hours 210 105 218
(SQRT) Highest chosen temperature*hours 14 4 218
Radiator Hours per day radiator on in living room 16 9 313
Hours per day radiator on in bedrooms 24 3 313
Hours per day radiator on in bathrooms 12.71 11.5 230
Hours per day radiator on in the attic 10.81 11.05 74
Hours per day radiator on in entrance 5.97 9.98 285
Hours per day radiator rest of the house 20 20 313
Grilles Hours per day grilles open in living room 14 11 313
Hours per day grilles open in bedrooms 16 11 313
Hours per day grilles open in bathrooms and in the attic 5 10 313
Hours grilles (total) 80 48 270
(LOG)Hours grilles (total) 1.81 .41 257
Windows Hours per day windows open in living room 6 8 124
Hours per day windows open in bedrooms 18 18 268
Hours per day windows open in bathrooms and attic 9 9 83
Hours windows open (total) 21 22 289
Showers (LOG) Showers in minutes per week 1.67 .30 303
Baths Number of baths per week 1.35 .61 313
Use of space Number of bedrooms used as living area 2.31 .96 313
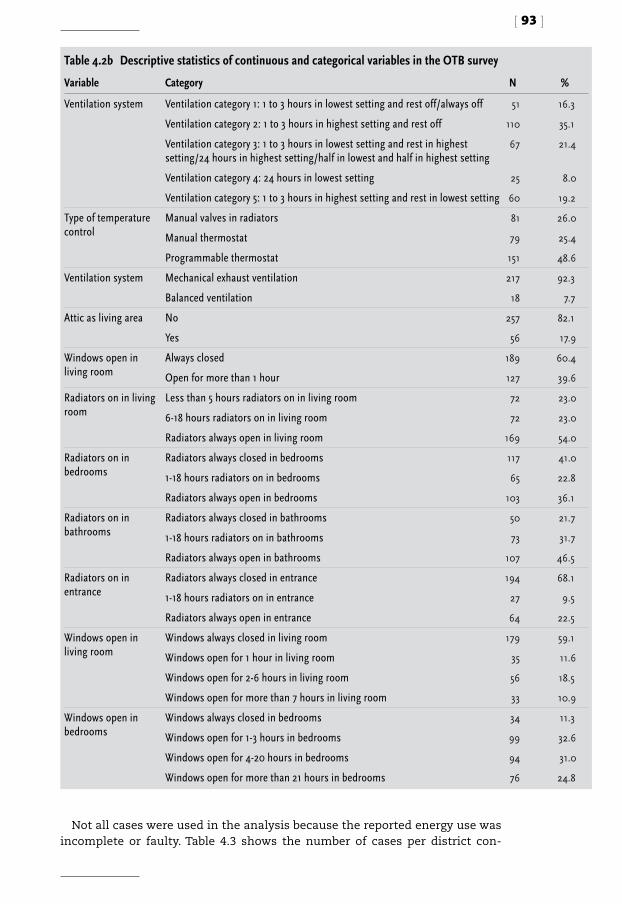
[ 93 ]
Not all cases were used in the analysis because the reported energy use was incomplete or faulty. Table 4.3 shows the number of cases per district con-
Table 4.2b Descriptive statistics of continuous and categorical variables in the OTB survey
Variable Category N %
Ventilation system Ventilation category 1: 1 to 3 hours in lowest setting and rest off/always off 51 16.3
Ventilation category 2: 1 to 3 hours in highest setting and rest off 110 35.1
Ventilation category 3: 1 to 3 hours in lowest setting and rest in highest setting/24 hours in highest setting/half in lowest and half in highest setting
67 21.4
Ventilation category 4: 24 hours in lowest setting 25 8.0
Ventilation category 5: 1 to 3 hours in highest setting and rest in lowest setting 60 19.2
Type of temperature control
Manual valves in radiators 81 26.0
Manual thermostat 79 25.4
Programmable thermostat 151 48.6
Ventilation system Mechanical exhaust ventilation 217 92.3
Balanced ventilation 18 7.7
Attic as living area No 257 82.1
Yes 56 17.9
Windows open in living room
Always closed 189 60.4
Open for more than 1 hour 127 39.6
Radiators on in living room
Less than 5 hours radiators on in living room 72 23.0
6-18 hours radiators on in living room 72 23.0
Radiators always open in living room 169 54.0
Radiators on in bedrooms
Radiators always closed in bedrooms 117 41.0
1-18 hours radiators on in bedrooms 65 22.8
Radiators always open in bedrooms 103 36.1
Radiators on in bathrooms
Radiators always closed in bathrooms 50 21.7
1-18 hours radiators on in bathrooms 73 31.7
Radiators always open in bathrooms 107 46.5
Radiators on in entrance
Radiators always closed in entrance 194 68.1
1-18 hours radiators on in entrance 27 9.5
Radiators always open in entrance 64 22.5
Windows open in living room
Windows always closed in living room 179 59.1
Windows open for 1 hour in living room 35 11.6
Windows open for 2-6 hours in living room 56 18.5
Windows open for more than 7 hours in living room 33 10.9
Windows open in bedrooms
Windows always closed in bedrooms 34 11.3
Windows open for 1-3 hours in bedrooms 99 32.6
Windows open for 4-20 hours in bedrooms 94 31.0
Windows open for more than 21 hours in bedrooms 76 24.8
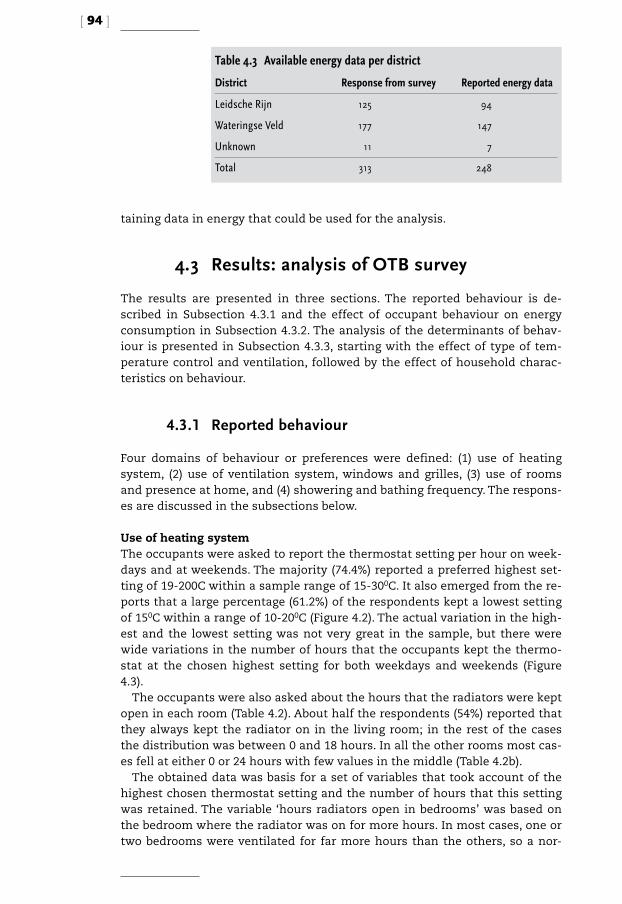
[ 94 ]
taining data in energy that could be used for the analysis.
4.3 Results: analysis of OTB survey
The results are presented in three sections. The reported behaviour is de-scribed in Subsection 4.3.1 and the effect of occupant behaviour on energy consumption in Subsection 4.3.2. The analysis of the determinants of behav-iour is presented in Subsection 4.3.3, starting with the effect of type of tem-perature control and ventilation, followed by the effect of household charac-teristics on behaviour.
4.3.1 Reported behaviour
Four domains of behaviour or preferences were defined: (1) use of heating system, (2) use of ventilation system, windows and grilles, (3) use of rooms and presence at home, and (4) showering and bathing frequency. The respons-es are discussed in the subsections below.
Use of heating systemThe occupants were asked to report the thermostat setting per hour on week-days and at weekends. The majority (74.4%) reported a preferred highest set-ting of 19-200C within a sample range of 15-300C. It also emerged from the re-ports that a large percentage (61.2%) of the respondents kept a lowest setting of 150C within a range of 10-200C (Figure 4.2). The actual variation in the high-est and the lowest setting was not very great in the sample, but there were wide variations in the number of hours that the occupants kept the thermo-stat at the chosen highest setting for both weekdays and weekends (Figure 4.3).
The occupants were also asked about the hours that the radiators were kept open in each room (Table 4.2). About half the respondents (54%) reported that they always kept the radiator on in the living room; in the rest of the cases the distribution was between 0 and 18 hours. In all the other rooms most cas-es fell at either 0 or 24 hours with few values in the middle (Table 4.2b).
The obtained data was basis for a set of variables that took account of the highest chosen thermostat setting and the number of hours that this setting was retained. The variable ‘hours radiators open in bedrooms’ was based on the bedroom where the radiator was on for more hours. In most cases, one or two bedrooms were ventilated for far more hours than the others, so a nor-
Table 4.3 Available energy data per district
District Response from survey Reported energy data
Leidsche Rijn 125 94
Wateringse Veld 177 147
Unknown 11 7
Total 313 248
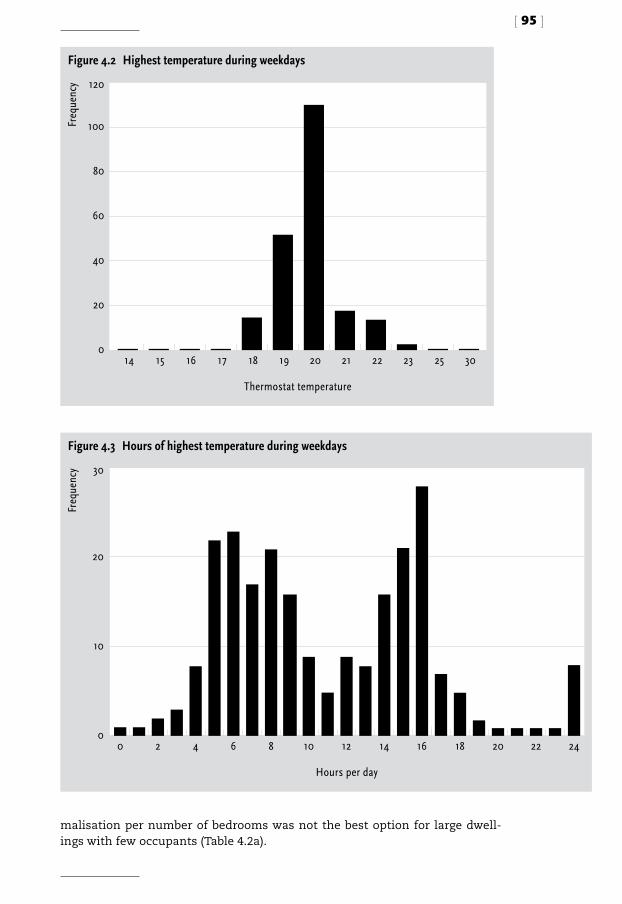
[ 95 ]
malisation per number of bedrooms was not the best option for large dwell-ings with few occupants (Table 4.2a).
0
20
40
60
80
100
120
302523222120191817161514
Figure 4.2 Highest temperature during weekdays
Thermostat temperature
Freq
uenc
y
0
10
20
30
16 18 20 22 2414121086420
Freq
uenc
y
Figure 4.3 Hours of highest temperature during weekdays
Hours per day
[ 96 ]
Ventilation: windows, grilles and mechanical ventilation 40% of the respondents reported that they opened the windows in the living room for a few hours a day in the winter. Only 8.1% kept them open all the time. A larger percentage always kept the windows open in the bedrooms, at-tic and bathrooms. Table 4.2b shows the statistics for open windows.
Grilles for air supply were mostly either open or closed all day in all rooms in all dwellings. More than half the respondents said that they always kept the grilles open in the living room and bedrooms. Most respondents said that the grilles in the remaining space were kept closed (bathroom, attic, entrance). Table 4.2a shows the statistics for open grilles per room.
The respondents were asked to report the setting of the ventilation system (mechanical exhaust or balanced) per hour. Most said that the ventilation was almost always off or in the lowest setting and that they increased the setting when cooking or taking a shower. Table 4.2b shows the statistics for hours per setting per week. Five main patterns of use were found (see Table 4.2b).
Showers and bathsThe users reported the number of showers taken by each family member per week and the usual duration. The duration in minutes of the shower use (for the complete household) per week was divided by household size. Users also reported the number the times a week that the bath was used (Table 4.2a). Ta-ble 4.2a-b presents the variables used in the analysis.
4.3.2 Effect of occupant behaviour on energy use
This section explores the relationships between occupant behaviour and en-ergy use. A variety of statistical tests were used according to the characteris-tics of the behaviour variables. For parametric variables (normal form) Pear-son product-moment correlation coefficients were used to determine the ef-fect of behaviour on energy use. Pearson’s p correlation coefficients were used for continuous but non-normal variables. For dichotomous variables, inde-pendent-samples t-tests were used to determine differences on energy use for different groups. For categorical variables, one-way ANOVA tests were used to determine the difference on energy use among groups.
A small positive correlation was found between ‘energy use’ and number of bedrooms used as a living area, hours in highest chosen temperature setting, hours with grilles open (transformed with base 10 logarithm), and with the hours with radiators on in living room, bedrooms, bathrooms, and entrance. No correlations were found at a significance level of .05 for the highest or lowest temperature setting (see Table 4.4 for statistics).
Since the data on gas use includes the energy used for heating water, the correlation between showers and baths frequency and energy use was ana-
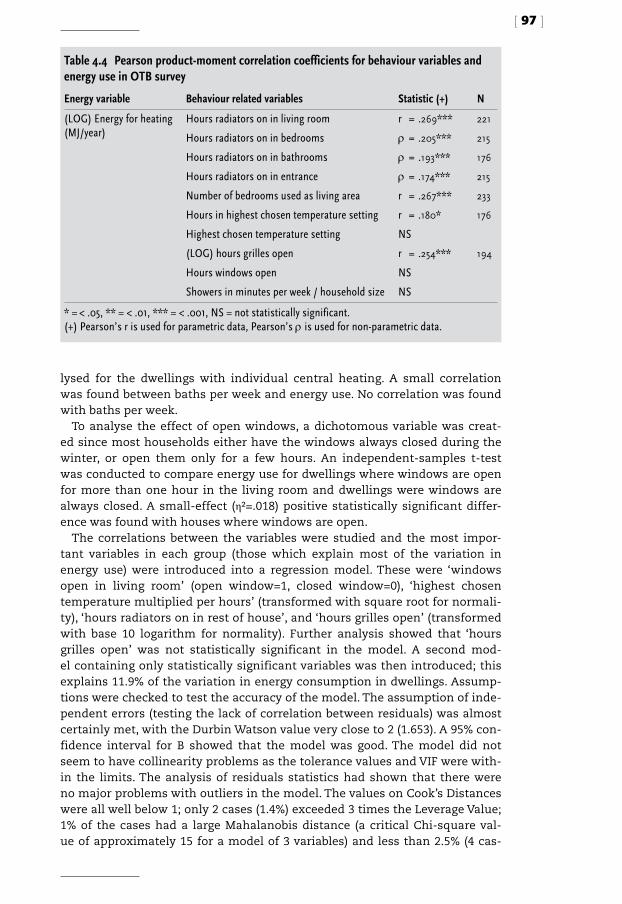
[ 97 ]
lysed for the dwellings with individual central heating. A small correlation was found between baths per week and energy use. No correlation was found with baths per week.
To analyse the effect of open windows, a dichotomous variable was creat-ed since most households either have the windows always closed during the winter, or open them only for a few hours. An independent-samples t-test was conducted to compare energy use for dwellings where windows are open for more than one hour in the living room and dwellings were windows are always closed. A small-effect (η2=.018) positive statistically significant differ-ence was found with houses where windows are open.
The correlations between the variables were studied and the most impor-tant variables in each group (those which explain most of the variation in energy use) were introduced into a regression model. These were ‘windows open in living room’ (open window=1, closed window=0), ‘highest chosen temperature multiplied per hours’ (transformed with square root for normali-ty), ‘hours radiators on in rest of house’, and ‘hours grilles open’ (transformed with base 10 logarithm for normality). Further analysis showed that ‘hours grilles open’ was not statistically significant in the model. A second mod-el containing only statistically significant variables was then introduced; this explains 11.9% of the variation in energy consumption in dwellings. Assump-tions were checked to test the accuracy of the model. The assumption of inde-pendent errors (testing the lack of correlation between residuals) was almost certainly met, with the Durbin Watson value very close to 2 (1.653). A 95% con-fidence interval for B showed that the model was good. The model did not seem to have collinearity problems as the tolerance values and VIF were with-in the limits. The analysis of residuals statistics had shown that there were no major problems with outliers in the model. The values on Cook’s Distances were all well below 1; only 2 cases (1.4%) exceeded 3 times the Leverage Value; 1% of the cases had a large Mahalanobis distance (a critical Chi-square val-ue of approximately 15 for a model of 3 variables) and less than 2.5% (4 cas-
Table 4.4 Pearson product-moment correlation coefficients for behaviour variables and energy use in OTB survey
Energy variable Behaviour related variables Statistic (+) N
(LOG) Energy for heating (MJ/year)
Hours radiators on in living room r = .269*** 221
Hours radiators on in bedrooms ρ = .205*** 215
Hours radiators on in bathrooms ρ = .193*** 176
Hours radiators on in entrance ρ = .174*** 215
Number of bedrooms used as living area r = .267*** 233
Hours in highest chosen temperature setting r = .180* 176
Highest chosen temperature setting NS
(LOG) hours grilles open r = .254*** 194
Hours windows open NS
Showers in minutes per week / household size NS
* = < .05, ** = < .01, *** = < .001, NS = not statistically significant.(+) Pearson’s r is used for parametric data, Pearson’s ρ is used for non-parametric data.
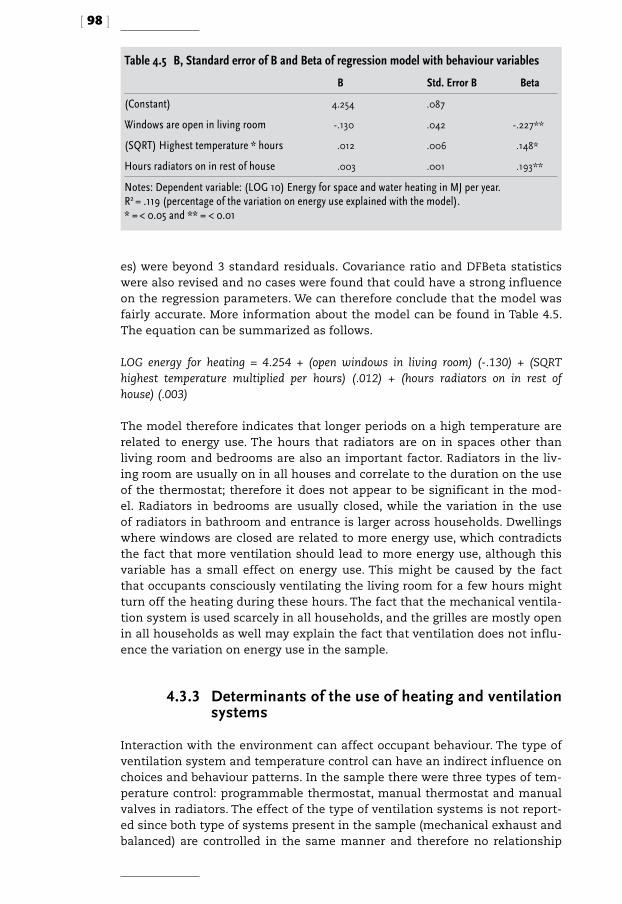
[ 98 ]
es) were beyond 3 standard residuals. Covariance ratio and DFBeta statistics were also revised and no cases were found that could have a strong influence on the regression parameters. We can therefore conclude that the model was fairly accurate. More information about the model can be found in Table 4.5. The equation can be summarized as follows.
LOG energy for heating = 4.254 + (open windows in living room) (-.130) + (SQRT highest temperature multiplied per hours) (.012) + (hours radiators on in rest of house) (.003)
The model therefore indicates that longer periods on a high temperature are related to energy use. The hours that radiators are on in spaces other than living room and bedrooms are also an important factor. Radiators in the liv-ing room are usually on in all houses and correlate to the duration on the use of the thermostat; therefore it does not appear to be significant in the mod-el. Radiators in bedrooms are usually closed, while the variation in the use of radiators in bathroom and entrance is larger across households. Dwellings where windows are closed are related to more energy use, which contradicts the fact that more ventilation should lead to more energy use, although this variable has a small effect on energy use. This might be caused by the fact that occupants consciously ventilating the living room for a few hours might turn off the heating during these hours. The fact that the mechanical ventila-tion system is used scarcely in all households, and the grilles are mostly open in all households as well may explain the fact that ventilation does not influ-ence the variation on energy use in the sample.
4.3.3 Determinants of the use of heating and ventilation systems
Interaction with the environment can affect occupant behaviour. The type of ventilation system and temperature control can have an indirect influence on choices and behaviour patterns. In the sample there were three types of tem-perature control: programmable thermostat, manual thermostat and manual valves in radiators. The effect of the type of ventilation systems is not report-ed since both type of systems present in the sample (mechanical exhaust and balanced) are controlled in the same manner and therefore no relationship
Table 4.5 B, Standard error of B and Beta of regression model with behaviour variables
B Std. Error B Beta
(Constant) 4.254 .087
Windows are open in living room -.130 .042 -.227**
(SQRT) Highest temperature * hours .012 .006 .148*
Hours radiators on in rest of house .003 .001 .193**
Notes: Dependent variable: (LOG 10) Energy for space and water heating in MJ per year.R2 = .119 (percentage of the variation on energy use explained with the model).* = < 0.05 and ** = < 0.01
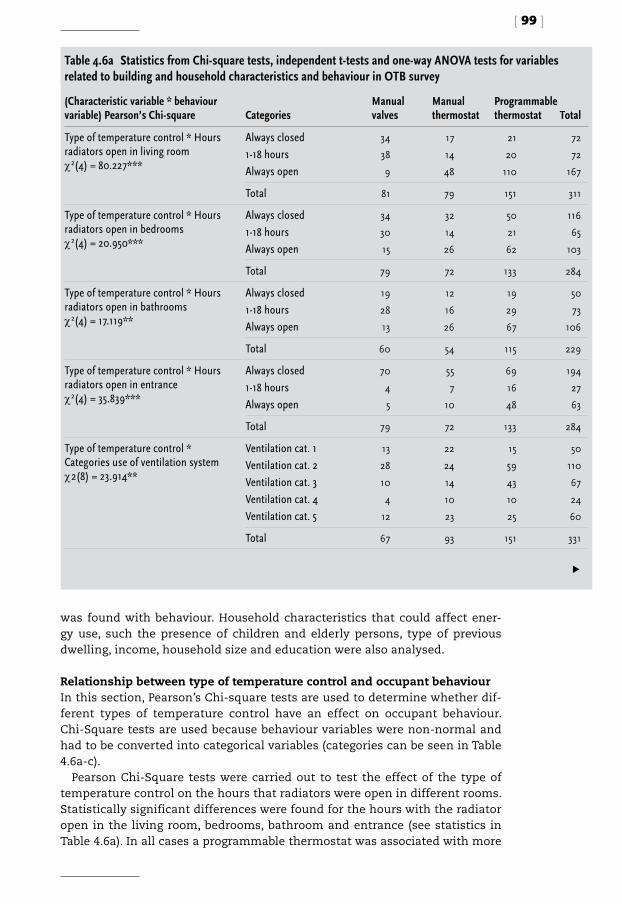
[ 99 ]
was found with behaviour. Household characteristics that could affect ener-gy use, such the presence of children and elderly persons, type of previous dwelling, income, household size and education were also analysed.
Relationship between type of temperature control and occupant behaviourIn this section, Pearson’s Chi-square tests are used to determine whether dif-ferent types of temperature control have an effect on occupant behaviour. Chi-Square tests are used because behaviour variables were non-normal and had to be converted into categorical variables (categories can be seen in Table 4.6a-c).
Pearson Chi-Square tests were carried out to test the effect of the type of temperature control on the hours that radiators were open in different rooms. Statistically significant differences were found for the hours with the radiator open in the living room, bedrooms, bathroom and entrance (see statistics in Table 4.6a). In all cases a programmable thermostat was associated with more
(Characteristic variable * behaviour variable) Pearson’s Chi-square Categories
Manual valves
Manual thermostat
Program mable thermostat Total
Type of temperature control * Hours radiators open in living roomχ2(4) = 80.227***
Always closed1-18 hoursAlways open
34
38
9
17
14
48
21
20
110
72
72
167
Total 81 79 151 311
Type of temperature control * Hours radiators open in bedroomsχ2(4) = 20.950***
Always closed1-18 hoursAlways open
34
30
15
32
14
26
50
21
62
116
65
103
Total 79 72 133 284
Type of temperature control * Hours radiators open in bathroomsχ2(4) = 17.119**
Always closed1-18 hoursAlways open
19
28
13
12
16
26
19
29
67
50
73
106
Total 60 54 115 229
Type of temperature control * Hours radiators open in entranceχ2(4) = 35.839***
Always closed1-18 hoursAlways open
70
4
5
55
7
10
69
16
48
194
27
63
Total 79 72 133 284
Type of temperature control * Categories use of ventilation systemχ2(8) = 23.914**
Ventilation cat. 1Ventilation cat. 2Ventilation cat. 3Ventilation cat. 4Ventilation cat. 5
13
28
10
4
12
22
24
14
10
23
15
59
43
10
25
50
110
67
24
60
Total 67 93 151 331
Table 4.6a Statistics from Chi-square tests, independent t-tests and one-way ANOVA tests for variables related to building and household characteristics and behaviour in OTB survey
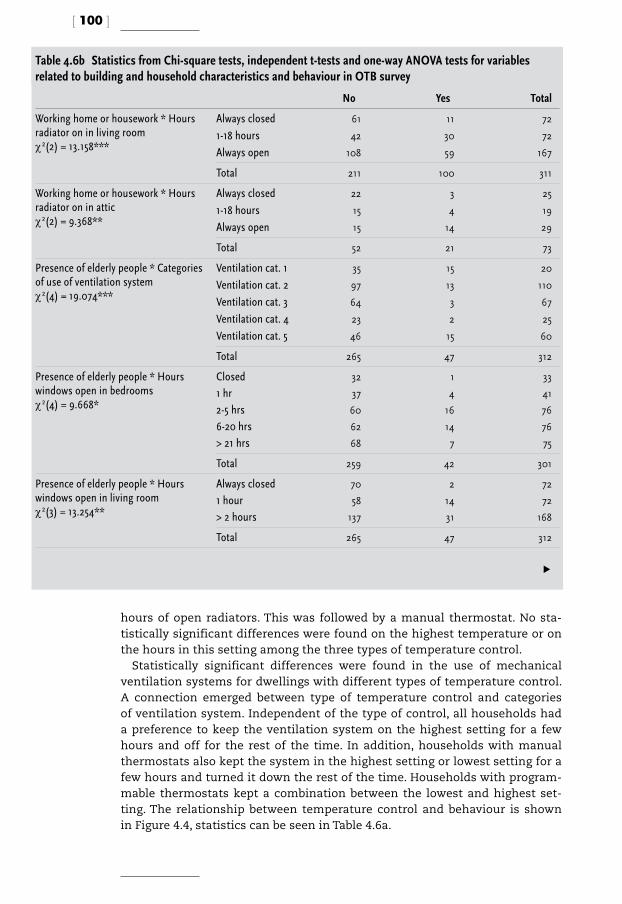
[ 100 ]
hours of open radiators. This was followed by a manual thermostat. No sta-tistically significant differences were found on the highest temperature or on the hours in this setting among the three types of temperature control.
Statistically significant differences were found in the use of mechanical ventilation systems for dwellings with different types of temperature control. A connection emerged between type of temperature control and categories of ventilation system. Independent of the type of control, all households had a preference to keep the ventilation system on the highest setting for a few hours and off for the rest of the time. In addition, households with manual thermostats also kept the system in the highest setting or lowest setting for a few hours and turned it down the rest of the time. Households with program-mable thermostats kept a combination between the lowest and highest set-ting. The relationship between temperature control and behaviour is shown in Figure 4.4, statistics can be seen in Table 4.6a.
No Yes Total
Working home or housework * Hours radiator on in living roomχ2(2) = 13.158***
Always closed1-18 hoursAlways open
61
42
108
11
30
59
72
72
167
Total 211 100 311
Working home or housework * Hours radiator on in atticχ2(2) = 9.368**
Always closed1-18 hoursAlways open
22
15
15
3
4
14
25
19
29
Total 52 21 73
Presence of elderly people * Categories of use of ventilation systemχ2(4) = 19.074***
Ventilation cat. 1Ventilation cat. 2Ventilation cat. 3Ventilation cat. 4Ventilation cat. 5
35
97
64
23
46
15
13
3
2
15
20
110
67
25
60
Total 265 47 312
Presence of elderly people * Hours windows open in bedrooms χ2(4) = 9.668*
Closed1 hr2-5 hrs6-20 hrs> 21 hrs
32
37
60
62
68
1
4
16
14
7
33
41
76
76
75
Total 259 42 301
Presence of elderly people * Hours windows open in living room χ2(3) = 13.254**
Always closed1 hour> 2 hours
70
58
137
2
14
31
72
72
168
Total 265 47 312
Table 4.6b Statistics from Chi-square tests, independent t-tests and one-way ANOVA tests for variables related to building and household characteristics and behaviour in OTB survey
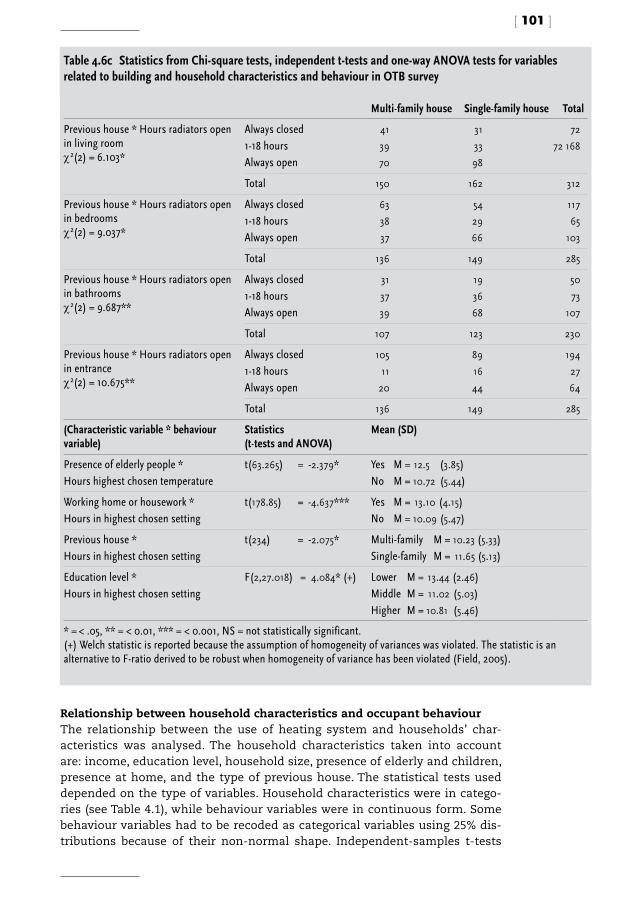
[ 101 ]
Relationship between household characteristics and occupant behaviourThe relationship between the use of heating system and households’ char-acteristics was analysed. The household characteristics taken into account are: income, education level, household size, presence of elderly and children, presence at home, and the type of previous house. The statistical tests used depended on the type of variables. Household characteristics were in catego-ries (see Table 4.1), while behaviour variables were in continuous form. Some behaviour variables had to be recoded as categorical variables using 25% dis-tributions because of their non-normal shape. Independent-samples t-tests
Multi-family house Single-family house Total
Previous house * Hours radiators open in living room χ2(2) = 6.103*
Always closed1-18 hoursAlways open
41
39
70
31
33
98
72
72 168
Total 150 162 312
Previous house * Hours radiators open in bedrooms χ2(2) = 9.037*
Always closed1-18 hoursAlways open
63
38
37
54
29
66
117
65
103
Total 136 149 285
Previous house * Hours radiators open in bathrooms χ2(2) = 9.687**
Always closed1-18 hoursAlways open
31
37
39
19
36
68
50
73
107
Total 107 123 230
Previous house * Hours radiators open in entrance χ2(2) = 10.675**
Always closed1-18 hoursAlways open
105
11
20
89
16
44
194
27
64
Total 136 149 285
(Characteristic variable * behaviour variable)
Statistics (t-tests and ANOVA)
Mean (SD)
Presence of elderly people *Hours highest chosen temperature
t(63.265) = -2.379* Yes M = 12.5 (3.85)No M = 10.72 (5.44)
Working home or housework *Hours in highest chosen setting
t(178.85) = -4.637*** Yes M = 13.10 (4.15)No M = 10.09 (5.47)
Previous house *Hours in highest chosen setting
t(234) = -2.075* Multi-family M = 10.23 (5.33)Single-family M = 11.65 (5.13)
Education level *Hours in highest chosen setting
F(2,27.018) = 4.084* (+) Lower M = 13.44 (2.46)Middle M = 11.02 (5.03)Higher M = 10.81 (5.46)
* = < .05, ** = < 0.01, *** = < 0.001, NS = not statistically significant.(+) Welch statistic is reported because the assumption of homogeneity of variances was violated. The statistic is an alternative to F-ratio derived to be robust when homogeneity of variance has been violated (Field, 2005).
Table 4.6c Statistics from Chi-square tests, independent t-tests and one-way ANOVA tests for variables related to building and household characteristics and behaviour in OTB survey
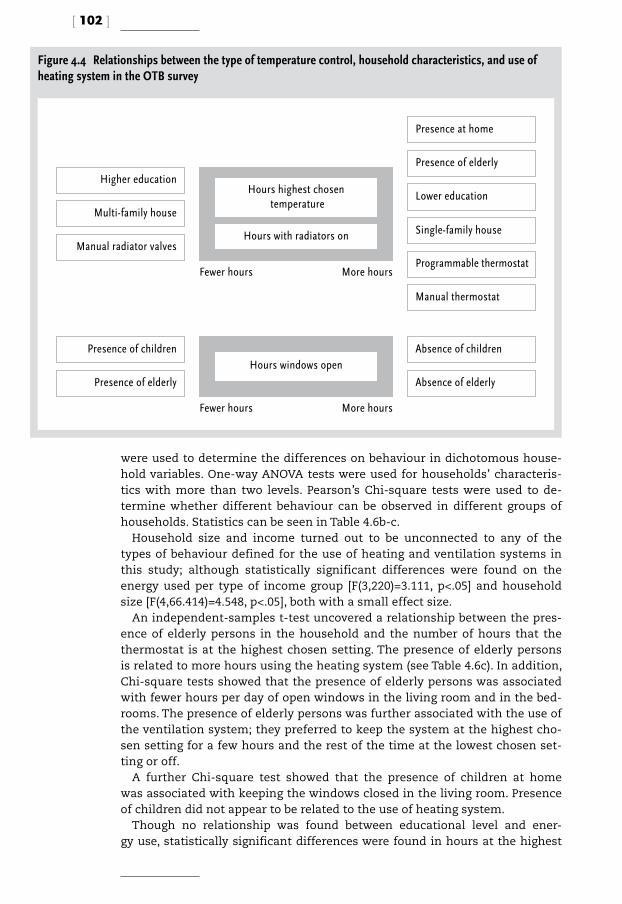
[ 102 ]
were used to determine the differences on behaviour in dichotomous house-hold variables. One-way ANOVA tests were used for households’ characteris-tics with more than two levels. Pearson’s Chi-square tests were used to de-termine whether different behaviour can be observed in different groups of households. Statistics can be seen in Table 4.6b-c.
Household size and income turned out to be unconnected to any of the types of behaviour defined for the use of heating and ventilation systems in this study; although statistically significant differences were found on the energy used per type of income group [F(3,220)=3.111, p<.05] and household size [F(4,66.414)=4.548, p<.05], both with a small effect size.
An independent-samples t-test uncovered a relationship between the pres-ence of elderly persons in the household and the number of hours that the thermostat is at the highest chosen setting. The presence of elderly persons is related to more hours using the heating system (see Table 4.6c). In addition, Chi-square tests showed that the presence of elderly persons was associated with fewer hours per day of open windows in the living room and in the bed-rooms. The presence of elderly persons was further associated with the use of the ventilation system; they preferred to keep the system at the highest cho-sen setting for a few hours and the rest of the time at the lowest chosen set-ting or off.
A further Chi-square test showed that the presence of children at home was associated with keeping the windows closed in the living room. Presence of children did not appear to be related to the use of heating system.
Though no relationship was found between educational level and ener-gy use, statistically significant differences were found in hours at the highest
Figure 4.4 Relationships between the type of temperature control, household characteristics, and use of heating system in the OTB survey
Higher education
Multi-family house
Manual radiator valves
Presence of children
Presence of elderly
Presence at home
Presence of elderly
Lower education
Single-family house
Programmable thermostat
Manual thermostat
Absence of children
Absence of elderly
More hours
Hours highest chosen temperature
Hours with radiators on
Fewer hours
Hours windows open
Fewer hours More hours

[ 103 ]
chosen setting on weekdays for households from different educational levels, albeit with a very small effect size [ω=.024]. A higher education level was relat-ed to fewer hours at the highest chosen setting (Table 4.6c). The presence of people at home was associated with longer hours with the heating system at the highest setting (Table 4.6c) and longer hours with radiators on (Table 4.6a).
Behavioural patterns in a previous house could influence behavioural pat-terns in a new house. A T-test showed that households that had previously lived in a single-family dwelling were more likely to have the thermostat at the highest chosen setting for a longer time than households that had previ-ously lived in a multi-family dwelling (Table 4.6c). Pearson’s Chi-square tests revealed that the type of previous house was associated with the hours that the radiator was on in the living room, the bedrooms the bathrooms; and the entrance. In all cases, households that had previously lived in a single-fami-ly dwelling were more likely to keep the radiators open for longer time (Table 4.6b). Figure 4.4 shows the relationship between occupant behaviour, type of temperature control and household characteristics. Presence of thermostat, single-family houses, presence at home, lower education and presence of eld-erly are all related to more hours on the use of radiators and thermostats.
4.4 Comparison with WoON database
Since the OTB survey was carried out in selected districts in the Netherlands, the results were compared with the WoON database of the Dutch Ministry of Housing (www.vrom.nl), which is assumed to be representative of the Neth-erlands. The WoON database holds data obtained from a household survey, dwelling inspections and data on energy use in the dwellings. Similar tests to those conducted with the OTB database were carried out as frequently as possible. Both surveys contained questions about occupant self-reported be-haviour, but with a few differences, particularly regarding the use of the heat-ing system. These differences and their implications for the results are dis-cussed below. The tests for the comparison were carried out solely with dwell-ings built after 1995. The variables for the analysis of the WoON survey and the differences between the WoON survey and the OTB survey are shown in Table 4.7a-b. Descriptive statistics can also be found in Table 4.7a-b.
4.4.1 Effect of behaviour on energy use (WoON survey)
This section analyses the relationships between energy consumption and be-haviour using the WoON survey. For these analyses, Pearson’s correlations were used for continuous variables and one-way ANOVA for categorical varia-bles (see Table 4.8 for statistics). The results of Pearson’s correlations showed
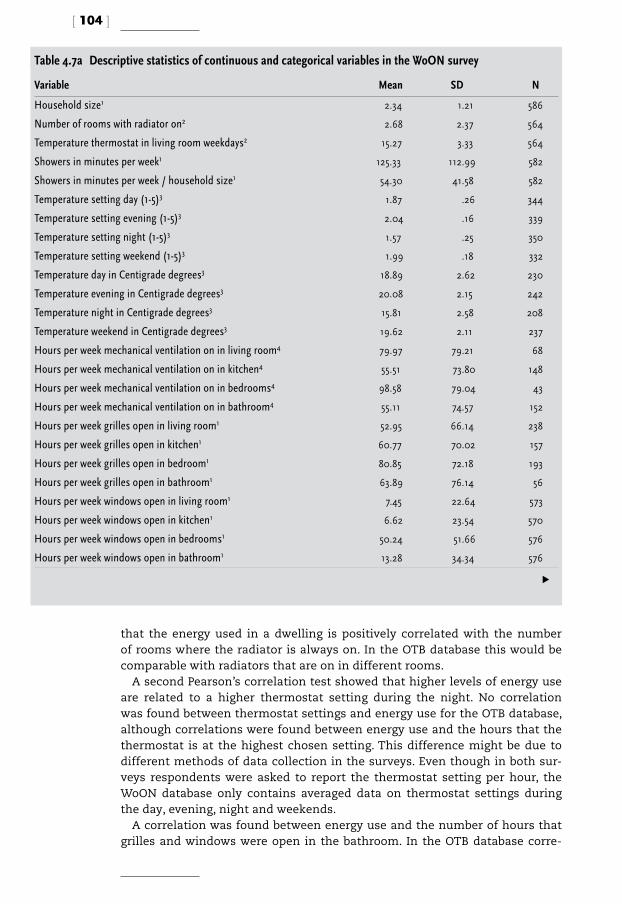
[ 104 ]
that the energy used in a dwelling is positively correlated with the number of rooms where the radiator is always on. In the OTB database this would be comparable with radiators that are on in different rooms.
A second Pearson’s correlation test showed that higher levels of energy use are related to a higher thermostat setting during the night. No correlation was found between thermostat settings and energy use for the OTB database, although correlations were found between energy use and the hours that the thermostat is at the highest chosen setting. This difference might be due to different methods of data collection in the surveys. Even though in both sur-veys respondents were asked to report the thermostat setting per hour, the WoON database only contains averaged data on thermostat settings during the day, evening, night and weekends.
A correlation was found between energy use and the number of hours that grilles and windows were open in the bathroom. In the OTB database corre-
Variable Mean SD N
Household size1 2.34 1.21 586
Number of rooms with radiator on2 2.68 2.37 564
Temperature thermostat in living room weekdays2 15.27 3.33 564
Showers in minutes per week1 125.33 112.99 582
Showers in minutes per week / household size1 54.30 41.58 582
Temperature setting day (1-5)3 1.87 .26 344
Temperature setting evening (1-5)3 2.04 .16 339
Temperature setting night (1-5)3 1.57 .25 350
Temperature setting weekend (1-5)3 1.99 .18 332
Temperature day in Centigrade degrees3 18.89 2.62 230
Temperature evening in Centigrade degrees3 20.08 2.15 242
Temperature night in Centigrade degrees3 15.81 2.58 208
Temperature weekend in Centigrade degrees3 19.62 2.11 237
Hours per week mechanical ventilation on in living room4 79.97 79.21 68
Hours per week mechanical ventilation on in kitchen4 55.51 73.80 148
Hours per week mechanical ventilation on in bedrooms4 98.58 79.04 43
Hours per week mechanical ventilation on in bathroom4 55.11 74.57 152
Hours per week grilles open in living room1 52.95 66.14 238
Hours per week grilles open in kitchen1 60.77 70.02 157
Hours per week grilles open in bedroom1 80.85 72.18 193
Hours per week grilles open in bathroom1 63.89 76.14 56
Hours per week windows open in living room1 7.45 22.64 573
Hours per week windows open in kitchen1 6.62 23.54 570
Hours per week windows open in bedrooms1 50.24 51.66 576
Hours per week windows open in bathroom1 13.28 34.34 576
Table 4.7a Descriptive statistics of continuous and categorical variables in the WoON survey

[ 105 ]
Temperature control1 Programmable thermostatManual thermostatManual valves in radiatorsTotal
229
339
12
580
39.5
58.4
2.1
100
Ventilation system1 Mechanical exhaustBalancedTotal
476
103
579
82.2
17.8
100
Heating off when ventilation via grilles5 Living roomKitchenBedroomsBathroom
48
30
93
36
43.2
27.0
83.8
32.4
Heating off when ventilation via windows5 Living roomKitchenBedroomsBathroom
118
66
228
74
43.4
24.3
83.8
27.2
Type of thermostat use5 Almost always on the same programThe program is sometimes changedTemperature is always manually set
116
72
41
50.7
31.4
7.0
1 Same in the OTB database.2 Data on the hours of radiators on per room are available in the OTB database.3 Setting per hour is available in the OTB database.4 In the OTB database all new houses have mechanical ventilation in the kitchen and bathroom.5 Not in the OTB database.
Table 4.7b Descriptive statistics of continuous and categorical variables in the WoON survey
Table 4.8 Pearson product-moment correlation coefficients for behaviour variables and energy use in WoON survey
Energy variable Behaviour variables Statistic N
(SQRT) Energy for heating (m3/year)
Number of rooms with radiator on r = .102* 545
Temperature setting by day NS
Temperature setting by evening NS
Temperature setting by night r = .163* 540
Temperature setting by weekend NS
Hours grilles open in bathroom ρ = .226* 56
Hours windows open in bathroom ρ = .148*** 576
Hours per week mechanical ventilation in bathroom ρ = .227** 152
Type of thermostat use F(2,221) = 5.014** 222
* = < .05, ** = < .01, *** = < .001, NS = not statistically significant.
Variable Category N %

[ 106 ]
lations were found only with the number of hours that grilles were open in the dwelling and with open windows in the living room. No relationship with ventilation in bathrooms was found in the OTB database because only a few dwellings had natural ventilation in the bathrooms. In the WoON survey the number of hours using mechanical ventilation in bathrooms also seemed to be correlated with energy use. No information on the use of mechanical ven-tilation in bathrooms was gathered in the OTB survey because all dwellings had mechanical ventilation with only one control switch for the whole house, mostly placed in the kitchen.
4.4.2 Determinants on the use of heating and ventilation behaviour (WoON survey)
Pearson’s Chi-square and one-way ANOVA tests were used to determine the relationship between occupants’ behaviour on the one hand, and temperature control and type of ventilation on the other hand (see Table 4.9a-c for statis-tics). One-way ANOVA tests showed that type of temperature control had an effect on the number of rooms where radiators were on. The number of rooms with the radiator on was greater in dwellings with a programmable thermo-
(Characteristic variable * behaviour variable) Pearson’s Chi-square Categories
Programmable thermostat
Manual thermostat Total
Type of temperature control * Hours per week mechanical ventilation on in living roomχ2(1) = 14.460***
< 15 hrs> 16 hrs
5
22
22
12
27
39
Total 27 34 66
Type of temperature control * Hours per week mechanical ventilation on in kitchenχ2(3) = 27.176***
< 3 hrs4-7 hrs8-167 hrsAlways
3
8
12
23
35
29
17
15
38
37
29
38
Total 46 96 142
Type of temperature control * Hours per week mechanical ventilation on in bedroomsχ2(1) = 8.337**
< 167 hrsAlways
8
15
12
6
20
21
Total 23 18 41
Type of temperature control * Hours per week mechanical ventilation on in bathroomχ2(3) = 31.415***
1 hr2-5 hrs6-124 hrs > 125 hrs
4
7
9
31
32
21
26
16
36
28
35
47
Total 51 95 146
Type of temperature control * Hours windows open in bathroomχ2(1) = 3.894*
< 6 hrs> 7 hrs
166
62
265
65
431
127
Total 228 330 558
Table 4.9a Statistics from Chi-square tests, independent t-tests and one-way ANOVA tests for variables related to building and household characteristics and behaviour variables in WoON survey

[ 107 ]
Mechanical ventilation
Balanced ventilation Total
Ventilation system type * Hours per week mechanical ventilation on in living room χ2(1) = 9.010**
< 15 hrs> 16 hrs
2614
721
3335
Total 40 28 68
Ventilation system type * Hours per week mechanical ventilation on in kitchen χ2(3) = 11.389**
1 hr2-5 hrs6-124 hrs> 125 hrs
11798
129114
846
23
125102135137
Total 458 41 499
Ventilation system type * Hours per week mechanical ventilation on in bathroom χ2(3) = 8.910*
< 3 hrs4-7 hrs6-176 hrsAlways
120109
7683
57
1118
12511687
101
Total 388 41 429
Ventilation system type * Heating off when ventilation via grilles χ2(1) = 4.048*
NoYes
120101
3313
153114
Total 221 46 267
No Yes Total
Presence of elderly * Hours per week windows open in bedrooms χ2(1) = 25.660***
< 10 hrs11-96 hrs > 97 hrs
174109115
584971
232158186
Total 398 178 576
Presence of elderly * Hours per week windows open in bathroom χ2(2) = 8.390*
< 6 hrs> 7 hrs
285114
16116
446130
Total 399 177 576
Presence of children * Hours per week grilles open in bedroomχ2(3) = 7.845*
< 3 hrs3-80 hrs81-167 hrsAlways
383315
49
10249
15
48572464
Total 135 58 193
Presence of children * Hours per week windows open in kitchenχ2(2) = 8.302*
Closed1-6 hrs> 7 hrs
2738360
823735
355120
95
Total 416 154 570
Presence of children * Hours per week windows open in bathroomχ2(2) = 11.757**
< 6 hrs> 7 hrs
35169
9561
446130
Total 420 156 576
Presence of children * Hours per week windows open in bedroomsχ2(1) = 32.179***
< 10 hrs11-96 hrs> 97 hrs
172100148
605838
232158186
Total 420 156 576
Table 4.9b Statistics from Chi-square tests, independent t-tests and one-way ANOVA tests for variables related to building and household characteristics and behaviour variables in WoON survey
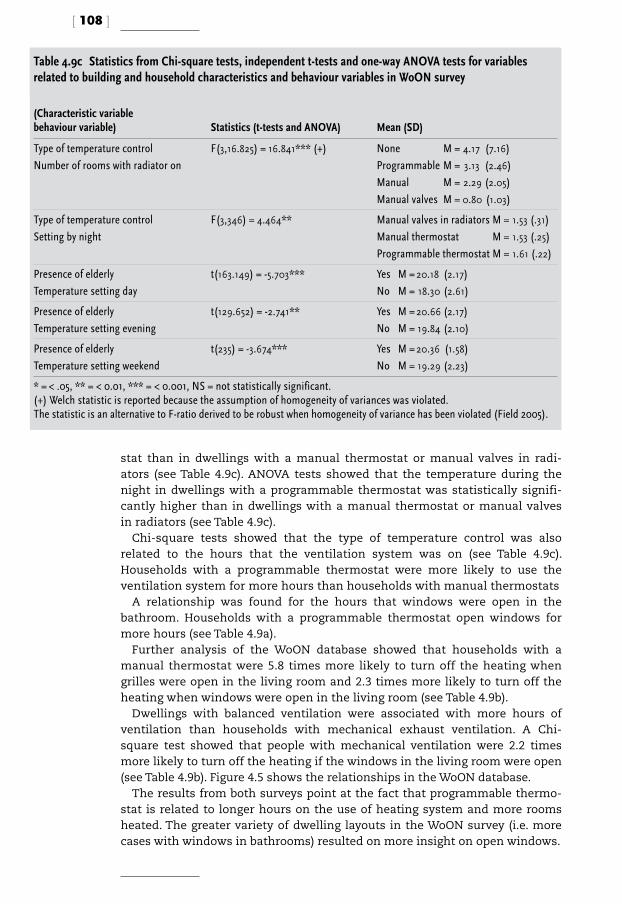
[ 108 ]
stat than in dwellings with a manual thermostat or manual valves in radi-ators (see Table 4.9c). ANOVA tests showed that the temperature during the night in dwellings with a programmable thermostat was statistically signifi-cantly higher than in dwellings with a manual thermostat or manual valves in radiators (see Table 4.9c).
Chi-square tests showed that the type of temperature control was also related to the hours that the ventilation system was on (see Table 4.9c). Households with a programmable thermostat were more likely to use the ventilation system for more hours than households with manual thermostats
A relationship was found for the hours that windows were open in the bathroom. Households with a programmable thermostat open windows for more hours (see Table 4.9a).
Further analysis of the WoON database showed that households with a manual thermostat were 5.8 times more likely to turn off the heating when grilles were open in the living room and 2.3 times more likely to turn off the heating when windows were open in the living room (see Table 4.9b).
Dwellings with balanced ventilation were associated with more hours of ventilation than households with mechanical exhaust ventilation. A Chi-square test showed that people with mechanical ventilation were 2.2 times more likely to turn off the heating if the windows in the living room were open (see Table 4.9b). Figure 4.5 shows the relationships in the WoON database.
The results from both surveys point at the fact that programmable thermo-stat is related to longer hours on the use of heating system and more rooms heated. The greater variety of dwelling layouts in the WoON survey (i.e. more cases with windows in bathrooms) resulted on more insight on open windows.
(Characteristic variable behaviour variable) Statistics (t-tests and ANOVA) Mean (SD)
Type of temperature controlNumber of rooms with radiator on
F(3,16.825) = 16.841*** (+) None M = 4.17 (7.16)Programmable M = 3.13 (2.46)Manual M = 2.29 (2.05)Manual valves M = 0.80 (1.03)
Type of temperature controlSetting by night
F(3,346) = 4.464** Manual valves in radiators M = 1.53 (.31)Manual thermostat M = 1.53 (.25)Programmable thermostat M = 1.61 (.22)
Presence of elderlyTemperature setting day
t(163.149) = -5.703*** Yes M = 20.18 (2.17)No M = 18.30 (2.61)
Presence of elderlyTemperature setting evening
t(129.652) = -2.741** Yes M = 20.66 (2.17)No M = 19.84 (2.10)
Presence of elderlyTemperature setting weekend
t(235) = -3.674*** Yes M = 20.36 (1.58)No M = 19.29 (2.23)
* = < .05, ** = < 0.01, *** = < 0.001, NS = not statistically significant.(+) Welch statistic is reported because the assumption of homogeneity of variances was violated.The statistic is an alternative to F-ratio derived to be robust when homogeneity of variance has been violated (Field 2005).
Table 4.9c Statistics from Chi-square tests, independent t-tests and one-way ANOVA tests for variables related to building and household characteristics and behaviour variables in WoON survey

[ 109 ]
4.4.3 Relationship between household characteristics and occupant behaviour (WoON survey)
An ANOVA test showed that households with elderly members were more strongly associated with higher temperature settings than households with-out elderly members (Table 4.9c). The presence of elderly persons was also found to be associated with fewer hours of open windows in bathrooms. Con-versely, it emerged that households with elderly persons ventilated for more hours via bedroom windows (Table 4.9b).
The presence of children was associated with open grilles in the bedrooms; households without children were more likely to open the grilles either all day or not at all. In addition, households without children were more likely to keep the windows closed in the kitchen, and more likely to open them for a longer time in the bedrooms and bathrooms (Table 4.9b).
The results for household characteristics and behaviour are similar for the OTB and the WoON survey. In both databases, the presence of elderly persons was related to more hours of use of the heating system or higher temperature
Figure 4.5 Relationships between the type of temperature control, the type of ventilation, and use of heating system in the Woononderzoek Nederland (WoON) survey
Manual thermostat
Absence of elderly
Programmable thermostat
Presence of elderlyTemperature during night time
Lower Higher
Manual thermostat Programmable thermostatHours with radiators on
Fewer hours More hours
Manual thermostat
Presence of elderly
Programmable thermostat
Absence of elderlyHours windows open in bathroom
Fewer hours More hours
Manual thermostat
Mechanical exhaust ventilation
Programmable thermostat
Balanced ventilationHours use of ventilation system
Fewer hours More hours
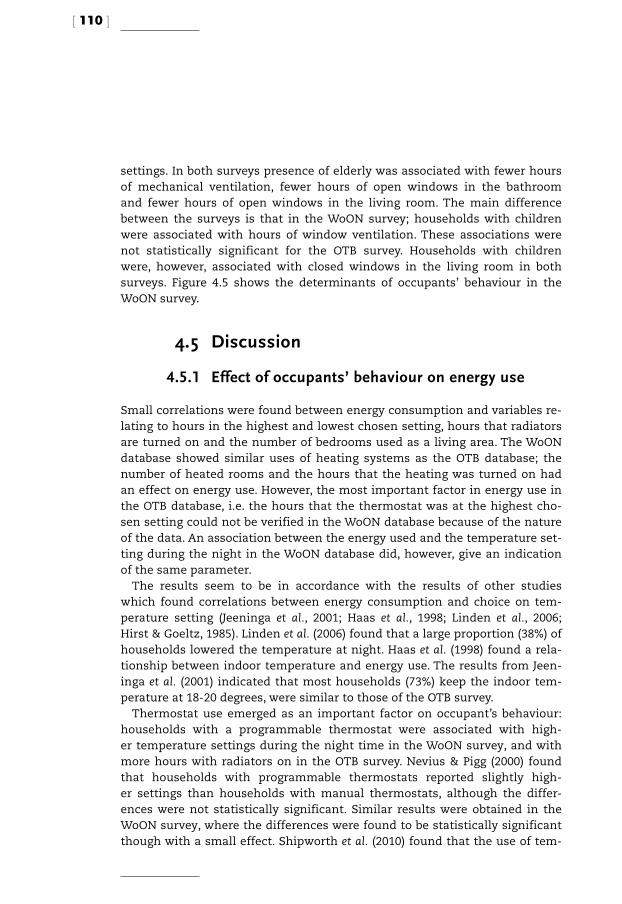
[ 110 ]
settings. In both surveys presence of elderly was associated with fewer hours of mechanical ventilation, fewer hours of open windows in the bathroom and fewer hours of open windows in the living room. The main difference between the surveys is that in the WoON survey; households with children were associated with hours of window ventilation. These associations were not statistically significant for the OTB survey. Households with children were, however, associated with closed windows in the living room in both surveys. Figure 4.5 shows the determinants of occupants’ behaviour in the WoON survey.
4.5 Discussion
4.5.1 Effect of occupants’ behaviour on energy use
Small correlations were found between energy consumption and variables re-lating to hours in the highest and lowest chosen setting, hours that radiators are turned on and the number of bedrooms used as a living area. The WoON database showed similar uses of heating systems as the OTB database; the number of heated rooms and the hours that the heating was turned on had an effect on energy use. However, the most important factor in energy use in the OTB database, i.e. the hours that the thermostat was at the highest cho-sen setting could not be verified in the WoON database because of the nature of the data. An association between the energy used and the temperature set-ting during the night in the WoON database did, however, give an indication of the same parameter.
The results seem to be in accordance with the results of other studies which found correlations between energy consumption and choice on tem-perature setting (Jeeninga et al., 2001; Haas et al., 1998; Linden et al., 2006; Hirst & Goeltz, 1985). Linden et al. (2006) found that a large proportion (38%) of households lowered the temperature at night. Haas et al. (1998) found a rela-tionship between indoor temperature and energy use. The results from Jeen-inga et al. (2001) indicated that most households (73%) keep the indoor tem-perature at 18-20 degrees, were similar to those of the OTB survey.
Thermostat use emerged as an important factor on occupant’s behaviour: households with a programmable thermostat were associated with high-er temperature settings during the night time in the WoON survey, and with more hours with radiators on in the OTB survey. Nevius & Pigg (2000) found that households with programmable thermostats reported slightly high-er settings than households with manual thermostats, although the differ-ences were not statistically significant. Similar results were obtained in the WoON survey, where the differences were found to be statistically significant though with a small effect. Shipworth et al. (2010) found that the use of tem-

[ 111 ]
perature controls did not reduce average maximum temperatures or hours of use, although households with programmable thermostats were found to use the heating for 0.4 hours longer than households with manual thermo-stats, the differences were not statistically significant. Shipworth et al. (2010) also found that households without thermostatic control set the tempera-ture 0.60C lower than households with control, though the difference was not statistically significant. On the contrary, Conner & Lucas (1990) found that households with programmable thermostats set the temperature an average of 0.50F lower than households with manual thermostats, though also not sta-tistically significant. For cooling, Lutzenhiser (1992) found comparable results: houses with manual thermostat use 21% less energy for cooling than hous-es with programmable thermostats. In the OTB survey, statistically significant differences on the hours than radiators are on, but not with the hours that the heating system is used. Therefore the results from the OTB survey are in agreement with past studies and offer additional information on the effect of different types of temperature control on the use of radiators.
In our study significant statistical correlations were found between ener-gy use and bath frequency, but no correlation was found between energy use and shouwer frequency. This contradicts the results of Jeeninga et al. (2001) in which shouwer frequency was important contributor to energy use. In our sample, households did not use the bath often, which may be related to the type of households living in the districts of study.
Jeeninga et al. (2001) found that 20% of households ventilated all rooms eve-ry day by opening windows and that bedrooms were more ventilated than other rooms. Similar results were found in the OTB survey.
Statistically significant differences were found between the energy used in dwellings where windows in the living room were open and dwellings where windows in the living room were always closed. This suggests a relationship between ventilation in the living room and lower energy use. Open grilles and windows seemed to be important in both databases. Households tended to ventilate more often with grilles and windows than with a mechanical venti-lation system. This corresponds with Iwashita and Akasaka (1997), who found that 87% of the total active (windows and grilles) air change was related to behaviour.
The behaviour observed in the OTB survey also seems to be in accordance with Ernhorn (1988), who found a higher frequency for natural ventilation in bedrooms, followed by children’s bedrooms and living rooms. A large varia-tion was also found in bedrooms but not in living rooms.
Maier et al. (2009) found that mechanical ventilation with heat recovery reduced energy use by 10-30% in low-energy houses in Germany. They (Maier et al., 2009) also ascertained a poor relationship between heat consump-tion and hours of open windows in dwellings with natural, mechanical and heat recovery ventilation. This finding is contrary to the findings for the OTB

[ 112 ]
and WoON databases, where no relationship was found between mechani-cal systems and energy use, but a relationship was found between energy use and natural ventilation. The difference might be explained by occupants in the OTB survey using natural ventilation more often, in combination with an inappropriate use of the mechanical ventilation systems (they were only scarcely used).
4.5.2 Regression model
A statistical regression model using occupant behaviour can predict 11.9% of the variation in energy use. The increase to 11.9% in the current study shows an increase in predictability with behaviour variables alone. In a previous study (Chapter 2) only 4.2% of the variation in energy use was explained by household characteristics and occupant behaviour (only a part of this was ex-plained by behaviour).
The relatively small size of the OTB sample might have prevented the emer-gence of other small correlations with energy use. Even so, it would be diffi-cult to find one predictor that was more important that the others, as energy use could be affected to a small extent by many different factors.
4.5.3 Determinants of behaviour: type of heating control ventilation and household characteristics
Temperature control turned out to be a very important factor in the use of heating and ventilation systems. Dwellings with a programmable thermostat were associated with more hours of heating system use, followed by dwell-ings with a manual thermostat. A validation conducted with the WoON data-base confirmed and provided more insight into the relationship between type of temperature control and behaviour. Temperature control was found to be associated with the number of rooms where the radiator was turned on. The relationship indicated that more radiators were turned on in dwellings with a programmable thermostat. A programmable thermostat for temperature con-trol was also associated with a higher temperature during the night. The anal-ysis of the WoON database further confirmed that temperature control was related to the ventilation of the dwelling. Households with a programmable thermostat were more likely to open windows for a longer time. It further emerged that households with a manual thermostat were more likely to turn off the heating system when windows or grilles were open.
Jeeninga et al. (2001) found that type of thermostat had no influence on the preferred setting. However, the OTB survey did find a relationship between type of thermostat and the hours that radiators were on while the WoON sur-
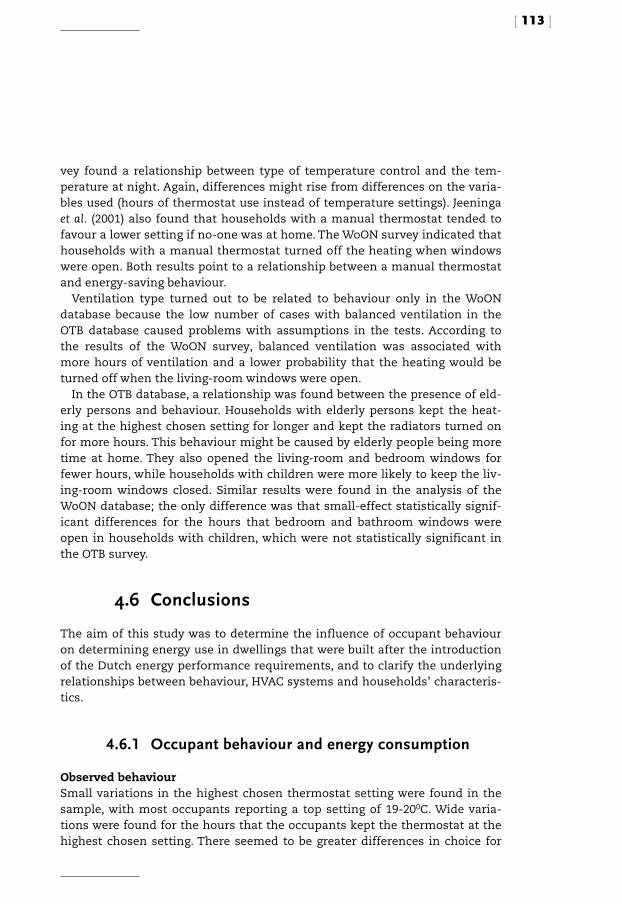
[ 113 ]
vey found a relationship between type of temperature control and the tem-perature at night. Again, differences might rise from differences on the varia-bles used (hours of thermostat use instead of temperature settings). Jeeninga et al. (2001) also found that households with a manual thermostat tended to favour a lower setting if no-one was at home. The WoON survey indicated that households with a manual thermostat turned off the heating when windows were open. Both results point to a relationship between a manual thermostat and energy-saving behaviour.
Ventilation type turned out to be related to behaviour only in the WoON database because the low number of cases with balanced ventilation in the OTB database caused problems with assumptions in the tests. According to the results of the WoON survey, balanced ventilation was associated with more hours of ventilation and a lower probability that the heating would be turned off when the living-room windows were open.
In the OTB database, a relationship was found between the presence of eld-erly persons and behaviour. Households with elderly persons kept the heat-ing at the highest chosen setting for longer and kept the radiators turned on for more hours. This behaviour might be caused by elderly people being more time at home. They also opened the living-room and bedroom windows for fewer hours, while households with children were more likely to keep the liv-ing-room windows closed. Similar results were found in the analysis of the WoON database; the only difference was that small-effect statistically signif-icant differences for the hours that bedroom and bathroom windows were open in households with children, which were not statistically significant in the OTB survey.
4.6 Conclusions
The aim of this study was to determine the influence of occupant behaviour on determining energy use in dwellings that were built after the introduction of the Dutch energy performance requirements, and to clarify the underlying relationships between behaviour, HVAC systems and households’ characteris-tics.
4.6.1 Occupant behaviour and energy consumption
Observed behaviourSmall variations in the highest chosen thermostat setting were found in the sample, with most occupants reporting a top setting of 19-200C. Wide varia-tions were found for the hours that the occupants kept the thermostat at the highest chosen setting. There seemed to be greater differences in choice for
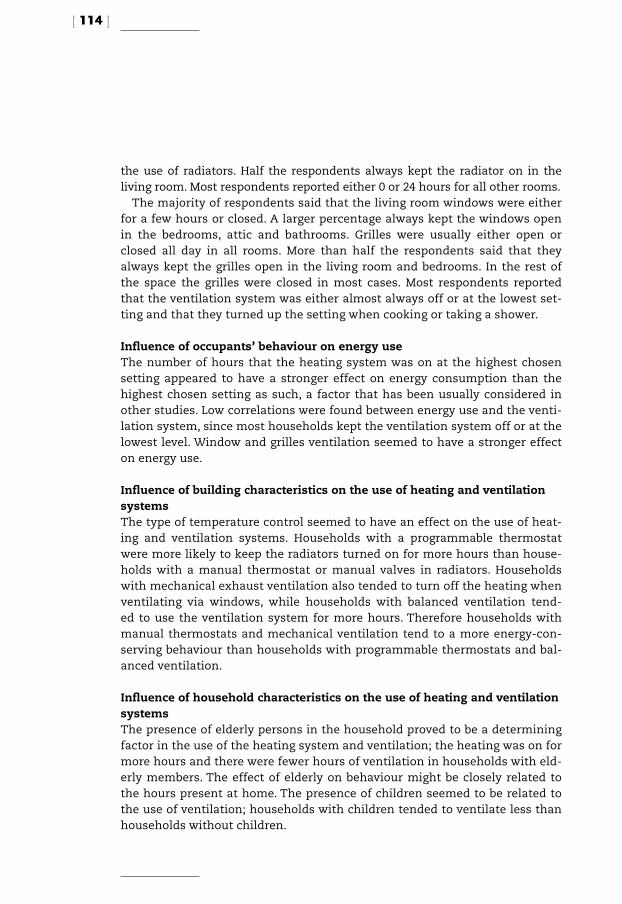
[ 114 ]
the use of radiators. Half the respondents always kept the radiator on in the living room. Most respondents reported either 0 or 24 hours for all other rooms.
The majority of respondents said that the living room windows were either for a few hours or closed. A larger percentage always kept the windows open in the bedrooms, attic and bathrooms. Grilles were usually either open or closed all day in all rooms. More than half the respondents said that they always kept the grilles open in the living room and bedrooms. In the rest of the space the grilles were closed in most cases. Most respondents reported that the ventilation system was either almost always off or at the lowest set-ting and that they turned up the setting when cooking or taking a shower.
Influence of occupants’ behaviour on energy useThe number of hours that the heating system was on at the highest chosen setting appeared to have a stronger effect on energy consumption than the highest chosen setting as such, a factor that has been usually considered in other studies. Low correlations were found between energy use and the venti-lation system, since most households kept the ventilation system off or at the lowest level. Window and grilles ventilation seemed to have a stronger effect on energy use.
Influence of building characteristics on the use of heating and ventilation systemsThe type of temperature control seemed to have an effect on the use of heat-ing and ventilation systems. Households with a programmable thermostat were more likely to keep the radiators turned on for more hours than house-holds with a manual thermostat or manual valves in radiators. Households with mechanical exhaust ventilation also tended to turn off the heating when ventilating via windows, while households with balanced ventilation tend-ed to use the ventilation system for more hours. Therefore households with manual thermostats and mechanical ventilation tend to a more energy-con-serving behaviour than households with programmable thermostats and bal-anced ventilation.
Influence of household characteristics on the use of heating and ventilation systemsThe presence of elderly persons in the household proved to be a determining factor in the use of the heating system and ventilation; the heating was on for more hours and there were fewer hours of ventilation in households with eld-erly members. The effect of elderly on behaviour might be closely related to the hours present at home. The presence of children seemed to be related to the use of ventilation; households with children tended to ventilate less than households without children.

[ 115 ]
4.6.2 Methodology
The data from two surveys were analysed in this research: the survey of the OTB Research Institute and WoON database of the Dutch Ministry of Housing. In both questionnaires the respondents had to fill tables with information on how they used heating systems. This generated very detailed data. Despite the similarities in the method of data collection, the databases from the two surveys contained different types of variables for synthesising the data ob-tained from the questionnaire. In the WoON database, the variables consisted of the average temperature setting during four specific periods: day, evening, night and weekends. Previous analysis of the KWR database – the predecessor of the WoON survey – (see Chapter 2) had highlighted the importance of tem-perature settings in the housing stock. For the OTB database, lower variations on temperature settings were assumed because the thermal properties of the building stock had improved after 1995, and therefore a decision was taken to use the highest and lowest chosen temperature instead of using average set-ting values as is common in other studies. The number of hours that the tem-perature was kept at the highest and lowest chosen setting was also intro-duced in the database.
The different decisions that are taken when data from the questionnaires is being processed into the database can influence the results of the study. The variables in the OTB database showed a stronger correlation with energy con-sumption than the variables in the WoON database. This was probably due to data loss during the averaging of values. The size of the WoON sample might have led to the use of variables that contained far less data than the data col-lected in the survey.
Accurate energy-user profiles cannot be built without detailed data on the use of heating and ventilation systems. However, too much or too detailed data is sometimes difficult to process and analyse and might therefore com-promise the quality of the data in databases, since important information could be lost. Data collection should focus on aspects of behaviour that tend to vary more widely across the population and that seem to have a stronger influence on energy use.
4.6.3 Recommendations for policy and practice
Although no statistically significant differences were found on the use of thermostat in terms of hours of use and highest setting between houses with manual and programmable thermostats, a statistically significant difference was found on the use of radiators, indicating that in dwellings with program-mable thermostats occupants take less deliberate actions and leave the con-trol to the thermostat. This gives an opportunity for improvement for exam-
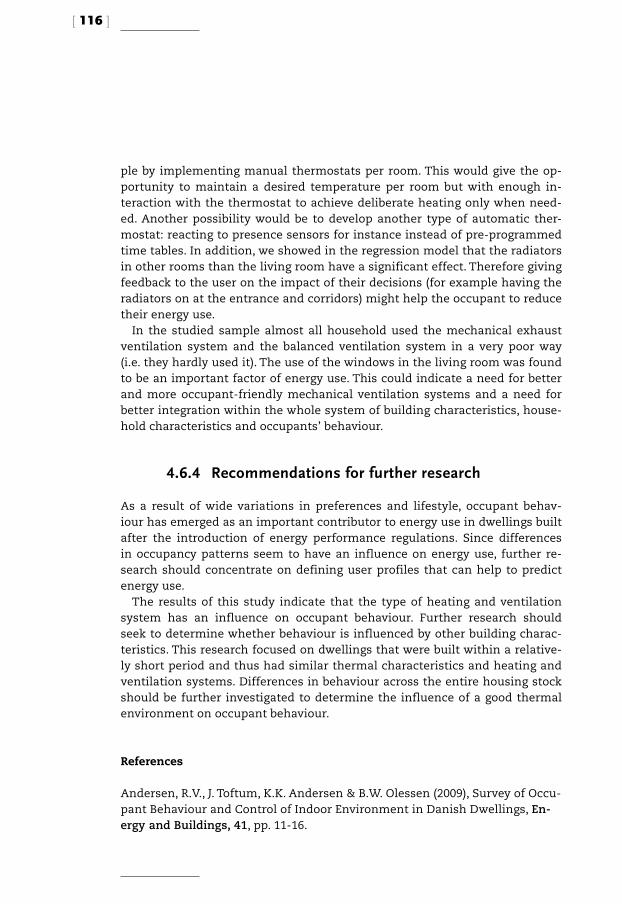
[ 116 ]
ple by implementing manual thermostats per room. This would give the op-portunity to maintain a desired temperature per room but with enough in-teraction with the thermostat to achieve deliberate heating only when need-ed. Another possibility would be to develop another type of automatic ther-mostat: reacting to presence sensors for instance instead of pre-programmed time tables. In addition, we showed in the regression model that the radiators in other rooms than the living room have a significant effect. Therefore giving feedback to the user on the impact of their decisions (for example having the radiators on at the entrance and corridors) might help the occupant to reduce their energy use.
In the studied sample almost all household used the mechanical exhaust ventilation system and the balanced ventilation system in a very poor way (i.e. they hardly used it). The use of the windows in the living room was found to be an important factor of energy use. This could indicate a need for better and more occupant-friendly mechanical ventilation systems and a need for better integration within the whole system of building characteristics, house-hold characteristics and occupants’ behaviour.
4.6.4 Recommendations for further research
As a result of wide variations in preferences and lifestyle, occupant behav-iour has emerged as an important contributor to energy use in dwellings built after the introduction of energy performance regulations. Since differences in occupancy patterns seem to have an influence on energy use, further re-search should concentrate on defining user profiles that can help to predict energy use.
The results of this study indicate that the type of heating and ventilation system has an influence on occupant behaviour. Further research should seek to determine whether behaviour is influenced by other building charac-teristics. This research focused on dwellings that were built within a relative-ly short period and thus had similar thermal characteristics and heating and ventilation systems. Differences in behaviour across the entire housing stock should be further investigated to determine the influence of a good thermal environment on occupant behaviour.
References
Andersen, R.V., J. Toftum, K.K. Andersen & B.W. Olessen (2009), Survey of Occu-pant Behaviour and Control of Indoor Environment in Danish Dwellings, En-ergy and Buildings, 41, pp. 11-16.

[ 117 ]
Becker, R. & M. Pacuik (2009), Thermal Comfort in Residential Buildings – Fail-ure to Predict by Standard Model, Building & Environment, 44, pp. 949-960.
Beerepoot, M. & N. Beerepoot (2007), Government Regulations as an Impe-tus for Innovations. Evidence for Energy Performance Regulation in the Dutch Residential Building Sector, Energy Policy, 35, pp. 4812-4825.
Branco, G., B. Lachal, P. Gallinelli & W. Weber (2004), Expected versus Observed Heat Consumption of a Low Energy Multifamily Complex in Switzerland based on Long-term Experimental Data, Energy and Buildings, 36, pp. 43-555.
Brown, Z. & R.J. Cole (2009), Influence of Occupants’ Knowledge on Comfort Expectations and Behaviour, Building Research & Information, 37 (30), pp. 227-245.
Conner, C.C. & R.L. Lucas (1990), Thermostat Related Behavior and Internal Temperatures Based on Measured Data in Residences, PNL-7465, Richland, WA: Pacific Northwest Laboratory.
CBS (2008), Centraal Bureau voor de Statistiek, StatLine Website statline.cbs.nl, accessed September.
de Dear, R. (2004), Thermal Comfort in Practice, Indoor Air, 14 (7), 32.
de Groot E., M. Spiekman & I. Opstelten (2008), Dutch Research into User Be-haviour in Relation to Energy Use of Residences, Proceedings PLEA Conference.
Ernhorn, H. (1988), Influence of Meteorological Conditions on Inhabitants’ Be-haviour in Dwellings with Mechanical Ventilation, Energy and Building, 11, pp. 267-275.
EuroACE (2004), Towards Energy Efficient Buildings in Europe, final report June (ec.europa.eu).
Field, A. (2005), Discovering Statistics Using SPSS, 2nd Edition, SAGE Publica-tions, London.
Haas, R., H. Auer & P. Biermayr (1998), The Impact of Consumer Behaviour on Residential Energy Demand for Space Heating, Energy and Buildings, 27, pp. 195-205.
Hirst, E. & R. Goeltz (1985), Comparison of Actual Energy Saving with Audit Predictions for Homes in the North Central Region of the USA, Building and
[ 118 ]
Environment, 20 (1), pp. 1-6.
Iwashita, G. & H. Akasaka (1997), The Effect of Human Behaviour on Natu-ral Ventilation Rate and Indoor Air Environment in Summer – a field study in southern Japan, Energy and Buildings, 25, pp. 195-205.
Jeeninga, H., M. Uyterlinde & J. Uitzinger (2001), Energieverbruik van energie-zuinige woningen, Report ECN & IVAM, ECN-C-01-072.
Karjalalainen, S. (2007), Gender Differences in Thermal Comfort and Use of Thermostats in Everyday Thermal Environments, Building and Environment, 42, pp. 1594-1603.
Lan, L., Z. Lian, W. Liu & Y. Liu (2008), Investigation of Gender Difference in Thermal Comfort for Chinese People, European Journal of Applied Physiolo-gy, 102 (4), p. 471.
Lenzuni, P., D. Freda & M. Del Guadio (2008), Classification of Thermal En-vironments for Comfort Assessment, The Annals of Occupational Hygiene doi:10.1093/annhyg/mep012.
Leth-Petersen S. & M. Togeby (2001), Demand for Space Heating in Apartment Blocks: measuring effect of policy measures aiming at reducing energy con-sumption, Energy Economics, 23, pp. 387-403.
Linden, A.L., A. Carlsson-Kanyama & B. Eriksson (2006), Efficient and Ineffi-cient Aspects of Residential Energy Behaviour: What are the policy instru-ments for change?, Energy Policy, 34, pp. 1918-1927.
Lutzenhiser, L. (1992), A Question Of Control – Alternative Patterns Of Room Air- Conditioner Use, Energy and Buildings, 18, pp. 193-200.
Maier, T., M. Krzaczek & J. Tejchman (2009), Comparison of Physical Perform-ances of the Ventilation Systems in Low-Energy Residential Houses, Energy and Buildings, 41, pp. 337-353.
Moujalled, B., R. Cantin & G. Guarracino (2008), Comparison of Thermal Com-fort Algorithms in Naturally Ventilated Office Buildings, Energy and Buildings, 40 (12), pp. 2215-2223.
NEN 5128: 2004, Energy Performance of Residential functions and residential buildings: determination method, ics 91.120.10, March.

[ 119 ]
Nevius, M.J. & S. Pigg (2000), Programmable Thermostats that Go Berserk? Tak-ing a Social Perspective on Space Heating in Wisconsin, in: ACEEE Summer Study in Energy Efficiency in Buildings.
Nicol, J.F. & M.A. Humphreys (2009), New Standards for Comfort and Energy Use in Buildings, Building Research & Information, 37 (1), pp. 68-73.
Papakostas, K.T. & B.A. Satiropoulos (1997), Occupational and Energy Behav-iour Patterns in Greek Residences, Energy and Buildings, 26, pp. 207-213.
Schweiker, M. & M. Shukuya (2009), Comparison of Theoretical and Statistical Models of Air-Conditioning-Unit Usage Behaviour in a Residential Setting under Japanese Climatic Conditions, Building and Environment, 44, pp. 2137-2149.
Shipworth, M., S.K. Firth, M.I. Gentry, A.J. Wright, D.T. Shipworth & K.J. Lomas (2010), Central heating thermostat settings and timing: building demograph-ics, Building Research & Information, 38, pp. 50-69.
Thermal Comfort Chapter (2005), Fundamentals volume of the ASHRAE Handbook, ASHRAE, Inc., Atlanta, GA.
US Department of Energy (2002), Whole-house ventilation systems, http://www.southface.org/web/resources&services/publications/technical_bulletins/WHVS-Wholehouse_vent%2002-0778.pdf.
VROM, Dutch Ministry of Housing, website: www.vrom.nl, accessed July 2009.
Ye, X.J., Z.P. Zhou, Z.W. Lian, H.M. Liu, C.Z. Li & Y.M. Liu (2006), Field Study of a Ther-mal Environment and Adaptive Model in Shanghai, Indoor Air, 16 (4), pp. 320-326.

[ 120 ]

[ 121 ]

[ 122 ]
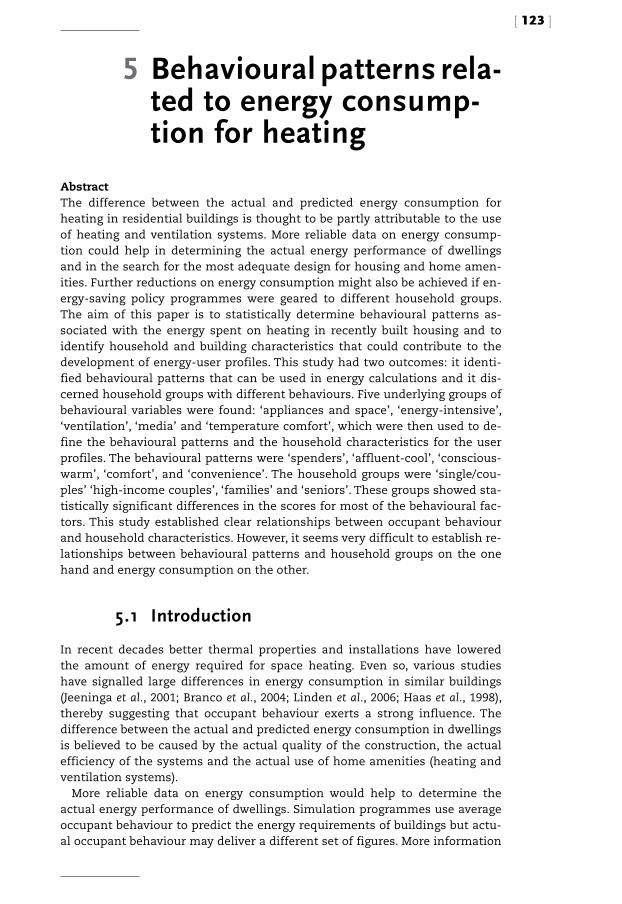
[ 123 ]
5 Behavioural patterns rela-ted to energy consump-tion for heating
AbstractThe difference between the actual and predicted energy consumption for heating in residential buildings is thought to be partly attributable to the use of heating and ventilation systems. More reliable data on energy consump-tion could help in determining the actual energy performance of dwellings and in the search for the most adequate design for housing and home amen-ities. Further reductions on energy consumption might also be achieved if en-ergy-saving policy programmes were geared to different household groups. The aim of this paper is to statistically determine behavioural patterns as-sociated with the energy spent on heating in recently built housing and to identify household and building characteristics that could contribute to the development of energy-user profiles. This study had two outcomes: it identi-fied behavioural patterns that can be used in energy calculations and it dis-cerned household groups with different behaviours. Five underlying groups of behavioural variables were found: ‘appliances and space’, ‘energy-intensive’, ‘ventilation’, ‘media’ and ‘temperature comfort’, which were then used to de-fine the behavioural patterns and the household characteristics for the user profiles. The behavioural patterns were ‘spenders’, ‘affluent-cool’, ‘conscious-warm’, ‘comfort’, and ‘convenience’. The household groups were ‘single/cou-ples’ ‘high-income couples’, ‘families’ and ‘seniors’. These groups showed sta-tistically significant differences in the scores for most of the behavioural fac-tors. This study established clear relationships between occupant behaviour and household characteristics. However, it seems very difficult to establish re-lationships between behavioural patterns and household groups on the one hand and energy consumption on the other.
5.1 Introduction
In recent decades better thermal properties and installations have lowered the amount of energy required for space heating. Even so, various studies have signalled large differences in energy consumption in similar buildings (Jeeninga et al., 2001; Branco et al., 2004; Linden et al., 2006; Haas et al., 1998), thereby suggesting that occupant behaviour exerts a strong influence. The difference between the actual and predicted energy consumption in dwellings is believed to be caused by the actual quality of the construction, the actual efficiency of the systems and the actual use of home amenities (heating and ventilation systems).
More reliable data on energy consumption would help to determine the actual energy performance of dwellings. Simulation programmes use average occupant behaviour to predict the energy requirements of buildings but actu-al occupant behaviour may deliver a different set of figures. More information
[ 124 ]
about the actual use of home amenities would help to determine the most adequate building design. Further reductions on energy consumption might also be achieved if energy-saving policy programmes were geared to different household groups (Raaij & Verhallen, 1983a; 1983b; Hamrin in Raaij & Verhal-len, 1983b).
In the Netherlands various studies have been conducted with the aim of identifying behavioural patterns related to higher levels of energy consump-tion and to energy-saving attitudes (Raaij & Verhallen, 1983a; Poortinga et al., 2005). Factors related to energy conservation have been identified as well as household characteristics related to higher levels of energy consumption through the use of heating and ventilation systems. However, studies have also shown that occupant behaviour is connected with certain types of build-ing characteristics and heating and ventilation systems. A rebound effect in energy consumption has also been identified based on the finding that households in dwellings with improved thermal properties still opt for high-er indoor temperatures (Hamrin in Raaij & Verhallen, 1983b; Hens, et al., 2010). We found the same effect in Chapter 6.
We assume that behaviour in dwellings with improved thermal properties and automatic HVAC systems will be different from the behaviour in older dwellings and that the characteristics of households living in newer dwellings will be different from those of households living in older dwellings. Behav-ioural patterns in new dwellings might therefore be different from those determined for the total housing stock. The aim of this paper is to statistically determine behavioural patterns related to the energy consumption for space and water heating in recently built housing given that occupant behaviour is expected to be more visible in newer than in older dwellings. We also seek to ascertain the household and building characteristics that can be used in the construction of profiles for energy consumption in recently built housing.
5.2 State of the art
This section introduces a selection of studies on behavioural patterns and us-er profiles on energy consumption for space heating. User profiles have been defined with household characteristics (Groot et al., 2008; Paauw et al., 2009), lifestyle and behavioural patterns (Raaij & Verhallen., 1983a; Groot et al., 2008; Paauw et al., 2009; Assimakopoulos, 1992) and cognitive variables such as val-ues, needs and attitudes (Poortinga et al., 2005; Vringer & Blok, 2007). Some studies focus on either behavioural patterns or cognitive variables while oth-ers focus on both.
Cognitive variables refer to values, motivations, needs and attitudes (Assael, 1995; Ajzen, 1991). Some studies have successfully found relation-ships between cognitive variables and energy consumption. Raaij & Verhal-
[ 125 ]
len (1983a) found in the 1980s that 5% of the variation in energy consumption could be explained by energy-related attitudes that could be categorised under price, environment, energy concerns, health concerns and personal comfort.
More recently, a survey by Poortinga et al. (2005) among 455 households in the Netherlands investigated the acceptability of different energy-saving measures for different household characteristics. They found that different socio-demographic groups and people with different environmental concerns preferred different types of energy-saving measures. The average acceptabil-ity of energy-saving measures varied among people with different environ-mental concerns. Seniors, singles and low-income households were less will-ing to apply energy-saving measures at home.
Vringer (2007) studied the effect of values, motivation and perception of climate change on the energy consumption of different groups of Dutch households. He found no significant differences in the energy consumption of groups of households with different value patterns (taking account of the socio-economic status), though he did establish that families that were least motivated to save energy used 4% more energy. The households were grouped according to income, age, education and household size.
Behaviour regarding the use of home amenities has been more successful-ly linked to energy consumption. In a recent study by TNO-ECN (Groot et al., 2008; Paauw et al., 2009) five groups of households were studied on the basis of composition: single inhabitant, couple (<60), single-parent, family and sen-iors (>60). Four profiles were built on the basis of answers to questions about potential drivers of energy consumption in relation to income, environment and personal convenience: ‘convenience/ease’ (comfort is important, no inter-est in saving energy, money or the environment), ‘conscious’ (comfort is important, some environmental- and cost-awareness), ‘costs’ (awareness of energy costs and a concern to save money) and ‘climate/environment’ (con-cern for the environment). According to Groot et al. (2008), these groups had different drivers to engage in energy-saving behaviour.
Raaij & Verhallen (1983a) maintain that, in most households, energy behav-iour is not a separate type of behaviour but is contingent on other behaviour associated with, for example, housework, childcare, and hobbies. They car-ried out a study in 145 households in the Netherlands in the early 1980s and defined five patterns of energy behaviour in relation to the use of heating sys-tems and ventilation habits: conservers, spenders, cool, warm, and average. They found that the age of occupants in the ‘warm’ cluster was higher than in the other four, that the educational level of ‘conservers’ was higher than that of ‘spenders’, and that the household size of ‘conservers’ was smaller than the rest. They ascertained no differences for income and employment. The conclusion was that the household lifestyle influences energy-related attitudes and behaviour. Family size and composition, besides presence or absence at home, had a direct effect on behaviour and energy consumption.
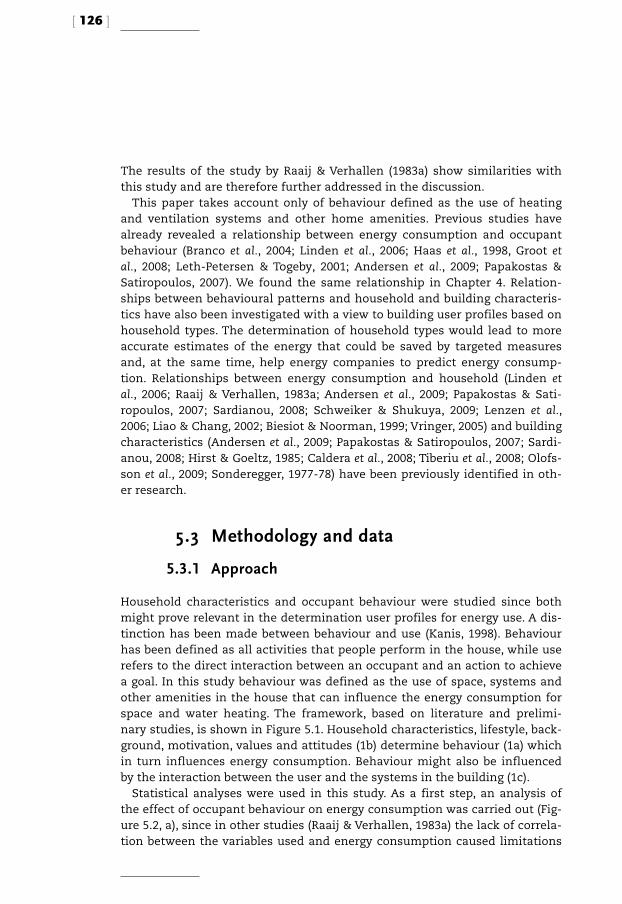
[ 126 ]
The results of the study by Raaij & Verhallen (1983a) show similarities with this study and are therefore further addressed in the discussion.
This paper takes account only of behaviour defined as the use of heating and ventilation systems and other home amenities. Previous studies have already revealed a relationship between energy consumption and occupant behaviour (Branco et al., 2004; Linden et al., 2006; Haas et al., 1998, Groot et al., 2008; Leth-Petersen & Togeby, 2001; Andersen et al., 2009; Papakostas & Satiropoulos, 2007). We found the same relationship in Chapter 4. Relation-ships between behavioural patterns and household and building characteris-tics have also been investigated with a view to building user profiles based on household types. The determination of household types would lead to more accurate estimates of the energy that could be saved by targeted measures and, at the same time, help energy companies to predict energy consump-tion. Relationships between energy consumption and household (Linden et al., 2006; Raaij & Verhallen, 1983a; Andersen et al., 2009; Papakostas & Sati-ropoulos, 2007; Sardianou, 2008; Schweiker & Shukuya, 2009; Lenzen et al., 2006; Liao & Chang, 2002; Biesiot & Noorman, 1999; Vringer, 2005) and building characteristics (Andersen et al., 2009; Papakostas & Satiropoulos, 2007; Sardi-anou, 2008; Hirst & Goeltz, 1985; Caldera et al., 2008; Tiberiu et al., 2008; Olofs-son et al., 2009; Sonderegger, 1977-78) have been previously identified in oth-er research.
5.3 Methodology and data
5.3.1 Approach
Household characteristics and occupant behaviour were studied since both might prove relevant in the determination user profiles for energy use. A dis-tinction has been made between behaviour and use (Kanis, 1998). Behaviour has been defined as all activities that people perform in the house, while use refers to the direct interaction between an occupant and an action to achieve a goal. In this study behaviour was defined as the use of space, systems and other amenities in the house that can influence the energy consumption for space and water heating. The framework, based on literature and prelimi-nary studies, is shown in Figure 5.1. Household characteristics, lifestyle, back-ground, motivation, values and attitudes (1b) determine behaviour (1a) which in turn influences energy consumption. Behaviour might also be influenced by the interaction between the user and the systems in the building (1c).
Statistical analyses were used in this study. As a first step, an analysis of the effect of occupant behaviour on energy consumption was carried out (Fig-ure 5.2, a), since in other studies (Raaij & Verhallen, 1983a) the lack of correla-tion between the variables used and energy consumption caused limitations
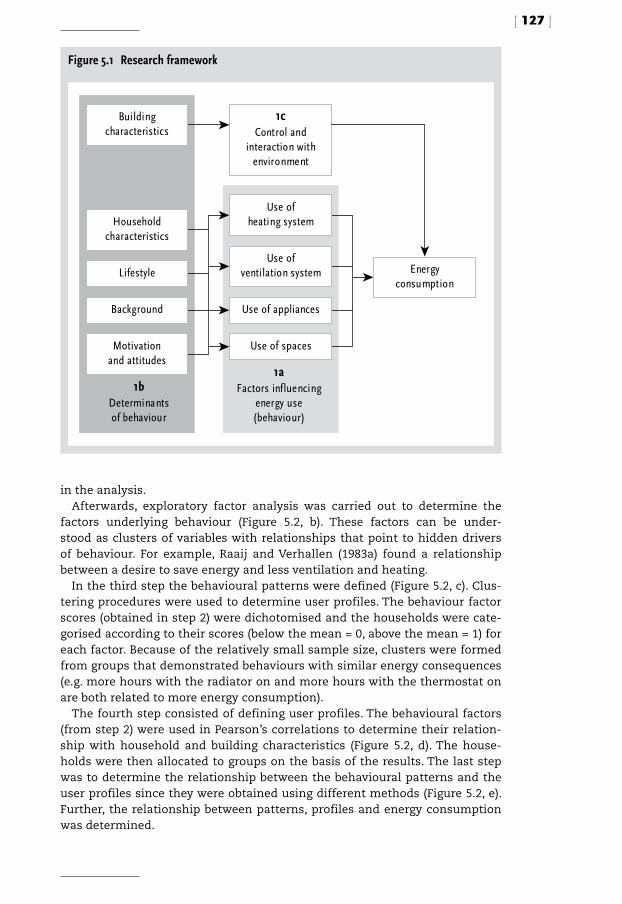
[ 127 ]
in the analysis. Afterwards, exploratory factor analysis was carried out to determine the
factors underlying behaviour (Figure 5.2, b). These factors can be under-stood as clusters of variables with relationships that point to hidden drivers of behaviour. For example, Raaij and Verhallen (1983a) found a relationship between a desire to save energy and less ventilation and heating.
In the third step the behavioural patterns were defined (Figure 5.2, c). Clus-tering procedures were used to determine user profiles. The behaviour factor scores (obtained in step 2) were dichotomised and the households were cate-gorised according to their scores (below the mean = 0, above the mean = 1) for each factor. Because of the relatively small sample size, clusters were formed from groups that demonstrated behaviours with similar energy consequences (e.g. more hours with the radiator on and more hours with the thermostat on are both related to more energy consumption).
The fourth step consisted of defining user profiles. The behavioural factors (from step 2) were used in Pearson’s correlations to determine their relation-ship with household and building characteristics (Figure 5.2, d). The house-holds were then allocated to groups on the basis of the results. The last step was to determine the relationship between the behavioural patterns and the user profiles since they were obtained using different methods (Figure 5.2, e). Further, the relationship between patterns, profiles and energy consumption was determined.
Figure 5.1 Research framework
1cControl and
interaction with environment
Energy consumption
Buildingcharacteristics
1bDeterminantsof behaviour
1aFactors influencing
energy use(behaviour)
Household characteristics
Motivationand attitudes
Lifestyle
Background
Use ofheating system
Use ofventilation system
Use of appliances
Use of spaces
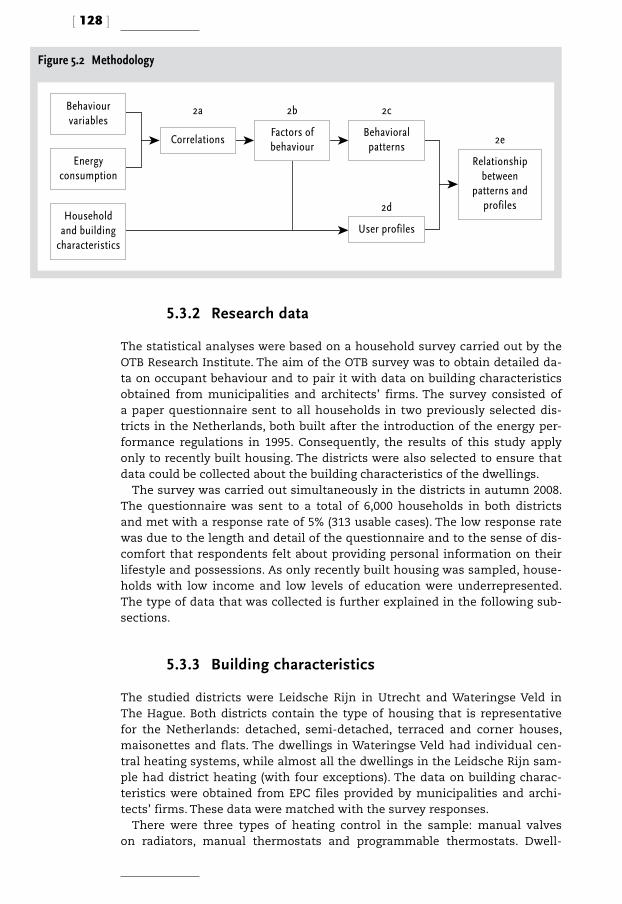
[ 128 ]
5.3.2 Research data
The statistical analyses were based on a household survey carried out by the OTB Research Institute. The aim of the OTB survey was to obtain detailed da-ta on occupant behaviour and to pair it with data on building characteristics obtained from municipalities and architects’ firms. The survey consisted of a paper questionnaire sent to all households in two previously selected dis-tricts in the Netherlands, both built after the introduction of the energy per-formance regulations in 1995. Consequently, the results of this study apply only to recently built housing. The districts were also selected to ensure that data could be collected about the building characteristics of the dwellings.
The survey was carried out simultaneously in the districts in autumn 2008. The questionnaire was sent to a total of 6,000 households in both districts and met with a response rate of 5% (313 usable cases). The low response rate was due to the length and detail of the questionnaire and to the sense of dis-comfort that respondents felt about providing personal information on their lifestyle and possessions. As only recently built housing was sampled, house-holds with low income and low levels of education were underrepresented. The type of data that was collected is further explained in the following sub-sections.
5.3.3 Building characteristics
The studied districts were Leidsche Rijn in Utrecht and Wateringse Veld in The Hague. Both districts contain the type of housing that is representative for the Netherlands: detached, semi-detached, terraced and corner houses, maisonettes and flats. The dwellings in Wateringse Veld had individual cen-tral heating systems, while almost all the dwellings in the Leidsche Rijn sam-ple had district heating (with four exceptions). The data on building charac-teristics were obtained from EPC files provided by municipalities and archi-tects’ firms. These data were matched with the survey responses.
There were three types of heating control in the sample: manual valves on radiators, manual thermostats and programmable thermostats. Dwell-
Figure 5.2 Methodology
Behaviour variables
Energy consumption
Household and building
characteristics
Behavioral patterns
User profiles
Factors of behaviour
Correlations
Relationship between
patterns and profiles
2a
2d
2c2b
2e

[ 129 ]
ings which had manual valves on radiators in addition to a manual or pro-grammable thermostat were categorised according to the type of thermostat. Only a few dwellings had balanced ventilation, and all others had mechani-cal exhaust ventilation, which is the representative situation in the Nether-lands. In this paper, only the building characteristics with a strong influence on energy consumption are analysed (Chapters 2 and 3). Based on the results from previous chapters (2 and 3), the building characteristics that affected energy consumption were the dwelling size (which is related to heat-trans-fer surfaces and total heated area), the insulation level and the presence of a programmable thermostat. Dwelling size and programmable thermostats were related to higher energy consumption and insulation level was relat-ed to lower energy consumption. The variables used were: heating, number of bedrooms, presence of attic, type of dwelling and presence of program-mable thermostat (see definitions in Table 5.1). Insulation was not taken into account since all the houses in the sample were well insulated.
Table 5.1 Definition of household and building characteristics
Variable Definition Mean, SD
Household size Number of people living in the dwelling M = 2.58 SD = 1.18
Heating area Heating area of the dwelling in m2 M = 127.33 SD = 36.02
Number of bedrooms Number of bedrooms in the dwelling M = 3 SD = 1
Variable Definition N %
Presence of elderly Presence of person > 65 years old NoYes
265
47
84.9
15.1
Presence of children Presence of child < 12 years old NoYes
231
81
74
26
Presence at home Presence at home (working at or in the home)
NoYes
221
100
67.8
32.2
Type of tenure (tenant) Occupant is not owner of the dwelling NoYes
247
66
78.9
21.1
Smoking at home A member of the household smokes inside the dwelling
NoYes
271
42
86.6
13.4
Pets at home Pets live in the dwelling NoYes
215
98
68.7
31.3
High level of education A member of household has high level of education (BSc, MSc, PhD, Post doc)
NoYes
88
220
28.6
71.4
High income Annual household income is € 56,000 or more
NoYes
175
118
59.7
40.3
Presence of attic There is an attic in the dwelling NoYes
185
128
59.1
40.9
Multi-family house The dwelling is a flat or maisonette NoYes
226
87
72.2
27.8
Presence of programmable thermostat
There is an programmable thermostat in the dwelling
NoYes
160
151
51.4
48.6
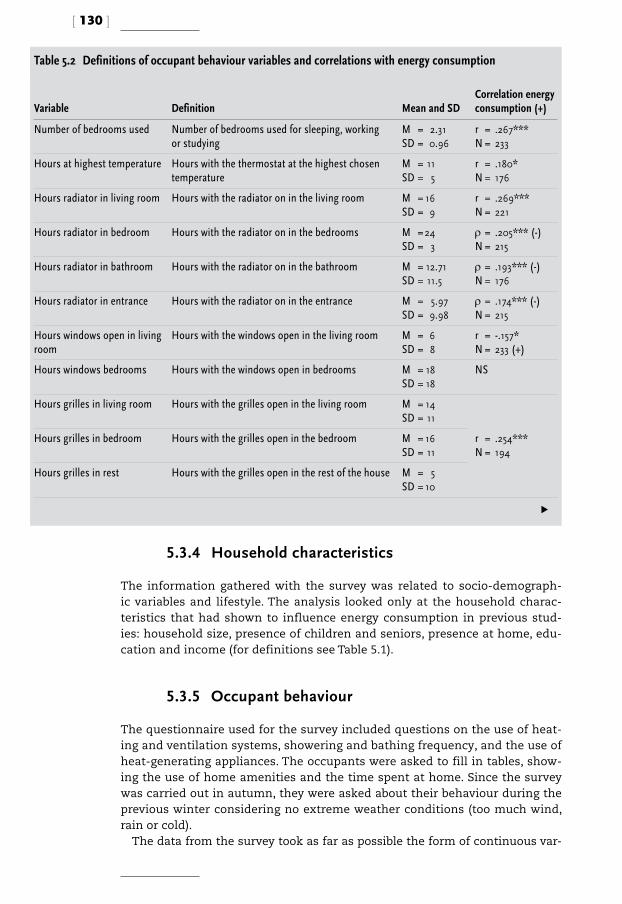
[ 130 ]
5.3.4 Household characteristics
The information gathered with the survey was related to socio-demograph-ic variables and lifestyle. The analysis looked only at the household charac-teristics that had shown to influence energy consumption in previous stud-ies: household size, presence of children and seniors, presence at home, edu-cation and income (for definitions see Table 5.1).
5.3.5 Occupant behaviour
The questionnaire used for the survey included questions on the use of heat-ing and ventilation systems, showering and bathing frequency, and the use of heat-generating appliances. The occupants were asked to fill in tables, show-ing the use of home amenities and the time spent at home. Since the survey was carried out in autumn, they were asked about their behaviour during the previous winter considering no extreme weather conditions (too much wind, rain or cold).
The data from the survey took as far as possible the form of continuous var-
Variable Definition Mean and SDCorrelation energy consumption (+)
Number of bedrooms used Number of bedrooms used for sleeping, working or studying
M = 2.31SD = 0.96
r = .267***N = 233
Hours at highest temperature Hours with the thermostat at the highest chosen temperature
M = 11SD = 5
r = .180*N = 176
Hours radiator in living room Hours with the radiator on in the living room M = 16SD = 9
r = .269***N = 221
Hours radiator in bedroom Hours with the radiator on in the bedrooms M = 24SD = 3
ρ = .205*** (-)N = 215
Hours radiator in bathroom Hours with the radiator on in the bathroom M = 12.71SD = 11.5
ρ = .193*** (-)N = 176
Hours radiator in entrance Hours with the radiator on in the entrance M = 5.97SD = 9.98
ρ = .174*** (-)N = 215
Hours windows open in living room
Hours with the windows open in the living room M = 6SD = 8
r = -.157*N = 233 (+)
Hours windows bedrooms Hours with the windows open in bedrooms M = 18SD = 18
NS
Hours grilles in living room Hours with the grilles open in the living room M = 14SD = 11
r = .254***N = 194
Hours grilles in bedroom Hours with the grilles open in the bedroom M = 16SD = 11
Hours grilles in rest Hours with the grilles open in the rest of the house M = 5SD = 10
Table 5.2 Definitions of occupant behaviour variables and correlations with energy consumption
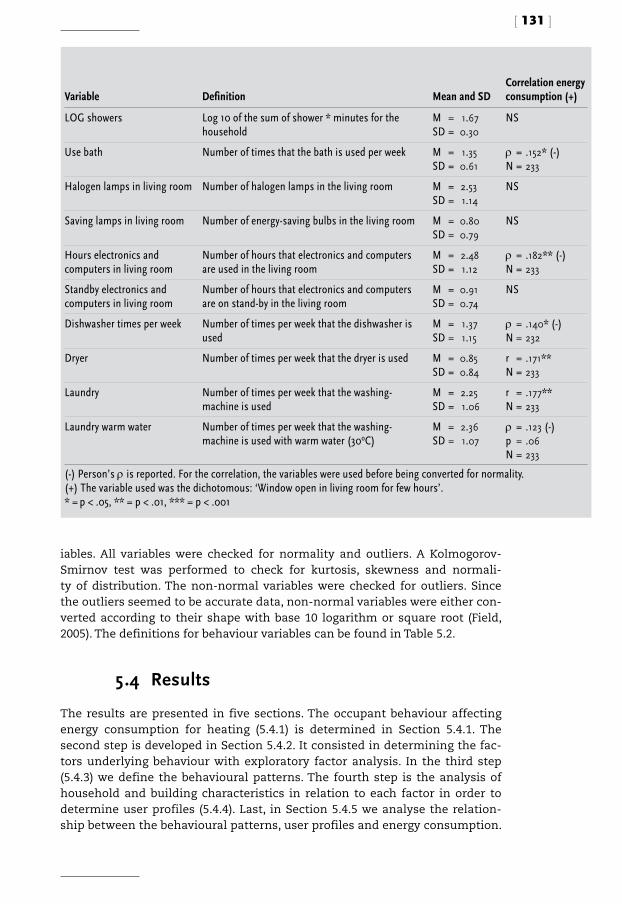
[ 131 ]
iables. All variables were checked for normality and outliers. A Kolmogorov-Smirnov test was performed to check for kurtosis, skewness and normali-ty of distribution. The non-normal variables were checked for outliers. Since the outliers seemed to be accurate data, non-normal variables were either con-verted according to their shape with base 10 logarithm or square root (Field, 2005). The definitions for behaviour variables can be found in Table 5.2.
5.4 Results
The results are presented in five sections. The occupant behaviour affecting energy consumption for heating (5.4.1) is determined in Section 5.4.1. The second step is developed in Section 5.4.2. It consisted in determining the fac-tors underlying behaviour with exploratory factor analysis. In the third step (5.4.3) we define the behavioural patterns. The fourth step is the analysis of household and building characteristics in relation to each factor in order to determine user profiles (5.4.4). Last, in Section 5.4.5 we analyse the relation-ship between the behavioural patterns, user profiles and energy consumption.
Variable Definition Mean and SDCorrelation energy consumption (+)
LOG showers Log 10 of the sum of shower * minutes for the household
M = 1.67SD = 0.30
NS
Use bath Number of times that the bath is used per week M = 1.35SD = 0.61
ρ = .152* (-)N = 233
Halogen lamps in living room Number of halogen lamps in the living room M = 2.53SD = 1.14
NS
Saving lamps in living room Number of energy-saving bulbs in the living room M = 0.80SD = 0.79
NS
Hours electronics and computers in living room
Number of hours that electronics and computers are used in the living room
M = 2.48SD = 1.12
ρ = .182** (-)N = 233
Standby electronics and computers in living room
Number of hours that electronics and computers are on stand-by in the living room
M = 0.91SD = 0.74
NS
Dishwasher times per week Number of times per week that the dishwasher is used
M = 1.37SD = 1.15
ρ = .140* (-)N = 232
Dryer Number of times per week that the dryer is used M = 0.85SD = 0.84
r = .171**N = 233
Laundry Number of times per week that the washing-machine is used
M = 2.25SD = 1.06
r = .177**N = 233
Laundry warm water Number of times per week that the washing-machine is used with warm water (30oC)
M = 2.36SD = 1.07
ρ = .123 (-)p = .06N = 233
(-) Person’s ρ is reported. For the correlation, the variables were used before being converted for normality.(+) The variable used was the dichotomous: ‘Window open in living room for few hours’.* = p < .05, ** = p < .01, *** = p < .001

[ 132 ]
5.4.1 Effects of occupant behaviour on energy consump-tion
In this section, correlations analyses are carried out to determine the rela-tionship between occupant behaviour and energy consumption for heating. The statistics are shown in Table 5.2.
The number of rooms in use turned out to be one of the most important variables determining energy consumption for space heating. The rooms con-sidered were those used for sleeping, studying or working.
The heating systems considered were thermostats and radiators. The occu-pants were asked to report retrospectively the thermostat setting per hour and the hours that the radiators were kept open in each room. The obtained data formed the basis for a set of variables that took account of the highest chosen thermostat setting and the number of hours that it was retained. The ‘thermostat setting’ by itself did not show a statistically significant correla-tion with energy consumption since there was not much variation in the sam-ple. This variable was therefore not taken into account for further analysis.
The respondents reported the setting of the mechanical ventilation system (mechanical exhaust or balanced) per hour and the hours with windows and grilles open in each room. However, only the use of windows and grilles was considered in this analysis, since most households reported that the mechan-ical ventilation was almost always off or at the lowest setting and since any relationship between energy consumption and use of mechanical ventilation systems was absent (Chapter 3).
The users reported the number and usual duration of showers taken by each family member per week. The duration in minutes of shower use (for the entire household) per week was divided by the household size. Users also reported the number of times per week that the bath was used. Although no correlation was found between the frequency of showers and energy con-sumption, this variable was still included in the analysis because it can help to identify trends in behaviour (Table 5.2).
Use of appliances, computers and electronics refers to the frequency of the use of heat-generating electronics and computers in the living room and the number of times per week that hot-water-consuming appliances such as washing-machines and dishwashers were used. No correlation was found between the use of halogen lamps, energy-saving bulbs, standby electronics and computers and energy consumption for heating. However, as in the case of showering frequency, these variables can point to trends that would other-wise be unidentifiable (e.g. greater use of energy-saving bulbs might indicate a positive attitude towards saving energy).
[ 133 ]
5.4.2 Factors underlying behaviour: exploratory factor analysis
Exploratory factor analysis was used to identify factors underlying occupant behaviour. Factor analysis describes the variability among variables in terms of factors, which can then help to determine related behaviours. The factors resulting from the analysis (groups of related variables) were further analysed in order to find hidden dimensions that could be understood as drivers of be-haviour. According to (Field, 2005), a factor can be described in terms of the variables measured and the relative importance of these variables to that fac-tor. The variables used for the exploratory factor analysis are shown in Table 5.2. The correlation of each variable with energy consumption is also shown in the table. Not all variables were correlated to energy consumption for space and water heating, but their inclusion in the analysis can shed light on un-derlying behaviours.
Twenty-one variables were used for the analysis. They were examined to ascertain whether factor analysis was suitable, taking account of the correla-tion between them. All variables correlated by at least .3 with other variables, thus suggesting reasonable factorability. Further analysis of the assumptions led to the conclusion that factor analysis including all variables was suitable. The initial Eigen values (degree of variation in the total sample accounted for by each factor) showed that the first factor explained 15.2% of the variance, the second 10.3%; the third 8.8%, the fourth 8.1%, and the fifth 5.9%. Fac-tors 6 to 21 could explain less than 5% each. After examining the Eigen val-ues in each of the resulting factors, the solution that included five factors and explained 48.4% of the variance was preferred. This decision was also based on the analysis of Eigen values on the scree plot. A final factor analysis test with the twenty-one variables was conducted with just the five factors. The factor loading matrix and communalities for this final solution are shown in Table 5.3. The first five columns show how much each variable contributes to each factor in the final solution. The sixth column contains the communali-ties, which are the common variance in one variable. The common variance is the variance shared with other variables.
Scores were created for each of the factors, based on the mean of the var-iables which have their primary loadings on each factor. These composite scores were named after the aspects that defined them: ‘use of appliances and space’, ‘energy-intensive’, ‘ventilation’, ‘media’, and ‘temperature comfort’.
The variable related to Factor 1 indicated a more intensive use of large appliance and spaces. The variables in Factor 2 were related to a more ener-gy-intensive lifestyle. The fact that greater use of halogen lamps and less use of energy-saving bulbs are related to higher scores for this factor indicates less concern for saving energy. The variables in Factor 3 were related to ven-tilation. The fact that no other variable has a high loading in this factor and

[ 134 ]
that loadings in these variables are not present in any other factor indicates that ventilation behaviour is almost independent of other types of behaviour. The variables in Factor 4 indicate a lifestyle with more use of media and mod-ern technology. Use of more halogen lamps might also indicate less concern for energy saving. The relationship between the variables in Factor 5 seems to indicate a preference for a warm indoor environment, since thermostats and radiators are on for more hours and bedrooms are less ventilated. The relationship with use of more energy-saving bulbs indicates that this factor is determined by comfort rather than lack of energy-awareness (as in ‘ener-
Table 5.3 Factor loadings and communalities based on a principle components analysis for 21 variables of occupant behaviour (N = 235)
Components
Communalities1 2 3 4 5
Number of bedrooms used .552 -.381 .462
(LOG) Dishwasher times per week .725 .575
(LOG) Dryer .562 .326
(LOG) Washing-machine .869 .768
(LOG) Washing-machine warm water .825 .693
(LOG) Halogen lamps in living room (main in other factor)
.406 .389 .442 .512
(SQRT) Hours radiator in living room .462 .360 .377
(SQRT) Hours radiator in bedroom .655 .529
(SQRT) Hours radiator in bathroom .773 .639
(SQRT) Hours radiator in entrance .632 .434
(LOG) Hours electronics and computers in living room
.310 .382 .364 .394
(LOG) Saving lamps -.398 .416 .418
Hours grilles in living room .855 .744
Hours grilles in bedroom .842 .722
Hours grilles in rest .586 .398
(LOG) Hours windows open in living room .387 .308
(LOG) Showers .650 .467
Use bath -.490 .347
Hours highest temperature .559 .324
(SQRT) Hours windows bedrooms -.500 .321
(LOG) Standby electronics and computers .589 .411
Rotation method: Varimax with Kaiser Normalization.Factor loadings < .4 are suppressed.The Kaiser-Meyer-Olkin measure of sampling adequacy was.644, above the recommended value of.6. The diagonals of the anti-image correlation matrix were all above.5, supporting the inclusion of each item in the factor analysis. Finally, the communalities were all above.3 (see column communalities), further confirming that each item shared some common variance with other items. Given these overall indicators, factor analysis was conducted with all 21 variables.
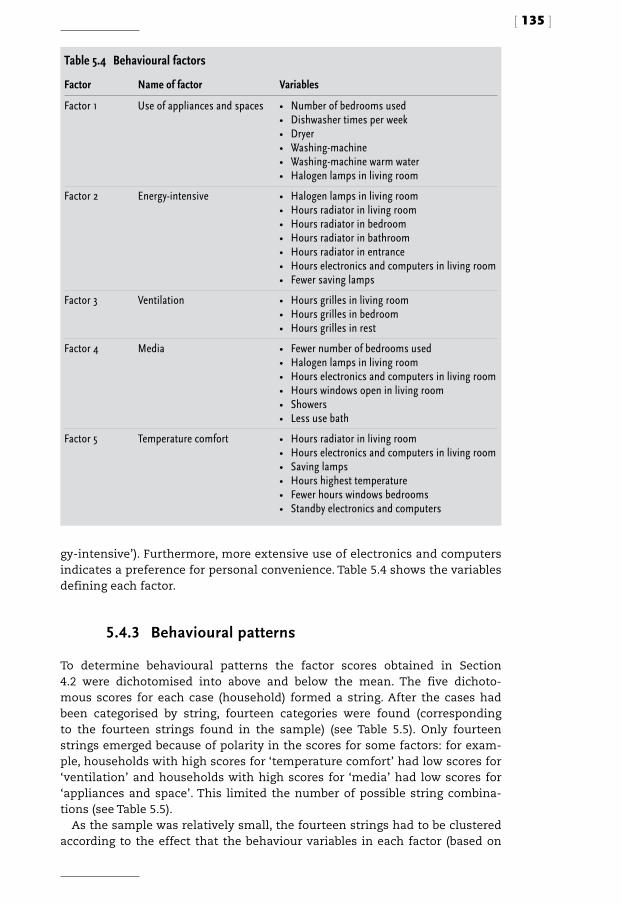
[ 135 ]
gy-intensive’). Furthermore, more extensive use of electronics and computers indicates a preference for personal convenience. Table 5.4 shows the variables defining each factor.
5.4.3 Behavioural patterns
To determine behavioural patterns the factor scores obtained in Section 4.2 were dichotomised into above and below the mean. The five dichoto-mous scores for each case (household) formed a string. After the cases had been categorised by string, fourteen categories were found (corresponding to the fourteen strings found in the sample) (see Table 5.5). Only fourteen strings emerged because of polarity in the scores for some factors: for exam-ple, households with high scores for ‘temperature comfort’ had low scores for ‘ventilation’ and households with high scores for ‘media’ had low scores for ‘appliances and space’. This limited the number of possible string combina-tions (see Table 5.5).
As the sample was relatively small, the fourteen strings had to be clustered according to the effect that the behaviour variables in each factor (based on
Table 5.4 Behavioural factors
Factor Name of factor Variables
Factor 1 Use of appliances and spaces • Number of bedrooms used• Dishwasher times per week• Dryer• Washing-machine• Washing-machine warm water• Halogen lamps in living room
Factor 2 Energy-intensive • Halogen lamps in living room • Hours radiator in living room• Hours radiator in bedroom• Hours radiator in bathroom• Hours radiator in entrance• Hours electronics and computers in living room• Fewer saving lamps
Factor 3 Ventilation • Hours grilles in living room• Hours grilles in bedroom• Hours grilles in rest
Factor 4 Media • Fewer number of bedrooms used• Halogen lamps in living room • Hours electronics and computers in living room• Hours windows open in living room• Showers• Less use bath
Factor 5 Temperature comfort • Hours radiator in living room• Hours electronics and computers in living room• Saving lamps• Hours highest temperature• Fewer hours windows bedrooms• Standby electronics and computers

[ 136 ]
the correlations in Table 5.1) had on energy consumption. In other words, fac-tors that were positively related to variables that were positively related to energy consumption were clustered. For example, three strings were catego-rised under ‘spenders’. The first contained 22 cases and consisted of house-holds with high scores for ‘appliances and space’, ‘energy-intensive’ and ‘ven-tilation’. The second contained 12 cases and consisted of households with higher scores for ‘appliances and space’, ‘energy-intensive’ and ‘temperature comfort’. The third string contained 8 cases and consisted of households with high scores for ‘appliances and space’ and ‘energy-intensive’. The fourteen strings were organised into five behavioural patterns: 1. Spenders: use of more space, more use of electronics, more hours of heat-
ing, more hours of ventilation, no energy-saving concerns;2. Affluent-cool: use of more space, more hours of ventilation;3. Conscious-warm: use of more space, more use of electronics, more hours of
heating, fewer hours of ventilation, energy-saving concerns;4. Comfort: more use of electronics, more hours of heating, more hours of
ventilation;5. Convenience-cool: more use of electronics, more hours of ventilation.
Table 5.5 shows the strings for each behavioural pattern. For classification purposes, priority was given to three factors that were more strongly associat-ed with energy consumption: factor 1, which was related to more use of bed-rooms and proved to be an important predictor of energy consumption; factor 2 which was related to more intensive use of the heating systems with less concern for saving energy; and factor 5 which was related to more intensive use of the heating system with more energy-saving concerns. The criteria for the classification can be seen in Table 5.5.
Table 5.5 Definition of behavioural patterns: strings classification and number of cases (N) per string
High score for this factor equals:
Factor 1 Appliances and space(More bedrooms used)
Factor 2Energy-intensive(More intensive use of heating, less concern for saving energy)
Factor 3 Ventilation(Moreventilation)
Factor 4Media(More ventilation, fewer bedrooms used)
Factor 5Temperature comfort(More intensive use of heating, more concern for saving energy) N
Spenders 111
111
100
000
010
22128
Affluent-cool 11
00
10
00
00
2812
Conscious-warm
100
000
000
010
111
182418
Comfort 0000
1111
1100
1010
0000
166
196
Convenience-cool
00
00
10
11
00
3115
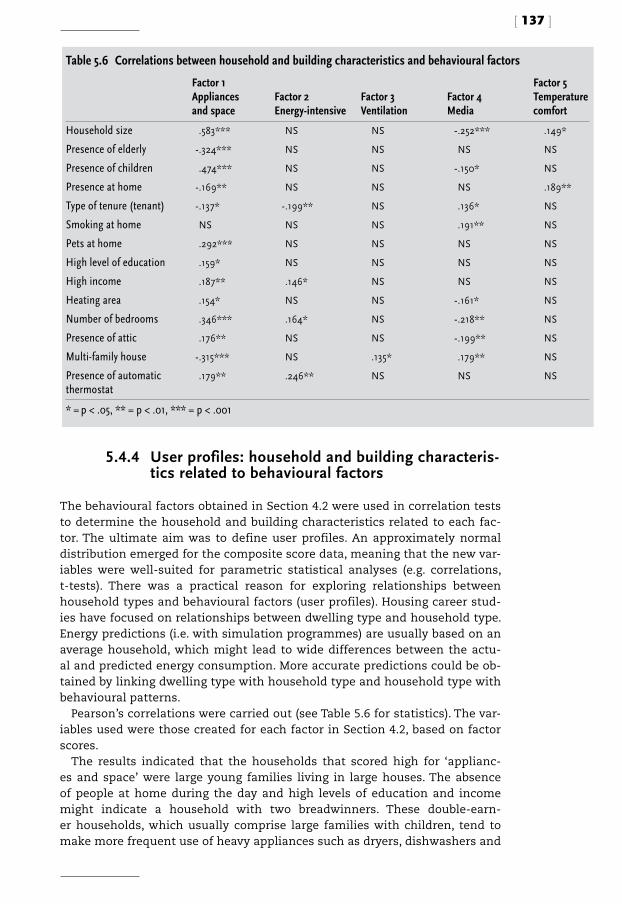
[ 137 ]
5.4.4 User profiles: household and building characteris-tics related to behavioural factors
The behavioural factors obtained in Section 4.2 were used in correlation tests to determine the household and building characteristics related to each fac-tor. The ultimate aim was to define user profiles. An approximately normal distribution emerged for the composite score data, meaning that the new var-iables were well-suited for parametric statistical analyses (e.g. correlations, t-tests). There was a practical reason for exploring relationships between household types and behavioural factors (user profiles). Housing career stud-ies have focused on relationships between dwelling type and household type. Energy predictions (i.e. with simulation programmes) are usually based on an average household, which might lead to wide differences between the actu-al and predicted energy consumption. More accurate predictions could be ob-tained by linking dwelling type with household type and household type with behavioural patterns.
Pearson’s correlations were carried out (see Table 5.6 for statistics). The var-iables used were those created for each factor in Section 4.2, based on factor scores.
The results indicated that the households that scored high for ‘applianc-es and space’ were large young families living in large houses. The absence of people at home during the day and high levels of education and income might indicate a household with two breadwinners. These double-earn-er households, which usually comprise large families with children, tend to make more frequent use of heavy appliances such as dryers, dishwashers and
Table 5.6 Correlations between household and building characteristics and behavioural factors
Factor 1Appliances and space
Factor 2Energy-intensive
Factor 3Ventilation
Factor 4Media
Factor 5Temperature comfort
Household size .583*** NS NS -.252*** .149*
Presence of elderly -.324*** NS NS NS NS
Presence of children .474*** NS NS -.150* NS
Presence at home -.169** NS NS NS .189**
Type of tenure (tenant) -.137* -.199** NS .136* NS
Smoking at home NS NS NS .191** NS
Pets at home .292*** NS NS NS NS
High level of education .159* NS NS NS NS
High income .187** .146* NS NS NS
Heating area .154* NS NS -.161* NS
Number of bedrooms .346*** .164* NS -.218** NS
Presence of attic .176** NS NS -.199** NS
Multi-family house -.315*** NS .135* .179** NS
Presence of automatic thermostat
.179** .246** NS NS NS
* = p < .05, ** = p < .01, *** = p < .001
[ 138 ]
washing-machines. Thus the first user profile was defined as ‘family’.The household variables related to ‘energy-intensive’ were ‘type of tenure’
and ‘household income’. Number of bedrooms and an automatic thermostat were also positively correlated to a higher score for this factor. Households with high scores for this factor were home-owners with high incomes living in large houses. They tended to keep a warmer indoor environment and use more electronics and lighting. The negative correlation with energy-saving bulbs combined with high income seems to indicate a low concern for saving energy. The second user profile was defined as ‘high-income household’.
No correlations were found between ‘ventilation’ and household character-istics, making it impossible to define the type of household with a high score for this factor. This indicates that a preference for a cool indoor environment is the main driver of behaviour in this group. No household group was there-fore assigned to this factor.
Households with high scores for ‘media’ were small without children and with smokers at home. They also tended to be tenants in small multi-family dwellings. The user profile for this factor was defined as ‘low-income house-hold’.
Although no correlation was found between building variables and ‘tem-perature comfort’, the household variables relating to ‘temperature comfort’ were considerable for households with somebody working at home. It seems, therefore, that the thermal properties of the building may have no influence on the preference for a warmer indoor environment. The household group assigned to this factor was therefore ‘seniors’ since this is the group spending more time at home.
5.4.5 Relationship between behavioural patterns and user profiles
Since the behavioural patterns and the user profiles were determined with different methods, in this section we explain the relationship between them. Figure 5.3 shows the relationship between the outcomes from the different steps of this analysis: behavioural factors, behavioural patterns and user pro-files.
Firstly, the figure shows how the behavioural factors (see Section 5.4.2) are opposed to each other (see also Table 5.6). ‘Appliances and space’ is opposed to ‘media’ in household characteristics since the former relates to large households and the latter to small households. ‘Temperature comfort’ is opposed to ‘media’ for the same reason. ‘Ventilation’ did not correlate with household characteristics, but we assumed that it is opposed to ‘temperature comfort’. ‘Appliances and space’ and ‘energy-intensive’ share ‘type of own-ership’ as household characteristic. ‘Appliances and space’ and ‘temperature

[ 139 ]
comfort’ are opposed in terms of absence but are the same in household size. The behavioural patterns can be seen in the outer circle of Figure 5.3. The
pattern ‘affluent-cool’ corresponds to the ‘ventilation’ factor and the ‘appli-ances and spaces’ factor. The second pattern ‘convenience-cool’ corresponds with the factors ‘ventilation’ and ‘media’. The third pattern ‘conscious-warm’ corresponds to the ‘temperature comfort’ factor. Last, the patterns ‘spenders’ and ‘comfort’ correspond to both ‘family’ and ‘high income’ profiles.
The user profiles are identified by the curved lines in the middle of Figure 5.3. The ‘family’ profile corresponds with ‘spenders’, ‘comfort’ and ‘affluent cool’ behavioural patterns. The ‘seniors’ profiles corresponds with the pattern ‘conscious-warm’. The ‘low-income’ profile corresponds with the ‘conven-ience-warm’ and ‘convenience-cool’ patterns. The ‘high-income’ profiles cor-responds to the patterns ‘affluent-cool’, ‘comfort’ and ‘spenders’.
Identifying household characteristics would allow determining the associ-
Figure 5.3 Relationships found between behavioural factors and household characteristics
Small household
Smoking
No children
Low incom
e
Tena
nt
Senior
s
Presence
Large household
Pets
Children
High incom
e
Absence
No seniorsO
wner
Conscious-warm
Spen
ders
ComfortAffluent-cool
Conveniou
s-coo
l
Appli
ances and spaces
Media
Ventilation
Low-income couples/singl
esSeniors
High-income couple
Energy-intensive
Family
Temperature comfort
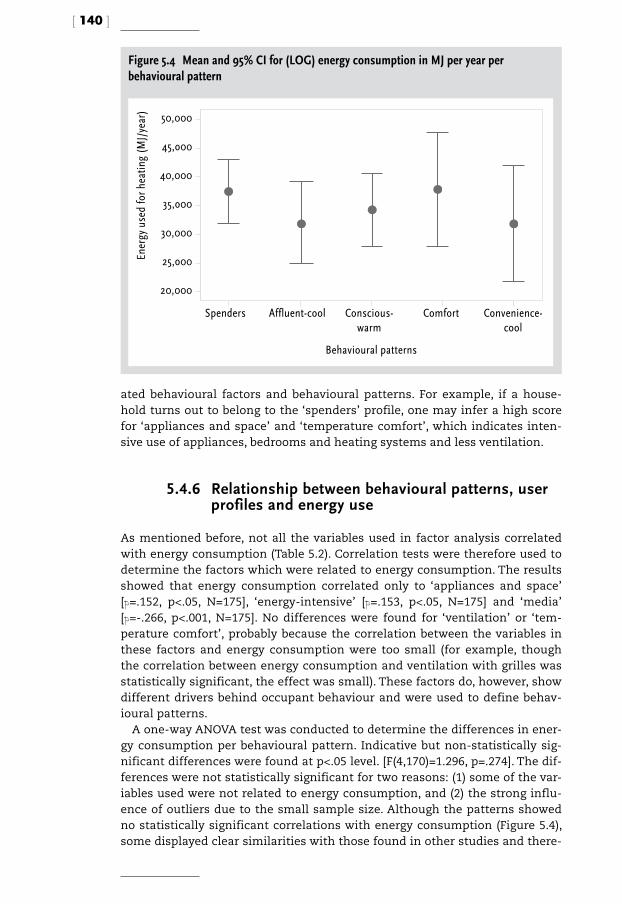
[ 140 ]
ated behavioural factors and behavioural patterns. For example, if a house-hold turns out to belong to the ‘spenders’ profile, one may infer a high score for ‘appliances and space’ and ‘temperature comfort’, which indicates inten-sive use of appliances, bedrooms and heating systems and less ventilation.
5.4.6 Relationship between behavioural patterns, user profiles and energy use
As mentioned before, not all the variables used in factor analysis correlated with energy consumption (Table 5.2). Correlation tests were therefore used to determine the factors which were related to energy consumption. The results showed that energy consumption correlated only to ‘appliances and space’ [p=.152, p<.05, N=175], ‘energy-intensive’ [p=.153, p<.05, N=175] and ‘media’ [p=-.266, p<.001, N=175]. No differences were found for ‘ventilation’ or ‘tem-perature comfort’, probably because the correlation between the variables in these factors and energy consumption were too small (for example, though the correlation between energy consumption and ventilation with grilles was statistically significant, the effect was small). These factors do, however, show different drivers behind occupant behaviour and were used to define behav-ioural patterns.
A one-way ANOVA test was conducted to determine the differences in ener-gy consumption per behavioural pattern. Indicative but non-statistically sig-nificant differences were found at p<.05 level. [F(4,170)=1.296, p=.274]. The dif-ferences were not statistically significant for two reasons: (1) some of the var-iables used were not related to energy consumption, and (2) the strong influ-ence of outliers due to the small sample size. Although the patterns showed no statistically significant correlations with energy consumption (Figure 5.4), some displayed clear similarities with those found in other studies and there-
Figure 5.4 Mean and 95% CI for (LOG) energy consumption in MJ per year per behavioural pattern
Ener
gy u
sed
for h
eatin
g (M
J/ye
ar)
Behavioural patterns
Spenders Affluent-cool Conscious-warm
Comfort Convenience-cool
20,000
25,o00
30,000
35,o00
40,000
45,o00
50,000
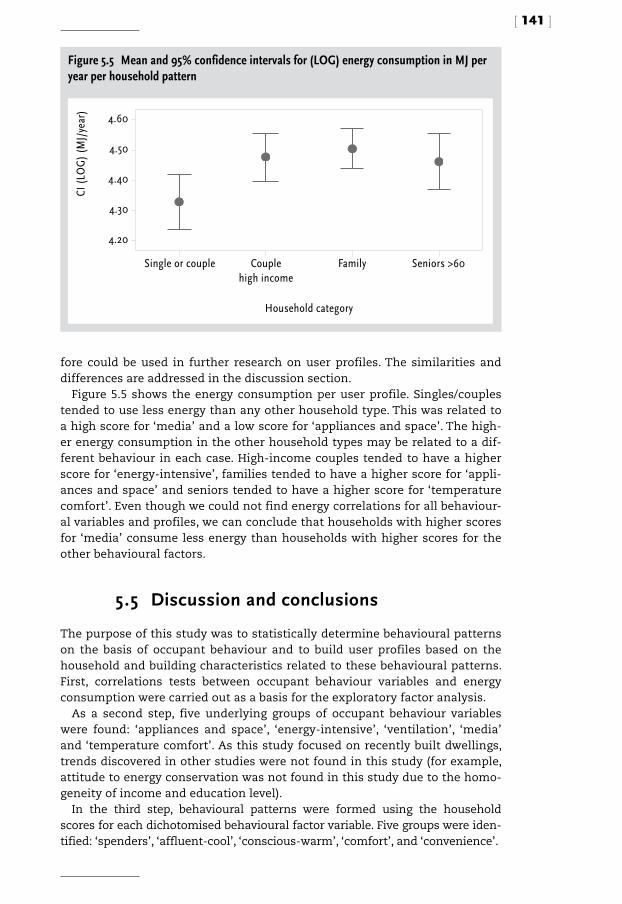
[ 141 ]
fore could be used in further research on user profiles. The similarities and differences are addressed in the discussion section.
Figure 5.5 shows the energy consumption per user profile. Singles/couples tended to use less energy than any other household type. This was related to a high score for ‘media’ and a low score for ‘appliances and space’. The high-er energy consumption in the other household types may be related to a dif-ferent behaviour in each case. High-income couples tended to have a higher score for ‘energy-intensive’, families tended to have a higher score for ‘appli-ances and space’ and seniors tended to have a higher score for ‘temperature comfort’. Even though we could not find energy correlations for all behaviour-al variables and profiles, we can conclude that households with higher scores for ‘media’ consume less energy than households with higher scores for the other behavioural factors.
5.5 Discussion and conclusions
The purpose of this study was to statistically determine behavioural patterns on the basis of occupant behaviour and to build user profiles based on the household and building characteristics related to these behavioural patterns. First, correlations tests between occupant behaviour variables and energy consumption were carried out as a basis for the exploratory factor analysis.
As a second step, five underlying groups of occupant behaviour variables were found: ‘appliances and space’, ‘energy-intensive’, ‘ventilation’, ‘media’ and ‘temperature comfort’. As this study focused on recently built dwellings, trends discovered in other studies were not found in this study (for example, attitude to energy conservation was not found in this study due to the homo-geneity of income and education level).
In the third step, behavioural patterns were formed using the household scores for each dichotomised behavioural factor variable. Five groups were iden-tified: ‘spenders’, ‘affluent-cool’, ‘conscious-warm’, ‘comfort’, and ‘convenience’.
Figure 5.5 Mean and 95% confidence intervals for (LOG) energy consumption in MJ per year per household pattern
CI (L
OG
) (M
J/ye
ar)
Household category
Single or couple Couplehigh income
Family Seniors >60
4.20
4.30
4.40
4.50
4.60

[ 142 ]
The differences on energy consumption of the different behavioural pat-terns were only indicative. There were three explanations for the non-statis-tically significant results: (1) the variations in energy consumption that can be explained by occupant behaviour in new dwellings are smaller than in the total housing stock (see Appendix 3), (2) the relatively small sample size, and (3) not all the occupant behaviour variables were related to energy consump-tion. We also used variables that were not related to energy consumption in order to gain more information on the underlying behaviour.
The fourth step consisted in determining user profiles. Four profiles – sen-iors, families, singles/couples and high-income couples – were defined with the correlations between the resulting behavioural factors and the household and building characteristics. No statistically significant differences on energy use were found for the user profiles, however from the analysis we can con-clude the type of behaviour observed in each profile. Singles/couples behav-iour was less related to temperature comfort or intensive use of appliances and space. High-income couples were less concerned about saving energy and sought a more convenient use of the dwelling. Families needed more space and made more use of heavy appliances. Seniors clearly preferred more com-fort given that they scored high for ‘ventilation’ and ‘temperature comfort’. Energy consumption turned out to be lower in senior households and higher in family households.
Some similarities in behavioural patterns were found with the findings of Raaij and Verhallen (1983a) and Groot et al. (2008). Raaij and Verhallen (1983a) gathered their data through retrospective self-reports on occupant behav-iour regarding thermostat settings and use of radiators, use of ventilation grilles, windows and mechanical ventilation systems. They found five behav-ioural patterns: ‘conservers’ (low temperature, low ventilation, higher educa-tion, small household size, working wife, less energy consumption), ‘spend-ers’ (high temperature, high ventilation, low education, more often at home, more energy consumption), ‘cool’ (low temperature, high ventilation, medium energy consumption, attitude does not explain energy consumption), ‘warm’ (high temperature, low ventilation, older people), and ‘average’. Their analysis showed statistically significant differences in the energy consumption of the groups. In our study, we found behavioural patterns similar to ‘cool’, ‘warm’ and ‘spenders’. We did not find patterns related to energy-saving efforts, but our pattern ‘convenience’ could be comparable, since it related to the factor ‘media’ which was defined by fewer bedrooms used and showers rather than baths. TNO (de Groot et al., 2008; Paauw et al., 2009) found four behavioural patterns: ‘convenience’, ‘conscious’, ‘costs’ and ‘environment’. The similari-ties with results (de Groot et al., 2008; Paauw et al., 2009) lie in ‘convenience/spender’ and ‘conscious/warm’. The ‘costs’ pattern was not found for the same reasons as ‘conservers’ in Raaij and Verhallen (1983a) was not found. The ‘climate / environment’ pattern was not found because this study did not
[ 143 ]
take account of energy-saving attitudes. The user profiles defined in our study correspond to those defined by TNO
(de Groot et al., 2008; Paauw et al., 2009) which were: ‘single’, ‘two adults below 60’, ‘single-parent families’, ‘two-parent families’, and ‘seniors above 60’. In our sample ‘single-parent families’ and ‘two-parent families’ were part of a single group because there were only a few ‘one-parent families’ among the households. In addition, ‘two adults below 60’ was split into high-income and low-income, because income turned out to be an important determinant of behaviour. Households in the ‘low-income couples’ category were merged with ‘singles’, since the range of income was similar and no notable differ-ences in behaviour were found between ‘singles’ and ‘low-income couples’.
5.6 Recommendations
This research had two outcomes: it identified behavioural patterns and user profiles with different behaviours. Behavioural variables for the use of home amenities can be used to develop behavioural profiles that can be applied in simulation programmes or energy-saving calculations by linking households with specific behaviour (more hours of ventilation, more use of energy-sav-ing light bulbs). User profiles can be used to formulate targeted energy-saving policy for specific sectors of society. The recommendations in this section are derived from the results for household groups.
Previous studies have shown that thermostat type has a significant effect on energy consumption. Hamrin (in Raaij & Verhallen, 1983a) showed that active involvement in energy conservation (by controlling home amenities) leads to lower energy consumption. He also found that energy-conscious households conserve more energy with systems that require active involve-ment, while less energy-conscious households conserve more energy with systems that do not require active involvement. Thus the type of system should be matched to the lifestyle of the household.
Programmable thermostats are related to higher energy consumption since they are used to heat space that might be used, whereas manual thermostats are used to heat space that is used. The installation of thermostats according to household type could help to reduce the energy consumed for space heating. For example, temperature comfort was found to be important for seniors, who also spend more time at home and therefore keep the heating on for longer. Manual thermostats might reduce energy consumption in these small house-holds, since it would mean that only the rooms that are in use would be heat-ed. In the case of large households, living in larger dwellings, a manual ther-mostat in each room might be more convenient to heat only the needed space. However, active and younger households might be better off with programma-ble thermostats since they might be less willing to interact with the system.

[ 144 ]
Further research should look into the causes of behaviour. The behaviour considered in this study related to the use of systems and other home ameni-ties. This research therefore focused on behaviour itself and not on the caus-es (cognitive variables). Though it showed that seniors prefer warmer temper-atures, it found no relationship between household characteristics and ven-tilation behaviour. The study of cognitive variables could help to explain why some households prefer higher temperatures or more ventilation than others.
Factor analysis delivered interesting results in relation to the behaviour-al patterns and factors underlying occupant behaviour. The results were used to identify households and the related building characteristics, which then formed the basis of household profiles. However, no relationships were found between some household profiles and energy consumption or between behavioural patterns and energy consumption because of the addition of var-iables not related to energy use for heating. A larger sample size and the use of electricity data could enhance the probability of finding such relationships.
AcknowledgementsThis research was funded under the EOS.LT programme of the Dutch Ministry of Financial Affairs in partnership with TNO and ECN. We would like to thank our partners for their collaboration.
References
Ajzen, I. (1991), The Theory of Planned Behaviour, Organizational behaviour and human decision processes, 50, pp. 179-211.
Andersen, R.V., J. Toftum, K.K. Andersen & B.W. Olessen (2009), Survey of Occu-pant Behaviour and Control of Indoor Environment in Danish Dwellings’, En-ergy and Buildings, 41, pp. 11-16.
Assael, H. (1995), Consumer Behaviour and Marketing Action, Cincinnati, South-Western College Publishing.
Assimakopoulos, V. (1992), Residential Energy Demand Modelling in Develop-ing Regions, The use of multivariate statistical techniques, Energy Economics, pp. 57-63.
Biesiot, W. & K.J. Noorman (1999), Energy Requirements of Household Con-sumption: a case study of Netherlands, Ecological Economics, 28, pp. 367-383.
Branco, G., B. Lachal, P. Gallinelli & W. Weber (2004), Expected versus Observed

[ 145 ]
Heat Consumption of a Low Energy Multifamily Complex in Switzerland based on Long-Term Experimental Data, Energy and Buildings, 36, pp. 543-555.
Caldera, M., S.P. Corgnati & M. Filippi (2008), Energy Demand for Space Heating through a Statistical Approach: application to residential buildings, Energy & Buildings, 40, pp. 1972-1983.
Field, A. (2005), Discovering Statistics using SPS, 2nd Edition, SAGE Publica-tions, London.
Groot de, E., M. Spiekman & I. Opstelten (2008), Dutch Research into User Be-haviour in relation to Energy Consumption of Residences, Proceedings PLEA Conference.
Haas, R., H. Auer & P. Biermayr (1998), The Impact of Consumer Behaviour on Residential Energy Demand for Space Heating, Energy and Buildings, 27, pp. 195-205.
Hamrin, J. (1983), Energy-Saving Homes: don’t bet on technology alone, in: Van Raaij & Verhallen 1983a.
Hens, H., W. Parijs & M. Deurinck (2010), Energy Consumption for Heating and Rebound Effects, in: Energy and Buildings, 42, pp. 105-110.
Hirst, E. & R. Goeltz (1985), Comparison of Actual Energy Saving with Audit Predictions for Homes in the North Central Region of the USA, Building and Environment, 20 (1), pp. 1-6.
Jeeninga, H., M. Uyterlinde & J. Uitzinger (2001), Energieverbruik van energie-zuinige woningen, Report ECN & IVAM, ECN-C-01-072.
Kanis, H. (1998), Usage Centred Research for Everyday Product Design, Applied Ergonomics, 1 (29), pp. 75-82.
Lenzen, M., M. Wier, C. Cohen, H. Hayami, S. Pachauri & R. Schaeffer (2006), A Comparative Multivariate Analysis of Household Energy Requirements in Aus-tralia, Brazil, Denmark, India and Japan, Energy, 31, pp. 181-207.
Leth-Petersen, S. & M. Togeby (2001), Demand for Space Heating in Apartment Blocks: measuring effect of policy measures aiming at reducing energy con-sumption, Energy Economics, 23, pp. 387-403.
[ 146 ]
Liao, H.C. & T.F. Chang (2002), Space-Heating and Water-Heating Energy De-mands of the Aged in the U.S., Energy Economics, 24, pp. 267-284.
Linden, A.L., A. Carlsson-Kanyama & B. Eriksson (2006), Efficient and Ineffi-cient Aspects of Residential Energy Behaviour: What are the policy instru-ments for change?’, Energy Policy, 34, pp. 1918-1927.
Olofsson, T., S. Andersson & J.U. Sjogren (2009), Building Energy Parameter Inves-tigations based on Multivariate Analysis, Energy and Buildings, 41, pp. 71-80.
Paauw, J., B. Roossien, M.B.C. Aries & O. Guerra Santin (2009), Energy Pattern Generator – understanding the effect of user behaviour on energy systems, Proceedings First European Conference on Energy Efficiency and Behaviour, 18-19 October, Maastricht, available at www.eceee.org/conference_proceed-ings/EE_and_Behaviour/2009.
Papakostas, K.T. & B.A. Satiropoulos (2007), Occupational and Energy Behav-iour Patterns in Greek Residences, Energy and Buildings, 26, pp. 207-213.
Poortinga, W., L. Steg, C. Vlek & G. Wiersma (2005), Household Preferences for Energy-Saving Measures: a conjoint analysis’, Journal of Economic Psycholo-gy, 29, pp. 49-64.
Raaij van, W.F. & T.M.M. Verhallen (1983a), Patterns of Residential Energy Be-haviour, Journal of Economic Psychology, 4, pp. 85-106.
Raaij van, W.F. & T.M.M. Verhallen (1983b), A Behavioural Model of Residential Energy Consumption, Journal of Economic Psychology, 3, pp. 39-63.
Sardianou, E. (2008), Estimating Space Heating Determinants: an analysis of Greek households, Energy and Buildings, 40, pp. 1084-1093.
Schweiker, M. & M. Shukuya, Comparison of Theoretical and Statistical Mod-els of Air-Conditioning-Unit Usage Behaviour in a Residential Setting under Japanese Climatic Conditions, Building and Environment, 44, pp. 2137-2149.
Sonderegger, R.C. (1977-78), Movers and Stayers: the resident’s contribution to variation across houses in energy consumption for space heating, Energy and Buildings, 1, pp. 313-324.
Tiberiu, C., J. Virgone and E. Blanco (2008), Development and Validation of Re-gression Models to Predict Monthly Heating Demand for Residential Build-ings, Energy and Buildings, 40, pp. 1825-1832.

[ 147 ]
Vringer, C.R. (2005), Analysis of the Requirements for Household Consump-tion, Netherlands Environmental Assessment Agency, Bilthoven, thesis ISBN 90-6960-1303.
Vringer, K. & K. Blok (2007), Household Energy Requirement and Value Pat-terns, Energy Policy, 35, pp. 553-566.

[ 148 ]

[ 149 ]

[ 150 ]
[ 151 ]
6 Occupant behaviour in dwellings with improved thermal characteristics
Evidence of a rebound effect
AbstractThe energy required for space heating has been significantly reduced in re-cent decades by improved insulation and by more efficient heating and ven-tilation systems. Even so, wide variations in energy consumption can still be observed between similar dwellings and between actual and predicted lev-els. It is thought that these variations stem from differences in occupant be-haviour, the structural quality of the building, and a rebound effect. This pa-per statistically examines differences in occupant behaviour in relation to the building characteristics of the housing stock in the Netherlands and explores the possible existence of a rebound effect on the consumption of energy for space heating. We found that although energy consumption is lower in re-cently built dwellings, analysis of the behaviour determinants indicates that occupants of newer dwellings and dwellings with better thermal properties tend to prefer higher indoor temperatures and to ventilate less than occu-pants of older dwellings. This finding might be related to a rebound effect on occupant behaviour in newer dwellings. However, the improvement of ther-mal properties and systems efficiency still lead to a reduction on energy con-sumption for heating.
6.1 Introduction
The energy required for space heating had has been significantly reduced in recent decades by improved insulation and by more efficient heating and ventilation systems. Though energy consumption has decreased, wide varia-tions can still be observed between similar dwellings and between actual and predicted levels (Branco et al., 2004; Haas et al., 1998; Hirst & Goeltz, 1985). It is thought that these differences are to some extent related to differences in oc-cupant behaviour.
Occupant behaviour and building characteristics are known determinants of the level of energy required for space heating in dwellings. But, where-as building characteristics can be directly influenced by regulations, occu-pant behaviour – which is determined by a whole string of variables including household characteristics, lifestyle, motivation and the interaction between the occupant and the dwelling – cannot be easily changed by external means.
System efficiency and the thermal properties of building elements have improved consistently in recent years; they create a better indoor environ-ment and, at the same time, lower the energy consumption for space heating. Several studies have demonstrated that lower energy consumption is relat-ed to better insulation levels and HVAC systems (Hirst & Goeltz, 1985; Cal-

[ 152 ]
dera et al., 2008; Leth-Petersen & Togeby, 2001; Tiberiu et al., 2008). However, others have found evidence of a rebound effect in better insulated dwellings (Haas et al., 1998; Hens et al., 2010; Brookes, 2000; Schipper & Grubb, 2007; Kre-witt et al., 2007). According to Herring & Sorrell (2009), since improvements on energy efficiency reduce the costs of energy services (e.g. gas for heating), the consumption of those services may be expected to increase. Rebound occurs when people compensate for efficiency improvements by increasing their spending (Hens et al., 2010). It is therefore plausible that lower energy costs for heating are offset by a demand for more heating-related benefits (Hens et al., 2010). A clearer understanding of the relationship between building char-acteristics and occupant behaviour could help to lower the influence of occu-pant behaviour on energy consumption and identify the factors behind the rebound effect.
Our previous research has focused on determining the effect of occupant behaviour on energy consumption in dwellings that were built after the intro-duction of the energy-performance regulations in the Netherlands. The type of temperature control and type of ventilation seemed to influence occupant behaviour in dwellings built after the introduction of the Dutch energy-per-formance regulations (Beerepoot & Beerepoot, 2007). This study showed that the behavioural patterns of users with programmable thermostats – which included higher settings and more hours of open radiators – could lead to higher energy consumption. Type of temperature control and ventilation also appeared to influence the use of mechanical ventilation. Households with a balanced ventilation system were more likely to keep the radiators on for longer and to turn off the heating during ventilation.
These preliminary studies on occupant behaviour in the Netherlands focused on houses built after the introduction of the energy-performance reg-ulations and therefore did not take account of building characteristics such as natural ventilation and low insulation levels. Hence, assuming that wid-er variations exist in the building characteristics of the total housing stock, one can expect wider differences in occupant behaviour. Since new building stock is more homogeneous and more effects may be assumed to exist in a heterogeneous sample, this paper will explore differences in occupant behav-iour in relation to building characteristics in the entire Dutch housing stock. It will also investigate the existence of a rebound effect on the energy used for space heating.
6.2 Effect of occupant behaviour and building characteristics on energy consumption
Several international studies have addressed the importance of the influence of building characteristics and occupant behaviour on levels of energy con-
[ 153 ]
sumption in housing. Authors agree that better thermal properties and sys-tem efficiency in dwellings built after the introduction of energy-perform-ance regulations have helped to significantly reduce the amount of energy used for space heating (Leth-Petersen & Togeby, 2001; Beerepoot & Beerepoot, 2007; Jeeninga et al., 2001). Additionally, international studies have identified a relationship between energy consumption and certain building character-istics, such as year of construction, the shape and size of the building, ther-mal properties and type of heating system (Hirst & Goeltz, 1985; Caldera et al., 2008; Leth-Petersen & Togeby, 2001; Tiberiu et al., 2008; Olofsson et al., 2009; Sardianou, 2008; Sonderegger, 1977-78). All confirm that newer, better insulat-ed buildings with more efficient systems are related to lower energy require-ments for space heating. The size and shape of the dwelling (though con-sidered less often) also seem to have an effect on energy consumption (An-dersen et al., 2009). We concluded the same in Chapter 2.
Considerable variations in energy consumption have been found in build-ings with the same physical characteristics. These variations are partly attrib-uted to differences in occupancy patterns (Branco et al., 2004; Haas et al. 1998; Leth-Petersen & Togeby, 2001; Jeeninga et al., 2001; Andersen et al., 2009; Groot et al., 2008; Linden et al., 2006; Papakostas & Satiropoulos, 2007), which are determined by household characteristics, lifestyle, cognitive variables and perception of comfort (Andersen et al., 2009; Poortinga et al., 2005; Vringer & Blok, 2007; Schweiker & Shukuya, 2009). The relationship between the amount of energy used for heating and household characteristics such as age, compo-sition and size has been extensively studied internationally (Leth-Petersen & Togeby, 2001; Sardianou, 2008; Andersen et al., 2009; Groot et al., 2008; Linden et al., 2006; Schweiker & Shukuya, 2009; Lenzen et al., 2006; Liao & Chang, 2002; Biesiot & Noorman, 1999; Vringer, 2005). Other studies have looked at the effect of household motivation, attitudes and values (Linden et al., 2006; Poortinga et al., 2005; Vringer & Blok, 2007; Schweiker & Shukuya, 2009; Raaij & Verhallen, 1983), although these have been more difficult to relate to energy use. In addition, authors agree, that the way in which the occupant controls the heating and ventilation systems is an important factor.
Our previous study of 313 households in the Netherlands showed that, in dwellings built after the introduction of energy performance regulations in 1995, 18.6% of the variation in energy consumption for space heating can be explained by building characteristics (Chapter 3) and 11.9% by occupant behaviour (Chapter 4). The building characteristics in this study were derived from the Dutch energy-performance regulations, namely: U-values, surface of facades, living area and the efficiency of heating and ventilation systems. The occupant behaviour was related to the use of the heating and ventilation sys-tem. In a previous study encompassing the entire Dutch housing stock, the variation explained by building characteristics was far higher at 42% (Chapter 2), since there is a larger variety of buildings’ characteristics in the housing
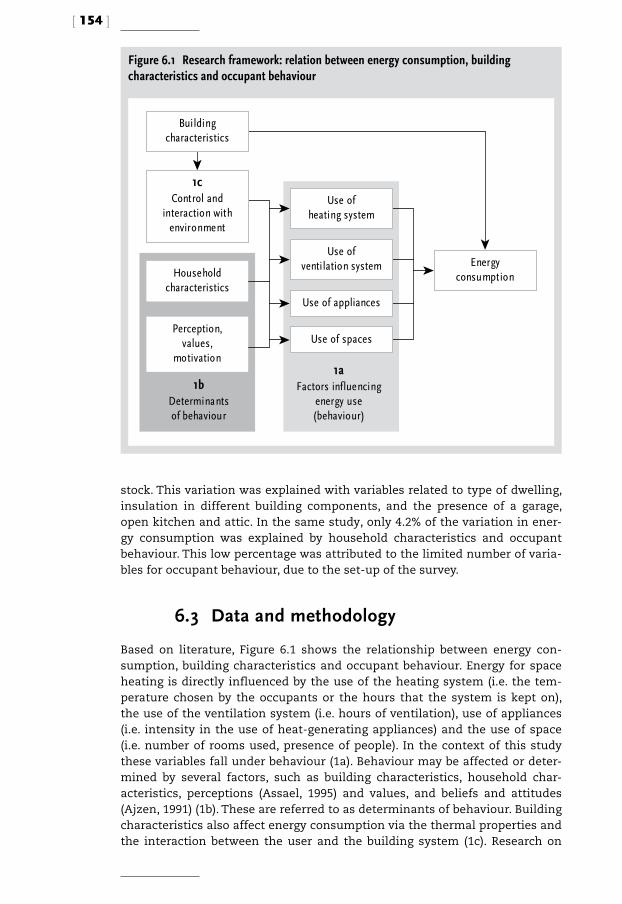
[ 154 ]
stock. This variation was explained with variables related to type of dwelling, insulation in different building components, and the presence of a garage, open kitchen and attic. In the same study, only 4.2% of the variation in ener-gy consumption was explained by household characteristics and occupant behaviour. This low percentage was attributed to the limited number of varia-bles for occupant behaviour, due to the set-up of the survey.
6.3 Data and methodology
Based on literature, Figure 6.1 shows the relationship between energy con-sumption, building characteristics and occupant behaviour. Energy for space heating is directly influenced by the use of the heating system (i.e. the tem-perature chosen by the occupants or the hours that the system is kept on), the use of the ventilation system (i.e. hours of ventilation), use of appliances (i.e. intensity in the use of heat-generating appliances) and the use of space (i.e. number of rooms used, presence of people). In the context of this study these variables fall under behaviour (1a). Behaviour may be affected or deter-mined by several factors, such as building characteristics, household char-acteristics, perceptions (Assael, 1995) and values, and beliefs and attitudes (Ajzen, 1991) (1b). These are referred to as determinants of behaviour. Building characteristics also affect energy consumption via the thermal properties and the interaction between the user and the building system (1c). Research on
Figure 6.1 Research framework: relation between energy consumption, building characteristics and occupant behaviour
Use ofventilation system
Use of appliances
Use of spaces
Household characteristics
Perception,values,
motivation
1cControl and
interaction with environment
Energy consumption
Buildingcharacteristics
1bDeterminantsof behaviour
1aFactors influencing
energy use(behaviour)
Use ofheating system
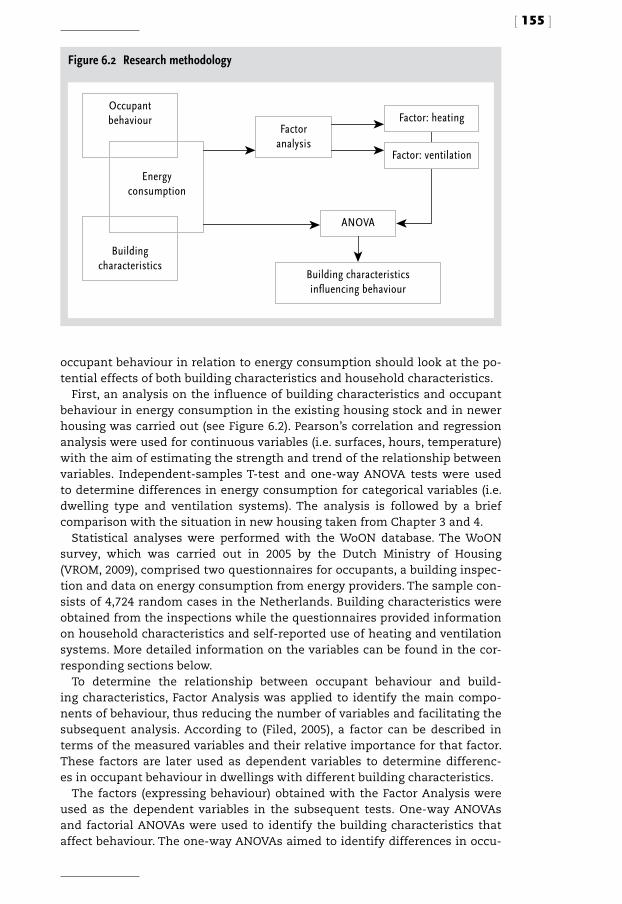
[ 155 ]
occupant behaviour in relation to energy consumption should look at the po-tential effects of both building characteristics and household characteristics.
First, an analysis on the influence of building characteristics and occupant behaviour in energy consumption in the existing housing stock and in newer housing was carried out (see Figure 6.2). Pearson’s correlation and regression analysis were used for continuous variables (i.e. surfaces, hours, temperature) with the aim of estimating the strength and trend of the relationship between variables. Independent-samples T-test and one-way ANOVA tests were used to determine differences in energy consumption for categorical variables (i.e. dwelling type and ventilation systems). The analysis is followed by a brief comparison with the situation in new housing taken from Chapter 3 and 4.
Statistical analyses were performed with the WoON database. The WoON survey, which was carried out in 2005 by the Dutch Ministry of Housing (VROM, 2009), comprised two questionnaires for occupants, a building inspec-tion and data on energy consumption from energy providers. The sample con-sists of 4,724 random cases in the Netherlands. Building characteristics were obtained from the inspections while the questionnaires provided information on household characteristics and self-reported use of heating and ventilation systems. More detailed information on the variables can be found in the cor-responding sections below.
To determine the relationship between occupant behaviour and build-ing characteristics, Factor Analysis was applied to identify the main compo-nents of behaviour, thus reducing the number of variables and facilitating the subsequent analysis. According to (Filed, 2005), a factor can be described in terms of the measured variables and their relative importance for that factor. These factors are later used as dependent variables to determine differenc-es in occupant behaviour in dwellings with different building characteristics.
The factors (expressing behaviour) obtained with the Factor Analysis were used as the dependent variables in the subsequent tests. One-way ANOVAs and factorial ANOVAs were used to identify the building characteristics that affect behaviour. The one-way ANOVAs aimed to identify differences in occu-
Figure 6.2 Research methodology
Occupant behaviour
Energy consumption
Factor analysis
Building characteristics influencing behaviour
ANOVA
Building characteristics
Factor: ventilation
Factor: heating
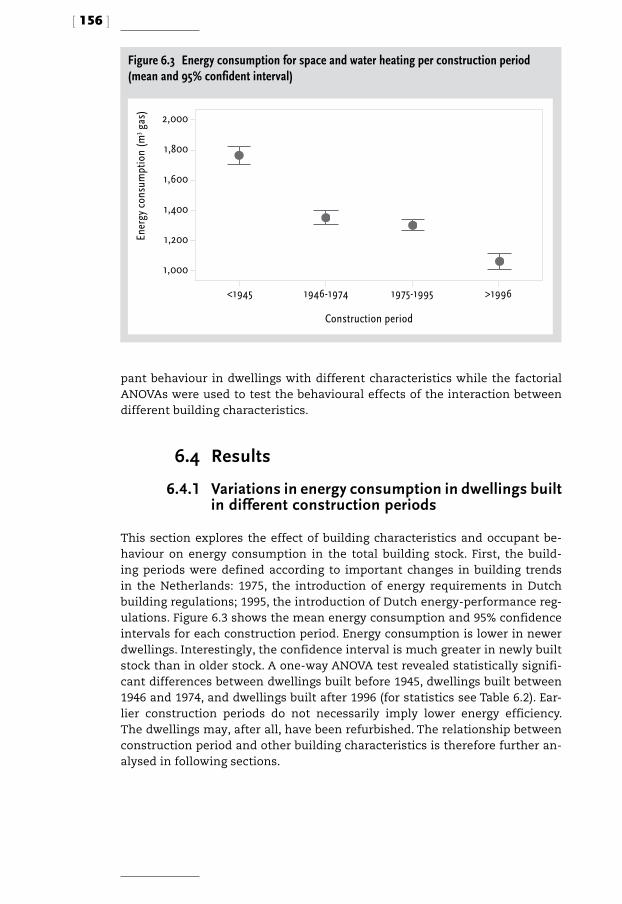
[ 156 ]
pant behaviour in dwellings with different characteristics while the factorial ANOVAs were used to test the behavioural effects of the interaction between different building characteristics.
6.4 Results
6.4.1 Variations in energy consumption in dwellings built in different construction periods
This section explores the effect of building characteristics and occupant be-haviour on energy consumption in the total building stock. First, the build-ing periods were defined according to important changes in building trends in the Netherlands: 1975, the introduction of energy requirements in Dutch building regulations; 1995, the introduction of Dutch energy-performance reg-ulations. Figure 6.3 shows the mean energy consumption and 95% confidence intervals for each construction period. Energy consumption is lower in newer dwellings. Interestingly, the confidence interval is much greater in newly built stock than in older stock. A one-way ANOVA test revealed statistically signifi-cant differences between dwellings built before 1945, dwellings built between 1946 and 1974, and dwellings built after 1996 (for statistics see Table 6.2). Ear-lier construction periods do not necessarily imply lower energy efficiency. The dwellings may, after all, have been refurbished. The relationship between construction period and other building characteristics is therefore further an-alysed in following sections.
Figure 6.3 Energy consumption for space and water heating per construction period (mean and 95% confident interval)
Ener
gy c
onsu
mpt
ion
(m3 g
as)
Construction period
<1945 1946-1974 1975-1995 >1996
1,200
1,400
1,600
1,800
2,000
1,000
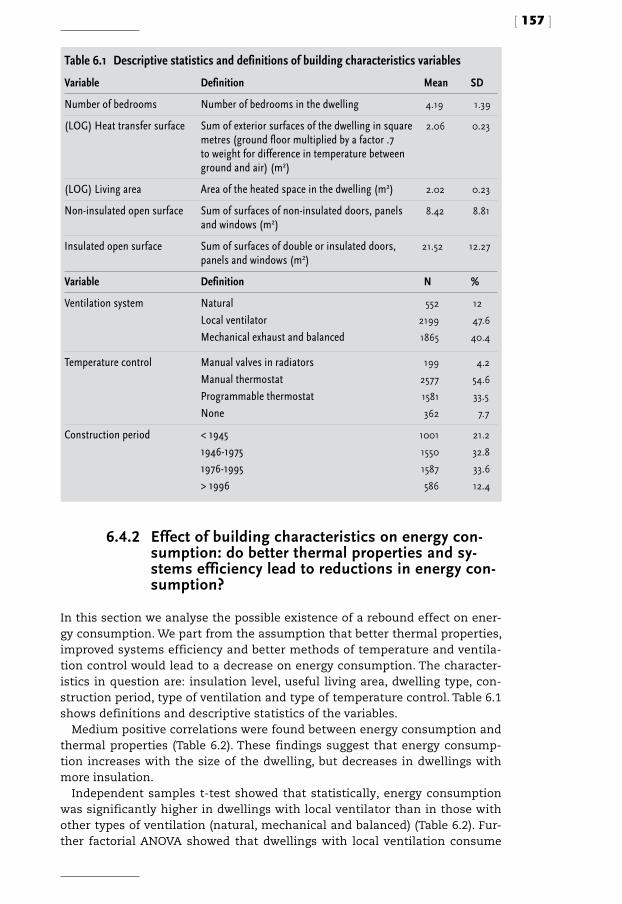
[ 157 ]
6.4.2 Effect of building characteristics on energy con-sumption: do better thermal properties and sy-stems efficiency lead to reductions in energy con-sumption?
In this section we analyse the possible existence of a rebound effect on ener-gy consumption. We part from the assumption that better thermal properties, improved systems efficiency and better methods of temperature and ventila-tion control would lead to a decrease on energy consumption. The character-istics in question are: insulation level, useful living area, dwelling type, con-struction period, type of ventilation and type of temperature control. Table 6.1 shows definitions and descriptive statistics of the variables.
Medium positive correlations were found between energy consumption and thermal properties (Table 6.2). These findings suggest that energy consump-tion increases with the size of the dwelling, but decreases in dwellings with more insulation.
Independent samples t-test showed that statistically, energy consumption was significantly higher in dwellings with local ventilator than in those with other types of ventilation (natural, mechanical and balanced) (Table 6.2). Fur-ther factorial ANOVA showed that dwellings with local ventilation consume
Table 6.1 Descriptive statistics and definitions of building characteristics variables
Variable Definition Mean SD
Number of bedrooms Number of bedrooms in the dwelling 4.19 1.39
(LOG) Heat transfer surface Sum of exterior surfaces of the dwelling in square metres (ground floor multiplied by a factor .7 to weight for difference in temperature between ground and air) (m2)
2.06 0.23
(LOG) Living area Area of the heated space in the dwelling (m2) 2.02 0.23
Non-insulated open surface Sum of surfaces of non-insulated doors, panels and windows (m2)
8.42 8.81
Insulated open surface Sum of surfaces of double or insulated doors, panels and windows (m2)
21.52 12.27
Variable Definition N %
Ventilation system NaturalLocal ventilatorMechanical exhaust and balanced
552
2199
1865
12
47.6
40.4
Temperature control Manual valves in radiatorsManual thermostatProgrammable thermostatNone
199
2577
1581
362
4.2
54.6
33.5
7.7
Construction period < 19451946-19751976-1995> 1996
1001
1550
1587
586
21.2
32.8
33.6
12.4

[ 158 ]
more energy because only few were built in the most recent period and there-fore have less insulation and less efficient systems.
A significant difference in energy consumption was also found for differ-ent types of temperature control. Programmable thermostats are associated with more energy consumption, followed by manual thermostats and no cen-tral temperature control, and finally by manual valves in radiator (Table 6.2, Figure 6.4).
From this section, we can conclude that better thermal properties and sys-tems efficiency seem to reduce energy consumption. However, the pres-ence of better systems control (temperature and ventilation control) does not reduce energy consumption. Mechanical and balanced ventilation were not related to lower energy use. Dwellings with thermostats actually consume more energy that dwellings without thermostat.
Table 6.2 also shows the results from Chapters 3 and 4, in which similar tests were conducted on recently built dwellings in the Netherlands (after
Table 6.2 Relationship between building characteristics and energy consumption for the total housing stock and housing built after 1995: statistics of Pearson’s correlations and ANOVAs
Variable WoON housing stock Comparison with
Number of bedrooms r = .443*** n = 4646 r = .311*** (OTB)r = .344*** (WoON)
(LOG) Living area r = .381*** n = 4646 r = .262*** (OTB)r= .270*** (WoON)
(LOG) Heat transfer surface r = .547*** n = 4646 r = .366*** (OTB)r = .450*** (WoON)
Non-insulated open surface r = .166*** n = 4303 r = .144** (WoON)
Insulated open surface r = -.166*** n = 4481 r = .345*** (WoON)
Ventilation system F(2,1451.19) = 190.294*** (+)Natural M = 31.02 (13.49)Local M = 38.95 (11.8)Mechanical M = 32.41(11.36)
t(216) = 2.962** (OTB) t(585) = 1.298 (NS) (WoON)
Type of temperature control F(3,609.24) = 170.668*** (+)Programmable M = 39.67 (10.76)Manual M = 34.24 (11.77)None M = 33.09 (11.73)Manual valves in radiators M = 18.65 (12.30)
F(2,236) = 3.380* (OTB)F(3,559) = 3.794** (WoON)
Construction period F(3,2036.58) = 96.45*** (+)< 1945 M = 40.34 (11.71)1946-1974 M = 34.39 (13.93)1975-1995 M = 34.69 (10.90)> 1996 M = 31.45 (9.47)
Dependent variable: (SQRT) Energy consumption for heating (m3/year).* = p < .05, ** = p < .01 and *** = p < .001(+) Welch statistic is reported. This statistic is an alternative to F-ratio derived to be robust when homogeneity of variance has been violated (Field, 2005).

[ 159 ]
1995) via the WoON survey and the OTB survey. The OTB survey was carried out in 2008 and contained 313 dwellings built after 1995. The correlations for the total building stock may be greater than the correlations for new hous-ing because there were more building characteristics for older housing than for new housing. The only exception in these findings is ‘insulation open sur-face’, which has a medium-size positive correlation in new dwellings and a small negative correlation in the older stock. This is because all new dwell-ings are insulated and therefore ‘insulated open surfaces’ correlates to larger dwellings, which consume more energy. In the older housing stock the corre-lation between ‘insulated open surfaces’ and energy consumption is negative because in this case, it is a matter of insulation level, since not all dwellings have insulation.
To further determine the effect of different building characteristics on ener-gy consumption, factorial ANOVA tests were used to determine the effects cause by combination of building characteristics. Dwellings with more insu-lation consume less energy as it would be expected. However, in dwellings built in the last period (after 1996), energy consumption was almost the same for both insulation levels. Multi-family homes built after 1996 consume more energy than those built before 1995 [F(2,4461)=30.347, p<.001]. This leads to think on a rebound effect caused by the improvement of the thermal quali-ty of the building and the socio-economical situation of the occupants. Other studies already concluded that a rebound effect could be more important in low-income households (Herring & Sorrell, 2009). In dwellings with higher lev-els of insulation, more energy is used in dwellings with mechanical ventila-tion than in dwellings with natural ventilation, which refutes the expectation that airtight housing consumes less energy [F(2,4536)=7.733, p<.001].
The results seem to indicate that dwellings with more modern technology
Figure 6.4 Energy consumption per type of temperature control (mean and 95% confident interval)
(SO
RT) E
nerg
y co
nsum
ptio
n (m
3 )
Type of temperature control
Programmablethermostat
Manualthermostat
Valvesin radiators
None
25
30
35
40
45
20
15
[ 160 ]
consume more energy for heating. This finding could stem from a rebound effect or be tied in with the structural quality of the building. However, this could also be explained by differences between the actual structural quali-ty of the building and the theoretical efficiency of systems (Elkhuizen et al., 2006; Nieman, 2007).
6.4.3 Effect of occupant behaviour on energy consump-tion: determining the main factors of occupant behaviour
This section analyses the effect of occupant behaviour on energy consump-tion in the existing stock. The behaviour relates to the use of heating and ven-tilation systems. The heating behaviour covers the thermostat settings during the day, evening, night and weekend expressed as standard deviations from the mean. Two variables for each time of the day were found in the database, one expressed in Celsius degrees and the other in settings from 1 to 5. To ena-ble all the cases to be included in the analysis, both variables were converted into standard deviations from the mean and then merged.
Ventilation behaviour refers to the number of hours of ventilation per room (living room, kitchen, bedroom, and bathroom) and includes all types of venti-lation. There were three ventilation variables in the database: grilles, windows and mechanical systems. As a result of the mixed combinations of ventilation type per dwelling, all cases had at least one missing value in one variable. To cover all cases, a new variable was formed by aggregating the three types of ventilation. Since all variables were reported in hours, the type of ventilation with more hours was taken into account. For example, in a case with three hours of window ventilation and one of mechanical ventilation, the new var-iable would be ‘three hours of ventilation’. This aggregation therefore omits the least used ventilation type on a case-by-case basis. No account could be taken of the sum of the variables as this would have created problems of nor-mality. Since the purpose is to determine the effect of behaviour and not to calculate the real energy performance, the omission of the real ventilation rate should not pose a problem. Descriptive statistics are shown in Table 6.3.
Factor analysis was used to identify the factors underlying occupant behav-iour and to reduce the number of variables. The variables for the factor anal-ysis were temperature settings during the day, evening, night and weekend (in SD from the mean) and variables for the number of hours of ventilation per room (as explained in Section 6.4.3). The descriptive statistics for occu-pant behaviour variables are shown in Table 6.4.
First, the eight behavioural variables were examined to determine wheth-er factor analysis was suitable for this analysis with regard to correla-tion between variables. All eight variables correlated at least .3 with at least

[ 161 ]
one other item, suggesting reasonable factorability. Further analysis of the assumptions led to the conclusion that factor analysis was suitable including all eight variables. Eight factors (clusters of correlated variables) were identi-fied. These initial Eigen values showed that the first factor explained 26% of the variance, the second explained 24%, the third explained 11%, the fourth and fifth explained 9%, the sixth explained 8%, and the seventh and eighth factors had Eigen values of 5%. The Eigen values were examined and the solu-tion that included two factors and explained 50% of the variance was selected because of its theoretical underpinning (clear division between heating and ventilation behaviour) and the ‘levelling off’ of Eigen values on the scree plot after two factors. The first factor is related to heating behaviour and the sec-ond to ventilation behaviour. A final factor analysis of the eight variables was conducted with the two factor solution (heating behaviour and ventilation behaviour). The factor loading matrix and communalities for this solution are shown in Table 6.5. The first two columns show the contribution of each vari-able to each factor in the solution. The third column contains the communali-ties, which are the common variance in one variable. The common variance is the variance shared with other variables.
Figure 6.5 shows the relationship between the eight original variables used in the factor analysis, and the two resulting factors. The variables related to ventilation are part of the ‘ventilation behaviour’ factor; while the variables related to the use of the heating system are part of the ‘heating behaviour’ factor.
Table 6.3 Descriptive statistics for ventilation behaviour variables
Variables
WoON total stock
Mean SD
(SQRT) Hours of ventilation in living room/day 1.27 1.53
(SQRT) Hours of ventilation in kitchen/day 1.37 1.62
(SQRT) Hours of ventilation in bedrooms/day 2.69 1.53
(SQRT) Hours of ventilation in bathroom/day 1.56 1.81
Table 6.4 Relationship between occupant behaviour and energy consumption for the total housing stock and housing built after 1995: statistics of Pearson’s correlations
Variables WoON total stock WoON new housingTemperature during the day (in SD) NS NS
Temperature during the evening (in SD) NS NS
Temperature during the night (in SD) r = .091 *** n = 3621 r = .163* n = 557
Temperature during the weekend (in SD) NS NS
(SQRT) Hours of ventilation in living room/day r = -.052*** n = 4541 NS
(SQRT) Hours of ventilation in kitchen/day r = -.067*** n = 4539 NS
(SQRT) Hours of ventilation in bedrooms/day r = .033* n = 4573 NS
(SQRT) Hours of ventilation in bathroom/day r = .108*** n = 4551 r = .120** n = 557
* = p < .05, ** = p < .01 and *** = p < .001
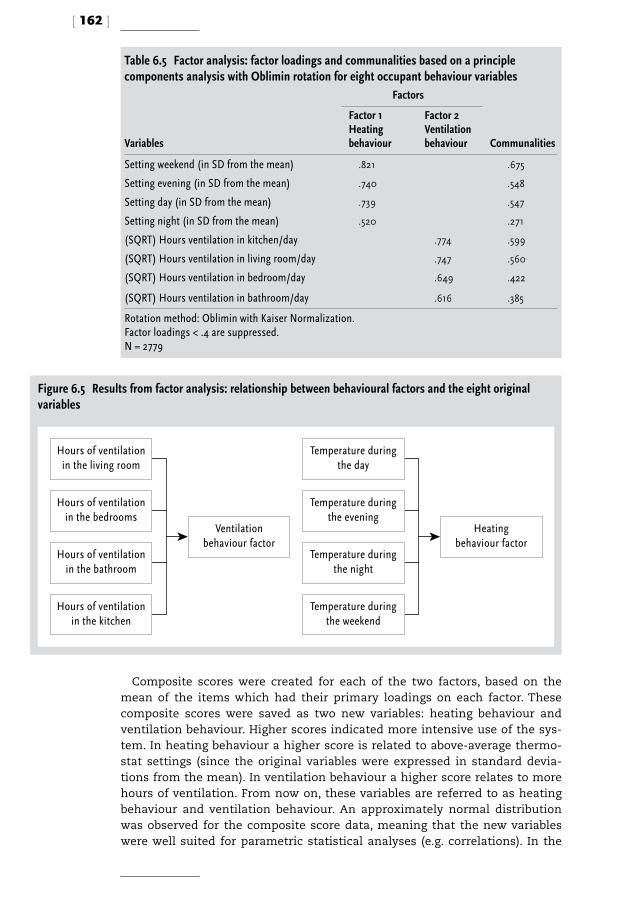
[ 162 ]
Composite scores were created for each of the two factors, based on the mean of the items which had their primary loadings on each factor. These composite scores were saved as two new variables: heating behaviour and ventilation behaviour. Higher scores indicated more intensive use of the sys-tem. In heating behaviour a higher score is related to above-average thermo-stat settings (since the original variables were expressed in standard devia-tions from the mean). In ventilation behaviour a higher score relates to more hours of ventilation. From now on, these variables are referred to as heating behaviour and ventilation behaviour. An approximately normal distribution was observed for the composite score data, meaning that the new variables were well suited for parametric statistical analyses (e.g. correlations). In the
Table 6.5 Factor analysis: factor loadings and communalities based on a principle components analysis with Oblimin rotation for eight occupant behaviour variables
Variables
Factors
Communalities
Factor 1 Heating behaviour
Factor 2 Ventilation behaviour
Setting weekend (in SD from the mean) .821 .675
Setting evening (in SD from the mean) .740 .548
Setting day (in SD from the mean) .739 .547
Setting night (in SD from the mean) .520 .271
(SQRT) Hours ventilation in kitchen/day .774 .599
(SQRT) Hours ventilation in living room/day .747 .560
(SQRT) Hours ventilation in bedroom/day .649 .422
(SQRT) Hours ventilation in bathroom/day .616 .385
Rotation method: Oblimin with Kaiser Normalization.Factor loadings < .4 are suppressed.N = 2779
Figure 6.5 Results from factor analysis: relationship between behavioural factors and the eight original variables
Heatingbehaviour factor
Temperature during the day
Temperature during the evening
Temperature during the night
Temperature during the weekend
Hours of ventilation in the living room
Hours of ventilation in the bedrooms
Ventilation behaviour factor
Hours of ventilation in the bathroom
Hours of ventilation in the kitchen
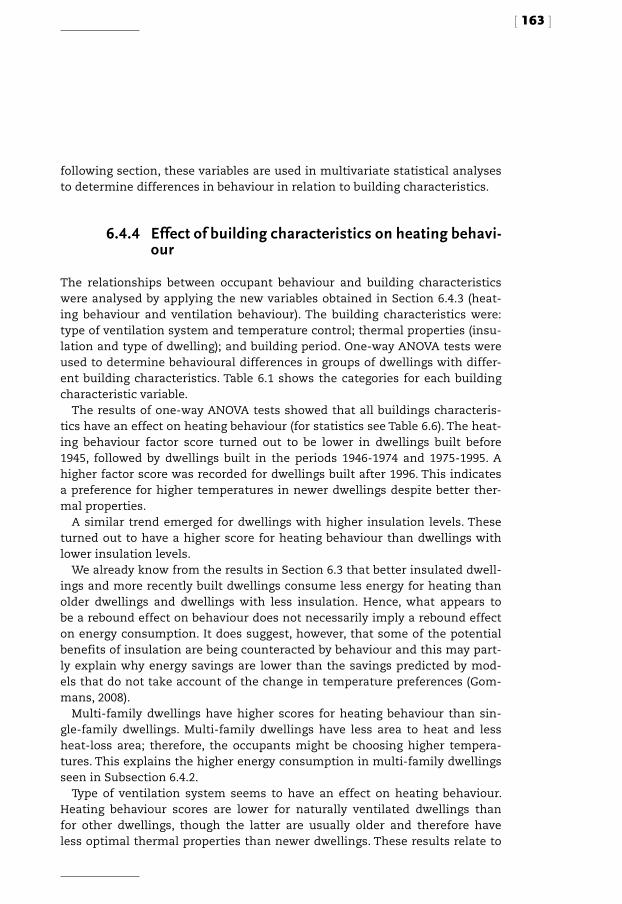
[ 163 ]
following section, these variables are used in multivariate statistical analyses to determine differences in behaviour in relation to building characteristics.
6.4.4 Effect of building characteristics on heating behavi-our
The relationships between occupant behaviour and building characteristics were analysed by applying the new variables obtained in Section 6.4.3 (heat-ing behaviour and ventilation behaviour). The building characteristics were: type of ventilation system and temperature control; thermal properties (insu-lation and type of dwelling); and building period. One-way ANOVA tests were used to determine behavioural differences in groups of dwellings with differ-ent building characteristics. Table 6.1 shows the categories for each building characteristic variable.
The results of one-way ANOVA tests showed that all buildings characteris-tics have an effect on heating behaviour (for statistics see Table 6.6). The heat-ing behaviour factor score turned out to be lower in dwellings built before 1945, followed by dwellings built in the periods 1946-1974 and 1975-1995. A higher factor score was recorded for dwellings built after 1996. This indicates a preference for higher temperatures in newer dwellings despite better ther-mal properties.
A similar trend emerged for dwellings with higher insulation levels. These turned out to have a higher score for heating behaviour than dwellings with lower insulation levels.
We already know from the results in Section 6.3 that better insulated dwell-ings and more recently built dwellings consume less energy for heating than older dwellings and dwellings with less insulation. Hence, what appears to be a rebound effect on behaviour does not necessarily imply a rebound effect on energy consumption. It does suggest, however, that some of the potential benefits of insulation are being counteracted by behaviour and this may part-ly explain why energy savings are lower than the savings predicted by mod-els that do not take account of the change in temperature preferences (Gom-mans, 2008).
Multi-family dwellings have higher scores for heating behaviour than sin-gle-family dwellings. Multi-family dwellings have less area to heat and less heat-loss area; therefore, the occupants might be choosing higher tempera-tures. This explains the higher energy consumption in multi-family dwellings seen in Subsection 6.4.2.
Type of ventilation system seems to have an effect on heating behaviour. Heating behaviour scores are lower for naturally ventilated dwellings than for other dwellings, though the latter are usually older and therefore have less optimal thermal properties than newer dwellings. These results relate to
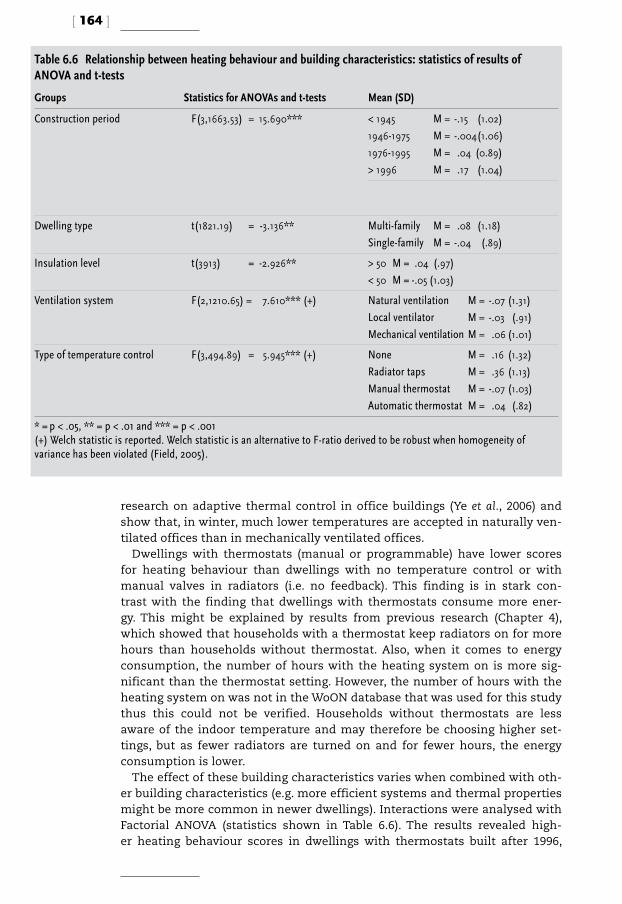
[ 164 ]
research on adaptive thermal control in office buildings (Ye et al., 2006) and show that, in winter, much lower temperatures are accepted in naturally ven-tilated offices than in mechanically ventilated offices.
Dwellings with thermostats (manual or programmable) have lower scores for heating behaviour than dwellings with no temperature control or with manual valves in radiators (i.e. no feedback). This finding is in stark con-trast with the finding that dwellings with thermostats consume more ener-gy. This might be explained by results from previous research (Chapter 4), which showed that households with a thermostat keep radiators on for more hours than households without thermostat. Also, when it comes to energy consumption, the number of hours with the heating system on is more sig-nificant than the thermostat setting. However, the number of hours with the heating system on was not in the WoON database that was used for this study thus this could not be verified. Households without thermostats are less aware of the indoor temperature and may therefore be choosing higher set-tings, but as fewer radiators are turned on and for fewer hours, the energy consumption is lower.
The effect of these building characteristics varies when combined with oth-er building characteristics (e.g. more efficient systems and thermal properties might be more common in newer dwellings). Interactions were analysed with Factorial ANOVA (statistics shown in Table 6.6). The results revealed high-er heating behaviour scores in dwellings with thermostats built after 1996,
Table 6.6 Relationship between heating behaviour and building characteristics: statistics of results of ANOVA and t-tests
Groups Statistics for ANOVAs and t-tests Mean (SD)
Construction period F(3,1663.53) = 15.690*** < 1945 M = -.15 (1.02)1946-1975 M = -.004 (1.06)1976-1995 M = .04 (0.89)> 1996 M = .17 (1.04)
Dwelling type t(1821.19) = -3.136** Multi-family M = .08 (1.18)Single-family M = -.04 (.89)
Insulation level t(3913) = -2.926** > 50 M = .04 (.97)< 50 M = -.05 (1.03)
Ventilation system F(2,1210.65) = 7.610*** (+) Natural ventilation M = -.07 (1.31)Local ventilator M = -.03 (.91)Mechanical ventilation M = .06 (1.01)
Type of temperature control F(3,494.89) = 5.945*** (+) None M = .16 (1.32)Radiator taps M = .36 (1.13)Manual thermostat M = -.07 (1.03)Automatic thermostat M = .04 (.82)
* = p < .05, ** = p < .01 and *** = p < .001(+) Welch statistic is reported. Welch statistic is an alternative to F-ratio derived to be robust when homogeneity of variance has been violated (Field, 2005).

[ 165 ]
although the differences were not statistically significant at a level of p< .05. Heating behaviour scores are higher in homes with more insulation – except in the case of naturally ventilated houses which confirms with the finding that occupants in offices with natural ventilation tend to accept lower tem-peratures in winter [F=6.339, p<.01].
6.4.5 Effect of building characteristics on ventilation be-haviour
Results of one-way ANOVA tests showed that ventilation behaviour is affect-ed by construction period, type of dwelling and type of ventilation system (for statistics see Table 6.7). Dwellings built before 1945 and after 1996 show a low-er score for ventilation behaviour than dwellings built in other periods. Low-er levels of ventilation in older houses might be related to the fact that the dwellings are not airtight and therefore need less ‘active’ ventilation (open windows, grilles and switched-on ventilation system). Lower levels of ventila-tion in newer houses might be due to sub-optimal use of the mechanical ven-tilation system. In Chapter 4 it is shown that almost all the households in the sample kept the mechanical ventilation system either off at all times or at the lowest setting.
The ventilation factor score in multi-family dwellings turned out to be low-er than in single-family dwellings. This might be related to behavioural dif-ferences between single occupants or couples and larger households. These results are in accordance with (Wouters & de Baets, 1986), who found differ-ences in ventilation for multi- and single-family housing.
The ventilation score for dwellings with natural ventilation differed from the score for dwellings with local ventilator and those with mechanical venti-lation. Dwellings with natural ventilation had higher scores than other dwell-ings. Results of Factorial ANOVA tests showed that, in dwellings built after 1996 and before 1945, the ventilation behaviour score was lower in homes
Table 6.7 Relationship between ventilation behaviour and building characteristics: statistics of results of ANOVA and t-tests
Groups Statistics for ANOVAs and t-tests Mean (SD)
Construction period F(3,1913.32) = 6.459*** < 1945 M = -.13 (.92)1946-1975 M = .05 (.97)1976-1995 M = .08 (1.04)> 1996 M = -.12 (1.06)
Dwelling type t(4303) = 4.687*** Multi-family house M = -.10 (.98)Single-family house M = .06 (1.00)
Ventilation system F(2,1410.63) = 3.713* (+) Natural ventilation M = .12 (1.06)Local ventilator M = -.02 (.95)Mechanical ventilation M = -.01 (1.04)
* = p < .05, ** = p < .01 and *** = p < .001(+) Welch statistic is reported. Welch statistic is an alternative to F-ratio derived to be robust when homogeneity of variance has been violated (Field, 2005).

[ 166 ]
with a thermostat [F=2.775, p<.05]. Figure 6.6 shows the relationship between building characteristics and
behaviour. A higher score for heating behaviour implies above-average ther-mostat settings. A higher score for ventilation behaviour implies more hours of ventilation. Each building characteristic is shown in the (heating and ven-tilation) behaviour factor scales. Higher ‘heating behaviour’ factor scores were related to multi-family dwellings houses built after 1996 with higher insula-tion level, no thermostat, and mechanical ventilation systems. Higher ‘venti-lation behaviour’ scores were seen in single-family dwellings built after 1945 and before 1996 with natural ventilation.
6.5 Discussion and conclusions
The aim of this paper was to determine differences in the behaviour of occu-pants of dwellings with different building characteristics and to ascertain the possible existence of a rebound effect on the consumption of energy for space heating.
Figure 6.6 Relationship between behavioural factors and building characteristics
Insulation level
<50% >50%
Type of temperature control
Thermostat No-thermostat
Type of ventilation system
Natural Local Mechanical
Type of ventilation system
Local Mechanical Natural
Type of dwelling
Multi-family Single
Construction period
<1945 / >1996 1946-1995
Type of dwelling
Single Multi-family
Construction period
<1945 1946-1995 >1996
Higher scoreLower score Higher scoreLower score
Heating behaviour factor Ventilation behaviour factor

[ 167 ]
6.5.1 Rebound effect on energy consumption in the Dutch residential stock
The periods were defined according to important changes in the energy reg-ulations in the Netherlands. Energy consumption was significantly lower for dwellings built in the most recent construction periods.
The correlations with energy consumption in the total housing stock seem to be larger than for recently built housing, which is explained by more types of building characteristics in the older housing. When comparing both sam-ples (recently built dwellings versus all dwellings) we can find comparable results in heating, only temperature by night showed a significant effect. For ventilation the results are different since there are larger variations on type of ventilation systems in the building stock (i.e. natural ventilation and local ventilators).
The building characteristics associated with an increase in energy con-sumption were low insulation levels, the presence of thermostats, and local ventilation. Insulation and thermal properties are related to lower energy consumption, as it was expected. However, more advanced control of heating and ventilation systems did not show to decrease energy consumption.
Analysis of energy consumption and type of temperature control indicates that dwellings with thermostats consume more energy than dwellings with-out thermostats. Mechanical and balanced ventilation systems did not show a reduction on energy consumption in comparison to naturally ventilated houses. Our previous study (Chapter 3) in dwellings built after 1996 showed that the use of thermostats was related to higher energy consumption. In addition, no statistical significant differences were found on the energy use for different types of ventilation systems.
6.5.2 Differences in behaviour determined by building characteristics
Analysis of the relationships between these characteristics and heating be-haviour (factor score) suggested that households living in dwellings with bet-ter thermal properties prefer above-average indoor temperatures, although this did not necessarily go hand in hand with higher energy consumption.
Type of temperature control seemed to have contrary effects, since thermo-stats appeared to be related to higher energy consumption but to lower scores for heating behaviour (i.e. below-average settings). Previous studies have indi-cated that energy consumption is more affected by hours of use than by ther-mostat settings. This finding could not be further tested since the required data were not in the database. It should therefore be tested in further studies in which the heating behaviour score relates not only to thermostat settings
[ 168 ]
but also to hours of use. There seems therefore to be evidence of a rebound effect on behaviour, but not on energy consumption. Another possibility is that higher settings could be compensating for air leaks caused by poor con-struction.
Occupant behaviour does appear to have a significant effect, given the higher temperature settings in dwellings with better thermal properties and better temperature control. This conclusion is confirmed by other interna-tional studies (Haas et al., 1998; Hens et al., 2010; Brookes, 2000; Schipper & Grubb, 2000; Krewitt & Sorrell, 2009). According to Hens et al., (2010), tempera-ture in daytime and in bedrooms and the mean indoor temperature are con-nected with direct rebound.
Ventilation behaviour seems to be affected by the type of ventilation sys-tem, type of dwelling and construction period. Households in dwellings with natural ventilation tend to ventilate more than households in other dwell-ings. Scores for ventilation behaviour are higher in single-family dwellings than in multi-family dwellings, probably because of the relationship between occupancy patterns and household composition. Dwellings built before 1946 and after 1996 tend to be ventilated for fewer hours than dwellings from oth-er periods. This finding could be related to higher levels of infiltration in older dwellings and the sub-optimal use of mechanical exhaust and balance venti-lation systems in newer dwellings. When combined with lower infiltration in newer dwellings, sub-optimal use of mechanical ventilations systems could result in poorer indoor air quality.
This study sought to understand the differences on behaviour in the hous-ing stock and explored the possible existence of a rebound effect on the con-sumption of energy for space heating. A more intensive use of the heating system and preferences for less ventilation were found for households liv-ing in recently built housing. As households living in newer dwellings might differ from those living in older dwellings, the occupant behaviour associat-ed to lower ventilation rates and higher temperature settings might be there-fore, related to household characteristics. Results from previous studies on occupant behaviour in recently built housing showed that a more intensive use of the heating systems was related to lifestyle of households (e.g. house-holds where somebody stays at home kept the thermostat on for longer time) (Chapter 4). Yet, the heating behaviour variables used in this study were relat-ed to thermostat settings, which pointed at preferences for a warmer indoor environment.
6.6 Recommendations
Factor analysis was used to reduce the number of behaviour variables and to facilitate the analysis. Heating and ventilation variables were applied but as

[ 169 ]
the data at our disposal was limited, we were unable to analyse all the fac-tors that determine energy consumption. Results from Chapter 4 showed that the number of hours that the heating system and radiators are turned on is more important than the temperature setting, but these sort of data were not available in the database owing to the large sample size. In addition, ventila-tion variables – windows, grilles and mechanical ventilation systems – had to be aggregated into one single variable per room because at least one type of ventilation was missing in each case. This simplification may not have seri-ous consequences, given that the aim of this study is to seek relationships be-tween behaviour and building characteristics. Other studies provide more in-formation on the relationships between occupant behaviour and energy con-sumption. These simplified variables are used solely as a proxy for behaviour and not to predict energy consumption.
The results pointed at a rebound effect on heating behaviour. The type of temperature control could help to reduce this effect, since it seems that households with more information about indoor temperature set the thermo-stat at below-average levels. In addition, it seems that programmable thermo-stats are related to more hours of use and that energy consumption might therefore be reduced by a switch to manual thermostats.
The results point to inefficient use of mechanical ventilation systems. Low levels of ventilation and low infiltration rates can adversely affect indoor air quality. Further research is needed to determine whether to give occupants more information on the correct use of ventilation systems or whether to develop better systems or interfaces between system and user.
Energy consumption seems to be lower in dwellings built more recently. However, further analysis of the behaviour determinants showed that occu-pants of newer dwellings and dwellings with better thermal properties tend to prefer higher indoor temperatures and fewer hours of ventilation. Further research should aim to determine the role of household characteristics in heating and ventilation preferences.
References
Ajzen, I. (1991), The theory of planned behaviour, Organizational behaviour and human decision processes, 50, pp. 179-211.
Andersen, R.V., J. Toftum, K.K. Andersen & B.W. Olessen (2009), Survey of occu-pant behaviour and control of indoor environment in Danish dwellings’, Ener-gy and Buildings, 41, pp. 11-16.
Assael, H. (1995), Consumer behaviour and marketing action, Cincinnati, South-Western College Publishing.
[ 170 ]
Beerepoot, M. & N. Beerepoot (2007), Government regulations as an impetus for innovations, Evidence for energy performance regulation in the Dutch res-idential building sector, Energy Policy, 35, pp. 4812-4825.
Biesiot, W. & K.J. Noorman (1999), Energy requirements of household con-sumption: a case study of Netherlands, Ecological Economics, 28, pp. 367-383.
Branco, G., B. Lachal, P. Gallinelli & W. Weber (2004), Expected versus observed heat consumption of a low energy multifamily complex in Switzerland based on long-term experimental data, Energy and Buildings, 36, pp. 543-555.
Brookes, L. (2000), Energy efficiency fallacies revisited, Energy Policy, 28, pp. 355-366.
Caldera, M., S.P. Corgnati & M. Filippi (2008), Energy demand for space heat-ing through a statistical approach: application to residential buildings, Energy and Buildings, 40, pp. 1972-1983.
Elkhuizen, P.A., J.E. Scholten, E.G. Rooijakkers, J. de Knegt & L. Deutz (2006), Kwaliteitsborging van installaties – Evaluatie van bestaande instrumenten en een visie voor toekomst, Report TNO bouw/Halmos for SenterNovem.
Field, A. (2005), Discovering statistics using SPSS, 2nd Edition, London, SAGE Publications.
Gommans, L.J. (2008), Energy performance of energy conscious buildings: be-tween design and reality, proceedings PLEA 2008, 25th Conference on Passive and Low Energy Architecture, Dublin, 22-24th.
Groot, E. de, M. Spiekman & I. Opstelten (2008), Dutch research into user be-haviour in relation to energy use of residences, proceedings PLEA Conference.
Haas, R., H. Auer & P. Biermayr (1998), The impact of consumer behaviour on residential energy demand for space heating, Energy and Buildings, 27, pp. 195-205.
Hens, H., W. Parijs & M. Deurinck (2010), Energy Consumption for heating and rebound effects, Energy and Buildings, 42, pp. 105-110.
Herring, H. & S. Sorrell (2009), Energy efficiency and sustainable consump-tion, The rebound effect, Energy, Climate and the Environment series, Pal-grave Macmillan, UK.
[ 171 ]
Hirst, E. & R. Goeltz (1985), Comparison of actual energy saving with audit pre-dictions for homes in the north central region of the USA, Building and Envi-ronment, 20 (1), pp. 1-6.
Jeeninga, H., M. Uyterlinde & J. Uitzinger (2001), Energieverbruik van energie-zuinige woningen, Report ECN & IVAM, ECN-C-01-072.
Krewitt, W., S. Simon, W. Graus, S. Teske, A. Zervos & O. Schafer (2007), The 2oC scenario -A sustainable world energy perspective, Energy Policy, 35, pp. 4969-4980.
Lenzen, M., M. Wier, C. Cohen, H. Hayami, S. Pachauri & R. Schaeffer (2006), A comparative multivariate analysis of household energy requirements in Aus-tralia, Brazil, Denmark, India and Japan, Energy, 31, pp. 181-207.
Leth-Petersen, S. & M. Togeby (2001), Demand for space heating in apartment blocks: measuring effect of policy measures aiming at reducing energy con-sumption, Energy Economics, 23, pp. 387-403.
Liao, H.C. & T.F. Chang (2002), Space-heating and water-heating energy de-mands of the aged in the U.S., Energy Economics, 24, pp. 267-284.
Linden, A.L., Carlsson-Kanyama & B. Eriksson (2006), Efficient and inefficient aspects of residential energy behaviour: What are the policy instruments for change?, Energy Policy, 34, pp. 1918-1927.
Milne, G. & B. Boardman (2000), Making cold homes warmer: the effect of en-ergy efficiency improvements in low-income homes, Energy Policy, 28, pp. 411-424.
Nieman (2007), Eindrapportage woonkwaliteit binnenmilieu in nieuwbouw-woning, Report Wu060315aaA4.PK, VROM Inspectie Regio Oost, Arnhem.
Olofsson, T., S. Andersson & J.U. Sjogren (2009), Building energy parameter in-vestigations based on multivariate analysis, Energy and Buildings, 41, pp. 71-80.
Papakostas, K.T. & B.A. Satiropoulos (2007), Occupational and energy behav-iour patterns in Greek residences, Energy and Buildings, 26, pp. 207-213.
Poortinga, W., L. Steg, C. Vlek & G. Wiersma (2005), Household preferences for energy saving measures: a conjoint analysis, Journal of Economic Psychology, 29, pp. 49-64.
[ 172 ]
Raaij, W.F. & T.M.M. Verhallen (1983), Patterns of residential energy behaviour, Journal of Economic Psychology, 4, pp. 85-106.
Sardianou, E. (2008), Estimating space heating determinants: an analysis of Greek households, Energy and Buildings, 40, pp. 1084-1093.
Schipper, L. & M. Grubb (2000), On the rebound? Feedback between energy in-tensities and energy uses in IEA countries, Energy Policy, 28, pp. 367-388
Schweiker, M. & M. Shukuya (2009), Comparison of theoretical and statistical models of air-conditioning-unit usage behaviour in a residential setting under Japanese climatic conditions, Building and Environment, 44, pp. 2137-2149.
Sonderegger, R.C. (1977-78), Movers and stayers: the resident’s contribution to variation across houses in energy consumption for space heating, Energy and Buildings, 1, pp. 313-324.
Tiberiu, C., J. Virgone & E. Blanco (2008), Development and validation of regres-sion models to predict monthly heating demand for residential buildings, En-ergy and Buildings, 40, pp. 1825-1832.
Vringer, C.R. (2005), Analysis of the requirements for household consumption, Netherlands environmental assessment agency, Bilthoven, thesis, ISBN 90-6960-1303.
Vringer, K. & K. Blok (2007), Household energy requirement and value pat-terns, Energy Policy, 35, pp. 553-566.
VROM (2009), Dutch Ministry of Housing, Website: www.vrom.nl, accessed July.
Wouters, P. & D. de Baets (1986), A detailed statistical analysis of window use and its effect on the ventilation rate in 2400 Belgian Social Houses, 7th AIC Conference, pp. 33-53.
Ye, X.J., Z.P. Zhou, Z.W. Lian, H.M. Liu, C.Z. Li & Y.M. Liu (2006), Field study of a thermal environment and adaptive model in Shanghai, Indoor Air, 16 (4), pp. 320-326.

[ 173 ]

[ 174 ]

[ 175 ]
7 Conclusions and recom-mendations
7.1 Introduction
This research sought to provide insight into the role of energy performance regulations and occupant behaviour in actual energy consumption of space and water heating in residential stock. Actual energy consumption was ana-lysed in dwellings built after the introduction of energy performance regula-tions in the Netherlands. The objective was to determine whether further tight-ening of Dutch energy performance regulations could be used to further de-crease energy consumption and to gain insight into household and building characteristics that determine occupant behaviour and its effect on actual en-ergy consumption for heating.
Figure 1.4 shows the relationships studied. The relationship between energy performance coefficient (EPC) and energy consumption was investigated first and this was followed by the relationship between energy consumption and occupant behaviour. The analysis of occupant behaviour determinants includ-ed looking at the effect of building characteristics and household characteris-tics on the use of heating and ventilation systems; these were used to deter-mine behavioural patterns of occupant behaviour related to energy consump-tion for heating. Differences between recently built housing (after 1995, when energy performance regulations were introduced) and the total housing stock were also analysed to determine the effect of energy performance regulations on actual energy consumption.
Statistical analyses determined the relationships between building charac-teristics, occupant behaviour and energy consumption for heating. These pro-vided correlations between variables that pointed at factors having a direct or indirect influence on energy consumption.
Three sources of data were used: the OTB database, and the KWR and WoON databases from the Dutch Ministry of Housing. The OTB database consists of a household survey and data collected from the legal document contain-ing the EPC calculation of the buildings. The survey was conducted in dwell-ings built after 1995 and the introduction of energy performance regulations. The aim was to collect data on the EPC level and detailed self-reported occu-pant behaviour. The WoON database consisted of two surveys and a build-ing inspection carried out by the Dutch Ministry of Housing. WoON was used to: (1) validate the OTB database with a random nationwide sample, and (2) to analyse the situation in the total housing stock. The KWR database, prede-cessor of WoON, was used for an exploratory analysis of building characteris-tics, household characteristics and occupant behaviour predicting energy con-sumption in the total housing stock.
The first part of the study (Chapter 2) used the KWR database to analyse the relative influence of building and household characteristics and occupant behaviour in energy consumption in the total housing stock. A regression model determined percentages for variation in energy consumption. Com-

[ 176 ]
parison with a second regression model and analysis of partial correlations pointed to interactions among the three types of variables: building charac-teristics, occupant behaviour and household characteristics; this established the relationships further studied in subsequent parts of the research.
Energy performance regulations introduced in 1995 made it compulso-ry to comply with the EPC level in new buildings. The EPC calculation takes account of thermal properties and systems efficiency of buildings. To deter-mine the effect of this regulation on actual energy consumption in dwellings built after 1995, differences on energy consumption between groups of dwell-ings were categorised according to their EPC level (Chapter 3).
The Chapter 2 results showed a small percentage of variation in energy consumption explained by occupant behaviour and household characteristics (4.2%). Since the variables in the KWR database related to occupant behaviour were not considered optimal for regression analysis, using a more appropriate set of variables would improve the analysis. Therefore, in Chapter 4, the effect of occupant behaviour in energy consumption was studied with the OTB data-base. In addition, the determinants of occupant behaviour with a large effect on energy consumption were studied to further determine the relationships found in Chapter 2 between building characteristics, household characteris-tics and occupant behaviour.
With relationships found between energy consumption and occupant behaviour, further analysis of behaviour was carried out in Chapter 5. Factor analysis was used to determine behavioural patterns to find the household and building characteristics useful for building user profiles for heating ener-gy consumption in recently built housing.
The introduction of energy performance regulations not only had a direct effect on energy consumption for heating (Chapter 3), it was thought to have an indirect effect as well due to the effect of building characteristics on occu-pant behaviour. Since recently built dwellings have better thermal proper-ties, households might be opting for different indoor conditions, identified as some causes of a rebound effect on energy consumption. Rebound occurs when people compensate for efficiency improvements by increasing their spending. It is therefore possible that lower energy costs for heating are off-set by a demand for more thermal comfort. In addition, the occupants’ inter-action with more advanced heating and ventilation systems is also thought to have an effect on occupant behaviour and therefore on energy consumption. The effects and determinants of occupant behaviour in recently built dwell-ings were analysed in Chapters 4 and 5.
Chapter 6 dealt with the building characteristics affecting occupant behav-iour in the total housing stock, and sought indications of a rebound effect in energy consumption. More insight into the differences of occupant behav-iour in recently built housing and the total housing stock provided another perspective on the effect of energy performance regulations on actual energy

[ 177 ]
consumption. The objective of this research was to determine the effect of occupant
behaviour and energy performance regulations on energy consumption for heating. Three research questions were defined. The first was related to the effect of energy performance regulations on actual energy consumption for heating. The second was related to the effect and determinants of occu-pant behaviour. The third referred to differences in energy consumption and behaviour observed in recently built housing in comparison to the total hous-ing stock.
The following sections present the conclusions and recommendations drawn from this analytical research. Sections 7.3 to 7.5 present the conclu-sions of each research question. Section 7.6 presents the discussion. Recom-mendations for policy, practice and further research are presented in Sections 7.7 to 7.9.
7.2 Effect of energy performance regulations on actual energy consumption
Q1 .1 What is the effect of a tighter EPC value on energy consumption for heating?The energy performance regulation is an instrument aimed at reducing build-ing-related energy consumption. The energy performance coefficient has been tightened three times in the past. Dwellings with a lower EPC are ex-pected to have lower energy consumption than dwellings with a higher EPC. The EPC is calculated by normalising the predicted energy consumption with a standard value taking into account the ‘total heated area’ and the ‘heat-transfer surface’ of the dwelling. The predicted energy consumption used in the EPC is the sum of the energy required for space and water heating, cool-ing, ventilation and lighting and also considers the energy efficiency of sys-tems. The energy required for space heating also takes account of the thermal properties of the building. The calculation makes assumptions about heating system use (see Appendix 1) with reference to thermostat settings at various times of the day.
Actual energy consumption for heating was not statistically significant-ly different in dwellings with various EPC values, even when the actual ener-gy consumption was normalised per ‘square meter heated area’. Therefore, a statistically significant reduction in energy consumption is not seen in dwell-ings with more stringent EPC levels. However, a statistically significant dif-ference was found between dwellings built before and after the introduction of the EPC, indicating that the EPC has helped to reduce energy consumption since its introduction.
Comparable results using the WoON database provided validation. The

[ 178 ]
WoON database does not contain the EPC value of dwellings but a comparable indicator, the Energy Index. Results showed that Energy Index was not corre-lated with the actual energy consumption for heating.
Although lower EPC values are not related to statistically significant lower energy consumption, the predicted energy consumption for heating correlat-ed to actual energy consumption for heating, indicating that dwellings with increased thermal properties consume less energy.
Q1 .2 What is the difference between actual and predicted energy consump-tion?With findings of a medium correlation between actual and predicted energy consumption for heating, it is remarkable that no statistically significant dif-ferences were found with the EPC values. The lack of statistically significant differences is thought to be related to an effect caused by the normalisation factor for building size or because energy requirements for water heating, lighting and ventilators, which are more dependent on occupant behaviour than on building characteristics, are not estimated correctly. Further tests es-tablished that ‘total expected energy consumption’ (Qpres;tot) showed the same correlation with actual energy consumption for heating than ‘expected en-ergy consumption for heating’ (Qpres; verw+tap), thus ruling out an effect caused by the energy requirements for lighting, ventilators and auxiliary energy for space heating. The lack of statistically significant differences in the EPC levels might thus be caused by the normalisation factor.
In most cases, actual energy consumption for heating was lower than expected, underlying the importance of occupant behaviour on energy con-sumption. These differences may arise if the calculation applies exces-sive energy requirements for occupant comfort or if small households live in large dwellings and therefore use less energy than anticipated. Therefore, the standard household behaviour used in the EPC might be far from reality (see EPC calculation detailed in Appendix 1). For example, the EPC calculation assumes that between 9 a.m. and 5 p.m. temperature is kept at 190C, assum-ing somebody is at home. However, the OTB sample showed statistically sig-nificant differences in energy consumption between households with people absent and present at home.
Q1 .3 Which building characteristics in the EPC have statistically a major in-fluence on energy consumption for space heating?The analysis of the building characteristics included in the EPC calculation was aimed at further determining the differences between actual and expect-ed energy consumption, and to study the building characteristics that have a major effect on energy consumption. According to the results, thermal prop-erties seemed better at decreasing energy consumption than increasing effi-ciency of ventilation and heating systems. Medium-sized correlations were
[ 179 ]
found between energy consumption and thermal properties, and small or not statistically significant correlations were found with the type of heating and ventilation systems.
A regression analysis showed that 18-22% of the variation on energy con-sumption in recently built housing can be explained with the building char-acteristics used to calculate the EPC level. A 78-82% variation in energy con-sumption is therefore unaccounted for, explaining the large difference between expected and actual energy consumption, the barely medium-size correlation, and the lack of statistically significant differences in energy con-sumption for dwellings with different EPC values.
Jeeninga et al., (2001) and Uitzinger (2004) found similar results for the effects of building characteristics, although the regression model (Uitzinger, 2004) claimed to predict 70% of the variation, contradicting other literature sources.
Two factors seem to explain the rest of the variation in energy consump-tion: actual quality of construction (e.g. actual thermal properties and sys-tems efficiency) and actual occupant behaviour. Studies have shown that buildings are constructed differently than specified in official documents (i.e. EPC document) and HVAC services run under very different conditions than is assumed on paper. A report by Nieman (2007) showed that in a sample of 154 dwellings, 25% did not meet EPC requirements, and in 50% of the dwell-ings, the construction was not in accordance with data used to calculate the EPC. Gommans (2008) monitored the energy performances of energy effi-cient buildings for 17 years. In his study 40% of solar boilers appeared to func-tion poorly, while only 25% of the heat pumps reached the expected efficien-cy. This was essentially due to construction faults, lack of control and lack of continuous monitoring.
Differences between the building characteristics specified in the EPC cal-culations and the actual building characteristics could partly justify the per-centage of variance that has not been explained. Such differences might also explain the absence of correlation between the EPC and actual energy con-sumption.
The fact that actual energy consumption for heating is lower than expected apparently contradicts the assumption that actual building characteristics are different from those described in the EPC document (therefore implying poor construction of buildings). However, the lower actual energy consumption is caused by the calculation method assuming high levels of comfort and usage of systems, as well as the use of average indoor and outdoor temperatures. Actual energy consumption is therefore only lower than expected if average occupant behaviour is taken into account as in the EPC calculations. A more accurate calculation method (such as an energy simulation model) would probably also show a large difference between the modelled energy consump-tion and the expected energy consumption in the EPC document.
[ 180 ]
7.3 Effect and determinants of occupant be-haviour in actual energy consumption for heating
Q2 .1 What is the effect of occupant behaviour on energy consumption from a statistical perspective?Analysis of the effect of building characteristics on energy consumption in recently built housing showed that a large percentage of variation in energy consumption is unaccounted for. Occupant behaviour is thought to play an important role in this variation.
Statistical analysis in Chapter 4 showed that the number of hours a heat-ing system was turned on at the highest chosen setting appeared to have a stronger effect on energy consumption than the highest chosen setting as such. Small variations in the setting in new houses are probably because of the similar thermal properties of all new houses. ‘Open radiators’ in more rooms was found to have a significant effect on energy consumption.
Low correlations were found between energy consumption and the use of a mechanical ventilation system since most households kept the mechani-cal ventilation system off or at the lowest level. Window and grille ventilation seemed to have a stronger effect on energy consumption than a mechanical ventilation system.
Occupant behaviour was found to explain 12% of the variation in ener-gy consumption for heating in recently built housing. This percentage was explained with four variables: ‘windows open in living room’, ‘hours at high-est chosen temperature’, ‘hours with radiators open’ and ‘hours with grilles open’.
The results seem in accordance with other studies finding important corre-lations between energy consumption and heating system use (Jeeninga et al., 2001; Haas et al., 1998; Linden et al., 2006; Hirst & Goeltz, 1985). Similar to the results of the OTB survey, the Jeeninga et al. results (2001) indicate that most Dutch households (73%) keep indoor temperature at 18-200C.
Thermostat use emerged as an important factor related to occupant behav-iour: households with a programmable thermostat were associated with high-er temperature settings during the night in the WoON sample, and with more hours with radiators on in the OTB sample. Nevius & Pigg (2000) found that households with programmable thermostats reported slightly higher settings than households with manual thermostats, although the differences were not statistically significant. Similar results were obtained in the WoON sur-vey, where statistically significant differences had a small effect. Shipworth et al. (2010) found that thermostat use did not reduce average maximum tem-peratures or hours of use. Although households with programmable thermo-stats were found to use heating for 0.4 hours a day longer than households with manual thermostats, the differences were not statistically significant. Ship-

[ 181 ]
worth et al. (2010) also found that households without thermostatic control set the temperature 0.60C lower than households with thermostatic control, though again the difference was not statistically significant.
Q2 .2 What are the determinants of occupant behaviour that have an effect on energy consumption?In Chapter 2 correlations between occupant behaviour, household and build-ing characteristics were found. Therefore Chapter 4 studied building charac-teristics and household characteristics related to occupant behaviour. The building characteristics analysed were the type of temperature control and type of ventilation since occupants interact with these systems. Other build-ing characteristics such as thermal properties were not considered because these are relatively constant in recently built housing. A relation between oc-cupant behaviour, its determinants and their effect on energy consumption is shown in Figure 1.6.
Both type of temperature control and type of mechanical ventilation seemed to have an effect on the use of heating and ventilation systems. Households with manual thermostats and mechanical exhaust ventilation have more energy-conserving behaviour than households with programmable thermostats and balanced ventilation systems.
Jeeninga et al. (2001) found that the type of thermostat had no influence on the preferred setting. However, in the OTB sample a relationship between type of thermostat and the hours that radiators were on was found while in the WoON sample a relationship between type of temperature control and the temperature at night was found. Differences might have risen from the type of variables used (hours of thermostat use instead of temperature set-tings). However, results from Jeeninga et al. (2001) also point to a relationship between a manual thermostat and energy-saving behaviour. Authors distin-guish between heating spaces when these are used (usually present in dwell-ings with programmable thermostat), independently of whether they are actually used and the heating of spaces actually in use (usually present in dwellings with manual thermostat). Chapter 4 results indicate that personal heating is less energy intensive than heating spaces.
In relation to the effect of household characteristics on energy consump-tion, the presence of elderly persons in the household proved to be a deter-mining factor in both heating system and ventilation use. A more intensive use of the heating system and less ventilation was associated with seniors. The presence of seniors might be closely related to hours spent at home.
The presence of children also had a significant effect on ventilation use. Other household characteristics related to a more intensive use of the heating system were average education levels (in comparison to high education lev-els) and having previously lived in a single-family dwelling.
[ 182 ]
Q2 .3 What are the main patterns of occupant behaviour?In Chapter 3 large differences between actual and expected energy consump-tion for heating were found. Expected energy consumption was found to be statistically significantly higher than actual energy consumption for heating. The low percentage of energy consumption explained for building character-istics was thought to be caused by the effect of actual building characteristics, and by actual occupant behaviour. The standard occupant behaviour taken in-to account in the EPC calculation might be causing a big difference between actual and expected energy consumption, since this could be far from actu-al behaviour. Therefore, this research also sought to (1) determine behavioural patterns and (2) define building characteristics and household characteristics to be taken into account in user profiles for energy consumption.
This study identified five underlying groups of behavioural factors in occu-pant behaviour: ‘appliances and space’, ‘energy intensive’, ‘ventilation’, ‘media’ and ‘temperature comfort’. The ‘appliances and space’ factor was related to more use of spaces and large appliances (i.e. laundry machine, dry-er, dish washer). The ‘energy intensive’ factor was related to behaviour lead-ing to more use of energy, for example more intensive use of the heating system. ‘Ventilation’ referred to more hours of ventilation. The fourth fac-tor, ‘media’ was related to behaviour seen in young households, for example using showers instead of baths, more use of electronics and computers, less use of spaces and more ventilation. The final factor, ‘temperature comfort’ was related to preferences for a warmer indoor environment and less venti-lation.
Five patterns were identified in relation to the factors: (1) spenders, (2) affluent-cool, (3) conscious-warm, (4) comfort and (5) convenience-cool. The behavioural patterns were developed to be used in simulation programmes or energy savings calculations by linking households types with specific behav-iour (more hours of ventilation, more use of energy-saving lamps). Though only indicative differences in energy consumption were found between the groups, results showed that ‘convenience-cool’ is related to lower energy con-sumption than other behaviour patterns, while ‘spenders’ is related to higher energy consumption than the other groups.
Other Dutch studies have found similar patterns. Raaij & Verhallen (1983) gathered data through retrospective self-reporting on 17 variables of occu-pant behaviour including: thermostat settings and use of radiators; use of ventilation grilles, windows and mechanical ventilation system; and closing of curtains. They found five behavioural patterns: ‘conservers’ (low temper-ature, low ventilation, higher education, small household size, working wife, less energy consumption), ‘spenders’ (high temperature, high ventilation, low education, more often home, more energy consumption), ‘cool’ (low tempera-ture, high ventilation, medium energy consumption, attitude does not explain energy consumption), ‘warm’ (high temperature, low ventilation, older peo-
[ 183 ]
ple), and ‘average’. Their analysis showed statistically significant differenc-es in energy consumption between groups. This study found patterns simi-lar to ‘cool’, ‘warm’ and ‘spenders’ but did not find patterns related to efforts to save energy (‘conservers’). ‘Convenience’ could be comparable, since this related to ‘media’ defined as less bedrooms used and using showers instead of baths.
Groot et al. (2008) found four behaviour groups: ‘convenience’, ‘conscious’, ‘costs’ and ‘environment’. This study showed similarities with the TNO study on ‘convenience/spender’ and ‘conscious/warm’. The pattern ‘costs’ was not found because low income and low education are less common household types in the sample (recently built dwellings). ‘Climate/environment’ was not found because this study did not take into account environment and energy-saving related attitudes.
Q2 .4 Which household categories show significant differences in energy-related behaviour?Correlations between resulting behaviour factors and households and build-ing characteristics were used to define household groups as: ‘seniors’, ‘fami-lies’, ‘singles/couples’ and ‘high-income couples’. Household groups with dif-ferent behaviour can be used to create policies for energy saving aimed at specific sectors of society. Families, seniors and high-income couples showed indicatively higher energy consumption (not statistically significant). The higher energy consumption in these three household groups has various rea-sons. Families showed higher energy consumption because of a high score for ‘space and appliances’; seniors because of a high score in ‘temperature com-fort’; and high-income couples scored highly in ‘energy intensive’.
Both household and building characteristics were found important in iden-tifying differences in behaviour patterns related to energy consumption. Knowing the type, size of a dwelling and HVAC systems, in addition to main household characteristics such as household size, age, background and life-style (hours at home) made it possible to identify behaviour patterns related to household groups.
No differences in energy consumption were found for different behaviour-al patterns and household groups due to the use of variables uncorrelated with energy consumption. However, the addition of behaviour variables relat-ed to use of appliances, electronics, computers and lighting provided infor-mation on relationships that could have not been found otherwise. For exam-ple, the relation between the use of energy-saving lamps and warmer indoor environment pointed to a preference for temperature comfort but with con-cern for saving energy in comparison to patterns where high heating systems use was correlated to more use of normal lighting. Use of variables not statis-tically correlated to energy consumption for heating made it hard to correlate the patterns and the household groups with energy consumption. However,

[ 184 ]
they provided more information in order to define underlying behaviour fac-tors. Using both energy consumption for heating and electricity to build pro-files could help overcome this problem.
7.4 Determinants of energy consumption in re-cently built housing in comparison to the complete housing stock
Q3 .1 Which building characteristics have the strongest influence on energy consumption in the total housing stock?Determining the effect of building characteristics and occupant behaviour in the total housing stock gave a different perspective to the research problem. Other studies have found a rebound effect in dwellings with improved ther-mal properties. Investigating the differences between recently built housing and the total housing stock can help to further understand the role of the en-ergy performance regulation in energy reductions.
The statistical analysis (regression) in Chapter 2 showed that household characteristics and behaviour significantly affect energy consumption (4.2% of variation in energy consumption for heating), but building characteristics still determine a larger part of the energy consumption in a dwelling (42% of variation in energy consumption for heating). In newly built dwellings this was 12% and 18-22% respectively. Therefore, in the total housing stock, build-ing characteristics (thermal properties) still seem to be more important than household characteristics or behaviour.
The most important building characteristics affecting energy consumption are related to the size of dwelling and insulation level. Energy consumption also tends to decrease in newer buildings (except in the most recent period, this is not statistically significant) and in non-detached dwellings, while the presence of a thermostat, garage, shed and basement tend to increase energy consumption.
Q3 .2 What is the relative importance of occupant behaviour and building characteristics on energy consumption in the total building stock?Occupant behaviour seems to be not as important as building characteristics (since these determine only 4.2% of the variation) in determining energy con-sumption; however behaviour is highly dependent on building characteristics. For example the thermostat presence and dwelling type might have larger ef-fects on energy consumption, as shown by a second regression model (see Chapter 2). Comparison with a second model showed that occupant behav-iour is determined by the type of dwelling and HVAC systems and specially by dwelling size and type of thermostat; therefore, the effect of occupant char-acteristics such as income or household size might be larger than expected,
[ 185 ]
since these are important in determining the type of dwelling. The household characteristics affecting energy consumption are the contin-
uous presence of people at home, the number of heated rooms and tempera-ture settings. Age of the respondent, household size and income also have a positive correlation with energy consumption for heating.
Occupant behaviour is in some cases as important as thermal properties: an increase of one degree Celsius on thermostat settings has a comparable effect on heating energy as roof insulation or a household income increase of 10,000 euros per year. Heating an extra bedroom has a comparable effect on heating energy as the presence of double glazing.
The small percentage of variation in energy consumption explained by household characteristics and occupant behaviour might be caused by a small number of behaviour variables present in the database and because these variables might not be in the right form to be used in a regression anal-ysis. A larger percentage of the explained variation was found in recently built housing using the OTB database, which contained more detailed data. This shows the importance of collecting and registering data in the right form.
Q3 .3 What are the differences in energy consumption between housing built after 1995 and the total housing stock?Energy performance regulations seem to have been successful in decreasing energy consumption for heating, since the better thermal properties of the dwellings have had a positive effect; this is corroborated by the larger varia-tion explained by building characteristics and occupant behaviour in the total housing stock in comparison to recently built housing.
Comparison of the regression analysis results (Chapter 3) with the regres-sion analysis described in Appendix 2 showed more energy consumption var-iation in both building characteristics and occupant behaviour in total hous-ing stock than in recently built housing. In the latter 19% to 23% of the vari-ation on energy can be explained by building characteristics (OTB survey and WoON database), while in the total housing stock, buildings’ characteristics can explain 34% with the same variables (WoON database) (see Appendix 2).
Using the OTB database, Chapter 4 showed that occupant behaviour explained 12% of the variation on energy consumption for heating in recent-ly built housing. The same analysis with the WoON database could explain only 3.2% of the same behavioural variables. However, the WoON survey does not contain sufficiently detailed data to be comparable with the OTB results. Regression analysis of the total housing stock with the WoON data-base showed an increase to 9.4% as compared to 3.2% in recently built hous-ing (see Appendix 2) as the explanation for consumption of heating energy, pointing to a larger effect of occupant behaviour in the total housing stock than in recently built housing.
In a regression model compiled by Schuler et al. (2000), building character-

[ 186 ]
istics were found to predict from 11.7 to 14.9% of the variation. Other stud-ies including broader selection of building characteristics, occupant behaviour and household characteristics in the total housing stock seem to predict more variation in energy consumption: Sonderegger 86% (1977-1978), Ledelmeijer & Grieken 50% (2005) and Pachauri 61-66% (2004).
In addition, the variation in energy consumption in recently built housing is more related to lifestyle (presence at home) and dwelling size (number of bedrooms) than to ventilation (hours of ventilation) or temperature (temper-ature setting), though this might be because there is a more homogeneous set of household types in the recently built housing sample than in the total housing stock sample.
Q3 .4 What are the differences in behaviour determined by building charac-teristics in the total housing stock?Energy consumption for heating was significantly lower in housing built in more recent construction periods. A slight increase in energy consumption was observed in the period after 2000 in comparison to 1997-1998 and 1998-1999. However, this was not statistically significant.
Building characteristics such as insulation and thermal properties were related to a decrease in energy consumption, but analysis of the relationships between these and heating behaviour (factor score) indicated that households living in dwellings with better thermal properties prefer higher than average indoor temperatures. Although this does not affect energy consumption, it might hinder the positive effects of better thermal properties and energy per-formance regulations.
Type of temperature control seemed to have contrary effects, since the presence of thermostats is related to higher energy consumption but to a low-er heating behaviour score (i.e. the heating system is set at a lower than aver-age temperature). Nevertheless Chapter 4’s results indicated that ‘hours’ and not ‘setting’ affects energy consumption, although this could not be further tested since the database used (WoON) did not contain this data.
7.5 Data collection: limitations and recommen-dations
This study was partly aimed at studying the relationship between build-ing characteristics, occupant behaviour and household characteristics. Given the large number of activities considered as aspects of behaviour, and the ex-tensive number of factors that might have an effect on it, statistical analyses seemed to be the right option to analyse these relationships. A large sample was needed to carry out the statistical analysis; therefore choices were made with regard to data collection that might have consequences on the generali-
[ 187 ]
sation of the results.First, since the study was focused on energy performance regulations, the
sample had to contain cases of dwellings built after their introduction in 1995. To facilitate this, districts in the Netherlands built after 1995 were cho-sen. This also facilitated the data collection about the EPC level, since only two municipalities had to be visited to obtain the EPC documents. Further-more, since the EPC documents often refer to groups of houses, it was not necessary to check individual documents per dwelling. This choice did not ensure a random sample.
The household characteristics of the OTB sample compared to the WoON sample consisted on higher education and income. Higher income is however determined by the type of neighbourhood and therefore becomes a character-istic of recently built housing.
Higher education could mean that the respondents had a higher than aver-age concern for the environment. However no statistical significant differenc-es were found between education and energy use, and although lower educa-tion was correlated to more hours using the heating system, this was actual-ly caused by the hours spent at home. Previous analyses with the KWR data-base (Chapter 2) had already shown that energy consumption is not affected by education level.
To solve these problems, the results were compared with a random nation-wide database. However, results of the analyses on energy consumption and behaviour showed similar results in the samples. Therefore, we conclud-ed that the OTB sample could be generalised to recently built housing in the Netherlands in similar housing districts.
Previous studies have addressed the problem of differences between actu-al characteristics of dwellings and the building characteristics written in the calculation document. In this study, we assumed these would be the same, since buildings are supposed to be constructed according to the specifications in the document; these being part of the building permit procedures. Inspec-tion of the buildings was not undertaken because the building characteristics defined in the document were needed to assess the role of the regulations on energy consumption. In addition, collecting data on actual building character-istics would have been prohibitive in costs and time.
Second, to collect data on behaviour, we decided to use a written question-naire for the detailed amount of data needed. A format similar to the one used by the Dutch Ministry of Housing for the WoON survey was used, there-fore allowing comparability between the databases. Retrospective questions might not be as accurate as real-time data (such as diaries); however, there is some doubt as to the accuracy of diaries. The measurement of real parame-ters and settings in the dwelling is considered better for obtaining high quali-ty data; however, the costs and time involved are also excessive.
Although data collection methods for occupant behaviour were similar
[ 188 ]
for the OTB and WoON surveys, differences were found in the data entered in the databases, which meant that the results on occupant behaviour were not entirely comparable and highlighted the importance of data processing. The WoON variables included average temperature settings in four specif-ic periods: day, evening, night and weekends. For the OTB study, we decid-ed to use the highest and lowest chosen temperature instead of average set-ting because this was more accurate. The OTB database also introduced the number of hours temperature was kept at its highest and lowest settings. The variables in the OTB database showed a stronger correlation with energy con-sumption than the variables in the WoON database. This was probably due to data loss during the averaging of values in the WoON database. The size of the WoON sample (more than 4,500 cases) might have led to the use of variables that contained far less data than the data originally collected in the survey.
Accurate relationships in energy consumption cannot be found with-out detailed data. However, too much or too detailed data is sometimes dif-ficult to process and might therefore compromise the quality of the data in databases, since important information could be lost. Data collection should focus on aspects of behaviour that tend to vary widely across the population and that seem to have a stronger influence on energy consumption. There-fore a literature study is important before setting out on data collection. This research analysed the KWR database as a first step in order to find the most important data to be obtained for the study. This proved to be effective since it determined only the most necessary variables for inclusion in the OTB database.
The results showed a large unexplained share of variance in energy con-sumption, which could be related to differences between the building charac-teristics as defined in the EPC document and actual building characteristics, but also to the quality of the data. However, similar results have been found in other studies, indicating that the sample size may not be a problem.
7.6 Recommendations
From this research, two types of general conclusions can be drawn. The first type refers to the EPC calculation method and its effect on energy consump-tion for heating; the second type is concerned with occupant behaviour.
Although lower energy consumption is not seen in dwellings with lower EPC values, there is a relationship between better thermal properties and less energy use. However, the actual energy consumption is lower than expected. Moreover, the analysis showed that only a small percentage of the variation in energy consumption could be explained by building characteristics includ-ed in the EPC calculation and occupant behaviour, leading to the conclusion that the unaccounted percentage could be due to the actual quality of the
[ 189 ]
construction (i.e. the real thermal properties of the dwelling). It was also concluded that the relationship between the EPC value and ener-
gy consumption could be improved with more accurate standardized occu-pant behaviour. The occupant behaviour leading to large variations in ener-gy consumption was mainly related to household characteristics or lifestyle aspects that are difficult to modify (i.e. hours spent at home). However, it was shown that although energy consumption is lower in dwellings built after 1995, the heating behaviour in these dwellings is more intensive.
In Subsection 7.6.1, recommendations for policy are drawn from the conclu-sions on the EPC calculation. These are considered to be easily implemented into energy performance regulations. The energy performance of a building is calculated taking into account a standardized behaviour. Behaviour can only be indirectly influenced by energy performance regulations through the type of control of heating and ventilation systems. Policies to influence occupant behaviour to decrease energy consumption fall within the scope of behaviour-al studies, and therefore are not part of this study. However, being aware of the behaviour of the occupants of buildings can help to predict more accu-rately energy savings and energy performance.
In this study we concluded that one of the most important factors of behav-iour influencing energy consumption for heating is the presence of people at home, since they keep the heating system on for a longer time. Nevertheless, an attempt to reduce the hours of heating system use (e.g. by increasing ener-gy prices) might have negative consequences on the comfort of these house-holds. Therefore, policies to reduce energy consumption for heating should consider the comfort and behaviour of different types of households. Sub-section 7.6.2 deals with recommendations for practice drawn from important findings regarding the role of occupant behaviour on energy consumption.
7.6.1 Recommendations for policy
Since 2006 the Energy Performance Building Directive (EPBD) requires all EU member states to implement performance-based energy requirements and label certification schemes aiming at lowering the energy consumed for heat-ing, cooling, ventilation, lighting and domestic hot water.
In the Netherlands energy performance regulations have been in use for fif-teen years. Therefore, the results from this research can be helpful for imple-menting energy performance regulations in other countries. Moreover, the Netherlands is currently developing the EPG, which will replace the EPN. The EPG includes calculation methods for new and existing buildings, and for res-idential and utility buildings. For the development of the EPG, the formulas used for the EPC are in revision.
Improving the thermal quality seemed more effective at decreasing ener-

[ 190 ]
gy consumption than improvements in the efficiency of heating and ventila-tion systems, since statistically significant correlations with energy consump-tion were found for thermal quality but these were very small or not signif-icant for type of systems. However, not all types of heating and ventilation systems were included in the sample. In the energy performance regulations, the designer may decide on which aspect to focus, which might undermine the effect of the regulations. More emphasis on the importance of thermal properties in comparison to systems efficiency could further decrease energy consumption.
The EPC value is expected to decrease the overall building-related energy consumption; therefore calculations take account of the energy required for water heating, lighting and ventilation. However these calculations are main-ly based on the size of the dwelling since standard values for occupant-relat-ed parameters are used (e.g. indoor temperature, presence at home and use of ventilators). Consequently, actual energy consumption differs statistical-ly from expected energy consumption for heating and is lower than calcu-lated. Taking into account in the calculations more accurate standard occu-pant behaviour could improve the energy consumption predictions. Further, an evaluation tool for the energy performance of a building (obtained in the EPC calculation) could be used to guarantee better energy predictions. Accu-rate user profiles for energy use could be used as a part of the evaluation tool. Although accurate energy prediction is not the aim of the EPC, a better estimation of the actual energy performance and the actual energy savings expected from the introduction or tightening of building regulations, could be achieved.
A large difference was found between actual and expected energy con-sumption for heating, pointing partly at differences between the building characteristics defined in the EPC document and the actual quality of the construction. The measurement and control of infiltration values and insu-lation levels after construction of the building might lead to large energy sav-ings since the construction quality might have a large effect on the energy consumption.
A missed opportunity for reducing energy consumption for heating in new dwellings is related to dwelling size and type of dwelling, but regulations on building size are more difficult to establish. The EPC currently corrects for dwelling size. A small dwelling will always consume less energy for heating than a large dwelling with the same thermal properties and systems efficien-cy. However, a review on the EPC calculation should consider dwelling size in order not to penalise small dwellings, since excessive cost would be expected for flats to reach the compulsory EPC level (Jeeninga & Kets, 2004). For exam-ple, EPC levels could be less stringent in smaller dwellings or flats than in larger dwellings.
[ 191 ]
7.6.2 Recommendations for practice
Less energy is consumed in housing built after 1995 in comparison to the to-tal housing stock but a more intensive use of the heating system was found in these. This factor might be reducing the effectiveness of energy perform-ance regulations. The development of more energy-friendly types of tempera-ture control and ventilation systems is important.
As indicated before, installation of manual thermostats instead of program-mable thermostats might have a positive effect on the reduction in energy consumption for heating. Households in dwellings with programmable ther-mostats take less deliberate actions and leave the control to the thermostat, which is insufficient when the time spent at home varies too much, or when interaction with other systems take place (e.g. during ventilation periods). This gives an opportunity for improvement, for example by installing manu-al thermostats per room. This would help to maintain a desired temperature per room leaving sufficient interaction with the thermostat to achieve delib-erate heating only when needed. Another possibility would be to develop a type of automatic thermostat that reacts to presence sensors instead of pre-programmed timetables. Moreover, giving immediate feedback to users on the impact of their choices in the use of the heating system might help to reduce energy consumption, for example, feedback on the effects of having the radi-ators on at entrances and in corridors, choosing higher temperatures, or leav-ing the heating on during the night.
The use of ventilation systems in recently built dwellings seems not to be as intended. Providing better instructions and feedback to users could help more efficient use of systems. Development of less noisy mechanical venti-lation systems is also of great importance since this is the main reason for turning the system down or off.
7.6.3 Recommendations for further research
This section gives recommendations for further research regarding sugges-tions drawn from the framework and the delimitation of the research.
Determinants of behaviourFurther research should be aimed at the causes of occupant behaviour (cog-nitive variables). The behaviour taken into account in this study is defined as use of systems and other provisions in the dwelling. Therefore this research focused on behaviour itself and not on its causes. Although this study showed for example that seniors prefer warmer temperatures, a relation between household characteristics and ventilation behaviour was not found. The study of cognitive variables could explain why some households prefer higher tem-
[ 192 ]
peratures or more ventilation than others.Factor analysis showed interesting results in relation to behaviour patterns
and factors underlying occupant behaviour. The results were used to identify households and their related building characteristics to determine household profiles. However, no relationships between household profiles and behaviour patterns and energy consumption were found. A larger sample size or the addition of electricity consumption could increase these relationships. Analy-sis of total housing stock could lead to different results due to a greater varie-ty of household and building characteristics affecting behaviour.
This research used self-reported occupant behaviour in retrospective. Thus there might be large differences with actual use of dwelling provisions. More research into these differences should be carried out in the future.
Electricity consumptionThis study focused on the effect of energy performance regulations on ener-gy use for space and water heating. The exclusion of electricity consumption was because even when the Dutch energy performance regulations include the energy used for ventilators and lighting, these make use of standardized values and are therefore merely based on the floor area of the building. In ad-dition, the use of electricity for appliances and electronics are not building-related.
The energy use for appliances, electronics and lighting is known to have increased in recent years. The effect of occupant behaviour and household characteristics on electricity consumption is believed to be higher than on space heating. Further research is therefore needed in this area in order to decrease the environmental burden caused by occupant behaviour in residen-tial buildings.
7.7 Closing remarks
The indoor environment of a dwelling is an important factor determining the quality of life of its inhabitants. Providing a safe and healthy environment is an objective of architects and urban designers. However, our society cannot afford to maintain current trends in over-consumption of resources. Housing should be made not only healthy and comfortable but sustainable as well; en-ergy efficiency is now one of the main goals of building regulations.
Energy efficient buildings will not achieve their expected effects if user behaviour is not taken into account. Occupants’ decisions on how they use building provisions have an important effect on the efficiency of the build-ing. That occupants understanding the effect of their decisions is crucial to achieving the expected energy performance of a building.

[ 193 ]
Summary Actual energy consumption in
dwellings The effect of energy performance regula-
tions and occupational behaviour Olivia Guerra Santín
Many governments have introduced regulations to make buildings more en-ergy-efficient. Policies and research on energy conservation in buildings are geared primarily to saving energy through technical measures relating to the building envelope and the heating and ventilation installations.
Since 2006 the Energy Performance Building Directive (EPBD) has required all EU member states to enhance their building regulations by implement-ing performance-based energy requirements and by introducing energy-label certification schemes in buildings. In the Netherlands, the energy-efficien-cy requirement is based on the energy performance coefficient (EPC), a non-dimensional figure that expresses the energy efficiency of a building.
The aim of energy performance regulations is to ease the environmental burden imposed by the energy consumed in the built environment. However, the energy savings from space heating might fall short of expectations. The effectiveness of energy regulations needs to be verified in order to discern whether more energy savings will be generated by tighter regulations. It is thought that occupant behaviour, the actual quality of the construction, and rebound effects might be undermining the effect of the regulations.
The aim of this research is to provide insight into the effect of energy per-formance regulations on the energy consumption for space heating and to clarify the role of occupant behaviour in determining this effectiveness. This will enable us to establish whether tighter energy performance regulations are required and to identify the factors (building characteristics) that could be causing households to consume more energy.
Research methodsThis research sought to draw conclusions on the determinants of energy consumption at macro-level in order to analyse the effects of national ener-gy regulations. The study at macro level was necessary because of the large number of variables that influence energy consumption.
Statistical analyses were therefore used to determine the factors that influence energy consumption for heating. The analyses carried out in this research were exploratory in nature. The objective was to deliver relation-ships between different variables (occupant behaviour, household character-istics and building characteristics) which would then deepen the understand-ing of the relative influence and interaction between the variables and pave the way for energy-consumption predictions for certain groups.
Thanks to the use of standardisations in statistical methods (i.e. stand-ard deviations) statistical analysis also enabled us to systematically compare
[ 194 ]
recently built housing with the total housing stock and also made compari-sons possible with other research and databases. This study made use of mul-tivariate statistical analyses.
Different methods were applied depending on the research questions. Regression analyses were used to carry out energy predictions in order to identify the building and household characteristics that have an effect on energy use. Based on the results from the regression analyses, more specific analyses of the building characteristics and occupant behaviour influencing energy consumption were carried out with a view to determining the effects of the energy performance regulations on actual energy consumption. ANO-VA tests were used to identify differences in behaviour and energy consump-tion across different groups. In order to further analyse the effect of behav-iour on energy consumption, exploratory factor analysis was used to deter-mine behavioural patterns. To conclude, an analysis of the possible existence of a rebound effect in recently built dwellings was carried out making use of Factorial ANOVAs.
The statistical analysis required detailed data on occupant behaviour, build-ing characteristics and household characteristics. Four types of data were used: data on building characteristics; demographic data on household char-acteristics; data on occupant behaviour; and data on the actual energy con-sumption for space and water heating.
The data were obtained from three sources. The main source was the OTB database carried out as part of this study. The other sources were two data-bases of the Dutch Ministry of Housing derived from household energy sur-veys in the Netherlands in 2000 and 2005.
Effect of energy performance regulations on actual energy consumptionEffect of EPC value on energy consumption for heatingThe energy performance regulation is an instrument for reducing building-re-lated energy consumption. In the Netherlands, the energy performance coef-ficient has been tightened three times in the past. The energy consumption in dwellings with a lower EPC is expected to be lower than the energy consump-tion in dwellings with a higher EPC. The EPC is calculated by normalising the predicted energy consumption per building size by applying a standard val-ue. The predicted energy consumption in the EPC is the sum of the energy re-quired for space and water heating, cooling, ventilation and lighting. The en-ergy efficiency of systems is also taken into consideration. The EPC calcula-tion makes assumptions about thermostat settings at various times of the day. The energy required for space heating also takes account of the thermal properties of the building.
Our results showed that actual energy consumption for heating was not statistically significantly lower in dwellings with stricter EPC values. Howev-er, substantial differences that were found between dwellings built before and
[ 195 ]
after the introduction of the EPC indicate that, since its introduction, the EPC has helped to reduce energy consumption.
Although lower EPC values are not related to statistically significant lower energy consumption, the predicted energy consumption for heating did cor-relate to the actual energy consumption for heating, indicating that dwellings with increased thermal properties consume less energy.
Difference between actual and predicted energy consumptionGiven that a medium correlation was found between actual and predicted en-ergy consumption for heating, it is remarkable that no statistically significant differences were found for the EPC values. This might conceivably be due to an effect triggered by the normalisation factor for building size or to incor-rect estimation of energy requirements for water heating, lighting and ven-tilators, which are more dependent on occupant behaviour than on build-ing characteristics. Further tests established that ‘total expected energy con-sumption’ showed the same correlation with actual energy consumption for heating than ‘expected energy consumption for heating’, thus ruling out an effect caused by the energy requirements for lighting, ventilators and auxilia-ry energy for space heating. The absence of statistically significant differenc-es in the EPC levels might therefore be caused by the normalisation factor.
In most cases, actual energy consumption for heating was lower than expected, again underlying the importance of the effect of occupant behav-iour on energy consumption. These differences may appear if the calcula-tion applies excessive energy requirements for occupant comfort or if small households live in large dwellings and therefore use less energy than antici-pated. Hence, the standard household behaviour used in the EPC might be far from reality.
The influence of building characteristics in the EPC on energy consumption for space heatingAnalysis of the building characteristics included in the EPC calculation aimed to further determine the differences between actual and expected energy consumption and to identify the building characteristics that have a major effect on energy consumption. According to the results, thermal properties seemed to be more effective than more efficient ventilation and heating sys-tems in lowering energy consumption. Medium-sized correlations were found between energy consumption and thermal properties and small or non-sta-tistically significant correlations were found for the type of heating and venti-lation system.
A regression analysis showed that 18-22% of the variation in energy con-sumption in recently built housing can be explained with the building charac-teristics that are used for the EPC. A 78-82% variation in energy consumption is therefore unaccounted for, explaining the wide difference between expect-
[ 196 ]
ed and actual energy consumption, the barely medium-size correlation, and the absence of statistically significant differences in energy consumption for dwellings with different EPC values.
Two factors seem to explain the remaining variation in energy consump-tion: actual quality of construction (e.g. actual thermal properties and system efficiency) and actual occupant behaviour. Studies have shown that build-ings are constructed differently than specified in official documents (i.e. EPC document) and HVAC services run under very different conditions than is assumed on paper.
The fact that actual energy consumption for heating is lower than expect-ed apparently contradicts the assumption that the actual building charac-teristics are different from those described in the EPC document (therefore implying poor construction practices). However, the lower actual energy con-sumption is caused by the fact that the calculation method assumes high lev-els of comfort and system usage as well as average indoor and outdoor tem-peratures. A more accurate calculation method (such as an energy simula-tion model) would probably also show a wide difference between the mod-elled energy consumption and the expected energy consumption in the EPC document.
Effect and determinants of occupant behaviour on actual energy consump-tion for heatingEffect of occupant behaviour on energy consumptionStatistical analyses showed that the number of hours a heating system was turned on at the highest chosen setting appeared to have a stronger effect on energy consumption than the highest chosen setting as such. Minor varia-tions in the setting in new dwellings are probably due to the similar thermal properties of all new houses. The number of hours that radiators were open also turned out to have a significant effect on energy consumption.
Low correlations were found between energy consumption and the use of a mechanical ventilation system since most households kept the mechani-cal ventilation system off or at the lowest level. Window and grille ventila-tion seemed to have a stronger effect on energy consumption than mechani-cal ventilation.
Thermostat use emerged as an important factor in occupant behaviour: households with a programmable thermostat were associated with higher temperature settings during the night and with more hours with the radia-tors on.
Determinants of occupant behaviour that have an effect on energy consumptionThe interaction of the occupant with the dwelling is thought to have an ef-fect on occupant behaviour. The building characteristics and household char-acteristics related to occupant behaviour were therefore analysed. The build-
[ 197 ]
ing characteristics were the type of temperature control and type of ventila-tion since occupants interact with these systems.
Both type of temperature control and type of mechanical ventilation seem to have an effect on the use of heating and ventilation systems. Households with manual thermostats and mechanical exhaust ventilation display more energy-conserving behaviour than households with programmable thermo-stats and balanced ventilation systems. Results also showed that person-al heating (heating space that is in use) is less energy-intensive than space heating (heating space whether it is used or not).
Analysis of the effect of household characteristics on occupant behaviour revealed that the presence of elderly persons in the household proved to be a determining factor in both heating system and ventilation use. More inten-sive use of the heating system and less ventilation was associated with sen-iors. The presence of seniors might be closely related to hours spent at home.
The presence of children also had a significant effect on ventilation use. Other household characteristics related to a more intensive use of the heating system were average education levels (compared with high education levels) and having previously lived in a single-family dwelling.
Main patterns of occupant behaviourThe standard occupant behaviour applied in the EPC calculation might be re-sponsible for the wide difference between actual and expected energy con-sumption, since it could be far from actual behaviour. This research there-fore also sought to (1) determine behavioural patterns and (2) define building characteristics and household characteristics for user profiles on energy con-sumption.
This study identified five underlying groups of behavioural factors in occupant behaviour: ‘appliances and space’, ‘energy-intensive’, ‘ventila-tion’, ‘media’ and ‘temperature comfort’. ‘Appliances and space’ was relat-ed to more use of space and heavy appliances (e.g. washing machine, dry-er, dish washer). ‘Energy-intensive’ was related to behaviour leading to more use of energy, such as more intensive use of the heating system. ‘Ventila-tion’ referred to more hours of ventilation. The fourth factor ‘media’ related to behaviour seen in young households, for example, taking showers instead of baths, more use of electronics and computers, less use of space and more ventilation. The final factor ‘temperature comfort’ related to preferences for a warmer indoor environment and less ventilation.
Five patterns were identified for the five factors: (1) spenders, (2) affluent-cool, (3) conscious-warm, (4) comfort and (5) convenience-cool. The behav-ioural patterns were developed for use in simulation programmes or energy-savings calculations by linking household types with specific behaviour (more hours of ventilation, more use of energy-saving light bulbs). Though only indicative differences in energy consumption were found between the groups,

[ 198 ]
results indicated that ‘convenience-cool’ was more strongly related to lower energy consumption than the other behaviour patterns, while ‘spenders’ is more strongly related to higher energy consumption than the other behaviour patterns.
Household categories showing significant differences in energy-related behaviourCorrelations between the behaviour factors and households and building characteristics were used to split the household groups into: ‘seniors’, ‘fami-lies’, ‘singles/couples’ and ‘high-income couples’. Household groups with dif-ferent behaviour patterns can be useful in the formulation of energy-saving policies that target specific sectors of society. Indicatively higher energy con-sumption (not statistically significant) was found for families, seniors and high-income couples. The higher energy consumption in these three house-hold groups has various reasons. The higher energy consumption by fami-lies stemmed from a high score for ‘space and appliances’. In the case of sen-iors it was caused by a high score for ‘temperature comfort’ and in the case of high-income couples by a high score for ‘energy-intensive’.
Both household and building characteristics proved important in identify-ing differences in behaviour patterns related to energy consumption. Infor-mation on the type and size of a dwelling and HVAC systems combined with information on the main household characteristics such as household size, age, background and lifestyle (hours at home) made it possible to identify behaviour patterns for the household groups.
Determinants of energy consumption in recently built housing in compari-son with the complete housing stockBuilding characteristics having the strongest influence on energy consumption in the total housing stockDetermining the effect of building characteristics and occupant behaviour in the total housing stock placed the research question in a different perspec-tive. Other studies have ascertained a rebound effect in dwellings with im-proved thermal properties. An investigation of the differences between re-cently built housing and the total housing stock would shed more light on the role of the energy performance regulations in lowering energy consumption. The results showed that, in the total housing stock, building characteristics (thermal properties) still seem to be more important than household charac-teristics or behaviour.
The most important building characteristics affecting energy consump-tion are related to the size of dwelling and insulation level. Energy consump-tion also tends to be lower in newer buildings and in non-detached dwell-ings, while the presence of a thermostat, garage, shed and basement tend to increase energy consumption.

[ 199 ]
Relative importance of occupant behaviour and building characteristics on energy consumption in the total building stockOccupant behaviour seems to be less important than building characteris-tics in determining energy consumption; however, occupant behaviour is highly dependent on building characteristics. It is determined by the dwell-ing type and HVAC systems and especially by the dwelling size and type of thermostat; therefore, the effect of occupant characteristics such as income or household size might be greater than expected, since these are important in determining the type of dwelling.
Energy performance regulations seem to have been successful in lower-ing energy consumption for heating, since better thermal properties in dwell-ings have had a positive effect; this is corroborated by the larger variation explained by building characteristics and occupant behaviour in the total housing stock compared with recently built housing.
Differences in behaviour determined by building characteristics in the total housing stockBuilding characteristics such as insulation and thermal properties were relat-ed to a decrease in energy consumption, but analysis of the relationships be-tween these characteristics and heating behaviour indicated that households living in dwellings with better thermal properties prefer higher indoor tem-peratures. Although this does not affect energy consumption, it might limit the positive effects of better thermal properties and energy performance reg-ulations.
Type of temperature control seemed to have contrary effects, since the presence of thermostats is related to higher energy consumption but to a low-er heating behaviour score (i.e. the heating system is set at a lower than aver-age temperature). Nevertheless, results indicated that it is ‘hours’ rather than ‘setting’ that affects energy consumption.
Final conclusionTwo types of general conclusions can be drawn from this research. The first concerns the EPC calculation method and its effect on energy consumption for heating; the second concerns occupant behaviour.
Although lower energy consumption is not observed in dwellings with low-er EPC values, a relationship does exist between better thermal properties and lower energy consumption. However, the actual energy consumption is low-er than estimated. Moreover, the analysis showed that only a small percent-age of the variation in energy consumption could be explained by the building characteristics in the EPC calculation and occupant behaviour, leading to the conclusion that the unaccounted percentage could be due to the actual quali-ty of the construction (i.e. the real thermal properties of the dwelling).
The improvement of energy efficiency in buildings is important to decrease

[ 200 ]
energy consumption. This is especially important in the building stock, since new buildings are designed to have a good energy performance. Howev-er, it has been shown that occupant behaviour could undermine the positive effects of energy performance regulations.
It was also concluded that the relationship between the EPC value and ener-gy consumption could be improved with more accurate standardised occu-pant behaviour. The occupant behaviour that led to wide variations in ener-gy consumption was related mainly to household characteristics or lifestyle aspects that are difficult to modify (i.e. hours spent at home).
Influencing behaviour as a method to decrease energy consumption presents an opportunity in energy efficient dwellings (i.e. recently built dwell-ings). Targeting the right groups in policies is however necessary to succeed, and therefore more knowledge in the causes of behaviour (cognitive variables) is needed.
It is necessary to make a distinction between household characteristics, and cognitive variables (preferences, attitudes). All these factors have an effect on energy use, but the possibility of influencing them are different. Household characteristics and often lifestyle cannot be externally influenced. There are more possibilities in influencing cognitive variables with the right methods. For further research, a clear distinction should be made between these types of variables.
Both factors, building characteristics and occupant behaviour, are impor-tant in the bid to decrease energy consumption for heating in residential buildings. The application of the right method would depend on the particu-lar situation.

[ 201 ]
Samenvatting Feitelijk energiegebruik van woningen Het effect van energieprestatieregelgeving
and bewonersgedrag Olivia Guerra Santín
Een groot aantal overheden heeft regelgeving uitgevaardigd om gebouwen energie-efficiënter te maken. Het beleid en het onderzoek naar energiebe-houd in gebouwen is er voornamelijk op gericht energie te besparen door middel van technische maatregelen met betrekking tot de gebouwschil en de verwarmings- en ventilatie-installaties.
In 2006 is de EPBD (Energy Performance Building Directive) van kracht geworden. Deze Europese richtlijn verplicht alle lidstaten maatregelen met betrekking tot energieprestaties voor gebouwen te implementeren en ener-gieprestatiecertificaten af te geven. Daartoe is in Nederland de Beoordelings-richtlijn (BRL 9500) ontwikkeld. De energieprestatiecoëfficiënt (EPC) voor nieuwbouwwoningen is een niet-dimensionaal getal waarin de energie-effi-cientie van een gebouw wordt uitgedrukt.
Het doel van de regelgeving is het energieverbruik in gebouwen terug te dringen en daarmee het milieu zoveel mogelijk te ontzien. Op het gebied van verwarming zal de energiereductie wellicht niet worden gehaald. De effectivi-teit van energiewetgeving zal moeten worden gecontroleerd om vast te kun-nen stellen of meer energiebesparingen en dus strengere wetgeving nodig zijn. Het gedrag van bewoners, de kwaliteit van het gebouw en eventuele terugslageffecten kunnen een negatief effect hebben op de effectiviteit van regelgeving.
Het doel van dit onderzoek is inzicht te verschaffen in de effectiviteit van energieprestatieregelgeving op het energieverbruik voor het verwarmen van woonruimten en de rol van bewoners in het bepalen van die effectiviteit. Aan de hand daarvan hopen we te kunnen vaststellen in hoeverre strengere regel-geving nodig is. Ook willen we graag weten welke factoren (bouwkenmerken) ertoe leiden dat huishoudens meer energie gebruiken.
OnderzoeksmethodenHet doel van dit onderzoek was om conclusies te kunnen trekken over de de-terminanten van energieconsumptie op macroniveau, om daarmee de effec-ten van nationale energieregelgeving te kunnen analyseren. Het was nood-zakelijk om het onderzoek op macroniveau uit te voeren in verband met het grote aantal variabelen dat van invloed is op de energieconsumptie.
Om de factoren die van invloed zijn op de energieconsumptie met betrek-king tot verwarming te kunnen bepalen, werd dan ook gebruikgemaakt van statistische analyses. De analyses die in dit onderzoek werden uitgevoerd waren verkennend van aard. Het doel was om verbanden tussen verschillende variabelen (gedrag van bewoners, kenmerken van huishoudens en woningen)

[ 202 ]
te vinden die meer inzicht zouden kunnen bieden in de relatieve wederzijd-se beïnvloeding en de interactie tussen variabelen, en die voorspellingen op het gebied van energieconsumptie voor verschillende groepen mogelijk zou-den maken.
Effect van energieprestatieregelgeving op het feitelijke energieverbruikHet effect van de EPC-waarde op het energieverbruik voor verwarmingDe energieprestatieregelgeving is een instrument waarmee het energiever-bruik met betrekking tot gebouwen kan worden teruggedrongen. De energie-prestatiecoëfficiënt is in het verleden in Nederland al drie keer aangescherpt. Van woningen met een lagere EPC wordt een lager energieverbruik verwacht dan van woningen met een hoge EPC. De EPC wordt berekend met behulp van een gestandaardiseerde gebouwengrootte, het verwachte energieverbruik vol-gens een standaardwaarde ten opzichte van de totaal te verwarmen ruimte en het warmtereflectie-oppervlak van de woning. Het verwachte energiever-bruik binnen de EPC is de som van de vereiste energie voor de verwarming van de ruimte en van water, van koeling, ventilatie en verlichting. Bovendien wordt de energie-efficiëntie van installaties in aanmerking genomen, wordt bij de berekening rekening gehouden met de thermostaatinstellingen gedu-rende de dag en worden de thermische eigenschappen van een gebouw mee-genomen in de berekening van de energie die benodigd is voor het verwar-men van ruimten.
Uit onze resultaten blijkt dat het feitelijke energieverbruik voor verwar-ming statistisch niet significant lager uitvalt in woningen met strenge EPC-waarden. Wel werden aanzienlijke verschillen vastgesteld tussen woningen gebouwd voor en na de invoering van de EPC. Daaruit blijkt dat de EPC een rol heeft gespeeld bij het terugdringen van het energieverbruik.
Hoewel lagere EPC-waarden statistisch gezien niet tot een significant lager energieverbruik leidden, kwam het verwachte verbruik overeen met het fei-telijke verwarmingsverbruik. Daaruit blijkt dat in woningen met verbeterde thermische eigenschappen minder energie wordt verbruikt.
Het verschil tussen het verwachte en feitelijke energieverbruikMet een gemiddelde correlatie tussen verwacht en feitelijk energieverbruik voor verwarming is het opmerkelijk dat geen statistisch significante verschil-len met de EPC-waarden konden worden vastgesteld. Het gebrek aan statis-tisch significante verschillen zou iets te maken kunnen hebben met de stan-daardisatiefactor voor de grootte van gebouwen. Aan de andere kant is het ook mogelijk dat de energievereisten voor de verwarming van water, voor ver-lichting en ventilatie (die meer afhankelijk zijn van bewonersgedrag dan de eigenschappen van een gebouw) niet helemaal correct worden ingeschat. Uit testen blijkt dat het ‘totaal verwachte energieverbruik’ dezelfde correlatie met het feitelijke verbruik vertoonde als het ‘verwachte verbruik voor verwar-
[ 203 ]
ming’. Dat betekent dat de energievereisten voor verlichting, ventilatie en bij-komende energie voor het verwarmen van ruimten geen factoren van belang zijn. Daarom kan worden geconcludeerd dat het gebrek aan statistisch signi-ficante verschillen in de EPC-waarden veroorzaakt wordt door de standaardi-satiefactor.
In de meeste gevallen viel het feitelijke energieverbruik voor verwarming lager uit dan verwacht. Daarmee werd het belang van het bewonersgedrag ten opzichte van energieverbruik nog eens onderstreept. Deze verschillen kunnen zich voordoen als binnen de berekening buitensporig veel ruimte wordt gela-ten voor de energievereisten ten aanzien van het comfort van de bewoners, of als er sprake is van kleine gezinnen in grote woningen en er dus minder ener-gie wordt verbruikt dan verwacht. Om die redenen kan het standaardgedrag van huishoudens zoals binnen de EPC is vastgesteld, aanzienlijk van de wer-kelijkheid verschillen.
De eigenschappen van gebouwen binnen de EPC die van invloed zijn op het energie-verbruik voor de verwarming van ruimtenDe analyse van de eigenschappen van gebouwen zoals deze in de EPC-bereke-ning worden meegenomen, dienen voor een verdere vaststelling van de ver-schillen tussen het verwachte en het feitelijke energieverbruik. Verder hoopt men dat de analyse een beter inzicht verschaft in de eigenschappen van ge-bouwen voor zover die van invloed zijn op het energieverbruik. De resulta-ten wijzen erop dat de thermische eigenschappen wel bijdragen aan een la-ger energieverbruik maar minder aan efficiëntere ventilatie- en verwarmings-installaties. Er kon een gemiddelde correlatie worden vastgesteld tussen ener-gieverbruik en thermische eigenschappen, terwijl kleine en niet statistisch significante correlaties werden vastgesteld met betrekking tot het type ver-warming en ventilatie.
Uit een regressieanalyse bleek dat 18 tot 22% van de variatie in energiever-bruik in recentelijk gebouwde woningen kan worden verklaard aan de hand van de bouwkenmerken die worden gebruikt om het EPC-niveau te bereke-nen. Voor de resterende variatie van 78 tot 82% in energieverbruik is daarmee geen verklaring gevonden. Dat verklaart echter wel het grote verschil tussen verwacht en feitelijk energieverbruik, de nauwelijks gemiddelde correlatie en het gebrek aan statistisch significante verschillen in energieverbruik voor woningen met verschillende EPC-waarden.
Toch zijn er voor de resterende variatie in energieverbruik twee factoren aan te wijzen: de feitelijke kwaliteit van de gebouwen (bijvoorbeeld de huidi-ge thermische eigenschappen en de efficiëntie van de gebruikte installaties) en het gedrag van de huidige bewoners. Onderzoek wijst uit dat woningbouw vaak anders verloopt dan in officiële documenten is vastgelegd (bijvoorbeeld een EPC-document) en dat de werking van verwarming, ventilatie en aircondi-tioning (HVAC) vaak afwijkt van de specificaties op papier.
[ 204 ]
Dat het feitelijke energieverbruik lager uitvalt dan verwacht, is in tegen-spraak met de veronderstelling dat bouwkenmerken afwijken van het EPC-document (wat met zich mee zou brengen dat de constructie van gebouwen te wensen overlaat). Het lagere feitelijke energieverbruik wordt echter veroor-zaakt door de berekeningsmethode, waarin een hoog niveau van comfort en gebruik van installaties is verdisconteerd, alsmede het gebruik van gemiddel-de binnen- en buitentemperaturen. Een nauwkeurigere berekeningsmethode (zoals een energiesimulatiemodel) zou waarschijnlijk ook een groot verschil aan het licht brengen tussen het energieverbruik binnen het model en het verwachte energieverbruik in het EPC-document.
Effecten en beslissende factoren in bewonersgedrag ten aanzien van het feitelijke energieverbruik voor verwarmingHet effect van bewonersgedrag op het energieverbruikUit statistische analyse blijkt dat het aantal uren dat een verwarming op de hoogste stand staat van meer invloed op het energieverbruik is dan de hoogst gekozen stand. Kleine variaties in de verwarmingsstand in nieuwe huizen worden waarschijnlijk veroorzaakt door vergelijkbare thermische eigenschap-pen van alle nieuwe huizen. Het aantal uren dat radiatoren worden gebruikt, was ook significant van invloed op het energieverbruik.
Lage correlaties werden aangetroffen tussen het energieverbruik en het gebruik van een mechanische ventilatie omdat deze in de meeste huishou-dens uit of op de laagste stand wordt gelaten. Raam- en roosterventilatie leek sterker van invloed op het energieverbruik dan een mechanisch ventilatiesys-teem.
Het thermostaatgebruik trad naar voren als een belangrijke factor in het bewonersgedrag: huishoudens met een programmeerbare thermostaat lie-ten ’s nachts een hogere temperatuurinstelling zien met langer ingeschakel-de radiatoren.
Factoren van bewonersgedrag die van invloed zijn op het energieverbruikDe interactie van bewoners met hun woning is vermoedelijk van invloed op het bewonersgedrag. De bouwkenmerken en eigenschappen van het huishou-den met betrekking tot het bewonersgedrag zijn daarom tot het onderwerp van onderzoek gemaakt. De geanalyseerde bouwkenmerken waren het type temperatuurregeling en het type ventilatie, omdat er sprake is van interactie tussen deze systemen en de bewoners.
Zowel het type temperatuurregeling als het type mechanische ventila-tie leek van invloed te zijn op het gebruik van verwarming en ventilatiesys-teem. Huishoudens met handmatige thermostaten en mechanische uitlaat-ventilatie gaan zuiniger met hun energie om dan huishoudens met program-meerbare thermostaten en uitgebalanceerde ventilatiesystemen. De resulta-ten wezen er ook op dat persoonlijke verwarming (van alleen de ruimten die
[ 205 ]
in gebruik zijn) minder energie verbruikt dan het verwarmen van alle ruimten (of deze nu wel of niet in gebruik zijn).
Met betrekking tot de invloed van de eigenschappen van het huishouden op het gedrag van de bewoners bleek de aanwezigheid van ouderen in het huis-houden een bepalende in zowel het gebruik van de verwarming als de venti-latie. Een intensiever gebruik van de verwarming en een lager gebruik van de ventilatie werd geassocieerd met ouderen. De aanwezigheid van ouderen kan ook sterk verband houden met het aantal uren dat thuis wordt doorgebracht.
Ook de aanwezigheid van kinderen was significant van invloed op het ven-tilatiegebruik. Andere huishoudelijke kenmerken die verband houden met een intensiever gebruik van de verwarming zijn een gemiddeld opleidingsni-veau van de bewoners (in vergelijking met een hoog opleidingsniveau) en of men eerder in een eengezinswoning heeft gewoond.
De voornaamste patronen van bewonersgedragHet standaardgedrag van bewoners zoals dat wordt meegenomen in de EPC-berekening kan een groot verschil veroorzaken tussen het verwachte en fei-telijke energieverbruik omdat dit sterk kan afwijken van het feitelijke bewo-nersgedrag. Daarom is binnen dit onderzoek ook getracht om (1) gedragspa-tronen vast te stellen en (2) eigenschappen en kenmerken van gebouwen en huishoudens vast te leggen, zodat daarmee rekening kan worden gehouden bij het opstellen van gebruikersprofielen voor energieverbruik.
In het kader van het onderzoek zijn vijf onderliggende groepen van gedragsfactoren vastgelegd: ‘apparatuur en ruimte’, ‘energie-intensief’, ‘ven-tilatie’, ‘media’ en ‘temperatuur en comfort’. De factor ‘apparatuur en ruim-te’ houdt verband met een intensiever gebruik van ruimten en witgoedappa-ratuur (zoals wasmachines, drogers en vaatwasmachines). De factor ‘energie-intensief’ houdt verband met gedrag dat leidt tot een intensiever gebruik van energie, bijvoorbeeld een hogere stand van de verwarming. ‘Ventilatie’ ver-wijst naar een intensiever gebruik van de ventilatie. De vierde factor, ‘media’, gaat over het gedrag in jonge huishoudens, bijvoorbeeld over het gebruik van de douche in plaats van het bad, een intensiever gebruik van elektronica en computers, minder gebruik van ruimten en meer ventilatie. De laatste factor, ‘temperatuur en comfort’ houdt verband met de voorkeur voor een warmer huis en minder ventilatie.
Met betrekking tot bovenstaande factoren werden ook vijf patronen vastge-steld: (1) grootverbruikers, (2) welvarend-koel, (3) bewust-warm, (4) comfort en (5) gemak-koel. De gedragspatronen zijn ontwikkeld voor gebruik in simula-tieprogramma’s of berekeningen met het oog op energiebesparing. Huishou-dens worden gekoppeld aan specifieke gedragspatronen (meer ventilatie-uren, meer gebruik van spaarlampen enz.). Hoewel er geen zeer betekenisvol-le verschillen konden worden vastgesteld in het energieverbruik van de diver-se groepen, bleek uit de resultaten toch dat ‘gemak-koel’ kon worden gerela-
[ 206 ]
teerd aan een lager energieverbruik dan de andere gedragspatronen, terwijl voor ‘grootverbruikers’ een hoger energieverbruik opging dan voor de andere groepen.
Huishoudenscategorieën met significante verschillen in energiegerelateerd gedragCorrelaties tussen gedragsfactoren en huishoudens en bouwkenmerken zijn gebruikt om verschillende huishoudensgroepen vast te stellen: ‘senioren’, ‘ge-zinnen’, ‘alleenstaanden/stellen’ en ‘veelverdieners/stellen’. Huishoudens-groepen met verschillende gedragspatronen kunnen worden gebruikt om richtlijnen voor een zuiniger energieverbruik op te stellen voor specifieke sec-toren van de samenleving. Gezinnen, senioren en veelverdienende stellen lie-ten een enigszins hoger energieverbruik zien (hoewel niet statistisch signifi-cant). Aan het hogere energieverbruik van deze drie huishoudensgroepen lig-gen diverse redenen ten grondslag. Gezinnen lieten een hoger energiever-bruik zien door een hoge score op ‘ruimte en apparatuur’, senioren door een hoge score in ‘temperatuur en comfort’ en veelverdienende stellen scoorden hoog op ‘energie-intensief’.
Zowel de huishoudens- als bouwkenmerken bleken van belang in het vast-stellen van verschillen in gedragspatronen met betrekking tot energiever-bruik. Als het type en de grootte van een woning, alsmede de gebruikte HVAC-installaties bekend zijn, en tevens de huishoudenskenmerken zoals omvang, leeftijd, achtergrond, en levensstijl (thuis doorgebrachte uren) zijn vastge-steld, kunnen gedragspatronen worden afgezet tegen huishoudensgroepen.
Factoren die het energieverbruik bepalen in recentelijk gebouwde wonin-gen ten opzichte van het totale woningaanbodBouwkenmerken met de sterkste invloed op het energieverbruik in het totale woningaanbodHet vaststellen van de bouwkenmerken en het bewonersgedrag in het tota-le woningaanbod bood een ander perspectief op het onderzoeksprobleem. Uit andere onderzoeken is een terugslageffect gebleken voor woningen met ver-beterde thermische eigenschappen. Het onderzoek naar de verschillen tussen recentelijk gebouwde woningen ten opzichte van het totale woningaanbod kan inzicht verschaffen in de rol van energieprestatieregelgeving met betrek-king tot het terugdringen van energieverbruik. Het totale woningaanbod, de bouwkenmerken (zoals thermische eigenschappen) lijken van groter belang dan huishoudenskenmerken en bewonersgedrag, zo blijkt uit de resultaten.
De bouwkenmerken die het meest van invloed zijn op het energieverbruik houden verband met de grootte van de woning en de mate van isolatie. Het energieverbruik daalt doorgaans ook in nieuwere gebouwen en vrijstaande huizen, terwijl de aanwezigheid van een thermostaat, garage, schuur en kel-der doorgaans leiden tot een hoger energieverbruik.
[ 207 ]
Het relatieve belang van bewonersgedrag en bouwkenmerken ten opzichte van ener-gieverbruik in het totale woningaanbodHet gedrag van bewoners lijkt van minder belang dan bouwkenmerken bij het vaststellen van energieverbruik; aan de andere kant is het bewonersgedrag weer sterk afhankelijk van de bouwkenmerken. Het bewonersgedrag wordt bepaald door het woningtype en de geïnstalleerde HVAC-installaties, en voor-al door de grootte van de woning en het type thermostaat; mede daarom kan de invloed van bewonerskenmerken zoals het inkomen of de grootte van het huishouden zwaarder wegen dan verwacht, omdat deze factoren weer een grote rol spelen bij het vaststellen van het woningtype.
De energieprestatieregelgeving lijkt zijn vruchten te hebben afgewor-pen met betrekking tot verwarming omdat de verbeterde thermische eigen-schappen van woningen een positief effect hebben; dit wordt bevestigd door de grotere variatie aan bouwkenmerken en bewonersgedrag binnen het totale woningaanbod in vergelijking met recentelijk gebouwde woningen.
Verschillen in gedrag zoals bepaald door bouwkenmerken in het totale woningaanbodBouwkenmerken zoals isolatie en thermische eigenschappen houden verband met een lager energieverbruik, maar uit een analyse van de relatie tussen de-ze en het verwarmingsgedrag blijkt dat huishoudens in woningen met betere thermische eigenschappen de voorkeur geven aan hogere binnentemperatu-ren. Dit is weliswaar niet direct van invloed op het energieverbruik maar staat wel de positieve effecten van betere thermische eigenschappen en energie-prestatieregelgeving in de weg.
Het type temperatuurbeheersing leek een tegengesteld effect te hebben omdat de aanwezigheid van een thermostaat verband houdt met een hoger energieverbruik maar tegelijkertijd met een lagere score voor verwarmings-gedrag (met andere woorden, de verwarming wordt op een lagere gemiddelde temperatuur ingesteld). Uit de resultaten blijkt echter dat het niet de instel-ling maar de uren zijn die van invloed zijn op het energieverbruik.
ConclusieUit het onderzoek kunnen twee algemene conclusies worden getrokken. De eerste conclusie betreft de voor de EPC gebruikte berekeningsmethode en het effect daarvan op het energieverbruik voor verwarming; de tweede conclusie betreft het bewonersgedrag.
Hoewel in woningen met lagere EPC-waarden geen lager energieverbruik kan worden geconstateerd, bestaat er een relatie tussen betere thermische eigenschappen en een verminderd gebruik van energie. Het feitelijke energie-verbruik is echter lager dan verwacht. Uit de analyse bleek zelfs dat slechts een klein percentage van de variatie in energieverbruik kon worden verklaard door de in de EPC-berekening opgenomen bouwkenmerken en het bewoners-gedrag. Dat heeft geleid tot de conclusie dat het resterende percentage kan

[ 208 ]
worden verklaard door de feitelijke kwaliteit van de gebouwen (met andere woorden, de echte thermische eigenschappen van de woningen).
Het verbeteren van de energie-efficiëntie van woningen is een belangrijk middel om de energieconsumptie te verminderen. Dit geldt vooral voor de bestaande woningvoorraad, aangezien een goede energieprestatie tegenwoor-dig al in het ontwerp van nieuwe gebouwen wordt meegenomen. Het is echter ook aangetoond dat het gedrag van bewoners de positieve effecten van ener-gieprestatieregelgeving kan ondermijnen.
De tweede conclusie was dat de relatie tussen de EPC-waarde en het ener-gieverbruik zou kunnen worden verbeterd door een nauwkeurigere vaststel-ling van het standaardgedrag van bewoners. Het bewonersgedrag leidt tot sterke variaties in het energieverbruik en houdt voornamelijk verband met de huishoudenskenmerken of de levensstijl van de bewoners. Deze zijn moeili-jk aan te passen (bijvoorbeeld het aantal uren dat thuis wordt doorgebracht).
Het beïnvloeden van gedrag om energieconsumptie te verminderen kan dus besparingen opleveren in energie-efficiënte (nieuwbouw)woningen. Het is hierbij echter van groot belang dat beleid gericht is op de juiste doelgroepen; hiervoor is meer inzicht nodig in de oorzaken van gedrag (cognitieve variabe-len).
Er moet een onderscheid gemaakt worden tussen de kenmerken van huis-houdens en cognitieve variabelen (voorkeuren, attitude). Beide soorten facto-ren zijn van invloed op het gebruik van energie, maar de mogelijkheden om ze te beïnvloeden zijn verschillend. De kenmerken van huishoudens en vaak ook leefstijl kunnen niet van buitenaf worden beïnvloed. Het beïnvloeden van cognitieve variabelen biedt meer mogelijkheden, mits de juiste metho-des worden ingezet. In verder onderzoek zou er een duidelijk onderscheid gemaakt moeten worden tussen deze soorten variabelen.
Beide soorten factoren – de kenmerken van woningen en het gedrag van bewoners – zijn van belang bij het zoeken naar maatregelen om de energie-consumptie met betrekking tot verwarming van woningen te verminderen. De juiste aanpak moet voor elke situatie apart bekeken worden.

[ 209 ]
Appendix 1 EPC calculation
Source: NEN 5128: 2004. Energy Performance of Residential functions and resi-dential buildings: determination method, ics 91.120.10, March 2004.
The EPC is calculated with the following formula:
where, Qpres;tot is the primary energy consumption in MJ, determined by eq. 2Ag;verwz is the useful surface of the heated zones of the building in m2
Averlies is the heat-transfer surface of the building in m2
CEPC is the correction factor for changes in the methodology
The required energy (MJ) is calculated with the following formula:Qpres;tot = Qprim;verw + Qprim;hulp;verw + Qprim;tap + Qprim;vent + Qprim;vl (2)
where,Qprim;verw is the primary energy consumption for space heating in the buildingQprim;hulp;verw is the primary auxiliary energy consumption for space heatingQprim;tap is the primary energy consumption for water heatingQprim;vent is the primary energy consumption for ventilatorsQprim;vl is the primary energy consumption for lighting
To determine the heat-transfer surface of the building, the surfaces are multiplied by a reduction factor determined by the type of space limiting with the surface. For an outdoor wall the factor is 1; for a floor the factor is 0.7 to account for the fact that the average ground temperature is higher than the outdoor average air temperature during the heating season.
The primary energy consumption for space heating is calculated by divid-ing the energy needed for space heating by the efficiency of the installations. The energy needed for space heating is determined by subtracting the effec-tive heat gain from the heat loss.
Heat loss takes account of the transmission and ventilation losses. It con-siders the difference between the average indoor (180C) and average outdoor (50C) temperature multiplied by the number of days in mega seconds (212 days). The considered indoor temperatures in Celsius degrees are:▪ 7-17 hrs = 19 (living area all week and sleeping area on weekends), 16 (sleeping area on weekdays)▪ 17-23 hrs = 21 (living area all week and sleeping area on weekends), 16 (sleeping area on weekdays)▪ 23-7 hrs (thermostat setting) = 16 (living area all week and sleeping area on weekends), 14 (sleeping area on weekdays).
Qpres;tot 1
[330 x Ag;verwz ] + [65 x Averlies] CEPC
xEPC =
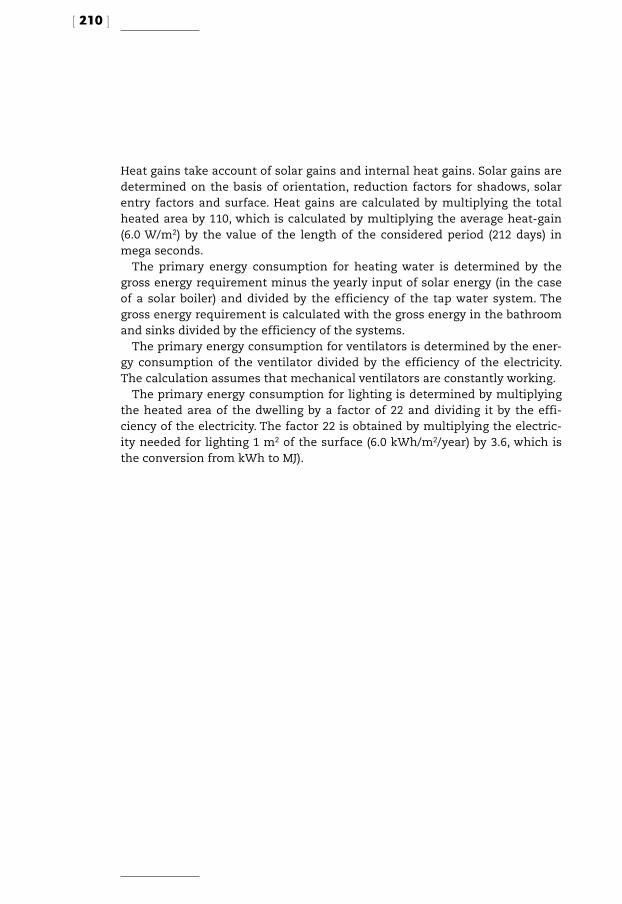
[ 210 ]
Heat gains take account of solar gains and internal heat gains. Solar gains are determined on the basis of orientation, reduction factors for shadows, solar entry factors and surface. Heat gains are calculated by multiplying the total heated area by 110, which is calculated by multiplying the average heat-gain (6.0 W/m2) by the value of the length of the considered period (212 days) in mega seconds.
The primary energy consumption for heating water is determined by the gross energy requirement minus the yearly input of solar energy (in the case of a solar boiler) and divided by the efficiency of the tap water system. The gross energy requirement is calculated with the gross energy in the bathroom and sinks divided by the efficiency of the systems.
The primary energy consumption for ventilators is determined by the ener-gy consumption of the ventilator divided by the efficiency of the electricity. The calculation assumes that mechanical ventilators are constantly working.
The primary energy consumption for lighting is determined by multiplying the heated area of the dwelling by a factor of 22 and dividing it by the effi-ciency of the electricity. The factor 22 is obtained by multiplying the electric-ity needed for lighting 1 m2 of the surface (6.0 kWh/m2/year) by 3.6, which is the conversion from kWh to MJ).

[ 211 ]
Appendix 2 OTB Survey question-naire
This appendix contains a condensed version of the questionnaire’s survey in the original Dutch and a translation to English. Only the questions relevant to this thesis are presented.
Note: In the original questionnaire, space for answers was given for up to 7 persons and 5 rooms.
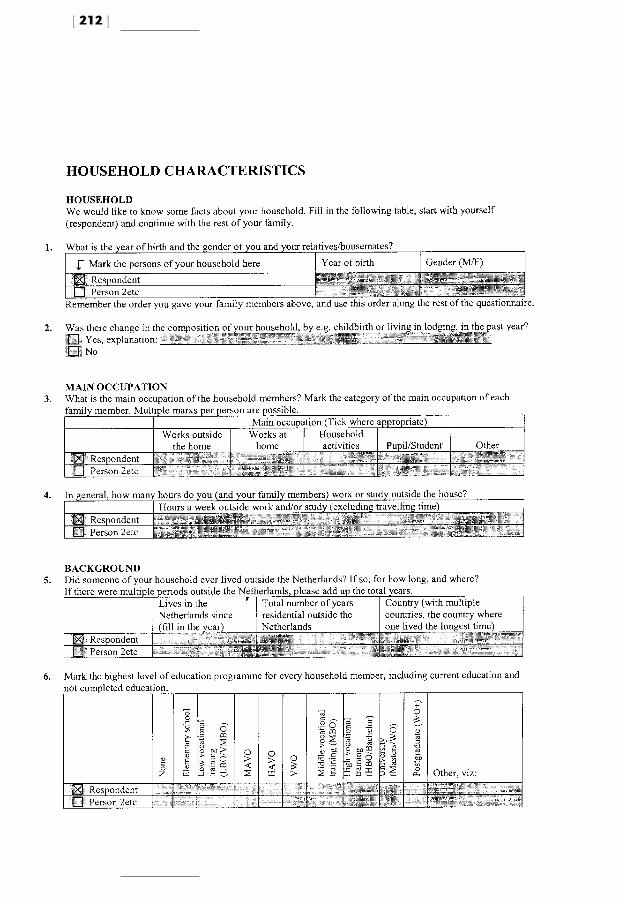
[ 212 ]

[ 213 ]
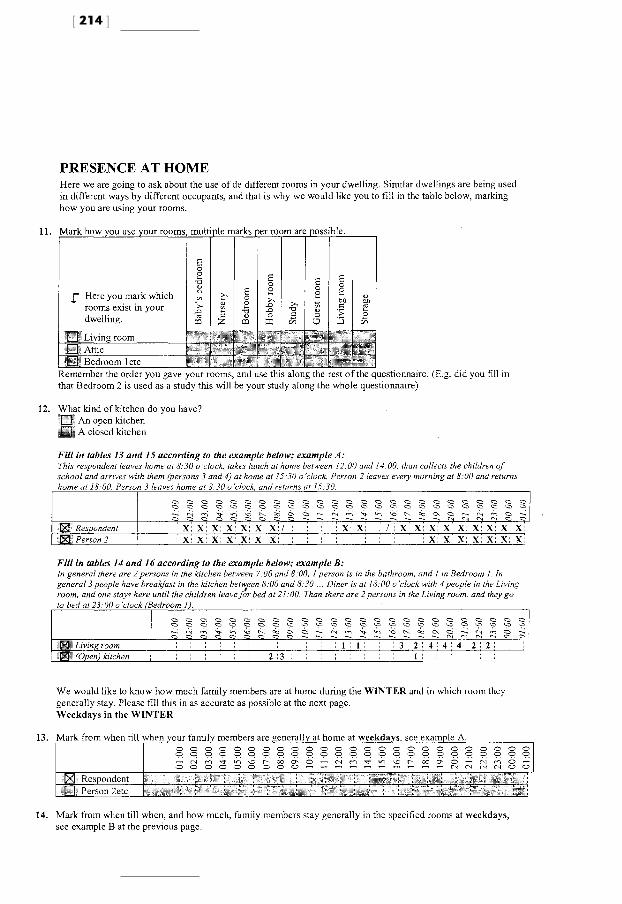
[ 214 ]

[ 215 ]
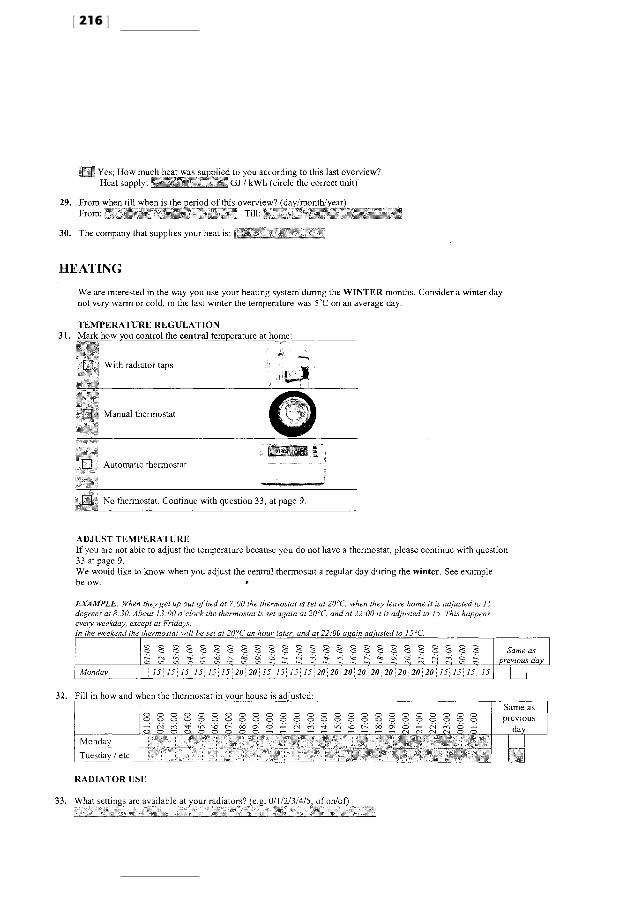
[ 216 ]
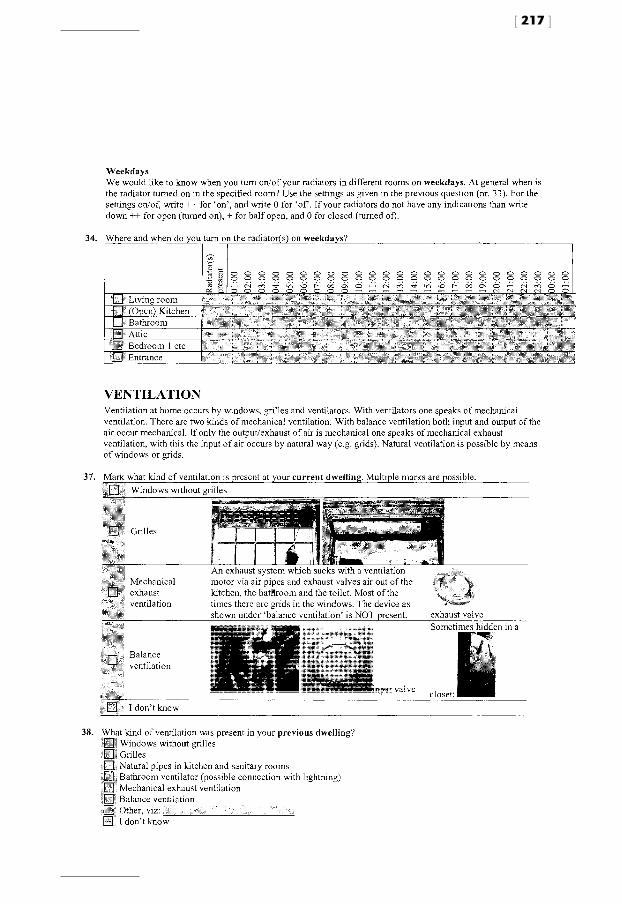
[ 217 ]

[ 218 ]
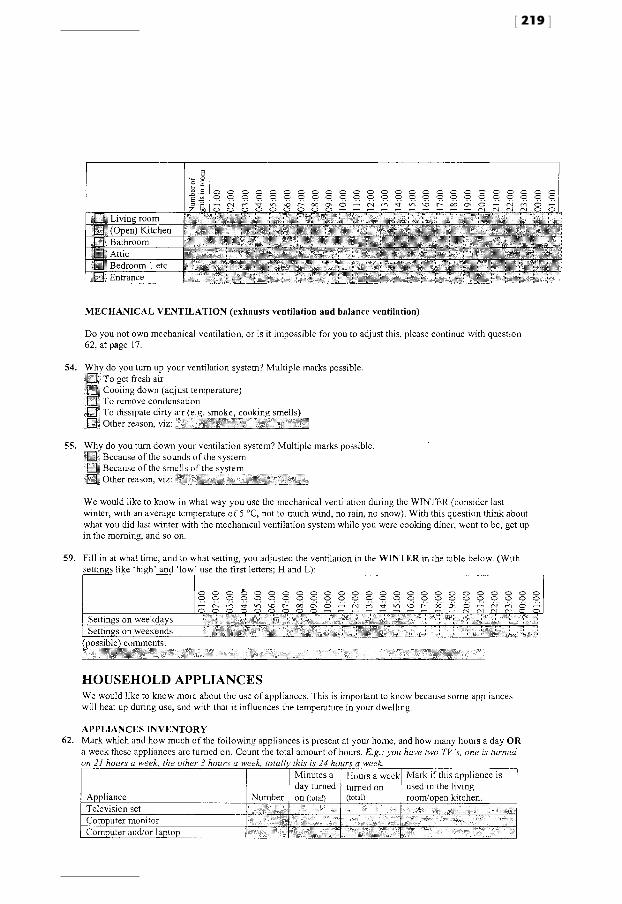
[ 219 ]

[ 220 ]
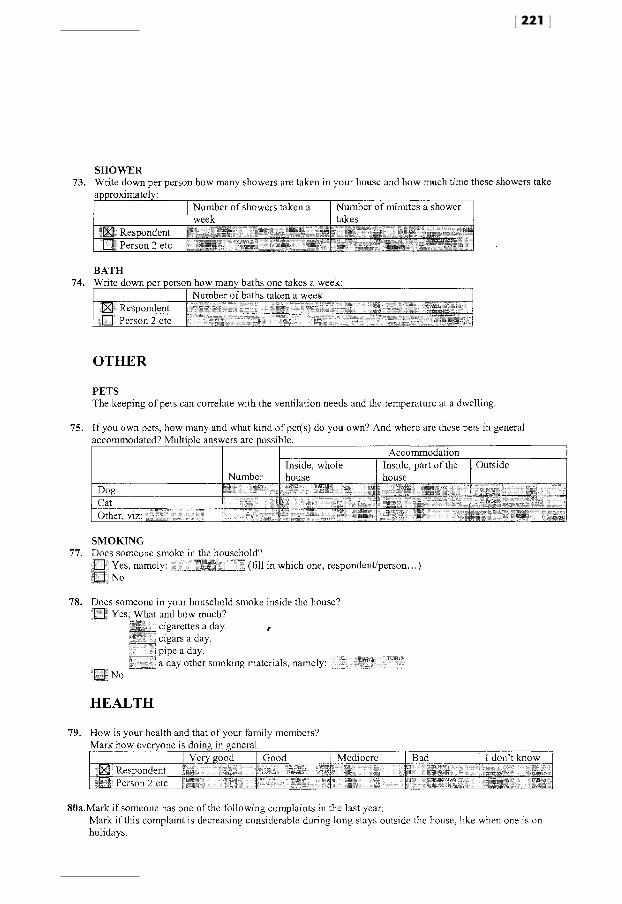
[ 221 ]
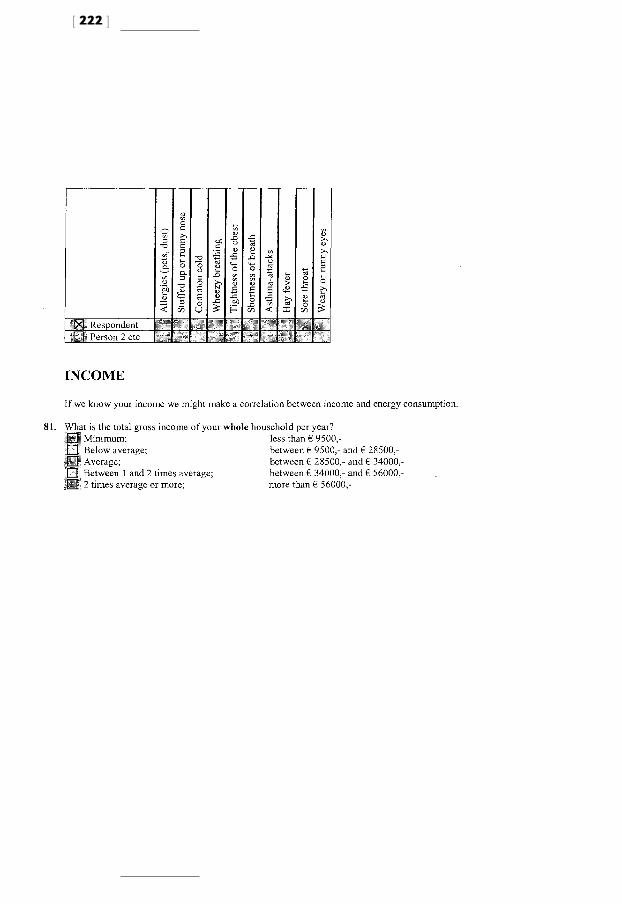
[ 222 ]

[ 223 ]

[ 224 ]
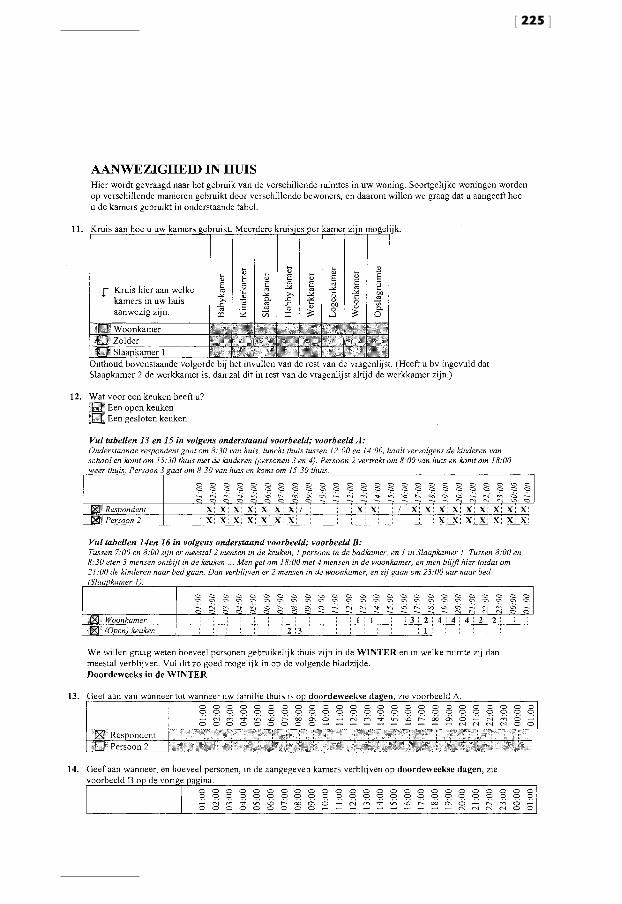
[ 225 ]

[ 226 ]

[ 227 ]
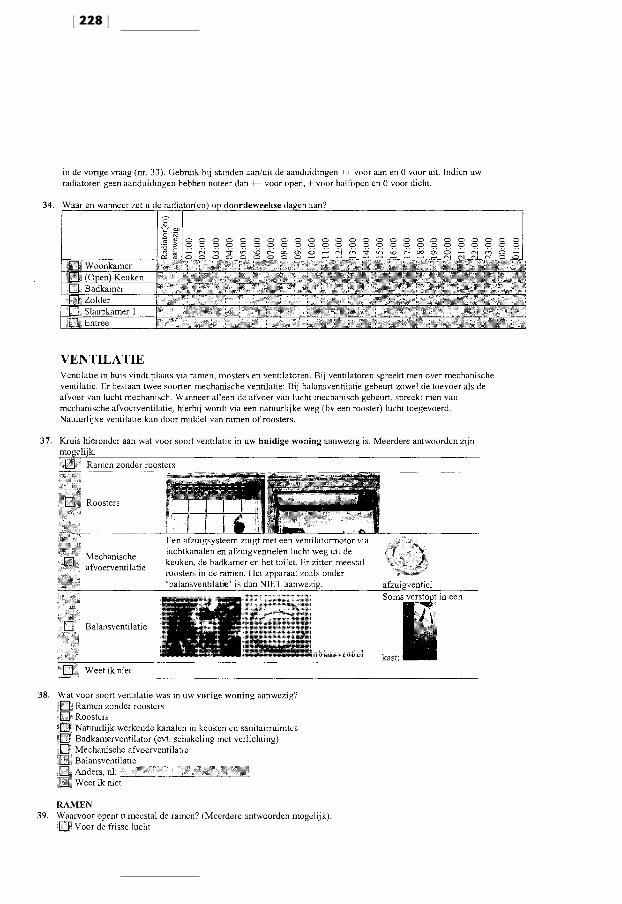
[ 228 ]
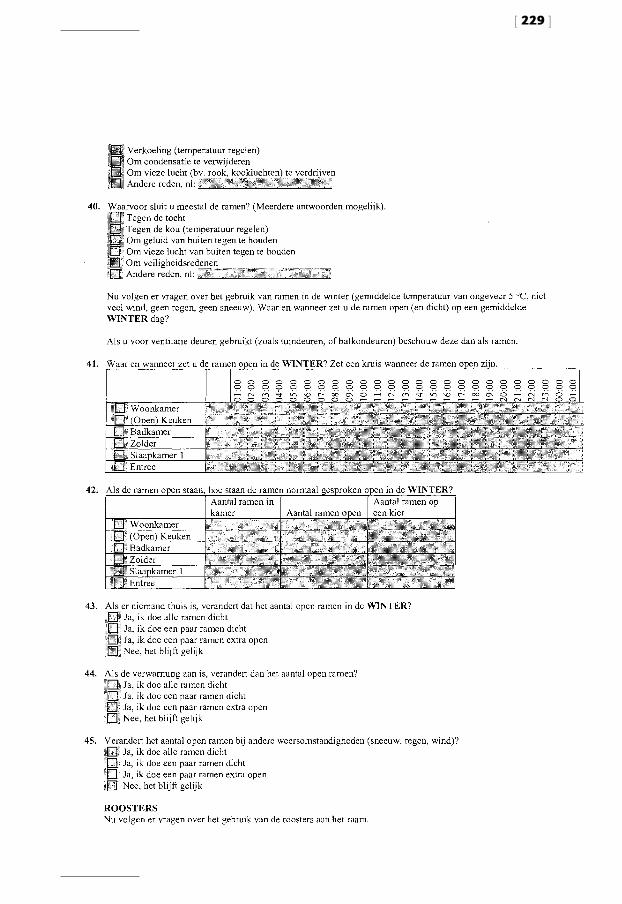
[ 229 ]
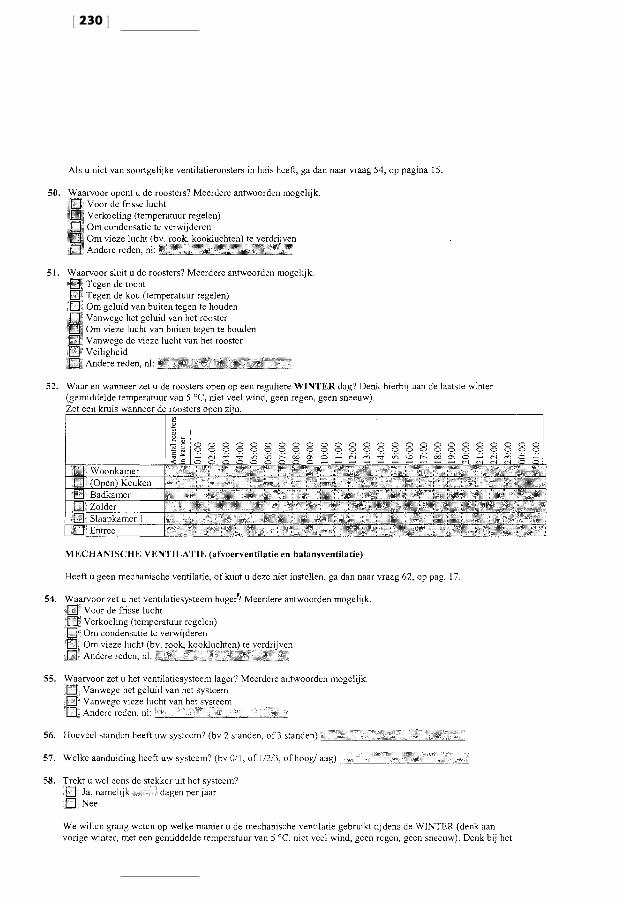
[ 230 ]
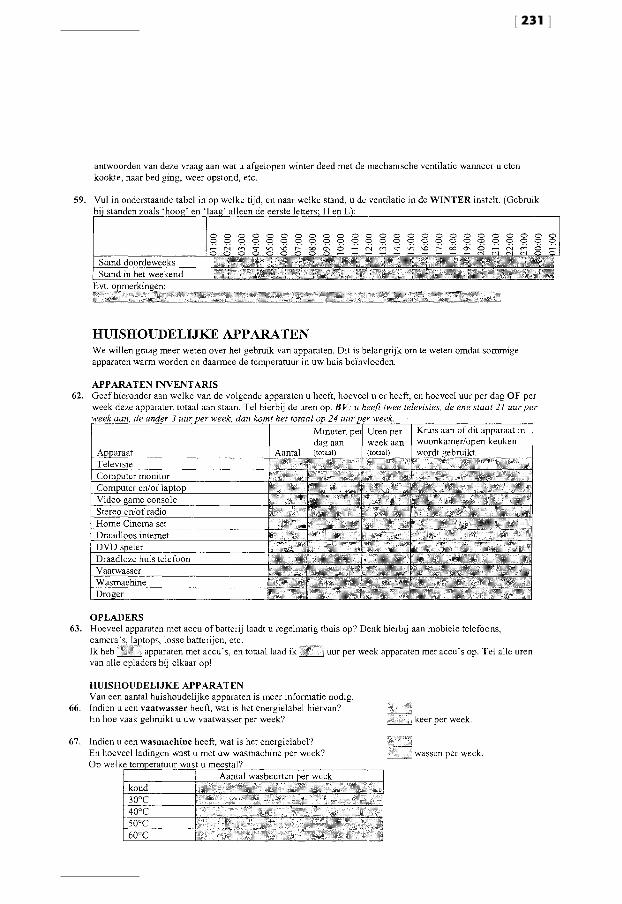
[ 231 ]

[ 232 ]

[ 233 ]

[ 234 ]
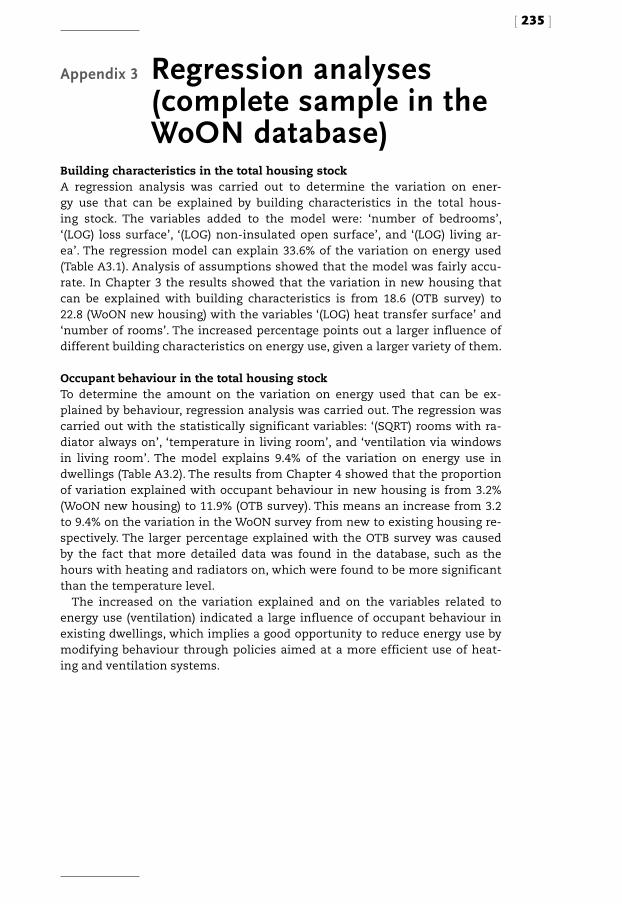
[ 235 ]
Appendix 3 Regression analyses (complete sample in the WoON database)
Building characteristics in the total housing stockA regression analysis was carried out to determine the variation on ener-gy use that can be explained by building characteristics in the total hous-ing stock. The variables added to the model were: ‘number of bedrooms’, ‘(LOG) loss surface’, ‘(LOG) non-insulated open surface’, and ‘(LOG) living ar-ea’. The regression model can explain 33.6% of the variation on energy used (Table A3.1). Analysis of assumptions showed that the model was fairly accu-rate. In Chapter 3 the results showed that the variation in new housing that can be explained with building characteristics is from 18.6 (OTB survey) to 22.8 (WoON new housing) with the variables ‘(LOG) heat transfer surface’ and ‘number of rooms’. The increased percentage points out a larger influence of different building characteristics on energy use, given a larger variety of them.
Occupant behaviour in the total housing stockTo determine the amount on the variation on energy used that can be ex-plained by behaviour, regression analysis was carried out. The regression was carried out with the statistically significant variables: ‘(SQRT) rooms with ra-diator always on’, ‘temperature in living room’, and ‘ventilation via windows in living room’. The model explains 9.4% of the variation on energy use in dwellings (Table A3.2). The results from Chapter 4 showed that the proportion of variation explained with occupant behaviour in new housing is from 3.2% (WoON new housing) to 11.9% (OTB survey). This means an increase from 3.2 to 9.4% on the variation in the WoON survey from new to existing housing re-spectively. The larger percentage explained with the OTB survey was caused by the fact that more detailed data was found in the database, such as the hours with heating and radiators on, which were found to be more significant than the temperature level.
The increased on the variation explained and on the variables related to energy use (ventilation) indicated a large influence of occupant behaviour in existing dwellings, which implies a good opportunity to reduce energy use by modifying behaviour through policies aimed at a more efficient use of heat-ing and ventilation systems.
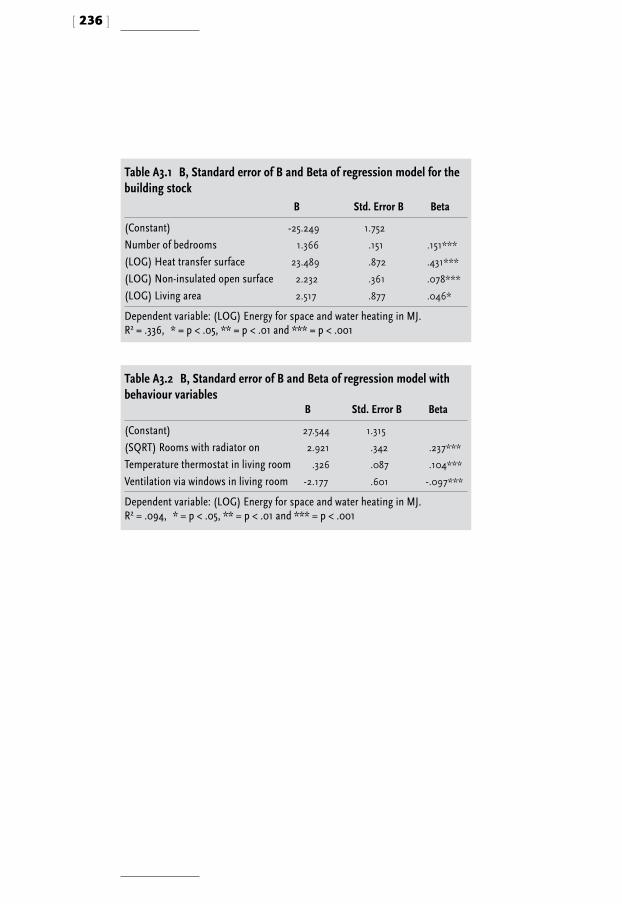
[ 236 ]
Table A3.1 B, Standard error of B and Beta of regression model for the building stock
B Std. Error B Beta
(Constant)Number of bedrooms(LOG) Heat transfer surface(LOG) Non-insulated open surface(LOG) Living area
-25.249
1.366
23.489
2.232
2.517
1.752
.151
.872
.361
.877
.151***
.431***
.078***
.046*
Dependent variable: (LOG) Energy for space and water heating in MJ.R2 = .336, * = p < .05, ** = p < .01 and *** = p < .001
Table A3.2 B, Standard error of B and Beta of regression model with behaviour variables
B Std. Error B Beta
(Constant)(SQRT) Rooms with radiator onTemperature thermostat in living roomVentilation via windows in living room
27.544
2.921
.326
-2.177
1.315
.342
.087
.601
.237***
.104***
-.097***
Dependent variable: (LOG) Energy for space and water heating in MJ.R2 = .094, * = p < .05, ** = p < .01 and *** = p < .001

[ 237 ]
Curriculum vitae
Olivia Guerra Santín was born in Toluca, México in 1980. She studied archi-tecture in the Faculty of Architecture and Design of the Universidad Autóno-ma del Estado de Mexico from 1997 to 2002. After concluding her studies, she moved to the Netherlands to obtain a masters degree in Urban Environmen-tal Management at the University of Wageningen, which she received in 2006. She wrote her MSc thesis on sustainable building in Mexico. From 2005 she carried out an internship at the OTB Research Institute for the Built Environ-ment at Delft University of Technology in the topic “health in the Life Cycle Assessment of buildings”. Olivia continued to do research at the OTB from 2006 to 2010. In 2010 she concluded her PhD research on the topics of energy consumption, occupant behaviour and building regulations.

[ 238 ]

Sustainable Urban Areas
1. Beerepoot, Milou, Renewable energy in energy performance regulations. A challenge for European member states in im-plementing the Energy Performance Building Directive
2004/202 pages/ISBN 90-407-2534-9 (978-90-407-2534-0)
2. Boon, Claudia and Minna Sunikka, Introduction to sustaina-ble urban renewal. CO2 reduction and the use of performance agreements: experience from The Netherlands
2004/153 pages/ISBN 90-407-2535-7 (978-90-407-2535-7)
3. Jonge, Tim de, Cost effectiveness of sustainable housing in-vestments
2005/196 pages/ISBN 90-407-2578-0 (978-90-407-2578-4)
4. Klunder, Gerda, Sustainable solutions for Dutch housing. Re-ducing the environmental impact of new and existing houses
2005/163 pages/ISBN 90-407-2584-5 (978-407-2584-5)
5. Bots, Pieter, Ellen van Bueren, Ernst ten Heuvelhof and Igor Mayer, Communicative tools in sustainable urban planning and building
2005/100 pages/ISBN 90-407-2595-0 (978-90-407-2595-1)
6. Kleinhans, R.J., Sociale implicaties van herstructurering en herhuisvesting
2005/371 pages/ISBN 90-407-2598-5 (978-90-407-2598-2)
7. Kauko, Tom, Comparing spatial features of urban housing markets. Recent evidence of submarket formation in metro-politan Helsinki and Amsterdam
2005/163 pages/ISBN 90-407-2618-3 (978-90-407-2618-7)
8. Kauko, Tom, Between East and West. Housing markets, prop-erty prices and locational preferences in Budapest from a comparative perspective
2006/142 pages/ISBN 1-58603-679-3 (978-1-58603-679-9)
9. Sunikka, Minna Marjaana, Policies for improving energy effi-ciency in the European housing stock
2006/251 pages/ISBN 1-58603-649-1 (978-1-58603-649-2)
10. Hasselaar, Evert, Health performance of housing. Indicators and tools
2006/298 pages/ISBN 1-58603-689-0 (978-1-58603-689-8)
11. Gruis, Vincent, Henk Visscher and Reinout Kleinhans (eds.), Sustainable neighbourhood transformation
2006/158 pages/ISBN 1-58603-718-8 (978-1-58603-718-5)
12. Trip, Jan Jacob, What makes a city? Planning for ‘quality of place’ The case of high-speed train station area redevelopment
2007/256 pages/ISBN 978-1-58603-716-1
13. Meijers, Evert, Synergy in polycentric urban regions. Comple-mentarity, organising capacity and critical mass
2007/182 pages/ISBN 978-1-58603-724-6
14. Chen, Yawei, Shanghai Pudong. Urban development in an era of global-local interaction
2007/368 pages/ISBN 978-1-58603-747-5
15. Beerepoot, Milou, Energy policy instruments and technical change in the residential building sector
2007/238 pages/ISBN 978-1-58603-811-3
16. Guerra Santin, Olivia, Environmental indicators for building design. Development and application on Mexican dwellings
2008/124 pages/ISBN 978-1-58603-894-6
17. Van Mossel, Johan Hendrik, The purchasing of maintenance service delivery in the Dutch social housing sector. Optimis-ing commodity strategies for delivering maintenance services to tenants
2008/283 pages/ISBN 978-1-58603-877-9
18. Waterhout, Bas, The institutionalisation of European spatial planning
2008/226 pages/ISBN 978-1-58603-882-3
19. Koopman, Marnix, Henk-Jan van Mossel and Ad Straub, Per-formance measurement in the Dutch social housing sector
2008/140 pages/ISBN 978-58603-962-2
20 Pal, Anirban, Planning from the bottom up. Democratic de-centralisation in action
2008/126 pages/ISBN 978-58603-910-3
21 Neuteboom, Peter, On the rationality of borrowers’ behaviour. Comparing risk attitudes of homeowners
2008/112 pages/ISBN 978-58603-918-9
22. Itard, Laure and Frits Meijer, Towards a sustainable northern European housing stock. Figures, Facts and future
2008/226 pages/ISBN 978-58603-977-6
23. Janssen-Jansen, Leonie, Marjolein Spaans and Menno van der Veen, New instruments in spatial planning. An international perspective on non-financial compensation
2008/258 pages/ISBN 978-1-58603-978-3
24. Coolen, Henny, The meaning of dwelling features. Conceptual and methodological issues
2008/164 pages/ISBN 978-58603-955-4
25. Van Rij, Evelien, Improving institutions for green landscapes in metropolitan areas
2008/226 pages/ISBN 978-58603-944-8
26. Van der Veen, Menno, Contracting for better places. A rela-tional analysis of development agreements in urban develop-ment projects
2009/394 pages/ISBN 978-1-60750-005-6
27. Meesters, Janine, The meaning of activities in the dwelling and residential environment. A structural approach in peo-ple-environment relations
2009/284 pages/ISBN 978-1-60750-012-4
28. Lux, Martin, Housing policy and housing finance in the Czech Republic during transition. An example of the schism be-tween the still-living past and the need of reform
2009/300 pages/ISBN 978-1-60750-058-2
29. Maat, Kees, Built environment and car travel. Analyses of in-terdependencies
2009/174 pages/ISBN 978-1-60750-064-3
30. Van Bueren, Ellen, Greening governance. An evolutionary ap-proach to policy-making for a sustainable built environment
2009/326 pages/ISBN 978-60750-078-0
31. Makasa, Paul, The 1996 Zambia National Housing Policy 2010/500 pages/ISBN 978-1-60750-566-2(print)/ 978-1-60750-
567-9 (online)
32. Eijk, Gwen van, Unequal networks. Spatial segregation, rela-tionships and inequality in the city
2010/356 pages/ISBN 978-1-60750-555-6 (print)/ISBN 978-1-60750-556-3 (online)
33. Guerra Santin, Olivia, Actual energy consumption in dwell-ings. The effect of energy performance regulations and occu-pant behaviour
2010/252 pages/ISBN 978-1-60750-650-8(print)/ISBN 978-1-60750-651-5 (online)
34. Doff, Wenda, Puzzling neighbourhood effects. Spatial selec-tion, ethnic concentration and neighbourhood impacts
2010/190 pages/ ISBN 978-1-60750-648-5 (print)/ 978-1-60750-642 (online)
Copies can be ordered at www.dupress.nl.

ISBN 978-1-60750-650-8 (print)ISSN 1574-6410 (print)
ISBN 978-1-60750-651-5 (online)ISSN 1879-8330 (online)
Residential buildings have continuously improved in energy efficiency, partly as a consequence of the introduction of energy regulations in many countries. Although better thermal properties and systems efficiency have lowered energy consumption for space heating in recent decades, substantial differences in energy consumption in similar dwellings are still being observed. These differences in consumption are
thought to be caused by differences in occupancy patterns, by quality of construction and by rebound effects.
This research addresses the effect of energy performance regulations and occupant behaviour on energy consumption for space and water heating in dwellings built after the introduction of the energy performance regulations in the Netherlands.
The results of this research show that improving the energy efficiency of buildings alone is not enough to decrease that energy consumption. The large
differences found in the use of dwellings indicate that, especially in energy efficient houses, occupant behaviour provides an opportunity for further reductions in the energy consumption for space heating which could boost the efforts to
conserve energy worldwide.
Delft Centre for Sustainable Urban Areas carries out research in the field of the built environment and is one of the multidisciplinary research centres at TU Delft.
The Delft Research Centres bundle TU Delft’s excellent research and provide integrated solutions for today’s and tomorrow’s problems in society.
OTB Research Institute for Housing, Urban and Mobility Studies and the Faculties of Architecture, Technology, Policy and Management and Civil Engineering and
Geosciences participate in this Delft Research Centre.
DELFT UNIVERSITY PRESS IS AN IMPRINT OF IOS PRESS